UNITED STATES
SECURITIES AND EXCHANGE COMMISSION
Washington, D.C. 20549
FORM N-CSR
CERTIFIED SHAREHOLDER REPORT OF REGISTERED MANAGEMENT
INVESTMENT COMPANIES
Investment Company Act file number: 811-04264
Name of Fund: BlackRock California Municipal Opportunities Fund of BlackRock California Municipal Series Trust
Fund Address: 100 Bellevue Parkway, Wilmington, DE 19809
Name and address of agent for service: John M. Perlowski, Chief Executive Officer, BlackRock California Municipal Opportunities Fund of BlackRock California Municipal Series Trust, 55 East 52nd Street, New York, NY 10055
Registrant’s telephone number, including area code: (800) 441-7762
Date of fiscal year end: 05/31/2020
Date of reporting period: 05/31/2020
Item 1 – Report to Stockholders
| | |
 | | MAY 31, 2020 |
BlackRock California Municipal Series Trust
| · | | BlackRock California Municipal Opportunities Fund |
BlackRock Multi-State Municipal Series Trust
| · | | BlackRock New Jersey Municipal Bond Fund |
| · | | BlackRock Pennsylvania Municipal Bond Fund |
BlackRock Municipal Series Trust
| · | | BlackRock Strategic Municipal Opportunities Fund |
Beginning on January 1, 2021, as permitted by regulations adopted by the Securities and Exchange Commission, paper copies of each Fund’s shareholder reports will no longer be sent by mail, unless you specifically request paper copies of the reports from BlackRock or from your financial intermediary, such as a broker-dealer or bank. Instead, the reports will be made available on a website, and you will be notified by mail each time a report is posted and provided with a website link to access the report.
You may elect to receive all future reports in paper free of charge. If you hold accounts directly with BlackRock, you can call (800) 441-7762 to inform BlackRock that you wish to continue receiving paper copies of your shareholder reports. If you hold accounts through a financial intermediary, you can follow the instructions included with this disclosure, if applicable, or contact your financial intermediary to request that you continue to receive paper copies of your shareholder reports. Please note that not all financial intermediaries may offer this service. Your election to receive reports in paper will apply to all funds advised by BlackRock Advisors, LLC, BlackRock Fund Advisors or their affiliates, or all funds held with your financial intermediary, as applicable.
If you already elected to receive shareholder reports electronically, you will not be affected by this change and you need not take any action. You may elect to receive electronic delivery of shareholder reports and other communications by: (i) accessing the BlackRock website at blackrock.com/edelivery and logging into your accounts, if you hold accounts directly with BlackRock, or (ii) contacting your financial intermediary, if you hold accounts through a financial intermediary. Please note that not all financial intermediaries may offer this service.
|
| Not FDIC Insured • May Lose Value • No Bank Guarantee |
The Markets in Review
Dear Shareholder,
The last 12 months have been a time of sudden change in global financial markets, as a long period of growth and positive returns was interrupted in early 2020 by the emergence and spread of the coronavirus. For the first part of the reporting period, U.S. equities and bonds both delivered impressive returns, despite fears and doubts about the economy that were ultimately laid to rest with unprecedented monetary stimulus and a sluggish yet resolute performance from the U.S. economy. But as the threat from the coronavirus became more apparent throughout February and March 2020, leading countries around the world took economically disruptive countermeasures, causing equity prices to fall sharply. While markets have since recovered some of these losses as countries around the world begin reopening, there is still significant uncertainty surrounding the long-term impact of the pandemic on the global economy.
Returns for most securities were robust for the first part of the reporting period, as investors began to realize that the U.S. economy was maintaining the modest yet steady growth that had characterized this economic cycle. However, once stay-at-home orders and closures of non-essential businesses became widespread, many workers were laid off and unemployment claims spiked. With large portions of the global economy on hold, all types of international equities ended the 12-month reporting period with negative performance, while in the United States large-capitalization stocks, which investors saw as more resilient than smaller companies, delivered solid returns.
The performance of different types of fixed-income securities diverged substantially due to a reduced investor appetite for risk. Treasuries benefited from the risk-off environment, and posted healthy returns, as the 10-year U.S. Treasury yield (which is inversely related to bond prices) fell to an all-time low. Investment-grade corporate bonds also delivered a solid return, while high-yield corporate returns were muted due to credit concerns.
The U.S. Federal Reserve (the “Fed”) reduced interest rates three times in 2019, to support slowing economic growth. After the coronavirus outbreak, the Fed instituted two emergency rate cuts, pushing short-term interest rates close to zero. To stabilize credit markets, the Fed also announced a new bond-buying program, as did several other central banks around the world, including the European Central Bank and the Bank of Japan.
Looking ahead, while coronavirus-related disruption is certain to hurt worldwide economic growth, the global expansion is likely to continue once the impact of the outbreak subsides. We are encouraged by the strong coordinated monetary and fiscal response that is underway, both in the United States and abroad. However, there remains a risk that policy fatigue and recent improvements in economic indicators could lead lawmakers to retreat from needed stimulus measures too soon.
Overall, we favor a neutral stance toward risk, given the uncertainty surrounding the path to recovery. Among equities, we see an advantage in U.S. stocks compared to other developed markets, given the diversity of the U.S. economy and the impressive scope of monetary and fiscal stimulus. In bonds, the swift action taken by the world’s central banks means there are attractive opportunities in credit, and we expect credit spreads to narrow as markets stabilize. Both U.S. Treasuries and sustainable investments can help provide portfolio resilience, and the disruption created by the coronavirus appears to be accelerating the shift toward sustainable investments.
In this environment, our view is that investors need to think globally, extend their scope across a broad array of asset classes, and be nimble as market conditions change. We encourage you to talk with your financial advisor and visit blackrock.com for further insight about investing in today’s markets.
Sincerely,

Rob Kapito
President, BlackRock Advisors, LLC

Rob Kapito
President, BlackRock Advisors, LLC
| | | | |
| Total Returns as of May 31, 2020 |
| | | 6-month | | 12-month |
U.S. large cap equities
(S&P 500® Index) | | (2.10)% | | 12.84% |
U.S. small cap equities
(Russell 2000® Index) | | (13.53) | | (3.44) |
International equities
(MSCI Europe, Australasia, Far East Index) | | (11.48) | | (2.81) |
Emerging market equities
(MSCI Emerging Markets Index) | | (9.69) | | (4.39) |
3-month Treasury bills
(ICE BofA 3-Month U.S. Treasury Bill Index) | | 0.73 | | 1.84 |
U.S. Treasury securities
(ICE BofA 10-Year U.S. Treasury Index) | | 11.55 | | 15.87 |
U.S. investment grade bonds
(Bloomberg Barclays U.S. Aggregate Bond Index) | | 5.40 | | 9.42 |
Tax-exempt municipal bonds
(S&P Municipal Bond Index) | | 1.52 | | 3.87 |
U.S. high yield bonds
(Bloomberg Barclays U.S. Corporate High Yield 2% Issuer Capped Index) | | (2.84) | | 1.31 |
| Past performance is no guarantee of future results. Index performance is shown for illustrative purposes only. You cannot invest directly in an index. |
| | |
| 2 | | THIS PAGEISNOT PARTOF YOUR FUND REPORT |
Table of Contents

| | |
| Fund Summary as of May 31, 2020 | | BlackRock California Municipal Opportunities Fund |
Investment Objective
BlackRock California Municipal Opportunities Fund’s (the “Fund”) investment objective is to provide shareholders with income exempt from Federal and California income taxes.
Portfolio Management Commentary
How did the Fund perform?
For the 12-month period ended May 31, 2020, the Fund underperformed its primary benchmark, the S&P® Municipal Bond Index, and its secondary benchmark, the S&P® California Municipal Bond Index. The following discussion of relative performance pertains to the S&P® California Municipal Bond Index.
What factors influenced performance?
Municipal bonds performed well for most of the period thanks to accommodative Fed policy and favorable supply-and-demand trends in the market. This supportive backdrop changed abruptly in March once the spread of the coronavirus pandemic led to travel restrictions, business closures and stay-at-home orders. The prospect of a sharp economic downturn caused significant, broad-based weakness across the financial markets. Tax-exempt issues were hard hit in the sell-off, as investors withdrew cash from municipal bond funds and limited market liquidity inhibited efficient pricing. Municipal bonds subsequently recovered in April and May following aggressive stimulus from the Fed and U.S. Congress, allowing the sector to post a gain for the full 12 months.
California municipal bonds outperformed the national market due to strong demand from both retail and institutional investors. The high tax regime for state residents, together with the anticipation of potential higher taxes nationally to finance growing deficits, helped make California municipal bonds an attractive investment vehicle. Despite concerns about the coronavirus pandemic, California’s diverse economic base gave investors confidence that the state’s debt service remained safely covered.
The Fund’s use of U.S. Treasury futures to manage interest rate risk proved detrimental to Fund performance given the breakdown in correlation between the Treasury and municipal markets in the first quarter of 2020. While municipal bond yields rose due to a substantial increase in yield spreads, Treasury yields declined amid investors’ “flight to quality.” (Prices and yields move in opposite directions.)
The Fund’s allocation to non-investment grade (high yield) issues performed poorly late in the period as coronavirus concerns caused investors to question municipalities’ ability to service debt in a time of economic stress. The Fund’s above-average cash position, which prevented the Fund from earning the higher income it would have with a more fully invested posture, also detracted from performance.
On the positive side, positions in higher-quality, longer-maturity securities outperformed. The Fund also benefited from an overweight in utilities, as essential-service revenue bonds held up best once the economic concerns associated with coronavirus became the primary driver of market performance. The Fund’s use of leverage, which helped generate additional yield, was a further positive.
Describe recent portfolio activity.
The Fund aims to deliver a balance of competitive total return and tax-free income using an active strategy designed to capitalize on credit, yield curve and interest rate trends.
The investment adviser gradually increased cash reserves throughout 2019 as valuations became less attractive. The Fund retained a cash position above its historical average at the end of May, as yield spreads in California’s market had returned to narrow levels following the rally in the final three months of the period. For the 12-month period, the cash position did not have a material impact on the Fund’s performance. Despite the elevated cash reserve, the Fund’s duration relative to its benchmark was still at a neutral posture.
The investment adviser used the market’s strength late in the period to reduce duration (interest-rate sensitivity) and lock in higher prices on certain positions. The investment adviser raised the Fund’s weighting in high yield debt to approximately 16% in the first half 2019 and kept the allocation close to that level for the remainder of the period.
Describe portfolio positioning at period end.
The Fund was positioned in a defensive manner. Its duration was 5.6 years when risk-management strategies were included, compared with 6.1 years for the index, due in part to the managers’ decision to rotate toward shorter-maturity debt. The Fund also continued to pursue risk-management strategies with respect to interest rates given the low absolute level of yields. The investment adviser maintained a high-quality bias, with an average credit rating of AA.
Leverage stood at about 5% at the end of May, compared to a high of 7.5% mid-way through the period. The portfolio’s weighting in taxable bonds remained stable at approximately 5%.
The views expressed reflect the opinions of BlackRock as of the date of this report and are subject to change based on changes in market, economic or other conditions. These views are not intended to be a forecast of future events and are no guarantee of future results.
| | |
| 4 | | 2020 BLACKROCK ANNUAL REPORTTO SHAREHOLDERS |
| | |
| Fund Summary as of May 31, 2020 (continued) | | BlackRock California Municipal Opportunities Fund |
TOTAL RETURN BASED ON A $10,000 INVESTMENT
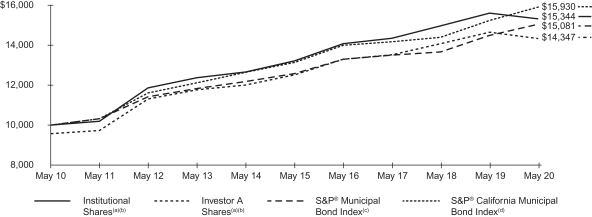
| (a) | Assuming maximum sales charges, if any, transaction costs and other operating expenses, including advisory fees. Institutional Shares do not have a sales charge. See “About Fund Performance” on page 14 for more information about the performance of Investor A Shares. |
| (b) | Under normal circumstances, the Fund will invest at least 80% of its assets in California municipal bonds. The Fund’s returns prior to January 26, 2015 are the returns of the Fund when it followed different investment strategies under the name BlackRock California Municipal Bond Fund. |
| (c) | The S&P® Municipal Bond Index is composed of bonds held by managed municipal bond fund customers of Standard & Poor’s Securities Pricing, Inc. that are priced daily. Bonds in the S&P® Municipal Bond Index must have an outstanding par value of at least $2 million and a remaining maturity of not less than one month. |
| (d) | The S&P® California Municipal Bond Index includes all California bonds in the S&P® Municipal Bond Index. |
Performance Summary for the Period Ended May 31, 2020
| | | | | | | | | | | | | | | | | | | | | | | | | | | | | | | | | | | | | | | | | | | | |
| | | | | | | | | | | | Average Annual Total Returns (a)(b) | |
| | | | | | | | | | | | 1 Year | | | | | | 5 Years | | | | | | 10 Years | |
| | | Standardized 30-Day Yields | | | Unsubsidized 30-Day Yields | | | 6-Month Total Returns | | | w/o sales charge | | | w/sales charge | | | | | | w/o sales charge | | | w/sales charge | | | | | | w/o sales charge | | | w/sales charge | |
Institutional | | | 1.86 | % | | | 1.84 | % | | | (3.47 | )% | | | (1.85 | )% | | | N/A | | | | | | | | 3.00 | % | | | N/A | | | | | | | | 4.37 | % | | | N/A | |
Investor A | | | 1.54 | | | | 1.52 | | | | (3.67 | ) | | | (2.18 | ) | | | (6.33 | )% | | | | | | | 2.74 | | | | 1.85 | % | | | | | | | 4.13 | | | | 3.67 | % |
Investor A1 | | | 1.70 | | | | 1.68 | | | | (3.59 | ) | | | (2.01 | ) | | | N/A | | | | | | | | 2.89 | | | | N/A | | | | | | | | 4.28 | | | | N/A | |
Investor C | | | 0.88 | | | | 0.86 | | | | (3.95 | ) | | | (2.82 | ) | | | (3.79 | ) | | | | | | | 1.98 | | | | 1.98 | | | | | | | | 3.36 | | | | 3.36 | |
Class K | | | 1.90 | | | | 1.87 | | | | (3.52 | ) | | | (1.80 | ) | | | N/A | | | | | | | | 3.03 | | | | N/A | | | | | | | | 4.39 | | | | N/A | |
S&P® Municipal Bond Index | | | — | | | | — | | | | 1.52 | | | | 3.87 | | | | N/A | | | | | | | | 3.68 | | | | N/A | | | | | | | | 4.19 | | | | N/A | |
S&P® California Municipal Bond Index | | | — | | | | — | | | | 1.98 | | | | 4.40 | | | | N/A | | | | | | | | 3.91 | | | | N/A | | | | | | | | 4.77 | | | | N/A | |
| | (a) | Assuming maximum sales charges, if any. Average annual total returns with and without sales charges reflect reductions for distribution and service fees. See “About Fund Performance” on page 14 for a detailed description of share classes, including any related sales charges and fees, and how performance was calculated for certain share classes. | |
| | (b) | Under normal circumstances, the Fund will invest at least 80% of its assets in California municipal bonds. The Fund’s returns prior to January 26, 2015 are the returns of the Fund when it followed different investment strategies under the name BlackRock California Municipal Bond Fund. | |
N/A — Not applicable as share class and index do not have a sales charge.
Past performance is not indicative of future results.
Performance results may include adjustments made for financial reporting purposes in accordance with U.S. generally accepted accounting principles.
| | |
| Fund Summary as of May 31, 2020 | | BlackRock New Jersey Municipal Bond Fund |
Investment Objective
BlackRock New Jersey Municipal Bond Fund’s (the “Fund”) investment objective is to provide shareholders with income exempt from Federal income tax and New Jersey personal income taxes.
Portfolio Management Commentary
How did the Fund perform?
For the 12-month period ended May 31, 2020, the Fund underperformed both its primary benchmark, the S&P® Municipal Bond Index, and its secondary benchmark, the Custom New Jersey Index. The following discussion of relative performance pertains to the Custom New Jersey Index.
What factors influenced performance?
Municipal bonds performed well for most of the period thanks to accommodative Fed policy and favorable supply-and-demand trends in the market. This supportive backdrop changed abruptly in March once the spread of the coronavirus pandemic led to travel restrictions, business closures and stay-at-home orders. The prospect of a sharp economic downturn caused significant, broad-based weakness across the financial markets. Tax-exempt issues were hard hit in the sell-off, as investors withdrew cash from municipal bond funds and low market liquidity inhibited efficient pricing. Municipal bonds subsequently recovered in April and May following aggressive stimulus from the Fed and U.S. Congress, allowing the sector to post a gain for the full 12 months.
New Jersey municipal bonds lagged the national index. The state’s revenue had exceeded spending prior to the pandemic, providing a cushion in the form of rising reserves. However, the loss of revenue resulting from the pandemic is certain to put stress on the state’s budget and pressure funding for education, infrastructure and underfunded pension liabilities. New Jersey reported a 14% decline in all major revenues in May, and Governor Murphy has said the state may have to cut half of its 400,000 public employees if the federal government doesn’t help make up a $10.1 billion revenue shortage through June 2021.
The Fund’s use of U.S. Treasury futures to manage interest rate risk proved detrimental to Fund performance given the breakdown in correlation between the Treasury and municipal markets in the first quarter of 2020. While municipal bond yields rose due to a substantial increase in yield spreads, Treasury yields declined amid investors’ “flight to quality.” (Prices and yields move in opposite directions.) An underweight in the education sector also played a role in the Fund’s underperformance, as did exposure to the high yield segment of the market.
On the positive side, the Fund benefited from its holdings in higher-quality bonds, particularly during the latter half of the period. Positions in the health care, corporate and state tax-backed sectors also added value. Pre-refunded bonds, which tend to be higher-quality securities with attractive income characteristics, further contributed to results.
Describe recent portfolio activity.
The Fund reduced its allocation to the higher education and airline-related sectors, both of which faced adverse effects from the coronavirus.
The investment adviser sought to capitalize on market turbulence related to the pandemic by raising the Fund’s allocation to the hospital sector. In addition, the portfolio increased its weightings in the state tax-backed sector through the addition of Puerto Rico issues. The investment adviser continued to favor the Puerto Rico Sales Tax Financing Corporation and general obligation bonds, the latter of which were recently settled at recovery rates significantly higher than current market prices. The investment adviser also raised the Fund’s cash weighting through sales and holdings in bonds that matured.
Describe portfolio positioning at period end.
The Fund maintained an underweight in state tax-backed securities due to the sector’s high benchmark weighting and the investment adviser’s long-standing focus on diversification and managing concentration risk. The Fund retained overweights in the health care, corporate and education sectors. The Fund continued to emphasize careful security selection with a focus on higher-quality sectors. Specifically, it preferred issuers whose durable revenues should help them navigate the effects of the pandemic.
The portfolio’s duration (interest-rate sensitivity) remained above that of the benchmark. The Fund focused the majority of its purchases on longer-term bonds to capitalize on their yield advantage.
The views expressed reflect the opinions of BlackRock as of the date of this report and are subject to change based on changes in market, economic or other conditions. These views are not intended to be a forecast of future events and are no guarantee of future results.
| | |
| 6 | | 2020 BLACKROCK ANNUAL REPORTTO SHAREHOLDERS |
| | |
| Fund Summary as of May 31, 2020 (continued) | | BlackRock New Jersey Municipal Bond Fund |
TOTAL RETURN BASED ON A $10,000 INVESTMENT
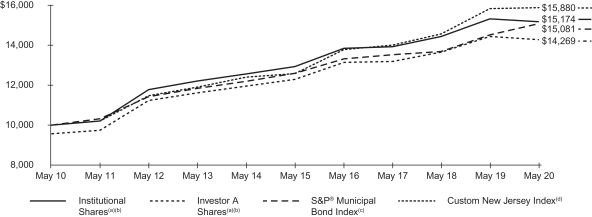
| (a) | Assuming maximum sales charges, if any, transaction costs and other operating expenses, including advisory fees. Institutional Shares do not have a sales charge. See “About Fund Performance” on page 14 for more information about the performance of Investor A Shares. |
| (b) | The Fund invests primarily in a portfolio of long-term investment grade New Jersey municipal bonds. |
| (c) | The S&P® Municipal Bond Index is composed of bonds held by managed municipal bond fund customers of Standard & Poor’s Securities Pricing, Inc. that are priced daily. Bonds in the S&P® Municipal Bond Index must have an outstanding par value of at least $2 million and a remaining maturity of not less than one month. |
| (d) | The Custom New Jersey Index is a customized benchmark that reflects the returns of the S&P® New Jersey Municipal Bond Index for periods prior to January 1, 2013, and the returns of only those New Jersey bonds in the S&P® New Jersey Municipal Bond Index that have maturities greater than 5 years for periods subsequent to January 1, 2013. |
Performance Summary for the Period Ended May 31, 2020
| | | | | | | | | | | | | | | | | | | | | | | | | | | | | | | | | | | | | | | | | | | | |
| | | | | | | | | | | | Average Annual Total Returns (a) | |
| | | | | | | | | | | | 1 Year | | | | | | 5 Years | | | | | | 10 Years | |
| | | Standardized 30-Day Yields | | | Unsubsidized 30-Day Yields | | | 6-Month Total Returns | | | w/o sales charge | | | w/sales charge | | | | | | w/o sales charge | | | w/sales charge | | | | | | w/o sales charge | | | w/sales charge | |
Institutional | | | 2.68 | % | | | 2.52 | % | | | (2.93 | )% | | | (0.89 | )% | | | N/A | | | | | | | | 3.26 | % | | | N/A | | | | | | | | 4.26 | % | | | N/A | |
Service | | | 2.36 | | | | 2.22 | | | | (3.05 | ) | | | (1.13 | ) | | | N/A | | | | | | | | 3.04 | | | | N/A | | | | | | | | 4.07 | | | | N/A | |
Investor A | | | 2.34 | | | | 2.23 | | | | (3.04 | ) | | | (1.13 | ) | | | (5.33 | )% | | | | | | | 3.04 | | | | 2.15 | % | | | | | | | 4.07 | | | | 3.62 | % |
Investor A1 | | | 2.49 | | | | 2.38 | | | | (2.97 | ) | | | (0.97 | ) | | | N/A | | | | | | | | 3.19 | | | | N/A | | | | | | | | 4.22 | | | | N/A | |
Investor C | | | 1.71 | | | | 1.59 | | | | (3.41 | ) | | | (1.87 | ) | | | (2.83 | ) | | | | | | | 2.29 | | | | 2.29 | | | | | | | | 3.28 | | | | 3.28 | |
Class K | | | 2.75 | | | | 2.61 | | | | (2.99 | ) | | | (0.93 | ) | | | N/A | | | | | | | | 3.27 | | | | N/A | | | | | | | | 4.26 | | | | N/A | |
S&P® Municipal Bond Index | | | — | | | | — | | | | 1.52 | | | | 3.87 | | | | N/A | | | | | | | | 3.68 | | | | N/A | | | | | | | | 4.19 | | | | N/A | |
Custom New Jersey Index | | | — | | | | — | | | | (2.65 | ) | | | 0.30 | | | | N/A | | | | | | | | 4.78 | | | | N/A | | | | | | | | 4.73 | | | | N/A | |
| | (a) | Assuming maximum sales charges, if any. Average annual total returns with and without sales charges reflect reductions for distribution and service fees. See “About Fund Performance” on page 14 for a detailed description of share classes, including any related sales charges and fees, and how performance was calculated for certain share classes. | |
N/A — Not applicable as share class and index do not have a sales charge.
Past performance is not indicative of future results.
Performance results may include adjustments made for financial reporting purposes in accordance with U.S. generally accepted accounting principles.
| | |
| Fund Summary as of May 31, 2020 | | BlackRock Pennsylvania Municipal Bond Fund |
Investment Objective
BlackRock Pennsylvania Municipal Bond Fund’s (the “Fund”) investment objective is to provide shareholders with income exempt from Federal income tax and Pennsylvania personal income taxes.
Portfolio Management Commentary
How did the Fund perform?
For the 12-month period ended May 31, 2020, the Fund underperformed both its primary benchmark, the S&P® Municipal Bond Index, and its secondary benchmark, the Custom Pennsylvania Index. The following discussion of relative performance pertains to the Custom Pennsylvania Index.
What factors influenced performance?
Municipal bonds performed well for most of the period thanks to accommodative Fed policy and favorable supply-and-demand trends in the market. This supportive backdrop changed abruptly in March once the spread of the coronavirus pandemic led to travel restrictions, business closures and stay-at-home orders. The prospect of a sharp economic downturn caused significant, broad-based weakness across the financial markets. Tax-exempt issues were hard hit in the sell-off, as investors withdrew cash from municipal bond funds and low market liquidity inhibited efficient pricing. Municipal bonds subsequently recovered in April and May following aggressive stimulus from the Fed and U.S. Congress, allowing the sector to post a gain for the full 12 months.
Pennsylvania municipal bonds outpaced the national index. The state’s revenue had exceeded spending prior to the pandemic, providing a cushion in the form of rising reserves. However, the downturn in economic growth is likely to put stress on the state’s budget and pressure funding for education, infrastructure and underfunded pension liabilities.
The Fund’s use of U.S. Treasury futures to manage interest rate risk proved detrimental to Fund performance given the breakdown in correlation between the Treasury and municipal markets in the first quarter of 2020. While municipal bond yields rose due to a substantial increase in yield spreads, Treasury yields declined amid investors’ “flight to quality.” (Prices and yields move in opposite directions.)
The Fund’s positioning in the housing sector further detracted from performance. The Fund was invested in a multi-family housing issue that was downgraded multiple notches to a below investment-grade rating by the S&P. The downgrade was a result of the facility owners’ financial trouble in an unrelated entity. The Fund continued to hold the securities at the close of the period based on the investment adviser’s view that they were trading below their intrinsic value.
Underweights in the state tax-backed, local tax-backed and transportation sectors also detracted, as did an allocation to high-yield issues.
On the positive side, the Fund benefited from its positions in higher-quality bonds, particularly during the latter half of the period. Positions in the health care and corporate sectors added value, as did an allocation to Puerto Rico. Pre-refunded bonds, which tend to be higher-quality securities with attractive income characteristics, further contributed to results.
Describe recent portfolio activity.
The Fund reduced its allocation to the senior living sectors, which faced adverse effects from the coronavirus. Conversely, the investment adviser increased the portfolio’s weightings in the state tax-backed sector through the addition of Puerto Rico issues. The investment adviser continued to favor the Puerto Rico Sales Tax Financing Corporation and general obligation bonds, the latter of which were recently settled at recovery rates significantly higher than current market prices.
The investment adviser also raised the Fund’s cash weighting through sales and holdings in bonds that matured. Higher liquidity allows the Fund to meet possible redemptions and provides greater flexibility for the Fund to take advantage of values that arise from market volatility. Despite a somewhat elevated cash position, the Fund was not positioned defensively since its duration (interest rate sensitivity) was above that of the benchmark.
Describe portfolio positioning at period end.
The investment adviser continued to emphasize careful security selection with a focus on higher-quality sectors. Specifically, it preferred issuers that should be well positioned to navigate the pandemic by virtue of their durable revenues.
The views expressed reflect the opinions of BlackRock as of the date of this report and are subject to change based on changes in market, economic or other conditions. These views are not intended to be a forecast of future events and are no guarantee of future results.
| | |
| 8 | | 2020 BLACKROCK ANNUAL REPORTTO SHAREHOLDERS |
| | |
| Fund Summary as of May 31, 2020 (continued) | | BlackRock Pennsylvania Municipal Bond Fund |
TOTAL RETURN BASED ON A $10,000 INVESTMENT
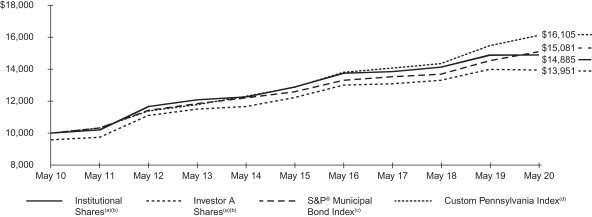
| (a) | Assuming maximum sales charges, if any, transaction costs and other operating expenses, including advisory fees. Institutional Shares do not have a sales charge. See “About Fund Performance” on page 14 for more information about the performance of Investor A Shares. |
| (b) | The Fund invests primarily in a portfolio of long-term investment grade Pennsylvania municipal bonds. |
| (c) | The S&P® Municipal Bond Index is composed of bonds held by managed municipal bond fund customers of Standard & Poor’s Securities Pricing, Inc. that are priced daily. Bonds in the S&P® Municipal Bond Index must have an outstanding par value of at least $2 million and a remaining maturity of not less than one month. |
| (d) | The Custom Pennsylvania Index is customized benchmark that reflects the returns of the S&P® Pennsylvania Municipal Bond Index for periods prior to January 1, 2013, and the returns of only those Pennsylvania bonds in the S&P® Pennsylvania Municipal Bond Index that have maturities greater than 5 years for periods subsequent to January 1, 2013. |
Performance Summary for the Period Ended May 31, 2020
| | | | | | | | | | | | | | | | | | | | | | | | | | | | | | | | | | | | | | | | | | | | |
| | | | | | | | | | | | Average Annual Total Returns (a) | |
| | | | | | | | | | | | 1 Year | | | | | | 5 Years | | | | | | 10 Years | |
| | | Standardized 30-Day Yields | | | Unsubsidized 30-Day Yields | | | 6-Month Total Returns | | | w/o sales charge | | | w/sales charge | | | | | | w/o sales charge | | | w/sales charge | | | | | | w/o sales charge | | | w/sales charge | |
Institutional | | | 2.43 | % | | | 2.27 | % | | | (1.42 | )% | | | 0.14 | % | | | N/A | | | | | | | | 2.92 | % | | | N/A | | | | | | | | 4.06 | % | | | N/A | |
Service | | | 2.19 | | | | 2.08 | | | | (1.54 | ) | | | (0.20 | ) | | | N/A | | | | | | | | 2.71 | | | | N/A | | | | | | | | 3.85 | | | | N/A | |
Investor A | | | 2.10 | | | | 2.03 | | | | (1.54 | ) | | | (0.20 | ) | | | (4.44 | )% | | | | | | | 2.69 | | | | 1.80 | % | | | | | | | 3.84 | | | | 3.39 | % |
Investor A1 | | | 2.24 | | | | 2.15 | | | | (1.47 | ) | | | 0.04 | | | | N/A | | | | | | | | 2.85 | | | | N/A | | | | | | | | 4.01 | | | | N/A | |
Investor C | | | 1.46 | | | | 1.38 | | | | (1.91 | ) | | | (0.85 | ) | | | (1.82 | ) | | | | | | | 1.92 | | | | 1.92 | | | | | | | | 3.04 | | | | 3.04 | |
Class K | | | 2.46 | | | | 2.37 | | | | (1.40 | ) | | | 0.19 | | | | N/A | | | | | | | | 2.95 | | | | N/A | | | | | | | | 4.07 | | | | N/A | |
S&P® Municipal Bond Index | | | — | | | | — | | | | 1.52 | | | | 3.87 | | | | N/A | | | | | | | | 3.68 | | | | N/A | | | | | | | | 4.19 | | | | N/A | |
Custom Pennsylvania Index | | | — | | | | — | | | | 1.46 | | | | 4.21 | | | | N/A | | | | | | | | 4.59 | | | | N/A | | | | | | | | 4.88 | | | | N/A | |
| | (a) | Assuming maximum sales charges, if any. Average annual total returns with and without sales charges reflect reductions for distribution and service fees. See “About Fund Performance” on page 14 for a description of share classes, including any related sales charges and fees, and how performance was calculated for certain share classes. | |
N/A — Not applicable as share class and index do not have a sales charge.
Past performance is not indicative of future results.
Performance results may include adjustments made for financial reporting purposes in accordance with U.S. generally accepted accounting principles.
| | |
| Fund Summary as of May 31, 2020 | | BlackRock Strategic Municipal Opportunities Fund |
Investment Objective
BlackRock Strategic Municipal Opportunities Fund’s (the “Fund”) investment objective is to provide shareholders with a high level of income exempt from Federal income taxes.
Portfolio Management Commentary
How did the Fund perform?
For the 12-month period ended May 31, 2020, the Fund underperformed its primary benchmark, the S&P® Municipal Bond Index, as well as its custom blended secondary benchmark comprised of 65% S&P® Municipal Bond Investment Grade Index, 30% S&P® Municipal Bond High Yield Index and 5% Bloomberg Barclays Taxable Municipal: U.S. Aggregate Eligible Index. The following discussion of relative performance pertains to the custom blended benchmark.
Municipal bonds performed well for most of the period thanks to accommodative Fed policy and favorable supply-and-demand trends in the market. This supportive backdrop changed abruptly in March once the spread of the coronavirus pandemic led to travel restrictions, business closures and stay-at-home orders. The prospect of a sharp economic downturn caused significant, broad-based weakness across the financial markets. Tax-exempt issues were hard hit in the sell-off, as investors withdrew cash from municipal bond funds and limited market liquidity inhibited efficient pricing. Municipal bonds subsequently recovered in April and May following aggressive stimulus from the Fed and U.S. Congress, allowing the sector to post a gain for the full 12 months.
The Fund’s use of U.S. Treasury futures to manage interest rate risk hurt Fund performance due to the breakdown in correlation between the Treasury and municipal markets in the first quarter of 2020. While municipal bond yields rose due to a substantial increase in yield spreads, Treasury yields declined amid investors’ “flight to quality.” (Prices and yields move in opposite directions.) This aspect of the Fund’s strategy accounted for the majority of its 12-month underperformance. An overweight in BBB rated issues also detracted, as did the underperformance of certain holdings in the utilities sector.
The Fund’s sector allocations and yield curve positioning contributed positively, led by overweights in housing issues and bonds with maturities of 20 years and above, respectively. An underweight position in non-rated credits was an additional positive.
Describe recent portfolio activity.
The Fund opened the period with a duration of 4.51 years and closed with a duration of 6.94. (Duration is a measure of interest rate sensitivity.) This shift was largely the result of the investment adviser’s decision to reduce the extent of its interest rate risk management program.
At the sector level, the Fund reduced its allocation to state tax-backed debt and increased its weighting in housing issues. The Fund maintained a high-quality bias, with its largest allocations to the AA and A rating tiers. About 22% of the Fund’s assets were in high yield (below investment grade) bonds at the close of the period, up from 18% one year ago. The majority of the high-yield position was held in the tobacco sector and Puerto Rico. With that said, the Fund’s was focused on identifying opportunities to reduce select high yield issues in order to boost liquidity and improve the portfolio’s overall credit profile. The investment adviser continued to be selective in its effort to reduce exposure to virus-prone sectors while adding to those in which it saw more compelling opportunities.
The Fund held an allocation of approximately 57% to bonds with maturities of 20 years and above, unchanged from the beginning of the period. The Fund’s weighting in taxable securities was 5%, down from 6% a year ago at the end of May 2019.
Describe portfolio positioning at period end.
The Fund’s duration was in line with the benchmark. The Fund was overweight in the transportation and housing sectors, and it was in underweight school districts and tax-backed debt. The Fund’s average credit quality was A+.
The views expressed reflect the opinions of BlackRock as of the date of this report and are subject to change based on changes in market, economic or other conditions. These views are not intended to be a forecast of future events and are no guarantee of future results.
| | |
| 10 | | 2020 BLACKROCK ANNUAL REPORTTO SHAREHOLDERS |
| | |
| Fund Summary as of May 31, 2020 (continued) | | BlackRock Strategic Municipal Opportunities Fund |
TOTAL RETURN BASED ON A $10,000 INVESTMENT
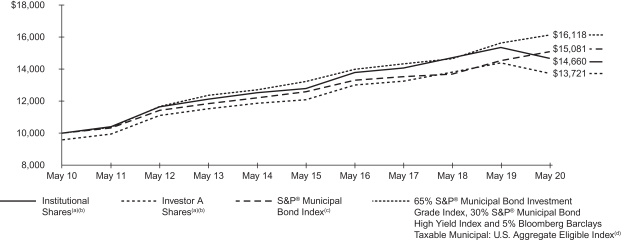
| (a) | Assuming maximum sales charges, if any, transaction costs and other operating expenses, including advisory fees. Institutional Shares do not have a sales charge. See “About Fund Performance” on page 14 for more information about the performance of Investor A Shares. |
| (b) | Under normal circumstances the Fund invests at least 80% of its assets in municipal bonds. The Fund’s returns prior to January 27, 2014 are the returns of the Fund when it followed different investment strategies under the name BlackRock Intermediate Municipal Fund. |
| (c) | The S&P® Municipal Bond Index is composed of bonds held by managed municipal bond fund customers of Standard & Poor’s Securities Pricing, Inc. that are priced daily. Bonds in the S&P® Municipal Bond Index must have an outstanding par value of at least $2 million and a remaining maturity of not less than one month. |
| (d) | See “About Fund Performance” on page 14 for descriptions of the indexes. |
Performance Summary for the Period Ended May 31, 2020
| | | | | | | | | | | | | | | | | | | | | | | | | | | | | | | | | | | | | | | | | | | | |
| | | | | | | | | | | | Average Annual Total Returns (a)(b) | |
| | | | | | | | | | | | 1 Year | | | | | | 5 Years | | | | | | 10 Years | |
| | | Standardized 30-Day Yields | | | Unsubsidized 30-Day Yields | | | 6-Month Total Returns | | | w/o sales charge | | | w/sales charge | | | | | | w/o sales charge | | | w/sales charge | | | | | | w/o sales charge | | | w/sales charge | |
Institutional | | | 2.50 | % | | | 2.45 | % | | | (5.92 | )% | | | (4.46 | )% | | | N/A | | | | | | | | 2.78 | % | | | N/A | | | | | | | | 3.90 | % | | | N/A | |
Investor A | | | 2.17 | | | | 2.12 | | | | (5.95 | ) | | | (4.59 | ) | | | (8.64 | )% | | | | | | | 2.58 | | | | 1.69 | % | | | | | | | 3.66 | | | | 3.21 | % |
Investor A1 | | | 2.40 | | | | 2.34 | | | | (5.95 | ) | | | (4.52 | ) | | | N/A | | | | | | | | 2.73 | | | | N/A | | | | | | | | 3.81 | | | | N/A | |
Investor C | | | 1.53 | | | | 1.47 | | | | (6.38 | ) | | | (5.39 | ) | | | (6.32 | ) | | | | | | | 1.80 | | | | 1.80 | | | | | | | | 2.88 | | | | 2.88 | |
Class K | | | 2.54 | | | | 2.49 | | | | (5.89 | ) | | | (4.39 | ) | | | N/A | | | | | | | | 2.81 | | | | N/A | | | | | | | | 3.92 | | | | N/A | |
S&P® Municipal Bond Index | | | — | | | | — | | | | 1.52 | | | | 3.87 | | | | N/A | | | | | | | | 3.68 | | | | N/A | | | | | | | | 4.19 | | | | N/A | |
S&P® Municipal Bond Investment Grade Index | | | — | | | | — | | | | 1.89 | | | | 4.14 | | | | N/A | | | | | | | | 3.63 | | | | N/A | | | | | | | | 4.07 | | | | N/A | |
S&P® Municipal Bond High Yield Index | | | — | | | | — | | | | (4.01 | ) | | | (0.19 | ) | | | N/A | | | | | | | | 4.42 | | | | N/A | | | | | | | | 6.15 | | | | N/A | |
Bloomberg Barclays Taxable Municipal: U.S. Aggregate Eligible Index | | | — | | | | — | | | | 3.41 | | | | 8.88 | | | | N/A | | | | | | | | 6.67 | | | | N/A | | | | | | | | 7.72 | | | | N/A | |
65% S&P® Municipal Bond Investment Grade Index, 30% S&P® Municipal Bond High Yield Index and 5% Bloomberg Barclays Taxable Municipal: U.S. Aggregate Eligible Index | | | — | | | | — | | | | 0.22 | | | | 3.12 | | | | N/A | | | | | | | | 4.04 | | | | N/A | | | | | | | | 4.89 | | | | N/A | |
| | (a) | Assuming maximum sales charges, if any. Average annual total returns with and without sales charges reflect reductions for distribution and service fees. See “About Fund Performance” on page 14 for a description of share classes, including any related sales charges and fees, and how performance was calculated for certain share classes. | |
| | (b) | Under normal circumstances, the Fund invests at least 80% of its assets in municipal bonds. The Fund’s returns prior to January 27, 2014 are the returns of the Fund when it followed different investment strategies under the name BlackRock Intermediate Municipal Fund. | |
N/A — Not applicable as share class and index do not have a sales charge.
Past performance is not indicative of future results.
Performance results may include adjustments made for financial reporting purposes in accordance with U.S. generally accepted accounting principles.
Portfolio Information as of May 31, 2020
BlackRock California Municipal Opportunities Fund
SECTOR ALLOCATION (a)
| | | | |
| Sector | | Percent of
Total Investments (b) | |
Utilities | | | 27 | % |
County/City/Special District/School District | �� | | 28 | |
State | | | 14 | |
Transportation | | | 13 | |
Education | | | 8 | |
Health | | | 5 | |
Tobacco | | | 5 | |
CREDIT QUALITY ALLOCATION (c)
| | | | |
| Credit Rating | | Percent of
Total Investments (b) | |
AAA/Aaa | | | 16 | % |
AA/Aa | | | 58 | |
A | | | 9 | |
BBB/Baa | | | 1 | |
BB/Ba | | | 1 | |
N/R(d) | | | 15 | |
CALL/MATURITY SCHEDULE (e)
| | | | |
| | | Percent of
Total Investments (b) | |
Calendar Year Ended December 31, | | | | |
2020 | | | 4 | % |
2021 | | | 2 | |
2022 | | | 6 | |
2023 | | | 1 | |
2024 | | | 9 | |
BlackRock New Jersey Municipal Bond Fund
SECTOR ALLOCATION (a)
| | | | |
| Sector | | Percent of
Total Investments (b) | |
Transportation | | | 26 | % |
County/City/Special District/School District | | | 18 | |
Education | | | 17 | |
Health | | | 16 | |
State | | | 10 | |
Utilities | | | 5 | |
Corporate | | | 3 | |
Tobacco | | | 3 | |
Housing | | | 2 | |
CREDIT QUALITY ALLOCATION (c)
| | | | |
| Credit Rating | | Percent of
Total Investments (b) | |
AAA/Aaa | | | 5 | % |
AA/Aa | | | 37 | |
A | | | 22 | |
BBB/Baa | | | 25 | |
BB/Ba | | | 4 | |
N/R(d) | | | 7 | |
CALL/MATURITY SCHEDULE (e)
| | | | |
| | | Percent of
Total Investments (b) | |
Calendar Year Ended December 31, | | | | |
2020 | | | 2 | % |
2021 | | | 11 | |
2022 | | | 4 | |
2023 | | | 5 | |
2024 | | | 16 | |
| | (a) | For Fund compliance purposes, the Fund’s sector classifications refer to one or more of the sector sub-classifications used by one or more widely recognized market indexes or rating group indexes, and/or as defined by the investment adviser. These definitions may not apply for purposes of this report, which may combine such sector sub-classifications for reporting ease. | |
| | (b) | Excludes short-term securities. | |
| | (c) | For financial reporting purposes, credit quality ratings shown above reflect the highest rating assigned by either S&P Global Ratings or Moody’s Investors Service (“Moody’s”) if ratings differ. These rating agencies are independent, nationally recognized statistical rating organizations and are widely used. Investment grade ratings are credit ratings of BBB/Baa or higher. Below investment grade ratings are credit ratings of BB/Ba or lower. Investments designated N/R are not rated by either rating agency. Unrated investments do not necessarily indicate low credit quality. Credit quality ratings are subject to change. | |
| | (d) | The investment adviser evaluates the credit quality of unrated investments based upon certain factors including, but not limited to, credit ratings for similar investments and financial analysis of sectors and individual investments. Using this approach, the investment adviser has deemed certain of these unrated securities as investment grade quality. As of May 31, 2020, the market value of unrated securities deemed by the investment adviser to be investment grade represented less than 1% of each Fund’s long-term investments. | |
| | (e) | Scheduled maturity dates and/or bonds that are subject to potential calls by issuers over the next five years. | |
| | |
| 12 | | 2020 BLACKROCK ANNUAL REPORTTO SHAREHOLDERS |
Portfolio Information as of May 31, 2020 (continued)
BlackRock Pennsylvania Municipal Bond Fund
SECTOR ALLOCATION (a)
| | | | |
| Sector | | Percent of
Total Investments (b) | |
Health | | | 26 | % |
Education | | | 21 | |
County/City/Special District/School District | | | 19 | |
Transportation | | | 11 | |
Utilities | | | 9 | |
State | | | 9 | |
Housing | | | 3 | |
Corporate | | | 2 | |
Tobacco | | | — | (e) |
CREDIT QUALITY ALLOCATION (c)
| | | | |
| Credit Rating | | Percent of
Total Investments (b) | |
AAA/Aaa | | | — | %(e) |
AA/Aa | | | 45 | |
A | | | 29 | |
BBB/Baa | | | 9 | |
BB/Ba | | | 2 | |
N/R(d) | | | 15 | |
CALL/MATURITY SCHEDULE (f)
| | | | |
| | | Percent of
Total Investments (b) | |
Calendar Year Ended December 31, | | | | |
2020 | | | 9 | % |
2021 | | | 14 | |
2022 | | | 3 | |
2023 | | | 2 | |
2024 | | | 3 | |
BlackRock Strategic Municipal Opportunities Fund
SECTOR ALLOCATION (a)
| | | | |
| Sector | | Percent of
Total Investments (b) | |
Transportation | | | 19 | % |
Housing | | | 19 | |
County/City/Special District/School District | | | 14 | |
Utilities | | | 12 | |
Health | | | 12 | |
State | | | 10 | |
Education | | | 7 | |
Tobacco | | | 4 | |
Corporate | | | 3 | |
CREDIT QUALITY ALLOCATION (c)
| | | | |
| Credit Rating | | Percent of
Total Investments (b) | |
AAA/Aaa | | | 10 | % |
AA/Aa | | | 39 | |
A | | | 15 | |
BBB/Baa | | | 11 | |
BB/Ba | | | 5 | |
B/B | | | 2 | |
N/R(d) | | | 18 | |
CALL/MATURITY SCHEDULE (f)
| | | | |
| | | Percent of
Total Investments (b) | |
Calendar Year Ended December 31, | | | | |
2020 | | | 5 | % |
2021 | | | 3 | |
2022 | | | 8 | |
2023 | | | 6 | |
2024 | | | 9 | |
| | (a) | For Fund compliance purposes, the Fund’s sector classifications refer to one or more of the sector sub-classifications used by one or more widely recognized market indexes or rating group indexes, and/or as defined by the investment adviser. These definitions may not apply for purposes of this report, which may combine such sector sub-classifications for reporting ease. | |
| | (b) | Excludes short-term securities. | |
| | (c) | For financial reporting purposes, credit quality ratings shown above reflect the highest rating assigned by either S&P Global Ratings or Moody’s if ratings differ. These rating agencies are independent, nationally recognized statistical rating organizations and are widely used. Investment grade ratings are credit ratings of BBB/Baa or higher. Below investment grade ratings are credit ratings of BB/Ba or lower. Investments designated N/R are not rated by either rating agency. Unrated investments do not necessarily indicate low credit quality. Credit quality ratings are subject to change. | |
| | (d) | The investment adviser evaluates the credit quality of unrated investments based upon certain factors including, but not limited to, credit ratings for similar investments and financial analysis of sectors and individual investments. Using this approach, the investment adviser has deemed certain of these unrated securities as investment grade quality. As of May 31, 2020, the market value of unrated securities deemed by the investment adviser to be investment grade represented 2% for BlackRock Pennsylvania Municipal Bond Fund and less than 1% for BlackRock Strategic Municipal Opportunities Fund long-term investments. | |
| | (e) | Represents less than 1% of total investments. | |
| | (f) | Scheduled maturity dates and/or bonds that are subject to potential calls by issuers over the next five years. | |
About Fund Performance
Institutional Shares are not subject to any sales charge. These shares bear no ongoing distribution or service fees and are available only to certain eligible investors.
Class K Shares are not subject to any sales charge. These shares bear no ongoing distribution or service fees and are available only to certain eligible investors. For each Fund, Class K Shares performance shown prior to the Class K Shares inception date of January 25, 2018 is that of Institutional Shares. The performance of the Funds’ Class K Shares would be substantially similar to Institutional Shares because Class K Shares and Institutional Shares invest in the same portfolio of securities and performance would only differ to the extent that Class K Shares and Institutional Shares have different expenses. The actual returns of Class K Shares would have been higher than those of the Institutional Shares because Class K Shares have lower expenses than the Institutional Shares.
Service Shares (available only in BlackRock New Jersey Municipal Bond Fund and BlackRock Pennsylvania Municipal Bond Fund) are not subject to any sales charge. These shares are subject to a service fee of 0.25% per year (but no distribution fee) and are only available to certain eligible investors.
Investor A Shares are subject to a maximum initial sales charge (front-end load) of 4.25% and a service fee of 0.25% per year (but no distribution fee). Certain redemptions of these shares may be subject to a contingent deferred sales charge (“CDSC”) where no initial sales charge was paid at the time of purchase. These shares are generally available through financial intermediaries. On February 24, 2020, BlackRock California Municipal Opportunities Fund, BlackRock New Jersey Municipal Bond Fund and BlackRock Pennsylvania Municipal Bond Fund issued and outstanding Investor C1 Shares converted into Investor A Shares with the same relative aggregate net asset value (“NAV”).
Investor A1 Shares (for all Funds except BlackRock Strategic Municipal Opportunities Fund) are subject to a maximum initial sales charge (front-end load) of 4.00% and a service fee of 0.10% per year (but no distribution fee). Investor A1 Shares for BlackRock Strategic Municipal Opportunities Fund incur a maximum initial sales charge (front-end load) of 1.00% and a service fee of 0.10% per year (but no distribution fee). The maximum initial sales charge does not apply to current eligible shareholders of Investor A1 Shares of the Funds. Certain redemptions of these shares may be subject to a CDSC where no initial sales charge was paid at the time of purchase. However, the CDSC does not apply to redemptions by certain employer-sponsored retirement plans or to redemptions of shares acquired through the reinvestment of dividends and capital gains by existing shareholders and, for BlackRock California Municipal Opportunities Fund only, fee based programs previously approved by the Fund.
Investor C Shares are subject to a 1.00% CDSC if redeemed within one year of purchase. In addition, these shares are subject to a distribution fee of 0.75% per year and a service fee of 0.25% per year. These shares are generally available through financial intermediaries. These shares automatically convert to Investor A Shares after approximately ten years.
Investor A1 Shares are only available for dividend and capital gain reinvestment by existing shareholders, and for purchase by certain employer-sponsored retirement plans and, for BlackRock California Municipal Opportunities Fund only, fee based programs previously approved by the Fund.
Performance information reflects past performance and does not guarantee future results. Current performance may be lower or higher than the performance data quoted. Refer to blackrock.com to obtain performance data current to the most recent month-end. Performance results do not reflect the deduction of taxes that a shareholder would pay on Fund distributions or the redemption of Fund shares. Figures shown in the performance tables on the previous pages assume reinvestment of all distributions, if any, at NAV on the ex-dividend date or payable date, as applicable. Investment return and principal value of shares will fluctuate so that shares, when redeemed, may be worth more or less than their original cost. Distributions paid to each class of shares will vary because of the different levels of service, distribution and transfer agency fees applicable to each class, which are deducted from the income available to be paid to shareholders.
BlackRock Advisors, LLC (the “Manager”), each Fund’s investment adviser, has contractually and/or voluntarily agreed to waive and/or reimburse a portion of each Fund’s expenses. Without such waiver and/or reimbursement, each Fund’s performance would have been lower. With respect to each Fund’s voluntary waiver, the Manager is under no obligation to waive and/or reimburse or to continue waiving and/or reimbursing its fees and such voluntary waivers may be reduced or discontinued at any time. With respect to each Fund’s contractual waivers, the Manager is under no obligation to continue waiving and/or reimbursing its fees after the applicable termination date of such agreement. See Note 6 of the Notes to Financial Statements for additional information on waivers and/or reimbursements. The standardized 30-day yield includes the effects of any waivers and/or reimbursements. The unsubsidized 30-day yield excludes the effects of any waivers and/or reimbursements.
Bloomberg Barclays Taxable Municipal: U.S. Aggregate Eligible Index — represents securities that are taxable, dollar-denominated, and issued by a U.S. state or territory, and have at least one year to final maturity regardless of call features, have at least $250 million par amount outstanding, and are rated investment-grade (at least BBB- by S&P or Fitch Ratings (“Fitch”) and/or Baa3 by Moody’s) by at least two of the following ratings agencies: S&P, Moody’s and Fitch.
S&P® Municipal Bond High Yield Index — a market-value-weighted index that consists of bonds in the S&P Municipal Bond Index that are nonrated or that are rated BB+ by S&P and/or Ba1 by Moody’s or lower; bonds that are prerefunded or escrowed to maturity are not included in this index.
S&P® Municipal Bond Investment Grade Index — a market-value-weighted index that consists of bonds in the S&P Municipal Bond Index that are rated at least BBB- by S&P and/or Baa3 by Moody’s.
| | |
| 14 | | 2020 BLACKROCK ANNUAL REPORTTO SHAREHOLDERS |
Shareholders of each Fund may incur the following charges: (a) transactional expenses, such as sales charges; and (b) operating expenses, including investment advisory fees, service and distribution fees, including 12b-1 fees, acquired fund fees and expenses, and other Fund expenses. The expense examples shown below (which are based on a hypothetical investment of $1,000 invested on December 1, 2019 and held through May 31, 2020) are intended to assist shareholders both in calculating expenses based on an investment in each Fund and in comparing these expenses with similar costs of investing in other mutual funds.
The expense examples provide information about actual account values and actual expenses. In order to estimate the expenses a shareholder paid during the period covered by this report, shareholders can divide their account value by $1,000 and then multiply the result by the number corresponding to their Fund and share class under the heading entitled “Expenses Paid During the Period.”
The expense examples also provide information about hypothetical account values and hypothetical expenses based on a Fund’s actual expense ratio and an assumed rate of return of 5% per year before expenses. In order to assist shareholders in comparing the ongoing expenses of investing in these Funds and other funds, compare the 5% hypothetical examples with the 5% hypothetical examples that appear in shareholder reports of other funds.
The expenses shown in the expense examples are intended to highlight shareholders’ ongoing costs only and do not reflect transactional expenses, such as sales charges, if any. Therefore, the hypothetical examples are useful in comparing ongoing expenses only, and will not help shareholders determine the relative total expenses of owning different funds. If these transactional expenses were included, shareholder expenses would have been higher.
Expense Examples
| | | | | | | | | | | | | | | | | | | | | | | | | | | | | | | | | | | | | | | | |
| | | Actual | | | | | | Hypothetical (c) | |
| | | | | | | | | Including
Interest
Expense
and Fees | | | Excluding
Interest
Expense
and Fees | | | | | | | | | Including
Interest
Expense
and Fees | | | Excluding
Interest
Expense
and Fees | |
BlackRock California Municipal
Opportunities Fund | | Beginning Account Value
(12/01/19) | | | Ending Account Value
(05/31/20) | | | Expenses
Paid During
the Period (a) | | | Expenses
Paid During
the Period (b) | | | | | | Beginning Account Value
(12/01/19) | | | Ending Account Value
(05/31/20) | | | Expenses
Paid During
the Period (a) | | | Ending Account Value
(05/31/20) | | | Expenses
Paid During
the Period (b) | |
Institutional | | $ | 1,000.00 | | | $ | 965.30 | | | $ | 2.65 | | | $ | 2.11 | | | | | | | $ | 1,000.00 | | | $ | 1,022.30 | | | $ | 2.73 | | | $ | 1,022.85 | | | $ | 2.17 | |
Investor A | | | 1,000.00 | | | | 963.30 | | | | 3.88 | | | | 3.34 | | | | | | | | 1,000.00 | | | | 1,021.05 | | | | 3.99 | | | | 1,021.60 | | | | 3.44 | |
Investor A1 | | | 1,000.00 | | | | 964.10 | | | | 3.04 | | | | 2.50 | | | | | | | | 1,000.00 | | | | 1,021.90 | | | | 3.13 | | | | 1,022.45 | | | | 2.58 | |
Investor C | | | 1,000.00 | | | | 960.50 | | | | 7.55 | | | | 7.01 | | | | | | | | 1,000.00 | | | | 1,017.30 | | | | 7.77 | | | | 1,017.85 | | | | 7.21 | |
Class K | | | 1,000.00 | | | | 964.80 | | | | 2.41 | | | | 1.87 | | | | | | | | 1,000.00 | | | | 1,022.55 | | | | 2.48 | | | | 1,023.10 | | | | 1.92 | |
| | (a) | For each class of the Fund, expenses are equal to the annualized expense ratio for the class (0.54% for Institutional, 0.79% for Investor A, 0.62 for Investor A1, 1.54% for Investor C and 0.49% for Class K), multiplied by the average account value over the period, multiplied by 183/366 (to reflect the one-half year period shown). | |
| | (b) | For each class of the Fund, expenses are equal to the annualized expense ratio for the class (0.43% for Institutional, 0.68% for Investor A, 0.51% for Investor A1, 1.43% for Investor C and 0.38% for Class K), multiplied by the average account value over the period, multiplied by 183/366 (to reflect the one-half year period shown). | |
| | (c) | Hypothetical 5% annual return before expenses is calculated by prorating the number of days in the most recent fiscal half year divided by 366. | |
| | | | | | | | | | | | | | | | | | | | | | | | | | | | | | | | | | | | | | | | |
| | | Actual | | | | | | Hypothetical (c) | |
| | | | | | | | | Including
Interest
Expense
and Fees | | | Excluding
Interest
Expense
and Fees | | | | | | | | | Including
Interest
Expense
and Fees | | | Excluding
Interest
Expense
and Fees | |
BlackRock New Jersey Municipal Bond Fund | | Beginning
Account Value
(12/01/19) | | | Ending
Account Value
(05/31/20) | | | Expenses
Paid During
the Period (a) | | | Expenses
Paid During
the Period (b) | | | | | | Beginning Account Value
(12/01/19) | | | Ending
Account Value
(05/31/20) | | | Expenses
Paid During
the Period (a) | | | Ending
Account Value
(05/31/20) | | | Expenses
Paid During
the Period (b) | |
Institutional | | $ | 1,000.00 | | | $ | 970.70 | | | $ | 3.10 | | | $ | 2.56 | | | | | | | $ | 1,000.00 | | | | 1,021.85 | | | $ | 3.18 | | | $ | 1,022.40 | | | $ | 2.63 | |
Service | | | 1,000.00 | | | | 969.50 | | | | 4.33 | | | | 3.79 | | | | | | | | 1,000.00 | | | | 1,020.60 | | | | 4.45 | | | | 1,021.15 | | | | 3.89 | |
Investor A | | | 1,000.00 | | | | 969.60 | | | | 4.33 | | | | 3.79 | | | | | | | | 1,000.00 | | | | 1,020.60 | | | | 4.45 | | | | 1,021.15 | | | | 3.89 | |
Investor A1 | | | 1,000.00 | | | | 970.30 | | | | 3.60 | | | | 3.00 | | | | | | | | 1,000.00 | | | | 1,021.35 | | | | 3.69 | | | | 1,021.95 | | | | 3.08 | |
Investor C | | | 1,000.00 | | | | 965.90 | | | | 8.01 | | | | 7.47 | | | | | | | | 1,000.00 | | | | 1,016.85 | | | | 8.22 | | | | 1,017.40 | | | | 7.67 | |
Class K | | | 1,000.00 | | | | 970.10 | | | | 2.86 | | | | 2.31 | | | | | | | | 1,000.00 | | | | 1,022.10 | | | | 2.93 | | | | 1,022.65 | | | | 2.38 | |
| | (a) | For each class of the Fund, expenses are equal to the annualized expense ratio for the class (0.63% for Institutional, 0.88% for Service, 0.88% for Investor A, 0.73% for Investor A1, 1.63% for Investor C and 0.58% for Class K), multiplied by the average account value over the period, multiplied by 183/366 (to reflect the one-half year period shown). | |
| | (b) | For each class of the Fund, expenses are equal to the annualized expense ratio for the class (0.52% for Institutional, 0.77% for Service, 0.77% for Investor A, 0.61% for Investor A1, 1.52% for Investor C and 0.47% for Class K), multiplied by the average account value over the period, multiplied by 183/366 (to reflect the one-half year period shown). | |
| | (c) | Hypothetical 5% annual return before expenses is calculated by prorating the number of days in the most recent fiscal half year divided by 366. | |
| | | | |
| DISCLOSURE OF EXPENSES | | | 15 | |
| | |
| Disclosure of Expenses (continued) | | |
Expense Examples (continued)
| | | | | | | | | | | | | | | | | | | | | | | | | | | | | | | | | | | | | | | | |
| | | Actual | | | | | | Hypothetical (c) | |
| | | | | | | | | Including
Interest
Expense
and Fees | | | Excluding
Interest
Expense
and Fees | | | | | | | | | Including
Interest
Expense
and Fees | | | Excluding
Interest
Expense
and Fees | |
BlackRock Pennsylvania Municipal Bond Fund | | Beginning
Account Value
(12/01/19) | | | Ending
Account Value
(5/31/20) | | | Expenses
Paid During
the Period (a) | | | Expenses
Paid During
the Period (b) | | | | | | Beginning
Account Value
(12/01/19) | | | Ending
Account Value
(5/31/20) | | | Expenses
Paid During
the Period (a) | | | Ending
Account Value
(5/31/20) | | | Expenses
Paid During
the Period (b) | |
Institutional | | $ | 1,000.00 | | | $ | 985.80 | | | $ | 3.72 | | | $ | 2.68 | | | | | | | $ | 1,000.00 | | | $ | 1,021.25 | | | $ | 3.79 | | | $ | 1,022.30 | | | $ | 2.73 | |
Service | | | 1,000.00 | | | | 984.60 | | | | 4.96 | | | | 3.92 | | | | | | | | 1,000.00 | | | | 1,020.00 | | | | 5.05 | | �� | | 1,021.05 | | | | 3.99 | |
Investor A | | | 1,000.00 | | | | 984.60 | | | | 4.96 | | | | 3.92 | | | | | | | | 1,000.00 | | | | 1,020.00 | | | | 5.05 | | | | 1,021.05 | | | | 3.99 | |
Investor A1 | | | 1,000.00 | | | | 985.30 | | | | 4.22 | | | | 3.18 | | | | | | | | 1,000.00 | | | | 1,020.75 | | | | 4.29 | | | | 1,021.80 | | | | 3.23 | |
Investor C | | | 1,000.00 | | | | 980.90 | | | | 8.67 | | | | 7.63 | | | | | | | | 1,000.00 | | | | 1,016.25 | | | | 8.82 | | | | 1,017.30 | | | | 7.77 | |
Class K | | | 1,000.00 | | | | 986.00 | | | | 3.48 | | | | 2.43 | | | | | | | | 1,000.00 | | | | 1,021.50 | | | | 3.54 | | | | 1,022.55 | | | | 2.48 | |
| | (a) | For each class of the Fund, expenses are equal to the annualized expense ratio for the class (0.75% for Institutional, 1.00% for Service, 1.00% for Investor A, 0.85% for Investor A1, 1.75% for Investor C and 0.70% for Class K), multiplied by the average account value over the period, multiplied by 183/366 (to reflect the one-half year period shown). | |
| | (b) | For each class of the Fund, expenses are equal to the annualized expense ratio for the class (0.54% for Institutional, 0.79% for Service, 0.79% for Investor A, 0.64% for Investor A1, 1.54% for Investor C and 0.49% for Class K), multiplied by the average account value over the period, multiplied by 183/366 (to reflect the one-half year period shown). | |
| | (c) | Hypothetical 5% annual return before expenses is calculated by prorating the number of days in the most recent fiscal half year divided by 366. | |
| | | | | | | | | | | | | | | | | | | | | | | | | | | | | | | | | | | | | | | | |
| | | Actual | | | | | | Hypothetical (c) | |
| | | | | | | | | Including
Interest
Expense
and Fees | | | Excluding
Interest
Expense
and Fees | | | | | | | | | Including
Interest
Expense
and Fees | | | Excluding
Interest
Expense
and Fees | |
BlackRock Strategic Municipal Opportunities Fund | | Beginning
Account Value
(12/01/19) | | | Ending
Account Value
(5/31/20) | | | Expenses
Paid During
the Period (a) | | | Expenses
Paid During
the Period (b) | | | | | | Beginning
Account Value
(12/01/19) | | | Ending
Account Value
(5/31/20) | | | Expenses
Paid During
the Period (a) | | | Ending
Account Value
(5/31/20) | | | Expenses
Paid During
the Period (b) | |
Institutional | | $ | 1,000.00 | | | $ | 940.80 | | | $ | 3.35 | | | $ | 2.62 | | | | | | | $ | 1,000.00 | | | $ | 1,021.55 | | | $ | 3.49 | | | $ | 1,022.30 | | | $ | 2.73 | |
Investor A | | | 1,000.00 | | | | 940.50 | | | | 4.46 | | | | 3.69 | | | | | | | | 1,000.00 | | | | 1,020.40 | | | | 4.65 | | | | 1,021.20 | | | | 3.84 | |
Investor A1 | | | 1,000.00 | | | | 940.50 | | | | 3.69 | | | | 2.96 | | | | | | | | 1,000.00 | | | | 1,021.20 | | | | 3.84 | | | | 1,021.95 | | | | 3.08 | |
Investor C | | | 1,000.00 | | | | 936.20 | | | | 8.08 | | | | 7.36 | | | | | | | | 1,000.00 | | | | 1,016.65 | | | | 8.42 | | | | 1,017.40 | | | | 7.67 | |
Class K | | | 1,000.00 | | | | 941.10 | | | | 3.06 | | | | 2.33 | | | | | | | | 1,000.00 | | | | 1,021.85 | | | | 3.18 | | | | 1,022.60 | | | | 2.43 | |
| | (a) | For each class of the Fund, expenses are equal to the annualized expense ratio for the class (0.69% for Institutional, 0.92% for Investor A, 0.76% for Investor A1, 1.67% for Investor C and 0.63% for Class K), multiplied by the average account value over the period, multiplied by 183/366 (to reflect the one-half year period shown). | |
| | (b) | For each class of the Fund, expenses are equal to the annualized expense ratio for the class (0.54% for Institutional, 0.76% for Investor A, 0.61% for Investor A1, 1.52% for Investor C and 0.48% for Class K), multiplied by the average account value over the period, multiplied by 183/366 (to reflect the one-half year period shown). | |
| | (c) | Hypothetical 5% annual return before expenses is calculated by prorating the number of days in the most recent fiscal half year divided by 366. | |
| | |
| 16 | | 2020 BLACKROCK ANNUAL REPORTTO SHAREHOLDERS |
The Benefits and Risks of Leveraging
The Funds may utilize leverage to seek to enhance returns and NAV. However, there is no guarantee that these objectives can be achieved in all interest rate environments.
Each Fund may leverage its assets through the use of proceeds received in tender option bond (“TOB”) transactions, as described in the Notes to Financial Statements. In a TOB Trust transaction, each Fund transfers municipal bonds or other municipal securities into a special purpose entity (a “TOB Trust”). TOB investments generally provide each Fund with economic benefits in periods of declining short-term interest rates, but expose each Fund to risks during periods of rising short-term interest rates. Additionally, fluctuations in the market value of municipal bonds deposited into a TOB Trust may adversely affect each Fund’s NAV per share.
In general, the concept of leveraging is based on the premise that the financing cost of leverage, which is based on short-term interest rates, is normally lower than the income earned by each Fund on its longer-term portfolio investments purchased with the proceeds from leverage. To the extent that the total assets of each Fund (including the assets obtained from leverage) are invested in higher-yielding portfolio investments, each Fund’s shareholders benefit from the incremental net income.
The interest earned on securities purchased with the proceeds from leverage is distributed to each Fund’s shareholders, and the value of these portfolio holdings is reflected in each Fund’s per share NAV. However, in order to benefit shareholders, the return on assets purchased with leverage proceeds must exceed the ongoing costs associated with the leverage. If interest and other ongoing costs of leverage exceed a Fund’s return on assets purchased with leverage proceeds, income to shareholders is lower than if the Funds had not used leverage.
Furthermore, the value of each Fund’s portfolio investments generally varies inversely with the direction of long-term interest rates, although other factors can also influence the value of portfolio investments. As a result, changes in interest rates can influence each Fund’s NAV positively or negatively in addition to the impact on each Fund’s performance from leverage. Changes in the direction of interest rates are difficult to predict accurately, and there is no assurance that a Fund’s leveraging strategy will be successful.
The use of leverage also generally causes greater changes in each Fund’s NAV and dividend rates than comparable portfolios without leverage. In a declining market, leverage is likely to cause a greater decline in the NAV of a Fund’s shares than if the Fund were not leveraged. In addition, each Fund may be required to sell portfolio securities at inopportune times or at distressed values in order to comply with regulatory requirements applicable to the use of leverage or as required by the terms of the leverage instruments, which may cause the Fund to incur losses. The use of leverage may limit a Fund’s ability to invest in certain types of securities or use certain types of hedging strategies. Each Fund incurs expenses in connection with the use of leverage, all of which are borne by each Fund’s shareholders and may reduce income.
Derivative Financial Instruments
The Funds may invest in various derivative financial instruments. These instruments are used to obtain exposure to a security, commodity, index, market, and/or other assets without owning or taking physical custody of securities, commodities and/or other referenced assets or to manage market, equity, credit, interest rate, foreign currency exchange rate, commodity and/or other risks. Derivative financial instruments may give rise to a form of economic leverage and involve risks, including the imperfect correlation between the value of a derivative financial instrument and the underlying asset, possible default of the counterparty to the transaction or illiquidity of the instrument. The Funds’ successful use of a derivative financial instrument depends on the investment adviser’s ability to predict pertinent market movements accurately, which cannot be assured. The use of these instruments may result in losses greater than if they had not been used, may limit the amount of appreciation a Fund can realize on an investment and/or may result in lower distributions paid to shareholders. The Funds’ investments in these instruments, if any, are discussed in detail in the Notes to Financial Statements.
| | | | |
| THE BENEFITSAND RISKSOF LEVERAGING / DERIVATIVE FINANCIAL INSTRUMENTS | | | 17 | |
| | |
Schedule of Investments May 31, 2020 | | BlackRock California Municipal Opportunities Fund (Percentages shown are based on Net Assets) |
| | | | | | | | |
| Security | | Par
(000) | | | Value | |
|
Corporate Bonds — 0.0% | |
|
Commercial Services & Supplies — 0.0% | |
University of Southern California, 3.03%, 10/01/39 | | $ | 650 | | | $ | 700,612 | |
| | | | | | | | |
| |
Total Corporate Bonds — 0.0%
(Cost — $591,242) | | | | 700,612 | |
| | | | | | | | |
|
Municipal Bonds — 81.9% | |
|
California — 72.7% | |
|
| County/City/Special District/School District — 22.5% | |
Butte-Glenn Community College District, GO, Election of 2016, Series A, 5.25%, 08/01/46 | | | 12,360 | | | | 15,205,025 | |
California Infrastructure & Economic Development Bank, RB: | | | | | | | | |
Goodwill Industry San Joaquin, 5.85%, 09/01/37 | | | 2,745 | | | | 2,747,525 | |
Green Bond, 5.00%, 08/01/38 | | | 1,130 | | | | 1,412,138 | |
California Statewide Communities Development Authority, RB, Lancer Educational Student Housing Project, 5.00%, 06/01/51(a) | | | 1,035 | | | | 978,903 | |
California Statewide Communities Development Authority, Special Assessment, Statewide Community Infrastructure Program, Series A: | | | | | | | | |
5.00%, 09/02/39 | | | 1,460 | | | | 1,609,504 | |
5.00%, 09/02/44 | | | 715 | | | | 774,767 | |
5.00%, 09/02/48 | | | 715 | | | | 772,786 | |
Cerritos Community College District, GO, Series A, 4.00%, 08/01/44 | | | 36,455 | | | | 40,188,357 | |
City & County of San Francisco, COP, Green Bond, 49 South Van Ness Project: | | | | | | | | |
4.00%, 04/01/41 | | | 5,705 | | | | 6,428,565 | |
4.00%, 04/01/42 | | | 8,000 | | | | 8,992,800 | |
City & County of San Francisco California Community Facilities District No. 2014-1, Special Tax, Green Bond, Series B: | | | | | | | | |
3.78%, 09/01/30 | | | 1,110 | | | | 1,222,265 | |
3.92%, 09/01/31 | | | 3,410 | | | | 3,774,938 | |
3.97%, 09/01/32 | | | 1,880 | | | | 2,078,979 | |
4.02%, 09/01/33 | | | 2,070 | | | | 2,286,895 | |
City & County of San Francisco California Redevelopment Agency, Tax Allocation Bonds, Series D: | | | | | | | | |
Mission Bay South Redevelopment Project, 0.00%, 08/01/31(a)(b) | | | 3,000 | | | | 1,742,820 | |
Mission Bay South Redevelopment Project, CAB, 0.00%, 08/01/23(a)(b): | | | 1,000 | | | | 873,840 | |
3.13%, 08/01/28 | | | 1,150 | | | | 1,149,310 | |
3.25%, 08/01/29 | | | 1,000 | | | | 1,001,830 | |
3.38%, 08/01/30 | | | 1,250 | | | | 1,256,225 | |
City of Los Angeles California, COP, Senior, Sonnenblick Del Rio West Los Angeles (AMBAC), 6.20%, 11/01/31 | | | 4,000 | | | | 4,035,680 | |
City of San Jose California Hotel Tax, RB, Convention Center Expansion & Renovation Project, 6.50%, 05/01/42 | | | 2,395 | | | | 2,498,775 | |
Coast Community College District, GO: | | | | | | | | |
Election of 2002, Series B (AGM), 0.00%, 08/01/30(b) | | | 26,425 | | | | 22,746,376 | |
Election of 2012, Series D, 4.50%, 08/01/39 | | | 2,175 | | | | 2,594,253 | |
County of Los Angeles California Metropolitan Transportation Authority, Refunding RB, Series A: | | | | | | | | |
Green Bond, 5.00%, 07/01/44 | | | 23,885 | | | | 29,661,587 | |
5.00%, 07/01/42 | | | 1,655 | | | | 2,019,481 | |
| | | | | | | | |
| Security | | Par
(000) | | | Value | |
|
| County/City/Special District/School District (continued) | |
County of Riverside California Public Financing Authority, RB, Capital Facilities Project, 5.25%, 11/01/45 | | $ | 11,210 | | | $ | 13,003,152 | |
County of Santa Clara California, GO, Election of 2008, Series B, 4.00%, 08/01/42 | | | 14,995 | | | | 15,773,841 | |
Evergreen School District, GO(b): | | | | | | | | |
0.00%, 08/01/22 | | | 1,410 | | | | 1,404,134 | |
0.00%, 08/01/23 | | | 1,435 | | | | 1,422,702 | |
0.00%, 08/01/24 | | | 1,460 | | | | 1,436,041 | |
0.00%, 08/01/25 | | | 1,435 | | | | 1,397,848 | |
0.00%, 08/01/26 | | | 1,400 | | | | 1,349,796 | |
0.00%, 08/01/27 | | | 1,425 | | | | 1,356,586 | |
Fremont Unified School District/Alameda County, GO, Series A, 4.00%, 08/01/46 | | | 66,330 | | | | 72,202,858 | |
Fremont Union High School District, GO, Series A, 4.00%, 08/01/46 | | | 14,000 | | | | 15,766,240 | |
Glendale Community California College District, GO, Election of 2016, Series A, 5.25%, 08/01/41 | | | 10,450 | | | | 12,985,902 | |
Glendale Unified School District, GO, Refunding, Election of 2011, Series B, 4.00%, 09/01/24(c) | | | 1,350 | | | | 1,559,318 | |
Grossmont-Cuyamaca Community College District, GO, Election of 2008, Series B, 5.00%, 08/01/44 | | | 30,215 | | | | 37,442,730 | |
Hacienda La Puente Unified School District, GO, Election 2016, Series A, 5.25%, 08/01/42 | | | 5,000 | | | | 6,180,800 | |
Imperial Irrigation District, RB, Taxable (AMBAC), 6.94%, 01/01/26 | | | 17,570 | | | | 20,732,776 | |
Los Altos Elementary School District, GO, Refunding, Election of 2014, Series A-1, 4.00%, 08/01/44 | | | 5,000 | | | | 5,664,700 | |
Los Angeles Community College District, GO, Election of 2008: | | | | | | | | |
Series F, 4.00%, 08/01/34 | | | 10,000 | | | | 11,069,400 | |
Series K, 4.00%, 08/01/37 | | | 10,000 | | | | 11,370,200 | |
Series K, 4.00%, 08/01/38 | | | 29,760 | | | | 33,616,003 | |
Series K, 4.00%, 08/01/39 | | | 22,740 | | | | 25,683,920 | |
Los Angeles Community College District California, GO, Series G, 4.00%, 08/01/39 | | | 5,645 | | | | 6,220,282 | |
Los Angeles County Facilities Inc, RB, Vermont Corridor County Administration Building, Series A, 5.00%, 12/01/43 | | | 4,000 | | | | 4,955,160 | |
Mount San Antonio Community College District, GO, Refunding, Election of 2018, Series A, 5.00%, 08/01/44 | | | 10,000 | | | | 12,775,400 | |
Mountain View-Whisman School District, GO, Election of 2012, Series A, 4.00%, 09/01/42 | | | 12,000 | | | | 13,472,760 | |
Orange County Local Transportation Authority, RB, 5.00%, 02/15/40 | | | 5,000 | | | | 6,292,450 | |
Palomar Community College District, GO, Election of 2006, Series D, 5.25%, 08/01/45 | | | 3,000 | | | | 3,711,330 | |
Pomona Redevelopment Agency Successor Agency, Refunding, Tax Allocation Bonds, 3.98%, 02/01/27 | | | 4,155 | | | | 4,559,780 | |
Sacramento Area Flood Control Agency, Special Assessment Bonds, Control Agency Consolidated Capital Assessment, 4.00%, 10/01/43 | | | 8,245 | | | | 9,618,040 | |
San Bernardino Community College District, GO, Series A, 3.00%, 08/01/41 | | | 5,000 | | | | 5,250,900 | |
San Diego Community College District, Refunding, GO, Refunding, 5.00%, 08/01/41 | | | 20,000 | | | | 24,165,400 | |
San Diego Public Facilities Financing Authority Sewer Revenue, Refunding RB, Series A, 5.00%, 05/15/38 | | | 13,595 | | | | 16,514,526 | |
| | |
| 18 | | 2020 BLACKROCK ANNUAL REPORTTO SHAREHOLDERS |
| | |
Schedule of Investments (continued) May 31, 2020 | | BlackRock California Municipal Opportunities Fund (Percentages shown are based on Net Assets) |
| | | | | | | | |
| Security | | Par
(000) | | | Value | |
|
| County/City/Special District/School District (continued) | |
San Francisco Bay Area Rapid Transit District, GO, Election of 2004, Green Bond: | | | | | | | | |
Series F-1, 3.00%, 08/01/38 | | $ | 10,000 | | | $ | 10,827,700 | |
Election of 2016, Series A, 5.00%, 08/01/47 | | | 8,980 | | | | 10,811,381 | |
San Francisco Bay Area Rapid Transit District, GO, Refunding, Series D, 4.00%, 08/01/35 | | | 5,985 | | | | 6,771,908 | |
San Francisco City & County Redevelopment Financing Authority, Tax Allocation Bonds (BHAC), 5.75%, 08/01/37 | | | 9,500 | | | | 12,460,485 | |
San Jose Evergreen Community College District, GO, Election of 2010, Series C, 4.13%, 09/01/43 | | | 18,435 | | | | 20,532,903 | |
San Jose Financing Authority, LRB, Convention Center Expansion & Renovation Project, Series A, 5.75%, 05/01/42 | | | 2,010 | | | | 2,094,943 | |
San Jose Redevelopment Agency Successor Agency, Refunding, Tax Allocation Bonds, Series A-T, 3.25%, 08/01/29 | | | 8,730 | | | | 9,203,864 | |
San Jose Unified School District, GO, Capital Appreciation Election of 2002, Series C (NPFCG), 0.00%, 06/01/31(b) | | | 25,000 | | | | 20,814,750 | |
San Leandro Unified School District, GO, Election of 2010, Series A, 5.75%, 08/01/41 | | | 5,000 | | | | 5,283,100 | |
San Mateo County Community College District, GO, Election of 2014, Series B, 5.00%, 09/01/45 | | | 32,650 | | | | 40,456,289 | |
Santa Monica Community College District, GO, Election of 2008, Series B, 4.00%, 08/01/44 | | | 40,015 | | | | 44,060,516 | |
| | | | | | | | |
| | | | | | | 740,326,438 | |
|
| Education — 3.7% | |
California Educational Facilities Authority, RB, Chapman University, Series A: | | | | | | | | |
3.43%, 04/01/30 | | | 1,000 | | | | 1,047,810 | |
3.56%, 04/01/31 | | | 2,000 | | | | 2,105,240 | |
California Municipal Finance Authority, RB: | | | | | | | | |
Urban Discovery Academy Project, Series A, 5.50%, 08/01/34(a) | | | 300 | | | | 304,503 | |
Vista Charter Middle School, 6.00%, 07/01/44 | | | 500 | | | | 516,720 | |
California Municipal Finance Authority, Refunding RB, William Jessup University: | | | | | | | | |
5.00%, 08/01/39 | | | 1,785 | | | | 1,728,255 | |
5.00%, 08/01/48 | | | 2,140 | | | | 1,988,852 | |
California Public Finance Authority, RB, Trinity Classical Academy Project(a): | | | | | | | | |
Series A, 5.00%, 07/01/36 | | | 385 | | | | 382,482 | |
Series A, 5.00%, 07/01/44 | | | 375 | | | | 365,985 | |
Series A, 5.00%, 07/01/54 | | | 520 | | | | 504,213 | |
Series B, 5.00%, 07/01/26 | | | 265 | | | | 260,495 | |
California School Finance Authority, RB(a): | | | | | | | | |
Arts in Action Charter Schools, 5.00%, 06/01/40 | | | 1,420 | | | | 1,380,978 | |
Arts in Action Charter Schools, 5.00%, 06/01/50 | | | 2,240 | | | | 2,151,722 | |
Arts in Action Charter Schools, 5.00%, 06/01/59 | | | 3,565 | | | | 3,370,814 | |
Larchmont Charter School Project, Series A, 5.00%, 06/01/33 | | | 525 | | | | 512,064 | |
Larchmont Charter School Project, Series A, 5.00%, 06/01/43 | | | 525 | | | | 502,646 | |
Larchmont Charter School Project, Series A, 5.00%, 06/01/55 | | | 1,000 | | | | 969,480 | |
Real Journey Academies, Series A, 5.00%, 06/01/49 | | | 7,105 | | | | 6,650,067 | |
Real Journey Academies, Series A, 5.00%, 06/01/58 | | | 3,355 | | | | 3,072,845 | |
Series A, 6.00%, 07/01/51 | | | 1,500 | | | | 1,560,285 | |
Series A, 6.00%, 06/01/59 | | | 8,925 | | | | 9,138,754 | |
Series B, 6.00%, 06/01/31 | | | 735 | | | | 679,485 | |
| | | | | | | | |
| Security | | Par
(000) | | | Value | |
|
| Education (continued) | |
California State University, Refunding RB, Systemwide, Series A, 5.00%, 11/01/41 | | $ | 28,825 | | | $ | 34,362,282 | |
Menifee Union School District, GO, Series A, 5.25%, 08/01/42 | | | 7,275 | | | | 8,905,036 | |
State of California University, Refunding RB, Systemwide, Series A, 5.00%, 11/01/42 | | | 16,790 | | | | 20,215,160 | |
University of California, RB: | | | | | | | | |
Build America Bonds, 6.30%, 05/15/50 | | | 3,790 | | | | 5,046,575 | |
Series AV, 5.25%, 05/15/42 | | | 12,220 | | | | 15,074,714 | |
| | | | | | | | |
| | | | | | | 122,797,462 | |
|
| Health — 5.0% | |
California Health Facilities Financing Authority, RB, Series A: | | | | | | | | |
Children’s Hospital, 5.25%, 11/01/41 | | | 7,000 | | | | 7,422,590 | |
Scripps Health, 5.00%, 11/15/40 | | | 20,220 | | | | 21,243,941 | |
Sutter Health, 5.00%, 11/15/36 | | | 2,755 | | | | 3,283,299 | |
Sutter Health, 5.00%, 11/15/41 | | | 4,350 | | | | 4,957,086 | |
California Health Facilities Financing Authority, Refunding RB: | | | | | | | | |
Kaiser Permanente, Sub-Series A, 4.00%, 11/01/38 | | | 5,005 | | | | 5,601,546 | |
Providence ST. Joseph Health, 5.00%, 10/01/39(d) | | | 10,000 | | | | 11,911,300 | |
Stanford Health Care, Series A, 4.00%, 11/15/40 | | | 5,140 | | | | 5,817,966 | |
Sutter Health, Series A, 5.00%, 11/15/38(c) | | | 15,050 | | | | 17,902,126 | |
California Infrastructure & Economic Development Bank, RB, Green Bond, Climate Bond Certified, 5.00%, 08/01/44 | | | 22,275 | | | | 27,730,815 | |
California Municipal Finance Authority, Refunding RB, Series A(a): | | | | | | | | |
5.00%, 11/01/39 | | | 980 | | | | 1,013,075 | |
5.00%, 11/01/49 | | | 1,105 | | | | 1,112,392 | |
California Statewide Communities Development Authority, RB, Series A: | | | | | | | | |
Kaiser Permanente, 5.00%, 04/01/42 | | | 10,000 | | | | 10,615,200 | |
Lancer Educational Student Housing Project, 5.00%, 06/01/46(a) | | | 4,100 | | | | 3,948,177 | |
California Statewide Communities Development Authority, Refunding RB, Lancer Educational Student Housing Project, Series A, 5.00%, 06/01/36(a) | | | 2,900 | | | | 2,910,643 | |
Marin Healthcare District, GO, Election of 2013: | | | | | | | | |
4.00%, 08/01/40 | | | 11,550 | | | | 12,723,711 | |
Series A, 5.00%, 08/01/41 | | | 21,670 | | | | 26,273,575 | |
| | | | | | | | |
| | | | | | | 164,467,442 | |
|
| Housing — 0.3% | |
California Community Housing Agency, RB, M/F Housing, Annadel Apartments, Series A, 5.00%, 04/01/49(a) | | | 8,230 | | | | 8,530,560 | |
| | | | | | | | |
|
| State — 7.3% | |
California State Public Works Board, RB: | | | | | | | | |
Series A, 5.00%, 09/01/34 | | | 500 | | | | 578,450 | |
Series C, 5.00%, 11/01/36 | | | 2,145 | | | | 2,765,806 | |
Series C, 5.00%, 11/01/37 | | | 5,810 | | | | 7,473,810 | |
Various Capital Projects, Series C, 5.00%, 11/01/38 | | | 5,000 | | | | 6,424,100 | |
Various Capital Projects, Series C, 5.00%, 11/01/44 | | | 28,275 | | | | 35,803,784 | |
State of California, GO, Refunding: | | | | | | | | |
5.25%, 02/01/30 | | | 7,725 | | | | 8,333,730 | |
5.00%, 03/01/35 | | | 11,775 | | | | 15,559,956 | |
| | | | |
| SCHEDULES OF INVESTMENTS | | | 19 | |
| | |
Schedule of Investments (continued) May 31, 2020 | | BlackRock California Municipal Opportunities Fund (Percentages shown are based on Net Assets) |
| | | | | | | | |
| Security | | Par
(000) | | | Value | |
|
| State (continued) | |
4.00%, 10/01/37 | | $ | 35,000 | | | $ | 42,561,050 | |
5.00%, 11/01/39 | | | 26,000 | | | | 32,817,200 | |
Construction Bonds, 4.00%, 10/01/44 | | | 4,000 | | | | 4,673,360 | |
Various Purpose, 4.00%, 03/01/37 | | | 10,780 | | | | 12,987,313 | |
Various Purpose, 5.25%, 10/01/39 | | | 10,170 | | | | 12,310,887 | |
State of California, GO: | | | | | | | | |
3.00%, 10/01/37 | | | 10,000 | | | | 10,862,900 | |
4.00%, 03/01/38 | | | 12,500 | | | | 14,975,375 | |
4.00%, 11/01/44 | | | 10,800 | | | | 11,756,232 | |
State of California Public Works Board, LRB, Series I: | | | | | | | | |
Correctional Facilities Improvements, Series A, 5.00%, 09/01/39 | | | 5,000 | | | | 5,746,750 | |
Various Capital Projects, 5.25%, 11/01/32 | | | 1,115 | | | | 1,277,533 | |
State of California Public Works Board, RB, Various Capital Projects, 5.50%, 11/01/33 | | | 2,315 | | | | 2,672,158 | |
State of California Public Works Board, Refunding RB, Various Capital Projects, Series C, 5.00%, 11/01/33 | | | 10,000 | | | | 12,104,800 | |
| | | | | | | | |
| | | | | | | 241,685,194 | |
|
| Tobacco — 3.6% | |
County of California Tobacco Securitization Agency, Refunding RB: | | | | | | | | |
Asset-Backed, Merced County, Series A, 5.13%, 06/01/38(e) | | | 955 | | | | 937,839 | |
Asset-Backed, Merced County, Series A, 5.25%, 06/01/45 | | | 4,765 | | | | 4,764,714 | |
Gold Country Settlement Funding Corp., 5.25%, 06/01/46 | | | 11,500 | | | | 11,314,505 | |
Golden Gate Tobacco Funding Corp., Series A, 5.00%, 06/01/36 | | | 2,410 | | | | 2,371,320 | |
Golden Gate Tobacco Funding Corp., Series A, 5.00%, 06/01/47 | | | 2,595 | | | | 2,553,714 | |
Golden State Tobacco Securitization Corp., Refunding RB, Series A-1, 5.00%, 06/01/47 | | | 13,125 | | | | 13,092,056 | |
Inland Empire Tobacco Securitization Corp., Refunding RB, 3.68%, 06/01/38(e) | | | 5,470 | | | | 5,277,839 | |
State of Golden Tobacco Securitization Corp., Refunding RB, Series A-2, 5.00%, 06/01/47 | | | 55,680 | | | | 55,540,243 | |
Tobacco Securitization Authority of Northern California, Refunding RB, Asset-Backed Bonds, Series A-1, 5.38%, 06/01/38 | | | 5,350 | | | | 5,349,839 | |
Tobacco Securitization Authority of Southern California, Refunding RB, Tobacco Asset Securitization Corporation: | | | | | | | | |
San Diego Country Series A, 5.00%, 06/01/48 | | | 5,000 | | | | 5,586,550 | |
5.00%, 06/01/48 | | | 10,670 | | | | 11,336,128 | |
| | | | | | | | |
| | | | | | | 118,124,747 | |
|
| Transportation — 12.2% | |
Bay Area Toll Authority, Refunding RB, San Francisco Bay Area Subordinate Toll Bridge, 4.00%, 04/01/34 | | | 8,075 | | | | 9,354,322 | |
Burbank-Glendale-Pasadena Airport Authority Brick Campaign, ARB, Series B, 5.56%, 07/01/32 | | | 1,000 | | | | 1,201,950 | |
California Municipal Finance Authority, Refunding ARB, United Airlines, Inc. Project, AMT, 4.00%, 07/15/29 | | | 8,645 | | | | 8,277,501 | |
City & County of San Francisco California, Refunding ARB, Series A, AMT, 5.25%, 05/01/42 | | | 40,370 | | | | 46,509,873 | |
City & County of San Francisco California Airports Commission, Refunding ARB, Series A, AMT, 5.00%, 05/01/42(e) | | | 29,480 | | | | 33,456,557 | |
| | | | | | | | |
| Security | | Par
(000) | | | Value | |
|
| Transportation (continued) | |
City & County of San Francisco California Airports Commission, Refunding RB, San Francisco International Airport, Series B, AMT, 5.00%, 05/01/41 | | $ | 22,485 | | | $ | 25,122,940 | |
City & County of San Francisco California Airports Commission, Refunding ARB, AMT: | | | | | | | | |
San Francisco International Airport, Series C, 5.00%, 05/01/46 | | | 1,640 | | | | 1,844,360 | |
Series A, 5.00%, 05/01/39 | | | 5,125 | | | | 5,608,236 | |
Series A, 5.00%, 05/01/40 | | | 14,000 | | | | 15,267,980 | |
Series A, 5.00%, 05/01/44 | | | 10,125 | | | | 10,930,444 | |
City of Long Beach California Harbor Revenue, ARB, Series A, 5.00%, 05/15/44 | | | 10,000 | | | | 12,216,800 | |
City of Los Angeles California Department of Airports, ARB, AMT: | | | | | | | | |
Los Angeles International Airport, Series D, 5.00%, 05/15/41 | | | 8,850 | | | | 9,982,977 | |
Los Angeles International Airport, Sub-Series A, 5.00%, 05/15/42 | | | 10,000 | | | | 11,331,300 | |
Senior Series A, 5.00%, 05/15/40 | | | 6,615 | | | | 7,474,884 | |
City of Los Angeles California Department of Airports, RB, AMT: | | | | | | | | |
Los Angeles International Airport, Series B, 5.00%, 05/15/41 | | | 18,710 | | | | 21,184,959 | |
Sub-Series A, 5.00%, 05/15/42 | | | 23,625 | | | | 27,161,899 | |
City of Los Angeles Department of Airports, ARB, Los Angeles International Airport, Series D, 5.25%, 05/15/33 | | | 7,330 | | | | 7,351,550 | |
City of Los Angeles Department of Airports, Refunding ARB, Los Angeles International Airport: | | | | | | | | |
5.00%, 05/15/36 | | | 11,260 | | | | 14,163,616 | |
5.00%, 05/15/38 | | | 6,870 | | | | 8,622,675 | |
City of Los Angeles Department of Airports, Refunding RB, Los Angeles International Airport, 5.00%, 05/15/39 | | | 3,000 | | | | 3,757,590 | |
City of San Jose California, Refunding ARB, Norman Y Mineta San Jose International Airport SJC, AMT: | | | | | | | | |
Series A (BAM), 4.00%, 03/01/42 | | | 6,755 | | | | 7,383,418 | |
Series A, 5.00%, 03/01/41 | | | 20,000 | | | | 23,101,200 | |
Series A-1, 5.75%, 03/01/34 | | | 6,720 | | | | 6,919,382 | |
Series A-1, 6.25%, 03/01/34 | | | 2,920 | | | | 3,017,411 | |
County of Los Angeles California Metropolitan Transportation Authority, RB, Green Bonds, Series A, 5.00%, 07/01/37 | | | 19,235 | | | | 23,758,303 | |
County of Los Angeles Metropolitan Transportation Authority, Refunding RB, Green Bond, Series A, 5.00%, 07/01/42 | | | 10,000 | | | | 12,202,300 | |
Port of Oakland, Refunding RB, Senior Lien, Series P, AMT, 5.00%, 05/01/27 | | | 12,850 | | | | 13,781,625 | |
San Francisco City & County Airport Comm-San Francisco International Airport, Refunding ARB, AMT, Series E, 5.00%, 05/01/38 | | | 9,000 | | | | 10,581,660 | |
San Joaquin County Transportation Authority, Refunding RB, Measure K Sale Tax Revenue, 5.00%, 03/01/41 | | | 17,955 | | | | 21,582,628 | |
| | | | | | | | |
| | | | | | | 403,150,340 | |
|
| Utilities — 18.1% | |
City & County of San Francisco Public Utilities Commission Wastewater Revenue, Refunding RB, Sewer System, Series B, 4.00%, 10/01/42 | | | 17,010 | | | | 18,156,814 | |
City of Los Angeles California Department of Water & Power, RB, Series A, 5.00%, 07/01/41 | | | 25,130 | | | | 29,781,060 | |
| | |
| 20 | | 2020 BLACKROCK ANNUAL REPORTTO SHAREHOLDERS |
| | |
Schedule of Investments (continued) May 31, 2020 | | BlackRock California Municipal Opportunities Fund (Percentages shown are based on Net Assets) |
| | | | | | | | |
| Security | | Par
(000) | | | Value | |
|
| Utilities (continued) | |
City of Los Angeles California Department of Water & Power, Refunding RB: | | | | | | | | |
Series B, 5.00%, 07/01/43 | | $ | 6,000 | | | $ | 7,471,500 | |
Water System, Series A, 5.25%, 07/01/39 | | | 8,000 | | | | 8,211,760 | |
City of Los Angeles California Wastewater System Revenue, RB, Green Bond, Series A, 5.00%, 06/01/38 | | | 2,000 | | | | 2,500,280 | |
City of Los Angeles California Wastewater System Revenue, Refunding RB, Green Bond: | | | | | | | | |
Series C, 5.00%, 06/01/35 | | | 4,520 | | | | 5,380,020 | |
Sub-Series A, 5.00%, 06/01/43 | | | 10,000 | | | | 12,298,600 | |
Sub-Series A, 5.25%, 06/01/47 | | | 20,000 | | | | 24,222,600 | |
City of Riverside California Electric Revenue, RB, Build America Bond, 7.61%, 10/01/40 | | | 2,500 | | | | 4,004,100 | |
City of Sacramento California Water Revenue, RB, 5.00%, 09/01/42 | | | 6,465 | | | | 7,879,736 | |
City of San Francisco CA Public Utilities Commission Water Revenue, Refunding RB, Green Bond, Series D, 5.00%, 11/01/35 | | | 10,025 | | | | 12,612,152 | |
City of San Francisco California Public Utilities Commission Wastewater Revenue, RB, Green Bond, Series A: | | | | | | | | |
5.00%, 10/01/31 | | | 5,000 | | | | 6,097,700 | |
5.00%, 10/01/32 | | | 5,000 | | | | 6,082,650 | |
City of San Francisco California Public Utilities Commission Water Revenue, Refunding RB, Public Utilities Commission, 4.00%, 11/01/30 | | | 19,910 | | | | 23,687,325 | |
County of San Diego California Water Authority, Refunding RB, 5.00%, 05/01/30 | | | 6,000 | | | | 6,648,600 | |
East Bay California Municipal Utility District Water System Revenue, RB, Green Bond, Series A, 4.00%, 06/01/45 | | | 5,885 | | | | 6,664,821 | |
East Bay Municipal Utility District Water System Revenue, Refunding RB, Series A, 5.00%, 06/01/37 | | | 7,160 | | | | 8,529,851 | |
Eastern Municipal Water District Financing Authority, RB, Series D, 5.25%, 07/01/42 | | | 18,500 | | | | 23,063,025 | |
Los Angeles Department of Water, Refunding RB, Series A: | | | | | | | | |
5.00%, 07/01/41 | | | 22,870 | | | | 27,640,911 | |
5.25%, 07/01/44 | | | 10,650 | | | | 13,046,676 | |
Los Angeles Department of Water & Power System Revenue, RB, Power System Revenue Bonds, Series C, 5.00%, 07/01/38 | | | 11,525 | | | | 14,951,844 | |
Mesa Water District, COP, 4.00%, 03/15/45 | | | 3,900 | | | | 4,596,969 | |
Metropolitan Water District of Southern California, RB, Series A, 5.00%, 07/01/40 | | | 16,105 | | | | 19,340,172 | |
Metropolitan Water District of Southern California, Refunding RB: | | | | | | | | |
5.00%, 01/01/38 | | | 7,000 | | | | 8,893,430 | |
Series A, 5.00%, 10/01/35 | | | 5,000 | | | | 5,412,550 | |
Series A, 5.00%, 07/01/38 | | | 5,000 | | | | 6,419,300 | |
Series A, 5.00%, 10/01/45 | | | 10,000 | | | | 12,884,600 | |
Northern California Power Agency, RB, Build America Bonds, Series B, 7.31%, 06/01/40 | | | 2,150 | | | | 3,176,797 | |
Orange County Water District, Refunding RB, Series A, 4.00%, 08/15/37 | | | 1,770 | | | | 2,041,093 | |
Sacramento Municipal Utility District, Refunding RB, Electric Revenue Bonds, Series H, 4.00%, 08/15/45 | | | 7,415 | | | | 8,823,331 | |
Sacramento Municipal Utility District, RB, Series G: | | | | | | | | |
5.00%, 08/15/38 | | | 22,390 | | | | 29,009,604 | |
5.00%, 08/15/41 | | | 20,000 | | | | 25,700,400 | |
| | | | | | | | |
| Security | | Par
(000) | | | Value | |
|
| Utilities (continued) | |
Sacramento Municipal Utility District, Refunding RB, Electric Revenue Bonds, Series H, 4.00%, 08/15/40 | | $ | 7,800 | | | $ | 9,280,284 | |
San Diego County Water Authority Financing Corp., Refunding RB, Series B, 5.00%, 05/01/38 | | | 20,405 | | | | 24,532,932 | |
San Diego Public Facilities Financing Authority, RB, Series A, 5.00%, 08/01/41 | | | 1,010 | | | | 1,208,889 | |
San Diego Public Facilities Financing Authority, Refunding RB, Series A: | | | | | | | | |
5.00%, 05/15/36 | | | 5,000 | | | | 6,101,300 | |
4.00%, 08/01/39 | | | 3,700 | | | | 4,443,626 | |
4.00%, 08/01/40 | | | 3,590 | | | | 4,285,096 | |
4.00%, 08/01/45 | | | 9,755 | | | | 11,522,216 | |
Subordinate, 5.00%, 08/01/43 | | | 36,795 | | | | 45,711,900 | |
Subordinated, 5.25%, 08/01/47 | | | 15,180 | | | | 19,107,218 | |
San Diego Public Facilities Financing Authority Water Revenue, Refunding RB, Series B, 5.00%, 08/01/38 | | | 16,460 | | | | 20,006,307 | |
Santa Clara County Financing Authority, RB, Series A, 4.00%, 04/01/35 | | | 6,975 | | | | 8,254,145 | |
State of California Department of Water Resources, Refunding RB, Central Valley Project Water System Revenue Bonds, Series AW, 4.00%, 12/01/34 | | | 24,000 | | | | 28,113,120 | |
Vista Joint Powers Financing Authority, Refunding LRB, Lease, 5.25%, 05/01/37 | | | 15,065 | | | | 17,889,688 | |
| | | | | | | | |
| | | | | | | 595,686,992 | |
| | | | | | | | |
| |
Total Municipal Bonds in California | | | | 2,394,769,175 | |
| | | | | | | | |
|
Connecticut — 0.2% | |
|
| State — 0.2% | |
Mashantucket Western Pequot Tribe, (6.35% Cash or 1.00% PIK), 7.35%, 07/01/26 | | | 36,909 | | | | 6,090,002 | |
| | | | | | | | |
| |
Total Municipal Bonds in Connecticut | | | | 6,090,002 | |
| | | | | | | | |
|
Illinois — 1.0% | |
|
| County/City/Special District/School District — 1.0% | |
Chicago Board of Education, GO: | | | | | | | | |
Build America Bonds, 6.52%, 12/01/40 | | | 8,075 | | | | 8,105,766 | |
Taxable Build America Bonds, 6.04%, 12/01/29 | | | 7,590 | | | | 7,559,944 | |
Taxable Build America Bonds, 6.14%, 12/01/39 | | | 13,850 | | | | 13,483,667 | |
Taxable Qualified School Construction Bonds, 6.32%, 11/01/29 | | | 3,650 | | | | 3,630,983 | |
| | | | | | | | |
| |
Total Municipal Bonds in Illinois | | | | 32,780,360 | |
| | | | | | | | |
|
Ohio — 0.9% | |
|
| Tobacco — 0.9% | |
Buckeye Tobacco Settlement Financing Authority, Refunding RB, Senior, Class 2, Series B-2, 5.00%, 06/01/55 | | | 29,510 | | | | 29,754,048 | |
| | | | | | | | |
| |
Total Municipal Bonds in Ohio | | | | 29,754,048 | |
| | | | | | | | |
|
Puerto Rico — 7.1% | |
|
| County/City/Special District/School District — 0.0% | |
Puerto Rico Sales Tax Financing Corp. Sales Tax Revenue, RB, Restructured, Series A-2, 4.33%, 07/01/40 | | | 380 | | | | 358,112 | |
| | | | | | | | |
|
| State — 4.3% | |
Commonwealth of Puerto Rico, GO(f)(g): | | | | | | | | |
Public Improvement, Series A, 5.25%, 07/01/22 | | | 940 | | | | 586,692 | |
| | | | |
| SCHEDULES OF INVESTMENTS | | | 21 | |
| | |
Schedule of Investments (continued) May 31, 2020 | | BlackRock California Municipal Opportunities Fund (Percentages shown are based on Net Assets) |
| | | | | | | | |
| Security | | Par
(000) | | | Value | |
|
| State (continued) | |
Public Improvement, Series A, 5.25%, 07/01/26 | | $ | 330 | | | $ | 205,966 | |
Public Improvement, Series A, 5.13%, 07/01/31 | | | 3,340 | | | | 2,084,628 | |
5.38%, 07/01/33 | | | 1,025 | | | | 639,743 | |
6.00%, 07/01/38 | | | 1,630 | | | | 1,028,258 | |
Commonwealth of Puerto Rico, GO, Refunding(f)(g): | | | | | | | | |
Public Improvement, 5.00%, 07/01/18 | | | 470 | | | | 292,367 | |
Public Improvement, Series A, 5.50%, 07/01/18 | | | 1,025 | | | | 637,609 | |
Public Improvement, Series A, 5.50%, 07/01/32 | | | 1,170 | | | | 730,244 | |
Public Improvement, Series A, 6.00%, 07/01/34 | | | 955 | | | | 561,858 | |
Public Improvement, Series A, 5.50%, 07/01/39 | | | 8,805 | | | | 5,072,807 | |
Public Improvement, Series A, 5.00%, 07/01/41 | | | 7,370 | | | | 4,291,190 | |
Public Improvement, Series A, 5.75%, 07/01/41 | | | 1,110 | | | | 653,050 | |
Public Improvement, Series B, 6.00%, 07/01/39 | | | 3,970 | | | | 2,504,407 | |
Public Improvement, Series C, 6.00%, 07/01/39 | | | 470 | | | | 296,492 | |
Series A, 8.00%, 07/01/35 | | | 27,405 | | | | 14,867,212 | |
Puerto Rico Public Buildings Authority, Refunding RB(f)(g): | | | | | | | | |
Government Facilities, Series F (GTD), 5.25%, 07/01/24 | | | 500 | | | | 361,786 | |
Series M, 10.00%, 07/01/34 | | | 1,045 | | | | 955,445 | |
Puerto Rico Sales Tax Financing Corp. Sales Tax Revenue, RB, Restructured: | | | | | | | | |
CAB, Series A-1, 0.00%, 07/01/29(b) | | | 1,117 | | | | 812,919 | |
CAB, Series A-1, 0.00%, 07/01/31(b) | | | 1,330 | | | | 880,207 | |
CAB, Series A-1, 0.00%, 07/01/33(b) | | | 1,909 | | | | 1,135,683 | |
CAB, Series A-1, 0.00%, 07/01/46(b) | | | 106,226 | | | | 27,074,883 | |
CAB, Series A-1, 0.00%, 07/01/51(b) | | | 7,750 | | | | 1,444,135 | |
Series A-1, 4.75%, 07/01/53 | | | 31,068 | | | | 29,996,775 | |
Series A-1, 5.00%, 07/01/58 | | | 11,287 | | | | 11,259,685 | |
Series A-2, 4.33%, 07/01/40 | | | 11,818 | | | | 11,311,008 | |
Series A-2, 4.54%, 07/01/53 | | | 114 | | | | 106,527 | |
Series A-2, 4.78%, 07/01/58 | | | 20,042 | | | | 19,320,488 | |
Series B-1, 0.00%, 07/01/46(b) | | | 5,761 | | | | 1,464,677 | |
| | | | | | | | |
| | | | | | | 140,576,741 | |
|
| Utilities — 2.8% | |
Commonwealth of Puerto Rico Aqueduct & Sewer Authority, RB, Senior Lien, Series A: | | | | | | | | |
5.00%, 07/01/33 | | | 630 | | | | 615,844 | |
5.13%, 07/01/37 | | | 3,485 | | | | 3,451,196 | |
5.75%, 07/01/37 | | | 1,085 | | | | 1,085,000 | |
Puerto Rico Commonwealth Aqueduct & Sewer Authority, Refunding RB, Senior Lien, Series B: | | | | | | | | |
5.00%, 07/01/23 | | | 5,615 | | | | 5,447,785 | |
5.35%, 07/01/27 | | | 6,705 | | | | 6,342,461 | |
6.15%, 07/01/38 | | | 3,620 | | | | 3,429,117 | |
Puerto Rico Electric Power Authority, 1.00%, 01/01/20(f)(g) | | | 593 | | | | 385,744 | |
Puerto Rico Electric Power Authority, RB(f)(g): | | | | | | | | |
Series A, 5.00%, 07/01/29 | | | 4,130 | | | | 2,551,824 | |
Series A, 7.00%, 07/01/33 | | | 2,230 | | | | 1,395,608 | |
Series A, 6.75%, 07/01/36 | | | 7,630 | | | | 4,775,106 | |
Series A, 5.00%, 07/01/42 | | | 8,830 | | | | 5,455,836 | |
Series A, 7.00%, 07/01/43 | | | 955 | | | | 597,671 | |
Series A-3, 10.00%, 07/01/19 | | | 2,137 | | | | 1,818,808 | |
Series B-3, 10.00%, 07/01/19 | | | 2,137 | | | | 1,818,808 | |
Series C-1, 5.40%, 01/01/18 | | | 5,870 | | | | 3,815,466 | |
Series C-2, 5.40%, 07/01/18 | | | 5,871 | | | | 3,816,084 | |
Series C-4, 5.40%, 07/01/20 | | | 593 | | | | 385,744 | |
Series CCC, 5.25%, 07/01/26 | | | 1,680 | | | | 1,038,030 | |
Series CCC, 5.25%, 07/01/28 | | | 955 | | | | 590,071 | |
Series D, 7.50%, 07/01/20 | | | 1,638 | | | | 1,025,114 | |
Series TT, 5.00%, 07/01/25 | | | 480 | | | | 296,580 | |
Series TT, 5.00%, 07/01/26 | | | 1,285 | | | | 793,969 | |
| | | | | | | | |
| Security | | Par
(000) | | | Value | |
|
| Utilities (continued) | |
Series TT, 5.00%, 07/01/32 | | $ | 1,075 | | | $ | 664,216 | |
Series WW, 5.50%, 07/01/17 | | | 1,315 | | | | 788,782 | |
Series WW, 5.50%, 07/01/18 | | | 1,155 | | | | 692,808 | |
Series WW, 5.50%, 07/01/19 | | | 935 | | | | 560,845 | |
Series WW, 5.38%, 07/01/22 | | | 1,250 | | | | 772,344 | |
Series WW, 5.38%, 07/01/24 | | | 875 | | | | 540,641 | |
Series WW, 5.25%, 07/01/33 | | | 885 | | | | 546,819 | |
Series WW, 5.50%, 07/01/38 | | | 1,170 | | | | 722,914 | |
Series XX, 5.25%, 07/01/27 | | | 645 | | | | 398,529 | |
Series XX, 5.25%, 07/01/35 | | | 400 | | | | 247,150 | |
Series XX, 5.75%, 07/01/36 | | | 555 | | | | 342,921 | |
Series XX, 5.25%, 07/01/40 | | | 11,490 | | | | 7,099,384 | |
Puerto Rico Electric Power Authority, Refunding RB(f)(g): | | | | | | | | |
Series AAA, 5.25%, 07/01/22 | | | 2,150 | | | | 1,328,431 | |
Series AAA, 5.25%, 07/01/24 | | | 480 | | | | 296,580 | |
Series AAA, 5.25%, 07/01/26 | | | 1,840 | | | | 1,136,890 | |
Series AAA, 5.25%, 07/01/27 | | | 6,540 | | | | 4,040,902 | |
Series AAA, 5.25%, 07/01/28 | | | 4,690 | | | | 2,897,834 | |
Series AAA, 5.25%, 07/01/29 | | | 530 | | | | 327,474 | |
Series BBB, 5.40%, 07/01/28 | | | 2,805 | | | | 1,733,139 | |
Series UU, 1.00%, 07/01/17(d) | | | 395 | | | | 256,750 | |
Series UU, 1.00%, 07/01/18(d) | | | 355 | | | | 230,750 | |
Series UU, 1.00%, 07/01/20(d) | | | 3,175 | | | | 1,840,960 | |
Series UU, 1.66%, 07/01/31(d) | | | 3,765 | | | | 2,183,060 | |
Series ZZ, 5.00%, 07/01/17 | | | 925 | | | | 554,846 | |
Series ZZ, 5.25%, 07/01/19 | | | 2,945 | | | | 1,766,511 | |
Series ZZ, 5.25%, 07/01/21 | | | 3,590 | | | | 2,218,171 | |
Series ZZ, 5.25%, 07/01/24 | | | 1,990 | | | | 1,229,571 | |
Series ZZ, 5.25%, 07/01/26 | | | 4,335 | | | | 2,678,488 | |
Series ZZ, 5.00%, 07/01/28 | | | 990 | | | | 611,696 | |
Taxable Build America Bonds, Series YY, 6.13%, 07/01/40 | | | 4,060 | | | | 2,508,573 | |
| | | | | | | | |
| | | | | | | 92,149,845 | |
| | | | | | | | |
| |
Total Municipal Bonds in Puerto Rico | | | | 233,084,698 | |
| | | | | | | | |
| |
Total Municipal Bonds — 81.9%
(Cost — $2,620,103,361) | | | | 2,696,478,283 | |
| | | | | | | | |
|
Municipal Bonds Transferred to Tender Option Bond Trusts — 10.8%(h) | |
|
California — 10.8% | |
|
| County/City/Special District/School District — 1.6% | |
Ohlone Community College District, GO, Election of 2010, Series B, 4.00%, 08/01/44 | | | 47,250 | | | | 52,060,995 | |
| | | | | | | | |
|
| Education — 4.0% | |
California State University, Refunding RB, Systemwide, Series A: | | | | | | | | |
5.00%, 11/01/42 | | | 10,000 | | | | 12,040,000 | |
5.00%, 11/01/43 | | | 35,250 | | | | 43,714,230 | |
University of California, RB, Limited Project, Series M, 5.00%, 05/15/42 | | | 20,000 | | | | 24,198,800 | |
University of California, Refunding RB, Series AZ, 5.00%, 05/15/43 | | | 41,740 | | | | 51,549,317 | |
| | | | | | | | |
| | | | | | | 131,502,347 | |
|
| State — 0.7% | |
State of California, GO, Refunding, Various Purpose, 5.25%, 10/01/39 | | | 18,150 | | | | 21,970,757 | |
| | | | | | | | |
| | |
| 22 | | 2020 BLACKROCK ANNUAL REPORTTO SHAREHOLDERS |
| | |
Schedule of Investments (continued) May 31, 2020 | | BlackRock California Municipal Opportunities Fund (Percentages shown are based on Net Assets) |
| | | | | | | | |
| Security | | Par
(000) | | | Value | |
|
| Utilities — 4.5% | |
City & County of San Francisco California Public Utilities Commission Wastewater Revenue, RB, Series B, 5.00%, 10/01/43 | | $ | 41,405 | | | $ | 50,727,730 | |
East Bay Municipal Utility District Water System Revenue, RB, Green Bond, Series A, 5.00%, 06/01/42 | | | 27,045 | | | | 32,824,775 | |
Eastern Municipal Water District Financing Authority, RB, Series D, 5.00%, 07/01/47 | | | 36,105 | | | | 43,674,773 | |
Irvine Ranch Water District, 5.00%, 03/01/46 | | | 19,330 | | | | 23,042,327 | |
| | | | | | | | |
| | | | | | | 150,269,605 | |
| | | | | | | | |
| |
Total Municipal Bonds Transferred to Tender Option Bond Trusts — 10.8%
(Cost — $329,146,088) | | | | 355,803,704 | |
| | | | | | | | |
| |
Total Long-Term Investments — 92.7%
(Cost — $2,949,840,691) | | | | 3,052,982,599 | |
| | | | | | | | |
|
Short-Term Securities — 10.6% | |
|
Commercial Paper — 0.8% | |
Los Angeles Municipal Improvement Corp.: | | | | | | | | |
1.00%, 06/16/20 | | | 15,000 | | | | 15,006,600 | |
1.22%, 06/16/20 | | | 11,000 | | | | 11,003,621 | |
| | | | | | | | |
| |
Total Commercial Paper — 0.8% | | | | 26,010,221 | |
| | | | | | | | |
| | | | | | | | |
| | |
Shares | | | Value | |
|
| Money Market Fund — 9.8% | |
BlackRock Liquidity Funds California Money Fund, Institutional Class, 0.00%(i)((j) | | | 322,451,958 | | | $ | 322,516,448 | |
| | | | | | | | |
| |
Total Money Market Fund — 9.8% | | | | 322,516,448 | |
| | | | | | | | |
| |
Total Short-Term Securities — 10.6%
(Cost — $348,474,263) | | | | 348,526,669 | |
| | | | | | | | |
| |
Total Investments — 103.3%
(Cost — $3,298,314,954) | | | | 3,401,509,268 | |
| |
Other Assets Less Liabilities — 1.2% | | | | 38,841,872 | |
| |
Liability for TOB Trust Certificates, Including Interest Expense and Fees Payable — (4.5)% | | | | (148,483,065 | ) |
| | | | | | | | |
| |
Net Assets — 100.0% | | | $ | 3,291,868,075 | |
| | | | | | | | |
| (a) | Security exempt from registration pursuant to Rule 144A under the Securities Act of 1933, as amended. These securities may be resold in transactions exempt from registration to qualified institutional investors. |
| (c) | U.S. Government securities held in escrow, are used to pay interest on this security as well as to retire the bond in full at the date indicated, typically at a premium to par. |
| (d) | Variable or floating rate security, which interest rate adjusts periodically based on changes in current interest rates and prepayments on the underlying pool of assets. Rate shown is the rate in effect as of period end. |
| (e) | When-issued security. |
| (f) | Issuer filed for bankruptcy and/or is in default. |
| (g) | Non-income producing security. |
| (h) | Represent bonds transferred to a TOB Trust in exchange of cash and residual certificates received by the Fund. These bonds serve as collateral in a secured borrowing. See Note 4 of the Notes to Financial Statements for details. |
| (i) | Annualized 7-day yield as of period end. |
| (j) | Investments in issuers considered to be an affiliate/affiliates of the Fund during the year ended May 31, 2020 for purposes of Section 2(a)(3) of the Investment Company Act of 1940, as amended, were as follows: |
| | | | | | | | | | | | | | | | | | | | | | | | | | | | | | | | |
| Affiliated Issuer | | Shares
Held at
05/31/19 | | | Shares
Purchased | | | Shares
Sold | | | Shares
Held at
05/31/20 | | | Value at
05/31/20 | | | Income | | | Net
Realized
Gain (Loss) (a) | | | Change in
Unrealized
Appreciation
(Depreciation) | |
BlackRock Liquidity Funds California Money Fund, Institutional Class | | | 256,535,508 | | | | 65,916,450 | (b) | | | — | | | | 322,451,958 | | | $ | 322,516,448 | | | $ | 1,455,390 | | | $ | 10,100 | | | $ | 42,185 | |
iShares National Municipal Bond ETF(c) | | | 335,000 | | | | 1,720,000 | | | | (2,055,000 | ) | | | — | | | | — | | | | 2,100,067 | | | | 5,214,665 | | | | (1,092,167 | ) |
iShares Short-Term National Muni Bond ETF(c) | | | — | | | | 500,000 | | | | (500,000 | ) | | | — | | | | — | | | | 66,210 | | | | 146,231 | | | | — | |
| | | | | | | | | | | | | | | | | | | | | | | | | | | | | | | | |
| | | | | | | | | | | | | | | | | | $ | 322,516,448 | | | $ | 3,621,667 | | | $ | 5,370,996 | | | $ | (1,049,982 | ) |
| | | | | | | | | | | | | | | | | | | | | | | | | | | | | | | | |
| | (a) | Includes net capital gain distributions, if applicable. | |
| | (b) | Represents net shares purchased (sold) | |
| | (c) | As of period end, the entity is no longer held by the Fund. | |
For Fund compliance purposes, the Fund’s sector classifications refer to one or more of the sector sub-classifications used by one or more widely recognized market indexes or rating group indexes, and/or as defined by the investment adviser. These definitions may not apply for purposes of this report, which may combine such sector sub-classifications for reporting ease.
| | | | |
| SCHEDULES OF INVESTMENTS | | | 23 | |
| | |
Schedule of Investments (continued) May 31, 2020 | | BlackRock California Municipal Opportunities Fund |
Derivative Financial Instruments Outstanding as of Period End
Futures Contracts
| | | | | | | | | | | | | | | | |
| Description | | Number of Contracts | | | Expiration
Date | | | Notional
Amount (000) | | | Value /
Unrealized
Appreciation (Depreciation) | |
Short Contracts | | | | | | | | | | | | | | | | |
10-Year US Treasury Notes | | | 2,782 | | | | 09/21/20 | | | $ | 386,872 | | | $ | (613,092 | ) |
Long U.S. Treasury Bond | | | 1,148 | | | | 09/21/20 | | | | 204,775 | | | | 68,304 | |
| | | | | | | | | | | | | | | | |
| | | | | | | | | | | | | | $ | (544,788 | ) |
| | | | | | | | | | | | | | | | |
Derivative Financial Instruments Categorized by Risk Exposure
As of period end, the fair values of derivative financial instruments located in the Statements of Assets and Liabilities were as follows:
| | | | | | | | | | | | | | | | | | | | | | | | | | | | |
| | | Commodity
Contracts | | | Credit
Contracts | | | Equity
Contracts | | | Foreign
Currency
Exchange
Contracts | | | Interest
Rate
Contracts | | | Other
Contracts | | | Total | |
Assets — Derivative Financial Instruments | | | | | | | | | | | | | | | | | | | | | | | | | | | | |
Futures contracts | | | | | | | | | | | | | | | | | | | | | | | | | | | | |
Unrealized appreciation on futures contracts(a) | | $ | — | | | $ | — | | | $ | — | | | $ | — | | | $ | 68,304 | | | $ | — | | | $ | 68,304 | |
| | | | | | | | | | | | | | | | | | | | | | | | | | | | |
Liabilities — Derivative Financial Instruments | | | | | | | | | | | | | | | | | | | | | | | | | | | | |
Futures contracts | | | | | | | | | | | | | | | | | | | | | | | | | | | | |
Unrealized depreciation on futures contracts(a) | | $ | — | | | $ | — | | | $ | — | | | $ | — | | | $ | (613,092 | ) | | $ | — | | | $ | (613,092 | ) |
| | | | | | | | | | | | | | | | | | | | | | | | | | | | |
| | (a) | Net cumulative unrealized appreciation (depreciation) on futures and centrally cleared swaps, if any, are reported in the Schedule of Investments. In the Statements of Assets and Liabilities, only current day’s variation margin is reported in receivables or payables and the net cumulative unrealized appreciation (depreciation) is included in accumulated earnings (loss). | |
For the year ended May 31, 2020, the effect of derivative financial instruments in the Statements of Operations was as follows:
| | | | | | | | | | | | | | | | | | | | | | | | | | | | |
| | | Commodity
Contracts | | | Credit
Contracts | | | Equity
Contracts | | | Foreign
Currency
Exchange
Contracts | | | Interest
Rate
Contracts | | | Other
Contracts | | | Total | |
Net Realized Gain (Loss) from: | | | | | | | | | | | | | | | | | | | | | | | | | | | | |
Futures contracts | | $ | — | | | $ | — | | | $ | — | | | $ | — | | | $ | (199,903,189 | ) | | $ | — | | | $ | (199,903,189 | ) |
| | | | | | | | | | | | | | | | | | | | | | | | | | | | |
| | | | | | | |
| Net Change in Unrealized Appreciation (Depreciation) on: | | | | | | | | | | | | | | | | | | | | | |
Futures contracts | | $ | — | | | $ | — | | | $ | — | | | $ | — | | | $ | 10,625,551 | | | $ | — | | | $ | 10,625,551 | |
| | | | | | | | | | | | | | | | | | | | | | | | | | | | |
Average Quarterly Balances of Outstanding Derivative Financial Instruments
| | | | |
Futures contracts: | |
Average notional value of contracts — long | | $ | — | (a) |
Average notional value of contracts — short | | $ | 1,055,961,426 | |
| | (a) | Derivative not held at any quarter-end. The risk exposure table serves as an indicator of activity during the period. | |
For more information about the Fund’s investment risks regarding derivative financial instruments, refer to the Notes to Financial Statements.
| | |
| 24 | | 2020 BLACKROCK ANNUAL REPORTTO SHAREHOLDERS |
| | |
Schedule of Investments (continued) May 31, 2020 | | BlackRock California Municipal Opportunities Fund |
Fair Value Hierarchy as of Period End
Various inputs are used in determining the fair value of investments and derivative financial instruments. For information about the Fund’s policy regarding valuation of investments and derivative financial instruments, refer to the Notes to Financial Statements.
The following tables summarize the Fund’s investments and derivative financial instruments categorized in the disclosure hierarchy:
| | | | | | | | | | | | | | | | |
| | | Level 1 | | | Level 2 | | | Level 3 | | | Total | |
Assets: | |
Investments: | |
Long-Term Investments(a) | | $ | — | | | $ | 3,052,982,599 | | | $ | — | | | $ | 3,052,982,599 | |
Short-Term Securities(a) | | | 322,516,448 | | | | 26,010,221 | | | | — | | | | 348,526,669 | |
| | | | | | | | | | | | | | | | |
| | $ | 322,516,448 | | | $ | 3,078,992,820 | | | $ | — | | | $ | 3,401,509,268 | |
| | | | | | | | | | | | | | | | |
Derivative Financial Instruments(b) | |
Assets: | |
Interest rate contracts | | $ | 68,304 | | | $ | — | | | $ | — | | | $ | 68,304 | |
Liabilities: | |
Interest rate contracts | | | (613,092 | ) | | | — | | | | — | | | | (613,092 | ) |
| | | | | | | | | | | | | | | | |
| | $ | (544,788 | ) | | $ | — | | | $ | — | | | $ | (544,788 | ) |
| | | | | | | | | | | | | | | | |
| | (a) | See above Schedule of Investments for values in each sector/security type. | |
| | (b) | Derivative financial instruments are futures contracts. Future contracts are valued at the unrealized appreciation (depreciation) on the instrument. | |
The Fund may hold assets and/or liabilities in which the fair value approximates the carrying amount for financial statement purposes. As of period end, TOB Trust Certificates of $148,144,977 are categorized as Level 2 within the disclosure hierarchy.
See notes to financial statements.
| | | | |
| SCHEDULES OF INVESTMENTS | | | 25 | |
| | |
Schedule of Investments May 31, 2020 | | BlackRock New Jersey Municipal Bond Fund (Percentages shown are based on Net Assets) |
| | | | | | | | |
| Security | | Par
(000) | | | Value | |
|
Municipal Bonds — 91.3% | |
|
New Jersey — 87.9% | |
|
| Corporate — 3.6% | |
New Jersey EDA, RB, Series A: | | | | | | | | |
Provident Group-Kean Properties,
5.00%, 06/15/42 | | $ | 4,545 | | | $ | 4,632,628 | |
5.00%, 07/01/47 | | | 265 | | | | 245,300 | |
New Jersey EDA, Refunding RB: | | | | | | | | |
American Water Co., Inc, AMT,
Series A, 2.20%, 10/01/39(a) | | | 2,130 | | | | 2,205,892 | |
Series B, AMT, 5.60%, 11/01/34 | | | 1,000 | | | | 1,003,261 | |
Series D, AMT, 4.88%, 11/01/29 | | | 1,000 | | | | 1,016,090 | |
Provident Group-Monteclair Properties LLC (AGM), 5.00%, 06/01/37 | | | 2,760 | | | | 3,196,742 | |
Sub Series A, 5.00%, 07/01/33 | | | 125 | | | | 129,401 | |
Sub Series A, 4.00%, 07/01/34 | | | 165 | | | | 160,048 | |
| | | | | | | | |
| | | | | | | 12,589,362 | |
|
| County/City/Special District/School District — 15.0% | |
Carlstadt School District, GO, Refunding, 4.00%, 05/01/30 | | | 1,415 | | | | 1,575,843 | |
Casino Reinvestment Development Authority, Inc., Refunding RB: | | | | | | | | |
5.25%, 11/01/39 | | | 1,020 | | | | 1,034,045 | |
5.25%, 11/01/44 | | | 1,590 | | | | 1,596,646 | |
(AGM), 4.00%, 11/01/34 | | | 500 | | | | 517,540 | |
City of Bayonne New Jersey, GO, Refunding, Qualified General Improvement (BAM), 5.00%, 07/01/39 | | | 660 | | | | 780,952 | |
City of East Orange New Jersey, GO, Refunding (AGM): | | | | | | | | |
3.00%, 09/15/30 | | | 2,200 | | | | 2,349,754 | |
3.00%, 09/15/31 | | | 2,200 | | | | 2,325,994 | |
City of Perth Amboy New Jersey, GO, CAB, Refunding (AGM): | | | | | | | | |
5.00%, 07/01/35 | | | 600 | | | | 601,536 | |
5.00%, 07/01/36 | | | 145 | | | | 145,371 | |
County of Essex New Jersey Improvement Authority, LRB, Newark Project, Series A (AGM), 5.00%, 11/01/20(b) | | | 257 | | | | 262,053 | |
County of Essex New Jersey Improvement Authority, RB: | | | | | | | | |
AMT, 5.25%, 07/01/45(c) | | | 1,000 | | | | 999,950 | |
Governmental Loan, 4.00%, 11/01/44 | | | 7,470 | | | | 8,310,076 | |
Newark Project, Series A (AGM), 6.00%, 11/01/20(d) | | | 1,090 | | | | 1,116,803 | |
County of Essex New Jersey Improvement Authority, Refunding RB, Project Consolidation (NPFGC), 5.50%, 10/01/29 | | | 1,500 | | | | 2,055,360 | |
County of Mercer New Jersey, GO, Refunding, 3.00%, 02/15/31 | | | 1,585 | | | | 1,733,530 | |
County of Union New Jersey Utilities Authority, Refunding RB, Covanta Union, Inc., Series A, AMT, 4.75%, 12/01/31 | | | 1,250 | | | | 1,319,788 | |
Ewing Township Board of Education, GO: | | | | | | | | |
4.00%, 07/15/38 | | | 920 | | | | 1,046,564 | |
4.00%, 07/15/39 | | | 840 | | | | 953,744 | |
Monmouth Regional High School District, GO, 3.00%, 02/01/34 | | | 1,260 | | | | 1,330,988 | |
New Jersey EDA, RB: | | | | | | | | |
Kapkowski Road Landfill Project, Series B, AMT, 6.50%, 04/01/31 | | | 1,835 | | | | 1,908,932 | |
School Facilities Construction, Series EEE, 5.00%, 06/15/43 | | | 2,155 | | | | 2,202,863 | |
New Jersey EDA, Refunding RB, Special Assessment, Kapkowski Road Landfill Project, 6.50%, 04/01/28 | | | 2,500 | | | | 2,717,875 | |
New Jersey Sports & Exposition Authority, Refunding RB, (NPFGC), 5.50%, 03/01/21(b) | | | 805 | | | | 836,725 | |
Toms River Board of Education, GO, River Regional School District, 3.00%, 07/15/37 | | | 4,605 | | | | 4,788,555 | |
| | | | | | | | |
| Security | | Par
(000) | | | Value | |
|
| County/City/Special District/School District (continued) | |
Township of Bloomfield New Jersey, GO, Refunding, General Improvement Bonds: | | | | | | | | |
3.00%, 02/01/32 | | $ | 1,000 | | | $ | 1,072,220 | |
3.00%, 02/01/33 | | | 1,040 | | | | 1,108,162 | |
Township of Egg Harbor New Jersey School District, GO, Refunding, (AGM), 5.75%, 07/15/25 | | | 2,000 | | | | 2,509,920 | |
Township of Irvington New Jersey, GO, Refunding, Series A (AGM), 5.00%, 07/15/31 | | | 2,445 | | | | 2,800,014 | |
Township of Monroe NJ/Gloucester County, GO, Refunding, 3.00%, 05/01/32 | | | 405 | | | | 430,564 | |
Township of Monroe NJ/Middlesex County, GO, Refunding: | | | | | | | | |
3.00%, 06/01/37 | | | 385 | | | | 407,673 | |
3.00%, 06/01/38 | | | 410 | | | | 433,190 | |
Township of Sparta New Jersey Board of Education, GO, Refunding, 5.00%, 02/15/36 | | | 1,350 | | | | 1,579,176 | |
| | | | | | | | |
| | | | | | | 52,852,406 | |
|
| Education — 13.7% | |
County of Atlantic New Jersey Improvement Authority, RB, Stockton University Atlantic City, Series A (AGM), 4.00%, 07/01/46 | | | 1,250 | | | | 1,384,137 | |
County of Gloucester New Jersey Improvement Authority, RB, Rowan University General Capital Improvement Projects: | | | | | | | | |
5.00%, 07/01/44 | | | 530 | | | | 574,223 | |
Series A, 5.00%, 07/01/34 | | | 1,855 | | | | 2,098,469 | |
New Jersey EDA, RB: | | | | | | | | |
Beloved Community Charter School, Inc. Project,(c): Series A, 5.00%, 06/15/39 | | | 825 | | | | 804,903 | |
Series A, 5.00%, 06/15/49 | | | 135 | | | | 125,947 | |
Foundation Academy Charter School Project, Series A, 5.00%, 07/01/50 | | | 200 | | | | 207,922 | |
Friends of Vineland Public Charter School Projects, Series A, 5.25%, 11/01/54(c) | | | 1,100 | | | | 985,314 | |
Golden Door Charter School Project, Series A,(c): | | | | | | | | |
5.13%, 11/01/29 | | | 100 | | | | 97,811 | |
6.25%, 11/01/38 | | | 210 | | | | 213,931 | |
6.50%, 11/01/52 | | | 1,210 | | | | 1,233,547 | |
Hatikvah International Academy Charter School Project, Series A,(c) | | | | | | | | |
5.00%, 07/01/27 | | | 170 | | | | 172,081 | |
5.25%, 07/01/37 | | | 470 | | | | 471,349 | |
5.38%, 07/01/47 | | | 815 | | | | 810,615 | |
Rutgers — The State University of New Jersey, College Avenue Redevelopment Project, 5.00%, 06/15/38 | | | 2,000 | | | | 2,244,700 | |
School Facilities Construction, 4.00%, 06/15/49 | | | 1,190 | | | | 1,083,971 | |
Series AAA, 5.00%, 06/15/41 | | | 1,990 | | | | 2,023,810 | |
Team Academy Charter School Project, Series A, 5.00%, 12/01/48 | | | 2,190 | | | | 2,353,045 | |
Team Academy Charter School Project, 6.00%, 10/01/43 | | | 1,000 | | | | 1,098,880 | |
New Jersey EDA, Refunding RB: | | | | | | | | |
Greater Brunswick Charter School, Inc. Project, Series A,(c):
4.75%, 08/01/24 | | | 250 | | | | 248,698 | |
5.63%, 08/01/34 | | | 250 | | | | 250,205 | |
5.88%, 08/01/44 | | | 430 | | | | 431,802 | |
School Facilities Construction, Series PP, 4.00%, 06/15/30 | | | 4,875 | | | | 4,886,846 | |
Teaneck Community Charter School Project, Series A,(c): | | | | | | | | |
3.50%, 09/01/22 | | | 125 | | | | 123,490 | |
5.00%, 09/01/37 | | | 315 | | | | 291,920 | |
5.13%, 09/01/52 | | | 1,000 | | | | 970,590 | |
New Jersey Educational Facilities Authority, RB: | | | | | | | | |
Green Bond, Series A, 5.00%, 07/01/45 | | | 1,080 | | | | 1,216,793 | |
Higher Educational Capital Improvement Fund, Series A, 5.00%, 09/01/33 | | | 1,750 | | | | 1,786,802 | |
| | |
| 26 | | 2020 BLACKROCK ANNUAL REPORTTO SHAREHOLDERS |
| | |
Schedule of Investments (continued) May 31, 2020 | | BlackRock New Jersey Municipal Bond Fund (Percentages shown are based on Net Assets) |
| | | | | | | | |
| Security | | Par
(000) | | | Value | |
|
| Education (continued) | |
Rider University Issue, Series F, 5.00%, 07/01/47 | | $ | 165 | | | $ | 156,102 | |
New Jersey Educational Facilities Authority, Refunding RB: | | | | | | | | |
Kean University, Series H, 4.00%, 07/01/39 | | | 715 | | | | 775,854 | |
Montclair State University, Series A, 5.00%, 07/01/33 | | | 2,005 | | | | 2,188,919 | |
Montclair State University, Series B, 5.00%, 07/01/32 | | | 2,465 | | | | 2,790,700 | |
Ramapo College, Series B, 5.00%, 07/01/42 | | | 560 | | | | 589,204 | |
New Jersey Higher Education Student Assistance Authority, RB, Student Loan, AMT, Sub-Series C, 4.00%, 12/01/48 | | | 700 | | | | 715,610 | |
New Jersey Higher Education Student Assistance Authority, Refunding RB: | | | | | | | | |
Series 1, AMT, 5.75%, 12/01/28 | | | 385 | | | | 408,150 | |
Series 1A, 5.00%, 12/01/25 | | | 35 | | | | 35,023 | |
Series 1A, 5.00%, 12/01/26 | | | 240 | | | | 240,158 | |
Series A, 2.38%, 12/01/29 | | | 3,000 | | | | 2,771,250 | |
Sub-Series C, AMT, 3.63%, 12/01/49 | | | 1,065 | | | | 1,030,973 | |
New Jersey Institute of Technology, RB, Series A: | | | | | | | | |
5.00%, 07/01/22(d) | | | 460 | | | | 506,764 | |
5.00%, 07/01/40 | | | 5,000 | | | | 5,848,000 | |
New Jersey State Turnpike Authority, RB, Series E, 5.00%, 01/01/45 | | | 2,000 | | | | 2,238,520 | |
| | | | | | | | |
| | | | | | | 48,487,028 | |
|
| Health — 14.1% | |
New Jersey EDA, Refunding RB, Cranes Mill Project: | | | | | | | | |
5.00%, 01/01/34 | | | 270 | | | | 268,415 | |
5.00%, 01/01/39 | | | 270 | | | | 261,206 | |
New Jersey Health Care Facilities Financing Authority, RB: | | | | | | | | |
Greystone Park Psychiatric Hospital Project, Series A, 5.00%, 09/15/29 | | | 2,000 | | | | 2,077,640 | |
Inspira Health Obligated Group, 5.00%, 07/01/42 | | | 4,660 | | | | 5,230,477 | |
Robert Wood Johnson University Hospital, Series A, 5.25%, 07/01/35 | | | 1,460 | | | | 1,610,818 | |
Robert Wood Johnson University Hospital, Series A, 5.00%, 07/01/39 | | | 1,150 | | | | 1,253,420 | |
Robert Wood Johnson University Hospital, Series A, 5.00%, 07/01/43 | | | 1,535 | | | | 1,665,536 | |
Robert Wood Johnson University Hospital, Series A, 5.50%, 07/01/43 | | | 920 | | | | 1,011,043 | |
Valley Health System Obligated Group, 4.00%, 07/01/44 | | | 4,120 | | | | 4,424,427 | |
New Jersey Health Care Facilities Financing Authority, Refunding RB: | | | | | | | | |
AHS Hospital Corp., 6.00%, 07/01/21(d) | | | 2,985 | | | | 3,176,398 | |
AHS Hospital Corp., 4.00%, 07/01/41 | | | 1,000 | | | | 1,081,450 | |
Hackensack Meridian Health Obligated Group, Series A, 5.00%, 07/01/37 | | | 6,000 | | | | 6,957,960 | |
Holy Name Medical Center, 5.00%, 07/01/25 | | | 500 | | | | 501,185 | |
Hunterdon Medical Center, 5.00%, 07/01/31 | | | 300 | | | | 331,929 | |
Hunterdon Medical Center, 5.00%, 07/01/45 | | | 2,650 | | | | 2,829,299 | |
Meridian Health System Obligated Group, 5.00%, 07/01/27 | | | 1,500 | | | | 1,615,050 | |
Princeton Healthcare System, 5.00%, 07/01/34 | | | 1,000 | | | | 1,174,450 | |
Princeton Healthcare System, 5.00%, 07/01/39 | | | 4,060 | | | | 4,681,464 | |
RWJ Barnabas Health Obligated Group, Series A, 4.00%, 07/01/32 | | | 2,300 | | | | 2,490,003 | |
RWJ Barnabas Health Obligated Group, Series A, 5.00%, 07/01/43 | | | 1,290 | | | | 1,445,303 | |
St. Barnabas Health Care System, Series A, 5.63%, 07/01/21(d) | | | 1,540 | | | | 1,630,275 | |
St. Barnabas Health Care System, Series A, 5.00%, 07/01/24 | | | 1,000 | | | | 1,078,910 | |
St. Barnabas Health Care System, Series A, 5.00%, 07/01/25 | | | 2,230 | | | | 2,404,007 | |
St. Luke’s Warren Hospital Obligated Group, 5.00%, 08/15/34 | | | 460 | | | | 494,505 | |
Virtua Health, 5.00%, 07/01/29 | | | 285 | | | | 321,574 | |
| | | | | | | | |
| | | | | | | 50,016,744 | |
| | | | | | | | |
| Security | | Par
(000) | | | Value | |
|
| Housing — 2.0% | |
New Jersey EDA, Refunding RB, Provident Group-Montclair Properties LLC (AGM), 5.00%, 06/01/42 | | $ | 690 | | | $ | 790,678 | |
New Jersey Housing & Mortgage Finance Agency, Refunding RB, Series A: | | | | | | | | |
M/F Housing, 4.00%, 11/01/48 | | | 150 | | | | 161,406 | |
M/F Housing, 4.10%, 11/01/53 | | | 100 | | | | 107,531 | |
S/F Housing, 3.75%, 10/01/35 | | | 1,100 | | | | 1,251,866 | |
Newark Housing Authority Scholarship Foundation A New Jersey Non (The), RB, M/F Housing, Series A: | | | | | | | | |
5.00%, 12/01/30 | | | 1,640 | | | | 1,871,043 | |
4.38%, 12/01/33 | | | 2,515 | | | | 2,738,609 | |
| | | | | | | | |
| | | | | | | 6,921,133 | |
|
| State — 7.7% | |
County of Monmouth Improvement Authority, RB, Series B (GTD): | | | | | | | | |
4.00%, 12/01/39 | | | 590 | | | | 701,138 | |
4.00%, 12/01/38 | | | 250 | | | | 297,925 | |
Garden State Preservation Trust, RB (AGM): | | | | | | | | |
CAB, Series B, 0.00%, 11/01/24(e) | | | 10,000 | | | | 9,194,600 | |
CAB, Series B, 0.00%, 11/01/27(e) | | | 4,135 | | | | 3,480,595 | |
Election of 2005, Series A, 5.75%, 11/01/28 | | | 2,565 | | | | 3,262,398 | |
New Jersey EDA, RB: | | | | | | | | |
CAB, Motor Vehicle Surcharge, Series A (NPFGC), 0.00%, 07/01/21(e) | | | 1,675 | | | | 1,633,845 | |
School Facilities Construction Bonds, Series DDD, 5.00%, 06/15/42 | | | 3,000 | | | | 3,054,570 | |
School Facilities Construction, Series KK,
5.00%, 09/01/22(d) | | | 1,070 | | | | 1,187,294 | |
New Jersey EDA, Refunding RB: | | | | | | | | |
CAB, Economic Fund, Series A (NPFGC),
0.00%, 03/15/21(e) | | | 2,000 | | | | 1,964,420 | |
Cigarette Tax, 5.00%, 06/15/22 | | | 1,700 | | | | 1,748,773 | |
Cigarette Tax, 5.00%, 06/15/29 | | | 640 | | | | 655,654 | |
| | | | | | | | |
| | | | | | | 27,181,212 | |
|
| Tobacco — 3.1% | |
Tobacco Settlement Financing Corp., Refunding RB: | | | | | | | | |
Series A, 5.00%, 06/01/46 | | | 1,500 | | | | 1,635,165 | |
Series A, 5.25%, 06/01/46 | | | 915 | | | | 1,014,827 | |
Sub-Series B, 5.00%, 06/01/46 | | | 8,085 | | | | 8,439,527 | |
| | | | | | | | |
| | | | | | | 11,089,519 | |
|
| Transportation — 24.5% | |
Delaware River Port Authority of Pennsylvania & New Jersey, RB, 5.00%, 01/01/40 | | | 1,500 | | | | 1,682,895 | |
New Jersey EDA, RB, Goethals Bridge Replacement Project, AMT: | | | | | | | | |
5.38%, 01/01/43 | | | 905 | | | | 975,825 | |
(AGM), 5.13%, 01/01/39 | | | 1,000 | | | | 1,082,750 | |
(AGM), 5.13%, 07/01/42 | | | 1,000 | | | | 1,072,290 | |
New Jersey State Turnpike Authority, RB, Series A, 4.00%, 01/01/48 | | | 9,000 | | | | 9,813,960 | |
New Jersey State Turnpike Authority, Refunding RB: | | | | | | | | |
Series A (BHAC), 5.25%, 01/01/30 | | | 1,000 | | | | 1,331,470 | |
Series B, 5.00%, 01/01/34 | | | 1,600 | | | | 1,933,248 | |
Series E, 5.00%, 01/01/32 | | | 1,350 | | | | 1,647,621 | |
New Jersey Transportation Trust Fund Authority, RB: | | | | | | | | |
CAB, Transportation System, Series A, 0.00%, 12/15/32(e) | | | 10,000 | | | | 5,685,700 | |
CAB, Transportation System, Series A, 0.00%, 12/15/35(e) | | | 8,900 | | | | 4,317,479 | |
CAB, Transportation System, Series A, 0.00%, 12/15/38(e) | | | 10,000 | | | | 4,094,500 | |
| | | | |
| SCHEDULES OF INVESTMENTS | | | 27 | |
| | |
Schedule of Investments (continued) May 31, 2020 | | BlackRock New Jersey Municipal Bond Fund (Percentages shown are based on Net Assets) |
| | | | | | | | |
| Security | | Par
(000) | | | Value | |
|
| Transportation (continued) | |
Federal Highway Reimbursement Revenue Notes, Series A, 5.00%, 06/15/30 | | $ | 1,250 | | | $ | 1,327,763 | |
Series B, 5.25%, 06/15/26 | | | 1,500 | | | | 1,525,320 | |
Series BB, 5.00%, 06/15/44 | | | 500 | | | | 511,000 | |
Series BB, 4.00%, 06/15/50 | | | 2,545 | | | | 2,313,609 | |
Series BB, 5.00%, 06/15/50 | | | 535 | | | | 543,961 | |
Transportation Program Notes, Series BB, 5.00%, 06/15/33 | | | 550 | | | | 572,033 | |
Transportation Program, Series AA, 5.25%, 06/15/31 | | | 2,000 | | | | 2,077,520 | |
Transportation Program, Series AA, 5.00%, 06/15/45 | | | 1,000 | | | | 1,013,460 | |
Transportation Program Bonds, Series S, 5.25%, 06/15/43 | | | 1,720 | | | | 1,787,114 | |
Federal Highway Reimbursement, Series A, 5.00%, 06/15/31 | | | 2,730 | | | | 2,873,380 | |
Transportation System Bond, 4.00%, 12/15/39 | | | 1,835 | | | | 1,703,449 | |
Transportation System, Series A, 5.00%, 12/15/32 | | | 1,775 | | | | 1,854,822 | |
Transportation System, Series A, 5.00%, 12/15/35 | | | 455 | | | | 467,426 | |
Transportation System, Series A, 6.00%, 06/15/21(d) | | | 3,185 | | | | 3,380,941 | |
Transportation System, Series B, 5.00%, 06/15/21(d) | | | 600 | | | | 630,450 | |
Transportation System, Series B (NPFGC), 5.50%, 12/15/21 | | | 1,800 | | | | 1,883,772 | |
Port Authority of New York & New Jersey, ARB: | | | | | | | | |
Consolidated Bonds, 218th Series, AMT, 4.00%, 11/01/34 | | | 2,345 | | | | 2,631,442 | |
Consolidated Bonds, 218th Series, AMT, 4.00%, 11/01/47 | | | 3,545 | | | | 3,689,565 | |
Consolidated, 93rd Series, 6.13%, 06/01/94 | | | 1,000 | | | | 1,178,180 | |
JFK International Air Terminal LLC, Special Project, Series 6, AMT (NPFGC), 5.75%, 12/01/22 | | | 1,270 | | | | 1,273,366 | |
Special Project, JFK International Air Terminal LLC Project, Series 8, 6.00%, 12/01/42 | | | 1,000 | | | | 1,008,550 | |
Port Authority of New York & New Jersey, Refunding ARB, AMT: | | | | | | | | |
Consolidated Bonds, Series 225th, 4.00%, 09/01/43 | | | 7,305 | | | | 7,925,048 | |
Consolidated, 178th Series, 5.00%, 12/01/43 | | | 285 | | | | 308,661 | |
Consolidated,186th Series, 5.00%, 10/15/44 | | | 3,000 | | | | 3,294,030 | |
Port Authority of New York & New Jersey, Refunding RB, Consolidated 205th series, 5.00%, 11/15/42 | | | 1,975 | | | | 2,323,311 | |
South Jersey Port Corp., Refunding ARB, Marine Terminal, Series B, AMT, 5.00%, 01/01/48 | | | 2,380 | | | | 2,385,212 | |
South Jersey Transportation Authority, Refunding RB, Series A: | | | | | | | | |
5.00%, 11/01/22(d) | | | 280 | | | | 312,914 | |
5.00%, 11/01/28 | | | 15 | | | | 15,869 | |
Transportation System, 5.00%, 11/01/32 | | | 440 | | | | 476,674 | |
Transportation System, 5.00%, 11/01/33 | | | 250 | | | | 270,030 | |
Transportation System, 5.00%, 11/01/39 | | | 1,500 | | | | 1,594,515 | |
| | | | | | | | |
| | | | | | | 86,791,125 | |
|
| Utilities — 4.2% | |
County of Gloucester New Jersey Pollution Control Financing Authority, Refunding RB, Keystone Urban Renewal Project, Series A, AMT, 5.00%, 12/01/24 | | | 425 | | | | 438,294 | |
New Jersey EDA, RB, Middlesex Water Company Project (AMT), 4.00%, 08/01/59 | | | 4,200 | | | | 4,753,644 | |
New Jersey EDA, Refunding RB, New Jersey Natural Gas Company Project: | | | | | | | | |
3.38%, 04/01/38 | | | 1,360 | | | | 1,419,432 | |
3.50%, 04/01/42 | | | 720 | | | | 752,810 | |
New Jersey Environmental Infrastructure Trust, RB, Series B, AMT, 5.00%, 09/01/28 | | | 1,355 | | | | 1,428,509 | |
North Hudson New Jersey Sewerage Authority, Refunding RB, Series A (NPFGC), 0.00%, 08/01/21(b)(e) | | | 5,000 | | | | 4,987,650 | |
| | | | | | | | |
| Security | | Par
(000) | | | Value | |
|
| Utilities (continued) | |
Passaic Valley Water Commission, RB, Series A, 6.00%, 12/15/20(d) | | $ | 980 | | | $ | 1,011,213 | |
| | | | | | | | |
| | | | | | | 14,791,552 | |
| | | | | | | | |
| |
Total Municipal Bonds in New Jersey | | | | 310,720,081 | |
| | | | | | | | |
|
Guam — 0.1% | |
|
| Utilities — 0.1% | |
Guam Government Waterworks Authority, RB, Series A, 5.00%, 01/01/50 | | | 500 | | | | 552,465 | |
| | | | | | | | |
|
Puerto Rico — 3.3% | |
|
| State — 2.6% | |
Puerto Rico Sales Tax Financing Corp. Sales Tax Revenue, RB, Restructured: | | | | | | | | |
CAB, Series A-1, 0.00%, 07/01/46(e) | | | 4,330 | | | | 1,103,630 | |
CAB, Series A-1, 0.00%, 07/01/51(e) | | | 2,155 | | | | 401,563 | |
Series A-1, 4.75%, 07/01/53 | | | 2,882 | | | | 2,782,629 | |
Series A-1, 5.00%, 07/01/58 | | | 2,622 | | | | 2,615,655 | |
Series A-2, 4.33%, 07/01/40 | | | 580 | | | | 555,118 | |
Series A-2, 4.78%, 07/01/58 | | | 1,518 | | | | 1,463,352 | |
Series B-1, 0.00%, 07/01/46(e) | | | 567 | | | | 144,154 | |
| | | | | | | | |
| | | | | | | 9,066,101 | |
|
| Utilities — 0.7% | |
Commonwealth of Puerto Rico Aqueduct & Sewer Authority, RB, Senior Lien, Series A: | | | | | | | | |
5.00%, 07/01/33 | | | 935 | | | | 913,990 | |
5.13%, 07/01/37 | | | 290 | | | | 287,187 | |
5.25%, 07/01/42 | | | 1,445 | | | | 1,419,727 | |
| | | | | | | | |
| | | | | | | 2,620,904 | |
| | | | | | | | |
| |
Total Municipal Bonds in Puerto Rico | | | | 11,687,005 | |
| | | | | | | | |
| |
Total Municipal Bonds — 91.3%
(Cost — $308,176,531) | | | | 322,959,551 | |
| | | | | | | | |
|
Municipal Bonds Transferred to Tender Option Bond Trusts(f) — 11.2% | |
|
New Jersey — 11.2% | |
|
| County/City/Special District/School District — 3.0% | |
County of Hudson New Jersey Improvement Authority, RB, Hudson County Vocational-Technical Schools Project, 5.25%, 05/01/51 | | | 1,440 | | | | 1,688,069 | |
County of Union New Jersey Utilities Authority, Refunding RB, Series A, AMT: | | | | | | | | |
County Deficiency Agreement, 5.00%, 06/15/41 | | | 2,000 | | | | 2,085,280 | |
Resource Recovery Facility, Covanta Union, Inc., 5.25%, 12/01/31 | | | 6,300 | | | | 6,631,632 | |
| | | | | | | | |
| | | | | | | 10,404,981 | |
|
| Education — 4.0% | |
New Jersey EDA, Refunding RB, New Jersey Natural Gas Company Project, AMT(g): | | | | | | | | |
3.00%, 08/01/41(a)(c) | | | 4,622 | | | | 4,688,472 | |
3.00%, 08/01/43(a)(c) | | | 6,648 | | | | 6,742,970 | |
Rutgers — The State University of New Jersey, Refunding RB, Series L, 5.00%, 05/01/23(d) | | | 2,500 | | | | 2,852,525 | |
| | | | | | | | |
| | | | | | | 14,283,967 | |
|
| Health — 2.2% | |
New Jersey Health Care Facilities Financing Authority, RB, Inspira Health Obligated Group, 4.00%, 07/01/47 | | | 7,332 | | | | 7,602,911 | |
| | | | | | | | |
| | |
| 28 | | 2020 BLACKROCK ANNUAL REPORTTO SHAREHOLDERS |
| | |
Schedule of Investments (continued) May 31, 2020 | | BlackRock New Jersey Municipal Bond Fund (Percentages shown are based on Net Assets) |
| | | | | | | | |
| Security | | Par
(000) | | | Value | |
|
| Transportation — 2.0% | |
New Jersey Transportation Trust Fund Authority, RB, Transportation System, Series B, 5.25%, 06/15/36 | | $ | 5,001 | | | $ | 5,032,811 | |
Port Authority of New York & New Jersey, Refunding ARB: | | | | | | | | |
Consolidated, 169th Series, AMT, 5.00%, 10/15/41 | | | 495 | | | | 516,257 | |
Series194th, 5.25%, 10/15/55 | | | 1,455 | | | | 1,643,408 | |
| | | | | | | | |
| | | | | | | 7,192,476 | |
| | | | | | | | |
| |
Total Municipal Bonds Transferred to Tender Option Bond Trusts — 11.2%
(Cost — $38,340,148) | | | | 39,484,335 | |
| | | | | | | | |
| |
Total Long-Term Investments — 102.5%
(Cost — $346,516,679) | | | | 362,443,886 | |
| | | | | | | | |
| | |
| | | Shares | | | | |
|
| Short-Term Securities — 2.6% | |
BlackRock Liquidity Funds, MuniCash, Institutional Class, 0.04%(h)(i) | | | 9,088,748 | | | | 9,091,474 | |
| | | | | | | | |
| |
Total Short-Term Securities — 2.6%
(Cost — $9,090,476) | | | | 9,091,474 | |
| | | | | | | | |
| |
Total Investments — 105.1%
(Cost — $355,607,155) | | | | 371,535,360 | |
| |
Other Assets Less Liabilities — 1.2% | | | | 4,273,671 | |
| |
Liability for TOB Trust Certificates, Including Interest Expense and Fees Payable — (6.3)% | | | | (22,154,317 | ) |
| | | | | | | | |
| |
Net Assets — 100.0% | | | $ | 353,654,714 | |
| | | | | | | | |
| (a) | Variable or floating rate security, which interest rate adjusts periodically based on changes in current interest rates and prepayments on the underlying pool of assets. Rate shown is the rate in effect as of period end. |
| (b) | Security is collateralized by municipal bonds or U.S. Treasury obligations. |
| (c) | Security exempt from registration pursuant to Rule 144A under the Securities Act of 1933, as amended. These securities may be resold in transactions exempt from registration to qualified institutional investors. |
| (d) | U.S. Government securities held in escrow, are used to pay interest on this security as well as to retire the bond in full at the date indicated, typically at a premium to par. |
| (f) | Represent bonds transferred to a TOB Trust in exchange of cash and residual certificates received by the Fund. These bonds serve as collateral in a secured borrowing. See Note 4 of the Notes to Financial Statements for details. |
| (g) | All or a portion of the security is subject to a recourse agreement. The aggregate maximum potential amount the Fund could ultimately be required to pay under the agreement, which expires on February 1, 2037, is $5,808,746. See Note 4 of the Notes to Financial Statements for details. |
| (h) | Annualized 7-day yield as of period end. |
| (i) | Investments in issuers considered to be an affiliate/affiliates of the Fund during the year ended May 31, 2020 for purposes of Section 2(a)(3) of the Investment Company Act of 1940, as amended, were as follows: |
| | | | | | | | | | | | | | | | | | | | | | | | | | | | | | | | |
| Affiliated Issuer | | Shares
Held at
05/31/19 | | | Shares
Purchased | | | Shares
Sold | | | Shares
Held at
05/31/20 | | | Value at
05/31/20 | | | Income | | | Net
Realized
Gain (Loss) (a) | | | Change in
Unrealized
Appreciation
(Depreciation) | |
BlackRock Liquidity Funds, MuniCash, Institutional Class | | | 15,937,171 | | | | — | | | | (6,848,423 | )(b) | | | 9,088,748 | | | $ | 9,091,474 | | | $ | 163,028 | | | $ | (9,918 | ) | | $ | (104 | ) |
iShares National Municipal Bond ETF(c) | | | — | | | | 33,000 | | | | (33,000 | ) | | | — | | | | — | | | | 14,610 | | | | (197,165 | ) | | | — | |
| | | | | | | | | | | | | | | | | | | | | | | | | | | | | | | | |
| | | $ | 9,091,474 | | | $ | 177,638 | | | $ | (207,083 | ) | | $ | (104 | ) |
| | | | | | | | | | | | | | | | | |
| | (a) | Includes net capital gain distributions, if applicable. | |
| | (b) | Represents net shares purchased (sold). | |
| | (c) | As of period end, the entity is no longer held by the Fund. | |
For Fund compliance purposes, the Fund’s sector classifications refer to one or more of the sector sub-classifications used by one or more widely recognized market indexes or rating group indexes, and/or as defined by the investment adviser. These definitions may not apply for purposes of this report, which may combine such sector sub-classifications for reporting ease.
Derivative Financial Instruments Categorized by Risk Exposure
For the year ended May 31, 2020, the effect of derivative financial instruments in the Statements of Operations was as follows:
| | | | | | | | | | | | | | | | | | | | | | | | | | | | |
| | | Commodity
Contracts | | | Credit
Contracts | | | Equity
Contracts | | | Foreign
Currency
Exchange
Contracts | | | Interest
Rate
Contracts | | | Other
Contracts | | | Total | |
Net Realized Gain (Loss) from: | | | | | | | | | | | | | | | | | | | | | | | | | | | | |
Futures contracts | | $ | — | | | $ | — | | | $ | — | | | $ | — | | | $ | (6,702,209 | ) | | $ | — | | | $ | (6,702,209 | ) |
| | | | | | | | | | | | | | | | | | | | | | | | | | | | |
| | | | | | | |
| Net Change in Unrealized Appreciation (Depreciation) on: | | | | | | | | | | | | | | | | | | | | | |
Futures contracts | | $ | — | | | $ | — | | | $ | — | | | $ | — | | | $ | 288,269 | | | $ | — | | | $ | 288,269 | |
| | | | | | | | | | | | | | | | | | | | | | | | | | | | |
| | | | |
| SCHEDULES OF INVESTMENTS | | | 29 | |
| | |
Schedule of Investments (continued) May 31, 2020 | | BlackRock New Jersey Municipal Bond Fund |
Average Quarterly Balances of Outstanding Derivative Financial Instruments
| | | | |
Futures contracts: | |
Average notional value of contracts — long | | $ | — | (a) |
Average notional value of contracts — short | | $ | 29,851,875 | |
| | (a) | Derivative not held at any quarter-end. The risk exposure table serves as an indicator of activity during the period. | |
For more information about the Fund’s investment risks regarding derivative financial instruments, refer to the Notes to Financial Statements.
Fair Value Hierarchy as of Period End
Various inputs are used in determining the fair value of investments. For information about the Fund’s policy regarding valuation of investments, refer to the Notes to Financial Statements.
The following table summarizes the Fund’s investments categorized in the disclosure hierarchy:
| | | | | | | | | | | | | | | | |
| | | Level 1 | | | Level 2 | | | Level 3 | | | Total | |
Assets: | |
Investments: | |
Long-Term Investments(a) | | $ | — | | | $ | 362,443,886 | | | $ | — | | | $ | 362,443,886 | |
Short-Term Securities | | | 9,091,474 | | | | — | | | | — | | | | 9,091,474 | |
| | | | | | | | | | | | | | | | |
| | $ | 9,091,474 | | | $ | 362,443,886 | | | $ | — | | | $ | 371,535,360 | |
| | | | | | | | | | | | | | | | |
| | (a) | See above Schedule of Investments for values in each sector, security type, state or political subdivision. | |
The Fund may hold assets and/or liabilities in which the fair value approximates the carrying amount for financial statement purposes. As of period end, TOB Trust Certificates of $22,053,726 are categorized as Level 2 within the disclosure hierarchy.
See notes to financial statements.
| | |
| 30 | | 2020 BLACKROCK ANNUAL REPORTTO SHAREHOLDERS |
| | |
Schedule of Investments May 31, 2020 | | BlackRock Pennsylvania Municipal Bond Fund (Percentages shown are based on Net Assets) |
| | | | | | | | |
| Security | | Par
(000) | | | Value | |
|
Municipal Bonds — 84.1% | |
|
Pennsylvania — 80.2% | |
|
| Corporate — 1.9% | |
County of Delaware Pennsylvania IDA, Refunding RB, Covanta Project, 5.00%, 07/01/43 | | $ | 5,000 | | | $ | 5,006,500 | |
Pennsylvania Economic Development Financing Authority, RB, Green Bond, Covanta Project, AMT, 3.25%, 08/01/39(a) | | | 2,800 | | | | 2,324,084 | |
Pennsylvania Economic Development Financing Authority, Refunding RB, AMT: | | | | | | | | |
Aqua Pennsylvania, Inc. Project, Series A, 5.00%, 12/01/34 | | | 1,540 | | | | 1,558,110 | |
National Gypsum Co., 5.50%, 11/01/44 | | | 1,355 | | | | 1,275,272 | |
| | | | | | | | |
| | | | | | | 10,163,966 | |
|
| County/City/Special District/School District — 19.7% | |
Allentown Neighborhood Improvement Zone Development Authority, RB, City Center Project, 5.00%, 05/01/42(a) | | | 330 | | | | 328,644 | |
Allentown Neighborhood Improvement Zone Development Authority, Refunding RB, Series A: | | | | | | | | |
5.00%, 05/01/35 | | | 2,310 | | | | 2,367,588 | |
5.00%, 05/01/42 | | | 3,900 | | | | 3,993,756 | |
Altoona Area School District, GO: | | | | | | | | |
(BAM), 5.00%, 12/01/36 | | | 215 | | | | 254,816 | |
(BAM), 5.00%, 12/01/45 | | | 1,000 | | | | 1,162,930 | |
Series A (AGM), 5.00%, 12/01/36 | | | 2,895 | | | | 3,431,125 | |
Bethlehem Area School District, GO (BAM), Series A: | | | | | | | | |
5.00%, 08/01/34 | | | 2,390 | | | | 2,786,190 | |
5.00%, 08/01/35 | | | 1,790 | | | | 2,076,418 | |
Boyertown Area School District, GO: | | | | | | | | |
5.00%, 10/01/36 | | | 890 | | | | 1,023,625 | |
5.00%, 10/01/38 | | | 1,335 | | | | 1,530,684 | |
Catasauqua Area School District, GO, Refunding, (BAM), 4.00%, 02/15/42 | | | 2,255 | | | | 2,536,762 | |
City of Philadelphia Pennsylvania, GO, Series B, 5.00%, 02/01/39 | | | 2,155 | | | | 2,705,495 | |
County of Chester IDA, RB, Green Bond, Longwood Gardens, Inc. Project, Sustainability Bonds, 4.00%, 12/01/49 | | | 3,750 | | | | 4,272,675 | |
County of Chester IDA, Special Assessment Bonds, Woodlands at Greystone Project(a): | | | | | | | | |
5.00%, 03/01/38 | | | 525 | | | | 483,488 | |
5.13%, 03/01/48 | | | 1,050 | | | | 918,067 | |
County of Delaware Springfield School District, GO, 5.00%, 03/01/40 | | | 1,710 | | | | 2,090,526 | |
County of Lancaster Pennsylvania, GO, Refunding: | | | | | | | | |
4.00%, 11/01/34 | | | 500 | | | | 581,720 | |
4.00%, 11/01/35 | | | 520 | | | | 601,962 | |
4.00%, 11/01/36 | | | 540 | | | | 622,874 | |
4.00%, 11/01/37 | | | 565 | | | | 650,485 | |
4.00%, 11/01/38 | | | 585 | | | | 672,411 | |
County of Northampton Pennsylvania IDA, Tax Allocation Bonds, Route 33 Project, 7.00%, 07/01/32 | | | 1,625 | | | | 1,718,600 | |
County of Washington Redevelopment Authority, Refunding, Tax Allocation Bonds: | | | | | | | | |
4.00%, 07/01/23 | | | 705 | | | | 697,259 | |
5.00%, 07/01/28 | | | 600 | | | | 598,416 | |
County of York Pennsylvania, GO, Refunding, 5.00%, 09/01/20(b) | | | 2,500 | | | | 2,529,775 | |
Dallastown Area School District, GO, Refunding, 5.00%, 04/15/34 | | | 1,835 | | | | 2,157,373 | |
East Pennsboro Area School District, GO (BAM): | | | | | | | | |
4.00%, 10/01/40 | | | 645 | | | | 737,435 | |
4.00%, 10/01/44 | | | 1,530 | | | | 1,730,920 | |
| | | | | | | | |
| Security | | Par
(000) | | | Value | |
|
| County/City/Special District/School District (continued) | |
Easton Area School District, GO, Series B, 5.00%, 02/01/31 | | $ | 1,650 | | | $ | 2,096,424 | |
Fox Chapel Area School District, GO: | | | | | | | | |
5.00%, 02/01/39 | | | 4,100 | | | | 5,000,729 | |
5.00%, 02/01/42 | | | 6,365 | | | | 7,632,144 | |
Marple Newtown School District, GO, 3.00%, 06/01/40 | | | 2,365 | | | | 2,565,505 | |
Mechanicsburg Area School District, GO, Series A: | | | | | | | | |
4.00%, 03/01/40 | | | 2,160 | | | | 2,485,728 | |
4.00%, 03/01/41 | | | 2,245 | | | | 2,580,740 | |
4.00%, 03/01/42 | | | 2,335 | | | | 2,681,047 | |
North Allegheny School District, GOL, 4.00%, 05/01/39 | | | 1,000 | | | | 1,163,070 | |
Pittsburgh School District, GO, Series A: | | | | | | | | |
4.00%, 09/01/37 | | | 2,240 | | | | 2,568,250 | |
4.00%, 09/01/38 | | | 2,235 | | | | 2,556,169 | |
School District of Philadelphia, Refunding, GOL, Series F, 5.00%, 09/01/37 | | | 1,815 | | | | 2,106,235 | |
State Public School Building Authority, RB, Community College, Allegheny County Project (AGM), 5.00%, 07/15/34 | | | 5,070 | | | | 5,284,714 | |
State Public School Building Authority, Refunding RB, Philadelphia School District (AGM), 5.00%, 06/01/33 | | | 5,000 | | | | 6,004,750 | |
Township of Bristol Pennsylvania School District, GO, (BAM), 5.00%, 06/01/42 | | | 2,550 | | | | 3,059,311 | |
Township of Falls Pennsylvania, Refunding RB, Water & Sewer Authority, 5.00%, 12/01/37 | | | 2,115 | | | | 2,246,913 | |
Township of Lower Paxton Pennsylvania, GO, 5.00%, 04/01/42 | | | 630 | | | | 720,525 | |
Township of West Bradford, GO, 4.00%, 12/15/49 | | | 1,125 | | | | 1,289,407 | |
Tredyffrin Easttown School District, GO, 5.00%, 02/15/39 | | | 1,130 | | | | 1,381,278 | |
West Shore School District Pennsylvania, GO: | | | | | | | | |
5.00%, 11/15/43 | | | 4,045 | | | | 4,834,058 | |
5.00%, 11/15/48 | | | 1,975 | | | | 2,346,004 | |
Williamsport Sanitary Authority, Refunding RB, (BAM), 4.00%, 01/01/40 | | | 1,420 | | | | 1,622,620 | |
| | | | | | | | |
| | | | | | | 107,487,640 | |
|
| Education — 14.4% | |
Berks County Municipal Authority, Refunding RB, Alvernia University Project: | | | | | | | | |
5.00%, 10/01/39 | | | 290 | | | | 278,058 | |
5.00%, 10/01/49 | | | 795 | | | | 729,683 | |
County of Adams Pennsylvania IDA, Refunding RB, Gettysburg College: | | | | | | | | |
5.00%, 08/15/24 | | | 580 | | | | 584,982 | |
5.00%, 08/15/25 | | | 765 | | | | 771,525 | |
5.00%, 08/15/26 | | | 760 | | | | 766,430 | |
County of Allegheny Higher Education Building Authority, Refunding RB, Carnegie Mellon University Revenue Bonds, Series A, 5.00%, 08/01/27 | | | 965 | | | | 1,254,317 | |
County of Cumberland Pennsylvania Municipal Authority, Refunding RB, Diakon Lutheran Social Ministries Project: | | | | | | | | |
4.13%, 01/01/38 | | | 260 | | | | 246,610 | |
4.00%, 01/01/36 | | | 645 | | | | 609,667 | |
5.00%, 01/01/39 | | | 1,240 | | | | 1,286,537 | |
County of Delaware Pennsylvania Authority, RB, Villanova University, 5.00%, 08/01/40 | | | 1,795 | | | | 2,037,989 | |
County of Delaware Pennsylvania Authority, Refunding RB, Cabrini University, 5.00%, 07/01/47 | | | 3,870 | | | | 3,937,338 | |
County of Montgomery Higher Education & Health Authority, Refunding RB, Series A: | | | | | | | | |
Thomas Jefferson University, 5.00%, 09/01/48 | | | 2,500 | | | | 2,803,325 | |
Thomas Jeferson University, 5.00%, 09/01/37 | | | 1,365 | | | | 1,567,634 | |
County of Northampton Pennsylvania General Purpose Authority, Refunding RB, Moravian College, 5.00%, 10/01/36 | | | 890 | | | | 960,105 | |
| | | | |
| SCHEDULES OF INVESTMENTS | | | 31 | |
| | |
Schedule of Investments (continued) May 31, 2020 | | BlackRock Pennsylvania Municipal Bond Fund (Percentages shown are based on Net Assets) |
| | | | | | | | |
| Security | | Par
(000) | | | Value | |
|
| Education (continued) | |
County of Westmoreland Pennsylvania Municipal Authority, Refunding RB, (BAM), 5.00%, 08/15/36 | | $ | 2,500 | | | $ | 2,977,550 | |
Pennsylvania Higher Educational Facilities Authority, RB, Series AT-1, 4.00%, 06/15/34 | | | 5,790 | | | | 6,404,840 | |
Pennsylvania Higher Educational Facilities Authority, Refunding RB: | | | | | | | | |
Drexel University, 4.00%, 05/01/36 | | | 500 | | | | 526,975 | |
Drexel University, Series A, 5.25%, 05/01/21(b) | | | 6,720 | | | | 7,031,270 | |
Drexel University, Series A, 5.25%, 05/01/41 | | | 420 | | | | 430,034 | |
La Salle University, 5.00%, 05/01/37 | | | 1,595 | | | | 1,634,285 | |
State System of Higher Education, Series AL, 5.00%, 06/15/35 | | | 650 | | | | 651,878 | |
Thomas Jefferson University, 5.00%, 09/01/45 | | | 3,000 | | | | 3,188,760 | |
University of Science in Philadelphia, 5.00%, 11/01/36 | | | 5,165 | | | | 5,186,176 | |
Widener University, Series A, 5.25%, 07/15/33 | | | 2,420 | | | | 2,636,590 | |
Widener University, Series A, 5.50%, 07/15/38 | | | 365 | | | | 394,926 | |
Pennsylvania State University, RB: | | | | | | | | |
5.00%, 09/01/48 | | | 2,615 | | | | 3,224,818 | |
Series A, 5.00%, 09/01/43 | | | 3,935 | | | | 4,988,832 | |
Philadelphia Authority for Industrial Development, RB: | | | | | | | | |
Alliance For Progress Charter School, Inc. Project, 4.00%, 06/15/29 | | | 485 | | | | 445,817 | |
Alliance For Progress Charter School, Inc. Project, 5.00%, 06/15/39 | | | 590 | | | | 546,311 | |
Independence Charter School West Project, 5.00%, 06/15/39 | | | 250 | | | | 227,415 | |
Independence Charter School West Project, 5.00%, 06/15/50 | | | 800 | | | | 696,096 | |
University of Sciences, 5.00%, 11/01/42 | | | 3,525 | | | | 3,565,608 | |
Philadelphia Authority for Industrial Development, Refunding RB: | | | | | | | | |
1st Series, 5.00%, 04/01/45 | | | 3,330 | | | | 3,776,287 | |
La Salle University, 4.00%, 05/01/42 | | | 4,780 | | | | 4,727,994 | |
Saint John’s University, 4.00%, 11/01/45 | | | 4,260 | | | | 4,399,984 | |
Township of East Hempfield Pennsylvania IDA, RB, Student Services, Inc., Student Housing Project at Millersville University of Pennsylvania: | | | | | | | | |
5.00%, 07/01/35 | | | 765 | | | | 754,642 | |
5.00%, 07/01/35 | | | 630 | | | | 635,512 | |
5.00%, 07/01/45 | | | 450 | | | | 452,570 | |
5.00%, 07/01/47 | | | 1,180 | | | | 1,190,325 | |
| | | | | | | | |
| | | | | | | 78,529,695 | |
|
| Health — 18.2% | |
City of Pottsville Pennsylvania Hospital Authority, Refunding RB, Lehigh Valley Health, Series B, 5.00%, 07/01/41 | | | 5,000 | | | | 5,588,450 | |
County of Allegheny Hospital Development Authority, Refunding RB, Series A: | | | | | | | | |
Allegheny Health Network Obligated Group Issue, 4.00%, 04/01/37 | | | 4,300 | | | | 4,583,671 | |
Allegheny Health Network Obligated Group Issue, 5.00%, 04/01/47 | | | 1,950 | | | | 2,180,802 | |
University Pittsburgh Medical Center,
4.00%, 07/15/38 | | | 2,500 | | | | 2,701,125 | |
County of Bucks Pennsylvania IDA, RB, St. Lukes University Health Network Project, 4.00%, 08/15/44 | | | 1,690 | | | | 1,769,717 | |
County of Bucks Pennsylvania IDA, Refunding RB: | | | | | | | | |
Grand View Hospital, VRDN, Series A, 0.12%, 07/01/34(c) | | | 2,680 | | | | 2,680,000 | |
Pennswood Village Project, 5.00%, 10/01/37 | | | 1,560 | | | | 1,618,219 | |
County of Centre Pennsylvania Hospital Authority, RB, Mount Nittany Medical Center Project, 7.00%, 11/15/21(b) | | | 4,110 | | | | 4,515,904 | |
County of Chester Health & Education Facilities Authority, Refunding RB, Simpson Senior Services Project: | | | | | | | | |
5.00%, 12/01/35 | | | 1,000 | | | | 935,100 | |
5.00%, 12/01/51 | | | 1,000 | | | | 858,710 | |
Series A, 5.25%, 12/01/45 | | | 1,500 | | | | 1,369,290 | |
| | | | | | | | |
| Security | | Par
(000) | | | Value | |
|
| Health (continued) | |
County of Cumberland Pennsylvania Municipal Authority, Refunding RB, Diakon Lutheran Social Ministries, 5.00%, 01/01/38 | | $ | 4,400 | | | $ | 4,503,048 | |
County of Franklin Pennsylvania IDA, RB, Menno-Haven, Inc. Project: | | | | | | | | |
5.00%, 12/01/29 | | | 125 | | | | 121,289 | |
5.00%, 12/01/39 | | | 235 | | | | 210,983 | |
5.00%, 12/01/49 | | | 150 | | | | 127,314 | |
5.00%, 12/01/54 | | | 635 | | | | 530,054 | |
County of Lancaster Pennsylvania Hospital Authority, Refunding RB, Masonic Villages of The Grand Lodge of Pennsylvania Project, 5.00%, 11/01/35 | | | 925 | | | | 1,008,278 | |
County of Lehigh Pennsylvania, Refunding RB, Lehigh Valley Health Network. Series A, 4.00%, 07/01/49 | | | 1,430 | | | | 1,496,552 | |
County of Montgomery Pennsylvania IDA, Refunding RB: | | | | | | | | |
Acts Retirement-Life Communities, 5.00%, 11/15/27 | | | 1,385 | | | | 1,432,672 | |
Acts Retirement-Life Communities, 5.00%, 11/15/28 | | | 895 | | | | 925,716 | |
Whitemarsh Continuing Care Retirement Community, 5.25%, 01/01/40 | | | 5,000 | | | | 4,570,450 | |
County of Northampton Pennsylvania General Purpose Authority, Refunding RB: | | | | | | | | |
St. Luke’s University Health Network Project, 5.00%, 08/15/46 | | | 1,350 | | | | 1,482,098 | |
St. Lukes University Health Network Project, 5.00%, 08/15/48 | | | 1,875 | | | | 2,104,031 | |
County of Northampton Pennsylvania IDA, Refunding RB, MorningStar Senior Living, Inc.: | | | | | | | | |
5.00%, 11/01/39 | | | 645 | | | | 569,761 | |
5.00%, 11/01/44 | | | 645 | | | | 551,075 | |
5.00%, 11/01/49 | | | 1,180 | | | | 981,630 | |
Doylestown Hospital Authority, RB, Doylestown Hospital, Series A, 4.00%, 07/01/45 | | | 1,250 | | | | 1,234,550 | |
DuBois Hospital Authority, Refunding RB, Penn Highlands Healthcare, 4.00%, 07/15/48 | | | 3,440 | | | | 3,571,546 | |
Geisinger Authority Pennsylvania, Refunding RB, Health System, Series A-2, 5.00%, 02/15/39 | | | 5,950 | | | | 6,974,888 | |
Lancaster IDA, RB, Willow Valley Communities Project: | | | | | | | | |
4.00%, 12/01/44 | | | 730 | | | | 758,580 | |
5.00%, 12/01/44 | | | 1,170 | | | | 1,296,383 | |
4.00%, 12/01/49 | | | 985 | | | | 1,016,569 | |
Lancaster IDA, Refunding RB, Garden Spot Village Project(b): | | | | | | | | |
5.38%, 05/01/23 | | | 730 | | | | 839,120 | |
5.75%, 05/01/23 | | | 1,285 | | | | 1,491,075 | |
Moon Industrial Development Authority, Refunding RB, 6.00%, 07/01/45 | | | 2,250 | | | | 2,215,575 | |
Mount Lebanon Hospital Authority, RB, St. Clair Memorial Hospital Project, 4.00%, 07/01/48 | | | 3,910 | | | | 4,190,034 | |
Pennsylvania Economic Development Financing Authority, RB, Series A-1, 4.00%, 04/15/45 | | | 6,500 | | | | 6,911,645 | |
Pennsylvania Economic Development Financing Authority, Refunding RB, Series A, 4.00%, 11/15/42 | | | 4,000 | | | | 4,229,600 | |
Pennsylvania Higher Educational Facilities Authority, RB, University of Pennsylvania Health System Obligation, 4.00%, 08/15/44 | | | 4,965 | | | | 5,526,690 | |
Pennsylvania Higher Educational Facilities Authority, Refunding RB, University of Pittsburgh Medical Center, Series E, 5.00%, 05/15/31 | | | 3,505 | | | | 3,514,674 | |
Philadelphia Authority for Industrial Development, Refunding RB, Children’s Hospital of Philadelphia,
4.00%, 07/01/35 | | | 2,450 | | | | 2,758,553 | |
South Fork Municipal Authority, Refunding RB, Conemaugh Valley Memorial Hospital, Series B (AGC),
5.38%, 07/01/20(b) | | | 3,590 | | | | 3,605,150 | |
| | | | | | | | |
| | | | | | | 99,550,571 | |
| | |
| 32 | | 2020 BLACKROCK ANNUAL REPORTTO SHAREHOLDERS |
| | |
Schedule of Investments (continued) May 31, 2020 | | BlackRock Pennsylvania Municipal Bond Fund (Percentages shown are based on Net Assets) |
| | | | | | | | |
| Security | | Par
(000) | | | Value | |
|
| Housing — 2.5% | |
Pennsylvania HFA, RB: | | | | | | | | |
Brinton Manor Apartments & Brinton Towers, M/F Housing, Series A, 4.25%, 10/01/35 | | $ | 565 | | | $ | 406,546 | |
Brinton Manor Apartments & Brinton Towers, M/F Housing, Series A, 4.50%, 10/01/40 | | | 600 | | | | 411,666 | |
S/F Housing, Series 128B, 4.00%, 10/01/47 | | | 6,190 | | | | 6,617,791 | |
Philadelphia IDA, RB, Series A: | | | | | | | | |
3.50%, 12/01/36 | | | 1,260 | | | | 846,531 | |
4.00%, 12/01/46 | | | 5,740 | | | | 3,776,575 | |
4.00%, 12/01/51 | | | 2,300 | | | | 1,463,697 | |
| | | | | | | | |
| | | | | | | 13,522,806 | |
|
| State — 4.3% | |
City of Philadelphia Pennsylvania Gas Works Co., Refunding RB, VRDN, 8th Series D (Royal Bank of Canada LOC), 0.15%, 08/01/31(c) | | | 650 | | | | 650,000 | |
Commonwealth Financing Authority, RB, Tobacco Master Settlement Payment, 5.00%, 06/01/35 | | | 2,205 | | | | 2,598,262 | |
Commonwealth of Pennsylvania, GO, Refunding, 5.00%, 07/15/21 | | | 9,000 | | | | 9,476,190 | |
Pennsylvania Economic Development Financing Authority, RB, AMT, 5.00%, 06/30/42 | | | 10,500 | | | | 11,078,235 | |
| | | | | | | | |
| | | | | | | 23,802,687 | |
|
| Tobacco — 0.2% | |
Commonwealth Financing Authority, RB, Tobacco Master Settlement Payment, 5.00%, 06/01/33 | | | 1,000 | | | | 1,192,910 | |
| | | | | | | | |
|
| Transportation — 10.2% | |
City of Philadelphia Pennsylvania, ARB, Series A, 5.00%, 06/15/40 | | | 14,000 | | | | 14,032,200 | |
City of Philadelphia Pennsylvania, GO, Refunding, Series A, 5.00%, 08/01/37 | | | 2,140 | | | | 2,581,183 | |
City of Philadelphia Pennsylvania Airport Revenue, Refunding ARB, AMT, Series B: | | | | | | | | |
5.00%, 07/01/37 | | | 1,800 | | | | 2,050,632 | |
5.00%, 07/01/47 | | | 2,545 | | | | 2,816,348 | |
Delaware River Joint Toll Bridge Commission, RB, Bridge System, 5.00%, 07/01/42 | | | 2,500 | | | | 3,094,150 | |
Pennsylvania Economic Development Financing Authority, Refunding RB, Amtrak Project, Series A, AMT, 5.00%, 11/01/41 | | | 1,510 | | | | 1,632,355 | |
Pennsylvania Turnpike Commission, RB: | | | | | | | | |
CAB, Sub-Series A-3, 0.00%, 12/01/42(d) | | | 6,740 | | | | 3,016,824 | |
CAB, Sub-Series A-3 (AGM), 0.00%, 12/01/40(d) | | | 2,225 | | | | 1,213,248 | |
Series A, 5.25%, 12/01/44 | | | 1,500 | | | | 1,883,445 | |
Series A-1, 5.00%, 12/01/41 | | | 100 | | | | 115,534 | |
Sub-Series B, 5.25%, 12/01/48 | | | 3,215 | | | | 3,806,721 | |
Sub-Series B-1, 5.00%, 06/01/42 | | | 3,705 | | | | 4,218,624 | |
Pennsylvania Turnpike Commission, Refunding RB, Sub-Series A-1, 5.25%, 12/01/45 | | | 4,730 | | | | 5,295,897 | |
Southeastern Pennsylvania Transportation Authority, RB, Capital Grant Receipts(b): | | | | | | | | |
5.00%, 06/01/21 | | | 3,140 | | | | 3,290,877 | |
5.00%, 06/01/21 | | | 4,155 | | | | 4,354,648 | |
Susquehanna Area Regional Airport Authority, Refunding RB, AMT, 5.00%, 01/01/38 | | | 2,200 | | | | 2,305,996 | |
| | | | | | | | |
| | | | | | | 55,708,682 | |
|
| Utilities — 8.8% | |
City of Lancaster Pennsylvania, GO, (BAM),
4.00%, 11/01/42 | | | 3,720 | | | | 4,202,819 | |
City of Philadelphia PA Water & Wastewater Revenue, RB, VRDN, 0.12%, 08/01/27(c) | | | 6,000 | | | | 6,000,000 | |
| | | | | | | | |
| Security | | Par
(000) | | | Value | |
|
| Utilities (continued) | |
City of Philadelphia Pennsylvania Gas Works, RB, 9th Series: | | | | | | | | |
5.25%, 08/01/20(b) | | $ | 1,280 | | | $ | 1,290,624 | |
5.25%, 08/01/40 | | | 2,020 | | | | 2,020,364 | |
City of Philadelphia Pennsylvania Gas Works, Refunding RB: | | | | | | | | |
5.00%, 08/01/30 | | | 700 | | | | 804,195 | |
5.00%, 08/01/31 | | | 900 | | | | 1,025,982 | |
5.00%, 08/01/32 | | | 1,200 | | | | 1,358,748 | |
5.00%, 08/01/33 | | | 600 | | | | 675,750 | |
5.00%, 08/01/34 | | | 1,050 | | | | 1,175,202 | |
City of Philadelphia Pennsylvania Water & Wastewater, RB: | | | | | | | | |
Series A, 5.25%, 10/01/52 | | | 1,190 | | | | 1,423,062 | |
Series C (AGM), 5.00%, 08/01/20(b) | | | 2,650 | | | | 2,670,908 | |
City of Philadelphia Pennsylvania Water & Wastewater Revenue, RB: | | | | | | | | |
Series A, 5.00%, 10/01/43 | | | 3,460 | | | | 4,239,330 | |
Series B, 5.00%, 11/01/49 | | | 2,000 | | | | 2,450,520 | |
County of Allegheny Pennsylvania Sanitary Authority, RB: | | | | | | | | |
5.00%, 06/01/43 | | | 4,000 | | | | 4,866,280 | |
Sewer Improvement (BAM), 5.25%, 12/01/41 | | | 2,090 | | | | 2,391,503 | |
County of Allegheny Pennsylvania Sanitary Authority, Refunding RB, Sewer Improvement (AGM), 5.00%, 06/01/40 | | | 1,000 | | | | 1,021,180 | |
County of Delaware Pennsylvania Regional Water Quality Control Authority, RB, Sewer Improvements, 5.00%, 05/01/23(b) | | | 980 | | | | 1,115,828 | |
Guam Government Waterworks Authority, RB, Series A, 5.00%, 01/01/50(e) | | | 820 | | | | 906,043 | |
New Kensington Municipal Sanitary Authority, RB, (AGM), 3.25%, 12/01/47 | | | 2,055 | | | | 2,106,848 | |
Pennsylvania Economic Development Financing Authority, RB, Philadelphia Biosolids Facility, 6.25%, 01/01/32 | | | 3,690 | | | | 3,698,782 | |
Pittsburgh Water & Sewer Authority, RB, First Lien, Series A (AGM), 5.00%, 09/01/44 | | | 2,045 | | | | 2,564,225 | |
| | | | | | | | |
| | | | | | | 48,008,193 | |
| | | | | | | | |
| |
Total Municipal Bonds in Pennsylvania | | | | 437,967,150 | |
| | | | | | | | |
|
Puerto Rico — 3.9% | |
|
| State — 3.0% | |
Puerto Rico Sales Tax Financing Corp. Sales Tax Revenue, RB, Restructured: | | | | | | | | |
CAB, Series A-1, 0.00%, 07/01/46(d) | | | 7,251 | | | | 1,848,135 | |
CAB, Series A-1, 0.00%, 07/01/51(d) | | | 4,315 | | | | 804,057 | |
Series A-1, 4.75%, 07/01/53 | | | 4,687 | | | | 4,525,392 | |
Series A-1, 5.00%, 07/01/58 | | | 4,566 | | | | 4,554,951 | |
Series A-2, 4.33%, 07/01/40 | | | 1,950 | | | | 1,866,345 | |
Series A-2, 4.78%, 07/01/58 | | | 2,660 | | | | 2,564,240 | |
Series B-1, 0.00%, 07/01/46(d) | | | 925 | | | | 235,172 | |
| | | | | | | | |
| | | | | | | 16,398,292 | |
|
| Utilities — 0.9% | |
Commonwealth of Puerto Rico Aqueduct & Sewer Authority, RB, Senior Lien, Series A: | | | | | | | | |
5.00%, 07/01/33 | | | 1,680 | | | | 1,642,250 | |
5.13%, 07/01/37 | | | 520 | | | | 514,956 | |
5.25%, 07/01/42 | | | 3,125 | | | | 3,070,344 | |
| | | | | | | | |
| | | | | | | 5,227,550 | |
| | | | | | | | |
| |
Total Municipal Bonds in Puerto Rico | | | | 21,625,842 | |
| | | | | | | | |
| |
Total Municipal Bonds — 84.1%
(Cost — $446,541,942) | | | | 459,592,992 | |
| | | | | | | | |
| | | | |
| SCHEDULES OF INVESTMENTS | | | 33 | |
| | |
Schedule of Investments (continued) May 31, 2020 | | BlackRock Pennsylvania Municipal Bond Fund (Percentages shown are based on Net Assets) |
| | | | | | | | |
| Security | | Par
(000) | | | Value | |
|
Municipal Bonds Transferred to Tender Option Bond Trusts(f) — 22.6% | |
|
Pennsylvania — 22.6% | |
|
| Education — 8.5% | |
County of Montgomery Pennsylvania Higher Education & Health Authority, Refunding RB, Thomas Jefferson University Projects, 4.00%, 09/01/44(g) | | $ | 7,550 | | | $ | 7,936,635 | |
County of Northampton General Purpose Authority, Refunding RB, Lafayette College: | | | | | | | | |
4.00%, 11/01/38(g) | | | 6,002 | | | | 6,854,840 | |
5.00%, 11/01/47 | | | 6,100 | | | | 7,198,244 | |
County of Westmoreland Pennsylvania Municipal Authority, Refunding RB, (BAM), 5.00%, 08/15/42 | | | 5,007 | | | | 5,709,094 | |
Pennsylvania Higher Educational Facilities Authority, RB, University of Pennsylvania Health System, Series A,
5.75%, 08/15/21(b) | | | 9,280 | | | | 9,900,554 | |
Philadelphia Authority for Industrial Development, RB, Philadelphia College of osteopathic Medicine, 4.00%, 12/01/48(g) | | | 8,090 | | | | 8,963,639 | |
| | | | | | | | |
| | | | | | | 46,563,006 | |
|
| Health — 9.6% | |
County of Lehigh Pennsylvania, Refunding RB, Lehigh Valley Health Network, Series A, 4.00%, 07/01/49(g) | | | 4,997 | | | | 5,229,558 | |
Geisinger Authority Pennsylvania, RB, Health System, Series A-1, 5.13%, 06/01/41 | | | 12,570 | | | | 13,038,484 | |
General Authority of Southcentral Pennsylvania, Refunding RB, Wellspan Health Obligated Group: | | | | | | | | |
4.00%, 06/01/49 | | | 9,015 | | | | 9,725,112 | |
Series A, 5.00%, 06/01/44 | | | 5,000 | | | | 5,556,550 | |
Pennsylvania Economic Development Financing Authority, RB, University of Pittsburgh Medical Center, Series B,
4.00%, 03/15/40 | | | 2,000 | | | | 2,095,920 | |
Philadelphia Hospitals & Higher Education Facilities Authority, RB, The Children’s Hospital of Philadelphia Project, Series C, 5.00%, 07/01/41 | | | 9,380 | | | | 9,748,634 | |
Saint Mary Pennsylvania Hospital Authority, Refunding RB, Trinity Health Credit Group, 5.00%, 12/01/48 | | | 6,096 | | | | 7,114,738 | |
| | | | | | | | |
| | | | | | | 52,508,996 | |
|
| Housing — 1.0% | |
Pennsylvania HFA, Refunding RB, S/F Mortgage, Series 114A, AMT, 3.70%, 10/01/42(g) | | | 5,197 | | | | 5,218,838 | |
| | | | | | | | |
|
| State — 2.3% | |
Commonwealth of Pennsylvania, GO, 1st Series, 4.00%, 03/01/38(g) | | | 11,000 | | | | 12,469,600 | |
| | | | | | | | |
| | | | | | | | |
| Security | | Par
(000) | | | Value | |
|
| Transportation — 1.2% | |
Pennsylvania Turnpike Commission, RB, Subordinate, Series A, 5.50%, 12/01/42 | | $ | 2,520 | | | $ | 2,923,780 | |
Pennsylvania Turnpike Commission, Refunding RB, Sub Series B-2 (AGM), 5.00%, 06/01/35 | | | 2,900 | | | | 3,454,190 | |
| | | | | | | | |
| | | | | | | 6,377,970 | |
| | | | | | | | |
| |
Total Municipal Bonds Transferred to Tender Option Bond
Trusts — 22.6%
(Cost — $116,531,531) | | | | 123,138,410 | |
| | | | | | | | |
| | |
| | | Shares | | | | |
| |
Total Long-Term Investments — 106.7%
(Cost — $563,073,473) | | | | 582,731,402 | |
| | | | | |
|
| Short-Term Securities — 4.3% | |
BlackRock Liquidity Funds, MuniCash, Institutional Class, 0.04%(h)(i) | | | 23,547,775 | | | | 23,554,839 | |
| | | | | | | | |
| |
Total Short-Term Securities — 4.3%
(Cost — $23,549,074) | | | | 23,554,839 | |
| | | | | |
| |
Total Investments — 111.0%
(Cost — $586,622,547) | | | | 606,286,241 | |
| |
Other Assets Less Liabilities — 0.9% | | | | 5,023,206 | |
| |
Liability for TOB Trust Certificates, Including Interest Expense and Fees Payable — (11.9)% | | | | (65,065,566 | ) |
| | | | | |
| |
Net Assets — 100.0% | | | $ | 546,243,881 | |
| | | | | |
| (a) | Security exempt from registration pursuant to Rule 144A under the Securities Act of 1933, as amended. These securities may be resold in transactions exempt from registration to qualified institutional investors. |
| (b) | U.S. Government securities held in escrow, are used to pay interest on this security as well as to retire the bond in full at the date indicated, typically at a premium to par. |
| (c) | Variable or floating rate security, which interest rate adjusts periodically based on changes in current interest rates and prepayments on the underlying pool of assets. Rate shown is the rate in effect as of period end. |
| (e) | When-issued security. |
| (f) | Represent bonds transferred to a TOB Trust in exchange of cash and residual certificates received by the Fund. These bonds serve as collateral in a secured borrowing. See Note 4 of the Notes to Financial Statements for details. |
| (g) | All or a portion of the security is subject to a recourse agreement. The aggregate maximum potential amount the Fund could ultimately be required to pay under the agreements, which expire between April 1, 2021 to June 1, 2039, is $25,258,217. See Note 4 of the Notes to Financial Statements for details. |
| (h) | Annualized 7-day yield as of period end. |
| (i) | Investments in issuers considered to be an affiliate/affiliates of the Fund during the year ended May 31, 2020 for purposes of Section 2(a)(3) of the Investment Company Act of 1940, as amended, were as follows: |
| | | | | | | | | | | | | | | | | | | | | | | | | | | | | | | | |
| Affiliated Issuer | | Shares
Held at
05/31/19 | | | Shares
Purchased | | | Shares Sold | | | Shares
Held at
05/31/20 | | | Value at
05/31/20 | | |
Income | | | Net
Realized
Gain (Loss) (a) | | | Change in
Unrealized
Appreciation
(Depreciation) | |
BlackRock Liquidity Funds, MuniCash, Institutional Class | | | — | | | | 23,547,775 | (b) | | | — | | | | 23,547,775 | | | $ | 23,554,839 | | | $ | 172,057 | | | $ | (11,913 | ) | | $ | 5,765 | |
iShares National Municipal Bond ETF(c) | | | — | | | | 50,000 | | | | (50,000 | ) | | | — | | | | — | | | | 22,138 | | | | (298,735 | ) | | | — | |
| | | | | | | | | | | | | | | | | | | | | | | | | | | | | | | | |
| | | $ | 23,554,839 | | | $ | 194,195 | | | $ | (310,648 | ) | | $ | 5,765 | |
| | | | | | | | | | | | | | | | | |
| | (a) | Includes net capital gain distributions, if applicable. | |
| | (b) | Represents net shares purchased (sold). | |
| | (c) | As of period end, the entity is no longer held by the Fund. | |
| | |
| 34 | | 2020 BLACKROCK ANNUAL REPORTTO SHAREHOLDERS |
| | |
Schedule of Investments (continued) May 31, 2020 | | BlackRock Pennsylvania Municipal Bond Fund |
For Fund compliance purposes, the Fund’s sector classifications refer to one or more of the sector sub-classifications used by one or more widely recognized market indexes or rating group indexes, and/or as defined by the investment adviser. These definitions may not apply for purposes of this report, which may combine such sector sub-classifications for reporting ease.
Derivative Financial Instruments Categorized by Risk Exposure
For the year ended May 31, 2020, the effect of derivative financial instruments in the Statements of Operations was as follows:
| | | | | | | | | | | | | | | | | | | | | | | | | | | | |
| | | Commodity
Contracts | | | Credit
Contracts | | | Equity
Contracts | | | Foreign
Currency
Exchange
Contracts | | | Interest
Rate
Contracts | | | Other
Contracts | | | Total | |
| | | | | | | |
| Net Realized Gain (Loss) from: | | | | | | | | | | | | | | | | | | | | | |
Futures contracts | | $ | — | | | $ | — | | | $ | — | | | $ | — | | | $ | (11,528,505 | ) | | $ | — | | | $ | (11,528,505 | ) |
| | | | | | | | | | | | | | | | | | | | | | | | | | | | |
| | | | | | | |
| Net Change in Unrealized Appreciation (Depreciation) on: | | | | | | | | | | | | | | | | | | | | | |
Futures contracts | | $ | — | | | $ | — | | | $ | — | | | $ | — | | | $ | 532,260 | | | $ | — | | | $ | 532,260 | |
| | | | | | | | | | | | | | | | | | | | | | | | | | | | |
Average Quarterly Balances of Outstanding Derivative Financial Instruments
| | | | | | | | | | | | |
Futures contracts: | |
Average notional value of contracts — long | | $ | — | (a) |
Average notional value of contracts — short | | $ | 43,166,213 | |
| | (a) | Derivative not held at any quarter-end. The risk exposure table serves as an indicator of activity during the period. | |
For more information about the Fund’s investment risks regarding derivative financial instruments, refer to the Notes to Financial Statements.
Fair Value Hierarchy as of Period End
Various inputs are used in determining the fair value of investments. For information about the Fund’s policy regarding valuation of investments, refer to the Notes to Financial Statements.
The following tables summarize the Fund’s investments categorized in the disclosure hierarchy:
| | | | | | | | | | | | | | | | |
| | | Level 1 | | | Level 2 | | | Level 3 | | | Total | |
Assets: | |
Investments: | |
Long-Term Investments(a) | | $ | — | | | $ | 582,731,402 | | | $ | — | | | $ | 582,731,402 | |
Short-Term Securities | | | 23,554,839 | | | | — | | | | — | | | | 23,554,839 | |
| | | | | | | | | | | | | | | | |
Total | | $ | 23,554,839 | | | $ | 582,731,402 | | | $ | — | | | $ | 606,286,241 | |
| | | | | | | | | | | | | | | | |
| | (a) | See above Schedule of Investments for values in each sector or political subdivision. | |
The Fund may hold assets and/or liabilities in which the fair value approximates the carrying amount for financial reporting purposes. As of period end, such assets and/or liabilities are categorized within the disclosure hierarchy as follows:
| | | | | | | | | | | | | | | | |
| | | Level 1 | | | Level 2 | | | Level 3 | | | Total | |
Liabilities: | |
Loan for TOB Trust Certificates | | $ | — | | | $ | (840,000 | ) | | $ | — | | | $ | (840,000 | ) |
TOB Trust Certificates | | | — | | | | (63,943,902 | ) | | | — | | | | (63,943,902 | ) |
| | | | | | | | | | | | | | | | |
| | $ | — | | | $ | (64,783,902 | ) | | $ | — | | | $ | (64,783,902 | ) |
| | | | | | | | | | | | | | | | |
See notes to financial statements.
| | | | |
| SCHEDULES OF INVESTMENTS | | | 35 | |
| | |
Schedule of Investments May 31, 2020 | | BlackRock Strategic Municipal Opportunities Fund (Percentages shown are based on Net Assets) |
| | | | | | | | |
Security | | Par
(000) | | | Value | |
|
Corporate Bonds — 0.3% | |
|
| Education — 0.0% | |
Conservation Fund A Non-Profit Corp., Series 2019,
3.47%, 12/15/29 | | $ | 3,577 | | | $ | 3,792,722 | |
| | | | | | | | |
|
| Health Care Providers & Services — 0.1% | |
PeaceHealth Obligated Group, Series 2018,
4.79%, 11/15/48 | | | 232 | | | | 298,787 | |
Sutter Health, Series 2018, 3.70%, 08/15/28 | | | 192 | | | | 214,324 | |
Tower Health, 4.45%, 02/01/50 | | | 7,385 | | | | 6,554,465 | |
| | | | | | | | |
| | | | | | | 7,067,576 | |
|
| Thrifts & Mortgage Finance — 0.2% | |
Community Preservation Corp., Series 2020,
2.87%, 02/01/30 | | | 18,537 | | | | 17,697,934 | |
| | | | | | | | |
| |
Total Corporate Bonds — 0.3%
(Cost — $29,935,192) | | | | 28,558,232 | |
| | | | | | | | |
| |
Municipal Bonds — 88.4% | | | | | |
| |
| Alabama — 0.4% | | | | |
Alabama Special Care Facilities Financing Authority-Birmingham, RB, Methodist Home for the Aging: | | | | | | | | |
5.75%, 06/01/35 | | | 1,200 | | | | 1,204,440 | |
5.75%, 06/01/45 | | | 2,145 | | | | 2,075,909 | |
6.00%, 06/01/50 | | | 2,700 | | | | 2,696,274 | |
County of Jefferson Alabama Sewer Revenue, Refunding RB, Sub-Lien, Series D: | | | | | | | | |
7.00%, 10/01/51 | | | 3,000 | | | | 3,530,370 | |
6.50%, 10/01/53 | | | 15,110 | | | | 17,366,981 | |
County of Tuscaloosa IDA, Refunding RB, Hunt Refining Project, Series A, 4.50%, 05/01/32(a) | | | 7,395 | | | | 7,362,314 | |
| | | | | | | | |
| | | | | | | 34,236,288 | |
| |
| Alaska — 0.2% | | | | |
Alaska Housing Finance Corp., RB, S/F, Series A,
3.70%, 12/01/38 | | | 4,310 | | | | 4,741,517 | |
State of Alaska International Airports System, Refunding RB, Series B: | | | | | | | | |
5.00%, 10/01/32 | | | 5,000 | | | | 5,841,200 | |
5.00%, 10/01/34 | | | 5,000 | | | | 5,810,300 | |
| | | | | | | | |
| | | | | | | 16,393,017 | |
| |
| Arizona — 3.5% | | | | |
Arizona Health Facilities Authority, Refunding RB: | | | | | | | | |
Banner Health, Series B, 1.77%, 01/01/37(b) | | | 50,000 | | | | 48,893,550 | |
Phoenix Children’s Hospital, Series A, 5.00%, 02/01/42 | | | 5,000 | | | | 5,245,200 | |
Scottsdale Lincoln Hospitals Project, 5.00%, 12/01/39 | | | 5,000 | | | | 5,454,500 | |
Arizona IDA, RB: | | | | | | | | |
Arizona Charter Schools Project, 7.10%, 01/01/55(a) | | | 3,350 | | | | 2,939,792 | |
Leman Academy of Excellence — Parker Colorado Campus Project,(a) 5.00%, 07/01/39 | | | 1,335 | | | | 1,288,395 | |
5.00%, 07/01/49(a) | | | 2,075 | | | | 1,965,668 | |
M/F Housing, Series 2019-2, Class A, 3.63%, 05/20/33 | | | 99,031 | | | | 99,091,150 | |
City of Phoenix Arizona IDA, RB, Legacy Traditional Schools Projects, Series A(a): | | | | | | | | |
6.50%, 07/01/34 | | | 965 | | | | 1,015,045 | |
5.00%, 07/01/36 | | | 7,315 | | | | 7,091,234 | |
5.00%, 07/01/41 | | | 10,075 | | | | 9,542,032 | |
6.75%, 07/01/44 | | | 1,690 | | | | 1,774,027 | |
City of Phoenix Arizona IDA, Refunding RB(a): | | | | | | | | |
Basis Schools, Inc. Projects,
5.00%, 07/01/35 | | | 2,795 | | | | 2,746,982 | |
5.00%, 07/01/45 | | | 8,285 | | | | 7,951,363 | |
| | | | | | | | |
Security | | Par
(000) | | | Value | |
| |
| Arizona (continued) | | | | |
Basis Schools, Inc. Projects, Series A, 5.00%, 07/01/35 | | $ | 1,775 | | | $ | 1,744,506 | |
Legacy Traditional School Projects,
5.00%, 07/01/35 | | | 2,205 | | | | 2,131,155 | |
5.00%, 07/01/45 | | | 1,495 | | | | 1,399,126 | |
City of Phoenix Civic Improvement Corp., ARB, Junior Lien Airport Revenue Bonds: | | | | | | | | |
5.00%, 07/01/44 | | | 10,000 | | | | 11,674,900 | |
5.00%, 07/01/49 | | | 25,000 | | | | 28,996,000 | |
Series B, AMT, 5.00%, 07/01/44 | | | 10,000 | | | | 11,459,800 | |
Series B, AMT, 5.00%, 07/01/49 | | | 10,000 | | | | 11,299,100 | |
City of Phoenix Civic Improvement Corp., Refunding RB: | | | | | | | | |
Junior Lien Airport, Series D, 5.00%, 07/01/37 | | | 10,000 | | | | 11,564,000 | |
Series B, 5.00%, 07/01/38 | | | 5,000 | | | | 5,759,150 | |
County of Maricopa IDA, Refunding RB: | | | | | | | | |
Banner Health Obligation, Series C, 0.68%, 01/01/35(b) | | | 4,865 | | | | 5,016,949 | |
Banner Health Obligation, Series D, 5.00%, 01/01/46(c) | | | 10,000 | | | | 12,300,100 | |
Paradise Schools Projects, 5.00%, 07/01/36(a) | | | 250 | | | | 246,985 | |
McAllister Academic Village LLC, Refunding RB, Arizona State University: | | | | | | | | |
5.00%, 07/01/30 | | | 5,000 | | | | 6,196,300 | |
5.00%, 07/01/32 | | | 5,000 | | | | 6,135,800 | |
5.00%, 07/01/34 | | | 5,000 | | | | 6,073,800 | |
State of Arizona, COP, Refunding, Series A, 5.00%, 10/01/26 | | | 5,000 | | | | 6,249,300 | |
| | | | | | | | |
| | | | | | | 323,245,909 | |
|
| Arkansas — 0.4% | |
Arkansas Development Finance Authority, RB, Big River Steel Project, AMT, 4.50%, 09/01/49(a) | | | 37,355 | | | | 32,458,880 | |
| | | | | | | | |
|
| California — 6.0% | |
California Health Facilities Financing Authority, RB, El Camino Hospital: | | | | | | | | |
5.00%, 02/01/36 | | | 5,000 | | | | 5,781,600 | |
5.00%, 02/01/37 | | | 5,000 | | | | 5,774,400 | |
California Health Facilities Financing Authority, Refunding RB: | | | | | | | | |
Children’s Hospital, Series A, 5.00%, 08/15/42 | | | 5,000 | | | | 5,624,350 | |
Children’s Hospital, Series A, 5.00%, 08/15/47 | | | 10,000 | | | | 11,188,100 | |
Kaiser Permanente, Sub-Series A-2, 5.00%, 11/01/47 | | | 10,000 | | | | 15,088,300 | |
California Housing Finance, RB, M/F Housing, Series A,
4.25%, 01/15/35 | | | 19 | | | | 19,699 | |
California Infrastructure & Economic Development Bank, RB, Academy of Motion Picture Arts and Sciences Obligated Group, Green Bonds, Series A, 5.00%, 11/01/30 | | | 20,065 | | | | 27,301,242 | |
California Infrastructure & Economic Development Bank, Refunding RB, Academy Motion Picture Arts and Sciences, Series A, 5.00%, 11/01/41 | | | 10,000 | | | | 11,259,100 | |
California Municipal Finance Authority, RB: | | | | | | | | |
S/F, Caritas Affordable Housing Inc., Series B,
5.88%, 08/15/49 | | | 1,000 | | | | 1,062,870 | |
Sycamore Academy Project, 5.38%, 07/01/34(a) | | | 1,000 | | | | 995,920 | |
Sycamore Academy Project, 5.63%, 07/01/44(a) | | | 2,760 | | | | 2,760,580 | |
Urban Discovery Academy Project,
6.00%, 08/01/44(a) | | | 330 | | | | 338,392 | |
Urban Discovery Academy Project,
6.13%, 08/01/49(a) | | | 285 | | | | 292,903 | |
Vista Charter Middle School, 6.00%, 07/01/44 | | | 1,960 | | | | 2,025,542 | |
California Municipal Finance Authority, Refunding RB, Eisenhower Medical Center, Series A, 5.00%, 07/01/47 | | | 10,000 | | | | 11,113,400 | |
| | |
| 36 | | 2020 BLACKROCK ANNUAL REPORTTO SHAREHOLDERS |
| | |
Schedule of Investments (continued) May 31, 2020 | | BlackRock Strategic Municipal Opportunities Fund (Percentages shown are based on Net Assets) |
| | | | | | | | |
Security | | Par
(000) | | | Value | |
|
| California (continued) | |
California Pollution Control Financing Authority, RB, Poseidon Resources (Channel Side) LP Desalination Project, AMT(a): | | | | | | | | |
5.00%, 07/01/30 | | $ | 4,000 | | | $ | 4,187,960 | |
5.00%, 07/01/37 | | | 25,000 | | | | 25,691,750 | |
5.00%, 11/21/45 | | | 50,000 | | | | 51,133,500 | |
California School Finance Authority, RB, Series A(a): | | | | | | | | |
Alta Public Schools Project, 6.50%, 11/01/34 | | | 1,015 | | | | 1,017,223 | |
Alta Public Schools Project, 6.75%, 11/01/45 | | | 1,395 | | | | 1,401,975 | |
Kipp Socal Projects, 5.00%, 07/01/39 | | | 1,000 | | | | 1,092,260 | |
Kipp Socal Projects, 5.00%, 07/01/54 | | | 1,000 | | | | 1,054,350 | |
California Statewide Communities Development Authority, RB, Kaiser Permanente, Series A, 5.00%, 04/01/42 | | | 5,000 | | | | 5,307,600 | |
California Statewide Communities Development Authority, Refunding RB, Series A, 5.25%, 11/01/44(a) | | | 1,250 | | | | 1,263,400 | |
City & County of San Francisco California Airports Commission, Refunding ARB, Series A, AMT,
5.00%, 05/01/44 | | | 10,000 | | | | 10,795,500 | |
City & County of San Francisco California Redevelopment Agency, Tax Allocation Bonds, Mission Bay South Redevelopment Project, Series D(a): | | | | | | | | |
3.00%, 08/01/21 | | | 2,445 | | | | 2,481,210 | |
0.00%, 08/01/26(d) | | | 1,170 | | | | 879,863 | |
0.00%, 08/01/43(d) | | | 20,000 | | | | 5,267,800 | |
City of Irvine California, Special Tax, Community Facilities District No. 2013-3, Great Park Improvement Area No. 1, 5.00%, 09/01/49 | | | 1,500 | | | | 1,591,395 | |
City of Los Angeles Department of Airports, Refunding RB, Senior, Private Activity Bond, Series B, 5.00%, 05/15/35 | | | 10,000 | | | | 10,696,100 | |
Coachella Valley Unified School District, GO, Election 2015, Series F, 5.00%, 08/01/46 | | | 10,000 | | | | 11,808,200 | |
Golden State Tobacco Securitization Corp., Refunding RB: | | | | | | | | |
Asset-Backed, Series A (AGM), 5.00%, 06/01/40 | | | 5,000 | | | | 5,745,750 | |
Series A-1, 5.00%, 06/01/25 | | | 5,000 | | | | 5,814,050 | |
Series A-1, 5.00%, 06/01/27 | | | 5,000 | | | | 5,993,000 | |
Series A-1, 5.00%, 06/01/28 | | | 5,000 | | | | 5,941,750 | |
Series A-1, 5.00%, 06/01/29 | | | 10,000 | | | | 11,795,400 | |
Series A-1, 5.00%, 06/01/30 | | | 6,955 | | | | 8,289,386 | |
Series A-1, 5.00%, 06/01/31 | | | 5,630 | | | | 6,653,309 | |
Series A-1, 5.00%, 06/01/47 | | | 19,555 | | | | 19,505,917 | |
Series A-1, 5.25%, 06/01/47 | | | 9,085 | | | | 9,130,334 | |
Modesto Irrigation District, RB, Index-Domestic Water Project (NPFCG), 0.86%, 09/01/37(b) | | | 10,000 | | | | 9,766,590 | |
Norman Y Mineta San Jose International Airport SJC, Refunding ARB, AMT, Series A, 5.00%, 03/01/23 | | | 5,000 | | | | 5,488,200 | |
Northern California Gas Authority No. 1, RB, Series B,
1.68%, 07/01/27(b) | | | 5,000 | | | | 4,774,385 | |
Port of Oakland, Refunding RB, AMT, Series O,
5.00%, 05/01/23 | | | 5,000 | | | | 5,186,200 | |
Sacramento County Sanitation Districts Financing Authority, Refunding RB, Series B (NPFGC), 0.77%, 12/01/35(b) | | | 100,000 | | | | 99,043,800 | |
Sacramento County Water Financing Authority, RB, Series B (NPFGC), 0.79%, 06/01/34(b) | | | 10,000 | | | | 10,058,560 | |
San Diego Association of Governments, RB, Mid-Coast Corridor Transit Project, Green Bond, 5.00%, 11/15/24 | | | 10,000 | | | | 11,427,100 | |
San Francisco City & County Airport Comm-San Francisco International Airport, Refunding ARB, Series F, 5.00%, 05/01/50 | | | 25,000 | | | | 29,437,250 | |
State of California, GO, Refunding: | | | | | | | | |
5.00%, 10/01/29 | | | 7,150 | | | | 9,706,983 | |
| | | | | | | | |
Security | | Par
(000) | | | Value | |
|
| California (continued) | |
5.00%, 11/01/32 | | $ | 10,000 | | | $ | 13,023,000 | |
Various Purpose, Bid Group, 5.00%, 08/01/30 | | | 5,910 | | | | 7,726,084 | |
State of Golden Tobacco Securitization Corp., Refunding RB, Series A-2, 5.00%, 06/01/47 | | | 33,630 | | | | 33,545,589 | |
| | | | | | | | |
| | | | | | | 554,349,121 | |
|
| Colorado — 1.7% | |
Centerra Metropolitan District No. 1, Tax Allocation Bonds,
5.00%, 12/01/47(a) | | | 5,125 | | | | 4,592,359 | |
City of Lakewood Colorado Plaza Metropolitan District No. 1, Refunding, Tax Allocation Bonds, 4.00%, 12/01/23(a) | | | 1,000 | | | | 996,820 | |
City of Loveland Colorado Electric & Communications Enterprise Revenue, RB, Series A (AGM), 5.00%, 12/01/44 | | | 10,000 | | | | 12,320,400 | |
Colorado Educational & Cultural Facilities Authority, RB: | | | | | | | | |
Charter Littleton Preparatory School, 5.00%, 12/01/22 | | | 80 | | | | 80,967 | |
Loveland Classical Schools, 5.00%, 07/01/46(a) | | | 2,000 | | | | 1,800,440 | |
Colorado Educational & Cultural Facilities Authority, Refunding RB: | | | | | | | | |
5.00%, 11/01/44 | | | 885 | | | | 925,259 | |
5.13%, 11/01/49 | | | 765 | | | | 798,476 | |
Colorado Health Facilities Authority, Refunding RB: | | | | | | | | |
Commonspirit Health, Series A, 5.00%, 08/01/26 | | | 5,000 | | | | 5,795,800 | |
5.00%, 08/01/27 | | | 5,000 | | | | 11,789,700 | |
5.00%, 08/01/30 | | | 5,000 | | | | 12,035,500 | |
5.00%, 08/01/31 | | | 5,000 | | | | 5,925,700 | |
5.00%, 08/01/32 | | | 5,000 | | | | 5,867,050 | |
5.00%, 08/01/35 | | | 5,000 | | | | 5,720,200 | |
5.00%, 08/01/36 | | | 5,000 | | | | 11,390,300 | |
5.00%, 08/01/37 | | | 5,000 | | | | 5,678,350 | |
5.00%, 08/01/38 | | | 5,000 | | | | 5,661,150 | |
5.00%, 08/01/39 | | | 5,000 | | | | 5,647,200 | |
NCMC, Inc. Project, 5.00%, 05/15/26(e) | | | 5,000 | | | | 6,319,650 | |
Colorado High Performance Transportation Enterprise, RB, C-470 Express Lanes, 5.00%, 12/31/56 | | | 10,000 | | | | 10,011,400 | |
Colorado Housing & Finance Authority, RB: | | | | | | | | |
M/F Housing, Multi Family Project, Series B-1,
2.75%, 10/01/34 | | | 1,000 | | | | 1,054,680 | |
M/F Housing, Multi Family Project, Series B-1,
3.00%, 10/01/39 | | | 1,000 | | | | 1,054,270 | |
M/F Housing, Multi Family Project, Series B-1,
3.50%, 10/01/59 | | | 1,160 | | | | 1,230,342 | |
M/F Housing, Multi Family Project, Series B-2,
1.35%, 02/01/22 | | | 5,000 | | | | 5,029,600 | |
S/F, Mortgage Class I Bond (Ginnie Mae), 3.60%, 11/01/38 | | | 2,985 | | | | 3,159,354 | |
S/F, Series B, 3.75%, 05/01/50 | | | 14,480 | | | | 15,893,103 | |
DIATC Metropolitan District, GO(a): | | | | | | | | |
5.00%, 12/01/39 | | | 1,245 | | | | 1,173,002 | |
5.00%, 12/01/49 | | | 2,000 | | | | 1,794,600 | |
Fitzsimons Village Metropolitan District No 1, GO, Refunding, Senior Lien, 5.00%, 12/01/49 | | | 1,045 | | | | 921,220 | |
Flying Horse Metropolitan District No. 3, GO, Refunding,
6.00%, 12/01/49(a) | | | 2,965 | | | | 2,421,931 | |
Public Authority for Colorado Energy, RB, 6.25%, 11/15/28 | | | 5,000 | | | | 6,241,950 | |
STC Metropolitan District No.2, GO, Refunding, Series A,
4.00%, 12/01/29 | | | 1,000 | | | | 924,750 | |
Village at Dry Creek Metropolitan District No. 2, GO,
4.38%, 12/01/44 | | | 3,010 | | | | 2,528,460 | |
| | | | | | | | |
| | | | | | | 156,783,983 | |
| | | | |
| SCHEDULES OF INVESTMENTS | | | 37 | |
| | |
Schedule of Investments (continued) May 31, 2020 | | BlackRock Strategic Municipal Opportunities Fund (Percentages shown are based on Net Assets) |
| | | | | | | | |
Security | | Par
(000) | | | Value | |
|
| Connecticut — 1.2% | |
Connecticut Housing Finance Authority, Refunding RB: | | | | | | | | |
M/F Housing, Series A-1, 2.88%, 11/15/30 | | $ | 5,700 | | | $ | 6,036,642 | |
M/F, Sub Series F-1, 3.90%, 11/15/44 | | | 1,500 | | | | 1,581,795 | |
M/F, Sub-Series F-1, 4.00%, 11/15/49 | | | 2,000 | | | | 2,108,100 | |
M/F, Sub-Series F-1, 4.05%, 11/15/54 | | | 2,000 | | | | 2,102,360 | |
S/F, Housing Mortgage Finance, Series A-1,
2.45%, 05/15/38 | | | 2,200 | | | | 2,228,094 | |
S/F, Housing Mortgage Finance, Series A-1,
3.50%, 11/15/45 | | | 13,000 | | | | 14,187,420 | |
S/F, Sub-Series C-1, 3.63%, 11/15/38 | | | 9,775 | | | | 10,676,548 | |
Connecticut State Health & Educational Facilities Authority, RB, Mary Wade Home Issue, Series A-1, 5.00%, 10/01/54(a) | | | 4,570 | | | | 3,990,981 | |
Mashantucket Western Pequot Tribe, (6.35% Cash or 1.00% PIK), 7.35%, 07/01/26 | | | 123,303 | | | | 20,344,935 | |
Mohegan Tribal Finance Authority, RB,
7.00%, 02/01/45(a) | | | 10,630 | | | | 9,563,705 | |
Mohegan Tribe of Indians of Connecticut, RB, Series A,
6.75%, 02/01/45(a) | | | 5,530 | | | | 5,551,343 | |
Mohegan Tribe of Indians of Connecticut, Refunding RB, Public Improvement, Priority Distribution, Series C(a): | | | | | | | | |
5.75%, 02/01/24 | | | 3,320 | | | | 3,457,382 | |
5.75%, 02/01/25 | | | 3,755 | | | | 3,931,973 | |
6.25%, 02/01/30 | | | 4,930 | | | | 5,250,351 | |
State of Connecticut, GO, Series A, 5.85%, 03/15/32 | | | 145 | | | | 187,784 | |
State of Connecticut Bradley International Airport CFC Revenue, ARB, AMT, Ground Transportation Center, Series A, 5.00%, 07/01/49 | | | 5,000 | | | | 5,780,100 | |
State of Connecticut Health & Educational Facilities Authority, RB, 5.00%, 07/01/29 | | | 10,000 | | | | 13,794,300 | |
| | | | | | | | |
| | | | | | | 110,773,813 | |
|
| Delaware — 0.4% | |
Delaware Transportation Authority, RB, 5.00%, 07/01/26 | | | 5,825 | | | | 7,365,188 | |
State of Delaware, GO, Series A: | | | | | | | | |
5.00%, 01/01/28 | | | 5,000 | | | | 6,634,750 | |
5.00%, 01/01/29 | | | 5,000 | | | | 6,802,100 | |
4.00%, 01/01/32 | | | 10,000 | | | | 12,660,500 | |
| | | | | | | | |
| | | | | | | 33,462,538 | |
|
| District of Columbia — 1.0% | |
District of Columbia, GO, Refunding, Series A: | | | | | | | | |
5.00%, 10/15/44 | | | 10,000 | | | | 12,732,500 | |
5.00%, 10/15/26 | | | 5,000 | | | | 6,365,700 | |
District of Columbia, GO: | | | | | | | | |
5.00%, 06/01/41 | | | 10,000 | | | | 12,011,900 | |
Series D, 5.00%, 06/01/26 | | | 5,475 | | | | 6,897,186 | |
District of Columbia, Refunding RB, Series B, 5.00%, 12/01/26 | | | 5,000 | | | | 5,569,600 | |
District of Columbia Housing Finance Agency, RB, M/F Housing, Petworth Station, Series A-2 (FHA), 3.40%, 03/01/40 | | | 7,705 | | | | 8,205,671 | |
District of Columbia Water & Sewer Authority, Refunding RB, Subordinate Lien, Series C, 5.00%, 10/01/39 | | | 10,000 | | | | 11,673,700 | |
Metropolitan Washington Airports Authority, Refunding ARB: | | | | | | | | |
AMT, 5.00%, 10/01/24 | | | 5,000 | | | | 5,717,850 | |
AMT, 5.00%, 10/01/27 | | | 5,000 | | | | 6,127,100 | |
AMT, Series A, 5.00%, 10/01/24 | | | 5,000 | | | | 5,717,850 | |
AMT, Series A, 5.00%, 10/01/30 | | | 5,000 | | | | 5,690,050 | |
Dulles Metrorail And Capital Improvement Projects, Series A, 5.00%, 10/01/53 | | | 5,000 | | | | 5,095,650 | |
| | | | | | | | |
| | | | | | | 91,804,757 | |
| | | | | | | | |
Security | | Par
(000) | | | Value | |
|
| Florida — 1.5% | |
Alta Lakes Community Development District, Special Assessment Bonds: | | | | | | | | |
3.50%, 05/01/24 | | $ | 380 | | | $ | 377,291 | |
3.75%, 05/01/29 | | | 555 | | | | 541,586 | |
4.40%, 05/01/39 | | | 1,035 | | | | 1,018,637 | |
4.63%, 05/01/49 | | | 1,780 | | | | 1,781,121 | |
Babcock Ranch Community Independent Special District, Special Assessment Bonds: | | | | | | | | |
4.75%, 11/01/26 | | | 400 | | | | 410,040 | |
5.00%, 11/01/31 | | | 500 | | | | 512,720 | |
5.25%, 11/01/46 | | | 3,485 | | | | 3,552,923 | |
Canaveral Port Authority, ARB: | | | | | | | | |
Series A, AMT, 5.00%, 06/01/45 | | | 5,000 | | | | 5,145,950 | |
Series B, 5.00%, 06/01/48 | | | 10,000 | | | | 10,382,000 | |
Capital Trust Agency, Inc., RB: | | | | | | | | |
1st Mortgage, Silver Creek St. Augustine Project, Series A, 8.00%, 01/01/34(f)(g) | | | 550 | | | | 319,000 | |
1st Mortgage, Silver Creek St. Augustine Project, Series A, 8.25%, 01/01/44(f)(g) | | | 940 | | | | 545,200 | |
1st Mortgage, Silver Creek St. Augustine Project, Series A, 8.25%, 01/01/49(f)(g) | | | 3,010 | | | | 1,745,800 | |
Advantage Academy of Hillsborough Projects, Series A,
5.00%, 12/15/39 | | | 1,775 | | | | 1,887,340 | |
Advantage Academy of Hillsborough Projects, Series A,
5.00%, 12/15/49 | | | 3,380 | | | | 3,494,886 | |
Advantage Academy of Hillsborough Projects, Series A,
5.00%, 12/15/54 | | | 1,955 | | | | 2,019,730 | |
Franklin Academy Project, 5.00%, 12/15/55(a) | | | 2,845 | | | | 2,759,422 | |
Renaissance Charter School, Inc., Series A,
5.00%, 06/15/49(a) | | | 5,000 | | | | 4,800,250 | |
Silver Creek St. Augustine Project, Series A,
5.75%, 01/01/50(f)(g) | | | 395 | | | | 387,100 | |
Silver Creek St. Augustine Project, Series B,
7.00%, 01/01/35(c) | | | 1,390 | | | | 1,362,200 | |
Celebration Pointe Community Development District, Special Assessment Bonds: | | | | | | | | |
4.75%, 05/01/24 | | | 190 | | | | 193,371 | |
5.00%, 05/01/34 | | | 710 | | | | 718,939 | |
5.13%, 05/01/45 | | | 985 | | | | 991,639 | |
County of Broward Florida Port Facilities Revenue, ARB, Series A, 5.00%, 09/01/49 | | | 5,000 | | | | 5,560,650 | |
County of Charlotte IDA, RB, AMT, Town & Country Utilities Project, 5.50%, 10/01/36(a) | | | 3,500 | | | | 3,572,520 | |
County of Collier Florida IDA, Refunding RB, Arlington of Naples Project, Series A, 8.25%, 05/15/49(a)(f)(g) | | | 1,000 | | | | 720,233 | |
County of Miami-Dade Florida Aviation Revenue, Refunding RB, Taxable, Series C, 4.06%, 10/01/31 | | | 11,120 | | | | 11,705,579 | |
County of Palm Beach Florida, RB, Palm Beach Atlantic University Housing Project(a): | | | | | | | | |
5.25%, 04/01/23 | | | 740 | | | | 736,026 | |
5.00%, 04/01/39 | | | 2,700 | | | | 2,653,587 | |
5.00%, 04/01/51 | | | 2,305 | | | | 2,139,224 | |
County of Palm Beach Florida Health Facilities Authority, Refunding RB, Sinai Residences Boca Raton Project, 7.50%, 06/01/49 | | | 1,000 | | | | 1,047,350 | |
County of Pinellas IDA, RB, 2017 Foundation for Global Understanding, Inc. Project, 5.00%, 07/01/39 | | | 2,030 | | | | 2,019,119 | |
Crossings at Fleming Island Community Development District, Refunding, Special Assessment Bonds, 6.50%, 05/01/44 | | | 2,300 | | | | 2,353,452 | |
Florida Development Finance Corp., RB: | | | | | | | | |
Midtown Campus Properties, 7.00%, 12/01/48(a) | | | 5,500 | | | | 4,951,815 | |
| | |
| 38 | | 2020 BLACKROCK ANNUAL REPORTTO SHAREHOLDERS |
| | |
Schedule of Investments (continued) May 31, 2020 | | BlackRock Strategic Municipal Opportunities Fund (Percentages shown are based on Net Assets) |
| | | | | | | | |
Security | | Par
(000) | | | Value | |
|
| Florida (continued) | |
Renaissance Charter School, Series A, 5.75%, 06/15/29 | | $ | 365 | | | $ | 379,498 | |
Renaissance Charter School, Series A, 6.00%, 06/15/34 | | | 440 | | | | 457,547 | |
Renaissance Charter School, Series A, 6.13%, 06/15/44 | | | 1,685 | | | | 1,740,386 | |
Harbor Bay Community Development District, Refunding, Special Assessment Bonds, Series A-2, 3.75%, 05/01/34 | | | 1,020 | | | | 976,497 | |
Harbor Bay Community Development District, Series A-1: | | | | | | | | |
3.88%, 05/01/39 | | | 2,250 | | | | 2,155,972 | |
4.10%, 05/01/48 | | | 1,500 | | | | 1,470,120 | |
Lakewood Ranch Stewardship District, Lakewood Centre North Projects, Village of Lakewood Ranch Sector Projects: | | | | | | | | |
Special Assessment Bonds, Cresswind Project, 4.50%, 05/01/49 | | | 805 | | | | 749,729 | |
Special Assessment Bonds, Lake Club Phase 4 project, 4.40%, 05/01/39 | | | 985 | | | | 929,771 | |
Special Assessment Bonds, Lake Club Phase 4 project, 4.50%, 05/01/49 | | | 1,120 | | | | 1,043,056 | �� |
Lakewood Ranch Stewardship District Special Assessment Bonds: | | | | | | | | |
Special Assessment Bonds, 4.25%, 05/01/25 | | | 355 | | | | 354,496 | |
Special Assessment Bonds, 4.88%, 05/01/35 | | | 1,110 | | | | 1,114,174 | |
Special Assessment Bonds, 4.88%, 05/01/45 | | | 2,275 | | | | 2,296,476 | |
4.00%, 05/01/21 | | | 205 | | | | 205,890 | |
4.25%, 05/01/26 | | | 1,065 | | | | 1,083,052 | |
5.13%, 05/01/46 | | | 6,030 | | | | 6,197,513 | |
Mid-Bay Bridge Authority, Refunding RB, Series A, 5.00%, 10/01/35 | | | 5,000 | | | | 5,241,600 | |
Midtown Miami Community Development District, Refunding, Special Assessment Bonds, Series B, 5.00%, 05/01/37 | | | 1,870 | | | | 1,871,328 | |
Portico Community Development District, Refunding, Special Assessment Bonds, Series 1: | | | | | | | | |
3.20%, 05/01/31 | | | 1,000 | | | | 955,460 | |
3.50%, 05/01/37 | | | 1,250 | | | | 1,126,288 | |
State of Florida, Department of Transportation, Right-of-Way Acquisition and Bridge Construction Bonds, 5.00%, 07/01/28 | | | 6,795 | | | | 9,078,799 | |
Sterling Hill Community Development District, Refunding, Special Assessment Bonds, Series B, 5.50%, 11/01/10(f)(g) | | | 143 | | | | 90,783 | |
Sumter Landing Community Development District, RB, Taxable Senior Recreational, Series 2016, 4.17%, 10/01/47 | | | 2,030 | | | | 2,249,362 | |
Talavera Community Development District, Special Assessment Bonds: | | | | | | | | |
4.35%, 05/01/40 | | | 495 | | | | 481,892 | |
4.50%, 05/01/50 | | | 770 | | | | 754,346 | |
Tolomato Community Development District, Refunding, Special Assessment Bonds: | | | | | | | | |
Convertible CAB, Series A4, 6.61%, 05/01/40(h) | | | 190 | | | | 162,615 | |
Series 1, 6.61%, 05/01/40(f)(g)(h) | | | 800 | | | | 623,016 | |
Series 2, 6.61%, 05/01/40(h) | | | 490 | | | | 292,976 | |
Series 3, 6.38%, 05/01/17(f)(g) | | | 425 | | | | 4 | |
Series 3, 6.61%, 05/01/40(f)(g) | | | 535 | | | | 5 | |
Trout Creek Community Development District, Special Assessment Bonds: | | | | | | | | |
5.50%, 05/01/35 | | | 2,325 | | | | 2,342,902 | |
5.63%, 05/01/45 | | | 3,655 | | | | 3,703,502 | |
| | | | | | | | |
Security | | Par
(000) | | | Value | |
|
| Florida (continued) | |
Village Center Community Development District, Refunding RB, 5.02%, 11/01/36 | | $ | 1,500 | | | $ | 1,875,975 | |
Village Community Development District No. 10, Special Assessment Bonds, Sumter County, 4.50%, 05/01/23 | | | 1,205 | | | | 1,233,414 | |
| | | | | | | | |
| | | | | | | 135,645,144 | |
|
| Georgia — 2.7% | |
Brookhaven Development Authority, RB, Children’s Healthcare of Atlanta, Series A, 5.00%, 07/01/26 | | | 1,250 | | | | 1,531,313 | |
City of Atlanta Georgia Department of Aviation, ARB: | | | | | | | | |
Airport General Revenue Bonds, Series B, AMT, 5.00%, 07/01/44 | | | 10,000 | | | | 11,793,100 | |
Airport Passenger Facility Charge and Subordinate Lien General, 5.00%, 07/01/37 | | | 25,000 | | | | 30,435,000 | |
City of Atlanta Georgia Department of Aviation, RB, Airport Revenue, Series A, 5.00%, 07/01/44 | | | 5,820 | | | | 6,992,905 | |
City of Atlanta Georgia Department of Aviation, Refunding RB, Subordinate, Series F: | | | | | | | | |
5.00%, 07/01/22 | | | 10,000 | | | | 10,787,700 | |
5.00%, 07/01/23 | | | 10,000 | | | | 11,126,500 | |
5.00%, 07/01/24 | | | 6,000 | | | | 6,854,880 | |
5.00%, 07/01/25 | | | 9,300 | | | | 10,885,092 | |
County of Fulton Development Authority, Refunding RB, Children’s Healthcare of Atlanta, Inc., Series C: | | | | | | | | |
5.00%, 07/01/23 | | | 1,315 | | | | 1,482,939 | |
5.00%, 07/01/26 | | | 1,285 | | | | 1,574,189 | |
County of Rockdale Georgia Development Authority, Refunding RB, Piedmont Healthcare, Inc. Project, Series A, 5.00%, 07/01/49 | | | 11,360 | | | | 12,902,688 | |
Georgia Housing & Finance Authority, RB, S/F: | | | | | | | | |
Series B, 4.15%, 12/01/43 | | | 7,320 | | | | 7,679,266 | |
Series B-1, 3.65%, 06/01/44 | | | 9,490 | | | | 9,919,612 | |
Georgia Housing & Finance Authority, Refunding RB, S/F, Series A: | | | | | | | | |
2.15%, 12/01/27 | | | 1,000 | | | | 1,046,420 | |
2.20%, 06/01/28 | | | 1,000 | | | | 1,048,600 | |
2.25%, 12/01/28 | | | 1,000 | | | | 1,050,520 | |
2.35%, 12/01/29 | | | 1,000 | | | | 1,052,380 | |
4.00%, 06/01/50 | | | 18,000 | | | | 20,041,200 | |
Main Street Natural Gas, Inc., RB, Series A: | | | | | | | | |
5.00%, 05/15/23 | | | 1,750 | | | | 1,906,695 | |
5.00%, 05/15/24 | | | 1,500 | | | | 1,670,775 | |
5.00%, 05/15/25 | | | 2,500 | | | | 2,839,225 | |
5.00%, 05/15/26 | | | 3,000 | | | | 3,468,900 | |
5.00%, 05/15/27 | | | 2,000 | | | | 2,351,740 | |
Metropolitan Atlanta Rapid Transit Authority, RB: | | | | | | | | |
Series A, 5.00%, 07/01/43 | | | 10,000 | | | | 11,690,700 | |
Series A, 5.00%, 07/01/44 | | | 10,000 | | | | 11,656,100 | |
Series A, 5.00%, 07/01/45 | | | 10,000 | | | | 11,623,200 | |
Series B, 5.00%, 07/01/44 | | | 10,000 | | | | 11,537,900 | |
Series B, 5.00%, 07/01/45 | | | 10,000 | | | | 11,519,400 | |
State of Georgia, GO: | | | | | | | | |
Series A, 5.00%, 07/01/27 | | | 11,960 | | | | 15,633,394 | |
Series A-2, 5.00%, 02/01/28 | | | 9,030 | | | | 11,600,931 | |
| | | | | | | | |
| | | | | | | 245,703,264 | |
|
| Hawaii — 0.0% | |
County of Kauai Community Facilities District, Special Tax Bonds, Kukui’ula Development Project: | | | | | | | | |
5.00%, 05/15/44 | | | 625 | | | | 660,206 | |
5.00%, 05/15/49 | | | 2,750 | | | | 2,874,795 | |
| | | | | | | | |
| | | | | | | 3,535,001 | |
| | | | |
| SCHEDULES OF INVESTMENTS | | | 39 | |
| | |
Schedule of Investments (continued) May 31, 2020 | | BlackRock Strategic Municipal Opportunities Fund (Percentages shown are based on Net Assets) |
| | | | | | | | |
Security | | Par
(000) | | | Value | |
|
| Idaho — 0.1% | |
Idaho Housing & Finance Association, RB, Hayden Canyon Charter School Project, Series A, 6.95%, 06/15/55(a) | | $ | 5,150 | | | $ | 4,698,706 | |
| | | | | | | | |
|
| Illinois — 3.2% | |
Chicago Board of Education, GO, Series D, Taxable Build America Bonds: | | | | | | | | |
Build America Bonds, 6.52%, 12/01/40 | | | 7,045 | | | | 7,071,842 | |
Dedicated Revenues, Series H, 5.00%, 12/01/46 | | | 5,000 | | | | 4,726,700 | |
Chicago Board of Education, GO, Refunding: | | | | | | | | |
Dedicated Revenues, Series C, 5.00%, 12/01/26 | | | 5,000 | | | | 5,156,550 | |
Dedicated Revenues, Series C, 5.00%, 12/01/27 | | | 4,585 | | | | 4,694,994 | |
Dedicated Revenues, Series C, 5.00%, 12/01/34 | | | 5,590 | | | | 5,585,304 | |
Dedicated Revenues, Series F, 5.00%, 12/01/23 | | | 7,220 | | | | 7,545,405 | |
Series B, 4.00%, 12/01/35 | | | 11,230 | | | | 10,236,257 | |
Series C, 5.00%, 12/01/25 | | | 1,440 | | | | 1,496,750 | |
Series C, 5.00%, 12/01/23 | | | 4,145 | | | | 4,331,898 | |
Series C, 5.00%, 12/01/24 | | | 4,280 | | | | 4,470,931 | |
Series C, 5.00%, 12/01/26 | | | 2,945 | | | | 3,037,208 | |
Chicago Board of Education, GO: | | | | | | | | |
Series A, 5.00%, 12/01/42 | | | 50,165 | | | | 48,388,657 | |
Series C, 5.25%, 12/01/39 | | | 7,050 | | | | 7,086,026 | |
5.00%, 12/01/46 | | | 10,615 | | | | 10,034,784 | |
5.00%, 12/01/46 | | | 27,465 | | | | 25,963,763 | |
6.04%, 12/01/29 | | | 19,810 | | | | 19,731,553 | |
6.14%, 12/01/39 | | | 8,460 | | | | 8,236,233 | |
Taxable Qualified School Construction Bonds, 6.32%, 11/01/29 | | | 14,270 | | | | 14,195,653 | |
City of Chicago Illinois, GO, Refunding, Series A, 6.00%, 01/01/38 | | | 11,020 | | | | 11,443,278 | |
City of Chicago Illinois, GO, Series B, 7.38%, 01/01/33 | | | 4,395 | | | | 4,674,039 | |
Illinois Finance Authority, Refunding RB: | | | | | | | | |
Mercy Health System Obligation, 5.00%, 12/01/21 | | | 5,000 | | | | 5,268,000 | |
Mercy Health System Obligation, 5.00%, 12/01/23 | | | 5,000 | | | | 5,577,350 | |
Mercy Health System Obligation, 5.00%, 12/01/46 | | | 5,000 | | | | 5,447,450 | |
Presence Health Network, Series C, 5.00%, 02/15/25 | | | 5,000 | | | | 5,826,450 | |
Presence Health Network, Series C, 5.00%, 02/15/26 | | | 5,000 | | | | 5,962,700 | |
Illinois Housing Development Authority, RB, S/F Housing: | | | | | | | | |
MBS Pass-Through Program, Series A (Ginnie Mae, Fannie Mae & Freddie Mac), 3.13%, 02/01/47 | | | 28,845 | | | | 31,350,714 | |
Series D (Ginnie Mae, Fannie Mae), 2.25%, 04/01/30 | | | 1,365 | | | | 1,443,610 | |
Series D (Ginnie Mae, Fannie Mae), 2.35%, 04/01/31 | | | 1,255 | | | | 1,324,728 | |
Series D (Ginnie Mae, Fannie Mae), 2.70%, 10/01/34 | | | 8,920 | | | | 9,436,022 | |
Series D (Ginnie Mae, Fannie Mae), 2.95%, 10/01/39 | | | 9,200 | | | | 9,751,724 | |
Series D (Ginnie Mae, Fannie Mae), 3.00%, 10/01/41 | | | 1,030 | | | | 1,091,264 | |
Illinois Housing Development Authority, Refunding RB, Housing, Sub-Series A-1: | | | | | | | | |
3.70%, 07/01/34 | | | 1,425 | | | | 1,518,366 | |
3.85%, 01/01/36 | | | 450 | | | | 480,515 | |
| | | | | | | | |
| | | | | | | 292,586,718 | |
|
| Indiana — 0.4% | |
City of Valparaiso Indiana, RB, Exempt Facilities, Pratt Paper LLC Project, AMT, 5.88%, 01/01/24 | | | 420 | | | | 435,464 | |
Indiana Finance Authority, RB, Private Activity Bond, Ohio River Bridges East End Crossing Project, Series A, AMT, 5.25%, 01/01/51 | | | 5,000 | | | | 5,194,650 | |
| | | | | | | | |
Security | | Par
(000) | | | Value | |
|
| Indiana (continued) | |
Indiana Finance Authority, Refunding RB, Marian University Project, Series B: | | | | | | | | |
3.53%, 09/15/34 | | $ | 4,520 | | | $ | 4,714,631 | |
3.75%, 09/15/37 | | | 7,715 | | | | 8,085,552 | |
3.83%, 09/15/41 | | | 2,780 | | | | 2,714,337 | |
Indianapolis Local Public Improvement Bond Bank, RB, Series E (AMBAC), 0.00%, 02/01/24(d) | | | 10,000 | | | | 9,678,000 | |
Indianapolis Local Public Improvement Bond Bank, Refunding RB, Indianapolis Airport Authority Project, 4.00%, 01/01/50 | | | 5,945 | | | | 6,290,880 | |
| | | | | | | | |
| | | | | | | 37,113,514 | |
|
| Iowa — 0.1% | |
Iowa Finance Authority, RB, S/F Housing, Series D (Ginnie Mae, Fannie Mae & Freddie Mac), 3.15%, 07/01/36 | | | 1,000 | | | | 1,066,760 | |
Iowa Tobacco Settlement Authority, Refunding RB, Asset-Backed, Series C: | | | | | | | | |
5.50%, 06/01/42 | | | 2,000 | | | | 2,000,140 | |
5.63%, 06/01/46 | | | 10,150 | | | | 10,150,812 | |
| | | | | | | | |
| | | | | | | 13,217,712 | |
|
| Kentucky — 0.1% | |
Kentucky Economic Development Finance Authority, RB, Baptist Healthcare System, Series B, 5.00%, 08/15/33 | | | 5,000 | | | | 5,550,350 | |
Westvaco Corp., RB, MeadWestvaco Corp., 7.67%, 01/15/27(a) | | | 3,100 | | | | 4,041,718 | |
| | | | | | | | |
| | | | | | | 9,592,068 | |
|
| Louisiana — 0.7% | |
Calcasieu Parish Memorial Hospital Service District, Refunding RB, Lake Charles Memorial Hospital Project: | | | | | | | | |
5.00%, 12/01/34 | | | 2,485 | | | | 2,612,903 | |
5.00%, 12/01/39 | | | 1,625 | | | | 1,670,045 | |
City of New Orleans Louisiana Aviation Board, ARB, Series B, AMT, 5.00%, 01/01/40 | | | 10,000 | | | | 10,933,900 | |
Juban Crossing Economic Development District, Refunding RB, General Infrastructure Project, Series C, 7.00%, 09/15/44(a) | | | 5,810 | | | | 4,945,240 | |
Louisiana Public Facilities Authority, RB: | | | | | | | | |
Louisiana Children’s Medical Center Project, Series A-3, 5.00%, 06/01/45(c) | | | 11,695 | | | | 13,013,377 | |
Young Audiences Charter School Project, Series A, 5.00%, 04/01/57(a) | | | 4,965 | | | | 4,631,104 | |
New Orleans Aviation Board, ARB, General Airport North Terminal Project, Series B, AMT, 5.00%, 01/01/48 | | | 10,000 | | | | 11,063,100 | |
Parish of East Baton Rouge Capital Improvements District, RB, 5.00%, 08/01/48 | | | 10,000 | | | | 12,720,300 | |
Parish of St. John the Baptist Louisiana, Refunding RB, Marathon Oil Corporation Project(c): | | | | | | | | |
2.00%, 06/01/37 | | | 3,750 | | | | 3,511,012 | |
2.10%, 06/01/37 | | | 2,180 | | | | 1,983,822 | |
2.20%, 06/01/37 | | | 2,285 | | | | 1,992,611 | |
| | | | | | | | |
| | | | | | | 69,077,414 | |
|
| Maine — 0.4% | |
Maine State Housing Authority, RB, S/F: | | | | | | | | |
Housing, Series A, 2.85%, 11/15/39 | | | 5,790 | | | | 5,962,774 | |
Housing, Series A, 3.00%, 11/15/44 | | | 2,500 | | | | 2,579,475 | |
Housing, Series C, 2.75%, 11/15/34 | | | 6,165 | | | | 6,371,712 | |
Housing, Series C, 3.20%, 11/15/45 | | | 7,580 | | | | 7,900,785 | |
Housing, Series H, 3.55%, 11/15/37 | | | 2,000 | | | | 2,140,100 | |
Series A, 3.75%, 11/15/38 | | | 1,500 | | | | 1,626,780 | |
| | |
| 40 | | 2020 BLACKROCK ANNUAL REPORTTO SHAREHOLDERS |
| | |
Schedule of Investments (continued) May 31, 2020 | | BlackRock Strategic Municipal Opportunities Fund (Percentages shown are based on Net Assets) |
| | | | | | | | |
Security | | Par
(000) | | | Value | |
|
| Maine (continued) | |
Maine State Housing Authority, Refunding RB, M/F, Series A-3: | | | | | | | | |
3.63%, 11/15/39 | | $ | 4,445 | | | $ | 4,699,121 | |
3.75%, 11/15/44 | | | 5,000 | | | | 5,304,150 | |
| | | | | | | | |
| | | | | | | 36,584,897 | |
|
| Maryland — 3.0% | |
County of Anne Arundel Maryland Consolidated, RB, Special Taxing District, Villages at Two Rivers Project: | | | | | | | | |
5.13%, 07/01/36 | | | 600 | | | | 556,332 | |
5.25%, 07/01/44 | | | 1,220 | | | | 1,065,304 | |
County of Baltimore Maryland, GO, Refunding, Consolidated Public Improvement Bonds, Series A: | | | | | | | | |
5.00%, 03/01/28 | | | 10,000 | | | | 13,232,800 | |
5.00%, 03/01/29 | | | 10,000 | | | | 13,541,700 | |
5.00%, 03/01/30 | | | 10,000 | | | | 13,834,700 | |
5.00%, 03/01/31 | | | 5,000 | | | | 6,865,500 | |
4.00%, 03/01/32 | | | 10,000 | | | | 12,562,800 | |
4.00%, 03/01/34 | | | 10,000 | | | | 12,317,000 | |
4.00%, 03/01/35 | | | 10,000 | | | | 12,286,800 | |
4.00%, 03/01/36 | | | 10,000 | | | | 12,225,000 | |
County of Frederick Maryland, Tax Allocation Bonds, Jefferson Technology Park Project, Series B, 7.13%, 07/01/43(a) | | | 2,830 | | | | 2,426,357 | |
County of Howard Maryland, Tax Allocation Bonds, Annapolis Junction Town Center Project, 6.10%, 02/15/44 | | | 1,170 | | | | 1,069,228 | |
County of Montgomery Maryland, GO, Refunding: | | | | | | | | |
Series A, 5.00%, 11/01/24 | | | 10,000 | | | | 12,042,800 | |
Series C, 5.00%, 10/01/26 | | | 10,000 | | | | 12,770,100 | |
Maryland Community Development Administration, RB, M/F, Series D: | | | | | | | | |
2.75%, 07/01/34 | | | 1,005 | | | | 1,032,286 | |
4.20%, 01/01/56 | | | 4,220 | | | | 4,397,156 | |
Maryland Community Development Administration, Refunding RB, M/F, Series A: | | | | | | | | |
2.30%, 09/01/35 | | | 4,445 | | | | 4,547,991 | |
2.50%, 09/01/40 | | | 10,450 | | | | 10,696,202 | |
2.60%, 03/01/42 | | | 3,490 | | | | 3,574,109 | |
3.75%, 03/01/50 | | | 32,000 | | | | 35,272,640 | |
Maryland EDC, RB, Purple Line Light Rail Project, AMT: | | | | | | | | |
5.00%, 03/31/24 | | | 5,000 | | | | 5,028,850 | |
5.00%, 09/30/26 | | | 5,000 | | | | 5,013,500 | |
5.00%, 03/31/41 | | | 10,000 | | | | 10,046,800 | |
5.00%, 03/31/46 | | | 10,000 | | | | 9,919,100 | |
5.00%, 03/31/51 | | | 10,000 | | | | 9,624,000 | |
Maryland EDC, Refunding RB: | | | | | | | | |
CNX Marine Terminal, Inc., 5.75%, 09/01/25 | | | 1,140 | | | | 1,145,814 | |
Potomac Electric Power Co., 1.70%, 09/01/22 | | | 25,000 | | | | 24,845,500 | |
Maryland Health & Higher Educational Facilities Authority, RB, Legends Charter School Project, Series A, 7.00%, 03/01/55(a) | | | 10,405 | | | | 9,723,681 | |
State of Maryland, GO, Series A, 5.00%, 08/01/26 | | | 6,575 | | | | 8,362,216 | |
State of Maryland Department of Transportation, RB, 5.00%, 09/01/28 | | | 6,345 | | | | 8,221,343 | |
| | | | | | | | |
| | | | | | | 278,247,609 | |
|
| Massachusetts — 3.2% | |
Commonwealth of Massachusetts, GO, Series A, 5.00%, 01/01/44 | | | 5,000 | | | | 6,172,550 | |
Commonwealth of Massachusetts Transportation Fund Revenue, RB, Rail Enhancement & Accelerated Bridge Programs, Series A, 5.00%, 06/01/42 | | | 5,000 | | | | 6,093,700 | |
| | | | | | | | |
Security | | Par
(000) | | | Value | |
|
| Massachusetts (continued) | |
Massachusetts Clean Water Trust, RB, Green Bonds, Series 20, 5.00%, 02/01/35 | | $ | 5,000 | | | $ | 5,993,650 | |
Massachusetts Development Finance Agency, RB: | | | | | | | | |
Boston Medical Center, Series D, 5.00%, 07/01/44 | | | 10,000 | | | | 10,680,600 | |
Caregroup, Series J-2, 5.00%, 07/01/43 | | | 10,000 | | | | 11,320,600 | |
Caregroup, Series J-2, 5.00%, 07/01/48 | | | 25,000 | | | | 28,072,000 | |
Caregroup, Series J-2, 5.00%, 07/01/53 | | | 20,000 | | | | 22,294,400 | |
UMass Dartmouth Student Housing Project, 5.00%, 10/01/32 | | | 2,525 | | | | 2,473,010 | |
UMass Dartmouth Student Housing Project, 5.00%, 10/01/33 | | | 1,860 | | | | 1,800,536 | |
UMass Dartmouth Student Housing Project, 5.00%, 10/01/38 | | | 10,000 | | | | 9,301,700 | |
UMass Dartmouth Student Housing Project, 5.00%, 10/01/43 | | | 5,000 | | | | 4,596,650 | |
UMass Dartmouth Student Housing Project, 5.00%, 10/01/48 | | | 10,000 | | | | 9,084,300 | |
UMass Dartmouth Student Housing Project, 5.00%, 10/01/54 | | | 10,000 | | | | 8,992,400 | |
Massachusetts Development Finance Agency, Refunding RB: | | | | | | | | |
Beth Israel Lahey Health Issue, 5.00%, 07/01/25 | | | 2,000 | | | | 2,339,640 | |
Caregroup, Series H-1, 5.00%, 07/01/23 | | | 5,000 | | | | 5,579,650 | |
Caregroup, Series H-1, 5.00%, 07/01/24 | | | 5,000 | | | | 5,725,000 | |
Caregroup, Series H-1, 5.00%, 07/01/25 | | | 5,000 | | | | 5,849,100 | |
CareGroup, Series I, 5.00%, 07/01/33 | | | 5,000 | | | | 5,667,650 | |
New Bridge Charles, Inc., 4.00%, 10/01/32(a) | | | 2,560 | | | | 2,328,371 | |
New Bridge Charles, Inc., 4.13%, 10/01/42(a) | | | 8,225 | | | | 7,050,552 | |
New Bridge Charles, Inc., 5.00%, 10/01/57(a) | | | 2,090 | | | | 2,008,323 | |
UMass Memorial Health Care Obligated Group Issue, Series K, 5.00%, 07/01/38 | | | 5,000 | | | | 5,443,950 | |
Umass Memorial Healthcare, 5.00%, 07/01/44 | | | 10,000 | | | | 10,871,000 | |
Worchester Polytechnic Institutes, Series B, 5.00%, 09/01/45 | | | 10,000 | | | | 11,094,200 | |
Massachusetts Educational Financing Authority, RB: | | | | | | | | |
Education Loan Revenue, Issue I (AMT), 5.00%, 01/01/24 | | | 5,000 | | | | 5,528,350 | |
Series A, AMT, 5.00%, 01/01/22 | | | 10,000 | | | | 10,502,400 | |
Massachusetts Housing Finance Agency, RB: | | | | | | | | |
M/F Housing, Series A, 3.40%, 12/01/49 | | | 3,115 | | | | 3,244,740 | |
M/F Housing, Series C-1, 2.65%, 12/01/34 | | | 2,950 | | | | 3,020,210 | |
M/F Housing, Series C-1, 2.90%, 12/01/39 | | | 3,370 | | | | 3,445,960 | |
M/F Housing, Series C-1, 3.10%, 12/01/44 | | | 2,500 | | | | 2,565,175 | |
M/F Housing, Series C-1, 3.15%, 12/01/49 | | | 2,890 | | | | 2,971,035 | |
M/F Housing, Series C-1, 3.25%, 12/01/54 | | | 7,790 | | | | 8,081,580 | |
M/F Housing, Series C-1, 3.30%, 12/01/59 | | | 9,185 | | | | 9,561,769 | |
M/F Housing, Series C-1, 3.35%, 06/01/62 | | | 5,010 | | | | 5,238,857 | |
Series C, 4.13%, 12/01/45 | | | 1,505 | | | | 1,593,930 | |
Series C, 4.25%, 06/01/55 | | | 1,470 | | | | 1,551,188 | |
Massachusetts Housing Finance Agency, Refunding RB: | | | | | | | | |
M/F Housing, Series B-1 (FHA), 2.75%, 12/01/34 | | | 2,235 | | | | 2,293,915 | |
M/F Housing, Series B-1 (FHA), 3.00%, 12/01/39 | | | 1,430 | | | | 1,473,300 | |
M/F Housing, Series B-1 (FHA), 3.30%, 12/01/56 | | | 5,960 | | | | 6,210,141 | |
M/F, Series A, 4.60%, 12/01/55 | | | 2,340 | | | | 2,466,805 | |
S/F, Series 172, 3.65%, 12/01/35 | | | 3,450 | | | | 3,752,910 | |
Massachusetts Port Authority, ARB, Series B, 5.00%, 07/01/44 | | | 10,000 | | | | 12,098,700 | |
Massachusetts Water Resources Authority, Refunding RB, Green Bond, Series C, 5.00%, 08/01/40 | | | 10,000 | | | | 12,019,600 | |
Metropolitan Boston Transit Parking Corp., Refunding RB, 5.00%, 07/01/41 | | | 5,000 | | | | 5,191,100 | |
| | | | | | | | |
| | | | | | | 293,645,197 | |
| | | | |
| SCHEDULES OF INVESTMENTS | | | 41 | |
| | |
Schedule of Investments (continued) May 31, 2020 | | BlackRock Strategic Municipal Opportunities Fund (Percentages shown are based on Net Assets) |
| | | | | | | | |
Security | | Par
(000) | | | Value | |
|
| Michigan — 2.7% | |
City of Detroit Michigan Sewage Disposal System Revenue, Refunding RB: | | | | | | | | |
Senior Lien, Series A, 5.25%, 07/01/39 | | $ | 5,000 | | | $ | 5,415,500 | |
Water & Sewerage Department, Senior Lien, Series A, 5.00%, 07/01/23 | | | 5,000 | | | | 5,470,750 | |
Water & Sewerage Department, Series D (AGM), 1.56%, 07/01/32(b) | | | 115,130 | | | | 116,757,593 | |
County of Monroe Michigan EDC, Refunding RB, Detroit Edison Co. Project, Series AA (NPFGC), 6.95%, 09/01/22 | | | 10,000 | | | | 11,478,900 | |
Great Lakes Water Authority Water Supply System Revenue, Refunding RB, Senior Lien, Series C, 5.25%, 07/01/33 | | | 5,000 | | | | 5,938,250 | |
Michigan Finance Authority, RB, Series A: | | | | | | | | |
Beaumont Health Credit Group, 5.00%, 11/01/44 | | | 5,000 | | | | 5,534,700 | |
Henry Ford Health System, 5.00%, 11/15/48 | | | 5,000 | | | | 5,776,050 | |
Michigan Finance Authority, Refunding RB: | | | | | | | | |
Henry Ford Health System, 5.00%, 11/15/37 | | | 5,000 | | | | 5,669,950 | |
Local Government Loan Program, Series B, 5.00%, 07/01/44 | | | 5,000 | | | | 5,180,450 | |
Michigan State Housing Development Authority, RB: | | | | | | | | |
M/F Housing, Series A-1, 2.88%, 10/01/34 | | | 8,795 | | | | 9,180,397 | |
M/F Housing, Series A, 4.00%, 10/01/43 | | | 1,940 | | | | 2,132,739 | |
M/F Housing, Series A-1, 3.00%, 10/01/39 | | | 3,500 | | | | 3,645,285 | |
M/F Housing, Series A-1, 3.25%, 10/01/44 | | | 3,550 | | | | 3,728,707 | |
M/F Housing, Series A-1, 3.50%, 10/01/54 | | | 5,000 | | | | 5,265,900 | |
M/F Housing, Series A-1, 3.60%, 10/01/60 | | | 5,000 | | | | 5,293,350 | |
S/F Housing, Series B, 3.10%, 12/01/44 | | | 6,540 | | | | 6,832,992 | |
Michigan State Housing Development Authority, Refunding RB, M/F, Rental Housing, Series D: | | | | | | | | |
3.95%, 10/01/37 | | | 3,180 | | | | 3,316,517 | |
4.00%, 10/01/42 | | | 3,495 | | | | 3,613,550 | |
4.50%, 10/01/48 | | | 6,485 | | | | 6,743,492 | |
Michigan State University, RB, Series B (AMBAC), 0.89%, 02/15/37(b) | | | 5,000 | | | | 5,055,570 | |
Michigan Tobacco Settlement Finance Authority, RB, Capital Appreciation Turbo Term Bonds, Series A, 7.31%, 06/01/34 | | | 14,985 | | | | 14,294,042 | |
Michigan Tobacco Settlement Finance Authority, Refunding RB, Series A, 6.88%, 06/01/42 | | | 2,375 | | | | 2,380,961 | |
Royal Oak Hospital Finance Authority Michigan, Refunding RB, Beaumont Health Credit Group, Series D, 5.00%, 09/01/39 | | | 5,000 | | | | 5,428,650 | |
State of Michigan Housing Development Authority, RB, M/F Housing, Series A-1, 3.35%, 10/01/49 | | | 5,585 | | | | 5,855,370 | |
| | | | | | | | |
| | | | | | | 249,989,665 | |
|
| Minnesota — 1.6% | |
City of Deephaven Minnesota, Refunding RB, Eagle Ridge Academy Project, Series A, 5.50%, 07/01/50 | | | 2,500 | | | | 2,524,325 | |
City of Minneapolis Minnesota, RB: | | | | | | | | |
Hiawatha Academies Project, Series A, 5.00%, 07/01/47 | | | 3,000 | | | | 2,818,410 | |
M/F housing (Fannie Mae), 2.35%, 02/01/38 | | | 7,000 | | | | 7,198,800 | |
Duluth Economic Development Authority, Refunding RB, Essentia Health Obligated Group, Series A: | | | | | | | | |
5.00%, 02/15/53 | | | 5,000 | | | | 5,538,500 | |
5.00%, 02/15/58 | | | 5,000 | | | | 5,528,800 | |
5.25%, 02/15/58 | | | 5,000 | | | | 5,613,800 | |
Minneapolis-St. Paul Metropolitan Airports Commission, Refunding RB, Senior, Series A, 5.00%, 01/01/28 | | | 5,000 | | | | 6,106,250 | |
Minnesota Housing Finance Agency, RB, S/F: | | | | | | | | |
Housing, Mortgage-Backed Securities Pass-Through, Series I, AMT (Ginnie Mae, Fannie Mae & Freddie Mac), 2.80%, 12/01/47 | | | 12,253 | | | | 13,014,973 | |
| | | | | | | | |
Security | | Par
(000) | | | Value | |
|
| Minnesota (continued) | |
Housing, Mortgage-Backed Securities, Series E, AMT (Ginnie Mae, Fannie Mae & Freddie Mac), 2.85%, 06/01/47 | | $ | 12,265 | | | $ | 13,039,983 | |
Housing, Series B (Ginnie Mae, Fannie Mae & Freddie Mac), 2.80%, 01/01/44 | | | 2,000 | | | | 2,112,000 | |
Series B (Fannie Mae), 3.50%, 07/01/50 | | | 14,920 | | | | 16,183,426 | |
Series B (Fannie Mae), 2.40%, 01/01/35 | | | 2,000 | | | | 2,080,380 | |
Series B (Fannie Mae), 2.63%, 01/01/40 | | | 8,000 | | | | 8,405,920 | |
Series G (Fannie Mae), 2.65%, 10/01/47 | | | 32,122 | | | | 33,840,737 | |
Minnesota Housing Finance Agency, Refunding RB, S/F, Residential Housing, Series B (Ginnie Mae, Fannie Mae & Freddie Mac), 3.10%, 07/01/35 | | | 1,610 | | | | 1,725,485 | |
St. Paul Housing & Redevelopment Authority, Refunding RB, Hmong College Prep Academy Project, Series A: | | | | | | | | |
5.75%, 09/01/46 | | | 1,805 | | | | 1,855,666 | |
6.00%, 09/01/51 | | | 2,710 | | | | 2,811,517 | |
State of Minnesota, GO, Series B, 5.00%, 08/01/28 | | | 9,315 | | | | 12,497,097 | |
| | | | | | | | |
| | | | | | | 142,896,069 | |
|
| Mississippi — 0.1% | |
Mississippi Hospital Equipment & Facilities Authority, RB, Baptist Memorial Health Corp., Series A, 5.00%, 09/01/46 | | | 10,000 | | | | 10,729,900 | |
| | | | | | | | |
|
| Missouri — 1.5% | |
City of State Louis Missouri Airport Revenue, ARB, Series C (AGM): | | | | | | | | |
5.00%, 07/01/42 | | | 5,000 | | | | 5,608,250 | |
5.00%, 07/01/47 | | | 5,000 | | | | 5,554,750 | |
City of State Louis Missouri Airport Revenue, Refunding ARB, Series A (AGM): | | | | | | | | |
5.00%, 07/01/23 | | | 5,000 | | | | 5,527,300 | |
5.00%, 07/01/24 | | | 5,000 | | | | 5,662,100 | |
Kansas City Missouri IDA, ARB, AMT: | | | | | | | | |
Kansas City International Airport Terminal Modernization Project Series A, 5.00%, 03/01/34 | | | 5,105 | | | | 6,005,114 | |
Kansas City International Airport Terminal Modernization Project Series A, 5.00%, 03/01/35 | | | 5,360 | | | | 6,263,481 | |
Kansas City International Airport Terminal Modernization Project Series A, 5.00%, 03/01/36 | | | 5,000 | | | | 5,815,650 | |
Kansas City International Airport Terminal Modernization Project Series A, 5.00%, 03/01/37 | | | 5,910 | | | | 6,854,595 | |
Kansas City International Airport Terminal Modernization Project Series A, 5.00%, 03/01/39 | | | 5,000 | | | | 5,774,450 | |
Kansas City International Airport Terminal Modernization Project Series B, 5.00%, 03/01/39 | | | 5,000 | | | | 5,747,000 | |
Kansas City Missouri IDA, Refunding RB, Kansas City United Methodist Church(a)(f)(g): | | | | | | | | |
5.75%, 11/15/36 | | | 8,055 | | | | 6,436,573 | |
6.00%, 11/15/46 | | | 5,125 | | | | 3,233,875 | |
6.00%, 11/15/51 | | | 2,060 | | | | 1,255,076 | |
Metropolitan St. Louis Sewer District, Refunding RB, Series A, 5.00%, 05/01/42 | | | 5,000 | | | | 6,137,200 | |
Missouri Highway & Transportation Commission, RB, Third Lien, Series B, 5.00%, 11/01/25 | | | 10,735 | | | | 13,301,846 | |
Missouri Housing Development Commission, RB, S/F Housing, First Place Homeownership Loan Program, Series A (Ginnie Mae, Fannie Mae & Freddie Mac): | | | | | | | | |
2.55%, 11/01/40 | | | 1,750 | | | | 1,809,692 | |
2.70%, 11/01/45 | | | 2,500 | | | | 2,580,500 | |
2.85%, 05/01/50 | | | 1,000 | | | | 1,054,430 | |
3.50%, 11/01/50 | | | 10,000 | | | | 10,723,300 | |
Missouri State Environmental Improvement & Energy Resources Authority, Refunding RB, Union Electric Company Project, Series C, 2.75%, 09/01/33 | | | 25,000 | | | | 25,900,500 | |
| | |
| 42 | | 2020 BLACKROCK ANNUAL REPORTTO SHAREHOLDERS |
| | |
Schedule of Investments (continued) May 31, 2020 | | BlackRock Strategic Municipal Opportunities Fund (Percentages shown are based on Net Assets) |
| | | | | | | | |
Security | | Par
(000) | | | Value | |
|
| Missouri (continued) | |
St. Louis Land Clearance for Redevelopment Authority, Refunding RB, Kiel Opera House Renovation Project, 3.88%, 10/01/35(c)(h) | | $ | 2,750 | | | $ | 3,055,264 | |
| | | | | | | | |
| | | | | | | 134,300,946 | |
|
| Nebraska — 0.1% | |
County of Douglas Nebraska Hospital Authority No. 2, RB, Health Facilities-Children’s Hospital Obligated Group, 5.00%, 11/15/47 | | | 5,000 | | | | 5,584,400 | |
| | | | | | | | |
|
| Nevada — 0.5% | |
City of North Las Vegas Nevada, GO, Build America Bonds, 6.57%, 06/01/40 | | | 5,175 | | | | 7,409,669 | |
County of Clark Department of Aviation, Refunding RB, Series B: | | | | | | | | |
5.00%, 07/01/40 | | | 5,000 | | | | 6,057,600 | |
5.00%, 07/01/41 | | | 5,000 | | | | 6,057,450 | |
5.00%, 07/01/42 | | | 5,000 | | | | 6,057,500 | |
County of Clark School District, GO, Refunding, Series B, 5.00%, 06/15/24 | | | 5,000 | | | | 5,784,700 | |
Las Vegas Nevada Special Improvement District 607, Refunding, Special Assessment Bonds, Local Improvement: | | | | | | | | |
5.00%, 06/01/23 | | | 295 | | | | 309,496 | |
5.00%, 06/01/24 | | | 170 | | | | 180,159 | |
Las Vegas Valley Water District, GO, Series B, 5.00%, 06/01/37 | | | 10,000 | | | | 10,793,500 | |
State of Nevada Department of Business & Industry, RB, Somerset Academy, Series A(a): | | | | | | | | |
4.50%, 12/15/29 | | | 335 | | | | 323,898 | |
5.00%, 12/15/38 | | | 965 | | | | 893,764 | |
| | | | | | | | |
| | | | | | | 43,867,736 | |
|
| New Hampshire — 0.9% | |
New Hampshire Business Finance Authority, Refunding RB, Resource Recovery, Covanta Project(a): | | | | | | | | |
Series B, 4.63%, 11/01/42 | | | 7,900 | | | | 7,602,881 | |
Series C, AMT, 4.88%, 11/01/42 | | | 2,995 | | | | 2,888,078 | |
New Hampshire Business Finance Authority, Series 2020-1, Class A, 4.13%, 01/20/34 | | | 59,712 | | | | 61,111,956 | |
New Hampshire Health and Education Facilities Authority, RB, Catholic Medical Center Issue, 5.00%, 07/01/44 | | | 5,000 | | | | 5,315,000 | |
New Hampshire Housing Finance Authority, RB, M/F Housing, Cimarron, Whittier Falls & Marshall (FHA), 3.55%, 07/01/37 | | | 1,385 | | | | 1,485,593 | |
| | | | | | | | |
| | | | | | | 78,403,508 | |
|
| New Jersey — 3.5% | |
County of Gloucester New Jersey Pollution Control Financing Authority, Refunding RB, Keystone Urban Renewal Project, Series A, AMT, 5.00%, 12/01/24 | | | 1,270 | | | | 1,309,726 | |
New Jersey EDA, ARB, Continental Airlines, Inc. Project, 5.13%, 09/15/23 | | | 4,660 | | | | 4,591,172 | |
New Jersey EDA, RB: | | | | | | | | |
Friends of Vineland Public Charter School Projects, Series B, 5.50%, 11/01/26(a) | | | 265 | | | | 255,293 | |
Goethals Bridge Replacement Project, AMT, 5.38%, 01/01/43 | | | 8,325 | | | | 8,976,514 | |
Motor Vehicle Surcharge, Series A (NPFGC), 5.25%, 07/01/25 | | | 5,000 | | | | 5,251,300 | |
School Facilities Construction, 5.00%, 06/15/29 | | | 5,000 | | | | 5,430,650 | |
School Facilities Construction, 5.00%, 06/15/30 | | | 5,000 | | | | 5,413,500 | |
School Facilities Construction, 5.00%, 06/15/31 | | | 5,500 | | | | 5,910,190 | |
School Facilities Construction, 5.00%, 06/15/36 | | | 5,500 | | | | 5,654,660 | |
School Facilities Construction, 5.00%, 06/15/37 | | | 4,000 | | | | 4,098,440 | |
| | | | | | | | |
Security | | Par
(000) | | | Value | |
|
| New Jersey (continued) | |
School Facilities Construction, 5.00%, 06/15/39 | | $ | 5,000 | | | $ | 5,111,500 | |
School Facilities Construction, Series EEE, 5.00%, 06/15/43 | | | 5,000 | | | | 5,111,050 | |
State House Project, Series B, Remark 10, 5.00%, 06/15/43 | | | 5,750 | | | | 5,877,708 | |
New Jersey EDA, Refunding RB: | | | | | | | | |
American Water Co., Inc, AMT, Series A, 2.20%, 10/01/39(c) | | | 57,140 | | | | 59,175,898 | |
Series A (BAM), 5.00%, 07/01/23 | | | 5,000 | | | | 5,347,800 | |
Series B, 5.00%, 11/01/23 | | | 5,000 | | | | 5,217,050 | |
Series B, 5.00%, 11/01/24 | | | 10,000 | | | | 10,515,300 | |
Series B, 5.00%, 11/01/25 | | | 5,000 | | | | 5,304,250 | |
Series MMM, 5.00%, 06/15/33 | | | 5,000 | | | | 5,220,350 | |
New Jersey Health Care Facilities Financing Authority, RB: | | | | | | | | |
RWJ Barnabas Health Obligated Group Issue, Series A, 4.00%, 07/01/35 | | | 5,000 | | | | 5,323,650 | |
Valley Health System Obligated Group, 5.00%, 07/01/31 | | | 6,430 | | | | 7,956,096 | |
New Jersey Health Care Facilities Financing Authority, Refunding RB: | | | | | | | | |
Barnabas Health Issue, Series A, 5.00%, 07/01/22 | | | 1,400 | | | | 1,513,344 | |
Hackensack Meridian Health Obligated Group Issue, Series A, 5.00%, 07/01/39 | | | 5,000 | | | | 5,776,600 | |
Hackensack Meridian Health Obligated Group Issue, Series A, 5.00%, 07/01/52 | | | 5,000 | | | | 5,617,600 | |
Hospital Asset Transformation Program, 5.00%, 10/01/23 | | | 5,000 | | | | 5,189,800 | |
St. Barnabas Health Care System, Series A, 5.00%, 07/01/25 | | | 2,000 | | | | 2,156,060 | |
St. Barnabas Health Care, Series A, 5.00%, 07/01/23 | | | 2,140 | | | | 2,310,301 | |
St. Barnabas Health Care, Series A, 5.00%, 07/01/24 | | | 5,165 | | | | 5,572,570 | |
New Jersey Higher Education Student Assistance Authority, RB, Senior Student Loan, Series 1A, AMT: | | | | | | | | |
5.00%, 12/01/21 | | | 5,000 | | | | 5,237,950 | |
5.00%, 12/01/22 | | | 5,000 | | | | 5,384,300 | |
5.00%, 12/01/23 | | | 5,000 | | | | 5,515,300 | |
5.00%, 12/01/24 | | | 6,000 | | | | 6,749,160 | |
New Jersey Transportation Trust Fund Authority, RB: | | | | | | | | |
Transportation Program Bonds, Series S, 5.25%, 06/15/43 | | | 5,000 | | | | 5,195,100 | |
Federal Highway Reimbursement Revenue Notes, Series A, 5.00%, 06/15/23 | | | 5,000 | | | | 5,327,550 | |
Federal Highway Reimbursement Revenue Notes, Series A, 5.00%, 06/15/27 | | | 5,000 | | | | 5,530,100 | |
Federal Highway Reimbursement Revenue Notes, Series A, 5.00%, 06/15/28 | | | 5,000 | | | | 5,505,400 | |
Transportation Program, Series AA, 5.00%, 06/15/24 | | | 10,000 | | | | 10,383,700 | |
New Jersey Transportation Trust Fund Authority, Refunding RB, Transportation System, Series A: | | | | | | | | |
5.00%, 12/15/36 | | | 10,000 | | | | 10,240,900 | |
5.00%, 12/15/34 | | | 10,000 | | | | 10,313,200 | |
Rahway Valley Sewerage Authority, RB, Capital Appreciation Bonds, Series A (NPFCG), 0.00%, 09/01/34(d) | | | 5,420 | | | | 4,096,057 | |
South Jersey Port Corp., RB, Sub-Marine Terminal, Series A, 5.00%, 01/01/49 | | | 5,000 | | | | 5,081,550 | |
| | | | |
| SCHEDULES OF INVESTMENTS | | | 43 | |
| | |
Schedule of Investments (continued) May 31, 2020 | | BlackRock Strategic Municipal Opportunities Fund (Percentages shown are based on Net Assets) |
| | | | | | | | |
Security | | Par
(000) | | | Value | |
|
| New Jersey (continued) | |
South Jersey Port Corp., Refunding ARB, Marine Terminal, Series B: | | | | | | | | |
5.00%, 01/01/42 | | $ | 10,000 | | | $ | 10,065,100 | |
AMT, 5.00%, 01/01/48 | | | 10,000 | | | | 10,021,900 | |
Tobacco Settlement Financing Corp., Refunding RB, Sub-Series B, 5.00%, 06/01/46 | | | 20,965 | | | | 21,884,315 | |
| | | | | | | | |
| | | | | | | 321,719,954 | |
|
| New Mexico — 0.2% | |
New Mexico Mortgage Finance Authority, RB, S/F (Ginnie Mae, Fannie Mae & Freddie Mac): | | | | | | | | |
3.70%, 09/01/42 | | | 3,785 | | | | 4,089,087 | |
2.50%, 07/01/35 | | | 1,000 | | | | 1,015,660 | |
2.70%, 07/01/40 | | | 2,750 | | | | 2,820,785 | |
2.88%, 07/01/45 | | | 2,205 | | | | 2,279,132 | |
3.50%, 01/01/51 | | | 5,000 | | | | 5,425,800 | |
| | | | | | | | |
| | | | | | | 15,630,464 | |
|
| New York — 13.1% | |
Chautauqua Tobacco Asset Securitization Corp., Refunding RB, 5.00%, 06/01/48 | | | 5,000 | | | | 4,514,300 | |
City of New York Housing Development Corp., RB: | | | | | | | | |
M/F Housing, Series J, 2.20%, 05/01/30 | | | 1,000 | | | | 1,022,650 | |
M/F Housing, Series J, 2.30%, 05/01/31 | | | 1,610 | | | | 1,639,173 | |
M/F Housing, Series J, 2.60%, 11/01/34 | | | 3,210 | | | | 3,272,017 | |
M/F Housing, Series J, 2.85%, 11/01/39 | | | 8,000 | | | | 8,165,520 | |
M/F Housing, Series J, 3.00%, 11/01/44 | | | 8,135 | | | | 8,358,957 | |
M/F Housing, Series J, 3.05%, 11/01/49 | | | 13,450 | | | | 13,770,110 | |
M/F Housing, Series J, 3.15%, 11/01/54 | | | 23,000 | | | | 23,663,780 | |
M/F Housing, Series J, 3.25%, 11/01/59 | | | 30,000 | | | | 30,999,300 | |
M/F Housing, Series J, 3.35%, 11/01/65 | | | 8,000 | | | | 8,315,760 | |
M/F Housing, Sustainable Development Bonds, Series A (HUD), 2.80%, 02/01/50 | | | 94,945 | | | | 93,995,550 | |
M/F Housing, Sustainable Neighborhood Bonds, Series C-1-A, 3.45%, 05/01/50 | | | 5,800 | | | | 5,995,228 | |
Sustainable Development Bond (Hud), 2.70%, 08/01/45 | | | 5,000 | | | | 4,977,100 | |
City of New York Housing Development Corp., Refunding RB, M/F Housing, Sustainable Neighborhood: | | | | | | | | |
Series B-1-A, 3.10%, 11/01/34 | | | 3,000 | | | | 3,178,650 | |
Series B-1-A, 3.40%, 11/01/39 | | | 3,000 | | | | 3,151,500 | |
Series B-1-A, 3.55%, 11/01/44 | | | 5,000 | | | | 5,279,750 | |
Series B-1-A, 3.65%, 11/01/49 | | | 5,000 | | | | 5,283,000 | |
Series B-1-A, 3.75%, 11/01/54 | | | 5,000 | | | | 5,307,300 | |
Series B-1-A, 3.85%, 05/01/58 | | | 5,000 | | | | 5,339,550 | |
Series G-1-A, 1.88%, 05/01/28 | | | 1,000 | | | | 1,023,960 | |
Series G-1-A, 2.25%, 11/01/31 | | | 1,500 | | | | 1,516,680 | |
City of New York Transitional Finance Authority Future Tax Secured Revenue, RB, Taxable, Future Tax Secured Fiscal, Sub-Series C-3, 3.50%, 11/01/32 | | | 22,000 | | | | 23,899,040 | |
Counties of New York Tobacco Trust IV, Refunding RB, Settlement Pass-Through Turbo, Series A: | | | | | | | | |
6.25%, 06/01/41(a) | | | 13,900 | | | | 13,903,614 | |
5.00%, 06/01/42 | | | 28,915 | | | | 28,161,764 | |
5.00%, 06/01/45 | | | 6,930 | | | | 6,694,796 | |
Counties of New York Tobacco Trust VI, Refunding RB, Tobacco Settlement Pass-Through, Series A-2B, 5.00%, 06/01/51 | | | 3,630 | | | | 3,613,955 | |
County of Nassau New York, GO, Refunding, Series B: | | | | | | | | |
5.00%, 04/01/44 | | | 10,000 | | | | 12,670,800 | |
5.00%, 04/01/49 | | | 10,000 | | | | 12,515,700 | |
County of Nassau New York Tobacco Settlement Corp., Refunding RB, Asset Backed, Series A-1, 6.83%, 06/01/21 | | | 2,602 | | | | 2,606,527 | |
| | | | | | | | |
Security | | Par
(000) | | | Value | |
|
| New York (continued) | |
County of Onondaga Trust for Cultural Resources, Refunding RB, Syracuse University Project: | | | | | | | | |
5.00%, 12/01/38 | | $ | 7,095 | | | $ | 8,962,191 | |
5.00%, 12/01/39 | | | 9,170 | | | | 11,580,976 | |
5.00%, 12/01/40 | | | 5,775 | | | | 7,288,223 | |
4.00%, 12/01/41 | | | 10,375 | | | | 12,036,141 | |
5.00%, 12/01/43 | | | 16,995 | | | | 21,259,555 | |
4.00%, 12/01/47 | | | 12,750 | | | | 14,551,958 | |
4.00%, 12/01/49 | | | 5,000 | | | | 5,676,800 | |
County of Westchester New York Healthcare Corp., Refunding RB, Senior Lien, Remarketing, Series A, 5.00%, 11/01/23 | | | 5,000 | | | | 5,186,150 | |
County of Westchester New York Local Development Corp., Refunding RB, Westchester Medical Center Obligation, 5.00%, 11/01/46 | | | 5,000 | | | | 5,185,750 | |
Dutchess County Local Development Corp., RB, Health Quest System, Inc., Series B, 5.00%, 07/01/46 | | | 20,000 | | | | 21,468,400 | |
Erie Tobacco Asset Securitization Corp., Refunding RB, Asset-Backed, Series A, 5.00%, 06/01/45 | | | 18,765 | | | | 18,365,868 | |
Metropolitan Transportation Authority, Refunding RB: | | | | | | | | |
Green Bond, Climate Bond Certified, Series C-1, 5.00%, 11/15/34 | | | 10,000 | | | | 10,713,200 | |
Green Bond, Group 1, Series C, 5.00%, 11/15/40 | | | 10,000 | | | | 10,774,500 | |
Green Bond, Group 1, Series C, 5.00%, 11/15/42 | | | 10,000 | | | | 10,788,100 | |
Green Bond, Group 1, Series C (AGM), 5.00%, 11/15/41 | | | 10,000 | | | | 11,605,900 | |
Green Bond, Group 1, Series C (BAM), 5.00%, 11/15/43 | | | 10,000 | | | | 11,545,800 | |
Green Bonds, Series C (AGM), 5.00%, 11/15/40 | | | 10,000 | | | | 11,647,700 | |
Green Bonds, Series C-1, 5.00%, 11/15/24 | | | 10,000 | | | | 10,557,600 | |
Series C-1, 5.25%, 11/15/56 | | | 10,000 | | | | 10,698,900 | |
Metropolitan Transportation Authority Hudson Rail Yards Trust Obligations, Refunding RB, Series A, 5.00%, 11/15/56 | | | 5,000 | | | | 5,386,700 | |
New York City Housing Development Corp., RB, M/F: | | | | | | | | |
Housing, Sustainable Neighborhood Bonds, Series A, 4.38%, 11/01/33 | | | 1,110 | | | | 1,204,605 | |
Series A-1, 3.95%, 11/15/44 | | | 15,000 | | | | 15,764,700 | |
Series C-1-A, 3.50%, 11/01/33 | | | 5,000 | | | | 5,389,250 | |
Series G-1, 4.00%, 05/01/48 | | | 5,000 | | | | 5,215,750 | |
Sustainable Neighborhood, 3.85%, 11/01/43 | | | 5,000 | | | | 5,338,100 | |
New York City Transitional Finance Authority Future Tax Secured Revenue, RB, Future Tax Secured Bonds, Series A-1, 3.90%, 08/01/31 | | | 10,000 | | | | 11,176,800 | |
New York City Water & Sewer System, RB, Series BB-1, 5.00%, 06/15/49 | | | 5,000 | | | | 6,355,400 | |
New York Liberty Development Corp., Refunding RB: | | | | | | | | |
3 World Trade Center Project, Class 1, 5.00%, 11/15/44(a) | | | 49,285 | | | | 48,447,648 | |
3 World Trade Center Project, Class 2, 5.15%, 11/15/34(a) | | | 240 | | | | 240,439 | |
3 World Trade Center Project, Class 2, 5.38%, 11/15/40(a) | | | 570 | | | | 538,901 | |
4 World Trade Center Project, 5.00%, 11/15/44 | | | 5,000 | | | | 5,208,900 | |
New York State Housing Finance Agency, RB: | | | | | | | | |
Green Bond, Series F (SONYMA), 3.90%, 11/01/48 | | | 6,905 | | | | 7,310,600 | |
M/F Housing, Climate Bond Certified/Sustainability (Fannie Mae) (SONYMA), 1.63%, 05/01/23 | | | 1,200 | | | | 1,207,992 | |
M/F Housing, Climate Bond Certified/Sustainability (Fannie Mae) (SONYMA), 2.25%, 11/01/29 | | | 275 | | | | 288,263 | |
M/F Housing, Climate Bond Certified/Sustainability (Fannie Mae) (SONYMA), 2.35%, 11/01/30 | | | 250 | | | | 260,095 | |
| | |
| 44 | | 2020 BLACKROCK ANNUAL REPORTTO SHAREHOLDERS |
| | |
Schedule of Investments (continued) May 31, 2020 | | BlackRock Strategic Municipal Opportunities Fund (Percentages shown are based on Net Assets) |
| | | | | | | | |
Security | | Par
(000) | | | Value | |
|
| New York (continued) | |
M/F Housing, Climate Bond Certified/Sustainability (Fannie Mae) (SONYMA), 2.40%, 11/01/31 | | $ | 250 | | | $ | 257,563 | |
M/F Housing, Climate Bond Certified/Sustainability (Fannie Mae) (SONYMA), 3.00%, 11/01/39 | | | 1,185 | | | | 1,202,811 | |
M/F Housing, Climate Bond Certified/Sustainability (Fannie Mae) (SONYMA), 3.15%, 11/01/44 | | | 1,000 | | | | 1,015,150 | |
M/F Housing, Climate Bond Certified/Sustainability (Fannie Mae) (SONYMA), 3.25%, 11/01/52 | | | 3,430 | | | | 3,535,438 | |
M/F Housing, Sustainable Bonds, Series I (Fannie Mae) (SONYMA), 1.75%, 05/01/24 | | | 3,000 | | | | 3,045,540 | |
M/F Housing, Sustainable Bonds, Series I (Fannie Mae) (SONYMA), 2.40%, 05/01/31 | | | 280 | | | | 290,270 | |
M/F Housing, Sustainable Bonds, Series I (Fannie Mae) (SONYMA), 2.75%, 11/01/34 | | | 1,250 | | | | 1,284,975 | |
M/F Housing, Sustainable Bonds, Series I (Fannie Mae) (SONYMA), 3.00%, 11/01/39 | | | 2,140 | | | | 2,172,164 | |
M/F Housing, Sustainable Bonds, Series I (Fannie Mae) (SONYMA), 3.15%, 11/01/44 | | | 3,275 | | | | 3,324,616 | |
M/F Housing, Sustainable Bonds, Series I (Fannie Mae) (SONYMA), 3.25%, 11/01/52 | | | 5,895 | | | | 5,982,423 | |
M/F, Affordable Housing, Series C (HUD), 4.10%, 11/01/45 | | | 4,000 | | | | 4,214,880 | |
M/F, Affordable Housing, Series F (Ginnie Mae, Fannie Mae & Freddie Mac) (SONYMA), 3.90%, 05/01/47 | | | 3,585 | | | | 3,719,294 | |
M/F, Affordable Housing, Series G (Ginnie Mae, Fannie Mae & Freddie Mac) (SONYMA), 3.90%, 11/01/44 | | | 7,110 | | | | 7,395,253 | |
New York State Urban Development Corp., RB, Bidding Group Bond, Series B, 2.84%, 03/15/32 | | | 20,000 | | | | 20,304,400 | |
New York Transportation Development Corp., ARB, AMT: | | | | | | | | |
Delta Air Lines, Inc. LaGuardia Airport Terminals C&D Redevelopment Project, 5.00%, 01/01/26 | | | 10,000 | | | | 10,130,100 | |
Delta Air Lines, Inc. LaGuardia Airport Terminals C&D Redevelopment Project, 5.00%, 01/01/27 | | | 10,000 | | | | 10,124,800 | |
Delta Air Lines, Inc. LaGuardia Airport Terminals C&D Redevelopment Project, 5.00%, 01/01/28 | | | 10,000 | | | | 10,107,600 | |
Delta Air Lines, Inc. LaGuardia Airport Terminals C&D Redevelopment Project, 5.00%, 01/01/29 | | | 10,000 | | | | 10,074,800 | |
Delta Air Lines, Inc. LaGuardia Airport Terminals C&D Redevelopment Project, 5.00%, 01/01/30 | | | 10,000 | | | | 10,061,100 | |
Delta Air Lines, Inc. LaGuardia Airport Terminals C&D Redevelopment Project, 5.00%, 01/01/32 | | | 15,000 | | | | 15,378,300 | |
Delta Air Lines, Inc. LaGuardia Airport Terminals C&D Redevelopment Project, 5.00%, 01/01/34 | | | 15,500 | | | | 16,188,200 | |
LaGuardia Airport Terminal B Redevelopment Project, Series A, 5.00%, 07/01/34 | | | 5,000 | | | | 5,215,200 | |
LaGuardia Airport Terminal B Redevelopment Project, Series A, 5.00%, 07/01/41 | | | 5,000 | | | | 5,194,400 | |
LaGuardia Airport Terminal B Redevelopment Project, Series A, 5.00%, 07/01/46 | | | 50,000 | | | | 51,961,500 | |
LaGuardia Airport Terminal B Redevelopment Project, Series A, 5.25%, 01/01/50 | | | 45,000 | | | | 47,249,550 | |
Niagara Area Development Corp., Refunding RB, Covanta Project, Series A, AMT, 4.75%, 11/01/42(a) | | | 5,280 | | | | 5,103,120 | |
State of New York Dormitory Authority, RB, Rockefeller University, Green Bond, 5.00%, 07/01/50 | | | 10,000 | | | | 12,693,200 | |
State of New York Dormitory Authority, Refunding RB: | | | | | | | | |
Bid Group, Series E, 5.00%, 03/15/48 | | | 5,000 | | | | 5,955,500 | |
Catholic Health System Obligation, 5.00%, 07/01/26 | | | 100 | | | | 113,754 | |
Catholic Health System Obligation, 5.00%, 07/01/27 | | | 300 | | | | 345,489 | |
Catholic Health System Obligation, 5.00%, 07/01/30 | | | 250 | | | | 291,998 | |
Catholic Health System Obligation, 5.00%, 07/01/32 | | | 360 | | | | 412,333 | |
| | | | | | | | |
Security | | Par
(000) | | | Value | |
|
| New York (continued) | |
Catholic Health System Obligation, 5.00%, 07/01/34 | | $ | 515 | | | $ | 581,188 | |
Catholic Health System Obligation, 5.00%, 07/01/35 | | | 600 | | | | 672,426 | |
Catholic Health System Obligation, 5.00%, 07/01/36 | | | 975 | | | | 1,088,110 | |
Catholic Health System Obligation, 4.00%, 07/01/37 | | | 1,860 | | | | 1,906,426 | |
Catholic Health System Obligation, 4.00%, 07/01/38 | | | 1,650 | | | | 1,686,317 | |
Catholic Health System Obligation, 4.00%, 07/01/39 | | | 1,755 | | | | 1,789,503 | |
Catholic Health System Obligation, 4.00%, 07/01/40 | | | 2,000 | | | | 2,035,000 | |
Catholic Health System Obligation, 5.00%, 07/01/41 | | | 3,400 | | | | 3,749,044 | |
Catholic Health System Obligation, 4.00%, 07/01/45 | | | 10,000 | | | | 10,060,800 | |
Catholic Healthcare Partners, 5.00%, 07/01/28 | | | 250 | | | | 290,675 | |
Group 3, Series A, 5.00%, 03/15/39 | | | 10,000 | | | | 12,395,700 | |
Group 3, Series A, 5.00%, 03/15/40 | | | 10,000 | | | | 12,353,800 | |
Touro College & University, Series B, 5.75%, 01/01/29 | | | 990 | | | | 1,115,582 | |
State of New York HFA, RB, M/F Housing: | | | | | | | | |
Affordable Housing, Series B (Ginnie Mae, Fannie Mae & Freddie Mac) (SONYMA), 3.45%, 11/01/41 | | | 1,200 | | | | 1,235,388 | |
Affordable Housing, Series E (Ginnie Mae, Fannie Mae & Freddie Mac) (SONYMA), 3.35%, 11/01/45 | | | 1,110 | | | | 1,132,666 | |
Affordable Housing, Series E (Ginnie Mae, Fannie Mae & Freddie Mac) (SONYMA), 3.45%, 05/01/49 | | | 2,850 | | | | 2,913,783 | |
Affordable Housing, Series M (Ginnie Mae, Fannie Mae & Freddie Mac) (SONYMA), 3.15%, 11/01/32 | | | 1,000 | | | | 1,052,610 | |
Affordable Housing, Series M (Ginnie Mae, Fannie Mae & Freddie Mac) (SONYMA), 3.50%, 11/01/37 | | | 415 | | | | 434,534 | |
Green Bond, Affordable Housing-Climate Bond Certified, Series K (Ginnie Mae, Fannie Mae & Freddie Mac) (SONYMA), 3.00%, 11/01/32 | | | 1,500 | | | | 1,563,015 | |
Green Bond, Series F (SONYMA), 2.30%, 05/01/22 | | | 5,000 | | | | 5,065,900 | |
Series C (Ginnie Mae, Fannie Mae & Freddie Mac) (SONYMA), 3.38%, 11/01/49 | | | 5,000 | | | | 5,090,750 | |
State of New York Mortgage Agency, RB, S/F: | | | | | | | | |
Housing, Series 223, 2.35%, 04/01/31 | | | 1,835 | | | | 1,927,392 | |
Housing, Series 223, 2.40%, 10/01/31 | | | 1,130 | | | | 1,192,060 | |
Housing, Series 223, 2.65%, 10/01/34 | | | 9,520 | | | | 9,993,525 | |
Series 188, 3.85%, 10/01/44 | | | 3,800 | | | | 3,988,518 | |
State of New York Mortgage Agency, Refunding RB, S/F Housing: | | | | | | | | |
AMT, Series 226, 1.80%, 04/01/28 | | | 1,000 | | | | 1,014,680 | |
AMT, Series 226, 1.85%, 10/01/28 | | | 1,000 | | | | 1,014,100 | |
AMT, Series 226, 3.50%, 10/01/50 | | | 2,050 | | | | 2,201,741 | |
Series 225, 2.00%, 10/01/35 | | | 2,400 | | | | 2,403,024 | |
Series 225, 2.30%, 10/01/40 | | | 8,275 | | | | 8,384,313 | |
Series 225, 2.45%, 10/01/45 | | | 29,730 | | | | 30,013,921 | |
Series 225, 2.55%, 04/01/50 | | | 2,905 | | | | 2,942,736 | |
State of New York Thruway Authority, RB, Series N: | | | | | | | | |
Group 1, 5.00%, 01/01/34 | | | 5,000 | | | | 6,221,150 | |
Group 2, 4.00%, 01/01/42 | | | 10,000 | | | | 11,244,100 | |
Group 2, 4.00%, 01/01/43 | | | 10,000 | | | | 11,179,800 | |
Group 2, 4.00%, 01/01/44 | | | 10,000 | | | | 11,050,200 | |
Group 2, 4.00%, 01/01/45 | | | 10,000 | | | | 11,051,200 | |
Group 2, 4.00%, 01/01/46 | | | 9,685 | | | | 10,669,868 | |
Group 2, 4.00%, 01/01/47 | | | 10,225 | | | | 11,248,420 | |
Troy Capital Resource Corp., Refunding RB, Rensselaer Polytechnic Institute Project, Series A (I): | | | | | | | | |
5.00%, 09/01/33 | | | 3,000 | | | | 3,633,870 | |
5.00%, 09/01/35 | | | 3,000 | | | | 3,582,750 | |
5.00%, 09/01/36 | | | 6,250 | | | | 7,425,438 | |
| | | | |
| SCHEDULES OF INVESTMENTS | | | 45 | |
| | |
Schedule of Investments (continued) May 31, 2020 | | BlackRock Strategic Municipal Opportunities Fund (Percentages shown are based on Net Assets) |
| | | | | | | | |
Security | | Par
(000) | | | Value | |
|
| New York (continued) | |
5.00%, 09/01/37 | | $ | 9,875 | | | $ | 11,677,681 | |
5.00%, 09/01/38 | | | 6,125 | | | | 7,206,736 | |
| | | | | | | | |
| | | | | | | 1,195,890,047 | |
|
| North Carolina — 1.6% | |
City of Charlotte North Carolina Airport Revenue, Refunding ARB, Charlotte Douglas International Airport: | | | | | | | | |
5.00%, 07/01/23 | | | 1,760 | | | | 1,963,456 | |
5.00%, 07/01/26 | | | 2,870 | | | | 3,439,896 | |
5.00%, 07/01/27 | | | 1,030 | | | | 1,261,142 | |
5.00%, 07/01/34 | | | 3,095 | | | | 3,807,624 | |
5.00%, 07/01/36 | | | 1,860 | | | | 2,265,201 | |
4.00%, 07/01/44 | | | 5,000 | | | | 5,504,050 | |
5.00%, 07/01/49 | | | 10,000 | | | | 11,763,800 | |
AMT, 5.00%, 07/01/49 | | | 5,000 | | | | 5,773,450 | |
North Carolina Housing Finance Agency, RB, S/F: | | | | | | | | |
Housing, Series 43 (Ginnie Mae, Fannie Mae & Freddie Mac), 2.63%, 01/01/35 | | | 3,500 | | | | 3,667,160 | |
Housing, Series 43 (Ginnie Mae, Fannie Mae & Freddie Mac), 2.80%, 01/01/40 | | | 6,000 | | | | 6,249,960 | |
Housing, Series 43 (Ginnie Mae, Fannie Mae & Freddie Mac), 2.95%, 07/01/43 | | | 1,375 | | | | 1,433,740 | |
Series 44, 1.75%, 01/01/26 | | | 1,000 | | | | 1,023,270 | |
Series 44, 1.80%, 07/01/26 | | | 1,265 | | | | 1,298,674 | |
Series 44, 2.05%, 01/01/28 | | | 1,360 | | | | 1,404,581 | |
Series 44, 2.10%, 07/01/28 | | | 1,060 | | | | 1,094,842 | |
Series 44, 2.20%, 07/01/29 | | | 1,065 | | | | 1,099,911 | |
Series 44, 2.25%, 07/01/30 | | | 1,425 | | | | 1,476,542 | |
Series 44, 2.30%, 01/01/31 | | | 1,120 | | | | 1,159,099 | |
Series 44, 2.35%, 07/01/31 | | | 1,000 | | | | 1,034,650 | |
Series 44, 2.50%, 07/01/33 | | | 1,000 | | | | 1,034,190 | |
Series 44, 2.55%, 07/01/35 | | | 1,250 | | | | 1,290,938 | |
Series 44, 4.00%, 07/01/50 | | | 7,000 | | | | 7,773,150 | |
North Carolina Medical Care Commission, Refunding RB: | | | | | | | | |
1st Mortgage, Galloway Ridge Project, Series A, 5.25%, 01/01/41 | | | 2,470 | | | | 2,471,902 | |
Vidant Health, 5.00%, 06/01/33 | | | 5,000 | | | | 5,625,400 | |
Vidant Health, 5.00%, 06/01/45 | | | 5,000 | | | | 5,436,800 | |
North Carolina Turnpike Authority, RB, Senior Lien, Triangle Express Way System (AGM), 5.00%, 01/01/49 | | | 15,980 | | | | 18,950,362 | |
Raleigh Durham Airport Authority, Refunding RB, Series A, AMT: | | | | | | | | |
5.00%, 05/01/34 | | | 5,000 | | | | 5,813,000 | |
5.00%, 05/01/35 | | | 5,000 | | | | 5,787,350 | |
State of North Carolina, GO, Series B: | | | | | | | | |
5.00%, 06/01/24 | | | 10,000 | | | | 11,872,000 | |
5.00%, 06/01/26 | | | 5,000 | | | | 6,329,050 | |
5.00%, 06/01/29 | | | 10,000 | | | | 13,695,900 | |
Town of Mooresville North Carolina, Special Assessment Bonds, 5.38%, 03/01/40(a) | | | 2,100 | | | | 2,115,687 | |
University of North Carolina at Charlotte, Refunding RB, Series A: | | | | | | | | |
4.00%, 10/01/37 | | | 1,000 | | | | 1,178,630 | |
5.00%, 10/01/38 | | | 1,375 | | | | 1,755,573 | |
4.00%, 10/01/45 | | | 1,500 | | | | 1,736,250 | |
4.00%, 10/01/49 | | | 1,500 | | | | 1,717,890 | |
| | | | | | | | |
| | | | | | | 151,305,120 | |
|
| North Dakota — 0.1% | |
North Dakota Housing Finance Agency, RB, S/F Housing, Home Mortgage, Series F: | | | | | | | | |
2.70%, 07/01/34 | | | 1,085 | | | | 1,114,610 | |
2.95%, 07/01/39 | | | 5,140 | | | | 5,294,148 | |
| | | | | | | | |
Security | | Par
(000) | | | Value | |
|
| North Dakota (continued) | |
3.05%, 07/01/43 | | $ | 1,035 | | | $ | 1,064,415 | |
| | | | | | | | |
| | | | | | | 7,473,173 | |
|
| Ohio — 1.6% | |
Buckeye Tobacco Settlement Financing Authority, Refunding RB, Senior, Class 2, Series B-2, 5.00%, 06/01/55 | | | 66,015 | | | | 66,560,944 | |
County of Allen Ohio Hospital Facilities Revenue, Refunding RB, Series A, 5.00%, 08/01/22 | | | 5,000 | | | | 5,441,950 | |
Northeast Ohio Medical University Foundation, RB, 5.00%, 12/01/42 | | | 5,000 | | | | 5,110,800 | |
Ohio Housing Finance Agency, RB S/F: | | | | | | | | |
Series A (Ginnie Mae, Fannie Mae & Freddie Mac), 2.50%, 09/01/35 | | | 2,500 | | | | 2,584,000 | |
Series A (Ginnie Mae, Fannie Mae & Freddie Mac), 2.75%, 09/01/40 | | | 4,560 | | | | 4,744,178 | |
Series A (Ginnie Mae, Fannie Mae & Freddie Mac), 2.90%, 09/01/45 | | | 19,705 | | | | 20,460,884 | |
Series A (Ginnie Mae, Fannie Mae & Freddie Mac), 3.00%, 03/01/50 | | | 10,000 | | | | 10,438,600 | |
Series A (Ginnie Mae, Fannie Mae & Freddie Mac), 3.75%, 09/01/50 | | | 12,000 | | | | 13,216,440 | |
Series B, 3.25%, 09/01/44 | | | 5,000 | | | | 5,368,600 | |
State of Ohio, RB, Portsmouth Bypass Project, AMT: | | | | | | | | |
5.00%, 06/30/21 | | | 1,975 | | | | 2,077,266 | |
5.00%, 06/30/22 | | | 2,190 | | | | 2,406,722 | |
5.00%, 12/31/22 | | | 1,550 | | | | 1,739,069 | |
5.00%, 06/30/23 | | | 1,305 | | | | 1,493,755 | |
5.00%, 12/31/23 | | | 1,295 | | | | 1,510,786 | |
| | | | | | | | |
| | | | | | | 143,153,994 | |
|
| Oklahoma — 0.6% | |
City of Tulsa Oklahoma, GO, 5.00%, 03/01/25 | | | 8,000 | | | | 9,668,880 | |
Norman Regional Hospital Authority, RB, Norman Regional Hospital Authority, 5.00%, 09/01/45 | | | 5,000 | | | | 5,532,600 | |
Oklahoma Development Finance Authority, RB, OU Medicine Project, Series B: | | | | | | | | |
5.25%, 08/15/48 | | | 10,000 | | | | 10,761,200 | |
5.50%, 08/15/52 | | | 11,620 | | | | 12,683,927 | |
Tulsa Airports Improvement Trust, Refunding RB, American Airlines, Inc., AMT, 5.00%, 06/01/35(c) | | | 17,820 | | | | 17,600,280 | |
| | | | | | | | |
| | | | | | | 56,246,887 | |
|
| Oregon — 0.3% | |
County of Multnomah Oregon Hospital Facilities Authority, Refunding RB, Mirabella at South Waterfront, 5.50%, 10/01/49 | | | 865 | | | | 855,649 | |
Port of Portland Oregon Airport Revenue, ARB: | | | | | | | | |
AMT, Series 24-B, 5.00%, 07/01/47 | | | 5,000 | | | | 5,561,000 | |
Portland International Airport, Series 25-A, 5.00%, 07/01/49 | | | 5,000 | | | | 5,818,350 | |
Portland International Airport, Series 25-B, AMT, 5.00%, 07/01/44 | | | 5,000 | | | | 5,782,300 | |
Series 24B, 5.00%, 07/01/47 | | | 5,000 | | | | 5,636,350 | |
Portland Community College District, GO, Refunding, 5.00%, 06/15/24 | | | 5,000 | | | | 5,683,500 | |
State of Oregon Housing & Community Services Department, RB, M/F Housing, AMT, Series B (Ginnie Mae, Fannie Mae & Freddie Mac): | | | | | | | | |
4.00%, 07/01/37 | | | 185 | | | | 194,702 | |
4.13%, 07/01/43 | | | 165 | | | | 170,757 | |
Yamhill County Hospital Authority, Refunding RB, Friends view Retirement Community, 5.00%, 11/15/46 | | | 1,000 | | | | 879,830 | |
| | | | | | | | |
| | | | | | | 30,582,438 | |
| | |
| 46 | | 2020 BLACKROCK ANNUAL REPORTTO SHAREHOLDERS |
| | |
Schedule of Investments (continued) May 31, 2020 | | BlackRock Strategic Municipal Opportunities Fund (Percentages shown are based on Net Assets) |
| | | | | | | | |
Security | | Par
(000) | | | Value | |
|
| Pennsylvania — 3.5% | |
Allentown Neighborhood Improvement Zone Development Authority, RB, City Center Project(a): | | | | | | | | |
5.00%, 05/01/33 | | $ | 1,250 | | | $ | 1,252,487 | |
Subordinate, 5.00%, 05/01/28 | | | 4,180 | | | | 4,265,439 | |
Subordinate, 5.13%, 05/01/32 | | | 4,700 | | | | 4,784,036 | |
Subordinate, 5.38%, 05/01/42 | | | 8,550 | | | | 8,486,302 | |
City of Philadelphia Pennsylvania Airport Revenue, Refunding ARB: | | | | | | | | |
AMT, Series A, 5.00%, 06/15/21 | | | 5,000 | | | | 5,179,550 | |
AMT, Series B, 5.00%, 07/01/21 | | | 5,000 | | | | 5,186,900 | |
AMT, Series B, 5.00%, 07/01/29 | | | 5,000 | | | | 5,875,200 | |
AMT, Series B, 5.00%, 07/01/30 | | | 5,000 | | | | 5,843,550 | |
AMT, Series B, 5.00%, 07/01/42 | | | 5,000 | | | | 5,612,650 | |
AMT, Series B, 5.00%, 07/01/47 | | | 5,000 | | | | 5,533,100 | |
Series A, 5.00%, 07/01/47 | | | 5,000 | | | | 5,607,750 | |
City of Philadelphia Pennsylvania Airport Revenue, Refunding RB, AMT, Series A, 5.00%, 06/15/22 | | | 5,000 | | | | 5,177,550 | |
City of Philadelphia Pennsylvania Hospitals & Higher Education Facilities Authority, RB, Temple University Health System, Series A: | | | | | | | | |
5.63%, 07/01/36 | | | 4,045 | | | | 4,221,847 | |
5.63%, 07/01/42 | | | 1,675 | | | | 1,741,816 | |
City of Philadelphia Pennsylvania Water & Wastewater Revenue, RB, Series B: | | | | | | | | |
5.00%, 11/01/44 | | | 5,000 | | | | 6,232,150 | |
5.00%, 11/01/49 | | | 10,000 | | | | 12,252,600 | |
Commonwealth Financing Authority, RB, Series A: | | | | | | | | |
Plankton Program, 3.86%, 06/01/38 | | | 2,095 | | | | 2,239,492 | |
Taxable Bond, 3.81%, 06/01/41 | | | 5,545 | | | | 5,987,436 | |
County of Allegheny Hospital Development Authority, Refunding RB, Allegheny Health Network Obligated Group Issue, Series A, 5.00%, 04/01/47 | | | 10,000 | | | | 11,183,600 | |
County of Allegheny Pennsylvania, GO, Refunding, Series C (AGM), 1.01%, 11/01/26(b) | | | 17,660 | | | | 18,085,941 | |
County of Berks IDA, Refunding RB, Tower Health Projects: | | | | | | | | |
5.00%, 11/01/26 | | | 5,000 | | | | 5,537,750 | |
5.00%, 11/01/47 | | | 10,000 | | | | 10,477,500 | |
County of Chester Health & Education Facilities Authority, Refunding RB, Simpson Senior Services Project, Series A: | | | | | | | | |
5.00%, 12/01/22 | | | 895 | | | | 892,288 | |
5.00%, 12/01/23 | | | 985 | | | | 978,203 | |
5.00%, 12/01/24 | | | 1,035 | | | | 1,022,611 | |
5.00%, 12/01/25 | | | 1,075 | | | | 1,055,790 | |
5.25%, 12/01/45 | | | 1,500 | | | | 1,369,290 | |
County of Lancaster Pennsylvania Hospital Authority, Refunding RB, St. Anne’s Retirement Community, 5.00%, 04/01/33 | | | 1,575 | | | | 1,532,428 | |
County of Lehigh Pennsylvania, Refunding RB, Lehigh Valley Health Network, 5.00%, 07/01/44 | | | 15,825 | | | | 18,120,891 | |
County of Montgomery Pennsylvania IDA, Refunding RB, Whitemarsh Continuing Care Retirement Community Project, 5.38%, 01/01/50 | | | 4,815 | | | | 4,357,671 | |
County of Northampton Pennsylvania General Purpose Authority, Refunding RB, St. Luke’s University Health Network Project, 5.00%, 08/15/46 | | | 5,000 | | | | 5,489,250 | |
County of Northampton Pennsylvania IDA, Tax Allocation Bonds, Route 33 Project, 7.00%, 07/01/32 | | | 1,965 | | | | 2,078,184 | |
General Authority of Southcentral Pennsylvania, Refunding RB, Well span Health Obligation Group, Series A, 5.00%, 06/01/44 | | | 10,000 | | | | 11,113,100 | |
| | | | | | | | |
Security | | Par
(000) | | | Value | |
|
| Pennsylvania (continued) | |
Pennsylvania Economic Development Financing Authority, RB: | | | | | | | | |
Build America Bonds, Series B, 6.53%, 06/15/39 | | $ | 5,000 | | | $ | 6,859,700 | |
Pennsylvania Rapid Bridge Replacement, 5.00%, 06/30/20 | | | 5,000 | | | | 5,008,950 | |
Pennsylvania Rapid Bridge Replacement, 5.00%, 06/30/21 | | | 5,000 | | | | 5,123,500 | |
Pennsylvania Rapid Bridge Replacement, 5.00%, 12/31/21 | | | 5,000 | | | | 5,176,200 | |
Pennsylvania Rapid Bridge Replacement, 5.00%, 06/30/22 | | | 4,495 | | | | 4,698,129 | |
Pennsylvania Rapid Bridge Replacement, 5.00%, 12/31/29 | | | 5,000 | | | | 5,475,900 | |
Pennsylvania Rapid Bridge Replacement Project, 5.00%, 06/30/23 | | | 5,000 | | | | 5,316,400 | |
Pennsylvania Rapid Bridge Replacement, 5.00%, 12/31/30 | | | 2,460 | | | | 2,686,960 | |
Pennsylvania Rapid Bridge Replacement, 5.00%, 12/31/34 | | | 5,000 | | | | 5,374,300 | |
Pennsylvania Rapid Bridge Replacement, 5.00%, 12/31/38 | | | 5,000 | | | | 5,318,050 | |
Pennsylvania Rapid Bridge Replacement Project, 5.00%, 06/30/42 | | | 5,000 | | | | 5,275,350 | |
Pennsylvania Economic Development Financing Authority, Refunding RB, National Gypsum Co., AMT, 5.50%, 11/01/44 | | | 3,250 | | | | 3,058,770 | |
Pennsylvania Housing Finance Agency, RB, S/F Housing, Series 130-A, 2.70%, 10/01/39 | | | 6,845 | | | | 6,962,666 | |
Pennsylvania Housing Finance Agency, Refunding RB: | | | | | | | | |
S/F Housing, Series 131-A, 1.85%, 04/01/26 | | | 1,550 | | | | 1,586,270 | |
S/F Housing, Series 131-A, 2.10%, 04/01/28 | | | 1,915 | | | | 1,963,890 | |
S/F Housing, Series 131-A, 2.15%, 10/01/28 | | | 1,380 | | | | 1,415,011 | |
Series 121, 2.80%, 10/01/31 | | | 11,770 | | | | 12,191,131 | |
Pennsylvania Turnpike Commission, RB: | | | | | | | | |
Series A-1, 5.00%, 12/01/47 | | | 5,000 | | | | 5,836,600 | |
Series B, 5.00%, 12/01/43 | | | 5,000 | | | | 5,876,300 | |
Series B, 5.00%, 12/01/48 | | | 5,000 | | | | 5,818,000 | |
Pennsylvania Turnpike Commission, Refunding RB, 5.00%, 12/01/23 | | | 5,000 | | | | 5,700,150 | |
Philadelphia Authority for Industrial Development, RB, University of the Sciences, 5.00%, 11/01/47 | | | 10,000 | | | | 10,101,800 | |
Philadelphia Authority for Industrial Development, Refunding RB, Thomas Jefferson University, Series A: | | | | | | | | |
5.00%, 09/01/35 | | | 5,000 | | | | 5,650,250 | |
5.00%, 09/01/36 | | | 5,000 | | | | 5,632,300 | |
Susquehanna Area Regional Airport Authority, ARB, Series A, AMT, 5.00%, 01/01/27 | | | 3,100 | | | | 3,128,923 | |
| | | | | | | | |
| | | | | | | 320,009,852 | |
|
| Puerto Rico — 8.2% | |
Commonwealth of Puerto Rico, GO(f)(g): | | | | | | | | |
Public Improvement, Series A, 5.25%, 07/01/22 | | | 3,075 | | | | 1,919,231 | |
Public Improvement, Series A, 5.25%, 07/01/23 | | | 2,620 | | | | 1,635,247 | |
Public Improvement, Series A, 5.25%, 07/01/26 | | | 1,085 | | | | 677,192 | |
Public Improvement, Series A, 5.00%, 07/01/29 | | | 5,220 | | | | 3,258,011 | |
Public Improvement, Series A, 5.13%, 07/01/31 | | | 10,900 | | | | 6,803,126 | |
Public Improvement, Series B, 5.25%, 07/01/17 | | | 1,605 | | | | 998,403 | |
Commonwealth of Puerto Rico, GO, Refunding: | | | | | | | | |
Public Improvement, Series A, 5.50%, 07/01/19 | | | 1,176 | | | | 731,540 | |
Public Improvement, Series A, 5.25%, 07/01/24(f)(g) | | | 1,765 | | | | 1,016,866 | |
Public Improvement, Series A, 5.00%, 07/01/32(f)(g) | | | 1,050 | | | | 604,934 | |
Public Improvement, Series A, 5.50%, 07/01/32(f)(g) | | | 4,245 | | | | 2,649,474 | |
Public Improvement, Series A, 5.13%, 07/01/37(f)(g) | | | 1,490 | | | | 858,431 | |
Public Improvement, Series A, 5.50%, 07/01/39(f)(g) | | | 14,225 | | | | 8,195,421 | |
| | | | |
| SCHEDULES OF INVESTMENTS | | | 47 | |
| | |
Schedule of Investments (continued) May 31, 2020 | | BlackRock Strategic Municipal Opportunities Fund (Percentages shown are based on Net Assets) |
| | | | | | | | |
Security | | Par
(000) | | | Value | |
|
| Puerto Rico (continued) | |
Public Improvement, Series A, 5.00%, 07/01/41(f)(g) | | $ | 23,430 | | | $ | 13,642,141 | |
Public Improvement, Series A, 5.75%, 07/01/41(f)(g) | | | 3,530 | | | | 2,076,815 | |
Public Improvement, Series B, 6.00%, 07/01/39(f)(g) | | | 2,555 | | | | 1,611,778 | |
Public Improvement, Series C, 6.00%, 07/01/39(f)(g) | | | 1,510 | | | | 952,558 | |
Series A, 8.00%, 07/01/35(f)(g) | | | 90,908 | | | | 49,317,590 | |
Commonwealth of Puerto Rico, GO, Series A, 6.00%, 07/01/38(f)(g) | | | 9,995 | | | | 6,305,176 | |
Commonwealth of Puerto Rico Aqueduct & Sewer Authority, RB, Senior Lien, Series A: | | | | | | | | |
5.00%, 07/01/33 | | | 455 | | | | 444,776 | |
5.13%, 07/01/37 | | | 11,795 | | | | 11,680,588 | |
5.75%, 07/01/37 | | | 5,145 | | | | 5,145,000 | |
5.25%, 07/01/42 | | | 313 | | | | 307,526 | |
Puerto Rico Commonwealth Aqueduct & Sewer Authority, Refunding RB, Senior Lien, Series B: | | | | | | | | |
5.00%, 07/01/23 | | | 19,690 | | | | 19,103,632 | |
5.35%, 07/01/27 | | | 14,980 | | | | 14,170,031 | |
6.15%, 07/01/38 | | | 6,205 | | | | 5,877,810 | |
Puerto Rico Electric Power Authority, 1.00%, 01/01/21(f)(g) | | | 1,908 | | | | 1,239,860 | |
Puerto Rico Electric Power Authority, RB: | | | | | | | | |
Series A, 5.00%, 07/01/29(f)(g) | | | 5,540 | | | | 3,423,027 | |
Series A, 7.00%, 07/01/33(f)(g) | | | 7,445 | | | | 4,659,327 | |
Series A, 6.75%, 07/01/36(f)(g) | | | 24,370 | | | | 15,251,550 | |
Series A, 5.00%, 07/01/42(f)(g) | | | 33,970 | | | | 20,989,214 | |
Series A, 7.00%, 07/01/43(f)(g) | | | 3,350 | | | | 2,096,541 | |
Series A-3, 10.00%, 07/01/19(f)(g) | | | 6,867 | | | | 5,846,029 | |
Series B-3, 10.00%, 07/01/19(f)(g) | | | 6,867 | | | | 5,846,029 | |
Series C-1, 5.40%, 01/01/18(f)(g) | | | 18,867 | | | | 12,263,703 | |
Series C-2, 5.40%, 07/01/18(f)(g) | | | 18,870 | | | | 12,265,687 | |
Series C-4, 5.40%, 07/01/20(f)(g) | | | 1,908 | | | | 1,239,860 | |
Series CCC, 5.25%, 07/01/26(f)(g) | | | 8,495 | | | | 5,248,848 | |
Series CCC, 5.25%, 07/01/27 | | | 5,010 | | | | 3,095,554 | |
Series CCC, 5.00%, 07/01/28 | | | 2,005 | | | | 1,238,839 | |
Series CCC, 5.25%, 07/01/28(f)(g) | | | 3,120 | | | | 1,927,770 | |
Series D, 7.50%, 07/01/20 | | | 5,100 | | | | 3,191,748 | |
Series TT, 5.00%, 07/01/20(f)(g) | | | 1,690 | | | | 1,044,209 | |
Series TT, 5.00%, 07/01/21 | | | 3,315 | | | | 2,048,256 | |
Series TT, 5.00%, 07/01/23(f)(g) | | | 1,930 | | | | 1,192,499 | |
Series TT, 5.00%, 07/01/32(f)(g) | | | 10,360 | | | | 6,401,185 | |
Series WW, 5.50%, 07/01/17(f)(g) | | | 4,300 | | | | 2,579,286 | |
Series WW, 5.50%, 07/01/18(f)(g) | | | 6,025 | | | | 3,614,000 | |
Series WW, 5.50%, 07/01/20(f)(g) | | | 1,000 | | | | 617,875 | |
Series WW, 5.38%, 07/01/23(f)(g) | | | 2,355 | | | | 1,455,096 | |
Series WW, 5.38%, 07/01/24(f)(g) | | | 4,545 | | | | 2,808,242 | |
Series WW, 5.25%, 07/01/25(f)(g) | | | 2,300 | | | | 1,421,113 | |
Series WW, 5.00%, 07/01/28 | | | 6,105 | | | | 3,772,127 | |
Series WW, 5.25%, 07/01/33(f)(g) | | | 2,725 | | | | 1,683,709 | |
Series WW, 5.50%, 07/01/38(f)(g) | | | 3,980 | | | | 2,459,142 | |
Series XX, 5.25%, 07/01/26(f)(g) | | | 2,385 | | | | 1,473,632 | |
Series XX, 5.25%, 07/01/27(f)(g) | | | 2,630 | | | | 1,625,011 | |
Series XX, 5.25%, 07/01/35(f)(g) | | | 1,310 | | | | 809,416 | |
Series XX, 5.75%, 07/01/36(f)(g) | | | 1,825 | | | | 1,127,622 | |
Series XX, 5.25%, 07/01/40(f)(g) | | | 46,125 | | | | 28,499,484 | |
Puerto Rico Electric Power Authority, Refunding RB(f)(g): | | | | | | | | |
Series AAA, 5.25%, 07/01/21 | | | 7,185 | | | | 4,439,432 | |
Series AAA, 5.25%, 07/01/22 | | | 7,025 | | | | 4,340,572 | |
Series AAA, 5.25%, 07/01/24 | | | 1,575 | | | | 973,153 | |
Series AAA, 5.25%, 07/01/25 | | | 5,750 | | | | 3,552,781 | |
Series AAA, 5.25%, 07/01/28 | | | 4,870 | | | | 3,009,051 | |
Series AAA, 5.25%, 07/01/29 | | | 5,420 | | | | 3,348,882 | |
Series AAA, 5.25%, 07/01/30 | | | 2,085 | | | | 1,288,269 | |
Series AAA, 5.25%, 07/01/31 | | | 5,720 | | | | 3,534,245 | |
| | | | | | | | |
Security | | Par
(000) | | | Value | |
|
| Puerto Rico (continued) | |
Series BBB, 5.40%, 07/01/28 | | $ | 9,505 | | | $ | 5,872,902 | |
Series DDD, 5.00%, 07/01/20 | | | 1,810 | | | | 1,118,354 | |
Series UU, 1.00%, 07/01/17(c) | | | 1,295 | | | | 841,750 | |
Series UU, 1.00%, 07/01/18(c) | | | 1,165 | | | | 757,250 | |
Series UU, 1.00%, 07/01/20(c) | | | 10,400 | | | | 6,030,232 | |
Series UU, 1.66%, 07/01/31(b) | | | 12,285 | | | | 7,123,212 | |
Series V, 5.50%, 07/01/20 | | | 6,440 | | | | 3,979,115 | |
Series ZZ, 5.25%, 07/01/18 | | | 10,185 | | | | 6,109,309 | |
Series ZZ, 5.25%, 07/01/19 | | | 4,745 | | | | 2,846,212 | |
Series ZZ, 5.25%, 07/01/21 | | | 2,480 | | | | 1,532,330 | |
Series ZZ, 5.25%, 07/01/22 | | | 1,115 | | | | 688,931 | |
Series ZZ, 5.25%, 07/01/24 | | | 1,435 | | | | 886,651 | |
Series ZZ, 5.25%, 07/01/25 | | | 2,440 | | | | 1,507,615 | |
Series ZZ, 5.25%, 07/01/26 | | | 790 | | | | 488,121 | |
Taxable Build America Bonds, Series YY, 6.13%, 07/01/40 | | | 13,440 | | | | 8,304,240 | |
Puerto Rico Public Buildings Authority, RB, Government Facilities, Series N, 5.00%, 07/01/37(f)(g) | | | 1,335 | | | | 965,967 | |
Puerto Rico Public Buildings Authority, Refunding RB: | | | | | | | | |
Government Facilities, Series F (GTD), 5.25%, 07/01/24(f)(g) | | | 2,175 | | | | 1,573,767 | |
Government Facilities, Series U (GTD), 5.25%, 07/01/42 | | | 3,120 | | | | 2,018,472 | |
Series M, 10.00%, 07/01/34(f)(g) | | | 3,325 | | | | 3,040,051 | |
Puerto Rico Sales Tax Financing Corp. Sales Tax Revenue, RB, Restructured: | | | | | | | | |
CAB, Series A-1, 0.00%, 07/01/29(d) | | | 3,745 | | | | 2,725,499 | |
CAB, Series A-1, 0.00%, 07/01/31(d) | | | 4,464 | | | | 2,954,320 | |
CAB, Series A-1, 0.00%, 07/01/33(d) | | | 6,377 | | | | 3,793,741 | |
CAB, Series A-1, 0.00%, 07/01/46(d) | | | 155,908 | | | | 39,737,831 | |
CAB, Series A-1, 0.00%, 07/01/51(d) | | | 259,203 | | | | 48,299,887 | |
Series A-1, 4.75%, 07/01/53 | | | 82,355 | | | | 79,515,400 | |
Series A-1, 5.00%, 07/01/58 | | | 29,725 | | | | 29,653,065 | |
Series A-2, 4.33%, 07/01/40 | | | 68,165 | | | | 65,240,721 | |
Series A-2, 4.33%, 07/01/40 | | | 4,554 | | | | 4,291,690 | |
Series A-2, 4.54%, 07/01/53 | | | 14,353 | | | | 13,412,161 | |
Series A-2, 4.78%, 07/01/58 | | | 54,227 | | | | 52,274,828 | |
Series B-1, 0.00%, 07/01/46(d) | | | 18,521 | | | | 4,708,779 | |
| | | | | | | | |
| | | | | | | 751,217,575 | |
|
| Rhode Island — 0.7% | |
Rhode Island Health & Educational Building Corp., Refunding RB, Brown University, 5.00%, 09/01/43 | | | 10,000 | | | | 11,300,100 | |
Rhode Island Housing & Mortgage Finance Corp., RB: | | | | | | | | |
M/F, Series 3-B (FHA), 3.88%, 10/01/39 | | | 1,610 | | | | 1,688,890 | |
S/F Housing, Series 70 (Ginnie Mae), 2.80%, 10/01/34 | | | 5,000 | | | | 5,185,950 | |
S/F Housing, Series 70 (Ginnie Mae), 3.00%, 10/01/39 | | | 4,125 | | | | 4,281,667 | |
S/F Housing, Series 70 (Ginnie Mae), 3.15%, 10/01/44 | | | 10,000 | | | | 10,329,400 | |
S/F Housing, Series 70 (Ginnie Mae), 3.25%, 10/01/46 | | | 4,200 | | | | 4,365,102 | |
S/F Housing, Series 71, 2.75%, 10/01/34 | | | 3,965 | | | | 4,099,850 | |
S/F Housing, Series 71, 3.00%, 10/01/39 | | | 4,000 | | | | 4,153,200 | |
S/F Housing, Series 71, 3.10%, 10/01/44 | | | 5,500 | | | | 5,669,125 | |
Tobacco Settlement Financing Corp., Refunding RB: | | | | | | | | |
Series A, 5.00%, 06/01/40 | | | 5,000 | | | | 5,345,800 | |
Series B, 4.50%, 06/01/45 | | | 5,000 | | | | 5,194,050 | |
| | | | | | | | |
| | | | | | | 61,613,134 | |
| | |
| 48 | | 2020 BLACKROCK ANNUAL REPORTTO SHAREHOLDERS |
| | |
Schedule of Investments (continued) May 31, 2020 | | BlackRock Strategic Municipal Opportunities Fund (Percentages shown are based on Net Assets) |
| | | | | | | | |
Security | | Par
(000) | | | Value | |
|
| South Carolina — 2.1% | |
County of Dorchester South Carolina, Special Assessment Bonds(a): | | | | | | | | |
5.88%, 10/01/40 | | $ | 2,310 | | | $ | 2,151,649 | |
6.00%, 10/01/51 | | | 6,240 | | | | 5,787,538 | |
County of Lexington South Carolina Health Services District, Inc., RB, Lexington Medical Center, 5.00%, 11/01/41 | | | 10,000 | | | | 11,192,600 | |
County of Spartanburg School District No. 7, GO, Refunding, Series D, 5.00%, 03/01/48 | | | 5,000 | | | | 6,275,550 | |
South Carolina Jobs EDA, Refunding RB, Prisma Health Obligated Group, Series A, 5.00%, 05/01/38 | | | 10,000 | | | | 10,737,800 | |
South Carolina Public Service Authority, RB: | | | | | | | | |
Build America Bonds, Series F (AGM), 6.45%, 01/01/50 | | | 10,950 | | | | 16,899,244 | |
Santee Cooper, Series F (AGM), 5.74%, 01/01/30 | | | 5,000 | | | | 6,105,650 | |
Series A, 5.00%, 12/01/49 | | | 10,000 | | | | 10,598,800 | |
South Carolina Public Service Authority, Refunding RB: | | | | | | | | |
Obligations, Series B, 5.00%, 12/01/41 | | | 10,000 | | | | 11,061,100 | |
Santee Cooper, Series D, 5.00%, 12/01/43 | | | 10,000 | | | | 10,362,300 | |
Taxable Obligation (AGM), 3.92%, 12/01/24 | | | 3,405 | | | | 3,638,311 | |
South Carolina State Housing Finance & Development Authority, RB, Series A, S/F: | | | | | | | | |
Housing, 2.80%, 07/01/34 | | | 1,780 | | | | 1,855,419 | |
Housing, 3.00%, 07/01/39 | | | 3,430 | | | | 3,575,672 | |
Housing, 3.20%, 07/01/49 | | | 5,000 | | | | 5,199,750 | |
1.75%, 01/01/26 | | | 1,215 | | | | 1,242,969 | |
1.85%, 01/01/27 | | | 1,040 | | | | 1,064,908 | |
1.88%, 07/01/27 | | | 1,000 | | | | 1,024,210 | |
2.40%, 07/01/32 | | | 1,195 | | | | 1,227,743 | |
4.00%, 07/01/50 | | | 16,000 | | | | 17,837,280 | |
South Carolina State Housing Finance & Development Authority, Refunding RB, S/F Housing, Series B: | | | | | | | | |
2.25%, 07/01/30 | | | 1,025 | | | | 1,055,955 | |
2.35%, 07/01/31 | | | 1,025 | | | | 1,054,602 | |
2.45%, 07/01/32 | | | 1,030 | | | | 1,060,818 | |
2.90%, 07/01/39 | | | 3,000 | | | | 3,110,700 | |
3.10%, 07/01/49 | | | 6,540 | | | | 6,767,396 | |
Spartanburg Regional Health Services District, Refunding RB, Series A, 5.00%, 04/15/48 | | | 10,000 | | | | 11,184,000 | |
State of South Carolina Jobs EDA, Refunding RB, Prisma Health Obligated Group, Series A, 5.00%, 05/01/43 | | | 5,000 | | | | 5,357,300 | |
State of South Carolina Public Service Authority, RB, Series E: | | | | | | | | |
5.00%, 12/01/48 | | | 10,000 | | | | 10,533,200 | |
5.50%, 12/01/53 | | | 5,000 | | | | 5,370,850 | |
State of South Carolina Public Service Authority, Refunding RB: | | | | | | | | |
Series A, 5.00%, 12/01/50 | | | 10,000 | | | | 10,730,700 | |
Series C, 5.00%, 12/01/46 | | | 10,000 | | | | 10,696,500 | |
| | | | | | | | |
| | | | | | | 194,760,514 | |
|
| Tennessee — 2.1% | |
County of Knox Tennessee Health Educational & Housing Facility Board, RB, University Health System, Inc.: | | | | | | | | |
5.00%, 04/01/23 | | | 1,000 | | | | 1,084,170 | |
5.00%, 04/01/25 | | | 1,000 | | | | 1,123,150 | |
5.00%, 04/01/27 | | | 1,400 | | | | 1,623,020 | |
5.00%, 04/01/28 | | | 1,000 | | | | 1,155,320 | |
County of Memphis-Shelby Tennessee Industrial Development Board, Refunding, Tax Allocation Bonds, Subordinate Tax Increment, Series C, 7.00%, 07/01/45 | | | 4,200 | | | | 4,245,108 | |
| | | | | | | | |
Security | | Par
(000) | | | Value | |
|
| Tennessee (continued) | |
County of Nashville & Davidson Metropolitan Government Health & Educational Facilities Board, RB, Vanderbilt University Medical Center, Series A, 5.00%, 07/01/40 | | $ | 5,000 | | | $ | 5,590,050 | |
County of Nashville & Davidson Metropolitan Tennessee, GO, Refunding, 5.00%, 07/01/26 | | | 10,000 | | | | 12,563,100 | |
Metropolitan Government of Nashville & Davidson County Health & Educational Facilities Board, RB, Vanderbilt University Medical Center, Series A, 5.00%, 07/01/46 | | | 5,000 | | | | 5,574,850 | |
Metropolitan Nashville Airport Authority, RB, Subordinate, Series A: | | | | | | | | |
5.00%, 07/01/32 | | | 1,000 | | | | 1,231,280 | |
5.00%, 07/01/33 | | | 1,000 | | | | 1,224,190 | |
5.00%, 07/01/35 | | | 1,000 | | | | 1,213,470 | |
5.00%, 07/01/36 | | | 1,435 | | | | 1,739,249 | |
5.00%, 07/01/37 | | | 2,000 | | | | 2,425,180 | |
5.00%, 07/01/38 | | | 2,160 | | | | 2,619,281 | |
5.00%, 07/01/39 | | | 1,430 | | | | 1,734,218 | |
5.00%, 07/01/44 | | | 10,000 | | | | 12,014,300 | |
4.00%, 07/01/49 | | | 10,000 | | | | 10,980,900 | |
5.00%, 07/01/49 | | | 10,000 | | | | 11,986,900 | |
4.00%, 07/01/54 | | | 5,000 | | | | 5,459,100 | |
5.00%, 07/01/54 | | | 20,000 | | | | 23,840,600 | |
Tennessee Energy Acquisition Corp., RB, Gas Project, Series A, 4.00%, 05/01/48(c) | | | 25,000 | | | | 26,572,750 | |
Tennessee Housing Development Agency, RB, S/F, Residential Finance Program Bonds, Series C, 3.65%, 07/01/45 | | | 5,745 | | | | 6,006,972 | |
Tennessee Housing Development Agency, Refunding RB, S/F: | | | | | | | | |
Housing, Residential Finance Program Bonds,
2.65%, 07/01/32 | | | 1,480 | | | | 1,564,878 | |
Housing, Residential Finance Program Bonds,
2.65%, 07/01/34 | | | 2,480 | | | | 2,595,617 | |
Housing, Residential Finance Program Bonds,
2.90%, 07/01/39 | | | 5,600 | | | | 5,905,032 | |
Housing, Residential Finance Program Bonds,
3.00%, 07/01/39 | | | 10,825 | | | | 11,257,675 | |
Housing, Residential Finance Program Bonds,
3.10%, 07/01/41 | | | 9,730 | | | | 10,140,509 | |
Housing, Residential Finance Program Bonds,
3.05%, 07/01/44 | | | 5,000 | | | | 5,279,150 | |
Housing, Residential Finance Program Bonds,
3.10%, 07/01/49 | | | 8,000 | | | | 8,407,280 | |
Housing, Series 1A, 2.05%, 07/01/35 | | | 4,025 | | | | 4,028,582 | |
AMT, Issue 4B, 3.00%, 07/01/32 | | | 1,320 | | | | 1,433,890 | |
| | | | | | | | |
| | | | | | | 192,619,771 | |
|
| Texas — 6.6% | |
Arlington Higher Education Finance Corp., RB: | | | | | | | | |
Austin Discovery School, Inc., 6.25%, 08/15/24(a) | | | 445 | | | | 442,294 | |
Universal Academy, Series A, 7.13%, 03/01/44 | | | 1,250 | | | | 1,251,800 | |
City of Austin Texas Airport System Revenue, Refunding RB, AMT: | | | | | | | | |
5.00%, 11/15/21 | | | 5,000 | | | | 5,289,700 | |
5.00%, 11/15/23 | | | 5,000 | | | | 5,632,000 | |
5.00%, 11/15/25 | | | 10,000 | | | | 11,761,300 | |
City of Houston Texas Airport System Revenue, ARB, Series B-1, AMT, 5.00%, 07/15/35 | | | 7,400 | | | | 6,999,586 | |
City of Houston Texas Airport System Revenue, Refunding ARB, AMT: | | | | | | | | |
Special Facilities, Continental Airlines, Inc., Series A, 6.50%, 07/15/30 | | | 1,000 | | | | 1,014,940 | |
| | | | |
| SCHEDULES OF INVESTMENTS | | | 49 | |
| | |
Schedule of Investments (continued) May 31, 2020 | | BlackRock Strategic Municipal Opportunities Fund (Percentages shown are based on Net Assets) |
| | | | | | | | |
Security | | Par
(000) | | | Value | |
|
| Texas (continued) | |
Subordinate Lien, Series A, 5.00%, 07/01/23 | | $ | 10,000 | | | $ | 10,734,600 | |
United Airlines, Inc., Airport Improvement Projects, Series C, 5.00%, 07/15/20 | | | 10,950 | | | | 10,927,443 | |
City of Houston Texas Airport System Revenue, Refunding RB: | | | | | | | | |
Special Facilities, Continental Airlines, Inc., Series A, AMT, 6.63%, 07/15/38 | | | 3,000 | | | | 3,036,390 | |
Sub-Series D, 5.00%, 07/01/37 | | | 5,000 | | | | 5,978,450 | |
Sub-Series D, 5.00%, 07/01/38 | | | 5,000 | | | | 5,979,100 | |
City of Houston Texas Combined Utility System Revenue, Refunding RB, Capital Appreciation, Series A (AGM),
0.00%, 12/01/28(d)(j) | | | 10,000 | | | | 9,110,900 | |
County of Harris Texas, Refunding RB, Series B (AMBAC), 0.93%, 08/15/35(b) | | | 10,250 | | | | 10,197,674 | |
County of Tarrant Cultural Education Facilities Finance Corp., RB, Christus Health, Series B, 5.00%, 07/01/43 | | | 6,000 | | | | 6,894,420 | |
Dallas-Fort Worth International Airport, ARB, Series H, AMT, 5.00%, 11/01/45 | | | 10,000 | | | | 10,326,800 | |
Dallas-Fort Worth International Airport, Refunding ARB, AMT, 1.35%, 11/01/20(a) | | | 60,000 | | | | 60,022,800 | |
Leander Independent School District, GO, School Building, Series C (PSF-GTD)(d)(e): | | | | | | | | |
CAB, 0.00%, 08/15/24 | | | 20,000 | | | | 7,104,000 | |
CAB, 0.00%, 08/15/24 | | | 5,000 | | | | 2,487,600 | |
CAB, 0.00%, 08/15/24 | | | 5,000 | | | | 2,349,800 | |
CAB, 0.00%, 08/15/24 | | | 25,000 | | | | 9,393,250 | |
CAB, 0.00%, 08/15/24 | | | 25,000 | | | | 7,894,000 | |
CAB 0.00%, 08/15/24 | | | 15,000 | | | | 3,692,850 | |
Matagorda County Navigation District No. 1, Refunding RB, Central Power & Light Co. Project, Series A,
2.60%, 11/01/29 | | | 20,000 | | | | 19,910,800 | |
New Hope Cultural Education Facilities Finance Corp., RB, Cityscape School, Inc., Series A(a): | | | | | | | | |
5.00%, 08/15/39 | | | 1,210 | | | | 1,211,307 | |
5.00%, 08/15/51 | | | 2,670 | | | | 2,546,379 | |
New Hope Cultural Education Facilities Finance Corp., Refunding RB, Series A: | | | | | | | | |
Children’s Health System, 5.00%, 08/15/47 | | | 5,745 | | | | 6,771,976 | |
Jubilee Academic Center, 5.00%, 08/15/46(a) | | | 4,055 | | | | 3,568,238 | |
Jubilee Academic, 5.00%, 08/15/36(a) | | | 4,055 | | | | 3,776,300 | |
North Texas Tollway Authority, Refunding RB: | | | | | | | | |
1st Tier System (AGC), 0.00%, 01/01/28(d) | | | 10,000 | | | | 8,988,400 | |
1st Tier-Series A, 5.00%, 01/01/36 | | | 5,000 | | | | 5,890,100 | |
2nd Tier, Series B, 5.00%, 01/01/24 | | | 5,500 | | | | 6,256,635 | |
2nd Tier, Series B, 5.00%, 01/01/25 | | | 5,000 | | | | 5,833,050 | |
2nd Tier, Series B, 5.00%, 01/01/43 | | | 5,000 | | | | 5,808,450 | |
Capital Appreciation, 1st Tier-Series I (AGC),
6.20%, 01/01/42 | | | 10,000 | | | | 12,137,700 | |
Plano Independent School District, GO, School Building (PSF-GTD), 5.00%, 02/15/25 | | | 5,000 | | | | 6,028,450 | |
Port Beaumont Navigation District, Refunding RB, Jefferson Gulf Coast, Series B, 6.00%, 01/01/25(a) | | | 6,415 | | | | 6,433,732 | |
Red River Health Facilities Development Corp., MRB, Eden Home, Inc. Project, 5.63%, 12/15/22(f)(g) | | | 2,570 | | | | 1,700,225 | |
Tarrant County Cultural Education Facilities Finance Corp., Refunding RB, Texas Health Resources System,
5.00%, 02/15/47 | | | 5,000 | | | | 5,783,050 | |
Texas Department of Housing & Community Affairs, RB, S/F Housing: | | | | | | | | |
Series A (Ginnie Mae), 2.70%, 09/01/34 | | | 4,955 | | | | 5,318,994 | |
Series A (Ginnie Mae, Fannie Mae & Freddie Mac),
2.84%, 09/01/47 | | | 12,853 | | | | 13,533,688 | |
| | | | | | | | |
Security | | Par
(000) | | | Value | |
|
| Texas (continued) | |
Texas Municipal Gas Acquisition & Supply Corp. I, RB, Senior Lien: | | | | | | | | |
Series B, 1.20%, 12/15/26(b) | | $ | 20,835 | | | $ | 19,903,467 | |
Series D, 6.25%, 12/15/26 | | | 22,855 | | | | 26,403,239 | |
Texas Municipal Gas Acquisition & Supply Corp. III, RB: | | | | | | | | |
5.00%, 12/15/26 | | | 5,000 | | | | 5,310,000 | |
5.00%, 12/15/28 | | | 5,000 | | | | 5,300,000 | |
Natural Gas Utility Improvements, 5.00%, 12/15/20 | | | 5,000 | | | | 5,074,500 | |
Natural Gas Utility Improvements, 5.00%, 12/15/23 | | | 10,000 | | | | 10,647,700 | |
Natural Gas Utility Improvements, 5.00%, 12/15/24 | | | 10,000 | | | | 10,640,500 | |
Natural Gas Utility Improvements, 5.00%, 12/15/25 | | | 10,000 | | | | 10,631,200 | |
Natural Gas Utility Improvements, 5.00%, 12/15/29 | | | 5,000 | | | | 5,295,000 | |
Natural Gas Utility Improvements, 5.00%, 12/15/30 | | | 5,000 | | | | 5,283,850 | |
Natural Gas Utility Improvements, 5.00%, 12/15/31 | | | 5,000 | | | | 5,277,200 | |
Natural Gas Utility Improvements, 5.00%, 12/15/32 | | | 10,000 | | | | 10,518,500 | |
Texas Private Activity Bond Surface Transportation Corp., RB, AMT: | | | | | | | | |
Segment 3C Project, 5.00%, 06/30/58 | | | 41,760 | | | | 45,772,718 | |
Senior Lien, Blueridge Transportation Group, 5.00%, 12/31/40 | | | 5,000 | | | | 5,094,700 | |
Senior Lien, Blueridge Transportation Group, 5.00%, 12/31/45 | | | 10,000 | | | | 10,055,400 | |
Senior Lien, Blueridge Transportation Group,
5.00%, 12/31/50 | | | 10,000 | | | | 10,015,700 | |
Senior Lien, Blueridge Transportation Group,
5.00%, 12/31/55 | | | 5,000 | | | | 5,002,100 | |
Texas Private Activity Bond Surface Transportation Corp., Refunding RB, NTE Mobility Partners LLC North Tarrant Express Managed Lanes Project, Series A: | | | | | | | | |
5.00%, 12/31/30 | | | 5,365 | | | | 6,181,446 | |
5.00%, 12/31/31 | | | 13,855 | | | | 15,894,733 | |
5.00%, 12/31/32 | | | 7,000 | | | | 8,015,210 | |
5.00%, 12/31/34 | | | 8,000 | | | | 9,117,680 | |
5.00%, 12/31/35 | | | 7,000 | | | | 7,956,480 | |
5.00%, 12/31/36 | | | 8,000 | | | | 9,078,720 | |
Town of Flower Mound Texas, Special Assessment Bonds, Riverwalk Public Improvement District No. 1,
6.75%, 09/01/43 | | | 2,000 | | | | 1,919,680 | |
University of Texas System, Refunding RB, Series A,
5.00%, 08/15/30 | | | 25,000 | | | | 34,775,750 | |
| | | | | | | | |
| | | | | | | 609,184,644 | |
|
| Utah — 0.4% | |
Salt Lake City Corp. Airport Revenue, ARB, Series A, AMT, 5.00%, 07/01/47 | | | 10,000 | | | | 11,092,400 | |
Salt Lake City Corp. Airport Revenue, RB, Series B,
5.00%, 07/01/47 | | | 10,000 | | | | 11,314,900 | |
State of Utah Board of Regents, RB: | | | | | | | | |
2.55%, 06/01/38 | | | 1,250 | | | | 1,273,213 | |
2.63%, 06/01/39 | | | 1,250 | | | | 1,276,425 | |
Utah Charter School Finance Authority, RB, American Academy of Innovation(a): | | | | | | | | |
Series A, 5.63%, 06/15/54 | | | 4,945 | | | | 3,751,673 | |
Series B, 5.63%, 06/15/26 | | | 440 | | | | 427,552 | |
Utah State Charter School Finance Authority, RB, Early Light Academy(a): | | | | | | | | |
5.00%, 07/15/34 | | | 530 | | | | 512,144 | |
5.13%, 07/15/49 | | | 4,830 | | | | 4,646,943 | |
| | | | | | | | |
| | | | | | | 34,295,250 | |
|
| Virginia — 3.0% | |
Ballston Quarter Community Development Authority, Tax Allocation Bonds, Series A: | | | | | | | | |
5.38%, 03/01/36 | | | 1,050 | | | | 962,189 | |
5.50%, 03/01/46 | | | 6,210 | | | | 5,567,389 | |
| | |
| 50 | | 2020 BLACKROCK ANNUAL REPORTTO SHAREHOLDERS |
| | |
Schedule of Investments (continued) May 31, 2020 | | BlackRock Strategic Municipal Opportunities Fund (Percentages shown are based on Net Assets) |
| | | | | | | | |
Security | | Par
(000) | | | Value | |
|
| Virginia (continued) | |
Cherry Hill Virginia Community Development Authority, Special Assessment Bonds, Potomac Shores Project(a): | | | | | | | | |
5.15%, 03/01/35 | | $ | 1,000 | | | $ | 1,014,040 | |
5.40%, 03/01/45 | | | 1,995 | | | | 2,019,060 | |
Chesapeake Bay Bridge & Tunnel District, RB: | | | | | | | | |
1st General Resolution Revenue, 5.00%, 07/01/46 | | | 5,000 | | | | 5,369,650 | |
1st General Resolution Revenue, 5.00%, 07/01/51 | | | 10,000 | | | | 10,676,900 | |
1st General Resolution Revenue (AGM), 5.00%, 07/01/41 | | | 10,000 | | | | 11,485,100 | |
1st Tier General Resolution Revenue, 5.00%, 11/01/23 | | | 20,000 | | | | 21,799,400 | |
City of Norfolk Virginia Water Revenue, Refunding RB,
5.00%, 11/01/24 | | | 14,985 | | | | 17,976,606 | |
City of Virginia Beach Virginia, GO, Series A,
5.00%, 07/15/24 | | | 5,000 | | | | 5,959,900 | |
County of Fairfax Virginia, GO, Refunding, Series A: | | | | | | | | |
5.00%, 10/01/28 | | | 5,000 | | | | 6,746,950 | |
5.00%, 10/01/29 | | | 5,000 | | | | 6,900,450 | |
5.00%, 10/01/32 | | | 5,000 | | | | 6,851,150 | |
5.00%, 10/01/33 | | | 5,000 | | | | 6,800,300 | |
County of Hanover Virginia EDA, Refunding RB, Covenant Woods: | | | | | | | | |
5.00%, 07/01/38 | | | 125 | | | | 118,615 | |
5.00%, 07/01/48 | | | 365 | | | | 330,800 | |
Series A, 4.00%, 07/01/22 | | | 615 | | | | 611,654 | |
Series A, 5.00%, 07/01/47 | | | 1,985 | | | | 1,806,211 | |
County of Henrico Virginia EDA, Refunding RB, United Methodist Homes: | | | | | | | | |
5.00%, 06/01/22 | | | 625 | | | | 639,375 | |
5.00%, 06/01/23 | | | 420 | | | | 429,370 | |
County of Loudoun Economic Development Authority, RB, Howard Hughes Medical Institute Issue, 0.00%, 07/01/49(d) | | | 25,115 | | | | 10,103,262 | |
Dulles Town Center Community Development Authority, Refunding, Special Assessment Bonds, Dulles Town Center Project, 4.00%, 03/01/23 | | | 1,000 | | | | 983,860 | |
FHLMC Multifamily VRD Certificates, Series M053, Class A, 2.55%, 06/15/35 | | | 19,955 | | | | 22,313,282 | |
Lower Magnolia Green Community Development Authority, Special Assessment Bonds(a): | | | | | | | | |
5.00%, 03/01/35 | | | 2,885 | | | | 2,907,359 | |
5.00%, 03/01/45 | | | 2,960 | | | | 2,914,919 | |
Norfolk Airport Authority, ARB, 5.00%, 07/01/43 | | | 2,700 | | | | 3,145,932 | |
Tobacco Settlement Financing Corp., Refunding RB, Series A-1, 6.71%, 06/01/46 | | | 16,145 | | | | 14,353,228 | |
Virginia College Building Authority, RB, Green Bond, Marymount University Project, Series B,
5.00%, 07/01/45(a) | | | 3,340 | | | | 3,165,919 | |
Virginia Housing Development Authority, RB, M/F: | | | | | | | | |
Housing, Series B, 3.10%, 05/01/41 | | | 1,040 | | | | 1,091,074 | |
Housing, Series E, 2.30%, 12/01/30 | | | 1,000 | | | | 1,040,230 | |
Housing, Series E, 2.35%, 12/01/31 | | | 1,050 | | | | 1,085,585 | |
Housing, Series E, 2.45%, 12/01/32 | | | 1,305 | | | | 1,347,817 | |
Housing, Series E, 2.55%, 12/01/33 | | | 1,335 | | | | 1,378,948 | |
Housing, Series E, 2.65%, 12/01/34 | | | 1,270 | | | | 1,313,980 | |
Housing, Series E, 2.70%, 12/01/35 | | | 1,400 | | | | 1,447,110 | |
Housing, Series E, 2.75%, 12/01/36 | | | 1,435 | | | | 1,484,823 | |
Housing, Series E, 2.80%, 12/01/37 | | | 1,475 | | | | 1,528,808 | |
Housing, Series E, 2.90%, 12/01/38 | | | 1,510 | | | | 1,573,299 | |
Rental Housing, Series A, 3.50%, 06/01/33 | | | 1,335 | | | | 1,463,227 | |
Rental Housing, Series A, 3.63%, 06/01/38 | | | 3,730 | | | | 4,043,656 | |
Rental Housing, Series A, 3.75%, 06/01/43 | | | 4,590 | | | | 4,975,652 | |
Rental Housing, Series A, 4.05%, 08/01/49 | | | 2,345 | | | | 2,469,238 | |
| | | | | | | | |
Security | | Par
(000) | | | Value | |
|
| Virginia (continued) | |
Series A, 3.65%, 03/01/43 | | $ | 5,000 | | | $ | 5,375,600 | |
Series A, 3.88%, 03/01/45 | | | 6,150 | | | | 6,466,356 | |
Series A, 3.75%, 03/01/48 | | | 5,000 | | | | 5,359,700 | |
Series C, 3.85%, 08/01/53 | | | 4,110 | | | | 4,419,606 | |
Virginia Small Business Financing Authority, RB, Transform 66 P3 Project, AMT: | | | | | | | | |
5.00%, 12/31/49 | | | 5,000 | | | | 5,228,550 | |
5.00%, 12/31/52 | | | 20,000 | | | | 20,856,200 | |
5.00%, 12/31/56 | | | 25,000 | | | | 25,993,000 | |
| | | | | | | | |
| | | | | | | 273,895,329 | |
|
| Washington — 0.7% | |
Central Puget Sound Regional Transit Authority, RB, Green Bond, Series S-1: | | | | | | | | |
5.00%, 11/01/41 | | | 10,000 | | | | 11,897,700 | |
5.00%, 11/01/46 | | | 15,000 | | | | 22,883,550 | |
County of King Housing Authority, Refunding RB, Highland Village Project, 2.75%, 01/01/40 | | | 1,900 | | | | 1,985,994 | |
Greater Wenatchee Regional Events Center Public Facilities District, Refunding RB, Series A, 5.25%, 09/01/32 | | | 2,255 | | | | 2,221,603 | |
Mason County Public Hospital District No.1, RB,
5.00%, 12/01/48 | | | 5,000 | | | | 5,561,900 | |
Port of Seattle Washington, ARB, International Lien, AMT, Series C, 5.00%, 05/01/21 | | | 5,000 | | | | 5,170,100 | |
Seattle Housing Authority, Refunding RB, M/F (HUD),
3.50%, 12/01/35 | | | 1,500 | | | | 1,612,320 | |
Washington Health Care Facilities Authority, Refunding RB: | | | | | | | | |
Commonspirit Health, Series A, 5.00%, 08/01/37 | | | 5,000 | | | | 5,678,350 | |
Commonspirit Health, Series A, 5.00%, 08/01/44 | | | 5,000 | | | | 5,575,900 | |
Providence Health Services, Series C, 5.00%, 10/01/44 | | | 5,000 | | | | 5,492,750 | |
| | | | | | | | |
| | | | | | | 68,080,167 | |
|
| West Virginia — 0.5% | |
West Virginia Hospital Finance Authority, Refunding RB: | | | | | | | | |
Charleston Area Medical Center, Inc., 5.00%, 09/01/31 | | | 2,775 | | | | 3,190,556 | |
Charleston Area Medical Center, Inc., 5.00%, 09/01/38 | | | 4,550 | | | | 5,073,159 | |
Charleston Area Medical Center, Inc., 5.00%, 09/01/39 | | | 1,970 | | | | 2,194,915 | |
West Virginia United Health System Obligated Group,
5.00%, 06/01/23 | | | 5,000 | | | | 5,580,100 | |
West Virginia United Health System Obligated Group,
5.00%, 06/01/24 | | | 5,000 | | | | 5,732,650 | |
West Virginia Housing Development Fund, RB, S/F, Series B, 3.95%, 11/01/34 | | | 6,530 | | | | 7,007,669 | |
West Virginia Housing Development Fund, Refunding RB, AMT, Series A, 3.70%, 11/01/29 | | | 1,280 | | | | 1,386,176 | |
West Virginia Tobacco Settlement Finance Authority, RB,
Series A, 7.47%, 06/01/47 | | | 12,140 | | | | 11,871,585 | |
| | | | | | | | |
| | | | | | | 42,036,810 | |
|
| Wisconsin — 2.0% | |
Public Finance Authority, RB(a): | | | | | | | | |
Affinity Living Group, 6.75%, 11/01/24 | | | 21,420 | | | | 20,404,692 | |
Alabama Proton Therapy Center, Series A, 6.25%, 10/01/31 | | | 1,285 | | | | 1,298,827 | |
Alabama Proton Therapy Center, Series A, 7.00%, 10/01/47 | | | 1,285 | | | | 1,284,165 | |
Delray Beach Radiation Therapy, 7.00%, 11/01/46 | | | 5,085 | | | | 5,270,094 | |
Gray Collagiate Academy Project, 6.00%, 06/15/24 | | | 385 | | | | 379,583 | |
| | | | |
| SCHEDULES OF INVESTMENTS | | | 51 | |
| | |
Schedule of Investments (continued) May 31, 2020 | | BlackRock Strategic Municipal Opportunities Fund (Percentages shown are based on Net Assets) |
| | | | | | | | |
Security | | Par
(000) | | | Value | |
|
| Wisconsin (continued) | |
Roseman University of Health Science Project,
5.00%, 04/01/40 | | $ | 1,175 | | | $ | 1,123,171 | |
Roseman University of Health Science Project,
5.00%, 04/01/50 | | | 1,470 | | | | 1,341,301 | |
Seattle Proton Center, Series A, 7.55%, 12/01/30 | | | 1,780 | | | | 1,801,093 | |
Seattle Proton Center, Series A, 7.63%, 12/01/48 | | | 6,440 | | | | 5,883,906 | |
Traders Point Christian Schools, Series B,
5.62%, 06/01/29 | | | 1,070 | | | | 1,041,078 | |
Public Finance Authority, Refunding RB: | | | | | | | | |
Fellowship Senior Living Project, Series A,
5.00%, 01/01/35 | | | 5,340 | | | | 5,638,506 | |
Fellowship Senior Living Project, Series A,
5.00%, 01/01/46 | | | 6,000 | | | | 6,111,900 | |
National Gypsum Co., AMT, 4.00%, 08/01/35 | | | 4,840 | | | | 4,168,305 | |
Ultimate Medical Academy Project,
5.00%, 10/01/34(a) | | | 2,620 | | | | 2,643,135 | |
Ultimate Medical Academy Project,
5.00%, 10/01/39(a) | | | 6,155 | | | | 6,179,681 | |
Ultimate Medical Academy Project, Series B,
6.13%, 10/01/49(a) | | | 8,530 | | | | 6,345,552 | |
Wakemed Hospital, Series A, 5.00%, 10/01/44 | | | 10,000 | | | | 11,620,700 | |
State of Wisconsin, GO, Refunding, Series 1,
5.00%, 11/01/24 | | | 10,000 | | | | 12,006,600 | |
State of Wisconsin, GO, Series B, 5.00%, 05/01/39 | | | 5,000 | | | | 6,120,950 | |
State of Wisconsin, Refunding RB, Series A,
5.00%, 05/01/24 | | | 10,000 | | | | 11,755,800 | |
Wisconsin Health & Educational Facilities Authority, RB, Series B, Marshfield Clinic: | | | | | | | | |
Health System, 5.00%, 02/15/42 | | | 10,000 | | | | 10,542,300 | |
Health System, 5.00%, 02/15/46 | | | 5,000 | | | | 5,246,600 | |
5.00%, 02/15/40 | | | 10,000 | | | | 10,176,300 | |
Wisconsin Health & Educational Facilities Authority, Refunding RB: | | | | | | | | |
Ascension Health Credit Group, Series A,
5.00%, 11/15/35 | | | 10,000 | | | | 11,667,600 | |
Thedacare, Inc., 5.00%, 12/15/44 | | | 10,000 | | | | 11,068,700 | |
Wisconsin Housing & Economic Development Authority, RB: | | | | | | | | |
M/F Housing, Series A, 3.00%, 11/01/39 | | | 2,500 | | | | 2,601,025 | |
M/F Housing, Series A, 3.15%, 11/01/44 | | | 2,000 | | | | 2,097,580 | |
M/F Housing, Series A, 3.38%, 05/01/57 | | | 2,730 | | | | 2,893,663 | |
S/F Housing (Ginnie Mae, Fannie Mae & Freddie Mac), 2.69%, 07/01/47 | | | 18,242 | | | | 19,291,282 | |
| | | | | | | | |
| | | | | | | 188,004,089 | |
| | | | | | | | |
| |
Total Municipal Bonds — 88.4%
(Cost — $8,124,607,917) | | | | 8,096,646,986 | |
| | | | | | | | |
|
Municipal Bonds Transferred to Tender Option Bond Trusts(k)— 15.6% | |
|
| Alaska — 0.1% | |
Alaska Housing Finance Corp., RB, S/F, Series A, 3.70%, 12/01/38 | | | 10,000 | | | | 11,001,200 | |
| | | | | | | | |
|
| Arizona — 0.4% | |
Arizona State University, Refunding RB, Arizona State University System Board of Regents, Series A, 5.00%, 07/01/22(e) | | | 10,000 | | | | 10,953,297 | |
City of Phoenix Arizona Civic Improvement Corp., ARB, AMT, Series A, 5.00%, 07/01/47 | | | 10,000 | | | | 11,143,800 | |
Salt River Project Agricultural Improvement & Power District, RB, Series A, 5.00%, 12/01/45 | | | 10,000 | | | | 11,748,700 | |
| | | | | | | | |
| | | | | | | 33,845,797 | |
| | | | | | | | |
Security | | Par
(000) | | | Value | |
|
| California — 2.7% | |
California Educational Facilities Authority, Refunding RB, Pepperdine University: | | | | | | | | |
5.00%, 09/01/45 | | $ | 10,490 | | | $ | 12,256,829 | |
5.00%, 10/01/46 | | | 10,000 | | | | 11,761,000 | |
California Health Facilities Financing Authority, RB, Series A: | | | | | | | | |
Lucile Salter Packard Children’s Hospital at Stanford, 5.00%, 08/15/43 | | | 10,000 | | | | 11,141,598 | |
Stanford Hospital and Clinics, 5.00%, 08/15/51 | | | 10,000 | | | | 10,731,300 | |
Sutter Health, 5.00%, 08/15/52 | | | 10,000 | | | | 10,838,500 | |
California Infrastructure & Economic Development Bank, RB, UCSF 2130 Third Street: | | | | | | | | |
5.00%, 05/15/47 | | | 10,000 | | | | 12,298,900 | |
5.00%, 05/15/52 | | | 10,000 | | | | 12,270,500 | |
California Public Finance Authority, Refunding RB, Sharp Healthcare, Series A, 5.00%, 08/01/47 | | | 10,000 | | | | 11,870,500 | |
Chaffey Joint Union High School District, GO, Election of 2012, Series C, 5.25%, 08/01/47 | | | 10,000 | | | | 12,033,000 | |
Chino Valley Unified School District, GO, Election 2016, Series A, 5.25%, 08/01/47 | | | 10,000 | | | | 12,175,000 | |
City of Los Angeles California Department of Airports, ARB, Subordinate, Series A, AMT, 5.00%, 05/15/45 | | | 10,000 | | | | 11,145,597 | |
City of Los Angeles California Department of Water & Power, RB, Series B, 5.00%, 07/01/43 | | | 10,000 | | | | 10,839,300 | |
City of Los Angeles Department of Airports, ARB, Los Angeles International Airports, Series A, AMT, 5.25%, 05/15/48 | | | 10,000 | | | | 11,774,000 | |
City of San Francisco California Public Utilities Commission Water Revenue, RB, 5.00%, 05/01/22(e) | | | 10,000 | | | | 10,922,000 | |
County of Ventura California Public Financing Authority, Refunding RB, Series A(e): | | | | | | | | |
5.00%, 11/01/22 | | | 8,450 | | | | 9,280,211 | |
5.00%, 11/01/22 | | | 8,530 | | | | 9,330,283 | |
East Bay Municipal Utility District Water System Revenue, RB, Green Bond, Series A, 5.00%, 06/01/42 | | | 10,000 | | | | 12,137,100 | |
Fresno Unified School District, GO, 5.00%, 08/01/44 | | | 10,000 | | | | 11,454,600 | |
Manteca California Unified School District, GO, Election of 2014, Series A, 5.00%, 08/01/40 | | | 10,000 | | | | 11,805,499 | |
Port of Los Angeles California, Refunding RB, Harbor Department, Series A, AMT, 5.00%, 08/01/44 | | | 10,000 | | | | 11,095,000 | |
San Marcos Unified School District, GO, Election of 2010,
Series C, 5.00%, 02/15/24(e) | | | 10,000 | | | | 11,722,999 | |
State of California, GO, Various Purposes, 5.00%, 04/01/43 | | | 10,000 | | | | 11,102,700 | |
| | | | | | | | |
| | | | | | | 249,986,416 | |
|
| Connecticut — 0.3% | |
Connecticut Housing Finance Authority, RB, S/F, Series A, 3.85%, 05/15/45(l) | | | 10,000 | | | | 10,550,500 | |
State of Connecticut Health & Educational Facility Authority, Refunding RB, Trinity Health Credit Group,
5.00%, 12/01/45 | | | 10,000 | | | | 11,241,500 | |
| | | | | | | | |
| | | | | | | 21,792,000 | �� |
|
| District of Columbia — 0.4% | |
District of Columbia Water & Sewer Authority, RB, Green Bonds, Series A, 5.00%, 10/01/52 | | | 10,000 | | | | 12,101,000 | |
District of Columbia Water & Sewer Authority, RB, Sub-Lien, Series A, 5.00%, 10/01/23(e) | | | 10,000 | | | | 11,639,900 | |
Metropolitan Washington Airports Authority, Refunding ARB, AMT, 5.00%, 10/01/42 | | | 10,000 | | | | 11,459,700 | |
| | | | | | | | |
| | | | | | | 35,200,600 | |
| | |
| 52 | | 2020 BLACKROCK ANNUAL REPORTTO SHAREHOLDERS |
| | |
Schedule of Investments (continued) May 31, 2020 | | BlackRock Strategic Municipal Opportunities Fund (Percentages shown are based on Net Assets) |
| | | | | | | | |
Security | | Par
(000) | | | Value | |
|
| Florida — 0.6% | |
East Central Regional Wastewater Treatment Facilities Operation Board, Refunding RB, 5.00%, 10/01/44 | | $ | 10,000 | | | $ | 12,153,800 | |
Florida Housing Finance Corp., RB, S/F, Series 1 (Ginnie Mae, Fannie Mae & Freddie Mac): | | | | | | | | |
3.70%, 07/01/38(a)(c) | | | 9,500 | | | | 10,407,445 | |
3.80%, 07/01/43(a)(c) | | | 9,483 | | | | 10,320,314 | |
Greater Orlando Aviation Authority, ARB, Series A, AMT, 5.00%, 10/01/46 | | | 10,000 | | | | 11,194,700 | |
Tampa Bay Water Utility System, RB, 5.00%, 10/01/38 | | | 10,000 | | | | 11,369,000 | |
| | | | | | | | |
| | | | | | | 55,445,259 | |
|
| Georgia — 1.0% | |
City of Atlanta Georgia Water & Wastewater Revenue, Refunding RB, 5.00%, 11/01/40 | | | 20,000 | | | | 23,509,200 | |
Clarke County Hospital Authority, Refunding RB, Piedmont Healthcare, Inc. Project, Series A, 5.00%, 07/01/46(l) | | | 10,000 | | | | 10,983,900 | |
County of Georgia Cobb Developmental Authority, RB, Georgia Tech Cobb Research Campus, Series A, 5.00%, 06/01/49(l) | | | 10,000 | | | | 11,841,400 | |
Gainesville & Hall County Hospital Authority, Refunding RB, Northeast Georgia Health Systems, Inc. Project, Series A, 5.50%, 08/15/54 | | | 10,000 | | | | 11,572,500 | |
Georgia Housing & Finance Authority, RB, S/F: | | | | | | | | |
Series B, 3.55%, 12/01/42 | | | 10,000 | | | | 10,670,797 | |
Series B1, 3.65%, 06/01/44(l) | | | 9,820 | | | | 10,264,777 | |
Georgia Housing & Finance Authority, Refunding RB, S/F, Series A-1, 3.80%, 12/01/40(l) | | | 10,000 | | | | 10,630,600 | |
| | | | | | | | |
| | | | | | | 89,473,174 | |
|
| Illinois — 0.1% | |
Illinois State Toll Highway Authority, RB, Series B, 5.00%, 01/01/36 | | | 10,000 | | | | 11,543,200 | |
| | | | | | | | |
|
| Indiana — 0.2% | |
Indiana Housing & Community Development Authority, RB, S/F, Series A (Ginnie Mae), 3.90%, 07/01/43 | | | 6,875 | | | | 7,574,254 | |
Indiana State Finance Authority, Refunding RB, Franciscan Alliance, Inc., 5.00%, 11/01/41 | | | 10,000 | | | | 11,102,400 | |
| | | | | | | | |
| | | | | | | 18,676,654 | |
|
| Iowa — 0.1% | |
Iowa Finance Authority, Refunding RB, Green Bonds, 5.00%, 08/01/42 | | | 10,000 | | | | 12,308,600 | |
| | | | | | | | |
|
| Maine — 0.1% | |
Maine State Housing Authority, RB, S/F, Series B, 3.75%, 11/15/38(a)(c) | | | 10,000 | | | | 10,867,600 | |
| | | | | | | | |
|
| Maryland — 0.5% | |
City of Baltimore Maryland, RB, Water Project, Series A, 5.00%, 07/01/43 | | | 10,000 | | | | 11,306,998 | |
County of Montgomery Maryland, RB, Trinity Health Credit Group, Series MD, 5.00%, 12/01/45 | | | 10,000 | | | | 11,254,200 | |
Maryland Health & Higher Educational Facilities Authority, RB, Johns Hopkins Health, Series C,
5.00%, 05/15/23(e) | | | 10,000 | | | | 11,420,097 | |
Maryland Stadium Authority, RB, Construction and Revitalization Program, 5.00%, 05/01/47 | | | 10,000 | | | | 11,693,700 | |
| | | | | | | | |
| | | | | | | 45,674,995 | |
|
| Massachusetts — 0.4% | |
Commonwealth of Massachusetts, GO, Series A, 5.00%, 03/01/46 | | | 10,000 | | | | 11,436,900 | |
Massachusetts Development Finance Agency, RB, Partners Healthcare System Issue, Series M-4, 5.00%, 07/01/23(e) | | | 10,000 | | | | 11,502,999 | |
| | | | | | | | |
Security | | Par
(000) | | | Value | |
|
| Massachusetts (continued) | |
Massachusetts Housing Finance Agency, RB, M/F Housing, Series C-1, 3.30%, 12/01/59(l) | | $ | 10,015 | | | $ | 10,343,075 | |
| | | | | | | | |
| | | | | | | 33,282,974 | |
|
| Michigan — 0.5% | |
Michigan Finance Authority, Refunding RB, Trinity Health Corp., Series 2016, 5.00%, 12/01/45 | | | 10,000 | | | | 11,228,205 | |
Michigan State Housing Development Authority, RB, M/F Housing, Series A: | | | | | | | | |
3.80%, 10/01/38(a)(c) | | | 10,000 | | | | 10,935,200 | |
4.15%, 10/01/53(a)(c)(l) | | | 20,000 | | | | 21,796,000 | |
| | | | | | | | |
| | | | | | | 43,959,405 | |
|
| Minnesota — 0.1% | |
Western Minnesota Municipal Power Agency, RB, Series A, 5.00%, 01/01/24(e) | | | 10,000 | | | | 11,677,299 | |
| | | | | | | | |
|
| Missouri — 0.5% | |
Health & Educational Facilities Authority of the State of Missouri, RB, BJC Health System, 5.00%, 01/01/44 | | | 10,000 | | | | 11,169,400 | |
Metropolitan St. Louis Sewer District, RB, Series B, 5.00%, 05/01/23(e) | | | 10,000 | | | | 11,374,500 | |
Metropolitan St. Louis Sewer District, Refunding RB: | | | | | | | | |
Series A, 5.00%, 05/01/47 | | | 10,000 | | | | 12,275,300 | |
Series B, 5.00%, 05/01/45 | | | 10,000 | | | | 11,817,600 | |
| | | | | | | | |
| | | | | | | 46,636,800 | |
|
| Nebraska — 0.2% | |
Nebraska Investment Finance Authority, RB, S/F, Series C: | | | | | | | | |
3.45%, 09/01/33 | | | 8,420 | | | | 9,177,825 | |
3.75%, 09/01/38 | | | 9,960 | | | | 10,955,198 | |
| | | | | | | | |
| | | | | | | 20,133,023 | |
|
| New York — 1.9% | |
City of New York Housing Development Corp., RB, M/F Housing, Series C-1-A, 4.00%, 11/01/53(a)(c) | | | 10,000 | | | | 10,690,900 | |
City of New York Housing Development Corp., Refunding RB, M/F Housing, Series J, 3.35%, 11/01/65 | | | 10,000 | | | | 10,394,700 | |
City of New York Water & Sewer System, RB, 2nd General Resolution, Fiscal 2017, Series DD, 5.00%, 06/15/47 | | | 20,000 | | | | 23,809,200 | |
City of New York Water & Sewer System, Refunding RB, 2nd General Resolution, Fiscal 2013, Series CC, 5.00%, 06/15/47 | | | 10,000 | | | | 11,275,775 | |
Metropolitan Transportation Authority, RB, Green Bonds, Series A, 5.00%, 11/15/42 | | | 10,000 | | | | 11,143,500 | |
Metropolitan Transportation Authority, Refunding RB, Green Bond, Series B-1, 5.00%, 11/15/46 | | | 10,000 | | | | 11,008,300 | |
New York City Housing Development Corp., RB, M/F(l): | | | | | | | | |
Series A-1, 3.95%, 11/15/44 | | | 10,000 | | | | 10,509,800 | |
Series C-1-A, 4.13%, 05/01/58(a)(c) | | | 10,000 | | | | 10,751,400 | |
Series G-1, 3.90%, 05/01/45 | | | 10,000 | | | | 10,372,600 | |
Port Authority of New York & New Jersey, Refunding ARB, Series 194th, 5.00%, 10/15/41 | | | 10,000 | | | | 11,335,899 | |
State of New York Dormitory Authority, RB, Series A: | | | | | | | | |
Bid Group 4, 5.00%, 03/15/45(a)(c) | | | 10,000 | | | | 11,941,100 | |
5.00%, 03/15/39 | | | 10,000 | | | | 11,388,098 | |
State of New York Dormitory Authority, Refunding RB, Series E, 5.00%, 02/15/39 | | | 10,000 | | | | 11,610,718 | |
Utility Debt Securitization Authority, Refunding RB, Restructuring Bonds, 5.00%, 12/15/37 | | | 10,000 | | | | 11,953,500 | |
| | | | | | | | |
| | | | | | | 168,185,490 | |
| | | | |
| SCHEDULES OF INVESTMENTS | | | 53 | |
| | |
Schedule of Investments (continued) May 31, 2020 | | BlackRock Strategic Municipal Opportunities Fund (Percentages shown are based on Net Assets) |
| | | | | | | | |
Security | | Par
(000) | | | Value | |
|
| North Carolina — 0.6% | |
City of Charlotte North Carolina Airport Revenue, ARB, Series A: | | | | | | | | |
5.00%, 07/01/42 | | $ | 10,000 | | | $ | 11,599,600 | |
5.00%, 07/01/47 | | | 10,000 | | | | 11,460,600 | |
North Carolina Capital Facilities Finance Agency, Refunding RB, Duke University Project, Series B, 5.00%, 10/01/25(e) | | | 10,000 | | | | 12,405,698 | |
North Carolina Housing Finance Agency, RB, S/F Housing, Series 39-B (Ginnie Mae, Fannie Mae & Freddie Mac): | | | | | | | | |
3.85%, 07/01/38 | | | 9,480 | | | | 10,598,941 | |
4.00%, 01/01/48 | | | 9,400 | | | | 10,482,798 | |
| | | | | | | | |
| | | | | | | 56,547,637 | |
|
| Ohio — 0.1% | |
University of Cincinnati, Refunding RB, Series A,
5.00%, 06/01/44 | | | 10,000 | | | | 12,038,800 | |
| | | | | | | | |
|
| Oklahoma — 0.1% | |
Oklahoma Turnpike Authority, RB, 2nd Series C,
5.00%, 01/01/47 | | | 10,000 | | | | 11,779,700 | |
| | | | | | | | |
|
| Oregon — 0.3% | |
Oregon State Facilities Authority, Refunding RB, Reed College Project, Series A, 5.00%, 07/01/47 | | | 10,000 | | | | 11,975,400 | |
University of Oregon, RB, Series A, 5.00%, 04/01/48 | | | 10,000 | | | | 12,162,500 | |
| | | | | | | | |
| | | | | | | 24,137,900 | |
|
| Pennsylvania — 0.9% | |
County of Lancaster Pennsylvania Hospital Authority, Refunding RB, University of Pennsylvania Health System Obligation, 5.00%, 08/15/46 | | | 10,000 | | | | 11,389,000 | |
General Authority of Southcentral Pennsylvania, Refunding RB, Wellspan Health Obligated Group, Series A, 5.00%, 06/01/44 | | | 10,000 | | | | 11,113,099 | |
Pennsylvania Housing Finance Agency, RB, S/F: | | | | | | | | |
Series 125B, 3.65%, 10/01/42(l) | | | 20,000 | | | | 21,365,800 | |
Series 127B, 3.55%, 10/01/33 | | | 10,000 | | | | 10,713,100 | |
Philadelphia Authority for Industrial Development, RB, The Children’s Hospital of Philadelphia Project, Series A, 5.00%, 07/01/42 | | | 20,000 | | | | 22,586,400 | |
| | | | | | | | |
| | | | | | | 77,167,399 | |
|
| South Carolina — 0.1% | |
City of Charleston South Carolina Waterworks & Sewer System Revenue, Refunding RB, Capital Improvement,
5.00%, 01/01/21(e) | | | 10,000 | | | | 10,277,200 | |
| | | | | | | | |
|
| Tennessee — 0.5% | |
Rutherford County Health & Educational Facilities Board, RB, Ascension Health, Series C, 5.00%, 11/15/21(e) | | | 10,000 | | | | 10,690,300 | |
Tennessee Housing Development Agency, RB, S/F, Issue 3: | | | | | | | | |
3.85%, 07/01/43(a)(c) | | | 9,920 | | | | 10,752,982 | |
3.95%, 01/01/49(a)(c) | | | 9,920 | | | | 10,720,966 | |
Tennessee Housing Development Agency, Refunding RB, S/F, Issue 2, 3.85%, 07/01/42 | | | 9,880 | | | | 10,741,198 | |
| | | | | | | | |
| | | | | | | 42,905,446 | |
|
| Texas — 0.8% | |
Alamo Texas Regional Mobility Authority, RB, Senior Lien, 5.00%, 06/15/46 | | | 10,000 | | | | 11,490,800 | |
City of San Antonio Texas Electric and Gas Systems, RB, Junior Lien, 5.00%, 02/01/48 | | | 10,000 | | | | 10,949,900 | |
| | | | | | | | |
Security | | Par
(000) | | | Value | |
|
| Texas (continued) | |
County of Harris Texas, Refunding RB, Senior Lien, Series A, 5.00%, 08/15/47 | | $ | 10,000 | | | $ | 11,876,900 | |
Midlothian Independent School District, GO, (PSF-GTD), 5.00%, 02/15/47 | | | 10,000 | | | | 12,112,900 | |
Tarrant Regional Water District, Refunding RB,
5.00%, 03/01/22(e) | | | 10,000 | | | | 10,839,700 | |
Texas Water Development Board, RB, State Water Implementation Revenue Fund , Series A, 5.00%, 10/15/47 | | | 10,000 | | | | 12,345,400 | |
| | | | | | | | |
| | | | | | | 69,615,600 | |
|
| Utah — 0.1% | |
Utah State Transit Authority, Refunding RB, Series A, 5.00%, 06/15/25(e) | | | 10,000 | | | | 12,401,200 | |
| | | | | | | | |
|
| Virginia — 0.8% | |
City of Norfolk Virginia Water Revenue, Refunding RB, 5.00%, 11/01/42 | | | 10,000 | | | | 12,289,200 | |
County of Fairfax IDA, RB, Inova Health Systems Project, Series A, 5.00%, 05/15/44 | | | 10,000 | | | | 11,221,700 | |
County of Fairfax Water Authority, Refunding RB,
5.00%, 04/01/46 | | | 10,000 | | | | 12,039,300 | |
University of Virginia, Refunding RB, Green Bond, Series A-2, 5.00%, 04/01/45 | | | 10,000 | | | | 11,935,000 | |
Virginia Housing Development Authority, RB, M/F, Rental Housing, Series D: | | | | | | | | |
3.90%, 10/01/48(a)(c) | | | 10,000 | | | | 10,900,500 | |
4.00%, 10/01/53(a)(c) | | | 10,000 | | | | 10,963,800 | |
| | | | | | | | |
| | | | | | | 69,349,500 | |
|
| Washington — 1.0% | |
Central Puget Sound Regional Transit Authority, RB, Green Bond, Series S-1, 5.00%, 11/01/46 | | | 10,000 | | | | 15,255,700 | |
King County Housing Authority, Refunding RB, Ballinger Commons Apartments, 3.50%, 05/01/38 | | | 10,000 | | | | 10,959,798 | |
Port of Seattle Washington, GO, 5.00%, 01/01/42 | | | 10,000 | | | | 12,085,500 | |
State of Washington, GO: | | | | | | | | |
Series B, 5.00%, 02/01/33 | | | 10,000 | | | | 11,963,000 | |
Various Purpose, Series A, 5.00%, 08/01/38 | | | 10,000 | | | | 11,315,198 | |
Washington Health Care Facilities Authority, Refunding RB, Providence Health & Services, Series D, 5.00%, 10/01/38 | | | 10,000 | | | | 11,110,499 | |
Washington State Convention Center Public Facilities District, RB, 5.00%, 07/01/58(a)(c) | | | 20,000 | | | | 21,361,600 | |
| | | | | | | | |
| | | | | | | 94,051,295 | |
|
| Wisconsin — 0.2% | |
Wisconsin Health & Educational Facilities Authority, RB, Ascension Health, Series D, 5.00%, 11/15/21(e) | | | 10,000 | | | | 10,697,200 | |
Wisconsin Health & Educational Facilities Authority, Refunding RB, Froedtert & Community Health, Inc., Obligated Group, Series A, 5.00%, 04/01/42 | | | 10,000 | | | | 10,769,799 | |
| | | | | | | | |
| | | | | | | 21,466,999 | |
| | | | | | | | |
| |
Total Municipal Bonds Transferred to Tender Option Bond Trusts — 15.6%
(Cost — $1,332,660,728) | | | | 1,421,429,162 | |
| | | | | | | | |
| |
Total Long-Term Investments — 104.3%
(Cost — $9,487,203,837) | | | | 9,546,634,380 | |
| | | | | | | | |
| | |
| 54 | | 2020 BLACKROCK ANNUAL REPORTTO SHAREHOLDERS |
| | |
Schedule of Investments (continued) May 31, 2020 | | BlackRock Strategic Municipal Opportunities Fund (Percentages shown are based on Net Assets) |
| | | | | | | | |
| Security | | Shares | | | Value | |
|
| Short-Term Securities — 4.0% | |
BlackRock Liquidity Funds, MuniCash, Institutional Class, 0.04%(m)(n) | | | 368,268,910 | | | $ | 368,379,391 | |
| | | | | | | | |
| |
Total Short-Term Securities — 4.0%
(Cost — $368,307,033) | | | | 368,379,391 | |
| | | | | |
| |
Total Investments — 108.3%
(Cost — $9,855,510,870) | | | | 9,915,013,771 | |
| | |
Other Assets Less Liabilities — 1.2% | | | | | | | 114,055,882 | |
| |
Liability for TOB Trust Certificates, Including Interest Expense and Fees Payable — (9.5)% | | | | (872,129,000 | ) |
| | | | | |
| |
Net Assets — 100.0% | | | $ | 9,156,940,653 | |
| | | | | |
| (a) | Security exempt from registration pursuant to Rule 144A under the Securities Act of 1933, as amended. These securities may be resold in transactions exempt from registration to qualified institutional investors. |
| (b) | Variable rate security. Rate shown is the rate in effect as of period end. |
| (c) | Variable or floating rate security, which interest rate adjusts periodically based on changes in current interest rates and prepayments on the underlying pool of assets. Rate shown is the rate in effect as of period end. |
| (e) | U.S. Government securities held in escrow, are used to pay interest on this security as well as to retire the bond in full at the date indicated, typically at a premium to par. |
| (f) | Issuer filed for bankruptcy and/or is in default. |
| (g) | Non-income producing security. |
| (h) | Step-up bond that pays an initial coupon rate for the first period and then a higher coupon rate for the following periods. Rate as of period end. |
| (i) | When-issued security. |
| (j) | Security is collateralized by municipal bonds or U.S. Treasury obligations. |
| (k) | Represent bonds transferred to a TOB Trust in exchange of cash and residual certificates received by the Fund. These bonds serve as collateral in a secured borrowing. See Note 4 of the Notes to Financial Statements for details. |
| (l) | All or a portion of the security is subject to a recourse agreement. The aggregate maximum potential amount the Fund could ultimately be required to pay under the agreements, which expire between May 1, 2022 to November 1, 2048, is $83,822,275. See Note 4 of the Notes to Financial Statements for details. |
| (m) | Annualized 7-day yield as of period end. |
| (n) | Investments in issuers considered to be an affiliate/affiliates of the Fund during the year ended May 31, 2020 for purposes of Section 2(a)(3) of the Investment Company Act of 1940, as amended, were as follows: |
| | | | | | | | | | | | | | | | | | | | | | | | | | | | | | | | |
| Affiliated Issuer | | Shares
Held at
05/31/19 | | | Shares
Purchased | | | Shares
Sold | | | Shares
Held at
05/31/20 | | | Value at
05/31/20 | | |
Income | | | Net
Realized
Gain (Loss) (a) | | | Change in
Unrealized
Appreciation
(Depreciation) | |
BlackRock Liquidity Funds, MuniCash, Institutional Class | | | 15,522,515 | | | | 352,746,395 | (b) | | | — | | | | 368,268,910 | | | $ | 368,379,391 | | | $ | 3,670,862 | | | $ | (269,757 | ) | | $ | 72,032 | |
iShares Short Term National Muni(c) | | | — | | | | 100,000 | | | | (100,000 | ) | | | — | | | | — | | | | 26,139 | | | | (43,943 | ) | | | — | |
iShares Short-Term National Muni Bond ETF(c) | | | — | | | | 4,000,000 | | | | (4,000,000 | ) | | | — | | | | — | | | | — | | | | 3,095,964 | | | | — | |
| | | | | | | | | | | | | | | | | | | | | | | | | | | | | | | | |
| | | $ | 368,379,391 | | | $ | 3,697,001 | | | $ | 2,782,264 | | | $ | 72,032 | |
| | | | | | | | | | | | | | | | | |
| | (a) | Includes net capital gain distributions, if applicable. | |
| | (b) | Represents net shares purchased (sold). | |
| | (c) | As of period end, the entity is no longer held by the Fund. | |
For Fund compliance purposes, the Fund’s sector classifications refer to one or more of the sector sub-classifications used by one or more widely recognized market indexes or rating group indexes, and/or as defined by the investment adviser. These definitions may not apply for purposes of this report, which may combine such sector sub-classifications for reporting ease.
Derivative Financial Instruments Outstanding as of Period End
Futures Contracts
| | | | | | | | | | | | | | | | |
| Description | | Number of
Contracts | | | Expiration
Date | | | Notional
Amount (000) | | | Value/ Unrealized
Appreciation
(Depreciation) | |
Short Contracts | | | | | | | | | | | | | | | | |
10-Year US Treasury Notes | | | 8,536 | | | | 09/21/20 | | | $ | 1,187,038 | | | $ | (1,881,147 | ) |
Long U.S. Treasury Bond | | | 3,524 | | | | 09/21/20 | | | | 628,594 | | | | 209,675 | |
| | | | | | | | | | | | | | | | |
| | | | | | | | | | | | | | $ | (1,671,472 | ) |
| | | | | | | | | | | | | | | | |
| | | | |
| SCHEDULES OF INVESTMENTS | | | 55 | |
| | |
Schedule of Investments (continued) May 31, 2020 | | BlackRock Strategic Municipal Opportunities Fund |
Derivative Financial Instruments Categorized by Risk Exposure
As of period end, the fair values of derivative financial instruments located in the Statements of Assets and Liabilities were as follows:
| | | | | | | | | | | | | | | | | | | | | | | | | | | | |
| | | Commodity
Contracts | | | Credit
Contracts | | | Equity
Contracts | | | Foreign
Currency
Exchange
Contracts | | | Interest
Rate
Contracts | | | Other
Contracts | | | Total | |
Assets — Derivative Financial Instruments | | | | | | | | | | | | | | | | | | | | | | | | | | | | |
Futures contracts | | | | | | | | | | | | | | | | | | | | | | | | | | | | |
Unrealized appreciation on futures contracts(a) | | $ | — | | | $ | — | | | $ | — | | | $ | — | | | $ | 209,675 | | | $ | — | | | $ | 209,675 | |
| | | | | | | | | | | | | | | | | | | | | | | | | | | | |
Liabilities — Derivative Financial Instruments | | | | | | | | | | | | | | | | | | | | | | | | | | | | |
Futures contracts | | | | | | | | | | | | | | | | | | | | | | | | | | | | |
Unrealized depreciation on futures contracts(a) | | $ | — | | | $ | — | | | $ | — | | | $ | — | | | $ | 1,881,147 | | | $ | — | | | $ | 1,881,147 | |
| | | | | | | | | | | | | | | | | | | | | | | | | | | | |
| | (a) | Net cumulative unrealized appreciation (depreciation) on futures contracts and centrally cleared swaps, if any, are reported in the Schedule of Investments. In the Statements of Assets and Liabilities, only current day’s variation margin is reported in receivables or payables and the net cumulative unrealized appreciation (depreciation) is included in accumulated earnings (loss). | |
For the year ended May 31, 2020, the effect of derivative financial instruments in the Statements of Operations was as follows:
| | | | | | | | | | | | | | | | | | | | | | | | | | | | |
| | | Commodity
Contracts | | | Credit
Contracts | | | Equity
Contracts | | | Foreign
Currency
Exchange
Contracts | | | Interest
Rate
Contracts | | | Other
Contracts | | | Total | |
Net Realized Gain (Loss) from: | | | | | | | | | | | | | | | | | | | | | | | | | | | | |
Futures contracts | | $ | — | | | $ | — | | | $ | — | | | $ | — | | | $ | (694,152,137 | ) | | $ | — | | | $ | (694,152,137 | ) |
| | | | | | | | | | | | | | | | | | | | | | | | | | | | |
| | | | | | | |
| Net Change in Unrealized Appreciation (Depreciation) on: | | | | | | | | | | | | | | | | | | | | | |
Futures contracts | | $ | — | | | $ | — | | | $ | — | | | $ | — | | | $ | 35,013,270 | | | $ | — | | | $ | 35,013,270 | |
| | | | | | | | | | | | | | | | | | | | | | | | | | | | |
Average Quarterly Balances of Outstanding Derivative Financial Instruments
| | | | |
Futures contracts: | |
Average notional value of contracts — long | | $ | — | (a) |
Average notional value of contracts — short | | $ | 3,991,319,292 | |
| | (a) | Derivative not held at any quarter-end. The risk exposure table serves as an indicator of activity during the period. | |
For more information about the Fund’s investment risks regarding derivative financial instruments, refer to the Notes to Financial Statements.
Fair Value Hierarchy as of Period End
Various inputs are used in determining the fair value of investments and derivative financial instruments. For information about the Fund’s policy regarding valuation of investments and derivative financial instruments, refer to the Notes to Financial Statements.
The following tables summarize the Fund’s investments and derivative financial instruments categorized in the disclosure hierarchy:
| | | | | | | | | | | | | | | | |
| | | Level 1 | | | Level 2 | | | Level 3 | | | Total | |
Assets: | |
Investments: | |
Long-Term Investments(a) | | $ | — | | | $ | 9,546,634,380 | | | $ | — | | | $ | 9,546,634,380 | |
Short-Term Securities | | | 368,379,391 | | | | — | | | | — | | | | 368,379,391 | |
| | | | | | | | | | | | | | | | |
| | $ | 368,379,391 | | | $ | 9,546,634,380 | | | $ | — | | | $ | 9,915,013,771 | |
| | | | | | | | | | | | | | | | |
Derivative Financial Instruments(b) | | | | | | | | | | | | | | | | |
Assets: | |
Interest rate contracts | | $ | 209,675 | | | $ | — | | | $ | — | | | $ | 209,675 | |
Liabilities: | |
Interest rate contracts | | | (1,881,147 | ) | | | — | | | | — | | | | (1,881,147 | ) |
| | | | | | | | | | | | | | | | |
| | $ | (1,671,472 | ) | | $ | — | | | $ | — | | | $ | (1,671,472 | ) |
| | | | | | | | | | | | | | | | |
| | (a) | See above Schedule of Investments for values in each sector, state or political subdivision. | |
| | (b) | Derivative financial instruments are futures contracts. Futures contracts are valued at the unrealized appreciation (depreciation) on the instrument. | |
The Fund may hold assets and/or liabilities in which the fair value approximates the carrying amount for financial statement purposes. As of period end, TOB Trust Certificates of $ 869,463,307 are categorized as Level 2 within the disclosure hierarchy.
See notes to financial statements.
| | |
| 56 | | 2020 BLACKROCK ANNUAL REPORTTO SHAREHOLDERS |
Statements of Assets and Liabilities
May 31, 2020
| | | | | | | | | | | | | | | | |
| | | BlackRock
California
Municipal
Opportunities Fund | | | BlackRock
New Jersey
Municipal
Bond Fund | | | BlackRock
Pennsylvania
Municipal
Bond Fund | | | BlackRock
Strategic
Municipal
Opportunities Fund | |
| | | | |
ASSETS | | | | | | | | | | | | | | | | |
Investments at value — unaffiliated(a) | | $ | 3,078,992,820 | | | $ | 362,443,886 | | | $ | 582,731,402 | | | $ | 9,546,634,380 | |
Investments at value — affiliated(b) | | | 322,516,448 | | | | 9,091,474 | | | | 23,554,839 | | | | 368,379,391 | |
Cash | | | 1,490,250 | | | | — | | | | — | | | | — | |
Cash pledged for futures contracts | | | 11,435,000 | | | | — | | | | — | | | | 35,095,000 | |
Receivables: | | | | | | | | | | | | | | | | |
Investments sold | | | 37,224,842 | | | | 733,986 | | | | 1,153,415 | | | | 47,309,437 | |
Capital shares sold | | | 8,302,580 | | | | 1,022,710 | | | | 796,047 | | | | 18,594,898 | |
Dividends — affiliated | | | 1,637 | | | | 641 | | | | 1,222 | | | | 21,627 | |
Interest — unaffiliated | | | 30,999,359 | | | | 5,200,260 | | | | 8,190,267 | | | | 113,134,117 | |
Prepaid expenses | | | 62,750 | | | | 15,781 | | | | 19,806 | | | | 353,560 | |
| | | | | | | | | | | | | | | | |
Total assets | | | 3,491,025,686 | | | | 378,508,738 | | | | 616,446,998 | | | | 10,129,522,410 | |
| | | | | | | | | | | | | | | | |
| | | | |
ACCRUED LIABILITIES | | | | | | | | | | | | | | | | |
Payables: | | | | | | | | | | | | | | | | |
Investments purchased | | | 21,674,218 | | | | 669,690 | | | | 887,420 | | | | 41,843,953 | |
TOB Trust | | | 13,844,023 | | | | — | | | | — | | | | — | |
Capital shares redeemed | | | 8,011,859 | | | | 1,215,288 | | | | 2,946,996 | | | | 33,847,695 | |
Income dividend distributions | | | 1,357,235 | | | | 347,275 | | | | 649,541 | | | | 5,942,264 | |
Interest expense and fees | | | 338,088 | | | | 100,591 | | | | 281,664 | | | | 2,665,693 | |
Investment advisory fees | | | 1,950,857 | | | | 233,530 | | | | 399,622 | | | | 7,030,997 | |
Trustees’ and Officer’s fees | | | 7,384 | | | | 879 | | | | 1,218 | | | | 52,205 | |
Other accrued expenses | | | 836,495 | | | | 180,925 | | | | 199,467 | | | | 2,997,856 | |
Other affiliates | | | 10,390 | | | | 1,070 | | | | 1,703 | | | | 34,513 | |
Service and distribution fees | | | 345,146 | | | | 51,050 | | | | 51,584 | | | | 610,313 | |
Variation margin on futures contracts | | | 2,636,939 | | | | — | | | | — | | | | 8,092,961 | |
| | | | | | | | | | | | | | | | |
Total accrued liabilities | | | 51,012,634 | | | | 2,800,298 | | | | 5,419,215 | | | | 103,118,450 | |
| | | | | | | | | | | | | | | | |
| | | | |
OTHER LIABILITIES | | | | | | | | | | | | | | | | |
Loan for TOB Trust Certificates | | | — | | | | — | | | | 840,000 | | | | — | |
TOB Trust Certificates | | | 148,144,977 | | | | 22,053,726 | | | | 63,943,902 | | | | 869,463,307 | |
| | | | | | | | | | | | | | | | |
Total other liabilities | | | 148,144,977 | | | | 22,053,726 | | | | 64,783,902 | | | | 869,463,307 | |
| | | | | | | | | | | | | | | | |
Total liabilities | | | 199,157,611 | | | | 24,854,024 | | | | 70,203,117 | | | | 972,581,757 | |
| | | | | | | | | | | | | | | | |
| | | | |
NET ASSETS | | $ | 3,291,868,075 | | | $ | 353,654,714 | | | $ | 546,243,881 | | | $ | 9,156,940,653 | |
| | | | | | | | | | | | | | | | |
| | | | |
NET ASSETS CONSIST OF | | | | | | | | | | | | | | | | |
Paid-in capital | | $ | 3,421,312,223 | | | $ | 350,574,571 | | | $ | 552,287,192 | | | $ | 9,968,510,993 | |
Accumulated earnings (loss) | | | (129,444,148 | ) | | | 3,080,143 | | | | (6,043,311 | ) | | | (811,570,340 | ) |
| | | | | | | | | | | | | | | | |
NET ASSETS | | $ | 3,291,868,075 | | | $ | 353,654,714 | | | $ | 546,243,881 | | | $ | 9,156,940,653 | |
| | | | | | | | | | | | | | | | |
| | | | |
(a) Investments at cost — unaffiliated | | $ | 2,975,840,691 | | | $ | 346,516,679 | | | $ | 563,073,473 | | | $ | 9,487,203,837 | |
(b) Investments at cost — affiliated | | $ | 322,474,263 | | | $ | 9,090,476 | | | $ | 23,549,074 | | | $ | 368,307,033 | |
See notes to financial statements.
Statements of Assets and Liabilities (continued)
May 31, 2020
| | | | | | | | | | | | | | | | |
| | | BlackRock
California
Municipal
Opportunities Fund | | | BlackRock
New Jersey
Municipal
Bond Fund | | | BlackRock
Pennsylvania
Municipal
Bond Fund | | | BlackRock
Strategic
Municipal
Opportunities Fund | |
| | | | |
NET ASSET VALUE | | | | | | | | | | | | | | | | |
| | | | |
| Institutional | | | | | | | | | | | | |
Net assets | | $ | 1,865,632,921 | | | $ | 188,511,950 | | | $ | 370,399,346 | | | $ | 6,827,754,959 | |
| | | | | | | | | | | | | | | | |
Shares outstanding(c) | | | 152,857,938 | | | | 17,391,198 | | | | 34,454,555 | | | | 626,309,823 | |
| | | | | | | | | | | | | | | | |
Net asset value | | $ | 12.21 | | | $ | 10.84 | | | $ | 10.75 | | | $ | 10.90 | |
| | | | | | | | | | | | | | | | |
| | | | |
| Service | | | | | | | | | | | | |
Net assets | | $ | — | | | $ | 7,465,929 | | | $ | 1,985,831 | | | $ | — | |
| | | | | | | | | | | | | | | | |
Shares outstanding(c) | | | — | | | | 688,801 | | | | 184,513 | | | | — | |
| | | | | | | | | | | | | | | | |
Net asset value | | $ | — | | | $ | 10.84 | | | $ | 10.76 | | | $ | — | |
| | | | | | | | | | | | | | | | |
| | | | |
| Investor A | | | | | | | | | | | | |
Net assets | | $ | 1,069,540,903 | | | $ | 106,048,154 | | | $ | 131,336,314 | | | $ | 1,871,556,726 | |
| | | | | | | | | | | | | | | | |
Shares outstanding(c) | | | 87,712,140 | | | | 9,776,090 | | | | 12,203,355 | | | | 171,754,328 | |
| | | | | | | | | | | | | | | | |
Net asset value | | $ | 12.19 | | | $ | 10.85 | | | $ | 10.76 | | | $ | 10.90 | |
| | | | | | | | | | | | | | | | |
| | | | |
| Investor A1 | | | | | | | | | | | | |
Net assets | | $ | 103,228,579 | | | $ | 17,240,554 | | | $ | 9,461,906 | | | $ | 23,880,722 | |
| | | | | | | | | | | | | | | | |
Shares outstanding(c) | | | 8,458,234 | | | | 1,588,719 | | | | 878,840 | | | | 2,190,973 | |
| | | | | | | | | | | | | | | | |
Net asset value | | $ | 12.20 | | | $ | 10.85 | | | $ | 10.77 | | | $ | 10.90 | |
| | | | | | | | | | | | | | | | |
| | | | |
| Investor C | | | | | | | | | | | | |
Net assets | | $ | 144,972,009 | | | $ | 32,312,667 | | | $ | 29,078,171 | | | $ | 271,381,891 | |
| | | | | | | | | | | | | | | | |
Shares outstanding(c) | | | 11,877,574 | | | | 2,981,996 | | | | 2,702,567 | | | | 24,895,897 | |
| | | | | | | | | | | | | | | | |
Net asset value | | $ | 12.21 | | | $ | 10.84 | | | $ | 10.76 | | | $ | 10.90 | |
| | | | | | | | | | | | | | | | |
| | | | |
| Class K | | | | | | | | | | | | |
Net assets | | $ | 108,493,663 | | | $ | 2,075,460 | | | $ | 3,982,313 | | | $ | 162,366,355 | |
| | | | | | | | | | | | | | | | |
Shares outstanding(c) | | | 8,886,156 | | | | 191,553 | | | | 370,491 | | | | 14,892,286 | |
| | | | | | | | | | | | | | | | |
Net asset value | | $ | 12.21 | | | $ | 10.83 | | | $ | 10.75 | | | $ | 10.90 | |
| | | | | | | | | | | | | | | | |
| (c) | Unlimited number of shares authorized, $0.10 par value. |
See notes to financial statements.
| | |
| 58 | | 2020 BLACKROCK ANNUAL REPORTTO SHAREHOLDERS |
Statements of Operations
Year Ended May 31, 2020
| | | | | | | | | | | | | | | | |
| | | BlackRock
California
Municipal
Opportunities Fund | | | BlackRock
New Jersey
Municipal
Bond Fund | | | BlackRock
Pennsylvania
Municipal
Bond Fund | | | BlackRock
Strategic
Municipal
Opportunities Fund | |
| | | | |
INVESTMENT INCOME | | | | | | | | | | | | | | | | |
Dividends — affiliated | | $ | 3,621,667 | | | $ | 177,638 | | | $ | 194,195 | | | $ | 3,697,001 | |
Dividends — unaffiliated | | | 597,030 | | | | 13,703 | | | | 21,833 | | | | 452,632 | |
Interest — unaffiliated | | | 95,128,548 | | | | 13,936,898 | | | | 23,314,829 | | | | 363,381,995 | |
| | | | | | | | | | | | | | | | |
Total investment income | | | 99,347,245 | | | | 14,128,239 | | | | 23,530,857 | | | | 367,531,628 | |
| | | | | | | | | | | | | | | | |
| | | | |
EXPENSES | | | | | | | | | | | | | | | | |
Investment advisory | | | 13,363,698 | | | | 1,883,632 | | | | 2,919,956 | | | | 56,328,144 | |
Service and distribution — class specific | | | 4,467,118 | | | | 639,581 | | | | 630,171 | | | | 8,174,920 | |
Transfer agent — class specific | | | 1,867,196 | | | | 301,891 | | | | 663,069 | | | | 7,370,254 | |
Accounting services | | | 405,184 | | | | 79,698 | | | | 110,608 | | | | 1,099,198 | |
Professional | | | 182,398 | | | | 82,099 | | | | 86,329 | | | | 385,625 | |
Registration | | | 135,823 | | | | 35,236 | | | | 35,231 | | | | 689,584 | |
Recoupment of past waived and/or reimbursed fees — class specific | | | 75,441 | | | | — | | | | — | | | | — | |
Recoupment of past waived and/or reimbursed fees | | | 60,680 | | | | — | | | | — | | | | — | |
Custodian | | | 50,862 | | | | 5,700 | | | | 13,642 | | | | 246,949 | |
Trustees and Officer | | | 47,499 | | | | 5,871 | | | | 8,263 | | | | 145,253 | |
Printing | | | 34,295 | | | | 28,371 | | | | 27,948 | | | | 104,916 | |
Miscellaneous | | | 109,082 | | | | 32,185 | | | | 35,728 | | | | 343,810 | |
| | | | | | | | | | | | | | | | |
Total expenses excluding interest expense and fees | | | 20,799,276 | | | | 3,094,264 | | | | 4,530,945 | | | | 74,888,653 | |
Interest expense and fees(a) | | | 4,531,206 | | | | 410,244 | | | | 1,191,794 | | | | 18,139,807 | |
| | | | | | | | | | | | | | | | |
Total expenses | | | 25,330,482 | | | | 3,504,508 | | | | 5,722,739 | | | | 93,028,460 | |
Less: | | | | | | | | | | | | | | | | |
Fees waived and/or reimbursed by the Manager | | | (484,827 | ) | | | (449,222 | ) | | | (485,151 | ) | | | (6,099,374 | ) |
Transfer agent fees waived and/or reimbursed — class specific | | | (1,093 | ) | | | (125,677 | ) | | | (385,617 | ) | | | — | |
| | | | | | | | | | | | | | | | |
Total expenses after fees waived and/or reimbursed | | | 24,844,562 | | | | 2,929,609 | | | | 4,851,971 | | | | 86,929,086 | |
| | | | | | | | | | | | | | | | |
Net investment income | | | 74,502,683 | | | | 11,198,630 | | | | 18,678,886 | | | | 280,602,542 | |
| | | | | | | | | | | | | | | | |
| | | | |
REALIZED AND UNREALIZED GAIN (LOSS) | | | | | | | | | | | | | | | | |
Net realized gain (loss) from: | | | | | | | | | | | | | | | | |
Futures contracts | | | (199,903,189 | ) | | | (6,702,209 | ) | | | (11,528,505 | ) | | | (694,152,137 | ) |
Investments — affiliated | | | 5,370,996 | | | | (207,083 | ) | | | (310,648 | ) | | | 2,782,264 | |
Investments — unaffiliated | | | 29,614,532 | | | | (919,834 | ) | | | 1,030,053 | | | | 97,406,843 | |
| | | | | | | | | | | | | | | | |
| | | (164,917,661 | ) | | | (7,829,126 | ) | | | (10,809,100 | ) | | | (593,963,030 | ) |
| | | | | | | | | | | | | | | | |
Net change in unrealized appreciation (depreciation) on: | | | | | | | | | | | | | | | | |
Futures contracts | | | 10,625,551 | | | | 288,269 | | | | 532,260 | | | | 35,013,270 | |
Investments — affiliated | | | (1,049,982 | ) | | | (104 | ) | | | 5,765 | | | | 72,032 | |
Investments — unaffiliated | | | (32,378,022 | ) | | | (9,365,301 | ) | | | (9,911,892 | ) | | | (392,463,178 | ) |
| | | | | | | | | | | | | | | | |
| | | (22,802,453 | ) | | | (9,077,136 | ) | | | (9,373,867 | ) | | | (357,377,876 | ) |
| | | | | | | | | | | | | | | | |
Net realized and unrealized loss | | | (187,720,114 | ) | | | (16,906,262 | ) | | | (20,182,967 | ) | | | (951,340,906 | ) |
| | | | | | | | | | | | | | | | |
NET DECREASE IN NET ASSETS RESULTING FROM OPERATIONS | | $ | (113,217,431 | ) | | $ | (5,707,632 | ) | | $ | (1,504,081 | ) | | $ | (670,738,364 | ) |
| | | | | | | | | | | | | | | | |
| (a) | Related to TOB Trusts. |
See notes to financial statements.
Statements of Changes in Net Assets
| | | | | | | | | | | | | | | | | | | | |
| | | BlackRock California
Municipal Opportunities Fund | | | | | | BlackRock New Jersey
Municipal Bond Fund | |
| | | Year Ended May 31, | | | | | | Year Ended May 31, | |
| | | 2020 | | | 2019 | | | | | | 2020 | | | 2019 | |
| | | | | |
INCREASE (DECREASE) IN NET ASSETS | | | | | | | | | | | | | | | | | | | | |
| | | | | |
OPERATIONS | | | | | | | | | | | | | | | | | | | | |
Net investment income | | $ | 74,502,683 | | | $ | 68,490,437 | | | | | | | $ | 11,198,630 | | | $ | 10,295,004 | |
Net realized loss | | | (164,917,661 | ) | | | (49,520,461 | ) | | | | | | | (7,829,126 | ) | | | (2,900,516 | ) |
Net change in unrealized appreciation (depreciation) | | | (22,802,453 | ) | | | 101,320,005 | | | | | | | | (9,077,136 | ) | | | 10,049,396 | |
| | | | | | | | | | | | | | | | | | | | |
Net increase (decrease) in net assets resulting from operations | | | (113,217,431 | ) | | | 120,289,981 | | | | | | | | (5,707,632 | ) | | | 17,443,884 | |
| | | | | | | | | | | | | | | | | | | | |
| | | | | |
DISTRIBUTIONS TO SHAREHOLDERS(a) | | | | | | | | | | | | | | | | | | | | |
Institutional | | | (46,598,483 | ) | | | (72,422,029 | ) | | | | | | | (6,319,333 | ) | | | (5,875,681 | ) |
Service | | | — | | | | — | | | | | | | | (232,863 | ) | | | (259,059 | ) |
Investor A | | | (20,907,590 | ) | | | (33,319,192 | ) | | | | | | | (3,169,958 | ) | | | (2,658,015 | ) |
Investor A1 | | | (2,258,176 | ) | | | (5,086,830 | ) | | | | | | | (597,949 | ) | | | (708,382 | ) |
Investor C | | | (1,782,575 | ) | | | (4,866,719 | ) | | | | | | | (761,510 | ) | | | (779,858 | ) |
Investor C1 | | | (2,285 | ) | | | (26,910 | ) | | | | | | | (445 | ) | | | (18,740 | ) |
Class K | | | (2,688,705 | ) | | | (2,475,633 | ) | | | | | | | (62,897 | ) | | | (65,270 | ) |
| | | | | | | | | | | | | | | | | | | | |
Decrease in net assets resulting from distributions to shareholders | | | (74,237,814 | ) | | | (118,197,313 | ) | | | | | | | (11,144,955 | ) | | | (10,365,005 | ) |
| | | | | | | | | | | | | | | | | | | | |
| | | | | |
CAPITAL SHARE TRANSACTIONS | | | | | | | | | | | | | | | | | | | | |
Net increase in net assets derived from capital share transactions | | | 145,089,557 | | | | 1,228,955,798 | | | | | | | | 41,185,822 | | | | 35,829,294 | |
| | | | | | | | | | | | | | | | | | | | |
| | | |
NET ASSETS | | | | | | | | | | | | | |
Total increase (decrease) in net assets | | | (42,365,688 | ) | | | 1,231,048,466 | | | | | | | | 24,333,235 | | | | 42,908,173 | |
Beginning of year | | | 3,334,233,763 | | | | 2,103,185,297 | | | | | | | | 329,321,479 | | | | 286,413,306 | |
| | | | | | | | | | | | | | | | | | | | |
End of year | | $ | 3,291,868,075 | | | $ | 3,334,233,763 | | | | | | | $ | 353,654,714 | | | $ | 329,321,479 | |
| | | | | | | | | | | | | | | | | | | | |
| (a) | Distributions for annual periods determined in accordance with U.S. federal income tax regulations. |
See notes to financial statements.
| | |
| 60 | | 2020 BLACKROCK ANNUAL REPORTTO SHAREHOLDERS |
Statements of Changes in Net Assets (continued)
| | | | | | | | | | | | | | | | | | | | |
| | | BlackRock Pennsylvania
Municipal Bond Fund | | | | | | BlackRock Strategic
Municipal Opportunities Fund | |
| | | Year Ended May 31, | | | | | | Year Ended May 31, | |
| | | 2020 | | | 2019 | | | | | | 2020 | | | 2019 | |
| | | | | |
INCREASE (DECREASE) IN NET ASSETS | | | | | | | | | | | | | | | | | | | | |
| | | | | |
OPERATIONS | | | | | | | | | | | | | | | | | | | | |
Net investment income | | $ | 18,678,886 | | | $ | 19,126,263 | | | | | | | $ | 280,602,542 | | | $ | 271,231,640 | |
Net realized loss | | | (10,809,100 | ) | | | (3,836,131 | ) | | | | | | | (593,963,030 | ) | | | (215,793,065 | ) |
Net change in unrealized appreciation (depreciation) | | | (9,373,867 | ) | | | 10,086,069 | | | | | | | | (357,377,876 | ) | | | 362,063,530 | |
| | | | | | | | | | | | | | | | | | | | |
Net increase (decrease) in net assets resulting from operations | | | (1,504,081 | ) | | | 25,376,201 | | | | | | | | (670,738,364 | ) | | | 417,502,105 | |
| | | | | | | | | | | | | | | | | | | | |
| | | | | |
DISTRIBUTIONS TO SHAREHOLDERS(a) | | | | | | | | | | | | | | | | | | | | |
Institutional | | | (13,323,193 | ) | | | (14,043,437 | ) | | | | | | | (220,891,704 | ) | | | (334,041,445 | ) |
Service | | | (68,557 | ) | | | (63,405 | ) | | | | | | | — | | | | — | |
Investor A | | | (3,995,842 | ) | | | (3,640,257 | ) | | | | | | | (46,246,783 | ) | | | (72,684,296 | ) |
Investor A1 | | | (338,836 | ) | | | (449,183 | ) | | | | | | | (651,181 | ) | | | (1,316,283 | ) |
Investor C | | | (725,675 | ) | | | (890,655 | ) | | | | | | | (4,710,313 | ) | | | (10,659,763 | ) |
Investor C1 | | | (37 | ) | | | (25,025 | ) | | | | | | | — | | | | — | |
Class K | | | (116,866 | ) | | | (89,471 | ) | | | | | | | (4,456,594 | ) | | | (4,089,237 | ) |
| | | | | | | | | | | | | | | | | | | | |
Decrease in net assets resulting from distributions to shareholders | | | (18,569,006 | ) | | | (19,201,433 | ) | | | | | | | (276,956,575 | ) | | | (422,791,024 | ) |
| | | | | | | | | | | | | | | | | | | | |
| | | | | |
CAPITAL SHARE TRANSACTIONS | | | | | | | | | | | | | | | | | | | | |
Net increase (decrease) in net assets derived from capital share transactions | | | 30,795,831 | | | | 22,898,530 | | | | | | | | (742,778,148 | ) | | | 3,257,020,457 | |
| | | | | | | | | | | | | | | | | | | | |
| |
NET ASSETS | | | | | |
Total increase (decrease) in net assets | | | 10,722,744 | | | | 29,073,298 | | | | | | | | (1,690,473,087 | ) | | | 3,251,731,538 | |
Beginning of year | | | 535,521,137 | | | | 506,447,839 | | | | | | | | 10,847,413,740 | | | | 7,595,682,202 | |
| | | | | | | | | | | | | | | | | | | | |
End of year | | $ | 546,243,881 | | | $ | 535,521,137 | | | | | | | $ | 9,156,940,653 | | | $ | 10,847,413,740 | |
| | | | | | | | | | | | | | | | | | | | |
| (a) | Distributions for annual periods determined in accordance with U.S. federal income tax regulations. |
See notes to financial statements.
Statement of Cash Flows
Year Ended May 31, 2020
| | | | |
| | | BlackRock
Pennsylvania
Municipal
Bond Fund | |
| |
CASH USED FOR OPERATING ACTIVITIES | | | | |
Net decrease in net assets resulting from operations | | $ | (1,504,081 | ) |
Adjustments to reconcile net decrease in net assets resulting from operations to net cash used for operating activities: | | | | |
Proceeds from sales of long-term investments | | | 171,512,460 | |
Purchases of long-term investments | | | (171,401,120 | ) |
Net purchases of short-term securities | | | (23,560,987 | ) |
Amortization of premium and accretion of discount on investments and other fees | | | 2,739,256 | |
Net realized gain on investments | | | (719,405 | ) |
Net unrealized (appreciation) depreciation on investments | | | 9,906,127 | |
| |
(Increase) Decrease in Assets: | | | | |
Receivables: | | | | |
Dividends — affiliated | | | 12,297 | |
Interest — unaffiliated | | | 45,772 | |
Prepaid expenses | | | 1,126 | |
| |
Increase (Decrease) in Liabilities: | | | | |
Payables: | | | | |
Investment advisory fees | | | 189,928 | |
Board realignment and consolidation | | | (1,614 | ) |
Interest expense and fees | | | (66,448 | ) |
Other affiliates | | | 186 | |
Service and distribution fees | | | 2,176 | |
Trustees’ and Officer’s fees | | | 63 | |
Variation margin on futures contracts | | | (443,766 | ) |
Other accrued expenses | | | (53,900 | ) |
| | | | |
Net cash used for operating activities | | | (13,341,930 | ) |
| | | | |
| |
CASH PROVIDED BY FINANCING ACTIVITIES | | | | |
Cash dividends paid to shareholders | | | (7,778,395 | ) |
Payments on redemption of capital shares | | | (102,667,675 | ) |
Repayments of Loan for TOB Trust Certificates | | | (2,138,472 | ) |
Repayments of TOB Trust Certificates | | | (9,708,472 | ) |
Proceeds from issuance of capital shares | | | 124,508,156 | |
Proceeds from TOB Trust Certificates | | | 9,248,362 | |
Proceeds from Loan for TOB Trust Certificates | | | 2,978,472 | |
Decrease in bank overdraft | | | (1,868,796 | ) |
| | | | |
Net cash provided by financing activities | | | 12,573,180 | |
| | | | |
| |
CASH | | | | |
Net decrease in restricted and unrestricted cash | | | (768,750 | ) |
Restricted and unrestricted cash at beginning of year | | | 768,750 | |
| | | | |
Restricted and unrestricted cash at end of year | | $ | — | |
| | | | |
| |
SUPPLEMENTAL DISCLOSURE OF CASH FLOW INFORMATION | | | | |
Cash paid during the year for interest expense | | $ | 1,258,242 | |
| | | | |
| |
NON-CASH FINANCING ACTIVITIES | | | | |
Capital shares issued in reinvestment of distributions paid to shareholders | | $ | 11,010,293 | |
| | | | |
| |
RECONCILIATION OF RESTRICTED AND UNRESTRICTED CASH AT THE END OF YEAR TO THE STATEMENTS OF ASSETS AND LIABILITIES | | | | |
Cash | | $ | — | |
| | | | |
Cash pledged: | | | | |
Futures contracts | | $ | — | |
| | | | |
|
RECONCILIATION OF RESTRICTED AND UNRESTRICTED CASH AT THE BEGINNING OF YEAR TO THE STATEMENTS OF ASSETS AND LIABILITIES | |
Cash pledged: | | | | |
Futures contracts | | $ | 768,750 | |
| | | | |
See notes to financial statements.
| | |
| 62 | | 2020 BLACKROCK ANNUAL REPORTTO SHAREHOLDERS |
Financial Highlights
(For a share outstanding throughout each period)
| | | | | | | | | | | | | | | | | | | | |
| | | BlackRock California Municipal Opportunities Fund | |
| |
| | | Institutional | |
| |
| | | Year Ended May 31, | |
| | | 2020 | | | 2019 | | | 2018 | | | 2017 | | | 2016 | |
| | | | | |
Net asset value, beginning of year | | $ | 12.71 | | | $ | 12.76 | | | $ | 12.60 | | | $ | 12.73 | | | $ | 12.33 | |
| | | | | | | | | | | | | | | | | | | | |
Net investment income(a) | | | 0.27 | | | | 0.34 | | | | 0.34 | | | | 0.36 | | | | 0.39 | |
Net realized and unrealized gain (loss) | | | (0.50 | ) | | | 0.19 | | | | 0.20 | | | | (0.13 | ) | | | 0.40 | |
| | | | | | | | | | | | | | | | | | | | |
Net increase (decrease) from investment operations | | | (0.23 | ) | | | 0.53 | | | | 0.54 | | | | 0.23 | | | | 0.79 | |
| | | | | | | | | | | | | | | | | | | | |
| | | | | |
Distributions(b) | | | | | | | | | | | | | | | | | | | | |
From net investment income | | | (0.27 | ) | | | (0.34 | ) | | | (0.34 | ) | | | (0.36 | ) | | | (0.39 | ) |
From net realized gain | | | — | | | | (0.24 | ) | | | (0.04 | ) | | | — | | | | — | |
| | | | | | | | | | | | | | | | | | | | |
Total distributions | | | (0.27 | ) | | | (0.58 | ) | | | (0.38 | ) | | | (0.36 | ) | | | (0.39 | ) |
| | | | | | | | | | | | | | | | | | | | |
| | | | | |
Net asset value, end of year | | $ | 12.21 | | | $ | 12.71 | | | $ | 12.76 | | | $ | 12.60 | | | $ | 12.73 | |
| | | | | | | | | | | | | | | | | | | | |
| | | | | |
Total Return(c) | | | | | | | | | | | | | | | | | | | | |
Based on net asset value | | | (1.85 | )% | | | 4.28 | % | | | 4.37 | % | | | 1.88 | % | | | 6.54 | % |
| | | | | | | | | | | | | | | | | | | | |
| | | | | |
Ratios to Average Net Assets(d) | | | | | | | | | | | | | | | | | | | | |
Total expenses(e) | | | 0.57 | % | | | 0.63 | % | | | 0.57 | % | | | 0.61 | % | | | 0.68 | % |
| | | | | | | | | | | | | | | | | | | | |
Total expenses after fees waived and/or reimbursed and paid indirectly | | | 0.55 | % | | | 0.61 | % | | | 0.54 | % | | | 0.54 | % | | | 0.66 | % |
| | | | | | | | | | | | | | | | | | | | |
Total expenses after fees waived and/or reimbursed and paid indirectly and excluding interest expense and fees, and amortization of offering costs(f) | | | 0.43 | % | | | 0.44 | % | | | 0.44 | % | | | 0.46 | % | | | 0.62 | % |
| | | | | | | | | | | | | | | | | | | | |
Net investment income | | | 2.13 | % | | | 2.70 | % | | | 2.68 | % | | | 2.88 | % | | | 3.10 | % |
| | | | | | | | | | | | | | | | | | | | |
| | | | | |
Supplemental Data | | | | | | | | | | | | | | | | | | | | |
Net assets, end of year (000) | | $ | 1,865,633 | | | $ | 2,016,387 | | | $ | 1,190,045 | | | $ | 611,571 | | | $ | 494,888 | |
| | | | | | | | | | | | | | | | | | | | |
Borrowings outstanding, end of year (000) | | $ | 148,145 | | | $ | 253,167 | | | $ | 141,267 | | | $ | 60,642 | | | $ | 40,310 | |
| | | | | | | | | | | | | | | | | | | | |
Portfolio turnover rate | | | 117 | % | | | 126 | % | | | 129 | % | | | 142 | % | | | 119 | % |
| | | | | | | | | | | | | | | | | | | | |
| (a) | Based on average shares outstanding. |
| (b) | Distributions for annual periods determined in accordance with U.S. federal income tax regulations. |
| (c) | Where applicable, assumes the reinvestment of distributions. |
| (d) | Excludes expenses incurred indirectly as a result of investments in underlying funds as follows: |
| | | | | | | | | | | | | | | | | | | | | | | | | | | | | | | | | | | | | | | | |
| | | For the Year Ended May 31, | |
| | | 2020 | | | | | | 2019 | | | | | | 2018 | | | | | | 2017 | | | | | | 2016 | | | | |
Investments in underlying funds | | | 0.02 | % | | | | | | | 0.02 | % | | | | | | | 0.01 | % | | | | | | | 0.01 | % | | | | | | | — | % | | | | |
| | | | | | | | | | | | | | | | | | | | | | | | | | | | | | | | | | | | | | | | |
| (e) | Includes recoupment of past waived and/or reimbursed fees. Excluding the recoupment of past waived and/or reimbursed fees, the expense ratios were as follows: |
| | | | | | | | | | | | | | | | | | | | | | | | | | | | | | | | | | | | | | | | |
| | | For the Year Ended May 31, | |
| | | 2020 | | | | | | 2019 | | | | | | 2018 | | | | | | 2017 | | | | | | 2016 | | | | |
Expense ratios | | | 0.56 | % | | | | | | | 0.62 | % | | | | | | | 0.57 | % | | | | | | | N/A | | | | | | | | 0.68 | % | | | | |
| | | | | | | | | | | | | | | | | | | | | | | | | | | | | | | | | | | | | | | | |
| (f) | Interest expense and fees relate to TOB Trusts. See Note 4 of the Notes to Financial Statements for details. |
See notes to financial statements.
Financial Highlights (continued)
(For a share outstanding throughout each period)
| | | | | | | | | | | | | | | | | | | | |
| | | BlackRock California Municipal Opportunities Fund (continued) | |
| |
| | | Investor A | |
| |
| | | Year Ended May 31, | |
| | | 2020 | | | 2019 | | | 2018 | | | 2017 | | | 2016 | |
| | | | | |
Net asset value, beginning of year | | $ | 12.70 | | | $ | 12.75 | | | $ | 12.58 | | | $ | 12.71 | | | $ | 12.32 | |
| | | | | | | | | | | | | | | | | | | | |
Net investment income(a) | | | 0.24 | | | | 0.31 | | | | 0.31 | | | | 0.33 | | | | 0.36 | |
Net realized and unrealized gain (loss) | | | (0.51 | ) | | | 0.19 | | | | 0.21 | | | | (0.13 | ) | | | 0.40 | |
| | | | | | | | | | | | | | | | | | | | |
Net increase (decrease) from investment operations | | | (0.27 | ) | | | 0.50 | | | | 0.52 | | | | 0.20 | | | | 0.76 | |
| | | | | | | | | | | | | | | | | | | | |
| | | | | |
Distributions(b) | | | | | | | | | | | | | | | | | | | | |
From net investment income | | | (0.24 | ) | | | (0.31 | ) | | | (0.31 | ) | | | (0.33 | ) | | | (0.37 | ) |
From net realized gain | | | — | | | | (0.24 | ) | | | (0.04 | ) | | | — | | | | — | |
| | | | | | | | | | | | | | | | | | | | |
Total distributions | | | (0.24 | ) | | | (0.55 | ) | | | (0.35 | ) | | | (0.33 | ) | | | (0.37 | ) |
| | | | | | | | | | | | | | | | | | | | |
| | | | | |
Net asset value, end of year | | $ | 12.19 | | | $ | 12.70 | | | $ | 12.75 | | | $ | 12.58 | | | $ | 12.71 | |
| | | | | | | | | | | | | | | | | | | | |
| | | | | |
Total Return(c) | | | | | | | | | | | | | | | | | | | | |
Based on net asset value | | | (2.18 | )% | | | 4.02 | % | | | 4.19 | % | | | 1.63 | % | | | 6.23 | % |
| | | | | | | | | | | | | | | | | | | | |
| | | | | |
Ratios to Average Net Assets(d) | | | | | | | | | | | | | | | | | | | | |
Total expenses(e) | | | 0.82 | % | | | 0.88 | % | | | 0.81 | % | | | 0.85 | % | | | 0.93 | % |
| | | | | | | | | | | | | | | | | | | | |
Total expenses after fees waived and/or reimbursed and paid indirectly | | | 0.80 | % | | | 0.86 | % | | | 0.79 | % | | | 0.79 | % | | | 0.88 | % |
| | | | | | | | | | | | | | | | | | | | |
Total expenses after fees waived and/or reimbursed and paid indirectly and excluding interest expense, fees and amortization of offering costs(f) | | | 0.68 | % | | | 0.69 | % | | | 0.69 | % | | | 0.71 | % | | | 0.84 | % |
| | | | | | | | | | | | | | | | | | | | |
Net investment income | | | 1.88 | % | | | 2.45 | % | | | 2.45 | % | | | 2.64 | % | | | 2.87 | % |
| | | | | | | | | | | | | | | | | | | | |
| | | | | |
Supplemental Data | | | | | | | | | | | | | | | | | | | | |
Net assets, end of year (000) | | $ | 1,069,541 | | | $ | 941,069 | | | $ | 631,410 | | | $ | 438,543 | | | $ | 364,093 | |
| | | | | | | | | | | | | | | | | | | | |
Borrowings outstanding, end of year (000) | | $ | 148,145 | | | $ | 253,167 | | | $ | 141,267 | | | $ | 60,642 | | | $ | 40,310 | |
| | | | | | | | | | | | | | | | | | | | |
Portfolio turnover rate | | | 117 | % | | | 126 | % | | | 129 | % | | | 142 | % | | | 119 | % |
| | | | | | | | | | | | | | | | | | | | |
| (a) | Based on average shares outstanding. |
| (b) | Distributions for annual periods determined in accordance with U.S. federal income tax regulations. |
| (c) | Where applicable, excludes the effects of any sales charges and assumes the reinvestment of distributions. |
| (d) | Excludes expenses incurred indirectly as a result of investments in underlying funds as follows: |
| | | | | | | | | | | | | | | | | | | | | | | | | | | | | | | | | | | | | | | | |
| | | For the Year Ended May 31, | |
| | | 2020 | | | | | | 2019 | | | | | | 2018 | | | | | | 2017 | | | | | | 2016 | | | | |
Investments in underlying funds | | | 0.02 | % | | | | | | | 0.02 | % | | | | | | | 0.01 | % | | | | | | | 0.01 | % | | | | | | | — | % | | | | |
| | | | | | | | | | | | | | | | | | | | | | | | | | | | | | | | | | | | | | | | |
| (e) | Includes recoupment of past waived and/or reimbursed fees. Excluding the recoupment of past waived and/or reimbursed fees, the expense ratios were as follows: |
| | | | | | | | | | | | | | | | | | | | | | | | | | | | | | | | | | | | | | | | |
| | | For the Year Ended May 31, | |
| | | 2020 | | | | | | 2019 | | | | | | 2018 | | | | | | 2017 | | | | | | 2016 | | | | |
Expense ratios | | | 0.82 | % | | | | | | | 0.88 | % | | | | | | | 0.81 | % | | | | | | | 0.85 | % | | | | | | | N/A | | | | | |
| | | | | | | | | | | | | | | | | | | | | | | | | | | | | | | | | | | | | | | | |
| (f) | Interest expense and fees relate to TOB Trusts. See Note 4 of the Notes to Financial Statements for details. |
See notes to financial statements.
| | |
| 64 | | 2020 BLACKROCK ANNUAL REPORTTO SHAREHOLDERS |
Financial Highlights (continued)
(For a share outstanding throughout each period)
| | | | | | | | | | | | | | | | | | | | |
| | | BlackRock California Municipal Opportunities Fund (continued) | |
| |
| | | Investor A1 | |
| |
| | | Year Ended May 31, | |
| | | 2020 | | | 2019 | | | 2018 | | | 2017 | | | 2016 | |
| | | | | |
Net asset value, beginning of year | | $ | 12.71 | | | $ | 12.76 | | | $ | 12.59 | | | $ | 12.72 | | | $ | 12.33 | |
| | | | | | | | | | | | | | | | | | | | |
Net investment income(a) | | | 0.26 | | | | 0.33 | | | | 0.33 | | | | 0.35 | | | | 0.38 | |
Net realized and unrealized gain (loss) | | | (0.51 | ) | | | 0.19 | | | | 0.21 | | | | (0.13 | ) | | | 0.39 | |
| | | | | | | | | | | | | | | | | | | | |
Net increase (decrease) from investment operations | | | (0.25 | ) | | | 0.52 | | | | 0.54 | | | | 0.22 | | | | 0.77 | |
| | | | | | | | | | | | | | | | | | | | |
| | | | | |
Distributions(b) | | | | | | | | | | | | | | | | | | | | |
From net investment income | | | (0.26 | ) | | | (0.33 | ) | | | (0.33 | ) | | | (0.35 | ) | | | (0.38 | ) |
From net realized gain | | | — | | | | (0.24 | ) | | | (0.04 | ) | | | — | | | | — | |
| | | | | | | | | | | | | | | | | | | | |
Total distributions | | | (0.26 | ) | | | (0.57 | ) | | | (0.37 | ) | | | (0.35 | ) | | | (0.38 | ) |
| | | | | | | | | | | | | | | | | | | | |
| | | | | |
Net asset value, end of year | | $ | 12.20 | | | $ | 12.71 | | | $ | 12.76 | | | $ | 12.59 | | | $ | 12.72 | |
| | | | | | | | | | | | | | | | | | | | |
| | | | | |
Total Return(c) | | | | | | | | | | | | | | | | | | | | |
Based on net asset value | | | (2.01 | )% | | | 4.18 | % | | | 4.35 | % | | | 1.78 | % | | | 6.35 | % |
| | | | | | | | | | | | | | | | | | | | |
| | | | | |
Ratios to Average Net Assets(d) | | | | | | | | | | | | | | | | | | | | |
Total expenses(e) | | | 0.65 | % | | | 0.72 | % | | | 0.66 | % | | | 0.70 | % | | | 0.79 | % |
| | | | | | | | | | | | | | | | | | | | |
Total expenses after fees waived and/or reimbursed and paid indirectly | | | 0.63 | % | | | 0.70 | % | | | 0.64 | % | | | 0.64 | % | | | 0.77 | % |
| | | | | | | | | | | | | | | | | | | | |
Total expenses after fees waived and/or reimbursed and paid indirectly and excluding interest expense, fees and amortization of offering costs(f) | | | 0.51 | % | | | 0.53 | % | | | 0.54 | % | | | 0.56 | % | | | 0.72 | % |
| | | | | | | | | | | | | | | | | | | | |
Net investment income | | | 2.08 | % | | | 2.61 | % | | | 2.61 | % | | | 2.78 | % | | | 3.06 | % |
| | | | | | | | | | | | | | | | | | | | |
| | | | | |
Supplemental Data | | | | | | | | | | | | | | | | | | | | |
Net assets, end of year (000) | | $ | 103,229 | | | $ | 112,554 | | | $ | 118,780 | | | $ | 126,274 | | | $ | 139,805 | |
| | | | | | | | | | | | | | | | | | | | |
Borrowings outstanding, end of year (000) | | $ | 148,145 | | | $ | 253,167 | | | $ | 141,267 | | | $ | 60,642 | | | $ | 40,310 | |
| | | | | | | | | | | | | | | | | | | | |
Portfolio turnover rate | | | 117 | % | | | 126 | % | | | 129 | % | | | 142 | % | | | 119 | % |
| | | | | | | | | | | | | | | | | | | | |
| (a) | Based on average shares outstanding. |
| (b) | Distributions for annual periods determined in accordance with U.S. federal income tax regulations. |
| (c) | Where applicable, excludes the effects of any sales charges and assumes the reinvestment of distributions. |
| (d) | Excludes expenses incurred indirectly as a result of investments in underlying funds as follows: |
| | | | | | | | | | | | | | | | | | | | | | | | | | | | | | | | | | | | | | | | |
| | | For the Year Ended May 31, | |
| | | 2020 | | | | | | 2019 | | | | | | 2018 | | | | | | 2017 | | | | | | 2016 | | | | |
Investments in underlying funds | | | 0.02 | % | | | | | | | 0.02 | % | | | | | | | 0.01 | % | | | | | | | 0.01 | % | | | | | | | — | % | | | | |
| | | | | | | | | | | | | | | | | | | | | | | | | | | | | | | | | | | | | | | | |
| (e) | Includes recoupment of past waived and/or reimbursed fees. Excluding the recoupment of past waived and/or reimbursed fees, the expense ratios were as follows: |
| | | | | | | | | | | | | | | | | | | | | | | | | | | | | | | | | | | | | | | | |
| | | For the Year Ended May 31, | |
| | | 2020 | | | | | | 2019 | | | | | | 2018 | | | | | | 2017 | | | | | | 2016 | | | | |
Expense ratios | | | 0.65 | % | | | | | | | 0.71 | % | | | | | | | 0.66 | % | | | | | | | N/A | | | | | | | | N/A | | | | | |
| | | | | | | | | | | | | | | | | | | | | | | | | | | | | | | | | | | | | | | | |
| (f) | Interest expense and fees relate to TOB Trusts. See Note 4 of the Notes to Financial Statements for details. |
See notes to financial statements.
Financial Highlights (continued)
(For a share outstanding throughout each period)
| | | | | | | | | | | | | | | | | | | | |
| | | BlackRock California Municipal Opportunities Fund (continued) | |
| |
| | | Investor C | |
| |
| | | Year Ended May 31, | |
| | | 2020 | | | 2019 | | | 2018 | | | 2017 | | | 2016 | |
| | | | | |
Net asset value, beginning of year | | $ | 12.71 | | | $ | 12.76 | | | $ | 12.60 | | | $ | 12.73 | | | $ | 12.33 | |
| | | | | | | | | | | | | | | | | | | | |
Net investment income(a) | | | 0.14 | | | | 0.21 | | | | 0.22 | | | | 0.24 | | | | 0.27 | |
Net realized and unrealized gain (loss) | | | (0.50 | ) | | | 0.19 | | | | 0.20 | | | | (0.13 | ) | | | 0.40 | |
| | | | | | | | | | | | | | | | | | | | |
Net increase (decrease) from investment operations | | | (0.36 | ) | | | 0.40 | | | | 0.42 | | | | 0.11 | | | | 0.67 | |
| | | | | | | | | | | | | | | | | | | | |
| | | | | |
Distributions(b) | | | | | | | | | | | | | | | | | | | | |
From net investment income | | | (0.14 | ) | | | (0.21 | ) | | | (0.22 | ) | | | (0.24 | ) | | | (0.27 | ) |
From net realized gain | | | — | | | | (0.24 | ) | | | (0.04 | ) | | | — | | | | — | |
| | | | | | | | | | | | | | | | | | | | |
Total distributions | | | (0.14 | ) | | | (0.45 | ) | | | (0.26 | ) | | | (0.24 | ) | | | (0.27 | ) |
| | | | | | | | | | | | | | | | | | | | |
| | | | | |
Net asset value, end of year | | $ | 12.21 | | | $ | 12.71 | | | $ | 12.76 | | | $ | 12.60 | | | $ | 12.73 | |
| | | | | | | | | | | | | | | | | | | | |
| | | | | |
Total Return(c) | | | | | | | | | | | | | | | | | | | | |
Based on net asset value | | | (2.82 | )% | | | 3.24 | % | | | 3.33 | % | | | 0.87 | % | | | 5.51 | % |
| | | | | | | | | | | | | | | | | | | | |
| | | | | |
Ratios to Average Net Assets(d) | | | | | | | | | | | | | | | | | | | | |
Total expenses | | | 1.57 | %(e) | | | 1.63 | %(e) | | | 1.57 | %(e) | | | 1.61 | %(e) | | | 1.70 | % |
| | | | | | | | | | | | | | | | | | | | |
Total expenses after fees waived and/or reimbursed and paid indirectly | | | 1.56 | % | | | 1.61 | % | | | 1.54 | % | | | 1.54 | % | | | 1.64 | % |
| | | | | | | | | | | | | | | | | | | | |
Total expenses after fees waived and/or reimbursed and paid indirectly and excluding interest expense, fees and amortization of offering costs(f) | | | 1.43 | % | | | 1.44 | % | | | 1.44 | % | | | 1.46 | % | | | 1.60 | % |
| | | | | | | | | | | | | | | | | | | | |
Net investment income | | | 1.14 | % | | | 1.70 | % | | | 1.70 | % | | | 1.89 | % | | | 2.14 | % |
| | | | | | | | | | | | | | | | | | | | |
| | | | | |
Supplemental Data | | | | | | | | | | | | | | | | | | | | |
Net assets, end of year (000) | | $ | 144,972 | | | $ | 150,543 | | | $ | 124,032 | | | $ | 112,978 | | | $ | 103,993 | |
| | | | | | | | | | | | | | | | | | | | |
Borrowings outstanding, end of year (000) | | $ | 148,145 | | | $ | 253,167 | | | $ | 141,267 | | | $ | 60,642 | | | $ | 40,310 | |
| | | | | | | | | | | | | | | | | | | | |
Portfolio turnover rate | | | 117 | % | | | 126 | % | | | 129 | % | | | 142 | % | | | 119 | % |
| | | | | | | | | | | | | | | | | | | | |
| (a) | Based on average shares outstanding. |
| (b) | Distributions for annual periods determined in accordance with U.S. federal income tax regulations. |
| (c) | Where applicable, excludes the effects of any sales charges and assumes the reinvestment of distributions. |
| (d) | Excludes expenses incurred indirectly as a result of investments in underlying funds as follows: |
| | | | | | | | | | | | | | | | | | | | | | | | | | | | | | | | | | | | | | | | |
| | | For the Year Ended May 31, | |
| | | 2020 | | | | | | 2019 | | | | | | 2018 | | | | | | 2017 | | | | | | 2016 | | | | |
Investments in underlying funds | | | 0.02 | % | | | | | | | 0.02 | % | | | | | | | 0.01 | % | | | | | | | 0.01 | % | | | | | | | — | % | | | | |
| | | | | | | | | | | | | | | | | | | | | | | | | | | | | | | | | | | | | | | | |
| (e) | Includes recoupment of past waived and/or reimbursed fees with no financial impact to the expense ratio. |
| (f) | Interest expense and fees relate to TOB Trusts. See Note 4 of the Notes to Financial Statements for details. |
See notes to financial statements.
| | |
| 66 | | 2020 BLACKROCK ANNUAL REPORTTO SHAREHOLDERS |
Financial Highlights (continued)
(For a share outstanding throughout each period)
| | | | | | | | | | | | | | | | |
| | | BlackRock California Municipal
Opportunities Fund (continued) | |
| |
| | | Class K | |
| | | Year Ended May 31, | | | | | | Period from
01/25/18 (a)
to 05/31/18 | |
| | | 2020 | | | 2019 | | | | |
| | | | |
Net asset value, beginning of period | | $ | 12.71 | | | $ | 12.76 | | | | | | | $ | 12.71 | |
| | | | | | | | | | | | | | | | |
Net investment income(b) | | | 0.28 | | | | 0.34 | | | | | | | | 0.11 | |
Net realized and unrealized gain (loss) | | | (0.50 | ) | | | 0.19 | | | | | | | | 0.06 | |
| | | | | | | | | | | | | | | | |
Net increase (decrease) from investment operations | | | (0.22 | ) | | | 0.53 | | | | | | | | 0.17 | |
| | | | | | | | | | | | | | | | |
| | | | |
Distributions(c) | | | | | | | | | | | | | | | | |
From net investment income | | | (0.28 | ) | | | (0.34 | ) | | | | | | | (0.12 | ) |
From net realized gain | | | — | | | | (0.24 | ) | | | | | | | — | |
| | | | | | | | | | | | | | | | |
Total distributions | | | (0.28 | ) | | | (0.58 | ) | | | | | | | (0.12 | ) |
| | | | | | | | | | | | | | | | |
| | | | |
Net asset value, end of period | | $ | 12.21 | | | $ | 12.71 | | | | | | | $ | 12.76 | |
| | | | | | | | | | | | | | | | |
| | | | |
Total Return(d) | | | | | | | | | | | | | | | | |
Based on net asset value | | | (1.80 | )% | | | 4.33 | % | | | | | | | 1.31 | %(e) |
| | | | | | | | | | | | | | | | |
| | | | |
Ratios to Average Net Assets(f) | | | | | | | | | | | | | | | | |
Total expenses | | | 0.51 | %(g) | | | 0.58 | % | | | | | | | 0.54 | %(h)(i) |
| | | | | | | | | | | | | | | | |
Total expenses after fees waived and/or reimbursed and paid indirectly | | | 0.50 | % | | | 0.56 | % | | | | | | | 0.49 | %(h) |
| | | | | | | | | | | | | | | | |
Total expenses after fees waived and/or reimbursed and paid indirectly and excluding interest expense, fees and amortization of offering costs(j) | | | 0.38 | % | | | 0.39 | % | | | | | | | 0.39 | %(h) |
| | | | | | | | | | | | | | | | |
Net investment income | | | 2.19 | % | | | 2.71 | % | | | | | | | 2.76 | %(h) |
| | | | | | | | | | | | | | | | |
| | | | |
Supplemental Data | | | | | | | | | | | | | | | | |
Net assets, end of period (000) | | $ | 108,494 | | | $ | 113,480 | | | | | | | $ | 36,441 | |
| | | | | | | | | | | | | | | | |
Borrowings outstanding, end of period (000) | | $ | 148,145 | | | $ | 253,167 | | | | | | | $ | 141,267 | |
| | | | | | | | | | | | | | | | |
Portfolio turnover rate | | | 117 | % | | | 126 | % | | | | | | | 129 | % |
| | | | | | | | | | | | | | | | |
| (a) | Commencement of operations. |
| (b) | Based on average shares outstanding. |
| (c) | Distributions for annual periods determined in accordance with U.S. federal income tax regulations. |
| (d) | Where applicable, assumes the reinvestment of distributions. |
| (e) | Aggregate total return. |
| (f) | Excludes expenses incurred indirectly as a result of investments in underlying funds as follows: |
| | | | | | | | | | | | | | | | | | | | |
| | | For the Year Ended May 31, | | | | | | Period from
01/25/18 (a) to 05/31/18 | |
| | | 2020 | | | | | | 2019 | |
Investments in underlying funds | | | 0.02 | % | | | | | | | 0.02 | % | | | | | | | 0.01 | % |
| | | | | | | | | | | | | | | | | | | | |
| (g) | Includes recoupment of past waived and/or reimbursed fees with no financial impact to the expense ratio. |
| (i) | Offering costs were not annualized in the calculation of the expense ratios. If these expenses were annualized, the total expenses would have been 0.54%. |
| (j) | Interest expense and fees relate to TOB Trusts. See Note 4 of the Notes to Financial Statements for details. |
See notes to financial statements.
Financial Highlights (continued)
(For a share outstanding throughout each period)
| | | | | | | | | | | | | | | | | | | | |
| | | BlackRock New Jersey Municipal Bond Fund | |
| |
| | | Institutional | |
| |
| | | Year Ended May 31, | |
| | | 2020 | | | 2019 | | | 2018 | | | 2017 | | | 2016 | |
| | | | | |
Net asset value, beginning of year | | $ | 11.30 | | | $ | 11.05 | | | $ | 11.05 | | | $ | 11.38 | | | $ | 11.01 | |
| | | | | | | | | | | | | | | | | | | | |
Net investment income(a) | | | 0.37 | | | | 0.40 | | | | 0.40 | | | | 0.39 | | | | 0.40 | |
Net realized and unrealized gain (loss) | | | (0.46 | ) | | | 0.25 | | | | 0.00 | (b) | | | (0.33 | ) | | | 0.37 | |
| | | | | | | | | | | | | | | | | | | | |
Net increase (decrease) from investment operations | | | (0.09 | ) | | | 0.65 | | | | 0.40 | | | | 0.06 | | | | 0.77 | |
| | | | | | | | | | | | | | | | | | | | |
Distributions from net investment income(c) | | | (0.37 | ) | | | (0.40 | ) | | | (0.40 | ) | | | (0.39 | ) | | | (0.40 | ) |
| | | | | | | | | | | | | | | | | | | | |
| | | | | |
Net asset value, end of year | | $ | 10.84 | | | $ | 11.30 | | | $ | 11.05 | | | $ | 11.05 | | | $ | 11.38 | |
| | | | | | | | | | | | | | | | | | | | |
| | | | | |
Total Return(d) | | | | | | | | | | | | | | | | | | | | |
Based on net asset value | | | (0.89 | )% | | | 6.05 | % | | | 3.69 | % | | | 0.56 | % | | | 7.13 | % |
| | | | | | | | | | | | | | | | | | | | |
| | | | | |
Ratios to Average Net Assets(e) | | | | | | | | | | | | | | | | | | | | |
Total expenses | | | 0.81 | % | | | 0.85 | % | | | 0.84 | % | | | 0.80 | % | | | 0.81 | % |
| | | | | | | | | | | | | | | | | | | | |
Total expenses after fees waived and/or reimbursed and paid indirectly | | | 0.63 | % | | | 0.65 | % | | | 0.64 | % | | | 0.66 | % | | | 0.75 | % |
| | | | | | | | | | | | | | | | | | | | |
Total expenses after fees waived and/or reimbursed and paid indirectly and excluding interest expense, fees and amortization of offering costs(f) | | | 0.52 | % | | | 0.52 | % | | | 0.54 | % | | | 0.61 | % | | | 0.72 | % |
| | | | | | | | | | | | | | | | | | | | |
Net investment income | | | 3.27 | % | | | 3.65 | % | | | 3.60 | % | | | 3.51 | % | | | 3.58 | % |
| | | | | | | | | | | | | | | | | | | | |
| | | | | |
Supplemental Data | | | | | | | | | | | | | | | | | | | | |
Net assets, end of year (000) | | $ | 188,512 | | | $ | 178,716 | | | $ | 152,759 | | | $ | 141,585 | | | $ | 135,174 | |
| | | | | | | | | | | | | | | | | | | | |
Borrowings outstanding, end of year (000) | | $ | 22,054 | | | $ | 16,419 | | | $ | 16,419 | | | $ | 9,281 | | | $ | 9,281 | |
| | | | | | | | | | | | | | | | | | | | |
Portfolio turnover rate | | | 21 | % | | | 15 | % | | | 16 | % | | | 21 | % | | | 7 | % |
| | | | | | | | | | | | | | | | | | | | |
| (a) | Based on average shares outstanding. |
| (b) | Amount is less than $0.005 per share. |
| (c) | Distributions for annual periods determined in accordance with U.S. federal income tax regulations. |
| (d) | Where applicable, assumes the reinvestment of distributions. |
| (e) | Excludes expenses incurred indirectly as a result of investments in underlying funds as follows: |
| | | | | | | | | | | | | | | | | | | | | | | | | | | | | | | | | | | | | | | | |
| | | For the Year Ended May 31, | |
| | | 2020 | | | | | | 2019 | | | | | | 2018 | | | | | | 2017 | | | | | | 2016 | | | | |
Investments in underlying funds | | | 0.01 | % | | | | | | | 0.01 | % | | | | | | | — | % | | | | | | | 0.01 | % | | | | | | | — | % | | | | |
| | | | | | | | | | | | | | | | | | | | | | | | | | | | | | | | | | | | | | | | |
| (f) | Interest expense and fees relate to TOB Trusts. See Note 4 of the Notes to Financial Statements for details. |
See notes to financial statements.
| | |
| 68 | | 2020 BLACKROCK ANNUAL REPORTTO SHAREHOLDERS |
Financial Highlights (continued)
(For a share outstanding throughout each period)
| | | | | | | | | | | | | | | | | | | | |
| | | BlackRock New Jersey Municipal Bond Fund (continued) | |
| |
| | | Service | |
| |
| | | Year Ended May 31, | |
| | | 2020 | | | 2019 | | | 2018 | | | 2017 | | | 2016 | |
| | | | | |
Net asset value, beginning of year | | $ | 11.30 | | | $ | 11.05 | | | $ | 11.05 | | | $ | 11.38 | | | $ | 11.01 | |
| | | | | | | | | | | | | | | | | | | | |
Net investment income(a) | | | 0.34 | | | | 0.37 | | | | 0.37 | | | | 0.36 | | | | 0.38 | |
Net realized and unrealized gain (loss) | | | (0.46 | ) | | | 0.25 | | | | (0.00 | )(b) | | | (0.32 | ) | | | 0.38 | |
| | | | | | | | | | | | | | | | | | | | |
Net increase (decrease) from investment operations | | | (0.12 | ) | | | 0.62 | | | | 0.37 | | | | 0.04 | | | | 0.76 | |
| | | | | | | | | | | | | | | | | | | | |
Distributions from net investment income(c) | | | (0.34 | ) | | | (0.37 | ) | | | (0.37 | ) | | | (0.37 | ) | | | (0.39 | ) |
| | | | | | | | | | | | | | | | | | | | |
| | | | | |
Net asset value, end of year | | $ | 10.84 | | | $ | 11.30 | | | $ | 11.05 | | | $ | 11.05 | | | $ | 11.38 | |
| | | | | | | | | | | | | | | | | | | | |
| | | | | |
Total Return(d) | | | | | | | | | | | | | | | | | | | | |
Based on net asset value | | | (1.13 | )% | | | 5.79 | % | | | 3.43 | % | | | 0.36 | % | | | 7.00 | % |
| | | | | | | | | | | | | | | | | | | | |
| | | | | |
Ratios to Average Net Assets(e) | | | | | | | | | | | | | | | | | | | | |
Total expenses | | | 1.02 | % | | | 1.08 | % | | | 1.09 | % | | | 1.05 | % | | | 1.05 | % |
| | | | | | | | | | | | | | | | | | | | |
Total expenses after fees waived and/or reimbursed and paid indirectly | | | 0.88 | % | | | 0.90 | % | | | 0.89 | % | | | 0.86 | % | | | 0.87 | % |
| | | | | | | | | | | | | | | | | | | | |
Total expenses after fees waived and/or reimbursed and paid indirectly and excluding interest expense, fees and amortization of offering costs(f) | | | 0.77 | % | | | 0.77 | % | | | 0.79 | % | | | 0.82 | % | | | 0.84 | % |
| | | | | | | | | | | | | | | | | | | | |
Net investment income | | | 2.98 | % | | | 3.34 | % | | | 3.35 | % | | | 3.27 | % | | | 3.43 | % |
| | | | | | | | | | | | | | | | | | | | |
| | | | | |
Supplemental Data | | | | | | | | | | | | | | | | | | | | |
Net assets, end of year (000) | | $ | 7,466 | | | $ | 7,874 | | | $ | 7,921 | | | $ | 9,594 | | | $ | 10,514 | |
| | | | | | | | | | | | | | | | | | | | |
Borrowings outstanding, end of year (000) | | $ | 22,054 | | | $ | 16,419 | | | $ | 16,419 | | | $ | 9,281 | | | $ | 9,281 | |
| | | | | | | | | | | | | | | | | | | | |
Portfolio turnover rate | | | 21 | % | | | 15 | % | | | 16 | % | | | 21 | % | | | 7 | % |
| | | | | | | | | | | | | | | | | | | | |
| (a) | Based on average shares outstanding. |
| (b) | Amount is greater than $(0.005) per share. |
| (c) | Distributions for annual periods determined in accordance with U.S. federal income tax regulations. |
| (d) | Where applicable, assumes the reinvestment of distributions. |
| (e) | Excludes expenses incurred indirectly as a result of investments in underlying funds as follows: |
| | | | | | | | | | | | | | | | | | | | | | | | | | | | | | | | | | | | | | | | |
| | | For the Year Ended May 31, | |
| | | 2020 | | | | | | 2019 | | | | | | 2018 | | | | | | 2017 | | | | | | 2016 | | | | |
Investments in underlying funds | | | 0.01 | % | | | | | | | 0.01 | % | | | | | | | — | % | | | | | | | 0.01 | % | | | | | | | — | % | | | | |
| | | | | | | | | | | | | | | | | | | | | | | | | | | | | | | | | | | | | | | | |
| (f) | Interest expense and fees relate to TOB Trusts. See Note 4 of the Notes to Financial Statements for details. |
See notes to financial statements.
Financial Highlights (continued)
(For a share outstanding throughout each period)
| | | | | | | | | | | | | | | | | | | | |
| | | BlackRock New Jersey Municipal Bond Fund (continued) | |
| |
| | | Investor A | |
| |
| | | Year Ended May 31, | |
| | | 2020 | | | 2019 | | | 2018 | | | 2017 | | | 2016 | |
| | | | | |
Net asset value, beginning of year | | $ | 11.31 | | | $ | 11.06 | | | $ | 11.06 | | | $ | 11.39 | | | $ | 11.02 | |
| | | | | | | | | | | | | | | | | | | | |
Net investment income(a) | | | 0.34 | | | | 0.37 | | | | 0.37 | | | | 0.37 | | | | 0.38 | |
Net realized and unrealized gain (loss) | | | (0.46 | ) | | | 0.25 | | | | (0.00 | )(b) | | | (0.33 | ) | | | 0.38 | |
| | | | | | | | | | | | | | | | | | | | |
Net increase (decrease) from investment operations | | | (0.12 | ) | | | 0.62 | | | | 0.37 | | | | 0.04 | | | | 0.76 | |
| | | | | | | | | | | | | | | | | | | | |
Distributions from net investment income(c) | | | (0.34 | ) | | | (0.37 | ) | | | (0.37 | ) | | | (0.37 | ) | | | (0.39 | ) |
| | | | | | | | | | | | | | | | | | | | |
| | | | | |
Net asset value, end of year | | $ | 10.85 | | | $ | 11.31 | | | $ | 11.06 | | | $ | 11.06 | | | $ | 11.39 | |
| | | | | | | | | | | | | | | | | | | | |
| | | | | |
Total Return(d) | | | | | | | | | | | | | | | | | | | | |
Based on net asset value | | | (1.13 | )% | | | 5.79 | % | | | 3.43 | % | | | 0.36 | % | | | 6.99 | % |
| | | | | | | | | | | | | | | | | | | | |
| | | | | |
Ratios to Average Net Assets(e) | | | | | | | | | | | | | | | | | | | | |
Total expenses | | | 1.02 | % | | | 1.05 | % | | | 1.02 | % | | | 0.99 | % | | | 0.99 | % |
| | | | | | | | | | | | | | | | | | | | |
Total expenses after fees waived and/or reimbursed and paid indirectly | | | 0.88 | % | | | 0.90 | % | | | 0.89 | % | | | 0.86 | % | | | 0.87 | % |
| | | | | | | | | | | | | | | | | | | | |
Total expenses after fees waived and/or reimbursed and paid indirectly and excluding interest expense, fees and amortization of offering costs(f) | | | 0.77 | % | | | 0.77 | % | | | 0.79 | % | | | 0.82 | % | | | 0.84 | % |
| | | | | | | | | | | | | | | | | | | | |
Net investment income | | | 3.01 | % | | | 3.39 | % | | | 3.35 | % | | | 3.29 | % | | | 3.44 | % |
| | | | | | | | | | | | | | | | | | | | |
| | | | | |
Supplemental Data | | | | | | | | | | | | | | | | | | | | |
Net assets, end of year (000) | | $ | 106,048 | | | $ | 90,055 | | | $ | 72,565 | | | $ | 77,920 | | | $ | 81,164 | |
| | | | | | | | | | | | | | | | | | | | |
Borrowings outstanding, end of year (000) | | $ | 22,054 | | | $ | 16,419 | | | $ | 16,419 | | | $ | 9,281 | | | $ | 9,281 | |
| | | | | | | | | | | | | | | | | | | | |
Portfolio turnover rate | | | 21 | % | | | 15 | % | | | 16 | % | | | 21 | % | | | 7 | % |
| | | | | | | | | | | | | | | | | | | | |
| (a) | Based on average shares outstanding. |
| (b) | Amount is greater than $(0.005) per share. |
| (c) | Distributions for annual periods determined in accordance with U.S. federal income tax regulations. |
| (d) | Where applicable, excludes the effects of any sales charges and assumes the reinvestment of distributions. |
| (e) | Excludes expenses incurred indirectly as a result of investments in underlying funds as follows: |
| | | | | | | | | | | | | | | | | | | | | | | | | | | | | | | | | | | | | | | | |
| | | For the Year Ended May 31, | |
| | | 2020 | | | | | | 2019 | | | | | | 2018 | | | | | | 2017 | | | | | | 2016 | | | | |
Investments in underlying funds | | | 0.01 | % | | | | | | | 0.01 | % | | | | | | | — | % | | | | | | | 0.01 | % | | | | | | | — | % | | | | |
| | | | | | | | | | | | | | | | | | | | | | | | | | | | | | | | | | | | | | | | |
��
| (f) | Interest expense and fees relate to TOB Trusts. See Note 4 of the Notes to Financial Statements for details. |
See notes to financial statements.
| | |
| 70 | | 2020 BLACKROCK ANNUAL REPORTTO SHAREHOLDERS |
Financial Highlights (continued)
(For a share outstanding throughout each period)
| | | | | | | | | | | | | | | | | | | | |
| | | BlackRock New Jersey Municipal Bond Fund (continued) | |
| |
| | | Investor A1 | |
| |
| | | Year Ended May 31, | |
| | | 2020 | | | 2019 | | | 2018 | | | 2017 | | | 2016 | |
| | | | | |
Net asset value, beginning of year | | $ | 11.31 | | | $ | 11.06 | | | $ | 11.07 | | | $ | 11.39 | | | $ | 11.02 | |
| | | | | | | | | | | | | | | | | | | | |
Net investment income(a) | | | 0.36 | | | | 0.39 | | | | 0.39 | | | | 0.38 | | | | 0.40 | |
Net realized and unrealized gain (loss) | | | (0.46 | ) | | | 0.25 | | | | (0.01 | ) | | | (0.32 | ) | | | 0.37 | |
| | | | | | | | | | | | | | | | | | | | |
Net increase (decrease) from investment operations | | | (0.10 | ) | | | 0.64 | | | | 0.38 | | | | 0.06 | | | | 0.77 | |
| | | | | | | | | | | | | | | | | | | | |
Distributions from net investment income(b) | | | (0.36 | ) | | | (0.39 | ) | | | (0.39 | ) | | | (0.38 | ) | | | (0.40 | ) |
| | | | | | | | | | | | | | | | | | | | |
| | | | | |
Net asset value, end of year | | $ | 10.85 | | | $ | 11.31 | | | $ | 11.06 | | | $ | 11.07 | | | $ | 11.39 | |
| | | | | | | | | | | | | | | | | | | | |
| | | | | |
Total Return(c) | | | | | | | | | | | | | | | | | | | | |
Based on net asset value | | | (0.97 | )% | | | 5.95 | % | | | 3.49 | % | | | 0.59 | % | | | 7.12 | % |
| | | | | | | | | | | | | | | | | | | | |
| | | | | |
Ratios to Average Net Assets(d) | | | | | | | | | | | | | | | | | | | | |
Total expenses | | | 0.85 | % | | | 0.88 | % | | | 0.87 | % | | | 0.83 | % | | | 0.83 | % |
| | | | | | | | | | | | | | | | | | | | |
Total expenses after fees waived and/or reimbursed and paid indirectly | | | 0.73 | % | | | 0.74 | % | | | 0.74 | % | | | 0.72 | % | | | 0.75 | % |
| | | | | | | | | | | | | | | | | | | | |
Total expenses after fees waived and/or reimbursed and paid indirectly and excluding interest expense, fees and amortization of offering costs(e) | | | 0.61 | % | | | 0.62 | % | | | 0.64 | % | | | 0.68 | % | | | 0.72 | % |
| | | | | | | | | | | | | | | | | | | | |
Net investment income | | | 3.16 | % | | | 3.54 | % | | | 3.50 | % | | | 3.43 | % | | | 3.57 | % |
| | | | | | | | | | | | | | | | | | | | |
| | | | | |
Supplemental Data | | | | | | | | | | | | | | | | | | | | |
Net assets, end of year (000) | | $ | 17,241 | | | $ | 19,760 | | | $ | 20,534 | | | $ | 22,697 | | | $ | 26,092 | |
| | | | | | | | | | | | | | | | | | | | |
Borrowings outstanding, end of year (000) | | $ | 22,054 | | | $ | 16,419 | | | $ | 16,419 | | | $ | 9,281 | | | $ | 9,281 | |
| | | | | | | | | | | | | | | | | | | | |
Portfolio turnover rate | | | 21 | % | | | 15 | % | | | 16 | % | | | 21 | % | | | 7 | % |
| | | | | | | | | | | | | | | | | | | | |
| (a) | Based on average shares outstanding. |
| (b) | Distributions for annual periods determined in accordance with U.S. federal income tax regulations. |
| (c) | Where applicable, excludes the effects of any sales charges and assumes the reinvestment of distributions. |
| (d) | Excludes expenses incurred indirectly as a result of investments in underlying funds as follows: |
| | | | | | | | | | | | | | | | | | | | | | | | | | | | | | | | | | | | | | | | |
| | | For the Year Ended May 31, | |
| | | 2020 | | | | | | 2019 | | | | | | 2018 | | | | | | 2017 | | | | | | 2016 | | | | |
Investments in underlying funds | | | 0.01 | % | | | | | | | 0.01 | % | | | | | | | — | % | | | | | | | 0.01 | % | | | | | | | — | % | | | | |
| | | | | | | | | | | | | | | | | | | | | | | | | | | | | | | | | | | | | | | | |
| (e) | Interest expense and fees relate to TOB Trusts. See Note 4 of the Notes to Financial Statements for details. |
See notes to financial statements.
Financial Highlights (continued)
(For a share outstanding throughout each period)
| | | | | | | | | | | | | | | | | | | | |
| | | BlackRock New Jersey Municipal Bond Fund (continued) | |
| |
| | | Investor C | |
| |
| | | Year Ended May 31, | |
| | | 2020 | | | 2019 | | | 2018 | | | 2017 | | | 2016 | |
| | | | | |
Net asset value, beginning of year | | $ | 11.30 | | | $ | 11.05 | | | $ | 11.05 | | | $ | 11.38 | | | $ | 11.00 | |
| | | | | | | | | | | | | | | | | | | | |
Net investment income(a) | | | 0.25 | | | | 0.29 | | | | 0.29 | | | | 0.28 | | | | 0.30 | |
Net realized and unrealized gain (loss) | | | (0.45 | ) | | | 0.25 | | | | 0.00 | (b) | | | (0.33 | ) | | | 0.38 | |
| | | | | | | | | | | | | | | | | | | | |
Net increase (decrease) from investment operations | | | (0.20 | ) | | | 0.54 | | | | 0.29 | | | | (0.05 | ) | | | 0.68 | |
| | | | | | | | | | | | | | | | | | | | |
Distributions from net investment income(c) | | | (0.26 | ) | | | (0.29 | ) | | | (0.29 | ) | | | (0.28 | ) | | | (0.30 | ) |
| | | | | | | | | | | | | | | | | | | | |
| | | | | |
Net asset value, end of year | | $ | 10.84 | | | $ | 11.30 | | | $ | 11.05 | | | $ | 11.05 | | | $ | 11.38 | |
| | | | | | | | | | | | | | | | | | | | |
| | | | | |
Total Return(d) | | | | | | | | | | | | | | | | | | | | |
Based on net asset value | | | (1.87 | )% | | | 5.00 | % | | | 2.65 | % | | | (0.41 | )% | | | 6.28 | % |
| | | | | | | | | | | | | | | | | | | | |
| | | | | |
Ratios to Average Net Assets(e) | | | | | | | | | | | | | | | | | | | | |
Total expenses | | | 1.76 | % | | | 1.79 | % | | | 1.78 | % | | | 1.73 | % | | | 1.73 | % |
| | | | | | | | | | | | | | | | | | | | |
Total expenses after fees waived and/or reimbursed and paid indirectly | | | 1.63 | % | | | 1.64 | % | | | 1.64 | % | | | 1.62 | % | | | 1.64 | % |
| | | | | | | | | | | | | | | | | | | | |
Total expenses after fees waived and/or reimbursed and paid indirectly and excluding interest expense, fees and amortization of offering costs(f) | | | 1.52 | % | | | 1.52 | % | | | 1.54 | % | | | 1.57 | % | | | 1.61 | % |
| | | | | | | | | | | | | | | | | | | | |
Net investment income | | | 2.26 | % | | | 2.64 | % | | | 2.60 | % | | | 2.53 | % | | | 2.67 | % |
| | | | | | | | | | | | | | | | | | | | |
| | | | | |
Supplemental Data | | | | | | | | | | | | | | | | | | | | |
Net assets, end of year (000) | | $ | 32,313 | | | $ | 31,234 | | | $ | 29,509 | | | $ | 29,276 | | | $ | 30,810 | |
| | | | | | | | | | | | | | | | | | | | |
Borrowings outstanding, end of year (000) | | $ | 22,054 | | | $ | 16,419 | | | $ | 16,419 | | | $ | 9,281 | | | $ | 9,281 | |
| | | | | | | | | | | | | | | | | | | | |
Portfolio turnover rate | | | 21 | % | | | 15 | % | | | 16 | % | | | 21 | % | | | 7 | % |
| | | | | | | | | | | | | | | | | | | | |
| (a) | Based on average shares outstanding. |
| (b) | Amount is less than $0.005 per share. |
| (c) | Distributions for annual periods determined in accordance with U.S. federal income tax regulations. |
| (d) | Where applicable, excludes the effects of any sales charges and assumes the reinvestment of distributions. |
| (e) | Excludes expenses incurred indirectly as a result of investments in underlying funds as follows: |
| | | | | | | | | | | | | | | | | | | | | | | | | | | | | | | | | | | | | | | | |
| | | For the Year Ended May 31, | |
| | | 2020 | | | | | | 2019 | | | | | | 2018 | | | | | | 2017 | | | | | | 2016 | | | | |
Investments in underlying funds | | | 0.01 | % | | | | | | | 0.01 | % | | | | | | | — | % | | | | | | | 0.01 | % | | | | | | | — | % | | | | |
| | | | | | | | | | | | | | | | | | | | | | | | | | | | | | | | | | | | | | | | |
| (f) | Interest expense and fees relate to TOB Trusts. See Note 4 of the Notes to Financial Statements for details. |
See notes to financial statements.
| | |
| 72 | | 2020 BLACKROCK ANNUAL REPORTTO SHAREHOLDERS |
Financial Highlights (continued)
(For a share outstanding throughout each period)
| | | | | | | | | | | | | | | | |
| | | BlackRock New Jersey
Municipal Bond Fund (continued) | |
| |
| | | Class K | |
| | | |
| | | Year Ended May 31, | | | | | | Period from
01/25/18 (a)
to 05/31/18 | |
| | | 2020 | | | 2019 | | | | |
| | | | | |
Net asset value, beginning of period | | $ | 11.30 | | | $ | 11.04 | | | | | | | $ | 11.11 | |
| | | | | | | | | | | | | | | | |
Net investment income(b) | | | 0.37 | | | | 0.41 | | | | | | | | 0.14 | |
Net realized and unrealized gain (loss) | | | (0.47 | ) | | | 0.26 | | | | | | | | (0.07 | ) |
| | | | | | | | | | | | | | | | |
Net increase from investment operations | | | (0.10 | ) | | | 0.67 | | | | | | | | 0.07 | |
| | | | | | | | | | | | | | | | |
Distributions from net investment income(c) | | | (0.37 | ) | | | (0.41 | ) | | | | | | | (0.14 | ) |
| | | | | | | | | | | | | | | | |
| | | | |
Net asset value, end of period | | $ | 10.83 | | | $ | 11.30 | | | | | | | $ | 11.04 | |
| | | | | | | | | | | | | | | | |
| | | | |
Total Return(d) | | | | | | | | | | | | | | | | |
Based on net asset value | | | (0.93 | )% | | | 6.20 | % | | | | | | | 0.66 | %(e) |
| | | | | | | | | | | | | | | | |
| | | | |
Ratios to Average Net Assets(f) | | | | | | | | | | | | | | | | |
Total expenses | | | 0.72 | % | | | 0.75 | % | | | | | | | 0.74 | %(g)(h) |
| | | | | | | | | | | | | | | | |
Total expenses after fees waived and/or reimbursed and paid indirectly | | | 0.58 | % | | | 0.60 | % | | | | | | | 0.57 | %(g) |
| | | | | | | | | | | | | | | | |
Total expenses after fees waived and/or reimbursed and paid indirectly and excluding interest expense, fees and amortization of offering costs(i) | | | 0.47 | % | | | 0.47 | % | | | | | | | 0.47 | %(g) |
| | | | | | | | | | | | | | | | |
Net investment income | | | 3.32 | % | | | 3.70 | % | | | | | | | 3.88 | %(g) |
| | | | | | | | | | | | | | | | |
| | | | |
Supplemental Data | | | | | | | | | | | | | | | | |
Net assets, end of period (000) | | $ | 2,075 | | | $ | 1,660 | | | | | | | $ | 1,776 | |
| | | | | | | | | | | | | | | | |
Borrowings outstanding, end of period (000) | | $ | 22,054 | | | $ | 16,419 | | | | | | | $ | 16,419 | |
| | | | | | | | | | | | | | | | |
Portfolio turnover rate | | | 21 | % | | | 15 | % | | | | | | | 16 | % |
| | | | | | | | | | | | | | | | |
| (a) | Commencement of operations. |
| (b) | Based on average shares outstanding. |
| (c) | Distributions for annual periods determined in accordance with U.S. federal income tax regulations. |
| (d) | Where applicable, assumes the reinvestment of distributions. |
| (e) | Aggregate total return. |
| (f) | Excludes expenses incurred indirectly as a result of investments in underlying funds as follows: |
| | | | | | | | | | | | | | | | | | | | |
| | | For the
Year Ended May 31, | | | | | | Period from
01/25/18 to 05/31/18 (a) | |
| | | 2020 | | | | | | 2019 | |
Investments in underlying funds | | | 0.01 | % | | | | | | | 0.01 | % | | | | | | | — | % |
| | | | | | | | | | | | | | | | | | | | |
| (h) | Offering costs were not annualized in the calculation of the expense ratios. If these expenses were annualized, the total expenses would have been 0.74%. |
| (i) | Interest expense and fees relate to TOB Trusts. See Note 4 of the Notes to Financial Statements for details. |
See notes to financial statements.
Financial Highlights (continued)
(For a share outstanding throughout each period)
| | | | | | | | | | | | | | | | | | | | |
| | | BlackRock Pennsylvania Municipal Bond Fund | |
| |
| | | Institutional | |
| |
| | | Year Ended May 31, | |
| | | 2020 | | | 2019 | | | 2018 | | | 2017 | | | 2016 | |
| | | | | |
Net asset value, beginning of year | | $ | 11.11 | | | $ | 10.98 | | | $ | 11.21 | | | $ | 11.58 | | | $ | 11.31 | |
| | | | | | | | | | | | | | | | | | | | |
Net investment income(a) | | | 0.38 | | | | 0.43 | | | | 0.45 | | | | 0.46 | | | | 0.46 | |
Net realized and unrealized gain (loss) | | | (0.36 | ) | | | 0.13 | | | | (0.23 | ) | | | (0.37 | ) | | | 0.27 | |
| | | | | | | | | | | | | | | | | | | | |
Net increase from investment operations | | | 0.02 | | | | 0.56 | | | | 0.22 | | | | 0.09 | | | | 0.73 | |
| | | | | | | | | | | | | | | | | | | | |
Distributions from net investment income(b) | | | (0.38 | ) | | | (0.43 | ) | | | (0.45 | ) | | | (0.46 | ) | | | (0.46 | ) |
| | | | | | | | | | | | | | | | | | | | |
| | | | | |
Net asset value, end of year | | $ | 10.75 | | | $ | 11.11 | | | $ | 10.98 | | | $ | 11.21 | | | $ | 11.58 | |
| | | | | | | | | | | | | | | | | | | | |
| | | | | |
Total Return(c) | | | | | | | | | | | | | | | | | | | | |
Based on net asset value | | | 0.14 | % | | | 5.22 | % | | | 2.02 | % | | | 0.81 | % | | | 6.59 | % |
| �� | | | | | | | | | | | | | | | | | | | |
| | | | | |
Ratios to Average Net Assets | | | | | | | | | | | | | | | | | | | | |
Total expenses | | | 0.93 | %(d) | | | 1.04 | % | | | 0.97 | % | | | 0.95 | % | | | 0.87 | % |
| | | | | | | | | | | | | | | | | | | | |
Total expenses after fees waived and/or reimbursed and paid indirectly | | | 0.75 | %(d) | | | 0.84 | % | | | 0.78 | % | | | 0.78 | % | | | 0.79 | % |
| | | | | | | | | | | | | | | | | | | | |
Total expenses after fees waived and/or reimbursed and paid indirectly and excluding interest expense and fees, and amortization of offering costs(e) | | | 0.54 | %(d) | | | 0.54 | % | | | 0.55 | % | | | 0.61 | % | | | 0.71 | % |
| | | | | | | | | | | | | | | | | | | | |
Net investment income | | | 3.44 | %(d) | | | 3.93 | % | | | 4.06 | % | | | 4.05 | % | | | 4.04 | % |
| | | | | | | | | | | | | | | | | | | | |
| | | | | |
Supplemental Data | | | | | | | | | | | | | | | | | | | | |
Net assets, end of year (000) | | $ | 370,399 | | | $ | 379,911 | | | $ | 356,315 | | | $ | 298,557 | | | $ | 327,314 | |
| | | | | | | | | | | | | | | | | | | | |
Borrowings outstanding, end of year (000) | | $ | 64,784 | | | $ | 64,404 | | | $ | 70,199 | | | $ | 59,064 | | | $ | 49,627 | |
| | | | | | | | | | | | | | | | | | | | |
Portfolio turnover rate | | | 26 | % | | | 23 | % | | | 17 | % | | | 18 | % | | | 19 | % |
| | | | | | | | | | | | | | | | | | | | |
| (a) | Based on average shares outstanding. |
| (b) | Distributions for annual periods determined in accordance with U.S. federal income tax regulations. |
| (c) | Where applicable, assumes the reinvestment of distributions. |
| (d) | Excludes 0.01% of expenses incurred indirectly as a result of investments in underlying funds. |
| (e) | Interest expense and fees relate to TOB Trusts. See Note 4 of the Notes to Financial Statements for details. |
See notes to financial statements.
| | |
| 74 | | 2020 BLACKROCK ANNUAL REPORTTO SHAREHOLDERS |
Financial Highlights (continued)
(For a share outstanding throughout each period)
| | | | | | | | | | | | | | | | | | | | |
| | | BlackRock Pennsylvania Municipal Bond Fund (continued) | |
| |
| | | Service | |
| |
| | | Year Ended May 31, | |
| | | 2020 | | | 2019 | | | 2018 | | | 2017 | | | 2016 | |
| | | | | |
Net asset value, beginning of year | | $ | 11.13 | | | $ | 10.99 | | | $ | 11.22 | | | $ | 11.59 | | | $ | 11.31 | |
| | | | | | | | | | | | | | | | | | | | |
Net investment income(a) | | | 0.35 | | | | 0.40 | | | | 0.42 | | | | 0.43 | | | | 0.44 | |
Net realized and unrealized gain (loss) | | | (0.37 | ) | | | 0.14 | | | | (0.23 | ) | | | (0.37 | ) | | | 0.28 | |
| | | | | | | | | | | | | | | | | | | | |
Net increase (decrease) from investment operations | | | (0.02 | ) | | | 0.54 | | | | 0.19 | | | | 0.06 | | | | 0.72 | |
| | | | | | | | | | | | | | | | | | | | |
Distributions from net investment income(b) | | | (0.35 | ) | | | (0.40 | ) | | | (0.42 | ) | | | (0.43 | ) | | | (0.44 | ) |
| | | | | | | | | | | | | | | | | | | | |
| | | | | |
Net asset value, end of year | | $ | 10.76 | | | $ | 11.13 | | | $ | 10.99 | | | $ | 11.22 | | | $ | 11.59 | |
| | | | | | | | | | | | | | | | | | | | |
| | | | | |
Total Return(c) | | | | | | | | | | | | | | | | | | | | |
Based on net asset value | | | (0.20 | )% | | | 5.05 | % | | | 1.76 | % | | | 0.59 | % | | | 6.50 | % |
| | | | | | | | | | | | | | | | | | | | |
| | | | | |
Ratios to Average Net Assets | | | | | | | | | | | | | | | | | | | | |
Total expenses | | | 1.14 | %(d) | | | 1.26 | % | | | 1.19 | % | | | 1.13 | % | | | 1.12 | % |
| | | | | | | | | | | | | | | | | | | | |
Total expenses after fees waived and/or reimbursed and paid indirectly | | | 1.00 | %(d) | | | 1.09 | % | | | 1.03 | % | | | 1.00 | % | | | 0.97 | % |
| | | | | | | | | | | | | | | | | | | | |
Total expenses after fees waived and/or reimbursed and paid indirectly and excluding interest expense and fees(e) | | | 0.79 | %(d) | | | 0.79 | % | | | 0.80 | % | | | 0.83 | % | | | 0.89 | % |
| | | | | | | | | | | | | | | | | | | | |
Net investment income | | | 3.19 | %(d) | | | 3.67 | % | | | 3.81 | % | | | 3.84 | % | | | 3.85 | % |
| | | | | | | | | | | | | | | | | | | | |
| | | | | |
Supplemental Data | | | | | | | | | | | | | | | | | | | | |
Net assets, end of year (000) | | $ | 1,986 | | | $ | 2,080 | | | $ | 1,783 | | | $ | 1,427 | | | $ | 1,217 | |
| | | | | | | | | | | | | | | | | | | | |
Borrowings outstanding, end of year (000) | | $ | 64,784 | | | $ | 64,404 | | | $ | 70,199 | | | $ | 59,064 | | | $ | 49,627 | |
| | | | | | | | | | | | | | | | | | | | |
Portfolio turnover rate | | | 26 | % | | | 23 | % | | | 17 | % | | | 18 | % | | | 19 | % |
| | | | | | | | | | | | | | | | | | | | |
| (a) | Based on average shares outstanding. |
| (b) | Distributions for annual periods determined in accordance with U.S. federal income tax regulations. |
| (c) | Where applicable, assumes the reinvestment of distributions. |
| (d) | Excludes 0.01% of expenses incurred indirectly as a result of investments in underlying funds. |
| (e) | Interest expense and fees relate to TOB Trusts. See Note 4 of the Notes to Financial Statements for details. |
See notes to financial statements.
Financial Highlights (continued)
(For a share outstanding throughout each period)
| | | | | | | | | | | | | | | | | | | | |
| | | BlackRock Pennsylvania Municipal Bond Fund (continued) | |
| |
| | | Investor A | |
| |
| | | Year Ended May 31, | |
| | | 2020 | | | 2019 | | | 2018 | | | 2017 | | | 2016 | |
| | | | | |
Net asset value, beginning of year | | $ | 11.13 | | | $ | 10.99 | | | $ | 11.22 | | | $ | 11.59 | | | $ | 11.32 | |
| | | | | | | | | | | | | | | | | | | | |
Net investment income(a) | | | 0.35 | | | | 0.40 | | | | 0.42 | | | | 0.43 | | | | 0.44 | |
Net realized and unrealized gain (loss) | | | (0.37 | ) | | | 0.14 | | | | (0.23 | ) | | | (0.37 | ) | | | 0.27 | |
| | | | | | | | | | | | | | | | | | | | |
Net increase (decrease) from investment operations | | | (0.02 | ) | | | 0.54 | | | | 0.19 | | | | 0.06 | | | | 0.71 | |
| | | | | | | | | | | | | | | | | | | | |
Distributions from net investment income(b) | | | (0.35 | ) | | | (0.40 | ) | | | (0.42 | ) | | | (0.43 | ) | | | (0.44 | ) |
| | | | | | | | | | | | | | | | | | | | |
| | | | | |
Net asset value, end of year | | $ | 10.76 | | | $ | 11.13 | | | $ | 10.99 | | | $ | 11.22 | | | $ | 11.59 | |
| | | | | | | | | | | | | | | | | | | | |
| | | | | |
Total Return(c) | | | | | | | | | | | | | | | | | | | | |
Based on net asset value | | | (0.20 | )% | | | 5.05 | % | | | 1.76 | % | | | 0.59 | % | | | 6.40 | % |
| | | | | | | | | | | | | | | | | | | | |
| | | | | |
Ratios to Average Net Assets | | | | | | | | | | | | | | | | | | | | |
Total expenses | | | 1.09 | %(d) | | | 1.19 | % | | | 1.16 | % | | | 1.11 | % | | | 1.04 | % |
| | | | | | | | | | | | | | | | | | | | |
Total expenses after fees waived and/or reimbursed and paid indirectly | | | 1.00 | %(d) | | | 1.09 | % | | | 1.03 | % | | | 1.00 | % | | | 0.97 | % |
| | | | | | | | | | | | | | | | | | | | |
Total expenses after fees waived and/or reimbursed and paid indirectly and excluding interest expense and fees(e) | | | 0.79 | %(d) | | | 0.79 | % | | | 0.80 | % | | | 0.83 | % | | | 0.89 | % |
| | | | | | | | | | | | | | | | | | | | |
Net investment income | | | 3.19 | %(d) | | | 3.67 | % | | | 3.82 | % | | | 3.83 | % | | | 3.85 | % |
| | | | | | | | | | | | | | | | | | | | |
| | | | | |
Supplemental Data | | | | | | | | | | | | | | | | | | | | |
Net assets, end of year (000) | | $ | 131,336 | | | $ | 110,756 | | | $ | 98,414 | | | $ | 130,405 | | | $ | 88,994 | |
| | | | | | | | | | | | | | | | | | | | |
Borrowings outstanding, end of year (000) | | $ | 64,784 | | | $ | 64,404 | | | $ | 70,199 | | | $ | 59,064 | | | $ | 49,627 | |
| | | | | | | | | | | | | | | | | | | | |
Portfolio turnover rate | | | 26 | % | | | 23 | % | | | 17 | % | | | 18 | % | | | 19 | % |
| | | | | | | | | | | | | | | | | | | | |
| (a) | Based on average shares outstanding. |
| (b) | Distributions for annual periods determined in accordance with U.S. federal income tax regulations. |
| (c) | Where applicable, excludes the effects of any sales charges and assumes the reinvestment of distributions. |
| (d) | Excludes 0.01% of expenses incurred indirectly as a result of investments in underlying funds. |
| (e) | Interest expense and fees relate to TOB Trusts. See Note 4 of the Notes to Financial Statements for details. |
See notes to financial statements.
| | |
| 76 | | 2020 BLACKROCK ANNUAL REPORTTO SHAREHOLDERS |
Financial Highlights (continued)
(For a share outstanding throughout each period)
| | | | | | | | | | | | | | | | | | | | |
| | | BlackRock Pennsylvania Municipal Bond Fund (continued) | |
| |
| | | Investor A1 | |
| |
| | | Year Ended May 31, | |
| | | 2020 | | | 2019 | | | 2018 | | | 2017 | | | 2016 | |
| | | | | |
Net asset value, beginning of year | | $ | 11.13 | | | $ | 11.00 | | | $ | 11.22 | | | $ | 11.60 | | | $ | 11.33 | |
| | | | | | | | | | | | | | | | | | | | |
Net investment income(a) | | | 0.37 | | | | 0.42 | | | | 0.44 | | | | 0.45 | | | | 0.46 | |
Net realized and unrealized gain (loss) | | | (0.36 | ) | | | 0.13 | | | | (0.22 | ) | | | (0.38 | ) | | | 0.27 | |
| | | | | | | | | | | | | | | | | | | | |
Net increase from investment operations | | | 0.01 | | | | 0.55 | | | | 0.22 | | | | 0.07 | | | | 0.73 | |
| | | | | | | | | | | | | | | | | | | | |
Distributions from net investment income(b) | | | (0.37 | ) | | | (0.42 | ) | | | (0.44 | ) | | | (0.45 | ) | | | (0.46 | ) |
| | | | | | | | | | | | | | | | | | | | |
| | | | | |
Net asset value, end of year | | $ | 10.77 | | | $ | 11.13 | | | $ | 11.00 | | | $ | 11.22 | | | $ | 11.60 | |
| | | | | | | | | | | | | | | | | | | | |
| | | | | |
Total Return(c) | | | | | | | | | | | | | | | | | | | | |
Based on net asset value | | | 0.04 | % | | | 5.11 | % | | | 2.01 | % | | | 0.66 | % | | | 6.57 | % |
| | | | | | | | | | | | | | | | | | | | |
| | | | | |
Ratios to Average Net Assets | | | | | | | | | | | | | | | | | | | | |
Total expenses | | | 0.96 | %(d) | | | 1.05 | % | | | 0.98 | % | | | 0.94 | % | | | 0.87 | % |
| | | | | | | | | | | | | | | | | | | | |
Total expenses after fees waived and/or reimbursed and paid indirectly | | | 0.85 | %(d) | | | 0.94 | % | | | 0.88 | % | | | 0.85 | % | | | 0.81 | % |
| | | | | | | | | | | | | | | | | | | | |
Total expenses after fees waived and/or reimbursed and paid indirectly and excluding interest expense and fees(e) | | | 0.64 | %(d) | | | 0.64 | % | | | 0.65 | % | | | 0.68 | % | | | 0.73 | % |
| | | | | | | | | | | | | | | | | | | | |
Net investment income | | | 3.34 | %(d) | | | 3.83 | % | | | 3.96 | % | | | 3.99 | % | | | 4.02 | % |
| | | | | | | | | | | | | | | | | | | | |
| | | | | |
Supplemental Data | | | | | | | | | | | | | | | | | | | | |
Net assets, end of year (000) | | $ | 9,462 | | | $ | 10,502 | | | $ | 13,763 | | | $ | 15,266 | | | $ | 16,030 | |
| | | | | | | | | | | | | | | | | | | | |
Borrowings outstanding, end of year (000) | | $ | 64,784 | | | $ | 64,404 | | | $ | 70,199 | | | $ | 59,064 | | | $ | 49,627 | |
| | | | | | | | | | | | | | | | | | | | |
Portfolio turnover rate | | | 26 | % | | | 23 | % | | | 17 | % | | | 18 | % | | | 19 | % |
| | | | | | | | | | | | | | | | | | | | |
| (a) | Based on average shares outstanding. |
| (b) | Distributions for annual periods determined in accordance with U.S. federal income tax regulations. |
| (c) | Where applicable, excludes the effects of any sales charges and assumes the reinvestment of distributions. |
| (d) | Excludes 0.01% of expenses incurred indirectly as a result of investments in underlying funds. |
| (e) | Interest expense and fees relate to TOB Trusts. See Note 4 of the Notes to Financial Statements for details. |
See notes to financial statements.
Financial Highlights (continued)
(For a share outstanding throughout each period)
| | | | | | | | | | | | | | | | | | | | |
| | | BlackRock Pennsylvania Municipal Bond Fund (continued) | |
| |
| | | Investor C | |
| |
| | | Year Ended May 31, | |
| | | 2020 | | | 2019 | | | 2018 | | | 2017 | | | 2016 | |
| | | | | |
Net asset value, beginning of year | | $ | 11.12 | | | $ | 10.99 | | | $ | 11.22 | | | $ | 11.59 | | | $ | 11.32 | |
| | | | | | | | | | | | | | | | | | | | |
Net investment income(a) | | | 0.27 | | | | 0.32 | | | | 0.34 | | | | 0.35 | | | | 0.35 | |
Net realized and unrealized gain (loss) | | | (0.36 | ) | | | 0.13 | | | | (0.23 | ) | | | (0.37 | ) | | | 0.27 | |
| | | | | | | | | | | | | | | | | | | | |
Net increase (decrease) from investment operations | | | (0.09 | ) | | | 0.45 | | | | 0.11 | | | | (0.02 | ) | | | 0.62 | |
| | | | | | | | | | | | | | | | | | | | |
Distributions from net investment income(b) | | | (0.27 | ) | | | (0.32 | ) | | | (0.34 | ) | | | (0.35 | ) | | | (0.35 | ) |
| | | | | | | | | | | | | | | | | | | | |
| | | | | |
Net asset value, end of year | | $ | 10.76 | | | $ | 11.12 | | | $ | 10.99 | | | $ | 11.22 | | | $ | 11.59 | |
| | | | | | | | | | | | | | | | | | | | |
| | | | | |
Total Return(c) | | | | | | | | | | | | | | | | | | | | |
Based on net asset value | | | (0.85 | )% | | | 4.18 | % | | | 1.01 | % | | | (0.17 | )% | | | 5.57 | % |
| | | | | | | | | | | | | | | | | | | | |
| | | | | |
Ratios to Average Net Assets | | | | | | | | | | | | | | | | | | | | |
Total expenses | | | 1.85 | %(d) | | | 1.95 | % | | | 1.87 | % | | | 1.84 | % | | | 1.76 | % |
| | | | | | | | | | | | | | | | | | | | |
Total expenses after fees waived and/or reimbursed and paid indirectly | | | 1.75 | %(d) | | | 1.84 | % | | | 1.78 | % | | | 1.76 | % | | | 1.76 | % |
| | | | | | | | | | | | | | | | | | | | |
Total expenses after fees waived and/or reimbursed and paid indirectly and excluding interest expense and fees(e) | | | 1.54 | %(d) | | | 1.54 | % | | | 1.54 | % | | | 1.59 | % | | | 1.68 | % |
| | | | | | | | | | | | | | | | | | | | |
Net investment income | | | 2.44 | %(d) | | | 2.93 | % | | | 3.06 | % | | | 3.08 | % | | | 3.07 | % |
| | | | | | | | | | | | | | | | | | | | |
| | | | | |
Supplemental Data | | | | | | | | | | | | | | | | | | | | |
Net assets, end of year (000) | | $ | 29,078 | | | $ | 29,936 | | | $ | 32,105 | | | $ | 33,427 | | | $ | 34,195 | |
| | | | | | | | | | | | | | | | | | | | |
Borrowings outstanding, end of year (000) | | $ | 64,784 | | | $ | 64,404 | | | $ | 70,199 | | | $ | 59,064 | | | $ | 49,627 | |
| | | | | | | | | | | | | | | | | | | | |
Portfolio turnover rate | | | 26 | % | | | 23 | % | | | 17 | % | | | 18 | % | | | 19 | % |
| | | | | | | | | | | | | | | | | | | | |
| (a) | Based on average shares outstanding. |
| (b) | Distributions for annual periods determined in accordance with U.S. federal income tax regulations. |
| (c) | Where applicable, excludes the effects of any sales charges and assumes the reinvestment of distributions. |
| (d) | Excludes 0.01% of expenses incurred indirectly as a result of investments in underlying funds. |
| (e) | Interest expense and fees relate to TOB Trusts. See Note 4 of the Notes to Financial Statements for details. |
See notes to financial statements.
| | |
| 78 | | 2020 BLACKROCK ANNUAL REPORTTO SHAREHOLDERS |
Financial Highlights (continued)
(For a share outstanding throughout each period)
| | | | | | | | | | | | |
| | | BlackRock Pennsylvania
Municipal Bond Fund (continued) | |
| |
| | | Class K | |
| | |
| | | Year Ended May 31, | | | Period from
01/25/18 (a)
to 05/31/18 | |
| | | 2020 | | | 2019 | |
| | | |
Net asset value, beginning of period | | $ | 11.11 | | | $ | 10.98 | | | $ | 11.07 | |
| | | | | | | | | | | | |
Net investment income(b) | | | 0.38 | | | | 0.43 | | | | 0.15 | |
Net realized and unrealized gain (loss) | | | (0.35 | ) | | | 0.13 | | | | (0.09 | ) |
| | | | | | | | | | | | |
Net increase from investment operations | | | 0.03 | | | | 0.56 | | | | 0.06 | |
| | | | | | | | | | | | |
Distributions from net investment income(c) | | | (0.39 | ) | | | (0.43 | ) | | | (0.15 | ) |
| | | | | | | | | | | | |
| | | |
Net asset value, end of period | | $ | 10.75 | | | $ | 11.11 | | | $ | 10.98 | |
| | | | | | | | | | | | |
|
Total Return(d) | |
Based on net asset value | | | 0.19 | % | | | 5.28 | % | | | 0.60 | %(e) |
| | | | | | | | | | | | |
|
Ratios to Average Net Assets | |
Total expenses | | | 0.80 | %(f) | | | 0.90 | % | | | 0.84 | %(g)(h) |
| | | | | | | | | | | | |
Total expenses after fees waived and/or reimbursed and paid indirectly | | | 0.70 | %(f) | | | 0.79 | % | | | 0.72 | %(g) |
| | | | | | | | | | | | |
Total expenses after fees waived and/or reimbursed and paid indirectly and excluding interest expense and fees(i) | | | 0.49 | %(f) | | | 0.49 | % | | | 0.49 | %(g) |
| | | | | | | | | | | | |
Net investment income | | | 3.48 | %(f) | | | 3.98 | % | | | 4.41 | %(g) |
| | | | | | | | | | | | |
|
Supplemental Data | |
Net assets, end of period (000) | | $ | 3,982 | | | $ | 2,329 | | | $ | 2,488 | |
| | | | | | | | | | | | |
Borrowings outstanding, end of period (000) | | $ | 64,784 | | | $ | 64,404 | | | $ | 70,199 | |
| | | | | | | | | | | | |
Portfolio turnover rate | | | 26 | % | | | 23 | % | | | 17 | % |
| | | | | | | | | | | | |
| (a) | Commencement of operations. |
| (b) | Based on average shares outstanding. |
| (c) | Distributions for annual periods determined in accordance with U.S. federal income tax regulations. |
| (d) | Where applicable, assumes the reinvestment of distributions. |
| (e) | Aggregate total return. |
| (f) | Excludes 0.01% of expenses incurred indirectly as a result of investments in underlying funds. |
| (h) | Offering costs were not annualized in the calculation of the expense ratios. If these expenses were annualized, the total expenses would have been 0.84%. |
| (i) | Interest expense and fees relate to TOB Trusts. See Note 4 of the Notes to Financial Statements for details. |
See notes to financial statements.
Financial Highlights (continued)
(For a share outstanding throughout each period)
| | | | | | | | | | | | | | | | | | | | |
| | | BlackRock Strategic Municipal Opportunities Fund | |
| |
| | | Institutional | |
| |
| | | Year Ended May 31, | |
| | | 2020 | | | 2019 | | | 2018 | | | 2017 | | | 2016 | |
| | | | | |
Net asset value, beginning of year | | $ | 11.70 | | | $ | 11.75 | | | $ | 11.57 | | | $ | 11.79 | | | $ | 11.24 | |
| | | | | | | | | | | | | | | | | | | | |
Net investment income(a) | | | 0.29 | | | | 0.35 | | | | 0.33 | | | | 0.31 | | | | 0.31 | |
Net realized and unrealized gain (loss) | | | (0.80 | ) | | | 0.14 | | | | 0.18 | | | | (0.07 | ) | | | 0.55 | |
| | | | | | | | | | | | | | | | | | | | |
Net increase (decrease) from investment operations | | | (0.51 | ) | | | 0.49 | | | | 0.51 | | | | 0.24 | | | | 0.86 | |
| | | | | | | | | | | | | | | | | | | | |
| | | | | |
Distributions(b) | | | | | | | | | | | | | | | | | | | | |
From net investment income | | | (0.29 | ) | | | (0.35 | ) | | | (0.33 | ) | | | (0.31 | ) | | | (0.31 | ) |
From net realized gain | | | — | | | | (0.19 | ) | | | — | | | | (0.15 | ) | | | — | |
| | | | | | | | | | | | | | | | | | | | |
Total distributions | | | (0.29 | ) | | | (0.54 | ) | | | (0.33 | ) | | | (0.46 | ) | | | (0.31 | ) |
| | | | | | | | | | | | | | | | | | | | |
| | | | | |
Net asset value, end of year | | $ | 10.90 | | | $ | 11.70 | | | $ | 11.75 | | | $ | 11.57 | | | $ | 11.79 | |
| | | | | | | | | | | | | | | | | | | | |
| | | | | |
Total Return(c) | | | | | | | | | | | | | | | | | | | | |
Based on net asset value | | | (4.46 | )% | | | 4.41 | % | | | 4.47 | % | | | 2.13 | % | | | 7.76 | % |
| | | | | | | | | | | | | | | | | | | | |
| | | | | |
Ratios to Average Net Assets(d) | | | | | | | | | | | | | | | | | | | | |
Total expenses | | | 0.75 | % | | | 0.82 | % | | | 0.81 | % | | | 0.74 | % | | | 0.72 | % |
| | | | | | | | | | | | | | | | | | | | |
Total expenses after fees waived and/or reimbursed and paid indirectly | | | 0.70 | % | | | 0.77 | % | | | 0.75 | % | | | 0.69 | % | | | 0.67 | % |
| | | | | | | | | | | | | | | | | | | | |
Total expenses after fees waived and/or reimbursed and paid indirectly and excluding interest expense and fees and amortization of offering costs(e) | | | 0.54 | % | | | 0.55 | % | | | 0.57 | % | | | 0.57 | % | | | 0.59 | % |
| | | | | | | | | | | | | | | | | | | | |
Net investment income | | | 2.53 | % | | | 3.05 | % | | | 2.83 | % | | | 2.71 | % | | | 2.69 | % |
| | | | | | | | | | | | | | | | | | | | |
| | | | | |
Supplemental Data | | | | | | | | | | | | | | | | | | | | |
Net assets, end of year (000) | | $ | 6,827,755 | | | $ | 8,539,776 | | | $ | 5,791,442 | | | $ | 3,512,455 | | | $ | 3,197,986 | |
| | | | | | | | | | | | | | | | | | | | |
Borrowings outstanding, end of year (000) | | $ | 869,463 | | | $ | 960,205 | | | $ | 767,480 | | | $ | 526,645 | | | $ | 412,485 | |
| | | | | | | | | | | | | | | | | | | | |
Portfolio turnover rate | | | 119 | % | | | 68 | % | | | 145 | % | | | 171 | % | | | 174 | % |
| | | | | | | | | | | | | | | | | | | | |
| (a) | Based on average shares outstanding. |
| (b) | Distributions for annual periods determined in accordance with U.S. federal income tax regulations. |
| (c) | Where applicable, assumes the reinvestment of distributions. |
| (d) | Excludes expenses incurred indirectly as a result of investments in underlying funds as follows: |
| | | | | | | | | | | | | | | | | | | | | | | | | | | | | | | | | | | | | | | | |
| | | For the Year Ended May 31, | |
| | | 2020 | | | | | | 2019 | | | | | | 2018 | | | | | | 2017 | | | | | | 2016 | | | | |
Investments in underlying funds | | | 0.01 | % | | | | | | | 0.01 | % | | | | | | | 0.01 | % | | | | | | | 0.01 | % | | | | | | | 0.01 | % | | | | |
| | | | | | | | | | | | | | | | | | | | | | | | | | | | | | | | | | | | | | | | |
| (e) | Interest expense and fees relate to TOB Trusts. See Note 4 of the Notes to Financial Statements for details. |
See notes to financial statements.
| | |
| 80 | | 2020 BLACKROCK ANNUAL REPORTTO SHAREHOLDERS |
Financial Highlights (continued)
(For a share outstanding throughout each period)
| | | | | | | | | | | | | | | | | | | | |
| | | BlackRock Strategic Municipal Opportunities Fund (continued) | |
| |
| | | Investor A | |
| |
| | | Year Ended May 31, | |
| | | 2020 | | | 2019 | | | 2018 | | | 2017 | | | 2016 | |
| | | | | |
Net asset value, beginning of year | | $ | 11.69 | | | $ | 11.74 | | | $ | 11.56 | | | $ | 11.78 | | | $ | 11.23 | |
| | | | | | | | | | | | | | | | | | | | |
Net investment income(a) | | | 0.27 | | | | 0.33 | | | | 0.31 | | | | 0.29 | | | | 0.28 | |
Net realized and unrealized gain (loss) | | | (0.79 | ) | | | 0.14 | | | | 0.18 | | | | (0.07 | ) | | | 0.55 | |
| | | | | | | | | | | | | | | | | | | | |
Net increase (decrease) from investment operations | | | (0.52 | ) | | | 0.47 | | | | 0.49 | | | | 0.22 | | | | 0.83 | |
| | | | | | | | | | | | | | | | | | | | |
| | | | | |
Distributions(b) | | | | | | | | | | | | | | | | | | | | |
From net investment income | | | (0.27 | ) | | | (0.33 | ) | | | (0.31 | ) | | | (0.29 | ) | | | (0.28 | ) |
From net realized gain | | | — | | | | (0.19 | ) | | | — | | | | (0.15 | ) | | | — | |
| | | | | | | | | | | | | | | | | | | | |
Total distributions | | | (0.27 | ) | | | (0.52 | ) | | | (0.31 | ) | | | (0.44 | ) | | | (0.28 | ) |
| | | | | | | | | | | | | | | | | | | | |
| | | | | |
Net asset value, end of year | | $ | 10.90 | | | $ | 11.69 | | | $ | 11.74 | | | $ | 11.56 | | | $ | 11.78 | |
| | | | | | | | | | | | | | | | | | | | |
| | | | | |
Total Return(c) | | | | | | | | | | | | | | | | | | | | |
Based on net asset value | | | (4.59 | )% | | | 4.17 | % | | | 4.26 | % | | | 1.92 | % | | | 7.62 | % |
| | | | | | | | | | | | | | | | | | | | |
| | | | | |
Ratios to Average Net Assets(d) | | | | | | | | | | | | | | | | | | | | |
Total expenses | | | 0.98 | % | | | 1.05 | % | | | 1.02 | % | | | 0.95 | % | | | 0.94 | % |
| | | | | | | | | | | | | | | | | | | | |
Total expenses after fees waived and/or reimbursed and paid indirectly | | | 0.92 | % | | | 1.00 | % | | | 0.96 | % | | | 0.90 | % | | | 0.89 | % |
| | | | | | | | | | | | | | | | | | | | |
Total expenses after fees waived and/or reimbursed and paid indirectly and excluding interest expense and fees and amortization of offering costs(e) | | | 0.76 | % | | | 0.78 | % | | | 0.78 | % | | | 0.78 | % | | | 0.80 | % |
| | | | | | | | | | | | | | | | | | | | |
Net investment income | | | 2.31 | % | | | 2.82 | % | | | 2.63 | % | | | 2.50 | % | | | 2.47 | % |
| | | | | | | | | | | | | | | | | | | | |
| | | | | |
Supplemental Data | | | | | | | | | | | | | | | | | | | | |
Net assets, end of year (000) | | $ | 1,871,557 | | | $ | 1,846,094 | | | $ | 1,441,879 | | | $ | 1,049,555 | | | $ | 1,111,770 | |
| | | | | | | | | | | | | | | | | | | | |
Borrowings outstanding, end of year (000) | | $ | 869,463 | | | $ | 960,205 | | | $ | 767,480 | | | $ | 526,645 | | | $ | 412,485 | |
| | | | | | | | | | | | | | | | | | | | |
Portfolio turnover rate | | | 119 | % | | | 68 | % | | | 145 | % | | | 171 | % | | | 174 | % |
| | | | | | | | | | | | | | | | | | | | |
| (a) | Based on average shares outstanding. |
| (b) | Distributions for annual periods determined in accordance with U.S. federal income tax regulations. |
| (c) | Where applicable, excludes the effects of any sales charges and assumes the reinvestment of distributions. |
| (d) | Excludes expenses incurred indirectly as a result of investments in underlying funds as follows: |
| | | | | | | | | | | | | | | | | | | | | | | | | | | | | | | | | | | | | | | | |
| | | For the Year Ended May 31, | |
| | | 2020 | | | | | | 2019 | | | | | | 2018 | | | | | | 2017 | | | | | | 2016 | | | | |
Investments in underlying funds | | | 0.01 | % | | | | | | | 0.01 | % | | | | | | | 0.01 | % | | | | | | | 0.01 | % | | | | | | | 0.01 | % | | | | |
| | | | | | | | | | | | | | | | | | | | | | | | | | | | | | | | | | | | | | | | |
| (e) | Interest expense and fees relate to TOB Trusts. See Note 4 of the Notes to Financial Statements for details. |
See notes to financial statements.
Financial Highlights (continued)
(For a share outstanding throughout each period)
| | | | | | | | | | | | | | | | | | | | |
| | | BlackRock Strategic Municipal Opportunities Fund (continued) | |
| |
| | | Investor A1 | |
| |
| | | Year Ended May 31, | |
| | | 2020 | | | 2019 | | | 2018 | | | 2017 | | | 2016 | |
| | | | | |
Net asset value, beginning of year | | $ | 11.70 | | | $ | 11.75 | | | $ | 11.56 | | | $ | 11.79 | | | $ | 11.23 | |
| | | | | | | | | | | | | | | | | | | | |
Net investment income(a) | | | 0.29 | | | | 0.35 | | | | 0.32 | | | | 0.31 | | | | 0.30 | |
Net realized and unrealized gain (loss) | | | (0.81 | ) | | | 0.14 | | | | 0.19 | | | | (0.09 | ) | | | 0.56 | |
| | | | | | | | | | | | | | | | | | | | |
Net increase (decrease) from investment operations | | | (0.52 | ) | | | 0.49 | | | | 0.51 | | | | 0.22 | | | | 0.86 | |
| | | | | | | | | | | | | | | | | | | | |
| | | | | |
Distributions(b) | | | | | | | | | | | | | | | | | | | | |
From net investment income | | | (0.28 | ) | | | (0.35 | ) | | | (0.32 | ) | | | (0.30 | ) | | | (0.30 | ) |
From net realized gain | | | — | | | | (0.19 | ) | | | — | | | | (0.15 | ) | | | — | |
| | | | | | | | | | | | | | | | | | | | |
Total distributions | | | (0.28 | ) | | | (0.54 | ) | | | (0.32 | ) | | | (0.45 | ) | | | (0.30 | ) |
| | | | | | | | | | | | | | | | | | | | |
| | | | | |
Net asset value, end of year | | $ | 10.90 | | | $ | 11.70 | | | $ | 11.75 | | | $ | 11.56 | | | $ | 11.79 | |
| | | | | | | | | | | | | | | | | | | | |
| | | | | |
Total Return(c) | | | | | | | | | | | | | | | | | | | | |
Based on net asset value | | | (4.52 | )% | | | 4.33 | % | | | 4.49 | % | | | 1.98 | % | | | 7.78 | % |
| | | | | | | | | | | | | | | | | | | | |
| | | | | |
Ratios to Average Net Assets(d) | | | | | | | | | | | | | | | | | | | | |
Total expenses | | | 0.82 | % | | | 0.90 | % | | | 0.88 | % | | | 0.81 | % | | | 0.79 | % |
| | | | | | | | | | | | | | | | | | | | |
Total expenses after fees waived and/or reimbursed and paid indirectly | | | 0.76 | % | | | 0.84 | % | | | 0.83 | % | | | 0.76 | % | | | 0.74 | % |
| | | | | | | | | | | | | | | | | | | | |
Total expenses after fees waived and/or reimbursed and paid indirectly and excluding interest expense and fees and amortization of offering costs(e) | | | 0.60 | % | | | 0.62 | % | | | 0.64 | % | | | 0.64 | % | | | 0.66 | % |
| | | | | | | | | | | | | | | | | | | | |
Net investment income | | | 2.48 | % | | | 2.99 | % | | | 2.77 | % | | | 2.64 | % | | | 2.65 | % |
| | | | | | | | | | | | | | | | | | | | |
| | | | | |
Supplemental Data | | | | | | | | | | | | | | | | | | | | |
Net assets, end of year (000) | | $ | 23,881 | | | $ | 27,606 | | | $ | 29,233 | | | $ | 30,691 | | | $ | 33,472 | |
| | | | | | | | | | | | | | | | | | | | |
Borrowings outstanding, end of year (000) | | $ | 869,463 | | | $ | 960,205 | | | $ | 767,480 | | | $ | 526,645 | | | $ | 412,485 | |
| | | | | | | | | | | | | | | | | | | | |
Portfolio turnover rate | | | 119 | % | | | 68 | % | | | 145 | % | | | 171 | % | | | 174 | % |
| | | | | | | | | | | | | | | | | | | | |
| (a) | Based on average shares outstanding. |
| (b) | Distributions for annual periods determined in accordance with U.S. federal income tax regulations. |
| (c) | Where applicable, excludes the effects of any sales charges and assumes the reinvestment of distributions. |
| (d) | Excludes expenses incurred indirectly as a result of investments in underlying funds as follows: |
| | | | | | | | | | | | | | | | | | | | | | | | | | | | | | | | | | | | | | | | |
| | | For the Year Ended May 31, | |
| | | 2020 | | | | | | 2019 | | | | | | 2018 | | | | | | 2017 | | | | | | 2016 | | | | |
Investments in underlying funds | | | 0.01 | % | | | | | | | 0.01 | % | | | | | | | 0.01 | % | | | | | | | 0.01 | % | | | | | | | 0.01 | % | | | | |
| | | | | | | | | | | | | | | | | | | | | | | | | | | | | | | | | | | | | | | | |
| (e) | Interest expense and fees relate to TOB Trusts. See Note 4 of the Notes to Financial Statements for details. |
See notes to financial statements.
| | |
| 82 | | 2020 BLACKROCK ANNUAL REPORTTO SHAREHOLDERS |
Financial Highlights (continued)
(For a share outstanding throughout each period)
| | | | | | | | | | | | | | | | | | | | |
| | | BlackRock Strategic Municipal Opportunities Fund (continued) | |
| |
| | | Investor C | |
| |
| | | Year Ended May 31, | |
| | | 2020 | | | 2019 | | | 2018 | | | 2017 | | | 2016 | |
| | | | | |
Net asset value, beginning of year | | $ | 11.70 | | | $ | 11.75 | | | $ | 11.56 | | | $ | 11.79 | | | $ | 11.23 | |
| | | | | | | | | | | | | | | | | | | | |
Net investment income(a) | | | 0.18 | | | | 0.24 | | | | 0.22 | | | | 0.20 | | | | 0.20 | |
Net realized and unrealized gain (loss) | | | (0.80 | ) | | | 0.14 | | | | 0.19 | | | | (0.08 | ) | | | 0.56 | |
| | | | | | | | | | | | | | | | | | | | |
Net increase (decrease) from investment operations | | | (0.62 | ) | | | 0.38 | | | | 0.41 | | | | 0.12 | | | | 0.76 | |
| | | | | | | | | | | | | | | | | | | | |
| | | | | |
Distributions(b) | | | | | | | | | | | | | | | | | | | | |
From net investment income | | | (0.18 | ) | | | (0.24 | ) | | | (0.22 | ) | | | (0.20 | ) | | | (0.20 | ) |
From net realized gain | | | — | | | | (0.19 | ) | | | — | | | | (0.15 | ) | | | — | |
| | | | | | | | | | | | | | | | | | | | |
Total distributions | | | (0.18 | ) | | | (0.43 | ) | | | (0.22 | ) | | | (0.35 | ) | | | (0.20 | ) |
| | | | | | | | | | | | | | | | | | | | |
| | | | | |
Net asset value, end of year | | $ | 10.90 | | | $ | 11.70 | | | $ | 11.75 | | | $ | 11.56 | | | $ | 11.79 | |
| | | | | | | | | | | | | | | | | | | | |
| | | | | |
Total Return(c) | | | | | | | | | | | | | | | | | | | | |
Based on net asset value | | | (5.39 | )% | | | 3.39 | % | | | 3.54 | % | | | 1.05 | % | | | 6.80 | % |
| | | | | | | | | | | | | | | | | | | | |
| | | | | |
Ratios to Average Net Assets(d) | | | | | | | | | | | | | | | | | | | | |
Total expenses | | | 1.73 | % | | | 1.81 | % | | | 1.79 | % | | | 1.72 | % | | | 1.70 | % |
| | | | | | | | | | | | | | | | | | | | |
Total expenses after fees waived and/or reimbursed and paid indirectly | | | 1.68 | % | | | 1.75 | % | | | 1.73 | % | | | 1.67 | % | | | 1.65 | % |
| | | | | | | | | | | | | | | | | | | | |
Total expenses after fees waived and/or reimbursed and paid indirectly and excluding interest expense and fees and amortization of offering costs(e) | | | 1.52 | % | | | 1.53 | % | | | 1.55 | % | | | 1.55 | % | | | 1.57 | % |
| | | | | | | | | | | | | | | | | | | | |
Net investment income | | | 1.56 | % | | | 2.07 | % | | | 1.86 | % | | | 1.73 | % | | | 1.72 | % |
| | | | | | | | | | | | | | | | | | | | |
| | | | | |
Supplemental Data | | | | | | | | | | | | | | | | | | | | |
Net assets, end of year (000) | | $ | 271,382 | | | $ | 307,887 | | | $ | 269,156 | | | $ | 251,966 | | | $ | 262,800 | |
| | | | | | | | | | | | | | | | | | | | |
Borrowings outstanding, end of year (000) | | $ | 869,463 | | | $ | 960,205 | | | $ | 767,480 | | | $ | 526,645 | | | $ | 412,485 | |
| | | | | | | | | | | | | | | | | | | | |
Portfolio turnover rate | | | 119 | % | | | 68 | % | | | 145 | % | | | 171 | % | | | 174 | % |
| | | | | | | | | | | | | | | | | | | | |
| (a) | Based on average shares outstanding. |
| (b) | Distributions for annual periods determined in accordance with U.S. federal income tax regulations. |
| (c) | Where applicable, excludes the effects of any sales charges and assumes the reinvestment of distributions. |
| (d) | Excludes expenses incurred indirectly as a result of investments in underlying funds as follows: |
| | | | | | | | | | | | | | | | | | | | | | | | | | | | | | | | | | | | | | | | |
| | | For the Year Ended May 31, | |
| | | 2020 | | | | | | 2019 | | | | | | 2018 | | | | | | 2017 | | | | | | 2016 | | | | |
Investments in underlying funds | | | 0.01 | % | | | | | | | 0.01 | % | | | | | | | 0.01 | % | | | | | | | 0.01 | % | | | | | | | 0.01 | % | | | | |
| | | | | | | | | | | | | | | | | | | | | | | | | | | | | | | | | | | | | | | | |
| (e) | Interest expense and fees relate to TOB Trusts. See Note 4 of the Notes to Financial Statements for details. |
See notes to financial statements.
Financial Highlights (continued)
(For a share outstanding throughout each period)
| | | | | | | | | | | | |
| | | BlackRock Strategic Municipal
Opportunities Fund (continued) | |
| |
| | | Class K | |
| | |
| | | Year Ended May 31, | | | Period from
01/25/18 (a)to 05/31/18 | |
| | | 2020 | | | 2019 | |
| | | |
Net asset value, beginning of period | | $ | 11.70 | | | $ | 11.75 | | | $ | 11.73 | |
| | | | | | | | | | | | |
Net investment income(b) | | | 0.30 | | | | 0.36 | | | | 0.11 | |
Net realized and unrealized gain (loss) | | | (0.80 | ) | | | 0.14 | | | | 0.02 | |
| | | | | | | | | | | | |
Net increase (decrease) from investment operations | | | (0.50 | ) | | | 0.50 | | | | 0.13 | |
| | | | | | | | | | | | |
|
Distributions(c) | |
From net investment income | | | (0.30 | ) | | | (0.36 | ) | | | (0.11 | ) |
From net realized gain | | | — | | | | (0.19 | ) | | | — | |
| | | | | | | | | | | | |
Total distributions | | | (0.30 | ) | | | (0.55 | ) | | | (0.11 | ) |
| | | | | | | | | | | | |
| | | |
Net asset value, end of period | | $ | 10.90 | | | $ | 11.70 | | | $ | 11.75 | |
| | | | | | | | | | | | |
|
Total Return(d) | |
Based on net asset value | | | (4.39 | )% | | | 4.47 | % | | | 1.16 | %(e) |
| | | | | | | | | | | | |
|
Ratios to Average Net Assets(f) | |
Total expenses | | | 0.69 | % | | | 0.76 | % | | | 0.74 | %(g)(h) |
| | | | | | | | | | | | |
Total expenses after fees waived and/or reimbursed and paid indirectly | | | 0.63 | % | | | 0.71 | % | | | 0.68 | %(h) |
| | | | | | | | | | | | |
Total expenses after fees waived and/or reimbursed and paid indirectly and excluding interest expense and fees and amortization of offering costs(i) | | | 0.47 | % | | | 0.48 | % | | | 0.50 | %(h) |
| | | | | | | | | | | | |
Net investment income | | | 2.59 | % | | | 3.11 | % | | | 3.20 | %(h) |
| | | | | | | | | | | | |
|
Supplemental Data | |
Net assets, end of period (000) | | $ | 162,366 | | | $ | 126,051 | | | $ | 63,971 | |
| | | | | | | | | | | | |
Borrowings outstanding, end of period (000) | | $ | 869,463 | | | $ | 960,205 | | | $ | 767,480 | |
| | | | | | | | | | | | |
Portfolio turnover rate | | | 119 | % | | | 68 | % | | | 145 | % |
| | | | | | | | | | | | |
| (a) | Commencement of operations. |
| (b) | Based on average shares outstanding. |
| (c) | Distributions for annual periods determined in accordance with U.S. federal income tax regulations. |
| (d) | Where applicable, assumes the reinvestment of distributions. |
| (e) | Aggregate total return. |
| (f) | Excludes expenses incurred indirectly as a result of investments in underlying funds. |
| | | | | | | | | | | | | | | | |
| | | For the Year Ended May 31, | | | Period from
01/25/18 (a)
to 05/31/18 | |
| | | 2020 | | | 2019 | | | | |
Investments in underlying funds | | | 0.01 | % | | | 0.01 | % | | | | | | | 0.01 | % |
| | | | | | | | | | | | | | | | |
| (g) | Offering costs were not annualized in the calculation of the expense ratios. If these expenses were annualized, the total expenses would have been 0.74%. |
| (i) | Interest expense and fees relate to TOB Trusts. See Note 4 of the Notes to Financial Statements for details. |
See notes to financial statements.
| | |
| 84 | | 2020 BLACKROCK ANNUAL REPORTTO SHAREHOLDERS |
Notes to Financial Statements
BlackRock California Municipal Series Trust, BlackRock Multi-State Municipal Series Trust and BlackRock Municipal Series Trust (each, a “Trust” or collectively, the “Trusts”) are each registered under the Investment Company Act of 1940, as amended (the “1940 Act”), as open-end management investment companies. Each Trust is organized as a Massachusetts business trust.
| | | | | | |
| Registrant Name | | Fund Name | | Herein Referred To As | | Diversification
Classification |
BlackRock California Municipal Series Trust | | BlackRock California Municipal Opportunities Fund | | California Municipal Opportunities | | Diversified |
BlackRock Multi-State Municipal Series Trust | | BlackRock New Jersey Municipal Bond Fund | | New Jersey Municipal Bond | | Non-diversified |
| | BlackRock Pennsylvania Municipal Bond Fund | | Pennsylvania Municipal Bond | | Non-diversified |
BlackRock Municipal Series Trust | | BlackRock Strategic Municipal Opportunities Fund | | Strategic Municipal Opportunities | | Diversified |
Each Fund offers multiple classes of shares. All classes of shares have identical voting, dividend, liquidation and other rights and are subject to the same terms and conditions, except that certain classes bear expenses related to the shareholder servicing and distribution of such shares. Institutional, Service and Class K Shares are sold only to certain eligible investors. Service, Investor A, Investor A1 and Investor C Shares bear certain expenses related to shareholder servicing of such shares and Investor C Shares also bear certain expenses related to the distribution of such shares. Investor A and Investor C Shares are generally available through financial intermediaries. Investor A1 Shares are only available for dividend and capital gain reinvestment by existing shareholders, and for purchase by certain employer-sponsored retirement plans and, for California Municipal Opportunities only, fee based programs previously approved by the Fund. Each class has exclusive voting rights with respect to matters relating to its shareholder servicing and distribution expenditures (except that Investor C shareholders may vote on material changes to the Investor A distribution and service plan).
| | | | | | | | | | |
| Share Class | | Initial Sales Charge | | | CDSC | | | Conversion Privilege |
Institutional, Service and Class K Shares | | | No | | | | No | | | None |
Investor A Shares | | | Yes | | | | No | (a) | | None |
Investor A1 Shares | | | No | (b) | | | No | (c) | | None |
Investor C Shares | | | No | | | | Yes | (d) | | To Investor A Shares after approximately 10 years |
| | (a) | Investor A Shares may be subject to a contingent deferred sales charge (“CDSC”) for certain redemptions where no initial sales charge was paid at the time of purchase. | |
| | (b) | Investor A1 Shares are subject to a maximum sales charge on purchases of 1.00%. The sales charge does not apply to dividend and capital gain reinvestments by existing shareholders and new purchases for certain employer-sponsored retirement plans or, for California Municipal Opportunities only, fee based programs previously approved by the Fund, which are currently the only investors who may invest in Investor A1 Shares. | |
| | (c) | Investor A1 Shares may be subject to CDSC for certain redemptions where no initial sales charge was paid at the time of purchase. However, the CDSC does not apply to redemptions by certain employer-sponsored retirement plans or to redemptions of shares acquired through reinvestment of dividends and capital gains by existing shareholders and, for California Municipal Opportunities only, fee based programs previously approved by the Fund. | |
| | (d) | A CDSC of 1.00% is assessed on certain redemptions of Investor C Shares made within one year after purchase. | |
On February 24, 2020, California Municipal Opportunities, New Jersey Municipal Bond and Pennsylvania Municipal Bond issued and outstanding Investor C1 Shares converted into Investor A Shares.
The Funds, together with certain other registered investment companies advised by BlackRock Advisors, LLC (the “Manager”) or its affiliates, are included in a complex of non-index fixed-income mutual funds and all BlackRock-advised closed-end funds referred to as the BlackRock Fixed-Income Complex.
| 2. | SIGNIFICANT ACCOUNTING POLICIES |
The financial statements are prepared in conformity with accounting principles generally accepted in the United States of America (“U.S. GAAP”), which may require management to make estimates and assumptions that affect the reported amounts of assets and liabilities in the financial statements, disclosure of contingent assets and liabilities at the date of the financial statements and the reported amounts of increases and decreases in net assets from operations during the reporting period. Actual results could differ from those estimates. Each Fund is considered an investment company under U.S. GAAP and follows the accounting and reporting guidance applicable to investment companies. Below is a summary of significant accounting policies:
Investment Transactions and Income Recognition: For financial reporting purposes, investment transactions are recorded on the dates the transactions are executed. Realized gains and losses on investment transactions are determined on the identified cost basis. Dividend income and non-cash dividend income, if any, are recorded on the ex-dividend date. Interest income, including amortization and accretion of premiums and discounts on debt securities, is recognized on an accrual basis. Income, expenses and realized and unrealized gains and losses are allocated daily to each class based on its relative net assets.
Segregation and Collateralization: In cases where a Fund enters into certain investments (e.g., futures contracts) or certain borrowings (e.g., TOB Trust transactions) that would be treated as “senior securities” for 1940 Act purposes, a Fund may segregate or designate on its books and records cash or liquid assets having a market value at least equal to the amount of its future obligations under such investments or borrowings. Doing so allows the investment or borrowings to be excluded from treatment as a “senior security.” Furthermore, if required by an exchange or counterparty agreement, the Funds may be required to deliver/deposit cash and/or securities to/with an exchange, or broker-dealer or custodian as collateral for certain investments or obligations.
Distributions: Distributions from net investment income are declared daily and paid monthly. Distributions of capital gains are recorded on the ex-dividend date and made at least annually. The portion of distributions, if any, that exceeds a fund’s current and accumulated earnings and profits, as measured on a tax basis, constitute a non-taxable return of capital. The character and timing of distributions are determined in accordance with U.S. federal income tax regulations, which may differ from U.S. GAAP.
| | | | |
| NOTESTO FINANCIAL STATEMENTS | | | 85 | |
Notes to Financial Statements (continued)
Deferred Compensation Plan: Under the Deferred Compensation Plan (the “Plan”) approved by the Board of Trustees of each Trust (the “Board”), the trustees who are not “interested persons” of the Funds, as defined in the 1940 Act (“Independent Trustees”), may defer a portion of their annual complex-wide compensation. Deferred amounts earn an approximate return as though equivalent dollar amounts had been invested in common shares of certain funds in the BlackRock Fixed-Income Complex selected by the Independent Trustees. This has the same economic effect for the Independent Trustees as if the Independent Trustees had invested the deferred amounts directly in certain funds in the BlackRock Fixed-Income Complex.
The Plan is not funded and obligations thereunder represent general unsecured claims against the general assets of each Trust, as applicable. Deferred compensation liabilities are included in the Trustees’ and Officer’s fees payable in the Statements of Assets and Liabilities and will remain as a liability of the Trusts until such amounts are distributed in accordance with the Plan.
Recent Accounting Standards: The Funds have adopted Financial Accounting Standards Board Accounting Standards Update 2017-08 to amend the amortization period for certain purchased callable debt securities held at a premium. Under the new standard, the Funds have changed the amortization period for the premium on certain purchased callable debt securities with non-contingent call features to the earliest call date. In accordance with the transition provisions of the standard, the Funds applied the amendments on a modified retrospective basis beginning with the fiscal period ended May 31, 2020. The adjusted cost basis of securities at May 31, 2019, are as follows:
| | | | |
California Municipal Opportunities | | $ | 3,450,938,849 | |
Pennsylvania Municipal Bond Fund | | | 576,927,449 | |
Strategic Municipal Opportunities | | | 11,343,555,410 | |
This change in accounting policy has been made to comply with the newly issued accounting standard and had no impact on accumulated earnings (loss) or the net asset value of the Funds.
Indemnifications: In the normal course of business, a Fund enters into contracts that contain a variety of representations that provide general indemnification. A Fund’s maximum exposure under these arrangements is unknown because it involves future potential claims against a Fund, which cannot be predicted with any certainty.
Other: Expenses directly related to a Fund or its classes are charged to that Fund or the applicable class. Other operating expenses shared by several funds, including other funds managed by the Manager, are prorated among those funds on the basis of relative net assets or other appropriate methods. Expenses directly related to the Funds and other shared expenses prorated to the Funds are allocated daily to each class based on their relative net assets or other appropriate methods.
| 3. | INVESTMENT VALUATION AND FAIR VALUE MEASUREMENTS |
Investment Valuation Policies: The Funds’ investments are valued at fair value (also referred to as “market value” within the financial statements) as of the close of trading on the New York Stock Exchange (“NYSE”) (generally 4:00 p.m., Eastern time) (or if the reporting date falls on a day the NYSE is closed, investments are valued at fair value as of the period end). U.S. GAAP defines fair value as the price the Funds would receive to sell an asset or pay to transfer a liability in an orderly transaction between market participants at the measurement date. The Funds determine the fair values of their financial instruments using various independent dealers or pricing services under policies approved by the Board. If a security’s market price is not readily available or does not otherwise accurately represent the fair value of the security, the security will be valued in accordance with a policy approved by the Board as reflecting fair value. The BlackRock Global Valuation Methodologies Committee (the “Global Valuation Committee”) is the committee formed by management to develop global pricing policies and procedures and to oversee the pricing function for all financial instruments.
Fair Value Inputs and Methodologies: The following methods and inputs are used to establish the fair value of each Fund’s assets and liabilities:
| | • | | Fixed-income securities for which market quotations are readily available are generally valued using the last available bid prices or current market quotations provided by independent dealers or third party pricing services. Floating rate loan interests are valued at the mean of the bid prices from one or more independent brokers or dealers as obtained from a third party pricing service. Pricing services generally value fixed-income securities assuming orderly transactions of an institutional round lot size, but a fund may hold or transact in such securities in smaller, odd lot sizes. Odd lots may trade at lower prices than institutional round lots. The pricing services may use matrix pricing or valuation models that utilize certain inputs and assumptions to derive values, including transaction data (e.g., recent representative bids and offers), credit quality information, perceived market movements, news, and other relevant information. Certain fixed-income securities, including asset-backed and mortgage related securities may be valued based on valuation models that consider the estimated cash flows of each tranche of the entity, establish a benchmark yield and develop an estimated tranche specific spread to the benchmark yield based on the unique attributes of the tranche. The amortized cost method of valuation may be used with respect to debt obligations with sixty days or less remaining to maturity unless the Manager determines such method does not represent fair value. |
| | • | | Municipal investments (including commitments to purchase such investments on a “when-issued” basis) are valued on the basis of prices provided by dealers or pricing services. In determining the value of a particular investment, pricing services may use certain information with respect to transactions in such investments, quotations from dealers, pricing matrixes, market transactions in comparable investments and information with respect to various relationships between investments. |
| | • | | Investments in open-end U.S. mutual funds are valued at net asset value (“NAV”) each business day. |
| | • | | Futures contracts traded on exchanges are valued at their last sale price. |
If events (e.g., a company announcement, market volatility or a natural disaster) occur that are expected to materially affect the value of such investments, or in the event that the application of these methods of valuation results in a price for an investment that is deemed not to be representative of the market value of such investment, or if a
| | |
| 86 | | 2020 BLACKROCK ANNUAL REPORTTO SHAREHOLDERS |
Notes to Financial Statements (continued)
price is not available, the investment will be valued by the Global Valuation Committee, or its delegate, in accordance with a policy approved by the Board as reflecting fair value (“Fair Valued Investments”). The fair valuation approaches that may be used by the Global Valuation Committee will include market approach, income approach and cost approach. Valuation techniques such as discounted cash flow, use of market comparables and matrix pricing are types of valuation approaches and are typically used in determining fair value. When determining the price for Fair Valued Investments, the Global Valuation Committee, or its delegate, seeks to determine the price that each Fund might reasonably expect to receive or pay from the current sale or purchase of that asset or liability in an arm’s-length transaction. Fair value determinations shall be based upon all available factors that the Global Valuation Committee, or its delegate, deems relevant and consistent with the principles of fair value measurement. The pricing of all Fair Valued Investments is subsequently reported to the Board or a committee thereof on a quarterly basis.
Fair Value Hierarchy: Various inputs are used in determining the fair value of investments and derivative financial instruments. These inputs to valuation techniques are categorized into a fair value hierarchy consisting of three broad levels for financial statement purposes as follows:
| | • | | Level 1 — Unadjusted price quotations in active markets/exchanges for identical assets or liabilities that each Fund has the ability to access. |
| | • | | Level 2 — Other observable inputs (including, but not limited to, quoted prices for similar assets or liabilities in markets that are active, quoted prices for identical or similar assets or liabilities in markets that are not active, inputs other than quoted prices that are observable for the assets or liabilities (such as interest rates, yield curves, volatilities, prepayment speeds, loss severities, credit risks and default rates) or other market-corroborated inputs). |
| | • | | Level 3 — Unobservable inputs based on the best information available in the circumstances, to the extent observable inputs are not available (including the Global Valuation Committee’s assumptions used in determining the fair value of investments and derivative financial instruments) |
The hierarchy gives the highest priority to unadjusted quoted prices in active markets for identical assets or liabilities (Level 1 measurements) and the lowest priority to unobservable inputs (Level 3 measurements). Accordingly, the degree of judgment exercised in determining fair value is greatest for instruments categorized in Level 3. The inputs used to measure fair value may fall into different levels of the fair value hierarchy. In such cases, for disclosure purposes, the fair value hierarchy classification is determined based on the lowest level input that is significant to the fair value measurement in its entirety. Investments classified within Level 3 have significant unobservable inputs used by the Global Valuation Committee in determining the price for Fair Valued Investments. Level 3 investments include equity or debt issued by privately held companies or funds. There may not be a secondary market, and/or there are a limited number of investors. The categorization of a value determined for investments and derivative financial instruments is based on the pricing transparency of the investments and derivative financial instruments and is not necessarily an indication of the risks associated with investing in those securities.
| 4. | SECURITIES AND OTHER INVESTMENTS |
Zero-Coupon Bonds: Zero-coupon bonds are normally issued at a significant discount from face value and do not provide for periodic interest payments. These bonds may experience greater volatility in market value than other debt obligations of similar maturity which provide for regular interest payments.
Forward Commitments, When-Issued and Delayed Delivery Securities: Certain funds may purchase securities on a when-issued basis and may purchase or sell securities on a forward commitment basis. Settlement of such transactions normally occurs within a month or more after the purchase or sale commitment is made. A fund may purchase securities under such conditions with the intention of actually acquiring them, but may enter into a separate agreement to sell the securities before the settlement date. Since the value of securities purchased may fluctuate prior to settlement, a fund may be required to pay more at settlement than the security is worth. In addition, a fund is not entitled to any of the interest earned prior to settlement. When purchasing a security on a delayed delivery basis, a fund assumes the rights and risks of ownership of the security, including the risk of price and yield fluctuations. In the event of default by the counterparty, a fund’s maximum amount of loss is the unrealized appreciation of unsettled when-issued transactions.
Municipal Bonds Transferred to TOB Trusts: Certain funds leverage their assets through the use of “TOB Trust” transactions. The funds transfer municipal bonds into a special purpose trust (a “TOB Trust”). A TOB Trust issues two classes of beneficial interests: short-term floating rate interests (“TOB Trust Certificates”), which are sold to third party investors, and residual inverse floating rate interests (“TOB Residuals”), which are issued to the participating funds that contributed the municipal bonds to the TOB Trust. The TOB Trust Certificates have interest rates that reset weekly and their holders have the option to tender such certificates to the TOB Trust for redemption at par and any accrued interest at each reset date. The TOB Residuals held by a fund provide the fund with the right to cause the holders of a proportional share of the TOB Trust Certificates to tender their certificates to the TOB Trust at par plus accrued interest. The funds may withdraw a corresponding share of the municipal bonds from the TOB Trust. Other funds managed by the investment adviser may also contribute municipal bonds to a TOB Trust into which a fund has contributed bonds. If multiple BlackRock-advised funds participate in the same TOB Trust, the economic rights and obligations under the TOB Residuals will be shared among the funds ratably in proportion to their participation in the TOB Trust.
TOB Trusts are supported by a liquidity facility provided by a third party bank or other financial institution (the “Liquidity Provider”) that allows the holders of the TOB Trust Certificates to tender their certificates in exchange for payment of par plus accrued interest on any business day. The tendered TOB Trust Certificates are remarketed by a Remarketing Agent. In the event of a failed remarketing, the TOB Trust may draw upon a loan from the Liquidity Provider to purchase the tendered TOB Trust Certificates. Any loans made by the Liquidity Provider will be secured by the purchased TOB Trust Certificates held by the TOB Trust and will be subject to an increased interest rate based on number of days the loan is outstanding.
The TOB Trust may be collapsed without the consent of a fund, upon the occurrence of a termination event as defined in the TOB Trust agreement. Upon the occurrence of a termination event, a TOB Trust would be liquidated with the proceeds applied first to any accrued fees owed to the trustee of the TOB Trust, the Remarketing Agent and the Liquidity Provider. Upon certain termination events, TOB Trust Certificates holders will be paid before the TOB Residuals holders (i.e., the Funds) whereas in other termination events, TOB Trust Certificates holders and TOB Residuals holders will be paid pro rata.
| | | | |
| NOTESTO FINANCIAL STATEMENTS | | | 87 | |
Notes to Financial Statements (continued)
While a fund’s investment policies and restrictions expressly permit investments in inverse floating rate securities, such as TOB Residuals, they restrict the ability of a fund to borrow money for purposes of making investments. Each fund’s transfer of the municipal bonds to a TOB Trust is considered a secured borrowing for financial reporting purposes. The cash received by the TOB Trust from the sale of the TOB Trust Certificates, less certain transaction expenses, is paid to a fund. A fund typically invests the cash received in additional municipal bonds.
Accounting for TOB Trusts: The municipal bonds deposited into a TOB Trust are presented in a fund’s Schedule of Investments and the TOB Trust Certificates are shown in Other Liabilities in the Statements of Assets and Liabilities. Any loans drawn by the TOB Trust pursuant to the liquidity facility to purchase tendered TOB Trust Certificates are shown as Loan for TOB Trust Certificates. The carrying amount of a fund’s payable to the holder of the TOB Trust Certificates or the Liquidity Provider, as reported in the Statements of Assets and Liabilities as TOB Trust Certificates or Loan for TOB Trust Certificates, approximates its fair value.
Interest income, including amortization and accretion of premiums and discounts, from the underlying municipal bonds is recorded by a fund on an accrual basis. Interest expense incurred on the TOB Trust transaction and other expenses related to remarketing, administration, trustee, liquidity and other services to a TOB Trust are shown as interest expense, fees and amortization of offering costs in the Statements of Operations. Fees paid upon creation of the TOB Trust are recorded as debt issuance costs and are amortized to interest expense, fees and amortization of offering costs in the Statements of Operations to the expected maturity of the TOB Trust. In connection with the restructurings of the TOB Trusts to non-bank sponsored TOB Trusts, a fund incurred non-recurring, legal and restructuring fees, which are recorded as interest expense, fees and amortization of deferred offering costs in the Statements of Operations. Amounts recorded within interest expense, fees and amortization of offering costs in the Statements of Operations are:
| | | | | | | | | | | | | | | | |
| | | Interest Expense | | | Liquidity Fees | | | Other Expenses | | | Total | |
California Municipal Opportunities | | $ | 3,258,994 | | | $ | 998,916 | | | $ | 273,296 | | | $ | 4,531,206 | |
New Jersey Municipal Bond | | | 281,541 | | | | 81,366 | | | | 47,337 | | | | 410,244 | |
Pennsylvania Municipal Bond | | | 846,568 | | | | 259,751 | | | | 85,475 | | | | 1,191,794 | |
Strategic Municipal Opportunities | | | 12,730,758 | | | | 4,143,130 | | | | 1,265,919 | | | | 18,139,807 | |
For the year ended May 31, 2020, the following table is a summary of each fund’s TOB Trusts:
| | | | | | | | | | | | | | | | | | | | |
| | | Underlying
Municipal Bonds
Transferred to
TOB Trusts (a) | | | Liability for
TOB Trust
Certificates (b) | | | Range of
Interest Rates
on TOB Trust
Certificates at
Period End | | | Average
TOB Trust
Certificates
Outstanding | | | Daily Weighted
Average Rate
of Interest and
Other Expenses
on TOB Trusts | |
California Municipal Opportunities | | $ | 355,803,704 | | | $ | 148,144,977 | | | | 0.08% — 0.17% | | | $ | 233,025,612 | | | | 1.94 | % |
New Jersey Municipal Bond | | | 39,484,335 | | | | 22,053,726 | | | | 0.08 — 0.29 | | | | 20,806,636 | | | | 1.97 | |
Pennsylvania Municipal Bond | | | 123,138,410 | | | | 63,943,902 | | | | 0.16 — 0.50 | | | | 62,917,543 | | | | 1.89 | |
Strategic Municipal Opportunities | | | 1,421,429,162 | | | | 869,463,307 | | | | 0.08 — 0.54 | | | | 942,246,038 | | | | 1.92 | |
| | (a) | The municipal bonds transferred to a TOB Trust are generally high grade municipal bonds. In certain cases, when municipal bonds transferred are lower grade municipal bonds, the TOB Trust transaction may include a credit enhancement feature that provides for the timely payment of principal and interest on the bonds to the TOB Trust by a credit enhancement provider in the event of default of the municipal bond. The TOB Trust would be responsible for the payment of the credit enhancement fee and the funds, as TOB Residuals holders, would be responsible for reimbursement of any payments of principal and interest made by the credit enhancement provider. The maximum potential amounts owed by the funds, for such reimbursements, as applicable, are included in the maximum potential amounts disclosed for recourse TOB Trusts. | |
| | (b) | TOB Trusts may be structured on a non-recourse or recourse basis. When a Fund invests in TOB Trusts on a non-recourse basis, the Liquidity Provider may be required to make a payment under the liquidity facility to allow the TOB Trust to repurchase TOB Trust Certificates. The Liquidity Provider will be reimbursed from the liquidation of bonds held in the TOB Trust. If a fund invests in a TOB Trust on a recourse basis, a fund enters into a reimbursement agreement with the Liquidity Provider where a fund is required to reimburse the Liquidity Provider for any shortfall between the amount paid by the Liquidity Provider and proceeds received from liquidation of municipal bonds held in the TOB Trust (the “Liquidation Shortfall”). As a result, if a fund invests in a recourse TOB Trust, a fund will bear the risk of loss with respect to any Liquidation Shortfall. If multiple funds participate in any such TOB Trust, these losses will be shared ratably, including the maximum potential amounts owed by a fund at May 31, 2020, in proportion to their participation in the TOB Trust. The recourse TOB Trusts are identified in the Schedules of Investments including the maximum potential amounts owed by a Fund at May 31, 2020. | |
For the year ended May 31, 2020, the following table is a summary of each fund’s Loan for TOB Trust Certificates:
| | | | | | | | | | | | | | | | |
| | | Loans Outstanding
at Period End | | | Range of
Interest Rates
on Loans at
Period End | | | Average
Loans
Outstanding | | | Daily Weighted
Average Rate
of Interest and
Other Expenses
on Loans | |
California Municipal Opportunities | | $ | — | | | | — | % | | $ | 545,067 | | | | 0.68 | % |
Pennsylvania Municipal Bond | | | 840,000 | | | | 0.18 | | | | 95,561 | | | | 0.71 | |
Strategic Municipal Opportunities | | | — | | | | — | | | | 830,457 | | | | 0.71 | |
| 5. | DERIVATIVE FINANCIAL INSTRUMENTS |
The Funds engage in various portfolio investment strategies using derivative contracts both to increase the returns of the Funds and/or to manage their exposure to certain risks such as credit risk, equity risk, interest rate risk, foreign currency exchange rate risk, commodity price risk or other risks (e.g., inflation risk). Derivative financial instruments categorized by risk exposure are included in the Schedules of Investments. These contracts may be transacted on an exchange or over-the-counter (“OTC”).
| | |
| 88 | | 2020 BLACKROCK ANNUAL REPORTTO SHAREHOLDERS |
Notes to Financial Statements (continued)
Futures Contracts: Futures contracts are purchased or sold to gain exposure to, or manage exposure to, changes in interest rates (interest rate risk) and changes in the value of equity securities (equity risk) or foreign currencies (foreign currency exchange rate risk).
Futures contracts are agreements between the Funds and a counterparty to buy or sell a specific quantity of an underlying instrument at a specified price and on a specified date. Depending on the terms of a contract, it is settled either through physical delivery of the underlying instrument on the settlement date or by payment of a cash amount on the settlement date. Upon entering into a futures contract, the Funds are required to deposit initial margin with the broker in the form of cash or securities in an amount that varies depending on a contract’s size and risk profile. The initial margin deposit must then be maintained at an established level over the life of the contract. Amounts pledged, which are considered restricted, are included in cash pledged for futures contracts in the Statements of Assets and Liabilities.
Securities deposited as initial margin are designated in the Schedules of Investments and cash deposited, if any, are shown as cash pledged for futures contracts in the Statements of Assets and Liabilities. Pursuant to the contract, the Funds agree to receive from or pay to the broker an amount of cash equal to the daily fluctuation in market value of the contract (“variation margin”). Variation margin is recorded as unrealized appreciation (depreciation) and, if any, shown as variation margin receivable (or payable) on futures contracts in the Statements of Assets and Liabilities. When the contract is closed, a realized gain or loss is recorded in the Statements of Operations equal to the difference between the notional amount of the contract at the time it was opened and the notional amount at the time it was closed. The use of futures contracts involves the risk of an imperfect correlation in the movements in the price of futures contracts and interest, foreign currency exchange rates or underlying assets.
| 6. | INVESTMENT ADVISORY AGREEMENT AND OTHER TRANSACTIONS WITH AFFILIATES |
Investment Advisory: Each Trust, on behalf of the Funds, entered into an Investment Advisory Agreement with the Manager, the Funds’ investment adviser and an indirect, wholly-owned subsidiary of BlackRock, Inc. (“BlackRock”), to provide investment advisory and administrative services. The Manager is responsible for the management of each Fund’s portfolio and provides the personnel, facilities, equipment and certain other services necessary to the operations of each Fund.
For such services, each Fund pays the Manager a monthly fee at an annual rate equal to the following percentages of the average daily value of each Fund’s net assets:
| | | | | | | | | | | | | | | | |
| | | Investment Advisory Fees | |
| Average Daily Net Assets | | California
Municipal
Opportunities | | | New Jersey
Municipal
Bond | | | Pennsylvania
Municipal
Bond | | | Strategic
Municipal
Opportunities | |
First $1 Billion | | | 0.38 | % | | | 0.52 | % | | | 0.52 | % | | | 0.55 | % |
$1 Billion — $3 Billion | | | 0.36 | | | | 0.49 | | | | 0.49 | | | | 0.52 | |
$3 Billion — $5 Billion | | | 0.34 | | | | 0.47 | | | | 0.47 | | | | 0.50 | |
$5 Billion — $10 Billion | | | 0.33 | | | | 0.45 | | | | 0.45 | | | | 0.48 | |
Greater than $10 Billion | | | 0.32 | | | | 0.44 | | | | 0.44 | | | | 0.47 | |
Service and Distribution Fees: Each Trust, on behalf of its Funds, entered into a Distribution Agreement and a Distribution and Service Plan with BlackRock Investments, LLC (“BRIL”), an affiliate of the Manager. Pursuant to the Distribution and Service Plan and in accordance with Rule 12b-1 under the 1940 Act, each Fund pays BRIL ongoing service and distribution fees. The fees are accrued daily and paid monthly at annual rates based upon the average daily net assets of the relevant share class of each Fund as follows:
| | | | | | | | | | | | | | | | |
| | | Service Fees | |
| | California
Municipal
Opportunities | | | New Jersey
Municipal
Bond | | | Pennsylvania
Municipal
Bond | | | Strategic
Municipal
Opportunities | |
Service | | | — | % | | | 0.25 | % | | | 0.25 | % | | | — | % |
Investor A | | | 0.25 | | | | 0.25 | | | | 0.25 | | | | 0.25 | |
Investor A1 | | | 0.10 | | | | 0.10 | | | | 0.10 | | | | 0.10 | |
Investor C | | | 0.25 | | | | 0.25 | | | | 0.25 | | | | 0.25 | |
Investor C1 | | | 0.25 | | | | 0.25 | | | | 0.25 | | | | — | |
| | | | | | | | | | | | | | | | |
| | | Distribution Fees | |
| | California
Municipal
Opportunities | | | New Jersey
Municipal
Bond | | | Pennsylvania
Municipal
Bond | | | Strategic
Municipal
Opportunities | |
Investor C | | | 0.75 | % | | | 0.75 | % | | | 0.75 | % | | | 0.75 | % |
Investor C1 | | | 0.35 | | | | 0.35 | | | | 0.35 | | | | — | |
BRIL and broker-dealers, pursuant to sub-agreements with BRIL, provide shareholder servicing and distribution services to the Funds. The ongoing service and/or distribution fee compensates BRIL and each broker-dealer for providing shareholder servicing and/or distribution related services to shareholders.
For the year ended May 31, 2020, the following table shows the class specific service and distribution fees borne directly by each share class of each Fund:
| | | | | | | | | | | | | | | | | | | | | | | | |
| Service and Distribution Fees | | Service | | | Investor A | | | Investor A1 | | | Investor C | | | Investor C1 | | | Total | |
California Municipal Opportunities | | $ | — | | | $ | 2,784,955 | | | $ | 109,854 | | | $ | 1,571,412 | | | $ | 897 | | | $ | 4,467,118 | |
New Jersey Municipal Bond | | | 19,393 | | | | 263,770 | | | | 18,949 | | | | 337,367 | | | | 102 | | | | 639,581 | |
Pennsylvania Municipal Bond | | | 5,407 | | | | 315,193 | | | | 10,205 | | | | 299,358 | | | | 8 | | | | 630,171 | |
Strategic Municipal Opportunities | | | — | | | | 5,072,027 | | | | 26,656 | | | | 3,076,237 | | | | — | | | | 8,174,920 | |
| | | | |
| NOTESTO FINANCIAL STATEMENTS | | | 89 | |
Notes to Financial Statements (continued)
Transfer Agent: Pursuant to written agreements, certain financial intermediaries, some of which may be affiliates, provide the Funds with sub-accounting, recordkeeping, sub-transfer agency and other administrative services with respect to servicing of underlying investor accounts. For these services, these entities receive an asset-based fee or an annual fee per shareholder account, which will vary depending on share class and/or net assets. For the year ended May 31, 2020, the Funds paid the following amounts to affiliates of BlackRock in return for these services, which are included in transfer agent — class specific in the Statements of Operations:
| | | | | | | | | | | | |
| | | Institutional | | | Investor A | | | Total | |
New Jersey Municipal Bond | | $ | 97,431 | | | $ | — | | | $ | 97,431 | |
Pennsylvania Municipal Bond | | | 360,585 | | | | — | | | | 360,585 | |
Strategic Municipal Opportunities | | | 964,495 | | | | 262 | | | | 964,757 | |
The Manager maintains a call center that is responsible for providing certain shareholder services to the Funds. Shareholder services include responding to inquiries and processing purchases and sales based upon instructions from shareholders. For the year ended May 31, 2020, each Fund reimbursed the Manager the following amounts for costs incurred in running the call center, which are included in transfer agent — class specific in the Statements of Operations:
| | | | | | | | | | | | | | | | | | | | | | | | | | | | |
| | | Institutional | | | Service | | | Investor A | | | Investor A1 | | | Investor C | | | Class K | | | Total | |
California Municipal Opportunities | | | 4,226 | | | $ | — | | | | 3,995 | | | | 995 | | | | 597 | | | | 255 | | | | 10,068 | |
New Jersey Municipal Bond | | | 433 | | | | 747 | | | | 556 | | | | 236 | | | | 192 | | | | 61 | | | | 2,225 | |
Pennsylvania Municipal Bond | | | 617 | | | | 54 | | | | 736 | | | | 239 | | | | 159 | | | | 61 | | | | 1,866 | |
Strategic Municipal Opportunities | | | 16,288 | | | | — | | | | 7,853 | | | | 100 | | | | 1,322 | | | | 343 | | | | 25,906 | |
For the year ended May 31, 2020, the following table shows the class specific transfer agent fees borne directly by each share class of each Fund:
| | | | | | | | | | | | | | | | | | | | | | | | | | | | | | | | |
| | | Institutional | | | Service | | | Investor A | | | Investor A1 | | | Investor C | | | Investor C1 | | | Class K | | | Total | |
California Municipal Opportunities | | $ | 1,145,051 | | | $ | — | | | $ | 594,320 | | | $ | 37,810 | | | $ | 87,253 | | | $ | 204 | | | $ | 2,558 | | | $ | 1,867,196 | |
New Jersey Municipal Bond | | | 205,521 | | | | 5,163 | | | | 65,350 | | | | 8,367 | | | | 17,322 | | | | 23 | | | | 145 | | | | 301,891 | |
Pennsylvania Municipal Bond | | | 568,026 | | | | 2,182 | | | | 66,520 | | | | 7,259 | | | | 18,741 | | | | 6 | | | | 335 | | | | 663,069 | |
Strategic Municipal Opportunities | | | 6,293,301 | | | | — | | | | 904,781 | | | | 9,511 | | | | 156,237 | | | | — | | | | 6,424 | | | | 7,370,254 | |
Other Fees: For the year ended May 31, 2020, affiliates earned underwriting discounts, direct commissions and dealer concessions on sales of each Fund’s Investor A Shares as follows:
| | | | | | | | | | | | | | | | |
| | | California Municipal
Opportunities | | | New Jersey
Municipal
Bond | | | Pennsylvania
Municipal
Bond | | | Strategic
Municipal
Opportunities | |
Investor A | | $ | 15,587 | | | $ | 4,568 | | | $ | 9,182 | | | $ | 35,010 | |
For the year ended May 31, 2020, affiliates received CDSCs as follows:
| | | | | | | | | | | | | | | | |
| | | California
Municipal
Opportunities | | | New Jersey
Municipal
Bond | | | Pennsylvania
Municipal
Bond | | | Strategic
Municipal
Opportunities | |
Investor A | | $ | 337,360 | | | $ | 11,799 | | | $ | 9,589 | | | $ | 540,028 | |
Investor A1 | | | — | | | | — | | | | 40 | | | | — | |
Investor C | | | 35,834 | | | | 5,712 | | | | 5,130 | | | | 41,763 | |
Expense Limitations, Waivers, Reimbursements, and Recoupments: With respect to each Fund, the Manager contractually agreed to waive its investment advisory fees by the amount of investment advisory fees each Fund pays to the Manager indirectly through its investment in affiliated money market funds (the “affiliated money market fund waiver”). The contractual agreement may be terminated upon 90 days’ notice by a majority of Independent Trustees, or by a vote of a majority of the outstanding voting securities of the Fund. These amounts are included in fees waived and/or reimbursed by the Manager in the Statements of Operations. For the year ended May 31, 2020, the amounts waived were as follows:
| | | | | | | | | | | | | | | | |
| | | California
Municipal
Opportunities | | | New Jersey
Municipal
Bond | | | Pennsylvania
Municipal
Bond | | | Strategic
Municipal
Opportunities | |
Amount waived | | $ | 106,732 | | | $ | 13,698 | | | $ | 15,648 | | | $ | 319,719 | |
The Manager has contractually agreed to waive its investment advisory fee with respect to any portion of each Fund’s assets invested in affiliated equity and fixed-income mutual funds and affiliated exchange-traded funds that have a contractual management fee through September 30, 2020. The contractual agreement may be terminated upon 90 days’ notice by a majority of Independent Trustees, or by a vote of a majority of the outstanding voting securities of the Fund. This amount is included in fees waived and/or reimbursed by the Manager in the Statements of Operations. For the year ended May 31, 2020, the amount waived in investment advisory fees pursuant to this arrangement were as follows:
| | | | | | | | | | | | | | | | |
| | | California
Municipal
Opportunities | | | New Jersey Municipal
Bond | | | Pennsylvania
Municipal
Bond | | | Strategic
Municipal
Opportunities | |
Amount waived | | $ | 326,807 | | | $ | 2,166 | | | $ | 4,842 | | | $ | 94,826 | |
| | |
| 90 | | 2020 BLACKROCK ANNUAL REPORTTO SHAREHOLDERS |
Notes to Financial Statements (continued)
With respect to California Municipal Opportunities, New Jersey Municipal Bond and Pennsylvania Municipal Bond, the Manager contractually agreed to waive and/or reimburse fees or expenses in order to limit expenses, excluding interest expense, dividend expense, tax expense, acquired fund fees and expenses and certain other fund expenses, which constitute extraordinary expenses not incurred in the ordinary course of each Fund’s business. The current expense limitations as a percentage of average daily net assets are as follows:
| | | | | | | | | | | | |
| Share Class | | California
Municipal
Opportunities | | | New Jersey
Municipal
Bond | | | Pennsylvania
Municipal
Bond | |
Institutional | | | 0.44 | % | | | 0.52 | % | | | 0.54 | % |
Service | | | — | | | | 0.77 | | | | 0.79 | |
Investor A | | | 0.69 | | | | 0.77 | | | | 0.79 | |
Investor A1 | | | 0.54 | | | | 0.62 | | | | 0.64 | |
Investor C | | | 1.44 | | | | 1.52 | | | | 1.54 | |
Investor C1 | | | 1.04 | | | | 1.12 | | | | 1.14 | |
Class K | | | 0.39 | | | | 0.47 | | | | 0.49 | |
The Manager has agreed not to reduce or discontinue these contractual expense limitations through September 30, 2020, unless approved by the Board, including a majority of the Independent Trustees, or by a vote of a majority of the outstanding voting securities of the applicable Fund.
With respect to Strategic Municipal Opportunities, the Manager contractually agreed to waive a portion of its investment advisory fees equal to the annual rate of 0.05% of the Fund’s average daily net assets through September 30, 2020. The agreement may be terminated upon 90 days’ notice by a majority of Independent Trustees of BlackRock Municipal Series Trust or by a vote of a majority of the outstanding voting securities of the Fund. For the year ended May 31, 2020, the Manager waived $5,684,829 which is included in fees waived and/or reimbursed by the Manager in the Statements of Operations.
In addition, the following Funds had a waiver of investment advisory fees, which are included in fees waived and/or reimbursed by the Manager in the Statements of Operations. For the year ended May 31, 2020, the amounts as follows:
| | | | | | | | | | | | |
| | | California
Municipal
Opportunities | | | New Jersey
Municipal
Bond | | | Pennsylvania
Municipal
Bond | |
Amount waived | | $ | 51,288 | | | $ | 433,358 | | | $ | 464,661 | |
For the year ended May 31, 2020, the Funds reimbursed the Manager for certain accounting services, which is included in accounting services in the Statements of Operations. The reimbursements were as follows:
| | | | | | | | | | | | | | | | |
| | | California
Municipal
Opportunities | | | New Jersey
Municipal
Bond | | | Pennsylvania
Municipal
Bond | | | Strategic
Municipal
Opportunities | |
Amount reimbursed | | $ | 43,730 | | | $ | 4,281 | | | $ | 6,710 | | | $ | 140,130 | |
For the year ended May 31, 2020, the amounts included in transfer agent fees waived and/or reimbursed — class specific in the Statements of Operations were as follows:
| | | | | | | | | | | | | | | | | | | | | | | | | | | | | | | | |
| | | Institutional | | | Service | | | Investor A | | | Investor A1 | | | Investor C | | | Investor C1 | | | Class K | | | Total | |
California Municipal Opportunities | | $ | — | | | $ | — | | | $ | 395 | | | $ | — | | | $ | 126 | | | $ | 119 | | | $ | 453 | | | $ | 1,093 | |
New Jersey Municipal Bond | | | 108,338 | | | | 1,285 | | | | 15,023 | | | | — | | | | 866 | | | | 21 | | | | 144 | | | | 125,677 | |
Pennsylvania Municipal Bond | | | 373,137 | | | | 1,101 | | | | 5,111 | | | | 2,156 | | | | 3,773 | | | | 5 | | | | 334 | | | | 385,617 | |
With respect to the contractual expense limitation, if during California Municipal Opportunities’ fiscal year the operating expenses of a share class, that at any time during the prior two fiscal years received a waiver and/or reimbursement from the Manager, are less than the current expense limitation for that share class, the Manager is entitled to be reimbursed by such share class up to the lesser of: (a) the amount of fees waived and/or expenses reimbursed during those prior two fiscal years under the agreement and (b) an amount not to exceed either the current expense limitation of that share class or the expense limitation of the share class in effect at the time that the share class received the applicable waiver and/or reimbursement, provided that:
(1) the Fund, of which the share class is a part, has more than $50 million in assets for the fiscal year, and
(2) the Manager or an affiliate continues to serve as the Fund’s investment adviser or administrator.
This repayment applies only to the contractual expense limitation on net expenses for California Municipal Opportunities and does not apply to the contractual investment advisory fee waiver described above or any voluntary waivers that may be in effect from time to time. Effective December 1, 2019, the repayment arrangement between the Fund and the Manager pursuant to which such Fund may be required to repay amounts waived and/or reimbursed under the Fund’s contractual caps on net expenses was terminated.
| | | | |
| NOTESTO FINANCIAL STATEMENTS | | | 91 | |
Notes to Financial Statements (continued)
For the year ended May 31, 2020, the Manager recouped the following fund level and class specific waivers and/or reimbursements previously recorded by California Municipal Opportunities:
| | | | |
Fund Level | | $ | 60,680 | |
Institutional | | | 51,483 | |
Investor A | | | 20,264 | |
Investor C | | | 2,872 | |
Class K | | | 822 | |
The following fund level and class specific waivers and/or reimbursements previously recorded by California Municipal Opportunities, which were subject to recoupment by the Manager, expired on December 1, 2019:
| | | | |
Fund Level | | $ | 214,197 | |
Investor A | | | 2,335 | |
Investor C | | | 12,049 | |
Investor C1 | | | 694 | |
Class K | | | 30 | |
Interfund Lending: In accordance with an exemptive order (the “Order”) from the U.S. Securities and Exchange Commission (“SEC”), each Fund may participate in a joint lending and borrowing facility for temporary purposes (the “Interfund Lending Program”), subject to compliance with the terms and conditions of the Order, and to the extent permitted by each Fund’s investment policies and restrictions. Each Fund is currently permitted to borrow under the Interfund Lending Program.
A lending BlackRock fund may lend in aggregate up to 15% of its net assets, but may not lend more than 5% of its net assets to any one borrowing fund through the Interfund Lending Program. A borrowing BlackRock fund may not borrow through the Interfund Lending Program or from any other source more than 33 1/3% of its total assets (or any lower threshold provided for by the fund’s investment restrictions). If a borrowing BlackRock fund’s total outstanding borrowings exceed 10% of its total assets, each of its outstanding interfund loans will be subject to collateralization of at least 102% of the outstanding principal value of the loan. All interfund loans are for temporary or emergency purposes and the interest rate to be charged will be the average of the highest current overnight repurchase agreement rate available to a lending fund and the bank loan rate, as calculated according to a formula established by the Board.
During the year ended May 31, 2020, the Funds did not participate in the Interfund Lending Program.
Trustees and Officers: Certain trustees and/or officers of the Trusts are directors and/or officers of BlackRock or its affiliates. The Funds reimburse the Manager for a portion of the compensation paid to the Funds’ Chief Compliance Officer, which is included in Trustees and Officer in the Statements of Operations.
For the year ended May 31, 2020, purchases and sales of investments, excluding short-term securities, were as follows:
| | | | | | | | | | | | | | | | |
| | | California Municipal Opportunities | | | New Jersey Municipal Bond | | | Pennsylvania Municipal Bond | | | Strategic Municipal Opportunities | |
Purchases | | $ | 4,051,421,164 | | | $ | 125,647,643 | | | $ | 160,734,837 | | | $ | 14,293,680,969 | |
Sales | | | 4,227,637,350 | | | | 78,203,720 | | | | 172,580,875 | | | | 16,099,339,728 | |
It is each Fund’s policy to comply with the requirements of the Internal Revenue Code of 1986, as amended, applicable to regulated investment companies, and to distribute substantially all of its taxable income to its shareholders. Therefore, no U.S. federal income tax provision is required.
Each Fund files U.S. federal and various state and local tax returns. No income tax returns are currently under examination. The statute of limitations on each Fund’s U.S. federal tax returns generally remains open for each of the four years ended May 31, 2020. The statutes of limitations on each Fund’s state and local tax returns may remain open for an additional year depending upon the jurisdiction.
Management has analyzed tax laws and regulations and their application to the Funds as of May 31, 2020, inclusive of the open tax return years, and does not believe that there are any uncertain tax positions that require recognition of a tax liability in the Funds’ financial statements.
| | |
| 92 | | 2020 BLACKROCK ANNUAL REPORTTO SHAREHOLDERS |
Notes to Financial Statements (continued)
The tax character of distributions paid was as follows:
| | | | | | | | | | | | | | | | |
| | | BlackRock
California
Municipal
Opportunities Fund | | | BlackRock
New Jersey
Municipal
Bond Fund | | | BlackRock
Pennsylvania
Municipal
Bond Fund | | | BlackRock
Strategic
Municipal
Opportunities Fund | |
Tax-exempt income(a) | | | | | | | | | | | | | | | | |
5/31/20 | | $ | 66,563,174 | | | $ | 11,137,126 | | | $ | 18,554,612 | | | $ | 252,282,790 | |
5/31/19 | | | 63,921,330 | | | | 10,353,312 | | | | 19,196,801 | | | | 250,420,858 | |
Ordinary income(b) | | | | | | | | | | | | | | | | |
5/31/20 | | | 7,674,640 | | | | 7,829 | | | | 14,394 | | | | 24,673,785 | |
5/31/19 | | | 20,969,717 | | | | 11,693 | | | | 4,632 | | | | 51,518,375 | |
Long-term capital gains | | | | | | | | | | | | | | | | |
5/31/20 | | | — | | | | — | | | | — | | | | — | |
5/31/19 | | | 33,306,266 | | | | — | | | | — | | | | 120,851,791 | |
| | | | | | | | | | | | | | | | |
Total | | | | | | | | | | | | | | | | |
5/31/20 | | $ | 74,237,814 | | | $ | 11,144,955 | | | $ | 18,569,006 | | | $ | 276,956,575 | |
| | | | | | | | | | | | | | | | |
5/31/19 | | $ | 118,197,313 | | | $ | 10,365,005 | | | $ | 19,201,433 | | | $ | 422,791,024 | |
| | | | | | | | | | | | | | | | |
| | (a) | The Funds designate these amounts paid during the fiscal year ended May 31, 2020, as exempt-interest dividends. | |
| | (b) | Ordinary income consists primarily of taxable income from bonds not federally tax-exempt and recognized market discount. Additionally, all ordinary income distributions are comprised of interest related dividends non-U.S. residents and are eligible for exemption from U.S. withholding tax for nonresident aliens and foreign corporations. | |
As of period end, the tax components of accumulated earnings (loss) were as follows:
| | | | | | | | | | | | | | | | |
| | | BlackRock
California
Municipal
Opportunities Fund | | | BlackRock
New Jersey
Municipal
Bond Fund | | | BlackRock
Pennsylvania
Municipal
Bond Fund | | | BlackRock
Strategic
Municipal
Opportunities Fund | |
Undistributed tax-exempt income | | $ | 403,944 | | | $ | 362,709 | | | | — | | | | — | |
Undistributed ordinary income | | | 23,498 | | | | 781 | | | $ | 1,222 | | | $ | 754,356 | |
Non-expiring capital loss carryforwards(a) | | | (227,807,093 | ) | | | (12,667,504 | ) | | | (25,384,879 | ) | | | (841,845,687 | ) |
Net unrealized gains(b) | | | 97,935,503 | | | | 15,384,157 | | | | 19,340,346 | | | | 29,520,991 | |
| | | | | | | | | | | | | | | | |
Total | | $ | (129,444,148 | ) | | $ | 3,080,143 | | | $ | (6,043,311 | ) | | $ | (811,570,340 | ) |
| | | | | | | | | | | | | | | | |
| | (a) | Amounts available to offset future realized capital gains. | |
| | (b) | The difference between book-basis and tax-basis net unrealized gains was attributable primarily to the tax deferral of losses on wash sales, amortization methods for premiums and discounts on fixed income securities, the accrual of income on securities in default, the realization for tax purposes of unrealized gains/losses on certain futures contracts, the treatment of residual interests in tender option bond trusts and the deferral of compensation to trustees. | |
As of May 31, 2020, gross unrealized appreciation and depreciation for investments and derivatives based on cost for U.S. federal income tax purposes were as follows:
| | | | | | | | | | | | | | | | |
| | | BlackRock
California
Municipal
Opportunities Fund | | | BlackRock
New Jersey
Municipal
Bond Fund | | | BlackRock
Pennsylvania
Municipal
Bond Fund | | | BlackRock
Strategic
Municipal
Opportunities Fund | |
Tax cost | | $ | 3,155,428,787 | | | $ | 334,097,476 | | | $ | 521,951,498 | | | $ | 9,014,979,721 | |
| | | | | | | | | | | | | | | | |
Gross unrealized appreciation | | $ | 132,572,826 | | | $ | 18,422,179 | | | $ | 27,825,321 | | | $ | 268,756,390 | |
Gross unrealized depreciation | | | (34,637,323 | ) | | | (3,038,022 | ) | | | (8,274,478 | ) | | | (238,185,649 | ) |
| | | | | | | | | | | | | | | | |
Net unrealized appreciation | | $ | 97,935,503 | | | $ | 15,384,157 | | | $ | 19,550,843 | | | $ | 30,570,741 | |
| | | | | | | | | | | | | | | | |
Each Trust, on behalf of the Funds, along with certain other funds managed by the Manager and its affiliates (“Participating Funds”), is a party to a 364-day, $2.25 billion credit agreement with a group of lenders. Under this agreement, the Funds may borrow to fund shareholder redemptions. Excluding commitments designated for certain individual funds, the Participating Funds, including the Funds, can borrow up to an aggregate commitment amount of $1.75 billion at any time outstanding, subject to asset coverage and other limitations as specified in the agreement. The credit agreement has the following terms: a fee of 0.10% per annum on unused commitment amounts and interest at a rate equal to the higher of (a) one-month LIBOR (but, in any event, not less than 0.00%) on the date the loan is made plus 0.80% per annum or (b) the Fed Funds rate (but, in any event, not less than 0.00%) in effect from time to time plus 0.80% per annum on amounts borrowed. The agreement expires in April 2021 unless extended or renewed. These fees were allocated among such funds based upon portions of the aggregate commitment available to them and relative net assets of Participating Funds. During the year ended May 31, 2020, the Funds did not borrow under the credit agreement.
| | | | |
| NOTESTO FINANCIAL STATEMENTS | | | 93 | |
Notes to Financial Statements (continued)
Many municipalities insure repayment of their bonds, which may reduce the potential for loss due to credit risk. The market value of these bonds may fluctuate for other reasons, including market perception of the value of such insurance, and there is no guarantee that the insurer will meet its obligation.
Inventories of municipal bonds held by brokers and dealers may decrease, which would lessen their ability to make a market in these securities. Such a reduction in market making capacity could potentially decrease a Fund’s ability to buy or sell bonds. As a result, a Fund may sell a security at a lower price, sell other securities to raise cash, or give up an investment opportunity, any of which could have a negative impact on performance. If a Fund needed to sell large blocks of bonds, those sales could further reduce the bonds’ prices and impact performance.
In the normal course of business, certain Funds invest in securities or other instruments and may enter into certain transactions, and such activities subject each Fund to various risks, including among others, fluctuations in the market (market risk) or failure of an issuer to meet all of its obligations. The value of securities or other instruments may also be affected by various factors, including, without limitation: (i) the general economy; (ii) the overall market as well as local, regional or global political and/or social instability; (iii) regulation, taxation or international tax treaties between various countries; or (iv) currency, interest rate and price fluctuations. Local, regional or global events such as war, acts of terrorism, the spread of infectious illness or other public health issues, recessions, or other events could have a significant impact on the Funds and their investments. Each Fund’s prospectus provides details of the risks to which each Fund is subject.
Each Fund may be exposed to prepayment risk, which is the risk that borrowers may exercise their option to prepay principal earlier than scheduled during periods of declining interest rates, which would force each Fund to reinvest in lower yielding securities. Each Fund may also be exposed to reinvestment risk, which is the risk that income from each Fund’s portfolio will decline if each Fund invests the proceeds from matured, traded or called fixed-income securities at market interest rates that are below each Fund portfolio’s current earnings rate.
The Funds may hold a significant amount of bonds subject to calls by the issuers at defined dates and prices. When bonds are called by issuers and the Funds reinvest the proceeds received, such investments may be in securities with lower yields than the bonds originally held, and correspondingly, could adversely impact the yield and total return performance of a Fund.
A Fund structures and “sponsors” the TOB Trusts in which it holds TOB Residuals and has certain duties and responsibilities, which may give rise to certain additional risks including, but not limited to, compliance, securities law and operational risks.
Should short-term interest rates rise, the Funds’ investments in the TOB Trusts may adversely affect the Funds’ net investment income and dividends to shareholders. Also, fluctuations in the market value of municipal bonds deposited into the TOB Trust may adversely affect the Funds’ NAVs per share.
The SEC and various federal banking and housing agencies have adopted credit risk retention rules for securitizations (the “Risk Retention Rules”). The Risk Retention Rules would require the sponsor of a TOB Trust to retain at least 5% of the credit risk of the underlying assets supporting the TOB Trust’s municipal bonds. The Risk Retention Rules may adversely affect the Funds’ ability to engage in TOB Trust transactions or increase the costs of such transactions in certain circumstances.
TOB Trusts constitute an important component of the municipal bond market. Any modifications or changes to rules governing TOB Trusts may adversely impact the municipal market and the Funds, including through reduced demand for and liquidity of municipal bonds and increased financing costs for municipal issuers. The ultimate impact of any potential modifications on the TOB Trust market and the overall municipal market is not yet certain.
An outbreak of respiratory disease caused by a novel coronavirus has developed into a global pandemic and has resulted in closing borders, quarantines, disruptions to supply chains and customer activity, as well as general concern and uncertainty. The impact of this pandemic, and other global health crises that may arise in the future, could affect the economies of many nations, individual companies and the market in general in ways that cannot necessarily be foreseen at the present time. This pandemic may result in substantial market volatility and may adversely impact the prices and liquidity of a fund’s investments. The duration of this pandemic and its effects cannot be determined with certainty.
Counterparty Credit Risk: The Funds may be exposed to counterparty credit risk, or the risk that an entity may fail to or be unable to perform on its commitments related to unsettled or open transactions. The Funds manage counterparty credit risk by entering into transactions only with counterparties that the Manager believes have the financial resources to honor their obligations and by monitoring the financial stability of those counterparties. Financial assets, which potentially expose the Funds to market, issuer and counterparty credit risks, consist principally of financial instruments and receivables due from counterparties. The extent of the Funds’ exposure to market, issuer and counterparty credit risks with respect to these financial assets is approximately their value recorded in the Statements of Assets and Liabilities, less any collateral held by the Funds.
A derivative contract may suffer a mark-to-market loss if the value of the contract decreases due to an unfavorable change in the market rates or values of the underlying instrument. Losses can also occur if the counterparty does not perform under the contract.
With exchange-traded futures, there is less counterparty credit risk to the Funds since the exchange or clearinghouse, as counterparty to such instruments, guarantees against a possible default. The clearinghouse stands between the buyer and the seller of the contract; therefore, credit risk is limited to failure of the clearinghouse. While offset rights may exist under applicable law, a Fund does not have a contractual right of offset against a clearing broker or clearinghouse in the event of a default (including the bankruptcy or insolvency). Additionally, credit risk exists in exchange-traded futures with respect to initial and variation margin that is held in a clearing broker’s customer accounts. While clearing brokers are required to segregate customer margin from their own assets, in the event that a clearing broker becomes insolvent or goes into bankruptcy and at that time there is a shortfall in the aggregate amount of margin held by the clearing broker for all its clients, typically the shortfall would be allocated on a pro rata basis across all the clearing broker’s customers, potentially resulting in losses to the Funds.
Concentration Risk: Each Fund invests a substantial amount of its assets in issuers located in a single state or limited number of states. This may subject each Fund to the risk that economic, political or social issues impacting a particular state or group of states could have an adverse and disproportionate impact on the income from, or the value or liquidity of, the Funds’ respective portfolios. Investment percentages in specific states or U.S. territories are presented in the Schedules of Investments.
| | |
| 94 | | 2020 BLACKROCK ANNUAL REPORTTO SHAREHOLDERS |
Notes to Financial Statements (continued)
As of period end, California Municipal Opportunities invested a significant portion of its assets in securities in the county, city, special district, school district and utilities sector. Pennsylvania Municipal Bond invested a significant portion of its assets in securities in the health sector. New Jersey Municipal Bond Fund invested a significant portion of its assets in securities in the transportation sector. Changes in economic conditions affecting such sectors would have a greater impact on the Funds and could affect the value, income and/or liquidity of positions in such securities.
The Funds invest a significant portion of their assets in fixed-income securities and/or use derivatives tied to the fixed-income markets. Changes in market interest rates or economic conditions may affect the value and/or liquidity of such investments. Interest rate risk is the risk that prices of bonds and other fixed-income securities will increase as interest rates fall and decrease as interest rates rise. The Funds may be subject to a greater risk of rising interest rates due to the current period of historically low rates.
| 11. | CAPITAL SHARE TRANSACTIONS |
Transactions in capital shares for each class were as follows:
| | | | | | | | | | | | | | | | |
| | | Year Ended
05/31/20 | | | Year Ended
05/31/19 | |
| California Municipal Opportunities | | Shares | | | Amount | | | Shares | | | Amount | |
Institutional | | | | | | | | | | | | | | | | |
Shares sold | | | 80,671,530 | | | $ | 1,020,668,423 | | | | 115,908,754 | | | $ | 1,456,570,908 | |
Shares issued in reinvestment of distributions | | | 3,147,367 | | | | 39,748,171 | | | | 4,793,829 | | | | 59,951,733 | |
Shares redeemed | | | (89,603,098 | ) | | | (1,100,509,206 | ) | | | (55,324,342 | ) | | | (691,717,890 | ) |
| | | | | | | | | | | | | | | | |
Net increase (decrease) | | | (5,784,201 | ) | | $ | (40,092,612 | ) | | | 65,378,241 | | | $ | 824,804,751 | |
| | | | | | | | | | | | | | | | |
| | | | |
Investor A | | | | | | | | | | | | | | | | |
Shares sold and automatic conversion of shares | | | 36,985,652 | | | $ | 471,317,122 | | | | 40,902,353 | | | $ | 514,860,620 | |
Shares issued in reinvestment of distributions | | | 1,559,250 | | | | 19,650,622 | | | | 2,456,061 | | | | 30,677,114 | |
Shares redeemed | | | (24,939,474 | ) | | | (307,195,670 | ) | | | (18,780,774 | ) | | | (235,673,424 | ) |
| | | | | | | | | | | | | | | | |
Net increase | | | 13,605,428 | | | $ | 183,772,074 | | | | 24,577,640 | | | $ | 309,864,310 | |
| | | | | | | | | | | | | | | | |
| | | | |
Investor A1 | | | | | | | | | | | | | | | | |
Shares sold | | | 22 | | | $ | 274 | | | | 218 | | | $ | 3,114 | |
Shares issued in reinvestment of distributions | | | 107,798 | | | | 1,360,745 | | | | 246,117 | | | | 3,077,643 | |
Shares redeemed | | | (505,244 | ) | | | (6,334,055 | ) | | | (699,828 | ) | | | (8,821,600 | ) |
| | | | | | | | | | | | | | | | |
Net decrease | | | (397,424 | ) | | $ | (4,973,036 | ) | | | (453,493 | ) | | $ | (5,740,843 | ) |
| | | | | | | | | | | | | | | | |
| | | | |
Investor C | | | | | | | | | | | | | | | | |
Shares sold | | | 3,106,412 | | | $ | 39,610,966 | | | | 4,097,737 | | | $ | 51,632,420 | |
Shares issued in reinvestment of distributions | | | 131,424 | | | | 1,657,881 | | | | 355,383 | | | | 4,436,387 | |
Shares redeemed and automatic conversion of shares | | | (3,203,262 | ) | | | (39,836,061 | ) | | | (2,330,412 | ) | | | (29,269,082 | ) |
| | | | | | | | | | | | | | | | |
Net increase | | | 34,574 | | | $ | 1,432,786 | | | | 2,122,708 | | | $ | 26,799,725 | |
| | | | | | | | | | | | | | | | |
| | | | |
Investor C1(a) | | | | | | | | | | | | | | | | |
Shares sold | | | — | | | $ | — | | | | — | | | $ | 69 | |
Shares issued in reinvestment of distributions | | | — | | | | 2 | | | | 1,970 | | | | 24,887 | |
Shares redeemed and automatic conversion of shares | | | (15,891 | ) | | | (206,596 | ) | | | (180,293 | ) | | | (2,263,760 | ) |
| | | | | | | | | | | | | | | | |
Net decrease | | | (15,891 | ) | | $ | (206,594 | ) | | | (178,323 | ) | | $ | (2,238,804 | ) |
| | | | | | | | | | | | | | | | |
|
Class K | |
Shares sold | | | 7,672,224 | | | $ | 97,769,190 | | | | 8,156,044 | | | $ | 101,572,186 | |
Shares issued in reinvestment of distributions | | | 160,372 | | | | 2,019,859 | | | | 170,426 | | | | 2,135,970 | |
Shares redeemed | | | (7,871,338 | ) | | | (94,632,110 | ) | | | (2,256,800 | ) | | | (28,241,497 | ) |
| | | | | | | | | | | | | | | | |
Net increase (decrease) | | | (38,742 | ) | | $ | 5,156,939 | | | | 6,069,670 | | | $ | 75,466,659 | |
| | | | | | | | | | | | | | | | |
Total Net Increase | | | 7,403,744 | | | $ | 145,089,557 | | | | 97,516,443 | | | $ | 1,228,955,798 | |
| | | | | | | | | | | | | | | | |
| | | | | | | | | | | | | | | | |
| | | Year Ended
05/31/20 | | | Year Ended
05/31/19 | |
| New Jersey Municipal Bond Fund | | Shares | | | Amount | | | Shares | | | Amount | |
Institutional | | | | | | | | | | | | | | | | |
Shares sold | | | 4,824,332 | | | $ | 54,566,741 | | | | 4,493,677 | | | $ | 49,467,803 | |
Shares issued in reinvestment of distributions | | | 368,838 | | | | 4,148,676 | | | | 308,429 | | | | 3,399,468 | |
Shares redeemed | | | (3,617,675 | ) | | | (39,891,335 | ) | | | (2,812,478 | ) | | | (30,789,124 | ) |
| | | | | | | | | | | | | | | | |
Net increase | | | 1,575,495 | | | $ | 18,824,082 | | | | 1,989,628 | | | $ | 22,078,147 | |
| | | | | | | | | | | | | | | | |
| | | | |
| NOTESTO FINANCIAL STATEMENTS | | | 95 | |
Notes to Financial Statements (continued)
| | | | | | | | | | | | | | | | |
| | | Year Ended
05/31/20 | | | Year Ended
05/31/19 | |
| New Jersey Municipal Bond Fund (continued) | | Shares | | | Amount | | | Shares | | | Amount | |
| | | | |
Service | | | | | | | | | | | | | | | | |
Shares sold | | | 2,949 | | | $ | 32,067 | | | | 47,225 | | | $ | 526,273 | |
Shares issued in reinvestment of distributions | | | 19,434 | | | | 218,731 | | | | 21,785 | | | | 239,932 | |
Shares redeemed | | | (30,381 | ) | | | (337,724 | ) | | | (89,106 | ) | | | (975,883 | ) |
| | | | | | | | | | | | | | | | |
Net decrease | | | (7,998 | ) | | $ | (86,926 | ) | | | (20,096 | ) | | $ | (209,678 | ) |
| | | | | | | | | | | | | | | | |
| | | | |
Investor A | | | | | | | | | | | | | | | | |
Shares sold and automatic conversion of shares | | | 4,061,579 | | | $ | 46,088,376 | | | | 3,440,961 | | | $ | 37,829,122 | |
Shares issued in reinvestment of distributions | | | 261,193 | | | | 2,941,842 | | | | 222,128 | | | | 2,449,784 | |
Shares redeemed | | | (2,509,844 | ) | | | (27,917,059 | ) | | | (2,262,696 | ) | | | (24,740,736 | ) |
| | | | | | | | | | | | | | | | |
Net increase | | | 1,812,928 | | | $ | 21,113,159 | | | | 1,400,393 | | | $ | 15,538,170 | |
| | | | | | | | | | | | | | | | |
| | | | |
Investor A1 | | | | | | | | | | | | | | | | |
Shares sold | | | 2 | | | $ | 28 | | | | 70 | | | $ | 762 | |
Shares issued in reinvestment of distributions | | | 36,105 | | | | 407,053 | | | | 42,174 | | | | 465,111 | |
Shares redeemed | | | (194,083 | ) | | | (2,193,404 | ) | | | (151,921 | ) | | | (1,669,810 | ) |
| | | | | | | | | | | | | | | | |
Net decrease | | | (157,976 | ) | | $ | (1,786,323 | ) | | | (109,677 | ) | | $ | (1,203,937 | ) |
| | | | | | | | | | | | | | | | |
| | | | |
Investor C | | | | | | | | | | | | | | | | |
Shares sold | | | 826,582 | | | $ | 9,394,118 | | | | 750,824 | | | $ | 8,268,272 | |
Shares issued in reinvestment of distributions | | | 59,478 | | | | 668,894 | | | | 59,723 | | | | 657,763 | |
Shares redeemed and automatic conversion of shares | | | (668,851 | ) | | | (7,417,679 | ) | | | (717,461 | ) | | | (7,849,651 | ) |
| | | | | | | | | | | | | | | | |
Net increase | | | 217,209 | | | $ | 2,645,333 | | | | 93,086 | | | $ | 1,076,384 | |
| | | | | | | | | | | | | | | | |
| | | | |
Investor C1(a) | | | | | | | | | | | | | | | | |
Shares sold | | | 3 | | | $ | 44 | | | | — | | | $ | (125 | ) |
Shares issued in reinvestment of distributions | | | 23 | | | | 260 | | | | 1,680 | | | | 18,429 | |
Shares redeemed and automatic conversion of shares | | | (2019 | ) | | | (23,542 | ) | | | (121,889 | ) | | | (1,315,730 | ) |
| | | | | | | | | | | | | | | | |
Net decrease | | | (1,993 | ) | | $ | (23,238 | ) | | | (120,209 | ) | | $ | (1,297,426 | ) |
| | | | | | | | | | | | | | | | |
|
Class K | |
Shares sold | | | 48,368 | | | $ | 539,457 | | | | 38,184 | | | $ | 422,503 | |
Shares issued in reinvestment of distributions | | | 5,021 | | | | 56,444 | | | | 5,229 | | | | 57,581 | |
Shares redeemed | | | (8,833 | ) | | | (96,166 | ) | | | (57,195 | ) | | | (632,450 | ) |
| | | | | | | | | | | | | | | | |
Net increase (decrease) | | | 44,556 | | | $ | 499,735 | | | | (13,782 | ) | | $ | (152,366 | ) |
| | | | | | | | | | | | | | | | |
Total Net Increase | | | 3,482,221 | | | $ | 41,185,822 | | | | 3,219,343 | | | $ | 35,829,294 | |
| | | | | | | | | | | | | | | | |
| | | | | | | | | | | | | | | | |
| | | Year Ended
05/31/20 | | | Year Ended
05/31/19 | |
| Pennsylvania Municipal Bond Fund | | Shares | | | Amount | | | Shares | | | Amount | |
Institutional | | | | | | | | | | | | | | | | |
Shares sold | | | 6,635,531 | | | $ | 73,402,433 | | | | 9,419,819 | | | $ | 102,303,401 | |
Shares issued in reinvestment of distributions | | | 555,062 | | | | 6,134,012 | | | | 500,787 | | | | 5,456,679 | |
Shares redeemed | | | (6,921,554 | ) | | | (75,151,282 | ) | | | (8,187,076 | ) | | | (88,538,178 | ) |
| | | | | | | | | | | | | | | | |
Net increase | | | 269,039 | | | $ | 4,385,163 | | | | 1,733,530 | | | $ | 19,221,902 | |
| | | | | | | | | | | | | | | | |
| | | | |
Service | | | | | | | | | | | | | | | | |
Shares sold | | | 141,441 | | | $ | 1,583,639 | | | | 87,159 | | | $ | 946,989 | |
Shares issued in reinvestment of distributions | | | 6,168 | | | | 68,277 | | | | 5,707 | | | | 62,276 | |
Shares redeemed | | | (150,019 | ) | | | (1,659,534 | ) | | | (68,175 | ) | | | (732,397 | ) |
| | | | | | | | | | | | | | | | |
Net increase (decrease) | | | (2,410 | ) | | $ | (7,618 | ) | | | 24,691 | | | $ | 276,868 | |
| | | | | | | | | | | | | | | | |
| | | | |
Investor A | | | | | | | | | | | | | | | | |
Shares sold and automatic conversion of shares | | | 3,456,983 | | | $ | 38,450,860 | | | | 3,381,545 | | | $ | 36,743,125 | |
Shares issued in reinvestment of distributions | | | 345,859 | | | | 3,824,111 | | | | 308,066 | | | | 3,359,167 | |
Shares redeemed | | | (1,554,429 | ) | | | (17,100,294 | ) | | | (2,688,372 | ) | | | (29,200,775 | ) |
| | | | | | | | | | | | | | | | |
Net increase | | | 2,248,413 | | | $ | 25,174,677 | | | | 1,001,239 | | | $ | 10,901,517 | |
| | | | | | | | | | | | | | | | |
| | |
| 96 | | 2020 BLACKROCK ANNUAL REPORTTO SHAREHOLDERS |
Notes to Financial Statements (continued)
| | | | | | | | | | | | | | | | |
| | | Year Ended
05/31/20 | | | Year Ended
05/31/19 | |
| Pennsylvania Municipal Bond Fund (continued) | | Shares | | | Amount | | | Shares | | | Amount | |
| | | | |
Investor A1 | | | | | | | | | | | | | | | | |
Shares sold | | | — | | | $ | — | | | | 16 | | | $ | 208 | |
Shares issued in reinvestment of distributions | | | 18,134 | | | | 200,819 | | | | 23,489 | | | | 256,039 | |
Shares redeemed | | | (82,870 | ) | | | (922,432 | ) | | | (331,516 | ) | | | (3,572,846 | ) |
| | | | | | | | | | | | | | | | |
Net decrease | | | (64,736 | ) | | $ | (721,613 | ) | | | (308,011 | ) | | $ | (3,316,599 | ) |
| | | | | | | | | | | | | | | | |
| | | | |
Investor C | | | | | | | | | | | | | | | | |
Shares sold | | | 707,983 | | | $ | 7,845,586 | | | | 351,430 | | | $ | 3,835,593 | |
Shares issued in reinvestment of distributions | | | 60,574 | | | | 670,191 | | | | 73,632 | | | | 802,268 | |
Shares redeemed and automatic conversion of shares | | | (757,294 | ) | | | (8,341,781 | ) | | | (655,353 | ) | | | (7,117,874 | ) |
| | | | | | | | | | | | | | | | |
Net increase (decrease) | | | 11,263 | | | $ | 173,996 | | | | (230,291 | ) | | $ | (2,480,013 | ) |
| | | | | | | | | | | | | | | | |
| | | | |
Investor C1(a) | | | | | | | | | | | | | | | | |
Shares sold | | | — | | | $ | — | | | | 5 | | | $ | (340 | ) |
Shares issued in reinvestment of distributions | | | 3 | | | | 38 | | | | 2,194 | | | | 23,818 | |
Shares redeemed and automatic conversion of shares | | | (746 | ) | | | (8,342 | ) | | | (145,368 | ) | | | (1,554,847 | ) |
| | | | | | | | | | | | | | | | |
Net decrease | | | (743 | ) | | $ | (8,304 | ) | | | (143,169 | ) | | $ | (1,531,369 | ) |
| | | | | | | | | | | | | | | | |
|
Class K | |
Shares sold | | | 237,976 | | | $ | 2,631,025 | | | | 113,348 | | | $ | 1,232,815 | |
Shares issued in reinvestment of distributions | | | 10,246 | | | | 112,845 | | | | 7,457 | | | | 81,120 | |
Shares redeemed | | | (87,302 | ) | | | (944,340 | ) | | | (137,868 | ) | | | (1,487,711 | ) |
| | | | | | | | | | | | | | | | |
Net increase (decrease) | | | 160,920 | | | $ | 1,799,530 | | | | (17,063 | ) | | $ | (173,776 | ) |
| | | | | | | | | | | | | | | | |
Total Net Increase | | | 2,621,746 | | | $ | 30,795,831 | | | | 2,060,926 | | | $ | 22,898,530 | |
| | | | | | | | | | | | | | | | |
| | | | | | | | | | | | | | | | |
| | | Year Ended
05/31/20 | | | Year Ended
05/31/19 | |
| Strategic Municipal Opportunities | | Shares | | | Amount | | | Shares | | | Amount | |
Institutional | | | | | | | | | | | | | | | | |
Shares sold | | | 315,544,558 | | | $ | 3,644,033,630 | | | | 424,159,901 | | | $ | 4,902,103,070 | |
Shares issued in reinvestment of distributions | | | 14,850,481 | | | | 171,358,616 | | | | 22,190,343 | | | | 255,471,978 | |
Shares redeemed | | | (434,132,060 | ) | | | (4,777,669,748 | ) | | | (209,250,857 | ) | | | (2,408,474,429 | ) |
| | | | | | | | | | | | | | | | |
Net increase (decrease) | | | (103,737,021 | ) | | $ | (962,277,502 | ) | | | 237,099,387 | | | $ | 2,749,100,619 | |
| | | | | | | | | | | | | | | | |
| | | | |
Investor A | | | | | | | | | | | | | | | | |
Shares sold and automatic conversion of shares | | | 62,666,949 | | | $ | 726,027,777 | | | | 70,818,841 | | | $ | 819,966,183 | |
Shares issued in reinvestment of distributions | | | 3,763,107 | | | | 43,316,515 | | | | 5,863,312 | | | | 67,460,707 | |
Shares redeemed | | | (52,565,272 | ) | | | (586,188,189 | ) | | | (41,574,543 | ) | | | (479,087,785 | ) |
| | | | | | | | | | | | | | | | |
Net increase | | | 13,864,784 | | | $ | 183,156,103 | | | | 35,107,610 | | | $ | 408,339,105 | |
| | | | | | | | | | | | | | | | |
|
Investor A1 | |
Shares sold | | | 2 | | | $ | 17 | | | | 14 | | | $ | 165 | |
Shares issued in reinvestment of distributions | | | 35,533 | | | | 409,360 | | | | 72,985 | | | | 840,116 | |
Shares redeemed | | | (204,948 | ) | | | (2,295,999 | ) | | | (201,324 | ) | | | (2,330,888 | ) |
| | | | | | | | | | | | | | | | |
Net decrease | | | (169,413 | ) | | $ | (1,886,622 | ) | | | (128,325 | ) | | $ | (1,490,607 | ) |
| | | | | | | | | | | | | | | | |
|
Investor C | |
Shares sold | | | 5,151,244 | | | $ | 60,181,739 | | | | 7,848,189 | | | $ | 90,763,176 | |
Shares issued in reinvestment of distributions | | | 366,506 | | | | 4,222,255 | | | | 840,284 | | | | 9,657,647 | |
Shares redeemed and automatic conversion of shares | | | (6,943,658 | ) | | | (78,577,192 | ) | | | (5,278,387 | ) | | | (61,026,197 | ) |
| | | | | | | | | | | | | | | | |
Net increase (decrease) | | | (1,425,908 | ) | | $ | (14,173,198 | ) | | | 3,410,086 | | | $ | 39,394,626 | |
| | | | | | | | | | | | | | | | |
|
Class K | |
Shares sold | | | 11,725,456 | | | $ | 136,433,122 | | | | 7,541,691 | | | $ | 87,217,846 | |
Shares issued in reinvestment of distributions | | | 303,001 | | | | 3,481,189 | | | | 297,854 | | | | 3,428,548 | |
Shares redeemed | | | (7,910,959 | ) | | | (87,511,240 | ) | | | (2,509,491 | ) | | | (28,969,680 | ) |
| | | | | | | | | | | | | | | | |
Net increase | | | 4,117,498 | | | $ | 52,403,071 | | | | 5,330,054 | | | $ | 61,676,714 | |
| | | | | | | | | | | | | | | | |
Total Net Increase (Decrease) | | | (87,350,060 | ) | | $ | (742,778,148 | ) | | | 280,818,812 | | | $ | 3,257,020,457 | |
| | | | | | | | | | | | | | | | |
| | (a) | On February 24, 2020, the Fund’s issued and outstanding Investor C1 Shares converted into Investor A Shares. | |
| | | | |
| NOTESTO FINANCIAL STATEMENTS | | | 97 | |
Notes to Financial Statements (continued)
As of May 31, 2020, shares owned by BlackRock Financial Management Inc., an affiliate of the Funds, were as follows:
| | | | |
| | | Class K | |
New Jersey Municipal Bond | | | 18,124 | |
Management has evaluated the impact of all subsequent events on the Funds through the date the financial statements were issued and has determined that there were no subsequent events requiring adjustment or additional disclosure in the financial statements.
| | |
| 98 | | 2020 BLACKROCK ANNUAL REPORTTO SHAREHOLDERS |
Report of Independent Registered Public Accounting Firm
To the Shareholders of BlackRock California Municipal Opportunities Fund, BlackRock New Jersey Municipal Bond Fund, BlackRock Pennsylvania Municipal Bond Fund, and BlackRock Strategic Municipal Opportunities Fund and the Boards of Trustees of BlackRock California Municipal Series Trust, BlackRock Multi-State Municipal Series Trust, and BlackRock Municipal Series Trust:
Opinion on the Financial Statements and Financial Highlights
We have audited the accompanying statements of assets and liabilities of BlackRock California Municipal Opportunities Fund of BlackRock California Municipal Series Trust, BlackRock New Jersey Municipal Bond Fund and BlackRock Pennsylvania Municipal Bond Fund of BlackRock Multi-State Municipal Series Trust, and BlackRock Strategic Municipal Opportunities Fund of BlackRock Municipal Series Trust (the “Funds”), including the schedules of investments, as of May 31, 2020, the related statements of operations for the year then ended and the statement of cash flows for BlackRock Pennsylvania Municipal Bond Fund for the year then ended, the statements of changes in net assets for each of the two years in the period then ended, the financial highlights for each of the five years in the period then ended, and the related notes. In our opinion, the financial statements and financial highlights present fairly, in all material respects, the financial position of the Funds as of May 31, 2020, and the results of their operations and BlackRock Pennsylvania Municipal Bond Fund’s cash flows for the year then ended, the changes in their net assets for each of the two years in the period then ended, and the financial highlights for each of the five years in the period then ended, in conformity with accounting principles generally accepted in the United States of America.
Basis for Opinion
These financial statements and financial highlights are the responsibility of the Funds’ management. Our responsibility is to express an opinion on the Funds’ financial statements and financial highlights based on our audits. We are a public accounting firm registered with the Public Company Accounting Oversight Board (United States) (PCAOB) and are required to be independent with respect to the Funds in accordance with the U.S. federal securities laws and the applicable rules and regulations of the Securities and Exchange Commission and the PCAOB.
We conducted our audits in accordance with the standards of the PCAOB. Those standards require that we plan and perform the audit to obtain reasonable assurance about whether the financial statements and financial highlights are free of material misstatement, whether due to error or fraud. The Funds are not required to have, nor were we engaged to perform, an audit of their internal control over financial reporting. As part of our audits we are required to obtain an understanding of internal control over financial reporting but not for the purpose of expressing an opinion on the effectiveness of the Funds’ internal control over financial reporting. Accordingly, we express no such opinion.
Our audits included performing procedures to assess the risks of material misstatement of the financial statements and financial highlights, whether due to error or fraud, and performing procedures that respond to those risks. Such procedures included examining, on a test basis, evidence regarding the amounts and disclosures in the financial statements and financial highlights. Our audits also included evaluating the accounting principles used and significant estimates made by management, as well as evaluating the overall presentation of the financial statements and financial highlights. Our procedures included confirmation of securities owned as of May 31, 2020, by correspondence with the custodian and brokers; when replies were not received from brokers, we performed other auditing procedures. We believe that our audits provide a reasonable basis for our opinion.
Deloitte & Touche LLP
Boston, Massachusetts
July 22, 2020
We have served as the auditor of one or more BlackRock investment companies since 1992.
| | | | |
| REPORT OF INDEPENDENT REGISTERED PUBLIC ACCOUNTING FIRM | | | 99 | |
Disclosure of Investment Advisory Agreement
The Board of Trustees (the “Board,” the members of which are referred to as “Board Members”) of each of BlackRock California Municipal Series Trust (the “California Municipal Series Trust”), BlackRock Multi-State Municipal Series Trust (the “Multi-State Municipal Series Trust”) and BlackRock Municipal Series Trust (the “Municipal Series Trust,” along with the California Municipal Series Trust and the Multi-State Municipal Series Trust, each, a “Trust”) met on April 16, 2020 (the “April Meeting”) and May 20-21, 2020 (the “May Meeting”) to consider the approval of the investment advisory agreements (collectively, the “Advisory Agreements” or the “Agreements”) between the California Municipal Series Trust, on behalf of its series BlackRock California Municipal Opportunities Fund (the “California Municipal Opportunities Fund”), the Multi-State Municipal Series Trust, on behalf of its series BlackRock New Jersey Municipal Bond Fund (the “New Jersey Municipal Bond Fund”) and BlackRock Pennsylvania Municipal Bond Fund (the “Pennsylvania Municipal Bond Fund”), and the Municipal Series Trust, on behalf of its series BlackRock Strategic Municipal Opportunities Fund (the “Strategic Municipal Opportunities Fund,” collectively with the California Municipal Opportunities Fund, the New Jersey Municipal Bond Fund and the Pennsylvania Municipal Bond Fund, the “Funds” and each, a “Fund”), respectively, and BlackRock Advisors, LLC (the “Manager” or “BlackRock”), each Fund’s investment advisor.
Activities and Composition of the Board
On the date of the May Meeting, the Board consisted of ten individuals, eight of whom were not “interested persons” of each Trust as defined in the Investment Company Act of 1940, as amended (the “1940 Act”) (the “Independent Board Members”). The Board Members are responsible for the oversight of the operations of each Fund and perform the various duties imposed on the directors of investment companies by the 1940 Act. The Independent Board Members have retained independent legal counsel to assist them in connection with their duties. The Co-Chairs of the Board are Independent Board Members. The Board has established five standing committees: an Audit Committee, a Governance and Nominating Committee, a Compliance Committee, a Performance Oversight Committee and an Executive Committee, each of which is chaired by an Independent Board Member and composed of Independent Board Members (except for the Executive Committee, which also has one interested Board Member).
The Agreements
Consistent with the requirements of the 1940 Act, the Board considers the continuation of the Agreements on an annual basis. The Board has four quarterly meetings per year, each typically extending for two days, and additional in-person and telephonic meetings throughout the year, as needed. While the Board also has a fifth one-day meeting to consider specific information surrounding the renewal of the Agreements, the Board’s consideration entails a year-long deliberative process whereby the Board and its committees assess BlackRock’s services to each Fund. In particular, the Board assessed, among other things, the nature, extent and quality of the services provided to each Fund by BlackRock, BlackRock’s personnel and affiliates, including (as applicable): investment management services; accounting oversight; administrative and shareholder services; oversight of each Fund’s service providers; risk management and oversight; and legal, regulatory and compliance services. Throughout the year, including during the contract renewal process, the Independent Board Members were advised by independent legal counsel, and met with independent legal counsel in various executive sessions outside of the presence of BlackRock’s management.
During the year, the Board, acting directly and through its committees, considers information that is relevant to its annual consideration of the renewal of the Agreements, including the services and support provided by BlackRock to each Fund and its shareholders. BlackRock also furnished additional information to the Board in response to specific questions from the Board. This additional information is discussed further in the section titled “Board Considerations in Approving the Agreements.” Among the matters the Board considered were: (a) investment performance for one-year, three-year, five-year, and/or since inception periods, as applicable, against peer funds, applicable benchmarks, and other performance metrics, as applicable, as well as BlackRock senior management’s and portfolio managers’ analyses of the reasons for any outperformance or underperformance relative to its peers, benchmarks, and other performance metrics, as applicable; (b) fees, including advisory, administration, if applicable, and other amounts paid to BlackRock and its affiliates by each Fund for services; (c) Fund operating expenses and how BlackRock allocates expenses to each Fund; (d) the resources devoted to, risk oversight of, and compliance reports relating to, implementation of each Fund’s investment objective, policies and restrictions, and meeting regulatory requirements; (e) BlackRock’s and each Fund’s adherence to applicable compliance policies and procedures; (f) the nature, character and scope of non-investment management services provided by BlackRock and its affiliates and the estimated cost of such services; (g) BlackRock’s and other service providers’ internal controls and risk and compliance oversight mechanisms; (h) BlackRock’s implementation of the proxy voting policies approved by the Board; (i) execution quality of portfolio transactions; (j) BlackRock’s implementation of each Fund’s valuation and liquidity procedures; (k) an analysis of management fees for products with similar investment mandates across the open-end fund, exchange-traded fund (“ETF”), closed-end fund, sub-advised mutual fund, separately managed account, collective investment trust, and institutional separate account product channels, as applicable, and the similarities and differences between these products and the services provided as compared to each Fund; (l) BlackRock’s compensation methodology for its investment professionals and the incentives and accountability it creates, along with investment professionals’ investments in the fund(s) they manage; and (m) periodic updates on BlackRock’s business.
Board Considerations in Approving the Agreements
The Approval Process: Prior to the April Meeting, the Board requested and received materials specifically relating to the Agreements. The Independent Board Members are continuously engaged in a process with their independent legal counsel and BlackRock to review the nature and scope of the information provided to the Board to better assist its deliberations. The materials provided in connection with the April Meeting included, among other things: (a) information independently compiled and prepared by Broadridge Financial Solutions, Inc. (“Broadridge”), based on either a Lipper classification or Morningstar category, regarding each Fund’s fees and expenses as compared with a peer group of funds as determined by Broadridge (“Expense Peers”) and the investment performance of each Fund as compared with a peer group of funds (“Performance Peers”); (b) information on the composition of the Expense Peers and Performance Peers and a description of Broadridge’s methodology; (c) information on the estimated profits realized by BlackRock and its affiliates pursuant to the Agreements and a discussion of fall-out benefits to BlackRock and its affiliates; (d) a general analysis provided by BlackRock concerning investment management fees received in connection with other types of investment products, such as institutional accounts, sub-advised mutual funds, ETFs, closed-end funds, open-end funds, and separately managed accounts, under similar investment mandates, as well as the performance of such other products, as applicable; (e) a review of non-management fees; (f) the existence, impact and sharing of potential economies of scale, if any, with each Fund; (g) a summary of aggregate amounts paid by each Fund to BlackRock; (h) sales and redemption data regarding each Fund’s shares; and (i) various additional information requested by the Board as appropriate regarding BlackRock’s and each Fund’s operations.
| | |
| 100 | | 2020 BLACKROCK ANNUAL REPORTTO SHAREHOLDERS |
Disclosure of Investment Advisory Agreement (continued)
At the April Meeting, the Board reviewed materials relating to its consideration of the Agreements. As a result of the discussions that occurred during the April Meeting, and as a culmination of the Board’s year-long deliberative process, the Board presented BlackRock with questions and requests for additional information. BlackRock responded to these questions and requests with additional written information in advance of the May Meeting. Topics covered included: (a) the methodology for measuring estimated fund profitability; (b) economies of scale; (c) fund expenses and potential fee waivers; and (d) differences in services provided and management fees between open-end funds and other product channels.
At the May Meeting, the Board concluded its assessment of, among other things: (a) the nature, extent and quality of the services provided by BlackRock; (b) the investment performance of each Fund as compared to its Performance Peers and to other metrics, as applicable; (c) the advisory fee and the estimated cost of the services and estimated profits realized by BlackRock and its affiliates from their relationship with each Fund; (d) each Fund’s fees and expenses compared to its Expense Peers; (e) the existence and sharing of potential economies of scale; (f) any fall-out benefits to BlackRock and its affiliates as a result of BlackRock’s relationship with each Fund; and (g) other factors deemed relevant by the Board Members.
The Board also considered other matters it deemed important to the approval process, such as other payments made to BlackRock or its affiliates relating to securities lending and cash management, and BlackRock’s services related to the valuation and pricing of Fund portfolio holdings. The Board noted the willingness of BlackRock’s personnel to engage in open, candid discussions with the Board. The Board did not identify any particular information as determinative, and each Board Member may have attributed different weights to the various items considered.
A. Nature, Extent and Quality of the Services Provided by BlackRock The Board, including the Independent Board Members, reviewed the nature, extent and quality of services provided by BlackRock, including the investment advisory services, and the resulting performance of each Fund. Throughout the year, the Board compared Fund performance to the performance of a comparable group of mutual funds, relevant benchmarks, and performance metrics, as applicable. The Board met with BlackRock’s senior management personnel responsible for investment activities, including the senior investment officers. The Board also reviewed the materials provided by each Fund’s portfolio management team discussing each Fund’s performance, investment strategies and outlook.
The Board considered, among other factors, with respect to BlackRock: the number, education and experience of investment personnel generally and each Fund’s portfolio management team; research capabilities; investments by portfolio managers in the funds they manage; portfolio trading capabilities; use of technology; commitment to compliance; credit analysis capabilities; risk analysis and oversight capabilities; and the approach to training and retaining portfolio managers and other research, advisory and management personnel. The Board also considered BlackRock’s overall risk management program, including the continued efforts of BlackRock and its affiliates to address cybersecurity risks and the role of BlackRock’s Risk & Quantitative Analysis Group. The Board engaged in a review of BlackRock’s compensation structure with respect to each Fund’s portfolio management team and BlackRock’s ability to attract and retain high-quality talent and create performance incentives.
In addition to investment advisory services, the Board considered the nature and quality of the administrative and other non-investment advisory services provided to each Fund. BlackRock and its affiliates provide each Fund with certain administrative, shareholder and other services (in addition to any such services provided to each Fund by third-parties) and officers and other personnel as are necessary for the operations of each Fund. In particular, BlackRock and its affiliates provide each Fund with administrative services including, among others: (i) responsibility for disclosure documents, such as the prospectus, the summary prospectus (as applicable), the statement of additional information and periodic shareholder reports; (ii) oversight of daily accounting and pricing; (iii) responsibility for periodic filings with regulators; (iv) overseeing and coordinating the activities of third-party service providers including, among others, each Fund’s custodian, fund accountant, transfer agent, and auditor; (v) organizing Board meetings and preparing the materials for such Board meetings; (vi) providing legal and compliance support; (vii) furnishing analytical and other support to assist the Board in its consideration of strategic issues such as the merger, consolidation or repurposing of certain open-end funds; and (viii) performing or managing administrative functions necessary for the operation of each Fund, such as tax reporting, expense management, fulfilling regulatory filing requirements, overseeing each Fund’s distribution partners, and shareholder call center and other services. The Board reviewed the structure and duties of BlackRock’s fund administration, shareholder services, and legal & compliance departments and considered BlackRock’s policies and procedures for assuring compliance with applicable laws and regulations.
B. The Investment Performance of each Fund and BlackRock The Board, including the Independent Board Members, also reviewed and considered the performance history of each Fund. In preparation for the April Meeting, the Board was provided with reports independently prepared by Broadridge, which included an analysis of each Fund’s performance as of December 31, 2019, as compared to its Performance Peers. Broadridge ranks funds in quartiles, ranging from first to fourth, where first is the most desirable quartile position and fourth is the least desirable. In connection with its review, the Board received and reviewed information regarding the investment performance of each Fund as compared to its Performance Peers. The Board and its Performance Oversight Committee regularly review and meet with Fund management to discuss the performance of each Fund throughout the year.
In evaluating performance, the Board focused particular attention on funds with less favorable performance records. The Board also noted that while it found the data provided by Broadridge generally useful, it recognized the limitations of such data, including in particular, that notable differences may exist between a fund and its Performance Peers (for example, the investment objectives and strategies). Further, the Board recognized that the performance data reflects a snapshot of a period as of a particular date and that selecting a different performance period could produce significantly different results. The Board also acknowledged that long-term performance could be impacted by even one period of significant outperformance or underperformance, and that a single investment theme could have the ability to disproportionately affect long-term performance.
The Board noted that for the one-, three- and five-year periods reported, the California Municipal Opportunities Fund ranked in the second, first, and first quartiles, respectively, against its Performance Peers.
The Board noted that for the one-, three- and five-year periods reported, the New Jersey Municipal Bond Fund ranked in the second, first and second quartiles, respectively, against its Performance Peers.
| | | | |
| DISCLOSUREOF INVESTMENT ADVISORY AGREEMENT | | | 101 | |
Disclosure of Investment Advisory Agreement (continued)
The Board noted that for the one-, three- and five-year periods reported, the Pennsylvania Municipal Bond Fund ranked in the third, second, and second quartiles, respectively, against its Performance Peers. The Board and BlackRock reviewed the Pennsylvania Municipal Bond Fund’s underperformance relative to its Performance Peers during the applicable period.
The Board noted that for the one-, three- and five-year periods reported, the Strategic Municipal Opportunities Fund ranked in the third, first and first quartiles, respectively, against its Performance Peers. The Board and BlackRock reviewed the Strategic Municipal Opportunities Fund’s underperformance relative to its Performance Peers during the applicable period.
C. Consideration of the Advisory/Management Fees and the Estimated Cost of the Services and Estimated Profits Realized by BlackRock and its Affiliates from their Relationship with each Fund The Board, including the Independent Board Members, reviewed each Fund’s contractual management fee rate compared with those of its Expense Peers. The contractual management fee rate represents a combination of the advisory fee and any administrative fees, before taking into account any reimbursements or fee waivers. The Board also compared each Fund’s total expense ratio, as well as its actual management fee rate, to those of its Expense Peers. The total expense ratio represents a fund’s total net operating expenses, including any 12b-1 or non-12b-1 service fees. The total expense ratio gives effect to any expense reimbursements or fee waivers, and the actual management fee rate gives effect to any management fee reimbursements or waivers. The Board considered the services provided and the fees charged by BlackRock and its affiliates to other types of clients with similar investment mandates, as applicable, including institutional accounts and sub-advised mutual funds (including mutual funds sponsored by third parties).
The Board received and reviewed statements relating to BlackRock’s financial condition. The Board reviewed BlackRock’s profitability methodology and was also provided with an estimated profitability analysis that detailed the revenues earned and the expenses incurred by BlackRock for services provided to each Fund. The Board reviewed BlackRock’s estimated profitability with respect to each Fund and other funds the Board currently oversees for the year ended December 31, 2019 compared to available aggregate estimated profitability data provided for the prior two years. The Board reviewed BlackRock’s estimated profitability with respect to certain other U.S. fund complexes managed by the Manager and/or its affiliates. The Board reviewed BlackRock’s assumptions and methodology of allocating expenses in the estimated profitability analysis, noting the inherent limitations in allocating costs among various advisory products. The Board recognized that profitability may be affected by numerous factors including, among other things, fee waivers and expense reimbursements by the Manager, the types of funds managed, precision of expense allocations and business mix. The Board thus recognized that calculating and comparing profitability at the individual fund level is difficult.
The Board noted that, in general, individual fund or product line profitability of other advisors is not publicly available. The Board reviewed BlackRock’s overall operating margin, in general, compared to that of certain other publicly traded asset management firms. The Board considered the differences between BlackRock and these other firms, including the contribution of technology at BlackRock, BlackRock’s expense management, and the relative product mix.
The Board considered whether BlackRock has the financial resources necessary to attract and retain high quality investment management personnel to perform its obligations under the Agreements and to continue to provide the high quality of services that is expected by the Board. The Board further considered factors including but not limited to BlackRock’s commitment of time, assumption of risk, and liability profile in servicing each Fund, including in contrast to what is required of BlackRock with respect to other products with similar investment mandates across the open-end fund, ETF, closed-end fund, sub-advised mutual fund, separately managed account, collective investment trust, and institutional separate account product channels, as applicable.
The Board noted that the California Municipal Opportunities Fund’s contractual management fee rate ranked in the first quartile, and that the actual management fee rate and total expense ratio ranked in the second and first quartiles, respectively, relative to the California Municipal Opportunities Fund’s Expense Peers. The Board also noted that the California Municipal Opportunities Fund has an advisory fee arrangement that includes breakpoints that adjust the fee rate downward as the size of the California Municipal Opportunities Fund increases above certain contractually specified levels. The Board noted that if the size of the California Municipal Opportunities Fund were to decrease, the California Municipal Opportunities Fund could lose the benefit of one or more breakpoints. In addition, the Board noted that BlackRock and the Board have contractually agreed to a cap on the California Municipal Opportunities Fund’s total expenses as a percentage of the California Municipal Opportunities Fund’s average daily net assets on a class-by-class basis.
The Board noted that the New Jersey Municipal Bond Fund’s contractual management fee rate ranked in the third quartile, and that the actual management fee rate and total expense ratio ranked in the first and second quartiles, respectively, relative to the New Jersey Municipal Bond Fund’s Expense Peers. The Board also noted that the New Jersey Municipal Bond Fund has an advisory fee arrangement that includes breakpoints that adjust the fee rate downward as the size of the New Jersey Municipal Bond Fund increases above certain contractually specified levels. The Board noted that if the size of the New Jersey Municipal Bond Fund were to decrease, the New Jersey Municipal Bond Fund could lose the benefit of one or more breakpoints. The Board further noted that BlackRock and the Board have contractually agreed to a cap on the New Jersey Municipal Bond Fund’s total expenses as a percentage of the New Jersey Municipal Bond Fund’s average daily net assets on a class-by-class basis.
The Board noted that the Pennsylvania Municipal Bond Fund’s contractual management fee rate ranked in the second quartile, and that the actual management fee rate and total expense ratio ranked in the second and first quartiles, respectively, relative to the Pennsylvania Municipal Bond Fund’s Expense Peers. The Board also noted that the Pennsylvania Municipal Bond Fund has an advisory fee arrangement that includes breakpoints that adjust the fee rate downward as the size of the Pennsylvania Municipal Bond Fund increases above certain contractually specified levels. The Board noted that if the size of the Pennsylvania Municipal Bond Fund were to decrease, the Pennsylvania Municipal Bond Fund could lose the benefit of one or more breakpoints. The Board further noted that BlackRock and the Board have contractually agreed to a cap on the Pennsylvania Municipal Bond Fund’s total expenses as a percentage of the Pennsylvania Municipal Bond Fund’s average daily net assets on a class-by-class basis.
The Board noted that the Strategic Municipal Opportunities Fund’s contractual management fee rate ranked in the fourth quartile, and that the actual management fee rate and total expense ratio ranked in the fourth and third quartiles, respectively, relative to the Strategic Municipal Opportunities Fund’s Expense Peers. The Board further noted that the Strategic Municipal Opportunities Fund has an advisory fee arrangement that includes breakpoints that adjust the fee rate downward as the size of the Strategic Municipal Opportunities Fund increases above certain contractually specified levels. The Board noted that if the size of the Strategic Municipal Opportunities Fund were to decrease, the Strategic Municipal Opportunities Fund could lose the benefit of one or more breakpoints. Additionally, the Board noted that BlackRock and the Board have contractually agreed to waive 0.05% of the advisory fee for the Strategic Municipal Opportunities Fund through September 30, 2021.
| | |
| 102 | | 2020 BLACKROCK ANNUAL REPORTTO SHAREHOLDERS |
Disclosure of Investment Advisory Agreement (continued)
D. Economies of Scale The Board, including the Independent Board Members, considered the extent to which economies of scale might be realized as the assets of each Fund increase, including the existence of fee waivers and/or expense caps, as applicable, noting that any contractual fee waivers and contractual expense caps had been approved by the Board. In its consideration, the Board further considered the continuation and/or implementation of fee waivers and/or expense caps, as applicable. The Board also considered the extent to which each Fund benefits from such economies of scale in a variety of ways, and whether there should be changes in the advisory fee rate or breakpoint structure in order to enable each Fund to more fully participate in these economies of scale. The Board considered each Fund’s asset levels and whether the current fee schedule was appropriate.
E. Other Factors Deemed Relevant by the Board Members The Board, including the Independent Board Members, also took into account other ancillary or “fall-out” benefits that BlackRock or its affiliates may derive from BlackRock’s respective relationships with each Fund, both tangible and intangible, such as BlackRock’s ability to leverage its investment professionals who manage other portfolios and its risk management personnel, an increase in BlackRock’s profile in the investment advisory community, and the engagement of BlackRock’s affiliates as service providers to each Fund, including for administrative, distribution, securities lending and cash management services. The Board also considered BlackRock’s overall operations and its efforts to expand the scale of, and improve the quality of, its operations. The Board also noted that, subject to applicable law, BlackRock may use and benefit from third-party research obtained by soft dollars generated by certain registered fund transactions to assist in managing all or a number of its other client accounts.
In connection with its consideration of the Agreements, the Board also received information regarding BlackRock’s brokerage and soft dollar practices. The Board received reports from BlackRock which included information on brokerage commissions and trade execution practices throughout the year.
The Board noted the competitive nature of the open-end fund marketplace, and that shareholders are able to redeem their Fund shares if they believe that each Fund’s fees and expenses are too high or if they are dissatisfied with the performance of each Fund.
Conclusion
The Board, including the Independent Board Members, unanimously approved the continuation of the Advisory Agreement between the Manager and each Trust, on behalf of its respective Fund(s), for a one-year term ending June 30, 2021. Based upon its evaluation of all of the aforementioned factors in their totality, as well as other information, the Board, including the Independent Board Members, was satisfied that the terms of the Agreements were fair and reasonable and in the best interest of each Fund and its shareholders. In arriving at its decision to approve the Agreements, the Board did not identify any single factor or group of factors as all-important or controlling, but considered all factors together, and different Board Members may have attributed different weights to the various factors considered. The Independent Board Members were also assisted by the advice of independent legal counsel in making this determination.
| | | | |
| DISCLOSUREOF INVESTMENT ADVISORY AGREEMENT | | | 103 | |
Trustee and Officer Information
| | | | | | | | |
| | | | | Independent Trustees (a) | | | | |
| | | | | |
Name Year of Birth (b) | | Position(s) Held (Length of Service) (c) | | Principal Occupation(s) During Past Five Years | | Number of BlackRock-Advised Registered Investment Companies (“RICs”) Consisting of Investment
Portfolios (“Portfolios”) Overseen | | Public Company and
Other Investment Company
Directorships Held
During Past Five Years |
Richard E. Cavanagh 1946 | | Co-Chair of the Board
and Trustee
(Since 2019) | | Director, The Guardian Life Insurance Company of America since 1998; Board Chair, Volunteers of America (a not-for-profit organization) from 2015 to 2018 (board member since 2009); Director, Arch Chemicals (chemical and allied products) from 1999 to 2011; Trustee, Educational Testing Service from 1997 to 2009 and Chairman thereof from 2005 to 2009; Senior Advisor, The Fremont Group since 2008 and Director thereof since 1996; Faculty Member/Adjunct Lecturer, Harvard University since 2007 and Executive Dean from 1987 to 1995; President and Chief Executive Officer, The Conference Board, Inc. (global business research organization) from 1995 to 2007. | | 87 RICs consisting of 111 Portfolios | | None |
Karen P. Robards 1950 | | Co-Chair of the Board
and Trustee
(Since 2019) | | Principal of Robards & Company, LLC (consulting and private investing) since 1987; Co-founder and Director of the Cooke Center for Learning and Development (a not-for-profit organization) since 1987; Director of Enable Injections, LLC (medical devices) since 2019; Investment Banker at Morgan Stanley from 1976 to 1987. | | 87 RICs consisting of 111 Portfolios | | Greenhill & Co., Inc.; AtriCure, Inc. (medical devices) from 2000 until 2017 |
Michael J. Castellano 1946 | | Trustee
(Since 2019) | | Chief Financial Officer of Lazard Group LLC from 2001 to 2011; Chief Financial Officer of Lazard Ltd from 2004 to 2011; Director, Support Our Aging Religious (non-profit) from 2009 to June 2015 and since 2017; Director, National Advisory Board of Church Management at Villanova University since 2010; Trustee, Domestic Church Media Foundation since 2012; Director, CircleBlack Inc. (financial technology company) since 2015. | | 87 RICs consisting of 111 Portfolios | | None |
Cynthia L. Egan 1955 | | Trustee
(Since 2019) | | Advisor, U.S. Department of the Treasury from 2014 to 2015; President, Retirement Plan Services, for T. Rowe Price Group, Inc. from 2007 to 2012; executive positions within Fidelity Investments from 1989 to 2007. | | 87 RICs consisting of 111 Portfolios | | Unum (insurance); The Hanover Insurance Group (insurance); Envestnet (investment platform) from 2013 until 2016 |
Frank J. Fabozzi (d) 1948 | | Trustee
(Since 2019) | | Editor of The Journal of Portfolio Management since 1986; Professor of Finance, EDHEC Business School (France) since 2011; Visiting Professor, Princeton University for the 2013 to 2014 academic year and Spring 2017 semester; Professor in the Practice of Finance, Yale University School of Management from 1994 to 2011 and currently a Teaching Fellow in Yale’s Executive Programs; Board Member, BlackRock Equity-Liquidity Funds from 2014 to 2016; affiliated professor Karlsruhe Institute of Technology from 2008 to 2011; Visiting Professor, Rutgers University for the Spring 2019 semester; Visiting Professor, New York University for the 2019 academic year. | | 88 RICs consisting of 112 Portfolios | | None |
R. Glenn Hubbard 1958 | | Trustee
(Since 2019) | | Dean, Columbia Business School from 2004 to 2019; Faculty member, Columbia Business School since 1988. | | 87 RICs consisting of 111 Portfolios | | ADP (data and information services); Metropolitan Life Insurance Company (insurance); KKR Financial Corporation (finance) from 2004 until 2014 |
| | |
| 104 | | 2020 BLACKROCK ANNUAL REPORTTO SHAREHOLDERS |
Trustee and Officer Information (continued)
| | | | | | | | |
| (continued) | | | | Independent Trustees (a) | | | | |
| | | | | |
Name Year of Birth (b) | | Position(s) Held (Length of Service) (c) | | Principal Occupation(s) During Past Five Years | | Number of BlackRock-Advised Registered Investment Companies (“RICs”) Consisting of Investment
Portfolios (“Portfolios”) Overseen | | Public Company and
Other Investment Company
Directorships Held
During Past Five Years |
W. Carl Kester (d) 1951 | | Trustee
(Since 2019) | | George Fisher Baker Jr. Professor of Business Administration, Harvard Business School since 2008; Deputy Dean for Academic Affairs from 2006 to 2010; Chairman of the Finance Unit, from 2005 to 2006; Senior Associate Dean and Chairman of the MBA Program from 1999 to 2005; Member of the faculty of Harvard Business School since 1981. | | 88 RICs consisting of 112 Portfolios | | None |
Catherine A. Lynch (d) 1961 | | Trustee
(Since 2019) | | Chief Executive Officer, Chief Investment Officer and various other positions, National Railroad Retirement Investment Trust from 2003 to 2016; Associate Vice President for Treasury Management, The George Washington University from 1999 to 2003; Assistant Treasurer, Episcopal Church of America from 1995 to 1999. | | 88 RICs consisting of 112 Portfolios | | None |
|
| Interested Trustees (a)(e) |
| | | | | |
Name Year of Birth (b) | | Position(s) Held (Length of Service) (c) | | Principal Occupation(s) During Past Five Years | | Number of BlackRock-Advised Registered Investment Companies (“RICs”) Consisting of Investment
Portfolios (“Portfolios”) Overseen | | Public Company and
Other Investment Company
Directorships Held
During Past Five Years |
Robert Fairbairn 1965 | | Trustee
(Since 2015) | | Vice Chairman of BlackRock, Inc. since 2019; Member of BlackRock’s Global Executive and Global Operating Committees; Co-Chair of BlackRock’s Human Capital Committee; Senior Managing Director of BlackRock, Inc. from 2010 to 2019; oversaw BlackRock’s Strategic Partner Program and Strategic Product Management Group from 2012 to 2019; Member of the Board of Managers of BlackRock Investments, LLC from 2011 to 2018; Global Head of BlackRock’s Retail and iShares® businesses from 2012 to 2016. | | 123 RICs consisting of 264 Portfolios | | None |
John M. Perlowski (d) 1964 | | Trustee
(Since 2015);
President and Chief Executive Officer
(Since 2010) | | Managing Director of BlackRock, Inc. since 2009; Head of BlackRock Global Accounting and Product Services since 2009; Advisory Director of Family Resource Network (charitable foundation) since 2009. | | 124 RICs consisting of 265 Portfolios | | None |
(a) The address of each Trustee is c/o BlackRock, Inc., 55 East 52nd Street, New York, New York 10055. |
(b) Each Independent Trustee holds office until his or her successor is duly elected and qualifies or until his or her earlier death, resignation, retirement or removal as provided by the Trust’s by-laws or charter or statute, or until December 31 of the year in which he or she turns 75. Trustees who are “interested persons,” as defined in the Investment Company Act serve until their successor is duly elected and qualifies or until their earlier death, resignation, retirement or removal as provided by the Trust’s by-laws or statute, or until December 31 of the year in which they turn 72. The Board may determine to extend the terms of Independent Trustees on a case-by-case basis, as appropriate. |
(c) Following the combination of Merrill Lynch Investment Managers, L.P. (“MLIM”) and BlackRock, Inc. in September 2006, the various legacy MLIM and legacy BlackRock fund boards were realigned and consolidated into three new fund boards in 2007. Certain Independent Trustees first became members of the boards of other legacy MLIM or legacy BlackRock funds as follows: Richard E. Cavanagh, 1994; Frank J. Fabozzi, 1988; R. Glenn Hubbard, 2004; W. Carl Kester, 1995; and Karen P. Robards, 1998. Certain other Independent Trustees became members of the boards of the closed-end funds in the Fixed-Income Complex as follows: Michael J. Castellano, 2011; Cynthia L. Egan, 2016; and Catherine A. Lynch, 2016. |
(d) Dr. Fabozzi, Dr. Kester, Ms. Lynch and Mr. Perlowski are also trustees of the BlackRock Credit Strategies Fund. |
(e) Mr. Fairbairn and Mr. Perlowski are both “interested persons,” as defined in the Investment Company Act 1940 Act, of the Trust based on their positions with BlackRock, Inc. and its affiliates. Mr. Fairbairn and Mr. Perlowski are also board members of the BlackRock Multi-Asset Complex. |
| | | | |
| TRUSTEEAND OFFICER INFORMATION | | | 105 | |
Trustee and Officer Information (continued)
| | | | |
| Officers Who Are Not Trustees (a) |
| | | |
Name Year of Birth (b) | | Position(s) Held (Length of Service) | | Principal Occupation(s) During Past Five Years |
Jennifer McGovern 1977 | | Vice President
(Since 2014) | | Managing Director of BlackRock, Inc. since 2016; Director of BlackRock, Inc. from 2011 to 2015; Head of Americas Product Development and Governance for BlackRock’s Global Product Group since 2019; Head of Product Structure and Oversight for BlackRock’s U.S. Wealth Advisory Group from 2013 to 2019. |
Neal J. Andrews 1966 | | Chief Financial Officer
(Since 2007) | | Chief Financial Officer of the iShares® exchange traded funds from 2019 to 2020; Managing Director of BlackRock, Inc. since 2006. |
Jay M. Fife 1970 | | Treasurer
(Since 2007) | | Managing Director of BlackRock, Inc. since 2007. |
Charles Park 1967 | | Chief Compliance Officer
(Since 2014) | | Anti-Money Laundering Compliance Officer for certain BlackRock-advised Funds from 2014 to 2015; Chief Compliance Officer of BlackRock Advisors, LLC and the BlackRock-advised Funds in the BlackRock Multi-Asset Complex and the BlackRock Fixed-Income Complex since 2014; Principal of and Chief Compliance Officer for iShares® Delaware Trust Sponsor LLC since 2012 and BlackRock Fund Advisors (“BFA”) since 2006; Chief Compliance Officer for the BFA-advised iShares® exchange traded funds since 2006; Chief Compliance Officer for BlackRock Asset Management International Inc. since 2012. |
Lisa Belle 1968 | | Anti-Money Laundering Compliance Officer
(Since 2019) | | Managing Director of BlackRock, Inc. since 2019; Global Financial Crime Head for Asset and Wealth Management of JP Morgan from 2013 to 2019; Managing Director of RBS Securities from 2012 to 2013; Head of Financial Crimes for Barclays Wealth Americas from 2010 to 2012. |
Janey Ahn 1975 | | Secretary
(Since 2019) | | Managing Director of BlackRock, Inc. since 2018; Director of BlackRock, Inc. from 2009 to 2017. |
(a) The address of each Officer is c/o BlackRock, Inc., 55 East 52nd Street, New York, New York 10055. |
(b) Officers of the Trusts serve at the pleasure of the Board. |
Further information about each Trust’s Trustees and Officers is available in each Trust’s Statement of Additional Information, which can be obtained without charge by calling (800) 441-7762.
Effective February 19, 2020, Henry Gabbay resigned as a Trustee of the Trusts.
Investment Adviser
BlackRock Advisors, LLC
Wilmington, DE 19809
Accounting Agent and Custodian
State Street Bank and Trust Company
Boston, MA 02111
Transfer Agent
BNY Mellon Investment Servicing (US) Inc.
Wilmington, DE 19809
Distributor
BlackRock Investments, LLC
New York, NY 10022
Legal Counsel
Willkie Farr & Gallagher LLP
New York, NY 10019
Independent Registered Public Accounting Firm
Deloitte & Touche LLP
Boston, MA 02116
Address of the Funds
100 Bellevue Parkway
Wilmington, DE 19809
| | |
| 106 | | 2020 BLACKROCK ANNUAL REPORTTO SHAREHOLDERS |
Additional Information
Dividend Policy
Each Fund’s dividend policy is to distribute all or a portion of its net investment income to its shareholders on a monthly basis. In order to provide shareholders with a more stable level of distributions, the Funds may at times pay out less than the entire amount of net investment income earned in any particular month and may at times in any particular month pay out such accumulated but undistributed income in addition to net investment income earned in that month. As a result, the distributions paid by the Funds for any particular month may be more or less than the amount of net investment income earned by the Funds during such month. The Funds’ current accumulated but undistributed net investment income, if any, is disclosed as accumulated earnings (loss) in the Statements of Assets and Liabilities, which comprises part of the financial information included in this report.
General Information
Quarterly performance, semi-annual and annual reports, current net asset value and other information regarding the Funds may be found on BlackRock’s website, which can be accessed at blackrock.com. Any reference to BlackRock’s website in this report is intended to allow investors public access to information regarding the Funds and does not, and is not intended to, incorporate BlackRock’s website in this report.
Householding
The Funds will mail only one copy of shareholder documents, including prospectuses, annual and semi-annual reports and proxy statements, to shareholders with multiple accounts at the same address. This practice is commonly called “householding” and is intended to reduce expenses and eliminate duplicate mailings of shareholder documents. Mailings of your shareholder documents may be householded indefinitely unless you instruct us otherwise. If you do not want the mailing of these documents to be combined with those for other members of your household, please call the Funds at (800) 441-7762.
Availability of Quarterly Schedule of Investments
The Funds file their complete schedule of portfolio holdings with the SEC for the first and third quarters of each fiscal year as an exhibit to its reports on Form N-PORT. The Funds’ Form N-PORT are available on the SEC’s website at sec.gov.
Availability of Proxy Voting Policies and Procedures
A description of the policies and procedures that the Funds use to determine how to vote proxies relating to portfolio securities is available upon request and without charge (1) by calling (800) 441-7762; (2) at blackrock.com; and (3) on the SEC’s website at sec.gov.
Availability of Proxy Voting Record
Information about how the Funds voted proxies relating to securities held in the Funds’ portfolios during the most recent 12-month period ended June 30 is available upon request and without charge (1) at blackrock.com; or by calling (800) 441-7762 and (2) on the SEC’s website at sec.gov.
BlackRock’s Mutual Fund Family
BlackRock offers a diverse lineup of open-end mutual funds crossing all investment styles and managed by experts in equity, fixed income and tax-exempt investing. Visit blackrock.com for more information.
Shareholder Privileges
Account Information
Call us at (800) 441-7762 from 8:00 AM to 6:00 PM ET on any business day to get information about your account balances, recent transactions and share prices. You can also visit blackrock.com for more information.
Automatic Investment Plans
Investor class shareholders who want to invest regularly can arrange to have $50 or more automatically deducted from their checking or savings account and invested in any of the BlackRock funds.
Systematic Withdrawal Plans
Investor class shareholders can establish a systematic withdrawal plan and receive periodic payments of $50 or more from their BlackRock funds, as long as their account balance is at least $10,000.
Retirement Plans
Shareholders may make investments in conjunction with Traditional, Rollover, Roth, Coverdell, Simple IRAs, SEP IRAs and 403(b) Plans.
| | | | |
| ADDITIONAL INFORMATION | | | 107 | |
Additional Information (continued)
BlackRock Privacy Principles
BlackRock is committed to maintaining the privacy of its current and former fund investors and individual clients (collectively, “Clients”) and to safeguarding their non-public personal information. The following information is provided to help you understand what personal information BlackRock collects, how we protect that information and why in certain cases we share such information with select parties.
If you are located in a jurisdiction where specific laws, rules or regulations require BlackRock to provide you with additional or different privacy-related rights beyond what is set forth below, then BlackRock will comply with those specific laws, rules or regulations.
BlackRock obtains or verifies personal non-public information from and about you from different sources, including the following: (i) information we receive from you or, if applicable, your financial intermediary, on applications, forms or other documents; (ii) information about your transactions with us, our affiliates, or others; (iii) information we receive from a consumer reporting agency; and (iv) from visits to our websites.
BlackRock does not sell or disclose to non-affiliated third parties any non-public personal information about its Clients, except as permitted by law or as is necessary to respond to regulatory requests or to service Client accounts. These non-affiliated third parties are required to protect the confidentiality and security of this information and to use it only for its intended purpose.
We may share information with our affiliates to service your account or to provide you with information about other BlackRock products or services that may be of interest to you. In addition, BlackRock restricts access to non-public personal information about its Clients to those BlackRock employees with a legitimate business need for the information. BlackRock maintains physical, electronic and procedural safeguards that are designed to protect the non-public personal information of its Clients, including procedures relating to the proper storage and disposal of such information.
Glossary of Terms Used in this Report
| | |
| Portfolio Abbreviations |
| |
| AGC | | Assured Guarantee Corp. |
| |
| AGM | | Assured Guaranty Municipal Corp. |
| |
| AMBAC | | American Municipal Bond Assurance Corp. |
| |
| AMT | | Alternative Minimum Tax (subject to) |
| |
| ARB | | Airport Revenue Bonds |
| |
| BAM | | Build America Mutual Assurance Co. |
| |
| BAN | | Bond Anticipation Notes |
| |
| BHAC | | Berkshire Hathaway Assurance Corp. |
| |
| CAB | | Capital Appreciation Bonds |
| |
| COP | | Certificates of Participation |
| |
| EDA | | Economic Development Authority |
| |
| EDC | | Economic Development Corp. |
| |
| ETF | | Exchange-Traded Fund |
| |
| GO | | General Obligation Bonds |
| | |
| Portfolio Abbreviations (continued) |
| |
| GTD | | Guaranteed |
| |
| HFA | | Housing Finance Agency |
| |
| IDA | | Industrial Development Authority |
| |
| LRB | | Lease Revenue Bonds |
| |
| M/F | | Multi-Family |
| |
| MRB | | Mortgage Revenue Bonds |
| |
| NPFGC | | National Public Finance Guarantee Corp. |
| |
| OTC | | Over-the-Counter |
| |
| PSF | | Permanent School Fund |
| |
| RB | | Revenue Bonds |
| |
| S&P | | Standard & Poor’s |
| |
| S/F | | Single-Family |
| |
| SONYMA | | State of New York Mortgage Agency |
| |
| SPDR | | Standard & Poor’s Depository Receipts |
| | |
| 108 | | 2020 BLACKROCK ANNUAL REPORTTO SHAREHOLDERS |
Want to know more?
blackrock.com | 800-441-7762
This report is intended for current holders. It is not authorized for use as an offer of sale or a solicitation of an offer to buy shares of the Funds unless preceded or accompanied by the Funds’ current prospectus. Past performance results shown in this report should not be considered a representation of future performance. Investment returns and principal value of shares will fluctuate so that shares, when redeemed, may be worth more or less than their original cost. Statements and other information herein are as dated and are subject to change.
MUNI4-5/20-AR
| Item 2 – | Code of Ethics – The registrant (or the “Fund”) has adopted a code of ethics, as of the end of the period covered by this report, applicable to the registrant’s principal executive officer, principal financial officer, principal accounting officer or controller, or persons performing similar functions. During the period covered by this report, the code of ethics was amended to update certain information and to make other non-material changes. During the period covered by this report, there have been no waivers granted under the code of ethics. The registrant undertakes to provide a copy of the code of ethics to any person upon request, without charge, who calls 1-800-441-7762. |
| Item 3 – | Audit Committee Financial Expert – The registrant’s board of trustees (the “board of trustees”), has determined that (i) the registrant has the following audit committee financial experts serving on its audit committee and (ii) each audit committee financial expert is independent: |
Michael Castellano
Frank J. Fabozzi
Catherine A. Lynch
Karen P. Robards
The registrant’s board of trustees has determined that Karen P. Robards qualifies as an audit committee financial expert pursuant to Item 3(c)(4) of Form N-CSR.
Ms. Robards has a thorough understanding of generally accepted accounting principles, financial statements and internal control over financial reporting as well as audit committee functions. Ms. Robards has been President of Robards & Company, a financial advisory firm, since 1987. Ms. Robards was formerly an investment banker for more than 10 years where she was responsible for evaluating and assessing the performance of companies based on their financial results. Ms. Robards has over 30 years of experience analyzing financial statements. She also is a member of the audit committee of one publicly held company and a non-profit organization. Under applicable securities laws, a person determined to be an audit committee financial expert will not be deemed an “expert” for any purpose, including without limitation for the purposes of Section 11 of the Securities Act of 1933, as a result of being designated or identified as an audit committee financial expert. The designation or identification as an audit committee financial expert does not impose on such person any duties, obligations, or liabilities greater than the duties, obligations, and liabilities imposed on such person as a member of the audit committee and board of trustees in the absence of such designation or identification. The designation or identification of a person as an audit committee financial expert does not affect the duties, obligations, or liability of any other member of the audit committee or board of trustees.
| Item 4 – | Principal Accountant Fees and Services |
The following table presents fees billed by Deloitte & Touche LLP (“D&T”) in each of the last two fiscal years for the services rendered to the Fund:
| | | | | | | | | | | | | | | | | | |
| | | | | (a) Audit Fees | | (b) Audit-Related Fees1 | | (c) Tax Fees2 | | (d) All Other Fees |
| Entity Name | | | | Current
Fiscal Year End | | Previous
Fiscal Year End | | Current
Fiscal Year End | | Previous
Fiscal Year End | | Current
Fiscal Year End | | Previous
Fiscal Year End | | Current
Fiscal Year End | | Previous
Fiscal Year End |
| BlackRock California Municipal Opportunities Fund of BlackRock California Municipal Series Trust | | | | $35,598 | | $35,598 | | $0 | | $4,000 | | $12,500 | | $13,500 | | $0 | | $0 |
2
The following table presents fees billed by D&T that were required to be approved by the registrant’s audit committee (the “Committee”) for services that relate directly to the operations or financial reporting of the Fund and that are rendered on behalf of BlackRock Advisors, LLC ( the “Investment Adviser” or “BlackRock”) and entities controlling, controlled by, or under common control with BlackRock (not including any sub-adviser whose role is primarily portfolio management and is subcontracted with or overseen by another investment adviser) that provide ongoing services to the Fund (“Affiliated Service Providers”):
| | | | |
| | | Current Fiscal Year End | | Previous Fiscal Year End |
(b) Audit-Related Fees1 | | $0 | | $0 |
(c) Tax Fees2 | | $0 | | $0 |
(d) All Other Fees3 | | $1,984,000 | | $2,050,500 |
1 The nature of the services includes assurance and related services reasonably related to the performance of the audit or review of financial statements not included in Audit Fees, including accounting consultations, agreed-upon procedure reports, attestation reports, comfort letters, out-of-pocket expenses and internal control reviews not required by regulators.
2 The nature of the services includes tax compliance and/or tax preparation, including services relating to the filing or amendment of federal, state or local income tax returns, regulated investment company qualification reviews, taxable income and tax distribution calculations.
3 Non-audit fees of $1,984,000 and $2,050,500 for the current fiscal year and previous fiscal year, respectively, were paid to the Fund’s principal accountant in their entirety by BlackRock, in connection with services provided to the Affiliated Service Providers of the Fund and of certain other funds sponsored and advised by BlackRock or its affiliates for a service organization review and an accounting research tool subscription. These amounts represent aggregate fees paid by BlackRock and were not allocated on a per fund basis.
(e)(1) Audit Committee Pre-Approval Policies and Procedures:
The Committee has adopted policies and procedures with regard to the pre-approval of services. Audit, audit-related and tax compliance services provided to the registrant on an annual basis require specific pre-approval by the Committee. The Committee also must approve other non-audit services provided to the registrant and those non-audit services provided to the Investment Adviser and Affiliated Service Providers that relate directly to the operations and the financial reporting of the registrant. Certain of these non-audit services that the Committee believes are (a) consistent with the SEC’s auditor independence rules and (b) routine and recurring services that will not impair the independence of the independent accountants may be approved by the Committee without consideration on a specific case-by-case basis (“general pre-approval”). The term of any general pre-approval is 12 months from the date of the pre-approval, unless the Committee provides for a different period. Tax or other non-audit services provided to the registrant which have a direct impact on the operations or financial reporting of the registrant will only be deemed pre-approved provided that any individual project does not exceed $10,000 attributable to the registrant or $50,000 per project. For this purpose, multiple projects will be aggregated to determine if they exceed the previously mentioned cost levels.
3
Any proposed services exceeding the pre-approved cost levels will require specific pre-approval by the Committee, as will any other services not subject to general pre-approval (e.g., unanticipated but permissible services). The Committee is informed of each service approved subject to general pre-approval at the next regularly scheduled in-person board meeting. At this meeting, an analysis of such services is presented to the Committee for ratification. The Committee may delegate to the Committee Chairman the authority to approve the provision of and fees for any specific engagement of permitted non-audit services, including services exceeding pre-approved cost levels.
(e)(2) None of the services described in each of Items 4(b) through (d) were approved by the Committee pursuant to the de minimis exception in paragraph (c)(7)(i)(C) of Rule 2-01 of Regulation S-X.
(f) Not Applicable
(g) The aggregate non-audit fees, defined as the sum of the fees shown under “Audit-Related Fees,” “Tax Fees” and “All Other Fees,” paid to the accountant for services rendered by the accountant to the registrant, the Investment Adviser and the Affiliated Service Providers were:
| | | | | | | | |
| Entity Name | | Current Fiscal Year End | | Previous Fiscal Year End | | | | |
| BlackRock California Municipal Opportunities Fund of BlackRock California Municipal Series Trust | | $12,500 | | $17,500 |
Additionally, the amounts billed by D&T in connection with services provided to the Affiliated Service Providers of the Fund and of other funds sponsored and advised by BlackRock or its affiliates during the current and previous fiscal years for a service organization review and an accounting research tool subscription were:
| | |
Current Fiscal Year End | | Previous Fiscal Year End |
$1,984,000 | | $2,050,500 |
These amounts represent aggregate fees paid by BlackRock and were not allocated on a per fund basis.
(h) The Committee has considered and determined that the provision of non-audit services that were rendered to the Investment Adviser and the Affiliated Service Providers that were not pre-approved pursuant to paragraph (c)(7)(ii) of Rule 2-01 of Regulation S-X is compatible with maintaining the principal accountant’s independence.
| Item 5 – | Audit Committee of Listed Registrant – Not Applicable |
(a) The registrant’s Schedule of Investments is included as part of the Report to Stockholders filed under Item 1 of this Form.
(b) Not Applicable due to no such divestments during the semi-annual period covered since the previous Form N-CSR filing.
4
| Item 7 – | Disclosure of Proxy Voting Policies and Procedures for Closed-End Management Investment Companies – Not Applicable |
| Item 8 – | Portfolio Managers of Closed-End Management Investment Companies – Not Applicable |
Item 9 – Purchases of Equity Securities by Closed-End Management Investment Company and Affiliated Purchasers – Not Applicable
| Item 10 – | Submission of Matters to a Vote of Security Holders – There have been no material changes to these procedures. |
| Item 11 – | Controls and Procedures |
(a) The registrant’s principal executive and principal financial officers, or persons performing similar functions, have concluded that the registrant’s disclosure controls and procedures (as defined in Rule 30a-3(c) under the Investment Company Act of 1940, as amended (the “1940 Act”)) are effective as of a date within 90 days of the filing of this report based on the evaluation of these controls and procedures required by Rule 30a-3(b) under the 1940 Act and Rule 15d-15(b) under the Securities Exchange Act of 1934, as amended.
(b) There were no changes in the registrant’s internal control over financial reporting (as defined in Rule 30a-3(d) under the 1940 Act) that occurred during the period covered by this report that have materially affected, or are reasonably likely to materially affect, the registrant’s internal control over financial reporting.
| Item 12 – | Disclosure of Securities Lending Activities for Closed-End Management Investment Companies – Not Applicable |
| Item 13 – | Exhibits attached hereto |
(a)(1) – Code of Ethics – See Item 2
(a)(2) – Section 302 Certifications are attached
(a)(3) – Not Applicable
(a)(4) – Not Applicable
(b) – Section 906 Certifications are attached
5
Pursuant to the requirements of the Securities Exchange Act of 1934 and the Investment Company Act of 1940, the registrant has duly caused this report to be signed on its behalf by the undersigned, thereunto duly authorized.
BlackRock California Municipal Opportunities Fund of BlackRock California Municipal Series Trust
| | |
| By: | | /s/ John M. Perlowski |
| | John M. Perlowski |
Chief Executive Officer (principal executive officer) of
BlackRock California Municipal Opportunities Fund of BlackRock California Municipal Series Trust
Date: August 4, 2020
Pursuant to the requirements of the Securities Exchange Act of 1934 and the Investment Company Act of 1940, this report has been signed below by the following persons on behalf of the registrant and in the capacities and on the dates indicated.
| | |
| By: | | /s/ John M. Perlowski |
| | John M. Perlowski |
Chief Executive Officer (principal executive officer) of
BlackRock California Municipal Opportunities Fund of BlackRock California Municipal Series Trust
Date: August 4, 2020
| | |
| By: | | /s/ Neal J. Andrews |
| | Neal J. Andrews |
Chief Financial Officer (principal financial officer) of
BlackRock California Municipal Opportunities Fund of BlackRock California Municipal Series Trust
Date: August 4, 2020
6