Exhibit 15.4
Caledonia Mining Corporation Plc S-K 1300 Technical Report Summary on the Blanket Gold Mine, Zimbabwe |
DATE AND SIGNATURE PAGE
This Report titled “S-K 1300 Technical Report Summary on the Blanket Gold Mine, Zimbabwe” was prepared for Caledonia Mining Corporation Plc. The Report is compiled in accordance with the United States Securities and Exchange Commission Part 229 Standard Instructions for Filing Forms Regulation S-K subpart 1300. The effective date of this Report is 31 December 2022.
The Qualified Persons (“QPs”) responsible for this Report are Mr. Uwe Engelmann (Geology and Mineral Resources) and Mr. Daniel (Daan) van Heerden (Mineral Processing, Mineral Extraction and Mineral Reserves).
U ENGELMANN
BSc (Zoo. & Bot.), BSc Hons (Geol.)
Pr.Sci.Nat., FGSSA
DIRECTOR, MINXCON (PTY) LTD
D VAN HEERDEN
B Eng (Min.), MCom (Bus. Admin.), MMC
Pr.Eng., FSAIMM, AMMSA
DIRECTOR, MINXCON (PTY) LTD
Signed at Little Falls, Gauteng, South Africa, on 28 April 2023.
Caledonia Mining Corporation Plc S-K 1300 Technical Report Summary on the Blanket Gold Mine, Zimbabwe |
INFORMATION RISK
This Report was prepared by Uwe Engelmann and Daniel van Heerden (the QPs) of Minxcon (Pty) Ltd (“Minxcon”). In the preparation of the Report, the QPs utilised information relating to operational methods and expectations provided to them by various sources. Where possible, the QPs have verified this information from independent sources after making due enquiry of all material issues that are required in order to comply with the requirements of the United States Securities and Exchange Commission Part 229 Standard Instructions for Filing Forms Regulation S-K subpart 1300. The authors of this report are not qualified to provide extensive commentary on legal issues associated with rights to the mineral properties and relied on the information provided to them by the issuer. No warranty or guarantee, be it express or implied, is made by the authors with respect to the completeness or accuracy of the legal aspects of this document.
OPERATIONAL RISKS
The business of mining and mineral exploration, development and production by their nature contain significant operational risks. The business depends upon, amongst other things, successful prospecting programmes and competent management. Profitability and asset values can be affected by unforeseen changes in operating circumstances and technical issues.
POLITICAL AND ECONOMIC RISK
Factors such as political and industrial disruption, currency fluctuation and interest rates could have an impact on future operations, and potential revenue streams can also be affected by these factors. The majority of these factors are, and will be, beyond the control of any operating entity.
FORWARD LOOKING STATEMENTS
Certain statements contained in this document other than statements of historical fact, contain forward-looking statements regarding the operations, economic performance or financial condition, including, without limitation, those concerning the economic outlook for the mining industry, expectations regarding commodity prices, exchange rates, production, cash costs and other operating results, growth prospects and the outlook of operations, including the completion and commencement of commercial operations of specific production projects, its liquidity and capital resources and expenditure, and the outcome and consequences of any pending litigation or enforcement proceedings.
Although the QPs believe that the expectations reflected in such forward-looking statements are reasonable, no assurance can be given that such expectations will prove to be correct. Accordingly, results may differ materially from those set out in the forward-looking statements as a result of, among other factors, changes in economic and market conditions, changes in the regulatory environment and other State actions, success of business and operating initiatives, fluctuations in commodity prices and exchange rates, and business and potential risk management.
TABLE OF CONTENTS

LIST OF UNITS AND ABBREVIATIONS
Units: The following units were used in this Report, and are in metric terms:-
Unit | Definition | | | |
% | Per cent | | ktpm | Kilo tonnes per month |
/ | Per | | kV | Kilovolt (1,000 volts) |
± or ~ | Approximately | | kVA | Kilovolt ampere |
° | Degrees | | kW | Kilowatt (1,000 W) |
°C | Degrees Celsius | | l | Litre |
a | Year | | m | Metre |
cm | Centimetre | | m2 | Square metres |
d | Day | | m3 | Cubic metres |
g | Grammes | | mm | Millimetre |
g/cm3 | Grammes per cubic centimetre | | Moz | Million ounces (1,000,000 oz) |
g/t | Grammes per tonne | | Mt | Million tonnes (1,000,000 t) |
Ga | Billion years (1,000,000,000 years) | | Mtpa | Million tonnes per annum |
ha | Hectares | | MVA | Megavolt ampere |
hr | Hour | | oz | Troy Ounces |
kg | Kilogram (1,000 g) | | t | Tonne |
kL | Kilolitres (1,000 l) | | t/m³ | Tonnes per cubic meter |
km | Kilometre (1,000 m) | | tpd | Tonnes per day |
km2 | Square kilometres | | V | Volts |
koz | Kilo ounces (1,000 oz) | | x | By / Multiplied by |
kt | Kilotonnes (1,000 t) | | | |
Computation: It is noted that throughout the Report, tables may not compute due to rounding.
Abbreviations: The following abbreviations were used in this Report:-
Abbreviation | Description |
AC | Asbestos Cement |
amsl | Above Mean Sea Level |
Au | Gold |
BETS | Employee Trust for the benefit of the present and future employees of Blanket Mine |
BIF | Banded Iron Formation |
Blanket Mine Company | Blanket Mine (1983) (Pvt) Ltd |
Blanket or the Mine | Blanket Gold Mine |
BQR | Blanket Quartz Reef |
Caledonia or the Company | Caledonia Mining Corporation Plc |
CAPM | Capital Asset Pricing Model |
CBDZ | Colleen Bawn Deformation Zone |
CIL | Carbon-in-Leach |
CIM | Canadian Institute of Mining, Metallurgy and Petroleum |
CMS | Central Main Shaft |
CPI | Consumer Price Indices |
CRM | Certified Reference Material |
DCF | Discounted Cash Flow |
DSR | Disseminated Sulphide Reefs |
EIA | Environmental Impact Assessment |
EM Act | Environmental Management Act (Chapter 20:27) No. 13/2002 |
EMA | Environmental Management Agency |
Epoch | Epoch Resources (Pty) Ltd |
FCFE | Free Cash Flow to Equity |
FCFF | Free Cash Flow to Firm |
Fidelity | Fidelity Printers and Refiners Limited |
FW | Footwall |
G&A | General and Administrative |
GGB | Gwanda Greenstone Belt |
GMS | Greenstone Management Services (Pty) Limited |
HG | High Grade |
HW | Hanging Wall |
IL | Intensive Leach |
Kinross | Kinross Gold Corporation |
KNA | Kriging Neighbourhood Analysis |
LG | Low Grade |
LIMS | Laboratory Information Management System |
LoM | Life of Mine |
Minxcon | Minxcon (Pty) Ltd |
ML40 | Mining Lease with registered number 40 |
| Abbreviation | Description |
MMA | Mines and Minerals Act (Chapter 21:05) of 1961 |
MMCZ | Minerals Marketing Corporation of Zimbabwe |
MSO | Geovia Stope Shape Optimiser |
NIEEF | National Indigenisation and Economic Empowerment Fund |
NIR | Not-In-Reserve |
NMD | Nominal Maximum Demand |
NPV | Net Present Value |
NSR | Net Smelter Royalty |
NWGDZ | North West Gwanda Deformation Zone |
OHL | Overhead Powerlines |
PEM | Prospectivity Enhancement Multiplier |
PPE | Personal Protective Equipment |
PSA | Pressure Swing Absorption |
QAQC | Quality Assurance and Quality Control |
QP | Qualified Person |
RoM | Run of Mine |
RoR | Rate of Rise |
SG | Specific Gravity |
SGDZ | South Gwanda Deformation Zone |
S-K 1300 | United States Securities and Exchange Commission Part 229 Standard Instructions for Filing Forms Regulation S-K subpart 1300 |
SoR | Slope of Regression |
The Act | Indigenisation and Economic Empowerment Act |
TRS | Technical Report Summary |
TSF | Tailings Storage Facility |
WACC | Weighted Average Cost of Capital |
ZESA | Zimbabwe Electricity Supply Authority |
ZINWA | Zimbabwe National Water Authority |
ZMDC | Zimbabwe Mining Development Corporation |
Caledonia Mining Corporation Plc S-K 1300 Technical Report Summary on the Blanket Gold Mine, Zimbabwe |
ITEM 1 | – EXECUTIVE SUMMARY |
The Blanket Mine is an operating underground gold mine situated on the Gwanda Greenstone Belt targeting shear zone hosted gold mineralisation. It is located in the southwest of Zimbabwe, approximately 15 km northwest of Gwanda, the provincial capital of Matabeleland South. Gwanda is located 147 km southeast of Bulawayo, 197 km northwest of the Beitbridge Border post with South Africa, and 560 km from Harare.
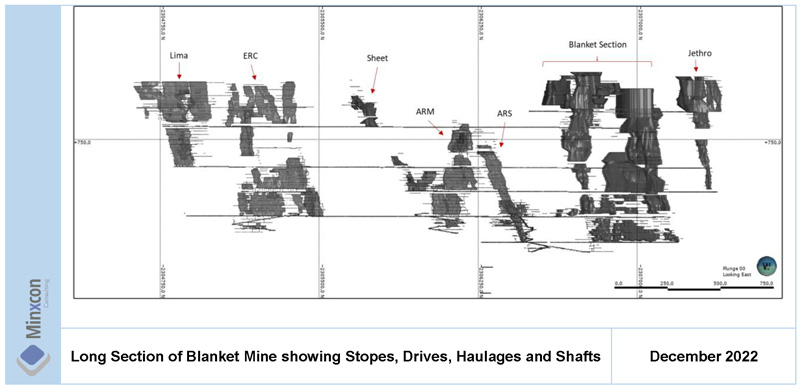
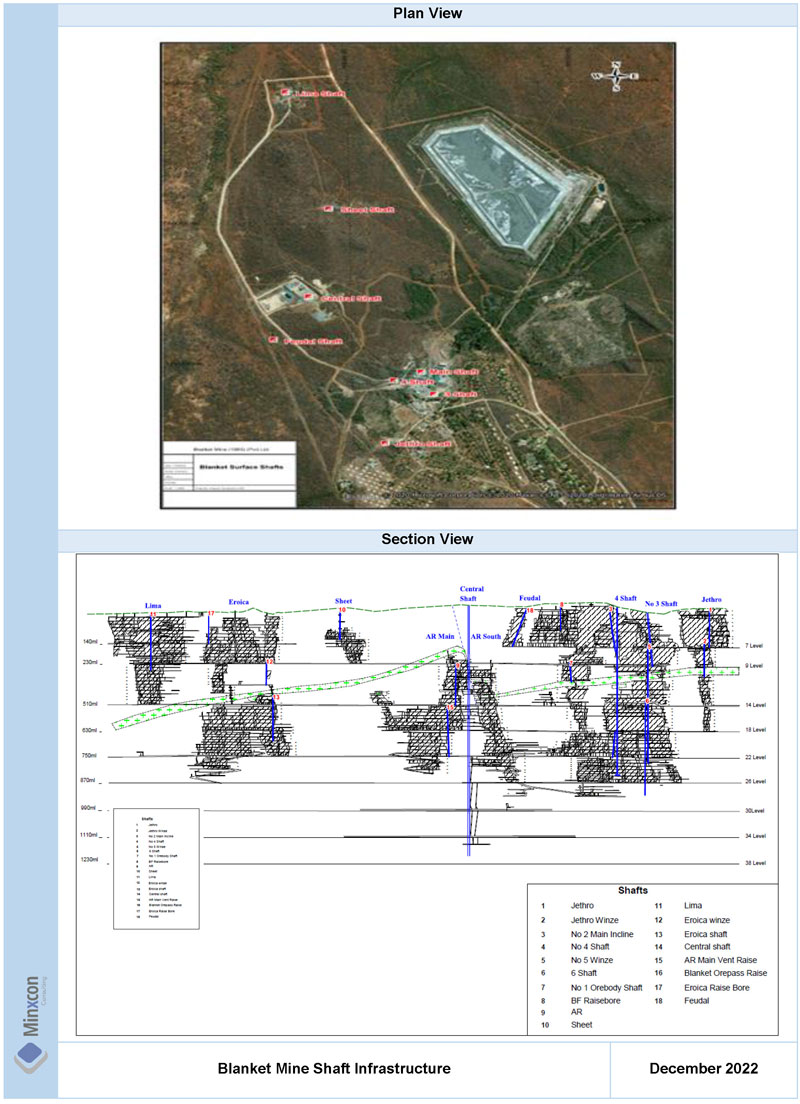
The Mine complex comprises a cluster of mines extending from Lima in the north, through Eroica, Sheet, AR Main, AR South, the currently defunct Feudal, Blanket Section (Blanket 1 to Blanket 6) and Jethro over a total strike length of some 3 km. Gold has been commercially mined at the Project Area from several closely spaced orebodies defining a mineralised trend via several shafts since the early 1900s. The Mine covers the operating claims of Jethro, Blanket, Feudal, Harvard, Mbudzane Rock, Oqueil, Sabiwa, Sheet, Eroica and Lima, largely encompassed in a 2,120 ha Mining Lease. Ore is processed at an on-site plant.
The Blanket Mine operates under a mining lease ML40 issued to Blanket Mine (1983) (Pvt) Ltd, which is incorporated in Zimbabwe and a 64% owned, indirect subsidiary of Caledonia Mining Corporation Plc. The mine’s claims under the lease cover an area of 2,120 ha.
I. | Geology and Mineral Deposit |
The Blanket Mine is situated on the north-western limb of the Archaean Gwanda Greenstone Belt along strike from several other gold deposits. In the Blanket Mine area, lithologies comprise non-mineralised basal felsic schists of igneous or sedimentary origin in the east. The felsics are overlain by a metabasaltic ultramafic to mafic unit with pillow basalts remnants.
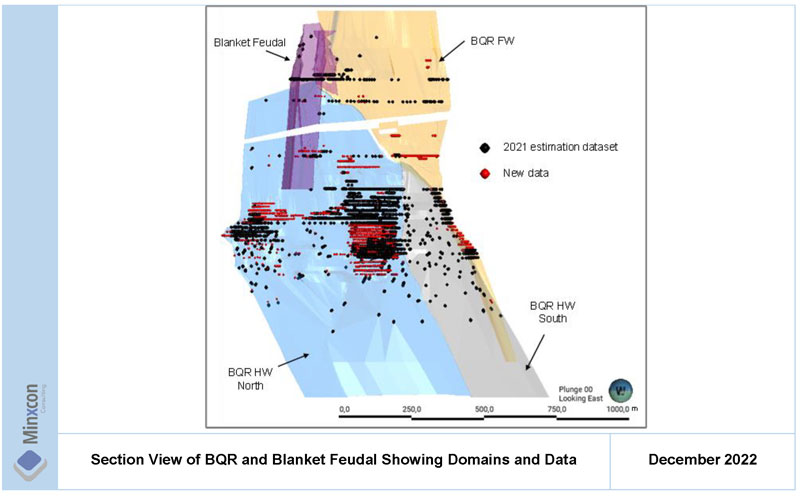
Mining at Blanket occurs over a 3 km strike that includes from north to south, the deposits of Lima, Eroica, Sheet, AR Main, AR South, Feudal, Blanket Section (Blanket 1 to Blanket 6) and Jethro. The main Blanket underground workings are connected to Lima by a 2 km long haulage which follows the strike of the main fabric. Mineralisation occurs in near vertical shoots aligned along an approximately N-S axis. The ore shoots vary in shape from the tabular-lensoidal quartz reefs to the massive to pipe-like disseminated sulphide reefs (or DSR). Gold is deposited at crustal levels within and near the brittle-ductile transition zone. The deposits may have a vertical extent of up to 2 km, demonstrate extensive down-plunge continuity, and lack pronounced zoning. The ore mineralogy is dominated by gold, pyrite and arsenopyrite.
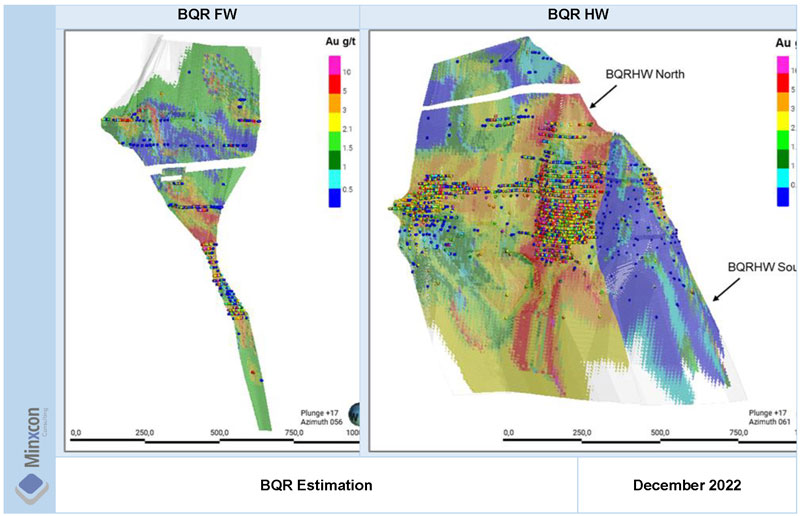
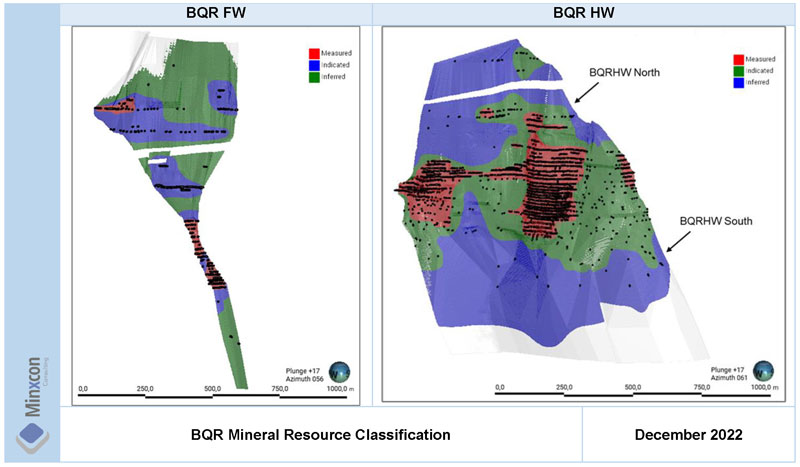
Two quartz-filled shear zones are mined, namely the Blanket Quartz Reef (or BQR) and the Eroica Reef, which have long strike lengths but are not uniformly mineralised although continuous pay shoots of over 100 m on strike are seen. Gold grade fluctuations are more extreme in the quartz reefs than in the DSR type reefs but on average these quartz shears have higher grades.
Blanket Mine is continuing with the down-dip exploration drilling (below 750 m Level) as drilling platforms are established. This drilling will confirm and improve the down-dip Inferred Mineral Resource. An electromagnetic survey may be considered; potentially delineating additional surface structural features and targets, which can be used in conjunction with and refinement of the geological concept being proposed.
The combination of the exploration drilling, geophysical survey and conceptual geological model (based on the sampling database) and structural geological modelling may increase the exploration targets and ultimately assist in increasing the Mineral Resource.
Caledonia Mining Corporation Plc S-K 1300 Technical Report Summary on the Blanket Gold Mine, Zimbabwe |
III. | Mineral Resource and Mineral Reserve Estimates |
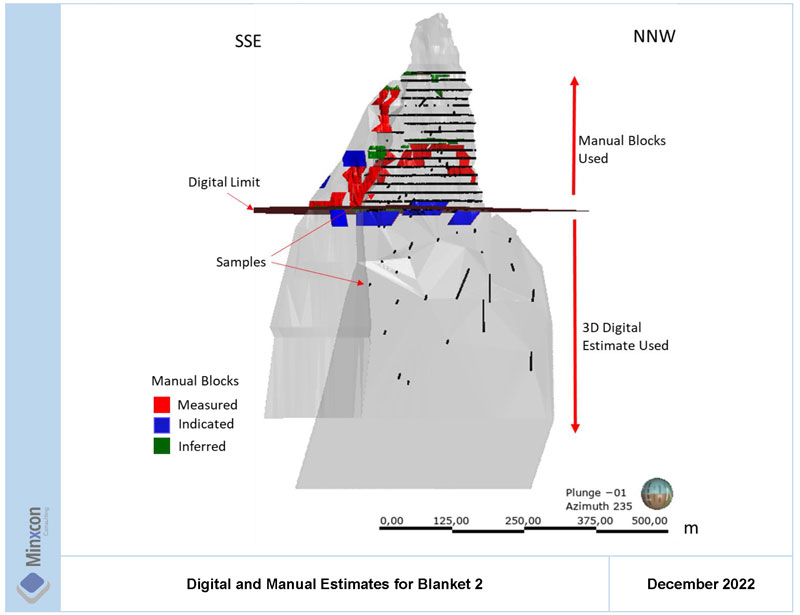
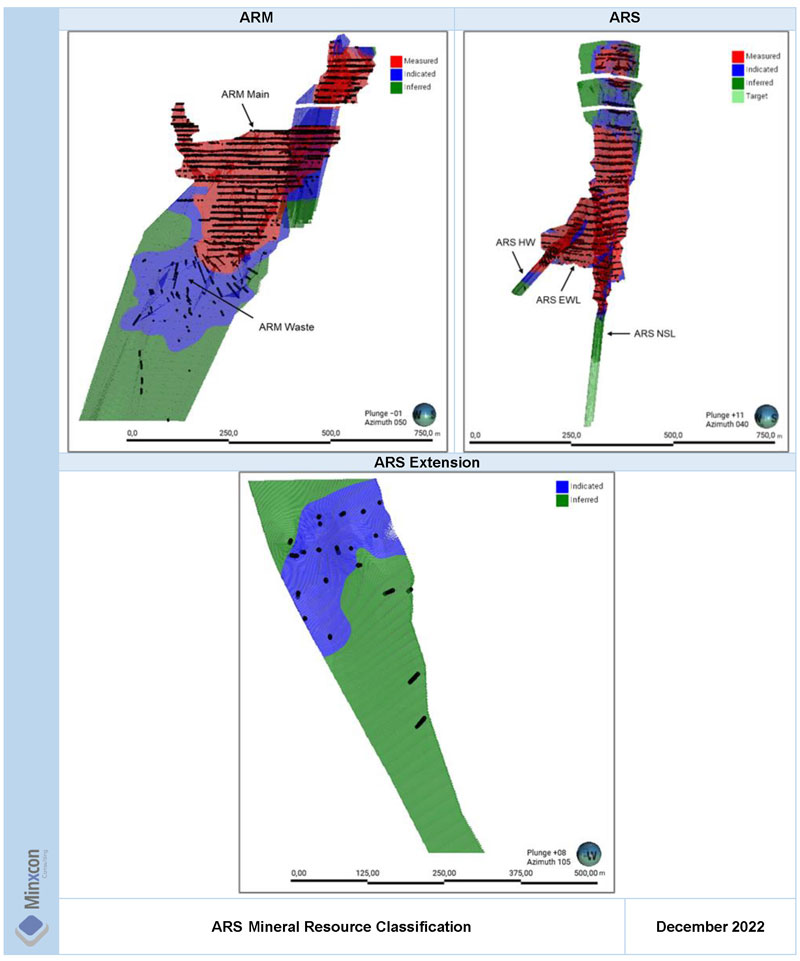
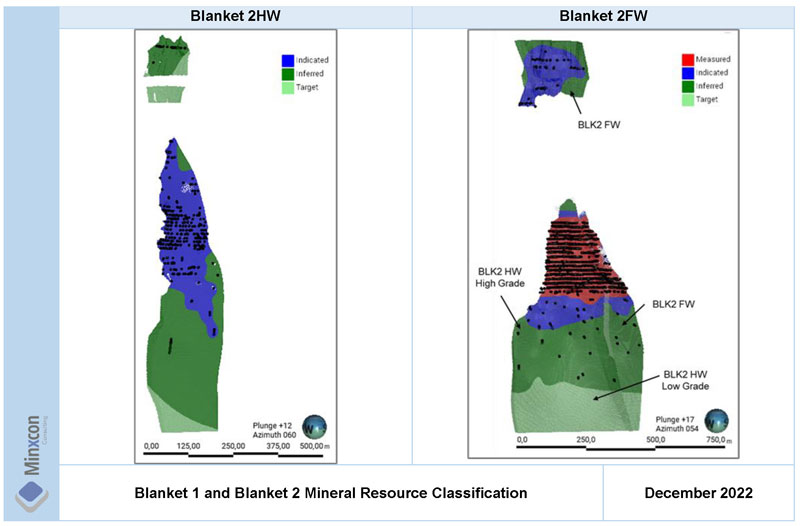
Measured, Indicated and Inferred Mineral Resources, based on ordinary kriging and inverse distance estimation methods, can be declared for Blanket Mine due to the continuity of the geology and grade as well as a history of proven historical mining. The Inferred resources show geological continuity, while grade continuity requires improvement through additional drilling. The 2022 estimates only include 3D digital estimates in the form of block models. Previous estimates were a combination of digital estimates and manual block listings above a specific elevation. The in situ Measured, Indicated and Inferred Mineral Resources are shown in the table to follow.
In Situ Measured and Indicated Mineral Resource Tabulation for Blanket Mine as at 31 December 2022 (inclusive of Mineral Reserves)
Mineral Resource Classification | Orebody | Tonnes | Au | Ounces |
| | | t | g/t | oz |
| ARM | 784,859 | 2.78 | 70,202 |
| | ARS | 797,656 | 3.18 | 81,460 |
| | BLK2 | 209,019 | 3.48 | 23,402 |
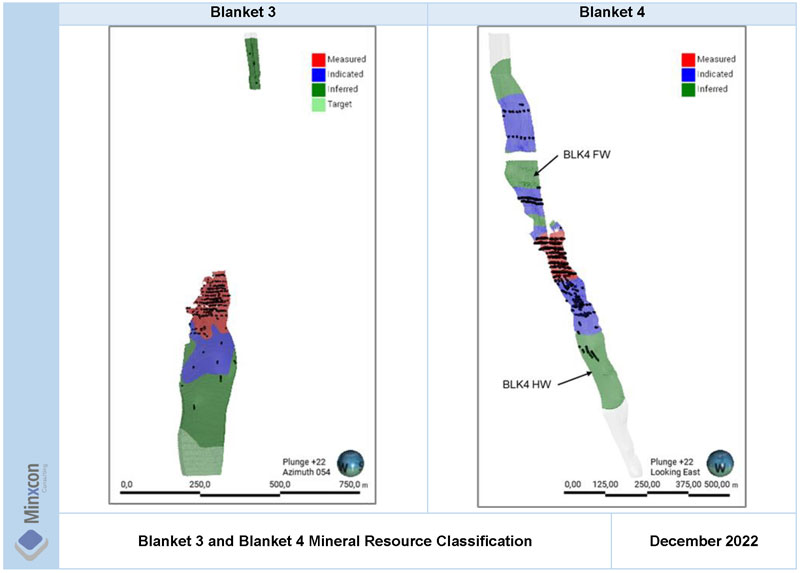
| | BLK3 | 67,586 | 2.47 | 5,364 |
| Measured | BLK4 | 63,651 | 3.61 | 7,387 |
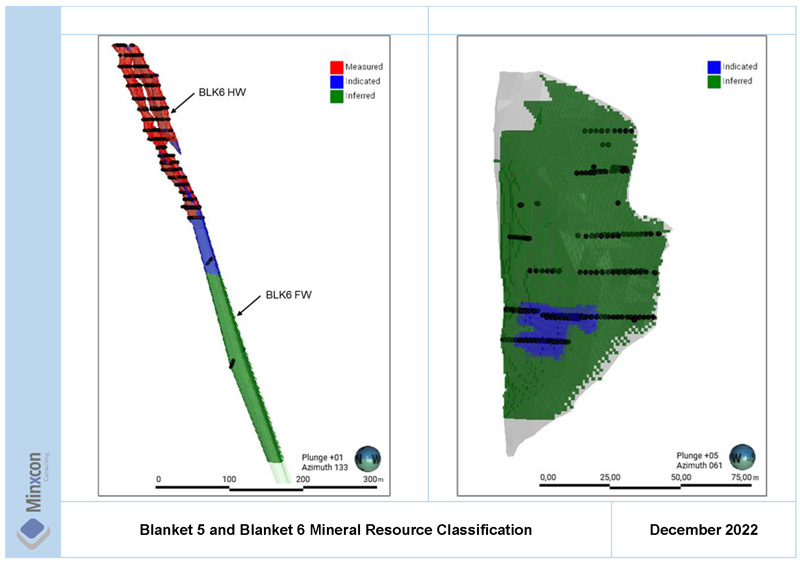
| | BLK6 | 72,639 | 3.73 | 8,703 |
| | BQR | 626,955 | 3.80 | 76,597 |
| | ERC | 116,689 | 3.45 | 12,932 |
| | Lima | 114,039 | 3.20 | 11,727 |
| | Sheet | 118,156 | 2.90 | 11,000 |
Measured Total | 2,971,249 | 3.23 | 308,774 |
| ARM | 560,464 | 2.38 | 42,839 |
| | ARS | 411,290 | 2.69 | 35,506 |
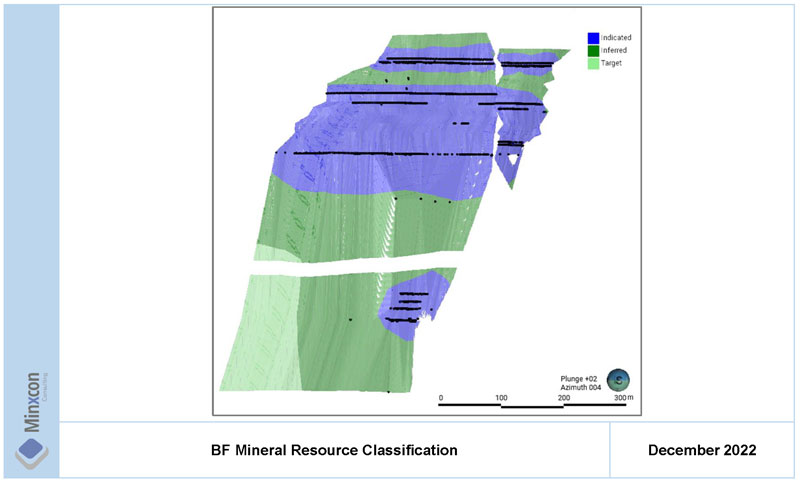
| | BF | 143,927 | 3.49 | 16,164 |
| | BLK1 | 77,270 | 1.98 | 4,927 |
| | BLK2 | 320,971 | 3.23 | 33,348 |
| | BLK3 | 118,516 | 2.55 | 9,701 |
| Indicated | BLK4 | 132,918 | 2.51 | 10,721 |
| | BLK5 | 1,285 | 2.78 | 115 |
| | BLK6 | 27,864 | 2.95 | 2,640 |
| | BQR | 766,467 | 3.36 | 82,743 |
| | ERC | 655,577 | 3.73 | 78,693 |
| | Jethro | 261,879 | 2.65 | 22,276 |
| | Lima | 64,037 | 2.91 | 5,988 |
| | Sheet | 37,754 | 2.40 | 2,913 |
Indicated Total | 3,580,218 | 3.03 | 348,574 |
M&I Total | 6,551,467 | 3.12 | 657,348 |
Notes:
| | 1. | Cut-off applied 1.5 g/t. |
| | 2. | No Geological loss applied for Measured, 5% for Indicated and Inferred. |
| | 3. | Commodity price utilised: USD1,800/oz. |
| | 4. | Mineral Resources are stated inclusive of Mineral Reserves. |
| | 5. | Mineral Resources are reported as 64% attributable to Caledonia. |
| | 6. | All orebodies are depleted for mining. |
Caledonia Mining Corporation Plc S-K 1300 Technical Report Summary on the Blanket Gold Mine, Zimbabwe |
In Situ Inferred Mineral Resource Tabulation for Blanket Mine as at 31 December 2022 (inclusive of Mineral Reserves)
Mineral Resource Classification | Orebody | Tonnes | Au | Ounces |
| | | t | g/t | oz |
| ARM | 213,581 | 2.40 | 16,503 |
| | ARS | 433,295 | 3.03 | 42,144 |
| | BF | 271,010 | 3.28 | 28,595 |
| | BLK1 | 833,042 | 2.41 | 64,623 |
| | BLK2 | 937,745 | 3.64 | 109,811 |
| | BLK3 | 466,743 | 2.68 | 40,275 |
| Inferred | BLK4 | 220,344 | 2.87 | 20,338 |
| | BLK5 | 10,578 | 2.68 | 910 |
| | BLK6 | 115,299 | 2.89 | 10,721 |
| | BQR | 1,771,552 | 2.74 | 156,097 |
| | ERC | 142,113 | 3.86 | 17,628 |
| | Jethro | 152,251 | 2.87 | 14,034 |
| | Lima | 134,774 | 3.13 | 13,550 |
| | Sheet | 46,114 | 2.61 | 3,872 |
Inferred Total | 5,748,440 | 2.92 | 539,101 |
Notes:
| | 1. | Cut-off applied 1.5 g/t. |
| | 2. | No Geological loss applied for Measured, 5% for Indicated and Inferred. |
| | 3. | Commodity price utilised: USD1,800/oz. |
| | 4. | Mineral Resources are stated inclusive of Mineral Reserves. |
| | 5. | Mineral Resources are reported as 64% attributable to Caledonia. |
| | 6. | All orebodies are depleted for mining. |
In Situ Measured and Indicated Mineral Resource Tabulation for Blanket Mine as at 31 December 2022 (exclusive of Mineral Reserves)
Mineral Resource Classification | Orebody | Tonnes | Au | Ounces |
| | | t | g/t | oz |
| ARM | 681,813 | 2.80 | 61,286 |
| | ARS | 389,873 | 2.93 | 36,747 |
| | BLK2 | 149,256 | 3.69 | 17,727 |
| | BLK3 | 47,499 | 2.58 | 3,946 |
| Measured | BLK4 | 54,648 | 3.53 | 6,210 |
| | BLK6 | 70,150 | 3.71 | 8,376 |
| | BQR | 185,102 | 3.86 | 22,973 |
| | ERC | 79,276 | 3.66 | 9,331 |
| | Lima | 85,266 | 2.89 | 7,932 |
| | Sheet | 112,473 | 2.88 | 10,400 |
Measured Total | 1,855,356 | 3.10 | 184,929 |
| ARM | 404,187 | 2.30 | 29,902 |
| | ARS | 311,353 | 2.68 | 26,780 |
| | BF | 109,816 | 3.48 | 12,283 |
| | BLK1 | 77,270 | 1.98 | 4,927 |
| | BLK2 | 164,208 | 3.19 | 16,851 |
| | BLK3 | 84,940 | 2.64 | 7,199 |
| Indicated | BLK4 | 117,027 | 2.38 | 8,946 |
| | BLK5 | 870 | 3.00 | 84 |
| | BLK6 | 10,879 | 2.84 | 994 |
| | BQR | 456,509 | 3.29 | 48,331 |
| | ERC | 276,994 | 3.80 | 33,884 |
| | Jethro | 261,879 | 2.65 | 22,276 |
| | Lima | 49,108 | 2.68 | 4,228 |
| | Sheet | 37,754 | 2.40 | 2,913 |
Indicated Total | 2,362,791 | 2.89 | 219,598 |
M&I Total | 4,218,148 | 2.98 | 404,527 |
Notes:
| | 1. | Cut-off applied 1.5 g/t. |
| | 2. | No Geological loss applied for Measured, 5% for Indicated and Inferred. |
| | 3. | Commodity price utilised: USD1,800/oz. |
| | 4. | Mineral Resources are stated exclusive of Mineral Reserves. |
| | 5. | Mineral Resources are reported as 64% attributable to Caledonia. |
| | 6. | All orebodies are depleted for mining. |
Caledonia Mining Corporation Plc S-K 1300 Technical Report Summary on the Blanket Gold Mine, Zimbabwe |
Inferred Mineral Resources inclusive and exclusive of Mineral Reserves are the same as there are no inferred Mineral Resources in the Mineral Reserve.
Mineral Resources in the Measured and Indicated Mineral Resource classifications have been converted into Proven and Probable Mineral Reserves respectively, by applying the applicable modifying factors.
The updated Mineral Reserve estimation as at 31 December 2022, is detailed in the table below. Mineral Reserves are stated as delivered to plant. Life of Mine (or LoM) as referred to in this TRS is remaining at 31 December 2022.
Blanket Mine Mineral Reserve Estimate as at 31 December 2022
Mineral Reserve Classification | Tonnes | Grade | Au Content |
| | kt | g/t | kg | oz |
Proven | 1,191 | 3.23 | 3,842 | 123,534 |
Probable | 1,300 | 2.92 | 3,801 | 122,205 |
Total | 2,491 | 3.07 | 7,643 | 245,739 |
Notes:
| | 1. | Mineral Reserve cut-off of 2.1 g/t applied. |
| | 2. | The gold price that has been utilised in the economic analysis to convert diluted Measured and Indicated Mineral Resources in the LoM plan to Mineral Reserves is an average real term price of USD1,655/oz over the LoM, using the forecast prices as per Economic Analysis. |
| | 3. | The Mineral Reserve estimation utilises the depleted 2022 Mineral Resource estimation the 31 December 2022 mine design and LoM plan |
| | 4. | Mineral Reserves are reported as 64% attributable to Caledonia. |
An uneconomical tail containing 125.5 koz of gold has been excluded from the Mineral Reserve, since it is not economical on its own.
IV. | Development and Operations |
Blanket Mine employs two mining methods that are well suited to the nature of the of the mineral deposits. The extreme variation within the Blanket Mine mineral deposits necessitates modification of the exact mining methods that suit the specific characteristics of each deposit. The general practice on the Mine is to implement one of two tailored mining methods, determined mainly by the width of the mineral deposit. Long-hole stoping is utilised in wider mineral deposits (orebody widths generally more than 3 m), and underhand stoping is utilised in narrow mineral deposits (orebody widths generally less than 3 m).
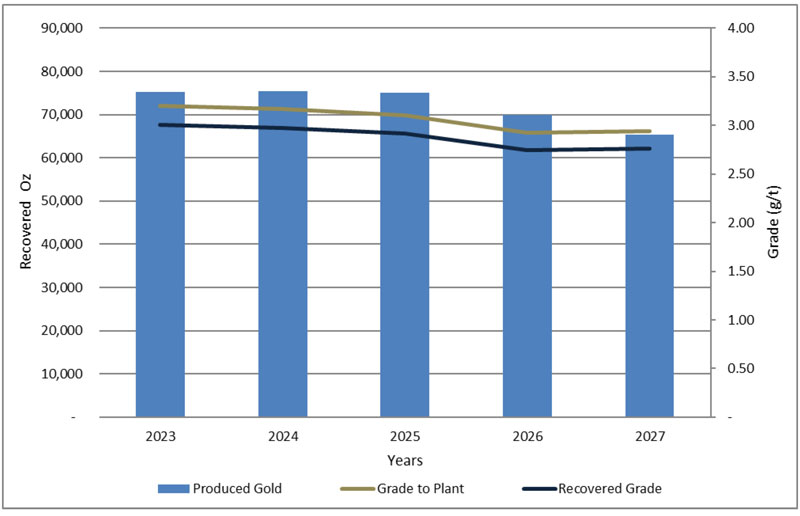
The planned thrust in development is aimed at opening up ground below 750 m Level which will be the primary production areas, as well as create the necessary exploration drilling platforms. In the Lima, ARS, Blanket and Blanket Feudal areas some mining activities will take place above 750 m Level. Blanket Mine plans to produce 80 koz (recovered) of gold per year.
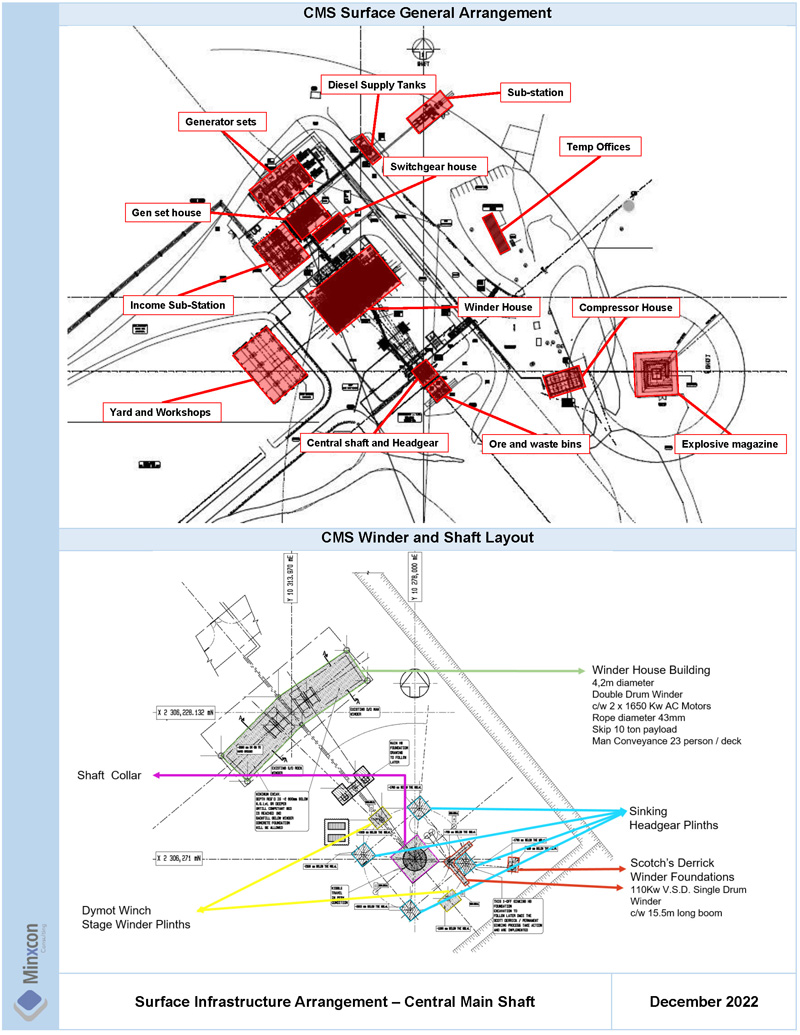
Blanket Mine is an operational mine with well-established infrastructure and no major modifications or upgrades - with the exception of the Central Main Shaft expansion project - are necessary to sustain mining and processing operations. Sufficient capital has been allowed for the Central Main Shaft as well as the associated development, equipment and infrastructure. An upgrade of the ore handling infrastructure between Central Shaft and the Blanket Gold Plant is planned. Power and water supply allocation to the total Blanket operation, including the Central Main Shaft expansion project, is deemed to be sufficient.
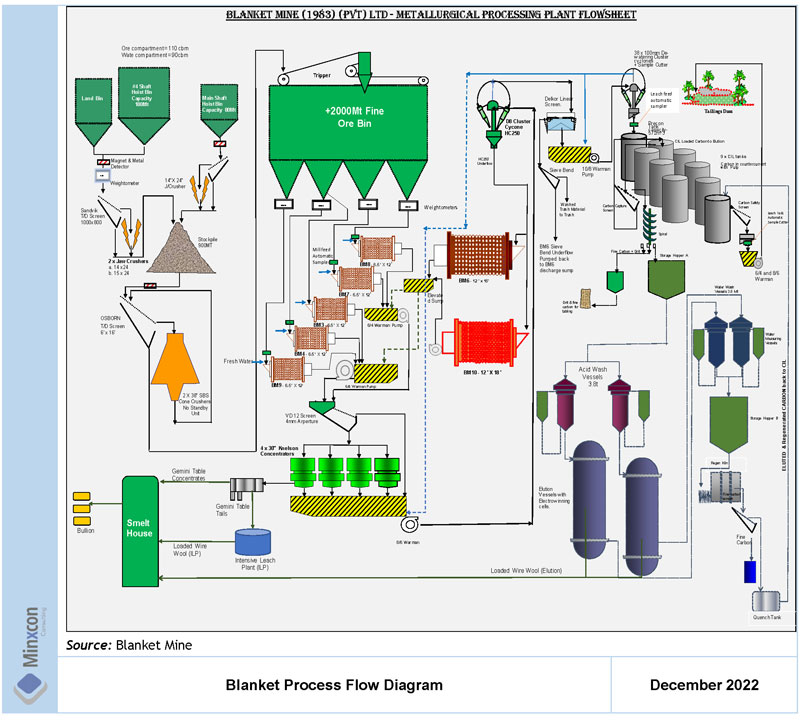
The process plant has been operating at a consistent recovery of 93.8%, and this can be expected to continue as long as the ore mineralogy does not change. The average processing rate for the past 12 months was 62.7 ktpm, and there are indications that higher processing rates can be achieved with operational improvements, as demonstrated in December 2022 where 79.8 kt was milled.
Caledonia Mining Corporation Plc S-K 1300 Technical Report Summary on the Blanket Gold Mine, Zimbabwe |
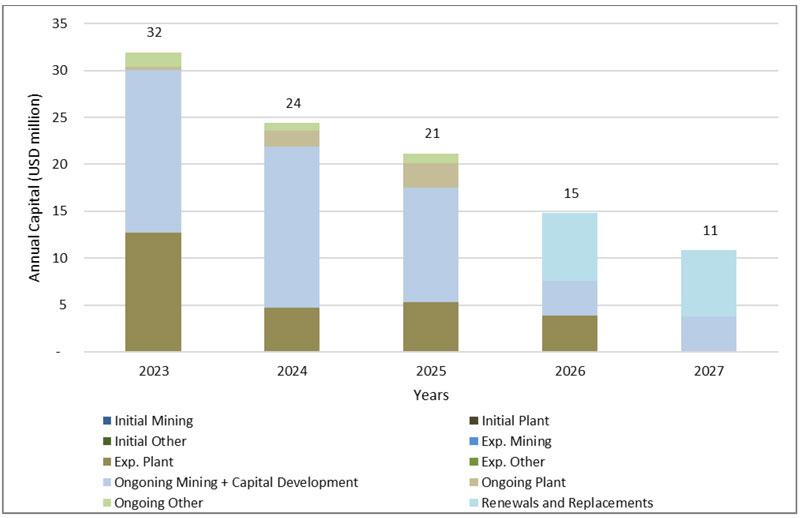
A new TSF is planned to allow for deposition towards the end of 2023 with Phase 1a costing USD12.74 million.
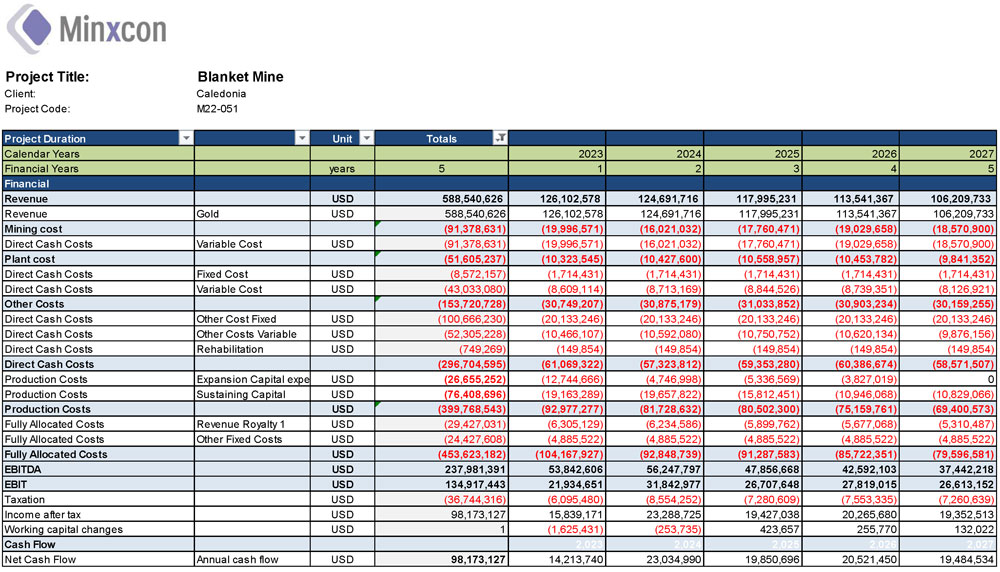
The evaluator performed an independent mineral asset economic analysis on the Blanket Mine and the diluted Indicated and Measured Resources in the LoM plan, for conversion to Mineral Reserves. The Discounted Cash Flow, or DCF, is based on the production schedule and all costs and capital associated to develop, mine and process the orebody. Relevant taxation and other operating factors, such as recoveries and stay-in-business costs were incorporated into the economic analysis to produce a cash flow over the life cycle of the Mine. The effective date of the economic analysis is 31 December 2022.
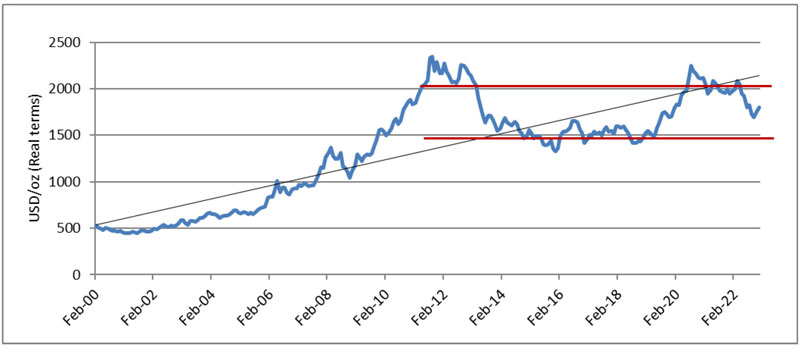
USD commodity prices for the period 2023-2025 have been converted from nominal to real terms. The table below illustrates the forecasts for these three years as well as the long-term forecast used in the financial model. The price forecasts are based on the median of various banks, brokers and analyst forecasts and are in real-terms throughout the life of mine. The long-term gold price was estimated as the real term average between the high and low gold price trading range over the past 10 years, USD1,650/oz. The average price over the LoM equates to USD1,655/oz. The inflation rate was sourced from the International Monetary Fund.
Macro-economic Forecasts (Real Terms)
Item | Unit | Year |
| | | 2023 | 2024 | 2025 | Long-Term |
| | | 1 | 2 | 3 | |
US Inflation Rate | % | 3.50% | 2.20% | 2.00% | 2.00% |
Gold | USD/oz | 1,700 | 1,679 | 1,597 | 1,650 |
Source: Median of various Banks and Broker forecasts (Minxcon) (Dec 2022)
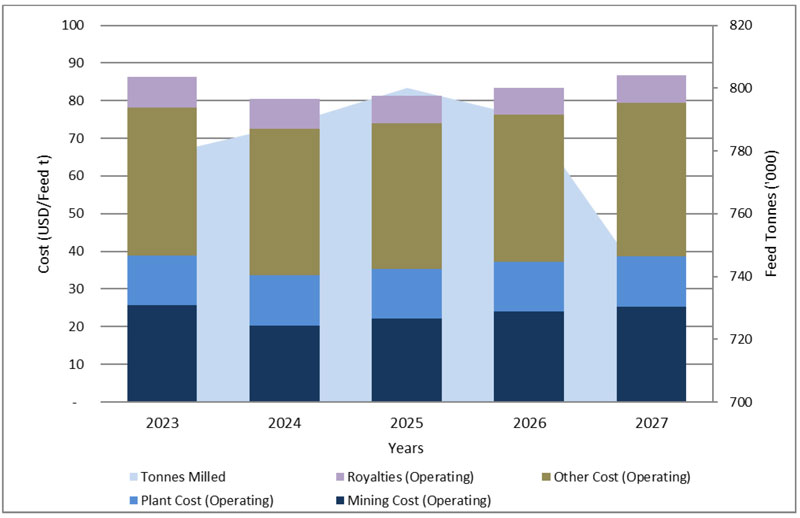
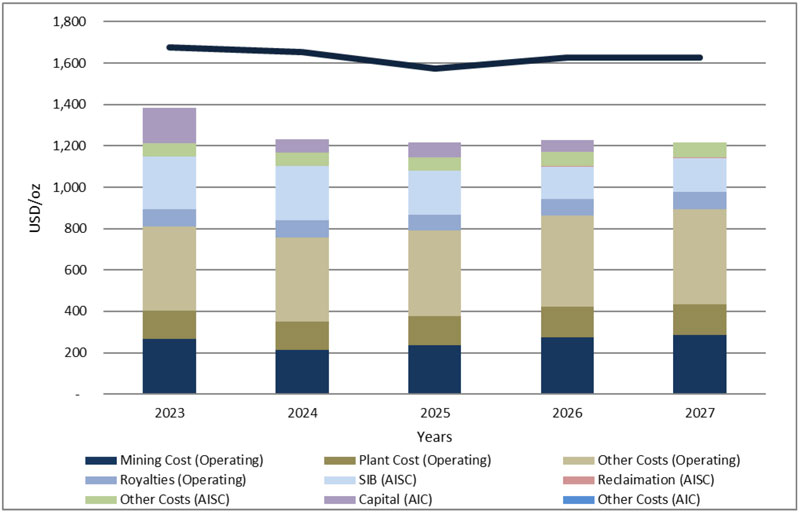
Costs reported for the Blanket Mine, which consists of mining, plant and other operating costs, as well as government royalty payments are displayed in the table to follow. Other costs in the Adjusted Operating Costs category include the central and technical services, general and administration, human resources, and other services costs. Other costs for the AISC category include the corporate management costs. The costs are displayed per milled tonne as well as per recovered gold ounce. Budget costs for 2023 were considered for the financial analysis.
Caledonia Mining Corporation Plc S-K 1300 Technical Report Summary on the Blanket Gold Mine, Zimbabwe |
Project Cost Indicators
Item | Unit | Blanket Mine |
Net Turnover | USD/Feed tonne | 151 |
Mine Cost | USD/Feed tonne | 23 |
Plant Costs | USD/Feed tonne | 13 |
Other Costs | USD/Feed tonne | 39 |
Royalties | USD/Feed tonne | 8 |
Operating Costs | USD/Feed tonne | 84 |
SIB | USD/Feed tonne | 20 |
Reclamation | USD/Feed tonne | 0 |
Other Costs | USD/Feed tonne | 6 |
All-in Sustaining Costs (AISC) | USD/Feed tonne | 110 |
Capital | USD/Feed tonne | 7 |
Other Cash Costs | USD/Feed tonne | 0 |
All-in Costs (AIC) | USD/Feed tonne | 117 |
All-in Cost Margin | % | 23% |
EBITDA1 | USD/Feed tonne | 61 |
EBITDA Margin | % | 40% |
Gold Recovered | oz | 360,929 |
Average Gold Price | USD/Gold oz | 1,655 |
Payability - Off-take Agreement | % | 98.5% |
Net Turnover2 | USD/Gold oz | 1,631 |
Mine Cost | USD/Gold oz | 253 |
Plant Costs | USD/Gold oz | 143 |
Other Costs | USD/Gold oz | 424 |
Royalties | USD/Gold oz | 82 |
Operating Costs | USD/Gold oz | 902 |
SIB Capex | USD/Gold oz | 212 |
Reclamation | USD/Gold oz | 2 |
Other Costs | USD/Gold oz | 68 |
All-in Sustaining Costs (AISC) | USD/Gold oz | 1,183 |
Capital | USD/Gold oz | 74 |
Other Cash Costs | USD/Gold oz | 0 |
All-in Costs (AIC) | USD/Gold oz | 1,257 |
EBITDA* | USD/Gold oz | 659 |
Notes:
| | 1. | *Earnings before interest, tax, depreciation and amortisation (excludes CAPEX). |
| | 2. | Net turnover will be the realised income per produced gold oz, after 98.5% payability has been applied. |
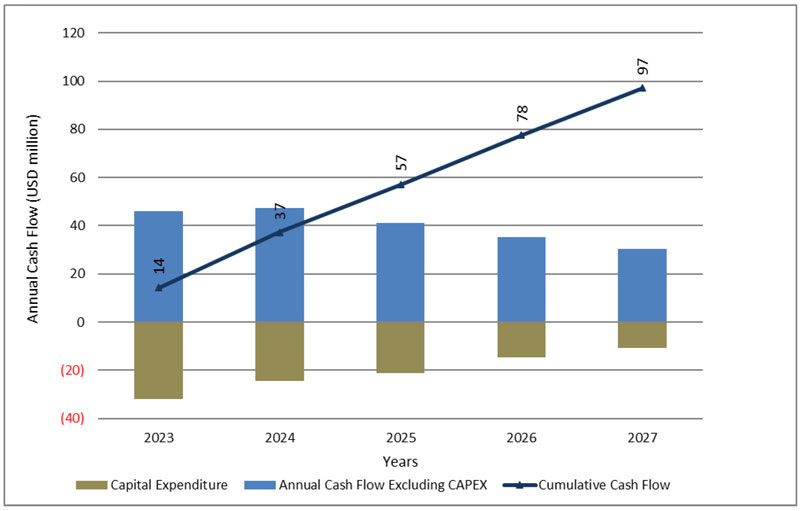
The total capital including the sustaining capital amounts to USD103 million over the mine life. The Mine has no funding requirement as it has long been in operation. The cash flow dips in the final two years as the grade is lower.
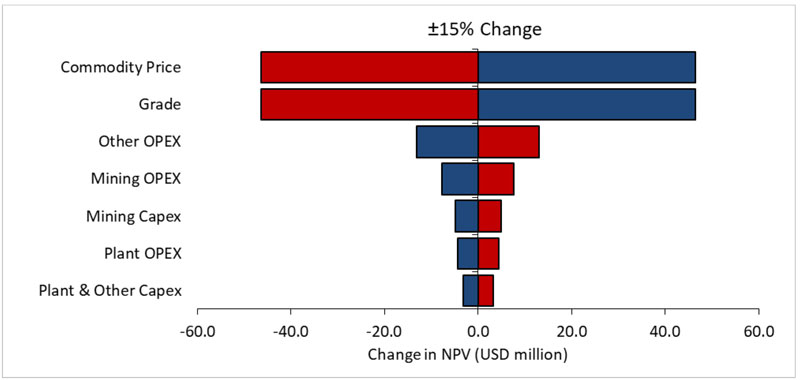
For the DCF, the gold price and grade have the most significant impact on the sensitivity of the Mine followed by the central services and mine operating costs. The Mine is least sensitive to capital and plant operating costs.
The value derived for the income approach only reflects the diluted Indicated and Measured Resources in the LoM plan, for conversion to Mineral Reserves. The Mineral Reserve is economically viable with a best estimated NPV of USD71 million (USD45 million attributable to Caledonia) at a real discount rate of 14.1%. No IRR could be calculated as Blanket is already in operation and no initial investment is required. The following table shows a summary of the economic analysis.
Caledonia Mining Corporation Plc S-K 1300 Technical Report Summary on the Blanket Gold Mine, Zimbabwe |
Blanket Mine Economic Analysis Summary – Real Terms
Real Discount Rate | Unit | Blanket Mine | Caledonia Attributable |
NPV @ 0% | USDm | 98 | 63 |
NPV @ 2.5% | USDm | 92 | 59 |
NPV @ 5% | USDm | 87 | 55 |
NPV @ 7.5% | USDm | 82 | 52 |
NPV @ 10% | USDm | 77 | 49 |
NPV @ 12.5% | USDm | 73 | 47 |
NPV @ 14.1% | USDm | 71 | 45 |
NPV @ 15% | USDm | 69 | 44 |
IRR | % | N/A | N/A |
All-in Cost Margin | % | 23% | 23% |
Break-even Gold Price (AIC) | USD/oz. | 1,257 | 1,257 |
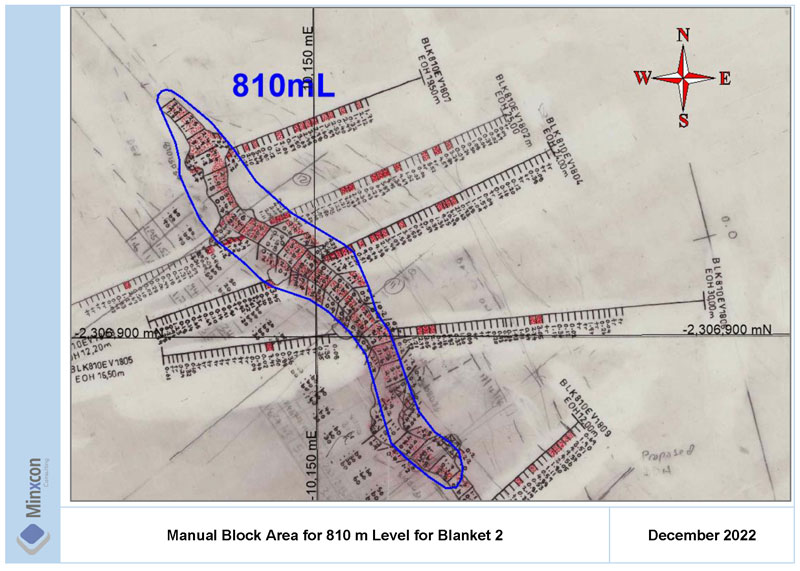
Over the past few years Blanket Mine have been in the process of upgrading their Mineral Resource estimation system from historical manual block listing methodology to digital estimation processes. The majority of the historical sampling database has been captured and can be used for more sophisticated estimation methodologies in the 3D environment. In addition to this, the historical mining voids and development have been captured and can be utilised for the Mineral Resource depletions and mine planning for Mineral Reserve purposes. All previous manual estimates have been replaced by 3D digital block model estimates in 2022.
The 3D digital environment allows for the scrutiny and review of the geological data in a holistic fashion that was previously not possible. By doing so, geological trends and patterns can be identified for the development of geological concepts that can be utilised in the exploration targeting and the planning of drilling programmes.
This change in Mineral Resource estimation and management systems has resulted in some fluctuations in the Mineral Resource in the short term but these should stabilise and has resulted in an increase in the Blanket Mine Mineral Resources due to improved geological understanding, geological modelling, estimation processes, and management and planning systems.
The life of mine plan is logical and the planned production rates are achievable. The mining strategy is focused on a thrust in development to open up ground for planned mining areas below 750 m Level in line with the planned production targets. Blanket mine plans to produce 80 koz (recovered) of gold per annum.
Existing and planned infrastructure at the Blanket Mine and Central Main Shaft extension projects are sufficient to sustain the current production profile and the planned increased production.
The process plant has been operating at a consistent recovery of 93.8%, and this can be expected to continue as long as the ore mineralogy does not change. The average processing rate for the past 12 months was 62.7 ktpm, and there are indications that higher processing rates can be achieved with operational improvements, as demonstrated in December 2022 where 79.8 kt was milled.
The Blanket Mine plan including only the diluted Indicated and Measured Resources in the LoM plan, for conversion to Mineral Reserves is financially feasible. The updated Mineral Reserve can therefore be declared. The DCF value of USD71 million for the Blanket Mine (USD45 million attributable to Caledonia) was calculated at a real discount rate of 14.1%. No IRR could be calculated since the mine is in operation and no initial investment is required.
A new TSF is planned to allow for deposition towards the end of 2023 with Phase 1a costing USD12.74 million.
Caledonia Mining Corporation Plc S-K 1300 Technical Report Summary on the Blanket Gold Mine, Zimbabwe |
Blanket Mine financials are most sensitive to commodity prices, and grade. The Mine financials are least sensitive to capital expenditure and plant operating costs.
The all-in sustaining costs for the Blanket Mine amount to USD110/milled t, which equates to USD1,183/oz. The all-in costs for the Blanket Mine was calculated as USD117/milled t, which equates to USD1,257/oz. The Mine therefore has a break-even gold price of USD1,257/oz including capital with an all-in cost margin of 23%, which is comparable to similar mines.
It is recommended that Blanket Mine continue with enhancements to the Mineral Resource estimation process in order to investigate potential increases in the Mineral Resources in areas above current infrastructure and enhance the planning down-dip. These digital modelling systems should be incorporated into the monthly planning system to ensure the Mineral Resource remains active and updated.
The QAQC data shows an improvement in the QAQC processes for the sampling database but still requires additional focus on immediate remedial action if required, especially for the down dip exploration drilling as this can impact the Mineral Resources significantly and thus requires the highest integrity.
It is recommended that additional drilling be conducted to determine the upside potential of Inferred Mineral Resources and Exploration Targets. A geotechnical study should be conducted to determine the geotechnical parameters for pillar extraction.
The TSF design study was completed in October 2022 and phase 1A of the TSF must be completed in 2023 to allow deposition to start.
Caledonia Mining Corporation Plc S-K 1300 Technical Report Summary on the Blanket Gold Mine, Zimbabwe |
| Item 2 (a) | – Issuer Receiving the Report; Authors |
Minxcon (Pty) Ltd (“Minxcon”) was commissioned by Caledonia Mining Corporation Plc (“Caledonia�� or “the Company”) to compile Technical Report Summary (“TRS”) on behalf of Blanket Mine (1983) (Pvt) Ltd (“Blanket Mine Company”), on the Blanket Gold Mine ( “Blanket” or the “Mine”), situated in the Gwanda area, Zimbabwe.
The authors of this TRS are Uwe Engelmann and Daniel van Heerden, each of which is a Qualified Person (“QP”). Mr. Engelmann was responsible for Sections 1-11 and jointly for 20-25 of this TRS, while Mr. van Heerden was responsible for Sections 12-19 and jointly for 20-25 of this TRS.
| Item 2 (b) | – Terms of Reference and Purpose of the Report |
Minxcon was commissioned to prepare the TRS on the Mine in accordance with the United States Securities and Exchange Commission Part 229 Standard Instructions for Filing Forms Regulation S-K subpart 1300 (“S-K 1300”). This TRS follows the guidelines as prescribed by S-K 1300, and only such terms as defined in §229.1300-1305 have been utilised. The TRS is structured in accordance with the format prescribed in §229.601(b)(96).
Blanket is an operating underground mine with ore processed at an on-site plant. The purpose of this TRS is to present the Mineral Resources and Mineral Reserves of the Mine as at the Company financial year end 31 December 2022. The Mineral Resources and Mineral Reserves are stated at the effective date of 31 December 2022.
The basis for the Mineral Reserves stated in this TRS is a life of mine plan, which constitutes a study with detail and accuracy levels better than the requirements for a pre-feasibility study. The QP has reviewed the life of mine plan and is satisfied that it has demonstrated that, at the time of reporting, the extraction of the Mineral Reserve is economically viable under reasonable investment and market assumptions. The life of mine plan is technically achievable and is the basis of determining the Mineral Reserve.
This TRS updates the previously filed TRS titled S-K 1300 Technical Report Summary on the Blanket Gold Mine, Zimbabwe and dated 31 December 2021, prepared for and filed by Caledonia, in terms of S-K 1300.
All monetary figures in this TRS are expressed in United States Dollars (“USD”).
| Item 2 (c) | – Sources of Information and Data Contained in the Report |
The following sources of information, all from Caledonia, were used to compile this TRS:-
| | ● | Legal aspects and tenure: Mr Curtis van Heerden and Mr Patrick Hill; |
| | ● | The life of mine (“LoM”) plan and supporting information that forms the basis of the revised plan: Mr Dana Roets, Ms Janet Hobkirk and Mr Caxton Mangezi; |
| | ● | Metallurgical information: Mr Gibson Kadzikano; |
| | ● | Engineering information: Mr Deon Niemand and Mr Martiens van Staaden, Mr Nico Spies and Mr Moses Matimba; and |
| | ● | Financial information: Mr Chester Goodburn and Mr Duncan Mpofu. |
Additional information was sourced from those references listed in Item 24 and is duly referenced in the text where appropriate.
Caledonia Mining Corporation Plc S-K 1300 Technical Report Summary on the Blanket Gold Mine, Zimbabwe |
| Item 2 (d) | – Qualified Persons’ Personal Inspection of the Property |
The Qualified Person (“QP”, as such term is defined S-K 1300) for this TRS are Mr U. Engelmann and Mr D. van Heerden.
Mr Engelmann has visited the operation on several occasions with the most recent being 2 to 3 November 2021 to review the progress in the upgrading of the Mineral Resource systems on the operation which included a visit to the on-site laboratory. In addition to Mr Engelmann’s visit, Mr Keith Osburn, previous Senior Resource Geologist at Minxcon, also visited the Geology Department at the Blanket operation from 9 to 11 March 2020 to review the geological modelling, estimation process (digital and manual), QAQC as well as inspecting some of the exploration core. The mine laboratory was also inspected during the site visit.
Mr van Heerden most recently visited the Mine property on 24 August 2022 during which the above-ground infrastructure, underground mine and treatment plant were investigated.
ITEM 3 | – PROPERTY DESCRIPTION AND LOCATION |
| Item 3 (a) | – Area of the Property |
The Blanket Mine is an operating underground gold mine situated on the Gwanda Greenstone Belt (“GGB”) targeting shear zone hosted gold mineralisation. The Mine complex comprises a cluster of mines extending from Lima in the north, through Eroica, Sheet, AR Main, AR South, the currently defunct Feudal, Blanket Section (Blanket 1 to Blanket 6) and Jethro over a total strike length of some 3 km. Gold has been commercially mined at the Project Area from several closely spaced orebodies defining a mineralised trend via several shafts since the early 1900s. The Mine covers the operating claims of Jethro, Blanket, Feudal, Harvard, Mbudzane Rock, Oqueil, Sabiwa, Sheet, Eroica and Lima, largely encompassed in a 2,120 ha Mining Lease. Ore is processed at an on-site plant.
| Item 3 (b) | – Location of the Property |
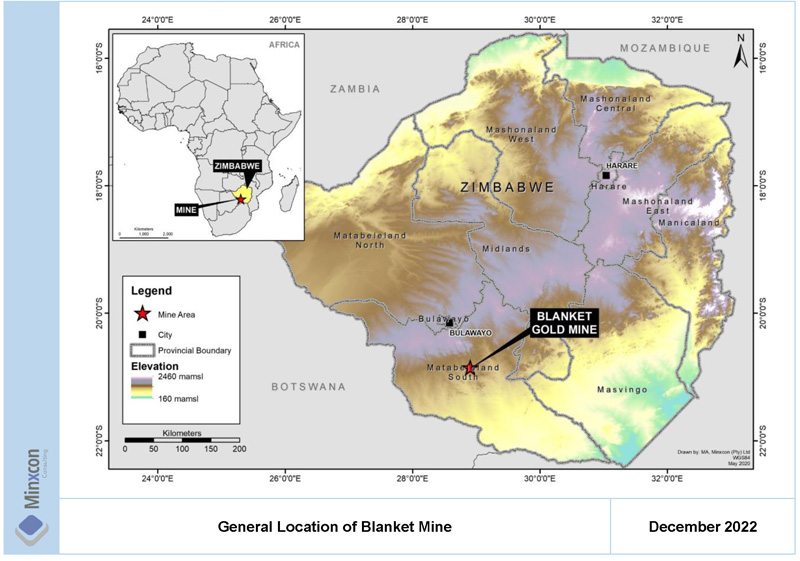
As illustrated in Figure 1, the Mine is located in the southwest of Zimbabwe, approximately 15 km northwest of Gwanda, the provincial capital of Matabeleland South. Gwanda is located 150 km southeast of Bulawayo, 196 km northwest of the Beitbridge Border post with South Africa, and 560 km from Harare, Zimbabwe's capital city. The Mine is centred on the coordinates (WGS84 system) 20°52' S, 28°54' E.
Caledonia Mining Corporation Plc S-K 1300 Technical Report Summary on the Blanket Gold Mine, Zimbabwe |
Figure 1: General Location of Blanket Mine
| Item 3 (c) | – Mineral Deposit Tenure |
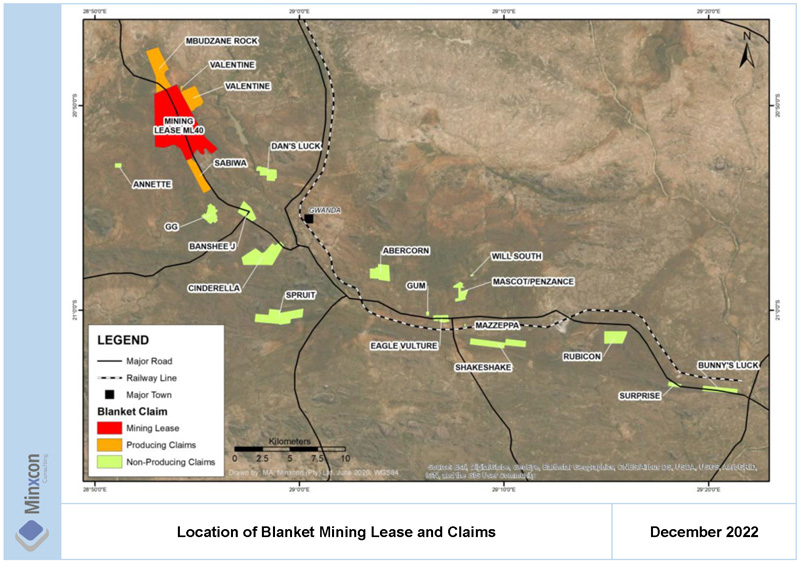
The Blanket Mine's interests in Zimbabwe include a Mining Lease, operating claims (i.e., on-mine), non-operating claims and a portfolio of brownfields exploration projects (satellite projects), as illustrated in Figure 2 as blocks of claims.
The Blanket Mine operates under a mining lease with registered number 40 (“ML40”) which was issued under the Mines and Minerals Act (Chapter 21:05) of 1961 (“MMA”) as detailed in Table 1. The mine’s claims under the lease cover an area of 2,120 ha, and include Lima, Sheet, Oqueil, Feudal, Sabiwa, Jethro, Harvard, and Blanket claims. The ML40, in which boundaries all current mining activities occur, is issued to Blanket Mine Company.
Table 1: Mining Lease Details
Mining Lease | Holder | Mining District | Area | Principal | Other | Date of | Validity Period |
| Number | | | ha | Mineral | Minerals | Issue | |
ML40 | Blanket Mine (1983) (Pvt) Ltd | Matabeleland South | 2,120.00 | Gold | Silver, Copper, Arsenic | 25 May 2022 | 1 year, renewable. Current tenure period expires on 24 May 2023 |
Blanket Mine also has several registered claims, not incorporated under the lease. The 59 claims contiguous to the mining lease comprise a total area of approximately 994 ha. Blanket Mine provided a separate list of non-operating claims located away from ML40 and the adjoining claims described above, that form a portion of their Gwanda portfolio. These non-producing claims (satellite projects) consist of 217 blocks of registered base metal (Ni, Cu and As) and precious metal claims covering a total area of 2,672 ha.
Caledonia Mining Corporation Plc S-K 1300 Technical Report Summary on the Blanket Gold Mine, Zimbabwe |
Figure 2: Location of Blanket Mining Lease and Claims
A summary of the Blanket mineral titles is provided in Table 2 and corresponds to the Figure 2.
Table 2: Blanket Mineral Title Areas and Status
Claim Block | Status | | Claim Block | Status |
ML40 | Operating | | Gum | Non-operating |
Valentine | Operating | | Banshee J | Non-operating |
Sabiwa | Operating | | Mazeppa | Non-operating |
Mbudzane Rock | Operating | | Will South | Non-operating |
GG | Non-operating (was under development for gold mining, currently on hold) | | Spruit | Non-operating |
Mascot | Non-operating (was under development for gold mining, currently on hold) | | Shakeshake | Non-operating |
Penzance | Non-operating | | Rubicon | Non-operating |
Annette | Non-operating | | Surprise | Non-operating |
Cinderella | Non-operating | | Bunny’s Luck | Non-operating |
Dan’s Luck | Non-operating | | Abercorn | Non-operating |
Eagle Vulture | Non-operating | | | |
A number of claims are subject to active tribute agreements between the Mine and local small scale miners as part of the Company’s Corporate Social Responsibility. This is further discussed in Item 17 (d).
Annual payments (non-material) are due to government authorities for each of the claims and lease areas in order to continue the validity of the licences.
Caledonia Mining Corporation Plc S-K 1300 Technical Report Summary on the Blanket Gold Mine, Zimbabwe |
In accordance with paragraph 178(2)(a)(b)(c) of the MMA, the owners of the claims of this project possess the following respective surface rights:-
| | ● | use of any surface within the boundaries for all necessary mining purposes; |
| | ● | the right to use, free of charge, soil, waste rock or indigenous grass situated within the claims boundaries for all necessary mining purposes; |
| | ● | the right to sell or dispose of recovered waste rock. |
The QPs believe that this clause provides sufficient rights to use the surfaces of the claim blocks that have been consolidated into the ML40. The MMA Amendment Bill makes instruction for landowner compensation in case of land loss due to mining activities in the form of land reallocation or outright purchase. Blanket Mine activities have not triggered this compensation and are not foreseen to do so.
Blanket Mine (1983) (Pvt) Ltd is held 64% by Caledonia Holdings Zimbabwe (Pvt) Ltd, which is a wholly owned subsidiary of Greenstone Management Services Holdings Limited (“GMS”), which in turn is wholly owned by Caledonia. Blanket Mine Company is incorporated in Zimbabwe and is the owner and operator of the Blanket Mine. 16% Share in Blanket Mine Company is held by the National Indigenisation and Economic Empowerment Fund, 10% by Gwanda Community Share Ownership Trust, and 10% by an Employee Trust for the benefit of the present and future employees of Blanket Mine.
Pursuant to an arrangement agreed in February 2020, the Gwanda Community Share Ownership Trust receives 20% of its dividends declared by Blanket and the remaining 80% is set off against the advance dividends. Previously, all dividends were applied against the advanced dividends.
| Item 3 (d) | – Royalties and Payments |
Mining royalties are charged in terms of the Mines and Minerals Act (Chapter 21:05). The royalties are collectable from all the minerals or mineral-bearing products obtained from any mining location and disposed of by a miner or on his behalf. The royalties are chargeable whether the disposal is made within or outside Zimbabwe.
In terms of Zimbabwean tax laws, where gold produced exceeds 0.5 kg a 5% royalty is applicable. For small scale miners the rate is 1% up to 0.5 kg gold produced and 2% for higher amounts. With the gold price exceeding USD1,200/oz, the applicable royalty rate will be 5% of the gross revenue from gold mining.
Blanket Mine does not have any net smelter royalties applicable to its current operations.
A number of claims were held under option agreements between Blanket Mine Company and the claim holders. Blanket Mine Company has exercised all its options and purchased the claims under conditions outlined in the option agreements. Each of these has a net smelter royalty (“NSR”) associated with it. The remainder of claims are 100% held by Blanket Mine Company. A summary of the ownership of each claims area is provided in Table 3.
Caledonia Mining Corporation Plc S-K 1300 Technical Report Summary on the Blanket Gold Mine, Zimbabwe |
Table 3: Blanket Mineral Title Areas and Ownership
Claim Block | Ownership | Royalty Condition |
ML40 | Blanket Mine (1983) (Pvt) Ltd | |
Valentine | Blanket Mine (1983) (Pvt) Ltd – Option exercised | 3.0% NSR |
Sabiwa | Blanket Mine (1983) (Pvt) Ltd | |
Mbudzane Rock | Blanket Mine (1983) (Pvt) Ltd | |
GG | Blanket Mine (1983) (Pvt) Ltd – Option exercised | 2.5% NSR |
Mascot | Blanket Mine (1983) (Pvt) Ltd – Option exercised | 2.5% NSR |
Penzance | Blanket Mine (1983) (Pvt) Ltd – Option exercised | 2.5% NSR |
Annette | Blanket Mine (1983) (Pvt) Ltd – Option exercised | 3.0% NSR |
Cinderella | Blanket Mine (1983) (Pvt) Ltd – Option exercised | 3.0% NSR |
Dan’s Luck | Blanket Mine (1983) (Pvt) Ltd – Option exercised | 2.5% NSR |
Eagle Vulture | Blanket Mine (1983) (Pvt) Ltd – Option exercised | 3.0% NSR |
Gum | Blanket Mine (1983) (Pvt) Ltd – Option exercised | 3.0% NSR |
Banshee J | Blanket Mine (1983) (Pvt) Ltd – Option exercised | 3.0% NSR |
Mazeppa | Blanket Mine (1983) (Pvt) Ltd – Option exercised | 2.5% NSR |
Will South | Blanket Mine (1983) (Pvt) Ltd – Option exercised | 2.5% NSR |
Spruit | Blanket Mine (1983) (Pvt) Ltd | |
Shakeshake | Blanket Mine (1983) (Pvt) Ltd | |
Rubicon | Blanket Mine (1983) (Pvt) Ltd | |
Surprise | Blanket Mine (1983) (Pvt) Ltd | |
Bunny’s Luck | Blanket Mine (1983) (Pvt) Ltd | |
Abercorn | Blanket Mine (1983) (Pvt) Ltd | |
| Item 3 (e) | – Environmental Liabilities |
Operating mines in Zimbabwe are required to set aside money as part of the closure plan and fulfilment of the provisions of the MMA and Environmental Management Act (Chapter 20:27) No. 13/2002 (“EM Act”). The Ministry of Mines is working on amendments to the MMA in which there will be conditions for protection of the environment through the Safety, Health and Rehabilitation Fund.
As far as the QPs are aware, no statutory instrument has been gazetted implementing an environmental fund as yet, thus so no fees are currently due. In addition, The QPs are not aware of any requests being made to Blanket Mine Company by the Minister to implement an environmental fund. As such, no environmental rehabilitation trusts and guarantees have been established for Blanket. In addition, the author is not aware that the liabilities have been calculated or budgeted for. However, a closure liability has been calculated (although not currently provided for) and is presented in Item 17 (e).
| Item 3 (f) | – Permits to Conduct Work |
The permits relating to the mining operations at Blanket are described in the sections to follow. Apart from administrative delays relating to COVID-19, the Mine is compliant in terms of authorisations and adheres to all government protocols and regulations as required.
Water for the operations is sourced from the Blanket Dam that is situated on the Mtshabezi River and owned by the Zimbabwe National Water Authority (“ZINWA”). The use of this water is authorised through a contract agreement between Blanket Mine Company and ZINWA in terms of the Zimbabwe National Water Authority Act (Chapter 20:251). In terms of this agreement, Blanket Mine Company is allowed to extract 1,200,000 m3 of water for the period 1 April 2020 to 31 March 2021. The agreement is valid for one-year periods and is renewed annually. ZINWA annually send to Blanket the renewable agreement for signing. Blanket continues to extract water in the interim at a rate of ZWL18.00/m3.
Caledonia Mining Corporation Plc S-K 1300 Technical Report Summary on the Blanket Gold Mine, Zimbabwe |
II. | Environmental Impact Assessment Certificates |
In Zimbabwean mining legislation, an Environmental Impact Assessment (“EIA”) is not required in order to issue a mining licence, and in terms of the EM Act and its First Schedule is only required prior to commencement of mining and forms part of the planning process. Blanket Mine was established in the early 1900s, long prior to the implementation of governing mining and environmental laws. As such, it appears that an EIA is not required for the Blanket Mine. However, the Company is in constant communication with the Environmental Management Agency (“EMA”) regarding environmental permitting requirements and an EIA was completed for the Mine in 1995. Should the EMA communicate that an EIA certificate for the Mine be obtained, the Company will submit all relevant and associated applications to obtain such and remain fully compliant.
III. | Additional Environmental Permits |
In order for operations to continue, the EMA has issued a number of additional environmental licences to Blanket Mining Company as listed in Table 4 – dates and licence numbers have been supplied by the Client. The certificates are valid for 1 year and renewed annually. New environmental disturbances will require additional permits further to those listed in Table 4, and currently no further disturbances have been identified.
Table 4: Environmental Permits
Licence Type | Licence Number | Activity | Validity |
Air Emissions* | 8000103302 | Diesel generator | 22 April 2022 – 31 Dec 2022 |
Air Emissions* | 8000101303 | Clinic incinerator | 22 April 2022 – 31 Dec 2022 |
Air Emissions* | 8000102171 | Blacksmith licence | 29 March 2022 – 31 Dec 2022 |
Air Emissions* | 8000101170 | Assay laboratory | 29 March 2022 – 31 Dec 2022 |
Air Emissions* | 8000102172 | Smelter licence | 29 March 2022 – 31 Dec 2022 |
Effluent Disposal* | 8000102176 | Car wash | 29 March 2022 – 31 Dec 2022 |
Effluent Disposal* | 8000102175 | Ablution facilities | 29 March 2022 – 31 Dec 2022 |
Energy-Solar | 8000112453 | Blanket Mine Solar PV Plant | 22 Sep 2022 – 21 Sep 2023 |
Hazardous Substance Importation | 8000103543 | Sodium cyanide, sodium hydroxide, acids | 18 May 2022 – 17 May 2023 |
Hazardous Substance Storage and Use | 8000102234 | Sodium cyanide, diesel, acids, caustic soda | 29 March 2022 – 28 March 2023 |
Hazardous Substance Transportation | 8000103299 | Sodium cyanide, caustic soda, acids, diesel | 18 May 2022 – 17 May 2023 |
Hazardous Waste Generation | 8000102243 | Used oils, clinical waste (0.5 t, salvage yard) | 29 March 2022 – 28 March 2023 |
Solid Waste Disposal | 8000112453 | Domestic waste (land filling, 1,500 t) | 29 March 2022 – 31 Dec 2022 |
Solid Waste Disposal | 8000102173 | Tailings storage facility (24,453 kL) | 29 March 2022 – 31 Dec 2022 |
Solid Waste Disposal | 8000102241 | Domestic waste (land filling, 1,500 t) | 29 March 2022 – 31 Dec 2022 |
Waste Management- Sanitary Landfill | 80000924448 | Blanket Mine Sanitary Landfill | 07 Aug – 06 Aug -2022 Projected completed now licenced under Solid Waste Disposal 8000102173 |
Note: Asterix indicates permits that are renewed annually
The QPs are not aware of any past material violations or fines.
| Item 3 (g) | – Other Significant Factors and Risks |
The QPs are not aware of any factors or risks that may affect access, title or right or the ability to perform work on the property.
Caledonia Mining Corporation Plc S-K 1300 Technical Report Summary on the Blanket Gold Mine, Zimbabwe |
ITEM 4 | – ACCESSIBILITY, CLIMATE, LOCAL RESOURCES, INFRASTRUCTURE AND PHYSIOGRAPHY |
| Item 4 (a) | – Topography, Elevation and Vegetation |
The area around the Blanket Mine is hilly and lies at an altitude of about 1,000 m to 1,300 m above mean sea level (“amsl”). Drainage is to the northeast, into the Mtshabezi River on which the Sheet Dam and the Blanket Dam are located (some 5 km to the east of the Mine). The main natural water sources include the Tuli River, with its main tributaries (in the east bank running in a north-south direction) being the Mnyabetsi River in the Dibilashaba Communal Area, the Sengezane River in the Garanyemba Communal Area, and the Ntswangu and Pelele Rivers in the Gwanda Bolamba Communal Area.
The indigenous vegetation is dominated by savannah with Marula (Sclerocarya birrea), a variety of Combretum species, Terminalia sericea, Mopane groves and patches of grassland. Around the mine and local settlements, vegetation has been cut down and invaded by secondary thorny scrub dominated by Dichrostachys cinerea. Agriculture is limited to subsistence farming of maize and vegetables.
| Item 4 (b) | – Access to the Property |
Access to the Blanket Mine is by an all-weather single lane tarred road from Gwanda. Gwanda is linked by national highways to Bulawayo, Harare, and the Beitbridge Border post. Earlier, Zimbabwe had good road infrastructure. However, lack of investment over the past ten to fifteen years resulted in its deterioration; substantial investment is required country wide. The railway line connecting the Zimbabwean national network to South Africa passes through Gwanda. An airstrip for light aircraft is located 5 km to the northwest of the town.
Gwanda Town is the provincial capital of Matabeleland South Province and district capital of Gwanda District. The village of Vubachikwe lies immediately adjacent to the southeast of ML 40. Blanket Mine labourers and their families are accommodated in a mine village about 1 km from the Mine. Gwanda offers a number of lodges and alternative accommodation options. Gwanda offers limited hospitals and medical services, business and financial services, educational facilities, shops, recreational facilities, and amenities. Larger hospitals and establishments are offered in Bulawayo, in addition to more skilled service industries. Neighbouring towns and villages to the Mine provide skilled and unskilled labour.
Major economic activities in the district include gold mining, cement production, livestock production, game ranching and tourism. A number of dams and irrigation schemes are established. The population in the district is mostly rural, with the majority of employed people servicing the agriculture and related industries.
The district is serviced by telecommunication services, and Blanket Mine provides its own Wi-Fi and communication systems.
The A6 highway, forming part of the Trans-African Highway network, is orientated roughly northwest-southeast and links Bulawayo with the Beitbridge border post and Musina in South Africa. The highway runs through the town of Gwanda. A major sealed road, the Old Gwanda Road, branches off from the A6 in Gwanda and runs directly through the ML 40 to Bulawayo. The Blanket claims are all located along these major roads and are thus easily accessible. The roads are sealed and although potholing is frequent, the surfaces are navigable by all vehicles. The Beitbridge Bulawayo Railway runs roughly parallel to the A6 through Gwanda Town.
Caledonia Mining Corporation Plc S-K 1300 Technical Report Summary on the Blanket Gold Mine, Zimbabwe |
An airstrip and informal airport building are located in Gwanda along the A6. The Joshua Mqabuko Nkomo International Airport is located in Bulawayo. The Mine can be accessed either via the Beitbridge-Bulawayo Road, or by flying into Bulawayo and driving two hours via the Old Gwanda Road or the A6 to the site.
| Item 4 (c) | – Climate and Length of Operating Season |
The climate in Gwanda is hot and semi-arid, classified as BSh type (extremely hot summers and warm to cool winters, with minimal precipitation) by the Köppen climate classification system. Temperatures are as high as 40ºC during summer months of November to February and average 13ºC during winter (May to August). The climatic conditions make the area vulnerable to meteorological hazards such as droughts, floods, gusty winds, as well as lightening during the wet and hot season.
The region experiences short, variable rainfall seasons (averaging generally below 400 mm per year), and long, dry winter periods. Rainfall is usually associated with thunderstorms, producing rainfall of short duration and high intensity. The rainfall, in general, is less than half of the potential evaporation which has necessitated irrigation development and infield rainwater harvesting to improve crop production which complements animal husbandry as well as reclaims open access areas such as grazing lands. It also induces underground water recharge as part of improving the environment.
No appreciable mine production downtime is expected owing to unfavourable climatic or weather conditions. The mine is able to operate year-round.
| Item 4 (d) | – Infrastructure |
I. | Regional Infrastructure |
The Blanket mine area is supplied with power through the national grid operated by the Zimbabwe Electricity Transmission and Distribution Company. Power is supplied from the grid to the operations via two overhead powerlines (“OHLs”) energized at 11 kV and 33 kV respectively. The Zimbabwe Electricity Supply Authority (“ZESA”) currently allocates a capacity of 18 MVA to the operations.
Water supply to the Blanket Mine area is sourced from the Blanket Dam located 5 km east of the Mine, as well as groundwater. The Blanket Dam has a capacity of 15 Mm³ and all water rights are held by ZINWA. Water users including Blanket Mine purchase all service and domestic / potable water from ZINWA.
Logistics infrastructure in the Blanket Mine area consists mainly of the local road network, national rail network and an airstrip located northwest of the town of Gwanda. All of the above-mentioned infrastructure is easily accessible from Blanket Mine.
Mine infrastructure comprises of underground workings, various shaft with head gear and hoisting facilities, a process plant, workshops, and a tailings storage facility (“TSF”). Stores, workshops, and offices, as well as an assay laboratory, are located adjacent to the mine shafts. There is adequate surface area for any potential future expansion.
With regards to the accessibility to personnel, services and supporting industries refer to Item 4 (b).
Caledonia Mining Corporation Plc S-K 1300 Technical Report Summary on the Blanket Gold Mine, Zimbabwe |
| Item 5 (a) | – Prior Ownership and Ownership Changes |
The Blanket Mine is part of the Sabiwa group of mines within the GGB from which gold was first extracted in the 19th century. The Blanket Mine is a cluster of mines extending some 3 km from Jethro in the south through Blanket itself, Feudal, AR South, AR Main, Sheet, and Eroica, to Lima in the north. Blanket Mine has produced over a million ounces of gold during its lifetime.
Following sporadic artisanal working, the Blanket Mine was acquired in 1904 by the Matabele Reefs and Estate Company. Mining and metallurgical operations commenced in 1906 and between then and 1911, 128,000 t were mined. From 1912 to 1916 mining was conducted by the Forbes Rhodesia Syndicate who achieved 23,000 t. There are no reliable records of mining for the period between 1917 and 1941 and it is possible that operations were adversely affected by political instability during World Wars I and II. In 1941 F.D.A. Payne produced some 214,000 t before selling the property to Falconbridge in 1964 (Blanket Mine, 2009). Under Falconbridge, production increased to 45 kg per month and the property yielded some 4 Mt of ore up until September 1993. Kinross Gold Corporation (“Kinross”) then took over the property and constructed a larger Carbon-in-Leach (“CIL”) plant with a capacity of 3,800 tpd. This was designed to treat both run of mine (“RoM”) ore and an old TSF.
Caledonia completed purchase of the mine from Kinross on 1 April 2006. The Blanket Mine re-started production in April 2009 after a temporary shut-down due to the economic difficulties in Zimbabwe. In late 2010, Blanket Mine successfully completed an expansion project which increased production capacity from 24 koz of gold per annum to 40 koz of gold per annum.
| Item 5 (b) | – Historical Exploration and Development |
Exploration was conducted between 1997 and 2006 around the GG and Mascot areas with follow-up exploration drilling in 2013 around these same areas. Currently, there are exploration shafts at these two sites.
Production from Blanket Mine was first recorded in 1906. Over its life to December 2021, the Mine produced some 1.52 Moz gold from 12.68 Mt ore milled.
ITEM 6 | – GEOLOGICAL SETTING, MINERALISATION AND DEPOSIT |
| Item 6 (a) | - Regional Geology |
The majority of Zimbabwe’s known gold mineralisation occurs in host rocks of the Zimbabwe Craton, which is comprised of Archaean-aged basement lithologies. The Archaean basement consists of supracrustal greenstone belts surrounded by granitoid rocks of various ages. The greenstones consist dominantly of meta-basalts with smaller proportions of ultramafic and felsic extrusives and intrusives, and sedimentary rocks. Various combinations of these rock types often occur in association with adjacent granitoid or internal granitoid bodies (Kalbskopf and Nutt, 2003). The Craton is flanked along the northern, eastern, and southern sides by mobile belts of varying ages.
The Blanket Mine is situated on the north-western limb of the Archaean GGB in south-western Zimbabwe, along strike from several other gold deposits. The GGB is approximately 70 km in length (west to east) and 15 km wide (north to south). The belt is typical of greenstone belts of the Zimbabwe Craton consisting of mafic to felsic volcanics with intercalated sedimentary units.
Caledonia Mining Corporation Plc S-K 1300 Technical Report Summary on the Blanket Gold Mine, Zimbabwe |
Repeated strong deformation affected all lithologies. Structurally, the GGB is dominated by a major periclinal synform, plunging 60° NW in the western half of the belt. It is flanked on both sides by two major deformation zones, namely the Northwest Gwanda Deformation Zone (“NWGDZ”) on the north-western limb and the South Gwanda Deformation Zone (“SGDZ”) along the southern limb. The SDGZ forms part of a regional structure bounding the southern margin of the belt. In the convergence zone of the NWGDZ and the SGDZ, the Colleen Bawn Deformation Zone (“CBDZ”) splays off the SGDZ eastwards, following the north-eastern arm of the belt. The NWGDZ is approximately 2 km wide and 18 km long with a general northwest to north-northwest trend, from the town of Gwanda to the north-western extremity of the belt (Campbell and Pitfield, 1994).
Four phases of deformation have been defined by Fuchter (1990). Repetition of lithological units, particularly in the north-west, is interpreted as evidence of D1 thrusting. The D2 event produced wide zones of intense schistose deformation, considered to be associated with the gold mineralisation. The D1 thrust phase has a coincident trend and may be an early part of the D2 event (AGS, 2006).
The large fold structures of the D3 deformation event dominate the eastern and western ends of the GGB. Blanket Mine mineralisation the lies on the northern limb of the large western fold (the Northwest Mineralised Camp). The final D4 deformation event produced major lineaments which dominate the southern margin of the GGB (Fuchter, 1990). Owing to the close proximity of the GGB to the high-grade metamorphic Limpopo Mobile Belt, GGB metamorphism reaches upper greenschist to amphibolite facies and is higher than in the typical Zimbabwean greenstone belts.
| Item 6 (b) | - Local and Property Geology |
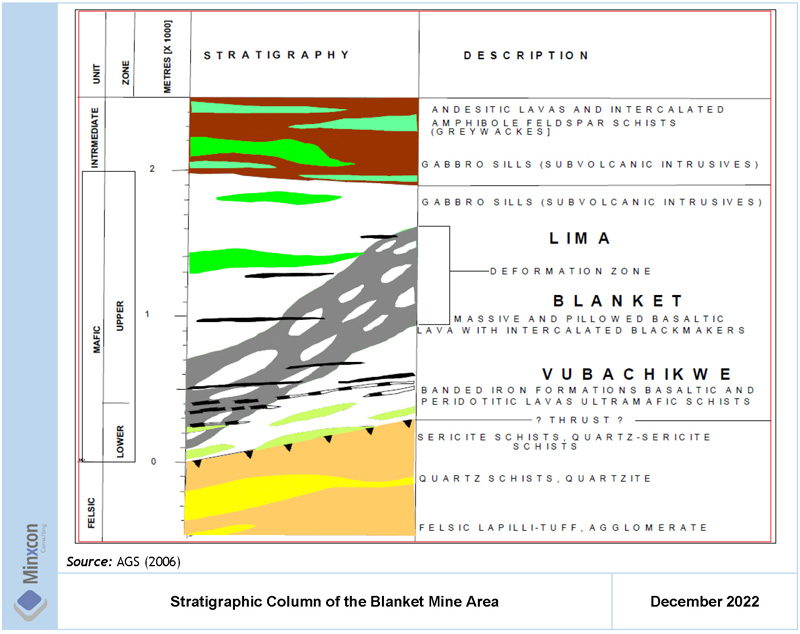
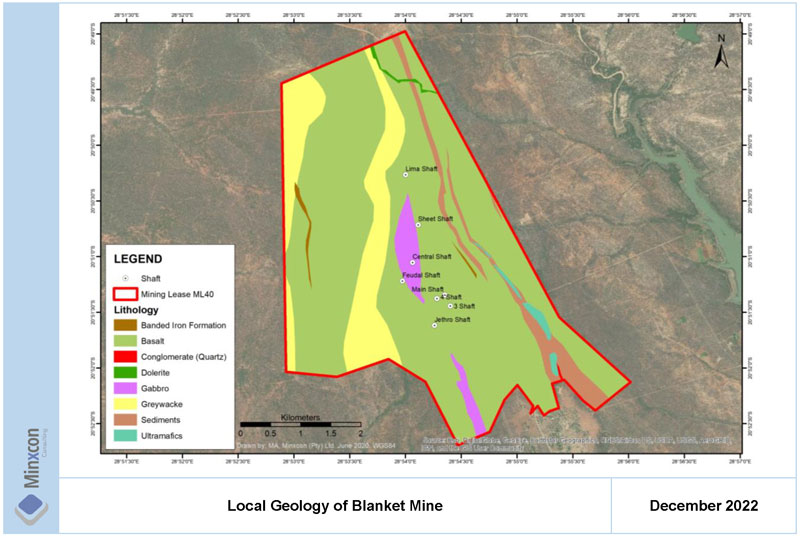
As described by AGS (2006), in the Blanket Mine area, lithologies comprise non-mineralised basal felsic schists of igneous or sedimentary origin in the east. Tailings facilities are generally sited on this Felsic Unit.
The felsics are overlain by a metabasaltic ultramafic to mafic unit with pillow basalts remnants. This Mafic Unit is subdivided into a lower zone and upper zone. Ultramafics and BIFs comprise the lower zone, while massive to pillowed lavas with intercalated interflow sediments (cherty argillites) comprise the upper zone (or Black Markers; MSA, 2011). Mineralisation at the adjacent Vubachikwe Mine is hosted in the BIF unit, while Blanket mineralisation occurs in the overlying mafics. Regionally, the rock is a fine-grained massive amphibolite with localised shear planes. A low angle transgressive shear zone characterised by biotite and a well-developed fabric, cuts through the mafic zone is the locus of the gold ore shoots. The shear zone may be up to 50 m wide (AGS, 2006).
Intruding this package is a younger, barren olivine-gabbro sheet. The entire sequence is capped by andesitic lavas with amphibolite feldspar schists of the Intermediate Unit (MSA, 2011).
The generalised stratigraphic column for the area is shown in Figure 3.
Caledonia Mining Corporation Plc S-K 1300 Technical Report Summary on the Blanket Gold Mine, Zimbabwe |
Figure 3: Stratigraphic Column of the Blanket Mine Area
The entire sequence is cut by a regional dolerite sill from the south at Vubachikwe, through the Blanket Mine, to the Smiler deposit which lies approximately 3 km north of the Blanket Mine. Although no significant displacement is caused by the sill, it truncates all the ore shoots, but below the sill continuity of mineralisation is observed (AGS, 2006).
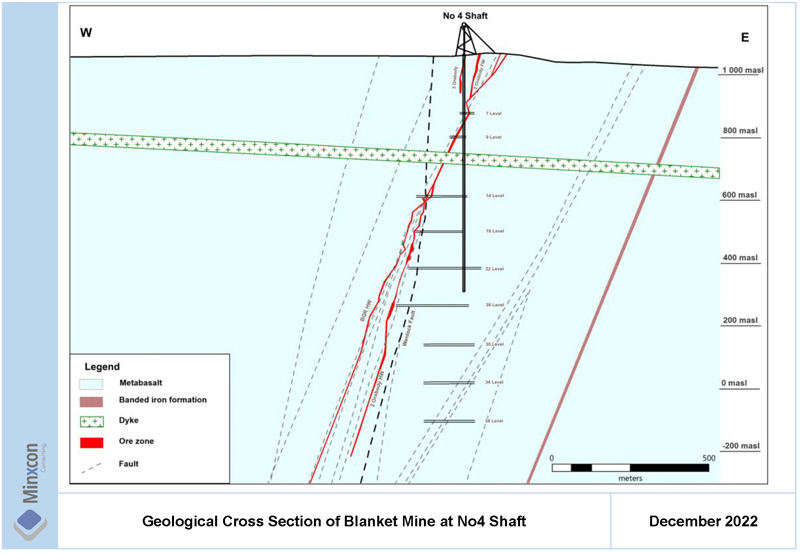
The geology at the Blanket Mine, including the shaft locations, is illustrated in Figure 4. A geological cross section at No 4 shaft is presented in Figure 5.
Caledonia Mining Corporation Plc S-K 1300 Technical Report Summary on the Blanket Gold Mine, Zimbabwe |
Figure 4: Local Geology of Blanket Mine
Figure 5: Geological Cross Section of Blanket Mine at No 4 Shaft
Caledonia Mining Corporation Plc S-K 1300 Technical Report Summary on the Blanket Gold Mine, Zimbabwe |
| Item 6 (c) | – Mineralisation and Deposit Type |
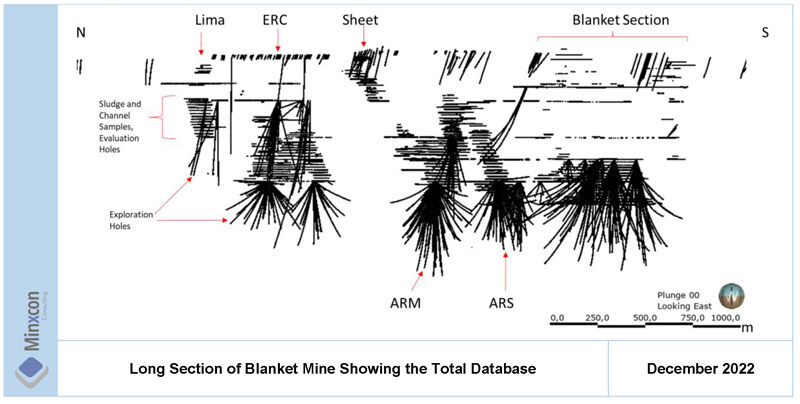
Mining at Blanket occurs over a 3 km strike that includes from north to south, the deposits of Lima, Eroica, Sheet, AR Main, AR South, Feudal, Blanket Section (Blanket 1 to Blanket 6) and Jethro. The main Blanket underground workings are connected to Lima by a 2 km long haulage which follows the strike of the main fabric.
Varying strikes are recorded for the deposits. As described by AGS (2006), mineralisation occurs in near vertical shoots aligned along an approximately N-S axis. The ore shoots vary in shape from the tabular-lensoidal quartz reefs to the massive to pipe-like disseminated sulphide reefs (“DSR”).
Wall rock alteration typically comprises silica−pyrite−muscovite within a broader carbonate alteration halo. Quartz-carbonate altered rock forms the most commonly recognised alteration assemblage. Gold is deposited at crustal levels within and near the brittle-ductile transition zone.
The deposits may have a vertical extent of up to 2 km, demonstrate extensive down-plunge continuity, and lack pronounced zoning. The ore mineralogy is dominated by gold, pyrite and arsenopyrite. Subordinate minerals such as galena, chalcopyrite, pyrrhotite, sphalerite, tellurides, scheelite, bismuth and stibnite also occur. Sulphide mineralogy commonly reflects the litho-geochemistry of the host rock with arsenopyrite being the most common sulphide mineral in metasedimentary host rocks and pyrite or pyrrhotite being more typical in metamorphosed igneous hosts. The gangue and alteration mineralogy are dominated by quartz and carbonate (ferroan dolomite, ankerite, siderite, calcite) with subordinate albite, fuchsite, sericite, muscovite, chlorite, and tourmaline.
Two quartz-filled shear zones are mined, namely the Blanket Quartz Reef (“BQR”) and the Eroica Reef, which have long strike lengths but are not uniformly mineralised although continuous pay shoots of over 100 m on strike are seen. Gold grade fluctuations are more extreme in the quartz reefs than in the DSR type reefs but on average these quartz shears have higher grades and are used as a sweetener of ore to the mill (MSA, 2011).
Table 5 provides a description of the mineralised sections at Blanket.
Table 5: Description of Deposits at Blanket Mine (after MSA, 2011)
Name | Description |
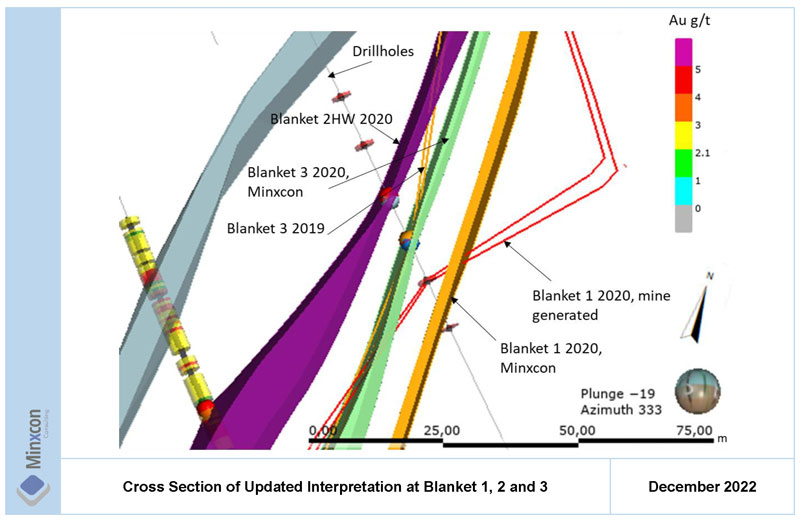
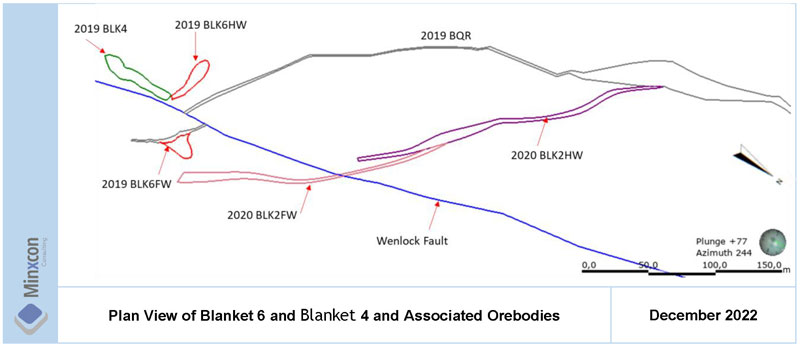
Blanket Quartz Reef | The BQR strikes some 500 m on surface and is up to 5 m wide, diminishing with depth, dipping 55°W. It displaces the DSR type orebodies with an apparent reverse movement of up to 250 m. The reef texture varies from typical quartz reef at depth through sheeted and boudinaged veinlets to ankeritic carbonate in schist and a sulphide replacement ore zone. This is interpreted as a transition from brittle ductile to a more ductile regime with depth. Towards the north of the reef outcrop, a Z-shaped inflection forms the thickest part of the reef, up to 5 m, compared to less than 1 m on the limbs. Similar inflections are found elsewhere in the Northwest Gwanda Shear Zone. Subsequent to mineralisation the reef was displaced by the north-striking vertical Wenlock Fault which has a dextral strike-slip component of about 60 m. Mineralisation in the BQR is not uniform and comprises native gold with galena. Arsenopyrite is more dominant down-dip. Economic mineralisation is restricted to three 90 m pay shoots. |
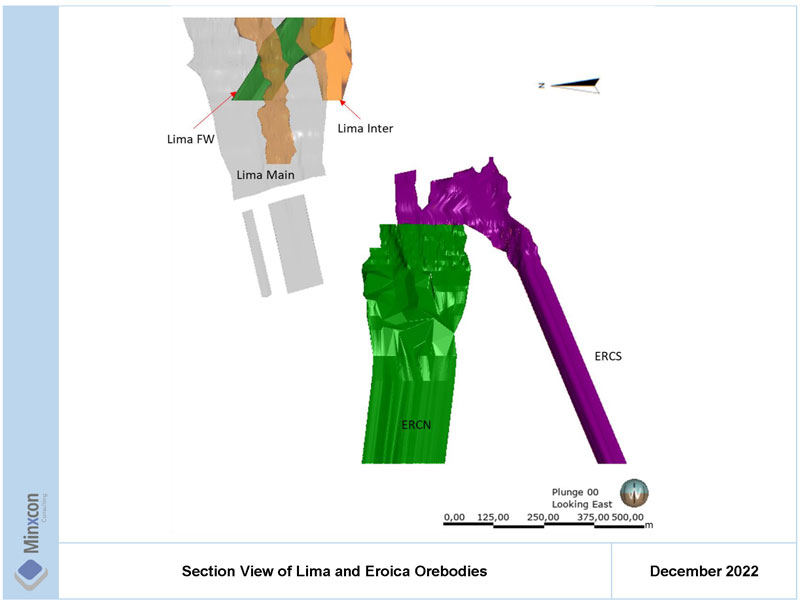
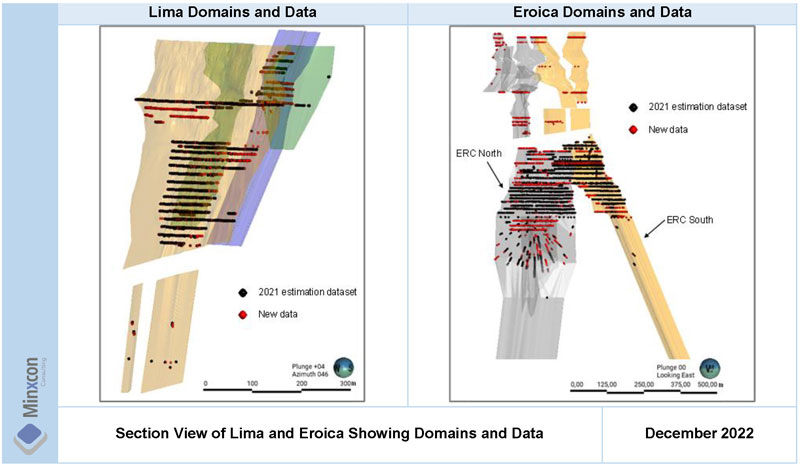
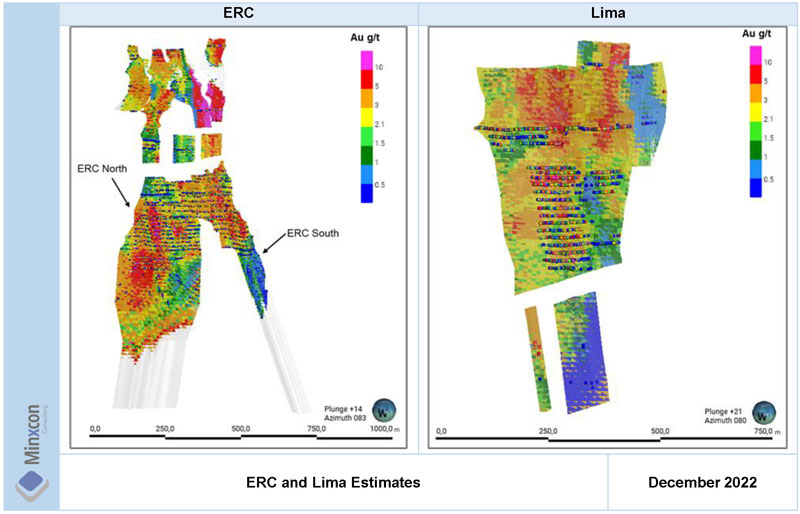
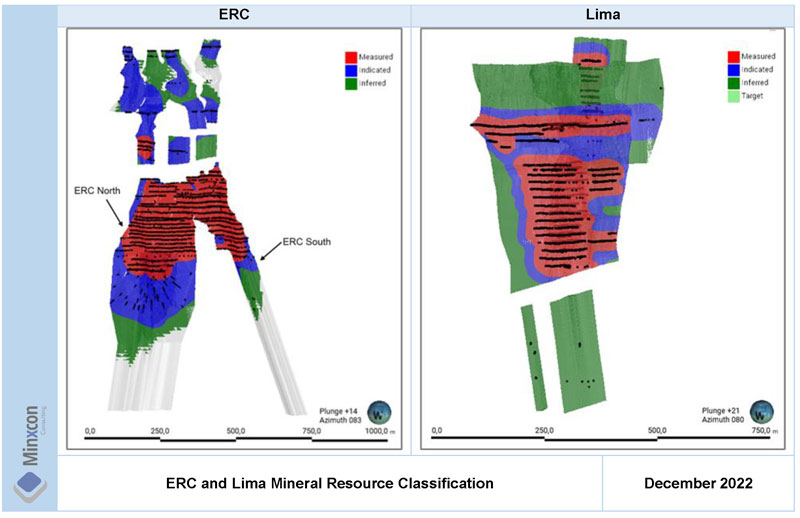
Lima | Lima is situated 2 km north of the Blanket Section and an underground haulage links the two mines. Like the Blanket Section orebodies, the Lima orebodies developed in very high-strain areas. The main shoots are the Hanging Wall and Interlimb. Mineralisation in the Hanging Wall limb comprises pyrite with subordinate arsenopyrite in cleavage planes within pervasive biotite/chlorite alteration. The Interlimb is characterised by a centrally silicified core with pyrite and arsenopyrite constituting the main sulphides. |
Eroica | The Eroica orebody lies approximately 1,300 m north of the Blanket Section orebodies and renowned for its high native gold content. It dips at 65°W and has a strike length of 300 m in a northerly direction. The Eroica orebody is hosted in a high-strain area where the shear is up to 15 m wide. Brown carbonate alteration characterises the shear in strong association with biotite development. The orebody is defined by thin silicified stringers that develop into swells of up to 5 m in width. The silicification shows pinch and swell both on strike and down-dip, resulting in a series of dismembered silicified pods developed within a particular shear. The biotite and carbonate alteration, together with the silicified stringers, form marker links between the dismembered pods. Finely disseminated arsenopyrite, pyrite and pyrrhotite are associated with the gold mineralisation. |
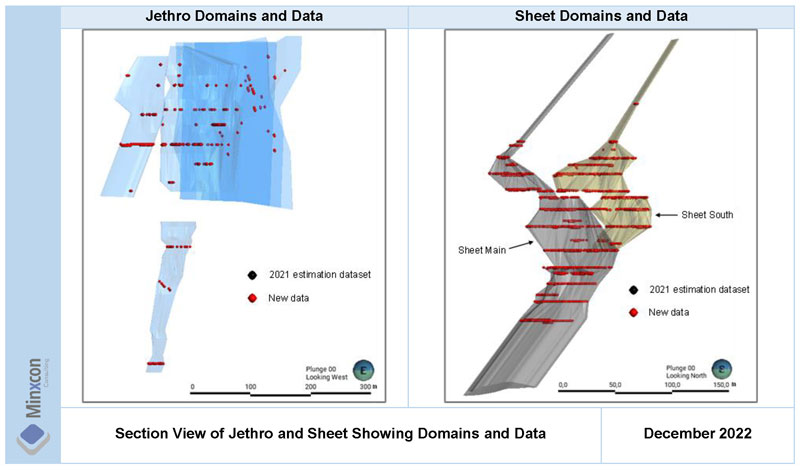
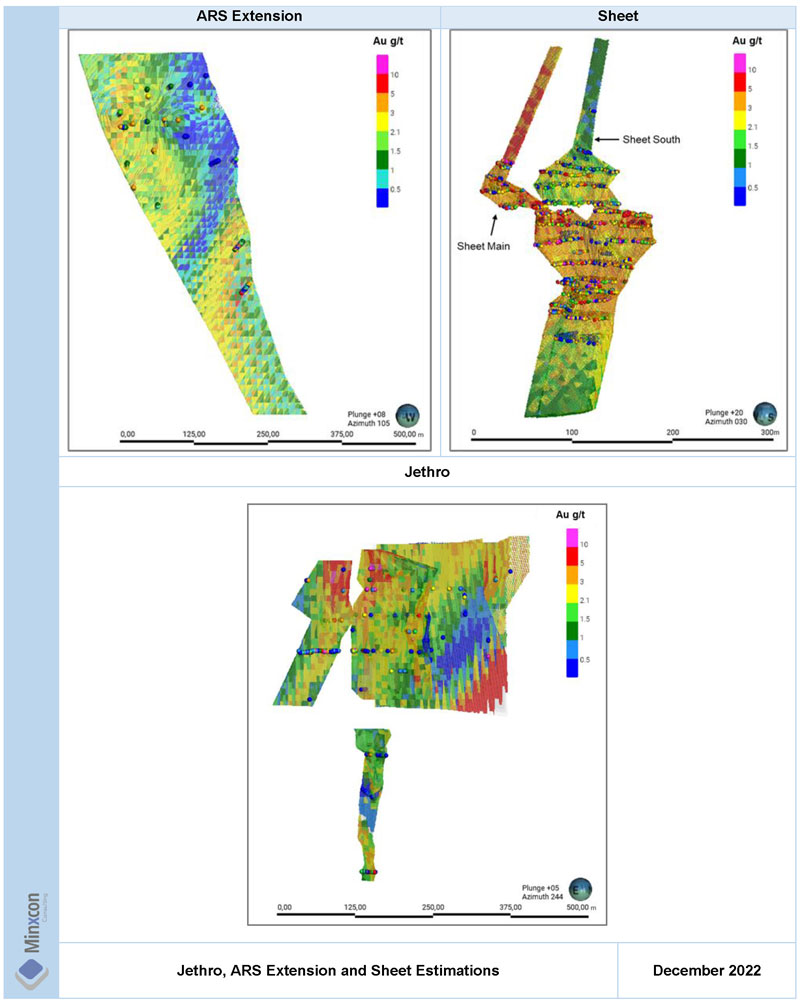
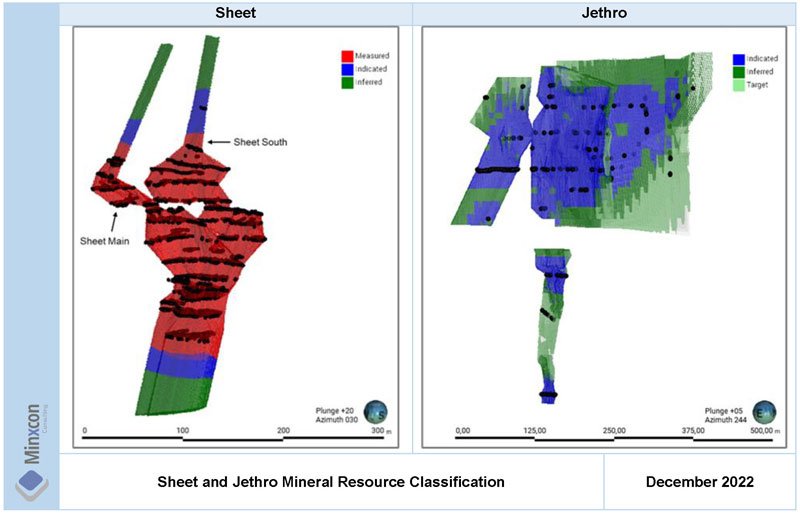
Sheet | The Sheet orebody lies about 500 m south of Eroica and is a typical example of a fault controlled mineralisation. It comprises of at least three stepped-out, sinistrally displaced and highly silicified hornblende-chlorite schist fault blocks. The orebody was subjected to both strike and “east-west” dip faulting, resulting in major bifurcation of the orebody up-dip into highly fractured North and South orebodies with variable dips. As with the other DSR orebodies at Blanket Mine, the less disturbed Sheet orebody down-dip extension has a 60-65°W dip and a fabric that is sympathetic to the north-northwest regional shear. The orebody can attain widths and strike lengths of up to 15 m and 60 m respectively. Mineralisation is associated with finely disseminated arsenopyrite. Pyrite and pyrrhotite occur as accessory minerals and are generally indicative of poor mineralisation. The orebody is encompassed within a ductile metabasalt country rock. The orebody was mined between 230 m Level and 870 m Level on separate dismembered shear zones. Further exploration is ongoing to assess the resource growth potential of the down-dip extension. |
Caledonia Mining Corporation Plc S-K 1300 Technical Report Summary on the Blanket Gold Mine, Zimbabwe |
| Name | Description |
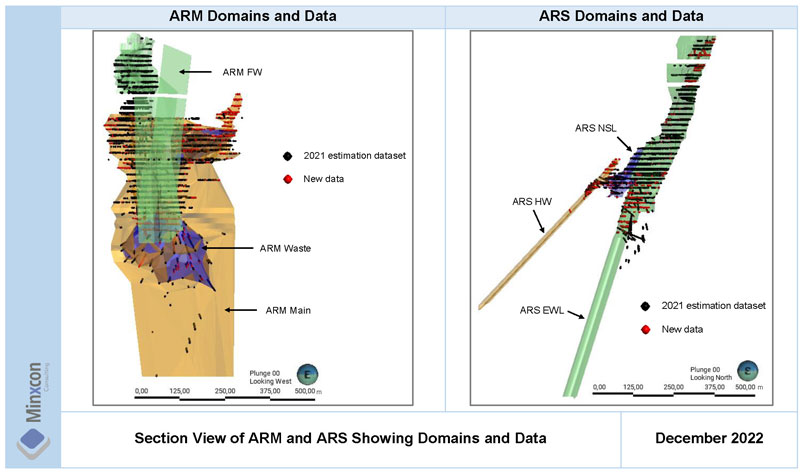
AR Orebodies | AR is a “Z”-shaped mineralised zone and consists of two separate orebodies (AR Main and AR South) with widths up to 30 m as a result of tectonic thickening from faulting and folding. The mineralised zone has no known surface expression and appears to form a ‘peak’ under the regional dolerite sill just above 9 Level some 500 m north of the Blanket Section orebodies. From this point the body splits into two the ore shoots of AR Main and AR South, which plunge 55°W and 58°SW respectively. AR Main AR Main is a DSR-type orebody and occurs within a broad shear envelope in pillowed metabasalts, which is generally irregular in plan and bounded by shears that assist in defining the limits of the mineralisation. At 750 m Level, a shear disrupts the bodies causing the plunge to flatten to the west. The orebody strikes between 40 m and 60 m with an average width of 30 m at the centre of the envelope. The ore is a silicified amphibolite predominantly comprised of quartz with minor carbonate and chlorite minerals. Gold mineralisation is associated with arsenopyrite and to a much lesser extent pyrrhotite and pyrite. Finely disseminated arsenopyrite occurs within the orebody which form the high grade areas. Sulphide minerals seldom amount to more than 5% of the rock by volume. The orebody is massive and is exploited using the long-hole open stoping method. AR South AR South plunges southwest, trending towards the Blanket 2 orebody at depth. AR South is also developed within a broad shear zone and is more pipe-like than AR Main. Its maximum thickness is approximately 50 m and high grade sections are defined by silicification and arsenopyrite. |
Feudal | Occurring in the hanging wall of the Blanket-Lima strike about 900 m northwest of Jethro is the almost mined out “outlier” Feudal orebody. The orebody is interpreted to be located at the focal point of two Blanket-Lima strike transgressing shears, namely the Blanket-Feudal and Jethro-Feudal shears. The rocks consist of intermediate to meta-basalt with hornblende chlorite schist hosting the mineralised quartz- sulphide (disseminated arsenopyrite and pyrrhotite) shear zones. The known orebody (surface outcrop to 7 Level for a 200 m lift) is now mined out. Geological models are being pursued to re-establish the reef down-dip. |
Blanket Section | The Blanket Section comprises six orebodies, namely Blanket 1 to Blanket 6, which occur some 500 m south of the AR orebodies. On average, the orebodies dip 80°SW. Blanket 1 and Blanket 4 are parallel and occur in north-south trending shear segments. Blanket 2 and Blanket 5, which are also parallel, strike northwest southeast. Blanket 3 is cylindrical and lies in a shear segment parallel to Blanket 2 and Blanket 5. On surface, the BQR lies in the footwall of the DSR type orebodies. The reef has a shallower dip than the DSR bodies but plunges in the same direction so that it progressively advances towards them with depth, displacing Blanket 2, 3, 1, 4. Blanket 2 reappears on the footwall of the BQR and is established on the 630 m Level through to the 870 m Level. |
Jethro | The Jethro orebody is located some 400 m south of the Blanket Section. The north-south striking Jethro orebody dips near vertical in a westerly direction and tends to roll over locally. |
In greenstone belts, gold mineralisation occurs mainly as vein type or shear zone hosted disseminations. Most of the larger deposits are found within the greenstone belts or their contacts with the granitoids. All mineralisation is hydrothermally emplaced and associated with the regionally developed D2 deformation characterised (at the Blanket Mine) by areas of high strain wrapping around relatively undeformed remnants of the original basaltic flows. It is within the more ductile tensional high strain areas that the wider of the orebodies are located.
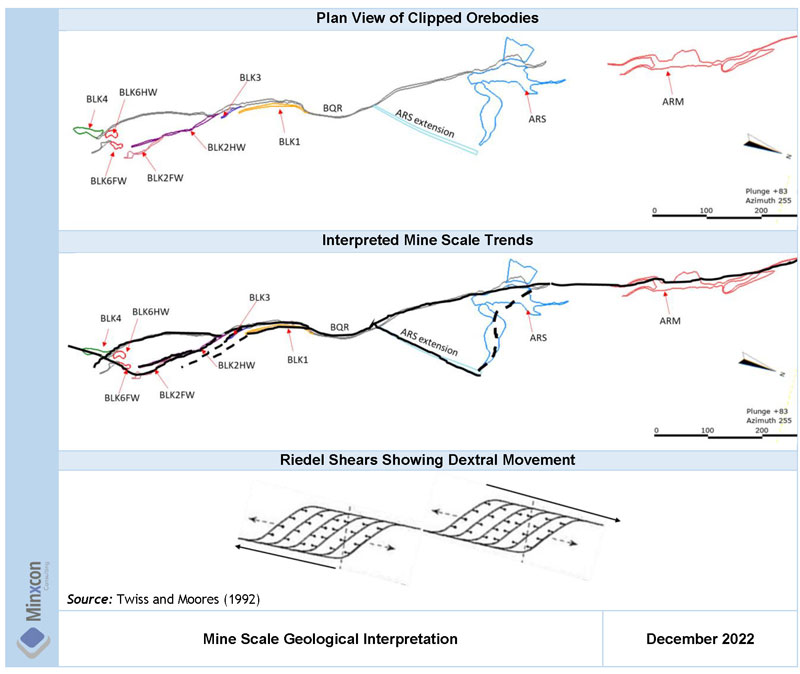
These orogenic gold deposits are commonly associated with late syntectonic intermediate to felsic magmatism. Vein systems occur as a system of echelon veins on all scales. The Blanket orebodies comprise up to 10% of precious metals (AGS, 2006), so that the gold-rich model is applicable. The Blanket mineralisation is hydrothermally emplaced and associated with the regionally developed D2 deformation characterised by areas of high strain wrapping around relatively undeformed remnants of the original basaltic flows. Wider orebodies occur within the more ductile tensional high strain areas. The localisation of the mineralised shears conforms to a Riedel pattern (AGS, 2006).
Two main types of mineralisation are recognised at Blanket, namely DSR and quartz-filled reefs and shears. A third type of mineralisation may be evidenced in the form of auriferous sulphide minerals as a replacement of the iron-rich minerals along the hinges of the folds in BIF, as is present at the neighbouring Vubachikwe Mine.
Caledonia Mining Corporation Plc S-K 1300 Technical Report Summary on the Blanket Gold Mine, Zimbabwe |
Disseminated Sulphide Replacement Reefs
DSRs host the best grades and comprise the majority of the ore shoots. The zones have a silicified core with finely disseminated arsenopyrite. Relatively high grades are found in a package of silicified biotite chlorite schist with irregular quartz stringers and disseminated and stringer arsenopyrite in the fabric planes. Due to lesser silicification, abundant biotite characterises the margins of these mineralised zones and as a result they have a lower gold content. Disseminated sulphide-replacement orebodies range up to 50 m in width with a strike of 60 m to 90 m. Free-milling gold constitutes up to 50% of the total metal content with the remainder locked in the arsenopyrite. The ore is not refractory despite its association with arsenopyrite. Generally, plant recoveries of 85% to 90% are achieved.
Quartz-Filled Reefs and Shears
Two quartz shears are mined at the Blanket Mine, namely the BQR and the Eroica Reef. These reefs have long strikes; however, they are not uniformly mineralised. Continuous pay shoots of over 100 m on strike are present. The Quartz Reef has a surface strike of approximately 500 m, but economic mineralisation is restricted to three 90 m long shoots.
Quartz-filled reefs display a much wider grade range compared to the DSR deposits. On average, these shears are of a higher grade and are used in blending the ore to the mill. Dominant ore minerals are native gold and galena although arsenopyrite becomes more prevalent below 470 m. Increasing levels of arsenopyrite association with depth confirm that the quartz shears represent higher level offshoots and splays with brittle deformation relative to the more ductile DSR-type core zone mineralised bodies.
| Item 6 (d) | – Geological Model |
The individual models were re-constructed by Blanket Mine to honour a 1.5 g/t cut-off which differs from the historical 2.1 g/t cut-off that has historically been utilised for reporting Mineral Resources. The wireframes are constructed explicitly by manually honouring drillhole intersections and in stope sampling data in GEOVIA Surpac software. The process of manually creating the wireframes is subjective and can differ based on the user.
As part of this work in 2020, QPs reconstructed Blanket 1, 2, 3 and created the new ARS extension utilising trends observed in the sampling database. This was performed to honour the new 1.5 g/t cut-off that is being applied and test the influence of updating the wireframes based on updated cut-offs. The orebodies remained well constrained, with grade confined to specific narrow veins, and as a result, the change in cut-off had a minimal change to the extents of the wireframes, with local changes only to include new samples. It was observed that there was a consistent trend in Blanket 2 hanging wall (“HW”), Blanket 2 footwall (“FW”) and Blanket 3. All these orebodies can also be interpreted to splay off of the BQR orebody. Typically, the higher-grade areas of BQR can be correlated to areas where other orebodies occur and may guide where potential orebodies join/splay off BQR such as Blanket 1 and ARS extension. Lithological descriptions are not present in the drillhole database; thus, all modelling done is performed on grade intersections. Geological modelling was performed from the known into the unknown, where mining activities assist to positively identify orebody intersections, trend and thickness that can be used as a guide for identifying and connecting that same orebody in grade intersections at depth.
All orebodies now have a 3D model and 3D estimation generated.
Caledonia Mining Corporation Plc S-K 1300 Technical Report Summary on the Blanket Gold Mine, Zimbabwe |
In 2021/22, all the wireframes except Blanket 1 to 6 were updated by the Blanket geological personnel to include any new or historical sampling and drilling data that was captured during this period. These wireframes were reviewed by QPs. Minor updates were made to the wireframes between 2020 and 2022. These updated 2022 wireframes are detailed in item 11 of this report. Furthermore, digital resource estimates are not restricted to a specific depth but rather generated within the orebody wireframes.
Below is a summary of the major changes in the previous resource update.
Figure 6: Plan View of BQR and Associated Orebodies
Blanket 1 was reconstructed by the QPs to honour the updated geological understanding. The trend of the previous Blanket 1 orebody was inconsistent with the local trends that are seen in other Blanket orebodies, the QPs updated Blanket 1 to reflect this. The previous versions of Blanket 1 have shown a large variance before the 2020 remodelling. During the course of the QPs’ work it was interpreted that some of the intersections previously attributed to Blanket 1 are on a different trend that can be better associated with ARS - this led to the interpretation of the ARS extension, which will be discussed separately.
Blanket 2HW and Blanket 2FW was updated to include all 1.5 g/t samples. The orebodies remain tightly constrained and changing cut-off has only minor local changes to the wireframes where additional samples are included. The upper portions of the orebody remain very similar to previous interpretations, while to depth some intersections were changed to honour intersections that are more representative of the trend and dip that can be inferred from the upper well-informed areas. In addition, despite some pinching and swelling in thickness that is seen throughout all orebodies, the middling between these orebodies (particularly Blanket 1, 2 and 3 does remain fairly consistent and can be used as a guide to geological modelling and assist when assigning intersections to the various orebodies. An additional update was performed for Blanket 2FW, previously interpreted as a standalone orebody, however by viewing grade intersections and following the same trends, the FW can be linked and interpreted to splay from Blanket 2HW (Figure 7). Orebodies are shown with a thick clipping of 10 m.
Blanket 3 was re-interpreted based on the updated geological understanding. The previous versions of Blanket 3 had been interchanged with Blanket 1 intersections as the Blanket 1 intersections had been reinterpreted from year to year. The upper portion of Blanket 3 where mining occurs remains consistent year to year, however the lower portion has varied significantly. The 2020 Model from QPs has attempted to follow the geological understanding from these well-informed areas into the poorer informed areas. As with the other orebodies, the trend and middling remain consistent and can be used with confidence in assigning intersections. It is for this reason that Blanket 1 and Blanket 3 were reinterpreted and remodelled, as Blanket 3 intersections have typically been assigned to Blanket 1 (Figure 8). The previous interpretations versus the updated 2020 model are shown in Figure 8. It must also be noted that for the Blanket 1 2020 model in this image, the drillhole intersections had not been honoured at this stage of wireframe creation and the wireframe generated is based only on the applied trend. By using the correct trend alone, it can be observed that corresponding drillhole intersections can be interpreted very easily.
Caledonia Mining Corporation Plc S-K 1300 Technical Report Summary on the Blanket Gold Mine, Zimbabwe |
Blanket 4 and Blanket 6 were generated by Blanket Mine. These two orebodies are interpreted to lie within a structurally disturbed area and Blanket 6 is separated into a HW and FW unit displaced by the Wenlock fault. A cross section is taken at an elevation of 206 amsl to show Blanket 4 and 6 in relation to neighbouring orebodies. Blanket 4 and 6 have not been updated at this stage, but it is recommended that they be re-interpreted using the same trends being observed.
Blanket Feudal is interpreted in the upper levels only of the Blanket section. This was not remodelled in 2020. This orebody occurs to the west of the BQR while Blanket 1, 2 and 3 all occur to the east (Figure 10). BQR is a continuous unit running through the Blanket section. It has been interpreted that all other Blanket orebodies are closely associated with the BQR and that grade in all orebodies can be correlated. This has not been remodelled in 2020. It is, however, recommended that Blanket Feudal be remodelled using the same principle as that applied to the Blanket models.
Lima and Eroica were modelled in 2019. It is recommended that these be remodelled using the same principle as that applied to the Blanket models. Eroica consists of ERCS and ERCN, while Lima consists of the main orebody (transparent in Figure 11), as well as a smaller inter reef orebody and a smaller FW body.
ARM and ARS occur to the north of the Blanket section. These orebodies have not been remodelled in 2020. It is however recommended that these be remodelled using the same principle as that applied to the Blanket models. An additional extension to ARS has been modelled that shows a continuous trend with the existing ARS. ARS and ARM are separated by a dyke, the structural controls of this dyke as well as the possible extension of the BQR into the ARM and ARS sections need to be tested (Figure 12). The samples used to generate ARS extension show a good correlation of the trend that is interpreted to exist over Blanket Mine.
Caledonia Mining Corporation Plc S-K 1300 Technical Report Summary on the Blanket Gold Mine, Zimbabwe |
Figure 7: Plan View of Updated Interpretation at Blanket 2
Caledonia Mining Corporation Plc S-K 1300 Technical Report Summary on the Blanket Gold Mine, Zimbabwe |
Figure 8: Cross Section of Updated Interpretation at Blanket 1, 2 and 3
Figure 9: Plan View of Blanket 6 and Blanket 4 and Associated Orebodies
Caledonia Mining Corporation Plc S-K 1300 Technical Report Summary on the Blanket Gold Mine, Zimbabwe |
Figure 10: Plan View of Section of BF and BQR
Figure 11: Section View of Lima and Eroica Orebodies
Caledonia Mining Corporation Plc S-K 1300 Technical Report Summary on the Blanket Gold Mine, Zimbabwe |
Figure 12: Plan View of ARS and ARM Orebodies
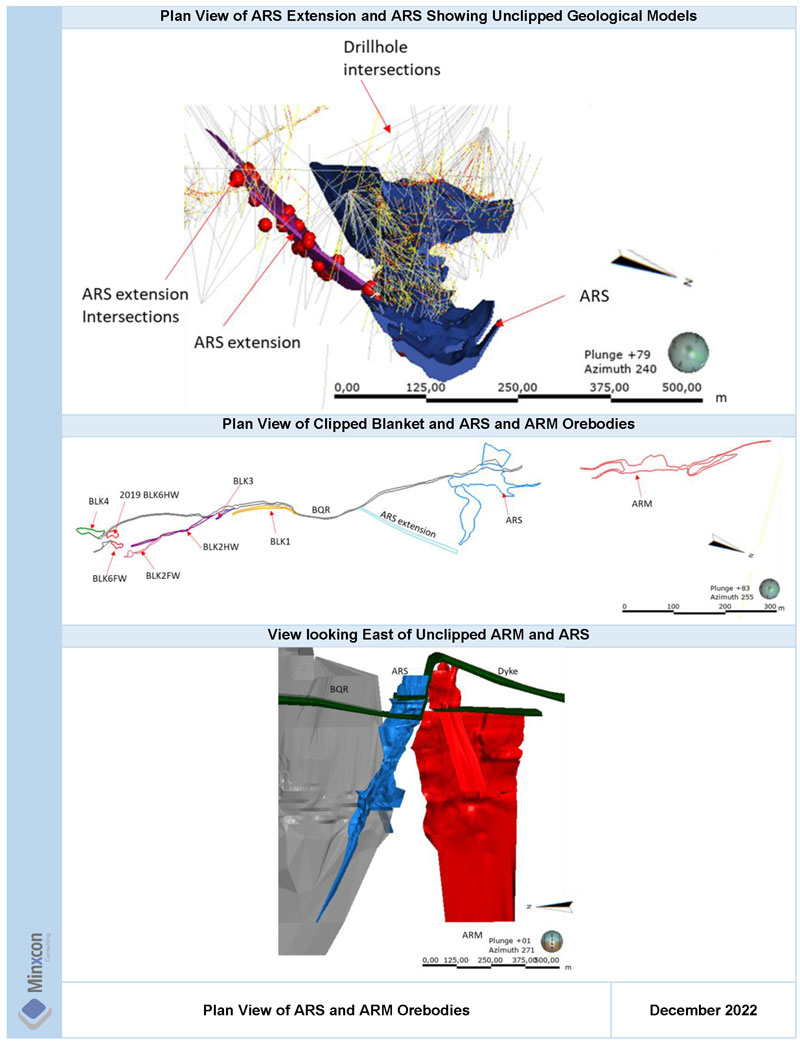
Based on the geological modelling performed on Blanket 1, 2, 3 and ARS extension the need for a mine scale geological model has become necessary as the basis of defining economic orebodies. Often what is seen on a regional or larger scale will be repeated in fractals on a smaller or orebody scale. In this case the trend and associations seen between orebodies is consistently seen between all orebodies. The trend of the mineralisation seen at Blanket is likely resulting from dextral shear, opening up fractures (extensional gashes) for vein and mineralisation emplacement. This zone of shear fractures has also been described as an extensional or contractional duplex by other authors. These Riedel shears along with the expected structures can be seen in Figure 13. This could potentially explain why the BQR and Eroica reefs are different to the ARM and ARS orebodies, i.e., the more tabular-lensoidal quartz reefs (BQR), which could be the main shear, to the massive pipe-like disseminated sulphide reefs (“DSR”) of ARM, ARS, and Jethro, which could be zones of Riedel shears.
Caledonia Mining Corporation Plc S-K 1300 Technical Report Summary on the Blanket Gold Mine, Zimbabwe |
Figure 13: Mine Scale Geological Interpretation
Further modelling of the remainder of the Blanket orebodies is required to confirm the trend and association of all other orebodies, in addition, modelling with a mine scale view of these expected Riedel shears will assist with modelling and infer continuity that may aid in the generation of exploration targets. An additional focus with future geological modelling should be on identifying the continuation of the orebodies and structures even where it is not mineralised to create a comprehensive geological model. Domaining prior to Mineral Resource estimation must then be used to separate out high grade and low-grade domains.
Caledonia Mining Corporation Plc S-K 1300 Technical Report Summary on the Blanket Gold Mine, Zimbabwe |
| Item 7 (a) | – Non-drilling Work |
I. | Survey Procedures and Parameters |
No recent trench or soil sampling or geophysics is available or considered during geological modelling or Mineral Resource Estimation.
Channel Sampling and Sludges
Underground channel/chip sampling and sludge sampling procedures are outlined as follows:-
| | ● | The distance from a known survey peg to the first sample section is noted. Subsequent sample sections are marked at 2 m intervals on the roof of the drives along strike. Jethro and Blanket Feudal sample sections are taken at 1.5 m intervals along strike. |
| | ● | Sample sections are taken using a chisel and collection dish starting from the hanging wall to the footwall. Samples are generally taken in 0.6 m lengths but may vary depending on geology or the width to be sampled. |
| | ● | In wider mineralised zones where not all the mineralisation is exposed by the primary development, sidewall sludge holes are drilled to a depth of 1.2 m. Sludge holes are drilled into the hanging wall and footwall along the same section line as the channel samples. Drill discharge water is collected in cloth bags and the water seeps out leaving a sludge sample. Samples are taken every 0.6 m. The hole is flushed between each sample to reduce contamination. |
| | ● | A sample weight of about 2 kg is collected in each instance. |
| | ● | A ticket tagging system is used with sketches drawn at the face showing the ticket numbers corresponding to the samples taken. This assists the data capture in that on receipt from the laboratory, results are plotted on the assay plan against the corresponding ticket numbers. |
| | ● | Blanks and CRMs are inserted into the sample sequence. |
| | ● | On receipt of assays, QAQC is carried out. Information for channel and sludge samples is both processed digitally (incorporation of all channel and sludge data into database, plotting in Surpac, 3D modelling, evaluation) and plotted manually on the level plans. |
| | ● | 1:250 scale survey plans are generated as ‘base plans’ for assay, stope assay and geology plans for each 15 m sub-level. |
Channel and sludge assay information is plotted manually on 1:250 scale assay plans for every 15 m sub-level. Within all of the mineralised zones, except the AR Main and AR South wider bodies, only 4.2 m is normally sampled (includes 1.8 m wide drive and 1.2 m of sludge sampling into both the hanging wall and the footwall) across the strike and any mineralisation beyond these limits is not included in the Mineral Resource. The unsampled payable sections outside of this width are mined but reported as coming from not-in-reserve (“NIR”) blocks. While the accuracy of sludge sampling is debatable, it is considered to give a reliable indication of mineralisation. By the nature of the sampling methodologies the roof chip sampling and sampling of the evaluation drillholes would appear to have a higher confidence than the sludge sampling. However, an analysis of the different sample types has shown a minor decrease in grade (per orebody) with the inclusion of the sludge samples. This is expected as the sludge samples are taken at the periphery of the orebodies to tests the limits of the orebody of acceptable grade. Exclusion of these sludge samples would result in local over estimation as these sludge samples often record the transition from high grade to low grade. In the case of the underground chip sampling the high volume of samples reduces the impact of isolated sampling inaccuracies.
Caledonia Mining Corporation Plc S-K 1300 Technical Report Summary on the Blanket Gold Mine, Zimbabwe |
Sampling is undertaken underground; thus, a plan view of sampling points is not appropriate for Blanket Mine.
II. | Sampling Methods and Sample Quality |
Blanket is an operational mine. Only underground Mineral Resource and exploration drilling are currently undertaken.
Only ongoing underground drilling and chip sampling is currently undertaken at Blanket Mine.
IV. | Results and Interpretation of Exploration Information |
The results of the exploration drillholes as described in the section to follow - once checked and validated - were included into the existing database to inform the geological modelling process as well as Mineral Resource estimation.
I. | Type and Extent of Drilling |
Blanket is an operating mine. Underground long-hole exploration drilling and evaluation drilling are undertaken to respectively investigate orebody depth extensions and delineate width of the mineralised body. To this end, a plan view of drilling collars is not appropriate for Blanket Mine. However, Figure 15 illustrates the distribution of the database.
Long-hole Exploration Drilling
The recent programmes of down-dip drilling from underground crosscuts to test depth extensions of the various orebodies has been underway since 2013. To date 332 holes have been drilled comprising 103,097 m (Table 6). The exploration holes planned for 2023 are shown in Figure 14. The non-drilling in 2021 and 2022 is directly related to the new Central Main Shaft (“CMS”) progress, waste handling and the need to create future drilling platforms.
Table 6: Exploration Holes and Meters by Year
Year | Number of Holes | Meters Drilled |
2013 | 10 | 4,228 |
2014 | 25 | 8,685 |
2015 | 40 | 14,948 |
2016 | 58 | 19,768 |
2017 | 54 | 19,035 |
2018 | 68 | 18,269 |
2019 | 42 | 9,456 |
2020 | 17 | 3,396 |
2021 | 0 | 0 |
2022 | 18 | 5,312 |
Total | 332 | 103,097 |
Caledonia Mining Corporation Plc S-K 1300 Technical Report Summary on the Blanket Gold Mine, Zimbabwe |
Figure 14: Section of ARM Showing the Planned Exploration Holes for 2023
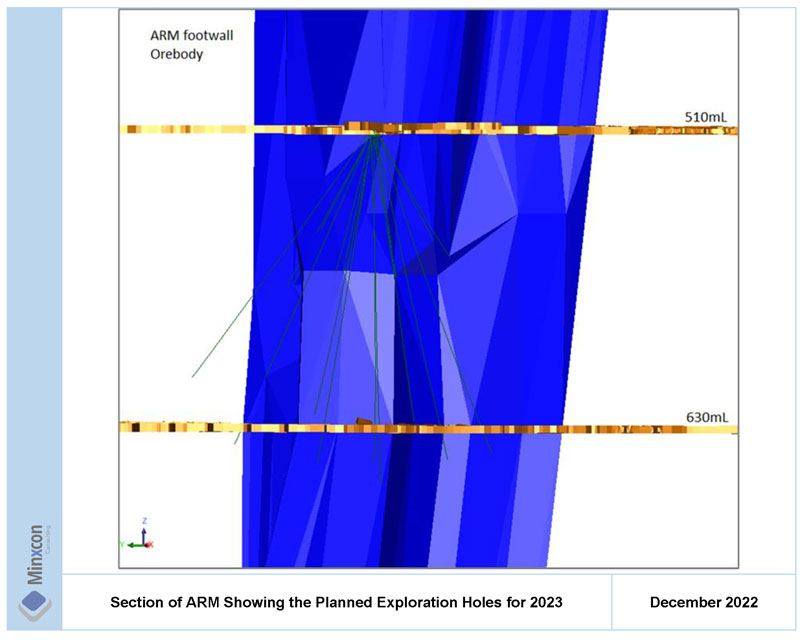
The recent drilling phases, which commenced in 2013, were focused on down-dip extensions to Blanket Section, AR Main, Eroica, and AR South, commencing in that order. The programme commenced with two refurbished rigs, and new machines were progressively acquired, bringing the total to five. The additional machines saw the productivity gradually increase, reaching a peak in 2017, before taking a downward trend, decreasing to zero in early 2020 when all the diamond drilling chambers were exhausted. There was no drilling in 2021. Development of new diamond drilling chambers resumed in 2022, and the first chamber was completed at the end of May. Drilling commenced in mid-June 2022 on 750 m level Eroica North Chamber 1. This drilling will target below the 990-m level, converting inferred resources to indicated resources. The crosscut is being extended to create an outer chamber, from which drilling will be 60 m below the first chamber target. The current drilling is being carried out by an on-site Kempe "K600" rig operated by an on-site crew. An external rig is in transit to the mine and will arrive at the end of June. A chamber is being prepared at 930 m level, Blanket, where drilling for BQR, Blanket 1, Blanket 2, and Blanket 3 orebodies will cover below 990 m level, upgrading Inferred Resources to Indicated Resources.
Further upgrade to Measured Mineral Resource category using the down-dip exploration drilling is not practical because of the amount of drilling that would be required to reach the required intersection spacing of 7.5 m along strike by 15 m vertical. Measured Mineral Resource status from down-dip exploration drilling will only be achieved where holes inadvertently deviate so that their spacing is much closer than planned. Measured Mineral Resource status is achieved by development of sub-levels within the orebody at 15 m vertical distance with channel and sludge sampling along strike and evaluation drilling every 7.5 m along strike. Current exploration drilling coverage is limited by available drilling chambers. Drilling is conducted from chambers on crosscuts developed into the hanging wall. Development to new chambers at ARSouth, Blanket Section and Eroica is ongoing.
Caledonia Mining Corporation Plc S-K 1300 Technical Report Summary on the Blanket Gold Mine, Zimbabwe |
Directional drilling techniques are not employed but holes are planned to incorporate a deviation based on knowledge from previous drilling. While this does not result in a perfectly regular intersection spacing due to irregular and unexpected deviations of holes, the areas are drilled until they are adequately covered.
Drilling coverage to Indicated Resource category spacing is only practical for hole lengths of up to 300 m due to unpredictable hole deviations, with further upgrades of Inferred to Indicated only possible once drilling positions have been developed in the hanging wall on the deeper levels. Drilling is carried out primarily by Blanket personnel but with a Contractor managing and overseeing the operation. The Contractor supplies key staff comprising Supervisors and trained drillers and provides ongoing maintenance requirements to ensure the smooth running of the operation. All drilling is currently being carried out by BQ (36.5 mm diameter) core.
The management of the drilling process rests with the responsible geologist. A summary of drilling procedures for exploration drilling is outlined as follows:-
| | ● | Planned hole collar set up information is provided by geologist. |
| | ● | Hole azimuth is set up by surveyor. Hole dip is set up using built in rig clinometer. Set up is checked by Blanket Mine geologist or geotechnician. Hole collar is surveyed when rig is established in position and drilling. |
| | ● | Drilling and core are monitored by geologist and geotechnician with checking to ensure core obtained attains a recovery of at least 95%. Hole is stopped based on geological observations. |
| | ● | Downhole survey is carried out using Icefield Multi-shot MI3 instrument. Survey readings are downloaded and checked for validity using quality assurance and quality control (“QAQC”) procedure. If not acceptable, request for resurvey. |
| | ● | Hole is capped with hole number clearly marked on cap. |
Core handling procedures are as follows:-
| | ● | The drillhole identification number and box number are clearly marked onto the upper left side and face of each core tray. |
| | ● | All core is packed into core trays as it is recovered from the hole with blocks indicating the depth placed at the end of each ‘run’ for each 3 m drill rod. Core trays are kept secure and guarded against possible mixing. All core boxes are transported to the core yard at the end of the drilling shift where their receipt is entered into a logbook. |
| | ● | Core boxes are laid out in the correct sequence. |
| | ● | Drill core is checked as orientated and assembled to ensure that all pieces fit, and that orientation lines are consistent. |
| | ● | Core recoveries are measured between drill depth markings by the geologist or geotechnician to record the core recovery. The complete length of the hole is metre marked. |
| | ● | RQD measurements are recorded by the geotechnician. |
| | ● | Core is photographed dry and wet. |
| | ● | Logging of core is carried out by the geologist. |
| | ● | Mineralised zones are identified and selected for sampling. Sample boundaries are marked at 0.6 m intervals in nearly homogeneous mineralised zones. Selective sampling intervals are employed on mineralised units with unique features, e.g. colour, concentration of mineralisation, alteration, and mineralogy. |
| | ● | The core is split into two equal halves with a diamond saw. One half is retained in the core tray. |
Caledonia Mining Corporation Plc S-K 1300 Technical Report Summary on the Blanket Gold Mine, Zimbabwe |
| | ● | Specific Gravity (“SG”) measurements are carried out for each sample prior to bagging and submission to mine laboratory for sample preparation and assay (Blanks and Certified Reference Material (“CRMs”) are inserted into the sample sequence at this point). |
| | ● | Split intersections retained in the core tray are photographed wet. |
| | ● | On receipt of assays, QAQC is carried out. Drilling data is incorporated into the database. Plotting in Surpac, 3D modelling, and evaluation are carried out. |
Evaluation Drilling
In addition to exploration drilling, evaluation drilling is performed within stope. Underground mining infrastructure in the form of development drives at 15 m vertical intervals within the orebody is required in order to achieve the required spacing of 7.5 m along strike by 15 m down-dip for the Measured Mineral Resource category. Evaluation drilling is normally only applicable to wider DSR orebodies, while Quartz Reef orebodies are either fully exposed by the actual development drives or can be fully evaluated with sludge holes where required to check for mineralisation in the immediate hanging wall or footwall.
A summary of evaluation drilling parameters and procedures is as follows:-
| | ● | Sub-level drives are mined within the orebodies along strike at 15 m vertical intervals. Drill cubbies are developed every 7.5 m for evaluation drilling. |
| | ● | Planned hole collar set up information is provided by the geologist. Holes are drilled into the hanging wall and footwall of the development drive to establish the extent of the mineralisation. Holes are normally horizontal and drilled perpendicular to strike. Holes are drilled using an air driven “meter eater” machine with AXT (30.5 mm diameter) core. |
| | ● | Drilling and core are monitored by the geologist and geotechnician with checking to ensure core obtained attains a recovery of at least 95%. Hole is stopped based on geological observations. |
| | ● | Hole collar coordinates, azimuth and dip is surveyed (usually when hole is completed, and rig is off |
| | ● | the hole using a drill rod inserted into the hole). Hole number is recorded by painting on sidewall. |
| | ● | Handling and processing of core follows a similar procedure as for exploration core as detailed above. However, for evaluation holes whole core is sampled. |
| | ● | Core is packed into 1 m long closable core trays as it is recovered from the hole with blocks indicating the depth placed at the end of each ‘run’ for each 3 m drill rod. Core trays are kept secure and guarded against possible mixing. |
| | ● | All core boxes are transported to the core yard at the end of the drilling shift where their receipt is entered into a log book. |
| | ● | Core is carefully repacked into 1.5 m long core trays. Drill core is checked as orientated and assembled to ensure that all pieces fit, and that orientation lines are consistent. The drillhole identification number and box number are clearly marked onto the upper left side and face of each core tray. |
| | ● | Core boxes are laid out in the correct sequence. |
| | ● | Core recoveries are measured between drill depth markings by the geologist or geotechnician to record the core recovery. The complete length of the hole is metre marked. |
| | ● | RQD measurements are recorded by the geotechnician. |
| | ● | Core is photographed dry and wet. |
| | ● | Logging of core is carried out by the geologist. |
| | ● | Mineralised zones are identified and selected for sampling. Sample boundaries are marked at 0.6 m intervals in nearly homogeneous mineralised zones. Selective sampling intervals are employed on mineralised units with unique features, e.g., colour, concentration of mineralisation, alteration, and mineralogy. |
Caledonia Mining Corporation Plc S-K 1300 Technical Report Summary on the Blanket Gold Mine, Zimbabwe |
| | ● | Whole core is sampled. SG measurements are carried out for each sample prior to bagging and submission to mine laboratory for sample preparation and assay (blanks and CRMs are inserted into the sample sequence at this point). |
| | ● | On receipt of assays, QAQC is carried out. Information for evaluation holes is both processed digitally (incorporation of all drilling data into database, plotting in Surpac, 3D modelling, evaluation) and plotted manually on the level plans. |
| | ● | 1:250 scale survey plans are generated as ‘base plans’ for assay, stope assay and geology plans for each 15 m sub-level. |
| | ● | Drill assay information is plotted manually on 1:250 scale assay plans for every 15 m sub-level. Assay plans also record the chip and sludge sampling on the surveyed development and are the basis for orebody delineation in conjunction with the geology plans (stope assay plans are generated to show stoping progress and stope assays). |
| | ● | Geological information for evaluation holes is plotted manually on 1:250 scale geology plans for every 15 m level. Geological plans provide the context of the mineralisation and validation of orebody shapes and structural discontinuities. |
II. | Factors Influencing the Accuracy of Results |
QAQC data prior to 2014 is not available, and thus data from before this period is subject to some degree of uncertainty. However, more recent samples do cover the areas being considered adequately, thus higher confidence samples are also informing the areas informed by lower confidence samples, this assists in reducing the uncertainty in the database.
III. | Exploration Properties – Drill Hole Details |
This section is not applicable to the Blanket Mine as it is an operating gold mine with sufficient drillhole data and underground sampling to declare a Measured and Indicated Mineral Resource and Mineral Reserve.
According to the Blanket Mine geological personnel no hydrogeological studies have been completed at the Blanket Mine.
Prior to 2020, no previous geotechnical work was completed at the Blanket Mine. An investigation into rock strengths was completed, where core of the different rock types was sent to Rock Lab SA for UCS Brazilian disc test, in order to determine the geomechanical properties of various lithologies and the parameters to be applied in the geotechnical model and mine design going forward.
Subsequently, Point Load index (PLi) assessments were introduced on mine, where core from exploration or run-of-mine drilling can be tested to determine the UCS of the rock and an index that will be used to classify geotechnical areas based on the rock PLi.
Rock Quality Designation (RQD) is being determined to assess the quality of the rock and is used as a criterium in the rock mass classification for mine design and blast designs. No specific joint analyses were done on current core, and this is an area of improvement that could form part of the analysis going forward where joint orientation, joint spacing, joint roughness and infilling would be used for Rock mass classification.
Blanket Mine has employed a rock engineering consultant as of February 2020 for the required geotechnical inspections and designs of the underground workings. All legal appointments pertaining to rock engineering requirements are in place. The geotechnical model for Blanket Mine is being revised and with this in mind support standards are continually reviewed and rock mechanics recommendations for the current mining operations are in place.
Caledonia Mining Corporation Plc S-K 1300 Technical Report Summary on the Blanket Gold Mine, Zimbabwe |
Stress measurements were conducted on 34 Level where the stress magnitude and orientation were determined. These parameters were used to update the numerical model and are currently being reviewed by a thirds party consultant.
All new geotechnical, and rock engineering work that is being conducted for the newly targeted mining areas below 750 m Level is being used to improve mining practice, limit excavation damage and improve safety. The studies and work associated with these parameters will be addressed by the rock engineering consultant as data is generated and access is obtained through development. This will further inform the geotechnical model.
ITEM 8 | – SAMPLE PREPARATION, ANALYSES AND SECURITY |
| Item 8 (a) | Sample Handling Prior to Dispatch |
All sample submissions to the laboratory are accompanied with clear instructions on a Sample Submission Sheet regarding sample preparation and assay methodology. The sample submission sheet contains spaces and selections to accommodate all necessary instructions for the laboratory. Each of the items on the Sample Submission Sheet is discussed below. QAQC procedures are constantly reviewed to ensure the best practices are followed. The sample preparation and analysis procedures outlined below describe the current information handling. All sampling and QAQC data are currently captured into access and excel. Samples are not released by the Geology department to the assay laboratory that do not satisfy all the required procedures. Each Section Geologist is responsible for ensuring that this is done for drilling, channel or sludge samples originating from their underground section. Samples are not accepted for assay by the laboratory if they do not satisfy the QAQC requirements. In the event of such an occurrence, it is reported to the Geology Manager or the Mineral Resource Manager.
| Item 8 (b) | – Sample Preparation and Analysis Procedures |
All samples are analysed by the Blanket Mine on-site Assay laboratory which is not accredited. The process is broadly as follows:-
| | ● | The sample is crushed to -10 mm and riffle split to produce a portion of approximately 400 g. |
| | ● | The 400 g portion is pulverised in a Rocklabs ring mill. Blank samples are run in the pulveriser after every 10 samples for channel chip and sludge samples as per normal laboratory procedure. For evaluation holes after every five samples and for exploration holes after every sample. |
| | ● | Pulp is measured into a crucible. For drill core samples, a new crucible is used for every sample. For other samples, it is acceptable for crucibles to be used multiple times but discarded when cracked or showing signs of absorbed impurities. |
| | ● | A 50 g aliquot is used for all drill core samples. A 25 g aliquot is used for channel chip samples and sludge hole samples. |
| | ● | All samples currently undergo Fire Assay analysis with gravimetric finish. |
| Item 8 (c) | – Quality Assurance and Quality Control |
Blanks
Blanks are inserted according to the sample type. For exploration drilling samples, two blanks are inserted for every 36 samples (the number of samples processed in a "batch" at one time in the laboratory). Exploration holes include deep drillholes but also other surface drillholes. Evaluation Holes are holes that are used to define the limits of the orebody, generally at 7.5 m spacing along strike. The mass of a blank sample needs to be only slightly higher than the weight of the aliquot (50 g for drill core samples and 25 g for all other samples). Blanks are prepared in advance in sealable card packets to avoid contamination. Blanks are inserted into the batch at random positions in the sequence within a mineralised zone. For samples submitted directly to the laboratory by the samplers (sludge and chip samples for both grade control and evaluation), blanks are currently inserted by the laboratory until a new procedure is in place. The blanks used are sourced from either local granite or certified AMIS blank standards. The results for the blanks and standards are monitored on a batch by batch basis, with the blanks treated separately from the standards.
Caledonia Mining Corporation Plc S-K 1300 Technical Report Summary on the Blanket Gold Mine, Zimbabwe |
Standards
Standards are inserted according to the sample type. For exploration drilling samples, three standards are inserted for every 36 samples (the number of samples processed at one time in the laboratory). The mass of the standard needs to be only slightly higher than the weight of the aliquot (50 g for drilling samples and 25 g for all other samples). Standards are prepared in advance in sealable card packets to avoid contamination. The main purpose of Standards is to check the accuracy of the assay procedure. There are generally three groups of standards: very low grade (±0.41 g/t), low grade (±1.74 g/t) and high grade (±2.44 g/t). All three types of standards are used and are inserted into the batch in logical positions in the sequence within a mineralised zone. The standard is included in the number sequence, is not labelled as a standard, and is not recorded as a standard on the sample submission sheet. Standards are currently inserted by the laboratory for sludge and chip samples that are submitted directly to the laboratory by the samplers (samples for both grade control and evaluation). Standards for drillholes are inserted by the samplers. The results for the standards are monitored on a batch by batch basis and on a standard by standard basis.
Duplicates
Duplicates are split by the laboratory from pulps as per instructions on the Sample Submission Sheet completed by the geologist. Duplicates are requested for exploration drilling samples only. On the sample submission sheet, the "Sample No." is the sequential number for the duplicate, and there will be a gap in the sequence of samples submitted for this duplicate. In the Sample Source column, the number of the sample from which the duplicate is sourced is recorded. The splitting of a sample is carried out by the laboratory, and the split fraction is assigned a new sample number for the duplicate.
A QAQC report for each batch is completed and saved (with the name of the batch) on the server. This report includes graphs showing the results for blanks, standards and duplicates and a short statement concluding whether the results are satisfactory or whether a re-assay is required. QAQC sample data is monitored monthly to ensure that sample batches with control sample data outside of acceptable limits are re-submitted for analysis in a timely manner.
Blanks
All blanks with values greater than the detection limit are flagged. A decision is then made by the Geology Manager as to whether to re-assay or not. Results for blanks for all batches are compiled into one table on an ongoing basis, so that the general blank results can be monitored. This is done on a quarterly basis and finalised at the end of every quarter. This is done in MS Excel and includes a table indicating Batch No., Sample No. and Grade (Au g/t), together with a graph depicting the results for all the blanks. If more than one type of blank is used, then this is done separately for each blank. The report is given the name of the particular blank in question followed by the year and the quarter number (e.g., AMIS0439_2016Q3) and saved on the Mine’s computer server.
Caledonia Mining Corporation Plc S-K 1300 Technical Report Summary on the Blanket Gold Mine, Zimbabwe |
Sample blank material is comprised of un-mineralised granite sourced from the local area. A threshold of ten times the analytical detection limit (i.e., a threshold of 0.08 g/t) was used to discriminate samples showing evidence of cross-contamination. For 2018 and 2019 31 blanks failed out of 317 total blank samples for this standard. Although some instances of mislabelling of Blanks or Standards has been identified in the past, these poorly performing blanks returned values that did not match any of those of the certified reference material. It was therefore assumed that they were either a result of mix-up between Blanks and mineralised material or resulted from cross-contamination. In addition to the granite, blank standards from Amis have also been utilised for 2018 and 2019.
Standards
Standards with values greater than two standard deviations are flagged. A decision can then be made by the Geology Manager as to whether to re-assay or not. For all batches, the results for each standard are compiled into one table on an ongoing basis, so that the trend and accuracy of each standard can be monitored over time. This is done on a quarterly basis and finalised at the end of every quarter. This is done in MS Excel and includes a table together with a graph depicting all the results for that standard. A separate report is done for each standard. The report is given the name of the standard in question followed by the year and the quarter number (e.g., AMIS0335_2016Q3) and saved on the Mine’s computer server. During the period 2020 to 2022, twelve different standards were utilised, the standards used are representative of the grade seen at Blanket and are thus suitable for QAQC purposes. The standards are sourced from Greenstone belts in South Africa. Care must be taken when selecting samples to ensure the standards relevant to the expected grade is used, particularly as the grade will differ slightly from orebody to orebody.
The most used standard for the period under review was AMIS0559. This is a high-grade standard with an expected grade of 12.01g/t. 316 Standards were used and 311 fell within the accepted two standard deviation range to make a pass rate of 98.4%. When testing AMIS719, a fair number of failures were observed. Of the 105 samples analysed, 33 failed the two-standard deviations. These represents a 68.6% pass rate. The expected grade for AMIS719 is 0.897 g/t. Some of the samples that failed were above and others below the limits of two-standard deviations. 101 Standards of AMIS0724 with an expected grade of 2.38 g/t were analysed during the period 2021-2022. This is a medium grade standard. The pass rate was very good. Only six out of the 101 samples failed the 94% pass rate.
It is recommended that follow up activities are undertaken to identify the source of these failures in the standards and if this results from laboratory procedures or sampling activities. In addition, duplicates of the various stages of the sampling and analyses process can be taken. Field duplicates (in the core yard), course duplicates (following crushing) as well as pulp duplicates (following pulverisation), this will eliminate any sources of contamination or identify the potential problem areas. A bias is seen in 2018 with numerous failures in standards, 2019 results are an improvement with acceptable pass rates of standards and the 2021 and 2022 QAQC results are also better. However, 2018 results are still included in the database. Where dense sampling exists (Reserve areas), the effect of this is minimised. However, where a larger area is informed by only one or two drillholes (Inferred or Target areas), any uncertainty would have a larger influence. For this reason, QAQC procedures should be stricter for exploration holes and any failures in QAQC followed up with re-assays as well as umpire assays. The mine procedures with regards to inclusion or exclusion of samples due to QAQC results must be implemented to ensure these failures are considered during the course of QAQC.
Due to the high sample density the effects of these inconsistencies in results will be minimised, however this accuracy and repeatability of results and standards is most important for exploration areas where one drillhole informs a large area. A focussed study of the QAQC of these exploration holes is recommended.
Caledonia Mining Corporation Plc S-K 1300 Technical Report Summary on the Blanket Gold Mine, Zimbabwe |
Duplicates
Duplicate results are plotted against each other, and poor correlations are flagged by the QAQC geologist. Appropriate action is then taken when failures are identified. Results for all duplicates for all batches are compiled into one table on an ongoing basis, so that the overall repeatability of duplicates can be monitored. This is done on a quarterly basis and finalised at the end of every quarter. This is done in MS Excel and includes a table indicating Batch No., Sample No. and Grade (Au g/t), Duplicate No. and Duplicate Au g/t, together with a XY correlation graph showing all of the results for all the duplicates. The report is given the name “Duplicates” followed by the year and the quarter number and saved on the Mine’s computer server.
Umpire Analyses
Umpire analysis and round robins are being run by the assay lab. For umpire analysis, comparison is being made with Zim Labs. Below is the scatter plot for batches run from 2021 to 2022. The sample materials comprising of Carbons, plant samples comprising of plant feed (M1s), C.I.L feed (M3s), and C.I.L tails (RM10), geology samples and CRM to check Zim Labs accuracy. The method used for Assay by Blanket mine lab was Fire assay method with gravimetric finish and Zimlabs used Fire assay method with AAS finish. According to the correlation graph it shows that most of the assays correlated, with a correlation value of 0.94.
Round robins are run among Turk Mine, How Mine, DGL 5 Mine and Blanket Mine. Comparisons show a good correlation. It is recommended that the Umpire laboratory checks are run more regularly and with a higher number of samples, particularly where a batch fails the second re-analyses, in the Blanket laboratory.
Storage of Pulps
According to mine procedure, pulps are retained for all drill core samples (both evaluation holes and exploration holes). They are collected by Geology and stored at the facility at the Exploration department offices. Pulps are stored in strong, sealed boxes clearly labelled with the drillhole name, batch number and sample numbers.
Storage of Coarse Rejects
Mine procedure is to retain all coarse rejects for all exploration drill core samples. They are collected by Geology and stored at the facility at the Exploration department offices.
| Item 8 (d) | – Adequacy of Sample Preparation, Security and Analytical Procedures |
This section sets out the opinion of the QPs regarding the adequacy of sample preparation, security, and analytical procedures.
Even though the mine laboratory is not accredited, a reasonable standard is maintained with good level of housekeeping apparent. Standards and blanks are run as part of the routine procedures. Blind checks are done within a batch of a single sample. If any internal laboratory QC fails, the batch is repeated automatically. However, the laboratory visit undertaken by the QP on 3 November 2021 did highlight some concerns that need to be addressed to ensure there is no contamination and sample weights are measured accurately.
In addition, as part of its external verification process the mine laboratory sends samples away to How Mine, Zimlabs, Turk mine laboratory and Performance Laboratories (accredited), to test their precision and accuracy. The results of the internal laboratory standards were viewed and are within acceptable limits, with minor failures. An in-house system for sample receipt and sample tracking has been implemented on the mine in 2019. This significantly improves the analytical system and improves accuracy and tracking of samples in the laboratory. The sample preparation methodology is considered adequate for Mineral Resource estimation purposes given the good correlation between planned production grades and actual recovered grades in the plant. A further inspection of the mine laboratory by an independent consultant Mr Jeremy Eliot was conducted In June 2016. Conclusions were similar in that improvements could be made, but, overall, the facilities and processes were of a satisfactory standard.
Caledonia Mining Corporation Plc S-K 1300 Technical Report Summary on the Blanket Gold Mine, Zimbabwe |
ITEM 9 | – DATA VERIFICATION |
| Item 9 (a) | – Data Verification Procedures |
The QPs have reviewed available data types from the sampling stage through to the resource estimates which feed into the Mineral Resource statement.
In 2021, orebody interpretation for active areas (mostly above 22 Level) for Mineral Resource estimation purposes was carried out manually while digital block models for the down-dip exploration areas (mostly below 22 Level) were progressed to the standard required for digital Mineral Resource estimation. This was a phased approach. In 2018, only AR Main and the Blanket Sections had digital Mineral Resource Estimates reported. In 2021, all orebodies except Sheet and Jethro were estimated digitally (below 22 Level), while the manual proportion was still retained above 22 Level; except for Lima, which is digital in the upper levels as well. Proceeding sections cover this in more detail. In 2022, all manual blocks were completely replaced by digital estimates, as represented by block models contained in the orebody wireframes. As part of the 2022 upgrade from manual blocks to digital estimates, additional samples were captured in older mining areas where previously only manual blocks were utilised.
In general, there are five types of samples considered at Blanket:-
| | ● | channel "chip" samples (evaluation and grade control); |
| | ● | sludge hole samples (evaluation and grade control); |
| | ● | grab samples (grade control); |
| | ● | evaluation drill core samples; and |
| | ● | exploration drill core samples. |
Evaluation Holes are holes which are used to define the limits of the orebody, generally at 7.5 m spacing along strike. All other holes are defined as Exploration Holes. Exploration holes can be what are currently deep drillholes but will also include other drillholes.
Database Validation
The database validations and checks were performed on all data received to identify and remove errors where identified. The database per year is summarised in Table 7. The Database summarised by sample type is in Table 8.
Table 7: Sample Database Summarised by Year
Year | Drillhole Count |
<1960 | 7,223 |
1960-1970 | 150 |
1970-1980 | 67 |
1980-1990 | 75 |
1990-2000 | 334 |
2000-2010 | 508 |
2010-2022 | 62,111 |
Total | 70,468 |
Caledonia Mining Corporation Plc S-K 1300 Technical Report Summary on the Blanket Gold Mine, Zimbabwe |
Table 8: Sample Database Summarised by Drillhole Type
Hole Type | Drillhole Count |
Channel | 40,084 |
Evaluation | 5,453 |
Exploration | 795 |
Sludge | 20,465 |
Stope | 1,646 |
Trench | 25 |
Grand Total | 70,468 |
For the purposes of estimation, stope and trench samples were excluded from the database. All other hole types were used. Some absent, 0 and -99 values were present in the assay table. These all result from illegible entries during data capture (-99), absent or missing samples when capturing (0, absent). For resource estimation purposes, all these values were assigned a value equal to half the detection limit (0.0025 g/t). Assigning a 0.0025 g/t value for these intervals is a conservative approach, as the low-grade values form part of the estimation dataset. Alternatively, if these intervals are removed, a possible overestimation may occur from neighbouring high-grade samples.
All samples noted here include the total database within and outside the orebodies. The individual samples used and clipped per domain is addressed in proceeding sections. The total database is shown in Table 9. The total database for Blanket Mine is illustrated in Figure 15. Sludge and channel samples as well as evaluation drillholes are typically located in mining areas, while exploration holes are longer drillholes used to inform new areas (Figure 15).
Table 9: Hole and Sample Count
Item | BHID | Entries |
Collar | 70,468 | 70,468 |
Survey | 70,468 | 70,468 |
Assay | 64,444 | 430,923 |
Figure 15: Long Section of Blanket Mine Showing the Total Database
Caledonia Mining Corporation Plc S-K 1300 Technical Report Summary on the Blanket Gold Mine, Zimbabwe |
| Item 9 (b) | – Limitations on/Failure to Conduct Data Verification |
The data capturing process has not been reviewed. The original drillhole logs were not compared to the final access drillhole database. The data as received from Blanket was accepted as received that all available drillholes have been captured and on-site checks pertaining to data capture on the database were performed. All relevant error checks were performed on the digital data that was available.
| Item 9 (c) | – Adequacy of Data |
The QP deems the data to be adequate for the purposes of conducting meaningful Mineral Resource estimations with appropriate Mineral Resource classification in accordance with the guidance as described by NI 43-101. Proof of this statement is validated by the fact that the mine has operated successfully for several years using the current Mineral Resource with good historical conversion rates for Inferred Mineral Resources to Indicated and then on to Measured. The QP is of the opinion that the sampling database is acceptable for the Mineral Resource estimation methodology being utilised at the Blanket Mine because of the sheer volume of sampling data. In addition, the Mine has been in operation for several years with historical gold recoveries around 3 g/t.
ITEM 10 | – MINERAL PROCESSING AND METALLURGICAL TESTING |
| Item 10 (a) | – Nature and Extent of Testing and Analytical Procedures |
The plant currently treats RoM from the main orebodies. The ore is free milling, and the mineralogy has not changed to a significant degree. Sufficient information from historic production is required to determine the expected production performance with reasonable confidence.
| Item 10 (b) | – Basis of Assumptions Regarding Recovery Estimates |
The expected processing efficiencies are based on historic production, and these are well in line with the budget, with 2022 recovery averaging 93.8% against the 2022 budget of 93.5%. The actual recovery has been higher than the budget recovery since 2020 approaching 94%. The budgeted recovery of 93.5% for 2022 can be assumed to continue, with improvements expected.
| Item 10 (c) | – Representativeness of Samples and Adequacy of Data |
The samples measured from historic production are considered reliable and representative. As a result, they can be used to adequately predict future performance.
The QPs are of the opinion the Blanket Mine plant recoveries are well understood as they are based on the actual historical production figures.
| Item 10 (d) | – Deleterious Elements for Extraction |
The arsenopyrite content of RoM material currently being treated from Blanket Mine is low enough not to pose a risk to economic extraction and deposition of tailings.
Blanket ores are free milling in that 93% of the gold is recovered via direct cyanidation with a further 1% achievable with the use of oxygen pre-treatment injection methods. Arsenic therefore reports to the mine residue deposit in the form of undecomposed arsenopyrite, constituting less than 1% of the ore. The ore contains approximately 35% carbonate minerals which results in the tailings having an alkaline chemistry which inhibits the decomposition of arsenopyrite which is not exposed to the atmosphere. Rainwater run-off from the tailings dam is channelled within bund walls to a sump from where it is returned to the plant as makeup water.
Caledonia Mining Corporation Plc S-K 1300 Technical Report Summary on the Blanket Gold Mine, Zimbabwe |
Blanket will be undertaking a pilot plant test work programme on the other more-refractory Mineral Deposits not currently being mined which may have a higher arsenopyrite content. Continuous testing and analysing of arsenic and other potential deleterious elements will be conducted as part of this test programme. Appropriate neutralisation steps will be included in the process design as required.
ITEM 11 | – MINERAL RESOURCE ESTIMATES |
The Mineral Resources were estimated as at 31 March 2022 based on drilling and sampling data, as well as the mining faces received for the Mine as at that date. The QP has depleted the 31 December 2022 Mineral Resources with updated mining faces to the period ending 31 December 2022. In addition, the Mineral Resource was also depleted with the Mineral Reserve as at 31 December 2022. New exploration drilling was undertaken in the second half of 2022 but this has not been included in the Mineral Resource estimate; however, underground chip sampling has been undertaken but in well-informed Measured and Indicated areas. The QP deems that this will not have a significant effect on the Mineral Resource grade, and thus deems the depletion to be appropriate.
All Manual Mineral Resources previously declared have now been converted into 3D digital format.
| Item 11 (a) | – Assumptions, Parameters and Methods Used for Resource Estimates |
I. | Mineral Resource Estimation Procedures |
The construction of the geological models is comprehensively discussed in Item 6 (d) of this TRS.
As part of the import into Leapfrog the samples and associated grade inside wireframes and grade outside is compared to display how closely the wireframes honour the data and shows where any possible grade exclusions occur.
Wireframes received from Blanket Mine were checked and imported into Leapfrog Edge for estimation. A requirement for Leapfrog is that the wireframes are closed and have no cross overs. As part of the validation exercise, Leapfrog’s boundary validation function was utilised. The domains and data utilised in the 2022 estimate per orebody is detailed below.
Blanket 1, Blanket 3, and Blanket 5 have single domains. While Blanket 2 has a FW and a HW orebody both with two domains. These are separated into High Grade (“HG”) and Low Grade (“LG”) domains (Figure 16). The data update from 2021 to 2022 is illustrated per domain. Previous 2021 data is shown in black, while new 2022 samples are depicted in red.
Caledonia Mining Corporation Plc S-K 1300 Technical Report Summary on the Blanket Gold Mine, Zimbabwe |
Figure 16: Section View of Blanket 1, 2, 3 and 5 Domains and Data
Blanket 4 and Blanket 6 occur around the Wenlock fault. Blanket 4 has one domain and Blanket 6 a HW and FW domain (Figure 17). Blanket Feudal occurs in the upper levels of the Blanket section. BQR is divided into a FW and HW unit, and the HW is further divided into a Northern and southern domain based on grade (Figure 18).
Caledonia Mining Corporation Plc S-K 1300 Technical Report Summary on the Blanket Gold Mine, Zimbabwe |
Figure 17: Section View of Blanket 4 and 6 Showing Domains and Data
Figure 18: Section View of BQR and Blanket Feudal Showing Domains and Data
For the main ARM orebody, an internal waste unit is present, this is clipped out and excluded from the ARM estimate. ARS has three domains, EWL, NSL and HW, all three are estimated separately (Figure 19).
Caledonia Mining Corporation Plc S-K 1300 Technical Report Summary on the Blanket Gold Mine, Zimbabwe |
Figure 19: Section View of ARM and ARS Showing Domains and Data
Lima is divided into three domains, Main, Inter-reef, and FW, all three domains were estimated (Figure 20). Eroica is divided into two domains, ERCN and ERCS (Figure 20).
Figure 20: Section View of Lima and Eroica Showing Domains and Data
Sheet has two domains and Jethro is constitutes one domain (Figure 21).
Caledonia Mining Corporation Plc S-K 1300 Technical Report Summary on the Blanket Gold Mine, Zimbabwe |
Figure 21: Section View of Jethro and Sheet Showing Domains and Data
Capping is applied to the data prior to kriging to limit the influence that anomalously high grades may have during estimation. A top cap was applied in Leapfrog Edge for variography and estimation. Probability plots were utilised to identify anomalous grade values.
Compositing is performed for all orebodies based on the most common sample length. The QPs agree with the compositing strategy employed for the resource estimation dataset. The composite applied was 0.6 m.
vi. | Geostatistical Analysis and Variography |
All variography was carried out in Leapfrog Edge. The previous 2021 semi-variogram models were updated where necessary using the new 2022 estimation datasets. Orientations previously determined were generally maintained unless there was a major change to the domain’s wireframes and data.
Kriging neighbourhood analysis (“KNA”) was undertaken to assess the optimal parameters for estimation in each of the separate domains. Different scenarios of minimum and maximum samples are run and the results plotted to define the estimation parameters for which the highest quality result can be kriged, this quality is measured by Slope of Regression (“SoR”), and kriging variance. The block sizes utilised for parent cell estimation were 3 m in x, 10 m in y and 10 m in z. This block size was chosen based on the requirements to enable an accurate representation of the data. The smaller block size in x was chosen to capture the variability in the shortest orientation of the orebodies. Sub-celling to 1 m was performed on the block models.
At lower search volumes, more samples are available (typically mining areas), and a higher minimum and maximum can be used, while further from the well-informed areas, the minimum and maximum samples will decrease to ensure more weighting is applied to nearby samples. An ordinary krige was employed were possible. Where the estimate did not inform the block model due to an increasing distance from sample data, a simple krige was employed. A declustered mean run with a shifting origin was utilised to determine the global mean value per domain where required. The distance from samples and search volume used to inform the block model is reflected in the Mineral Resource Classification.
Caledonia Mining Corporation Plc S-K 1300 Technical Report Summary on the Blanket Gold Mine, Zimbabwe |
vii. | Block Model Creation and Grade Interpolation |
Parent cell estimation with sub-celling was applied. The parent cell size is 3 m(X) by 10 m(Y) by 10 m(Z). Sub-celling down to 1 m was applied to capture the resolution that exists in the geological models. The Y direction is approximately along strike and the Z direction is approximately down-dip, the smallest parent cell size in the X direction (3 m) is orientated along the thinnest direction of the orebody.
QPs utilised Leapfrog Edge software for running the estimates. Individual orebodies were domained to reflect high and low-grade areas. The domain wireframes were used as hard boundaries during estimation. This ensures that only samples falling within the domain wireframe’s extents were utilised during estimation. Variograms could be generated for most of the domains allowing for ordinary kriging to be performed. Where the estimate needed to extend far beyond the range of the data a simple krige was employed. This is detailed per domain along with the estimation parameters employed. Robust variograms could not be generated for the Blanket Feudal and Blanket 4 Footwall domains. Therefore, inverse distance estimates were employed for these domains.
Between May 2016 and February 2020, 32,633 SG samples were taken for Blanket Mine. Only the orebodies under review and valid samples (totalling 25,260) were considered. The average for all orebodies is 2.88 and this was applied in tonnage calculations for all orebodies.
Digital 3D estimates into block models per domain were performed using Leapfrog Edge. The digital estimates replaced the combined digital and manual block listings that were used in 2021. In 2021, digital estimates were performed below a specific level as detailed in Table 10. Manual block listings were reported above these levels (Table 10). An example of the combined digital and manual block listing methodology employed in 2021 for the Blanket 2 domain is illustrated in Figure 22.
Caledonia Mining Corporation Plc S-K 1300 Technical Report Summary on the Blanket Gold Mine, Zimbabwe |
Table 10: Dimensions of Each Orebody Along with Depth from which the 2021 Digital Estimate Occurred
Orebody | Strike | Width | Depth | Digital from Level Down | Digital from Elevation down (amsl) |
| | m | m | m | | |
Blanket 1 | 173 | 3 | -215 | 22 Level | 389 |
Blanket 2HW | 351 | 3.5 | -214 | 26 Level | 269 |
Blanket 2FW | 244 | 2.7 | -215 | 22 Level | 389 |
Blanket 3 | 165 | 3.8 | -215 | 22 Level | 389 |
Blanket 4 | 35 | 7 | -93 | 22 Level | 389 |
Blanket 6HW | 35 | 8.2 | -91 | 22 Level | 389 |
Blanket 6FW | 34 | 10.5 | -94 | 22 Level | 389 |
BQR HW | 880 | 3 | -215 | 22 Level - manually edited limit | 389 - manually edited limit |
BQR FW | 520 | 2.5 | -94 | 22 Level | 389 |
BF | 390 | 2.6 | 508 | 7 Level | 878 |
ARS NSL | 174 | 15 | 312 | 22 Level | 389 |
ARS EWL | 147 | 15 | -95 | 22 Level | 389 |
ARS HW | 60 | 15 | 229 | 22 Level | 389 |
ARS Ext | 210 | 4.5 | -215 | 22 Level | 389 |
ARM Main | 395 | 12 | -97 | 22 Level | 389 |
ARM HW | 45 | 12 | 497 | 22 Level | 389 |
ARM FW | 94 | 12 | 383 | 22 Level | 389 |
Lima Main | 285 | 2 | 324 | Total Digital | |
Lima FW | 98 | 2 | 814 | Total Digital | |
Lima Inter | 235 | 2 | 654 | Total Digital | |
ERCS | 105 | 5 | -91 | 22 Level | 389 |
ERCN | 255 | 5 | -92 | 22 Level | 389 |
Figure 22: Digital and Manual Estimates for Blanket 2
Caledonia Mining Corporation Plc S-K 1300 Technical Report Summary on the Blanket Gold Mine, Zimbabwe |
Manual block listings utilised assay plans to define grade and tonnages. The grade of each block was calculated by averaging the length weighted grades of all the samples in the bottom and top drives of the block. The area is then measured to obtain the area per level. The upper and lower level is then averaged and the perpendicular distance between the levels is used to determine the volume. The SG was applied to calculate the tonnes per block. An example for Blanket 2 is shown in Figure 23, the outlined perimeter is the area measured for this level.
Figure 23: Manual Block Area for 810 m Level for Blanket 2
In the 2022 estimates, all manual block listings are completely replaced by digital 3D block model estimates for all orebodies and domains. Due to the use of averages, the physical volumes created in 3D space differs from the volumes calculated manually. An expected difference between the 2021 and 2022 estimates is a decrease in grade, as the manual block listings typically only consider selective higher grade mining areas (reserves). Alternatively, the digital estimate considers potential larger resource areas that forms part of the geological model and electronic sampling database. In addition, an average grade is calculated between two adjacent levels in the manual block listings versus a kriged estimate that utilises samples within the search ellipse confined by the domain orebody wireframe. However, samples used in estimates are typically limited to reduce smearing and keep the estimate as local as possible.
The estimation results were compared visually to the data to confirm continuity between the data and block models (Figure 24 to Figure 30). Figures illustrate un-depleted models with no additional filters applied. The Lima and Eroica estimates are depicted in Figure 24 and reflect the data well.
Caledonia Mining Corporation Plc S-K 1300 Technical Report Summary on the Blanket Gold Mine, Zimbabwe |
Figure 24: ERC and Lima Estimations
The Jethro block model is depicted in Figure 25. Data is very limited in this domain; however, the data compares well to the estimate. ARM orebodies are shown in Figure 25, the internal waste unit captures the low-grade portions of ARM, with higher grade being covered by ARM Main. ARS is illustrated in Figure 25.
Caledonia Mining Corporation Plc S-K 1300 Technical Report Summary on the Blanket Gold Mine, Zimbabwe |
Figure 25: Jethro, ARS HW and ARS NSL Estimations
The estimations for ARS extension and Sheet are shown in Figure 26. Blanket 1 and Blanket 2 estimations are shown in Figure 27.
Caledonia Mining Corporation Plc S-K 1300 Technical Report Summary on the Blanket Gold Mine, Zimbabwe |
Figure 26: ARS Extension and Sheet Estimations
Figure 27: Blanket 1 and 2 Estimations
Caledonia Mining Corporation Plc S-K 1300 Technical Report Summary on the Blanket Gold Mine, Zimbabwe |
Blanket 3 estimation is shown in Figure 28, with some high-grade intersections down-dip. Blanket 4 is also shown in Figure 28, with lower grades intersected to depth.
Figure 28: Blanket 3 and Blanket 4 Estimations
Blanket 6 is shown in Figure 29, Blanket 4 and BQR are closely associated with Blanket 6. The BF estimate is also shown in Figure 29, the domain has many samples higher in the domain and very few at depth.
Caledonia Mining Corporation Plc S-K 1300 Technical Report Summary on the Blanket Gold Mine, Zimbabwe |
Figure 29: Blanket 6 and BF Estimations
The BQR estimates are shown in Figure 30. The domaining in BQR HW shows are clear separation into high-grade and low-grade domains.
Figure 30: BQR Estimation
Caledonia Mining Corporation Plc S-K 1300 Technical Report Summary on the Blanket Gold Mine, Zimbabwe |
Depletions are correct as at 31 December 2022. All haulages, development and stoping is accounted for in the block models and the Resource excluding mining is presented in Mineral Resource tabulations. An image of all stoping and development is shown in Figure 31.
Figure 31: Long Section of Blanket Mine showing Stopes, Drives, Haulages and Shafts
xi. | Block Model Validation |
The purpose of swath plots is to verify the estimate versus the original input data. Swath plots show the average of the samples versus the average of the estimate within the same perimeter (swath) that is spaced a regular distance apart. This is repeated in X, Y and Z space to get a representative view of the correlation in all orientations. For Blanket, swaths in Y are generally across strike and swaths in X are along strike, swaths in Z represent the down-dip direction. This is typically displayed with an additional estimation technique, an inverse distance estimate in this instance. This aids in determining if any variance is due to the estimation technique. In all instances, the inverse distance weighting and ordinary kriging estimates compare well.
In addition, all swath plots compare well with the data. Better-informed domains show the best swaths, with sparsely sampled domains less so (e.g., Blanket 5).
The following are reflected on the swath plot analysis (SVOL1):-
| | ● | Sheet: The swath of the Ordinary Kriged estimates show a good correlation with the Inverse Distance estimate and data with some degree of smoothing compared to the data. Smoothing at the edge of the data limits results in estimated grades that are higher than the data. |
| | ● | ERCN domain, the swaths accurately reflect the data, with good correlation in X and Y directions. Ordinary Kriging results in smoothing relative to the data with swaths close to the edge of the estimates showing an under or over-estimate relative to the data. ERCS domain: A good correlation is seen with the data and Inverse Distance estimate. |
| | ● | Lima Main domain: The swaths of the Ordinary Kriged estimate shows some smoothing relative to the data. However, there is a good correlation with the Inverse Distance estimate and where the data is dense; some over estimation is observed at the edge of the data limits. |
Caledonia Mining Corporation Plc S-K 1300 Technical Report Summary on the Blanket Gold Mine, Zimbabwe |
Lima FW domain: The swaths of the Ordinary Kriged estimate shows a good correlation with the data and Inverse Distance estimate.
Lima Intermediate: The swaths of the Ordinary Kriged estimate shows some smoothing relative to the data; however, a good overall correlation is observed from the swath plots. A small degree of under, or over-estimation, occurs at the edge of the data limits.
| | ● | Jethro: The swath plots illustrate smoothing of the Ordinary Kriged estimates relative to the data. However, a good correlation is observed between the Ordinary Kriged and Inverse Distance estimates. Smoothing at the edge of the data limits results in under, or over-estimation relative to the data. |
| | ● | ARS HW domain: north-south orientated swaths show good correlation between the data, Ordinary Kriged and Inverse Distance estimates. East-west orientated swaths shows that Ordinary Kriged Inverse Distance estimates are smoothing relative to the data. |
ARS EWL domain: A good correlation is observed between the Ordinary Kriged and Inverse Distance estimates and data. Smoothing is observed at the edge of the data resulting in under, or over estimation compared to the data.
ARS NSL domain: A good correlation between the Ordinary Kriged, Inverse Distance estimates and data are observed.
ARS Extension: The swath plots show a good correlation to the data, with some smoothing of the estimates compared to the data.
| | ● | The ARM Main domain: The Ordinary Kriged and Inverse Distance estimates show a good correlation to the data. |
| | ● | The ARM FW domain: The Ordinary Kriged and Inverse distance estimates show a good correlation with smoothing relative to the data observed. This results in areas that have higher Au grade estimates compared to the data. |
| | ● | The Blanket 1 domain: The Ordinary Kriged and Inverse distance estimates show a good correlation with smoothing relative to the data observed. Areas at the edge of the data, or swath show a degree of over-estimation compared to the data. It is noted there are some significant high grades which skew the average for the data, while kriging serves to smooth the effects of these outliers. |
| | ● | The Blanket 2 HW HG domain: The Ordinary Kriged and Inverse Distance estimates show a good correlation with the data with some degree of smoothing. Estimates near the edge of the data show a possible under, or over-estimate compared to the data due to smoothing. |
The Blanket 2 HW LG domain: A good correlation between the estimates and the data is observed.
The Blanket 2
FW HG domain: A good correlation between the Ordinary Kriged and Inverse Distance estimate and the data is observed. A small degree of smoothing is evident in the estimate relative to the data.
| | ● | Blanket 3: The Ordinary Kriged and Inverse Distance estimates observed from the swath plots show a good correlation to the data. |
| | ● | Blanket 4 HW domain: The Ordinary Kriged and Inverse Distance estimates observed from the swath plots show a good correlation to the data. |
| | ● | Blanket 4 FW domain: The east-west orientated swaths illustrate that some areas may have been under, or over-estimated compared to the data. However, the north-south and Z directions are more representative of the direction of continuity and show good correlation. |
| | ● | The Blanket 5: A good correlation is observed the estimates and the data. |
| | ● | Blanket 6 domains: A good correlation is observed the estimates and the data. The Ordinary Kriged estimates shows some degree of smoothing relative to the data. |
| | ● | BQR FW: Swath plots show some smoothing relative to data, due to some higher-grade outliers increasing the average of the grade for the samples. Swaths in the X and Z directions show better correlation with the data. |
Caledonia Mining Corporation Plc S-K 1300 Technical Report Summary on the Blanket Gold Mine, Zimbabwe |
BQR HWN and BQR HWS: Swaths of the Ordinary Kriged and Inverse Distance estimates show a good correlation with some smoothing relative to the data.
| | ● | BF: A good correlation is seen from the swath plots. The Inverse Distance estimate shows smoothing relative to the data. |
The QP undertook an initial assessment of the mineralised body to determine the reasonable prospects of eventual economic extraction (“RPEEE”).
Economic, metallurgical, and mining parameters were used to derive the cut-offs. The parameters are tabulated in Table 11. The gold price used is the 90th percentile of the real term gold price since 1980, which currently fluctuates between USD/oz 1,800 and USD/oz 2,000, and the total operating cost supplied by Blanket Mine, for reasonable prospects of eventual economic extraction. The plant recovery and mine call factor are also based on the Blanket Mine historical production figures. Reasonable prospects of eventual economic extraction are based on a 10-to-15-year view for precious metals.
Table 11: Cut-off Derivation Factors
Parameter | Unit | Quantity |
Metal price | USD/oz | 1,800 |
Total operating cost (Mining and Processing) | USD/t | 77 |
Dilution | % | 8 |
Plant recovery factor | % | 94 |
Mine call factor | % | 100 |
All underground Mineral Resources are stated at a cut-off grade 1.5 g/t. The QP deems the total Mineral Resource as stated in this TRS to have RPEEE.
III. | Mineral Resource Classification |
Mineral Resources have been reported separately in the Measured, Indicated and Inferred Mineral Resource categories. Inferred Mineral Resources have been reported separately and have not been incorporated with the Measured and Indicated Mineral Resources. Inferred Mineral Resources have a low level of confidence and while it would be reasonable to expect that the majority of Inferred Mineral Resources would upgrade to Indicated Mineral Resources with continued exploration, due to the uncertainty of Inferred Mineral Resources, it should not be assumed that such upgrading will occur.
For classification of Mineral Resources, variogram ranges and density of sampling were used to define Mineral Resource classification. The standardised classification criteria are summarised in Table 12.
Caledonia Mining Corporation Plc S-K 1300 Technical Report Summary on the Blanket Gold Mine, Zimbabwe |
Table 12: Mineral Resource Classification Criteria for Blanket Mine
Domains | Mineral Resource Categories |
| | Measured | Indicated | Inferred |
Blanket 1 | NA | (SVOL = 1 or 2) and MinD<=40 | (SVOL = 1 or 2 or 3 or 4) and MinD<200 |
Blanket 2 HW HG | SVOL = 1 and MinD <=20 | SVOL = 1 or SVOL = 2 | (SVOL = 1, 2, 3 or 4) and AvgD<250 |
Blanket 2 HW LG | SVOL = 1 and MinD <=20 | (SVOL = 1 or 2) and MinD <= 40 | (SVOL = 1, 2, 3 or 4) and AvgD<200 |
Blanket 2 FW | SVOL = 1 and MinD <=20 | (SVOL = 1 or 2) and MinD <= 40 | (SVOL = 1, 2, 3 or 4) and AvgD<250 |
Blanket 3 | SVOL = 1 and MinD <=20 | (SVOL = 1 or 2) and MinD<=40 | (SVOL = 1, 2, 3 or 4) and AvgD<250 |
Blanket 4 HW | SVOL = 1 and MinD <=20 and SoR>=0.7 | (SVOL = 1 or 2) and MinD<=40 | (SVOL = 1, 2, 3 or 4) and AvgD<200 |
Blanket 4 FW | SVOL = 1 and MinD <=20 and NS >= 80 | (SVOL = 1 or 2) and MinD<=40 | (SVOL = 1, 2, 3 or 4) and AvgD<170 |
Blanket 5 | SVOL = 1 and MinD <= 20 and SoR >= 0.7 | (SVOL = 1 or 2) and MinD <=40 and SoR>=0.5 | SVOL 1, 2 or 3 |
Blanket 6 HW | SVOL = 1 and MinD <=20 | (SVOL = 1 or 2) and MinD<=40 | SVOL 1, 2 or 3 |
Blanket 6 FW | SVOL = 1 and MinD<=20 and SoR >= 0.8 | (SVOL = 1 or 2) and MinD<=40 | (SVOL 1, 2, 3 or 4) and MinD<300 |
BQR FW | SVOL=1 and MinD<=20 and SoR>=0.5 | (SVOL = 1 or 2) and MinD<=40 | (SVOL 1, 2, 3 or 4) and AvgD<250 |
BQR HW NORTH | SVOL=1 and MinD<=20 and SoR>=0.7 | (SVOL = 1 or 2) and MinD<=40 | (SVOL 1, 2, 3 or 4) and AvgD<360 |
BQR HW SOUTH | SVOL=1 and MinD<=20 and SoR>=0.8 | SVOL=1, 2 or 3 | (SVOL 1, 2, 3 or 4) and AvgD<250 |
ARM Main | SVOL=1 and MinD <=20 and NS>=80 | (SVOL = 1 or 2) and MinD<=40 | SVOL = 1, 2 or 3 |
ARM Waste | SVOL=1 and MinD <=20 and NS>=80 | (SVOL = 1 or 2) and MinD<=40 | SVOL = 1, 2 or 3 |
ARM FW | SVOL=1 and MinD <=20 and NS>=80 | (SVOL = 1 or 2) and MinD<=40 | SVOL = 1, 2 or 3 |
ARS Ext. | SVOL=1 and MinD<=20 and SoR>=0.8 | SVOL = 1 or 2 | SVOL =1, 2, 3 or 4 |
BF | SVOL1 and NS>=80 and MinD<=20 | (SVOL = 1 or 2) and MinD<=40 | (SVOL =1, 2, 3 or 4) and AvgD<250 |
ERC | SVOL1 and NS>=80 and MinD<=20 | (SVOL = 1 or 2) and MinD<=40 | SVOL= 1, 2 or 3 |
JETHRO | SVOL=1 and MinD<=20 and SoR>=0.8 | (SVOL=1 or 2) and MinD<=30 | SVOL= 1, 2 or 3 |
LIMA MAIN | SVOL=1 and MinD<=20 | (SVOL = 1 or 2) and MinD<=40 | (SVOL =1, 2, 3 or 4) and AvgD<200 |
LIMA INTER | SVOL=1 and MinD<=20 | (SVOL = 1 or 2) and MinD<=40 | (SVOL =1, 2, 3 or 4) and AvgD<250 |
LIMA FW | SVOL=1 and MinD<=20 | (SVOL = 1 or 2) and MinD<=40 | (SVOL= 1, 2, 3 or 4) and AvgD<100 |
SHEET MAIN | SVOL=1 and MinD<=20 | (SVOL = 1 or 2) and MinD<=40 | (SVOL= 1, 2, 3 or 4) and AvgD<200 |
SHEET SOUTH | SVOL=1 and MinD<=20 | (SVOL = 1, 2 or 3) and MinD<=40 | (SVOL= 1, 2, 3 or 4) and AvgD<150 |
ARS EWL | SVOL = 1 and SoR>=0.7 | (SVOL=1 or 2) and SoR>=0.5 | SVOL = 1 or 2 |
ARS HW | SVOL = 1 and MinD<=20 and NS>=20 | (SVOL=1, 2 or 3) and MinD<=40 | (SVOL=1, 2, 3 or 4) and AvgD<100 |
ARS NSL | SVOL = 1 and MinD<=20 | (SVOL = 1 or 2) and MinD<=40 | SVOL = 1, 2 or 3 |
Caledonia Mining Corporation Plc S-K 1300 Technical Report Summary on the Blanket Gold Mine, Zimbabwe |
The minimum distance to samples measures the minimum distance to the nearest samples for a block being estimated. In mining areas, this distance is typically less than five to ten metres. The distance to samples increasing as you move further away from a mining area. Classification of Measured Resources generally considered estimates within 1x the variogram range and the minimum distance to data is within 20 m. Indicated resources are typically within 1.5x the variogram range and where the minimum distance from data is 40 m. The Slope of regression and number of samples were also utilised during classification for some of the domains. The classification was generally extended up to a maximum of 3X the variogram range for Inferred Resources. This is considered suitable for the Blanket orebodies as geological and grade continuity is observed from mined-out areas, and the down-dip continuity of orebodies is informed by exploration drillholes. Therefore, there is sufficient confidence in geological continuity for Inferred Resources. All classification results are manually smoothed to create connectivity between blocks and exclude outliers. For example, an isolated Measured resource block occurring within an Inferred area will be manually classified as an Inferred resource.
The Mineral Resource classification for Eroica and Lima is shown in Figure 32. The Jethro and Sheet classifications are also shown in Figure 33. The ARS and ARM classifications are also shown in Figure 34.
Figure 32: ERC and Lima Mineral Resource Classification
Caledonia Mining Corporation Plc S-K 1300 Technical Report Summary on the Blanket Gold Mine, Zimbabwe |
Figure 33: Sheet and Jethro Mineral Resource Classification
Caledonia Mining Corporation Plc S-K 1300 Technical Report Summary on the Blanket Gold Mine, Zimbabwe |
Figure 34: ARM and ARS Mineral Resource Classification
The classification applied for Blanket 1 and Blanket 2 is shown in Figure 35, while Blanket 3 and Blanket 4 classification are shown in Figure 36.
Caledonia Mining Corporation Plc S-K 1300 Technical Report Summary on the Blanket Gold Mine, Zimbabwe |
Figure 35: Blanket 1 and Blanket 2 Mineral Resource Classification
Figure 36: Blanket 3 and Blanket 4 Mineral Resource Classification
Caledonia Mining Corporation Plc S-K 1300 Technical Report Summary on the Blanket Gold Mine, Zimbabwe |
The applied classification for Blanket 5 and Blanket 6 is shown in Figure 37, and the classification for BQR FW and BQR HW is shown in Figure 38. The classification for BF is shown in Figure 39.
Figure 37: Blanket 5 and Blanket 6 Mineral Resource Classification
Figure 38: BQR Mineral Resource Classification
Caledonia Mining Corporation Plc S-K 1300 Technical Report Summary on the Blanket Gold Mine, Zimbabwe |
Figure 39: BF Mineral Resource Classification
IV. | Mineral Resource Statement |
The Combined Measured and Indicated Mineral Resources, inclusive of Mineral Reserves, declared for the Blanket operations are shown in Table 13. The Inferred Resources, inclusive of Mineral Reserves, are shown in Table 14. Mineral Resources are stated as in situ.
A cut-off of 1.5 g/t is utilised for all Resource declarations. A geological loss of 0% for Measured and 5% for Indicated and Inferred, in line with the current Blanket Mine practices, has been applied. It is recommended that the geological loss is changed to reflect the respective confidence levels that are reflected by the classification category. The QPs suggest 5%, 10% and 15% for Measured, Indicated and Inferred respectively. All manual estimates have been replaced by 3D digital block model estimates in 2022. The block models were depleted as of 31 December 2022.
Caledonia Mining Corporation Plc S-K 1300 Technical Report Summary on the Blanket Gold Mine, Zimbabwe |
Table 13: In Situ Measured and Indicated Mineral Resources for Blanket Mine as at 31 December 2022 (Inclusive of Mineral Reserves)
Mineral Resource | Orebody | Tonnes | Au | Ounces |
| Classification | | t | g/t | Oz |
| ARM | 784,859 | 2.78 | 70,202 |
| | ARS | 797,656 | 3.18 | 81,460 |
| | BLK2 | 209,019 | 3.48 | 23,402 |
| | BLK3 | 67,586 | 2.47 | 5,364 |
| Measured | BLK4 | 63,651 | 3.61 | 7,387 |
| | BLK6 | 72,639 | 3.73 | 8,703 |
| | BQR | 626,955 | 3.80 | 76,597 |
| | ERC | 116,689 | 3.45 | 12,932 |
| | Lima | 114,039 | 3.20 | 11,727 |
| | Sheet | 118,156 | 2.90 | 11,000 |
Measured Total | 2,971,249 | 3.23 | 308,774 |
| ARM | 560,464 | 2.38 | 42,839 |
| | ARS | 411,290 | 2.69 | 35,506 |
| | BF | 143,927 | 3.49 | 16,164 |
| | BLK1 | 77,270 | 1.98 | 4,927 |
| | BLK2 | 320,971 | 3.23 | 33,348 |
| | BLK3 | 118,516 | 2.55 | 9,701 |
| Indicated | BLK4 | 132,918 | 2.51 | 10,721 |
| | BLK5 | 1,285 | 2.78 | 115 |
| | BLK6 | 27,864 | 2.95 | 2,640 |
| | BQR | 766,467 | 3.36 | 82,743 |
| | ERC | 655,577 | 3.73 | 78,693 |
| | Jethro | 261,879 | 2.65 | 22,276 |
| | Lima | 64,037 | 2.91 | 5,988 |
| | Sheet | 37,754 | 2.40 | 2,913 |
Indicated Total | 3,580,218 | 3.03 | 348,574 |
M&I Total | 6,551,467 | 3.12 | 657,348 |
Notes:
| | 1. | Cut-off applied 1.5 g/t. |
| | 2. | No Geological loss applied for Measured, 5% for Indicated and Inferred. |
| | 3. | Gold price: USD1,800/oz. |
| | 4. | Mineral Resources are stated inclusive of Mineral Reserves. |
| | 5. | Mineral Resources are reported as 64% attributable to Caledonia. |
| | 6. | All orebodies are depleted for mining. |
Table 14: In Situ Inferred Mineral Resources for Blanket Mine as at 31 December 2022 (Inclusive of Mineral Reserves)
Mineral Resource | Orebody | Tonnes | Au | Ounces |
| Classification | | t | g/t | oz |
| ARM | 213,581 | 2.40 | 16,503 |
| | ARS | 433,295 | 3.03 | 42,144 |
| | BF | 271,010 | 3.28 | 28,595 |
| | BLK1 | 833,042 | 2.41 | 64,623 |
| | BLK2 | 937,745 | 3.64 | 109,811 |
| | BLK3 | 466,743 | 2.68 | 40,275 |
| Inferred | BLK4 | 220,344 | 2.87 | 20,338 |
| | BLK5 | 10,578 | 2.68 | 910 |
| | BLK6 | 115,299 | 2.89 | 10,721 |
| | BQR | 1,771,552 | 2.74 | 156,097 |
| | ERC | 142,113 | 3.86 | 17,628 |
| | Jethro | 152,251 | 2.87 | 14,034 |
| | Lima | 134,774 | 3.13 | 13,550 |
| | Sheet | 46,114 | 2.61 | 3,872 |
Inferred Total | 5,748,440 | 2.92 | 539,101 |
Notes:
| | 1. | Cut-off applied 1.5 g/t. |
| | 2. | No Geological loss applied for Measured, 5% for Indicated and Inferred. |
| | 3. | Gold price: USD1,800/oz. |
| | 4. | Mineral Resources are stated inclusive of Mineral Reserves. |
| | 5. | Mineral Resources are reported as 64% attributable to Caledonia. |
| | 6. | All orebodies are depleted for mining. |
Caledonia Mining Corporation Plc S-K 1300 Technical Report Summary on the Blanket Gold Mine, Zimbabwe |
The Combined Measured and Indicated Mineral Resources, exclusive of Mineral Reserves, declared for the Blanket operations are shown in Table 15.
Table 15: In Situ Measured and Indicated Mineral Resources for Blanket Mine as at 31 December 2022 (Exclusive of Mineral Reserves)
Mineral Resource | Orebody | Tonnes | Au | Ounces |
| Classification | | t | g/t | oz |
| ARM | 681,813 | 2.80 | 61,286 |
| | ARS | 389,873 | 2.93 | 36,747 |
| | BLK2 | 149,256 | 3.69 | 17,727 |
| | BLK3 | 47,499 | 2.58 | 3,946 |
| Measured | BLK4 | 54,648 | 3.53 | 6,210 |
| | BLK6 | 70,150 | 3.71 | 8,376 |
| | BQR | 185,102 | 3.86 | 22,973 |
| | ERC | 79,276 | 3.66 | 9,331 |
| | Lima | 85,266 | 2.89 | 7,932 |
| | Sheet | 112,473 | 2.88 | 10,400 |
Measured Total | 1,855,356 | 3.10 | 184,929 |
| ARM | 404,187 | 2.30 | 29,902 |
| | ARS | 311,353 | 2.68 | 26,780 |
| | BF | 109,816 | 3.48 | 12,283 |
| | BLK1 | 77,270 | 1.98 | 4,927 |
| | BLK2 | 164,208 | 3.19 | 16,851 |
| | BLK3 | 84,940 | 2.64 | 7,199 |
| Indicated | BLK4 | 117,027 | 2.38 | 8,946 |
| | BLK5 | 870 | 3.00 | 84 |
| | BLK6 | 10,879 | 2.84 | 994 |
| | BQR | 456,509 | 3.29 | 48,331 |
| | ERC | 276,994 | 3.80 | 33,884 |
| | Jethro | 261,879 | 2.65 | 22,276 |
| | Lima | 49,108 | 2.68 | 4,228 |
| | Sheet | 37,754 | 2.40 | 2,913 |
Indicated Total | 2,362,791 | 2.89 | 219,598 |
M&I Total | 4,218,148 | 2.98 | 404,527 |
Notes:
| | 1. | Cut-off applied 1.5 g/t. |
| | 2. | No Geological loss applied for Measured, 5% for Indicated and Inferred. |
| | 3. | Gold price: USD1,800/oz. |
| | 4. | Mineral Resources are stated exclusive of Mineral Reserves. |
| | 5. | Mineral Resources are reported as 64% attributable to Caledonia. |
| | 6. | All orebodies are depleted for mining. |
| Item 11 (b) | – Individual Grade of Metals |
Mineral Resources for gold have been estimated for the Blanket Gold Mine. No other metals or minerals have been estimated for the Project.
| Item 11 (c) | – Factors Affecting Mineral Resource Estimates |
No socio-economic, legal, or political modifying factors have been taken into account in the estimation of Mineral Resources for Blanket Mine. QPs are not aware of any known environmental, permitting, legal, title, taxation, socio-economic, marketing, and political or other factors that will materially affect the Mineral Resource estimates.
All underground Mineral Resources are stated at a cut-off grade 1.5 g/t.
Caledonia Mining Corporation Plc S-K 1300 Technical Report Summary on the Blanket Gold Mine, Zimbabwe |
Caledonia has operated the Blanket Mine successfully for several years and understands the Zimbabwean mining environment and as such eliminated any risk to a large degree and hence the QPs are of the opinion that the factors affecting the Mineral Resource have been considered.
It is imperative that Blanket Mine proceed with resource conversion drilling to replace the higher grade measured and indicated Mineral Resources that have converted to Mineral Reserves by converting the higher grade inferred Mineral Resources to indicated Mineral Resources.
ITEM 12 | – MINERAL RESERVE ESTIMATES |
| Item 12 (a) | - Key Assumptions, Parameters and Methods |
The LoM planning was completed in line with current operational planning to produce 80 koz of gold per year. Only diluted Indicated and Measured Resources in the LoM plan were considered for conversion to Mineral Reserves. LoM as referred to in this TRS is remaining at 31 December 2022.
Inferred Mineral Resources have been excluded from the economic assessment for Mineral Reserve estimates. The LoM plan aims to produce 80 koz of gold per year from Measured and Indicated Mineral Resources only.
The LoM plan was developed utilising the 3D Mineral Resource model, estimates as reviewed and updated by the QPs. The Mineral Resource classifications were incorporated from the 2022 Mineral Resource estimate. The mine design and scheduling utilise the updated 2022 Mineral Resource model.
I. | Stope Design Methodology |
Blanket mine made use of the geological wireframes to create the stope shapes utilised in the LoM design process. Each orebody was segmented horizontally on existing ROM and capital intersecting ends, where no existing ends were found the orebody wireframes were segmented at 15 meters intervals. Along strike these orebody wireframes were segmented at 10 m with the width represented by the full width of the orebody wireframes. Areas where the width of the orebody was less than 1.8 m (width of sub-drives), these stopes were manually modified to a width of 1.8 m.
Evaluation was run on all segmented stopes utilising block models provided by Minxcon, legends were applied to identify stopes above cut-off grade (2.1 g/t), marginal (1.5 g/t - 2.1 g/t) and low grade (<1.5g/t). To identify areas to be mined, each block was investigated on its own merit, where a block consists of the unique lists of orebody and tramming levels. Marginal stopes were introduced where practical mining dictated necessary.
The cut-off grade calculation for the Blanket Mine is detailed in Table 16.
Table 16: Cut-Off Grade Calculation
Description | Unit | Value |
Gold Price | USD/oz | 1650 |
Dilution | % | 8 |
Mine Call Factor | % | 100 |
Recovery | % | 94 |
Metal price | USD/g | 53.05 |
Total Operating Cost | USD/t | 82 |
Cut-off Grade in Place | g/t | 1.79 |
Reserve Cut-off Grade | g/t | 2.10 |
Caledonia Mining Corporation Plc S-K 1300 Technical Report Summary on the Blanket Gold Mine, Zimbabwe |
Blanket Mine utilises a 2.1 g/t planning cut-off grade. The mine design and schedule were completed using the accepted 2.1 g/t cut-off grade.
Mineral Reserve conversion factors are the consideration of mining factors used to convert Mineral Resources to Mineral Reserves. These factors are applied to adjust the in situ Mineral Resources in the LoM planning to realistic and accurate mill feed, volumes, and grade. The Mineral Reserve conversion factors applied to the Mineral Resources in the LoM plan, are detailed in Table 17.
Table 17: Mineral Reserve Conversion Factors Summary
Description | Unit | Value |
Geological Losses |
Measured | % | 0 |
Indicated | % | 5 |
Inferred | % | 5 |
Exploration Target | % | 15 |
Other Dilution Factors |
Pillar Extraction | % | 50 |
Dilution | % | 8 |
Mine Call Factor | % | 100 |
The following additional factors were considered:-
| | ● | Processing and Metallurgical: The conventional CIL recovery method is well proven and has been used consistently on this orebody. The recovery used was 94% and no other metallurgical factors are known that may impact the Mineral Reserve. |
| | ● | Infrastructure: Infrastructure required for the planned production is either in place or planned for. Sufficient capital provision has been made for all planned infrastructure required for the planned production. |
| | ● | Economic and Marketing: The gold price that has been utilised for the Mineral Reserve estimate is a real term forecast taken as the median of various bank and analyst forecasts. The average gold price over the LoM is USD1,655/oz. An uneconomical tail has been cut from the first negative cashflow year and has been excluded from the Mineral Reserve. The tail contains 125.5 koz of gold but is not economically viable on its own. |
| | ● | Legal, Environmental, Social and Governmental: There are no legal, environmental, social or governmental factors that are deemed to be classified as modifying factors applied to the Mineral Reserves. |
IV. | Mineral Resource to Mineral Reserve Conversion |
All Mineral Reserves have been categorised and reported in accordance with the guidelines of §229.1302(e)(2) of S-K 1300. Only Indicated and Measured Resources in the LoM plan were considered for conversion to Mineral Reserves. Inferred Mineral Resources have been excluded from the LoM plan for economic assessment for Mineral Reserve estimates. Only diluted Measured and Indicated Mineral Resources have been converted into Proven and Probable Mineral Reserves, respectively. Mineral Reserves have been reported separately in the Proven and Probable Mineral Reserve categories. Inferred Mineral Resources have not been incorporated with the Proven and Probable Mineral Reserves.
The Mineral Resources as estimated by the QP as at 31 March 2022 were utilised for the updated 2022 Mineral Reserve estimation. The QP has depleted the 31 March 2022 Mineral Resources with updated mining faces to the period ending 31 December 2022.
Caledonia Mining Corporation Plc S-K 1300 Technical Report Summary on the Blanket Gold Mine, Zimbabwe |
The depleted Mineral Resources as at 31 December 2022, was utilised with the 2022 LoM plan as detailed in Item 13 (b). The QP utilised the 31 December 2022 LoM plan with the depleted Mineral Resources to conduct an updated Mineral Reserve estimation, which accounts for the mining depletions from 31 December 2022.
A new mine design and schedule was conducted for the Mineral Reserve estimation as at 31 December 2022 as illustrated in Figure 40.
Figure 40: Diluted Life of Mine Production Schedule by Mineral Resource Classification (2022)
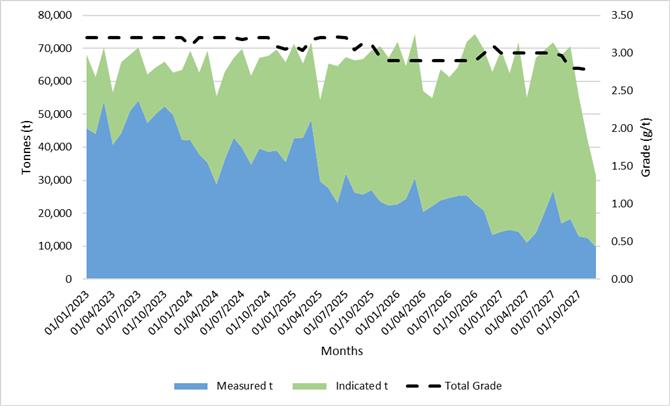
The updated Mineral Reserve estimation as at 31 December 2022, is detailed in Table 18. Mineral Reserves are stated as delivered to plant.
Table 18: Blanket Mine Mineral Reserve Estimate as at 31 December 2022
Mineral Reserve Classification | Tonnes | Grade | Au Content |
| | kt | g/t | kg | oz |
Proven | 1,191 | 3.23 | 3,842 | 123,534 |
Probable | 1,300 | 2.92 | 3,801 | 122,205 |
Total | 2,491 | 3.07 | 7,643 | 245,739 |
Notes:
| | 1. | Mineral Reserve cut-off of 2.1 g/t applied. |
| | 2. | The gold price that has been utilised in the economic analysis to convert diluted Measured and Indicated Mineral Resources in the LoM plan to Mineral Reserves is an average real term price of USD1,655/oz over the LoM, using the forecast prices as per Economic Analysis. |
| | 3. | The Mineral Reserve estimation utilises the depleted 2022 Mineral Resource estimation and the 2022 mine design and LoM plan. |
| | 4. | Mineral Reserves are reported as 64% attributable to Caledonia. |
Mineral Resources from the Measured and Indicated Mineral Resource Classifications were converted into Proven and Probable Mineral Reserves. The attributable Blanket Mine Mineral Reserve estimate consists of 50% Proven and 50% Probable Mineral Reserves on a gold content basis.
| Item 12 (b) | - Multiple Commodity Reserve |
Gold is the only commodity within the Blanket mining areas that is present in significant concentrations.
Caledonia Mining Corporation Plc S-K 1300 Technical Report Summary on the Blanket Gold Mine, Zimbabwe |
| Item 12 (c) | - Factors Affecting Mineral Reserve Estimation |
No socio-economic, legal or political modifying factors have been taken into account in the estimation of Mineral Reserves for the Blanket Mine. The QPs are not aware of any known environmental, permitting, legal, title, taxation, socio-economic, marketing, and political or other factors that will materially affect the Mineral Reserve estimates. No material issues have been identified for the Blanket Mine.
The Mineral Reserve conversion factors detailed in Table 17 have been applied to the Mineral Resource for conversion to Mineral Reserves. The classification of Mineral Reserves can be affected by changes in the status of the factors. In particular, the gold price will affect the viability of the mineralised target.
An uneconomical tail has been cut from the first negative cashflow year and has been excluded from the Mineral Reserve. The tail contains 125.5 koz of gold but is not economically viable on its own.
Blanket Mine uses two mining methods which are well suited to the nature of the greenstone belt deposits. The orebodies range from generally steeply dipping sheet-like deposits of a few meters in width, to pipe-shaped and massive deposits with widths more than 50 m. The extreme variation within the Blanket Mine mineral deposits, necessitates modification of the exact mining methods that suits the specific characteristics of each mineral deposit The general practice on Blanket Mine is to implement one of two tailored mining methods, determined mainly by the width of the mineral deposit.
The two mining methods utilised are:-
| | ● | Long-hole stoping in wider mineral deposits (orebody widths generally more than 3 m); and |
| | ● | Underhand stoping in narrow mineral deposits (orebody widths generally less than 3 m). |
Blanket Mine uses long-hole stoping in the orebodies with a width greater than 3 m. It can also be applied in instances where the ground conditions render an area unsafe to be mined using conventional underhand stoping method. Long-hole stoping is a selective and highly productive mining method that provides good ore recovery. The method is flexible and allows for practical modifications to the mining sequence and configuration to suit the characteristics of the orebody. Long Hole drilling entails using drifter machines to drill holes which cover the full span of the sublevel interval and then blasting them. When the block has been delineated and made ready for production mining cones are created at the lowermost level above the main extraction haulage. These cones will be linked to the draw point system established at the main level. Once the third cone has been established a slot is then created on the sublevel immediately above the coning level, which opens the sub drive face for subsequent drilling and blasting.
Holes parallel to the slot face spanning the full length of the sublevel interval are then drilled and depending on the width of the slot will make up what is known as a ring. These holes are then blasted after completion and this cycle will continue until the full strike of the orebody on the sublevel is exhausted. Long hole drilling and blasting is done in a vertical retreat fashion maintaining a lead 72-degree angle between the lower and upper stopes. Mining the orebody creates a void or “open-stope” that is unsupported, however sill pillars are left between tramming haulage levels and rib pillars along strike for regional support.
To access the orebody, crosscuts are developed from the tramming haulage to the extraction haulage which is located approximately 20 m from the orebody. Draw point crosscuts are developed at 15 m intervals along the extraction haulage at 990 m level and above while below 990 m level a 20 m interval spacing is utilised which provide access to the draw points. A twin raise system is developed upwards to establish a sliping point for the development of the sub-drive. One raise serves as an access raise, while the other serves as an ore pass to handle ore from the sub-drive development. The twin raise system is developed from one sub-drive to the next for the entire 120 m or 60 m lift.
Caledonia Mining Corporation Plc S-K 1300 Technical Report Summary on the Blanket Gold Mine, Zimbabwe |
Drawpoint raises are established at each draw point crosscut near the centre of the orebody to a sublevel height of 15 m. A lead angle of 45° is always maintained for the sub-drive development. Production faces have a lead angle of 72° with the bottom most production face leading. Mining of the orebody is done in retreat from the one extreme end of the orebody to the other along its strike.
Coning is done from the coning level and can only commence once sufficient raises for access and ore handling have been developed and holed into the sub-drive. Once coning starts, the raise can no longer be used as an access way. As a rule of thumb, three cones are established before any production may commence.
Production drilling is done in a retreat fashion from the orebody limit and drilling is done top down with Seco S36 drifter machines. Depending on production requirements, multiple sub-levels may be mined simultaneously. The orebody width will ultimately determine the width of the stoping panel. Ore is then extracted from the stope draw points via the lower extraction haulage using mechanical loaders. The ore is then loaded onto Granby cars for transportation to the station orepasses.
Conventional underhand stoping is used in orebodies with a width less than 3 m. Underhand stoping is particularly suitable for steeply dipping, narrow orebodies and allows for better control of the stoping width and dilution. The sublevel spacing and coning arrangement is similar to the long hole mining approach, the only difference is that in the conventional underhand the extraction haulage can be established in the orebody. Box raises are established instead of draw points in instances where the haulage is established in the orebody. Once box raises have been established coning can take place on the coning sublevel. A slot is created on the sublevel above the coning level once the third cone has been established. Underhand jackhammer drilling and blasting cycle commences once slot has been created. Whereas in long hole the holes cover the full span of the sublevel in underhand drilling 2 m bench lifts are drilled and blasted at each cycle until the bench holes onto the sublevel below and the sequence continues over the strike of the orebody panel until it is exhausted. Retreat direction on a panel is dependent on the number of slot raises established within the particular panel. In most cases in a 60-70 m panel a slot raise system is established midway which allows for retreat from the central slot in two directions.
Stoping preparations commence by mining slot raises at 15 m intervals along the extraction haulage from the footwall of the orebody. Development within the orebody is the same as in the long-hole stoping sections, with the difference being that boxes are mined instead of draw points.
Upon establishment of sufficient slot raises, production commences with sliping around the slot raise to establish faces. Mining is done in both directions on strike with one face leading the other. Extreme end raises are equipped to serve as access raises for men and material. The lower level is equipped with boxes at set intervals from which ore will be drawn.
The sequence is repeated and as the stope grows horizontally and progresses downwards, additional raises are developed, and new stopes established to maintain the required production rates. The stope is mined up to the limits of the sill pillars.
| Item 13 (a) | – Parameters Relevant to Mine Design |
I. | Geotechnical and Hydrological Parameters |
Blanket Mine has employed a rock engineering consultant as of February 2020 for the required geotechnical inspections and designs of the underground workings. All legal appointments pertaining to rock engineering requirements are in place. The geotechnical model for Blanket Mine is being revised & with this in mind support standards are continually reviewed and rock mechanics recommendations for the current mining operations are in place.
Caledonia Mining Corporation Plc S-K 1300 Technical Report Summary on the Blanket Gold Mine, Zimbabwe |
No new geotechnical, hydrological, or rock engineering work has been conducted for the newly targeted mining areas below 750 m Level. The studies and work associated with these parameters will be addressed by the rock engineering consultant as data is generated & access is obtained through development. This will further inform the geotechnical model.
II. | Underground Access, Ore Flow and Material Handling |
The Mine consists of several small shafts that provide access to the various orebodies in which mining operations take place. With CMS being completed and providing access to Mineral Resources from 750 m Level up to 1,110 m Level and beyond, mining activities will be focused on Mineral Resources below 750 m Level. Production below 750 m Level is planned to be accessed through declines from the respective mining areas. The hoisting capacity and current utilisation of the shafts are detailed in Table 19. The Blanket Mine shaft infrastructure is illustrated in Figure 41.
Caledonia Mining Corporation Plc S-K 1300 Technical Report Summary on the Blanket Gold Mine, Zimbabwe |
Figure 41: Blanket Mine Shaft Infrastructure
Caledonia Mining Corporation Plc S-K 1300 Technical Report Summary on the Blanket Gold Mine, Zimbabwe |
Table 19: Shaft Utilisation and Hoisting Capacity
Shaft | Access Description | Utilisation | Hoisting Capacity |
Central Shaft | Surface to 35 Level | Ore, men and material | 2 x 10 tonne skips |
No. 4 Shaft | Surface to 825 m Level | Ore and material | 2 x 5 tonne skips |
Jethro Shaft | Surface to 7 Level | Men and material | Single deck cage |
Lima Shaft | Surface to 8 Level | Ore, men and material | 1 x 2 tonne skip |
Incline Shaft | Surface to 7 Level | Ore | 1 x 2 tonne skip |
5 Winze | 7 Level to 22 Level | Men and material | Double deck cage |
Eroica Shaft | 14 Level to 675 m Level | Men and material | Single Deck cage |
No. 6 Shaft | 22 Level to 900 m Level | Ore, men and material | 2 x 3 tonne skip |
The Blanket Mine is ventilated by an ascensional ventilation system. In an ascensional ventilation system, intake air is directed to the lowest active mining level and the air then ascends along the working faces to the main returns by means of fans.
The ventilation intakes are located in the southern part of the mine and consist of the Jethro, Number 4, Main and Feudal Shafts. The air is directed to the respective ventilation districts by means of fans and is returned in the northern part of the mine via the Sheet, Eroica 1 and 2, Eroica Raise Bore, Lima, and Lima North Shafts.
Central shaft is currently isolated from the rest of the mine with respect to ventilation. Significant changes to the ventilation layout and air quantities are expected when CMS will be connected to the Mine. The connection of Central Shaft to other mining areas will require a new ventilation strategy which also allows for the planned expansion in mechanisation.
Blanket Mine employs a ventilation consultant to advise on changes in the ventilation strategy and design.
| Item 13 (b) | – Production Rates, Expected Mine Life, Mining Unit Dimensions, and Mining Dilution |
The production days may vary from month to month and are dictated by the public holidays in each month where this calendar is shared by the plant manager to all HODs. Drilling and blasting operations are conducted on dayshift while nightshift conducts cleaning operations. The Blanket Mine shift system is detailed in Table 21.
Table 20: Blanket Mine Shift System
Shift | Activity | Duration |
Morning Shift | Drilling and blasting | 8 Hours |
Night Shift | Lashing and cleaning | 12 Hours |
Tramming is conducted on both morning and night shift.
The planned development rates for the Blanket Mine are detailed in Table 21.
Caledonia Mining Corporation Plc S-K 1300 Technical Report Summary on the Blanket Gold Mine, Zimbabwe |
Table 21: Blanket Mine Development Rates
Development Type | Unit | Value |
Bypass | m/d | 1.3 |
Box Raise | m/d | 1 |
Cut off Raise | m/d | 1 |
Connection Crosscut | m/d | 1.3 |
DD Cubbies | m/d | 1.3 |
DD Chamber | m/d | 1.3 |
DD Crosscut | m/d | 2.25 |
Decline | m/d | 2.7 |
Decline Connection | m/d | 2.7 |
Draw point Raise | m/d | 1 |
Draw point Crosscut | m/d | 2.7 |
Sub drive | m/d | 1.3 |
Dump Truck Access Bay | m/d | 2.7 |
Decline Crosscut | m/d | 2.7 |
Extraction Haulage | m/d | 2.7 |
Haulage | m/d | 2.7 |
Layby | m/d | 2.7 |
Loading Bay | m/d | 2.7 |
Lead Drive | m/d | 1.3 |
LHD Access Bay | m/d | 2.7 |
Muck Bay | m/d | 2.7 |
Ore pass Raise | m/d | 1 |
Sub Station Crosscut | m/d | 2.7 |
Slot Raise | m/d | 1 |
Sump | m/d | 2.7 |
Service Raise | m/d | 1 |
TW Raise | m/d | 1 |
Vent Raise | m/d | 1 |
Blanket Mine plans to produce 80 koz of gold per year. The LoM plan reflects 80 koz of gold production from Mineral Reserves only. The planned production rates from the different orebodies are detailed in Table 22.
Table 22: Blanket Mine Production Rates
Type | Unit | Value |
LH Stoping | tpd | 100 |
UH Stoping | tpd | 40 |
Pillar | tpd | 100 |
Draw point | tpd | 30 |
The Blanket LoM plan commences in 2023. The LoM plan includes Measured, Indicated and Inferred Mineral Resources, however only diluted Measured and Indicated Mineral Resources in the LoM plan were considered for conversion to Mineral Reserves. A LoM of five years from the beginning of 2023 is expected for the Blanket Mine.
The mining strategy targets primarily the Mineral Resources below 750 m Level. Mining in the Lima orebody targets Mineral Resources above 750 m Level. In the ARS East West Limb, Blanket and Blanket Feudal orebodies, some mining will take place above 630 m Level. The diluted production schedule for the Blanket Mine is illustrated in Figure 42.
Caledonia Mining Corporation Plc S-K 1300 Technical Report Summary on the Blanket Gold Mine, Zimbabwe |
Figure 42: Diluted Life of Mine Production Schedule by Mineral Resource Classification
A total of 1,861 kt Measured Mineral Resources at a grade of 3.23 g/t and 2,032 kt Indicated Mineral Resources at a grade of 2.92 g/t is included in the LoM plan. Of this 64% is attributable to Caledonia (1,191 kt Measured Mineral Resources and 1,300 kt Indicated Mineral Resources). The content delivered to the plant from the Blanket Mine is illustrated in Figure 43.
Figure 43: Blanket Mine Content Delivered to the Plant
Caledonia Mining Corporation Plc S-K 1300 Technical Report Summary on the Blanket Gold Mine, Zimbabwe |
The LoM plan includes a total of 193 koz and 191 koz of gold from the Measured and Indicated Mineral Resource Classifications, respectively. Of this 64% is attributable to Caledonia (124 koz Measured Mineral Resources and 122 koz Indicated Mineral Resources). The monthly ore tonne production is illustrated in Figure 42 and Figure 43.
IV. | Mining Unit Dimensions |
The mine design criteria for the Blanket Mine is detailed in Table 23.
Table 23: Mine Design Criteria for Blanket Mine
Item | Unit | Unit |
Level Parameters |
Main Haulage Level Spacing | m | 120 |
Sub-level Spacing (Middling) | m | 15 |
Draw point Crosscut Spacing | m | 15 |
Diamond Drilling Crosscut Spacing (Along sub drives and leader drives) | m | 7.5 |
Extraction Haulage Spacing from Orebody | m | 20 |
Development Lead Angle | Degrees | 45 |
Production Lead Angle | Degrees | 72 |
Pillars |
Sill Pillar Thickness | m | 15 |
Crown Pillar Thickness | m | 15 |
Rib Pillar Thickness | m | 20 |
Sill Pillar Spacing | m | 90 |
The Blanket Mine design is illustrated in Figure 44.
Figure 44: Blanket Mine Design
V. | Mineral Reserve Conversion Factors |
Mineral Reserve conversion factors are applied to convert the Mineral Resources to Mineral Reserves. The applied Mineral Reserve conversion factors are detailed as follows:-
Caledonia Mining Corporation Plc S-K 1300 Technical Report Summary on the Blanket Gold Mine, Zimbabwe |
| | ● | Geological Losses: Geological loss is applied to account for geological uncertainty associated with different Mineral Resource categories. The mine plan includes Inferred Mineral Resources, Indicated Mineral Resources and Measured Mineral Resources. Geological losses of 0% was applied to Measured Mineral Resources, and 5% to Indicated and Inferred Mineral Resources. |
| | ● | Pillar Extraction: A pillar extraction of 50% has been applied to account for pillars which will be extracted on retreat when a block has been mined out. The pillar extraction accounts for the extraction of sill pillars (including pillars between drawpoints) which will be extracted. A detailed rock engineering recommendation is required to determine which pillars are eligible for partial or total extraction. |
| | ● | Ore Losses: Ore losses occur when mined material containing grade, is mixed with waste material, and can be attributed to several different causes. Different ore losses have been applied to account for ore to waste losses during mining of the various orebodies. It was assumed that the entire thickness of the reef is taken out, with negligible ore lost to waste. |
| | ● | Dilution: Dilution is defined as a percentage value representing a certain amount of waste material that is mixed with the ore during the mining process. This results in increased ore tonnages, but due to waste material containing no or very little grade, the overall grade delivered to the plant is decreased. The thickness of the orebodies mined at the Blanket Mine vary significantly and are in some instances very irregularly shaped. The Blanket Mine applies an accepted dilution of 8%, derived from actual production figures. Dilution of 15 cm in the hanging wall and footwall was applied to orebodies which are mined using the conventional underhand mining method and dilution of 30 cm was applied to orebodies which are mined using long-hole stoping. It has been assumed that drilling with shorter drill steels in conventional mining results in less overbreak than drilling with long drill steels used in long-hole stoping. The average dilution calculation is detailed in Table 24. |
Table 24: Blanket Mine Average Dilution Calculation
Orebody | Mining Method | Average Orebody Thickness | HW and FW Dilution | Dilution |
| | | cm | cm | % |
Blanket 1 | Underhand | 300 | 30 | 10.00 |
Blanket 2FW | Underhand | 270 | 30 | 11.11 |
Blanket 2HW | Underhand | 350 | 30 | 8.57 |
Blanket 3 | Underhand | 380 | 30 | 7.89 |
Blanket 4 | Underhand | 700 | 30 | 4.29 |
Blanket 6FW | Underhand | 1050 | 30 | 2.86 |
Blanket 6HW | Underhand | 820 | 30 | 3.66 |
ARS | Long-hole | 1500 | 60 | 4.00 |
ARS EXTENSION | Long-hole | 450 | 60 | 13.33 |
ARM | Long-hole | 1200 | 60 | 5.00 |
Lima | Underhand | 200 | 30 | 15.00 |
Eroica | Underhand | 500 | 30 | 6.00 |
Average Dilution | 8.00 |
| | ● | Mine Call Factor: MCF is the ratio, expressed as a percentage, which the specific product accounted for in recovery plus residues bears to the corresponding product called for by, the Mine's measuring methods. The MCF was calculated from historic and current figures. The MCF calculation from 2015 to 2022 is detailed in Table 25. A MCF of 100% has been used for the Blanket Mine, derived from the actual MCF calculations from 2015 to 2022. |
Caledonia Mining Corporation Plc S-K 1300 Technical Report Summary on the Blanket Gold Mine, Zimbabwe |
Table 25: Blanket Mine - Mine Call Factor Calculation 2015 to 2022
Year | Milled Tonnes | Gold Recovered | Gold in Tails | Gold Accounted For | Total Mined Tonnes | Mined Grade | Gold Called For | MCF |
| | t | oz | oz | oz | t | g/t | oz | % |
2015 | 440,057 | 42,804 | 3,243 | 46,047 | 440,057 | 3.22 | 42,574 | 108% |
2016 | 510,662 | 50,351 | 3,794 | 54,145 | 510,662 | 3.28 | 50,903 | 106% |
2017 | 547,060 | 56,133 | 3,941 | 60,074 | 547,060 | 3.42 | 56,826 | 106% |
2018 | 560,913 | 54,512 | 4,166 | 58,678 | 545,267 | 3.26 | 56,626 | 104% |
2019 | 556,746 | 55,182 | 3,902 | 59,084 | 556,440 | 3.31 | 57,248 | 103% |
2020 | 597,962 | 57,899 | 3,845 | 61,744 | 571,061 | 3.26 | 59,854 | 103% |
2021 | 665,627 | 69,435 | 4,409 | 73,844 | 668,933 | 3.38 | 72,631 | 102% |
2022 | 469,530 | 53,548 | 3,377 | 56,925 | 493,675 | 3.65 | 57,951 | 98% |
Note: Figures for 2022 are as at 1 September 2022.
| Item 13 (c) | – Requirements for Stripping, Underground Development and Backfilling |
I. | Underground Development |
The existing development forms part of the mine plan to provide access to the underground workings and the targeted mining areas. Additional development is required for opening sufficient ground and to provide access to the mining areas below 750 m Level. Different development requirements exist for the orebodies included in this study.
The Blanket Mine will focus on increased development throughout 2022, focusing on key development ends to open ground below 750 m Level. The planned capital development consists of:-
| | ● | Eroica decline 3 from 870 m Level to 930 m Level to create an intermediate level; |
| | ● | Extension of haulage north and south on 990 m level and 1110 m level; |
| | ● | 1110 m Level to 1230 m level twin declines, where first decline will serve as men and material access and the second decline for conveyor material movement; |
| | ● | 1110 m Level incline to serves as tipping point for conveyor; and |
| | ● | 930 Blanket extraction haulage to serve as an intermediate production level for the Blanket 990 blocks. |
The planned capital development is in line with the No. 4 Shaft and Central Shaft capacity constraints. The Blanket Mine development design is illustrated Figure 45.
Caledonia Mining Corporation Plc S-K 1300 Technical Report Summary on the Blanket Gold Mine, Zimbabwe |
Figure 45: Blanket Mine Development Design
Central Shaft development has been split into infrastructure development and 30 Level and 34 Level capital development. Infrastructure development consists of the Western and Eastern Drive haulages, station tips and crosscuts, workshops, laydown areas and load level development.
The capital development consists of the 30 Level and 34 Level North and South haulages, re-muck bays, tipping bays, cubbies and exploration crosscuts. The development profile for the Blanket Mine is illustrated in Figure 46.
The capital development was rescheduled in MineRP to optimise capital development meters required for the Mineral Reserve areas in the LoM plan. Ore drive cubbies was not accounted for in USD/m costing but was accounted for on a USD/tonne basis.
Figure 46: Blanket Mine Development Profile
Caledonia Mining Corporation Plc S-K 1300 Technical Report Summary on the Blanket Gold Mine, Zimbabwe |
Development meters are high in the first two years of the LoM plan with the focus on opening up Mineral Resources below 870 m Level and to establish the intermediate production levels on 810 m Level to serve the Eroica orebody and on 930 m Level to serve the ARS and Blanket orebodies.
The Blanket Mine currently does not have any requirements for backfilling within any of the mining areas. If future depth extensions are planned, it may require an investigation into backfill requirements.
| Item 13 (d) | – Required Mining Fleet, Machinery and Personnel |
I. | Mining Fleet and Machinery |
The underground mining fleet consists of rail-bound and trackless equipment. Mining below 750 m Level is planned to be mainly mechanised mining. Production and development drilling is done by using a combination of Seco 25 jackhammers in conventional underhand mining areas while Seco 36 drifters are used in long-hole stoping areas. The underground rail-bound and trackless fleet is detailed in Table 26.
Table 26: Blanket Mine Current Mining Fleet
Fleet | Quantity |
Rail-bound Fleet |
Air loaders | 27 |
Battery operated locomotives | 24 |
Cars (Material & Hoppers) | 192 |
Trackless Fleet |
Dump trucks | 12 |
LHDs | 18 |
Bobcat | 1 |
Utility vehicles | 1 |
Rock breakers | 1 installed, 2 to be installed |
The mining personnel for the Blanket Mine is detailed in Table 27.
Table 27: Blanket Mine Mining Personnel
Positions | Capital Project | Run Of Mine | Total |
Air Loader Driver | 4 | 0 | 4 |
Assistant Drifter Operator | 0 | 4 | 4 |
Assistant Loco Driver | 0 | 2 | 2 |
Assistant Machine Operator | 27 | 72 | 99 |
Assistant Shaft Timberman | 1 | 0 | 1 |
Assistant Overseer Miner | 0 | 2 | 2 |
Banksman Assistant | 4 | 0 | 4 |
Bellman | 5 | 29 | 34 |
Construction Assistant | 0 | 9 | 9 |
Construction Gangleader | 1 | 8 | 9 |
Crusher Attendant | 0 | 10 | 10 |
Crushing Gangleader | 0 | 1 | 1 |
Drifter Assistant | 0 | 3 | 3 |
Drifter Gangleaders | 0 | 1 | 1 |
Drifter Operator | 5 | 24 | 29 |
Drill Rig Jumbo Operator | 1 | 0 | 1 |
Drill Rig Operator | 5 | 0 | 5 |
Driller Assistant | 1 | 0 | 1 |
Dump Truck Driver | 0 | 10 | 10 |
Gangleader | 5 | 34 | 39 |
Grizzley Attendant | 0 | 2 | 2 |
Lasher | 91 | 405 | 496 |
Caledonia Mining Corporation Plc S-K 1300 Technical Report Summary on the Blanket Gold Mine, Zimbabwe |
| Positions | Capital Project | Run Of Mine | Total |
Lashing Gangleader | 1 | 10 | 11 |
LHD Driver | 12 | 37 | 49 |
LHD Operator | 0 | 5 | 5 |
Loader Driver | 1 | 20 | 21 |
Loco Assistant | 4 | 5 | 9 |
Loco Driver | 6 | 53 | 59 |
Machine Assistant | 0 | 2 | 2 |
Machine Gangleadeer | 1 | 21 | 22 |
Machine Operator | 43 | 126 | 169 |
Magazine Attendants | 1 | 4 | 5 |
Magazine Man | 0 | 2 | 2 |
Mahewu brewers | 0 | 1 | 1 |
Mine Captain | 0 | 8 | 8 |
Overseer miner | 3 | 13 | 16 |
PVT Assistant | 10 | 2 | 12 |
PVT Gangleader | 2 | 0 | 2 |
Raise Riggers | 2 | 12 | 14 |
Rockbreaker Operator | 0 | 3 | 3 |
Sanitation Attendant | 1 | 1 | 2 |
Senior Crusher Attendant | 0 | 1 | 1 |
Senior Gangleader | 1 | 7 | 8 |
Senior LHD Driver | 0 | 1 | 1 |
Senior Magazine man | 0 | 1 | 1 |
Senior Mine Captain | 1 | 0 | 1 |
Senior Overseer Miner | 0 | 4 | 4 |
Senior Underground Manager | 1 | 0 | 1 |
Shaft Assistant | 2 | 0 | 2 |
Shaft Clerk | 1 | 3 | 4 |
Shaft Gangleader | 0 | 1 | 1 |
Shaft Timberman | 0 | 2 | 2 |
Shaft Timberman Assistant | 3 | 7 | 10 |
Shafts Gangleader | 2 | 0 | 2 |
Shift Boss | 1 | 0 | 1 |
Strata Control Officer | 0 | 1 | 1 |
Timberman`s Assistant | 0 | 0 | 0 |
Tip Attendant | 0 | 1 | 1 |
Trammer | 2 | 20 | 22 |
Tramming Gangleader | 0 | 8 | 8 |
Underground Manager | 0 | 3 | 3 |
Underground Sanitation Attendant | 0 | 2 | 2 |
Ventilation Officer | 0 | 1 | 1 |
Ventilation Technician | 0 | 2 | 2 |
Strata Control Technician | 0 | 1 | 1 |
Grand Total | 251 | 1,007 | 1,258 |
Source: Blanket Mine
ITEM 14 | – RECOVERY METHODS |
| Item 14 (a) | - Flow Sheets and Process Recovery Methods |
The Blanket Mine plant consists of a conventional crushing, milling, CIL, batch elution and smelting running at 70.1 ktpm. The crushing and milling circuits are designed to process RoM. However, the CIL and downstream circuits were designed to treat tailings dam material at a rate of 91.45 ktpm and RoM at 17.70 ktpm to give a combined capacity of 109 ktpm. The CIL is currently used exclusively for treatment of RoM at a rate of up to 70.1 ktpm. A process flow diagram is depicted in Figure 47.
The plant consists of the following circuits:-
| | ● | Primary crushing - jaw crushing; |
| | ● | Secondary crushing - cone crushing in closed circuit with a screen; |
| | ● | Primary Milling - rod mills in open circuit; |
Caledonia Mining Corporation Plc S-K 1300 Technical Report Summary on the Blanket Gold Mine, Zimbabwe |
| | ● | Regrind - ball mill in closed circuit with cyclones; |
| | ● | Gravity Concentration – Knelson concentrators and Gemini table; |
| | ● | Intensive leach for gravity concentrate; |
| | ● | Thickening - Dewatering cyclones; |
| | ● | Leaching – carbon-in-leach (“CIL”); |
| | ● | Elution and electrowinning – Combined in batch mode; |
| | ● | Casting - smelt house; |
| | ● | Carbon regeneration - Re-activation kiln; |
| | ● | Reagent make-up and dosing circuits; and |
| | ● | Water recycling and storage. |
Figure 47: Blanket Process Flow Diagram
The milled tonnes varied between 364 kt/yr and 750 kt/yr for the past 11 years from 2012 to 2022, increasing steadily with 752 kt milled in 2022. The overall recoveries varied between 92.91% and 93.79% with an average of 93.41%. The gravity gold recovery varies between 48.51% and 54.51% with an average of 50.87%. The CIL circuit gold recovery is also very steady with an average of 86.14%. It is worth noting that the use of oxygen improved CIL recovery from an average of 82.6% to 85.4%. This has led to an increased overall recovery to an annual average of greater than 93% in the past 11 years. The plant is expected to maintain a similar recovery in the future when treating current Blanket RoM material. RoM material from other sources may be more refractory and will have to be tested before being treated in the Blanket plant.
Caledonia Mining Corporation Plc S-K 1300 Technical Report Summary on the Blanket Gold Mine, Zimbabwe |
There is a fully equipped assay laboratory which is located 200 m from plant offices. The mine laboratory was inspected by Mr Dario Clemente and even though the mine laboratory is not accredited, it does have the necessary equipment required to prepare and analyse mine and plant samples. The sample preparation areas are demarcated for low grade and high-grade areas, especially where cross-contamination is a risk.
Good housekeeping standards are applied in the sample crushing and preparation and fire assay areas. As part of its external verification process the mine laboratory sends samples away to Met Solution and Performance Laboratories (accredited according to the mine personnel), to test their precision and accuracy. Minxcon was supplied with figures for January, April, July and August 2014 which (apart from April) had a good correlation coefficient. In addition, the laboratory makes use of standard reference material which it sources from Geostats in Australia or AMIS from South Africa. Graphs, which show a good correlation, were supplied to Minxcon. The laboratory does not have an electronic tracking system. The implementation of a Laboratory Information Management system (“LIMS”) will reduce human error.
The current TSF will support deposition until 2023, after which a new TSF must be commissioned. An Engineer of Records has confirmed that deposition on the new Tailings Dam to start in 2023 since the current dam has reached its end of life. The new TSF was designed by Knight Piesold (Pty) Ltd a consulting company in South Africa. The estimated design work and construction was USD16 million.
| Item 14 (b) | – Plant Design, Equipment Characteristics and Specifications |
The plant was designed and constructed by Kinross Mining Company to treat RoM ore from the Blanket mine. The ore is fed over 14" x 24" jaw crushers to reduce the top size from -300 mm to less than 80 mm. The ore from No. 4 Shaft is crushed to -135 mm underground. Tramp iron magnets (located ahead of the crushers) remove scrap iron before it enters the cone crushers. Metal detectors have been installed to detect any residual metal that is in the feed which might have failed to be picked up by the magnet. The crushed ore is stored on a 900t open stockpile from where material is fed to the cone crushers.
At the new central shaft a 25 x 40 jaw crusher has been installed and crushes the ROM ore being hoisted from the central shaft down to -150 mm. This material is then trucked to the plant for processing using a land bin at No. 4 shaft.
The cone crushers were upgraded recently and replaced with two 38" hydraulically adjusted Nordberg crushers (figure 107). The crushers can operate independently and feed Osborn vibrating screens. The screened product which is smaller than 13 mm is delivered to the mill feed bin. The equipment quality is good and good maintenance is applied (an observation made during the site visit).
There are four 6.5 ft. x 12 ft. rod mills which operate in parallel. Each feed belt has a mill feed mass meter which is used to control and measure the mill feed rate. A new regrind mill (BM10), 12 ft x 18 ft was commissioned in August 2022 and running in parallel with the old regrind mill (BM6), the 12 ft x 16 ft. The Fine-Ore-Bin (FOB) has a capacity of 2000 tons and a live capacity of approximately 1500t and providing the ROM primary mills with about 12 to 14hrs run. The crushing section runs on three shifts per day throughout the week.
The BM3 regrind mill which was running in parallel with BM6 has since been converted to a primary rod mill and enabled the ROM milling capacity from 100tph to 115 tph.
Caledonia Mining Corporation Plc S-K 1300 Technical Report Summary on the Blanket Gold Mine, Zimbabwe |
The regrind duty is performed by BM6 (12 ft x 16 ft) and BM10 (12 ft x 18 ft) which are operated in parallel and both mills in closed circuit with a set of eight x 250 mm diameter cyclones.
Approximately 48% to 55% of the gold production is recovered as gravity gold using Knelson Concentrators. Knelson Gravity Concentrators are fed from the primary mills and their concentrate is stored and processed further on a Gemini shaking table every 24 hours with the tailings recycled back into the circuit. Gemini table concentrates are taken for direct smelting whilst the tailings are sent to an Intensive Leach (“IL”) circuit. The tails from the IL are sent back to milling.
The tails of the Knelson Concentrators are pumped to a cyclone cluster with the coarse product (U/F) going for regrind and the fine product (O/F) sent to the Carbon in Leach (CIL) plant. The CIL consists of one pre-aeration tank and eight leach tanks where alkaline-cyanide leaching and simultaneous adsorption of dissolved gold onto granular activated carbon takes place.
Oxygen generated from a Pressure Swing Absorption (“PSA”) oxygen plant is added into the first CIL tank; liquid oxygen is also available in the event of the oxygen plant being out of circuit for maintenance or breakdowns. There is a TAC 1000 cyanide online analyser which measures and controls cyanide addition. This process control system, in conjunction with oxygen injection, has reduced cyanide consumption.
Elution of the gold from the loaded carbon and subsequent electro-winning is done on site. There are two 2.5 tonne elution columns which operate in parallel. The design of the columns is unique in that the elution and the electro-winning processes take place in the same pressurised vessel. The advantage of this is that there is no circulation of solution outside the vessel which requires heat exchangers for heating and cooling. The overall effect is that the system is very energy efficient and cost effective.
During electrowinning the gold is deposited on steel wool cathodes within the elution column, and the loaded cathodes are removed on a planned cycle and acid digested. The resultant gold solids from acid digestion and the re-dressed gold concentrate from Knelson Concentrators are smelted into bars. The granular activated carbon is regenerated in a kiln before it is recirculated back to the CIL section. Loaded carbon is not acid treated to reduce reagent costs. Carbon reactivation has remained acceptable although the acid treatment can be re-introduced if required. The gold bullion, in the form of doré bars, is delivered, as required by Zimbabwean gold-mining law, to the Government-operated Fidelity Printers and Refiners for sampling and refining.
Power is supplied from the national grid, but a fully automated diesel driven power plant is available when power trips occur. The diesel power generation sets have a capacity of 10 Megawatts and can service both the mine and the plant when required. A 12.5 Megawatt solar plant was erected and commissioned to act as an alternative power source for the plant and mining operations.
The plant tailings from CIL are deposited to a Tailings-Storage-Facility (TSF), located close to the plant. The maximum amount of tailings water is pumped back to the metallurgical plant for re-use. Daily management and operation of the tailing deposition area is contracted out to the Zimbabwean subsidiary of Fraser Alexander
| Item 14 (c) | – Energy, Water and Process Materials Requirements |
Table 28 summarises the current labour complement for the Blanket Gold Plant. The Electrical Engineer is not included in the above table as he is shared between the plant and the mine. All the plant employees are adequately trained and from observation around the plant, as well as the condition of equipment. The higher labour complement is in part due to the manual control nature of the plant. The plant does not have a central process control system, but there are local controls in areas such as mill feed control, cyanide addition.
Caledonia Mining Corporation Plc S-K 1300 Technical Report Summary on the Blanket Gold Mine, Zimbabwe |
Table 28: Plant Labour Complement
Section | Position | Number |
Plant Senior Staff | Plant Manager | 1 |
| | Asst. Plant Manager | 1 |
| Plant Metallurgist | 1 |
| | Plant Foreman | 1 |
| | Metallurgical Technician | 1 |
| Plant Staff | Plant Operators | 4 |
| | Mill Clerk | 1 |
| | Elution Supervisor | 1 |
| | Senior Smelting Assistant | 1 |
| | Senior Lab. Assistant | 1 |
Primary Crusher | Senior Crusher Attendants | 2 |
| | Crusher Attendants | 13 |
| Senior Crusher Attendants | 1 |
| Secondary Crusher | Crusher Attendants | 5 |
| | Crusher Attendants | 1 |
| | Gravity &Smelting Assistants | 3 |
Milling | Mill Attendants | 4 |
| | Mill Attendants | 10 |
| Senior Elution Assistant | 1 |
| Elution | Elution Assistants | 2 |
| | Elution Attendants | 3 |
| Supervisor | 1 |
| Tailings | Slimes Dam Attendants | 3 |
| | Pump Attendants | 3 |
| CIL Attendants | 4 |
| CIL | CIL Attendants | 6 |
| | CIL Attendants | 1 |
| Water Works Attendant | 1 |
| Water | Water Works Attendant | 2 |
| | Water Works Attendant | 1 |
Metallurgical Lab and Sample preparation | Laboratory Assistants | 2 |
| | Laboratory Assistants | 1 |
Sub Total | | 83 |
| Mechanical Engineer | 1 |
| | Foreman | 1 |
| | Fitter | 5 |
| | B/Maker | 4 |
| | Plumber | 1 |
| | Rubber Liner | 1 |
| Engineering | Assistant Fitter | 5 |
| | B/maker Assistant | 4 |
| | Lubricator | 1 |
| | R/Liner Assistant | 1 |
| | Plumber’s Assistant | 1 |
| | Electrician | 1 |
| | Assistant Electricians | 1 |
Sub Total | | 27 |
Total | | 114 |
Source: Blanket Mine
II. | Reagents and Consumables |
The reagent and consumable consumptions are shown in Table 29. The forecasted consumptions are not expected to change significantly.
Caledonia Mining Corporation Plc S-K 1300 Technical Report Summary on the Blanket Gold Mine, Zimbabwe |
Table 29: Reagent and Consumable Consumptions
Item | Unit | Average Past Year |
Grinding Media and CIL Reagents | | |
Rods | kg/t | 0.68 |
Balls- 40 mm | kg/t | 0.89 |
Total Steel Media | kg/t | 1.57 |
Lime | kg/t | 1.68 |
Carbon | kg/t | 0.07 |
Sodium Cyanide | kg/t | 0.85 |
PSA Oxygen | kg/t | 3.42 |
Elution Consumables | | |
Steel Wool | kg/t C | 0.244 |
Caustic Soda | kg/t C | 42.91 |
Source: Blanket Mine
Some of the higher consumptions of reagents was due to the high retention times of approximately 72 hours in the CIL circuit. This mainly affects carbon consumption due to the long exposure to agitation and abrasion in the CIL tanks, as well as cyanide consumption.
ITEM 15 | – PROJECT INFRASTRUCTURE |
| Item 15 (a) | - Mine Layout and Operations |
The Blanket Mine consists of a series of small shafts (Table 30) providing access to the underground workings of the various orebodies that are being mined.
Table 30: Blanket Mine Shaft Access
Name | Description |
Jethro Shaft | The shaft has dimensions of 3 m x 2 m and is mainly utilised for the transport of men and material from surface to 7 Level. The shaft is equipped with a single drum winder with a 22 mm rope and capacity of 10 men. |
5 Winze (Sub-Shaft) | 5 Winze has dimensions of 3 m x 2 m and is a sub-shaft and is mainly used to transport men and materials between 7 Level and 22 Level. This shaft is similarly to Jethro shaft equipped with a single drum winder with a 20 mm rope and a capacity of 10 men |
6 Winze (Sub-Shaft) | 6 Winze has dimensions of 3 m diameter and is a sub-shaft used mainly for the hoisting of ore from 26 Level to 22 Level from where ore is transported to No. 4 Shaft for hoisting to surface. This shaft is equipped with a 112 kW single drum winder with a 24 mm rope and a capacity of 3 t skip or 500 tpd. At the bottom of 6 Winze shaft is a 12 kW spillage pump. |
Blanket Shaft (No. 4 Shaft) | No. 4 Shaft was historically the main production shaft of Blanket Mine. No. 4 Shaft has dimensions of 4 m x 2 m with two compartments. This shaft is mainly used for the hoisting of ore and waste rock from 22 Level to surface. The shaft is equipped with a 560 kW thyristor driven double drum winder with a 34 mm rope and capacity of 5t per skip or 2,000 tpd. |
The current access infrastructure is detailed in Figure 48.
Caledonia Mining Corporation Plc S-K 1300 Technical Report Summary on the Blanket Gold Mine, Zimbabwe |
Figure 48: Current Shaft Infrastructure – Blanket Mine
Caledonia Mining Corporation Plc S-K 1300 Technical Report Summary on the Blanket Gold Mine, Zimbabwe |
Several expansion projects have either been completed or are planned for the Blanket mining operations in order to increase production. The majority of the expansion projects will consist of the below 750 m Level (22 Level) expansion projects.
The first project includes the sinking and construction of the new CMS in-between the AR Main and AR South / Blanket orebodies from surface to below 1,203 m Level (just above 38 Level) and its associated infrastructure. Sinking and equipping of the shaft has been completed with the development of the associated ore pass system and loading station development currently in progress.
Further projects include the development of various decline shaft infrastructure targeting specific mining areas in order to increase production. The planned shaft infrastructure development declines planned are listed inTable 31.
Table 31: Planned Shaft Infrastructure Development
Description | Target Area | From (Level / Area) | To (Level / Area) |
Decline 2 | AR Main | 750 mL / ARM | Below 870 mL / ARM |
Decline 3 | Eroica | 750 mL / Eroica | 990 mL / Eroica |
Decline 4 | AR South / Blanket | 870 mL / ARS(Blanket) | 930 mL / ARS(Blanket) |
Decline 5 | AR South / Blanket | 885 mL / ARS(BL Blanket) | 930 mL / ARS(Blanket) |
Decline 6 | AR South / Blanket | 930 mL / ARS(Blanket) | 990 ml / ARS(Blanket) |
| Item 15 (b) | – Infrastructure |
Surface infrastructure comprises mine offices, change houses, mine headgears, workshops, storerooms, a processing plant, hospital, tailings facility and an assay laboratory.
Production shafts on surface consist of the No. 4 Shaft and the Jethro Shaft. Sub-shaft infrastructure in the form of the No 5 Winze connects Jethro to the underground workings. Other shafts and raise bore holes on surface, primarily used for ventilation purposes, include Lima, Eroica and Sheet. A total of 11 hoists are installed at the mine, three of which are used for ore handling (No. 2 incline shaft, the No. 4 vertical shaft and 6 Winze shaft). The surface infrastructure at the Blanket Mine is illustrated in Figure 108.
The existing infrastructure at the Blanket mine will be utilised in parallel with new infrastructure which is specifically aimed at targeting the Below 750 m Level mining areas. The extensions entail the sinking of the new CMS (currently completed except for the loading station and ore pass system) from surface down to 1,203 m Level (just above 38 Level). 6 Winze sub-shaft located close to 5 Winze sub-shaft is used to access the Blanket complex below 750 m Level and will provide secondary access to the new CMS.
The new CMS is not lined and has a four-compartment, 6 m diameter layout, equipped with a 2 x 3,642 kW double-drum winders one rock and the other men and material. Once fully equipped and commissioned, this shaft will be used as the main route for the transport of men, material, and rock.
On surface, a 900 mm wide, 50 m long overland waste conveyor will transport waste rock to a rock dump. Additional supporting surface infrastructure will include shaft offices, change rooms, lamp rooms, etc. New housing for both senior and junior staff is also planned in anticipation of the increased production profile.
A TSF is also located near the Project Area. The labour force and their families reside within a kilometre of the mine in accommodation provided by the Mine.
Caledonia Mining Corporation Plc S-K 1300 Technical Report Summary on the Blanket Gold Mine, Zimbabwe |
Figure 49: Surface Infrastructure Arrangement
The planned surface infrastructure layout and general arrangement of the CMS is illustrated in Figure 50.
Caledonia Mining Corporation Plc S-K 1300 Technical Report Summary on the Blanket Gold Mine, Zimbabwe |
Figure 50: Surface Infrastructure Arrangement – Central Main Shaft
The 5 Winze currently extends from 140 m Level down to the 750 m Level, while 6 Winze currently extends down to 870 m Level. Men and materials are hoisted via the Jethro vertical shaft, 5 Winze and 6 Winze to the new underground mining areas, as well as through CMS since its commissioning in July 2021.
Caledonia Mining Corporation Plc S-K 1300 Technical Report Summary on the Blanket Gold Mine, Zimbabwe |
Development waste and ore are hoisted with two 5t skips at No. 4 Shaft and two 10 t auto discharging rock skips through the CMS. The loading level at CMS is being equipped with a loading station as well as ore bins. The loading arrangement is equipped with loading flasks and spillage bins similar to the current arrangement at 765 m Level at No. 4 Shaft.
The CMS loading station (currently being developed) will include two silos, 1 x waste and 1 x reef with bulkheads on Load and Pump level feeding into the loading bin utilising a 1,050 mm conveyor belt. CMS is equipped with 2 x 3,642 kW double drum winders the on a rock winder with two 10 t skips attached to 44 mm diameter rope. The other winder is a men/material winder with a double deck cage and counterweight with 44 mm diameter rope. The cage has a capacity of 40 persons per deck.
Underground drilling is conducted with Seco 25, Seco 215 rock drills and Seco 36 (Konkola) drifters. The rock drills are used mainly for development and the drifters for production, i.e. long-hole drilling.
Similar to the underground rail-bound fleet, the same mining equipment utilised at the operational sections of Blanket Mine will be utilised once the expansion projects of CMS have been completed with some additional quantities to allow for the planned increase in production.
Currently, underground water is pumped to surface from the 7 Level pump station at a rate of between 70 m³ and 100 m³ per hour. The pump station has a maximum pumping capacity of 150 m³ per hour to handle excessive water inflow (especially during the rainy seasons). Pumping is done in stages on different major levels: 7, 9, 14, 22 and 26, and smaller sectional stations below 26 Level. All shafts have submersible pumps at the bottom of the shafts (Jethro, 5 Winze, 6 Winze shaft, No. 4 vertical shaft and CMS) which pump to the nearest major pump station.
The CMS main pump station located just below 34 Level (belt and pump level) will be equipped with a 5 m diameter high-rate clarifier settler as well as a 7 m diameter vertical dam with a capacity of 1.5 Ml. Clear water will overflow from the settling arrangement into the clear water dam and the settler underflow will be pumped directly to surface with a positive displacement pump.
I. | Power Supply and Reticulation |
ZESA supplies power to Blanket Mine from their main Eagle Vulture 132KV/33KV substation about 17km out of Gwanda. The main supplies are the 33 kV and the 11 kV overhead lines. The 33 kV supply feeds Lima, Reclamation, the main substation at No. 4 Shaft (and adjacent to the processing plant) and Central shaft. The 11 kV supply feeds slimes dam, Smiler shaft and the village. The 11 kV is further transformed to 550 V supply at Smiler and at Slimes dam. The ZESA power allocation to No. 4 Shaft, Jethro Shaft, 5 Winze and 6 Winze Complex is 12 MVA with a current notified maximum demand (“NMD”) of 11.5 MVA.
The Blanket Mine has investigated and approved the option of employing a solar power plant to supplement existing power supply to the Blanket Mine. The solar plant has been installed and commissioning is planned for September 2022. The solar plant will potentially add 12 MW AC of capacity to the Blanket Mine power supply.
Caledonia Mining Corporation Plc S-K 1300 Technical Report Summary on the Blanket Gold Mine, Zimbabwe |
Blanket also has 4 x 2.5 MVA generators at No. 4 Shaft and with total installed capacity of 10 MVA. Additional standalone diesel generators with suitable switchgear, transformers, and controls were also installed at CMS to ensure that the mine can stay operational during power interruptions. This additional installation has a total installed capacity of 8 MVA and is illustrated in Figure 113 Figure 113. Total installed generator capacity at Blanket is 18 MVA.
At the Blanket main substation, the 33 kV line terminates into 3 x 3 MVA and 1 by 6MVA, 33 kV/2.2 kV transformers: all four are active. The Mine de-commissioned one 3 MVA 33 KV/2.2 kV transformer when 6 MVA transformer was commissioned. The 2.2 kV supply from one transformer feeds the main Blanket compressors and the underground reticulation feeder through a 1,250 A vacuum circuit breaker. The other 2.2 kV supply from the second transformer feeds the RoM section of the processing plant (on 2.2 kV and 550 V supply) through a 1,250 A vacuum circuit breaker.
The third transformer feeds the 2.2 kV No. 6 Ball Mill, CIL section and elution plant which operates on 400 V supply.
The main substation has a maximum demand of 15 MVA at a calculated power factor of 0.85. The acquisition and installation of a power factor correction unit to increase the power factor to the required 0.99 is currently underway.
All equipment underground, i.e., winders, pumps and fans operate on 550 V. The 2.2 kV underground feeder is therefore transformed at different levels to run the relevant equipment on those levels.
The 33 kV ZESA supply at Lima terminates into a 2.5 MVA 33 kV/550 V transformer which supplies mainly the Lima hoist, 2 x GA250 and 1 x GA160 screw compressors. A power factor correction unit has been installed in this substation.
The 33 kV supply at reclamation terminates into a 1 MVA 33 kV/400 V transformer, which feeds the raw water supply pumps for the Central shaft.
Power to the new shaft complex will be supplied via a 2.5 km 33 kV overland powerline leading to the shaft sub-station. Power will be distributed through 2 x 6.3 MVA 33 kV/ 6.6 kV/525 V transformers and its associated switchgear. For the underground environment 250 kVA 6.6 kV/550 V transformers will be used to drive larger components such as conveyors and larger portions of the production sections. 50 kVA 550 V/110 V transformers will be used to step power down from 550 V for lighting purposes.
The expected NMD for CMS is 8MVA. Metering of the actual NMD is only 7.5 MVA, while the current ZESA total allocation to CMS is up to 12 MVA. This indicates that application will be required to increase the allocation for the CMS by 4 MVA.
There are no material risks associated with the power supply to Blanket.
II. | Water Supply and Reticulation |
ZIMWA holds all water rights in Zimbabwe and Blanket subsequently purchases process and domestic water from ZIMWA. Water for the mine, metallurgical plant and the mine village is obtained from the Blanket dam which is located 5 km east of the Mine. The Blanket Dam has a total capacity of 15 Mm³. In addition to this water source, the mine has equipped several boreholes to alleviate water shortages during the dry season and droughts.
An average of 80,000 m³ per month is pumped from the dam using 2 x 80/250 CEN stork pumps which are installed at the dam.
Caledonia Mining Corporation Plc S-K 1300 Technical Report Summary on the Blanket Gold Mine, Zimbabwe |
Two x 80/250 CEN stork pumps are also installed halfway between the dam and the mine. One of the pumps supplies water to the domestic water tanks where the water treatment plant is installed and the other pumps to the processing plant. The domestic water is purified at the water treatment plant, pumped to storage tanks and then gravitated to all the houses on the mine.
Most of the processing plant water is recycled from the slimes dam and underground. However, besides additional water from the Blanket dam, as stated above, five boreholes have been drilled to augment the processing plant supply.
Capital is allowed for new pumps, valves and pipelines to be used for the reticulation of water on surface. Service water will be transported through these pipelines separate from potable water. Water on surface will be used for fire suppression and will service the ablution facilities of the shaft offices and change houses. New 80/250 single stage stork pumps will service the dams and water will be pumped through a 250 mm Asbestos Cement (“AC”) pipeline system to the new shaft complex. The CMS will include a 7 ML dam on surface that will be the main storage facility for the complex.
There are no material risks associated with the water supply to Blanket.
Ventilation at the Blanket Mine is largely natural with the No. 2 incline shaft, Jethro shaft, 5 Winze shaft and 6 Winze sub-vertical shaft down-casting. Shafts such as Lima, Sheet and Jethro Winze are used for up-casting ventilation. A single booster fan as well as several other fans are installed at development ends to aid ventilation.
Once mining operations expand to the below 750 m Level the operation will remain naturally ventilated with the assistance of a number of booster fans, specifically in development ends. Ventilation throughout the workings is deemed to be sufficient for the current and planned production rates.
Underground drilling and lashing is aided by compressed air. This creates a significant compressed air demand and subsequently a total compressed air capacity of 37,600 cfm is installed on the mine. Compressed air is fed underground at Blanket via an 12" pipeline with an additional 4" line feeding the plant. The air supply at Lima is fed underground via a 6" pipeline.
CMS currently has an additional compressor house comprising of two GA 250 and two GA 160 compressor units capable of combined capacity of 5,000 cfm at a pressure of 7 bar, pumping through and 8” line that is connected to the main 12-inch shaft pipeline that goes all the way to the bottom of the shaft, with tee-off at each level from 22 Level. As a permanent set-up at CMS, a new compressor house, complete with a 16t overhead gantry crane is being constructed on surface. This compressor house will accommodate and extra 1 x Ingersoll Rand TurboAir 6000 (to be commissioned by end of 2022) in addition to the existing compressors. This additional compressed air supply will complement the existing compressed air infrastructure in order to sustain the increased tonnage profile and subsequent increase in drilling equipment.
For details on logistics infrastructure (road, rail and means of transport) refer to Item 4 (b) and Item 4 (d).
Caledonia Mining Corporation Plc S-K 1300 Technical Report Summary on the Blanket Gold Mine, Zimbabwe |
| Item 16 (a) | – Commodity Market Assessment |
The following sections provide an overview of the gold market. The QPs have reviewed these studies and analyses and are satisfied that the results support the assumptions in the TRS.
The following gold market conditions for the year 2022 have been identified by the World Gold Council, as extracted from their Gold Demand Trends report and other World Gold Council data.
| | I. | Gold demand (excluding OTC) jumped 18% year-on-year (“y-o-y”) to 4,741 t, almost on a par with 2011, which boasted strong investment demand. Q4 2022 alone saw a record demand of 1,337 t. |
| | II. | Total annual gold supply increased by 2% y-o-y to 4,755 t, supported mainly by improved mine production that saw a four-year high, but remaining below the record 2018. |
| | III. | The gold price averaged USD1,800/oz in 2021, rising marginally to USD1,825/oz in 2022. |
| | IV. | The average global All-In Sustaining Costs (“AISC”) rose to USD1,289/oz in Q3 2022, a 14% y-o-y increase and a record high. |
I. | World Gold Deposits and Reserves |
The global minable gold reserves are dominated by Australia, Russia and South Africa due to the higher-grade deposits found in these regions, with averages generally well above the global average of 1.01 g/t. Africa continues to be home to some of the highest grade (and highest risk) projects in the world. The average grade differs significantly (33%) between producing and undeveloped deposits. This has important implications on future gold production, and at a gold price reaching low levels, many of these projects will simply not be economically feasible. Gold reserves globally total some 1,617 Moz Au (USGS, 2023).
II. | Gold Supply and Demand Fundamentals |
Gold supply increased in 2022, with marginally increased mine production supported by upturn in recycling:-
| | ● | Mine Production: Global mine production slowed down from its 2.9% improvement from 2020 to 2021, although this was attributed directly to the impacts of lifting of COVID-19 lockdown restrictions. Primary production increased by a marginal 1.2% in 2022 (3,612 t) from 2021 (3,569 t) (World Gold Council, 2022a). Of this, China, Russia and Australia each contributed 10-11% (USGS, 2023). Canada and the United States are the fifth and sixth largest producers, despite the United States seeing a 9% production decline from 2021 to 2022. Colombia and Indonesia notably ramped up output through the year, as did Burkina Faso, Kazakhstan and Peru. South Africa increased output by 2.8%. Ghana remains the largest producer in Africa. |
| | ● | Net Producer Hedging: According to the World Gold Council (2022a), the global hedgebook remained almost unchanged over the 2022 year ending at 167 t. Industry sentiments towards hedging have adjusted over the past two decades, with new hedging positions mainly either made opportunistically in the short-term, and small in size, or from companies with project or debt finance requirements. |
| | ● | Recycling: Recycled gold supply in 2022 increased by 1%, remaining still 30% below the 2012 all-time high, despite a record annual average gold price in 2022. The first half of the year saw 6% y-o-y recycling volumes increases following a jump in gold price, slipping 4% y-o-y in the second half of the year as prices downturned (World Gold Council, 2022a). notable supply decline was noted from the Middle East, while India and Europe increased output |
Caledonia Mining Corporation Plc S-K 1300 Technical Report Summary on the Blanket Gold Mine, Zimbabwe |
The 2022 year recorded highest demand levels in 11 years. This was driven by strong central bank purchases, boosted by slower ETF outflows and strong retail investor buying, as described by the World Gold Council (2022a). The World Gold Council highlights the following for the year 2022 across the demand sectors:-
| | ● | Investment: In 2022, investment demand (excluding OTC) increased 10% to 1,107 t. Abrupt Chinese investment demand slowdown due to COVID impacts was offset by strong growth in Turkey, Europe and the Middle East. Gold bars and coins demand grew by 2% to a nine-year high of 1,217 t. Exchange traded fund (“ETF”) holdings fell by a 110 t (versus 189 t in 2021), further contributing to total investment growth. |
| | ● | Technology: Hampered demand for consumer electronics in response to deteriorating global economic conditions drove down gold demand for technological applications, fuelled by drastically declined in Q4, with a full-year decline of 7%. |
| | ● | Jewellery: Jewellery consumption softened by 3% at 2,086 t, mainly attributed to gold price surge in Q4. |
| | ● | Central Banks: Gold is politically independent and bears no credit risk. Some central banks have been pursuing an overt policy of de-dollarisation. Gold is a safe haven as the international monetary system shifting towards multipolarity, thus will continue to be an important reserve asset for central banks. Annual buying in the sector reached a 55-year high of 1,136 t due to massive central bank demand over two consecutive quarters. |
The average annual gold price in 2022 was USD1,800/oz, which is a new average record (World Gold Council, 2022a). Increases in US interest rates continued to outpace those of other major currencies in 2022 such as the euro and pound sterling, resulting in strong demand for the US dollar and pressuring US dollar gold prices. Initial strong US dollar and rising global interest rates resulted in downward pressure on gold prices, offset sharply in from October 2022 by a lower-than-expected US inflation result of 7.7%. Owing to this, as described by the Australian Office of the Chief Economist (2022), bond yields and the US dollar declined as markets revises down expectations for US interest rate increases.
The appeal of gold is undermined by increased bond yields for institutional and retail investors as a secure hedging asset as the opportunity cost of holding gold is increased. Since the commencement of the Russia-Ukraine war, heightened safe-haven gold demand has weakened the gold price-real bond yields relationship significantly Australian (Office of the Chief Economist, 2022).
Consensus opinion has the real gold price reducing over the short to medium term (Table 32).
Table 32: Gold Price Forecast (Nominal Terms)
| | Unit | 2023 | 2024 | 2025 |
Gold | USD/oz | 1,700 | 1,716 | 1,665 |
Source: Consensus (December 2022)
According to the Australian Office of the Chief Economist (2022), buying and investment demand will ease from stronger levels in 2022 and drive consumption down by 10% in 2023. Real bond yields are unlikely to decline significantly, and alternative safe-haven assets such as interest-bearing bonds will attract investment, offsetting safe-haven gold investment demand driven by political and economic concerns. Into 2024, consumption is expected to recover by 8%. This is mainly due to growth in global jewellery demand, with jewellery consumption expected to grow by 12% as economic recovery and forecasted gold price declines support purchases in key consuming nations such as India and China.
Caledonia Mining Corporation Plc S-K 1300 Technical Report Summary on the Blanket Gold Mine, Zimbabwe |
Into 2023, gold supply expected to fall as recycling activities ease in response to lower gold price, with scrap supply declining some 6.5% (Australian Office of the Chief Economist, 2022). Mine supply is projected to increase up to 2024, before falling slightly to 2027. A number of large mines in South Africa have been mothballed due to the deep nature of the orebodies and thus high running costs and increased risk. Other parts of the world are also seeing mines become unprofitable as rising costs and lower prices squeeze margins. Significantly less funds have been spent on gold exploration in recent years, and less major gold discoveries are being made. Notwithstanding, Australia, Canada, Chile, Brazil and Argentina have a number of pipeline projects set to come into operation over the period, offsetting mine closures in China due to stricter environmental and safety regulations. The supply is anticipated to recalibrate through mine production increases, to support relatively steady global supply of gold in 2023 and 2024.
In the short to medium term, gold prices are forecast to fall at an average annual rate of 4.9%, from USD1,800/oz in 2022 to USD1,625/oz in 2024 (Australian Office of the Chief Economist, 2022). The resistance that gold prices displayed towards sharp increases in real bond yields in 2022 is expected to weaken as global inflation cools and interest rates continue to rise. As described by the Australian Office of the Chief Economist (2022), “Lower safe haven demand will do less to ameliorate the impact of higher interest rates on gold demand”.
A major risk to the gold supply chain and pricing in the short to medium term is the potential for new COVID variants, as well as disruptions associated with the COVID containment toolkit announced by China that could impede demand from this major importer. New COVID-related factors that may emerge have the potential to other positively (gold as safe haven asset) or negatively (lower demand) affect the gold price. Geopolitical tensions due to the Russian invasion of Ukraine may also continue to provide higher price support.
On January 28, 2014 Caledonia announced that as a result of new regulations introduced by the Zimbabwe Ministry of Finance, all gold produced in Zimbabwe must now be sold to Fidelity Printers and Refiners Limited ("Fidelity"), a company which is controlled by the Zimbabwean authorities and which is now responsible for the final refining and marketing of all gold produced in Zimbabwe. Accordingly, all of Blanket’s production has subsequently been sold to Fidelity, effective March 2014. According to the agreement, Blanket should receive 98.5% of the value of the gold (LMBA pm fix discounted by 1.5%) within a maximum of 9 days of a sale to Fidelity.
ITEM 17 | – ENVIRONMENTAL STUDIES, PERMITTING AND PLANS, NEGOTIATIONS, OR AGREEMENTS WITH LOCAL INDIVIDUALS OR GROUPS |
| Item 17 (a) | – Relevant Environmental Issues and Results of Studies Done |
Information regarding environmental consideration is taken largely from AGS (2006), Fraser Alexander Zimbabwe (Pty) Ltd (March 2010) and Blanket Mine (November 2009).
SRK completed a full EIA in 1995 to identify the major detrimental aspects of the mining operation and recommend remedial measures. It was identified that there is potential to pollute groundwater from the TSF. Per MSA (2011), a risk assessment of the TSF complex was completed in 2002 including safety and environmental aspects of deposition and stability analysis. The dam was not lined prior to deposition, and MSA stated that seepage will decline as the slime level rises. An additional mitigating factor is that the seepage waters are not acidic and established dewatering holes lower the pollution to more acceptable levels.
Caledonia Mining Corporation Plc S-K 1300 Technical Report Summary on the Blanket Gold Mine, Zimbabwe |
No further significant detrimental environmental impacts were identified by that study. No further environmental studies or assessments have been provided to the QPs. The QPs are not aware of environmental issues that could materially impact the issuer’s ability to extract the Mineral Resources or Mineral Reserves.
Caledonia, the owners of the mine from June 2006 to date, developed an Environment Management Plan, which describes the plan followed by the mine staff to ensure continuous environmental improvement and management An updated Environment Management Plan was registered with the EMA in 2020. This serves as the guideline for all environmental issues at Blanket Mine and deals with new environmental disturbances that requires additional permits and authorisations further to those described in Table 4.
Caledonia endeavours to address any newly identified potential environmental impacts through appropriate study work, and remain transparent and complaint in terms of required authorisations.
| Item 17 (b) | – Waste Disposal, Site Monitoring and Water Management |
The Blanket Mine tailings operation is a gold tailings operation, comprising two TSFs/compartments adjacent to one another. These TSFs, namely A & B, were combined in 2015 to make one TSF. All tailings effluent is now being decanted via the previously TSF A penstock. The TSF is operated as a paddock (or day wall) operation. Decanting of the TSF occurs through the penstock, with Dam A having an elevated penstock installed in 2005/2006. TSF A is the initial TSF with TSF B having been constructed subsequently and adjacent to Dam A. The TSF has very current annual survey which is done by an external consultant and the information is available at the survey office. The TSFs are operated by Frazer Alexander Zimbabwe.
The unresolved issue of the hard naturally occurring groundwater is an outstanding concern for the closure plan of Blanket. A letter was written in December 2012 to the EMA requesting:-
| | 1. | Oxygen absorbed to be removed from the sampling parameters because it has limited relevance to groundwater. |
| | 2. | The TDS Limit Value increased to ≤2,500 blue band to reflect the naturally occurring groundwater. |
| | 3. | In response to EMA suggesting the sewage pond outflows be used to irrigate the TSF vegetation which is being done; the sewage outflow should be removed from the sampling parameters as the “end of pipe” will reflect in the TSF unsaturated zone monitoring. |
| | 4. | In terms of the current tailings disposal permit, Blanket Mine is required to measure parameters including pH, conductivity, sulphates, nitrate, TDS, zinc, iron, manganese, free cyanide and turbidity. Generally, all results have been within acceptable limits except for manganese and conductivity, which are apparent in the control borehole. |
Similar monitoring of the sewage disposal area shows that all holes are in the acceptable green category. The sewerage ponds are now classified in the red category under the EMA as they are not lined. In March of 2020 Blanket Mine engaged Epoch Resources (Pty) Ltd (“Epoch”) to undertake an audit review of the tailings operation at the Blanket Mine. The audit review identified no significant operational or design risks associated with the dam. Although an official report has not been received, this has been hampered by the COVID-19 pandemic.
Caledonia Mining Corporation Plc S-K 1300 Technical Report Summary on the Blanket Gold Mine, Zimbabwe |
The TSF is audited annually by Fraser Alexander, however there is a requirement for an audit to be done by an independent auditor once every third year, as was the case during the 2020 audit. Tonnages are recorded monthly by the contractor to facilitate the determination of the rate of rise (“RoR”). However, at a production rate of 1,768 tpd the RoR is 1.5 m per year based on the final design area of 28 ha, which is well below the legal maximum of 2 m per year. The following practices are being carried out on the TSF maintenances:-
| | ● | The annual dam survey is carried out annually by an external survey consultant in the last quarter of the year |
| | ● | All monitoring tools are in place and well documented and Fraser Alexander is providing monthly reports. |
| | ● | A minimum vertical freeboard of 2.0 m for the dam is maintained at all times. |
| | ● | Piezometers are checked by carrying out Upset Tests to confirm that they are fully operational. This is currently being done once per month. |
| | ● | An updated comprehensive survey be carried out on the entire TSF, including the dam basins, position of drains, penstock outlets and piezometers. This is now being done every October. |
| | ● | During the audit of the TSF the stability assessment is undertaken. |
Environmental monitoring or sampling requirements are stipulated for the environmental permits issued (Table 4). The requirement for the majority of these is quarterly. Air emissions sampling exercises are completed annually. Blanket Mine Company has informed the QP that EMA conduct quarterly site inspections and are satisfied with these procedures.
The TSF borehole monitoring, sewage ponds and car wash monitoring are done quarterly. The domestic waste has no monitoring facilities and Blanket are in the process of obtaining an EIA to construct a lined landfill with monitoring boreholes.
| Item 17 (c) | – Permit Requirements |
Permit requirements for the Mine are detailed in Item 3 (f). A number of licence are renewed annually; renewal periods are not expected to hinder operations. Blanket Mine remains compliant with legislation and all regulations applicable to the mine site.
| Item 17 (d) | – Social and Community-Related Requirements |
In 2012, 10% of Blanket Mine was donated to Gwanda Community Share Ownership Trust and 10% is held by Blanket Employee Trust. Blanket’s investment in community and social projects is not limited to the operation of the mine and the welfare of its employees but includes payments to the Gwanda Community Share Ownership Trust in terms of Blankets dividends as well as certain ex gratia project related payments.
In December 2019 Blanket Mine launched a formal Corporate Social Responsibility Programme which will see the Mine making a greater, more visible, investment in corporate social giving. The five key pillars of focus are Education, Health, Environment, Agriculture and Women and Youth Empowerment. In the first quarter of 2020, under the Agriculture pillar, Blanket Mine re-equipped a four-hectare irrigation plot that supports 20 families in Gwakwe Communal lands. A new perimeter fence was erected around the plot and the farmers were provided with seed and farming tools. Under the Education pillar, work commenced on the renovation of two primary schools which were in a state of disrepair. One school is in Gwanda South, the other is situated close to Blanket Mine. During the same period another school received a donation of school desks.
When the COVID-19 pandemic became a major issue of concern in Zimbabwe, Blanket Mine responded by embarking on an awareness campaign, distributing informative flyers and putting up awareness posters at schools around the mine, in the surrounding communal lands and in Gwanda town. Cash donations amounting to ZWL21 million were made towards the Chamber of Mines’ COVID-19 response initiative while the Mine committed to further weekly contributions. A donation of hygiene consumables and personal protective equipment (“PPE”) was made to the Gwanda Prison. A consignment of PPE was procured for donation to Gwanda Provincial Hospital. In addition, Blanket Mine committed to renovating and extending Phakama Polyclinic in preparation for the imminent arrival of COVID-19 in Gwanda.
Caledonia Mining Corporation Plc S-K 1300 Technical Report Summary on the Blanket Gold Mine, Zimbabwe |
Several more projects are planned for the upcoming financial year and plans are well underway to complete these.
Small scale and artisanal gold miners are present within the Project Area. Satellite projects deemed to have limited exploration potential are viewed in terms of their potential to generate goodwill by making them available to local small scale miners and artisanal groups through 3-year renewable Tribute Agreements as part of the Company’s Corporate Social Responsibility. The claims that are being tribute are Mbudzane Rock, Annette, Dan’s Luck, Banshee J, Cinderella, Gum, Mascot, Mazeppa, Spruit, Rubicon and Bunny’s Luck. Other than for the purpose of the Company’s Corporate’s Social Responsibility, tributing claims provides Blanket Mine with security of tenure against the “Use it or Lose it” principle. The tribute agreements do not have any effect on Blanket Mine’s exploration/mining plans.
| Item 17 (e) | – Mine Closure Costs and Requirements |
In October Blanket Mine contracted Knight Piésold to update the mine closure plan, which is required to be updated regularly, including estimate the costs of decommissioning and closure of the mine. This study included all aspects of the mining operation such as open workings, waste dumps and infrastructure. An updated decommissioning and reclamation cost estimate was undertaken by Blanket Mine and reported in December 2021.
There are a number of Government of Zimbabwe regulations and guidelines including the Mining General Regulations, the EM Act and the Waste Disposal Regulations which cover a mine’s closure obligations. These are all addressed and costed in the Knight Piésold report. The closure plan aims to ensure site stability and safety from both a physical and chemical perspective, allowing for a post-closure environment that suits current land uses. The plan envisages concurrent closure obligations being carried out, where possible, with mining operations. Focus is placed on minimisation of environmental damage, protection of stream water quality, decrease in public health and safety hazards and provision for domestic livestock use.
The closure cost estimate was calculated at USD3.1 million by Knight Piésold, including a 13.8% contingency. The mine is not required to post a guarantee for this amount, but has reached an agreement with government that the break-up value of the plant and mine infrastructure be pledged as a guarantee for the closure cost. It is the intention of Blanket to continue self-funded small scale operations for five years after closure, during which time salvaged material and equipment will be sold off and operations will be wound down.
| Item 17 (f) | - Adequacy of Current Plans |
It is the opinion of the QPs that Blanket Mine has adequate plans, protocols and execution strategies in place to remain compliant with social and environmental obligations. No risks have been identified.
| Item 17 (g) | – Local Procurement and Hiring |
The main priority of Blanket Mine Company with respect to procurement of goods and services is to procure such goods and services from within Zimbabwe. However, the cost, quality, and availability of goods and services is considered when a procurement decision is being made. If goods or services are not available within Zimbabwe or there is a significant benefit to buying outside of Zimbabwe, the blanket mine company would buy elsewhere.
All of Blanket Mine Company’s employees at Blanket are Zimbabwean nationals and the company recruits Zimbabwe people with the level of skill and experience required of the relevant position.
Caledonia Mining Corporation Plc S-K 1300 Technical Report Summary on the Blanket Gold Mine, Zimbabwe |
ITEM 18 | – CAPITAL AND OPERATING COSTS |
| Item 18 (a) | – Capital Costs |
The total Blanket operation mining and infrastructure project and sustaining capital budget for the years 2023 to 2025 is listed in Table 33. It should be noted that subsequent to capital budgets approval, updated capital estimates were received from Knight Piesold for the new TSF, hence the TSF capital will not reconcile with the NI43-101 capital budgets. Renewals and replacements capital expenditure are capital expenditures resulting from improvements to and major renewals of existing assets. Such expenditures serve to maintain existing operations, but do not generate additional revenue. Renewals and replacement capital for the operation from 2026 has been allowed for and is based on 12% of total OPEX per annum.
Table 33: Blanket Operation Project Capital Budget 2023 - 2025
Capital Expenditure | 2023 | 2024 | 2025 | Total |
Mechanical Engineering | 1.69 | 6.54 | 4.72 | 12.95 |
Electrical Engineering | 1.02 | 0.39 | 0.31 | 1.71 |
Deep drilling | 0.99 | 0.99 | 0.78 | 2.77 |
Central Shaft | 3.80 | 0.99 | 1.11 | 5.90 |
Capital development | 9.77 | 8.23 | 5.24 | 23.24 |
Mill Engineering | 0.39 | 1.65 | 2.63 | 4.67 |
Milling | 0.00 | 0.00 | 1.51 | 1.51 |
TSF Phase 1a | 12.74 | 0.00 | 0.00 | 12.74 |
TSF Phase 1b | 0.00 | 4.75 | 0.00 | 4.75 |
TSF Phase 2 | 0.00 | 0.00 | 3.83 | 3.83 |
Technical (Planning & Survey) | 0.22 | 0.72 | 0.47 | 1.41 |
Technical (Geology & Assay) | 0.00 | 0.15 | 0.26 | 0.41 |
Exploration | 0.29 | 0.00 | 0.00 | 0.29 |
Administration | 0.99 | 0.00 | 0.30 | 1.29 |
Total | 31.91 | 24.40 | 21.15 | 77.46 |
Off-reef development and infrastructure development has been capitalised from the mining operating cost and is reported as capital development. The capital development is undertaken throughout the LoM and consists mainly of opening-up development and 30 Level, 34 Level and declines to 38 Level infrastructure development. The QPs applied the capital development rates provided by Caledonia in the 2023 budget. The capital development rates are detailed in Table 34.
Table 34: Capital and Infrastructure Development Costs
Capital and Infrastructure Development | Unit | Cost |
TMM Development | USDm | 2,150 |
Track bound Development | USDm | 900 |
Notes: Other development costs have been included in the development operating costs.
The current TSF is nearing the end of its life and provision has been made for the construction of a new TSF. The capital estimate is USD12.74 million for Phase 1a that would be spent over the one-year construction period, followed by USD4.75 million for Phase 1b in 2024 and USD7.65 million for Phase 2 split evenly over 2025 and 2026. Phase 1a construction would need to be completed by the end of 2023 at which time the current TSF would have reached its capacity.
Table 35 details the total capital expenditure over the LoM. Capital expenditure totals USD103 million over the LoM, of which USD30.7 million is capital development and USD14.3 million is renewals and replacement expenditure. No additional contingencies have been applied to the budgeted capital expenditure, with longer terms budgets provided. A sensitivity to inclusion of contingencies can be seen in Item 19 (b).
Caledonia Mining Corporation Plc S-K 1300 Technical Report Summary on the Blanket Gold Mine, Zimbabwe |
Table 35: Capital Summary
Capital Expenditure | Over LoM | Blanket Mine |
Mining Capital | Unit | |
Mechanical Engineering | USDm | 12.95 |
Electrical Engineering | USDm | 1.71 |
Deep drilling | USDm | 2.77 |
Central Shaft | USDm | 5.90 |
Capitalised Development | USDm | 30.74 |
Renewals and Replacements | USDm | 4.51 |
Sub-Total Sustaining Mining Capital | USDm | 58.58 |
Total Mining Capital | USDm | 58.58 |
Plant Capital | | 1.00 |
TSF Phase 1a | USDm | 12.74 |
TSF Phase 1b | USDm | 4.75 |
Milling | USDm | 1.51 |
TSF Phase 2 | USDm | 7.65 |
Sub-Total Expansion Plant Capital | USDm | 26.66 |
Mill Engineering | USDm | 4.67 |
Renewals and Replacements | USDm | 2.44 |
Sub-Total Sustaining Plant Capital | USDm | 7.11 |
Total Plant Capital | USDm | 33.76 |
Other Non-Direct Capital | | 1.00 |
Technical (Planning & Survey) | USDm | 1.41 |
Technical (Geology & Assay) | USDm | 0.41 |
Exploration | USDm | 0.29 |
Administration | USDm | 1.29 |
Renewals and Replacements | USDm | 7.33 |
Sub-Total Sustaining Other Capital | USDm | 10.72 |
Total Other Capital | USDm | 10.72 |
Total Expansion Capital | USDm | 26.66 |
Total Sustaining Capital | USDm | 76.41 |
Total Capital Contingencies | USDm | 0.00 |
Total Capital | USDm | 103.06 |
Figure 51 illustrates the capital schedule over the LoM.
Caledonia Mining Corporation Plc S-K 1300 Technical Report Summary on the Blanket Gold Mine, Zimbabwe |
Figure 51: Capital Schedule
| Item 18 (b) | – Operating Cost |
The Blanket operating costs were updated to a 31 December 2022 effective date using the 2023 budget costs from the mine. The QPs reviewed Blanket Mine’s actual historic costs since 2017, converted to real terms to determine if the budget costs are realistic. From the information received it is clear that the historic costs have increased steadily since 2020 from ~USD3.5 million per month to ~USD4.5 million per month in line with increased tonnes. The cost per tonne has ranged between USD70/t and USD85/t with a few outliers. The weighted average cost since 2020 is USD78/t. The 2022 budget costs are a lower compared to the historic costs as the mine had experienced some milling constraints which are being resolved and subsequently the milling throughput has increased. The 2023 budget rates were utilised for financial modelling which equated to a total weighted average cost of USD76/t excluding corporate and management fees and USD82/t including corporate and management fees. A sensitivity to the operating cost applied is included in Item 19 (b).
Caledonia Mining Corporation Plc S-K 1300 Technical Report Summary on the Blanket Gold Mine, Zimbabwe |
Figure 52: Historic OPEX vs Budget
Note: Excluding management and head office costs
Management and Head Office costs as per the 2023 Blanket budget were also considered for the financial analysis. These costs are detailed in Table 36.
Table 36: Management and Head Office Costs
Area | Unit | Cost |
Management Fees | USD/month | 284,327 |
Harare Office Costs | USD/month | 108,000 |
Exploration Office Costs | USD/month | 14,800 |
A sensitivity to the operating cost applied is included in Item 19 (d).
I. | Financial Costs Indicators |
The operating costs in the financial model were reported into different categories as defined by the World Gold Council. The Adjusted Operating Cost represents the cash cost incurred at each processing stage, from mining through to recoverable metal delivered to market, and, if any, less net by-product credits. In addition, royalty taxes are included in Adjusted Operating Costs. Costs are reported as “per oz” of gold. The operating margin is defined as metal price received minus Adjusted Operating Costs. AISC is the sum of net Adjusted Operating Costs (Operating), Sustaining Capital, reclamation costs and other non-direct operating costs. The AISC margin is defined as metal price received per ore tonne or gold ounce minus the AISC, over the metal price received. AIC is the sum of the AISC, all non-sustaining capital costs and non-current operational costs. The AIC margin is defined as metal price received per ore tonne or gold ounce minus the AIC, over the metal price received.
Costs reported for the Mine on this basis are displayed per plant feed tonne as well as per recovered gold ounce in Table 37. It should be noted that no contingencies have been applied to the operating costs as most of these costs are based on contracts or actuals A sensitivity analysis to increase in OPEX and CAPEX is included in Item 19 (d).
Caledonia Mining Corporation Plc S-K 1300 Technical Report Summary on the Blanket Gold Mine, Zimbabwe |
Table 37: Project Cost Indicators
Item | Unit | Blanket Mine |
Net Turnover | USD/Feed tonne | 151 |
Mine Cost | USD/Feed tonne | 23 |
Plant Costs | USD/Feed tonne | 13 |
Other Costs | USD/Feed tonne | 39 |
Royalties | USD/Feed tonne | 8 |
Operating Costs | USD/Feed tonne | 84 |
SIB | USD/Feed tonne | 20 |
Reclamation | USD/Feed tonne | 0 |
Other Costs | USD/Feed tonne | 6 |
All-in Sustaining Costs (AISC) | USD/Feed tonne | 110 |
Capital | USD/Feed tonne | 7 |
Other Cash Costs | USD/Feed tonne | 0 |
All-in Costs (AIC) | USD/Feed tonne | 117 |
All-in Cost Margin | % | 23% |
EBITDA1 | USD/Feed tonne | 61 |
EBITDA Margin | % | 40% |
Gold Recovered | oz | 360,929 |
Average Gold Price | USD/Gold oz | 1,655 |
Payability - Off-take Agreement | % | 98.5% |
Net Turnover2 | USD/Gold oz | 1,631 |
Mine Cost | USD/Gold oz | 253 |
Plant Costs | USD/Gold oz | 143 |
Other Costs | USD/Gold oz | 424 |
Royalties | USD/Gold oz | 82 |
Operating Costs | USD/Gold oz | 902 |
SIB Capex | USD/Gold oz | 212 |
Reclamation | USD/Gold oz | 2 |
Other Costs | USD/Gold oz | 68 |
All-in Sustaining Costs (AISC) | USD/Gold oz | 1,183 |
Capital | USD/Gold oz | 74 |
Other Cash Costs | USD/Gold oz | 0 |
All-in Costs (AIC) | USD/Gold oz | 1,257 |
EBITDA | USD/Gold oz | 659 |
Notes:
| | 1. | Earnings before interest, tax, depreciation and amortisation (excludes CAPEX). |
| | 2. | Net turnover will be the realised income per produced gold oz, after 98.5% payability has been applied. |
The net turnover indicates the net realised income received per produced gold oz after applying the 98.5% payability as per the Fidelity agreement. Blanket Mine has an all-in sustaining cost of USD110/milled t, which equates to USD1,183/oz. The all-in costs for the Blanket Mine amount to USD117/milled t, which equates to USD1,257/oz.
Figure 53 illustrates the annual operating cost per plant feed tonne against the feed tonnes. The increase in costs towards the end of life is due to the depletion of the potential Mineral Reserves.
Caledonia Mining Corporation Plc S-K 1300 Technical Report Summary on the Blanket Gold Mine, Zimbabwe |
Figure 53: Operating Costs vs. Feed Tonnes
Figure 54 illustrates the all-in costs of the operation along with the realised gold price after applying the 98.5% payability.
Figure 54: AIC vs. Realised Gold Price
Caledonia Mining Corporation Plc S-K 1300 Technical Report Summary on the Blanket Gold Mine, Zimbabwe |
| Item 18 (c) | – Accuracy of Estimates |
Blanket Mine is an operating mine. Costs are from the mine budgets and based on actual rates and are deemed accurate to within a 10% to 15% range. The basis of this TRS is a life of mine plan, which is of sufficient detail to support declaration of Mineral Reserves.
ITEM 19 | – ECONOMIC ANALYSIS |
The purpose of this section is to demonstrate the economic viability of the Mine Plan in order to declare updated Mineral Reserves.
Value relates to a specific point in time. The effective date for the economic analysis is 31 December 2022.
The evaluator performed an independent economic analysis on the Mine’s diluted Indicated and Measured Mineral Resources for conversion to Mineral Reserves. The Project has a budget plan based on a compliant mine plan with Indicated and Measured Resources. Thus, the income approach was applied on the total mineable reserve incorporated in the detailed mine plan as the primary economic analysis methodology in determining the economic viability for conversion to Mineral Reserves.
| Item 19 (a) | - Principal Assumptions |
The scope of this economic analysis exercise was to determine the financial viability of the diluted Indicated and Measured Resources in the LoM plan, for conversion to Mineral Reserves. This is illustrated by using the DCF method on a Free cash flow to firm (“FCFF”) basis, to calculate the net present value (“NPV”) and subsequently, the intrinsic value of the Mine in real terms. The NPV is derived from post-royalties and tax, pre-debt real cash flows, after taking into account operating costs, capital expenditures for the mining operations and the processing plant and using forecast macro-economic parameters.
I. | Basis of Evaluation of the Mining Assets |
In generating the financial model and deriving the economic analysis, the following were considered:-
| | ● | Only diluted Indicated and Measured Resources in the LoM plan were considered for conversion to Mineral Reserves. |
| | ● | Any Inferred Mineral Resources in the LoM plan have been excluded from the economic analysis. |
| | ● | This Report details the optimised cash flow model with economic input parameters. |
| | ● | The cash flow model is in constant money terms and completed in USD. |
| | ● | The DCF economic analysis was set up in calendar years from January to December with the mine plan starting in January 2023. |
| | ● | A hurdle rate of 14.1% (in real terms) was calculated for the discount factor, with an NPV sensitivity to the discount rate also included in the analysis. |
| | ● | The impact of the Mineral Royalties Act as per the Zimbabwean Mining Regulation. |
| | ● | Sensitivity analyses were performed to ascertain the impact of discount factors, commodity prices, grade, working costs and capital expenditures. |
| | ● | Economic analysis of the tax entity was performed on a stand-alone basis. |
| | ● | The full value of the operation was reported for Blanket Mine as well as attributable values to CMC, i.e. 64%. |
Caledonia Mining Corporation Plc S-K 1300 Technical Report Summary on the Blanket Gold Mine, Zimbabwe |
II. | Macro-Economic Forecasts |
The following section includes the macro-economic and commodity price forecasts for the operation over the LoM. Forecast data is based on projections for the different commodity prices and the country-specific macro-economic parameters and is in calendar years from January to December starting January 2023.
USD commodity prices for the period 2023-2025 have been converted from nominal to real terms. Table 38 illustrates the forecasts for these three years as well as the long-term forecast used in the financial model. The price forecasts are based on the median of various banks, brokers and analyst forecasts and are in real-terms throughout the life of mine. The average price over the LoM equates to USD1,655/oz. The inflation rate was sourced from the International Monetary Fund.
Table 38: Macro-economic Forecasts (Real Terms)
| | Year |
| Item | Unit | 2023 | 2024 | 2025 | Long-Term |
| | | 1 | 2 | 3 | |
US Inflation Rate | % | 3.50% | 2.20% | 2.00% | 2.00% |
Gold | USD/oz | 1,700 | 1,679 | 1,597 | 1,650 |
Source: Median of various Banks and Broker forecasts (Minxcon) (Dec 2022)
Figure 55 illustrates the 20-year real-terms historic gold price. For the past ten years, the gold price has been staying in a band between USD1,300/oz and USD2,000/oz. The long-term gold price was estimated as the real term average between the high and low gold price trading range over the past 10 years, USD1,650/oz.
Figure 55: Real-term Historic Gold Price
The creditors and debtors days were sourced from the client and are based on historic actual numbers. The creditors’ days were calculated at 90 days and debtors days at 14 days, which is slightly longer than the off-take agreement stipulates.
The ore from the Blanket Mine operation is treated at the existing Blanket Plant; the expected recovery is 94%. The recovery is detailed in the processing Section of this TRS.
Caledonia Mining Corporation Plc S-K 1300 Technical Report Summary on the Blanket Gold Mine, Zimbabwe |
To test the appropriateness of the discount rate for the specific Mine, the QPs used the Capital Asset Pricing Model (“CAPM”) to calculate the discount rate. The company has negligible debt, hence the use of CAPM over Weighted Average Cost of Capital (“WACC”). An additional country risk premium for Zimbabwe was included. The following were considered:-
| | ● | The US Risk Free Rate (10 years) at 3.87% was considered as an acceptable risk-free rate at the time of the analysis. |
| | ● | The market risk premium of 6.0%, a rate generally considered as being the investor’s expectation for investing in equity above the risk-free government bond. |
| | ● | The beta of a stock is normally used to reflect the stock price’s volatility over and above other general equity investments in the country of listing – the Beta was calculated at 0.86 as described below. |
| | ● | A Zimbabwe country risk premium of 7.41% as calculated by Aswath Damodaran from the Stern School of Business at New York University. |
| | ● | By using the CAPM, the QPs calculated a nominal discount rate of 16.43% which translates in a real discount rate of 14.10%. |
Table 39: Capital Asset Pricing Model Discount Rate Calculation
Cost of Equity | Discount Rate |
US Risk free rate | 3.87% |
Risk premium of market | 7.41% |
Country Risk Premium | 6.0% |
Operational Risk (Base Beta) | 0.86 |
Nominal Cost of equity (CAPM) | 16.43% |
Real Cost of equity (CAPM) | 14.10% |
Beta is a measure of the volatility or systematic risk of a security or a portfolio in comparison to the market as a whole. The QPs analysed the Betas of a number of major gold mining companies listed on the Johannesburg Stock Exchange (JSE) to serve as a comparison for Caledonia. Although not directly comparable because it is on different stock exchanges it does provide some indication of volatility. The unlevered Betas of the South African gold mining companies on the Johannesburg Securities Exchange were found to range between 0.47 (Pan African Resources) and 1.85 (Sibanye Stillwater, which is a gold and PGM miner). Caledonia’s shares are listed on the NYSE American LLC (CMCL) and depositary interests in the shares are traded on AIM of the London Stock Exchange plc (CMCL). The levered Beta of 0.86 (unlevered Beta is the same since debt is negligible) which falls within this range and is closest to AngloGold Ashanti, with a Beta of 1.05. The listed Beta of 0.86 is therefore deemed appropriate. Table 40 shows the Betas of the gold mining companies considered.
Table 40: Table 41: Southern African Gold Mining Companies' Beta Values
Gold Company | Unlevered Betas | Levered Betas | Exchange |
AngloGold Ashanti | 1.05 | 1.21 | JSE |
Gold Fields | 1.07 | 1.02 | JSE |
Harmony | 1.20 | 1.18 | JSE |
Sibanye Stillwater | 1.85 | N/A | JSE |
Pan African Resources | 0.47 | 0.46 | JSE |
Mean | 1.03 | 0.90 | |
Median | 1.07 | 1.10 | |
Caledonia | 0.86 | 0.86 | NYSE |
Source: InfrontAnalytics (Sep 2022), Reuters (Sep 2022)
Caledonia Mining Corporation Plc S-K 1300 Technical Report Summary on the Blanket Gold Mine, Zimbabwe |
The saleable product tonnes and ounces are displayed in Table 42. The current mine plan includes 3,892 kt of ore containing 384 koz of gold at an average grade of 3.07 g/t. A total of 361 koz of gold is recovered over the remaining 5-year LoM.
Table 42: Production Breakdown in Life of Mine
Item | Mine | Blanket Gold Mine |
Ore Tonnes Mined | kt | 3,892 |
Average Mined Grade | g/t | 3.07 |
Total Oz in Mine Plan | oz | 383,967 |
Grade Delivered to Plant | g/t | 3.07 |
Recovered grade | g/t | 2.88 |
Yield/Recovery | % | 94.00% |
Total Oz Recovered | oz | 360,929 |
The gold ounces produced along with the mined and recovered grades are illustrated in Figure 56. The gold production starts decreasing after 2025 as the grade drops in 2026 and 2027.
Figure 56: Recovered Gold
The annual cash flow before capital expenditure, total capital expenditure and cumulative cash flow forecast for the mine over the LoM is illustrated in Figure 57. Table 43 and Table 44 illustrate the detailed annual cash flow for the Mine in real terms.
Caledonia Mining Corporation Plc S-K 1300 Technical Report Summary on the Blanket Gold Mine, Zimbabwe |
Figure 57: Undiscounted Cash Flow
Caledonia Mining Corporation Plc S-K 1300 Technical Report Summary on the Blanket Gold Mine, Zimbabwe |
Table 43: Annual Cash Flow – Techno-economic Inputs
Caledonia Mining Corporation Plc S-K 1300 Technical Report Summary on the Blanket Gold Mine, Zimbabwe |
Table 44: Annual Real Cash Flow
Caledonia Mining Corporation Plc S-K 1300 Technical Report Summary on the Blanket Gold Mine, Zimbabwe |
| Item 19 (b) | - Net Present Value |
Minxcon’s in-house DCF model was employed to illustrate the NPV for the Mine in real terms. The NPV was derived from post Government royalties and tax, pre-debt real cash flows, using the techno-economic parameters, commodity price and macro-economic projections. This economic analysis is based on a free cash flow and measures the economic viability of the diluted Indicated and Measured Resources in the LoM plan, for conversion to Mineral Reserves under a defined set of realistically assumed modifying factors.
Table 45 illustrates the Mine NPV at various discount rates with a best estimated value of USD71 million (USD45 million attributable to Caledonia) at a real calculated discount rate of 14.1%. The mine plan is therefore economically viable indicating that an updated Mineral Reserve can be declared on the mine plan.
Table 45: Blanket Mine NPV Summary – Real Terms
Real Discount Rate | Unit | Blanket Mine | Caledonia Attributable |
NPV @ 0% | USDm | 98 | 63 |
NPV @ 2.5% | USDm | 92 | 59 |
NPV @ 5% | USDm | 87 | 55 |
NPV @ 7.5% | USDm | 82 | 52 |
NPV @ 10% | USDm | 77 | 49 |
NPV @ 12.5% | USDm | 73 | 47 |
NPV @ 14.1% | USDm | 71 | 45 |
NPV @ 15% | USDm | 69 | 44 |
Table 46 illustrates the Mine profitability ratios. The mine has a break-even gold price of USD1,257/oz. No IRR could be calculated as the mine is already operating with no upfront investment required.
Table 46: Profitability Ratios
Item | Profitability Ratios | Blanket Mine |
Internal Rate of Return (IRR) | % | N/A |
Total ounces in Mine plan | oz | 383,967 |
NPV 14.1% per oz in Mine Plan | USD/oz | 184 |
LoM (remaining as at 31 December 2022) | Years | 5 |
Present Value of Income flow* | USDm | 178 |
Break-even Feed Grade (Excluding Capex) | g/t | 1.83 |
Break-even Feed Grade (Including Capex) | g/t | 2.36 |
Break-even Gold Price (Excluding Capex) | USD/oz | 971 |
Break-even Gold Price (Including Capex) | USD/oz | 1,257 |
Note: *Calculated on an EBITDA basis.
| Item 19 (c) | - Regulatory Items |
As described in Item 3 (d) mining royalties are charged in terms of the MMA. With the gold price exceeding USD1,200/oz, the applicable royalty rate will be 5% of the gross revenue from gold mining. The royalty will be tax deductible, with the tax rate applied on the earnings after royalty deductions.
The prevailing taxation regime for mining companies in Zimbabwe includes the following provisions:-
| | ● | Corporate Income tax at 24.72%. This includes an AIDS levy of 3% on the 24% corporate tax for an effective 24.72% tax rate. |
| | ● | Exploration, development, and capital costs can be expensed against profit in the year incurred or carried forward to be expensed against the first year of production. |
Caledonia Mining Corporation Plc S-K 1300 Technical Report Summary on the Blanket Gold Mine, Zimbabwe |
| | ● | Tangible and intangible property included in definition of capital expenditure to allow the inclusion of computer software used by the taxpayer in connection with the mining operations. |
| | ● | Exemptions on customs duty and import taxes on capital items during exploration and development phases. |
| | ● | Government Royalties are tax deductible from January 2020. |
| | ● | Deductions for management and general administration expenses is limited based on such expenses exceeding 1% and 0.75%, respectively, of total tax-deductible expenses. |
| | ● | Withholding tax on dividend payments to non-Zimbabweans and on services provided by foreign suppliers at a rate of 5% to 15%, depending on the location of the payee. |
| Item 19 (d) | - Sensitivity Analysis |
Based on the real cash flow calculated in the financial model, the QPs performed single-parameter sensitivity analyses to ascertain the impact on the NPV. The bars represent various inputs into the model; each being increased or decreased by 15%. The left-hand side of the graph indicates a negative 15% change in the input while the right-hand side of the graph indicating a positive 15% change in the input. A negative effect to the NPVs represented by red bars and a positive effect represented by blue bars. For the DCF, the gold price and grade have the biggest impact on the sensitivity of the Mine followed by the central services and mining operating costs. The Mine is least sensitive to capital and plant operating costs.
Figure 58: Mine Sensitivity (NPV14.1%)
A sensitivity analysis was also conducted on the exchange rate and the commodity prices to better indicate the effect these two factors have on the NPV as well as the total costs and the grade. This is displayed in Table 47 and Table 48.
Caledonia Mining Corporation Plc S-K 1300 Technical Report Summary on the Blanket Gold Mine, Zimbabwe |
Table 47: Sensitivity Analysis of Commodity Prices and Grade to NPV14.1% (USDm)
| | Grade (g/t) | 2.15 | 2.30 | 2.45 | 2.61 | 2.76 | 2.91 | 3.07 | 3.22 | 3.38 | 3.53 | 3.68 | 3.84 | 3.99 |
Average Gold Price (USD/oz) | Change % | -30% | -25% | -20% | -15% | -10% | -5% | | 5% | 10% | 15% | 20% | 25% | 30% |
1,100 | -33.5% | -123 | -109 | -95 | -82 | -68 | -54 | -41 | -27 | -13 | -2 | 8 | 18 | 29 |
1,200 | -27.5% | -105 | -90 | -75 | -61 | -46 | -31 | -16 | -3 | 8 | 19 | 30 | 42 | 53 |
1,300 | -21.5% | -88 | -72 | -56 | -39 | -23 | -8 | 4 | 16 | 29 | 41 | 53 | 65 | 77 |
1,400 | -15.4% | -70 | -53 | -36 | -18 | -3 | 10 | 23 | 36 | 49 | 62 | 75 | 88 | 101 |
1,500 | -9.4% | -53 | -34 | -16 | 0 | 14 | 28 | 42 | 56 | 70 | 84 | 98 | 112 | 126 |
1,600 | -3.3% | -36 | -16 | 1 | 16 | 30 | 45 | 60 | 75 | 90 | 105 | 120 | 135 | 150 |
1,655 | 0.0% | -26 | -7 | 9 | 24 | 40 | 55 | 71 | 86 | 102 | 117 | 133 | 148 | 163 |
1,700 | 2.7% | -18 | 0 | 16 | 31 | 47 | 63 | 79 | 95 | 111 | 127 | 143 | 158 | 174 |
1,800 | 8.7% | -3 | 14 | 30 | 47 | 64 | 81 | 98 | 115 | 131 | 148 | 165 | 182 | 199 |
1,900 | 14.8% | 10 | 28 | 45 | 63 | 81 | 99 | 116 | 134 | 152 | 170 | 187 | 205 | 223 |
2,000 | 20.8% | 23 | 42 | 60 | 79 | 98 | 116 | 135 | 154 | 173 | 191 | 210 | 229 | 247 |
2,100 | 26.9% | 36 | 56 | 75 | 95 | 115 | 134 | 154 | 173 | 193 | 213 | 232 | 252 | 272 |
2,200 | 32.9% | 49 | 70 | 90 | 111 | 131 | 152 | 173 | 193 | 214 | 234 | 255 | 275 | 296 |
Note: Sensitivity illustrates average gold prices and not constant gold prices.
Table 48: Sensitivity Analysis of Cash Operating Costs and Capital to NPV14.1% (USDm)
| | Capital (USDm) | 115.4 | 111.0 | 106.5 | 102.1 | 97.7 | 93.2 | 88.8 | 84.3 | 79.9 | 75.5 | 71.0 | 66.6 | 62.2 |
OPEX (USD/Milled t) | Change % | 30.0% | 25.0% | 20.0% | 15.0% | 10.0% | 5.0% | | -5.0% | -10.0% | -15.0% | -20.0% | -25.0% | -30.0% |
99 | 30% | 4 | 7 | 10 | 12 | 15 | 18 | 20 | 23 | 26 | 29 | 31 | 34 | 37 |
95 | 25% | 13 | 15 | 18 | 21 | 23 | 26 | 29 | 32 | 34 | 37 | 40 | 42 | 45 |
91 | 20% | 21 | 24 | 26 | 29 | 32 | 34 | 37 | 40 | 43 | 45 | 48 | 51 | 53 |
88 | 15% | 29 | 32 | 35 | 37 | 40 | 43 | 46 | 48 | 51 | 54 | 56 | 59 | 62 |
84 | 10% | 38 | 40 | 43 | 46 | 49 | 51 | 54 | 57 | 59 | 62 | 65 | 67 | 70 |
80 | 5% | 46 | 49 | 51 | 54 | 57 | 60 | 62 | 65 | 68 | 70 | 73 | 76 | 79 |
76 | | 54 | 57 | 60 | 63 | 65 | 68 | 71 | 73 | 76 | 79 | 82 | 84 | 87 |
72 | -5% | 63 | 66 | 68 | 71 | 74 | 76 | 79 | 82 | 84 | 87 | 90 | 93 | 95 |
69 | -10% | 71 | 74 | 77 | 79 | 82 | 85 | 87 | 90 | 93 | 96 | 98 | 101 | 104 |
65 | -15% | 80 | 82 | 85 | 88 | 90 | 93 | 96 | 99 | 101 | 104 | 107 | 109 | 112 |
61 | -20% | 88 | 91 | 93 | 96 | 99 | 102 | 104 | 107 | 110 | 112 | 115 | 118 | 120 |
57 | -25% | 96 | 99 | 102 | 104 | 107 | 110 | 113 | 115 | 118 | 121 | 123 | 126 | 129 |
53 | -30% | 105 | 107 | 110 | 113 | 116 | 118 | 121 | 124 | 126 | 129 | 132 | 135 | 137 |
Note: OPEX excludes Royalties in Sensitivity Analysis as the Royalties are dependent on operating margins. Capital excludes renewals and replacement capital as this is dependent on OPEX.
Caledonia Mining Corporation Plc S-K 1300 Technical Report Summary on the Blanket Gold Mine, Zimbabwe |
| Item 19 (e) | – Economic Analysis Conclusions |
The value derived for the income approach only reflects the diluted Indicated and Measured Resources in the LoM plan, for conversion to Mineral Reserves. It is noted that Mineral Resources that are not Mineral Reserves do not have demonstrated economic viability. The Mineral Reserve is economically viable with a best estimated NPV of USD71 million (USD45 million attributable to Caledonia) at a real discount rate of 14.1%. No IRR could be calculated as Blanket is already in operation and no initial investment is required. The all-in cost margin is 23% with a break-even gold price of USD1,257/oz. Table 49 shows a summary of the economic analysis.
Table 49: Blanket Mine Economic Analysis Summary – Real Terms
Real Discount Rate | Unit | Blanket Mine | Caledonia Attributable |
NPV @ 0% | USDm | 98 | 63 |
NPV @ 2.5% | USDm | 92 | 59 |
NPV @ 5% | USDm | 87 | 55 |
NPV @ 7.5% | USDm | 82 | 52 |
NPV @ 10% | USDm | 77 | 49 |
NPV @ 12.5% | USDm | 73 | 47 |
NPV @ 14.1% | USDm | 71 | 45 |
NPV @ 15% | USDm | 69 | 44 |
IRR | % | N/A | N/A |
All-in Cost Margin | % | 23% | 23% |
Break-even Gold Price (AIC) | USD/oz. | 1,257 | 1,257 |
ITEM 20 | – ADJACENT PROPERTIES |
The GGB is host to numerous gold occurrences, the majority of which have been worked by large-scale or artisanal miners. At least 268 mines have been operational across the geological terrain, of which only three are currently active. These include Blanket Mine, the adjacent Vubachikwe Mine and Jessie Mine at the south-eastern end of the belt near West Nicholson. At the western end of the belt some 22 km west of Gwanda, Freda is mined out. Blanket and Vubachikwe are sometimes referred to as the Sabiwa group of mines or the North Western Mining Camp.
Vubachikwe Mine of Forbes and Thompson (Pvt) Ltd is an operating, underground mine located on the northern limb of a plunging syncline and has reached a depth of 1,155 m. Gold mineralisation is hosted in mafic and ultramafic greenstones and BIF (MSA, 2011). Ore occurs in 5-40 m thick lenses and up to 200 m down-dip, and are hosted mainly in northwest-plunging, north-south striking BIF which dips 75°SW. Gold occurs as free gold and inclusions in arsenopyrite, as well as disseminated carbonate replacements in the BIF (Spilpunt, 2001; MSA, 2011). The mineralised bodies are folded and boudinaged (Spilpunt, 2001).
Vubachikwe Mine produced almost 21,744 kg of gold to the end of 1991 at an average of 7 g/t (MSA, 2011). Underground workings have reached depths of 1,000 m (AGS, 2006). Blanket Mine purchased the Vubachikwe dump material between 2000 and 2005 treated it through the Blanket metallurgical plant.
Auriferous quartz veins at the underground Jessie Mine are hosted in hornblende schist dipping steeply to the southwest Erratically distributed pyrite, pyrrhotite, chalcopyrite and galena are observed. Ore grades reach up to 10.5 g/t, with production pre-2001 recorded by Spilpunt (2001) at some 11.5 t Au with minor copper. The mine is operated as an underground mine by FA Stewart (Pvt) Ltd.
The Freda Mine commenced production in 1919 targeting surficial oxidised ore as well as underlying ore containing pyrrhotite, pyrite and arsenopyrite, with minor amounts of tetradymite. The vein-type ores are hosted in epidiorite surrounded by grits and quartz-mica schist with the mined-out bodies reaching thicknesses of up to 30 m, striking 115° and inclining steeply to the southwest. Spilpunt (2001) reports that the deposit is mined out, with workings reaching a depth of 1,100 m with 7,550 kg Au recovered at a recovered grade of about 0.8 g/t Au.
Caledonia Mining Corporation Plc S-K 1300 Technical Report Summary on the Blanket Gold Mine, Zimbabwe |
The QPs have relied on the information as is presented by the referenced sources. Verification has been limited to that data which is made available publicly and has been limited to cross-referencing information presented by the individual sources.
The only nearby property of significance is Vubachikwe Mine. Blanket and Vubachikwe target different gold orebodies but the mineralisation style is similar, implying a structural relationship (AGS, 2006). Economic mineralisation also continues to similar depths. However, although the style of gold mineralisation is similar, the mineralisation of adjacent property is not necessarily indicative of that at Blanket.
The QPs have been unable to verify the information, and the information is not necessarily indicative of the mineralisation on the Blanket property .
ITEM 21 | – OTHER RELEVANT DATA AND INFORMATION |
| Item 21 (a) | – Upside Potential |
Based on the updated geological model, there are numerous targets that have been identified that would fit in with the trends identified in the geological model. These targets would also assist in proving or disproving and refining the proposed geological model. The focus should be on confirming the continuity of the BQR, as it is very likely this continues throughout Blanket Mine, albeit locally at lower grades. A targeted drilling campaign can be proposed to confirm the continuity (Figure 13). At Blanket 4, a very strong trend is observed from the upper levels of Blanket all the way into future mine areas, to the south, Jethro falls along the same trend. Connectivity could be established between these two orebodies which could result in potential additional resources close to existing infrastructure. In addition, another trend in the data is seen linking Jethro and Feudal that is running subparallel to BQR which also needs to be understood.
Additional targets would include considering the optimisation of existing wireframes, and trends used to define these wireframes. An example of this is Eroica, where a very strong trend is seen at 70-65°. By inferring this beyond the boundary of the wireframe there is potential to extend the domain as well as providing additional targets, if these down-dip extensions are seen not to be informed by any samples.
| Item 21 (b) | – Risk Assessment |
A risk assessment to consider and quantify risks associated with the Mine was conducted by the QPs based on a simplified approach. The result is not designed to be a definitive assessment of the risks, but is rather a tool to articulate and evaluate those risks as identified by persons present at the risk assessment session. All items were reviewed and assessed using the risk severity criteria shown below:-
| | ● | Green–Low risk (score 1-5); |
| | ● | Yellow–Medium risk (score 6-12); |
| | ● | Orange-Significant risk (score 13-20); and |
| | ● | Red–High risk (score greater than 21). |
Once a high risk is identified, the project team is required to take remedial action to either resolve or mitigate the risk. The identification and recording of corrective and remedial measures was beyond the scope of this particular risk assessment exercise.
Caledonia Mining Corporation Plc S-K 1300 Technical Report Summary on the Blanket Gold Mine, Zimbabwe |
The outcome of the risk assessment is provided in Table 50. No major risks have been identified relating to the Blanket Mine operations.
Table 50: Risk Assessment
Risk Category | Risk | Description / Cause | Risk Likelihood | Impact | Risk Rating | Mitigation/Control | Risk Likelihood | Impact | Residual Risk Rating |
Metallurgy / Processing | Limited tailings storage capacity | The existing TSF is nearing the end of its life. | 1 | 3 | 6 | A new TSF facility should be designed and built. | 1 | 1 | 1 |
Mining | Potential delay in newly planned mining areas | Detailed ventilation work has not been completed, which may require new ventilation layouts and infrastructure to be established and thus delay mining. | 1 | 2 | 3 | A detailed ventilation study should be completed. | 1 | 1 | 1 |
Mining | Potential increase in pillar loss | Pillar extraction factor may be reduced to less than 50%. | 2 | 2 | 5 | Geotechnical work required to confirm pillar extraction factor. | 1 | 1 | 1 |
ITEM 22 | – INTERPRETATION AND CONCLUSIONS |
Mineral Resources
All data sources have been verified as much as possible and deemed to be suitable for the establishment of a 3D geological model and Mineral Resource Estimation. Updates were made to the geological models of multiple orebodies. For all the domains were significant volume or data changes occurred, all geostatistics, variography and estimation parameters were reconsidered.
The estimates generally show good reconciliation to data. However, scope may exist to further domain the orebodies and improve the quality of the estimates. Measured, Indicated and Inferred Mineral Resources can be declared for Blanket Mine due to the continuity of the geology and grade as well as a history of proven historical mining. The Inferred Mineral Resources show geological continuity, while grade continuity still needs to be improved by additional drilling.
The 2022 estimate has replaced all manual estimates with 3D digital block model estimates. Locally some orebodies saw large changes to tonnage or grade due to this transition. However, it is believed that the resulting block models better represent the data and geology of the orebodies and will prove to be a more robust Mineral Resource than the mixed manual and digital estimates.
The 2021 QP laboratory visit concluded that there were some concerns at the laboratory that need to be addressed.
There have been improvements in the QAQC systems and monitoring but there is still room for improvement, especially for the deep exploration drillholes.
Mining
The LoM plan includes Measured, Indicated and Inferred Mineral Resources; however, only diluted Measured and Indicated Mineral Resources have been considered for economic assessment for Mineral Reserve estimates and have been converted into Proven and Probable Mineral Reserves respectively. A significant portion of Inferred Mineral Resources has been included in the LoM plan for mining practicality.
Caledonia Mining Corporation Plc S-K 1300 Technical Report Summary on the Blanket Gold Mine, Zimbabwe |
The mining strategy is focused on opening up ground below 870 m Level and is in line with the planned capital and infrastructure development thrust on 30 Level and 34 Level. Mining targets the Mineral Resources below 870 m Level with less mining above 750 m Level in the Blanket, ARS and Blanket Feudal orebodies.
An uneconomical tail containing 125.5 koz of gold has been excluded from the Mineral Reserve since it is not viable on its own.
Engineering and Infrastructure
Existing and planned infrastructure at the Blanket Mine and CMS extension projects are sufficient to sustain the current production profile and the planned increased production.
Processing
The process plant has been operating at a consistent recovery of 93.8%, and this can be expected to continue as long as the ore mineralogy does not change.
The average processing rate for the past 12 months was 62.7 ktpm, and there are indications that higher processing rates can be achieved with operational improvements, as demonstrated in December 2022 where 79.8kt was milled.
A new TSF is planned to allow for deposition towards the end of 2023 with Phase 1a costing USD12.74 million.
Economic Analysis
The Blanket Mine plan including only the diluted Indicated and Measured Resources in the LoM plan, for conversion to Mineral Reserves is financially feasible at a 14.1% real discount rate, and therefore the Mineral Reserve can be declared.
The DCF value of USD71 million for the Blanket Mine (USD45 million attributable to Caledonia) was calculated at a real discount rate of 14.1%. No IRR could be calculated since the Mine is in operation and no initial investment is required. Blanket Mine has an all-in cost margin of 23%, which is comparable to similar mines.
The Mine is most sensitive to commodity prices, and grade. The Mine has a break-even gold price of USD1,257/oz including capital.
All-in sustaining costs for the Blanket Mine amount to USD110/milled t, which equates to USD1,183/oz. All-in costs for the Blanket Mine amount to USD117/milled t, which equates to USD1,257/oz.
Mineral Resources
Upside potential exists due to new geological interpretations. This can be used in targeted exploration drilling, in many cases close to existing infrastructure. There are areas where historical data has not yet been captured (in previous manual areas). This data should be captured to increase confidence in these areas, as well as allow for new potential targets to be identified.
A geological loss of only 5% is applied to Indicated and Inferred resource categories. It is recommended that the geological losses applied is reflective of the confidence. A geological loss of 5% for Measured, 10% for Indicated and 15% for Inferred resource is recommended. It is proposed that future estimates consider applying these geological losses.
Orientated core should be obtained during exploration drilling. Structural information should be collected and utilised to assist in the development of a geological model and construction of orebody wireframes. Predictive mineralisation mapping should be introduced to assist in exploration drilling planning, based on the conceptual geological model.
Caledonia Mining Corporation Plc S-K 1300 Technical Report Summary on the Blanket Gold Mine, Zimbabwe |
The QAQC data shows an improvement in the QAQC processes for the sampling database but still requires additional focus on immediate remedial action if required, especially for the down dip exploration drilling as this can impact the Mineral Resources significantly and thus requires the highest integrity.
To determine the upside potential of the Inferred and Exploration Target Mineral Resources, it is recommended to do additional drilling to increase the level of confidence of the Mineral Resources from the Inferred Classification to Indicated Classification for conversion to Probable Mineral Reserves. The onsite assay laboratory and QAQC processes should be upgraded.
Mining
It is recommended that rock engineering studies and modelling continue in order to improve the recommended strategy for pillar extraction.
Processing
The TSF design study was completed in October 2022 and phase 1A of the TSF must be completed in 2023 to allow deposition to start.
| | ● | Applied Geology Services cc (2006). Independent Qualified Person’s Report - Blanket Mine, Zimbabwe. Prepared for: Caledonia Mining Corporation. July 2006. 81pp |
| | ● | Australian Government, Office of the Chief Economist (2022). Department of Industry, Science, Energy and Resources. Resources and Energy Quarterly, December 2022. |
| | ● | Caledonia Mining Corp (2006). Acquisition of Gold Mine. 20 June 2006. https://www.investegate.co.uk/caledonia-mining-crp--cmcl-/rns/acquisition-of-gold-mine/200606201300058747E/ |
| | ● | Campbell, S.G.G. and Pitfield, P.E.J. (1994). Structural Controls of Gold Mineralisation in the Zimbabwe Craton – Exploration Guidelines. Zimbabwe Geological Survey Bulletin No. 101. |
| | ● | Canadian Institute of Mining, Metallurgy and Petroleum (CIM) (2014). Definition Standards for Mineral Resources and Mineral Reserves, 10 May 2014. |
| | ● | Canadian Institute of Mining, Metallurgy and Petroleum (CIM) (2019). Estimation of Mineral Resources and Mineral Reserves Best Practices Guidelines. |
| | ● | Clark, J. (2020). 2020 Gold Price Forecast, Trends, & 5 Year Predictions, GoldSilver. Accessed on 15 February 2020 via https://goldsilver.com/blog/gold-price-forecast-predictions/ |
| | ● | GFMS (2019). GFMS Gold Survey 2019. 28pp. |
| | ● | Fuchter, W.A.H. (1990). The Geology and Gold Mineralisation of the North Western Mining Camp, Gwanda Greenstone Belt, Zimbabwe. Unpublished PhD thesis, Queens University. |
| | ● | Kalbskopf, S., and Nutt, T., (2003). Lithological Contrasts and Constraints on Gold Mineralisation in Granitoids in the Zimbabwe Craton: Structural Controls and Implications for Exploration. Economic Geology Research Unit, Hugh Allsop Laboratory. University of the Witwatersrand, Johannesburg. Information Circular, No. 370, 27 pp. |
| | ● | Knight Piésold Africa Limited (2019). Caledonia Mining Corporation - Blanket Mine (1983) (Pvt) Limited Blanket Mine Closure Plan, Closure Cost Estimates January 2019. Project Number: RI301-00588/02. Revision A. January 2019. 127pp. |
Caledonia Mining Corporation Plc S-K 1300 Technical Report Summary on the Blanket Gold Mine, Zimbabwe |
| | ● | Mhlanga, G. (2002). Data Driven Predictive Modelling for Archean Lode Gold Potential, Bubi Greenstone Belt, Southwest Zimbabwe. MSc Thesis, International Institute for Geo-information Science and Earth Observation, Enscehe, Netherlands. 108 pp. |
| | ● | Robert, F. (1996). Diversity of Archaean Lode Gold Deposits and Implications for Exploration. Course Notes, AMF Workshop Course No. 973/96, Australian Mineral Foundation, Adelaide. |
| | ● | Spilpunt. Mineral Commodities and Africa – Gwanda Greenstone Belt (updated 2001). Available from: http://spilpunt.blogspot.com/2007/04/zimbabwe.html. Viewed 3 August 2020. |
| | ● | The MSA Group (2011). NI 43 101 Technical Report on the Blanket Gold Mine, Zimbabwe. J2225. Prepared on behalf of Caledonia Mining Corporation. 28 June 2011. |
| | ● | United States Geological Survey (2023). Gold Data Sheet - Mineral Commodity Summaries 2023, 31 January 2023. |
| | ● | World Gold Council (2022a). Gold Demand Trends, Full Year and Q4 2022. London, United Kingdom. Published: 31 January 2023. |
| | ● | World Gold Council (2022b). Gold Demand Trends Data Tables, FY 2022 Statistics. |
| | ● | World Gold Council (2023). Latest World Official Reserves. Accessed on 13 March 2023 via https://www.gold.org/goldhub/data/gold-reserves-by-country. |
ITEM 25 | – RELIANCE ON INFORMATION PROVIDED BY THE REGISTRANT |
The QPs have accepted information supplied by Caledonia regarding the permits and licences as valid and complete, which is included in Item 3 of this TRS. The QPs consider such reliance reasonable because the information constitutes legal and environmental matters outside the expertise of the QPs.