Exhibit 15.4
Caledonia Mining Corporation Plc S-K 1300 Technical Report Summary on the Blanket Gold Mine, Zimbabwe |
Caledonia Mining Corporation Plc
S-K 1300 Technical Report Summary on
the Blanket Gold Mine, Zimbabwe
QUALIFIED PERSONS: Mr. C Harvey NHD Econ. Geol MAIG, MGSSA Mr M. Van Staden B. Eng (Mining) Pr. Eng MAMMSA, MSAIMM Effective Date: 31 December 2023 Version: Final Issue Date: 15 May 2024 |
Caledonia Mining Corporation Plc
S-K 1300 Technical Report Summary on the Blanket Gold Mine, Zimbabwe
DATE AND SIGNATURE PAGE
This Report titled “S-K 1300 Technical Report Summary on the Blanket Gold Mine, Zimbabwe” has been prepared for Caledonia Mining Corporation Plc. The Report is compiled in accordance with the United States Securities and Exchange Commission Part 229 Standard Instructions for Filing Forms Regulation S-K subpart 1300. The effective date of this Report is 31 December 2023.
The Qualified Person (“QP”) responsible for the compilation of this Report is Mr. Craig Harvey who has relied on contributions from various sources.
__________________________________________________________
C HARVEY NHD Economic Geology MAIG (5458), MGSSA (966008) VP Technical Services Caledonia Mining |
__________________________________________________________
M VAN STADEN B. Eng (Mining) Pr. Eng (20150089). AMMSA (MB3709). SAIMM (20422) Technical Services Manager Caledonia Mining |
Signed at Little Falls, Gauteng, South Africa, on 15 May 2024.
ii
Caledonia Mining Corporation Plc
S-K 1300 Technical Report Summary on the Blanket Gold Mine, Zimbabwe
INFORMATION RISK
This Report was prepared by Craig Harvey, Vice President Technical Services for Caledonia Mining Corporation Plc (“Caledonia”), the QP. Mr Harvey is a full-time employee of the Caledonia group and in the preparation of the Report, has utilised information relating to operational methods and expectations provided by various sources. The QP has, where possible, verified this information from independent sources after making due enquiry of all material issues that are required in order to comply with the requirements of the United States Securities and Exchange Commission Part 229 Standard Instructions for Filing Forms Regulation S-K subpart 1300. No warranty or guarantee, be it express or implied, is made by the QP with respect to the completeness or accuracy of the legal aspects of this document.
OPERATIONAL RISKS
The business of mining and mineral exploration, development and production by their nature contain significant operational risks. The business depends upon, amongst other things, successful prospecting programmes and competent management. Profitability and asset values can be affected by unforeseen changes in operating circumstances and technical issues.
POLITICAL AND ECONOMIC RISK
Factors such as political and industrial disruption, currency fluctuation and interest rates could have an impact on future operations, and potential revenue streams can also be affected by these factors. The majority of these factors are, and will be, beyond the control of any operating entity.
FORWARD LOOKING STATEMENTS
Certain statements contained in this document other than statements of historical fact, contain forward-looking statements regarding the operations, economic performance or financial condition, including, without limitation, those concerning the economic outlook for the mining industry, expectations regarding commodity prices, exchange rates, production, cash costs and other operating results, growth prospects and the outlook of operations, including the completion and commencement of commercial operations of specific production projects, its liquidity and capital resources and expenditure, and the outcome and consequences of any pending litigation or enforcement proceedings.
Although the QP believes that the expectations reflected in such forward-looking statements are reasonable, no assurance can be given that such expectations will prove to be correct. Accordingly, results may differ materially from those set out in the forward-looking statements as a result of, among other factors, changes in economic and market conditions, changes in the regulatory environment and other State actions, success of business and operating initiatives, fluctuations in commodity prices and exchange rates, and business and potential risk management.
iii
Caledonia Mining Corporation Plc
S-K 1300 Technical Report Summary on the Blanket Gold Mine, Zimbabwe
TABLE OF CONTENTS
Item 1 | – Executive Summary | 13 |
I. | Geology and Mineral Deposit | 13 |
II. | Status of Exploration | 13 |
III. | Mineral Resource and Mineral Reserve Estimates | 14 |
IV. | Development and Operations | 16 |
V. | Economic Analysis | 17 |
VI. | Conclusions | 19 |
VII. | Recommendations | 20 |
Item 2 | – Introduction | 21 |
Item 2 (a) | Author | 21 |
Item 2 (b) | – Terms of Reference and Purpose of the Report | 21 |
Item 2 (c) | – Sources of Information and Data Contained in the Report | 21 |
Item 2 (d) | – Qualified Persons’ Personal Inspection of the Property | 22 |
Item 3 | – Property Description and Location | 22 |
Item 3 (a) | – Area of the Property | 22 |
Item 3 (b) | – Location of the Property | 22 |
Item 3 (c) | – Mineral Deposit Tenure | 23 |
Item 3 (d) | – Royalties and Payments | 25 |
I. | Government Royalties | 25 |
II. | Net Smelter Royalties | 26 |
Item 3 (e) | – Environmental Liabilities | 26 |
Item 3 (f) | – Permits to Conduct Work | 26 |
I. | Water Agreement | 27 |
II. | . Environmental Impact Assessment Certificates | 27 |
III. | Additional Environmental Permits | 27 |
Item 3 (g) | – Other Significant Factors and Risks | 28 |
Item 4 | – Accessibility, Climate, Local Resources, Infrastructure and Physiography | 28 |
Item 4 (a) | – Topography, Elevation and Vegetation | 28 |
Item 4 (b) | – Access to the Property | 28 |
Item 4 (c) | – Climate and Length of Operating Season | 29 |
Item 4 (d) | – Infrastructure | 30 |
I. | Regional Infrastructure | 30 |
I. | Mine Infrastructure | 30 |
Item 5 | – History | 30 |
Item 5 (a) | – Prior Ownership and Ownership Changes | 30 |
Item 5 (b) | – Historical Exploration and Development | 30 |
Item 6 | – Geological Setting, Mineralisation and Deposit | 31 |
Item 6 (a) | - Regional Geology | 31 |
Item 6 (b) | - Local and Property Geology | 32 |
Item 6 (c) | – Mineralisation and Deposit Type | 35 |
Item 6 (d) | – Geological Model | 37 |
Item 7 | – Exploration | 44 |
Item 7 (a) | – Non-drilling Work | 44 |
I. | Survey Procedures and Parameters | 44 |
II. | Sampling Methods and Sample Quality | 45 |
III. | Sample Data | 45 |
IV. | Results and Interpretation of Exploration Information | 45 |
Item 7 (b) | – Drilling | 45 |
Caledonia Mining Corporation Plc
S-K 1300 Technical Report Summary on the Blanket Gold Mine, Zimbabwe
I. | Type and Extent of Drilling | 45 |
II. | Factors Influencing the Accuracy of Results | 54 |
III. | Exploration Properties – Drill Hole Details | 54 |
Item 7 (c) | – Hydrogeology | 54 |
Item 7 (d) | – Geotechnical | 54 |
Item 8 | – Sample Preparation, Analyses and Security | 55 |
Item 8 (a) | Sample Handling Prior to Dispatch | 55 |
Item 8 (b) | – Sample Preparation and Analysis Procedures | 55 |
Item 8 (c) | – Quality Assurance and Quality Control | 55 |
I. | Assessment of Results | 56 |
Item 8 (d) | – Adequacy of Sample Preparation, Security and Analytical Procedures | 59 |
Item 9 | – Data Verification | 59 |
Item 9 (a) | – Data Verification Procedures | 59 |
Item 9 (b) | – Limitations on/Failure to Conduct Data Verification | 61 |
Item 9 (c) | – Adequacy of Data | 61 |
Item 10 | – Mineral Processing and Metallurgical Testing | 61 |
Item 10 (a) | – Nature and Extent of Testing and Analytical Procedures | 61 |
Item 10 (b) | Basis off Assumptions Regarding Recovery Estimates | 61 |
Item 10 (c) | – Representativeness of Samples and Adequacy of Data | 62 |
Item 10 (d) | – Deleterious Elements for Extraction | 62 |
Item 11 | – Mineral Resource Estimates | 62 |
Item 11 (a) | – Assumptions, Parameters and Methods Used for Resource Estimates | 62 |
I. | Mineral Resource Estimation Procedures | 62 |
II. | Initial Assessment | 83 |
III. | Mineral Resource Classification | 84 |
IV. | Mineral Resource Statement | 96 |
Item 11 (b) | – Individual Grade of Metals | 99 |
Item 11 (c) | – Factors Affecting Mineral Resource Estimates | 100 |
Item 12 | – Mineral Reserve Estimates | 100 |
Item 12 (a) | - Key Assumptions, Parameters and Methods | 100 |
I. | Stope Design Methodology | 100 |
II. | Cut- Off Grade | 101 |
III. | Modifying Factors | 101 |
IV. | Mineral Resource to Mineral Reserve Conversion | 102 |
Item 12 (b) | - Multiple Commodity Reserve | 103 |
Item 12 (c) | - Factors Affecting Mineral Reserve Estimation | 103 |
Item 13 | – Mining Methods | 103 |
Item 13 (a) | – Parameters Relevant to Mine Design | 108 |
I. | Geotechnical and Hydrological Parameters | 109 |
II. | Ventilation | 111 |
Item 13 (b) | – Production Rates, Expected Mine Life, Mining Unit Dimensions, and Mining Dilution | 112 |
I. | Shift Cycle | 112 |
II. | Production Rates | 112 |
| Life of Mine Plan | 114 |
III. | Mineral Reserve Conversion Factors | 118 |
Item 13 (c) | – Requirements for Stripping, Underground Development and Backfilling | 120 |
I. | Underground Development | 120 |
II. | Backfilling | 122 |
Item 13 (d) | – Required Mining Fleet, Machinery and Personnel | 123 |
I. | Mining Fleet and Machinery | 123 |
Caledonia Mining Corporation Plc
S-K 1300 Technical Report Summary on the Blanket Gold Mine, Zimbabwe
II. | Personnel | 123 |
Item 14 | – Recovery Methods | 126 |
Item 14 (a) | - Flow Sheets and Process Recovery Methods | 126 |
Item 14 (b) | Process Flow and Equipment Specifications. | 128 |
Item 14 (c) | Slurry Deposition. | 133 |
Item 15 | – Project Infrastructure | 135 |
Item 15 (a) | - Mine Layout and Operations | 135 |
Item 15 (b) | – Infrastructure | 137 |
I. | Surface Infrastructure | 137 |
II. | Mining Section | 140 |
III. | Dewatering | 140 |
Item 15 (c) | – Services | 140 |
I. | Power Supply and Reticulation | 140 |
II. | Water Supply and Reticulation | 141 |
III. | Ventilation | 142 |
IV. | Compressed Air | 142 |
V. | Logistics | 143 |
Item 16 | – Market Studies | 143 |
Item 16 (a) | – Commodity Market Assessment | 143 |
Item 16 (b) | – Contracts | 154 |
Item 17 | – Environmental Studies, Permitting and Plans, Negotiations, or Agreements with Local Individuals or Groups | 154 |
Item 17 (a) | – Relevant Environmental Issues and Results of Studies Done | 154 |
Item 17 (b) | – Waste Disposal, Site Monitoring and Water Management | 155 |
Item 17 (c) | – Permit Requirements | 156 |
Item 17 (d) | – Social and Community-Related Requirements | 156 |
Item 17 (e) | – Mine Closure Costs and Requirements | 156 |
Item 17 (f) | - Adequacy of Current Plans | 157 |
Item 17 (g) | – Local Procurement and Hiring | 157 |
Item 18 | – Capital and Operating Costs | 157 |
Item 18 (a) | – Capital Costs | 157 |
Item 18 (b) | – Operating Cost | 159 |
VI. | Financial Costs Indicators | 160 |
Item 18 (c) | – Accuracy of Estimates | 165 |
Item 19 | – Economic Analysis | 165 |
Item 19 (a) | - Principal Assumptions | 166 |
I. | Basis of Evaluation of the Mining Assets | 166 |
II. | Macro-Economic Forecasts | 166 |
III. | Working Capital | 167 |
IV. | Recoveries | 167 |
V. | Discount Rate | 167 |
VI. | Cash Flow Forecast | 168 |
Item 19 (b) | - Net Present Value | 171 |
Item 19 (c) | - Regulatory Items | 171 |
I. | Government Royalties | 171 |
VII. | Corporate Taxes | 171 |
Item 19 (d) | - Sensitivity Analysis | 172 |
Item 19 (e) | – Economic Analysis Conclusions | 175 |
Item 20 | – Adjacent Properties | 175 |
Item 20 (a) | Sources of Information | 177 |
Caledonia Mining Corporation Plc
S-K 1300 Technical Report Summary on the Blanket Gold Mine, Zimbabwe
Item 21 | – Other Relevant Data and Information | 177 |
Item 21 (a) | – Upside Potential | 177 |
Item 21 (b) | – Risk Assessment | 177 |
Item 22 | – Interpretation and Conclusions | 178 |
| Mineral Resources | 178 |
| Mining | 179 |
| Engineering and Infrastructure | 179 |
| Processing | 179 |
| Economic Analysis | 179 |
Item 23 | – Recommendations | 180 |
Item 24 | – References | 180 |
Item 25 | – Reliance on Information Provided by the Registrant | 181 |
FIGURES
Figure 1: General Location of Blanket Mine | 22 |
Figure 2: Location of Blanket Mining Lease and Claims | 23 |
Figure 3: Stratigraphic Column of the Blanket Mine Area | 32 |
Figure 4: Local Geology of Blanket Mine | 33 |
Figure 5: Geological Cross Section of Blanket Mine at No 4 Shaft | 33 |
Figure 6: General Orebody Domain Wireframes and Major Structures | 37 |
Figure 7: Blanket Section Orebodies and the Wenlock Fault on 630m Level | 38 |
Figure 8: Sectional View of the Blanket Orebodies, Looking North | 39 |
Figure 9: Sectional View of Blanket Feudal Hanging Wall in Relation to BQR Hanging Wall, Looking North | 40 |
Figure 10: Plan View of the Blanket Feudal, Blanket Orebodies and BQR at 140m Level. | 40 |
Figure 11: Plan View of the Blanket, AR South and AR Main Orebodies on 810m Level. | 42 |
Figure 12: Plan View of the ERC and Lima Orebodies at the 140m Level. | 42 |
Figure 13: Long Section of Blanket Mine Showing the Total Database | 58 |
Figure 14: 3-Dimensional view of the AR Main Domain and is Associated Data | 60 |
Figure 15: Section View of ARS_EXT and ARS Domains and Data. | 60 |
Figure 16: Section View of BLK1, BLK2, BLK3, BLK4_5 and BLK6 Domains and their Data. | 62 |
Figure 17: Section View of BF and BQR Domains and their Data. | 64 |
Figure 18: Section View of the LIMA and EROICA Domains with their Data. | 65 |
Figure 19: Section View of JETHRO and SHEET Domains and their Data. | 65 |
Figure 20: ARM Estimates | 68 |
Figure 21: ARS Estimates (including ARS_Ext) | 68 |
Figure 22: BLK1 Estimates | 69 |
Figure 23: BLK2 Estimates | 70 |
Figure 24: BLK3 Estimates | 71 |
Figure 25: BLK4_5 Estimates | 72 |
Figure 26: BLK6 Estimates | 72 |
Figure 27: BF Estimates | 73 |
Figure 28: BQR Estimates | 74 |
Figure 29: LIMA Estimates | 74 |
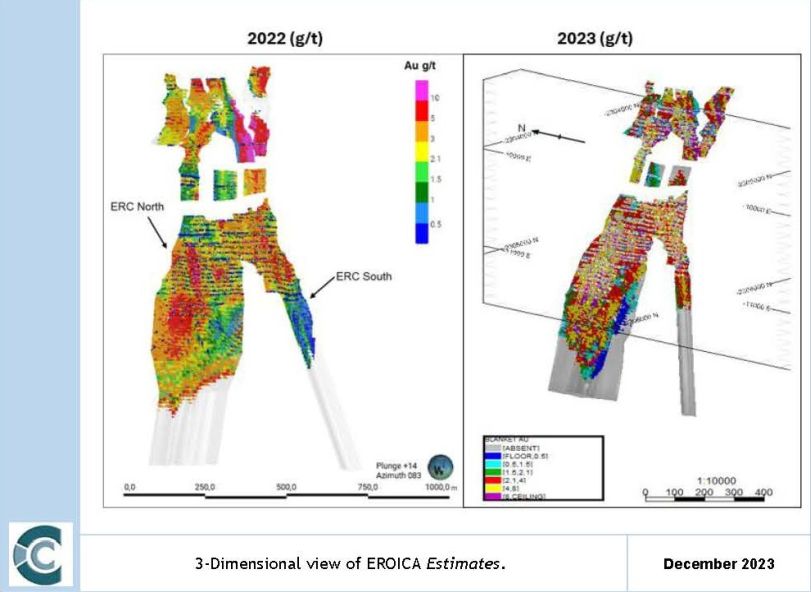
Figure 30: ERC Estimates | 75 |
Figure 31: JTH Estimates | 76 |
Figure 32: SHT Estimates | 77 |
Figure 33: Long Section of Blanket Mine showing Stopes, Drives, Haulages and Shafts | 78 |
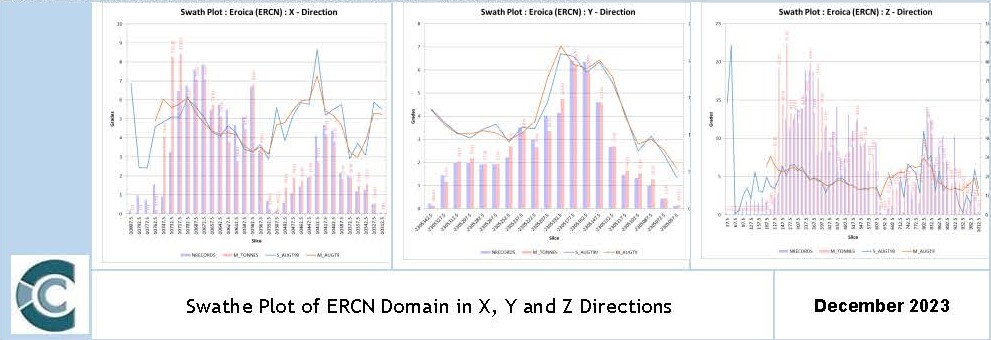
Figure 34: Swathe Plot of ERCN Domain in X, Y and Z Directions | 79 |
Caledonia Mining Corporation Plc
S-K 1300 Technical Report Summary on the Blanket Gold Mine, Zimbabwe
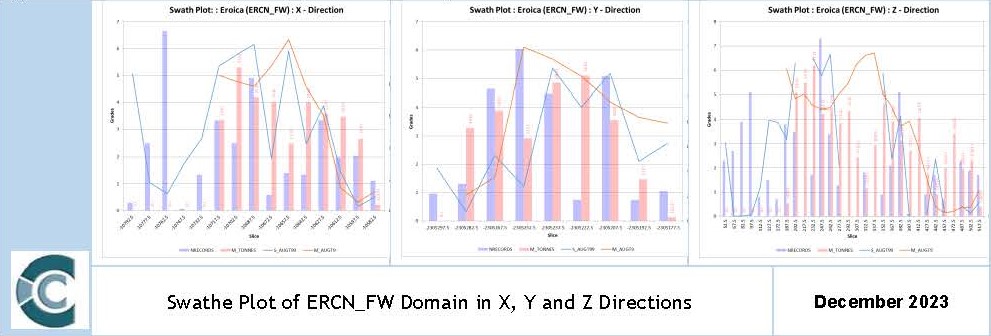
Figure 35: Swathe Plot of ERCN_FW Domain in X, Y and Z Directions | 79 |
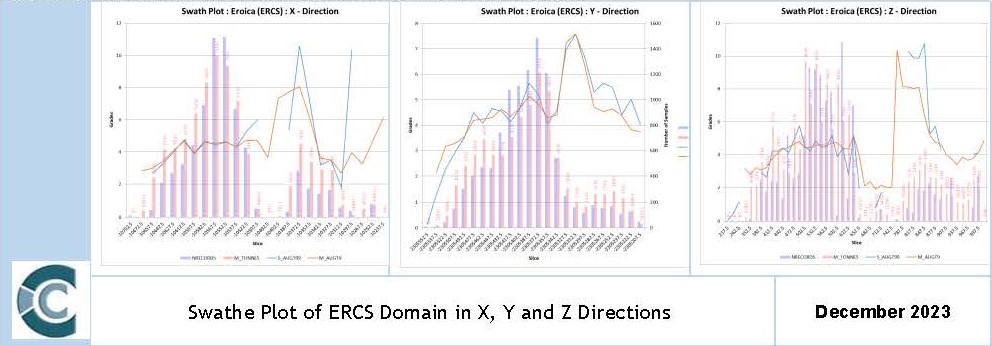
Figure 36: Swathe Plot of ERCS Domain in X, Y and Z Directions | 79 |
Figure 37: ARM Mineral Resource Classification | 83 |
Figure 38: ARS Mineral Resource Classification (Including ARS_Ext) | 84 |
Figure 39: BLK1 Mineral Resource Classification | 85 |
Figure 40: BLK2 Mineral Resource Classification | 86 |
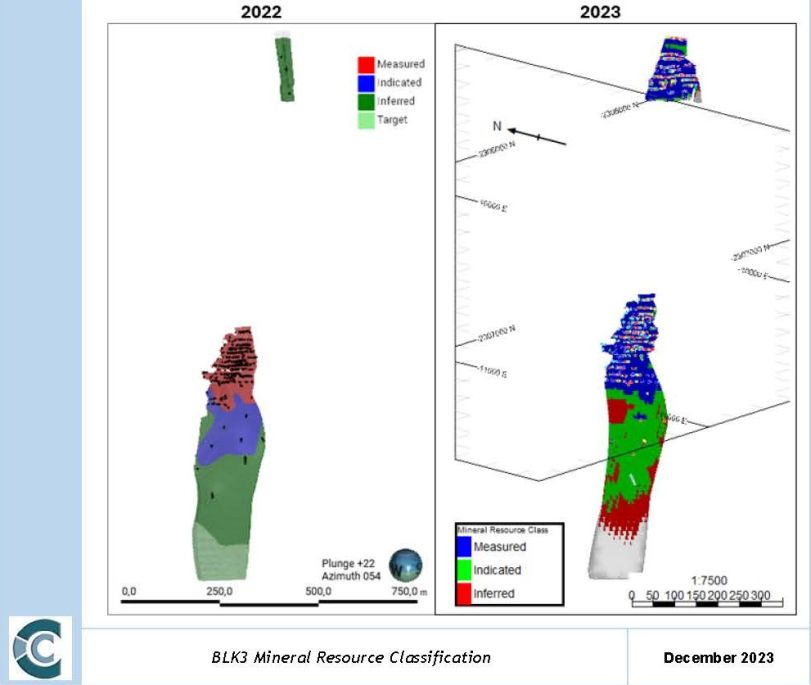
Figure 41: BLK3 Mineral Resource Classification | 87 |
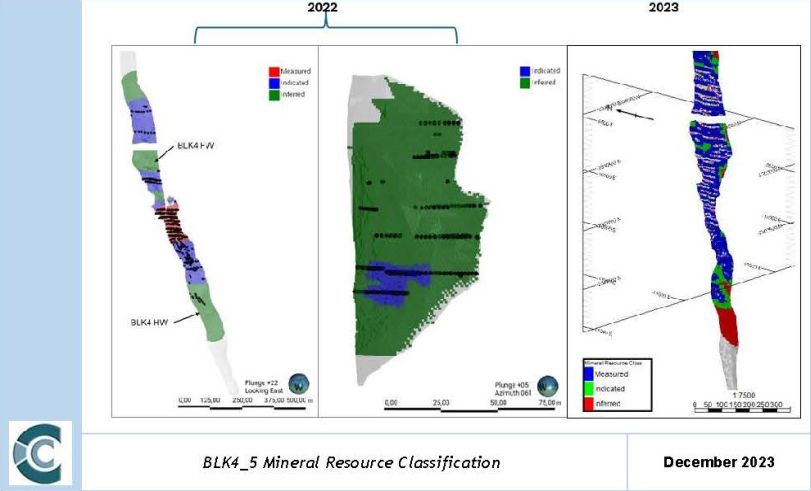
Figure 42: BLK4_5 Mineral Resource Classification | 88 |
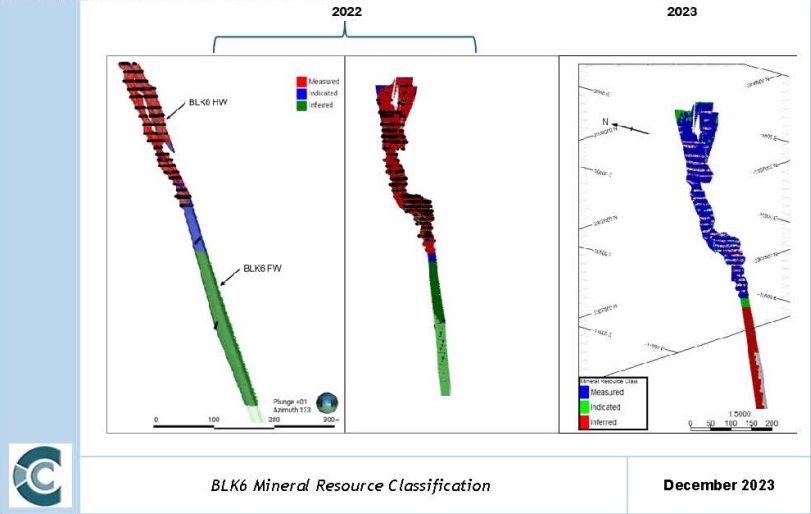
Figure 43: BLK6 Mineral Resource Classification | 88 |
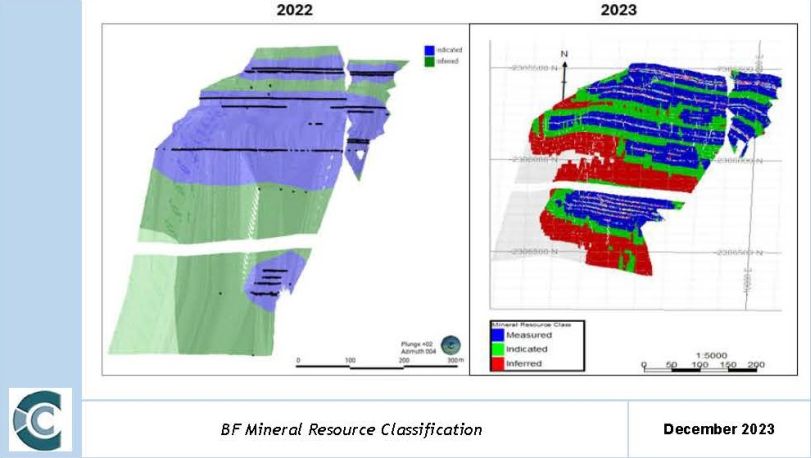
Figure 44: BF Mineral Resource Classification | 89 |
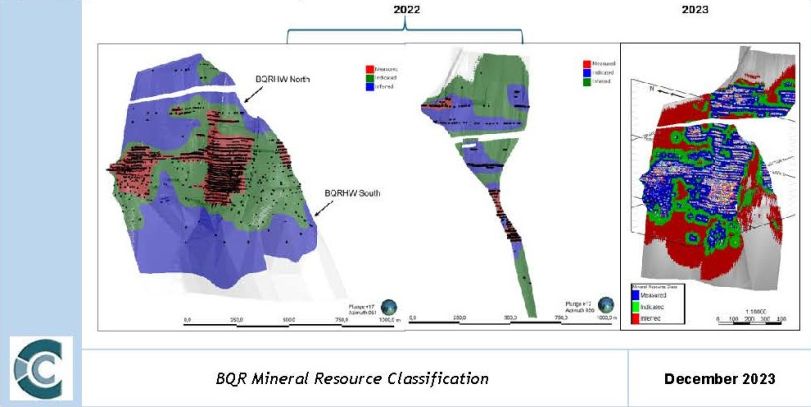
Figure 45: BQR Mineral Resource Classification | 89 |
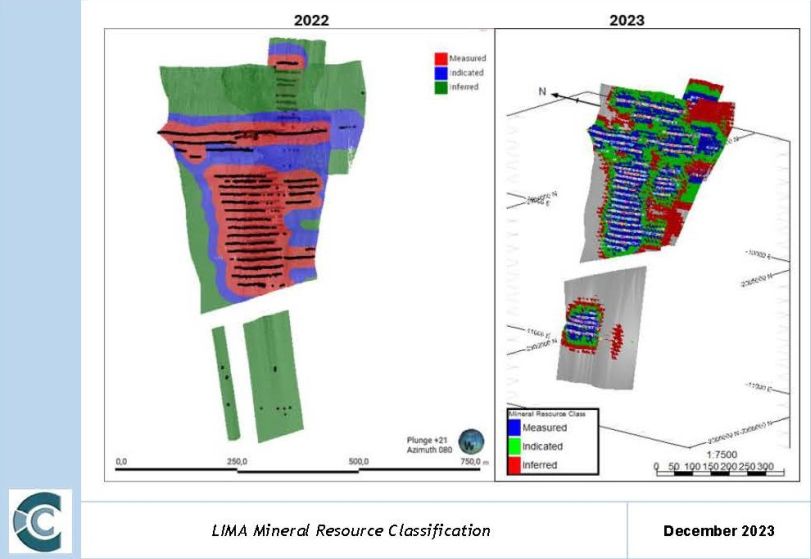
Figure 46: LIMA Mineral Resource Classification | 90 |
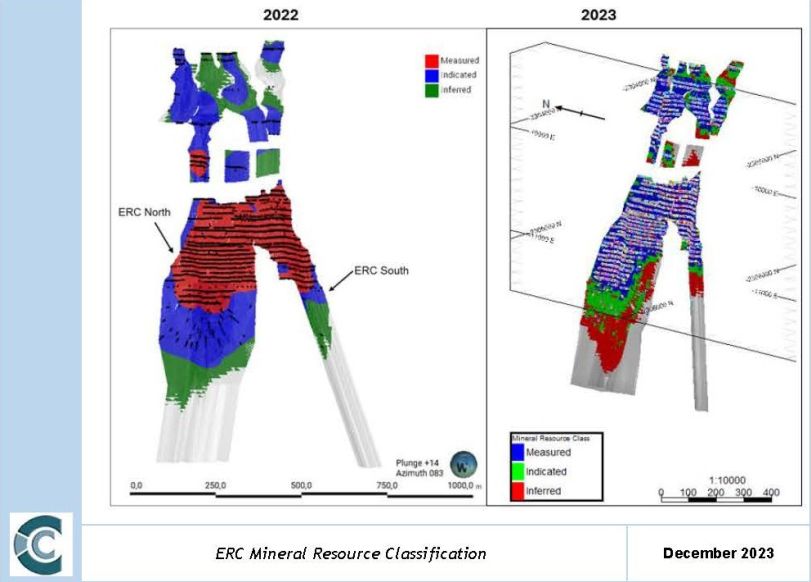
Figure 47: ERC Mineral Resource Classification | 91 |
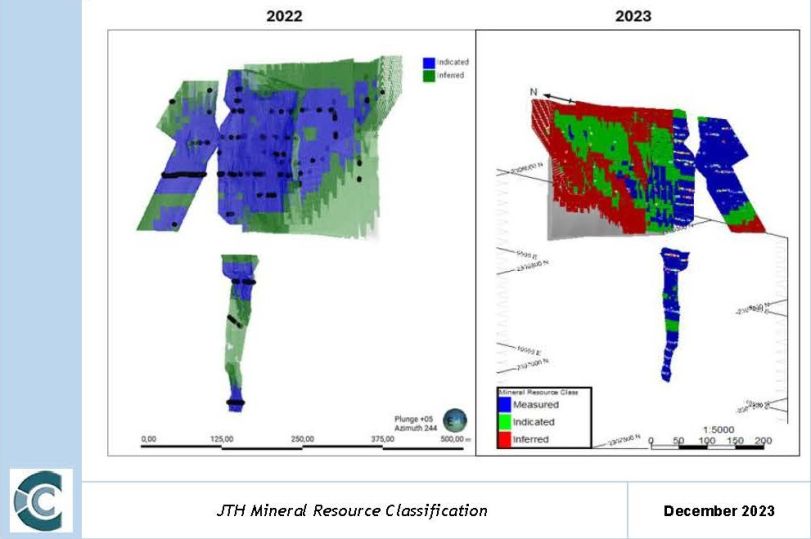
Figure 48: JTH Mineral Resource Classification | 92 |
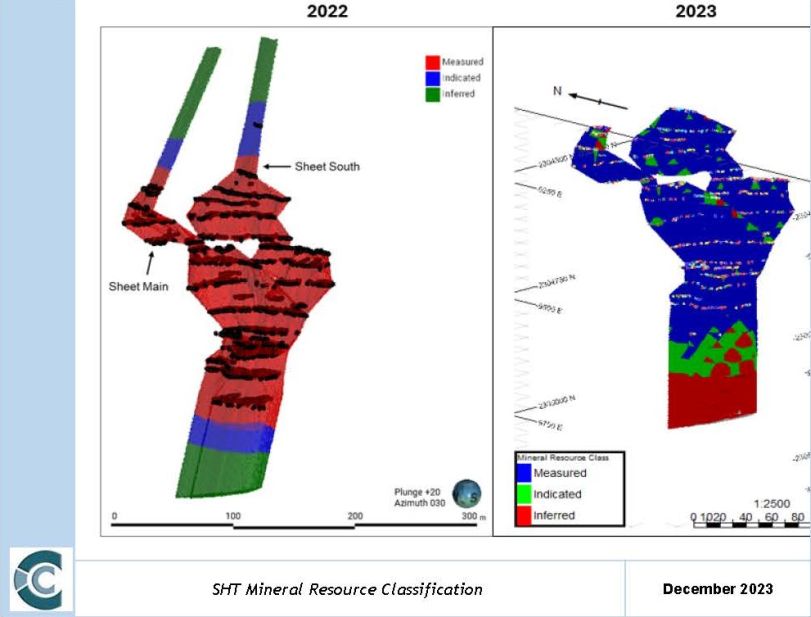
Figure 49: SHT Mineral Resource Classification | 93 |
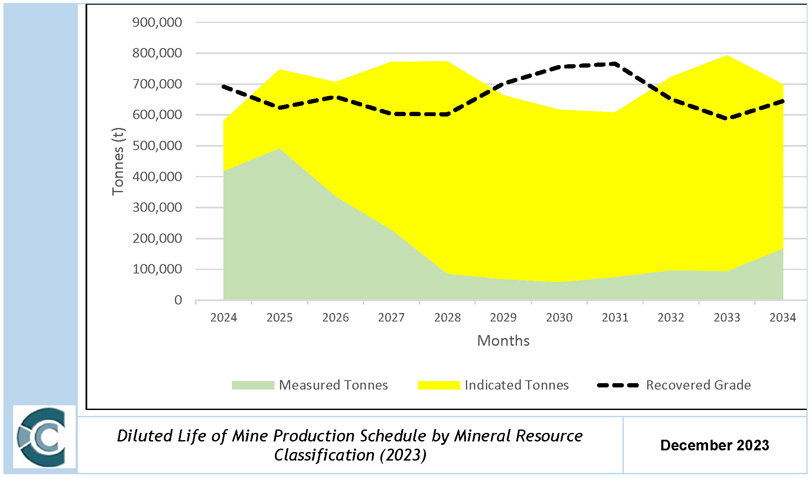
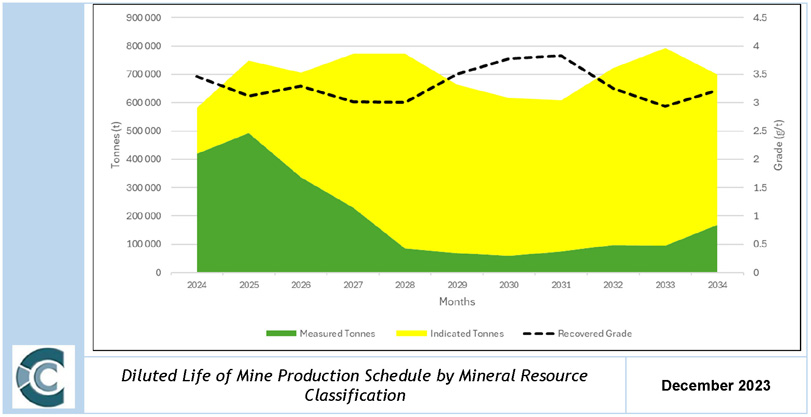
Figure 50: Diluted Life of Mine Production Schedule by Mineral Resource Classification (2023) | 99 |
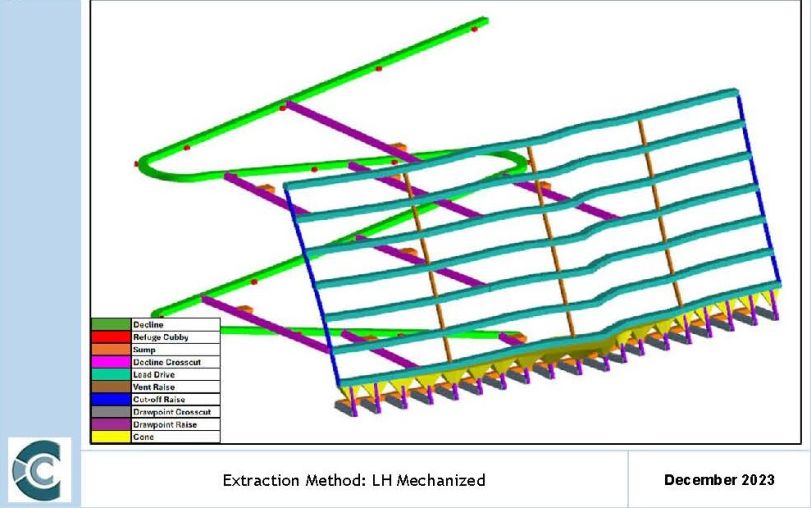
Figure 51: Extraction Method: LH Mechanized | 101 |
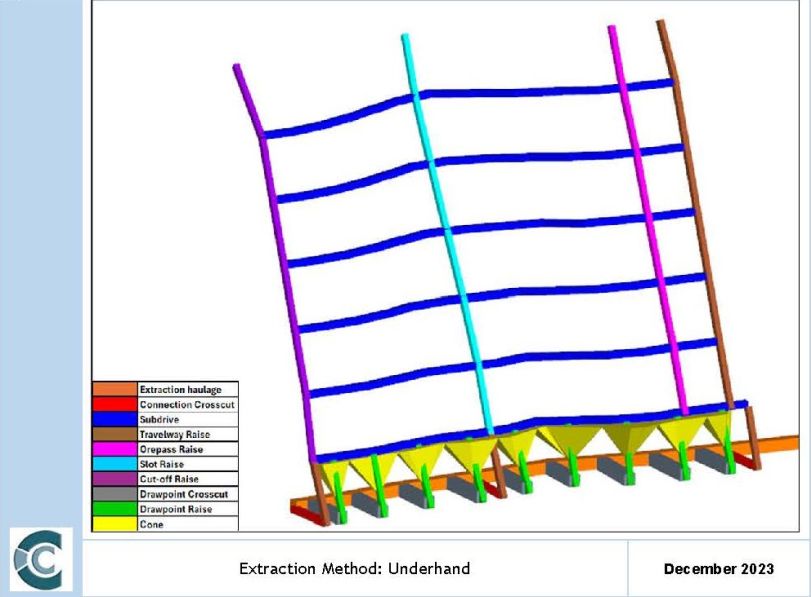
Figure 52: Extraction Method: Underhand | 102 |
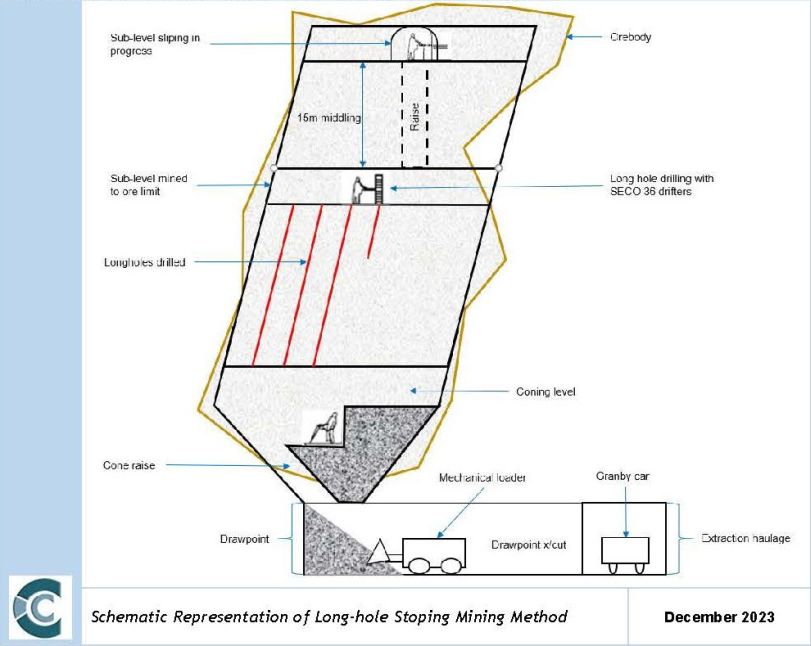
Figure 53: Schematic Representation of Long-hole Stoping Mining Method | 104 |
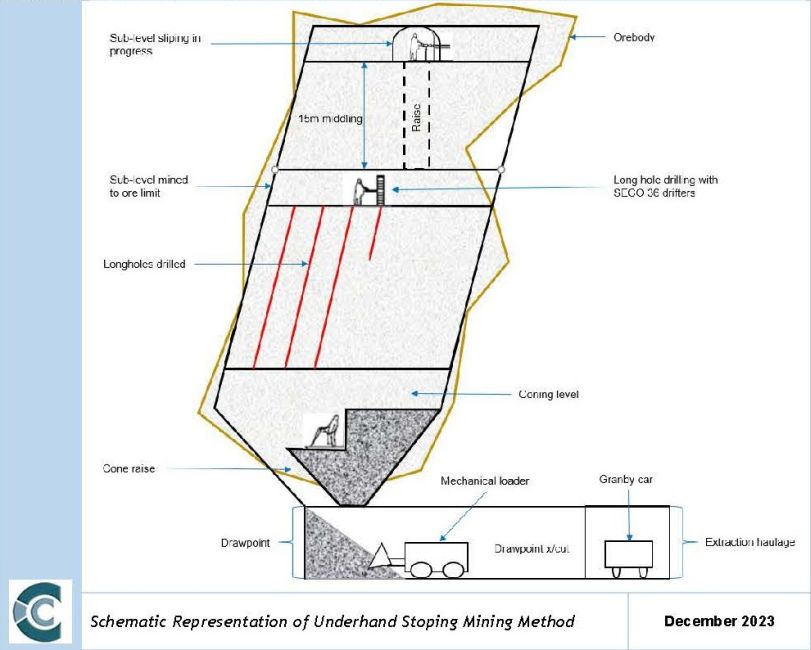
Figure 54: Schematic Representation of Underhand Stoping Mining Method | 105 |
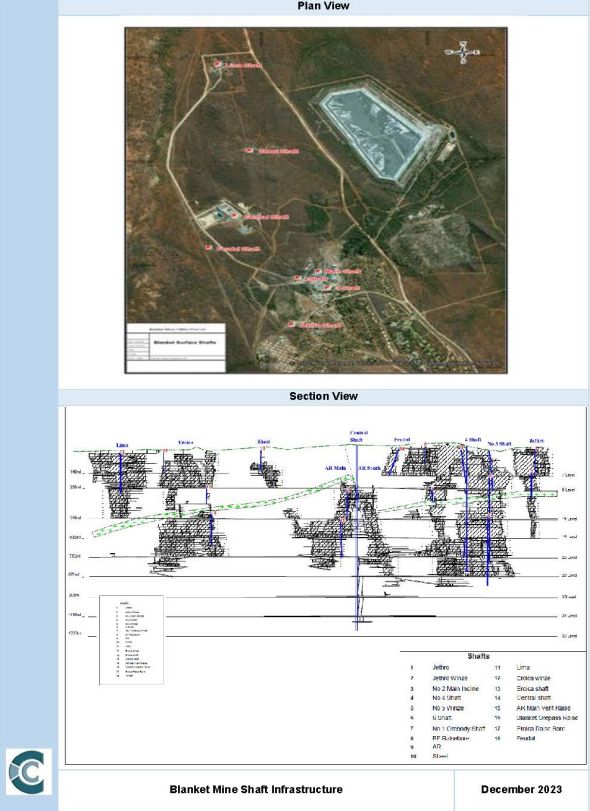
Figure 55: Blanket Mine Shaft Infrastructure | 107 |
Figure 56: Blanket Mine Simulated Ventilation airflow | 108 |
Figure 57: Diluted Life of Mine Production Schedule by Mineral Resource Classification | 111 |
Figure 58: Blanket Mine Content Delivered to the Plant | 112 |
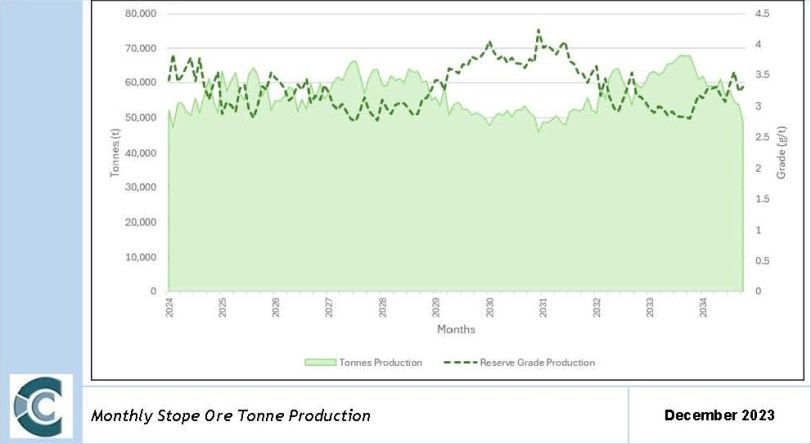
Figure 59: Monthly Stope Ore Tonne Production | 112 |
Figure 60: Monthly Development Ore Tonne Production | 113 |
Figure 61: Blanket Mine Design | 115 |
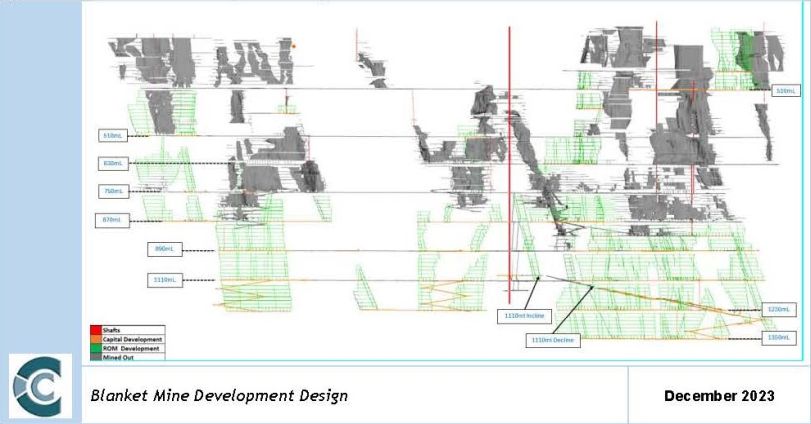
Figure 62: Blanket Mine Development Design | 119 |
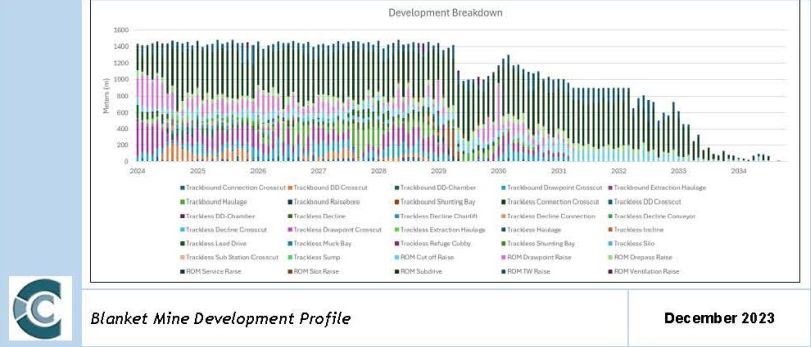
Figure 63: Blanket Mine Development Profile | 119 |
Figure 64: Crushing and Milling Process Flow Diagram | 123 |
Figure 65: Historic Milled Tonnes Plant Feed Grade against Plant Final Tails from 2014 to 2023 | 124 |
Figure 66: Historic Recoveries and Gold Production from June 2014 to May 2023 | 125 |
Figure 67: Cone Crusher Building | 126 |
Figure 68: Cone Crushers | 126 |
Figure 69: Rod Mills | 127 |
Figure 70: CIL Circuit | 128 |
Figure 71: Elution and Electrowinning Vessels | 129 |
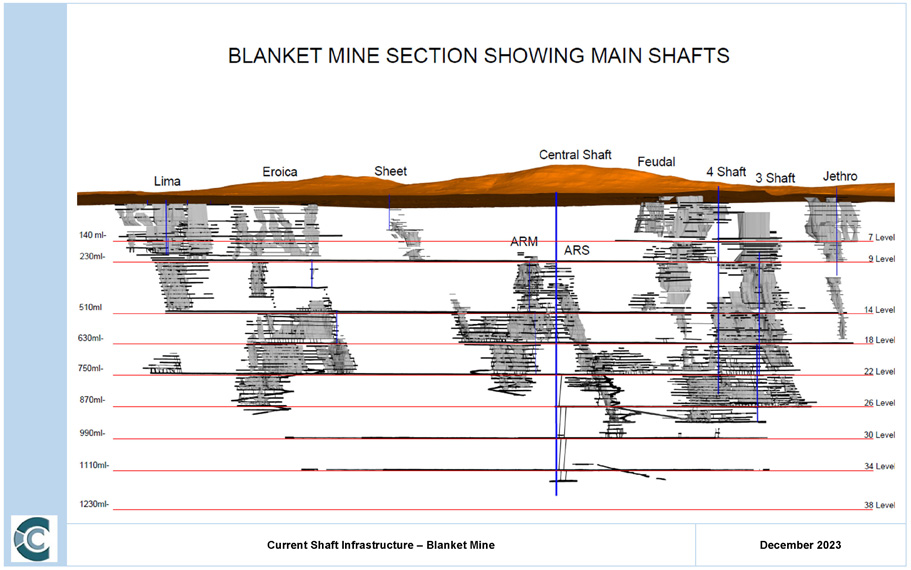
Figure 72: Current Shaft Infrastructure – Blanket Mine | 133 |
Figure 73: Surface Infrastructure Arrangement | 135 |
Figure 74: Surface Infrastructure Arrangement – Central Main Shaft | 136 |
Figure 75: Compressors at Blanket | 139 |
Figure 76: Compressors at Central Main Shaft | 140 |
Figure 77: Global Distribution of Gold Deposits | 141 |
Figure 78: Country Listing of Gold Reserves as at End 2023 | 142 |
Figure 79: Gold Demand 2022 vs. 2023 | 144 |
Figure 80: Gold Price vs Trade Weighted U.S. Dollar Index | 147 |
Figure 81: Gold Price vs. Real USD Rate | 148 |
Figure 82: Gold Yearly Prices | 149 |
Figure 83: Capital Schedule | 155 |
Figure 84: Historical Operating Costs | 156 |
Caledonia Mining Corporation Plc
S-K 1300 Technical Report Summary on the Blanket Gold Mine, Zimbabwe
Figure 85: Operating Costs vs. Feed Tonnes | 160 |
Figure 86: AIC vs. Realised Gold Price | 161 |
Figure 87: Inflation Adjusted Historic Gold Price | 163 |
Figure 88: Recovered Gold | 164 |
Figure 89: Undiscounted Cash Flow | 165 |
Figure 90: Project Sensitivity (NPV 15.4%) | 168 |
Figure 91: Gold Mines of the Gwanda Greenstone Belt | 172 |
TABLES
Table 1: Mining Lease Details | 21 |
Table 2: Blanket Mineral Title Areas and Status | 22 |
Table 3: Blanket Mineral Title Areas and Ownership | 24 |
Table 4: EIA Certificates | 25 |
Table 5: Environmental Permits | 26 |
Table 6: Description of Deposits at Blanket Mine (after MSA, 2011) | 33 |
Table 7: Exploration Holes and Meters by Year | 44 |
Table 8: Long Hole Deep Drilling Results at Blanket (2022 - 2023) | 44 |
Table 9: Long Hole Deep Drilling Location and Information at Blanket (2022-2023) | 46 |
Table 10: Standards Utilised at Blanket Mine with Expected Value and the Number Used | 53 |
Table 11: Sample Database Summarised by Year | 55 |
Table 12: Sample Database Summarised by Drillhole Type | 56 |
Table 13: Hole and Sample Count | 56 |
Table 14: Capping Valuers Applied per Domain | 65 |
Table 15: SG Samples per Orebody | 67 |
Table 16: Cut-off Derivation Factors | 80 |
Table 17: Mineral Resource Classification Criteria for Blanket Mine | 81 |
Table 18: In Situ Measured and Indicated Mineral Resources for Blanket Mine as at 31 December 2023 (Inclusive of Mineral Reserves) | 93 |
Table 19: In Situ Inferred Mineral Resources for Blanket Mine as of 31 December 2023 (Inclusive of Mineral Reserves) | 94 |
Table 20: In Situ Measured and Indicated Mineral Resources for Blanket Mine as at 31 December 2023 (Exclusive of Mineral Reserves) | 95 |
Table 21: Cut-Off Grade Calculation | 97 |
Table 22: Mineral Reserve Conversion Factors Summary | 97 |
Table 23: Blanket Mine Mineral Reserve Estimate as at 31 December 2023 | 99 |
Table 24: Shaft Utilisation and Hoisting Capacity | 107 |
Table 25: Blanket Mine Shift System | 108 |
Table 26: Blanket Mine Development Rates | 108 |
Table 27: Blanket Mine Production Rates | 109 |
Table 28: Development Dimensions | 113 |
Table 29: Mine Design Criteria for Blanket Mine | 114 |
Table 30: Blanket Mine Average Dilution Calculation | 115 |
Table 31: Blanket Mine - Mine Call Factor Calculation 2015 to 2022 | 116 |
Table 32: Development Designs Naming Convention | 116 |
Table 33: Blanket Mine Current Mining Fleet | 119 |
Table 34: Blanket Mine Mining Personnel | 119 |
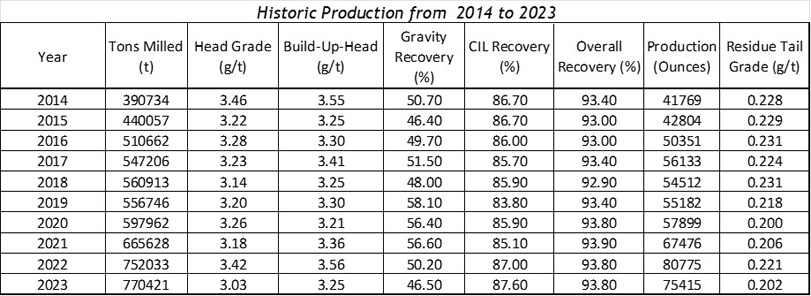
Table 35: Historic Plant Production 2014 – 2023 | 123 |
Table 36: Reagent and Consumable Consumptions | 128 |
Caledonia Mining Corporation Plc
S-K 1300 Technical Report Summary on the Blanket Gold Mine, Zimbabwe
Table 37: Plant Labour Complement | 129 |
Table 38: Blanket Mine Shaft Access | 131 |
Table 39: Planned Shaft Infrastructure Development | 133 |
Table 40: Top 20 Gold Mining Countries | 142 |
Table 41: Official Gold Holdings per Country, 31 December 2023 | 144 |
Table 42: Gold Price Forecast (Nominal Terms) | 148 |
Table 43: Capital and Infrastructure Development Costs | 152 |
Table 44: Capital Summary | 153 |
Table 45: Management and shared service costs | 155 |
Table 46: Financial Cost Indicators | 155 |
Table 47: Project Cost Indicators | 158 |
Table 48: Macro-economic Forecasts (Real Terms) | 161 |
Table 49: Capital Asset Pricing Model Discount Rate Calculation | 162 |
Table 50: Production Breakdown in Life of Mine | 163 |
Table 51: Annual Cash Flow – Techno-economic Inputs | 165 |
Table 52: Annual Real Cash Flow | 165 |
Table 53: Blanket Mine NPV Summary – Real Terms | 166 |
Table 54: Profitability Ratios | 166 |
Table 55: Sensitivity Analysis of Commodity Prices and Mill Head Grade to NPV15.4% (USDm) | 168 |
Table 56: Sensitivity Analysis of Cash Operating Costs and Capital spend to NPV15.4% (USDm) | 169 |
Table 57: Blanket Mine Economic Analysis Summary – Real Terms | 170 |
Table 58: Risk Assessment | 173 |
7
Caledonia Mining Corporation Plc
S-K 1300 Technical Report Summary on the Blanket Gold Mine, Zimbabwe
LIST OF UNITS AND ABBREVIATIONS
Units: The following units were used in this Report, and are in metric terms:-
Unit | Definition | | | |
% | Per cent | | ktpm | Kilo tonnes per month |
/ | Per | | kV | Kilovolt (1,000 volts) |
± or ~ | Approximately | | kVA | Kilovolt ampere |
° | Degrees | | kW | Kilowatt (1,000 W) |
°C | Degrees Celsius | | l | Litre |
a | Year | | m | Metre |
cm | Centimetre | | m2 | Square metres |
d | Day | | m3 | Cubic metres |
g | Grammes | | mm | Millimetre |
g/cm3 | Grammes per cubic centimetre | | Moz | Million ounces (1,000,000 oz) |
g/t | Grammes per tonne | | Mt | Million tonnes (1,000,000 t) |
Ga | Billion years (1,000,000,000 years) | | Mtpa | Million tonnes per annum |
ha | Hectares | | MVA | Megavolt ampere |
hr | Hour | | oz | Troy Ounces |
kg | Kilogram (1,000 g) | | t | Tonne |
kL | Kilolitres (1,000 l) | | t/m³ | Tonnes per cubic meter |
km | Kilometre (1,000 m) | | tpd | Tonnes per day |
km2 | Square kilometres | | V | Volts |
koz | Kilo ounces (1,000 oz) | | x | By / Multiplied by |
kt | Kilotonnes (1,000 t) | | | |
Computation: It is noted that throughout the Report, tables may not compute due to rounding.
Abbreviations: The following abbreviations were used in this Report:-
Abbreviation | Description |
AC | Asbestos Cement |
amsl | Above Mean Sea Level |
Au | Gold |
BETS | Employee Trust for the benefit of the present and future employees of Blanket Mine |
BIF | Banded Iron Formation |
Blanket Mine Company | Blanket Mine (1983) (Pvt) Ltd |
Blanket or the Mine | Blanket Gold Mine |
BQR | Blanket Quartz Reef |
Caledonia or the Company | Caledonia Mining Corporation Plc |
CAPM | Capital Asset Pricing Model |
CBDZ | Colleen Bawn Deformation Zone |
CIL | Carbon-in-Leach |
CIM | Canadian Institute of Mining, Metallurgy and Petroleum |
CMS | Central Main Shaft |
CPI | Consumer Price Indices |
CRM | Certified Reference Material |
DCF | Discounted Cash Flow |
DSR | Disseminated Sulphide Reefs |
EIA | Environmental Impact Assessment |
EM Act | Environmental Management Act (Chapter 20:27) No. 13/2002 |
EMA | Environmental Management Agency |
Epoch | Epoch Resources (Pty) Ltd |
FCFE | Free Cash Flow to Equity |
FCFF | Free Cash Flow to Firm |
Fidelity | Fidelity Printers and Refiners Limited |
FW | Footwall |
G&A | General and Administrative |
GGB | Gwanda Greenstone Belt |
GMS | Greenstone Management Services (Pty) Limited |
HG | High Grade |
HW | Hanging Wall |
ID2 | Inverse Distance Squared |
IL | Intensive Leach |
Kinross | Kinross Gold Corporation |
KNA | Kriging Neighbourhood Analysis |
LG | Low Grade |
LHDP | Long Hole Drilling Program |
LIMS | Laboratory Information Management System |
LoM | Life of Mine |
Caledonia Mining Corporation Plc
S-K 1300 Technical Report Summary on the Blanket Gold Mine, Zimbabwe
Abbreviation | Description |
Minxcon | Minxcon (Pty) Ltd |
ML40 | Mining Lease with registered number 40 |
MMA | Mines and Minerals Act (Chapter 21:05) of 1961 |
MMCZ | Minerals Marketing Corporation of Zimbabwe |
MSO | Geovia Stope Shape Optimiser |
NIEEF | National Indigenisation and Economic Empowerment Fund |
NIR | Not-In-Reserve |
NMD | Nominal Maximum Demand |
NPV | Net Present Value |
NSR | Net Smelter Royalty |
NWGDZ | North West Gwanda Deformation Zone |
OHL | Overhead Powerlines |
PEM | Prospectivity Enhancement Multiplier |
PPE | Personal Protective Equipment |
PSA | Pressure Swing Absorption |
QAQC | Quality Assurance and Quality Control |
QP | Qualified Person |
RoM | Run of Mine |
RoR | Rate of Rise |
SG | Specific Gravity |
SGDZ | South Gwanda Deformation Zone |
S-K 1300 | United States Securities and Exchange Commission Part 229 Standard Instructions for Filing Forms Regulation S-K subpart 1300 |
SoR | Slope of Regression |
The Act | Indigenisation and Economic Empowerment Act |
TRS | Technical Report Summary |
TSF | Tailings Storage Facility |
WACC | Weighted Average Cost of Capital |
ZESA | Zimbabwe Electricity Supply Authority |
ZINWA | Zimbabwe National Water Authority |
ZMDC | Zimbabwe Mining Development Corporation |
Caledonia Mining Corporation Plc
S-K 1300 Technical Report Summary on the Blanket Gold Mine, Zimbabwe
ITEM 1 - EXECUTIVE SUMMARY
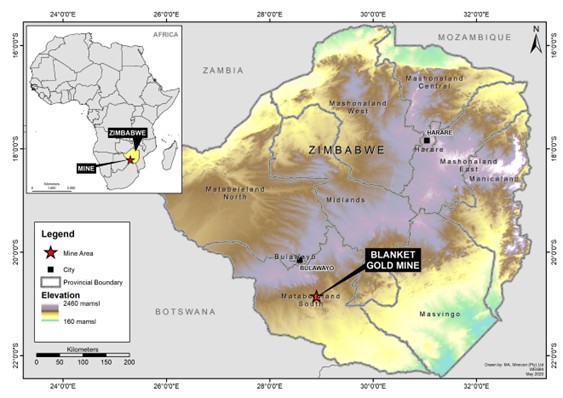
The Blanket Mine is an operating underground gold mine situated on the Gwanda Greenstone Belt targeting shear zone hosted gold mineralisation. It is located in the southwest of Zimbabwe, approximately 15 km northwest of Gwanda, the provincial capital of Matabeleland South. Gwanda is located 147 km southeast of Bulawayo, 197 km northwest of the Beitbridge Border post with South Africa, and 560 km from Harare.
The Mine complex comprises a cluster of mines extending from Lima in the north, through Eroica, Sheet, AR Main, AR South, the currently defunct Feudal, Blanket Section (Blanket 1 to Blanket 6) and Jethro over a total strike length of some 3 km. Gold has been commercially mined at the Project Area from several closely spaced orebodies, defining a mineralised trend via several shafts since the early 1900s. The Mine covers the operating claims of Jethro, Blanket, Feudal, Harvard, Mbudzane Rock, Oqueil, Sabiwa, Sheet, Eroica and Lima, largely encompassed in a 2,120 ha Mining Lease. Ore is processed at an on-site plant.
The Blanket Mine operates under a mining lease ML40 issued to Blanket Mine (1983) (Pvt) Ltd, which is incorporated in Zimbabwe and a 64% owned, indirect subsidiary of Caledonia. The mine’s claims under the lease cover an area of 2,120 ha.
I. Geology and Mineral Deposit
The Blanket Mine is situated on the north-western limb of the Archaean Gwanda Greenstone Belt along strike from several other gold deposits. In the Blanket Mine area, lithologies comprise non-mineralised basal felsic schists of igneous or sedimentary origin in the east. The felsics are overlain by a metabasaltic ultramafic to mafic unit with pillow basalts remnants.
Mining at Blanket occurs over a 3 km strike that includes from north to south, the deposits of Lima, Eroica, Sheet, AR Main, AR South, Feudal, Blanket Section (Blanket 1 to Blanket 6) and Jethro. The main Blanket underground workings are connected to Lima by a 2 km long haulage which follows the strike of the main fabric. Mineralisation occurs in near vertical shoots aligned along an approximately N-S axis. The ore shoots vary in shape from the tabular-lensoidal quartz reefs to the massive to pipe-like disseminated sulphide reefs (or DSR). Gold is deposited at crustal levels within and near the brittle-ductile transition zone. The deposits may have a vertical extent of up to 2 km, demonstrate extensive down-plunge continuity, and lack pronounced zoning. The ore mineralogy is dominated by gold, pyrite and arsenopyrite.
Two quartz-filled shear zones are mined, namely the Blanket Quartz Reef (or BQR) and the Eroica Reef, which have long strike lengths but are not uniformly mineralised although continuous pay shoots of over 100 m on strike are seen. Gold grade fluctuations are more extreme in the quartz reefs than in the DSR type reefs but on average these quartz shears have higher grades.
II. Status of Exploration
Blanket Mine is continuing with the Long Hole Drilling Program (“LHDP”) which is the down-dip exploration drilling (below 750 m Level) as drilling platforms are established. This drilling will continue to improve the interpretation and confidence in the down-dip continuity of the fourteen current mineralised domains at Blanket. An electromagnetic survey may be considered which could potentially delineate additional structural features and targets. These targets, in conjunction with the structural model and underground observations may be used may be tested with underground drilling and further refine the geological model at Blanket and potentially target areas in the upper levels of the mine between existing orebodies.
Caledonia Mining Corporation Plc
S-K 1300 Technical Report Summary on the Blanket Gold Mine, Zimbabwe
The combination of the exploration drilling, geophysical surveys, conceptual geological model (based on the sampling database) and structural geological modelling may increase the exploration targets and ultimately assist in increasing the Mineral Resource.
III. Mineral Resource and Mineral Reserve Estimates
Measured, Indicated and Inferred Mineral Resources, based on ordinary kriging and inverse distance estimation methods, can be declared for Blanket Mine due to the continuity of the geology and grade as well as a history of proven historical mining. The Inferred resources show geological continuity, while grade continuity requires improvement through additional drilling. The 2023 estimates are complete 3D digital estimates in the form of block models. Previous estimates were a combination of digital estimates and manual block listings above a specific elevation. The in situ Measured, Indicated and Inferred Mineral Resources, inclusive and exclusive of Mineral Reserves are shown in the tables below.
In Situ Measured and Indicated Mineral Resource Tabulation for Blanket Mine as of 31 December 2023 (inclusive of Mineral Reserves)
Mineral Resource Classification | Orebody | Tonnes | Au Grade | Gold Content |
| | | Kt | g/t | Koz |
Measured (2.5% Geological Loss) | ARM | 660 | 3.12 | 66 |
ARS | 514 | 3.62 | 60 |
ARS_Ext | 32 | 2.56 | 3 |
BF | 176 | 3.43 | 19 |
BLK1 | 261 | 3.43 | 29 |
BLK2 | 150 | 3.66 | 18 |
BLK3 | 180 | 3.41 | 20 |
BLK4_5 | 490 | 3.26 | 51 |
BLK6 | 49 | 3.78 | 6 |
BQR | 785 | 4.36 | 110 |
ERC | 303 | 5.21 | 51 |
Jethro | 53 | 3.11 | 5 |
Lima | 203 | 3.94 | 26 |
Sheet | 88 | 2.99 | 9 |
Measured Total | 3 943 | 3.72 | 471 |
Indicated (5.0% Geological Loss) | ARM | 630 | 2.78 | 56 |
ARS | 437 | 3.48 | 49 |
ARS_Ext | 189 | 2.93 | 18 |
BF | 205 | 2.99 | 20 |
BLK1 | 663 | 3.21 | 68 |
BLK2 | 442 | 4.98 | 71 |
BLK3 | 189 | 2.91 | 18 |
BLK4_5 | 126 | 3.05 | 12 |
BLK6 | 27 | 3.99 | 4 |
BQR | 1 888 | 3.61 | 219 |
ERC | 593 | 4.76 | 91 |
Jethro | 288 | 3.34 | 31 |
Lima | 115 | 3.73 | 14 |
Sheet | 41 | 2.60 | 3 |
Indicated Total | 5 832 | 3.59 | 673 |
Measured + Indicated Total | 9 775 | 3.64 | 1 145 |
Caledonia Mining Corporation Plc
S-K 1300 Technical Report Summary on the Blanket Gold Mine, Zimbabwe
Notes:
| | 1. | Cut-off applied 1.5 g/t. |
| | 2. | Geological Losses: 2.5% Measured, 5.0% Indicated, 10.0% Inferred |
| | 3. | Commodity price utilised: USD2,150/oz. |
| | 4. | Mineral Resources are stated inclusive of Mineral Reserves. |
| | 5. | Mineral Resources are reported as 64% attributable to Caledonia. |
| | 6. | All orebodies are depleted for mining. |
In Situ Inferred Mineral Resource Tabulation for Blanket Mine as of 31 December 2023 (inclusive of Mineral Reserves)
Mineral Resource Classification | Orebody | Tonnes | Au | Ounces |
| | | Kt | g/t | Koz |
Inferred | ARM | 299 | 2.87 | 28 |
ARS | 170 | 3.88 | 21 |
ARS_Ext | 68 | 3.48 | 8 |
BF | 150 | 3.05 | 15 |
BLK1 | 871 | 3.20 | 90 |
BLK2 | 584 | 4.91 | 92 |
BLK3 | 73 | 3.33 | 8 |
BLK4_5 | 269 | 3.32 | 29 |
BLK6 | 83 | 3.57 | 10 |
BQR | 1 900 | 3.71 | 227 |
ERC | 928 | 4.30 | 128 |
Jethro | 108 | 3.28 | 11 |
Lima | 95 | 3.41 | 10 |
Sheet | 47 | 2.52 | 4 |
Inferred Total | 5 646 | 3.74 | 679 |
Notes:
| | 1. | Cut-off applied 1.5 g/t. |
| | 2. | Geological Losses: 2.5% Measured, 5.0% Indicated, 10.0% Inferred |
| | 3. | Commodity price utilised: USD2,150/oz. |
| | 4. | Mineral Resources are stated inclusive of Mineral Reserves. |
| | 5. | Mineral Resources are reported as 64% attributable to Caledonia. |
| | 6. | All orebodies are depleted for mining. |
In Situ Measured and Indicated Mineral Resource Tabulation for Blanket Mine as of 31 December 2023 (exclusive of Mineral Reserves)
Mineral Resource Classification | Orebody | Tonnes | Au Grade | Gold Content |
| | | Kt | g/t | Koz |
Measured (2.5% Geological Loss) | ARM | 653 | 3.12 | 66 |
ARS | 329 | 3.70 | 39 |
ARS_Ext | 11 | 1.83 | 1 |
BF | 89 | 3.58 | 10 |
BLK1 | 136 | 3.74 | 16 |
BLK2 | 148 | 3.66 | 17 |
BLK3 | 109 | 3.44 | 12 |
BLK4_5 | 194 | 3.85 | 24 |
BLK6 | 48 | 3.79 | 6 |
BQR | 482 | 4.31 | 67 |
ERC | 208 | 4.93 | 33 |
Jethro | 53 | 3.11 | 5 |
Lima | 151 | 3.64 | 18 |
Sheet | 88 | 2.99 | 9 |
Caledonia Mining Corporation Plc
S-K 1300 Technical Report Summary on the Blanket Gold Mine, Zimbabwe
Measured Total | 2 700 | 3.72 | 323 |
Indicated (5.0% Geological Loss) | ARM | 475 | 2.68 | 41 |
ARS | 337 | 3.13 | 34 |
ARS_Ext | 50 | 2.31 | 4 |
BF | 103 | 3.04 | 10 |
BLK1 | 232 | 3.19 | 24 |
BLK2 | 228 | 3.86 | 28 |
BLK3 | 66 | 2.45 | 5 |
BLK4_5 | 70 | 2.99 | 7 |
BLK6 | 17 | 4.17 | 2 |
BQR | 711 | 3.45 | 79 |
ERC | 144 | 4.69 | 22 |
Jethro | 177 | 2.82 | 16 |
Lima | 74 | 3.44 | 8 |
Sheet | 41 | 2.60 | 3 |
Indicated Total | 2 726 | 3.23 | 283 |
Measured + Indicated Total | 5 426 | 3.47 | 606 |
Notes:
| | 1. | Cut-off applied 1.5 g/t. |
| | 2. | Geological Losses: 2.5% Measured, 5.0% Indicated, 10.0% Inferred |
| | 3. | Commodity price utilised: USD2,150/oz. |
| | 4. | Mineral Resources are stated exclusive of Mineral Reserves. |
| | 5. | Mineral Resources are reported as 64% attributable to Caledonia. |
| | 6. | All orebodies are depleted for mining. |
Inferred Mineral Resources inclusive and exclusive of Mineral Reserves are the same as there are no inferred Mineral Resources in the Mineral Reserve.
Mineral Resources in the Measured and Indicated Mineral Resource classifications have been converted into Proven and Probable Mineral Reserves respectively, by applying the applicable modifying factors.
The updated Mineral Reserve estimation as of 31 December 2023, is detailed in the table below. Mineral Reserves are stated as delivered to plant, fully diluted with the application of modifying factors.
Diluted Proven and Probable Mineral Reserve Tabulation for Blanket Mine as of 31 December 2023
Mineral Reserve Classification | Tonnes | Grade | Au Content |
| | Kt | g/t | Kg | Koz |
Proven | 1 363 | 3.21 | 4 377 | 141 |
Probable | 3 555 | 3.31 | 11 782 | 379 |
Total | 4 918 | 3.29 | 16 158 | 519 |
Notes:
| | 1. | Mineral Reserve cut-off of 2.1 g/t applied. |
| | 2. | The gold price that has been utilised in the economic analysis to convert diluted Measured and Indicated Mineral Resources in the LoM plan to Mineral Reserves is an average real term price of USD1,877/oz over the LoM, using the forecast prices as per Economic Analysis. |
| | 3. | The Mineral Reserve estimation utilises the depleted 2023 Mineral Resource estimation, the 31 December 2023 mine design and LoM plan. |
| | 4. | Mineral Reserves are reported as 64% attributable to Caledonia. |
An uneconomical tail containing 212.5 koz of gold over a period of 6 years has been excluded from the Mineral Reserve since it is not economical on its own.
IV. Development and Operations
Blanket Mine employs two mining methods that are well suited to the nature of the mineral deposits. The variation within the Blanket Mine mineral deposits necessitates modification of the exact mining methods that suit the specific characteristics of each deposit. The general practice on the Mine is to implement one of two tailored mining methods, determined mainly by the width of the mineral deposit. Long-hole stoping is utilised in wider mineral deposits (orebody widths generally more than 3 m), and underhand stoping is utilised in narrow mineral deposits (orebody widths generally less than 3m).
Caledonia Mining Corporation Plc
S-K 1300 Technical Report Summary on the Blanket Gold Mine, Zimbabwe
The planned thrust in development is aimed at opening up ground below 750 m Level which will be the primary production areas, as well as create the necessary exploration drilling platforms. In the Lima, ARS, Blanket and Blanket Feudal areas some mining activities will take place above 750 m Level. Blanket Mine plans to produce in a range of 75 - 80 koz (recovered) of gold per year.
Blanket Mine is an operational mine with well-established infrastructure and no major modifications or upgrades are necessary to sustain mining and processing operations. Sufficient capital has been allowed for the development, equipment and infrastructure. An upgrade of the ore handling infrastructure between Central Shaft and the Blanket Gold Plant is planned. Power and water supply allocation to the total Blanket operation is deemed to be sufficient to meet current needs although further expansion to the solar plant and efficiency improvements to equipment are under consideration.
The process plant has been operating at a consistent recovery of 93.8%, and this can be expected to continue as long as the ore mineralogy does not change. The average processing rate for the past 12 months was 64.2ktpm, and there are indications that higher processing rates can be achieved with operational improvements, as demonstrated in December 2023 where 85.2 kt was milled.
A new TSF was constructed during 2023 and commissioned in February 2024. Deposition commenced on the phase 1A during December 2023 and is currently in use. Construction on a phase 1B has commenced and is earmarked to be completed during 2024. Phase 2, the final stage of the TSF design is planned for construction during 2025.
V. Economic Analysis
The company performed a mineral asset economic analysis on the Blanket Mine and the diluted Indicated and Measured Resources in the LoM plan, for conversion to Mineral Reserves. The Discounted Cash Flow, or DCF, is based on the production schedule and all costs and capital associated to develop, mine and process the orebody. Relevant taxation and other operating factors, such as recoveries and stay-in-business costs were incorporated into the economic analysis to produce a cash flow over the life cycle of the Mine.
USD commodity prices for the period 2024-2029 have been converted from nominal to real terms. The table below illustrates the forecasts for these six years as well as the long-term forecast used in the financial model. The price forecasts are based on the median of various banks, brokers and analyst forecasts and are in real-terms throughout the life of mine. The average price over the LoM equates to USD1,877/oz. The inflation rate was sourced from the World Economic Outlook.
Gold price forecast (Real Terms)
Item | Unit | 2024 | 2025 | 2026 | 2027 | 2028 | 2029 | Long-Term |
| | | 1 | 2 | 3 | 4 | 5 | 6 | |
Gold | USD/oz | 2,205 | 2,167 | 2,093 | 1,987 | 1,852 | 1,731 | 1,731 |
Source: Consensus Economic Inc. & World Economic Outlook January 2024.
Caledonia Mining Corporation Plc
S-K 1300 Technical Report Summary on the Blanket Gold Mine, Zimbabwe
Costs reported for the Blanket Mine, which consists of mining, plant and other operating costs, as well as government royalty payments are displayed in the table to follow. Other costs in the Adjusted Operating Costs category include the central and technical services, general and administration, human resources, and other services costs. Other costs for the AISC category include corporate management costs. The costs are displayed per milled tonne as well as per recovered gold ounce.
Project Cost Indicators
Item | Unit | Blanket Mine |
Net Turnover | USD/Feed tonne | 171 |
Mine Cost | USD/Feed tonne | 31 |
Plant Costs | USD/Feed tonne | 17 |
Other Costs | USD/Feed tonne | 48 |
| | | |
Operating Costs | USD/Feed tonne | 96 |
SIB | USD/Feed tonne | 18 |
Royalties | USD/Feed tonne | 9 |
Reclamation | USD/Feed tonne | 0 |
Other Costs | USD/Feed tonne | 7 |
All-in Sustainable Costs (AISC) | USD/Feed tonne | 130 |
Capital | USD/Feed tonne | 2 |
Other Cash Costs | USD/Feed tonne | 0 |
All-in Costs (AIC) | USD/Feed tonne | 132 |
All-in Cost Margin | % | 23% |
EBITDA1 | USD/Feed tonne | 76 |
EBITDA Margin | % | 44% |
Gold Recovered | oz | 757 238 |
| | | |
Average Gold Price | USD/Gold oz | 1,877 |
| | | |
Net Turnover2 | USD/Gold oz | 1,739 |
Mine Cost | USD/Gold oz | 311 |
Plant Costs | USD/Gold oz | 171 |
Other Costs | USD/Gold oz | 485 |
Operating Costs | USD/Gold oz | 967 |
SIB Capex | USD/Gold oz | 179 |
Royalties | USD/Gold oz | 93 |
Reclamation | USD/Gold oz | 1 |
Other Costs | USD/Gold oz | 72 |
All-in Sustainable Costs (AISC) | USD/Gold oz | 1,312 |
Capital | USD/Gold oz | 18 |
Other Cash Costs | USD/Gold oz | 0 |
All-in Costs (AIC) | USD/Gold oz | 1,330 |
EBITDA* | USD/Gold oz | 771 |
Notes:
| | 1. | *Earnings before interest, tax, depreciation and amortisation (excludes CAPEX). |
The total capital including the sustaining capital amounts to USD149.6 million over the mine life. The Mine has no funding requirement as it has long been in operation.
For the DCF, the gold price and grade have the most significant impact on the sensitivity of the Mine followed by the central services and operating costs. The Mine is least sensitive to capital and plant operating costs.
The value derived for the income approach only reflects the diluted Indicated and Measured Resources in the LoM plan, for conversion to Mineral Reserves. The Mineral Reserve is economically viable with a best estimated NPV of USD107 million (USD83 million attributable to Caledonia) at a real discount rate of 15.4%. No IRR could be calculated as Blanket is already in operation and no initial investment is required. The following table shows a summary of the economic analysis.
Caledonia Mining Corporation Plc
S-K 1300 Technical Report Summary on the Blanket Gold Mine, Zimbabwe
Blanket Mine Economic Analysis Summary – Real Terms
Item | Unit | Blanket Gold Mine | Caledonia Attributable* |
NPV @ 0% | USDm | 204 | 158 |
NPV @ 2.5% | USDm | 181 | 140 |
NPV @ 5% | USDm | 161 | 125 |
NPV @ 7.5% | USDm | 145 | 112 |
NPV @ 10% | USDm | 131 | 101 |
NPV @ 12.5% | USDm | 119 | 92 |
NPV @ 15.0% | USDm | 109 | 84 |
NPV @ 15.4% | USDm | 107 | 83 |
NPV @ 17% | USDm | 102 | 79 |
IRR | % | N/A | N/A |
All-in Cost Margin | % | 23% | 23% |
Break-even Gold Price (AIC) | USD/oz. | 1 331 | 1 331 |
*Caledonia has a 64% direct equity holding in Blanket and receives dividends, facilitation loan repayments, procurement fees, and management fees.
VI. Conclusions
Over the past few years Blanket Mine have been in the process of upgrading their Mineral Resource estimation system from historical manual block listing methodology to digital estimation processes. Much of the historical sampling database has been captured and can be used for more sophisticated estimation methodologies in the 3D environment. In addition to this, the historical mining voids and development have been captured and can be utilised for the Mineral Resource depletions and mine planning for Mineral Reserve purposes.
The 3D digital environment allows for the scrutiny and review of the geological data in a holistic fashion that was previously not possible. By doing so, geological trends and patterns can be identified for the development of geological concepts that can be utilised in the exploration targeting and the planning of drilling programmes.
This change in Mineral Resource estimation and management systems has resulted in some fluctuations in the Mineral Resource in the short term but these should stabilise and has resulted in an increase in the Blanket Mine Mineral Resources due to improved geological understanding, geological modelling, estimation processes, management and planning systems.
The life of mine plan is logical and the planned production rates are achievable. The mining strategy is focused on a thrust in development to open up ground for planned mining areas below 750 m Level in line with the planned production targets. Blanket mine plans to produce 74 - 80 koz (recovered) of gold per annum.
Existing and planned infrastructure at Blanket are sufficient to sustain the current production profile and the planned increased production.
The process plant has been operating at a consistent recovery of 93.8%, and this can be expected to continue as long as the ore mineralogy does not change. The average processing rate for the past 12 months was 64.2ktpm, and there are indications that higher processing rates can be achieved with operational improvements, as demonstrated in December 2023 where 85.2kt was milled.
Caledonia Mining Corporation Plc
S-K 1300 Technical Report Summary on the Blanket Gold Mine, Zimbabwe
The Blanket Mine plan including only the diluted Indicated and Measured Resources in the LoM plan, for conversion to Mineral Reserves is financially feasible. The updated Mineral Reserve can therefore be declared. The DCF value of USD107 million for the Blanket Mine (USD83 million attributable to Caledonia) was calculated at a real discount rate of 15.4%. No IRR could be calculated since the mine is in operation and no initial investment is required.
Blanket Mine financials are most sensitive to commodity prices, and grade. The Mine financials are least sensitive to capital expenditure and plant operating costs.
The all-in sustaining costs for the Blanket Mine amount to USD130/milled t, which equates to USD1,312/oz. The all-in costs for the Blanket Mine were calculated as USD132/milled t, which equates to USD1,330/oz.
VII. Recommendations
It is recommended that Blanket Mine continue with enhancements to the Mineral Resource estimation process to investigate potential increases in the Mineral Resources in areas above current infrastructure and enhance the planning down-dip. These digital modelling systems should be incorporated into the monthly planning system to ensure the Mineral Resource remains active and updated. The exploration activities, being so successful, should focus along the trends of the main orebodies to determine geological continuity at depths approaching an equivalent 50 level. This will allow the company to obtain a view of longer-term strategies and planning for the mine.
The QAQC data shows an improvement in the QAQC processes for the sampling database but still requires additional focus to ensure accuracy and precision, and to implement remedial action if required, especially for the down dip exploration drilling as this can impact the Mineral Resources significantly and thus requires the highest integrity.
The geotechnical study should be maintained, enhanced and broadened to determine the geotechnical parameters for pillar extraction and the possible changes in support strategy required at depth.
Caledonia Mining Corporation Plc
S-K 1300 Technical Report Summary on the Blanket Gold Mine, Zimbabwe
ITEM 2 - INTRODUCTION
Item 2 (a) – Author
The author of this Technical Report Summary (“TRS”) is Craig Harvey who is a Qualified Person (“QP”). Mr. Harvey was responsible for the compilation of the TRS document with input provided by specialists in relevant sections. Mr Harvey is responsible for the Mineral Resources disclosed in this TRS.
Mr Martiens van Staden is a Qualified Person (“QP”) and is responsible for the Mineral Reserves disclosed in this TRS.
Item 2 (b) – Terms of Reference and Purpose of the Report
This TRS follows the guidelines as prescribed by S-K 1300, and only such terms as defined in §229.1300-1305 have been utilised. The TRS is structured in accordance with the format prescribed in §229.601(b)(96).
Blanket is an operating underground mine with ore processed at an on-site plant. The purpose of this TRS is to present the Mineral Resources and Mineral Reserves of the Mine as at the Company financial year end 31 December 2023. The Mineral Resources and Mineral Reserves are stated at the effective date of 31 December 2023.
The basis for the Mineral Reserves stated in this TRS is a life of mine plan, which constitutes a study with detail and accuracy levels better than the requirements for a pre-feasibility study. The QP has reviewed the life of mine plan and is satisfied that it has demonstrated that, at the time of reporting, the extraction of the Mineral Reserve is economically viable under reasonable investment and market assumptions. The life of mine plan is technically achievable and is the basis of determining the Mineral Reserve.
This TRS updates the previously filed TRS titled S-K 1300 Technical Report Summary on the Blanket Gold Mine, Zimbabwe and dated 31 December 2022, prepared by Minxcon and filed by Caledonia, in terms of S-K 1300.
All monetary figures in this TRS are expressed in United States Dollars (“USD”).
Item 2 (c) – Sources of Information and Data Contained in the Report
The following sources of information, all from Caledonia, were used to compile this TRS:-
| | ● | Legal aspects and tenure: Mr Curtis van Heerden and Mr Patrick Hill; |
| | ● | The Mineral Resource estimate: Mr Craig Harvey, Ms Sego Mashego and Ms Elizabeth van Tubbergh. |
| | ● | The Mineral Reserve estimate: Mr Craig Harvey, Mr Moses Matimba, Mr Ettienne de Villiers and Mr Martiens van Staden. |
| | ● | The life of mine (“LoM”) plan and supporting information that forms the basis of the revised plan: Mr Craig Harvey, Mrs Sego Mashego, Mrs Elizabeth van Tubbergh, Mr Ettienne de Villiers, Mr Martiens van Staden, Mr Elton Gwatidzo and Mr Caxton Mangezi; |
| | ● | Metallurgical information: Mr Gibson Kadzikano; |
| | ● | Engineering information: Mr Deon Niemand and Mr Martiens van Staden, Mr Dirk Bleeker, Mr Nico Spies and Mr Pieter Greyling |
| | ● | Environmental information: Ms Colleen Parkins; and |
| | ● | Financial information: Mr Chester Goodburn, Ms Anja Grobler, Yolandi van den Berg, Mr Darlington Mabvoro and Mr Duncan Mpofu. |
Additional information was sourced from those references listed in Item 24 and is duly referenced in the text where appropriate.
Caledonia Mining Corporation Plc
S-K 1300 Technical Report Summary on the Blanket Gold Mine, Zimbabwe
Item 2 (d) – Qualified Persons’ Personal Inspection of the Property
The Qualified Person (“QP”), term as defined within S-K 1300, responsible for the compilation of this TRS is Mr Craig Harvey. Mr Harvey additionally is QP for the Mineral Resource estimate while Mr Martiens van Staden is QP for the Mineral Reserve estimate.
Mr Harvey is a full-time employee of Caledonia Mining South Africa since 1 March 2023 and has visited the operation on numerous occasions in 2023 to review and assist with the upgrading of the Mineral Resource systems on the operation.
Mr van Staden is a full-time employee of Caledonia Mining South Africa since 2021 and has visited the operation on numerous occasions in 2023 to review and assist with the mining and engineering relating to the underground operations of Blanket.
On visits to the property, time has been spent underground viewing the ore mining operations, including the development operations, the shaft hoisting systems, underground reticulation systems and all aspects relating to the gathering of geological information, underground surveying, and exploration drilling activities. Surface visits have included the new and old TSF’s, the mineral processing plant, on-site analytical laboratory, exploration core logging yard, and the technical service departments.
ITEM 3 – PROPERTY DESCRIPTION AND LOCATION
Item 3 (a) – Area of the Property
The Blanket Mine is an operating underground gold mine situated on the Gwanda Greenstone Belt (“GGB”) targeting shear zone hosted gold mineralisation. The Mine complex comprises a cluster of mines extending from Lima in the north, through Eroica, Sheet, AR Main, AR South, Feudal, Blanket Section (Blanket 1 to Blanket 6) and Jethro over a total strike length of some 3km. Gold has been commercially mined at the Project Area from several closely spaced orebodies defining a mineralised trend via several shafts since the early 1900s. The Mine covers the operating claims of Jethro, Blanket, Feudal, Harvard, Mbudzane Rock, Oqueil, Sabiwa, Sheet, Eroica and Lima, largely encompassed in a 2,120ha mining lease. Ore is processed at an on-site processing plant.
Item 3 (b) – Location of the Property
As illustrated in Figure 1, the Mine is located in the southwest of Zimbabwe, approximately 15 km northwest of Gwanda, the provincial capital of Matabeleland South. Gwanda is located 150 km southeast of Bulawayo, 196 km northwest of the Beitbridge Border post with South Africa, and 560 km from Harare, Zimbabwe's capital city. The Mine is centred on the coordinates (WGS84 system) 20°52' S, 28°54' E.
Caledonia Mining Corporation Plc
S-K 1300 Technical Report Summary on the Blanket Gold Mine, Zimbabwe
Figure 1: General Location of Blanket Mine
| |
 | General Location of Blanket Mine | December 2023 |
Item 3 (c) – Mineral Deposit Tenure
The Blanket Mine's interests in Zimbabwe include a Mining Lease, operating claims (i.e., on-mine), non- operating claims and a portfolio of brownfields exploration projects (satellite projects), as illustrated in Figure 2 as blocks of claims.
The Blanket Mine operates under a mining lease with registered number 40 (“ML40”) which was issued under the Mines and Minerals Act (Chapter 21:05) of 1961 (“MMA”) as detailed in Table 1. The mine’s claims under the lease cover an area of 2,120 ha, and include Lima, Sheet, Oqueil, Feudal, Sabiwa, Jethro, Harvard, and Blanket claims. The ML40, in which boundaries all current mining activities occur, is issued to Blanket Mine Company.
Table 1: Mining Lease Details
Mining Lease Number | Holder | Mining District | Area | Principal Mineral | Other Minerals | Date of Issue | Validity Period |
| | | | ha | | | | |
ML40 | Blanket Mine (1983) (Pvt) Ltd | Matabeleland South | 2,120.00 | Gold | Silver, Copper, Arsenic | 25 May 2023 | 1 year, renewable. Current tenure period expires on 24 May 2024 |
Blanket Mine also has several registered claims not incorporated under the lease. The 90 claims contiguous to the mining lease comprise a total area of approximately 998 ha. The registration numbers, area, number of claims and number of blocks for the individual claims are listed in Appendix 1.
Caledonia Mining Corporation Plc
S-K 1300 Technical Report Summary on the Blanket Gold Mine, Zimbabwe
In addition, Blanket Mine holds several non-operating claims located away from ML40 and the adjoining claims described above, that form a portion of the Gwanda portfolio. The names of each claim, as well as registration numbers and type of minerals are listed in Appendix 2. These non-producing claims (satellite projects) consist of 184 blocks of registered base metal (Ni, Cu and As) and precious metal claims covering a total area of 2,443ha.
Figure 2: Location of Blanket Mining Lease and Claims

A summary of the Blanket mineral titles is provided in Table 2 and corresponds to the Figure 2.
Table 2: Blanket Mineral Title Areas and Status
Claim Block | Status |
ML40 | Operating |
Valentine | Operating |
Sabiwa | Operating |
Mbudzane Rock | Operating |
GG | Non-operating (was under development for gold mining, currently on hold) |
Annette | Non-operating |
Cinderella | Non-operating |
Dan’s Luck | Non-operating |
Gum | Non-operating |
Banshee J | Non-operating |
Caledonia Mining Corporation Plc
S-K 1300 Technical Report Summary on the Blanket Gold Mine, Zimbabwe
Mazeppa | Non-operating |
Will South | Non-operating |
Spruit | Non-operating |
Shakeshake | Non-operating |
Rubicon | Non-operating |
Surprise | Non-operating |
Bunny’s Luck | Non-operating |
Abercorn | Non-operating |
A number of claims are subject to active tribute agreements between the Mine and local small-scale miners as part of the Company’s Corporate Social Responsibility. This is further discussed in Item 17 (d).
Annual payments (non-material) are due to government authorities for each of the claims and lease areas in order to continue the validity of the licences.
In accordance with paragraph 178(2)(a)(b)(c) of the MMA, the owners of the claims of this project possess the following respective surface rights:-
| | ● | use of any surface within the boundaries for all necessary mining purposes; |
| | ● | the right to use, free of charge, soil, waste rock or indigenous grass situated within the claims boundaries for all necessary mining purposes; |
| | ● | the right to sell or dispose of recovered waste rock. |
It is the belief of Caledonia that this clause provides sufficient rights to use the surfaces of the claim blocks that have been consolidated into the ML40. The MMA Amendment Bill makes instruction for landowner compensation in case of land loss due to mining activities in the form of land reallocation or outright purchase. Blanket Mine activities have not triggered this compensation and are not foreseen to do so.
Blanket Mine (1983) (Pvt) Ltd is held 64% by Caledonia Holdings Zimbabwe (Pvt) Ltd, which is a wholly owned subsidiary of Greenstone Management Services Holdings Limited (“GMS”), which in turn is wholly owned by Caledonia. Blanket Mine Company is incorporated in Zimbabwe and is the owner and operator of the Blanket Mine. 16% Share in Blanket Mine Company is held by the National Indigenisation and Economic Empowerment Fund, 10% by Gwanda Community Share Ownership Trust, and 10% by an Employee Trust for the benefit of the present and future employees of Blanket Mine.
Pursuant to an arrangement agreed in February 2020, the Gwanda Community Share Ownership Trust (“GSCOT”) received 20% of its dividends declared by Blanket and the remaining 80% was set off against the advance dividends. As of September 2023, GSCOT repaid the advance dividends and now receives its full dividend entitlement.
Item 3 (d) – Royalties and Payments
I. Government Royalties
Mining royalties are charged in terms of the MMA. The royalties are collectable from all the minerals or mineral-bearing products obtained from any mining location and disposed of by a miner or on his behalf. The royalties are chargeable whether the disposal is made within or outside Zimbabwe.
In terms of Zimbabwean tax laws, where gold produced exceeds 0.5kg, a 5% royalty is applicable. For primary gold producers a two-tier system that is based on gold prices is applicable. For gold prices below US$1,200/oz, the rate is 3%, and for gold prices above US$1,200/oz, the rate is 5% of the gross revenue from gold mining.
Caledonia Mining Corporation Plc
S-K 1300 Technical Report Summary on the Blanket Gold Mine, Zimbabwe
II. Net Smelter Royalties
Blanket Mine does not have any net smelter royalties applicable to its current operations.
A number of claims were held under option agreements between Blanket Mine Company and the claim holders. Blanket Mine Company has exercised all its options and purchased the claims under conditions outlined in the option agreements. Each of these has a net smelter royalty (“NSR”) associated with it. The remainder of claims are 100% held by Blanket Mine Company. A summary of the ownership of each claims area is provided in Table 3.
Table 3: Blanket Mineral Title Areas and Ownership
Claim Block | Ownership | Royalty Condition |
ML40 | Blanket Mine (1983) (Pvt) Ltd | |
Valentine | Blanket Mine (1983) (Pvt) Ltd – Option exercised | 3.0% NSR |
Sabiwa | Blanket Mine (1983) (Pvt) Ltd | |
Mbudzane Rock | Blanket Mine (1983) (Pvt) Ltd | |
GG | Blanket Mine (1983) (Pvt) Ltd – Option exercised | 2.5% NSR |
Annette | Blanket Mine (1983) (Pvt) Ltd – Option exercised | 3.0% NSR |
Cinderella | Blanket Mine (1983) (Pvt) Ltd – Option exercised | 3.0% NSR |
Dan’s Luck | Blanket Mine (1983) (Pvt) Ltd – Option exercised | 2.5% NSR |
Gum | Blanket Mine (1983) (Pvt) Ltd – Option exercised | 3.0% NSR |
Banshee J | Blanket Mine (1983) (Pvt) Ltd – Option exercised | 3.0% NSR |
Mazeppa | Blanket Mine (1983) (Pvt) Ltd – Option exercised | 2.5% NSR |
Will South | Blanket Mine (1983) (Pvt) Ltd – Option exercised | 2.5% NSR |
Spruit | Blanket Mine (1983) (Pvt) Ltd | |
Shakeshake | Blanket Mine (1983) (Pvt) Ltd | |
Rubicon | Blanket Mine (1983) (Pvt) Ltd | |
Surprise | Blanket Mine (1983) (Pvt) Ltd | |
Bunny’s Luck | Blanket Mine (1983) (Pvt) Ltd | |
Abercorn | Blanket Mine (1983) (Pvt) Ltd | |
Item 3 (e) – Environmental Liabilities
Operating mines in Zimbabwe are required to set aside money as part of the closure plan and fulfilment of the provisions of the MMA and Environmental Management Act (Chapter 20:27) (“EM Act”). The Ministry of Mines is working on amendments to the MMA in which there will be conditions for protection of the environment through the Safety, Health and Rehabilitation Fund.
At the time of writing, no statutory instrument has been gazetted implementing an environmental fund as yet, thus no fees are currently due. As such, no environmental rehabilitation trusts and guarantees have been established for Blanket Mine in terms of Zimbabwean law. The closure report for Blanket Mine (which has been undertaken independently by Knight Piesold) was updated at the end of 2023, and closure costs are accounted for as a contingent liability internally in terms of the accounting standard IAS 37 (Provisions, Contingent Liabilities and Contingent Assets).
Item 3 (f) – Permits to Conduct Work
The permits relating to the mining operations at Blanket are described in the sections to follow. The Mine is compliant in terms of authorisations and adheres to all government protocols and regulations as required.
Caledonia Mining Corporation Plc
S-K 1300 Technical Report Summary on the Blanket Gold Mine, Zimbabwe
I. Water Agreement
Water for the operations is sourced from the Blanket Dam that is situated on the Mtshabezi River and owned by the Zimbabwe National Water Authority (“ZINWA”). The use of this water is authorised through a contract agreement between Blanket Mine and ZINWA in terms of the Zimbabwe National Water Authority Act (Chapter 20:251).
In terms of this agreement, Blanket Mine is allowed to extract 1,200,000 m3 of water for the period 1 April 2023 to 31 March 2024. The agreement is valid for one-year periods and is renewed annually. ZINWA sends the renewable agreement for signing to Blanket on an annual basis.
Blanket continues to extract water in the interim at a rate of USD $0.17/m3.
II. Environmental Impact Assessment Certificates
In Zimbabwean mining legislation, an Environmental Impact Assessment (“EIA”) is not required in order to issue a mining licence, and in terms of the EM Act and its First Schedule is only required prior to commencement of mining and forms part of the planning process. Blanket Mine was established in the early 1900s, long prior to the implementation of governing mining and environmental laws. As such, it appears that an EIA is not required for the Blanket Mine. However, the Company is in constant communication with the Environmental Management Agency (“EMA”) regarding environmental permitting requirements and an EIA was completed for the Mine in 1995. Should the EMA communicate that an EIA certificate for the Mine be obtained, the Company will submit all relevant and associated applications to obtain such and remain fully compliant.
Blanket Mine holds EIA certificates as issued by the EMA for the solar plant, both the old and new TSF’s and development of the additional GG and Abercorn gold mines, which do not form subject of this Report but are detailed in Table 4 for completeness.
Table 4: EIA Certificates
Licence Number | Activity | Valid Period |
8000120641 | EIA Certificate - Abercorn Mine | 15 June 2023 – 14 June 2024 |
44GC0094/2020 | Solar Plant Licence (generation licence) | 25 years (from 2020) |
8000120642 | GG Mine – Gold Mining Development | 15 June 2023 – 14 June 2024 |
8000124691 | EIA Certificate – new TSF | 10 October 2023 – 9 October 2024 |
The new TSF is currently operating under the authorisation granted through the approval of the Environmental Impact Assessment, and a licence will be issued by the Zimbabwean Environmental Management Agency (EMA).
III. Additional Environmental Permits
In order for operations to continue, the EMA has issued a number of additional environmental licences to Blanket Mining Company, including:
| | ● | air emissions (clinic incinerator, blacksmith shop, laboratory, smelter house and power plant generators); |
| | ● | solid waste (landfill and tailings); |
| | ● | effluent disposal (sewerage and car wash bay); |
| | ● | hazardous substances (importation, transportation and storage); and |
| | ● | hazardous waste generation (oils and clinical waste). |
Caledonia Mining Corporation Plc
S-K 1300 Technical Report Summary on the Blanket Gold Mine, Zimbabwe
These licences are listed in Table 5.
Table 5: Environmental Permits
Licence Number | Activity | Valid Period |
L0000010451 | Diesel generator | 18 Mar 2024 – 31 Dec 2024 |
L0000010449 | Clinic incinerator | 18 Mar 2024 – 31 Dec 2024 |
L0000010452 | Blacksmith Licence | 18 Mar 2024 – 31 Dec 2024 |
L0000010453 | Assay laboratory | 18 Mar 2024 – 31 Dec 2024 |
L0000010450 | Smelter Licence | 18 Mar 2024 – 31 Dec 2024 |
L0000010455 | Washbay effluent disposal | 18 Mar 2024 – 31 Dec 2024 |
L0000010454 | Sewage effluent disposal | 18 Mar 2024 – 31 Dec 2024 |
L0000010463 | Hazardous substance generation | 18 Mar 2024 – 31 Dec 2024 |
L0000010457 | Solid waste Disposal (Landfill) | 18 Mar 2024 – 31 Dec 2024 |
L0000010458 | TSF Licence (old TSF) | 18 Mar 2024 – 31 Dec 2024 |
L0000010462 | TSF Licence (new TSF) | 18 Mar 2024 – 31 Dec 2024 |
L0000010456 | Workshops and oil separators | 18 Mar 2024 – 31 Dec 2024 |
L0000010451 | Diesel generator | 18 Mar 2024 – 31 Dec 2024 |
L0000010449 | Clinic incinerator | 18 Mar 2024 – 31 Dec 2024 |
L0000010452 | Blacksmith Licence | 18 Mar 2024 – 31 Dec 2024 |
The QP is not aware of any past material violations or fines.
Item 3 (g) – Other Significant Factors and Risks
The QP is not aware of any factors or risks that may affect access, title or right or the ability to perform work on the property.
ITEM 4 – ACCESSIBILITY, CLIMATE, LOCAL RESOURCES, INFRASTRUCTURE AND PHYSIOGRAPHY
Item 4 (a) – Topography, Elevation and Vegetation
The area around the Blanket Mine is hilly and lies at an altitude of about 1,000 m to 1,300 m above mean sea level (“amsl”). Drainage is to the northeast, into the Mtshabezi River on which the Sheet Dam and the Blanket Dam are located (some 5 km to the east of the Mine). The main natural water sources include the Tuli River, with its main tributaries (in the east bank running in a north-south direction) being the Mnyabetsi River in the Dibilashaba Communal Area, the Sengezane River in the Garanyemba Communal Area, and the Ntswangu and Pelele Rivers in the Gwanda Bolamba Communal Area.
The indigenous vegetation is dominated by savannah with Marula (Sclerocarya birrea), a variety of Combretum species, Terminalia sericea, Mopane groves and patches of grassland. Around the mine and local settlements, vegetation has been cut down and invaded by secondary thorny scrub dominated by Dichrostachys cinerea. Agriculture is limited to subsistence farming of maize and vegetables.
Caledonia Mining Corporation Plc
S-K 1300 Technical Report Summary on the Blanket Gold Mine, Zimbabwe
Item 4 (b) – Access to the Property
Access to the Blanket Mine is by an all-weather single lane tarred road from Gwanda. Gwanda is linked by national highways to Bulawayo, Harare, and the Beitbridge Border post. Earlier, Zimbabwe had good road infrastructure. However, lack of investment over the past ten to fifteen years resulted in its deterioration; substantial investment is required country wide. The railway line connecting the Zimbabwean national network to South Africa passes through Gwanda. An airstrip for light aircraft is located 5 km to the northwest of the town.
Gwanda Town is the provincial capital of Matabeleland South Province and district capital of Gwanda District. The village of Vubachikwe lies immediately adjacent to the southeast of ML 40. Blanket Mine labourers and their families are accommodated in a mine village about 1 km from the Mine. Gwanda offers a number of lodges and alternative accommodation options. Gwanda offers limited hospitals and medical services, business and financial services, educational facilities, shops, recreational facilities, and amenities. Larger hospitals and establishments are offered in Bulawayo, in addition to more skilled service industries. Neighbouring towns and villages to the Mine provide skilled and unskilled labour.
Major economic activities in the district include gold mining, cement production, livestock production, game ranching and tourism. A number of dams and irrigation schemes are established. The population in the district is mostly rural, with the majority of employed people servicing the agriculture and related industries.
The district is serviced by telecommunication services, and Blanket Mine provides its own Wi-Fi and communication systems.
The A6 highway, forming part of the Trans-African Highway network, is orientated roughly northwest-southeast and links Bulawayo with the Beitbridge border post and Musina in South Africa. The highway runs through the town of Gwanda. A major sealed road, the Old Gwanda Road, branches off from the A6 in Gwanda and runs directly through the ML 40 to Bulawayo. The Blanket claims are all located along these major roads and are thus easily accessible. The roads are sealed and although potholing is frequent, the surfaces are navigable by all vehicles. The Beitbridge Bulawayo Railway runs roughly parallel to the A6 through Gwanda Town.
An airstrip and informal airport building are located in Gwanda along the A6. The Joshua Mqabuko Nkomo International Airport is located in Bulawayo. The Mine can be accessed either via the Beitbridge-Bulawayo Road, or by flying into Bulawayo and driving two hours via the Old Gwanda Road or the A6 to the site.
Item 4 (c) – Climate and Length of Operating Season
The climate in Gwanda is hot and semi-arid, classified as BSh type (extremely hot summers and warm to cool winters, with minimal precipitation) by the Köppen climate classification system. Temperatures are as high as 40ºC during summer months of November to February and average 13ºC during winter (May to August). The climatic conditions make the area vulnerable to meteorological hazards such as droughts, floods, gusty winds, as well as lightening during the wet and hot season.
The region experiences short, variable rainfall seasons (averaging generally below 400 mm per year), and long, dry winter periods. Rainfall is usually associated with thunderstorms, producing rainfall of short duration and high intensity. The rainfall, in general, is less than half of the potential evaporation which has necessitated irrigation development and infield rainwater harvesting to improve crop production which complements animal husbandry as well as reclaims open access areas such as grazing lands. It also induces underground water recharge as part of improving the environment.
Caledonia Mining Corporation Plc
S-K 1300 Technical Report Summary on the Blanket Gold Mine, Zimbabwe
No appreciable mine production downtime is expected owing to unfavourable climatic or weather conditions. The mine is able to operate year-round.
Item 4 (d) – Infrastructure
I. Regional Infrastructure
The Blanket mine area is supplied with power through the national grid operated by the Zimbabwe Electricity Transmission and Distribution Company. Power is supplied from the grid to the operations via three overhead powerlines (“OHLs”) energized at 11 kV and 33 kV supplying 18MVA and Mtshabezi line adding another 7MVA. This totals to a maximum demand supply of 25MVA. The Zimbabwe Electricity Supply Authority (“ZESA”) currently allocates a capacity of 18MVA to the operations.
Water supply to the Blanket Mine area is sourced from the Blanket Dam located 5 km east of the Mine, as well as groundwater. The Blanket Dam has a capacity of 15 Mm³ and all water rights are held by ZINWA. Water users including Blanket Mine purchase all service and domestic / potable water from ZINWA.
Logistics infrastructure in the Blanket Mine area consists mainly of the local road network, national rail network and an airstrip located northwest of the town of Gwanda. All of the above-mentioned infrastructure is easily accessible from Blanket Mine.
I. Mine Infrastructure
Mine infrastructure comprises of underground workings, various shaft with head gear and hoisting facilities, a process plant, workshops and a new tailings storage facility (“TSF”) commenced deposition during December 2023 and was fully commissioned during February 2024. Stores, workshops and offices, as well as an assay laboratory, are located adjacent to the mine shafts. There is adequate surface area for any potential future expansion. With regards to the accessibility to personnel, services and supporting industries refer to Item 4 (b).
ITEM 5 – HISTORY
Item 5 (a) – Prior Ownership and Ownership Changes
The Blanket Mine is part of the Sabiwa group of mines within the GGB from which gold was first extracted in the 19th century. The Blanket Mine is a cluster of mines extending some 3 km from Jethro in the south through Blanket itself, Feudal, AR South, AR Main, Sheet, and Eroica, to Lima in the north. Blanket Mine has produced over a million ounces of gold during its lifetime.
Following sporadic artisanal working, the Blanket Mine was acquired in 1904 by the Matabele Reefs and Estate Company. Mining and metallurgical operations commenced in 1906 and between then and 1911, 128,000 t were mined. From 1912 to 1916 mining was conducted by the Forbes Rhodesia Syndicate who achieved 23,000 t. There are no reliable records of mining for the period between 1917 and 1941 and it is possible that operations were adversely affected by political instability during World Wars I and II. In 1941 F.D.A. Payne produced some 214,000 t before selling the property to Falconbridge in 1964 (Blanket Mine, 2009). Under Falconbridge, production increased to 45 kg per month and the property yielded some 4 Mt of ore up until September 1993. Kinross Gold Corporation (“Kinross”) then took over the property and constructed a larger Carbon-in-Leach (“CIL”) plant with a capacity of 3,800tpd. This was designed to treat both run of mine (“RoM”) ore and an old TSF.
Caledonia Mining Corporation Plc
S-K 1300 Technical Report Summary on the Blanket Gold Mine, Zimbabwe
Item 5 (b) – Historical Exploration and Development
Exploration was conducted between 1997 and 2006 around the GG and Mascot areas with follow-up exploration drilling in 2013 around these same areas. Currently, there are exploration shafts at these two sites.
Caledonia completed the purchase of the Blanket Mine from Kinross on 1 April 2006. The Mine re-started production in April 2009 after a temporary shut-down due to the economic difficulties in Zimbabwe. In late 2010, The Mine successfully completed an expansion project which increased production capacity from 24,000 oz of gold per annum to 40,000 oz of gold per annum. More recently, the Central Shaft was sunk to a depth of 1201.3 metres below surface elevation and the permanent rock handling facilities commissioned during April 2023. Minor infrastructure construction work is continuing the shaft system including the water handling system and spillage loading arrangement before the shaft can be considered to be fully commissioned. The Central Shaft system has allowed Blanket Mine to maintain production between 74koz to 80Koz. Over its life to December 2023, Blanket has produced some 1.78 Moz gold from 14.21 Mt ore milled.
ITEM 6 – GEOLOGICAL SETTING, MINERALISATION AND DEPOSIT
Item 6 (a) - Regional Geology
The majority of Zimbabwe’s known gold mineralisation occurs in host rocks of the Zimbabwe Craton, which is comprised of Archaean-aged basement lithologies. The Archaean basement consists of supracrustal greenstone belts surrounded by granitoid rocks of various ages. The greenstones consist dominantly of meta-basalts with smaller proportions of ultramafic and felsic extrusives and intrusives, and sedimentary rocks. Various combinations of these rock types often occur in association with adjacent granitoid or internal granitoid bodies (Kalbskopf and Nutt, 2003). The Craton is flanked along the northern, eastern, and southern sides by mobile belts of varying ages.
A total of 28 discrete recognised greenstone belts of various ages are hosted on the Zimbabwe Craton. The greenstone belts are subdivided into three main stratigraphic units, namely the Sebakwian, Bulawayan and Shamvaian Groups, with the Bulawayan being further subdivided into Upper and Lower Groups. All of these are bounded by unconformities (Mhlanga, 2002). The stratigraphic units are described as follows:
Older greenstones called the Sebakwian Group (~3.5 Ga), which are mostly metamorphosed to amphibolite facies. They comprise komatiitic and basaltic volcanic rocks, some banded iron formation (“BIF”), as well as clastic sediments.
The Lower Bulawayan Group (~3.1 Ga to 2.9 Ga), which comprises basalts, high-Mg basalts, felsic volcanic rocks and mixed chemical and clastic sediments. The Lower Bulawayan Group forms the Belingwe (Mberengwa) greenstones.
The Upper Bulawayan Group (~2.7 Ga) consists dominantly of meta-basalts with a basal unit of meta-sediments, including BIF, and komatiites overlain by a further sequence of clastic meta-sediments.
The Shamvaian Group (~2.6 Ga) is essentially a sedimentary unit interlayered with felsic volcanic rocks.
The Blanket Mine is situated on the north-western limb of the Archaean Gwanda Greenstone Belt (“GGB”) in south-western Zimbabwe. The GGB is approximately 70 km in length (west to east) and 15 km wide (north to south). The belt is typical of greenstone belts of the Zimbabwe Craton consisting of mafic to felsic volcanics with intercalated sedimentary units.
Caledonia Mining Corporation Plc
S-K 1300 Technical Report Summary on the Blanket Gold Mine, Zimbabwe
Repeated strong deformation affected all lithologies. Structurally, the GGB is dominated by a major periclinal synform, plunging 60° NW in the western half of the belt. It is flanked on both sides by two major deformation zones, namely the Northwest Gwanda Deformation Zone (“NWGDZ”) on the north-western limb and the South Gwanda Deformation Zone (“SGDZ”) along the southern limb. The SDGZ forms part of a regional structure bounding the southern margin of the belt. In the convergence zone of the NWGDZ and the SGDZ, the Colleen Bawn Deformation Zone (“CBDZ”) splays off the SGDZ eastwards, following the north-eastern arm of the belt. The NWGDZ is approximately 2 km wide and 18 km long with a general northwest to north-northwest trend, from the town of Gwanda to the north-western extremity of the belt (Campbell and Pitfield, 1994).
Four phases of deformation have been defined by Fuchter (1990). Repetition of lithological units, particularly in the north-west, is interpreted as evidence of D1 thrusting. The D2 event produced wide zones of intense schistose deformation, considered to be associated with the gold mineralisation. The D1 thrust phase has a coincident trend and may be an early part of the D2 event (AGS, 2006).
The large fold structures of the D3 deformation event dominate the eastern and western ends of the GGB. Blanket Mine mineralisation the lies on the northern limb of the large western fold (the Northwest Mineralised Camp). The final D4 deformation event produced major lineaments which dominate the southern margin of the GGB (Fuchter, 1990). Owing to the close proximity of the GGB to the high-grade metamorphic Limpopo Mobile Belt, GGB metamorphism reaches upper greenschist to amphibolite facies and is higher than in the typical Zimbabwean greenstone belts.
Item 6 (b) - Local and Property Geology
As described by AGS (2006), in the Blanket Mine area, lithologies comprise non-mineralised basal felsic schists of igneous or sedimentary origin in the east. Tailings facilities are generally sited on this Felsic Unit.
The felsics are overlain by a metabasaltic ultramafic to mafic unit with pillow basalts remnants. This Mafic Unit is subdivided into a lower zone and upper zone. Ultramafics and BIFs comprise the lower zone, while massive to pillowed lavas with intercalated interflow sediments (cherty argillites) comprise the upper zone (or Black Markers; MSA, 2011). Mineralisation at the adjacent Vubachikwe Mine is hosted in the BIF unit, while Blanket mineralisation occurs in the overlying mafics. Regionally, the rock is a fine-grained massive amphibolite with localised shear planes. A low angle transgressive shear zone characterised by biotite and a well-developed fabric, cuts through the mafic zone is the locus of the gold ore shoots. The shear zone may be up to 50 m wide (AGS, 2006).
Intruding this package is a younger, barren olivine-gabbro sheet. The entire sequence is capped by andesitic lavas with amphibolite feldspar schists of the Intermediate Unit (MSA, 2011).
The generalised stratigraphic column for the area is shown in Figure 3.
Caledonia Mining Corporation Plc
S-K 1300 Technical Report Summary on the Blanket Gold Mine, Zimbabwe
Figure 3: Stratigraphic Column of the Blanket Mine Area
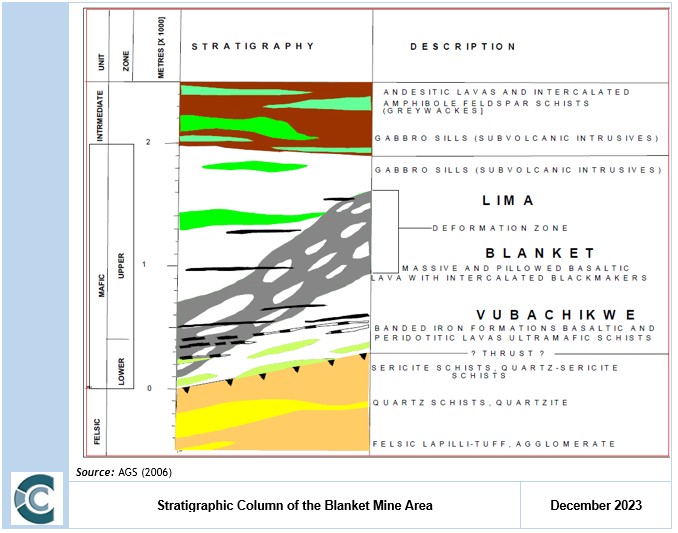
The entire sequence is cut by a regional dolerite sill from the south at Vubachikwe, through the Blanket Mine, to the Smiler deposit which lies approximately 3 km north of the Blanket Mine. Although no significant displacement is caused by the sill, it truncates all the ore shoots, but below the sill continuity of mineralisation is observed (AGS, 2006).
The geology at the Blanket Mine, including the shaft locations, is illustrated in Figure 4. A geological cross section at No 4 shaft is presented in Figure 5.
Caledonia Mining Corporation Plc
S-K 1300 Technical Report Summary on the Blanket Gold Mine, Zimbabwe
Figure 4: Local Geology of Blanket Mine
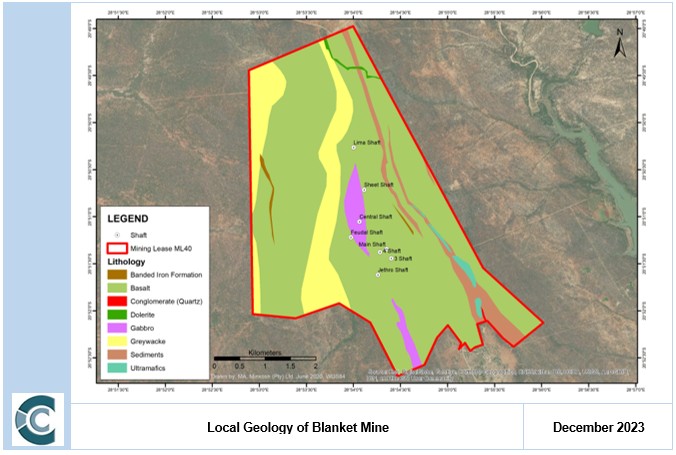
Figure 5: Geological Cross Section of Blanket Mine at No 4 Shaft
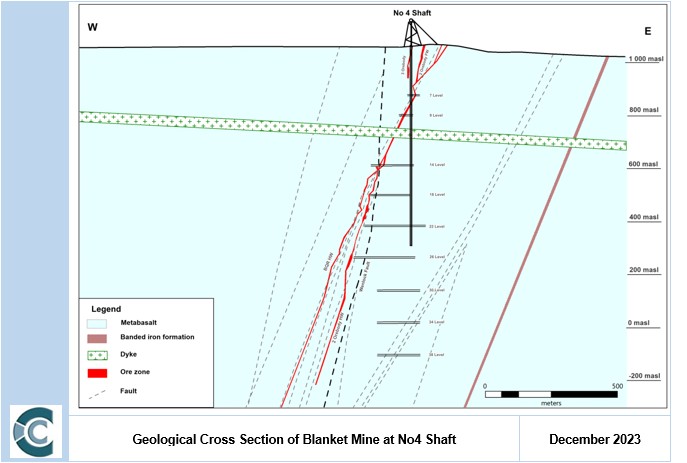
Caledonia Mining Corporation Plc
S-K 1300 Technical Report Summary on the Blanket Gold Mine, Zimbabwe
Item 6 (c) – Mineralisation and Deposit Type
Mining at Blanket occurs over a 3 km strike that includes from north to south, the deposits of Lima, Eroica, Sheet, AR Main, AR South, Feudal, Blanket Section (Blanket 1 to Blanket 6) and Jethro. The main Blanket underground workings are connected to Lima by a 2 km long haulage which follows the strike of the main fabric.
Varying strikes are recorded for the deposits. As described by AGS (2006), mineralisation occurs in near vertical shoots aligned along an approximately N-S axis. The ore shoots vary in shape from the tabular-lensoidal quartz reefs to the massive to pipe-like disseminated sulphide reefs (“DSR”).
Wall rock alteration typically comprises silica−pyrite−muscovite within a broader carbonate alteration halo. Quartz-carbonate altered rock forms the most commonly recognised alteration assemblage. Gold is deposited at crustal levels within and near the brittle-ductile transition zone.
The deposits may have a vertical extent of up to 2 km, demonstrate extensive down-plunge continuity, and lack pronounced zoning. The ore mineralogy is dominated by gold, pyrite and arsenopyrite. Subordinate minerals such as galena, chalcopyrite, pyrrhotite, sphalerite, tellurides, scheelite, bismuth and stibnite also occur. Sulphide mineralogy commonly reflects the litho-geochemistry of the host rock with arsenopyrite being the most common sulphide mineral in metasedimentary host rocks and pyrite or pyrrhotite being more typical in metamorphosed igneous hosts. The gangue and alteration mineralogy are dominated by quartz and carbonate (ferroan dolomite, ankerite, siderite, calcite) with subordinate albite, fuchsite, sericite, muscovite, chlorite, and tourmaline.
Two quartz-filled shear zones are mined, namely the Blanket Quartz Reef (“BQR”) and the Eroica Reef, which have long strike lengths but are not uniformly mineralised although continuous pay shoots of over 100 m on strike are seen. Gold grade fluctuations are more extreme in the quartz reefs than in the DSR type reefs but on average these quartz shears have higher grades and are used as a sweetener of ore to the mill (MSA, 2011).
Table 6 provides a description of the mineralised sections at Blanket.
Table 6: Description of Deposits at Blanket Mine (after MSA, 2011)
Name | Description |
Blanket Quartz Reef | The BQR strikes some 500 m on surface and is up to 5 m wide, diminishing with depth, dipping 55°W. It displaces the DSR type orebodies with an apparent reverse movement of up to 250 m. The reef texture varies from typical quartz reef at depth through sheeted and boudinaged veinlets to ankeritic carbonate in schist and a sulphide replacement ore zone. This is interpreted as a transition from brittle ductile to a more ductile regime with depth. Towards the north of the reef outcrop, a Z-shaped inflection forms the thickest part of the reef, up to 5 m, compared to less than 1 m on the limbs. Similar inflections are found elsewhere in the Northwest Gwanda Shear Zone. Subsequent to mineralisation the reef was displaced by the north-striking vertical Wenlock Fault which has a dextral strike-slip component of about 60 m. Mineralisation in the BQR is not uniform and comprises native gold with galena. Arsenopyrite is more dominant down-dip. Economic mineralisation is restricted to three 90 m pay shoots. |
Lima | Lima is situated 2 km north of the Blanket Section and an underground haulage links the two mines. Like the Blanket Section orebodies, the Lima orebodies developed in very high-strain areas. The main shoots are the Hanging Wall and Interlimb. Mineralisation in the Hanging Wall limb comprises pyrite with subordinate arsenopyrite in cleavage planes within pervasive biotite/chlorite alteration. The Interlimb is characterised by a centrally silicified core with pyrite and arsenopyrite constituting the main sulphides. |
Eroica | The Eroica orebody lies approximately 1,300 m north of the Blanket Section orebodies and renowned for its high native gold content. It dips at 65°W and has a strike length of 300 m in a northerly direction. The Eroica orebody is hosted in a high-strain area where the shear is up to 15 m wide. Brown carbonate alteration characterises the shear in strong association with biotite development. The orebody is defined by thin silicified stringers that develop into swells of up to 5 m in width. The silicification shows pinch and swell both on strike and down-dip, resulting in a series of dismembered silicified pods developed within a particular shear. The biotite and carbonate alteration, together with the silicified stringers, form marker links between the dismembered pods. Finely disseminated arsenopyrite, pyrite and pyrrhotite are associated with the gold mineralisation. |
Sheet | The Sheet orebody lies about 500 m south of Eroica and is a typical example of a fault-controlled mineralisation. It comprises of at least three stepped-out, sinistrally displaced and highly silicified hornblende-chlorite schist fault blocks. The orebody was subjected to both strike and “east-west” dip faulting, resulting in major bifurcation of the orebody up-dip into highly fractured North and South orebodies with variable dips. As with the other DSR orebodies at Blanket Mine, the less disturbed Sheet orebody down-dip extension has a 60-65°W dip and a fabric that is sympathetic to the north-northwest regional shear. The orebody can attain widths and strike lengths of up to 15 m and 60 m respectively. Mineralisation is associated with finely disseminated arsenopyrite. Pyrite and pyrrhotite occur as accessory minerals and are generally indicative of poor mineralisation. The orebody is encompassed within a ductile metabasalt country rock. The orebody was mined between 230 m Level and 870 m Level on separate dismembered shear zones. Further exploration is ongoing to assess the resource growth potential of the down-dip extension. |
Caledonia Mining Corporation Plc
S-K 1300 Technical Report Summary on the Blanket Gold Mine, Zimbabwe
Name | Description |
AR Orebodies | AR is a “Z”-shaped mineralised zone and consists of two separate orebodies (AR Main and AR South) with widths up to 30 m as a result of tectonic thickening from faulting and folding. The mineralised zone has no known surface expression and appears to form a ‘peak’ under the regional dolerite sill just above 9 Level some 500 m north of the Blanket Section orebodies. From this point the body splits into two the ore shoots of AR Main and AR South, which plunge 55°W and 58°SW respectively. AR Main AR Main is a DSR-type orebody and occurs within a broad shear envelope in pillowed metabasalts, which is generally irregular in plan and bounded by shears that assist in defining the limits of the mineralisation. At 750 m Level, a shear disrupts the bodies causing the plunge to flatten to the west. The orebody strikes between 40 m and 60 m with an average width of 30 m at the centre of the envelope. The ore is a silicified amphibolite predominantly comprised of quartz with minor carbonate and chlorite minerals. Gold mineralisation is associated with arsenopyrite and to a much lesser extent pyrrhotite and pyrite. Finely disseminated arsenopyrite occurs within the orebody which form the high grade areas. Sulphide minerals seldom amount to more than 5% of the rock by volume. The orebody is massive and is exploited using the long-hole open stoping method. AR South AR South plunges southwest, trending towards the Blanket 2 orebody at depth. AR South is also developed within a broad shear zone and is more pipe-like than AR Main. Its maximum thickness is approximately 50 m and high grade sections are defined by silicification and arsenopyrite. |
Feudal | Occurring in the hanging wall of the Blanket-Lima strike about 900 m northwest of Jethro is the almost mined out “outlier” Feudal orebody. The orebody is interpreted to be located at the focal point of two Blanket-Lima strike transgressing shears, namely the Blanket-Feudal and Jethro-Feudal shears. The rocks consist of intermediate to meta-basalt with hornblende chlorite schist hosting the mineralised quartz- sulphide (disseminated arsenopyrite and pyrrhotite) shear zones. The known orebody (surface outcrop to 7 Level for a 200 m lift) is now mined out. Geological models are being pursued to re-establish the reef down-dip. |
Blanket Section | The Blanket Section comprises six orebodies, namely Blanket 1 to Blanket 6, which occur some 500 m south of the AR orebodies. On average, the orebodies dip 80°SW. Blanket 1 and Blanket 4 are parallel and occur in north-south trending shear segments. Blanket 2 and Blanket 5, which are also parallel, strike northwest southeast. Blanket 3 is cylindrical and lies in a shear segment parallel to Blanket 2 and Blanket 5. On surface, the BQR lies in the footwall of the DSR type orebodies. The reef has a shallower dip than the DSR bodies but plunges in the same direction so that it progressively advances towards them with depth, displacing Blanket 2, 3, 1, 4. Blanket 2 reappears on the footwall of the BQR and is established on the 630 m Level through to the 870 m Level. |
Jethro | The Jethro orebody is located some 400 m south of the Blanket Section. The north-south striking Jethro orebody dips near vertical in a westerly direction and tends to roll over locally. |
In greenstone belts, gold mineralisation occurs mainly as vein type or shear zone hosted disseminations. Most of the larger deposits are found within the greenstone belts or their contacts with the granitoids. All mineralisation is hydrothermally emplaced and associated with the regionally developed D2 deformation characterised (at the Blanket Mine) by areas of high strain wrapping around relatively undeformed remnants of the original basaltic flows. It is within the more ductile tensional high strain areas that the wider of the orebodies are located.
These orogenic gold deposits are commonly associated with late syntectonic intermediate to felsic magmatism. Vein systems occur as a system of echelon veins on all scales. The Blanket orebodies comprise up to 10% of precious metals (AGS, 2006), so that the gold-rich model is applicable. The Blanket mineralisation is hydrothermally emplaced and associated with the regionally developed D2 deformation characterised by areas of high strain wrapping around relatively undeformed remnants of the original basaltic flows. Wider orebodies occur within the more ductile tensional high strain areas. The localisation of the mineralised shears conforms to a Riedel pattern (AGS, 2006).
Two main types of mineralisation are recognised at Blanket, namely DSR and quartz-filled reefs and shears. A third type of mineralisation may be evidenced in the form of auriferous sulphide minerals as a replacement of the iron-rich minerals along the hinges of the folds in BIF, as is present at the neighbouring Vubachikwe Mine.
Caledonia Mining Corporation Plc
S-K 1300 Technical Report Summary on the Blanket Gold Mine, Zimbabwe
Disseminated Sulphide Replacement Reefs
DSRs host the best grades and comprise the majority of the ore shoots. The zones have a silicified core with finely disseminated arsenopyrite. Relatively high grades are found in a package of silicified biotite chlorite schist with irregular quartz stringers and disseminated and stringer arsenopyrite in the fabric planes. Due to lesser silicification, abundant biotite characterises the margins of these mineralised zones and as a result they have a lower gold content. Disseminated sulphide-replacement orebodies range up to 50 m in width with a strike of 60 m to 90 m. Free-milling gold may constitute up to 50% of the total metal content with the remainder locked in the arsenopyrite. The ore is not refractory despite its association with arsenopyrite and plant recoveries in excess of 90% are achievable.
Quartz-Filled Reefs and Shears
Two quartz shears are mined at the Blanket Mine, namely the BQR and the Eroica Reef. These reefs have long strikes; however, they are not uniformly mineralised. Continuous pay shoots of over 100 m on strike are present. The Quartz Reef has a surface strike of approximately 500 m, but economic mineralisation is restricted to three 90 m long shoots.
Quartz-filled reefs display a much wider grade range compared to the DSR deposits. On average, these shears are of a higher grade and are used in blending the ore to the mill. Dominant ore minerals are native gold and galena although arsenopyrite becomes more prevalent below 470 m. Increasing levels of arsenopyrite association with depth confirm that the quartz shears represent higher level offshoots and splays with brittle deformation relative to the more ductile DSR-type core zone mineralised bodies.
Item 6 (d) – Geological Model
Mineralised envelopes are constructed on a 1.5 g/t cut-off grade for each of the individual orebodies. The wireframes are constructed explicitly by manually honouring drillhole intersections and in stope sampling data in Deswik and Datamine Studio RM software. The process of manually creating the wireframes is subjective and can differ based on the user.
The orebodies remained well constrained, with grade confined to specific narrow veins with local changes only to include new samples derived from underground development and drilling activities. Lithological descriptions are only present in the database for the more recent drilling data (post 2022); thus, all modelling done is performed on grade intersections. Modelling was performed from the known into the unknown, where mining activities assist to positively identify orebody intersections, trend and thickness that can be used as a guide for identifying and connecting that same orebody in grade intersections at depth.
All orebodies now have a 3D model and 3D resource estimate generated.
As part of the software upgrades undertaken at Blanket, all geological data observations from underground are now captured using the Deswik Mapping module. This uses the Deswik survey information as the base map upon which all recorded observations can be captured digitally. On a quarterly basis, the mineralised envelopes are formally reviewed to ascertain if they remain representative of the mineralised zones and updated as necessary. This applies to all sources of exploration drilling data where the captured intersections are subject to review for their validity and incorporated into the process of quarterly updates to the mineralised domains. An overview of the orebody domains and major structures is provided in Figure 6.
Caledonia Mining Corporation Plc
S-K 1300 Technical Report Summary on the Blanket Gold Mine, Zimbabwe
These updated 2023 wireframes are detailed in item 11 of this report. Furthermore, digital resource estimates are not restricted to a specific depth but rather generated within the orebody wireframes. The Mineral Resources are classified within these mineralised shells and may comprise Measured, Indicated and Inferred Mineral Resources together with a “target” classification which is used to generate future drilling target areas.
Figure 6: General Orebody Domain Wireframes and Major Structures
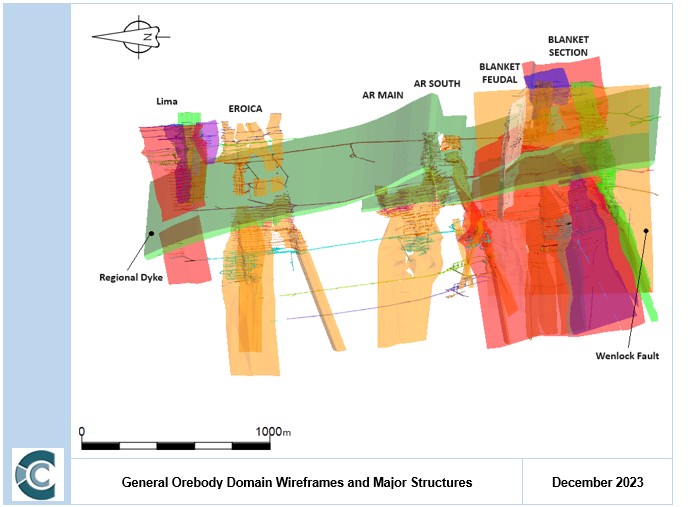
The Blanket Section orebodies consist of several domains extending from north to south, named Blanket 1 through to Blanket 6 (Figure 7). Footwall and hanging wall domains are further named for parts of these orebodies that are displaced in either the footwall or hanging wall of a structural feature. These domains are characterized by disseminated sulphide replacement (DSR) within the same shear zone.
Caledonia Mining Corporation Plc
S-K 1300 Technical Report Summary on the Blanket Gold Mine, Zimbabwe
Figure 7: Blanket Section Orebodies and the Wenlock Fault on 630m Level
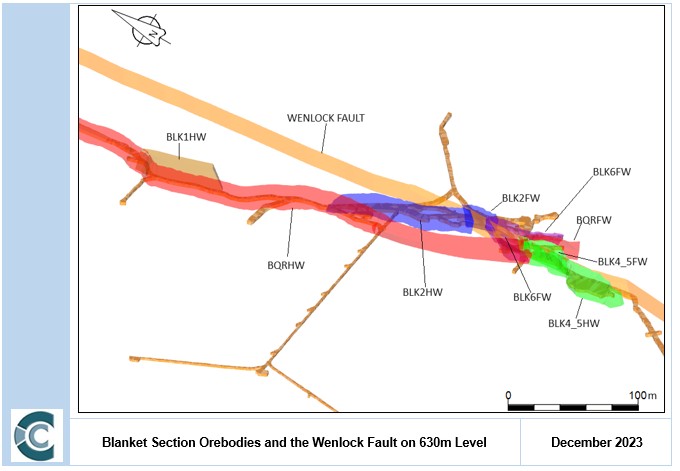
The Wenlock Fault (WF), the youngest fault in the area, exhibits both lateral and vertical displacement of orebodies within the Blanket group. In Figure 1 the lateral displacement between Blanket 2 hanging wall and Blanket 2 footwall on 630m Level is shown, and in this example this displacement measures 30m although this may vary due to differences in rock competency. The general trend of the Wenlock Fault is approximately 345°/84°. Notably, the Wenlock Fault displaces the BQR, which subsequently displaces DSR orebodies (Figure 8).
It was observed that there was a consistent trend in Blanket 2 hanging wall, Blanket 2 footwall and Blanket 3. All these orebodies can also be interpreted to splay off of the BQR orebody.
Caledonia Mining Corporation Plc
S-K 1300 Technical Report Summary on the Blanket Gold Mine, Zimbabwe
Figure 8: Sectional View of the Blanket Orebodies, Looking North
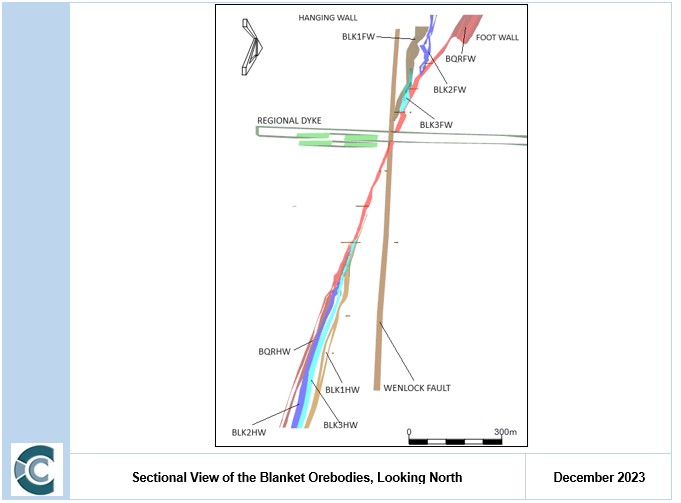
Blanket Feudal
The Blanket Feudal system is characterized as a narrow reef occasionally exhibiting swells, and it consists of a nearly vertical ore body that exhibits rolling characteristics (Figure 9). It shares contact with BQR along a significant strike. Unlike the dominant shear system, the Blanket Feudal system possesses a different strike; it serves as a connection between the primary shear system, which hosts numerous ore bodies, and the Jethro shear. Moving towards the northern direction, the Blanket Feudal system deviates from its predominantly near-vertical orientation and transitions to a shallow eastward dip, which is contrary to the westward dipping observed in most ore bodies.
Caledonia Mining Corporation Plc
S-K 1300 Technical Report Summary on the Blanket Gold Mine, Zimbabwe
Figure 9: Sectional View of Blanket Feudal Hanging Wall in Relation to BQR Hanging Wall, Looking North
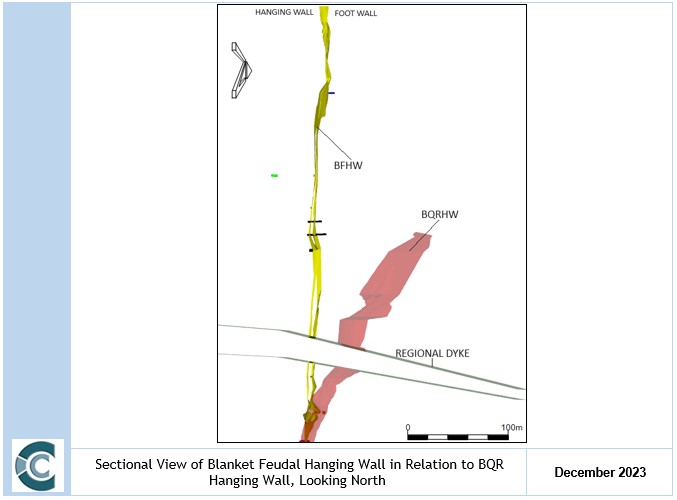
Blanket Quartz Reef
Blanket Quartz Reef is a quartz-filled fault, primarily composed of quartz material. It is situated on the footwall of the Blanket DSR orebodies. Notably, this fault exhibits a shallower dip of 57° compared to 72° of the DSR orebodies.
The consequence of this geological arrangement is that the younger BQR structure intersects and truncates the Blanket orebodies, depicted in Figure 10. Additionally, the DSR orebodies terminate where they meet the BQR structure.
The magnitude of displacement along this fault can vary, as described by Fuchter (1990), although it typically averages around 300 meters. The disparity in displacement across various orebodies can be attributed to variations in intersection angles resulting from differences in the observed strike and dip of the affected orebodies.
BQR has pay shoots that are high grade and punctuated by low-grade waste patches.
Blanket Feudal occurs to the west of the BQR while Blanket 1, 2 and 3 all occur to the east (Figure 10). BQR is a continuous unit running through the Blanket section. It has been interpreted that all other Blanket orebodies are closely associated with the BQR.
Caledonia Mining Corporation Plc
S-K 1300 Technical Report Summary on the Blanket Gold Mine, Zimbabwe
Figure 10: Plan View of the Blanket Feudal, Blanket Orebodies and BQR at 140m Level.
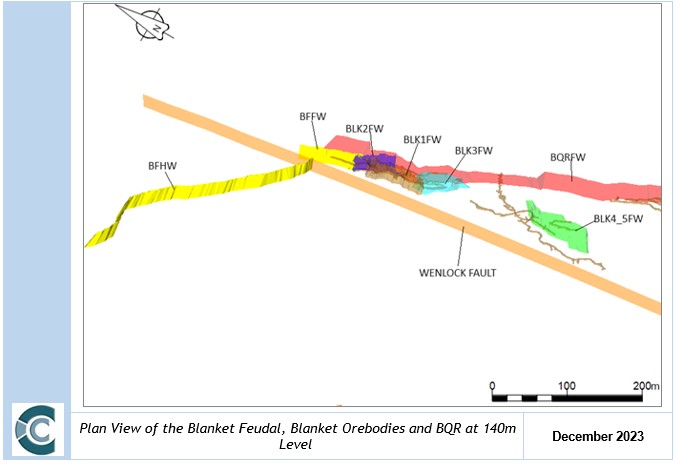
AR Main and AR South
AR Main and AR South occur to the north of the Blanket section. An additional extension to AR South has been modelled that shows a continuous trend with the existing orebody Figure 11. AR South and AR Main are separated by a dyke, the structural controls of this dyke as well as the possible extension of the BQR into the AR Main and AR South sections need to be tested. The samples used to generate AR South extension show a good correlation of the trend that is interpreted to exist over Blanket Mine.
Caledonia Mining Corporation Plc
S-K 1300 Technical Report Summary on the Blanket Gold Mine, Zimbabwe
Figure 11: Plan View of the Blanket, AR South and AR Main Orebodies on 810m Level.
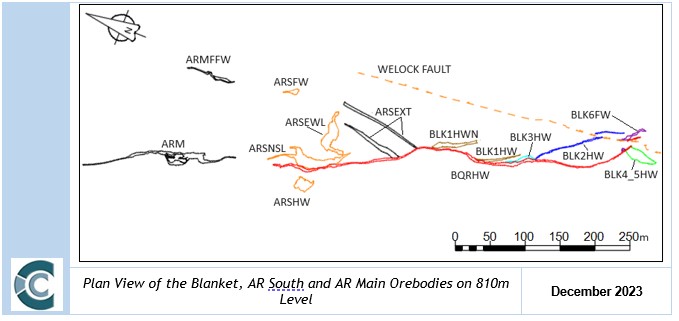
Lima and Eroica
Eroica consists of Eroica South and Eroica North, while Lima consists of the main orebody well as a smaller inter-reef orebody and a smaller foot wall body as depicted in Figure 12.
Figure 12: Plan View of the ERC and Lima Orebodies at the 140m Level.
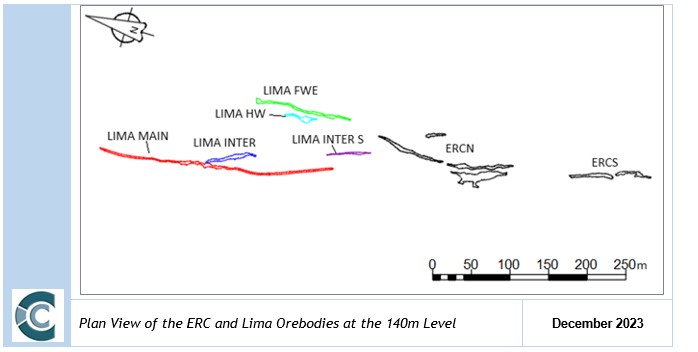
Caledonia Mining Corporation Plc
S-K 1300 Technical Report Summary on the Blanket Gold Mine, Zimbabwe
ITEM 7 – EXPLORATION
Item 7 (a) – Non-drilling Work
I. Survey Procedures and Parameters
No recent trench or soil sampling or geophysics is available or considered during geological modelling or Mineral Resource Estimation.
Channel Sampling and Sludges
Underground channel/chip sampling and sludge sampling procedures are outlined as follows:-
| | ● | The distance from a known survey peg to the first sample section is noted. Subsequent sample sections are marked at 2 m intervals on the roof of the drives along strike. |
| | ● | In the Jethro and Blanket Feudal orebodies, sample sections are taken at 1.5 m intervals along strike. |
| | ● | Sample sections are taken using a chisel and collection dish starting from the hanging wall to the footwall. Samples are generally taken in 0.6 m lengths but may vary depending on geology or the width to be sampled. |
| | ● | In wider mineralised zones where not all the mineralisation is exposed by the primary development, sidewall sludge holes are drilled to a depth of 1.2 m. Sludge holes are drilled into the hanging wall and footwall along the same section line as the channel samples. Drill discharge water is collected in cloth bags and the water seeps out leaving a sludge sample. Samples are taken every 0.6 m. The hole is flushed between each sample to reduce contamination. |
| | ● | A sample weight of about 2 kg is collected in each instance. |
| | ● | A ticket tagging system is used with sketches drawn at the face showing the ticket numbers corresponding to the samples taken. This assists the data capture in that on receipt from the laboratory, results are plotted on the assay plan against the corresponding ticket numbers. |
| | ● | Blanks and CRMs are inserted into the sample sequence. |
| | ● | On receipt of assays, QAQC is carried out. Information for channel and sludge samples is both processed digitally (incorporation of all channel and sludge data into database, plotting in Deswik, 3D modelling, evaluation) and plotted manually on the level plans. |
| | ● | 1:250 scale survey plans are generated as ‘base plans’ for assay, stope assay and geology plans for each 15 m sub-level. |
Channel and sludge assay information is plotted manually on 1:250 scale assay plans for every 15 m sub-level. Within all of the mineralised zones, except the AR Main and AR South wider bodies, only 4.2 m is normally sampled (includes 1.8 m wide drive and 1.2 m of sludge sampling into both the hanging wall and the footwall) across the strike and any mineralisation beyond these limits is not included in the Mineral Resource. The unsampled payable sections outside of this width are mined but reported as coming from not-in-reserve (“NIR”) blocks.
While the accuracy of sludge sampling is debatable, it is considered to give a reliable indication of mineralisation. By the nature of the sampling methodologies the roof chip sampling and sampling of the evaluation drillholes would appear to have a higher confidence than the sludge sampling. However, an analysis of the different sample types has shown a minor decrease in grade (per orebody) with the inclusion of the sludge samples. This is expected as the sludge samples are taken at the periphery of the orebodies to tests the limits of the orebody of acceptable grade.
Caledonia Mining Corporation Plc
S-K 1300 Technical Report Summary on the Blanket Gold Mine, Zimbabwe
Exclusion of these sludge samples would result in local over estimation as these sludge samples often record the transition from high grade to low grade and have a further effect on the delineation of the mineralised zones. In the case of the underground chip sampling the high volume of samples reduces the impact of isolated sampling inaccuracies.
Sampling is undertaken underground; thus, a plan view of sampling points is not appropriate for Blanket Mine.
II. Sampling Methods and Sample Quality
Blanket is an operational mine. Only underground Mineral Resource and exploration drilling are currently undertaken.
III. Sample Data
Only ongoing underground drilling and chip sampling is currently undertaken at Blanket Mine.
IV. Results and Interpretation of Exploration Information
The results of the exploration drillholes as described in the section to follow - once checked and validated - were included into the existing database to inform the geological modelling process as well as Mineral Resource estimation.
Item 7 (b) – Drilling
I. Type and Extent of Drilling
Blanket is an operating mine. Underground long-hole exploration drilling and evaluation drilling are undertaken to respectively investigate orebody depth extensions and delineate width of the mineralised body. To this end, a plan view of drilling collars is not appropriate for Blanket Mine. However, Figure 13 illustrates the distribution of the database.
Long-hole Exploration Drilling
There was a hiatus in the amount of drilling defined as exploration drilling in the period 2020 – 2022 as a result of the activities relating to the sinking of Central Shaft. Drilling activities actively recommenced during 2022 and to date, a total of 387 holes have been drilled comprising 117,552 m (Table 7).
Caledonia Mining Corporation Plc
S-K 1300 Technical Report Summary on the Blanket Gold Mine, Zimbabwe
Table 7: Exploration Holes and Meters by Year
Year | Number of Holes | Metres Drilled |
2013 | 10 | 4,228 |
2014 | 25 | 8,685 |
2015 | 40 | 14,948 |
2016 | 58 | 19,768 |
2017 | 54 | 19,035 |
2018 | 68 | 18,269 |
2019 | 42 | 9,456 |
2020 | 17 | 3,396 |
2021 | - | - |
2022 | 18 | 5,320 |
2023 | 55 | 14,448 |
Total | 387 | 117,552 |
The recent drilling phases, which commenced in 2022, were focused on down-dip extensions to the Blanket Section, Eroica, and AR South orebodies. Drilling commenced in mid-June 2022 on 750mL Eroica North chamber 2. Drilling on in Eroica has since been completed at chamber 2 and 3, upgrading inferred into indicated resources down to 990mL and adding inferred down to 1110m Level.
Drilling is planned on 750mL at Eroica on chamber 4 targeting below 1110mL. The second rig will be on 870m Level in Blanket where drilling for Blanket 4-5 and Blanket 6 will cover below 990mL and upgrading inferred into indicated resources. The third rig will be on 1110mL targeting AR South and BQR below 1110m Level. This drilling programme is being done by on-mine Kempe 600 rigs, comprising of 3 rigs, operated by on-mine crews. Two rigs acquired in the early nineties are aged and scrapped. For the long-term drilling, a new rig is being motivated for to bolster the current fleet.
Directional drilling techniques are not employed but holes are planned to incorporate a deviation based on knowledge from previous drilling. While this does not result in a perfectly regular intersection spacing due to irregular and unexpected deviations of holes, the areas are drilled until they are adequately covered.
Drilling is carried out by Blanket personnel. All drilling is currently being carried out by BQ (36.5 mm diameter) core.
Results of the long hole exploration drilling, published on July 10, 2023, and January 30, 2024, intersected wider orebodies with better grade than initially expected. These expectations were derived from the 2022 resource modelling as targets for the drilling programs. The drillhole results are provided in Table 8 and the drillhole information in Table 9.
Table 8: Long Hole Deep Drilling Results at Blanket (2022 - 2023)
Holes Identifier | Orebody Name | Orebody Intersection | Core Length (m) | True width (m) | Grade (g/t) | Orebody Intersection depth from surface (m) | E.O.H (m) |
| | | From (m) | To (m) | | | | | |
ERC750EX2307 | ERCN_HW | 330.45 | 332.25 | 1.80 | 1.50 | 0.72 | 1082.25 | 356.25 |
ERC750EX2308 | ERCN_HW | 302.60 | 306.80 | 4.20 | 3.50 | 5.97 | 1056.80 | 392.40 |
ERC750EX2308 | ERCN_FW | 350.00 | 358.40 | 8.40 | 5.80 | 4.95 | 1108.40 | 392.40 |
ERC750EX2309 | ERCN_HW | 304.80 | 307.80 | 3.00 | 1.66 | 3.62 | 1057.80 | 347.40 |
Caledonia Mining Corporation Plc
S-K 1300 Technical Report Summary on the Blanket Gold Mine, Zimbabwe
Holes Identifier | Orebody Name | Orebody Intersection | Core Length (m) | True width (m) | Grade (g/t) | Orebody Intersection depth from surface (m) | E.O.H (m) |
| | | From (m) | To (m) | | | | | |
ERC750EX2310 | ERCN_HW | 303.60 | 304.20 | 0.60 | 0.48 | 5.49 | 1054.20 | 324.50 |
ERC750EX2312 | ERC _STH | | | Traces | | | | 287.20 |
ERC750EX2313 | ERC _STH | | | Traces | | | | 279.60 |
BLK870EX2301 | BLK4_5 | 38.20 | 50.20 | 12.00 | 3.58 | 5.10 | 920.20 | 287.40 |
BLK870EX2302 | BLK4_5 | 34.10 | 40.10 | 6.00 | 3.92 | 7.46 | 910.10 | 272.30 |
BLK870EX2303 | BLK4_5 | 28.60 | 39.40 | 10.80 | 4.27 | 8.80 | 909.40 | 272.20 |
BLK870EX2303 | BLK2FW | 241.00 | 242.80 | 1.80 | 1.27 | 4.35 | 1112.80 | 275.50 |
BLK870EX2304 | BLK4_5 | 26.20 | 40.60 | 14.40 | 7.74 | 4.14 | 910.60 | 275.50 |
BLK 930EX2301 | BQR_HW | 148.60 | 152.80 | 4.20 | 5.12 | 2.85 | 1082.80 | 299.20 |
BLK 930EX2301 | BLK3HW | 220.60 | 226.00 | 5.40 | 4.39 | 4.41 | 1156.00 | 299.20 |
BLK 930EX2302 | BQR_HW | 130.60 | 133.00 | 2.40 | 1.86 | 2.42 | 1063.00 | 299.20 |
BLK 930EX2303 | BQR_HW | 134.30 | 139.10 | 4.80 | 3.20 | 2.39 | 1069.10 | 233.30 |
BLK 930EX2304 | BQR_HW | 205.70 | 219.50 | 13.80 | 8.32 | 3.63 | 1149.50 | 251.30 |
BLK 930EX2305 | BQR_HW | 197.90 | 209.30 | 11.40 | 7.69 | 3.99 | 1139.30 | 259.30 |
BLK 930EX2305 | BLK1HW | 230.30 | 255.30 | 25.00 | 16.69 | 3.16 | 1185.30 | 259.30 |
BLK 930EX2306 | BQR_HW | 170.90 | 179.90 | 9.00 | 4.02 | 5.38 | 1109.90 | 275.30 |
BLK 930EX2306 | BLK2HW | 181.10 | 203.30 | 22.20 | 8.18 | 3.75 | 1133.30 | 275.30 |
BLK 930EX2307 | BQR_HW | 157.80 | 169.80 | 12.00 | 6.57 | 4.05 | 1099.80 | 259.30 |
BLK 930EX2308 | BQR_HW | 176.03 | 200.63 | 24.60 | 13.33 | 5.92 | 1130.63 | 304.25 |
BLK 930EX2309 | BQR_HW | 205.00 | 210.40 | 5.40 | 2.24 | 12.44 | 1140.40 | 287.30 |
BLK 930EX2310 | BQR_HW | 165.10 | 170.50 | 5.40 | 3.01 | 10.02 | 1100.50 | 293.50 |
BLK 930EX2310 | BLK2HW | 181.30 | 217.30 | 36.00 | 16.31 | 6.12 | 1147.30 | 293.50 |
BLK 930EX2311 | BQR_HW | 247.90 | 261.10 | 13.20 | 6.97 | 4.28 | 1191.10 | 293.40 |
BLK 930EX2313 | BQR_HW | 152.00 | 159.80 | 7.80 | 4.43 | 2.23 | 1089.80 | 312.95 |
BLK 930EX2313 | BLK2HW | 202.40 | 238.40 | 36.00 | 20.56 | 2.90 | 1168.40 | 312.95 |
ARS1110EX2301 | BQR | 3.00 | 9.00 | 6.00 | 4.16 | 4.23 | 1119.00 | 158.20 |
ARS1110EX2301 | BLK1HW | 104.20 | 106.60 | 2.40 | 1.70 | 4.48 | 1216.60 | 158.30 |
ARS1110EX2302 | BQR | 6.00 | 12.00 | 6.00 | 4.44 | 7.15 | 1122.00 | 158.30 |
ARS1110EX2302 | BLK1HW | 43.80 | 61.20 | 17.40 | 12.37 | 8.76 | 1171.20 | 158.20 |
ARS1110EX2303 | BQR | 6.00 | 9.00 | 3.00 | 2.09 | 8.29 | 1119.00 | 149.00 |
ARS1110EX2303 | BLK1HW | 25.20 | 32.20 | 7.00 | 3.36 | 5.27 | 1142.20 | 149.00 |
ARS1110EX2304 | BQR | 3.00 | 18.00 | 15.00 | 8.22 | 3.62 | 1128.00 | 161.00 |
ARS1110EX2304 | BLK1HW | 65.00 | 78.80 | 13.80 | 7.15 | 6.45 | 1188.80 | 161.00 |
ERC750EX2201 | ERCN_HW | 183.5 | 193.7 | 10.2 | 7.11 | 4.23 | 812.7 | 248.3 |
ERC750EX2202 | ERCN_HW | 170.4 | 177 | 6.6 | 6.29 | 1.96 | 810.1 | 254.4 |
ERC750EX2202 | ERCN_FW | 212.4 | 226.8 | 14.4 | 9.17 | 2.7 | 853.1 | 254.4 |
ERC750EX2203 | ERCN_HW | 204.45 | 221.45 | 17 | 10.36 | 2.82 | 841.4 | 260.3 |
ERC750EX2204 | ERCN_HW | 224.95 | 272.95 | 48 | 30.25 | 2.79 | 896.1 | 308.4 |
ERC750EX2205 | ERCN_HW | 208.3 | 232.9 | 24.6 | 13.48 | 3.63 | 871.1 | 290.5 |
ERC750EX2205 | ERCN_FW | 268.3 | 272.5 | 4.2 | 2.4 | 3.11 | 922.5 | 290.5 |
Caledonia Mining Corporation Plc
S-K 1300 Technical Report Summary on the Blanket Gold Mine, Zimbabwe
Holes Identifier | Orebody Name | Orebody Intersection | Core Length (m) | True width (m) | Grade (g/t) | Orebody Intersection depth from surface (m) | E.O.H (m) |
| | | From (m) | To (m) | | | | | |
ERC750EX2206 | ERCN_HW | 203.9 | 246.5 | 42.6 | 22.32 | 4.03 | 870.3 | 281.3 |
ERC750EX2206 | ERCN_FW | 263.9 | 272.3 | 8.4 | 4.37 | 3.5 | 918.5 | 281.3 |
ERC750EX2207 | ERCN_HW | 218.9 | 223.5 | 4.6 | 3.06 | 10.33 | 864.9 | 290.3 |
ERC750EX2208 | ERCN_HW | 200.1 | 214.6 | 14.5 | 8.81 | 9.1 | 852.8 | 278.2 |
ERC750EX2209 | ERCN_HW | 199.5 | 208.3 | 8.8 | 4.49 | 3.64 | 831.0 | 254.1 |
ERC750EX2210 | ERCN_HW | 205.65 | 208.65 | 3 | 1.92 | 3.24 | 837.0 | 269.1 |
ERC750EX2211 | ERCN_HW | 232.1 | 233.9 | 1.8 | 1.26 | 2.17 | 849.4 | 287.1 |
ERC750EX2212 | ERCN_HW | 229.57 | 231.37 | 1.8 | 0.97 | 1.84 | 830.5 | 271.8 |
ERC750EX2213 | ERCN_HW | 221.2 | 221.8 | 0.6 | 0.30 | 4.47 | 825.7 | 271.8 |
ERC750EX2214 | ERCN_HW | 269.13 | 275.73 | 6.6 | 5.78 | 8.18 | 909.1 | 401.3 |
ERC750EX2214 | ERCN_FW | 294.33 | 308.13 | 13.8 | 8 | 7.7 | 933.1 | 401.3 |
ERC750EX2215 | ERCN_HW | 299.57 | 303.77 | 4.2 | 3.6 | 2.57 | 932.3 | 382.1 |
ERC750EX2216 | ERCN_HW | 292.6 | 310.9 | 18.3 | 12.9 | 3.76 | 924.5 | 377.0 |
ERC750EX2216 | ERCN_FW | 318.4 | 329.6 | 11.2 | 9.2 | 3.88 | 964.1 | 377.0 |
ERC750EX2301 | ERCN_HW | 263.8 | 281.2 | 17.4 | 13.44 | 6.62 | 914.9 | 352.2 |
ERC750EX2302 | ERCN_HW | 236.1 | 247.2 | 11.1 | 7.51 | 6.33 | 888.7 | 359.1 |
ERC750EX2303 | ERCN_HW | 262.7 | 278.3 | 15.6 | 8.6 | 15.56 | 891.4 | 356.3 |
ERC750EX2305 | ERCN_HW | 293.8 | 296.2 | 1.8 | 4.01 | 0.37 | 923.9 | 365.6 |
ERC750EX2306 | ERCN_HW | 237.6 | 242.4 | 4.8 | 3.06 | 2.51 | 869.7 | 350.3 |
ERCN_HW - Eroica North Hanging wall, ERCN_FW - Eroica North Footwall, ERC_STH - Eroica South, BQR - Blanket Quartz Reef, BLK1HW - Blanket 1 Hanging wall, BLK2HW - Blanket 2 Hanging wall, BLK2FW - Blanket 2 Footwall, BLK3HW - Blanket 3 Hanging wall, BLK4_5 - Blanket 4 and 5, ARS EXT - AR South Extension
Table 9: Long Hole Deep Drilling Location and Information at Blanket (2022-2023)
Hole Identifier | Azimuth (°) | Dip (°) | Drilled Length (m) | UTM Easting (m) | UTM Northing (m) | UTM Elevation (m) |
ERC750EX2307 | 31 | - 75 | 356.3 | 697 206.3 | 7 694 516.0 | 388.1 |
ERC750EX2308 | 89 | - 67 | 392.4 | 697 206.0 | 7 694 516.2 | 388.2 |
ERC750EX2309 | 124 | - 81 | 374.4 | 697 205.5 | 7 694 512.7 | 388.0 |
ERC750EX2310 | 118 | - 65 | 324.5 | 697 206.6 | 7 694 512.0 | 388.0 |
ERC750EX2312 | 150 | - 56 | 287.2 | 697 312.7 | 7 694 284.6 | 387.0 |
ERC750EX2313 | 141 | - 58 | 204.6 | 697 313.2 | 7 694 285.1 | 387.1 |
BLK870EX2301 | 65 | - 71 | 287.4 | 698 043.0 | 7 692 507.8 | 263.6 |
BLK870EX2302 | 45 | - 69 | 272.3 | 698 043.0 | 7 692 508.0 | 263.7 |
BLK870EX2303 | 28 | - 63 | 272.2 | 698 043.0 | 7 692 508.0 | 263.7 |
BLK870EX2304 | 12 | - 63 | 275.2 | 698 042.2 | 7 692 508.7 | 263.6 |
BLK930EX2301 | 37 | - 61 | 299.2 | 697 784.1 | 7 692 827.9 | 206.4 |
BLK930EX2302 | 81 | - 61 | 275.2 | 697 784.0 | 7 692 830.2 | 206.4 |
BLK930EX2303 | 76 | - 72 | 233.3 | 697 784.4 | 7 692 826.4 | 206.5 |
BLK930EX2304 | 28 | - 77 | 251.3 | 697 783.2 | 7 692 829.4 | 206.5 |
BLK930EX2305 | 23 | - 69 | 259.3 | 697 782.9 | 7 692 829.9 | 206.4 |
Caledonia Mining Corporation Plc
S-K 1300 Technical Report Summary on the Blanket Gold Mine, Zimbabwe
Hole Identifier | Azimuth (°) | Dip (°) | Drilled Length (m) | UTM Easting (m) | UTM Northing (m) | UTM Elevation (m) |
BLK930EX2306 | 127 | - 74 | 275.3 | 697 784.5 | 7 692 825.4 | 206.5 |
BLK930EX2307 | 35 | - 79 | 272.4 | 697 783.5 | 7 692 828.4 | 206.5 |
BLK930EX2308 | 122 | - 67 | 304.3 | 697 784.8 | 7 692 825.9 | 206.3 |
BLK930EX2309 | 133 | - 76 | 287.3 | 697 784.5 | 7 692 825.7 | 206.5 |
BLK930EX2310 | 85 | - 86 | 293.5 | 697 784.2 | 7 692 825.8 | 206.4 |
BLK930EX2311 | 21 | - 81 | 293.4 | 697 783.4 | 7 692 828.7 | 206.9 |
BLK930EX2313 | 25 | - 76 | 313.0 | 697 783.2 | 7 692 829.4 | 206.5 |
ARS1110EX2301 | 93 | - 64 | 158.2 | 697 765.7 | 7 693 020.3 | 25.4 |
ARS1110EX2302 | 54 | - 65 | 158.3 | 697 761.5 | 7 693 022.4 | 25.2 |
ARS1110EX2303 | 10 | - 46 | 149.0 | 697 765.5 | 7 693 022.3 | 25.0 |
ARS1110EX2304 | 125 | - 44 | 161.0 | 697 765.7 | 7 693 019.1 | 25.8 |
ERC750EX2201 | 28.68 | -65.74 | 248.3 | 697293.97 | 7694520.35 | 387.24 |
ERC750EX2202 | 122.15 | -71.33 | 254.4 | 697294.02 | 7694518.55 | 387.28 |
ERC750EX2203 | 134.01 | -66.13 | 260.25 | 697293.43 | 7694515.39 | 387.22 |
ERC750EX2205 | 64.65 | -82.27 | 290.5 | 697294.22 | 7694518.74 | 387.20 |
ERC750EX2206 | 80.24 | -82.13 | 281.3 | 697294.15 | 7694518.38 | 387.23 |
ERC750EX2207 | 25.10 | -79.18 | 290.3 | 697293.05 | 7694519.71 | 387.15 |
ERC750EX2204 | 126.73 | -81.37 | 308.35 | 697293.68 | 7694518.23 | 387.21 |
ERC750EX2208 | 21.35 | -73.80 | 278.2 | 697292.55 | 7694520.03 | 387.25 |
ERC750EX2209 | 16.83 | -63.62 | 254.1 | 697292.54 | 7694520.35 | 386.94 |
ERC750EX2210 | 13.81 | -64.94 | 269.1 | 697292.47 | 7694520.36 | 386.96 |
ERC750EX2211 | 144.29 | -60.21 | 287.05 | 697292.52 | 7694517.26 | 387.03 |
ERC750EX2212 | 151.74 | -52.44 | 271.8 | 697292.14 | 7694516.75 | 386.99 |
ERC750EX2213 | 12.70 | -53.74 | 304.9 | 697291.26 | 7694521.81 | 387.18 |
ERC750EX2214 | 101.48 | -70.97 | 401.3 | 697206.10 | 7694514.52 | 388.00 |
ERC750EX2215 | 119.61 | -68.33 | 398.1 | 697206.49 | 7694513.08 | 388.04 |
ERC750EX2216 | 97.17 | -76.86 | 377.2 | 697206.09 | 7694514.30 | 387.98 |
ERC750EX2301 | 58.43 | -73.25 | 352.2 | 697205.90 | 7694514.12 | 388.05 |
ERC750EX2302 | 63.22 | -63.51 | 359.1 | 697206.09 | 7694514.99 | 388.10 |
ERC750EX2303 | 64.05 | -64.99 | 356.3 | 697206.37 | 7694517.17 | 388.10 |
ERC750EX2304 | 40.08 | -68.88 | 359.3 | 697205.73 | 7694517.32 | 388.14 |
ERC750EX2305 | 39.47 | -70.26 | 365.5 | 697205.07 | 7694518.30 | 388.22 |
ERC750EX2306 | 44.84 | -56.80 | 350.3 | 697206.27 | 7694517.19 | 388.00 |
Access to Blanket Mine premises is controlled by security personnel on the first gate. On the second gate, in addition to security, entry is gained by biometric entry system. Diamond drilling is performed by qualified diamond drillers under the supervision of a diamond drill foreperson. Drilled core is routinely brought to surface to the core shed where it is received and laid down. A qualified geological technician performs geotechnical logging while a qualified geologist logs the core and marks the portions for splitting. The core is split in half along the core axis using an electric core cutter equipped with a diamond saw cutter. The geologist marks the sample intervals, put tickets, insert standards and blanks. One half of the sample is put into a plastic sample bag and sealed with cable ties. The sampling information is entered into the database. The other half of the core is marked with sample intervals and sample numbers and returned to the core box and retained for future reference. The samples are put in marked grain bags and tied with cable ties.
Caledonia Mining Corporation Plc
S-K 1300 Technical Report Summary on the Blanket Gold Mine, Zimbabwe
Transportation is by road using mine vehicle to a SADCAS accredited testing laboratory (accreditation number TEST-05 0030) in Kwekwe, some 330km from Blanket Mine. A delivery note is signed as proof of dispatch.
Gold is analysed by a 50 grams fire assay with an Atomic Absorption (AA) finish. The laboratory also has internal quality control ("QC") programs that include insertion of reagent blanks, reference materials, and pulp duplicates.
Blanket Mine inserts QC samples (blanks and reference materials) at regular intervals to monitor laboratory performance. When results are received, the assay results are painted against the sample numbers on the core retained.
The management of the drilling process rests with the responsible geologist. A summary of drilling procedures for exploration drilling is outlined as follows:-
| | ● | Planned hole collar set up information is provided by geologist. |
| | ● | Hole azimuth is set up by surveyor. Hole dip is set up using built in rig clinometer. Set up is checked by Blanket Mine geologist or geotechnician. Hole collar is surveyed when rig is established in position and drilling. |
| | ● | Drilling and core are monitored by geologist and geotechnician with checking to ensure core obtained attains a recovery of at least 95%. Hole is stopped based on geological observations. |
| | ● | Downhole survey is carried out using Icefield Multi-shot MI3 instrument. Survey readings are downloaded and checked for validity using quality assurance and quality control (“QAQC”) procedure. If not acceptable, request for resurvey. |
| | ● | Hole is capped with hole number clearly marked on cap. |
Core handling procedures are as follows:-
| | ● | The drillhole identification number and box number are clearly marked onto the upper left side and face of each core tray. |
| | ● | All core is packed into core trays as it is recovered from the hole with blocks indicating the depth placed at the end of each ‘run’ for each 3 m drill rod. Core trays are kept secure and guarded against possible mixing. All core boxes are transported to the core yard at the end of the drilling shift where their receipt is entered into a logbook. |
| | ● | Core boxes are laid out in the correct sequence. |
| | ● | Drill core is checked as orientated and assembled to ensure that all pieces fit, and that orientation lines are consistent. |
| | ● | Core recoveries are measured between drill depth markings by the geologist or geotechnician to record the core recovery. The complete length of the hole is metre marked. |
| | ● | RQD measurements are recorded by the geotechnician. |
| | ● | Core is photographed dry and wet. |
| | ● | Logging of core is carried out by the geologist. |
| | ● | Mineralised zones are identified and selected for sampling. Sample boundaries are marked at 0.6 m intervals in nearly homogeneous mineralised zones. Selective sampling intervals are employed on mineralised units with unique features, e.g. colour, concentration of mineralisation, alteration, and mineralogy. |
| | ● | The core is split into two equal halves with a diamond saw. One half is retained in the core tray. |
| | ● | Specific Gravity (“SG”) measurements are carried out for each sample prior to bagging and submission to mine laboratory for sample preparation and assay (Blanks and Certified Reference Material (“CRMs”) are inserted into the sample sequence at this point). |
Caledonia Mining Corporation Plc
S-K 1300 Technical Report Summary on the Blanket Gold Mine, Zimbabwe
| | ● | Split intersections retained in the core tray are photographed wet. |
| | ● | On receipt of assays, QAQC is carried out. Drilling data is incorporated into the database. Plotting in Deswik, 3D modelling, and evaluation are carried out. |
Evaluation Drilling
In addition to exploration drilling, evaluation drilling is performed within stope. Underground mining infrastructure in the form of development drives at 15 m vertical intervals within the orebody is required in order to achieve the required spacing of 7.5 m along strike by 15 m down-dip for the Measured Mineral Resource category. Evaluation drilling is normally only applicable to wider DSR orebodies, while Quartz Reef orebodies are either fully exposed by the actual development drives or can be fully evaluated with sludge holes where required to check for mineralisation in the immediate hanging wall or footwall.
A summary of evaluation drilling parameters and procedures is as follows:-
Sub-level drives are mined within the orebodies along strike at 15 m vertical intervals. Drill cubbiesare developed every 7.5 m for evaluation drilling.
| | ● | Planned hole collar set up information is provided by the geologist. Holes are drilled into the hanging wall and footwall of the development drive to establish the extent of the mineralisation. Holes are normally horizontal and drilled perpendicular to strike. Holes are drilled using an air driven “meter eater” machine with AXT (30.5 mm diameter) core. |
| | ● | Drilling and core are monitored by the geologist and geotechnician with checking to ensure core obtained attains a recovery of at least 95%. Hole is stopped based on geological observations. |
| | ● | Hole collar coordinates, azimuth and dip is surveyed (usually when hole is completed, and the rig is off the hole using a drill rod inserted into the hole). Hole number is recorded by painting on sidewall. |
| | ● | Handling and processing of core follows a similar procedure as for exploration core as detailed above. However, for evaluation holes whole core is sampled. |
| | ● | Core is packed into 1 m long closable core trays as it is recovered from the hole with blocks indicating the depth placed at the end of each ‘run’ for each 3 m drill rod. Core trays are kept secure and guarded against possible mixing. |
| | ● | All core boxes are transported to the core yard at the end of the drilling shift where their receipt is entered into a log book. |
| | ● | Core is carefully repacked into 1.5 m long core trays. Drill core is checked as orientated and assembled to ensure that all pieces fit, and that orientation lines are consistent. The drillhole identification number and box number are clearly marked onto the upper left side and face of each core tray. |
| | ● | Core boxes are laid out in the correct sequence. |
| | ● | Core recoveries are measured between drill depth markings by the geologist or geotechnician to record the core recovery. The complete length of the hole is metre marked. |
| | ● | RQD measurements are recorded by the geotechnician. |
| | ● | Core is photographed dry and wet. |
| | ● | Logging of core is carried out by the geologist. |
| | ● | Mineralised zones are identified and selected for sampling. Sample boundaries are marked at 0.6 m intervals in nearly homogeneous mineralised zones. Selective sampling intervals are employed on mineralised units with unique features, e.g., colour, concentration of mineralisation, alteration, and mineralogy. |
| | ● | Whole core is sampled. SG measurements are carried out for each sample prior to bagging and submission to mine laboratory for sample preparation and assay (blanks and CRMs are inserted into the sample sequence at this point). |
Caledonia Mining Corporation Plc
S-K 1300 Technical Report Summary on the Blanket Gold Mine, Zimbabwe
| | ● | On receipt of assays, QAQC is carried out. Information for evaluation holes is both processed digitally (incorporation of all drilling data into database, plotting in Deswik, 3D modelling, evaluation) and plotted manually on the level plans. |
| | ● | 1:250 scale survey plans are generated as ‘base plans’ for assay, stope assay and geology plans for each 15 m sub-level. |
| | ● | Drill assay information is plotted manually on 1:250 scale assay plans for every 15 m sub-level. Assay plans also record the chip and sludge sampling on the surveyed development and are the basis for orebody delineation in conjunction with the geology plans (stope assay plans are generated to show stoping progress and stope assays). |
| | ● | Geological information for evaluation holes is plotted manually on 1:250 scale geology plans for every 15 m level. Geological plans provide the context of the mineralisation and validation of orebody shapes and structural discontinuities. |
II. Factors Influencing the Accuracy of Results
QAQC data prior to 2014 is not available, and thus data from before this period is subject to some degree of uncertainty. However, more recent samples do cover the areas being considered adequately, thus higher confidence samples are also informing the areas informed by lower confidence samples, this assists in reducing the uncertainty in the database.
III. Exploration Properties – Drill Hole Details
This section is not applicable to the Blanket Mine as it is an operating gold mine with sufficient drillhole data and underground sampling to declare a Measured and Indicated Mineral Resource and Mineral Reserve.
Item 7 (c) – Hydrogeology
According to the Blanket Mine geological personnel no hydrogeological studies have been completed at the Blanket Mine. A hydrological area was intersected at 850 level which halted the development area where 46l/hr was measured and was drained successfully which enabled development to continue.
Item 7 (d) – Geotechnical
Prior to 2020, no previous geotechnical work was completed at the Blanket Mine. An investigation into rock strengths was completed, where core of the different rock types was sent to Rock Lab SA for UCS Brazilian disc test, in order to determine the geomechanical properties of various lithologies and the parameters to be applied in the geotechnical model and mine design going forward.
Subsequently, Point Load index (PLi) assessments were introduced on mine, where core from exploration or run-of-mine drilling can be tested to determine the UCS of the rock and an index that will be used to classify geotechnical areas based on the rock PLi.
Rock Quality Designation (RQD) is being determined to assess the quality of the rock and is used as a criterium in the rock mass classification for mine design and blast designs. No specific joint analyses were done on current core, and this is an area of improvement that could form part of the analysis going forward where joint orientation, joint spacing, joint roughness and infilling would be used for Rock mass classification.
Rock mass conditions are simulated with Flack 3D numerical modelling program on a quarterly basis and were deemed necessary. Rock strength testing that was conducted by Groundwork consulting and laboratory testing done by Rock lab in South Africa to gain a better understanding of the rock mass failure mechanisms. The poisons ratio, Youngs modulus, friction angles and intact rock strengths were tested and is now followed up with intact rock strength and core samples being tested with point load tested on mine to corelate and indicate anomalies for the use in new layouts and designs. New geotechnical information is gained via borehole logging and mapping by the geological department and placed on plans and into the electronic model as a layer within Deswik which provides the base for all plans.
Caledonia Mining Corporation Plc
S-K 1300 Technical Report Summary on the Blanket Gold Mine, Zimbabwe
Rock engineering work has been conducted for the newly targeted mining areas below 1100m Level. The studies and work associated with these parameters will be addressed by the rock engineering department as data is generated and access is obtained through development. This will further inform the geotechnical model which will be constructed as information becomes available and be placed into the electronic model.
Two secondary support crews have been trained by specialist in the installation of wire-mesh, lacing, guniting and mechanical anchors. They are deployed to planned areas where high stresses are expected from the numerical modelling or in life of mine excavations to safeguard the areas for the future accesses.
ITEM 8 – SAMPLE PREPARATION, ANALYSES AND SECURITY
Item 8 (a) Sample Handling Prior to Dispatch
All sample submissions to the laboratory are accompanied with clear instructions on a Sample Submission Sheet regarding sample preparation and assay methodology. The sample submission sheet contains spaces and selections to accommodate all necessary instructions for the laboratory. Each of the items on the Sample Submission Sheet is discussed below.
Quality assurance and quality control (QAQC) procedures are regularly reviewed to ensure that best practices are followed. The sample preparation and analysis procedures outlined below describe the current information handling as sampling and QAQC data are currently captured into a Microsoft Excel workbook. Samples are not released by the Geology department to the assay laboratory that do not satisfy all the required procedures. Each section geologist is responsible for ensuring that this is done for drilling, channel or sludge samples originating from their underground section. Samples are not accepted for assay by the laboratory if they do not satisfy requirements. In the event of such an occurrence, it is reported to the Geology Manager or the Mineral Resource Manager.
Item 8 (b) – Sample Preparation and Analysis Procedures
All samples are analysed by the Blanket Mine on-site Assay laboratory which is not accredited. The process is broadly as follows:-
| | ● | The sample is crushed to -10 mm and riffle split to produce a portion of approximately 400 g. |
| | ● | The 400 g portion is pulverised in a Rocklabs ring mill. Blank samples are run in the pulveriser after every 10 samples for channel chip and sludge samples as per normal laboratory procedure. For evaluation holes after every five samples and for exploration holes after every sample. |
| | ● | Pulp is measured into a crucible. For drill core samples, a new crucible is used for every sample. For other samples, it is acceptable for crucibles to be used multiple times but discarded when cracked or showing signs of absorbed impurities. |
| | ● | A 50 g aliquot is used for all drill core samples. A 25 g aliquot is used for channel chip samples and sludge hole samples. |
| | ● | All samples currently undergo Fire Assay analysis with gravimetric finish. |
Item 8 (c) – Quality Assurance and Quality Control
Blanks
Blanks are inserted according to the sample type. For exploration drilling samples, two blanks are inserted for every 36 samples (the number of samples processed in a “batch” at one time in the laboratory). Exploration holes include deep drillholes. Evaluation Holes are holes which are used to define the limits of the orebody, generally at 7.5m spacing along strike. The mass of a blank sample needs to be only slightly higher than the weight of the aliquot (50g for drill core samples and 25g for all other samples).
Caledonia Mining Corporation Plc
S-K 1300 Technical Report Summary on the Blanket Gold Mine, Zimbabwe
Blanks are prepared in advance in sealable card packets to avoid any contamination. Blanks are inserted into the batch in random positions in the sequence within a mineralised zone. For samples submitted directly to the laboratory by the samplers (sludge and chip samples for both grade control and evaluation), blanks are currently inserted by the laboratory. The blanks utilised are sourced from certified AMIS blank standards. The results for the blanks and standards are monitored on a batch-by-batch basis with the blanks treated separately from the standards.
Standards
Standards are inserted according to the sample type. For exploration drilling samples, three standards are inserted for every 36 samples (the number of samples processed at one time in the laboratory and one batch). The mass of the standard needs to be only slightly higher than the weight of the aliquot (50g for drilling samples and 25g for all other samples). Standards are prepared in advance in sealable card packets to avoid contamination.
The main purpose of Standards is to check the accuracy of the assay procedure. There are generally three groups of standards - very low grade (±0.41g/t), low grade (±1.74g/t) and high grade (± 3.50g/t). All three types of standards are used and are inserted into the batch in logical positions in the sequence within a mineralised zone. The standard is included in the number sequence, is not labelled as a standard and is not recorded as a standard on the sample submission sheet. For sludge and chip samples which are submitted directly to the laboratory by the samplers (samples for both grade control and evaluation), standards are currently inserted by the laboratory. Standards for drillholes are inserted by the samplers. The results for the standards are monitored on a batch-by-batch basis and on a standard-by-standard basis.
Duplicates
Duplicates are split by the laboratory from pulps as per instructions on the sample submission sheet completed by the geologist. Duplicates are requested for exploration drilling samples only. On the sample submission sheet, the sequential number for the duplicate will be excluded from samples submitted on initial submission. In the Sample Source column, the number of the sample from which the duplicate is sourced, is recorded. The splitting of a sample is carried out by the laboratory and the split fraction allocated the new sample number for the duplicate.
I. Assessment of Results
A QAQC report for each batch is completed and saved (with the name of the batch) on the server. This report includes graphs showing the results for blanks, standards and duplicates and a short statement concluding whether the results are satisfactory or whether a re-assay is required. QAQC sample data is monitored monthly to ensure that sample batches with control sample data outside of acceptable limits are re-submitted for analysis in a timely manner.
Blanks
All blanks with values greater than the detection limit are flagged. A decision is then made by the Geology Manager as to whether to re-assay or not. Results for blanks for all batches are compiled into one table on an ongoing basis, so that the general blank results can be monitored. This is done on a quarterly basis and finalised at the end of every quarter. This is done in MS Excel and includes a table indicating Batch No., Sample No. and Grade (Au g/t), together with a graph depicting the results for all the blanks. If more than one type of blank is used, then this is done separately for each blank. The report is given the name of the blank in question followed by the year and the quarter number (e.g., AMIS0577_2023Q4) and saved on the Mine’s computer server.
Caledonia Mining Corporation Plc
S-K 1300 Technical Report Summary on the Blanket Gold Mine, Zimbabwe
For 2023, 20 blanks failed out of 166 total blank samples for this standard. Only blank standards from Amis have been utilised for 2023.
Standards
Standards with values greater than two standard deviations are flagged. A decision can then be made by the Geology Manager as to whether to re-assay or not. For all batches, the results for each standard are compiled into one table on an ongoing basis, so that the trend and accuracy of each standard can be monitored over time. This is done on a quarterly basis and finalised at the end of every quarter. This is done in MS Excel and includes a table together with a graph depicting all the results for that standard. A separate report is done for each standard. The report is given the name of the standard in question followed by the year and the quarter number (e.g., AMIS0797_2023Q4) and saved on the Mine’s computer server. During the period 2023, eleven different standards were utilised (Table 11), the standards used are representative of the grade seen at Blanket and are thus suitable for QAQC purposes.
The standards are sourced from Greenstone belts in South Africa. Care must be taken when selecting samples to ensure the standards relevant to the expected grade is used, particularly as the grade will differ slightly from orebody to orebody.
The standards used on the mine with their expected average values and the number used during 2023 are provided inTable 10.
Table 10: Standards Utilised at Blanket Mine with Expected Value and the Number Used
Standards | Expected value(g/t) | Count |
AMIS0748 | 1.38 | 34 |
AMIS0519 | 1.61 | 14 |
AMIS0718 | 1.33 | 23 |
AMIS0798 | 11.16 | 9 |
AMIS0791 | 2.11 | 21 |
AMIS0790 | 1.52 | 46 |
AMIS0724 | 2.38 | 72 |
AMIS0772 | 0.37 | 35 |
AMIS0792 | 3.55 | 129 |
AMIS0796 | 3.73 | 22 |
AMIS0797 | 4.87 | 10 |
The most used standard for the period under review was AMIS0792. This is a high-grade standard with an expected grade of 3.55g/t. A total of 129 standards were used, of which 112 fell within accepted two standard deviation range to make a pass rate of 86.8%.
For AMIS0748, 4 out of 34 samples analysed failed the two-standard deviation (2SD). This represents a 88.2% pass rate. The expected grade for AMIS0748 is 1.38g/t. All the samples that failed were above the limits of 2SD.
For AMIS0772, a total of 35 standards were analysed with an expected value of 0.37g/t during 2023. This is a low-grade standard for which the results were good with 2 out of the 35 samples failing, making a 94.3% pass rate.
Caledonia Mining Corporation Plc
S-K 1300 Technical Report Summary on the Blanket Gold Mine, Zimbabwe
It is recommended that follow up activities are undertaken to identify the source of these failures in the standards, particularly the higher-grade standards, and to determine if this results from laboratory procedures or sampling activities. In addition, duplicates of the various stages of the sampling and analyses process can be taken. Field duplicates (in the core yard), course duplicates (following crushing) as well as pulp duplicates (following pulverisation), this will eliminate any sources of contamination or identify the potential problem areas.
A bias has been noted by previous QP’s in the 2018 data with numerous failures in standards, while the 2019, 2022 and 2023 results are an improvement with acceptable pass rates of standards. However, 2018 results are still included in the database. Where dense sampling exists (Reserve areas), the effect of this is minimised. However, where a larger area is informed by only one or two drillholes (Inferred or Target areas), any uncertainty would have a larger influence. For this reason, QAQC procedures should be stricter for exploration holes and any failures in QAQC followed up with re-assays as well as umpire assays. The mine procedures with regards to inclusion or exclusion of samples due to QAQC results must be implemented to ensure these failures are considered during the course of QAQC.
Due to the high sample density the effects of these inconsistencies in results will be minimised, however this accuracy and repeatability of results and standards is most important for exploration areas where one drillhole informs a large area. A focussed study of the QAQC of these exploration holes is recommended.
Duplicates
Duplicate results are plotted against each other, and poor correlations are flagged by the QAQC geologist. Appropriate action is then taken when failures are identified. Results for all duplicates for all batches are compiled into one table on an ongoing basis, so that the overall repeatability of duplicates can be monitored. This is done on a quarterly basis and finalised at the end of every quarter. This is done in MS Excel and includes a table indicating Batch No., Sample No. and Grade (Au g/t), Duplicate No. and Duplicate Au g/t, together with a XY correlation graph showing all of the results for all the duplicates. The report is given the name "Duplicates" followed by the year and the quarter number and saved on the Mine’s computer server. An example of duplicates for the year 2023 is shown in Figure 34. A good reproducibility of results is seen between the lower grade samples (<4 g/t), with some outliers and a bias towards a higher grade in the original samples above 4 g/t.
Figure 34: Duplicate Results for 2023
Umpire Analyses
Umpire analysis and round robins are being run by the assay lab. For umpire analysis, comparison is being made with Zim Labs. The sample materials comprised plant samples which included plant feed (M1s), C.I.L feed (M3s), and C.I.L tails (RM10), together with geology samples and CRM’s to check Zim Labs accuracy. The method used for assay by Blanket mine lab was Fire assay method with gravimetric finish and Zimlabs used Fire assay method with AAS finish. According to the correlation graph it shows that most of the assays correlated, with a correlation value of 0.94.
Round robins are run among Turk Mine, How Mine, DGL 5 Mine and Blanket Mine. It was noted that the high-grade samples fall outside the confidence limit while the low-grade samples are within range.
Storage of Pulps
According to mine procedure, pulps are retained for all drill core samples (both evaluation holes and exploration holes). They are collected by Geology and stored at the facility at the Exploration department offices. Pulps are stored in strong, sealed boxes clearly labelled with the drillhole name, batch number and sample numbers.
Caledonia Mining Corporation Plc
S-K 1300 Technical Report Summary on the Blanket Gold Mine, Zimbabwe
Storage of Coarse Rejects
Mine procedure is to retain all coarse rejects for all exploration drill core samples. They are collected by Geology and stored at the facility at the Exploration department offices.
Item 8 (d) – Adequacy of Sample Preparation, Security and Analytical Procedures
This section sets out the opinion of the QP regarding the adequacy of sample preparation, security, and analytical procedures.
Even though the mine laboratory is not accredited, a reasonable standard is maintained with good level of housekeeping apparent. Standards and blanks are run as part of the routine procedures. Blind checks are done within a batch of a single sample. If any internal laboratory QC fails, the batch is repeated automatically. However, the laboratory visit undertaken by the QP on 3 November 2021 did highlight some concerns that need to be addressed to ensure there is no contamination and sample weights are measured accurately.
In addition, as part of its external verification process the mine laboratory sends samples away to How Mine, Zimlabs, Turk mine laboratory and Performance Laboratories (accredited), to test their precision and accuracy. The results of the internal laboratory standards were viewed and are within acceptable limits, with minor failures. An in-house system for sample receipt and sample tracking has been implemented on the mine in 2019. This significantly improves the analytical system and improves accuracy and tracking of samples in the laboratory. The sample preparation methodology is considered adequate for Mineral Resource estimation purposes given the good correlation between planned production grades and actual recovered grades in the plant. A further inspection of the mine laboratory by an independent consultant Mr Jeremy Eliot was conducted In June 2016. Conclusions were similar in that improvements could be made, but, overall, the facilities and processes were of a satisfactory standard.
ITEM 9 – DATA VERIFICATION
Item 9 (a) – Data Verification Procedures
The QPs have reviewed available data types from the sampling stage through to the resource estimates which feed into the Mineral Resource statement.
In general, there are five types of samples considered at Blanket:-
| | ● | channel "chip" samples (evaluation and grade control); |
| | ● | sludge hole samples (evaluation and grade control); |
| | ● | grab samples (grade control); |
| | ● | evaluation drill core samples; and |
| | ● | exploration drill core samples. |
Evaluation Holes are holes which are used to define the limits of the orebody, generally at 7.5 m spacing along strike. All other holes are defined as Exploration Holes.
Database Validation
The database validations and checks were performed on all data received to identify and remove errors where identified. The database per year is summarised in Table 11. The Database summarised by sample type is in Table 12.
Caledonia Mining Corporation Plc
S-K 1300 Technical Report Summary on the Blanket Gold Mine, Zimbabwe
Table 11: Sample Database Summarised by Year
Year | Total Number of Hole Identifiers |
<1960 | 12 454 |
1960-1970 | 123 |
1970-1980 | 83 |
1980-1990 | 58 |
1990-2000 | 228 |
2000-2010 | 529 |
2010-2020 | 6 152 |
2010-2023 | 15 920 |
Historical data captured up to 2022 with unknown sampling date | 61 736 |
Total | 97 283 |
For the purposes of estimation, stope and trench samples were excluded from the database. All other hole types were used. Illegible assay values in the capture of historical data are marked as such in the database. For resource estimation purposes, all these values were assigned a value equal to half the detection limit (0.0025 g/t). Assigning a 0.0025 g/t value for these intervals is a conservative approach, as the low-grade values form part of the estimation dataset. Alternatively, if these intervals are removed, a possible overestimation may occur from neighbouring high-grade samples.
Table 12: Sample Database Summarised by Drillhole Type
Hole Type | Total Number of Samples | Total Number of Hole Identifiers |
Channel | 222 369 | 54 859 |
Evaluation | 211 667 | 5 771 |
Sludge | 72 198 | 32 351 |
Exploration | 40 224 | 765 |
Stope | 30 295 | 3 512 |
Trench | 1 473 | 25 |
Total | 578 226 | 97 283 |
All samples noted here include the total database within and outside the orebodies. The individual samples used and clipped per domain is addressed in following sections. The total database is shown in Table 13. The total database for Blanket Mine is illustrated in Figure 13. Sludge and channel samples as well as evaluation drillholes are typically located in mining areas, while exploration holes are long, deep drillholes used to inform new areas.
Table 13: Hole and Sample Count
Table | Total Number of Hole Identifiers | Number of Individual Records |
Collar | 97 283 | 97 283 |
Survey | 97 283 | 294 110 |
Assay | 97 283 | 578 224 |
Caledonia Mining Corporation Plc
S-K 1300 Technical Report Summary on the Blanket Gold Mine, Zimbabwe
Figure 13: Long Section of Blanket Mine Showing the Total Database

Item 9 (b) – Limitations on/Failure to Conduct Data Verification
The data capturing process has been reviewed on a quarterly basis throughout 2023 by conducting Planned Task Observations (“PTO’s”) at the mine. The data as received from Blanket was accepted as received that all available drillholes have been captured and on-site checks pertaining to data capture on the database were performed. All relevant error checks were performed on the digital data that was available.
Item 9 (c) – Adequacy of Data
The QP deems the data to be adequate for the purposes of conducting meaningful Mineral Resource estimations with appropriate Mineral Resource classification in accordance with the guidance as described by NI 43-101. Proof of this statement is validated by the fact that the mine has operated successfully for several years using the current Mineral Resource with good historical conversion rates for Inferred Mineral Resources to Indicated and then on to Measured. The QP is of the opinion that the sampling database is acceptable for the Mineral Resource estimation methodology being utilised at the Blanket Mine because of the sheer volume of sampling data. In addition, the Mine has been in operation for several years with historical gold recoveries around 3 g/t.
ITEM 10 – MINERAL PROCESSING AND METALLURGICAL TESTING
Item 10 (a) – Nature and Extent of Testing and Analytical Procedures
The plant currently treats RoM from the main orebodies. The ore is free milling, and the mineralogy has not changed to a significant degree. Sufficient information from historic production exists to determine the expected production performance with reasonable confidence.
Item 10 (b) Basis off Assumptions Regarding Recovery Estimates
The expected processing efficiencies are based on historic production, and these are well in line with the budget, with 2023 recovery averaging 93.8% against the 2023 budget of 93.5%. The actual recovery has been higher than the budget recovery year on year since 2020 approaching 94%. The budgeted recovery of 93.8% for 2024 can be assumed to continue, with improvements expected.
Caledonia Mining Corporation Plc
S-K 1300 Technical Report Summary on the Blanket Gold Mine, Zimbabwe
Item 10 (c) – Representativeness of Samples and Adequacy of Data
The samples measured from historic production are considered reliable and representative. As a result, they can be used to adequately predict future performance.
The QP is of the opinion the Blanket Mine plant recoveries are well understood as they are based on the actual historical production figures.
Item 10 (d) – Deleterious Elements for Extraction
The arsenopyrite content of RoM material currently being treated from Blanket Mine is low enough not to pose a risk to economic extraction and deposition of tailings.
Blanket ores are free milling in that 93% of the gold is recovered via direct cyanidation with a further 1% achievable with the use of oxygen pre-treatment injection methods. Arsenic therefore reports to the mine residue deposit in the form of undecomposed arsenopyrite, constituting less than 1% of the ore. The ore contains approximately 35% carbonate minerals which results in the tailings having an alkaline chemistry which inhibits the decomposition of arsenopyrite which is not exposed to the atmosphere. Rainwater run-off from the tailings dam is channelled within bund walls to a sump from where it is returned to the plant as makeup water.
Blanket will be undertaking a pilot plant test work programme on the other more-refractory Mineral Deposits not currently being mined which may have a higher arsenopyrite content. Continuous testing and analysing of arsenic and other potential deleterious elements will be conducted as part of this test programme. Appropriate neutralisation steps will be included in the process design as required.
ITEM 11 – MINERAL RESOURCE ESTIMATES
The Mineral Resources were estimated as of 31 December 2023 based on updated drilling and sampling data, as well as the mining faces received for the Mine as at that date. The QP has depleted the 31 December 2023 Mineral Resources with updated mining faces to the period ending 31 December 2023. In addition, the Mineral Resource was depleted with the LOM planning to derive an updated Mineral Reserve estimate as of 31 December 2023. Extensive exploration drilling was undertaken during the period with a significant number of intersections at depth from the LHDP.
Item 11 (a) – Assumptions, Parameters and Methods Used for Resource Estimates
I. Mineral Resource Estimation Procedures
i. Geological Modelling
The construction of the geological models is comprehensively discussed in Item 6 (d) of this TRS.
ii. Statistical Analysis
An additional 57 990 composite samples were added between 2022 and 2023, representing a 32% increase in data. Data changes affected all orebodies, with major changes being made to BLK1_FW, BLK2_FW, BQR_FW and LIMA_FW. The data changes are due to new exploration drill hole results derived from the LHDP, for which results have been released during 2023, from ongoing ROM drilling, and from new underground sample data derived from underground development activities.
iii. Domaining
Wireframes received from Blanket Mine were checked and imported into Datamine Studio RM for estimation. A requirement for Datamine is that the wireframes are closed and have no cross overs. Fourteen main orebodies are represented, each with a number of separate domains which were estimated separately. A total of 29 domains were estimated in 2022 while 43 domains were estimated in 2023. The increase in volumes is due to an increase in the number of domains based on an increase in data and continuous geological modelling.
Caledonia Mining Corporation Plc
S-K 1300 Technical Report Summary on the Blanket Gold Mine, Zimbabwe
The data update from 2022 to 2023 is illustrated per domain in Figure 3 to Figure 16. Previous 2022 data is shown in black, while new 2023 samples are depicted in red.
ARM and ARS
ARM contains six domains, including an internal waste unit that is clipped out and estimated separately. ARS has four domains: EWL, NSL, HW, and a new FW domain. ARS_Ext includes a 990mL domain which is a target area for further drilling to determine its up and down dip extents.
Figure 14: 3-Dimensional view of the AR Main Domain and is Associated Data
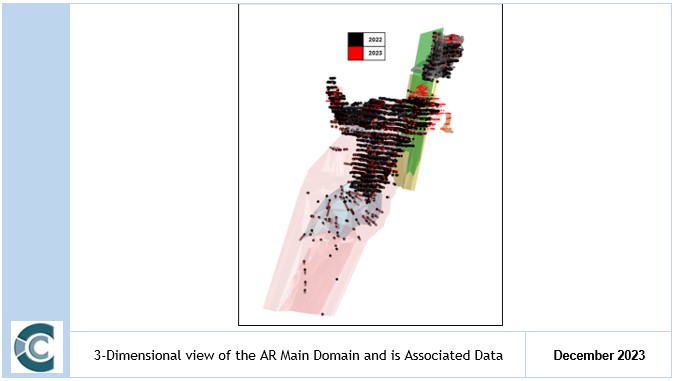
Caledonia Mining Corporation Plc
S-K 1300 Technical Report Summary on the Blanket Gold Mine, Zimbabwe
Figure 15: Section View of ARS_EXT and ARS Domains and Data.
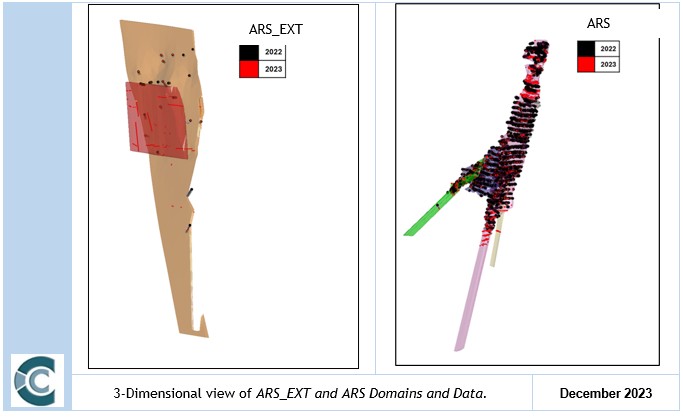
Blanket 1, Blanket 2, Blanket 3, Blanket4_ 5 and Blanket 6
Blanket 1 and Blanket 2 have 3 domains each with Blanket 2 HW sub-domained into a higher and a lower grade section. Blanket 3 has been sub-domained into FW and HW sections for 2023. Blanket 4 and 5 have been merged to create Blanket4_5 with FW and HW sections. Blanket 6 is also sub-domained into FW and HW sections. Blanket 4_5 and Blanket 6 are divided by the Wenlock fault and BQR.
Caledonia Mining Corporation Plc
S-K 1300 Technical Report Summary on the Blanket Gold Mine, Zimbabwe
Figure 16: Section View of BLK1, BLK2, BLK3, BLK4_5 and BLK6 Domains and their Data.
Caledonia Mining Corporation Plc
S-K 1300 Technical Report Summary on the Blanket Gold Mine, Zimbabwe
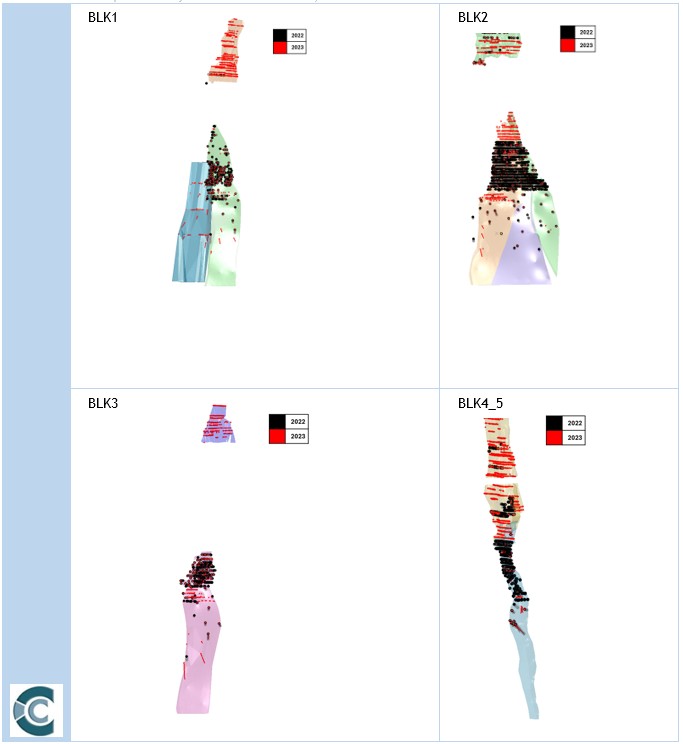
Caledonia Mining Corporation Plc
S-K 1300 Technical Report Summary on the Blanket Gold Mine, Zimbabwe
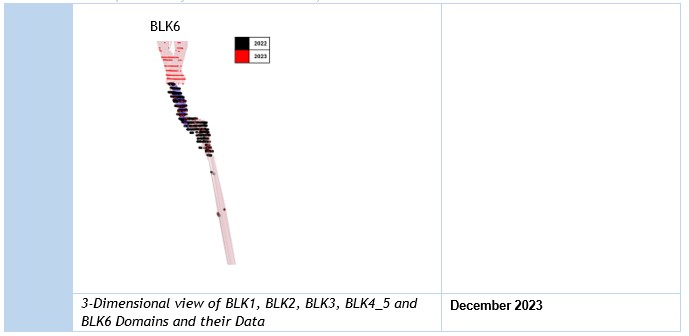
Blanket Feudal and BQR
BQR includes a FW, and the HW is further divided into a Northern and Southern domain based on grade. Blanket Feudal has been sub-domained into a HW and FW for 2023.
Figure 17: Section View of BF and BQR Domains and their Data.
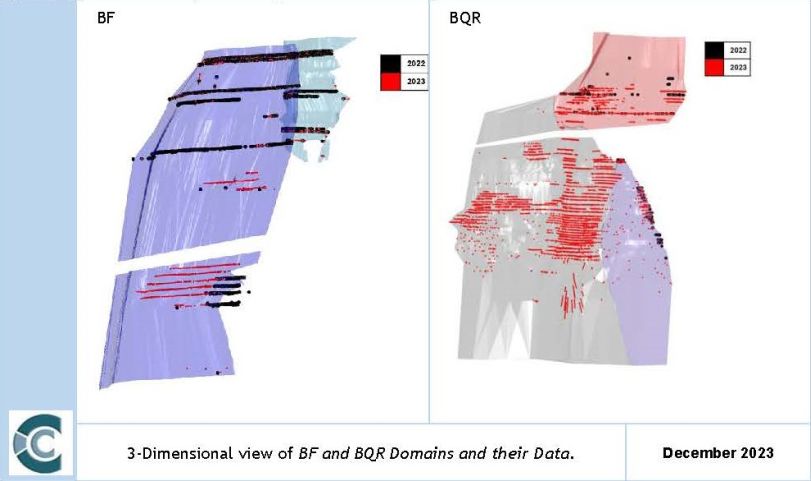
Lima and Eroica
Lima is divided into four domains: Main; Inter-reef; Inter-reef South and FW. Eroica is divided into three domains, ERCN, ERCS and a newly modelled domain ERCN_FW
Caledonia Mining Corporation Plc
S-K 1300 Technical Report Summary on the Blanket Gold Mine, Zimbabwe
Figure 18: Section View of the LIMA and EROICA Domains with their Data.
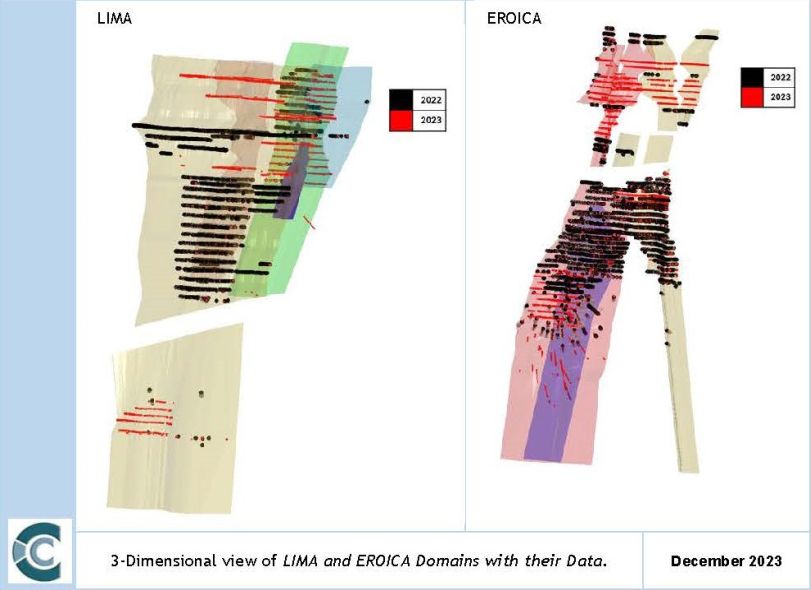
Jethro and Sheet
Jethro was sub-domained into four units for the 2023 estimation and Sheet remains with a Main and a South domain.
Figure 19: Section View of JETHRO and SHEET Domains and their Data.
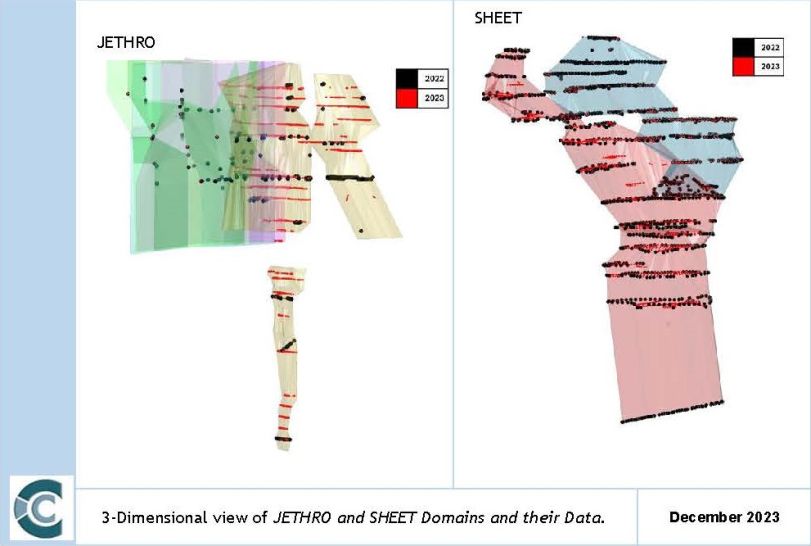
Caledonia Mining Corporation Plc
S-K 1300 Technical Report Summary on the Blanket Gold Mine, Zimbabwe
Capping is carried out during the kriging stage to limit the influence that anomalously high grades may have during estimation. A top cap was applied in Datamine for variography and estimation. As a capping strategy, the data was divided into quantiles for each domain. The 90th to 100th quantile was further sub-divided into 0.5% percentiles. The metal content represented by each 0.5% percentile is examined and in conjunction with probability plots and histograms, anomalous values are identified. The capping values per domain are documented in Table 14. The top caps are based on the 99th percentile except for the Eroica orebodies which are capped at the 98th percentile.
Table 14: Capping Valuers Applied per Domain
Domain | 2022 Top Capped Value (g/t) | 2023 Top Capped Value (g/t) |
ARM_MAIN | 75 | 20.5 |
ARM_480_615mL | - | 13.8 |
ARM_ABV_DYK | - | 21.68 |
ARM_FFW1 | - | 13.8 |
ARM_FFW2 | - | 29.4 |
ARM_WASTE | 43.1 | 8.77 |
ARS_EWL | 87 | 32.4 |
ARS_FW | - | 34 |
ARS_HW | 17 | 16.07 |
ARS_NSL | 47 | 19.92 |
ARS_EXT | 12 | 28.41 |
ARS_EXT_990mL | - | 12.26 |
BF_FW | - | 28.5 |
BF_HW | - | 27.19 |
BLK1_FW | - | 49.45 |
BLK1_HW | - | 12.63 |
BLK1_HWN | - | 19.86 |
BLK2_FW | - | 32.03 |
BLK2_HW | - | 39.45 |
BLK_2HW_LG | 44 | |
BLK3_FW | - | 20 |
BLK3_HW | - | 20.79 |
BLK4_5_FW | - | 29.08 |
BLK4_5_HW | - | 29.1 |
BLANKET_6FW | 28 | 32.81 |
BLANKET_6HW | 45 | 30 |
BQR_FW | 39 | 97.04 |
BQR_HW_NORTH | 76 | 49.1 |
BQR_HW_SOUTH | 30 | 48.05 |
ERCN | 56.4 | 39.2 |
ERCN_FW | - | 27.4 |
ERCS | 56.4 | 26.9 |
JET | - | 16.32 |
JTH_CENTRAL | - | 21.92 |
JTH_HW1 | - | 57.63 |
JTH_HW2 | - | 26.59 |
LIMA_FW | 40 | 53.8 |
LIMA_HW | - | 115.09 |
LIMA_INTER | 23 | 18.3 |
LIMA_INTER_S | | 15.59 |
LIMA_MAIN | 40 | 25.75 |
SHT_MAIN | 38 | 20.9 |
SHT_SOUTH | 15.8 | 17.5 |
Caledonia Mining Corporation Plc
S-K 1300 Technical Report Summary on the Blanket Gold Mine, Zimbabwe
Compositing is performed for all orebodies based on the most common sample length of 0.6m.
| | vi. | Geostatistical Analysis and Variography |
All variography was carried out in Datamine. All variograms were recalculated in 2023 due to a material change in data. Variogram analysis was done in a transformed normal score space with the variograms being back transformed for resource estimation purposes. Orientations previously determined were generally maintained unless there was a major change to the domain’s wireframes.
Kriging neighbourhood analysis (“KNA”) was undertaken to assess the optimal parameters for estimation in each of the separate domains. Different scenarios of minimum and maximum samples are run, and the results plotted to define the estimation parameters for which the highest quality result can be kriged, this quality is measured by Slope of Regression (“SoR”), and kriging variance. The block sizes utilised for parent cell estimation were 3 m in x, 10 m in y and 10 m in z. This block size was chosen based on the requirements to enable an accurate representation of the data. The smaller block size in x was chosen to capture the variability in the shortest orientation of the orebodies. Sub-celling was allowed to occur to 0.10m in the X direction and 1.25m in the Y and Z directions to allow for the filling of the mining voids at a viable resolution.
At lower search volumes, more samples are available (typically within the mining areas), and a higher minimum and maximum can be used, while further from the well-informed areas, the minimum and maximum samples will decrease to ensure more weighting is applied to nearby samples. An ordinary krige was employed were possible. The distance from samples and search volume used to inform the block model is reflected in the Mineral Resource Classification.
| | vii. | Block Model Creation and Grade Interpolation |
Parent cell estimation with sub-celling was applied. The parent cell size is 3 m(X) by 10 m(Y) by 10 m(Z). The Y direction is approximately along strike and the Z direction is approximately down-dip, the smallest parent cell size in the X direction (3 m) is orientated along the thinnest direction of the orebody.
The resource interpolation utilised Datamine Studio RM software for running the estimates. Individual orebodies were domained to reflect high and low-grade areas. The domain wireframes were used as hard boundaries during estimation. This ensures that only samples falling within the domain wireframe’s extents were utilised during estimation. Variograms could be generated for most of the domains allowing for ordinary kriging to be performed. An ordinary krige was employed in all domains except for ARM_480_615ml, ARM_FFW1 and ARM_FFW2 which utilised Inverse Distance Squared (“ID2”) as the interpolation technique.
Caledonia Mining Corporation Plc
S-K 1300 Technical Report Summary on the Blanket Gold Mine, Zimbabwe
Bulk Density
Between May 2016 and February 2020, 32 633 SG samples were taken for Blanket Mine. The breakdown per orebody is detailed in Table 15. Only the orebodies being considered, and valid samples are shown. Tonnage for each domain was calculated with the individual applicable density.
Table 15: SG Samples per Orebody
Orebody | Valid Samples | SG (g/cm3) |
ARM | 6,222 | 2.90 |
ARS | 8,629 | 2.88 |
Feudal | 67 | 2.97 |
Blanket | 6,266 | 2.84 |
Eroica | 2,849 | 2.87 |
Lima | 712 | 2.95 |
Sheet | 515 | 2.88 |
Grand Total | 25,260 | 2.88 |
Digital 3D estimates into block models per domain were performed using Datamine Studio RM.
The estimation results were compared visually to the data to confirm continuity between the data and resource block models. The undepleted resource block models are illustrated in Figure 20 through Figure 32.
Figure 20: ARM Estimates
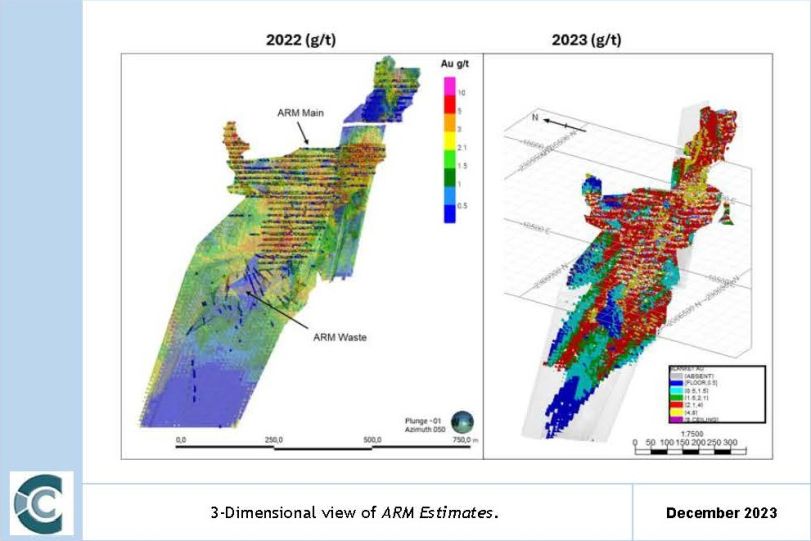
Caledonia Mining Corporation Plc
S-K 1300 Technical Report Summary on the Blanket Gold Mine, Zimbabwe
Figure 21: ARS Estimates (including ARS_Ext)

Figure 22: BLK1 Estimates
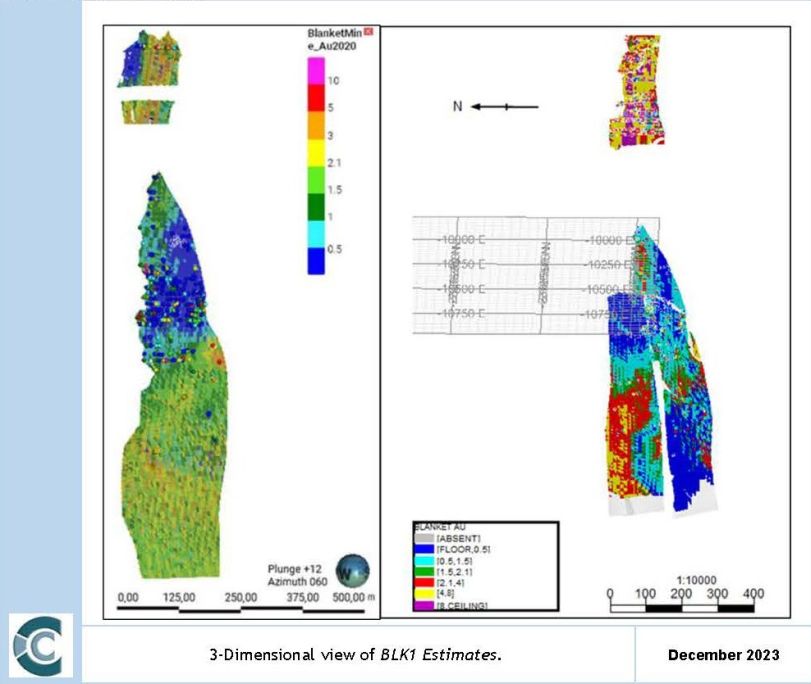
Caledonia Mining Corporation Plc
S-K 1300 Technical Report Summary on the Blanket Gold Mine, Zimbabwe
Figure 23: BLK2 Estimates
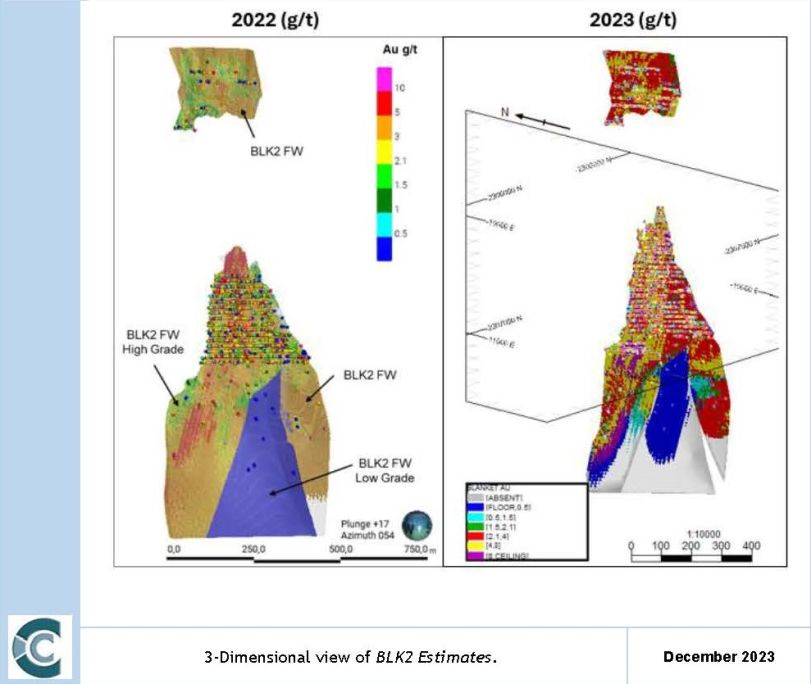
Caledonia Mining Corporation Plc
S-K 1300 Technical Report Summary on the Blanket Gold Mine, Zimbabwe
Figure 24: BLK3 Estimates
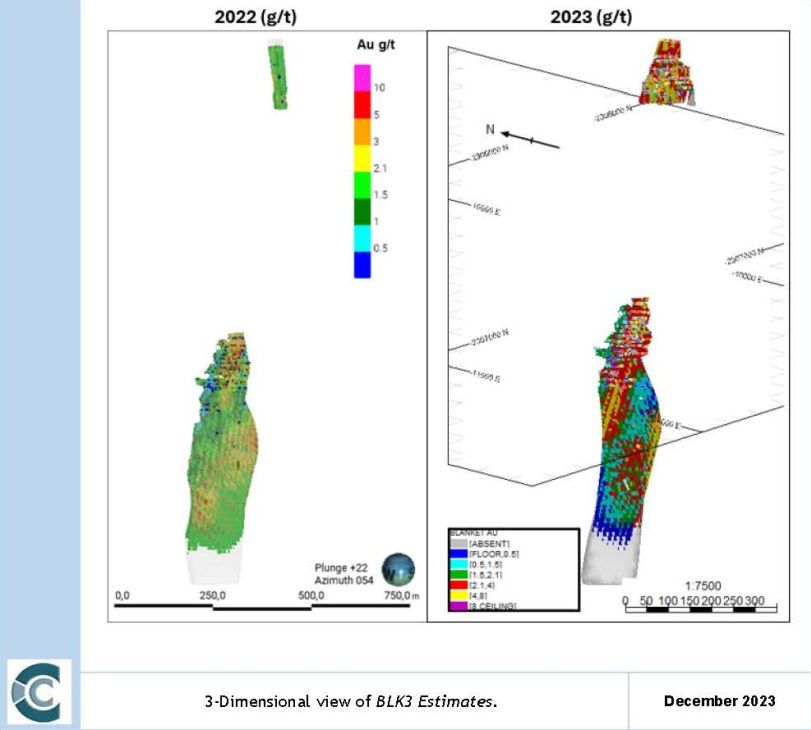
Caledonia Mining Corporation Plc
S-K 1300 Technical Report Summary on the Blanket Gold Mine, Zimbabwe
Figure 25: BLK4_5 Estimates
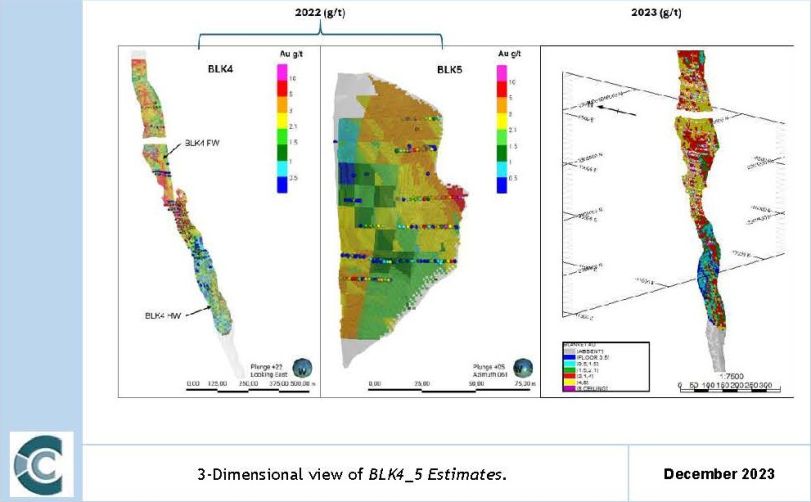
Figure 26: BLK6 Estimates
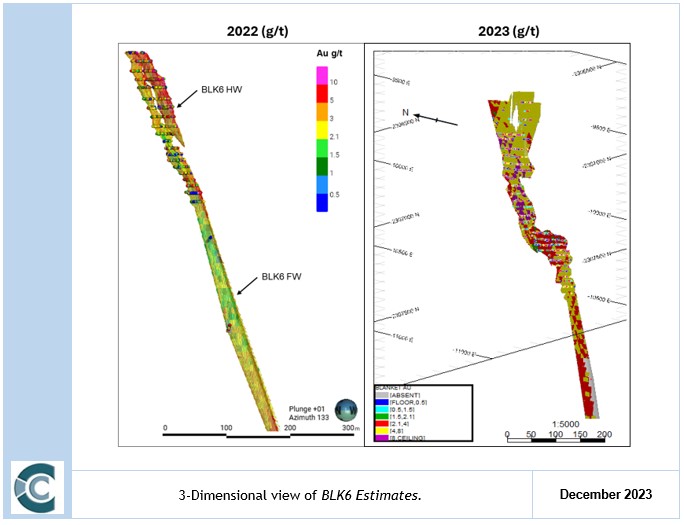
Caledonia Mining Corporation Plc
S-K 1300 Technical Report Summary on the Blanket Gold Mine, Zimbabwe
Figure 27: BF Estimates
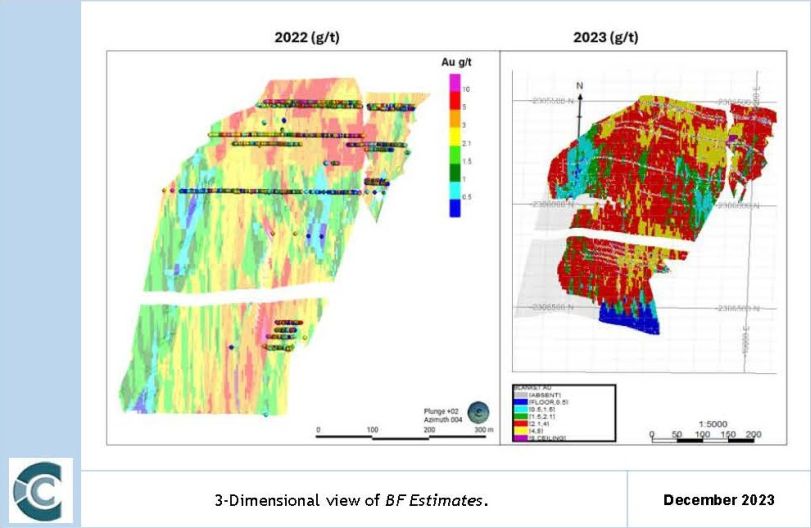
Caledonia Mining Corporation Plc
S-K 1300 Technical Report Summary on the Blanket Gold Mine, Zimbabwe
Figure 28: BQR Estimates
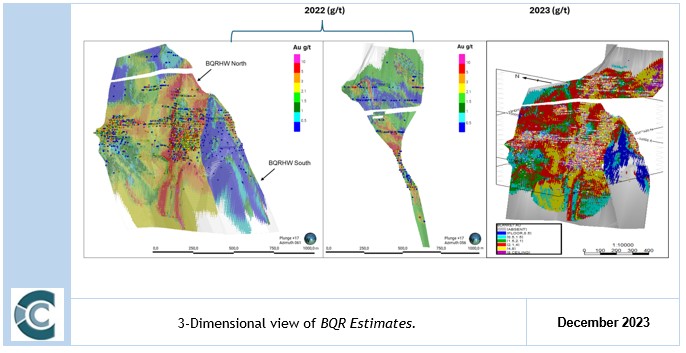
Figure 29: LIMA Estimates
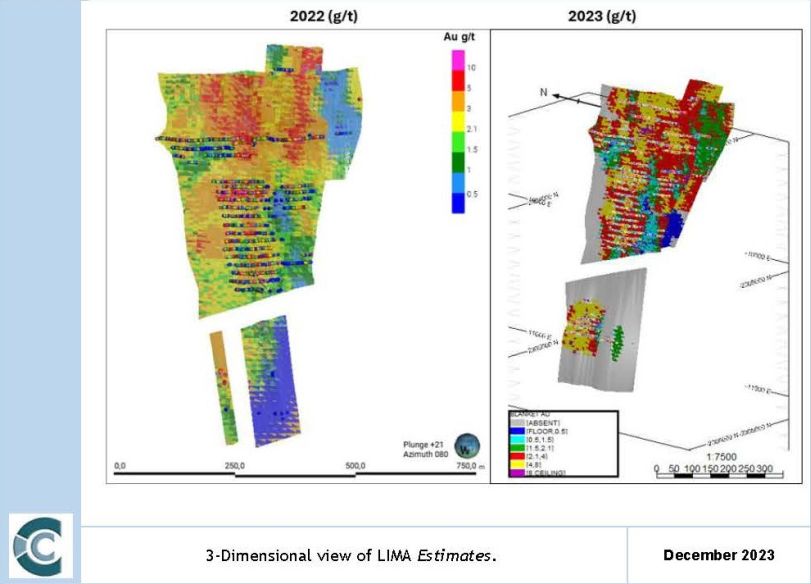
Caledonia Mining Corporation Plc
S-K 1300 Technical Report Summary on the Blanket Gold Mine, Zimbabwe
Figure 30: ERC Estimates
Caledonia Mining Corporation Plc
S-K 1300 Technical Report Summary on the Blanket Gold Mine, Zimbabwe
Figure 31: JTH Estimates
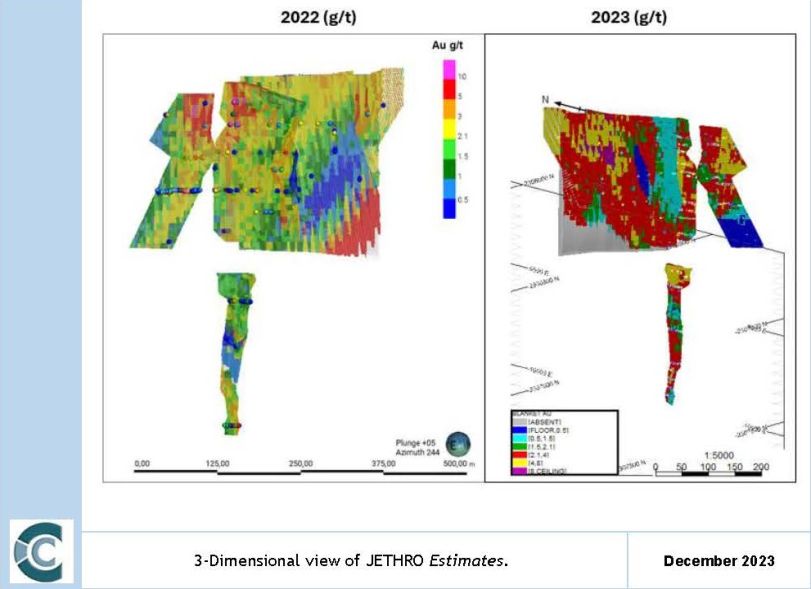
Caledonia Mining Corporation Plc
S-K 1300 Technical Report Summary on the Blanket Gold Mine, Zimbabwe
Figure 32: SHT Estimates
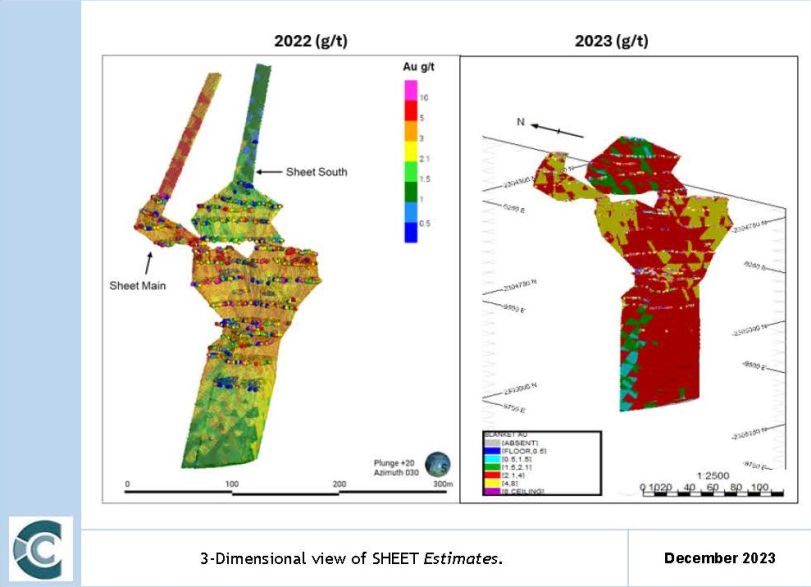
Depletions are correct as of 31 December 2023. All haulages, development and stoping are accounted for in the block models and the Mineral Resource excluding mining is presented in the Mineral Resource tabulations. An image of all stoping and development is shown in Figure 33.
Caledonia Mining Corporation Plc
S-K 1300 Technical Report Summary on the Blanket Gold Mine, Zimbabwe
Figure 33: Long Section of Blanket Mine showing Stopes, Drives, Haulages and Shafts
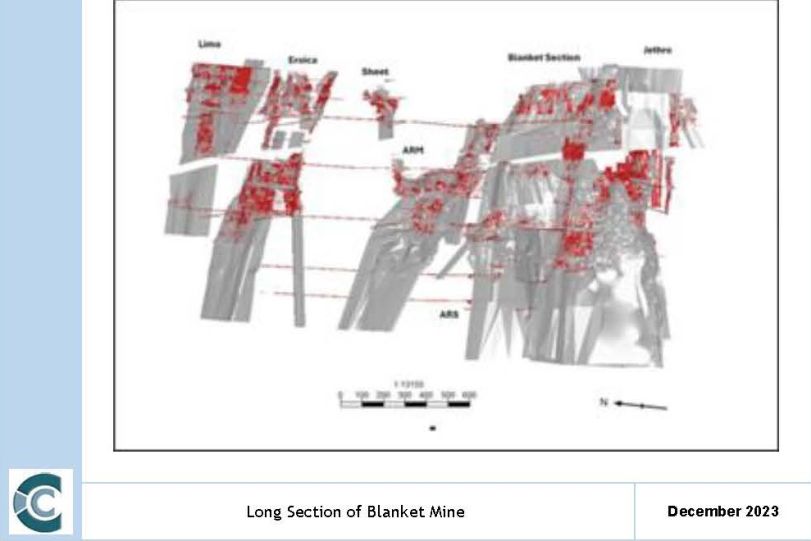
The purpose of swath plots is to verify the estimate versus the original input data. Swath plots show the average of the samples versus the average of the estimate within the same perimeter (swath) that is spaced a regular distance apart. This is repeated in X, Y and Z space to get a representative view of the correlation in all orientations. For Blanket, swaths in Y are generally across strike and swaths in X are along strike, swaths in Z represent the down-dip direction. This is typically displayed with an additional estimation technique, an inverse distance estimate in this instance. This aids in determining if any variance is due to the estimation technique. In all instances, the inverse distance weighting and ordinary kriging estimates compare well.
In addition, all swath plots compare well with the data. Better-informed domains show the best swaths, with sparsely sampled domains less so.
Examples of swath plots for the Eroica domains (ERCN, ERCN_FW and ERCS) are provided in Figure 34 to Figure 36 respectively.
Caledonia Mining Corporation Plc
S-K 1300 Technical Report Summary on the Blanket Gold Mine, Zimbabwe
Figure 34: Swathe Plot of ERCN Domain in X, Y and Z Directions
Figure 35: Swathe Plot of ERCN_FW Domain in X, Y and Z Directions
Figure 36: Swathe Plot of ERCS Domain in X, Y and Z Directions
Caledonia Mining Corporation Plc
S-K 1300 Technical Report Summary on the Blanket Gold Mine, Zimbabwe
The following are reflected on the swath plot analysis (SVOL1):
| | ● | Sheet: The swath of the Ordinary Kriged estimates shows a good correlation with the sample data with some degree of smoothing compared to the data. |
| | ● | ERCN domain, the swaths accurately reflect the data, with good correlation in all directions. Some minor smoothing is apparent on the extreme edges. |
| | ● | ERCS domain: A good correlation is seen with the data. |
| | ● | ERN_FW domain: This is a new domain with limited data. Generally, the estimate fits with the data set and additional data will inform the estimate in a better manner. |
| | ● | Lima Orebody: All domains correlate well although in domains LIM_FWE, LIMA_HW and INTERS the edges exhibit some variance due to sparseness of data. |
| | ● | Jethro: The swath plots illustrate smoothing of the Ordinary Kriged estimates relative to the data due to patchy data. Smoothing at the edge of the data limits results in under, or over-estimation relative to the data. Domain 4 shows the best correlation. |
| | ● | ARS Orebody: Swath plots show good correlation in all directions with localised variance around the edges of the orebody limits or data limits relative to SVOL1. The domains interpolated with ID2 exhibit a degree of smoothing due to the sparse data sets. |
| | ● | ARS Extension: ARS has been extensively remodelled with the addition of a ARS_EXT_990 domain. The estimates show moderate correlation with smoothing as a result of low sample data. |
| | ● | The ARM Main domain: The Ordinary Kriged estimates show a good correlation to the data. |
| | ● | The Blanket 1: The Ordinary Kriged show a good correlation with smoothing relative to the data observed for the BLK1_HW and BLK1_FW domains. It is noted in the X and Y swath plots, the BLK1_HWN domain exhibits a degree of over estimation. |
| | ● | The Blanket 2: The Ordinary Kriged show a good correlation with the data. Estimates near the edge of the data show a possible under, or over-estimate compared to the data as the data numbers reduce. |
| | ● | Blanket 3: The Ordinary Kriged estimates observed from the swath plots show correlation to the data. |
| | ● | Blanket 4_5: The previous Blanket 4 and Blanket 5 domains were combined. The Ordinary Kriged estimates observed from the swath plots show a good correlation to the data with a minor bias towards under-estimation. |
| | ● | Blanket 6: A good correlation is observed the estimates and the data. |
| | ● | BQR: Swath plots generally correlate well with the data. For domain BQR_HWN, there appears to be an area of under estimation in the Y direction and less so in the Z direction. |
| | ● | BF: A good correlation is seen from the swath plots. |
II. Initial Assessment
The QP undertook an initial assessment of the mineralised body to determine the reasonable prospects of eventual economic extraction (“RPEEE”).
Economic, metallurgical, and mining parameters were used to derive the cut-offs. The parameters are tabulated in Table 16 below. The gold price used is the gold price as per the annual budget plan increased by 10% while the total operating cost as per on mine budgets is the cost supplied by Blanket Mine (USD96/t) with a 10% improvement, for potential operational improvements, for reasonable prospects of eventual economic extraction. The plant recovery and mine call factor are also based on the Blanket Mine historical production figures. Reasonable prospects of eventual economic extraction are based on a 10-to-15-year view for precious metals.
Caledonia Mining Corporation Plc
S-K 1300 Technical Report Summary on the Blanket Gold Mine, Zimbabwe
Table 16: Cut-off Derivation Factors
Parameter | Unit | Quantity |
Metal price | USD/oz | 2 150 |
Total operating cost (Mining and Processing) | USD/t | 86.4 |
Dilution | % | 8 |
Plant recovery factor | % | 95 |
Mine call factor | % | 100 |
All underground Mineral Resources are stated at a cut-off grade 1.5 g/t. The QP deems the total Mineral Resource as stated in this TRS to have RPEEE.
III. MINERAL RESOURCE CLASSIFICATION
Mineral Resources have been reported separately in the Measured, Indicated and Inferred Mineral Resource categories. Inferred Mineral Resources have been reported separately and have not been incorporated with the Measured and Indicated Mineral Resources. Inferred Mineral Resources have a lower level of confidence and while it would be reasonable to expect that the majority of the Inferred Mineral Resources would upgrade to Indicated Mineral Resources with continued exploration, due to the uncertainty of Inferred Mineral Resources, it should not be assumed that such upgrading will occur.
For classification of Mineral Resources, variogram ranges and density of sampling were used to define Mineral Resource classification. The classification has been more restrictive when compared to the 2022 classification criteria. The standardised mineral resource classification criteria is summarised in Table 17.
Caledonia Mining Corporation Plc
S-K 1300 Technical Report Summary on the Blanket Gold Mine, Zimbabwe
Table 17: Mineral Resource Classification Criteria for Blanket Mine
Domains | Mineral Resource Categories |
Measured | Indicated | Inferred |
Blanket 1_HW | SVOL = 1 : MinD <=20 : SR >=0.5 | (SVOL = 1 or 2) : MinD<=40 : NSamp>=20 | (SVOL = 1 or 2 or 3) and MinD<200 |
Blanket 1_HWN | SVOL = 1 : MinD <=20 : SR >=0.5 | (SVOL = 1 or 2) : MinD<=40 : NSamp>=20 | (SVOL = 1 or 2 or 3) and MinD<200 |
Blanket 1_FW | SVOL = 1 : MinD <=20 : SR >=0.5 | (SVOL = 1 or 2) : MinD<=40 : NSamp>=20 | (SVOL = 1 or 2 or 3) and MinD<200 |
Blanket 2 FW | SVOL = 1 : MinD <=20 : SR >=0.5 | (SVOL = 1 or 2) : MinD<=40 : NSamp>=20 | (SVOL = 1 or 2 or 3) and MinD<250 |
Blanket 2 HW | SVOL = 1 : MinD <=20 : SR >=0.5 | (SVOL = 1 or 2) : MinD<=40 : NSamp>=20 | (SVOL = 1 or 2 or 3) and MinD<200 |
Blanket 2 HW LG | SVOL = 1 : MinD <=20 : SR >=0.5 | (SVOL = 1 or 2) : MinD<=40 : NSamp>=20 | (SVOL = 1 or 2 or 3) and MinD<200 |
Blanket 3_FW | SVOL = 1 and MinD <=20 | (SVOL = 1 or 2) and MinD<=40 | (SVOL = 1 or 2 or 3) and MinD<250 |
Blanket 3_HW | SVOL = 1 and MinD <=20 | (SVOL = 1 or 2) and MinD<=40 | (SVOL = 1 or 2 or 3) and MinD<175 |
Blanket 4_5 HW | SVOL = 1 : MinD <=20 : SR >=0.7 | (SVOL = 1 or 2) and MinD<=40 | (SVOL = 1 or 2 or 3) and MinD<250 |
Blanket 4_5 FW | SVOL = 1 and MinD<=20 | (SVOL = 1 or 2) : MinD<=40 : SR>=0.5 | (SVOL = 1 or 2 or 3) and MinD<175 |
Blanket 6 HW | SVOL = 1 : MinD <=20 : SR >=0.7 | (SVOL = 1 or 2) and MinD<=40 | (SVOL = 1 or 2 or 3) and MinD<200 |
Blanket 6 FW | SVOL = 1 and MinD<=20 | (SVOL = 1 or 2) and MinD<=40 | (SVOL = 1 or 2 or 3) and MinD<200 |
BQR FW | SVOL = 1 : MinD <=20 : SR >=0.7 | (SVOL = 1 or 2) : MinD<=40 : NSamp>=20 | (SVOL = 1 or 2 or 3) and MinD<200 |
BQR HW NORTH | SVOL = 1 : MinD <=20 : SR >=0.7 | (SVOL = 1 or 2) : MinD<=40 : NSamp>=20 | (SVOL = 1 or 2 or 3) and MinD<250 |
BQR HW SOUTH | SVOL = 1 : MinD <=20 : SR >=0.7 | (SVOL = 1 or 2) : MinD<=40 : NSamp>=20 | (SVOL = 1 or 2 or 3) and MinD<200 |
ARM Main | SVOL = 1 : MinD <=20 : NSamp >=80 | (SVOL = 1 or 2) : MinD<=40 : SR>=0.5 | (SVOL = 1 or 2 or 3) and MinD<175 |
ARM Waste | SVOL = 1 : MinD <=20 : NSamp >=80 | (SVOL = 1 or 2) and MinD<=40 | (SVOL = 1 or 2 or 3) and MinD<175 |
ARM_480L | SVOL=1 and MinD <=20 | (SVOL = 1 or 2) and MinD<=40 | (SVOL = 1 or 2 or 3) and MinD<175 |
ARS_ABV_DYK | SVOL = 1 and MinD <=20 | (SVOL = 1 or 2) and MinD<=40 | (SVOL = 1 or 2 or 3) and MinD<175 |
ARM_FFW1 | SVOL = 1 : MinD <=20 : NSamp >=40 | (SVOL = 1 or 2) and MinD<=40 | (SVOL = 1 or 2 or 3) and MinD<175 |
ARM_FFW2 | SVOL = 1 : MinD <=20 : NSamp >=40 | (SVOL = 1 or 2) and MinD<=40 | (SVOL = 1 or 2 or 3) and MinD<175 |
BF_FW | SVOL = 1 : MinD <=20 : NSamp >=80 | (SVOL = 1 or 2) and MinD<=40 | (SVOL = 1 or 2 or 3) and MinD<250 |
BF_HW | SVOL = 1 : MinD <=20 : NSamp >=80 | (SVOL = 1 or 2) and MinD<=40 | (SVOL = 1 or 2 or 3) and MinD<250 |
ERC_N | SVOL = 1 : MinD <=20 : NSamp >=60 | (SVOL = 1 or 2) : MinD<=40 : NSamp>=20 | (SVOL = 1 or 2 or 3) and MinD<175 |
ERC_NFW | SVOL = 1 : MinD <=20 : NSamp >=60 | (SVOL = 1 or 2) : MinD<=40 : NSamp>=20 | (SVOL = 1 or 2 or 3) and MinD<175 |
ERC_S | SVOL = 1 : MinD <=20 : NSamp >=60 | (SVOL = 1 or 2) : MinD<=40 : NSamp>=20 | (SVOL = 1 or 2 or 3) and MinD<175 |
JETHRO_MAIN | SVOL = 1 : MinD <=20 : NSamp >=80 | (SVOL = 1 or 2) and MinD<=40 | (SVOL = 1 or 2 or 3) and MinD<175 |
JETHRO_CENTRAL | SVOL = 1 : MinD <=20 : SR >=0.7 | (SVOL = 1 or 2) and MinD<=40 | (SVOL = 1 or 2 or 3) and MinD<175 |
JETHRO_HW1 | SVOL = 1 : MinD <=20 : NSamp >=80 | (SVOL = 1 or 2) and MinD<=40 | (SVOL = 1 or 2 or 3) and MinD<175 |
JETHRO_HW2 | SVOL = 1 : MinD <=20 : SR >=0.7 | (SVOL = 1 or 2) and MinD<=40 | (SVOL = 1 or 2 or 3) and MinD<175 |
LIMA MAIN | SVOL = 1 and MinD <=20 | (SVOL = 1 or 2) and MinD<=40 | (SVOL = 1 or 2 or 3) and MinD<175 |
LIMA_FWE | SVOL = 1 and MinD <=20 | (SVOL = 1 or 2) and MinD<=40 | (SVOL = 1 or 2 or 3) and MinD<175 |
LIMA _HW | SVOL = 1 and MinD <=20 | (SVOL = 1 or 2) and MinD<=40 | (SVOL = 1 or 2 or 3) and MinD<175 |
LIMA INTER | SVOL = 1 and MinD <=20 | (SVOL = 1 or 2) and MinD<=40 | (SVOL = 1 or 2 or 3) and MinD<175 |
LIMA INTERS | SVOL = 1 and MinD <=20 | (SVOL = 1 or 2) and MinD<=40 | (SVOL = 1 or 2 or 3) and MinD<175 |
SHEET MAIN | SVOL = 1 : MinD <=20 : NSamp >=40 | (SVOL = 1 or 2) and MinD<=40 | (SVOL = 1 or 2 or 3) and MinD<175 |
SHEET SOUTH | SVOL = 1 : MinD <=20 : NSamp >=40 | (SVOL = 1 or 2) and MinD<=40 | (SVOL = 1 or 2 or 3) and MinD<175 |
ARS EWL | SVOL = 1 : MinD <=20 : SR >=0.7 | (SVOL = 1 or 2) and MinD<=40 | (SVOL = 1 or 2 or 3) and MinD<175 |
ARS HW | SVOL = 1 : MinD <=20 : NSamp >=40 | (SVOL = 1 or 2) and MinD<=40 | (SVOL = 1 or 2 or 3) and MinD<175 |
ARS_FW | SVOL = 1 : MinD <=20 : NSamp >=40 | (SVOL = 1 or 2) and MinD<=40 | (SVOL = 1 or 2 or 3) and MinD<175 |
ARS NSL | SVOL = 1 : MinD <=20 : NSamp >=40 | (SVOL = 1 or 2) and MinD<=40 | (SVOL = 1 or 2 or 3) and MinD<175 |
ARS_EXT | SVOL = 1 and MinD <=20 | (SVOL = 1 or 2) and MinD<=40 | (SVOL = 1 or 2 or 3) and MinD<175 |
ARS_EXT_990 | SVOL = 1 and MinD <=20 | (SVOL = 1 or 2) and MinD<=40 | (SVOL = 1 or 2 or 3) and MinD<175 |
80
Caledonia Mining Corporation Plc
S-K 1300 Technical Report Summary on the Blanket Gold Mine, Zimbabwe
The minimum distance to samples measures the minimum distance to the nearest samples for a block being estimated. In mining areas, this distance is typically less than five to ten metres. The distance to samples increasing as you move further away from a mining area. The distance between sub-levels is typically 15.0 meters vertical so for Measured Resources, the area between two sub-levels can be classified as such. Indicated Resources would encompass up to three sub-levels while for Inferred, the criteria was relaxed, and the classification was extended for up to a maximum of 3X the variogram range for Inferred Resources to aid in long term planning. This is considered suitable for the Blanket orebodies as the geological and grade continuity observed from mined-out areas exhibits a strong trend. This is further enhanced by the continuity of the orebodies as evidenced informed by LHDP exploration drillholes. Therefore, there is sufficient confidence in geological continuity for Inferred Resources. No smoothing of the Mineral Resource classification boundaries has been undertaken and are reported as is. Comparative views of the Mineral Resource classification are provided in Figure 37 to Figure 49 below.
Figure 37: ARM Mineral Resource Classification
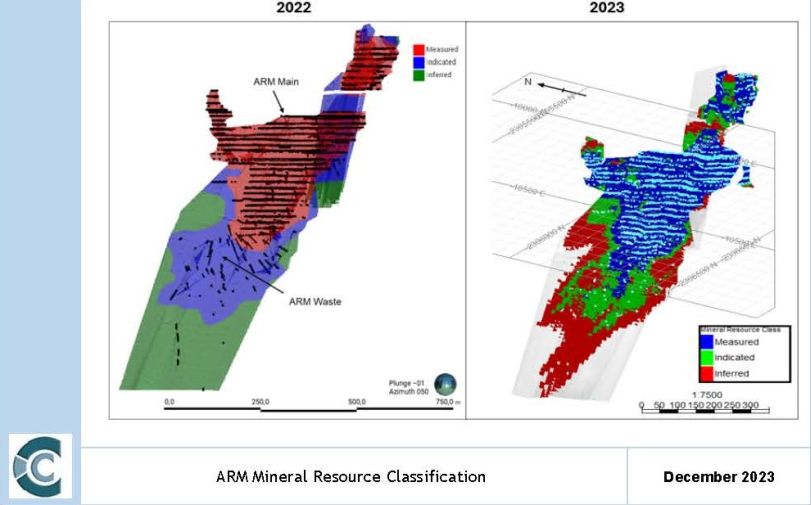
Caledonia Mining Corporation Plc
S-K 1300 Technical Report Summary on the Blanket Gold Mine, Zimbabwe
Figure 38: ARS Mineral Resource Classification (Including ARS_Ext)
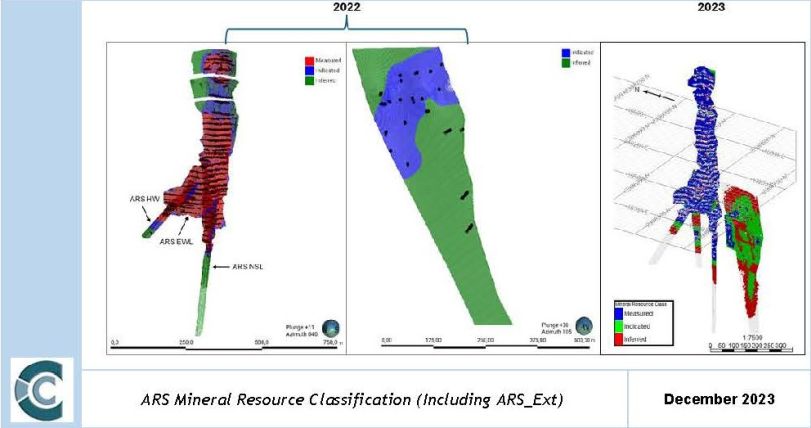
Caledonia Mining Corporation Plc
S-K 1300 Technical Report Summary on the Blanket Gold Mine, Zimbabwe
Figure 39: BLK1 Mineral Resource Classification
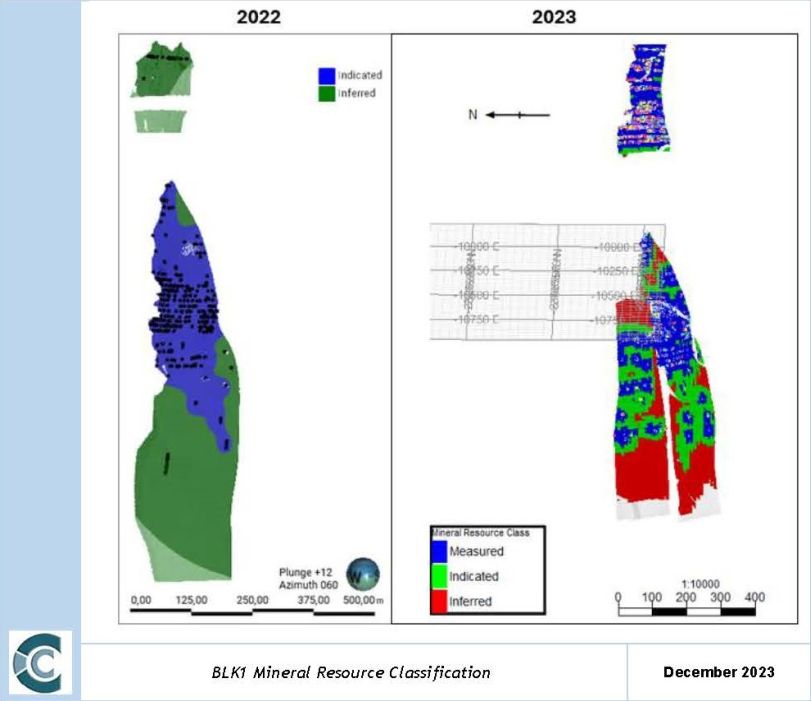
Caledonia Mining Corporation Plc
S-K 1300 Technical Report Summary on the Blanket Gold Mine, Zimbabwe
Figure 40: BLK2 Mineral Resource Classification
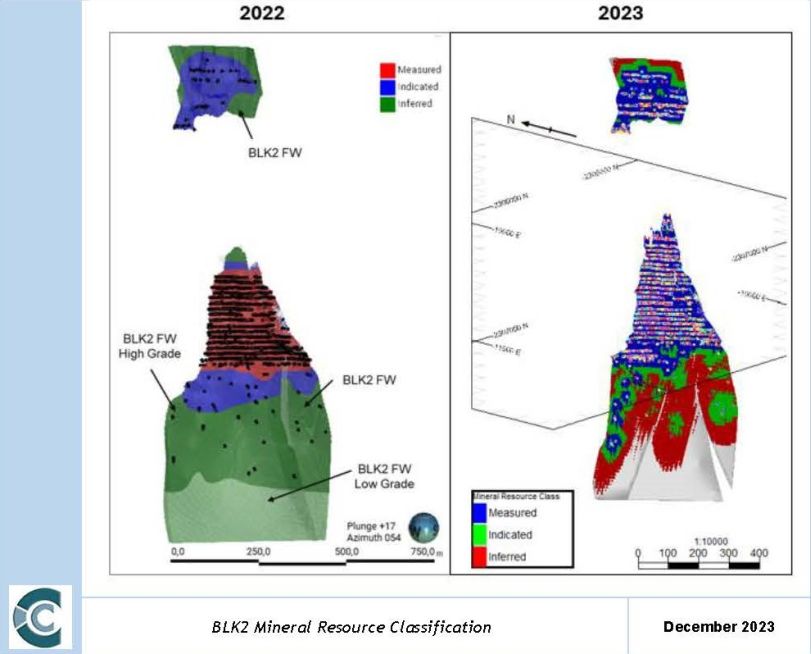
Caledonia Mining Corporation Plc
S-K 1300 Technical Report Summary on the Blanket Gold Mine, Zimbabwe
Figure 41: BLK3 Mineral Resource Classification
Caledonia Mining Corporation Plc
S-K 1300 Technical Report Summary on the Blanket Gold Mine, Zimbabwe
Figure 42: BLK4_5 Mineral Resource Classification
Figure 43: BLK6 Mineral Resource Classification
Caledonia Mining Corporation Plc
S-K 1300 Technical Report Summary on the Blanket Gold Mine, Zimbabwe
Figure 44: BF Mineral Resource Classification
Figure 45: BQR Mineral Resource Classification
Caledonia Mining Corporation Plc
S-K 1300 Technical Report Summary on the Blanket Gold Mine, Zimbabwe
Figure 46: LIMA Mineral Resource Classification
Caledonia Mining Corporation Plc
S-K 1300 Technical Report Summary on the Blanket Gold Mine, Zimbabwe
Figure 47: ERC Mineral Resource Classification
Caledonia Mining Corporation Plc
S-K 1300 Technical Report Summary on the Blanket Gold Mine, Zimbabwe
Figure 48: JTH Mineral Resource Classification
Caledonia Mining Corporation Plc
S-K 1300 Technical Report Summary on the Blanket Gold Mine, Zimbabwe
Figure 49: SHT Mineral Resource Classification
| | IV. | MINERAL RESOURCE STATEMENT |
The Combined Measured and Indicated Mineral Resources, inclusive of Mineral Reserves, declared for the Blanket operations are shown in Table 18. The Inferred Resources, inclusive of Mineral Reserves, are shown in Table 19. Mineral Resources are stated as in situ.
A cut-off of 1.5 g/t is utilised for all Resource declarations. A geological loss of 0% for Measured and 5% for Indicated and Inferred was applied in 2022. For 2023, this has been modified to 2.5% for Measured, 5% for Indicated and 10% for Inferred respectively. The Measured losses has been added to account for potential survey errors in the mined-out workings, predominantly the older areas which are now inaccessible. The block models were depleted with current mining faces as of 31 December 2023.
Caledonia Mining Corporation Plc
S-K 1300 Technical Report Summary on the Blanket Gold Mine, Zimbabwe
Table 18: In Situ Measured and Indicated Mineral Resources for Blanket Mine as at 31 December 2023 (Inclusive of Mineral Reserves)
Mineral Resource Classification | Orebody | Tonnes | Au Grade | Gold Content |
Kt | g/t | Koz |
Measured (2.5% Geological Loss) | ARM | 660 | 3.12 | 66 |
ARS | 514 | 3.62 | 60 |
ARS_Ext | 32 | 2.56 | 3 |
BF | 176 | 3.43 | 19 |
BLK1 | 261 | 3.43 | 29 |
BLK2 | 150 | 3.66 | 18 |
BLK3 | 180 | 3.41 | 20 |
BLK4_5 | 490 | 3.26 | 51 |
BLK6 | 49 | 3.78 | 6 |
BQR | 785 | 4.36 | 110 |
ERC | 303 | 5.21 | 51 |
Jethro | 53 | 3.11 | 5 |
Lima | 203 | 3.94 | 26 |
Sheet | 88 | 2.99 | 9 |
Measured Total | 3 943 | 3.72 | 471 |
Indicated (5.0% Geological Loss) | ARM | 630 | 2.78 | 56 |
ARS | 437 | 3.48 | 49 |
ARS_Ext | 189 | 2.93 | 18 |
BF | 205 | 2.99 | 20 |
BLK1 | 663 | 3.21 | 68 |
BLK2 | 442 | 4.98 | 71 |
BLK3 | 189 | 2.91 | 18 |
BLK4_5 | 126 | 3.05 | 12 |
BLK6 | 27 | 3.99 | 4 |
BQR | 1 888 | 3.61 | 219 |
ERC | 593 | 4.76 | 91 |
Jethro | 288 | 3.34 | 31 |
Lima | 115 | 3.73 | 14 |
Sheet | 41 | 2.60 | 3 |
Indicated Total | 5 832 | 3.59 | 673 |
Measured + Indicated Total | 9 775 | 3.64 | 1 145 |
Notes:
| | 1. | Cut-off applied 1.5 g/t. |
| | 2. | 2.5% Geological loss applied for Measured, 5% for Indicated and 10% for Inferred. |
| | 3. | Gold price: USD2,150/oz. |
| | 4. | Mineral Resources are stated inclusive of Mineral Reserves. |
| | 5. | Mineral Resources are reported as 64% attributable to Caledonia. |
| | 6. | All orebodies are depleted for mining. |
Caledonia Mining Corporation Plc
S-K 1300 Technical Report Summary on the Blanket Gold Mine, Zimbabwe
Table 19: In Situ Inferred Mineral Resources for Blanket Mine as of 31 December 2023 (Inclusive of Mineral Reserves)
Mineral Resource Classification | Orebody | Tonnes | Au | Ounces |
Inferred | | Kt | g/t | Koz |
ARM | 299 | 2.87 | 28 |
ARS | 170 | 3.88 | 21 |
ARS_Ext | 68 | 3.48 | 8 |
BF | 150 | 3.05 | 15 |
BLK1 | 871 | 3.20 | 90 |
BLK2 | 584 | 4.91 | 92 |
BLK3 | 73 | 3.33 | 8 |
BLK4_5 | 269 | 3.32 | 29 |
BLK6 | 83 | 3.57 | 10 |
BQR | 1 900 | 3.71 | 227 |
ERC | 928 | 4.30 | 128 |
Jethro | 108 | 3.28 | 11 |
Lima | 95 | 3.41 | 10 |
Sheet | 47 | 2.52 | 4 |
Inferred Total | 5 646 | 3.74 | 679 |
Notes:
| | 1. | Cut-off applied 1.5 g/t. |
| | 2. | 2.5% Geological loss applied for Measured, 5% for Indicated and 10% for Inferred. |
| | 3. | Gold price: USD2,150/oz. |
| | 4. | Mineral Resources are stated inclusive of Mineral Reserves. |
| | 5. | Mineral Resources are reported as 64% attributable to Caledonia. |
| | 6. | All orebodies are depleted for mining. |
The Combined Measured and Indicated Mineral Resources, exclusive of Mineral Reserves, declared for the Blanket operations are shown in Table 20.
Caledonia Mining Corporation Plc
S-K 1300 Technical Report Summary on the Blanket Gold Mine, Zimbabwe
Table 20: In Situ Measured and Indicated Mineral Resources for Blanket Mine as at 31 December 2023 (Exclusive of Mineral Reserves)
Mineral Resource Classification | Orebody | Tonnes | Au Grade | Gold Content |
Kt | g/t | Koz |
Measured (2.5% Geological Loss) | ARM | 653 | 3.12 | 66 |
ARS | 329 | 3.70 | 39 |
ARS_Ext | 11 | 1.83 | 1 |
BF | 89 | 3.58 | 10 |
BLK1 | 136 | 3.74 | 16 |
BLK2 | 148 | 3.66 | 17 |
BLK3 | 109 | 3.44 | 12 |
BLK4_5 | 194 | 3.85 | 24 |
BLK6 | 48 | 3.79 | 6 |
BQR | 482 | 4.31 | 67 |
ERC | 208 | 4.93 | 33 |
Jethro | 53 | 3.11 | 5 |
Lima | 151 | 3.64 | 18 |
Sheet | 88 | 2.99 | 9 |
Measured Total | 2 700 | 3.72 | 323 |
Indicated (5.0% Geological Loss) | ARM | 475 | 2.68 | 41 |
ARS | 337 | 3.13 | 34 |
ARS_Ext | 50 | 2.31 | 4 |
BF | 103 | 3.04 | 10 |
BLK1 | 232 | 3.19 | 24 |
BLK2 | 228 | 3.86 | 28 |
BLK3 | 66 | 2.45 | 5 |
BLK4_5 | 70 | 2.99 | 7 |
BLK6 | 17 | 4.17 | 2 |
BQR | 711 | 3.45 | 79 |
ERC | 144 | 4.69 | 22 |
Jethro | 177 | 2.82 | 16 |
Lima | 74 | 3.44 | 8 |
Sheet | 41 | 2.60 | 3 |
Indicated Total | 2 726 | 3.23 | 283 |
Measured + Indicated Total | 5 426 | 3.47 | 606 |
Notes:
| | 1. | Cut-off applied 1.5 g/t. |
| | 2. | 2.5% Geological loss applied for Measured, 5% for Indicated and 10% for Inferred. |
| | 3. | Gold price: USD2,150/oz. |
| | 4. | Mineral Resources are stated exclusive of Mineral Reserves. |
| | 5. | Mineral Resources are reported as 64% attributable to Caledonia. |
| | 6. | All orebodies are depleted for mining. |
Inferred Mineral Resources inclusive and exclusive of Mineral Reserves are the same as there are no inferred Mineral Resources in the Mineral Reserve.
Caledonia Mining Corporation Plc
S-K 1300 Technical Report Summary on the Blanket Gold Mine, Zimbabwe
Item 11 (b) – INDIVIDUAL GRADE OF METALS
Mineral Resources for gold have been estimated for the Blanket Gold Mine. No other metals or minerals have been estimated for the Project.
Item 11 (c) – FACTORS AFFECTING MINERAL RESOURCE ESTIMATES
No socio-economic, legal, or political modifying factors have been taken into account in the estimation of Mineral Resources for Blanket Mine. QPs are not aware of any known environmental, permitting, legal, title, taxation, socio-economic, marketing, and political or other factors that will materially affect the Mineral Resource estimates.
All underground Mineral Resources are stated at a cut-off grade 1.5 g/t.
Caledonia has operated the Blanket Mine successfully for several years and understands the Zimbabwean mining environment and as such eliminated any risk to a large degree and hence the QPs are of the opinion that the factors affecting the Mineral Resource have been considered.
It is imperative that Blanket Mine proceed with resource conversion drilling to replace the higher grade measured and indicated Mineral Resources that have converted to Mineral Reserves by converting the higher grade Inferred Mineral Resources to Indicated Mineral Resources.
ITEM 12 – MINERAL RESERVE ESTIMATES
Item 12 (a) – KEY ASSUMPTIONS, PARAMETERS AND METHODS
The LoM planning was completed in line with current operational planning to produce in the range of 74 - 80 koz of gold per year. Only diluted Indicated and Measured Resources in the LoM plan were considered for conversion to Mineral Reserves. LoM as referred to in this TRS is as of 31 December 2023.
Inferred Mineral Resources have been excluded from the economic assessment for Mineral Reserve estimates. The LoM plan aims to produce in the range of 68 - 72 koz of gold per year from Measured and Indicated Mineral Resources only.
The LoM plan was developed utilising the 3D Mineral Resource model estimates as reviewed and updated by the QPs. The Mineral Resource classifications were incorporated from the 2023 Mineral Resource estimate. The mine design and scheduling utilise the updated 2023 Mineral Resource model.
| | I. | STOPE DESIGN METHODOLOGY |
Blanket mine made use of the geological wireframes to create the stope shapes utilised in the LoM design process. Each orebody was segmented horizontally on existing ROM and capital intersecting ends, where no existing ends were found the orebody wireframes were segmented at 15 meters intervals. Along strike these orebody wireframes were segmented at 10 m with the width represented by the full width of the orebody wireframes. Areas where the width of the orebody was less than 1.8 m (width of sub-drives), these stopes were manually modified to a width of 1.8 m.
Evaluation was run on all segmented stopes utilising block models provided by Minxcon, legends were applied to identify stopes above cut-off grade (2.1 g/t), marginal (1.5 g/t - 2.1 g/t) and low grade (<1.5g/t). To identify areas to be mined, each block was investigated on its own merit, where a block consists of the unique lists of orebodies and tramming levels. Marginal stopes were introduced where practical mining dictated necessary.
Caledonia Mining Corporation Plc
S-K 1300 Technical Report Summary on the Blanket Gold Mine, Zimbabwe
The cut-off grade calculation for the Blanket Mine is detailed in Table 21.
Table 21: Cut-Off Grade Calculation
Description | Unit | Value |
Gold Price | USD/oz | 1,877 |
Dilution | % | 8 |
Mine Call Factor | % | 100 |
Recovery | % | 93.6 |
Metal price | USD/g | 60.35 |
Total Operating Cost | USD/t | 96 |
Cut-off Grade (calculated) | g/t | 1.62 |
Reserve Cut-off Grade (in use) | g/t | 2.10 |
Blanket Mine utilises a 2.1 g/t planning cut-off grade. The mine design and schedule were completed using the accepted 2.1 g/t cut-off grade.
Mineral Reserve conversion factors are the consideration of mining factors used to convert Mineral Resources to Mineral Reserves. These factors are applied to adjust the in situ Mineral Resources in the LoM planning to realistic and accurate mill feed, volumes, and grade. The Mineral Reserve conversion factors applied to the Mineral Resources in the LoM plan, are detailed in Table 22.
Table 22: Mineral Reserve Conversion Factors Summary
Description | Unit | Value |
Geological Losses |
Measured | % | 2.5 |
Indicated | % | 5 |
Inferred | % | 10 |
Other Dilution Factors |
Pillar Extraction | % | 50 |
Dilution | % | 8 |
Mine Call Factor | % | 100 |
The following additional factors were considered:
| | ● | Processing and Metallurgical: The conventional CIL recovery method is well proven and has been used consistently on this orebody. The recovery used was 93.6% and no other metallurgical factors are known that may impact the Mineral Reserve. |
| | ● | Infrastructure: Infrastructure required for the planned production is either in place or planned for. Sufficient capital provision has been made for all planned infrastructure required for the planned production. |
| | ● | Economic and Marketing: The gold price that has been utilised for the Mineral Reserve estimate is a real term forecast taken as the median of various bank and analyst forecasts. The average gold price over the LoM is USD1,877/oz. An uneconomical tail has been cut from the first negative cashflow year based Measured and Indicated Mineral Resources and has been excluded from the Mineral Reserve. The tail contains 212.5 koz of gold and runs for 6 years but is not economically viable on its own. |
| | ● | Legal, Environmental, Social and Governmental: There are no legal, environmental, social or governmental factors that are deemed to be classified as modifying factors applied to the Mineral Reserves. |
Caledonia Mining Corporation Plc
S-K 1300 Technical Report Summary on the Blanket Gold Mine, Zimbabwe
| | IV. | MINERAL RESOURCE TO MINERAL RESERVE CONVERSION |
All Mineral Reserves have been categorised and reported in accordance with the guidelines of §229.1302(e)(2) of S-K 1300. Only Indicated and Measured Resources in the LoM plan were considered for conversion to Mineral Reserves. Inferred Mineral Resources have been excluded from the LoM plan for economic assessment for Mineral Reserve estimates. Only diluted Measured and Indicated Mineral Resources have been converted into Proven and Probable Mineral Reserves, respectively. Mineral Reserves have been reported separately in the Proven and Probable Mineral Reserve categories. Inferred Mineral Resources have not been incorporated with the Proven and Probable Mineral Reserves.
The Mineral Resources as estimated by the QP as of 31 December 2023 were utilised for the updated 2023 Mineral Reserve estimation. The QP has depleted the 31 December 2023 Mineral Resources with updated mining faces to the period ending 31 December 2023.
The depleted Mineral Resources as of 31 December 2023, was utilised with the 2023 LoM plan as detailed in Item 13 (b). The QP utilised the 31 December 2023 LoM plan with the depleted Mineral Resources to conduct an updated Mineral Reserve estimation, which accounts for the mining depletions from 31 December 2023.
A new mine design and schedule was conducted for the Mineral Reserve estimation as of 31 December 2023 as illustrated in Figure 50.
Figure 50: Diluted Life of Mine Production Schedule by Mineral Resource Classification (2023)
The updated attributable Mineral Reserve estimation as of 31 December 2023, is detailed in Table 23. Mineral Reserves are stated as delivered to plant.
Caledonia Mining Corporation Plc
S-K 1300 Technical Report Summary on the Blanket Gold Mine, Zimbabwe
Table 23: Blanket Mine Mineral Reserve Estimate as at 31 December 2023
Mineral Reserve Classification | Tonnes | Grade | Au Content |
Kt | g/t | Kg | Koz |
Proven | 1 363 | 3.21 | 4 377 | 141 |
Probable | 3 555 | 3.31 | 11 782 | 379 |
Total | 4 918 | 3.29 | 16 158 | 519 |
Notes:
| | 1. | Mineral Reserve cut-off of 2.1 g/t applied. |
| | 2. | The gold price that has been utilised in the economic analysis to convert diluted Measured and Indicated Mineral Resources in the LoM plan to Mineral Reserves is an average real term price of USD1,877/oz over the LoM, using the forecast prices as per Economic Analysis. |
| | 3. | The Mineral Reserve estimation utilises the depleted 2023 Mineral Resource estimation and the 2023 mine design and LoM plan. |
| | 4. | Mineral Reserves are reported as 64% attributable to Caledonia. |
| | 5. | Totals may not add due to rounding. |
Mineral Resources from the Measured and Indicated Mineral Resource Classifications were converted into Proven and Probable Mineral Reserves. The attributable Blanket Mine Mineral Reserve estimate consists of 27% Proven and 73% Probable Mineral Reserves on a gold content basis.
Item 12 (b) – MULTIPLE COMMODITY RESERVE
Gold is the only commodity within the Blanket mining areas that is present in significant concentrations.
Item 12 (c) – FACTORS AFFECTING MINERAL RESERVE ESTIMATION
No socio-economic, legal or political modifying factors have been taken into account in the estimation of Mineral Reserves for the Blanket Mine. The QPs are not aware of any known environmental, permitting, legal, title, taxation, socio-economic, marketing, and political or other factors that will materially affect the Mineral Reserve estimates. No material issues have been identified for the Blanket Mine.
The Mineral Reserve conversion factors detailed in Table 22 have been applied to the Mineral Resource for conversion to Mineral Reserves. The classification of Mineral Reserves can be affected by changes in the status of the factors. In particular, the gold price will affect the viability of the mineralised target.
An uneconomical tail has been cut from the first negative cashflow year and has been excluded from the Mineral Reserve. The tail contains 212.5 koz of gold but is not economically viable on its own.
ITEM 13 – MINING METHODS
There are two mining approaches currently employed at Blanket mine namely the Mechanized Mining approach which utilizes the Decline system and trackless mobile machinery, and the Conventional mining method which utilizes track bound equipment. The mechanized mining method utilizes decline development to access lower orebodies in a top-down approach contrary to the normal bottom-up approach which is dependent on shaft sinking. In this method declines are developed at a gradient of –9 degrees in the footwall of the orebody over a 120m lift. At every 15m height interval, access cross-cuts are developed to intersect the orebody.
The subsequent intra-orebody development will be used to define orebody strike extent at each 15m interval. Normal link up raise system will also be developed and will comprise of cut off and ventilation raises serving the Decline area. Main level extraction haulage will be developed at the lowest level of the 120m lift to facilitate draw point crosscut and raise development for subsequent coning and production mining. Mid-level extraction haulage can also be developed on the 4th level of the 120m lift to facilitate draw point crosscut and raise development for subsequent coning and production mining.
Caledonia Mining Corporation Plc
S-K 1300 Technical Report Summary on the Blanket Gold Mine, Zimbabwe
The Decline system utilizes trackless mobile mining equipment such as Dump trucks and LHDs. In Figure 51 below a basic layout of the mechanized mining method is displayed. Stoping is then done on the sublevel above the coning level through the creation of the slot at the ore pass raise immediately above and then subsequently carrying out stoping using either long hole or conventional underhand.
Figure 51: Extraction Method: LH Mechanized
In the conventional mining approach, the bottom-up approach is used and main level development is done at 120m intervals as illustrated Figure 52. The main haulages are developed in the footwall to access the major orebodies of the mine. The orebodies are accessed from the main haulage via extraction haulages which facilitates exploitation of the ore from the respective orebodies.
Most of the extraction haulages are developed to the footwall of the orebody at a minimum distance of 15.0m. Draw point crosscuts at 15m and 20m (depth and rock type dependant) intervals along strike are developed to access the relevant orebody. Draw point raises reaching the next sublevel will be developed to facilitate coning for production. Sublevel drive development in the Blanket mine setup is done within the confines of the orebody. The Sublevel drives are developed at either 10m or 15m intervals and are interlinked by a system of raises namely travelling way, ore pass, slot, and cut off raises. This series of raises is mined to a vertical distance of 120 meters and ultimately provides link between the lower and upper main levels of the respective block.
Each block will be defined by travelling way and ore pass raises separated by 60m while ore pass, and waste pass raise distances will be at 10-15 m depending on sublevel interval distance. Production mining commences through establishment of cones on the sublevel immediately above the main level. Stoping is then done on the sublevel above the coning level through the creation of the slot at the ore pass raise immediately above and then subsequently carrying out stoping using either long hole or conventional underhand.
Caledonia Mining Corporation Plc
S-K 1300 Technical Report Summary on the Blanket Gold Mine, Zimbabwe
Figure 52: Extraction Method: Underhand
Blanket mine uses long-hole stoping in the orebodies with a width greater than 3 m. It can also be applied in instances where the geotechnical challenges such as jointing and faulting are experienced to be mined using conventional underhand stoping method. Long-hole stoping is a selective and highly productive mining method that provides good ore recovery. The method is flexible and allows for practical modifications to the mining sequence and configuration to suit the characteristics of the orebody. A schematic layout is provided in Figure 53.
Long Hole drilling entails using drifter machines to drill holes which cover the full span of the sublevel interval and then blasting them. When the block has been delineated and made ready for production mining cones are created at the lowermost level above the main extraction haulage. These cones will be linked to the draw point system established at the main level. Once the third cone has been established a slot is then created on the sublevel immediately above the coning level, which opens the sub drive face for subsequent drilling and blasting. Holes parallel to the slot face spanning the full length of the sublevel interval are then drilled and depending on the width of the slot will make up what is known as a ring. These holes are then blasted after completion and this cycle will continue until the full strike of the orebody on the sublevel is exhausted. Long hole drilling and blasting is done in a vertical retreat fashion maintaining a lead 72-degree angle between the lower and upper stopes, with lead lags not more than 10m between panels where ground conditions allow.
Caledonia Mining Corporation Plc
S-K 1300 Technical Report Summary on the Blanket Gold Mine, Zimbabwe
It is an overhand, vertical stoping method utilising drifter machines for long-hole drilling and blasting carried out from sub-levels. Mining the orebody creates a void or “open-stope” that is unsupported, however sill pillars are left between tramming haulage levels and Dip pillars along strike for regional support. Figure 94 illustrates a schematic of the long-hole stoping mining method.
To access the orebody, crosscuts are developed from the tramming haulage to the extraction haulage which is located approximately 20 m from the orebody. Draw point crosscuts are developed at 15 m intervals along the extraction haulage at 990m level and above while below 990m level a 20m interval spacing is utilized which provide access to the draw points. A twin raise system is developed upwards to establish a sliping point for the development of the sub-drive. One raise serves as an access raise, while the other serves as an ore pass to handle ore from the sub-drive development. The twin raise system is developed from one sub-drive to the next for the entire 120 m or 60 m lift.
Coning is done from the coning level and can only commence once sufficient raises for access and ore handling have been developed and holed into the sub-drive. Once coning starts, the raise can no longer be used as an access way. As a rule of thumb, three cones are established before any production may commence.
Production drilling is done in a retreat fashion from the orebody limit and drilling is done top down with Seco 36 drifter machines. The use of mechanical props and mesh as a temporary support iare used to safeguards the workers during the drilling process. Depending on production requirements, multiple sub-levels may be mined simultaneously. The orebody width will ultimately determine the width of the stoping panel.
Ore will then be extracted from the stope drawpoints via the lower extraction haulage using mechanical loaders or mechanized machinery. The ore is then loaded onto granby cars or dump trucks for transportation to the station orepasses.
Caledonia Mining Corporation Plc
S-K 1300 Technical Report Summary on the Blanket Gold Mine, Zimbabwe
Figure 53: Schematic Representation of Long-hole Stoping Mining Method
Conventional underhand stoping is used in orebodies with a width less than 3 m. Underhand stoping is particularly suitable for steeply dipping, narrow orebodies and allows for better control of the stoping width and dilution. The sublevel spacing and coning arrangement is similar to the long hole mining approach, the only difference is that in the conventional underhand the extraction haulage can be established within the orebody.
Box raises are established instead of draw points in instances where the extraction haulage only services a single orebody and will have no interference with tramming from other orebodies. Once box raises have been established coning can take place on the coning sublevel. A slot is created on the sublevel above the coning level once the third cone has been established. Underhand jackhammer drilling and blasting cycle commences once slot has been created and temporary support are installed. Whereas in long hole the holes cover the full span of the sublevel in underhand drilling 2m bench lifts are drilled and blasted at each cycle until the bench holes onto the sublevel below and the sequence continues over the strike of the orebody panel until it is exhausted.
Retreat direction on a panel is dependent on the number of slot -raises established within the panel. In some cases in a 60-70m panel, a slot raise system is established midway which allows for retreat from the central slot is two directions.
Caledonia Mining Corporation Plc
S-K 1300 Technical Report Summary on the Blanket Gold Mine, Zimbabwe
Stoping preparations commence by mining ore handling raises at 15 m intervals along the extraction haulage from the footwall of the orebody. Development within the orebody is the same as in the long-hole stoping sections, with the difference being that boxes can be mined instead of draw points.
Upon establishment of sufficient ore handling raises, production commences with sliping around the ore handling raise to establish faces. Mining is done in both directions on strike with one face leading the other. Extreme end raises are equipped to serve as access raises for men, material and ventilation. The lower level is equipped with boxes at set intervals from which ore will be drawn. A schematic representation of the mining method is illustrated in Figure 54.
Figure 54: Schematic Representation of Underhand Stoping Mining Method
The sequence is repeated and as the stope extends horizontally, new stopes are established to maintain the required production rates. The stope is mined up to the extents of the orebody.
Item 13 (a) – PARAMETERS RELEVANT TO MINE DESIGN
| | I. | GEOTECHNICAL AND HYDROLOGICAL PARAMETERS |
Rock Engineering, Geotechnical and Hydrological Parameters
Blanket Mine has employed a rock engineering department as of February 2020 for the required geotechnical inspections and designs of the underground workings. All legal appointments pertaining to rock engineering requirements are in place. The geotechnical model for Blanket Mine is being revised & with this in mind support standards are continually reviewed and rock mechanics recommendations for the current mining operations are in place.
Caledonia Mining Corporation Plc
S-K 1300 Technical Report Summary on the Blanket Gold Mine, Zimbabwe
Rock mass conditions are simulated with Flack 3D numerical modelling program on a quarterly basis and were deemed necessary. Rock strength testing that was conducted by Groundwork consulting and laboratory testing done by Rock lab in South Africa to gain a better understanding of the rock mass failure mechanisms. The poisons ratio, Youngs modulus, friction angles and intact rock strengths were tested and is now followed up with intact rock strength and core samples being tested with point load tested on mine to corelate and indicate anomalies for the use in new layouts and designs. New geotechnical information is gained via borehole logging and mapping by the geological department and placed on plans and into the electronic model. A hydrological area was intersected at 850 level which halted the development area where 46l/hr was measured and was drained successfully which enabled development to continue. Rock engineering work has been conducted for the newly targeted mining areas below 1,100m Level. The studies and work associated with these parameters will be addressed by the rock engineering department as data is generated and access is obtained through development. This will further inform the geotechnical model which will be constructed as information become available and be placed into the electronic model.
Two secondary support crews have been trained by specialist in the installation of wire-mesh, lacing, gunniting and mechanical anchors. They are deployed to planned areas where high stresses are expected from the numerical modelling or in life of mine excavations to safeguard the areas for the future accesses.
Underground Access, Ore Flow and Material Handling
The Blanket Mine consists of several small shafts that provide access to the various orebodies in which mining operations take place. With CMS being completed, it now provides access to Mineral Resources from 750 m Level down to 1,110 m Level. Mining activities will be focused on Mineral Resources below 750 m Level. Production below 1110 m Level is planned to be accessed through declines from the respective mining areas. The hoisting capacity and current utilisation of the shafts are detailed in Table 24.
Caledonia Mining Corporation Plc
S-K 1300 Technical Report Summary on the Blanket Gold Mine, Zimbabwe
Figure 55: Blanket Mine Shaft Infrastructure
Caledonia Mining Corporation Plc
S-K 1300 Technical Report Summary on the Blanket Gold Mine, Zimbabwe
Table 24: Shaft Utilisation and Hoisting Capacity
Shaft | Access Description | Utilisation | Hoisting Capacity |
Central Shaft | Surface to 35 Level | Ore, men and material | 2 x 10 tonne skips |
No. 4 Shaft | Surface to 22 Level | Ore and material | 2 x 6 tonne skips |
Jethro Shaft | Surface to 7 Level | Men and material | Single deck cage |
Lima Shaft | Surface to 8 Level | Ore, men and material | 1 x 1 tonne skip |
Incline Shaft | Surface to 7 Level | Material | 1 x 2 tonne skip |
5 Winze | 7 Level to 22 Level | Men and material | Double deck cage |
Eroica Shaft | 14 Level to 18 Level | Ore, men and material | 1 x 1.5 tonne skip |
No. 6 Shaft | 22 Level to 26 m Level | Ore, men and material | 2 x 3 tonne skip |
Blanket Mine ventilation system is designed with common intakes and several exhaust shafts. Intake air is directed to the lowest active mining workings where the air then ascends along the working faces to the main returns by means of Natural Ventilation Pressure (NVP) and mechanical ventilation.
The majority intake air is through Central Shaft and distributed via 22,26,30,34 and 35 Level to the workings, with additional intakes from Jethro Shaft.
The mechanised decline sections are ventilated mechanically with force exhaust overlap system, and each layout is approved by the ventilation officer, underground manager and general manager.
The ventilation system is constructed and simulated with the use of electronic software (VUMA) to develop a plan to ensure Blanket mine can be ventilated effectively and assist with any major ventilation changeover that can be micro modelled with fan and column selection to ensure compliance. Figure 25 below indicates the simulated ventilation system for Blanket Mine at December 2023.
The Caledonia group employs a full time Group Ventilation Engineer to advise on changes in the ventilation strategy and design.
Figure 56: Blanket Mine Simulated Ventilation airflow
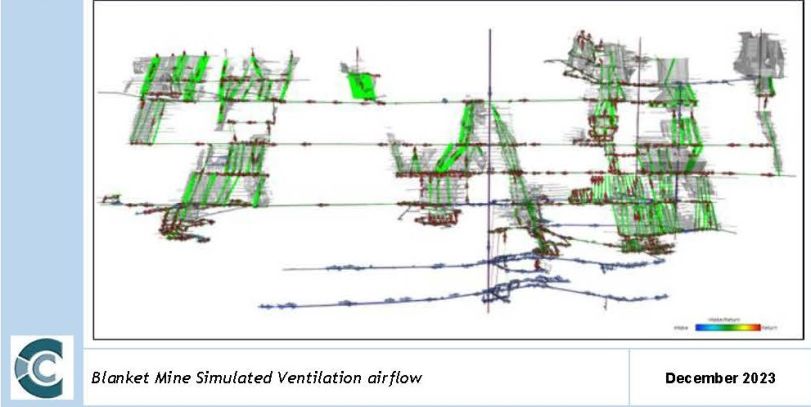
Caledonia Mining Corporation Plc
S-K 1300 Technical Report Summary on the Blanket Gold Mine, Zimbabwe
The current Blanket Mine ventilation system limit is reached with NVP at 26 level. Mechanical ventilation systems installed on 30,34 and 35 Level. To alleviate the limit of the NVP and to reduce the underground ventilation installations, an alternative solution was investigated and determined. The solution coincides with the current ventilation system, which entails several exhaust shafts combined with surface fans. The following shafts are earmarked for a bifurcated fan installation:
The exhaust shaft installations are planned to exhaust volume of 300m³/s when completed. This is a significant investment into the LOM of Blanket Mine.
Item 13 (b) – PRODUCTION RATES, EXPECTED MINE LIFE, MINING UNIT DIMENSIONS, AND MINING DILUTION
The production days may vary from month to month and are dictated by the public holidays in each month. The calendar is shared by the plant manager to all HODs. Drilling and blasting operations are conducted on dayshift while nightshift conducts cleaning operations. The Blanket Mine shift system is detailed in Table 25.
Table 25: Blanket Mine Shift System
Shift | Activity | Duration |
Day Shift | Drilling and blasting | 8 Hours |
Blasting and Re-entry | Blasting and Re-entry | 4 Hours |
Night Shift | Lashing and cleaning | 12 Hours |
Tramming is conducted on both morning and night shift.
The planned development rates for the Blanket Mine are detailed in Table 26.
Table 26: Blanket Mine Development Rates
Development Type | Unit | Value |
Box Raise | m/d | 1.3 |
Cut off Raise | m/d | 1.3 |
Connection Crosscut | m/d | 1.3 |
DD Cubbies | m/d | 1.3 |
DD Chamber | m/d | 1.7 |
DD Crosscut | m/d | 1.7 |
Decline | m/d | 1.7 |
Decline Connection | m/d | 1.7 |
Decline Crosscut | m/d | 1.7 |
Decline Chairlift | m/d | 1.7 |
Decline Conveyor | m/d | 1.7 |
Drawpoint Raise | m/d | 1.3 |
Drawpoint Crosscut | m/d | 1.7 |
Subdrive | m/d | 1.3 |
Dump Truck Access Bay | m/d | 1.7 |
Extraction Haulage | m/d | 1.7 |
Haulage | m/d | 1.7 |
Caledonia Mining Corporation Plc
S-K 1300 Technical Report Summary on the Blanket Gold Mine, Zimbabwe
Development Type | Unit | Value |
Laybye | m/d | 1.7 |
Loading Bay | m/d | 1.7 |
Lead Drive | m/d | 1.7 |
LHD Access Bay | m/d | 1.7 |
Muck Bay | m/d | 1.7 |
Orepass Raise | m/d | 1.3 |
Raisebore | m/d | 1.2 |
Refuge Cubby | m/d | 1.7 |
Shunting Bay | m/d | 1.7 |
Sub Station Crosscut | m/d | 1.7 |
Slot Raise | m/d | 1 |
Sump | m/d | 1.7 |
Service Raise | m/d | 1.3 |
TW Raise | m/d | 1.3 |
Vent Raise | m/d | 1.3 |
Blanket Mine plans to produce 74-80 koz of gold per year. The LoM plan reflects a consistent 70 koz of gold production from Mineral Reserves only over an 11-year period from 2024 until 2034. The planned production rates from the different orebodies are detailed in Table 27.
Table 27: Blanket Mine Production Rates
Type | Unit | Value |
LH Stoping | tpd | 100 |
UH Stoping | tpd | 40 |
Pillar | tpd | 80 |
Draw point | tpd | 40 |
Caledonia Mining Corporation Plc
S-K 1300 Technical Report Summary on the Blanket Gold Mine, Zimbabwe
LIFE OF MINE PLAN
The Blanket LoM plan commences on the January 1, 2024. The LoM plan includes Measured, Indicated and Inferred Mineral Resources, however only diluted Measured and Indicated Mineral Resources in the LoM plan were considered for conversion to Mineral Reserves.
The mining strategy targets primarily the Mineral Resources below 750 m Level. Mining in the Lima orebody targets Mineral Resources above 750 m Level. In the ARS East West Limb, Blanket and Blanket Feudal orebodies, some mining will take place above 630 m Level.
The diluted production schedule for the Blanket Mine is illustrated in Figure 57.
Figure 57: Diluted Life of Mine Production Schedule by Mineral Resource Classification
A total of 2,129 kt Measured Mineral Resources at a grade of 3.21 g/t and 5,555 kt Indicated Mineral Resources at a grade of 3.31g/t is included in the LoM plan. A LoM of 11 years is envisaged for the Blanket Mine. Of this 64% is attributable to Caledonia (1,363 kt Measured Mineral Resources and 3,555 kt Indicated Mineral Resources). The content delivered to the plant from the Blanket Mine is illustrated in Figure 58.
Caledonia Mining Corporation Plc
S-K 1300 Technical Report Summary on the Blanket Gold Mine, Zimbabwe
Figure 58: Blanket Mine Content Delivered to the Plant
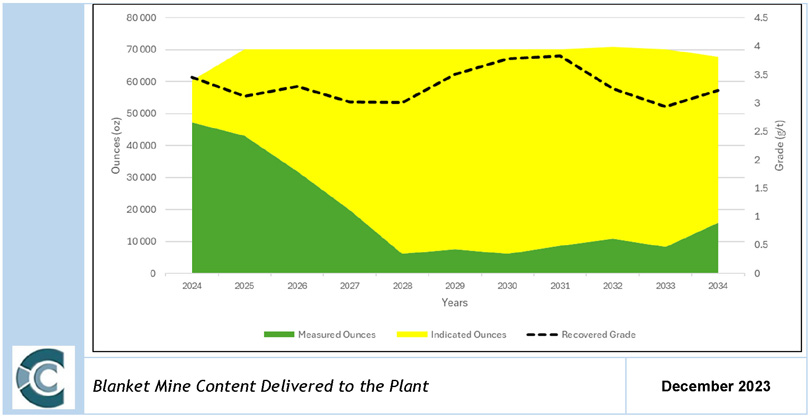
The LoM plan includes a total of 220 koz and 592 koz of gold from the Measured and Indicated Mineral Resource Classifications, respectively. Of this 64% is attributable to Caledonia (141 koz Measured Mineral Resources and 379 koz Indicated Mineral Resources). The monthly ore tonne production is illustrated in Figure 59 and Figure 60.
Figure 59: Monthly Stope Ore Tonne Production
Caledonia Mining Corporation Plc
S-K 1300 Technical Report Summary on the Blanket Gold Mine, Zimbabwe
Figure 60: Monthly Development Ore Tonne Production
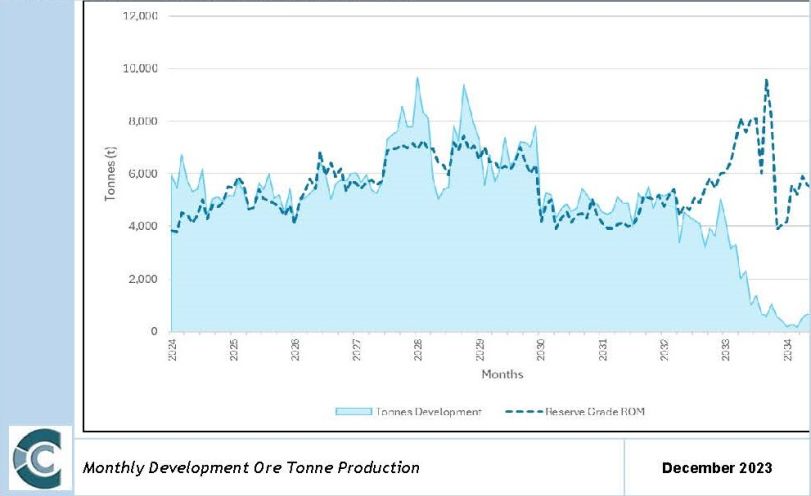
Caledonia Mining Corporation Plc
S-K 1300 Technical Report Summary on the Blanket Gold Mine, Zimbabwe
Mining Unit Dimensions
The planned dimensions for development are detailed in Table 28.
Table 28: Development Dimensions
Description | Width | Height |
m | m |
Box Raise | 1.5 | 1.5 |
Cut off Raise | 1.5 | 1.5 |
Connection Crosscut | 1.6 | 1.8 |
DD Cubbies | 1.6 | 1.8 |
DD Chamber | 6.0 | 7.0 |
DD Crosscut | 2.5 | 2.0 |
Decline | 4.0 | 3.0 |
Decline Connection | 3.0 | 3.0 |
Decline Crosscut | 3.0 | 3.0 |
Decline Chairlift | 5.5 | 3.0 |
Decline Conveyor | 4.0 | 3.0 |
Drawpoint Raise | 1.5 | 1.5 |
Drawpoint Crosscut | 3.0 | 3.0 |
Subdrive | 1.6 | 1.8 |
Dump Truck Access Bay | 4.0 | 3.0 |
Extraction Haulage | 3.0 | 3.0 |
Haulage | 3.0 | 3.0 |
Laybye | 3.0 | 3.0 |
Loading Bay | 4.0 | 3.0 |
Lead Drive | 4.0 | 3.0 |
LHD Access Bay | 4.0 | 3.0 |
Muck Bay | 5.5 | 3.0 |
Orepass Raise | 1.5 | 1.5 |
Raisebore | 2.0 | 2.0 |
Refuge Cubby | 2.5 | 2.0 |
Shunting Bay | 3.0 | 3.0 |
Sub Station Crosscut | 3.0 | 3.0 |
Slot Raise | 1.5 | 1.5 |
Sump | 5.5 | 3.0 |
Service Raise | 1.5 | 1.5 |
TW Raise | 1.5 | 1.5 |
Vent Raise | 1.5 | 1.5 |
The mine design criteria for the Blanket Mine is detailed in Table 29.
Caledonia Mining Corporation Plc
S-K 1300 Technical Report Summary on the Blanket Gold Mine, Zimbabwe
Table 29: Mine Design Criteria for Blanket Mine
| | Unit | Unit |
Level Parameters |
Main Level Spacing | m | 120 |
Sub-level Spacing (Middling) | m | 15 |
Draw point Crosscut Spacing | m | 15 |
Diamond Drilling Crosscut Spacing (Along sub drives and lead drives) | m | 7.5 |
Extraction Haulage Spacing from Orebody | m | 15 |
Development Lead Angle | Degrees | 45 |
Production Lead Angle | Degrees | 72 |
Pillars |
Sill Pillar Thickness | m | 15 |
Crown Pillar Thickness | m | 15 |
Sill Pillar Spacing | m | 90 |
The Blanket Mine design is illustrated in Figure 61.
Figure 61: Blanket Mine Design
| | III. | MINERAL RESERVE CONVERSION FACTORS |
Mineral Reserve conversion factors are applied to convert the Mineral Resources to Mineral Reserves. The applied Mineral Reserve conversion factors are detailed as follows:
Geological Losses
Geological loss is applied to account for geological uncertainty associated with different Mineral Resource categories. The mine plan includes Inferred Mineral Resources, Indicated Mineral Resources and Measured Mineral Resources. Geological losses of 2.5% was applied to Measured Mineral Resources, 5.0% to Indicated and 10.0%Inferred Mineral Resources.
Caledonia Mining Corporation Plc
S-K 1300 Technical Report Summary on the Blanket Gold Mine, Zimbabwe
Pillar Extraction
A pillar extraction of 50% has been applied to account for pillars which will be extracted on retreat when a block has been mined out. The pillar extraction accounts for the extraction of sill pillars (including pillars between draw points) which will be extracted.
A detailed rock engineering recommendation, risk assessment involving Mining, MRM, Ventilation is required to determine which pillars are eligible for partial or total extraction.
Mining Losses
Ore losses occur when mined material containing grade, is mixed with waste material, and can be attributed to several different causes. Different ore losses have been applied to account for ore to waste losses during mining of the various orebodies. It was assumed that the entire thickness of the reef is taken out, with negligible ore lost to waste.
Dilution
Dilution is defined as a percentage value representing a certain amount of waste material that is mixed with the ore during the mining process. This results in increased ore tonnages, but due to waste material containing no or very little grade, the overall grade delivered to the plant is decreased.
The thickness of the orebodies mined at the Blanket Mine vary significantly and are in some instances very irregularly shaped. The Blanket Mine applies an accepted dilution of 8.0%, derived from actual production figures.
Dilution of 15 cm in the hanging wall and footwall was applied to orebodies which are mined using the conventional underhand mining method and dilution of 30 cm was applied to orebodies which are mined using long-hole stoping. It has been assumed that drilling with shorter drill steels in conventional mining results in less overbreak than drilling with long drill steels used in long-hole stoping.
The average dilution calculation is detailed in Table 30.
Table 30: Blanket Mine Average Dilution Calculation
Orebody | Mining Method | Average Orebody Thickness | HW and FW Dilution | Dilution |
cm | cm | % |
BLK1HW | Underhand | 300 | 30 | 10.00 |
BLK2FW | Underhand | 270 | 30 | 11.11 |
BLK2HW | Underhand | 800 | 30 | 3.75 |
BLK3 | Underhand | 380 | 30 | 7.89 |
BLK45 | Underhand | 700 | 30 | 4.29 |
BLK6FW | Underhand | 1050 | 30 | 2.86 |
BLK6HW | Underhand | 820 | 30 | 3.66 |
BQRHWN | Long-hole | 700 | 30 | 4.29 |
BFHW | Underhand | 400 | 30 | 7.50 |
ARS | Long-hole | 1500 | 60 | 4.00 |
ARS EXTENSION | Long-hole | 450 | 60 | 13.33 |
ARM | Long-hole | 1200 | 60 | 5.00 |
ARMFFW1 | Underhand | 120 | 30 | 25.00 |
LIMA MAIN | Underhand | 200 | 30 | 15.00 |
ERCN | Underhand | 500 | 30 | 6.00 |
Average Dilution | 8.00 |
Caledonia Mining Corporation Plc
S-K 1300 Technical Report Summary on the Blanket Gold Mine, Zimbabwe
| | ● | Mine Call Factor: MCF is the ratio, expressed as a percentage, which the specific product accounted for in recovery plus residues bears to the corresponding product called for by, the Mine's measuring methods. The MCF was calculated from historic and current figures. The MCF calculation from 2015 to 2023 is detailed in Table 31. A MCF of 100% has been used for the Blanket Mine, derived from the actual MCF calculations from 2015 to 2023. A MCF of 100% has been maintained and will need to be monitored for fluctuations due to the move to a fully electronic resource estimation system. |
Table 31: Blanket Mine - Mine Call Factor Calculation 2015 to 2022
Year | Milled Tonnes | Gold Recovered | Gold in Tails | Gold Accounted For | Total Mined Tonnes | Mined Grade | Gold Called For | MCF |
t | oz | oz | oz | t | g/t | oz | % |
2015 | 440,057 | 42804 | 3,243 | 46,047 | 442,451 | 3.25 | 42,574 | 108% |
2016 | 510,662 | 50,351 | 3,794 | 54,145 | 506,086 | 3.3 | 50,903 | 106% |
2017 | 547,060 | 56,133 | 3,941 | 60,074 | 547,060 | 3.41 | 56,826 | 106% |
2018 | 560,913 | 54,512 | 4,166 | 58,678 | 545,267 | 3.25 | 56,626 | 104% |
2019 | 556,746 | 55,182 | 3,902 | 59,084 | 556,440 | 3.3 | 57,248 | 103% |
2020 | 597,962 | 57,899 | 3,845 | 61,744 | 571,061 | 3.21 | 59,854 | 103% |
2021 | 665,627 | 67,476 | 4,409 | 73,844 | 667,342 | 3.36 | 72,631 | 102% |
2022 | 752,033 | 80,775 | 5,343 | 86,118 | 756,478 | 3.5 | 80,235 | 98% |
2023 | 770,421 | 75,416 | 5,003 | 80,419 | 751,087 | 3.25 | 80,272 | 94% |
Average MCF | 103% |
Notes:
| | 1. | A MCF of 100% has been used for the Blanket Mine, derived from the actual MCF calculations from 2015 to 2023. |
Item 13 (c) – REQUIREMENTS FOR STRIPPING, UNDERGROUND DEVELOPMENT AND BACKFILLING
| | I. | UNDERGROUND DEVELOPMENT |
The existing development forms part of the mine plan to provide access to the underground workings and the targeted mining areas.
Additional development is required for opening sufficient ground and to provide access to the mining areas below 750 m Level. Different development requirements exist for the orebodies included in this study.
The naming convention used in the development designs are detailed in Table 32.
Table 32: Development Designs Naming Convention
Design Naming Convention | Definition |
CON | Draw point Cone. Refers to the cone that is established for each draw point. |
CTO | Cut off Raise. Refers to the raises developed connection the economic limits of an orebody along strike. |
HLG | Diamond Drill Crosscut. Refers to crosscuts that are developed along declines and haulages from which exploration drilling is typically done. |
DXT | Diamond Drill Chamber. Refers to a cubby that has been slyped to required size for Diamond Drilling activities. |
DEC | Decline. Refers to the development of the declines to provide access to the different areas in the Blanket Mine. |
Caledonia Mining Corporation Plc
S-K 1300 Technical Report Summary on the Blanket Gold Mine, Zimbabwe
Design Naming Convention | Definition |
CHL | Decline Chairlift. Refers to the development of the declines to provide access for Men and material. |
CON | Decline. Refers to the development of the declines to provide exacation for conveyor belt and return air. |
DXT | Decline Crosscut. Refers to the access crosscuts which offramp from the declines to the main haulages and extraction haulages. |
HLE | Drawpoint Crosscut. Provides access from the extraction haulage or main haulage to the draw point. |
RSE | Drawpoint Raise. Refers to the raises developed from the lower main level to the first sub-level as a starting point for coning. |
HLE | Extraction Haulage. Refers to horizontal off-reef development which services tramming activities for individual orebodies. |
HLG | Haulage. Refers to horizontal off-reef development along the strike of the orebody. Also called the tramming haulage. |
LDR | Lead Drive. Refers to the main level drive that are developed first and leads the sub-level development. |
OPS | Orepass Raise. Refers to the raises developed to facilitate ore movement from in-ore development activities. |
RBR | Raisebore. Refers to Raisebore drilling done to support ventilation requirements. |
DRV | Subdrive. Refers to horizontal on-reef development along the strike of the orebody. |
TWA | Travelway Raise. Refers to the raises developed to faciliate initial orebody access per level. |
VNT | Ventilation raises. Refers to the raises that are developed between levels for ventilation purposes. |
The Blanket Mine will focus on key development ends to open ground on 30, 34 and 38 Level. The planned capital development consists of:
| | ● | 30 Level North and South to the full extent of the orebody limits |
| | ● | 34 Level North and South to the full extent of the orebody limits |
| | ● | Decline from 34 to 38 level |
| | ● | Diamond Drill cross cuts for exploration purposes |
Caledonia Mining Corporation Plc
S-K 1300 Technical Report Summary on the Blanket Gold Mine, Zimbabwe
Figure 62: Blanket Mine Development Design
Development meters are high throughout the first 5 years of the LoM plan with the focus on opening up Mineral Resources below 870 m. The development profile for the Blanket Mine is illustrated in Figure 63.
Figure 63: Blanket Mine Development Profile
The Blanket Mine currently does not have any requirements for backfilling within any of the mining areas. If future depth extensions are planned, it may require an investigation into backfill requirements.
Caledonia Mining Corporation Plc
S-K 1300 Technical Report Summary on the Blanket Gold Mine, Zimbabwe
Item 13 (d) – REQUIRED MINING FLEET, MACHINERY AND PERSONNEL
| | I. | MINING FLEET AND MACHINERY |
The underground mining fleet consists of rail-bound and trackless equipment. Production and development drilling is done by using a combination of Seco 25 jackhammers in conventional underhand mining areas while Seco 36 drifters are used in long-hole stoping areas. The underground rail-bound and trackless fleet is detailed in Table 33.
Table 33: Blanket Mine Current Mining Fleet
Fleet | Quantity |
Rail-bound Fleet |
Air loaders | 33 |
Battery operated locomotives | 27 |
Cars (Material & Hoppers) | 192 |
Trackless Fleet |
Dump trucks | 13 |
LHDs | 18 |
Bobcat | 1 |
Utility vehicles | 1 |
Rock breakers | 3 installed (Eroica 740mL, 870mL,990mL) |
The mining personnel for the Blanket mine is detailed in Table 34.
Table 34: Blanket Mine Mining Personnel
Positions | Run Of Mine | Capital Project | Total |
Executive Vehicle Driver | 1 | 0 | 1 |
Heavy Vehicle Driver | 5 | 0 | 5 |
Senior Vehicle Driver | 2 | 0 | 2 |
Air Loader Driver | 2 | 1 | 3 |
Assistant Banksman | 4 | 0 | 4 |
Assistant Boilermaker | 24 | 1 | 25 |
Assistant Drifter Operator | 7 | 1 | 8 |
Assistant Fitter | 39 | 8 | 47 |
Assistant Loco driver | 1 | 1 | 2 |
Assistant Machine Operator | 58 | 25 | 83 |
Assistant Overseer Miner | 2 | 0 | 2 |
Assistant Plumbers | 3 | 0 | 3 |
Assistant Auto-Electrician | 0 | 4 | 4 |
Assistant Diesel Plant Fitter | 1 | 19 | 20 |
Assistant Mechanics | 1 | 0 | 1 |
Assistant Shaft Timberman | 1 | 0 | 1 |
Auto Electrician Class 2 | 1 | 1 | 2 |
Bellman | 33 | 0 | 33 |
Black Smiths | 2 | 0 | 2 |
Boilermaker | 16 | 0 | 16 |
Caledonia Mining Corporation Plc
S-K 1300 Technical Report Summary on the Blanket Gold Mine, Zimbabwe
Builder's Assistant | 5 | 0 | 5 |
Bus Driver | 1 | 0 | 1 |
Carpenter | 3 | 0 | 3 |
Carpenter's Assistant | 4 | 0 | 4 |
Compressor Attendants | 10 | 0 | 10 |
Construction Assistants | 7 | 3 | 10 |
Conveyor Attendants | 1 | 0 | 1 |
CRANE OPERATOR | 3 | 0 | 3 |
Crusher Attendants | 10 | 0 | 10 |
Desilting Lashers | 11 | 1 | 12 |
Diesel Plant Fitter | 1 | 7 | 8 |
Drifter Operator | 26 | 0 | 26 |
Drill Rig Operator | 4 | 0 | 4 |
Dump Truck Drivers | 7 | 3 | 10 |
Electrical Assistants | 28 | 0 | 28 |
Electrical Charge Hand | 2 | 0 | 2 |
Electrician | 8 | 0 | 8 |
Fitter | 19 | 0 | 19 |
Gang-leader | 73 | 17 | 90 |
General Hand | 8 | 0 | 8 |
Graded Boilermaker | 4 | 0 | 4 |
Graded Fitter | 6 | 0 | 6 |
Hoist Driver | 29 | 0 | 29 |
Instrument Technician | 1 | 0 | 1 |
Lamp Attendant | 10 | 0 | 10 |
Lasher | 452 | 77 | 529 |
LHD Driver | 35 | 15 | 50 |
Loader Driver | 24 | 1 | 25 |
Loco Assistant | 7 | 1 | 8 |
Loco driver | 50 | 5 | 55 |
Lubricator | 2 | 0 | 2 |
Machine Operator | 115 | 25 | 140 |
Magazine Attendants | 6 | 1 | 7 |
Mahewu brewers | 1 | 0 | 1 |
Maintenance Planner | 1 | 0 | 1 |
Mechanic | 2 | 0 | 2 |
Mobile Crane Driver | 1 | 0 | 1 |
Overseer miner | 7 | 1 | 8 |
Planned Maintenance Clerk | 2 | 0 | 2 |
Planned Maintenance Officer | 1 | 0 | 1 |
Plumber | 1 | 0 | 1 |
Projects Vehicle Drivers | 2 | 0 | 2 |
PTV Assistant | 7 | 4 | 11 |
Pump Attendants | 22 | 0 | 22 |
Rock Drill Fitter | 4 | 0 | 4 |
Rock Drill Fitters Assistant | 4 | 0 | 4 |
Rubber Liner Assistant | 1 | 0 | 1 |
Caledonia Mining Corporation Plc
S-K 1300 Technical Report Summary on the Blanket Gold Mine, Zimbabwe
Raise Riggers | 14 | 0 | 14 |
Rigger's Assistant | 1 | 0 | 1 |
Rockbreaker Operators | 2 | 1 | 3 |
Rubber Liner | 1 | 0 | 1 |
Sanitation Attendant | 4 | 0 | 4 |
Scada Attendant | 3 | 0 | 3 |
Senior Crusher Attendant | 1 | 0 | 1 |
Senior Gang Leader | 8 | 3 | 11 |
Senior Hoist Driver | 1 | 0 | 1 |
Senior LHD Driver | 1 | 0 | 1 |
Senior Magazine man | 1 | 0 | 1 |
Senior Overseer Miner | 10 | 3 | 13 |
Shaft Assistant | 2 | 0 | 2 |
Shaft Clerk | 5 | 0 | 5 |
Shaft Timberman | 2 | 0 | 2 |
Shaft Timberman Assistant | 7 | 0 | 7 |
Shift Boss | 1 | 0 | 1 |
Stand-by Vehicle Driver | 3 | 0 | 3 |
Tractor Driver | 4 | 0 | 4 |
TRAMMER | 18 | 2 | 20 |
Tyre Fitter | 0 | 1 | 1 |
U/Graded Builder | 4 | 0 | 4 |
U/Graded Carpenter | 1 | 0 | 1 |
U/Graded Electricians | 3 | 0 | 3 |
U/Graded Mechanics | 3 | 0 | 3 |
U/Graded Painter | 2 | 0 | 2 |
U/Graded Plumber | 1 | 0 | 1 |
Upgraded Boilermaker | 8 | 0 | 8 |
Upgraded Fitter | 4 | 0 | 4 |
Grand Total | 1346 | 232 | 1578 |
Source: Blanket Mine
Caledonia Mining Corporation Plc
S-K 1300 Technical Report Summary on the Blanket Gold Mine, Zimbabwe
ITEM 14 – RECOVERY METHODS
Item 14 (a) – FLOW SHEETS AND PROCESS RECOVERY METHODS
The Blanket gold plant consists of a conventional crushing, milling, CIL, batch elution and smelting configuration current running at 66 ktpm. A process flow diagram is shown in Figure 64.
The plant consists of the following circuits:
| | ● | Primary crushing - jaw crushers |
| | ● | Secondary crushing - cone crushing in closed circuit with a screen. |
| | ● | Primary Milling - rod mills in open circuit |
| | ● | Regrind - ball mills in closed circuit with cyclones. |
| | ● | Gravity Concentration – Knelson concentrators and Gemini table |
| | ● | Intensive leach for gravity concentrate. |
| | ● | Thickening - Dewatering cyclones |
| | ● | Leaching - Carbon in Leach (CIL) |
| | ● | Elution and electrowinning – Combined in batch mode |
| | ● | Carbon regeneration - Re-activation kiln |
| | ● | Tailing Deposition – Tailing Storage Facility (TSF) |
| | ● | Figure 103: Crushing and Milling Process Flow Diagram |
Figure 64: Crushing and Milling Process Flow Diagram
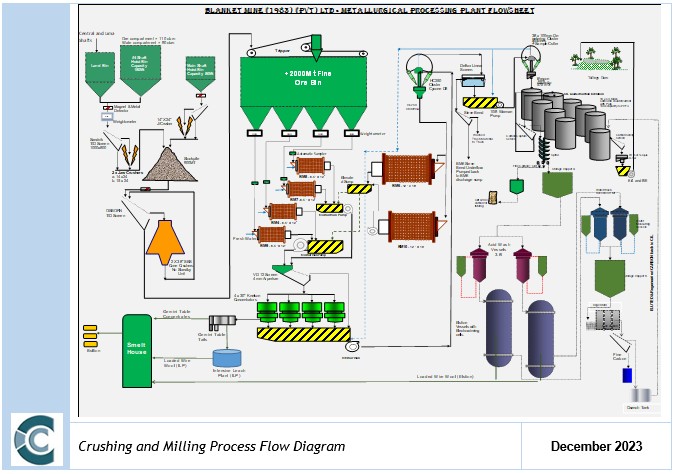
Caledonia Mining Corporation Plc
S-K 1300 Technical Report Summary on the Blanket Gold Mine, Zimbabwe
There was a gradual increase in milled tonnes from 2014 to 2023 at a rate of 42,200 tonnes per year. The tonnes milled in 2023 was the highest at 770,421 tonnes from 390,734 in 2014 as evidenced in Table 35.This gradual ramping up of tonnage saw a corresponding increase in production at a rate of 3,738 ounces per year with the highest in 2022 when 80.8k ounces were achieved.
Table 35: Historic Plant Production 2014 – 2023
It is worth noting that the use of oxygen improved CIL recovery from an average of 85.0% to 87.6% from the time the Oxygen Plant was commissioned in the fourth quarter of 2019. This has led to an increased overall recovery from 93.0% to the current 93.8%. The gravity gold recovery was varying between 46.50% and 58.10% over the 10-year period with no significant trend pattern.
The plant is expected to achieve a similar recovery in future when treating current Blanket RoM material. RoM material from other sources may be more refractory and will have to be tested before being treated in the Blanket plant.
Figure 65: Historic Milled Tonnes Plant Feed Grade against Plant Final Tails from 2014 to 2023
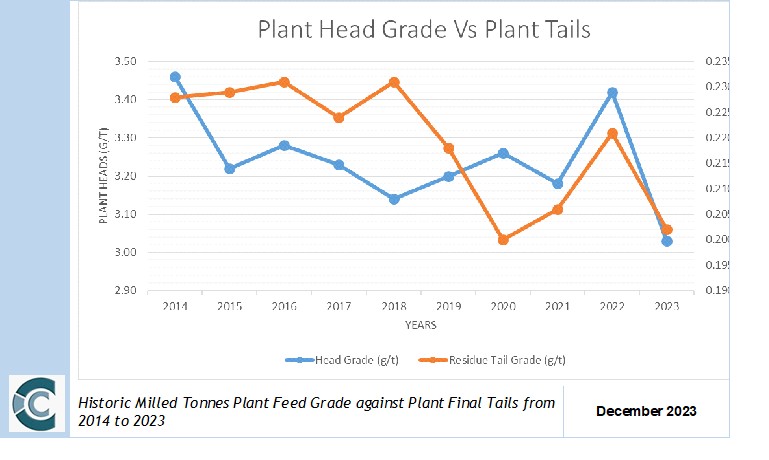
Caledonia Mining Corporation Plc
S-K 1300 Technical Report Summary on the Blanket Gold Mine, Zimbabwe
Figure 66: Historic Recoveries and Gold Production from June 2014 to May 2023
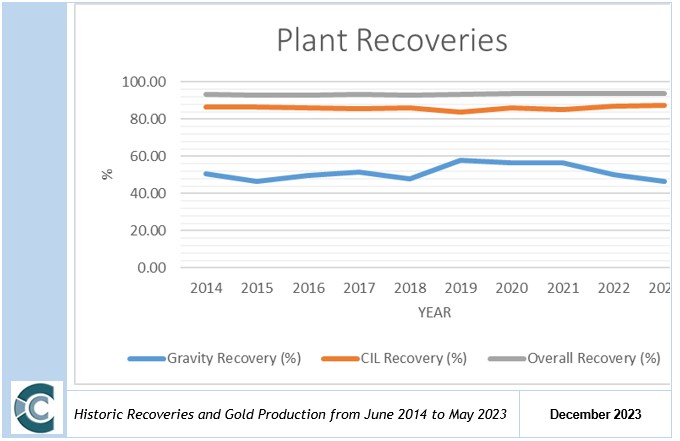
A new TSF has been commissioned on Blanket during February 2024. The engineer of record has been appointed and the latest report will be available after each quarter. The decommissioned TSF, available for use, if necessary, has been equipped with electronic piezometers that can be monitored live. The current phreatic surface does not pose any risk of planar or wedge failure as the dam is relatively dry and well drained. The new TSF was designed as per latest Global Industry Standards of TSF Management.
The new TSF, Phase 1A commenced with deposition during December 2023 as planned and fully commissioned during February 2024. The Phase 1B is currently under construction for completion in by Q4 2024. A final Phase 2 is planned to commence and be completed in 2025. The completion of the new TSF will provide a further 20 years of depositional life at current production rates until 2044, sufficient for the LoM based upon Mineral Reserves. The appropriate liner as per the GSTIM is being used and all the necessary documentation on the design and implementation is available.
Item 14 (b) Process Flow and Equipment Specifications.
The plant was designed and constructed by Kinross Mining Company to treat RoM ore from the Blanket mine. The ore is fed over 14" x 24" jaw crushers to reduce the top size from -300 mm to less than 80 mm. The ore from No. 4 Shaft is crushed to -135 mm underground. Tramp iron magnets (located ahead of the crushers) remove scrap iron before it enters the cone crushers. The crushed ore is stored on a 900-tonne open stockpile from where material is fed to the cone crushers (Figure 67).
Caledonia Mining Corporation Plc
S-K 1300 Technical Report Summary on the Blanket Gold Mine, Zimbabwe
Figure 67: Cone Crusher Building
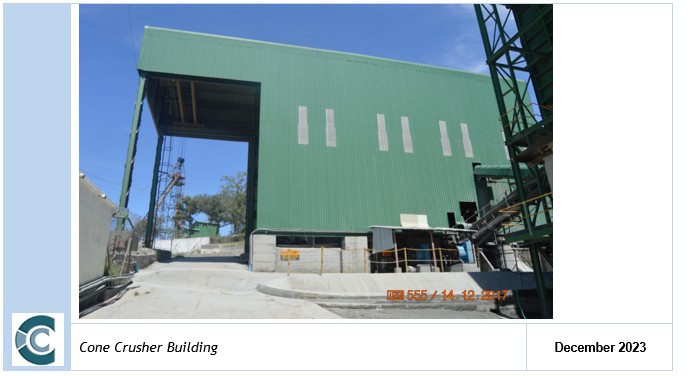
The cone crushers were upgraded recently and replaced with two 38" hydraulically adjusted Nordberg crushers (Figure 68). The crushers can operate independently and feed Osborn vibrating screens. The screened product which is smaller than 10 mm is delivered to the mill feed bin. The equipment quality is good and good maintenance is applied (an observation made during the site visit).
Figure 68: Cone Crushers
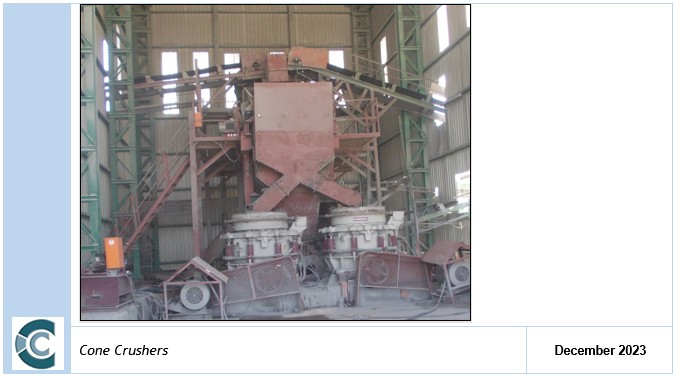
Caledonia Mining Corporation Plc
S-K 1300 Technical Report Summary on the Blanket Gold Mine, Zimbabwe
There are three 6.5 ft. x 12 ft. rod mills which operate in parallel. Each feed belt has a mill feed mass meter which is used to control and measure the mill feed rate. The foundations of the previous mills were in the process of being demolished which leaves adequate space for future expansion. The rod mill feed bin live capacity is small which, in turn, requires that the crushers operate on a three-shift cycle to ensure that the rod mills have adequate feed for continuous operation, Figure 69.
The regrind duty is performed by BM6 (12 ft x 16 ft) and BM3 (6.5 ft x 12 ft) which are operated in parallel and closed circuit. BM3 was originally configured for primary duty in parallel with the primary mills (BM4, BM7 and BM8) but was reconfigured for as a regrind mill early in 2019. Another 12 ft x 16 ft mill has been installed and will be commissioned in April 2021.
Figure 69: Rod Mills
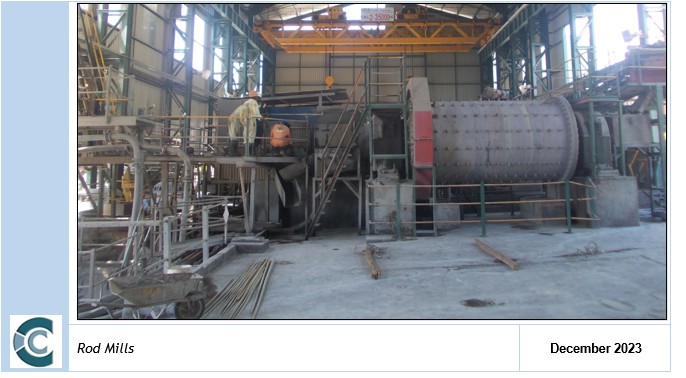
Approximately 50% to 60% of the gold production is recovered as gravity gold. Knelson Gravity Concentrators are fed from the primary mills and their concentrate is stored and processed further on a Gemini shaking table every 24 hours with the tailings recycled back into the circuit. Gemini table concentrates are taken for direct smelting whilst the tailings are sent to an Intensive Leach (“IL”) circuit. The tails from the IL are sent back to milling.
The tails of the Knelson gravity concentrator are pumped to a cyclone cluster with the coarse product (U/F) going for regrind and the fine product (O/F) sent to the Carbon in Leach (CIL) plant. The CIL consists of one pre-aeration tank and seven leach tanks where alkaline-cyanide leaching and simultaneous absorption of dissolved gold onto granular activated carbon takes place (Figure 70).
Caledonia Mining Corporation Plc
S-K 1300 Technical Report Summary on the Blanket Gold Mine, Zimbabwe
Figure 70: CIL Circuit
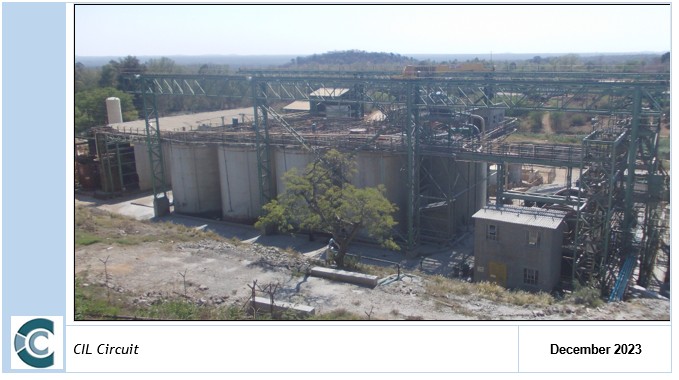
Oxygen generated from a Pressure Swing Absorption (“PSA”) oxygen plant is added into the first CIL tank; liquid oxygen is also available in the event of the oxygen plant being out of circuit for maintenance or breakdowns. There is a TAC 1000 cyanide online analyser which measures and controls cyanide addition. This process control system, in conjunction with oxygen injection, has reduced cyanide consumption.
Elution of the gold from the loaded carbon and subsequent electro-winning is done on site. There are two 2.5 tonne elution columns which operate in parallel. The design of the columns is unique in that the elution and the electro-winning processes take place in the same pressurised vessel. The advantage of this is that there is no circulation of solution outside the vessel which requires heat exchangers for heating and cooling. The overall effect is that the system is very energy efficient and cost effective. During electrowinning (Figure 71) the gold is deposited on steel wool cathodes within the elution column, and the loaded cathodes are removed on a planned cycle and acid digested. The resultant gold solids from acid digestion and the re-dressed gold concentrate from Knelson Concentrators are smelted into bars. The granular activated carbon is regenerated in a kiln before it is recirculated back to the CIL section. Loaded carbon is not acid treated to reduce reagent costs. Carbon reactivation has remained acceptable although the acid treatment can be re-introduced if required. The gold bullion, in the form of doré bars, is delivered, as required by Zimbabwean gold-mining law, to the Government-operated Fidelity Printers and Refiners for sampling and refining.
Caledonia Mining Corporation Plc
S-K 1300 Technical Report Summary on the Blanket Gold Mine, Zimbabwe
Figure 71: Elution and Electrowinning Vessels
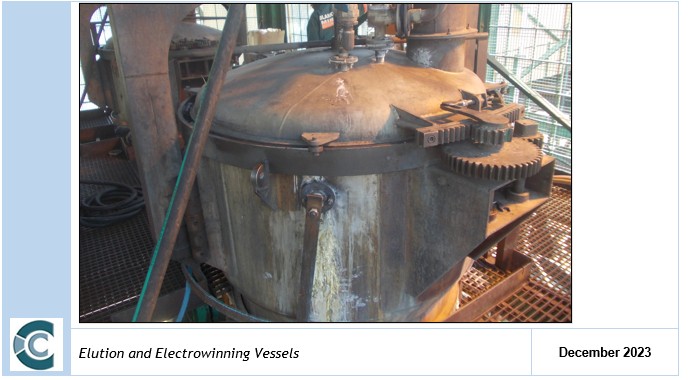
Power is supplied from the national grid, but a fully automated diesel driven power plant is available when power trips occur. The diesel power generation sets have a capacity of 10 Megawatts and can service both the mine and the plant when required.
The plant tailings from CIL are reduced in cyanide content and deposited on two licensed tailing impoundment areas located close to the plant. The maximum amount of tailings water is pumped back to the metallurgical plant for re-use. Daily management and operation of the tailing deposition area is contracted out to the Zimbabwean subsidiary of Fraser Alexander.
Table 36: Reagent and Consumable Consumptions
Item Unit Average Past Year | Item Unit Average Past Year | Item Unit Average Past Year |
Grinding Media and CIL Reagents | Grinding Media and CIL Reagents | Grinding Media and CIL Reagents |
Rods kg/t 0.68 | Rods kg/t 0.68 | Rods kg/t 0.68 |
Balls- 40 mm kg/t 0.89 | Balls- 40 mm kg/t 0.89 | Balls- 40 mm kg/t 0.89 |
Total Steel Media kg/t 1.57 | Total Steel Media kg/t 1.57 | Total Steel Media kg/t 1.57 |
Lime kg/t 1.68 | Lime kg/t 1.68 | Lime kg/t 1.68 |
Some of the higher consumptions of reagents as referred to in Table 36 was due to the high retention times of approximately 72 hours in the CIL circuit. This mainly affects carbon consumption due to the long exposure to agitation and abrasion in the CIL tanks, as well as cyanide consumption.
Caledonia Mining Corporation Plc
S-K 1300 Technical Report Summary on the Blanket Gold Mine, Zimbabwe
Item 14 (c) Slurry Deposition.
Tailings slurry from the CIL circuit is detoxified using ferrous sulphate to less than 100 ppm of free cyanide and is pumped to a Tailings Storage Facility (TSF) which is operated and maintained by a contractor (Fraser Alexander Zimbabwe), whereas a consultant (Epoch Resources) who is the Slime Dam Engineer of records do an inspection on a quarterly basis. The old TSF is partially decommissioned as pumping is 100% to the new TSF.
The new TSF was designed in accordance with Global Industry Standard of Tailings Management (GISTM). The new TSF is still under construction while deposition is taking place at completed lower ends of the new TSF basin. When completed the new TSF will cover an area of 61 hectares and the Return Water Dam (RWD) footage is 3 hectares. The slurry is pumped to the new TSF using two x 6/4 slurry pumps connected in series. The slurry line when completed would be equipped with a cross-over station that would enable to switch slurry lines using the same series pumps in case there are issues with the running slurry line.
The new TSF construction project commenced in March 2023 after the old TSF reached the end of its life. The construction of the new TSF was divided into three construction phases namely Phase 1A, Phase 1B and Phase 2. Phase 1A commenced with deposition during December 2023 and was fully commissioned at the end of February 2024 and Phase 1B commenced on 4 March 2024. Deposition of slurry at the new TSF commenced on 30 October 2023 and 144,906 tons of solids has been deposited by end of March 2024 and has risen a height of 1.9m at the intermediate penstock. The new TSF is lined with geomembrane and HDPE. Due to no seepage at the new TSF about 78% of the water is now recycled to the Plant opposed to 40% at the old TSF. The increase of recycled water has greatly assisted in reducing dependence on fresh water from the Dam. The construction of the new TSF is expected to be completed in the third quarter of 2025.
Labour Requirements
The current processing plant labour compliment is provided in Table 37.
Table 37: Plant Labour Complement
Section Position Number | Section Position Number | Section Position Number |
Plant Senior Staff Mill Superintendent 1 Asst. Mill Superintendent 1 | Plant Senior Staff Mill Superintendent 1 Asst. Mill Superintendent 1 | Plant Senior Staff Mill Superintendent 1 Asst. Mill Superintendent 1 |
Plant Staff Plant Metallurgist 1 Plant Foreman 1 Metallurgical Technician 1 Plant Operators 3 Mill Clerk 1 Elution Supervisor 1 Senior Smelting Assistant 1 Senior Lab. Assistant 1 Primary Crusher Senior Crusher Attendants 2 Crusher Attendants 13 Section Position Number Secondary Crusher Senior Crusher Attendants 1 Crusher Attendants 5 Crusher Attendants 1 Gravity &Smelting Assistants 3 | Plant Staff Plant Metallurgist 1 Plant Foreman 1 Metallurgical Technician 1 Plant Operators 3 Mill Clerk 1 Elution Supervisor 1 Senior Smelting Assistant 1 Senior Lab. Assistant 1 | Plant Staff Plant Metallurgist 1 Plant Foreman 1 Metallurgical Technician 1 Plant Operators 3 Mill Clerk 1 Elution Supervisor 1 Senior Smelting Assistant 1 Senior Lab. Assistant 1 |
| | Primary Crusher Senior Crusher Attendants 2 Crusher Attendants 13 | Primary Crusher Senior Crusher Attendants 2 Crusher Attendants 13 |
| | Section Position Number | Section Position Number |
| | Secondary Crusher Senior Crusher Attendants 1 Crusher Attendants 5 Crusher Attendants 1 Gravity &Smelting Assistants 3 | Secondary Crusher Senior Crusher Attendants 1 Crusher Attendants 5 Crusher Attendants 1 Gravity &Smelting Assistants 3 |
Caledonia Mining Corporation Plc
S-K 1300 Technical Report Summary on the Blanket Gold Mine, Zimbabwe
Section Position Number | Section Position Number | Section Position Number |
| Milling Mill Attendants 4 Mill Attendants 10 | Milling Mill Attendants 4 Mill Attendants 10 | Milling Mill Attendants 4 Mill Attendants 10 |
| Elution Senior Elution Assistant 1 Elution Assistants 2 Elution Attendants 3 | Elution Senior Elution Assistant 1 Elution Assistants 2 Elution Attendants 3 | Elution Senior Elution Assistant 1 Elution Assistants 2 Elution Attendants 3 |
| Tailings Supervisor 1 Slimes Dam Attendants 3 Pump Attendants 3 | Tailings Supervisor 1 Slimes Dam Attendants 3 Pump Attendants 3 | Tailings Supervisor 1 Slimes Dam Attendants 3 Pump Attendants 3 |
CIL CIL Attendants 4 CIL Attendants 6 CIL Attendants 1 Water Water Works Attendant 1 Water Works Attendant 2 Water Works Attendant 1 | CIL CIL Attendants 4 CIL Attendants 6 CIL Attendants 1 | CIL CIL Attendants 4 CIL Attendants 6 CIL Attendants 1 |
| | Water Water Works Attendant 1 Water Works Attendant 2 Water Works Attendant 1 | Water Water Works Attendant 1 Water Works Attendant 2 Water Works Attendant 1 |
| Metallurgical Lab and Sample | Metallurgical Lab and Sample | Metallurgical Lab and Sample |
preparation Laboratory Assistants 2 Laboratory Assistants 4 Wet Assay Supervisor 1 Lab Assistants 1 | preparation Laboratory Assistants 2 Laboratory Assistants 4 | preparation Laboratory Assistants 2 Laboratory Assistants 4 |
| | Wet Assay Supervisor 1 Lab Assistants 1 | Wet Assay Supervisor 1 Lab Assistants 1 |
| Sub Total 87 | Sub Total 87 | Sub Total 87 |
Engineering Mechanical Engineer 1 Foreman 1 Fitter 5 B/Maker 4 Plumber 1 Rubber Liner 1 Assistant Fitter 5 B/maker Assistant 4 Lubricator 1 R/Liner Assistant 1 Plumber’s Assistant 1 Electrician 1 Assistant Electricians 1 | Engineering Mechanical Engineer 1 Foreman 1 Fitter 5 B/Maker 4 Plumber 1 Rubber Liner 1 Assistant Fitter 5 B/maker Assistant 4 Lubricator 1 R/Liner Assistant 1 Plumber’s Assistant 1 Electrician 1 Assistant Electricians 1 | Engineering Mechanical Engineer 1 Foreman 1 Fitter 5 B/Maker 4 Plumber 1 Rubber Liner 1 Assistant Fitter 5 B/maker Assistant 4 Lubricator 1 R/Liner Assistant 1 Plumber’s Assistant 1 Electrician 1 Assistant Electricians 1 |
Sub Total 27 | Sub Total 27 | Sub Total 27 |
Electrical Engineering is not included in the above table as he is shared between the plant and the mine. All the plant employees are adequately trained and from observation around the plant, as well as the condition of equipment, management is of a high standard. The higher labour complement is in part due to the manual control nature of the plant.
The laboratory personnel account for an additional ten people. The laboratory is used for plant analysis as well as management of mine and exploration samples. The plant does not have a central process control system, but there are local controls in the important areas such as mill feed control cyanide addition and level controls in relevant areas.
Caledonia Mining Corporation Plc
S-K 1300 Technical Report Summary on the Blanket Gold Mine, Zimbabwe
ITEM 15 – PROJECT INFRASTRUCTURE
Item 15 (a) - Mine Layout and Operations
The Blanket Mine consists of a series of small shafts (Table 38) providing access to the underground workings of the various orebodies that are being mined.
Table 38: Blanket Mine Shaft Access
Name | Description |
Jethro Shaft | The shaft has dimensions of 3 m x 2 m and is mainly utilised for the transport of men and material from surface to 7 Level. The shaft is equipped with a single drum winder with a 22 mm rope and capacity of 10 men. |
5 Winze (Sub-Shaft) | 5 Winze has dimensions of 2 m x 2 m and is a sub-shaft which is mainly used to transport men and materials between 7 Level and 22 Level. This shaft is similarly to Jethro shaft equipped with a single drum winder with a 20 mm rope and a capacity of 14 men |
6 Winze (Sub-Shaft) | 6 Winze has dimensions of 3 m diameter and is a sub-shaft used mainly for the hoisting of ore from 26 Level to 22 Level from where ore is transported to No. 4 Shaft for hoisting to surface. This shaft is equipped with a 117 kW single drum winder with a 24 mm rope and a capacity of 3 t skip or 500 tpd. At the bottom of 6 Winze shaft is a 12Kw spillage pump. |
Blanket Shaft (No. 4 Shaft) | No. 4 Shaft was historically the main production shaft of Blanket Mine. No. 4 Shaft has dimensions of 4 m x 2 m with two compartments. This shaft is mainly used for the hoisting of ore and waste rock from 22 Level to surface. The shaft is equipped with a 560Kw thyristor driven double drum winder with a 34 mm rope and capacity of 5t per skip or 2,000 tpd. |
Central Shaft (CMS) | The new CMS is not lined and has a four-compartment, 6 m diameter layout, equipped with 2 x 3,132 kW double-drum winders, one rock and the other men and material. The shaft is used as the main route for the transport of men, material, and rock. The shaft reaches a depth of 1,201.3 meters. The man compartment has a double deck and can transport 40 persons per deck. |
The current access infrastructure is detailed in Figure 72.
130
Caledonia Mining Corporation Plc
S-K 1300 Technical Report Summary on the Blanket Gold Mine, Zimbabwe
Figure 72: Current Shaft Infrastructure – Blanket Mine
131
Caledonia Mining Corporation Plc
S-K 1300 Technical Report Summary on the Blanket Gold Mine, Zimbabwe
Several expansion projects have either been completed or are planned for the Blanket mining operations in order to increase production. The majority of the expansion projects will consist of the below 750 m Level (22 Level) expansion projects.
The first project includes the sinking and construction of the new CMS in-between the AR Main and AR South / Blanket orebodies from surface to below 1,201.3 m Level (just above 38 Level) and its associated infrastructure. Sinking and equipping of the shaft has been completed with the construction of the associated ore pass system and loading station currently. The water handling systems are currently in their final stages of completion. Additional projects include the development of various decline shaft infrastructure targeting specific mining areas in order to increase production. The planned shaft infrastructure development declines planned are listed in Table 39.
Table 39: Planned Shaft Infrastructure Development
Description | Target Area | From (Level / Area) | To (Level / Area) |
Decline 2 | AR Main | 750 mL / ARM | Below 870 mL / ARM |
Decline 3 | Eroica | 750 mL / Eroica | 990 mL / Eroica |
Decline 4 | AR South / Blanket | 870 mL / ARS(Blanket) | 930 mL / ARS(Blanket) |
Decline 5 | AR South / Blanket | 885 mL / ARS(BL Blanket) | 930 mL / ARS(Blanket) |
Decline 6 | AR South / Blanket | 930 mL / ARS(Blanket) | 990 ml / ARS(Blanket) |
Item 15 (b) – Infrastructure
I. Surface Infrastructure
Surface infrastructure comprises mine offices, change houses, mine headgears, workshops, storerooms, a processing plant, hospital, tailings facility and an assay laboratory.
Production shafts on surface consist of the No. 4 Shaft, Lima Shaft, Sheet Shaft and the Jethro Shaft. Sub-shaft infrastructure in the form of the No 5 Winze connects Jethro to the underground workings. Other shafts and raise bore holes on surface, primarily used for ventilation purposes, include Blanket 2, Blanket 3, Lima, Eroica and Sheet. A total of 11 hoists are installed at the mine, four of which are used for ore handling (No. 2 Main Incline Shaft, the No. 4 Vertical Shaft, 6 Winze shaft and Lima Shaft). The surface infrastructure at the Blanket Mine is illustrated in Figure 73.
The existing infrastructure at the Blanket mine will be utilised in parallel with new infrastructure which is specifically aimed at targeting the Below 750 m Level mining areas. The extensions entail the sinking of the new CMS from surface down to 1,201.3 m Level (just above 38 Level). 6 Winze sub-shaft located close to 5 Winze sub-shaft is used to access the Blanket complex below 750 m Level and will provide secondary access to the new CMS.
The new CMS is not lined and has a four-compartment, 6 m diameter layout, equipped with 2 x 3,132 kW double-drum winders, one for rock hoisting and the other men and material transportation. Once fully equipped and commissioned, this shaft will be used as the main route for the transport of men, material, and rock.
On surface, a 1050 mm wide, 152 m long overland ore conveyor will transport the hoisted rock at CMS to the primary crusher and then to an ore dump. Additional supporting surface infrastructure will include shaft offices, change rooms, lamp rooms, etc. New housing for both senior and junior staff is also planned in anticipation of the increased production profile.
A TSF is also located near the Project Area. The labour force and their families reside within a kilometre of the mine in accommodation provided by the Mine.
Caledonia Mining Corporation Plc
S-K 1300 Technical Report Summary on the Blanket Gold Mine, Zimbabwe
Figure 73: Surface Infrastructure Arrangement
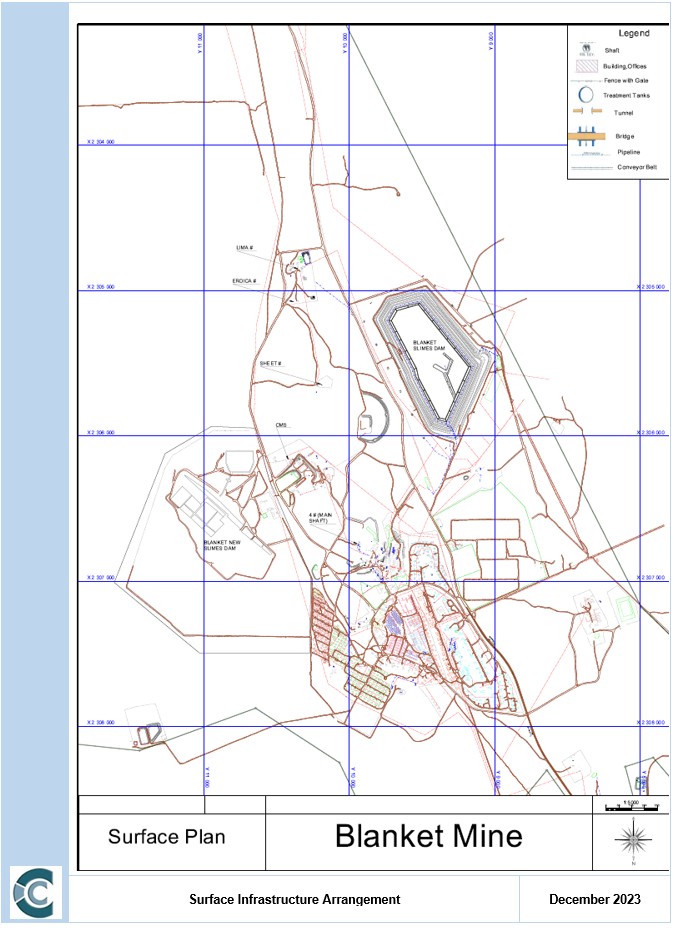
The planned surface infrastructure layout and general arrangement of the CMS is illustrated in Figure 74.
Caledonia Mining Corporation Plc
S-K 1300 Technical Report Summary on the Blanket Gold Mine, Zimbabwe
Figure 74: Surface Infrastructure Arrangement – Central Main Shaft
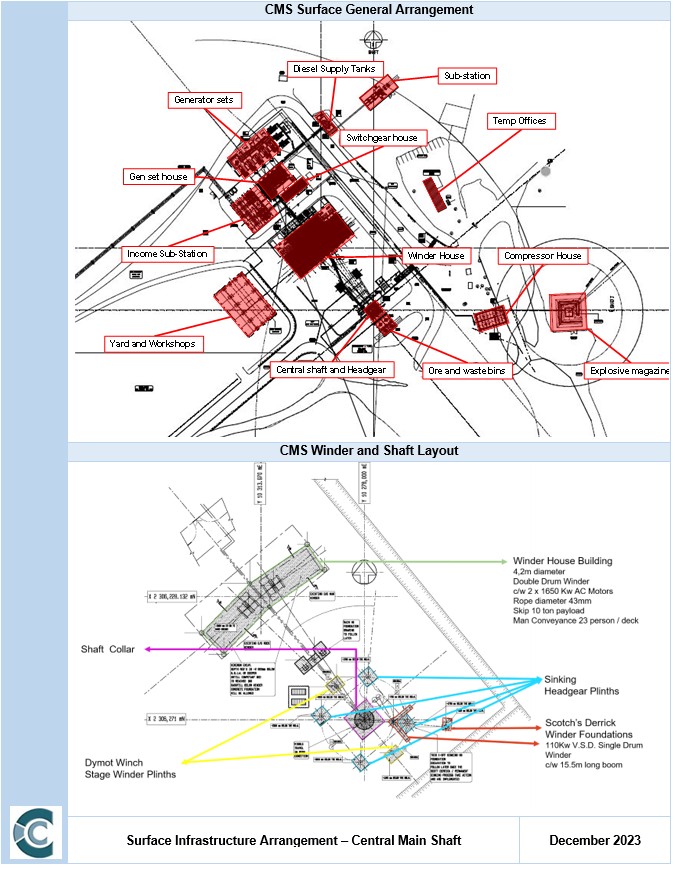
The 5 Winze currently extends from 140 m Level down to the 750 m Level, while 6 Winze currently extends down to 870 m Level. Men and materials are hoisted via the Jethro vertical shaft, 5 Winze and 6 Winze to underground mining areas, as well as through CMS since its commissioning in July 2021.
Caledonia Mining Corporation Plc
S-K 1300 Technical Report Summary on the Blanket Gold Mine, Zimbabwe
Development waste and ore are hoisted with two 5t skips at No. 4 Shaft and two 10 t auto discharging rock skips through the CMS. The loading level at CMS is equipped with a loading station as well as ore bins. The loading arrangement is equipped with loading flasks and spillage bins similar to the current arrangement at 789 - 813 m Level at No. 4 Shaft, which was fully automated by end of 2023.
The CMS loading station included two silos, 1 x waste and 1 x reef with bulkheads on 35 level feeding into the loading bin utilising a 1 050 mm conveyor belt.
II. Mining Section
Underground drilling is conducted with Seco 25, Seco 215 rock drills and Seco 36 (Konkola) drifters. The rock drills are used mainly for development and the drifters for production, i.e. long-hole drilling.
Similar to the underground rail-bound fleet, the same mining equipment utilised at the operational sections of Blanket Mine will be utilised once the expansion projects of CMS have been completed with some additional quantities to allow for the planned increase in production.
III. Dewatering
Currently, underground water is pumped to surface from the 7 Level pump station at a rate of between 70 m³ and 100 m³ per hour. The pump station has a maximum pumping capacity of 150 m³ per hour to handle excess water inflow (especially during the rainy seasons). Pumping is done in stages on different major levels: 7, 9, 14, 22 and 26, and all declines below 22L which include Decline 3, Decline 4 and Decline 5. CMS sections pump from 35L to 34L to 30L to 26L to 22L where all the water is combined before being pumped to 14L. All shafts have submersible pumps at the bottom of the shafts (Jethro, 5 Winze, 6 Winze shaft, No. 4 vertical shaft and CMS) which pump to the nearest major pump station. The pumps and dams throughout the section is listed in Table 58.
The CMS main pump station located at 35Level (belt and pump level) will be equipped with a 5 m diameter high-rate clarifier settler as well as a 7 m diameter vertical dam with a capacity of 1.5 Ml. Clear water will overflow from the settling arrangement into the clear water dam and the settler underflow will be pumped directly to surface with a positive displacement pump.
Item 15 (c) – Services
I. Power Supply and Reticulation
ZESA supplies power to Blanket Mine from their main Eagle Vulture 132KV/33KV substation about 17km out of Gwanda. The main supplies are the 33 kV and the 11 kV overhead lines. The 33 kV supply feeds Lima, Reclamation, the main substation at No. 4 Shaft (and adjacent to the processing plant) and Central Shaft and New Compressors. The 11 kV supply feeds slimes dam, Smiler shaft and the village. The 11 kV is further transformed to 550 V supply at Smiler and at Slimes dam. The ZESA power allocation to No. 4 Shaft, Central Shaft, Jethro Shaft, 5 Winze and 6 Winze Complex is 18MVA with a current nominal maximum demand (“NMD”) of 18MVA. An additional (Mtshabezi line) feeder is installed with a current nominal maximum demand (“NMD”) of 7 MVA.
Caledonia has constructed a solar plant adjacent to Blanket Mine. The solar plant was installed and commissioned by February 2023. The solar plant supplies 12 MW AC to the Blanket Mine power supply during daytime by way of a PPA.
Blanket also has 4 x 2.5 MVA generators located at No. 4 Shaft with total installed capacity of 10 MVA. Additional standalone diesel generators with suitable switchgear, transformers, and controls were also installed at CMS to ensure that the mine can stay operational during power interruptions. This additional installation has a total installed capacity of 8 MVA and is illustrated in Figure 119 Figure 119. Total installed generator capacity at Blanket is 18 MVA and connects by way of a ring feed to the entire mine.
Caledonia Mining Corporation Plc
S-K 1300 Technical Report Summary on the Blanket Gold Mine, Zimbabwe
At the Blanket main substation, the 33 kV line terminates into 2 x 3 MVA and 2 by 6MVA, 33 kV/2.2 kV transformers, and all 4 transformers are active. The 2.2 kV supply from one transformer feeds the main Blanket compressors and the underground reticulation feeder through an 1250A vacuum circuit breaker. The other 2.2 kV supply from the second transformer feeds the ROM section of the processing plant (on 2.2 kV and 550 V supply) through a 1250A vacuum circuit breaker.
The third transformer feeds the 2.2 kV No. 6 Ball Mill, CIL section and elution plant which operates on 400 V supply.
The main substation has a maximum demand of 15MVA at a calculated power factor of 0.85. The acquisition and installation of a power factor correction unit in 2022 improved the power factor to the required 0.99.
All equipment underground, i.e., winders, pumps and fans operate on 550 V. The 2.2 kV underground feeder is therefore transformed at different levels to run the relevant equipment on those levels.
The 33 kV ZESA supply at Lima terminates into a 2.5 MVA 33 kV/550 V transformer which supplies mainly the Lima hoist. The 2 x GA250 and 1 x GA160 screw compressors which used to be at Lima were moved to the new compressor shed at CMS. A power factor correction unit has been installed in this substation.
The 33 kV supply at reclamation terminates into a 1 MVA 33 kV/400 V transformer, which feeds the raw water supply pumps for the Central shaft.
Power to the new CMS complex is supplied via a 2.5 km 33 kV overland powerline leading to the shaft sub-station. Power is distributed through 2 x 6.3 MVA 33 kV/ 6.6 kV/525 V transformers and its associated switchgear. For the underground environment 250 kVA 6.6 kV/550 V transformers are used to drive larger components such as conveyors and larger portions of the production sections. 50 kVA 550 V/110 V transformers are used to step power down from 550 V for lighting purposes.
The expected NMD for CMS is 8MVA. Metering of the actual NMD is only 7.5 MVA, while the current ZESA total allocation to CMS is up to 12 MVA. The additional 4MVA is supplied by the Mtshabezi feeder.
II. Water Supply and Reticulation
ZIMWA holds all water rights in Zimbabwe and Blanket subsequently purchases process and domestic water from ZIMWA. Water for the mine, metallurgical plant and the mine village is obtained from the Blanket dam which is located 5 km east of the Mine. The Blanket Dam has a total capacity of 15 Mm³. In addition to this water source, the mine has equipped several boreholes to alleviate water shortages during the dry season and droughts.
An average of 120,000 m³ per month is pumped from the dam using 2 x 80/250 CEN stork pumps which are installed at the dam.
Two x 80/250 CEN stork pumps are also installed halfway between the dam and the mine. One of the pumps supplies water to the domestic water tanks where the water treatment plant is installed and the other pumps to the processing plant. The domestic water is purified at the water treatment plant, pumped to storage tanks and then gravitated to all the houses on the mine.
Most of the processing plant water is recycled from the new tailings facility and the old slimes dam and underground. However, besides additional water from the Blanket dam, as stated above, five boreholes have been drilled to augment the processing plant supply.
Capital is allowed for new pumps, valves and pipelines to be used for the reticulation of water on surface. Service water will be transported through these pipelines separate from potable water. Water on surface will be used for fire suppression and will service the ablution facilities of the shaft offices and change houses.
Caledonia Mining Corporation Plc
S-K 1300 Technical Report Summary on the Blanket Gold Mine, Zimbabwe
Additional water is pumped through to CMS for cooling the winders and compressors, with a smaller portion treated for potable use at CMS.
There are no material risks associated with the water supply to Blanket.
III. Ventilation
Ventilation at the Blanket Mine is largely natural with the No. 2 Main Incline shaft, Jethro shaft, 5 Winze shaft and 6 Winze sub-vertical shaft down-casting. Shafts such as Lima, Sheet and Jethro Winze are used for up-casting ventilation. A single booster fan as well as several other fans are installed at development ends to aid ventilation.
Once mining operations expand to the below 750 m Level the operation will remain naturally ventilated with the assistance of a number of booster fans, specifically in development ends. Ventilation throughout the workings is deemed to be sufficient for the current and planned production rates.
IV. Compressed Air
Underground drilling and lashing are aided by compressed air. This creates a significant compressed air demand and subsequently a total compressed air capacity of 44 450 cfm is installed on the mine.
Compressed air is fed underground at Blanket via an 12" pipeline with an additional 4" line feeding the plant. The air supply at Lima is fed underground via a 6" pipeline, although currently there is no compressor installed at Lima.
A new compressor shed, complete with a 16t overhead gantry crane, was constructed and commissioned in 2023 at CMS to house the new TA6000 Ingersoll Rand 7000cfm compressor and all the other smaller compressors that were installed at CMS. Provision has been made in the new shed for a second TA6000 compressor to be installed at a later stage. This new battery of compressors supply CMS through a 12-inch column that runs from surface to 35L, branching off at every station from 22L.
This additional compressed air supply complements the existing compressed air infrastructure in order to sustain the increased tonnage profile and subsequent increase in drilling equipment. The compressors available at the Blanket No. 4 Shaft and CMS are listed in Figure 75 and Figure 76 respectively.
Figure 75: Compressors at Blanket
Item | Description | Voltage
Rating | Rated
Current | Avg
Running
Current | Power KW | CFM | CFM/KW |
1 | ER8 No. 1 | 550 | 388 | 354 | 380 | 2,200 | 5.79 |
2 | ER8 No. 2 | 2,200 | 105 | 89 | 380 | 2,200 | 5.79 |
3 | Sullair No. 1 | 2,200 | 276 | 223 | 185 | 1,000 | 5.41 |
4 | Sullair No. 2 | 550 | 276 | 220 | 185 | 1,000 | 5.41 |
5 | Sullair No. 3 | 550 | 276 | 217 | 185 | 1,000 | 5.41 |
6 | Centac No. 1 | 2,200 | 328 | 318 | 1,100 | 6,900 | 6.27 |
7 | Centac No. 2 | 2,200 | 328 | 318 | 1,100 | 6,900 | 6.27 |
8 | GA200 | 550 | 325 | 290 | 250 | 1,250 | 5.00 |
9 | GA160 | 550 | 325 | 290 | 250 | 1,000 | 4.00 |
10 | GA250 @ Plant | 380 | 325 | 290 | 250 | 1,500 | 6.00 |
11 | GA250 @ Plant | 380 | 325 | 290 | 250 | 1,500 | 6.00 |
12 | GA250 @ Plant | 380 | 325 | 290 | 250 | 1,500 | 6.00 |
| | Total Installed | | | | 4,765 | 27,950 | 5.87 |
Caledonia Mining Corporation Plc
S-K 1300 Technical Report Summary on the Blanket Gold Mine, Zimbabwe
Figure 76: Compressors at Central Main Shaft
Item | Description | Voltage
Rating | Rated
Current | Avg
Running
Current | Power KW | CFM | CFM/KW |
1 | GA250 No. 3 | 550 | 325 | 290 | 250 | 1,500 | 6.00 |
2 | GA250 No. 4 | 550 | 325 | 290 | 250 | 1,500 | 6.00 |
3 | GA250 No. 9 | 550 | 325 | 290 | 250 | 1,500 | 6.00 |
4 | GA250 No. 1 | 550 | 325 | 290 | 250 | 1,500 | 6.00 |
5 | GA250 No. 2 | 550 | 325 | 290 | 250 | 1,500 | 6.00 |
6 | GA160 No. 1 | 550 | 216 | 204 | 250 | 1,000 | 4.00 |
7 | GA160 No. 3 | 550 | 216 | 203 | 250 | 1,000 | 4.00 |
8 | TA6000 No. 1 | 6,600 | 328 | 318 | 1,250 | 7,000 | 5.60 |
| | Total Installed | | | | 3,000 | 16,500 | 5.50 |
V. Logistics
For details on logistics infrastructure (road, rail and means of transport) refer to Item 4 (b) and Item 4 (d).
ITEM 16 – MARKET STUDIES
Item 16 (a) – Commodity Market Assessment
The following sections provide an overview of the gold market. The QPs have reviewed these studies and analyses and are satisfied that the results support the assumptions in the Report.
Gold Commodity Overview - 2023
The following gold market conditions for the year of 2023 have been identified by the World Gold Council, as extracted from their Gold Demands Trends report and other World Gold Council data.
| | ● | Annual gold demand (excluding over-the-counter (“OTC”) demand) fell by 5% year-on-year (“y-o-y”). |
| | ● | Inclusive of significant OTC and stock flows (450t), total gold demand in 2023 was the highest on record at 4,899t. |
| | ● | Global central bank buying maintained a breakneck pace, |
| | ● | Global gold exchange traded finds (“ETFs”) saw a third consecutive annual outflow. |
| | ● | Annual bar and coin investment saw a mild contraction (-3% y/y) as divergent trends in key Western and Eastern markets offset one another. |
| | ● | Annual jewellery consumption held steady at 2,093t, even in the very high gold price environment. |
Caledonia Mining Corporation Plc
S-K 1300 Technical Report Summary on the Blanket Gold Mine, Zimbabwe
| | ● | Despite a Q4 recovery in electronics, the annual volume of gold used in technology fell below 300t for the first time in the data series. |
| | ● | Global central bank gold reserves swell by more than 1,000t for the second successive year. |
| | ● | Total gold supply in 2023 increased by 3% y-o-y as mine supply and recycling both posted growth. |
| | ● | The gold price averaged USD1,941/oz in 2023 compared to 1,825/oz in 2022. The gold price ended the year at USD2,078/oz, a record high year end close. |
World Gold Deposits and Reserves
According to the USGS minerals commodity database, there are almost 66,000 identified deposits in the world where gold features as the primary mineral. The geographical distribution of these is illustrated in Figure 77.
Figure 77: Global Distribution of Gold Deposits
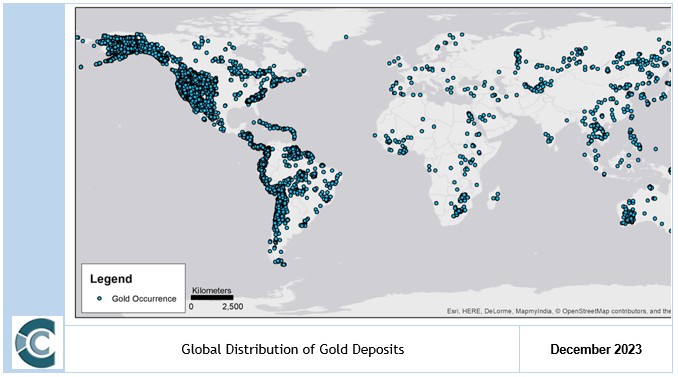
Notes: May be skewed towards availability of North American data
Source: USGC (2022)
From the image it can be seen that the majority of occurrences are concentrated in North America. The global minable gold reserves, however, are dominated by Australia, Russia and South Africa due to the higher-grade deposits found in these regions, with averages generally well above the global average of 1.01 g/t. Africa continues to be home to some of the highest grade (and highest risk) projects in the world. The average grade differs significantly (33%) between producing and undeveloped deposits. This has important implications on future gold production, and at a gold price reaching low levels, many of these projects will simply not be economically feasible.
Gold reserves are distributed globally as graphically portrayed in Figure 78, for some 1,907Moz Au.
Caledonia Mining Corporation Plc
S-K 1300 Technical Report Summary on the Blanket Gold Mine, Zimbabwe
Figure 78: Country Listing of Gold Reserves as at End 2023

Data Source: US Geological Survey, Gold Data Sheet - Mineral Commodity Summaries 2024, January 2024
Gold Supply and Demand Fundamentals
Gold Supply
Total gold supply increased by 3% to y-o-y in the 2023 to 4,899 t - largely due to an increase in both mine production and recycling.
Mine Production
According to the World Gold Council (2023), mine production posted another gain, up 1% to 3,644 t. This total fell just short of the 3,656t record set in 2018. Table 40 shows the top 20 gold mining countries for the years 2021to 2022. China is the largest producer followed by Russia and Australia. South Arica occupies the 14th position, while Ghana is the largest producer in Africa.
Caledonia Mining Corporation Plc
S-K 1300 Technical Report Summary on the Blanket Gold Mine, Zimbabwe
Table 40: Top 20 Gold Mining Countries
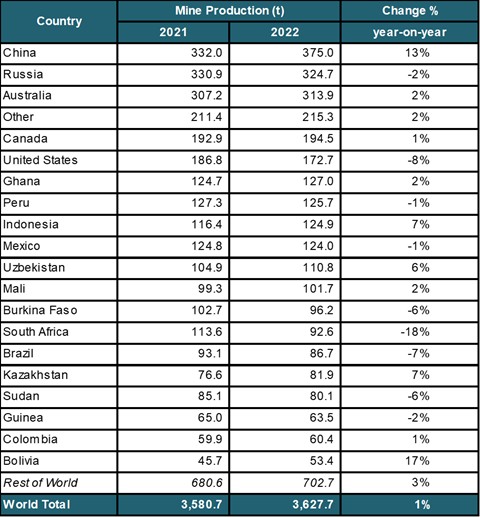
Source: World Gold Council (2023)
Net Producer Hedging
The industry aggregate producer hedge book is estimated to have increased 17t to 190t in 2023 (World Gold Council, 2023). Record high spot gold prices and attractive forward premiums for gold (due to much higher interest rates around the world) have made forward selling appear much more attractive than has been the case over the past decade when interest rates were essentially zero.
Recycling
The supply of recycled gold increased 9% y/y to 1,237t in 2023 as gold moved to record highs in almost every currency. Recycling rose y/y in all four quarters, with the largest increase (+13% y/y) in Q2’23 when the US dollar gold price surged to a new quarterly average high. (World Gold Council, 2023).
Gold Demand
Gold demand dipped 5% y-o-y from a strong 2022 (World Gold Council, 2023).
It has been another year of blistering central bank buying, together with resilient jewellery consumption that offset sizable ETF outflows.
Caledonia Mining Corporation Plc
S-K 1300 Technical Report Summary on the Blanket Gold Mine, Zimbabwe
Central bank buying maintained a breakneck pace. Annual net purchases of 1,037t almost matched the 2022 record, falling just 45t short.
Global gold ETFs saw a third consecutive annual outflow, losing 244t. The pace of outflows slowed markedly into year-end, but October’s hefty outflows dominated the Q4 picture.
Annual bar and coin investment saw a mild contraction (-3% y/y) as divergent trends in key Western and Eastern markets offset one another.
Annual jewellery consumption held steady at 2,093t, even in the very high gold price environment. China’s recovery supported the robust global total.
Despite a Q4 recovery in electronics, the annual volume of gold used in technology fell below 300t for the first time in our data series.
A breakdown of quarterly gold demand by sector is detailed in Figure 79.
Figure 79: Gold Demand 2022 vs. 2023
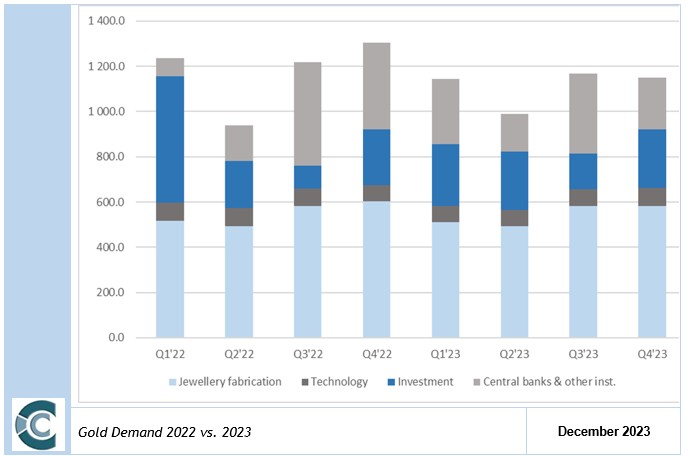
Investment
Gold exchange-traded products are traded on the major global stock exchanges including Zurich, Mumbai, London, Paris and New York and most funds are physically backed by vaulted gold. According to the World Gold Council (2023), total investment demand declined to a 10-year low of 945t in 2023 driven by the ETF outflows and the modest decline in bar and coin demand.
Caledonia Mining Corporation Plc
S-K 1300 Technical Report Summary on the Blanket Gold Mine, Zimbabwe
The 2023 full-year global investment demand (including bars, coins, and ETF’s) was the lowest since 2014. Gold ETFs contributed to much of the decline, as global outflows continued. Holdings of global gold ETFs fell by 244t in 2023 (-7%) with outflows of US$15bn.
Bar and coin demand softened by 3% in 2023, to 1,190t.
Technology
Application of gold in the technology sector remains relatively small. According to the World Gold Council (2023), demand rose by 12% y-o-y to 81t during Q4, driven by a recovery in electronics (+14% y-o-y to 66t). The full-year demand was down 4% to 298t. Consumer electronics demand has suffered throughout the year but there is optimism that the late recovery will continue into 2024.
Jewellery
According to the World Gold Council (2023), the annual gold jewellery consumption was only fractionally higher y-o-y even though the gold price set new records.
Central Banks
Central banks added more than 1,000 t to official gold reserves in 2023. Demand totalled 229 t in Q4, 35% lower q-o-q. This lifted the full year net purchases to 1,073 t, 4% lower than 2022. Sales were primarily from Uzbekistan and Kazakhstan.
Gold is politically independent and bears no credit risk. Some central banks have been pursuing an overt policy of dedollarisation. In response to the pressure of financial sanctions from the West, the Bank of Russia has been actively dedollarising their reserves, purchasing some 274 t of gold in 2019 (slowed sharply in 2020), and equally substantially decreasing the country’s holdings of US Treasuries. Gold is a safe haven as the international monetary system shifting towards multipolarity, thus will continue to be an important reserve asset for central banks. The top 40 countries’ official gold holdings as of December 2023 are displayed in Table 41.
Table 41: Official Gold Holdings per Country, 31 December 2023
Rank | Country | Tonnes | | Rank | Country | Tonnes |
1 | United States | 8 133 | | 21 | Lebanon | 287 |
2 | Germany | 3 352 | | 22 | Spain | 282 |
3 | IMF | 2 814 | | 23 | Austria | 280 |
4 | Italy | 2 452 | | 24 | Thailand | 244 |
5 | France | 2 437 | | 25 | Singapore | 232 |
6 | Russian Federation | 2 330 | | 26 | Belgium | 227 |
7 | China, P.R.: Mainland | 2 257 | | 27 | Algeria | 174 |
8 | Switzerland | 1 040 | | 28 | Venezuela, Republica Bolivariana de | 161 |
9 | Japan | 846 | | 29 | Philippines | 157 |
10 | India | 817 | | 30 | Iraq | 143 |
11 | Netherlands, The | 612 | | 31 | Brazil | 130 |
12 | Turkey | 556 | | 32 | Egypt, Arab Rep. of | 126 |
13 | ECB | 507 | | 33 | Sweden | 126 |
14 | Taiwan Province of China | 422 | | 34 | South Africa | 125 |
15 | Portugal | 383 | | 35 | Mexico | 120 |
16 | Uzbekistan, Rep. of | 369 | | 36 | Libya | 117 |
17 | Poland, Rep. of | 359 | | 37 | Greece | 114 |
18 | Saudi Arabia | 323 | | 38 | Korea, Rep. of | 104 |
19 | United Kingdom | 310 | | 39 | Romania | 104 |
20 | Kazakhstan, Rep. of | 306 | | 40 | Qatar | 103 |
Source: World Gold Council (2024)
Caledonia Mining Corporation Plc
S-K 1300 Technical Report Summary on the Blanket Gold Mine, Zimbabwe
Currency
As gold is usually traded relative to its USD price, the value of the dollar has a meaningful impact on gold. More importantly, gold is viewed as a natural hedge to the USD as it is not directly linked to the monetary or fiscal policies of a particular government. This characteristic strengthens their inverse relationship. Because the USD is also the primary currency used in global transactions and is seen as a stable and reliable unit of exchange, countries aim to have ample reserves to be able to meet their USD denominated liabilities. As such, the dollar forms the lion’s share of foreign reserve portfolios. However, governments need to manage the concentration risk in their reserves by diversifying into high quality, liquid assets that lack credit risk – like gold.
Gold is often seen as a currency that provides a natural alternative to money. Gold satisfies many criteria that define a currency, including its use as convertibility, store of value and medium of exchange. Through the years gold has the evolving nature of the relationship with the USD, its geological scarcity and its physical/chemical qualities as a non-corrosive, durable metal make it a natural hedge to paper currencies. Because fiat money can be printed as a result of monetary policies, part of gold’s value as a hard asset is derived from its lack of supply growth. Gold is a highly liquid asset, with daily trading volumes comparable to major currency pairs such as the USD-pound sterling and is eclipsed only by USD-Yen and USD-Euro transactions. The trade weighted US dollar index, which compares the US dollar to 23 different world currencies, can be compared to the gold price to demonstrate the relationship between the gold price and world currencies (Figure 80).
Caledonia Mining Corporation Plc
S-K 1300 Technical Report Summary on the Blanket Gold Mine, Zimbabwe
Figure 80: Gold Price vs Trade Weighted U.S. Dollar Index
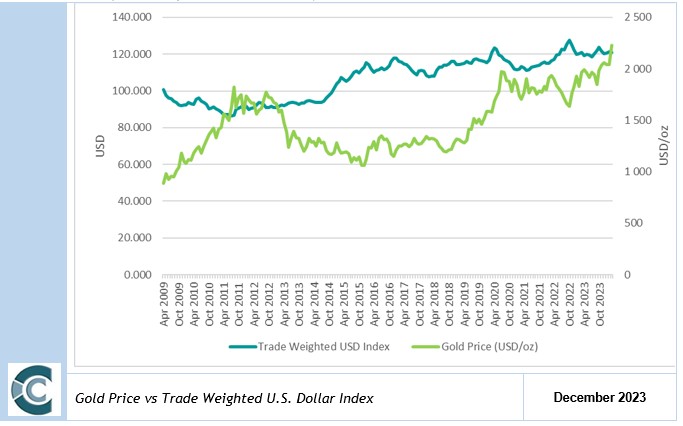
While gold is considered a commodity by many, in practice, its role as a currency stands out. It is used by central banks as part of their foreign reserves, accepted in exchange for goods in parts of the world, and traded alongside other currencies in the financial system. According to the Bank for International Settlements’ 2013 annual report, “gold is to be dealt with as a foreign exchange position rather than a commodity because of its volatility (which is almost consistently lower than commodities) is more in line with foreign currencies, and banks manage it in a similar manner to foreign currencies”.
An allocation to gold, denominated in USD, represents an implicit exposure to a foreign currency, providing international investors with protection against falls in their local currency.
Further, when evaluating a portfolio’s exchange risk in light of its foreign currency denominated holdings, gold can be used as a cost-effective and better-rounded complement to other hedging strategies. For example, for a US investor trying to hedge currency risk stemming from emerging market exposure, gold has been historically less costly than a basket of currencies and including gold as part of the hedging strategy has significantly reduced drawdowns.
Driven by China’s desire to increase its financial influence, the Chinese Renminbi is likely to emerge gradually as a genuine international currency as Beijing eases restrictions on its use in transactions and investments abroad. It is expected that during the coming period of uncertainty and transition between different reserve currencies, official central bank asset managers around the world are likely to increase their interest in gold as a result of doubts about the overall strength of global monetary arrangements. This has been prominent since the economic downturn in 2008.
US Inflation and Interest Rates
A common argument for buying gold is that it is seen as an inflation hedge. Consumer price indices (“CPI”) measure ‘representative’ baskets of goods that may well reflect a general price trend, but these will likely not reflect everyone’s experience of inflation. The reason for the US CPI being the measure most widely used to measure gold’s effectiveness as hedge, is due to the fact that gold is traded by the USD and that real interest rates create an opportunity cost for holding gold make US inflation a logical candidate to use as a reference in long-term pricing.
Caledonia Mining Corporation Plc
S-K 1300 Technical Report Summary on the Blanket Gold Mine, Zimbabwe
Real US rate is the lending interest rate adjusted for inflation, as measured by the gross domestic product deflator. From Figure 81 when the real US rate becomes negative, the gold price increases, which indicates that investors start investing in gold rather than the banks to receive better returns. The change in real interest rates since 2018 has been a supportive driver of the gold price.
Figure 81: Gold Price vs. Real USD Rate
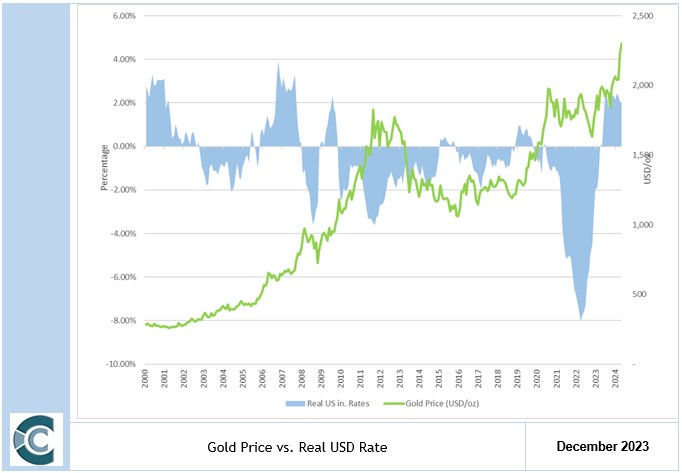
Gold Pricing
Gold was one of the best performing assets in 2023. The gold price ended 2023 at USD2,078/oz – a record high year end close. The average gold price for the year of USD1,941/oz was also a record and 8% higher y-o-y.
The gains were primarily driven by investors turning to gold as a safe-haven investment amid the COVID-19 pandemic uncertainties, the Ukraine and Gaza wars as well as the very low interest rate environment. As economies have started recuperating, gold prices have declined while remaining relatively high.
Gold's price forecast for Q1 2024 at Bloomberg Terminal is between USD1,913.63 - USD2,224.22. Commodity analysts expect the potential upside of the gold price to be closely tied to changes in US interest rates and dollar movements, leading them to raise the gold price target for 2024 to USD2,050 an ounce. Figure 82 shows the gold price since 2000, with the impact of COVID-19 and the various wars clearly reflected in 2020 and 2023.
Caledonia Mining Corporation Plc
S-K 1300 Technical Report Summary on the Blanket Gold Mine, Zimbabwe
Figure 82: Gold Yearly Prices
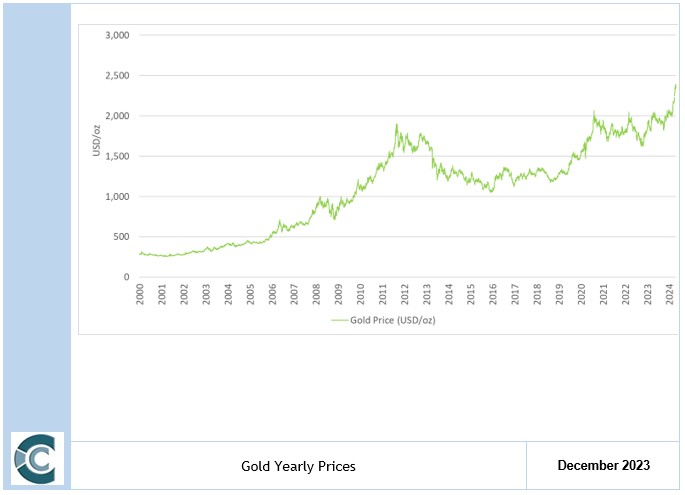
Consensus opinion has the real gold price remaining relatively constant (and high) over the short term and reducing over the medium to long term.
Table 42: Gold Price Forecast (Nominal Terms)
| | Unit | 2024 | 2025 | 2026 | 2027 | 2028 | 2029 | Long term (Constant) |
Gold | USD/oz | 2,205 | 2,195 | 2,054 | 2,024 | 1,852 | 1,982 | 1,982 |
Source: Consensus Economics Inc.
Gold Outlook
The World Gold Council, said in its annual gold outlook research that Central Bank buying and geopolitical tensions may provide support for the gold price in 2024. Their outlook for 2024 presents a variety of scenarios depending on how the economy fares, and how that could affect the gold price. If the economy contracts (recession) gold tends to rise because people look to put their assets in a safe-haven investment while markets are volatile. If the economy grows, gold may coast along with little growth as investors seek returns elsewhere.
Whatever the actual performance of the economy in 2024, the World Gold Council believes there is support for gold from the volatility caused by geopolitical tensions and more Central Bank demand.
Gold's price forecast for Q1 2024 at Bloomberg Terminal is between USD1,913.63 - USD2,224.22. Commodity analysts expect the potential upside of the gold price to be closely tied to changes in US interest rates and dollar movements, leading them to raise the gold price target for 2024 to USD2,050 an ounce.
The Office of Australia’s chief economist (2024) is forecasting gold prices to remain elevated in 2024.
Caledonia Mining Corporation Plc
S-K 1300 Technical Report Summary on the Blanket Gold Mine, Zimbabwe
The latest Energy Quarterly report from the Australian Department of Industry, Science and Resources (DISR) expects gold to average about US$2,020/oz in 2024 – a 6% upward revision to its previous estimate.
It is expected that once monetary easing commences, gold prices are expected to receive a further boost leading into 2025 as the US dollar eases and investors gain greater clarity on the pace and scale of further rate cuts.
Gold prices are forecast to average US$2,030/oz in 2025, supported by monetary easing and continued strength in demand. World gold consumption is forecast to grow by 2.7% a year from 2026 to reach 4,700 tonnes in 2029.
Item 16 (b) – Contracts
On 28 January 2014 Caledonia announced that as a result of new regulations introduced by the Zimbabwe Ministry of Finance, all gold produced in Zimbabwe must now be sold to Fidelity Gold Refinery (Private) Limited ("Fidelity"), a company which is controlled by the Zimbabwean authorities, and which is now responsible for the final refining and marketing of all gold produced in Zimbabwe. Blanket produces oré bullion which is processed at ("Fidelity), a subsidiary of the Reserve Bank of Zimbabwe (“RBZ”). Fidelity processes Blanket’s bullion in accordance with requirements of the Zimbabwe government for in-country refining and to allow the Zimbabwe authorities full visibility over the bullion sold to Fidelity or exported by Caledonia.
25% of the Blanket bullion ounces is sold to Fidelity. A 5% royalty is levied on 100% of bullion ounces sold by Blanket and is collected by Fidelity on behalf of the Zimbabwean government. Fidelity collects half of the 5% royalty in physical bullion and reduces 100% of the bullion proceeds on a 75:25 USD to RTGS$ basis. The remaining 71.25% per cent of the bullion ounces (i.e. 75% of the ounces after deducting the USD royalty portion (75%*5%)) are refined at Fidelity on a toll-treatment basis and then exported by Caledonia using Fidelity’s gold dealing licence to a refiner outside Zimbabwe which undertakes final refining and purchases the bullion.
Revenue for each RTGS$ delivery to Fidelity is measured at the previous day’s London Bullion Market Association afternoon fix of the day of packing for bullion export and the quantities are determined on local lodgement date. Per the contract, settlement on precious metal sales to Fidelity should occur within 14 days.
Revenue for each USD export delivery is measured at the London Bullion Market Association price post-delivery less a refining fee and the quantities are determined on Export lodgement date. On average settlement occurs within two days of delivery.
ITEM 17 – ENVIRONMENTAL STUDIES, PERMITTING AND PLANS, NEGOTIATIONS, OR AGREEMENTS WITH LOCAL INDIVIDUALS OR GROUPS
Item 17 (a) – Relevant Environmental Issues and Results of Studies Done
Information regarding environmental consideration is taken largely from AGS (2006), Fraser Alexander Zimbabwe (Pty) Ltd (March 2010) and Blanket Mine (November 2009).
SRK completed a full EIA in 1995 to identify the major detrimental aspects of the mining operation and recommend remedial measures. It was identified that there is potential to pollute groundwater from the TSF. Per MSA (2011), a risk assessment of the TSF complex was completed in 2002 including safety and environmental aspects of deposition and stability analysis. The dam was not lined prior to deposition, and MSA stated that seepage will decline as the slime level rises. An additional mitigating factor is that the seepage waters are not acidic and established dewatering holes lower the pollution to more acceptable levels.
Caledonia Mining Corporation Plc
S-K 1300 Technical Report Summary on the Blanket Gold Mine, Zimbabwe
No further significant detrimental environmental impacts were identified by that study. No further environmental studies or assessments have been provided to the QPs. The QPs are not aware of environmental issues that could materially impact the issuer’s ability to extract the Mineral Resources or Mineral Reserves.
Caledonia, the owners of the mine from June 2006 to date, developed an Environment Management Plan, which describes the plan followed by the mine staff to ensure continuous environmental improvement and management. An updated Environment Management Plan was registered with the EMA in 2020. This serves as the guideline for all environmental issues at Blanket Mine and deals with new environmental disturbances that requires additional permits and authorisations further to those described in Table 4.
Caledonia endeavours to address any newly identified potential environmental impacts through appropriate study work, and remain transparent and complaint in terms of required authorisations.
Item 17 (b) – Waste Disposal, Site Monitoring and Water Management
Blanket Mine has two tailings storage facilities as described above for disposal of tailings from the gold processing plant. The old TSF has reached capacity, and deposition is being phased out on this dam. A closure plan will be developed and implemented, and the dam continues to be monitored for stability, phreatic levels and groundwater quality. Rehabilitation of the side slopes of the dam has commenced.
The new TSF was commissioned in February 2024, and deposition of tailings is now taking place into this facility. The new TSF has been classified as Type 3 waste, and the recommended barrier system of a 1.5mm HDPE geomembrane placed over a 300mm compacted clay liner has been put in place. According to the SANS 10286 Safety Classification, the facility is classified as a medium hazard. Phase 1A of the new TSF was commissioned in February 2024, and deposition of tailings has been phased over to the new facility.
Fraser Alexander Zimbabwe manages both of the TSFs at Blanket Mine, and the Engineer of Record is Epoch Resources.
The EMA has stipulated water monitoring parameters in the tailings disposal permits for the TSFs. The parameters to be sampled for the old TSF (red licence) are pH, chemical oxygen demand (COD), cyanide (CN), manganese (Mn), iron (Fe), conductivity, arsenic (As), copper (Cu), lead (Pb) and zinc (Zn). Elevated levels of Mn have been detected in the water samples of the old TSF, but these occur in both the control and TSF boreholes, indicating that the elevated Mn levels are a result of local conditions rather than as a result of tailings disposal. Parameters to be sampled for the new TSF (blue licence) are heavy metals, pH, conductivity, phosphates and nitrates.
Similar monitoring of the sewage disposal area shows that all holes are in the acceptable green category. The sewerage ponds are classified in the red category under the EMA as they are not lined.
Environmental monitoring or sampling requirements are stipulated for a number of the environmental permits issued (shown in Table 12), as listed in Table 64.
Table 64: Environmental Permits Monitoring and Sampling Requirements
Licence | Licence Number | Monitoring/Sampling Requirement | Period |
Air Emissions - Diesel generator | L0000010451 | Particulate matter (PM10), NOx, CO, SOx | Quarterly |
Air Emissions - Clinic incinerator | L0000010449 | Particulate matter (PM10), NOx, CO, SOx | Quarterly |
Air Emissions - Blacksmith | L0000010452 | Particulate matter (PM10), NOx, CO, SOx | Quarterly |
Air Emissions - Assay laboratory | L0000010453 | Particulates (lead oxide) | Quarterly |
Air Emissions - Smelter | L0000010450 | Particulate matter (PM10), NOx, CO, SOx | Quarterly |
Effluent Disposal - Washbay | L0000010455 | EC, pH, Phosphates, Nitrates, Grease & Oils | Quarterly |
Effluent Disposal - Workshop | L0000010456 | EC, pH, Phosphates, Nitrates, Grease & Oils | Quarterly |
Effluent Disposal - Sewage ablution | L0000010454 | Phosphates, Nitrates, BOD, EC, TSS, TDS | Quarterly |
Solid Waste Disposal - Domestic waste | L0000010457 | Heavy metals, pH, Phosphates, Nitrates, Electrical conductivity | Quarterly |
Solid Waste Disposal – old TSF | L0000010458 | Heavy metals, pH, Phosphates, Nitrates, Electrical conductivity | Quarterly |
Solid Waste Disposal – new TSF | L0000010462 | Heavy metals, pH, Phosphates, Nitrates, Electrical conductivity | Quarterly |
Caledonia Mining Corporation Plc
S-K 1300 Technical Report Summary on the Blanket Gold Mine, Zimbabwe
Air emissions sampling exercises are completed annually. Blanket Mine has informed the QP that EMA conducts quarterly site inspections and is satisfied with these procedures.
The TSF borehole monitoring, sewage ponds and car wash monitoring are undertaken quarterly.
Item 17 (c) – Permit Requirements
Permit requirements for the Mine are detailed in Item 3 (f). A number of licences are renewed annually; renewal periods are not expected to hinder operations. Blanket Mine remains compliant with legislation and all regulations applicable to the mine site.
Item 17 (d) – Social and Community-Related Requirements
10% of Blanket Mine is owned by the Gwanda Community Share Ownership Trust (GSCOT), whereby local socio-economic development is facilitated through dividends paid to the entity.
In addition to the dividend payments to the GSCOT, Blanket Mine undertakes investment in community and social projects under six pillars, which include education, health, women and youth empowerment, agriculture, environment and charity. Projects undertaken during 2023 included the renovation of and construction of science and computer laboratories at Sitezi Secondary School, upgrading of Sabiwa stadium, upgrades to Sitezi clinic, community boreholes at Gwakwe, funding of attachment students, road repairs, irrigation water supplied to Gwakwe gardens, as well as donations to various charities. Community investment in 2023 was $1,504,000.
Small scale and artisanal gold miners are present within the Project Area. Satellite projects deemed to have limited exploration potential are viewed in terms of their potential to generate goodwill by making them available to local small-scale miners and artisanal groups through 3-year renewable Tribute Agreements as part of the Company’s Corporate Social Responsibility. The claims that are being tributed are Mbudzane Rock, Annette, Dan’s Luck, Banshee J, Cinderella, Gum, Mazeppa, Will South, Rubicon and Bunny’s Luck. Other than for the purpose of the Company’s Corporate’s Social Responsibility, tributing claims provides Blanket Mine with security of tenure against the “Use it or lose it principle”. The tribute agreements do not have any effect on Blanket Mine’s exploration/mining plans.
Item 17 (e) – Mine Closure Costs and Requirements
The closure plan for Blanket Mine was updated by Knight Piésold in December 2023. The purpose of the report was to update the closure plan assessment undertaken in 2021, and to include material changes to the mine’s operations in the closure cost calculation (12.2 MWAC solar plant and the new tailings storage facility). The gross closure cost for Blanket Mine, before discounting, as at the end of 2023 was $5.7 million.
Caledonia Mining Corporation Plc
S-K 1300 Technical Report Summary on the Blanket Gold Mine, Zimbabwe
There are a number of Government of Zimbabwe regulations and guidelines including the Mining General Regulations, the EMA Act and the Waste Disposal Regulations which cover a mine’s closure obligations. These are all addressed and costed in the Knight Piésold report. The closure plan aims to ensure site stability and safety from both a physical and chemical perspective, allowing for a post-closure environment that suits current land uses. The plan envisages concurrent closure obligations being carried out, where possible, with mining operations. Focus is placed on minimisation of environmental damage, protection of stream water quality, decrease in public health and safety hazards and provision for domestic livestock use.
Item 17 (f) - Adequacy of Current Plans
It is the opinion of the QPs that Blanket Mine has adequate plans, protocols and execution strategies in place to remain compliant with social and environmental obligations. No risks have been identified.
Item 17 (g) – Local Procurement and Hiring
The main priority of Blanket Mine Company with respect to procurement of goods and services is to procure such goods and services from within Zimbabwe. However, the cost, quality, and availability of goods and services is considered when a procurement decision is being made. If goods or services are not available within Zimbabwe or there is a significant benefit to buying outside of Zimbabwe, the blanket mine company would buy elsewhere.
All of Blanket Mine Company’s employees at Blanket are Zimbabwean nationals and the company recruits Zimbabwe people with the level of skill and experience required of the relevant position.
ITEM 18 – CAPITAL AND OPERATING COSTS
Item 18 (a) – Capital Costs
The capital cost includes mainly capital expenditure for the completion of the CMS project as well as the sustaining capital associated with existing infrastructure and equipment. Sustaining capital expenditures are capital expenditures resulting from improvements to and major renewals of existing assets. Such expenditures serve to maintain existing operations, but do not generate additional revenue. Sustaining capital for the operation from 2024 has been allowed for and is based on 12% of total OPEX per annum, in line with the previous report.
Off-reef development and infrastructure development has been capitalised from the mining operating cost and is reported as capital development. The capital development is undertaken throughout the LoM and consists mainly of opening-up development and 30 Level, 34 Level and declines to 38 Level infrastructure development. The QPs applied the capital development rates provided by Caledonia in the 2023 budget. The capital development rates are detailed in Table 43.
Table 43: Capital and Infrastructure Development Costs
Capital and Infrastructure Development | Unit | Cost |
Decline | USD/m | 2,150 |
Haulage | USD/m | 900 |
Draw point Crosscut | USD/m | 900 |
Crosscut | USD/m | 900 |
Shaft | USD/m | 900 |
Ventilation Raise | USD/m | 478 |
Access Crosscut | USD/m | 900 |
Notes: Other development costs have been included in the development operating costs.
Caledonia Mining Corporation Plc
S-K 1300 Technical Report Summary on the Blanket Gold Mine, Zimbabwe
Table 44 details the total capital expenditure over the LoM. Capital expenditure totals USD149.6 million over the LoM, of which USD47.4 million is capital development. No additional contingencies have been applied to the budgeted capital expenditure, with longer terms budgets provided. A sensitivity to inclusion of contingencies can be seen in Table 44.
Table 44: Capital Summary
Capital Expenditure | Over LoM | Blanket Mine |
Mining Capital | Unit | |
Mechanical Engineering | USDm | 18.6 |
Electrical Engineering | USDm | 11.8 |
Deep drilling | USDm | 10.0 |
Central Shaft | USDm | 23.1 |
Capitalised Development | USDm | 47.7 |
Sub-Total Sustaining Mining Capital | USDm | 110.9 |
Total Mining Capital | USDm | 110.9 |
Plant Capital | | |
TSF Phase 1 | USDm | 6.8 |
TSF Phase 2 | USDm | 6.7 |
Sub-Total Expansion Plant Capital | USDm | 13.5 |
Mill Engineering | USDm | 10.1 |
Milling | USDm | 4.1 |
Sub-Total Sustaining Plant Capital | USDm | 14.2 |
Total Plant Capital | USDm | 27.7 |
Other Non-Direct Capital | | |
Technical (Planning & Survey) | USDm | 7.5 |
Administration | USDm | 3.5 |
Sub-Total Sustaining Other Capital | USDm | 11.0 |
Total Other Capital | USDm | 11.0 |
Total Expansion Capital | USDm | 13.5 |
Total Sustaining Capital | USDm | 136.1 |
Total Capital | USDm | 149.6 |
Caledonia Mining Corporation Plc
S-K 1300 Technical Report Summary on the Blanket Gold Mine, Zimbabwe
Figure 83 illustrates the capital schedule over the LoM.
Figure 83: Capital Schedule
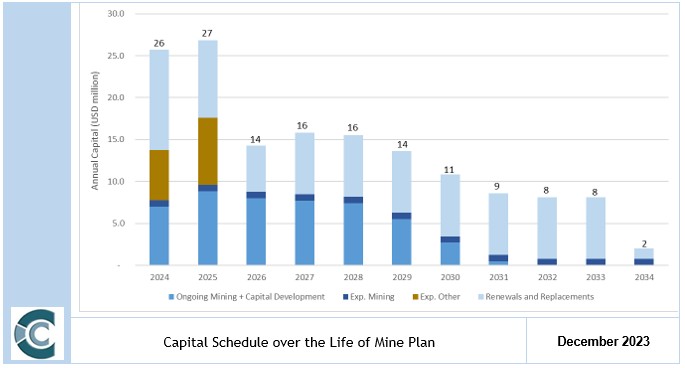
Item 18 (b) – Operating Cost
The Company reviewed Blanket Mine’s actual historic costs since 2017. From the information received it is clear that the historic costs remained relatively consistent ranging between USD2.7 million per month and USD3.6 million per month, fluctuating with tonnes from 2017 to June 2021. The cost per milled tonne in the same period typically ranged between USD65/t and USD80/t excluding outliers and ignoring June 2018 and July 2019, where extraordinary cost adjustments on power were applied. Operating costs considerably increased from July 2021 to 2024 due to increased milling capacity, headcount and increased power utility costs, ranging between USD4.2m and USD5.6m per month. Blanket opted to use the conservative twelve-month average 2024 forecast for financial modelling as this is deemed a true reflection of the actual costs on the mine. A sensitivity to the operating cost applied is included in Item 19 (b).
Caledonia Mining Corporation Plc
S-K 1300 Technical Report Summary on the Blanket Gold Mine, Zimbabwe
Figure 84: Historical Operating Costs
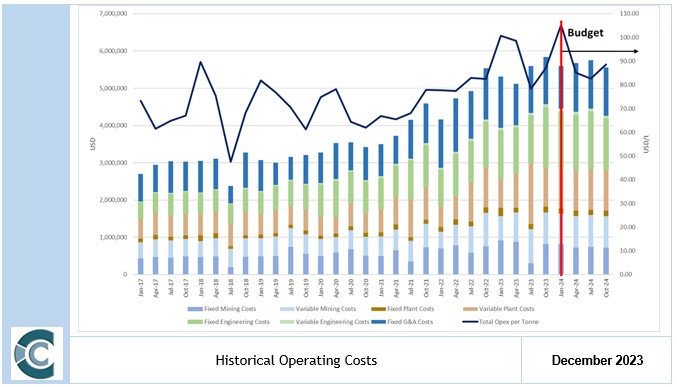
Note: Excluding management and shared service costs
Management and shared service costs as per the 2023 Blanket budget were also considered for the financial analysis. These costs are detailed in Table 45.
Table 45: Management and shared service costs
Management Costs | Unit | USD |
Shares Service Centre South Africa | USD/month | 305,280 |
Shares Service Centre Zimbabwe | USD/month | 222,300 |
Total Management Cost | USD/month | 527,580 |
A sensitivity to the operating cost applied is included in Item 19 (d).
IV. Financial Costs Indicators
The operating costs in the financial model were reported into different categories as defined by the World Gold Council. Table 46 illustrates a breakdown off all the costs included in each costing category:
· (Operating) Adjusted Operating Cost;
· AISC; and
· AIC.
Caledonia Mining Corporation Plc
S-K 1300 Technical Report Summary on the Blanket Gold Mine, Zimbabwe
Table 46: Financial Cost Indicators
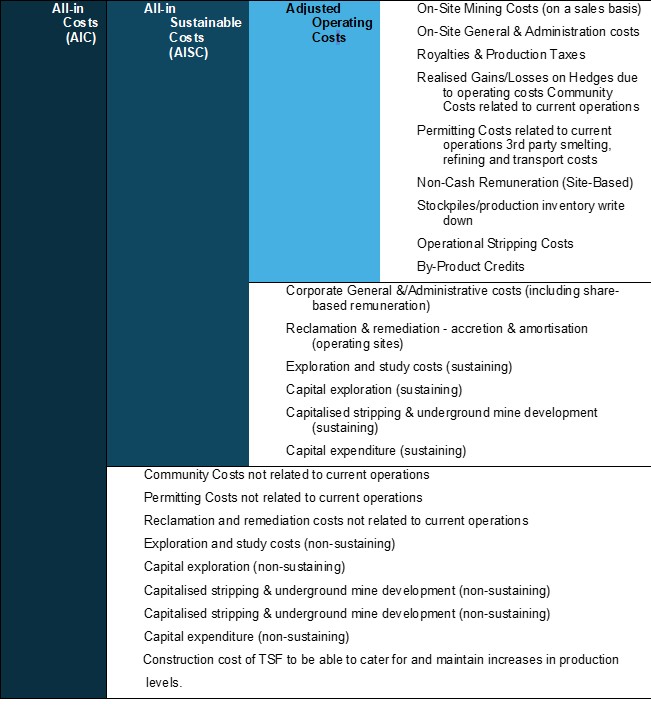
The general definitions of these costs are as follows:
Adjusted Operating Cost
The Adjusted Operating Cost represents the cash cost incurred at each processing stage, from mining through to recoverable metal delivered to market, and, if any, less net by-product credits. In addition, royalty taxes are included in Adjusted Operating Costs. Costs are reported as “per oz” of gold. The operating margin is defined as metal price received minus Adjusted Operating Costs.
Adjusted Operating Costs cover:
· mining, ore freight and milling costs;
· ore purchase and freight costs from third parties in the case of custom smelters or mills;
Caledonia Mining Corporation Plc
S-K 1300 Technical Report Summary on the Blanket Gold Mine, Zimbabwe
· mine-site administration and general expenses;
· concentrate freight, smelting and smelter general and administrative costs;
· matte freight, refining and refinery general and administrative costs;
· marketing costs (freight and selling);
· community relations costs; and
· royalty taxes.
All-in Sustainable Cost
AISC is the sum of net Adjusted Operating Costs (Operating), Sustaining Capital, reclamation costs and other non-direct operating costs. The AISC margin is defined as metal price received per ore tonne or gold ounce minus the AISC, over the metal price received. Non-direct operating costs cover:
· the portion of corporate and divisional overhead costs attributable to the operation; and
· research and exploration not attributable to the operation.
All-in Cost
AIC is the sum of the AISC, all non-sustaining capital costs and non-current operational costs and includes the construction cost of tailings facilities to enable to mine to increase and maintain production over the life of mine. The AIC margin is defined as metal price received per ore tonne or gold ounce minus the AIC, over the metal price received.
Costs reported for the Mine on this basis are displayed per plant feed tonne as well as per recovered gold ounce in Table 47. It should be noted that no contingencies have been applied to the operating costs as most of these costs are based on contracts or actuals. A 13% contingency has been applied to the capital expenditure. A sensitivity analysis to increase in OPEX and CAPEX has been included in Item 19 (d).
Caledonia Mining Corporation Plc
S-K 1300 Technical Report Summary on the Blanket Gold Mine, Zimbabwe
Table 47: Project Cost Indicators
Item | Unit | Blanket Mine |
Net Turnover | USD/Feed tonne | 171 |
Mine Cost | USD/Feed tonne | 31 |
Plant Costs | USD/Feed tonne | 17 |
Other Costs | USD/Feed tonne | 48 |
Operating Costs | USD/Feed tonne | 96 |
SIB | USD/Feed tonne | 18 |
Royalties | USD/Feed tonne | 9 |
Reclamation | USD/Feed tonne | 0 |
Other Costs | USD/Feed tonne | 7 |
All-in Sustainable Costs (AISC) | USD/Feed tonne | 130 |
Capital | USD/Feed tonne | 2 |
Other Cash Costs | USD/Feed tonne | 0 |
All-in Costs (AIC) | USD/Feed tonne | 132 |
All-in Cost Margin | % | 23% |
EBITDA1 | USD/Feed tonne | 76 |
EBITDA Margin | % | 44% |
Gold Recovered | oz | 757,238 |
| | | |
Average Gold Price | USD/Gold oz | 1,877 |
Net Turnover2 | USD/Gold oz | 1,739 |
Mine Cost | USD/Gold oz | 311 |
Plant Costs | USD/Gold oz | 171 |
Other Costs | USD/Gold oz | 485 |
Operating Costs | USD/Gold oz | 967 |
SIB Capex | USD/Gold oz | 179 |
Royalties | USD/Gold oz | 93 |
Reclamation | USD/Gold oz | 1 |
Other Costs | USD/Gold oz | 72 |
All-in Sustainable Costs (AISC) | USD/Gold oz | 1,312 |
Capital | USD/Gold oz | 18 |
Other Cash Costs | USD/Gold oz | 0 |
All-in Costs (AIC) | USD/Gold oz | 1,330 |
EBITDA | USD/Gold oz | 771 |
Notes:1. Earnings before interest, tax, depreciation and amortisation (excludes CAPEX)
Figure 85 illustrates the annual operating cost per plant feed tonne against the feed tonnes. The increase in costs towards the end of life is due to the depletion of the potential Mineral Reserves.
Caledonia Mining Corporation Plc
S-K 1300 Technical Report Summary on the Blanket Gold Mine, Zimbabwe
Figure 85: Operating Costs vs. Feed Tonnes
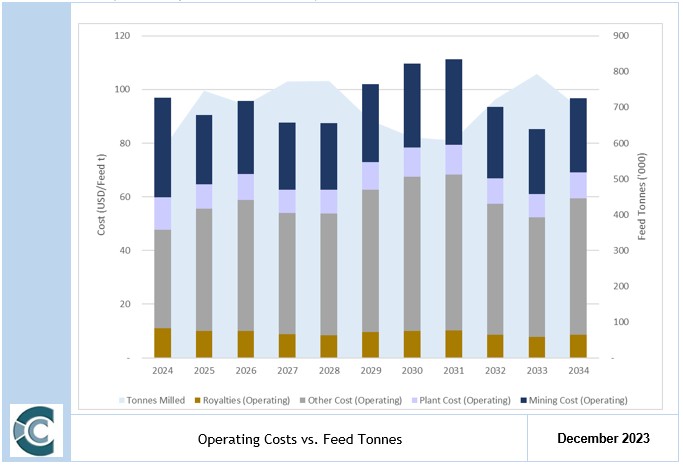
Caledonia Mining Corporation Plc
S-K 1300 Technical Report Summary on the Blanket Gold Mine, Zimbabwe
Figure 86 illustrates the all-in costs of the operation along with the realised gold price after applying the 98.5% payability.
Figure 86: AIC vs. Realised Gold Price

Item 18 (c) – Accuracy of Estimates
Blanket Mine is an operating mine. Costs are from the mine budgets and based on actual rates and are deemed accurate to within a 10% to 15% range. The basis of this TRS is a life of mine plan, which is of sufficient detail to support declaration of Mineral Reserves.
ITEM 19 – ECONOMIC ANALYSIS
The purpose of this section is to demonstrate the economic viability of the Mine Plan in order to declare updated Mineral Reserves.
Value relates to a specific point in time. The effective date for the economic analysis is March 1, 2024.
The evaluator performed an independent economic analysis on the Mine’s diluted Indicated and Measured Mineral Resources for conversion to Mineral Reserves. The Project has a budget plan based on a compliant mine plan with Indicated and Measured Resources. Thus, the income approach was applied on the total mineable reserve incorporated in the detailed mine plan as the primary economic analysis methodology in determining the economic viability for conversion to Mineral Reserves.
Caledonia Mining Corporation Plc
S-K 1300 Technical Report Summary on the Blanket Gold Mine, Zimbabwe
Item 19 (a) - Principal Assumptions
The scope of this economic analysis exercise was to determine the financial viability of the diluted Indicated and Measured Resources in the LoM plan, for conversion to Mineral Reserves. This is illustrated by using the DCF method on a Free cash flow to firm (“FCFF”) basis, to calculate the net present value (“NPV”) and subsequently, the intrinsic value of the Mine in real terms. The NPV is derived from post-royalties and tax, pre-debt real cash flows, after considering operating costs, capital expenditures for the mining operations and the processing plant and using forecast macro-economic parameters.
I. Basis of Evaluation of the Mining Assets
In generating the financial model and deriving the economic analysis, the following were considered: -
| | ● | Only diluted Indicated and Measured Resources in the LoM plan were considered for conversion to Mineral Reserves. |
| | ● | Any Inferred Mineral Resources in the LoM plan have been excluded from the economic analysis. |
| | ● | This Report details the optimised cash flow model with economic input parameters. |
| | ● | The cash flow model is in constant money terms and completed in USD. |
| | ● | The DCF economic analysis was set up in calendar years from January to December with the mine plan starting on March 1, 2024. |
| | ● | A hurdle rate of 15.4% (in real terms) was calculated for the discount factor, with an NPV sensitivity to the discount rate also included in the analysis. |
| | ● | The impact of the Mineral Royalties Act as per the Zimbabwean Mining Regulation. |
| | ● | Sensitivity analyses were performed to ascertain the impact of discount factors, commodity prices, grade, working costs and capital expenditures. |
| | ● | Economic analysis of the tax entity was performed on a stand-alone basis. |
| | ● | The full value of the operation was reported for Blanket as well as attributable values to CMC, i.e., 64% equity holding as well as facilitation loans repayments, management fees, and procurement margins. |
II. Macro-Economic Forecasts
The following section includes the macro-economic and commodity price forecasts for the operation over the LoM. Forecast data is based on projections for the different commodity prices and the country-specific macro-economic parameters and is in calendar years from January to December starting January 2024. USD commodity prices for the period 2024-2029 have been converted from nominal to real terms. Table 48 illustrates the forecasts for the next six years as well as the long-term forecast used in the financial model. The price forecasts are based on the median of various banks, brokers and analyst forecasts and are in real-terms throughout the LoM. The inflation rate was sourced from the World Economic Outlook January 2024.
Table 48: Macro-economic Forecasts (Real Terms)
Item | Unit | | Year |
| | | 2024 | 2025 | 2026 | 2027 | 2028 | 2029 | Long-Term |
| | | 1 | 2 | 3 | 4 | 5 | 6 | |
US Inflation Rate | % | 2.10% | 1.70% | 1.70% | 1.70% | 1.70% | 1.70% | 1.70% |
Gold | USD/oz | 2,205 | 2,167 | 2,093 | 1,987 | 1,852 | 1,731 | 1,731 |
Source: Consensus Economic Inc. & World Economic Outlook January 2024.
Figure 87 illustrates the 20-year inflation adjusted historic gold price. For the past ten years, the gold price has mostly been staying in a band between USD1,300/oz and USD2,000/oz, with increases to USD2,400 between 2020 and 2021. The price is starting to increase again during 2024, currently sitting at approximately USD2,300.
Caledonia Mining Corporation Plc
S-K 1300 Technical Report Summary on the Blanket Gold Mine, Zimbabwe
The long-term gold price was estimated as the real term average between the high and low gold price trading range over the past 10 years.
Figure 87: Inflation Adjusted Historic Gold Price
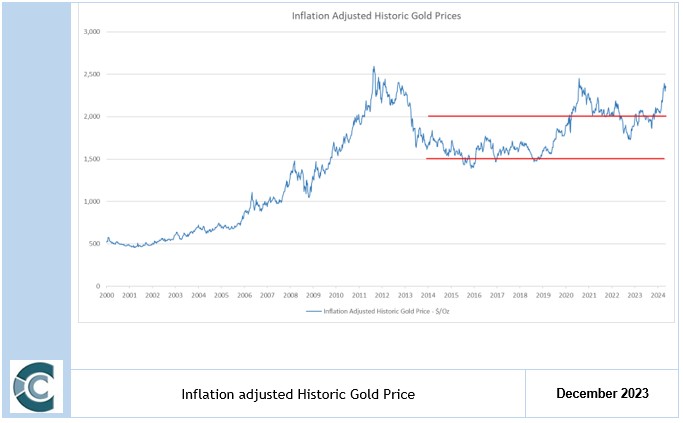
III. Working Capital
Working capital was considered to stay consistent with the repayment of current overdrafts at the end of LoM.
IV. Recoveries
The ore from the Blanket Mine operation is treated at the existing Blanket Plant. The economic analysis assumed a recovery percentage of 93.60% This compares to actual recoveries of 93.9% in 2021, 93.8% in 2022 and 93.8% in 2023. The recovery is detailed in the processing Section of this Report.
V. Discount Rate
It is generally accepted valuation practice to utilise a mathematical model such as the Capital Asset Pricing Model (“CAPM”) and relevant inputs from the capital markets to estimate the cost of equity and an appropriate cost of debt to estimate the respective Cash generating Units (“CGUs”) Weighted Average Cost of Capital (“WACC”). The WACC represents a blend of cost of debt and cost discount rate for the specific Project. A capital structure comprising 75% equity financing and 25% debt financing was used.
Table 49: Capital Asset Pricing Model Discount Rate Calculation
WACC | Discount Rate |
Risk-free rate and country premium | 10.80% |
Equity Risk premium | 8.00% |
Firm specific risk premium | 2.20% |
Operational Risk (Base Beta) | 1.17 |
Cost of Debt | 5.70% |
Nominal Cost of equity | 18.20% |
WACC | 15.40% |
Caledonia Mining Corporation Plc
S-K 1300 Technical Report Summary on the Blanket Gold Mine, Zimbabwe
VI. Cash Flow Forecast
The saleable product tonnes and ounces are displayed in Table 79. The current mine plan includes 7,684 kt of ore containing 812 koz of gold at an average grade of 3.41 g/t. A total of 757 koz of gold is recovered over the 11-year LoM.
Table 50: Production Breakdown in Life of Mine
Item | Project | Blanket Gold Mine | Caledonia Attributable* |
Ore Tonnes Mined | kt | 7 684 | 4 918 |
Total Oz in Mine Plan | oz | 811 718 | 519 500 |
Grade Delivered to Plant | g/t | 3.41 | 3.41 |
Recovered grade | g/t | 3.19 | 3.19 |
Yield/Recovery | % | 93.6% | 93.6% |
Total Oz Recovered | oz | 757 238 | 484 632 |
*Based on the legal ownership of 64%
The gold ounces produced along with the mined and recovered grades are illustrated in Figure 88. The gold production starts decreasing after 2032 as the grade drops in 2032 and 2033, and the tonnes milled decrease in 2034, nearing the end of LoM.
Figure 88: Recovered Gold
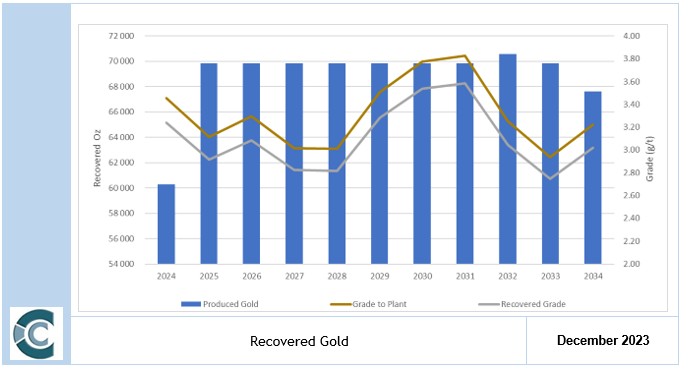
Cash Flow Forecast
The annual cash flow before capital expenditure, total capital expenditure and cumulative cash flow forecast for the mine over the LoM is illustrated in Figure 89.
Caledonia Mining Corporation Plc
S-K 1300 Technical Report Summary on the Blanket Gold Mine, Zimbabwe
Figure 89: Undiscounted Cash Flow
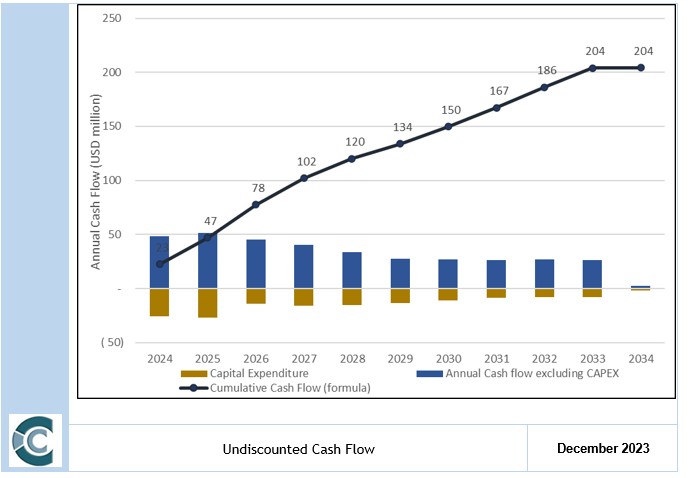
163
Caledonia Mining Corporation Plc
S-K 1300 Technical Report Summary on the Blanket Gold Mine, Zimbabwe
Table 51: Annual Cash Flow – Techno-economic Inputs
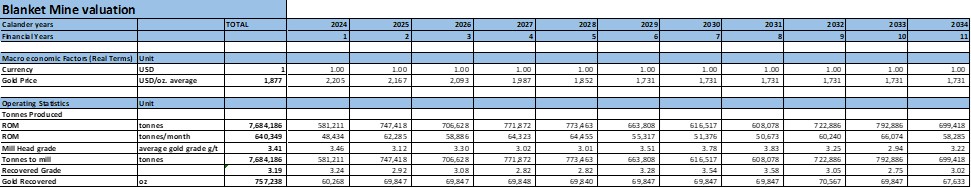
**2024 is only 10 months starting March 1, 2024 – December 31,2024.
Table 52: Annual Real Cash Flow
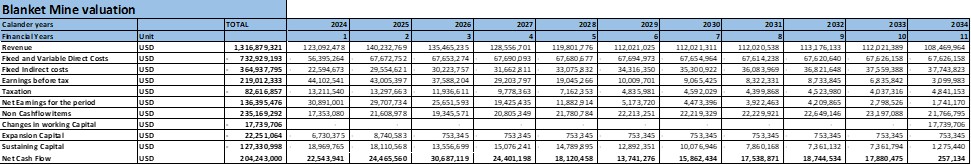
**2024 is only 10 months starting March 1, 2024 – December 31,2024.
Caledonia Mining Corporation Plc
S-K 1300 Technical Report Summary on the Blanket Gold Mine, Zimbabwe
Item 19 (b) - Net Present Value
The highlights of the economic analysis conducted by Caledonia are discussed in the following sections.
The Company’s in-house DCF model was employed to illustrate the NPV for the Project in real terms. The NPV was derived from post Government royalties and tax, pre-debt real cash flows, using the techno-economic parameters, commodity price and macro-economic projections. This economic analysis is based on a free cash flow and measures the economic viability of the diluted Indicated and Measured Resources in the LoM plan, for conversion to Mineral Reserves under a defined set of realistically assumed modifying factors.
Table 53 illustrates the Project NPV at various discount rates with a best estimated value of USD107 million at a real calculated discount rate of 15.4%. The mine plan is therefore economically viable indicating that an updated Mineral Reserve can be declared on the mine plan.
Table 53: Blanket Mine NPV Summary – Real Terms
Real Discount Rate | Unit | Blanket Mine | Caledonia Attributable |
NPV @ 0% | USDm | 204 | 158 |
NPV @ 2.5% | USDm | 181 | 140 |
NPV @ 5% | USDm | 161 | 125 |
NPV @ 7.5% | USDm | 145 | 112 |
NPV @ 10.0% | USDm | 131 | 101 |
NPV @ 12.5% | USDm | 119 | 92 |
NPV @ 15% | USDm | 109 | 84 |
NPV @ 15.4% | USDm | 107 | 83 |
NPV @ 17% | USDm | 102 | 79 |
Table 54 illustrates the Mine profitability ratios. The mine has a break-even gold price of USD1,331/oz. No IRR could be calculated as the mine is already operating with no upfront investment required.
Table 54: Profitability Ratios
Item | Profitability Ratios | Blanket Mine |
Internal Rate of Return (IRR) | % | N/A |
Total ounces in Mine plan | oz | 811,718 |
NPV 15.4% per oz in Mine Plan | USD/oz | 132 |
LoM | Years | 11 |
Present Value of Income flow* | USDm | 107 |
Break-even Gold Price (AIC) | USD/oz | 1,331 |
Note: *Calculated on an EBITDA basis.
Item 19 (c) - Regulatory Items
I. Government Royalties
As described in Item 3 (d) mining royalties are charged in terms of the Mines and Minerals Act (Chapter 21:05). With the gold price exceeding USD1,200/oz, the applicable royalty rate will be 5% of the gross revenue from gold mining. The royalty will be tax deductible, with the tax rate applied on the earnings after royalty deductions.
II. Corporate Taxes
The prevailing taxation regime for mining companies in Zimbabwe includes the following provisions:
Caledonia Mining Corporation Plc
S-K 1300 Technical Report Summary on the Blanket Gold Mine, Zimbabwe
| | ● | Corporate Income tax at 25.75%. This includes an AIDS levy of 3% on the 25% corporate tax for an effective 25.75% tax rate. |
| | ● | Exploration, development, and capital costs can be expensed against profit in the year incurred or carried forward to be expensed against the first year of production. |
| | ● | Tangible and intangible property included in definition of capital expenditure to allow the inclusion of computer software used by the taxpayer in connection with the mining operations. |
| | ● | Exemptions on customs duty and import taxes on capital items during exploration and development phases. |
| | ● | Government Royalties are tax deductible. |
| | ● | Deductions for management fees expenses is limited based on such expenses exceeding 1% of total tax-deductible expenses |
| | ● | Withholding tax on dividend payments to non-Zimbabweans and on services provided by foreign suppliers at a rate of 5% to 20%, depending on the location of the payee. |
Item 19 (d) - Sensitivity Analysis
Based on the real cash flow calculated in the financial model, the Company performed single-parameter sensitivity analyses to ascertain the impact on the NPV. The bars represent various inputs into the model; each being increased or decreased by 15%. The left-hand side of the graph indicates a negative 15% change in the input while the right-hand side of the graph indicating a positive 15% change in the input. A negative effect to the NPVs represented by red bars and a positive effect represented by blue bars. For the DCF, the gold price and grade have the biggest impact on the sensitivity of the Project followed by the operating costs. The Project is least sensitive to capital.
Figure 90: Project Sensitivity (NPV 15.4%)
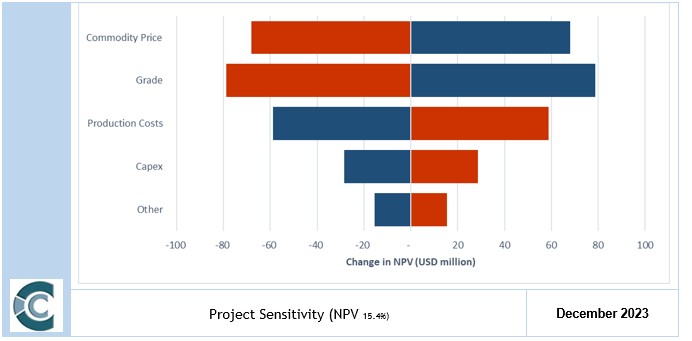
A sensitivity analysis was also conducted on the exchange rate and the commodity prices to better indicate the effect these two factors have on the NPV as well as the total costs and the grade. This is displayed in Table 55 and Table 56.
166
Caledonia Mining Corporation Plc
S-K 1300 Technical Report Summary on the Blanket Gold Mine, Zimbabwe
Table 55: Sensitivity Analysis of Commodity Prices and Mill Head Grade to NPV15.4% (USDm)
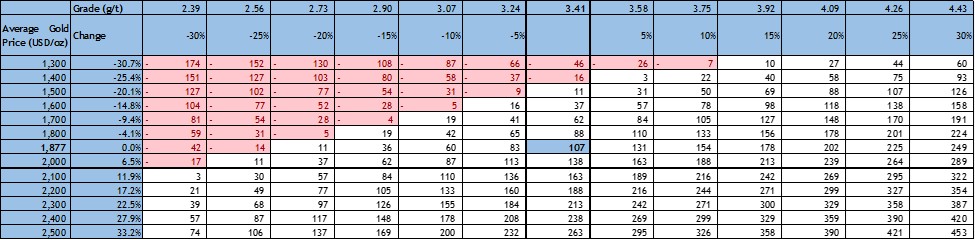
Note: Sensitivity illustrates average gold prices and not constant gold prices.
Caledonia Mining Corporation Plc
S-K 1300 Technical Report Summary on the Blanket Gold Mine, Zimbabwe
Table 56: Sensitivity Analysis of Cash Operating Costs and Capital spend to NPV15.4% (USDm)
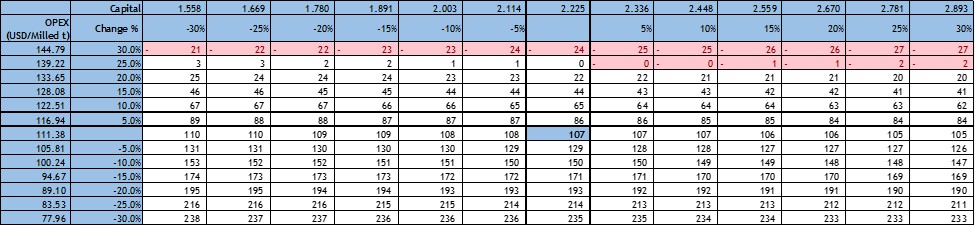
Note: OPEX excludes Royalties in Sensitivity Analysis as the Royalties are dependent on operating margins. Capital excludes renewals and replacement capital as this is dependent on OPEX.
Caledonia Mining Corporation Plc
S-K 1300 Technical Report Summary on the Blanket Gold Mine, Zimbabwe
Item 19 (e) – Economic Analysis Conclusions
The value derived for the income approach only reflects the diluted Indicated and Measured Resources in the LoM plan, for conversion to Mineral Reserves. It is noted that Mineral Resources that are not Mineral Reserves do not have demonstrated economic viability. The Mineral Reserve is economically viable with a best estimated NPV of USD107 million at a real discount rate of 15.4%. No IRR could be calculated as Blanket is already in operation and no initial investment is required. The all-in cost margin is 24% with a break-even gold price of USD1,201/oz. Table 57 shows a summary of the economic analysis.
Table 57: Blanket Mine Economic Analysis Summary – Real Terms
Item | Unit | Blanket Mine | Caledonia Attributable |
NPV @ 0% | USDm | 204 | 158 |
NPV @ 2.5% | USDm | 181 | 140 |
NPV @ 5% | USDm | 161 | 125 |
NPV @ 7.5% | USDm | 145 | 112 |
NPV @ 10.0% | USDm | 131 | 101 |
NPV @ 12.5% | USDm | 119 | 92 |
NPV @ 15% | USDm | 109 | 84 |
NPV @ 15.4% | USDm | 107 | 83 |
NPV @ 17% | USDm | 102 | 79 |
IRR | % | N/A | N/A |
All-in Cost Margin | % | 24% | 24% |
ITEM 20 – ADJACENT PROPERTIES
The GGB is host to numerous gold occurrences, the majority of which have been worked by large-scale or artisanal miners. At least 268 mines have been operational across the geological terrain, of which only two are currently active. These include Blanket Mine and Jessie Mine at the south-eastern end of the belt near West Nicholson. At the western end of the belt some 22 km west of Gwanda, Freda is mined out. Blanket and Vubachikwe are sometimes referred to as the Sabiwa group of mines or the North Western Mining Camp. The locations of these mines are illustrated in Figure 91. The figure also displays several mining occurrences which are adjacent to or coincide with claims held by Blanket Mine Company.
Caledonia Mining Corporation Plc
S-K 1300 Technical Report Summary on the Blanket Gold Mine, Zimbabwe
Figure 91: Gold Mines of the Gwanda Greenstone Belt
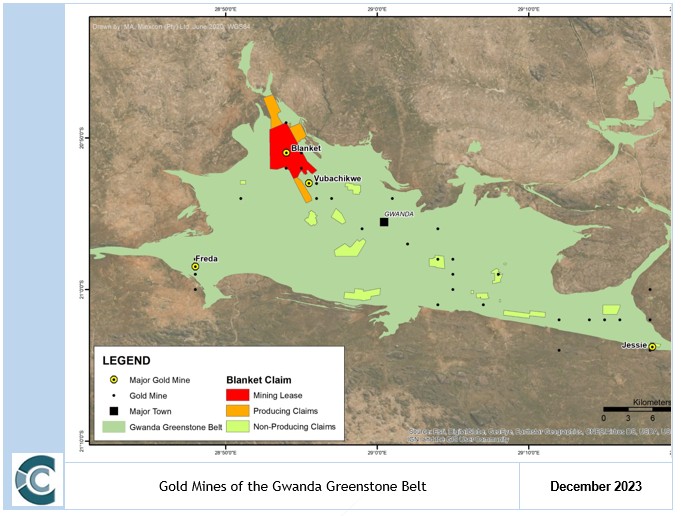
Vubachikwe Mine of Forbes and Thompson (Pvt) Ltd is an underground mine located on the northern limb of a plunging syncline which reached a depth of 1,155 m. Operations ceased on 8 November 2022 following a workers protest over unpaid salaries and has since not recommenced. Gold mineralisation is hosted in mafic and ultramafic greenstones and BIF (MSA, 2011). Ore occurs in 5-40 m thick lenses and up to 200 m down-dip, and are hosted mainly in northwest-plunging, north-south striking BIF which dips 75°SW. Gold occurs as free gold and inclusions in arsenopyrite, as well as disseminated carbonate replacements in the BIF (Spilpunt, 2001; MSA, 2011). The mineralised bodies are folded and boudinaged (Spilpunt, 2001).
Vubachikwe Mine produced almost 21,744 kg of gold to the end of 1991 at an average of 7 g/t (MSA, 2011). Underground workings have reached depths of 1,000 m (AGS, 2006). Blanket Mine purchased the Vubachikwe dump material between 2000 and 2005 treated it through the Blanket metallurgical plant.
Auriferous quartz veins at the underground Jessie Mine are hosted in hornblende schist dipping steeply to the southwest Erratically distributed pyrite, pyrrhotite, chalcopyrite and galena are observed. Ore grades reach up to 10.5 g/t, with production pre-2001 recorded by Spilpunt (2001) at some 11.5 t Au with minor copper. The mine is operated as an underground mine by FA Stewart (Pvt) Ltd.
The Freda Mine commenced production in 1919 targeting surficial oxidised ore as well as underlying ore containing pyrrhotite, pyrite and arsenopyrite, with minor amounts of tetradymite. The vein-type ores are hosted in epidiorite surrounded by grits and quartz-mica schist with the mined-out bodies reaching thicknesses of up to 30 m, striking 115° and inclining steeply to the southwest. Spilpunt (2001) reports that the deposit is mined out, with workings reaching a depth of 1,100 m with 7,550 kg Au recovered at a recovered grade of about 0.8 g/t Au.
Caledonia Mining Corporation Plc
S-K 1300 Technical Report Summary on the Blanket Gold Mine, Zimbabwe
Item 20 (a) Sources of Information
| | ● | Applied Geology Services cc (2006). Independent Qualified Person’s Report - Blanket Mine, Zimbabwe. Prepared for: Caledonia Mining Corporation. July 2006. 81pp |
| | ● | Spilpunt. Mineral Commodities and Africa – Gwanda Greenstone Belt (updated 2001). Available from: http://spilpunt.blogspot.com/2007/04/zimbabwe.html. Viewed 3 August 2020. |
| | ● | The MSA Group (2011). NI 43 101 Technical Report on the Blanket Gold Mine, Zimbabwe. J2225. Prepared on behalf of Caledonia Mining Corporation. 28 June 2011. |
| | ● | Forensic Report Dashes Hopes for Vumbachikwe Gold Mine's Reopening (miningzimbabwe.com). 8 February 2024 |
ITEM 21 – OTHER RELEVANT DATA AND INFORMATION
Item 21 (a) – Upside Potential
Item 21 (b) – Risk Assessment
A risk assessment to consider and quantify risks associated with the Mine was conducted by the 2022 QP’s, Minxcon, which has been retained as a matrix for this document. The result is not designed to be a definitive assessment of the risks but is rather a tool to articulate and evaluate those risks as identified by persons present at the risk assessment session. All items were reviewed and assessed using the risk severity criteria shown below:-
| | ● | Green – Low risk (score 1-5); |
| | ● | Yellow – Medium risk (score 6-12); |
| | ● | Orange - Significant risk (score 13-20); and |
| | ● | Red – High risk (score greater than 21). |
Once a high risk is identified, the project team is required to take remedial action to either resolve or mitigate the risk. The identification and recording of corrective and remedial measures was beyond the scope of this particular risk assessment exercise.
The outcome of the risk assessment is provided in Table 58. No major risks have been identified relating to the Blanket Mine operations.
Caledonia Mining Corporation Plc
S-K 1300 Technical Report Summary on the Blanket Gold Mine, Zimbabwe
Table 58: Risk Assessment
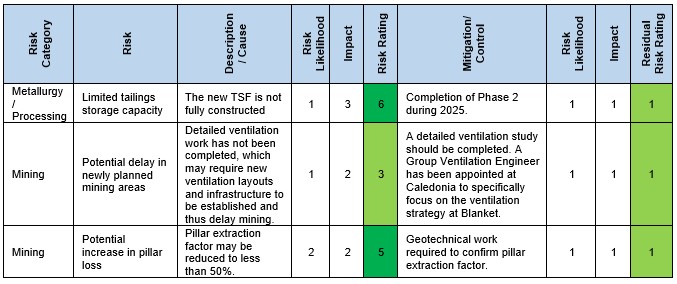
ITEM 22 – INTERPRETATION AND CONCLUSIONS
Mineral Resources
Caledonia Mining Corporation Plc reviewed all the information and has made the following observations regarding the Project:
Mineral Resources
| | ● | All data sources have been verified to be suitable for the establishment of a 3D geological model and Mineral Resource Estimation. Updates were made to the geological models of multiple orebodies from on mine geological observations and interpretations. |
| | ● | For all the domains were significant volume or data changes occurred, all geostatistics, variography and estimation parameters were reconsidered and updated where necessary. |
| | ● | The estimates generally show good reconciliation to data. However, scope may exist to further domain the orebodies and improve the quality of the estimates. |
| | ● | Some of the newer domains, typically with low data quantities, were interpolated using Inverse Distance Squared |
| | ● | Measured, Indicated and Inferred Mineral Resources can be declared for Blanket Mine due to the continuity of the geology and grade as well as a history of proven historical mining. The Inferred resources show geological continuity as defined through the extensive Long Hole Drilling program, while grade continuity has been improved by the increase in Run of Mine drilling and the Short Hole Drilling program in areas in the immediate vicinity of mining activities. |
| | ● | The 2023 estimate is a completely 3D digital block model estimate undertaken with Datamine Studio RM. The geological orebodies or wireframes outlining the grade shells are completely electronic and utilise the Deswik suite of software for the base maps together with the Deswik Geological Mapper as the interface for capturing geological information. |
| | ● | There has been a significant increase in the orebody volumes as defined by the geological wireframes. This work has been done on-mine by the relevant geological personnel who keep the structural and orebody models updated on a regular basis. |
Caledonia Mining Corporation Plc
S-K 1300 Technical Report Summary on the Blanket Gold Mine, Zimbabwe
Mining
| | ● | The LoM plan includes Measured, Indicated and Inferred Mineral Resources; however, only diluted Measured and Indicated Mineral Resources have been considered for economic assessment for Mineral Reserve estimates and have been converted into Proved and Probable Mineral Reserves respectively. |
| | ● | A significant portion of Inferred Mineral Resources has been included in the LoM plan for mining practicality. Typically, with a bottom – up mining strategy, the development enters the area to be mined on Inferred Resources and will then proceed to develop the sub-levels upwards to the mining area above which is in Measured or Indicated Mineral Resources. Clearly as development in ore progresses, the areas are sampled and with the new data points, these Inferred Resource areas are converted through development to Measured or Indicated Mineral Resources. In compiling a LOM plan, there will inevitably be an amount of mining taking place in Inferred Resources due to the vertical nature of the Blanket Mine orebodies. |
| | ● | The mining strategy is focused on opening up ground below 870 m Level and is in line with the planned capital and infrastructure development thrust on 30 Level and 34 Level. |
| | ● | Mining targets the Mineral Resources below 870 m Level with less mining above 750 m Level in the Blanket, ARS and Blanket Feudal orebodies. |
| | ● | An uneconomical tail containing 212.5 koz of gold continuing for a further 6 years has been excluded from the Mineral Reserve since it is not viable on its own. |
Engineering and Infrastructure
| | ● | Existing and planned infrastructure at the Blanket Mine and CMS extension projects are sufficient to sustain the current production profile and the planned production profile. |
Processing
| | ● | The process plant has been operating at a very consistent recovery of 93.5%, and this can be expected to continue as long as the ore mineralogy does not change. |
| | ● | The average processing rate for the past 12 months was 64.2 ktpm, and there are indications that slightly higher processing rates can be achieve with operational improvements. |
| | ● | A new TSF was commissioned in February 2024 and once the phase 1B and 2 extensions are fully completed in 2025, will provide depositional capacity at current production rates for a further 20 years until 2044. |
| | ● | Process Operating cost has been consistent at USD15/t ore treated. |
Economic Analysis
| | ● | The Blanket Mine plan including only the diluted Indicated and Measured Resources in the LoM plan, for conversion to Mineral Reserves is financially feasible at an 15.4% real discount rate, and therefore the Mineral Reserve can be declared. |
| | ● | The DCF value of USD107 million for the Blanket Mine (USD83 million at 78% attributable) was calculated at a real discount rate of 15.4%. |
| | ● | No IRR could be calculated since the mine is in operation and no initial investment is required. |
| | ● | Blanket Mine has an all-in cost margin of 24%, which is comparable to similar mines. |
| | ● | The Mine is most sensitive to commodity prices, and grade. |
| | ● | The Mine has a break-even gold price of USD1,331/oz including capital. |
| | ● | All-in sustainable costs for the Blanket Mine amount to USD130/milled t, which equates to USD1,312/oz. |
| | ● | All-in costs for the Blanket Mine amount to USD132/milled t, which equates to USD1,330/oz. |
Caledonia Mining Corporation Plc
S-K 1300 Technical Report Summary on the Blanket Gold Mine, Zimbabwe
ITEM 23 – RECOMMENDATIONS
Mineral Resources
Upside potential exists due to new geological interpretations. This can be used in targeted exploration drilling, in many cases close to existing infrastructure. There are areas where historical data has not yet been captured (in previous manual areas). This data should be captured to increase confidence in these areas, as well as allow for new potential targets to be identified.
Orientated core should be obtained during exploration drilling. Structural information should be collected and utilised to assist in the development of a geological model and construction of orebody wireframes. Predictive mineralisation mapping should be introduced to assist in exploration drilling planning, based on the conceptual geological model.
The QAQC data shows an improvement in the QAQC processes for the sampling database but still requires additional focus on immediate remedial action if required, especially for the down dip exploration drilling as this can impact the Mineral Resources significantly and thus requires the highest integrity.
To determine the upside potential of the Inferred and Exploration Target Mineral Resources, it is recommended to do additional drilling to increase the level of confidence of the Mineral Resources from the Inferred Classification to Indicated Classification for conversion to Probable Mineral Reserves. The onsite assay laboratory and QAQC processes should be upgraded.
Mining
It is recommended that rock engineering studies and modelling continue in order to improve the recommended strategy for pillar extraction.
Processing
The TSF Phase 1A was completed in February 2023 and Phase 2 of the TSF must be completed in 2025 to secure depositional capacity.
ITEM 24 – REFERENCES
| | ● | Applied Geology Services cc (2006). Independent Qualified Person’s Report - Blanket Mine, Zimbabwe. Prepared for: Caledonia Mining Corporation. July 2006. 81pp |
| | ● | Australian Government, Office of the Chief Economist (2022). Department of Industry, Science, Energy and Resources. Resources and Energy Quarterly, December 2022. |
| | ● | Caledonia Mining Corp (2006). Acquisition of Gold Mine. 20 June 2006. https://www.investegate.co.uk/caledonia-mining-crp--cmcl-/rns/acquisition-of-gold-mine/200606201300058747E/ |
| | ● | Campbell, S.G.G. and Pitfield, P.E.J. (1994). Structural Controls of Gold Mineralisation in the Zimbabwe Craton – Exploration Guidelines. Zimbabwe Geological Survey Bulletin No. 101. |
| | ● | Canadian Institute of Mining, Metallurgy and Petroleum (CIM) (2014). Definition Standards for Mineral Resources and Mineral Reserves, 10 May 2014. |
| | ● | Canadian Institute of Mining, Metallurgy and Petroleum (CIM) (2019). Estimation of Mineral Resources and Mineral Reserves Best Practices Guidelines. |
| | ● | GFMS (2019). GFMS Gold Survey 2019. 28pp. |
| | ● | Fuchter, W.A.H. (1990). The Geology and Gold Mineralisation of the North Western Mining Camp, Gwanda Greenstone Belt, Zimbabwe. Unpublished PhD thesis, Queens University. |
Caledonia Mining Corporation Plc
S-K 1300 Technical Report Summary on the Blanket Gold Mine, Zimbabwe
| | ● | Kalbskopf, S., and Nutt, T., (2003). Lithological Contrasts and Constraints on Gold Mineralisation in Granitoids in the Zimbabwe Craton: Structural Controls and Implications for Exploration. Economic Geology Research Unit, Hugh Allsop Laboratory. University of the Witwatersrand, Johannesburg. Information Circular, No. 370, 27 pp. |
| | ● | Knight Piésold Africa Limited (2019). Caledonia Mining Corporation - Blanket Mine (1983) (Pvt) Limited Blanket Mine Closure Plan, Closure Cost Estimates January 2019. Project Number: RI301-00588/02. Revision A. January 2019. 127pp. |
| | ● | Mhlanga, G. (2002). Data Driven Predictive Modelling for Archean Lode Gold Potential, Bubi Greenstone Belt, Southwest Zimbabwe. MSc Thesis, International Institute for Geo-information Science and Earth Observation, Enscehe, Netherlands. 108 pp. |
| | ● | Robert, F. (1996). Diversity of Archaean Lode Gold Deposits and Implications for Exploration. Course Notes, AMF Workshop Course No. 973/96, Australian Mineral Foundation, Adelaide. |
| | ● | Spilpunt. Mineral Commodities and Africa – Gwanda Greenstone Belt (updated 2001). Available from: http://spilpunt.blogspot.com/2007/04/zimbabwe.html. Viewed 3 August 2020. |
| | ● | The MSA Group (2011). NI 43 101 Technical Report on the Blanket Gold Mine, Zimbabwe. J2225. Prepared on behalf of Caledonia Mining Corporation. 28 June 2011. |
| | ● | United States Geological Survey (2024). Gold Data Sheet - Mineral Commodity Summaries 2024, 31 January 2024 via https://pubs.usgs.gov/periodicals/mcs2024/mcs2024-gold.pdf |
| | ● | Consensus Economics Inc. for Nominal and Real gold prices. |
| | ● | US inflation from World Economic Outlook January 2024. |
| | ● | Bloomberg for share price information. |
| | ● | The Office of Australia’s chief economist (2024) for gold outlook. |
| | ● | World Gold Council. Gold Demand Trends Data Tables, FY 2023 Statistics. |
| | ● | World Gold Council. Gold Demand Trends, Full Year and Q4 2023. London, United Kingdom. Published: 31 January 2024. |
| | ● | World Gold Council (2023). Latest World Official Reserves. Accessed on 8 April 2014 via https://www.gold.org/goldhub/data/gold-demand-by-country. |
| | ● | World Gold Council (2023). Latest World Official Reserves. Accessed on 8 April 2014 via https://www.gold.org/goldhub/data/gold-production-by-country. |
ITEM 25 – RELIANCE ON INFORMATION PROVIDED BY THE REGISTRANT
The QPs have accepted information supplied by Caledonia regarding the permits and licences as valid and complete, which is included in Item 3 of this TRS. The QPs consider such reliance reasonable because the information constitutes legal and environmental matters outside the expertise of the QPs.