Exhibit 15.6
DATE AND SIGNATURE PAGE
This technical report summary titled "Bilboes Gold Project Technical Report Summary" was prepared for Caledonia Mining Corporation Pie, in accordance with Subpart 1300 and Item 601(b)(96) of Regulation S-K, as adopted by the United States Securities and Exchange Commission. Its effective date is December 31 2023.
The Qualified Person ("QP") responsible for this Report is DRA Projects (Pty) Ltd.
Signature Date: May 15, 2024
ABBREVIATIONS, TERMS AND DEFINITIONS
Abbreviations/Terms | Definition |
°C | Degrees |
AACE | American Association of Cost Engineers |
AMIS | African Mineral Standards |
amsl | above mean sea level |
AMZIM | Anglo American Corporation of Zimbabwe Ltd |
Archean | Bubi Greenstone Belt |
Au | Native Gold |
Baker Steel | Baker Steel Resources Limited |
BBWi | Bond Ball Work Index |
BFS | Basic Ferric Sulphate |
Bilboes | Bilboes Gold Limited |
BIOX | Biological Oxidation |
BoQ | Bill of Quantities |
Caledonia | Caledonia Mining Corporation Plc |
CCD | Counter Current Decantation |
CCE | Capital Cost Estimate |
CIL | Carbon in Leach |
CIM | Canadian Institute of Mining |
CMCL | AIM of the London Stock Exchange plc |
COS | Crushed Ore Stockpile |
CRM’s | Certified Reference Materials |
CSR | Corporate Social Responsibility |
Datamine | Datamine Studio™ |
DD | Diamond Drilling |
DEM | Digital Elevation Model |
DRA | DRA Projects (Pty) Ltd |
EC&I | Electrical, Control and Instrumentation |
EHS | Environmental, Health and Safety |
EIA | Environmental Impact Assessment |
EMA | Environmental Management Agency |
EMC | Eurus Mineral Consultants |
EMP | Environmental Management Plans |
| EPCM | Engineering, Procurement, Construction Management |
EPO | Exclusive Prospecting Orders |
ESIA | Environmental and Social Impact Assessment |
ESMP | Environmental and Social Management Plan |
Abbreviations/Terms | Definition |
ESSMS | Environmental, Social and Safety Management System |
FEED | Front End Engineering Design |
FGR | Fidelity Gold Refinery |
GEV | Generalized Extreme Value |
IFC | International Finance Commission |
ILO | International Labor Organization |
IMTT | Intermediated Money Transfer Tax |
Infinite Treasure | Infinite Treasure Limited |
IRR | Internal Rate of Return |
ISBN | Isabella North |
ISBS | Isabella South |
LBMA | London Bullion Market Association |
LCR | Lab Coarse Duplicates |
LG | Lerchs-Grossman |
LoM | Life of Mine |
LPR | Lab Pulp Duplicates |
LRP | Livelihoods Restoration Plan |
ma | mega annum |
mamsl | Meter above mean sea level |
MAP | Mean Annual Precipitation |
MCC | Motor Control Centre |
MEL | Mechanical Equipment List |
MRE | Mineral Resource Estimate |
MSD-Z | Meteorological Services Department of Zimbabwe |
NPV | Net Present Value |
| OPEX | Operating Expenditure |
P&G | Preliminary and General |
PDC | Process Design Criteria |
PERC | percussion Reverse Circulation |
PFD | Process Flow Diagram |
PFS | Pre-Feasibility Study |
PGM | Platinum Group Metals |
PLZ | Performance Laboratories Zimbabwe Limited |
POX | Pressure Oxidation |
PSD | Particle Size Distribution |
PV | Prospecting Ventures |
QA/QC | Quality Assurance / Quality Control |
Abbreviations/Terms | Definition |
QP | Qualified Person as defined in S-K 1300 |
RC | Reverse Circulation |
RFQ | Rock Quality Designation |
RMR | Rock Mass Rating |
RoM | Run of Mine |
RoR | Rate of Rise |
RWD | Return Water Dam |
SANAS | South African National Accreditation System |
SEX | Sodium Ethyl Xanthate |
SIB | Stay in Business |
| S-K 1300 | Subpart 1300 and Item 601(b)(96) of Regulation S-K |
SLR | SLR Consulting (Africa) (Pty) Ltd |
TRS | Technical Report Summary within the meaning of S-K 1300 |
TSF | Tailings Storage Facility |
US$ | United States Dollar |
VAT | Value Added Tax |
WGC | World Gold Council |
WRD | Waste Rock Dumps |
ZETDC | Zimbabwe Electricity Transmission and Distribution Company |
ZINWA | Zimbabwe National Water Authority |
SYSTEM OF UNITS
The international metric system of units (SI) will be used throughout the design in all documentation, specifications, drawings, reports, and all other documents associated.
TABLE OF CONTENT
1 | EXECUTIVE SUMMARY | 20 |
| 1.1 | Introduction | 20 |
| | 1.2 | Report Purpose | 20 |
| | 1.3 | Project Location | 20 |
| | 1.4 | Permits | 20 |
| | 1.5 | History | 21 |
| | 1.6 | Geology and Resource Estimate | 21 |
| | 1.7 | Exploration | 21 |
| | 1.8 | Sample Preparation, Analysis and Security | 22 |
| | 1.9 | Mineral Resource Estimate | 24 |
| | 1.10 | Mineral Reserve | 26 |
| | 1.11 | Mining Strategy | 27 |
| | 1.12 | Mine Production Schedules | 28 |
| | 1.13 | Tailings Storage Facility | 29 |
| 1.14 | Infrastructure and Site Layout | 29 |
| 1.15 | Environmental | 31 |
| 1.16 | Project Permitting | 32 |
| 1.17 | Social and Community Related Requirements and Plans | 32 |
| 1.18 | Mine Closure | 33 |
| 1.19 | Process Plant | 33 |
| 1.20 | Capital Costs | 34 |
| 1.21 | Operating Costs | 35 |
| 1.22 | Market Studies | 36 |
| 1.23 | Economic Outcomes | 36 |
| 1.24 | Project Development | 37 |
| | 1.25 | Conclusions | 37 |
| | 1.26 | Recommendations | 39 |
| 2 | INTRODUCTION | 40 |
| | 2.1 | Report Purpose | 40 |
| | 2.2 | Sources of Information | 40 |
| | 2.3 | Personal Inspections / Site Visits | 40 |
| | 2.4 | QP Responsibilities and Relationships | 41 |
| 3 | PROPERTY DESCRIPTION | 42 |
| | 3.1 | Project Location | 42 |
| | 3.2 | Property Area | 42 |
| | 3.3 | Mineral Tenure and Title | 43 |
| | 3.4 | Royalties | 44 |
| | 3.5 | Permits | 44 |
| 3.6 | Political Risks | 45 |
| 3.7 | Indigenization and Economic Empowerment | 45 |
4 | ACCESSIBILITY, CLIMATE, LOCAL RESOURCES, INFRASTRUCTURE AND PHYSIOGRAPHY. | 47 |
| 4.1 | Access | 47 |
| | 4.2 | Physiography | 47 |
| | 4.3 | Climate | 47 |
| | 4.4 | Local Resources and Infrastructure | 47 |
| | 4.5 | Personnel | 48 |
| | 4.6 | Supplies | 48 |
5 | HISTORY | 49 |
| | 5.1 | Holdings | 49 |
| | 5.2 | Historical Sulfide Mineral Resource Estimates | 49 |
| | 5.3 | Production | 52 |
6 | GEOLOGICAL SETTING, MINERALIZATION AND DEPOSIT | 54 |
| | 6.1 | Regional Geology | 54 |
| 6.2 | Regional Geology as it Relates to the Bilboes Properties | 58 |
| | 6.3 | Stratigraphy | 59 |
| | 6.4 | Deposit Types | 60 |
7 | EXPLORATION | 62 |
| | 7.1 | Geological Mapping | 62 |
| | 7.2 | Trenching | 63 |
| | 7.3 | Ground Geophysical Surveying | 63 |
| | 7.4 | Prospecting and Sampling | 64 |
| | 7.5 | Drilling | 64 |
| | 7.6 | Hydrology and Hydrological Drilling | 68 |
| | 7.7 | Geotechnical Drilling | 69 |
8 | SAMPLE PREPARATION, ANALYSES AND SECURITY | 70 |
| | 8.1 | Sampling | 70 |
| | 8.2 | Analysis | 70 |
| | 8.3 | Sample Security | 71 |
| | 8.4 | Quality Control | 71 |
| | 8.5 | QP Commentary | 73 |
9 | DATA VERIFICATION | 74 |
| | 9.1 | Historical Data | 74 |
| | 9.2 | 2017/2018 Drilling Campaign | 74 |
| | 9.3 | QP Commentary | 74 |
10 | MINERAL PROCESSING AND METALLURGICAL TESTING | 75 |
| | 10.1 | Test Work Programme Overview | 75 |
| | 10.2 | Discussion of the Results | 75 |
| | 10.3 | Process Route Identification | 77 |
| 10.4 | Variability Testing | 78 |
| | 10.5 | Pilot Plant Test Work | 78 |
| | 10.6 | Pilot Plant Results | 79 |
| | 10.7 | BIOX® | 81 |
| | 10.8 | QP Commentary | 83 |
11 | MINERAL RESOURCE ESTIMATES | 84 |
| | 11.1 | Topography | 84 |
| | 11.2 | Geological Database | 84 |
| | 11.3 | Bulk Density | 84 |
| | 11.4 | Geological Model | 85 |
| | 11.5 | Weathering and Oxidation | 87 |
| | 11.6 | Compositing | 88 |
| | 11.7 | Variography | 88 |
| | 11.8 | Top Capping | 89 |
| | 11.9 | Grade Estimation | 89 |
| | 11.10 | Model Validations | 91 |
| | 11.11 | Reconciliation | 92 |
| | 11.12 | Resource Classification | 92 |
| | 11.13 | Declaration | 94 |
| | 11.14 | QP Commentary | 96 |
12 | MINERAL RESERVE ESTIMATES | 97 |
| | 12.1 | Basis of Mineral Reserve Estimate | 97 |
| | 12.2 | Mineral Reserve Declaration | 98 |
| | 12.3 | Risk Assessment | 99 |
13 | MINING METHODS | 100 |
| | 13.1 | Hydrological and Geotechnical Investigation | 100 |
| | 13.2 | Rock Mass Classification | 101 |
| | 13.3 | Geotechnical Conclusions and Recommendations | 101 |
| | 13.4 | Mining Pit Locations | 103 |
| | 13.5 | Mining Strategy | 104 |
| | 13.6 | Mine Design | 108 |
| | 13.7 | Mine Production | 108 |
| | 13.8 | Operating Assumptions | 109 |
| | 13.9 | Fleet Requirements | 110 |
| | 13.10 | Mining Personnel | 111 |
14 | PROCESSING AND RECOVERY METHODS | 114 |
| | 14.1 | Process Test work Results | 114 |
| | 14.2 | Process Flow Description | 115 |
| | 14.3 | Plant Water Requirements | 121 |
| | 14.4 | Reagent Services | 121 |
15 | INFRASTRUCTURE | 123 |
| | 15.1 | Geotechnical Investigation and Design | 124 |
| | 15.2 | Tailings Storage Facility | 126 |
| | 15.3 | Civil Engineering and Earthworks | 130 |
| | 15.4 | Mechanical Engineering | 131 |
| | 15.5 | Electrical Power Supply and Reticulation (including Communications) | 132 |
| | 15.6 | General Infrastructure | 133 |
| | 15.7 | Water Management Infrastructure | 134 |
| | 15.8 | Sewage Management | 135 |
| | 15.9 | Project Execution | 135 |
16 | MARKET STUDIES | 137 |
| | 16.1 | Historical Supply and Demand | 137 |
| | 16.2 | Gold Sales in Zimbabwe | 140 |
| | 16.3 | Gold Price Predictions | 141 |
17 | ENVIRONMENTAL STUDIES, PERMITTING, AND PLANS, NEGOTIATIONS, OR AGREEMENTS WITH LOCAL INDIVIDUALS OR GROUPS | 142 |
| | 17.1 | Environmental Issues | 142 |
| | 17.2 | Waste, Tailings, Monitoring and Water Management | 143 |
| | 17.3 | Water Management | 146 |
| | 17.4 | Project Permitting | 146 |
| | 17.5 | Social and Community Related Requirements and Plans | 147 |
| | 17.6 | Social / Community Issues | 148 |
| | 17.7 | Mine Closure | 148 |
| | 17.8 | Estimated Environmental Costs for Closure | 150 |
| | 17.9 | QP Commentary | 150 |
| 18 | CAPITAL AND OPERATING COSTS | 151 |
| | 18.2 | Operating Cost Estimate | 155 |
19 | ECONOMIC ANALYSIS | 159 |
| | 19.1 | Introduction | 159 |
| | 19.2 | Method | 159 |
| | 19.3 | Sources of Information | 160 |
| | 19.4 | Base Date | 160 |
| | 19.5 | Production Profile | 160 |
| | 19.6 | Capital Expenditure and Phasing | 161 |
| | 19.7 | Stay in Business Capital | 161 |
| | 19.8 | Operating Expenditure | 161 |
| | 19.9 | Gold Recovery | 162 |
| | 19.10 | Gold Pricing | 162 |
| | 19.11 | Salvage Value | 162 |
| | 19.12 | Working Capital | 162 |
| | 19.13 | Sunk and On-going Capital | 162 |
| | 19.14 | Reclamation and Closure | 162 |
| | 19.15 | Royalty Tax | 163 |
| | 19.16 | Corporate Income Tax | 163 |
| | 19.17 | Discount Rate | 163 |
| | 19.18 | Economic Outcomes | 164 |
| | 19.19 | Cash Flow Model | 164 |
| | 19.20 | Sensitivity Analysis | 168 |
20 | ADJACENT PROPERTIES | 170 |
21 | OTHER RELEVANT DATA AND INFORMATION. | 172 |
| | 21.1 | Royalties, Taxes and Economic Climate in Zimbabwe | 172 |
| 21.2 | Mining Legislation | 177 |
22 | INTERPRETATION AND CONCLUSIONS | 178 |
| | 22.1 | Mineral Resource Estimate | 178 |
| | 22.2 | Mineral Reserves Estimate | 179 |
| | 22.3 | Economic Outcomes | 179 |
| | 22.4 | Risk Assessment | 180 |
23 | RECOMMENDATIONS | 183 |
| | 23.1 | Project Feasibility / Pre Project Execution / Implementation | 183 |
| | 23.2 | Mineral Resource Estimation | 183 |
| | 23.3 | Mineral Reserve Estimate | 183 |
24 | REFERENCES | 184 |
25 | RELIANCE ON INFORMATION PROVIDED BY THE REGISTRANT | 185 |
| Table 1-1: | Test work Program Outline | 26 |
| Table 1-2: | Mineral Resource based on a 0.9g/t Au Cut-Off Grade | 28 |
| Table 1-3: | Bilboes Gold Project Mineral Reserve Statement | 30 |
| Table 1-4: | Process Plant Main Design Criteria | 36 |
| Table 1-5: | Capital Summaries per Project Phase | 38 |
| Table 1-6: | Mining Contractor OPEX | 38 |
| Table 1-7: | Plant OPEX | 38 |
| Table 1-8: | LoM Operating Cost Summary | 39 |
| Table 1-9: | Project Economics Summary | 40 |
| Table 1-10: | Key Development Milestones | 40 |
| Table 3-1: | Bilboes Claims | 45 |
| Table 5-1: | Sulfide Inferred Mineral Resources as of 2009 | 52 |
| Table 5-2: | Sulfide Mineral Resources as of 31 March 2017, 0.0 g/t Au Block Cut-Off Applied | 54 |
| Table 5-3: | Sulfide Mineral Resources as of 31 March 2017, 0.9 g/t Au Block Cut-Off Applied | 54 |
| Table 5-4: | Production Data from Bilboes Mines to 31 December 2020 | 56 |
| Table 7-1: | History of Sulfide Project Core Drilling 1994 - 1999 (From Ngilazi & Martin, 2017) | 69 |
| Table 10-1: | Test work Program Outline | 78 |
| Table 10-2: | Optimum Flotation Conditions | 80 |
| Table 10-3: | Comparative Pilot Plant Simulated Recoveries | 83 |
| Table 10-4: | Flotation Residence Times | 83 |
| Table 10-5: | Summary of the Test Work Pre-Feasibility Results | 85 |
| Table 11-1: | Summary of Drill Holes | 87 |
| Table 11-2: | Summary of Density Measurement per Resource Area | 88 |
| Table 11-3: | Summary of the Geological Parameters for the Geological Models | 88 |
| Table 11-4: | Variogram Parameters used for Grade Estimation | 91 |
| Table 11-5: | Summary of Search Parameters | 93 |
| Table 11-6: | Block Model Configuration | 94 |
| Table 11-7: | Checklist Criteria for Resource Classification | 96 |
| Table 11-8: | Summary of Optimization Parameters used for the Lerchs-Grossmann Shells | 97 |
| Table 11-9: | Mineral Resource based on a 0.9g/t Au Cut-Off Grade | 98 |
| Table 12-1: | Bilboes Gold Project Mineral Reserve Statement (31 December 2023) | 101 |
| Table 12-2: | Risks associated with the Declaration of the Mineral Reserve | 102 |
| Table 13-1: | Isabella – McCays – Bubi – Predicted drawdown vs. time | 103 |
| Table 13-2: | Percentage Rock Types at Different Mining Pits | 104 |
| Table 13-3: | Slope Design | 105 |
| Table 13-4: | Optimization Financial Parameters | 108 |
| Table 13-5: | Geotechnical - Mining | 109 |
| Table 13-6: | Mining Continued – Throughput - Process | 109 |
| Table 13-7: | Summary of Selected Shells at US$1,800/oz | 110 |
| Table 13-8: | Bilboes Labor Compliments and Job Grades | 115 |
| Table 14-1: | Process Plant Design Criteria | 117 |
| Table 14-2: | Process Plant Major Reagents / Commodities | 124 |
| Table 15-1: | Proposed Soil and Rock Properties for Foundation Modelling on the TSF Site | 128 |
| Table 15-2: | Proposed Soil and Rock Properties for Foundation Modelling on Process Plant Site | 128 |
| Table 15-3: | Production Profile | 130 |
| Table 15-4: | Liner System | 132 |
| Table 15-5: | Substation Loading | 136 |
| Table 15-6: | Building Infrastructure | 136 |
| Table 16-1: | Predicted Gold Price | 144 |
| Table 17-1: | Potential Environmental Impacts | 145 |
| Table 18-1: | Exchange Rates | 154 |
| Table 18-2: | Capital Summary by Discipline | 156 |
| Table 18-3: | Capital Summaries per Project Phase | 157 |
| Table 18-4: | Mining Contractor Costs per Area (US$/total tonne) | 159 |
| Table 18-5: | Reagent Cost and Consumption for Isabella McCay’s and Bubi | 159 |
| Table 18-6: | Process Plant OPEX – Power | 161 |
| Table 18-7: | Process Plant OPEX | 161 |
| Table 19-1: | Sources of Information | 163 |
| Table 19-2: | Initial Capital Cost – Constant Terms (2023) | 164 |
| Table 19-3: | SIB Capital Cost (LoM) – Constant Terms (2023) | 164 |
| Table 19-4: | Operational Cost Estimate (LoM) – Constant Terms (2023) | 164 |
| Table 19-5: | Gold Recovery per Mineralization Property | 165 |
| Table 19-6: | Summary of Economic Outcomes | 167 |
| Table 19-7: | Cash Flow Model | 169 |
| Table 20-1: | Historic Gold Production from Mines around Isabella McCays and Bubi to 1980 | 174 |
| Table 21-1: | Capital Gains Tax | 177 |
| Table 21-2: | Vat Collection | 178 |
| Table 22-1: | Project Economics Summary | 182 |
| Table 22-2: | Summary of Identified Risks and The Mitigation Strategies | 184 |
LIST OF FIGURES
| Figure 1‑1: | Total Mine Material Movements for LoM | 34 |
| Figure 1‑2: | Overall Site Plan | 35 |
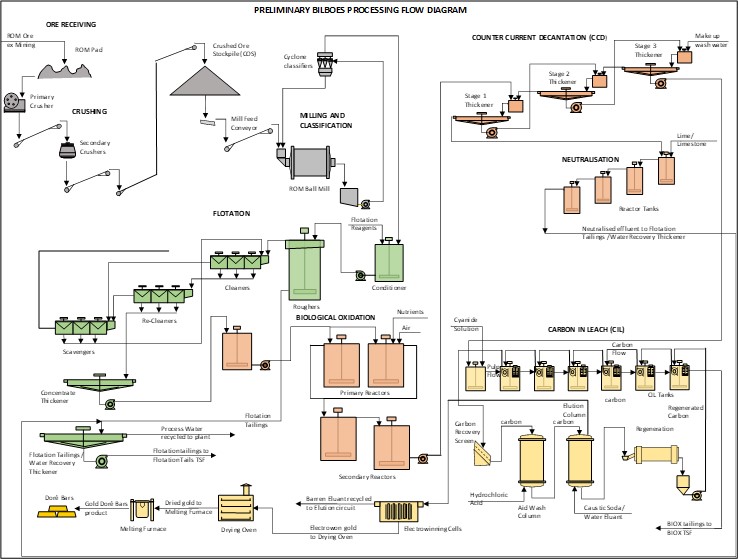
| Figure 1‑3: | Bilboes Simplified Process Flow Diagram | 39 |
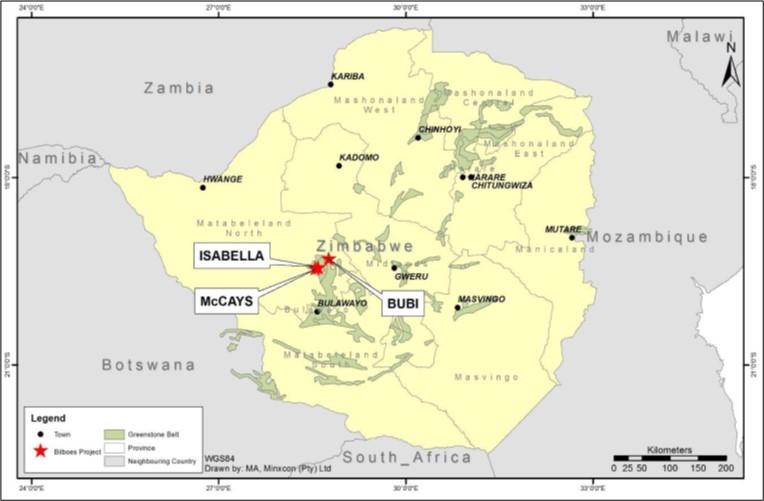
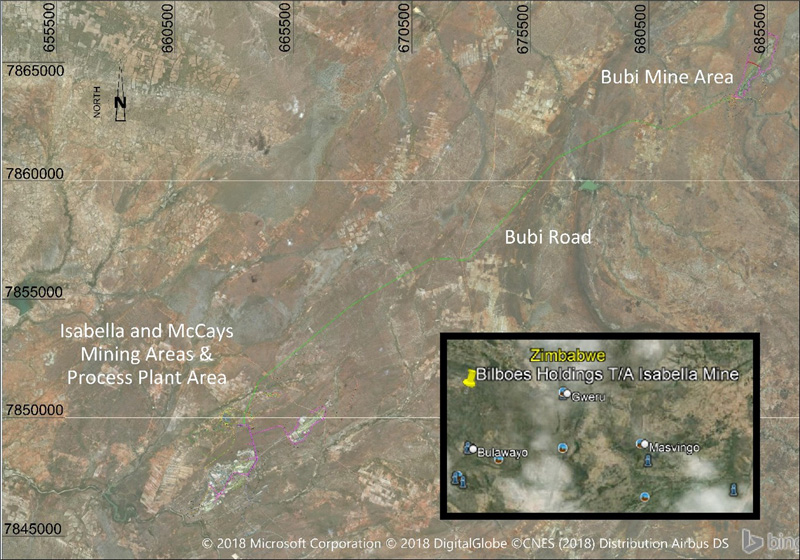
| Figure 3‑1: | Regional Location of the Bilboes | 47 |
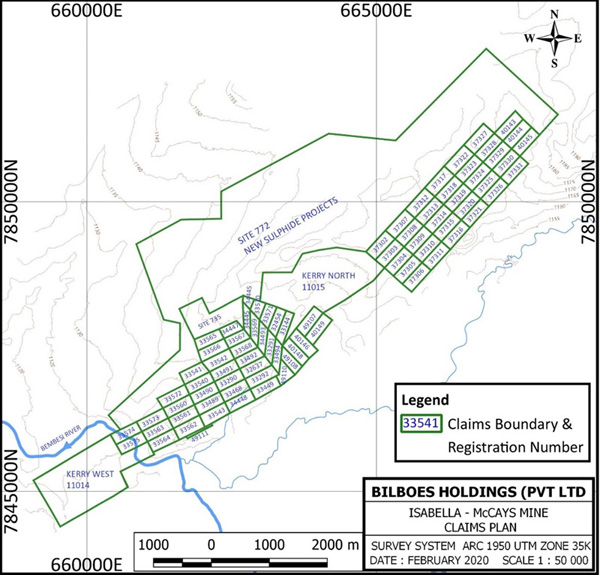
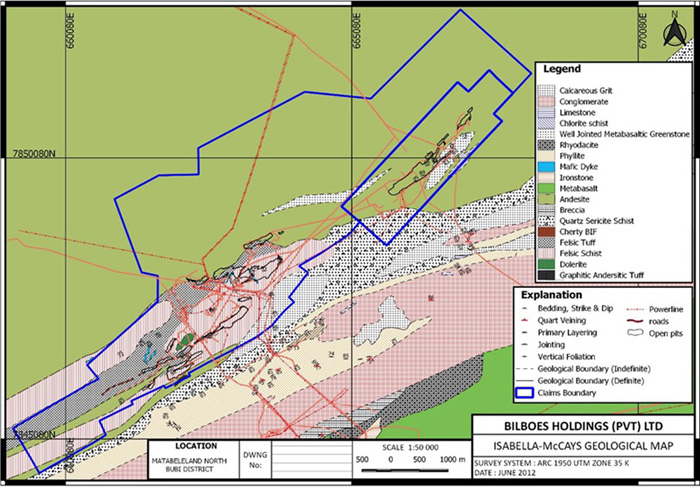
| Figure 3‑2: | Isabella-McCays Mine Claims Map | 48 |
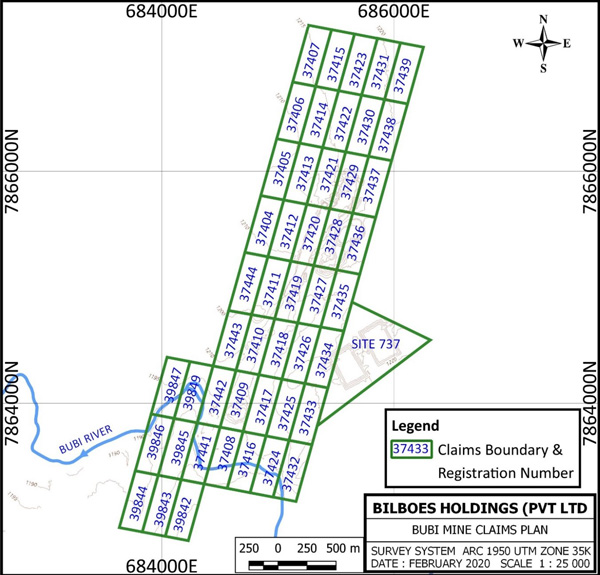
| Figure 3‑3: | Bubi Mine Claims Map | 49 |
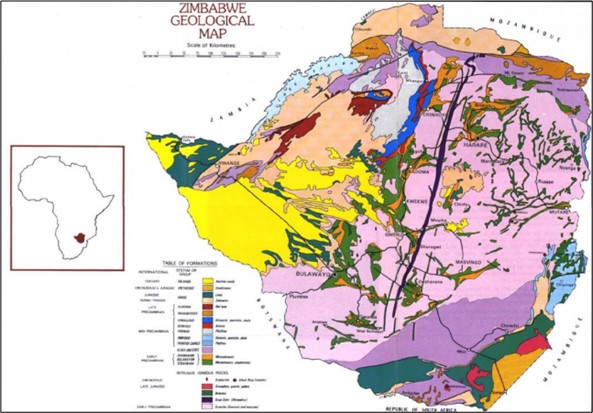
| Figure 6‑1: | Geological Map Zimbabwe (taken from Mugumbate, unknown year) | 59 |
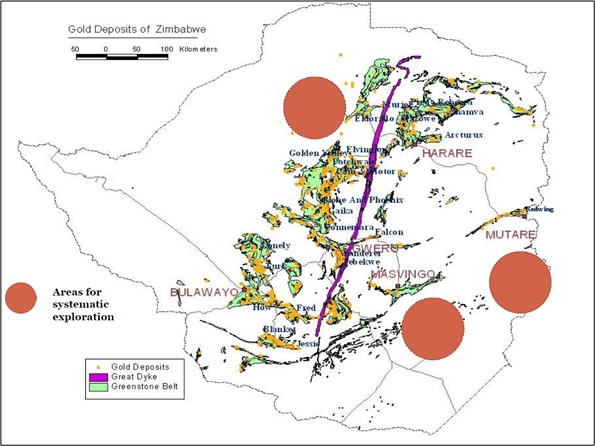
| Figure 6‑2: | Greenstone Belts and known Gold Deposits in Zimbabwe (Mugandani 2017) | 60 |
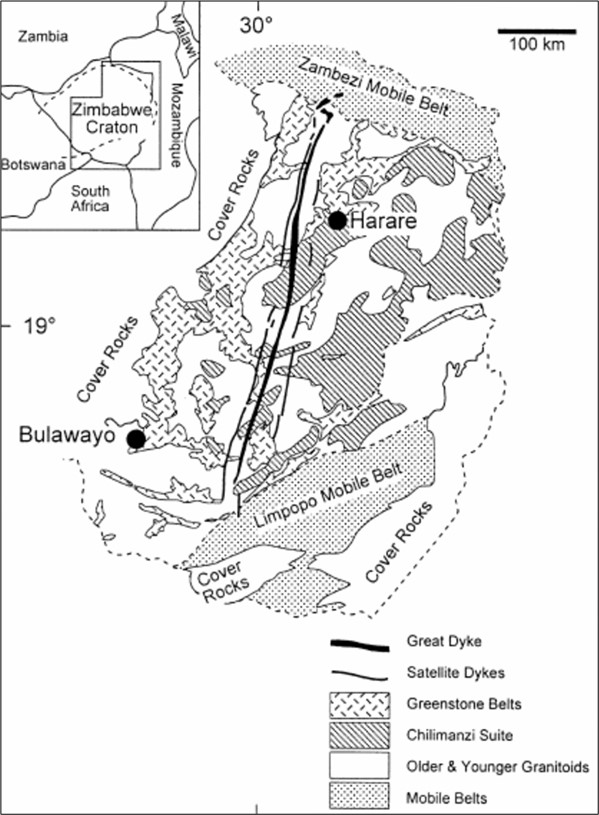
| Figure 6‑3: | NNE Trending Great Dyke Cutting Across the Zimbabwe Craton (Mukaka et al 1998) | 61 |
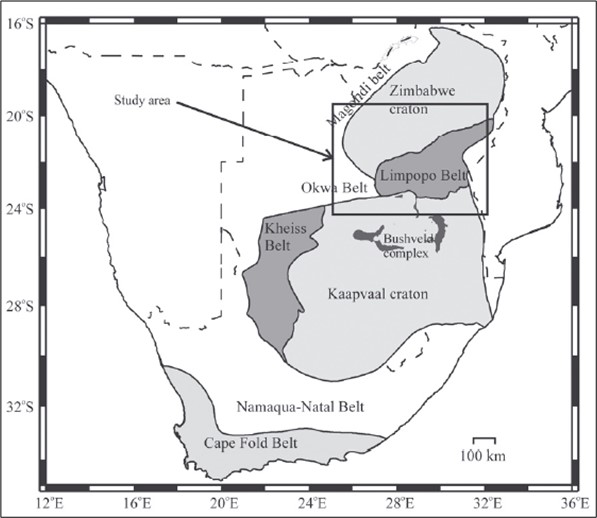
| Figure 6‑4: | Geological Map showing the Zimbabwe Craton and Mobile Belts (Gore et al 2009) | 62 |
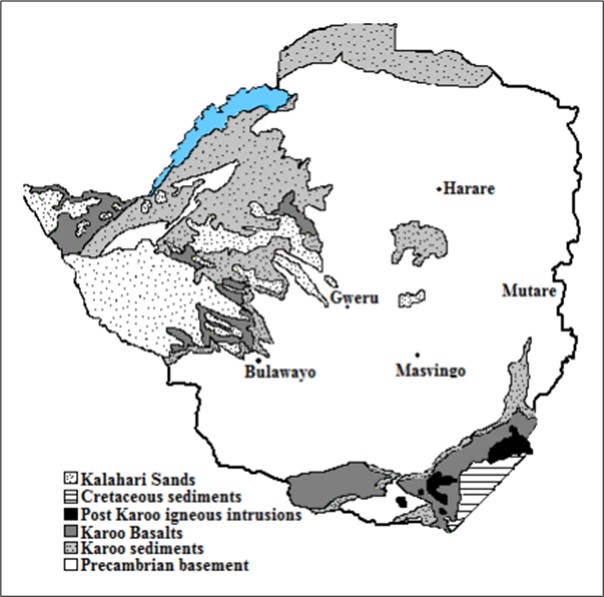
| Figure 6‑5: | Sedimentary Basins of Zimbabwe (taken from Mugumbate, unknown year) | 63 |
| Figure 6‑6: | Regional Geological Map showing Bilboes Properties (from Ngilazi and Martin ’17) | 64 |
| Figure 6‑7: | Bilboes Site Stratigraphy | 65 |
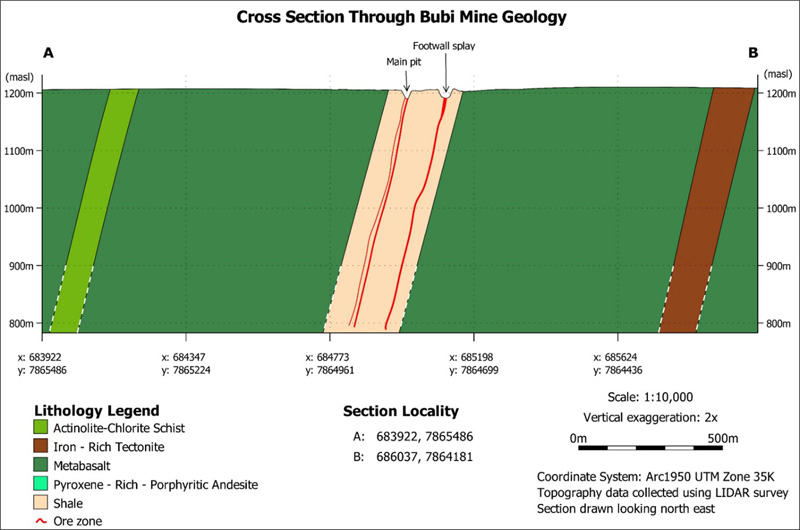
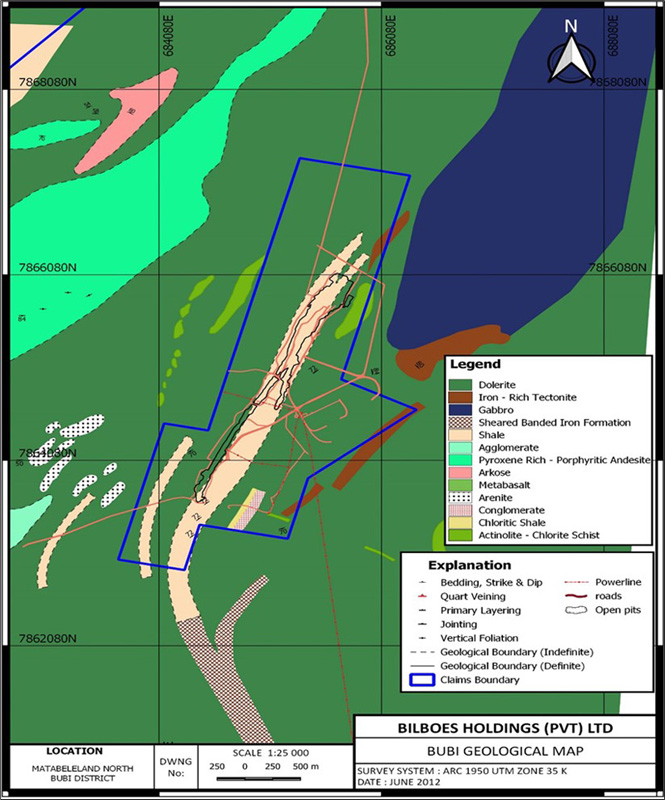
| Figure 7‑1: | Map of the Surface Geology at Bubi | 67 |
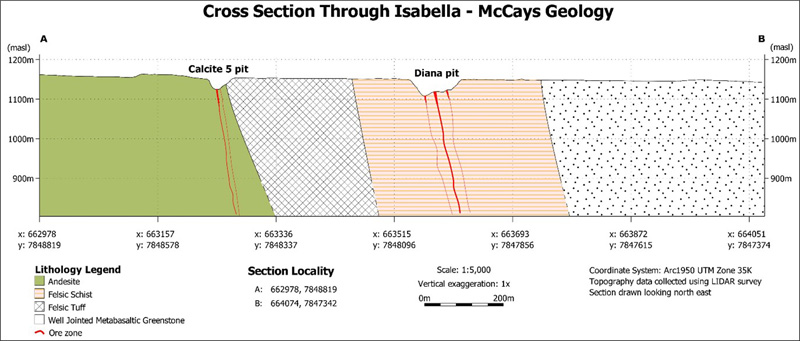
| Figure 7‑2: | Map of the Surface Geology at Isabella McCays | 68 |
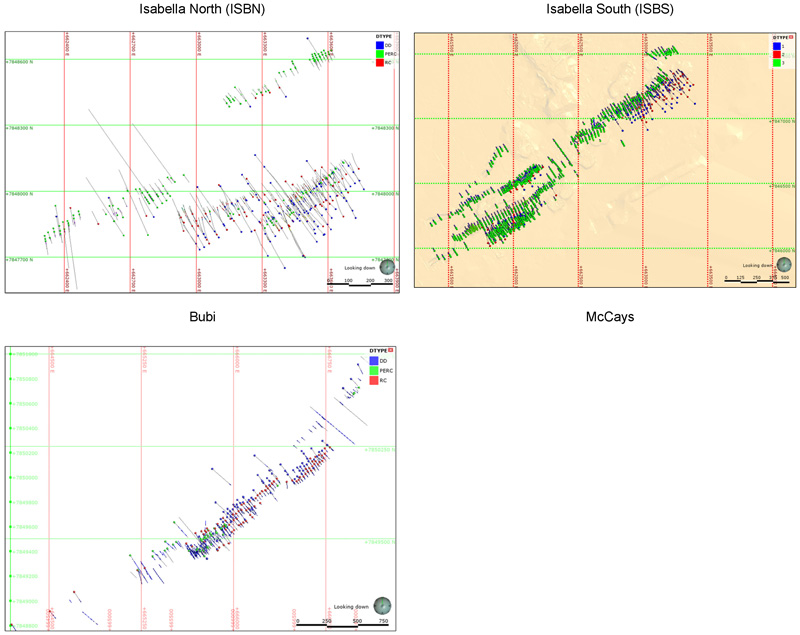
| Figure 7‑3: | Plans Showing the Drilling for the Various Areas | 72 |
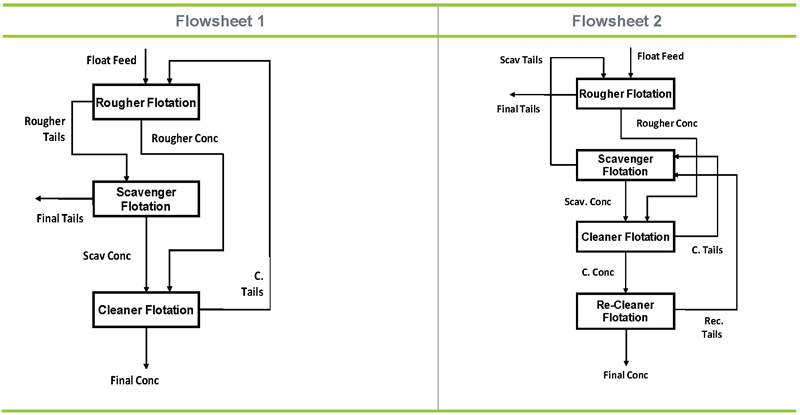
| Figure 10‑1: | Pilot Plant Campaign Flowsheets | 84 |
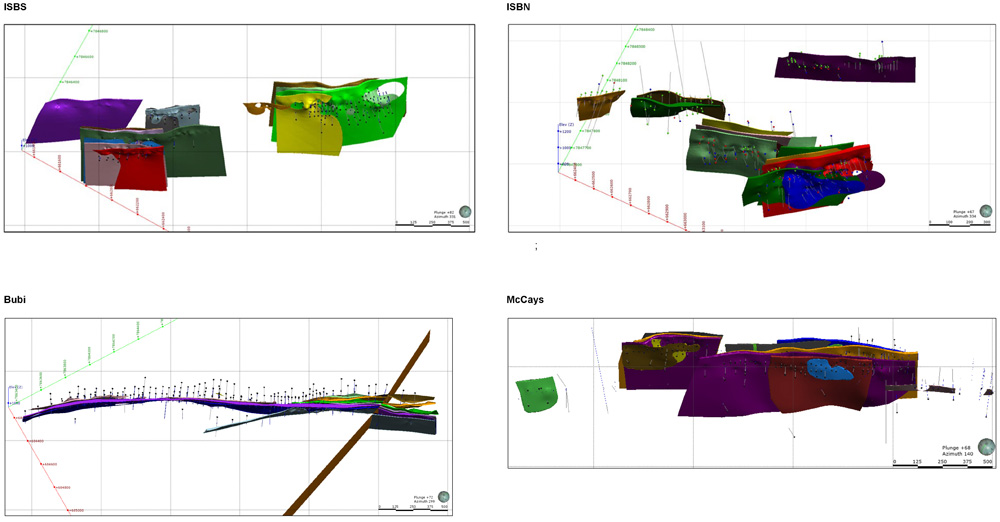
| Figure 11‑1: | Views of the Mineralization Zones | 91 |
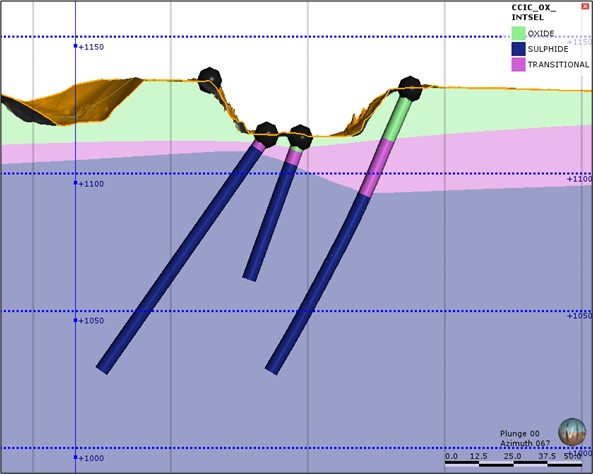
| Figure 11‑2: | Section View showing Oxidation Profile at ISBS | 92 |
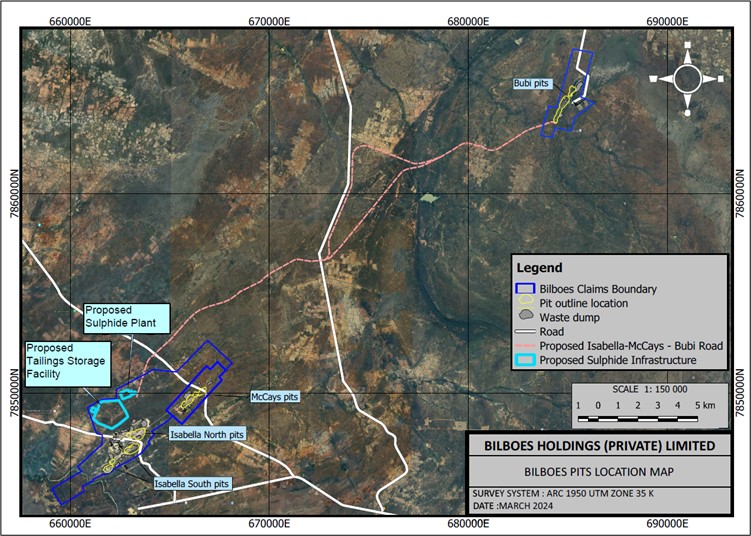
| Figure 13‑1: | Block Plan Showing Bilboes Pits and Process Plant Location | 108 |
| Figure 13‑2: | Block Plan Showing Bilboes Pits Location | 109 |
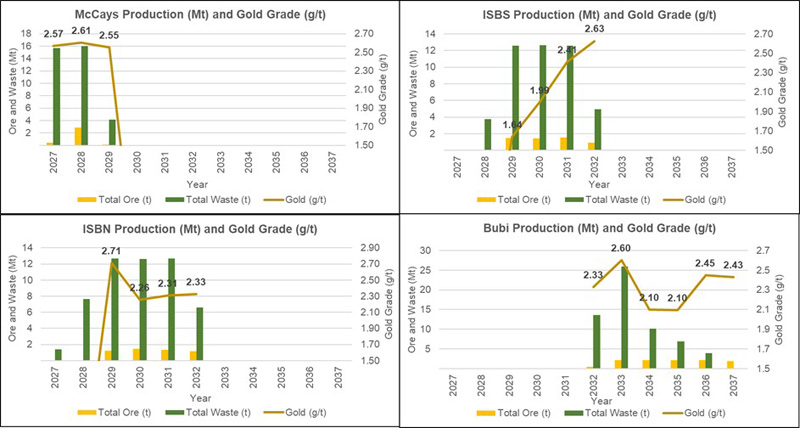
| Figure 13‑3: | Production Schedules per Area | 115 |
| Figure 14‑1: | Bilboes Simplified Process Flow Diagram | 121 |
| Figure 15‑1: | Mine Layout | 128 |
| Figure 15‑2: | Overall Site Plan | 129 |
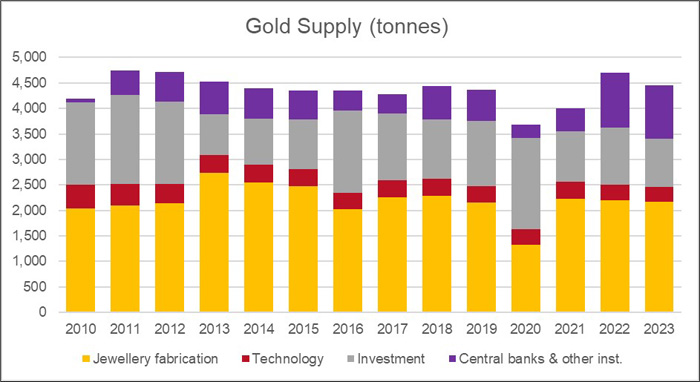
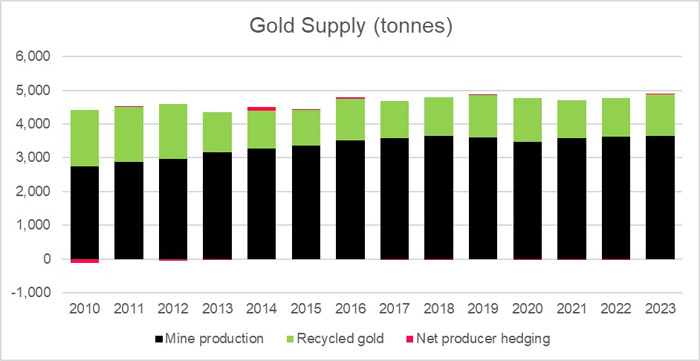
| Figure 16‑1: | Historical Gold Supply (2010 -2023) | 142 |
| Figure 16‑2: | Historical Gold Demand (2010 - 2023) | 143 |
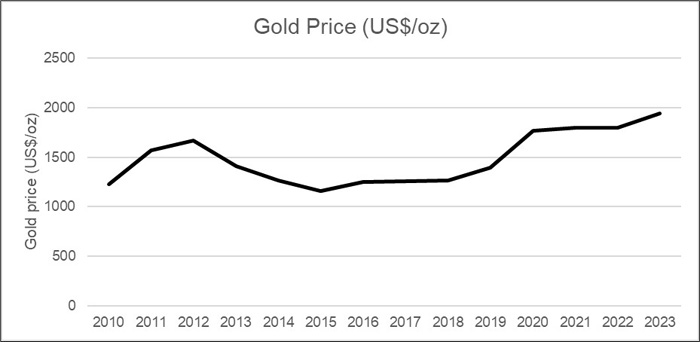
| Figure 16‑3: | Gold Price (2010 - 2023) | 144 |
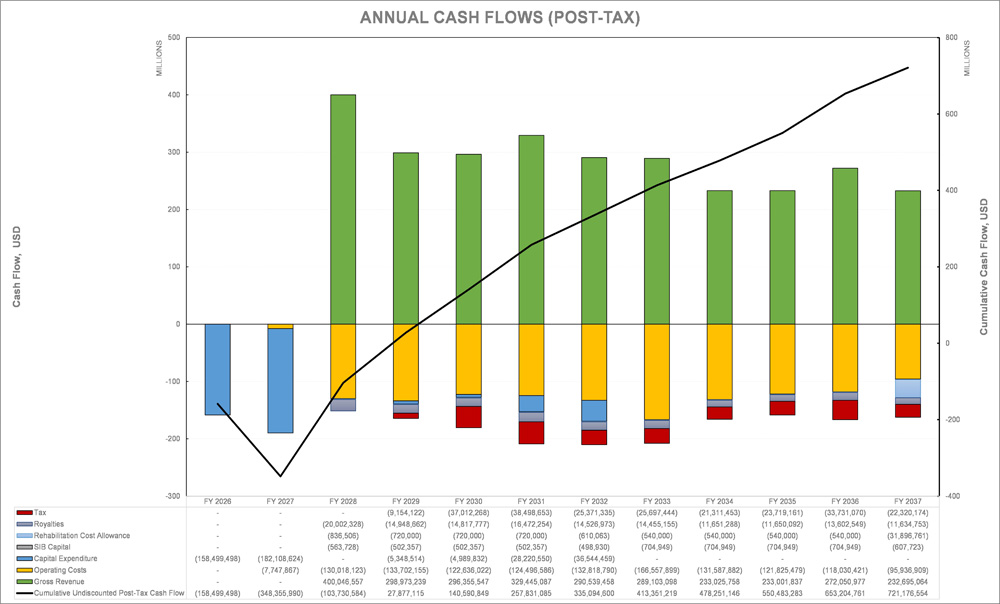
| Figure 19‑1: | LoM Cash Flow Model | 170 |
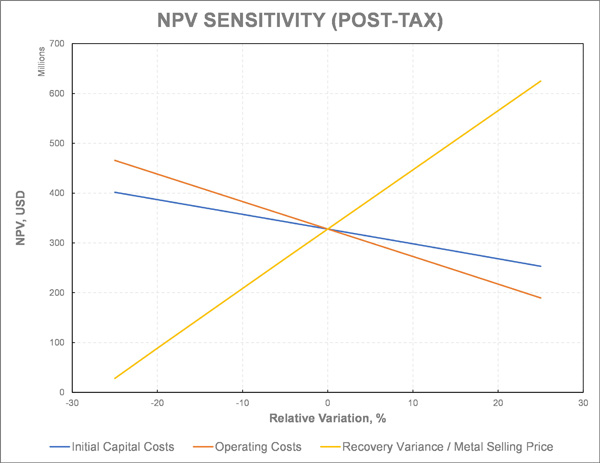
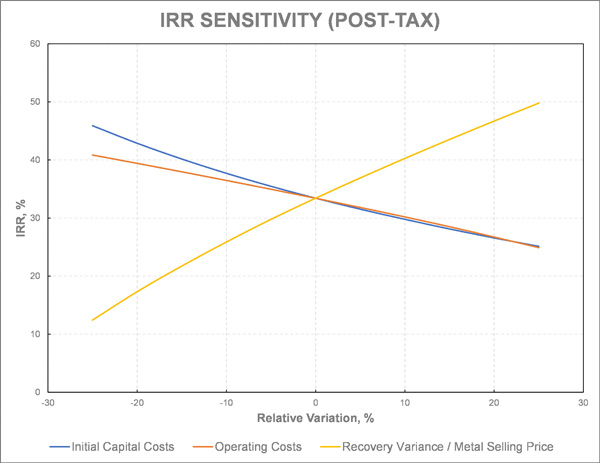
| Figure 19‑2: | Sensitivity Analysis | 174 |
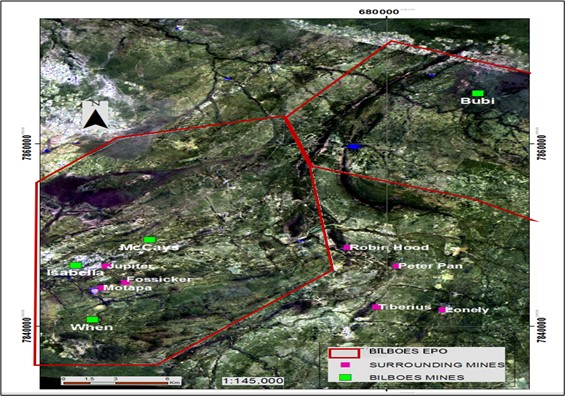
| Figure 20‑1: | Adjacent Properties around Isabella McCays and Bubi | 175 |
This Technical Report Summary (TRS) has been prepared for Caledonia Mining Corporation Plc (Caledonia) on the Bilboes Gold Mine, Zimbabwe which Caledonia acquired with the acquisition of Bilboes Gold Limited (Bilboes) on 6 January 2023. Caledonia is a Zimbabwean focused exploration, development, and mining corporation. Caledonia shares are listed on the NYSE American LLC and depositary interests in the shares are traded on the AIM of the London Stock Exchange plc (symbol: CMCL). Caledonia listed depositary receipts on the Victoria Falls Stock Exchange, a subsidiary of the Zimbabwe Stock Exchange, on December 2, 2021.
Caledonia mandated DRA Projects (Pty) Ltd (DRA) to complete this TRS to report the Mineral Resources and Mineral Reserves on the Bilboes Gold Mine effective as of 31 December 2023. This is the initial filing of a TRS in respect of the Bilboes Mine.
The Bilboes properties are located in the Matabeleland North Province of Zimbabwe. The Isabella-McCays properties are situated approximately 80 km north of Bulawayo while Bubi is situated approximately 100 km north of Bulawayo. Bubi is 32 km due north-east of Isabella.
Bilboes have rights to three groups of claims covering an area of 2,664.4 ha that consist of four open-pit mining properties in Matabeleland North Province of Zimbabwe. These open pits are referred to as Isabela North; Isabela South; McCays and Bubi.
Average daily temperatures range from 24°C in June, to 32° in October and apart from the occasional heavy downpour in the rainy season, there are no climatic conditions that prevent all year-round exploration and mining.
Bilboes has been operating in Matabeleland since 1989. It holds the necessary mining permits and complies with the terms of the Mines and Minerals Act and allied regulations with respect to all of their claims and in particular that all of the registration certificates are valid, and the protection certificates are up to date. Bilboes thus requires no further permits to explore or produce from the current operational areas, but further permits will be required for the proposed haul road between Bubi and Isabella plant.
Further exploration outside the current claims will require approvals by the Environmental Management Agency (EMA) who may request an Environmental Impact Assessment (EIA) study.
Initial exploration allowed the estimation of a small oxide Resource and an open-pit, heap-leach mine was commissioned in 1989. Some 90,048 oz of gold was produced since 2003. Subsequent exploration extended Isabella and new discoveries were made at Bubi and McCays, which has yielded production of 8,954 kg of gold (287,883 oz) to December 2020. All mining has been from open pit oxide ore utilizing the heap leach extraction processing method.
Exploration for sulfide Mineral Resources began in 1994/95, with 17,650m of exploratory drilling being completed by 1999, covering a strike length of 3,440 m. A maiden Mineral Resource estimate for the sulfide Mineral Resources was completed by SRK in 2009, containing 4.75 Mt of Inferred Mineral Resources grading 3.49 g/t. This estimate used a 2.0 g/t cut-off for delineation of the mineral Resource estimation domains.
1.6 | Geology and Resource Estimate |
| | 1.6.1 | Geological Setting and Mineralization |
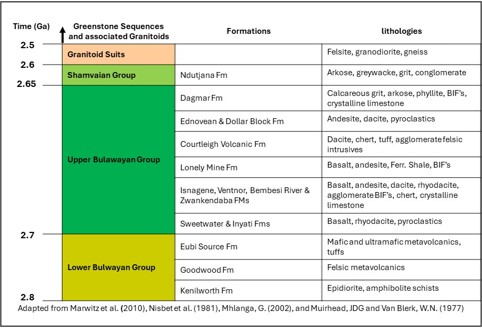
The Bubi Greenstone Belt (Archean) which consists of volcanic rocks of the Upper Bulawayan Group and capped by sedimentary sequences of the Shamvaian Group, all of which have been metamorphosed into felsic and mafic schists, underlies the Bilboes Properties. Gold deposits are concentrated at the interface between these two groups, where major structural breaks and splays provide pathways for hydrothermal vein mineralization.
Gold is associated with sulfides that is commonly found in hydrothermal systems. These include pyrite and arsenopyrite as major components, but copper, lead, zinc, antimony, are also present in some deposits. Common alteration associated with gold mineralization is silicification, with lesser sericite and chlorite alteration.
Mineralization is hydrothermal and consists of silicified stockworks that host pyrite and arsenopyrite. The stockworks are characterized by a series of subparallel echelon zones. The gold is very finely dispersed within the sulfides and is refractory. All the deposits are oxidized with the sulfide interface occurring between 6 m and 50 m below surface.
Soil sampling, trenching and geological mapping have been progressively conducted since exploration and oxide mining commenced in 1982. Soil sampling was used to identify areas for trenching and mapping. Trenches were sampled at 1 m to 2 m intervals. The assays were used to guide the interpretation and projection of oxide mineralization along strike and at depth. The assays from trench sampling were not used in grade estimation.
Ground Magnetics and Induced Polarization geophysical surveys have been conducted at Isabella, as part of the oxide ore exploration since 1996.
Drilling of the sulfides to provide data for the mineral resource estimate was done in three phases totaling 93,400 m. The first phase by Anglo American Corporation was between 1994 and 1999 and the second phase by Bilboes from 2011 to 2013. The latest drilling was from December 2017 to November 2018. The third campaign focused on upgrading of the mineral resources from the Inferred and Indicated to Indicated and Measured categories.
1.8 | Sample Preparation, Analysis and Security |
During the drilling campaigns, all geological logging and sampling was conducted in accordance with Bilboes standard operating procedures which were adopted by AMZIM and enhanced over time to keep up with industry best practices.
Independent South African National Accreditation System (SANAS) accredited laboratories were used in the analyses of samples. Performance Laboratories Zimbabwe Limited (PLZ) in Harare was selected as the primary laboratory. ZIMLABS and Antech Laboratories (Antech) in Zimbabwe were used for check analyses.
Certified Reference Materials (CRMs), blanks, field duplicates, coarse and pulp repeats were used for Quality Assurance Quality Control (QA/QC) purposes.
The QP has assessed the standard operating procedures together with the results of the QA/QC program and are of the view that these are adequate for the purposes of reporting the Mineral Resources contained herein.
Before commencement of the 2017/2018 drilling campaign in addition to the Datamine™ software already in place Bilboes acquired Fusion database software for the capture: storage and management of drill hole information. This software has built in data verification tools to minimize transcription errors. Bilboes standard operating procedure involves a thorough audit by a senior geologist of each drillholes’ geology and sampling logs, from data logging through to capturing into the database and QA/QC checks.
Each hardcopy log is audited and signed-off by a senior geologist prior to being used in modelling and estimation.
DRA visited the site during drilling and performed various checks to verify the integrity of the collar co-ordinates, logging and sampling procedures, and assay results and concluded that the data collection was consistent with industry standards.
| | 1.8.2 | Metallurgical Test Work |
The metallurgical test work campaign was concluded in different phases over a period extending from September 2013 to March 2019 and involved various laboratories and consultants as outlined in Table 1‑1. The outcomes from the test work have been used to define the processing route, process design basis and gold recoveries.
Table 1‑1: Test work Program Outline
Phase | Test work Description | Done By | Supervision and Oversight | Date |
1A | Sample characterization detailing mineralogical and chemical analysis | Mintek, South Africa | Bilboes, MMC and MDM Engineering | September 13 to December 13 |
1B | Comminution test work done on the two composites namely Composite 1 (Bubi ore) and Composite 2 (combination of Diana, Calcite, Castile, Maria and McCays ores) | Mintek, South Africa | Bilboes, MMC and MDM Engineering | January 14 to April 14 |
2 | Selection of a process route covering gravity amenability tests, flotation optimization and treatment of the sulfide flotation concentrates via POX, Bio-Oxidation and Ultra-fine grinding followed by cyanidation | Mintek and Suntech, South Africa | Bilboes and MMC | May 14 to September 14 |
3 | Variability flotation tests and bulk flotation concentrate production for additional BIOX® and gold leach tests | Suntech and SGS, South Africa | Bilboes, Minxcon and MMC | October 15 to August 16 |
4A | Laboratory and Pilot plant test work campaigns on the different ore types to generate additional flotation kinetics and grind data, bulk concentrates for BIOX® pilot plants, flotation design parameters and validate flowsheet | MMC at the client's project site in Zimbabwe | Bilboes and DRA | April 18 to September 18 |
4B | Review, modelling and simulation of laboratory and pilot plant test results | EMC, South Africa | Bilboes, MMC and DRA | October 18 to March 19 |
| | 1.8.3 | Process Route Identification |
Gravity amenability tests indicated poor gold recoveries and varied from 14% to 22% at 0.5% mass pull. Initial milling and flotation results indicated high gold recoveries of 89 - 97% with high mass pulls ranging 10 -15%, low concentrate grades of 12-20 g/t Au and unacceptable high levels of carbonates in the range of 7-13% which were bound to negatively affect the down-stream gold recovery process. Gold Dissolution from Flotation Concentrates using Biological Oxidation (BIOX®) provided 99% sulfide decomposition with 97% gold dissolution by cyanidation of the bio-residue.
Based on the test work and consideration of environmental impacts and risk minimization by adopting commercially established and proven processes, the process route identified for additional evaluation was flotation, pre-treatment of the concentrate by Bio-oxidation followed by cyanidation.
| | 1.8.4 | Pilot Plant Test Work |
The pilot plant test work was conducted over a period of three months from July 2018 to September 2018, utilizing 20 t of the Isabella McCays ore and 15 t of Bubi ore. The Isabella McCays ores gold recoveries ranged from 85.9% to 91.0% and the mass pulls ranged from 3.8% to 6.0% with a weighted average of 88.4% recovery and 5.0% mass pull. The Bubi ore recoveries ranged from 85.9% to 88.8% and mass pulls ranged from 7.8% to 15.2% with averages of 87.5% recovery and 10.0% mass pull.
Test work was conducted during 2019 on Ore samples from Isabella McCays and Bubi deposits to develop test work data to design a gold processing plant.
The BIOX® test work indicated the following:
| | ● | An average BIOX® sulfide oxidation of 90% was achieved at a 6.5-day retention time and a feed slurry solids concentration of 20%, |
| | ● | This resulted in an average CIL gold dissolution of 95.7% on the BIOX® product solids, |
| | ● | The BAT tests completed on the Bubi concentrate sample achieved sulfide oxidation levels in the range 97 – 98% and yielded gold dissolutions in the range 92.3 to 96.8%. |
1.9 | Mineral Resource Estimate |
The Mineral Resource Estimate (MRE) has been declared in terms of S-K 1300 Table 1‑2.
The Mineral Resource Estimate is summarized in Table 1‑2 using a cut-off grade of 0.9 g/t Au and constrained inside a Lerchs-Grossman (LG) optimized pit shell using US$ 2,400 per ounce gold price. Mineral Resources exclude Mineral Reserves.
Table 1‑2: Mineral Resource based on a 0.9g/t Au Cut-Off Grade
Mineral Ressources (0.9 g/t Au) Reference Point: In Situ |
Property | Classification | Tonnes (Mt) | Au (g/t) | Metal (kg) | Ounces (koz) |
Isabella South (ISBS) | Measured | 0.034 | 1.80 | 61.66 | 1.98 |
| | Indicated | 1.043 | 2.07 | 2,154.20 | 69.26 |
| | Total Measured and Indicated | 1.077 | 2.06 | 2 215.85 | 71.24 |
| | Inferred | 1.335 | 1.80 | 2,403.91 | 77.29 |
Isabella North (ISBN) | Measured | 0.082 | 2.40 | 196.56 | 6.32 |
| | Indicated | 1.734 | 2.29 | 3,971.85 | 127.70 |
| | Total Measured and Indicated | 1.816 | 2.29 | 4,168.41 | 134.02 |
| | Inferred | 1.613 | 2.18 | , 519.53 | 113.16 |
Bubi | Measured | 0.059 | 1.22 | 72.17 | 2.32 |
| | Indicated | 4.437 | 1.51 | 6,702.28 | 215.49 |
| | Total Measured and Indicated | 4.496 | 1.51 | 6,774.44 | 217.81 |
| | Inferred | 5.116 | 1.80 | 9,208.47 | 296.06 |
McCays | Measured | 0.066 | 1.77 | 117.27 | 3.77 |
| | Indicated | 1.261 | 1.85 | 2,338.52 | 75.19 |
| | Total Measured and Indicated | 1.327 | 1.85 | 2,455.79 | 78.96 |
| | Inferred | 1.054 | 2.16 | 2,273.84 | 73.11 |
Totals (ISBS +ISBN+ Bubi + McCays) | Total Measured | 0.241 | 1.85 | 447.66 | 14.39 |
| | Total Indicated | 8.475 | 1.79 | 15,166.84 | 487.63 |
| | Total Measured and Indicated | 8.716 | 1.79 | 15,614.50 | 502.03 |
| | Total Inferred | 9.118 | 1.91 | 17,405.76 | 559.62 |
| | ● | S-K 1300 definitions observed for classification of Mineral Resources. |
| | ● | Mineral Resources are reported exclusive of Mineral Reserves Block bulk density interpolated from specific gravity measurements taken from core samples. |
| | ● | Resources are constrained by a Lerchs-Grossman (LG) optimized pit shell using Whittle software. |
| | ● | Mineral Resources are not Mineral Reserves and have no demonstrated economic viability. The estimate of Mineral Resources may be materially affected by mining, processing, metallurgical, infrastructure, economic, marketing, legal, environmental, social, and governmental factors (Modifying Factors). |
| | ● | Numbers may not add due to rounding. |
| | ● | The Mineral Resource Estimate has been depleted to reflect mining up to 31 December 2023 |
| | ● | Effective Date of Resource Estimate is 31 December 2023. |
The process to develop the Mineral Reserve estimate in accordance with S-K 1300 was as follows:
| | ● | Ore recovery of 95% and fixed dilution parameters of 20 cm of hanging wall and 20 cm of footwall (4% in Whittle) were applied in the optimizations, |
| | ● | A Whittle Pit optimization was performed, |
| | ● | A base gold price of United States Dollar (US$) 1,800/oz. A government royalty of 5.0% of revenue and a Refining/Selling Cost of 1.0% of revenue was then applied. This resulted in a Net Gold Price of ~US$ 1,692/oz, |
| | ● | Pit slopes inter-ramp angles ranging from 30° to 55°. Resulting overall pit slopes account for access ramps where applicable, |
| | ● | Gold recovery ranging from 83.62% to 88.88% dependent on mining area and ore type being processed, |
| | ● | Processing throughput of 2.88 Mtpa for Phase 1 and 2.16 Mtpa for Phase 2, |
| | ● | Mining contractor costs based on budget submissions from Southern African based mining contractors, |
| | ● | Average annual processing cost per tonne of ore, inclusive of general / administration costs range from US$ 21.56/t to US$ 44.24/t for all transitional and fresh ores depending on processing parameters, |
| | ● | The reference point for all grade and plant feed ore is the RoM plant feed tip and the plant feed stockpiles, |
A sensitivity assessment was done on gold prices of US$ 1,650/oz and US$ 1,950/oz. A gold price of US$2,400/oz scenario assessment was also completed to determine surface infrastructure boundaries only to ensure that no potential future resource is sterilized. This indicated that the optimal shell inventory (i.e., the size and shape of the optimal shell and therefore the ore and waste generated) was relatively robust for all mining areas.
Optimal shells (maximum profit) were selected for each deposit area based on a US$ 1,800/oz gold price that were then used as the basis for pit designs.
These shell selection criteria are relatively conservative, based on a 24-month (2022-2023) trailing average gold price of US$ 1,875/oz.
A conservative cut-off grade of 0.9 g/t based on project specific projected revenue and cost was applied to all Project resources to ensure tonnes milled generate enough revenue to cover processing costs as shown in Table 1‑3.
Table 1‑3: Bilboes Gold Project Mineral Reserve Statement
| | Classification | Tonnage (Mt) | Au Grade (g/t) | Cut-off grade (g/t) | In-situ Gold Content (koz) |
McCays | Proven | 0.8 | 2.99 | 0.9 | 80 |
| | Probable | 2.7 | 2.47 | 0.9 | 212 |
Isabella South | Proven | 1.3 | 2.24 | 0.9 | 93 |
| | Probable | 4.1 | 2.08 | 0.9 | 272 |
Isabella North | Proven | 2.5 | 2.57 | 0.9 | 207 |
| | Probable | 2.7 | 2.23 | 0.9 | 192 |
Bubi | Proven | 1.2 | 1.90 | 0.9 | 75 |
| | Probable | 9.7 | 2.39 | 0.9 | 743 |
Total | Proven | 5.9 | 2.42 | 0.9 | 455 |
| | Probable | 19.1 | 2.31 | 0.9 | 1,418 |
Grand Total | Probable + Proven | 24.9 | 2.34 | 0.9 | 1,873 |
| | ● | S-K 1300 definitions observed for classification of Mineral Reserves. |
| | ● | Mineral reserves are quoted as head grade or as plant feed. |
| | ● | All tonnes quoted are dry tonnes. |
| | ● | Numbers may not add due to rounding. |
| | ● | No metal equivalents are reported. |
| | ● | Effective Date of Mineral Reserve Estimate is 31 December 2023. |
The estimate of Mineral Reserves of the Bilboes Gold Mine could be affected by any unknown environmental, permitting, legal, title, taxation, socioeconomic, marketing, political, or other relevant issue. Furthermore, the estimate of Mineral Reserves could be affected by any unknown mining, metallurgical, infrastructure, or other relevant factor.
A Life of Mine (LoM) schedule has been developed to supply two processing phases. These consist of Phase 1 at a processing capacity of 2.88 Mtpa (Isabella and McCays) and Phase 2 at a processing capacity of 2.16 Mtpa (Bubi). The LoM schedule considers the blending requirement that a maximum of 50% of feed to plant be sourced from Isabella North and the remainder from Isabella South (preferred blend) or McCays for Phase 1.
The mining utilizes conventional truck and shovel method with a mining contractor will be used for all open pit mining related earthmoving activities. Free dig and blasted waste will be loaded, hauled with 60t haul trucks, and dumped to designated waste dump locations which will be systematically dozed and levelled to allow dump to be raised to design heights.
The Bubi ore will be dumped on the pit rim stockpiles before being loaded and hauled with a fleet of road trucks to the central processing facility at Isabella. There it will either be directly tipped into the crushing facility or placed on the RoM pad stockpile areas.
McCays will commence production first. This will assist in delivering higher mill feed grades early in the project life.
Approximately eleven months of waste stripping will be required to expose sufficient ore to maintain a constant ore feed rate during Phase 1 once the processing plant has been commissioned.
The mining of all four deposits will run for a period of approximately 10 years at full process capacity - based on the current production schedule. The peak production requirements are 32.3 Mtpa (total material movement) in year 2029.
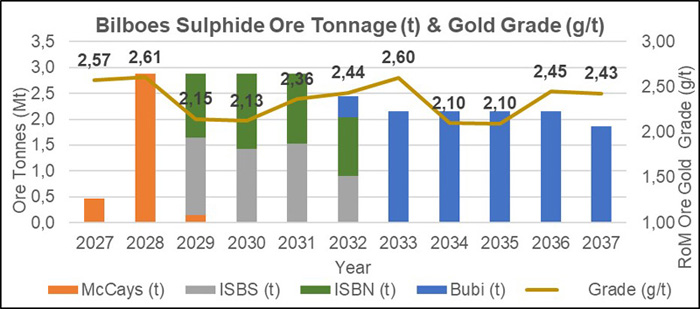
1.12 | Mine Production Schedules |
For scheduling purposes, it was assumed that 100 t excavators with 6 m³ bucket will be deployed on waste and 75 t excavators (4 m³ bucket) on ore. These excavators will be loading trucks with a payload capacity of 60 t and 40 t, respectively.
The production profile is reported as ore fed to the plant from four mineralization properties which are McCays, Isabella North, Isabella South and Bubi. A total of 24.9 million tonnes of mineralized material is delivered to the processing facility, with 198 million tonnes of waste removed over the same period. The average gold grade over life of mine is estimated at 2.34 g/t.
The scheduling results are summarized in Figure 1‑1. The results show that the schedule is a practical solution that targets value and meets all mining and processing goals monthly.
Figure 1‑1: Total Mine Material Movements for LoM
1.13 | Tailings Storage Facility |
Two streams of tailings were envisaged: the flotation circuit (which produces flotation tailings), and the BIOX® circuit (which produces BIOX® CIL tailings and the neutralized BIOX® product that is mixed back with flotation tailings). The flotation and BIOX® tailings will be stored separately in two compartments due to variations in chemistry and rheology. A hybrid lined TSF development system that incorporated full containment of tailings during the initial high Rate of Rise (RoR) deposition phases, followed by upstream development in the latter phases of development when the RoR reduces to the permissible 2 m/year, was designed.
Full wall containment during the initial stages of deposition allows for storage of water on top of the TSF for as long as freeboard is maintained and seepage through surrounding embankments is prevented. Storage of water on the dam further allows for the deferment of the construction of the flotation Return Water Dam RWD (together with associated return water infrastructure) to that time when upstream construction commences. A floating barge, or an on-shore skid-mounted appropriately sized pump can then be used during that time. The return water flows have been provided accordingly.
The BIOX® RWD was designed assuming return to the plant or elsewhere for treatment. The BIOX® return water flows have also been provided accordingly.
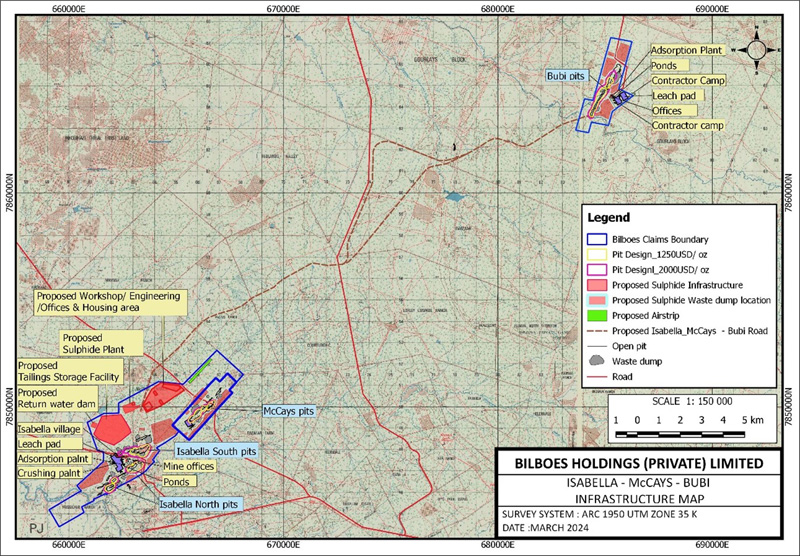
1.14 | Infrastructure and Site Layout |
The overall site plan is shown in Figure 1‑2 and includes major facilities of the Project including the Isabella North and South, McCays and Bubi open pit mines, gold processing plan, TSF, Waste Stockpiles, demarcated areas for mine buildings and accommodation facilities, main power line internal mine roads and access public roads.
Grid power will be supplied from the Zimbabwe National Grid by constructing a 70 km 132 kV Lynx line from Shangani Substation. To feed the line, a line bay will be constructed at Shangani. A mine substation will be constructed at Isabella. The estimate received is for a 132kV substation, equipped with a 50 MVA 132/33 kV step-down transformer.
Raw water will be provided from open pit dewatering and the wellfield boreholes located across the mine license area.
Figure 1‑2: Overall Site Plan
The ESIA and accompanying specialist studies were conducted in conformance with the relevant International Finance Corporation (IFC) Performance Standards and associated guidelines and in compliance with the legal framework of Zimbabwe. The EIA (SLR, 2019) identified the following potential environmental impacts:
The EIA (SLR, 2019) concluded that the proposed project presents several potential positive and negative impacts associated with the unmitigated scenario. With mitigation (in the residual impact scenario) some of the identified potential impacts can be prevented and the remainder can be managed and mitigated to remain within acceptable environmental limits so long as the mitigation set out in the Environmental and Social Management Plan (ESMP) is implemented and Bilboes develops, implements, and annually reviews the Environmental, Social and Safety Management System (ESSMS). Positive impacts can be enhanced by developing and implementing a Community Development Plan as set out in the ESMP.
Bilboes is committed to implementing the mitigation measures within the ESMP together with the ESSMS which will be implemented as part of Bilboes’ on-going efforts of continuous environmental improvement. The management system will contain plans and procedures to help manage environmental aspects and impacts and help ensure legal compliance.
Requirements for post-closure monitoring to determine whether the mitigation and rehabilitation measures are effective would be incorporated into a final Closure Plan to be compiled for the operations prior to the commencement of decommissioning.
An approved EIA is required in terms of the Environmental Management Act (Chapter 20:27) No. 13 of 2002 and the Mines and Minerals Act (Chapter 21:05) of 1996. The ESIA was undertaken for the project to satisfy the requirement and an ESIA Report completed for submission to Environmental Management Agency (EMA) within the first quarter of 2020. Thereafter, public feedback meetings were held to disclose the findings of the ESIA Report to the identified stakeholders. A record of this disclosure process was compiled and submitted to the EMA. An Environmental Impact Assessment (EIA) certificate was issued to Bilboes for the project in February 2021 and was valid for 2 years. The EIA certificate was renewed for 1 year to March 2024 and now to March 2025. The EIA certificate renewal process will continue annually for the duration of the operations, subject to conditions which include project update reports, compliance to Environmental Management Plans (EMP) outlined in the ESIA Report and notification to EMA for any changes in the project likely to alter the project as stipulated in the ESIA Report. Other project related licenses include air emissions (generators, smelter, incinerator), explosives (purchase and storage), firearms, medicines control, public health (medical examination), water abstract and hazardous substances (importation, transportation, storage and use), solid waste disposal which are renewed quarterly or annually.
1.17 | Social and Community Related Requirements and Plans |
An Environmental and Social Management Plan (ESMP) has been developed which contains the environmental, social and safety management and monitoring commitments that Bilboes will implement to manage the negative impacts and enhance the positive impacts identified in the EIA. This will include
| | ● | A Livelihoods Restoration Plan (LRP). |
| | ● | Several Corporate Social Responsibility (CSR) programmes. |
| | ● | Develop fair and transparent labor, working conditions and recruitment policy. |
| | ● | A local procurement policy will be developed and implemented. |
| | ● | Develop a Stakeholder Engagement Plan. |
| | ● | Addressing the social or community impacts. |
Generally accepted “good international practice” mine closure methods were used as the basis for the conceptual closure plan, as well as, for determining the unit rates for the various closure components used in the LoM liability calculation. The mine closure methods also conform to the statutory requirements of Zimbabwe EMA who are the regulatory body.
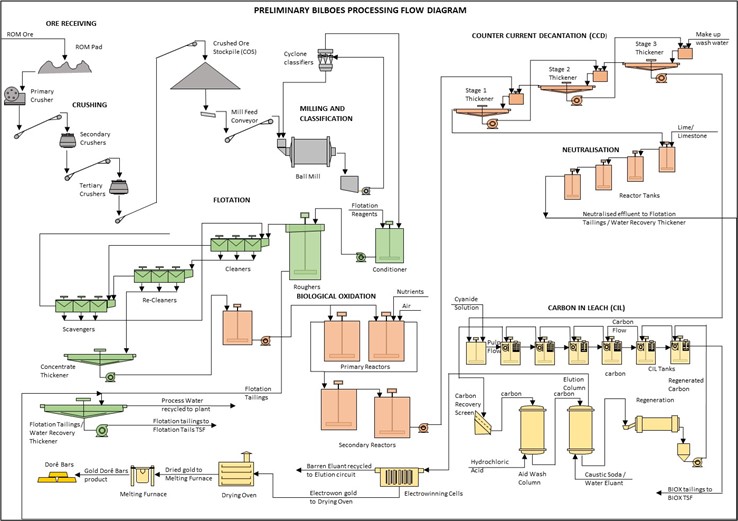
Extensive test work has been undertaken. The ore (fresh sulfide) is refractory to normal free milling processing due to the ultrafine gold particles being largely encapsulated (and generally appearing in solid solution) within the sulfide minerals. As a result, the selected process encompasses a biological sulfide destruction step (the Outotec proprietary BIOX® process) to liberate the gold particles and allow dissolution by a cyanide solution in the CIL circuit. The test work results were used to derive the Process Design Criteria (PDC) for the processing plant as depicted in Table 1‑4.
Table 1‑4: Process Plant Main Design Criteria
Description | Unit | Design | Remarks |
Plant Annual RoM Throughput | | | |
Phase 1 Isabella McCays | tpa | 2,880,000 | |
Phase 2 Bubi | tpa | 2,160,000 | |
Plant Monthly RoM Throughput | | | |
Phase 1 Isabella McCays | tpm | 240,000 | |
Phase 2 Bubi | tpm | 180,000 | |
Au Head Grade Analysis (LoM) | | | |
Isabella McCays | g/t | 2.51 | |
Bubi | g/t | 2.33 | |
Ore Characteristics | | | |
SG (specific gravity) | | | |
Isabella McCays | t/m³ | 2.77 | |
Bubi | t/m³ | 2.85 | |
BBWi (Bond ball work index) | | | |
Isabella McCays | kWh/t | 17.00 | |
Bubi | kWh/t | 21.45 | |
Ore Product Sizes | | | |
Crushed Ore (P80) (80% passing size) | mm | 13 | |
Milled Ore (P80) (80% passing size) | microns | 75 | |
Flotation Mass Pull | | | |
Isabella McCays | % | 5 | |
Bubi | % | 10 | |
Ore will be derived from the two main mining areas (Isabella McCays and Bubi) with production throughput to be phased over the LoM based on tonnage, proximity to the process plant and metallurgical characteristics. Bubi ore, destined to be processed over the latter part of the LoM will be trucked approximately 23 km to the processing plant which will be situated at the Isabella McCays complex. The envisaged phasing is as depicted in Figure 1‑3.
Figure 1‑3: Bilboes Simplified Process Flow Diagram
DRA developed and costed the two phases:
| | ● | Phase 1: 240 ktpm milled ore originating from the Isabella McCays mining area (years 1-6), |
| | ● | Phase 2: 180 ktpm milled ore originating from the Bubi mining area (years 6-10). |
The Capital Cost Estimate (CCE) (December 2023) meets the required accuracy criteria of -15% +25% and is equivalent to a Class 4 Estimate as defined by the American Association of Cost Engineers, (AACE).
The estimate further assumes that the project would be executed on an EPCM basis.
The Capital Estimate is summarized in Table 1‑5.
Table 1‑5: Capital Summaries per Project Phase
Description | Grand Total | Sub Total Phase 1 | Sub Total Phase 2 |
| (Million US$) | (Million US$) | (Million US$) |
Mining | 32.03 | 32.03 | - |
Process | 170.02 | 146.90 | 23.12 |
Infrastructure, Utilities and Ancillaries | 132.55 | 110.76 | 21.79 |
Indirect Cost | 45.18 | 42.98 | 2.20 |
Contingency | 34.23 | 29.83 | 4.40 |
Total Project Costs | 414.03 | 362.50 | 51.51 |
The operating cost estimate has been completed from a zero base and presented in US$. Costs associated with labor, materials and consumables have been included in this estimate.
| | 1.21.1 | Mining Contractor Costing |
The average mining cost based on pricing received is US$ 3.01 /t including the ore transport cost from all mining areas process plant. The cost breakdown is shown in Table 1‑6.
Table 1‑6: Mining Contractor OPEX
Area | Cost per Total Tonne Mined (Ore and Waste) (US$) |
G & A | 0.34 |
Drill and Blast | 0.44 |
Load and Haul Incl. Rehandle & Services | 2.23 |
Total | 3.01 |
Diesel Cost | $1.52 (October 2023) |
| | 1.21.2 | Process Plant Operating Cost |
Operating costs have been estimated and based on the production profile for LoM. For illustrative purposes, static costs are presented for Phase 1 and Phase 2 in Table 1‑7. Main drivers in costs include reagents and power which collectively account for more than 70% of total plant operating costs.
Table 1‑7: Plant OPEX
Description | Unit | Phase 1: 240 ktpm IM | Phase 2: 180 ktpm Bubi |
RoM | t/a | 2,880,000 | 2,160,000 |
Total variable | US$ m/a | 38 | 53 |
Total fixed | US$ m/a | 12 | 17 |
Total | US$ m/a | 50 | 71 |
Unit cost | US$/t ore | 17.47 | 32.69 |
| | 1.21.3 | General and Administration Cost |
The G&A cost includes administrative personnel, general office supplies, safety and training, travel (both on site and off site), independent contractors, insurance, permits, fuel levies, security, camp power, camp costs, ICT, relocation, and recruitment.
Total G&A costs amount to US$ 4,912,650 per annum in Phases 1 and 2.
| | 1.21.4 | Total Operating Costs Summary |
The Bilboes Gold Mines total operating costs have been estimated and based on the production profile over LoM. A summary of LoM operating costs is shown in Table 1‑8.
Table 1‑8: LoM Operating Cost Summary
Description | Cost (US$ m) | Unit cost (US$ / t RoM) |
Mining | 639 | 26 |
Process Plant | 600 | 24 |
G&A | 46 | 2 |
Total | 1,285 | 52 |
The Gold Trade Act empowers the Minister responsible for Finance to issue a Gold Dealers License which entitles entities to export and sell gold from Zimbabwe to customers of its choice. Prior to 1 June 2021, only Fidelity Gold Refinery (Private) Limited (FGR) had the Gold Dealership License and therefore all gold bullion was sold to FGR. With effect from 1 August 2021, all gold producers can directly sell any incremental production to customers of their choice using FGR’s license to export. Caledonia’s Blanket Mine is currently selling its gold to a customer of its choice but exporting the gold using FGR’s license. Sales proceeds come directly into Caledonia’s bank account. As all Bilboes’ production is considered incremental, Bilboes will be able to choose to sell its gold directly to customers of its choice or to continue selling to FGR.
Bilboes is confident that it will be able to export and sell its gold production on similar terms as those obtaining from FGR.
The financial model has been prepared on a 100% equity project basis and does not consider alternative financing scenarios. A discount rate of 10% has been applied in the analysis. The outcomes are presented on a pre-tax and post-tax basis. A static metal price of US$ 1,800/oz has been applied. All-in sustaining costs have been reported as per the World Gold Council (WGC) guideline dated November 2018 and is exclusive of project capital, depreciation, and amortization costs. Capital payback is exclusive of the construction period and referenced to the start of first production. Key financial outcomes are shown in Table 1‑9.
Table 1‑9: Project Economics Summary
Description | Units | Value |
Financial Outcomes (Post-tax, Constant Model Terms) |
NPV @ 10% | US$ m | 328 |
IRR | % | 33.4 |
Peak Cash Funding | US$ m | 348 |
AISC | US$/oz | 922 |
Payback (UNDISCOUNTED) - From Production Start | years | 1.8 |
The key development milestones are as follows:
Table 1‑10: Key Development Milestones
Project Milestones | Completion |
Client reviews and project roadmap decision making | June 2024 |
FS revision phase | February 2025 |
Funding for execution | October 2025 |
Project execution of Phase 1 to achieve 240 ktpm | December 2027 |
Phase 2 project execution for Bubi | December 2032 |
| | 1.25.1 | Mineral Resource Estimates |
The data was reviewed and validated by the QP who concluded that the data is suitable for the construction of the geological model and for the estimation of the Mineral Resource.
The QP is confident that enough geological work has been undertaken, and sufficient geological understanding gained, to enable the construction of a geological model suitable for the determination of a Mineral Resource estimate.
The geological modelling, Mineral Resource estimate and classification were undertaken utilizing recognized deposit and industry strategies/methodologies for the type of deposit of the Bilboes Gold Mine.
The MR is constrained in an optimized pit shell. This together with the assumptions relating to mining, processing, infrastructure, and market factors supports the “reasonable prospects for eventual economic extraction”.
The QP is not aware of any metallurgical, infrastructural, environmental, legal, title, taxation, socio-economic, or marketing issues that would impact on the Mineral Resource, or Reserve statements as presented.
Based on an assessment including: - data quality and integrity, data spacing, confidence in the grade interpolation, confidence in the geological interpretation and confidence in the estimate the QP believes the Mineral Resource estimated is robust.
| | 1.25.2 | Mining and Mineral Reserves |
The QP responsible for the declaration of the Mineral Reserve, is confident that significant geological work has been undertaken, and sufficient geological understanding gained, to enable the construction of an ore body model suitable for the derivation of Mineral Resource and Mineral Reserve estimates.
Based on the information presented in this TRS, the QP considers the MRE to be supported by the appropriate technical data and assumptions.
The open pit modelling is based on suitably supported assumptions and parameters and completed utilizing appropriate industry standards suitable for the Bilboes Gold Mine.
The economic modelling is supported by technical studies in mining, processing, infrastructure, environmental, social, and marketing. Based on the inputs from these disciplines, the financial model demonstrates a feasible mine. The economic analysis is based on a US$ 1,800/oz.
The sensitivity analyses demonstrates that the profitability of the project is most sensitive to revenue related factors such as gold price and recovery.
The QP is not aware of any metallurgical, infrastructural, environmental, legal, title, taxation, socio-economic, or marketing issues that would impact on the Mineral Reserve statements as presented or that would impact on the reliability and/or confidence of the declaration.
Various risks have been identified with consideration of the appropriate mitigating factors.
| | 1.26.1 | Geology and Mineral Resource |
During the operational phase, drilling is required to develop an advanced grade control model prior to mining. A drill spacing study will be required to determine the optimum spacing for “grade control” drilling. The closed space drilling will also enable a more accurate estimation of tonnage and grade as well as a greater definition of oxide, transitional and sulfide ore boundaries.
Investigate waste stripping optimization in the early LoM to reduce early operating costs and improve the overall business case.
Investigate pit slope optimization due to very short pits life, to reduce stripping ratio and total waste movements.
On-going geotechnical analysis is recommended during future mining operations to assess pit slope angles to investigate if improvements can be made for less waste stripping, reduced operating costs, and improve overall business economics.
Optimization efforts could be considered during the project execution front-end engineering and design phase, by conducting further test work focused on flotation optimization (including variability tests) to establish a grade-recovery relationship and validate recovery upsides.
Development of the skills base to effectively run the BIOX® operations is crucial for the business and should be prioritized prior and during the operational phase.
A sufficiently sized water storage dam should be constructed to collect and store water during the wet season and times when the operation is water positive to cater for the dry season.
This TRS has been prepared for Caledonia on the Bilboes Gold Mine, Zimbabwe, by DRA Projects (Pty) Ltd, which is a Qualified Person, in accordance with S-K 1300. For purposes of S-K 1300, this TRS is considered a Pre-Feasibility Study, or PFS. Caledonia acquired Bilboes on 6 January 2023. Caledonia is a Zimbabwean focused exploration, development, and mining corporation. Caledonia shares are listed on the NYSE American LLC and depositary interests in the shares are traded on the AIM of the London Stock Exchange plc (symbol: CMCL). Caledonia listed depositary receipts on the Victoria Falls Stock Exchange, a subsidiary of the Zimbabwe Stock Exchange, on December 2, 2021.
Caledonia mandated the completion of this TRS to report the Mineral Resources and Mineral Reserves on the Bilboes Gold Mine effective as of 31 December 2023 in compliance with S-K 1300. This is the first TRS to be prepared on the Bilboes Gold Mine. This is the initial filing of a TRS in respect of the Bilboes Mine.
2.2 | Sources of Information |
All input drilling data used for the generation of the geological and resource models were supplied by Bilboes who also supplied all historical information including geological data, reports, and maps. The Whittle shells used to define the Mineral Resource and Mineral Reserve were created by DRA, using the latest block models supplied by DRA.
| | ● | All exploration and mining permit information was supplied by Bilboes, |
| | ● | Information on the process was obtained from the pilot plant test work, |
| | ● | The rest of the technical information was obtained by the various consultants engaged by Bilboes. |
2.3 | Personal Inspections / Site Visits |
The following personal inspections/site visits were completed by the QP on the properties by DRA on 3 - 6 July 2017, 6 and 7 December 2017, 21 and 22 February 2018, 20 and 22 March 2018, 26 September 2018.
After discussion with the mine and based on the lack of any significant mine production or construction, it was deemed that site visits in 2023 would not add any value to the work completed.
2.4 | QP Responsibilities and Relationships |
The QP is not affiliated with Caledonia or any other entity that has an ownership, royalty or other interest in the Bilboes properties.
The Bilboes properties are located in the Matabeleland North Province of Zimbabwe. The Isabella-McCays properties are situated approximately 80 km north of Bulawayo while Bubi is situated approximately 100 km north of Bulawayo. Bubi is 32 km due north-east of Isabella See Table 3‑1 for coordinates).
Figure 3‑1: Regional Location of the Bilboes1
The Isabella-McCays-Bubi properties comprise 130 claim blocks covering an area of 2,731.6 ha as shown in Table 3‑1.
Table 3‑1: Bilboes Claims
Group of Claims | Mining District | Province | No. of Blocks | Area (ha) | Coordinate X1 | Coordinate Y1 |
Calcite and Kerry
(Isabella Mine) | Bulawayo | Matabeleland North | 49 | 1,894.4 | 662,106 | 7,846,712 |
Ruswayi
(McCays Mine | Bulawayo | Matabeleland North | 33 | 330 | 666,339 | 7,849,975 |
Chikosi
(Bubi Mine) | Bulawayo | Matabeleland North | 48 | 507.2 | 684,838 | 7,865,515 |
Total | | | 130 | 2,731.6 | | |
Coordinates are in UTM Arc 1950 Zone 35K, Clarke 1880 spheroid format.
________________________________
1 Source: Burger et al, 2017
3.3 | Mineral Tenure and Title |
Bilboes consist of 130 claim blocks wholly owned by Bilboes. Of the 130 blocks, 49 gold and base metal blocks and a Special Mine site belong to the Isabella mining area while McCays comprise of 33 gold blocks (Figure 3‑2) and Bubi consisting of 48 gold blocks (Figure 3‑3). The rights were obtained through certificates of Registration After Transfer from Prospecting Ventures, an exploration entity owned Anglo American which had pegged these claims after carrying out exploration work. Bilboes also thereafter registered additional claims in the surrounding area. The claims are protected annually against forfeiture through gold production and exploration work. The Company has exclusive rights to subsurface areas to produce gold from these properties and the rights are transferable and do not expire if the annual protection fees are paid when they become due.
Figure 3‑2: Isabella-McCays Mine Claims Map
Figure 3‑3: Bubi Mine Claims Map
Royalty in Zimbabwe is levied as 5% on gross gold sales revenue.
Bilboes has been operating in Matabeleland since 1989. It holds the necessary mining permits and complies with the terms of the Mines and Minerals Act and allied regulations with respect to all of their claims and in particular that all of the registration certificates are valid, and the protection certificates are up to date. Bilboes thus requires no further permits to explore or produce from the current operational areas, but further permits will be required for the proposed haul road between Bubi and Isabella plant.
Further exploration outside the current claims will require approvals by the EMA who may request an EIA study.
SLR Consulting based in South Africa in partnership with the local GryinOva Environmental Consultants conducted an ESIA study for the project and an EIA certificate of approval was issued by EMA in February 2021 and the certificate was valid for 2 years and subject to renewal on an annual basis for the duration of the operations. The current EIA certificate expires in March 2025. The conditions of renewal are notification to the agency of any changes in the project, compliance to the approved environmental plan and submission of progress report on the project. There is no reason that the renewal will not be granted.
Other project related licenses which are currently in use include air emissions (generators, smelter, incinerator), explosives (purchase and storage), firearms, medicines control, public health (medical examination), water abstract and hazardous substances (importation, transportation, storage and use), solid waste disposal which are renewed when they become due either quarterly or annually. The conditions of renewal involve payment of applicable fees to the regulatory bodies for an amount of $70,000 per annum.
Bilboes also hold 3,935 ha of additional claims and 51,900 ha of exploration licenses referred to as Exclusive Prospecting Orders (EPOs) around Isabella-McCays-Bubi and the Gweru area. These claims and EPOs have highly prospective targets which offer Bilboes excellent prospects for organic growth. The company has applied for an extension of the EPOs tenure for a further 3 years after the initial 3-year tenure expired in July 2021. The decision on the EPO applications is pending.
Political uncertainties are risks, which may lead to unfavorable legislative and taxation framework changes, exchange control restrictions, international monetary fluctuations, civil unrest, or any other political instability. However, the current political environment is looking favorable due to the recent reforms by the Government under the new dispensation. It is expected that this or any other politically related risks will not affect Bilboes now or in the foreseeable future.
All the properties belonging to Bilboes are protected in respect of the Mines and Minerals Act. All the blocks of claims are registered with the Mining Commissioner’s office and are regularly inspected in compliance with the mining regulations and preserved against forfeiture.
3.7 | Indigenization and Economic Empowerment |
The Indigenization and Economic Empowerment Act has since been amended and it now allows foreign entities to own 100% mining rights. Foreign shareholding will now be negotiated with investors.
All new foreign investment into Zimbabwe requires an investment license issued by the Zimbabwe Investment Authority in terms of the Zimbabwe Investment Authority Act.
Moreover, in the mid-term budgetary review statement of 2019 the Indigenization and Economic Empowerment Act was repealed and replaced by the Economic Empowerment Act, which is consistent with the current thrust “Zimbabwe is Open for Business".
4 | ACCESSIBILITY, CLIMATE, LOCAL RESOURCES, INFRASTRUCTURE AND PHYSIOGRAPHY. |
Isabella McCays and Bubi are approximately 80 km and 100 km directly north and northeast of Bulawayo, the second largest city of Zimbabwe with an approximate population of 655,675 (2013). All the mines are accessed via public roads and although these are of variable quality, they are accessible by all types of vehicles. Isabella is 110 km (1.5 hours) whilst Bubi is 140 km (2 hours) by road from Bulawayo. Bubi can also be accessed by road from Isabella (70 km in 1 hour).
The properties lie between 1,150 m and 1,200 m above mean sea level (amsl). The area is covered by red and grey soils characteristic of greenstone rocks in Zimbabwe. Vegetation is dominated by scrubby Colophospermum Mopane, Acacia, and Combretum woodlands and minor occurrences of miombo with no extensive grasslands. Agricultural activities are restricted to ranching.
Despite lying in the tropics, the climate is subtropical due to its relatively high altitude. The mean annual temperature is 19°C. Three broad seasons are prevalent: a dry, cool winter season from May to August; a dry, hot early summer from late August to Early November and a wet, warm summer from early November to April. Rainfall during the wet season averages 594 mm. The climatic conditions allow for a year-round exploration and mining activities.
4.4 | Local Resources and Infrastructure |
The terms of the claims tenure system in Zimbabwe confer rights to use of the land surface for mining and construction of all related infrastructure such as housing, offices, plant, and tailings/waste disposal facilities subject to adherence to the environmental legislation. In 2019, Bilboes obtained rights for an additional 1,128 ha for a mine site at Isabella which will be adequate to cater for the additional sulfide mine infrastructure such as the sulfide plant, tailing’s storage facility, waste dumps, housing, and additional office infrastructure.
There is sufficient underground water around the mines to run the current heap-leach operations, but additional drill holes and pumping capacity will be required for the proposed sulfide-mining project. This issue was identified in the Pre-Feasibility stage of the project, along with water-use permits.
There are 33 kV power lines within 5 km and 25 km of the Isabella McCays and Bubi deposits respectively, that form part of the national grid, but new lines will have to be constructed to meet the increased capacity of the proposed exploitation of the sulfides.
A 70 km kV Lynx line will be constructed from Shangani Substation to a substation which will be constructed at Isabella. An alternative 88 kV power line, which is sufficient for the sulfide project, is located at Turk Mine about 40 km from Isabella McCays and 60 km from Bubi, but this line has recently had an increased consumer load.
Workshops, offices, and housing amenities are available for heap leach extraction, and these will require to be upgraded for the proposed sulfide mining project.
The mines have cell phone and internet connectivity and utilize a two-way radio system.
Generators at all mines allow continued production during load shedding. The capacity will need to be upgraded to cater for the sulfide operation.
Zimbabwe continues to boast the highest literacy rate in sub-Saharan Africa National examinations are written during the third term in November, with "O" level and "A" level subjects (UK based qualification for students aged 16 and above). Currently, there are seven public universities as well as four church-related universities in Zimbabwe that are fully internationally accredited. Zimbabwean culture places a high premium on education. Various mining related qualification such as geology, mining engineering and mineral processing are offered at tertiary level.
Mining supplies, including mining and processing equipment, are readily available in Zimbabwe.
Bilboes was previously owned by Anglo American Corporation of Zimbabwe Ltd (AMZIM) and was later taken over by GAT investments (Pvt) Ltd in 2003. Bilboes held the Isabella, McCays and Bubi claims. AMZIM acquired the Isabella claims in 1982.
The Bilboes Properties are wholly owned by Bilboes Holdings (Pvt) Ltd, which is 100% owned by Bilboes Gold Limited (Bilboes Gold), which was acquired by Caledonia on 6 January 2023. Prior to its acquisition by Caledonia, Bilboes was a private company owned by three shareholders, Gat Investments (Private) Limited (Gat Investments), Baker Steel Resources (Baker Steel), and Infinite Treasure Limited (Infinite Treasure).
5.2 | Historical Sulfide Mineral Resource Estimates |
In 2009, SRK undertook a Mineral Resource Estimate for the sulfide Properties based on the drill holes and geological interpretations supplied by Bilboes.
Geological models were created for all these deposits, excluding the oxide portions, to a depth of up to 150 m. Solid models were created from the wireframes generated and assays for gold within these were used for geostatistical modelling and resource estimation. The Mineral Resource of 5.2 Mt containing 533,000 oz was declared to 100 mbs with mineralization from 3.5 Mt containing 240,000 oz being declared from 100 – 150 mbs.
The grade estimation for the Sulfide Projects was based on a 2.0 g/t cut-off mineralized envelope. In general, the drill coverage was poor, with drill spacing ranging from 25 m (Bubi) to up to 100 m for McCays. In most cases there was only one hole per drill line.
Classification of the anomalies was based on the quality of the estimate, which in turn was based on grade continuity and data spacing and was done according to the guidelines contained within the JORC code (2012).
Estimates were validated by visually comparing the drill hole grades to the block model grades for each section line in Datamine Studio™ (Datamine).
The results of the estimation for the classification as an Inferred Mineral Resource (Table 5‑1).
Table 5‑1: Sulfide Inferred Mineral Resources as of 2009
Deposit | Cut-Off (g/t) | Tonnes (Mt) | Au (g/t) | Content (koz) |
Bubi | 2.00 | 1.435 | 2.68 | 124 |
Calcite | 2.00 | 0.500 | 4.96 | 80 |
Castile | 2.00 | 0.902 | 4.32 | 125 |
Diana | 2.00 | 0.915 | 3.49 | 103 |
Maria | 2.00 | 0.177 | 3.10 | 18 |
McCays | 2.00 | 0.821 | 3.20 | 84 |
Total / Average | 4.750 | 3.49 | 534 |
Subsequent to the 17,650 m core drilling by Anglo of 1994 - 1999, additional exploration work under Bilboes resumed in 2011 through to 2016 where an additional 20,527 m of core and 20,235 m of RC drilling was completed bringing the total metreage to 58,412 m. The drilling culminated in an interim Mineral Resource update by Mr. Arimon Ngilazi and Dr Anthony Martin in 2017.
These results are presented in Table 5‑2 and Table 5‑3, respectively.
Table 5‑2: Sulfide Mineral Resources as of 31 March 2017, 0.0 g/t Au Block Cut-Off Applied
Property | Indicated | Inferred |
| Mass (Mt) | Au Grade (g/t) | Au (kg) | Au (Moz) | Mass (Mt) | Au Grade (g/t) | Au (kg) | Au (Moz) |
BUBI | 29.96 | 2.20 | 65,912 | 2.12 | 9.05 | 1.90 | 17,195 | 0.55 |
ISBN | 12.07 | 2.19 | 26,433 | 0.85 | 1.55 | 2.01 | 3,116 | 0.10 |
ISBS | 7.90 | 2.43 | 19,197 | 0.62 | 0.51 | 2.62 | 1,336 | 0.04 |
MCCAYS | 3.48 | 2.44 | 8,491 | 0.27 | 7.07 | 1.97 | 13,928 | 0.45 |
Total | 53.41 | 2.25 | 120,034 | 3.86 | 18.17 | 1.96 | 35,575 | 1.14 |
Table 5‑3: Sulfide Mineral Resources as of 31 March 2017, 0.9 g/t Au Block Cut-Off Applied
Property | Indicated | Inferred |
| Mass (Mt) | Au Grade (g/t) | Au (kg) | Au (Moz) | Mass (Mt) | Au Grade (g/t) | Au (kg) | Au (Moz) |
BUBI | 28.05 | 2.27 | 63,674 | 2.05 | 8.66 | 1.93 | 16,714 | 0.54 |
ISBN | 9.94 | 2.53 | 25,148 | 0.81 | 1.29 | 2.27 | 2,928 | 0.09 |
ISBS | 7.05 | 2.60 | 18,330 | 0.59 | 0.44 | 2.86 | 1,258 | 0.04 |
MCCAYS | 2.55 | 3.19 | 8,135 | 0.26 | 5.58 | 2.38 | 13,280 | 0.43 |
Total | 47.60 | 2.42 | 115,286 | 3.71 | 15.97 | 2.14 | 34,181 | 1.10 |
| | 5.3.1 | Oxide Mineralization |
There are early records of insignificant gold production for the Isabella Mine prior to 1982. In its first year of operation the Isabella open pit operation produced 170 kg of gold from a monthly rate of 15,000 t of ore. At start of production there were three pits with a Mineral Reserve life of 18 months and as of 31 December 2020, the Mine had treated 6.4 Mt of oxides at 1.16 g/t (239 koz) and recovered 147 koz of gold inclusive of re-leached gold from the old heap leach pads. The bulk of the production from Isabella was from uncrushed ore with only 33 koz of gold being recovered from 2.3 Mt of crushed oxide ore after the installation of a crushing plant in 2007.
Bubi was commissioned in 1997 at 25,000 t per month of oxide ore and produced 9.5 koz of gold in its first year. Mining activities were suspended at Bubi Mine in 2007 after running out of oxide ore. Gold production from that period to 2013 has been from re-leaching of the old heaps. Progressively inclusive of re-leached gold from the old heap leach pads, the mine has produced 84 koz of gold as at end of December 2020 from 4.3 Mt of oxide ore at 1.00 g/t (138 koz). All the ore at Bubi Mine was treated without crushing. There has not been any mining at Bubi from 2005 after the exhaustion of oxides until the commencement of re-leaching activities at the beginning of 2019.
As a result of regional exploration by Prospecting Ventures (PV), an Anglo American Corporation exploration company based in Zimbabwe at the time, a new gold deposit was discovered at McCays in 1997. In 1998 production from an open pit, heap-leach mine started. Further exploration work within the claims area during the operational phase of the mine was added to the Reserves until depletion and temporary closure in 2002. No mining activities took place between 2002 and 2012 at McCays. Gold production was through re-leaching from the year 2004 until 2009. No gold production occurred from 2010 to 2012. Activities commenced after the recapitalization of Bilboes in 2013. Cumulative gold production from inception at McCays was 55 koz) as of 31 December 2020. This included the re-leached gold from the old heap leach pads from treating 2.1 Mt of oxide ore at 1.16 g/t (78 koz). Inclusive of this, an estimated 22 koz) of gold was recovered from 950,000 t of crushed oxide ore after the installation of a crushing plant in 2013. The oxides at McCays are finished and only re-leaching activity is taking place.
Prior to the open-pit exploitation of the Isabella Mineral Resource by Bilboes, the Calcite Mine (underground and now part of the Isabella strike) produced 559 kg of gold at an average recovered grade of 8.2 g/t.
The production from Bilboes mines including When Mine from inception to 31 December 2020 is presented in Table 5‑4.
Bilboes has produced some 90,048 oz of gold from the four mines since the takeover of the company in 2003 to 31 December 2020
Table 5‑4: Production Data from Bilboes Mines to 31 December 2020
| | Start-up Date | Ore Treated (kt) | Grade (g/t) | Au Recovered (koz) |
Isabella | 1989 | 6,384 | 1.16 | 146.8 |
Bubi | 1997 | 4,342 | 1.00 | 84.0 |
McCays | 1998 | 2,094 | 1.16 | 55.2 |
When | 2005 | 184 | 0.78 | 1.9 |
Total | 13,004 | 1.10 | 287.9 |
6 | GEOLOGICAL SETTING, MINERALIZATION AND DEPOSIT |
Geology in Zimbabwe can be divided into three main areas, the Archean, the Proterozoic, and the Phanerozoic (Figure 6‑1).
Figure 6‑1: Geological Map Zimbabwe (taken from Mugumbate, unknown year)
Rocks from the Archean era in Zimbabwe occupy most of the Zimbabwe Craton, an ancient stable continental block. This is the basement and primarily comprises granites and gneisses with remnants of volcano-sedimentary piles known as Greenstone Belts. Greenstone Belts cover approximately 60% of the land surface of Zimbabwe. The Greenstone Belts are renowned for their rich variety of Mineral Resources as shown in Figure 6‑2.
Figure 6‑2: Greenstone Belts and known Gold Deposits in Zimbabwe (Mugandani 2017)
In Zimbabwe, the Proterozoic era followed immediately after the emplacement of the Great Dyke intrusion at the end of the Archean era. The Great Dyke is a layered mafic to ultramafic intrusion akin to the Bushveld Complex in South Africa. It was emplaced at the end of the Archaean era at approximately 2,500 mega annum (ma). It has a strike length of 550 km and ranges in width from 4 km to 11 km. It cuts across the entire Zimbabwe Craton in a roughly N-S direction as shown in Figure 6‑3. The Great Dyke hosts world-class reserves of Platinum Group Metals (PGMs) and chrome ore.
Figure 6‑3: NNE Trending Great Dyke Cutting Across the Zimbabwe Craton (Mukaka et al 1998)
There are three metamorphic mobile belts that border the Craton to the north-east, south, and north-west. The neo-Archaean Limpopo mobile belt borders the Craton on the southern boundary. The paleo-Proterozoic Magondi mobile belt borders the Craton to the north-west while the neo-Proterozoic Zambezi mobile belt borders the Craton to the north (Figure 6‑4). These metamorphic belts are hosts to economic metamorphic minerals. They also host several gemstones, precious, and base metals. To the east are the Umkondo group sediments which were deposited in a large basin and are capped by younger dolerite sills and basaltic flows. The Umkondo sediments host the Chiadzwa placer diamond deposits.
Figure 6‑4: Geological Map showing the Zimbabwe Craton and Mobile Belts (Gore et al 2009)
The Phanerozoic consists of several sequences of sedimentary rocks covering the peripheries of the Craton. Included in the Phanerozoic are sedimentary basins: the Permian - Triassic Jurassic Karoo Supergroup, Cretaceous sediments, and Tertiary to recent sand of the Kalahari Figure 6‑5.
Figure 6‑5: Sedimentary Basins of Zimbabwe (taken from Mugumbate, unknown year)
6.2 | Regional Geology as it Relates to the Bilboes Properties |
The Bubi Greenstone Belt covering the Bilboes Properties consists of volcanic rocks of the Upper Bulawayan Group capped by sedimentary sequences of the Shamvaian Group locally represented by Mdutjana and Dagmar Formations respectively (Figure 6‑6). The deposits occur within the meta-volcanic and meta-sediments close to the contact between these two stratigraphic units.
Figure 6‑6: Regional Geological Map showing Bilboes Properties (from Ngilazi and Martin ’17)
The Bilboes stratigraphic presentation is depicted in Figure 6‑7.
Figure 6‑7: Bilboes Site Stratigraphy
Mineralization at Bilboes’ four properties are Archaean lode, structurally controlled deposits. It consists of silicified stock-works/veins. The veins comprise pyrite and arsenopyrite. Gold is disseminated within the sulfide mineralization and is refractory. Pyrite is the dominant sulphide mineral, with minor arsenopyrite at Isabella & McCays, with the exception of the Isabella North orebodies here an equal proportion of pyrite to arsenopyrite is evident. At Bubi the dominant sulphides is pyrite with minor arsenopyrite. The mineralized zones are often subparallel to each other and are hosted in a much broader shear zone. The best mineralized zones are associated with brecciation and silicification.
The sulphide tends to weather readily and all of the deposits are covered by oxide caps to a depth of 12 m to 50 m which are readily amenable to heap-leach extraction.
Orebody widths at Isabella and McCays range from 5 m to 20 m and are wider near surface. Individual orebodies have strike ranges from 75 m to 500 m and are typically in en echelon pattern in a northwest to south-eastern pattern. The oxide cap is deepest at Isabella where the range is 12 m to 50 m. The overall mineralized strike is 4,400 m.
The oxide-sulphides interface at Bubi is shallow in the southwest at about 10 m to 12 m below surface and increases to 30 m in the central parts and to 40 m in the northeast. Orebody widths vary from 10 m in the southwest to as wide as 100 m in the central portions of the claims. The overall mineralized strike is 2,950 m,
Mapping has been conducted progressively at the Bilboes mines since commencement of oxide gold operations, with the latest exercise being conducted between January and September 2018. Below are some of the maps produced for Bubi (Figure 7‑1) and the Isabella McCays area (Figure 7‑2). Mapping was done to decipher surface and in-pit geological and geotechnical information, critical for structural and alteration interpretation of mineralized units and in aiding pit geotechnical slope stability studies.
Figure 7‑1: Map of the Surface Geology at Bubi
Figure 7‑2: Map of the Surface Geology at Isabella McCays
Trenching was conducted across all deposits as part of exploration work for the purposes of defining near surface geology and mineralization envelopes within the oxide horizons. The trenches were sampled generally on a 1 m to 2 m interval and analysed by the bottle roll method (excluded fire assay of the residual tails). These assays were used to help in the projection of oxide ore envelopes and excluded from any Mineral Resource estimation. Channel sampling was also done in all accessible sections of the pits during 2017, which also assisted in the projection of mineralized envelopes in the oxide and transition ore horizons, but the assays were also not used for Mineral Resource estimation.
7.3 | Ground Geophysical Surveying |
Ground Magnetics and Induced Polarization Geophysical surveys were conducted at the Isabella North deposit by PV as part of the oxide ore exploration in 1996. The anomalies were followed up with oxide trenching and drilling. The oxide drilling data forms part of the depth interpretation of the Bilboes deposits from oxide through transitional and sulfide horizons. Further geophysical surveys were conducted in the Kerry West claims located west of the Isabella South claims and Kerry North claims, between Isabella North and McCays. Further drilling is outstanding on these targets and these offer potential for oxide and sulfide resources.
7.4 | Prospecting and Sampling |
Early exploration works targeted oxide mineralization and includes soil sampling, trenching, and drilling. Assays from this work were not used in the sulfide Mineral Resource estimate but were used to guide the interpretation of the ore outlines at depth.
Drilling of the sulfides to provide data for the Mineral Resource estimate was completed in three phases:
| | ● | Phase 1: Anglo American Corporation between 1994 and 1999, |
| | ● | Phase 2: Bilboes between 2011 and 2013, |
| | ● | Phase 3: Bilboes between December 2017 and November 2018. |
Phase 1: Anglo explored the sulfide potential beneath the oxides between 1994 and 1999. The results of widely spaced core drilling of the sulfides were used by Anglo American to estimate a non-compliant Mineral Resource for this mineralization and delineated 4.7 Mt at a grade of 3.49 g/t and containing 533,000 oz of gold over a 3,400 m strike to a vertical depth of 120 m from 17,650 m of core drilling.
Phase 2: Between 2011 and 2012, Bilboes completed further exploration on the sulfides with 16,230 m from 69 core holes and 14,021 m from 101 Reverse Circulation (RC) holes in 2013 and extended the strike to 7,000 m and achieved a vertical depth of 160 m for the mineralization.
Phase 3: An additional 34,987 m of drilling, split as 17,015 m from 129 core holes and 17,972 m from 178 RC holes was completed between December 2017 and November 2018. This was largely an infill drilling programme for a Mineral Resource upgrade across all deposits at Isabella, McCays and Bubi and achieved a vertical depth of 200 m. The total project drilling conducted over the three phases is 93,400 m of core and RC holes with an additional 2,500 m of core drilled for geotechnical work for the PFS.
Sulfide mineralization underlies all the oxide deposits at variable depths from 15 mbs to 50 mbs. Two exploration campaigns account for historical exploration of sulfide gold deposits at Bilboes. Both exploration campaigns were headed by PV. The first drilling campaign occurred in 1994/5. During this campaign 24 drill holes were completed. In the second drilling campaign which took place in 1997/9, 99 drill holes were completed. A total of 123 holes totaling 17,650 m (12,650 m core and 5,000 m percussion) were drilled at Isabella, McCays and Bubi covering a strike of 3,440 m.
Drill holes depths varied between 70 m and 350 m for the core holes, with the holes being collared through percussion drilling to a depth of 50 m. The percussion holes were largely used to estimate the oxide Mineral Resource and to define the oxide / sulfide interface. Only core drill holes were included in the sulfide databases. The drill line spacing varied between 25 m and 100 m with 25 m between holes along these lines.
The initial holes drilled by PV before 1995 targeted the Calcite (5), Castile (9) and McCays (10) deposits. The majority of these were drilled at 45° inclinations and from hanging wall positions of the mineralized zone. A few exceptions resulted from unavailability of a suitable collar position due to the open pits. Sampling was limited to the visually recognizable alteration zones resulting in approximately 30% of the total hole length being sampled.
At the Diana pit (Isabella Mine), 14 holes were drilled, two spaced at 10 m and two at 50 m with the rest spaced at approximately 25 m intervals. One hole was drilled on each line; all from the hanging wall with one from the footwall. The mineralized intersections occurred at 45 m to 95 m with one intersection at 125 m (DE15-530S). The footwall of the mineralization intersected was at 169 m to 182 m.
At Maria pit (Isabella) all six holes (1998-9) were drilled from the hanging wall with five holes spaced at 25 m and the rest at 50 m. The average intersection depths occurred at 45 m from surface and geological envelopes were modelled down to 100 m from surface. Two parallel, mineralized zones steeply dip at 70° to SE and the hanging wall ore body stretches along the entire length of the pit, but the footwall zone is restricted to the eastern end of the strike.
A total of 15 holes were drilled along the Calcite strike from the footwall and two from the hanging wall at 50 m to 120 m line spacing. The deepest intersection occurred at 130 m from surface and the intersection depths ranged from 50 m to 120 m. The eastern end of the strike remains open.
The Castile drilling intersected two mineralized zones that were modelled to 110 m from surface, but the mineralization remains open on all sides. Two holes intersected a significant parallel mineralization (6.68 g/t over 10.59 m and 4.90 g/t over 9 m) in the footwall of the two main zones. Both holes ended in mineralization and require further investigation in future. These holes have not been investigated in the 2017/8 drilling campaign because they lie outside of the proposed open pit.
The 25 holes at Bubi covered a strike of 900 m on lines 25 m apart except for two holes which were spaced at 50 m and 100 m. All the holes (but one) were drilled from the hanging wall in the same SE direction inclined at 45°. Three distinct, parallel zones were identified but these were discontinuous along strike and the mineralization remained open ended towards the southern strike of 1,500 m. The oxide cap is at 15 m to 30 m from surface and only 10 m in the southern strike. Drilled intercepts start at 20 m to 80 m and the deepest occurs at 130 m. The geological models were done to a vertical depth of 170 m from surface.
At McCays 23 holes were drilled in the pit and two mineralized zones were defined along strike but broken up mid-way. Drill spacing was at 50 m to 100 m with a few lines having two holes each. All holes were drilled from the hanging wall but at varying inclinations from 45° to 60°. The geological models were created to 160 m vertical depth with average intersections occurring at 75 m. Two of the holes at McCays had deep (but low grade) intersections that do not form part of the established pattern of mineralization.
A summary of the drilling completed is presented as Table 7‑1 with the drill hole distribution being presented in Figure 7‑3.
Table 7‑1: History of Sulfide Project Core Drilling 1994 - 1999 (From Ngilazi & Martin, 2017)
Mine | Deposit | Pit | No. of Holes | Total Strike (m) | Drilled Length (m) | Depth Achieved (m) |
| Isabella North | Diana | 14 | 315 | 2,200 | 150 |
| Isabella | | Calcite | 17 | 575 | 2,600 | 150 |
| | Isabella South | Castile | 37 | 450 | 5,100 | 100 |
| | | Maria | 7 | 200 | 550 | 70 |
McCays | McCays | Central / Eastern | 23 | 1,000 | 4,000 | 100 |
Bubi | Bubi | North | 25 | 900 | 3,200 | 120 |
Total | 123 | 3,440 | 17,650 | |
green = Percussion drilling
blue = Diamond Drilling
red = Reverse Circulation drilling
Figure 7‑3: Plans Showing the Drilling for the Various Areas
| | 7.5.2 | Logging and Sampling Procedure |
There are no written accounts of the historic sampling procedures, but Mr. Chimedza, who has been employed by Bilboes since 1996, was closely involved with the exploration of the sulfide deposits. He confirms that the sampling of the core followed Anglo American Corporation standard procedures. This was considered to have been sufficiently accurate for the purpose of reporting of Inferred Mineral Resource estimates contained in the 2009 Mineral Resource declaration.
The geological logging included descriptions of lithologies, structures, alteration, and visible sulfide mineralization. The information was entered into core logging sheets and mineralized zones were identified. All geological boundaries were defined with reference to the drill length. On completion of assaying, the gold results for each sample were recorded on the log sheets for easy reference. Core recoveries were recorded, and any depth discrepancies were checked and corrected. Geotechnical logging, including the RQD index and fracture spacing, was also undertaken.
Bilboes has hardcopy and digital datasets of all information except for the geotechnical logs for which only hard copies are available.
Core was fitted together, and a longitudinal line drawn to guide splitting. Within the mineralized zones sample intervals were marked between 0.5 m and 1.0 m, taking cognizance of geological and structural boundaries, and sampling was continued at 1 m intervals to 5 m on either side of the mineralization.
All the visually recognizable mineralized portions of the drill holes were cut, half core sampled, and assayed with well over 10,000 samples being assayed for gold.
7.6 | Hydrology and Hydrological Drilling |
The project site falls within the Bembezi river sub-catchment which drains north towards the Zambezi River. The Gwayi catchment largely comprises the Northern Matabeleland area of hydrological zone A.
Daily and monthly rainfall were obtained from the Nkayi station from the Meteorological Services Department of Zimbabwe (MSD-Z) for 38 hydrological years (from 1980 to June 2018) and were analysed to determine the long-term monthly averages, minimum and maximum monthly rainfall. The Mean Annual Precipitation (MAP) is 657.0 mm, the wettest hydrological year saw 53% more rainfall than the MAP and the driest hydrological year saw only 60% of the MAP. The driest period was associated with the drought experienced in the 1990s.
Data from the Nkayi station was adopted as the design data owing to the weather station having an acceptable length of record of monthly rainfall data and being located closest to the site and at a similar altitude.
Ten years of monthly pan evaporation measurements for Bulawayo Goertz were provided by the MSD-Z. A pan coefficient of 0.75 was adopted for the conversion of Epan measurements to a reference evapotranspiration.
The annual maximum rainfall analysis for various duration storm events (from 24 hours up to 7 days) was undertaken on the 38 years of daily rainfall records supplied by the MSD-Z. The Generalized Extreme Value (GEV) distribution was then fitted to the annual maximum series to estimate storm depths for events with an annual probability of occurrence of up to 1:10,000 (0.01%).
No hydrological drilling has been undertaken. For pits that contained water ingress, a bathymetric survey was done to determine pit bottom.
A total of 18 geotechnical drill holes: ten at the Isabella McCays and five at Bubi, varying in depth from a minimum of 120 m to a maximum of 260 m were logged. The cumulative length of the drill holes at Isabella McCays Isabella McCays was about 1.67 km; and those at the Bubi was about 0.88 km.
SLR Consulting (Africa) (Pvt) Ltd, from South Africa was contracted by DRA to conduct a detailed geotechnical study across all the sulfide deposits. SLR Rock Engineers visited site at various stages of the geological drilling campaign during 2018 with the following tasks being conducted; review of geological and geotechnical data; geotechnical logging of core and the collection of intact rock samples for testing. Structural data was collected by both the Acoustic and Optical Televiewer from the geotechnical boreholes. Packer testing was also conducted in each borehole to determine the hydrogeological parameters of the rock mass, for groundwater modelling. Based on the analysis of the geological aspects of the deposits which included rock mass characterization, hydrogeology, and structural geology, a geotechnical model was developed for pit design parameters. Using these design parameters, kinematic, empirical and limit equilibrium analysis was conducted to determine the optimal slope configuration for the various deposits.
8 | SAMPLE PREPARATION, ANALYSES AND SECURITY |
The recovery of samples from the RC and core drill rigs was done in accordance with laid down procedures adequate for the purposes of reporting of Mineral Resources. Once field measurements, markings and numbering and recording of critical information were completed, the core samples were transported daily from the drill site to the core yard and RC samples to secure metal containers to ensure security and avoid tampering, damage, loss, or contamination. The core was adequately secured to prevent damage, loss, or mix-up during transportation. Wet RC samples were collected in calico bags to allow water to drain out and minimize sample loss prior to sun drying in metal trays in a securely fenced section of the core shed which was free from dust ingress and other forms of contamination. Core samples were half split using a core saw and the samples averaged 2 - 3 kg. The core sizes were largely NQ with a few HQ cores being encountered at the start of drill holes. RC samples were collected by way of a Jones riffle splitter and the aliquots also averaged 2 - 3 kg. After sampling, excess cores and RC samples have been stored at the mine in secure sample containers and the core shed and have been retained for future use. All samples were labelled appropriately prior to dispatch. No further sample preparation was done at site and the half cores and riffle split RC samples were transported to the external accredited Laboratory. Transportation of samples to the Assay Laboratories was done utilizing Bilboes vehicles accompanied by a senior member of the technical team followed the laid down chain of custody procedure between the company and the Lab to ensure sample security in transit and proper handover-takeover. Transportation of samples to the Lab was done on the same day within working hours with no unnecessary stopovers along the way to reduce risk of loss, contamination, or damage.
DRA reviewed the procedures for sampling, sample preparation protocol, sample handling and storage and are of the view that these are adequate for the purposes of reporting of Mineral Resources contained herein. Bilboes and an Independent SRK Consultant also visited and inspected the laboratories used in the analyses and can confirm that these also followed the correct procedures for sample preparation.
Independent SANAS accredited laboratories were used in the analyses of samples. Samples were analysed for gold by Fire Assay on 50 g pulp aliquots and completed by Atomic Adsorption spectrophotometry method. Samples with grades at 3 g/t and above were repeated by the gravimetric finish.
Performance Laboratory (PLZ) in Harare, was selected as the primary laboratory (accreditation number T0533) ZIMLABS Laboratory located in Harare (accreditation number T0339), and Antech Laboratories (Antech) located in Kwekwe (accreditation number T0411) were used for check analyses. All Laboratories are in Zimbabwe and have all since migrated to the Southern African Development Community Accreditation Service “SADCAS” which accreditation is in accordance with ISO/IEC 17025 system. Current accreditation are:-
| | ● | Performance Laboratory - TEST-500070 issued on 3 June 2022, |
| | ● | ZIMLABS - TEST-50010 issued on 20 February 2015, |
| | ● | Antech - TEST-50030 issued on 1 June 2023. |
At all times during sample collection, storage, and shipment to the laboratory facilities, the samples were in the control of Bilboes. The samples were then trucked to Performance Laboratories in Harare for geochemical analysis.
During the 2018 drilling and sampling campaign, all analytical results were emailed by Performance Laboratories to Bilboes. Comparisons were done between the drilling database received from Bilboes and the assay results received from Performance Laboratories to verify the database.
All the laboratories that conducted the sampling and analytical work were independent of Bilboes. Performance Laboratories in Zimbabwe is an entity of SGS. SGS produces impartial results that are considered suitable for Mineral Resource estimation.
As part of their QA/QC protocols to test for the precision of the analytical process, Bilboes inserted CRMs, blanks into their sampling stream, and created duplicates for re-analysis. During the 2017 Mineral Resource review of the Bilboes properties, DRA did a thorough review of the QA/QC protocols. The findings of that review concluded were that the protocols employed at Bilboes were adequate and the database was deemed fit for the purposes of geological modelling and Mineral Resource estimations. The review was in respect of all protocols from commencement of drilling campaigns by Bilboes in 2011 till completion in 2018.
CRMs were sourced from AMIS in South Africa, Geostats in Australia, and Rocklabs in New Zealand. Silica powder from AMIS and local dolerite were used as blanks. Bilboes utilized two types of duplicate materials: a Pulp Duplicate (LPR) and a Coarse Duplicate (LCR). In a batch of twenty samples, at least four out of the twenty samples were control samples. This represents an insertion ratio of at least 20%. If more than 20% of CRM results in a batch returned results that fell outside the allowable deviation of the recommended value; all results from that batch were failed and re-analysed.
For the 2018 sampling campaign, Silica powder and local dolerite were used as blank material. AMIS0415, AMIS0439, and AMIS0484 were used as silica blanks. During the 2017 review by DRA, 272 blanks were present in the database. An additional 859 blanks were added to the database for the 2018 campaign, taking the total number of blanks to 1,131.
A detection limit of 0.02 g/t was set for the exercise while the upper acceptable limit was set at 0.1 g/t for the silica blanks and 0.15 g/t for the field blank. All samples for AMIS0415 and AMIS0439 plotted within the allowable upper limit of 0.1 g/t. Only one sample returned a gold value more than the 0.1 g/t allowable upper limit for AMIS0484. Similarly, with the field blank, only one sample returned a gold value more than the allowable 0.15 g/t upper limit.
CRMs were sourced from African Mineral Standards (AMIS) in South Africa and Geostats Pty Ltd in Australia for the previous drilling campaign. For the 2018 drilling campaign, CRMs were sourced from AMIS - AMIS0440, AMIS0441, AMIS0473, AMIS0525, and AMIS0526. These represent the grade distribution observed at Bilboes. AMIS0473 has a recommended grade of 0.41 g/t, for AMIS0526 the recommended grade is 1.03 g/t, 1.74 g/t for AMIS0440, 2.44 g/t for AMIS0441, and 8.04 g/t for AMIS0525.
Most of the control samples of AMIS0440 plot within three standard deviations of the recommended mean value of 1.74 g/t. some seventeen samples plot outside the allowable three standard deviations limit. This is to be expected of a low/middle grade CRM.
All the control samples representing CRM AMIS0441 plot within three standard deviations of the recommended mean value of 2.44 g/t with most samples lying within two standard deviations.
For AMIS0473 all the control samples lie within one standard deviation of the mean of 0.41 g/t. For AMIS0525 all the control samples, bar one, plot within two standard deviations of the mean value of 8.04 g/t. However, a slight positive bias is observed for AMIS0525 with a majority of the samples lying above the recommended mean value. Five samples lie outside three standard deviations of the recommended mean value of 103 g/t for CRM AMIS0526
Two types of duplicates were employed in the 2011 to 2018 drilling and sampling campaigns i.e., Lab repeats and field duplicates. The former is made up of LPR and LCR. There were 721 LPRs and 875 LCRs in the database for the 2018 campaign. The majority of samples were within a 15% margin. Samples that fell outside of the 15% margin could be attributed to the inherent nugget effect of the deposit.
Performance Laboratories was used as the primary laboratory for analysis in the recent drilling campaigns from 2011 to 2018. To check the reliability of the results obtained from Performance Laboratories, ZIMLABS and Antech Lab were used as umpire laboratories. The results show the acceptable correlation between the primary laboratory and the umpire laboratories.
The QP is of the opinion that sample preparation, security and analytical procedures were adequate.
DRA’ engagement with Bilboes began with a review of the previous Mineral Resource estimate. During the review process, rigorous tests were conducted to verify the integrity of the Bilboes database. A recommendation from the review process by DRA was to implement a commercial data management software, to which Bilboes complied by acquiring Datamine™ Fusion database software for the capture, storage, and management of drill hole information. This Fusion database was implemented prior to the start of the 2018 drilling campaign.
9.2 | 2017/2018 Drilling Campaign |
Before commencement of the 2017/2018 drilling campaign in addition to the Datamine™ software already in place Bilboes utilized Fusion database software for the capture: storage and management of drill hole information.
The 2018 drilling programme contained 41 RC and 55 DD holes for ISBN, 27 RC and 20 DD holes for ISBS, 76 RC and 55 DD holes for McCays, and 40 RC and 13 DD holes for Bubi. With regards to the 2018 data, DRA visited the site during drilling and performed various checks to verify the integrity of the collar co-ordinates, logging and sampling procedures, and assay results. Collar locations in the field were clearly marked. The mineralisation zones were observed in the cores as well as from outcrops in the surface mining pits.
The core logging and sampling processes at the core storage facility were observed to be consistent with industry standards. Each hardcopy log is audited and signed-off by a senior geologist prior to being used in modelling and estimation.
The data collected during the exploration, drilling and sampling programmes, including surveying, drill hole logging, sampling, geochemical analysis, and data quality assurance, was collected in a professional manner and in accordance with appropriate industry standards by suitably qualified and experienced personnel.
The data was reviewed and validated by the QP who concluded that the data is suitable for the construction of the geological model and for the purposes used in this TRS.
10 | MINERAL PROCESSING AND METALLURGICAL TESTING |
10.1 | Test Work Programme Overview |
The metallurgical test work was concluded in different phases over a period extending from September 2013 to March 2019 and involved various independent laboratories and consultants as outlined in Table 10‑1.
Table 10‑1: Test work Program Outline
Phase | Test work Description | Done By | Supervision and Oversight | Date |
1A | Sample characterization detailing mineralogical and chemical analysis | Mintek, South Africa | Bilboes, MMC and MDM Engineering | September 13 to December 13 |
1B | Comminution test work done on the two composites namely Composite 1 (Bubi ore) and Composite 2 (combination of Diana, Calcite, Castile, Maria and McCays ores) | Mintek, South Africa | Bilboes, MMC and MDM Engineering | January 14 to April 14 |
2 | Selection of a process route covering gravity amenability tests, flotation optimization and treatment of the sulfide flotation concentrates via POX, Bio-Oxidation and Ultra-fine grinding followed by cyanidation | Mintek and Suntech, South Africa | Bilboes and MMC | May 14 to September 14 |
3 | Variability flotation tests and bulk flotation concentrate production for additional BIOX® and gold leach tests | Suntech and SGS, South Africa | Bilboes, Minxcon and MMC | October 15 to August 16 |
4A | Laboratory and Pilot plant test work campaigns on the different ore types to generate additional flotation kinetics and grind data, bulk concentrates for BIOX® pilot plants, flotation design parameters and validate flowsheet | MMC at the client's project site in Zimbabwe | Bilboes and DRA | April 18 to September 18 |
4B | Review, modelling and simulation of laboratory and pilot plant test results | EMC, South Africa | Bilboes, MMC and DRA | October 18 to March 19 |
Phases 1 to 3 constituted preliminary test work and Phase 4 (Pilot plant), supplementary laboratory test work, modelling, and simulation the definitive test work.
10.2 | Discussion of the Results |
The mineralogical and chemical analyses of the ores conducted on the individual and composite samples is summarized as follows:
| | ● | Gold content in the samples varied from 1.8 mg/kg to 6.8 mg/kg. |
| | ● | All samples contained high concentrations of Si, Al, Ca, Fe and As. Total sulfur concentrations in the samples varied from 1.2% to 5.3% and significant amounts of it were sulfide species. |
| | ● | The Total carbon in the ores was detected at 1.3% - 5.3% and was mainly present as carbonate. Organic carbon was low for all samples tested, indicating low potential for preg-robbing. Carbon (as carbonate) content was high, especially for Bubi and McCays pits (double amount in comparison to other composite samples). Carbonate concentrations of between 7.4% and 18.4% were detected in the samples. |
| | ● | The Total sulfur content in the samples was found to be mainly in the sulfide form with the lowest content of 0.69% in the McCays ore and the highest content of 2.65% in the Bubi ore. The concentration of elemental sulfur and sulphate was very low. High As content was detected in all samples which highlighted the importance of investigating the As behavior during the processing steps and to consider possible environmental issues in deciding on process route and economics. The As content in the McCays ore was disproportionately higher than the other pits. |
| | 10.2.2 | Mineralogical Characterization |
| | ● | Diagnostic leach results showed that gold recovery via direct cyanidation was low, varying from 25% to 50% and Au locked in sulfides and carbonate minerals varied from 46% to 72%. |
| | ● | Bulk Modal Analysis (BMA) showed that quartz, feldspar, and mica were present in major to intermediate amounts in all the samples, followed by major to minor amounts of carbonates. Sulfide minerals, pyrite and arsenopyrite, were present in minor to trace amounts throughout all samples. All other mineral phases are present in trace amounts in all samples. |
| | ● | The Au bearing minerals identified in this study were electrum (AuAg) and native gold (Au). Native gold and electrum are variably distributed throughout all samples. |
| | ● | Most Au-bearing grains reported to the 0 μm -10 μm size class fraction and a smaller quantity in the 10 μm -15 μm size class fraction. |
| | ● | Pyrite was the dominant BMS mineral present as majority of the samples followed by arsenopyrite (from 5 to 58%) and trace amounts of other sulfides (sphalerite, pentlandite, chalcopyrite, chalcostibnite, ullmannite, gersdorfiite and galena) |
| | ● | The majority of all BMS mineral grains (>50 mass%) in all samples reported to the finer, 0 μm -21 μm size classes, with lesser amounts reporting to the coarser size classes. |
| | ● | The majority (>80 mass%) of pyrite, arsenopyrite and other sulfides had free surface with lesser amounts being associated with other mineral phases in all the samples examined. |
Comminution test work showed that Isabella and McCays samples with Bond Ball Work Index (BBWi) values ranging from 15.70 kWh/t to 17.81 kWh/t and A*b values ranging 27.50 to 32.80 could be classified as being hard, while Bubi ore with a BBWi value of 21.45 kWh/t and A*b value of 19.0 was very hard. All samples were characterized as being moderately abrasive with Ai indices ranging from 0.22 to 0.42.
10.3 | Process Route Identification |
Gravity amenability tests indicated poor gold recoveries and varied from 14% to 22% at 0.5% mass pull. Gravity separation at higher mass pull provided higher gold recovery but still was not a feasible option.
| | 10.3.2 | Preliminary Flotation |
Initial milling and flotation results indicated high gold recoveries of 89% - 97% with high mass pulls ranging from 10%- 15%, low concentrate grades of 12 g/t - 20 g/t Au and unacceptable high levels of carbonates in the range of 7% - 13% which were bound to negatively affect the down-stream gold recovery process. The test work established that the ores can be easily floated with good recoveries at grinds ranging from 80% of 106 µm - 75 µm and that flotation optimization with respect to mass pulls, concentrate grade and other concentrate quality metrics was required.
| | 10.3.3 | Flotation Optimization |
Subsequent flotation optimization tests involving the addition of depressant and 1 and 2 cleaning stages improved the overall flotation performance with recoveries ranging from 88% to 94%, with mass pulls ranging from 4% - 12%, concentrate grades of 50 g/t – 120 g/t Au and acceptable carbonates levels in the range of 4% - 10%.
The optimum flotation conditions determined are presented in Table 10‑2.
Table 10‑2: Optimum Flotation Conditions
Description | Value |
Grind | 80% - 75 µm |
Reagents Dosages – g/t | - |
Copper Sulphate | 80 g/t |
Sodium Ethyl Xanthate | 100 g/t |
Sodium Carbonate | 200 – 350 g/t |
Starch | 70 – 125 g/t |
XP200 Frother | 35 – 60 g/t |
| | 10.3.4 | Gold Dissolution from Flotation Concentrates |
| | ● | Direct cyanidation of the flotation concentrate resulted in a 27% gold dissolution, |
| | ● | Ultra-fine grinding (80% -20 µm) followed by cyanidation and oxygenation resulted in a marginal improvement in gold dissolution from 27% to 30%, |
| | ● | A single Pressure Oxidation (POX) test was done on concentrate with the main objective to oxidize 100% of the sulfide which then resulted in a further 98% gold dissolution by cyanidation of the POX leach residue. Formation of Basic Ferric Sulphate (BFS) resulting in high lime and cyanide consumption in the downstream processing (cyanidation) was observed. A significant amount of arsenic was also detected in the POX filtrate. |
| | ● | BIOX® of the concentrate provided 99% sulfide decomposition with 97% gold dissolution by cyanidation of the bio-residue. Formation of iron and cyanide complexes was observed. The solid residue after cyanidation was of the bioleach product was stable with respect to arsenic. |
Based on the above results, historical test work and consideration of environmental impacts and risk minimization by adopting commercially established and proven processes, the process route identified for additional evaluation was flotation, pre-treatment of the concentrate by Bio-oxidation followed by cyanidation.
Variability flotation test work on the ores indicated an average recovery of 89.2%, a recovery range of 83.4% - 95.9% and recovery standard deviation of 3.4% for Isabella McCays ore and average recovery of 86.6%, a recovery range of 80.5% - 94.2% and recovery standard deviation of 4.4% for Bubi ore.
10.5 | Pilot Plant Test Work |
The pilot plant test work was conducted over a period of three months from July 2018 to September 2018, with the follow up laboratory test work being conducted between September 2018 and January 2019.The pilot plant utilized a total of 20 t of the Isabella McCays ore and 15 t of Bubi ore.
| | 10.5.1 | Pilot Plant Operation and Flowsheets |
The flowsheets evaluated during the pilot plant campaigns are shown Figure 10‑1.
Flowsheet 2 was ultimately adopted as the preferred flowsheet based on better recoveries and concentrate grades.
Reagent addition was as per optimum flotation conditions outlined above.
Figure 10‑1: Pilot Plant Campaign Flowsheets
| | 10.6.1 | Recoveries and Mass Pulls |
The Isabella McCays ores gold recoveries ranged from 85.9% to 91.0% and the mass pulls ranged from 3.8% to 6.0% with a weighted average of 88.4% recovery and 5.0% mass pull. The Bubi ore recoveries ranged from 85.9% to 88.8% and mass pulls ranged from 7.8% to 15.2% with averages of 87.5% recovery and 10.0% mass pull.
| | 10.6.2 | Chemical Analyses of Bulk Concentrates |
The analyses of the individual and blended concentrates produced from the pilot plant operation for the BIOX® process piloting was within the limits of the BIOX® process requirements.
| | 10.6.3 | Additional Laboratory Test Work and Simulation |
Due to constraints on the classification circuit, the grind on the flotation feed ranged from 63% to 68% - 75 µm against a targeted grind of 80% - 75 µm. This outcome was addressed by conducting additional comparative laboratory flotation tests at these grinds to validate the effect of grind with modelling and simulation applied to the actual pilot plant recoveries to derive expected recoveries at the target grind as explained in the latter section.
| | 10.6.4 | Flotation Rate and Comparative Grind Tests |
To determine the expected pilot plant recoveries at the target grind of 80% - 75 µm, comparative flotation rate tests were conducted on the individual ores at the pilot plant grind of 65% - 75 µm and the target grind. The results showed that the target finer grind of 80% - 75 µm consistently resulted in higher recoveries in comparison to the pilot plant grind of 65% - 75 µm with recovery increments ranging from 0.2% - 4.7% on all ore types.
| | 10.6.5 | Modelling and Simulation |
| | 10.6.5.1 | Grind and Recoveries |
Eurus Mineral Consultants (EMC) were engaged to review and conduct modelling and simulation on the laboratory and pilot plant test work results.
The comparative results of the simulated pilot plant recoveries at 80% - 75 µm and the actual recoveries at 65% - 75 µm are presented in Table 10‑3. The results indicate an expected recovery improvement of 3.1% and 4.2% on the Isabella McCays and Bubi ores with grind improvement from 65% - 75 µm to 80% - 75 µm respectively.
Table 10‑3: Comparative Pilot Plant Simulated Recoveries
Ore Source | Head g/t | 65% - 75 µm (Pilot Plant) | 80% - 75 µm (Simulation) | Var:(80% - 75 µm) -(65% - 75 µm) |
| | % Mass Pull | Conc g/t | % Rec | % Mass Pull | Conc g/t | % Rec | % Mass Pull | Conc g/t | % Rec |
Isabella North | 2.00 | 4.2 | 41.3 | 86.1 | 4.4 | 40.5 | 89.2 | 0.2 | -0.8 | 3.1 |
Isabella South | 2.54 | 5.1 | 45.4 | 90.3 | 5.2 | 44.6 | 92.0 | 0.2 | -0.8 | 1.7 |
McCays | 2.20 | 5.5 | 33.7 | 83.7 | 5.9 | 33.3 | 88.8 | 0.4 | -0.4 | 5.1 |
Isabella McCays Total* | 2.20 | 4.7 | 41.0 | 86.9 | 4.9 | 40.3 | 90.0 | 0.3 | -0.7 | 3.1 |
Bubi | 2.59 | 8.7 | 26.0 | 86.9 | 9.2 | 25.6 | 91.1 | 0.6 | -0.4 | 4.2 |
*Based on ISBN-50%, ISBS-30%, McCays-20% |
| | 10.6.5.2 | Flotation Residence Times |
The modelling and simulation were also applied to derive requisite flotation residence times for the proposed Flowsheet 2 (Table 10‑4).
Table 10‑4: Flotation Residence Times
Flotation Stage | Residence Time-Mins |
Rougher | 84 |
Cleaner | 68 |
Re-Cleaner | 46 |
Cleaner and Re-Cleaner Scavenger | 55 |
| | 10.6.6 | Projected Operational Gold Recovery |
The following observations from the test work programme results provide evidence of expected higher operational recoveries than the average expected 90.0% and 91.1% derived for the Isabella McCays and Bubi ores, respectively.
| | ● | Both Isabella McCays and Bubi ores indicated a positive correlation of head grade and recoveries. With pilot plant head grades being slightly lower than the planned LoM grades, actual plant recoveries can be expected to be better than pilot and simulated recoveries at the same grind. |
| | ● | Laboratory test work and plant simulation results showed marginal improvement in recoveries ranging from 0.3% to 0.9% with finer grinding from 80% - 75 µm to 90% - 75 µm. Although marginal and subject to further validation and analysis of economic benefits, the trend provides a basis for additional optimization prior to implementation or continuous improvement during the operational phase. |
| | ● | Comparative simulation of the proposed flotation circuit comprised of a Rougher, Cleaner Scavenger and a common 2-stage cleaning and a flowsheet comprising a Rougher, Cleaner Scavenger and separate 2 -stage showed marginal recovery improvement of 0.5% to 0.8% with the latter indicating potential to improve recoveries with flowsheet reconfiguration subject to validation and analysis of economic benefits. |
| | ● | Statistical analysis of results from all laboratory and pilot plant test work results showed expected recoveries of 90.2% and 92.1% and recovery ranges of 85.4% - 95.1% and 89.2% - 95.0% at one standard deviation for the Isabella McCays and Bubi ores, respectively. |
| | 10.6.7 | Improvements in Flotation Gold Recovery |
It is anticipated that with better knowledge of the recovery relationships, optimal milling and flotation design, steady state operation, higher head grades with continuous improvement and the benefits of the economies of operating experience, the downside recoveries can be avoided and that the operational recoveries ranging from a minimum of the expected values of 90.0% and 91.1% for Isabella McCays and Bubi respectively to a maximum of 95.0% for both ores may be realized.
The test work was conducted on ore samples from Isabella McCays and Bubi deposits to develop test work data to design a gold processing plant. Test Work Results
Summary of the test work results is presented in Table 10‑5.
Table 10‑5: Summary of the Test Work Pre-Feasibility Results
BIOX® Test work on Sulfide Concentrate |
| | | Isabella McCays | Bubi |
Sulfide oxidation | % | 89.6 | 90.0 |
Gold recovery | % | 88.8 | 95.7 |
NaCN consumption | kg/tconc | 16 - 18 | 18 - 20 |
Lime consumption | kg/tconc | 5 - 15 | 5 - 15 |
BIOX® pilot plant test work programs were completed on composite Isabella McCays and Bubi concentrates produced during the on-site flotation test work programs. The pilot plant programs have provided details of sulfide oxidation performance under various operating conditions for each concentrate, as well as the relationship between gold dissolution and sulfide oxidation. This data has been used to specify certain design criteria for a full-scale BIOX® plant treating both concentrates. Associated metallurgical test work programs focusing on unit processes such as liquid – solids separation, neutralization and BIOX® product CIL were also completed on slurries generated during each pilot plant campaign.
The Isabella McCays bulk concentrate sample had a gold grade of 49.9 g/t and a sulfide sulfur grade of 18%. The mineralogical assemblage comprised of 28.5% pyrite, 22.2% arsenopyrite and 0.02% stibnite. The continuous BIOX® pilot plant operated on this sample for a period of 103 days and the run included detailed sampling phases at 6.5 and 6-day retention times.
The BIOX® test work indicated the following:
| | ● | An average BIOX® sulfide oxidation of 89.6% was achieved at a 6-day retention time and a feed slurry solids concentration of 20%, |
| | ● | This resulted in an average CIL gold dissolution of 88.8% on the BIOX® product solids, |
| | ● | The lower-than-expected sulfide sulfur oxidation levels in the pilot plant overflow product slurry are believed to be due to short-circuiting of unoxidized/partially oxidized solids between the reactors, |
| | ● | The BAT BIOX® tests completed on the various Isabella McCays concentrate samples achieved sulfide oxidation levels in the range 86.4 to 99.3% and yielded gold dissolutions in the range 92.3 to 97.9%. |
The continuous neutralization pilot run conducted on an Isabella McCays BIOX® liquor sample produced a suitable effluent since the As(T) concentration in the neutralized solution was at 0.5 ppm and the TCLP testing of the residue showed a final As(T) leachate of <3 ppm, below the stipulated 5 ppm requirement. Continuous neutralization tests are recommended to optimize the use of the Isabella McCays float tails for Stage 1 pH control with respect to high Fe concentration in TCLP extract for the batch neutralization tests.
The settling behaviour and flocculent requirement for the various Isabella McCays process slurries were found to be comparable to projects with a similar concentrate mineralogy previously evaluation during BIOX® test work programs.
The Bubi bulk concentrate sample had a gold grade of 28 g/t and a sulfide sulfur grade of 27.1%. The mineralogical assemblage comprised of 57.2% pyrite and 9.00% arsenopyrite. The continuous BIOX® pilot plant operated on this sample for a period of 235 days and the run included detailed sampling phases at 6.5 and 6-day retention times.
The BIOX® test work indicated the following:
| | ● | An average BIOX® sulfide oxidation of 90% was achieved at a 6.5-day retention time and a feed slurry solids concentration of 20%, |
| | ● | This resulted in an average Carbon in Leach (CIL) gold dissolution of 95.7% on the BIOX® product solids, |
| | ● | The BAT tests completed on the Bubi concentrate sample achieved sulfide oxidation levels in the range 97 – 98% and yielded gold dissolutions in the range 92.3 to 96.8%. |
The continuous neutralization pilot run conducted on a Bubi McCays BIOX® liquor sample produced a suitable effluent since the As(T) concentration in the neutralized solution was at 0.5 ppm and the TCLP testing of the residue showed a final As(T) leachate of < 0.4 ppm, below the stipulated 5 ppm requirement. Continuous neutralization tests are recommended to optimize the use of Bubi / Isabella McCays float tails for Stage 1 pH with respect to high Fe concentration in TCLP extract for the batch neutralization test.
The settling behaviour and flocculent requirement for the for the various Bubi process slurries were found to be comparable to that achieved on the Isabella McCays process slurries. The test work indicated higher settling area requirement of 4,00 m²/t/h for the Bubi BIOX® product compared the 2,90 m²/t/h for the Isabella McCays BIOX® product.
The QP is of the opinion that the mineral processing and metallurgical testing data is adequate for the purposes used in the TRS.
11 | MINERAL RESOURCE ESTIMATES |
The MRE was prepared by DRA in terms of S-K 1300.
Leapfrog Geo™ software was used to construct volumetric solids for the zones of weathering, structural discontinuities, and mineralization. Three-dimensional (3D) resource modelling, using geostatistical techniques for grade estimation, was done in Datamine Studio RM™. The key assumptions and methodologies used for the mineral resource estimates are outlined below.
A 3D Digital Elevation Model (DEM) was provided by Bilboes. The points were generated from an airborne photogrammetric survey conducted in 2018 incorporating the existing rock dumps, heap leach pads, and mining pits. For pits that contained water ingress, a bathymetric survey was done to determine pit bottom.
The database comprised of Diamond Drilling (DD), RC and percussion (PERC) holes, summarized in Table 11‑1.
At Isabella South (ISBS), drill holes dip between 40° and 60° towards the NW. At Isabella North (ISBN), drill holes dip between 45° and 60° towards the NW/SE while at McCays, they dip at 60°towards the SE. At Bubi, the majority of drill holes dip at approximately 60° towards the SE.
Table 11‑1: Summary of Drill Holes
Property | DD Holes | RC Holes | Perc Holes | Total |
| No. of Holes | Meters | No. of Holes | Meters | No. of Holes | Meters | No. of Holes | Total Meters |
ISBS | 68 | 10,233.74 | 72 | 9,636 | 957 | 34,312 | 1,097 | 54,181.74 |
ISBN | 105 | 19,574.97 | 67 | 9,279 | 765 | 34,325 | 937 | 63,179.01 |
BUBI | 68 | 11,500.02 | 90 | 10,376 | 1,663 | 65,532 | 1,821 | 87,408.02 |
McCays | 89 | 12,565.49 | 88 | 8,931 | 298 | 20,055 | 475 | 41,551.49 |
For drilling campaigns prior to 2011, density measurements were taken at irregular intervals. During the 2011 to 2018 drilling campaigns, every metre of core was sampled, and submitted for density measurements. The Archimedes method of density measurement was used. A summary of these measurements per project area are presented in Table 11‑2.
Table 11‑2: Summary of Density Measurement per Resource Area
Resource Area | No of Measurements | Minimum (g/cm3) | Maximum (g/cm3) | Mean (g/cm3) |
ISBS | 2,599 | 2.01 | 3.39 | 2.76 |
ISBN | 3,604 | 2.00 | 3.94 | 2.78 |
McCays | 3,967 | 2.18 | 3.93 | 2.8 |
Bubi | 7,152 | 2.25 | 4.65 | 2.83 |
To check the reliability of the density measurements that were done in-house, 36 samples from Bubi, 25 from ISBS, 25 from ISBN and 15 from McCays were submitted to an independent third-party laboratory at the Institute of Mining Research, University of Zimbabwe. The in-house measurements compare well with the check analysis.
Mineralization at Bilboes is classified as Archaean hydrothermal alteration within broad shear zones. Discrete mineralized zones have been observed from the oxide open cast mining. A summary of the mineralized zone is presented in Table 11‑3 and displayed in Figure 11‑1.
Table 11‑3: Summary of the Geological Parameters for the Geological Models
Resource Area | Strike | Dip (°) | No of Mineralized zones |
ISBS | NE | ~65° to 75° towards the SE | 16 |
ISBN | NE | 79° to 85° towards the SE | 16 |
Bubi | NE-SW | SE at approximately 75° | 10 |
McCays | NE-SW. | 73° towards the NW | 16 |
Figure 11‑1: Views of the Mineralization Zones
11.5 | Weathering and Oxidation |
Oxidation profiles are important in determining the different rock mass densities of ‘ore’ and ‘waste’ and the metallurgical processing method, costs, and recoveries important during mine planning. The geological models included a transitional zone, as illustrated in purple in Figure 11‑2.
Figure 11‑2: Section View showing Oxidation Profile at ISBS
In areas with limited DD or RC drilling, percussion drilling data was used to inform the mineralized zones during the geological modelling process. Where percussion holes were used for geological modelling, they were also included in the estimation.
Oxidation of the “ore zones” is a result of chemical alteration that postdates mineralization. The moderately weathered part of the Transitional Zone was historically mined as part of Oxide Zone because the two zones were considered economically viable by heap leaching. The weakly weathered material was mined together with the fresh sulfide ore. For these reasons, the moderately weathered Transitional Zone was estimated together with the Oxide Zone. All DD and RC samples that occur within a mineralized zone, irrespective of whether they are located in the Oxide, Transitional, or Sulfide Zone, were used to estimate grade in all three zones. Percussion samples that occur in the Transitional and Oxide parts of the model, were used to estimate grade in the moderately weathered Transitional and Oxide parts of the model.
For all four properties, the predominant sampling interval was 0.5 m and 1.0 m; hence a composite length of 1.0 m was used. The statistics for the Au grade before and after compositing were reviewed to ensure that a bias had not been introduced into the database.
For ISBS, a reliable semi-variogram was obtained for the Castile Main mineralized zone, because this zone contained the most samples. These variogram model parameters were used for all other zones in the Castile area (northern part of the project).
For the southern part of the project (Maria area), samples from these zones were grouped together to increase the number of sample pairs, while paying attention to the across strike direction to ensure that samples from one zone do not form pairs with samples from another zone.
At Bubi, the Main zone produced a reliable semi-variogram. All the other zones used these variogram parameters for estimation.
For McCays, a reliable semi-variogram was obtained for Main-1 and footwall West mineralized zones, which occur in fault block 2 and fault block 3, respectively. The variogram obtained within fault block 2 was applied to all mineralized zones within block 2, similarly the variogram obtained within fault block 3 was used for zones within that block. For the remaining mineralized zones, the variogram for the mineralized zone with a similar orientation was selected.
Diana Main was the zone that produced a robust semi-variogram in ISBN and was used for all other mineralized zones within ISBN. Table 11‑4 contains the normalized variogram parameters used for the estimation.
Table 11‑4: Variogram Parameters used for Grade Estimation
Property | Zone | Normalized Variogram Parameters |
| | | Spherical Range 1 | Spherical Range 2 |
| | | Nugget (Co) | X1 | Y1 | Z1 | C1 | X2 | Y2 | Z2 | C2 |
ISBS | Castile Main | 0.26 | 4.1 | 4.1 | 4.1 | 0.56 | 42 | 42 | 14.2 | 0.19 |
| | Maria Area | 0.44 | 3.2 | 3.2 | 3.2 | 0.28 | 20.8 | 20.8 | 6.3 | 0.28 |
ISBN | Diana Main-1 | 0.31 | 17 | 17 | 4 | 0.32 | 36 | 36 | 7 | 0.38 |
Bubi | Main Zone | 0.32 | 10.6 | 10.6 | 4.1 | 0.41 | 70 | 70 | 12.3 | 0.27 |
McCays | Main-1 | 0.26 | 4 | 4 | 4 | 0.51 | 30 | 30 | 5 | 0.23 |
| | FW West | 0.19 | 8 | 8 | 1 | 0.2 | 30 | 30 | 6 | 0.61 |
The top capping strategy considered various criteria to determine the optimum values.
Based on the above criteria, it was determined that Au values should remain uncapped. Top and bottom capping for density values was however necessary.
| | 11.9.1 | Krige Neighborhood Analysis |
The aim of Krige Neighborhood Analysis is to determine the optimal theoretical search and estimation parameters during Kriging to achieve an acceptable Kriging Variance and Slope of Regression whilst ensuring that none or a minimal number of samples are assigned negative Kriging Weights.
The search parameters used are presented in Table 11‑5.
The method of estimations for Au was Ordinary Kriging while density was estimated using Inverse Power of Distance with a Power of 2. Estimations were undertaken using the Estimate process in Datamine. The boundaries between the waste / ore were treated as hard boundaries. Parental cell estimation was used.
Dynamic Anisotropy was used to search for samples during estimation to account for the change in dip of the mineralized zones.
Table 11‑5: Summary of Search Parameters
Project | Search Method | Search Distance Along Axis (M) | 3-1-3 Rotation Around Axis (°) | Search Volume Factor | Number of Samples |
| | | | | | | | | S vol 1 | S vol 2 | S vol 3 |
| | X (Strike) | Y
(Down-Dip) | Z (Across Strike) | Z (3) | X (1) | Z (3) | S
vol 2 | S
vol 3 | Min | Max | Min | Max | Min | Max |
ISBS | Dynamic Anisotropy (Rectangular) | 60 | 40 | 6 | 150 | 62 | 0 | 2 | 50 | 24 | 48 | 12 | 60 | 12 | 72 |
ISBN | Dynamic Anisotropy (Rectangular) | 70 | 50 | 20 | 140 | 80 | 0 | 1.5 | 5 | 24 | 54 | 20 | 60 | 2 | 72 |
Bubi | Dynamic Anisotropy (Rectangular) | 100 | 40 | 20 | 300 | 80 | 0 | 2 | 50 | 24 | 60 | 12 | 60 | 12 | 72 |
McCays | Dynamic Anisotropy (Rectangular) | 60 | 60 | 20 | 320 | 78 | 0 | 1.5 | 5 | 6 | 30 | 6 | 30 | 1 | 70 |
| | 11.9.3 | Block Model Parameters |
The block model parameters are presented in Table 11‑6. Sub-cell splitting was used to ensure that the volumes are adequately represented in the block model. Zonal control was applied during grade estimation to ensure that samples from one zone were not used to estimate in another zone.
Table 11‑6: Block Model Configuration
Field | Description | ISBS | ISBN | Bubi | McCays |
XMORIG | Block Model Origin X Coordinate | 661,200 | 662,100 | 684,150 | 665,100 |
YMORIG | Block Model Origin Y Coordinate | 7,845,850 | 7,847,600 | 7,863,300 | 7,849,200 |
ZMORIG | Block Model Origin Z Coordinate | 750 | 690 | 900 | 730 |
XINC | Parent Block Dimension in the X direction | 20 | 20 | 20 | 10 |
YINC | Parent Block Dimension in the Y direction | 10 | 10 | 10 | 10 |
ZINC | Parent Block Dimension in the Z direction | 5 | 5 | 5 | 5 |
NX | Number of Parent cells in the X direction | 115 | 92 | 98 | 220 |
NY | Number of Parent cells in the Y direction | 180 | 118 | 300 | 190 |
NZ | Number of Parent cells in the Z direction | 90 | 112 | 70 | 100 |
Model validation included the following:
| | ● | Visual comparisons of the estimated grades against the composite sample grades, |
| | ● | Statistical comparisons for the mean of estimated grades against the mean of the composited samples, |
| | ● | Trends (or swath analysis checking) to ensure that the regional grade trends from the drill holes were preserved in the model. The ordinary kriging algorithm calculates the best estimate by minimizing the estimation error (kriging variance). This results in smoothing of the block estimates, compared to the samples. The objective of this exercise was therefore to ensure that both regional and local trends were best preserved, |
| | ● | Filtering out the upper and lower deciles of the sample distribution and comparing that to the same for the estimated blocks. This was to assess whether there was over or under extrapolation. |
The means between sample and model estimates compared favourably.
Block on block analysis (Swath plots) compares local trends in the samples against model estimates. The approach was to divide the study areas into 50 m* 50 m* 20 m blocks in the X, Y and Z direction respectively, and to select samples within each block, and compare their mean against the mean of the model. Sample and model mean compared favourably.
Compared to the October 2021 MRE for the Measured and Indicated categories, which was prepared in accordance with CIM Standards, there is a 3.1 % decrease in tonnage and 0.8 % decrease in grade. Tonnage for the Inferred category has decreased by 2.8 %, and the grade has increased by 0.7%. Reasons for the change is due to in-fill grade control drilling as well as mining depletions.
11.12 | Resource Classification |
Mineral Resource classification used a “Checklist” approach, where various criteria were considered and rated. These included:
| | ● | Data quality and integrity, |
| | ● | Data spacing for confidence in geological interpretations and grade interpolation, |
| | ● | Confidence in the geological interpretation from a regional and local perspective, and how that interpretation influences the controls for Au mineralization, |
| | ● | Reliability of the estimate in the mined-out areas, |
| | ● | Geostatistical confidence in grade continuity, |
| | ● | Geostatistical parameters such as kriging variance, kriging efficiency and search distances, to measure the relative confidence in the block estimates. |
All the above criteria were linked to drill hole spacing as the minimal qualifier for consideration. Areas with drillholes spacing less than 25 m; blocks estimated with at least 6 drillholes and with a relative ordinate kriging variance of less than 0.20 were considered for classification of Measured Mineral Resources; areas with drillholes spacing less than 50 m: blocks estimated with less than 4 drillholes and with a relative ordinary variance of less than 0.3 were considered for classification of Indicated Mineral Resources. Areas with drill hole spacing less than 100 m was considered for Inferred Mineral Resources. The drill spacing distance buffer was created in Leapfrog Geo™. A checklist used for the assessment of the Mineral Resources during classification criteria is summarized in Table 11‑7.
To determine what qualifies as surface mineable resources, whittle shells provided by DRA using a gold price of US$2,400/oz were used. Details of the additional Whittle parameters are presented in Table 11‑7 Mineral Resources within these shells were considered to have the potential for eventual economic extraction by open cast mining methods.
Table 11‑7: Checklist Criteria for Resource Classification
Items | Discussion | Confidence |
Drilling Techniques | Diamond drill holes | High |
| | Reverse Circulation drilling | Medium |
| | Percussion drilling (predominantly in the oxidized zone) | Low |
Logging | All drill holes were logged by qualified geologists using standardized codes. Completed logs are checked and signed off by the senior geologist prior to capture into the database. The logging was of an appropriate standard for mineral resource estimation. | High |
Drill Sample Recovery | Recoveries recorded for every core run. | High |
Sampling Methods | Half core sampled at 1 m intervals for diamond drilling. Sampling occurs wherever there is evidence of alternation. | High |
| | Portion of the rock chips collected at 1 m intervals sampled for RC drilling and Percussion drilling. | Medium |
Quality of Assay Data and Laboratory Tests | An external independent commercial laboratory has been used for all analytical test work for diamond and RC drilling. Appropriate sample preparations and assaying procedures have been used. Duplicate samples and industry CRMs were inserted within the sampling stream. The data has been declared fit for the purposes of geological and mineral resource modelling. | High |
| | Percussion drilling used Bottle-Roll Analysis that was performed in-house. Analytical results are considered of low reliability because the method can only measure acid soluble gold. | Low |
Verification of Sampling and Assaying | Data integrity checks performed by DRA and Bilboes have confirmed data reliability. | High |
Location of Data Points | Drill hole collar location and orientation were surveyed by a qualified surveyor. | High |
Tonnage Factors (Density) | The Archimedes method of density determination was used in-house. Verification analysis was performed at the University of Zimbabwe and. The comparison of the in-house density determination and the check analysis compare favorably. | High |
Data Density and Distribution | Diamond and RC drilling was done at 25 m X 25 m on well informed areas, 50 m X 50 m on moderately informed areas, and 100 m X 100 m on less informed areas. The level of data density is sufficient to place Mineral Resources into the Measured, Indicated, and Inferred categories, respectively. | High |
Database Integrity | Data is stored in Datamine™ Fusion Database. | High |
Geological Controls on Mineralization | Geological setting and mineralization are very well understood. Mineralization is constrained to shear zones within a broad hydrothermal alteration halo. | High |
Statistics and Variography | Anisotropic spherical variograms were used to model the spatial continuity for the main mineralization domains. | Medium |
Top or Bottom Cuts | No cutting was applied to the Au estimation. Top and bottom cuts were applied to the density during estimation. | High |
| Items | Discussion | Confidence |
Data Clustering | Drill holes were drilled on an approximately regular grid, with decreasing regularization at depths. | Medium |
Block Size | Determined by QKNA. 20 mE x 10 mN x 20 mRL 3D block model constructed for ISBS, ISBN, and Bubi. For McCays the blocks were 10 mE x 10 mN x 5 mRL. | High |
Search Distance | Determined with the aid of QKNA as well as drilling spacing. | High |
Grade Estimation | Au estimated using Ordinary Kriging. Density estimated using Inverse Distance to the power if two. | High |
Resource Classification | Reported on a checklist bases with the drilling space. | High |
Metallurgical Factors | Metallurgical parameters were considered during the whittle optimization process, based on comprehensive test work and pilot plant. | High |
Block Cut-offs | 0.9 g/t Au is used for block cut-offs. Other sensitivities at 0.0 g/t, 0.5 g/t and 1.5 g/t Au cut-off have also been presented. | High |
This MRE was constrained to a Lerchs-Grossmann pit shell using 0.9 g/t Au as the cut-off grade (Table 11‑8). A gold price of US$2,400/oz scenario assessment was also completed to determine surface infrastructure boundaries to ensure that no potential future resource is sterilized through siting of future infrastructure.
Table 11‑8: Summary of Optimization Parameters used for the Lerchs-Grossmann Shells
Parameter | Description | Unit | Bubi | Isabella | McCays |
Optimization Parameters | Oxide Slope Angle - Weathered | Degrees | 30 | 30 | 30 |
| | Trans Slope Angle | Degrees | 48 | 48 | 48 |
| | Fresh Slope Angle | Degrees | 51/55 | 51/55 | 48/51/55 |
| | Production Rate | Ktpm | 180 | 240 | 240 |
| | Gold Price | US$/Oz | 2,400 | 2,400 | 2,400 |
| | Discount Rate | % | 10.0% | 10.0% | 10.0% |
Mining Costs | Ore Cost | US$/t Mined | 3.30 | 3.20 | 3.20 |
| | Waste Cost | US$/t Mined | 2.30 | 2.30 | 2.30 |
| | Fixed Cost and Other | US$/t Ore | 10.25 | 4.05 | 3.09 |
Processing Costs | Processing Cost (Sulfide) | US$/t Treated | 32.81 | 19.02 | 19.02 |
| | Recovery - Sulfides | % | 88.90% | 83.60% | 83.60% |
Financial Parameters | Royalties | % | 5.00% | 5.00% | 5.00% |
| | Taxes | % | 25.00% | 25.00% | 25.00% |
The Mineral Resource Estimate is summarized in the following table using a cut-off grade of 0.9 g/t Au and constrained inside a Lerchs-Grossman (LG) optimized pit shell using US$ 2,400 per ounce gold price (Table 11‑9). Mineral Resources exclude Mineral Reserves.
Table 11‑9: Mineral Resource based on a 0.9g/t Au Cut-Off Grade
Mineral Ressources (0.9 g/t Au) Reference Point: In Situ |
Property | Classification | Tonnes (Mt) | Au (g/t) | Metal (kg) | Ounces (koz) |
Isabella South (ISBS) | Measured | 0.034 | 1.80 | 61.66 | 1.98 |
| | Indicated | 1.043 | 2.07 | 2,154.20 | 69.26 |
| | Total Measured and Indicated | 1.077 | 2.06 | 2,215.85 | 71.24 |
| | Inferred | 1.335 | 1.80 | 2,403.91 | 77.29 |
Isabella North (ISBN) | Measured | 0.082 | 2.40 | 196.56 | 6.32 |
| | Indicated | 1.734 | 2.29 | 3,971.85 | 127.70 |
| | Total Measured and Indicated | 1.816 | 2.29 | 4,168.41 | 134.02 |
| | Inferred | 1.613 | 2.18 | 3,519.53 | 113.16 |
Bubi | Measured | 0.059 | 1.22 | 72.17 | 2.32 |
| | Indicated | 4.437 | 1.51 | 6,702.28 | 215.49 |
| | Total Measured and Indicated | 4.496 | 1.51 | 6,774.44 | 217.81 |
| | Inferred | 5.116 | 1.80 | 9,208.47 | 296.06 |
McCays | Measured | 0.066 | 1.77 | 117.27 | 3.77 |
| | Indicated | 1.261 | 1.85 | 2,338.52 | 75.19 |
| | Total Measured and Indicated | 1.327 | 1.85 | 2,455.79 | 78.96 |
| | Inferred | 1.054 | 2.16 | 2,273.84 | 73.11 |
Totals (ISBS +ISBN+ Bubi + McCays) | Total Measured | 0.241 | 1.85 | 447.66 | 14.39 |
| | Total Indicated | 8.475 | 1.79 | 15,166.84 | 487.63 |
| | Total Measured and Indicated | 8.716 | 1.79 | 15,614.50 | 502.03 |
| | Total Inferred | 9.118 | 1.91 | 17,405.76 | 559.62 |
| | ● | S-K 1300 definitions observed for classification of Mineral Resources. |
| | ● | Mineral Resources are reported exclusive of Mineral Reserves |
| | ● | Block bulk density interpolated from specific gravity measurements taken from core samples. |
| | ● | Resources are constrained by a Lerchs-Grossman (LG) optimized pit shell using Whittle software. |
| | ● | Mineral Resources are not Mineral Reserves and have no demonstrated economic viability. The estimate of Mineral Resources may be materially affected by mining, processing, metallurgical, infrastructure, economic, marketing, legal, environmental, social, and governmental factors (Modifying Factors). |
| | ● | Numbers may not add due to rounding. |
| | ● | The Mineral Resource Estimate has been depleted to reflect mining up to 31 December 2023 |
| | ● | Effective Date of Mineral Resource Estimate is 31 December 2023. |
The QP is of the opinion that all issues relating to all relevant technical and economic factors likely to influence the prospect of economic extraction can be resolved with further work.
12 | MINERAL RESERVE ESTIMATES |
12.1 | Basis of Mineral Reserve Estimate |
The process to develop the Mineral Reserve estimate in accordance with S-K 1300 was as follows:
| | ● | Ore recovery of 95% and fixed dilution parameters of 20 cm of hanging wall and 20 cm of footwall (4% in Whittle) were applied in the optimizations, |
| | ● | A Whittle Pit optimization was performed, |
| | ● | A base gold price of US$ 1,800/oz. A government royalty of 5.0% of revenue and a Refining/Selling Cost of 1.0% of revenue was then applied. This resulted in a Net Gold Price of ~US$ 1,692/oz, |
| | ● | Pit slopes inter-ramp angles ranging from 30° to 55°. Resulting overall pit slopes account for access ramps where applicable, |
| | ● | Gold recovery ranging from 83.62% to 88.88% dependent on mining area and ore type being processed, |
| | ● | Processing throughput of 2.88 Mtpa for Phase 1 and 2.16 Mtpa for Phase 2, |
| | ● | Mining contractor costs based on budget submissions from Southern African based mining contractors, |
| | ● | Average annual processing cost per tonne of ore, inclusive of general / administration costs range from US$ 21.56/t to US$ 44.24/t for all transitional and fresh ores depending on processing parameters, |
| | ● | The reference point for all grade and plant feed ore is the RoM plant feed tip and the plant feed stockpiles. |
A sensitivity assessment was done on gold prices of US$ 1,650/oz and US$ 1,950/oz. A gold price of US$2,400/oz scenario assessment was also completed to determine surface infrastructure boundaries only to ensure that no potential future resource is sterilized. This indicated that the optimal shell inventory (i.e., the size and shape of the optimal shell and therefore the ore and waste generated) was relatively robust for all mining areas.
Optimal shells (maximum profit) were selected for each deposit area based on a US$ 1,800/oz gold price that were then used as the basis for pit designs.
These shell selection criteria are relatively conservative, based on a 24-month (2022-2023 S&P Global) trailing average gold price of US$ 1,875/oz.
A conservative cut-off grade of 0.9 g/t based on project specific projected revenue and cost was applied to all Project resources to ensure tonnes milled generate enough revenue to cover processing costs as shown in Table 12‑1.
12.2 | Mineral Reserve Declaration |
Table 12‑1 summarizes the Mineral Reserve Statement based on the work detailed above, undertaken as part of the Bilboes Gold Mine Project. The measured resources were converted to proven reserves and the indicated resources were converted to probable reserves. indicated and unclassified ore was considered and waste with any ores below the 0.9g/t cutoff grade. This indicated and unclassified ore would be drilled and upgrade to probable or proven reserve during the project life. The low grade would be stockpiled for consideration as potential plant feed at the end of the LOM depending on project economics at that time.
Table 12‑1: Bilboes Gold Project Mineral Reserve Statement (31 December 2023)
Deposit | Classification | Tonnage (Mt) | Au Head Grade (g/t) | Cut-of grade (g/t) | Content (koz) |
McCays | Proven | 0.8 | 2.99 | 0.9 | 80 |
| | Probable | 2.7 | 2.47 | 0.9 | 212 |
Isabella South | Proven | 1.3 | 2.24 | 0.9 | 93 |
| | Probable | 4.1 | 2.08 | 0.9 | 272 |
Isabella North | Proven | 2.5 | 2.57 | 0.9 | 207 |
| | Probable | 2.7 | 2.23 | 0.9 | 192 |
Bubi | Proven | 1.2 | 1.90 | 0.9 | 75 |
| | Probable | 9.7 | 2.39 | 0.9 | 743 |
Total | Proven | 5.9 | 2.42 | 0.9 | 455 |
| | Probable | 19.1 | 2.31 | 0.9 | 1,418 |
Grand Total | Probable + Proven | 24.9 | 2.34 | 0.9 | 1,873 |
| | ● | Point of Reference: Plant Feed |
| | ● | S-K 1300 definitions observed for classification of Mineral Reserves. |
| | ● | Mineral reserves are quoted as head grade or as plant feed. |
| | ● | All tonnes quoted are dry tonnes. |
| | ● | Numbers may not add due to rounding. |
| | ● | No metal equivalents are reported. |
| | ● | Effective Date of Mineral Reserve Estimate is 31 December 2023. |
The estimate of Mineral Reserves of the Bilboes Gold Mine could be affected by any known environmental, permitting, legal, title, taxation, socioeconomic, marketing, political, or other relevant issue. Furthermore, the estimate of Mineral Reserves could be affected by any known mining, metallurgical, infrastructure, or other relevant factor.
Various risks have been identified with consideration of the appropriate mitigating factors. These are presented in Table 12‑2.
Table 12‑2: Risks associated with the Declaration of the Mineral Reserve
Risk Category | Risk | Description / Cause | Mitigation / Control |
Mining | Poor run of mine ore grade | Poor grade control of the ore zones could result in excessive dilution and/or ore losses in the run of mine ore grades. | 1. Grade control drilling will be conducted pre-mining and the cost for this has been allowed for in the PFS. 2. Grade controllers will be employed to monitor the mining team during operations. |
Mining | Thin waste parting between ore zones | Thin waste parting of less than 2 meters could be difficult to mine selectively and bulk mining may be preferred resulting in lower feed grades to plant. | These areas have been modelled and allowed for in the mining blocks and provided there in strict monitoring the resultant grades will not vary significantly from planned grades. |
Mining | Reduction in ore produced | Poor drilling and blasting controls could cause overbreak on waste blocks that could accidently break good quality ore and mix it with waste. | 1. Due to on-going advance grade control and blast hole grade control geologists can accurately monitor the ore zones and grades. 2. Ore is visually different from waste to mapping and monitoring of broken waste and ore will show where controls have not been effective. |
13.1 | Hydrological and Geotechnical Investigation |
Little was known of the hydrogeology for either the Isabella-McCays or Bubi Mines. There are some hydrogeological boreholes drilled around the Isabella-McCays pits, however there are no existing records for these boreholes, therefore no historical water levels or groundwater quality baseline could be determined.
The only levels measured and recorded are related to the geotechnical boreholes drilled around the Isabella-McCays and the Bubi open pits, where packer-testing was performed.
The estimation of an initial general hydraulic head over the entire area was done using the correlation between the elevation and hydraulic head values measured in each of the geotechnical boreholes.
Nine geotechnical boreholes were selected for packer testing. The interval selection was based on the presence of discontinuities determined on the televiewer log along the borehole interval.
The results of the packer testing have been incorporated in the numerical model.
| | 13.1.2 | Conclusion and Recommendations |
The numerical simulation for Isabella – McCays Mines and Bubi Mine lead to the following conclusions:
Each model indicates that a cone of drawdown will develop as a result of the mining activities. The open pits simulated act as hydrogeological sinks and groundwater inflows into the open pits will need to be pumped out for the duration of mining. After mining activities stop, the groundwater levels start to recover due to the formation of the pit lakes and the decrease of the hydraulic gradients towards the open pits.
The following shows the maximum drawdown at the end of mining and the recovery of the groundwater levels vs. time.
Table 13‑1: Isabella – McCays – Bubi – Predicted drawdown vs. time
Isabella - McCays drawdown vs. time | Bubi drawdown vs. time |
Year | Max. Drawdown (m) | Year | Max. Drawdown (m) |
7 | 112 | 6 | 85 |
25 | 43 | 25 | 77 |
50 | 33 | 50 | 45 |
75 | 21 | 75 | 10 |
100 | 13 | 100 | 9 |
Following the geotechnical logging of the drill holes, the following major rock domains were encountered (Table 13‑2).
Table 13‑2: Percentage Rock Types at Different Mining Pits
Rock Type | Percentage Rock (%) |
| Isabella South | Isabella North | McCays | Bubi |
Arkose | 26 | 14 | - | - |
Chlorite Schist | 23 | - | - | - |
Schist | 16 | - | - | - |
Felsic Schist | 35 | 83 | - | - |
Mafic Schist | - | 2 | 21 | 13 |
Meta-Basalt | - | 1 | 65 | 28 |
Banded-Iron Formation (BIF) / Chert | - | - | 4 | - |
Meta-Andesite | - | - | 10 | 55 |
Saprock | - | - | - | 4 |
13.2 | Rock Mass Classification |
The rock mass quality for the different Bilboes pits (Isabella South, Isabella North, McCays and Bubi) was assessed using the Rock Mass Rating (RMR) RMR89 classification system developed by Bieniawski (1976, 1989). The results of the rock assessments show that the rock mass for all the four mining pits is considered to be fair to good.
13.3 | Geotechnical Conclusions and Recommendations |
Based on the analysis of the engineering geological aspects of the investigated deposits which included rock mass characterization, hydrogeology, intact rock properties and structural geology, a geotechnical model comprising design parameters was developed. Using these design parameters; kinematic, empirical and limit equilibrium analysis was conducted to determine the optimal slope configuration for the various deposits.
Based on the analysis conducted, it is understood that the capacity of the slopes should be affected by the following:
| | ● | Completely weathered slopes should be a maximum of 3 m in height, and it is recommended that the material is pushed back from the crest, |
| | ● | For the transitional rock (highly to moderately weathered), by a combination of rock mass strength and adverse structural orientation. Inter-ramp heights of 60 m are achievable with inter-ramp angles between 45 degrees and 50°, |
| | ● | For the unweather rock slopes adverse structural orientation should determine the slope angle which is achievable. Inter-ramp heights of 90 m are achievable with inter-ramp angles of between 50 degrees and 55 degrees, depending on the wall direction. |
The controls on slope design are listed for the Bilboes pits with comments on the reliability of the data and descriptions of how the design issues were addressed for the purposes of the slope design (Table 13‑3).
Table 13‑3: Slope Design
Slope Design Issue | Confidence | Mitigation |
Faulting Faults were inferred to be sub-vertical; however, the width of fractured / disturbed ground either side of the faults is not understood. | Moderate | Kinematics was used to assess the stability of inter-ramp and overall slope. Inter-ramp and slope angles are restricted to between 50 and 55 degrees and 45 to 50 degrees respectively to ensure sub-vertical faults do not daylight |
Rock Fabric Large amounts of structural data were collected, defining the local occurrence, intensity, and orientation (dip and dip direction) of the structures | High | Good practice to collect and expand on the structural data collected to ensure that unknown structures are defined |
Soil and Intact Rock Properties Intact samples of rocks were collected and tested. | Moderate | Good practice to have an ongoing soil and rock testing program to build on the database |
Rock Mass Characterization Rock mass characterization was conducted and generally is representative of rock mass conditions. | High | Rock mass characterization should be ongoing to expand on the rock mass database. |
Groundwater The groundwater studies were conducted by SLR and included in the limit equilibrium analysis | High | All excess water inflows can be sent to local PCDs and then used as process water make up. |
The detailed pit slope design should require the following phasing once a final pit shell and pit stages are defined and inter-related.
| | ● | Additional intact strength testing is required for the rock and soil formations, |
| | ● | Additional structural data needs to be collected from the pits using a televiewer, |
| | ● | Continual collection of rock mass data from drilled core, |
| | ● | Conducting of additional stability analysis using the new pit shells, generated from with recommended slope angles recommendations presented on this document, and the revised geological and geotechnical models, |
| | ● | Developing the Ground Control Management Plan, |
| | ● | Projecting major structures onto the pit phases and final pit for geotechnical review and development of remedial measures and the timing of their implementation as required, |
| | ● | Defining the locations of the initial vibrating wire piezometers, the initial prisms, survey stations and trial horizontal drains and their specifications and the target dates for their installations. |
The Bilboes Gold Mine consists of four mining areas containing between one to three pits each. These areas are McCays, Isabella South, Isabella North and Bubi as shown in Figure 13‑1, Figure 13‑2 and Figure 13‑3.
Figure 13‑1: Block Plan Showing Bilboes Pits and Process Plant Location
Figure 13‑2: Block Plan Showing Bilboes Pits Location
A LoM schedule has been developed to supply two processing phases. These consist of Phase 1 at a processing capacity of 2.88 Mtpa (Isabellas and McCays) and Phase 2 at a processing capacity of 2.16 Mtpa (Bubi). The LoM schedule considers the blending requirement that a maximum of 50% of feed to plant be sourced from Isabella North and the remainder from Isabella South (preferred blend) or McCays for Phase 1.
A mining contractor will be used for all open pit mining related earthmoving activities.
All deposits will be mined utilizing conventional truck and shovel method.
Transitional and fresh ore and waste will be drilled and blasted.
Free dig and blasted waste will be loaded, hauled with 60 t haul trucks, and dumped to designated waste dump locations which will be systematically dozed and levelled to allow dump to be raised to design heights.
Free dig and blasted ore will be loaded and hauled with 40 or 60 t haul trucks and will either be directly tipped into the crushing facility, heap leach pads or placed on the Run of Mine (RoM) pad stockpile areas.
The Bubi ore will be dumped on the pit rim stockpiles before being loaded and hauled with a fleet of road trucks to the central processing facility at Isabella. There it will either be directly tipped into the crushing facility or placed on the RoM pad stockpile areas.
McCays will commence production first. This will assist in delivering higher mill feed grades early in the project life.
Nine months of pre-development waste stripping will be required to expose sufficient ore to maintain a constant ore feed rate during Phase 1 prior to the commissioning of the processing plant.
The mining of all four deposits will run for a period of approximately 10.8 years based on the current production schedule. The peak production requirements are 32.3 Mtpa (total material movement).
Mining costs are based on December 2023 contractor mining budget cost estimates.
| | 13.5.2 | Processing Recoveries and Costs |
Processing costs and recoveries for each metallurgical domain were received from DRA and modelled in 3D for each of the deposits.
| | 13.5.3 | Whittle Pit Optimization |
The gold prices and discount rate used in the optimizations are summarized in Table 13‑4.
Table 13‑4: Optimization Financial Parameters
Financial Parameters for Net Commodity Price | Unit | US$2,400 | US$1,950 | US$1,650 | US$1,800 |
Date of Information: | Oct 2023 | Resource | High | Middle | Base Case |
Base Currency | US$ | 0 | 0 | 0 | 0 |
Annual Discount Rate (%) | (%) | 10.0% | 10.0% | 10.0% | 10.0% |
Gold Price | US$/Oz | 2,400 | 1,950 | 1,650 | 1,800 |
Royalties | (%) | 5% | 5% | 5% | 5% |
Refining Cost | US$/Oz | 1.0% | 1.0% | 1.0% | 1.0% |
Total Selling Cost | US$/Oz | 144.00 | 117.00 | 99.00 | 108.00 |
Net Gold Price | US$/g | 72.53 | 58.93 | 49.87 | 54.40 |
The geotechnical and waste parameters are presented in Table 13‑5.
Table 13‑5: Geotechnical - Mining
Geotechnical Parameters | Unit | Value | Value | Value | Value |
Inter-Ramp Slope Angle | | ISBN | ISBS | McCays | Bubi |
Oxide | degrees | 30 | 30 | 30 | 30 |
Trans | degrees | 48 | 48 | 48 | 48 |
Fresh | degrees | 51/55 | 51/55 | 48/51/55 | 51/55 |
Bench Face Slope Angle | | | | | |
Oxide | degrees | 55 | 55 | 55 | 55 |
Trans | degrees | 90 | 90 | 90 | 90 |
Fresh | degrees | 90 | 90 | 90 | 90 |
Ramp Specifications – 70t truck | | | | | |
Single Lane Width | m | 12.5 | 12.5 | 12.5 | 12.5 |
Dual Lane Width | m | 18.6 | 18.6 | 18.6 | 18.6 |
Design gradient (%) | (%) | 10% | 10% | 10% | 10% |
Dilution and Mining Recovery | Unit | Value | Value | Value | Value |
Mining Dilution | (%) | 4% | 4% | 4% | 4% |
Mining Recovery | (%) | 95% | 95% | 95% | 95% |
Distance ex-pit to Plant | km | 2.5 | 3.5 | 2.6 | 28 |
Mining Cost Parameters | Unit | Value | Value | Value | Value |
Reference Level Elevation | RL | 1,151 | 1,135 | 1,163 | 1,195 |
Mining Cost Adjustment Factor (MCAF) | US$/vert. meter | 0.006 | 0.006 | 0.006 | 0.006 |
Waste Mining Cost | | | | | |
Oxide free dig | US$/tonne | 1.49 | 1.49 | 1.49 | 1.59 |
Transitional and Fresh - including drill and blast | US$/tonne | 1.99 | 1.99 | 1.99 | 2.03 |
The Whittle mining parameters are presented in Table 13‑6.
Table 13‑6: Mining Continued – Throughput - Process
Mining Cost Parameters | Unit | ISBN | ISBS | McCays | Bubi |
Total Ore Mining Cost | US$/tonne ore | | | | |
Trans & Fresh – incl. drill and blast | US$/tonne | 2.70 | 2.99 | 2.71 | 2.20 |
Extra Ore Cost (haul cost to plant) | US$/tonne ore | | | | |
Trans + Fresh | US$/tonne | 1.52 | 1.81 | 1.53 | 9.01 |
Mill throughput Requirement | | | | | |
LOM throughput Requirement | Mtpa | 2.88 | 2.88 | 2.88 | 2.16 |
Additional Ore Mining Cost | US$/tonne ore | 0.81 | 0.81 | 0.81 | 0.91 |
Processing Cost Parameters | Unit | Value | Value | Value | Value |
Processing Cost Base | | | | | |
Fresh - CIL 240(180) ktpm | US$/tonne ore | 17.44 | 17.44 | 17.44 | 32.64 |
GA's | US$/tonne ore | 2.59 | 2.59 | 2.59 | 2.59 |
Total Processing Cost | | | | | |
Fresh - CIL 240(180) ktpm | US$/tonne ore | 20.04 | 20.04 | 20.04 | 35.23 |
WHITTLE PROCESSING COST | | | | | |
Fresh - CIL 240(180) ktpm | US$/tonne ore | 21.56 | 21.85 | 21.57 | 44.24 |
Process Recovery | | | | | |
Trans & Fresh - Biox & CIL Mean Recovery | (%) | 83.6 | 83.6 | 83.6 | 88.9 |
To achieve mining selectivity and dilution reduction the decision was made to select mining equipment to mine the ore zone in 5 m flitches, the waste zones are to be mined in 10 m height.
The assumed dilution of 4% with a 5% mining loss was applied because the ore domains are continuous and will be clearly delineated and marked. Sampling of blast holes would be the basis for grade control in this analysis. The accuracy of the resulting ore/waste boundary is limited by the grade control resolution, a function of the drilling pattern's density.
| | 13.5.4 | Whittle Optimization Results |
The Whittle Optimization results of the median process recovery case are shown in Table 13‑7. To gauge the project sensitivity to the gold price fluctuations, three scenarios were run at US$1,650, US$1,800, and US$1,950.
Based on the Whittle shells selected there is a potential of 1,849 gold kilo-ounces available for processing and gold recovery after mining depending on the final pit wall and ramps design losses.
Predictably, the project value indicates linear sensitivity behavior as result of gold price variation. The Metal Mined, Mine Life and Ore Tonnes Mined sensitivities indicate that the Mineral Resource is relatively robust and insensitive to commodity prices. This analysis confirms the robustness of the optimal shells. Predictably, all DCF sensitivities to gold price fluctuations exhibit similar linear behavior.
The inventories of the selected shells are summarized in Table 13‑7.
Table 13‑7: Summary of Selected Shells at US$1,800/oz
All Run Results Max Profit | Abb | Units / Gold Price | US$1,800 | US$1,950 | US$1,650 |
Parameter | | | 5% loss & 4% dilution |
O-P Discounted Cashflow | | US$ m | 911.29 | 1,079.64 | 741.44 |
Mine Life Mine | LOM | Year | 10 | 10.80 | 9.40 |
Mineable Inventory | Ore | Mt | 24.95 | 27.74 | 23.50 |
Measured and Indicated | Ore | Mt | 24.95 | 27.74 | 23.50 |
Mineable Inventory | Waste | Mt | 198.10 | 222.50 | 189.80 |
Strip Ratio | SR | t:t | 7.94 | 8.02 | 8.08 |
Head grade | Au | g/t | 2.34 | 2.32 | 2.43 |
Au Metal In-situ | Au | koz | 1,874.43 | 2,069.33 | 1,835.97 |
Au Recovery | Au | % | 85.87% | 85.93% | 85.84% |
Au Metal Recovered | Au | koz | 1,610 | 1,778 | 1,576 |
Measured and Indicated | Au | koz | 1,610 | 1,778 | 1,576 |
EBIT before CAPEX | | US$ m | 1,116 | 1,346 | 898 |
All the pit designs were developed using the DeswikCAD software package based on the selected optimal shells and utilizing the latest geological block models for each planned mining area.
The criteria for pit and waste dump ramp designs were based on the width and turning circle of a Caterpillar 773, as this size truck is likely to be used by mining contractors. Ramp gradients are 10%. Wherever possible, the ramp exits were located at the closest possible distance to the waste dumps to minimize ex-pit haulage.
The pit and waste dump design outlines recognized lease boundaries, neighboring villages, and the local road infrastructure. An additional requirement to siting the dump locations was to avoid all identified future exploration zones so as not to sterilize these areas. This had a slightly negative impact of increasing the ex-pit hauling distances in some cases.
Within the pit designs, a minimum distance of 50 m is required between the pit edge and final dump toe, which is considered acceptable. However, this is only a minimum separation distance, based on the Pit Shell from the US$2,400/oz gold pricing scenario was used to demarcate surface area to be left free of infrastructure that might sterilize remaining open pit/underground resource. Hence, pit rim to waste rock dump toe distances will exceed the minimum of 50 m in most cases.
Where possible existing haul roads will be re-used, but where none exist several new haul roads will be required.
The scheduling undertaken for the Study is based on the ore and waste inventories for each of the pit designs. The aim of the scheduling component was to ensure that the mining process allowed for:
| | ● | Pre-stripping and stockpiling of sufficient ore in time for commissioning of the processing plant and then reaching the annual processing plant feed rate, |
| | ● | A practical and realistically achievable schedule in terms of fleet deployment, equipment productivities and bench turnover rates. |
The mining schedule aims to maximize value by:
| | ● | Reducing waste mining during the early years as much as possible, |
| | ● | Mining high grade materials during early years of LoM, |
| | ● | Delaying mining of deposits with higher ore mining cost, |
| | ● | Limit the waste excavator fleet to four excavators. |
Further requirements for the mining schedule were:
| | ● | McCays to be mined first due to highest average grade, |
| | ● | Isabella North ore must be blended with that of Isabella South (or McCays) with maximum of 50% of the feed to plant coming from Isabella North, |
| | ● | Bubi mined last due to long transport distance to plant. |
The mining schedule aims to meet the following processing plant feed criteria, during each scheduling period:
| | ● | Phase 1 production ramp up to 2.88 Mtpa of ore from McCays, Isabella South and North combined, |
| | ● | Phase 2 feed to plant rate of 2.16 Mtpa of ore from Bubi. |
Due to the relatively short life of each mining area, the production schedule was done in months. For reporting purposes, the monthly production schedule was also aggregated into calendar years.
All mining schedules were generated in XPAC, RPM’s propriety scheduling software.
13.8 | Operating Assumptions |
The schedule is a practical solution that targets value and meets all mining and processing goals annually (Figure 13‑4). The key features of the schedule include:
| | ● | The operation is planned to utilize three crews on a two 10-hour shift roster for 353 days (365 / year less 12 public holidays) of the year based on mining being conducted by a mining contractor, |
| | ● | The need for 17.1 Mt of pre-strip material movement over nine months of pre stripping in the McCays and Isabella mining area will allow the process plant to commence its throughput ramp up, |
| | ● | Both Isabella South and North need to be pre-stripped while producing ore from McCays. The pre-strip requirements for these areas are 15.7 Mt and 1.4 Mt for Isabella North, respectively, |
| | ● | A maximum annual materials movement of 32.3 Mtpa in 2029, |
| | ● | The initial production ramp up needs four waste excavators and two ore excavators during the production ramp up for McCays, Isabella South and North. This remains constant during the LoM at Bubi except at stages where all the excavators are not fully utilized. |
| | ● | The ore excavators are never fully utilized for mining ore only and are used to mine the waste partings between the various reefs. |
Figure 13‑3: Production Schedules per Area
The scheduling in XPAC is driven by the excavating capability during each period (i.e., the product of the number of excavators and their productivity).
For scheduling purposes, it was assumed that 100 t excavators with 6m3 bucket will be deployed on waste and 75 t excavators (4 m3 bucket) on ore. These excavators will be loading trucks with a payload capacity of 60 t and 40 t, respectively.
This selection was based on the likely equipment size that will be used by the mining contractors.
The waste dumps were staged appropriately to minimize haul distances throughout the LoM.
The waste dump construction and final landform are based on the following criteria:
| | ● | The maximum height of waste dumps is currently set at 40 m above ground level, |
| | ● | A swell and re-compaction factor of 30% was utilized to calculate a material placement density of waste on the waste dumps, |
| | ● | Dump bench face angle is designed at 30° during construction, with 10 m berms separating benches. During the rehabilitation phase, the WRD side slopes will be progressively dozed down into continuous slopes without benches, as required for agricultural use. After rehabilitation, the final landform slope will not exceed 19° overall slope angle, |
| | ● | The waste dumps will be built with a minimum 1:100 gradient on the top surface to ensure effective water shedding, |
| | ● | All dump locations were selected outside the boundaries as indicated by the Whittle gold price scenario of US$2,400/oz. Future prospecting zones were also considered so as not to sterilize any potential mineral resource, |
| | ● | The minimum operating width on the waste dump is 40 m, |
| | ● | All the waste dumps were designed with ramps of 10% gradient, |
| | ● | It has been assumed that all waste is benign and does not require any neutralizing treatment, or containment. |
The placement of the waste rock dumps was used to determine the expected hauling distances over LoM. The haul distances for ore for McCays, Isabella South and Isabella North is the direct haul to the processing plant. The Ore haul distances for Bubi only reflect the distance to the Bubi RoM pad where the ore will be re-handled onto on-road trucks for transport to the processing plant.
The operation is planned to utilize three crews on a two 10-hour shift roster for 353 days (365 / year less 12 public holidays) of the year based on mining being conducted by a mining contractor.
The Bilboes Sulphides Project will have a management and technical services departments that are responsible for the overall operations and who’s costs are included in the owners general and administrative costs. (See table Table 13‑8)
The balance of the work force will be provided by the mining contractor and the costs are included in the contractor general and administrative costs or operators’ costs are included in the rates for specific operations.
Table 13‑8: Bilboes Labor Compliments and Job Grades
Personnel Complement Breakdown | Job Grade | Number |
General Manager | D4 | 1 |
Mine Manager | D3 | 1 |
Safety Manager | D2 | 1 |
Environmental Manager | D2 | 1 |
Security Manager | D2 | 1 |
Administrator | C4 | 1 |
Bilboes Management | | 6 |
Tech Manager | D3 | 1 |
Geologist | D3 | 2 |
Surveyor | C4 | 1 |
Grade Controller | C4 | 8 |
Mine Planner | D2 | 2 |
Accountant - DS | D2 | 2 |
Assistant: Stores & Warehouse | C4 | 6 |
Safety Officer | C4 | 6 |
Security | B3 | 24 |
Surface & Infrastructure Cook | B3 | 6 |
Surface & Infrastructure Staff | A1 | 20 |
Bilboes Technical Services | | 78 |
Contracts Manager | D5 | 1 |
Pit Manager | D3 | 1 |
Pit Superintendents - DS | D2 | 1 |
Pit Supervisor | C4 | 4 |
Safety / Training Manager | D3 | 1 |
Safety Officer | C4 | 1 |
Training Officer | C4 | 4 |
Miner Blaster | A2 | 2 |
Production Foreman | C4 | 8 |
Blasting / Grade Assistants | A2 | 4 |
| Personnel Complement Breakdown | Job Grade | Number |
Surveyor Assistants | B3 | 4 |
Pumping / Cleaning | A2 | 3 |
Excavator Operator | B4 | 24 |
FEL Operator | B4 | 8 |
Truck Operators | B4 | 96 |
Drill Operator | B4 | 12 |
Dozer Operator | B4 | 16 |
Dozer Operator | B4 | 3 |
Truck W/E Operator | B4 | 6 |
Comp / Grader Operator | B4 | 6 |
Relief Operator | B4 | 21 |
Mining Contractor | | 226 |
Engineering Planner | D1 | 1 |
Engineering GES | D1 | 1 |
Diesel Mechanic | C2 | 8 |
Electrician | C2 | 2 |
Auto Electrician | C2 | 2 |
Boilermaker | C2 | 4 |
Artisan Assistant | A3 | 16 |
Mining Contractor Engineering | | 34 |
TOTAL MINING STAFF | | 344 |
14 | PROCESSING AND RECOVERY METHODS |
14.1 | Process Test work Results |
Extensive test work (Section 10) has been undertaken. The ore (fresh sulfide) is refractory to normal free milling processing due to the ultrafine gold particles being largely encapsulated (and generally appearing in solid solution) within the sulfide minerals. As a result, the selected process encompasses a biological sulfide destruction step (Outotec proprietary BIOX® process) to liberate the gold particles and allow dissolution by a cyanide solution in the CIL circuit. The test work results were used to derive the PDC for the processing plant as depicted in Table 14‑1.
Table 14‑1: Process Plant Design Criteria
Description | Unit | Design | Remarks |
Plant Annual RoM Throughput | | | |
Phase 1 Isabella McCays | tpa | 2,880,000 | Years approx. 1-6 |
Phase 2 Bubi | tpa | 2,160,000 | Years approx. 6-11 |
Plant Monthly RoM Throughput | | | |
Phase 1 Isabella McCays | tpm | 240,000 | |
Phase 2 Bubi | tpm | 180,000 | |
Head Grade Analysis | | | |
Transitional Ore Gold | | | |
Isabella Mc Cays | g/t | 1.94 | Average |
Bubi | g/t | 1.61 | Average |
Sulfides Ore Gold | | | |
Isabella McCays | g/t | 2.42 | Average |
Bubi | g/t | 2.42 | Average |
Ore Characteristics | | | |
Density | | | |
Isabella McCays | t/m³ | 2.77 | Average |
Bubi | t/m³ | 2.85 | |
BBWi (Bond ball work index) | | | |
Isabella McCays | kWh/t | 17.00 | Average |
Bubi | kWh/t | 21.45 | |
Ore Product Sizes | | | |
Crushed Ore (P80) (80% passing size) | mm | 13 | |
Milled Ore (P80) (80% passing size) | microns | 75 | |
Flotation Mass Pull | | | |
Isabella McCays | % | 5 | |
Bubi | % | 10 | |
14.2 | Process Flow Description |
Ore will be derived from two main mining areas, namely Isabella McCays and Bubi, with production throughput to be phased over the LoM based on tonnage, proximity to the process plant and metallurgical characteristics. Bubi ore, destined to be processed over the latter part of the LoM will be trucked approximately 23km to the processing plant which will be situated at the Isabella McCays complex. The envisaged phasing is as depicted in Table 14‑1.
Operations in the process plant can essentially be divided into seven main sections (Figure 14‑1).
| | ● | Comminution (ore size reduction by crushing and milling to facilitate liberation of the mineral particles for subsequent downstream concentration), |
| | ● | Flotation (concentration of sulfides and gold into a small concentrate mass), |
| | ● | Biological oxidation - BIOX® (destruction of the sulfides in the concentrate using oxidizing bacteria to expose the gold particles for downstream recovery), |
| | ● | Carbon in leach (cyanidation leach of the BIOX® residue and recovery of the solubilized gold onto activated carbon), |
| | ● | Electrowinning and smelting, |
Figure 14‑1: Bilboes Simplified Process Flow Diagram
The crusher circuit has been designed to process the full LoM design monthly tonnage (240 ktpm ISBM). When processing Bubi ore the crushing circuit monthly throughput will reduce to approximately 180 ktpm due to the harder nature of the Bubi ore. Ore with a top size of approximately 900 mm is received from the open pit mining operations at the RoM Pad by haul truck. The ore may be stockpiled on the RoM Pad (for blending or delayed feeding purposes) or directly tipped into the primary jaw crusher. The crusher circuit comprises primary jaw and secondary cone stages to produce a product with P80 of 30 mm for stockpiling on the Crushed Ore Stockpile (COS) ahead of the milling circuit. Total capacity of the COS is approximately 26 ktpm t with a live capacity of 8 ktpm (24 hours). In times of ore shortages, the excess stockpile capacity may be processed using dozers and loaders to feed through the COS chutes.
| | 14.2.1.2 | Milling and Classification |
The crushed ore is withdrawn from beneath the COS and fed onto the mill feed conveyor by vibratory feeders. The mill feed conveyor discharges directly into the single RoM Ball Mill feed hopper. The conveyor is fitted with a weightometer to measure the throughput as well as controlling the speed of the vibratory feeder to give the set tonnage to the mill. The ball mill is a grated discharge mill with steel liners and utilizing steel balls as the grinding media. Milled slurry discharges via a trommel screen into the mill discharge sump and is pumped to the cyclone classification circuit. The cyclone overflow containing the fine particles gravitates to the flotation conditioning tank in the flotation section. The coarse particles exit in the cyclone underflow stream and return to the ball mill. Product size from the milling section is 80% passing 75 μm. During processing of the Bubi ore monthly milling throughput will reduce to 180 ktpm due to the harder nature of the Bubi ore.
Cyclone overflow from the milling section discharges into the flotation conditioning tank where it is adjusted with process water to the set flotation feed density. Flotation reagents are also added in this tank and the slurry is allowed to condition for a set period prior to being pumped to the flotation cells. The circuit will operate at natural pH and be configured in a rougher, cleaner, recleaner and cleaner scavenger format to facilitate maximum gold and sulfide recoveries while minimizing the carbonate recovery to the concentrate. Sodium Ethyl Xanthate (SEX) is used as the collector for the sulfide minerals, copper sulphate as an activator for the sulfide minerals while starch and sodium carbonate are used as depressants for the carbonates. The rougher tails, forming the tailings product, are dewatered in the water recovery thickener circuit, and pumped to the flotation tailings storage facility. The recleaner concentrate forms the concentrate and is pumped to the concentrate thickener for dewatering ahead of processing in the biological oxidation section. Supernatant water from the tailings and concentrate thickeners is recycled to the milling and flotation sections. The supernatant solution is recycled back to the process plant.
| | 14.2.3 | Biological Oxidation (BIOX®) |
In the BIOX® section bacterial oxidation of the sulfide minerals occurs, (by mesophilic bacteria, operating in the range of 15°C – 45°C) resulting in liberation of the included gold particles for further downstream recovery.
| | 14.2.3.1 | Biological Leaching |
Dewatered flotation concentrate is pumped to the BIOX® surge tank where it is diluted to the required density of approximately 18% solids. The slurry is then fed to the primary reactors (in parallel), with slurry overflowing to the secondary reactors (in series). Oxygen and carbon dioxide (air), nutrients, defoamer and sulfuric acid are added to the tanks. The required bacteria cultures are contained within the tanks; oxygen, solids feed rate, pH and temperature control are essential to ensure the bacterial activity level is maintained. Bacterial oxidation of the sulfides optimally takes place at a pH of 1.5 - 2.2 and a temperature of approximately 42oC. As the concentrate contains a relatively high amount of carbonate the addition of sulfuric acid will be required to maintain the required pH. Temperature is maintained by the circulation of cooling water via cooling coils within the reactors. Aeration of the tanks (oxygen supply) is by medium pressure air blowers (240 kPa). Air hold-up in the tanks is approximately 17% of live volume. Total required residence time in the reactors is 6.5 days. The oxidized slurry product exits the final Stage 2 reactor and is pumped to the Counter Current Decantation (CCD) section for separation of the acidic liquid and oxidized solids components.
| | 14.2.3.2 | Counter Current Decantation (CCD) |
A three stage CCD (counter current decantation) circuit allows for removal of the acidic solution components from the oxidized solids. The thickener underflow solids are progressively washed of acidic solution in an up-flow manner from Thickener 1 to 3, exiting as Thickener 3 underflow, while the acidic solution is progressively concentrated in a down flow manner exiting as Thickener 1 overflow. Make up water is added to the feed of Thickener 3 to maximize the washing efficiency. The Thickener 3 underflow slurry (washed oxidized product) is pumped to the CIL section for final gold recovery, while the Thickener 1 overflow acidic solution is pumped to the neutralization section for precipitation of the acidic and other acidic deleterious components.
The neutralization circuit comprises eight stages, where the acidic solution is initially neutralized to a pH of approximately 4.5 with limestone (Stage 3) and then to a pH of 7 (Stage 7) with lime. The acidic components and solubilized arsenic are precipitated to the various sulphates with the arsenic fixed insolubly as basic ferric arsenate. The slurry is pumped to the water recovery thickener, where it combines with flotation tails, where the solids are dewatered (thickener underflow) and thereafter pumped to the Flotation tailings storage facility. The supernatant thickener overflow solution is channelled to the process water circuit for recycling to the process plant in general. Residence time per neutralization stage (8 off) is 1.5 hours thereby resulting in a circuit residence time of 12hrs.
| | 14.2.4 | Carbon in Leach (CIL) |
Washed oxidized slurry from the neutralization section is pumped to the pre-leach tank (CIL Tank 1) of the CIL circuit, where the slurry will be subjected pH adjustment with lime and additional aeration to ensure complete oxidation of cyanide consumers. The slurry will then overflow to CIL Tank 2 where cyanide is added and from there down the circuit to the final CIL tank. Tanks 2 to the final tank all contain activated carbon, retained within the tank by an interstage screen. Slurry residence time in the circuit is set at 36 hours, by which time maximum gold dissolution will have occurred and the carbon will have adsorbed approximately 99% of the soluble gold. The exiting slurry from the final CIL tank will pass over a carbon safety screen to ensure no loss of carbon due to possible interstage screen perforations, before gravitating to the tailings surge tank. From here the slurry is pumped to the detoxification circuit for cyanide destruction before being pumped into the BIOX® tailings storage facility. The carbon within the CIL tanks is pumped counter currently to the slurry flow, together with the relevant slurry, upstream from the last CIL tank to the CIL Tank 2. The carbon Au value increases as it progresses upstream in the circuit while the slurry solids and liquids Au values decrease as the slurry flows downstream in the circuit. Loaded carbon is recovered from CIL Tank 2 by pumping the carbon / slurry to the Loaded Carbon Screen. The slurry passes through the screen and returns to CIL Tank 2. The loaded carbon discharges from the screen into a hopper from where it is transferred the Acid Treatment Vessel at the head of the carbon treatment circuit.
A loaded carbon batch (5 t) is treated at ambient temperature with a 3% hydrochloric acid solution for approximately 1 hour in the acid wash vessel to remove inorganic foulants, predominantly calcium, ahead of the elution process. At the end of the process the spent acid is washed from the column with water and pumped to the BIOX® tailings tank and ultimately sent to the BIOX® tailings storage facility.
The acid washed carbon is transferred by water eduction to the elution column ahead of desorption of the Au. The elution process is the split AARL (Anglo American Research Laboratory) type. This process separates the elution (desorption) cycle from the electrowinning cycle thereby adding flexibility to the process. The loaded carbon is pre-soaked at 110°C with a solution comprising 1% cyanide and 2% caustic soda solution for approximately 1 hour. After this the carbon is eluted with high quality water at 125°C for a period of approximately 4 hours. The gold bearing solution (preg solution) is stored in the Preg Solution Tank in readiness for gold recovery in the electrowinning section. For flexibility, a second preg solution tank is installed to allow fully independent electrowinning to take place. The total elution cycle (including acid treatment) takes approximately 10 hours. The barren carbon is transferred by water eduction from the elution column to the regeneration kiln feed hopper.
The Regeneration Kiln is a horizontal retort type, operating at a temperature of 750°C (hot zone) in a non-oxidizing atmosphere to prevent ignition of the carbon. In this process organic foulants such as oils, greases and flotation reagents are removed thus returning the carbon close to its original virgin activity in readiness for reuse in the CIL circuit. Carbon discharges the kiln into a quench tank (cold water filled) and is then recycled by eductor back to the CIL circuit.
| | 14.2.6 | Electrowinning and Smelting |
The preg solution is pumped to the electrowinning circuit (situated in the Gold Room), comprising two electrowinning cells, each with 16 cathodes and 18 anodes. The cathode is stainless steel mesh wrapped around a stainless-steel frame, connected to the negative terminal, and encapsulated in a non-conducting, perforated cathode box. The anode comprises a stainless-steel perforated plate connected to the positive terminal. DC power to each cell is supplied by a dedicated rectifier (2,000 amps). The preg solution is circulated through the electrowinning circuit over 12 hours. Au in the preg solution deposits onto the stainless-steel mesh in the cathode box with the generation of hydrogen gas (resulting in localized acidic conditions in the cell). The pH in the preg solution must be maintained at approximately 13 to prevent excessive corrosion of the stainless-steel anode due to localized low pH. Oxidation reactions at the anode result in the generation of ammonia and hydrogen amongst others. The gases are vented off in a very diluted form to the atmosphere via an extraction system. Once the residual Au value in the preg solution has reached the low setpoint the process is deemed to be complete and is halted.
The cathode boxes are removed periodically from the electrowinning cell and the gold recovered from the stainless-steel mesh by high pressure water jets. The gold is then filtered and dried in a drying oven. The dried gold is mixed with fluxes (generally borax, silica, and sodium carbonate) and melted in a single pot diesel fired furnace at a temperature of approximately 1,100°C. (Melting point of gold is 1,064°C). Once molten the gold is poured into Molds, cooled, cleaned, stamped, and stored in the vault awaiting dispatch to the refinery.
Tailings from the CIL circuit are detoxified to reduce the Weak Acid Dissociable Cyanide (WAD) levels to below 50 ppm prior to discharge to the BIOX® tailings TSF. This is accomplished using the INCO SO2 / Air-process. The process requires a copper catalyst, added as CuSO4 (copper sulphate). The SO2 source is sodium meta bi-sulphite (SMBS), while oxygen is generally sourced from compressed air. Minimum O2 requirement is generally 1 ppm - 2 ppm. Optimum pH is 8 - 10. The process results in the generation of sulfuric acid and thus requires the addition of lime (generally) or caustic soda to maintain pH at the optimum level.
14.3 | Plant Water Requirements |
Raw water will be supplied to the raw water storage tank, with a live capacity of 2,560 m³, from the pit dewatering pumps and several borehole pumps. The raw water is used for gland service, carbon transfer duties, elution, gravity concentrator circuit water, reagent make-up and fire service duties. The raw water storage tank will have a reserve for firefighting purposes. This reserve will be maintained by suitability positioned fire water and raw water pump suctions.
Process water is stored in the process water dam, an earthen lined structure with a live volume of 10,400 m³. The process water dam collects water from the water recovery thickener, flotation tailings TSF and any plant run-off from pollution control dams. Process water is supplied to all sections of the plant for hosing and screen spraying and specifically to the milling and flotation sections for slurry dilution purposes. The process water balance is negative and relies on a make-up volume (from raw water) of approximately 4,000 m³/day under phase 2 conditions.
The Bilboes plant will use a substantial number of chemical reagents / commodities due to its complexity. Limestone will be sourced locally; all the other reagents will require importation into Zimbabwe.
Table 14‑2: Process Plant Major Reagents / Commodities
Reagent / Commodity | Delivery Form | Area(s) of Use | Make up Facilities |
Quick / Burnt lime CaO (85%) | Bulk powder, -1 mm solids | Milling, BIOX® Neutralisation, CIL, Cyanide Detoxification | Bulk Slaking (Hydration)plant supplying hydrated lime – Ca (OH)2 - via a ring main system |
Limestone (CaCO3) (45%) | Bulk crushed, -40 mm solids | BIOX® Neutralisation | Milling plant with dedicated supply to neutralisation area |
| Reagent / Commodity | Delivery Form | Area(s) of Use | Make up Facilities |
Flocculant (various) | Dry powder, 25 kg bags | Flotation tails thickener, Flotation Conc. thickener, BIOX® CCD thickeners, Water recovery thickener | Dedicated batch make up plants at each relevant site supplying liquid flocculant |
Flotation Collector: Sodium Ethyl Xanthate (SEX) | Dry pellets, 850 kg bulk bags | Flotation | Dedicated batch make up plant supplying liquid reagent |
Flotation Activator Copper Sulphate (CuSO4) | Dry powder, 25 kg bags | Flotation | Dedicated batch make up plant supplying liquid reagent |
Flotation Frother | Dry powder, 200 kg drums | Flotation | Dedicated batch make up plant supplying liquid reagent |
Flotation Depressant 1 Sodium Carbonate (Na2CO3) | Dry powder, 25 kg bags | Flotation | Dedicated batch make up plant supplying liquid reagent |
Flotation Depressant 2 Starch | Dry powder, 25 kg bags | Flotation | Dedicated batch make up plant supplying liquid reagent |
Sulphuric Acid | Bulk tanker liquid 93% H2SO4 | BIOX® | Ring main system feeding from storage tank to BIOX® circuit. |
BIOX® Nutrients | Dry powder, 25 kg bags | BIOX® | Dedicated batch make up plant supplying liquid reagent |
Sodium Cyanide NaCN | Briquettes, 1,000 kg bulk bags | CIL, Elution | Solution make-up and storage facility |
Caustic Soda NaOH | Pellets, 1,000 kg bulk bags | Carbon Treatment, Cyanide make-up facility | Solution make-up, storage and distribution facility |
Hydrochloric Acid HCl | 33% Liquid, 200 l plastic drums | Carbon Treatment Acid Wash | Direct pumping from drum into Acid Wash solution make up tank |
Sodium Metabisulphite Na2S2O5 | Powder, 1,000 kg bulk bags | Cyanide Detoxification | Solution make-up, storage and distribution facility |
Diesel | Bulk Tanker | Fire water system, Elution and Gold Room | Local diesel storage tank for distribution |
Milling grinding media 80 mm dia. forged Cr-Mo steel | 200 l steel drums | Milling | Ball loader onto Mill feed conveyor |
The mine layout is shown in Figure 15‑1.
Figure 15‑1: Mine Layout
Figure 15‑2: Overall Site Plan
15.1 | Geotechnical Investigation and Design |
The Bilboes Gold Project geotechnical engineering investigation involved the investigation for the Open Pit, TSF, the Process Plant (Plant) and Waste Rock Dump (WRD) foundation material analysis - Field Investigation and Data Collation
SLR Rock Engineers visited the site at various stages of the geological drilling campaign during 2018 which included, review of geological and geotechnical data, geotechnical logging of core and the collection of intact rock samples for laboratory testing.
Prior to the field investigation, a site reconnaissance study was conducted, during which the site was assessed with the view to planning the investigation methodology. This was followed by a desktop study investigation which involved the compilation and assessment of available information on the site including geology, aerial photography, and previous investigations on the site, where available.
The test pit locations were selected based on early conceptual site layouts of the TSF, RWD and Plant Site to gain maximum coverage of the area.
Selected soil samples were retrieved from the test pits and were submitted to the Contech Geotechnical Testing laboratory in Harare, Zimbabwe. The samples were chosen to determine the design parameters of each material units encountered at the site.
The following soil and rock properties were derived from the investigation and are recommended for use in design, slope stability analysis and seepage modelling (Table 15‑1).
Table 15‑1: Proposed Soil and Rock Properties for Foundation Modelling on the TSF Site
Geotechnical Domain | Depth (m) [mean values] | USCS | Dry Density (kg/m3) | V | Confined Modulus (MPa) | Effective Cohesion (KPa) | Effective Friction Angle (Degrees | Ksat (m/s) |
Topsoil | 0.0 - 0.6 | CL | 1,700 | 0.3 | 4 | 0 | 27 | 1 x 10⁻⁶ |
Residual Arkose | 0.6 - 1.0 | CL/SC/GC | 1,700 | 0.3 | 8 | 0 | 27 | 1 x 10⁻⁶ |
Residual Andesite | 0.4 - 1.0 | CL/SC | 1,800 | 0.3 | 15 | 0 | 30 | 1 x 10⁻⁶ |
Residual Meta-Basalt | 0.1 - 0.6 | CL/SC/GC | 1,800 | 0.3 | 8 | 0 | 30 | 1 x 10⁻⁶ |
Rock Type | Depth (m) [mean values] | Rock Classification | Dry Density (kg/m3) | V | GSI | Rock Strength (MPa) | Confined Modulus (KPa) | Ksat (m/s) |
Arkose / Andesite / Meta-Basalt | 1.0 - 2.0 | Poor Quality Rock Mass | 2,600 | 0.4 | 25 - 35 | 1 - 5 | 50 | 1 x 10⁻⁸ |
The following soil and rock properties were derived from the investigation and are recommended for use in plant siting and foundation design (Table 15‑2).
Table 15‑2: Proposed Soil and Rock Properties for Foundation Modelling on Process Plant Site
Geotechnical Domain | Depth (m) [mean values] | USCS | Dry Density (kg/m3) | V | Confined Modulus (MPa) | Effective Cohesion (KPa) | Effective Friction Angle (Degrees) |
Topsoil | 0.0 - 0.4 | Not considered suitable for founding |
Residual Arkose | 0.4 - 1.0 | CL | 1,700 | 2 | | 0 | 27 |
Residual Arkose - Medium Dense to Dense | 1.0 - 1.3 | CL/SC/GC | 1,800 | 0.3 | 8 | 0 | 30 |
Rock Type | Depth (m) [mean values] | Rock Classification | Dry Density (kg/m3) | V | GSI | Rock Strength (MPa) | Confined Modulus (KPa) |
Arkose | 1.3 | Poor Quality Rock Mass | 2,600 | 0.4 | 25 - 35 | 1-5 | 50 |
| | 15.1.3 | Waste Rock Dump Sites |
| | ● | The Waste Rock Dumps classifies geotechnically as a Class II Low Hazard, |
| | ● | Waste Rock Dump lift heights should be limited to 10 m with a minimum of a 10 m berm, with an overall height of 40 m. |
15.2 | Tailings Storage Facility |
SLR Consulting (Africa) (Pty) Ltd (SLR) were appointed to design and cost a new TSF and the associated sundry infrastructure which include RWD, silt traps, pollution control system, access roads and perimeter fencing.
It is understood that there are no specific Zimbabwean regulations or standards that are applicable to TSF designs. The Bilboes TSF design complies with various international regulations, standards, and guidelines as well as the necessary supplementary Zimbabwean regulations e.g., the environmental protection associated with the disposal of mining waste, the Zimbabwe Statutory Instrument 6 of 2007 applied and The Zimbabwe Standard Specification for Hazardous Waste Management (ZWS 806:2012)
According to Bilboes, the Zimbabwe EMA views the incorporation of a 1.5 mm thick HDPE geomembrane in the lining system as minimum best practice.
It is understood that the flotation and BIOX® CIL tailings streams are chemically and physically diverse, and as a result, it was considered appropriate to design a facility with two separate compartments.
The general area for a TSF site was preselected by Bilboes. SLR conducted a trade-off study that compared various TSF construction, development, and deposition techniques over several TSF layout options on the pre-selected site area. The trade-off costing exercise demonstrated that the lowest start-up and sustaining capital costs were associated with a hybrid development system that incorporated full containment of tailings during the initial high RoR deposition phases, followed by upstream development in the latter phases of development when the RoR reduces to the permissible 2 m/year.
Conventional tailings slurry disposal by way of spigotting with a maximum allowable RoR of 2 m/year above the containment wall crest was adopted for the project.
EPCM supplied the tailings production profile indicating three distinct phases of production as presented in Table 15‑3.
Table 15‑3: Production Profile
Phase | Year | Deposition Rate (tpm) | Cumulative Tonnage (t) |
| | Flotation Tailings | BIOX® Tailings | Flotation Tailings | BIOX® Tailings |
Phase 1 | 1.75 to 7.25 | 240,000 | 12,000 | 14,977,000 | 803,000 |
Phase 2 | 7.25 to 13 | 180,000 | 18,000 | 11,178,000 | 1,242,000 |
| | TOTAL | 28,549,000 | 2,171,000 |
Based on the production profile and plant process data supplied by DRA, the TSF was sized to accommodate a deposition rate of 28.5 Mt for the flotation tailings compartment, and 2.2 Mt for the BIOX® compartment.
TSF sizing was further based on an overall downstream (outer) embankment slope of 1V:4H which is considered an environmentally stable slope to encourage indigenous vegetation growth.
The properties derived from the geotechnical site investigation and were used for stability analysis and TSF foundation design:
| | ● | Selected embankment fill material friction angle (Φ’) | : 25 degrees. |
| | | | |
| | ● | Selected embankment fill material cohesion (C’) | : 20 KPa |
| | | | |
| | ● | Selected embankment fill material unit weight | : 1,600 kg/m³ |
| | | | |
| | ● | Waste Rock friction angle (Φ’) | : 35 degrees. |
| | | | |
| | ● | Waste Rock cohesion (C’) | : 5 KPa |
| | | | |
| | ● | Waste Rock unit weight | : 2,100 kg/m³ |
| | | | |
| | ● | Foundation material (residual arkose / andesite) friction angle (Φ’) | : 30 degrees |
| | | | |
| | ● | Foundation material (residual arkose / andesite) cohesion (C’) | : 12.5 KPa |
| | | | |
| | ● | Foundation material (residual arkose / andesite) unit weight | : 1,700 kg/m³ |
| | | | |
| | ● | Bedrock friction angle (Φ) | : 50 degrees |
| | | | |
| | ● | Bedrock cohesion (C’) | : 50 KPa |
| | | | |
| | ● | Bedrock unit weight | : 2,600 kg/m³ |
| | 15.2.3 | Tailings Physical Characterization |
A full suite of geotechnical laboratory tests including foundation indicator tests, consolidated undrained triaxial tests, slurry settling tests, volumetric shrinkage tests, dispersiveness tests, evaporation / air-drying tests were conducted on representative Isabella McCays composite and the Bubi flotation tailings samples provided by Bilboes from the on-site pilot plant. The Isabella McCays Isabella McCays composite sample was blended at the Isabella-North: Isabella-South: McCays ratio of 50%: 30%: 20% in line with the mining plan.
The following tailings physical properties were derived from the geotechnical site investigation and were used in the design of the Bilboes TSF:
| | ● | In-situ dry density of deposited tailings for capacity calculations | : 1,35 t/m³ |
| | | | |
| | ● | Flotation tailings solids concentration in slurry (by mass) | : 40% |
| | | | |
| | ● | BIOX® tailings solids concentration in slurry (by mass) | : 20% |
| | | | |
| | ● | Flotation tailings specific gravity | : 2,70 |
| | | | |
| | ● | BIOX® tailings specific gravity | : 2,75 |
| | | | |
| | ● | Flotation tailings slurry density | : 1,337 t/m³ |
| | | | |
| | ● | BIOX® tailings slurry density | : 1,144 t/m³ |
| | | | |
| | ● | Flotation and BIOX® tailings effective friction angle (Φ’) | : 31° |
| | | | |
| | ● | Flotation and BIOX® tailings cohesion (C’ (KPa) | : 0 |
| | | | |
| | ● | Flotation and BIOX® tailings unit weight (kg/m³) | : 1,500 |
Against expectation, the Isabella McCays BIOX® tailings foundation indicator tests results showed a very fine uniformly graded material (99% passing 0.075 mm sieve).
Based on preliminary discussions with Bilboes regarding the tailings Particle Size Distribution (PSD), the design envisaged a hybrid system of TSF construction incorporating full wall containment using waste rock material during the initial stages of deposition
(up to Year 7), together with upstream wall raises using dried consolidated tailings from Year 7 onwards. However, safe upstream construction will not be achievable using such fine tailings, and as such BIOX® tailings may require full containment. The Isabella McCays BIOX® tailings PSD will therefore need further testing and confirmation during the detailed design phase.
Based on the XRF results for the Isabella McCays BIOX® material, the Zimbabwe Standard Specification for Hazardous Waste Management (ZWS 806:2012) prescribes the following liner system as the minimum liner required for the Bilboes BIOX® tailings:
The design presented in this report is based on the following selected liner systems (Table 15‑4):
Table 15‑4: Liner System
Layer Description | Flotation Tailings | BIOX Tailings |
| TSF | RWD | TSF | RWD |
HDPE geomembrane thickness | 1.5 mm | 2 mm | 2 mm | 2 mm |
Base layers | 300 mm selected clayey material (compacted in 2x150 mm thick layers) | 300 mm compacted clay liner (compacted in 2x150 mm thick layers) | 600 mm compacted clay liner (compacted in 4x150 mm thick layers) | 600 mm compacted clay liner (compacted in 4x150 mm thick layers) |
In-situ base preparation | Rip and re-compact 150 mm in-situ layer | Rip and re-compact 150 mm in-situ layer | Rip and re-compact 150 mm in-situ layer | Rip and re-compact 150 mm in-situ layer |
For the flotation compartment, the above only applies up to 200 m into the basin. The central portion of the flotation compartment will be lined with CCL as described below: | N/A |
Flotation Compartment Central Portion of Basin Liner | |
1 | 600 mm CCL | |
2 | 150 mm Base preparation | | |
| | 15.2.5 | Seepage / Leakage Quality |
The geochemical assessment report also provides expected seepage and liner leakage water qualities following source term modelling.
The geochemical assessment indicated that the BIOX® tailings are likely to be Potentially Acid Generating (PAG) whilst the flotation tailings are non-PAG.
| | 15.2.6 | Contaminant Plume Modelling |
Using the results of the geochemical assessment and source term modelling of tailings, SLR further conducted contaminant plume modelling to determine plume extents because of seepage or leakage from the TSF and associated RWDs. The composite liner option is expected to confine plume migration to the TSF site with the plume not expected to exceed 260 m from the source over a 100-year period.
The TSF complex development incorporates an outer containment wall, constructed in stages using approved available mine waste and developed in a downstream manner and sized to fully contain all deposited tailings up to the point when the tailings deposition rate reduces from 240 ktpm to 180 ktpm. The remainder of the facility up to the LoM will then be raised progressively with upstream wall raises using compacted tailings.
| | 15.2.7.1 | TSF Hazard Classification |
The Bilboes TSF hazard classification was conducted in accordance with both SANS 10286:1998 and ANCOLD (2012). Based on the assessment the Bilboes TSF can be classified as follows:
| | ● | A “High” hazard facility per the SANS 10286:1998 safety classification criteria, |
| | ● | A “High B” consequence category per ANCOLD (2012). |
| | 15.2.8 | TSF Operation and Monitoring |
During the life of the TSF, various elements should be monitored to ensure the integrity of the TSF complex. Monitoring elements will typically include:
| | ● | TSF engineering parameters, |
| | ● | Groundwater monitoring programme, |
| | ● | Dust monitoring programme. |
| | 15.2.9 | TSF Closure Concept |
The closure concept is envisaged to include a covering of the mine waste with a low hydraulic conductivity layer such as a clay or geosynthetic membrane. There will be on-going rehabilitation of the TSF complex through on-going vegetating of the embankment slopes.
15.3 | Civil Engineering and Earthworks |
The general approach adopted was to design / measure and quantify elements, identified as major capital expenses, from the compiled infrastructure layout drawings, and to make the necessary estimation for the following items.
| | ● | Haul road (± 26 km) between Isabella and Bubi, |
| | ● | Internal mining haul roads for Isabella and Bubi, between the proposed open pit mining access and RoM handling facilities, |
| | ● | Mine access roads to the proposed mining infrastructure including road to the Plant, Administration and Village terraces, Lime stockpile terrace, Substation terrace and existing mine infrastructure, |
| | ● | Service roads to the PCD, RWD and the relocated Explosive Magazines, |
| | ● | Re-alignment of a public gravel road around the McCays extension, |
| | ● | Internal plant roads, bus drop-off and parking, |
| | ● | Raw water pipeline from the wellfields supply to the Plant Process Water Dam, |
| | ● | Return water pipelines from the TSF to Plant PCD, |
| | ● | Bulk earthworks for terraces at Isabella including the Plant, RoM tip ramp and platform, Substation, Village, Administration, Lime stockpile, Contractor’s Laydown terrace and the RoM transfer terrace at Bubi, |
| | ● | Relocation of existing Explosives Magazines at Isabella and Bubi, |
| | ● | Brake test ramp for the Contractor’s Laydown terrace, |
| | ● | Mine Village and Administration building layout, |
| | ● | Sewer reticulation and Wastewater Treatment Works for the Plant, Administration and Village, |
| | ● | Fire and Potable water reticulation for the Plant, Administration and Village, |
| | ● | Stormwater channels for the Plant, Administration and Village, |
| | ● | Process Water Dam at the Plant, |
| | ● | PDC, provided for the Plant and Administration, as well as the Contractors Laydown, |
| | ● | Process Plant including the RoM tip, Primary Crusher, Secondary Crusher, Screening building, Transfer Towers, Floatation Concentrates Thickener, Cooling Towers, Neutralization Tanks, Reactors, BIOX® Area, Flotation, Reagents Area, Gold Room, Leaching Area, Mill Structure, Tailing’s area, Conveyors, Water reticulation, Sewer reticulation, Buildings. |
15.4 | Mechanical Engineering |
The mechanical design criteria cover the process plant and mining related equipment and is based on established technology and practices in the gold mining and processing industry.
Engineering aspects will be developed and optimized for clear definition of scope for the project. Mechanical equipment design shall be based on the application of established technology and practices in the gold mining and processing industry. Equipment will be designed and selected on a “fit for purpose” basis, to carry out required duties over the LoM period.
Mining and process plant equipment and infrastructure will be designed for LoM, of. approximately 15 years.
Mechanized and automated methods shall be implemented where there is a clear contribution to a safer, more productive, and less labour-intensive environment.
Total life cycle costing of equipment and processes over "LoM” shall be considered during design and equipment selection phase.
Engineering design will endeavor to address outcomes of risk assessments and HAZOP studies. Resulting designs, selected equipment and processes shall be safe for operating and maintenance by personnel and shall be eco-friendly.
Value improving initiatives will be undertaken through application of practical value engineering techniques and the philosophy of standardization and rationalization of equipment (to reduce spares holding requirements). Design to capacity and process simplification will be applied where possible.
15.5 | Electrical Power Supply and Reticulation (including Communications) |
| | 15.5.1 | Interconnection to National Grid |
Power will be supplied from the Zimbabwe National Grid by constructing a 70 km 132 kV Lynx line from Shangani Substation. To feed the line, a line bay will be constructed at Shangani. A mine substation will be constructed at Isabella. The estimate received is for a 132-kV substation, equipped with a 50 MVA 132/33 kV step-down transformer.
Detailed design should be considered to reduce the secondary voltage to 11 kV to enable the MV motors to be fed directly without an additional 33 / 11 kV transformer. The 1.5 MVA required by Bubi can also be supplied at 11 kV.
Power factor correction will be done with 11 kV capacitors.
Interfaces with other designs occur at the following battery limits:
| | ● | Zimbabwe Electricity Transmission and Distribution Company (ZETDC), |
The bulk electricity supply for the project is being planned to cater for a production rate of 508 tph RoM. This corresponds to an electrical load of up to 34 MVA.
The connected and anticipated running power demand of the mine and plant can be seen in Table 15‑5 which compares the installed and anticipated running power and lists the estimated running maximum demand.
Table 15‑5: Substation Loading
| | Installed Power (kW) | Run Power (kW) | Estimated Maximum Demand (kVA) |
Mills and other 11 kV motors | 22,360 | 18,836 | 19,220 |
Plant LV Load | 18,960 | 13,858 | 14,146 |
Infrastructure | 1,700 | 1,700 | 2,205 |
Total | 43,020 | 34,394 | 35,571 |
Four 2.5 MVA emergency power generator sets will be installed and connected to the 11 kV consumer substation. Emergency power is reticulated to downstream substations at 11 kV, where it is distributed to the Motor Control Centre (MCCs).
15.6 | General Infrastructure |
Table 15‑6 lists the building infrastructure that was considered.
Table 15‑6: Building Infrastructure
Building | Type | Size (m2) |
Security and Access Control | Prefabricated building | 170 |
Admin Building | A prefabricated building. Office furniture has been included in the square meter rate. | 430 |
Plant Laboratory | A prefabricated building. Typical laboratory equipment has been included in the square meter rate. | 540 |
Control Room | Prefabricated building | 170 |
Change house/s | Prefabricated building/s | 325 |
Stores | Two conventionally constructed buildings (brick and mortar) | 220 and 100 |
General Workshop | A conventional constructed building (brick and mortar) | 520 |
Crusher Workshop | Conventional constructed building (brick and mortar) | 270 |
Electrowinning and Gold Room | Conventional constructed building (brick and mortar) | 220 |
Crusher MCC | Prefabricated building | 302 |
CIL MCCs | Prefabricated buildings | 253 |
Floatation MCC | Prefabricated building | 65 |
Substation | Prefabricated building | 351 |
Return Water Dam Pumphouses | Two conventionally constructed buildings (brick and mortar) | 38 |
15.7 | Water Management Infrastructure |
The stormwater collection dams, and the pollution control dams as proposed herein, were designed in compliance with the IFC Environmental, Health and Safety (EHS) Guidelines for Mining (2007), together with the applicable local Zimbabwean Standards.
The project site falls within the Bembezi river sub-catchment which drains north towards the Zambezi River. The Bembezi river sub-catchment form part of the Gwayi catchment which largely comprises the Northern Matabeleland area of hydrological zone A.
The stormwater management plan was developed to comply primarily with the IFC EHS Guidelines for Mining (2007); while ensuring adherence to all the applicable local Zimbabwean Standards namely: the Environmental Management Act (Chapter 20:27) implemented by the EMA of Zimbabwe; and the Zimbabwe National Water Act (Chapter 20:24) implemented by the Zimbabwe National Water Authority (ZINWA) through the Zimbabwe National Water Authority Act (Chapter 20:25). In developing the conceptual stormwater management plan, reference was also made to regulation GN 704 of the South African National Water Act, 1998 (Act No. 36 of 1998).
Daily and monthly rainfall were obtained from the ZMSD Nkayi Stations over 38 years of hydrological records (from 1980 to June 2018) and were analysed to understand the long-term monthly averages, minimum and maximum monthly rainfall. The MAP adopted for this project is 657 mm.
A site wide monthly static water balance model was developed for the Bilboes operation to establish the storage sizes of the pollution control systems; and the average wet, dry season and average monthly water balance.
The water balance simulated water re-use associated with the processing plant, as a pump rate out of the PCD for each of the two mining phases.
The steady state water balance analysis indicates that the Bilboes flotation circuit requires on average approximately 250 m3/hr (6,015.6 m3/day) during Phase 1 before decreasing to 201.3 m3/hr (4,854.0 m3/day) in Phase 2. For the steady state water balance analysis, there is no make-up water required for the BIOX® circuit in all phases of mining.
To improve the understanding of the movement and the status of the water storage and transport infrastructure elements on the mine and how these changes in response to the varying climatic conditions, a Dynamic Daily Time Step Water Balance analysis was conducted for the project.
The daily time step water balance analysis for the RWD capacity of 380,000 m³, a return water pumping rate of 490 m³/hr and a worst-case tailings deposition rate of 240 ktpm yielded only two major spillages in a 70-year period which is considered to be in line with the IFC Environmental, Health and Safety guidelines for stormwater collection dams.
Groundwater numerical modelling was undertaken to simulate the mining operation at Bubi Isabella McCays and the related establishment of the TSF at Isabella McCays. The objective of the modelling is to determine the potential impact on the groundwater flow and groundwater quality during and post mining, for Isabella McCays and Bubi. Isabella McCays and Bubi are located 32 km apart, and therefore a separate groundwater model was developed for each site.
The cone of drawdown predicted for both mines show that after 100 years of simulation, both pits will present a residual drawdown of approximately 10 m. However, the extent of each cone of drawdown is decreasing in time and will remain within the boundaries of the mine sites.
The mass transport simulations indicate that a liner is necessary to contain the migration of the contaminant plume from the contaminant sources.
Waterborne sewage networks have been allowed at the Process plant, Admin area, Residential Village and Contractor area at Isabella McCays. All areas mentioned above will gravitate to a central sewage purification plant. The purification plant was designed and costed for 400 people @ 150 litres per person per day. The purification plant will be a vendor supply package.
Phase 1 of the project is to be executed initially mostly at Isabella McCays and will involve the engineering, detailed design, procurement, construction, and commissioning of a 240 ktpm gold plant and associated infrastructure.
Phase 2 of the project involves mining at Bubi and a step change in production to 180 ktpm, due to the higher mass pull expected from the different type of ore. Phase 2 will only commence later in November 2028 to suit the life of mine production schedule.
| | 15.9.2 | Engineering and Design |
It has been advocated that a short Front End Engineering Design (FEED) phase be implemented to bridge any gaps arising from the PFS and Detailed Engineering period. The FEED phase will allow detailed design scoping to be done and focus on the key requirements for procurement planning and management.
| | 15.9.3 | Construction Philosophy |
The EPCM Contractor will mobilize a Project Construction Management Team who, under the overall direction of the EPCM Project Manager, through the EPCM Construction Manager will manage and co-ordinate the activities of the appointed construction contractors.
These appointed construction contractors will perform the construction operations for the duration of the construction phase.
The schedule is used for long term planning, including cash flow. The schedule will be revised to be aligned with the latest information available before the project can be progressed from the planning phase to the execution phase.
| | 16.1 | Historical Supply and Demand |
Gold is a precious metal refined and sold as bullion on the international market. Aside from the gold holdings of central banks, current uses include jewellery, private investment, dentistry, medicine, and technology (Figure 16‑1).
Gold is mined in many countries around the globe; China, Australia and Russia are major gold producers providing 31.5% of world gold supply with recycled gold being a significant part of global supply (Figure 16‑2). Globally jewellery is the main application sphere of this precious metal accounting for over 48% of total demand.
Figure 16‑1: Historical Gold Supply (2010 -2023)2
_______________________________
2 Source: World Gold Council
Figure 16‑2: Historical Gold Demand (2010 - 2023)3
About half of gold jewellery consumption is in India and China and these markets trends greatly influence the overall gold industry. Investment in gold is another important application sphere and its share is about 29%. Demand from national central banks has also been growing especially from banks of developing countries in Latin America, the Middle East and Asia.
The supply and demand of gold does not follow typical supply and demand logic as gold is indestructible and can easily be recycled and is stored in vaults of banks. Gold is therefore relatively liquid and subject to the vagaries of global economics. These characteristics of the gold market make it challenging to forecast the gold price.
_______________________________
3 Source: World Gold Council
Figure 16‑3: Gold Price (2010 - 2023)4
Over the past century, gold has consistently shown as both a beacon of potential stability and a mirror reflecting global economic fluctuations. Gold's value over time is marked by significant fluctuations influenced by economic policies, global crises, and shifts in demand.
With a backdrop of financial and geopolitical uncertainties, the outlook for gold prices suggests a continued appeal of the precious metal as a so-called safe-haven asset. In recent years, gold has demonstrated resilience in the face of global economic challenges, including inflationary pressures and currency fluctuations.
Several macroeconomic factors could shape the gold projections in the future.
| | ● | Inflation: While many assume a direct correlation between inflation and gold, the relationship is complex and not as straightforward. Inflation can impact the metal, but other factors often mitigate its effects, |
| | ● | Currency Fluctuations: Gold and the US dollar share an inverse relationship. As the dollar weakens, gold often rises, becoming more attractive to investors holding other currencies, |
| | ● | Geopolitical Tensions: Conflicts and political instability historically drive investors towards gold as a so-called safe haven, potentially boosting its price during periods of heightened uncertainty. |
_______________________________
4 Source: World Gold Council
| | ● | Interest Rates: Gold's appeal can diminish with the expectation of rising interest rates, as higher yields on bonds and savings accounts compete with the non-yielding metal. |
16.2 | Gold Sales in Zimbabwe |
The Gold Trade Act empowers the Minister responsible for Finance to issue a Gold Dealers License which entitles entities to export and sell gold from Zimbabwe to customers of its choice. Prior to 1 June 2021, only FGR had the Gold Dealership License and therefore all gold bullion was sold to FGR. With effect from 1 August 2021, all gold producers can directly sell any incremental production to customers of their choice using FGR’s license to export. Caledonia’s Blanket Mine is currently selling its gold to a customer of its choice but exporting the gold using FGR’s license. Sales proceeds come directly into Caledonia’s bank account. As all Bilboes’ production is considered incremental, Bilboes will be able to choose to sell its gold directly to customers of its choice or to continue selling to FGR.
Bilboes is confident that it will be able to export and sell its gold production on similar terms as those obtaining from FGR. Fidelity has two payment terms for its customers that gold producers may choose from as per the terms and conditions below:
| | 16.2.1 | Category A - Outright Purchase |
Payment within two days of lodgement of the gold using a spot price based on the London Bullion Market Association (LBMA) price discounted by 2.5%.
The applicable price is the day’s afternoon fix on the date of lodgement at Fidelity.
Melting and assaying charges of US$21 /kg gross bullion weight applies.
The applicable Government royalty is deducted from proceeds due to the customer.
| | 16.2.2 | Category B - Part Payment and Final Payment after a week |
| | ● | Fidelity will pay 85% of the value within two days of lodgment at Fidelity as initial payment, |
| | ● | The LBMA price will be discounted by 1.25%, |
| | ● | Final payment will be made after a week, |
| | ● | Lodgments must be made by Tuesday 12:00 noon, |
| | ● | Any deposit lodged after Tuesday cut-off shall be treated like a deposit for the following Tuesday, i.e., initial payment will be made the following Tuesday, |
| | ● | Melting and assaying charges of US$21/kg gross bullion weight apply, |
| | ● | The applicable Government royalty is deducted from final payment due to the customer. |
Bilboes is confident that it will be able to export and sell its gold production on similar terms as those obtaining from FGR.
16.3 | Gold Price Predictions |
A summary of the predicted gold prices for 2024 are presented in Table 16‑1
Table 16‑1: Predicted Gold Price
Analyst/Firm | 2024 Gold Price Prediction |
Bank of America | US$ 2,400/oz by end of 2024 |
UBS Bank | US$ 2,200/oz by end of 2024 |
Goldman Sachs | US$ 2,133/oz by end of 2024 |
World Bank | US$ 1,900/oz by end of 2024 |
Citibank | US$ 2,400/oz by end of 2024 |
ING | US$ 2,100/oz by end of 2024 |
Wells Fargo | US$ 2,100 – 2,200/oz by end of 2024 |
Ronald Stoeferle, Incrementum AG | US$ 2,500/oz by end of 2024 |
Zach Scheidt, Rich Retirement Letter | US$ 3,000/oz by end of 2024 |
Source: 2024 Gold Price Prediction, Trends, & 5-Year Forecast (goldsilver.com)
17 | ENVIRONMENTAL STUDIES, PERMITTING, AND PLANS, NEGOTIATIONS, OR AGREEMENTS WITH LOCAL INDIVIDUALS OR GROUPS |
The natural environment within the project site has been significantly transformed by existing mining operations. The surrounding environment is more natural with disturbances from communities and subsistence farming activities. Other mining operations do occur in the region, however over time several mines in the area have been closed. The EIA (SLR, 2019) identified a number of potential environmental impacts are shown in Table 17‑1.
Table 17‑1: Potential Environmental Impacts
Potential Environmental Impacts | Mitigation | Significance after mitigation |
Potential loss of soil and related grazing land capability within the proposed project footprint | Soil can be conserved and reused during rehabilitation | Low |
Potential contamination of soils, surface water and/or groundwater features | Design of potentially contaminating facilities and managing the storage and handling of polluting substances and related clean-up of spills reduces the Intensity of these potential impacts | Medium to High |
Alternation of drainage patterns and related downstream functionality of aquatic habitat due to encroachment of the Bubi open pit into the non-perennial Bubi River | The Bubi River will be diverted to ensure that that the Hydraulic connectivity of the river is retained, and pollution, sedimentation and erosion impacts are generally avoided. | Medium |
Potential contamination of surface and groundwater resources from various operational activities and contamination from the new TSF and WRDs | Implementation of industry-aligned surface water management measures and a composite lining for the floatation compartment and full HDPE liner for the BIOX® compartment of TSF | Surface water = Medium Groundwater = High |
Lowering of groundwater levels potentially affecting third party water supply should third party boreholes be located within the dewatering cone of depression | Any third-party water sources that have a proven decrease in yield or dry up because of the proposed operations would be compensated with an alternative water supply of equivalent quality and quantity | Medium |
Potential reduction in ambient air quality due to particulate emissions | Implementation of an air quality and dust management plan during the implementation and operation of the proposed project lowers the intensity, and probability of such impacts occurring | Medium (operational phase) to Very Low (construction and decommissioning phases) |
Elevation in ambient noise levels creating a potential disturbance to nearby receptors. | Incorporating mitigation into the site design, as well as adopting sound management practices (e.g., maintaining machinery and equipment in good working order). | Medium (operational phase) to Low (construction and decommissioning phases) |
Visual disturbance to nearby local communities | Undertaking rehabilitation throughout the course of the proposed operations, | Low |
Physical destruction and general disturbance of terrestrial and/or aquatic biodiversity | By ensuring that the project footprint for planned clearing and infrastructure establishment is clearly demarcated and all areas of increased ecological sensitivity, outside of the mining footprint are designated as No-Go areas would limit the associated significance of these impacts | Medium |
The EIA (SLR, 2019) concluded that the proposed project presents several potential positive and negative impacts associated with the unmitigated scenario. With mitigation (in the residual impact scenario) some of the identified potential impacts can be prevented and the remainder can be managed and mitigated to remain within acceptable environmental limits so long as the mitigation set out in the ESMP is implemented and Bilboes develops, implements, and annually reviews the ESSMS. Positive impacts can be enhanced by developing and implementing a Community Development Plan as set out in the ESMP.
Bilboes is committed to implementing the mitigation measures within the ESMP together with the ESSMS which will be implemented as part of Bilboes’ on-going efforts of continuous environmental improvement. The management system will contain plans and procedures to help manage environmental aspects and impacts and help ensure legal compliance.
17.2 | Waste, Tailings, Monitoring and Water Management |
| | 17.2.1 | Tailings Management and Disposal |
Gold recovery at Bilboes would entail a two-stage process that would result in the generation of two different tailings streams - Flotation and BIOX® tailings. The TSF would be developed with two separate compartments to accommodate each tailings stream.
The proposed liner system for each comportment would incorporate (from top down):
| | ● | Floatation Compartment – A 1.5 mm HDPE geomembrane, a base layer of 300 mm selected clayey material (compacted in 2 x 150 mm thick layers), |
| | ● | BIOX® Compartment – A 2 mm HDPE geomembrane, a base layer of 600 mm selected compacted clay liner (compacted in 4 x 150 mm thick layers), |
| | ● | Both compartments would have a ripped and re-compacted 150 mm in-situ base layer, |
| | ● | The TSF would incorporate a filter drainage system comprising an 8.5 m wide, 500 mm deep toe drain located immediately adjacent to the upstream toe of the starter wall for the Floatation compartment and a 7.5 m wide, 500 mm deep toe drain located immediately adjacent to the upstream toe of the starter wall for the BIOX® compartment, |
Both compartments would have a reticulation of above-liner finger drains consisting of a configuration of 160 mm and 110 mm diameter slotted seepage collector pipes in the basin discharging to the solution trench independently of the toe drains to allow monitoring. The proposed decant systems consist of temporary intake structures (designated FT) and permanent intakes (designated FP). The intake structures have both top and side inlets.
There would be on-going rehabilitation of tailings through the application of the rising green wall. The TSF design slopes adopted (1V:4H) are considered environmentally stable to allow for indigenous vegetation growth with minimal ongoing maintenance. To assist with the vegetation establishment, the vegetation will be manually planted and irrigated during the initial stages. A cover involving topsoil and subsoil (in combination with the rocky waste rock material placed during construction protruding) will be progressively placed onto the side slopes of the TSF as the same is developed. These protrusions are advantageous as they mimic natural slopes and dissipate the kinetic energy of rain drops as they strike the surface.
The tops surface will be covered with topsoil mixed into tailings. The top surface will then be paddocked into smaller catchments to reduce water flow lengths.
The Bilboes TSF is classified as a Medium Hazard to High Hazard facility due to the number of residents in zone of influence estimated to be between 8 and 16 (determined in accordance within terms of the South African Code of Practice for Mine Residue Deposits (SABS 0286:1998) and the requirements of Mineral Regulation 527 of 23 April 2004). The classification considered the two compartments as one facility.
| | 17.2.2 | Waste Rock Management and Disposal |
The planned WRD construction method would entail the following:
| | ● | A nominal wall of waste material would initially be constructed to confine the extent of the dumping area within the planned WRD footprint. |
| | ● | Waste material will be delivered to WRD by truck and tipped from the leading edge of the WRD towards the inside of the WRD footprint. The waste will then be spread and shaped as necessary by earthmoving equipment. |
| | ● | The WRD would then be developed in successive lifts of up to 10 m in height, with each lift being completed before commencement of the subsequent lift. |
The WRD will be constructed at an angle of repose slopes of approximately 35°.
In principle, the WRD lift heights shall be limited to 10 m with a minimum of a 10 m berm, with an overall height of 40 m. Seepage from the toe of the WRD, as well as runoff from the slopes, would be controlled by the construction of an outer containment wall. The containment wall will be the boundary between the clean and potentially contaminated water systems for the purposes of stormwater management.
Some compaction of the waste is expected to take place during placement as trucks pass repeatedly over previously placed material on their way to and from the advancing faces of the WRDs. While compaction of wastes is desirable to maximize density and storage capacity, it is not a requirement for structural stability. Compaction will assist in reducing differential settlements with time, which will assist in ensuring the longer-term integrity of surface water management measures.
| | 17.2.3 | Non-Mineralized Waste Management |
Non-mineralized waste (including general industrial waste, medical clinic waste, hazardous industrial and domestic waste) would be temporarily handled and stored on site before being removed for recycling by suppliers, reuse by scrap dealers or final disposal at the existing waste disposal area located at Isabella. Bilboes has a designated burning site for all waste materials associated with cyanide packaging and hazardous waste on the heap leach pad where all leachate goes into the heap leach cyanide circulation stream as recommended by the cyanide suppliers. An internal waste management procedure will be developed for waste generated by the project.
With respect to sewage, it is proposed that the existing sewage treatment facility located at Isabella would handle the sewage generated. It is proposed that a sewage treatment plant would be established at Bubi.
| | 17.2.4 | Site Environmental Monitoring |
The proposed monitoring programme is detailed in the ESMP for the proposed project. The aspects for which monitoring is proposed includes:
| | ● | Annual monitoring (physical observation) for erosion, as well as slope / TSF failure, |
| | ● | Monthly surface and groundwater monitoring (of parameters including water quality, volumes, levels, spillages, and management infrastructure), |
| | ● | Monthly updating of the site-wide water balance (including biennial updates of the water balance model), |
| | ● | Air and noise monitoring to establish baseline constituent concentrations / ambient noise levels, as well as regular monitoring during construction and operations, as applicable. |
Requirements for post-closure monitoring to determine whether the mitigation and rehabilitation measures are effective would be incorporated into a final Closure Plan to be compiled for the operations prior to the commencement of decommissioning.
There is evidence that the Bembezi, Mdutshane and Bubi Rivers have been impacted open by various anthropogenic activities in the broader area. Furthermore, the planned widening of the open pits at Bubi would encroach directly on the Bubi River and the tributary located within Bubi claims area. This would have a material impact on this feature and may have an impact on downstream water users. It is thus recommended that the Bubi River be diverted around the proposed expansion of the southern open pit to:
| | ● | ensure that the hydraulic connectivity of the river is retained, and that pollution, sedimentation and erosion impacts are avoided; |
| | ● | limit the risk of flooding the southern open pit during a high flow event in the Bubi River. |
| | ● | The measures to be implemented by Bilboes to address potential adverse water quality effects and to ensure that the planned infrastructure is constructed, operated, and maintained to comply with the provisions of the IFC guidelines, include: |
| | ● | Separating clean water systems from dirty water systems, |
| | ● | Minimizing the size of dirty areas and divert clean run-off and rainfall water around dirty areas and back into its normal flow in the environment, |
| | ● | Locating all activities and infrastructure outside of the specified zones and/or flood lines of watercourses, as far as possible. Where this is not possible, the affected area should be remediated / rehabilitated to restore the original ecological function post-closure, |
| | ● | Maintaining specified zones around surface water features in instances where flood lines are unknown or un-surveyed, |
Incorporating suitable erosion protection measures at all discharge points, should any discharge be required. Furthermore, all discharges from the mine into the environment will comply with the IFC Effluent discharge standards.
An approved EIA is required in terms of the Environmental Management Act (Chapter 20:27) No. 13 of 2002 and the Mines and Minerals Act (Chapter 21:05) of 1996. The ESIA was undertaken for the project to satisfy the requirement and an ESIA Report was completed for submission to EMA within the first quarter of 2020. Thereafter, SLR held a public feedback meeting to disclose the findings of the ESIA Report to the identified stakeholders. A record of this disclosure process was compiled and submitted to EMA. An Environmental Impact Assessment (EIA) certificate was issued to Bilboes for the project in February 2021 and was valid for 2 years to February 2023. The EIA certificate is renewable on an annual basis subject to conditions which include project update reports, compliance to Environmental Management Plans (EMP) outlined in the ESIA Report and notification to EMA for any changes in the project likely to alter the project as stipulated in the ESIA Report. The current EIA certificate is valid until March 2025 and the renewal process will continue annually for the duration of the operations.
Other project related licenses / permits currently in use include explosives (purchase and storage), firearms, medicines control, public health (medical examination), water abstract and hazardous substances (importation, transportation, storage and use), solid waste disposal which are renewed quarterly or annually when become due. The conditions of renewal are limited to payment of applicable fees to the relevant statutory bodies. A total of $70,000 is required to cover all the license fees and permits on an annual basis.
17.5 | Social and Community Related Requirements and Plans |
An ESMP has been developed which contains the environmental, social and safety management and monitoring commitments that Bilboes will implement to manage the negative impacts and enhance the positive impacts identified in the EIA.
To mitigate against the loss of, or reduced access to, land for livelihood activities, a LRP will be compiled and implemented prior to the commencement of construction.
As part of the existing operations Bilboes have undertaken several CSR programmes. These include the supply of various community boreholes at communities and local schools, building and repairs of school blocks, the repair of various local roads, excavation and scooping of dams and provision of various other services including access to health facilities at the mines and transport in cases of emergency.
To address potential issues related to employment, Bilboes will develop a fair and transparent labour, working conditions and recruitment policy. The policy will comply with local law, IFC Performance Standard 2: Labor and Working Conditions, and International Labor Organization (ILO) conventions.
To optimize local small business development, a local procurement policy will be developed and implemented and communicated to all local stakeholders.
The Stakeholder Engagement Plan developed for the project will be maintained and updated to provide a formal procedure for communications with the regulatory authorities and communities.
17.6 | Social / Community Issues |
Based on the EIA undertaken for the proposed project, social or community impacts that were identified and assessed include the following:
| | ● | Positive economic impact because of the direct construction and operational project expenditure, direct and indirect business opportunities. Significance after mitigation = Very High Positive, |
| | ● | Potential reduction of access to land for livelihood activities (e.g., cattle ranching and subsistence agriculture) undertaken within the mine claims area. A key recommendation to ensure that these land users are appropriately identified, engaged, and compensated. Significance after mitigation = Medium, |
| | ● | Inward migration due to the expectation of employment. Bilboes should aim to source most employees from the surrounding local communities, as far as possible. Significance after mitigation = High to Medium, |
| | ● | Various health and safety risks for third parties are associated with the proposed project. While the likelihood of incidents is deemed to be low (with mitigation) any injuries or fatalities of third parties would be of high intensity. Significance after mitigation = Medium, |
| | ● | No cultural-heritage Resources were found to be located within the proposed project footprint. Significance after mitigation = Very Low. |
A conceptual closure plan and LoM closure liability estimate, based on the environmental, social, and economic risks identified in the EIA, is included in the EIA. Furthermore, the closure issues and concerns raised by stakeholders were also incorporated, where applicable.
Generally accepted “good international practice” mine closure methods were used as the basis for the conceptual closure plan, as well as, for determining the unit rates for the various closure components used in the LoM liability calculation. The mine closure methods also conform to the statutory requirements of Zimbabwe EMA who are the regulatory body.
Mine closure planning is a dynamic process that is integrated with LoM planning to ensure a seamless transition from the operational to the decommissioning phases in the mine life cycle. The environmental objective for closure is to minimize the impacts associated with the decommissioning and closure of the mine and to achieve post closure land use as outlined below.
The conceptual closure plan objectives include the following:
| | ● | Environmental damage is minimized to the extent that it is acceptable to all parties involved. |
| | ● | The land is rehabilitated to achieve a condition approximating its natural state (as far as practicable), or so that the envisaged post closure land use/land capability is achieved. |
| | ● | Some of the smaller open pits shall be completely backfilled with material from the overburden/WRDs. Inert building rubble from the decommissioning activities can also be buried in the pit voids. The remaining open pits would not be backfilled and remain open. The pit side-walls and end-walls will only be ‘made safe. |
| | ● | All surface infrastructure, excluding the TSF and any other surface infrastructure that will support the envisaged post-closure end use, will be removed from site after rehabilitation. |
| | ● | Contamination beyond the mine site by wind, surface run-off or groundwater movement will be prevented through appropriate erosion resistant covers, containment facilities (i.e., stormwater ponds) and drainage controls. |
| | ● | Mine closure is achieved efficiently, cost effectively and in compliance with the law. |
| | ● | The social and economic impacts resulting from mine closure are managed in such a way that negative socio-economic impacts are minimized. |
| | ● | Based on the above, the closure outcomes for the mine site are assumed to be as follows: |
| | ● | To achieve chemical, physical, and biological stability for an indefinite, extended time period over all disturbed landscapes and residual mining infrastructure |
| | ● | To protect surrounding surface water, groundwater, soils, and other natural resources from loss of utility value or environmental functioning |
| | ● | To limit the rate of emissions to the atmosphere of particulate matter and salts to the extent that degradation of the surrounding properties’ land value and land capability does not occur. |
| | ● | To create a final land use that has economic, environmental, and social benefits for future generations that outweigh the long-term aftercare costs associated with the facility. |
| | ● | These broad closure objectives and outcomes will be continually refined as operations continue. |
17.8 | Estimated Environmental Costs for Closure |
The quantities used in the closure liability calculations were derived from the layout plans and general arrangements for the project; the project infrastructure details within the feasibility study report; and the proposed mining and deposition schedule. The closure liability calculation has been determined for the LoM (end of year 10) and is calculated to be US$ 32m (excl. VAT) (2023). The closure liability calculations will be regularly reviewed and updated during the project up and until the commencement of closure activities (i.e., final closure plan). On-going environmental rehabilitation is based on a unit rate of US$0.25 / t ore.
The QP is of the opinion that the current plans to address issues related to environmental compliance, permitting and local individuals and groups are adequate.
18 | CAPITAL AND OPERATING COSTS |
The basis of the CCE covers the process plant, associated infrastructure, and indirect costs for the 240 ktpm and 180 ktpm phased Bilboes PFS for which DRA developed the estimate.
The CCE for the process plant and associated infrastructure was prepared by DRA based on the Process Flow Diagram (PFD’s), Mechanical Equipment List (MEL), GA drawings and layout drawings. These drawings were developed per process plant area.
Phases 1 and 2
| | ● | Phase 1: 240 ktpm milled ore originating from the Isabella McCays (ISBM) mining area |
| | ● | Phase 2: 180 ktpm milled ore originating from the Bubi mining area |
The base date for the CCE is December 2023.
The cost estimates outlined in this section of the report are denoted in US dollars ($). In cases where relevant, specific costs have been initially expressed in local currency and subsequently converted to US dollars for consistency. The following static exchange rates have been applied and shown in Table 18‑1 below. The rates correspond to the base date of the estimate and have been agreed with by the Bilboes owners' team.
Table 18‑1: Exchange Rates
Exchange | Rate |
US$:ZAR | 18.74 |
US$:AUD | 1.50 |
US$:EUR | 0.92 |
US$:CNY | 7.24 |
US$:GBP | 0.79 |
US$:CAD | 1.32 |
US$:JPY | 144.57 |
| | 18.1.3 | Project Specific Estimate Development Methodology |
| | 18.1.3.1 | Mining Contractor |
The basis of the Bilboes PFS mining cost estimate was that all mining will be done by an experienced mining contractor. The pricing was based on a mining bill of quantities that was derived from the PFS production schedule. The dump locations/RoM tip location and haul distances for all material types was provided on a monthly and annual basis. This methodology ensures that all budget pricing receive is of a high accuracy level in real terms.
| | 18.1.3.2 | Bulk Earthworks and Infrastructure |
The earthworks and infrastructure Bill of Quantities (BoQs) produced by DRA for the 2019 FS were used and sent into the market for revalidation by the contractors. Initial preliminary BoQ was prepared and issued into the market for cost estimation purposes and to obtain relevant fixed and firm rates. The initial budget was based on the known scope of works and the best estimate was done on quantities based on experience from previous DRA projects. Basic engineering was completed for major cost contributors. Major earthworks cost contributors were modelled to obtain required quantities. The preliminary priced BoQ’s were then adjudicated, and a contractor was recommended. The recommended contractor’s rates were incorporated into the final measured BoQ.
Once the layout drawings and engineering were completed, the QS updated quantities in preliminary BoQ’s.
DRA Infrastructure quantified the Bulk Earthworks and General Infrastructure Services for all areas from layout drawings.
Preliminary and General (P&G’s) have been taken as 16% of the total supply and installation cost, in line with the P&G value quoted from the chosen Earthworks, Mining and Civils contractor.
| | 18.1.4 | Infrastructure Services |
The following infrastructure services were included in the costing: - Stormwater, Sewage, Potable and RAW Water Reticulation and Fire Water.
| | 18.1.5 | Infrastructure Building Works |
The infrastructure buildings BoQs were sent into the market for revalidation by the contractors. Architectural layouts for selected buildings and structures were developed. Building P&Gs of 31% have been used for the capital estimate for the total supply and installation cost, in accordance with the P&G value quoted from the chosen building works scope.
| | 18.1.6 | Mechanical Equipment |
From the MEL and PFD’s, DRA issued enquiries for all mechanical equipment to vendors for costing. Where necessary the mechanical equipment was revalidated using the adjudicated quotes.
The erection cost for the mechanical equipment was based on rates received from the steelwork and platework fabrication/erection contractor.
The mechanical P&Gs were applied at 74% of the erection component only, in line with the P&G value quoted by SMP contractors.
| | 18.1.7 | EPCM and External Services |
The EPCM costs has been escalated to base date December 2023. The EPCM costs cover the project management, detailed engineering, procurement, and construction management costs directly associated with the implementation of the project.
| | 18.1.8 | Process Plant and Infrastructure Capital Costs |
The process plant capital cost included: Ore Receiving and Crushing, Milling, Classification and Thickening, Flotation, BIOX®, CIL, Carbon Treatment, Gold Room, Tailings Handling and Cyanide Detoxification, Reagents, Process Plant Water Services and Reticulation, Process Plant Utility Services, E, C & I Plant, Plant Services, Fire Protection and Detection, Potable Water and Treatment, Sewage Treatment, Storm Water Management, Fencing, Pipe and Cable Racks, Plant Buildings and Workshops, Plant Management Offices Facility, Security, Change house, Crib Room Facility, Security, Control Room, Metallurgical Lab Facility, Mechanical Workshop, Plant Electrical Structures, Overhead Line, MV Substation, MCCs (Motor Control Centers), General Earthworks, Roads and Terraces, Buildings, Flotation TSF, BIOX TSF, Crossings, Temporary Facilities, Project Fleet, EPCM Contractor, First Fill and Commissioning, Spares and General Administration Costs.
| | 18.1.9 | Capital Estimate Summary |
A summary of the Capital cost is presented in Table 18‑2 with a breakdown per phase being presented in Table 18‑3.
Table 18‑2: Capital Summary by Discipline
Description | Million US$ |
Open Pit Mining | 32.03 |
Earthworks | 37.53 |
Tailing Storage Facility | 75.25 |
Civils & Infrastructure | 14.70 |
Building Works | 5.93 |
Steelwork | 19.56 |
Platework | 11.82 |
Mechanicals | 78.43 |
Turnkey Packages | - |
| Description | Million US$ |
EC&I | 35.39 |
Piping & Valves | 19.43 |
Transport | 8.73 |
Project Services, EPCM & Consultants | 22.68 |
Construction Services | 0.54 |
Consumables And Spares | 8.90 |
Owners Cost | 8.88 |
Project Contingency | 34.23 |
Client Contingency | - |
Escalation | - |
Total | 414.03 |
Table 18‑3: Capital Summaries per Project Phase
Description | Grand Total | Sub Total Phase 1 (Million US$) | Sub Total Phase 2 (Million US$) |
| | (Million US$) | | |
Mining | 32.03 | 32.03 | - |
Process | 170.02 | 146.90 | 23.12 |
Infrastructure, Utilities and Ancillaries | 132.55 | 110.76 | 21.79 |
Indirect Cost | 45.18 | 42.98 | 2.20 |
Contingency | 34.23 | 29.83 | 4.40 |
Total Project Costs | 414.03 | 362.50 | 51.51 |
| | 18.1.10 | Exclusions and Assumptions |
The following are items which are not included in the CCE: escalation beyond capex base date, forex variation allowances, forward cover for any foreign content , environmental permitting activities, hydrological / water supply related costs, costs of socio-economic development, costs for skills development, costs for enterprise and supplier development, costs for financial modelling and evaluation, cost of financing, sunk costs, legal costs, all Value Added Tax (VAT), import duties, surcharges and any other statutory taxation, levies, or government duties, acquisition costs including mineral rights and the purchase or use of land, all royalties, commissions, lease payments, rentals and other payments to landowners, title holders, mineral rights holders, surface right holders, and/or any other third parties and any provision for project risks outside of those related to design and estimating confidence levels.
The following assumptions have been made in the preparation of this estimate:
| | ● | The project would proceed on an EPCM basis. |
| | ● | The project would generally be implemented as per the execution program. |
| | ● | All material and equipment will be purchased from recognized vendors. |
| | ● | The EPCM would be granted a site office location near to the works. |
| | 18.1.11 | Risks and Opportunities to Capital Estimate |
| | 18.1.11.1 | Foreign Exchange |
Changes in the costing can be expected due to the volatility of the local currency.
Project Contingency has been allowed for estimating inaccuracy, because of the limited detail engineering conducted in the PFS (level of engineering approximately to 15%). These confidence levels were then factored to reflect as a percentage of the individual cost categories, from which an overall estimating contingency was derived.
18.2 | Operating Cost Estimate |
| | 18.2.1 | Mining Operating Cost |
| | 18.2.1.1 | Basis of Cost Estimate |
The operating cost estimate has been completed from a zero base and presented in US$. Costs associated with labour, materials and consumables were included in this estimate.
| | 18.2.1.2 | Operating Cost Summary |
The basis of the mining cost estimate was that all mining will be done by an experienced mining contractor. The pricing was based on a mining BoQ that was derived from the PFS production schedule. The dump locations/RoM tip location and haul distances for all material types was provided on a monthly and annual basis. This methodology ensures that all budget pricing receive is of a high accuracy level in real terms.
The average mining contractor based on pricing received for life of mine for Bilboes is US$3.01/t including the ore transport cost from all mining areas to the Bilboes process plant near Isabella North. The cost per area is shown in Table 18‑4.
Table 18‑4: Mining Contractor Costs per Area (US$/total tonne)
Area | Cost per Total Tonne Mined (Ore and Waste) (US$) |
Contractor G & A | 0.34 |
Drill and Blast | 0.44 |
Load and Haul Incl. Rehandle & Services | 2.23 |
Total | 3.01 |
Diesel Cost | $1.52 (October 2023) |
| | 18.2.2 | Process Plant Operating Cost |
The operating cost estimate was completed from a zero base. All labour, energy costs, materials and consumables have been included in this estimate. The bulk of the inputs were generated by DRA based on outcomes from mass balance results, equipment sizing and budget quotations for the supply of reagents from typical suppliers within the region. Labor rates were supplied by the Bilboes owners’ team with the compliment developed to support the plant operation. Engineering maintenance costs are based on a % applied to direct costs and can be treated as an annual allowance. All costs presented below are for steady state throughput.
| | 18.2.3 | Reagent Consumption and Supply Rates |
Table 18‑5 presented below provides a summary of the expected reagent and consumable consumptions for Isabella McCay’s and Bubi ore, based on results obtained from test work, vendor specifications, benchmark data and mass balances.
Table 18‑5: Reagent Cost and Consumption for Isabella McCay’s and Bubi
Description | Consumption Rate, kg/t ore | Supply Cost, US$/t RoM | Supplier Name |
Isabella McKay’s | | | |
Collector (SEX) | 0.150 | 3,125 | BetaChem (SA) |
Modifier (CuSO4) | 0.100 | 3,170 | BetaChem (SA) |
Frother (DOW) | 0.045 | 3,063 | BetaChem (SA) |
Depressant (Na2SO3) | 0.350 | 500 | BetaChem (SA) |
Depressant (Starch) | 0.110 | 1,825 | BetaChem (SA) |
Sulfuric acid (H2SO4) | 1.050 | 575 | Curechem (Local) |
Limestone | 2.183 | 65 | PPC Zim |
Lime | 3.074 | 330 | PPC Zim |
Nutrient | 0.430 | 423 | - |
Anti-scalant | 0.002 | 3,810 | - |
Corrosion inhibitor | 0.002 | 3,542 | - |
| Description | Consumption Rate, kg/t ore | Supply Cost, US$/t RoM | Supplier Name |
Biocide | 0.002 | 4,500 | - |
Defoamer - BIOX | 0.001 | 5,940 | - |
Defoamer - CIL | 0.005 | 5,940 | - |
Flocculant | 0.017 | 4,000 | - |
Cyanide | 1.000 | 3,030 | Curechem (Local) |
Carbon | 0.001 | 3,540 | Acol chemicals (Local) |
Hydrochloric acid | 0.025 | 770 | Curechem (Local) |
Caustic soda (NaOH) | 0.065 | 1,050 | Curechem (Local) |
SMBS | 0.250 | 860 | Acol chemicals (Local) |
Copper sulphate (CuSO4) | 0.005 | 3,167 | Acol chemicals (Local) |
Bubi | | | |
Collector (SEX) | 0.150 | 3,125 | BetaChem (SA) |
Modifier (CuSO4) | 0.100 | 3,170 | BetaChem (SA) |
Frother (DOW) | 0.045 | 3.063 | BetaChem (SA) |
Depressant (Na2SO3) | 0.350 | 500 | BetaChem (SA) |
Depressant (Starch) | 0.110 | 1,825 | BetaChem (SA) |
Limestone | 45.708 | 65 | PPC Zim |
Lime | 7.831 | 330 | PPC Zim |
Nutrient | 0.860 | 423 | - |
Anti-scalant | 0.003 | 3,810 | - |
Corrosion inhibitor | 0.003 | 3,542 | - |
Biocide | 0.003 | 5,727 | - |
Defoamer - BIOX | 0.001 | 5,940 | - |
Defoamer - CIL | 0.020 | 5,940 | - |
Flocculant | 0.030 | 4,000 | - |
Cyanide | 2.000 | 3,030 | Curechem (Local) |
Carbon | 0.012 | 3,540 | Acol chemicals (Local) |
Hydrochloric acid | 0.050 | 770 | Curechem (Local) |
Caustic soda (NaOH) | 0.130 | 1,050 | Curechem (Local) |
SMBS | 0.500 | 860 | Acol chemicals (Local) |
Copper sulphate (CuSO4) | 0.100 | 3,167 | Acol chemicals (Local) |
The estimated average running load has been calculated using expected power draw from the equipment. Plant power has been based on grid supply at a unit rate of 0.10 US$/kWh. A summary is shown in Table 18‑6.
Table 18‑6: Process Plant OPEX – Power
Description | Unit | Value | Source |
Power Supply Cost | US$/kWh | 0.10 | Bilboes Owners Team |
Power Draw: Isabella McCay’s | kWh/t RoM | 66 | Calculated |
Power Draw: Bubi | kWh/t RoM | 114 | Calculated |
An annual maintenance allowance has been included and is based on a percentage of mechanical equipment, platework, steelwork, ECI, piping and valve capital costs. An allowance equivalent to 5% has been included in the cost estimate.
Labor rates have been supplied by the Bilboes owners’ team. The complement has been reviewed between DRA, Bilboes and Metso Outotec covering the main process plant and BIOX for each scenario.
Costs associated with the laboratory covering labour, consumables, and sample analysis have been considered. An estimated cost of 0.177 US$/t RoM was used for the various scenarios.
| | 18.2.8 | TSP Deposition and Operation |
SLR have conducted a concept level revalidation costing exercise for the tailing storage facility covering both the flotation and BIOX tailings storage. A unit operational cost of US$ 0.30/t flotation tails and US$ 0.49/t BIOX tails has been estimated and used in the cost estimate.
| | 18.2.9 | Operating Cost Estimate Summary |
Table 18‑7 provides an approximate breakdown of operating costs per major section of the proposed Bilboes plant and phase of the project.
Table 18‑7: Process Plant OPEX
| | Phase 1: | Phase 2: |
Description | Unit | 240 ktpm IM | 180 ktpm Bubi |
Overview | | | |
RoM | t/a | 2,880,000 | 2,160,000 |
Total variable | US$ m/a | 37.93 | 53.33 |
Total fixed | US$ m/a | 12.38 | 17.27 |
Total | US$ m/a | 50.31 | 70.60 |
Unit cost | US$/t ore | 17.47 | 32.69 |
The potential economic viability and performance of the Bilboes study has been determined through developing a financial model founded on the results derived from the study and information provided by the Bilboes owner's team.
The results tabled in this section have been based on forward looking statements, including (but not limited to) the feed profiles, grade profiles, gold recoveries, capital and operating cost requirements and gold pricing profiles.
The economic analysis for this option has been conducted using Discounted Cash Flow (DCF) methodologies. The analysis has been based on earnings after taxation modelled in constant terms and does not consider the effects of inflation, interest, escalation, and other financial charges. The economic model has been populated on a 100% equity basis and does not consider alternative financing scenarios. Financing related costs such as interest expense, withholding taxes on dividends and interest income, are excluded from the economic model. Additional exclusions pertaining to capital and operating costs can be sourced from the relevant report chapter detailing these sections.
The interpretation of the taxation and the associated legislation relevant to Zimbabwe has been based on information available in the public domain as well as guidance received from the Bilboes team. DRA does not provide expert advice on taxation matters. VAT refunds and exemptions have not been considered in the economic model. Any other tax or levy, not explicitly defined, has not been considered in the model. The tax model used should be regarded as indicative but is deemed to be suitable for this level of study.
Cash flows considered in the cash flow model include annual revenue, operating costs, initial capital expenditure, Stay in Business (SIB) capital allowance, capital contingency, environmental rehabilitation capital allowance, royalties and income tax presented on a year-by-year basis. The project start date has been based on year 2026. All currency figures are reported in US$ with all cashflows presented in financial years starting in January and ending in December.
19.3 | Sources of Information |
The basis of the financial evaluation has been founded on information sources from DRA and the Bilboes owners’ team. An overview of key sources of information is presented in Table 19‑1 below.
Table 19‑1: Sources of Information
Description | Source of Information / Responsible / Notes |
General |
Discount rate | Bilboes Owners Team |
Royalty tax rate | Bilboes Owners Team |
Aids levy | Bilboes Owners Team |
Macro Variables |
Exchange rates | Bilboes Owners Team |
Product pricing | Bilboes Owners Team |
Production Schedules |
RoM tonnes and ounces | DRA |
Initial Capital Expenditure (CAPEX) |
Mining | DRA |
Process plant | DRA (with input from others) |
TSF | SLR |
Stay in Business (SIB) Capital |
Mining | DRA |
Process plant | DRA |
Operational Expenditure (OPEX) |
Mining | DRA |
Process plant | DRA (with input from others) |
TSF | SLR |
G&A | Bilboes Owners Team |
Revenue |
Product recoveries | Bilboes Owners Team (previous test work) |
Product pricing | Bilboes Owners Team |
The base date for the model is 31 December 2023.
The production profile is reported as ore fed to the plant from four mineralization properties which are McCays, Isabella North, Isabella South and Bubi for all three scenarios. A total of ~25 million tonnes of ore is delivered to the processing facility, with ~198 million tonnes of waste removed over the same period. The average grade over life of mine is estimated at ~2.34 g/t Au. The production schedule over life of mine can be found in Section 13 of this report.
19.6 | Capital Expenditure and Phasing |
The total initial capital estimate for the project includes capital required to expand the mining operation and a contingency allowance. Initial capital has been phased, based on a high-level project execution schedule for each scenario. Further detail covering the execution schedule and basis of costs can be found in Section of this report.
A summary of initial capital costs is shown in Table 19‑2 below. This is inclusive of mining, processing, tailings, and a contingency allowance.
Table 19‑2: Initial Capital Cost – Constant Terms (2023)5
Total | FY 2025 | FY 2026 | FY 2027 | FY 2028 | FY 2029 | FY 2030 | FY 2031 | FY 2032 | FY 2033 | FY 2034 |
US$ m | US$ m | US$ m | US$ m | US$ m | US$ m | US$ m | US$ m | US$ m | US$ m | US$ m |
414 | - | 157 | 182 | - | 5 | 5 | 28 | 37 | - | - |
19.7 | Stay in Business Capital |
SIB capital expenditure has been considered, covering the process plant allowances. No mining SIB costs are expected due to the short duration between phases 1 and 2 which have been capitalized. Process plant SIB has been based on an annual allowance of 1% of process plant Operating Expenditure (OPEX). Total SIB costs are summarized in Table 19‑2 below.
Table 19‑3: SIB Capital Cost (LoM) – Constant Terms (2023)
Scenario | Unit | Total (LoM) |
SIB Capital | US$ m | 6 |
19.8 | Operating Expenditure |
The operating costs for the LoM include the mining operation, processing plant (incl. tailings disposal) and G&A costs. Table 19‑4 shows the estimated operating cost by category over the LoM. These costs have been developed from first principles and do not include a contingency.
Table 19‑4: Operational Cost Estimate (LoM) – Constant Terms (2023)6
Description | Cost (US$ m) | Unit cost (US$ / t RoM) |
Mining | 639 | 26 |
Process Plant | 600 | 24 |
G&A | 46 | 2 |
Total | 1,285 | 52 |
_______________________________
5 Due to rounding, numbers presented in this table may not add up precisely to the totals provided.
6 Due to rounding, numbers presented in this table may not add up precisely to the totals provided.
Process specific parameters have been applied for each mineralization property, informed from historical test work outcomes, third party consultation and discussions with the Bilboes owners’ team.
Metal recoveries have been applied as static variables over the prescribed LoM for each scenario. A summary of these inputs is shown in Table 19‑5 below.
Table 19‑5: Gold Recovery per Mineralization Property
Property | Unit | Recovery | Reference |
McCays | % | 83.62 | Test work / Third party / Client |
Isabella north | % | 83.62 | Test work / Third party / Client |
Isabella south | % | 83.62 | Test work / Third party / Client |
Bubi | % | 88.88 | Test work / Third party / Client |
A static metal price has been applied as prescribed by the Bilboes owners’ team. A price of US$ 1,800/oz has been applied in the financial model for all scenarios considered.
No allowance for asset disposal at the end of life of mine has been included in the financial model.
No allowance for working capital has been included in the financial model.
19.13 | Sunk and On-going Capital |
No on-going, historical, or sunk costs have been considered in the financial model.
19.14 | Reclamation and Closure |
An allowance for on-going environmental rehabilitation is included in the financial model together with a final closure cost of US$32 m expended during the last year of operation for each scenario. On-going environmental rehabilitation is based on a unit rate of US$0.25 / t ore.
Royalty tax has been based on Zimbabwean legislation (Mines and Minerals/Finance Act) and supported by the Bilboes team. Royalties’ payable are a function of gross revenue and a royalty percentage. The royalty percentage is fixed at 5% for gold and enforced regardless of operating margin achieved. The formula used to calculate royalty’s payable has been defined below:
Royalty USD=Gross Sales (USD)×Royalty %
Where royalty % is defined as:
Royalty %=5% for gold sales
19.16 | Corporate Income Tax7 |
Corporate income tax has been based on Zimbabwean legislation (Income Tax Act) and as advised by the Bilboes owners’ team. Income tax payable are a function of pre-tax profit and a taxation rate. Pre-tax profit is inclusive of all revenue, capital and development costs, operating costs, depreciation, amortization, and royalties. Capital expenditure (and development costs) incurred prior to production are claimed in full during the first production year. Subsequent capital expenditure is expended in full during the year of occurrence. Losses are carried over indefinitely until a profit is realized following which tax is levied based on annual pre-tax profits. A fixed effective taxation rate of 24.72% has been applied and is inclusive of an AIDs levy.
The project is based on an execution start date of 2026. A 10% discount rate has been applied in the financial model. A day zero discounting has been applied i.e., the full financial year of 2026 has not been discounted in the model.
_______________________________
7 The interpretation of the taxation and the associated legislation relevant to Zimbabwe has been based on information available in the public domain as well as guidance received from the Bilboes team. DRA does not provide expert advice on taxation matters. It is recommended, during the next project phase, to seek validation through a third-party consulting firm who specialise in taxation and legislative conformance in Zimbabwe.
The financial model has been prepared on a 100% equity project basis and does not consider alternative financing scenarios. A discount rate of 10% has been applied in the analysis. The outcomes are presented on a pre-tax and post-tax basis. A static metal price of US$ 1,800/oz has been applied. All-in sustaining costs have been reported as per the WGC guideline dated November 2018 and is exclusive of project capital, depreciation, and amortization costs. Capital payback is exclusive of the construction period and referenced to the start of first production. Key financial outcomes are shown in Table 19‑6 below.
Table 19‑6: Summary of Economic Outcomes
Description | Units | Value |
Production Statistics (LoM) |
Life of Mine | years | 11 |
Total RoM Tonnes | Mt | 25 |
Cost Estimate Summary (LoM) |
Capital Cost (incl. contingency) | US$ m | 414 |
SIB Capital Cost | US$ m | 6 |
Operating Cost | US$ m | 1,285 |
Unit Cost | US$/t RoM | 52 |
Revenue (LoM) |
Au Recovered | koz | 1,597 |
Ave. Price | US$/oz | 1,800 |
Financial Outcomes (Post-tax, Constant Model Terms) |
NPV @ 10% | US$ m | 328 |
IRR | % | 33.4 |
Peak Cash Funding | US$ m | 348 |
AISC | US$/oz | 922 |
Payback (UNDISCOUNTED) - From Production Start | years | 1.8 |
The LoM cash flow is summarized in Figure 19‑1 below. Figure 19‑1 shows the distribution of cash flow inclusive of capital costs, SIB capital, operating costs, revenue, rehab costs, royalties, and income tax.
Figure 19‑1: LoM Cash Flow Model
Table 19‑7: Cash Flow Model
| | | FY 2025 | FY 2026 | FY 2027 | FY 2028 | FY 2029 | FY 2030 | FY 2031 | FY 2032 | FY 2033 | FY 2034 | FY 2035 | FY 2036 | FY 2037 |
Total Gold Produced | koz | - | - | - | 222.25 | 166.10 | 164.64 | 183.03 | 161.41 | 160.61 | 129.46 | 129.45 | 151.14 | 129.28 |
Gross Revenue | US$ m | - | - | - | 400.05 | 298.97 | 296.36 | 329.45 | 290.54 | 289.10 | 233.03 | 233.00 | 272.05 | 232.70 |
Operating Costs | | | | | | | | | | | | | | |
Mining costs | US$ m | - | - | 7.75 | 70.69 | 78.55 | 67.49 | 69.35 | 78.01 | 91.15 | 56.18 | 46.42 | 42.62 | 30.93 |
Process plant costs | US$ m | - | - | - | 56.37 | 50.24 | 50.24 | 50.24 | 49.89 | 70.49 | 70.49 | 70.49 | 70.49 | 60.77 |
Process plant costs - Oxides | US$ m | - | - | - | - | - | - | - | - | - | - | - | - | - |
G&A costs | US$ m | - | - | - | 2.95 | 4.91 | 4.91 | 4.91 | 4.91 | 4.91 | 4.91 | 4.91 | 4.91 | 4.24 |
Refining | US$ m | - | - | - | 4.00 | 2.99 | 2.96 | 3.29 | 2.91 | 2.89 | 2.33 | 2.33 | 2.72 | 2.33 |
Total Operating Costs | US$ m | - | - | 7.75 | 134.02 | 136.69 | 125.60 | 127.79 | 135.72 | 169.45 | 133.92 | 124.16 | 120.75 | 98.26 |
SIB Capital | | | | | | | | | | | | | | |
Mining | US$ m | - | - | - | - | - | - | - | - | - | - | - | - | - |
Process plant | US$ m | - | - | - | 0.56 | 0.50 | 0.50 | 0.50 | 0.50 | 0.70 | 0.70 | 0.70 | 0.70 | 0.61 |
Total SIB Capital | US$ m | - | - | - | 0.56 | 0.50 | 0.50 | 0.50 | 0.50 | 0.70 | 0.70 | 0.70 | 0.70 | 0.61 |
| | | | | | | | | | | | | | | |
Rehabilitation Cost | US$ m | - | - | - | 0.84 | 0.72 | 0.72 | 0.72 | 0.61 | 0.54 | 0.54 | 0.54 | 0.54 | 31.90 |
| | | FY 2025 | FY 2026 | FY 2027 | FY 2028 | FY 2029 | FY 2030 | FY 2031 | FY 2032 | FY 2033 | FY 2034 | FY 2035 | FY 2036 | FY 2037 |
Royalties | US$ m | - | - | - | 20.00 | 14.95 | 14.82 | 16.47 | 14.53 | 14.46 | 11.65 | 11.65 | 13.60 | 11.63 |
Capital Expenditure | | | | | | | | | | | | | | |
Mining | US$ m | - | - | 30.99 | - | - | - | - | - | - | - | - | - | - |
Process and Infrastructure | US$ m | - | 128.05 | 109.48 | - | 5.35 | 4.94 | 24.69 | 33.02 | - | - | - | - | - |
Indirect | US$ m | - | 21.67 | 21.02 | - | - | 0.05 | 1.30 | 0.86 | - | - | - | - | - |
Contingency | US$ m | - | 8.77 | 20.61 | - | - | 0.00 | 2.23 | 2.66 | - | - | - | - | - |
Total Capital | US$ m | - | 158.50 | 182.11 | - | 5.35 | 4.99 | 28.22 | 36.54 | - | - | - | - | - |
Pre-Tax Cash Flow | US$ m | 0.00 | -158.50 | -189.86 | 244.63 | 140.76 | 149.73 | 155.74 | 102.63 | 103.95 | 86.21 | 95.95 | 136.45 | 90.29 |
Tax | | - | - | - | - | 9.15 | 37.01 | 38.50 | 25.37 | 25.70 | 21.31 | 23.72 | 33.73 | 22.32 |
Post-Tax Cash Flow | US$ m | 0.00 | -158.50 | -189.86 | 244.63 | 131.61 | 112.71 | 117.24 | 77.26 | 78.26 | 64.90 | 72.23 | 102.72 | 67.97 |
19.20 | Sensitivity Analysis |
A sensitivity analysis has been conducted assessing the impact of variations in initial capital cost, operating cost, and metal selling price. Each variable is assessed in isolation to determine the impact on Net Present Value (NPV) and Internal Rate of Return (IRR).
The impact of initial capital costs has a limited elasticity in impacting overall project value due to the capital phasing profile and relatively low expenditure in comparison to revenue and operating costs over the prescribed LoM. A summary of these relative variations is shown in Figure 19‑2.
Figure 19‑2: Sensitivity Analysis
Several small mines and two larger ones have operated in the past in the area around the Isabella property and within the Isabella and Gwizaan EPOs (Figure 20‑1) but all of these had been dormant for at least 15 years prior to the renewal of exploration activity in the area in the early 1980s. The productions listed in Table 20‑1 are for the period to 1980. The Calcite Mine is located in the area now covered by the Isabella operation and its production is included in the History section. The Motapa, Fossicker and Jupiter Mines are situated immediately to the south of the Mine and trend in the same general strike of Isabella, McCays and Bubi.
The Isabella EPO 1726 surrounds Isabella McCays while the Gwizaan EPO 1646 surrounds Bubi as well as a cluster of other Bilboes exploration claims namely When, Sandy and Ferroro. The two EPOs which are contiguous were approved for exploration through a government gazette of 13 July 2018 and had a combined ground holding of 67,419 ha. The EPOs has a three-year tenure which expired on 12 July 2021. Applications for extension the tenure of the EPOs is still pending. Several high quality geological and aeromagnetic targets are located within the major northeast-southwest trending deformation zones that transect the EPOs such as along the Peter-Pan, Courtleigh and Gabriella-Mulungwane shear zones. These targets in addition to the existing exploration claims offer potential for organic growth of Bilboes’ gold Mineral Resources.
Figure 20‑1: Adjacent Properties around Isabella McCays and Bubi
Table 20‑1: Historic Gold Production from Mines around Isabella McCays and Bubi to 1980
Mine | Au kg | Grade g/t | Coordinates | Locality from Isabella |
| | | Easting | Northing | |
Motapa | 9,467 | 4.3 | 663,613 | 7,844,250 | 2 km south |
Fossicker | 472 | 3.7 | 664,953 | 7,844,803 | 3 km south-east |
Jupiter | 201 | 3.9 | 663,870 | 7,846,633 | 1 km east |
Lonely | 34,786 | 17.5 | 683,276 | 7,841,837 | 20 km east |
Peter Pan | 968 | 2.9 | 680,606 | 7,846,618 | 18 km east |
Robin Hood | 248 | 2.1 | 677,790 | 7,848,663 | 15 km east |
Tiberius | 263 | 2.2 | 679,408 | 7,842,128 | 17 km east |
Source Bartholomew (1990), Coordinate system: UTM, Arc1950, Zone 35S, Spheroid-Clarke 1880.
The QP has been unable to verify the information in this section. The information in this section is not necessarily indicative of the mineralization on the Bilboes properties.
21 | OTHER RELEVANT DATA AND INFORMATION. |
Note: The information below relates to the fiscal year 2023 and is in Zimbabwe Dollars (Z$), unless otherwise stated. An appropriate exchange rate to the US$ will be applied at the time of any transaction.
21.1 | Royalties, Taxes and Economic Climate in Zimbabwe |
| | 21.1.1 | Royalties, Taxes and Economic Climate in Zimbabwe |
The tax regime in Zimbabwe has remained relatively stable and favourable regionally over the past few years and those directly affecting the mining industry are listed below.
Royalties are levied on gross revenue from the sale of gold.
| | ● | Royalties are levied at source hence payments made by Fidelity Printers and Refiners (Private) Limited (Fidelity) (the entity that buys all of the official production in Zimbabwe) are net of royalties. |
| | ● | From 1 January 2020, mining royalties are an allowable expense in the determination of taxable income. |
| | ● | For primary gold producers a two-tier system that is based on gold prices is applicable. For gold prices below US$1,200/oz the rate is 3% and for gold prices above US$1,200/oz the rate is 5% |
| | ● | The government is still considering other proposals submitted by mining houses to restore viability through review of other fees and charges. |
| | ● | The basis of determination of royalty payments on opaque mining products as follows: |
| | ● | Concentrate – computed on 80% of the international price of the refined mineral contained therein. |
| | ● | Matte- computed on 85% of the international price of the refined mineral contained therein. |
| | ● | Gold: invoice value as determined by Fidelity Printers and Refineries |
| | ● | Diamonds and all other minerals, the invoice value as determined by the MMCZ. |
| | ● | Maximum applied on cost of imports | : 10% |
| | | | |
| | ● | Capital equipment imports | : 0% |
| | ● | Locally procured and imported inputs and equipment | : 15% |
| | | | |
| | ● | Exports are zero rated and input VAT is fully recoverable in most cases or can be used to set off against other tax liabilities. No output VAT is levied on gold sales as they are zero-rated. Silver is subject to VAT at 14.5%. |
| | ● | Supplies by unregistered traders (without Tax Clearance Certificate) | : 30% |
| | | | |
| | ● | Non-Resident Shareholders’ Tax on dividends | : 15% |
| | | | |
| | ● | On fees, royalties, dividends, and interest | : 15% |
| | | | |
| | ● | On dividends distributed by a ZSE listed company | : 10% |
| | | | |
| | ● | Services from non-residents | : 15% |
| | ● | On taxable profits: 25% flat rate [plus 3% AIDS levy] to make effective rate 25.75%, |
| | ● | Capital redemption allowances in year incurred |
| | | |
| | | : 100%, |
| | ● | Deduction limits on passenger vehicles |
| | | |
| | | : Z$5million /US$10,000, |
| | ● | Deduction limits on employee housing |
| | | : Z$12,5 million / US$ 25,000, |
| | ● | Deduction limits on donations to medical centers |
| | | : Z$50 million/ US$ 100,000 per annum, |
| | ● | Deduction limits on donations to research and development institutions |
| | | : Z$50 million / US$100,000 per annum. |
| | ● | Pre-production operating expenditure |
| | | : 100% in first year of production |
| | | : Indefinite for mining operations. |
| | ● | Each mining location is ring fenced and only costs applicable to location are deductible. |
| | ● | National Social Security | : 4.5% of an employee wage rate. |
| | | | |
| | ● | The cap is declared monthly | : Z$2,414,896per month. |
| | | | |
| | ● | Workmen’s compensation | : 1.77% base earnings |
| | | | |
| | ● | Manpower Development Levy | : 1% of the gross earnings |
| | | | |
| | ● | Standards Development Levy | : 0.5% of the gross earnings |
| | ● | Rural Electrification Levy | : 6% of electricity bill |
| | 21.1.10 | Rural Council Levies |
| | ● | Unit tax: Z$12,000 / unit |
| | ● | The number of units for each company is dependent on number of employees with the first 100 employees making a unit and any other 50 employees thereafter forming units. |
| | 21.1.11 | Other Relevant Points |
| | ● | Administration fees in excess of 1% of other tax-deductible expenses is disallowed and taxed as a dividend. |
| | ● | Capital gains tax (Table 21‑1) |
Table 21‑1: Capital Gains Tax
Acquired | Rate | Currency |
Before 22 February 2019 | 5% of gross capital amount | ZWL |
| | 5% of foreign currency gross capital amount | US$ |
On or after 22 February 2019 | 20% of capital gain | ZWL |
| | 20% of foreign currency capital gain | US$ |
| | ● | Capital gains withholding tax: |
| | ● | On listed marketable securities | : 1.5% |
| | | | |
| | ● | On listed marketable securities held for less than 6 months | : 4% |
| | | | |
| | ● | On unlisted marketable securities | : 5% |
| | | | |
| | ● | On immovable property acquired before 22 February 2019 | : 5% |
| | | | |
| | ● | On immovable property acquired after 22 February 2019 | : 15% |
| | | | |
| | ● | All items consumer price index to be used in computing inflation allowance for ZWL disposals and 2.5% for US$ transactions. |
Note: In respect of any sale of a specified asset that is purported to have been sold in Zimbabwe dollars, it shall be presumed that the specified asset was paid for in a foreign currency at the United Sates dollar market valuation of the specified asset on the date of sale, and that the capital gains tax thereon shall be paid in United States dollars accordingly, unless the seller provides documentary proof satisfactory to the commissioner of taxes that the specified assets in question was sold for Zimbabwean dollars Deferment of VAT collection on imported capital equipment is as per Table 21‑2:
Table 21‑2: Vat Collection
Value of Equipment (US$) | Deferment period (Days) |
100,000 to 1,000,000 | 90 |
1,000,001 to 10,000,000 | 120 |
10,000,001 and above | 180 |
| | ● | Mining claims fees are based on land area. The Mines and Minerals Act provides for maintenance of mining title through payment of annual protection fees. Protection fees for a gold / base metal block is US$150 per 5 ha per annum. For Exclusive Prospecting Orders (EPOs) they have a two to three-year tenure and can be renewed for an additional period to a cumulative maximum of six years subject to approval by the Ministry of Mines and Mining Development’s Mining Affairs Board and a renewal fee of US$1,500 is required with the application. The annual rental fee US$0.08 per ha in the first year, US$0.11 in the second year and US$0.15 in the third year. A company is allowed to peg claims during the tenure of the EPO subject to the following conditions: |
| | ● | That the area to be Pegged is not prohibited from pegging under the Mines and Minerals Act after the acquisition of a prospecting licenses at US$75 per gold / base metal block |
| | ● | Appointment of an Approved Pegger for the requisite groundwork and filing of paperwork for registration. |
| | ● | Payment of registration fees of US$300 or a base metal block and US$ 563 for a special base metal block. |
| | ● | Approval by the Ministry of Mines for erection of permanent beacons around the blocks as per Mines and Minerals Act. |
| | ● | EIA fees charged based on a sliding scale from 0.8% to 1.2% of the relevant project cost. |
| | ● | Payroll tax (Pay as You Earn) is deducted from employees’ earnings and paid to the government. The tax-free band has been increased to Z$9,000,000 per annum or Z$750,000 per month. The upper income tax bands moved to Z$270,000,000 per annum or Z$22,500,000 per month. The effective maximum rate of tax (including AIDS levy) is 41.2%. |
| | ● | Exemption of customs duty import tax and surtax on all capital goods during exploration phase of a mining project and for a period of up to 5 years from date of grant of a mining title, during the development phase of the mining project. |
| | ● | A 2% Intermediated Money Transfer Tax (IMTT) charged per e-commerce ZWL denominated transaction. Any transaction exceeding equivalent in ZWL of US$500,000 has a maximum tax of US$10,150 (at the Interbank Rate) payable in ZWL. |
| | ● | A 1% IMTT charged per e-commerce foreign currency denominated transaction. Any transaction exceeding US$500,000 has a maximum tax of US$10,150. |
| | ● | IMTT (Outbound Foreign Payment Tax) at a rate of 1% for every outbound foreign payment or partial payment made. This tax applies to each transaction that is subject to the tax thin capitalization - Offshore borrowings require Reserve Bank of Zimbabwe approval, and interest paid on borrowings of a debt-to-equity ratio of up to a maximum of three to one is tax deductible. Beyond the maximum allowable ratio any interest paid is assumed to be a dividend pay-out and is liable to withholding tax at the non-resident tax rate. |
The following tax rebates are allowed:
| | ● | Rebate of duty on goods for the prospecting and search for mineral deposits. |
| | ● | Rebate of duty on goods imported in terms of an agreement entered pursuant to a special mining lease. |
| | ● | Rebate of duty on goods imported temporarily for an approved project. |
| | ● | Rebate of duty on goods for incorporation in the construction of approved projects; and |
| | ● | No export duties for all mineral commodities. |
| | ● | Rebate of duty extended to capital equipment imported by mining and manufacturing sectors for values above 1 million, effective 1 January 2016. |
The Government, as of 2019, had amended the mining laws, thereby decriminalizing the operation of small-scale miners to allow more locals to participate in the exploitation of the country’s mineral wealth. More emphasis is being placed on the “use it or lose it” regulations, which allow the government to repossess unused mining claims from holders.
22 | INTERPRETATION AND CONCLUSIONS |
22.1 | Mineral Resource Estimate |
| | ● | The data collected during the exploration, drilling and sampling programmes, including surveying, drill hole logging, sampling, geochemical analysis, and data quality assurance, was collected in a professional manner and in accordance with appropriate industry standards by suitably qualified and experienced personnel. |
| | ● | The data was reviewed and validated by the QP who concluded that the data is suitable for the construction of the geological model and for the estimation of the Mineral Resource. |
| | ● | The QP is confident that enough geological work has been undertaken, and sufficient geological understanding gained, to enable the construction of a geological model suitable for the determination of a Mineral Resource estimate. |
| | ● | The geological modelling and Mineral Resource estimate were undertaken utilizing recognized deposit and industry strategies/methodologies for the type of deposit of the Bilboes Gold Mine. |
| | ● | The QP considers that both the modelling and the grade interpolation have been conducted in an unbiased manner and that the resulting grade and tonnage estimates should be reliable within the context of the classification applied. |
| | ● | The Mineral Resource estimate was suitably verified prior to sign off by the QP. |
| | ● | The approach to the classification of the Mineral Resource estimate is considered appropriate for the Bilboes Gold Mine. Sufficient detail is presented to confirm the robustness of the approach. |
| | ● | The Mineral Resource is constrained in an optimized pit shell. This together with the assumptions relating to mining, processing, infrastructure, and market factors supports the “reasonable prospects for eventual economic extraction. |
| | ● | The QP is not aware of any metallurgical, infrastructural, environmental, legal, title, taxation, socio-economic, or marketing issues that would impact on the Mineral Resource, or Reserve statements as presented. |
| | ● | Based on an assessment including: - data quality and integrity, data spacing, confidence in the grade interpolation, confidence in the geological interpretation and confidence in the estimate the QP believes the Mineral Resource estimated is robust. |
22.2 | Mineral Reserves Estimate |
| | ● | The QP responsible for the declaration of the Mineral Reserve, is confident that significant geological work has been undertaken, and sufficient geological understanding gained, to enable the construction of an ore body model suitable for the derivation of Mineral Resource and Mineral Reserve estimates. |
| | ● | Based on the information presented in this TRS, the QP considers the Mineral Reserve estimate to be supported by the appropriate technical data and assumptions. |
| | ● | The QP considers that both the modelling and the grade interpolation have been conducted in an unbiased manner and that the resulting grade and tonnage estimates should be reliable within the context of the classification applied. |
| | ● | The open pit modelling is based on suitably supported assumptions and parameters and completed utilizing appropriate industry standards suitable for the Bilboes Gold Mine. |
| | ● | The economic modelling is supported by technical studies in mining, processing, infrastructure, environmental, social, and marketing. Based on the inputs from these disciplines, the financial model demonstrates a feasible mine. The economic analysis is based on a US$ 1,800/oz. |
| | ● | The sensitivity analyses demonstrates that the profitability of the project is most sensitive to revenue related factors such as gold price and recovery. |
| | ● | The QP is not aware of any metallurgical, infrastructural, environmental, legal, title, taxation, socio-economic, or marketing issues that would impact on the Mineral Reserve statements as presented or that would impact on the reliability and/or confidence of the declaration. |
The financial model has been prepared on a 100% equity project basis and does not consider alternative financing scenarios. A discount rate of 10% has been applied in the analysis. The outcomes are presented in Table 22‑1 on a pre-tax and post-tax basis. A static metal price of US$1,800 /oz has been applied.
Table 22‑1: Project Economics Summary
Description | Unit | Pre-Tax | Post-Tax |
Project Economics | |
NPV @ 10% | Million US$ | 411 | 328 |
IRR | % | 38.6 | 33.4 |
Peak Cash Funding | Million US$ | 348 | 348 |
AISC* | US$/oz | 922 | 922 |
Payback (UNDISCOUNTED) | yrs | 1.8 | 1.8 |
*As per updated guidance note published by WGC, 2018. Excludes project capital, depreciation, and amortization costs.
Various risks have been identified with consideration of the appropriate mitigating factors. These are presented in Table 22‑2.
Table 22‑2: Summary of Identified Risks and The Mitigation Strategies
Risk Category | Risk | Description / Cause | Mitigation / Control |
Permitting | Significant effect of ability to produce | The lapsing of permits or license | Proactive management oof permits, licenses, compliance etc. |
Geology and Mineral Resources | Significant Variance in Mineral Resource Tonnage | 1. Inaccurate mineral resource models due to poor geological understanding of the deposit. 2. Inaccurate mineral resource models due to geological complexity of the deposit. 3. The tonnage is expected to change on a local scale but is unlikely to vary significantly on a global scale. | 1. Contingency measures applied during mineral resource modelling to ensure mineral resource models remain conservative. 2. Continued drilling conducted on the deposit to improve geological understanding of the deposit. 3. A infill drilling programme will be conducted pre-mining and throughout the life of the mine. |
Geology and Mineral Resources | Significant Variance in Mineral Resource Grade | The estimation of the grade is based on a limited number of intersection points. Although care has been taken to provide a robust estimate, the grade is expected to change on a local scale but is unlikely to vary significantly on a global scale. | 1. A grade control programme including drilling will be conducted pre-mining and throughout the life of the mine. Provision has been made for infill drilling and on-going exploration drilling during LoM. |
Geology and Mineral Resources | Inaccurate oxide, transitional and sulfide Ore Reserve tonnes and grades | Poor interpretation of the oxide, transitional and sulfide zones resulting in non-optimal planning. | Continued monitoring of the Oxide-Sulfide interface during the mining operation. |
Mining | Poor run of mine ore grade | Poor grade control of the RoM ore resulting in excessive dilution or the run of mine ore grades. | 1. Grade control drilling will be conducted pre-mining and the cost for this has been allowed for in the PFS. 2. Grade controllers will be employed to monitor the mining team during operations. |
Mining | Significant reduction in ore produced | Lack of production due to aspects of geology, personnel, and resources | 1. Continuous skills training 2. Monitoring of critical resources of production e.g. fleet 3. Proactive production management |
Processing | Lower than planned gold recovery from the plant | Inaccurate gold recovery from the plant | 1. Gold recovery assumptions were informed by the on-site flotation and BIOX® pilot plant test work. 2. Bilboes procured a flotation and a BIOX pilot plant for on-site test works during the operational phase to optimize the flotation and BIOX® gold recovery. 3. Sulfide / Sulphur concentrate feed grade which ensures high bacterial activity and process stability is higher than the minimum of 4-6% required. |
| Risk Category | Risk | Description / Cause | Mitigation / Control |
Processing | Operational inefficiencies in the BIOX® plant | 1. As it will be the first BIOX plant in Zimbabwe there may not be local operators / metallurgists with appropriate expertise. 2. Shortage of BIOX critical skills in Zimbabwe. | 1. Provision made for experienced in the budget. 2. Bilboes will enter into a BIOX® Technology License Agreement with Outotec for technical support in the running of the BIOX plant. 3. Outotec will train and develop local personnel in the running of the BIOX® plant. 4. Bilboes will second personnel to similar operations for exposure before commencement of its own operation. |
Finance | Inflation | The project is in Zimbabwe, which is facing severe economic challenges, which seriously undermines confidence for investment in major projects. | The project earns its revenues and pays all its costs in US$ and has minimal exposure to Zimbabwe inflation. |
23.1 | Project Feasibility / Pre Project Execution / Implementation |
Revise the earlier feasibility study to restate the base case to the required accuracy class and introduce areas of optimization to maximise the business case and finalise planning for the project execution phase. The revised feasibility study will also be the main foundation for project execution funding. The feasibility study revision will require $3.5 million.
23.2 | Mineral Resource Estimation |
During a future operational phase, drilling is required to develop an advanced grade control model prior to mining. The costs for this have been allocated at 5% of G&A costs.
23.3 | Mineral Reserve Estimate |
| | ● | As part of a revised feasibility study, conduct Whittle optimization studies at higher gold prices than the current plan to investigate the potential for additional Mineral Reserves. |
| | ● | On-going geotechnical analysis is recommended during future mining operations to assess pit slope angles to investigate if improvements can be made for less waste stripping, reduced operating costs, and improve overall business economics. |
| | ● | Bartholomew DS (1990) Gold Deposits in Zimbabwe. Geological Survey of Zimbabwe Mineral Resources Series, 23, pp 75 |
| | ● | Gore, J., James, D. E., Zengeni, T. G., & Gwavava, O. G. (2009). Crustal Structure of the Zimbabwe Craton and the Limpopo Belt of South Africa: New Constraints from Seismic Data and Implications for its Evolution. The Geological Society of South Africa, 112, 213-228. |
| | ● | Mugandani, E. T. (2017). Status of Mineral Exploration and Development in Zimbabwe. SAIMM Conference. |
| | ● | Mukasa, S. B.; Wilson, A. H.; and Carlson, R. W. 1998. A multielement geochronologic study of the Great Dyke, Zimbabwe: significance of the robust and reset ages. Earth Planet. Sci. Lett. 164:353–369. |
| | ● | Ngilazi, A., & Martin, A. (2017). Independent Technical Report on Bilboes Properties, Matabeleland, Zimbabwe. Technical Report, Bibloes Holdings (Pvt) Ltd. |
| | ● | Subramani D, Mungoshi J, Olivier J, Thompson D (15 December 2021). Bilboes Gold Project Feasibility Study, National Instrument 43-101 Technical Report. Document Number: J JZWEBR7537-STU-REP-001. Prepared on behalf of Bilboes Gold Limited. |
| | ● | SLR Consulting (Pty) ltd (August 2019) Hydrogeological Study for Bubi-Isabella-McCays Mines. Project No.: 710.04026.00019. Prepared for: DRA Projects (Pty) Ltd |
| | ● | SLR Consulting (Pty) ltd (August 2019) Geotechnical Study for Bubi-Isabella-McCays Mines. Project No.: 710.04026.00019. Prepared for: DRA Projects (Pty) Ltd |
| | ● | World Gold Council (2018) Guidance Note on Expenditure Definitions |
| | ● | World Gold Council (2024) Statistics for Gold Demand and Supply |
25 | RELIANCE ON INFORMATION PROVIDED BY THE REGISTRANT |
The following chart identifies the categories of information for which the QP has relied on information provided by Bilboes and the particular portions of the TRS that were prepared in reliance upon such information and the extent of such reliance.
| | ● | Geological Data (drilling, assays etc.) and Exploration Information, |
| | ● | Metallurgical test work reports, |
| | ● | Processing labour rates, unit power costs and unit reagent costs delivered to site, |
| | ● | General and administrative costs, |
| | ● | Maro variables covering exchange rates and gold pricing (including refining), |
| | ● | General economic input variables, taxation and levy rates, |
| | ● | Geotechnical Studies where completed by SLR, |
| | ● | The Tailings Storage Facility design and costing was also completed by SLR. |
The QP affirms that the inputs mentioned above which have been supplied by other sources meet an acceptable standard, drawing from relevant sources derived from prior experience, current applicable operations and/or applicable benchmarks/studies.
The QP believes such reliance is reasonable after the data/information has been reviewed.