UNITED STATES
SECURITIES AND EXCHANGE COMMISSION
Washington, D.C. 20549
FORM N-CSR
CERTIFIED SHAREHOLDER REPORT OF REGISTERED MANAGEMENT INVESTMENT COMPANIES
Investment Company Act file number 811-04282
| | |
| Name of Fund: | | BlackRock Natural Resources Trust |
| |
| Fund Address: | | 100 Bellevue Parkway, Wilmington, DE 19809 |
Name and address of agent for service: John M. Perlowski, Chief Executive Officer, BlackRock Natural Resources
Trust, 55 East 52nd Street, New York, NY 10055
Registrant’s telephone number, including area code: (800) 441-7762
Date of fiscal year end: 07/31/2013
Date of reporting period: 01/31/2013
| | | | |
| Item 1 | | – | | Report to Stockholders |
JANUARY 31, 2013
| | | | | | |
SEMI-ANNUAL REPORT (UNAUDITED) | | | | | |  |
BlackRock Equity Dividend Fund
BlackRock Natural Resources Trust
|
| Not FDIC Insured • May Lose Value • No Bank Guarantee |
| | | | | | |
| | | | | | | |
| 2 | | SEMI-ANNUAL REPORT | | JANUARY 31, 2013 | | |
Financial markets have substantially improved over the past year, providing investors with considerable relief compared to where things were during the global turmoil seen in 2011. Despite a number of headwinds, higher-risk asset classes boasted strong returns as investors sought meaningful yields in the ongoing low-interest-rate environment.
Rising investor confidence drove equity markets higher in early 2012, while climbing US Treasury yields pressured higher-quality fixed income assets. The second quarter, however, brought a market reversal as Europe’s debt crisis boiled over once again. Political instability in Greece and severe deficit and liquidity problems in Spain raised the specter of a euro collapse. Alongside the drama in Europe, investors were discouraged by gloomy economic reports from various parts of the world. A slowdown in China, a key powerhouse for global growth, emerged as a particular concern. But as the outlook for the global economy worsened, investors grew increasingly optimistic that the world’s largest central banks would soon intervene to stimulate growth. This theme, along with the European Central Bank’s (“ECB’s”) firm commitment to preserve the euro currency bloc, drove most asset classes higher through the summer. Policy relief came in early September, when the ECB announced its decision to support the eurozone’s troubled peripheral countries with unlimited purchases of short term sovereign debt. Days later, the US Federal Reserve announced its own much-anticipated stimulus package.
Although financial markets world-wide were buoyed by accommodative monetary policy, risk assets weakened in the fall. Global trade slowed as many European countries fell into recession and growth continued to decelerate in China, where a once-a-decade leadership change compounded uncertainty. In the United States, stocks slid on lackluster corporate earnings reports and market volatility rose during the lead up to the US Presidential election. In the post-election environment, investors grew increasingly concerned over automatic tax increases and spending cuts that had been scheduled to take effect at the beginning of 2013 (known as the “fiscal cliff”). There was widespread fear that the fiscal cliff would push the nation into recession unless politicians could agree upon alternate measures to reduce the deficit before the end of 2012. Worries that bipartisan gridlock would preclude a timely budget deal triggered higher levels of volatility in financial markets around the world in the months leading up to the last day of the year. Ultimately, the United States averted the worst of the fiscal cliff with a last-minute tax deal; however, decisions relating to spending cuts and the debt ceiling continue to weigh on investors’ minds.
Investors shook off the nerve-wracking finale to 2012 and began the New Year with a powerful equity rally. Key indicators signaled broad-based improvements in the world’s major economies, particularly China. In the United States, economic data was mixed, but pointed to a continued recovery. The risk of inflation remained low and the US Federal Reserve showed no signs of curtailing its stimulus programs. Additionally, January saw the return of funds that investors had pulled out of the market in late 2012 amid uncertainty about tax-rate increases ahead of the fiscal cliff deadline. In fixed income markets, rising US Treasuries yields dragged down higher-quality asset classes, while high yield bonds continued to benefit from investor demand for yield in the low-rate environment.
On the whole, riskier asset classes outperformed lower-risk investments for the 6- and 12-month periods ended January 31, 2013. International equities were the strongest performers. US stocks and high yield bonds also generated significant returns. Emerging market equities were particularly volatile, but still posted gains for both the 6- and 12-month periods. US Treasury yields remained low, but experienced increasing volatility in recent months. Rising yields near the end of the period resulted in negative returns for Treasuries and investment-grade bonds for the 6-month period. Tax-exempt municipal bonds, however, benefited from favorable supply-and-demand dynamics. Near-zero short term interest rates continued to keep yields on money market securities near their all-time lows.
While investors continue to face a host of unknowns, we believe new opportunities abound. BlackRock was built to provide the global market insight, breadth of capabilities, unbiased investment advice and deep risk management expertise these times require. We encourage you to visit www.blackrock.com/newworld for more information.
Sincerely,

Rob Kapito
President, BlackRock Advisors, LLC

“Despite a number of headwinds, higher-risk asset classes boasted strong returns as investors sought meaningful yields in the ongoing low-interest-rate environment.”
Rob Kapito
President, BlackRock Advisors, LLC
| | | | | | | | |
| Total Returns as of January 31, 2013 | |
| | | 6-month | | | 12-month | |
US large cap equities
(S&P 500® Index) | | | 9.91 | % | | | 16.78 | % |
US small cap equities
(Russell 2000® Index) | | | 15.51 | | | | 15.47 | |
International equities
(MSCI Europe, Australasia, Far East Index) | | | 18.61 | | | | 17.25 | |
Emerging market equities (MSCI Emerging Markets Index) | | | 13.11 | | | | 7.64 | |
3-month Treasury bill
(BofA Merrill Lynch
3-Month US Treasury Bill Index) | | | 0.07 | | | | 0.11 | |
US Treasury securities
(BofA Merrill Lynch
10-Year US Treasury Index) | | | (2.90 | ) | | | 1.28 | |
US investment grade
bonds (Barclays US Aggregate Bond Index) | | | (0.29 | ) | | | 2.59 | |
Tax-exempt municipal
bonds (S&P Municipal Bond Index) | | | 2.21 | | | | 5.50 | |
US high yield bonds
(Barclays US Corporate High Yield 2% Issuer Capped Index) | | | 7.37 | | | | 13.87 | |
| Past performance is no guarantee of future results. Index performance is shown for illustrative purposes only. You cannot invest directly in an index. | |
| | | | | | |
| | | | | | | |
| | THIS PAGE NOT PART OF YOUR FUND REPORT | | | | 3 |
| | |
| Fund Summary as of January 31, 2013 | | BlackRock Equity Dividend Fund |
BlackRock Equity Dividend Fund’s (the “Fund”) investment objective is to seek long-term total return and current income.
|
| Portfolio Management Commentary |
How did the Fund perform?
| Ÿ | | For the six-month period ended January 31, 2013, the Fund underperformed its performance benchmark, the Russell 1000® Value Index, and the broad-market S&P 500® Index. The following discussion of relative performance pertains to the Russell 1000® Value Index. |
What factors influenced performance?
| Ÿ | | The most significant detractor from the Fund’s relative performance was a combination of stock selection and a large underweight in the financials sector, followed by stock selection within consumer staples. Also having a negative impact was stock selection within information technology (“IT”), consumer discretionary, health care, industrials and materials, as the Fund’s bias toward high-quality, less volatile stocks led to underperformance versus the benchmark index in these sectors. |
| Ÿ | | Contributing positively to relative performance during the period was a combination of stock selection and an underweight in the energy sector. Stock selection within utilities also had a positive impact. An overweight in the consumer discretionary sector was another significant contributor to relative returns. Adding marginally to performance was an overweight in the materials sector and stock selection within telecommunication services. |
Describe recent portfolio activity.
| Ÿ | | The Fund largely maintained its allocations during the period, relying on its quality bias to weather heightened uncertainty resulting from the US Presidential election, a hotly debated fiscal cliff, budgetary issues and stumbling global growth. These factors created a challenging environment for US equities and deterred the Fund from implementing material changes to its overall positioning. |
| Ÿ | | The Fund maintained its preference for US-domiciled multinational companies, especially dividend payers. The Fund also continued to maintain exposure to emerging markets and favored mega-cap, industry leaders with the ability to price their products on par with or above the rate of inflation and maintain dividend growth. |
Describe portfolio positioning at period end.
| Ÿ | | Relative to the Russell 1000® Value Index, the Fund ended the period overweight in industrials, consumer staples and materials and underweight in financial, health care, energy and IT. |
The views expressed reflect the opinions of BlackRock as of the date of this report and are subject to change based on changes in market, economic or other conditions. These views are not intended to be a forecast of future events and are no guarantee of future results.
| | |
| Ten Largest Holdings | | Percent of
Long-Term Investments |
| | | | |
Chevron Corp. | | | 3 | % |
JPMorgan Chase & Co. | | | 3 | |
Wells Fargo & Co. | | | 3 | |
Pfizer, Inc. | | | 2 | |
Home Depot, Inc. | | | 2 | |
Exxon Mobil Corp. | | | 2 | |
BHP Billiton Ltd. | | | 2 | |
General Electric Co. | | | 2 | |
International Business Machines Corp. | | | 2 | |
Philip Morris International, Inc. | | | 2 | |
| | |
| Sector Allocation | | Percent of Long-Term Investments |
| | | | |
Financials | | | 18 | % |
Industrials | | | 15 | |
Energy | | | 14 | |
Consumer Staples | | | 12 | |
Consumer Discretionary | | | 10 | |
Health Care | | | 8 | |
Materials | | | 7 | |
Utilities | | | 7 | |
Telecommunication Services | | | 5 | |
Information Technology | | | 4 | |
For Fund compliance purposes, the Fund’s sector classifications refer to any one or more of the sector sub-classifications used by one or more widely recognized market indexes or rating group indexes, and/or as defined by Fund management. These definitions may not apply for purposes of this report, which may combine such sector sub-classifications for reporting ease.
| | | | | | |
| | | | | | | |
| 4 | | SEMI-ANNUAL REPORT | | JANUARY 31, 2013 | | |
| | |
| | | BlackRock Equity Dividend Fund |
|
| Total Return Based on a $10,000 Investment |
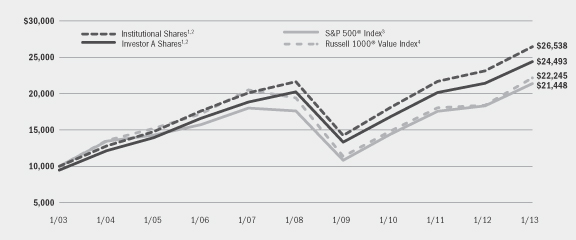
| | 1 | | Assuming maximum sales charges, if any, transaction costs and other operating expenses, including investment advisory fees. Institutional Shares do not have a sales charge. |
| | 2 | | Under normal circumstances, the Fund invests at least 80% of its assets in equity securities and at least 80% of its assets in dividend paying securities. |
| | 3 | | This unmanaged index covers 500 industrial, utility, transportation and financial companies of the US markets (mostly New York Stock Exchange (“NYSE”) issues), representing about 75% of NYSE market capitalization and 30% of NYSE issues. |
| | 4 | | This unmanaged broad-based index is a subset of the Russell 1000® Index consisting of those Russell 1000® securities with lower price-to-book ratios and lower forecasted growth values. |
|
| Performance Summary for the Period Ended January 31, 2013 |
| | | | | | | | | | | | | | | | | | | | | | | | | | | | |
| | | | | | Average Annual Total Returns5 | |
| | | | | | 1 Year | | | 5 Years | | | 10 Years | |
| | | 6-Month
Total Returns | | | w/o sales
charge | | | w/sales
charge | | | w/o sales
charge | | | w/sales
charge | | | w/o sales
charge | | | w/sales
charge | |
Institutional | | | 7.89 | % | | | 14.38 | % | | | N/A | | | | 4.11 | % | | | N/A | | | | 10.25 | % | | | N/A | |
Service | | | 7.68 | | | | 13.99 | | | | N/A | | | | 3.84 | | | | N/A | | | | 9.97 | | | | N/A | |
Investor A | | | 7.72 | | | | 14.00 | | | | 8.02 | % | | | 3.81 | | | | 2.70 | % | | | 9.96 | | | | 9.37 | % |
Investor B | | | 7.28 | | | | 13.12 | | | | 8.62 | | | | 3.00 | | | | 2.64 | | | | 9.27 | | | | 9.27 | |
Investor C | | | 7.36 | | | | 13.20 | | | | 12.20 | | | | 3.05 | | | | 3.05 | | | | 9.14 | | | | 9.14 | |
Investor C1 | | | 7.43 | | | | 13.35 | | | | 12.35 | | | | 3.25 | | | | 3.25 | | | | 9.36 | | | | 9.36 | |
Class R | | | 7.56 | | | | 13.71 | | | | N/A | | | | 3.50 | | | | N/A | | | | 9.73 | | | | N/A | |
S&P 500® Index | | | 9.91 | | | | 16.78 | | | | N/A | | | | 3.97 | | | | N/A | | | | 7.93 | | | | N/A | |
Russell 1000® Value Index | | | 13.97 | | | | 20.58 | | | | N/A | | | | 2.70 | | | | N/A | | | | 8.32 | | | | N/A | |
| | 5 | | Assuming maximum sales charges, if any. Average annual total returns with and without sales charges reflect reductions for distribution and service fees. See “About Fund Performance” on page 8 for a detailed description of share classes, including any related sales charges and fees. |
| | | | N/A — Not applicable as share class and index do not have a sales charge. |
| | | | Past performance is not indicative of future results. |
| | | | | | | | | | | | | | | | | | | | | | | | | | | | |
| | | Actual | | | Hypothetical7 | | | | |
| | | Beginning
Account Value
August 1, 2012 | | | Ending
Account Value
January 31, 2013 | | | Expenses Paid
During the
Period6 | | | Beginning
Account Value
August 1, 2012 | | | Ending
Account Value
January 31, 2013 | | | Expenses Paid
During the
Period6 | | | Annualized
Expense Ratio | |
Institutional | | $ | 1,000.00 | | | $ | 1,078.90 | | | $ | 3.62 | | | $ | 1,000.00 | | | $ | 1,021.73 | | | $ | 3.52 | | | | 0.69 | % |
Service | | $ | 1,000.00 | | | $ | 1,076.80 | | | $ | 4.97 | | | $ | 1,000.00 | | | $ | 1,020.42 | | | $ | 4.84 | | | | 0.95 | % |
Investor A | | $ | 1,000.00 | | | $ | 1,077.20 | | | $ | 4.97 | | | $ | 1,000.00 | | | $ | 1,020.42 | | | $ | 4.84 | | | | 0.95 | % |
Investor B | | $ | 1,000.00 | | | $ | 1,072.80 | | | $ | 9.04 | | | $ | 1,000.00 | | | $ | 1,016.48 | | | $ | 8.79 | | | | 1.73 | % |
Investor C | | $ | 1,000.00 | | | $ | 1,073.60 | | | $ | 8.68 | | | $ | 1,000.00 | | | $ | 1,016.84 | | | $ | 8.44 | | | | 1.66 | % |
Investor C1 | | $ | 1,000.00 | | | $ | 1,074.30 | | | $ | 7.74 | | | $ | 1,000.00 | | | $ | 1,017.74 | | | $ | 7.53 | | | | 1.48 | % |
Class R | | $ | 1,000.00 | | | $ | 1,075.60 | | | $ | 6.54 | | | $ | 1,000.00 | | | $ | 1,018.90 | | | $ | 6.36 | | | | 1.25 | % |
| | 6 | | For each class of the Fund, expenses are equal to the annualized expense ratio for the class, multiplied by the average account value over the period, multiplied by 184/365 (to reflect the one-half year period shown). |
| | 7 | | Hypothetical 5% annual return before expenses is calculated by pro rating the number of days in the most recent fiscal half year divided by 365. |
| | | | See “Disclosure of Expenses” on page 9 for further information on how expenses were calculated. |
| | | | | | |
| | | | | | | |
| | SEMI-ANNUAL REPORT | | JANUARY 31, 2013 | | 5 |
| | |
| Fund Summary as of January 31, 2013 | | BlackRock Natural Resources Trust |
BlackRock Natural Resources Trust’s (the “Fund”) investment objective is to seek long-term growth of capital and to protect the purchasing power of shareholders’ capital by investing in a portfolio of equity securities of domestic and foreign companies with substantial natural resource assets.
| | |
| Portfolio Management Commentary | | |
How did the Fund perform?
| Ÿ | | For the six-month period ended January 31, 2013, the Fund outperformed its benchmark, the MSCI Natural Resources Index, and the broad-market S&P 500® Index. The following discussion of relative performance pertains to the MSCI Natural Resources Index. |
What factors influenced performance?
| Ÿ | | Stock selection in the energy sector drove the Fund’s outperformance relative to the benchmark index during the period. The strongest results in this group came from oil-levered names in the oil & gas exploration & production industry, particularly EOG Resources, Inc. and Coastal Energy Co. Relative performance was also strong in the integrated oil & gas industry, where the Fund’s underweight positions in Exxon Mobil Corp. and BG Group Plc proved advantageous. (While the Fund held a large position in Exxon Mobil Corp. in absolute terms, this weighting was proportionately lower than the stock’s representation in the benchmark index.) By contrast, overweight positions in Hess Corp. and Murphy Oil Corp. were beneficial as these stocks delivered strong returns. |
| Ÿ | | Detracting from relative performance was the Fund’s positioning in the materials sector. More specifically, a significant underweight to the chemicals industry had a negative impact as the industry posted strong returns during the period. Within the metals & mining industry, an underweight to base metals hurt results during the fourth quarter of 2012 when these stocks benefited from an improving outlook for China’s economy, which is a huge consumer of base metals for industrial production. |
Describe recent portfolio activity.
| Ÿ | | Early in the six-month period, the Fund trimmed exposure to oil & gas exploration & production name Coastal Energy Co. following its strong price appreciation. During the fourth quarter of 2012, the Fund trimmed other oil & gas exploration & production positions including EOG Resources, Inc. and Canadian Independents, Nexen, Inc. and Progress Energy Resources Corp., to take profits and maintain portfolio diversification. Both Progress Energy Resources Corp. and Nexen, Inc. share prices had moved higher due to takeover bids. In the metals & mining industry, the Fund trimmed iron ore name Cliffs Natural Resources, Inc. on concerns about falling iron ore prices. |
Describe portfolio positioning at period end.
| Ÿ | | Relative to the MSCI Natural Resources Index, the Fund was overweight in energy and underweight in materials as of period end. Within the energy sector, the Fund maintained a bias for oil-levered names in the exploration & production and service groups and held an underweight to the integrated oil & gas industry. In the materials sector, the Fund was underweight in chemicals and fertilizers as well as industrial metals, while slightly overweight in precious metals. The Fund also maintained an underweight to the utilities sector. |
The views expressed reflect the opinions of BlackRock as of the date of this report and are subject to change based on changes in market, economic or other conditions. These views are not intended to be a forecast of future events and are no guarantee of future results.
| | |
| Ten Largest Holdings | | Percent of
Long-Term Investments |
| | | | |
EOG Resources, Inc. | | | 5 | % |
National Oilwell Varco, Inc. | | | 4 | |
Exxon Mobil Corp. | | | 4 | |
Chevron Corp. | | | 4 | |
Apache Corp. | | | 3 | |
FMC Technologies, Inc. | | | 3 | |
Occidental Petroleum Corp. | | | 3 | |
Dresser-Rand Group, Inc. | | | 3 | |
Suncor Energy, Inc. | | | 3 | |
Cameron International Corp. | | | 3 | |
| | |
| Industry Allocation | | Percent of
Long-Term Investments |
| | | | |
Oil & Gas Exploration & Production | | | 22 | % |
Energy Equipment & Services | | | 21 | |
Oil, Gas & Consumable Fuels | | | 17 | |
Integrated Oil & Gas | | | 15 | |
Metals & Mining | | | 7 | |
Oil & Gas Equipment & Services | | | 5 | |
Canadian Independents | | | 5 | |
Oil & Gas Drilling | | | 2 | |
Gold | | | 2 | |
Oil & Gas Producers | | | 1 | |
Chemicals | | | 1 | |
Refining, Marketing & Transportation | | | 1 | |
Utilities | | | 1 | |
For Fund compliance purposes, the Fund’s industry classifications refer to any one or more of the industry sub-classifications used by one or more widely recognized market indexes or rating group indexes, and/or as defined by Fund management. These definitions may not apply for purposes of this report, which may combine such industry sub-classifications for reporting ease.
| | | | | | |
| | | | | | | |
| 6 | | SEMI-ANNUAL REPORT | | JANUARY 31, 2013 | | |
| | |
| | | BlackRock Natural Resources Trust |
| | |
| Total Return Based on a $10,000 Investment | | |
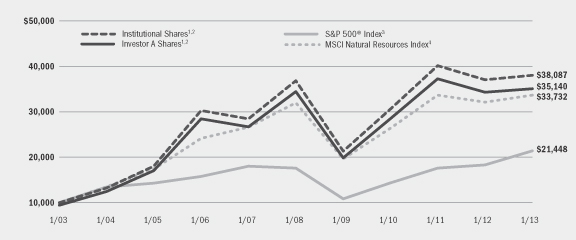
| | 1 | | Assuming maximum sales charges, if any, transaction costs and other operating expenses, including investment advisory fees. Institutional Shares do not have a sales charge. |
| | 2 | | Under normal circumstances, the Fund invests at least 80% of its assets in companies with substantial natural resource assets or in securities the value of which is related to the market value of some natural resource asset. |
| | 3 | | This unmanaged index covers 500 industrial, utility, transportation and financial companies of the US markets (mostly NYSE issues), representing about 75% of NYSE market capitalization and 30% of NYSE issues. |
| | 4 | | This unmanaged index is an index consisting primarily of equity securities of companies engaged in the natural resources industry. |
| | |
| Performance Summary for the Period Ended January 31, 2013 | | |
| | | | | | | | | | | | | | | | | | | | | | | | | | | | |
| | | | | | Average Annual Total Returns5 | |
| | | | | | 1 Year | | | 5 Years | | | 10 Years | |
| | | 6-Month
Total Returns | | | w/o sales
charge | | | w/sales
charge | | | w/o sales
charge | | | w/sales
charge | | | w/o sales
charge | | | w/sales
charge | |
Institutional | | | 11.64 | % | | | 2.71 | % | | | N/A | | | | 0.65 | % | | | N/A | | | | 14.31 | % | | | N/A | |
Investor A | | | 11.49 | | | | 2.42 | | | | (2.96 | )% | | | 0.38 | | | | (0.70 | )% | | | 14.00 | | | | 13.39 | % |
Investor B | | | 11.00 | | | | 1.62 | | | | (2.88 | ) | | | (0.39 | ) | | | (0.79 | ) | | | 13.30 | | | | 13.30 | |
Investor C | | | 11.04 | | | | 1.63 | | | | 0.63 | | | | (0.41 | ) | | | (0.41 | ) | | | 13.12 | | | | 13.12 | |
S&P 500® Index | | | 9.91 | | | | 16.78 | | | | N/A | | | | 3.97 | | | | N/A | | | | 7.93 | | | | N/A | |
MSCI Natural Resources Index | | | 10.82 | | | | 5.00 | | | | N/A | | | | 1.07 | | | | N/A | | | | 12.93 | | | | N/A | |
| | 5 | | Assuming maximum sales charges, if any. Average annual total returns with and without sales charges reflect reductions for distribution and service fees. See “About Fund Performance” on page 8 for a detailed description of share classes, including any related sales charges and fees. |
| | | | N/A — Not applicable as share class and index do not have a sales charge. |
| | | | Past performance is not indicative of future results. |
| | | | | | | | | | | | | | | | | | | | | | | | | | | | |
| | | Actual | | | Hypothetical7 | | | | |
| | | Beginning
Account Value
August 1, 2012 | | | Ending
Account Value
January 31, 2013 | | | Expenses Paid
During the
Period6 | | | Beginning
Account Value
August 1, 2012 | | | Ending
Account Value
January 31, 2013 | | | Expenses Paid
During the
Period6 | | | Annualized
Expense Ratio | |
Institutional | | $ | 1,000.00 | | | $ | 1,116.20 | | | $ | 4.37 | | | $ | 1,000.00 | | | $ | 1,021.07 | | | $ | 4.18 | | | | 0.82 | % |
Investor A | | $ | 1,000.00 | | | $ | 1,114.90 | | | $ | 5.76 | | | $ | 1,000.00 | | | $ | 1,019.76 | | | $ | 5.50 | | | | 1.08 | % |
Investor B | | $ | 1,000.00 | | | $ | 1,110.00 | | | $ | 10.10 | | | $ | 1,000.00 | | | $ | 1,015.63 | | | $ | 9.65 | | | | 1.90 | % |
Investor C | | $ | 1,000.00 | | | $ | 1,110.40 | | | $ | 9.95 | | | $ | 1,000.00 | | | $ | 1,015.78 | | | $ | 9.50 | | | | 1.87 | % |
| | 6 | | For each class of the Fund, expenses are equal to the annualized expense ratio for the class, multiplied by the average account value over the period, multiplied by 184/365 (to reflect the one-half year period shown). |
| | 7 | | Hypothetical 5% annual return before expenses is calculated by pro rating the number of days in the most recent fiscal half year divided by 365. |
| | | | See “Disclosure of Expenses” on page 9 for further information on how expenses were calculated. |
| | | | | | |
| | | | | | | |
| | SEMI-ANNUAL REPORT | | JANUARY 31, 2013 | | 7 |
| Ÿ | | Institutional Shares are not subject to any sales charge. These shares bear no ongoing distribution or service fees and are available only to eligible investors. |
| Ÿ | | Service Shares (available only in BlackRock Equity Dividend Fund) are not subject to any sales charge. These shares are subject to a service fee of 0.25% per year (but no distribution fee) and are available only to eligible investors. Prior to October 2, 2006, Service Share performance results are those of Institutional Shares (which have no distribution or service fees) restated to reflect the Service Share fees. |
| Ÿ | | Investor A Shares are subject to a maximum initial sales charge (front-end load) of 5.25% and a service fee of 0.25% per year (but no distribution fee). |
| Ÿ | | Investor B Shares are subject to a maximum contingent deferred sales charge (“CDSC”) of 4.50% declining to 0% after six years. In addition, these shares are subject to a distribution fee of 0.75% per year and a service fee of 0.25% per year. These shares automatically convert to Investor A Shares after approximately eight years. (There is no initial sales charge for automatic share conversions.) All returns for periods greater than eight years reflect this conversion. |
| Ÿ | | Investor C Shares are subject to a 1.00% CDSC if redeemed within one year of purchase. In addition, these shares are subject to a distribution fee of 0.75% per year and a service fee of 0.25% per year. |
| Ÿ | | Investor C1 Shares (available only in BlackRock Equity Dividend Fund) are subject to a distribution fee of 0.55% per year and a service fee of 0.25% per year. In addition, these shares are subject to a 1.00% CDSC if redeemed within one year of purchase. Prior to September 12, 2011, Investor C1 Shares performance results are those of Institutional Shares (which have no distribution or service fees) restated to reflect the Investor C1 Share fees. |
| Ÿ | | Class R Shares (available only in BlackRock Equity Dividend Fund) are not subject to any sales charge. These shares are subject to a distribution fee of 0.25% per year and a service fee of 0.25% per year. Class R Shares are available only to certain retirement plans and other similar plans. |
Investor B and C1 Shares of the Funds are only available for purchase through exchanges, dividend reinvestment by existing shareholders or for purchase by certain qualified employee benefit plans.
Performance information reflects past performance and does not guarantee future results. Current performance may be lower or higher than the performance data quoted. Refer to www.blackrock.com/funds to obtain performance data current to the most recent month end. Performance results do not reflect the deduction of taxes that a shareholder would pay on fund distributions or the redemption of fund shares. Figures shown in the performance tables on the previous pages assume reinvestment of all dividends and capital gain distributions, if any, at net asset value (“NAV”) on the ex-dividend date. Investment return and principal value of shares will fluctuate so that shares, when redeemed, may be worth more or less than their original cost. Dividends paid to each class of shares will vary because of the different levels of service, distribution and transfer agency fees applicable to each class, which are deducted from the income available to be paid to shareholders. The Funds’ investment advisor waived a portion of its investment advisory fee. Without such waiver, the Funds’ performance would have been lower.
| | | | | | |
| | | | | | | |
| 8 | | SEMI-ANNUAL REPORT | | JANUARY 31, 2013 | | |
Shareholders of the Funds may incur the following charges: (a) transactional expenses, such as sales charges; and (b) operating expenses, including investment advisory fees, service and distribution fees, including 12b-1 fees, and other Fund expenses. The expense examples on the previous pages (which are based on a hypothetical investment of $1,000 invested on August 1, 2012 and held through January 31, 2013) are intended to assist shareholders both in calculating expenses based on an investment in each Fund and in comparing these expenses with similar costs of investing in other mutual funds.
The expense examples provide information about actual account values and actual expenses. In order to estimate the expenses a shareholder paid during the period covered by this report, shareholders can divide their account value by $1,000 and then multiply the result by the number corresponding to their Fund and share class under the heading entitled “Expenses Paid During the Period.”
The expense examples also provide information about hypothetical account values and hypothetical expenses based on each Fund’s actual expense ratio and an assumed rate of return of 5% per year before expenses. In order to assist shareholders in comparing the ongoing expenses of investing in these Funds and other funds, compare the 5% hypothetical example with the 5% hypothetical examples that appear in other funds’ shareholder reports.
The expenses shown in the expense examples are intended to highlight shareholders’ ongoing costs only and do not reflect any transactional expenses, such as sales charges, if any. Therefore, the hypothetical examples are useful in comparing ongoing expenses only, and will not help shareholders determine the relative total expenses of owning different funds. If these transactional expenses were included, shareholder expenses would have been higher.
| | |
| Derivative Financial Instruments | | |
The Funds may invest in various derivative financial instruments, including foreign currency exchange contracts, as specified in Note 2 of the Notes to Financial Statements, which may constitute forms of economic leverage. Such derivative financial instruments are used to obtain exposure to a security, index and/or market without owning or taking physical custody of securities or to hedge market, equity, foreign currency exchange rate and/or other risks. Derivative financial instruments involve risks, including the imperfect correlation between the value of a derivative financial instrument and the underlying asset, possible default of the counterparty to the transaction or illiquidity of the derivative financial instrument. The Funds’ ability to use a derivative financial instrument successfully depends on the investment advisor’s ability to predict pertinent market movements accurately, which cannot be assured. The use of derivative financial instruments may result in losses greater than if they had not been used, may require a Fund to sell or purchase portfolio investments at inopportune times or for distressed values, may limit the amount of appreciation a Fund can realize on an investment, may result in lower dividends paid to shareholders or may cause a Fund to hold an investment that it might otherwise sell. The Funds’ investments in these instruments are discussed in detail in the Notes to Financial Statements.
| | | | | | |
| | | | | | | |
| | SEMI-ANNUAL REPORT | | JANUARY 31, 2013 | | 9 |
| | |
Schedule of Investments January 31, 2013 (Unaudited) | | BlackRock Equity Dividend Fund (Percentages shown are based on Net Assets) |
| | | | | | | | |
| Common Stocks | | Shares | | | Value | |
Aerospace & Defense — 5.3% | | | | | | | | |
General Dynamics Corp. | | | 2,733,488 | | | $ | 181,230,254 | |
Honeywell International, Inc. | | | 3,776,383 | | | | 257,700,376 | |
Northrop Grumman Corp. | | | 3,315,600 | | | | 215,646,624 | |
Raytheon Co. | | | 5,993,200 | | | | 315,721,776 | |
Rockwell Collins, Inc. | | | 883,900 | | | | 52,044,032 | |
United Technologies Corp. | | | 4,440,700 | | | | 388,872,099 | |
| | | | | | | | |
| | | | | | | | 1,411,215,161 | |
Air Freight & Logistics — 0.7% | | | | | | | | |
United Parcel Service, Inc., Class B | | | 2,518,600 | | | | 199,699,794 | |
Auto Components — 0.4% | | | | | | | | |
Johnson Controls, Inc. | | | 3,427,600 | | | | 106,564,084 | |
Beverages — 2.4% | | | | | | | | |
The Coca-Cola Co. | | | 8,445,600 | | | | 314,514,144 | |
Diageo Plc | | | 10,871,100 | | | | 323,612,525 | |
| | | | | | | | |
| | | | | | | | 638,126,669 | |
Chemicals — 2.8% | | | | | | | | |
The Dow Chemical Co. | | | 4,353,400 | | | | 140,179,480 | |
E.I. du Pont de Nemours & Co. | | | 7,279,100 | | | | 345,393,295 | |
Olin Corp. | | | 3,352,300 | | | | 77,974,498 | |
Praxair, Inc. | | | 1,621,300 | | | | 178,942,881 | |
| | | | | | | | |
| | | | | | | | 742,490,154 | |
Commercial Banks — 8.3% | | | | | | | | |
Bank of Nova Scotia | | | 4,457,700 | | | | 262,125,632 | |
Fifth Third Bancorp | | | 12,715,000 | | | | 207,127,350 | |
M&T Bank Corp. | | | 614,500 | | | | 63,103,005 | |
National Bank of Canada | | | 3,693,400 | | | | 293,724,171 | |
SunTrust Banks, Inc. | | | 1,157,210 | | | | 32,830,048 | |
The Toronto-Dominion Bank | | | 3,139,200 | | | | 262,145,546 | |
US Bancorp | | | 11,301,000 | | | | 374,063,100 | |
Wells Fargo & Co. | | | 20,817,400 | | | | 725,070,042 | |
| | | | | | | | |
| | | | | | | | 2,220,188,894 | |
Consumer Finance — 1.1% | | | | | | | | |
American Express Co. | | | 4,818,800 | | | | 283,393,628 | |
Containers & Packaging — 0.1% | | | | | | | | |
Packaging Corp. of America | | | 1,010,000 | | | | 38,814,300 | |
Diversified Financial Services — 3.0% | | | | | | | | |
JPMorgan Chase & Co. | | | 16,735,200 | | | | 787,391,160 | |
Diversified Telecommunication Services — 4.5% | | | | | |
AT&T, Inc. | | | 9,518,700 | | | | 331,155,573 | |
BCE, Inc. | | | 2,001,000 | | | | 88,884,420 | |
CenturyLink, Inc. | | | 8,929,700 | | | | 361,206,365 | |
Verizon Communications, Inc. | | | 9,529,600 | | | | 415,585,856 | |
| | | | | | | | |
| | | | | | | | 1,196,832,214 | |
Electric Utilities — 3.6% | | | | | | | | |
American Electric Power Co., Inc. | | | 2,734,500 | | | | 123,845,505 | |
Duke Energy Corp. | | | 1,712,000 | | | | 117,682,880 | |
Edison International | | | 2,378,600 | | | | 114,624,734 | |
FirstEnergy Corp. | | | 3,098,900 | | | | 125,474,461 | |
Electric Utilities (concluded) | | | | | | | | |
ITC Holdings Corp. | | | 769,400 | | | $ | 62,321,400 | |
NextEra Energy, Inc. | | | 3,393,300 | | | | 244,487,265 | |
Northeast Utilities, Inc. | | | 2,657,200 | | | | 108,227,756 | |
PPL Corp. | | | 1,965,900 | | | | 59,547,111 | |
| | | | | | | | |
| | | | | | | | 956,211,112 | |
Electrical Equipment — 0.3% | | | | | | | | |
Rockwell Automation, Inc. | | | 1,015,000 | | | | 90,527,850 | |
Energy Equipment & Services — 0.5% | | | | | | | | |
Schlumberger Ltd. | | | 1,801,500 | | | | 140,607,075 | |
Food & Staples Retailing — 0.6% | | | | | | | | |
Wal-Mart Stores, Inc. | | | 2,124,100 | | | | 148,580,795 | |
Food Products — 3.8% | | | | | | | | |
General Mills, Inc. | | | 4,943,500 | | | | 207,330,390 | |
H.J. Heinz Co. | | | 2,670,100 | | | | 161,888,163 | |
Kraft Foods Group, Inc. | | | 2,595,700 | | | | 119,973,254 | |
Mondelez International, Inc., Class A | | | 7,787,100 | | | | 216,403,509 | |
Unilever NV – NY Shares | | | 7,726,700 | | | | 312,776,816 | |
| | | | | | | | |
| | | | | | | | 1,018,372,132 | |
Health Care Providers & Services — 0.5% | | | | | |
Quest Diagnostics, Inc. | | | 2,169,500 | | | | 125,722,525 | |
Hotels, Restaurants & Leisure — 1.5% | | | | | |
McDonald’s Corp. | | | 4,189,100 | | | | 399,179,339 | |
Household Products — 2.0% | | | | | |
Kimberly-Clark Corp. | | | 2,392,200 | | | | 214,125,822 | |
The Procter & Gamble Co. | | | 4,355,400 | | | | 327,351,864 | |
| | | | | | | | |
| | | | | | | | 541,477,686 | |
Industrial Conglomerates — 2.7% | | | | | |
3M Co. | | | 2,294,800 | | | | 230,742,140 | |
General Electric Co. | | | 22,330,972 | | | | 497,534,056 | |
| | | | | | | | |
| | | | | | | | 728,276,196 | |
Insurance — 4.3% | | | | | | | | |
ACE Ltd. | | | 2,696,700 | | | | 230,109,411 | |
The Chubb Corp. | | | 3,339,200 | | | | 268,171,152 | |
Prudential Financial, Inc. | | | 4,690,900 | | | | 271,509,292 | |
The Travelers Cos., Inc. | | | 4,902,900 | | | | 384,681,534 | |
| | | | | | | | |
| | | | | | | | 1,154,471,389 | |
IT Services — 2.1% | | | | | | | | |
Automatic Data Processing, Inc. | | | 1,143,900 | | | | 67,821,831 | |
International Business Machines Corp. | | | 2,448,700 | | | | 497,257,509 | |
| | | | | | | | |
| | | | | | | | 565,079,340 | |
Leisure Equipment & Products — 0.6% | | | | | | | | |
Mattel, Inc. | | | 4,000,400 | | | | 150,535,052 | |
| | | | | | | | |
| To simplify the listings of portfolio holdings in the Schedules of Investments, the names and descriptions of many of the securities have been abbreviated according to the following list: | | ADR | | American Depositary Receipts | | | | |
| | AUD | | Australian Dollar | | | | |
| | CAD | | Canadian Dollar | | | | |
| | GBP | | British Pound | | | | |
| | USD | | US Dollar | | | | |
See Notes to Financial Statements.
| | | | | | |
| | | | | | | |
| 10 | | SEMI-ANNUAL REPORT | | JANUARY 31, 2013 | | |
| | |
Schedule of Investments (continued) | | BlackRock Equity Dividend Fund (Percentages shown are based on Net Assets) |
| | | | | | | | |
| Common Stocks | | Shares | | | Value | |
Machinery — 3.6% | | | | | | | | |
Caterpillar, Inc. | | | 4,691,000 | | | $ | 461,547,490 | |
Deere & Co. | | | 5,239,800 | | | | 492,855,588 | |
| | | | | | | | |
| | | | | | | | 954,403,078 | |
Media — 2.7% | | | | | | | | |
Comcast Corp., Special Class A | | | 10,109,200 | | | | 371,310,916 | |
Time Warner Cable, Inc. | | | 2,428,800 | | | | 216,988,992 | |
The Walt Disney Co. | | | 2,242,900 | | | | 120,847,452 | |
| | | | | | | | |
| | | | | | | | 709,147,360 | |
Metals & Mining — 3.4% | | | | | | | | |
Barrick Gold Corp. | | | 1,907,238 | | | | 60,731,781 | |
BHP Billiton Ltd. | | | 13,132,100 | | | | 516,511,775 | |
Newmont Mining Corp. | | | 1,391,729 | | | | 59,788,678 | |
Rio Tinto Ltd. | | | 2,319,400 | | | | 161,085,850 | |
Southern Copper Corp. | | | 2,636,600 | | | | 103,855,674 | |
| | | | | | | | |
| | | | | | | | 901,973,758 | |
Multi-Utilities — 2.4% | | | | | | | | |
Dominion Resources, Inc. | | | 4,532,400 | | | | 245,248,164 | |
Public Service Enterprise Group, Inc. | | | 5,154,400 | | | | 160,714,192 | |
Sempra Energy | | | 1,616,300 | | | | 121,303,315 | |
Wisconsin Energy Corp. | | | 2,746,100 | | | | 108,278,723 | |
| | | | | | | | |
| | | | | | | | 635,544,394 | |
Oil, Gas & Consumable Fuels — 12.6% | | | | | | | | |
Chevron Corp. | | | 7,072,700 | | | | 814,421,405 | |
ConocoPhillips | | | 2,237,300 | | | | 129,763,400 | |
CONSOL Energy, Inc. | | | 499,400 | | | | 15,651,196 | |
Enbridge, Inc. | | | 8,506,400 | | | | 373,977,983 | |
EQT Corp. | | | 1,833,771 | | | | 108,944,335 | |
Exxon Mobil Corp. | | | 6,256,700 | | | | 562,915,299 | |
Kinder Morgan, Inc. | | | 3,592,526 | | | | 134,576,024 | |
Marathon Oil Corp. | | | 4,624,600 | | | | 155,432,806 | |
Marathon Petroleum Corp. | | | 2,371,600 | | | | 175,996,436 | |
Occidental Petroleum Corp. | | | 2,461,000 | | | | 217,232,470 | |
Peabody Energy Corp. | | | 545,300 | | | | 13,714,295 | |
Phillips 66 | | | 1,446,800 | | | | 87,632,676 | |
Royal Dutch Shell Plc, Class A | | | 2,121,200 | | | | 75,193,809 | |
Spectra Energy Corp. | | | 3,738,400 | | | | 103,852,752 | |
Total SA — ADR | | | 7,049,300 | | | | 382,706,497 | |
| | | | | | | | |
| | | | | | | | 3,352,011,383 | |
Paper & Forest Products — 0.6% | | | | | | | | |
MeadWestvaco Corp. | | | 5,112,600 | | | | 160,280,010 | |
Pharmaceuticals — 6.8% | | | | | | | | |
Abbott Laboratories | | | 2,610,200 | | | | 88,433,576 | |
AbbVie, Inc. | | | 2,610,200 | | | | 95,768,238 | |
Bristol-Myers Squibb Co. | | | 6,195,500 | | | | 223,905,370 | |
Johnson & Johnson | | | 5,311,500 | | | | 392,626,080 | |
Merck & Co., Inc. | | | 9,449,900 | | | | 408,708,175 | |
Pfizer, Inc. | | | 22,127,000 | | | | 603,624,560 | |
| | | | | | | | |
| | | | | | | | 1,813,065,999 | |
Real Estate Investment Trusts (REITs) — 0.8% | | | | | |
American Tower Corp. | | | 1,348,256 | | | | 102,669,694 | |
Weyerhaeuser Co. | | | 4,087,000 | | | | 123,100,440 | |
| | | | | | | | |
| | | | | | | | 225,770,134 | |
| Common Stocks | | Shares | | | Value | |
Road & Rail — 2.0% | | | | | | | | |
Canadian National Railway Co. | | | 3,316,400 | | | $ | 317,246,824 | |
Union Pacific Corp. | | | 1,571,200 | | | | 206,549,952 | |
| | | | | | | | |
| | | | | | | | 523,796,776 | |
Semiconductors & Semiconductor Equipment — 0.9% | | | | | |
Intel Corp. | | | 11,098,400 | | | | 233,510,336 | |
Software — 1.2% | | | | | |
Microsoft Corp. | | | 11,834,900 | | | | 325,104,703 | |
Specialty Retail — 3.3% | | | | | | | | |
The Home Depot, Inc. | | | 8,521,200 | | | | 570,238,704 | |
Limited Brands, Inc. | | | 6,521,771 | | | | 313,175,444 | |
| | | | | | | | |
| | | | | | | | 883,414,148 | |
Textiles, Apparel & Luxury Goods — 1.2% | | | | | |
VF Corp. | | | 2,105,700 | | | | 310,759,206 | |
Tobacco — 3.2% | | | | | |
Altria Group, Inc. | | | 4,321,300 | | | | 145,541,384 | |
Lorillard, Inc. | | | 5,117,100 | | | | 199,925,097 | |
Philip Morris International, Inc. | | | 5,606,000 | | | | 494,224,960 | |
| | | | | | | | |
| | | | | | | | 839,691,441 | |
Water Utilities — 0.6% | | | | | | | | |
American Water Works Co., Inc. | | | 4,418,000 | | | | 169,121,040 | |
Wireless Telecommunication Services — 0.4% | | | | | |
Vodafone Group Plc — ADR | | | 3,550,400 | | | | 96,996,928 | |
| Total Common Stocks — 96.8% | | | | | | | 25,778,347,243 | |
| | | | | | | | |
| | |
| | |
| Preferred Stocks | | | | | | |
Oil, Gas & Consumable Fuels — 0.1% | | | | | |
Apache Corp., 6.00% (a) | | | 247,000 | | | | 11,690,510 | |
Total Long-Term Investments (Cost — $21,106,028,197) — 96.9% | | | | 25,790,037,753 | |
| | | | | | | | |
| | |
| | |
| Short-Term Securities | | | | | | |
BlackRock Liquidity Funds, TempFund,
Institutional Class, 0.10% (b)(c) | | | 992,709,099 | | | | 992,709,099 | |
Total Short-Term Securities (Cost — $992,709,099) — 3.7% | | | | 992,709,099 | |
| Total Investments (Cost — $22,098,737,296) — 100.6% | | | | 26,782,746,852 | |
| Liabilities in Excess of Other Assets — (0.6)% | | | | (161,154,657 | ) |
| | | | | | | | |
Net Assets — 100.0% | | | | | | $ | 26,621,592,195 | |
| | | | | | | | |
See Notes to Financial Statements.
| | | | | | |
| | | | | | | |
| | SEMI-ANNUAL REPORT | | JANUARY 31, 2013 | | 11 |
| | |
Schedule of Investments (continued) | | BlackRock Equity Dividend Fund |
|
| Notes to Schedule of Investments |
| (a) | | Convertible security. |
| (b) | | Investments in issuers considered to be an affiliate of the Fund during the six months ended January 31, 2013, for purposes of Section 2(a)(3) of the Investment Company Act of 1940, as amended, were as follows: |
| | | | | | | | | | | | | | | | | | | | |
| Affiliate | | Shares Held at
July 31,
2012 | | | Net
Activity | | | Shares Held at
January 31,
2013 | | | Income | | | Realized
Gain | |
BlackRock Liquidity Funds, TempFund, Institutional Class | | | 1,001,163,465 | | | | (8,454,366 | ) | | | 992,709,099 | | | $ | 715,551 | | | $ | 9,448 | |
| (c) | | Represents the current yield as of report date. |
| Ÿ | | Foreign currency exchange contracts as of January 31, 2013 were as follows: |
| | | | | | | | | | | | | | | | | | | | |
Currency Purchased | | | Currency Sold | | | Counterparty | | Settlement Date | | | Unrealized
Appreciation
(Depreciation) | |
| AUD | | | 3,575,433 | | | USD | | | 3,734,579 | | | UBS AG | | | 2/01/13 | | | $ | (6,119 | ) |
| GBP | | | 1,411,000 | | | USD | | | 2,226,685 | | | BNP Paribas SA | | | 2/01/13 | | | | 11,161 | |
| USD | | | 2,108,710 | | | CAD | | | 2,115,000 | | | Royal Bank of Scotland Group Plc | | | 2/01/13 | | | | (11,803 | ) |
| Total | | | | | | | | | | | | | | | | | | $ | (6,761 | ) |
| | | | | | | | | | | | | | | | | | | | |
| Ÿ | | For Fund compliance purposes, the Fund’s Industry classifications refer to any one or more of the industry sub-classifications used by one or more widely recognized market indexes or ratings group indexes, and/or as defined by Fund management. These definitions may not apply for purposes of this report, which may combine such industry sub-classifications for reporting ease. |
| Ÿ | | Fair Value Measurements — Various inputs are used in determining the fair value of investments and derivative financial instruments. These inputs to valuation techniques are categorized into a disclosure hierarchy consisting of three broad levels for financial statement purposes as follows: |
| Ÿ | | Level 1 — unadjusted price quotations in active markets/exchanges for identical assets and liabilities that the Fund has the ability to access |
| Ÿ | | Level 2 — other observable inputs (including, but not limited to, quoted prices for similar assets or liabilities in markets that are active, quoted prices for identical or similar assets or liabilities in markets that are not active, inputs other than quoted prices that are observable for the assets or liabilities (such as interest rates, yield curves, volatilities, prepayment speeds, loss severities, credit risks and default rates) or other market-corroborated inputs) |
| Ÿ | | Level 3 — unobservable inputs based on the best information available in the circumstances, to the extent observable inputs are not available (including the Fund’s own assumptions used in determining the fair value of investments and derivative financial instruments) |
The hierarchy gives the highest priority to unadjusted quoted prices in active markets for identical assets or liabilities (Level 1 measurements) and the lowest priority to unobservable inputs (Level 3 measurements). Accordingly, the degree of judgment exercised in determining fair value is greatest for instruments categorized in Level 3. The inputs used to measure fair value may fall into different levels of the fair value hierarchy. In such cases, for disclosure purposes, the level in the fair value hierarchy within which the fair value measurement falls in its entirety is determined based on the lowest level input that is significant to the fair value measurement in its entirety.
Changes in valuation techniques may result in transfers into or out of an assigned level within the disclosure hierarchy. In accordance with the Fund’s policy, transfers between different levels of the fair value disclosure hierarchy are deemed to have occurred as of the beginning of the reporting period. The categorization of a value determined for investments and derivative financial instruments is based on the pricing transparency of the investment and derivative financial instrument and is not necessarily an indication of the risks associated with investing in those securities. For information about the Fund’s policy regarding valuation of investments and derivative financial instruments and other significant accounting policies, please refer to Note 1 of the Notes to Financial Statements.
The following tables summarize the Fund’s investments and derivative financial instruments categorized in the disclosure hierarchy as of January 31, 2013:
| | | | | | | | | | | | | | |
| | | Level 1 | | | Level 2 | | | Level 3 | | Total | |
Assets: | | | | | | | | | | | | | | |
| Investments: | | | | | | | | | | | | | | |
Long-Term Investments: | | | | | | | | | | | | | | |
Common Stocks: | | | | | | | | | | | | | | |
Aerospace & Defense | | $ | 1,411,215,161 | | | | — | | | — | | $ | 1,411,215,161 | |
Air Freight & Logistics | | | 199,699,794 | | | | — | | | — | | | 199,699,794 | |
Auto Components | | | 106,564,084 | | | | — | | | — | | | 106,564,084 | |
Beverages | | | 314,514,144 | | | $ | 323,612,525 | | | — | | | 638,126,669 | |
Chemicals | | | 742,490,154 | | | | — | | | — | | | 742,490,154 | |
Commercial Banks | | | 2,220,188,894 | | | | — | | | — | | | 2,220,188,894 | |
Consumer Finance | | | 283,393,628 | | | | — | | | — | | | 283,393,628 | |
Containers & Packaging | | | 38,814,300 | | | | — | | | — | | | 38,814,300 | |
Diversified Financial Services | | | 787,391,160 | | | | — | | | — | | | 787,391,160 | |
Diversified Telecommunication Services | | | 1,196,832,214 | | | | — | | | — | | | 1,196,832,214 | |
Electric Utilities | | | 956,211,112 | | | | — | | | — | | | 956,211,112 | |
See Notes to Financial Statements.
| | | | | | |
| | | | | | | |
| 12 | | SEMI-ANNUAL REPORT | | JANUARY 31, 2013 | | |
| | |
Schedule of Investments (concluded) | | BlackRock Equity Dividend Fund |
| | | | | | | | | | | | | | | | |
| | | Level 1 | | | Level 2 | | | Level 3 | | | Total | |
Assets: | | | | | | | | | | | | | | | | |
| Investments (concluded): | | | | | | | | | | | | | | | | |
Long-Term Investments (concluded): | | | | | | | | | | | | | | | | |
Common Stocks (concluded): | | | | | | | | | | | | | | | | |
Electrical Equipment | | $ | 90,527,850 | | | | — | | | | — | | | $ | 90,527,850 | |
Energy Equipment & Services | | | 140,607,075 | | | | — | | | | — | | | | 140,607,075 | |
Food & Staples Retailing | | | 148,580,795 | | | | — | | | | — | | | | 148,580,795 | |
Food Products | | | 1,018,372,132 | | | | — | | | | — | | | | 1,018,372,132 | |
Health Care Providers & Services | | | 125,722,525 | | | | — | | | | — | | | | 125,722,525 | |
Hotels, Restaurants & Leisure | | | 399,179,339 | | | | — | | | | — | | | | 399,179,339 | |
Household Products | | | 541,477,686 | | | | — | | | | — | | | | 541,477,686 | |
Industrial Conglomerates | | | 728,276,196 | | | | — | | | | — | | | | 728,276,196 | |
Insurance | | | 1,154,471,389 | | | | — | | | | — | | | | 1,154,471,389 | |
IT Services | | | 565,079,340 | | | | — | | | | — | | | | 565,079,340 | |
Leisure Equipment & Products | | | 150,535,052 | | | | — | | | | — | | | | 150,535,052 | |
Machinery | | | 954,403,078 | | | | — | | | | — | | | | 954,403,078 | |
Media | | | 709,147,360 | | | | — | | | | — | | | | 709,147,360 | |
Metals & Mining | | | 224,376,133 | | | $ | 677,597,625 | | | | — | | | | 901,973,758 | |
Multi-Utilities | | | 635,544,394 | | | | — | | | | — | | | | 635,544,394 | |
Oil, Gas & Consumable Fuels | | | 3,276,817,574 | | | | 75,193,809 | | | | — | | | | 3,352,011,383 | |
Paper & Forest Products | | | 160,280,010 | | | | — | | | | — | | | | 160,280,010 | |
Pharmaceuticals | | | 1,813,065,999 | | | | — | | | | — | | | | 1,813,065,999 | |
Real Estate Investment Trusts (REITs) | | | 225,770,134 | | | | — | | | | — | | | | 225,770,134 | |
Road & Rail | | | 523,796,776 | | | | — | | | | — | | | | 523,796,776 | |
Semiconductors & Semiconductor Equipment | | | 233,510,336 | | | | — | | | | — | | | | 233,510,336 | |
Software | | | 325,104,703 | | | | — | | | | — | | | | 325,104,703 | |
Specialty Retail | | | 883,414,148 | | | | — | | | | — | | | | 883,414,148 | |
Textiles, Apparel & Luxury Goods | | | 310,759,206 | | | | — | | | | — | | | | 310,759,206 | |
Tobacco | | | 839,691,441 | | | | — | | | | — | | | | 839,691,441 | |
Water Utilities | | | 169,121,040 | | | | — | | | | — | | | | 169,121,040 | |
Wireless Telecommunication Service | | | 96,996,928 | | | | — | | | | — | | | | 96,996,928 | |
Preferred Securities: | | | | | | | | | | | | | | | | |
Oil, Gas & Consumable Fuels | | | 11,690,510 | | | | — | | | | — | | | | 11,690,510 | |
Short-Term Securities | | | 992,709,099 | | | | — | | | | — | | | | 992,709,099 | |
| | | | |
Total | | $ | 25,706,342,893 | | | $ | 1,076,403,959 | | | | — | | | $ | 26,782,746,852 | |
| | | | |
| | | | | | | | | | | | | | | | |
| | | Level 1 | | | Level 2 | | | Level 3 | | | Total | |
| Derivative Financial Instruments1 | | | | | | | | | | | | | | | | |
Assets: | | | | | | | | | | | | | | | | |
Foreign currency exchange contracts | | | — | | | $ | 11,161 | | | | — | | | $ | 11,161 | |
Liabilities: | | | | | | | | | | | | | | | | |
Foreign currency exchange contracts | | | — | | | | (17,922 | ) | | | — | | | | (17,922 | ) |
| | | | | | | | | | | | | | | | |
Total | | | — | | | $ | (6,761 | ) | | | — | | | $ | (6,761 | ) |
| | | | | | | | | | | | | | | | |
| 1 | | Derivative financial instruments are foreign currency exchange contracts, which are valued at the unrealized appreciation/depreciation on the instrument. |
Certain of the Fund’s assets are held at carrying amount, which approximates fair value for financial statement purposes. As of January 31, 2013, foreign currency at value of $4,138,790 is categorized as Level 1 within the disclosure hierarchy.
There were no transfers between levels during the six months ended January 31, 2013.
See Notes to Financial Statements.
| | | | | | |
| | | | | | | |
| | SEMI-ANNUAL REPORT | | JANUARY 31, 2013 | | 13 |
| | |
Schedule of Investments January 31, 2013 (Unaudited) | | BlackRock Natural Resources Trust (Percentages shown are based on Net assets) |
| | | | | | | | |
| Common Stocks | | Shares | | | Value | |
Canadian Independents — 4.6% | | | | | |
Canadian Natural Resources Ltd. | | | 240,500 | | | $ | 7,262,743 | |
Crew Energy, Inc. (a) | | | 283,300 | | | | 1,690,029 | |
Encana Corp. | | | 124,622 | | | | 2,408,976 | |
Husky Energy, Inc. | | | 81,000 | | | | 2,525,667 | |
Nexen, Inc. | | | 29,200 | | | | 781,087 | |
Paramount Resources Ltd., Class A (a) | | | 24,500 | | | | 795,869 | |
Talisman Energy, Inc. | | | 713,300 | | | | 8,910,886 | |
| | | | | | | | |
| | | | | | | | 24,375,257 | |
Chemicals — 1.0% | | | | | |
E.I. du Pont de Nemours & Co. | | | 54,800 | | | | 2,600,260 | |
Praxair, Inc. | | | 22,300 | | | | 2,461,251 | |
| | | | | | | | |
| | | | | | | | 5,061,511 | |
Energy Equipment & Services — 20.6% | | | | | |
Cameron International Corp. (a) | | | 220,300 | | | | 13,947,193 | |
Dresser-Rand Group, Inc. (a) | | | 237,600 | | | | 14,505,480 | |
Dril-Quip, Inc. (a) | | | 96,600 | | | | 7,833,294 | |
Ensco Plc, Class A | | | 175,181 | | | | 11,136,256 | |
Forum Energy Technologies, Inc. (a) | | | 49,100 | | | | 1,252,541 | |
Halliburton Co. | | | 231,400 | | | | 9,413,352 | |
National Oilwell Varco, Inc. | | | 289,801 | | | | 21,485,846 | |
Noble Corp. | | | 185,200 | | | | 7,500,600 | |
Rowan Cos. Plc, Class A (a) | | | 61,800 | | | | 2,130,864 | |
Schlumberger Ltd. | | | 176,015 | | | | 13,737,971 | |
Seahawk Drilling, Inc. (a) | | | 4,713 | | | | 6,033 | |
Transocean Ltd. | | | 52,209 | | | | 2,960,772 | |
Trican Well Service Ltd. | | | 86,500 | | | | 1,183,803 | |
Weatherford International Ltd. (a) | | | 113,952 | | | | 1,521,259 | |
| | | | | | | | |
| | | | | | | | 108,615,264 | |
Gold — 1.4% | | | | | |
Barrick Gold Corp. | | | 61,800 | | | | 1,967,885 | |
Eldorado Gold Corp. | | | 499,600 | | | | 5,585,061 | |
| | | | | | | | |
| | | | | | | | 7,552,946 | |
Integrated Oil & Gas — 14.6% | | | | | |
Chevron Corp. | | | 178,591 | | | | 20,564,754 | |
ConocoPhillips | | | 69,675 | | | | 4,041,150 | |
Exxon Mobil Corp. | | | 229,090 | | | | 20,611,227 | |
Hess Corp. | | | 102,200 | | | | 6,863,752 | |
Marathon Oil Corp. | | | 180,700 | | | | 6,073,327 | |
Murphy Oil Corp. | | | 204,100 | | | | 12,148,032 | |
Total SA — ADR | | | 125,600 | | | | 6,818,824 | |
| | | | | | | | |
| | | | | | | | 77,121,066 | |
Metals & Mining — 7.1% | | | | | |
BHP Billiton Ltd. | | | 77,300 | | | | 3,040,364 | |
First Quantum Minerals Ltd. | | | 284,800 | | | | 5,742,258 | |
Franco-Nevada Corp. | | | 75,000 | | | | 4,008,672 | |
Goldcorp, Inc. | | | 167,082 | | | | 5,884,891 | |
HudBay Minerals, Inc. | | | 161,900 | | | | 1,882,936 | |
Inmet Mining Corp. | | | 10,100 | | | | 729,096 | |
Newcrest Mining Ltd. | | | 185,000 | | | | 4,531,397 | |
Newmont Mining Corp. | | | 10,600 | | | | 455,376 | |
Southern Copper Corp. | | | 171,554 | | | | 6,757,512 | |
Vale SA — ADR | | | 215,000 | | | | 4,336,550 | |
| | | | | | | | |
| | | | | | | | 37,369,052 | |
Oil & Gas Drilling — 2.2% | | | | | |
Helmerich & Payne, Inc. | | | 123,300 | | | $ | 7,933,122 | |
Saipem SpA | | | 121,600 | | | | 3,452,785 | |
| | | | | | | | |
| | | | | | | | 11,385,907 | |
Oil & Gas Equipment & Services — 5.4% | | | | | |
Baker Hughes, Inc. | | | 126,180 | | | | 5,642,770 | |
FMC Technologies, Inc. (a) | | | 340,400 | | | | 16,117,940 | |
Technip SA — ADR | | | 254,600 | | | | 6,899,660 | |
| | | | | | | | |
| | | | | | | | 28,660,370 | |
Oil & Gas Exploration & Production — 21.9% | | | | | |
Anadarko Petroleum Corp. | | | 158,800 | | | | 12,707,176 | |
Apache Corp. | | | 212,212 | | | | 17,774,877 | |
Cabot Oil & Gas Corp. | | | 242,500 | | | | 12,799,150 | |
Carrizo Oil & Gas, Inc. (a) | | | 73,100 | | | | 1,570,188 | |
Cimarex Energy Co. | | | 54,794 | | | | 3,499,145 | |
Devon Energy Corp. | | | 225,198 | | | | 12,879,073 | |
Newfield Exploration Co. (a) | | | 85,200 | | | | 2,513,400 | |
Noble Energy, Inc. | | | 102,700 | | | | 11,070,033 | |
Occidental Petroleum Corp. | | | 173,400 | | | | 15,306,018 | |
Pioneer Natural Resources Co. | | | 74,700 | | | | 8,780,238 | |
Range Resources Corp. | | | 189,800 | | | | 12,748,866 | |
Southwestern Energy Co. (a) | | | 113,800 | | | | 3,903,340 | |
| | | | | | | | |
| | | | | | | | 115,551,504 | |
Oil & Gas Producers — 1.1% | | | | | |
Whiting Petroleum Corp. (a) | | | 122,300 | | | | 5,819,034 | |
Oil, Gas & Consumable Fuels — 17.0% | | | | | |
Berry Petroleum Co., Class A | | | 85,200 | | | | 3,137,064 | |
Cenovus Energy, Inc. | | | 152,722 | | | | 5,069,807 | |
CNOOC Ltd. — ADR | | | 20,800 | | | | 4,270,864 | |
Coastal Energy Co. (a) | | | 328,100 | | | | 7,223,858 | |
CONSOL Energy, Inc. | | | 73,000 | | | | 2,287,820 | |
EOG Resources, Inc. | | | 222,500 | | | | 27,808,050 | |
EQT Corp. | | | 121,700 | | | | 7,230,197 | |
Legacy Oil + Gas, Inc. (a) | | | 107,253 | | | | 746,276 | |
Marathon Petroleum Corp. | | | 88,000 | | | | 6,530,480 | |
MEG Energy Corp. (a)(b) | | | 49,400 | | | | 1,688,436 | |
Peabody Energy Corp. | | | 153,800 | | | | 3,868,070 | |
PetroBakken Energy, Ltd. | | | 36,737 | | | | 324,129 | |
Petroleo Brasileiro SA — ADR | | | 29,400 | | | | 537,432 | |
Phillips 66 | | | 56,437 | | | | 3,418,389 | |
Suncor Energy, Inc. | | | 419,404 | | | | 14,254,858 | |
Uranium Energy Corp. (acquired 10/21/10,
cost $1,679,682) (a)(c) | | | 494,024 | | | | 1,111,554 | |
| | | | | | | | |
| | | | | | | | 89,507,284 | |
Refining, Marketing & Transportation — 0.8% | | | | | |
Valero Energy Corp. | | | 95,000 | | | | 4,154,350 | |
Utilities — 0.5% | | | | | | | | |
Williams Cos., Inc. | | | 70,500 | | | | 2,471,025 | |
| Total Common Stocks — 98.2% | | | | | | | 517,644,570 | |
| | | | | | | | |
| | |
| | |
| Investment Companies | | | | | | |
Sprott Physical Silver Trust (a) | | | 187,400 | | | | 2,348,122 | |
| Total Investment Companies — 0.5% | | | | | | | 2,348,122 | |
Total Long-Term Investments
(Cost — $246,228,441) — 98.7% | | | | | | | 519,992,692 | |
See Notes to Financial Statements.
| | | | | | |
| | | | | | | |
| 14 | | SEMI-ANNUAL REPORT | | JANUARY 31, 2013 | | |
| | |
Schedule of Investments (continued) | | BlackRock Natural Resources Trust (Percentages shown are based on Net assets) |
| | | | | | | | |
| Short-Term Securities | | Shares | | | Value | |
Money Market Funds — 1.6% | | | | | | | | |
BlackRock Liquidity Funds, TempFund, Institutional Class, 0.10% (d)(e) | | | 8,465,397 | | | $ | 8,465,397 | |
Total Short-Term Securities
(Cost — $8,465,397) — 1.6% | | | | 8,465,397 | |
| Total Investments (Cost — $254,693,838) — 100.3% | | | | 528,458,089 | |
| Liabilities in Excess of Other Assets — (0.3)% | | | | (1,483,209 | ) |
| | | | | | | | |
Net Assets — 100.0% | | | | | | $ | 526,974,880 | |
| | | | | | | | |
| | |
| Notes to Schedule of Investments | | |
| (a) | | Non-income producing security. |
| (b) | | Security exempt from registration pursuant to Rule 144A under the Securities Act of 1933, as amended. These securities may be resold in transactions exempt from registration to qualified institutional investors. |
| (c) | | Restricted security as to resale. As of report date, the Fund held 0.2% of its net assets, with a current value of $1,111,554 and an original cost of $1,679,682, in this security. |
| (d) | | Investments in issuers considered to be an affiliate of the Fund during the six months ended January 31, 2013, for purposes of Section 2(a)(3) of the Investment Company Act of 1940, as amended, were as follows: |
| | | | | | | | | | | | | | | | | | | | | | | | |
| Affiliate | | Shares Held at
July 31,
2012 | | | Net
Activity | | | Shares Held at
January 31,
2013 | | | Income | | | Realized
Gain | |
BlackRock Liquidity Funds, TempFund, Institutional Class | | | 8,283,385 | | | | 182,012 | | | | 8,465,397 | | | $ | 4,878 | | | $ | 37 | |
| (e) | | Represents the current yield as of report date. |
| Ÿ | | For Fund compliance purposes, the Fund’s industry classifications refer to any one or more of the industry sub-classifications used by one or more widely recognized market indexes or ratings group indexes, and/or as defined by Fund management. These definitions may not apply for purposes of this report, which may combine such industry sub-classifications for reporting ease. |
| Ÿ | | Fair Value Measurements — Various inputs are used in determining the fair value of investments. These inputs to valuation techniques are categorized into a disclosure hierarchy consisting of three broad levels for financial statement purposes as follows: |
| Ÿ | | Level 1 — unadjusted price quotations in active markets/exchanges for identical assets and liabilities that the Fund has the ability to access |
| Ÿ | | Level 2 — other observable inputs (including, but not limited to, quoted prices for similar assets or liabilities in markets that are active, quoted prices for identical or similar assets or liabilities in markets that are not active, inputs other than quoted prices that are observable for the assets or liabilities (such as interest rates, yield curves, volatilities, prepayment speeds, loss severities, credit risks and default rates) or other market-corroborated inputs) |
| Ÿ | | Level 3 — unobservable inputs based on the best information available in the circumstances, to the extent observable inputs are not available (including the Fund’s own assumptions used in determining the fair value of investments) |
The hierarchy gives the highest priority to unadjusted quoted prices in active markets for identical assets or liabilities (Level 1 measurements) and the lowest priority to unobservable inputs (Level 3 measurements). Accordingly, the degree of judgment exercised in determining fair value is greatest for instruments categorized in Level 3. The inputs used to measure fair value may fall into different levels of the fair value hierarchy. In such cases, for disclosure purposes, the level in the fair value hierarchy within which the fair value measurement falls in its entirety is determined based on the lowest level input that is significant to the fair value measurement in its entirety.
Changes in valuation techniques may result in transfers into or out of an assigned level within the disclosure hierarchy. In accordance with the Fund’s policy, transfers between different levels of the fair value disclosure hierarchy are deemed to have occurred as of the beginning of the reporting period. The categorization of a value determined for investments is based on the pricing transparency of the investment and is not necessarily an indication of the risks associated with investing in those securities. For information about the Fund’s policy regarding valuation of investments and other significant accounting policies, please refer to Note 1 of the Notes to Financial Statements.
See Notes to Financial Statements.
| | | | | | |
| | | | | | | |
| | SEMI-ANNUAL REPORT | | JANUARY 31, 2013 | | 15 |
| | |
Schedule of Investments (concluded) | | BlackRock Natural Resources Trust |
The following table summarizes the Fund’s investments categorized in the disclosure hierarchy as of January 31, 2013:
| | | | | | | | | | | | | | | | |
| | | Level 1 | | | Level 2 | | | Level 3 | | | Total | |
Assets: | | | | | | | | | | | | | | | | |
| Investments: | | | | | | | | | | | | | | | | |
Long-Term Investments: | | | | | | | | | | | | | | | | |
Common Stocks: | | | | | | | | | | | | | | | | |
Canadian Independents | | $ | 24,375,257 | | | | — | | | | — | | | $ | 24,375,257 | |
Chemicals | | | 5,061,511 | | | | — | | | | — | | | | 5,061,511 | |
Energy Equipment & Services | | | 108,609,231 | | | $ | 6,033 | | | | — | | | | 108,615,264 | |
Gold | | | 7,552,946 | | | | — | | | | — | | | | 7,552,946 | |
Integrated Oil & Gas | | | 77,121,066 | | | | — | | | | — | | | | 77,121,066 | |
Metals & Mining | | | 29,797,291 | | | | 7,571,761 | | | | — | | | | 37,369,052 | |
Oil & Gas Drilling | | | 7,933,122 | | | | 3,452,785 | | | | — | | | | 11,385,907 | |
Oil & Gas Equipment & Services | | | 28,660,370 | | | | — | | | | — | | | | 28,660,370 | |
Oil & Gas Exploration & Production | | | 115,551,504 | | | | — | | | | — | | | | 115,551,504 | |
Oil & Gas Producers | | | 5,819,034 | | | | — | | | | — | | | | 5,819,034 | |
Oil, Gas & Consumable Fuels | | | 86,707,294 | | | | 2,799,990 | | | | — | | | | 89,507,284 | |
Refining, Marketing & Transportation | | | 4,154,350 | | | | — | | | | — | | | | 4,154,350 | |
Utilities | | | 2,471,025 | | | | — | | | | — | | | | 2,471,025 | |
Investment Companies | | | 2,348,122 | | | | — | | | | — | | | | 2,348,122 | |
Short-Term Securities | | | 8,465,397 | | | | — | | | | — | | | | 8,465,397 | |
| | | | |
Total | | $ | 514,627,520 | | | $ | 13,830,569 | | | | — | | | $ | 528,458,089 | |
| | | | |
Certain of the Fund’s assets are held at carrying amount, which approximates fair value for financial statement purposes. As of January 31, 2013, foreign currency at value of $6,062 is categorized as Level 1 within the disclosure hierarchy.
There were no transfers between levels during the six months ended January 31, 2013.
See Notes to Financial Statements.
| | | | | | |
| | | | | | | |
| 16 | | SEMI-ANNUAL REPORT | | JANUARY 31, 2013 | | |
| | |
| Statements of Assets and Liabilities | | |
| | | | | | | | |
| January 31, 2013 (Unaudited) | | BlackRock
Equity
Dividend
Fund | | | BlackRock
Natural
Resources
Trust | |
| | | | | | | | |
| Assets | | | | | | | | |
Investments at value — unaffiliated1 | | $ | 25,790,037,753 | | | $ | 519,992,692 | |
Investments at value — affiliated2 | | | 992,709,099 | | | | 8,465,397 | |
Capital shares sold receivable | | | 89,337,630 | | | | 726,624 | |
Investments sold receivable | | | 52,662,984 | | | | — | |
Dividends receivable | | | 39,780,521 | | | | 97,138 | |
Foreign currency at value3 | | | 4,138,790 | | | | 6,062 | |
Unrealized appreciation on foreign currency exchange contracts | | | 11,161 | | | | — | |
Prepaid expenses | | | 144,931 | | | | 4,835 | |
| | | | | | | | |
Total assets | | | 26,968,822,869 | | | | 529,292,748 | |
| | | | | | | | |
| | | | | | | | |
| Liabilities | | | | | | | | |
Investments purchased payable | | | 262,783,300 | | | | — | |
Capital shares redeemed payable | | | 65,112,948 | | | | 1,551,472 | |
Investment advisory fees payable | | | 12,027,064 | | | | 261,878 | |
Service and distribution fees payable | | | 4,724,089 | | | | 152,579 | |
Officer’s and Trustees’ fees payable | | | 10,837 | | | | 9,500 | |
Unrealized depreciation on foreign currency exchange contracts | | | 17,922 | | | | — | |
Other affiliates payable | | | 5,618 | | | | 1,994 | |
Other accrued expenses payable | | | 2,548,896 | | | | 340,445 | |
| | | | | | | | |
Total liabilities | | | 347,230,674 | | | | 2,317,868 | |
| | | | | | | | |
Net Assets | | $ | 26,621,592,195 | | | $ | 526,974,880 | |
| | | | | | | | |
| | | | | | | | |
| Net Assets Consist of | | | | | | | | |
Paid-in capital | | $ | 22,258,783,433 | | | $ | 256,888,114 | |
Undistributed (distributions in excess of) net investment income | | | 20,293,862 | | | | (3,149,075 | ) |
Accumulated net realized loss | | | (341,480,334 | ) | | | (528,991 | ) |
Net unrealized appreciation/depreciation | | | 4,683,995,234 | | | | 273,764,832 | |
| | | | | | | | |
Net Assets | | $ | 26,621,592,195 | | | $ | 526,974,880 | |
| | | | | | | | |
1 Investments at cost — unaffiliated | | $ | 21,106,028,197 | | | $ | 246,228,441 | |
2 Investments at cost — affiliated | | $ | 992,709,099 | | | $ | 8,465,397 | |
3 Foreign currency at cost | | $ | 4,132,767 | | | $ | 5,990 | |
| | | | | | |
| See Notes to Financial Statements. | | | | |
| | | | | | | |
| | SEMI-ANNUAL REPORT | | JANUARY 31, 2013 | | 17 |
| | |
| Statements of Assets and Liabilities (concluded) | | |
| | | | | | | | |
| January 31, 2013 (Unaudited) | | BlackRock
Equity
Dividend
Fund | | | BlackRock
Natural
Resources
Trust | |
| | | | | | | | |
| Net Asset Value | | | | | | | | |
| Institutional: | | | | | | | | |
Net assets | | $ | 12,979,214,412 | | | $ | 110,740,889 | |
| | | | |
Shares outstanding | | | 624,345,227 | | | | 1,733,698 | |
| | | | |
Net asset value | | $ | 20.79 | | | $ | 63.88 | |
| | | | |
Par value | | $ | 0.10 | | | $ | 0.10 | |
| | | | |
Shares authorized | | | Unlimited | | | | Unlimited | |
| | | | |
| Service: | | | | | | | | |
Net assets | | $ | 273,302,362 | | | | — | |
| | | | |
Shares outstanding | | | 13,187,247 | | | | — | |
| | | | |
Net asset value | | $ | 20.72 | | | | — | |
| | | | |
Par value per share | | $ | 0.10 | | | | — | |
| | | | |
Shares authorized | | | Unlimited | | | | — | |
| | | | |
| Investor A: | | | | | | | | |
Net assets | | $ | 9,641,859,765 | | | $ | 309,419,285 | |
| | | | |
Shares outstanding | | | 464,850,255 | | | | 4,961,151 | |
| | | | |
Net asset value | | $ | 20.74 | | | $ | 62.37 | |
| | | | |
Par value | | $ | 0.10 | | | $ | 0.10 | |
| | | | |
Shares authorized | | | Unlimited | | | | Unlimited | |
| | | | |
| Investor B: | | | | | | | | |
Net assets | | $ | 45,826,967 | | | $ | 7,784,033 | |
| | | | |
Shares outstanding | | | 2,193,359 | | | | 137,980 | |
| | | | |
Net asset value | | $ | 20.89 | | | $ | 56.41 | |
| | | | |
Par value | | $ | 0.10 | | | $ | 0.10 | |
| | | | |
Shares authorized | | | Unlimited | | | | Unlimited | |
| | | | |
| Investor C: | | | | | | | | |
Net assets | | $ | 2,614,836,459 | | | $ | 99,030,673 | |
| | | | |
Shares outstanding | | | 128,878,628 | | | | 1,783,039 | |
| | | | |
Net asset value | | $ | 20.29 | | | $ | 55.54 | |
| | | | |
Par value | | $ | 0.10 | | | $ | 0.10 | |
| | | | |
Shares authorized | | | Unlimited | | | | Unlimited | |
| | | | |
| Investor C1: | | | | | | | | |
Net assets | | $ | 7,408,229 | | | | — | |
| | | | |
Shares outstanding | | | 365,610 | | | | — | |
| | | | |
Net asset value | | $ | 20.26 | | | | — | |
| | | | |
Par value per share | | $ | 0.10 | | | | — | |
| | | | |
Shares authorized | | | Unlimited | | | | — | |
| | | | |
| Class R: | | | | | | | | |
Net assets | | $ | 1,059,144,001 | | | | — | |
| | | | |
Shares outstanding | | | 50,831,454 | | | | — | |
| | | | |
Net asset value | | $ | 20.84 | | | | — | |
| | | | |
Par value per share | | $ | 0.10 | | | | — | |
| | | | |
Shares authorized | | | Unlimited | | | | — | |
| | | | |
| | | | | | |
| See Notes to Financial Statements. | | | | |
| | | | | | | |
| 18 | | SEMI-ANNUAL REPORT | | JANUARY 31, 2013 | | |
| | | | | | | | |
| Six Months Ended January 31, 2013 (Unaudited) | | BlackRock
Equity
Dividend
Fund | | | BlackRock
Natural
Resources
Trust | |
| | | | | | | | |
| Investment Income | | | | | | | | |
Dividends — unaffiliated | | $ | 415,592,941 | | | $ | 4,536,216 | |
Dividends — affiliated | | | 715,551 | | | | 4,878 | |
Foreign taxes withheld | | | (6,380,796 | ) | | | (125,987 | ) |
| | | | |
Total income | | | 409,927,696 | | | | 4,415,107 | |
| | | | |
| | | | | | | | |
| Expenses | | | | | | | | |
Investment advisory | | | 67,907,839 | | | | 1,552,919 | |
Service — Service | | | 296,539 | | | | – | |
Service — Investor A | | | 11,379,941 | | | | 380,538 | |
Service and distribution — Investor B | | | 237,694 | | | | 43,704 | |
Service and distribution — Investor C | | | 12,103,017 | | | | 500,612 | |
Service and distribution — Investor C1 | | | 29,294 | | | | — | |
Service and distribution — Class R | | | 2,467,980 | | | | — | |
Transfer agent — Institutional | | | 7,293,833 | | | | 72,706 | |
Transfer agent — Service | | | 162,975 | | | | — | |
Transfer agent — Investor A | | | 6,131,167 | | | | 233,210 | |
Transfer agent — Investor B | | | 40,126 | | | | 9,527 | |
Transfer agent — Investor C | | | 1,198,725 | | | | 97,143 | |
Transfer agent — Investor C1 | | | 4,360 | | | | — | |
Transfer agent — Class R | | | 890,668 | | | | — | |
Accounting services | | | 1,102,151 | | | | 63,600 | |
Registration | | | 419,278 | | | | 44,749 | |
Custodian | | | 430,462 | | | | 21,660 | |
Officer and Trustees | | | 212,414 | | | | 16,618 | |
Printing | | | 189,993 | | | | 23,301 | |
Professional | | | 113,263 | | | | 27,620 | |
Miscellaneous | | | 132,823 | | | | 12,786 | |
| | | | |
Total expenses | | | 112,744,542 | | | | 3,100,693 | |
Less fees waived and/or reimbursed by Manager | | | (350,309 | ) | | | (2,215 | ) |
| | | | |
Total expenses after fees waived and/or reimbursed | | | 112,394,233 | | | | 3,098,478 | |
| | | | |
Net investment income | | | 297,533,463 | | | | 1,316,629 | |
| | | | |
| | | | | | | | |
| Realized and Unrealized Gain (Loss) | | | | | | | | |
| Net realized gain (loss) from: | | | | | | | | |
Investments — unaffiliated | | | (41,668,374 | ) | | | 149,276 | |
Investments — affiliated | | | 9,448 | | | | 37 | |
Foreign currency transactions | | | 67,252 | | | | 20,429 | |
| | | | |
| | | (41,591,674 | ) | | | 169,742 | |
| | | | |
| Net change in unrealized appreciation/depreciation on: | | | | | | | | |
Investments | | | 1,607,576,253 | | | | 53,978,914 | |
Foreign currency translations | | | (78,428 | ) | | | 1,658 | |
| | | | |
| | | 1,607,497,825 | | | | 53,980,572 | |
| | | | |
Total realized and unrealized gain | | | 1,565,906,151 | | | | 54,150,314 | |
| | | | |
Net Increase in Net Assets Resulting from Operations | | $ | 1,863,439,614 | | | $ | 55,466,943 | |
| | | | |
| | | | | | |
| See Notes to Financial Statements. | | | | |
| | | | | | | |
| | SEMI-ANNUAL REPORT | | JANUARY 31, 2013 | | 19 |
| | |
| Statements of Changes in Net Assets | | |
| | | | | | | | | | | | | | | | | | |
| | | BlackRock Equity Dividend Fund | | | | | BlackRock Natural Resources Trust | |
| Increase (Decrease) in Net Assets: | | Six Months Ended
January 31,
2013
(Unaudited) | | | Year Ended
July 31,
2012 | | | | | Six Months Ended
January 31,
2013
(Unaudited) | | | Year Ended
July 31,
2012 | |
| | | | | | | | | | | | | | | | | | |
| Operations | | | | | | | | | | | | | | | | | | |
Net investment income | | $ | 297,533,463 | | | $ | 387,811,555 | | | | | $ | 1,316,629 | | | $ | 901,029 | |
Net realized gain (loss) | | | (41,591,674 | ) | | | 181,235,788 | | | | | | 169,742 | | | | 4,757,588 | |
Net change in unrealized appreciation/depreciation | | | 1,607,497,825 | | | | 1,389,682,440 | | | | | | 53,980,572 | | | | (124,729,610 | ) |
| | | | | | | | | | |
Net increase (decrease) in net assets resulting from operations | | | 1,863,439,614 | | | | 1,958,729,783 | | | | | | 55,466,943 | | | | (119,070,993 | ) |
| | | | | | | | | | |
| | | | | | | | | | | | | | | | | | |
| Dividends and Distribution to Shareholders From | | | | | | | | | | | | | | | | | | |
Net investment income: | | | | | | | | | | | | | | | | | | |
Institutional | | | (153,242,659 | ) | | | (199,312,172 | )1 | | | | | (722,547 | ) | | | (511,913 | )1 |
Service | | | (2,625,507 | ) | | | (3,257,542 | )1 | | | | | — | | | | — | |
Investor A | | | (104,284,369 | ) | | | (141,162,002 | )1 | | | | | (1,027,459 | ) | | | (956,764 | )1 |
Investor B | | | (345,171 | ) | | | (558,333 | )1 | | | | | — | | | | — | |
Investor C | | | (20,061,692 | ) | | | (24,421,865 | )1 | | | | | — | | | | — | |
Investor C1 | | | (64,160 | ) | | | (112,583 | )1 | | | | | — | | | | — | |
Class R | | | (9,728,705 | ) | | | (12,571,113 | )1 | | | | | — | | | | — | |
| Net realized gain: | | | | | | | | | | | | | | | | | | |
Institutional | | | (3,258,174 | ) | | | (3,265,417 | )1 | | | | | — | | | | — | |
Service | | | (67,570 | ) | | | (57,605 | )1 | | | | | — | | | | — | |
Investor A | | | (2,456,884 | ) | | | (2,730,897 | )1 | | | | | — | | | | — | |
Investor B | | | (12,350 | ) | | | (21,672 | )1 | | | | | — | | | | — | |
Investor C | | | (669,634 | ) | | | (698,467 | )1 | | | | | — | | | | — | |
Investor C1 | | | (1,994 | ) | | | (3,009 | )1 | | | | | — | | | | — | |
Class R | | | (266,878 | ) | | | (275,856 | )1 | | | | | — | | | | — | |
| | | | | | | | | | |
Decrease in net assets resulting from dividends and distributions to shareholders | | | (297,085,747 | ) | | | (388,448,533 | ) | | | | | (1,750,006 | ) | | | (1,468,677 | ) |
| | | | | | | | | | |
| | | | | | | | | | | | | | | | | | |
| Capital Share Transactions | | | | | | | | | | | | | | | | | | |
Net increase (decrease) in net assets derived from capital share transactions | | | 1,992,337,533 | | | | 7,275,627,654 | | | | | | (33,093,607 | ) | | | (58,873,399 | ) |
| | | | | | | | | | |
| | | | | | | | | | | | | | | | | | |
| Net Assets | | | | | | | | | | | | | | | | | | |
Total increase (decrease) in net assets | | | 3,558,691,400 | | | | 8,845,908,904 | | | | | | 20,623,330 | | | | (179,413,069 | ) |
Beginning of period | | | 23,062,900,795 | | | | 14,216,991,891 | | | | | | 506,351,550 | | | | 685,764,619 | |
| | | | | | | | | | |
End of period | | $ | 26,621,592,195 | | | $ | 23,062,900,795 | | | | | $ | 526,974,880 | | | $ | 506,351,550 | |
| | | | | | | | | | |
Undistributed net investment income | | $ | 20,293,862 | | | $ | 13,112,662 | | | | | $ | (3,149,075 | ) | | $ | (2,715,698 | ) |
| | | | | | | | | | |
| | 1 | | Dividends and distributions are determined in accordance with federal income tax regulations. |
| | | | | | |
| See Notes to Financial Statements. | | | | |
| | | | | | | |
| 20 | | SEMI-ANNUAL REPORT | | JANUARY 31, 2013 | | |
| | |
| Financial Highlights | | BlackRock Equity Dividend Fund |
| | | | | | | | | | | | | | | | | | | | | | | | |
| | | Institutional | |
| | | Six Months Ended
January 31,
2013 (Unaudited) | | | Year Ended July 31, | |
| | | | 2012 | | | 2011 | | | 2010 | | | 2009 | | | 2008 | |
| | | | | | | | | | | | | | | | | | | | | | | | |
| Per Share Operating Performance | | | | | | | | | | | | | | | | | | | | | | | | |
Net asset value, beginning of period | | $ | 19.52 | | | $ | 18.17 | | | $ | 15.66 | | | $ | 14.22 | | | $ | 18.23 | | | $ | 19.57 | |
| | | | |
Net investment income1 | | | 0.26 | | | | 0.43 | | | | 0.37 | | | | 0.37 | | | | 0.37 | | | | 0.45 | |
Net realized and unrealized gain (loss) | | | 1.28 | | | | 1.34 | | | | 2.53 | | | | 1.38 | | | | (4.02 | ) | | | (1.12 | ) |
| | | | |
Net increase (decrease) from investment operations | | | 1.54 | | | | 1.77 | | | | 2.90 | | | | 1.75 | | | | (3.65 | ) | | | (0.67 | ) |
| | | | |
Dividends and distributions from: | | | | | | | | | | | | | | | | | | | | | | | | |
Net investment income | | | (0.26 | ) | | | (0.41 | )2 | | | (0.39 | )2 | | | (0.31 | )2 | | | (0.36 | )2 | | | (0.39 | )2 |
Net realized gain | | | (0.01 | ) | | | (0.01 | )2 | | | — | | | | — | | | | — | | | | (0.27 | )2 |
Tax return of capital | | | — | | | | — | | | | — | | | | — | | | | — | | | | (0.01 | )2 |
| | | | |
Total dividends and distributions | | | (0.27 | ) | | | (0.42 | ) | | | (0.39 | ) | | | (0.31 | ) | | | (0.36 | ) | | | (0.67 | ) |
| | | | |
Net asset value, end of period | | $ | 20.79 | | | $ | 19.52 | | | $ | 18.17 | | | $ | 15.66 | | | $ | 14.22 | | | $ | 18.23 | |
| | | | |
| | | | | | | | | | | | | | | | | | | | | | | | |
| Total Investment Return3 | | | | | | | | | | | | | | | | | | | | | | | | |
Based on net asset value | | | 7.89% | 4 | | | 9.90% | | | | 18.62% | | | | 12.31% | | | | (19.80)% | | | | (3.67)% | |
| | | | |
| | | | | | | | | | | | | | | | | | | | | | | | |
| Ratios to Average Net Assets | | | | | | | | | | | | | | | | | | | | | | | | |
Total expenses | | | 0.69% | 5 | | | 0.71% | | | | 0.75% | | | | 0.78% | | | | 0.77% | | | | 0.74% | |
| | | | |
Total expenses after fees waived and/or reimbursed | | | 0.69% | 5 | | | 0.70% | | | | 0.75% | | | | 0.77% | | | | 0.76% | | | | 0.74% | |
| | | | |
Net investment income | | | 2.62% | 5 | | | 2.34% | | | | 2.10% | | | | 2.37% | | | | 2.78% | | | | 2.31% | |
| | | | |
| | | | | | | | | | | | | | | | | | | | | | | | |
| Supplemental Data | | | | | | | | | | | | | | | | | | | | | | | | |
Net assets, end of period (000) | | $ | 12,979,214 | | | $ | 11,068,796 | | | $ | 6,122,019 | | | $ | 3,058,137 | | | $ | 1,651,607 | | | $ | 1,107,277 | |
| | | | |
Portfolio turnover | | | 3% | | | | 3% | | | | 5% | | | | 4% | | | | 7% | | | | 2% | |
| | | | |
| | 1 | | Based on average shares outstanding. |
| | 2 | | Dividends and distributions are determined in accordance with federal income tax regulations. |
| | 3 | | Where applicable, total investment returns include the reinvestment of dividends and distributions. |
| | 4 | | Aggregate total investment return. |
| | | | | | |
| See Notes to Financial Statements. | | | | |
| | | | | | | |
| | SEMI-ANNUAL REPORT | | JANUARY 31, 2013 | | 21 |
| | |
| Financial Highlights (continued) | | BlackRock Equity Dividend Fund |
| | | | | | | | | | | | | | | | | | | | | | | | |
| | | Service | |
| | | Six Months Ended
January 31,
2013
(Unaudited) | | | Year Ended July 31, | |
| | | | 2012 | | | 2011 | | | 2010 | | | 2009 | | | 2008 | |
| | | | | | | | | | | | | | | | | | | | | | | | |
| | | | | | | | | | | | | | | | | | | | | | | | |
| Per Share Operating Performance | | | | | | | | | | | | | | | | | | | | | | | | |
Net asset value, beginning of period | | $ | 19.46 | | | $ | 18.12 | | | $ | 15.63 | | | $ | 14.19 | | | $ | 18.19 | | | $ | 19.55 | |
| | | | |
Net investment income1 | | | 0.24 | | | | 0.37 | | | | 0.33 | | | | 0.32 | | | | 0.32 | | | | 0.39 | |
Net realized and unrealized gain (loss) | | | 1.25 | | | | 1.36 | | | | 2.51 | | | | 1.39 | | | | (3.98 | ) | | | (1.11 | ) |
| | | | |
Net increase (decrease) from investment operations | | | 1.49 | | | | 1.73 | | | | 2.84 | | | | 1.71 | | | | (3.66 | ) | | | (0.72 | ) |
| | | | |
| Dividends and distributions from: | | | | | | | | | | | | | | | | | | | | | | | | |
Net investment income | | | (0.22 | ) | | | (0.38 | )2 | | | (0.35 | )2 | | | (0.27 | )2 | | | (0.34 | )2 | | | (0.36 | )2 |
Net realized gain | | | (0.01 | ) | | | (0.01 | )2 | | | — | | | | — | | | | — | | | | (0.27 | )2 |
Tax return of capital | | | — | | | | — | | | | — | | | | — | | | | — | | | | (0.01 | )2 |
| | | | |
Total dividends and distributions | | | (0.23 | ) | | | (0.39 | ) | | | (0.35 | ) | | | (0.27 | ) | | | (0.34 | ) | | | (0.64 | ) |
| | | | |
Net asset value, end of period | | $ | 20.72 | | | $ | 19.46 | | | $ | 18.12 | | | $ | 15.63 | | | $ | 14.19 | | | $ | 18.19 | |
| | | | |
| | | | | | | | | | | | | | | | | | | | | | | | |
| Total Investment Return3 | | | | | | | | | | | | | | | | | | | | | | | | |
Based on net asset value | | | 7.68% | 4 | | | 9.68% | | | | 18.24% | | | | 12.07% | | | | (19.95)% | | | | (3.93)% | |
| | | | |
| | | | | | | | | | | | | | | | | | | | | | | | |
| Ratios to Average Net Assets | | | | | | | | | | | | | | | | | | | | | | | | |
Total expenses | | | 0.96% | 5 | | | 1.02% | | | | 1.01% | | | | 1.01% | | | | 1.01% | | | | 0.99% | |
| | | | |
Total expenses after fees waived and/or reimbursed | | | 0.95% | 5 | | | 1.01% | | | | 1.01% | | | | 1.00% | | | | 1.01% | | | | 0.99% | |
| | | | |
Net investment income | | | 2.36% | 5 | | | 2.00% | | | | 1.85% | | | | 2.10% | | | | 2.47% | | | | 2.02% | |
| | | | |
| | | | | | | | | | | | | | | | | | | | | | | | |
| Supplemental Data | | | | | | | | | | | | | | | | | | | | | | | | |
Net assets, end of period (000) | | $ | 273,302 | | | $ | 207,027 | | | $ | 67,367 | | | $ | 37,479 | | | $ | 31,356 | | | $ | 9,688 | |
| | | | |
Portfolio turnover | | | 3% | | | | 3% | | | | 5% | | | | 4% | | | | 7% | | | | 2% | |
| | | | |
| | 1 | | Based on average shares outstanding. |
| | 2 | | Dividends and distributions are determined in accordance with federal income tax regulations. |
| | 3 | | Where applicable, total investment returns include the reinvestment of dividends and distributions. |
| | 4 | | Aggregate total investment return. |
| | | | | | |
| See Notes to Financial Statements. | | | | |
| | | | | | | |
| 22 | | SEMI-ANNUAL REPORT | | JANUARY 31, 2013 | | |
| | |
| Financial Highlights (continued) | | BlackRock Equity Dividend Fund |
| | | | | | | | | | | | | | | | | | | | | | | | |
| | | Investor A | |
| | | Six Months Ended January 31,
2013
(Unaudited) | | | Year Ended July 31, | |
| | | | 2012 | | | 2011 | | | 2010 | | | 2009 | | | 2008 | |
| | | | | | | | | | | | | | | | | | | | | | | | |
| Per Share Operating Performance | | | | | | | | | | | | | | | | | | | | | | | | |
Net asset value, beginning of period | | $ | 19.48 | | | $ | 18.13 | | | $ | 15.63 | | | $ | 14.20 | | | $ | 18.20 | | | $ | 19.55 | |
| | | | |
Net investment income1 | | | 0.24 | | | | 0.38 | | | | 0.33 | | | | 0.32 | | | | 0.33 | | | | 0.39 | |
Net realized and unrealized gain (loss) | | | 1.26 | | | | 1.34 | | | | 2.53 | | | | 1.38 | | | | (4.01 | ) | | | (1.12 | ) |
| | | | |
Net increase (decrease) from investment operations | | | 1.50 | | | | 1.72 | | | | 2.86 | | | | 1.70 | | | | (3.68 | ) | | | (0.73 | ) |
| | | | |
| Dividends and distributions from: | | | | | | | | | | | | | | | | | | | | | | | | |
Net investment income | | | (0.23 | ) | | | (0.36 | )2 | | | (0.36 | )2 | | | (0.27 | )2 | | | (0.32 | )2 | | | (0.34 | )2 |
Net realized gain | | | (0.01 | ) | | | (0.01 | )2 | | | — | | | | — | | | | — | | | | (0.27 | )2 |
Tax return of capital | | | — | | | | — | | | | — | | | | — | | | | — | | | | (0.01 | )2 |
| | | | |
Total dividends and distributions | | | (0.24 | ) | | | (0.37 | ) | | | (0.36 | ) | | | (0.27 | ) | | | (0.32 | ) | | | (0.62 | ) |
| | | | |
Net asset value, end of period | | $ | 20.74 | | | $ | 19.48 | | | $ | 18.13 | | | $ | 15.63 | | | $ | 14.20 | | | $ | 18.20 | |
| | | | |
| | | | | | | | | | | | | | | | | | | | | | | | |
| Total Investment Return3 | | | | | | | | | | | | | | | | | | | | | | | | |
Based on net asset value | | | 7.72% | 4 | | | 9.63% | | | | 18.28% | | | | 11.96% | | | | (20.03)% | | | | (3.94)% | |
| | | | |
| | | | | | | | | | | | | | | | | | | | | | | | |
| Ratios to Average Net Assets | | | | | | | | | | | | | | | | | | | | | | | | |
Total expenses | | | 0.95% | 5 | | | 0.98% | | | | 1.03% | | | | 1.05% | | | | 1.09% | | | | 1.02% | |
| | | | |
Total expenses after fees waived and/or reimbursed | | | 0.95% | 5 | | | 0.98% | | | | 1.02% | | | | 1.04% | | | | 1.08% | | | | 1.02% | |
| | | | |
Net investment income | | | 2.36% | 5 | | | 2.09% | | | | 1.85% | | | | 2.09% | | | | 2.46% | | | | 2.01% | |
| | | | |
| | | | | | | | | | | | | | | | | | | | | | | | |
| Supplemental Data | | | | | | | | | | | | | | | | | | | | | | | | |
Net assets, end of period (000) | | $ | 9,641,860 | | | $ | 8,582,557 | | | $ | 5,852,184 | | | $ | 4,055,036 | | | $ | 2,435,103 | | | $ | 1,733,008 | |
| | | | |
Portfolio turnover | | | 3% | | | | 3% | | | | 5% | | | | 4% | | | | 7% | | | | 2% | |
| | | | |
| | 1 | | Based on average shares outstanding. |
| | 2 | | Dividends and distributions are determined in accordance with federal income tax regulations. |
| | 3 | | Where applicable, total investment returns exclude the effects of any sales charges and include the reinvestment of dividends and distributions. |
| | 4 | | Aggregate total investment return. |
| | | | | | |
| See Notes to Financial Statements. | | | | |
| | | | | | | |
| | SEMI-ANNUAL REPORT | | JANUARY 31, 2013 | | 23 |
| | |
| Financial Highlights (continued) | | BlackRock Equity Dividend Fund |
| | | | | | | | | | | | | | | | | | | | | | | | |
| | | Investor B | |
| | | Six Months Ended January 31,
2013
(Unaudited) | | | Year Ended July 31, | |
| | | | 2012 | | | 2011 | | | 2010 | | | 2009 | | | 2008 | |
| | | | | | | | | | | | | | | | | | | | | | | | |
| Per Share Operating Performance | | | | | | | | | | | | | | | | | | | | | | | | |
Net asset value, beginning of period | | $ | 19.62 | | | $ | 18.25 | | | $ | 15.73 | | | $ | 14.28 | | | $ | 18.27 | | | $ | 19.62 | |
| | | | |
Net investment income1 | | | 0.16 | | | | 0.24 | | | | 0.19 | | | | 0.19 | | | | 0.24 | | | | 0.26 | |
Net realized and unrealized gain (loss) | | | 1.27 | | | | 1.34 | | | | 2.53 | | | | 1.40 | | | | (4.03 | ) | | | (1.16 | ) |
| | | | |
Net increase (decrease) from investment operations | | | 1.43 | | | | 1.58 | | | | 2.72 | | | | 1.59 | | | | (3.79 | ) | | | (0.90 | ) |
| | | | |
| Dividends and distributions from: | | | | | | | | | | | | | | | | | | | | | | | | |
Net investment income | | | (0.15 | ) | | | (0.20 | )2 | | | (0.20 | )2 | | | (0.14 | )2 | | | (0.20 | )2 | | | (0.17 | )2 |
Net realized gain | | | (0.01 | ) | | | (0.01 | )2 | | | — | | | | — | | | | — | | | | (0.27 | )2 |
Tax return of capital | | | — | | | | — | | | | — | | | | — | | | | — | | | | (0.01 | )2 |
| | | | |
Total dividends and distributions | | | (0.16 | ) | | | (0.21 | ) | | | (0.20 | ) | | | (0.14 | ) | | | (0.20 | ) | | | (0.45 | ) |
| | | | |
Net asset value, end of period | | $ | 20.89 | | | $ | 19.62 | | | $ | 18.25 | | | $ | 15.73 | | | $ | 14.28 | | | $ | 18.27 | |
| | | | |
| | | | | | | | | | | | | | | | | | | | | | | | |
| Total Investment Return3 | | | | | | | | | | | | | | | | | | | | | | | | |
Based on net asset value | | | 7.28% | 4 | | | 8.74% | | | | 17.35% | | | | 11.10% | | | | (20.62)% | | | | (4.75)% | |
| | | | |
| | | | | | | | | | | | | | | | | | | | | | | | |
| Ratios to Average Net Assets | | | | | | | | | | | | | | | | | | | | | | | | |
Total expenses | | | 1.74% | 5 | | | 1.79% | | | | 1.81% | | | | 1.84% | | | | 1.87% | | | | 1.80% | |
| | | | |
Total expenses after fees waived and/or reimbursed | | | 1.73% | 5 | | | 1.79% | | | | 1.81% | | | | 1.83% | | | | 1.86% | | | | 1.80% | |
| | | | |
Net investment income | | | 1.60% | 5 | | | 1.33% | | | | 1.10% | | | | 1.26% | | | | 1.73% | | | | 1.31% | |
| | | | |
| | | | | | | | | | | | | | | | | | | | | | | | |
| Supplemental Data | | | | | | | | | | | | | | | | | | | | | | | | |
Net assets, end of period (000) | | $ | 45,827 | | | $ | 48,906 | | | $ | 55,195 | | | $ | 57,788 | | | $ | 69,474 | | | $ | 100,597 | |
| | | | |
Portfolio turnover | | | 3% | | | | 3% | | | | 5% | | | | 4% | | | | 7% | | | | 2% | |
| | | | |
| | 1 | | Based on average shares outstanding. |
| | 2 | | Dividends and distributions are determined in accordance with federal income tax regulations. |
| | 3 | | Where applicable, total investment returns exclude the effects of any sales charges and include the reinvestment of dividends and distributions. |
| | 4 | | Aggregate total investment return. |
| | | | | | |
| See Notes to Financial Statements. | | | | |
| | | | | | | |
| 24 | | SEMI-ANNUAL REPORT | | JANUARY 31, 2013 | | |
| | |
| Financial Highlights (continued) | | BlackRock Equity Dividend Fund |
| | | | | | | | | | | | | | | | | | | | | | | | |
| | | Investor C | |
| | | Six Months Ended January 31, 2013 (Unaudited) | | | Year Ended July 31, | |
| | | | 2012 | | | 2011 | | | 2010 | | | 2009 | | | 2008 | |
| | | | | | | | | | | | | | | | | | | | | | | | |
| Per Share Operating Performance | | | | | | | | | | | | | | | | | | | | | | | | |
Net asset value, beginning of period | | $ | 19.06 | | | $ | 17.76 | | | $ | 15.33 | | | $ | 13.94 | | | $ | 17.87 | | | $ | 19.22 | |
| | | | |
Net investment income1 | | | 0.16 | | | | 0.24 | | | | 0.19 | | | | 0.20 | | | | 0.23 | | | | 0.25 | |
Net realized and unrealized gain (loss) | | | 1.24 | | | | 1.31 | | | | 2.47 | | | | 1.36 | | | | (3.94 | ) | | | (1.11 | ) |
| | | | |
Net increase (decrease) from investment operations | | | 1.40 | | | | 1.55 | | | | 2.66 | | | | 1.56 | | | | (3.71 | ) | | | (0.86 | ) |
| | | | |
| Dividends and distributions from: | | | | | | | | | | | | | | | | | | | | | | | | |
Net investment income | | | (0.16 | ) | | | (0.24 | )2 | | | (0.23 | )2 | | | (0.17 | )2 | | | (0.22 | )2 | | | (0.21 | )2 |
Net realized gain | | | (0.01 | ) | | | (0.01 | )2 | | | — | | | | — | | | | — | | | | (0.27 | )2 |
Tax return of capital | | | — | | | | — | | | | — | | | | — | | | | — | | | | (0.01 | )2 |
| | | | |
Total dividends and distributions | | | (0.17 | ) | | | (0.25 | ) | | | (0.23 | ) | | | (0.17 | ) | | | (0.22 | ) | | | (0.49 | ) |
| | | | |
Net asset value, end of period | | $ | 20.29 | | | $ | 19.06 | | | $ | 17.76 | | | $ | 15.33 | | | $ | 13.94 | | | $ | 17.87 | |
| | | | |
| | | | | | | | | | | | | | | | | | | | | | | | |
| Total Investment Return3 | | | | | | | | | | | | | | | | | | | | | | | | |
Based on net asset value | | | 7.36% | 4 | | | 8.80% | | | | 17.40% | | | | 11.15% | | | | (20.62)% | | | | (4.67)% | |
| | | | |
| | | | | | | | | | | | | | | | | | | | | | | | |
| Ratios to Average Net Assets | | | | | | | | | | | | | | | | | | | | | | | | |
Total expenses | | | 1.67% | 5 | | | 1.73% | | | | 1.76% | | | | 1.79% | | | | 1.83% | | | | 1.76% | |
| | | | |
Total expenses after fees waived and/or reimbursed | | | 1.66% | 5 | | | 1.73% | | | | 1.75% | | | | 1.78% | | | | 1.83% | | | | 1.76% | |
| | | | |
Net investment income | | | 1.64% | 5 | | | 1.33% | | | | 1.11% | | | | 1.35% | | | | 1.73% | | | | 1.31% | |
| | | | |
| | | | | | | | | | | | | | | | | | | | | | | | |
| Supplemental Data | | | | | | | | | | | | | | | | | | | | | | | | |
Net assets, end of period (000) | | $ | 2,614,836 | | | $ | 2,245,569 | | | $ | 1,495,227 | | | $ | 942,989 | | | $ | 615,159 | | | $ | 570,963 | |
| | | | |
Portfolio turnover | | | 3% | | | | 3% | | | | 5% | | | | 4% | | | | 7% | | | | 2% | |
| | | | |
| | 1 | | Based on average shares outstanding. |
| | 2 | | Dividends and distributions are determined in accordance with federal income tax regulations. |
| | 3 | | Where applicable, total investment returns exclude the effects of any sales charges and include the reinvestment of dividends and distributions. |
| | 4 | | Aggregate total investment return. |
| | | | | | |
| See Notes to Financial Statements. | | | | |
| | | | | | | |
| | SEMI-ANNUAL REPORT | | JANUARY 31, 2013 | | 25 |
| | |
| Financial Highlights (continued) | | BlackRock Equity Dividend Fund |
| | | | | | | | |
| | | Investor C1 | |
| | | Six Months Ended
January 31,
2013
(Unaudited) | | | Period
September 12,
20111 to
July 31, 2012 | |
| | | | | | | | |
| | | | | | | | |
| Per Share Operating Performance | �� | | | | | | | |
Net asset value, beginning of period | | $ | 19.03 | | | $ | 16.32 | |
| | | | |
Net investment income2 | | | 0.18 | | | | 0.22 | |
Net realized and unrealized gain | | | 1.23 | | | | 2.78 | |
| | | | |
Net increase (decrease) from investment operations | | | 1.41 | | | | 3.00 | |
| | | | |
| Dividends and distributions from: | | | | | | | | |
Net investment income | | | (0.17 | ) | | | (0.28 | )3 |
Net realized gain | | | (0.01 | ) | | | (0.01 | )3 |
| | | | |
Total dividends and distributions | | | (0.18 | ) | | | (0.29 | ) |
| | | | |
Net asset value, end of period | | $ | 20.26 | | | $ | 19.03 | |
| | | | |
| | | | | | | | |
| Total Investment Return4 | | | | | | | | |
Based on net asset value | | | 7.43% | 5 | | | 18.51% | 5 |
| | | | |
| | | | | | | | |
| Ratios to Average Net Assets | | | | | | | | |
Total expenses | | | 1.49% | 6 | | | 1.63% | 6 |
| | | | |
Total expenses after fees waived and/or reimbursed | | | 1.48% | 6 | | | 1.63% | 6 |
| | | | |
Net investment income | | | 1.83% | 6 | | | 1.37% | 6 |
| | | | |
| | | | | | | | |
| Supplemental Data | | | | | | | | |
Net assets, end of period (000) | | $ | 7,408 | | | $ | 7,255 | |
| | | | |
Portfolio turnover | | | 3% | | | | 3% | |
| | | | |
| | 1 | | Commencement of operations. |
| | 2 | | Based on average shares outstanding. |
| | 3 | | Dividends and distributions are determined in accordance with federal income tax regulations. |
| | 4 | | Where applicable, total investment returns exclude the effects of any sales charges and include the reinvestment of dividends and distributions. |
| | 5 | | Aggregate total investment return. |
| | | | | | |
| See Notes to Financial Statements. | | | | |
| | | | | | | |
| 26 | | SEMI-ANNUAL REPORT | | JANUARY 31, 2013 | | |
| | |
| Financial Highlights (concluded) | | BlackRock Equity Dividend Fund |
| | | | | | | | | | | | | | | | | | | | | | | | |
| | | Class R | |
| | | Six Months Ended January 31,
2013 (Unaudited) | | | Year Ended July 31, | |
| | | | 2012 | | | 2011 | | | 2010 | | | 2009 | | | 2008 | |
| | | | | | | | | | | | | | | | | | | | | | | | |
| Per Share Operating Performance | | | | | | | | | | | | | | | | | | | | | | | | |
Net asset value, beginning of period | | $ | 19.57 | | | $ | 18.21 | | | $ | 15.71 | | | $ | 14.27 | | | $ | 18.29 | | | $ | 19.66 | |
| | | | |
Net investment income1 | | | 0.21 | | | | 0.32 | | | | 0.27 | | | | 0.30 | | | | 0.29 | | | | 0.33 | |
Net realized and unrealized gain (loss) | | | 1.27 | | | | 1.36 | | | | 2.52 | | | | 1.37 | | | | (4.02 | ) | | | (1.13 | ) |
| | | | |
Net increase (decrease) from investment operations | | | 1.48 | | | | 1.68 | | | | 2.79 | | | | 1.67 | | | | (3.73 | ) | | | (0.80 | ) |
| | | | |
| Dividends and distributions from: | | | | | | | | | | | | | | | | | | | | | | | | |
Net investment income | | | (0.20 | ) | | | (0.31 | )2 | | | (0.29 | )2 | | | (0.23 | )2 | | | (0.29 | )2 | | | (0.29 | )2 |
Net realized gain | | | (0.01 | ) | | | (0.01 | )2 | | | — | | | | — | | | | — | | | | (0.27 | )2 |
Tax return of capital | | | — | | | | — | | | | — | | | | — | | | | — | | | | (0.01 | )2 |
| | | | |
Total dividends and distributions | | | (0.21 | ) | | | (0.32 | ) | | | (0.29 | ) | | | (0.23 | ) | | | (0.29 | ) | | | (0.57 | ) |
| | | | |
Net asset value, end of period | | $ | 20.84 | | | $ | 19.57 | | | $ | 18.21 | | | $ | 15.71 | | | $ | 14.27 | | | $ | 18.29 | |
| | | | |
| | | | | | | | | | | | | | | | | | | | | | | | |
| Total Investment Return3 | | | | | | | | | | | | | | | | | | | | | | | | |
Based on net asset value | | | 7.56% | 4 | | | 9.33% | | | | 17.85% | | | | 11.67% | | | | (20.25)% | | | | (4.26)% | |
| | | | |
| | | | | | | | | | | | | | | | | | | | | | | | |
| Ratios to Average Net Assets | | | | | | | | | | | | | | | | | | | | | | | | |
Total expenses | | | 1.25% | 5 | | | 1.31% | | | | 1.36% | | | | 1.39% | | | | 1.46% | | | | 1.34% | |
| | | | |
Total expenses after fees waived and/or reimbursed | | | 1.25% | 5 | | | 1.30% | | | | 1.34% | | | | 1.36% | | | | 1.38% | | | | 1.33% | |
| | | | |
Net investment income | | | 2.06% | 5 | | | 1.76% | | | | 1.53% | | | | 1.79% | | | | 2.14% | | | | 1.68% | |
| | | | |
| | | | | | | | | | | | | | | | | | | | | | | | |
| Supplemental Data | | | | | | | | | | | | | | | | | | | | | | | | |
Net assets, end of period (000) | | $ | 1,059,144 | | | $ | 902,790 | | | $ | 625,000 | | | $ | 412,493 | | | $ | 217,370 | | | $ | 118,681 | |
| | | | |
Portfolio turnover | | | 3% | | | | 3% | | | | 5% | | | | 4% | | | | 7% | | | | 2% | |
| | | | |
| | 1 | | Based on average shares outstanding. |
| | 2 | | Dividends and distributions are determined in accordance with federal income tax regulations. |
| | 3 | | Where applicable, total investment returns include the reinvestment of dividends and distributions. |
| | 4 | | Aggregate total investment return. |
| | | | | | |
| See Notes to Financial Statements. | | | | |
| | | | | | | |
| | SEMI-ANNUAL REPORT | | JANUARY 31, 2013 | | 27 |
| | |
| Financial Highlights | | BlackRock Natural Resources Trust |
| | | | | | | | | | | | | | | | | | | | | | | | |
| | | Institutional | |
| | | Six Months Ended
January 31, 2013 (Unaudited) | | | Year Ended July 31, | |
| | | | 2012 | | | 2011 | | | 2010 | | | 2009 | | | 2008 | |
| | | | | | | | | | | | | | | | | | | | | | | | |
| Per Share Operating Performance | | | | | | | | | | | | | | | | | | | | | | | | |
Net asset value, beginning of period | | $ | 57.65 | | | $ | 69.76 | | | $ | 52.59 | | | $ | 47.18 | | | $ | 71.61 | | | $ | 63.83 | |
| | | | |
Net investment income1 | | | 0.27 | | | | 0.33 | | | | 0.16 | | | | 0.18 | | | | 0.24 | | | | 0.17 | |
Net realized and unrealized gain (loss) | | | 6.41 | | | | (12.09 | ) | | | 17.01 | | | | 5.23 | | | | (23.88 | ) | | | 10.48 | |
| | | | |
Net increase (decrease) from investment operations | | | 6.68 | | | | (11.76 | ) | | | 17.17 | | | | 5.41 | | | | (23.64 | ) | | | 10.65 | |
| | | | |
| Dividends and distributions from: | | | | | | | | | | | | | | | | | | | | | | | | |
Net investment income | | | (0.45 | ) | | | (0.35 | )2 | | | — | | | | — | | | | — | | | | — | |
Net realized gain | | | — | | | | — | | | | — | | | | — | | | | (0.79 | )2 | | | (2.87 | )2 |
| | | | |
Total dividends and distributions | | | (0.45 | ) | | | (0.35 | ) | | | — | | | | — | | | | (0.79 | ) | | | (2.87 | ) |
| | | | |
Net asset value, end of period | | $ | 63.88 | | | $ | 57.65 | | | $ | 69.76 | | | $ | 52.59 | | | $ | 47.18 | | | $ | 71.61 | |
| | | | |
| | | | | | | | | | | | | | | | | | | | | | | | |
| Total Investment Return3 | | | | | | | | | | | | | | | | | | | | | | | | |
Based on net asset value | | | 11.64% | 4 | | | (16.88)% | | | | 32.65% | | | | 11.47% | | | | (32.68)% | | | | 16.86% | |
| | | | |
| | | | | | | | | | | | | | | | | | | | | | | | |
| Ratios to Average Net Assets | | | | | | | | | | | | | | | | | | | | | | | | |
Total expenses | | | 0.82% | 5 | | | 0.85% | | | | 0.80% | | | | 0.83% | | | | 0.92% | | | | 0.80% | |
| | | | |
Total expenses after fees waived | | | 0.82% | 5 | | | 0.85% | | | | 0.79% | | | | 0.82% | | | | 0.91% | | | | 0.80% | |
| | | | |
Net investment income | | | 0.87% | 5 | | | 0.56% | | | | 0.25% | | | | 0.33% | | | | 0.54% | | | | 0.23% | |
| | | | |
| | | | | | | | | | | | | | | | | | | | | | | | |
| Supplemental Data | | | | | | | | | | | | | | | | | | | | | | | | |
Net assets, end of period (000) | | $ | 110,741 | | | $ | 102,940 | | | $ | 117,786 | | | $ | 65,221 | | | $ | 49,900 | | | $ | 87,353 | |
| | | | |
Portfolio turnover | | | — | | | | 3% | | | | 2% | | | | 3% | | | | 3% | | | | 4% | |
| | | | |
| | 1 | | Based on average shares outstanding. |
| | 2 | | Dividends and distributions are determined in accordance with federal income tax regulations. |
| | 3 | | Where applicable, total investment returns include the reinvestment of dividends and distributions. |
| | 4 | | Aggregate total investment return. |
| | | | | | |
| See Notes to Financial Statements. | | | | |
| | | | | | | |
| 28 | | SEMI-ANNUAL REPORT | | JANUARY 31, 2013 | | |
| | |
| Financial Highlights (continued) | | BlackRock Natural Resources Trust |
| | | | | | | | | | | | | | | | | | | | | | | | |
| | | Investor A | |
| | | Six Months Ended
January 31, 2013 (Unaudited) | | | Year Ended July 31, | |
| | | | 2012 | | | 2011 | | | 2010 | | | 2009 | | | 2008 | |
| | | | | | | | | | | | | | | | | | | | | | | | |
| Per Share Operating Performance | | | | | | | | | | | | | | | | | | | | | | | | |
Net asset value, beginning of period | | $ | 56.14 | | | $ | 67.92 | | | $ | 51.34 | | | $ | 46.18 | | | $ | 70.34 | | | $ | 62.73 | |
| | | | |
Net investment income (loss)1 | | | 0.19 | | | | 0.17 | | | | (0.01 | ) | | | 0.03 | | | | 0.10 | | | | (0.02 | ) |
Net realized and unrealized gain (loss) | | | 6.25 | | | | (11.78 | ) | | | 16.59 | | | | 5.13 | | | | (23.47 | ) | | | 10.32 | |
| | | | |
Net increase (decrease) from investment operations | | | 6.44 | | | | (11.61 | ) | | | 16.58 | | | | 5.16 | | | | (23.37 | ) | | | 10.30 | |
| | | | |
| Dividends and distributions from: | | | | | | | | | | | | | | | | | | | | | | | | |
Net investment income | | | (0.21 | ) | | | (0.17 | )2 | | | — | | | | — | | | | — | | | | — | |
Net realized gain | | | — | | | | — | | | | — | | | | — | | | | (0.79 | )2 | | | (2.69 | )2 |
| | | | |
Total dividends and distributions | | | (0.21 | ) | | | (0.17 | ) | | | — | | | | — | | | | (0.79 | ) | | | (2.69 | ) |
| | | | |
Net asset value, end of period | | $ | 62.37 | | | $ | 56.14 | | | $ | 67.92 | | | $ | 51.34 | | | $ | 46.18 | | | $ | 70.34 | |
| | | | |
| | | | | | | | | | | | | | | | | | | | | | | | |
| Total Investment Return3 | | | | | | | | | | | | | | | | | | | | | | | | |
Based on net asset value | | | 11.49% | 4 | | | (17.11)% | | | | 32.29% | | | | 11.17% | | | | (32.89)% | | | | 16.57% | |
| | | | |
| | | | | | | | | | | | | | | | | | | | | | | | |
| Ratios to Average Net Assets | | | | | | | | | | | | | | | | | | | | | | | | |
Total expenses | | | 1.08% | 5 | | | 1.12% | | | | 1.07% | | | | 1.09% | | | | 1.23% | | | | 1.06% | |
| | | | |
Total expenses after fees waived | | | 1.08% | 5 | | | 1.12% | | | | 1.06% | | | | 1.08% | | | | 1.22% | | | | 1.06% | |
| | | | |
Net investment income (loss) | | | 0.62% | 5 | | | 0.30% | | | | (0.01)% | | | | 0.06% | | | | 0.24% | | | | (0.03)% | |
| | | | |
| | | | | | | | | | | | | | | | | | | | | | | | |
| Supplemental Data | | | | | | | | | | | | | | | | | | | | | | | | |
Net assets, end of period (000) | | $ | 309,419 | | | $ | 295,462 | | | $ | 406,230 | | | $ | 301,813 | | | $ | 229,126 | | | $ | 317,892 | |
| | | | |
Portfolio turnover | | | — | | | | 3% | | | | 2% | | | | 3% | | | | 3% | | | | 4% | |
| | | | |
| | 1 | | Based on average shares outstanding. |
| | 2 | | Dividends and distributions are determined in accordance with federal income tax regulations. |
| | 3 | | Where applicable, total investment returns exclude the effects of any sales charges and include the reinvestment of dividends and distributions. |
| | 4 | | Aggregate total investment return. |
| | | | | | |
| See Notes to Financial Statements. | | | | |
| | | | | | | |
| | SEMI-ANNUAL REPORT | | JANUARY 31, 2013 | | 29 |
| | |
| Financial Highlights (continued) | | BlackRock Natural Resources Trust |
| | | | | | | | | | | | | | | | | | | | | | | | |
| | | Investor B | |
| | | Six Months Ended
January 31,
2013 (Unaudited) | | | Year Ended July 31, | |
| | | | 2012 | | | 2011 | | | 2010 | | | 2009 | | | 2008 | |
| | | | | | | | | | | | | | | | | | | | | | | | |
| Per Share Operating Performance | | | | | | | | | | | | | | | | | | | | | | | | |
Net asset value, beginning of period | | $ | 50.82 | | | $ | 61.77 | | | $ | 47.05 | | | $ | 42.66 | | | $ | 65.57 | | | $ | 59.05 | |
| | | | |
Net investment loss1 | | | (0.04 | ) | | | (0.24 | ) | | | (0.44 | ) | | | (0.34 | ) | | | (0.20 | ) | | | (0.51 | ) |
Net realized and unrealized gain (loss) | | | 5.63 | | | | (10.71 | ) | | | 15.16 | | | | 4.73 | | | | (21.92 | ) | | | 9.70 | |
| | | | |
Net increase (decrease) from investment operations | | | 5.59 | | | | (10.95 | ) | | | 14.72 | | | | 4.39 | | | | (22.12 | ) | | | 9.19 | |
| | | | |
Distributions from net realized gain | | | — | | | | — | | | | — | | | | — | | | | (0.79 | )2 | | | (2.67 | )2 |
| | | | |
Net asset value, end of period | | $ | 56.41 | | | $ | 50.82 | | | $ | 61.77 | | | $ | 47.05 | | | $ | 42.66 | | | $ | 65.57 | |
| | | | |
| | | | | | | | | | | | | | | | | | | | | | | | |
| Total Investment Return3 | | | | | | | | | | | | | | | | | | | | | | | | |
Based on net asset value | | | 11.00% | 4 | | | (17.73)% | | | | 31.29% | | | | 10.29% | | | | (33.39)% | | | | 15.69% | |
| | | | |
| | | | | | | | | | | | | | | | | | | | | | | | |
| Ratios to Average Net Assets | | | | | | | | | | | | | | | | | | | | | | | | |
Total expenses | | | 1.90% | 5 | | | 1.89% | | | | 1.84% | | | | 1.88% | | | | 1.96% | | | | 1.81% | |
| | | | |
Total expenses after fees waived | | | 1.90% | 5 | | | 1.89% | | | | 1.83% | | | | 1.87% | | | | 1.96% | | | | 1.81% | |
| | | | |
Net investment loss | | | (0.16)% | 5 | | | (0.46)% | | | | (0.78)% | | | | (0.71)% | | | | (0.50)% | | | | (0.77)% | |
| | | | |
| | | | | | | | | | | | | | | | | | | | | | | | |
| Supplemental Data | | | | | | | | | | | | | | | | | | | | | | | | |
Net assets, end of period (000) | | $ | 7,784 | | | $ | 9,365 | | | $ | 18,036 | | | $ | 18,065 | | | $ | 21,719 | | | $ | 46,394 | |
| | | | |
Portfolio turnover | | | — | | | | 3% | | | | 2% | | | | 3% | | | | 3% | | | | 4% | |
| | | | |
| | 1 | | Based on average shares outstanding. |
| | 2 | | Distributions are determined in accordance with federal income tax regulations. |
| | 3 | | Where applicable, total investment returns exclude the effects of any sales charges and include the reinvestment of dividends and distributions. |
| | 4 | | Aggregate total investment return. |
| | | | | | |
| See Notes to Financial Statements. | | | | |
| | | | | | | |
| 30 | | SEMI-ANNUAL REPORT | | JANUARY 31, 2013 | | |
| | |
| Financial Highlights (concluded) | | BlackRock Natural Resources Trust |
| | | | | | | | | | | | | | | | | | | | | | | | |
| | | Investor C | |
| | | Six Months Ended
January 31,
2013 (Unaudited) | | | Year Ended July 31, | |
| | | | 2012 | | | 2011 | | | 2010 | | | 2009 | | | 2008 | |
| | | | | | | | | | | | | | | | | | | | | | | | |
| Per Share Operating Performance | | | | | | | | | | | | | | | | | | | | | | | | |
Net asset value, beginning of period | | $ | 50.02 | | | $ | 60.81 | | | $ | 46.33 | | | $ | 42.01 | | | $ | 64.63 | | | $ | 58.25 | |
| | | | |
Net investment loss1 | | | (0.04 | ) | | | (0.24 | ) | | | (0.45 | ) | | | (0.35 | ) | | | (0.22 | ) | | | (0.53 | ) |
Net realized and unrealized gain (loss) | | | 5.56 | | | | (10.55 | ) | | | 14.93 | | | | 4.67 | | | | (21.61 | ) | | | 9.58 | |
| | | | |
Net increase (decrease) from investment operations | | | 5.52 | | | | (10.79 | ) | | | 14.48 | | | | 4.32 | | | | (21.83 | ) | | | 9.05 | |
| | | | |
Distributions from net realized gain | | | — | | | | — | | | | — | | | | — | | | | (0.79 | )2 | | | (2.67 | )2 |
| | | | |
Net asset value, end of period | | $ | 55.54 | | | $ | 50.02 | | | $ | 60.81 | | | $ | 46.33 | | | $ | 42.01 | | | $ | 64.63 | |
| | | | |
| | | | | | | | | | | | | | | | | | | | | | | | |
| Total Investment Return3 | | | | | | | | | | | | | | | | | | | | | | | | |
Based on net asset value | | | 11.04% | 4 | | | (17.74)% | | | | 31.25% | | | | 10.28% | | | | (33.43)% | | | | 15.67% | |
| | | | |
| | | | | | | | | | | | | | | | | | | | | | | | |
| Ratios to Average Net Assets | | | | | | | | | | | | | | | | | | | | | | | | |
Total expenses | | | 1.88% | 5 | | | 1.89% | | | | 1.85% | | | | 1.91% | | | | 2.01% | | | | 1.84% | |
| | | | |
Total expenses after fees waived | | | 1.87% | 5 | | | 1.89% | | | | 1.84% | | | | 1.90% | | | | 2.01% | | | | 1.84% | |
| | | | |
Net investment loss | | | (0.16)%5 | | | | (0.47)% | | | | (0.80)% | | | | (0.75)% | | | | (0.55)% | | | | (0.81)% | |
| | | | |
| | | | | | | | | | | | | | | | | | | | | | | | |
| Supplemental Data | | | | | | | | | | | | | | | | | | | | | | | | |
Net assets, end of period (000) | | $ | 99,031 | | | $ | 98,585 | | | $ | 143,712 | | | $ | 105,251 | | | $ | 83,174 | | | $ | 118,825 | |
| | | | |
Portfolio turnover | | | — | | | | 3% | | | | 2% | | | | 3% | | | | 3% | | | | 4% | |
| | | | |
| | 1 | | Based on average shares outstanding. |
| | 2 | | Distributions are determined in accordance with federal income tax regulations. |
| | 3 | | Where applicable, total investment returns exclude the effects of any sales charges and include the reinvestment of dividends and distributions. |
| | 4 | | Aggregate total investment return. |
| | | | | | |
| See Notes to Financial Statements. | | | | |
| | | | | | | |
| | SEMI-ANNUAL REPORT | | JANUARY 31, 2013 | | 31 |
| | |
| Notes to Financial Statements (Unaudited) | | |
1. Organization and Significant Accounting Policies:
BlackRock Equity Dividend Fund (“Equity Dividend”) and BlackRock Natural Resources Trust (“Natural Resources”) (collectively referred to as the “Funds” or individually as a “Fund”) are registered under the Investment Company Act of 1940, as amended (the “1940 Act”). Equity Dividend is registered as a diversified, open-end management investment company. Natural Resources is registered as a non-diversified, open-end management investment company. Each Fund is organized as a Massachusetts business trust. The Funds’ financial statements are prepared in conformity with accounting principles generally accepted in the United States of America (“US GAAP”), which may require management to make estimates and assumptions that affect the reported amounts of assets and liabilities in the financial statements and the reported amounts of increases and decreases in net assets from operations during the reporting period. Actual results could differ from those estimates. Each Fund offers multiple classes of shares. Institutional Shares are sold without a sales charge and only to certain eligible investors. Service Shares are sold without a sales charge. Investor A Shares are generally sold with a front-end sales charge. Investor B, Investor C and Investor C1 Shares may be subject to a CDSC. Class R Shares are sold without a sales charge and only to certain retirement and other similar plans. All classes of shares have identical voting, dividend, liquidation and other rights and the same terms and conditions, except that Service, Investor A, Investor B, Investor C, Investor C1 and Class R Shares bear certain expenses related to the shareholder servicing of such shares, and Investor B, Investor C, Investor C1 and Class R Shares also bear certain expenses related to the distribution of such shares. Investor B Shares automatically convert to Investor A Shares after approximately eight years. Investor B and Investor C1 Shares are only available through exchanges and dividend reinvestments by existing shareholders and for purchase by certain qualified employee benefit plans. Each class has exclusive voting rights with respect to matters relating to its shareholder servicing and distribution expenditures (except that Investor B shareholders may vote on material changes to the Investor A distribution and service plan).
Reorganization: The Board of Equity Dividend and the Board and shareholders of BlackRock Utilities and Telecommunications Fund, Inc. (the “Target Fund”) approved the reorganization of the Target Fund into Equity Dividend pursuant to which Equity Dividend acquired substantially all of the assets and substantially all of the liabilities of the Target Fund in exchange for an equal aggregate value of newly-issued shares of Equity Dividend.
Each shareholder of the Target Fund received shares of Equity Dividend in an amount equal to the aggregate net asset value of such shareholder’s Target Fund shares, as determined at the close of business on September 9, 2011, less the costs of the Target Fund’s reorganization. In connection with the reorganization, Equity Dividend issued newly-created Investor C1 Shares.
The reorganization was accomplished by a tax-free exchange of shares of Equity Dividend in the following amounts and at the following conversion ratios:
| | | | | | | | | | | | | | | | |
Target Fund’s Share Class | | Target Fund’s
Shares Prior to
Reorganization | | | Conversion
Ratio | | | Equity
Dividend’s
Share
Class | | | Shares of
Equity
Dividend | |
Institutional | | | 1,070,842 | | | | 0.6978647 | | | | Institutional | | | | 747,303 | |
Investor A | | | 5,458,885 | | | | 0.7002220 | | | | Investor A | | | | 3,822,431 | |
Investor B | | | 58,101 | | | | 0.6913849 | | | | Investor B | | | | 40,170 | |
Investor B1 | | | 67,882 | | | | 0.7014217 | | | | Investor A | | | | 47,614 | |
Investor C | | | 585,806 | | | | 0.6975252 | | | | Investor C | | | | 408,614 | |
Investor C1 | | | 592,378 | | | | 0.7045611 | | | | Investor C1 | | | | 417,366 | |
The Target Fund’s net assets and composition of net assets on September 9, 2011, the date of the merger, were as follows:
| | | | | | | | | | | | |
| Net Assets | | Paid-in
Capital | | | Accumulated
Net Realized
Loss | | | Net
Unrealized
Appreciation | |
$91,151,057 | | $ | 67,224,663 | | | $ | (2,331,754 | ) | | $ | 26,258,148 | |
For financial reporting purposes, assets received and shares issued by Equity Dividend were recorded at fair value. However, the cost basis of the investments received from the Target Fund were carried forward to align ongoing reporting of Equity Dividend’s realized and unrealized gains and losses with amounts distributable to shareholders for tax purposes.
The aggregate net assets of Equity Dividend immediately after the acquisition amounted to $13,885,784,778. The Target Fund’s fair value and cost of investments prior to the reorganization were $87,340,910 and $61,056,386, respectively.
The purpose of this transaction was to combine two funds managed by BlackRock Advisors, LLC (“the Manager”) with the same or substantially similar (but not identical) investment objectives, investment policies, strategies, risks and restrictions. The reorganization was a tax-free event and was effective on September 12, 2011.
Assuming the acquisition had been completed on August 1, 2011, the beginning of the fiscal reporting period of Equity Dividend, the pro forma results of operations for the year ended July 31, 2012, are as follows:
| Ÿ | | Net investment income: $388,138,83 |
| Ÿ | | Net realized and change in unrealized gain/loss on investments: $1,566,205,617 |
| Ÿ | | Net increase in net assets resulting from operations: $1,954,344,499 |
Because the combined investment portfolios have been managed as a single integrated portfolio since the acquisition was completed, it is not practicable to separate the amounts of revenue and earnings of the Target Fund that have been included in Equity Dividend’s Statement of Operations since September 12, 2011.
| | | | | | |
| | | | | | | |
| 32 | | SEMI-ANNUAL REPORT | | JANUARY 31, 2013 | | |
| | |
| Notes to Financial Statements (continued) | | |
Reorganization costs incurred by Equity Dividend in connection with the reorganization were expensed by Equity Dividend. The Manager reimbursed Equity Dividend $128,063, which was included in fees waived and/or reimbursed by Manager in the Statements of Operations.
The following is a summary of significant accounting policies followed by the Funds:
Valuation: US GAAP defines fair value as the price the Funds would receive to sell an asset or pay to transfer a liability in an orderly transaction between market participants at the measurement date. The Funds determine the fair value of their financial instruments at market value using independent dealers or pricing services under policies approved by the Board of Trustees of each Fund (the “Board”). The BlackRock Global Valuation Methodologies Committee (the “Global Valuation Committee”) is the committee formed by management to develop global pricing policies and procedures and to provide oversight of the pricing function for the Funds for all financial instruments.
Equity investments traded on a recognized securities exchange or the NASDAQ Global Market System (“NASDAQ”) are valued at the last reported sale price that day or the NASDAQ official closing price, if applicable. For equity investments traded on more than one exchange, the last reported sale price on the exchange where the stock is primarily traded is used. Equity investments traded on a recognized exchange for which there were no sales on that day are valued at the last available bid (long positions) or ask (short positions) price. If no bid or ask price is available, the prior day’s price will be used, unless it is determined that such prior day’s price no longer reflects the fair value of the security. Investments in open-end registered investment companies are valued at NAV each business day. Short-term securities with remaining maturities of 60 days or less may be valued at amortized cost, which approximates fair value.
The Funds value their investments in BlackRock Liquidity Series, LLC Money Market Series (the “Money Market Series”) at fair value, which is ordinarily based upon their pro rata ownership in the underlying fund’s net assets. The Money Market Series seeks current income consistent with maintaining liquidity and preserving capital. Although the Money Market Series is not registered under the 1940 Act, its investments will follow the parameters of investments by a money market fund that is subject to Rule 2a-7 under the 1940 Act. The Funds may withdraw up to 25% of their investment daily, although the manager of the Money Market Series, in its sole discretion, may permit an investor to withdraw more than 25% on any one day.
Securities and other assets and liabilities denominated in foreign currencies are translated into US dollars using exchange rates determined as of the close of business on the New York Stock Exchange (“NYSE”). Foreign currency exchange contracts are valued at the mean between the bid and ask prices and are determined as of the close of business on the NYSE. Interpolated values are derived when the settlement date of the contract is an interim date for which quotations are not available.
In the event that application of these methods of valuation results in a price for an investment that is deemed not to be representative of the market value of such investment, or if a price is not available, the investment will be valued by the Global Valuation Committee, or its delegate, in accordance with a policy approved by the Board as reflecting fair value (“Fair Value Assets”). When determining the price for Fair Value Assets, the Global Valuation Committee, or its delegate, seeks to determine the price that each Fund might reasonably expect to receive from the current sale of that asset in an arm’s-length transaction. Fair value determinations shall be based upon all available factors that the Global Valuation Committee deem relevant consistent with the principles of fair value measurement, which include the market approach, income approach and/or in the case of recent investments, the cost approach, as appropriate. A market approach generally consists of using comparable market transactions. The income approach generally is used to discount future cash flows to present value and adjusted for liquidity as appropriate. These factors include but are not limited to: (i) attributes specific to the investment or asset; (ii) the principal market for the investment or asset; (iii) the customary participants in the principal market for the investment or asset; (iv) data assumptions by market participants for the investment or asset, if reasonably available; (v) quoted prices for similar investments or assets in active markets; and (vi) other factors, such as future cash flows, interest rates, yield curves, volatilities, prepayment speeds, loss severities, credit risks, recovery rates, liquidation amounts and/or default rates. Due to the inherent uncertainty of valuations of such investments, the fair values may differ from the values that would have been used had an active market existed. The Global Valuation Committee, or its delegate, employs various methods for calibrating valuation approaches for investments where an active market does not exist, including regular due diligence of the Funds’ pricing vendors, a regular review of key inputs and assumptions, transactional back-testing or disposition analysis to compare unrealized gains and losses to realized gains and losses, reviews of missing or stale prices and large movements in market values and reviews of any market related activity. The pricing of all Fair Value Assets is subsequently reported to the Board or a committee thereof on a quarterly basis.
Generally, trading in foreign instruments is substantially completed each day at various times prior to the close of business on the NYSE. Occasionally, events affecting the values of such instruments may occur between the foreign market close and the close of business on the NYSE that may not be reflected in the computation of each Fund’s net assets. If events (for example, a company announcement, market volatility or a natural disaster) occur during such periods that are expected to affect the value of such instruments materially, those instruments may be Fair Value Assets and valued at their fair value, as determined in good faith by the Global Valuation Committee using a pricing service and/or policies approved by the Board. Each business day, the Funds use a pricing service to assist with the valuation of certain foreign exchange-traded
| | | | | | |
| | | | | | | |
| | SEMI-ANNUAL REPORT | | JANUARY 31, 2013 | | 33 |
| | |
| Notes to Financial Statements (continued) | | |
equity securities (the “Systematic Fair Value Price”). Using current market factors, the Systematic Fair Value Price is designed to value such foreign securities and foreign options at fair value as of the close of business on the NYSE, which follows the close of the local markets.
Foreign Currency: The Funds’ books and records are maintained in US dollars. Purchases and sales of investment securities are recorded at the rates of exchange prevailing on the respective date of such transactions. Generally, when the US dollar rises in value against a foreign currency, the Funds’ investments denominated in that currency will lose value because that currency is worth fewer US dollars; the opposite effect occurs if the US dollar falls in relative value.
The Funds do not isolate the portion of the results of operations arising as a result of changes in the foreign exchange rates from the changes in the market prices of investments held or sold for financial reporting purposes. Accordingly, the effects of changes in foreign currency exchange rates on investments are not segregated in the Statements of Operations from the effects of changes in market prices of those investments but are included as a component of net realized and unrealized gain (loss) from investments. The Funds report realized currency gains (losses) on foreign currency related transactions as components of net realized gain (loss) for financial reporting purposes, whereas such components are treated as ordinary income for federal income tax purposes.
Preferred Stock: The Funds may invest in preferred stock. Preferred stock has a preference over common stock in liquidation (and generally in receiving dividends as well) but is subordinated to the liabilities of the issuer in all respects. As a general rule, the market value of preferred stock with a fixed dividend rate and no conversion element varies inversely with interest rates and perceived credit risk, while the market price of convertible preferred stock generally also reflects some element of conversion value. Because preferred stock is junior to debt securities and other obligations of the issuer, deterioration in the credit quality of the issuer will cause greater changes in the value of a preferred stock than in a more senior debt security with similar stated yield characteristics. Unlike interest payments on debt securities, preferred stock dividends are payable only if declared by the issuer’s board of directors. Preferred stock also may be subject to optional or mandatory redemption provisions.
Segregation and Collateralization: In cases in which the 1940 Act and the interpretive positions of the Securities and Exchange Commission (“SEC”) require that a Fund either deliver collateral or segregate assets in connection with certain investments (e.g., foreign currency exchange contracts), the Fund will, consistent with SEC rules and/or certain interpretive letters issued by the SEC, segregate collateral or designate on their books and records cash or liquid securities having a market value at least equal to the amount that would otherwise be required to be physically segregated. Furthermore, based on requirements and agreements with certain exchanges and third party broker-dealers, each party to such transactions has to deliver/deposit securities as collateral for certain investments.
Investment Transactions and Investment Income: For financial reporting purposes, investment transactions are recorded on the dates the transactions are entered into (the trade dates). Realized gains and losses on investment transactions are determined on the identified cost basis. Dividend income is recorded on the ex-dividend dates. Dividends from foreign securities where the ex-dividend date may have passed are subsequently recorded when the Funds are informed of the ex-dividend date. Under the applicable foreign tax laws, a withholding tax at various rates may be imposed on capital gains, dividends and interest. Upon notification from issuers, some of the dividend income received from a real estate investment trust may be redesignated as a reduction of cost of the related investment and/or realized gain. Interest income, including amortization and accretion of premiums and discounts on debt securities, is recognized on the accrual basis. Income and realized and unrealized gains and losses are allocated daily to each class based on its relative net assets.
Dividends and Distributions: Dividends and distributions paid by the Funds are recorded on the ex-dividend dates. The portion of distributions that exceeds a Fund’s current and accumulated earnings and profits, which are measured on a tax basis, will constitute a nontaxable return of capital. Distributions in excess of a Fund’s taxable income and net capital gains, but not in excess of a Fund’s earnings and profits, will be taxable to shareholders as ordinary income and will not constitute a nontaxable return of capital. Capital losses carried forward from years beginning before 2011 do not reduce earnings and profits, even if such carried forward losses offset current year realized gains. The character and timing of dividends and distributions are determined in accordance with federal income tax regulations, which may differ from US GAAP.
Income Taxes: It is the Funds’ policy to comply with the requirements of the Internal Revenue Code of 1986, as amended, applicable to regulated investment companies and to distribute substantially all of their taxable income to their shareholders. Therefore, no federal income tax provision is required.
Each Fund files US federal and various state and local tax returns. No income tax returns are currently under examination. The statute of limitations on the Funds’ US federal tax returns remains open for each of the four years ended July 31, 2012. The statutes of limitations on each Fund’s state and local tax returns may remain open for an additional year depending upon the jurisdiction. Management does not believe there are any uncertain tax positions that require recognition of a tax liability.
Recent Accounting Standards: In December 2011, the Financial Accounting Standards Board (the “FASB”) issued guidance that will expand current disclosure requirements on the offsetting of certain assets and liabilities. The new disclosures will be required for
| | | | | | |
| | | | | | | |
| 34 | | SEMI-ANNUAL REPORT | | JANUARY 31, 2013 | | |
| | |
| Notes to Financial Statements (continued) | | |
investments and derivative financial instruments subject to master netting or similar agreements, which are eligible for offset in the Statements of Assets and Liabilities and will require an entity to disclose both gross and net information about such investments and transactions in the financial statements. In January 2013, the FASB issued guidance that clarifies which investments and transactions are subject to the offsetting disclosure requirements. The scope of the disclosure requirements for offsetting will be limited to derivative instruments, repurchase agreements and reverse repurchase agreements, and securities borrowing and securities lending transactions. The guidance is effective for financial statements with fiscal years beginning on or after January 1, 2013, and interim periods within those fiscal years. Management is evaluating the impact of this guidance on the Funds’ financial statement disclosures.
Other: Expenses directly related to a Fund or its classes are charged to that Fund or class. Other operating expenses shared by several funds are pro rated among those funds on the basis of relative net assets or other appropriate methods. Expenses directly related to the Funds and other shared expenses pro rated to the Funds are allocated daily to each class based on its relative net assets or other appropriate methods.
The Funds have an arrangement with the custodian whereby fees may be reduced by credits earned on uninvested cash balances, which, if applicable, are shown as fees paid indirectly in the Statements of Operations. The custodian imposes fees on overdrawn cash balances, which can be offset by accumulated credits earned or may result in additional custody charges.
2. Derivative Financial Instruments:
The Funds engage in various portfolio investment strategies using derivative contracts both to increase the returns of the Funds and/or to economically hedge, or protect, their exposure to certain risks such as foreign currency exchange rate risk. These contracts may be transacted on an exchange or over-the-counter (“OTC”).
Losses may arise if the value of the contract decreases due to an unfavorable change in the market rates or values of the underlying instrument or if the counterparty does not perform under the contract. The Funds’ maximum risk of loss from counterparty credit risk on OTC derivatives is generally the aggregate unrealized gain netted against any collateral pledged by/posted to the counterparty.
The Funds may mitigate counterparty risk by procuring collateral and through netting provisions included within an International Swaps and Derivatives Association, Inc. master agreement (“ISDA Master Agreement”) implemented between a Fund and each of its respective counterparties. An ISDA Master Agreement allows each Fund to offset with each separate counterparty certain derivative financial instrument’s payables and/or receivables with collateral held. The amount of collateral moved to/from applicable counterparties is generally based upon minimum transfer amounts of up to $500,000. To the extent amounts due to the Funds from their counterparties are not fully collateralized, contractually or otherwise, the Funds bear the risk of loss from counterparty non-performance. See Note 1 “Segregation and Collateralization” for information with respect to collateral practices. In addition, the Funds manage counterparty risk by entering into agreements only with counterparties that they believe have the financial resources to honor their obligations and by monitoring the financial stability of those counterparties.
Certain ISDA Master Agreements allow counterparties to OTC derivatives to terminate derivative contracts prior to maturity in the event the Funds’ net assets decline by a stated percentage or the Funds fail to meet the terms of their ISDA Master Agreements, which would cause the Funds to accelerate payment of any net liability owed to the counterparty.
Foreign Currency Exchange Contracts: The Funds enter into foreign currency exchange contracts as an economic hedge against either specific transactions or portfolio instruments or to obtain exposure to foreign currencies (foreign currency exchange rate risk). A foreign currency exchange contract is an agreement between two parties to buy and sell a currency at a set exchange rate on a future date. Foreign currency exchange contracts, when used by the Funds, help to manage the overall exposure to the currencies in which some of the investments held by the Funds are denominated. The contract is marked-to-market daily and the change in market value is recorded by the Funds as an unrealized gain or loss. When the contract is closed, the Funds record a realized gain or loss equal to the difference between the value at the time it was opened and the value at the time it was closed. The use of foreign currency exchange contracts involves the risk that the value of a foreign currency exchange contract changes unfavorably due to movements in the value of the referenced foreign currencies and the risk that the counterparty to the contract does not perform its obligations under the agreement.
| | | | | | |
| Derivative Financial Instruments Categorized by Risk Exposure: | |
| Fair Values of Derivative Financial Instruments as of January 31, 2013 | |
| | | Asset Derivatives | |
| | | Equity Dividend | |
| | | Statements of
Assets and Liabilities Location | | Value | |
Foreign currency exchange contracts | | Unrealized appreciation on foreign currency exchange contracts | | $ | 11,161 | |
| | | | | | |
| | | | | | | |
| | SEMI-ANNUAL REPORT | | JANUARY 31, 2013 | | 35 |
| | |
| Notes to Financial Statements (continued) | | |
| | | | | | |
| | | Liability Derivatives | |
| | | Equity Dividend | |
| | | Statements of
Assets and Liabilities Location | | Value | |
Foreign currency exchange contracts | | Unrealized depreciation on foreign currency exchange contracts | | $ | (17,922 | ) |
| | | | | | | | |
The Effect of Derivative Financial Instruments in the Statements of Operations Six Months Ended January 31, 2013 | |
| | | Net Realized Gain (Loss) From | |
| | | Equity Dividend | | | Natural Resources | |
| Foreign currency exchange contracts: | | | | | | | | |
Foreign currency transactions | | | $252,280 | | | | $(25,142) | |
| |
| | | Net Change in Unrealized
Appreciation/Depreciation on | |
| | | Equity Dividend | | | Natural Resources | |
| Foreign currency exchange contracts: | | | | | | | | |
Foreign currency translations | | | $(1,543) | | | | $1,102 | |
For the six months ended January 31, 2013, the average quarterly balances of outstanding derivative financial instruments were as follows:
| | | | | | | | |
| | | Equity Dividend | | | Natural
Resources | |
| Foreign currency exchange contracts: | | | | | | | | |
Average number of contracts – US dollars purchased | | | 1 | | | | 181 | |
Average number of contracts – US dollars sold | | | 1 | | | | 11 | |
Average US dollar amounts purchased | | | $2,066,156 | | | | $5,358,1931 | |
Average US dollar amounts sold | | | $2,980,632 | | | | $11,6611 | |
| 1 | | Actual contract amount shown due to limited activity. |
3. Investment Advisory Agreement and Other Transactions with Affiliates:
The PNC Financial Services Group, Inc. (“PNC”) is the largest stockholder and an affiliate, for 1940 Act purposes, of BlackRock, Inc. (“BlackRock”).
Each Fund entered into an Investment Advisory Agreement with the Manager, the Funds’ investment advisor, an indirect, wholly owned subsidiary of BlackRock, to provide investment advisory and administration services. The Manager is responsible for the management of each Fund’s portfolio and provides the necessary personnel, facilities, equipment and certain other services necessary to the operations of each Fund. For such services, each Fund pays the Manager a monthly fee based on a percentage of each Fund’s average daily net assets at the following annual rates:
| | | | |
| Equity Dividend | | | |
| Average Daily Net Assets | | Investment
Advisory
Fee | |
First $8 Billion | | | 0.60 | % |
$8 Billion — $10 Billion | | | 0.56 | % |
$10 Billion — $12 Billion | | | 0.54 | % |
$12 Billion — $17 Billion | | | 0.52 | % |
$17 Billion — $25 Billion | | | 0.51 | % |
$25 Billion — $35 Billion | | | 0.50 | % |
$35 Billion — $50 Billion | | | 0.49 | % |
Greater than $50 Billion | | | 0.48 | % |
| | | | |
| Natural Resources | | | |
| Average Daily Net Assets | | Investment
Advisory
Fee | |
First $1 Billion | | | 0.60 | % |
$1 Billion — $3 Billion | | | 0.56 | % |
$3 Billion — $5 Billion | | | 0.54 | % |
$5 Billion — $10 Billion | | | 0.52 | % |
Greater than $10 Billion | | | 0.51 | % |
The Manager voluntarily agreed to waive its investment advisory fees by the amount of investment advisory fees each Fund pays to the Manager indirectly through its investment in affiliated money market funds. However, the Manager does not waive its investment advisory fees by the amount of investment advisory fees paid in connection with each Fund’s investment in other affiliated investment companies, if any. These amounts waived or reimbursed are included in fees waived by Manager in the Statements of Operations. For the six months ended January 31, 2013, the amounts waived were as follows:
| | | | |
Equity Dividend. | | $ | 350,309 | |
Natural Resources | | $ | 2,215 | |
With respect to each Fund, the Manager entered into separate sub-advisory agreements with BlackRock Investment Management, LLC (“BIM”), an affiliate of the Manager. The Manager pays BIM, for services it provides, a monthly fee that is a percentage of the investment advisory fees paid by each Fund to the Manager.
For the six months ended January 31, 2013, each Fund reimbursed the Manager for certain accounting services, which is included in accounting services in the Statements of Operations. The reimbursements were as follows:
| | | | |
Equity Dividend. | | $ | 93,840 | |
Natural Resources | | $ | 3,128 | |
The Funds entered into a Distribution Agreement and Distribution and Service Plan with BlackRock Investments, LLC (“BRIL”), an affiliate of the Manager. Pursuant to the Distribution and Service Plan and in accordance with Rule 12b-1 under the 1940 Act, each Fund pays BRIL ongoing service and distribution fees. The fees are accrued daily and
| | | | | | |
| | | | | | | |
| 36 | | SEMI-ANNUAL REPORT | | JANUARY 31, 2013 | | |
| | |
| Notes to Financial Statements (continued) | | |
paid monthly at annual rates based upon the average daily net assets of the shares of each Fund as follows:
| | | | | | | | |
| | | Service Fees | |
| | | Equity Dividend | | | Natural Resources | |
Service | | | 0.25 | % | | | — | |
Investor A | | | 0.25 | % | | | 0.25 | % |
Investor B | | | 0.25 | % | | | 0.25 | % |
Investor C | | | 0.25 | % | | | 0.25 | % |
Investor C1 | | | 0.25 | % | | | — | |
Class R | | | 0.25 | % | | | — | |
| | | | | | | | |
| | | Distribution Fees | |
| | | Equity Dividend | | | Natural Resources | |
Investor B | | | 0.75 | % | | | 0.75 | % |
Investor C | | | 0.75 | % | | | 0.75 | % |
Investor C1 | | | 0.55 | % | | | — | |
Class R | | | 0.25 | % | | | — | |
Pursuant to sub-agreements with BRIL, broker-dealers and BRIL provide shareholder servicing and distribution services to each Fund. The ongoing service and/or distribution fee compensates BRIL and each broker-dealer for providing shareholder servicing and/or distribution related services to Service, Investor A, Investor B, Investor C and Class R shareholders.
Pursuant to written agreements, certain financial intermediaries, some of which may be affiliates, provide the Funds with sub-accounting, recordkeeping, sub-transfer agency and other administrative services with respect to sub-accounts they service. For these services, these entities receive an asset based fee or an annual fee per shareholder account, which will vary depending on share class and/or net assets. For the six months ended January 31, 2013, the Funds paid the following to affiliates in return for these services, which is included in transfer agent – class specific in the Statements of Operations.
| | | | | | | | |
| | | Equity Dividend | | | Natural Resources | |
Institutional | | $ | 1,210,303 | | | $ | 139 | |
Investor A | | $ | 5,638 | | | $ | 1,185 | |
Investor C | | $ | 647 | | | $ | 55 | |
For the six months ended January 31, 2013, affiliates earned underwriting discounts, direct commissions and dealer concessions on sales of the Funds’ Investor A Shares as follows:
| | | | |
| | | Investor A | |
Equity Dividend | | $ | 424,980 | |
Natural Resources | | $ | 5,382 | |
For the six months ended January 31, 2013, affiliates received CDSCs as follows:
| | | | | | | | | | | | | | | | |
| | | Investor A | | | Investor B | | | Investor C | | | Investor C1 | |
Equity Dividend | | $ | 139,021 | | | $ | 28,094 | | | $ | 219,043 | | | $ | 186 | |
Natural Resources | | $ | 104 | | | $ | 7,929 | | | $ | 3,278 | | | | — | |
The Manager maintains a call center, which is responsible for providing certain shareholder services to the Funds, such as responding to shareholder inquiries and processing transactions based upon instructions from shareholders with respect to the subscription and redemption of Fund shares. For the six months ended January 31, 2013, each Fund reimbursed the Manager the following amounts for costs incurred in running the call center, which are included in transfer agent — class specific in the Statements of Operations:
| | | | | | | | |
| | | Equity Dividend | | | Natural Resources | |
Institutional | | $ | 29,211 | | | $ | 1,166 | |
Service | | $ | 960 | | | | — | |
Investor A | | $ | 54,040 | | | $ | 3,333 | |
Investor B | | $ | 874 | | | $ | 235 | |
Investor C | | $ | 17,304 | | | $ | 1,324 | |
Investor C1 | | $ | 27 | | | | — | |
Class R | | $ | 4,959 | | | | — | |
Certain officers and/or trustees of the Funds are officers and/or directors of BlackRock or its affiliates. The Funds reimburse the Manager for a portion of the compensation paid to the Funds’ Chief Compliance Officer, which is included in officer and trustees in the Statement of Operations.
4. Investments:
Purchases and sales of investments excluding short-term securities for the six months ended January 31, 2013, were as follows:
| | | | | | | | |
| | | Purchases | | | Sales | |
Equity Dividend | | $ | 2,946,146,159 | | | $ | 771,896,455 | |
Natural Resources | | | — | | | $ | 27,244,531 | |
5. Income Tax Information:
As of July 31, 2012, the Funds had capital loss carryforwards available to offset future realized capital gains through the indicated expiration dates as follows:
| | | | | | | | |
| Expires July 31, | | Equity Dividend | | | Natural Resources | |
2016 | | $ | 2,982,312 | | | | — | |
2017 | | | 23,133,126 | | | | — | |
2018 | | | 242,816,904 | | | $ | 1,033,380 | |
2019 | | | 28,330,637 | | | | — | |
| | | | | | | | |
Total | | $ | 297,262,979 | | | $ | 1,033,380 | |
| | | | | | | | |
As of January 31, 2013, gross unrealized appreciation and gross unrealized depreciation based on cost for federal income tax purposes were as follows:
| | | | | | | | |
| | | Equity Dividend | | | Natural Resources | |
Tax cost | | $ | 22,101,361,879 | | | $ | 255,868,568 | |
| | | | | | | | |
Gross unrealized appreciation | | $ | 4,801,329,850 | | | $ | 279,218,519 | |
Gross unrealized depreciation | | | (119,944,877 | ) | | | (6,628,998 | ) |
| | | | | | | | |
Net unrealized appreciation | | $ | 4,681,384,973 | | | $ | 272,589,521 | |
| | | | | | | | |
| | | | | | |
| | | | | | | |
| | SEMI-ANNUAL REPORT | | JANUARY 31, 2013 | | 37 |
| | |
| Notes to Financial Statements (continued) | | |
6. Borrowings:
The Funds, along with certain other funds managed by the Manager and its affiliates, are each a party to a $500 million credit agreement with a group of lenders. The Funds may borrow under the credit agreement to fund shareholder redemptions. Effective November 2011 to November 2012, the credit agreement had the following terms: a commitment fee of 0.065% per annum based on each Fund’s pro rata share of the unused portion of the credit agreement and interest at a rate equal to the higher of (a) the one-month London Interbank Offered Rate (“LIBOR”) plus 0.80% per annum or (b) the Fed Funds rate plus 0.80% per annum on amounts borrowed. In addition, the Funds paid administration and arrangement fees which were allocated to the Funds based on their net assets as of October 31, 2011. The credit agreement, which expired in November 2012, was renewed with the same terms until November 2013. Effective November 2012 to November 2013, the credit agreement has the following terms: a commitment fee of 0.065% per annum based on each Fund’s pro rata share of the unused portion of the credit agreement and interest at a rate equal to the higher of (a) the one-month LIBOR plus 0.80% per annum or (b) the Fed Funds rate plus 0.80% per annum on amounts borrowed. In addition, the Funds paid administration and arrangement fees which were allocated to the Funds based on their net assets as of October 31, 2012. The Funds did not borrow under the credit agreement during the six months ended January 31, 2013.
7. Concentration, Market and Credit Risk:
In the normal course of business, the Funds invest in securities and enter into transactions where risks exist due to fluctuations in the market (market risk) or failure of the issuer of a security to meet all its obligations (issuer credit risk). The value of securities held by the Funds may decline in response to certain events, including those directly involving the issuers whose securities are owned by the Funds; conditions affecting the general economy; overall market changes; local, regional or global political, social or economic instability; and currency and interest rate and price fluctuations. Similar to issuer credit risk, the Funds may be exposed to counterparty credit risk, or the risk that an entity with which the Funds have unsettled or open transactions may fail to or be unable to perform on its commitments. The Funds manage counterparty credit risk by entering into transactions only with counterparties that they believe have the financial resources to honor their obligations and by monitoring the financial stability of those counterparties. Financial assets, which potentially expose the Funds to market, issuer and counterparty credit risks, consist principally of financial instruments and receivables due from counterparties. The extent of the Funds’ exposure to market, issuer and counterparty credit risks with respect to these financial assets is generally approximated by their value recorded in the Statements of Assets and Liabilities, less any collateral held by the Funds.
As of January 31, 2013, Natural Resources invested a significant portion of its assets in securities in the energy sector. Changes in economic conditions affecting the energy sector would have a greater impact on Natural Resources and could affect the value, income and/or liquidity of positions in such securities.
8. Capital Shares Transactions:
Transactions in capital shares for each class were as follows:
| | | | | | | | | | | | | | | | | | |
| Equity Dividend | | Six Months Ended
January 31, 2013 | | | | | Year Ended
July 31, 2012 | |
| | Shares | | | Amount | | | | | Shares | | | Amount | |
| Institutional | | | | | | | | | | | | | | |
Shares sold | | | 122,230,762 | | | $ | 2,451,746,291 | | | | | | 341,738,716 | | | $ | 6,241,154,289 | |
Shares issued to shareholders in reinvestment of dividends | | | 6,908,999 | | | | 139,484,630 | | | | | | 9,562,584 | | | | 177,430,524 | |
Shares issued resulting from reorganization | | | — | | | | — | | | | | | 747,303 | | | | 12,486,985 | |
Shares redeemed | | | (71,748,596 | ) | | | (1,438,820,971 | ) | | | | | (122,086,798 | ) | | | (2,259,589,021 | ) |
| | | | | | | | | | |
Net increase | | | 57,391,165 | | | $ | 1,152,409,950 | | | | | | 229,961,805 | | | $ | 4,171,482,777 | |
| | | | | | | | | | |
| | | | | | | | | | | | | | | | | | |
| Service | | | | | | | | | | | | | | | | | | |
Shares sold | | | 3,568,159 | | | $ | 71,343,134 | | | | | | 8,203,754 | | | $ | 146,524,296 | |
Shares issued to shareholders in reinvestment of dividends | | | 132,913 | | | | 2,671,995 | | | | | | 177,070 | | | | 3,273,511 | |
Shares redeemed | | | (1,154,726 | ) | | | (23,140,404 | ) | | | | | (1,457,176 | ) | | | (26,835,207 | ) |
| | | | | | | | | | |
Net increase | | | 2,546,346 | | | $ | 50,874,725 | | | | | | 6,923,648 | | | $ | 122,962,600 | |
| | | | | | | | | | |
| | | | | | |
| | | | | | | |
| 38 | | SEMI-ANNUAL REPORT | | JANUARY 31, 2013 | | |
| | |
| Notes to Financial Statements (continued) | | |
| | | | | | | | | | | | | | | | | | |
| | | Six Months Ended
January 31, 2013 | | | | | Year Ended
July 31, 2012 | |
| Equity Dividend (concluded) | | Shares | | | Amount | | | | | Shares | | | Amount | |
| Investor A | | | | | | | | | | | | | | |
Shares sold and automatic conversion of shares | | | 85,571,118 | | | $ | 1,706,908,666 | | | | | | 205,534,436 | | | $ | 3,768,483,603 | |
Shares issued to shareholders in reinvestment of dividends | | | 5,194,622 | | | | 104,636,694 | | | | | | 7,495,591 | | | | 138,511,807 | |
Shares issued resulting from reorganization | | | — | | | | — | | | | | | 3,870,045 | | | | 64,513,835 | |
Shares redeemed | | | (66,471,933 | ) | | | (1,328,136,093 | ) | | | | | (99,149,311 | ) | | | (1,814,907,098 | ) |
| | | | | | | | | | |
Net increase | | | 24,293,807 | | | $ | 483,409,267 | | | | | | 117,750,761 | | | $ | 2,156,602,147 | |
| | | | | | | | | | |
| | | | | | | | | | | | | | | | | | |
| Investor B | | | | | | | | | | | | | | | | | | |
Shares sold | | | 102,126 | | | $ | 2,057,140 | | | | | | 360,518 | | | $ | 6,627,598 | |
Shares issued to shareholders in reinvestment of dividends | | | 15,750 | | | | 319,623 | | | | | | 27,609 | | | | 509,202 | |
Shares issued resulting from reorganization | | | — | | | | — | | | | | | 40,170 | | | | 673,398 | |
Shares redeemed | | | (417,154 | ) | | | (8,399,498 | ) | | | | | (960,454 | ) | | | (17,670,882 | ) |
| | | | | | | | | | |
Net decrease | | | (299,278 | ) | | $ | (6,022,735 | ) | | | | | (532,157 | ) | | $ | (9,860,684 | ) |
| | | | | | | | | | |
| | | | | | | | | | | | | | | | | | |
| Investor C | | | | | | | | | | | | | | | | | | |
Shares sold | | | 20,679,168 | | | $ | 404,815,521 | | | | | | 48,856,993 | | | $ | 880,450,238 | |
Shares issued to shareholders in reinvestment of dividends | | | 975,101 | | | | 19,218,069 | | | | | | 1,277,118 | | | | 23,124,319 | |
Shares issued resulting from reorganization | | | — | | | | — | | | | | | 408,614 | | | | 6,667,130 | |
Shares redeemed | | | (10,570,368 | ) | | | (206,218,803 | ) | | | | | (16,943,670 | ) | | | (303,416,327 | ) |
| | | | | | | | | | |
Net increase | | | 11,083,901 | | | $ | 217,814,787 | | | | | | 33,599,055 | | | $ | 606,825,360 | |
| | | | | | | | | | |
| | | | | | | | | | | | | | | | | | |
| | | | | | | | Period
September 12, 20111
to July 31, 2012 | |
| | | | | | | | | | Shares | | | Amount | |
| Investor C1 | | | | | | | | | | | | | | |
Shares sold | | | 12,719 | | | $ | 246,807 | | | | | | 35,895 | | | $ | 663,759 | |
Shares issued to shareholders in reinvestment of dividends | | | 2,743 | | | | 53,968 | | | | | | 5,222 | | | | 93,109 | |
Shares issued resulting from reorganization | | | — | | | | — | | | | | | 417,366 | | | | 6,809,898 | |
Shares redeemed | | | (31,044 | ) | | | (600,143 | ) | | | | | (77,291 | ) | | | (1,397,593 | ) |
| | | | | | | | | | |
Net increase (decrease) | | | (15,582 | ) | | $ | (299,368 | ) | | | | | 381,192 | | | $ | 6,169,173 | |
| | | | | | | | | | |
| | | | | | | | | | | | | | | | | | |
| | | | | | | | | | | Year Ended
July 31, 2012 | |
| | | | | | | | | | | Shares | | | Amount | |
| Class R | | | | | | | | | | | | | | |
Shares sold | | | 10,080,418 | | | $ | 202,093,232 | | | | | | 20,088,111 | | | $ | 373,437,193 | |
Shares issued to shareholders in reinvestment of dividends | | | 493,852 | | | | 9,993,360 | | | | | | 690,355 | | | | 12,836,263 | |
Shares redeemed | | | (5,883,077 | ) | | | (117,935,685 | ) | | | | | (8,953,654 | ) | | | (164,827,175 | ) |
| | | | | | | | | | |
Net increase | | | 4,691,193 | | | $ | 94,150,907 | | | | | | 11,824,812 | | | $ | 221,446,281 | |
| | | | | | | | | | |
Total Net Increase | | | 99,691,552 | | | $ | 1,992,337,533 | | | | | | 399,909,116 | | | $ | 7,275,627,654 | |
| | | | | | | | | | |
| | | | | | | | | | | | | | | | | | |
| | | | | | |
| | | | | | | |
| | SEMI-ANNUAL REPORT | | JANUARY 31, 2013 | | 39 |
| | |
| Notes to Financial Statements (continued) | | |
| | | | | | | | | | | | | | | | | | |
| | | Six Months Ended
January 31, 2013 | | | | | Year Ended
July 31, 2012 | |
| Natural Resources | | Shares | | | Amount | | | | | Shares | | | Amount | |
| Institutional | | | | | | | | | | | | | | |
Shares sold | | | 472,664 | | | $ | 29,117,620 | | | | | | 871,405 | | | $ | 52,350,374 | |
Shares issued to shareholders in reinvestment of dividends | | | 10,985 | | | | 661,290 | | | | | | 7,266 | | | | 438,880 | |
Shares redeemed | | | (535,411 | ) | | | (32,669,572 | ) | | | | | (781,762 | ) | | | (44,983,698 | ) |
| | | | | | | | | | |
Net increase (decrease) | | | (51,762 | ) | | $ | (2,890,662 | ) | | | | | 96,909 | | | $ | 7,805,556 | |
| | | | | | | | | | |
| | | | | | | | | | | | | | | | | | |
| Investor A | | | | | | | | | | | | | | | | | | |
Shares sold and automatic conversion of shares | | | 560,114 | | | $ | 33,434,322 | | | | | | 1,303,275 | | | $ | 76,152,880 | |
Shares issued to shareholders in reinvestment of dividends | | | 15,911 | | | | 935,741 | | | | | | 14,702 | | | | 866,289 | |
Shares redeemed | | | (877,574 | ) | | | (52,220,183 | ) | | | | | (2,036,525 | ) | | | (118,090,966 | ) |
| | | | | | | | | | |
Net decrease | | | (301,549 | ) | | $ | (17,850,120 | ) | | | | | (718,548 | ) | | $ | (41,071,797 | ) |
| | | | | | | | | | |
| | | | | | | | | | | | | | | | | | |
| Investor B | | | | | | | | | | | | | | | | | | |
Shares sold | | | 3,820 | | | $ | 203,826 | | | | | | 5,352 | | | $ | 287,729 | |
Shares redeemed and automatic conversion of shares | | | (50,133 | ) | | | (2,692,027 | ) | | | | | (113,046 | ) | | | (5,980,482 | ) |
| | | | | | | | | | |
Net decrease | | | (46,313 | ) | | $ | (2,488,201 | ) | | | | | (107,694 | ) | | $ | (5,692,753 | ) |
| | | | | | | | | | |
| | | | | | | | | | | | | | | | | | |
| Investor C | | | | | | | | | | | | | | | | | | |
Shares sold | | | 113,747 | | | $ | 6,026,415 | | | | | | 246,893 | | | $ | 12,903,004 | |
Shares redeemed | | | (301,562 | ) | | | (15,891,039 | ) | | | | | (639,433 | ) | | | (32,817,409 | ) |
| | | | | | | | | | |
Net decrease | | | (187,815 | ) | | $ | (9,864,624 | ) | | | | | (392,540 | ) | | $ | (19,914,405 | ) |
| | | | | | | | | | |
Total Net Decrease | | | (587,439 | ) | | $ | (33,093,607 | ) | | | | | (1,121,873 | ) | | $ | (58,873,399 | ) |
| | | | | | | | | | |
| 1 | | Commencement of operations. |
| | | | | | |
| | | | | | | |
| 40 | | SEMI-ANNUAL REPORT | | JANUARY 31, 2013 | | |
| | |
| Notes to Financial Statements (concluded) | | |
9. Subsequent Events:
Management has evaluated the impact of all subsequent events on each Fund through the date the financial statements were issued and has determined that there were no subsequent events requiring adjustment or additional disclosure in the financial statements.
| | | | | | |
| | | | | | | |
| | SEMI-ANNUAL REPORT | | JANUARY 31, 2013 | | 41 |
Robert M. Hernandez, Chairman of the Board and Trustee
Fred G. Weiss, Vice Chairman of the Board and Trustee
Paul L. Audet, President1 and Trustee
James H. Bodurtha, Trustee
Bruce R. Bond, Trustee
Donald W. Burton, Trustee
Honorable Stuart E. Eizenstat, Trustee
Laurence D. Fink, Trustee
Kenneth A. Froot, Trustee
Henry Gabbay, Trustee
John F. O’Brien, Trustee
Roberta Cooper Ramo, Trustee
David H. Walsh, Trustee
John M. Perlowski, President2 and Chief Executive Officer
Brendan Kyne, Vice President
Neal Andrews, Chief Financial Officer
Jay Fife, Treasurer
Brian Kindelan, Chief Compliance Officer and Anti-Money Laundering Officer
Benjamin Archibald, Secretary
Investment Advisor
BlackRock Advisors, LLC
Wilmington, DE 19809
Sub-Advisor
BlackRock Investment Management, LLC
Princeton, NJ 08540
Custodians
State Street Bank and Trust Company1
Boston, MA 02110
The Bank of New York Mellon2
New York, NY 10286
Transfer Agent
BNY Mellon Investment Servicing (US) Inc.
Wilmington, DE 19809
Accounting Agent
State Street Bank and Trust Company
Boston, MA 02110
Distributor
BlackRock Investments, LLC
New York, NY 10022
Independent Registered Public Accounting Firm
Deloitte & Touche LLP
Boston, MA 02116
Legal Counsel
Willkie Farr & Gallagher LLP
New York, NY 10019
Address of the Funds
100 Bellevue Parkway
Wilmington, DE 19809
| | | | | | |
| | | | | | | |
| 42 | | SEMI-ANNUAL REPORT | | JANUARY 31, 2013 | | |
Electronic Delivery
Electronic copies of most financial reports and prospectuses are available on the Funds’ websites or shareholders can sign up for e-mail notifications of quarterly statements, annual and semi-annual reports and prospectuses by enrolling in the Funds’ electronic delivery program.
To enroll:
Shareholders Who Hold Accounts with Investment Advisors, Banks or Brokerages:
Please contact your financial advisor. Please note that not all investment advisors, banks or brokerages may offer this service.
Shareholders Who Hold Accounts Directly with BlackRock:
| 1) | Access the BlackRock website at http://www.blackrock.com/edelivery |
| 2) | Select “eDelivery” under the “More Information” section |
Householding
The Funds will mail only one copy of shareholder documents, including prospectuses, annual and semi-annual reports and proxy statements, to shareholders with multiple accounts at the same address. This practice is commonly called “householding” and is intended to reduce expenses and eliminate duplicate mailings of shareholder documents. Mailings of your shareholder documents may be householded indefinitely unless you instruct us otherwise. If you do not want the mailing of these documents to be combined with those for other members of your household, please call the Funds at (800) 441-7762.
Availability of Quarterly Schedule of Investments
The Funds file their complete schedule of portfolio holdings with the SEC for the first and third quarters of each fiscal year on Form N-Q. The Funds’ Forms N-Q are available on the SEC’s website at http://www.sec.gov and may also be reviewed and copied at the SEC’s Public Reference Room in Washington, DC. Information on how to access documents on the SEC’s website without charge may be obtained by calling (800) SEC-0330. The Funds’ Forms N-Q may also be obtained upon request and without charge by calling (800) 441-7762.
Availability of Proxy Voting Policies and Procedures
A description of the policies and procedures that the Funds use to determine how to vote proxies relating to portfolio securities is available (1) without charge, upon request, by calling (800) 441-7762; (2) at http://www.blackrock.com; and (3) on the SEC’s website at http://www.sec.gov.
Availability of Proxy Voting Record
Information about how the Funds voted proxies relating to securities held in the Funds’ portfolios during the most recent 12-month period ended June 30 is available upon request and without charge (1) at http://www.blackrock.com or by calling (800) 441-7762 and (2) on the SEC’s website at http://www.sec.gov.
| | | | | | |
| | | | | | | |
| | SEMI-ANNUAL REPORT | | JANUARY 31, 2013 | | 43 |
| | |
| Additional Information (continued) | | |
Account Information
Call us at (800) 441-7762 from 8:00 AM to 6:00 PM EST on any business day to get information about your account balances, recent transactions and share prices. You can also reach us on the Web at http://www.blackrock.com/funds.
Automatic Investment Plans
Investor Class shareholders who want to invest regularly can arrange to have $50 or more automatically deducted from their checking or savings account and invested in any of the BlackRock funds.
Systematic Withdrawal Plans
Investor Class shareholders can establish a systematic withdrawal plan and receive periodic payments of $50 or more from their BlackRock funds, as long as their account balance is at least $10,000.
Retirement Plans
Shareholders may make investments in conjunction with Traditional, Rollover, Roth, Coverdell, Simple IRAs, SEP IRAs and 403(b) Plans.
| | | | | | |
| | | | | | | |
| 44 | | SEMI-ANNUAL REPORT | | JANUARY 31, 2013 | | |
| | |
| Additional Information (concluded) | | |
|
| BlackRock Privacy Principles |
BlackRock is committed to maintaining the privacy of its current and former fund investors and individual clients (collectively, “Clients”) and to safeguarding their non-public personal information. The following information is provided to help you understand what personal information BlackRock collects, how we protect that information and why in certain cases we share such information with select parties.
If you are located in a jurisdiction where specific laws, rules or regulations require BlackRock to provide you with additional or different privacy-related rights beyond what is set forth below, then BlackRock will comply with those specific laws, rules or regulations.
BlackRock obtains or verifies personal non-public information from and about you from different sources, including the following: (i) information we receive from you or, if applicable, your financial intermediary, on applications, forms or other documents; (ii) information about your transactions with us, our affiliates, or others; (iii) information we receive from a consumer reporting agency; and (iv) from visits to our websites.
BlackRock does not sell or disclose to non-affiliated third parties any non-public personal information about its Clients, except as permitted by law or as is necessary to respond to regulatory requests or to service Client accounts. These non-affiliated third parties are required to protect the confidentiality and security of this information and to use it only for its intended purpose.
We may share information with our affiliates to service your account or to provide you with information about other BlackRock products or services that may be of interest to you. In addition, BlackRock restricts access to non-public personal information about its Clients to those BlackRock employees with a legitimate business need for the information. BlackRock maintains physical, electronic and procedural safeguards that are designed to protect the non-public personal information of its Clients, including procedures relating to the proper storage and disposal of such information.
| | | | | | |
| | | | | | | |
| | SEMI-ANNUAL REPORT | | JANUARY 31, 2013 | | 45 |
| | |
| A World-Class Mutual Fund Family | | |
BlackRock offers a diverse lineup of open-end mutual funds crossing all investment styles and managed by experts in equity, fixed income and tax-exempt investing.
BlackRock ACWI ex-US Index Fund
BlackRock All-Cap Energy & Resources Portfolio
BlackRock Basic Value Fund
BlackRock Capital Appreciation Fund
BlackRock China Fund
BlackRock Commodity Strategies Fund
BlackRock Disciplined Small Cap Core Fund
BlackRock Emerging Markets Fund
BlackRock Emerging Markets Long/Short Equity Fund
BlackRock Energy & Resources Portfolio
BlackRock Equity Dividend Fund
BlackRock EuroFund
BlackRock Flexible Equity Fund
BlackRock Focus Growth Fund
BlackRock Global Dividend Income Portfolio
BlackRock Global Long/Short Equity Fund
BlackRock Global Opportunities Portfolio
BlackRock Global SmallCap Fund
BlackRock Health Sciences Opportunities Portfolio
BlackRock Index Equity Portfolio
BlackRock India Fund
BlackRock International Fund
BlackRock International Index Fund
BlackRock International Opportunities Portfolio
BlackRock Large Cap Core Fund
BlackRock Large Cap Core Plus Fund
BlackRock Large Cap Growth Fund
BlackRock Large Cap Value Fund
BlackRock Latin America Fund
BlackRock Long-Horizon Equity Fund
BlackRock Mid-Cap Growth Equity Portfolio
BlackRock Mid Cap Value Opportunities Fund
BlackRock Natural Resources Trust
BlackRock Pacific Fund
BlackRock Real Estate Securities Fund
BlackRock Russell 1000 Index Fund
BlackRock Science & Technology Opportunities Portfolio
BlackRock Small Cap Growth Equity Portfolio
BlackRock Small Cap Growth Fund II
BlackRock Small Cap Index Fund
BlackRock S&P 500 Index Fund
BlackRock S&P 500 Stock Fund
BlackRock U.S. Opportunities Portfolio
BlackRock Value Opportunities Fund
BlackRock World Gold Fund
| | |
| Taxable Fixed Income Funds | | |
BlackRock Bond Index Fund
BlackRock Core Bond Portfolio
BlackRock CoreAlpha Bond Fund
BlackRock Emerging Market Local Debt Portfolio
BlackRock Floating Rate Income Portfolio
BlackRock Global Long/Short Credit Fund
BlackRock GNMA Portfolio
BlackRock High Yield Bond Portfolio
BlackRock Inflation Protected Bond Portfolio
BlackRock International Bond Portfolio
BlackRock Long Duration Bond Portfolio
BlackRock Low Duration Bond Portfolio
BlackRock Secured Credit Portfolio
BlackRock Strategic Income Opportunities Portfolio
BlackRock Total Return Fund
BlackRock U.S. Government Bond Portfolio
BlackRock U.S. Mortgage Portfolio
BlackRock World Income Fund
| | |
| Municipal Fixed Income Funds | | |
BlackRock California Municipal Bond Fund
BlackRock High Yield Municipal Fund
BlackRock Intermediate Municipal Fund
BlackRock National Municipal Fund
BlackRock New Jersey Municipal Bond Fund
BlackRock New York Municipal Bond Fund
BlackRock Pennsylvania Municipal Bond Fund
BlackRock Short-Term Municipal Fund
| | | | | | | | | | | | | | | | |
BlackRock Balanced Capital Fund | | LifePath Active Portfolios | | | | LifePath Index Portfolios |
BlackRock Global Allocation Fund | | | | 2015 | | 2040 | | | | | | | | Retirement | | 2040 |
BlackRock Managed Volatility Portfolio | | | | 2020 | | 2045 | | | | | | | | 2020 | | 2045 |
BlackRock Multi-Asset Income Portfolio | | | | 2025 | | 2050 | | | | | | | | 2025 | | 2050 |
BlackRock Multi-Asset Real Return Fund | | | | 2030 | | 2055 | | | | | | | | 2030 | | 2055 |
BlackRock Strategic Risk Allocation Fund | | | | 2035 | | | | | | | | | | 2035 | | |
| | | | | | | | | | | | | | | | |
| BlackRock Prepared Portfolios | | LifePath Portfolios | | | | | | | | |
Conservative Prepared Portfolio | | | | Retirement | | 2040 | | | | | | | | | | |
Moderate Prepared Portfolio | | | | 2020 | | 2045 | | | | | | | | | | |
Growth Prepared Portfolio | | | | 2025 | | 2050 | | | | | | | | | | |
Aggressive Growth Prepared Portfolio | | | | 2030 | | 2055 | | | | | | | | | | |
| | | | 2035 | | | | | | | | | | | | |
BlackRock mutual funds are currently distributed by BlackRock Investments, LLC. You should consider the investment objectives, risks, charges and expenses of the funds under consideration carefully before investing. Each fund’s prospectus contains this and other information and is available at www.blackrock.com or by calling (800) 441-7762 or from your financial advisor. The prospectus should be read carefully before investing.
| | | | | | |
| | | | | | | |
| 46 | | SEMI-ANNUAL REPORT | | JANUARY 31, 2013 | | |
This report is transmitted to shareholders only. It is not authorized for use as an offer of sale or a solicitation of an offer to buy shares of the Funds unless accompanied or preceded by that Fund’s current prospectus. Past performance results shown in this report should not be considered a representation of future performance. Investment returns and principal value of shares will fluctuate so that shares, when redeemed, may be worth more or less than their original cost. Statements and other information herein are as dated and are subject to change. Please see the Funds’ prospectus for a description of risks associated with global investments.

| | |
| #EDNR-1/13-SAR | | |
| |
| |  |
| | | | |
| Item 2 | | – | | Code of Ethics – Not Applicable to this semi-annual report |
| | |
| Item 3 | | – | | Audit Committee Financial Expert – Not Applicable to this semi-annual report |
| | |
| Item 4 | | – | | Principal Accountant Fees and Services – Not Applicable to this semi-annual report |
| | |
| Item 5 | | – | | Audit Committee of Listed Registrants – Not Applicable |
| | |
| Item 6 | | – | | Investments |
| | | | (a) The registrant’s Schedule of Investments is included as part of the Report to Stockholders filed under Item 1 of this Form. |
| | | | (b) Not Applicable due to no such divestments during the semi-annual period covered since the previous Form N-CSR filing. |
| | |
| Item 7 | | – | | Disclosure of Proxy Voting Policies and Procedures for Closed-End Management Investment Companies – Not Applicable |
| | |
| Item 8 | | – | | Portfolio Managers of Closed-End Management Investment Companies – Not Applicable |
| | |
| Item 9 | | – | | Purchases of Equity Securities by Closed-End Management Investment Company and Affiliated Purchasers – Not Applicable |
| | |
| Item 10 | | – | | Submission of Matters to a Vote of Security Holders – There have been no material changes to these procedures. |
| | |
| Item 11 | | – | | Controls and Procedures |
| | |
| | | | (a) – The registrant’s principal executive and principal financial officers, or persons performing similar functions, have concluded that the registrant’s disclosure controls and procedures (as defined in Rule 30a-3(c) under the Investment Company Act of 1940, as amended (the “1940 Act”)) are effective as of a date within 90 days of the filing of this report based on the evaluation of these controls and procedures required by Rule 30a-3(b) under the 1940 Act and Rule 15d-15(b) under the Securities Exchange Act of 1934, as amended. |
| | |
| | | | (b) – There were no changes in the registrant’s internal control over financial reporting (as defined in Rule 30a-3(d) under the 1940 Act) that occurred during the second fiscal quarter of the period covered by this report that have materially affected, or are reasonably likely to materially affect, the registrant’s internal control over financial reporting. |
| | |
| Item 12 | | – | | Exhibits attached hereto |
| | |
| | | | (a)(1) – Code of Ethics – Not Applicable to this semi-annual report |
| | |
| | | | (a)(2) – Certifications – Attached hereto |
| | |
| | | | (a)(3) – Not Applicable |
| | |
| | | | (b) – Certifications – Attached hereto |
2
Pursuant to the requirements of the Securities Exchange Act of 1934 and the Investment Company Act of 1940, the registrant has duly caused this report to be signed on its behalf by the undersigned, thereunto duly authorized.
BlackRock Natural Resources Trust
| | |
| By: | | /s/ John M. Perlowski |
|
John M. Perlowski |
Chief Executive Officer (principal executive officer) of |
BlackRock Natural Resources Trust |
Date: April 3, 2013
Pursuant to the requirements of the Securities Exchange Act of 1934 and the Investment Company Act of 1940, this report has been signed below by the following persons on behalf of the registrant and in the capacities and on the dates indicated.
| | |
| By: | | /s/ John M. Perlowski |
|
John M. Perlowski |
Chief Executive Officer (principal executive officer) of |
BlackRock Natural Resources Trust |
Date: April 3, 2013
|
Neal J. Andrews |
Chief Financial Officer (principal financial officer) of |
BlackRock Natural Resources Trust |
Date: April 3, 2013
3