UNITED STATES
SECURITIES AND EXCHANGE COMMISSION
Washington, D.C. 20549
FORM N-CSR
CERTIFIED SHAREHOLDER REPORT OF REGISTERED MANAGEMENT INVESTMENT COMPANIES
Investment Company Act file number: 811-04282
Name of Fund: BlackRock Natural Resources Trust
Fund Address: 100 Bellevue Parkway, Wilmington, DE 19809
Name and address of agent for service: John M. Perlowski, Chief Executive Officer, BlackRock Natural Resources Trust, 55 East 52nd Street, New York, NY 10055
Registrant’s telephone number, including area code: (800) 441-7762
Date of fiscal year end: 07/31/2015
Date of reporting period: 01/31/2015
Item 1 – Report to Stockholders
JANUARY 31, 2015
| | | | |
SEMI-ANNUAL REPORT (UNAUDITED) | | | |  |
BlackRock Equity Dividend Fund
BlackRock Natural Resources Trust
|
| Not FDIC Insured • May Lose Value • No Bank Guarantee |

| | | | | | |
| | | | | | | |
| 2 | | SEMI-ANNUAL REPORT | | JANUARY 31, 2015 | | |
Dear Shareholder,
Market volatility, while remaining below the long-term average level, increased over the course of 2014 and into 2015, driven largely by higher valuations in risk assets (such as equities and high yield bonds), escalating geopolitical risks, uneven global economic growth and expectations around policy moves from the world’s largest central banks. Surprisingly, U.S. interest rates trended lower through the period even as the U.S. Federal Reserve (the “Fed”) gradually reduced its bond buying program, which ultimately ended in October.
The first half of 2014 was generally a strong period for most asset classes; however, volatility ticked up in the summer as geopolitical tensions intensified in Ukraine and the Middle East and investors feared that better U.S. economic indicators may compel the Fed to increase short-term interest rates sooner than previously anticipated. Global credit markets tightened as the U.S. dollar strengthened versus other currencies, ultimately putting a strain on investor flows, and financial markets broadly weakened in the third quarter.
Several themes dominated the markets in the fourth quarter that resulted in the strong performance of U.S. markets versus other areas of the world. Economic growth strengthened considerably in the United States while the broader global economy showed signs of slowing. The European Central Bank and the Bank of Japan took aggressive measures to stimulate growth while the Fed moved toward tighter policy, causing further strengthening in the U.S. dollar. Fixed income investors piled into U.S. Treasuries where yields, although persistently low, were comparatively higher than yields on international sovereign debt, while equity investors favored the relative stability of U.S.-based companies amid rising global risks.
Oil prices, which had been gradually declining since mid-summer, suddenly plummeted in the fourth quarter due to a global supply-and-demand imbalance. Energy stocks sold off sharply and oil-exporting economies struggled, mainly within emerging markets. Conversely, the consumer sectors benefited from lower oil prices as savings at the gas pumps freed up discretionary income for other goods and services.
These trends shifted at the beginning of 2015. U.S. equity markets starkly underperformed international markets due to stretched valuations and uncertainty around the Fed’s pending rate hike. In addition, the stronger U.S. dollar began to hurt earnings of large cap companies. The energy sector continued to struggle, although oil prices showed signs of stabilizing toward the end of January as suppliers became more disciplined in their exploration and production efforts.
At BlackRock, we believe investors need to think globally, extend their scope across a broad array of asset classes and be prepared to move freely as market conditions change over time. We encourage you to talk with your financial advisor and visit blackrock.com for further insight about investing in today’s markets.
Sincerely,

Rob Kapito
President, BlackRock Advisors, LLC

Rob Kapito
President, BlackRock Advisors, LLC
| | | | | | | | |
| Total Returns as of January 31, 2015 | |
| | | 6-month | | | 12-month | |
U.S. large cap equities
(S&P 500® Index) | | | 4.37 | % | | | 14.22 | % |
U.S. small cap equities
(Russell 2000® Index) | | | 4.72 | | | | 4.41 | |
International equities
(MSCI Europe, Australasia,
Far East Index) | | | (6.97 | ) | | | (0.43 | ) |
Emerging market equities
(MSCI Emerging
Markets Index) | | | (9.05 | ) | | | 5.23 | |
3-month Treasury bills
(BofA Merrill Lynch 3-Month
U.S. Treasury Bill Index) | | | 0.01 | | | | 0.03 | |
U.S. Treasury securities
(BofA Merrill Lynch 10-Year
U.S. Treasury Index) | | | 9.29 | | | | 12.25 | |
U.S. investment-grade
bonds (Barclays
U.S. Aggregate Bond Index) | | | 4.36 | | | | 6.61 | |
Tax-exempt municipal
bonds (S&P Municipal
Bond Index) | | | 4.51 | | | | 8.81 | |
U.S. high yield bonds
(Barclays U.S.
Corporate High Yield 2%
Issuer Capped Index) | | | (0.89 | ) | | | 2.41 | |
| Past performance is no guarantee of future results. Index performance is shown for illustrative purposes only. You cannot invest directly in an index. | |
| | | | | | |
| | | | | | | |
| | THIS PAGE NOT PART OF YOUR FUND REPORT | | | | 3 |
| | |
| Fund Summary as of January 31, 2015 | | BlackRock Equity Dividend Fund |
BlackRock Equity Dividend Fund’s (the “Fund”) investment objective is to seek long-term total return and current income.
|
| Portfolio Management Commentary |
How did the Fund perform?
| Ÿ | | For the six-month period ended January 31, 2015, the Fund underperformed its benchmark, the Russell 1000® Value Index, and the broad-market S&P 500® Index. The following discussion of relative performance pertains to the Russell 1000® Value Index. |
What factors influenced performance?
| Ÿ | | The largest detractor from relative performance during the semi-annual period was stock selection in the financials sector. In particular, the Fund’s underweighting of real estate investment trusts proved costly, as did positions in The Toronto-Dominion Bank and Fifth Third Bancorp. Stock selection in information technology (“IT”) also detracted from relative performance, as the performance of the fund’s non-benchmark holdings in International Business Machines Corp. and QUALCOMM, Inc. lagged that of their peers. Underweight positions in the health care and utilities sectors also detracted from relative returns. |
| Ÿ | | The largest contribution to relative return for the period came from stock selection in the industrials sector. The Fund’s overweighting of aerospace & defense companies proved particularly beneficial, as did a non-benchmark position in Union Pacific Corp., which benefited from stronger freight volumes and a recovering domestic economy. A combination of stock selection and an underweight in the energy sector also added to relative returns. Within energy, the Fund’s large-cap posture and limited exposure to the exploration & production industry benefited performance amid the sharp decline in the price of crude oil. Lastly, stock selection in consumer discretionary contributed favorably to results. |
Describe recent portfolio activity.
| Ÿ | | During the six-month period, the Fund’s exposure to health care, financials, industrials and IT was increased, based on the view that these sectors display the strongest fundamentals, the greatest potential for dividend growth, and relatively attractive valuations. At the same time, the Fund reduced its allocation in more defensive sectors including consumer staples and utilities based on current valuations and/or limited dividend growth potential. The Fund also selectively reduced exposure to the energy and materials sectors. |
Describe portfolio positioning at period end.
| Ÿ | | As of period end, the Fund’s largest allocations were in the financials, industrials and health care sectors. Relative to the benchmark, the largest overweight positions were in industrials, materials and consumer discretionary. Conversely, the fund’s largest relative underweights were in the financials, IT and utilities sectors. |
| Ÿ | | In addition to company fundamentals, the investment advisor continues to assess the interest rate environment and inflation indicators, while monitoring overall levels of domestic equity valuation and market volatility. The Fund was positioned with careful consideration of capital preservation and growth of income. |
The views expressed reflect the opinions of BlackRock as of the date of this report and are subject to change based on changes in market, economic or other conditions. These views are not intended to be a forecast of future events and are no guarantee of future results.
| | |
| Ten Largest Holdings | | Percent of
Long-Term Investments |
| | | | |
Wells Fargo & Co. | | | 4 | % |
Home Depot, Inc. | | | 3 | |
JPMorgan Chase & Co. | | | 3 | |
Comcast Corp. | | | 3 | |
General Electric Co. | | | 3 | |
Pfizer, Inc. | | | 2 | |
Merck & Co., Inc. | | | 2 | |
Raytheon Co. | | | 2 | |
Bristol-Myers Squibb Co. | | | 2 | |
Procter & Gamble Co. | | | 2 | |
| | |
| Sector Allocation | | Percent of Long-Term Investments |
| | | | |
Financials | | | 25 | % |
Industrials | | | 15 | |
Health Care | | | 14 | |
Energy | | | 10 | |
Consumer Discretionary | | | 8 | |
Consumer Staples | | | 8 | |
Information Technology | | | 8 | |
Materials | | | 5 | |
Utilities | | | 5 | |
Telecommunication Services | | | 2 | |
For Fund compliance purposes, the Fund’s sector classifications refer to any one or more of the sector sub-classifications used by one or more widely recognized market indexes or rating group indexes, and/or as defined by the investment advisor. These definitions may not apply for purposes of this report, which may combine such sector sub-classifications for reporting ease.
| | | | | | |
| | | | | | | |
| 4 | | SEMI-ANNUAL REPORT | | JANUARY 31, 2015 | | |
| | |
| | | BlackRock Equity Dividend Fund |
|
| Total Return Based on a $10,000 Investment |
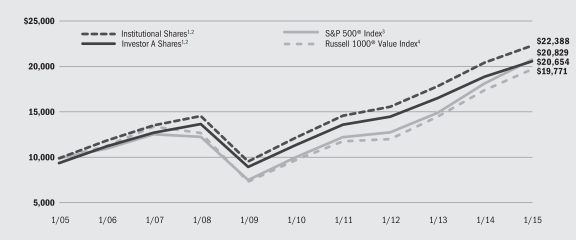
| | 1 | | Assuming maximum sales charges, if any, transaction costs and other operating expenses, including investment advisory fees. Institutional Shares do not have a sales charge. |
| | 2 | | Under normal circumstances, the Fund invests at least 80% of its assets in equity securities and at least 80% of its assets in dividend paying securities. |
| | 3 | | An unmanaged index that covers 500 leading companies and captures approximately 80% coverage of available market capitalization. |
| | 4 | | An unmanaged index that is a subset of the Russell 1000® Index and consists of those Russell 1000® securities with lower price-to-book ratios and lower expected growth values. |
|
| Performance Summary for the Period Ended January 31, 2015 |
| | | | | | | | | | | | | | | | | | | | | | | | | | | | |
| | | | | | Average Annual Total Returns5 | |
| | | | | | 1 Year | | | 5 Years | | | 10 Years | |
| | | 6-Month
Total Returns | | | w/o sales
charge | | | w/sales
charge | | | w/o sales
charge | | | w/sales
charge | | | w/o sales
charge | | | w/sales
charge | |
Institutional | | | 1.90 | % | | | 9.05 | % | | | N/A | | | | 12.82 | % | | | N/A | | | | 8.39 | % | | | N/A | |
Service | | | 1.77 | | | | 8.70 | | | | N/A | | | | 12.51 | | | | N/A | | | | 8.11 | | | | N/A | |
Investor A | | | 1.79 | | | | 8.77 | | | | 3.06 | % | | | 12.52 | | | | 11.32 | % | | | 8.10 | | | | 7.52 | % |
Investor B | | | 1.35 | | | | 7.93 | | | | 3.43 | | | | 11.65 | | | | 11.39 | | | | 7.43 | | | | 7.43 | |
Investor C | | | 1.43 | | | | 8.00 | | | | 7.00 | | | | 11.72 | | | | 11.72 | | | | 7.31 | | | | 7.31 | |
Investor C1 | | | 1.53 | | | | 8.21 | | | | 7.21 | | | | 11.91 | | | | 11.91 | | | | 7.53 | | | | 7.53 | |
Class R | | | 1.67 | | | | 8.48 | | | | N/A | | | | 12.17 | | | | N/A | | | | 7.79 | | | | N/A | |
S&P 500® Index | | | 4.37 | | | | 14.22 | | | | N/A | | | | 15.60 | | | | N/A | | | | 7.61 | | | | N/A | |
Russell 1000® Value Index | | | 2.33 | | | | 12.93 | | | | N/A | | | | 15.14 | | | | N/A | | | | 7.05 | | | | N/A | |
| | 5 | | Assuming maximum sales charges, if any. Average annual total returns with and without sales charges reflect reductions for distribution and service fees. See “About Fund Performance” on page 8 for a detailed description of share classes, including any related sales charges and fees. |
| | | | N/A — Not applicable as share class and index do not have a sales charge. |
| | | | Past performance is not indicative of future results. |
| | | | | | | | | | | | | | | | | | | | | | | | | | | | |
| | | Actual | | | Hypothetical7 | | | | |
| | | Beginning
Account Value
August 1, 2014 | | | Ending
Account Value
January 31, 2015 | | | Expenses Paid
During the
Period6 | | | Beginning
Account Value
August 1, 2014 | | | Ending
Account Value
January 31, 2015 | | | Expenses Paid
During the
Period6 | | | Annualized
Expense Ratio | |
Institutional | | $ | 1,000.00 | | | $ | 1,019.00 | | | $ | 3.51 | | | $ | 1,000.00 | | | $ | 1,021.73 | | | $ | 3.52 | | | | 0.69 | % |
Service | | $ | 1,000.00 | | | $ | 1,017.70 | | | $ | 5.19 | | | $ | 1,000.00 | | | $ | 1,020.06 | | | $ | 5.19 | | | | 1.02 | % |
Investor A | | $ | 1,000.00 | | | $ | 1,017.90 | | | $ | 4.93 | | | $ | 1,000.00 | | | $ | 1,020.32 | | | $ | 4.94 | | | | 0.97 | % |
Investor B | | $ | 1,000.00 | | | $ | 1,013.50 | | | $ | 8.78 | | | $ | 1,000.00 | | | $ | 1,016.48 | | | $ | 8.79 | | | | 1.73 | % |
Investor C | | $ | 1,000.00 | | | $ | 1,014.30 | | | $ | 8.43 | | | $ | 1,000.00 | | | $ | 1,016.84 | | | $ | 8.44 | | | | 1.66 | % |
Investor C1 | | $ | 1,000.00 | | | $ | 1,015.30 | | | $ | 7.52 | | | $ | 1,000.00 | | | $ | 1,017.74 | | | $ | 7.53 | | | | 1.48 | % |
Class R | | $ | 1,000.00 | | | $ | 1,016.70 | | | $ | 6.46 | | | $ | 1,000.00 | | | $ | 1,018,80 | | | $ | 6.46 | | | | 1.27 | % |
| | 6 | | For each class of the Fund, expenses are equal to the annualized net expense ratio for the class, multiplied by the average account value over the period, multiplied by 184/365 (to reflect the one-half year period shown). |
| | 7 | | Hypothetical 5% annual return before expenses is calculated by pro rating the number of days in the most recent fiscal half year divided by 365. |
| | | | See “Disclosure of Expenses” on page 9 for further information on how expenses were calculated. |
| | | | | | |
| | | | | | | |
| | SEMI-ANNUAL REPORT | | JANUARY 31, 2015 | | 5 |
| | |
| Fund Summary as of January 31, 2015 | | BlackRock Natural Resources Trust |
BlackRock Natural Resources Trust’s (the “Fund”) investment objective is to seek long-term growth of capital and to protect the purchasing power of shareholders’ capital by investing in a portfolio of equity securities of domestic and foreign companies with substantial natural resource assets.
| | |
| Portfolio Management Commentary | | |
How did the Fund perform?
| Ÿ | | For the six-month period ended January 31, 2015, the Fund underperformed its benchmark, the MSCI Natural Resources Index, and the broad-market S&P 500® Index. The following discussion of relative performance pertains to the MSCI Natural Resources Index. |
What factors influenced performance?
| Ÿ | | The largest detractor from relative performance was an overweight position in the oil & gas exploration & production industry, as crude oil prices experienced a sharp sell-off during the period. An underweight position in the chemicals industry also detracted from relative performance, as did an overweight in the energy equipment & services industry. Lastly, an underweight position in multi-utilities and road & rail subtracted from returns during the semi-annual period. |
| Ÿ | | The largest contributor to relative performance was an underweight position in the metals & mining industry. Stock selection in the oil & gas equipment & services industry also added to relative return, as the fund’s non-benchmark holding Dresser-Rand Group, Inc. posted a strong return. |
Describe recent portfolio activity.
| Ÿ | | During the six-month period, there was limited portfolio activity given the Fund’s fundamental long-term investment horizon. |
Describe portfolio positioning at period end.
| Ÿ | | The Fund remained dually focused on company fundamentals and longer-term industry trends within the energy and materials sectors. Despite the recent declines in energy and commodity prices, exposure to these sectors remains important over the long term given the diversity, pricing power and potential inflation benefits naturally embedded within industry participants. |
| Ÿ | | The Fund was substantially overweight in the energy exploration & production industry, and in general was more heavily allocated to oil-weighted companies as opposed to those related to natural gas. Additionally, the Fund maintained significant weightings in integrated oil and large-cap servicers due to their diverse revenue streams and balance sheet strength. |
The views expressed reflect the opinions of BlackRock as of the date of this report and are subject to change based on changes in market, economic or other conditions. These views are not intended to be a forecast of future events and are no guarantee of future results.
| | |
| Ten Largest Holdings | | Percent of
Long-Term Investments |
| | | | |
EOG Resources, Inc. | | | 8 | % |
Exxon Mobil Corp. | | | 6 | |
Chevron Corp. | | | 4 | |
Dresser-Rand Group, Inc. | | | 4 | |
Schlumberger Ltd. | | | 4 | |
Occidental Petroleum Corp. | | | 4 | |
Devon Energy Corp. | | | 3 | |
Anadarko Petroleum Corp. | | | 3 | |
Suncor Energy, Inc. | | | 3 | |
Halliburton | | | 3 | |
| | |
| Industry Allocation | | Percent of
Long-Term Investments |
| | | | |
Oil & Gas Exploration & Production | | | 25 | % |
Oil, Gas & Consumable Fuels | | | 20 | |
Energy Equipment & Services | | | 17 | |
Integrated Oil & Gas | | | 16 | |
Metals & Mining | | | 6 | |
Oil & Gas Equipment & Services | | | 5 | |
Canadian Independents | | | 3 | |
Oil & Gas Drilling | | | 2 | |
Chemicals | | | 2 | |
Oil & Gas Producers | | | 1 | |
Refining, Marketing & Transportation | | | 1 | |
Gold | | | 1 | |
Utilities | | | 1 | |
For Fund compliance purposes, the Fund’s industry classifications refer to any one or more of the industry sub-classifications used by one or more widely recognized market indexes or ratings group indexes, and/or as defined by the investment advisor. These definitions may not apply for purposes of this report, which may combine industry sub-classifications for reporting ease.
| | | | | | |
| | | | | | | |
| 6 | | SEMI-ANNUAL REPORT | | JANUARY 31, 2015 | | |
| | |
| BlackRock Natural Resources Trust | | |
| | |
| Total Return Based on a $10,000 Investment | | |
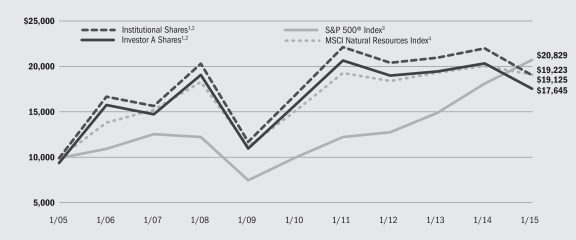
| | 1 | | Assuming maximum sales charges, if any, transaction costs and other operating expenses, including investment advisory fees. Institutional Shares do not have a sales charge. |
| | 2 | | Under normal circumstances, the Fund invests at least 80% of its assets in companies with substantial natural resource assets or in securities the value of which is related to the market value of some natural resource asset. |
| | 3 | | An unmanaged index that covers 500 leading companies and captures approximately 80% coverage of available market capitalization. |
| | 4 | | An unmanaged index consisting primarily of equity securities of companies engaged in the natural resources industry. |
| | |
| Performance Summary for the Period Ended January 31, 2015 | | |
| | | | | | | | | | | | | | | | | | | | | | | | | | | | |
| | | | | | Average Annual Total Returns5 | |
| | | | | | 1 Year | | | 5 Years | | | 10 Years | |
| | | 6-Month
Total Returns | | | w/o sales
charge | | | w/sales
charge | | | w/o sales
charge | | | w/sales
charge | | | w/o sales
charge | | | w/sales
charge | |
Institutional | | | (25.74 | )% | | | (13.47 | )% | | | N/A | | | | 2.40 | % | | | N/A | | | | 6.70 | % | | | N/A | |
Investor A | | | (25.85 | ) | | | (13.70 | ) | | | (18.23 | )% | | | 2.13 | | | | 1.03 | % | | | 6.41 | | | | 5.84 | % |
Investor B | | | (26.16 | ) | | | (14.41 | ) | | | (17.87 | ) | | | 1.31 | | | | 0.95 | | | | 5.76 | | | | 5.76 | |
Investor C | | | (26.13 | ) | | | (14.36 | ) | | | (15.13 | ) | | | 1.33 | | | | 1.33 | | | | 5.59 | | | | 5.59 | |
S&P 500® Index | | | 4.37 | | | | 14.22 | | | | N/A | | | | 15.60 | | | | N/A | | | | 7.61 | | | | N/A | |
MSCI Natural Resources Index | | | (16.35 | ) | | | (4.66 | ) | | | N/A | | | | 4.78 | | | | N/A | | | | 6.75 | | | | N/A | |
| | 5 | | Assuming maximum sales charges, if any. Average annual total returns with and without sales charges reflect reductions for distribution and service fees. See “About Fund Performance” on page 8 for a detailed description of share classes, including any related sales charges and fees. |
| | | | N/A — Not applicable as share class and index do not have a sales charge. |
| | | | Past performance is not indicative of future results. |
| | | | | | | | | | | | | | | | | | | | | | | | | | | | |
| | | Actual | | | Hypothetical7 | | | | |
| | | Beginning
Account Value
August 1, 2014 | | | Ending
Account Value
January 31, 2015 | | | Expenses Paid
During the
Period6 | | | Beginning
Account Value
August 1, 2014 | | | Ending
Account Value
January 31, 2015 | | | Expenses Paid
During the
Period6 | | | Annualized
Expense Ratio | |
Institutional | | $ | 1,000.00 | | | $ | 742.60 | | | $ | 3.65 | | | $ | 1,000.00 | | | $ | 1,021.02 | | | $ | 4.23 | | | | 0.83 | % |
Investor A | | $ | 1,000.00 | | | $ | 741.50 | | | $ | 4.83 | | | $ | 1,000.00 | | | $ | 1,019.66 | | | $ | 5.60 | | | | 1.10 | % |
Investor B | | $ | 1,000.00 | | | $ | 738.40 | | | $ | 8.54 | | | $ | 1,000.00 | | | $ | 1,015.38 | | | $ | 9.91 | | | | 1.95 | % |
Investor C | | $ | 1,000.00 | | | $ | 738.70 | | | $ | 8.24 | | | $ | 1,000.00 | | | $ | 1,015.73 | | | $ | 9.55 | | | | 1.88 | % |
| | 6 | | For each class of the Fund, expenses are equal to the annualized net expense ratio for the class, multiplied by the average account value over the period, multiplied by 184/365 (to reflect the one-half year period shown). |
| | 7 | | Hypothetical 5% annual return before expenses is calculated by pro rating the number of days in the most recent fiscal half year divided by 365. |
| | | | See “Disclosure of Expenses” on page 9 for further information on how expenses were calculated. |
| | | | | | |
| | | | | | | |
| | SEMI-ANNUAL REPORT | | JANUARY 31, 2015 | | 7 |
| Ÿ | | Institutional Shares are not subject to any sales charge. These shares bear no ongoing distribution or service fees and are available only to certain eligible investors. |
| Ÿ | | Service Shares (available only in BlackRock Equity Dividend Fund) are not subject to any sales charge. These shares are subject to a service fee of 0.25% per year (but no distribution fee) and are available only to eligible investors. Prior to October 2, 2006, Service Share performance results are those of Institutional Shares (which have no distribution or service fees) restated to reflect the Service Share fees. |
| Ÿ | | Investor A Shares are subject to a maximum initial sales charge (front-end load) of 5.25% and a service fee of 0.25% per year (but no distribution fee). Certain redemptions of these shares may be subject to a contingent deferred sales charge (“CDSC”) where no initial sales charge was paid at the time of purchase. These shares are generally available through financial intermediaries. |
| Ÿ | | Investor B Shares are subject to a maximum CDSC of 4.50% declining to 0% after six years. In addition, these shares are subject to a distribution fee of 0.75% per year and a service fee of 0.25% per year. These shares automatically convert to Investor A Shares after approximately eight years. (There is no initial sales charge for automatic share conversions.) All returns for periods greater than eight years reflect this conversion. |
| Ÿ | | Investor C Shares are subject to a 1.00% CDSC if redeemed within one year of purchase. In addition, these shares are subject to a distribution fee of 0.75% per year and a service fee of 0.25% per year. These shares are generally available through financial intermediaries. |
| Ÿ | | Investor C1 Shares (available only in BlackRock Equity Dividend Fund) are subject to a 1.00% CDSC if redeemed within one year of purchase. In addition, these shares are subject to a distribution fee of 0.55% per year and a service fee of 0.25% per year. Prior to September 12, 2011, Investor C1 Shares performance results are those of Institutional Shares (which have no distribution or service fees) restated to reflect the Investor C1 Share fees. |
| Ÿ | | Class R Shares (available only in BlackRock Equity Dividend Fund) are not subject to any sales charge. These shares are subject to a distribution fee of 0.25% per year and a service fee of 0.25% per year. Class R Shares are available only to certain employer-sponsored retirement plans. |
Investor B and C1 Shares of the Funds are only available for purchase through exchanges, dividend reinvestment by existing shareholders or for purchase by certain employer-sponsored retirement plans.
Performance information reflects past performance and does not guarantee future results. Current performance may be lower or higher than the performance data quoted. Refer to www.blackrock.com/funds to obtain performance data current to the most recent month end. Performance results do not reflect the deduction of taxes that a shareholder would pay on fund distributions or the redemption of fund shares. Figures shown in the performance tables on the previous pages assume reinvestment of all distributions, if any, at net asset value (“NAV”) on the ex-dividend date. Investment return and principal value of shares will fluctuate so that shares, when redeemed, may be worth more or less than their original cost. Distributions paid to each class of shares will vary because of the different levels of service, distribution and transfer agency fees applicable to each class, which are deducted from the income available to be paid to shareholders. The Funds’ investment advisor waived a portion of its investment advisory fee. Without such waiver, the Funds’ performance would have been lower.
| | | | | | |
| | | | | | | |
| 8 | | SEMI-ANNUAL REPORT | | JANUARY 31, 2015 | | |
Shareholders of the Funds may incur the following charges: (a) transactional expenses, such as sales charges; and (b) operating expenses, including investment advisory fees, service and distribution fees, including 12b-1 fees, acquired fund fees and expenses and other Fund expenses. The expense examples on previous pages (which are based on a hypothetical investment of $1,000 invested on August 1, 2014 and held through January 31, 2015) are intended to assist shareholders both in calculating expenses based on an investment in each Fund and in comparing these expenses with similar costs of investing in other mutual funds.
The expense examples provide information about actual account values and actual expenses. In order to estimate the expenses a shareholder paid during the period covered by this report, shareholders can divide their account value by $1,000 and then multiply the result by the number corresponding to their Fund and share class under the heading entitled “Expenses Paid During the Period.”
The expense examples also provide information about hypothetical account values and hypothetical expenses based on a Fund’s actual expense ratio and an assumed rate of return of 5% per year before expenses. In order to assist shareholders in comparing the ongoing expenses of investing in these Funds and other funds, compare the 5% hypothetical example with the 5% hypothetical examples that appear in shareholder reports of other funds.
The expenses shown in the expense examples are intended to highlight shareholders’ ongoing costs only and do not reflect any transactional expenses, such as sales charges, if any. Therefore, the hypothetical examples are useful in comparing ongoing expenses only, and will not help shareholders determine the relative total expenses of owning different funds. If these transactional expenses were included, shareholder expenses would have been higher.
| | | | | | |
| | | | | | | |
| | SEMI-ANNUAL REPORT | | JANUARY 31, 2015 | | 9 |
| | |
Schedule of Investments January 31, 2015 (Unaudited) | | BlackRock Equity Dividend Fund (Percentages shown are based on Net Assets) |
| | | | | | | | |
| Common Stocks | | Shares | | | Value | |
Aerospace & Defense — 7.3% | | | | | | | | |
Honeywell International, Inc. | | | 3,690,697 | | | $ | 360,802,539 | |
Lockheed Martin Corp. | | | 1,350,030 | | | | 254,305,151 | |
Northrop Grumman Corp. | | | 3,131,822 | | | | 491,539,463 | |
Raytheon Co. | | | 5,661,629 | | | | 566,445,981 | |
United Technologies Corp. | | | 2,868,374 | | | | 329,231,968 | |
| | | | | | | | |
| | | | | | | | 2,002,325,102 | |
Air Freight & Logistics — 1.1% | | | | | | | | |
United Parcel Service, Inc., Class B | | | 3,059,302 | | | | 302,381,410 | |
Auto Components — 0.5% | | | | | | | | |
Johnson Controls, Inc. | | | 3,238,289 | | | | 150,483,290 | |
Banks — 13.5% | | | | | | | | |
Bank of America Corp. | | | 24,893,476 | | | | 377,136,161 | |
Citigroup, Inc. | | | 8,245,338 | | | | 387,118,619 | |
Fifth Third Bancorp | | | 11,624,370 | | | | 201,101,601 | |
JPMorgan Chase & Co. | | | 15,165,160 | | | | 824,681,401 | |
SunTrust Banks, Inc. | | | 11,429,794 | | | | 439,132,686 | |
US Bancorp | | | 10,676,053 | | | | 447,433,381 | |
Wells Fargo & Co. | | | 19,076,865 | | | | 990,470,831 | |
| | | | | | | | |
| | | | | | | | 3,667,074,680 | |
Beverages — 1.5% | | | | | | | | |
The Coca-Cola Co. | | | 3,298,747 | | | | 135,809,414 | |
Diageo PLC | | | 9,341,297 | | | | 276,508,185 | |
| | | | | | | | |
| | | | | | | | 412,317,599 | |
Capital Markets — 1.8% | | | | | | | | |
The Goldman Sachs Group, Inc. | | | 1,120,478 | | | | 193,181,612 | |
Morgan Stanley | | | 8,429,801 | | | | 285,011,572 | |
| | | | | | | | |
| | | | | | | | 478,193,184 | |
Chemicals — 3.2% | | | | | | | | |
The Dow Chemical Co. | | | 4,112,106 | | | | 185,702,707 | |
E.I. du Pont de Nemours & Co. | | | 6,875,892 | | | | 489,632,269 | |
Praxair, Inc. | | | 1,531,804 | | | | 184,720,245 | |
| | | | | | | | |
| | | | | | | | 860,055,221 | |
Commercial Services & Supplies — 0.5% | | | | | | | | |
Tyco International PLC | | | 3,180,418 | | | | 129,792,859 | |
Communications Equipment — 1.7% | | | | | | | | |
Motorola Solutions, Inc. | | | 3,318,673 | | | | 207,118,382 | |
QUALCOMM, Inc. | | | 4,038,107 | | | | 252,220,163 | |
| | | | | | | | |
| | | | | | | | 459,338,545 | |
Consumer Finance — 0.9% | | | | | | | | |
American Express Co. | | | 3,138,843 | | | | 253,273,242 | |
Diversified Financial Services — 0.8% | | | | | | | | |
CME Group, Inc. | | | 2,709,603 | | | | 231,129,136 | |
Diversified Telecommunication Services — 2.0% | |
BCE, Inc. | | | 1,889,768 | | | | 86,834,840 | |
Verizon Communications, Inc. | | | 10,039,102 | | | | 458,887,352 | |
| | | | | | | | |
| | | | | | | | 545,722,192 | |
| Common Stocks | | Shares | | | Value | |
Electric Utilities — 2.1% | | | | | | | | |
ITC Holdings Corp. | | | 2,181,107 | | | $ | 92,784,292 | |
NextEra Energy, Inc. | | | 3,205,421 | | | | 350,160,190 | |
Northeast Utilities | | | 2,509,501 | | | | 139,478,065 | |
| | | | | | | | |
| | | | | | | | 582,422,547 | |
Electrical Equipment — 0.4% | | | | | | | | |
Rockwell Automation, Inc. | | | 959,279 | | | | 104,484,669 | |
Energy Equipment & Services — 0.5% | | | | | | | | |
Schlumberger Ltd. | | | 1,702,317 | | | | 140,253,898 | |
Food & Staples Retailing — 1.3% | | | | | | | | |
The Kroger Co. | | | 3,849,048 | | | | 265,776,764 | |
Wal-Mart Stores, Inc. | | | 1,116,870 | | | | 94,911,613 | |
| | | | | | | | |
| | | | | | | | 360,688,377 | |
Food Products — 1.0% | | | | | | | | |
Kraft Foods Group, Inc. | | | 1,251,618 | | | | 81,780,720 | |
Mondelez International, Inc., Class A | | | 3,638,643 | | | | 128,225,780 | |
Unilever NV — NY Shares | | | 1,379,460 | | | | 59,827,180 | |
| | | | | | | | |
| | | | | | | | 269,833,680 | |
Health Care Equipment & Supplies — 1.0% | | | | | | | | |
Abbott Laboratories | | | 2,465,871 | | | | 110,372,386 | |
Becton Dickinson & Co. | | | 1,216,662 | | | | 167,996,689 | |
| | | | | | | | |
| | | | | | | | 278,369,075 | |
Health Care Providers & Services — 3.0% | | | | | | | | |
Anthem, Inc. | | | 1,517,957 | | | | 204,863,476 | |
Quest Diagnostics, Inc. | | | 2,049,828 | | | | 145,681,276 | |
UnitedHealth Group, Inc. | | | 4,505,711 | | | | 478,731,794 | |
| | | | | | | | |
| | | | | | | | 829,276,546 | |
Hotels, Restaurants & Leisure — 1.0% | | | | | | | | |
McDonald’s Corp. | | | 3,005,202 | | | | 277,800,873 | |
Household Products — 2.0% | | | | | | | | |
The Procter & Gamble Co. | | | 6,579,526 | | | | 554,588,246 | |
Industrial Conglomerates — 3.7% | | | | | | | | |
3M Co. | | | 2,167,856 | | | | 351,843,029 | |
General Electric Co. | | | 27,725,285 | | | | 662,357,058 | |
| | | | | | | | |
| | | | | | | | 1,014,200,087 | |
Insurance — 5.9% | | | | | | | | |
ACE Ltd. | | | 2,660,287 | | | | 287,204,585 | |
American International Group, Inc. | | | 2,579,073 | | | | 126,039,297 | |
The Chubb Corp. | | | 1,955,193 | | | | 191,413,395 | |
MetLife, Inc. | | | 6,955,127 | | | | 323,413,405 | |
Prudential Financial, Inc. | | | 4,215,745 | | | | 319,890,731 | |
The Travelers Cos., Inc. | | | 3,557,129 | | | | 365,744,004 | |
| | | | | | | | |
| | | | | | | | 1,613,705,417 | |
IT Services — 1.2% | | | | | | | | |
Automatic Data Processing, Inc. | | | 1,080,795 | | | | 89,198,011 | |
International Business Machines Corp. | | | 1,512,028 | | | | 231,809,013 | |
| | | | | | | | |
| | | | | | | | 321,007,024 | |
Media — 2.5% | | | | | | | | |
Comcast Corp., Special Class A | | | 12,775,177 | | | | 675,806,863 | |
| | |
| ADR | | American Depositary Receipts |
See Notes to Financial Statements.
| | | | | | |
| | | | | | | |
| 10 | | SEMI-ANNUAL REPORT | | JANUARY 31, 2015 | | |
| | |
Schedule of Investments (continued) | | BlackRock Equity Dividend Fund (Percentages shown are based on Net Assets) |
| | | | | | | | |
| Common Stocks | | Shares | | | Value | |
Metals & Mining — 0.5% | | | | | | | | |
BHP Billiton Ltd. | | | 5,435,956 | | | $ | 125,378,861 | |
Multi-Utilities — 2.4% | | | | | | | | |
Dominion Resources, Inc. | | | 4,281,640 | | | | 329,215,300 | |
Sempra Energy | | | 1,527,308 | | | | 170,936,311 | |
Wisconsin Energy Corp. | | | 2,594,752 | | | | 144,709,319 | |
| | | | | | | | |
| | | | | | | | 644,860,930 | |
Oil, Gas & Consumable Fuels — 9.2% | | | | | | | | |
Chevron Corp. | | | 3,339,315 | | | | 342,379,967 | |
ConocoPhillips | | | 2,113,074 | | | | 133,081,401 | |
Exxon Mobil Corp. | | | 5,910,337 | | | | 516,681,661 | |
Marathon Oil Corp. | | | 6,224,301 | | | | 165,566,407 | |
Marathon Petroleum Corp. | | | 2,925,834 | | | | 270,902,970 | |
Occidental Petroleum Corp. | | | 5,362,429 | | | | 428,994,320 | |
Phillips 66 | | | 1,366,548 | | | | 96,095,655 | |
Spectra Energy Corp. | | | 3,517,276 | | | | 117,617,709 | |
Total SA — ADR | | | 8,331,236 | | | | 429,141,966 | |
| | | | | | | | |
| | | | | | | | 2,500,462,056 | |
Paper & Forest Products — 1.1% | | | | | | | | |
International Paper Co. | | | 5,790,320 | | | | 304,918,251 | |
Pharmaceuticals — 9.1% | | | | | | | | |
AbbVie, Inc. | | | 2,465,871 | | | | 148,815,315 | |
Bristol-Myers Squibb Co. | | | 9,233,897 | | | | 556,526,972 | |
Johnson & Johnson | | | 4,757,042 | | | | 476,370,186 | |
Merck & Co., Inc. | | | 10,579,730 | | | | 637,746,124 | |
Pfizer, Inc. | | | 20,902,187 | | | | 653,193,344 | |
| | | | | | | | |
| | | | | | | | 2,472,651,941 | |
Professional Services — 0.4% | | | | | | | | |
Nielsen Holdings NV | | | 2,411,588 | | | | 105,048,773 | |
Real Estate Investment Trusts (REITs) — 1.0% | | | | | |
American Tower Corp. | | | 1,273,379 | | | | 123,454,094 | |
Weyerhaeuser Co. | | | 4,016,402 | | | | 143,988,012 | |
| | | | | | | | |
| | | | | | | | 267,442,106 | |
Road & Rail — 1.5% | | | | | | | | |
CSX Corp. | | | 3,302,934 | | | | 109,987,702 | |
Union Pacific Corp. | | | 2,492,829 | | | | 292,184,487 | |
| | | | | | | | |
| | | | | | | | 402,172,189 | |
| Common Stocks | | Shares | | | Value | |
Semiconductors & Semiconductor Equipment — 2.8% | | | | | |
Intel Corp. | | | 16,115,765 | | | $ | 532,464,876 | |
Samsung Electronics Co. Ltd. | | | 188,370 | | | | 233,842,254 | |
| | | | | | | | |
| | | | | | | | 766,307,130 | |
Software — 1.9% | | | | | | | | |
Microsoft Corp. | | | 12,722,393 | | | | 513,984,677 | |
Specialty Retail — 3.1% | | | | | | | | |
The Home Depot, Inc. | | | 8,048,524 | | | | 840,426,876 | |
Textiles, Apparel & Luxury Goods — 0.7% | | | | | | | | |
VF Corp. | | | 2,792,277 | | | | 193,700,255 | |
Tobacco — 1.7% | | | | | | | | |
Altria Group, Inc. | | | 3,353,729 | | | | 178,083,010 | |
Lorillard, Inc. | | | 2,249,320 | | | | 147,577,885 | |
Philip Morris International, Inc. | | | 1,596,240 | | | | 128,082,298 | |
| | | | | | | | |
| | | | | | | | 453,743,193 | |
Water Utilities — 0.9% | | | | | | | | |
American Water Works Co., Inc. | | | 4,173,774 | | | | 234,315,672 | |
Total Long-Term Investments
(Cost — $18,449,338,797) — 96.7% | | | | | | | 26,339,936,672 | |
| | | | | | | | |
| | | | | | | | | |
| | |
| Short-Term Securities | | | | | | |
BlackRock Liquidity Funds, TempFund, Institutional Class, 0.03% (a)(b) | | | 929,428,116 | | | | 929,428,116 | |
Total Short-Term Securities
(Cost — $929,428,116) — 3.4% | | | | | | | 929,428,116 | |
| Total Investments (Cost — $19,378,766,913) — 100.1% | | | | 27,269,364,788 | |
| Liabilities in Excess of Other Assets — (0.1)% | | | | (21,156,667 | ) |
| | | | | | | | |
| Net Assets — 100.0% | | | $ | 27,248,208,121 | |
| | | | | | | | |
|
| Notes to Schedule of Investments |
| (a) | | During the six months ended January 31, 2015, investments in issuers considered to be an affiliate of the Fund for purposes of Section 2(a)(3) of the Investment Company Act of 1940, as amended, were as follows: |
| | | | | | | | | | | | | | | | |
| Affiliate | | Shares Held
at July 31,
2014 | | | Net Activity | | | Shares Held
at January 31,
2015 | | | Income | |
BlackRock Liquidity Funds, TempFund, Institutional Class | | | 85,056,698 | | | | 844,371,418 | | | | 929,428,116 | | | $ | 173,849 | |
| (b) | | Represents the current yield as of report date. |
| Ÿ | | For Fund compliance purposes, the Fund’s industry classifications refer to any one or more of the industry sub-classifications used by one or more widely recognized market indexes or ratings group indexes, and/or as defined by the investment advisor. These definitions may not apply for purposes of this report, which may combine such industry sub-classifications for reporting ease. |
| Ÿ | | Fair Value Measurements — Various inputs are used in determining the fair value of investments. These inputs to valuation techniques are categorized into a disclosure hierarchy consisting of three broad levels for financial statement purposes. The hierarchy gives the highest priority to unadjusted quoted prices in active markets for identical assets or liabilities (Level 1 measurements) and the lowest priority to unobservable inputs (Level 3 measurements). Accordingly, the degree of judgment exercised in determining fair value is greatest for instruments categorized in Level 3. The inputs used to measure fair value may fall into different levels of the fair value hierarchy. In such cases, for disclosure purposes, the fair value hierarchy classification is determined based on the lowest level input that is significant to the fair value measurement in its |
See Notes to Financial Statements.
| | | | | | |
| | | | | | | |
| | SEMI-ANNUAL REPORT | | JANUARY 31, 2015 | | 11 |
| | |
Schedule of Investments (concluded) | | BlackRock Equity Dividend Fund |
| | entirety. The categorization of a value determined for investments is based on the pricing transparency of the investment and is not necessarily an indication of the risks associated with investing in those securities. The three levels of the fair value hierarchy are as follows: |
| | Ÿ | | Level 1 — unadjusted quoted prices in active markets/exchanges for identical assets or liabilities that the Fund has the ability to access |
| | Ÿ | | Level 2 — other observable inputs (including, but not limited to, quoted prices for similar assets or liabilities in markets that are active, quoted prices for identical or similar assets or liabilities in markets that are not active, inputs other than quoted prices that are observable for the assets or liabilities (such as interest rates, yield curves, volatilities, prepayment speeds, loss severities, credit risks and default rates or other market–corroborated inputs) |
| | Ÿ | | Level 3 — unobservable inputs based on the best information available in the circumstances, to the extent observable inputs are not available (including the Fund’s own assumptions used in determining the fair value of investments) |
Changes in valuation techniques may result in transfers into or out of an assigned level within the disclosure hierarchy. In accordance with the Fund’s policy, transfers between different levels of the fair value disclosure hierarchy are deemed to have occurred as of the beginning of the reporting period. For information about the Fund’s policy regarding valuation of investments, refer to Note 2 of the Notes to Financial Statements.
As of January 31, 2015, the following table summarizes the Fund’s investments categorized in the disclosure hierarchy:
| | | | | | | | | | | | | | | | |
| | | Level 1 | | | Level 2 | | | Level 3 | | | Total | |
Assets: | | | | | | | | | | | | | | | | |
| Long-Term Investments: | | | | | | | | | | | | | | | | |
Common Stocks: | | | | | | | | | | | | | | | | |
Aerospace & Defense | | $ | 2,002,325,102 | | | | — | | | | — | | | $ | 2,002,325,102 | |
Air Freight & Logistics | | | 302,381,410 | | | | — | | | | — | | | | 302,381,410 | |
Auto Components | | | 150,483,290 | | | | — | | | | — | | | | 150,483,290 | |
Banks | | | 3,667,074,680 | | | | — | | | | — | | | | 3,667,074,680 | |
Beverages | | | 135,809,414 | | | $ | 276,508,185 | | | | — | | | | 412,317,599 | |
Capital Markets | | | 478,193,184 | | | | — | | | | — | | | | 478,193,184 | |
Chemicals | | | 860,055,221 | | | | — | | | | — | | | | 860,055,221 | |
Commercial Services & Supplies | | | 129,792,859 | | | | — | | | | — | | | | 129,792,859 | |
Communications Equipment | | | 459,338,545 | | | | — | | | | — | | | | 459,338,545 | |
Consumer Finance | | | 253,273,242 | | | | — | | | | — | | | | 253,273,242 | |
Diversified Financial Services | | | 231,129,136 | | | | — | | | | — | | | | 231,129,136 | |
Diversified Telecommunication Services | | | 545,722,192 | | | | — | | | | — | | | | 545,722,192 | |
Electric Utilities | | | 582,422,547 | | | | — | | | | — | | | | 582,422,547 | |
Electrical Equipment | | | 104,484,669 | | | | — | | | | — | | | | 104,484,669 | |
Energy Equipment & Services | | | 140,253,898 | | | | — | | | | — | | | | 140,253,898 | |
Food & Staples Retailing | | | 360,688,377 | | | | — | | | | — | | | | 360,688,377 | |
Food Products | | | 269,833,680 | | | | — | | | | — | | | | 269,833,680 | |
Health Care Equipment & Supplies | | | 278,369,075 | | | | — | | | | — | | | | 278,369,075 | |
Health Care Providers & Services | | | 829,276,546 | | | | — | | | | — | | | | 829,276,546 | |
Hotels, Restaurants & Leisure | | | 277,800,873 | | | | — | | | | — | | | | 277,800,873 | |
Household Products | | | 554,588,246 | | | | — | | | | — | | | | 554,588,246 | |
Industrial Conglomerates | | | 1,014,200,087 | | | | — | | | | — | | | | 1,014,200,087 | |
Insurance | | | 1,613,705,417 | | | | — | | | | — | | | | 1,613,705,417 | |
IT Services | | | 321,007,024 | | | | — | | | | — | | | | 321,007,024 | |
Media | | | 675,806,863 | | | | — | | | | — | | | | 675,806,863 | |
Metals & Mining | | | — | | | | 125,378,861 | | | | — | | | | 125,378,861 | |
Multi-Utilities | | | 644,860,930 | | | | — | | | | — | | | | 644,860,930 | |
Oil, Gas & Consumable Fuels | | | 2,500,462,056 | | | | — | | | | — | | | | 2,500,462,056 | |
Paper & Forest Products | | | 304,918,251 | | | | — | | | | — | | | | 304,918,251 | |
Pharmaceuticals | | | 2,472,651,941 | | | | — | | | | — | | | | 2,472,651,941 | |
Professional Services | | | 105,048,773 | | | | — | | | | — | | | | 105,048,773 | |
Real Estate Investment Trusts (REITs) | | | 267,442,106 | | | | — | | | | — | | | | 267,442,106 | |
Road & Rail | | | 402,172,189 | | | | — | | | | — | | | | 402,172,189 | |
Semiconductors & Semiconductor Equipment | | | 532,464,876 | | | | 233,842,254 | | | | — | | | | 766,307,130 | |
Software | | | 513,984,677 | | | | — | | | | — | | | | 513,984,677 | |
Specialty Retail | | | 840,426,876 | | | | — | | | | — | | | | 840,426,876 | |
Textiles, Apparel & Luxury Goods | | | 193,700,255 | | | | — | | | | — | | | | 193,700,255 | |
Tobacco | | | 453,743,193 | | | | — | | | | — | | | | 453,743,193 | |
Water Utilities | | | 234,315,672 | | | | — | | | | — | | | | 234,315,672 | |
Short-Term Securities | | | 929,428,116 | | | | — | | | | — | | | | 929,428,116 | |
| | | | | | | | | | | | | | | | |
Total | | $ | 26,633,635,488 | | | $ | 635,729,300 | | | | — | | | $ | 27,269,364,788 | |
| | | | | | | | | | | | | | | | |
The Fund may hold assets and/or liabilities in which the fair value approximates the carrying amount for financial statement purposes. As of January 31, 2015, foreign currency at value of $1,500 are categorized as Level 1 within the disclosure hierarchy.
During the period ended January 31, 2015, there were no transfers between levels.
See Notes to Financial Statements.
| | | | | | |
| | | | | | | |
| 12 | | SEMI-ANNUAL REPORT | | JANUARY 31, 2015 | | |
| | |
Schedule of Investments January 31, 2015 (Unaudited) | | BlackRock Natural Resources Trust (Percentages shown are based on Net Assets) |
| | | | | | | | |
| Common Stocks | | Shares | | | Value | |
Canadian Independents — 3.1% | | | | | | | | |
Canadian Natural Resources Ltd. | | | 251,300 | | | $ | 7,285,663 | |
Crew Energy, Inc. (a) | | | 278,300 | | | | 1,145,439 | |
Encana Corp. | | | 76,322 | | | | 933,378 | |
Husky Energy, Inc. | | | 87,100 | | | | 1,874,703 | |
Paramount Resources Ltd., Class A (a)(b) | | | 24,100 | | | | 540,719 | |
| | | | | | | | |
| | | | | | | | 11,779,902 | |
Chemicals — 1.7% | | | | | | | | |
E.I. du Pont de Nemours & Co. | | | 52,500 | | | | 3,738,525 | |
Praxair, Inc. | | | 20,900 | | | | 2,520,331 | |
| | | | | | | | |
| | | | | | | | 6,258,856 | |
Energy Equipment & Services — 21.8% | | | | | | | | |
Baker Hughes, Inc. | | | 88,380 | | | | 5,125,156 | |
Cameron International Corp. (a) | | | 145,700 | | | | 6,524,446 | |
Dresser-Rand Group, Inc. (a) | | | 177,400 | | | | 14,206,192 | |
Dril-Quip, Inc. (a) | | | 73,100 | | | | 5,426,213 | |
Ensco PLC, Class A | | | 45,781 | | | | 1,283,699 | |
FMC Technologies, Inc. (a) | | | 220,300 | | | | 8,256,844 | |
Halliburton Co. | | | 247,300 | | | | 9,889,527 | |
Helmerich & Payne, Inc. | | | 100,500 | | | | 5,985,780 | |
National Oilwell Varco, Inc. | | | 147,801 | | | | 8,044,809 | |
Noble Corp. PLC | | | 96,800 | | | | 1,570,096 | |
Rowan Cos. PLC, Class A | | | 67,000 | | | | 1,415,040 | |
Schlumberger Ltd. | | | 156,415 | | | | 12,887,032 | |
Seahawk Drilling, Inc. | | | 4,713 | | | | 6,033 | |
Trican Well Service Ltd. | | | 85,000 | | | | 327,772 | |
Weatherford International PLC (a) | | | 95,752 | | | | 989,118 | |
| | | | | | | | |
| | | | | | | | 81,937,757 | |
Gold — 0.6% | | | | | | | | |
Eldorado Gold Corp. | | | 460,500 | | | | 2,210,632 | |
Metals & Mining — 6.2% | | | | | | | | |
BHP Billiton Ltd. | | | 110,700 | | | | 2,553,266 | |
First Quantum Minerals Ltd. | | | 267,211 | | | | 2,437,220 | |
Franco-Nevada Corp. | | | 75,000 | | | | 4,328,126 | |
Goldcorp, Inc. | | | 205,582 | | | | 4,965,225 | |
HudBay Minerals, Inc. | | | 159,100 | | | | 1,158,161 | |
Newcrest Mining Ltd. (a) | | | 181,800 | | | | 1,962,978 | |
Newmont Mining Corp. | | | 35,400 | | | | 890,310 | |
Southern Copper Corp. | | | 140,754 | | | | 3,839,769 | |
Vale SA — ADR | | | 143,300 | | | | 1,007,399 | |
| | | | | | | | |
| | | | | | | | 23,142,454 | |
Oil & Gas Equipment & Services — 0.8% | | | | | | | | |
Technip SA — ADR | | | 206,700 | | | | 3,071,562 | |
Oil & Gas Exploration & Production — 0.8% | | | | | | | | |
Carrizo Oil & Gas, Inc. (a) | | | 66,900 | | | | 3,017,190 | |
Oil, Gas & Consumable Fuels — 60.7% | | | | | | | | |
Anadarko Petroleum Corp. | | | 143,000 | | | | 11,690,250 | |
Antero Resources Corp. (a) | | | 13,500 | | | | 467,775 | |
Apache Corp. | | | 114,912 | | | | 7,190,044 | |
Cabot Oil & Gas Corp. | | | 330,100 | | | | 8,747,650 | |
Cenovus Energy, Inc. | | | 139,922 | | | | 2,650,447 | |
Chevron Corp. | | | 139,891 | | | | 14,343,024 | |
Cimarex Energy Co. | | | 50,894 | | | | 5,252,261 | |
CNOOC Ltd. — ADR | | | 11,800 | | | | 1,571,170 | |
ConocoPhillips | | | 63,675 | | | | 4,010,251 | |
CONSOL Energy, Inc. | | | 68,800 | | | | 1,991,760 | |
Devon Energy Corp. | | | 201,798 | | | | 12,162,365 | |
| | | | | | | | |
| Common Stocks | | Shares | | | Value | |
Oil, Gas & Consumable Fuels (concluded) | | | | | | | | |
EOG Resources, Inc. | | | 312,780 | | | $ | 27,846,803 | |
EQT Corp. | | | 105,000 | | | | 7,816,200 | |
Exxon Mobil Corp. | | | 232,390 | | | | 20,315,534 | |
Hess Corp. | | | 116,700 | | | | 7,876,083 | |
Kosmos Energy Ltd. (a) | | | 195,700 | | | | 1,716,289 | |
Legacy Oil + Gas, Inc. (a) | | | 105,353 | | | | 127,681 | |
Marathon Oil Corp. | | | 178,700 | | | | 4,753,420 | |
Marathon Petroleum Corp. | | | 81,700 | | | | 7,564,603 | |
MEG Energy Corp. | | | 49,400 | | | | 753,421 | |
Murphy Oil Corp. | | | 58,700 | | | | 2,636,217 | |
Murphy USA, Inc. (a) | | | 32,675 | | | | 2,281,042 | |
Newfield Exploration Co. (a) | | | 70,500 | | | | 2,099,490 | |
Noble Energy, Inc. | | | 159,900 | | | | 7,633,626 | |
Occidental Petroleum Corp. | | | 159,600 | | | | 12,768,000 | |
Peabody Energy Corp. | | | 113,400 | | | | 706,482 | |
Phillips 66 | | | 60,737 | | | | 4,271,026 | |
Pioneer Natural Resources Co. | | | 61,700 | | | | 9,287,701 | |
Range Resources Corp. | | | 151,000 | | | | 6,986,770 | |
Southwestern Energy Co. (a) | | | 47,800 | | | | 1,184,962 | |
Suncor Energy, Inc. | | | 391,304 | | | | 11,671,064 | |
Surge Energy, Inc. | | | 272,700 | | | | 551,538 | |
Total SA — ADR | | | 107,000 | | | | 5,511,570 | |
Uranium Energy Corp. (a) | | | 261,724 | | | | 332,389 | |
Vaalco Energy, Inc. (a) | | | 205,400 | | | | 1,137,916 | |
Valero Energy Corp. | | | 100,600 | | | | 5,319,727 | |
Whiting Petroleum Corp. (a) | | | 107,400 | | | | 3,224,148 | |
The Williams Cos., Inc. | | | 44,500 | | | | 1,951,770 | |
| | | | | | | | |
| | | | | | | | 228,402,469 | |
| Total Common Stocks — 95.7% | | | | | | | 359,820,822 | |
| | | | | | | | |
| | | | | | | | | |
| | |
| Investment Companies — 0.3% | | | | | | |
Sprott Physical Silver Trust (a) | | | 187,400 | | | | 1,291,186 | |
Total Long-Term Investments
(Cost — $170,474,277) — 96.0% | | | | | | | 361,112,008 | |
| | | | | | | | |
| | | | | | | | | |
| | |
| Short-Term Securities | | | | | | |
BlackRock Liquidity Funds, TempFund, Institutional Class, 0.03% (c)(d) | | | 14,556,933 | | | | 14,556,933 | |
| | |
| | | Benefical
Interest
(000) | | | | |
BlackRock Liquidity Series, LLC, Money Market Series, 0.21% (c)(d)(e) | | $ | 403 | | | | 402,750 | |
Total Short-Term Securities
(Cost — $14,959,683) — 4.0% | | | | | | | 14,959,683 | |
| Total Investments (Cost — $185,433,960) — 100.0% | | | | 376,071,691 | |
| Other Assets Less Liabilities — 0.0% | | | | 110,447 | |
| | | | | | | | |
| Net Assets — 100.0% | | | $ | 376,182,138 | |
| | | | | | | | |
See Notes to Financial Statements.
| | | | | | |
| | | | | | | |
| | SEMI-ANNUAL REPORT | | JANUARY 31, 2015 | | 13 |
| | |
Schedule of Investments (continued) | | BlackRock Natural Resources Trust |
|
| Notes to Schedule of investments |
| (a) | | Non-income producing security. |
| (b) | | Security, or a portion of security, is on loan. |
| (c) | | During the six months ended January 31, 2015, investments in issuers considered to be an affiliate of the Fund, for purposes of Section 2(a)(3) of the Investment Company Act of 1940, as amended, were as follows: |
| | | | | | | | | | | | | | | | |
| Affiliate | | Shares/Beneficial
Interest Held at July 31,
2014 | | | Net Activity | | | Shares/Beneficial
Interest Held at January 31,
2015 | | | Income | |
BlackRock Liquidity Funds, TempFund, Institutional Class | | | 4,339,592 | | | | 10,217,341 | | | | 14,556,933 | | | $ | 1,189 | |
BlackRock Liquidity Series, LLC, Money Market Series | | $ | 2,180,425 | | | $ | (1,777,675 | ) | | $ | 402,750 | | | $ | 5,225 | |
| (d) | | Represents the current yield as of report date. |
| (e) | | Security was purchased with the cash collateral from loaned securities. The Fund may withdraw up to 25% of its investment daily, although the manager of the BlackRock Liquidity Series, LLC, Money Market Series, in its sole discretion, may permit an investor to withdraw more than 25% on any one day. |
| Ÿ | | For Fund compliance purposes, the Fund’s industry classifications refer to any one or more of the industry sub-classifications used by one or more widely recognized market indexes or ratings group indexes, and/or as defined by the investment advisor. These definitions may not apply for purposes of this report, which may combine such industry sub-classifications for reporting ease. |
| Ÿ | | Fair Value Measurements — Various inputs are used in determining the fair value of investments. These inputs to valuation techniques are categorized into a disclosure hierarchy consisting of three broad levels for financial statement purposes. The hierarchy gives the highest priority to unadjusted quoted prices in active markets for identical assets or liabilities (Level 1 measurements) and the lowest priority to unobservable inputs (Level 3 measurements). Accordingly, the degree of judgment exercised in determining fair value is greatest for instruments categorized in Level 3. The inputs used to measure fair value may fall into different levels of the fair value hierarchy. In such cases, for disclosure purposes, the fair value hierarchy classification is determined based on the lowest level input that is significant to the fair value measurement in its entirety. The categorization of a value determined for investments is based on the pricing transparency of the investment and is not necessarily an indication of the risks associated with investing in those securities. The three levels of the fair value hierarchy are as follows: |
| | Ÿ | | Level 1 — unadjusted quoted prices in active markets/exchanges for identical assets or liabilities that the Fund has the ability to access |
| | Ÿ | | Level 2 — other observable inputs (including, but not limited to, quoted prices for similar assets or liabilities in markets that are active, quoted prices for identical or similar assets or liabilities in markets that are not active, inputs other than quoted prices that are observable for the assets or liabilities (such as interest rates, yield curves, volatilities, prepayment speeds, loss severities, credit risks and default rates or other market–corroborated inputs) |
| | Ÿ | | Level 3 — unobservable inputs based on the best information available in the circumstances, to the extent observable inputs are not available (including the Fund’s own assumptions used in determining the fair value of investments) |
Changes in valuation techniques may result in transfers into or out of an assigned level within the disclosure hierarchy. In accordance with the Fund’s policy, transfers between different levels of the fair value disclosure hierarchy are deemed to have occurred as of the beginning of the reporting period. For information about the Fund’s policy regarding valuation of investments, refer to Note 2 of the Notes to Financial Statements.
As of January 31, 2015, the following table summarizes the Fund’s investments categorized in the disclosure hierarchy:
| | | | | | | | | | | | | | | | |
| | | Level 1 | | | Level 2 | | | Level 3 | | | Total | |
Assets: | | | | | | | | | | | | | | | | |
| Long-Term Investments: | | | | | | | | | | | | | | | | |
Common Stocks: | | | | | | | | | | | | | | | | |
Canadian Independents | | $ | 11,779,902 | | | | — | | | | — | | | $ | 11,779,902 | |
Chemicals | | | 6,258,856 | | | | — | | | | — | | | | 6,258,856 | |
Energy Equipment & Services | | | 81,931,724 | | | $ | 6,033 | | | | — | | | | 81,937,757 | |
Gold | | | 2,210,632 | | | | — | | | | — | | | | 2,210,632 | |
Metals & Mining | | | 18,626,210 | | | | 4,516,244 | | | | — | | | | 23,142,454 | |
Oil & Gas Equipment & Services | | | 3,071,562 | | | | — | | | | — | | | | 3,071,562 | |
Oil & Gas Exploration & Production | | | 3,017,190 | | | | — | | | | — | | | | 3,017,190 | |
Oil, Gas & Consumable Fuels | | | 227,316,659 | | | | 1,085,810 | | | | — | | | | 228,402,469 | |
Investment Companies | | | 1,291,186 | | | | — | | | | — | | | | 1,291,186 | |
Short-Term Securities | | | 14,556,933 | | | | 402,750 | | | | — | | | | 14,959,683 | |
| | | | | | | | | | | | | | | | |
Total | | $ | 370,060,854 | | | $ | 6,010,837 | | | | — | | | $ | 376,071,691 | |
| | | | | | | | | | | | | | | | |
See Notes to Financial Statements.
| | | | | | |
| | | | | | | |
| 14 | | SEMI-ANNUAL REPORT | | JANUARY 31, 2015 | | |
| | |
Schedule of Investments (concluded) | | BlackRock Natural Resources Trust |
The Fund may hold assets and/or liabilities in which the fair value approximates the carrying amount for financial statement purposes. As of January 31, 2015, such assets and/or liabilities are categorized within the disclosure hierarchy as follows:
| | | | | | | | | | | | | | | | |
| | | Level 1 | | | Level 2 | | | Level 3 | | | Total | |
Assets: | | | | | | | | | | | | | | | | |
Foreign currency at value | | $ | 38,774 | | | | — | | | | — | | | $ | 38,774 | |
Liabilities: | | | | | | | | | | | | | | | | |
Collateral on securities loaned at value | | | — | | | $ | (402,750 | ) | | | — | | | | (402,750 | ) |
| | | | | | | | | | | | | | | | |
Total | | $ | 38,774 | | | $ | (402,750 | ) | | | — | | | $ | (363,976 | ) |
| | | | | | | | | | | | | | | | |
During the period ended January 31, 2015, there were no transfers between levels.
See Notes to Financial Statements.
| | | | | | |
| | | | | | | |
| | SEMI-ANNUAL REPORT | | JANUARY 31, 2015 | | 15 |
| | |
| Statements of Assets and Liabilities | | |
| | | | | | | | |
| January 31, 2015 (Unaudited) | | BlackRock
Equity
Dividend
Fund | | | BlackRock
Natural
Resources
Trust | |
| | | | | | | | |
| Assets | | | | | | | | |
Investments at value — unaffiliated1,2 | | $ | 26,339,936,672 | | | $ | 361,112,008 | |
Investments at value — affiliated3 | | | 929,428,116 | | | | 14,959,683 | |
Capital shares sold receivable | | | 42,169,185 | | | | 1,992,783 | |
Dividends receivable | | | 32,030,795 | | | | 113,707 | |
Investments sold receivable | | | 29,641,763 | | | | 401,790 | |
Foreign currency at value4 | | | 1,500 | | | | 38,774 | |
Securities lending income receivable — affiliated | | | — | | | | 29 | |
Prepaid expenses | | | 488,044 | | | | 45,886 | |
| | | | | | | | |
Total assets | | | 27,373,696,075 | | | | 378,664,660 | |
| | | | | | | | |
| | | | | | | | |
| Liabilities | | | | | | | | |
Collateral on securities loaned at value | | | — | | | | 402,750 | |
Capital shares redeemed payable | | | 92,999,203 | | | | 1,496,281 | |
Investment advisory fees payable | | | 12,933,197 | | | | 189,198 | |
Transfer agent fees payable | | | 12,683,115 | | | | — | |
Service and distribution fees payable | | | 5,308,847 | | | | 100,800 | |
Other affiliates payable | | | 80,261 | | | | 1,342 | |
Officer’s and Trustees’ fees payable | | | 66,864 | | | | 7,816 | |
Investments purchased payable | | | 780 | | | | 214 | |
Other accrued expenses payable | | | 1,415,687 | | | | 284,121 | |
| | | | | | | | |
Total liabilities | | | 125,487,954 | | | | 2,482,522 | |
| | | | | | | | |
Net Assets | | $ | 27,248,208,121 | | | $ | 376,182,138 | |
| | | | | | | | |
| | | | | | | | |
| Net Assets Consist of | | | | | | | | |
Paid-in capital | | $ | 18,735,102,307 | | | $ | 183,137,941 | |
Undistributed (distributions in excess of) net investment income | | | 10,007,606 | | | | (2,935,221 | ) |
Undistributed net realized gain | | | 612,610,511 | | | | 5,345,194 | |
Net unrealized appreciation/depreciation | | | 7,890,487,697 | | | | 190,634,224 | |
| | | | | | | | |
Net Assets | | $ | 27,248,208,121 | | | $ | 376,182,138 | |
| | | | | | | | |
1 Investments at cost — unaffiliated | | $ | 18,449,338,797 | | | $ | 170,474,277 | |
2 Securities loaned at value | | | — | | | $ | 401,676 | |
3 Investments at cost — affiliated | | $ | 929,428,116 | | | $ | 14,959,683 | |
4 Foreign currency at cost | | $ | 1,519 | | | $ | 40,194 | |
| | | | | | |
| See Notes to Financial Statements. | | | | |
| | | | | | | |
| 16 | | SEMI-ANNUAL REPORT | | JANUARY 31, 2015 | | |
| | |
| Statements of Assets and Liabilities (concluded) | | |
| | | | | | | | |
| January 31, 2015 (Unaudited) | | BlackRock
Equity
Dividend
Fund | | | BlackRock
Natural
Resources
Trust | |
| | | | | | | | |
| Net Asset Value | | | | | | | | |
| Institutional: | | | | | | | | |
Net assets | | $ | 14,546,056,059 | | | $ | 95,079,791 | |
| | | | | | | | |
Shares outstanding | | | 609,795,696 | | | | 1,832,818 | |
| | | | | | | | |
Net asset value | | $ | 23.85 | | | $ | 51.88 | |
| | | | | | | | |
Par value | | $ | 0.10 | | | $ | 0.10 | |
| | | | | | | | |
Shares authorized | | | Unlimited | | | | Unlimited | |
| Service: | | | | | | | | |
Net assets | | $ | 263,486,925 | | | | — | |
| | | | | | | | |
Shares outstanding | | | 11,081,622 | | | | — | |
| | | | | | | | |
Net asset value | | $ | 23.78 | | | | — | |
| | | | | | | | |
Par value | | $ | 0.10 | | | | — | |
| | | | | | | | |
Shares authorized | | | Unlimited | | | | Unlimited | |
| Investor A: | | | | | | | | |
Net assets | | $ | 7,890,342,373 | | | $ | 214,961,205 | |
| | | | | | | | |
Shares outstanding | | | 331,519,479 | | | | 4,268,307 | |
| | | | | | | | |
Net asset value | | $ | 23.80 | | | $ | 50.36 | |
| | | | | | | | |
Par value | | $ | 0.10 | | | $ | 0.10 | |
| | | | | | | | |
Shares authorized | | | Unlimited | | | | Unlimited | |
| Investor B: | | | | | | | | |
Net assets | | $ | 27,765,829 | | | $ | 2,086,156 | |
| | | | | | | | |
Shares outstanding | | | 1,156,438 | | | | 46,770 | |
| | | | | | | | |
Net asset value | | $ | 24.01 | | | $ | 44.60 | |
| | | | | | | | |
Par value | | $ | 0.10 | | | $ | 0.10 | |
| | | | | | | | |
Shares authorized | | | Unlimited | | | | Unlimited | |
| Investor C: | | | | | | | | |
Net assets | | $ | 3,414,899,596 | | | $ | 64,054,986 | |
| | | | | | | | |
Shares outstanding | | | 147,048,565 | | | | 1,463,247 | |
| | | | | | | | |
Net asset value | | $ | 23.22 | | | $ | 43.78 | |
| | | | | | | | |
Par value | | $ | 0.10 | | | $ | 0.10 | |
| | | | | | | | |
Shares authorized | | | Unlimited | | | | Unlimited | |
| Investor C1: | | | | | | | | |
Net assets | | $ | 7,313,632 | | | | — | |
| | | | | | | | |
Shares outstanding | | | 315,271 | | | | — | |
| | | | | | | | |
Net asset value | | $ | 23.20 | | | | — | |
| | | | | | | | |
Par value | | $ | 0.10 | | | | — | |
| | | | | | | | |
Shares authorized | | | Unlimited | | | | | |
| Class R: | | | | | | | | |
Net assets | | $ | 1,098,343,707 | | | | — | |
| | | | | | | | |
Shares outstanding | | | 45,926,143 | | | | — | |
| | | | | | | | |
Net asset value | | $ | 23.92 | | | | — | |
| | | | | | | | |
Par value | | $ | 0.10 | | | | — | |
| | | | | | | | |
Shares authorized | | | Unlimited | | | | | |
| | | | | | |
| See Notes to Financial Statements. | | | | |
| | | | | | | |
| | SEMI-ANNUAL REPORT | | JANUARY 31, 2015 | | 17 |
| | | | | | | | |
| Six Months Ended January 31, 2015 (Unaudited) | | BlackRock Equity
Dividend
Fund | | | BlackRock
Natural
Resources Trust | |
| | | | | | | | |
| Investment Income | | | | | | | | |
Dividends — unaffiliated | | $ | 381,712,663 | | | $ | 3,797,188 | |
Dividends — affiliated | | | 173,849 | | | | 1,189 | |
Securities lending — affiliated — net | | | — | | | | 5,225 | |
Foreign taxes withheld | | | (4,299,930 | ) | | | (137,880 | ) |
| | | | |
Total income | | | 377,586,582 | | | | 3,665,722 | |
| | | | |
| | | | | | | | |
| Expenses | | | | | | | | |
Investment advisory | | | 79,680,116 | | | | 1,390,299 | |
Service — Service | | | 348,658 | | | | — | |
Service — Investor A | | | 11,387,384 | | | | 323,209 | |
Service and distribution — Investor B | | | 159,319 | | | | 15,083 | |
Service and distribution — Investor C | | | 17,751,067 | | | | 394,639 | |
Service and distribution — Investor C1 | | | 30,954 | | | | — | |
Service and distribution — Class R | | | 3,005,125 | | | | — | |
Transfer agent — Institutional | | | 10,237,524 | | | | 84,423 | |
Transfer agent — Service | | | 289,284 | | | | — | |
Transfer agent — Investor A | | | 7,285,289 | | | | 212,151 | |
Transfer agent — Investor B | | | 26,223 | | | | 3,912 | |
Transfer agent — Investor C | | | 1,814,666 | | | | 73,782 | |
Transfer agent — Investor C1 | | | 4,712 | | | | — | |
Transfer agent — Class R | | | 1,260,370 | | | | — | |
Accounting services | | | 1,559,747 | | | | 65,515 | |
Custodian | | | 538,798 | | | | 20,062 | |
Registration | | | 231,935 | | | | 42,674 | |
Printing | | | 256,523 | | | | 16,469 | |
Professional | | | 208,077 | | | | 40,765 | |
Officer and Trustees | | | 195,869 | | | | 11,883 | |
Miscellaneous | | | 175,732 | | | | 13,943 | |
| | | | |
Total expenses | | | 136,447,372 | | | | 2,708,809 | |
Less fees waived by Manager | | | (186,302 | ) | | | (1,777 | ) |
Less fees paid indirectly | | | (114 | ) | | | — | |
| | | | |
Total expenses after fees waived and paid indirectly | | | 136,260,956 | | | | 2,707,032 | |
| | | | |
Net investment income | | | 241,325,626 | | | | 958,690 | |
| | | | |
| | | | | | | | |
| Realized and Unrealized Gain (Loss) | | | | | | | | |
| Net realized gain (loss) from: | | | | | | | | |
Investments | | | 1,586,323,223 | | | | 8,795,737 | |
Foreign currency transactions | | | (2,928,051 | ) | | | (24,927 | ) |
| | | | |
| | | 1,583,395,172 | | | | 8,770,810 | |
| | | | |
| Net change in unrealized appreciation/depreciation on: | | | | | | | | |
Investments | | | (1,240,749,452 | ) | | | (146,796,430 | ) |
Foreign currency translations | | | (110,175 | ) | | | (3,437 | ) |
| | | | |
| | | (1,240,859,627 | ) | | | (146,799,867 | ) |
| | | | |
Net realized and unrealized gain (loss) | | | 342,535,545 | | | | (138,029,057 | ) |
| | | | |
Net Increase (decrease) in Net Assets Resulting from Operations | | $ | 583,861,171 | | | $ | (137,070,367 | ) |
| | | | |
| | | | | | |
| See Notes to Financial Statements. | | | | |
| | | | | | | |
| 18 | | SEMI-ANNUAL REPORT | | JANUARY 31, 2015 | | |
| | |
| Statements of Changes in Net Assets | | BlackRock Equity Dividend Fund |
| | | | | | | | |
| Increase (Decrease) in Net Assets: | | Six Months Ended
January 31,
2015
(Unaudited) | | | Year Ended
July 31,
2014 | |
| | | | | | | | |
| Operations | | | | | | | | |
Net investment income | | $ | 241,325,626 | | | $ | 533,972,710 | |
Net realized gain | | | 1,583,395,172 | | | | 272,065,530 | |
Net change in unrealized appreciation/depreciation | | | (1,240,859,627 | ) | | | 2,403,283,780 | |
| | | | |
Net increase in net assets resulting from operations | | | 583,861,171 | | | | 3,209,322,020 | |
| | | | |
| | | | | | | | |
| Distributions to Shareholders From1 | | | | | | | | |
| Net investment income: | | | | | | | | |
Institutional | | | (145,100,279 | ) | | | (295,768,757 | ) |
Service | | | (2,134,396 | ) | | | (5,359,779 | ) |
Investor A | | | (72,041,530 | ) | | | (187,267,755 | ) |
Investor B | | | (125,163 | ) | | | (387,871 | ) |
Investor C | | | (17,196,940 | ) | | | (38,884,066 | ) |
Investor C1 | | | (44,723 | ) | | | (102,332 | ) |
Class R | | | (7,856,564 | ) | | | (17,908,936 | ) |
| Net realized gain: | | | | | | | | |
Institutional | | | (655,224,706 | ) | | | (13,391,696 | ) |
Service | | | (11,735,392 | ) | | | (301,877 | ) |
Investor A | | | (360,625,429 | ) | | | (9,793,847 | ) |
Investor B | | | (1,290,098 | ) | | | (38,713 | ) |
Investor C | | | (154,480,564 | ) | | | (3,156,741 | ) |
Investor C1 | | | (336,253 | ) | | | (7,242 | ) |
Class R | | | (50,501,947 | ) | | | (1,135,064 | ) |
| | | | |
Decrease in net assets resulting from distributions to shareholders | | | (1,478,693,984 | ) | | | (573,504,676 | ) |
| | | | |
| | | | | | | | |
| Capital Share Transactions | | | | | | | | |
Net decrease in net assets derived from capital share transactions | | | (1,583,741,346 | ) | | | (2,795,106,790 | ) |
| | | | |
| | | | | | | | |
| Net Assets | | | | | | | | |
Total decrease in net assets | | | (2,478,574,159 | ) | | | (159,289,446 | ) |
Beginning of period | | | 29,726,782,280 | | | | 29,886,071,726 | |
| | | | |
End of period | | $ | 27,248,208,121 | | | $ | 29,726,782,280 | |
| | | | |
Undistributed net investment income, end of period | | $ | 10,007,606 | | | $ | 13,181,575 | |
| | | | |
1 Distributions for annual periods determined in accordance with federal income tax regulations. | |
| | | | | | |
| See Notes to Financial Statements. | | | | |
| | | | | | | |
| | SEMI-ANNUAL REPORT | | JANUARY 31, 2015 | | 19 |
| | |
| Statements of Changes in Net Assets | | BlackRock Natural Resources Trust |
| | | | | | | | |
| Increase (Decrease) in Net Assets: | | Six Months Ended
January 31,
2015
(Unaudited) | | | Year Ended
July 31,
2014 | |
| | | | | | | | |
| Operations | | | | | | | | |
Net investment income | | $ | 958,690 | | | $ | 1,607,567 | |
Net realized gain | | | 8,770,810 | | | | 34,553,505 | |
Net change in unrealized appreciation/depreciation | | | (146,799,867 | ) | | | 58,434,988 | |
| | | | |
Net increase (decrease) in net assets resulting from operations | | | (137,070,367 | ) | | | 94,596,060 | |
| | | | |
| | | | | | | | |
| Distributions to Shareholders From1 | | | | | | | | |
| Net investment income: | | | | | | | | |
Institutional | | | (630,696 | ) | | | (607,459 | ) |
Investor A | | | (1,077,452 | ) | | | (1,130,822 | ) |
Investor B | | | (2,489 | ) | | | (2,149 | ) |
Investor C | | | (139,363 | ) | | | (109,172 | ) |
Net realized gain: | | | | | | | | |
Institutional | | | (8,497,039 | ) | | | (788,301 | ) |
Investor A | | | (18,561,542 | ) | | | (1,936,403 | ) |
Investor B | | | (231,702 | ) | | | (35,884 | ) |
Investor C | | | (6,555,562 | ) | | | (670,277 | ) |
| | | | |
Decrease in net assets resulting from distributions to shareholders | | | (35,695,845 | ) | | | (5,280,467 | ) |
| | | | |
| | | | | | | | |
| Capital Share Transactions | | | | | | | | |
Net decrease in net assets derived from capital share transactions | | | (3,256,032 | ) | | | (34,980,766 | ) |
| | | | |
| | | | | | | | |
| Net Assets | | | | | | | | |
Total increase (decrease) in net assets | | | (176,022,244 | ) | | | 54,334,827 | |
Beginning of period | | | 552,204,382 | | | | 497,869,555 | |
| | | | |
End of period | | $ | 376,182,138 | | | $ | 552,204,382 | |
| | | | |
Distributions in excess of net investment income, end of period | | $ | (2,935,221 | ) | | $ | (2,043,911 | ) |
| | | | |
1 Distributions for annual periods determined in accordance with federal income tax regulations. | |
| | | | | | |
| See Notes to Financial Statements. | | | | |
| | | | | | | |
| 20 | | SEMI-ANNUAL REPORT | | JANUARY 31, 2015 | | |
| | |
| Financial Highlights | | BlackRock Equity Dividend Fund |
| | | | | | | | | | | | | | | | | | | | | | | | |
| | | Institutional | |
| | | Six Months Ended
January 31,
2015
(Unaudited) | | | Year Ended July 31, | |
| | | | 2014 | | | 2013 | | | 2012 | | | 2011 | | | 2010 | |
| | | | | | | | | | | | | | | | | | | | | | | | |
| Per Share Operating Performance | | | | | | | | | | | | | | | | | |
Net asset value, beginning of period | | $ | 24.71 | | | $ | 22.64 | | | $ | 19.52 | | | $ | 18.17 | | | $ | 15.66 | | | $ | 14.22 | |
| | | | |
Net investment income1 | | | 0.24 | | | | 0.48 | | | | 0.48 | | | | 0.43 | | | | 0.37 | | | | 0.37 | |
Net realized and unrealized gain | | | 0.24 | | | | 2.10 | | | | 3.12 | | | | 1.34 | | | | 2.53 | | | | 1.38 | |
| | | | |
Net increase from investment operations | | | 0.48 | | | | 2.58 | | | | 3.60 | | | | 1.77 | | | | 2.90 | | | | 1.75 | |
| | | | |
| Distributions from:2 | | | | | | | | | | | | | | | | | | | | | | | | |
Net investment income | | | (0.24 | ) | | | (0.49 | ) | | | (0.47 | ) | | | (0.41 | ) | | | (0.39 | ) | | | (0.31 | ) |
Net realized gain | | | (1.10 | ) | | | (0.02 | ) | | | (0.01 | ) | | | (0.01 | ) | | | — | | | | — | |
| | | | |
Total distributions | | | (1.34 | ) | | | (0.51 | ) | | | (0.48 | ) | | | (0.42 | ) | | | (0.39 | ) | | | (0.31 | ) |
| | | | |
Net asset value, end of period | | $ | 23.85 | | | $ | 24.71 | | | $ | 22.64 | | | $ | 19.52 | | | $ | 18.17 | | | $ | 15.66 | |
| | | | |
| | | | | | | | | | | | | | | | | | | | | | | | |
| Total Return3 | | | | | | | | | | | | | | | | | |
Based on net asset value | | | 1.90% | 4 | | | 11.49% | | | | 18.63% | | | | 9.90% | | | | 18.62% | | | | 12.31% | |
| | | | |
| | | | | | | | | | | | | | | | | | | | | | | | |
| Ratios to Average Net Assets | | | | | | | | | | | | | | | | | |
Total expenses | | | 0.70% | 5 | | | 0.70% | | | | 0.73% | | | | 0.71% | | | | 0.75% | | | | 0.78% | |
| | | | |
Total expenses after fees waived and paid indirectly | | | 0.69% | 5 | | | 0.70% | | | | 0.72% | | | | 0.70% | | | | 0.75% | | | | 0.77% | |
| | | | |
Net investment income | | | 1.86% | 5 | | | 2.00% | | | | 2.28% | | | | 2.34% | | | | 2.10% | | | | 2.37% | |
| | | | |
| | | | | | | | | | | | | | | | | | | | | | | | |
| Supplemental Data | | | | | | | | | | | | | | | | | |
Net assets, end of period (000) | | $ | 14,546,056 | | | $ | 14,595,350 | | | $ | 14,610,283 | | | $ | 11,068,796 | | | $ | 6,122,019 | | | $ | 3,058,137 | |
| | | | |
Portfolio turnover rate | | | 13% | | | | 6% | | | | 15% | | | | 3% | | | | 5% | | | | 4% | |
| | | | |
| | 1 | | Based on average shares outstanding. |
| | 2 | | Distributions for annual periods determined in accordance with federal income tax regulations. |
| | 3 | | Where applicable, assumes the reinvestment of distributions. |
| | 4 | | Aggregate total return. |
| | | | | | |
| See Notes to Financial Statements. | | | | |
| | | | | | | |
| | SEMI-ANNUAL REPORT | | JANUARY 31, 2015 | | 21 |
| | |
| Financial Highlights (continued) | | BlackRock Equity Dividend Fund |
| | | | | | | | | | | | | | | | | | | | | | | | |
| | | Service | |
| | | Six Months Ended
January 31,
2015
(Unaudited) | | | Year Ended July 31, | |
| | | | 2014 | | | 2013 | | | 2012 | | | 2011 | | | 2010 | |
| | | | | | | | | | | | | | | | | | | | | | | | |
| Per Share Operating Performance | | | | | | | | | | | | | | | | | |
Net asset value, beginning of period | | $ | 24.63 | | | $ | 22.56 | | | $ | 19.46 | | | $ | 18.12 | | | $ | 15.63 | | | $ | 14.19 | |
| | | | |
Net investment income1 | | | 0.20 | | | | 0.40 | | | | 0.42 | | | | 0.37 | | | | 0.33 | | | | 0.32 | |
Net realized and unrealized gain | | | 0.25 | | | | 2.10 | | | | 3.10 | | | | 1.36 | | | | 2.51 | | | | 1.39 | |
| | | | |
Net increase from investment operations | | | 0.45 | | | | 2.50 | | | | 3.52 | | | | 1.73 | | | | 2.84 | | | | 1.71 | |
| | | | |
Distributions from:2 | | | | | | | | | | | | | | | | | | | | | | | | |
Net investment income | | | (0.20 | ) | | | (0.41 | ) | | | (0.41 | ) | | | (0.38 | ) | | | (0.35 | ) | | | (0.27 | ) |
Net realized gain | | | (1.10 | ) | | | (0.02 | ) | | | (0.01 | ) | | | (0.01 | ) | | | — | | | | — | |
| | | | |
Total distributions | | | (1.30 | ) | | | (0.43 | ) | | | (0.42 | ) | | | (0.39 | ) | | | (0.35 | ) | | | (0.27 | ) |
| | | | |
Net asset value, end of period | | $ | 23.78 | | | $ | 24.63 | | | $ | 22.56 | | | $ | 19.46 | | | $ | 18.12 | | | $ | 15.63 | |
| | | | |
| | | | | | | | | | | | | | | | | | | | | | | | |
| Total Return3 | | | | | | | | | | | | | | | | | |
Based on net asset value | | | 1.77% | 4 | | | 11.17% | | | | 18.23% | | | | 9.68% | | | | 18.24% | | | | 12.07% | |
| | | | |
| | | | | | | | | | | | | | | | | | | | | | | | |
| Ratios to Average Net Assets | | | | | | | | | | | | | | | | | |
Total expenses | | | 1.02% | 5 | | | 1.01% | | | | 1.01% | | | | 1.02% | | | | 1.01% | | | | 1.01% | |
| | | | |
Total expenses after fees waived and paid indirectly | | | 1.02% | 5 | | | 1.01% | | | | 1.01% | | | | 1.01% | | | | 1.01% | | | | 1.00% | |
| | | | |
Net investment income | | | 1.55% | 5 | | | 1.69% | | | | 1.99% | | | | 2.00% | | | | 1.85% | | | | 2.10% | |
| | | | |
| | | | | | | | | | | | | | | | | | | | | | | | |
| Supplemental Data | | | | | | | | | | | | | | | | | |
Net assets, end of period (000) | | $ | 263,487 | | | $ | 295,017 | | | $ | 323,071 | | | $ | 207,027 | | | $ | 67,367 | | | $ | 37,479 | |
| | | | |
Portfolio turnover rate | | | 13% | | | | 6% | | | | 15% | | | | 3% | | | | 5% | | | | 4% | |
| | | | |
| | 1 | | Based on average shares outstanding. |
| | 2 | | Distributions for annual periods determined in accordance with federal income tax regulations. |
| | 3 | | Where applicable, assumes the reinvestment of distributions. |
| | 4 | | Aggregate total return. |
| | | | | | |
| See Notes to Financial Statements. | | | | |
| | | | | | | |
| 22 | | SEMI-ANNUAL REPORT | | JANUARY 31, 2015 | | |
| | |
| Financial Highlights (continued) | | BlackRock Equity Dividend Fund |
| | | | | | | | | | | | | | | | | | | | | | | | |
| | | Investor A | |
| | | Six Months Ended
January 31,
2015
(Unaudited) | | | Year Ended July 31, | |
| | | | 2014 | | �� | 2013 | | | 2012 | | | 2011 | | | 2010 | |
| | | | | | | | | | | | | | | | | | | | | | | | |
| Per Share Operating Performance | | | | | | | | | | | | | | | | | |
Net asset value, beginning of period | | $ | 24.65 | | | $ | 22.59 | | | $ | 19.48 | | | $ | 18.13 | | | $ | 15.63 | | | $ | 14.20 | |
| | | | |
Net investment income1 | | | 0.20 | | | | 0.42 | | | | 0.42 | | | | 0.38 | | | | 0.33 | | | | 0.32 | |
Net realized and unrealized gain | | | 0.26 | | | | 2.09 | | | | 3.11 | | | | 1.34 | | | | 2.53 | | | | 1.38 | |
| | | | |
Net increase from investment operations | | | 0.46 | | | | 2.51 | | | | 3.53 | | | | 1.72 | | | | 2.86 | | | | 1.70 | |
| | | | |
Distributions from:2 | | | | | | | | | | | | | | | | | | | | | | | | |
Net investment income | | | (0.21 | ) | | | (0.43 | ) | | | (0.41 | ) | | | (0.36 | ) | | | (0.36 | ) | | | (0.27 | ) |
Net realized gain | | | (1.10 | ) | | | (0.02 | ) | | | (0.01 | ) | | | (0.01 | ) | | | — | | | | — | |
| | | | |
Total distributions | | | (1.31 | ) | | | (0.45 | ) | | | (0.42 | ) | | | (0.37 | ) | | | (0.36 | ) | | | (0.27 | ) |
| | | | |
Net asset value, end of period | | $ | 23.80 | | | $ | 24.65 | | | $ | 22.59 | | | $ | 19.48 | | | $ | 18.13 | | | $ | 15.63 | |
| | | | |
| | | | | | | | | | | | | | | | | | | | | | | | |
| Total Return3 | | | | | | | | | | | | | | | | | |
Based on net asset value | | | 1.79% | 4 | | | 11.19% | | | | 18.31% | | | | 9.63% | | | | 18.28% | | | | 11.96% | |
| | | | |
| | | | | | | | | | | | | | | | | | | | | | | | |
| Ratios to Average Net Assets | | | | | | | | | | | | | | | | | |
Total expenses | | | 0.97% | 5 | | | 0.95% | | | | 0.99% | | | | 0.98% | | | | 1.03% | | | | 1.05% | |
| | | | |
Total expenses after fees waived and paid indirectly | | | 0.97% | 5 | | | 0.95% | | | | 0.99% | | | | 0.98% | | | | 1.02% | | | | 1.04% | |
| | | | |
Net investment income | | | 1.61% | 5 | | | 1.75% | | | | 2.03% | | | | 2.09% | | | | 1.85% | | | | 2.09% | |
| | | | |
| | | | | | | | | | | | | | | | | | | | | | | | |
| Supplemental Data | | | | | | | | | | | | | | | | | |
Net assets, end of period (000) | | $ | 7,890,342 | | | $ | 10,115,394 | | | $ | 10,573,927 | | | $ | 8,582,557 | | | $ | 5,852,184 | | | $ | 4,055,036 | |
| | | | |
Portfolio turnover rate | | | 13% | | | | 6% | | | | 15% | | | | 3% | | | | 5% | | | | 4% | |
| | | | |
| | 1 | | Based on average shares outstanding. |
| | 2 | | Distributions for annual periods determined in accordance with federal income tax regulations. |
| | 3 | | Where applicable, excludes the effects of any sales charges and assumes the reinvestment of distributions. |
| | 4 | | Aggregate total return. |
| | | | | | |
| See Notes to Financial Statements. | | | | |
| | | | | | | |
| | SEMI-ANNUAL REPORT | | JANUARY 31, 2015 | | 23 |
| | |
| Financial Highlights (continued) | | BlackRock Equity Dividend Fund |
| | | | | | | | | | | | | | | | | | | | | | | | |
| | | Investor B | |
| | | Six Months Ended
January 31,
2015
(Unaudited) | | | Year Ended July 31, | |
| | | | 2014 | | | 2013 | | | 2012 | | | 2011 | | | 2010 | |
| | | | | | | | | | | | | | | | | | | | | | | | |
| Per Share Operating Performance | | | | | | | | | | | | | | | | | |
Net asset value, beginning of period | | $ | 24.86 | | | $ | 22.76 | | | $ | 19.62 | | | $ | 18.25 | | | $ | 15.73 | | | $ | 14.28 | |
| | | | |
Net investment income1 | | | 0.11 | | | | 0.24 | | | | 0.28 | | | | 0.24 | | | | 0.19 | | | | 0.19 | |
Net realized and unrealized gain | | | 0.24 | | | | 2.11 | | | | 3.12 | | | | 1.34 | | | | 2.53 | | | | 1.40 | |
| | | | |
Net increase from investment operations | | | 0.35 | | | | 2.35 | | | | 3.40 | | | | 1.58 | | | | 2.72 | | | | 1.59 | |
| | | | |
Distributions from:2 | | | | | | | | | | | | | | | | | | | | | | | | |
Net investment income | | | (0.10 | ) | | | (0.23 | ) | | | (0.25 | ) | | | (0.20 | ) | | | (0.20 | ) | | | (0.14 | ) |
Net realized gain | | | (1.10 | ) | | | (0.02 | ) | | | (0.01 | ) | | | (0.01 | ) | | | — | | | | — | |
| | | | |
Total distributions | | | (1.20 | ) | | | (0.25 | ) | | | (0.26 | ) | | | (0.21 | ) | | | (0.20 | ) | | | (0.14 | ) |
| | | | |
Net asset value, end of period | | $ | 24.01 | | | $ | 24.86 | | | $ | 22.76 | | | $ | 19.62 | | | $ | 18.25 | | | $ | 15.73 | |
| | | | |
| | | | | | | | | | | | | | | | | | | | | | | | |
| Total Return3 | | | | | | | | | | | | | | | | | |
Based on net asset value | | | 1.35% | 4 | | | 10.40% | | | | 17.41% | | | | 8.74% | | | | 17.35% | | | | 11.10% | |
| | | | |
| | | | | | | | | | | | | | | | | | | | | | | | |
| Ratios to Average Net Assets | | | | | | | | | | | | | | | | | |
Total expenses | | | 1.73% | 5 | | | 1.71% | | | | 1.73% | | | | 1.79% | | | | 1.81% | | | | 1.84% | |
| | | | |
Total expenses after fees waived and paid indirectly | | | 1.73% | 5 | | | 1.71% | | | | 1.73% | | | | 1.79% | | | | 1.81% | | | | 1.83% | |
| | | | |
Net investment income | | | 0.86% | 5 | | | 1.02% | | | | 1.33% | | | | 1.33% | | | | 1.10% | | | | 1.26% | |
| | | | |
| | | | | | | | | | | | | | | | | | | | | | | | |
| Supplemental Data | | | | | | | | | | | | | | | | | |
Net assets, end of period (000) | | $ | 27,766 | | | $ | 34,515 | | | $ | 44,315 | | | $ | 48,906 | | | $ | 55,195 | | | $ | 57,788 | |
| | | | |
Portfolio turnover rate | | | 13% | | | | 6% | | | | 15% | | | | 3% | | | | 5% | | | | 4% | |
| | | | |
| | 1 | | Based on average shares outstanding. |
| | 2 | | Distributions for annual periods determined in accordance with federal income tax regulations. |
| | 3 | | Where applicable, excludes the effects of any sales charges and assumes the reinvestment of distributions. |
| | 4 | | Aggregate total return. |
| | | | | | |
| See Notes to Financial Statements. | | | | |
| | | | | | | |
| 24 | | SEMI-ANNUAL REPORT | | JANUARY 31, 2015 | | |
| | |
| Financial Highlights (continued) | | BlackRock Equity Dividend Fund |
| | | | | | | | | | | | | | | | | | | | | | | | |
| | | Investor C | |
| | | Six Months Ended
January 31,
2015
(Unaudited) | | | Year Ended July 31, | |
| | | | 2014 | | | 2013 | | | 2012 | | | 2011 | | | 2010 | |
| | | | | | | | | | | | | | | | | | | | | | | | |
| Per Share Operating Performance | | | | | | | | | | | | | | | | | |
Net asset value, beginning of period | | $ | 24.08 | | | $ | 22.08 | | | $ | 19.06 | | | $ | 17.76 | | | $ | 15.33 | | | $ | 13.94 | |
| | | | |
Net investment income1 | | | 0.11 | | | | 0.24 | | | | 0.27 | | | | 0.24 | | | | 0.19 | | | | 0.20 | |
Net realized and unrealized gain | | | 0.25 | | | | 2.05 | | | | 3.04 | | | | 1.31 | | | | 2.47 | | | | 1.36 | |
| | | | |
Net increase from investment operations | | | 0.36 | | | | 2.29 | | | | 3.31 | | | | 1.55 | | | | 2.66 | | | | 1.56 | |
| | | | |
Distributions from:2 | | | | | | | | | | | | | | | | | | | | | | | | |
Net investment income | | | (0.12 | ) | | | (0.27 | ) | | | (0.28 | ) | | | (0.24 | ) | | | (0.23 | ) | | | (0.17 | ) |
Net realized gain | | | (1.10 | ) | | | (0.02 | ) | | | (0.01 | ) | | | (0.01 | ) | | | — | | | | — | |
| | | | |
Total distributions | | | (1.22 | ) | | | (0.29 | ) | | | (0.29 | ) | | | (0.25 | ) | | | (0.23 | ) | | | (0.17 | ) |
| | | | |
Net asset value, end of period | | $ | 23.22 | | | $ | 24.08 | | | $ | 22.08 | | | $ | 19.06 | | | $ | 17.76 | | | $ | 15.33 | |
| | | | |
| | | | | | | | | | | | | | | | | | | | | | | | |
| Total Return3 | | | | | | | | | | | | | | | | | |
Based on net asset value | | | 1.43% | 4 | | | 10.43% | | | | 17.47% | | | | 8.80% | | | | 17.40% | | | | 11.15% | |
| | | | |
| | | | | | | | | | | | | | | | | | | | | | | | |
| Ratios to Average Net Assets | | | | | | | | | | | | | | | | | |
Total expenses | | | 1.66% | 5 | | | 1.67% | | | | 1.69% | | | | 1.73% | | | | 1.76% | | | | 1.79% | |
| | | | |
Total expenses after fees waived and paid indirectly | | | 1.66% | 5 | | | 1.67% | | | | 1.68% | | | | 1.73% | | | | 1.75% | | | | 1.78% | |
| | | | |
Net investment income | | | 0.89% | 5 | | | 1.02% | | | | 1.32% | | | | 1.33% | | | | 1.11% | | | | 1.35% | |
| | | | |
| | | | | | | | | | | | | | | | | | | | | | | | |
| Supplemental Data | | | | | | | | | | | | | | | | | |
Net assets, end of period (000) | | $ | 3,414,900 | | | $ | 3,476,705 | | | $ | 3,124,236 | | | $ | 2,245,569 | | | $ | 1,495,227 | | | $ | 942,989 | |
| | | | |
Portfolio turnover rate | | | 13% | | | | 6% | | | | 15% | | | | 3% | | | | 5% | | | | 4% | |
| | | | |
| | 1 | | Based on average shares outstanding. |
| | 2 | | Distributions for annual periods determined in accordance with federal income tax regulations. |
| | 3 | | Where applicable, excludes the effects of any sales charges and assumes the reinvestment of distributions. |
| | 4 | | Aggregate total return. |
| | | | | | |
| See Notes to Financial Statements. | | | | |
| | | | | | | |
| | SEMI-ANNUAL REPORT | | JANUARY 31, 2015 | | 25 |
| | |
| Financial Highlights (continued) | | BlackRock Equity Dividend Fund |
| | | | | | | | | | | | | | | | | | |
| | | Investor C1 | | | |
| | | Six Months
Ended
January 31,
2015
(Unaudited) | | | Year Ended July 31, | | | Period
September 12,
20111 to
July 31,
2012 | | | |
| | | | 2014 | | | 2013 | | | |
| | | | | | | | | | | | | | | | | | |
| Per Share Operating Performance | | | | | | | | | | | |
Net asset value, beginning of period | | $ | 24.06 | | | $ | 22.06 | | | $ | 19.03 | | | $ | 16.32 | | | |
| | | |
Net investment income2 | | | 0.13 | | | | 0.28 | | | | 0.32 | | | | 0.22 | | | |
Net realized and unrealized gain | | | 0.25 | | | | 2.05 | | | | 3.03 | | | | 2.78 | | | |
| | | |
Net increase from investment operations | | | 0.38 | | | | 2.33 | | | | 3.35 | | | | 3.00 | | | |
| | | |
Distributions from:3 | | | | | | | | | | | | | | | | | | |
Net investment income | | | (0.14 | ) | | | (0.31 | ) | | | (0.31 | ) | | | (0.28 | ) | | |
Net realized gain | | | (1.10 | ) | | | (0.02 | ) | | | (0.01 | ) | | | (0.01 | ) | | |
| | | |
Total distributions | | | (1.24 | ) | | | (0.33 | ) | | | (0.32 | ) | | | (0.29 | ) | | |
| | | |
Net asset value, end of period | | $ | 23.20 | | | $ | 24.06 | | | $ | 22.06 | | | $ | 19.03 | | | |
| | | |
| | | | | | | | | | | | | | | | | | |
| Total Return4 | | | | | | | | | | | |
Based on net asset value | | | 1.53% | 5 | | | 10.63% | | | | 17.74% | | | | 18.51% | 5 | | |
| | | |
| | | | | | | | | | | | | | | | | | |
| Ratios to Average Net Assets | | | | | | | | | | | |
Total expenses | | | 1.48% | 6 | | | 1.49% | | | | 1.46% | | | | 1.63% | 6 | | |
| | | |
Total expenses after fees waived and paid indirectly | | | 1.48% | 6 | | | 1.49% | | | | 1.45% | | | | 1.63% | 6 | | |
| | | |
Net investment income | | | 1.07% | 6 | | | 1.21% | | | | 1.59% | | | | 1.37% | 6 | | |
| | | |
| | | | | | | | | | | | | | | | | | |
| Supplemental Data | | | | | | | | | | | |
Net assets, end of period (000) | | $ | 7,314 | | | $ | 7,680 | | | $ | 7,670 | | | $ | 7,255 | | | |
| | | |
Portfolio turnover rate | | | 13% | | | | 6% | | | | 15% | | | | 3% | | | |
| | | |
| | 1 | | Commencement of operations. |
| | 2 | | Based on average shares outstanding. |
| | 3 | | Distributions for annual periods determined in accordance with federal tax regulations. |
| | 4 | | Where applicable, excludes the effects of any sales charges and assumes the reinvestment of distributions. |
| | 5 | | Aggregate total return. |
| | | | | | |
| See Notes to Financial Statements. | | | | |
| | | | | | | |
| 26 | | SEMI-ANNUAL REPORT | | JANUARY 31, 2015 | | |
| | |
| Financial Highlights (concluded) | | BlackRock Equity Dividend Fund |
| | | | | | | | | | | | | | | | | | | | | | | | |
| | | Class R | |
| | | Six Months Ended
January 31,
2015
(Unaudited) | | | Year Ended July 31, | |
| | | | 2014 | | | 2013 | | | 2012 | | | 2011 | | | 2010 | |
| | | | | | | | | | | | | | | | | | | | | | | | |
| Per Share Operating Performance | | | | | | | | | | | | | | | | | |
Net asset value, beginning of period | | $ | 24.76 | | | $ | 22.69 | | | $ | 19.57 | | | $ | 18.21 | | | $ | 15.71 | | | $ | 14.27 | |
| | | | |
Net investment income1 | | | 0.16 | | | | 0.34 | | | | 0.36 | | | | 0.32 | | | | 0.27 | | | | 0.30 | |
Net realized and unrealized gain | | | 0.27 | | | | 2.10 | | | | 3.12 | | | | 1.36 | | | | 2.52 | | | | 1.37 | |
| | | | |
Net increase from investment operations | | | 0.43 | | | | 2.44 | | | | 3.48 | | | | 1.68 | | | | 2.79 | | | | 1.67 | |
| | | | |
Distributions from:2 | | | | | | | | | | | | | | | | | | | | | | | | |
Net investment income | | | (0.17 | ) | | | (0.35 | ) | | | (0.35 | ) | | | (0.31 | ) | | | (0.29 | ) | | | (0.23 | ) |
Net realized gain | | | (1.10 | ) | | | (0.02 | ) | | | (0.01 | ) | | | (0.01 | ) | | | — | | | | — | |
| | | | |
Total distributions | | | (1.27 | ) | | | (0.37 | ) | | | (0.36 | ) | | | (0.32 | ) | | | (0.29 | ) | | | (0.23 | ) |
| | | | |
Net asset value, end of period | | $ | 23.92 | | | $ | 24.76 | | | $ | 22.69 | | | $ | 19.57 | | | $ | 18.21 | | | $ | 15.71 | |
| | | | |
| | | | | | | | | | | | | | | | | | | | | | | | |
| Total Return3 | | | | | | | | | | | | | | | | | |
Based on net asset value | | | 1.67% | 4 | | | 10.83% | | | | 17.93% | | | | 9.33% | | | | 17.85% | | | | 11.67% | |
| | | | |
| | | | | | | | | | | | | | | | | | | | | | | | |
| Ratios to Average Net Assets | | | | | | | | | | | | | | | | | |
Total expenses | | | 1.27% | 5 | | | 1.27% | | | | 1.28% | | | | 1.31% | | | | 1.36% | | | | 1.39% | |
| | | | |
Total expenses after fees waived and paid indirectly | | | 1.27% | 5 | | | 1.27% | | | | 1.28% | | | | 1.30% | | | | 1.34% | | | | 1.36% | |
| | | | |
Net investment income | | | 1.29% | 5 | | | 1.43% | | | | 1.72% | | | | 1.76% | | | | 1.53% | | | | 1.79% | |
| | | | |
| | | | | | | | | | | | | | | | | | | | | | | | |
| Supplemental Data | | | | | | | | | | | | | | | | | |
Net assets, end of period (000) | | $ | 1,098,344 | | | $ | 1,202,121 | | | $ | 1,202,571 | | | $ | 902,790 | | | $ | 625,000 | | | $ | 412,493 | |
| | | | |
Portfolio turnover rate | | | 13% | | | | 6% | | | | 15% | | | | 3% | | | | 5% | | | | 4% | |
| | | | |
| | 1 | | Based on average shares outstanding. |
| | 2 | | Distributions for annual periods determined in accordance with federal income tax regulations. |
| | 3 | | Where applicable, assumes the reinvestment of distributions. |
| | 4 | | Aggregate total return. |
| | | | | | |
| See Notes to Financial Statements. | | | | |
| | | | | | | |
| | SEMI-ANNUAL REPORT | | JANUARY 31, 2015 | | 27 |
| | |
| Financial Highlights | | BlackRock Natural Resources Trust |
| | | | | | | | | | | | | | | | | | | | | | | | |
| | | Institutional | |
| | | Six Months Ended
January 31,
2015
(Unaudited) | | | Year Ended July 31, | |
| | | | 2014 | | | 2013 | | | 2012 | | | 2011 | | | 2010 | |
| | | | | | | | | | | | | | | | | | | | | | | | |
| Per Share Operating Performance | | | | | | | | | | | | | | | | | |
Net asset value, beginning of period | | $ | 77.17 | | | $ | 64.89 | | | $ | 57.65 | | | $ | 69.76 | | | $ | 52.59 | | | $ | 47.18 | |
| | | | |
Net investment income1 | | | 0.25 | | | | 0.45 | | | | 0.48 | | | | 0.33 | | | | 0.16 | | | | 0.18 | |
Net realized and unrealized gain (loss) | | | (20.22 | ) | | | 12.61 | | | | 7.21 | | | | (12.09 | ) | | | 17.01 | | | | 5.23 | |
| | | | |
Net increase (decrease) from investment operations | | | (19.97 | ) | | | 13.06 | | | | 7.69 | | | | (11.76 | ) | | | 17.17 | | | | 5.41 | |
| | | | |
Distributions from:2 | | | | | | | | | | | | | | | | | | | | | | | | |
Net investment income | | | (0.37 | ) | | | (0.34 | ) | | | (0.45 | ) | | | (0.35 | ) | | | — | | | | — | |
Net realized gain | | | (4.95 | ) | | | (0.44 | ) | | | — | | | | — | | | | — | | | | — | |
| | | | |
Total distributions | | | (5.32 | ) | | | (0.78 | ) | | | (0.45 | ) | | | (0.35 | ) | | | — | | | | — | |
| | | | |
Net asset value, end of period | | $ | 51.88 | | | $ | 77.17 | | | $ | 64.89 | | | $ | 57.65 | | | $ | 69.76 | | | $ | 52.59 | |
| | | | |
| | | | | | | | | | | | | | | | | | | | | | | | |
| Total Return3 | | | | | | | | | | | | | | | | | |
Based on net asset value | | | (25.74)% | 4 | | | 20.31% | | | | 13.41% | | | | (16.88)% | | | | 32.65% | | | | 11.47% | |
| | | | |
| | | | | | | | | | | | | | | | | | | | | | | | |
| Ratios to Average Net Assets | | | | | | | | | | | | | | | | | |
Total expenses | | | 0.83% | 5 | | | 0.80% | | | | 0.80% | | | | 0.85% | | | | 0.80% | | | | 0.83% | |
| | | | |
Total expenses after fees waived | | | 0.83% | 5 | | | 0.80% | | | | 0.80% | | | | 0.85% | | | | 0.79% | | | | 0.82% | |
| | | | |
Net investment income | | | 0.76% | 5 | | | 0.64% | | | | 0.76% | | | | 0.56% | | | | 0.25% | | | | 0.33% | |
| | | | |
| | | | | | | | | | | | | | | | | | | | | | | | |
| Supplemental Data | | | | | | | | | | | | | | | | | |
Net assets, end of period (000) | | $ | 95,080 | | | $ | 142,323 | | | $ | 109,009 | | | $ | 102,940 | | | $ | 117,786 | | | $ | 65,221 | |
| | | | |
Portfolio turnover rate | | | 0% | | | | 5% | | | | 1% | | | | 3% | | | | 2% | | | | 3% | |
| | | | |
| | 1 | | Based on average shares outstanding. |
| | 2 | | Distributions for annual periods determined in accordance with federal income tax regulations. |
| | 3 | | Where applicable, assumes the reinvestment of distributions. |
| | 4 | | Aggregate total return. |
| | | | | | |
| See Notes to Financial Statements. | | | | |
| | | | | | | |
| 28 | | SEMI-ANNUAL REPORT | | JANUARY 31, 2015 | | |
| | |
| Financial Highlights (continued) | | BlackRock Natural Resources Trust |
| | | | | | | | | | | | | | | | | | | | | | | | |
| | | Investor A | |
| | | Six Months Ended
January 31,
2015
(Unaudited) | | | Year Ended July 31, | |
| | | | 2014 | | | 2013 | | | 2012 | | | 2011 | | | 2010 | |
| | | | | | | | | | | | | | | | | | | | | | | | |
| Per Share Operating Performance | | | | | | | | | | | | | | | | | |
Net asset value, beginning of period | | $ | 75.12 | | | $ | 63.28 | | | $ | 56.14 | | | $ | 67.92 | | | $ | 51.34 | | | $ | 46.18 | |
| | | | |
Net investment income (loss)1 | | | 0.15 | | | | 0.27 | | | | 0.31 | | | | 0.17 | | | | (0.01 | ) | | | 0.03 | |
Net realized and unrealized gain (loss) | | | (19.67 | ) | | | 12.27 | | | | 7.04 | | | | (11.78 | ) | | | 16.59 | | | | 5.13 | |
| | | | |
Net increase (decrease) from investment operations | | | (19.52 | ) | | | 12.54 | | | | 7.35 | | | | (11.61 | ) | | | 16.58 | | | | 5.16 | |
| | | | |
Distributions from:2 | | | | | | | | | | | | | | | | | | | | | | | | |
Net investment income | | | (0.29 | ) | | | (0.26 | ) | | | (0.21 | ) | | | (0.17 | ) | | | — | | | | — | |
Net realized gain | | | (4.95 | ) | | | (0.44 | ) | | | — | | | | — | | | | — | | | | — | |
| | | | |
Total distributions | | | (5.24 | ) | | | (0.70 | ) | | | (0.21 | ) | | | (0.17 | ) | | | — | | | | — | |
| | | | |
Net asset value, end of period | | $ | 50.36 | | | $ | 75.12 | | | $ | 63.28 | | | $ | 56.14 | | | $ | 67.92 | | | $ | 51.34 | |
| | | | |
| | | | | | | | | | | | | | | | | | | | | | | | |
| Total Return3 | | | | | | | | | | | | | | | | | |
Based on net asset value | | | (25.85)% | 4 | | | 19.98% | | | | 13.11% | | | | (17.11)% | | | | 32.29% | | | | 11.17% | |
| | | | |
| | | | | | | | | | | | | | | | | | | | | | | | |
| Ratios to Average Net Assets | | | | | | | | | | | | | | | | | |
Total expenses | | | 1.10% | 5 | | | 1.06% | | | | 1.07% | | | | 1.12% | | | | 1.07% | | | | 1.09% | |
| | | | |
Total expenses after fees waived | | | 1.10% | 5 | | | 1.06% | | | | 1.07% | | | | 1.12% | | | | 1.06% | | | | 1.08% | |
| | | | |
Net investment income (loss) | | | 0.48% | 5 | | | 0.39% | | | | 0.51% | | | | 0.30% | | | | (0.01)% | | | | 0.06% | |
| | | | |
| | | | | | | | | | | | | | | | | | | | | | | | |
| Supplemental Data | | | | | | | | | | | | | | | | | |
Net assets, end of period (000) | | $ | 214,961 | | | $ | 313,210 | | | $ | 293,272 | | | $ | 295,462 | | | $ | 406,230 | | | $ | 301,813 | |
| | | | |
Portfolio turnover rate | | | 0% | | | | 5% | | | | 1% | | | | 3% | | | | 2% | | | | 3% | |
| | | | |
| | 1 | | Based on average shares outstanding. |
| | 2 | | Distributions for annual periods determined in accordance with federal income tax regulations. |
| | 3 | | Where applicable, excludes the effects of any sales charges and assumes the reinvestment of distributions. |
| | 4 | | Aggregate total return. |
| | | | | | |
| See Notes to Financial Statements. | | | | |
| | | | | | | |
| | SEMI-ANNUAL REPORT | | JANUARY 31, 2015 | | 29 |
| | |
| Financial Highlights (continued) | | BlackRock Natural Resources Trust |
| | | | | | | | | | | | | | | | | | | | | | | | |
| | | Investor B | |
| | | Six Months Ended
January 31,
2015
(Unaudited) | | | Year Ended July 31, | |
| | | | 2014 | | | 2013 | | | 2012 | | | 2011 | | | 2010 | |
| | | | | | | | | | | | | | | | | | | | | | | | |
| Per Share Operating Performance | | | | | | | | | | | | | | | | | |
Net asset value, beginning of period | | $ | 67.31 | | | $ | 57.01 | | | $ | 50.82 | | | $ | 61.77 | | | $ | 47.05 | | | $ | 42.66 | |
| | | | |
Net investment loss1 | | | (0.10 | ) | | | (0.24 | ) | | | (0.14 | ) | | | (0.24 | ) | | | (0.44 | ) | | | (0.34 | ) |
Net realized and unrealized gain (loss) | | | (17.61 | ) | | | 11.01 | | | | 6.33 | | | | (10.71 | ) | | | 15.16 | | | | 4.73 | |
| | | | |
Net increase (decrease) from investment operations | | | (17.71 | ) | | | 10.77 | | | | 6.19 | | | | (10.95 | ) | | | 14.72 | | | | 4.39 | |
| | | | |
Distributions from:2 | | | | | | | | | | | | | | | | | | | | | | | | |
Net investment income | | | (0.05 | ) | | | (0.03 | ) | | | — | | | | — | | | | — | | | | — | |
Net realized gain | | | (4.95 | ) | | | (0.44 | ) | | | — | | | | — | | | | — | | | | — | |
| | | | |
Total distributions | | | (5.00 | ) | | | (0.47 | ) | | | — | | | | — | | | | — | | | | — | |
| | | | |
Net asset value, end of period | | $ | 44.60 | | | $ | 67.31 | | | $ | 57.01 | | | $ | 50.82 | | | $ | 61.77 | | | $ | 47.05 | |
| | | | |
| | | | | | | | | | | | | | | | | | | | | | | | |
| Total Return3 | | | | | | | | | | | | | | | | | |
Based on net asset value | | | (26.16)% | 4 | | | 19.01% | | | | 12.18% | | | | (17.73)% | | | | 31.29% | | | | 10.29% | |
| | | | |
| | | | | | | | | | | | | | | | | | | | | | | | |
| Ratios to Average Net Assets | | | | | | | | | | | | | | | | | |
Total expenses | | | 1.95% | 5 | | | 1.88% | | | | 1.88% | | | | 1.89% | | | | 1.84% | | | | 1.88% | |
| | | | |
Total expenses after fees waived | | | 1.95% | 5 | | | 1.88% | | | | 1.88% | | | | 1.89% | | | | 1.83% | | | | 1.87% | |
| | | | |
Net investment (loss) | | | (0.34)% | 5 | | | (0.39)% | | | | (0.26)% | | | | (0.46)% | | | | (0.78)% | | | | (0.71)% | |
| | | | |
| | | | | | | | | | | | | | | | | | | | | | | | |
| Supplemental Data | | | | | | | | | | | | | | | | | |
Net assets, end of period (000) | | $ | 2,086 | | | $ | 3,861 | | | $ | 5,970 | | | $ | 9,365 | | | $ | 18,036 | | | $ | 18,065 | |
| | | | |
Portfolio turnover rate | | | 0% | | | | 5% | | | | 1% | | | | 3% | | | | 2% | | | | 3% | |
| | | | |
| | 1 | | Based on average shares outstanding. |
| | 2 | | Distributions for annual periods determined in accordance with federal income tax regulations. |
| | 3 | | Where applicable, excludes the effects of any sales charges and assumes the reinvestment of distributions. |
| | 4 | | Aggregate total return. |
| | | | | | |
| See Notes to Financial Statements. | | | | |
| | | | | | | |
| 30 | | SEMI-ANNUAL REPORT | | JANUARY 31, 2015 | | |
| | |
| Financial Highlights (concluded) | | BlackRock Natural Resources Trust |
| | | | | | | | | | | | | | | | | | | | | | | | |
| | | Investor C | |
| | | Six Months Ended
January 31,
2015
(Unaudited) | | | Year Ended July 31, | |
| | | | 2014 | | | 2013 | | | 2012 | | | 2011 | | | 2010 | |
| | | | | | | | | | | | | | | | | | | | | | | | |
| Per Share Operating Performance | | | | | | | | | | | | | | | | | |
Net asset value, beginning of period | | $ | 66.24 | | | $ | 56.13 | | | $ | 50.02 | | | $ | 60.81 | | | $ | 46.33 | | | $ | 42.01 | |
| | | | |
Net investment loss1 | | | (0.08 | ) | | | (0.24 | ) | | | (0.15 | ) | | | (0.24 | ) | | | (0.45 | ) | | | (0.35 | ) |
Net realized and unrealized gain (loss) | | | (17.32 | ) | | | 10.86 | | | | 6.26 | | | | (10.55 | ) | | | 14.93 | | | | 4.67 | |
| | | | |
Net increase (decrease) from investment operations | | | (17.40 | ) | | | 10.62 | | | | 6.11 | | | | (10.79 | ) | | | 14.48 | | | | 4.32 | |
| | | | |
Distributions from:2 | | | | | | | | | | | | | | | | | | | | | | | | |
Net investment income | | | (0.11 | ) | | | (0.07 | ) | | | — | | | | — | | | | — | | | | — | |
Net realized gain | | | (4.95 | ) | | | (0.44 | ) | | | — | | | | — | | | | — | | | | — | |
| | | | |
Total distributions | | | (5.06 | ) | | | (0.51 | ) | | | — | | | | — | | | | — | | | | — | |
| | | | |
Net asset value, end of period | | $ | 43.78 | | | $ | 66.24 | | | $ | 56.13 | | | $ | 50.02 | | | $ | 60.81 | | | $ | 46.33 | |
| | | | |
| | | | | | | | | | | | | | | | | | | | | | | | |
| Total Return3 | | | | | | | | | | | | | | | | | |
Based on net asset value | | | (26.13)% | 4 | | | 19.06% | | | | 12.22% | | | | (17.74)% | | | | 31.25% | | | | 10.28% | |
| | | | |
| | | | | | | | | | | | | | | | | | | | | | | | |
| Ratios to Average Net Assets | | | | | | | | | | | | | | | | | |
Total expenses | | | 1.88% | 5 | | | 1.84% | | | | 1.86% | | | | 1.89% | | | | 1.85% | | | | 1.91% | |
| | | | |
Total expenses after fees waived | | | 1.88% | 5 | | | 1.84% | | | | 1.86% | | | | 1.89% | | | | 1.84% | | | | 1.90% | |
| | | | |
Net investment (loss) | | | (0.30)% | 5 | | | (0.39)% | | | | (0.27)% | | | | (0.47)% | | | | (0.80)% | | | | (0.75)% | |
| | | | |
| | | | | | | | | | | | | | | | | | | | | | | | |
| Supplemental Data | | | | | | | | | | | | | | | | | |
Net assets, end of period (000) | | $ | 64,055 | | | $ | 92,811 | | | $ | 89,618 | | | $ | 98,585 | | | $ | 143,712 | | | $ | 105,251 | |
| | | | |
Portfolio turnover rate | | | 0% | | | | 5% | | | | 1% | | | | 3% | | | | 2% | | | | 3% | |
| | | | |
| | 1 | | Based on average shares outstanding. |
| | 2 | | Distributions for annual periods determined in accordance with federal income tax regulations. |
| | 3 | | Where applicable, excludes the effects of any sales charges and assumes the reinvestment of distributions. |
| | 4 | | Aggregate total return. |
| | | | | | |
| See Notes to Financial Statements. | | | | |
| | | | | | | |
| | SEMI-ANNUAL REPORT | | JANUARY 31, 2015 | | 31 |
| | |
| Notes to Financial Statements (Unaudited) | | |
1. Organization:
BlackRock Equity Dividend Fund (“Equity Dividend”) and BlackRock Natural Resources Trust (“Natural Resources”) (collectively referred to as the “Funds” or individually as a “Fund”) are registered under the Investment Company Act of 1940, as amended (the “1940 Act”). Equity Dividend is registered as a diversified, open-end management investment company. Natural Resources is registered as a non-diversified, open end management investment company. Each Fund is organized as a Massachusetts business trust.
Each Fund offers multiple classes of shares. Information in this report pertains to the Institutional, Service, Investor A, Investor B, Investor C, Investor C1 and Class R Shares. All classes of shares have identical voting, dividend, liquidation and other rights and are subject to the same terms and conditions, except that certain classes bear expenses related to shareholder servicing, expenses related to the distribution, and may be subject to a CDSC of such shares. Each class has exclusive voting rights with respect to matters relating to its shareholder servicing and distribution expenditures (except that Investor B shareholders may vote on material changes to the Investor A distribution and service plan).
| | | | | | |
| Share Class | | Initial Sales Charge | | CDSC | | Conversion Privilege |
Institutional, Service and Class R Shares | | No | | No | | None |
Investor A | | Yes | | No1 | | None |
Investor B Shares | | No | | Yes | | To Investor A Shares
after approximately
8 years |
Investor C and Investor C1 | | No | | Yes | | None |
| | 1 | | Investor A Shares may be subject to a CDSC where no initial sales charge was paid at the time of purchase. |
The Funds, together with certain other registered investment companies advised by BlackRock Advisors, LLC (the “Manager”) or its affiliates, are included in a complex of open-end funds referred to as the Equity-Bond Complex.
2. Significant Accounting Policies
The Funds’ financial statements are prepared in conformity with accounting principles generally accepted in the United States of America (“U.S. GAAP”), which may require management to make estimates and assumptions that affect the reported amounts of assets and liabilities in the financial statements and the reported amounts of increases and decreases in net assets from operations during the reporting period. Actual results could differ from those estimates. Each Fund is considered an investment company under U.S. GAAP and follows the accounting and reporting guidance applicable to investment companies. The following is a summary of significant accounting policies followed by the Funds:
Valuation: The Funds’ investments are valued at fair value as of the close of trading on the New York Stock Exchange (“NYSE”) (generally 4:00 p.m., Eastern time) (or if the reporting date falls on a day the NYSE is closed, investments are valued at fair value as of the report date). U.S. GAAP defines fair value as the price the Funds would receive to sell an asset or pay to transfer a liability in an orderly transaction between market participants at the measurement date. The Funds determine the fair values of their financial instruments at market value using independent dealers or pricing services under policies approved by the Board of Directors of the Funds (the “Board”). The BlackRock Global Valuation Methodologies Committee (the “Global Valuation Committee”) is the committee formed by management to develop global pricing policies and procedures and to provide oversight of the pricing function for the Funds for all financial instruments.
Equity investments traded on a recognized securities exchange are valued at the official close each day, if available. For equity investments traded on more than one exchange, the official close price on the exchange where the stock is primarily traded is used. Equity investments traded on a recognized exchange for which there were no sales on that day may be valued at the last available bid (long positions) or ask (short positions) price. Investments in open-end registered investment companies are valued at NAV each business day.
Securities and other assets and liabilities denominated in foreign currencies are translated into U.S. dollars using exchange rates determined as of the close of business on the NYSE. Forward foreign currency exchange contracts are valued at the mean between the bid and ask prices and are determined as of the close of business on the NYSE. Interpolated values are derived when the settlement date of the contract is an interim date for which quotations are not available.
The Funds value their investments in BlackRock Liquidity Series, LLC Money Market Series (the “Money Market Series”) at fair value, which is ordinarily based upon their pro rata ownership in the underlying fund’s net assets. The Money Market Series seeks current income consistent with maintaining liquidity and preserving capital. Although the Money Market Series is not registered under the 1940 Act, its investments will follow the parameters of investments by a money market fund that is subject to Rule 2a-7 under the 1940 Act. The Funds may withdraw up to 25% of their investment daily, although the manager of the Money Market Series, in its sole discretion, may permit an investor to withdraw more than 25% on any one day.
| | | | | | |
| | | | | | | |
| 32 | | SEMI-ANNUAL REPORT | | JANUARY 31, 2015 | | |
| | | | |
| Notes to Financial Statements (continued) | | |
In the event that the application of these methods of valuation results in a price for an investment that is deemed not to be representative of the market value of such investment, or if a price is not available, the investment will be valued by the Global Valuation Committee, or its delegate, in accordance with a policy approved by the Board as reflecting fair value (“Fair Value Investments”). When determining the price for Fair Value Investments, the Global Valuation Committee, or its delegate, seeks to determine the price that each Fund might reasonably expect to receive or pay from the current sale or purchase of that asset or liability in an arm’s-length transaction. Fair value determinations shall be based upon all available factors that the Global Valuation Committee, or its delegate, deems relevant consistent with the principles of fair value measurement. The pricing of all Fair Value Investments is subsequently reported to the Board or a committee thereof on a quarterly basis.
Generally, trading in foreign instruments is substantially completed each day at various times prior to the close of business on the NYSE. Occasionally, events affecting the values of such instruments may occur between the foreign market close and the close of business on the NYSE that may not be reflected in the computation of the Fund’s net assets. If events (e.g., a company announcement, market volatility or a natural disaster) occur during such periods that are expected to materially affect the value of such instruments, those instruments may be Fair Value Investments and be valued at their fair value, as determined in good faith by the Global Valuation Committee, or its delegate, using a pricing service and/or policies approved by the Board. Each business day, the Fund uses a pricing service to assist with the valuation of certain foreign exchange-traded equity securities and foreign exchange-traded and over-the-counter options (the “Systematic Fair Value Price”). Using current market factors, the Systematic Fair Value Price is designed to value such foreign securities and foreign options at fair value as of the close of business on the NYSE, which follows the close of the local markets.
Foreign Currency: The Funds’ books and records are maintained in U.S. dollars. Purchases and sales of investment securities are recorded at the rates of exchange prevailing on the respective date of such transactions. Generally, when the U.S. dollar rises in value against a foreign currency, the Funds’ investments denominated in that currency will lose value because that currency is worth fewer U.S. dollars; the opposite effect occurs if the U.S. dollar falls in relative value.
The Funds do not isolate the portion of the results of operations arising as a result of changes in the foreign exchange rates from the changes in the market prices of investments held or sold for financial reporting purposes. Accordingly, the effects of changes in foreign currency exchange rates on investments are not segregated in the Statements of Operations from the effects of changes in market prices of those investments but are included as a component of net realized and unrealized gain (loss) from investments. The Funds report realized currency gains (losses) on foreign currency related transactions as components of net realized gain (loss) for financial reporting purposes, whereas such components are generally treated as ordinary income for federal income tax purposes.
Investment Transactions and Investment Income: For financial reporting purposes, investment transactions are recorded on the dates the transactions are entered into (the trade dates). Realized gains and losses on investment transactions are determined on the identified cost basis. Dividend income is recorded on the ex-dividend date. Dividends from foreign securities where the ex-dividend date may have passed are subsequently recorded when the Funds are informed of the ex-dividend date. Under the applicable foreign tax laws, a withholding tax at various rates may be imposed on capital gains, dividends and interest. Upon notification from issuers, some of the dividend income received from a real estate investment trust may be redesignated as a reduction of cost of the related investment and/or realized gain. Income, expenses and realized and unrealized gains and losses are allocated daily to each class based on its relative net assets.
Distributions: Distributions paid by the Funds are recorded on the ex-dividend date. The character and timing of distributions are determined in accordance with federal income tax regulations, which may differ from U.S. GAAP.
Recent Accounting Standard: In June 2014, the Financial Accounting Standards Board issued guidance to improve the financial reporting of reverse repurchase agreements and other similar transactions. The guidance will require expanded disclosure for entities that enter into reverse repurchase agreements and similar transactions accounted for as secured borrowings. It is effective for financial statements with fiscal years beginning on or after December 15, 2014 and interim periods within those fiscal years. Management is evaluating the impact, if any, of this guidance on the Funds’ financial statement disclosures.
Other: Expenses directly related to a Fund or their classes are charged to the Funds or the applicable class. Other operating expenses shared by several funds are prorated among those funds on the basis of relative net assets or other appropriate methods. Expenses directly related to the Funds and other shared expenses prorated to the Funds are allocated daily to each class based on its relative net assets or other appropriate methods.
The Funds have an arrangement with the custodian whereby fees may be reduced by credits earned on uninvested cash balances, which, if applicable, are shown as fees paid indirectly in the Statements of Operations. The custodian imposes fees on overdrawn cash balances, which can be offset by accumulated credits earned or may result in additional custody charges.
| | | | | | |
| | | | | | | |
| | SEMI-ANNUAL REPORT | | JANUARY 31, 2015 | | 33 |
| | |
| Notes to Financial Statements (continued) | | |
3. Securities and Other Investments:
Preferred Stock: The Funds may invest in preferred stock. Preferred stock has a preference over common stock in liquidation (and generally in receiving dividends as well) but is subordinated to the liabilities of the issuer in all respects. As a general rule, the market value of preferred stock with a fixed dividend rate and no conversion element varies inversely with interest rates and perceived credit risk, while the market price of convertible preferred stock generally also reflects some element of conversion value. Because preferred stock is junior to debt securities and other obligations of the issuer, deterioration in the credit quality of the issuer will cause greater changes in the value of a preferred stock than in a more senior debt security with similar stated yield characteristics. Unlike interest payments on debt securities, preferred stock dividends are payable only if declared by the issuer’s board of directors. Preferred stock also may be subject to optional or mandatory redemption provisions.
Securities Lending: Each Fund may lend its securities to approved borrowers, such as brokers, dealers and other financial institutions. The borrower pledges and maintains with the Fund collateral consisting of cash, an irrevocable letter of credit issued by a bank, or securities issued or guaranteed by the U.S. government. The initial collateral received by each Fund is required to have a value of at least 102% of the current value of the loaned securities for securities traded on U.S. exchanges and a value of at least 105% for all other securities. The collateral is maintained thereafter, at a value equal to at least 100% of the current market value of the securities on loan. The market value of the loaned securities is determined at the close of each business day of the Fund and any additional required collateral is delivered to the Fund on the next business day. During the term of the loan, the Fund is entitled to all distributions made on or in respect of the loaned securities. Loans of securities are terminable at any time and the borrower, after notice, is required to return borrowed securities within the standard time period for settlement of securities transactions.
The market value of securities on loan and the value of the related collateral are shown separately in the Statements of Assets and Liabilities as a component of investments at value — unaffiliated, and collateral on securities loaned at value, respectively. As of January 31, 2015, any securities on loan were collateralized by cash. The cash collateral invested by the securities lending agent, BlackRock Investment Management, LLC (“BIM”), if any, is disclosed in the Schedules of Investments.
Securities lending transactions are entered into by the Funds under Master Securities Lending Agreements (each, an “MSLA”) which provide the right, in the event of default (including bankruptcy or insolvency), for the non-defaulting party to liquidate the collateral and calculate a net exposure to the defaulting party or request additional collateral. In the event that a borrower defaults, each Fund, as lender, would offset the market value of the collateral received against the market value of the securities loaned. When the value of the collateral is greater than that of the market value of the securities loaned, the lender is left with a net amount payable to the defaulting party. However, bankruptcy or insolvency laws of a particular jurisdiction may impose restrictions on or prohibitions against such a right of offset in the event of an MSLA counterparty’s bankruptcy or insolvency. Under the MSLA, the borrower can resell or re-pledge the loaned securities, and the Fund can reinvest cash collateral, or, upon an event of default, resell or re-pledge the collateral.
As of January 31, 2015, the following table is a summary of Natural Resources’ securities lending agreements by counterparty which are subject to offset under an MSLA:
| | | | | | | | | | | | |
| Counterparty | | Securities
Loaned
at Value | | | Cash
Collateral
Received1 | | | Net
Amount | |
Credit Suisse Securities (USA) LLC | | $ | 401,676 | | | $ | (401,676 | ) | | | — | |
| | | | |
| | 1 | | Collateral with a value of $402,750 has been received in connection with securities lending agreements. Excess of collateral received from the individual counterparty is not shown for financial reporting purposes. |
The risks of securities lending include the risk that the borrower may not provide additional collateral when required or may not return the securities when due. To mitigate these risks, the Funds benefit from a borrower default indemnity provided by BIM. BIM’s indemnity allows for full replacement of the securities lent if the collateral received does not cover the value on the securities loaned in the event of borrower default. Each Fund could suffer a loss if the value of an investment purchased with cash collateral falls below the market value of loaned securities or if the value of an investment purchased with cash collateral falls below the value of the original cash collateral received.
4. Investment Advisory Agreement and Other Transactions with Affiliates:
The PNC Financial Services Group, Inc. is the largest stockholder and an affiliate, for 1940 Act purposes, of BlackRock, Inc. (“BlackRock”).
Each Fund entered into an Investment Advisory Agreement with the Manager, the Funds’ investment advisor, an indirect, wholly owned subsidiary of BlackRock, to provide investment advisory and administration services. The Manager is responsible for the management of each Fund’s portfolio and
| | | | | | |
| | | | | | | |
| 34 | | SEMI-ANNUAL REPORT | | JANUARY 31, 2015 | | |
| | | | |
| Notes to Financial Statements (continued) | | |
provides the necessary personnel, facilities, equipment and certain other services to the operations of each Fund. For such services, each Fund pays the Manager a monthly fee based on a percentage of each Fund’s average daily net assets at the following annual rates:
Equity Dividend
| | | | |
| Average Daily Net Assets | | Investment Advisory Fee | |
First $8 Billion | | | 0.60% | |
$8 Billion — $10 Billion | | | 0.56% | |
$10 Billion — $12 Billion | | | 0.54% | |
$12 Billion — $17 Billion | | | 0.52% | |
$17 Billion — $25 Billion | | | 0.51% | |
$25 Billion — $30 Billion | | | 0.50% | |
$30 Billion — $40 Billion | | | 0.49% | |
Greater than $40 Billion | | | 0.48% | |
Natural Resources
| | | | |
| Average Daily Net Assets | | Investment Advisory Fee | |
First $1 Billion | | | 0.60% | |
$1 Billion — $3 Billion | | | 0.56% | |
$3 Billion — $5 Billion | | | 0.54% | |
$5 Billion — $10 Billion | | | 0.52% | |
Greater than $10 Billion | | | 0.51% | |
The Manager voluntarily agreed to waive its investment advisory fees by the amount of investment advisory fees each Fund pays to the Manager indirectly through its investment in affiliated money market funds. However, the Manager does not waive its investment advisory fees by the amount of investment advisory fees paid in connection with each Fund’s investment in other affiliated investment companies, if any. These amounts are shown as fees waived by the Manager in the Statements of Operations.
For the six months ended January 31, 2015, each Fund reimbursed the Manager for certain accounting services, which is included in accounting services in the Statements of Operations. The reimbursements were as follows:
| | |
| Equity Dividend | | Natural Resources |
$155,519 | | $2,754 |
The Funds entered into a Distribution Agreement and a Distribution and Service Plan with BlackRock Investments, LLC (“BRIL”), an affiliate of the Manager. Pursuant to the Distribution and Service Plan and in accordance with Rule 12b-1 under the 1940 Act, each Fund pays BRIL ongoing service and distribution fees. The fees are accrued daily and paid monthly at annual rates based upon the average daily net assets of the relevant share class of each Fund as follows:
| | | | | | | | | | | | | | | | | | | | | | | | |
| | | Service Fees | |
| | | Service | | | Investor A | | | Investor B | | | Investor C | | | Investor C1 | | | Class R | |
Equity Dividend | | | 0.25% | | | | 0.25% | | | | 0.25% | | | | 0.25% | | | | 0.25% | | | | 0.25% | |
Natural Resources | | | — | | | | 0.25% | | | | 0.25% | | | | 0.25% | | | | — | | | | — | |
| | | | | | | | | | | | | | | | |
| | | Distribution Fees | |
| | | Investor B | | | Investor C | | | Investor C1 | | | Class R | |
Equity Dividend | | | 0.75% | | | | 0.75% | | | | 0.55% | | | | 0.25% | |
Natural Resources | | | 0.75% | | | | 0.75% | | | | — | | | | — | |
Pursuant to sub-agreements with BRIL, broker-dealers and BRIL provide shareholder servicing and distribution services to the Funds. The ongoing service and/or distribution fee compensates BRIL and each broker-dealer for providing shareholder servicing and/or distribution related services to Service, Investor A, Investor B, Investor C and Class R shareholders.
Pursuant to written agreements, certain financial intermediaries, some of which may be affiliates, provide the Funds with sub-accounting, recordkeeping, sub-transfer agency and other administrative services with respect to sub-accounts they service. For these services, these entities receive an
| | | | | | |
| | | | | | | |
| | SEMI-ANNUAL REPORT | | JANUARY 31, 2015 | | 35 |
| | |
| Notes to Financial Statements (continued) | | |
asset-based fee or an annual fee per shareholder account, which will vary depending on share class and/or net assets. For the six months ended January 31, 2015, the Funds paid the following amounts to affiliates of BlackRock in return for these services, which are included in transfer agent— class specific in the Statements of Operations:
| | | | | | | | | | | | |
| | | Institutional | | | Investor A | | | Investor C | |
Equity Dividend | | $ | 427,781 | | | $ | 12,394 | | | $ | 61 | |
Natural Resources | | $ | 7 | | | | — | | | | — | |
The Manager maintains a call center, which is responsible for providing certain shareholder services to the Funds, such as responding to shareholder inquiries and processing transactions based upon instructions from shareholders with respect to the subscription and redemption of Fund shares. For the six months ended January 31, 2015, the Funds reimbursed the Manager the following amounts for costs incurred in running the call center, which are included in transfer agent — class specific in the Statements of Operations:
| | | | | | | | | | | | | | | | | | | | | | | | | | | | |
| | | Institutional | | | Service | | | Investor A | | | Investor B | | | Investor C | | | Investor C | | | Investor R | |
Equity Dividend | | $ | 14,894 | | | $ | 593 | | | $ | 60,237 | | | $ | 895 | | | $ | 23,227 | | | $ | 11 | | | $ | 3,908 | |
Natural Resources | | $ | 168 | | | | — | | | $ | 5,542 | | | $ | 179 | | | $ | 1,432 | | | | — | | | | — | |
For the six months ended January 31, 2015, affiliates earned underwriting discounts, direct commissions and dealer concessions on sales of the Funds’ Investor A Shares as follows:
| | | | |
| | | Investor A | |
Equity Dividend | | $ | 304,688 | |
Natural Resources | | $ | 12,538 | |
For the six months ended January 31, 2015, affiliates received CDSCs as follows:
| | | | | | | | | | | | | | | | |
| | | Investor A | | | Investor B | | | Investor C | | | Investor C1 | |
Equity Dividend | | $ | 73,312 | | | $ | 2,628 | | | $ | 151,892 | | | $ | 20 | |
Natural Resources | | $ | 102 | | | $ | 946 | | | $ | 2,235 | | | | — | |
The U.S. Securities and Exchange Commission has issued an exemptive order which permits BIM, an affiliate of the Manager, to serve as securities lending agent for the Funds subject to applicable conditions. As securities lending agent, BIM bears all operational costs directly related to securities lending. The Funds are responsible for expenses in connection with the investment of cash collateral received for securities on loan (the “collateral investment expenses”). The cash collateral is invested in a private investment company managed by the Manager or its affiliates. However, BIM has agreed to cap the collateral investment expenses of the private investment company to an annual rate of 0.04%. The investment advisor to the private investment company will not charge any advisory fees with respect to shares purchased by the Funds.
Securities lending income is equal to the total of income earned from the reinvestment of cash collateral, net of fees and other payments to and from borrowers of securities, and less the collateral investment expenses. Each Fund retains a portion of securities lending income and remits a remaining portion to BIM as compensation for its services as securities lending agent.
Pursuant to a securities lending agreement effective January 1, 2015, each Fund retains 71.5% of securities lending income, and this amount retained can never be less than 65% of the total of securities lending income plus the collateral investment expenses.
In addition, commencing the business day following the date that the aggregate securities lending income earned across the Equity-Bond Complex in a calendar year exceeds a specified threshold, each Fund, pursuant to the securities lending agreement, will retain for the remainder of that calendar year securities lending income as follows: 75% of securities lending income, and this amount retained can never be less than 65% of the total securities lending income plus the collateral investment expenses.
For the period February 1, 2014 through December 31, 2014, each Fund retained 70% (75% commencing on the business day following the date that the aggregate securities lending income earned across the Equity-Bond Complex in the calendar year 2014 exceeded a specified threshold and for the remainder of that calendar year) of securities lending income, and this amount retained could never be less than 65% of the total securities lending income plus the collateral investment expenses.
The share of securities lending income earned by each Fund is shown as securities lending — affiliated — net in the Statements of Operations. For the six months ended January 31, 2015, each Fund paid BIM the following amounts for securities lending agent services:
| | | | | | |
| | | | | | | |
| 36 | | SEMI-ANNUAL REPORT | | JANUARY 31, 2015 | | |
| | | | |
| Notes to Financial Statements (continued) | | |
Certain officers and/or directors of the Funds are officers and/or directors of BlackRock or its affiliates. The Funds reimburse the Manager for a portion of the compensation paid to the Funds’ Chief Compliance Officer, which is included in officer and trustees in the Statements of Operations.
The Funds may purchase securities from, or sell securities to, an affiliated fund provided the affiliation is due solely to having a common investment advisor, common officers, or common trustees. For the six months ended January 31, 2015, the purchase and sale transactions with an affiliated fund in compliance with Rule 17a-7 under the 1940 Act were as follows:
| | | | | | | | |
| | | Purchases | | | Sales | |
Equity Dividend | | $ | 52,915,091 | | | | — | |
5. Purchases and Sales: For the six months ended January 31, 2015, purchases and sales of investments excluding short-term securities, were as follows: | |
| | | Purchases | | | Sales | |
Equity Dividend | | $ | 3,636,463,200 | | | $ | 7,298,673,867 | |
Natural Resources | | $ | 2,028,674 | | | $ | 41,854,558 | |
6. Income Tax Information:
It is the Funds’ policy to comply with the requirements of the Internal Revenue Code of 1986, as amended, applicable to regulated investment companies, and to distribute substantially all of their taxable income to their shareholders. Therefore, no federal income tax provision is required.
The Funds file U.S. federal and various state and local tax returns. No income tax returns are currently under examination. The statute of limitations on the Funds’ U.S. federal tax returns remains open for each of the four years ended July 31, 2014. The statutes of limitations on the Funds’ state and local tax returns may remain open for an additional year depending upon the jurisdiction.
Management has analyzed tax laws and regulations and their application to the Funds’ facts and circumstances and does not believe that there are any uncertain tax positions that require recognition of a tax liability.
As of July 31, 2014, the Fund had capital loss carryforwards available to offset future realized capital gains through the indicated expiration dates as follows:
| | | | |
| Expires July 31, | | Equity
Dividend1 | |
2016 | | $ | 1,491,156 | |
2018 | | | 1,491,156 | |
| | | | |
Total | | $ | 2,982,312 | |
| | | | |
| | 1 | | Subject to annual limitations. |
As of January 31, 2015, gross unrealized appreciation and depreciation based on cost for federal income tax purposes were as follows:
| | | | | | | | |
| | | Equity
Dividend | | | Natural
Resources | |
Tax cost | | $ | 19,380,689,761 | | | $ | 185,841,478 | |
| | | | | | | | |
Gross unrealized appreciation | | $ | 8,080,473,500 | | | $ | 203,948,030 | |
Gross unrealized depreciation | | | (191,798,473 | ) | | | (13,717,817 | ) |
| | | | | | | | |
Net unrealized appreciation | | $ | 7,888,675,027 | | | $ | 190,230,213 | |
| | | | | | | | |
7. Bank Borrowings:
The Funds, along with certain other funds managed by the Manager and its affiliates (“Participating Funds”), were a party to a 364-day, $1.1 billion credit agreement with a group of lenders, under which the Funds may borrow to fund shareholder redemptions. Excluding commitments designated for a certain individual fund, the Participating Funds, including the Funds, could borrow up to an aggregate commitment amount of $650 million, subject to asset coverage and other limitations as specified in the agreement. Effective November 25, 2014, the credit agreement was amended to an aggregate commitment amount of $2.1 billion, of which the Participating Funds, including the Funds, can borrow up to $1.6 billion at any time outstanding, subject to asset coverage and other limitations as specified in the agreement. The agreement terminates on April 23, 2015, unless otherwise extended to November 24, 2015 or renewed for a period of 364 days from April 23, 2015. The ameded agreement has the following terms: a fee of 0.06% per annum on unused commitment amounts and interest at a rate equal to the higher of (a) one-month LIBOR (but, in any event, not
| | | | | | |
| | | | | | | |
| | SEMI-ANNUAL REPORT | | JANUARY 31, 2015 | | 37 |
| | |
| Notes to Financial Statements (continued) | | |
less than 0.00%) on the date the loan is made plus 0.80% per annum or (b) the Fed Funds rate (but, in any event, not less than 0.00%) in effect from time to time plus 0.80% per annum on amounts borrowed. Participating Funds paid administration, legal and arrangement fees, which are included in miscellaneous expenses in the Statements of Operations, and along with commitment fees, were allocated among such funds based upon portions of the aggregate commitment available to them and relative net assets of Participating Funds. During the six months ended January 31, 2015, the Funds did not borrow under the credit agreement.
8. Principal Risks:
In the normal course of business, the Funds invest in securities and enter into transactions where risks exist due to fluctuations in the market (market risk) or failure of the issuer of a security to meet all its obligations (issuer credit risk). The value of securities held by the Funds may decline in response to certain events, including those directly involving the issuers whose securities are owned by the Funds; conditions affecting the general economy; overall market changes; local, regional or global political, social or economic instability; and currency ,interest rate and price fluctuations. Similar to issuer credit risk, the Funds may be exposed to counterparty credit risk, or the risk that an entity with which the Funds have unsettled or open transactions may fail to or be unable to perform on its commitments. The Funds manage counterparty credit risk by entering into transactions only with counterparties that they believe have the financial resources to honor their obligations and by monitoring the financial stability of those counterparties. Financial assets, which potentially expose the Funds to market, issuer and counterparty credit risks, consist principally of financial instruments and receivables due from counterparties. The extent of the Funds’ exposure to market, issuer and counterparty credit risks with respect to these financial assets is generally approximated by their value recorded in the Statements of Assets and Liabilities, less any collateral held by the Funds.
As of January 31, 2015, Equity Dividend invested a significant portion of its assets in securities in the financial sector and Natural Resources invested a significant portion of its assets in securities in the energy sector. Changes in economic conditions affecting such sectors would have a greater impact on the Funds and could affect the value, income and/or liquidity of positions in such securities.
9. Capital Share Transactions:
Transactions in capital shares for each class were as follows:
| | | | | | | | | | | | | | | | | | |
| | | Six Months Ended
January 31, 2015 | | | | | Year Ended
July 31, 2014 | |
| Equity Dividend | | Shares | | | Amount | | | | | Shares | | | Amount | |
| Institutional | | | | | | | | | | | | | | | | | | |
Shares sold | | | 110,788,916 | | | $ | 2,808,993,631 | | | | | | 147,343,678 | | | $ | 3,521,851,750 | |
Shares issued in reinvestment of dividends | | | 31,025,307 | | | | 748,264,378 | | | | | | 11,869,985 | | | | 283,300,140 | |
Shares redeemed | | | (122,694,382 | ) | | | (3,087,737,455 | ) | | | | | (213,916,345 | ) | | | (5,090,012,666 | ) |
| | | | | | | | | | | | | | |
Net increase (decrease) | | | 19,119,841 | | | $ | 469,520,554 | | | | | | (54,702,682 | ) | | $ | (1,284,860,776 | ) |
| | | | | | | | | | |
| | | | | | | | | | | | | | | | | | |
| Service | | | | | | | | | | | | | | | | | | |
Shares sold | | | 991,930 | | | $ | 25,041,683 | | | | | | 2,308,812 | | | $ | 54,394,964 | |
Shares issued in reinvestment of dividends | | | 574,718 | | | | 13,829,374 | | | | | | 237,573 | | | | 5,640,466 | |
Shares redeemed | | | (2,463,139 | ) | | | (61,593,157 | ) | | | | | (4,886,527 | ) | | | (115,541,944 | ) |
| | | | | | | | | | |
Net decrease | | | (896,491 | ) | | $ | (22,722,100 | ) | | | | | (2,340,142 | ) | | $ | (55,506,514 | ) |
| | | | | | | | | | |
| | | | | | | | | | | | | | | | | | |
| Investor A | | | | | | | | | | | | | | | | | | |
Shares sold and automatic conversion of shares | | | 25,507,127 | | | $ | 638,081,545 | | | | | | 88,124,447 | | | $ | 2,087,322,892 | |
Shares issued in reinvestment of dividends | | | 17,545,294 | | | | 422,435,246 | | | | | | 8,106,705 | | | | 192,878,657 | |
Shares redeemed | | | (121,850,705 | ) | | | (3,076,742,846 | ) | | | | | (154,066,721 | ) | | | (3,672,183,893 | ) |
| | | | | | | | | | |
Net decrease | | | (78,798,284 | ) | | $ | (2,016,226,055 | ) | | | | | (57,835,569 | ) | | $ | (1,391,982,344 | ) |
| | | | | | | | | | |
| | | | | | | | | | | | | | | | | | |
| Investor B | | | | | | | | | | | | | | | | | | |
Shares sold and automatic conversion of shares | | | 21,846 | | | $ | 552,501 | | | | | | 64,535 | | | $ | 1,523,101 | |
Shares issued in reinvestment of dividends | | | 53,201 | | | | 1,294,731 | | | | | | 16,158 | | | | 385,691 | |
Shares redeemed | | | (307,257 | ) | | | (7,714,058 | ) | | | | | (639,078 | ) | | | (15,369,223 | ) |
| | | | | | | | | | |
Net decrease | | | (232,210 | ) | | $ | (5,866,826 | ) | | | | | (558,385 | ) | | $ | (13,460,431 | ) |
| | | | | | | | | | |
| | | | | | |
| | | | | | | |
| 38 | | SEMI-ANNUAL REPORT | | JANUARY 31, 2015 | | |
| | | | |
| Notes to Financial Statements (continued) | | |
| | | | | | | | | | | | | | | | | | |
| | | Six Months Ended
January 31, 2015 | | | | | Year Ended
July 31, 2014 | |
| Equity Dividend (concluded) | | Shares | | | Amount | | | | | Shares | | | Amount | |
| Investor C | | | | | | | | | | | | | | | | | | |
Shares sold | | | 9,621,070 | | | $ | 234,640,626 | | | | | | 26,804,308 | | | $ | 618,169,818 | |
Shares issued in reinvestment of dividends | | | 6,865,920 | | | | 161,597,639 | | | | | | 1,681,159 | | | | 39,083,938 | |
Shares redeemed and automatic conversion of shares | | | (13,798,599 | ) | | | (336,847,167 | ) | | | | | (25,599,704 | ) | | | (596,764,819 | ) |
| | | | | | | | | | |
Net increase | | | 2,688,391 | | | $ | 59,391,098 | | | | | | 2,885,763 | | | $ | 60,488,937 | |
| | | | | | | | | | |
| | | | | | | | | | | | | | | | | | |
| Investor C1 | | | | | | | | | | | | | | | | | | |
Shares sold | | | 3,589 | | | $ | 87,845 | | | | | | 18,489 | | | $ | 419,722 | |
Shares issued in reinvestment of dividends | | | 13,621 | | | | 319,987 | | | | | | 3,898 | | | | 90,520 | |
Shares redeemed and automatic conversion of shares | | | (21,115 | ) | | | (517,162 | ) | | | | | (50,874 | ) | | | (1,172,742 | ) |
| | | | | | | | | | |
Net decrease | | | (3,905 | ) | | $ | (109,330 | ) | | | | | (28,487 | ) | | $ | (662,500 | ) |
| | | | | | | | | | |
| | | | | | | | | | | | | | | | | | |
| Class R | | | | | | | | | | | | | | | | | | |
Shares sold | | | 3,058,954 | | | $ | 76,936,223 | | | | | | 8,692,666 | | | $ | 207,058,702 | |
Shares issued in reinvestment of dividends | | | 2,409,554 | | | | 58,347,004 | | | | | | 796,943 | | | | 19,040,410 | |
Shares redeemed and automatic conversion of shares | | | (8,083,835 | ) | | | (203,011,914 | ) | | | | | (13,952,535 | ) | | | (335,222,274 | ) |
| | | | | | | | | | |
Net decrease | | | (2,615,327 | ) | | $ | (67,728,687 | ) | | | | | (4,462,926 | ) | | $ | (109,123,162 | ) |
| | | | | | | | | | |
Total Net Decrease | | | (60,737,985 | ) | | $ | (1,583,741,346 | )) | | | | | (117,042,428 | ) | | $ | (2,795,106,790 | ) |
| | | | | | | | | | |
| | | |
| | | Six Months Ended
January 31, 2015 | | | | | Year Ended
July 31, 2014 | |
| Natural Resources | | Shares | | | Amount | | | | | Shares | | | Amount | |
| Institutional | | | | | | | | | | | | | | | | | | |
Shares sold | | | 630,855 | | | $ | 41,091,079 | | | | | | 827,152 | | | $ | 58,647,909 | |
Shares issued in reinvestment of dividends | | | 154,158 | | | | 7,829,645 | | | | | | 18,943 | | | | 1,262,925 | |
Shares redeemed | | | (796,530 | ) | | | (50,607,901 | ) | | | | | (681,574 | ) | | | (48,707,962 | ) |
| | | | | | | | | | | | | | |
Net increase (decrease) | | | (11,517 | ) | | $ | (1,687,177 | ) | | | | | 164,521 | | | $ | 11,202,872 | |
| | | | | | | | | | |
| | | | | | | | | | | | | | | | | | |
| Investor A | | | | | | | | | | | | | | | | | | |
Shares sold and automatic conversion of shares | | | 785,741 | | | $ | 45,013,494 | | | | | | 763,652 | | | $ | 53,551,195 | |
Shares issued in reinvestment of dividends | | | 359,923 | | | | 17,754,674 | | | | | | 42,825 | | | | 2,783,600 | |
Shares redeemed | | | (1,046,780 | ) | | | (65,280,333 | ) | | | | | (1,271,693 | ) | | | (87,759,766 | ) |
| | | | | | | | | | |
Net increase (decrease) | | | 98,884 | | | $ | (2,512,165 | ) | | | | | (465,216 | ) | | $ | (31,424,971 | ) |
| | | | | | | | | | |
| | | | | | | | | | | | | | | | | | |
| Investor B | | | | | | | | | | | | | | | | | | |
Shares sold | | | 268 | | | $ | 12,454 | | | | | | 982 | | | $ | 59,170 | |
Shares issued in reinvestment of dividends | | | 4,695 | | | | 205,327 | | | | | | 562 | | | | 32,872 | |
Shares redeemed | | | (15,548 | ) | | | (853,938 | ) | | | | | (48,915 | ) | | | (2,987,696 | ) |
| | | | | | | | | | |
Net decrease | | | (10,585 | ) | | $ | (636,157 | ) | | | | | (47,371 | ) | | $ | (2,895,654 | ) |
| | | | | | | | | | |
| | | | | | | | | | | | | | | | | | |
| Investor C | | | | | | | | | | | | | | | | | | |
Shares sold and automatic conversion of shares | | | 181,585 | | | $ | 9,045,855 | | | | | | 166,156 | | | $ | 10,178,391 | |
Shares issued in reinvestment of dividends | | | 142,305 | | | | 6,107,564 | | | | | | 12,305 | | | | 708,772 | |
Shares redeemed | | | (261,778 | ) | | | (13,573,952 | ) | | | | | (373,899 | ) | | | (22,750,176 | ) |
| | | | | | | | | | |
Net increase (decrease) | | | 62,112 | | | $ | 1,579,467 | | | | | | (195,438 | ) | | $ | (11,863,013 | ) |
| | | | | | | | | | |
Total Net Increase (Decrease) | | | 138,894 | | | $ | (3,256,032 | ) | | | | | (543,504 | ) | | $ | (34,980,766 | ) |
| | | | | | | | | | |
| | | | | | |
| | | | | | | |
| | SEMI-ANNUAL REPORT | | JANUARY 31, 2015 | | 39 |
| | |
| Notes to Financial Statements (concluded) | | |
10. Subsequent Events:
Management has evaluated the impact of all subsequent events on each Fund through the date the financial statements were issued and has determined that there were no subsequent events requiring adjustment or additional disclosure in the financial statements.
| | | | | | |
| | | | | | | |
| 40 | | SEMI-ANNUAL REPORT | | JANUARY 31, 2015 | | |
Robert M. Hernandez, Chairman of the Board and Trustee
Fred G. Weiss, Vice Chairman of the Board and Trustee
James H. Bodurtha, Trustee
Bruce R. Bond, Trustee
Donald W. Burton, Trustee
Honorable Stuart E. Eizenstat, Trustee
Robert Fairburn, Trustee
Kenneth A. Froot, Trustee
Henry Gabbay, Trustee
John F. O’Brien, Trustee
Roberta Cooper Ramo, Trustee
David H. Walsh, Trustee
John M. Perlowski, President, Chief Executive Officer and Trustee
Jennifer McGovern, Vice President
Neal Andrews, Chief Financial Officer
Jay Fife, Treasurer
Charles Park, Chief Compliance Officer and Anti-Money Laundering Compliance Officer
Benjamin Archibald, Secretary
Effective September 10, 2014, Brendan Kyne resigned as a Vice President of the Funds and Jennifer McGovern became a Vice President of the Funds.
Effective December 31, 2014, Paul L. Audet and Laurence D. Fink resigned as Trustees of the Funds. Effective January 1, 2015, Robert Fairburn and John M. Perlowski were appointed to serve as Trustees of the Funds.
Effective March 1, 2015, Charles Park resigned as Anti-Money Laundering Compliance Officer of the Funds and Fernanda Piedra became Anti-Money Laundering Compliance Officer of the Funds.
| | | | | | | | |
| | | | | |
Investment Advisor BlackRock Advisors, LLC Wilmington, DE 19809 | | Custodian State Street Bank and
Trust Company Boston, MA 02110 | | Accounting Agent State Street Bank and
Trust Company Boston, MA 02110 | | Independent Registered
Public Accounting Firm Deloitte & Touche LLP Boston, MA 02116 | | Address of the Funds 100 Bellevue Parkway Wilmington, DE 19809 |
| | | | |
| | Transfer Agent BNY Mellon Investment
Servicing (US) Inc. Wilmington, DE 19809 | | Distributor BlackRock Investments, LLC New York, NY 10022 | | Legal Counsel Willkie Farr & Gallagher LLP New York, NY 10019 | | |
| | | | | | |
| | | | | | | |
| | SEMI-ANNUAL REPORT | | JANUARY 31, 2015 | | 41 |
Householding
The Funds will mail only one copy of shareholder documents, including prospectuses, annual and semi-annual reports and proxy statements, to shareholders with multiple accounts at the same address. This practice is commonly called “householding” and is intended to reduce expenses and eliminate duplicate mailings of shareholder documents. Mailings of your shareholder documents may be householded indefinitely unless you instruct us otherwise. If you do not want the mailing of these documents to be combined with those for other members of your household, please call the Funds at (800) 441-7762.
Availability of Quarterly Schedule of Investments
The Funds file their complete schedule of portfolio holdings with the SEC for the first and third quarters of each fiscal year on Form N-Q. The Funds’ Forms N-Q are available on the SEC’s website at http://www.sec.gov and may also be reviewed and copied at the SEC’s Public Reference Room in Washington, D.C. Information on how to access documents on the SEC’s website without charge may be obtained by calling (800) SEC-0330. The Funds’ Forms N-Q may also be obtained upon request and without charge by calling (800) 441-7762.
Availability of Proxy Voting Policies and Procedures
A description of the policies and procedures that the Funds use to determine how to vote proxies relating to portfolio securities is available (1) without charge, upon request, by calling (800) 441-7762; (2) at http://www.blackrock.com; and (3) on the SEC’s website at http://www.sec.gov.
Availability of Proxy Voting Record
Information about how the Funds voted proxies relating to securities held in the Funds’ portfolios during the most recent 12-month period ended June 30 is available upon request and without charge (1) at http://www.blackrock.com or by calling (800) 441-7762 and (2) on the SEC’s website at http://www.sec.gov.
Account Information
Call us at (800) 441-7762 from 8:00 AM to 6:00 PM EST on any business day to get information about your account balances, recent transactions and share prices. You can also reach us on the Web at http://www.blackrock.com/funds.
Automatic Investment Plans
Investor Class shareholders who want to invest regularly can arrange to have $50 or more automatically deducted from their checking or savings account and invested in any of the BlackRock funds.
Systematic Withdrawal Plans
Investor Class shareholders can establish a systematic withdrawal plan and receive periodic payments of $50 or more from their BlackRock funds, as long as their account balance is at least $10,000.
Retirement Plans
Shareholders may make investments in conjunction with Traditional, Rollover, Roth, Coverdell, Simple IRAs, SEP IRAs and 403(b) Plans.
| | | | | | |
| | | | | | | |
| 42 | | SEMI-ANNUAL REPORT | | JANUARY 31, 2015 | | |
| | | | |
| Additional Information (concluded) | | |
|
| BlackRock Privacy Principles |
BlackRock is committed to maintaining the privacy of its current and former fund investors and individual clients (collectively, “Clients”) and to safeguarding their non-public personal information. The following information is provided to help you understand what personal information BlackRock collects, how we protect that information and why in certain cases we share such information with select parties.
If you are located in a jurisdiction where specific laws, rules or regulations require BlackRock to provide you with additional or different privacy-related rights beyond what is set forth below, then BlackRock will comply with those specific laws, rules or regulations.
BlackRock obtains or verifies personal non-public information from and about you from different sources, including the following: (i) information we receive from you or, if applicable, your financial intermediary, on applications, forms or other documents; (ii) information about your transactions with us, our affiliates, or others; (iii) information we receive from a consumer reporting agency; and (iv) from visits to our websites.
BlackRock does not sell or disclose to non-affiliated third parties any non-public personal information about its Clients, except as permitted by law or as is necessary to respond to regulatory requests or to service Client accounts. These non-affiliated third parties are required to protect the confidentiality and security of this information and to use it only for its intended purpose.
We may share information with our affiliates to service your account or to provide you with information about other BlackRock products or services that may be of interest to you. In addition, BlackRock restricts access to non-public personal information about its Clients to those BlackRock employees with a legitimate business need for the information. BlackRock maintains physical, electronic and procedural safeguards that are designed to protect the non-public personal information of its Clients, including procedures relating to the proper storage and disposal of such information.
| | | | | | |
| | | | | | | |
| | SEMI-ANNUAL REPORT | | JANUARY 31, 2015 | | 43 |
This report is intended for current holders. It is not authorized for use as an offer of sale or a solicitation of an offer to buy shares of the Funds unless preceded or accompanied by the Funds’ current prospectus. Past performance results shown in this report should not be considered a representation of future performance. Investment returns and principal value of shares will fluctuate so that shares, when redeemed, may be worth more or less than their original cost. Statements and other information herein are as dated and are subject to change.

| | |
| EDNR-1/15-SAR | | |
| |
| |  |
| Item 2 – | Code of Ethics – Not Applicable to this semi-annual report |
| Item 3 – | Audit Committee Financial Expert – Not Applicable to this semi-annual report |
| Item 4 – | Principal Accountant Fees and Services – Not Applicable to this semi-annual report |
| Item 5 – | Audit Committee of Listed Registrants – Not Applicable |
(a) The registrant’s Schedule of Investments is included as part of the Report to Stockholders filed under Item 1 of this Form.
(b) Not Applicable due to no such divestments during the semi-annual period covered since the previous Form N-CSR filing.
| Item 7 – | Disclosure of Proxy Voting Policies and Procedures for Closed-End Management Investment Companies – Not Applicable |
| Item 8 – | Portfolio Managers of Closed-End Management Investment Companies – Not Applicable |
| Item 9 – | Purchases of Equity Securities by Closed-End Management Investment Company and Affiliated Purchasers – Not Applicable |
| Item 10 – | Submission of Matters to a Vote of Security Holders – There have been no material changes to these procedures. |
| Item 11 – | Controls and Procedures |
(a) – The registrant’s principal executive and principal financial officers, or persons performing similar functions, have concluded that the registrant’s disclosure controls and procedures (as defined in Rule 30a-3(c) under the Investment Company Act of 1940, as amended (the “1940 Act”)) are effective as of a date within 90 days of the filing of this report based on the evaluation of these controls and procedures required by Rule 30a-3(b) under the 1940 Act and Rule 15d-15(b) under the Securities Exchange Act of 1934, as amended.
(b) – There were no changes in the registrant’s internal control over financial reporting (as defined in Rule 30a-3(d) under the 1940 Act) that occurred during the second fiscal quarter of the period covered by this report that have materially affected, or are reasonably likely to materially affect, the registrant’s internal control over financial reporting.
| Item 12 – | Exhibits attached hereto |
(a)(1) – Code of Ethics – Not Applicable to this semi-annual report
(a)(2) – Certifications – Attached hereto
(a)(3) – Not Applicable
(b) – Certifications – Attached hereto
2
Pursuant to the requirements of the Securities Exchange Act of 1934 and the Investment Company Act of 1940, the registrant has duly caused this report to be signed on its behalf by the undersigned, thereunto duly authorized.
BlackRock Natural Resources Trust
| | | | |
| By: | | /s/ John M. Perlowski | | |
| | John M. Perlowski | | |
| | Chief Executive Officer (principal executive officer) of |
| | BlackRock Natural Resources Trust |
Date: April 2, 2015
Pursuant to the requirements of the Securities Exchange Act of 1934 and the Investment Company Act of 1940, this report has been signed below by the following persons on behalf of the registrant and in the capacities and on the dates indicated.
| | | | |
| By: | | /s/ John M. Perlowski �� | | |
| | John M. Perlowski | | |
| | Chief Executive Officer (principal executive officer) of |
| | BlackRock Natural Resources Trust |
Date: April 2, 2015 | | |
| By: | | /s/ Neal J. Andrews | | |
| | Neal J. Andrews | | |
| | Chief Financial Officer (principal financial officer) of |
| | BlackRock Natural Resources Trust |
Date: April 2, 2015
3