UNITED STATES
SECURITIES AND EXCHANGE COMMISSION
Washington, D.C. 20549
FORM N-CSR
CERTIFIED SHAREHOLDER REPORT OF REGISTERED MANAGEMENT INVESTMENT COMPANIES
Investment Company Act file number: 811-04282
Name of Fund: BlackRock Natural Resources Trust
Fund Address: 100 Bellevue Parkway, Wilmington, DE 19809
Name and address of agent for service: John M. Perlowski, Chief Executive Officer, BlackRock Natural Resources Trust, 55 East 52nd Street, New York, NY 10055
Registrant’s telephone number, including area code: (800) 441-7762
Date of fiscal year end: 07/31/2017
Date of reporting period: 01/31/2017
Item 1 – Report to Stockholders
JANUARY 31, 2017
| | | | |
SEMI-ANNUAL REPORT (UNAUDITED) | | | |  |
BlackRock Equity Dividend Fund
BlackRock Natural Resources Trust
|
| Not FDIC Insured • May Lose Value • No Bank Guarantee |
Dear Shareholder,
The 12 months ended January 31, 2017 was an exceptionally strong period for risk assets (such as stocks and high yield bonds), while higher-quality assets generated muted returns after struggling in the latter part of 2016. As the period began, worries about slowing growth in China and the instability of oil prices had global equity prices sliding. However, the broad market momentum shifted in the second half of 2016 as reflationary expectations in the United States helped drive a pick-up in global growth.
Markets were remarkably resilient during the period. Big surprises such as the United Kingdom’s vote to leave the European Union and the outcome of the U.S. presidential election brought spikes in equity market volatility, but they were ultimately short-lived. Instead, investors used the sell-offs to seize upon buying opportunities, allowing markets to quickly rebound. We believe this reinforces the case for taking the long view rather than reacting to short-term market noise.
The global reflationary theme — rising nominal growth, wages and inflation — was the dominant driver of asset returns during the period, outweighing significant political upheavals and uncertainty. This trend accelerated after the U.S. election and continued into the beginning of 2017, stoked by expectations for an extra boost to U.S. growth via fiscal policy.
Although economic momentum is gaining traction, the capacity for rapid global growth is restrained by structural factors including an aging population, low productivity growth and excess savings. A tempered economic growth trend and high valuations across most assets have set the stage for muted investment returns going forward.
Equity markets still have room to move, although the disparity between winners and losers is widening, making stock selection increasingly important. Fixed income investors are also facing challenges as bond markets recalibrate to accommodate rising rates and higher inflation expectations. And in a world where political risk and policy uncertainty abound, there is no lack of potential catalysts for higher volatility.
In this environment, investors need to think globally, extend their scope across a broad array of asset classes and be nimble as market conditions change. We encourage you to talk with your financial advisor and visit blackrock.com for further insight about investing in today’s markets.
Sincerely,

Rob Kapito
President, BlackRock Advisors, LLC

Rob Kapito
President, BlackRock Advisors, LLC
| | | | | | | | |
| Total Returns as of January 31, 2017 | |
| | | 6-month | | | 12-month | |
U.S. large cap equities
(S&P 500® Index) | | | 5.96 | % | | | 20.04 | % |
U.S. small cap equities
(Russell 2000® Index) | | | 12.43 | | | | 33.53 | |
International equities
(MSCI Europe, Australasia,
Far East Index) | | | 3.49 | | | | 12.03 | |
Emerging market equities
(MSCI Emerging Markets Index) | | | 4.92 | | | | 25.41 | |
3-month Treasury bills
(BofA Merrill Lynch 3-Month
U.S. Treasury Bill Index) | | | 0.20 | | | | 0.37 | |
U.S. Treasury securities
(BofA Merrill Lynch
10-Year U.S. Treasury
Index) | | | (7.87 | ) | | | (3.26 | ) |
U.S. investment grade bonds
(Bloomberg Barclays U.S.
Aggregate Bond Index) | | | (2.95 | ) | | | 1.45 | |
Tax-exempt municipal
bonds (S&P Municipal
Bond Index) | | | (2.94 | ) | | | 0.24 | |
U.S. high yield bonds
(Bloomberg Barclays U.S. Corporate High Yield 2% Issuer
Capped Index) | | | 6.09 | | | | 20.77 | |
| Past performance is no guarantee of future results. Index performance is shown for illustrative purposes only. You cannot invest directly in an index. | |
| | | | | | |
| | | | | | | |
| 2 | | THIS PAGE NOT PART OF YOUR FUND REPORT | | | | |

| | | | | | |
| | | | | | | |
| | SEMI-ANNUAL REPORT | | JANUARY 31, 2017 | | 3 |
| | |
| Fund Summary as of January 31, 2017 | | BlackRock Equity Dividend Fund |
BlackRock Equity Dividend Fund’s (the “Fund”) investment objective is to seek long-term total return and current income.
|
| Portfolio Management Commentary |
How did the Fund perform?
| • | | For the six-month period ended January 31, 2017, the Fund’s Institutional, Service, Investor A and Class K Shares outperformed the benchmark, the Russell 1000® Value Index, while Class R Shares was in line and the Fund’s other share classes underperformed. For the same period, all of the Fund’s share classes outperformed the broad-market S&P 500® Index. The following discussion of relative performance pertains to the Russell 1000® Value Index. |
What factors influenced performance?
| • | | The largest contribution to relative return for the six-month period came from a combination of stock selection and allocation decisions within the financials sector, with a significant overweight to banks. In particular, the overweight to banks proved beneficial as investors anticipated higher growth and rising interest rates following the U.S. election, which resulted in Republican control of the White House and both houses of Congress. Allocation and stock selection decisions in the health care sector also added to performance. Within health care, an underweight in health care equipment & supplies and stock selection in the health care providers & services boosted performance. Underweight positions to real estate and consumer staples also added to relative returns. |
| • | | The largest detractors from relative performance derived from a combination of stock selection and allocation decisions in the industrials sector. Within industrials, an underweight to the machinery industry weighed on returns, as strong performance for the segment was driven by improved U.S. manufacturing and activity data, as well as raised post-election growth expectations. An overweight to the industrial conglomerates industry and stock selection in the professional services industry also detracted from the Fund’s performance within industrials. |
| | | Additionally, stock selection in consumer discretionary detracted from relative performance. This was primarily due to the non-benchmark holding Dollar General Corp., which lagged following weaker-than-expected quarterly earnings. Lastly, stock selection in the energy sector also detracted from results. |
Describe recent portfolio activity.
| • | | During the six-month period, the Fund’s exposures to the energy, health care and consumer staples sectors were increased. The Fund’s allocation within energy was boosted by adding to existing positions in Hess Corp. and Suncor Energy, Inc. Within health care, sector exposure was increased by initiating a position in McKesson Corp., as well as increased holdings in Aetna, Inc. and Anthem, Inc. Notable transactions within consumer staples included initiating a position in Mead Johnson Nutrition Co. and adding to existing holdings in Diageo PLC and Unilever NV. Conversely, the Fund reduced exposure to the consumer discretionary sector by exiting McDonald’s Corp. and reducing its positions in Dollar General Corp. and Home Depot, Inc. In addition, the Fund decreased its holdings in the information technology sector by trimming its positions in Intel Corp. and QUALCOMM Inc. and exiting NVIDIA Corp. following strong performance. Lastly, the Fund reduced its holdings within the industrials sector by trimming positions in Raytheon Co. and General Electric Co. |
Describe portfolio positioning at period end.
| • | | As of period end, the Fund’s largest allocations were in the financials, health care and energy sectors. Relative to the benchmark, the largest overweight positions were in health care, consumer discretionary and materials. Conversely, the largest relative underweights were in the real estate, telecommunication services and energy sectors. |
The views expressed reflect the opinions of BlackRock as of the date of this report and are subject to change based on changes in market, economic or other conditions. These views are not intended to be a forecast of future events and are no guarantee of future results.
| | | | | | |
| | | | | | | |
| 4 | | SEMI-ANNUAL REPORT | | JANUARY 31, 2017 | | |
| | |
| | | BlackRock Equity Dividend Fund |
|
| Total Return Based on a $10,000 Investment |
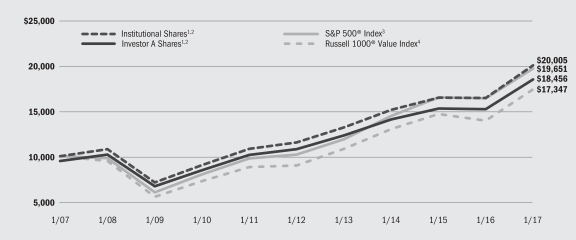
| | 1 | | Assuming maximum sales charges, if any, transaction costs and other operating expenses, including investment advisory fees. Institutional Shares do not have a sales charge. |
| | 2 | | Under normal circumstances, the Fund invests at least 80% of its assets in equity securities and at least 80% of its assets in dividend paying securities. |
| | 3 | | An unmanaged index that covers 500 leading companies and captures approximately 80% coverage of available market capitalization. |
| | 4 | | An unmanaged index that is a subset of the Russell 1000® Index that consists of those Russell 1000® securities with lower price-to-book ratios and lower expected growth values. |
|
| Performance Summary for the Period Ended January 31, 2017 |
| | | | | | | | | | | | | | | | | | | | | | | | | | | | |
| | | | | | Average Annual Total Returns5 | |
| | | | | | 1 Year | | | 5 Years | | | 10 Years | |
| | | 6-Month
Total Returns | | | w/o sales
charge | | | w/sales
charge | | | w/o sales
charge | | | w/sales
charge | | | w/o sales
charge | | | w/sales
charge | |
Institutional | | | 8.37 | % | | | 21.89 | % | | | N/A | | | | 11.67 | % | | | N/A | | | | 7.18 | % | | | N/A | |
Service | | | 8.27 | | | | 21.59 | | | | N/A | | | | 11.34 | | | | N/A | | | | 6.90 | | | | N/A | |
Investor A | | | 8.22 | | | | 21.62 | | | | 15.24 | % | | | 11.38 | | | | 10.18 | % | | | 6.89 | | | | 6.32 | % |
Investor B | | | 7.78 | | | | 20.56 | | | | 16.06 | | | | 10.52 | | | | 10.25 | | | | 6.23 | | | | 6.23 | |
Investor C | | | 7.86 | | | | 20.67 | | | | 19.67 | | | | 10.58 | | | | 10.58 | | | | 6.11 | | | | 6.11 | |
Investor C1 | | | 7.93 | | | | 20.90 | | | | N/A | | | | 10.79 | | | | N/A | | | | 6.32 | | | | N/A | |
Class K | | | 8.42 | | | | 21.99 | | | | N/A | | | | 11.80 | | | | N/A | | | | 7.31 | | | | N/A | |
Class R | | | 8.03 | | | | 21.19 | | | | N/A | | | | 11.03 | | | | N/A | | | | 6.56 | | | | N/A | |
S&P 500® Index | | | 5.96 | | | | 20.04 | | | | N/A | | | | 14.09 | | | | N/A | | | | 6.99 | | | | N/A | |
Russell 1000® Value Index | | | 8.04 | | | | 24.62 | | | | N/A | | | | 14.11 | | | | N/A | | | | 5.66 | | | | N/A | |
| | 5 | | Assuming maximum sales charges, if any. Average annual total returns with and without sales charges reflect reductions for distribution and service fees. See “About Fund Performance” on page 10 for a detailed description of share classes, including any related sales charges and fees. |
| | | | N/A — Not applicable as share class and index do not have a sales charge. |
| | | | Past performance is not indicative of future results. |
| | | | Performance results may include adjustments made for financial reporting purposes in accordance with U.S. generally accepted accounting principles. |
| | | | | | | | | | | | | | | | | | | | | | | | | | | | |
| | | Actual | | | Hypothetical7 | | | | |
| | | Beginning
Account Value August 1, 2016 | | | Ending
Account Value
January 31, 2017 | | | Expenses Paid
During the
Period6 | | | Beginning
Account Value August 1, 2016 | | | Ending
Account Value
January 31, 2017 | | | Expenses Paid
During the
Period6 | | | Annualized
Expense Ratio | |
Institutional | | $ | 1,000.00 | | | $ | 1,083.70 | | | $ | 3.62 | | | $ | 1,000.00 | | | $ | 1,021.73 | | | $ | 3.52 | | | | 0.69 | % |
Service | | $ | 1,000.00 | | | $ | 1,082.70 | | | $ | 4.78 | | | $ | 1,000.00 | | | $ | 1,020.62 | | | $ | 4.63 | | | | 0.91 | % |
Investor A | | $ | 1,000.00 | | | $ | 1,082.20 | | | $ | 4.83 | | | $ | 1,000.00 | | | $ | 1,020.57 | | | $ | 4.69 | | | | 0.92 | % |
Investor B | | $ | 1,000.00 | | | $ | 1,077.80 | | | $ | 9.06 | | | $ | 1,000.00 | | | $ | 1,016.48 | | | $ | 8.79 | | | | 1.73 | % |
Investor C | | $ | 1,000.00 | | | $ | 1,078.60 | | | $ | 8.80 | | | $ | 1,000.00 | | | $ | 1,016.74 | | | $ | 8.54 | | | | 1.68 | % |
Investor C1 | | $ | 1,000.00 | | | $ | 1,079.30 | | | $ | 7.76 | | | $ | 1,000.00 | | | $ | 1,017.74 | | | $ | 7.53 | | | | 1.48 | % |
Class K | | $ | 1,000.00 | | | $ | 1,084.20 | | | $ | 2.12 | | | $ | 1,000.00 | | | $ | 1,022.23 | | | $ | 2.06 | | | | 0.59 | % |
Class R | | $ | 1,000.00 | | | $ | 1,080.30 | | | $ | 6.50 | | | $ | 1,000.00 | | | $ | 1,018.95 | | | $ | 6.31 | | | | 1.24 | % |
| | 6 | | For each class of the Fund, expenses are equal to the annualized net expense ratio for the class, multiplied by the average account value over the period, multiplied by 184/365 (to reflect the one-half year period shown). |
| | 7 | | Hypothetical 5% annual return before expenses is calculated by prorating the number of days in the most recent fiscal half year divided by 365. |
| | | | See “Disclosure of Expenses” on page 11 for further information on how expenses were calculated. |
| | | | | | |
| | | | | | | |
| | SEMI-ANNUAL REPORT | | JANUARY 31, 2017 | | 5 |
| | |
| | | BlackRock Equity Dividend Fund |
|
| Portfolio Information as of January 31, 2017 |
| | | | |
| Ten Largest Holdings | | Percent of
Net Assets | |
JPMorgan Chase & Co. | | | 4 | % |
Bank of America Corp. | | | 4 | |
Pfizer, Inc. | | | 3 | |
Wells Fargo & Co. | | | 3 | |
Citigroup, Inc. | | | 3 | |
General Electric Co. | | | 2 | |
Microsoft Corp. | | | 2 | |
Oracle Corp. | | | 2 | |
Merck & Co., Inc. | | | 2 | |
Comcast Corp., Class A | | | 2 | |
| | | | |
| Sector Allocation | | Percent of Net Assets | |
Financials | | | 27 | % |
Health Care | | | 14 | |
Energy | | | 11 | |
Industrials | | | 10 | |
Information Technology | | | 10 | |
Consumer Staples | | | 7 | |
Consumer Discretionary | | | 6 | |
Utilities | | | 5 | |
Short-Term Securities | | | 4 | |
Materials | | | 4 | |
Telecommunication Services | | | 2 | |
Real Estate | | | — | 1 |
Other Assets Less Liabilities | | | — | 1 |
For Fund compliance purposes, the Fund’s sector classifications refer to one or more of the sector sub-classifications used by one or more widely recognized market indexes, and/or as defined by the investment adviser. These definitions may not apply for purposes of this report, which may combine such sector sub-classifications for reporting ease.
| | | | | | |
| | | | | | | |
| 6 | | SEMI-ANNUAL REPORT | | JANUARY 31, 2017 | | |
| | |
| Fund Summary as of January 31, 2017 | | BlackRock Natural Resources Trust |
BlackRock Natural Resources Trust’s (the “Fund”) investment objective is to seek long-term growth of capital and to protect the purchasing power of shareholders’ capital by investing in a portfolio of equity securities of domestic and foreign companies with substantial natural resource assets.
| | |
| Portfolio Management Commentary | | |
How did the Fund perform?
| • | | For the six-month period ended January 31, 2017, the Fund outperformed its benchmark, the S&P North American Natural Resources Sector Index, with the exception of the Fund’s Investor B Shares, which performed in line with its benchmark. |
What factors influenced performance?
| • | | The largest contributor to relative performance for the period came from the portfolio’s stock selection and allocation decisions within the exploration & production industry, where overweight positions in ConocoPhillips, EOG Resources, Inc. and Pioneer Natural Resources Co. proved beneficial. These companies continue to offer valuable growth qualities, capable management teams, reliable revenue and earnings, and improving cash flow generation. In addition, stock selection in the equipment & services industry, notably within the drilling segment, also generated strong performance. In particular, an overweight in Halliburton Co. was additive, as the company announced that it was adding staff to its product service lines and support functions in the Permian Basin (southeastern United States). Lastly, an underweight within the containers & packaging industry contributed to relative performance. |
| • | | The largest detractor from relative performance came from an underweight allocation to and stock selection within metals & mining. In particular, an underweight to gold producer Newmont Mining Corp. detracted from returns, as the company benefited from the strong rebound in gold prices seen over much of 2016. An underweight to the storage & transportation |
| | | industry also weighed on relative returns, as pipeline companies posted strong performance on expectations that increased gas production will result in greater demand within the segment. Lastly, the Fund’s cash position weighed on performance. |
Describe recent portfolio activity.
| • | | The Fund takes a longer-term, structural investment view within the energy and materials sectors, and as a result portfolio turnover remains very low. There were no significant changes in portfolio allocation during the six-month period. The Fund remained substantially overweight in exploration & production companies due to their operating specialization and the investment adviser’s favorable view of the industry’s prospects. The Fund also remained more heavily allocated to oil-weighted companies than those levered to natural gas. Additionally, allocations to large-cap oil servicers were increased based on their diverse revenue streams, balance sheet strength and propensity to recover with the commodity cycle. |
Describe portfolio positioning at period end.
| • | | The Fund remained focused on both company fundamentals and longer-term industry trends within energy and materials, in seeking to benefit over time from the diversity, pricing power and potential inflation benefits that naturally occur within these sectors. The Fund continued to favor oil over natural gas, as well as exploration & production companies with exposure to key shale basins. The Fund also placed additional emphasis on the equipment & services industry, as well as select equipment producers. |
The views expressed reflect the opinions of BlackRock as of the date of this report and are subject to change based on changes in market, economic or other conditions. These views are not intended to be a forecast of future events and are no guarantee of future results.
| | | | | | |
| | | | | | | |
| | SEMI-ANNUAL REPORT | | JANUARY 31, 2017 | | 7 |
| | |
| | | BlackRock Natural Resources Trust |
| | |
| Total Return Based on a $10,000 Investment | | |
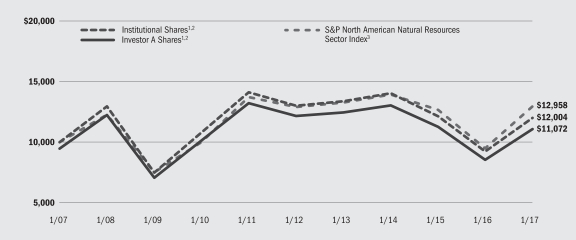
| | 1 | | Assuming maximum sales charges, if any, transaction costs and other operating expenses, including investment advisory fees. Institutional Shares do not have a sales charge. |
| | 2 | | Under normal circumstances, the Fund invests at least 80% of its assets in companies with substantial natural resource assets or in securities the value of which is related to the market value of some natural resource asset. |
| | 3 | | This unmanaged index consists primarily of U.S. equities classified under the energy and materials sector. |
| | |
| Performance Summary for the Period Ended January 31, 2017 | | |
| | | | | | | | | | | | | | | | | | | | | | | | | | | | |
| | | | | | Average Annual Total Returns4 | |
| | | | | | 1 Year | | | 5 Years | | | 10 Years | |
| | | 6-Month
Total Returns | | | w/o sales
charge | | | w/sales
charge | | | w/o sales
charge | | | w/sales
charge | | | w/o sales
charge | | | w/sales
charge | |
Institutional | | | 9.23 | % | | | 29.91 | % | | | N/A | | | | (1.62 | )% | | | N/A | | | | 1.84 | % | | | N/A | |
Investor A | | | 9.08 | | | | 29.58 | | | | 22.78 | % | | | (1.88 | ) | | | (2.94 | )% | | | 1.57 | | | | 1.02 | % |
Investor B | | | 8.46 | | | | 28.30 | | | | 23.80 | | | | (2.72 | ) | | | (3.04 | ) | | | 0.94 | | | | 0.94 | |
Investor C | | | 8.63 | | | | 28.56 | | | | 27.56 | | | | (2.65 | ) | | | (2.65 | ) | | | 0.77 | | | | 0.77 | |
S&P North American Natural Resources Sector Index | | | 8.49 | | | | 36.42 | | | | N/A | | | | 0.10 | | | | N/A | | | | 2.63 | | | | N/A | |
| | 4 | | Assuming maximum sales charges, if any. Average annual total returns with and without sales charges reflect reductions for distribution and service fees. See “About Fund Performance” on page 10 for a detailed description of share classes, including any related sales charges and fees. |
| | | | N/A — Not applicable as share class and index do not have a sales charge. |
| | | | Past performance is not indicative of future results. |
| | | | Performance results may include adjustments made for financial reporting purposes in accordance with U.S. generally accepted accounting principles. |
| | | | | | | | | | | | | | | | | | | | | | | | | | | | |
| | | Actual | | | Hypothetical6 | | | | |
| | | Beginning
Account Value August 1, 2016 | | | Ending
Account Value
January 31, 2017 | | | Expenses Paid
During the
Period5 | | | Beginning
Account Value August 1, 2016 | | | Ending
Account Value January 31, 2017 | | | Expenses Paid
During the
Period5 | | | Annualized
Expense Ratio | |
Institutional | | $ | 1,000.00 | | | $ | 1,092.30 | | | $ | 4.32 | | | $ | 1,000.00 | | | $ | 1,021.07 | | | $ | 4.18 | | | | 0.82 | % |
Investor A | | $ | 1,000.00 | | | $ | 1,090.80 | | | $ | 5.80 | | | $ | 1,000.00 | | | $ | 1,019.66 | | | $ | 5.60 | | | | 1.10 | % |
Investor B | | $ | 1,000.00 | | | $ | 1,084.60 | | | $ | 11.24 | | | $ | 1,000.00 | | | $ | 1,014.42 | | | $ | 10.87 | | | | 2.14 | % |
Investor C | | $ | 1,000.00 | | | $ | 1,086.30 | | | $ | 9.89 | | | $ | 1,000.00 | | | $ | 1,015.73 | | | $ | 9.55 | | | | 1.88 | % |
| | 5 | | For each class of the Fund, expenses are equal to the annualized net expense ratio for the class, multiplied by the average account value over the period, multiplied by 184/365 (to reflect the one-half year period shown). |
| | 6 | | Hypothetical 5% annual return before expenses is calculated by prorating the number of days in the most recent fiscal half year divided by 365. |
| | | | See “Disclosure of Expenses” on page 11 for further information on how expenses were calculated. |
| | | | | | |
| | | | | | | |
| 8 | | SEMI-ANNUAL REPORT | | JANUARY 31, 2017 | | |
| | |
| | | BlackRock Natural Resources Trust |
| | |
| Portfolio Information as of January 31, 2017 | | |
| | | | |
| Ten Largest Holdings | | Percent of
Net Assets | |
EOG Resources Inc. | | | 9 | % |
Schlumberger Ltd. | | | 5 | |
Exxon Mobil Corp. | | | 5 | |
Chevron Corp. | | | 5 | |
Pioneer Natural Resources Co. | | | 4 | |
Halliburton Co. | | | 4 | |
Suncor Energy, Inc. | | | 4 | |
Anadarko Petroleum Corp. | | | 4 | |
Devon Energy Corp. | | | 3 | |
Occidental Petroleum Corp. | | | 3 | |
| | | | |
| Industry Allocation | | Percent of
Net Assets | |
Oil & Gas Exploration & Production | | | 27 | % |
Oil, Gas & Consumable Fuels | | | 25 | |
Integrated Oil & Gas | | | 17 | |
Energy Equipment & Services | | | 14 | |
Metals & Mining | | | 7 | |
Short-Term Securities | | | 5 | |
Chemicals | | | 3 | |
Refining, Marketing & Transport | | | 2 | |
Oil & Gas Equipment & Services | | | 2 | |
Oil & Gas Drilling | | | 1 | |
Diversified Financial Services | | | — | 1 |
Oil & Gas Producers | | | — | 1 |
Utilities | | | — | 1 |
Liabilities in Excess of Other Assets | | | (3 | ) |
For Fund compliance purposes, the Fund’s industry classifications refer to one or more of the industry sub-classifications used by one or more widely recognized market indexes, and/or as defined by the investment adviser. These definitions may not apply for purposes of this report, which may combine such industry sub-classifications for reporting ease.
| | | | | | |
| | | | | | | |
| | SEMI-ANNUAL REPORT | | JANUARY 31, 2017 | | 9 |
| • | | Institutional and Class K Shares (Class K Shares are available only in BlackRock Equity Dividend Fund) are not subject to any sales charge. These shares bear no ongoing distribution or service fees and are available only to certain eligible investors. Prior to the Class K Shares inception date of March 28, 2016, Class K Shares performance results are those of Institutional Shares (which have no distribution or service fees) and were restated to reflect Class K Shares fees. |
| • | | Service Shares (available only in BlackRock Equity Dividend Fund) are not subject to any sales charge. These shares are subject to a service fee of 0.25% per year (but no distribution fee) and are available only to eligible investors. |
| • | | Investor A Shares are subject to a maximum initial sales charge (front-end load) of 5.25% and a service fee of 0.25% per year (but no distribution fee). Certain redemptions of these shares may be subject to a contingent deferred sales charge (“CDSC”) where no initial sales charge was paid at the time of purchase. These shares are generally available through financial intermediaries. |
| • | | Investor B Shares are subject to a maximum CDSC of 4.50% declining to 0% after six years. In addition, these shares are subject to a distribution fee of 0.75% per year and a service fee of 0.25% per year. These shares automatically convert to Investor A Shares after approximately eight years. (There is no initial sales charge for automatic share conversions.) All returns for periods greater than eight years reflect this conversion. |
| • | | Investor C Shares are subject to a 1.00% CDSC if redeemed within one year of purchase. In addition, these shares are subject to a distribution fee of 0.75% per year and a service fee of 0.25% per year. These shares are generally available through financial intermediaries. |
| • | | Investor C1 Shares (available only in BlackRock Equity Dividend Fund) are subject to a 1.00% contingent deferred sales charge (“CDSC”) if redeemed within one year of purchase. However, the CDSC does not apply to redemptions by certain employer-sponsored retirement plans or to redemptions of shares acquired through reinvestment of dividends and capital gains by existing shareholders. In addition, these shares are subject to a distribution fee of 0.55% per year and a service fee of 0.25% per year. |
| | | Prior to September 12, 2011, Investor C1 Shares performance results are those of Institutional Shares (which have no distribution or service fees) restated to reflect the Investor C1 Share fees. |
| • | | Class R Shares (available only in BlackRock Equity Dividend Fund) are not subject to any sales charge. These shares are subject to a distribution fee of 0.25% per year and a service fee of 0.25% per year. These Shares are available only to certain employer-sponsored retirement plans. |
Investor B Shares of their respective Funds are only available through exchanges and dividend and capital gain reinvestment by existing shareholders, and for purchase by certain employer-sponsored retirement plans.
Investor C1 Shares of their respective Funds are only available for dividend and capital gain reinvestment by existing shareholders, and for purchase by certain employer-sponsored retirement plans.
Performance information reflects past performance and does not guarantee future results. Current performance may be lower or higher than the performance data quoted. Refer to www.blackrock.com/funds to obtain performance data current to the most recent month end. Performance results do not reflect the deduction of taxes that a shareholder would pay on fund distributions or the redemption of fund shares. Figures shown in the performance tables on the previous pages assume reinvestment of all distributions, if any, at net asset value (“NAV”) on the ex-dividend date. Investment return and principal value of shares will fluctuate so that shares, when redeemed, may be worth more or less than their original cost. Distributions paid to each class of shares will vary because of the different levels of service, distribution and transfer agency fees applicable to each class, which are deducted from the income available to be paid to shareholders.
BlackRock Advisors, LLC (the “Manager”), the Funds’ investment adviser, voluntarily waived a portion of the Funds’ expenses. Without such waiver, the Funds’ performance would have been lower. The Manager is under no obligation to waive or to continue waiving its fees and such voluntary waiver may be reduced or discontinued at any time. See Note 5 of the Notes to Financial Statements for additional information on waivers.
| | | | | | |
| | | | | | | |
| 10 | | SEMI-ANNUAL REPORT | | JANUARY 31, 2017 | | |
Shareholders of these Funds may incur the following charges: (a) transactional expenses, such as sales charges; and (b) operating expenses, including investment advisory fees, service and distribution fees, including 12b-1 fees, acquired fund fees and expenses and other Fund expenses. The expense examples on previous pages (which are based on a hypothetical investment of $1,000 invested on August 1, 2016 and held through January 31, 2017) are intended to assist shareholders both in calculating expenses based on an investment in each Fund and in comparing these expenses with similar costs of investing in other mutual funds.
The expense examples provide information about actual account values and actual expenses. In order to estimate the expenses a shareholder paid during the period covered by this report, shareholders can divide their account value by $1,000 and then multiply the result by the number corresponding to their Fund and share class under the heading entitled “Expenses Paid During the Period.”
The expense examples also provide information about hypothetical account values and hypothetical expenses based on a Fund’s actual expense ratio and an assumed rate of return of 5% per year before expenses. In order to assist shareholders in comparing the ongoing expenses of investing in these Funds and other funds, compare the 5% hypothetical examples with the 5% hypothetical examples that appear in shareholder reports of other funds.
The expenses shown in the expense examples are intended to highlight shareholders’ ongoing costs only and do not reflect any transactional expenses, such as sales charges, if any. Therefore, the hypothetical examples are useful in comparing ongoing expenses only, and will not help shareholders determine the relative total expenses of owning different funds. If these transactional expenses were included, shareholder expenses would have been higher.
| | | | | | |
| | | | | | | |
| | SEMI-ANNUAL REPORT | | JANUARY 31, 2017 | | 11 |
| | |
Schedule of Investments January 31, 2017 (Unaudited) | | BlackRock Equity Dividend Fund (Percentages shown are based on Net Assets) |
| | | | | | | | |
| Common Stocks | | Shares | | | Value | |
Aerospace & Defense — 3.2% | | | | | | | | |
Lockheed Martin Corp. | | | 958,070 | | | $ | 240,791,733 | |
Northrop Grumman Corp. | | | 1,272,212 | | | | 291,438,325 | |
Raytheon Co. | | | 976,679 | | | | 140,798,045 | |
| | | | | | | | |
| | | | | | | | 673,028,103 | |
Air Freight & Logistics — 0.8% | | | | | | | | |
United Parcel Service, Inc., Class B | | | 1,606,012 | | | | 175,264,089 | |
Banks — 16.8% | | | | | | | | |
Bank of America Corp. | | | 36,796,596 | | | | 833,074,933 | |
Citigroup, Inc. | | | 10,682,968 | | | | 596,430,103 | |
JPMorgan Chase & Co. | | | 9,940,160 | | | | 841,235,741 | |
KeyCorp | | | 5,651,730 | | | | 101,561,588 | |
SunTrust Banks, Inc. | | | 4,323,553 | | | | 245,664,282 | |
U.S. Bancorp | | | 6,025,713 | | | | 317,253,789 | |
Wells Fargo & Co. | | | 10,963,575 | | | | 617,578,180 | |
| | | | | | | | |
| | | | | | | | 3,552,798,616 | |
Beverages — 2.0% | | | | | | | | |
Coca-Cola Co. | | | 5,311,147 | | | | 220,784,381 | |
Diageo PLC | | | 7,323,055 | | | | 203,418,639 | |
| | | | | | | | |
| | | | | | | | 424,203,020 | |
Capital Markets — 3.5% | | | | | | | | |
Goldman Sachs Group, Inc. | | | 1,022,858 | | | | 234,561,796 | |
Invesco Ltd. | | | 4,139,124 | | | | 119,703,466 | |
Morgan Stanley | | | 8,887,171 | | | | 377,615,896 | |
| | | | | | | | |
| | | | | | | | 731,881,158 | |
Chemicals — 3.0% | | | | | | | | |
Dow Chemical Co. | | | 6,599,736 | | | | 393,542,258 | |
E.I. du Pont de Nemours & Co. | | | 2,345,602 | | | | 177,092,951 | |
Praxair, Inc. | | | 490,564 | | | | 58,102,400 | |
| | | | | | | | |
| | | | | | | | 628,737,609 | |
Communications Equipment — 0.8% | | | | | | | | |
Motorola Solutions, Inc. | | | 2,128,683 | | | | 171,806,005 | |
Diversified Financial Services — 0.8% | | | | | | | | |
CME Group, Inc. | | | 1,381,053 | | | | 167,217,897 | |
Diversified Telecommunication Services — 1.6% | | | | | |
BCE, Inc. (a) | | | 1,212,938 | | | | 54,727,763 | |
Verizon Communications, Inc. | | | 5,608,502 | | | | 274,872,683 | |
| | | | | | | | |
| | | | | | | | 329,600,446 | |
Electric Utilities — 2.1% | | | | | | | | |
Exelon Corp. | | | 3,906,480 | | | | 140,164,502 | |
FirstEnergy Corp. | | | 1,646,100 | | | | 49,909,752 | |
NextEra Energy, Inc. | | | 2,140,151 | | | | 264,779,482 | |
| | | | | | | | |
| | | | | | | | 454,853,736 | |
Electrical Equipment — 0.3% | | | | | | | | |
Rockwell Automation, Inc. | | | 361,509 | | | | 53,499,717 | |
Energy Equipment & Services — 0.4% | | | | | | | | |
Schlumberger Ltd. | | | 1,092,777 | | | | 91,476,363 | |
Food & Staples Retailing — 1.3% | | | | | | | | |
Kroger Co. | | | 8,259,746 | | | | 280,500,974 | |
Food Products — 0.8% | | | | | | | | |
Mead Johnson Nutrition Co. | | | 1,031,200 | | | | 72,658,352 | |
Mondelez International, Inc., Class A | | | 2,356,493 | | | | 104,345,510 | |
| | | | | | | | |
| | | | | | | | 177,003,862 | |
Health Care Equipment & Supplies — 0.7% | | | | | | | | |
Becton Dickinson & Co. | | | 780,372 | | | | 138,352,152 | |
| | | | | | | | |
| Common Stocks | | Shares | | | Value | |
Health Care Providers & Services — 5.9% | | | | | | | | |
Aetna, Inc. | | | 3,045,839 | | | $ | 361,266,964 | |
Anthem, Inc. | | | 2,580,816 | | | | 397,806,978 | |
McKesson Corp. | | | 168,960 | | | | 23,510,784 | |
Quest Diagnostics, Inc. | | | 2,257,402 | | | | 207,500,392 | |
UnitedHealth Group, Inc. | | | 1,657,451 | | | | 268,672,807 | |
| | | | | | | | |
| | | | | | | | 1,258,757,925 | |
Hotels, Restaurants & Leisure — 0.5% | | | | | | | | |
Hilton Grand Vacations, Inc. (b) | | | 421,173 | | | | 12,353,001 | |
Hilton Worldwide Holdings, Inc. | | | 1,445,958 | | | | 83,258,262 | |
| | | | | | | | |
| | | | | | | | 95,611,263 | |
Household Products — 1.0% | | | | | | | | |
Procter & Gamble Co. | | | 2,448,326 | | | | 214,473,358 | |
Industrial Conglomerates — 4.2% | | | | | | | | |
3M Co. | | | 482,206 | | | | 84,299,253 | |
General Electric Co. | | | 17,534,285 | | | | 520,768,264 | |
Honeywell International, Inc. | | | 2,218,737 | | | | 262,520,962 | |
Koninklijke Philips NV | | | 851,684 | | | | 24,990,530 | |
| | | | | | | | |
| | | | | | | | 892,579,009 | |
Insurance — 6.1% | | | | | | | | |
Allstate Corp. | | | 1,368,750 | | | | 102,943,688 | |
American International Group, Inc. | | | 5,534,443 | | | | 355,643,307 | |
Marsh & McLennan Cos., Inc. | | | 1,483,080 | | | | 100,879,102 | |
MetLife, Inc. | | | 4,819,537 | | | | 262,231,008 | |
Prudential Financial, Inc. | | | 2,938,255 | | | | 308,839,983 | |
Travelers Cos., Inc. | | | 1,424,099 | | | | 167,730,380 | |
| | | | | | | | |
| | | | | | | | 1,298,267,468 | |
Media — 2.4% | | | | | | | | |
Comcast Corp., Class A | | | 5,377,737 | | | | 405,588,925 | |
Publicis Groupe SA | | | 1,603,560 | | | | 110,162,930 | |
| | | | | | | | |
| | | | | | | | 515,751,855 | |
Multi-Utilities — 2.5% | | | | | | | | |
CMS Energy Corp. | | | 2,851,440 | | | | 121,471,344 | |
Dominion Resources, Inc. | | | 2,745,860 | | | | 209,454,201 | |
DTE Energy Co. | | | 369,850 | | | | 36,482,004 | |
Public Service Enterprise Group, Inc. | | | 3,838,560 | | | | 169,856,280 | |
| | | | | | | | |
| | | | | | | | 537,263,829 | |
Multiline Retail — 1.0% | |
Dollar General Corp. | | | 2,852,130 | | | | 210,544,237 | |
Oil, Gas & Consumable Fuels — 10.9% | | | | | | | | |
Anadarko Petroleum Corp. | | | 954,670 | | | | 66,378,205 | |
Chevron Corp. | | | 2,821,735 | | | | 314,200,192 | |
ConocoPhillips | | | 2,144,544 | | | | 104,567,966 | |
Exxon Mobil Corp. | | | 3,567,387 | | | | 299,268,095 | |
Hess Corp. | | | 3,746,963 | | | | 203,010,455 | |
Marathon Oil Corp. | | | 3,953,170 | | | | 66,215,598 | |
Marathon Petroleum Corp. | | | 3,270,088 | | | | 157,127,728 | |
Occidental Petroleum Corp. | | | 5,307,359 | | | | 359,679,720 | |
Pioneer Natural Resources Co. | | | 288,270 | | | | 51,954,902 | |
Spectra Energy Corp. | | | 2,256,246 | | | | 93,972,646 | |
Suncor Energy, Inc. | | | 9,247,860 | | | | 287,053,574 | |
TOTAL SA—ADR | | | 6,192,226 | | | | 313,078,947 | |
| | | | | | | | |
| | | | | | | | 2,316,508,028 | |
Paper & Forest Products — 0.6% | |
International Paper Co. | | | 2,078,450 | | | | 117,640,270 | |
Personal Products — 0.9% | |
Unilever NV—NY Shares | | | 4,507,680 | | | | 183,237,192 | |
| | |
| ADR | | American Depositary Receipts |
See Notes to Financial Statements.
| | | | | | |
| | | | | | | |
| 12 | | SEMI-ANNUAL REPORT | | JANUARY 31, 2017 | | |
| | |
Schedule of Investments (continued) | | BlackRock Equity Dividend Fund |
| | | | | | | | |
| Common Stocks | | Shares | | | Value | |
Pharmaceuticals — 7.4% | |
AstraZeneca PLC | | | 5,642,064 | | | $ | 299,418,588 | |
Johnson & Johnson | | | 1,143,612 | | | | 129,514,059 | |
Merck & Co., Inc. | | | 7,111,470 | | | | 440,840,025 | |
Pfizer, Inc. | | | 22,215,007 | | | | 704,882,172 | |
| | | | | | | | |
| | | | | | | | 1,574,654,844 | |
Professional Services — 1.0% | |
Experian PLC | | | 6,037,565 | | | | 116,598,952 | |
Nielsen Holdings PLC | | | 2,556,958 | | | | 104,605,152 | |
| | | | | | | | |
| | | | | | | | 221,204,104 | |
Real Estate Investment Trusts (REITs) — 0.5% | |
Park Hotels & Resorts, Inc. | | | 761,598 | | | | 20,669,770 | |
Weyerhaeuser Co. | | | 2,575,752 | | | | 80,698,310 | |
| | | | | | | | |
| | | | | | | | 101,368,080 | |
Road & Rail — 0.6% | |
Union Pacific Corp. | | | 1,123,439 | | | | 119,736,129 | |
Semiconductors & Semiconductor Equipment — 2.6% | |
Intel Corp. | | | 7,021,825 | | | | 258,543,596 | |
QUALCOMM, Inc. | | | 2,214,007 | | | | 118,294,394 | |
Taiwan Semiconductor Manufacturing Co. Ltd. | | | 11,185,000 | | | | 66,649,855 | |
Taiwan Semiconductor Manufacturing Co. Ltd. — ADR | | | 3,186,400 | | | | 98,491,624 | |
| | | | | | | | |
| | | | | | | | 541,979,469 | |
Software — 4.3% | |
Microsoft Corp. | | | 7,335,163 | | | | 474,218,288 | |
Oracle Corp. | | | 11,118,350 | | | | 445,957,018 | |
| | | | | | | | |
| | | | | | | | 920,175,306 | |
Specialty Retail — 1.6% | |
Gap, Inc. | | | 5,495,910 | | | | 126,570,807 | |
Home Depot, Inc. | | | 1,602,334 | | | | 220,449,112 | |
| | | | | | | | |
| | | | | | | | 347,019,919 | |
| | | | | | | | |
| Common Stocks | | Shares | | | Value | |
Technology Hardware, Storage & Peripherals — 2.1% | |
Lenovo Group Ltd. | | | 138,004,000 | | | $ | 90,395,048 | |
Samsung Electronics Co. Ltd. | | | 202,780 | | | | 344,883,133 | |
| | | | | | | | |
| | | | | | | | 435,278,181 | |
Tobacco — 0.8% | |
Altria Group, Inc. | | | 1,231,649 | | | | 87,668,776 | |
Philip Morris International, Inc. | | | 815,800 | | | | 78,422,854 | |
| | | | | | | | |
| | | | | | | | 166,091,630 | |
Water Utilities — 0.2% | |
American Water Works Co., Inc. | | | 510,834 | | | | 37,515,649 | |
Wireless Telecommunication Services — 0.5% | |
SK Telecom Co. Ltd. | | | 534,490 | | | | 102,465,210 | |
Total Long-Term Investments
(Cost — $13,847,141,135) — 95.7% | | | | 20,258,346,702 | |
| | | | | | | | |
| | | | | | | | | |
| | |
| Short-Term Securities | | | | | | |
BlackRock Liquidity Funds, T-Fund, Institutional Class, 0.40% (c)(d) | | | 858,085,691 | | | | 858,085,691 | |
SL Liquidity Series, LLC, Money Market Series, 0.94% (c)(d)(e) | | | 249,402 | | | | 249,452 | |
Total Short-Term Securities
(Cost — $858,335,095) — 4.1% | | | | 858,335,143 | |
| Total Investments (Cost — $14,705,476,230) — 99.8% | | | $ | 21,116,681,845 | |
| Other Assets Less Liabilities — 0.2% | | | | | | | 41,163,123 | |
| | | | | | | | |
Net Assets — 100.0% | | | | | | $ | 21,157,844,968 | |
| | | | | | | | |
|
| Notes to Schedule of Investments |
| (a) | | Security, or a portion of security, is on loan. |
| (b) | | Non-income producing security. |
| (c) | | During the six months ended January 31, 2017, investments in issuers considered to be affiliates of the Fund for purposes of Section 2(a)(3) of the Investment Company Act of 1940, as amended, were as follows: |
| | | | | | | | | | | | | | | | | | | | | | | | | | | | |
| Affiliate | | Shares Held at July 31,
2016 | | | Net
Activity | | | Shares Held
at January 31,
2017 | | | Value at
January 31,
2017 | | | Income | | | Net
Realized
Gain (Loss)2 | | | Change in
Unrealized
Appreciation | |
BlackRock Liquidity Funds, T-Fund, Institutional Class | | | — | | | | 858,085,691 | | | | 858,085,691 | | | $ | 858,085,691 | | | $ | 897,152 | | | $ | 4,153 | | | | — | |
BlackRock Liquidity Funds, TempFund, Institutional Class* | | | 738,056,559 | | | | (738,056,559 | ) | | | — | | | | — | | | | 248,941 | | | | — | | | | — | |
SL Liquidity Series, LLC, Money Market Series | | | — | | | | 249,402 | | | | 249,402 | | | | 249,452 | | | | 1,224,603 | 1 | | | (20,521 | ) | | $ | 48 | |
Total | | | | | | | | | | | | | | $ | 858,335,143 | | | $ | 2,370,696 | | | $ | (16,368 | ) | | $ | 48 | |
| | | | | | | | | | | | | | | | |
* No longer held by the Fund as of period end. | |
1 Represents securities lending income earned from the reinvestment of cash collateral from loaned securities, net of fees and collateral investment expenses, and other payments to and from borrowers of securities. | |
2 Includes net capital gain distributions. | |
| (d) | | Current yield as of period end. |
| (e) | | Security was purchased with the cash collateral from loaned securities. |
| • | | For Fund compliance purposes, the Fund’s sector classifications refer to one or more of the sector sub-classifications used by one or more widely recognized market indexes or rating group indexes, and/or as defined by the investment adviser. These definitions may not apply for purposes of this report, which may combine such sector sub-classifications for reporting ease. |
See Notes to Financial Statements.
| | | | | | |
| | | | | | | |
| | SEMI-ANNUAL REPORT | | JANUARY 31, 2017 | | 13 |
| | |
Schedule of Investments (concluded) | | BlackRock Equity Dividend Fund |
|
| Fair Value Hierarchy as of Period End |
Various inputs are used in determining the fair value of investments. For information about the Fund’s policy regarding valuation of investments, refer to the Notes to Financial Statements.
The following tables summarize the Fund’s investments categorized in the disclosure hierarchy:
| | | | | | | | | | | | | | | | |
| | | Level 1 | | | Level 2 | | | Level 3 | | | Total | |
Assets: | | | | | | | | | | | | | | | | |
| Investments: | | | | | | | | | | | | | | | | |
| Common Stocks: | | | | | | | | | | | | | | | | |
Aerospace & Defense | | $ | 673,028,103 | | | | — | | | | — | | | $ | 673,028,103 | |
Air Freight & Logistics | | | 175,264,089 | | | | — | | | | — | | | | 175,264,089 | |
Banks | | | 3,552,798,616 | | | | — | | | | — | | | | 3,552,798,616 | |
Beverages | | | 220,784,381 | | | $ | 203,418,639 | | | | — | | | | 424,203,020 | |
Capital Markets | | | 731,881,158 | | | | — | | | | — | | | | 731,881,158 | |
Chemicals | | | 628,737,609 | | | | — | | | | — | | | | 628,737,609 | |
Communications Equipment | | | 171,806,005 | | | | — | | | | — | | | | 171,806,005 | |
Diversified Financial Services | | | 167,217,897 | | | | — | | | | — | | | | 167,217,897 | |
Diversified Telecommunication Services | | | 329,600,446 | | | | — | | | | — | | | | 329,600,446 | |
Electric Utilities | | | 454,853,736 | | | | — | | | | — | | | | 454,853,736 | |
Electrical Equipment | | | 53,499,717 | | | | — | | | | — | | | | 53,499,717 | |
Energy Equipment & Services | | | 91,476,363 | | | | — | | | | — | | | | 91,476,363 | |
Food & Staples Retailing | | | 280,500,974 | | | | — | | | | — | | | | 280,500,974 | |
Food Products | | | 177,003,862 | | | | — | | | | — | | | | 177,003,862 | |
Health Care Equipment & Supplies | | | 138,352,152 | | | | — | | | | — | | | | 138,352,152 | |
Health Care Providers & Services | | | 1,258,757,925 | | | | — | | | | — | | | | 1,258,757,925 | |
Hotels, Restaurants & Leisure | | | 95,611,263 | | | | — | | | | — | | | | 95,611,263 | |
Household Products | | | 214,473,358 | | | | — | | | | — | | | | 214,473,358 | |
Industrial Conglomerates | | | 867,588,479 | | | | 24,990,530 | | | | — | | | | 892,579,009 | |
Insurance | | | 1,298,267,468 | | | | — | | | | — | | | | 1,298,267,468 | |
Media | | | 405,588,925 | | | | 110,162,930 | | | | — | | | | 515,751,855 | |
Multi-Utilities | | | 537,263,829 | | | | — | | | | — | | | | 537,263,829 | |
Multiline Retail | | | 210,544,237 | | | | — | | | | — | | | | 210,544,237 | |
Oil, Gas & Consumable Fuels | | | 2,316,508,028 | | | | — | | | | — | | | | 2,316,508,028 | |
Paper & Forest Products | | | 117,640,270 | | | | — | | | | — | | | | 117,640,270 | |
Personal Products | | | 183,237,192 | | | | — | | | | — | | | | 183,237,192 | |
Pharmaceuticals | | | 1,275,236,256 | | | | 299,418,588 | | | | — | | | | 1,574,654,844 | |
Professional Services | | | 104,605,152 | | | | 116,598,952 | | | | — | | | | 221,204,104 | |
Real Estate Investment Trusts (REITs) | | | 101,368,080 | | | | — | | | | — | | | | 101,368,080 | |
Road & Rail | | | 119,736,129 | | | | — | | | | — | | | | 119,736,129 | |
Semiconductors & Semiconductor Equipment | | | 475,329,614 | | | | 66,649,855 | | | | — | | | | 541,979,469 | |
Software | | | 920,175,306 | | | | — | | | | — | | | | 920,175,306 | |
Specialty Retail | | | 347,019,919 | | | | — | | | | — | | | | 347,019,919 | |
Technology Hardware, Storage & Peripherals | | | — | | | | 435,278,181 | | | | — | | | | 435,278,181 | |
Tobacco | | | 166,091,630 | | | | — | | | | — | | | | 166,091,630 | |
Water Utilities | | | 37,515,649 | | | | — | | | | — | | | | 37,515,649 | |
Wireless Telecommunication Services | | | — | | | | 102,465,210 | | | | — | | | | 102,465,210 | |
Short-Term Securities | | | 858,085,691 | | | | — | | | | — | | | | 858,085,691 | |
| | | | |
Subtotal | | $ | 19,757,449,508 | | | $ | 1,358,982,885 | | | | — | | | $ | 21,116,432,393 | |
| | | | |
Investments valued at NAV1 | | | | | | | | | | | | | | | 249,452 | |
| | | | | | | | | | | | | | | | |
Total Investments | | | | | | | | | | | | | | $ | 21,116,681,845 | |
| | | | | | | | | | | | | | | | |
1 As of January 31, 2017, certain investments of the Fund were fair valued using NAV per share as no quoted market value is available and therefore have been excluded from the fair value hierarchy. | |
During the six months ended January 31, 2017, there were no transfers between levels.
See Notes to Financial Statements.
| | | | | | |
| | | | | | | |
| 14 | | SEMI-ANNUAL REPORT | | JANUARY 31, 2017 | | |
| | |
Schedule of Investments January 31, 2017 (Unaudited) | | BlackRock Natural Resources Trust (Percentages shown are based on Net Assets) |
| | | | | | | | |
| Common Stocks | | Shares | | | Value | |
Chemicals — 2.6% | |
Dow Chemical Co. | | | 61,900 | | | $ | 3,691,097 | |
E.I. du Pont de Nemours & Co. | | | 38,700 | | | | 2,921,850 | |
Praxair, Inc. | | | 20,200 | | | | 2,392,488 | |
| | | | | | | | |
| | | | | 9,005,435 | |
Energy Equipment & Services — 17.2% | |
Baker Hughes, Inc. | | | 96,080 | | | | 6,060,726 | |
Dril-Quip, Inc. (a)(b) | | | 50,120 | | | | 3,117,464 | |
Halliburton Co. | | | 241,000 | | | | 13,633,370 | |
Helmerich & Payne, Inc. | | | 55,280 | | | | 3,933,725 | |
National Oilwell Varco, Inc. | | | 55,401 | | | | 2,094,712 | |
Patterson-UTI Energy, Inc. | | | 133,518 | | | | 3,743,845 | |
Rowan Cos. PLC, Class A (a) | | | 71,900 | | | | 1,288,448 | |
Schlumberger Ltd. | | | 224,486 | | | | 18,791,723 | |
Seahawk Drilling, Inc. | | | 4,713 | | | | — | |
TechnipFMC PLC (a) | | | 174,100 | | | | 5,853,242 | |
Weatherford International PLC (a)(b) | | | 92,452 | | | | 481,675 | |
| | | | | | | | |
| | | | | 58,998,930 | |
Metals & Mining — 6.7% | |
Agnico Eagle Mines Ltd. | | | 17,500 | | | | 834,755 | |
BHP Billiton Ltd. | | | 141,976 | | | | 2,880,442 | |
Eldorado Gold Corp. (a) | | | 444,600 | | | | 1,571,689 | |
Franco-Nevada Corp. | | | 68,600 | | | | 4,462,097 | |
Goldcorp, Inc. | | | 181,182 | | | | 2,929,544 | |
HudBay Minerals, Inc. | | | 153,600 | | | | 1,202,831 | |
Newcrest Mining Ltd. | | | 156,875 | | | | 2,572,620 | |
Newmont Mining Corp. | | | 34,200 | | | | 1,240,776 | |
Southern Copper Corp. | | | 140,454 | | | | 5,387,816 | |
| | | | | | | | |
| | | | | 23,082,570 | |
Oil & Gas Exploration & Production — 1.0% | |
Carrizo Oil & Gas, Inc. (a)(b) | | | 94,961 | | | | 3,357,821 | |
Oil, Gas & Consumable Fuels — 70.5% | |
Anadarko Petroleum Corp. | | | 181,300 | | | | 12,605,789 | |
Antero Resources Corp. (a)(b) | | | 22,390 | | | | 546,540 | |
Apache Corp. | | | 109,492 | | | | 6,549,811 | |
Birchcliff Energy Ltd. (a) | | | 218,700 | | | | 1,347,915 | |
Cabot Oil & Gas Corp. | | | 331,401 | | | | 7,118,493 | |
Canadian Natural Resources Ltd. | | | 258,300 | | | | 7,809,047 | |
Cenovus Energy, Inc. | | | 135,122 | | | | 1,844,201 | |
Chevron Corp. | | | 138,991 | | | | 15,476,648 | |
Cimarex Energy Co. | | | 56,561 | | | | 7,647,613 | |
CNOOC Ltd.—ADR | | | 12,900 | | | | 1,623,207 | |
Concho Resources, Inc. (a)(b) | | | 25,000 | | | | 3,486,000 | |
ConocoPhillips | | | 72,775 | | | | 3,548,509 | |
CONSOL Energy, Inc. (b) | | | 66,500 | | | | 1,126,510 | |
Crew Energy, Inc. (a) | | | 268,700 | | | | 1,195,599 | |
Devon Energy Corp. | | | 262,414 | | | | 11,950,334 | |
Diamondback Energy, Inc. (a) | | | 20,900 | | | | 2,198,053 | |
Encana Corp. | | | 94,322 | | | | 1,203,987 | |
EOG Resources, Inc. | | | 286,980 | | | | 29,151,428 | |
EQT Corp. | | | 111,400 | | | | 6,754,182 | |
| | | | | | | | |
| Common Stocks | | Shares | | | Value | |
Exxon Mobil Corp. | | | 203,490 | | | $ | 17,070,776 | |
Hess Corp. | | | 137,800 | | | | 7,466,004 | |
Husky Energy, Inc. (a) | | | 85,869 | | | | 1,107,966 | |
Kosmos Energy Ltd. (a)(b) | | | 156,300 | | | | 1,022,202 | |
Marathon Oil Corp. | | | 221,500 | | | | 3,710,125 | |
Marathon Petroleum Corp. | | | 176,530 | | | | 8,482,266 | |
Murphy Oil Corp. | | | 56,700 | | | | 1,639,197 | |
Murphy USA, Inc. (a) | | | 22,635 | | | | 1,441,849 | |
Newfield Exploration Co. (a) | | | 85,357 | | | | 3,421,109 | |
Noble Energy, Inc. | | | 168,901 | | | | 6,715,504 | |
Occidental Petroleum Corp. | | | 163,600 | | | | 11,087,172 | |
Phillips 66 | | | 55,017 | | | | 4,490,488 | |
Pioneer Natural Resources Co. | | | 76,798 | | | | 13,841,303 | |
PrairieSky Royalty Ltd. | | | 5,166 | | | | 121,086 | |
Range Resources Corp. | | | 144,900 | | | | 4,686,066 | |
Southwestern Energy Co. (a) | | | 43,400 | | | | 391,034 | |
Suncor Energy, Inc. | | | 428,167 | | | | 13,280,169 | |
Surge Energy, Inc. | | | 263,300 | | | | 570,610 | |
TOTAL SA — ADR | | | 154,772 | | | | 7,825,272 | |
Uranium Energy Corp. (a) | | | 261,724 | | | | 421,376 | |
Valero Energy Corp. | | | 112,439 | | | | 7,393,989 | |
Whiting Petroleum Corp. (a) | | | 105,900 | | | | 1,174,431 | |
Williams Cos., Inc. | | | 39,500 | | | | 1,139,180 | |
| | | | | | | | |
| | | | | 241,683,040 | |
Total Common Stocks— 98.0% | | | | 336,127,796 | |
| | | | | | | | |
| | | | | | | | | |
Investment Companies — 0.3% | | | | | | | | |
Sprott Physical Silver Trust (a) | | | 187,400 | | | | 1,255,580 | |
Total Long-Term Investments
(Cost — $178,547,994) — 98.3% | | | | 337,383,376 | |
| | | | | | | | |
| | | | | | | | | |
| | |
| Short-Term Securities | | | | | | |
BlackRock Liquidity Funds, T-Fund, Institutional Class, 0.40% (c)(d) | | | 5,819,014 | | | | 5,819,014 | |
SL Liquidity Series, LLC, Money Market Series, 0.94% (c)(d)(e) | | | 9,882,838 | | | | 9,884,814 | |
Total Short-Term Securities
(Cost — $15,702,582) — 4.6% | | | | 15,703,828 | |
| Total Investments (Cost — $194,250,576) — 102.9% | | | | 353,087,204 | |
Liabilities in Excess of Other Assets — (2.9)% | | | | (10,002,747 | ) |
| | | | | | | | |
Net Assets — 100.0% | | | $ | 343,084,457 | |
| | | | | | | | |
|
| Notes to Schedule of Investments |
| (a) | | Non-income producing security. |
| (b) | | Security, or a portion of security, is on loan. |
See Notes to Financial Statements.
| | | | | | |
| | | | | | | |
| | SEMI-ANNUAL REPORT | | JANUARY 31, 2017 | | 15 |
| | |
Schedule of Investments (concluded) | | BlackRock Natural Resources Trust |
| (c) | | During the six months ended January 31, 2017, investments in issuers considered to be affiliates of the Fund for purposes of Section 2(a)(3) of the Investment Company Act of 1940, as amended, were as follows: |
| | | | | | | | | | | | | | | | | | | | | | | | | | | | |
| Affiliate | | Shares Held
at July 31, 2016 | | | Net
Activity | | | Shares Held
at January 31,
2017 | | | Value at
January 31,
2017 | | | Income | | | Net Realized Gain (Loss)2 | | | Change in
Unrealized
Appreciation | |
BlackRock Liquidity Funds, T-Fund, Institutional Class | | | — | | | | 5,819,014 | | | | 5,819,014 | | | $ | 5,819,014 | | | $ | 12,398 | | | $ | 74 | | | | — | |
BlackRock Liquidity Funds, TempFund, Institutional Class* | | | 8,049,300 | | | | (8,049,300 | ) | | | — | | | | — | | | | 2,440 | | | | — | | | | — | |
SL Liquidity Series, LLC, Money Market Series | | $ | 5,900,982 | | | | 3,981,856 | | | | 9,882,838 | | | | 9,884,814 | | | | 10,034 | 1 | | | (695 | ) | | $ | 1,246 | |
Total | | | $ | 15,703,828 | | | $ | 24,872 | | | $ | (621 | ) | | $ | 1,246 | |
| | | | | | | | | | | | | | | | | | | | | | | | | | | | |
* No longer held by the Fund as of period end. | |
1 Represents securities lending income earned from the reinvestment of cash collateral from loaned securities, net of fees and collateral investment expenses, and other payments to and from borrowers of securities. | |
2 Includes net capital gain distributions. | |
| (d) | | Current yield as of period end. |
| (e) | | Security was purchased with the cash collateral from loaned securities. |
| • | | For Fund compliance purposes, the Fund’s industry classifications refer to one or more of the industry sub-classifications used by one or more widely recognized market indexes or rating group indexes, and/or as defined by the investment adviser. These definitions may not apply for purposes of this report, which may combine such industry sub-classifications for reporting ease. |
|
| Fair Value Hierarchy as of Period End |
Various inputs are used in determining the fair value of investments. For information about the Fund’s policy regarding valuation of investments, refer to the Notes to Financial Statements.
The following tables summarize the Fund’s investments categorized in the disclosure hierarchy:
| | | | | | | | | | | | | | | | |
| | | Level 1 | | | Level 2 | | | Level 3 | | | Total | |
Assets: | |
| Investments: | |
| Common Stocks: | |
Chemicals | | $ | 9,005,435 | | | | — | | | | — | | | $ | 9,005,435 | |
Energy Equipment & Services | | | 58,998,930 | | | | — | | | | — | | | | 58,998,930 | |
Metals & Mining | | | 17,629,508 | | | $ | 5,453,062 | | | | — | | | | 23,082,570 | |
Oil & Gas Exploration & Production | | | 3,357,821 | | | | — | | | | — | | | | 3,357,821 | |
Oil, Gas & Consumable Fuels | | | 241,261,664 | | | | 421,376 | | | | — | | | | 241,683,040 | |
Investment Companies | | | 1,255,580 | | | | — | | | | — | | | | 1,255,580 | |
Short-Term Securities | | | 5,819,014 | | | | — | | | | — | | | | 5,819,014 | |
| | | | |
Subtotal | | $ | 337,327,952 | | | $ | 5,874,438 | | | | — | | | $ | 343,202,390 | |
| | | | |
Investments valued at NAV1 | | | | | | | | | | | | | | | 9,884,814 | |
| | | | | | | | | | | | | | | | |
Total Investments | | | | | | | | | | | | | | $ | 353,087,204 | |
| | | | | | | | | | | | | | | | |
1 As of January 31, 2017, certain investments of the Fund were fair valued using NAV per share as no quoted market value is available and therefore have been excluded from the fair value hierarchy. | |
During the six months ended January 31, 2017, there were no transfers between levels.
See Notes to Financial Statements.
| | | | | | |
| | | | | | | |
| 16 | | SEMI-ANNUAL REPORT | | JANUARY 31, 2017 | | |
| | |
| Statements of Assets and Liabilities | | |
| | | | | | | | |
| January 31, 2017 (Unaudited) | | BlackRock Equity Dividend Fund | | | BlackRock
Natural
Resources
Trust | |
| | | | | | | | |
| Assets | | | | | | | | |
Investments at value — unaffiliated1,2 | | $ | 20,258,346,702 | | | $ | 337,383,376 | |
Investments at value — affiliated3 | | | 858,335,143 | | | | 15,703,828 | |
Foreign currency at value4 | | | 2,794,243 | | | | 181 | |
| Receivables: | |
Investments sold | | | 143,873,660 | | | | — | |
Securities lending income — affiliated | | | 57 | | | | 2,100 | |
Capital shares sold | | | 32,583,923 | | | | 1,027,620 | |
Dividends — affiliated | | | 261,767 | | | | 3,578 | |
Dividends — unaffiliated | | | 17,435,512 | | | | 65,884 | |
Other | | | 82,263 | | | | — | |
Deferred offering costs | | | 11,572 | | | | — | |
Prepaid expenses | | | 287,914 | | | | 39,725 | |
| | | | | | | | |
Total assets | | | 21,314,012,756 | | | | 354,226,292 | |
| | | | | | | | |
| | | | | | | | |
| Liabilities | | | | | | | | |
Cash collateral on securities loaned at value | | | 269,925 | | | | 9,884,263 | |
| Payables: | |
Investments purchased | | | 75,167,280 | | | | — | |
Capital shares redeemed | | | 59,467,218 | | | | 716,396 | |
Investment advisory fees | | | 10,044,837 | | | | 179,855 | |
Offering costs | | | 42,338 | | | | — | |
Officer’s and Trustees’ fees | | | 54,784 | | | | 6,125 | |
Other accrued expenses | | | 6,881,778 | | | | 266,104 | |
Other affiliates | | | 73,634 | | | | 844 | |
Service and distribution fees | | | 4,165,994 | | | | 88,248 | |
| | | | | | | | |
Total liabilities | | | 156,167,788 | | | | 11,141,835 | |
| | | | | | | | |
Net Assets | | $ | 21,157,844,968 | | | $ | 343,084,457 | |
| | | | | | | | |
| | | | | | | | |
| Net Assets Consist of | | | | | | | | |
Paid-in capital | | $ | 14,007,331,157 | | | $ | 181,088,550 | |
Distributions in excess of net investment income | | | (2,275,872 | ) | | | (2,271,496 | ) |
Accumulated net realized gain | | | 741,270,894 | | | | 5,430,765 | |
Net unrealized appreciation (depreciation) | | | 6,411,518,789 | | | | 158,836,638 | |
| | | | | | | | |
Net Assets | | $ | 21,157,844,968 | | | $ | 343,084,457 | |
| | | | | | | | |
1 Investments at cost — unaffiliated | | $ | 13,847,141,135 | | | $ | 178,547,994 | |
| | | | | | | | |
2 Securities loaned at value | | $ | 266,208 | | | $ | 9,560,780 | |
| | | | | | | | |
3 Investments at cost — affiliated | | $ | 858,335,095 | | | $ | 15,702,582 | |
| | | | | | | | |
4 Foreign currency at cost | | $ | 2,793,776 | | | $ | 182 | |
| | | | | | | | |
| | | | | | |
| See Notes to Financial Statements. | | | | |
| | | | | | | |
| | SEMI-ANNUAL REPORT | | JANUARY 31, 2017 | | 17 |
| | |
| Statements of Assets and Liabilities (concluded) | | |
| | | | | | | | |
| January 31, 2017 (Unaudited) | | BlackRock
Equity
Dividend Fund | | | BlackRock
Natural
Resources
Trust | |
| | | | | | | | |
| Net Assets Value | |
| Institutional: | |
Net assets | | $ | 11,402,596,378 | | | $ | 83,577,279 | |
| | | | |
Shares outstanding5 | | | 505,281,503 | | | | 1,778,687 | |
| | | | |
Net asset value | | $ | 22.57 | | | $ | 46.99 | |
| | | | |
| Service: | |
Net assets | | $ | 64,917,310 | | | | — | |
| | | | |
Shares outstanding5 | | | 2,885,624 | | | | — | |
| | | | |
Net asset value | | $ | 22.50 | | | | — | |
| | | | |
| Investor A: | |
Net assets | | $ | 5,841,521,403 | | | $ | 212,202,575 | |
| | | | |
Shares outstanding5 | | | 259,530,287 | | | | 4,665,156 | |
| | | | |
Net asset value | | $ | 22.51 | | | $ | 45.49 | |
| | | | |
| Investor B: | |
Net assets | | $ | 4,846,100 | | | $ | 235,752 | |
| | | | |
Shares outstanding5 | | | 212,337 | | | | 5,936 | |
| | | | |
Net asset value | | $ | 22.82 | | | $ | 39.72 | |
| | | | |
| Investor C: | |
Net assets | | $ | 2,919,821,790 | | | $ | 47,068,851 | |
| | | | |
Shares outstanding5 | | | 133,898,068 | | | | 1,206,610 | |
| | | | |
Net asset value | | $ | 21.81 | | | $ | 39.01 | |
| | | | |
| Investor C1: | |
Net assets | | $ | 6,509,729 | | | | — | |
| | | | |
Shares outstanding5 | | | 298,990 | | | | — | |
| | | | |
Net asset value | | $ | 21.77 | | | | — | |
| | | | |
| Class K: | |
Net assets | | $ | 70,653,916 | | | | — | |
| | | | |
Shares outstanding5 | | | 3,131,522 | | | | — | |
| | | | |
Net asset value | | $ | 22.56 | | | | — | |
| | | | |
| Class R: | |
Net assets | | $ | 846,978,342 | | | | — | |
| | | | |
Shares outstanding5 | | | 37,390,808 | | | | — | |
| | | | |
Net asset value | | $ | 22.65 | | | | — | |
| | | | |
5 Unlimited number of shares authorized, $0.10 par value. | |
| | | | | | |
| See Notes to Financial Statements. | | | | |
| | | | | | | |
| 18 | | SEMI-ANNUAL REPORT | | JANUARY 31, 2017 | | |
| | | | | | | | |
| Six Months Ended January 31, 2017 (Unaudited) | | BlackRock Equity Dividend Fund | | | BlackRock
Natural
Resources Trust | |
| | | | | | | | |
| Investment Income | |
Dividends — unaffiliated | | $ | 279,600,135 | | | $ | 2,749,144 | |
Dividends — affiliated | | | 1,146,093 | | | | 14,838 | |
Securities lending — affiliated — net | | | 1,224,603 | | | | 10,034 | |
Foreign taxes withheld | | | (4,360,623 | ) | | | (84,645 | ) |
| | | | |
Total investment income | | | 277,610,208 | | | | 2,689,371 | |
| | | | |
| | | | | | | | |
| Expenses | |
Investment advisory | | | 59,152,171 | | | | 1,012,705 | |
Service and distribution — class specific | | | 24,622,979 | | | | 506,584 | |
Transfer agent — class specific | | | 11,148,608 | | | | 245,041 | |
Accounting services | | | 1,140,609 | | | | 30,322 | |
Custodian | | | 623,232 | | | | 11,493 | |
Professional | | | 567,876 | | | | 58,193 | |
Registration | | | 203,466 | | | | 42,358 | |
Officer and Trustees | | | 172,869 | | | | 11,290 | |
Printing | | | 168,793 | | | | 13,899 | |
Offering | | | 38,018 | | | | — | |
Miscellaneous | | | 156,079 | | | | 12,710 | |
| | | | | | | | |
Total expenses | | | 97,994,700 | | | | 1,944,595 | |
Less fees waived by the Manager | | | (241,201 | ) | | | (3,024 | ) |
| | | | |
Total expenses after fees waived | | | 97,753,499 | | | | 1,941,571 | |
| | | | |
Net investment income | | | 179,856,709 | | | | 747,800 | |
| | | | |
| | | | | | | | |
| Realized and Unrealized Gain (Loss) | |
| Net realized gain (loss) from: | |
Investments — unaffiliated | | | 1,289,759,758 | | | | 6,852,814 | |
Investments — affiliated | | | (20,521 | ) | | | (695 | ) |
Capital gain distributions from investment companies — affiliated | | | 4,153 | | | | 74 | |
Foreign currency transactions | | | 11,195 | | | | (1,392 | ) |
| | | | |
| | | 1,289,754,585 | | | | 6,850,801 | |
| | | | |
| Net change in unrealized appreciation (depreciation) on: | |
Investments — unaffiliated | | | 210,831,661 | | | | 21,065,167 | |
Investments — affiliated | | | 48 | | | | 1,246 | |
Foreign currency translations | | | 420,462 | | | | (23 | ) |
| | | | |
| | | 211,252,171 | | | | 21,066,390 | |
| | | | |
Net realized and unrealized gain | | | 1,501,006,756 | | | | 27,917,191 | |
| | | | |
Net Increase in Net Assets Resulting from Operations | | $ | 1,680,863,465 | | | $ | 28,664,991 | |
| | | | |
| | | | | | |
| See Notes to Financial Statements. | | | | |
| | | | | | | |
| | SEMI-ANNUAL REPORT | | JANUARY 31, 2017 | | 19 |
| | |
| Statements of Changes in Net Assets | | |
| | | | | | | | |
| | | BlackRock Equity Dividend Fund | |
| Increase (Decrease) in Net Assets: | | Six Months Ended
January 31,
2017
(Unaudited) | | | Year Ended July 31,
2016 | |
| | | | | | | | |
| Operations | |
Net investment income | | $ | 179,856,709 | | | $ | 388,787,924 | |
Net realized gain | | | 1,289,754,585 | | | | 1,926,705,912 | |
Net change in unrealized appreciation (depreciation) | | | 211,252,171 | | | | (1,169,260,416 | ) |
| | | | |
Net increase in net assets resulting from operations | | | 1,680,863,465 | | | | 1,146,233,420 | |
| | | | |
| | | | | | | | |
| Distributions to Shareholders1 | |
| From net investment income: | |
Institutional | | | (115,620,705 | ) | | | (233,498,259 | ) |
Service | | | (633,950 | ) | | | (1,433,295 | ) |
Investor A | | | (53,513,822 | ) | | | (106,229,120 | ) |
Investor B | | | (31,399 | ) | | | (119,647 | ) |
Investor C | | | (16,368,269 | ) | | | (32,648,938 | ) |
Investor C1 | | | (43,671 | ) | | | (86,900 | ) |
Class K | | | (490,151 | ) | | | (148,003 | ) |
Class R | | | (6,301,242 | ) | | | (12,433,373 | ) |
| From net realized gain: | |
Institutional | | | (672,066,433 | ) | | | (1,683,334,063 | ) |
Service | | | (3,819,685 | ) | | | (12,599,222 | ) |
Investor A | | | (344,308,949 | ) | | | (884,371,335 | ) |
Investor B | | | (364,601 | ) | | | (2,344,995 | ) |
Investor C | | | (178,364,937 | ) | | | (448,362,765 | ) |
Investor C1 | | | (401,877 | ) | | | (1,000,980 | ) |
Class K | | | (3,265,282 | ) | | | — | |
Class R | | | (49,822,736 | ) | | | (126,579,288 | ) |
| | | | |
Decrease in net assets resulting from distributions to shareholders | | | (1,445,417,709 | ) | | | (3,545,190,183 | ) |
| | | | |
| | | | | | | | |
| Capital Share Transactions | |
Net decrease in net assets derived from capital share transactions | | | (681,418,900 | ) | | | (943,744,197 | ) |
| | | | |
| | | | | | | | |
| Net Assets | |
Total decrease in net assets | | | (445,973,144 | ) | | | (3,342,700,960 | ) |
Beginning of period | | | 21,603,818,112 | | | | 24,946,519,072 | |
| | | | | | | | |
End of period | | $ | 21,157,844,968 | | | $ | 21,603,818,112 | |
| | | | |
Undistributed (distributions in excess of) net investment income, end of period | | $ | (2,275,872 | ) | | $ | 10,870,628 | |
| | | | |
1 Distributions for annual periods determined in accordance with federal income tax regulations. | |
| | | | | | |
| See Notes to Financial Statements. | | | | |
| | | | | | | |
| 20 | | SEMI-ANNUAL REPORT | | JANUARY 31, 2017 | | |
| | |
| Statements of Changes in Net Assets | | |
| | | | | | | | |
| | | BlackRock Natural Resources Trust | |
| Increase (Decrease) in Net Assets: | | Six Months Ended
January 31,
2017
(Unaudited) | | | Year Ended
July 31,
2016 | |
| | | | | | | | |
| Operations | |
Net investment income | | $ | 747,800 | | | $ | 2,351,764 | |
Net realized gain (loss) | | | 6,850,801 | | | | (766,291 | ) |
Net change in unrealized appreciation (depreciation) | | | 21,066,390 | | | | (2,465,565 | ) |
| | | | |
Net increase (decrease) in net assets resulting from operations | | | 28,664,991 | | | | (880,092 | ) |
| | | | |
| | | | | | | | |
| Distributions to Shareholders1 | |
| From net investment income: | |
Institutional | | | (731,574 | ) | | | (570,693 | ) |
Investor A | | | (1,411,416 | ) | | | (1,300,435 | ) |
Investor C | | | (27,010 | ) | | | — | |
| From net realized gain: | |
Institutional | | | — | | | | (3,729,060 | ) |
Investor A | | | — | | | | (11,614,900 | ) |
Investor B | | | — | | | | (83,426 | ) |
Investor C | | | — | | | | (3,644,530 | ) |
| | | | |
Decrease in net assets resulting from distributions to shareholders | | | (2,170,000 | ) | | | (20,943,044 | ) |
| | | | |
| | | | | | | | |
| Capital Share Transactions | |
Net increase (decrease) in net assets derived from capital share transactions | | | 1,407,776 | | | | (1,168,875 | ) |
| | | | |
| | | | | | | | |
| Net Assets | |
Total increase (decrease) in net assets | | | 27,902,767 | | | | (22,992,011 | ) |
Beginning of period | | | 315,181,690 | | | | 338,173,701 | |
| | | | |
End of period | | $ | 343,084,457 | | | $ | 315,181,690 | |
| | | | |
Distributions in excess of net investment income, end of period | | $ | (2,271,496 | ) | | $ | (849,296 | ) |
| | | | |
| | 1 | | Distributions for annual periods determined in accordance with federal income tax regulations. |
| | | | | | |
| See Notes to Financial Statements. | | | | |
| | | | | | | |
| | SEMI-ANNUAL REPORT | | JANUARY 31, 2017 | | 21 |
| | |
| Financial Highlights | | BlackRock Equity Dividend Fund |
| | | | | | | | | | | | | | | | | | | | | | | | |
| | | Institutional | |
| | | Six Months Ended
January 31, 2017
(Unaudited) | | | Year Ended July 31, | |
| | | | 2016 | | | 2015 | | | 2014 | | | 2013 | | | 2012 | |
| | | | | | | | | | | | | | | | | | | | | | | | |
| Per Share Operating Performance | |
Net asset value, beginning of period | | $ | 22.33 | | | $ | 24.94 | | | $ | 24.71 | | | $ | 22.64 | | | $ | 19.52 | | | $ | 18.17 | |
| | | | |
Net investment income1 | | | 0.22 | | | | 0.44 | | | | 0.47 | | | | 0.48 | | | | 0.48 | | | | 0.43 | |
Net realized and unrealized gain | | | 1.61 | | | | 0.79 | | | | 1.34 | | | | 2.10 | | | | 3.12 | | | | 1.34 | |
| | | | |
Net increase from investment operations | | | 1.83 | | | | 1.23 | | | | 1.81 | | | | 2.58 | | | | 3.60 | | | | 1.77 | |
| | | | |
| Distributions:2 | | | | | | | | | | | | | | | | | | | | | | | | |
From net investment income | | | (0.23 | ) | | | (0.45 | ) | | | (0.48 | ) | | | (0.49 | ) | | | (0.47 | ) | | | (0.41 | ) |
From net realized gain | | | (1.36 | ) | | | (3.39 | ) | | | (1.10 | ) | | | (0.02 | ) | | | (0.01 | ) | | | (0.01 | ) |
| | | | |
Total distributions | | | (1.59 | ) | | | (3.84 | ) | | | (1.58 | ) | | | (0.51 | ) | | | (0.48 | ) | | | (0.42 | ) |
| | | | |
Net asset value, end of period | | $ | 22.57 | | | $ | 22.33 | | | $ | 24.94 | | | $ | 24.71 | | | $ | 22.64 | | | $ | 19.52 | |
| | | | |
| | | | | | | | | | | | | | | | | | | | | | | | |
| Total Return3 | |
Based on net asset value | | | 8.37% | 4 | | | 6.29% | | | | 7.55% | | | | 11.49% | | | | 18.63% | | | | 9.90% | |
| | | | |
| | | | | | | | | | | | | | | | | | | | | | | | |
| Ratios to Average Net Assets | |
Total expenses | | | 0.69% | 5,6 | | | 0.71% | 6 | | | 0.70% | | | | 0.70% | | | | 0.73% | | | | 0.71% | |
| | | | |
Total expenses after fees waived | | | 0.69% | 5,6 | | | 0.69% | 6 | | | 0.69% | | | | 0.70% | | | | 0.72% | | | | 0.70% | |
| | | | |
Net investment income | | | 1.91% | 5 | | | 2.00% | | | | 1.86% | | | | 2.00% | | | | 2.28% | | | | 2.34% | |
| | | | |
| | | | | | | | | | | | | | | | | | | | | | | | |
| Supplemental Data | |
Net assets, end of period (000) | | $ | 11,402,596 | | | $ | 11,620,763 | | | $ | 13,242,101 | | | $ | 14,595,350 | | | $ | 14,610,283 | | | $ | 11,068,796 | |
| | | | |
Portfolio turnover rate | | | 14% | | | | 25% | | | | 25% | | | | 6% | | | | 15% | | | | 3% | |
| | | | |
| | 1 | | Based on average shares outstanding. |
| | 2 | | Distributions for annual periods determined in accordance with federal income tax regulations. |
| | 3 | | Where applicable, assumes the reinvestment of distributions. |
| | 4 | | Aggregate total return. |
| | 6 | | Excludes expenses incurred indirectly as a result of investments in underlying funds as follows: |
| | | | | | | | |
| | | Six Months Ended
January 31, 2017
(Unaudited) | | | Year Ended July 31, 2016 | |
| | | | | | | | |
Investments in underlying funds | | | 0.01% | | | | 0.01% | |
| | | | |
| | | | | | |
| See Notes to Financial Statements. | | | | |
| | | | | | | |
| 22 | | SEMI-ANNUAL REPORT | | JANUARY 31, 2017 | | |
| | |
| Financial Highlights | | BlackRock Equity Dividend Fund |
| | | | | | | | | | | | | | | | | | | | | | | | |
| | | Service | |
| | | Six Months Ended
January 31, 2017
(Unaudited) | | | Year Ended July 31, | |
| | | | 2016 | | | 2015 | | | 2014 | | | 2013 | | | 2012 | |
| | | | | | | | | | | | | | | | | | | | | | | | |
| Per Share Operating Performance | |
Net asset value, beginning of period | | $ | 22.26 | | | $ | 24.86 | | | $ | 24.63 | | | $ | 22.56 | | | $ | 19.46 | | | $ | 18.12 | |
| | | | |
Net investment income1 | | | 0.20 | | | | 0.37 | | | | 0.39 | | | | 0.40 | | | | 0.42 | | | | 0.37 | |
Net realized and unrealized gain | | | 1.61 | | | | 0.79 | | | | 1.33 | | | | 2.10 | | | | 3.10 | | | | 1.36 | |
| | | | |
Net increase from investment operations | | | 1.81 | | | | 1.16 | | | | 1.72 | | | | 2.50 | | | | 3.52 | | | | 1.73 | |
| | | | |
| Distributions:2 | |
From net investment income | | | (0.21 | ) | | | (0.37 | ) | | | (0.39 | ) | | | (0.41 | ) | | | (0.41 | ) | | | (0.38 | ) |
From net realized gain | | | (1.36 | ) | | | (3.39 | ) | | | (1.10 | ) | | | (0.02 | ) | | | (0.01 | ) | | | (0.01 | ) |
| | | | |
Total distributions | | | (1.57 | ) | | | (3.76 | ) | | | (1.49 | ) | | | (0.43 | ) | | | (0.42 | ) | | | (0.39 | ) |
| | | | |
Net asset value, end of period | | $ | 22.50 | | | $ | 22.26 | | | $ | 24.86 | | | $ | 24.63 | | | $ | 22.56 | | | $ | 19.46 | |
| | | | |
| | | | | | | | | | | | | | | | | | | | | | | | |
| Total Return3 | |
Based on net asset value | | | 8.27% | 4 | | | 5.95% | | | | 7.19% | | | | 11.17% | | | | 18.23% | | | | 9.68% | |
| | | | |
| | | | | | | | | | | | | | | | | | | | | | | | |
| Ratios to Average Net Assets | |
Total expenses | | | 0.91% | 5,6 | | | 1.04% | 6 | | | 1.02% | | | | 1.01% | | | | 1.01% | | | | 1.02% | |
| | | | |
Total expenses after fees waived | | | 0.91% | 5,6 | | | 1.01% | 6 | | | 1.01% | | | | 1.01% | | | | 1.01% | | | | 1.01% | |
| | | | |
Net investment income | | | 1.75% | 5 | | | 1.68% | | | | 1.58% | | | | 1.69% | | | | 1.99% | | | | 2.00% | |
| | | | |
| | | | | | | | | | | | | | | | | | | | | | | | |
| Supplemental Data | |
Net assets, end of period (000) | | $ | 64,917 | | | $ | 86,382 | | | $ | 99,271 | | | $ | 295,017 | | | $ | 323,071 | | | $ | 207,027 | |
| | | | |
Portfolio turnover rate | | | 14% | | | | 25% | | | | 25% | | | | 6% | | | | 15% | | | | 3% | |
| | | | |
| | 1 | | Based on average shares outstanding. |
| | 2 | | Distributions for annual periods determined in accordance with federal income tax regulations. |
| | 3 | | Where applicable, assumes the reinvestment of distributions. |
| | 4 | | Aggregate total return. |
| | 6 | | Excludes expenses incurred indirectly as a result of investments in underlying funds as follows: |
| | | | | | | | |
| | | Six Months Ended
January 31, 2017
(Unaudited) | | | Year Ended July 31, 2016 | |
| | | | | | | | |
Investments in underlying funds | | | 0.01% | | | | 0.01% | |
| | | | |
| | | | | | |
| See Notes to Financial Statements. | | | | |
| | | | | | | |
| | SEMI-ANNUAL REPORT | | JANUARY 31, 2017 | | 23 |
| | |
| Financial Highlights (continued) | | BlackRock Equity Dividend Fund |
| | | | | | | | | | | | | | | | | | | | | | | | |
| | | Investor A | |
| | | Six Months Ended
January 31, 2017
(Unaudited) | | | Year Ended July 31, | |
| | | | 2016 | | | 2015 | | | 2014 | | | 2013 | | | 2012 | |
| | | | | | | | | | | | | | | | | | | | | | | | |
| Per Share Operating Performance | |
Net asset value, beginning of period | | $ | 22.28 | | | $ | 24.88 | | | $ | 24.65 | | | $ | 22.59 | | | $ | 19.48 | | | $ | 18.13 | |
| | | | |
Net investment income1 | | | 0.19 | | | | 0.39 | | | | 0.40 | | | | 0.42 | | | | 0.42 | | | | 0.38 | |
Net realized and unrealized gain | | | 1.61 | | | | 0.79 | | | | 1.33 | | | | 2.09 | | | | 3.11 | | | | 1.34 | |
| | | | |
Net increase from investment operations | | | 1.80 | | | | 1.18 | | | | 1.73 | | | | 2.51 | | | | 3.53 | | | | 1.72 | |
| | | | |
| Distributions:2 | | | | | | | | | | | | | | | | | | | | | | | | |
From net investment income | | | (0.21 | ) | | | (0.39 | ) | | | (0.40 | ) | | | (0.43 | ) | | | (0.41 | ) | | | (0.36 | ) |
From net realized gain | | | (1.36 | ) | | | (3.39 | ) | | | (1.10 | ) | | | (0.02 | ) | | | (0.01 | ) | | | (0.01 | ) |
| | | | |
Total distributions | | | (1.57 | ) | | | (3.78 | ) | | | (1.50 | ) | | | (0.45 | ) | | | (0.42 | ) | | | (0.37 | ) |
| | | | |
Net asset value, end of period | | $ | 22.51 | | | $ | 22.28 | | | $ | 24.88 | | | $ | 24.65 | | | $ | 22.59 | | | $ | 19.48 | |
| | | | |
| | | | | | | | | | | | | | | | | | | | | | | | |
| Total Return3 | |
Based on net asset value | | | 8.22% | 4 | | | 6.07% | | | | 7.25% | | | | 11.19% | | | | 18.31% | | | | 9.63% | |
| | | | |
| | | | | | | | | | | | | | | | | | | | | | | | |
| Ratios to Average Net Assets | |
Total expenses | | | 0.92% | 5,6 | | | 0.96% | 6 | | | 0.97% | | | | 0.95% | | | | 0.99% | | | | 0.98% | |
| | | | |
Total expenses after fees waived | | | 0.92% | 5,6 | | | 0.93% | 6 | | | 0.96% | | | | 0.95% | | | | 0.99% | | | | 0.98% | |
| | | | |
Net investment income | | | 1.68% | 5 | | | 1.76% | | | | 1.61% | | | | 1.75% | | | | 2.03% | | | | 2.09% | |
| | | | |
| | | | | | | | | | | | | | | | | | | | | | | | |
| Supplemental Data | |
Net assets, end of period (000) | | $ | 5,841,521 | | | $ | 5,951,054 | | | $ | 7,226,833 | | | $ | 10,115,394 | | | $ | 10,573,927 | | | $ | 8,582,557 | |
| | | | |
Portfolio turnover rate | | | 14% | | | | 25% | | | | 25% | | | | 6% | | | | 15% | | | | 3% | |
| | | | |
| | 1 | | Based on average shares outstanding. |
| | 2 | | Distributions for annual periods determined in accordance with federal income tax regulations. |
| | 3 | | Where applicable, excludes the effects of any sales charges and assumes the reinvestment of distributions. |
| | 4 | | Aggregate total return. |
| | 6 | | Excludes expenses incurred indirectly as a result of investments in underlying funds as follows: |
| | | | | | | | |
| | | Six Months Ended
January 31, 2017
(Unaudited) | | | Year Ended July 31, 2016 | |
| | | | | | | | |
Investments in underlying funds | | | 0.01% | | | | 0.01% | |
| | | | |
| | | | | | |
| See Notes to Financial Statements. | | | | |
| | | | | | | |
| 24 | | SEMI-ANNUAL REPORT | | JANUARY 31, 2017 | | |
| | |
| Financial Highlights (continued) | | BlackRock Equity Dividend Fund |
| | | | | | | | | | | | | | | | | | | | | | | | |
| | | Investor B | |
| | | Six Months Ended
January 31, 2017
(Unaudited) | | | Year Ended July 31, | |
| | | | 2016 | | | 2015 | | | 2014 | | | 2013 | | | 2012 | |
| | | | | | | | | | | | | | | | | | | | | | | | |
| Per Share Operating Performance | | | | | | | | | | | | | | | | | | | | | | | | |
Net asset value, beginning of period | | $ | 22.55 | | | $ | 25.11 | | | $ | 24.86 | | | $ | 22.76 | | | $ | 19.62 | | | $ | 18.25 | |
| | | | |
Net investment income1 | | | 0.11 | | | | 0.24 | | | | 0.22 | | | | 0.24 | | | | 0.28 | | | | 0.24 | |
Net realized and unrealized gain | | | 1.62 | | | | 0.78 | | | | 1.33 | | | | 2.11 | | | | 3.12 | | | | 1.34 | |
| | | | |
Net increase from investment operations | | | 1.73 | | | | 1.02 | | | | 1.55 | | | | 2.35 | | | | 3.40 | | | | 1.58 | |
| | | | |
| Distributions:2 | | | | | | | | | | | | | | | | | | | | | | | | |
From net investment income | | | (0.10 | ) | | | (0.19 | ) | | | (0.20 | ) | | | (0.23 | ) | | | (0.25 | ) | | | (0.20 | ) |
From net realized gain | | | (1.36 | ) | | | (3.39 | ) | | | (1.10 | ) | | | (0.02 | ) | | | (0.01 | ) | | | (0.01 | ) |
| | | | |
Total distributions | | | (1.46 | ) | | | (3.58 | ) | | | (1.30 | ) | | | (0.25 | ) | | | (0.26 | ) | | | (0.21 | ) |
| | | | |
Net asset value, end of period | | $ | 22.82 | | | $ | 22.55 | | | $ | 25.11 | | | $ | 24.86 | | | $ | 22.76 | | | $ | 19.62 | |
| | | | |
| | | | | | | | | | | | | | | | | | | | | | | | |
| Total Return3 | | | | | | | | | | | | | | | | | | | | | | | | |
Based on net asset value | | | 7.78% | 4 | | | 5.22% | | | | 6.38% | | | | 10.40% | | | | 17.41% | | | | 8.74% | |
| | | | |
| | | | | | | | | | | | | | | | | | | | | | | | |
| Ratios to Average Net Assets | | | | | | | | | | | | | | | | | | | | | | | | |
Total expenses | | | 1.73% | 5,6 | | | 1.74% | 6 | | | 1.72% | | | | 1.71% | | | | 1.73% | | | | 1.79% | |
| | | | |
Total expenses after fees waived | | | 1.73% | 5,6 | | | 1.72% | 6 | | | 1.72% | | | | 1.71% | | | | 1.73% | | | | 1.79% | |
| | | | |
Net investment income | | | 1.00% | 5 | | | 1.05% | | | | 0.87% | | | | 1.02% | | | | 1.33% | | | | 1.33% | |
| | | | |
| | | | | | | | | | | | | | | | | | | | | | | | |
| Supplemental Data | | | | | | | | | | | | | | | | | | | | | | | | |
Net assets, end of period (000) | | $ | 4,846 | | | $ | 9,636 | | | $ | 21,395 | | | $ | 34,515 | | | $ | 44,315 | | | $ | 48,906 | |
| | | | |
Portfolio turnover rate | | | 14% | | | | 25% | | | | 25% | | | | 6% | | | | 15% | | | | 3% | |
| | | | |
| | 1 | | Based on average shares outstanding. |
| | 2 | | Distributions for annual periods determined in accordance with federal income tax regulations. |
| | 3 | | Where applicable, excludes the effects of any sales charges and assumes the reinvestment of distributions. |
| | 4 | | Aggregate total return. |
| | 6 | | Excludes expenses incurred indirectly as a result of investments in underlying funds as follows: |
| | | | | | | | |
| | | Six Months Ended
January 31, 2017
(Unaudited) | | | Year Ended July 31, 2016 | |
| | | | | | | | |
Investments in underlying funds | | | 0.01% | | | | 0.01% | |
| | | | |
| | | | | | |
| See Notes to Financial Statements. | | | | |
| | | | | | | |
| | SEMI-ANNUAL REPORT | | JANUARY 31, 2017 | | 25 |
| | |
| Financial Highlights (continued) | | BlackRock Equity Dividend Fund |
| | | | | | | | | | | | | | | | | | | | | | | | |
| | | Investor C | |
| | | Six Months Ended
January 31, 2017
(Unaudited) | | | Year Ended July 31, | |
| | | | 2016 | | | 2015 | | | 2014 | | | 2013 | | | 2012 | |
| | | | | | | | | | | | | | | | | | | | | | | | |
| Per Share Operating Performance | |
Net asset value, beginning of period | | $ | 21.62 | | | $ | 24.27 | | | $ | 24.08 | | | $ | 22.08 | | | $ | 19.06 | | | $ | 17.76 | |
| | | | |
Net investment income1 | | | 0.10 | | | | 0.22 | | | | 0.22 | | | | 0.24 | | | | 0.27 | | | | 0.24 | |
Net realized and unrealized gain | | | 1.57 | | | | 0.76 | | | | 1.31 | | | | 2.05 | | | | 3.04 | | | | 1.31 | |
| | | | |
Net increase from investment operations | | | 1.67 | | | | 0.98 | | | | 1.53 | | | | 2.29 | | | | 3.31 | | | | 1.55 | |
| | | | |
| Distributions:2 | | | | | | | | | | | | | | | | | | | | | | | | |
From net investment income | | | (0.12 | ) | | | (0.24 | ) | | | (0.24 | ) | | | (0.27 | ) | | | (0.28 | ) | | | (0.24 | ) |
From net realized gain | | | (1.36 | ) | | | (3.39 | ) | | | (1.10 | ) | | | (0.02 | ) | | | (0.01 | ) | | | (0.01 | ) |
| | | | |
Total distributions | | | (1.48 | ) | | | (3.63 | ) | | | (1.34 | ) | | | (0.29 | ) | | | (0.29 | ) | | | (0.25 | ) |
| | | | |
Net asset value, end of period | | $ | 21.81 | | | $ | 21.62 | | | $ | 24.27 | | | $ | 24.08 | | | $ | 22.08 | | | $ | 19.06 | |
| | | | |
| | | | | | | | | | | | | | | | | | | | | | | | |
| Total Return3 | |
Based on net asset value | | | 7.86% | 4 | | | 5.24% | | | | 6.51% | | | | 10.43% | | | | 17.47% | | | | 8.80% | |
| | | | |
| | | | | | | | | | | | | | | | | | | | | | | | |
| Ratios to Average Net Assets | |
Total expenses | | | 1.68% | 5,6 | | | 1.69% | 6 | | | 1.67% | | | | 1.67% | | | | 1.69% | | | | 1.73% | |
| | | | |
Total expenses after fees waived | | | 1.68% | 5,6 | | | 1.67% | 6 | | | 1.66% | | | | 1.67% | | | | 1.68% | | | | 1.73% | |
| | | | |
Net investment income | | | 0.93% | 5 | | | 1.02% | | | | 0.88% | | | | 1.02% | | | | 1.32% | | | | 1.33% | |
| | | | |
| | | | | | | | | | | | | | | | | | | | | | | | |
| Supplemental Data | |
Net assets, end of period (000) | | $ | 2,919,822 | | | $ | 3,043,757 | | | $ | 3,361,651 | | | $ | 3,476,705 | | | $ | 3,124,236 | | | $ | 2,245,569 | |
| | | | |
Portfolio turnover rate | | | 14% | | | | 25% | | | | 25% | | | | 6% | | | | 15% | | | | 3% | |
| | | | |
| | 1 | | Based on average shares outstanding. |
| | 2 | | Distributions for annual periods determined in accordance with federal income tax regulations. |
| | 3 | | Where applicable, excludes the effects of any sales charges and assumes the reinvestment of distributions. |
| | 4 | | Aggregate total return. |
| | 6 | | Excludes expenses incurred indirectly as a result of investments in underlying funds as follows: |
| | | | | | | | |
| | | Six Months Ended
January 31, 2017
(Unaudited) | | | Year Ended July 31, 2016 | |
| | | | | | | | |
Investments in underlying funds | | | 0.01% | | | | 0.01% | |
| | | | |
| | | | | | |
| See Notes to Financial Statements. | | | | |
| | | | | | | |
| 26 | | SEMI-ANNUAL REPORT | | JANUARY 31, 2017 | | |
| | |
| Financial Highlights (continued) | | BlackRock Equity Dividend Fund |
| | | | | | | | | | | | | | | | | | | | | | | | | | | | |
| | | Investor C1 | |
| | | Six Months Ended
January 31,
2017
(Unaudited) | | | Year Ended July 31, | | | Period
September 12,
20111 to
July 31, 2012 | | | | |
| | | | 2016 | | | 2015 | | | 2014 | | | 2013 | | | |
| | | | | | | | | | | | | | | | | | | | | | | | | | | | |
| Per Share Operating Performance | | | | | |
Net asset value, beginning of period | | $ | 21.59 | | | $ | 24.24 | | | $ | 24.06 | | | $ | 22.06 | | | $ | 19.03 | | | $ | 16.32 | | | | | |
| | | | |
Net investment income2 | | | 0.12 | | | | 0.26 | | | | 0.26 | | | | 0.28 | | | | 0.32 | | | | 0.22 | | | | | |
Net realized and unrealized gain | | | 1.57 | | | | 0.76 | | | | 1.30 | | | | 2.05 | | | | 3.03 | | | | 2.78 | | | | | |
| | | | |
Net increase from investment operations | | | 1.69 | | | | 1.02 | | | | 1.56 | | | | 2.33 | | | | 3.35 | | | | 3.00 | | | | | |
| | | | |
| Distributions:3 | | | | | |
From net investment income | | | (0.15 | ) | | | (0.28 | ) | | | (0.28 | ) | | | (0.31 | ) | | | (0.31 | ) | | | (0.28 | ) | | | | |
From net realized gain | | | (1.36 | ) | | | (3.39 | ) | | | (1.10 | ) | | | (0.02 | ) | | | (0.01 | ) | | | (0.01 | ) | | | | |
| | | | |
Total distributions | | | (1.51 | ) | | | (3.67 | ) | | | (1.38 | ) | | | (0.33 | ) | | | (0.32 | ) | | | (0.29 | ) | | | | |
| | | | |
Net asset value, end of period | | $ | 21.77 | | | $ | 21.59 | | | $ | 24.24 | | | $ | 24.06 | | | $ | 22.06 | | | $ | 19.03 | | | | | |
| | | | |
| | | | | | | | | | | | | | | | | | | | | | | | | | | | |
| Total Return4 | | | | | |
Based on net asset value | | | 7.93% | 5 | | | 5.47% | | | | 6.69% | | | | 10.63% | | | | 17.74% | | | | 18.51% | 5 | | | | |
| | | | |
| | | | | | | | | | | | | | | | | | | | | | | | | | | | |
| Ratios to Average Net Assets | | | | | |
Total expenses | | | 1.48% | 6,7 | | | 1.49% | 7 | | | 1.49% | | | | 1.49% | | | | 1.46% | | | | 1.63% | 6 | | | | |
| | | | |
Total expenses after fees waived | | | 1.48% | 6,7 | | | 1.47% | 7 | | | 1.48% | | | | 1.49% | | | | 1.45% | | | | 1.63% | 6 | | | | |
| | | | |
Net investment income | | | 1.13% | 6 | | | 1.22% | | | | 1.07% | | | | 1.21% | | | | 1.59% | | | | 1.37% | 6 | | | | |
| | | | |
| | | | | | | | | | | | | | | | | | | | | | | | | | | | |
| Supplemental Data | | | | | |
Net assets, end of period (000) | | $ | 6,510 | | | $ | 6,834 | | | $ | 7,340 | | | $ | 7,680 | | | $ | 7,670 | | | $ | 7,255 | | | | | |
| | | | |
Portfolio turnover rate | | | 14% | | | | 25% | | | | 25% | | | | 6% | | | | 15% | | | | 3% | | | | | |
| | | | |
| | 1 | | Commencement of operations. |
| | 2 | | Based on average shares outstanding. |
| | 3 | | Distributions for annual periods determined in accordance with federal income tax regulations. |
| | 4 | | Where applicable, excludes the effects of any sales charges and assumes the reinvestment of distributions. |
| | 5 | | Aggregate total return. |
| | 7 | | Excludes expenses incurred indirectly as a result of investments in underlying funds as follows: |
| | | | | | | | |
| | | Six Months Ended
January 31, 2017
(Unaudited) | | | Year Ended July 31, 2016 | |
| | | | | | | | |
Investments in underlying funds | | | 0.01% | | | | 0.01% | |
| | | | |
| | | | | | |
| See Notes to Financial Statements. | | | | |
| | | | | | | |
| | SEMI-ANNUAL REPORT | | JANUARY 31, 2017 | | 27 |
| | |
| Financial Highlights (continued) | | BlackRock Equity Dividend Fund |
| | | | | | | | | | | | |
| | | Class K | |
| | | Six Months Ended
January 31,
2017
(Unaudited) | | | Period
March 28, 20161
to July 31, 2016 | | | | |
| | | | | | | | | | | | |
| Per Share Operating Performance | | | | | |
Net asset value, beginning of period | | $ | 22.32 | | | $ | 20.97 | | | | | |
| | | | |
Net investment income2 | | | 0.20 | | | | 0.09 | | | | | |
Net realized and unrealized gain | | | 1.65 | | | | 1.48 | | | | | |
| | | | |
Net increase from investment operations | | | 1.85 | | | | 1.57 | | | | | |
| | | | |
| Distributions:3 | | | | | |
From net investment income | | | (0.25 | ) | | | (0.22 | ) | | | | |
From net realized gain | | | (1.36 | ) | | | — | | | | | |
| | | | |
Total distributions | | | (1.61 | ) | | | (0.22 | ) | | | | |
| | | | |
Net asset value, end of period | | $ | 22.56 | | | $ | 22.32 | | | | | |
| | | | |
| | | | | | | | | | | | |
| Total Return4 | | | | | |
Based on net asset value | | | 8.42% | 5 | | | 7.50% | 5 | | | | |
| | | | |
| | | | | | | | | | | | |
| Ratios to Average Net Assets | | | | | |
Total expenses | | | 0.59% | 6,7,8 | | | 0.58% | 6,8,9 | | | | |
| | | | |
Total expenses after fees waived | | | 0.59% | 6,8 | | | 0.57% | 6,8 | | | | |
| | | | |
Net investment income | | | 1.77% | 6 | | | 1.22% | 6 | | | | |
| | | | |
| | | | | | | | | | | | |
| Supplemental Data | | | | | |
Net assets, end of period (000) | | $ | 70,654 | | | $ | 22,861 | | | | | |
| | | | |
Portfolio turnover rate | | | 14% | | | | 25% | | | | | |
| | | | |
| | 1 | | Commencement of operations. |
| | 2 | | Based on average shares outstanding. |
| | 3 | | Distributions for annual periods determined in accordance with federal income tax regulations. |
| | 4 | | Where applicable, assumes the reinvestment of distributions. |
| | 5 | | Aggregate total return. |
| | 7 | | Offering costs were not annualized in the calculation of the expense ratios. If these expenses were annualized, the total expenses would have been 0.59%. |
| | 8 | | Excludes expenses incurred indirectly as a result of investments in underlying funds as follows: |
| | | | | | | | |
| | | Six Months Ended
January 31,
2017
(Unaudited) | | | Period
March 28, 20161
to July 31,
2016 | |
| | | | | | | | |
Investments in underlying funds | | | 0.01% | | | | 0.01% | |
| | | | |
| | 9 | | Audit and offering costs were not annualized in the calculation of the expense ratios. If these expenses were annualized, the total expenses would have been 0.58%. |
| | | | | | |
| See Notes to Financial Statements. | | | | |
| | | | | | | |
| 28 | | SEMI-ANNUAL REPORT | | JANUARY 31, 2017 | | |
| | |
| Financial Highlights (concluded) | | BlackRock Equity Dividend Fund |
| | | | | | | | | | | | | | | | | | | | | | | | | | | | |
| | | Class R | |
| | | Six Months Ended
January 31, 2017
(Unaudited) | | | Year Ended July 31, | |
| | | | 2016 | | | 2015 | | | 2014 | | | 2013 | | | 2012 | | | | |
| | | | | | | | | | | | | | | | | | | | | | | | | | | | |
| Per Share Operating Performance | | | | | |
Net asset value, beginning of period | | $ | 22.41 | | | $ | 25.01 | | | $ | 24.76 | | | $ | 22.69 | | | $ | 19.57 | | | $ | 18.21 | | | | | |
| | | | |
Net investment income1 | | | 0.15 | | | | 0.32 | | | | 0.32 | | | | 0.34 | | | | 0.36 | | | | 0.32 | | | | | |
Net realized and unrealized gain | | | 1.62 | | | | 0.79 | | | | 1.35 | | | | 2.10 | | | | 3.12 | | | | 1.36 | | | | | |
| | | | |
Net increase from investment operations | | | 1.77 | | | | 1.11 | | | | 1.67 | | | | 2.44 | | | | 3.48 | | | | 1.68 | | | | | |
| | | | |
| Distributions:2 | | | | | | | | | | | | | | | | | | | | | | | | | | | | |
From net investment income | | | (0.17 | ) | | | (0.32 | ) | | | (0.32 | ) | | | (0.35 | ) | | | (0.35 | ) | | | (0.31 | ) | | | | |
From net realized gain | | | (1.36 | ) | | | (3.39 | ) | | | (1.10 | ) | | | (0.02 | ) | | | (0.01 | ) | | | (0.01 | ) | | | | |
| | | | |
Total distributions | | | (1.53 | ) | | | (3.71 | ) | | | (1.42 | ) | | | (0.37 | ) | | | (0.36 | ) | | | (0.32 | ) | | | | |
| | | | |
Net asset value, end of period | | $ | 22.65 | | | $ | 22.41 | | | $ | 25.01 | | | $ | 24.76 | | | $ | 22.69 | | | $ | 19.57 | | | | | |
| | | | |
| | | | | | | | | | | | | | | | | | | | | | | | | | | | |
| Total Return3 | | | | | |
Based on net asset value | | | 8.03% | 4 | | | 5.70% | | | | 6.96% | | | | 10.83% | | | | 17.93% | | | | 9.33% | | | | | |
| | | | |
| | | | | | | | | | | | | | | | | | | | | | | | | | | | |
| Ratios to Average Net Assets | | | | | |
Total expenses | | | 1.25% | 5,6 | | | 1.27% | 6 | | | 1.28% | | | | 1.27% | | | | 1.28% | | | | 1.31% | | | | | |
| | | | |
Total expenses after fees waived | | | 1.24% | 5,6 | | | 1.25% | 6 | | | 1.28% | | | | 1.27% | | | | 1.28% | | | | 1.30% | | | | | |
| | | | |
Net investment income | | | 1.35% | 5 | | | 1.44% | | | | 1.28% | | | | 1.43% | | | | 1.72% | | | | 1.76% | | | | | |
| | | | |
| | | | | | | | | | | | | | | | | | | | | | | | | | | | |
| Supplemental Data | | | | | |
Net assets, end of period (000) | | $ | 846,978 | | | $ | 862,531 | | | $ | 987,928 | | | $ | 1,202,121 | | | $ | 1,202,571 | | | $ | 902,790 | | | | | |
| | | | |
Portfolio turnover rate | | | 14% | | | | 25% | | | | 25% | | | | 6% | | | | 15% | | | | 3% | | | | | |
| | | | |
| | 1 | | Based on average shares outstanding. |
| | 2 | | Distributions for annual periods determined in accordance with federal income tax regulations. |
| | 3 | | Where applicable, assumes the reinvestment of distributions. |
| | 4 | | Aggregate total return. |
| | 6 | | Excludes expenses incurred indirectly as a result of investments in underlying funds as follows: |
| | | | | | | | |
| | | Six Months Ended
January 31,
2017
(Unaudited) | | | Year Ended
July 31,
2016 | |
| | | | | | | | |
Investments in underlying funds | | | 0.01% | | | | 0.01% | |
| | | | |
| | | | | | |
| See Notes to Financial Statements. | | | | |
| | | | | | | |
| | SEMI-ANNUAL REPORT | | JANUARY 31, 2017 | | 29 |
| | |
| Financial Highlights | | BlackRock Natural Resources Trust |
| | | | | | | | | | | | | | | | | | | | | | | | |
| | | Institutional | |
| | | Six Months Ended
January 31, 2017
(Unaudited) | | | Year Ended July 31, | |
| | | | 2016 | | | 2015 | | | 2014 | | | 2013 | | | 2012 | |
| | | | | | | | | | | | | | | | | | | | | | | | |
| Per Share Operating Performance | |
Net asset value, beginning of period | | $ | 43.39 | | | $ | 47.03 | | | $ | 77.17 | | | $ | 64.89 | | | $ | 57.65 | | | $ | 69.76 | |
| | | | |
Net investment income1 | | | 0.18 | | | | 0.47 | | | | 0.53 | | | | 0.45 | | | | 0.48 | | | | 0.33 | |
Net realized and unrealized gain (loss) | | | 3.83 | | | | (0.96 | ) | | | (25.35 | ) | | | 12.61 | | | | 7.21 | | | | (12.09 | ) |
| | | | |
Net increase (decrease) from investment operations | | | 4.01 | | | | (0.49 | ) | | | (24.82 | ) | | | 13.06 | | | | 7.69 | | | | (11.76 | ) |
| | | | |
| Distributions:2 | | | | | | | | | | | | | | | | | | | | | | | | |
From net investment income | | | (0.41 | ) | | | (0.42 | ) | | | (0.37 | ) | | | (0.34 | ) | | | (0.45 | ) | | | (0.35 | ) |
From net realized gain | | | — | | | | (2.73 | ) | | | (4.95 | ) | | | (0.44 | ) | | | — | | | | — | |
| | | | |
Total distributions | | | (0.41 | ) | | | (3.15 | ) | | | (5.32 | ) | | | (0.78 | ) | | | (0.45 | ) | | | (0.35 | ) |
| | | | |
Net asset value, end of period | | $ | 46.99 | | | $ | 43.39 | | | $ | 47.03 | | | $ | 77.17 | | | $ | 64.89 | | | $ | 57.65 | |
| | | | |
| | | | | | | | | | | | | | | | | | | | | | | | |
| Total Return3 | |
Based on net asset value | | | 9.23% | 4 | | | (0.15 | )% | | | (32.68 | )% | | | 20.31% | | | | 13.41% | | | | (16.88 | )% |
| | | | |
| | | | | | | | | | | | | | | | | | | | | | | | |
| Ratios to Average Net Assets | |
Total expenses | | | 0.82% | 5,6 | | | 0.88% | 6 | | | 0.83% | | | | 0.80% | | | | 0.80% | | | | 0.85% | |
| | | | |
Total expenses after fees waived | | | 0.82% | 5,6 | | | 0.88% | 6 | | | 0.83% | | | | 0.80% | | | | 0.80% | | | | 0.85% | |
| | | | |
Net investment income | | | 0.76% | 5 | | | 1.12% | | | | 0.89% | | | | 0.64% | | | | 0.76% | | | | 0.56% | |
| | | | |
| | | | | | | | | | | | | | | | | | | | | | | | |
| Supplemental Data | |
Net assets, end of period (000) | | $ | 83,577 | | | $ | 69,602 | | | $ | 80,864 | | | $ | 142,323 | | | $ | 109,009 | | | $ | 102,940 | |
| | | | |
Portfolio turnover rate | | | 2% | | | | 7% | | | | 6% | | | | 5% | | | | 1% | | | | 3% | |
| | | | |
| | 1 | | Based on average shares outstanding. |
| | 2 | | Distributions for annual periods determined in accordance with federal income tax regulations. |
| | 3 | | Where applicable, assumes the reinvestment of distributions. |
| | 4 | | Aggregate total return. |
| | 6 | | Excludes expenses incurred indirectly as a result of investments in underlying funds as follows: |
| | | | | | | | |
| | | Six Months Ended
January 31, 2017 (Unaudited) | | | Year Ended
July 31,
2016 | |
| | | | | | | | |
Investments in underlying funds | | | 0.01% | | | | 0.01% | |
| | | | |
| | | | | | |
| See Notes to Financial Statements. | | | | |
| | | | | | | |
| 30 | | SEMI-ANNUAL REPORT | | JANUARY 31, 2017 | | |
| | |
| Financial Highlights (continued) | | BlackRock Natural Resources Trust |
| | | | | | | | | | | | | | | | | | | | | | | | |
| | | Investor A | |
| | | Six Months Ended
January 31, 2017
(Unaudited) | | | Year Ended July 31, | |
| | | | 2016 | | | 2015 | | | 2014 | | | 2013 | | | 2012 | |
| | | | | | | | | | | | | | | | | | | | | | | | |
| Per Share Operating Performance | |
Net asset value, beginning of period | | $ | 41.97 | | | $ | 45.59 | | | $ | 75.12 | | | $ | 63.28 | | | $ | 56.14 | | | $ | 67.92 | |
| | | | |
Net investment income1 | | | 0.11 | | | | 0.34 | | | | 0.36 | | | | 0.27 | | | | 0.31 | | | | 0.17 | |
Net realized and unrealized gain (loss) | | | 3.71 | | | | (0.92 | ) | | | (24.65 | ) | | | 12.27 | | | | 7.04 | | | | (11.78 | ) |
| | | | |
Net increase (decrease) from investment operations | | | 3.82 | | | | (0.58 | ) | | | (24.29 | ) | | | 12.54 | | | | 7.35 | | | | (11.61 | ) |
| | | | |
| Distributions:2 | | | | | | | | | | | | | | | | | | | | | | | | |
From net investment income | | | (0.30 | ) | | | (0.31 | ) | | | (0.29 | ) | | | (0.26 | ) | | | (0.21 | ) | | | (0.17 | ) |
From net realized gain | | | — | | | | (2.73 | ) | | | (4.95 | ) | | | (0.44 | ) | | | — | | | | — | |
| | | | |
Total distributions | | | (0.30 | ) | | | (3.04 | ) | | | (5.24 | ) | | | (0.70 | ) | | | (0.21 | ) | | | (0.17 | ) |
| | | | |
Net asset value, end of period | | $ | 45.49 | | | $ | 41.97 | | | $ | 45.59 | | | $ | 75.12 | | | $ | 63.28 | | | $ | 56.14 | |
| | | | |
| | | | | | | | | | | | | | | | | | | | | | | | |
| Total Return3 | |
Based on net asset value | | | 9.08% | 4 | | | (0.40 | )% | | | (32.87 | )% | | | 19.98% | | | | 13.11% | | | | (17.11)% | |
| | | | |
| | | | | | | | | | | | | | | | | | | | | | | | |
| Ratios to Average Net Assets | |
Total expenses | | | 1.11% | 5,6 | | | 1.14% | 6 | | | 1.10% | | | | 1.06% | | | | 1.07% | | | | 1.12% | |
| | | | |
Total expenses after fees waived | | | 1.10% | 5,6 | | | 1.14% | 6 | | | 1.10% | | | | 1.06% | | | | 1.07% | | | | 1.12% | |
| | | | |
Net investment income | | | 0.49% | 5 | | | 0.84% | | | | 0.62% | | | | 0.39% | | | | 0.51% | | | | 0.30% | |
| | | | |
| | | | | | | | | | | | | | | | | | | | | | | | |
| Supplemental Data | |
Net assets, end of period (000) | | $ | 212,203 | | | $ | 197,713 | | | $ | 198,816 | | | $ | 313,210 | | | $ | 293,272 | | | $ | 295,462 | |
| | | | |
Portfolio turnover rate | | | 2% | | | | 7% | | | | 6% | | | | 5% | | | | 1% | | | | 3% | |
| | | | |
| | 1 | | Based on average shares outstanding. |
| | 2 | | Distributions for annual periods determined in accordance with federal income tax regulations. |
| | 3 | | Where applicable, excludes the effects of any sales charges and assumes the reinvestment of distributions. |
| | 4 | | Aggregate total return. |
| | 6 | | Excludes expenses incurred indirectly as a result of investments in underlying funds as follows: |
| | | | | | | | |
| | | Six Months Ended
January 31, 2017 (Unaudited) | | | Year Ended
July 31,
2016 | |
| | | | | | | | |
Investments in underlying funds | | | 0.01% | | | | 0.01% | |
| | | | |
| | | | | | |
| See Notes to Financial Statements. | | | | |
| | | | | | | |
| | SEMI-ANNUAL REPORT | | JANUARY 31, 2017 | | 31 |
| | |
| Financial Highlights (continued) | | BlackRock Natural Resources Trust |
| | | | | | | | | | | | | | | | | | | | | | | | |
| | | Investor B | |
| | | Six Months Ended
January 31, 2017
(Unaudited) | | | Year Ended July 31, | |
| | | | 2016 | | | 2015 | | | 2014 | | | 2013 | | | 2012 | |
| | | | | | | | | | | | | | | | | | | | | | | | |
| Per Share Operating Performance | |
Net asset value, beginning of period | | $ | 36.62 | | | $ | 40.22 | | | $ | 67.31 | | | $ | 57.01 | | | $ | 50.82 | | | $ | 61.77 | |
| | | | |
Net investment income (loss)1 | | | (0.09 | ) | | | 0.02 | | | | (0.11 | ) | | | (0.24 | ) | | | (0.14 | ) | | | (0.24 | ) |
Net realized and unrealized gain (loss) | | | 3.19 | | | | (0.89 | ) | | | (21.98 | ) | | | 11.01 | | | | 6.33 | | | | (10.71 | ) |
| | | | |
Net increase (decrease) from investment operations | | | 3.10 | | | | (0.87 | ) | | | (22.09 | ) | | | 10.77 | | | | 6.19 | | | | (10.95 | ) |
| | | | |
| Distributions:2 | | | | | | | | | | | | | | | | | | | | | | | | |
From net investment income | | | — | | | | — | | | | (0.05 | ) | | | (0.03 | ) | | | — | | | | — | |
From net realized gain | | | — | | | | (2.73 | ) | | | (4.95 | ) | | | (0.44 | ) | | | — | | | | — | |
| | | | |
Total distributions | | | — | | | | (2.73 | ) | | | (5.00 | ) | | | (0.47 | ) | | | — | | | | — | |
| | | | |
Net asset value, end of period | | $ | 39.72 | | | $ | 36.62 | | | $ | 40.22 | | | $ | 67.31 | | | $ | 57.01 | | | $ | 50.82 | |
| | | | |
| | | | | | | | | | | | | | | | | | | | | | | | |
| Total Return3 | |
Based on net asset value | | | 8.46 | %4 | | | (1.31 | )% | | | (33.41 | )% | | | 19.01 | % | | | 12.18 | % | | | (17.73) | % |
| | | | |
| | | | | | | | | | | | | | | | | | | | | | | | |
| Ratios to Average Net Assets | |
Total expenses | | | 2.14 | %5,6 | | | 2.07 | %6 | | | 1.94 | % | | | 1.88 | % | | | 1.88 | % | | | 1.89 | % |
| | | | |
Total expenses after fees waived | | | 2.14 | %5,6 | | | 2.06 | %6 | | | 1.94 | % | | | 1.88 | % | | | 1.88 | % | | | 1.89 | % |
| | | | |
Net investment income (loss) | | | (0.45) | %5 | | | 0.05 | % | | | (0.21) | % | | | (0.39) | % | | | (0.26) | % | | | (0.46) | % |
| | | | |
| | | | | | | | | | | | | | | | | | | | | | | | |
| Supplemental Data | |
Net assets, end of period (000) | | $ | 236 | | | $ | 471 | | | $ | 1,468 | | | $ | 3,861 | | | $ | 5,970 | | | $ | 9,365 | |
| | | | |
Portfolio turnover rate | | | 2% | | | | 7% | | | | 6% | | | | 5% | | | | 1% | | | | 3% | |
| | | | |
| | 1 | | Based on average shares outstanding. |
| | 2 | | Distributions for annual periods determined in accordance with federal income tax regulations. |
| | 3 | | Where applicable, excludes the effects of any sales charges and assumes the reinvestment of distributions. |
| | 4 | | Aggregate total return. |
| | 6 | | Excludes expenses incurred indirectly as a result of investments in underlying funds as follows: |
| | | | | | | | |
| | | Six Months Ended
January 31, 2017
(Unaudited) | | | Year Ended
July 31,
2016 | |
| | | | | | | | |
Investments in underlying funds | | | 0.01% | | | | 0.01% | |
| | | | |
| | | | | | |
| See Notes to Financial Statements. | | | | |
| | | | | | | |
| 32 | | SEMI-ANNUAL REPORT | | JANUARY 31, 2017 | | |
| | |
| Financial Highlights (concluded) | | BlackRock Natural Resources Trust |
| | | | | | | | | | | | | | | | | | | | | | | | |
| | | Investor C | |
| | | Six Months Ended
January 31, 2017
(Unaudited) | | | Year Ended July 31, | |
| | | | 2016 | | | 2015 | | | 2014 | | | 2013 | | | 2012 | |
| | | | | | | | | | | | | | | | | | | | | | | | |
| Per Share Operating Performance | |
Net asset value, beginning of period | | $ | 35.93 | | | $ | 39.48 | | | $ | 66.24 | | | $ | 56.13 | | | $ | 50.02 | | | $ | 60.81 | |
| | | | |
Net investment income (loss)1 | | | (0.05 | ) | | | 0.02 | | | | (0.08 | ) | | | (0.24 | ) | | | (0.15 | ) | | | (0.24 | ) |
Net realized and unrealized gain (loss) | | | 3.15 | | | | (0.84 | ) | | | (21.62 | ) | | | 10.86 | | | | 6.26 | | | | (10.55 | ) |
| | | | |
Net increase (decrease) from investment operations | | | 3.10 | | | | (0.82 | ) | | | (21.70 | ) | | | 10.62 | | | | 6.11 | | | | (10.79 | ) |
| | | | |
| Distributions:2 | | | | | | | | | | | | | | | | | | | | | | | | |
From net investment income | | | (0.02 | ) | | | — | | | | (0.11 | ) | | | (0.07 | ) | | | — | | | | — | |
From net realized gain | | | — | | | | (2.73 | ) | | | (4.95 | ) | | | (0.44 | ) | | | — | | | | — | |
| | | | |
Total distributions | | | (0.02 | ) | | | (2.73 | ) | | | (5.06 | ) | | | (0.51 | ) | | | — | | | | — | |
| | | | |
Net asset value, end of period | | $ | 39.01 | | | $ | 35.93 | | | $ | 39.48 | | | $ | 66.24 | | | $ | 56.13 | | | $ | 50.02 | |
| | | | |
| | | | | | | | | | | | | | | | | | | | | | | | |
| Total Return3 | |
Based on net asset value | | | 8.63% | 4 | | | (1.20)% | | | | (33.38)% | | | | 19.06% | | | | 12.22% | | | | (17.74)% | |
| | | | |
| | | | | | | | | | | | | | | | | | | | | | | | |
| Ratios to Average Net Assets | |
Total expenses | | | 1.88% | 5,6 | | | 1.94% | 6 | | | 1.88% | | | | 1.84% | | | | 1.86% | | | | 1.89% | |
| | | | |
Total expenses after fees waived | | | 1.88% | 5,6 | | | 1.94% | 6 | | | 1.88% | | | | 1.84% | | | | 1.86% | | | | 1.89% | |
| | | | |
Net investment income (loss) | | | (0.26)% | 5 | | | 0.06% | | | | (0.16)% | | | | (0.39)% | | | | (0.27)% | | | | (0.47)% | |
| | | | |
| | | | | | | | | | | | | | | | | | | | | | | | |
| Supplemental Data | |
Net assets, end of period (000) | | $ | 47,069 | | | $ | 47,397 | | | $ | 57,026 | | | $ | 92,811 | | | $ | 89,618 | | | $ | 98,585 | |
| | | | |
Portfolio turnover rate | | | 2% | | | | 7% | | | | 6% | | | | 5% | | | | 1% | | | | 3% | |
| | | | |
| | 1 | | Based on average shares outstanding. |
| | 2 | | Distributions for annual periods determined in accordance with federal income tax regulations. |
| | 3 | | Where applicable, excludes the effects of any sales charges and assumes the reinvestment of distributions. |
| | 4 | | Aggregate total return. |
| | 6 | | Excludes expenses incurred indirectly as a result of investments in underlying funds as follows: |
| | | | | | | | |
| | | Six Months Ended
January 31, 2017 (Unaudited) | | | Year Ended
July 31,
2016 | |
| | | | | | | | |
Investments in underlying funds | | | 0.01% | | | | 0.01% | |
| | | | |
| | | | | | |
| See Notes to Financial Statements. | | | | |
| | | | | | | |
| | SEMI-ANNUAL REPORT | | JANUARY 31, 2017 | | 33 |
| | |
| Notes to Financial Statements (Unaudited) | | |
1. Organization:
BlackRock Equity Dividend Fund and BlackRock Natural Resources Trust are each registered under the Investment Company Act of 1940, as amended (the “1940 Act”), as open-end management investment companies. Each Fund is organized as a Massachusetts business trust. The following are referred to herein collectively as the “Funds” or individually, a “Fund”.
| | | | |
| Fund Name | | Herein Referred to As | | Diversification
Classification |
| BlackRock Equity Dividend Fund | | Equity Dividend | | Diversified |
| BlackRock Natural Resources Trust | | Natural Resources | | Non-diversified |
Each Fund offers multiple classes of shares. All classes of shares have identical voting, dividend, liquidation and other rights and are subject to the same terms and conditions, except that certain classes bear expenses related to the shareholder servicing and distribution of such shares. Institutional, Service and Class K Shares are sold only to certain eligible investors. Class R Shares are available only to certain employer-sponsored retirement plans. Investor A and Investor C Shares are generally available through financial intermediaries. Investor B Shares are available only through exchanges and dividend and capital gain reinvestments by existing shareholders, and for purchase by certain employer-sponsored retirement plans. Investor C1 Shares are only available for dividend and capital gain reinvestment by existing shareholders, and for purchase by certain employer-sponsored retirement plans. Each class has exclusive voting rights with respect to matters relating to its shareholder servicing and distribution expenditures (except that Investor B shareholders may vote on material changes to the Investor A distribution and service plan).
| | | | | | |
| Share Class | | Initial Sales Charge | | CDSC | | Conversion Privilege |
Institutional, Service, Class K and Class R Shares | | No | | No | | None |
Investor A Shares | | Yes | | No1 | | None |
Investor B Shares | | No | | Yes | | To Investor A Shares after approximately 8 years |
Investor C Shares | | No | | Yes | | None |
Investor C1 Shares | | No | | No2 | | None |
| | 1 | | Investor A Shares may be subject to a contingent deferred sales charge (“CDSC”) for certain redemptions where no initial sales charge was paid at the time of purchase. |
| | 2 | | A CDSC of 1.00% is assessed on certain redemptions of Investor C1 Shares made within one year after purchase. The CDSC does not apply to redemptions by certain employer-sponsored retirement plans or to redemptions of shares acquired through reinvestment of dividends and capital gains by existing shareholders. |
The Funds, together with certain other registered investment companies advised by BlackRock Advisors, LLC ( the “Manager”) or its affiliates, are included in a complex of open-end funds referred to as the Equity-Bond Complex.
2. Significant Accounting Policies:
The financial statements are prepared in conformity with accounting principles generally accepted in the United States of America (“U.S. GAAP”), which may require management to make estimates and assumptions that affect the reported amounts of assets and liabilities in the financial statements, disclosure of contingent assets and liabilities at the date of the financial statements and the reported amounts of increases and decreases in net assets from operations during the reporting period. Actual results could differ from those estimates. Each Fund is considered an investment company under U.S. GAAP and follows the accounting and reporting guidance applicable to investment companies. Below is a summary of significant accounting policies:
Foreign Currency: Each Fund’s books and records are maintained in U.S. dollars. Purchases and sales of investments are recorded at the rates of exchange prevailing on the respective dates of such transactions. Generally, when the U.S. dollar rises in value against a foreign currency, the investments denominated in that currency will lose value; the opposite effect occurs if the U.S. dollar falls in relative value.
Each Fund does not isolate the portion of the results of operations arising as a result of changes in the exchange rates from the changes in the market prices of investments held or sold for financial reporting purposes. Accordingly, the effects of changes in exchange rates on investments are not segregated in the Statements of Operations from the effects of changes in market prices of those investments, but are included as a component of net realized and unrealized gain (loss) from investments. Each Fund reports realized currency gains (losses) on foreign currency related transactions as components of net realized gain (loss) for financial reporting purposes, whereas such components are generally treated as ordinary income for federal income tax purposes.
Investment Transactions and Investment Income: For financial reporting purposes, investment transactions are recorded on the dates the transactions are entered into (the trade dates). Realized gains and losses on investment transactions are determined on the identified cost basis. Dividend income is recorded on the ex-dividend date. Dividends from foreign securities where the ex-dividend date may have passed are subsequently recorded when the Funds are informed of the ex-dividend date. Under the applicable foreign tax laws, a withholding tax at various rates may be imposed on capital gains, dividends and interest. Upon notification from issuers, some of the dividend income received from a real estate investment trust may be redesignated as a reduction of cost of the related investment and/or realized gain. Income, expenses and realized and unrealized gains and losses are allocated daily to each class based on its relative net assets.
Distributions: Distributions paid by the Funds are recorded on the ex-dividend date. Distributions of capital gains are recorded on the ex-dividend date and made at least annually. The character and timing of distributions are determined in accordance with federal income tax regulations, which may differ from U.S. GAAP.
| | | | | | |
| | | | | | | |
| 34 | | SEMI-ANNUAL REPORT | | JANUARY 31, 2017 | | |
| | | | |
| Notes to Financial Statements (continued) | | |
Recent Accounting Standard: In April 2015, the Financial Accounting Standards Board issued “Disclosures for Investments in Certain Entities that Calculate Net Asset Value (“NAV”) per Share” which eliminates the requirement to categorize investments within the fair value hierarchy when fair value is based on the NAV per share and no quoted market value is available. As of January 31, 2017, certain investments of the Fund were valued using NAV per share as no quoted market value is available and therefore have been excluded from the fair value hierarchy.
In November 2016, the Financial Accounting Standards Board issued Accounting Standards Update “Restricted Cash” which will require entities to include the total of cash, cash equivalents, restricted cash, and restricted cash equivalents in the beginning and ending cash balances in the Statements of Cash Flows. The guidance will be applied retrospectively and is effective for fiscal years beginning after December 15, 2017, and interim periods within those years. Management is evaluating the impact, if any, of this guidance on the Funds’ presentation in the Statements of Cash Flows.
Indemnifications: In the normal course of business, a Fund enters into contracts that contain a variety of representations that provide general indemnification. A Fund’s maximum exposure under these arrangements is unknown because it involves future potential claims against a Fund, which cannot be predicted with any certainty.
Other: Expenses directly related to a Fund or its classes are charged to that Fund or the applicable class. Other operating expenses shared by several funds, including other funds managed by the Manager, are prorated among those funds on the basis of relative net assets or other appropriate methods. Expenses directly related to the Funds and other shared expenses prorated to the Funds are allocated daily to each class based on their relative net assets or other appropriate methods.
Through May 31, 2016, the Funds had an arrangement with their custodian whereby credits were earned on uninvested cash balances, which could be used to reduce custody fees and/or overdraft charges. Credits previously earned may have been utilized until December 31, 2016. Under current arrangements effective June 1, 2016, the Funds no longer earn credits on uninvested cash, and may incur charges on uninvested cash balances and overdrafts, subject to certain conditions.
3. Investment Valuation and Fair Value Measurements:
Investment Valuation Policies: The Funds’ investments are valued at fair value (also referred to as “market value” within the financial statements) as of the close of trading on the New York Stock Exchange (“NYSE”) (generally 4:00 p.m., Eastern time). U.S. GAAP defines fair value as the price the Funds would receive to sell an asset or pay to transfer a liability in an orderly transaction between market participants at the measurement date. The Funds determine the fair values of their financial instruments using various independent dealers or pricing services under policies approved by the Board of Trustees of each Fund (the “Board”). The BlackRock Global Valuation Methodologies Committee (the “Global Valuation Committee”) is the committee formed by management to develop global pricing policies and procedures and to oversee the pricing function for all financial instruments.
Fair Value Inputs and Methodologies: The following methods and inputs are used to establish the fair value of each Fund’s assets and liabilities:
| • | | Equity investments traded on a recognized securities exchange are valued at the official closing price each day, if available. For equity investments traded on more than one exchange, the official closing price on the exchange where the stock is primarily traded is used. Equity investments traded on a recognized exchange for which there were no sales on that day may be valued at the last available bid (long positions) or ask (short positions) price. Generally, trading in foreign instruments is substantially completed each day at various times prior to the close of trading on the NYSE. Occasionally, events affecting the values of such instruments may occur between the foreign market close and the close of trading on the NYSE that may not be reflected in the computation of the Funds’ net assets. Each business day, the Funds use a pricing service to assist with the valuation of certain foreign exchange-traded equity securities and foreign exchange-traded over-the-counter (“OTC”) options (the “Systematic Fair Value Price”). Using current market factors, the Systematic Fair Value Price is designed to value such foreign securities and foreign options at fair value as of the close of trading on the NYSE, which follows the close of the local markets. |
| • | | Investments in open-end U.S. mutual funds are valued at net asset value (“NAV”) each business day. |
| • | | The Funds value their investment in SL Liquidity Series, LLC, Money Market Series (the “Money Market Series”) at fair value, which is ordinarily based upon their pro rata ownership in the underlying fund’s net assets. The Money Market Series seeks current income consistent with maintaining liquidity and preserving capital. Although the Money Market Series is not registered under the 1940 Act, its investments may follow the parameters of investments by a money market fund that is subject to Rule 2a-7 under the 1940 Act. |
| • | | Securities and other assets and liabilities denominated in foreign currencies are translated into U.S. dollars using exchange rates determined as of the close of trading on the NYSE. Forward foreign currency exchange contracts are valued at the mean between the bid and ask prices and are determined as of the close of trading on the NYSE. Interpolated values are derived when the settlement date of the contract is an interim date for which quotations are not available |
| | | | | | |
| | | | | | | |
| | SEMI-ANNUAL REPORT | | JANUARY 31, 2017 | | 35 |
| | |
| Notes to Financial Statements (continued) | | |
If events (e.g., a company announcement, market volatility or a natural disaster) occur that are expected to materially affect the value of such investments, or in the event that the application of these methods of valuation results in a price for an investment that is deemed not to be representative of the market value of such investment, or if a price is not available, the investment will be valued by the Global Valuation Committee, or its delegate, in accordance with a policy approved by the Board as reflecting fair value (“Fair Valued Investments”).
The fair valuation approaches that may be used by the Global Valuation Committee will include Market approach, Income approach and Cost approach. Valuation techniques such as discounted cash flow, use of market comparables and matrix pricing are types of valuation approaches and typically used in determining fair value. When determining the price for Fair Valued Investments, the Global Valuation Committee, or its delegate, seeks to determine the price that each Fund might reasonably expect to receive or pay from the current sale or purchase of that asset or liability in an arm’s-length transaction. Fair value determinations shall be based upon all available factors that the Global Valuation Committee, or its delegate, deems relevant and consistent with the principles of fair value measurement. The pricing of all Fair Valued Investments is subsequently reported to the Board or a committee thereof on a quarterly basis.
Fair Value Hierarchy: Various inputs are used in determining the fair value of investments. These inputs to valuation techniques are categorized into a fair value hierarchy consisting of three broad levels for financial statement purposes as follows:
| • | | Level 1 — unadjusted price quotations in active markets/exchanges for identical assets or liabilities that each Fund has the ability to access |
| • | | Level 2 — other observable inputs (including, but not limited to, quoted prices for similar assets or liabilities in markets that are active, quoted prices for identical or similar assets or liabilities in markets that are not active, inputs other than quoted prices that are observable for the assets or liabilities (such as interest rates, yield curves, volatilities, prepayment speeds, loss severities, credit risks and default rates) or other market–corroborated inputs) |
| • | | Level 3 — unobservable inputs based on the best information available in the circumstances, to the extent observable inputs are not available (including each Fund’s own assumptions used in determining the fair value of investments) |
The hierarchy gives the highest priority to unadjusted quoted prices in active markets for identical assets or liabilities (Level 1 measurements) and the lowest priority to unobservable inputs (Level 3 measurements). Accordingly, the degree of judgment exercised in determining fair value is greatest for instruments categorized in Level 3. The inputs used to measure fair value may fall into different levels of the fair value hierarchy. In such cases, for disclosure purposes, the fair value hierarchy classification is determined based on the lowest level input that is significant to the fair value measurement in its entirety. Investments classified within Level 3 have significant unobservable inputs used by the Global Valuation Committee in determining the price for Fair Valued Investments. Level 3 investments include equity or debt issued by Private Companies. There may not be a secondary market, and/or there are a limited number of investors. Level 3 investments may also be adjusted to reflect illiquidity and/or non-transferability, with the amount of such discount estimated by the Global Valuation Committee in the absence of market information.
Changes in valuation methodologies may result in transfers into or out of an assigned level within the hierarchy. In accordance with each Fund’s policy, transfers between different levels of the fair value hierarchy are deemed to have occurred as of the beginning of the reporting period. The categorization of a value determined for investments is based on the pricing transparency of the investments and is not necessarily an indication of the risks associated with investing in those securities.
4. Securities and Other Investments:
Securities Lending: Certain Funds may lend their securities to approved borrowers, such as brokers, dealers and other financial institutions. The borrower pledges and maintains with the Funds collateral consisting of cash, an irrevocable letter of credit issued by a bank, or securities issued or guaranteed by the U.S. Government. The initial collateral received by each Fund is required to have a value of at least 102% of the current value of the loaned securities for securities traded on U.S. exchanges and a value of at least 105% for all other securities. The collateral is maintained thereafter at a value equal to at least 100% of the current market value of the securities on loan. The market value of the loaned securities is determined at the close of each business day of the Fund and any additional required collateral is delivered to the Fund, or excess collateral returned by the Fund, on the next business day. During the term of the loan, the Funds are entitled to all distributions made on or in respect of the loaned securities but does not receive interest income on securities received as collateral. Loans of securities are terminable at any time and the borrower, after notice, is required to return borrowed securities within the standard time period for settlement of securities transactions.
The market value of any securities on loan, all of which were classified as common stocks in the Funds’ Schedules of Investments, and the value of any related collateral are shown separately in the Statements of Assets and Liabilities as a component of investments at value-unaffiliated, and collateral on securities loaned at value, respectively. As of period end, any securities on loan were collateralized by cash and/or U.S. Government obligations. Cash collateral invested by the securities lending agent, BlackRock Investment Management, LLC (“BIM”), if any, is disclosed in the Schedules of Investments.
Securities lending transactions are entered into by the Funds under Master Securities Lending Agreements (each, an “MSLA”), which provide the right, in the event of default (including bankruptcy or insolvency), for the non-defaulting party to liquidate the collateral and calculate a net exposure to the defaulting party or request additional collateral. In the event that a borrower defaults, the Funds, as lender, would offset the market value of the collateral
| | | | | | |
| | | | | | | |
| 36 | | SEMI-ANNUAL REPORT | | JANUARY 31, 2017 | | |
| | | | |
| Notes to Financial Statements (continued) | | |
received against the market value of the securities loaned. When the value of the collateral is greater than that of the market value of the securities loaned, the lender is left with a net amount payable to the defaulting party. However, bankruptcy or insolvency laws of a particular jurisdiction may impose restrictions on or prohibitions against such a right of offset in the event of an MSLA
counterparty’s bankruptcy or insolvency. Under the MSLA, absent an event of default, the borrower can resell or re-pledge the loaned securities, and a Fund can reinvest cash collateral received in connection with loaned securities. Upon an event of default, the parties’ obligations to return the securities or collateral to the other party are extinguished, and the parties can resell or re-pledge the loaned securities or the collateral received in connection with the loaned securities in order to satisfy the defaulting party’s net payment obligation for all transactions under the MSLA. The defaulting party remains liable for any deficiency.
As of period end, the following table is a summary of the Funds’ securities lending agreements by counterparty which are subject to offset under an MSLA:
Equity Dividend
| | | | | | | | | | | | |
| | | Securities
Loaned
at Value | | | Cash
Collateral
Received1 | | | Net
Amount2 | |
Citigroup Global Markets, Inc. | | $ | 266,208 | | | $ | (266,208 | ) | | | — | |
| | | |
| Natural Resources | | | | | | | | | | | | |
| | | Securities
Loaned
at Value | | | Cash
Collateral
Received1 | | | Net
Amount2 | |
Citigroup Global Markets, Inc. | | $ | 533,749 | | | $ | (533,749 | ) | | | — | |
Deutsche Bank Securities, Inc. | | | 4,895,484 | | | | (4,895,484 | ) | | | — | |
JPMorgan Securities LLC. | | | 1,902,435 | | | | (1,902,435 | ) | | | — | |
Morgan Stanley & Co. LLC | | | 1,204,379 | | | | (1,204,379 | ) | | | — | |
State Street Bank & Trust Co. | | | 1,024,733 | | | | (1,024,733 | ) | | | — | |
| | | | |
| | $ | 9,560,780 | | | $ | (9,560,780 | ) | | | — | |
| | | | |
| | 1 | | Cash collateral with a value of $269,925 and $9,884,263, respectively, has been received in connection with securities lending agreements. Collateral received in excess of the value of securities loaned from the individual counterparty is not shown for financial reporting purposes in the table above. |
| | 2 | | The market value of the loaned securities is determined as of January 31, 2017. Additional collateral is delivered to the Fund on the next business day in accordance with the MSLA. The net amount would be subject to the borrower default indemnity in the event of default by the counterparty. |
The risks of securities lending include the risk that the borrower may not provide additional collateral when required or may not return the securities when due. To mitigate these risks, the Funds benefit from a borrower default indemnity provided by BIM. BIM’s indemnity allows for full replacement of the securities loaned if the collateral received does not cover the value on the securities loaned in the event of borrower default. Each Fund could suffer a loss if the value of an investment purchased with cash collateral falls below the market value of loaned securities or if the value of an investment purchased with cash collateral falls below the value of the original cash collateral received.
5. Investment Advisory Agreement and Other Transactions with Affiliates:
The PNC Financial Services Group, Inc. is the largest stockholder and an affiliate of BlackRock, Inc. (“BlackRock”) for 1940 Act purposes.
Investment Advisory: Each Fund entered into an Investment Advisory Agreement with the Manager, the Funds’ investment adviser, an indirect, wholly-owned subsidiary of BlackRock, to provide investment advisory and administration services. The Manager is responsible for the management of each Fund’s portfolio and provides the personnel, facilities, equipment and certain other services necessary to the operations of each Fund.
For such services, each Fund pays the Manager a monthly fee at an annual rate equal to the following percentages of the average daily value of each Fund’s net assets.
Equity Dividend
| | | | |
| Average Daily Net Assets | | Investment Advisory Fee | |
First $8 Billion | | | 0.60% | |
$8 Billion — $10 Billion | | | 0.56% | |
$10 Billion — $12 Billion | | | 0.54% | |
$12 Billion — $17 Billion | | | 0.52% | |
$17 Billion — $25 Billion | | | 0.51% | |
$25 Billion — $30 Billion | | | 0.50% | |
$30 Billion — $40 Billion | | | 0.47% | |
Greater than $40 Billion | | | 0.45% | |
| | | | | | |
| | | | | | | |
| | SEMI-ANNUAL REPORT | | JANUARY 31, 2017 | | 37 |
| | |
| Notes to Financial Statements (continued) | | |
| | | | |
Natural Resources | |
| Average Daily Net Assets | | Investment Advisory Fee | |
First $1 Billion | | | 0.60% | |
$1 Billion — $3 Billion | | | 0.56% | |
$3 Billion — $5 Billion | | | 0.54% | |
$5 Billion — $10 Billion | | | 0.52% | |
Greater than $10 Billion | | | 0.51% | |
Service and Distribution Fees: The Fund entered into a Distribution Agreement and a Distribution and Service Plan with BlackRock Investments, LLC (“BRIL”), an affiliate of the Manager. Pursuant to the Distribution and Service Plan and in accordance with Rule 12b-1 under the 1940 Act, each Fund pays BRIL ongoing service and distribution fees. The fees are accrued daily and paid monthly at annual rates based upon the average daily net assets of the relevant share class of each Fund as follows:
| | | | | | | | |
| | | Service Fees | |
| | | Equity Dividend | | | Natural Resources | |
Service | | | 0.25% | | | | N/A | |
Investor A | | | 0.25% | | | | 0.25% | |
Investor B | | | 0.25% | | | | 0.25% | |
Investor C | | | 0.25% | | | | 0.25% | |
Investor C1 | | | 0.25% | | | | N/A | |
Class R | | | 0.25% | | | | N/A | |
| | | | | | | | |
| | | Distribution Fees | |
| | | Equity Dividend | | | Natural Resources | |
Investor B | | | 0.75% | | | | 0.75% | |
Investor C | | | 0.75% | | | | 0.75% | |
Investor C1 | | | 0.55% | | | | N/A | |
Class R | | | 0.25% | | | | N/A | |
BRIL and broker-dealers, pursuant to sub-agreements with BRIL, provide shareholder servicing and distribution services to the Funds. The ongoing service and/or distribution fee compensates BRIL and each broker-dealer for providing shareholder servicing and/or distribution related services to the shareholders.
For the six months ended January 31, 2017, the following table shows the class specific service and distribution fees borne directly by each share class of each Fund:
| | | | | | | | | | | | | | | | | | | | | | | | | | | | |
| | | Service | | | Investor A | | | Investor B | | | Investor C | | | Investor C1 | | | Class R | | | Total | |
Equity Dividend | | $ | 92,917 | | | $ | 7,381,484 | | | $ | 35,440 | | | $ | 19,945,960 | | | $ | 26,780 | | | $ | 2,140,398 | | | $ | 24,622,979 | |
Natural Resources | | | — | | | $ | 262,767 | | | $ | 1,853 | | | $ | 241,964 | | | | — | | | | — | | | $ | 506,584 | |
Transfer Agent: Pursuant to written agreements, certain financial intermediaries, some of which may be affiliates, provide the Funds with sub-accounting, recordkeeping, sub-transfer agency and other administrative services with respect to sub-accounts they service. For these services, these entities receive an asset-based fee or an annual fee per shareholder account, which will vary depending on share class and/or net assets. For the six months ended January 31, 2017, the Funds paid the following amounts to affiliates of BlackRock in return for these services, which are included in transfer agent — class specific in the Statements of Operations:
| | | | | | | | | | | | | | | | |
| | | Institutional | | | Investor A | | | Investor C | | | Total | |
Equity Dividend | | $ | 205,374 | | | $ | 6,589 | | | $ | 63 | | | $ | 212,026 | |
The Manager maintains a call center that is responsible for providing certain shareholder services to the Funds. Shareholder services include responding to inquiries and processing subscriptions and redemptions transactions based upon instructions from shareholders. For the six months ended January 31, 2017, each Fund reimbursed the Manager the following amounts for costs incurred in running the call center, which are included in transfer agent — class specific in the Statements of Operations:
| | | | | | | | | | | | | | | | | | | | | | | | | | | | | | | | | | | | |
| | | Institutional | | | Service | | | Investor A | | | Investor B | | | Investor C | | | Investor C1 | | | Class K | | | Class R | | | Total | |
Equity Dividend | | $ | 11,379 | | | $ | 57 | | | $ | 31,961 | | | $ | 368 | | | $ | 16,500 | | | $ | 28 | | | $ | 856 | | | $ | 2,361 | | | $ | 63,510 | |
Natural Resources | | $ | 272 | | | | — | | | $ | 3,162 | | | $ | 17 | | | $ | 793 | | | | — | | | | — | | | | — | | | $ | 4,244 | |
| | | | | | |
| | | | | | | |
| 38 | | SEMI-ANNUAL REPORT | | JANUARY 31, 2017 | | |
| | | | |
| Notes to Financial Statements (continued) | | |
For the six months ended January 31, 2017, the following table shows the class specific transfer agent fees borne directly by each class of each Fund:
| | | | | | | | | | | | | | | | | | | | | | | | | | | | | | | | | | | | |
| | | Institutional | | | Service | | | Investor A | | | Investor B | | | Investor C | | | Investor C1 | | | Class K | | | Class R | | | Total | |
Equity Dividend | | $ | 6,309,087 | | | $ | 28,336 | | | $ | 2,634,741 | | | $ | 5,510 | | | $ | 1,458,902 | | | $ | 3,210 | | | $ | 1,039 | | | $ | 707,783 | | | $ | 11,148,608 | |
Natural Resources | | $ | 45,456 | | | | — | | | $ | 157,131 | | | $ | 804 | | | $ | 41,650 | | | | — | | | | — | | | | — | | | $ | 245,041 | |
Other Fees: For the six months ended January 31, 2017, affiliates earned underwriting discounts, direct commissions and dealer concessions on sales of each Fund’s Investor A Shares as follows:
| | | | |
| | | Investor A | |
Equity Dividend | | $ | 126,875 | |
Natural Resources | | $ | 5,886 | |
For the six months ended January 31, 2017, affiliates received CDSCs as follows:
| | | | | | | | |
| | | Equity Dividend | | | Natural Resources | |
Investor A | | $ | 71,550 | | | $ | 423 | |
Investor B | | $ | 84 | | | $ | 46 | |
Investor C | | $ | 81,209 | | | $ | 3,550 | |
Expense Waivers and Reimbursements: With respect to the Funds, the Manager voluntarily agreed to waive its investment advisory fees by the amount of investment advisory fees each Fund pays to the Manager indirectly through its investment in affiliated money market funds (the “affiliated money market fund waiver”). These amounts are shown as fees waived by the Manager in the Statements of Operations. For the six months ended January 31, 2017, the amounts waived were as follows:
| | | | |
| | | Total | |
Equity Dividend | | $ | 241,201 | |
Natural Resources | | $ | 3,024 | |
Effective September 1, 2016, the Manager voluntarily agreed to waive its investment advisory fee with respect to any portion of each Fund’s assets invested in affiliated equity or fixed-income mutual funds or affiliated exchange-traded funds that have a contractual management fee. Prior to September 1, 2016, the Manager did not waive such fees. Effective November 28, 2016, the waiver became contractual through November 30, 2017. The contractual agreement may be terminated upon 90 days’ notice by a majority of the non-interested trustees of the Funds or by a vote of a majority of the outstanding voting securities of the Funds. For the six months ended January 31, 2017, there were no advisory fees waived pursuant to the Agreements.
For the six months ended January 31, 2017, the Funds reimbursed the Manager for certain accounting services, which is included in accounting services in the Statements of Operations. The reimbursements were as follows:
| | | | |
| | | Total | |
Equity Dividend | | $ | 125,974 | |
Natural Resources | | $ | 1,648 | |
Securities Lending: The U.S. Securities and Exchange Commission has issued an exemptive order which permits BIM, an affiliate of the Manager, to serve as securities lending agent for the Funds, subject to applicable conditions. As securities lending agent, BIM bears all operational costs directly related to securities lending. The Funds are responsible for expenses in connection with the investment of cash collateral received for securities on loan (the “collateral investment expenses”). The cash collateral is invested in a private investment company managed by the Manager or its affiliates. However, BIM has agreed to cap the collateral investment expenses of the private investment company to an annual rate of 0.04%. The investment adviser to the private investment company will not charge any advisory fees with respect to shares purchased by the Funds.
Securities lending income is equal to the total of income earned from the reinvestment of cash collateral, net of fees and other payments to and from borrowers of securities, and less the collateral investment expenses. Each Fund retains a portion of securities lending income and remits a remaining portion to BIM as compensation for its services as securities lending agent.
Pursuant to a securities lending agreement, each Fund retains 71.5% of securities lending income, and this amount retained can never be less than 65% of the total of securities lending income plus the collateral investment expenses.
In addition, commencing the business day following the date that the aggregate securities lending income earned across the Equity-Bond Complex in a calendar year exceeds a specified threshold, each Fund, pursuant to the securities lending agreement, will retain for the remainder of that calendar year securities lending income as follows: 75% of securities lending income, and this amount retained can never be less than 65% of the total of securities lending income plus the collateral investment expenses.
| | | | | | |
| | | | | | | |
| | SEMI-ANNUAL REPORT | | JANUARY 31, 2017 | | 39 |
| | |
| Notes to Financial Statements (continued) | | |
The share of securities lending income earned by each Fund is shown as securities lending — affiliated — net in the Statements of Operations. For the six months ended January 31, 2017, each Fund paid BIM the following amounts for securities lending agent services:
| | | | |
Equity Dividend | | $ | 408,204 | |
Natural Resources | | $ | 3,444 | |
Interfund Lending: In accordance with an exemptive order (the “Order”) from the U.S. Securities and Exchange Commission, Natural Resources may participate in a joint lending and borrowing facility for temporary purposes (the “Interfund Lending Program”), subject to compliance with the terms and conditions of the Order, and to the extent permitted by Natural Resources’ investment policies and restrictions. Natural Resources is currently permitted to borrow and lend under the Interfund Lending Program.
Natural Resources may lend in aggregate up to 15% of its net assets, but may not lend more than 5% of its net assets to any one borrowing fund through the Interfund Lending Program. Natural Resources may not borrow through the Interfund Lending Program or from any other source more than 33 1/3% of its total assets (or any lower threshold provided for by the Fund’s investment restrictions). If Natural Resources’ total outstanding borrowings exceed 10% of its total assets, each of its outstanding interfund loans will be subject to collateralization of at least 102% of the outstanding principal value of the loan. All interfund loans are for temporary or emergency purposes and the interest rate to be charged will be the average of the highest current overnight repurchase agreement rate available to a lending fund and the bank loan rate, as calculated according to a formula established by the Board.
During the period ended January 31, 2017, Natural Resources did not participate in the Interfund Lending Program.
Officers and Trustees: Certain officers and/or trustees of the Funds are officers and/or trustees of BlackRock or its affiliates The Funds reimburse the Manager for a portion of the compensation paid to the Funds’ Chief Compliance Officer, which is included in Officer and Trustees in the Statements of Operations.
Other Transactions: The Funds may purchase securities from, or sell securities to, an affiliated fund provided the affiliation is due solely to having a common investment adviser, common officers, or common trustees. For the six months ended January 31, 2017, the purchase and sale transactions and any net realized gains (losses) with an affiliated fund in compliance with Rule 17a-7 under the 1940 Act were as follows:
| | | | | | | | | | | | |
| | | Purchases | | | Sales | | | Net Realized
Gain (Loss) | |
Equity Dividend | | | $22,479,048 | | | | — | | | | — | |
6. Purchases and Sales:
For the six months ended January 31, 2017, purchases and sales of investments, excluding short-term securities, were as follows:
| | | | | | | | |
| | | Purchases | | | Sales | |
Equity Dividend | | $ | 2,805,954,565 | | | $ | 4,956,396,229 | |
Natural Resources | | $ | 7,621,274 | | | $ | 5,772,683 | |
7. Income Tax Information:
It is the Funds’ policy to comply with the requirements of the Internal Revenue Code of 1986, as amended, applicable to regulated investment companies, and to distribute substantially all of their taxable income to their shareholders. Therefore, no federal income tax provision is required.
Each Fund files U.S. federal and various state and local tax returns. No income tax returns are currently under examination. The statute of limitations on each Fund’s U.S. federal tax returns generally remains open for each of the four years ended July 31, 2016. The statutes of limitations on each Fund’s state and local tax returns may remain open for an additional year depending upon the jurisdiction.
Management has analyzed tax laws and regulations and their application to the Funds as of January 31, 2017, inclusive of the open tax return years, and does not believe that there are any uncertain tax positions that require recognition of a tax liability in the Funds’ financial statements.
As of July 31, 2016, the Funds had capital loss carryforwards available to offset future realized capital gains through the indicated expiration dates as follows:
| | | | | | | | | | | | |
| Expires July 31, | | Equity Dividend1 | | | Natural Resources | | | | |
No expiration date2 | | | — | | | $ | 1,035,562 | | | | | |
2018 | | $ | 1,491,156 | | | | — | | | | | |
| | | | |
Total | | $ | 1,491,156 | | | $ | 1,035,562 | | | | | |
| | | | |
| | 1 | | Subject to annual limitations. |
| | 2 | | Must be utilized prior to losses subject to expiration. |
| | | | | | |
| | | | | | | |
| 40 | | SEMI-ANNUAL REPORT | | JANUARY 31, 2017 | | |
| | | | |
| Notes to Financial Statements (continued) | | |
As of January 31, 2017, gross unrealized appreciation and depreciation based on cost for federal income tax purposes were as follows:
| | | | | | | | |
| | | Equity Dividend | | | Natural Resources | |
Tax cost | | $ | 14,782,225,335 | | | $ | 196,431,747 | |
| | | | | | | | |
Gross unrealized appreciation | | $ | 6,609,348,277 | | | $ | 167,213,179 | |
Gross unrealized depreciation | | | (274,891,767 | ) | | | (10,557,722 | ) |
| | | | | | | | |
Net unrealized appreciation | | $ | 6,334,456,510 | | | $ | 156,655,457 | |
| | | | | | | | |
8. Bank Borrowings:
The Funds, along with certain other funds managed by the Manager and its affiliates (“Participating Funds”), is a party to a 364-day, $2.1 billion credit agreement with a group of lenders. Under this agreement, the Funds may borrow to fund shareholder redemptions. Excluding commitments designated for certain individual funds, the Participating Funds, including the Funds, can borrow up to an aggregate commitment amount of $1.6 billion at any time outstanding, subject to asset coverage and other limitations as specified in the agreement.
The credit agreement has the following terms: a fee of 0.12% per annum on unused commitment amounts and interest at a rate equal to the higher of (a) one-month LIBOR (but, in any event, not less than 0.00%) on the date the loan is made plus 0.80% per annum or (b) the
Fed Funds rate (but, in any event, not less than 0.00%) in effect from time to time plus 0.80% per annum on amounts borrowed. The agreement expires in April 2017 unless extended or renewed. Prior to April 21, 2016, the credit agreement had a fee per annum of 0.06% on unused commitment amounts and interest at a rate equal to the higher of (a) one-month LIBOR (but, in any event, not less than 0.00%) on the date the loan is made plus 0.80% per annum or (b) the Fed Funds rate (but, in any event, not less than 0.00%) in effect from time to time plus 0.80% per annum on amounts borrowed. Participating Funds paid administration, legal and arrangement fees, which, if applicable, are included in miscellaneous expenses in the Statements of Operations. These fees were allocated among such funds based upon portions of the aggregate commitment available to them and relative net assets of Participating Funds. During the six months ended January 31, 2017, the Funds did not borrow under the credit agreement.
9. Principal Risks:
In the normal course of business, certain Funds invest in securities and enter into transactions where risks exist due to fluctuations in the market (market risk) or failure of the issuer to meet all its obligations, including the ability to pay principal and interest when due (issuer credit risk). The value of securities held by the Funds may decline in response to certain events, including those directly involving the issuers of securities owned by the Funds. Changes arising from the general economy, the overall market and local, regional or global political and/or social instability, as well as currency, interest rate and price fluctuations, may also affect the securities’ value.
On October 11, 2016, BlackRock implemented certain changes required by amendments to Rule 2a-7 under the 1940 Act, which governs the operations of U.S. money market funds. The Funds may be exposed to additional risks when reinvesting cash collateral in money market funds that do not seek to maintain a stable NAV per share of $1.00 and which may be subject to redemption gates or liquidity fees under certain circumstances.
Valuation Risk: The market values of equities, such as common stocks and preferred securities or equity related investments, such as futures and options, may decline due to general market conditions which are not specifically related to a particular company. They may also decline due to factors which affect a particular industry or industries. A Fund may invest in illiquid investments and may experience difficulty in selling those investments in a timely manner at the price that it believes the investments are worth. Prices may fluctuate widely over short or extended periods in response to company, market or economic news. Markets also tend to move in cycles, with periods of rising and falling prices. This volatility may cause each Fund’s NAV to experience significant increases or decreases over short periods of time. If there is a general decline in the securities and other markets, the NAV of a Fund may lose value, regardless of the individual results of the securities and other instruments in which the Fund invests.
Counterparty Credit Risk: Similar to issuer credit risk, the Funds may be exposed to counterparty credit risk, or the risk that an entity may fail to or be unable to perform on its commitments related to unsettled or open transactions. The Funds manage counterparty credit risk by entering into transactions only with counterparties that the Manager believes have the financial resources to honor their obligations and by monitoring the financial stability of those counterparties. Financial assets, which potentially expose the Funds to market, issuer and counterparty credit risks, consist principally of financial instruments and receivables due from counterparties. The extent of the Funds’ exposure to market, issuer and counterparty credit risks with respect to these financial assets is approximately their value recorded in the Statements of Assets and Liabilities, less any collateral held by the Funds.
Concentration Risk: As of period end, Equity Dividend and National Resources invested a significant portion of their assets in securities in the Financials and Oil, Gas Exploration & Production sectors, respectively. Changes in economic conditions affecting such sectors would have a greater impact on the Funds and could affect the value, income and/or liquidity of positions in such securities.
| | | | | | |
| | | | | | | |
| | SEMI-ANNUAL REPORT | | JANUARY 31, 2017 | | 41 |
| | |
| Notes to Financial Statements (continued) | | |
10. Capital Share Transactions:
Transactions in capital shares for each class were as follows:
| | | | | | | | | | | | | | | | | | | | | | | | | | | | |
| | | Six Months Ended
January 31, 2017 | | | | | | Year Ended
July 31, 2016 | |
| BlackRock Equity Dividend Fund | | Shares | | | Amount | | | | | | Shares | | | Amount | | | | |
| Institutional | | | | | | | | | | | | | | | | | | | | | | | | | | | | |
Shares sold | | | 49,654,049 | | | $ | 1,119,963,854 | | | | | | | | | | | | 98,661,291 | | | $ | 2,140,500,332 | | | | | |
Shares issued in reinvestment of distributions | | | 31,841,175 | | | | 708,012,003 | | | | | | | | | | | | 84,562,904 | | | | 1,760,775,380 | | | | | |
Shares redeemed | | | (96,665,864 | ) | | | (2,176,566,437 | ) | | | | | | | | | | | (193,797,774 | ) | | | (4,256,112,995 | ) | | | | |
| | | | | | | | | | | | |
Net decrease | | | (15,170,640 | ) | | $ | (348,590,580 | ) | | | | | | | | | | | (10,573,579 | ) | | $ | (354,837,283 | ) | | | | |
| | | | | | | | | | | | |
| | | | | | | | | | | | | | | | | | | | | | | | | | | | |
| Service | | | | | | | | | | | | | | | | | | | | | | | | | | | | |
Shares sold | | | 228,381 | | | $ | 5,119,311 | | | | | | | | | | | | 479,410 | | | $ | 10,382,294 | | | | | |
Shares issued in reinvestment of distributions | | | 200,107 | | | | 4,438,948 | | | | | | | | | | | | 673,882 | | | | 13,980,961 | | | | | |
Shares redeemed | | | (1,423,105 | ) | | | (31,945,646 | ) | | | | | | | | | | | (1,265,951 | ) | | | (27,923,427 | ) | | | | |
| | | | | | | | | | | | |
Net decrease | | | (994,617 | ) | | $ | (22,387,387 | ) | | | | | | | | | | | (112,659 | ) | | $ | (3,560,172 | ) | | | | |
| | | | | | | | | | | | |
| | | | | | | | | | | | | | | | | | | | | | | | | | | | |
| Investor A | | | | | | | | | | | | | | | | | | | | | | | | | | | | |
Shares sold | | | 21,137,933 | | | $ | 474,032,285 | | | | | | | | | | | | 37,732,443 | | | $ | 825,274,106 | | | | | |
Shares issued in reinvestment of distributions | | | 17,404,766 | | | | 386,315,964 | | | | | | | | | | | | 46,287,226 | | | | 961,171,515 | | | | | |
Shares redeemed | | | (46,172,737 | ) | | | (1,036,885,799 | ) | | | | | | | | | | | (107,302,972 | ) | | | (2,375,393,685 | ) | | | | |
| | | | | | | | | | | | |
Net decrease | | | (7,630,038 | ) | | $ | (176,537,550 | ) | | | | | | | | | | | (23,283,303 | ) | | $ | (588,948,064 | ) | | | | |
| | | | | | | | | | | | |
| | | | | | | | | | | | | | | | | | | | | | | | | | | | |
| Investor B | | | | | | | | | | | | | | | | | | | | | | | | | | | | |
Shares sold | | | 6,847 | | | $ | 156,206 | | | | | | | | | | | | 24,565 | | | $ | 528,746 | | | | | |
Shares issued in reinvestment of distributions | | | 16,497 | | | | 371,878 | | | | | | | | | | | | 108,651 | | | | 2,276,122 | | | | | |
Shares redeemed | | | (238,260 | ) | | | (5,404,272 | ) | | | | | | | | | | | (557,825 | ) | | | (12,255,828 | ) | | | | |
| | | | | | | | | | | | |
Net decrease | | | (214,916 | ) | | $ | (4,876,188 | ) | | | | | | | | | | | (424,609 | ) | | $ | (9,450,960 | ) | | | | |
| | | | | | | | | | | | |
| | | | | | | | | | | | | | | | | | | | | | | | | | | | |
| Investor C | | | | | | | | | | | | | | | | | | | | | | | | | | | | |
Shares sold | | | 5,409,096 | | | $ | 118,134,600 | | | | | | | | | | | | 13,682,936 | | | $ | 288,713,734 | | | | | |
Shares issued in reinvestment of distributions | | | 8,526,413 | | | | 183,632,736 | | | | | | | | | | | | 22,491,389 | | | | 452,761,655 | | | | | |
Shares redeemed | | | (20,801,768 | ) | | | (453,058,102 | ) | | | | | | | | | | | (33,919,106 | ) | | | (721,272,962 | ) | | | | |
| | | | | | | | | | | | |
Net increase (decrease) | | | (6,866,259 | ) | | $ | (151,290,766 | ) | | | | | | | | | | | 2,255,219 | | | $ | 20,202,427 | | | | | |
| | | | | | | | | | | | |
| | | | | | | | | | | | | | | | | | | | | | | | | | | | |
| Investor C1 | | | | | | | | | | | | | | | | | | | | | | | | | | | | |
Shares sold | | | 2,494 | | | $ | 54,023 | | | | | | | | | | | | 6,225 | | | $ | 135,439 | | | | | |
Shares issued in reinvestment of distributions | | | 17,463 | | | | 375,366 | | | | | | | | | | | | 45,313 | | | | 911,495 | | | | | |
Shares redeemed | | | (37,470 | ) | | | (818,986 | ) | | | | | | | | | | | (37,817 | ) | | | (801,960 | ) | | | | |
| | | | | | | | | | | | |
Net increase (decrease) | | | (17,513 | ) | | $ | (389,597 | ) | | | | | | | | | | | 13,721 | | | $ | 244,974 | | | | | |
| | | | | | | | | | | | |
| | | | | | | | | | | | | | | | | | | | | | | | | | | | |
| Class K1 | | | | | | | | | | | | | | | | | | | | | | | | | | | | |
Shares sold | | | 2,591,081 | | | $ | 59,061,126 | | | | | | | | | | | | 1,074,737 | | | $ | 23,221,737 | | | | | |
Shares issued in reinvestment of distributions | | | 150,622 | | | | 3,349,807 | | | | | | | | | | | | 6,627 | | | | 145,927 | | | | | |
Shares redeemed | | | (634,336 | ) | | | (14,364,123 | ) | | | | | | | | | | | (57,209 | ) | | | (1,221,860 | ) | | | | |
| | | | | | | | | | | | |
Net increase | | | 2,107,367 | | | $ | 48,046,810 | | | | | | | | | | | | 1,024,155 | | | $ | 22,145,804 | | | | | |
| | | | | | | | | | | | |
| | 1 | | Commenced operations on March 28, 2016. |
| | | | | | |
| | | | | | | |
| 42 | | SEMI-ANNUAL REPORT | | JANUARY 31, 2017 | | |
| | |
| Notes to Financial Statements (concluded) | | |
| | | | | | | | | | | | | | | | | | | | | | | | |
| | | Six Months Ended
January 31, 2017 | | | | | | Year Ended
July 31, 2016 | |
| BlackRock Equity Dividend Fund (concluded) | | Shares | | | Amount | | | | | | Shares | | | Amount | | | | |
| Class R | | | | | | | | | | | | | | | | | | | | | | | | |
Shares sold | | | 2,442,930 | | | $ | 55,238,678 | | | | | | | | 5,347,738 | | | $ | 118,119,176 | | | | | |
Shares issued in reinvestment of distributions | | | 2,510,074 | | | | 56,096,403 | | | | | | | | 6,658,665 | | | | 138,975,708 | | | | | |
Shares redeemed | | | (6,056,411 | ) | | | (136,728,723 | ) | | | | | | | (13,020,924 | ) | | | (286,635,807 | ) | | | | |
| | | | | | | | | | | | |
Net decrease | | | (1,103,407 | ) | | $ | (25,393,642 | ) | | | | | | | (1,014,521 | ) | | $ | (29,540,923 | ) | | | | |
| | | | | | | | | | | | |
Total Net Decrease | | | (29,890,023 | ) | | $ | (681,418,900 | ) | | | | | | | (32,115,576 | ) | | $ | (943,744,197 | ) | | | | |
| | | | | | | | | | | | |
| | | | | | | | | | | | | | | | | | | | | | | | |
| | | Six Months Ended
January 31, 2017 | | | | | | Year Ended
July 31, 2016 | |
| BlackRock Natural Resources Fund | | Shares | | | Amount | | | | | | Shares | | | Amount | | | | |
| Institutional | | | | | | | | | | | | | | | | | | | | | | | | |
Shares sold | | | 564,312 | | | $ | 25,816,853 | | | | | | | | 836,276 | | | $ | 34,012,068 | | | | | |
Shares issued in reinvestment of distributions | | | 12,857 | | | | 621,010 | | | | | | | | 101,571 | | | | 3,890,188 | | | | | |
Shares redeemed | | | (402,572 | ) | | | (18,616,098 | ) | | | | | | | (1,053,338 | ) | | | (44,932,495 | ) | | | | |
| | | | | | | | | | | | |
Net increase (decrease) | | | 174,597 | | | $ | 7,821,765 | | | | | | | | (115,491 | ) | | $ | (7,030,239 | ) | | | | |
| | | | | | | | | | | | |
| | | | | | | | | | | | | | | | | | | | | | | | |
| Investor A | | | | | | | | | | | | | | | | | | | | | | | | |
Shares sold | | | 722,890 | | | $ | 32,329,484 | | | | | | | | 1,832,581 | | | $ | 72,520,771 | | | | | |
Shares issued in reinvestment of distributions | | | 28,193 | | | | 1,318,601 | | | | | | | | 321,755 | | | | 11,940,300 | | | | | |
Shares redeemed | | | (796,429 | ) | | | (35,522,528 | ) | | | | | | | (1,804,514 | ) | | | (72,997,222 | ) | | | | |
| | | | | | | | | | | | |
Net increase (decrease) | | | (45,346 | ) | | $ | (1,874,443 | ) | | | | | | | 349,822 | | | $ | 11,463,849 | | | | | |
| | | | | | | | | | | | |
| | | | | | | | | | | | | | | | | | | | | | | | |
| Investor B | | | | | | | | | | | | | | | | | | | | | | | | |
Shares sold | | | — | | | | — | | | | | | | | 178 | | | $ | 6,570 | | | | | |
Shares issued in reinvestment of distributions | | | — | | | | — | | | | | | | | 2,341 | | | | 76,229 | | | | | |
Shares redeemed | | | (6,915 | ) | | $ | (266,198 | ) | | | | | | | (26,175 | ) | | | (910,793 | ) | | | | |
| | | | | | | | | | | | |
Net decrease | | | (6,915 | ) | | $ | (266,198 | ) | | | | | | | (23,656 | ) | | $ | (827,994 | ) | | | | |
| | | | | | | | | | | | |
| | | | | | | | | | | | | | | | | | | | | | | | |
| Investor C | | | | | | | | | | | | | | | | | | | | | | | | |
Shares sold | | | 67,044 | | | $ | 2,563,504 | | | | | | | | 278,994 | | | $ | 9,399,837 | | | | | |
Shares issued in reinvestment of distributions | | | 627 | | | | 25,193 | | | | | | | | 106,217 | | | | 3,391,494 | | | | | |
Shares redeemed | | | (180,348 | ) | | | (6,862,045 | ) | | | | | | | (510,514 | ) | | | (17,565,822 | ) | | | | |
| | | | | | | | | | | | |
Net decrease | | | (112,677 | ) | | $ | (4,273,348 | ) | | | | | | | (125,303 | ) | | $ | (4,774,491 | ) | | | | |
| | | | | | | | | | | | |
Total Net Increase (Decrease) | | | 9,659 | | | $ | 1,407,776 | | | | | | | | 85,372 | | | $ | (1,168,875 | ) | | | | |
| | | | | | | | | | | | |
11. Subsequent Events:
Management has evaluated the impact of all subsequent events on the Funds through the date the financial statements were issued and has determined that there were no subsequent events requiring adjustment or additional disclosure in the financial statements.
| | | | | | |
| | | | | | | |
| | SEMI-ANNUAL REPORT | | JANUARY 31, 2017 | | 43 |
Robert M. Hernandez, Chair of the Board and Trustee
Fred G. Weiss, Vice Chair of the Board and Trustee
James H. Bodurtha, Trustee
Bruce R. Bond, Trustee
Donald W. Burton, Trustee
Honorable Stuart E. Eiszenstat, Trustee
Henry Gabbay, Trustee
Lena G. Goldberg, Trustee
Henry R. Keizer, Trustee
John F. O’Brien, Trustee
Donald C. Opatrny, Trustee
Roberta Cooper Ramo, Trustee
David H. Walsh, Trustee
Robert Fairbairn, Trustee
John M. Perlowski, Trustee, President and Chief Executive Officer
Jennifer McGovern, Vice President
Neal J. Andrews, Chief Financial Officer
Jay M. Fife, Treasurer
Charles Park, Chief Compliance Officer
Fernanda Piedra, Anti-Money Laundering Compliance Officer
Benjamin Archibald, Secretary
On September 26, 2016, the Board appointed Lena G. Goldberg as a Trustee of the Funds effective November 4, 2016.
Effective January 31, 2017, David H. Walsh and Fred G. Weiss retired as Trustees of the Funds.
| | | | | | | | |
| | | | | |
Investment Adviser
BlackRock Advisors, LLC
Wilmington, DE 19809 | | Accounting Agent and Custodian State Street Bank and Trust Company Boston, MA 02110 | | Distributor BlackRock Investments, LLC
New York, NY 10022 | | Independent Registered
Public Accounting Firm
Deloitte & Touche LLP
Boston, MA 02116 | | Address of the Funds
100 Bellevue Parkway
Wilmington, DE 19809 |
| | | | |
| | Transfer Agent
BNY Mellon Investment
Servicing (US) Inc.
Wilmington, DE 19809 | | Legal Counsel Willkie Farr & Gallagher LLP New York, NY 10019 | | | | |
| | | | | | |
| | | | | | | |
| 44 | | SEMI-ANNUAL REPORT | | JANUARY 31, 2017 | | |
Householding
The Funds will mail only one copy of shareholder documents, including prospectuses, annual and semi-annual reports and proxy statements, to shareholders with multiple accounts at the same address. This practice is commonly called “householding” and is intended to reduce expenses and eliminate duplicate mailings of shareholder documents. Mailings of your shareholder documents may be householded indefinitely unless you instruct us otherwise. If you do not want the mailing of these documents to be combined with those for other members of your household, please call the Funds at (800) 441-7762.
Availability of Quarterly Schedule of Investments
The Funds file their complete schedule of portfolio holdings with the SEC for the first and third quarters of each fiscal year on Form N-Q. The Funds’ Forms N-Q are available on the SEC’s website at http://www.sec.gov and may also be reviewed and copied at the SEC’s Public Reference Room in Washington, D.C. Information on the operation of the Public Reference Room or how to access documents on the SEC’s website without charge may be obtained by calling (800) SEC-0330. The Funds’ Forms N-Q may also be obtained upon request and without charge by calling (800) 441-7762.
Availability of Proxy Voting Policies and Procedures
A description of the policies and procedures that the Funds use to determine how to vote proxies relating to portfolio securities is available upon request, without charge, (1) by calling (800) 441-7762; (2) at http://www.blackrock.com; and (3) on the SEC’s website at http://www.sec.gov.
Availability of Proxy Voting Record
Information about how the Funds voted proxies relating to securities held in the Funds’ portfolios during the most recent 12-month period ended June 30 is available upon request and without charge (1) at http://www.blackrock.com or by calling (800) 441-7762 and (2) on the SEC’s website at http://www.sec.gov.
BlackRock’s Mutual Fund Family
BlackRock offers a diverse line up of open-end mutual funds crossing all investment styles and managed by experts in equity, fixed income and tax-exempt investing. Visit http://www.blackrock.com for more information.
Account Information
Call us at (800) 441-7762 from 8:00 AM to 6:00 PM ET on any business day to get information about your account balances, recent transactions and share prices. You can also reach us on the Web at http://www.blackrock.com/funds.
Automatic Investment Plans
Investor Class shareholders who want to invest regularly can arrange to have $50 or more automatically deducted from their checking or savings account and invested in any of the BlackRock funds.
Systematic Withdrawal Plans
Investor Class shareholders can establish a systematic withdrawal plan and receive periodic payments of $50 or more from their BlackRock funds, as long as their account balance is at least $10,000.
Retirement Plans
Shareholders may make investments in conjunction with Traditional, Rollover, Roth, Coverdell, Simple IRAs, SEP IRAs and 403(b) Plans.
| | | | | | |
| | | | | | | |
| | SEMI-ANNUAL REPORT | | JANUARY 31, 2017 | | 45 |
| | | | |
| Additional Information (concluded) | | |
|
| BlackRock Privacy Principles |
BlackRock is committed to maintaining the privacy of its current and former fund investors and individual clients (collectively, “Clients”) and to safeguarding their non-public personal information. The following information is provided to help you understand what personal information BlackRock collects, how we protect that information and why in certain cases we share such information with select parties.
If you are located in a jurisdiction where specific laws, rules or regulations require BlackRock to provide you with additional or different privacy-related rights beyond what is set forth below, then BlackRock will comply with those specific laws, rules or regulations.
BlackRock obtains or verifies personal non-public information from and about you from different sources, including the following: (i) information we receive from you or, if applicable, your financial intermediary, on applications, forms or other documents; (ii) information about your transactions with us, our affiliates, or others; (iii) information we receive from a consumer reporting agency; and (iv) from visits to our websites.
BlackRock does not sell or disclose to non-affiliated third parties any non-public personal information about its Clients, except as permitted by law or as is necessary to respond to regulatory requests or to service Client accounts. These non-affiliated third parties are required to protect the confidentiality and security of this information and to use it only for its intended purpose.
We may share information with our affiliates to service your account or to provide you with information about other BlackRock products or services that may be of interest to you. In addition, BlackRock restricts access to non-public personal information about its Clients to those BlackRock employees with a legitimate business need for the information. BlackRock maintains physical, electronic and procedural safeguards that are designed to protect the non-public personal information of its Clients, including procedures relating to the proper storage and disposal of such information.
| | | | | | |
| | | | | | | |
| 46 | | SEMI-ANNUAL REPORT | | JANUARY 31, 2017 | | |
This report is intended for current holders. It is not authorized for use as an offer of sale or a solicitation of an offer to buy shares a Fund unless preceded or accompanied by the Fund’s current prospectus. Past performance results shown in this report should not be considered a representation of future performance. Investment returns and principal value of shares will fluctuate so that shares, when redeemed, may be worth more or less than their original cost. Statements and other information herein are as dated and are subject to change.

| | |
| EDNR-1/17-SAR | |  |
| Item 2 – | Code of Ethics – Not Applicable to this semi-annual report |
| Item 3 – | Audit Committee Financial Expert – Not Applicable to this semi-annual report |
| Item 4 – | Principal Accountant Fees and Services – Not Applicable to this semi-annual report |
| Item 5 – | Audit Committee of Listed Registrants – Not Applicable |
(a) The registrant’s Schedule of Investments is included as part of the Report to Stockholders filed under Item 1 of this Form.
(b) Not Applicable due to no such divestments during the semi-annual period covered since the previous Form N-CSR filing.
| Item 7 – | Disclosure of Proxy Voting Policies and Procedures for Closed-End Management Investment Companies – Not Applicable |
| Item 8 – | Portfolio Managers of Closed-End Management Investment Companies – Not Applicable |
| Item 9 – | Purchases of Equity Securities by Closed-End Management Investment Company and Affiliated Purchasers – Not Applicable |
| Item 10 – | Submission of Matters to a Vote of Security Holders – There have been no material changes to these procedures. |
| Item 11 – | Controls and Procedures |
(a) – The registrant’s principal executive and principal financial officers, or persons performing similar functions, have concluded that the registrant’s disclosure controls and procedures (as defined in Rule 30a-3(c) under the Investment Company Act of 1940, as amended (the “1940 Act”)) are effective as of a date within 90 days of the filing of this report based on the evaluation of these controls and procedures required by Rule 30a-3(b) under the 1940 Act and Rule 15d-15(b) under the Securities Exchange Act of 1934, as amended.
(b) – There were no changes in the registrant’s internal control over financial reporting (as defined in Rule 30a-3(d) under the 1940 Act) that occurred during the second fiscal quarter of the period covered by this report that have materially affected, or are reasonably likely to materially affect, the registrant’s internal control over financial reporting.
| Item 12 – | Exhibits attached hereto |
(a)(1) – Code of Ethics – Not Applicable to this semi-annual report
(a)(2) – Certifications – Attached hereto
(a)(3) – Not Applicable
(b) – Certifications – Attached hereto
2
Pursuant to the requirements of the Securities Exchange Act of 1934 and the Investment Company Act of 1940, the registrant has duly caused this report to be signed on its behalf by the undersigned, thereunto duly authorized.
BlackRock Natural Resources Trust
| | | | |
| By: | | /s/ John M. Perlowski | | |
| | John M. Perlowski | | |
| | Chief Executive Officer (principal executive officer) of |
| | BlackRock Natural Resources Trust |
Date: April 5, 2017
Pursuant to the requirements of the Securities Exchange Act of 1934 and the Investment Company Act of 1940, this report has been signed below by the following persons on behalf of the registrant and in the capacities and on the dates indicated.
| | | | |
| By: | | /s/ John M. Perlowski | | |
| | John M. Perlowski | | |
| | Chief Executive Officer (principal executive officer) of |
| | BlackRock Natural Resources Trust |
Date: April 5, 2017 | | |
| By: | | /s/ Neal J. Andrews | | |
| | Neal J. Andrews | | |
| | Chief Financial Officer (principal financial officer) of |
| | BlackRock Natural Resources Trust |
Date: April 5, 2017
3