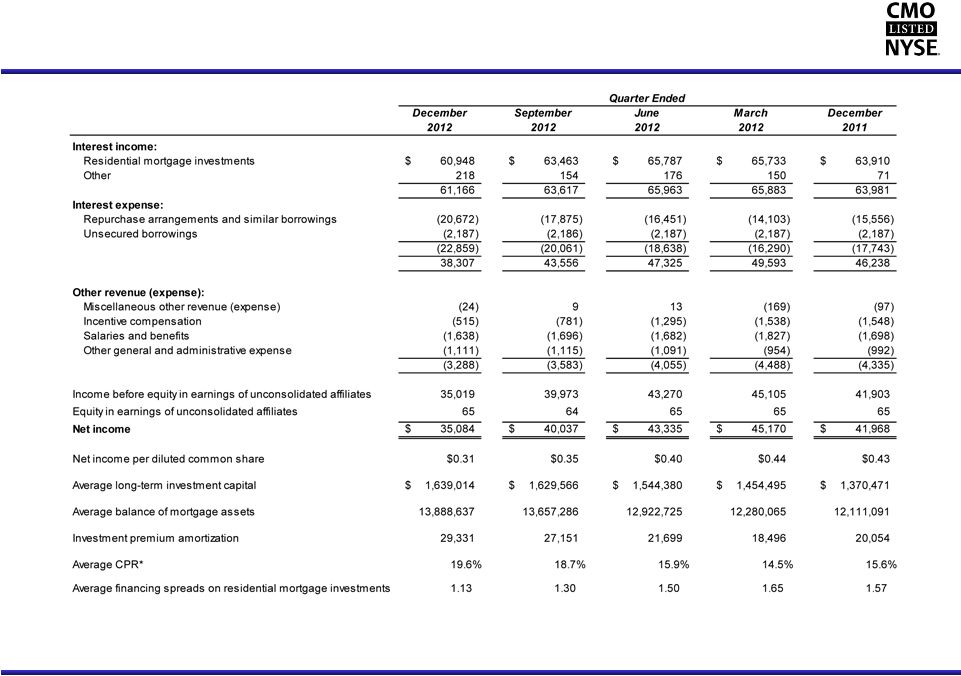
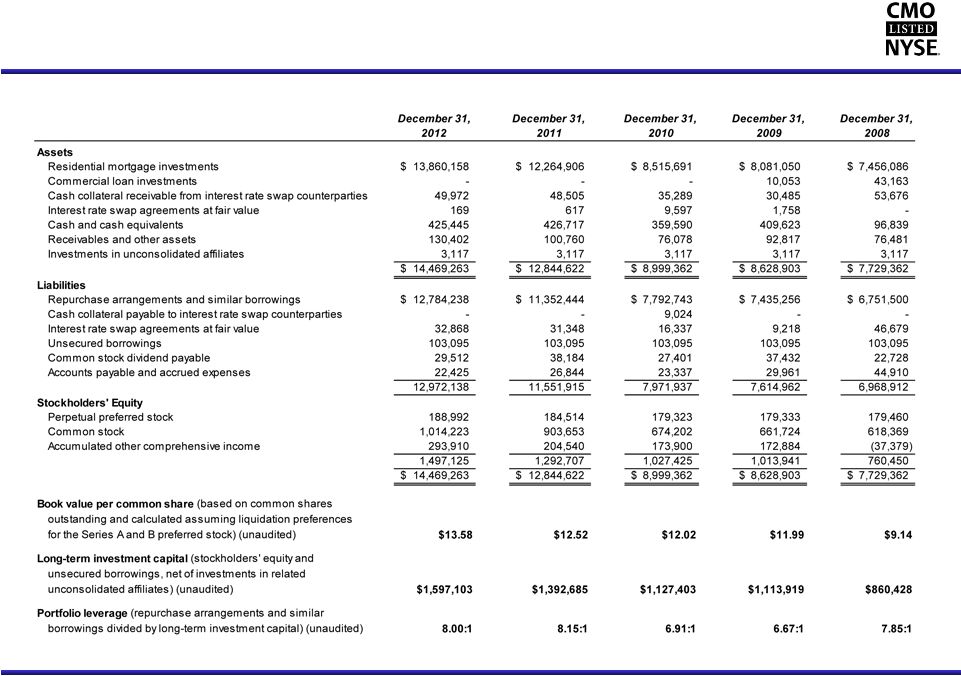
Capstead’s Annual Income Statements – Five Years Ended 2012 (dollars in thousands, except per share amounts) (unaudited) 13 December December December December December 2012 2011 2010 2009 2008 Interest income: Residential mortgage investments 255,931 $ 243,077 $ 198,488 $ 313,676 $ 394,729 $ Other 698 301 1,290 919 5,760 256,629 243,378 199,778 314,595 400,489 Interest expense: Repurchase arrangements and similar borrowings (69,101) (57,328) (47,502) (120,083) (249,706) Unsecured borrowings (8,747) (8,747) (8,747) (8,747) (8,747) Other - (5) (2) - - (77,848) (66,080) (56,251) (128,830) (258,453) 178,781 177,298 143,527 185,765 142,036 Other revenue (expense): Miscellaneous other revenue (expense) (171) (1,023) (904) (40,641) (1,593) Incentive compensation (4,129) (5,697) (5,055) (4,769) (6,000) Salaries and benefits (6,843) (6,701) (6,097) (5,655) (4,978) Other general and administrative expense (4,271) (3,932) (4,834) (5,696) (3,801) (15,414) (17,353) (16,890) (56,761) (16,372) Income before equity in earnings of unconsolidated affiliates 163,367 159,945 126,637 129,004 125,664 Equity in earnings of unconsolidated affiliates 259 259 259 259 259 Net income 163,626 $ 160,204 $ 126,896 $ 129,263 $ 125,923 $ Net income per diluted common share $1.50 $1.75 $1.52 $1.66 $1.93 Average long-term investment capital 1,567,232 $ 1,284,057 $ 1,120,647 $ 1,032,853 $ 813,428 $ Average balance of mortgage assets 13,190,380 10,839,749 7,665,796 7,604,530 7,630,958 Investment premium amortization 96,677 68,077 57,634 29,426 29,336 Average CPR* Average financing spreads on residential mortgage investments 1.68 16.1% Year Ended 16.6% 1.67 16.0% 1.93 29.1% 2.42 1.38 17.2% * The constant prepayment rate, or CPR, represents only prepayments. |