FINANCIAL HIGHLIGHTS
(Dollars in thousands except per share data)
Year Ended December 31
| | | 2011 | | | 2010 | | | 2009 | | | 2008 | | | 2007 | |
| | | | | | | | | | | | | | | | |
| EARNINGS | | | | | | | | | | | | | | | | | | | | |
| Interest income | | $ | 27,509 | | | $ | 29,564 | | | $ | 32,591 | | | $ | 32,669 | | | $ | 33,010 | |
| Interest expense | | | 6,798 | | | | 9,602 | | | | 11,592 | | | | 15,141 | | | | 18,222 | |
| Net interest income | | | 20,711 | | | | 19,962 | | | | 20,999 | | | | 17,528 | | | | 14,788 | |
| Provision for loan losses | | | 1,994 | | | | 10,588 | | | | 5,738 | | | | 690 | | | | 521 | |
| Noninterest income | | | 13,857 | | | | 20,819 | | | | 29,304 | | | | 27,891 | | | | 26,861 | |
| Noninterest expense | | | 30,253 | | | | 52,308 | | | | 44,843 | | | | 37,387 | | | | 36,637 | |
| Provision (credit) for income taxes | | | 658 | | | | (6,502 | ) | | | (660 | ) | | | 2,125 | | | | 1,234 | |
| Net income (loss) | | | 1,664 | | | | (15,613 | ) | | | 382 | | | | 5,217 | | | | 3,257 | |
| | | | | | | | | | | | | | | | | | | | | |
| PER SHARE DATA | | | | | | | | | | | | | | | | | | | | |
| Basic earnings | | $ | 0.34 | | | $ | (3.21 | ) | | $ | 0.07 | | | $ | 1.06 | | | $ | 0.65 | |
| Diluted earnings | | | 0.34 | | | | (3.21 | ) | | | 0.07 | | | | 1.06 | | | | 0.65 | |
| Cash dividends declared | | | - | | | | - | | | | 0.36 | | | | 0.34 | | | | 0.26 | |
| | | | | | | | | | | | | | | | | | | | | |
| AVERAGE BALANCES | | | | | | | | | | | | | | | | | | | | |
| Average shareholders’ equity | | $ | 47,035 | | | $ | 57,281 | | | $ | 63,576 | | | $ | 59,964 | | | $ | 57,945 | |
| Average total assets | | | 643,528 | | | | 673,781 | | | | 667,470 | | | | 575,491 | | | | 556,572 | |
| | | | | | | | | | | | | | | | | | | | | |
| RATIOS | | | | | | | | | | | | | | | | | | | | |
| Return on average shareholders' equity | | | 3.54 | % | | | -27.26 | % | | | 0.60 | % | | | 8.70 | % | | | 5.62 | % |
| Return on average total assets | | | 0.26 | | | | (2.32 | ) | | | 0.06 | | | | 0.91 | | | | 0.59 | |
| Cash dividend payout ratio (cash dividends divided by net income) | | | - | | | | - | | | | 458.18 | | | | 32.14 | | | | 40.01 | |
| Average shareholders' equity to average total assets | | | 7.31 | | | | 8.50 | | | | 9.52 | | | | 10.42 | | | | 10.41 | |
| | | | | | | | | | | | | | | | | | | | | |
| PERIOD END TOTALS | | | | | | | | | | | | | | | | | | | | |
| Total assets | | $ | 628,664 | | | $ | 660,288 | | | $ | 673,049 | | | $ | 657,619 | | | $ | 561,214 | |
| Total investments; fed funds sold | | | 111,978 | | | | 132,762 | | | | 105,083 | | | | 112,606 | | | | 94,661 | |
| Total loans and leases | | | 442,554 | | | | 427,544 | | | | 452,558 | | | | 450,112 | | | | 389,269 | |
| Loans held for sale | | | 5,238 | | | | 9,055 | | | | 16,858 | | | | 3,824 | | | | 1,650 | |
| Allowance for loan losses | | | 6,529 | | | | 6,715 | | | | 7,030 | | | | 5,020 | | | | 3,990 | |
| Total deposits | | | 518,765 | | | | 515,678 | | | | 491,242 | | | | 484,221 | | | | 406,031 | |
| Notes Payable | | | 2,788 | | | | 3,290 | | | | 2,147 | | | | 1,000 | | | | 922 | |
| Advances from FHLB | | | 12,776 | | | | 22,807 | | | | 35,267 | | | | 36,647 | | | | 24,000 | |
| Trust Preferred Securities | | | 20,620 | | | | 20,620 | | | | 20,620 | | | | 20,620 | | | | 20,620 | |
| Shareholders' equity | | | 47,932 | | | | 46,024 | | | | 61,708 | | | | 61,662 | | | | 59,325 | |
| Shareholders' equity per share | | $ | 9.86 | | | $ | 9.47 | | | $ | 12.69 | | | $ | 12.63 | | | $ | 11.92 | |
Management’s Report on Internal Control
Over Financial Reporting
The management of Rurban Financial Corp. (the “Company”) is responsible for establishing and maintaining adequate internal control over financial reporting as defined in Rules 13a-15(f) and 15d-15(f) under the Securities Exchange Act of 1934. The Company’s internal control over financial reporting is designed to provide reasonable assurance regarding the reliability of financial reporting and the preparation of financial statements for external purposes in conformity with U.S. generally accepted accounting principles. The Company’s internal control over financial reporting includes those policies and procedures that:
| a) | Pertain to the maintenance of records that, in reasonable detail, accurately and fairly reflect the transactions and dispositions of the assets of the Company and its consolidated subsidiaries; |
| b) | Provide reasonable assurance that transactions are recorded as necessary to permit preparation of financial statements in conformity with U.S. generally accepted accounting principles, and that receipts and expenditures of the Company and its consolidated subsidiaries are being made only in accordance with authorizations of management and directors of the Company; and |
| c) | Provide reasonable assurance regarding prevention or timely detection of unauthorized acquisition, use or disposition of the assets of the Company and its consolidated subsidiaries that could have a material effect on the financial statements. |
With the supervision and participation of our President and Chief Executive Officer, and our Chief Financial Officer, management assessed the effectiveness of the Company’s internal control over financial reporting as of December 31, 2011, based on the criteria set forth for effective internal control over financial reporting by the Committee of Sponsoring Organizations of the Treadway Commission in “Internal Control Integrated Framework”. Based on our assessment and those criteria, management concluded that, as of December 31, 2011, the Company’s internal control over financial reporting is effective.
This Annual Report does not include an attestation report of the Company’s registered public accounting firm regarding internal control over financial reporting. Management’s report was not subject to attestation by the Company’s registered public accounting firm pursuant to rules of the Securities and Exchange Commission that permit the Company to provide only management’s report in this Annual Report.
RURBAN FINANCIAL CORP.
 | |  |
| | | |
| Mark A. Klein | | Anthony V. Cosentino |
| President and Chief Executive Officer | | Chief Financial Officer |
March 22, 2012

Report of Independent Registered Public Accounting Firm
Audit Committee, Board of Directors and Stockholders
Rurban Financial Corp.
Defiance, Ohio
We have audited the accompanying consolidated balance sheets of Rurban Financial Corp. as of December 31, 2011 and 2010, and the related consolidated statements of operations, stockholders’ equity and cash flows for each of the years in the three-year period ended December 31, 2011. The Company's management is responsible for these financial statements. Our responsibility is to express an opinion on these financial statements based on our audits.
We conducted our audits in accordance with the standards of the Public Company Accounting Oversight Board (United States). Those standards require that we plan and perform the audits to obtain reasonable assurance about whether the financial statements are free of material misstatement. The Company is not required to have, nor were we engaged to perform, an audit of its internal control over financial reporting. Our audits included consideration of internal control over financial reporting as a basis for designing auditing procedures that are appropriate in the circumstances, but not for the purpose of expressing an opinion on the effectiveness of the Company's internal control over financial reporting. Accordingly, we express no such opinion. Our audits also included examining, on a test basis, evidence supporting the amounts and disclosures in the financial statements, assessing the accounting principles used and significant estimates made by management and evaluating the overall financial statement presentation. We believe that our audits provide a reasonable basis for our opinion.
In our opinion, the consolidated financial statements referred to above present fairly, in all material respects, the financial position of Rurban Financial Corp. as of December 31, 2011 and 2010, and the results of its operations and its cash flows for each of the years in the three-year period ended December 31, 2011, in conformity with accounting principles generally accepted in the United States of America.

Cincinnati, Ohio
March 22, 2012

Rurban Financial Corp.
Consolidated Balance Sheets
December 31
| | | 2011 | | | 2010 | |
| | | | | | | |
| ASSETS | | | | | | | | |
| | | | | | | | | |
| Cash and due from banks | | $ | 14,846,362 | | | $ | 30,417,813 | |
| Available-for-sale securities | | | 111,977,673 | | | | 132,762,058 | |
| Loans held for sale | | | 5,237,914 | | | | 9,055,268 | |
| Loans, net of unearned income | | | 442,554,386 | | | | 427,544,414 | |
| Allowance for loan losses | | | (6,529,208 | ) | | | (6,715,397 | ) |
| Premises and equipment, net | | | 13,773,138 | | | | 14,622,541 | |
| Federal Reserve and Federal Home Loan Bank Stock, at cost | | | 3,685,100 | | | | 3,748,250 | |
| Foreclosed assets held for sale, net | | | 1,830,288 | | | | 1,538,307 | |
| Interest receivable | | | 1,635,322 | | | | 2,068,965 | |
| Goodwill | | | 16,353,082 | | | | 16,733,830 | |
| Core deposits and other intangibles | | | 1,848,550 | | | | 2,585,132 | |
| Purchased software | | | 158,846 | | | | 1,021,036 | |
| Cash value of life insurance | | | 12,223,931 | | | | 13,211,247 | |
| Deferred income taxes | | | 2,285,977 | | | | 3,202,986 | |
| Mortgage servicing rights | | | 2,819,939 | | | | 3,190,389 | |
| Other assets | | | 3,962,366 | | | | 5,300,846 | |
| | | | | | | | | |
| Total assets | | $ | 628,663,666 | | | $ | 660,287,685 | |
| | | | | | | | | |
| LIABILITIES AND SHAREHOLDERS' EQUITY | | | | | | | | |
| | | | | | | | | |
| Liabilities | | | | | | | | |
| Deposits | | | | | | | | |
| Non interest bearing demand | | $ | 65,963,133 | | | $ | 62,745,906 | |
| Interest bearing NOW | | | 107,445,961 | | | | 105,708,472 | |
| Savings | | | 49,665,067 | | | | 47,662,315 | |
| Money Market | | | 74,243,505 | | | | 84,635,537 | |
| Time Deposits | | | 221,447,059 | | | | 214,925,512 | |
| Total deposits | | | 518,764,725 | | | | 515,677,742 | |
| Short-term borrowings | | | 18,778,522 | | | | 45,785,254 | |
| Notes payable | | | 2,788,123 | | | | 3,290,471 | |
| Federal Home Loan Bank advances | | | 12,775,866 | | | | 22,807,351 | |
| Trust preferred securities | | | 20,620,000 | | | | 20,620,000 | |
| Interest payable | | | 2,953,541 | | | | 1,971,587 | |
| Other liabilities | | | 4,051,301 | | | | 4,111,182 | |
| Total liabilities | | | 580,732,078 | | | | 614,263,587 | |
| | | | | | | | | |
| Commitments and Contingent Liabilities | | | | | | | | |
| | | | | | | | | |
| Stockholders' Equity | | | | | | | | |
| Preferred stock, $0.00 stated value; authorized | | | | | | | | |
| 200,000 shares; 0 shares issued | | | | | | | | |
| Common stock, $2.50 stated value; authorized | | | - | | | | - | |
| 10,000,000 shares; 5,027,433 shares issued | | | 12,568,583 | | | | 12,568,583 | |
| Additional paid-in capital | | | 15,323,182 | | | | 15,235,206 | |
| Retained earnings | | | 20,466,005 | | | | 18,802,106 | |
| Accumulated other comprehensive income (loss) | | | 1,343,129 | | | | 1,187,514 | |
| Treasury stock, at cost | | | | | | | | |
| Common; 2011 - 165,654 shares, 2010 -165,654 shares | | | (1,769,311 | ) | | | (1,769,311 | ) |
| Total stockholders' equity | | | 47,931,588 | | | | 46,024,098 | |
| Total liabilities and stockholders' equity | | $ | 628,663,666 | | | $ | 660,287,685 | |
See Notes to Consolidated Financial Statements
Rurban Financial Corp.
Consolidated Statements of Operations
Years Ended December 31
| | | 2011 | | | 2010 | | | 2009 | |
| | | | | | | | | | |
| Interest Income | | | | | | | | | | | | |
| Loans | | | | | | | | | | | | |
| Taxable | | $ | 24,444,643 | | | $ | 25,838,773 | | | $ | 27,272,465 | |
| Tax-exempt | | | 74,697 | | | | 62,721 | | | | 91,294 | |
| Securities | | | | | | | | | | | | |
| Taxable | | | 2,010,014 | | | | 2,266,719 | | | | 4,082,639 | |
| Tax-exempt | | | 978,886 | | | | 1,395,143 | | | | 1,063,190 | |
| Other | | | 740 | | | | 260 | | | | 81,562 | |
| Total interest income | | | 27,508,980 | | | | 29,563,616 | | | | 32,591,150 | |
| | | | | | | | | | | | | |
| Interest Expense | | | | | | | | | | | | |
| Deposits | | | 3,981,876 | | | | 5,123,015 | | | | 6,525,942 | |
| Notes payable | | | 96,135 | | | | 116,198 | | | | 132,116 | |
| Repurchase Agreements | | | 912,047 | | | | 1,731,227 | | | | 1,733,668 | |
| Federal funds purchased | | | 58 | | | | 3,990 | | | | 2,827 | |
| Federal Home Loan Bank advances | | | 402,251 | | | | 1,093,659 | | | | 1,624,700 | |
| Trust preferred securities | | | 1,405,714 | | | | 1,533,806 | | | | 1,573,293 | |
| Total interest expense | | | 6,798,081 | | | | 9,601,895 | | | | 11,592,546 | |
| | | | | | | | | | | | | |
| Net Interest Income | | | 20,710,899 | | | | 19,961,721 | | | | 20,998,604 | |
| | | | | | | | | | | | | |
| Provision for Loan Losses | | | | | | | | | | | | |
| Provision for loan losses - Bank Only | | | 1,993,688 | | | | 7,587,603 | | | | 5,738,098 | |
| Provision for loan losses - RDSI | | | - | | | | 3,000,000 | | | | - | |
| Total provision for loan losses | | | 1,993,688 | | | | 10,587,603 | | | | 5,738,098 | |
| | | | | | | | | | | | | |
| Net Interest Income After Provision for Loan Losses | | | 18,717,211 | | | | 9,374,118 | | | | 15,260,506 | |
| | | | | | | | | | | | | |
| Non-interest Income | | | | | | | | | | | | |
| Data service fees | | | 3,629,589 | | | | 9,736,416 | | | | 18,859,701 | |
| Trust fees | | | 2,616,494 | | | | 2,547,699 | | | | 2,508,723 | |
| Customer service fees | | | 2,531,363 | | | | 2,460,733 | | | | 2,607,985 | |
| Gain on sale of mortgage loans and OMSR's | | | 3,620,101 | | | | 4,493,671 | | | | 3,213,089 | |
| Mortgage loan servicing fees, net | | | (969,524 | ) | | | 276,568 | | | | 83,959 | |
| Gain on sale of non-mortgage loans | | | 207,634 | | | | 307,141 | | | | 141,565 | |
| Net gains on sales of securities | | | 1,871,387 | | | | 450,885 | | | | 960,320 | |
| Investment securities recoveries | | | - | | | | 73,774 | | | | - | |
| Loss on sale of assets | | | (333,288 | ) | | | (199,903 | ) | | | (134,732 | ) |
| Other | | | 683,619 | | | | 671,839 | | | | 1,063,987 | |
| Total non-interest income | | $ | 13,857,375 | | | $ | 20,818,823 | | | $ | 29,304,597 | |
See Notes to Consolidated Financial Statements
Rurban Financial Corp.
Consolidated Statements of Operations
Years Ended December 31
| | | 2011 | | | 2010 | | | 2009 | |
| | | | | | | | | | |
| Non-interest Expense | | | | | | | | | | | | |
| Salaries and employee benefits | | $ | 14,174,020 | | | $ | 17,932,196 | | | $ | 21,034,671 | |
| Net occupancy expense | | | 2,112,716 | | | | 2,100,958 | | | | 2,227,452 | |
| FDIC Insurance Expense | | | 908,310 | | | | 1,137,615 | | | | 1,131,550 | |
| Equipment expense | | | 2,827,192 | | | | 6,433,537 | | | | 7,463,352 | |
| Fixed asset and software impairment expense | | | 608,585 | | | | 4,892,231 | | | | - | |
| Data processing fees | | | 624,522 | | | | 743,538 | | | | 609,876 | |
| Professional fees | | | 1,920,263 | | | | 2,545,552 | | | | 2,891,607 | |
| Marketing expense | | | 327,803 | | | | 455,967 | | | | 857,727 | |
| Printing and office supplies | | | 332,808 | | | | 453,702 | | | | 601,626 | |
| Telephone and communications | | | 580,376 | | | | 1,191,497 | | | | 1,622,077 | |
| Postage and delivery expense | | | 1,098,634 | | | | 1,748,545 | | | | 2,079,463 | |
| Insurance expense | | | 88,377 | | | | 71,791 | | | | 91,086 | |
| Employee expense | | | 524,433 | | | | 818,375 | | | | 1,151,438 | |
| Other intangible amortization expense | | | 736,583 | | | | 800,747 | | | | 858,423 | |
| Goodwill impairment | | | 380,748 | | | | 4,680,960 | | | | - | |
| Other intangibles impairment | | | - | | | | 1,591,844 | | | | - | |
| FHLB/Repo, prepayment penalty | | | 1,083,106 | | | | - | | | | - | |
| OREO impairment | | | 214,200 | | | | 971,517 | | | | - | |
| State, local and other taxes | | | 457,026 | | | | 543,673 | | | | 724,546 | |
| Other | | | 1,252,956 | | | | 3,194,201 | | | | 1,498,106 | |
| Total non-interest expense | | | 30,252,658 | | | | 52,308,446 | | | | 44,843,000 | |
| | | | | | | | | | | | | |
| Income (Loss) Before Income Tax | | | 2,321,928 | | | | (22,115,505 | ) | | | (277,897 | ) |
| | | | | | | | | | | | | |
| Provision (Credit) for Income Taxes | | | 658,029 | | | | (6,502,295 | ) | | | (660,388 | ) |
| | | | | | | | | | | | | |
| Net Income (Loss) | | $ | 1,663,899 | | | $ | (15,613,210 | ) | | $ | 382,491 | |
| | | | | | | | | | | | | |
| Basic Earnings (Loss) Per Share | | $ | 0.34 | | | $ | (3.21 | ) | | $ | 0.07 | |
| | | | | | | | | | | | | |
| Diluted Earnings (Loss) Per Share | | $ | 0.34 | | | $ | (3.21 | ) | | $ | 0.07 | |
See Notes to Consolidated Financial Statements
Rurban Financial Corp.
Consolidated Statements of Stockholders’ Equity
Years Ended December 31
| | | | | | | | | | | | | | | Accumulated | | | | | | | |
| | | | | | | | | | | | | | | Other | | | | | | | |
| | | Preferred | | | Common | | | Additional | | | Retained | | | Comprehensive | | | Treasury | | | | |
| | | Stock | | | Stock | | | Paid-In Capital | | | Earnings | | | Income (Loss) | | | Stock | | | Total | |
| | | | | | | | | | | | | | | | | | | | | | |
| Balance, January 1, 2009 | | | - | | | | 12,568,583 | | | | 15,042,781 | | | | 35,785,317 | | | | (121,657 | ) | | | (1,613,020 | ) | | | 61,662,004 | |
| Comprehensive Income | | | | | | | | | | | | | | | | | | | | | | | | | | | | |
| | | | | | | | | | | | | | | | | | | | | | | | | | | | | |
| Net Income | | | | | | | | | | | | | | | 382,491 | | | | | | | | | | | | 382,491 | |
| | | | | | | | | | | | | | | | | | | | | | | | | | | | | |
| Change in unrealized gain on securities available for sale, net of reclassification adjustment and tax effect | | | | | | | | | | | | | | | | | | | 1,428,682 | | | | | | | | 1,428,682 | |
| | | | | | | | | | | | | | | | | | | | | | | | | | | | | |
| Total comprehensive income | | | | | | | | | | | | | | | | | | | | | | | | | | | 1,811,173 | |
| | | | | | | | | | | | | | | | | | | | | | | | | | | | | |
| Dividends on common stock, $0.36 per share | | | | | | | | | | | | | | | (1,752,492 | ) | | | | | | | | | | | (1,752,492 | ) |
| | | | | | | | | | | | | | | | | | | | | | | | | | | | | |
| Expense of stock option plan | | | | | | | | | | | 143,261 | | | | | | | | | | | | | | | | 143,261 | |
| | | | | | | | | | | | | | | | | | | | | | | | | | | | | |
| Shares repurchased under stock repurchase plan | | | | | | | | | | | | | | | | | | | | | | | (156,291 | ) | | | (156,291 | ) |
| | | | | | | | | | | | | | | | | | | | | | | | | | | | | |
| Balance, December 31, 2009 | | $ | - | | | $ | 12,568,583 | | | $ | 15,186,042 | | | $ | 34,415,316 | | | $ | 1,307,025 | | | $ | (1,769,311 | ) | | $ | 61,707,655 | |
| Comprehensive Income | | | | | | | | | | | | | | | | | | | | | | | | | | | | |
| | | | | | | | | | | | | | | | | | | | | | | | | | | | | |
| Net Loss | | | | | | | | | | | | | | | (15,613,210 | ) | | | | | | | | | | | (15,613,210 | ) |
| | | | | | | | | | | | | | | | | | | | | | | | | | | | | |
| Change in unrealized loss on securities available for sale, net of reclassification adjustment and tax effect | | | | | | | | | | | | | | | | | | | (119,511 | ) | | | | | | | (119,511 | ) |
| | | | | | | | | | | | | | | | | | | | | | | | | | | | | |
| Total comprehensive loss | | | | | | | | | | | | | | | | | | | | | | | | | | | (15,732,721 | ) |
| | | | | | | | | | | | | | | | | | | | | | | | | | | | | |
| Expense of stock option plan | | | | | | | | | | | 49,164 | | | | | | | | | | | | | | | | 49,164 | |
| | | | | | | | | | | | | | | | | | | | | | | | | | | | | |
| Balance, December 31, 2010 | | $ | - | | | $ | 12,568,583 | | | $ | 15,235,206 | | | $ | 18,802,106 | | | $ | 1,187,514 | | | $ | (1,769,311 | ) | | $ | 46,024,098 | |
| | | | | | | | | | | | | | | | | | | | | | | | | | | | | |
| Comprehensive Income | | | | | | | | | | | | | | | | | | | | | | | | | | | | |
| | | | | | | | | | | | | | | | | | | | | | | | | | | | | |
| Net Income | | | | | | | | | | | | | | | 1,663,899 | | | | | | | | | | | | 1,663,899 | |
| | | | | | | | | | | | | | | | | | | | | | | | | | | | | |
| Change in unrealized gain on securities available for sale, net of reclassification adjustment and tax effect | | | | | | | | | | | | | | | | | | | 155,615 | | | | | | | | 155,615 | |
| | | | | | | | | | | | | | | | | | | | | | | | | | | | | |
| Total comprehensive income | | | | | | | | | | | | | | | | | | | | | | | | | | | 1,819,514 | |
| | | | | | | | | | | | | | | | | | | | | | | | | | | | | |
| Expense of stock option plan | | | | | | | | | | | 87,976 | | | | | | | | | | | | | | | | 87,976 | |
| | | | | | | | | | | | | | | | | | | | | | | | | | | | | |
| Balance, December 31, 2011 | | $ | - | | | $ | 12,568,583 | | | $ | 15,323,182 | | | $ | 20,466,005 | | | $ | 1,343,129 | | | $ | (1,769,311 | ) | | $ | 47,931,588 | |
See Notes to Consolidated Financial Statements
Rurban Financial Corp.
Consolidated Statements of Cash Flows
December 31, 2011 and 2010
| | | 2011 | | | 2010 | | | 2009 | |
| | | | | | | | | | |
| Operating Activities | | | | | | | | | | | | |
| Net Income (Loss) | | $ | 1,663,899 | | | $ | (15,613,210 | ) | | $ | 382,491 | |
| Items not requiring (providing) cash | | | | | | | | | | | | |
| Depreciation and amortization | | | 1,782,675 | | | | 4,007,624 | | | | 4,473,367 | |
| Provision for loan losses | | | 1,993,688 | | | | 10,587,603 | | | | 5,738,098 | |
| Expense of share-based compensation plan | | | 87,976 | | | | 49,164 | | | | 143,261 | |
| Amortization of premiums and discounts on securities | | | 1,603,739 | | | | 1,546,843 | | | | 608,534 | |
| Amortization of intangible assets | | | 736,582 | | | | 800,537 | | | | 858,423 | |
| Amortization of Originated Mortgage Servicing Rights | | | 744,575 | | | | 483,822 | | | | 305,489 | |
| Deferred income taxes | | | 658,028 | | | | (5,857,134 | ) | | | (1,008,042 | ) |
| Proceeds from sale of loans held for sale | | | 199,627,788 | | | | 240,632,657 | | | | 219,243,608 | |
| Originations of loans held for sale | | | (193,475,484 | ) | | | (228,029,465 | ) | | | (228,922,103 | ) |
| Gain from sale of loans | | | (3,827,735 | ) | | | (4,800,812 | ) | | | (3,354,654 | ) |
| Loss on sale of foreclosed assets | | | 333,288 | | | | 201,934 | | | | 102,713 | |
| (Gain) loss on sales of fixed assets | | | (9,300 | ) | | | (2,031 | ) | | | 32,019 | |
| Net realized gains on available-for-sale securities | | | (1,871,387 | ) | | | (450,885 | ) | | | (960,320 | ) |
| Software and fixed asset impairment | | | 608,585 | | | | 4,892,231 | | | | - | |
| OREO impairment | | | 214,200 | | | | 971,517 | | | | - | |
| Goodwill Impairment | | | 380,748 | | | | 4,680,960 | | | | - | |
| Originated Mortgage Servicing Rights Impairment | | | 1,118,660 | | | | (85,000 | ) | | | 85,000 | |
| Other intangible impairment | | | - | | | | 1,591,844 | | | | - | |
| Changes in | | | | | | | | | | | | |
| Interest receivable | | | 433,643 | | | | 255,903 | | | | 639,795 | |
| Other assets | | | 1,186,115 | | | | 2,216,436 | | | | (5,802,784 | ) |
| Interest payable and other liabilities | | | 922,073 | | | | (1,224,705 | ) | | | 251,756 | |
| | | | | | | | | | | | | |
| Net cash provided by (used in) operating activities | | | 14,912,356 | | | | 16,855,833 | | | | (7,183,349 | ) |
| | | | | | | | | | | | | |
| Investing Activities | | | | | | | | | | | | |
| Purchases of available-for-sale securities | | | (52,227,133 | ) | | | (76,637,203 | ) | | | (67,881,565 | ) |
| Proceeds from maturities of available-for-sale securities | | | 29,182,948 | | | | 37,686,088 | | | | 40,839,927 | |
| Proceeds from sales of available-for-sale securities | | | 44,331,997 | | | | 9,995,135 | | | | 27,081,457 | |
| Net change in loans | | | (19,732,959 | ) | | | 11,081,255 | | | | (7,721,644 | ) |
| Purchase of premises, equipment and software | | | (679,668 | ) | | | (2,146,254 | ) | | | (3,406,256 | ) |
| Proceeds from sales of premises, equipment and software | | | 9,300 | | | | (63,188 | ) | | | 57,567 | |
| Proceeds from sale of bank owned life insurance | | | 1,353,762 | | | | - | | | | - | |
| Proceeds from sale of foreclosed assets | | | 1,668,378 | | | | 1,958,804 | | | | 987,208 | |
| Purchase of FHLB stock | | | - | | | | - | | | | (204,150 | ) |
| Proceeds from the sale of Fed stock | | | 63,150 | | | | - | | | | - | |
| Proceeds for the sale of FHLB stock | | | - | | | | - | | | | 700,000 | |
| Net cash provided by (used in) investing activities | | $ | 3,969,775 | | | $ | (18,125,363 | ) | | $ | (9,547,456 | ) |
See Notes to Consolidated Financial Statements
Rurban Financial Corp.
Consolidated Statements of Cash Flows
December 31, 2011 and 2010
| | | 2011 | | | 2010 | | | 2009 | |
| | | | | | | | | | |
| Financing Activities | | | | | | | | | | | | |
| Net increase (decrease) in demand deposits, money market, interest checking and savings accounts | | $ | (3,434,564 | ) | | $ | 26,067,145 | | | $ | 32,730,724 | |
| Net increase (decrease) in certificates of deposit | | | 6,521,547 | | | | (1,631,555 | ) | | | (25,709,156 | ) |
| Net increase (decrease) in securities sold under agreements to repurchase | | | (27,006,732 | ) | | | (1,257,567 | ) | | | 3,616,842 | |
| Net increase (decrease) in federal funds purchased | | | - | | | | (5,000,000 | ) | | | 5,000,000 | |
| Proceeds from Federal Home Loan Bank advances | | | 23,000,000 | | | | - | | | | 7,500,000 | |
| Repayment of Federal Home Loan Bank advances | | | (33,031,485 | ) | | | (12,459,160 | ) | | | (8,880,344 | ) |
| Proceeds from notes payable | | | - | | | | 1,700,000 | | | | 2,700,000 | |
| Net change in short term line of credit | | | - | | | | - | | | | (1,000,000 | ) |
| Repayment of notes payable | | | (502,348 | ) | | | (556,305 | ) | | | (553,224 | ) |
| Purchase of treasury stock | | | - | | | | - | | | | (156,291 | ) |
| Dividends paid | | | - | | | | - | | | | (1,752,493 | ) |
| Net cash provided by (used in) financing activities | | | (34,453,582 | ) | | | 6,862,558 | | | | 13,496,058 | |
| | | | | | | | | | | | | |
| Increase (Decrease) in Cash and Cash Equivalents | | | (15,571,451 | ) | | | 5,593,028 | | | | (3,234,747 | ) |
| | | | | | | | | | | | | |
| Cash and Cash Equivalents, Beginning of Year | | | 30,417,813 | | | | 24,824,785 | | | | 28,059,532 | |
| | | | | | | | | | | | | |
| Cash and Cash Equivalents, End of Year | | $ | 14,846,362 | | | $ | 30,417,813 | | | $ | 24,824,785 | |
| | | | | | | | | | | | | |
| Supplemental Cash Flows Information | | | | | | | | | | | | |
| Interest paid | | $ | 5,816,127 | | | $ | 9,137,829 | | | $ | 12,050,867 | |
| Income taxes paid (refunded) | | $ | (687,831 | ) | | $ | (1,054,236 | ) | | $ | (71,000 | ) |
| Transfer of loans to foreclosed assets | | $ | 2,498,677 | | | $ | 5,149,182 | | | $ | 1,547,599 | |
| Sale and financing of foreclosed assets | | $ | - | | | $ | 2,249,532 | | | $ | - | |
See Notes to Consolidated Financial Statements
Rurban Financial Corp.
Notes to Consolidated Financial Statements
December 31, 2011 and 2010
Note 1: Nature of Operations and Summary of Significant Accounting Policies
Nature of Operations
Rurban Financial Corp. (“Company”) is a bank holding company whose principal activity is the ownership and management of its wholly-owned subsidiaries, The State Bank and Trust Company (“State Bank”), RFCBC, Inc. (“RFCBC”), Rurbanc Data Services, Inc. dba RDSI Banking Systems (“RDSI”), Rurban Statutory Trust I (“RST I”), and Rurban Statutory Trust II (“RST II”). State Bank owns all the outstanding stock of Rurban Mortgage Company (“RMC”), Rurban Investments, Inc. (“RII”) and State Bank Insurance, LLC (“SBI”). State Bank is primarily engaged in providing a full range of banking and financial services to individual and corporate customers in Northwest Ohio and Northeast Indiana. State Bank is subject to competition from other financial institutions. State Bank is regulated by certain federal and state agencies and undergoes periodic examinations by those regulatory authorities. RFCBC operates as a loan subsidiary that continues to administer one classified loan. RDSI provides item processing services to community banks in Illinois, Indiana, Kentucky, Michigan, Ohio and Wisconsin. Reliance Financial Services (“RFS”), operating as a division of State Bank, offers a diversified array of trust and financial services to customers nationwide. RST I and RST II are trusts which were organized in 2000 and 2005, respectively, to manage the Company’s trust preferred securities.
Principles of Consolidation
The consolidated financial statements include the accounts of the Company, State Bank, RFCBC, RDSI, RMC, RII, and SBI. All significant intercompany accounts and transactions have been eliminated in consolidation.
Use of Estimates
The preparation of financial statements in conformity with accounting principles generally accepted in the United States of America requires management to make estimates and assumptions that affect the reported amounts of assets and liabilities and disclosure of contingent assets and liabilities at the date of the financial statements and the reported amounts of revenues and expenses during the reporting period. Actual results could differ from those estimates. Material estimates that are particularly susceptible to significant change relate to the determination of the allowance for loan losses, valuation of real estate acquired in connection with foreclosures or in satisfaction of loans, loan servicing rights, valuation of deferred tax assets, other-than-temporary impairment (OTTI) and fair value of financial instruments.
Cash Equivalents
The Company considers all liquid investments with original maturities of three months or less to be cash equivalents. At December 31, 2011 and 2010, cash equivalents consisted primarily of interest and non-interest bearing demand deposit balances held by correspondent banks.
Effective October 3, 2009, the FDIC’s insurance limits increased to $250,000, which were made permanent with the Wall Street Reform and Consumer Protection Act, signed on July 21, 2010.The Bank’s interest-bearing cash accounts did not exceed federally insured limits at December 31, 2011. Pursuant to legislation enacted in 2010, the FDIC will fully insure all noninterest bearing transaction accounts beginning December 31, 2010 through December 31, 2012, at all FDIC insured institutions.
Rurban Financial Corp.
Notes to Consolidated Financial Statements
December 31, 2011 and 2010
Securities
Available-for-sale securities, which include any security for which the Company has no immediate plan to sell but which may be sold in the future, are carried at fair value. Unrealized gains and losses are recorded, net of related income tax effects, in other comprehensive income.
Amortization of premiums and accretion of discounts are recorded as interest income from securities. Realized gains and losses are recorded as net security gains (losses). Gains and losses on sales of securities are determined on the specific-identification method.
For debt securities with fair value below carrying value when the Company does not intend to sell a debt security, and it is more likely than not, the Company will not have to sell the security before recovery of its cost basis, it recognizes the credit component of an other-than-temporary impairment of a debt security in earnings and the remaining portion in other comprehensive income.
Mortgage Loans Held for Sale
Mortgage loans originated and intended for sale in the secondary market are carried at the lower of cost or fair value in the aggregate. Net unrealized losses, if any, are recognized through a valuation allowance by charges to non-interest income. Gains and losses on loan sales are recorded in non-interest income.
Loans
Loans that management has the intent and ability to hold for the foreseeable future, or until maturity or payoffs, are reported at their outstanding principal balances adjusted for any charge-offs, the allowance for loan losses, any deferred fees or costs on originated loans and unamortized premiums or discounts on purchased loans. Interest income is reported on the interest method and includes amortization of net deferred loan fees and costs over the loan term. Generally, loans are placed on non-accrual status not later than 90 days past due, unless the loan is well-secured and in the process of collection. All interest accrued, but not collected for loans that are placed on non-accrual or charged-off, are reversed against interest income. The interest on these loans is accounted for on the cash-basis or cost-recovery method, until qualifying for return to accrual. Loans are returned to accrual status when all the principal and interest amounts contractually due are brought current and future payments are reasonably assured.
Allowance for Loan Losses
The allowance for loan losses is established as losses are estimated to have occurred through a provision for loan losses charged to income. Loan losses are charged against the allowance when management believes the non-collectability of a loan balance is probable. Subsequent recoveries, if any, are credited to the allowance.
The allowance for loan losses is evaluated on a regular basis by management and is based upon management’s periodic review of the collectability of the loans in light of historical experience, the nature and volume of the loan portfolio, adverse situations that may affect the borrower’s ability to repay, estimated value of any underlying collateral and prevailing economic conditions. This evaluation is inherently subjective as it requires estimates that are susceptible to significant revision as new information becomes available.
Rurban Financial Corp.
Notes to Consolidated Financial Statements
December 31, 2011 and 2010
The allowance consists of allocated and general components. The allocated component relates to loans that are classified as impaired. For those loans that are classified as impaired, an allowance is established when the discounted cash flows (or collateral value or observable market price) of the impaired loan is lower than the carrying value of that loan. The general component covers nonclassified loans and is based on historical charge-off experience and expected loss given default derived from the Company’s internal risk rating process. Other adjustments may be made to the allowance for pools of loans after an assessment of internal or external influences on credit quality that are not fully reflected on the historical loss or risk rating data.
A loan is considered impaired when, based on current information and events, it is probable that State Bank will be unable to collect the scheduled payments of principal or interest when due according to the contractual terms of the loan agreement. Factors considered by management in determining impairment include payment status, collateral value and the probability of collecting scheduled principal and interest payments when due. Loans that experience insignificant payment delays and payment shortfalls generally are not classified as impaired. Management determines the significance of payment delays and payment shortfalls on a case-by-case basis, taking into consideration each of the circumstances surrounding the loan and the borrower, including the length of the delay, the reasons for the delay, the borrower’s prior payment record and the amount of the shortfall in relation to the principal and interest owed. Impairment is measured on a loan-by-loan basis for commercial, agricultural, and construction loans by either the present value of expected future cash flows discounted at the loan’s effective interest rate, the loan’s obtainable market price or the fair value of the collateral if the loan is collateral dependent.
When State Bank moves a loan to non-accrual status, total unpaid interest accrued to date is reversed from income. Subsequent payments are applied to the outstanding principal balance with the interest portion of the payment recorded on the balance sheet as a contra-loan. Interest received on impaired loans may be realized once all contractual principal amounts are received or when a borrower establishes a history of six consecutive timely principal and interest payments. It is at the discretion of Management to determine when a loan is placed back on accrual status upon receipt of six consecutive timely payments.
Large groups of smaller balance homogenous loans are collectively evaluated for impairment. Accordingly, State Bank does not separately identify individual consumer and residential loans for impairment measurements, unless such loans are the subject of a restructuring agreement due to financial difficulties of the borrower.
Premises and Equipment
Depreciable assets are stated at cost less accumulated depreciation. Depreciation is charged to expense using the straight-line method for buildings and equipment over the estimated useful lives of the assets. Leasehold improvements are capitalized and depreciated using the straight-line method over the terms of the respective leases.
Long-lived Asset Impairment
The Company evaluates the recoverability of the carrying value of long-lived assets whenever events or circumstances indicate the carrying amount may not be recoverable. If a long-lived asset is tested for recoverability and the undiscounted estimated future cash flows expected to result from the use and eventual disposition of the asset is less than the carrying amount of the asset, the asset’s cost is adjusted to fair value and an impairment loss is recognized as the amount by which the carrying amount of a long-lived asset exceeds its fair value.
A fixed asset and software impairment of $608,585 and $4,892,231 was recognized during the years ended December 31, 2011 and 2010, respectively.
Rurban Financial Corp.
Notes to Consolidated Financial Statements
December 31, 2011 and 2010
Federal Reserve and Federal Home Loan Bank Stock
Federal Reserve and Federal Home Loan Bank stock are required investments for institutions that are members of the Federal Reserve and Federal Home Loan Bank systems. The required investment in the common stock is based on a predetermined formula.
Foreclosed Assets Held for Sale
Assets acquired through, or in lieu of, loan foreclosure are held for sale and are initially recorded at fair value at the date of foreclosure, establishing a new cost basis. Subsequent to foreclosure, valuations are periodically performed by management and the assets are carried at the lower of the carrying amount or the fair value less cost to sell. Revenue and expenses from operations related to foreclosed assets and changes in the valuation allowance are included in net income or expense from foreclosed assets.
Goodwill
Goodwill is tested for impairment annually. If the implied fair value of goodwill is lower than its carrying amount, goodwill impairment is indicated and goodwill is written down to its implied fair value.
Subsequent increases in goodwill value, if any, are not recognized in the financial statements. Goodwill impairment of $380,748 and $4,681,000 was recognized during the years ended December 31, 2011 and 2010, respectively.
Intangible Assets
Intangible assets are being amortized on a straight-line basis over weighted-average periods ranging from one to fifteen years. Such assets are periodically evaluated as to the recoverability of their carrying value. Purchased software is being amortized using the straight-line method over periods ranging from one to three years. Other intangible impairments of $0 and $1,592,000 were recognized during the years ended December 31, 2011 and 2010, respectively.
Mortgage Servicing Rights
Mortgage servicing assets are recognized separately when rights are acquired through purchase or through sale of financial assets. Under the servicing assets and liabilities accounting guidance (ASC 806-50), servicing rights from the sale or securitization of loans originated by the Company are initially measured at fair value at the date of transfer. The Company subsequently measures each class of servicing asset using the amortization method. Under the amortization method, servicing rights are amortized in proportion to and over the period of estimated net servicing income. The amortized assets are assessed for impairment or increased obligation based on fair value at each reporting date.
Fair value is based on market prices for comparable mortgage servicing contracts, when available, or alternatively, is based on a valuation model that calculates the present value of estimated future net servicing income. The valuation model incorporates assumptions that market participants would use in estimating future net servicing income, such as the cost of service, the discount rate, the custodial earning rate, an inflation rate, ancillary income, prepayment speeds and default rates and losses. These variables change from quarter to quarter as market conditions and projected interest rates change, and may have an adverse impact on the value of the mortgage servicing right and may result in a reduction to noninterest income.
Rurban Financial Corp.
Notes to Consolidated Financial Statements
December 31, 2011 and 2010
Each class of separately recognized servicing assets subsequently measured using the amortization method are evaluated and measured for impairment. Impairment is determined by stratifying rights into tranches based on predominant characteristics, such as interest rate, loan type and investor type. Impairment is recognized through a valuation allowance for an individual tranche, to the extent that fair value is less than the carrying amount of the servicing assets for that tranche. The valuation allowance is adjusted to reflect changes in the measurement of impairment after the initial measurement of impairment. Changes in valuation allowances are reported with “Mortgage Loan Servicing Fees, net” on the income statement. Fair value in excess of the carrying amount of servicing assets for that stratum is not recognized.
Servicing fee income is recorded for fees earned for servicing loans. The fees are based on a contractual percentage of the outstanding principal or a fixed amount per loan and are recorded as income when earned. The amortization of mortgage servicing rights is netted against loan servicing fee income.
Share-Based Employee Compensation Plan
At December 31, 2011 and 2010, the Company had a share-based employee compensation plan, which is described more fully in Note 19.
Transfers of Financial Assets
Transfers of financial assets are accounted for as sales, when control over the assets has been surrendered. Control over transferred assets is deemed to be surrendered when (1) the assets have been isolated from the Company – put presumptively beyond the reach of the transferor and its creditors, even in bankruptcy or other receivership, (2) the transferee obtains the right (free of conditions that constrain it from taking advantage of that right) to pledge or exchange the transferred assets and (3) the Company does not maintain effective control over the transferred assets through an agreement to repurchase them before the maturity or the ability to unilaterally cause the holder to return specific assets.
Income Taxes
The Company accounts for income taxes in accordance with income tax accounting guidance (ASC 740, Income Taxes). The income tax accounting guidance results in two components of income tax expense: current and deferred. Current income tax expense reflects taxes to be paid or refunded for the current period by applying the provisions of the enacted tax law to the taxable income or excess of deductions over revenues. The Company determines deferred income taxes using the liability (or balance sheet) method. Under this method, the net deferred tax asset or liability is based on the tax effects of the differences between the book and tax bases of assets and liabilities, and enacted changes in tax rates and laws are recognized in the period in which they occur. Deferred income tax expense results from changes in deferred tax assets and liabilities between periods. Deferred tax assets are reduced by a valuation allowance if, based on the weight of evidence available, it is more likely than not that some portion or all of a deferred tax asset will not be realized.
Uncertain tax positions are recognized if it is more likely than not, based on the technical merits, that the tax position will be realized or sustained upon examination. The term more likely than not means a likelihood of more than 50 percent; the terms examined and upon examination also include resolution of the related appeals or litigation processes, if any. A tax position that meets the more-likely-than-not recognition threshold is initially and subsequently measured as the largest amount of tax benefit that has a greater than 50 percent likelihood of being realized upon settlement with a taxing authority that has full knowledge of all relevant information. The determination of whether or not a tax position has met the more-likely-than-not recognition threshold considers the facts, circumstances and information available at the reporting date and is subject to management’s judgment.
Rurban Financial Corp.
Notes to Consolidated Financial Statements
December 31, 2011 and 2010
The Company recognizes interest and penalties on income taxes as a component of income tax expense.
The Company files consolidated income tax returns with its subsidiaries. With a few exceptions, the Company is no longer subject to U.S. Federal, State and Local examinations by tax authorities for the years before 2008. As of December 31, 2011, the Company had no uncertain income tax positions.
Treasury Shares
Treasury stock is stated at cost. Cost is determined by the first-in, first-out method. On April 12, 2007, Rurban initiated a stock repurchase program, authorizing the repurchase of up to 250,000 shares, or approximately five percent, of the Company’s outstanding shares. The plan expired on October 12, 2010 with the Company having purchased a total of 165,654 shares at an average cost of $10.68 per share.
Earnings Per Share
Basic earnings per share represent income available to common stockholders divided by the weighted-average number of common shares outstanding during each period. Diluted earnings per share reflect additional potential common shares that would have been outstanding if dilutive potential common shares had been issued, as well as any adjustment to income that would result from the assumed issuance. Potential common shares that may be issued by the Company relate solely to outstanding stock options and are determined using the treasury stock method. Treasury stock shares are not deemed outstanding for earnings per share calculations.
Current Economic Conditions
The current economic environment presents financial institutions with unprecedented circumstances and challenges, which in some cases have resulted in large declines in the fair values of investments and other assets, constraints on liquidity and significant credit quality problems, including severe volatility in the valuation of real estate and other collateral supporting loans. The financial statements have been prepared using values and information currently available to the Company.
Given the volatility of current economic conditions, the values of assets and liabilities recorded in the financial statements could change rapidly, resulting in material future adjustments in asset values, the allowance for loan losses, and capital that could negatively impact the Company’s ability to meet regulatory capital requirements and maintain sufficient liquidity.
Comprehensive Income
Comprehensive income consists of net income and othercomprehensive income, net of applicable income taxes. Other comprehensive income includes unrealized appreciation (depreciation) on available-for-sale securities, unrealized appreciation (depreciation) on available-for-sale securities for which a portion of an other-than-temporary impairment has been recognized in income, unrealized appreciation (depreciation) on held-to-maturity securities for which a portion of an other-than-temporary impairment has been recognized in income, unrealized and realized gains and losses in derivative financial instruments and changes in the funded status of defined benefit pension plans.
Rurban Financial Corp.
Notes to Consolidated Financial Statements
December 31, 2011 and 2010
Reclassifications
Certain reclassifications have been made to the 2009 and 2010 financial statements to conform to the 2011 financial statement presentation. These reclassifications had no affect on net income.
Note 2: Restriction on Cash and Due From Banks
State Bank is required to maintain reserve funds in cash and/or on deposit with the Federal Reserve Bank. The reserve required at December 31, 2011, was $1,492,000.
Rurban Financial Corp.
Notes to Consolidated Financial Statements
December 31, 2011 and 2010
Note 3: Securities
The amortized cost and approximate fair values of securities were as follows:
| | | | | | Gross | | | Gross | | | | |
| | | Amortized | | | Unrealized | | | Unrealized | | | Approximate | |
| | | Cost | | | Gains | | | Losses | | | Fair Value | |
| Available-for-Sale Securities: | | | | | | | | | | | | | | | | |
| December 31, 2011: | | | | | | | | | | | | | | | | |
| U.S. Treasury and Government agencies | | $ | 25,237,896 | | | $ | 186,420 | | | $ | (400 | ) | | $ | 25,423,916 | |
| Mortgage-backed securities | | | 67,055,401 | | | | 760,482 | | | | (117,888 | ) | | | 67,697,995 | |
| State and political subdivisions | | | 15,586,215 | | | | 1,210,221 | | | | (3,791 | ) | | | 16,792,645 | |
| Money Market Mutual Fund | | | 2,040,117 | | | | - | | | | - | | | | 2,040,117 | |
| Equity securities | | | 23,000 | | | | - | | | | - | | | | 23,000 | |
| | | | | | | | | | | | | | | | | |
| | | $ | 109,942,629 | | | $ | 2,157,123 | | | $ | (122,079 | ) | | $ | 111,977,673 | |
| | | | | | | | | | | | | | | | | |
| December 31, 2010: | | | | | | | | | | | | | | | | |
| U.S. Treasury and Government agencies | | $ | 43,572,741 | | | $ | 298,653 | | | $ | (220,262 | ) | | $ | 43,651,132 | |
| Mortgage-backed securities | | | 53,652,288 | | | | 1,395,036 | | | | (419,232 | ) | | | 54,628,092 | |
| State and political subdivisions | | | 31,552,709 | | | | 895,794 | | | | (150,724 | ) | | | 32,297,779 | |
| Money Market Mutual Fund | | | 2,162,055 | | | | - | | | | - | | | | 2,162,055 | |
| Equity securities | | | 23,000 | | | | - | | | | - | | | | 23,000 | |
| | | | | | | | | | | | | | | | | |
| | | $ | 130,962,793 | | | $ | 2,589,483 | | | $ | (790,218 | ) | | $ | 132,762,058 | |
The amortized cost and fair value of securities available for sale at December 31, 2011, by contractual maturity, are shown below. Expected maturities will differ from contractual maturities because issuers may have the right to call or prepay obligations with or without call or prepayment penalties.
| | | Available for Sale | |
| | | Amortized | | | Fair | |
| | | Cost | | | Value | |
| | | | | | | |
| Within one year | | $ | 384,320 | | | $ | 383,890 | |
| Due after one year through five years | | | 4,467,285 | | | | 4,538,415 | |
| Due after five years through ten years | | | 10,452,781 | | | | 10,695,235 | |
| Due after ten years | | | 25,519,725 | | | | 26,599,021 | |
| | | | 40,824,111 | | | | 42,216,561 | |
| | | | | | | | | |
| Mortgage-backed securities, money market mutual fund & equity securities | | | 69,118,518 | | | | 69,761,112 | |
| | | | | | | | | |
| Totals | | $ | 109,942,629 | | | $ | 111,977,673 | |
Rurban Financial Corp.
Notes to Consolidated Financial Statements
December 31, 2011 and 2010
The carrying value of securities pledged as collateral, to secure public deposits and for other purposes, was $52,819,227 at December 31, 2011, and $30,412,621 at December 31, 2010. The securities delivered for repurchase agreements were $21,024,591 at December 31, 2011 and $58,621,708 at December 31, 2010.
Gross gains of $1,888,618, $451,474, and $961,013, and gross losses of $17,231, $590, and $693 resulting from sales of available-for-sale securities were realized for 2011, 2010, and 2009, respectively. The tax expense for net security gains for 2011, 2010, and 2009 was $636,272, $153,301, and $326,509, respectively.
Certain investments in debt securities are reported in the financial statements at an amount less than their historical cost. Total fair value of these investments at December 31, 2011 and 2010, were $15,165,941 and $40,399,444 which is approximately 14% and 30% of the Company's available-for-sale investment portfolio, respectively. Based on evaluation of available evidence, including recent changes in market interest rates, credit rating information and information obtained from regulatory filings, management believes the declines in fair value for these securities are temporary. Should the impairment of any of these securities become other than temporary, the cost basis of the investment will be reduced and the resulting loss recognized in net income in the period the other-than-temporary impairment is identified.In 2002, the Company took an after-tax loss of $1.1 million on an investment in WorldCom bonds. In 2006, $889,454 of this loss was recovered, which resulted in a $587,000 after-tax gain. In 2008, an additional $197,487 of this loss was recovered, which resulted in a $130,000 after-tax gain. In 2010, an additional $73,774 of this loss was recovered, which resulted in a $49,000 after-tax gain.
The following tables present securities with unrealized losses at December 31, 2011 and December 31, 2010 as follows:
| | | Less than 12 Months | | | 12 Months or Longer | | | Total | |
| December 31, 2011 | | Fair Value | | | Unrealized
Losses | | | Fair Value | | | Unrealized
Losses | | | Fair Value | | | Unrealized
Losses | |
| Available-for-Sale Securities: | | | | | | | | | | | | | | | | | | | | | | | | |
| U.S. Treasury and Government agencies | | $ | 2,499,600 | | | $ | (400 | ) | | $ | - | | | $ | - | | | $ | 2,499,600 | | | $ | (400 | ) |
| Mortgage-backed securities | | | 11,321,273 | | | | (54,484 | ) | | | 843,858 | | | | (63,404 | ) | | | 12,165,131 | | | | (117,888 | ) |
| State and political subdivisions | | | 501,210 | | | | (3,791 | ) | | | | | | | - | | | | 501,210 | | | | (3,791 | ) |
| | | | | | | | | | | | | | | | | | | | | | | | | |
| | | $ | 14,322,083 | | | $ | (58,675 | ) | | $ | 843,858 | | | $ | (63,404 | ) | | $ | 15,165,941 | | | $ | (122,079 | ) |
Rurban Financial Corp.
Notes to Consolidated Financial Statements
December 31, 2011 and 2010
| | | Less than 12 Months | | | 12 Months or Longer | | | Total | |
| December 31, 2010 | | Fair Value | | | Unrealized
Losses | | | Fair Value | | | Unrealized
Losses | | | Fair Value | | | Unrealized
Losses | |
| Available-for-Sale Securities: | | | | | | | | | | | | | | | | | | | | | | | | |
| U.S. Treasury and Government agencies | | $ | - | | | $ | - | | | $ | 11,483,130 | | | $ | (220,262 | ) | | $ | 11,483,130 | | | $ | (220,262 | ) |
| Mortgage-backed securities | | | 1,164,431 | | | | (99,297 | ) | | | 20,281,713 | | | | (319,935 | ) | | | 21,446,144 | | | | (419,232 | ) |
| State and political subdivisions | | | 349,460 | | | | (24,611 | ) | | | 7,120,710 | | | | (126,113 | ) | | | 7,470,170 | | | | (150,724 | ) |
| | | | | | | | | | | | | | | | | | | | | | | | | |
| | | $ | 1,513,891 | | | $ | (123,908 | ) | | $ | 38,885,553 | | | $ | (666,310 | ) | | $ | 40,399,444 | | | $ | (790,218 | ) |
The total unrealized losses on the mortgage-backed securities portfolio, all of which are residential mortgage-backs, is derived mainly from three private label senior tranche residential collateralized mortgage obligation (CMO) securities with a book value of $1.1 million and a fair value of $1.0 million. Management evaluates securities for other-than-temporary impairment at least on a quarterly basis, and more frequently when economic or market concern warrants such evaluation. When the Company does not intend to sell a debt security, and it is more likely than not, the Company will not have to sell the security before recovery of its cost basis, it recognizes the credit component of an other-than-temporary impairment of a debt security in earnings and the remaining portion in other comprehensive income. Management has determined there is no other-than-temporary-impairment on its CMO securities.
Note 4: Loans and Allowance for Loan Losses
Categories of loans at December 31 include:
| ($ in thousands) | | Total Loans | | | Non-Accrual Loans | | | Non-Accrual Percentage | |
| | | 2011 | | | 2010 | | | 2011 | | | 2010 | | | 2011 | | | 2010 | |
| Commercial | | $ | 78,112 | | | $ | 72,489 | | | | 2,393 | | | | 3,032 | | | | 3.06 | % | | | 4.18 | % |
| Commercial real estate | | | 187,829 | | | | 177,890 | | | | 1,456 | | | | 5,428 | | | | 0.78 | % | | | 3.05 | % |
| Agricultural | | | 38,361 | | | | 40,762 | | | | - | | | | - | | | | 0.00 | % | | | 0.00 | % |
| Residential real estate | | | 87,656 | | | | 84,775 | | | | 2,471 | | | | 3,285 | | | | 2.82 | % | | | 3.87 | % |
| Consumer | | | 50,681 | | | | 51,710 | | | | 580 | | | | 538 | | | | 1.14 | % | | | 1.04 | % |
| Leasing | | | 216 | | | | 194 | | | | - | | | | - | | | | 0.00 | % | | | 0.00 | % |
| Total loans | | | 442,855 | | | | 427,820 | | | | 6,900 | | | | 12,283 | | | | 1.56 | % | | | 2.87 | % |
| Less | | | | | | | | | | | | | | | | | | | | | | | | |
| Net deferred loan fees, premiums and discounts | | | (301 | ) | | | (276 | ) | | | | | | | | | | | | | | | | |
| Loans, net of unearned income | | | 442,554 | | | | 427,544 | | | | | | | | | | | | | | | | | |
| Allowance for loan losses | | $ | (6,529 | ) | | $ | (6,715 | ) | | | | | | | | | | | | | | | | |
Rurban Financial Corp.
Notes to Consolidated Financial Statements
December 31, 2011 and 2010
The following tables present the balance of the allowance for loan losses and the recorded investment in loans based on portfolio segment and impairment method as of December 31, 2011 and 2010.
| For the Year Ended | | | | | Commercial | | | | | | | | | | | | | | | | | | | |
| December 31, 2011 | | Commercial | | | RE & | | | Agricultural | | | Residential | | | Home Equity | | | | | | | | | | |
| ($'s in thousands) | | & Industrial | | | Construction | | | & Farmland | | | Real Estate | | | & Consumer | | | Other | | | Unallocated | | | Total | |
| | | | | | | | | | | | | | | | | | | | | | | | | |
| Beginning balance | | $ | 1,723 | | | $ | 3,774 | | | $ | 16 | | | $ | 643 | | | $ | 401 | | | $ | 128 | | | $ | 30 | | | $ | 6,715 | |
| Charge Offs | | | (642 | ) | | | (2,057 | ) | | | - | | | | (248 | ) | | | (460 | ) | | | - | | | | - | | | | (3,407 | ) |
| Recoveries | | | 465 | | | | 32 | | | | 3 | | | | 700 | | | | 21 | | | | 6 | | | | - | | | | 1,227 | |
| Provision | | | 368 | | | | 1,131 | | | | 32 | | | | (139 | ) | | | 637 | | | $ | 5 | | | | (40 | ) | | | 1,994 | |
| Ending Balance | | $ | 1,914 | | | $ | 2,880 | | | $ | 51 | | | $ | 956 | | | $ | 599 | | | $ | 139 | | | $ | (10 | ) | | $ | 6,529 | |
| | | | | | | | | | | | | | | | | | | | | | | | | | | | | | | | | |
| Ending balance: | | | | | | | | | | | | | | | | | | | | | | | | | | | | | | | | |
| individually evaluated for impairment | | $ | 1,017 | | | $ | 19 | | | $ | 5 | | | $ | 280 | | | $ | 212 | | | | | | | | | | | $ | 1,533 | |
| Ending balance: | | | | | | | | | | | | | | | | | | | | | | | | | | | | | | | | |
| individually evaluated for impairment | | $ | 897 | | | $ | 2,861 | | | $ | 46 | | | $ | 676 | | | $ | 387 | | | $ | 139 | | | $ | (10 | ) | | $ | 4,996 | |
| | | | | | | | | | | | | | | | | | | | | | | | | | | | | | | | | |
| Loans: | | | | | | | | | | | | | | | | | | | | | | | | | | | | | | | | |
| Ending balance: | | | | | | | | | | | | | | | | | | | | | | | | | | | | | | | | |
| individually evaluated for impairment | | $ | 3,283 | | | $ | 2,473 | | | $ | 5 | | | $ | 2,074 | | | $ | 543 | | | | | | | | | | | $ | 8,378 | |
| Ending balance: | | | | | | | | | | | | | | | | | | | | | | | | | | | | | | | | |
| individually evaluated for impairment | | $ | 74,829 | | | $ | 185,356 | | | $ | 38,356 | | | $ | 85,582 | | | $ | 50,138 | | | $ | 216 | | | $ | - | | | $ | 434,477 | |
| For the Year Ended | | | | | Commercial | | | | | | | | | | | | | | | | | | | |
| December 31, 2010 | | Commercial | | | RE & | | | Agricultural | | | Residential | | | Home Equity | | | | | | | | | | |
| ($'s in thousands) | | & Industrial | | | Construction | | | & Farmland | | | Real Estate | | | & Consumer | | | Other | | | Unallocated | | | Total | |
| | | | | | | | | | | | | | | | | | | | | | | | | |
| Beginning balance | | $ | 2,604 | | | $ | 3,210 | | | $ | 92 | | | $ | 715 | | | $ | 255 | | | $ | 154 | | | $ | - | | | $ | 7,030 | |
| Charge Offs | | | (4,739 | ) | | | (4,748 | ) | | | - | | | | (1,210 | ) | | | (542 | ) | | | (95 | ) | | | - | | | | (11,334 | ) |
| Recoveries | | | 182 | | | | 171 | | | | 11 | | | | 53 | | | | - | | | | 14 | | | | - | | | | 431 | |
| Provision | | | 3,676 | | | | 5,141 | | | | (87 | ) | | | 1,085 | | | | 688 | | | | 55 | | | | 30 | | | | 10,588 | |
| Ending Balance | | $ | 1,723 | | | $ | 3,774 | | | $ | 16 | | | $ | 643 | | | $ | 401 | | | $ | 128 | | | $ | 30 | | | $ | 6,715 | |
| | | | | | | | | | | | | | | | | | | | | | | | | | | | | | | | | |
| Ending balance: | | | | | | | | | | | | | | | | | | | | | | | | | | | | | | | | |
| individually evaluated for impairment | | $ | 684 | | | $ | 1,157 | | | $ | - | | | $ | - | | | $ | - | | | | | | | | | | | $ | 1,841 | |
| Ending balance: | | | | | | | | | | | | | | | | | | | | | | | | | | | | | | | | |
| individually evaluated for impairment | | $ | 1,039 | | | $ | 2,617 | | | $ | 16 | | | $ | 643 | | | $ | 401 | | | $ | 128 | | | $ | 30 | | | $ | 4,874 | |
| Loans: | | | | | | | | | | | | | | | | | | | | | | | | | | | | | | | | |
| Ending balance: | | | | | | | | | | | | | | | | | | | | | | | | | | | | | | | | |
| individually evaluated for impairment | | $ | 3,121 | | | $ | 3,774 | | | $ | - | | | $ | - | | | $ | - | | | | | | | | | | | $ | 6,895 | |
| Ending balance: | | | | | | | | | | | | | | | | | | | | | | | | | | | | | | | | |
| individually evaluated for impairment | | $ | 69,368 | | | $ | 174,116 | | | $ | 40,762 | | | $ | 84,775 | | | $ | 51,710 | | | $ | 194 | | | $ | - | | | $ | 420,925 | |
Rurban Financial Corp.
Notes to Consolidated Financial Statements
December 31, 2011 and 2010
Credit Risk Profile
The Company categorizes loans into risk categories based on relevant information about the ability of borrowers to service their debt such as: current financial information, historical payment experience, credit documentation, public information and current economic trends, among other factors. The Company analyzes loans individually by classifying the loans as to credit risk. This analysis includes loans with an outstanding balance greater than $100 thousand and non-homogeneous loans, such as commercial and commercial real estate loans. This analysis is performed on a quarterly basis. The Company uses the following definitions for risk ratings:
Special Mention: Assets have potential weaknesses that deserve managements close attention. If left uncorrected, these potential weaknesses may result in deterioration of the repayment prospects for the asset or in the institution’s credit position at some future date. Special mention assets are not adversely classified and do not expose an institution to sufficient risk to warrant adverse classification. Ordinarily, special mention credits have characteristics which corrective management action would remedy.
Substandard: Loans are inadequately protected by the current sound worth and paying capacity of the obligor or of the collateral pledged, if any. Loans so classified must have a well-defined weakness or weaknesses that jeopardized the liquidation of the debt. They are characterized by the distinct possibility that the Company will sustain some loss if the deficiencies are not corrected.
Doubtful: Loans classified as doubtful have all the weaknesses inherent in those classified Substandard with the added characteristic that the weaknesses make collection or liquidation in full, on the basis of current known facts, conditions and values, highly questionable and improbable.
Loans not meeting the criteria above that are analyzed individually as part of the above described process are considered to be pass rated loans.
Rurban Financial Corp.
Notes to Consolidated Financial Statements
December 31, 2011 and 2010
The following tables present the credit risk profile of the Company’s loan portfolio based on rating category as of December 31, 2011 and 2010 (dollars in thousands).
| Dec. 31, 2011 | | Commercial | | | Comm. RE | | | Agricultural | | | Residential | | | Home Equity | | | | | | | |
| Loan Grade | | & Industrial | | | & Construction | | | & Farmland | | | Real Estate | | | & Consumer | | | Other | | | Total | |
| 1-2 | | $ | 909 | | | $ | 188 | | | $ | 152 | | | $ | 1,548 | | | $ | 127 | | | $ | 140 | | | $ | 3,064 | |
| 3 | | | 24,375 | | | | 62,506 | | | | 13,203 | | | | 78,122 | | | | 43,814 | | | | - | | | | 222,020 | |
| 4 | | | 48,004 | | | | 110,633 | | | | 24,950 | | | | 1,576 | | | | 6,095 | | | | 76 | | | | 191,334 | |
| Total Pass | | | 73,288 | | | | 173,327 | | | | 38,305 | | | | 81,246 | | | | 50,036 | | | | 216 | | | | 416,418 | |
| | | | | | | | | | | | | | | | | | | | | | | | | | | | | |
| Special Mention | | | 610 | | | | 9,703 | | | | 5 | | | | 1,666 | | | | 72 | | | | - | | | | 12,056 | |
| Substandard | | | 2,037 | | | | 3,358 | | | | 51 | | | | 1,834 | | | | 92 | | | | - | | | | 7,372 | |
| Doubtful | | | 2,177 | | | | 1,441 | | | | - | | | | 2,910 | | | | 481 | | | | - | | | | 7,009 | |
| Loss | | | - | | | | - | | | | - | | | | - | | | | - | | | | - | | | | - | |
| Total | | $ | 78,112 | | | $ | 187,829 | | | $ | 38,361 | | | $ | 87,656 | | | $ | 50,681 | | | $ | 216 | | | $ | 442,855 | |
| Dec. 31, 2010 | | Commercial | | | Commercial | | | Agricultural | | | Residential | | | Home Equity | | | | | | | |
| Loan Grade | | & Industrial | | | Real Estate | | | & Farmland | | | Real Estate | | | & Consumer | | | Other | | | Total | |
| 1-2 | | $ | 903 | | | $ | 735 | | | $ | 180 | | | $ | 3,861 | | | $ | 444 | | | $ | 127 | | | $ | 6,250 | |
| 3 | | | 25,101 | | | | 63,789 | | | | 15,883 | | | | 68,979 | | | | 47,650 | | | | - | | | | 221,402 | |
| 4 | | | 40,159 | | | | 97,307 | | | | 24,204 | | | | 5,535 | | | | 2,589 | | | | 67 | | | | 169,861 | |
| Total Pass | | | 66,163 | | | | 161,831 | | | | 40,267 | | | | 78,375 | | | | 50,683 | | | | 194 | | | | 397,513 | |
| | | | | | | | | | | | | | | | | | | | | | | | | | | | | |
| Special Mention | | | 1,021 | | | | 7,141 | | | | 6 | | | | 2,465 | | | | 217 | | | | - | | | | 10,850 | |
| Substandard | | | 2,739 | | | | 3,176 | | | | 489 | | | | 2,605 | | | | 450 | | | | - | | | | 9,459 | |
| Doubtful | | | 2,566 | | | | 5,742 | | | | - | | | | 1,330 | | | | 360 | | | | - | | | | 9,998 | |
| Loss | | | - | | | | - | | | | - | | | | - | | | | - | | | | - | | | | - | |
| Total | | $ | 72,489 | | | $ | 177,890 | | | $ | 40,762 | | | $ | 84,775 | | | $ | 51,710 | | | $ | 194 | | | $ | 427,820 | |
Rurban Financial Corp.
Notes to Consolidated Financial Statements
December 31, 2011 and 2010
The following tables present the Company’s loan portfolio aging analysis as of December 21, 2011 and December 31, 2010 (dollars in thousands).
| | | 30-59 Days | | | 60-89 Days | | | Greater Than | | | Total Past | | | | | | Total Loans | |
| December 31, 2011 | | Past Due | | | Past Due | | | 90 Days | | | Due | | | Current | | | Receivable | |
| | | | | | | | | | | | | | | | | | | |
| Commercial & Industrial | | $ | 58 | | | $ | - | | | $ | 2,334 | | | $ | 2,392 | | | $ | 75,720 | | | $ | 78,112 | |
| Commercial RE | | | 67 | | | | - | | | | 1,656 | | | | 1,723 | | | | 186,106 | | | | 187,829 | |
| Agricultural & Farmland | | | - | | | | - | | | | - | | | | - | | | | 38,361 | | | | 38,361 | |
| Residential Real Estate | | | 412 | | | | 784 | | | | 569 | | | | 1,765 | | | | 85,891 | | | | 87,656 | |
| Home Equity & Consumer | | | 465 | | | | 194 | | | | 505 | | | | 1,164 | | | | 49,517 | | | | 50,681 | |
| Other | | | - | | | | - | | | | - | | | | - | | | | 216 | | | | 216 | |
| Loans | | | 1,002 | | | | 978 | | | | 5,064 | | | | 7,044 | | | | 435,811 | | | | 442,855 | |
| Loans held for Sale | | | - | | | | - | | | | - | | | | - | | | | 5,238 | | | | 5,238 | |
| | | | | | | | | | | | | | | | | | | | | | | | | |
| Total | | $ | 1,002 | | | $ | 978 | | | $ | 5,064 | | | $ | 7,044 | | | $ | 441,049 | | | $ | 448,093 | |
| | | 30-59 Days | | | 60-89 Days | | | Greater Than | | | Total Past | | | | | | Total Loans | |
| December 31, 2010 | | Past Due | | | Past Due | | | 90 Days | | | Due | | | Current | | | Receivable | |
| | | | | | | | | | | | | | | | | | | |
| Commercial & Industrial | | $ | 242 | | | $ | 73 | | | $ | 2,744 | | | $ | 3,059 | | | $ | 69,430 | | | $ | 72,489 | |
| Commercial RE | | | 148 | | | | 10 | | | | 5,617 | | | | 5,775 | | | | 172,115 | | | | 177,890 | |
| Agricultural & Farmland | | | - | | | | 88 | | | | - | | | | 88 | | | | 40,674 | | | | 40,762 | |
| Residential Real Estate | | | 427 | | | | 372 | | | | 1,584 | | | | 2,383 | | | | 82,392 | | | | 84,775 | |
| Home Equity & Consumer | | | 255 | | | | 25 | | | | 547 | | | | 827 | | | | 50,883 | | | | 51,710 | |
| Other | | | - | | | | - | | | | - | | | | - | | | | 194 | | | | 194 | |
| Loans | | | 1,072 | | | | 568 | | | | 10,492 | | | | 12,132 | | | | 415,688 | | | | 427,820 | |
| Loans held for Sale | | | - | | | | - | | | | - | | | | - | | | | 9,055 | | | | 9,055 | |
| | | | | | | | | | | | | | | | | | | | | | | | | |
| Total | | $ | 1,072 | | | $ | 568 | | | $ | 10,492 | | | $ | 12,132 | | | $ | 424,743 | | | $ | 436,875 | |
All loans past due 90 days are systematically placed on nonaccrual status.
Rurban Financial Corp.
Notes to Consolidated Financial Statements
December 31, 2011 and 2010
The following tables present impaired loan activity for the twelve months ended December 31, 2011 and 2010.
| Twelve Months Ended | | | | | | | | | | | | | | | |
| December 31, 2011 | | | | | Unpaid | | | | | | Average | | | Interest | |
| ($'s in thousands) | | Recorded | | | Principal | | | Related | | | Recorded | | | Income | |
| | | Investment | | | Balance | | | Allowance | | | Investment | | | Recognized | |
| With no related allowance recorded: | | | | | | | | | | | | | | | | | | | | |
| Commercial & Industrial | | $ | 1,206 | | | $ | 1,856 | | | $ | - | | | $ | 1,737 | | | $ | 89 | |
| Commercial RE & Construction | | | 1,061 | | | | 2,149 | | | | - | | | | 2,264 | | | | 4 | |
| Agricultural & Farmland | | | - | | | | - | | | | - | | | | - | | | | - | |
| Residential Real Estate | | | 581 | | | | 581 | | | | - | | | | 678 | | | | 42 | |
| Home Equity & Consumer | | | 189 | | | | 217 | | | | - | | | | 191 | | | | 2 | |
| All Impaired Loans < $100,000 | | | 1,065 | | | | 1,065 | | | | - | | | | 1,065 | | | | - | |
| With a specific allowance recorded: | | | | | | | | | | | | | | | | | | | | |
| Commercial & Industrial | | | 2,077 | | | | 3,787 | | | | 1,017 | | | | 2,528 | | | | - | |
| Commercial RE & Construction | | | 1,412 | | | | 2,827 | | | | 19 | | | | 2,029 | | | | 21 | |
| Agricultural & Farmland | | | 5 | | | | 5 | | | | 5 | | | | 5 | | | | 1 | |
| Residential Real Estate | | | 1,493 | | | | 1,596 | | | | 280 | | | | 1,655 | | | | 66 | |
| Home Equity & Consumer | | | 354 | | | | 354 | | | | 212 | | | | 365 | | | | 8 | |
| All Impaired Loans < $100,000 | | | - | | | | - | | | | - | | | | - | | | | - | |
| Totals: | | | | | | | | | | | | | | | | | | | | |
| Commercial & Industrial | | $ | 3,283 | | | $ | 5,643 | | | $ | 1,017 | | | $ | 4,265 | | | $ | 89 | |
| Commercial RE & Construction | | $ | 2,473 | | | $ | 4,976 | | | $ | 19 | | | $ | 4,293 | | | $ | 25 | |
| Agricultural & Farmland | | $ | 5 | | | $ | 5 | | | $ | 5 | | | $ | 5 | | | $ | 1 | |
| Residential Real Estate | | $ | 2,074 | | | $ | 2,177 | | | $ | 280 | | | $ | 2,333 | | | $ | 108 | |
| Home Equity & Consumer | | $ | 543 | | | $ | 571 | | | $ | 212 | | | $ | 556 | | | $ | 10 | |
| All Impaired Loans < $100,000 | | | 1,065 | | | | 1,065 | | | | - | | | | 1,065 | | | | - | |
| Twelve Months Ended | | | | | | | | | | | | | | | |
| December 31, 2010 | | | | | Unpaid | | | | | | Average | | | Interest | |
| ($'s in thousands) | | Recorded | | | Principal | | | Related | | | Recorded | | | Income | |
| | | Investment | | | Balance | | | Allowance | | | Investment | | | Recognized | |
| With no related allowance recorded: | | | | | | | | | | | | | | | | | | | | |
| Commercial & Industrial | | $ | 436 | | | $ | 786 | | | $ | - | | | $ | 2,075 | | | $ | 4 | |
| Commercial RE & Construction | | | 2,744 | | | | 4,040 | | | | - | | | | 4,195 | | | | 52 | |
| Agricultural & Farmland | | | - | | | | - | | | | - | | | | - | | | | 10 | |
| Residential Real Estate | | | 616 | | | | 741 | | | | - | | | | 1,045 | | | | 2 | |
| Home Equity & Consumer | | | 43 | | | | 43 | | | | - | | | | 72 | | | | - | |
| All Impaired Loans < $100,000 | | | 1,062 | | | | 1,062 | | | | - | | | | 1,062 | | | | - | |
| With a specific allowance recorded: | | | | | | | | | | | | | | | | | | | | |
| Commercial & Industrial | | | 2,438 | | | | 3,938 | | | | 684 | | | | 2,147 | | | | (48 | ) |
| Commercial RE & Construction | | | 3,202 | | | | 3,202 | | | | 1,187 | | | | 3,147 | | | | 44 | |
| Agricultural & Farmland | | | - | | | | - | | | | - | | | | - | | | | - | |
| Residential Real Estate | | | - | | | | - | | | | - | | | | - | | | | - | |
| Home Equity & Consumer | | | - | | | | - | | | | - | | | | - | | | | - | |
| All Impaired Loans < $100,000 | | | - | | | | - | | | | - | | | | - | | | | - | |
| Totals: | | | | | | | | | | | | | | | | | | | | |
| Commercial & Industrial | | $ | 2,874 | | | $ | 4,724 | | | $ | 684 | | | $ | 4,222 | | | $ | (44 | ) |
| Commercial RE & Construction | | $ | 5,946 | | | $ | 7,242 | | | $ | 1,187 | | | $ | 7,342 | | | $ | 96 | |
| Agricultural & Farmland | | $ | - | | | $ | - | | | $ | - | | | $ | - | | | $ | 10 | |
| Residential Real Estate | | $ | 616 | | | $ | 741 | | | $ | - | | | $ | 1,045 | | | $ | 2 | |
| Home Equity & Consumer | | $ | 43 | | | $ | 43 | | | $ | - | | | $ | 72 | | | $ | - | |
| All Impaired Loans < $100,000 | | $ | 1,062 | | | $ | 1,062 | | | $ | - | | | $ | 1,062 | | | $ | - | |
Rurban Financial Corp.
Notes to Consolidated Financial Statements
December 31, 2011 and 2010
Impaired loans less than $100,000 are included in groups of homogenous loans. These loans are evaluated based on delinquency status.
Interest income recognized on a cash basis does not materially differ from interest income recognized on an accrual basis.
A loan is considered impaired, in accordance with the impairment accounting guidance (ASC 310-10-35-16), when based on current information and events, it is probable State Bank will be unable to collect all amounts due from the borrower in accordance with the contractual terms of the loan. Impaired loans include non-performing commercial loans but also include loans modified in troubled debt restructurings where concessions have been granted to borrowers experiencing financial difficulties. These concessions could include a reduction in the interest rate on the loan, payment extensions, forgiveness of principal, forbearance or other actions intended to maximize collection.
Troubled Debt Restructured (TDR) Loans
TDR’s are modified loans where a concession was provided to a borrower experiencing financial difficulties. Loan modifications are considered TDR’s when the concessions provided are not available to the borrower through either normal channels or other sources. However, not all loan modifications are TDR’s.
TDR Concession Types
The Company’s standards relating to loan modifications consider, among other factors, minimum verified income requirements, cash flow analysis, and collateral valuations. Each potential loan modification is reviewed individually and the terms of the loan are modified to meet a borrower’s specific circumstances at a point in time. All loan modifications, including those classified as TDR’s, are reviewed and approved. The types of concessions provided to borrowers include:
| · | Interest rate reduction: A reduction of the stated interest rate to a nonmarket rate for the remaining original life of the debt. The Company also may grant interest rate concessions for a limited timeframe on a case by case basis. |
| · | Amortization or maturity date change beyond what the collateral supports, including any of the following: |
| (1) | Lengthens the amortization period of the amortized principal beyond market terms. This concession reduces the minimum monthly payment and increases the amount of the balloon payment at the end of the term of the loan. Principal is generally not forgiven. |
| (2) | Reduces the amount of loan principal to be amortized. This concession also reduces the minimum monthly payment and increases the amount of the balloon payment at the end of the term of the loan. Principal is generally not forgiven. |
| (3) | Extends the maturity date or dates of the debt beyond what the collateral supports. This concession generally applies to loans without a balloon payment at the end of the term of the loan. In addition, there may be instances where renewing loans potentially require non-market terms and would then be reclassified as TDRs. |
Rurban Financial Corp.
Notes to Consolidated Financial Statements
December 31, 2011 and 2010
| · | Other: A concession that is not categorized as one of the concessions described above. These concessions include, but are not limited to: principal forgiveness, collateral concessions, covenant concessions, and reduction of accrued interest. Principal forgiveness may result from any TDR modification of any concession type. |
The table below presents the activity of TDR’s during the prior year.
| | | Twelve Months Ended December 31, 2011 | |
| | | | | | Pre-Modification | | | Post-Modification | |
| | | Number of | | | Recorded | | | Recorded | |
| | | Contracts | | | Investment | | | Investment | |
| | | | | | | | | | |
| Residential Real Estate | | | 14 | | | $ | 1,011 | | | $ | 1,011 | |
Of the troubled debt restructurings entered into during 2011, none had subsequently defaulted as of December 31, 2011. Redefaults are defined as loans that were performing troubled debt restructurings that became 90 days or more past due post restructuring. The Company has specifically allocated $1.2 million of the $6.5 million in loan loss allowance to all troubled debt restructured loans. All troubled debt restructures resulted from a reduction to a borrowers rate. No principal reductions have been granted.
Note 5: Premises and Equipment
Major classifications of premises and equipment stated at cost were as follows at December 31:
| | | 2011 | | | 2010 | |
| | | | | | | | | |
| Land | | $ | 1,977,333 | | | $ | 1,977,333 | |
| Buildings and improvements | | | 15,327,244 | | | | 15,292,194 | |
| Equipment | | | 7,927,231 | | | | 7,740,609 | |
| Construction in progress | | | 452,205 | | | | 85,238 | |
| | | | 25,684,013 | | | | 25,095,374 | |
| | | | | | | | | |
| Less accumulated depreciation | | | (11,910,876 | ) | | | (10,472,833 | ) |
| | | | | | | | | |
| Net premises and equipment | | $ | 13,773,137 | | | $ | 14,622,541 | |
Rurban Financial Corp.
Notes to Consolidated Financial Statements
December 31, 2011 and 2010
Note 6: Goodwill
The changes in the carrying amount of goodwill for the years ended December 31, 2011, 2010, and 2009 were:
| | | 2011 | | | 2010 | | | 2009 | |
| Balance as of January 1 | | | | | | | | | | | | |
| Goodwill | | $ | 21,414,790 | | | $ | 21,414,790 | | | $ | 21,414,790 | |
| Accumulated impairment losses - Data Processing | | | (4,680,960 | ) | | | - | | | | - | |
| | | | | | | | | | | | | |
| Impairment losses during the year - Data Processing | | | (380,748 | ) | | | (4,680,960 | ) | | | - | |
| Balance as of December 31 | | | | | | | | | | | | |
| Goodwill | | | 21,414,790 | | | | 21,414,790 | | | | 21,414,790 | |
| Accumulated impairment losses | | | (5,061,708 | ) | | | (4,680,960 | ) | | | - | |
| | | $ | 16,353,082 | | | $ | 16,733,830 | | | $ | 21,414,790 | |
Goodwill impairment is tested on the last day of the last quarter of each calendar year. The goodwill impairment test is performed in two steps. If the fair market value of the stock is greater than the calculated book value of the stock, the goodwill is deemed not to be impaired and no further testing is required. If the fair market value is less than the calculated book value, an additional step of determining fair value is taken to determine impairment. Goodwill at both State Bank and RDSI was reviewed independently as of December 31, 2011 and 2010. Step one indicated the fair market value of State Bank was in excess of its book value at the end of both 2011 and 2010 and no further testing was required. Goodwill at RDSI was also reviewed as of December 31, 2011 and December 31, 2010. After an extensive review, it was determined that the Goodwill evaluation failed step one, and the step two evaluation indicated that the carrying value of Goodwill was in excess of its fair value by $381,000 in 2011 and $4.7 million in 2010.
Rurban Financial Corp.
Notes to Consolidated Financial Statements
December 31, 2011 and 2010
Note 7: Other Intangible Assets
The carrying basis and accumulated amortization of recognized intangible assets at December 31, 2011 and 2010 were:
| | | 2011 | | | 2010 | |
| | | Gross Carrying | | | Accumulated | | | Gross Carrying | | | Accumulated | |
| | | Amount | | | Amortization | | | Amount | | | Amortization | |
| Core deposits intangible | | $ | 5,450,647 | | | $ | (3,681,144 | ) | | $ | 5,450,647 | | | $ | (3,059,520 | ) |
| Customer relationship intangible | | | 200,627 | | | | (121,580 | ) | | | 200,627 | | | | (113,622 | ) |
| Banking intangibles | | | 5,651,274 | | | | (3,802,724 | ) | | | 5,651,274 | | | | (3,173,142 | ) |
| | | | | | | | | | | | | | | | | |
| Customer relationship intangible | | | 797,156 | | | | (797,156 | ) | | | 797,156 | | | | (690,156 | ) |
| Trademark intangible | | | 180,000 | | | | (180,000 | ) | | | 180,000 | | | | (180,000 | ) |
| Non-compete intangible | | | 83,000 | | | | (83,000 | ) | | | 83,000 | | | | (83,000 | ) |
| Data processing intangibles | | | 1,060,156 | | | | (1,060,156 | ) | | | 1,060,156 | | | | (953,156 | ) |
| | | | | | | | | | | | | | | | | |
| | | | | | | | | | | | | | | | | |
| Purchased software - banking | | | 679,148 | | | | (597,555 | ) | | | 679,148 | | | | (512,814 | ) |
| Purchased software - data processing | | | 161,564 | | | | (84,311 | ) | | | 960,240 | | | | (105,538 | ) |
| Purchased software - other | | | 86,200 | | | | (86,200 | ) | | | 86,200 | | | | (86,200 | ) |
| Purchased software | | | 926,912 | | | | (768,066 | ) | | | 1,725,588 | | | | (704,552 | ) |
| Total | | $ | 7,638,342 | | | $ | (5,630,946 | ) | | $ | 8,437,018 | | | $ | (4,830,850 | ) |
Amortization expense for Core Deposits and Other for the years ended December 31, 2011, 2010 and 2009, was $736,582, $800,747 and $858,423, respectively. Amortization expense for purchased software for the years ended December 31, 2011, 2010 and 2009 was $281,075, $1,608,017 and $1,816,247, respectively. At December 31, 2011 RDSI wrote-off software related to a specialized vendor that was an RDSI partner. At June 30, 2010, RDSI impaired the purchased software related to the Single Source data processing system. The gross carrying amount for purchased software-data processing was reduced by $11.7 million. Estimated amortization expense for each of the following five years is:
| | | 2012 | | | 2013 | | | 2014 | | | 2015 | | | 2016 | |
| | | | | | | | | | | | | | | | |
| Core deposit intangible | | $ | 617,490 | | | $ | 566,994 | | | $ | 365,465 | | | $ | 194,702 | | | $ | 8,068 | |
| Customer relationship intangible | | | 7,934 | | | | 7,202 | | | | 6,461 | | | | 5,805 | | | | 5,242 | |
| Banking intangibles | | | 625,424 | | | | 574,195 | | | | 371,926 | | | | 200,507 | | | | 13,310 | |
| | | | | | | | | | | | | | | | | | | | | |
| Purchased software - Banking | | | 41,339 | | | | 24,161 | | | | 16,093 | | | | - | | | | - | |
| Purchased software - Data Processing | | | 34,755 | | | | 23,911 | | | | 15,231 | | | | 3,356 | | | | - | |
| Purchased Software | | | 76,094 | | | | 48,072 | | | | 31,324 | | | | 3,356 | | | | - | |
| Total | | $ | 701,518 | | | $ | 622,267 | | | $ | 403,250 | | | $ | 203,863 | | | $ | 13,310 | |
Rurban Financial Corp.
Notes to Consolidated Financial Statements
December 31, 2011 and 2010
Note 8: Mortgage Servicing Rights
Mortgage loans serviced for others are not included in the accompanying consolidated balance sheets. The unpaid principal balance of mortgage loans service for others approximated $402,062,000, $328,435,000 and $208,276,000 at December 31, 2011, 2010 and 2009, respectively. Contractually specified servicing fees, late fees and ancillary fees of approximately $904 thousand, $607 thousand and $374 thousand are included in loan servicing fees in the income statement at December 31, 2011, 2010 and 2009, respectively.
The following table summarizes mortgage servicing rights capitalized and related amortization, along with activity in the related valuation allowance:
| | | 2011 | | | 2010 | | | 2009 | |
| | | | | | | | | | |
| Carrying amount, beginning of year | | $ | 3,190,389 | | | $ | 1,955,153 | | | $ | 607,078 | |
| Mortgage servicing rights capitalized during the year | | | 1,492,785 | | | | 1,634,058 | | | | 1,638,564 | |
| Mortgage servicing rights amortization during the year | | | (744,575 | ) | | | (483,822 | ) | | | (305,489 | ) |
| Net change in valuation allowance | | | (1,118,660 | ) | | | 85,000 | | | | 15,000 | |
| Carrying amount, end of year | | $ | 2,819,939 | | | $ | 3,190,389 | | | $ | 1,955,153 | |
| | | | | | | | | | | | | |
| Valuation allowance: | | | | | | | | | | | | |
| Beginning of year | | $ | - | | | $ | 85,000 | | | $ | 100,000 | |
| Additions | | | 1,118,660 | | | | 725,000 | | | | 25,000 | |
| Reduction | | | - | | | | (810,000 | ) | | | (40,000 | ) |
| | | | | | | | | | | | | |
| End of year | | $ | 1,118,660 | | | $ | - | | | $ | 85,000 | |
| | | | | | | | | | | | | |
| Fair Value, beginning of period | | $ | 3,263,804 | | | $ | 1,955,153 | | | $ | 607,078 | |
| Fair Value, end of period | | $ | 2,819,939 | | | $ | 3,263,804 | | | $ | 1,955,153 | |
During 2011, a valuation allowance of $1.1 million was taken to adjust the carrying value of the Mortgage Servicing Rights to the Fair Market Value. The fair market value is determined by an independent analysis conducted by an external expert on a quarterly basis.
Note 9: Interest-Bearing Time Deposits
Interest-bearing time deposits in denominations of $100,000 or more were $99,861,000 on December 31, 2011, and $86,100,000 on December 31, 2010. Certificates of Deposit obtained from brokers totaled approximately $5,930,000 and $5,930,000 at December 31, 2011 and 2010, respectively, and mature between 2013 and 2015.
Rurban Financial Corp.
Notes to Consolidated Financial Statements
December 31, 2011 and 2010
At December 31, 2011, the scheduled maturities of time deposits were as follows:
| 2012 | | | $ | 118,906,795 | |
| 2013 | | | | 43,873,606 | |
| 2014 | | | | 31,822,774 | |
| 2015 | | | | 14,334,890 | |
| 2016 | | | | 10,367,688 | |
| Thereafter | | | | 2,141,305 | |
| | | | | | |
| | | | $ | 221,447,059 | |
Included in time deposits at December 31, 2011 and 2010 were $37,811,000 and $34,799,000, respectively, of deposits which were obtained through the Certificate of Deposit Account Registry Service (CDARS). This service allows deposit customers to maintain fully insured balances in excess of the $250,000 FDIC limit without the inconvenience of having multi-banking relationships. Under the reciprocal program that the Company is currently participating in, customers agree to allow the Company to place their deposits with other participating banks in the CDARS program in insurable amounts under $250,000. In exchange, other banks in the program agree to place their deposits with the Company also in insurable amounts under $250,000.
Note 10: Short-Term Borrowings
| | | 2011 | | | 2010 | |
| | | | | | | |
| Federal funds purchased | | $ | - | | | $ | - | |
| Securities sold under repurchase agreements - retail | | | 13,778,522 | | | | 10,785,254 | |
| Securities sold under repurchase agreements - broker | | | 5,000,000 | | | | 35,000,000 | |
| | | | | | | | | |
| Total short-term borrowings | | $ | 18,778,522 | | | $ | 45,785,254 | |
At December 31, 2011, State Bank had $11.5 million in federal funds lines, of which $0 was drawn upon. At December 31, 2010, State Bank had $11.5 million in federal funds lines, of which $0 million was drawn upon.
State Bank has retail repurchase agreements to facilitate cash management transactions with commercial customers. These obligations are secured by agency and mortgage-backed securities and such collateral is held by Wilmington Trust Company. At December 31, 2011, retail repurchase agreements totaled $13,778,522. The maximum amount of outstanding agreements at any month-end during 2011 and 2010 totaled $15,239,000 and $18,336,000, respectively, and the monthly average of such agreements totaled $13,238,000 and $12,755,000, respectively. The agreements at December 31, 2011 and 2010 mature within one month.
State Bank also has a repurchase agreement with a brokerage firm who is in possession of the underlying securities. The securities are returned to State Bank on the repurchase date. The maximum amount of outstanding agreements at any month-end during 2011 and 2010 totaled $35,000,000 and $35,000,000, respectively, and the monthly average of such agreements totaled $18,068,000 and $35,000,000, respectively. This repurchase agreement matures in 2012 and at December 31, 2011, totaled $5,000,000 with an interest rate at year-end of 4.95%.
Rurban Financial Corp.
Notes to Consolidated Financial Statements
December 31, 2011 and 2010
Note 11: Notes Payable
Notes payable at December 31, included:
| | | 2011 | | | 2010 | |
| Note payable in the amount of $2,700,000, secured by all equipment and receivables of RDSI, monthly payments of $33,648 together with interest at a fixed rate of 6.50%, maturing July 20, 2012. | | $ | 1,288,123 | | | $ | 1,590,471 | |
| | | | | | | | | |
| Note payable with First Tennessee Bank, in the amount of $1,500,000, secured by 300,000 shares of State Bank common stock, principal payments of $187,500 quarterly together with interest at the greater of the 3 Month LIBOR rate plus 3.75%, or 6.0%, maturing October 31, 2013. | | $ | 1,500,000 | | | $ | 1,700,000 | |
| | | | | | | | | |
| | | $ | 2,788,123 | | | $ | 3,290,471 | |
Aggregate annual maturities of notes payable at December 31, 2011 were:
| | | | Debt | |
| | | | | |
| 2012 | | | | 2,038,123 | |
| 2013 | | | | 750,000 | |
| | | | | | | |
| | | | | $ | 2,788,123 | |
Pursuant to a loan covenant agreement between the Company and First Tennessee Bank, National Association (“FTB”), State Bank must maintain certain performance ratios, including a minimum Tier 1 Capital to average assets ratio of 7.5 percent, a year-to-date return on assets (ROA) of 50 basis points and a nonperforming asset ratio (calculated as non-performing loans plus OREO divided by total loans plus OREO) of less than 2.25 percent. In addition the issuance of any regulatory order would constitute a covenant violation.
At December 31, 2011, State Bank’s compliance with the loan covenant was as follows: Tier 1 capital was 8.0 percent, year to date ROA was 77 basis points and the nonperforming asset ratio was 1.90 percent. On March 9, 2010, a consent order was issued for RDSI which is still in place as of December 31, 2011. FTB agreed to waive this non financial covenant violation and enter into a new agreement which requires full payout of the obligation by October 31, 2013.
Rurban Financial Corp.
Notes to Consolidated Financial Statements
December 31, 2011 and 2010
Note 12: Federal Home Loan Bank Advances
The Federal Home Loan Bank advances were secured by $55,031,770 in balances from mortgage loans at December 31, 2011. Advances, at interest rates from 1.07 to 3.26 percent, are subject to restrictions or penalties in the event of prepayment.
Aggregate annual maturities of Federal Home Loan Bank advances at December 31, 2011, were:
| | | Debt | |
| | | | |
| 2012 | | $ | 275,866 | |
| 2013 | | | 1,500,000 | |
| 2014 | | | 8,500,000 | |
| 2015 | | | 0 | |
| 2016 | | | 2,500,000 | |
| Total | | $ | 12,775,866 | |
Rurban Financial Corp.
Notes to Consolidated Financial Statements
December 31, 2011 and 2010
Note 13: Trust Preferred Securities
On September 15, 2005, RST II, a wholly-owned subsidiary of the Company, closed a pooled private offering of 10,000 Capital Securities with a liquidation amount of $1,000 per security. The proceeds of the offering were loaned to the Company in exchange for junior subordinated debentures with terms similar to the Capital Securities. The sole assets of RST II are the junior subordinated debentures of the Company and payments there under. The junior subordinated debentures and the back-up obligations, in the aggregate, constitute a full and unconditional guarantee by the Company of the obligations of RST II under the Capital Securities. Distributions on the Capital Securities are payable quarterly at an interest rate that changes quarterly and is based on the 3-month LIBOR and are included in interest expense in the consolidated financial statements. These securities are considered Tier 1 capital (with certain limitations applicable) under current regulatory guidelines. As of December 31, 2011 and 2010, the outstanding principal balance of the Capital Securities was $10,000,000.
On September 7, 2000, RST I, a wholly-owned subsidiary of the Company, closed a pooled private offering of 10,000 Capital Securities with a liquidation amount of $1,000 per security. The proceeds of the offering were loaned to the Company in exchange for junior subordinated debentures with terms similar to the Capital Securities. The sole assets of RST I are the junior subordinated debentures of the Company and payments thereunder. The junior subordinated debentures and the back-up obligations, in the aggregate, constitute a full and unconditional guarantee by the Company of the obligations of RST I under the Capital Securities. Distributions on the Capital Securities are payable semi-annually at the annual rate of 10.6 percent and are included in interest expense in the consolidated financial statements. These securities are considered Tier 1 capital (with certain limitations applicable) under current regulatory guidelines. As of December 31, 2011 and 2010, the outstanding principal balance of the Capital Securities was $10,000,000.
The junior subordinated debentures are subject to mandatory redemption, in whole or in part, upon repayment of the Capital Securities at maturity or their earlier redemption at the liquidation amount. Subject to the Company having received prior approval of the Federal Reserve, if then required, the Capital Securities are redeemable prior to the maturity date of September 7, 2030, at the option of the Company: on or after September 7, 2020 at par; or on or after September 7, 2010 at a premium; or upon occurrence of specific events defined within the trust indenture.
On August 5, 2010, the Company notified the trustees of the Capital Securities of the Company’s election to defer (a) the quarterly interest payments on the RST II Capital Securities, beginning on September 15, 2010 and extending through December 15, 2011, and (b) the next semi-annual interest payments on the RST I Capital Securities, beginning on September 7, 2010 and extending through March 7, 2012. During any interest deferral period, the trust preferred indentures prohibit the Company from paying common stock dividends or repurchasing shares of common stock.
Rurban Financial Corp.
Notes to Consolidated Financial Statements
December 31, 2011 and 2010
Note 14: Income Taxes
The provision for income taxes includes these components:
| | | For The Year Ended December 31, | |
| | | 2011 | | | 2010 | | | 2009 | |
| Taxes currently payable | | $ | (178,817 | ) | | $ | (645,161 | ) | | $ | 347,655 | |
| Deferred provision (benefit) | | | 836,845 | | | | (5,857,134 | ) | | | (1,008,043 | ) |
| Income tax expense (benefit) | | $ | 658,028 | | | $ | (6,502,295 | ) | | $ | (660,388 | ) |
A reconciliation of income tax expense at the statutory rate to the Company's actual income tax expense is shown below:
| | | For The Year Ended December 31, | |
| | | 2011 | | | 2010 | | | 2009 | |
| Computed at the statutory rate (34%) | | $ | 789,455 | | | $ | (7,519,272 | ) | | $ | (94,485 | ) |
| Decrease resulting from | | | | | | | | | | | | |
| Tax exempt interest | | | (328,603 | ) | | | (458,031 | ) | | | (370,944 | ) |
| Goodwill impairment | | | - | | | | 1,591,526 | | | | - | |
| BOLI Income | | | (125,889 | ) | | | - | | | | - | |
| BOLI Surrender | | | 216,631 | | | | - | | | | - | |
| Penalty on Modified Endowment Contracts (MEC) | | | 63,715 | | | | - | | | | - | |
| Other | | | 42,719 | | | | (116,518 | ) | | | (194,959 | ) |
| Actual tax expense (benefit) | | $ | 658,028 | | | $ | (6,502,295 | ) | | $ | (660,388 | ) |
The Company or one of its subsidiaries files income tax returns in the U.S. federal and Ohio state and local jurisdictions. With few exceptions, the Company is no longer subject to U.S. federal, state and local examinations by tax authorities for years before 2008.
The Company accounts for uncertainties in income taxes in accordance with ASC 740, “Income Taxes”. ASC 740 prescribes a recognition threshold and measurement attribute for the financial statement recognition and measurement of a tax position taken, or expected to be taken, in a tax return. ASC 740 also provides guidance on derecognition, classification, interest and penalties, accounting in interim periods, disclosure and transition. As a result of the implementation of ASC 740, the Company did not become aware of any liability for uncertain tax positions that it believes should be recognized in the financial statements.
Rurban Financial Corp.
Notes to Consolidated Financial Statements
December 31, 2011 and 2010
The tax effects of temporary differences related to deferred taxes shown on the balance sheets are:
| | | At December 31, | |
| | | 2011 | | | 2010 | |
| Deferred tax assets | | | | | | | | |
| Allowance for loan losses | | $ | 2,219,931 | | | $ | 2,250,143 | |
| OREO Writedowns/Expense | | | 192,519 | | | | 270,416 | |
| Accrued compensation and benefits | | | 453,939 | | | | 441,894 | |
| Net deferred loan fees | | | 100,844 | | | | 93,730 | |
| Mark to market adjustments | | | 200,026 | | | | 513,782 | |
| Purchase accounting adjustments | | | 30,145 | | | | 57,621 | |
| NOL carry over | | | 3,888,931 | | | | 4,755,310 | |
| AMT credit carry over | | | 201,638 | | | | 282,639 | |
| Other | | | 220,214 | | | | 180,430 | |
| | | | 7,508,187 | | | | 8,845,965 | |
| | | | | | | | | |
| Deferred tax liabilities | | | | | | | | |
| Depreciation | | | (1,078,195 | ) | | | (1,424,244 | ) |
| Mortgage servicing rights | | | (958,780 | ) | | | (1,084,732 | ) |
| Unrealized gains on available-for-sale securities | | | (691,914 | ) | | | (611,750 | ) |
| Purchase accounting adjustments | | | (1,793,916 | ) | | | (1,881,443 | ) |
| Prepaids | | | (233,843 | ) | | | (175,248 | ) |
| FHLB stock dividends | | | (465,562 | ) | | | (465,562 | ) |
| | | | (5,222,210 | ) | | | (5,642,979 | ) |
| | | | | | | | | |
| Net deferred tax asset | | $ | 2,285,977 | | | $ | 3,202,986 | |
The NOL carry over of $11,438,000 begins to expire in 2024.
The Company performed a valuation analysis based on income projections of the deferred tax asset as of December 31, 2011. Based upon that analysis, no valuation reserve was required.
Rurban Financial Corp.
Notes to Consolidated Financial Statements
December 31, 2011 and 2010
Note 15: Other Comprehensive Income (Loss)
Other comprehensive income (loss) components and related taxes are as follows:
| | | 2011 | | | 2010 | | | 2009 | |
| | | | | | | | | | |
| Unrealized gains on securities available for sale | | $ | 2,107,167 | | | $ | 269,808 | | | $ | 3,124,990 | |
| Reclassification for realized amount included in income | | | (1,871,387 | ) | | | (450,885 | ) | | | (960,320 | ) |
| Other comprehensive income (loss), before tax effect | | | 235,780 | | | | (181,077 | ) | | | 2,164,670 | |
| Tax expense (benefit) | | | 80,165 | | | | (61,566 | ) | | | 735,988 | |
| | | | | | | | | | | | | |
| Other comprehensive income (loss) | | $ | 155,615 | | | $ | (119,511 | ) | | $ | 1,428,682 | |
Accumulated other comprehensive income consists entirely of the net unrealized gain on available-for-sale securities.
Note 16: Regulatory Matters
The Company and State Bank are subject to various regulatory capital requirements administered by the federal and state banking agencies. Failure to meet minimum capital requirements can initiate certain mandatory and possibly additional discretionary actions by regulators that, if undertaken, could have a direct material effect on the Company’s financial statements. Under capital adequacy guidelines and the regulatory framework for prompt corrective action, the Company and State Bank must meet specific capital guidelines that involve quantitative measures of assets, liabilities and certain off-balance-sheet items as calculated under regulatory accounting practices. The capital amounts and classification are also subject to qualitative judgments by the regulators about components, risk weightings and other factors.
Quantitative measures established by regulation to ensure capital adequacy require the Company and State Bank to maintain minimum amounts and ratios (set forth in the table below) of total and Tier I capital (as defined in the regulations) to risk-weighted assets (as defined), and of Tier I capital (as defined) to average assets (as defined). Management believes, as of December 31, 2011, that the Company and State Bank exceeded all capital adequacy requirements to which they were subject.
As of December 31, 2011, the most recent notification to the regulators categorized State Bank as well-capitalized under the regulatory framework for prompt corrective action. To be categorized as well-capitalized, State Bank must maintain capital ratios as set forth in the table. There are no conditions or events since that notification that management believes have changed State Bank’s status as well-capitalized.
Rurban Financial Corp.
Notes to Consolidated Financial Statements
December 31, 2011 and 2010
The Company and State Bank’s actual capital amounts (in millions) and ratios are presented in the following table.
| | | Actual | | | For Capital Adequacy
Purposes | | | To Be Well-Capitalized
Under Prompt Corrective
Action Provisions | |
| | | Amount | | | Ratio | | | Amount | | | Ratio | | | Amount | | | Ratio | |
| As of December 31, 2011 | | | | | | | | | | | | | | | | | | | | | | | | |
| Total Capital | | | | | | | | | | | | | | | | | | | | | | | | |
| (to Risk-Weighted Assets) | | | | | | | | | | | | | | | | | | | | | | | | |
| Consolidated | | $ | 52.0 | | | | 11.4 | % | | $ | 36.8 | | | | 8.0 | % | | $ | - | | | | N/A | |
| State Bank | | | 54.6 | | | | 12.0 | % | | | 36.3 | | | | 8.0 | % | | | 45.4 | | | | 10.0 | % |
| | | | | | | | | | | | | | | | | | | | | | | | | |
| Tier 1 Capital | | | | | | | | | | | | | | | | | | | | | | | | |
| (to Risk-Weighted Assets) | | | | | | | | | | | | | | | | | | | | | | | | |
| Consolidated | | | 40.2 | | | | 8.8 | % | | | 18.4 | | | | 4.0 | % | | | - | | | | N/A | |
| State Bank | | | 48.9 | | | | 10.8 | % | | | 18.2 | | | | 4.0 | % | | | 27.3 | | | | 6.0 | % |
| | | | | | | | | | | | | | | | | | | | | | | | | |
| Tier 1 Capital | | | | | | | | | | | | | | | | | | | | | | | | |
| (to Average Assets) | | | | | | | | | | | | | | | | | | | | | | | | |
| Consolidated | | | 40.2 | | | | 6.5 | % | | | 24.6 | | | | 4.0 | % | | | - | | | | N/A | |
| State Bank | | | 48.9 | | | | 8.0 | % | | | 24.4 | | | | 4.0 | % | | | 30.5 | | | | 5.0 | % |
| | | | | | | | | | | | | | | | | | | | | | | | | |
| As of December 31, 2010 | | | | | | | | | | | | | | | | | | | | | | | | |
| Total Capital | | | | | | | | | | | | | | | | | | | | | | | | |
| (to Risk-Weighted Assets) | | | | | | | | | | | | | | | | | | | | | | | | |
| Consolidated | | $ | 48.4 | | | | 11.0 | % | | $ | 35.1 | | | | 8.0 | % | | $ | - | | | | N/A | |
| State Bank | | | 50.8 | | | | 11.7 | % | | | 34.8 | | | | 8.0 | % | | | 43.5 | | | | 10.0 | % |
| | | | | | | | | | | | | | | | | | | | | | | | | |
| Tier 1 Capital | | | | | | | | | | | | | | | | | | | | | | | | |
| (to Risk-Weighted Assets) | | | | | | | | | | | | | | | | | | | | | | | | |
| Consolidated | | | 42.9 | | | | 9.8 | % | | | 17.5 | | | | 4.0 | % | | | - | | | | N/A | |
| State Bank | | | 45.4 | | | | 10.4 | % | | | 17.4 | | | | 4.0 | % | | | 26.1 | | | | 6.0 | % |
| | | | | | | | | | | | | | | | | | | | | | | | | |
| Tier 1 Capital | | | | | | | | | | | | | | | | | | | | | | | | |
| (to Average Assets) | | | | | | | | | | | | | | | | | | | | | | | | |
| Consolidated | | | 42.9 | | | | 6.5 | % | | | 27.5 | | | | 4.0 | % | | | - | | | | N/A | |
| State Bank | | | 45.4 | | | | 6.9 | % | | | 26.3 | | | | 4.0 | % | | | 32.9 | | | | 5.0 | % |
Rurban Financial Corp.
Notes to Consolidated Financial Statements
December 31, 2011 and 2010
Note 17: Related Party Transactions
Certain directors, executive officers and principal shareholders of the Company, including associates of such persons, are loan customers. A summary of the related party loan activity, for loans aggregating $60,000 or more to any one related party, follows for the years ended December 31, 2011 and 2010:
| | | 2011 | | | 2010 | |
| | | | | | | |
| Balance, January 1 | | $ | 344,291 | | | $ | 2,620,000 | |
| New Loans | | | - | | | | 155,000 | |
| Repayments | | | (344,291 | ) | | | (159,645 | ) |
| Other changes | | | - | | | | (2,271,064 | ) |
| | | | | | | | | |
| Balance, December 31 | | $ | - | | | $ | 344,291 | |
In management’s opinion, such loans and other extensions of credit and deposits were made in the ordinary course of business and were made on substantially the same terms (including interest rates and collateral) as those prevailing at the time for comparable transactions with other persons. Further, in management’s opinion, these loans did not involve more than normal risk of collectability or present other unfavorable features.
Deposits from related parties held by the Bank at December 31, 2011 and 2010 totaled $709,000 and $264,000, respectively.
Note 18: Employee Benefits
The Company entered into an Employment Agreement with Mark A. Klein, President and Chief Executive Officer of the Company and State Bank. Under the terms of the Employment Agreement, Mr. Klein is entitled to receive certain severance or change in control payments and benefits if he is terminated by the Company under certain circumstances.
The Company has retirement savings 401(k) plans covering substantially all employees. Employees contributing up to 4 percent of their compensation receive a Company match of 100 percent of the employee’s contribution. Employee contributions are vested immediately and the Company’s matching contributions are fully vested after three years of employment. Employer contributions charged to expense for 2011, 2010 and 2009 were $373,898, $487,681, and $551,716, respectively.
Also, the Company has deferred compensation agreements with certain active and retired officers. The agreements provide monthly payments for up to 15 years that equal 15 percent to 25 percent of average compensation prior to retirement or death. The charges to expense for the current agreements were $136,157, $178,442, and $115,656 for 2011, 2010, and 2009, respectively. In 2010 previously accrued benefits under the agreements in the amount of $68,728 were reversed and credited to expense. Such charges reflect the straight-line accrual over the period until full eligibility of the present value of benefits due each participant on the full eligibility date, using a 6 percent discount factor.
Rurban Financial Corp.
Notes to Consolidated Financial Statements
December 31, 2011 and 2010
Life insurance plans are provided for certain executive officers on a split-dollar basis. The Company is the owner of the split-dollar policies. The officers are entitled to a sum equal to two times either the employee’s annual salary at death, if actively employed, or final annual salary, if retired, less $50 thousand, not to exceed the employee’s portion of the death benefit. The Company is entitled to the portion of the death proceeds which equates to the cash surrender value less any loans on the policy and unpaid interest or cash withdrawals previously incurred by the Company. The employees have the right to designate one or more beneficiaries to receive their share of the proceeds payable upon death. The cash surrender value of these life insurance policies and life insurance policies related to the Company’s supplemental retirement plan totaled approximately $823,873 at December 31, 2011, and $2,171,737 at December 31, 2010.
Additional life insurance is provided to certain officers through a bank-owned life insurance policy (“BOLI”). By way of a separate split-dollar agreement, the policy interests are divided between the bank and the insured’s beneficiary. State Bank owns the policy cash value and a portion of the policy net death benefit, over and above the cash value assigned to the insured’s beneficiary. During 2007, State Bank elected to add $1 million in additional BOLI on two key executive officers. The cash surrender value of all life insurance policies totaled approximately $11,400,058 at December 31, 2011, and $11,039,510 at December 31, 2010.
The Company has a noncontributory employee stock ownership plan (“ESOP”) covering substantially all employees of the Company and its subsidiaries. Voluntary contributions are made by the Company to the plan. Each eligible employee is vested based upon years of service, including prior years of service. The Company’s contributions to the account of each employee become fully vested after three years of service.
Benefit expense for the value of the stock purchased is recorded equal to the fair market value of the stock when contributions, which are determined annually by the Board of Directors of the Company, are made to the ESOP. Allocated shares in the ESOP for each of the three years ended December 31, 2011, 2010 and 2009, were 370,820, 467,928, and 523,600, respectively.
Dividends on allocated shares are recorded as dividends and charged to retained earnings. Compensation expense is recorded equal to the fair market value of the stock when contributions, which are determined annually by the Board of Directors of the Company, are made to the ESOP. ESOP expense for the years ended December 31, 2011, 2010 and 2009 were $297,911, $0, and $618,543, respectively.
Rurban Financial Corp.
Notes to Consolidated Financial Statements
December 31, 2011 and 2010
Note 19: Share Based Compensation Plan
On March 12, 2007, the Company's share-based compensation plan, the 1997 Stock Option Plan (the "1997 Plan") expired in accordance with its terms. In April 2008, the shareholders approved the Rurban Financial Corp. 2008 Stock Incentive Plan (the "2008 Plan").
The 2008 Plan permits the grant or award of incentive stock options, nonqualified stock options, stock appreciation rights ("SARs"), and restricted stock for up to 250,000 Common Shares of the Company.
The 2008 Plan is intended to advance the interests of the Company and its shareholders by offering employees, directors and advisory board members of the Company and its subsidiaries an opportunity to acquire or increase their ownership interest in the Company through grants of equity-based awards. The 2008 Plan permits equity-based Awards to be used to attract, motivate, reward and retain highly competent individuals upon whose judgment, initiative, leadership and efforts are key to the success of the Company by encouraging those individuals to become shareholders of the Company.
Option awards are generally granted with an exercise price equal to the market price of the Company’s stock at the date of grant, and those option awards generally vest based on 5 years of continuous service and have 10-year contractual terms.
The compensation cost charged against income for both the 1997 and 2008 Plans were $87,976, $49,164 and $143,261 for 2011, 2010 and 2009, respectively. The total income tax benefit recognized in the income statement for share-based compensation arrangements were $29,912, $16,716 and $48,709 for 2011, 2010 and 2009, respectively.
The fair value of each option award is estimated on the date of grant using the Black-Scholes valuation model that uses the assumptions noted in the following table. Expected volatility is based on historical volatility of the Company’s stock and other factors. The Company uses the simplified method for valuing options granted. Historical data is insufficient to estimate option exercise and employee termination within the valuation model. The expected term of options granted is derived from the output of the option valuation model and represents the period of time that options granted are expected to be outstanding. The risk-free rate for the period within the contractual life of the option is based on the U.S. Treasury yield curve in effect at the time of the grant. In 2011, no options were granted. In 2010, 185,750 options were granted.
| | | 2011 | | | 2010 | |
| | | | | | | |
| Expected volatility | | | 0.0% - 0.0 | % | | | 26.2% - 26.9 | % |
| Weighted-average volatility | | | - | | | | 26.21 | % |
| Expected dividends | | | - | | | | 1.0 | % |
| Expected term (in years) | | | 0.0 - 0.0 | | | | 5.0 - 5.0 | |
| Risk-free rate | | | - | | | | 2.40 | % |
Rurban Financial Corp.
Notes to Consolidated Financial Statements
December 31, 2011 and 2010
A summary of option activity under the 2008 Plan as of December 31, 2011 and changes during the year then ended, is presented below:
| | | 2011 | |
| | | Shares | | | Weighted-
Average
Exercise
Price | | | Weighted-
Average
Remaining
Contractual
Term | | | Aggregate
Intrinsic
Value | |
| | | | | | | | | | | | | |
| Outstanding, beginning of year | | | 334,728 | | | $ | 9.94 | | | | | | | | | |
| Granted | | | - | | | | - | | | | | | | | | |
| Forfeited | | | 29,292 | | | | 10.38 | | | | | | | | | |
| Expired | | | 1,462 | | | | 13.65 | | | | | | | | | |
| Outstanding, end of year | | | 303,974 | | | $ | 9.88 | | | | 5.77 | | | $ | - | |
| | | | | | | | | | | | | | | | | |
| Exercisable, end of year | | | 174,739 | | | $ | 11.77 | | | | 4.20 | | | $ | - | |
The weighted-average grant-date fair value of options granted during the years 2011 and 2010 were $0and $1.65, respectively. There were no options exercised during the years ended December 31, 2011, 2010, and 2009.
As of December 31, 2011, there was $153,431 of total unrecognized compensation cost related to non-vested share-based compensation arrangements granted under the 1997 Plan and 2008 Plan. That cost is expected to be recognized over a weighted-average period of 1.44 years.
Rurban Financial Corp.
Notes to Consolidated Financial Statements
December 31, 2011 and 2010
Note 20: Earnings Per Share
Earnings per share (EPS) is computed as follows:
| | | Year Ended December 31, 2011 | |
| | | Income | | | Weighted-
Average
Shares | | | Per Share
Amount | |
| Basic earnings per share | | | | | | | | | | | | |
| Net income available to common shareholders | | $ | 1,663,899 | | | | 4,861,779 | | | $ | 0.34 | |
| Effect of dilutive securities | | | | | | | | | | | | |
| Stock options & restricted stock | | | - | | | | - | | | | | |
| Diluted earnings per share | | | | | | | | | | | | |
| Net income available to common shareholders and assumed conversions | | $ | 1,663,899 | | | | 4,861,779 | | | $ | 0.34 | |
Options to purchase 303,974 common shares at $6.66 to $14.15 per share were outstanding at December 31, 2011, but were not included in the computation of diluted EPS because the options' exercise price was greater than the average market price of the common shares.
| | | Year Ended December 31, 2010 | |
| | | Income | | | Weighted-
Average
Shares | | | Per Share
Amount | |
| Basic earnings per share | | | | | | | | | |
| Net income available to common shareholders | | $ | (15,613,210 | ) | | | 4,861,779 | | | $ | (3.21 | ) |
| Effect of dilutive securities | | | | | | | | | | | | |
| Stock options & restricted stock | | | - | | | | - | | | | | |
| Diluted earnings per share | | | | | | | | | | | | |
| Net income available to common shareholders and assumed conversions | | $ | (15,613,210 | ) | | | 4,861,779 | | | $ | (3.21 | ) |
Options to purchase 334,728 common shares at $6.66 to $15.20 per share were outstanding at December 31, 2010, but were not included in the computation of diluted EPS because all of the options’ exercise prices were greater than the average market price of the common shares.
Rurban Financial Corp.
Notes to Consolidated Financial Statements
December 31, 2011 and 2010
| | | Year Ended December 31, 2009 | |
| | | Income | | | Weighted-
Average
Shares | | | Per Share
Amount | |
| Basic earnings per share | | | | | | | | | | | | |
| Net income available to common shareholders | | $ | 382,491 | | | | 4,867,030 | | | $ | 0.07 | |
| Effect of dilutive securities | | | | | | | | | | | | |
| Stock options & restricted stock | | | - | | | | 3,373 | | | | | |
| Diluted earnings per share | | | | | | | | | | | | |
| Net income available to common shareholders and assumed conversions | | $ | 382,491 | | | | 4,870,403 | | | $ | 0.07 | |
Options to purchase 311,213 common shares at $7.55 to $15.20 per share were outstanding at December 31, 2009, but were not included in the computation of diluted EPS because all of the options’ exercise prices were greater than the average market price of the common shares.
Note 21: Leases
The Company’s subsidiaries, The State Bank and Trust Company and RDSI Banking Systems, have several non-cancellable operating leases for business use that expire over the next ten years. These leases generally contain renewal options for periods of five years and require the lessee to pay all executory costs such as taxes, maintenance and insurance. Aggregate rental expense for these leases was $441,225, $436,545 and $467,105 for the years ended December 31, 2011, 2010 and 2009, respectively.
Future minimum lease payments under operating leases are:
| 2012 | | | | 323,711 | |
| 2013 | | | | 304,702 | |
| 2014 | | | | 221,600 | |
| 2015 | | | | 65,000 | |
| 2016 | | | | 69,579 | |
| Thereafter | | | | 285,833 | |
| | | | | | |
| Total minimum lease payments | | | $ | 1,270,425 | |
RDSI has entered into an operating lease with an individual effective October 1, 2008 for various office space. Total monthly rent expense under this agreement is $700. The lease will remain in effect until either party terminates following a sixty day grace period.
Rurban Financial Corp.
Notes to Consolidated Financial Statements
December 31, 2011 and 2010
Also, The State Bank and Trust Company has entered into an operating lease with Remax Reality for various office storage. The total monthly rent expense under the agreement is $500. The lease will remain in effect until either party terminates following a thirty day grace period.
Note 22: Disclosures About Fair Value of Assets and Liabilities
ASC 820 defines fair value as the price that would be received to sell an asset or paid to transfer a liability in an orderly transaction between market participants at the measurement date. ASC 820 also establishes a fair value hierarchy which requires an entity to maximize the use of observable inputs and minimize the use of unobservable inputs when measuring fair value. The standard describes three levels of inputs that may be used to measure fair value:
| | Level 1 | Quoted prices in active markets for identical assets or liabilities |
| | | |
| | Level 2 | Observable inputs other than Level 1 prices, such as quoted prices for similar assets or liabilities; quoted prices in markets that are not active; or other inputs that are observable or can be corroborated by observable market data for substantially the full term of the assets or liabilities |
| | | |
| | Level 3 | Unobservable inputs that are supported by little or no market activity and that are significant to the fair value of the assets or liabilities |
Following is a description of the valuation methodologies, inputs used for assets measured at fair value on a recurring basis, recognized in the accompanying balance sheets, as well as the general classification of such assets pursuant to the valuation hierarchy.
Available-for-Sale Securities
The fair value of available-for-sale securities are determined by various valuation methodologies. Level 1 securities include money market mutual funds. Level 1 inputs include quoted prices in an active market. Level 2 securities include U.S. government agencies, mortgage-backed securities and obligations of political and state subdivisions. Level 2 inputs do not include quoted prices for individual securities in active markets; however, they do include inputs that are either directly or indirectly observable for the individual security being valued. Such observable inputs include interest rates and yield curves at commonly quoted intervals, volatilities, prepayment speeds, credit risks and default rates. Also included are inputs derived principally from or corroborated by observable market data by correlation or other means.
Rurban Financial Corp.
Notes to Consolidated Financial Statements
December 31, 2011 and 2010
The following table presents the fair value measurements of assets measured at fair value on a recurring basis and the level within ASC 820 fair value hierarchy in which the fair value measurements fall at December 31, 2011 and 2010:
| Fair Value Measurements Using: | |
| Description | | Fair Values at
12/31/2011 | | | (Level 1) | | | (Level 2) | | | (Level 3) | |
| Available-for-Sale Securities: | | | | | | | | | | | | |
| U.S. Treasury and Government Agencies | | $ | 25,423,916 | | | | - | | | $ | 25,423,916 | | | | - | |
| Mortgage-backed securities | | | 67,697,995 | | | | - | | | | 67,697,995 | | | | - | |
| State and political subdivisions | | | 16,792,645 | | | | - | | | | 16,792,645 | | | | - | |
| Money Market Mutual Fund | | | 2,040,117 | | | | 2,040,117 | | | | - | | | | - | |
| Equity securities | | | 23,000 | | | | - | | | | 23,000 | | | | - | |
| Fair Value Measurements Using: | |
| Description | | Fair Values at
12/31/2010 | | | (Level 1) | | | (Level 2) | | | (Level 3) | |
| Available-for-Sale Securities: | | | | | | | | | | | | | | | | |
| U.S. Treasury and Government Agencies | | $ | 43,651,132 | | | | - | | | $ | 43,651,132 | | | | - | |
| Mortgage-backed securities | | | 54,628,091 | | | | - | | | | 54,628,091 | | | | - | |
| State and political subdivisions | | | 32,297,779 | | | | - | | | | 32,297,779 | | | | - | |
| Money Market Mutual Fund | | | 2,162,055 | | | | 2,162,055 | | | | - | | | | - | |
| Equity securities | | | 23,000 | | | | - | | | | 23,000 | | | | - | |
Level 1 - Quoted Prices in Active Markets for Identical Assets
Level 2 - Significant Other Observable Inputs
Level 3 - Significant Unobservable Inputs
Following is a description of the valuation methodologies and inputs used for assets measured at fair value on a non recurring basis and recognized in the accompanying balance sheets, as well as the general classification of such assets pursuant to the valuation hierarchy.
Impaired Loans (Collateral Dependent)
Loans for which it is probable the Company will not collect all principal and interest due according to contractual terms are measured for impairment. If the impaired loan is collateral dependent, then the fair value method of measuring the amount of impairment is utilized. This method requires obtaining an independent appraisal of the collateral and applying a discount factor to the value based on the Company’s loan review policy. All impaired loans held by the Company were collateral dependent at December 31, 2011 and 2010.
Rurban Financial Corp.
Notes to Consolidated Financial Statements
December 31, 2011 and 2010
Mortgage Servicing Rights
Mortgage servicing rights do not trade in an active, open market with readily observable prices. Accordingly, fair value is estimated using discounted cash flow models associated with the servicing rights and discounting the cash flows using discount market rates. The servicing portfolio has been valued using all relevant positive and negative cash flows including servicing fees, miscellaneous income and float; marginal costs of servicing; the cost of carry of advances; and foreclosure losses; and applying certain prevailing assumptions used in the marketplace. Due to the nature of the valuation inputs, mortgage servicing rights are classified within Level 3 of the hierarchy.
Foreclosed Assets Held For Sale
Assets acquired through, or in lieu of, loan foreclosure are held for sale and are initially recorded at fair value (based on current appraised value) at the date of foreclosure, establishing a new cost basis. Subsequent to foreclosure, valuations are periodically performed by management and the assets are carried at the lower of carrying amount or fair value less cost to sell. Management has determined fair value measurements on other real estate owned primarily through evaluations of appraisals performed, and current and past offers for the other real estate under evaluation.
Software
The Company reviews the carrying value of software for impairment whenever events and circumstances indicate that the carrying value of an asset may not be recoverable from the estimated future cash flows expected to result from its use and eventual disposition. In cases where undiscounted expected future cash flows are less than the carrying value, an impairment loss is recognized equal to an amount by which the carrying value exceeds the fair value of assets. The factors considered by management in performing this assessment include current operating results, trends and prospects, the manner in which the property is used, and the effects of obsolescence, demand, competition, and other economic factors.
Goodwill
Goodwill is evaluated independently for its fair value. This measurement uses projected cash flows from operations and discounts those using appropriate discount rates to calculate fair value. Management engaged a third party to determine the fair value of Goodwill in line with procedures pursuant to FASB Accounting Standards Codification Topic 350-20.
Intangible
Intangible assets are evaluated independently for fair value on an annual basis. The measurement of these intangible assets is in line with procedures pursuant to FASB Accounting Standards Codification Topic 350-30.
Rurban Financial Corp.
Notes to Consolidated Financial Statements
December 31, 2011 and 2010
The following table presents the fair value measurements of assets measured at fair value on a non-recurring basis and the level within the fair value hierarchy in which the fair value measurements fall at December 31, 2011 and 2010:
| Fair Value Measurements Using: |
| Description | | Fair Values at
12/31/2011 | | | (Level 1) | | | (Level 2) | | | (Level 3) | |
| Impaired loans | | $ | 5,574,891 | | | | - | | | | - | | | $ | 5,574,891 | |
| Mortgage Servicing Rights | | $ | 2,819,939 | | | | - | | | | - | | | $ | 2,819,939 | |
| Foreclosed Assets | | $ | 877,219 | | | | - | | | | - | | | $ | 877,219 | |
| Impaired Software | | $ | 158,846 | | | | | | | | | | | $ | 158,846 | |
| Goodwill (RDSI) | | $ | - | | | | - | | | | - | | | $ | - | |
| Fair Value Measurements Using: |
| Description | | Fair Values at
12/31/2010 | | | (Level 1) | | | (Level 2) | | | (Level 3) | |
| Impaired loans | | $ | 6,709,231 | | | | - | | | | - | | | $ | 6,709,231 | |
| Mortgage Servicing Rights | | $ | 3,190,389 | | | | - | | | | - | | | $ | 3,190,389 | |
| Foreclosed Assets | | $ | 1,054,500 | | | | - | | | | - | | | $ | 1,054,500 | |
| Goodwill (RDSI) | | $ | 380,748 | | | | - | | | | - | | | $ | 380,748 | |
| Intangible (RDSI) | | $ | 107,000 | | | | | | | | | | | $ | 107,000 | |
Level 1 - Quoted Prices in Active Markets for Identical Assets
Level 2 - Significant Other Observable Inputs
Level 3 - Significant Unobservable Inputs
The following methods were used to estimate the fair value of all other financial instruments recognized in the accompanying balance sheets at amounts other than fair value.
Cash and Cash Equivalents and Federal Reserve and Federal Home Loan Bank Stock and Accrued Interest Payable and Receivable
The carrying amount approximates the fair value.
Loans
The estimated fair value for loans receivable, net, is based on estimates of the rate State Bank would charge for similar loans at December 31, 2011 and 2010, applied for the time period until the loans are assumed to re-price or be paid.
Loans Held for Sale
The fair value of loans held for sale are based upon quoted market prices, where available, or are determined by discounting estimated cash flows using interest rates approximating the Company’s current origination rates for similar loans and adjusted to reflect the inherent credit risk.
Rurban Financial Corp.
Notes to Consolidated Financial Statements
December 31, 2011 and 2010
Deposits, Short-term borrowings, Notes Payable & Federal Home Loan Bank Advances
Deposits include demand deposits, savings accounts, NOW accounts and certain money market deposits. The carrying amount approximates the fair value. The estimated fair value for fixed-maturity time deposits, as well as borrowings, is based on estimates of the rate State Bank could pay on similar instruments with similar terms and maturities at December 31, 2011 and 2010.
Loan Commitments
The fair value of commitments is estimated using the fees currently charged to enter into similar agreements, taking into account the remaining terms of the agreements and the present creditworthiness of the counterparties. The estimated fair value for other financial instruments and off-balance-sheet loan commitments approximate cost at December 31, 2011 and 2010 are not considered significant to this presentation.
Trust Preferred Securities
The fair value for Trust Preferred Securities is estimated by discounting the cash flows using an appropriate discount rate.
The following table presents estimated fair values of the Company’s financial instruments. The fair values of certain of these instruments were calculated by discounting expected cash flows, which involves significant judgments by management and uncertainties. Fair value is the estimated amount at which financial assets or liabilities could be exchanged in a current transaction between willing parties, other than in a forced or liquidation sale. Because no market exists for certain of these financial instruments, and because management does not intend to sell these financial instruments, the Company does not know whether the fair values shown below represent values at which the respective financial instruments could be sold individually or in the aggregate.
| | | December 31, 2011 | | | December 31, 2010 | |
| | | Carrying | | | Fair | | | Carrying | | | Fair | |
| | | Amount | | | Value | | | Amount | | | Value | |
| | | | | | | | | | | | | |
| Financial assets | | | | | | | | | | | | | | | | |
| Cash and cash equivalents | | $ | 14,846,362 | | | $ | 14,846,000 | | | $ | 30,417,813 | | | $ | 30,418,000 | |
| Available-for-sale securities | | $ | 111,977,673 | | | $ | 111,978,000 | | | $ | 132,762,058 | | | $ | 132,762,000 | |
| Loans held for sale | | $ | 5,237,914 | | | $ | 5,334,000 | | | $ | 9,055,268 | | | $ | 8,901,000 | |
| Loans, net of allowance for loan losses | | $ | 436,025,178 | | | $ | 443,727,000 | | | $ | 420,829,017 | | | $ | 424,144,000 | |
| Federal Reserve and FHLB Bank stock | | $ | 3,685,100 | | | $ | 3,685,000 | | | $ | 3,748,250 | | | $ | 3,748,000 | |
| Interest receivable | | $ | 1,635,322 | | | $ | 1,635,000 | | | $ | 2,068,965 | | | $ | 2,069,000 | |
| | | | | | | | | | | | | | | | | |
| Financial liabilities | | | | | | | | | | | | | | | | |
| Deposits | | $ | 518,764,725 | | | $ | 521,654,000 | | | $ | 515,677,742 | | | $ | 519,123,000 | |
| Short-term borrowings | | $ | 18,778,522 | | | $ | 18,903,000 | | | $ | 45,785,254 | | | $ | 47,515,000 | |
| Notes payable | | $ | 2,788,123 | | | $ | 2,815,000 | | | $ | 3,290,471 | | | $ | 3,276,000 | |
| Federal Home Loan Bank advances | | $ | 12,775,866 | | | $ | 13,149,000 | | | $ | 22,807,351 | | | $ | 23,243,000 | |
| Trust preferred securities | | $ | 20,620,000 | | | $ | 8,320,000 | | | $ | 20,620,000 | | | $ | 353,000 | |
| Interest payable | | $ | 2,953,541 | | | $ | 2,954,000 | | | $ | 1,971,587 | | | $ | 1,972,000 | |
Rurban Financial Corp.
Notes to Consolidated Financial Statements
December 31, 2011 and 2010
Note 23: Commitments and Credit Risk
State Bank grants commercial, agri-business, consumer and residential loans to customers throughout the states of Ohio, Indiana, and Michigan. Although State Bank has a diversified loan portfolio, agricultural loans comprised approximately 9% and 10% of the portfolio as of December 31, 2011 and 2010, respectively.
Commitments to extend credit are agreements to lend to a customer as long as there is no violation of any condition established in the contract. Commitments generally have fixed expiration dates or other termination clauses and may require payment of a fee. Since a portion of the commitments may expire without being drawn upon, the total commitment amounts do not necessarily represent future cash requirements. Each customer’s creditworthiness is evaluated on a case-by-case basis. The amount of collateral obtained, if deemed necessary, is based on management’s credit evaluation of the customer. Collateral held varies, but may include accounts receivable, inventory, property, plant and equipment, commercial real estate and residential real estate.
Standby letters of credit are conditional commitments issued by State Bank to guarantee the performance of a customer to a third party. Those guarantees are primarily issued to support public and private borrowing arrangements, including commercial paper, bond financing and similar transactions. The credit risk involved in issuing letters of credit is essentially the same as that involved in extending loans to customers.
Forward sale commitments are commitments to sell groups of residential mortgage loans that the Company originates or purchases as part of its mortgage banking activities. The Company commits to sell the loans at specified prices in a future period, typically within forty-five days. These commitments are acquired to reduce market risk on mortgage loans in the process of origination and mortgage loans held for sales since the Company is exposed to interest rate risk during the period between issuing a loan commitment and the sales of the loan into the secondary market. At December 31, 2011, the Company had approximately $14.1 million in forward rate commitments to sell residential mortgage loans.
Lines of credit are agreements to lend to a customer as long as there is no violation of any condition established in the contract. Lines of credit generally have fixed expiration dates. Since a portion of the line may expire without being drawn upon, the total unused lines do not necessarily represent future cash requirements. Each customer’s creditworthiness is evaluated on a case-by-case basis. The amount of collateral obtained, if deemed necessary, is based on management’s credit evaluation of the customer. Collateral held varies but may include accounts receivable, inventory, property, plant and equipment, commercial real estate and residential real estate. Management uses the same credit policies in granting lines of credit as it does for on-balance-sheet instruments.
| | | 2011 | | | 2010 | |
| Loan commitments and unused lines of credit | | $ | 75,272,000 | | | $ | 72,938,000 | |
| Standby letters of credit | | $ | 5,587,000 | | | $ | 804,000 | |
| Total | | $ | 80,859,000 | | | $ | 73,742,000 | |
There are various contingent liabilities that are not reflected in the consolidated financial statements, including claims and legal actions arising in the ordinary course of business. In the opinion of management, after consultation with legal counsel, the ultimate disposition of these matters is not expected to have a material effect on the Company’s consolidated financial condition or results of operations.
Rurban Financial Corp.
Notes to Consolidated Financial Statements
December 31, 2011 and 2010
Salary continuation agreements with certain executive officers contain provisions regarding certain events leading to separation from the Company, before the executive officer’s normal retirement date, which could result in cash payments in excess of amounts accrued.
Note 24: Effect of Recent Accounting Standards
ASU No. 2011-02, Receivables (Topic 310): A Creditor’s Determination of Whether a Restructuring Is a Troubled Debt Restructuring.
In April 2011, FASB issued ASU No. 2011-02 due to concerns about whether additional guidance or clarification is needed to help creditors in determining whether a creditor has granted a concession and whether a debtor is experiencing financial difficulties for purposes of determining whether a restructuring constitutes a troubled debt restructuring. In evaluating whether a restructuring constitutes a troubled debt restructuring, a creditor must separately conclude that both of the following exist:
| 1) | The restructuring constitutes a concession. |
| 2) | The debtor is experiencing financial difficulties. |
The amendments in this update are effective for the first interim or annual period beginning on or after June 15, 2011, and should be applied retrospectively to the beginning of the annual period of adoption.
The Company adopted this standard effective July 1, 2011 retroactive to January 1, 2011. The effect of this adoption has had no impact on the financial results of the Company. These new disclosures are included in Note 4 – Loans and Allowance for Loan Losses.
ASU No. 2011-03, Transfers and Servicing (Topic 860): Reconsideration of Effective Control for Repurchase Agreements (April 2011).
In April 2011, FASB issued ASU No. 2011-03 in order to improve the accounting for repurchase agreements (repos) and other agreements that both entitle and obligate a transferor to repurchase or redeem financial assets before their maturity. The transferor is deemed to have maintained effective control over the financial assets transferred (and thus must account for the transaction as a secured borrowing), for agreements that both entitle and obligate the transferor to repurchase or redeem the financial assets before their maturity, if all of the following conditions are met:
| 1) | The financial assets to be repurchased or redeemed are the same or substantially the same as those transferred. |
| 2) | The agreement is to repurchase or redeem them before maturity, at a fixed or determinable price. |
| 3) | The agreement is entered into contemporaneously with, or in contemplation of, the transfer. |
The amendments in this update are effective for the first interim or annual period beginning on or after December 15, 2011, and should be applied retrospectively to the beginning of the annual period of adoption. Management has determined there will be no material impact on Rurban’s Condensed Consolidated Financial Statements.
Rurban Financial Corp.
Notes to Consolidated Financial Statements
December 31, 2011 and 2010
ASU 2011-04, Fair Value Measurements and Disclosures (Topic 820): Amendments to Achieve Common Fair Value Measurement and Disclosure Requirements in U.S. GAAP and IFRSs.
The ASU amends Topic 820 to add both additional clarifications to existing fair value measurement and disclosure requirements and changes to existing principles and disclosure guidance. Clarifications were made to the relevancy of the highest and best use valuation concept, measurement of an instrument classified in an entity’s shareholder’s equity and disclosure of quantitative information about the unobservable inputs for level 3 fair value measurements. Changes to existing principles and disclosures included measurement of financial instruments managed within a portfolio, the application of premiums and discounts in fair value measurement, and additional disclosures related to fair value measurements. The updated guidance and requirements are effective for financial statements issued for the first interim or annual period beginning after December 15, 2011, and should be applied prospectively. Early adoption is permitted. Management does not believe the principle amendments will have a material impact on Rurban’s Condensed Consolidated Financial Statements.
ASU 2011-05, Other Comprehensive Income (Topic 220): Presentation of Comprehensive Income.
The ASU amends Topic 220 to require an entity the option to present the total of comprehensive income, the components of net income, and the components of other comprehensive income either in a single continuous statement of comprehensive income or in two separate but consecutive statements. An entity is also required to present on the face of the financial statement reclassification adjustments for items that are reclassified from other comprehensive income to net income in the statement(s) where the components of net income and the components of other comprehensive income are presented. The amendments do not change items that must be reported in other comprehensive income or when an item of other comprehensive income must be reclassified to net income, only the format for presentation. The updated guidance and requirements are effective for financial statements issued for the fiscal years, and the interim periods within those years, beginning after December 15, 2011. The amendments should be applied retrospectively. On October 21, 2011, the FASB exposed a proposed deferral of the requirement that companies present reclassification adjustments for each component of OCI in both net income and OCI on the face of the financial statements. Early adoption is permitted. Management is currently evaluating the impact of the guidance on Rurban’s Condensed Consolidated Financial Statements.
ASC 2011-08 – Intangibles – Goodwill and Other (Topic 350): Testing Goodwill for Impairment.
The ASU amends Topic 350 to permit an entity the option to first assess qualitative factors to determine whether it is more likely than not (50% threshold) that the fair value of a reporting unit is less than its carrying amount as a basis for determining whether it is necessary to perform the two-step goodwill impairment test. The amendments are effective for annual and interim goodwill impairment tests performed for fiscal years beginning after December 15, 2011. Early adoption is permitted, including for annual and interim goodwill impairment tests performed as of a date before September 15, 2011, if an entity’s financial statements for the most recent annual or interim period have not yet been issued. Management anticipates no material effect to Rurban’s Condensed Consolidated Financial Statements.
Rurban Financial Corp.
Notes to Consolidated Financial Statements
December 31, 2011 and 2010
Note 25: Condensed Financial Information (Parent Company Only)
Presented below is condensed financial information as to financial position, results of operations and cash flows of the Company:
Condensed Balance Sheets
| | | 2011 | | | 2010 | |
| | | | | | | |
| Assets | | | | | | | | |
| Cash and cash equivalents | | $ | 1,157,874 | | | $ | 38,509 | |
| Investment in common stock of banking subsidiaries | | | 68,914,535 | | | | 66,124,973 | |
| Investment in nonbanking subsidiaries | | | (1,588,758 | ) | | | (216,162 | ) |
| Notes Receivable | | | 2,000,000 | | | | 2,000,000 | |
| Other assets | | | 2,724,114 | | | | 2,675,248 | |
| | | | | | | | | |
| Total assets | | $ | 73,207,765 | | | $ | 70,622,568 | |
| | | | | | | | | |
| Liabilities | | | | | | | | |
| Trust preferred securities | | $ | 20,000,000 | | | $ | 20,000,000 | |
| Borrowings from nonbanking subsidiaries | | | 620,000 | | | | 620,000 | |
| Notes Payable | | | 1,500,000 | | | | 1,700,000 | |
| Other liabilities & accrued interest payable | | | 3,462,630 | | | | 2,278,469 | |
| | | | | | | | | |
| Total liabilities | | | 25,582,630 | | | | 24,598,469 | |
| | | | | | | | | |
| Stockholders' Equity | | | 47,625,135 | | | | 46,024,099 | |
| | | | | | | | | |
| Total liabilities and stockholders' equity | | $ | 73,207,765 | | | $ | 70,622,568 | |
Rurban Financial Corp.
Notes to Consolidated Financial Statements
December 31, 2011 and 2010
Condensed Statements of Income
| | | 2011 | | | 2010 | | | 2009 | |
| Income | | | | | | | | | | | | |
| Interest income | | $ | 120,435 | | | $ | 102,167 | | | $ | 752 | |
| Dividends from subsidiaries: | | | | | | | | | | | | |
| Banking subsidiaries | | | 2,165,000 | | | | 800,000 | | | | 2,400,000 | |
| Nonbanking subsidiaries | | | - | | | | 225,000 | | | | 1,922,076 | |
| Total | | | 2,165,000 | | | | 1,025,000 | | | | 4,322,076 | |
| Other income | | | 154,185 | | | | 536,586 | | | | 1,550,032 | |
| | | | | | | | | | | | | |
| Total income | | | 2,439,620 | | | | 1,663,753 | | | | 5,872,860 | |
| | | | | | | | | | | | | |
| Expenses | | | | | | | | | | | | |
| Interest expense | | | 1,405,714 | | | | 1,529,815 | | | | 1,573,293 | |
| Other expense | | | 1,580,191 | | | | 1,834,675 | | | | 3,864,674 | |
| | | | | | | | | | | | | |
| Total expenses | | | 2,985,905 | | | | 3,364,490 | | | | 5,437,967 | |
| | | | | | | | | | | | | |
| Income (loss) before income tax and equity in undistributed (excess distributed) income (loss) of subsidiaries | | | (546,285 | ) | | | (1,700,737 | ) | | | 434,893 | |
| | | | | | | | | | | | | |
| Income tax benefit | | | (642,381 | ) | | | (942,754 | ) | | | (1,321,333 | ) |
| | | | | | | | | | | | | |
| Income (loss) before equity in undistributed (excess distributed) income (loss) of subsidiaries | | | 96,096 | | | | (757,983 | ) | | | 1,756,226 | |
| | | | | | | | | | | | | |
| Equity in undistributed (excess distributed) income (loss) of subsidiaries | | | | | | | | | | | | |
| Banking subsidiaries | | | 2,633,947 | | | | (676,077 | ) | | | (355,146 | ) |
| Nonbanking subsidiaries | | | (1,372,596 | ) | | | (14,179,150 | ) | | | (1,018,589 | ) |
| | | | | | | | | | | | | |
| Total | | | 1,261,351 | | | | (14,855,227 | ) | | | (1,373,735 | ) |
| | | | | | | | | | | | | |
| Net income (loss) | | $ | 1,357,447 | | | $ | (15,613,210 | ) | | $ | 382,491 | |
In December of 2011, the Company executed a transaction between two of its affiliates that was offset in the Parent Company financial statements. The transaction in the amount of $306,452 involved the transfer of assets that were valued at less than the carrying value of the assets on the affiliate. Due to the assets remaining in the Company and for the purposes initially intended the loss was offset at the parent level.
Rurban Financial Corp.
Notes to Consolidated Financial Statements
December 31, 2011 and 2010
Condensed Statements of Cash Flows
| | | 2011 | | | 2010 | | | 2009 | |
| | | | | | | | | | |
| Operating Activities | | | | | | | | | | | | |
| Net income (loss) | | $ | 1,357,447 | | | $ | (15,613,210 | ) | | $ | 382,491 | |
| Items not requiring (providing) cash | | | | | | | | | | | | |
| Equity in (undistributed) excess distributed net income (loss) of subsidiaries | | | (1,261,351 | ) | | | 14,855,227 | | | | 1,373,735 | |
| Expense of Stock Option Plan | | | 87,975 | | | | 49,164 | | | | 143,261 | |
| Other assets | | | (48,866 | ) | | | 263,858 | | | | (1,002,630 | ) |
| Other liabilities | | | 1,184,160 | | | | 405,406 | | | | (929,910 | ) |
| Net cash provided by (used in) operating activities | | | 1,319,365 | | | | (39,555 | ) | | | (33,053 | ) |
| | | | | | | | | | | | | |
| Investing Activities | | | | | | | | | | | | |
| Increase in Notes Receivable | | | - | | | | (2,000,000 | ) | | | - | |
| Net cash used in investing activities | | | - | | | | (2,000,000 | ) | | | - | |
| | | | | | | | | | | | | |
| Financing Activities | | | | | | | | | | | | |
| Cash dividends paid | | | - | | | | - | | | | (1,752,493 | ) |
| Proceeds from Notes Payable | | | - | | | | 1,700,000 | | | | - | |
| Repayment of Nots Payable | | | (200,000 | ) | | | | | | | | |
| Purchase of treasury stock | | | - | | | | - | | | | (156,291 | ) |
| Net cash provided by (used in) financing activities | | | (200,000 | ) | | | 1,700,000 | | | | (1,908,784 | ) |
| | | | | | | | | | | | | |
| Net Change in Cash and Cash Equivalents | | | 1,119,365 | | | | (339,555 | ) | | | (1,941,837 | ) |
| | | | | | | | | | | | | |
| Cash and Cash Equivalents at Beginning of Year | | | 38,509 | | | | 378,064 | | | | 2,319,901 | |
| | | | | | | | | | | | | |
| Cash and Cash Equivalents at End of Year | | $ | 1,157,874 | | | $ | 38,509 | | | $ | 378,064 | |
Rurban Financial Corp.
Notes to Consolidated Financial Statements
December 31, 2011 and 2010
Note 26: Segment Information
The reportable segments are determined by the products and services offered, primarily distinguished between Banking and Item Processing operations. Loans, investments, deposits and financial services provide the revenues in the Banking segment and include the accounts of State Bank and RFCBC.
Service fees provide the revenues in the Item Processing operation and include the accounts of RDSI. Other segments include the accounts of the Company, Rurban Financial Corp., which provides management services to its subsidiaries.
The accounting policies used are the same as those described in the summary of significant accounting policies. Segment performance is evaluated using net interest income, other revenue, operating expense and net income. Goodwill is allocated. Income taxes and indirect expenses are allocated based on revenue. Transactions among segments are made at fair value. The Company allocates certain expenses to other segments. Information reported internally for performance assessment follows.
| | | | | | Data | | | | | | Total | | | Intersegment | | | Consolidated | |
| 2011 | | Banking | | | Processing | | | Other | | | Segments | | | Elimination | | | Totals | |
| | | | | | | | | | | | | | | | | | | |
| Income Statement information: | | | | | | | | | | | | | | | | | | | | | | | | |
| | | | | | | | | | | | | | | | | | | | | | | | | |
| Net interest income (expense) | | $ | 22,301,413 | | | $ | (305,235 | ) | | $ | (1,285,279 | ) | | $ | 20,710,899 | | | $ | - | | | $ | 20,710,899 | |
| Other revenue - external customers | | | 10,186,594 | | | | 3,332,437 | | | | 31,892 | | | | 13,550,923 | | | | - | | | | 13,550,923 | |
| Other revenue - other segments | | | 300,701 | | | | 1,387,500 | | | | 146,231 | | | | 1,834,432 | | | | (1,527,980 | ) | | | 306,452 | |
| Net interest income and other revenue | | | 32,788,708 | | | | 4,414,702 | | | | (1,107,156 | ) | | | 36,096,254 | | | | (1,527,980 | ) | | | 34,568,274 | |
| Non-interest expense | | | 24,172,240 | | | | 6,334,659 | | | | 1,580,191 | | | | 32,087,090 | | | | (1,834,432 | ) | | | 30,252,658 | |
| Significant noncash items: | | | | | | | | | | | | | | | | | | | | | | | | |
| Depreciation and amortization | | | 869,521 | | | | 903,352 | | | | 9,802 | | | | 1,782,675 | | | | - | | | | 1,782,675 | |
| Fixed asset and software impairment | | | | | | | 608,585 | | | | | | | | 608,585 | | | | - | | | | 608,585 | |
| Goodwill impairment | | | - | | | | 380,748 | | | | - | | | | 380,748 | | | | - | | | | 380,748 | |
| Provision for loan losses | | | 1,993,688 | | | | - | | | | - | | | | 1,993,688 | | | | - | | | | 1,993,688 | |
| Income tax expense (benefit) | | | 1,823,833 | | | | (523,423 | ) | | | (642,381 | ) | | | 658,029 | | | | - | | | | 658,029 | |
| Segment profit (loss) | | $ | 4,798,947 | | | $ | (1,396,534 | ) | | $ | (2,044,966 | ) | | $ | 1,357,447 | | | $ | 306,452 | | | $ | 1,663,899 | |
| | | | | | | | | | | | | | | | | | | | | | | | | |
| Balance sheet information: | | | | | | | | | | | | | | | | | | | | | | | | |
| | | | | | | | | | | | | | | | | | | | | | | | | |
| Total assets | | $ | 623,501,172 | | | $ | 3,576,899 | | | $ | 73,207,765 | | | $ | 700,285,836 | | | $ | (71,622,170 | ) | | $ | 628,663,666 | |
| Goodwill and intangibles | | | 18,201,632 | | | | - | | | | - | | | | 18,201,632 | | | | - | | | | 18,201,632 | |
| Premises and equipment expenditures | | $ | 559,762 | | | $ | 106,688 | | | $ | 13,218 | | | $ | 679,668 | | | $ | - | | | $ | 679,668 | |
Rurban Financial Corp.
Notes to Consolidated Financial Statements
December 31, 2011 and 2010
| | | | | | Data | | | | | | Total | | | Intersegment | | | Consolidated | |
| 2010 | | Banking | | | Processing | | | Other | | | Segments | | | Elimination | | | Totals | |
| | | | | | | | | | | | | | | | | | | |
| Income Statement information: | | | | | | | | | | | | | | | | | | | | | | | | |
| | | | | | | | | | | | | | | | | | | | | | | | | |
| Net interest income (expense) | | $ | 21,843,737 | | | $ | (454,369 | ) | | $ | (1,427,647 | ) | | $ | 19,961,721 | | | $ | - | | | $ | 19,961,721 | |
| Other revenue - external customers | | | 10,958,388 | | | | 9,725,869 | | | | 134,566 | | | | 20,818,823 | | | | - | | | | 20,818,823 | |
| Other revenue - other segments | | | 99,356 | | | | 1,297,789 | | | | 428,773 | | | | 1,825,918 | | | | (1,825,918 | ) | | | - | |
| Net interest income and other revenue | | | 32,901,481 | | | | 10,569,289 | | | | (864,308 | ) | | | 42,606,462 | | | | (1,825,918 | ) | | | 40,780,544 | |
| Non-interest expense | | | 25,958,617 | | | | 26,341,072 | | | | 1,834,675 | | | | 54,134,364 | | | | (1,825,918 | ) | | | 52,308,446 | |
| Significant noncash items: | | | | | | | | | | | | | | | | | | | | | | | | |
| Depreciation and amortization | | | 974,967 | | | | 2,985,813 | | | | 46,844 | | | | 4,007,624 | | | | - | | | | 4,007,624 | |
| Fixed asset and software impairment | | | - | | | | 4,892,231 | | | | - | | | | 4,892,231 | | | | - | | | | 4,892,231 | |
| Goodwill impairment | | | - | | | | 4,680,960 | | | | - | | | | 4,680,960 | | | | - | | | | 4,680,960 | |
| Other intangible impairment | | | - | | | | 1,591,844 | | | | - | | | | 1,591,844 | | | | - | | | | 1,591,844 | |
| Provision for loan losses | | | 7,587,603 | | | | 3,000,000 | | | | - | | | | 10,587,603 | | | | - | | | | 10,587,603 | |
| Income tax expense (benefit) | | | (768,661 | ) | | | (4,790,880 | ) | | | (942,754 | ) | | | (6,502,295 | ) | | | - | | | | (6,502,295 | ) |
| Segment profit (loss) | | $ | 123,922 | | | $ | (13,980,903 | ) | | $ | (1,756,229 | ) | | $ | (15,613,210 | ) | | $ | - | | | $ | (15,613,210 | ) |
| | | | | | | | | | | | | | | | | | | | | | | | | |
| Balance sheet information: | | | | | | | | | | | | | | | | | | | | | | | | |
| | | | | | | | | | | | | | | | | | | | | | | | | |
| Total assets | | $ | 653,940,003 | | | $ | 6,852,940 | | | $ | 70,622,568 | | | $ | 731,415,511 | | | $ | (71,127,826 | ) | | $ | 660,287,685 | |
| Goodwill and intangibles | | | 18,831,214 | | | | 487,748 | | | | - | | | | 19,318,962 | | | | - | | | | 19,318,962 | |
| Premises and equipment expenditures | | $ | 1,018,127 | | | $ | 1,128,127 | | | $ | - | | | $ | 2,146,254 | | | $ | - | | | $ | 2,146,254 | |
| | | | | | Data | | | | | | Total | | | Intersegment | | | Consolidated | |
| 2009 | | Banking | | | Processing | | | Other | | | Segments | | | Elimination | | | Totals | |
| | | | | | | | | | | | | | | | | | | |
| Income Statement information: | | | | | | | | | | | | | | | | | | | | | | | | |
| | | | | | | | | | | | | | | | | | | | | | | | | |
| Net interest income (expense) | | $ | 22,753,280 | | | $ | (182,136 | ) | | $ | (1,572,540 | ) | | $ | 20,998,604 | | | $ | - | | | $ | 20,998,604 | |
| Other revenue - external customers | | | 10,386,902 | | | | 18,836,667 | | | | 81,028 | | | | 29,304,597 | | | | - | | | | 29,304,597 | |
| Other revenue - other segments | | | 92,493 | | | | 1,599,589 | | | | 1,497,767 | | | | 3,189,849 | | | | (3,189,849 | ) | | | - | |
| Net interest income and other revenue | | | 33,232,675 | | | | 20,254,120 | | | | 6,255 | | | | 53,493,050 | | | | (3,189,849 | ) | | | 50,303,201 | |
| Non-interest expense | | | 25,239,393 | | | | 18,928,782 | | | | 3,864,674 | | | | 48,032,849 | | | | (3,189,849 | ) | | | 44,843,000 | |
| Significant noncash items: | | | | | | | | | | | | | | | | | | | | | | | | |
| Depreciation and amortization | | | 1,039,284 | | | | 3,334,636 | | | | 99,447 | | | | 4,473,367 | | | | - | | | | 4,473,367 | |
| Provision for loan losses | | | 5,738,098 | | | | - | | | | - | | | | 5,738,098 | | | | - | | | | 5,738,098 | |
| Income tax expense (benefit) | | | 210,330 | | | | 450,615 | | | | (1,321,333 | ) | | | (660,388 | ) | | | - | | | | (660,388 | ) |
| Segment profit (loss) | | $ | 2,044,854 | | | $ | 874,723 | | | $ | (2,537,086 | ) | | $ | 382,491 | | | $ | - | | | $ | 382,491 | |
| | | | | | | | | | | | | | | | | | | | | | | | | |
| Balance sheet information: | | | | | | | | | | | | | | | | | | | | | | | | |
| | | | | | | | | | | | | | | | | | | | | | | | | |
| Total assets | | $ | 652,166,943 | | | $ | 22,774,098 | | | $ | 83,110,060 | | | $ | 758,051,101 | | | $ | (85,001,999 | ) | | $ | 673,049,102 | |
| Goodwill and intangibles | | | 19,472,484 | | | | 6,919,819 | | | | - | | | | 26,392,303 | | | | - | | | | 26,392,303 | |
| Premises and equipment expenditures | | $ | 548,824 | | | $ | 2,805,922 | | | $ | 51,510 | | | $ | 3,406,256 | | | $ | - | | | $ | 3,406,256 | |
Rurban Financial Corp.
Notes to Consolidated Financial Statements
December 31, 2011 and 2010
Note 27: Quarterly Financial Information (Unaudited)
The following tables summarize selected quarterly results of operations for 2011 and 2010.
| December 31, 2011 | | March | | | June | | | September | | | December | |
| | | | | | | | | | | | | |
| Interest income | | $ | 6,810,437 | | | $ | 7,053,332 | | | $ | 6,893,024 | | | $ | 6,752,187 | |
| Interest expense | | | 1,977,135 | | | | 1,839,934 | | | | 1,507,592 | | | | 1,473,420 | |
| Net interest income | | | 4,833,302 | | | | 5,213,398 | | | | 5,385,432 | | | | 5,278,767 | |
| Provision for loan losses | | | 498,840 | | | | 898,440 | | | | 297,368 | | | | 299,040 | |
| Non-interest income | | | 2,862,826 | | | | 5,096,965 | | | | 2,474,922 | | | | 3,422,662 | |
| Non-interest expense | | | 7,059,691 | | | | 8,398,278 | | | | 6,823,137 | | | | 7,971,552 | |
| Income tax expense | | | 126,672 | | | | 236,852 | | | | 137,356 | | | | 157,149 | |
| Net income | | | 10,925 | | | | 776,793 | | | | 602,493 | | | | 273,688 | |
| | | | | | | | | | | | | | | | | |
| Earnings per share | | | | | | | | | | | | | | | | |
| Basic | | | - | | | | 0.16 | | | | 0.12 | | | | 0.06 | |
| Diluted | | | - | | | | 0.16 | | | | 0.12 | | | | 0.06 | |
| | | | | | | | | | | | | | | | | |
| Dividends per share | | | - | | | | - | | | | - | | | | - | |
| December 31, 2010 | | March | | | June | | | September | | | December | |
| | | | | | | | | | | | | |
| Interest income | | $ | 7,483,263 | | | $ | 7,499,239 | | | $ | 7,244,962 | | | $ | 7,336,152 | |
| Interest expense | | | 2,578,782 | | | | 2,441,218 | | | | 2,364,319 | | | | 2,217,576 | |
| Net interest income | | | 4,904,481 | | | | 5,058,021 | | | | 4,880,643 | | | | 5,118,576 | |
| Provision for loan losses | | | 1,391,433 | | | | 6,498,710 | | | | 898,570 | | | | 1,798,890 | |
| Non-interest income | | | 6,751,363 | | | | 4,526,269 | | | | 4,534,561 | | | | 5,006,630 | |
| Non-interest expense | | | 11,760,035 | | | | 15,905,043 | | | | 8,738,415 | | | | 15,904,953 | |
| Income tax (benefit) | | | (647,686 | ) | | | (4,612,572 | ) | | | (247,696 | ) | | | (994,341 | ) |
| Net income (loss) | | | (847,938 | ) | | | (8,206,891 | ) | | | 25,915 | | | | (6,584,296 | ) |
| | | | | | | | | | | | | | | | | |
| Earnings (loss) per share | | | | | | | | | | | | | | | | |
| Basic | | | (0.17 | ) | | | (1.69 | ) | | | 0.01 | | | | (1.36 | ) |
| Diluted | | | (0.17 | ) | | | (1.69 | ) | | | 0.01 | | | | (1.36 | ) |
| | | | | | | | | | | | | | | | | |
| Dividends per share | | | - | | | | - | | | | - | | | | - | |
Management’s Discussion and Analysis of Financial Condition
and Results of Operations
Rurban Financial Corp. (“Rurban”), is a bank holding company registered with the Federal Reserve Board under the Bank Holding Company Act of 1956, as amended. Through its direct and indirect subsidiaries, Rurban is engaged in commercial banking, computerized item processing, and trust and financial services.
The following discussion is intended to provide a review of the consolidated financial condition and results of operations of Rurban and its subsidiaries (collectively, the “Company”). This discussion should be read in conjunction with the Company’s consolidated financial statements and related footnotes for the year ended December 31, 2011.
Critical Accounting Policies
The accounting and reporting policies of the Company are in accordance with generally accepted accounting principles in the United States and conform to general practices within the banking industry. The Company’s significant accounting policies are described in detail in the notes to the Company’s consolidated financial statements for the year ended December 31, 2011. The preparation of financial statements in conformity with generally accepted accounting principles requires management to make estimates and assumptions. The Company’s financial position and results of operations can be affected by these estimates and assumptions and are integral to the understanding of reported results. Critical accounting policies are those policies that management believes are the most important to the portrayal of the Company’s financial condition and results, and they require management to make estimates that are difficult, subjective or complex.
Allowance for Loan Losses -The allowance for loan losses provides coverage for probable losses inherent in the Company’s loan portfolio. Management evaluates the adequacy of the allowance for loan losses each quarter based on changes, if any, in the nature and amount of problem assets and associated collateral, underwriting activities, loan portfolio composition (including product mix and geographic, industry or customer-specific concentrations), trends in loan performance, regulatory guidance and economic factors. This evaluation is inherently subjective, as it requires the use of significant management estimates. Many factors can affect management’s estimates of specific and expected losses, including volatility of default probabilities, rating migrations, loss severity and economic and political conditions. The allowance is increased through provisions charged to operating earnings and reduced by net charge-offs.
The Company determines the amount of the allowance based on relative risk characteristics of the loan portfolio. The allowance recorded for commercial loans is based on reviews of individual credit relationships and an analysis of the migration of commercial loans and actual loss experience. The allowance recorded for homogeneous consumer loans is based on an analysis of loan mix, risk characteristics of the portfolio, fraud loss and bankruptcy experiences, and historical losses, adjusted for current trends, for each homogeneous category or group of loans. The allowance for credit losses relating to impaired loans is based on each impaired loan’s observable market price, the collateral for certain collateral-dependent loans, or the discounted cash flows using the loan’s effective interest rate.
Regardless of the extent of the Company’s analysis of customer performance, portfolio trends or risk management processes, certain inherent, but undetected, losses are probable within the loan portfolio. This is due to several factors including inherent delays in obtaining information regarding a customer’s financial condition or changes in their unique business conditions, the subjective nature of individual loan valuations, collateral assessments and the interpretation of economic trends. Volatility of economic or customer-specific conditions affecting the identification and estimation of losses for larger non-homogeneous credits and the sensitivity of assumptions utilized to establish allowances for homogenous groups of loans are also factors. The Company estimates a range of inherent losses related to the existence of these exposures. The estimates are based upon the Company’s evaluation of imprecise risk associated with the commercial and consumer allowance levels and the estimated impact of the current economic environment.
Goodwill and Other Intangibles-The Company records all assets and liabilities acquired in purchase acquisitions, including goodwill and other intangibles, at fair value as required. Goodwill is subject, at a minimum, to annual tests for impairment. Other intangible assets are amortized over their estimated useful lives using straight-line and accelerated methods, and are subject to impairment if events or circumstances indicate a possible inability to realize the carrying amount. The initial goodwill and other intangibles recorded and subsequent impairment analysis requires management to make subjective judgments concerning estimates of how the acquired asset will perform in the future. Events and factors that may significantly affect the estimates include, among others, customer attrition, changes in revenue growth trends, specific industry conditions and changes in competition.
New Accounting Pronouncements
ASU No. 2011-02, Receivables (Topic 310): A Creditor’s Determination of Whether a Restructuring Is a Troubled Debt Restructuring.
In April 2011, FASB issued ASU No. 2011-02 due to concerns about whether additional guidance or clarification is needed to help creditors in determining whether a creditor has granted a concession and whether a debtor is experiencing financial difficulties for purposes of determining whether a restructuring constitutes a troubled debt restructuring. In evaluating whether a restructuring constitutes a troubled debt restructuring, a creditor must separately conclude that both of the following exist:
| 1) | The restructuring constitutes a concession. |
| 2) | The debtor is experiencing financial difficulties. |
The amendments in this update are effective for the first interim or annual period beginning on or after June 15, 2011, and should be applied retrospectively to the beginning of the annual period of adoption.
The Company adopted this standard effective July 1, 2011 retroactive to January 1, 2011. The effect of this adoption has had no impact on the financial results of the Company. These new disclosures are included in Note 4 – Loans and Allowance for Loan Losses.
ASU No. 2011-03, Transfers and Servicing (Topic 860): Reconsideration of Effective Control for Repurchase Agreements (April 2011).
In April 2011, FASB issued ASU No. 2011-03 in order to improve the accounting for repurchase agreements (repos) and other agreements that both entitle and obligate a transferor to repurchase or redeem financial assets before their maturity. The transferor is deemed to have maintained effective control over the financial assets transferred (and thus must account for the transaction as a secured borrowing), for agreements that both entitle and obligate the transferor to repurchase or redeem the financial assets before their maturity, if all of the following conditions are met:
| 1) | The financial assets to be repurchased or redeemed are the same or substantially the same as those transferred. |
| 2) | The agreement is to repurchase or redeem them before maturity, at a fixed or determinable price. |
| 3) | The agreement is entered into contemporaneously with, or in contemplation of, the transfer. |
The amendments in this update are effective for the first interim or annual period beginning on or after December 15, 2011, and should be applied retrospectively to the beginning of the annual period of adoption. Management has determined there will be no material impact on Rurban’s Condensed Consolidated Financial Statements.
ASU 2011-04, Fair Value Measurements and Disclosures (Topic 820): Amendments to Achieve Common Fair Value Measurement and Disclosure Requirements in U.S. GAAP and IFRSs.
The ASU amends Topic 820 to add both additional clarifications to existing fair value measurement and disclosure requirements and changes to existing principles and disclosure guidance. Clarifications were made to the relevancy of the highest and best use valuation concept, measurement of an instrument classified in an entity’s shareholder’s equity and disclosure of quantitative information about the unobservable inputs for level 3 fair value measurements. Changes to existing principles and disclosures included measurement of financial instruments managed within a portfolio, the application of premiums and discounts in fair value measurement, and additional disclosures related to fair value measurements. The updated guidance and requirements are effective for financial statements issued for the first interim or annual period beginning after December 15, 2011, and should be applied prospectively. Early adoption is permitted. Management does not believe the principle amendments will have a material impact on Rurban’s Condensed Consolidated Financial Statements.
ASU 2011-05, Other Comprehensive Income (Topic 220): Presentation of Comprehensive Income.
The ASU amends Topic 220 to require an entity the option to present the total of comprehensive income, the components of net income, and the components of other comprehensive income either in a single continuous statement of comprehensive income or in two separate but consecutive statements. An entity is also required to present on the face of the financial statement reclassification adjustments for items that are reclassified from other comprehensive income to net income in the statement(s) where the components of net income and the components of other comprehensive income are presented. The amendments do not change items that must be reported in other comprehensive income or when an item of other comprehensive income must be reclassified to net income, only the format for presentation. The updated guidance and requirements are effective for financial statements issued for the fiscal years, and the interim periods within those years, beginning after December 15, 2011. The amendments should be applied retrospectively. On October 21, 2011, the FASB exposed a proposed deferral of the requirement that companies present reclassification adjustments for each component of OCI in both net income and OCI on the face of the financial statements. Early adoption is permitted. Management is currently evaluating the impact of the guidance on Rurban’s Condensed Consolidated Financial Statements.
ASC 2011-08 – Intangibles – Goodwill and Other (Topic 350): Testing Goodwill for Impairment.
The ASU amends Topic 350 to permit an entity the option to first assess qualitative factors to determine whether it is more likely than not (50% threshold) that the fair value of a reporting unit is less than its carrying amount as a basis for determining whether it is necessary to perform the two-step goodwill impairment test. The amendments are effective for annual and interim goodwill impairment tests performed for fiscal years beginning after December 15, 2011. Early adoption is permitted, including for annual and interim goodwill impairment tests performed as of a date before September 15, 2011, if an entity’s financial statements for the most recent annual or interim period have not yet been issued. Management anticipates no material effect to Rurban’s Condensed Consolidated Financial Statements.
Earnings Summary
Net income for 2011 was $1,663,899, or $0.34 per diluted share, compared with net loss of $15,613,210, or $3.21 per diluted share, and net income of $382,491, or $0.07 per diluted share, reported for 2010 and 2009, respectively. Cash dividends per share were $0.00 in 2011, $0.00 in 2010, and $0.36 in 2009.
The 2011 earnings continue to reflect the impact of the economic downturn as problem asset costs remained above historical levels. Charge-offs for the year of $2.2 million resulted in loan loss provision of $2.0 million, which was well down from the $10.6 million in 2010. The State Bank reported net income for 2011 of $4.8 million, which is up significantly from the $123,922 in net income in 2010. RDSI reported a 2011 fiscal year net loss of $1.4 million, compared to net loss of $14.0 million reported for the 2010 fiscal year. Significantly affecting the 2011 results were the write-down of goodwill ($380,748) and impairment of assets ($608,585).
Positive results for 2011 include loan growth of $15.1 million, and organic deposit growth of $3.1 million. Both of these factors helped to maintain the net interest margin to 3.92 percent at State Bank, the same 3.92 percent State Bank held year-end 2010. The mortgage banking business line continues to grow, with residential real estate loan production of $220 million for the year, resulting in $3.6 million of revenue from gain on sale. The Company’s loans serviced for others ended the year at $402 million.
Changes in Financial Condition
Total assets at December 31, 2011 were $628.7 million, compared to $660.3 million at December 31, 2010. The Company executed a significant deleveraging of the Balance Sheet during 2011, which resulted in investment securities reduced by $43 million and long term borrowings reduced by $32 million. Loans (excluding loans held for sale) were $442.6 million at December 31, 2011, compared to $427.5 million at December 31, 2010. Total deposits were $518.8 million at year-end 2011, compared to $515.7 million at December 31, 2010. Non-interest bearing deposits at December 31, 2011 were $66.0 million, compared to $62.7 million at December 31, 2010. Total shareholders’ equity was $47.9 million at year-end 2011, up from $46.0 million from the prior year-end.
Balance Sheet DELEVERAGING
In a series of transactions completed during June of 2011, the Company completed a balance sheet deleveraging. The deleveraging involved selling $43 million of investment securities with a weighted average yield of 3.97 percent, recognizing a gain on sale totaling $1.9 million. The proceeds from the transaction were applied to the pay down of $32 million in borrowings with a weighted average rate of 4.64 percent. The prepayment penalty for the pay down of $30 million in repos and $2 million in FHLB advances was $1.1 million. This reduction in asset size had a positive impact on the majority of capital ratios as well as the tangible equity to asset ratio.
SMALL BUSINESS LENDING FUND (SBLF)
The Company applied for $21.5 million in capital from the Small Business Lending Fund (SBLF) in January of 2011. Subsequent to that application, changes were made to the program that prevented the Company’s participation. The Company has no immediate plans to issue any of the preferred shares that were authorized by shareholders and contemplated to be issued as part of the SBLF application.
Significant Events of 2011
The Company returned to profitability during 2011 with net income of $1.7 million. This was a dramatic improvement from the loss of $15.6 million incurred for 2010. Our Banking subsidiary, State Bank, had net income of $4.8 million, while our technology subsidiary, RDSI, lost $1.4 million during 2011.
Improvements in problem assets continued to be a strong part of the Company’s increase in profitability during 2011. At December 31, 2011, non-performing assets had declined $4.9 million from the prior year. The level of non-performing assets to total assets fell to 1.60 percent from 2.26 percent for the prior year. (The Company began to include accruing restructured loans in non-performing assets during 2011). Loan delinquency ended the year at 1.54 percent at December 31, 2011 versus 2.77 percent at December 31, 2010.
Mortgage loan production and sale continued to be a significant part of our business model during 2011. During the year, the Company sold $199 million of originated balances and had net mortgage banking revenue of $2.7 million.
Operating expense was reduced dramatically during 2011 as expenses at RDSI declined due to customer losses and goodwill impairment. State Bank made efforts to become more efficient with the reduction of 14 FTE.
Loan loss provision for 2011 totaled $2.0 million during 2011, which was down substantially from the $10.6 million incurred during 2010. The provision level for 2011 was just slightly below the $2.2 million of net charge-offs incurred during the year.
RDSI continued to recover during 2011 from the significant losses incurred during 2010. While RDSI still suffered a net loss in 2011 ($1.4 million), it was substantially improved from the $14.0 million loss incurred during 2010. The 2011 results include a goodwill impairment of $380,748, which reduced the RDSI goodwill and intangible value to zero. RDSI also incurred impairments on assets that are no longer in use of $608,585.
Significant Events of 2010
The State Bank aggressively managed down the level of problem assets throughout the year. At December 31, 2010, non-performing assets had declined $6.5 million from the prior year. The level of non-performing assets to total assets of 2.09 percent was down from 3.02 percent for the prior year. Loan delinquency has trended downward from a high of 4.33 percent of total loans in February to 2.77 percent as of the end of December 2010.
Operating expense reductions were a critical part of State Bank’s efforts during the year, and included a branch closing, staff reductions and operating efficiencies throughout the organization.
Mortgage loan production continued to be a key part of State Bank revenue growth. Total gain on sale from saleable loans, the majority of which was mortgage production, was $4.8 million during 2010, an increase of 43 percent over the 2009 revenue levels.
Loan loss provision was a significant drain on earnings during 2010. For the year, provision expense was $10.6 million to cover loan net charge-offs of $10.9 million, of which $3.0 million was at RDSI and $7.9 million was for State Bank. The bank’s loan loss allowance of 1.57 percent is up 7 basis points from the prior year. This allowance provided a coverage level for our non-performing loans of 55 percent.
On July 28, 2010, RDSI announced that the proposed strategic partnership and merger with New Core Holdings, Inc. could not be successfully completed as previously contemplated. As part of that announcement, RDSI incurred a significant write-off of hardware, software and development costs. That pretax write-off of $10.0 million drove the bulk of the net loss in 2010 at the Company.
On December 31, 2010, after an extensive review of the operation and projections at RDSI, the Company recorded impairments to goodwill and customer intangible held at RDSI. Goodwill was reduced by $4.7 million and the customer intangible was reduced by $1.6 million to reflect its fair value.
RESULTS OF OPERATIONS
| | | Year Ended December 31, | | | Year Ended December 31, | |
(dollars in thousands
except per share data) | | 2011 | | | 2010 | | | % Change | | | 2010 | | | 2009 | | | % Change | |
| | | | | | | | | | | | | | | | | | | |
| Total Assets | | $ | 628,664 | | | $ | 660,288 | | | | -5 | % | | $ | 660,288 | | | $ | 673,049 | | | | -2 | % |
| Total Securities | | | 111,978 | | | | 132,762 | | | | -16 | % | | | 132,762 | | | | 105,083 | | | | 26 | % |
| Loans Held for Sale | | | 5,238 | | | | 9,055 | | | | -42 | % | | | 9,055 | | | | 16,858 | | | | -46 | % |
| Loans (Net) | | | 442,554 | | | | 427,544 | | | | 4 | % | | | 427,544 | | | | 452,558 | | | | -6 | % |
| Allowance for Loan Losses | | | 6,529 | | | | 6,715 | | | | -3 | % | | | 6,715 | | | | 7,030 | | | | -4 | % |
| Total Deposits | | $ | 518,765 | | | $ | 515,678 | | | | 1 | % | | $ | 515,678 | | | $ | 491,242 | | | | 5 | % |
| | | | | | | | | | | | | | | | | | | | | | | | | |
| Total Revenues | | $ | 34,568 | | | $ | 40,781 | | | | -15 | % | | $ | 40,781 | | | $ | 50,303 | | | | -19 | % |
| Net Interest Income | | | 20,711 | | | | 19,962 | | | | 4 | % | | | 19,962 | | | | 20,999 | | | | -5 | % |
| Loan Loss Provision | | | 1,994 | | | | 10,588 | | | | -81 | % | | | 10,588 | | | | 5,738 | | | | 85 | % |
| Non-interest Income | | | 13,857 | | | | 20,819 | | | | -33 | % | | | 20,819 | | | | 29,304 | | | | -29 | % |
| Non-interest Expense | | | 30,253 | | | | 52,308 | | | | -42 | % | | | 52,308 | | | | 44,843 | | | | 17 | % |
| Net Income (Loss) | | | 1,664 | | | | (15,613 | ) | | | * | | | | (15,613 | ) | | | 382 | | | | * | |
| Basic Earnings (Loss) per Share | | $ | 0.34 | | | $ | (3.21 | ) | | | * | | | $ | (3.21 | ) | | $ | 0.07 | | | | * | |
| Diluted Earnings (Loss) per Share | | $ | 0.34 | | | $ | (3.21 | ) | | | * | | | $ | (3.21 | ) | | $ | 0.07 | | | | * | |
*Percentage comparison not meaningful
Net Interest Income
| | | Year Ended December 31, | | | Year Ended December 31, | |
| (dollars in thousands) | | 2011 | | | 2010 | | | % Change | | | 2010 | | | 2009 | | | % Change | |
| | | | | | | | | | | | | | | | | | | | | | | | | |
| Net Interest Income | | $ | 20,711 | | | $ | 19,962 | | | | 4 | % | | $ | 19,962 | | | $ | 20,999 | | | | -5 | % |
Net interest income was $20.7 million for 2011 compared to $20.0 million for 2010, an increase of 3.8 percent driven by higher loan volumes and the reduction of higher rate borrowings. Average earning assets decreased to $558.0 million in 2011 compared to $564.6 million in 2010, also due to loan volume. The consolidated 2011 full-year net interest margin increased 14 basis points to 3.81 percent compared to 3.67 percent at December 31, 2010.
Net interest incomewas $20.0 million for 2010 compared to $21.0 million for 2009, a decrease of 4.9 percent driven mainly by lower loan volumes. Average earning assets declined to $564.6 million in 2010 compared to $570.1 million in 2009, also due to loan volume. The consolidated full-year net interest margin declined 12 basis points to 3.67 percent compared to 3.79 percent at December 31, 2009.
Loan Loss Provision
Provision for Loan Lossesof$2.0 million was taken in 2011 compared to $10.6 million taken for 2010. The $8.6 million decrease was due to the lower level of charge-offs and the improvement in the Company’s non-performing asset levels. For 2011, net charge-offs totaled $2.2 million, or 0.50 percent of average loans. Management continues to proactively identify problem loans and is developing strategies for removing these loans from non-performing status. State Bank anticipates that 2012 will show improvement from the current level of problem assets.
Provision for Loan Lossesof$10.6 million was taken in 2010 compared to $5.7 million taken for 2009. The $4.9 million increase was due to the higher level of charge-offs driven by the continual weakening of the economy. For 2010, net charge-offs totaled $10.9 million, or 2.55 percent of average loans.
Non-interest Income
| | | Year Ended December 31, | | | Year Ended December 31, | |
| (dollars in thousands) | | 2011 | | | 2010 | | | % Change | | | 2010 | | | 2009 | | | % Change | |
| | | | | | | | | | | | | | | | | | | |
| Total Non-interest Income | | $ | 13,857 | | | $ | 20,819 | | | | -33 | % | | $ | 20,819 | | | $ | 29,305 | | | | -29 | % |
| | | | | | | | | | | | | | | | | | | | | | | | | |
| Data Service Fees | | $ | 3,630 | | | $ | 9,736 | | | | -63 | % | | $ | 9,736 | | | $ | 18,860 | | | | -48 | % |
| Trust Fees | | $ | 2,616 | | | $ | 2,548 | | | | 3 | % | | $ | 2,548 | | | $ | 2,509 | | | | 2 | % |
| Deposit Service Fees | | $ | 2,531 | | | $ | 2,461 | | | | 3 | % | | $ | 2,461 | | | $ | 2,608 | | | | -6 | % |
| Gains on Sale of Loans | | $ | 3,828 | | | $ | 4,801 | | | | -20 | % | | $ | 4,801 | | | $ | 3,355 | | | | 43 | % |
| Mortgage Loan Servicing Fees, net | | $ | (970 | ) | | $ | 277 | | | | -451 | % | | $ | 277 | | | $ | 84 | | | | 229 | % |
| Investment Securities Recoveries | | $ | - | | | $ | 74 | | | | N/A | | | $ | 74 | | | $ | - | | | | N/A | |
| Gains on Sale of Securities | | $ | 1,871 | | | $ | 451 | | | | 315 | % | | $ | 451 | | | $ | 960 | | | | N/A | |
| Other | | $ | 350 | | | $ | 472 | | | | -26 | % | | $ | 472 | | | $ | 1,013 | | | | -53 | % |
Total non-interest income was $13.9 million for 2011 compared to $20.8 million for 2010, representing a $7.0 million, or 33.4 percent decrease year-over-year. This decrease was driven by a $6.1 million decline in data processing income as a result of the loss of clients by RDSI during 2010. The equity markets throughout 2011 held trust fees flat, which are generally calculated on invested balances. The decrease in gain on sale of loans and loan servicing fees was driven by mortgage banking. The Company sold $199 million into the secondary market, which allowed for the sold and serviced loan portfolio to grow from $328 million in 2010 to over $402million at December 31, 2011. This portfolio provides a servicing fee annuity, which is expected to provide servicing revenue for the foreseeable future.
Total non-interest income was $20.8 million for 2010 compared to $29.3 million for 2009, representing an $8.5 million, or 29.0 percent decrease year-over-year. This decrease was driven by a $9.1 million decline in data processing income as a result of the loss of data processing clients by RDSI during 2010. As of December 31, 2010, only one client bank (State Bank) remained as a data processing customer of RDSI. The equity markets throughout 2010 held trust fees flat, which are generally calculated on invested balances. The increase in gain on sale of loans and loan servicing fees was driven by mortgage banking. The Company originated $241 million in saleable loan production during 2010. The sales of these loans allowed for the sold and serviced loan portfolio to grow from $208 million in 2009 to over $328 million at December 31, 2010.
Data Service Fees (“RDSI”)
| | | Year Ended December 31, | | | Year Ended December 31, | |
| (dollars in thousands) | | 2011 | | | 2010 | | | % Change | | | 2010 | | | 2009 | | | % Change | |
| | | | | | | | | | | | | | | | | | | | | | | | | |
| Data Service Fees | | $ | 3,630 | | | $ | 9,736 | | | | -63 | % | | $ | 9,736 | | | $ | 18,860 | | | | -48 | % |
Data service fees decreased $6.1 million, or 62.7 percent, to $3.6 million in 2011 from $9.7 million in 2010. During 2011, RDSI became exclusively an item processing and network services provider. The decision was made in late 2011 that State Bank would become an in-house provider of data processing.
RDSI reported a 2011 fiscal year net loss of $994,868, compared to a $14.0 million net loss reported for the 2010 fiscal year. Significantly affecting our 2011 results were the continued decline in client revenues as well as an impairment expense for goodwill.
Data service fees decreased $9.1 million, or 48.4 percent, to $9.7 million in 2010 from $18.9 million in 2009. During 2010, RDSI’s data processing clients, utilizing the ITI software administered by RDSI, decreased from 77 to only one utilizing this software, State Bank. In late 2009, the decrease of clients began, accounting for the 6 percent revenue decline in the 2009 fiscal year.
RDSI reported a 2010 fiscal year net loss of $14.0 million, compared to $875 thousand reported for the 2009 fiscal year. Significantly affecting our 2010 results were the impairment expenses incurred due to RDSI’s unsuccessful merger with New Core Banking Systems, as well as the goodwill and other intangible impairment taken at RDSI.
Non-interest Expense
| | | Year Ended December 31, | | | Year Ended December 31, | |
| (dollars in thousands) | | 2011 | | | 2010 | | | % Change | | | 2010 | | | 2009 | | | % Change | |
| | | | | | | | | | | | | | | | | | | |
| Total Non-interest Expense | | $ | 30,253 | | | $ | 52,308 | | | | -42 | % | | $ | 52,308 | | | $ | 44,843 | | | | 17 | % |
| Salaries & Employee Benefits | | $ | 14,174 | | | $ | 17,932 | | | | -21 | % | | $ | 17,932 | | | $ | 21,035 | | | | -15 | % |
| Professional Fees | | $ | 1,920 | | | $ | 2,546 | | | | -25 | % | | $ | 2,546 | | | $ | 2,891 | | | | -12 | % |
| FDIC Insurance Expense | | $ | 908 | | | $ | 1,138 | | | | -20 | % | | $ | 1,138 | | | $ | 1,132 | | | | 1 | % |
| Goodwill & Intangible Impairment | | $ | 381 | | | $ | 6,273 | | | | N/A | | | $ | 6,273 | | | $ | - | | | | N/A | |
| Fixed Asset & Software Impairment | | $ | 609 | | | $ | 4,892 | | | | N/A | | | $ | 4,892 | | | $ | - | | | | N/A | |
| All Other | | $ | 12,261 | | | $ | 19,527 | | | | -37 | % | | $ | 19,527 | | | $ | 19,785 | | | | -1 | % |
Non-interest expensefor 2011 decreased $22.1 million, or 42.2 percent over 2010. Excluding non-core items, non interest expense was down $10.2 million from the prior year. The Company made further declines in staffing levels for efficiency purposes and to reflect the commensurate declines in RDSI revenues. Total Full-time equivalent headcount (FTE) ended 2011 at 210, which was down 32 from year end 2010. State Bank continued to have higher than normal expenses related to OREO and single family residential foreclosures. Total expense writedowns at RDSI for 2011 included a Goodwill impairment of $380,748 and a fixed asset and software impairment charge of $608,585.
Non-interest expensefor 2010 increased $7.5 million, or 16.7 percent over 2009. Impairment expenses at RDSI were $13.0 million, and when excluded, total non-interest expense was down 12.3 percent from the prior year. As RDSI clients declined, the Company made commensurate declines in expenses, mainly through a reduction in workforce, as decreased staff levels were required to service remaining clients. State Bank had significantly higher than normal expenses related to OREO and single family residential foreclosures. Total expense writedowns at RDSI for 2010 included software, hardware and other developmental costs due to Single Source™ ($6.7 million), a Goodwill impairment ($4.7 million) and customer intangible impairment ($1.6 million).
FINANCIAL CONDITION
Investments
During 2011, the Company decreased its level of available for sale securities by nearly $20.8 million and ended the year at $112.0 million. This decrease was the result of a significant deleveraging transaction that was completed in June of 2011. The decreased levels of investments impacted the Company’s net interest margin as investment yields were lower than potential loan yields.
Loans
| ($ in thousands) | | Total Loans | | | Non-Accrual Loans | | | Non-Accrual Percentage | |
| | | 2011 | | | 2010 | | | 2011 | | | 2010 | | | 2011 | | | 2010 | |
| Commercial | | $ | 78,112 | | | $ | 72,489 | | | | 2,393 | | | | 3,032 | | | | 3.06 | % | | | 4.18 | % |
| Commercial real estate | | | 187,829 | | | | 177,890 | | | | 1,456 | | | | 5,428 | | | | 0.78 | % | | | 3.05 | % |
| Agricultural | | | 38,361 | | | | 40,762 | | | | - | | | | - | | | | 0.00 | % | | | 0.00 | % |
| Residential real estate | | | 87,656 | | | | 84,775 | | | | 2,471 | | | | 3,285 | | | | 2.82 | % | | | 3.87 | % |
| Consumer | | | 50,681 | | | | 51,710 | | | | 580 | | | | 538 | | | | 1.14 | % | | | 1.04 | % |
| Leasing | | | 216 | | | | 194 | | | | - | | | | - | | | | 0.00 | % | | | 0.00 | % |
| Total loans | | | 442,855 | | | | 427,820 | | | | 6,900 | | | | 12,283 | | | | 1.56 | % | | | 2.87 | % |
| Less | | | | | | | | | | | | | | | | | | | | | | | | |
| Net deferred loan fees, premiums and discounts | | | (301 | ) | | | (276 | ) | | | | | | | | | | | | | | | | |
| Loans, net of unearned income | | | 442,554 | | | | 427,544 | | | | | | | | | | | | | | | | | |
| Allowance for loan losses | | $ | (6,529 | ) | | $ | (6,715 | ) | | | | | | | | | | | | | | | | |
Loansincreased $15.0 million to $442.6 million at December 31, 2011. Loan volume increased in most categories, except for agricultural loans. State Bank continued to aggressively move out a number of problem credits during the year. Loans held for sale decreased $3.8 million as sold mortgage loans increased and pipeline length decreased during the year during the year.
Loans decreased $25.1 million to $427.5 million at December 31, 2010. Loan volume declined in most categories, except for residential loans. Loans held for sale decreased by nearly $8 million, as the bank reduced the level of residential loans in process.
Asset Quality
| | | | | | | | | Change in | | | | | | Change in | |
| | | | | | | | | Dollars / | | | | | | Dollars / | |
| (dollars in thousands) | | 12/31/2011 | | | 12/31/2010 | | | Percentages | | | 12/31/2009 | | | Percentages | |
| | | | | | | | | | | | | | | | |
| Non-accruing loans | | $ | 6,900 | | | $ | 12,283 | | | $ | (5,383 | ) | | $ | 18,543 | | | $ | (6,260.0 | ) |
| Accruing restructured loans | | $ | 1,334 | | | $ | 1,107 | | | $ | 227 | | | $ | 1,693 | | | $ | (585.6 | ) |
| OREO & Repossessed assets | | $ | 1,830 | | | $ | 1,538 | | | $ | 292 | | | $ | 1,775 | | | $ | (237.0 | ) |
| Non-performing assets | | $ | 10,064 | | | $ | 14,928 | | | $ | (4,864 | ) | | $ | 22,011 | | | $ | (7,082.6 | ) |
| Non-performing assets/total assets | | | 1.60 | % | | | 2.26 | % | | | -0.66 | % | | | 3.27 | % | | | -1.01 | % |
| Net charge-offs | | $ | 2,180 | | | $ | 10,901 | | | $ | (8,721 | ) | | $ | 3,826 | | | $ | 7,075 | |
| Net charge-offs/total loans | | | 0.49 | % | | | 2.55 | % | | | -2.06 | % | | | 0.85 | % | | | 1.70 | % |
| Loan loss provision | | $ | 1,994 | | | $ | 10,588 | | | $ | (8,594 | ) | | $ | 5,738 | | | $ | 4,850 | |
| Allowance for loan losses | | $ | 6,529 | | | $ | 6,715 | | | $ | (186 | ) | | $ | 7,030 | | | $ | (315 | ) |
| Allowance/loans | | | 1.48 | % | | | 1.57 | % | | | -0.10 | % | | | 1.55 | % | | | 0.02 | % |
| Allowance/non-accruing loans | | | 94.6 | % | | | 54.7 | % | | | 40.0 | % | | | 37.9 | % | | | 16.8 | % |
| Allowance/non-performing assets | | | 64.9 | % | | | 45.0 | % | | | 19.9 | % | | | 31.9 | % | | | 13.0 | % |
Non-performing assets (loans + OREO(Other Real Estate Owned) + OAO(Other Assets Owned)+ accruing TDR’s) were $10.0 million, or 1.60 percent, of total assets at December 31, 2011, a decrease of $4.9 million from 2010. Charge-offs were also down significantly during 2011 at $2.2 million, which was an $8.7 million improvement over 2010. Our loan loss allowance at December 31, 2011 now covers our non-accruing loans at 82 percent, up from 55 percent at December 31, 2010.
CAPITAL RESOURCES
Stockholders’ equity at December 31, 2011, was $47.9 million, equivalent to 7.6 percent of total assets. The total consolidated risk-based capital ratio was 11.4 percent at December 31, 2011. Total consolidated regulatory (risk-based) capital was $52.0 million at December 31, 2011, and $48.4 million at December 31, 2010. Capital ratios for the Company’s banking subsidiary, State Bank, were 8.0 percent for the Tier 1 leverage ratio and 12.0 percent for the risk-based capital ratio at December 31, 2011.
Goodwill and Intangibles
The Company completed the most recent annual goodwill impairment test as of December 31, 2011. The first step impairment test compares the fair value of the reporting units with the carrying values, including goodwill. The reporting units are State Bank and RDSI. At December 31, 2011, State Bank passed step one, which resulted in no impairment. RDSI failed the step one test, which resulted in an impairment of goodwill in the amount of $380,748, which removed all remaining goodwill from RDSI. At December 31, 2010, both goodwill and customer intangible were impaired at RDSI. These impairments were substantial, resulting in write-downs of $6.3 million for 2010.
The fair value testing of Goodwill and Intangibles was conducted pursuant to ASC Topic 350 and utilized company prepared projections of cash flows, historical financial results and market based comparisons. These inputs were used to evaluate the expected future cash flows of the businesses and those results determined the fair value of the Goodwill and Intangibles.
Planned Purchases of Premises and Equipment
Management plans to purchase additional premises and equipment to meet the current and future needs of the Company’s customers. These purchases, including buildings and improvements and furniture and equipment (which includes computer hardware, software, office furniture and license agreements), are currently expected to total approximately $471 thousand for State Bank and $0 for RDSI, over the next year. These purchases are expected to be funded by cash on hand and from cash generated from current operations.
LIQUIDITY
Liquidity relates primarily to the Company’s ability to fund loan demand, meet deposit customers’ withdrawal requirements and provide for operating expenses. Sources used to satisfy these needs consist of cash and due from banks, interest bearing deposits in other financial institutions, securities available for sale, loans held for sale, and borrowings from various sources. The assets, excluding the borrowings, are commonly referred to as liquid assets. Liquid assets were $132.1 million at December 31, 2011 compared to $172.2 million at December 31, 2010. During 2011, the Company continued to utilize strategies that would move the balance sheet to a more asset-sensitive position.
The Company’s commercial real estate, first mortgage residential and multi-family mortgage portfolio of $264.7 millionat December 31, 2011 can and has been readily used to collateralize borrowings, which is an additional source of liquidity. Management believes the Company’s current liquidity level, without these borrowings, is sufficient to meet its current and anticipated liquidity needs. At December 31, 2011, all eligible commercial real estate, residential first, and multi-family mortgage loans were pledged under an FHLB blanket lien.
The cash flow statements for the periods presented provide an indication of the Company’s sources and uses of cash as well as an indication of the ability of the Company to maintain an adequate level of liquidity. A discussion of the cash flow statements for 2011, 2010, and 2009 follows.
The Company experienced positive cash flows from operating activities in 2011, positive cash flows from operating activities in 2010, and negative cash flows from operating activities in 2009. Net cash from operating activities was $14.9 million, $16.9 million and ($7.2) million for the years ended December 31, 2011, 2010 and 2009, respectively. Significant non-cash items from operations for 2011 included OMSR impairment ($1.1 million), goodwill impairment ($0.39 million) and OREO impairments ($214 thousand). Net cash flows from loans originated and held for sale were a positive $6.2 million.
The Company experiencedpositive cash flows from investing activities in 2011, negative cash flows from investing activities in 2010, and negative cash flows from investing activities in 2009. Net cash from investing activities was $4.0million, ($18.1) million, and ($9.5) million for the years ended December 31, 2011, 2010, and 2009, respectively. The changes in net cash from investing for 2011 include the purchase of available-for-sale securities of $52.2 million, net change in loans of negative $19.7 million and the purchase of premises and equipment of $0.68 million. The changes in net cash from investing activities for 2010 include the purchase of available-for-sale securities of $76.6 million, net change in loans of $11.1 million and the purchase of premises and equipment of $2.1 million. The changes in net cash from investing activities for 2009 include the purchase of available-for-sale securities of $67.9 million, net change in loans of $7.7 million and the purchase of premises and equipment of $3.4 million. In 2011, 2010 and 2009 the Company received $44.3 million, $10.0 million and $27.1 million, respectively, from sales of securities available for sale, while proceeds from repayments, maturities and calls of securities were $29.2 million, $37.7 million and $40.8 million in 2011, 2010 and 2009, respectively.
The Company experiencednegative cash flows from financing activities in 2011, positive cash flows from financing activities in 2010, and positive cash flows from financing activities in 2009. Net cash from financing activities was ($34.5) million, $6.9 million, and $13.5 million for the years ended December 31, 2011, 2010, and 2009, respectively. Significant financing activity during 2011 included net FHLB activity of ($10.0) million. Finally, $3.1million, $24.5 million and $7.0 million of the change is attributable to the change in deposits for 2011, 2010 and 2009, respectively.
Off-Balance-Sheet Borrowing Arrangements:
Significant additional off-balance-sheet liquidity is available in the form of FHLB advances, unused federal funds lines from correspondent banks and the national certificate of deposit market. Management expects the risk of changes in off-balance-sheet arrangements to be immaterial to earnings.
The Company’s commercial real estate, first mortgage residential, and multi-family mortgage portfolios of $264.7 million have been pledged to meet collateralization requirements as of December 31, 2011. Based on the current collateralization requirements of the FHLB, approximately $22.4 million of additional borrowing capacity existed at December 31, 2011.
At December 31, 2011 and 2010, the Company had $11.5 million in federal funds lines available. The Company also had $36.0 million in unpledged securities that may be used to pledge for additional borrowings.
At December 31, 2011, Rurban Financial Corp., the bank Holding Company, had a $1.5 million term note which had been converted from a $2.0 million line of credit (LOC) at December 31, 2010. The balance at December 31, 2011 and 2010 was $1.5 million and $1.7 million, respectively.
TABULAR DISCLOSURE OF CONTRACTUAL OBLIGATIONS
| | | Payment due by period | |
| | | | | | Less than 1 | | | | | | | | | More than 5 | |
| Contractual Obligations | | Total | | | year | | | 1 - 3 years | | | 3 - 5 years | | | years | |
| | | | | | | | | | | | | | | | |
| Long-Term Debt Obligations | | $ | 12,775,866 | | | $ | 275,866 | | | $ | 10,000,000 | | | $ | 2,500,000 | | | $ | - | |
| Other Debt Obligations | | | 23,408,123 | | | | 2,038,123 | | | | 750,000 | | | | - | | | | 20,620,000 | |
| Operating Lease Obligations | | | 1,270,425 | | | | 323,711 | | | | 526,302 | | | | 134,579 | | | | 285,833 | |
| Other Long-Term Liabilities Reflected on the Registrant's Balance Sheet under GAAP | | | 221,447,059 | | | | 118,906,795 | | | | 75,696,380 | | | | 24,702,579 | | | | 2,141,305 | |
| Total | | $ | 258,901,472 | | | $ | 121,544,494 | | | $ | 86,972,682 | | | $ | 27,337,158 | | | $ | 23,047,138 | |
The Company’s contractual obligations as of December 31, 2011 were comprised of long-term debt obligations, other debt obligations, operating lease obligations and other long-term liabilities. Long-term debt obligations are comprised of FHLB Advances of $12.8 million. Other debt obligations are comprised of Trust Preferred securities of $20.6 million and Notes Payable of $2.8 million. The operating lease obligation is a lease on the RDSI-North building of $162,000 per year and the DCM-Lansing facility of $104,600 per year. Other long-term liabilities include time deposits of $221.4 million.
ASSET LIABILITY MANAGEMENT
Asset liability management involves developing, executing and monitoring strategies to maintain appropriate liquidity, maximize net interest income and minimize the impact that significant fluctuations in market interest rates would have on current and future earnings. The business of the Company and the composition of its balance sheet consist of investments in interest-earning assets (primarily loans, mortgage-backed securities, and securities available for sale) which are primarily funded by interest-bearing liabilities (deposits and borrowings). With the exception of specific loans which are originated and held for sale, all of the financial instruments of the Company are for other than trading purposes. All of the Company’s transactions are denominated in U.S. dollars with no specific foreign exchange exposure. In addition, the Company has limited exposure to commodity prices related to agricultural loans. The impact of changes in foreign exchange rates and commodity prices on interest rates are assumed to be insignificant. The Company’s financial instruments have varying levels of sensitivity to changes in market interest rates resulting in market risk. Interest rate risk is the Company’s primary market risk exposure; to a lesser extent, liquidity risk also impacts market risk exposure.
Interest rate risk is the exposure of a banking institution’s financial condition to adverse movements in interest rates. Accepting this risk can be an important source of profitability and shareholder value; however, excessive levels of interest rate risk could pose a significant threat to the Company’s earnings and capital base. Accordingly, effective risk management that maintains interest rate risks at prudent levels is essential to the Company’s safety and soundness.
Evaluating a financial institution’s exposure to changes in interest rates includes assessing both the adequacy of the management process used to control interest rate risk and the organization’s quantitative level of exposure. When assessing the interest rate risk management process, the Company seeks to ensure that appropriate policies, procedures, management information systems and internal controls are in place to maintain interest rate risks at prudent levels of consistency and continuity. Evaluating the quantitative level of interest rate risk exposure requires the Company to assess the existing and potential future effects of changes in interest rates on its consolidated financial condition, including capital adequacy, earnings, liquidity and asset quality (when appropriate).
The Federal Reserve Board together with the Office of the Comptroller of the Currency and the Federal Deposit Insurance Company adopted a Joint Agency Policy Statement on interest rate risk effective June 26, 1996. The policy statement provides guidance to examiners and bankers on sound practices for managing interest rate risk, which will form the basis for ongoing evaluation of the adequacy of interest rate risk management at supervised institutions. The policy statement also outlines fundamental elements of sound management that have been identified in prior Federal Reserve guidance and discusses the importance of these elements in the context of managing interest rate risk. Specifically, the guidance emphasizes the need for active board of director and senior management oversight and a comprehensive risk management process that effectively identifies, measures and controls interest rate risk.
Financial institutions derive their income primarily from the excess of interest collected over interest paid. The rates of interest an institution earns on its assets and owes on its liabilities generally are established contractually for a period of time. Since market interest rates change over time, an institution is exposed to lower profit margins (or losses) if it cannot adapt to interest rate changes. For example, assume that an institution’s assets carry intermediate or long-term fixed rates and that those assets are funded with short-term liabilities. If market interest rates rise by the time the short-term liabilities must be refinanced, the increase in the institution’s interest expense on its liabilities may not be sufficiently offset if assets continue to earn at the long-term fixed rates. Accordingly, an institution’s profits could decrease on existing assets because the institution will either have lower net interest income or possibly, net interest expense. Similar risks exist when assets are subject to contractual interest rate ceilings, or rate-sensitive assets are funded by longer-term, fixed-rate liabilities in a declining rate environment.
There are several ways an institution can manage interest rate risk including: 1) matching repricing periods for new assets and liabilities, for example, by shortening or lengthening terms of new loans, investments, or liabilities; 2) selling existing assets or repaying certain liabilities; and 3) hedging existing assets, liabilities, or anticipated transactions. An institution might also invest in more complex financial instruments intended to hedge or otherwise change interest rate risk. Interest rate swaps, futures contracts, options on futures contracts, and other such derivative financial instruments can be used for this purpose. Because these instruments are sensitive to interest rate changes, they require management’s expertise to be effective. The Company has not purchased derivative financial instruments in the past but may purchase such instruments in the future if market conditions are favorable.
Quantitative Market Risk Disclosure. The following table provides information about the Company’s financial instruments used for purposes other than trading that are sensitive to changes in interest rates as of December 31, 2011. The table does not present when these items may actually reprice. For loans receivable, securities, and liabilities with contractual maturities, the table presents principal cash flows and related weighted-average interest rates by contractual maturities as well as the historical impact of interest rate fluctuations on the prepayment of loans and mortgage backed securities. For core deposits (demand deposits, interest-bearing checking, savings, and money market deposits) that have no contractual maturity, the table presents principal cash flows and applicable related weighted-average interest rates based upon the Company’s historical experience, management’s judgment and statistical analysis, as applicable, concerning their most likely withdrawal behaviors. The current historical interest rates for core deposits have been assumed to apply for future periods in this table as the actual interest rates that will need to be paid to maintain these deposits are not currently known. Weighted average variable rates are based upon contractual rates existing at the reporting date.
Principal/Notional Amount Maturing or Assumed to be Withdrawn In:
(Dollars in thousands)
| | | 2012 | | | 2013 | | | 2014 | | | 2015 | | | 2016 | | | Thereafter | | | Total | |
| Rate Sensitive Assets | | | | | | | | | | | | | | | | | | | | | | | | | | | | |
| Variable Rate Loans | | $ | 54,975 | | | $ | 12,139 | | | $ | 7,138 | | | $ | 6,368 | | | $ | 3,696 | | | $ | 13,537 | | | $ | 97,853 | |
| Average interest rate | | | 4.17 | % | | | 3.97 | % | | | 3.93 | % | | | 3.88 | % | | | 3.98 | % | | | 3.63 | % | | | 4.03 | % |
| Adjustable Rate Loans | | $ | 38,688 | | | $ | 31,487 | | | $ | 27,714 | | | $ | 21,079 | | | $ | 17,751 | | | $ | 80,364 | | | $ | 217,083 | |
| Average interest rate | | | 5.01 | % | | | 5.06 | % | | | 5.07 | % | | | 5.09 | % | | | 5.08 | % | | | 5.25 | % | | | 5.13 | % |
| Fixed Rate Loans | | $ | 48,967 | | | $ | 21,593 | | | $ | 17,548 | | | $ | 9,789 | | | $ | 9,611 | | | $ | 25,347 | | | $ | 132,857 | |
| Average interest rate | | | 5.40 | % | | | 5.63 | % | | | 5.50 | % | | | 5.42 | % | | | 5.36 | % | | | 4.82 | % | | | 5.34 | % |
| Total Loans | | $ | 142,630 | | | $ | 65,219 | | | $ | 52,400 | | | $ | 37,236 | | | $ | 31,058 | | | $ | 119,248 | | | $ | 447,792 | |
| Average interest rate | | | 4.82 | % | | | 5.05 | % | | | 5.06 | % | | | 4.97 | % | | | 5.03 | % | | | 4.97 | % | | | 4.95 | % |
| Fixed rate investment securities | | $ | 20,363 | | | $ | 16,159 | | | $ | 10,109 | | | $ | 8,666 | | | $ | 7,258 | | | $ | 43,336 | | | $ | 105,891 | |
| Average interest rate | | | 2.54 | % | | | 1.88 | % | | | 1.99 | % | | | 2.14 | % | | | 2.19 | % | | | 2.51 | % | | | 2.32 | % |
| Variable rate investment securities | | $ | 3,423 | | | $ | 1,315 | | | $ | 1,332 | | | $ | 1,344 | | | $ | 820 | | | $ | 1,538 | | | $ | 9,772 | |
| Average interest rate | | | 0.94 | % | | | 2.33 | % | | | 2.34 | % | | | 2.34 | % | | | 2.32 | % | | | 2.31 | % | | | 1.84 | % |
| Fed Funds Sold & Other | | $ | - | | | $ | - | | | $ | - | | | $ | - | | | $ | - | | | $ | - | | | $ | - | |
| Average interest rate | | | 0.00 | % | | | 0.00 | % | | | 0.00 | % | | | 0.00 | % | | | 0.00 | % | | | 0.00 | % | | | 0.00 | % |
| Total Rate Sensitive Assets | | $ | 166,416 | | | $ | 82,693 | | | $ | 63,841 | | | $ | 47,246 | | | $ | 39,136 | | | $ | 164,122 | | | $ | 563,455 | |
| Average interest rate | | | 4.46 | % | | | 4.39 | % | | | 4.51 | % | | | 4.38 | % | | | 4.45 | % | | | 4.30 | % | | | 4.40 | % |
| | | | | | | | | | | | | | | | | | | | | | | | | | | | | |
| Rate Sensitive Liabilities | | | | | | | | | | | | | | | | | | | | | | | | | | | | |
| Demand - Non Interest Bearing | | $ | 13,220 | | | $ | 13,219 | | | $ | 13,219 | | | $ | 13,219 | | | $ | 13,086 | | | $ | - | | | $ | 65,963 | |
| Demand - Interest Bearing | | $ | 21,532 | | | $ | 21,532 | | | $ | 21,532 | | | $ | 21,532 | | | $ | 21,318 | | | $ | - | | | $ | 107,446 | |
| Average interest rate | | | 0.08 | % | | | 0.08 | % | | | 0.08 | % | | | 0.08 | % | | | 0.08 | % | | | 0.00 | % | | | 0.08 | % |
| Money Market Accounts | | $ | 14,879 | | | $ | 14,879 | | | $ | 14,879 | | | $ | 14,879 | | | $ | 14,728 | | | $ | - | | | $ | 74,244 | |
| Average interest rate | | | 0.20 | % | | | 0.20 | % | | | 0.20 | % | | | 0.20 | % | | | 0.20 | % | | | 0.00 | % | | | 0.20 | % |
| Savings | | $ | 10,138 | | | $ | 9,907 | | | $ | 9,907 | | | $ | 9,907 | | | $ | 9,806 | | | $ | - | | | $ | 49,665 | |
| Average interest rate | | | 0.06 | % | | | 0.06 | % | | | 0.06 | % | | | 0.06 | % | | | 0.06 | % | | | 0.00 | % | | | 0.06 | % |
| Certificates of Deposit | | $ | 118,936 | | | $ | 43,893 | | | $ | 31,825 | | | $ | 14,334 | | | $ | 10,268 | | | $ | 2,191 | | | $ | 221,447 | |
| Average interest rate | | | 1.25 | % | | | 1.52 | % | | | 1.75 | % | | | 2.72 | % | | | 1.90 | % | | | 3.62 | % | | | 1.52 | % |
| Fixed rate FHLB Advances | | $ | 276 | | | $ | 1,500 | | | $ | 8,500 | | | $ | - | | | $ | 2,500 | | | $ | - | | | $ | 12,776 | |
| Average interest rate | | | 3.26 | % | | | 2.84 | % | | | 2.37 | % | | | 0.00 | % | | | 1.99 | % | | | 0.00 | % | | | 2.37 | % |
| Variable rate FHLB Advances | | $ | - | | | $ | - | | | $ | - | | | $ | - | | | $ | - | | | $ | - | | | $ | - | |
| Average interest rate | | | 0.00 | % | | | 0.00 | % | | | 0.00 | % | | | 0.00 | % | | | 0.00 | % | | | 0.00 | % | | | 0.00 | % |
| Fixed rate Notes Payable | | $ | 1,288 | | | $ | - | | | $ | - | | | $ | - | | | $ | - | | | $ | 10,310 | | | $ | 11,598 | |
| Average interest rate | | | 6.50 | % | | | 0.00 | % | | | 0.00 | % | | | 0.00 | % | | | 0.00 | % | | | 10.60 | % | | | 10.14 | % |
| Variable rate Notes Payable | | $ | 750 | | | $ | 750 | | | $ | - | | | $ | - | | | $ | - | | | $ | 10,310 | | | $ | 11,810 | |
| Average interest rate | | | 6.00 | % | | | 6.00 | % | | | 0.00 | % | | | 0.00 | % | | | 0.00 | % | | | 2.35 | % | | | 2.81 | % |
| Fed Funds Purchased, Repos & Other | | $ | 18,779 | | | $ | - | | | $ | - | | | $ | - | | | $ | - | | | $ | - | | | $ | 18,779 | |
| Average interest rate | | | 1.47 | % | | | 0.00 | % | | | 0.00 | % | | | 0.00 | % | | | 0.00 | % | | | 0.00 | % | | | 1.47 | % |
| Total Rate Sensitive Liabilities | | $ | 199,798 | | | $ | 105,680 | | | $ | 99,862 | | | $ | 73,871 | | | $ | 71,706 | | | $ | 22,811 | | | $ | 573,728 | |
| Average interest rate | | | 0.98 | % | | | 0.76 | % | | | 0.81 | % | | | 0.60 | % | | | 0.42 | % | | | 6.20 | % | | | 1.00 | % |
Principal/Notional Amount Maturing or Assumed to be Withdrawn In:
(Dollars in thousands)
| Comparison of 2011 to 2010 | | First
Year | | | Years
2 - 5 | | | Thereafter | | | Total | |
| Total Rate Sensitive Assets: | | | | | | | | | | | | | | | | |
| At December 31, 2011 | | $ | 166,416 | | | $ | 232,916 | | | $ | 164,122 | | | $ | 563,455 | |
| At December 31, 2010 | | | 167,818 | | | | 207,206 | | | | 198,085 | | | | 573,109 | |
| Increase (decrease) | | $ | (1,401 | ) | | $ | 25,710 | | | $ | (33,962 | ) | | $ | (9,653 | ) |
| | | | | | | | | | | | | | | | | |
| Total Rate Sensitive Liabilities: | | | | | | | | | | | | | | | | |
| At December 31, 2011 | | $ | 199,798 | | | $ | 351,119 | | | $ | 22,811 | | | $ | 573,728 | |
| At December 31, 2010 | | | 209,256 | | | | 375,960 | | | | 22,964 | | | | 608,180 | |
| Increase (decrease) | | $ | (9,458 | ) | | $ | (24,841 | ) | | $ | (153 | ) | | $ | (34,452 | ) |
The above table reflects expected maturities, not expected repricing. The contractual maturities adjusted for anticipated prepayments and anticipated renewals at current interest rates, as shown in the preceding table, are only part of the Company’s interest rate risk profile. Other important factors include the ratio of rate-sensitive assets to rate-sensitive liabilities (which takes into consideration loan repricing frequency but not when deposits may be repriced) and the general level and direction of market interest rates. For core deposits, the repricing frequency is assumed to be longer than when such deposits actually reprice. For some rate-sensitive liabilities, their repricing frequency is the same as their contractual maturity. For variable rate loans receivable, repricing frequency can be daily or monthly. For adjustable rate loans receivable, repricing can be as frequent as annually for loans whose contractual maturities range from one to thirty years.
The Company manages its interest rate risk by the employment of strategies to assure that desired levels of both interest-earning assets and interest-bearing liabilities mature or reprice with similar time frames. Such strategies include: 1) loans receivable which are renewed (and repriced) annually, 2) variable rate loans, 3) certificates of deposit with terms from one month to six years, 4) securities available for sale which mature at various times primarily from one through ten years, 5) federal funds borrowings with terms of one day to 90 days, and 6) Federal Home Loan Bank borrowings with terms of one day to ten years.
Impact of Inflation and Changing Prices
The majority of assets and liabilities of the Company are monetary in nature and therefore, the Company differs greatly from most commercial and industrial companies that have significant investments in fixed assets or inventories. However, inflation does have an important impact on the growth of total assets in the banking industry and the resulting need to increase equity capital at higher than normal rates in order to maintain an appropriate equity to assets ratio. Inflation significantly affects non-interest expense, which tends to rise during periods of general inflation.
Management believes the most significant impact on financial results is the Company’s ability to react to changes in interest rates. Management seeks to maintain an essentially balanced position between interest sensitive assets and liabilities and actively manages loan, security, and liability maturities in order to protect against the effects of wide interest rate fluctuations on net income and shareholders’ equity.
Forward-Looking Statements
This report may contain forward-looking statementsabout the Company and its subsidiaries within the meaning of the Private Securities Litigation Reform Act of 1995, which are not statements of historical fact. These forward-looking statements provide current expectations or forecasts of future financial performance. Examples of forward-looking statements include: (a) projections of income or expense, earning per share, the payments or non-payments of dividends, capital structure and other financial items; (b) statements of plans and objectives of the Company or our management or Board of Directors, including those relating to products or services and those relating to the previously planned spin-off of RDSI and merger of RDSI with New Core; (c) statements of future economic performance; (d) statements of future customer attraction or retention; and (e) statements of assumptions underlying such statements. Words such as “anticipates”, “believes”, “plans”, “intends”, “expects”, “projects”, “estimates”, “should”, “may”, “would be”, “will allow”, “will likely result”, “will continue”, “will remain”, or similar expressions are intended to identify forward-looking statements, but are not the exclusive means of identifying those statements. Forward-looking statements are based on management’s expectations and are subject to numerous risks and uncertainties. Although management believes that the expectations reflected in such forward-looking statements are reasonable, actual results may differ materially from those expressed or implied in such statements. These risks and uncertainties include, but are not limited to, risks and uncertainties inherent in the national and regional banking industry, changes in economic conditions in the market areas in which the Company and its subsidiaries operate, changes in policies by regulatory agencies, fluctuations in interest rates, demand for loans in the market areas in which the Company and its subsidiaries operate, increases in FDIC insurance premiums, changes in the competitive environment, losses of significant customers, geopolitical events, the loss of key personnel and other factors. For a more detailed discussion of the factors that could affect the Company’s financial results, please see Item 1A “Risk Factors” in the Company’s most recent Annual Report on Form 10-K filed with the SEC.
The Company wishes to caution readers not to place undue reliance on any such forward-looking statements, which speak only as of the date made. The Company does not undertake, and specifically disclaims any obligation, to update any forward looking statements to reflect occurrences or unanticipated events or circumstances after the date of such statements, except as required by law.
Market for Rurban Financial Corp. Common Stock Related Shareholder Matters
Our common stock is traded on the NASDAQ Global Market under the symbol “RBNF”. There were approximately 1,520 holders of record of our common stock as of December 31, 2011.
The following table presents quarterly market price information and cash dividends paid per share for our common stock for 2011 and 2010:
| | | Market Price Range | | | Dividends | |
| 2011 | | High | | | Low | | | Paid | |
| | | | | | | | | | |
| Quarter ended December 31, 2011 | | $ | 3.26 | | | $ | 2.35 | | | $ | - | |
| Quarter ended September 30, 2011 | | | 3.15 | | | | 2.36 | | | | - | |
| Quarter ended June 30, 2011 | | | 3.78 | | | | 2.75 | | | | - | |
| Quarter ended March 31, 2011 | | | 4.74 | | | | 2.71 | | | | - | |
| | | | | | | | | | | | | |
| 2010 | | | | | | | | | | | | |
| | | | | | | | | | | | | |
| Quarter ended December 31, 2010 | | $ | 4.10 | | | $ | 2.33 | | | $ | - | |
| Quarter ended September 30, 2010 | | | 4.45 | | | | 2.84 | | | | - | |
| Quarter ended June 30, 2010 | | | 7.19 | | | | 4.03 | | | | - | |
| Quarter ended March 31, 2010 | | | 7.25 | | | | 5.75 | | | | - | |
On January 27, 2010, the Company announced that it had elected to suspend payment of quarterly cash dividends. There can be no assurance as to the amount of dividends which may be declared in future periods with respect to the common shares of the Company, since such dividends are subject to the discretion of the Company’s Board of Directors, cash needs, general business conditions, dividends from the subsidiaries and applicable governmental regulations and policies.
The ability of the Company to obtain funds for the payment of dividends and for other cash requirements is largely dependent on the amount of dividends that may be declared by its subsidiaries. State Bank may not pay dividends to the Company if, after paying such dividends, it would fail to meet the required minimum levels under the risk-based capital guidelines and the minimum leverage ratio requirements. State Bank must obtain the approval of the Federal Reserve Board and the Ohio Division of Financial Institutions if a dividend in any year would cause the total dividends for that year to exceed the sum of the current year’s net profits and the retained net profits for the preceding two years, less required transfers to surplus. At December 31, 2011, State Bank had $2.2 million of excess earnings that were eligible for potential dividend to the Company.
Payment of dividends by State Bank may be restricted at any time at the discretion of the regulatory authorities, if they deem such dividends to constitute an unsafe and/or unsound banking practice. As of December 31, 2011 State Bank was required to obtain regulatory approval to pay dividends to the Company. These provisions could have the effect of limiting the Company’s ability to pay dividends on its outstanding common shares. Moreover, the Federal Reserve Board expects the Company to serve as a source of strength to its subsidiary banks, which may require it to retain capital for further investment in the subsidiary, rather than for dividends to shareholders of the Company.
Stock Performance Presentation
The following line graph shows a comparison of the cumulative returns for the Company, the NASDAQ Market Bank Index and the NASDAQ Composite Index, for the period beginning December 31, 2006 and ending December 31, 2011. The information assumes that $100 was invested at the closing price on December 31, 2006 in the Common Stock and each index, and that all dividends were reinvested.
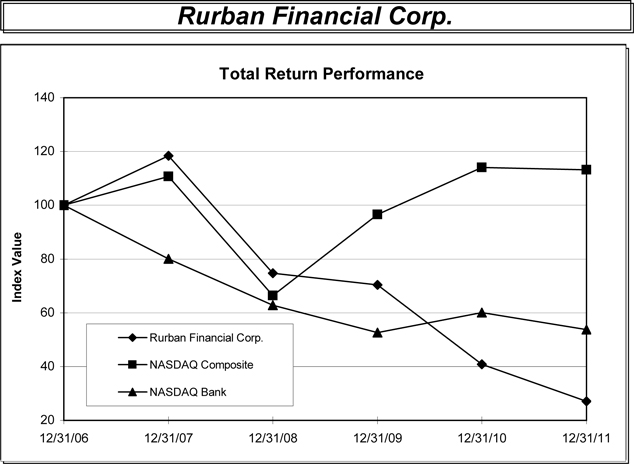
| | | Period Ending | |
| Index | | 12/31/06 | | | 12/31/07 | | | 12/31/08 | | | 12/31/09 | | | 12/31/10 | | | 12/31/11 | |
| Rurban Financial Corp. | | | 100.00 | | | | 118.45 | | | | 74.70 | | | | 70.38 | | | | 40.85 | | | | 27.06 | |
| NASDAQ Composite | | | 100.00 | | | | 110.66 | | | | 66.42 | | | | 96.54 | | | | 114.06 | | | | 113.16 | |
| NASDAQ Bank | | | 100.00 | | | | 80.09 | | | | 62.84 | | | | 52.60 | | | | 60.04 | | | | 53.74 | |
| Source : SNL Financial LC, Charlottesville, VA | |
| © 2011 | (434) 977-1600 |
| www.snl.com | www.snl.com |