Exhibit 99.1
1 PRESENTATION NAME TO GO HERE 201 7 ANNUAL MEETING OF SHAREHOLDERS
10 :30am Business Meeting • Four Shareholder Proposals Business Overview • SB Financial Group, Inc. • 201 6 Performance Adjournment ANNUAL MEETING AGENDA 2
Ms. Cindy Batt, SVP Ms. Carol Robbins, SVP Inspectors of Election 3 VOTING RESULTS
SHAREHOLDER PROPOSALS Proposal 1 – To elect three (3) directors to serve for terms of three (3) years each: Mr. Robert A. Fawcett, Jr. Mr. Gaylyn J. Finn Ms. Rita A. Kissner 4
SHAREHOLDER PROPOSALS Proposal 2 – To ratify the appointment of BKD, LLP as the independent registered public accounting firm of SB Financial Group, Inc. for the fiscal year ending December 31, 201 7 . 5

SHAREHOLDER PROPOSALS Proposal 3 – To approve the 2017 SB Financial Group Stock Incentive Plan 6
SHAREHOLDER PROPOSALS Proposal 4 – To approve a non - binding advisory resolution to approve the compensation of the Company’s named executive officers. 7

PROPOSAL QUESTIONS , COMMENTS, AND DISCUSSION 8
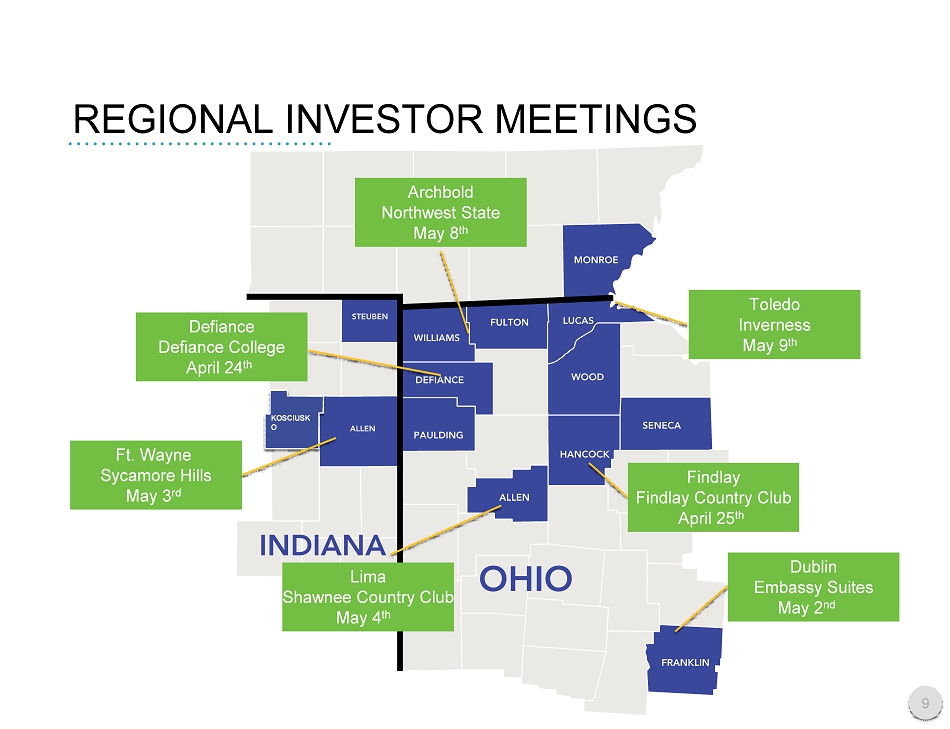
KOSCIUSK O REGIONAL INVESTOR MEETINGS Ft. Wayne Sycamore Hills May 3 rd 9 Dublin Embassy Suites May 2 nd Toledo Inverness May 9 th Defiance Defiance College April 24 th Archbold Northwest State May 8 th Findlay Findlay Country Club April 25 th Lima Shawnee Country Club May 4 th

BOARD LEADERSHIP SB FINANCIAL GROUP • Richard L. Hardgrove LEAD INDEPENDENT DIRECTOR AUDIT COMMITTEE COMPENSATION COMMITTEE • Chair: Gaylyn J. Finn • Gary M. Cates • Rita A. Kissner • Timothy J. Stolly • Chair: Rita A. Kissner • George W. Carter • Gary M. Cates • Robert A. Fawcett Jr. • Richard L. Hardgrove 10
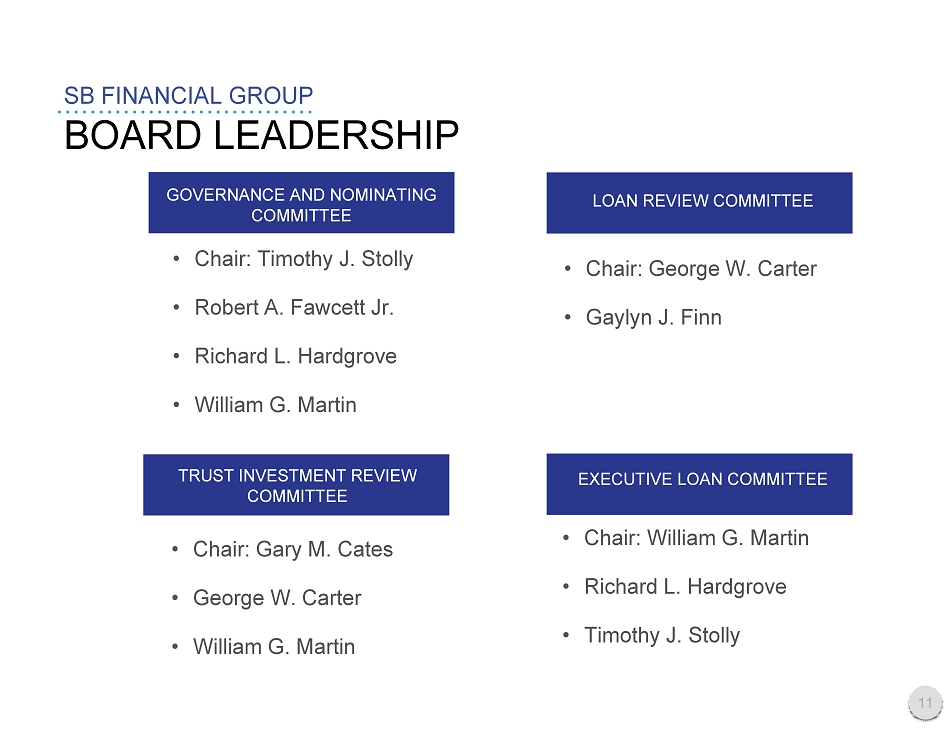
BOARD LEADERSHIP SB FINANCIAL GROUP GOVERNANCE AND NOMINATING COMMITTEE LOAN REVIEW COMMITTEE TRUST INVESTMENT REVIEW COMMITTEE EXECUTIVE LOAN COMMITTEE • Chair: Timothy J. Stolly • Robert A. Fawcett Jr. • Richard L. Hardgrove • William G. Martin • Chair: George W. Carter • Gaylyn J. Finn • Chair: Gary M. Cates • George W. Carter • William G. Martin • Chair: William G. Martin • Richard L. Hardgrove • Timothy J. Stolly TRUST INVESTMENT REVIEW COMMITTEE 11
VOTING RESULTS Ms. Cindy Batt, SVP Ms. Carol Robbins, SVP Inspectors of Election 12
B USINESS OVERVIEW BUILDING A HIGH - PERFORMANCE COMPANY 13
SAFE HARBOR STATEMENT SB FINANCIAL GROUP Certain statements within this document, which are not statements of historical fact, constitute forward - looking statements within the meaning of the Private Securities Litigation Reform Act of 1995. Forward - looking statements involve risks and uncertainties and actual results may differ materially from those predicted by the forward - looking statements. These risks and uncertainties include, but are not limited to, risks and uncertainties inherent in the national and regional banking, insurance and mortgage industries, competitive factors specific to markets in which SB Financial Group and its subsidiaries operate, future interest rate levels, legislative and regulatory actions, capital market conditions, general economic conditions, geopolitical events, the loss of key personnel and other factors. Additional factors that could cause results to differ from those described above can be found in the Company’s Annual Report on Form 10 - K and documents subsequently filed by SB Financial Group with the Securities and Exchange Commission. Forward - looking statements speak only as of the date on which they are made, and SB Financial Group undertakes no obligation to update any forward - looking statement to reflect events or circumstances after the date on which the statement is made except as required by law. All subsequent written and oral forward - looking statements attributable to SB Financial Group or any person acting on its behalf are qualified by these cautionary statements. 14
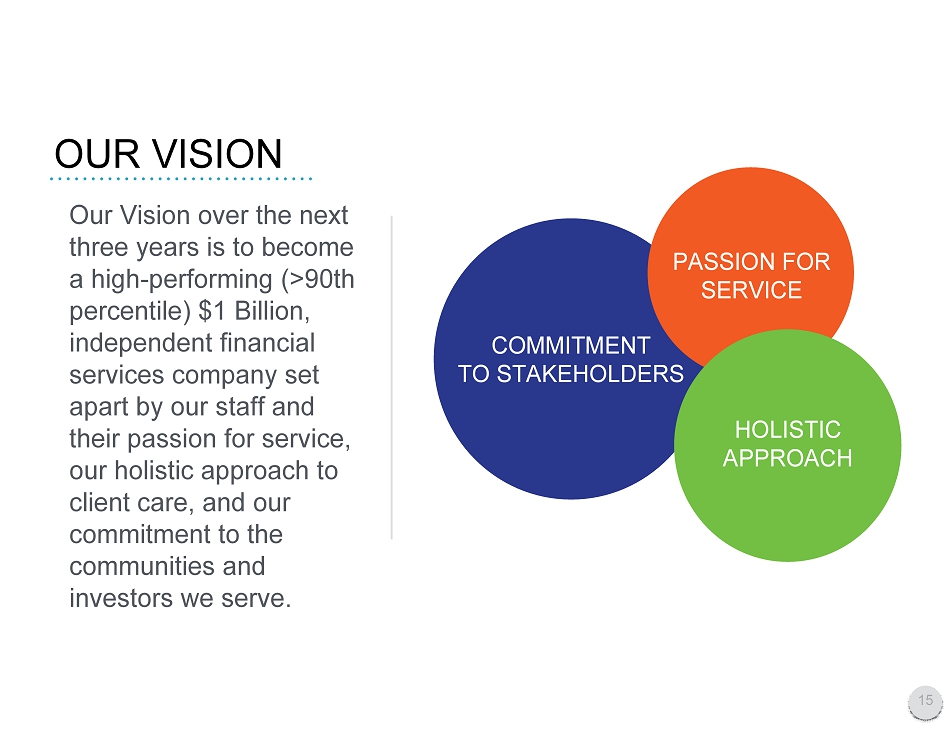
OUR VISION COMMITMENT TO S TAKEHOLDERS PASSION FOR SERVICE Our Vision over the next three years is to become a high - performing ( > 90th percentile) $1 Billion, independent financial services company set apart by our staff and their passion for service, our holistic approach to client care, and our commitment to the communities and investors we serve. HOLISTIC APPROACH 15
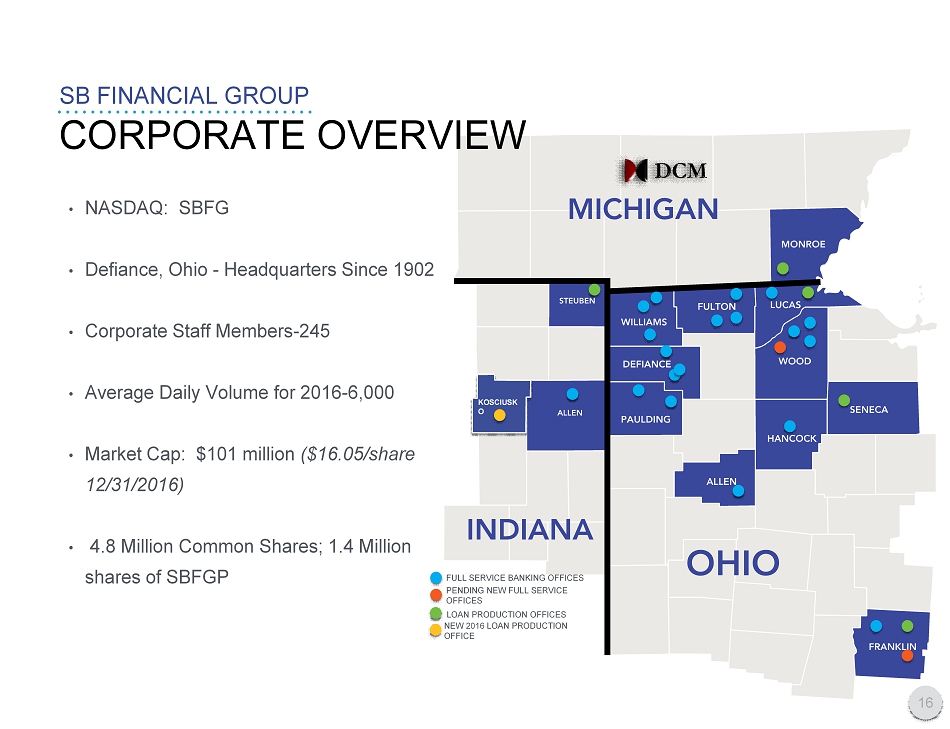
KOSCIUSK O • NASDAQ: SBFG • Defiance , Ohio - Headquarters Since 1902 • Corporate Staff Members - 245 • Average Daily Volume for 2016 - 6,000 • Market Cap: $101 million ($16.05/share 12/31/2016 ) • 4.8 Million Common Shares; 1.4 Million shares of SBFGP CORPORATE OVERVIEW SB FINANCIAL GROUP 16 FULL SERVICE BANKING OFFICES LOAN PRODUCTION OFFICES NEW 2016 LOAN PRODUCTION OFFICE PENDING NEW FULL SERVICE OFFICES
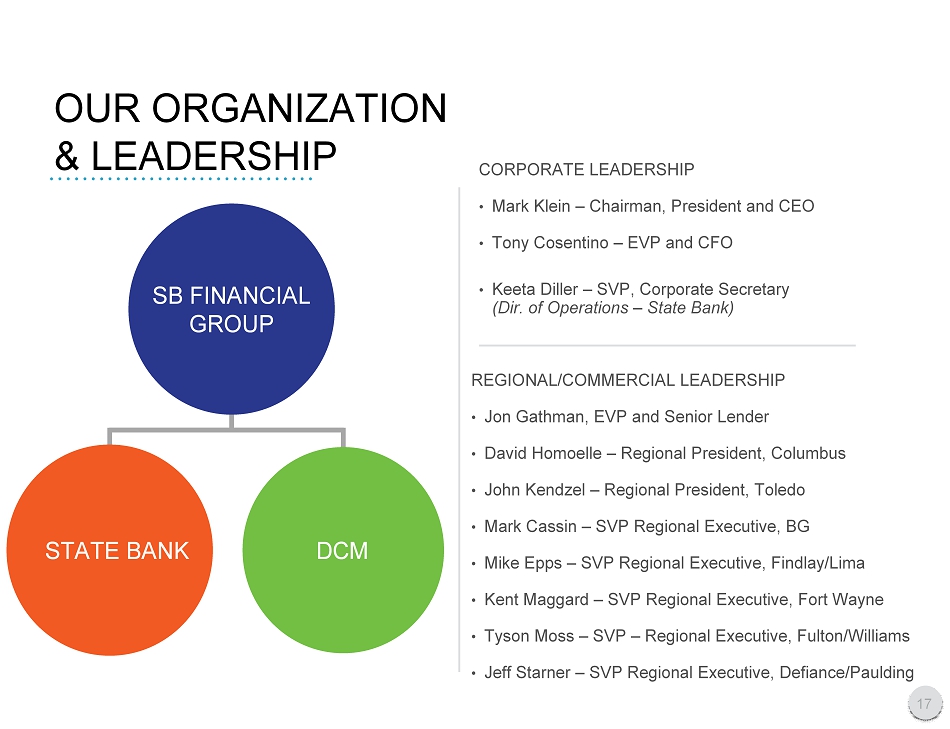
OUR ORGANIZATION & LEADERSHIP CORPORATE LEADERSHIP • Mark Klein – Ch airman, President and CEO • Tony Cosentino – EVP and CFO • Keeta Diller – SVP, Corporate Secretary (Dir. of Operations – State Bank) REGIONAL /COMMERCIAL LEADERSHIP • Jon Gathman, EVP and Senior Lender • David Homoelle – Regional President, Columbus • John Kendzel – Regional President, Toledo • Mark Cassin – SVP Regional Executive, BG • Mi ke Epps – SVP Regional Executive, Findlay/Lima • Kent Maggard – SVP Regional Executive, Fort Wayne • Tyson Moss – SVP – Regional Executive, Fulton/Williams • Jeff Starner – SVP Regional Executive, Defiance/Paulding SB FINANCIAL GROUP STATE BANK DCM 17
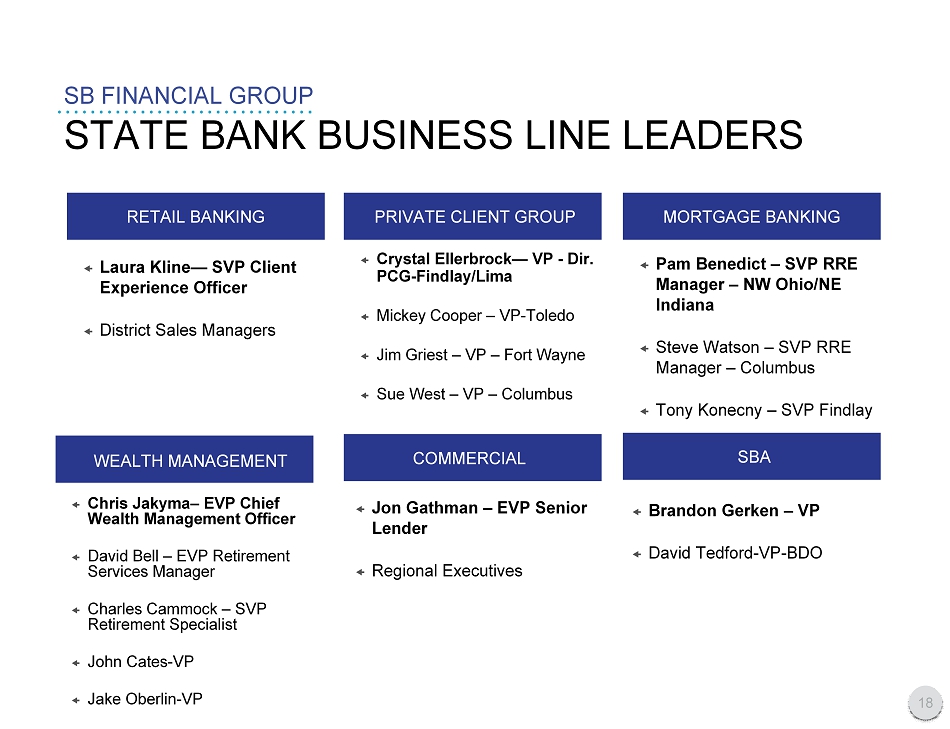
STATE BANK BUSINESS LINE LEADERS SB FINANCIAL GROUP RETAIL BANKING COMMERCIAL Chris Jakyma – EVP Chief Wealth Management Officer David Bell – EVP Retirement Services Manager Charles Cammock – SVP Retirement Specialist John Cates - VP Jake Oberlin - VP PRIVATE CLIENT GROUP Crystal Ellerbrock — VP - Dir. PCG - Findlay/Lima Mickey Cooper – VP - Toledo Jim Griest – VP – Fort Wayne Sue West – VP – Columbus MORTGAGE BANKING Pam Benedict – SVP RRE Manager – NW Ohio/NE Indiana Steve Watson – SVP RRE Manager – Columbus Tony Konecny – S VP Findlay SBA Brandon Gerken – VP David Tedford - VP - BDO 18 WEALTH MANAGEMENT Jon Gathman – EVP Senior Lender Regional Executives Laura Kline — S VP Client Experience Officer District Sales Managers
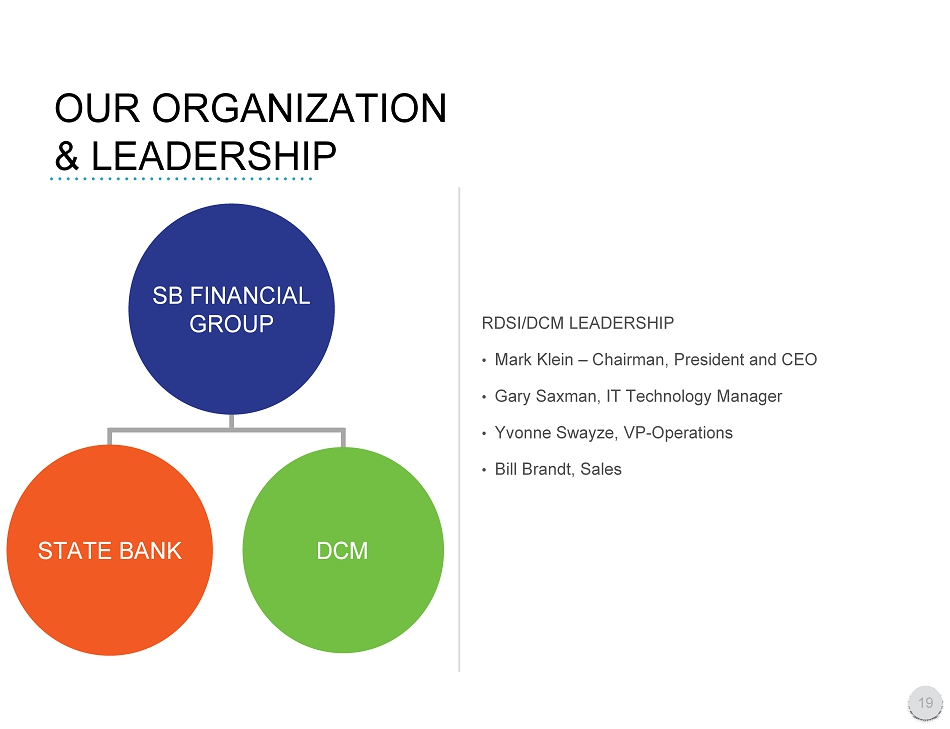
OUR ORGANIZATION & LEADERSHIP RDSI/DCM LEADERSHIP • Mark Klein – Chairman, President and CEO • Gary Saxman, IT Technology Manager • Yvonne Swayze, VP - Operations • Bill Brandt, Sales SB FINANCIAL GROUP STATE BANK DCM 19
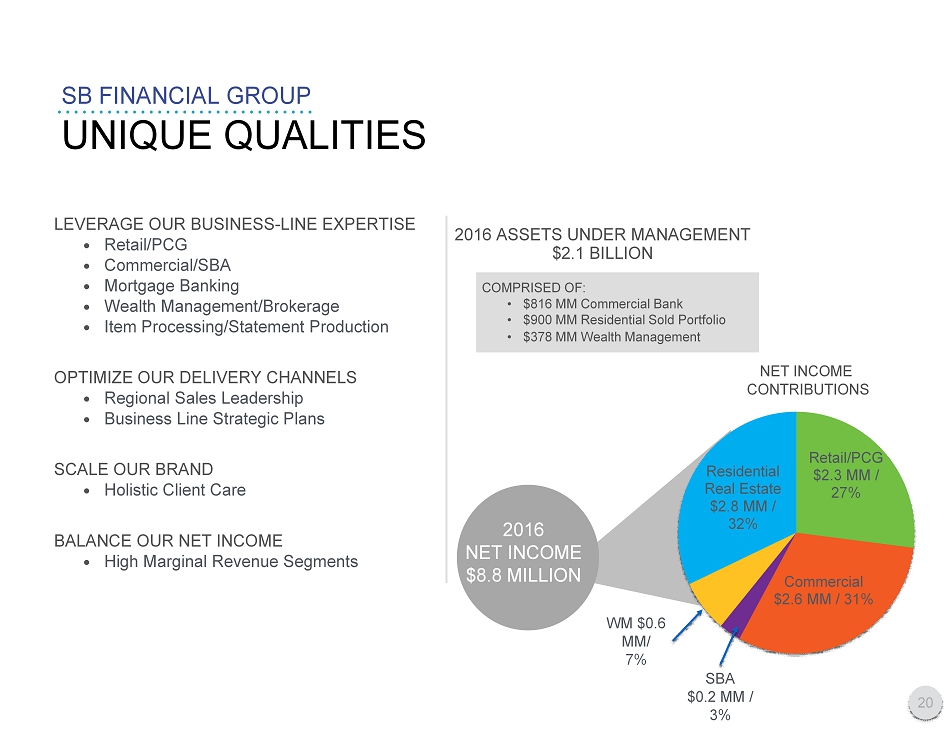
LEVERAG E OUR BUSINESS - LINE EXPERTISE • Retail/PCG • Commercial/SBA • Mortgage Banking • Wealth Management /Brokerage • Item Processing/Statement Production OPTIMIZ E OUR DELIVERY CHANNELS • Regional Sales Leadership • Business Line Strategic Plans SCALE OUR BRAND • Holistic Client Care BALANCE OUR NET INCOME • High Marginal Revenue Segments 201 6 NET INCOME $ 8.8 MILLION UNIQUE QUALITIES SB FINANCIAL GROUP Retail/PCG $2.3 MM / 27% Commercial $2.6 MM / 31% Residential Real Estate $2.8 MM / 32% 201 6 ASSETS UNDER MANAGEMENT $ 2.1 BILLION COMPRISED OF: • $ 816 MM Commercial Bank • $ 900 MM Residential Sold Portfolio • $3 78 MM Wealth Management 20 WM $0.6 MM/ 7% SBA $0.2 MM / 3% NET INCOME CONTRIBUTIONS

Become a Top - Decil e , Independent Financial Services Company KEY INITIATIVES 21 Increase profitability through ongoing diversification of revenue streams Strengthen penetration in all markets served Expand product service utilization by new and existing customers Deliver gains in operational excellence Sustain asset quality
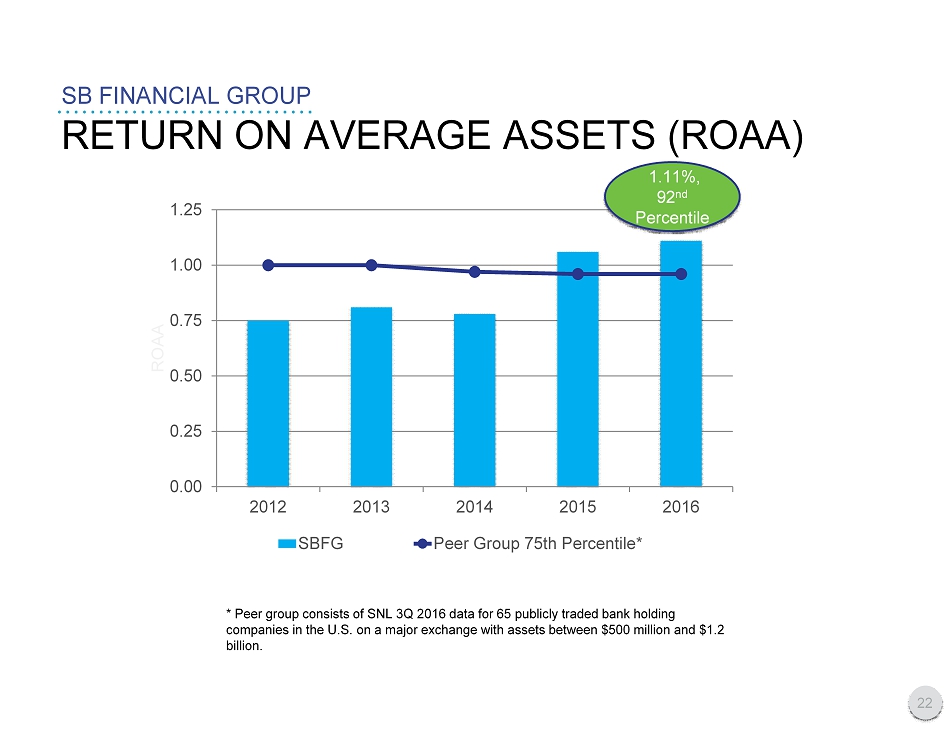
RETURN ON AVERAGE ASSETS (ROAA) SB FINANCIAL GROUP 0.00 0.25 0.50 0.75 1.00 1.25 2012 2013 2014 2015 2016 ROAA SBFG Peer Group 75th Percentile* * Peer group consists of SNL 3Q 201 6 data for 65 publicly traded bank holding companies in the U.S. on a major exchange with assets between $500 million and $1. 2 billion. 22 1.11%, 92 nd Percentile

SB FINANCIAL GROUP 23 90 th Percentile Peer Banks with an ROAA >1% Peer Banks Above Median Peer Banks – Assets between $.5B and $1.2B HIGH PERFORMANCE 7 Institutions (Including SBFG) 10 Institutions 33 Institutions 65 Institutions
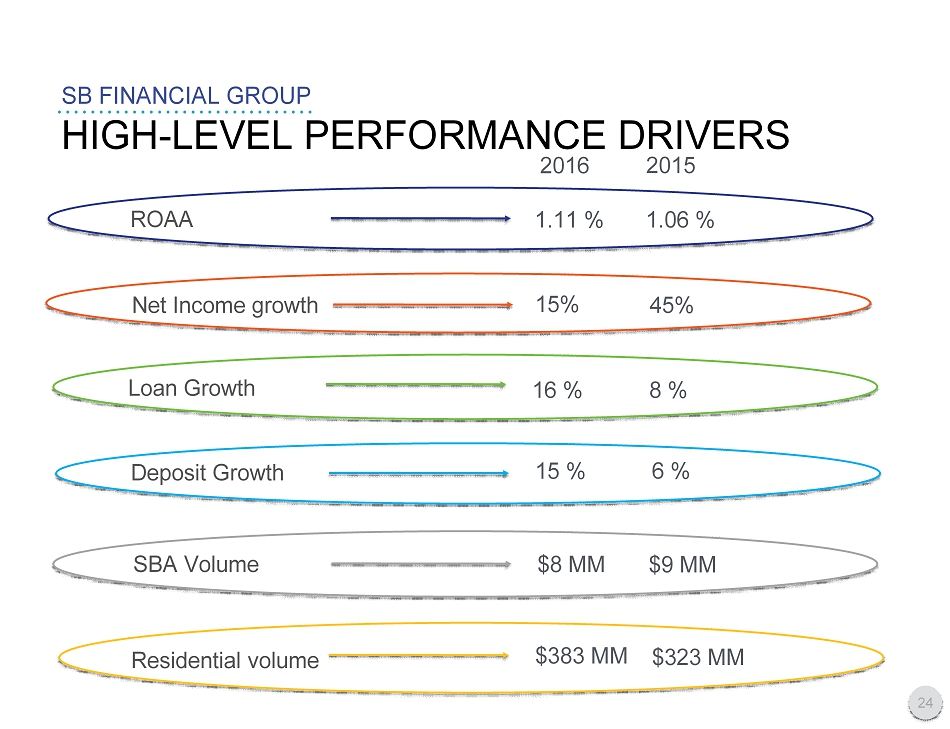
HIGH - LEVEL PERFORMANCE DRIVERS SB FINANCIAL GROUP 24 2016 2015 SBA Volume $8 MM $9 MM $383 MM $323 MM Residential volume Deposit Growth 15 % 6 % Loan Growth 16 % 8 % 45% 15% Net Income growth 1.06 % 1.11 % ROAA
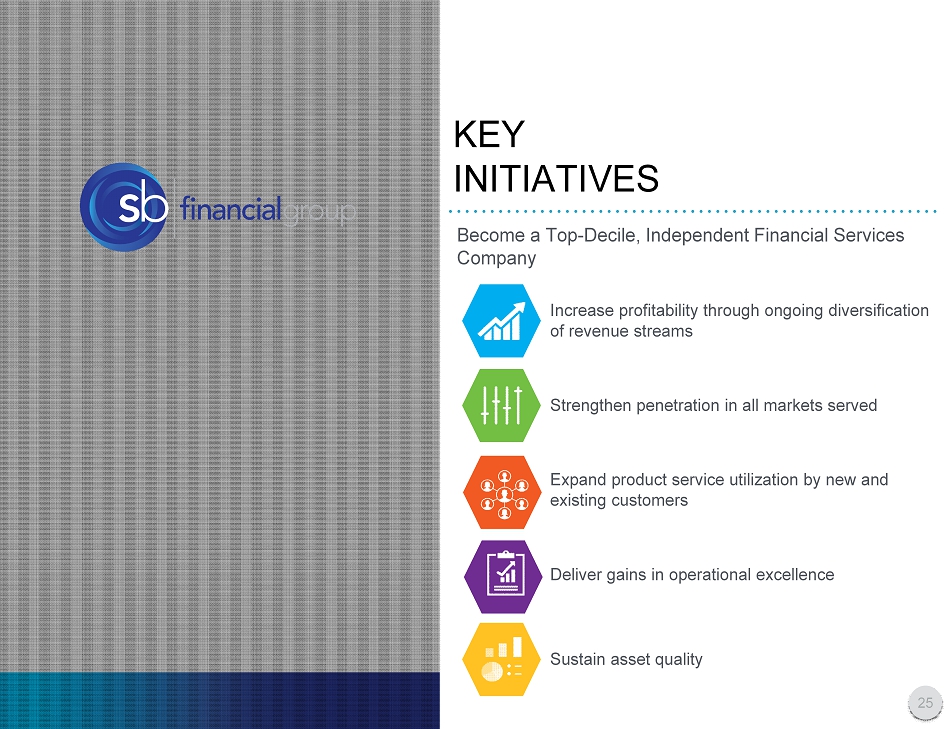
Become a Top - Dec ile , Independent Financial Services Company KEY INITIATIVES 25 Sustain asset quality Expand product service utilization by new and existing customers Strengthen penetration in all markets served Deliver gains in operational excellence Increase profitability through ongoing diversification of revenue streams
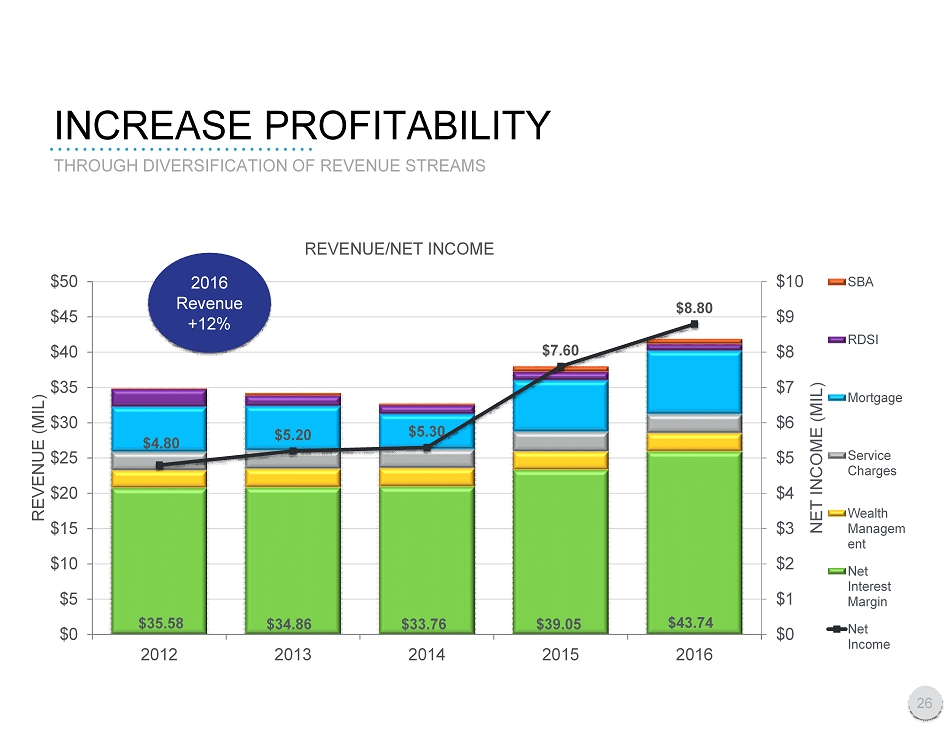
INCREASE PROFITABILITY $35.58 $34.86 $33.76 $39.05 $43.74 $4.80 $5.20 $5.30 $7.60 $8.80 $0 $1 $2 $3 $4 $5 $6 $7 $8 $9 $10 $0 $5 $10 $15 $20 $25 $30 $35 $40 $45 $50 2012 2013 2014 2015 2016 NET INCOME (MIL) REVENUE (MIL) REVENUE/NET INCOME SBA RDSI Mortgage Service Charges Wealth Managem ent Net Interest Margin Net Income THROUGH DIVERSIFICATION OF REVENUE STREAMS 26 2016 Revenue +12%
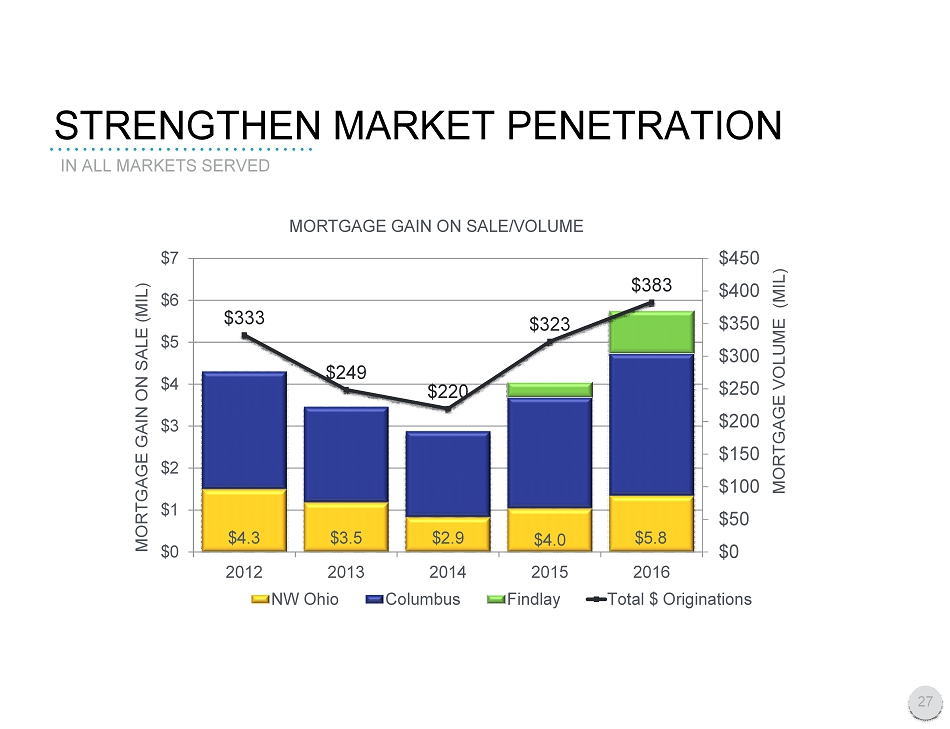
STRENGTHEN MARKET PENETRATION $333 $249 $220 $323 $383 $0 $50 $100 $150 $200 $250 $300 $350 $400 $450 $0 $1 $2 $3 $4 $5 $6 $7 2012 2013 2014 2015 2016 MORTGAGE VOLUME (MIL) MORTGAGE GAIN ON SALE (MIL) MORTGAGE GAIN ON SALE/VOLUME NW Ohio Columbus Findlay Total $ Originations IN ALL MARKETS SERVED 27 $3.5 $4.3 $2.9 $5.8 $4.0

Strengthen penetration in all markets served Increase profitability through ongoing diversification of revenue streams Sustain asset quality Deliver gains in operational excellence Expand product service utilization by new and existing customers Become a Top - Deci le, Independent Financial Services Company KEY INITIATIVES 28
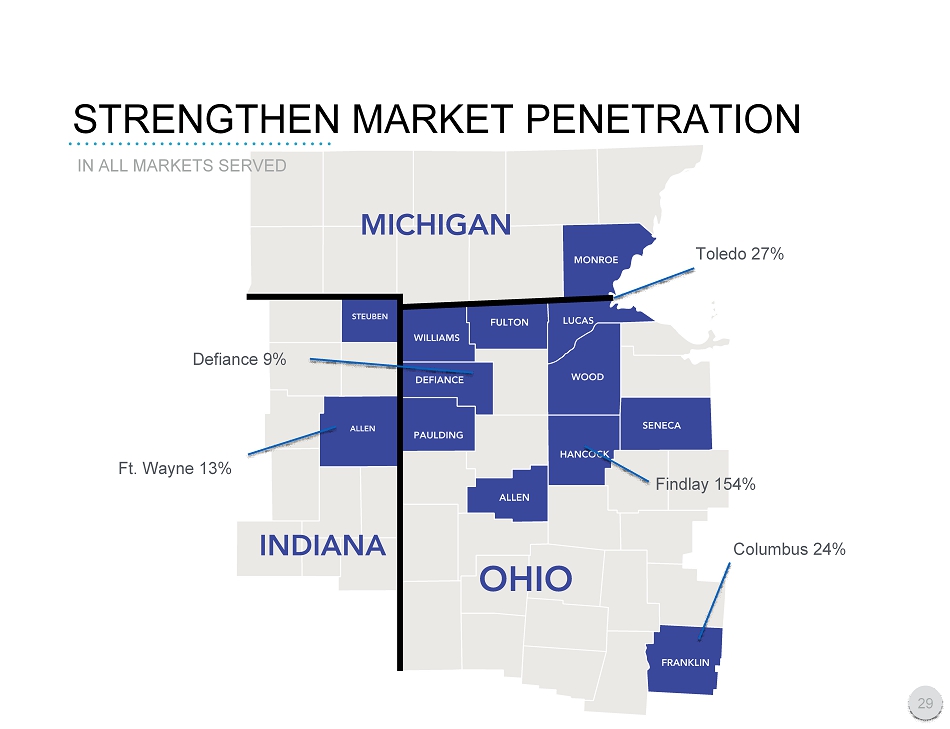
STRENGTHEN MARKET PENETRATION IN ALL MARKETS SERVED Toledo 27% Columbus 2 4 % Ft. Wayne 13 % 29 Defiance 9% Findlay 154 %
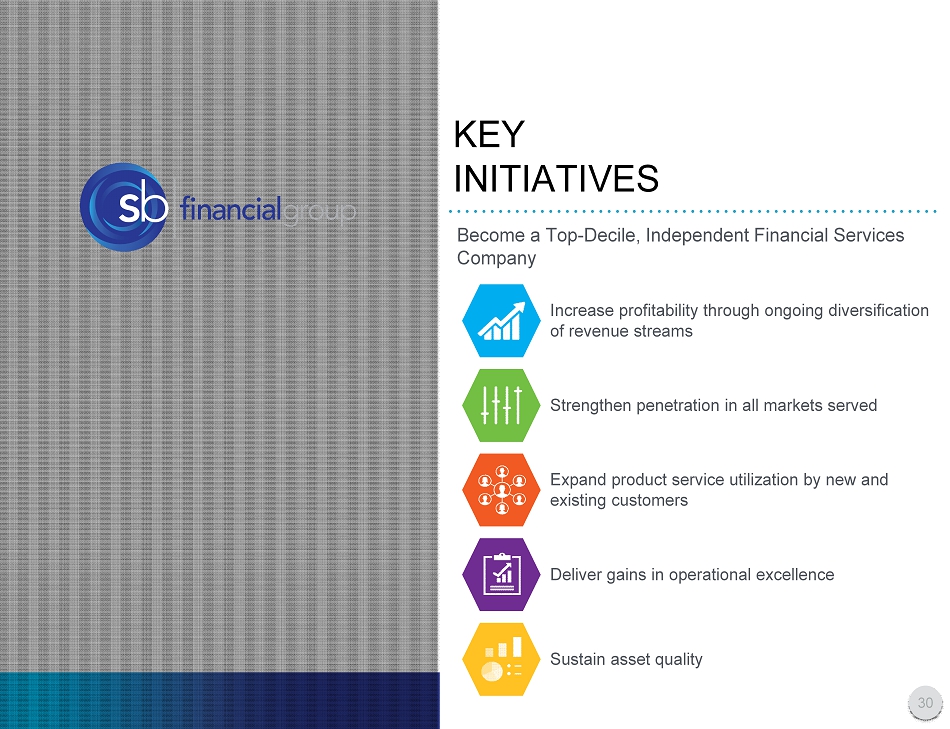
Expand product service utilization by new and existing customers Increase profitability through ongoing diversification of revenue streams Sustain asset quality Deliver gains in operational excellence Strengthen penetration in all markets served Become a Top - Dec ile , Independent Financial Services Company KEY INITIATIVES 30
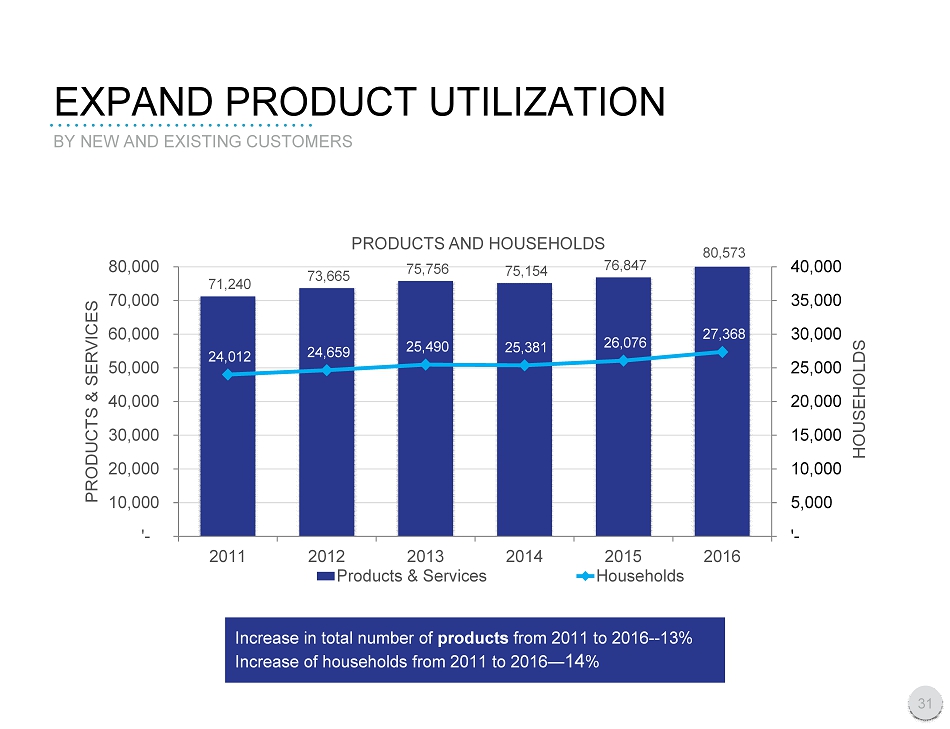
EXPAND PRODUCT U TILIZATION BY NEW AND EXISTING CUSTOMERS 71,240 73,665 75,756 75,154 76,847 80,573 24,012 24,659 25,490 25,381 26,076 27,368 '- 5,000 10,000 15,000 20,000 25,000 30,000 35,000 40,000 '- 10,000 20,000 30,000 40,000 50,000 60,000 70,000 80,000 2011 2012 2013 2014 2015 2016 HOUSEHOLDS PRODUCTS & SERVICES PRODUCTS AND HOUSEHOLDS Products & Services Households Increase in total number of products from 2011 to 201 6 - - 13 % Increase of households from 2011 to 201 6 — 14 % 31
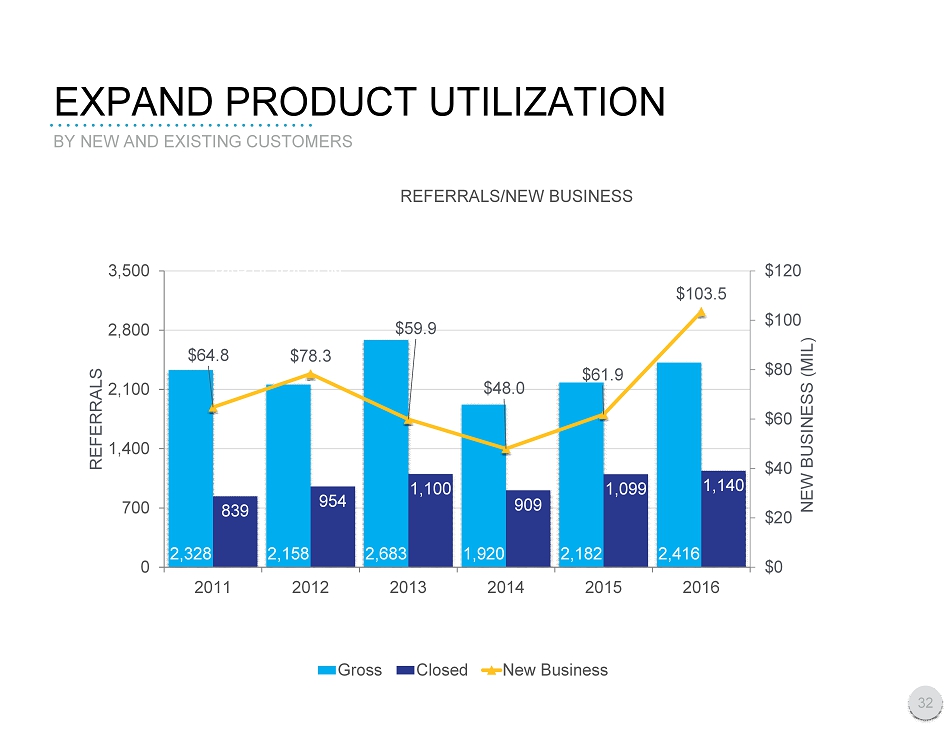
EXPAND PRODUCT U TILIZATION BY NEW AND EXISTING CUSTOMERS 2,328 2,158 2,683 1,920 2,182 2,416 839 954 1,100 909 1,099 1,140 $64.8 $78.3 $59.9 $48.0 $61.9 $103.5 $0 $20 $40 $60 $80 $100 $120 0 700 1,400 2,100 2,800 3,500 2011 2012 2013 2014 2015 2016 NEW BUSINESS (MIL) REFERRALS REFERRALS/NEW BUSINESS Gross Closed New Business 32 201 EMPLOYEE PARTICIPATION
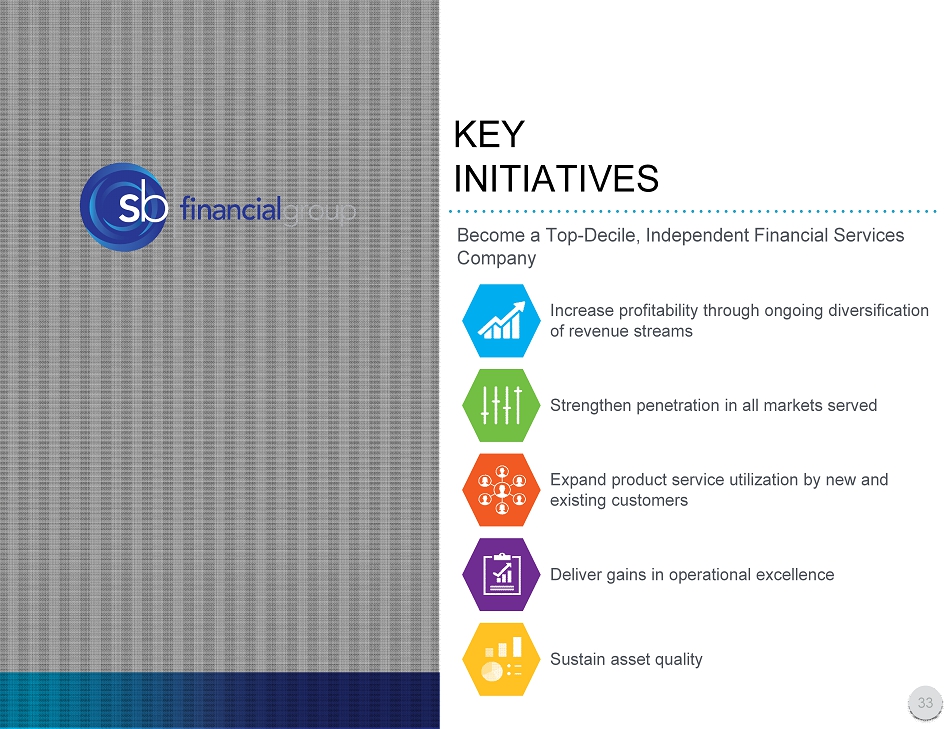
Become a Top - Dec ile , Independent Financial Services Company KEY INITIATIVES 33 Deliver gains in operational excellence Increase profitability through ongoing diversification of revenue streams Sustain asset quality Expand product service utilization by new and existing customers Strengthen penetration in all markets served
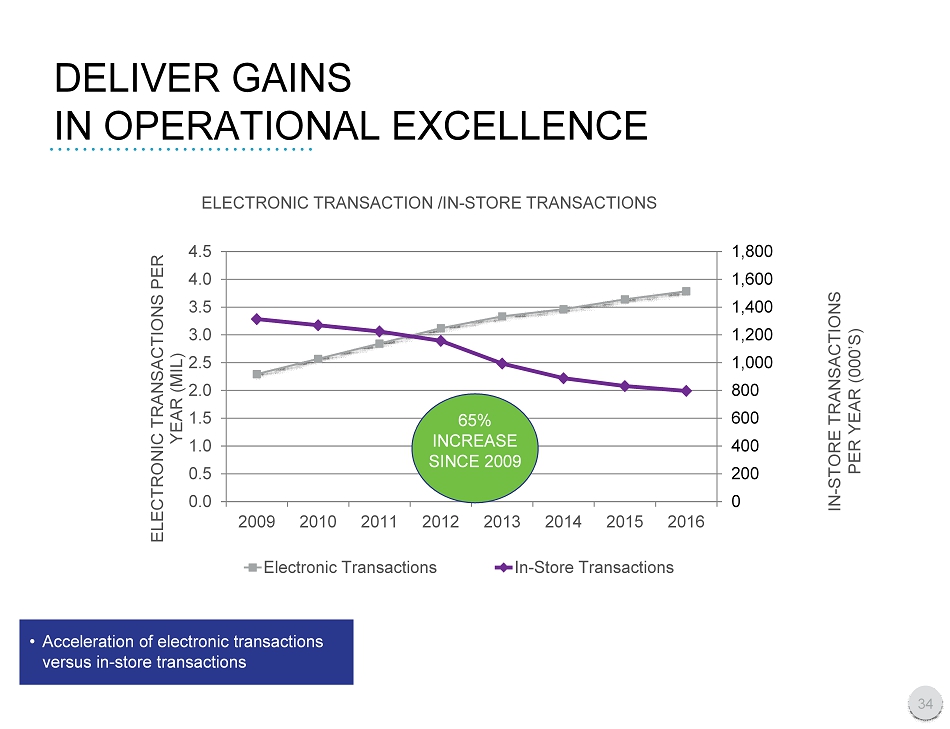
• Acceleration of electronic transactions versus in - store transactions DELIVER GAINS IN OPERATIONAL EXCELLENCE 0 200 400 600 800 1,000 1,200 1,400 1,600 1,800 0.0 0.5 1.0 1.5 2.0 2.5 3.0 3.5 4.0 4.5 2009 2010 2011 2012 2013 2014 2015 2016 ELECTRONIC TRANSACTIONS PER YEAR (MIL) ELECTRONIC TRANSACTION /IN - STORE TRANSACTIONS Electronic Transactions In-Store Transactions 65 % INCREASE SINCE 2009 IN - STORE TRANSACTIONS PER YEAR (000’S) 34

Increase profitability through ongoing diversification of revenue streams Deliver gains in operational excellence Expand product service utilization by new and existing customers Strengthen penetration in all markets served Sustain asset quality Become a Top - Dec ile , Independent Financial Services Company KEY INITIATIVES 35
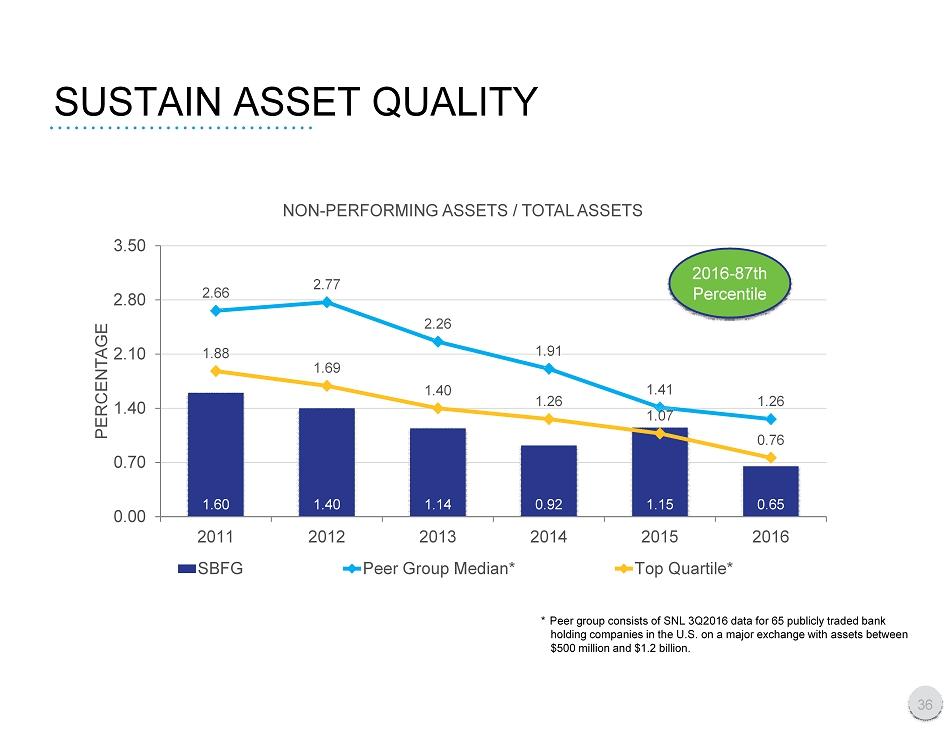
SUSTAIN ASSET Q UALITY 1.60 1.40 1.14 0.92 1.15 0.65 2.66 2.77 2.26 1.91 1.41 1.26 1.88 1.69 1.40 1.26 1.07 0.76 0.00 0.70 1.40 2.10 2.80 3.50 2011 2012 2013 2014 2015 2016 PERCENTAGE NON - PERFORMING ASSETS / TOTAL ASSETS SBFG Peer Group Median* Top Quartile* 2016 - 87th Percentile * Peer group consists of SNL 3Q2016 data for 65 publicly traded bank holding companies in the U.S. on a major exchange with assets between $500 million and $1. 2 billion. 36
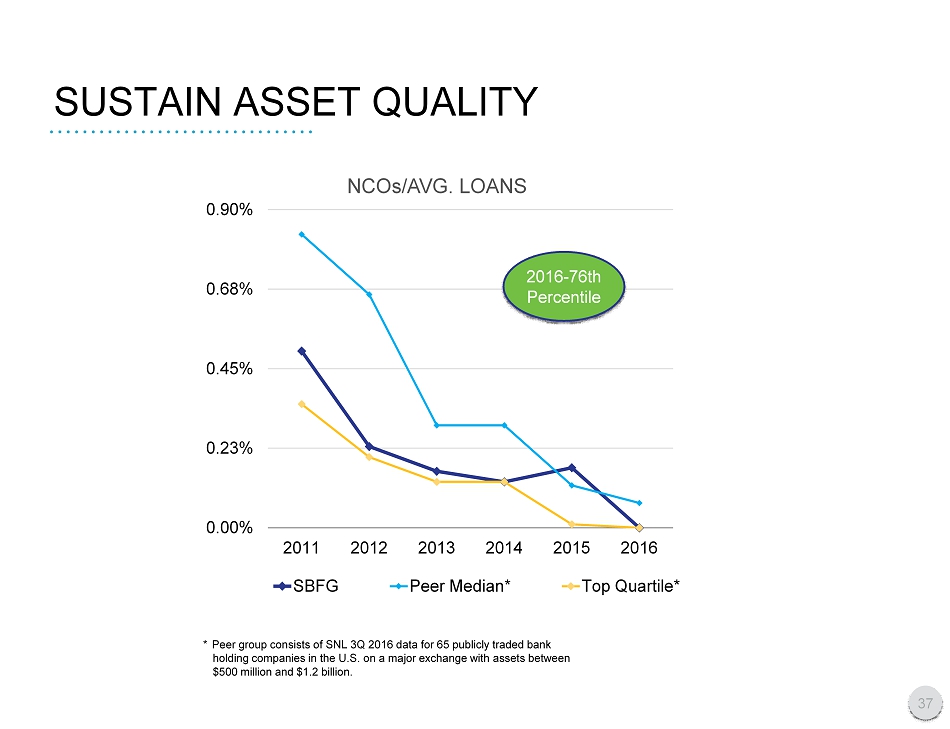
SUSTAIN ASSET Q UALITY * Peer group consists of SNL 3Q 201 6 data for 65 publicly traded bank holding companies in the U.S. on a major exchange with assets between $500 million and $1. 2 billion. 0.00% 0.23% 0.45% 0.68% 0.90% 2011 2012 2013 2014 2015 2016 NCOs/AVG. LOANS SBFG Peer Median* Top Quartile* 2016 - 76th Percentile 37

Become a Top - Dec ile , Independent Financial Services Company KEY INITIATIVES 38 Increase profitability through ongoing diversification of revenue streams Strengthen penetration in all markets served Expand product service utilization by new and existing customers Deliver gains in operational excellence Sustain asset quality
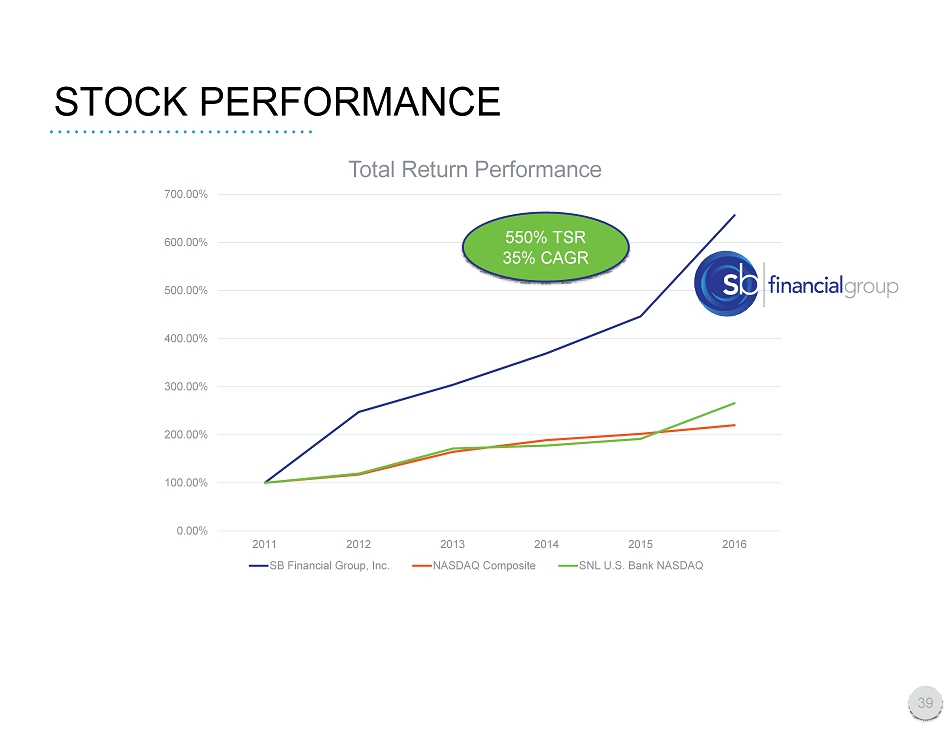
STOCK PERFORMANCE 39 Other Retail Ownership, 60% Institutional Ownership, 28% 0.00% 100.00% 200.00% 300.00% 400.00% 500.00% 600.00% 700.00% 2011 2012 2013 2014 2015 2016 Total Return Performance SB Financial Group, Inc. NASDAQ Composite SNL U.S. Bank NASDAQ 550% TSR 35% CAGR
MARK A. KLEIN – CHAIRMAN, PRESIDENT AND CEO SB FINANCIAL GROUP, INC. 40