Exhibit 99.1
1
SB FINANCIAL GROUP, INC. SAFE HARBOR STATEMENT Certain statements within this document, which are not statements of historical fact, constitute forward - looking statements within the meaning of the Private Securities Litigation Reform Act of 1995. Forward - looking statements involve risks and uncertainties and actual results may differ materially from those predicted by the forward - looking statements. These risks and uncertainties include, but are not limited to, risks and uncertainties inherent in the national and regional banking, insurance and mortgage industries, competitive factors specific to markets in which SB Financial Group and its subsidiaries operate, future interest rate levels, legislative and regulatory actions, capital market conditions, general economic conditions, geopolitical events, the loss of key personnel and other factors. Additional factors that could cause results to differ from those described above can be found in the Company’s Annual Report on Form 10 - K and documents subsequently filed by SB Financial Group with the Securities and Exchange Commission. Forward - looking statements speak only as of the date on which they are made, and SB Financial Group undertakes no obligation to update any forward - looking statement to reflect events or circumstances after the date on which the statement is made except as required by law. All subsequent written and oral forward - looking statements attributable to SB Financial Group or any person acting on its behalf are qualified by these cautionary statements. 2
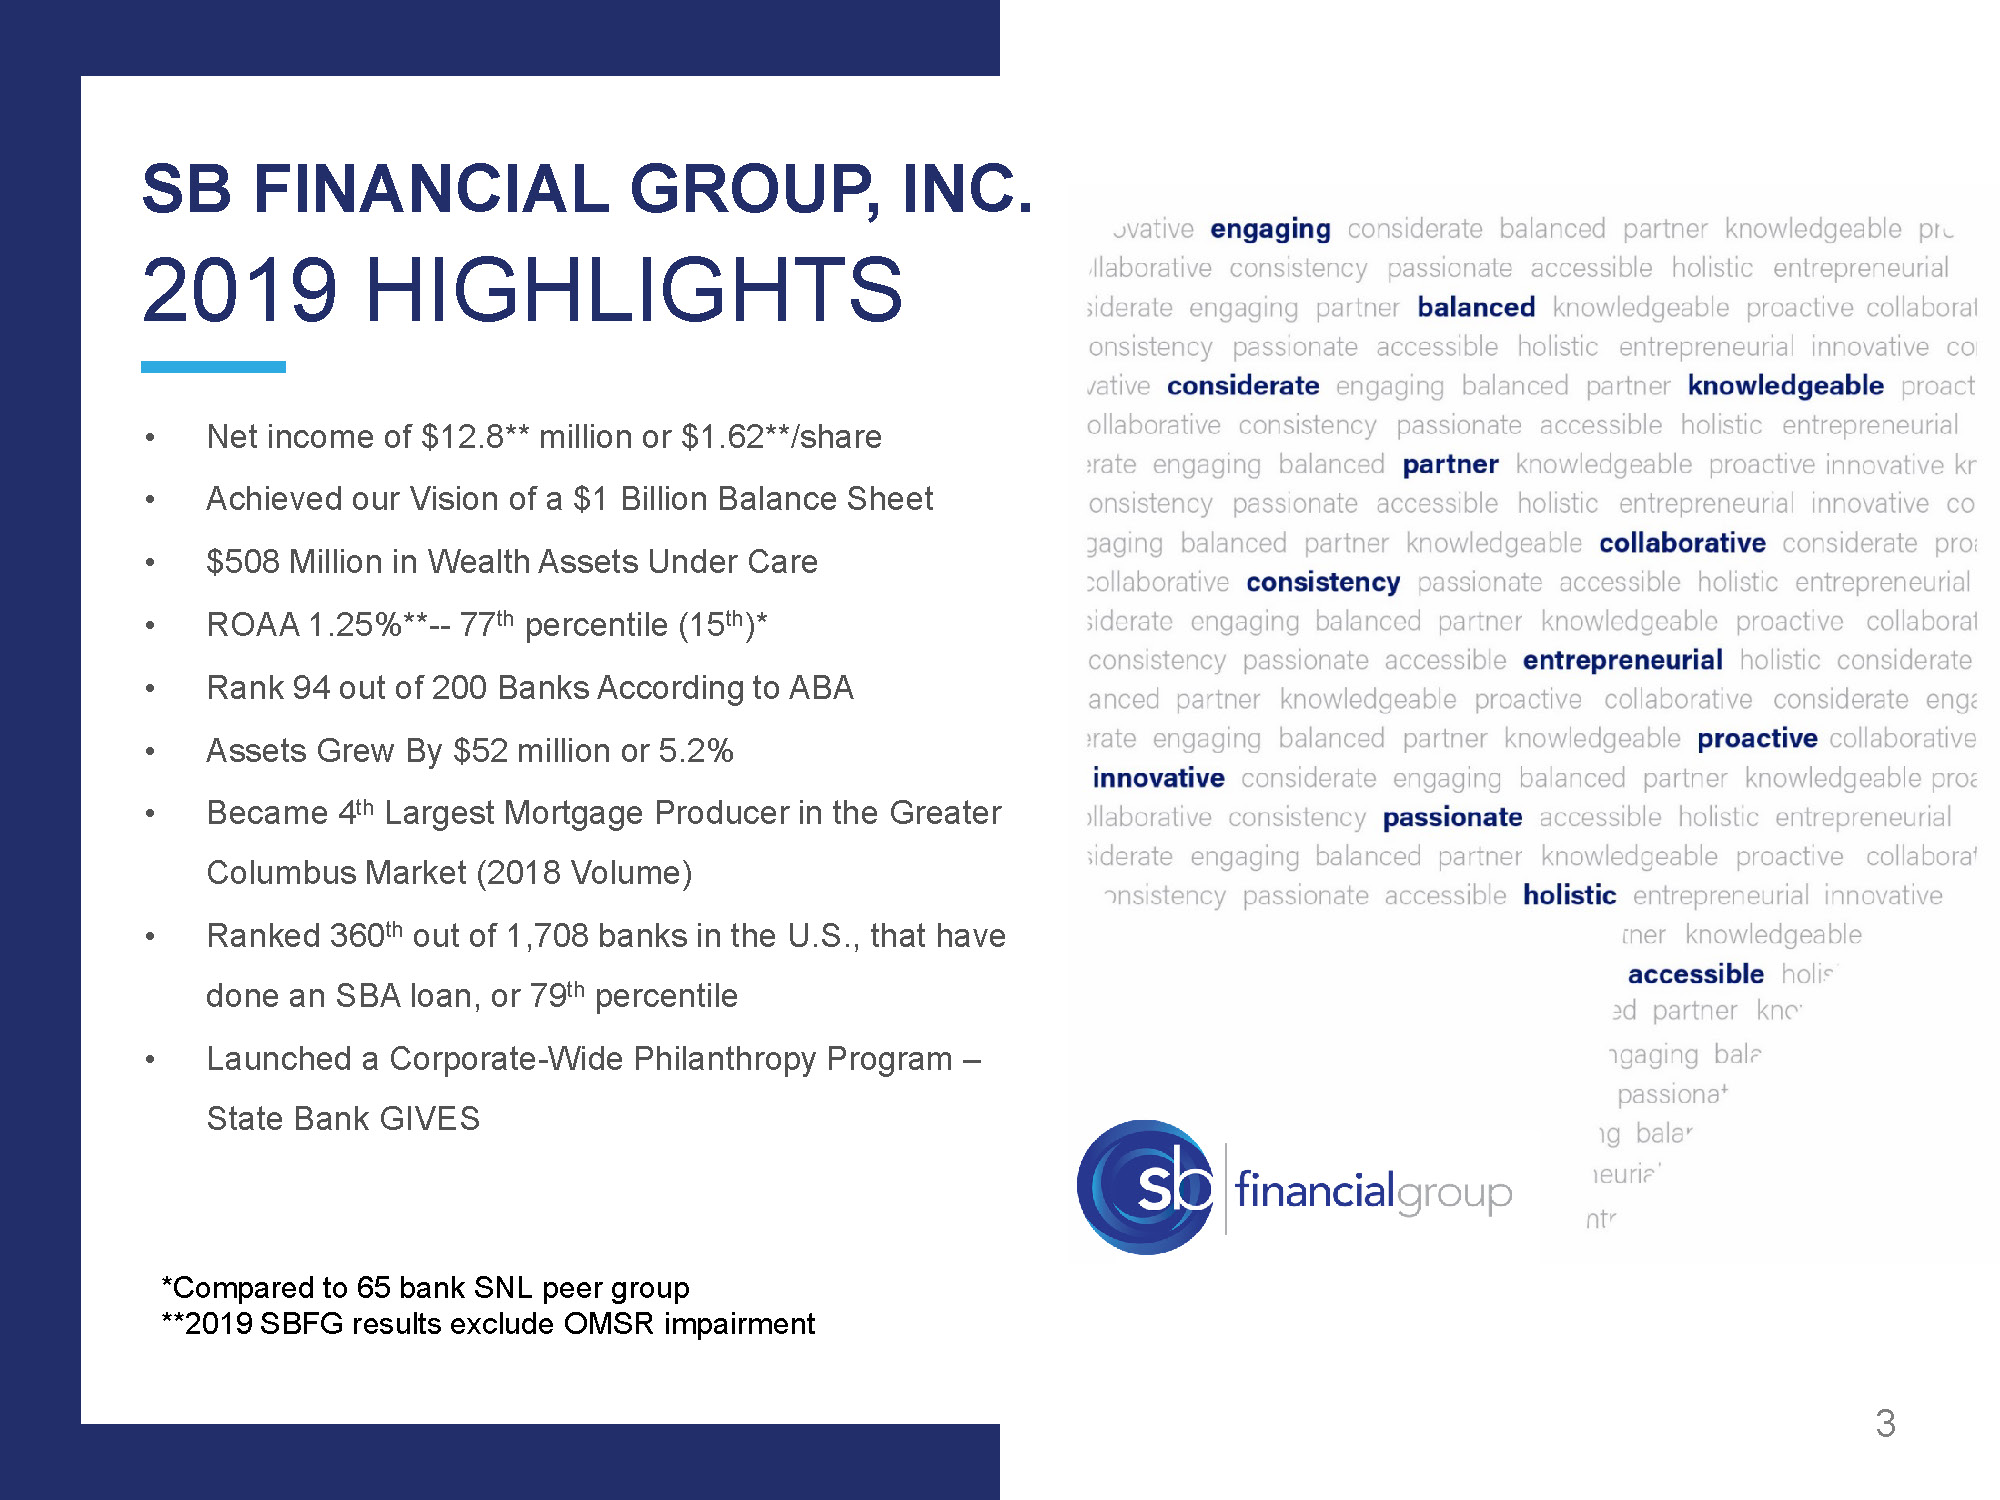
SB FINANCIAL GROUP, INC. 2019 HIGHLIGHTS • Net income of $12.8** million or $1.62**/share • Achieved our Vision of a $1 Billion Balance Sheet • $508 Million in Wealth Assets Under Care • ROAA 1.25%** -- 77 th percentile (15 th )* • Rank 94 out of 200 Banks According to ABA • Assets Grew By $52 million or 5.2% • Became 4 th Largest Mortgage Producer in the Greater Columbus Market (2018 Volume) • Ranked 360 th out of 1,708 banks in the U.S., that have done an SBA loan, or 79 th percentile • Launched a Corporate - Wide Philanthropy Program – State Bank GIVES *Compared to 65 bank SNL peer group **2019 SBFG results exclude OMSR impairment 3
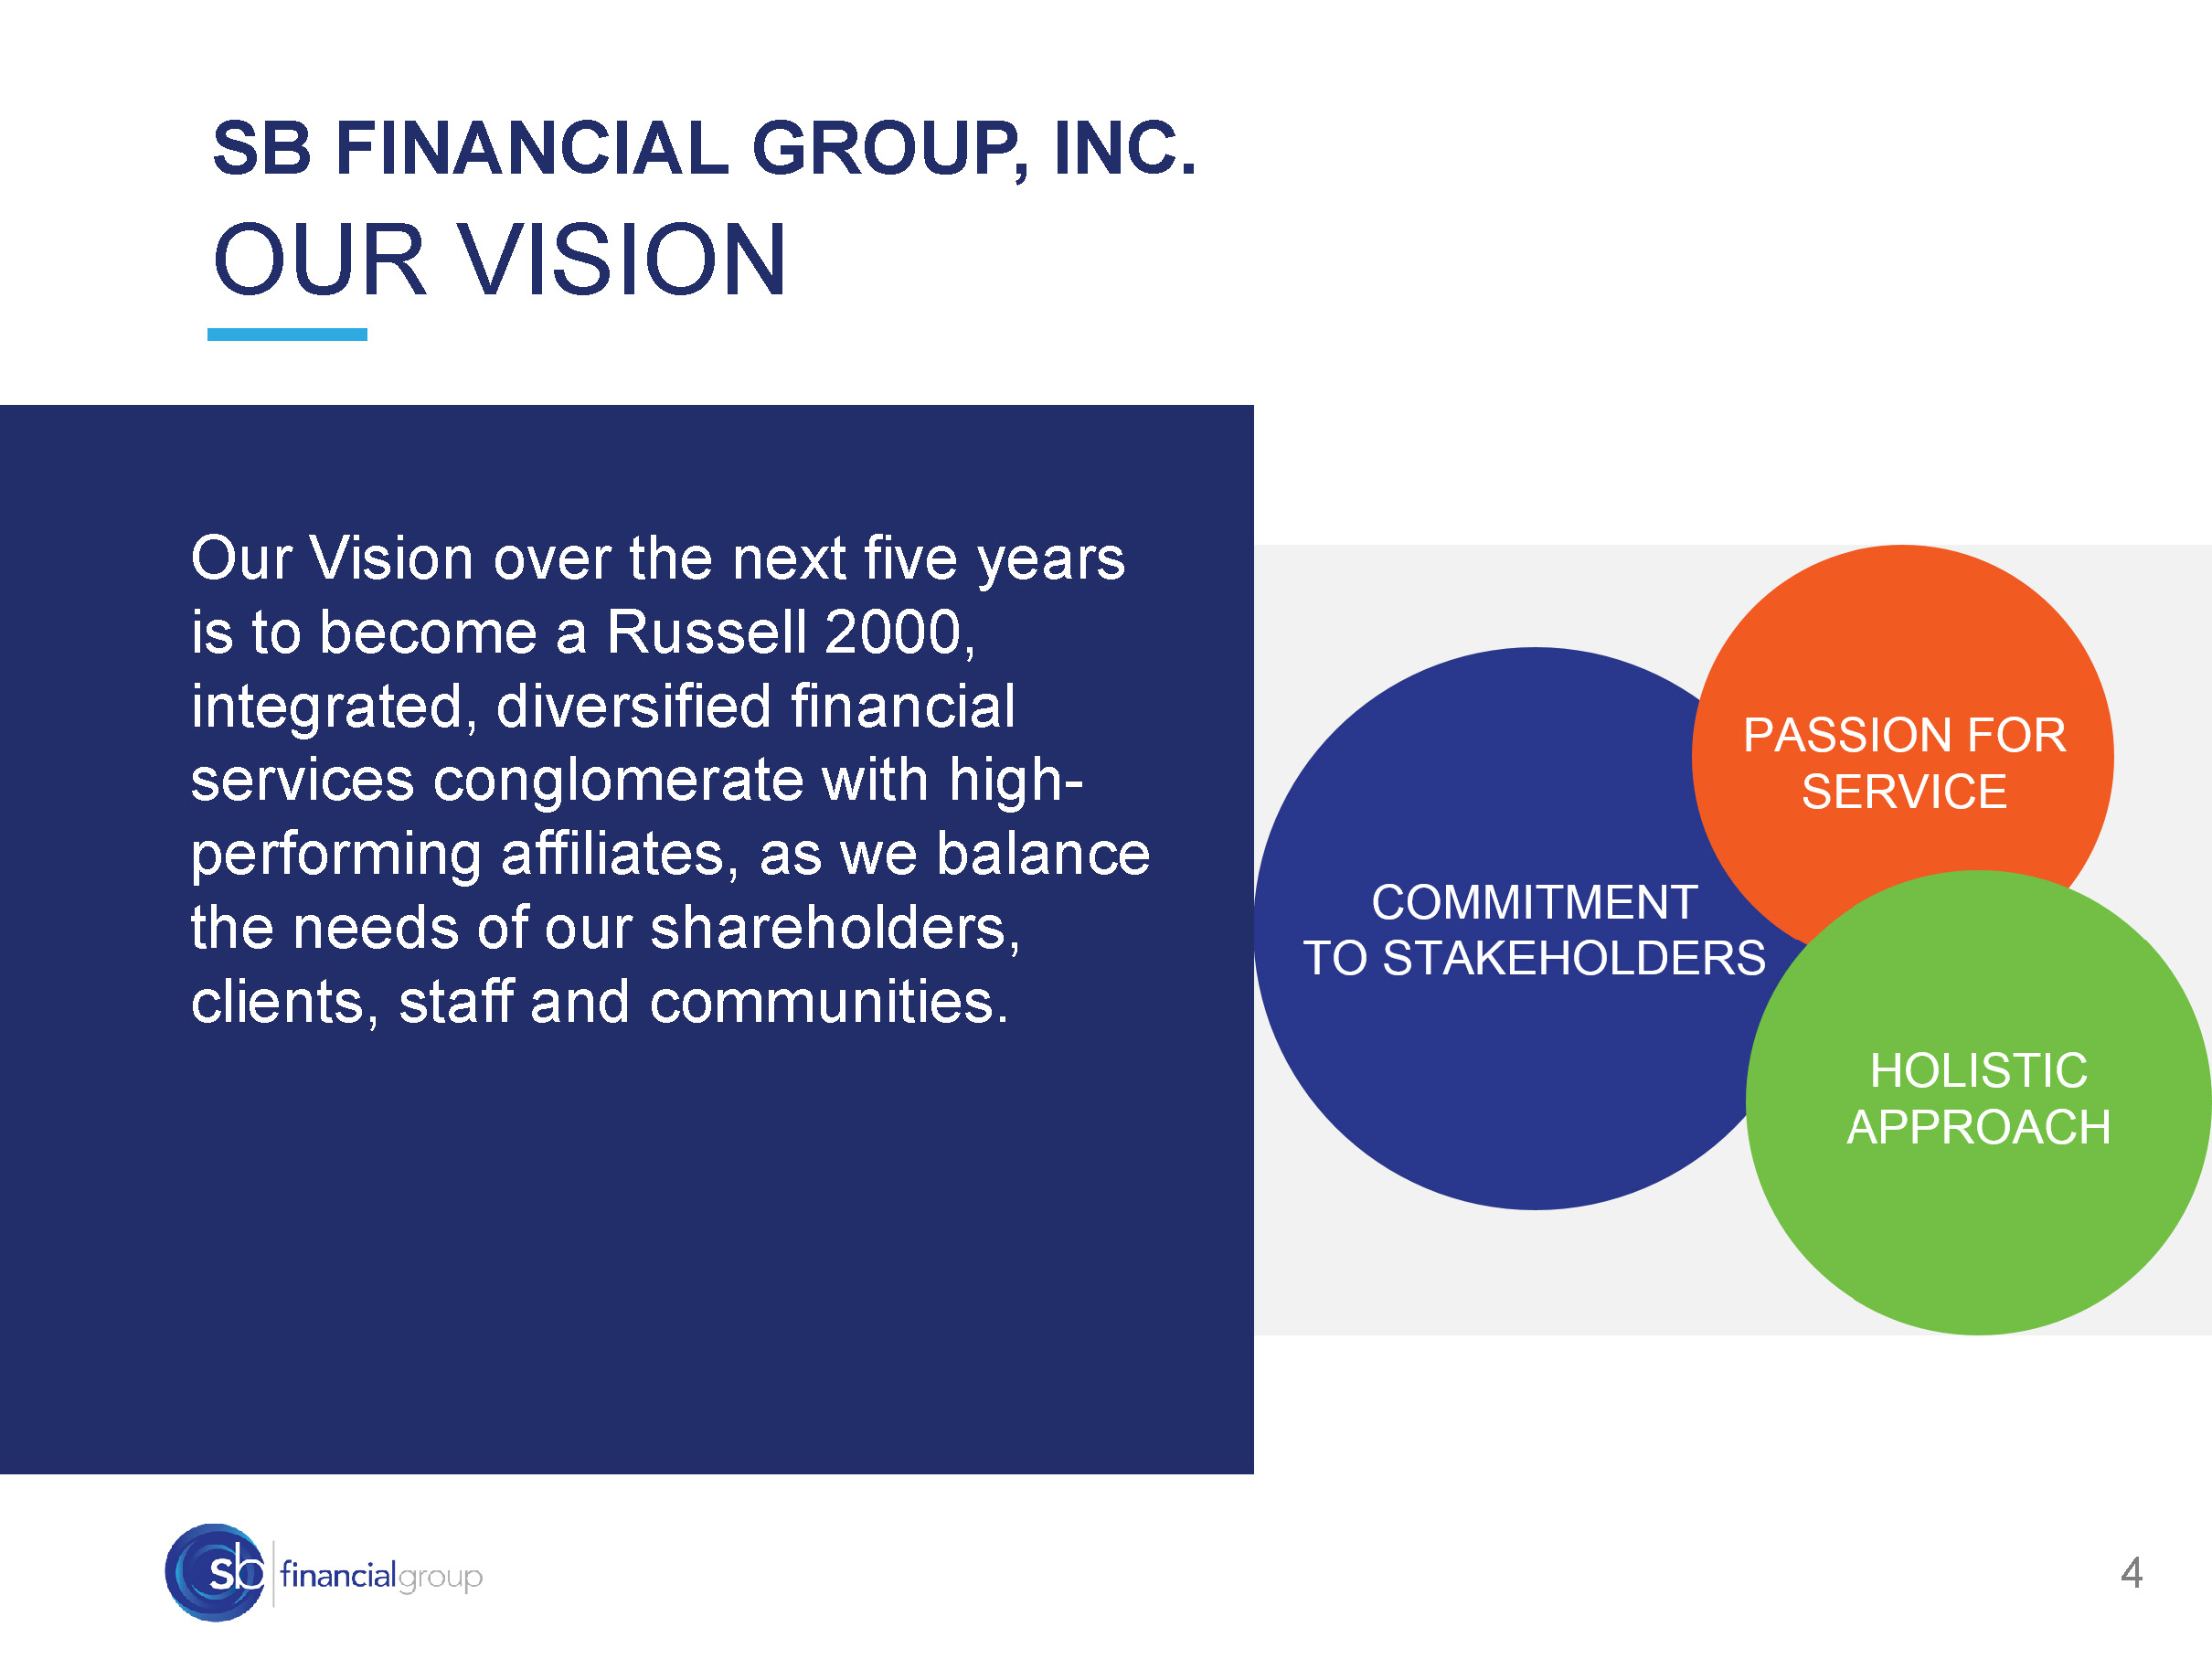
Our Vision over the next five years is to become a Russell 2000, integrated, diversified financial services conglomerate with high - performing affiliates, as we balance the needs of our shareholders, clients, staff and communities. SB FINANCIAL GROUP, INC. OUR VISION 4
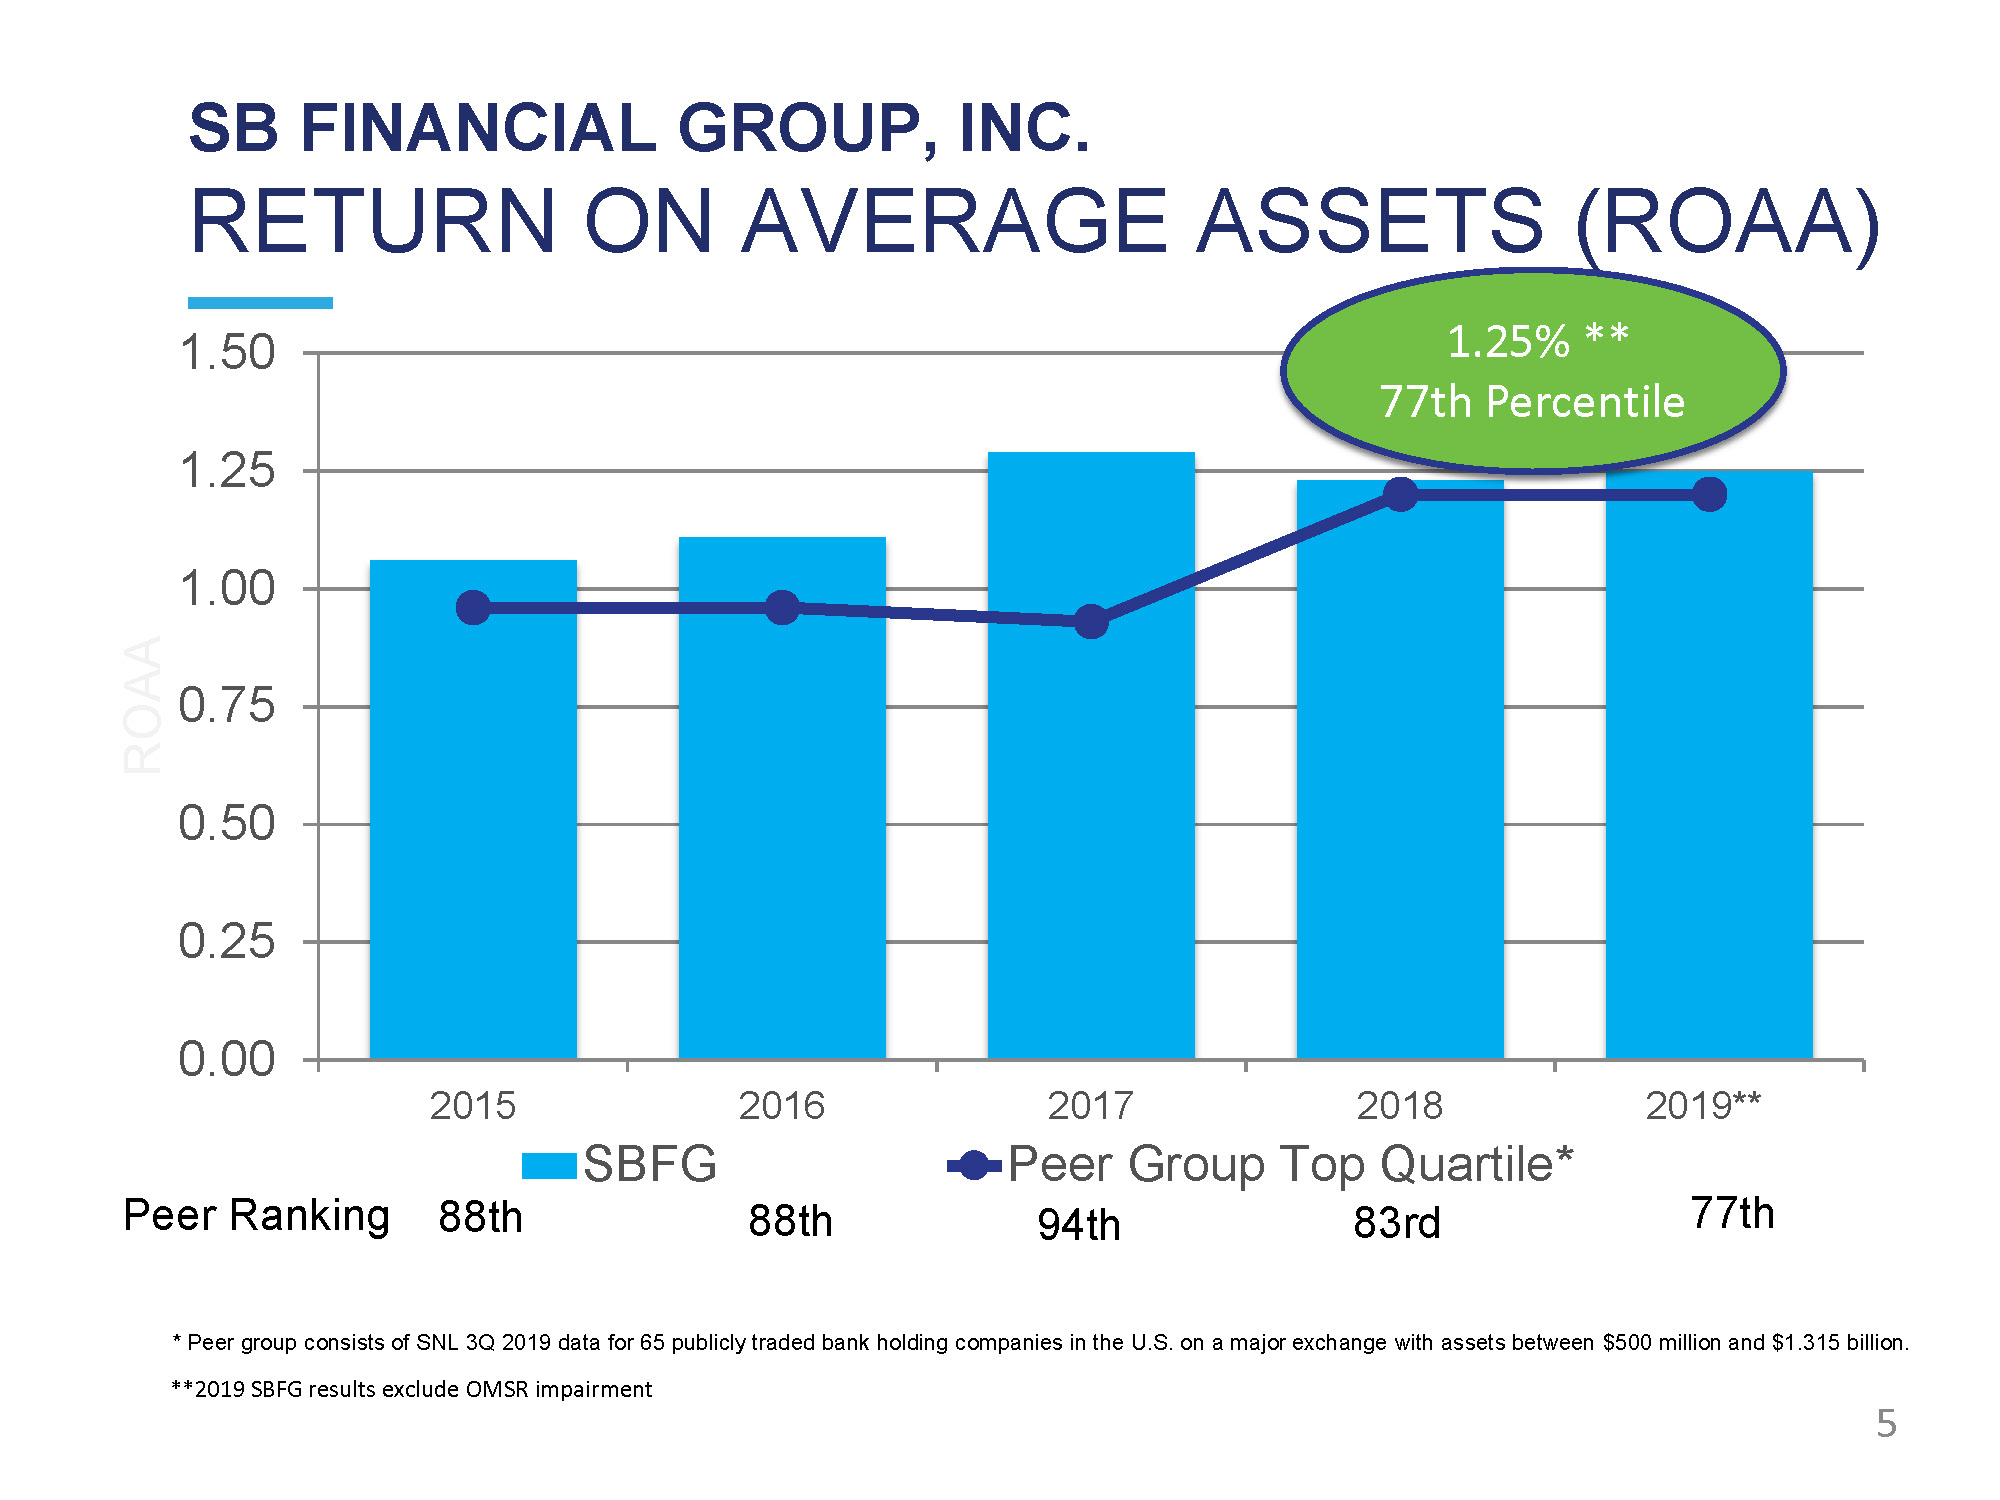
SB FINANCIAL GROUP, INC. RETURN ON AVERAGE ASSETS (ROAA) 1 . 2 5 1 . 0 0 0 . 7 5 0 . 5 0 0 . 2 5 0 . 0 0 1 . 5 0 201 5 201 6 2019 * * R O A A SBFG 2017 2018 Peer Group Top Quartile* 1.25% ** 5 77th Percentile * Peer group consists of SNL 3Q 2019 data for 65 publicly traded bank holding companies in the U.S. on a major exchange with assets between $500 million and $1.315 billion. **2019 SBFG results exclude OMSR impairment 88th Peer Ranking 88th 94th 83rd 77th

• NASDAQ: SBFG • Defiance, Ohio - Headquarters Since 1902 • Corporate Staff Members - 252 • Average Daily Share Volume for 2019 - 7,900; 7.8 Million Common shares • Institutional Ownership: 49.6% • Market Cap: $153 million ($19.69 share 12/31/2019) SB FINANCIAL GROUP, INC. CORPORATE OVERVIEW 6
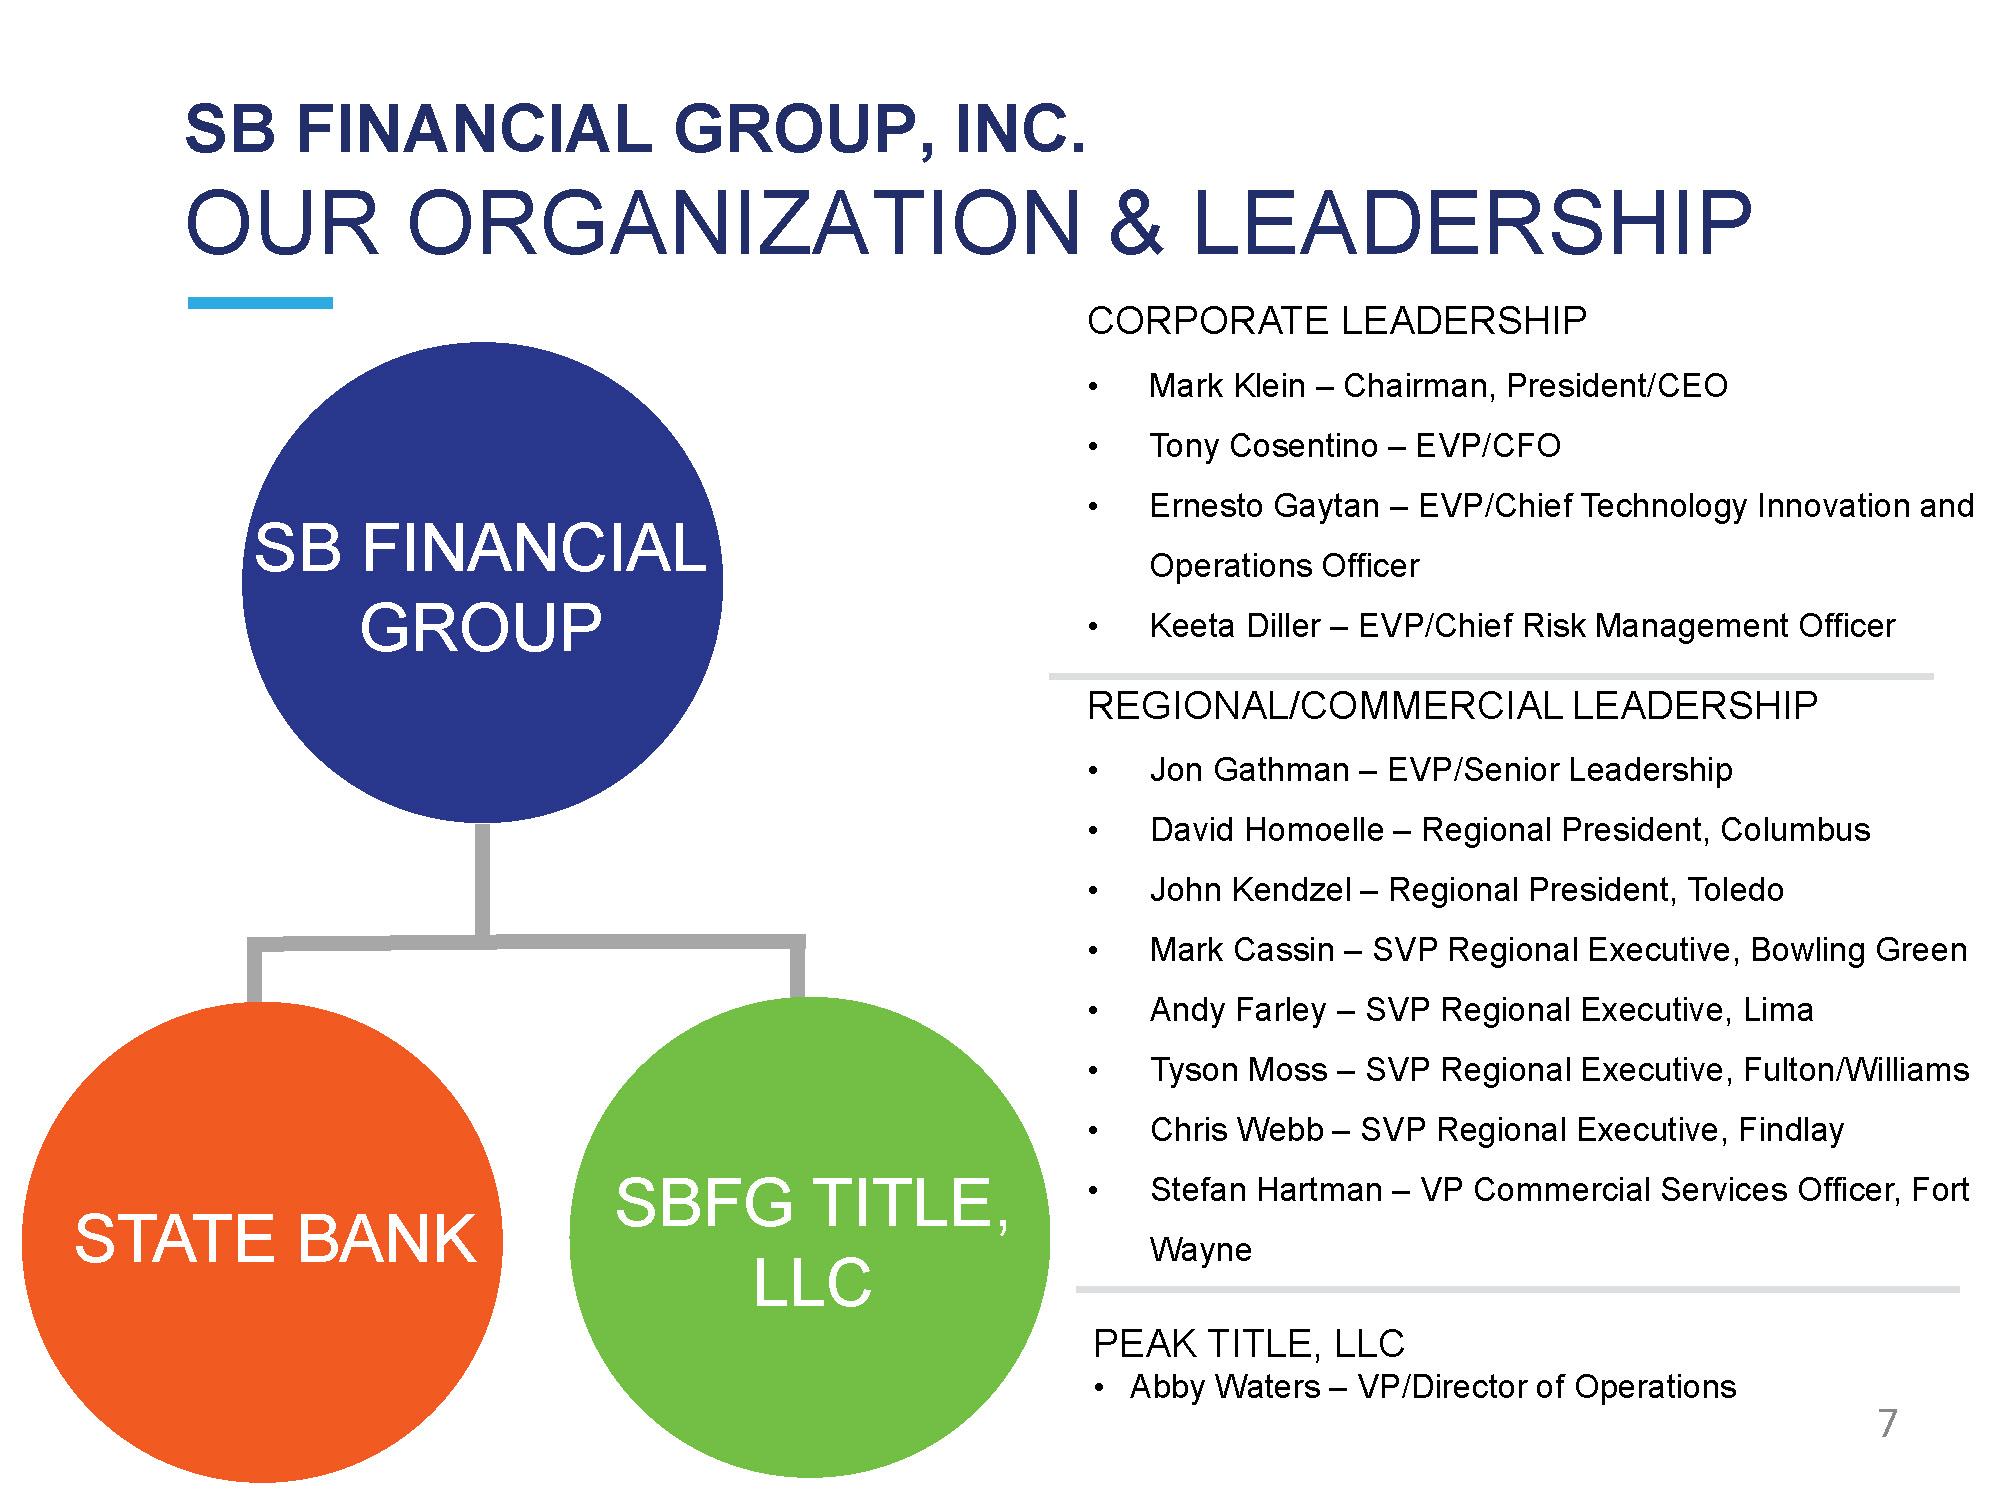
SB FINANCIAL GROUP, INC. OUR ORGANIZATION & LEADERSHIP CORPORATE LEADERSHIP • Mark Klein – Chairman, President/CEO • Tony Cosentino – EVP/CFO • Ernesto Gaytan – EVP/Chief Technology Innovation and Operations Officer • Keeta Diller – EVP/Chief Risk Management Officer REGIONAL/COMMERCIAL LEADERSHIP • Jon Gathman – EVP/Senior Leadership • David Homoelle – Regional President, Columbus • John Kendzel – Regional President, Toledo • Mark Cassin – SVP Regional Executive, Bowling Green • Andy Farley – SVP Regional Executive, Lima • Tyson Moss – SVP Regional Executive, Fulton/Williams • Chris Webb – SVP Regional Executive, Findlay • Stefan Hartman – VP Commercial Services Officer, Fort Wayne SB FINANCIAL GROUP STATE BANK SBFG TITLE, LLC PEAK TITLE, LLC • Abby Waters – VP/Director of Operations 7

8 RRE $1.7M / 14% Retail/PCG $4.0M / 31% C o mm e rc i a l $5.8M / 46% WM $0.7M/ 5% SBA $0.6M / 4% NET INCOME CON T R IB U TI ONS 2019 NET INCOME $ 12.8** MI LL I ON 2019 ASSETS UNDER MANAGEMENT $2.7 BILLION COMPRISED OF: • $1,039M Commercial Bank • $1,199M Residential Sold Portfolio • $508M Wealth Management SB FINANCIAL GROUP, INC. UNIQUE QUALITIES **2019 SBFG results exclude OMSR impairment

SB FINANCIAL GROUP, INC. KEY INITIATIVES Become a Top - Decile, Independent Financial Services Company Increase profitability through ongoing diversification of revenue streams Strengthen penetration in all markets served Expand product service utilization by new and existing customers Deliver gains in operational excellence Sustain asset quality 9

SB FINANCIAL GROUP, INC. REVENUE DIVERSITY HIGHLIGHTS • Expanded Operating Revenue • Maintained an Asset Sensitive Balance Sheet • Grew our Fee - Based Business Lines • Generated market - leading Non - Interest Income 10

INCREASE PROFITABILITY $7.6 $8.8 $ 1 1.1 $ 1 1.6 $12.8 $0 $2 $4 $6 $8 $10 $12 $14 $55 $50 $45 $40 $35 $30 $25 $20 $15 $10 $5 $0 NET INCOME (MIL) REVENUE (MIL) THROUGH DIVERSIFICATION OF REVENUE STREAMS TOTAL REVENUE/NET INCOME Title Revenue Ot h e r S B A M o rt gag e Service C h a r ge s Wealth M a nag e m ent Net Interest Margin 2015 2016 2017 2018 2 0 19 * * Fee/Revenue 40.2% 40.9% 37.8% 33.3% 34 . 1% Net Income $39.1 $43.7 $49.9 $53.9 11 ** 2019 SBFG Results exclude OMSR impairment
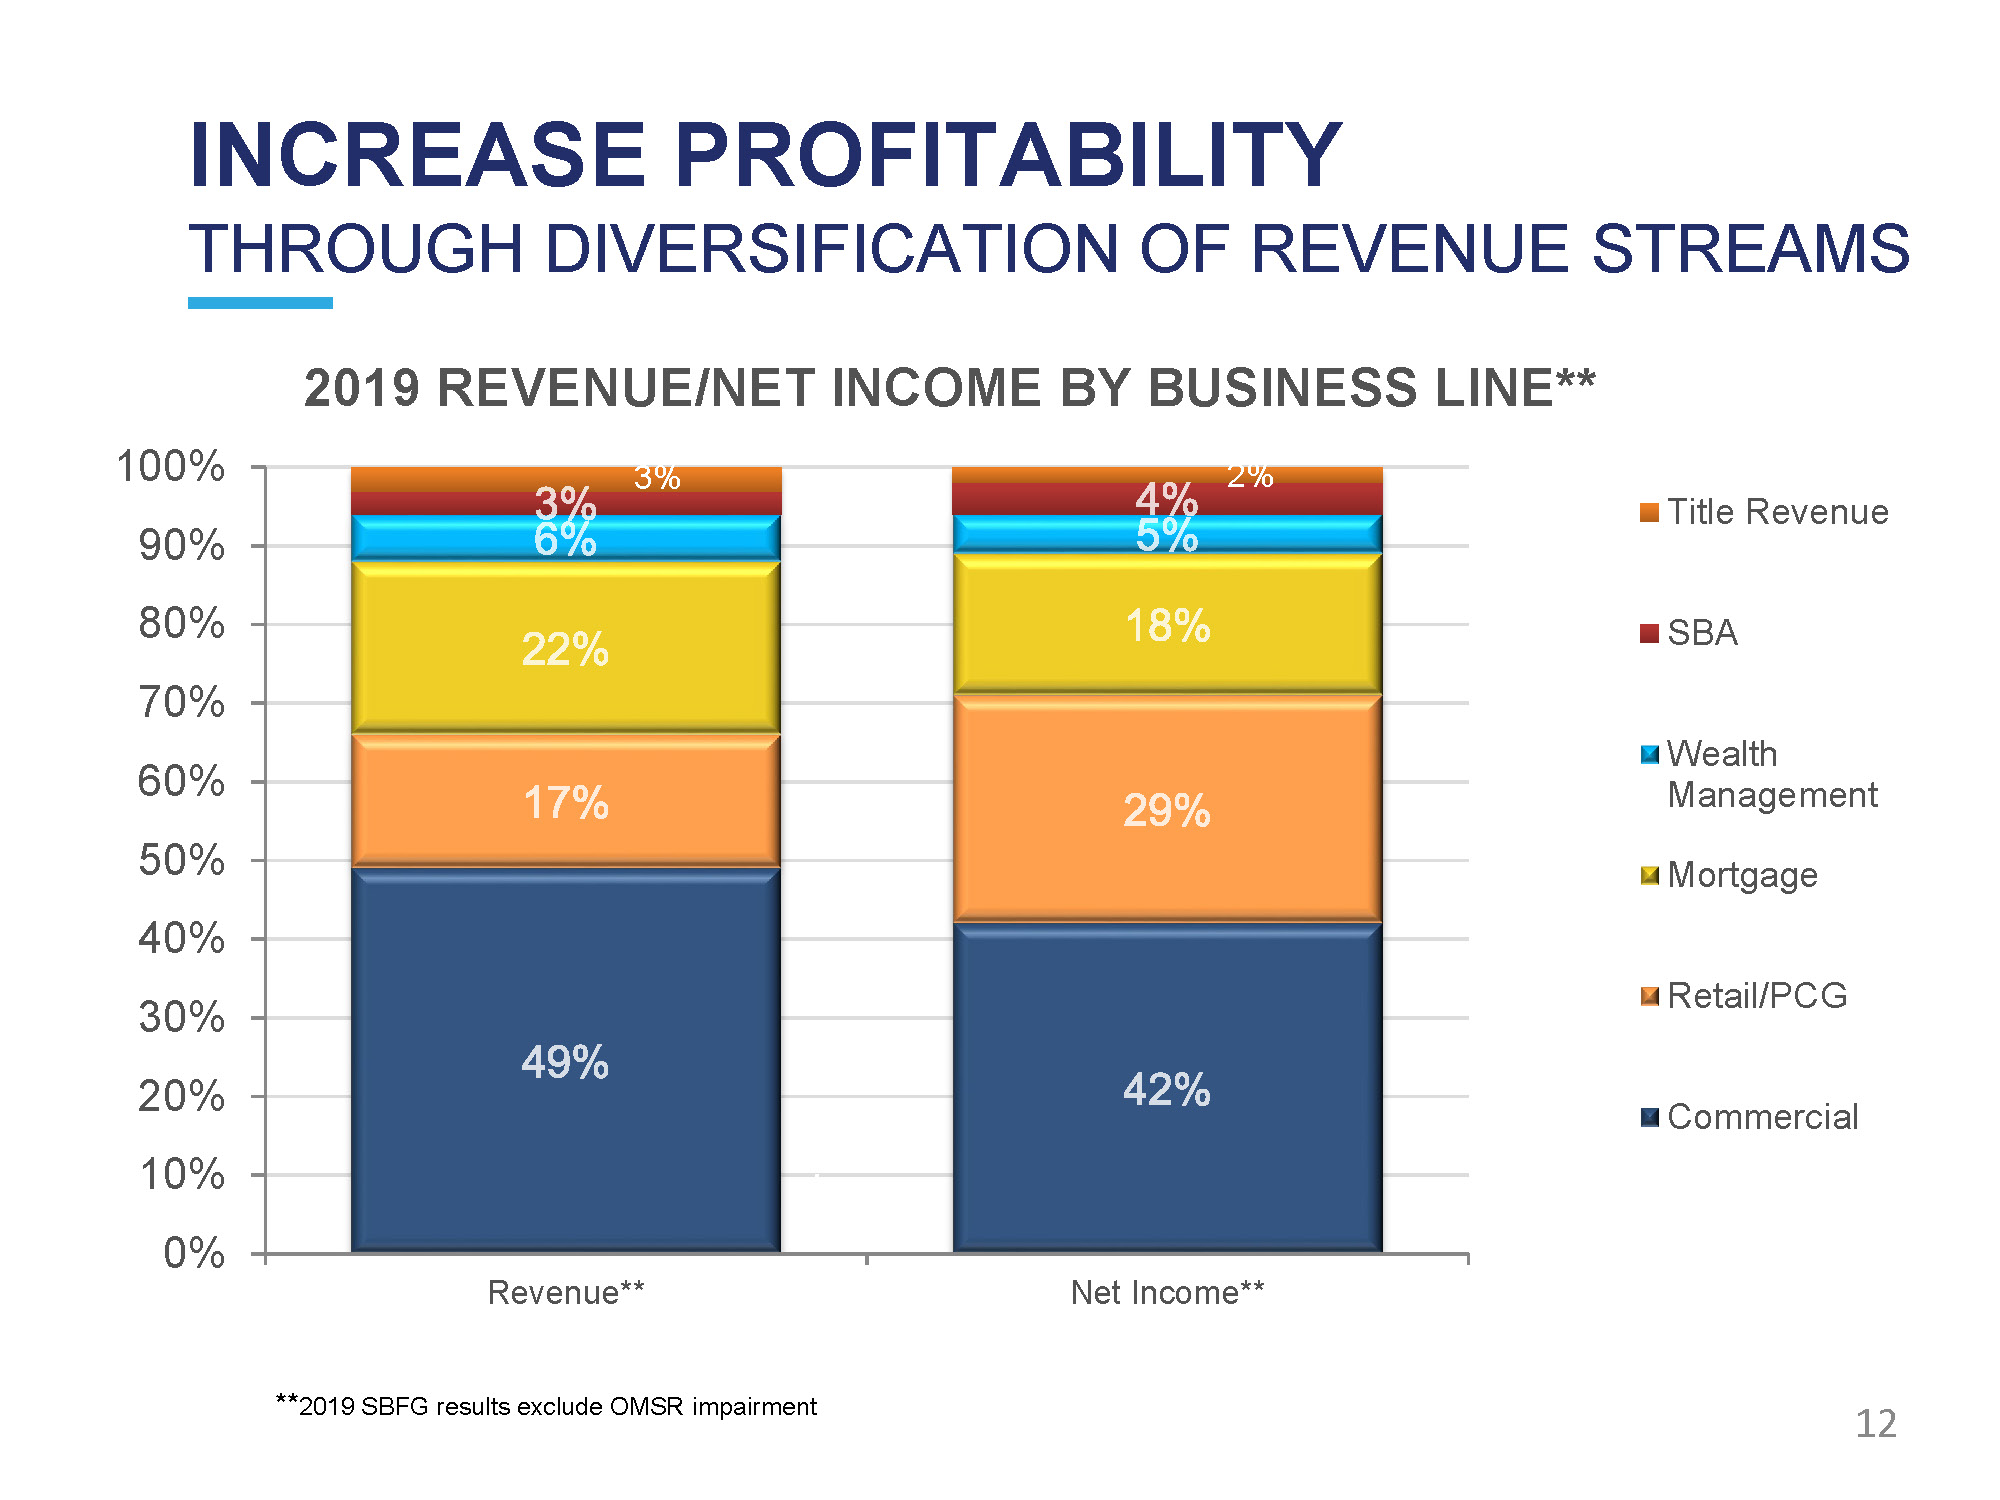
INCREASE PROFITABILITY THROUGH DIVERSIFICATION OF REVENUE STREAMS 10 0 % 90% 80% 70% 60% 50% 40% 30% 20% 10% 0% Revenue** Net Income** 2019 REVENUE/NET INCOME BY BUSINESS LINE** 3% 2% Title Revenue S B A Wealth M a nag e m ent M o rt gag e Retail/PCG Commercial ** 2019 SBFG results exclude OMSR impairment 12
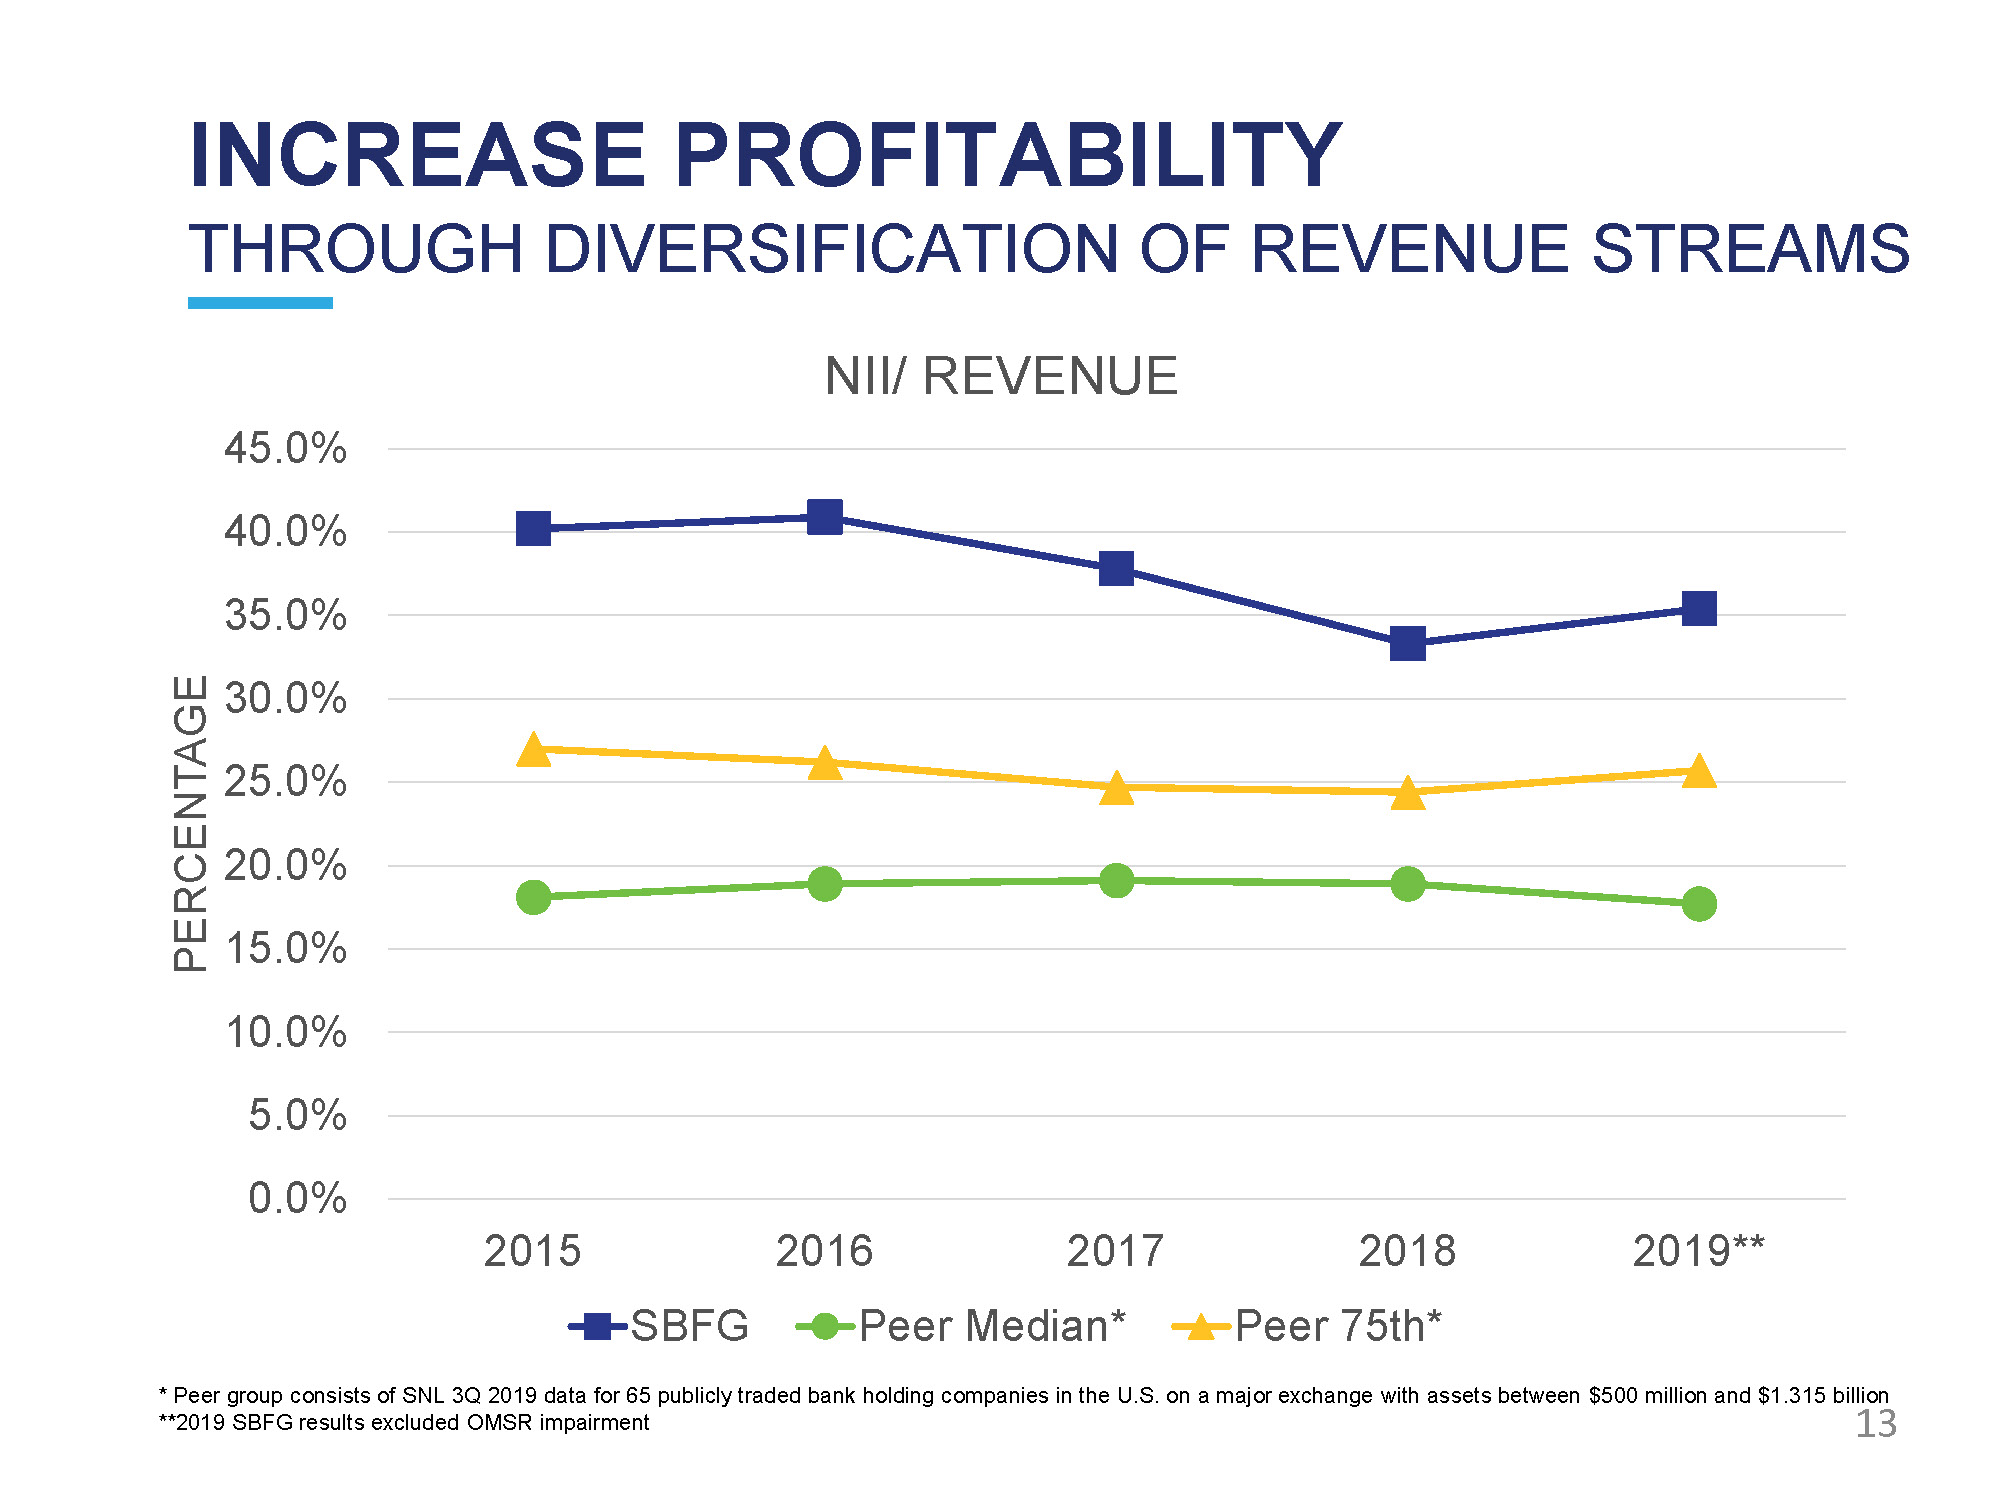
INCREASE PROFITABILITY * Peer group consists of SNL 3Q 2019 data for 65 publicly traded bank holding companies in the U.S. on a major exchange with assets between $500 million and $1.315 billion **2019 SBFG results excluded OMSR impairment 45. 0 % 40. 0 % 35. 0 % 30. 0 % 25. 0 % 20. 0 % 15. 0 % 10. 0 % 5.0% 0.0% 20 1 5 20 1 9 ** PERCENTAGE THROUGH DIVERSIFICATION OF REVENUE STREAMS NII/ REVENUE SB F G 20 1 6 20 1 7 Peer Median* 20 1 8 Peer 75th* 13
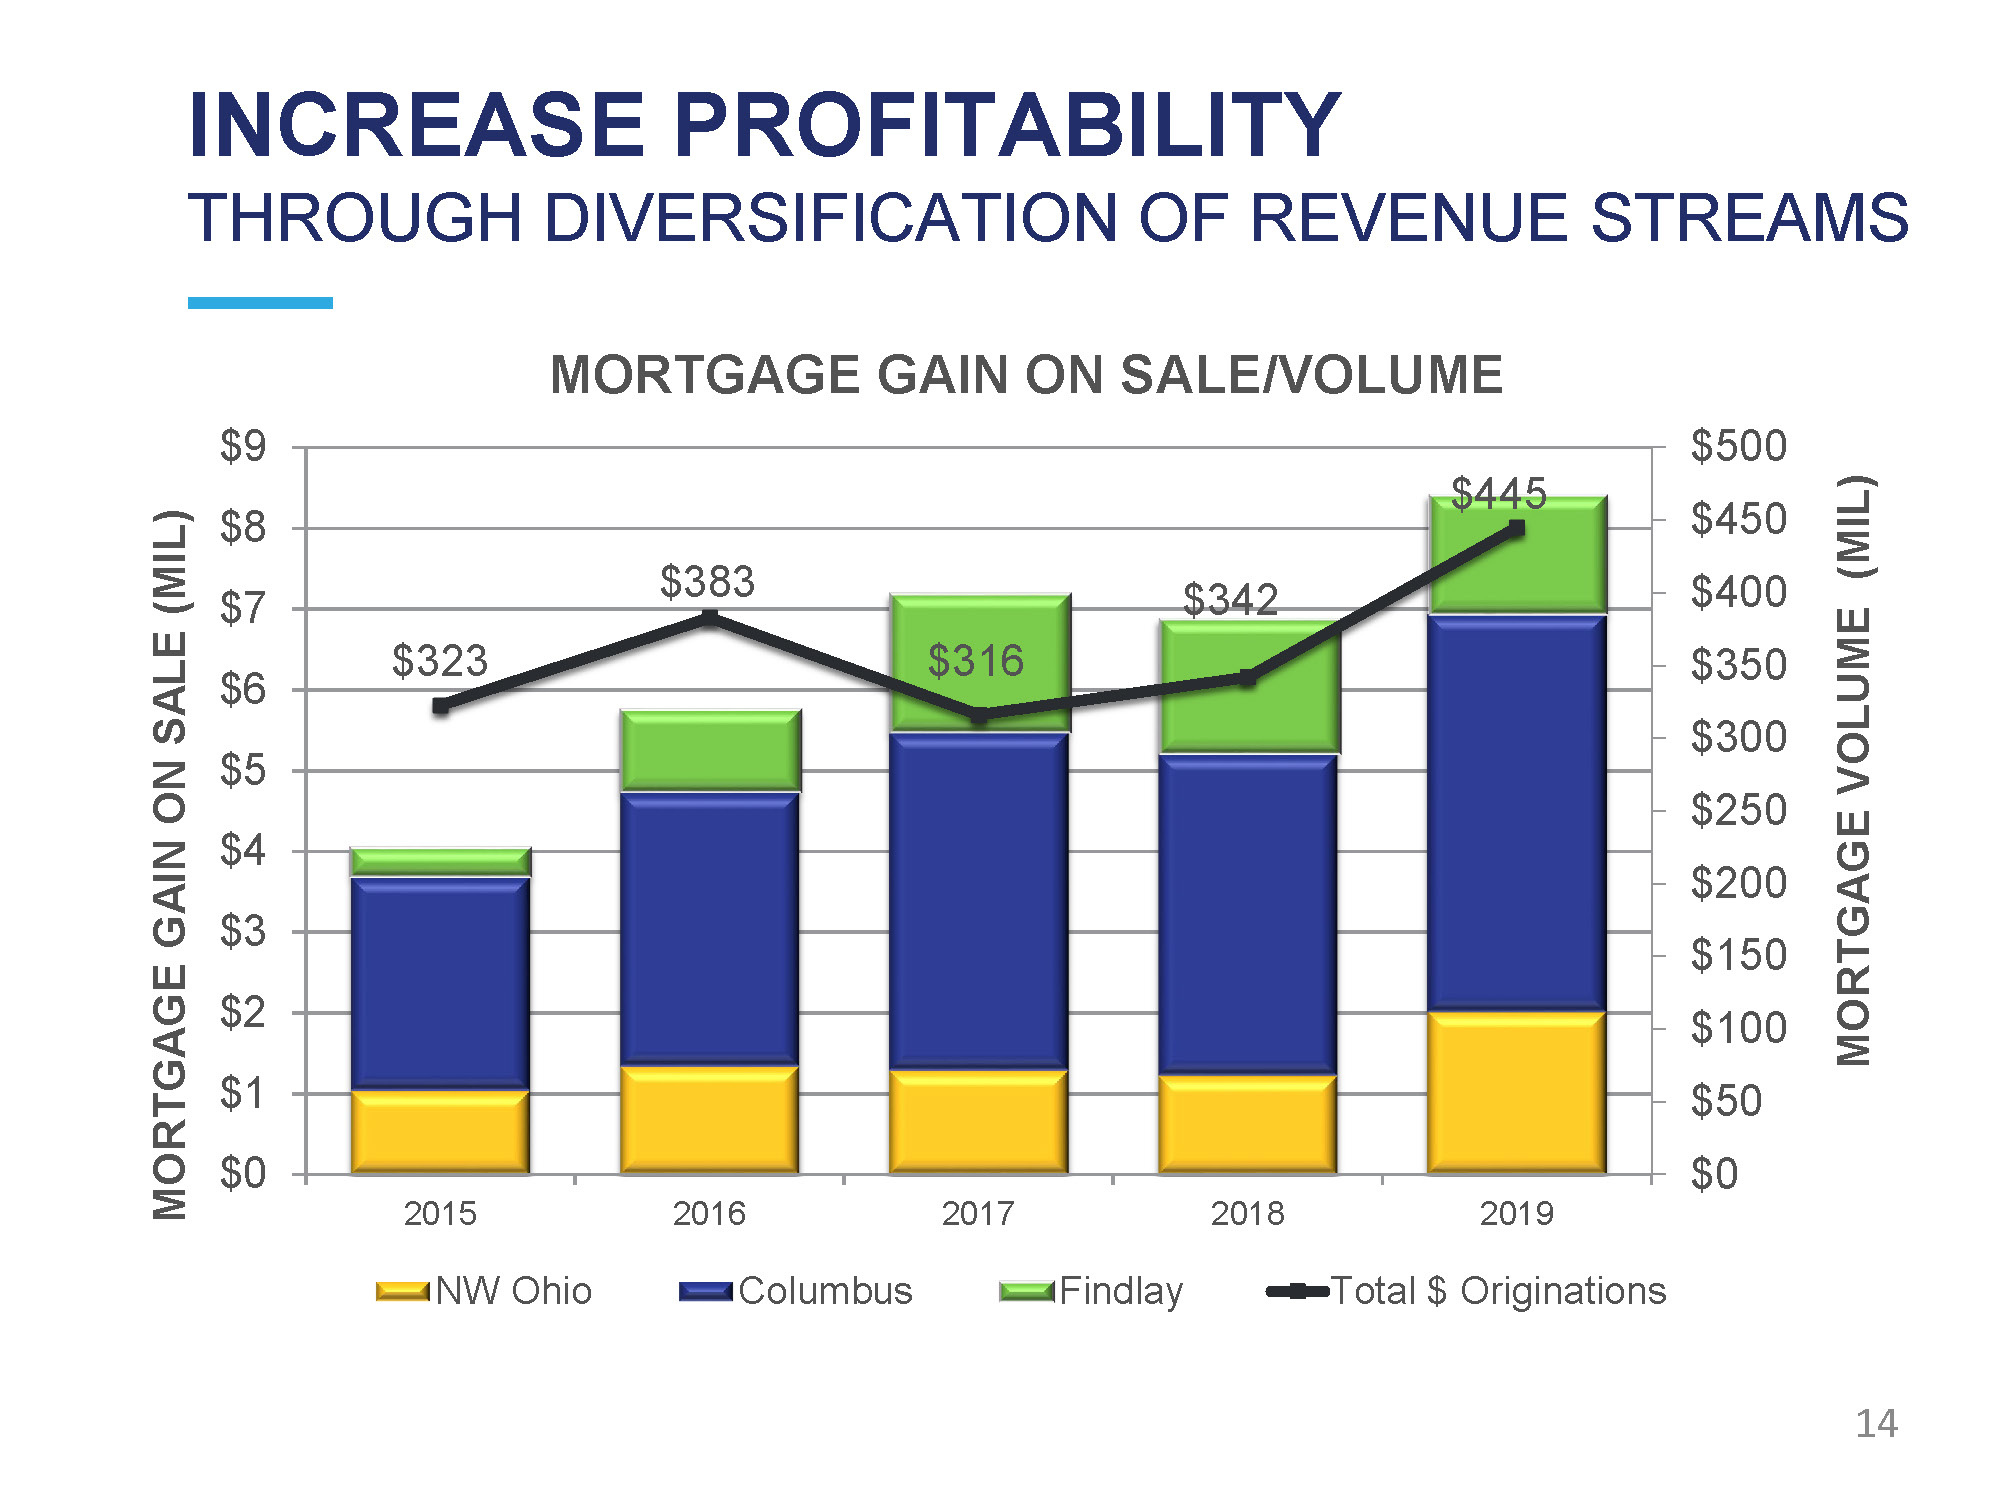
INCREASE PROFITABILITY THROUGH DIVERSIFICATION OF REVENUE STREAMS $323 $383 $316 $342 $445 $5 0 0 $4 5 0 $4 0 0 $3 5 0 $3 0 0 $2 5 0 $2 0 0 $1 5 0 $1 0 0 $50 $0 $9 $8 $7 $6 $5 $4 $3 $2 $1 $0 2 0 15 2 0 16 2 0 17 2 0 18 2 0 19 MORTGAGE VOLUME (MIL) MORTGAGE GAIN ON SALE (MIL) MORTGAGE GAIN ON SALE/VOLUME NW Ohio Columbus Findlay Total $ Originations 14
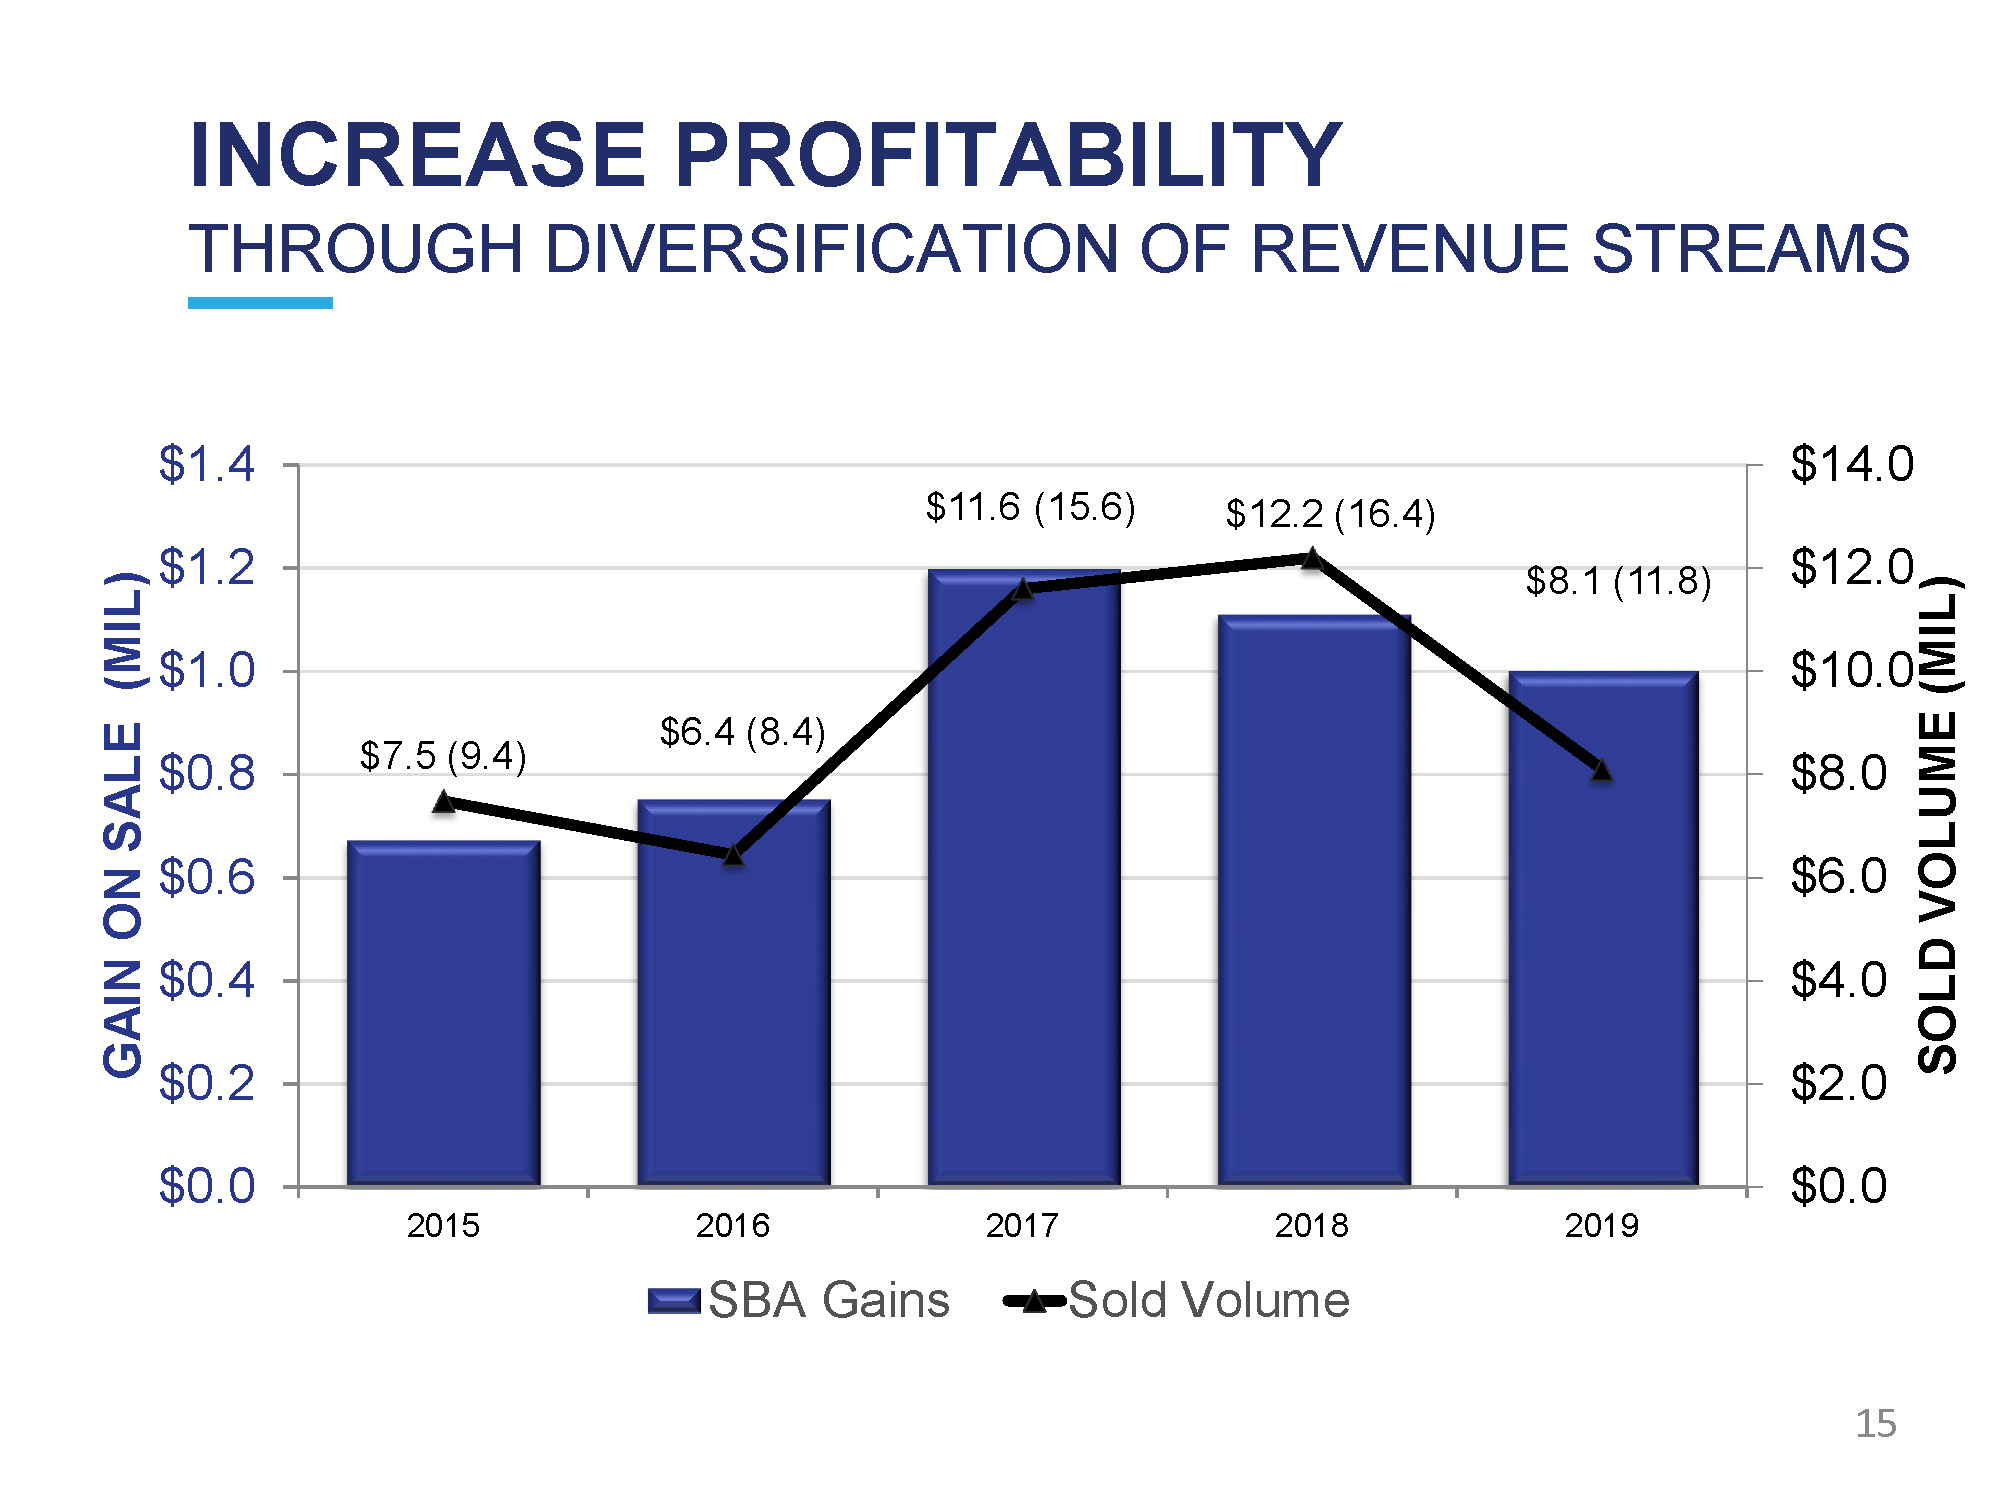
INCREASE PROFITABILITY THROUGH DIVERSIFICATION OF REVENUE STREAMS $7.5 (9.4) $6.4 (8.4) $11.6 (15.6) $12.2 (16.4) $8.1 (11.8) $ 0 .0 $ 2 .0 $ 1 2 .0 $ 1 0 .0 $8.0 $6.0 $4.0 $ 1 4 .0 $ 0 .0 $ 0 .2 $ 0 .4 $ 1 .2 $ 1 .0 $ 0 .8 $ 0 .6 $ 1 .4 SOLD VOLUME (MIL) GAIN ON SALE (MIL) 2015 2016 2017 2 0 18 2019 SBA Gains Sold Volume 15
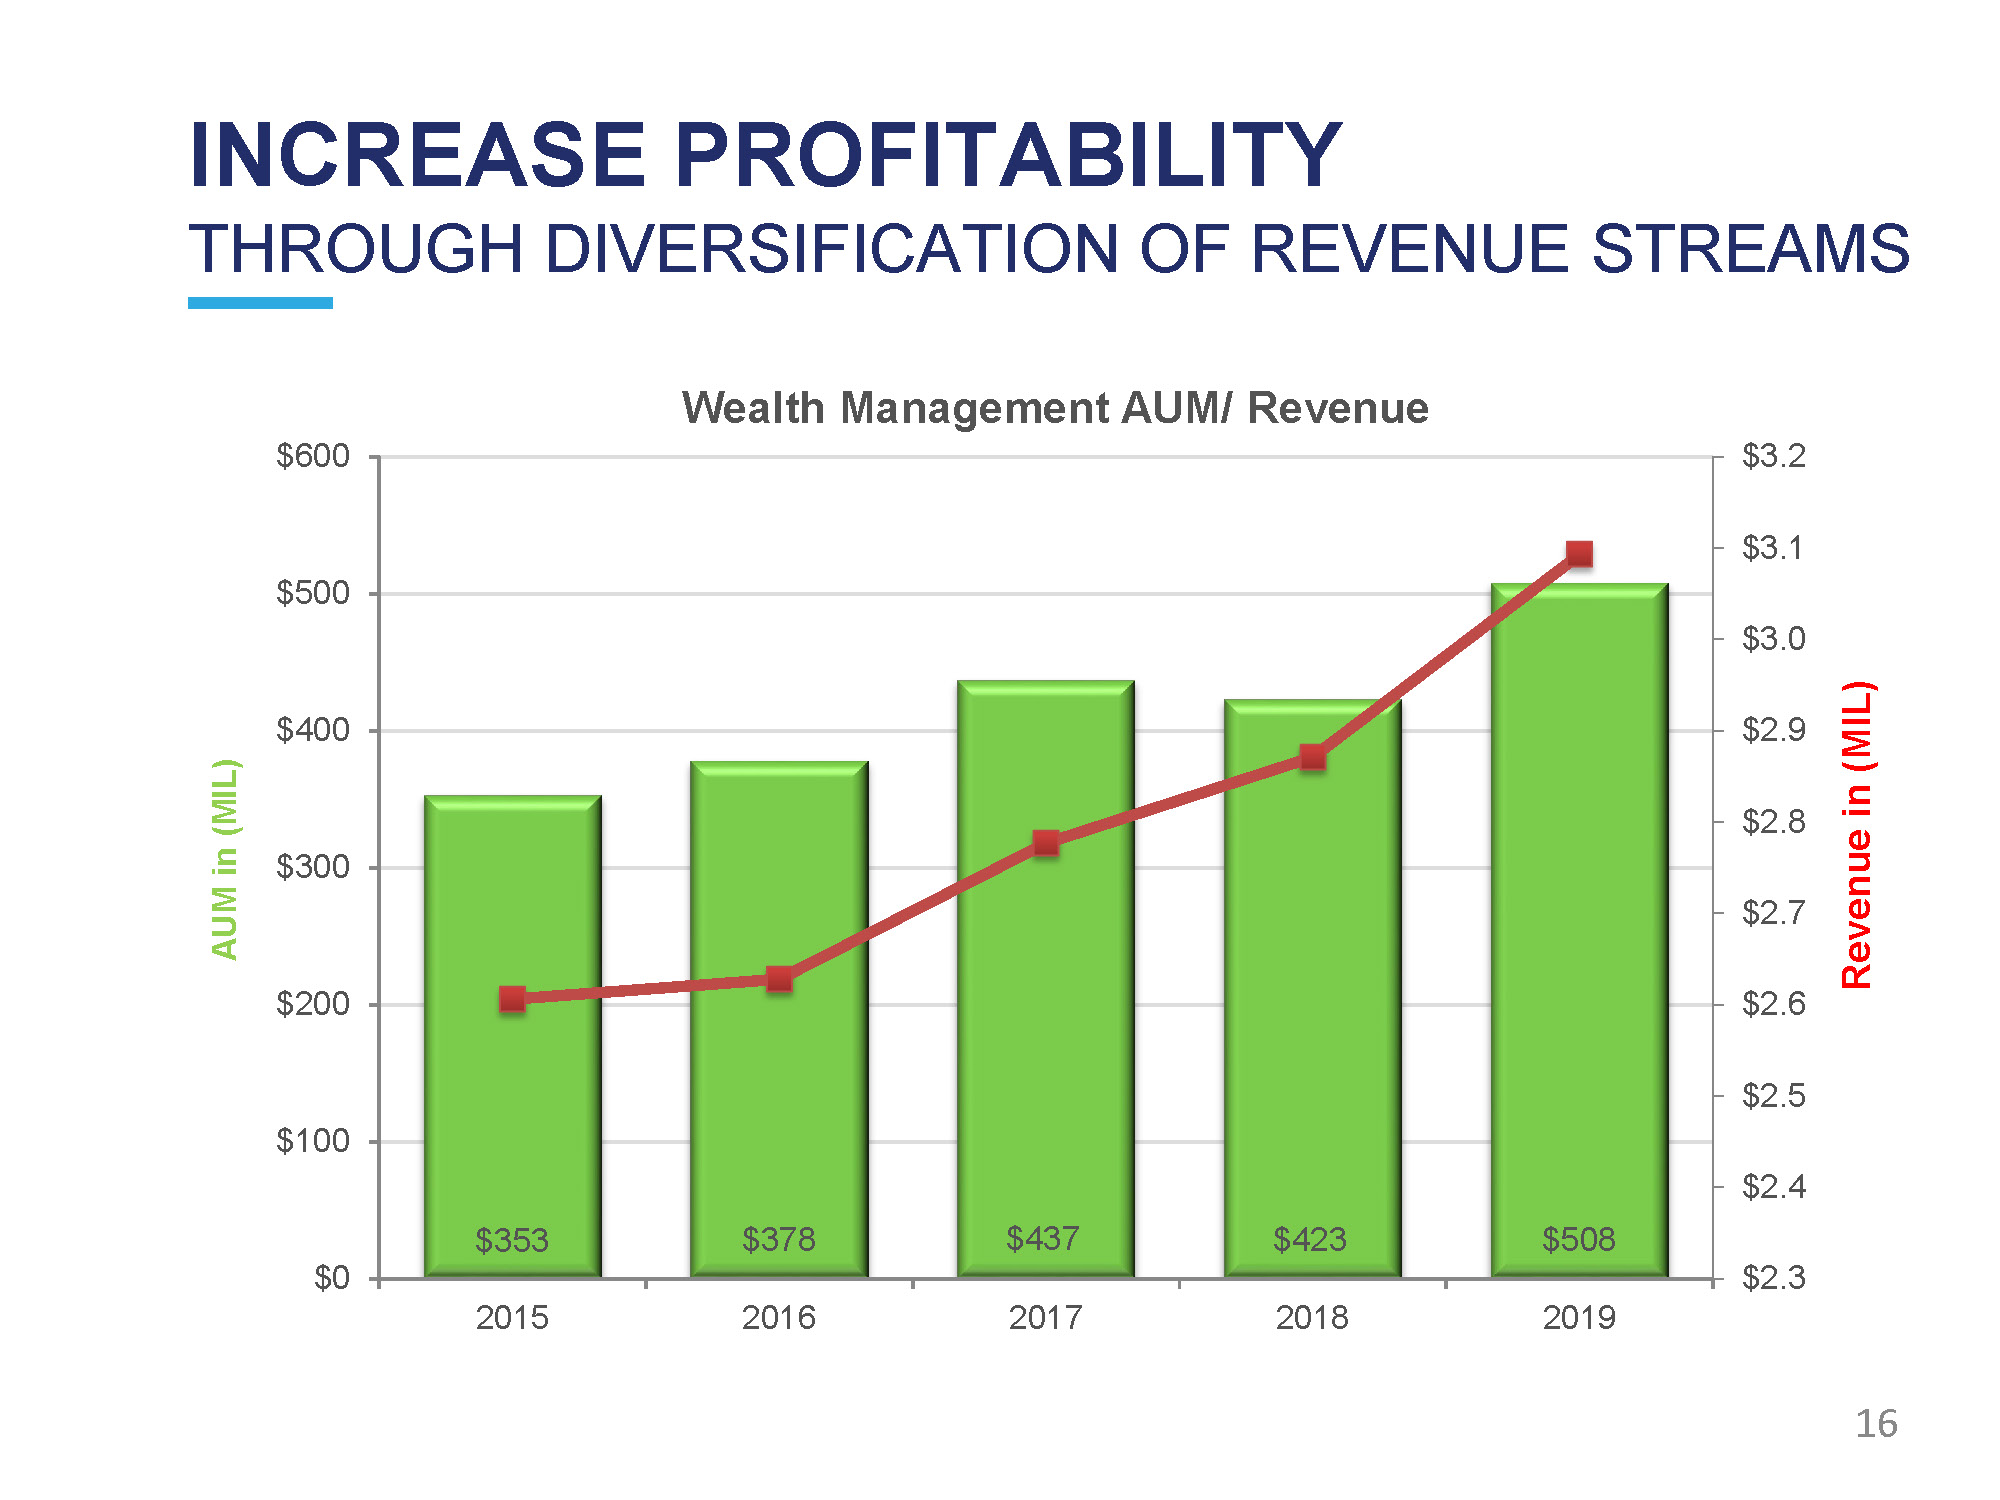
INCREASE PROFITABILITY THROUGH DIVERSIFICATION OF REVENUE STREAMS $353 16 $378 $437 $423 $508 $ 2 .3 $ 2 .4 $ 2 .5 $ 2 .6 $ 2 .7 $ 2 .8 $ 2 .9 $ 3 .0 $ 3 .1 $ 3 .2 $0 $ 1 00 $ 2 00 $ 3 00 $ 4 00 $ 5 00 $ 6 00 2 0 15 2 0 16 2 0 17 2 0 18 2 0 19 AUM in (MIL) Wealth Management AUM/ Revenue Revenue in (MIL)
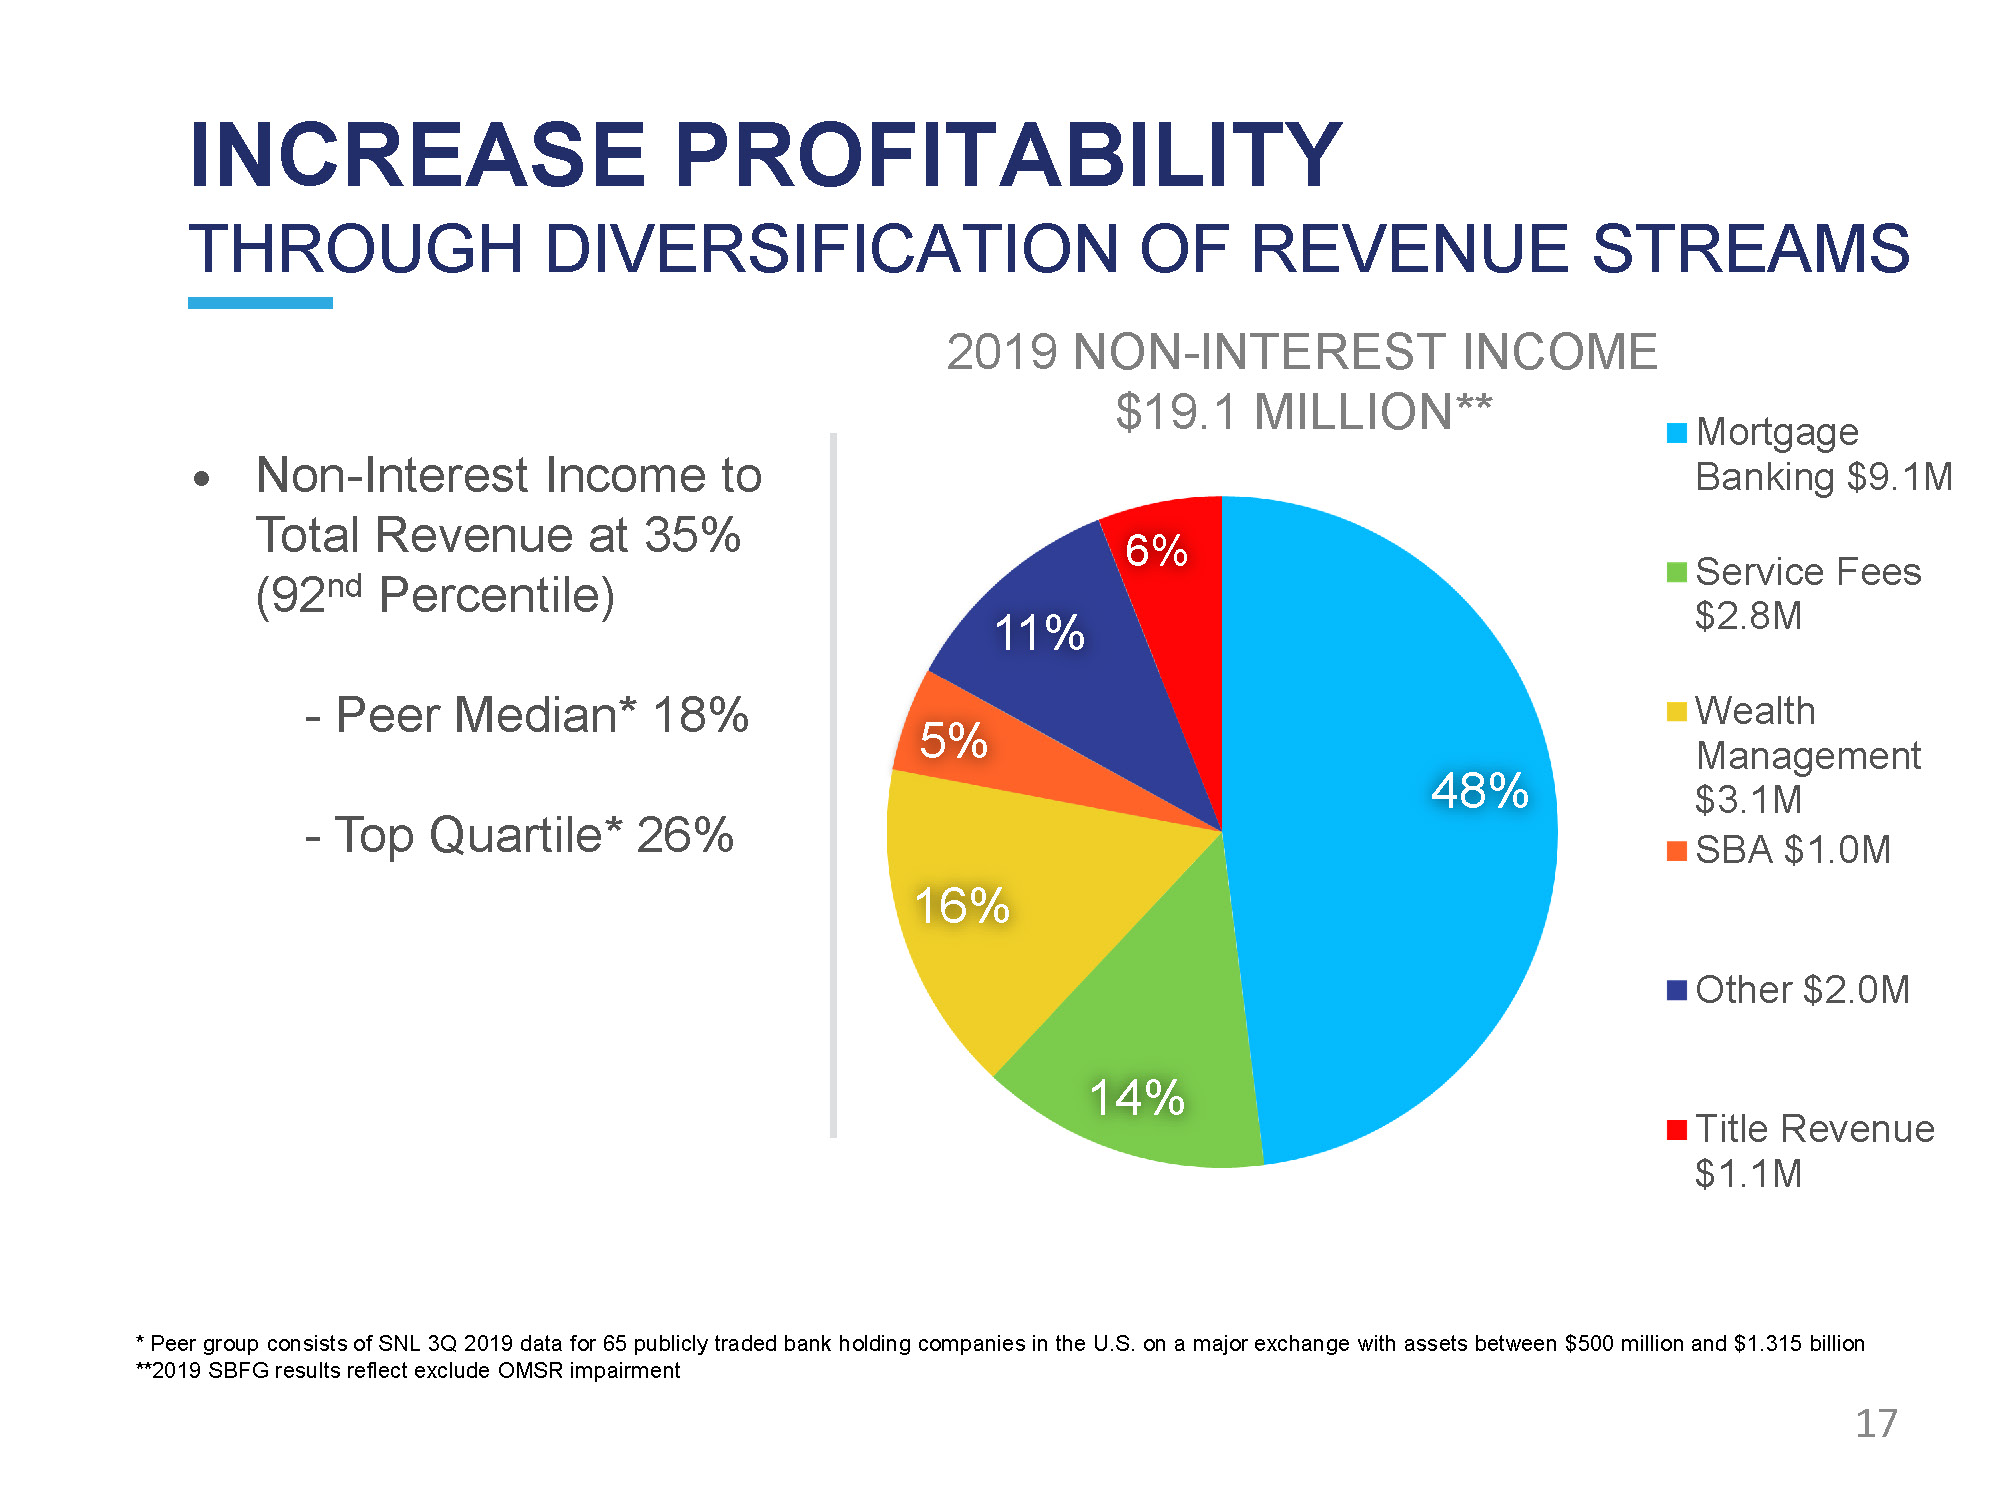
INCREASE PROFITABILITY THROUGH DIVERSIFICATION OF REVENUE STREAMS 48% 14% 16% 5% 1 1 % 6% Mortgage Banking $9.1M Service Fees $2.8M Wealth M anage m e n t $3.1M SBA $1.0M Other $2.0M Title Revenue $1.1M 2019 NON - INTEREST INCOME $19.1 MILLION** • Non - Interest Income to Total Revenue at 35% (92 nd Percentile) - Peer Median* 18% - Top Quartile* 26% * Peer group consists of SNL 3Q 2019 data for 65 publicly traded bank holding companies in the U.S. on a major exchange with assets between $500 million and $1.315 billion **2019 SBFG results reflect exclude OMSR impairment 17
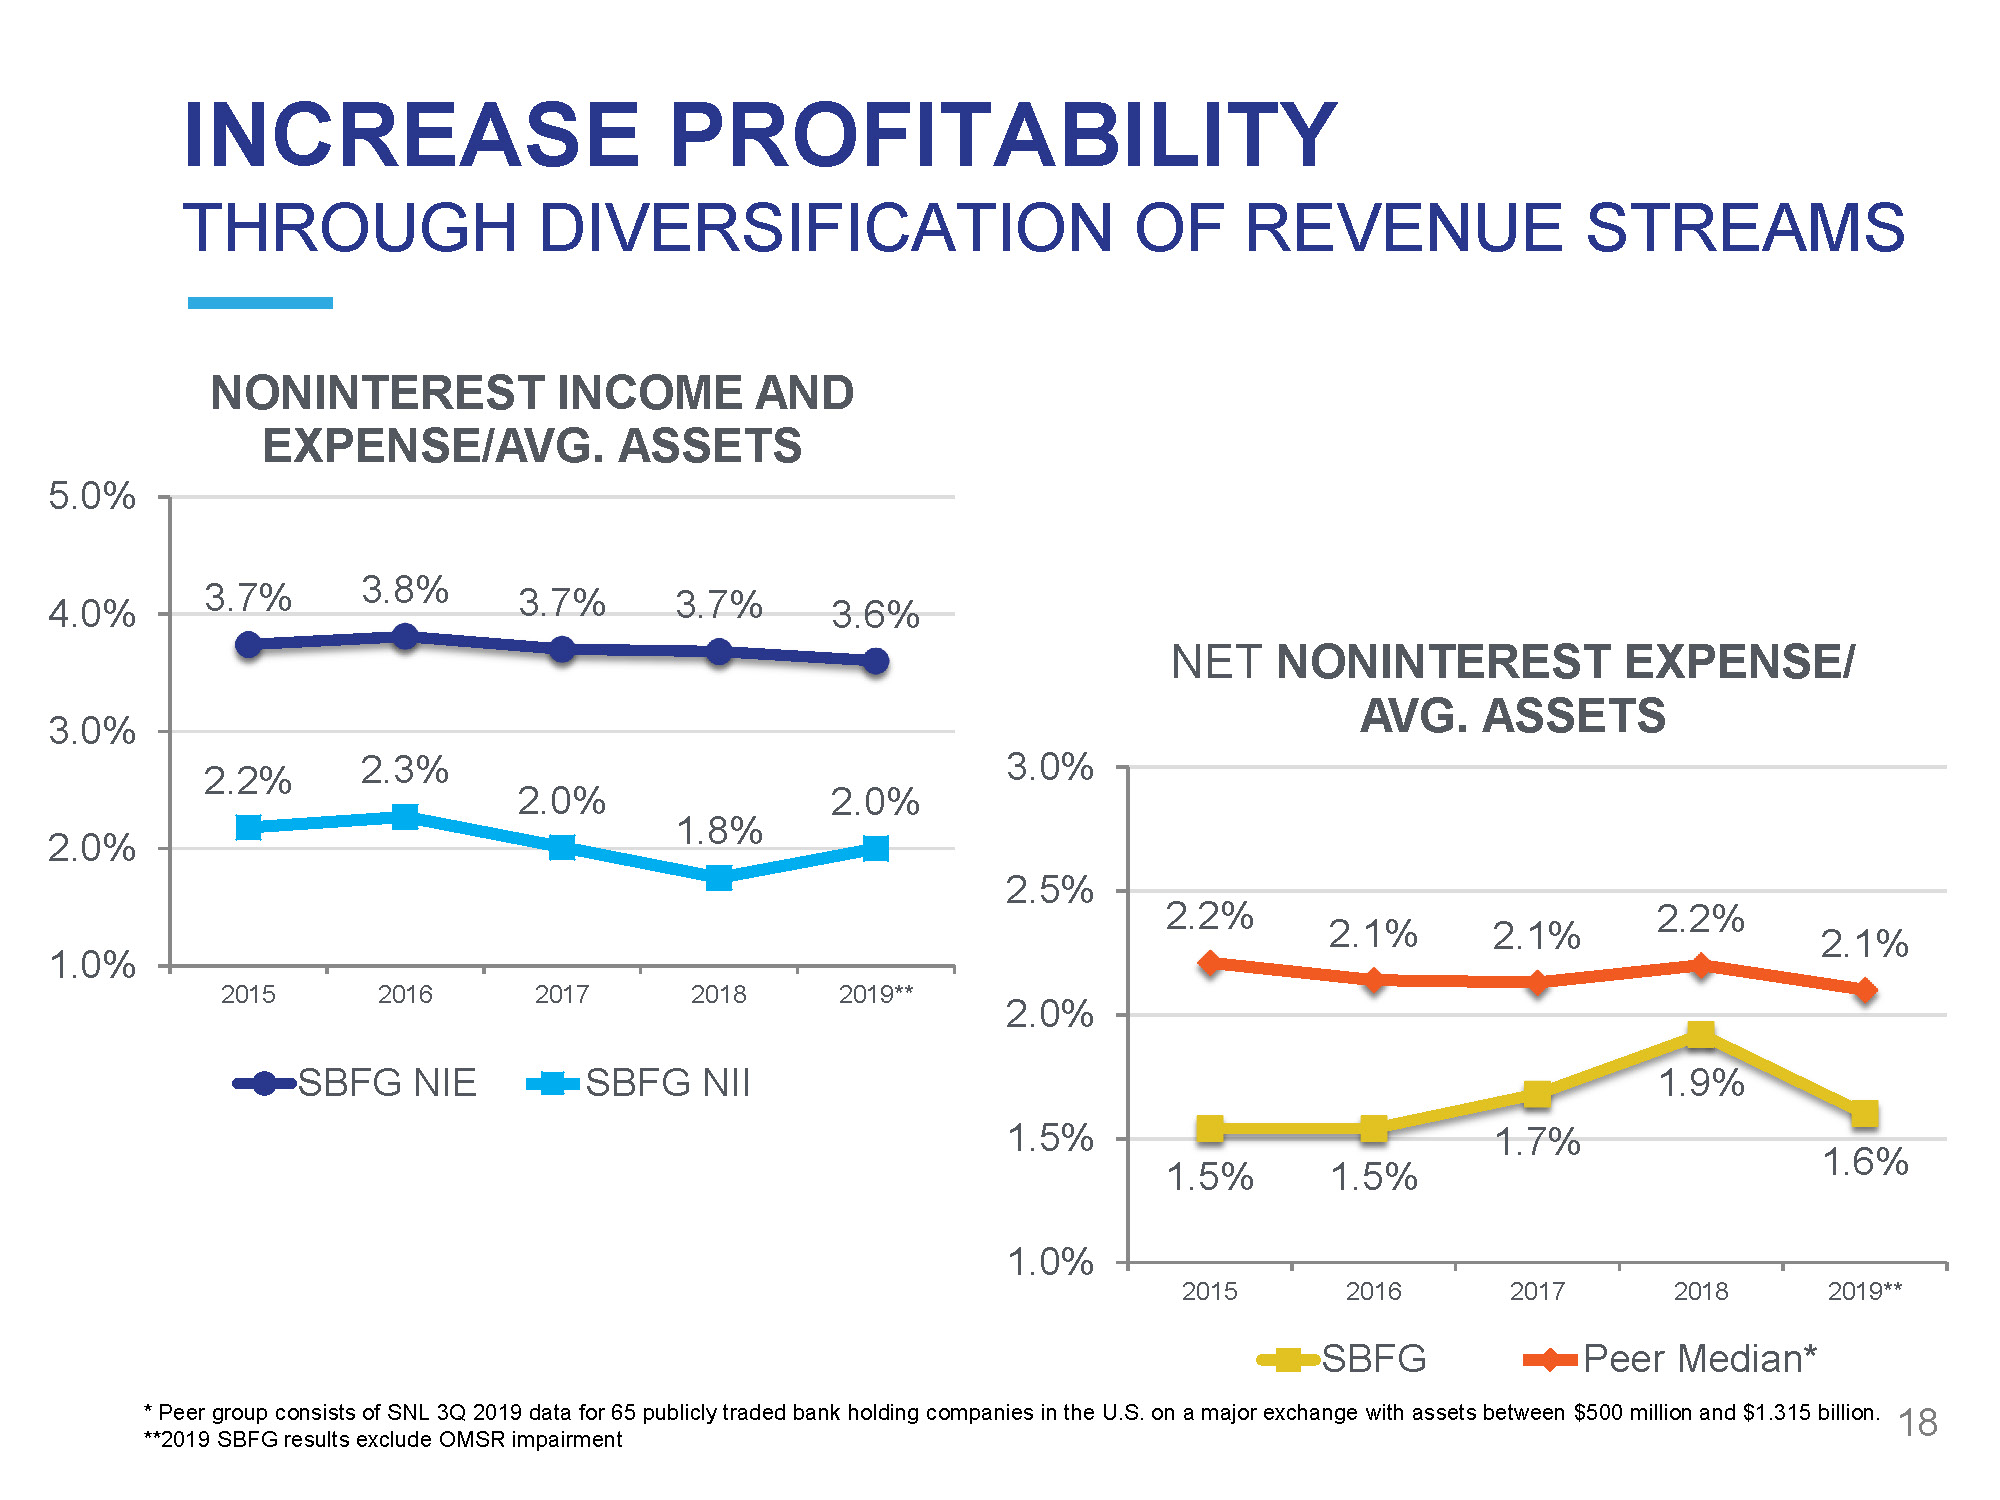
1 . 5 % 1 . 5 % 1 . 7 % 1 . 9 % 1 . 6 % 2 . 2 % 2 . 1 % 2 . 1 % 2 . 2 % 2 . 1 % 1 . 0% 1 . 5% 2 . 0% 2 . 5% 3 . 0% 2 0 15 2 0 16 2 0 17 2 0 18 2 0 19 * * NET NONINTEREST EXPENSE/ AVG. ASSETS 3 . 7 % 3 . 8 % 3 . 7 % 3 . 7 % 3 . 6 % 2 . 2 % 2 . 3 % 2 . 0 % 1 . 8 % 2 . 0 % 1 . 0% 2 . 0% 3 . 0% 4 . 0% 2 0 15 2 0 16 2 0 17 2 0 18 2 0 19 * * NONINTEREST INCOME AND EXPENSE/AVG. ASSETS 5.0% SBFG NIE SBFG NII INCREASE PROFITABILITY THROUGH DIVERSIFICATION OF REVENUE STREAMS SBFG Peer Median* * Peer group consists of SNL 3Q 2019 data for 65 publicly traded bank holding companies in the U.S. on a major exchange with assets between $500 million and $1.315 billion. 18 **2019 SBFG results exclude OMSR impairment
SB FINANCIAL GROUP, INC. SCALE THROUGH ORGANIC GROWTH HIGHLIGHTS • Grew Balance Sheet • Expanded our Footprint • Built Market Share 19

20 STRENGTHEN MARKET PENETRATION IN ALL MARKETS SERVED

STRENGTHEN MARKET PENETRATION IN ALL MARKETS SERVED Toledo $125M Findlay $66M Columbus $182M Ft. Wayne $31M Defiance $85M Total Loan and Deposit Growth Over Last 5 Years: $606M 21
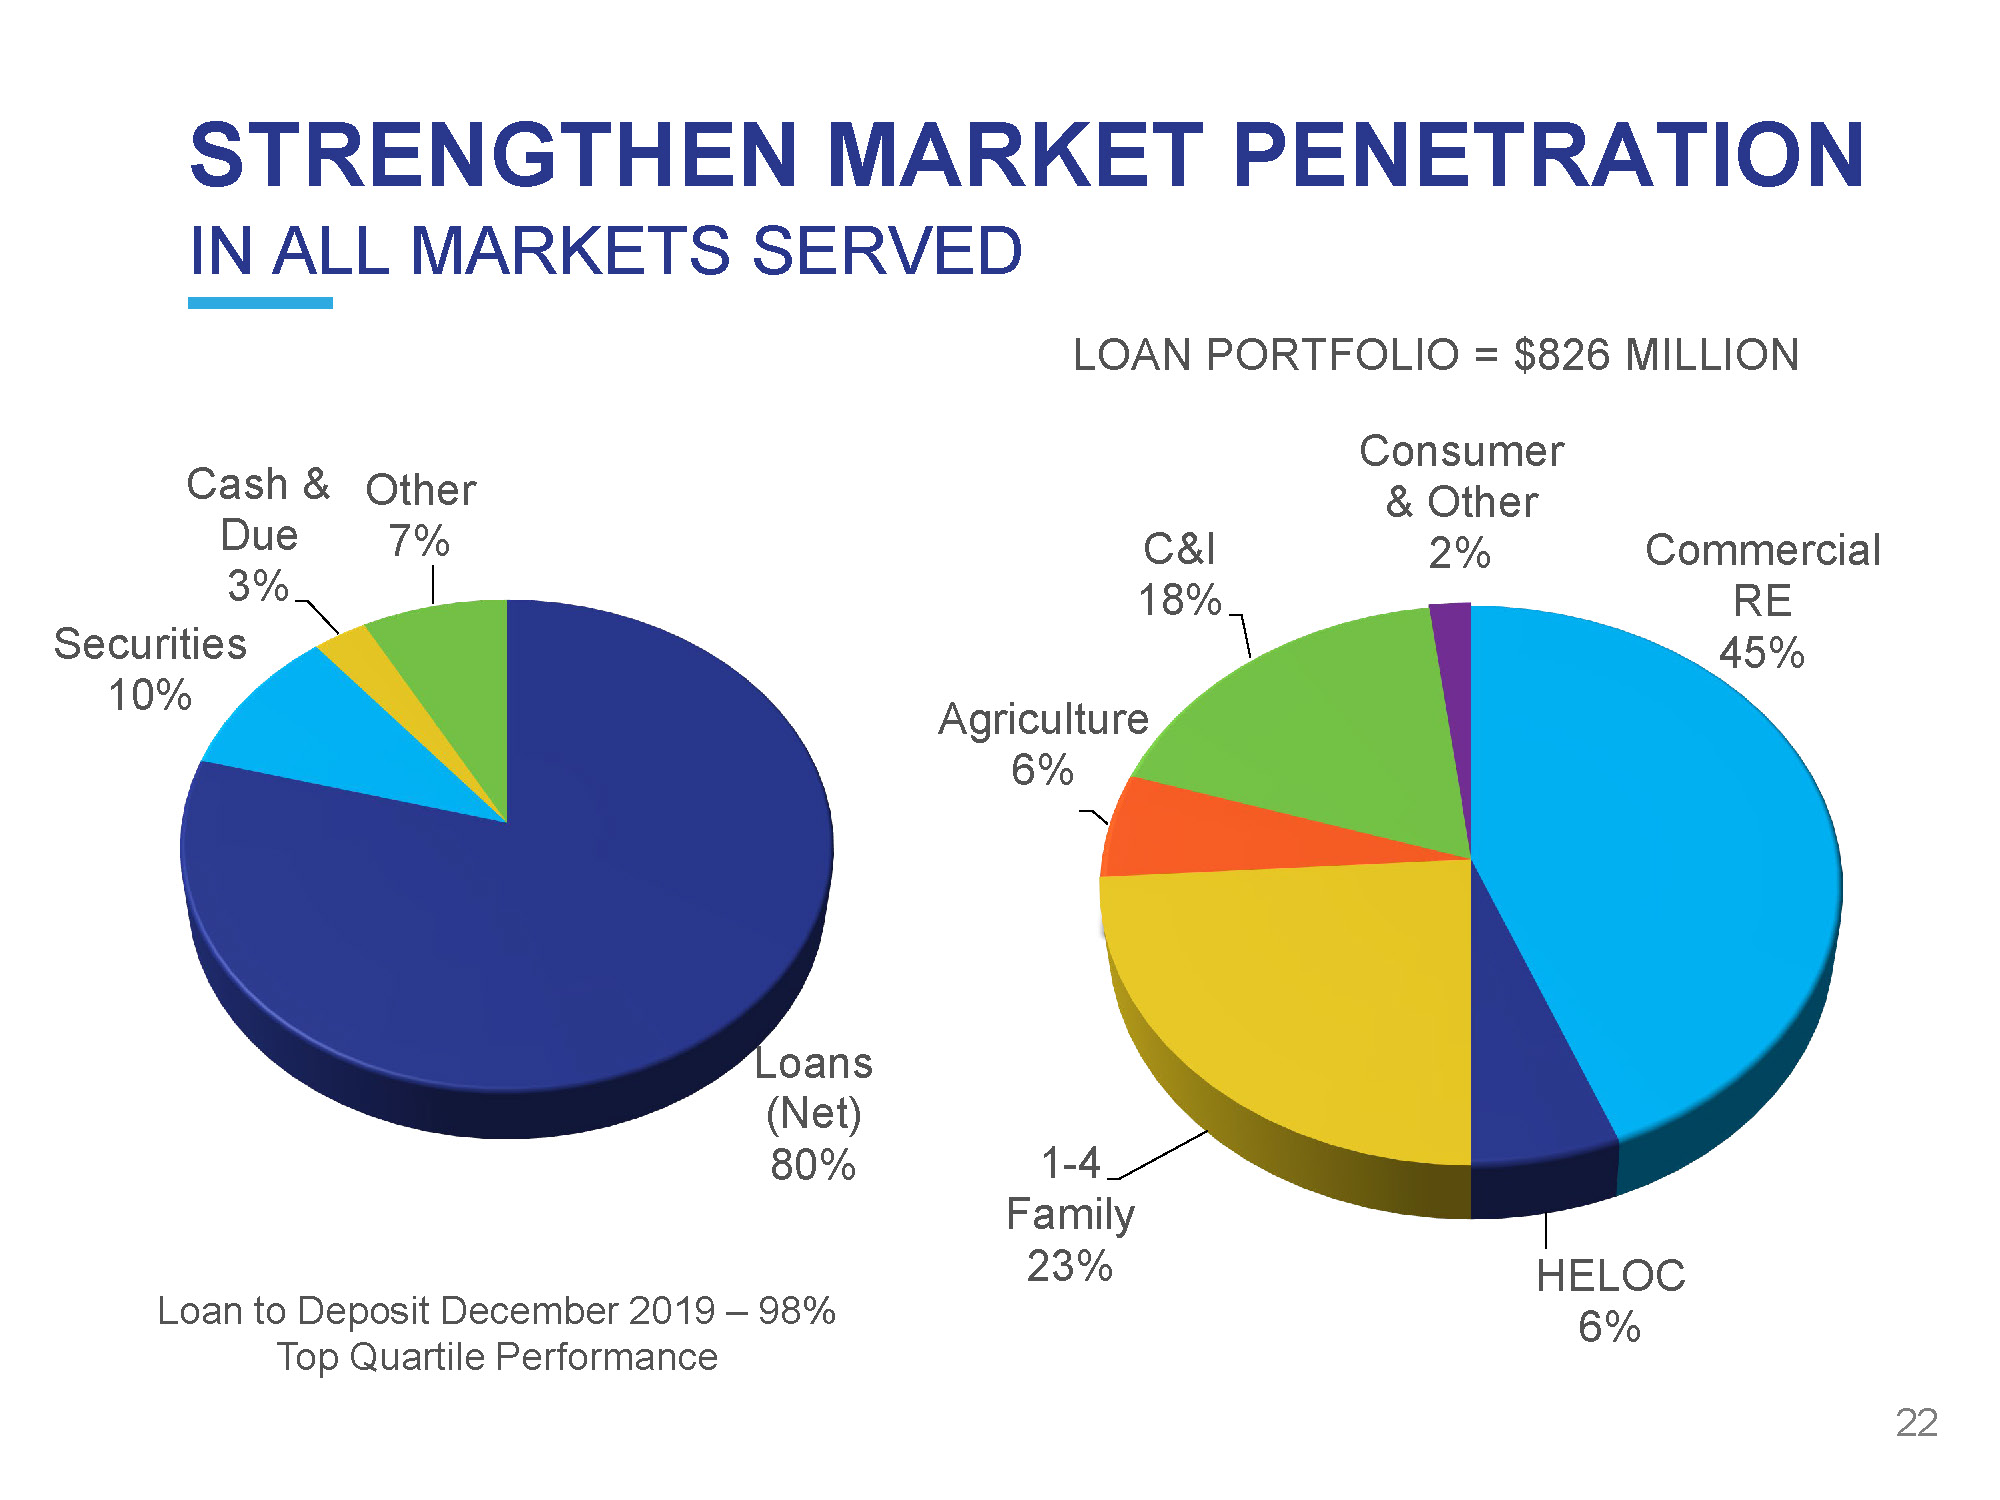
STRENGTHEN MARKET PENETRATION IN ALL MARKETS SERVED Loans (Net) 80 % Cash & Due 3% S e c ur i t i es 10% O ther 7% Co mm er ci al RE 45% 22 H E L O C 6% 1 - 4 F ami l y 23% A gr ic u l tu r e 6% C&I 18% Con s u m er & Other 2% Loan to Deposit December 2019 – 98% Top Quartile Performance LOAN PORTFOLIO = $826 MILLION

STRENGTHEN MARKET PENETRATION IN ALL MARKETS SERVED 2 3 Bo rr o w i ngs 4% D epo s i t s 81% C ap i t al 13% O t he r 2% T i m e 30% MMDA 21% Sa v i ng s 14% I n t e r e st Bea ri ng 16% N on - I n t e r e s t 19% DEPOSIT PORTFOLIO = $840 MILLION Transactional deposits = 70% of total deposits Weighted average cost of deposits = 104 bps* *2019 Full Year
SB FINANCIAL GROUP, INC. ADDED SCOPE HIGHLIGHTS • Emphasized Business Line Leadership • Added more Services and more Households • Defined Communication Channels • Worked Interdependently - Referrals • Expanded Client Interaction 24
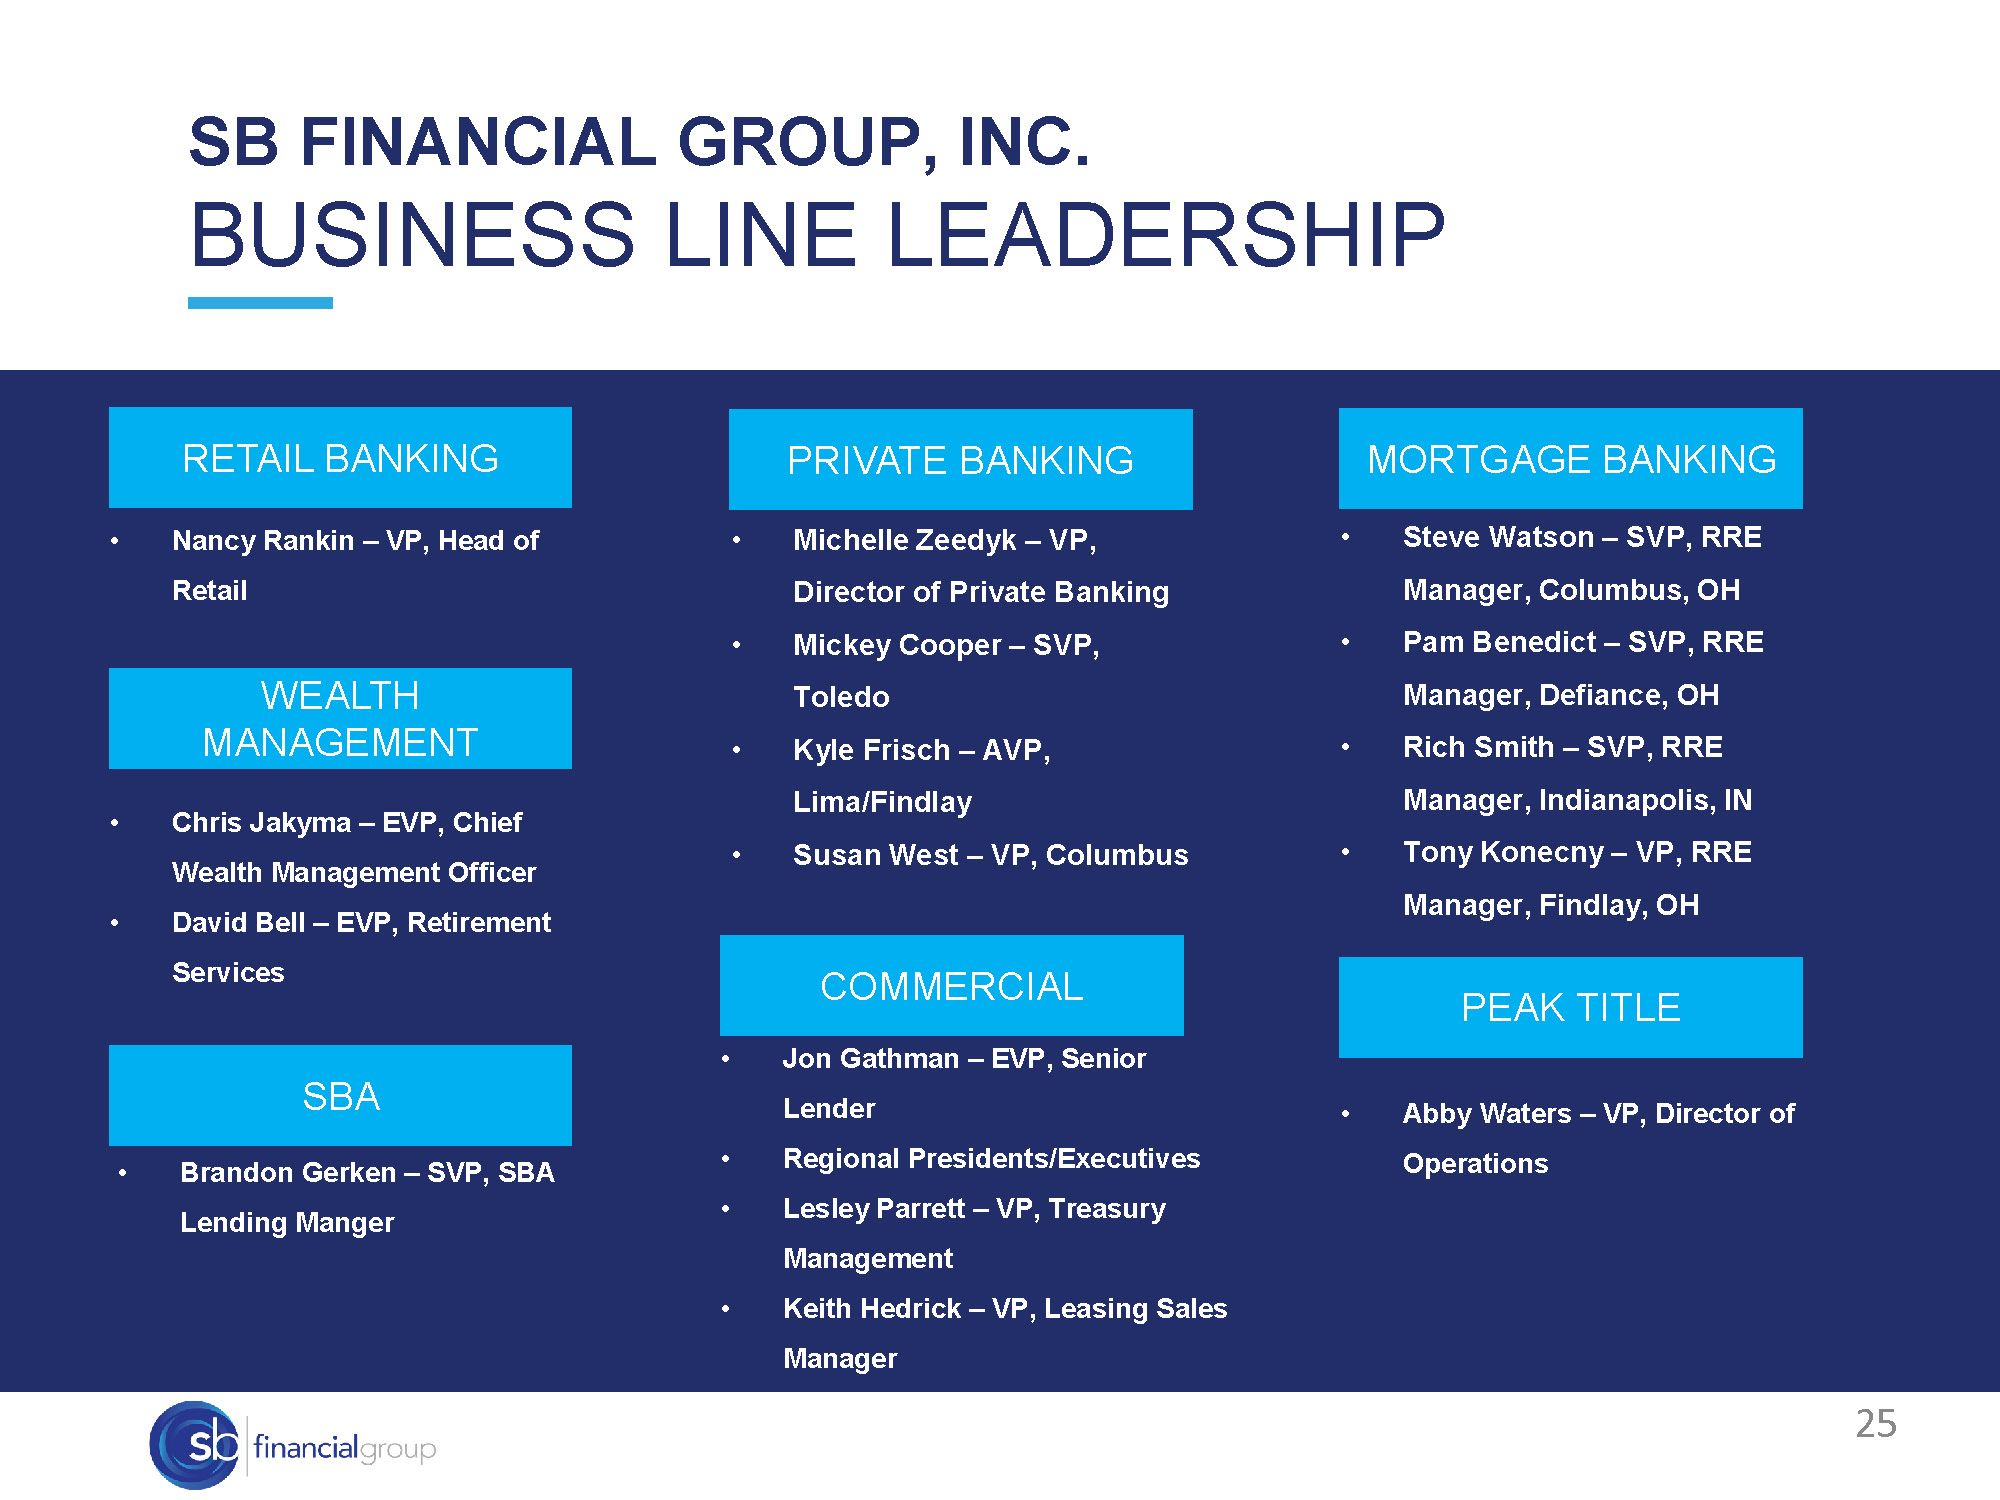
SB FINANCIAL GROUP, INC. BUSINESS LINE LEADERSHIP RETAIL BANKING 25 PRIVATE BANKING • Nancy Rankin – VP, Head of Retail MORTGAGE BANKING • Michelle Zeedyk – VP, Director of Private Banking • Mickey Cooper – SVP, Toledo • Kyle Frisch – AVP, Lima/Findlay • Susan West – VP, Columbus • Steve Watson – SVP, RRE Manager, Columbus, OH • Pam Benedict – SVP, RRE Manager, Defiance, OH • Rich Smith – SVP, RRE Manager, Indianapolis, IN • Tony Konecny – VP, RRE Manager, Findlay, OH PEAK TITLE • Chris Jakyma – EVP, Chief Wealth Management Officer • David Bell – EVP, Retirement Services COMMERCIAL WEALTH M A N AGE M E N T • Jon Gathman – EVP, Senior Lender • Regional Presidents/Executives • Lesley Parrett – VP, Treasury Management • Keith Hedrick – VP, Leasing Sales Manager • Brandon Gerken – SVP, SBA Lending Manger SBA • Abby Waters – VP, Director of Operations
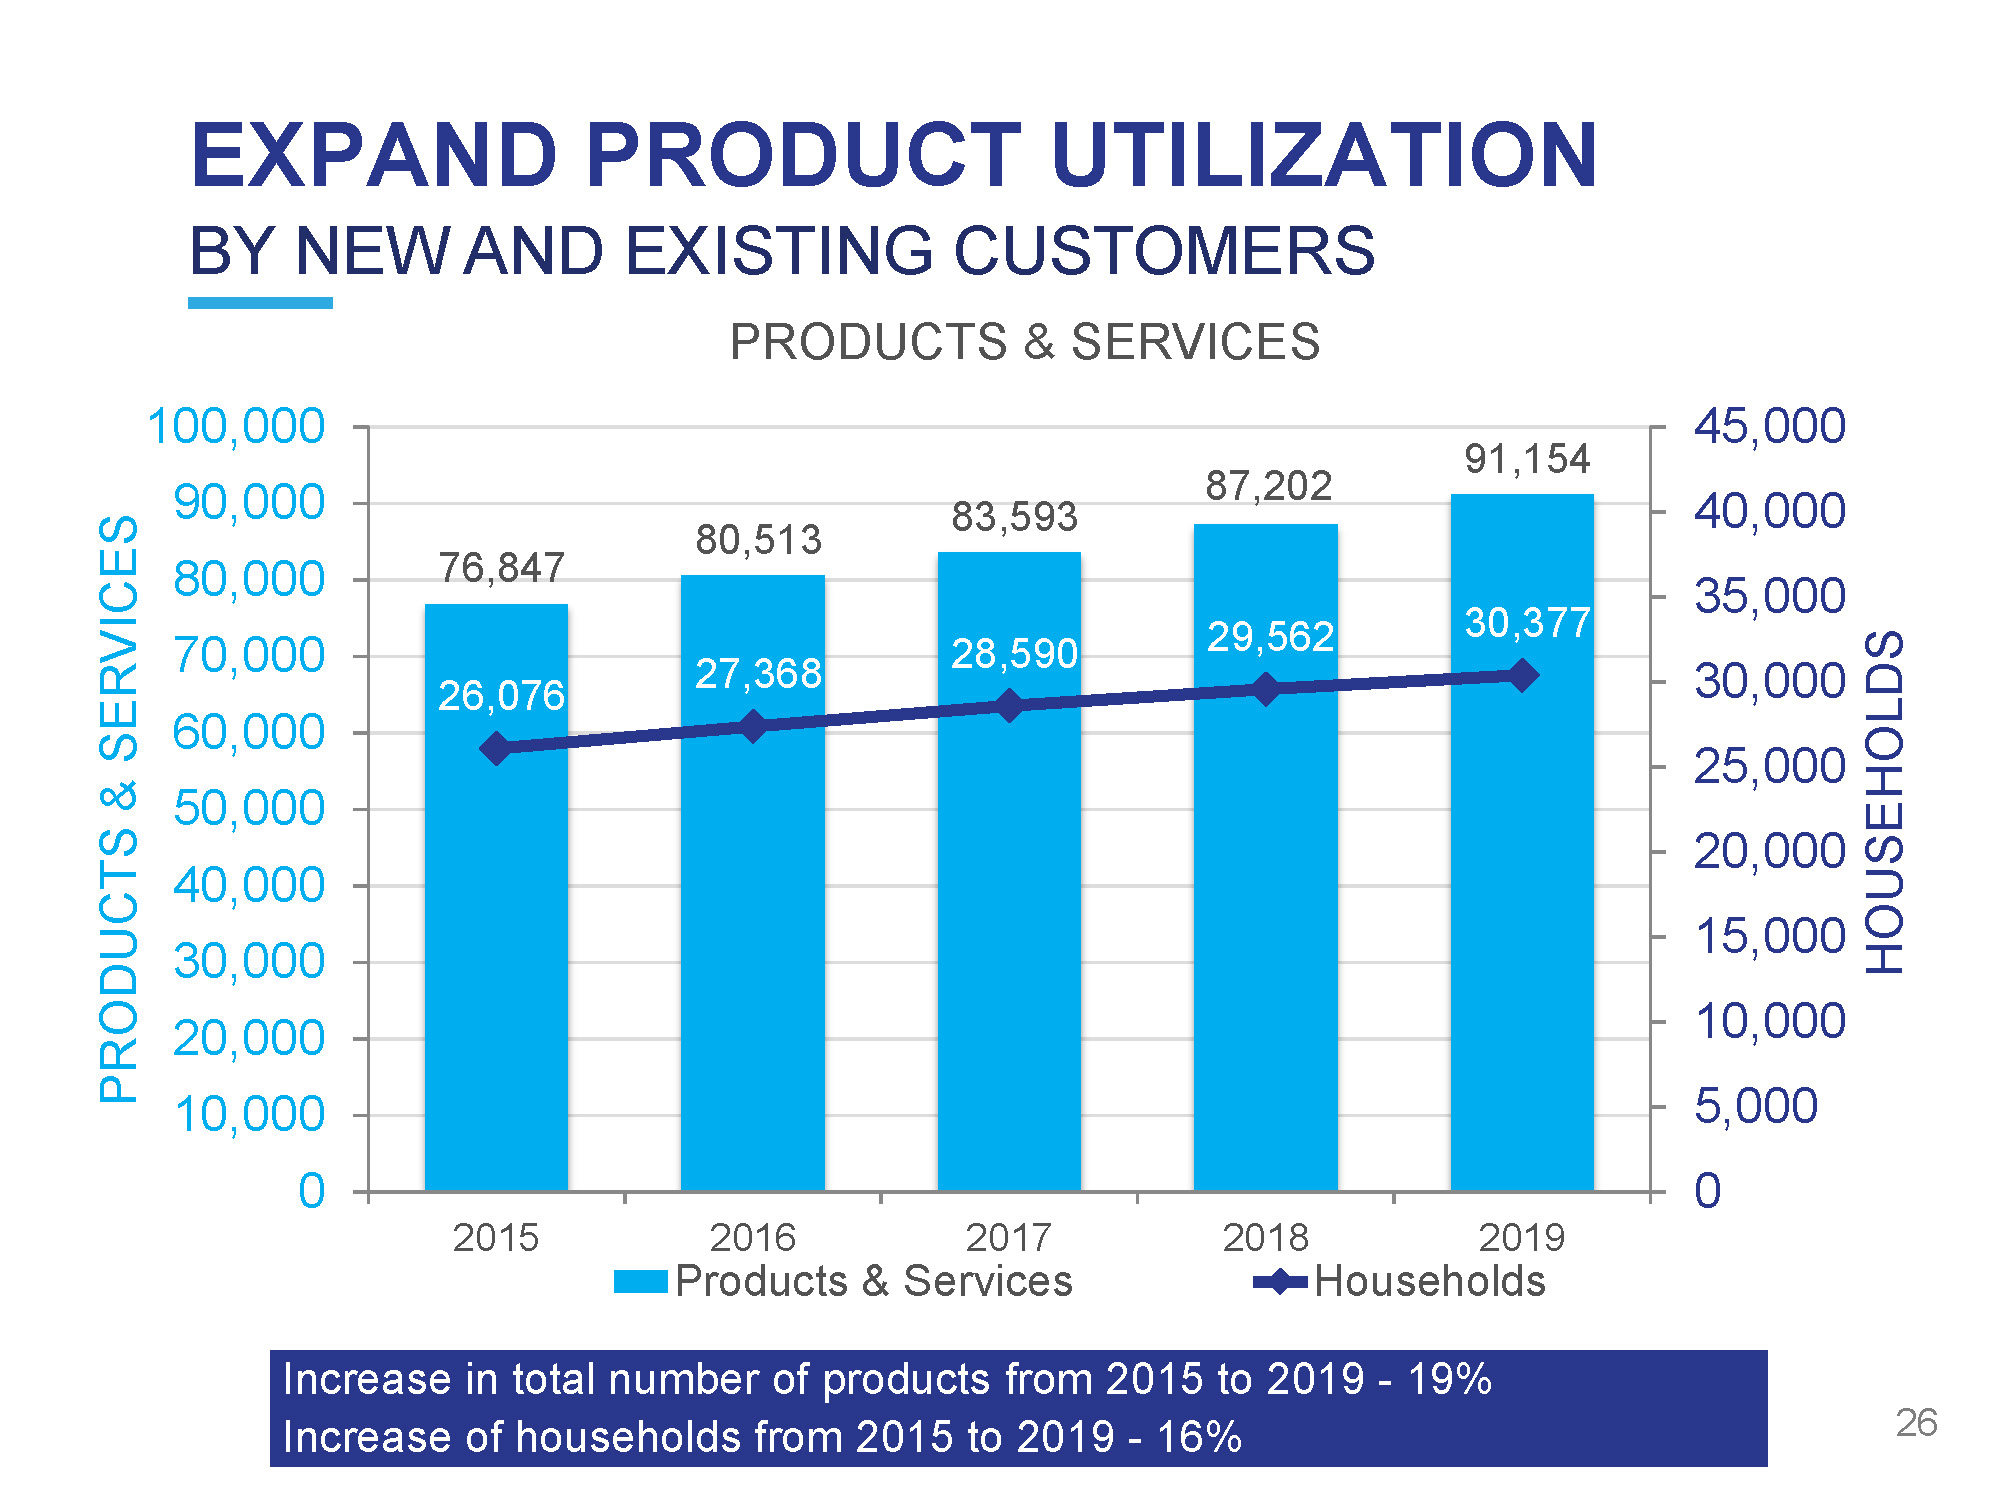
EXPAND PRODUCT UTILIZATION 2 6 76 , 847 80 , 513 83 , 593 87 , 202 91 , 154 26 , 076 27 , 368 28 , 590 29 , 562 30 , 377 45,000 40,000 35,000 30,000 25,000 20,000 15,000 10,000 5,000 0 1 0 0 , 0 0 0 9 0 , 000 8 0 , 000 7 0 , 000 6 0 , 000 5 0 , 000 4 0 , 000 3 0 , 000 2 0 , 000 1 0 , 000 0 201 5 201 8 H O USEH O LDS PRODUCTS & SERVICES BY NEW AND EXISTING CUSTOMERS PRODUCTS & SERVICES 2016 2017 Products & Services 201 9 Households Increase in total number of products from 2015 to 2019 - 19% Increase of households from 2015 to 2019 - 16%
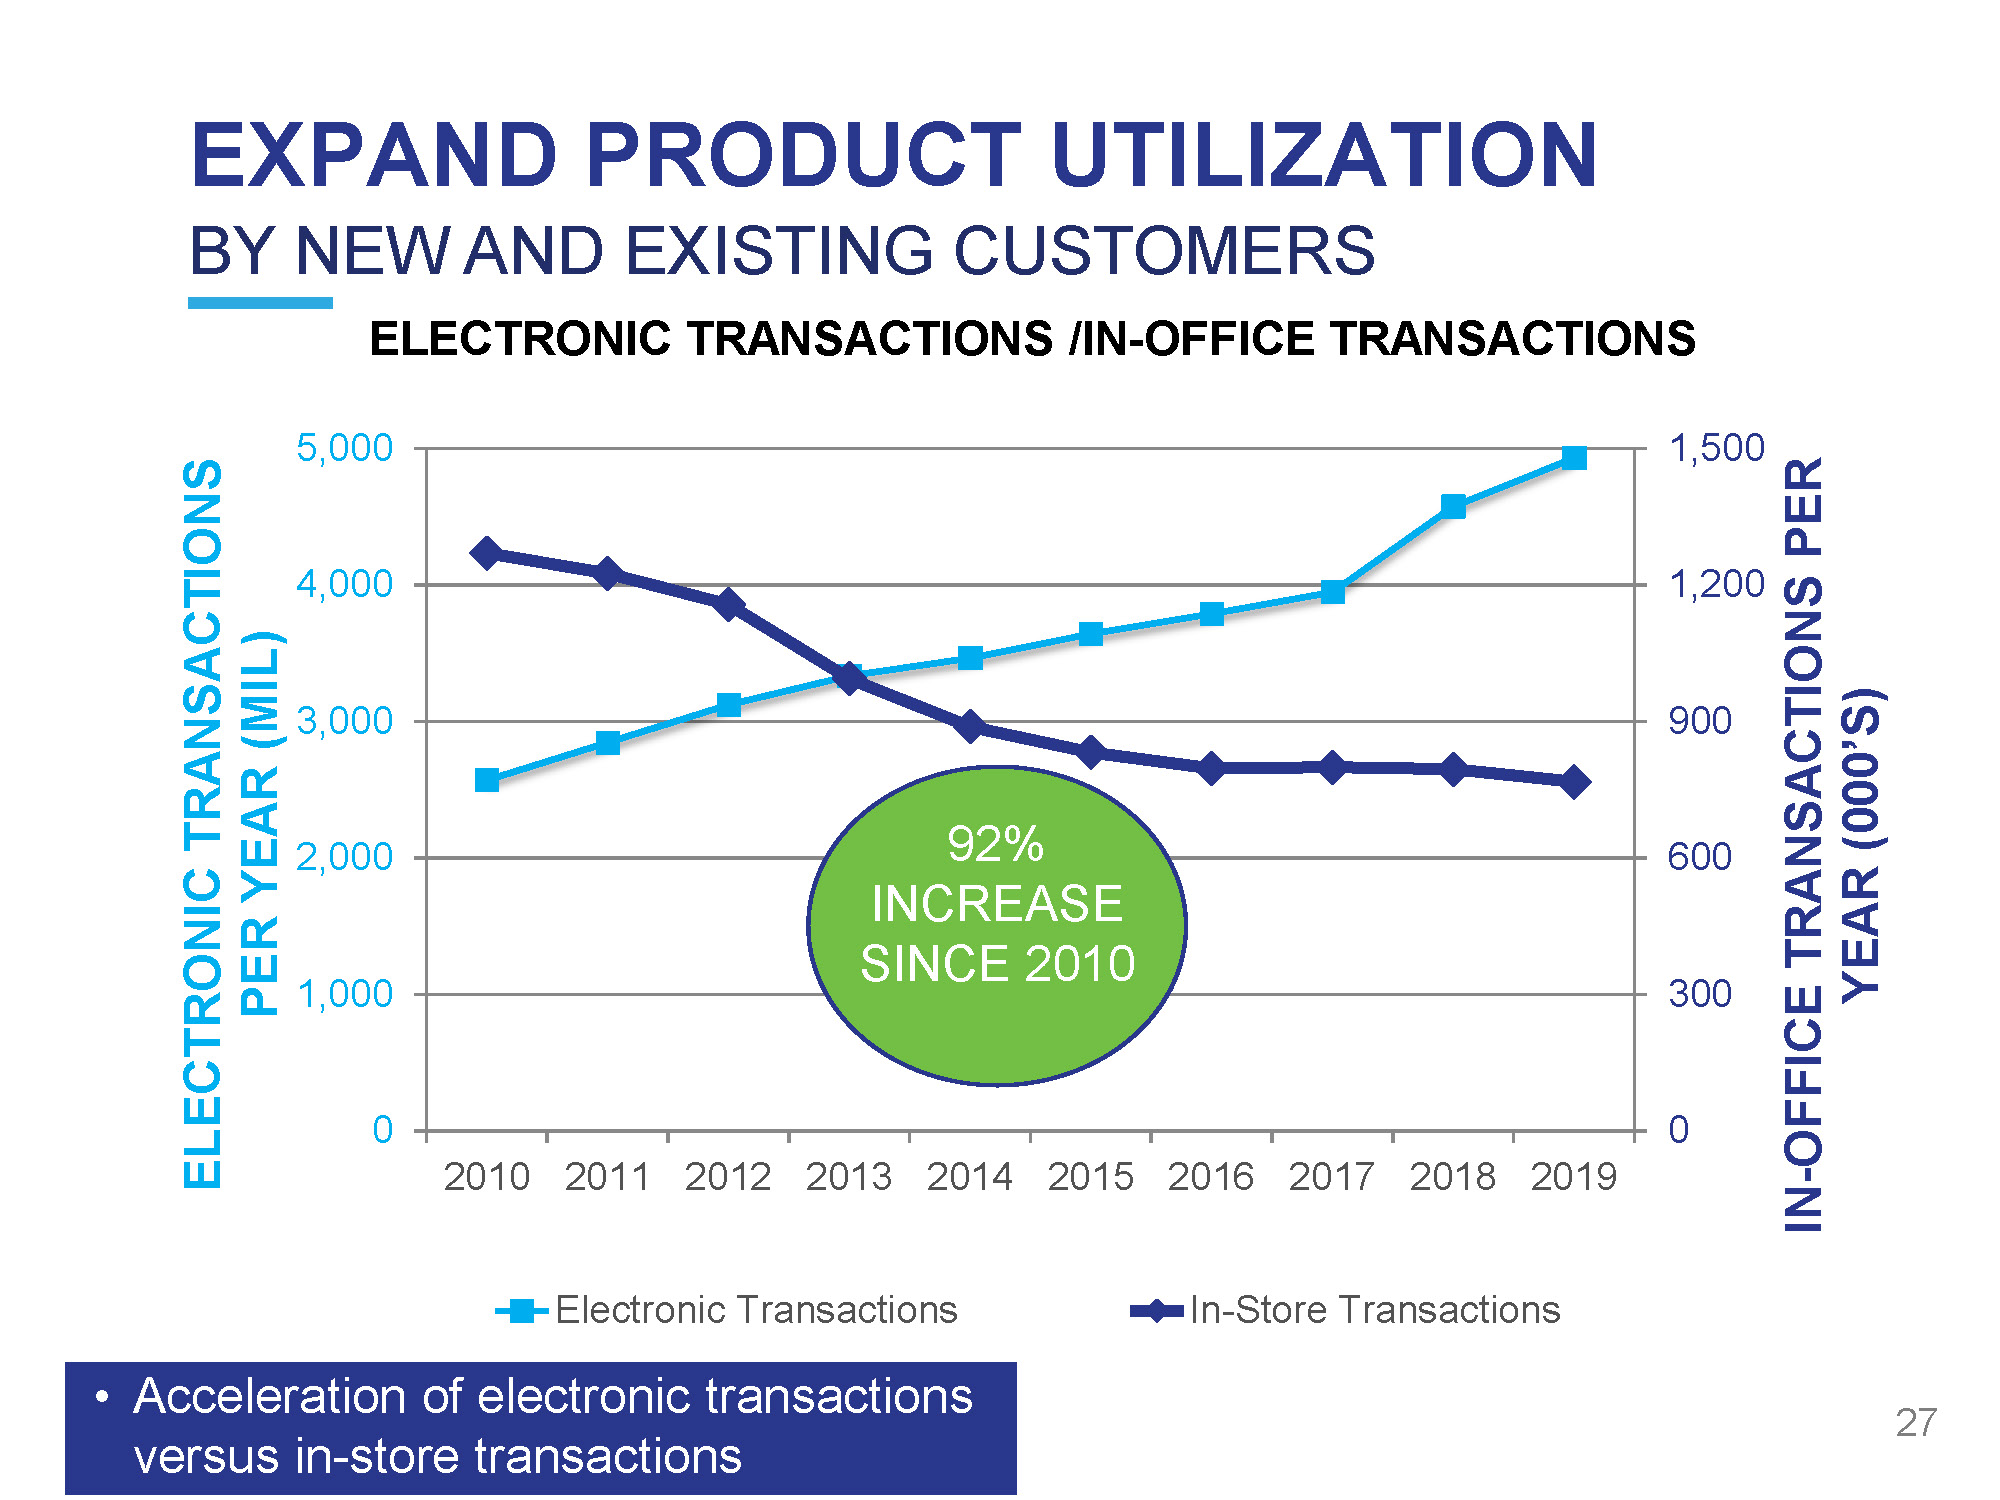
EXPAND PRODUCT UTILIZATION 2 7 0 300 600 900 1 , 20 0 0 1 , 00 0 2 , 00 0 3 , 00 0 4 , 00 0 201 0 201 1 201 2 201 3 201 4 201 5 201 6 201 7 201 8 201 9 IN - OFFICE TRANSACTIONS PER YEAR (000’S) ELECTRONIC TRANSACTIONS PER YEAR (MIL) BY NEW AND EXISTING CUSTOMERS ELECTRONIC TRANSACTIONS /IN - OFFICE TRANSACTIONS 5 , 00 0 1 , 50 0 Electronic Transactions In - Store Transactions • Acceleration of electronic transactions versus in - store transactions 92 % INCREASE SINCE 2010
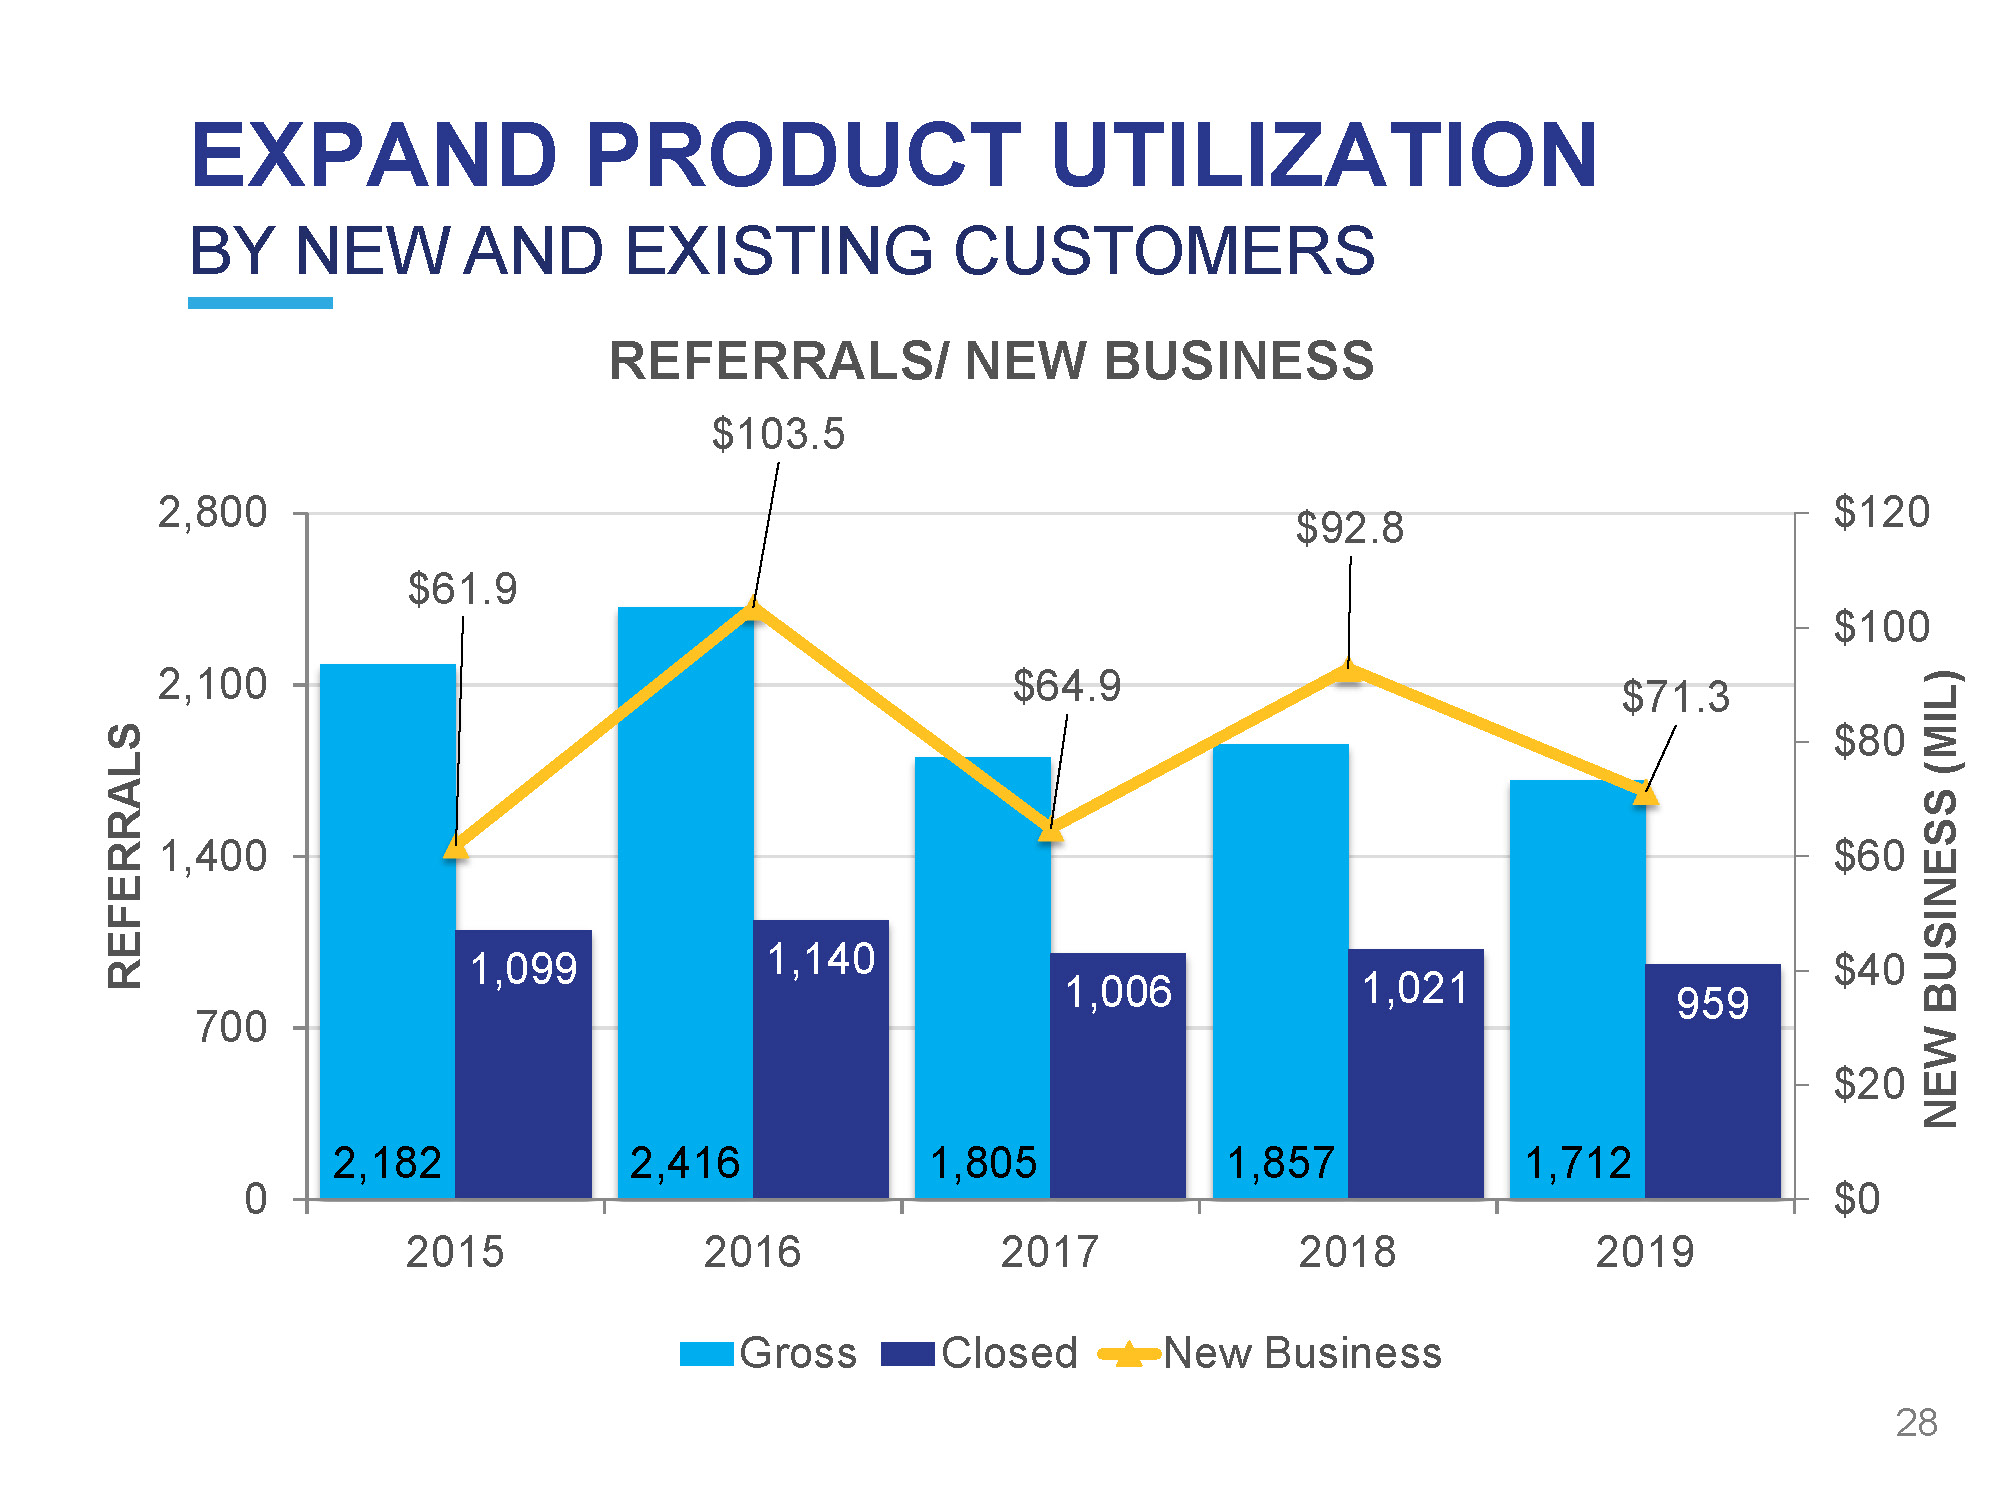
EXPAND PRODUCT UTILIZATION 2,182 2,416 1,805 1,857 1,712 1,099 1,140 1,006 1,021 959 $61.9 $64.9 $92.8 $71.3 $0 $20 $40 $60 $80 $1 0 0 $1 2 0 0 700 1,4 0 0 2,1 0 0 2,8 0 0 20 1 5 20 1 6 20 1 7 20 1 8 20 1 9 NEW BUSINESS (MIL) R E F E RR A L S BY NEW AND EXISTING CUSTOMERS REFERRALS/ NEW BUSINESS $103.5 G r o ss C l o s ed New Business 28
SB FINANCIAL GROUP, INC. DELIVER GAINS IN OPERATIONAL EXCELLENCE HIGHLIGHTS • Embraced New Technology Solutions • Deepened Bench with New Talent • Keyed on Process Improvement and Resource Optimization • Strengthened “Brand” of each Business line Ecosystem 29

DELIVER GAINS IN OPERATIONAL EXCELLENCE $772,533 $899,710 $994,915 $1,084,678 $1,199,107 5 , 63 2 6 , 41 4 7 , 05 1 7 , 58 6 8 , 15 5 0 1 , 70 0 3 , 40 0 5 , 10 0 6 , 80 0 $0 $250,000 $500,000 $750,000 $1,000,000 $1,250,000 NUMBER OF LOANS $ OF LOANS ($000s) MORTGAGE SERVICING PORTFOLIO 2015 2016 Servicing Portfolio 20 1 7 20 1 8 20 1 9 Number of Loans Serviced CAGR = 11.7% 30
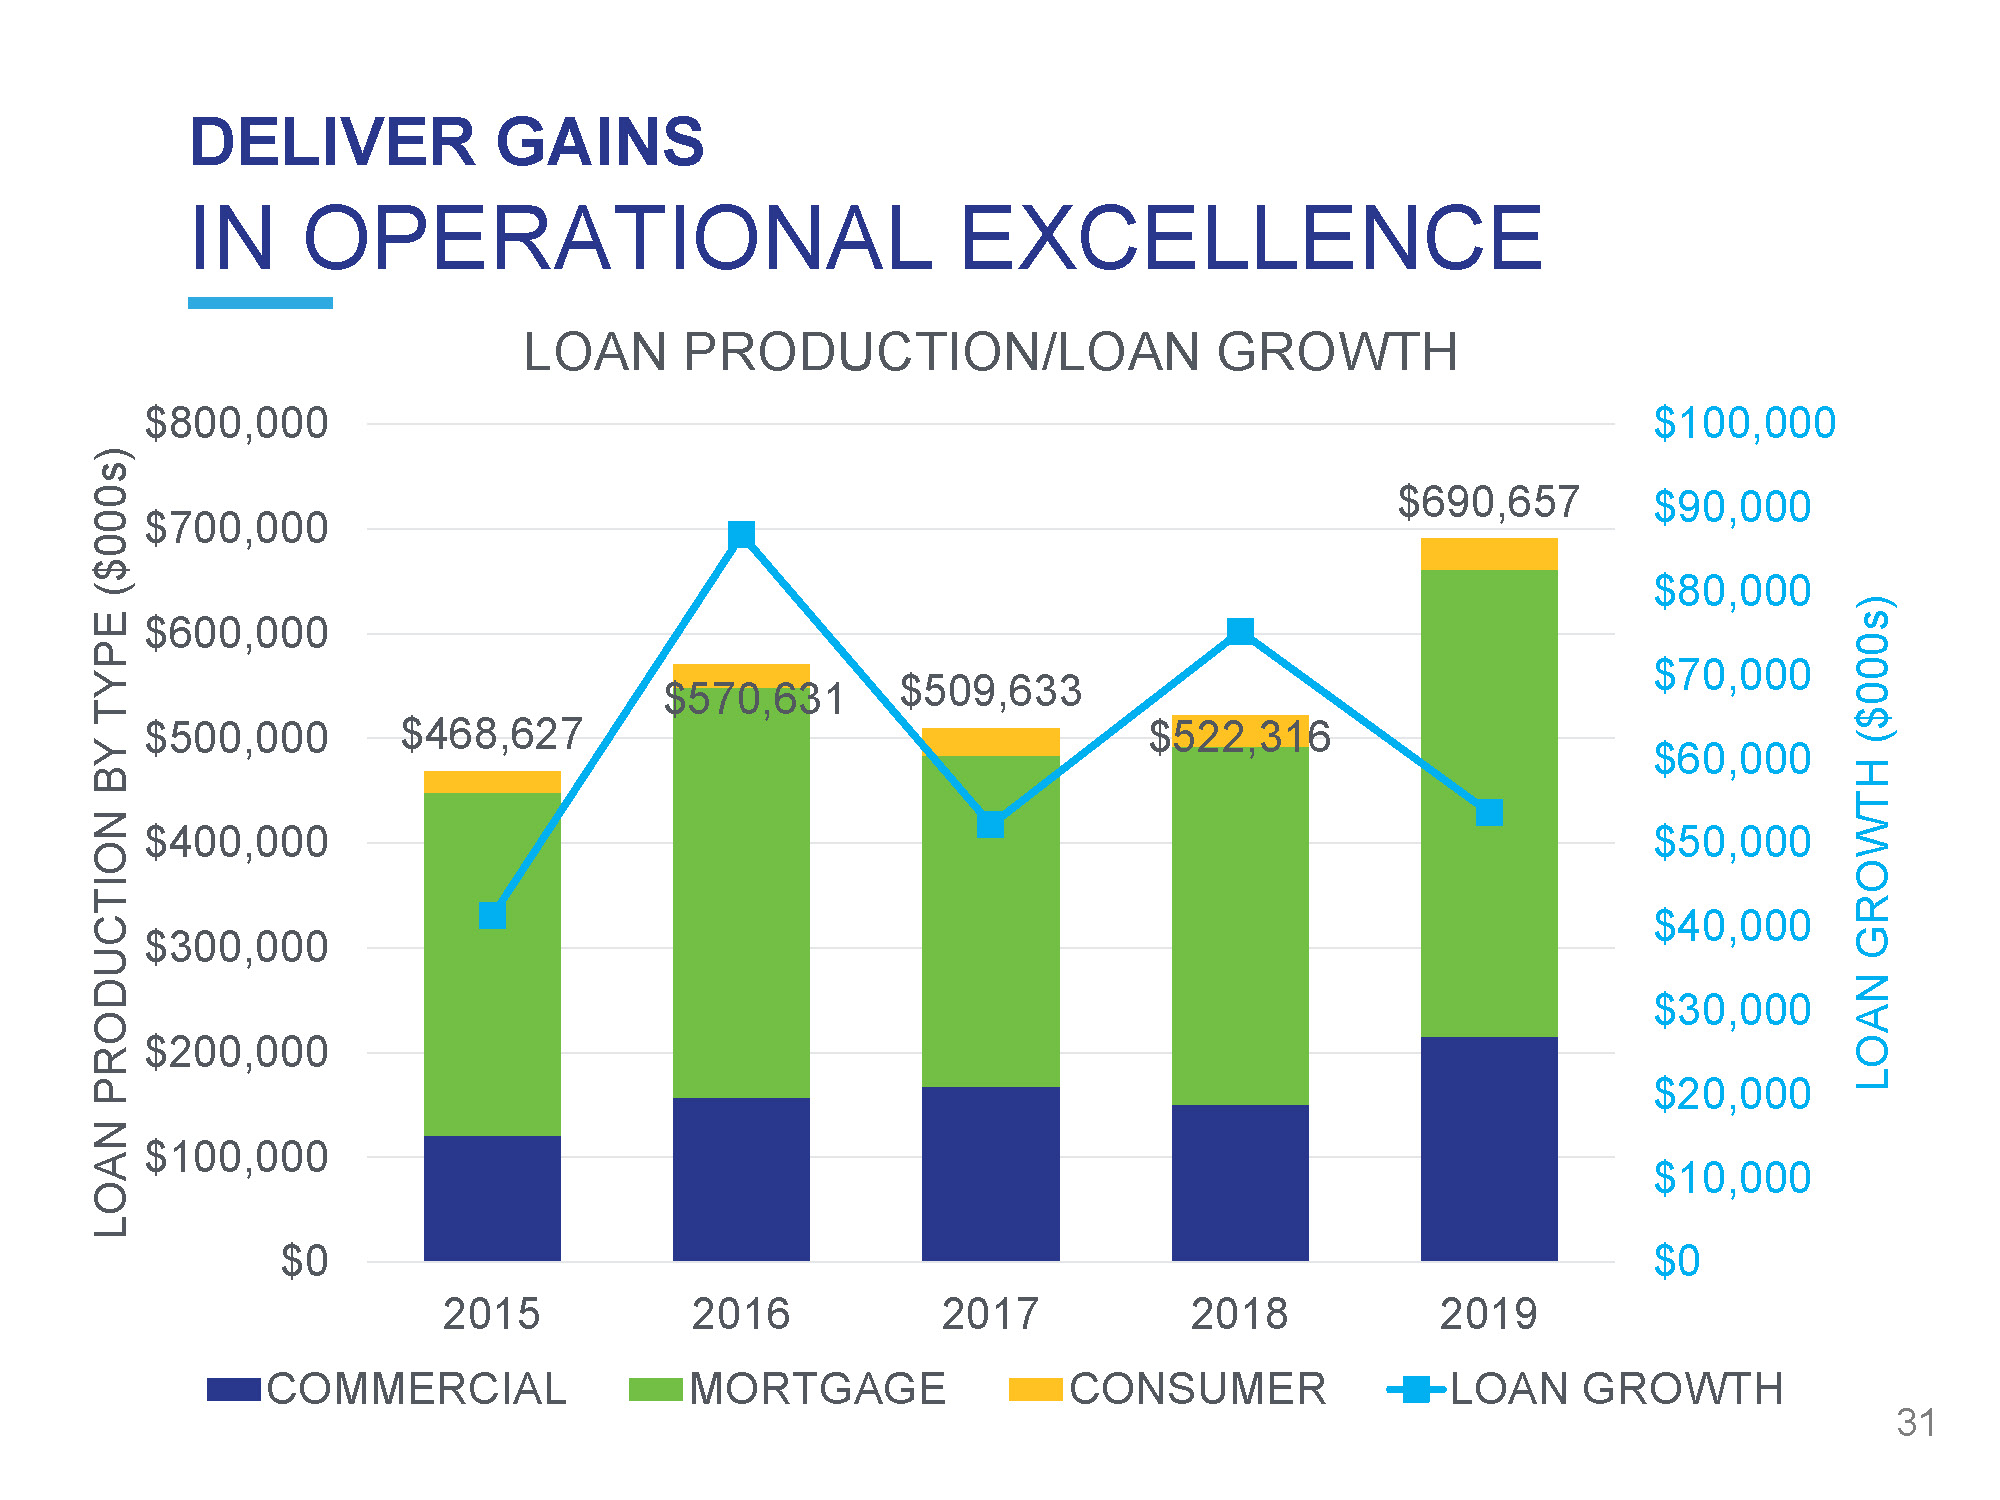
DELIVER GAINS IN OPERATIONAL EXCELLENCE $468,627 $570,631 $509,633 $522,316 $690,657 $100,000 $90,000 $80,000 $70,000 $60,000 $50,000 $40,000 $30,000 $20,000 $10,000 $0 $0 $100,000 $200,000 $300,000 $400,000 $500,000 $600,000 $700,000 $800,000 LOAN GROWTH ($000s) LOAN PRODUCTION BY TYPE ($000s) LOAN PRODUCTION/LOAN GROWTH 2015 COMMERCIAL 20 1 6 20 1 7 MORTGAGE 2018 CONSUMER 2019 LOAN GROWTH 31

SB FINANCIAL GROUP, INC. TE CHNO L OGY INITIATIVES • Precision Lender (A/I pricing tool) • nCino (Next generation loan origination system) • Sales Force (Company - wide CRM) • Consumer Connect (Mortgage POS) 32

SB FINANCIAL GROUP, INC. ASSET QUALITY HIGHLIGHTS • Robust Loan - Review Process • Dynamic Loan - Approval Process • Portfolio Stress - Testing • Strong AQ Metrics 33
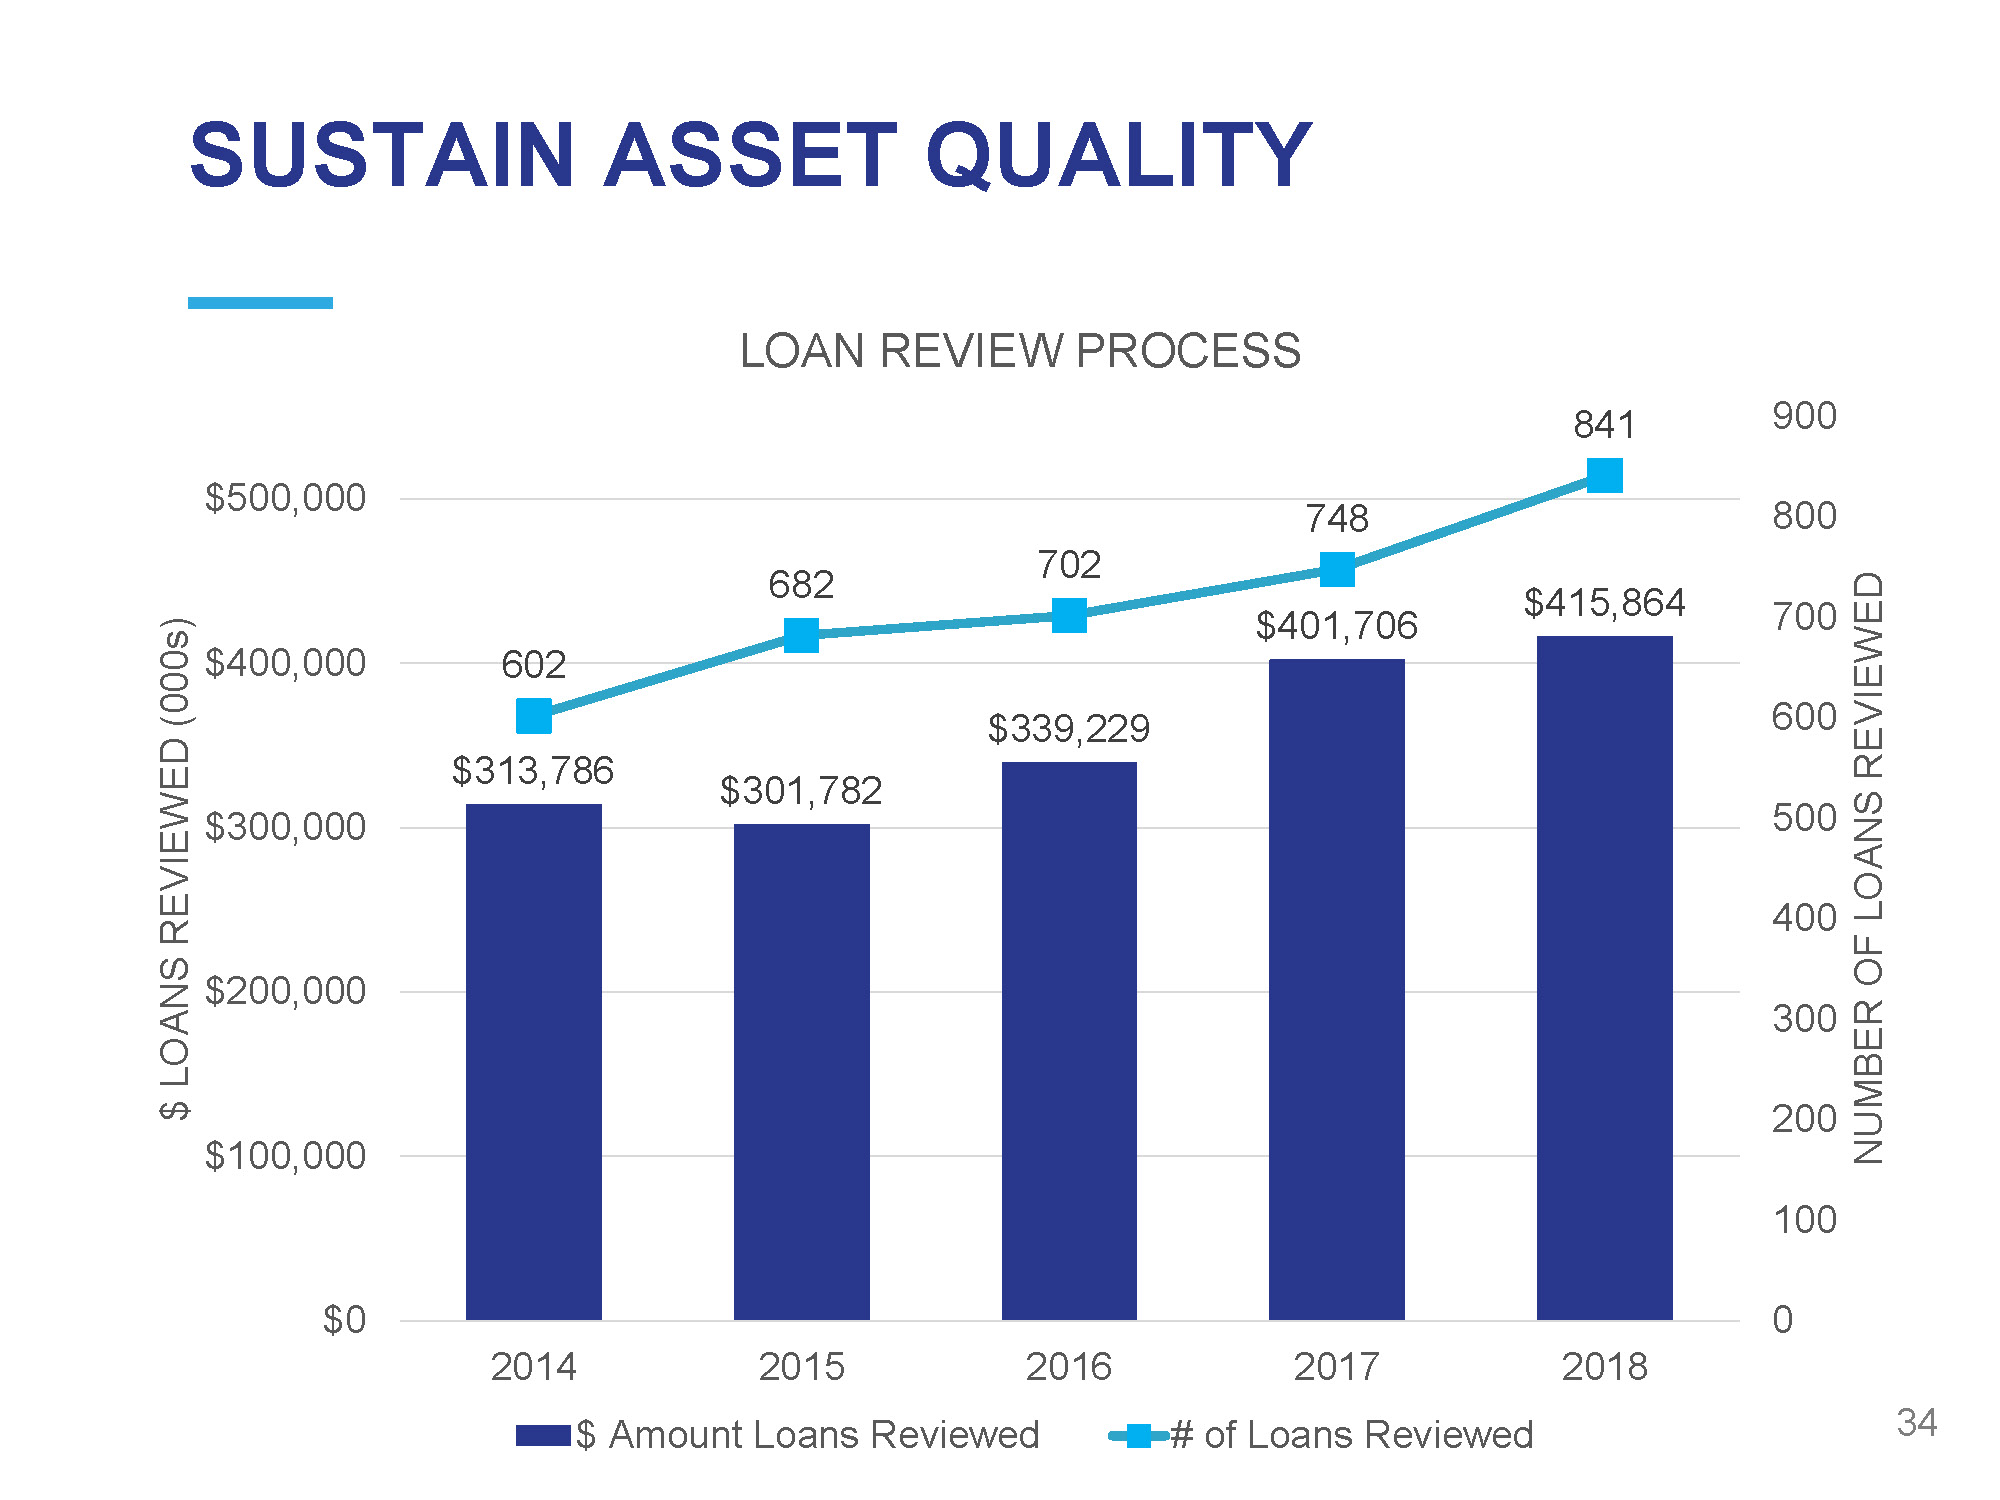
SUSTAIN ASSET QUALITY 3 4 $313,786 $301,782 $339,229 $401,706 $415,864 602 682 702 748 841 0 100 200 300 400 500 600 700 800 900 $ 0 $100,000 $200,000 $300,000 $400,000 $500,000 201 8 NUMBER OF LOANS REVIEWED $ LOANS REVIEWED (000s) LOAN REVIEW PROCESS 201 4 201 5 201 6 $ Amount Loans Reviewed 2017 # of Loans Reviewed
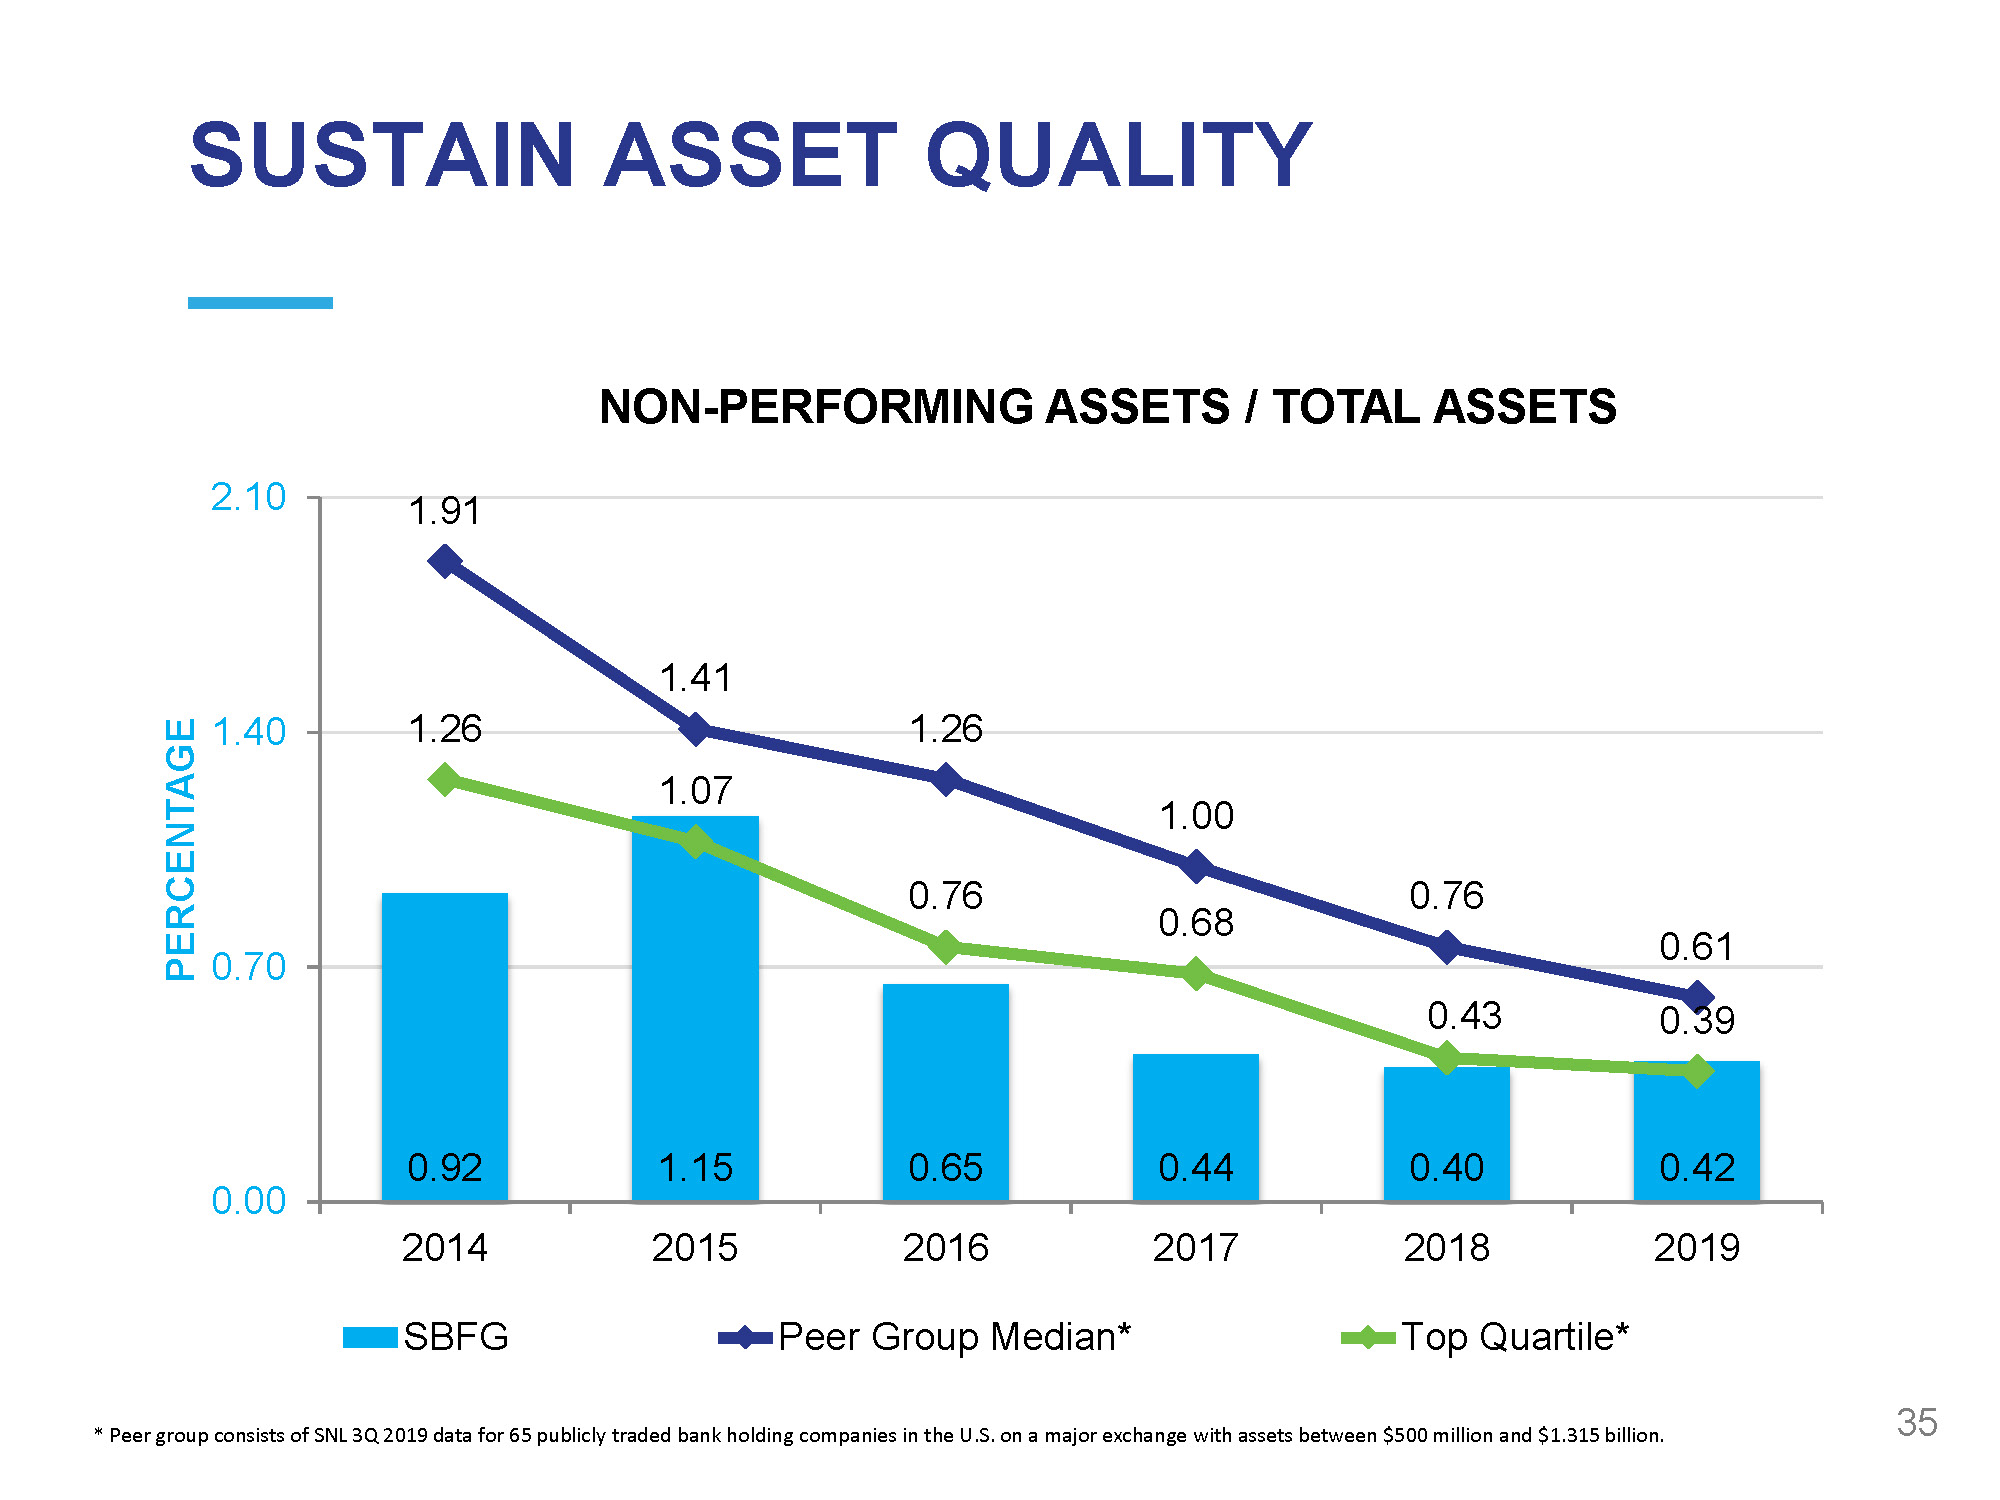
SUSTAIN ASSET QUALITY 3 5 0 . 9 2 1 . 1 5 0 . 6 5 0.44 0 . 4 0 0 . 4 2 1 . 9 1 1 . 4 1 1 . 2 6 1 . 0 0 0 . 7 6 0 . 6 1 1 . 2 6 1 . 0 7 0 . 7 6 0 . 6 8 0 . 4 3 0 . 3 9 0 . 00 0 . 70 1 . 40 2 . 10 201 4 201 5 201 6 201 7 201 8 201 9 PERCENTAGE NON - PERFORMING ASSETS / TOTAL ASSETS SBFG Peer Group Median* Top Quartile* * Peer group consists of SNL 3Q 2019 data for 65 publicly traded bank holding companies in the U.S. on a major exchange with assets between $500 million and $1.315 billion.
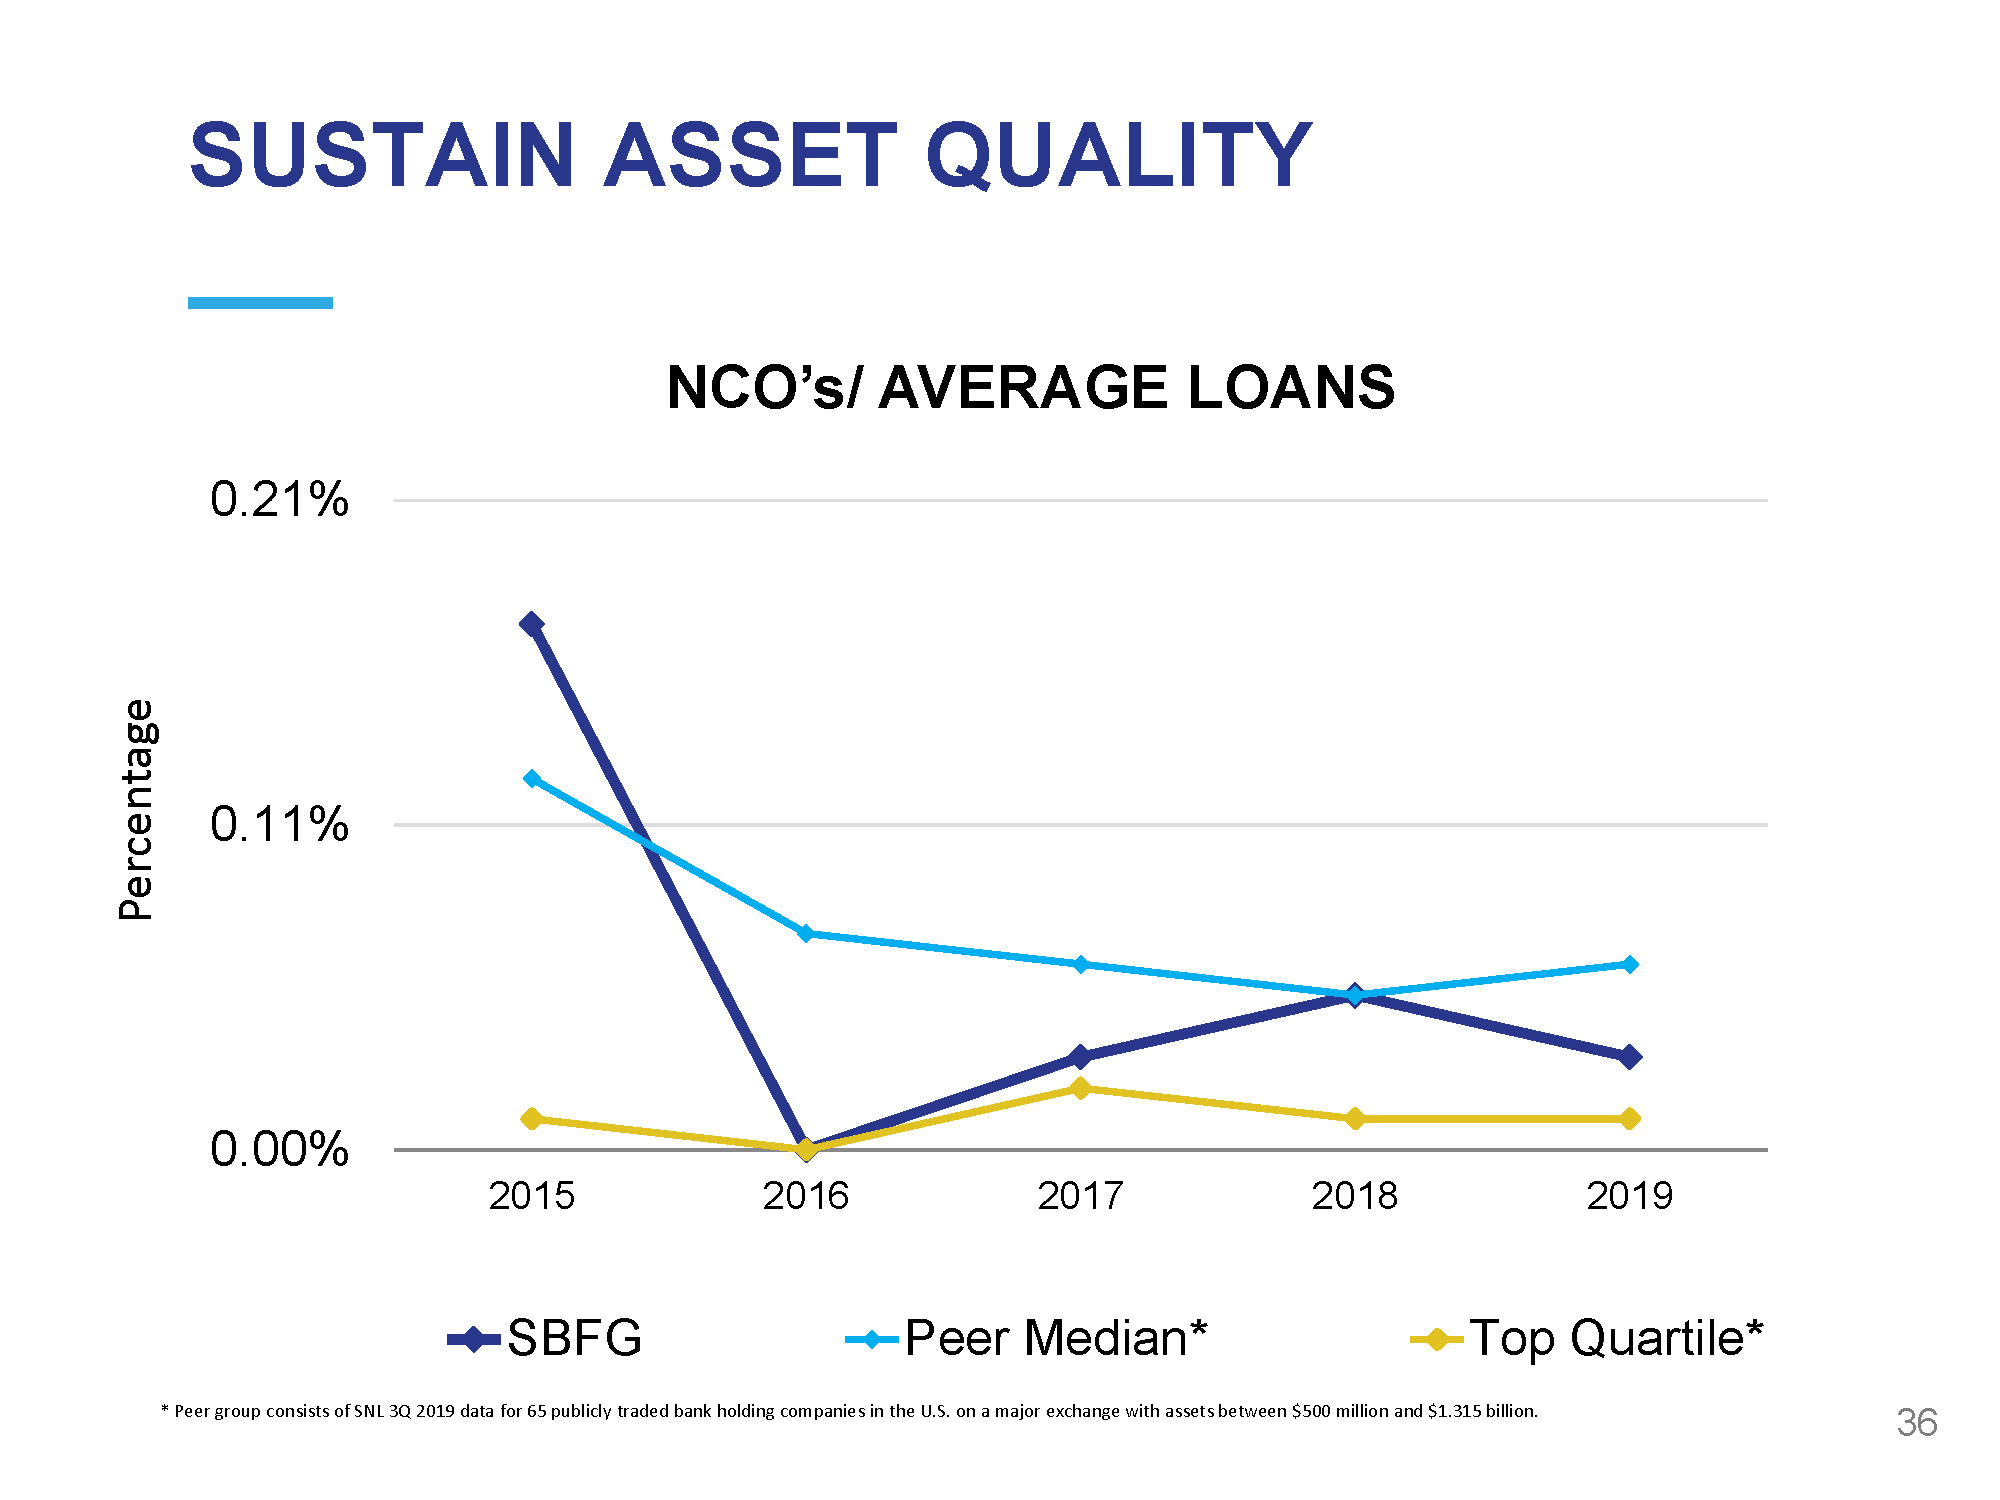
SUSTAIN ASSET QUALITY 3 6 0 . 0 0% 0 . 1 1% 0 . 2 1% 201 5 201 6 201 7 201 8 201 9 NCO’s/ AVERAGE LOANS SBFG Peer Median* Top Quartile* * Peer group consists of SNL 3Q 2019 data for 65 publicly traded bank holding companies in the U.S. on a major exchange with assets between $500 million and $1.315 billion. Percentage

$ 0 . 00 $ 0 . 20 $ 0 . 40 $ 0 . 60 $ 0 . 80 $ 1 . 00 $ 1 . 20 $ 1 . 40 $ 1 . 60 $ 1 . 80 $ 2 . 00 $ 0 . 00 $ 3 . 00 $ 6 . 00 $ 9 . 00 $12.00 $15.00 $18.00 $21.00 2 0 17 2 0 18 2 0 19 * * $ Earnings & Dividends per Share $Price per Share 2 0 1 5 2 0 16 SBFG Market Price Earnings Per Share Dividends Per Share One - time tax cut impact 37 Maximizing Shareholder Value ** 2019 SBFG results exclude OMSR impairment

$1.19 $1.38 $1.74 $1.51 $1.62 $ 2 .00 $ 1 .80 $ 1 .60 $ 1 .40 $ 1 .20 $ 1 .00 $ 0 .80 $ 0 .60 $ 0 .40 $ 0 .20 $ 0 .00 2 0 15 2 0 16 2 0 17 2 0 18 2 0 19 * * Diluted EPS ** 2019 SBFG results exclude OMSR impairment $10.39 38 $11.59 $13.27 $15.39 $15.23 $ 1 8. 0 0 $ 1 6. 0 0 $ 1 4. 0 0 $ 1 2. 0 0 $ 1 0. 0 0 $ 8 .00 $ 6 .00 $ 4 .00 $ 2 .00 $ 0 .00 2 0 15 2 0 16 2 0 17 2 0 18 2019** Tangible Book Value per Share Maximizing Shareholder Value
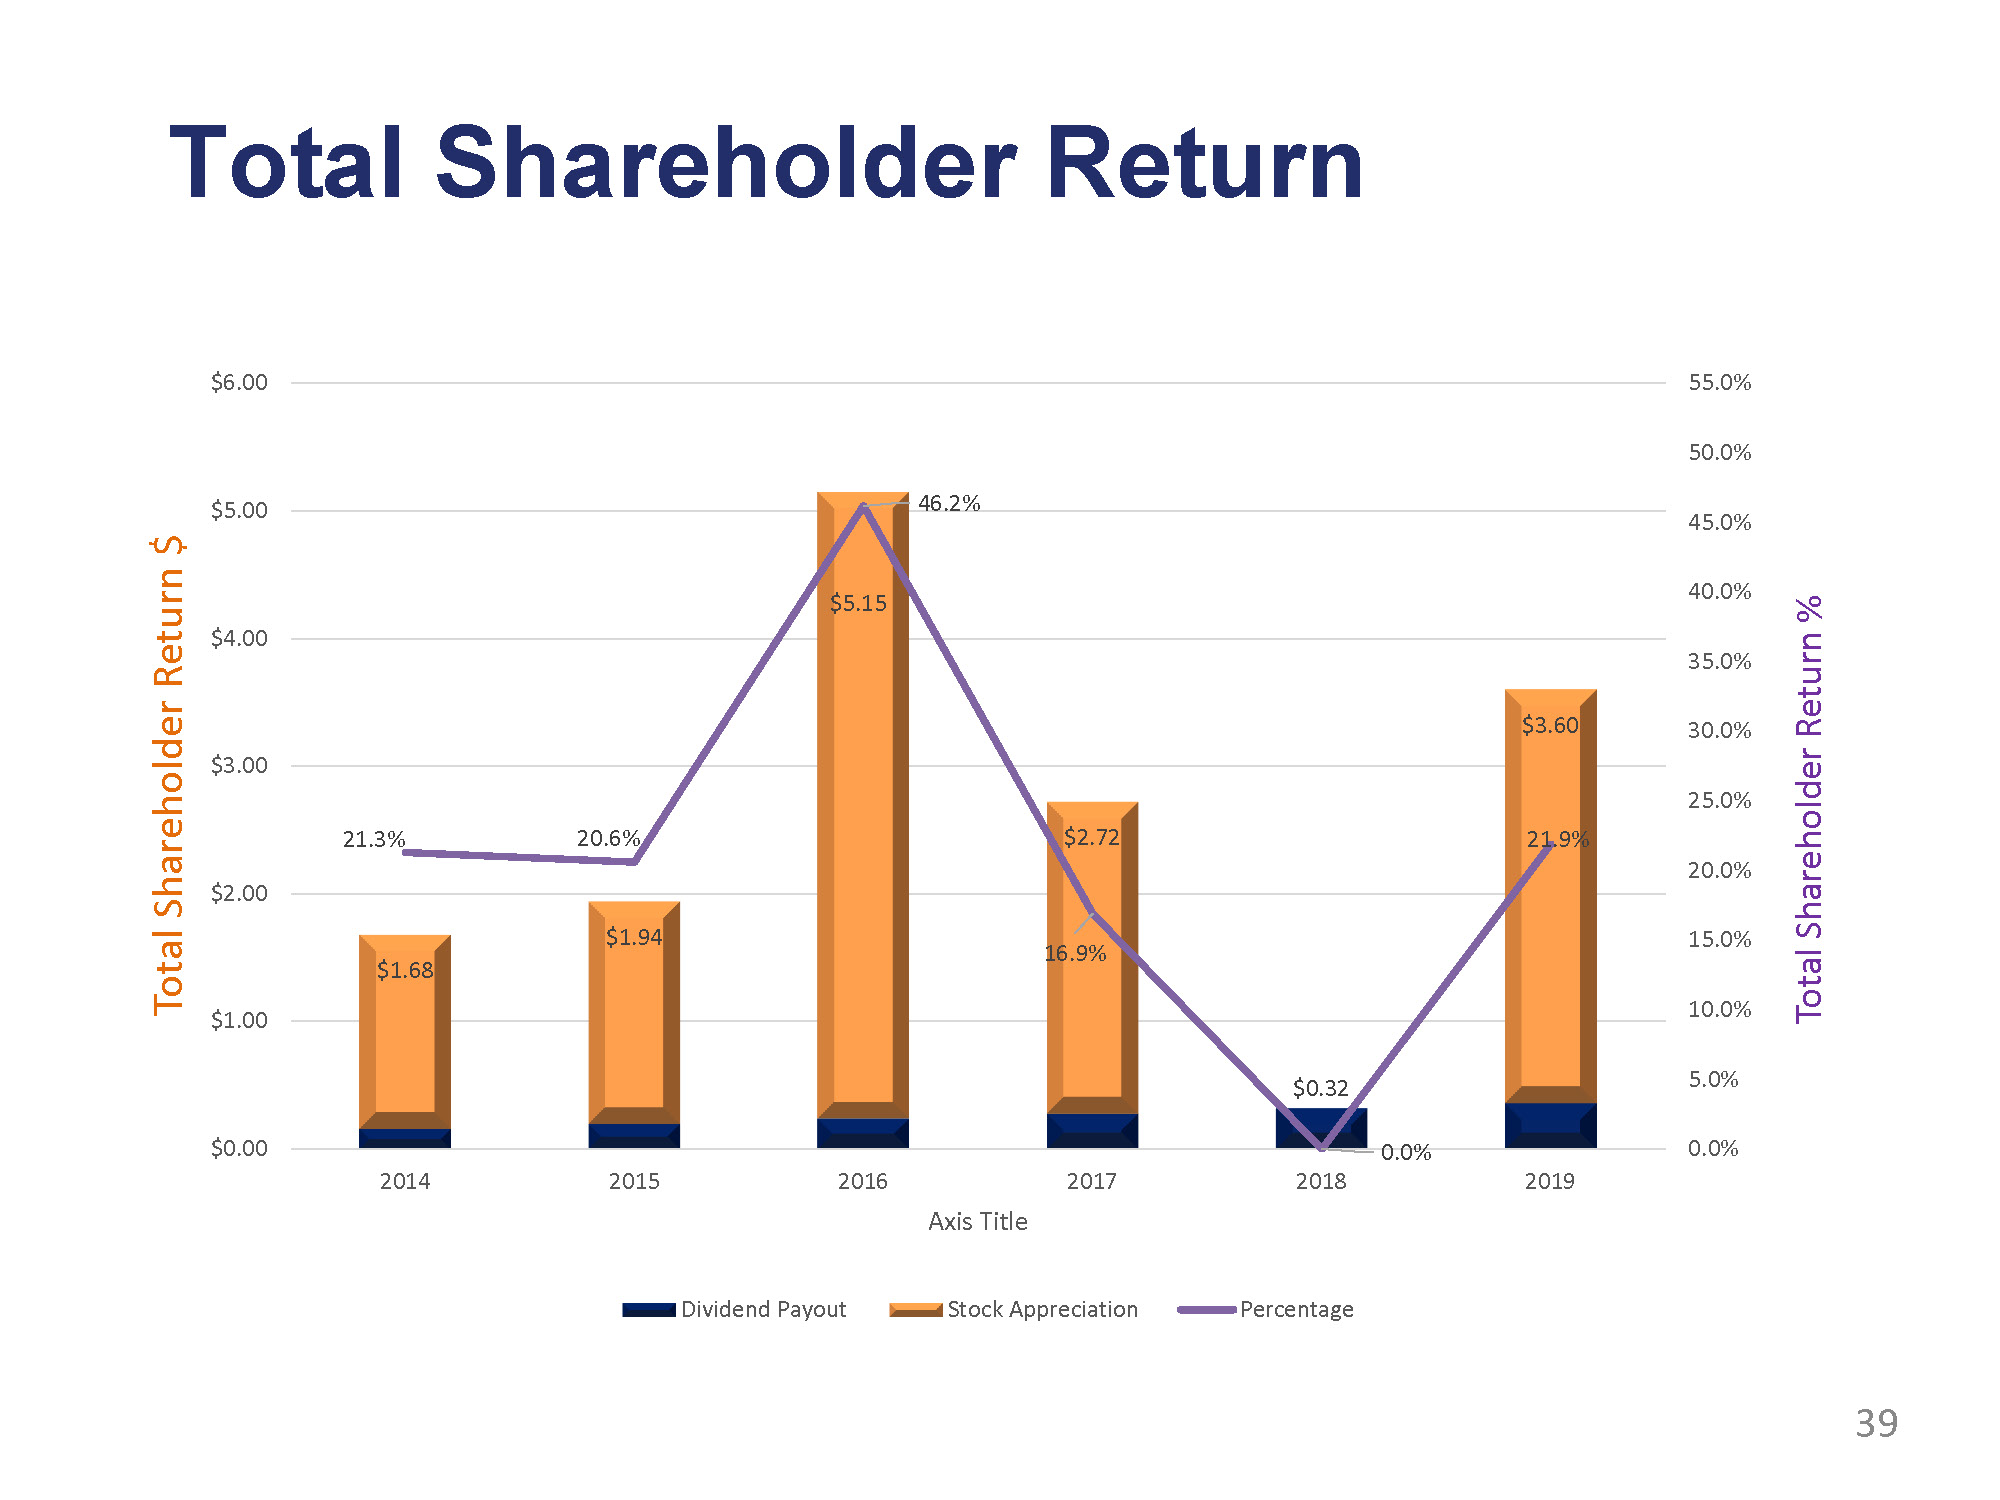
Total Shareholder Return $1.68 $1.94 $5.15 $2.72 $0.32 $3.60 21.3% 20.6% 46.2% 16.9% 0.0% 21.9% 0.0% 5.0% 10.0% 15.0% 20.0% 25.0% 30.0% 35.0% 40.0% 45.0% 50.0% 55.0% $0.00 $1.00 $2.00 $3.00 $4.00 $5.00 $6.00 2014 2015 2016 2017 2018 2019 Total Shareholder Return % Total Shareholder Return $ Axis Title Dividend Payout Stock Appreciation Percentage 39
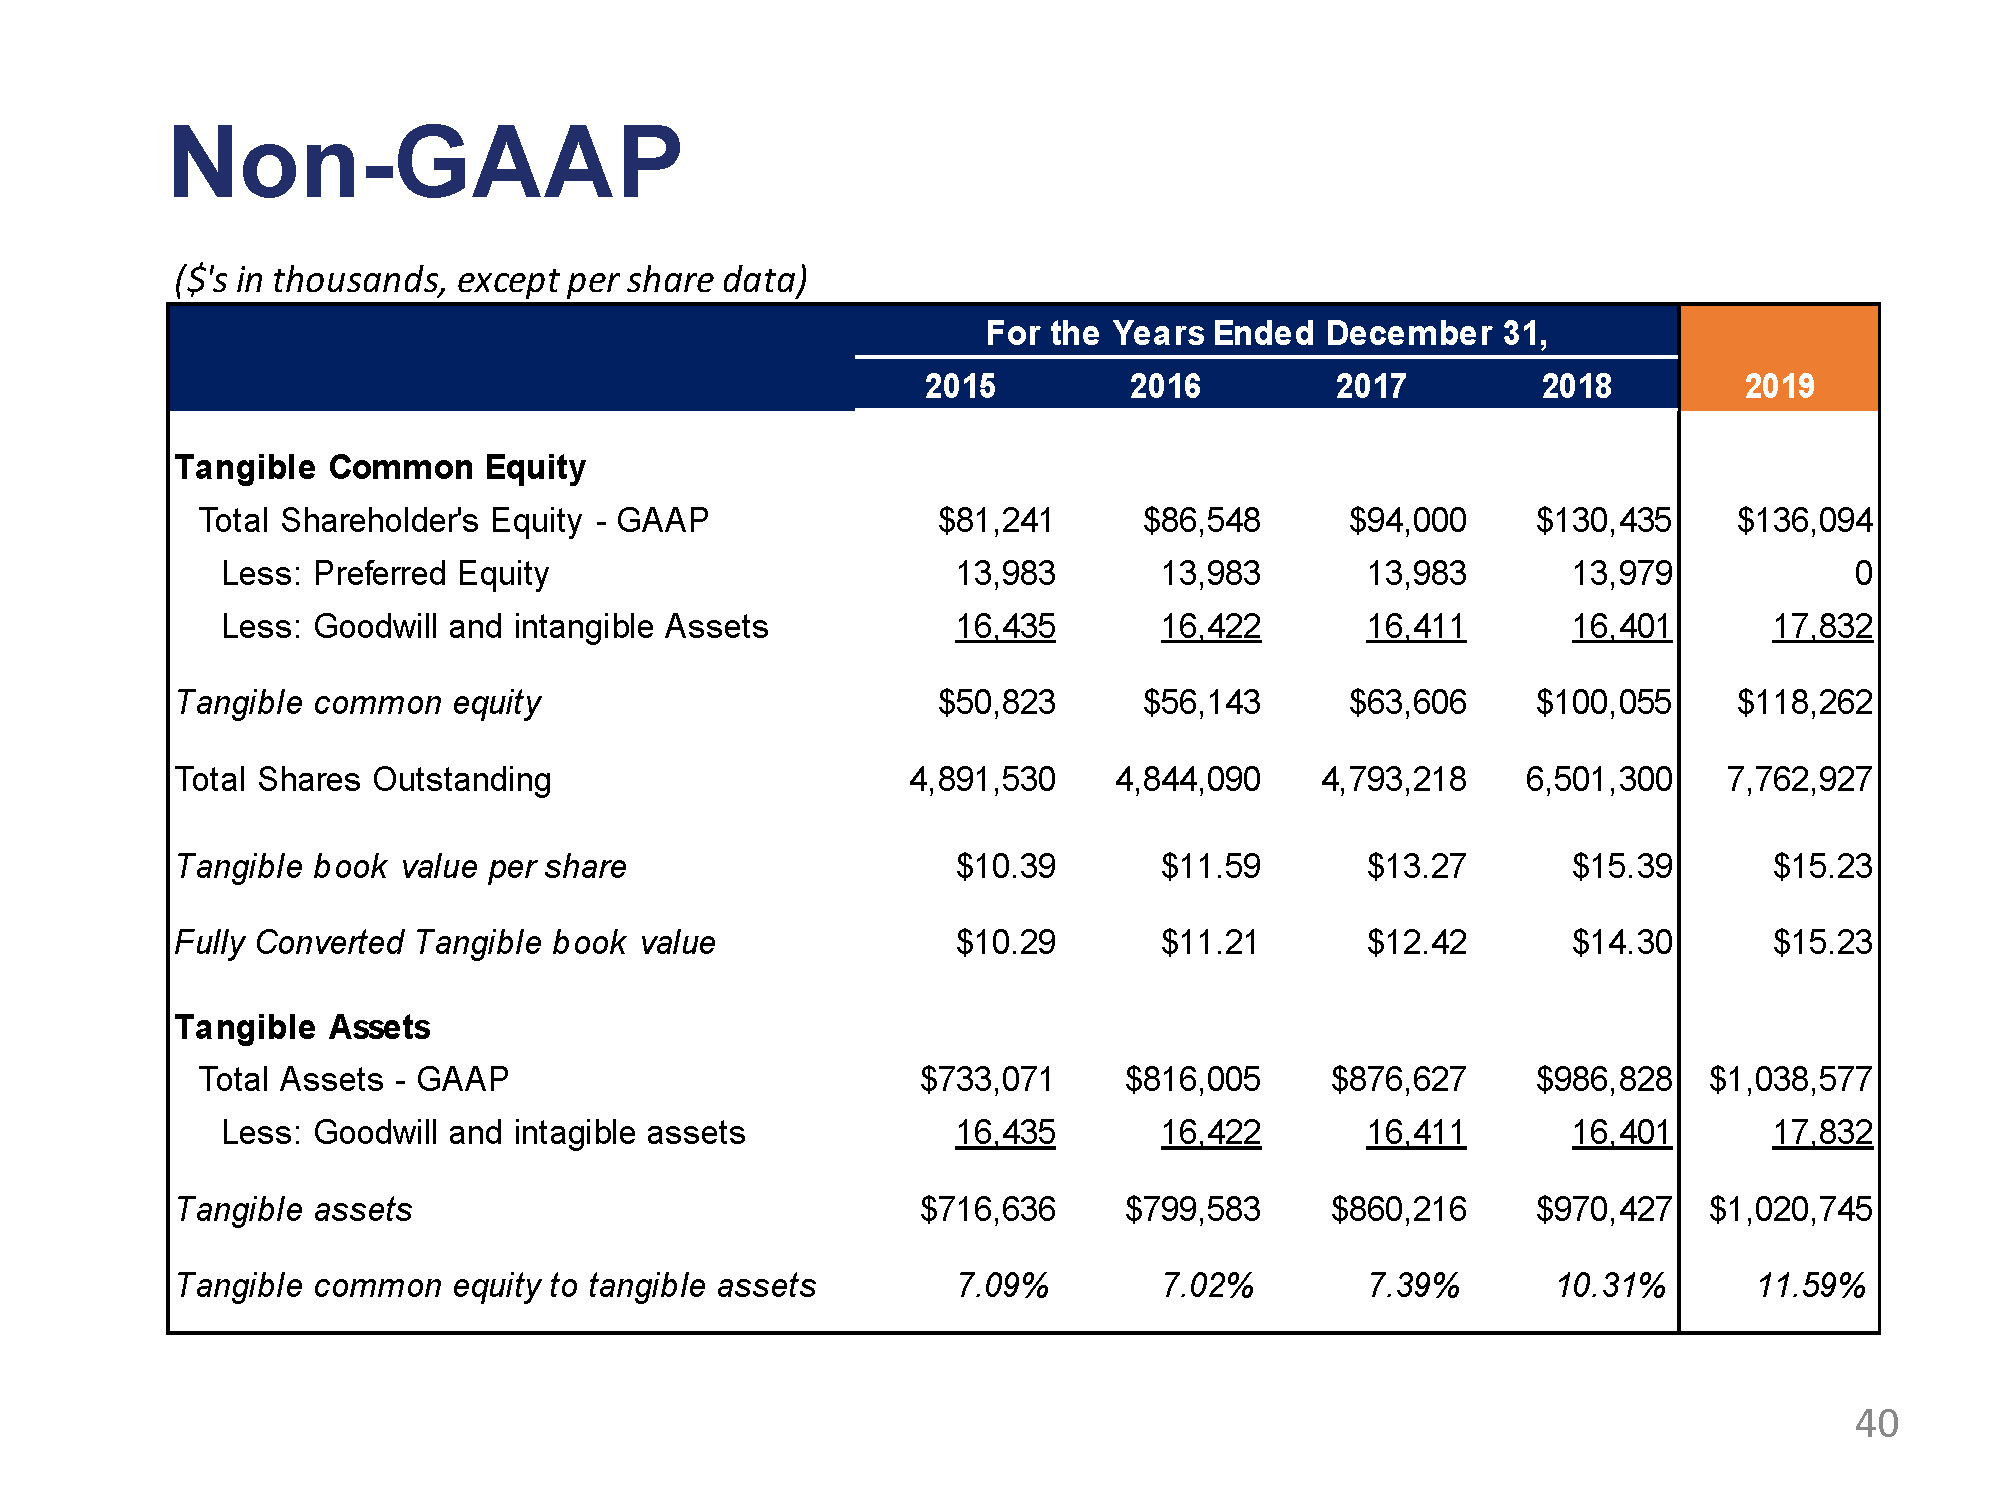
40 Non - GAAP For the Years Ended December 31, 2019 2015 2016 2017 2018 Tangible Common Equity Total Shareholder's Equity - GAAP Less: Preferred Equity Less: Goodwill and intangible Assets Tangible common equity Total Shares Outstanding Tangible book value per share Fully Converted Tangible book value Tangible Assets Total Assets - GAAP Less: Goodwill and intagible assets Tangible assets Tangible common equity to tangible assets $81 , 241 $86 , 548 $94 , 000 $130 , 435 $136 , 094 13 , 983 13 , 983 13 , 983 13 , 979 0 16 , 435 16 , 422 16 , 411 16 , 401 17 , 832 $50 , 823 $56 , 143 $63 , 606 $100 , 055 $118 , 262 4 , 891 , 530 4,844,090 4,793,218 6 , 501 , 300 7 , 762 , 927 $10 . 39 $11 . 59 $13 . 27 $15 . 39 $15 . 23 $10 . 29 $11 . 21 $12 . 42 $14 . 30 $15 . 23 $733 , 071 $816 , 005 $876 , 627 $986 , 828 $1 , 038 , 577 16 , 435 16 , 422 16 , 411 16 , 401 17 , 832 $716 , 636 $799 , 583 $860 , 216 $970 , 427 $1 , 020 , 745 7 . 09% 7 . 02% 7.39% 10 . 31% 11 . 59% ($'s in thousands, except per share data)
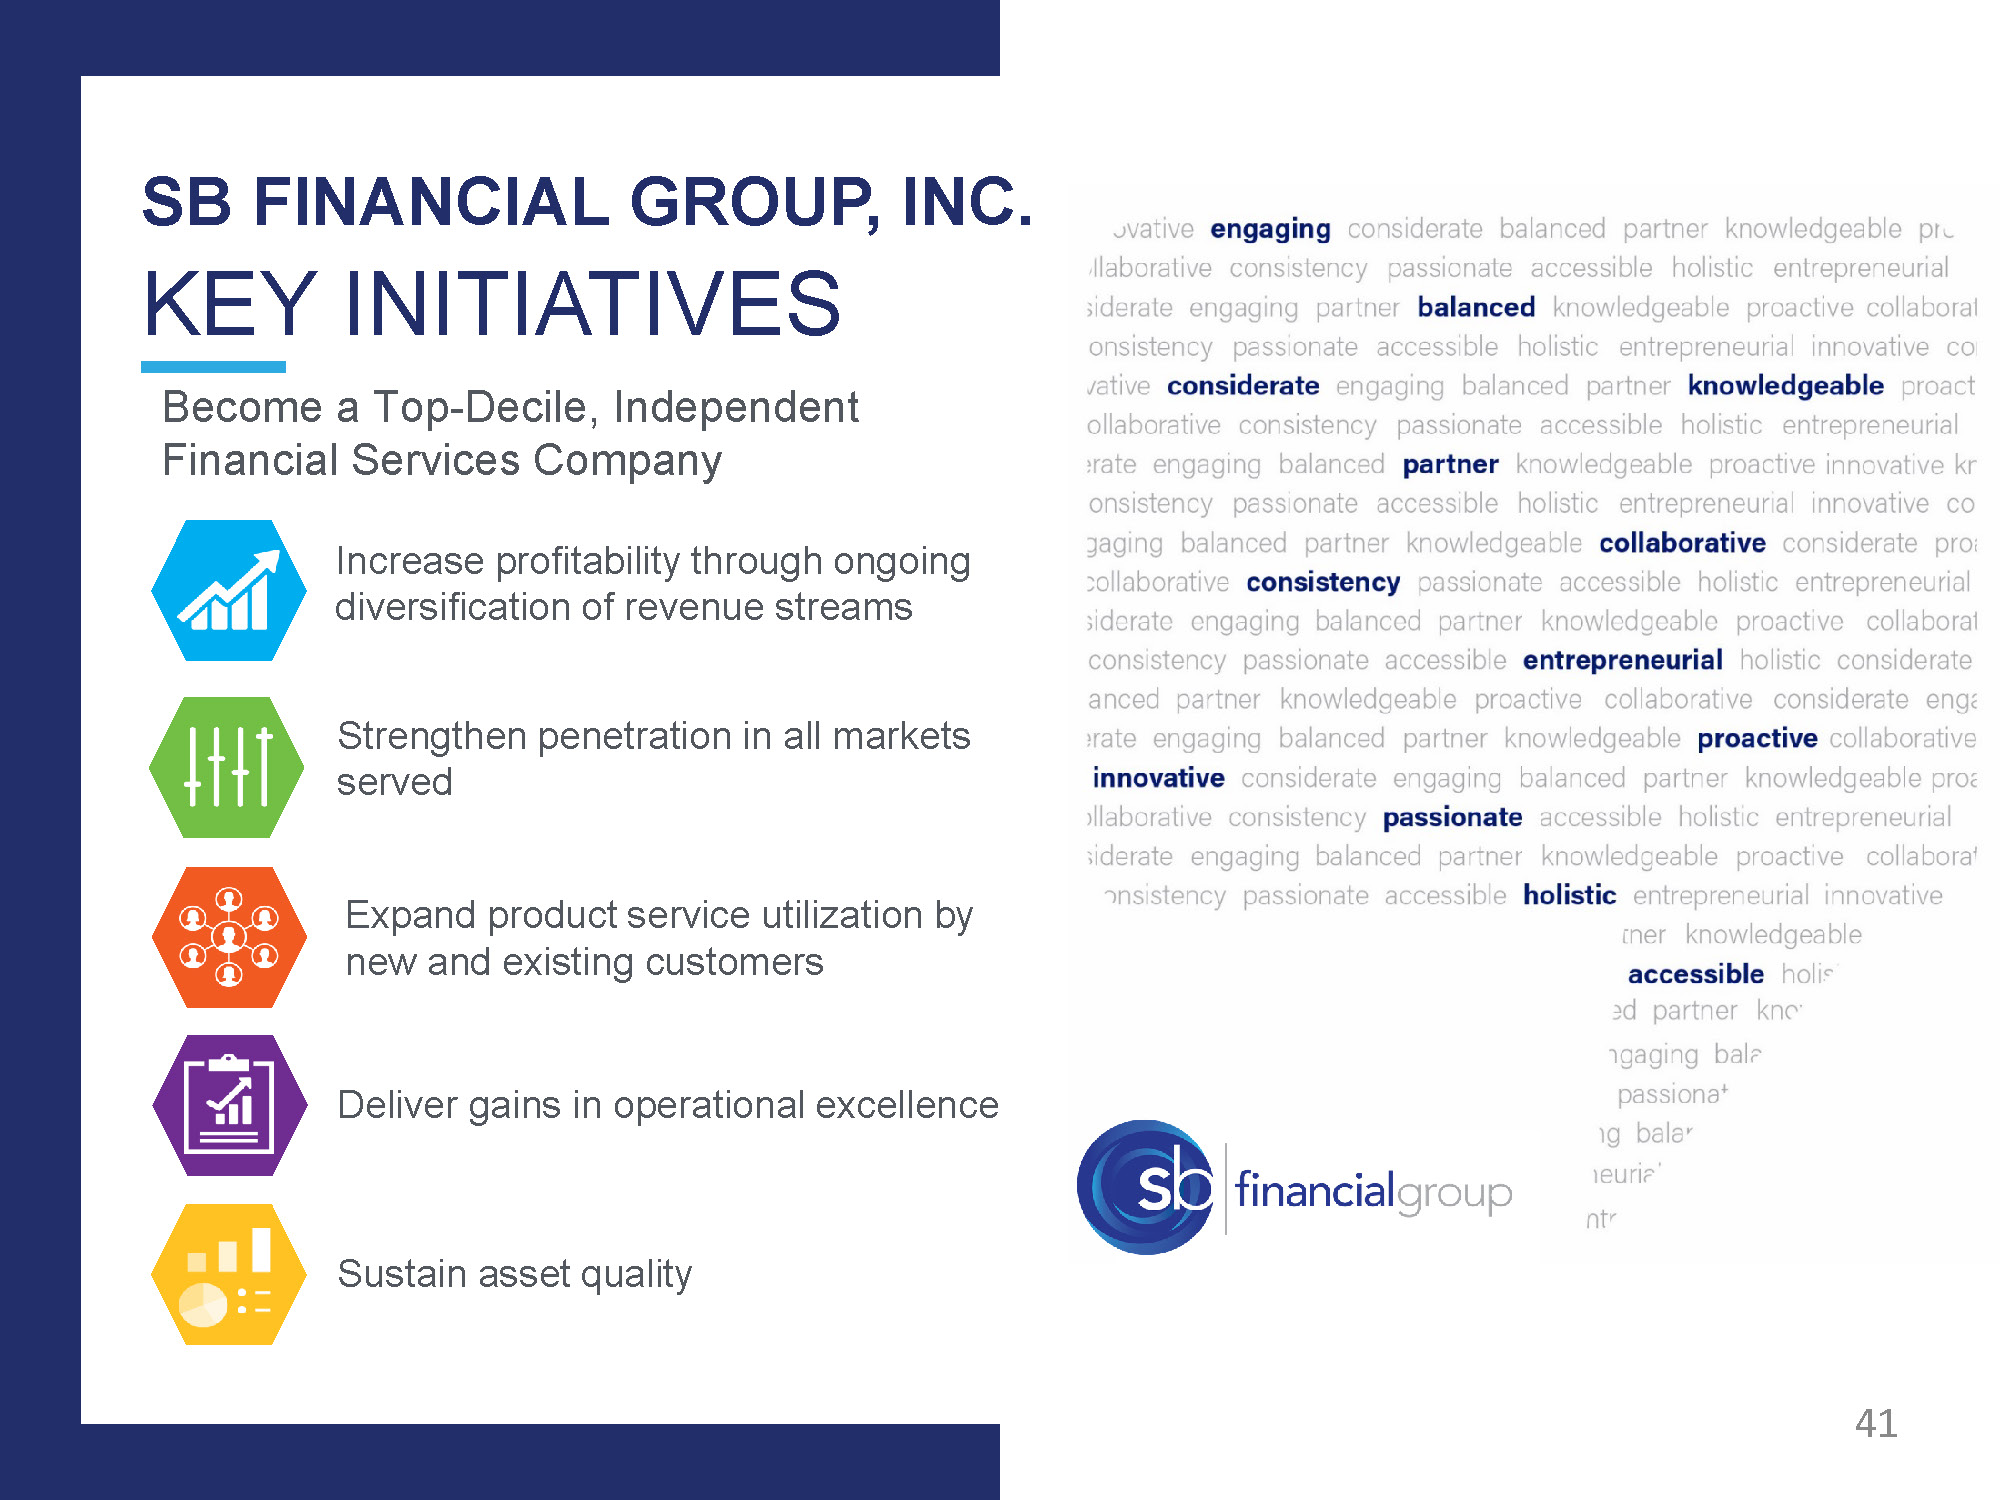
SB FINANCIAL GROUP, INC. KEY INITIATIVES Become a Top - Decile, Independent Financial Services Company Increase profitability through ongoing diversification of revenue streams Strengthen penetration in all markets served Expand product service utilization by new and existing customers Deliver gains in operational excellence Sustain asset quality 41
