Exhibit 99.1

2021 ANNUAL MEETING OF SHAREHOLDERS 1
2020 Business Overview 2

Safe Harbor Statement Certain statements within this document, which are not statements of historical fact, constitute forward - looking statements within the meaning of the Private Securities Litigation Reform Act of 1995. Forward - looking statements involve risks and uncertainties and actual results may differ materially from those predicted by the forward - looking statements. These risks and uncertainties include, but are not limited to the duration and scope of the COVID - 19 outbreak in the United States and the market areas in which SB Financial and its subsidiaries operate, including the impact to the state and local economies of prolonged shelter in place orders and the pandemic generally, risks and uncertainties inherent in the national and regional banking, insurance and mortgage industries, competitive factors specific to markets in which SB Financial Group and its subsidiaries operate, future interest rate levels, legislative and regulatory actions, capital market conditions, general economic conditions, geopolitical events, the loss of key personnel and other factors. Additional factors that could cause results to differ from those described above can be found in the Company’s Annual Report on Form 10 - K and documents subsequently filed by SB Financial Group with the Securities and Exchange Commission. Forward - looking statements speak only as of the date on which they are made, and SB Financial Group undertakes no obligation to update any forward - looking statement to reflect events or circumstances after the date on which the statement is made except as required by law. All subsequent written and oral forward - looking statements attributable to SB Financial Group or any person acting on its behalf are qualified by these cautionary statements. 3

• Net income of $18.8* million or $2.44*/ share • Assets grew by $219 million or 21.1 % • ROAA 1.61%* -- 83 rd percentile (12 th place )** • Ranked 125 out of 200 Banks According to ABA (2019 ) • Improved our position to the 3 rd largest mortgage producer in the greater Columbus market (2019 Volume) • Provided over 670 PPP loans with total balances of $84 million *2020 SBFG results exclude OMSR impairment, merger costs ** Peer group consists of SNL 2020 data for 65 publicly traded bank holding companies in the U.S. on a major exchange with assets between $500 million and $2.06 billion. 2020 Highlights 4
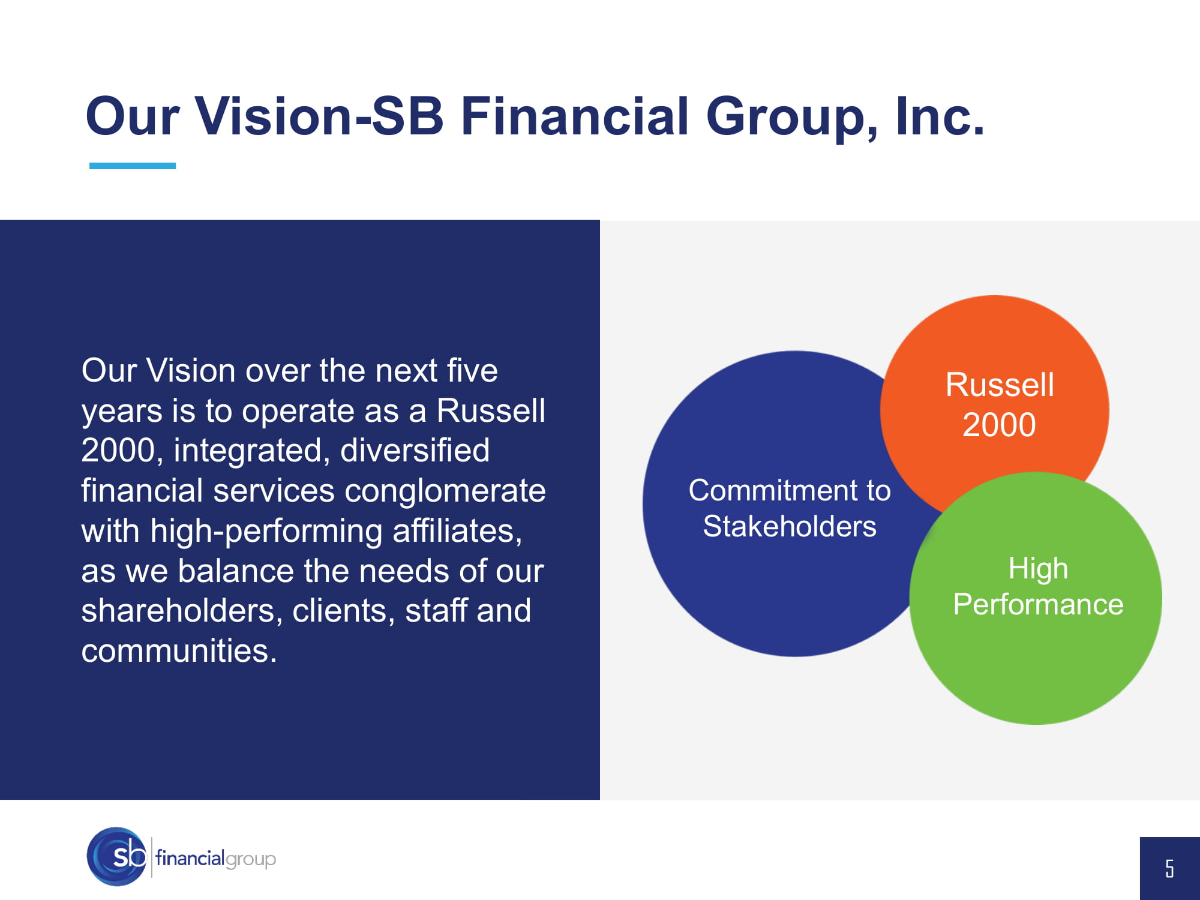
Our Vision over the next five years is to operate as a Russell 2000, integrated, diversified financial services conglomerate with high - performing affiliates, as we balance the needs of our shareholders, clients, staff and communities. Russell 2000 Commitment to Stakeholders High Performance Our Vision - SB Financial Group, Inc. 5
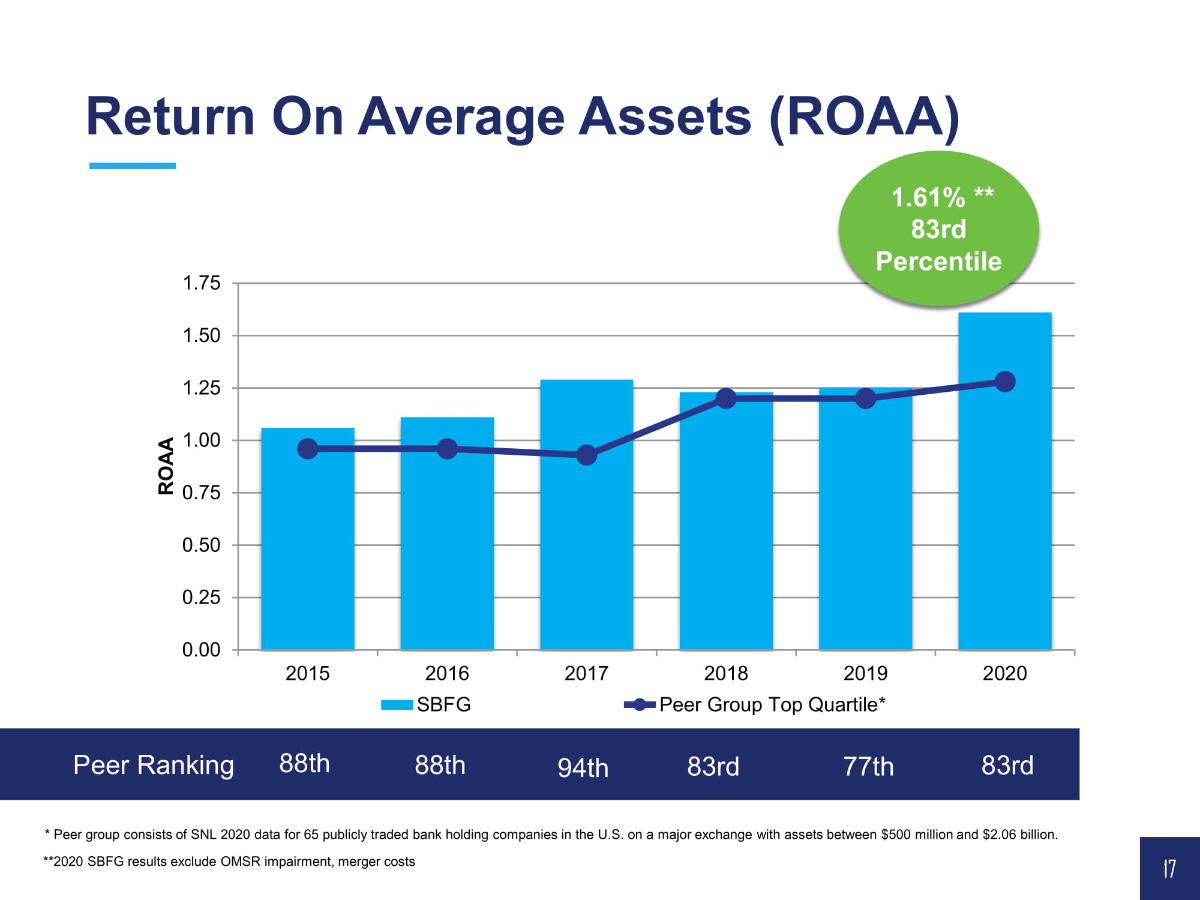
0.00 0.25 0.50 0.75 1.00 1.25 1.50 1.75 2015 2016 2017 2018 2019 2020 ROAA SBFG Peer Group Top Quartile* 1.61% ** 83rd Percentile * Peer group consists of SNL 20 20 data for 65 publicly traded bank holding companies in the U.S. on a major exchange with assets between $500 million and $ 2.06 billion. **2020 SBFG results exclude OMSR impairment, merger costs 88th Peer Ranking 88th 94th 83rd 77th Return On Average Assets (ROAA) 17 83rd

• NASDAQ: SBFG • Defiance, Ohio - Headquarters since 1902 • Corporate Staff Members - 244 • Average Daily Share Volume for 2020 – 16,900; 7.4 million common shares • Institutional Ownership: 49.6% • Market Cap: $135 million ($18.28 share 12/31/2020) Corporate Overview 18

Our Organization & Leadership 19 CORPORATE LEADERSHIP • Mark Klein – Chairman, President/CEO • Tony Cosentino – EVP/CFO • Ernesto Gaytan – EVP/Chief Technology Innovation and Operations Officer • Keeta Diller – EVP/Chief Risk Officer REGIONAL/COMMERCIAL LEADERSHIP • David Homoelle – Regional President, Columbus • Jon Gathman – EVP/Senior Lender • Mark Cassin – SVP Regional Executive, Bowling Green • Andy Farley – SVP Regional Executive, Lima • Tyson Moss – SVP Regional Executive, Fulton/Williams • Chris Webb – SVP Regional Executive, Findlay • Stefan Hartman – SVP Regional Executive, Fort Wayne • Zac Isaac – SVP Regional Executive, Toledo SB FINANCIAL GROUP STATE BANK PEAK TITLE • Abby Waters – President PEAK TITLE
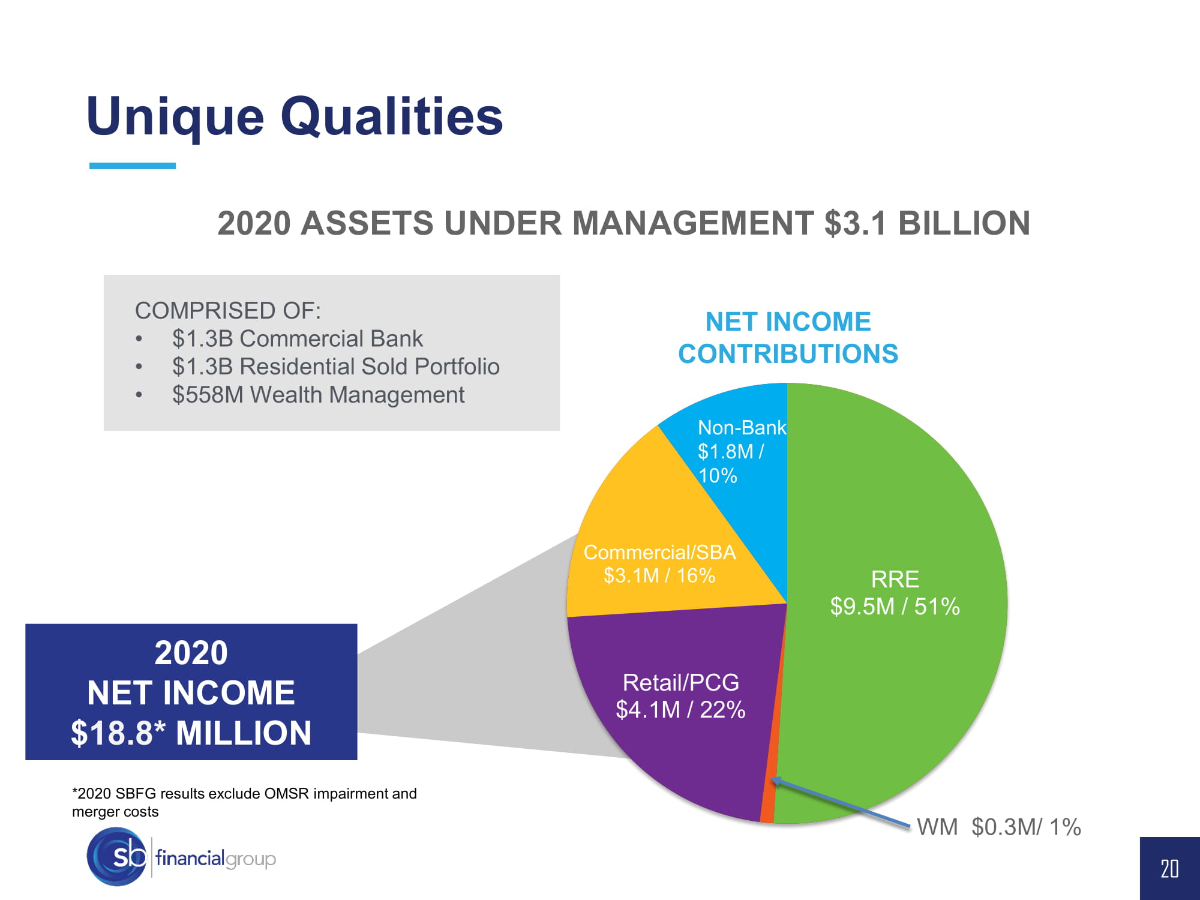
RRE $9.5M / 51% Retail/PCG $4.1M / 22% Commercial /SBA $3.1M / 16% Non - Bank $1.8M / 10% WM $0.3M/ 1% NET INCOME CONTRIBUTIONS 20 20 NET INCOME $ 18.8* MILLION 20 20 ASSETS UNDER MANAGEMENT $ 3.1 BILLION COMPRISED OF: • $ 1.3B Commercial Bank • $1.3B Residential Sold Portfolio • $ 558 M Wealth Management *2020 SBFG results exclude OMSR impairment and merger costs Unique Qualities 20
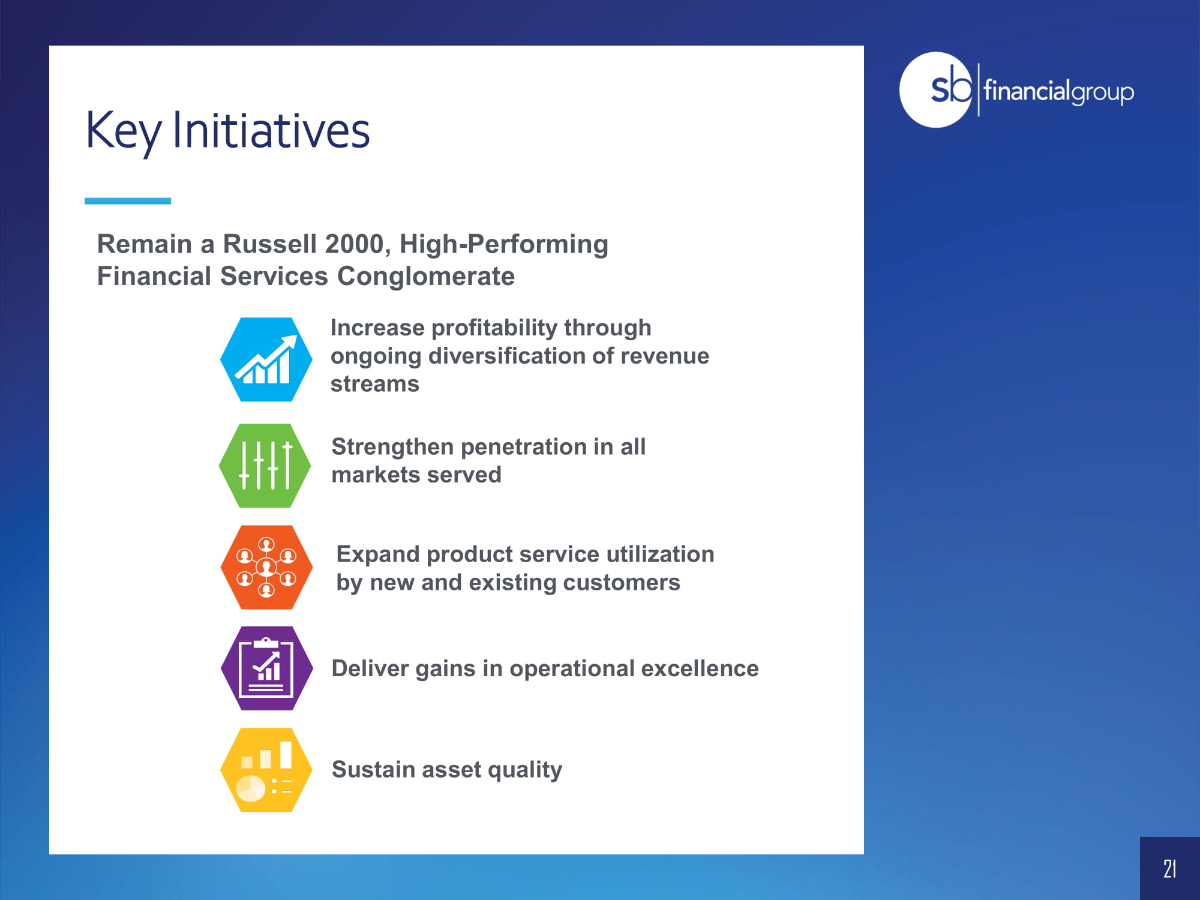
Key Initiatives Remain a Russell 2000, High - Performing Financial Services Conglomerate Increase profitability through ongoing diversification of revenue streams Strengthen penetration in all markets served Expand product service utilization by new and existing customers Deliver gains in operational excellence Sustain asset quality 21

Key Initiatives Become a Top - Decil e, Independent Financial Services Company Increase profitability through ongoing diversification of revenue streams Strengthen penetration in all markets served Expand product service utilization by new and existing customers Deliver gains in operational excellence Sustain asset quality 22
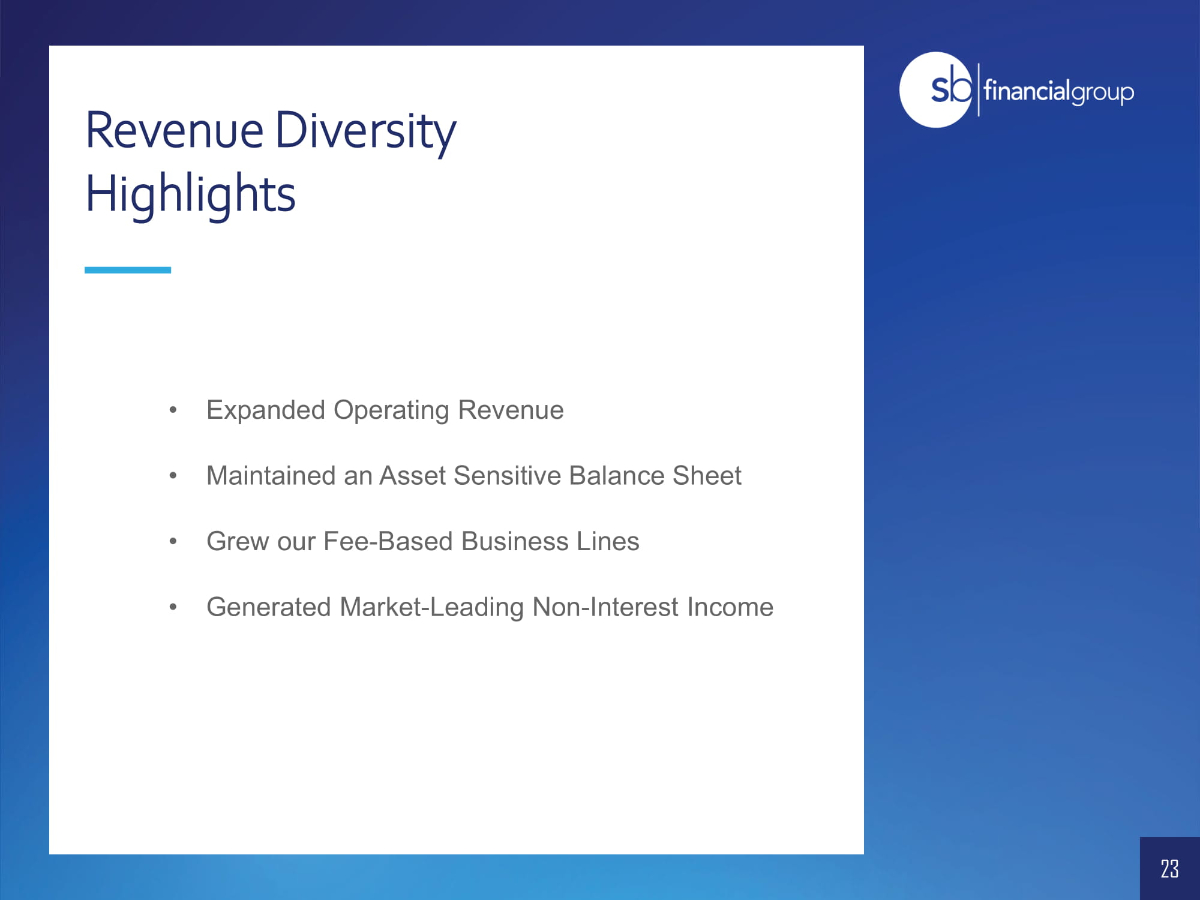
• Expanded Operating Revenue • Maintained an Asset Sensitive Balance Sheet • Grew our Fee - Based Business Lines • Generated Market - Leading Non - Interest Income Revenue Diversity Highlights 23
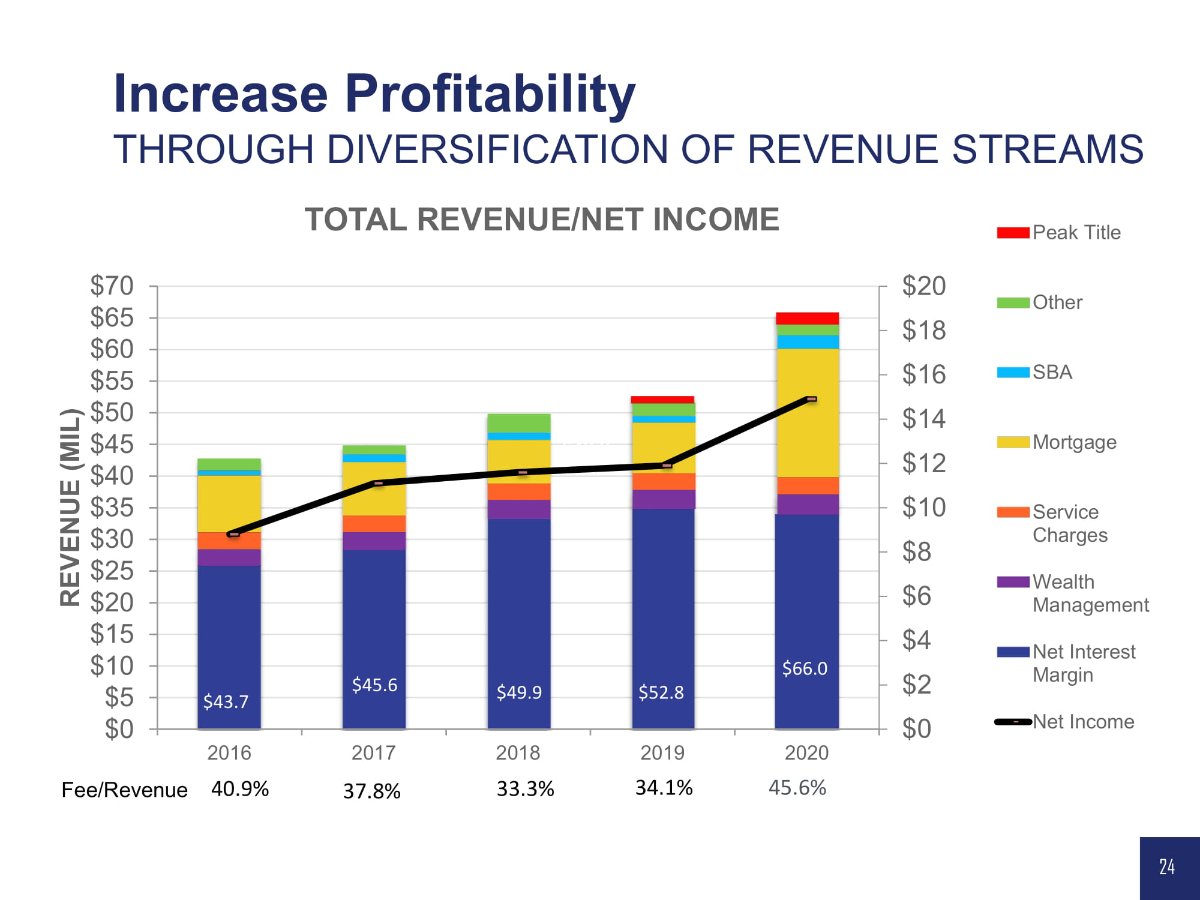
Increase Profitability THROUGH DIVERSIFICATION OF REVENUE STREAMS $0 $2 $4 $6 $8 $10 $12 $14 $16 $18 $20 $0 $5 $10 $15 $20 $25 $30 $35 $40 $45 $50 $55 $60 $65 $70 2016 2017 2018 2019 2020 REVENUE (MIL) TOTAL REVENUE/NET INCOME Peak Title Other SBA Mortgage Service Charges Wealth Management Net Interest Margin Net Income $43.7 $49.9 $52.8 45.6% $66.0 Fee/Revenue 40.9% 37.8% 33.3% 34.1% 24 $49.9 $45.6
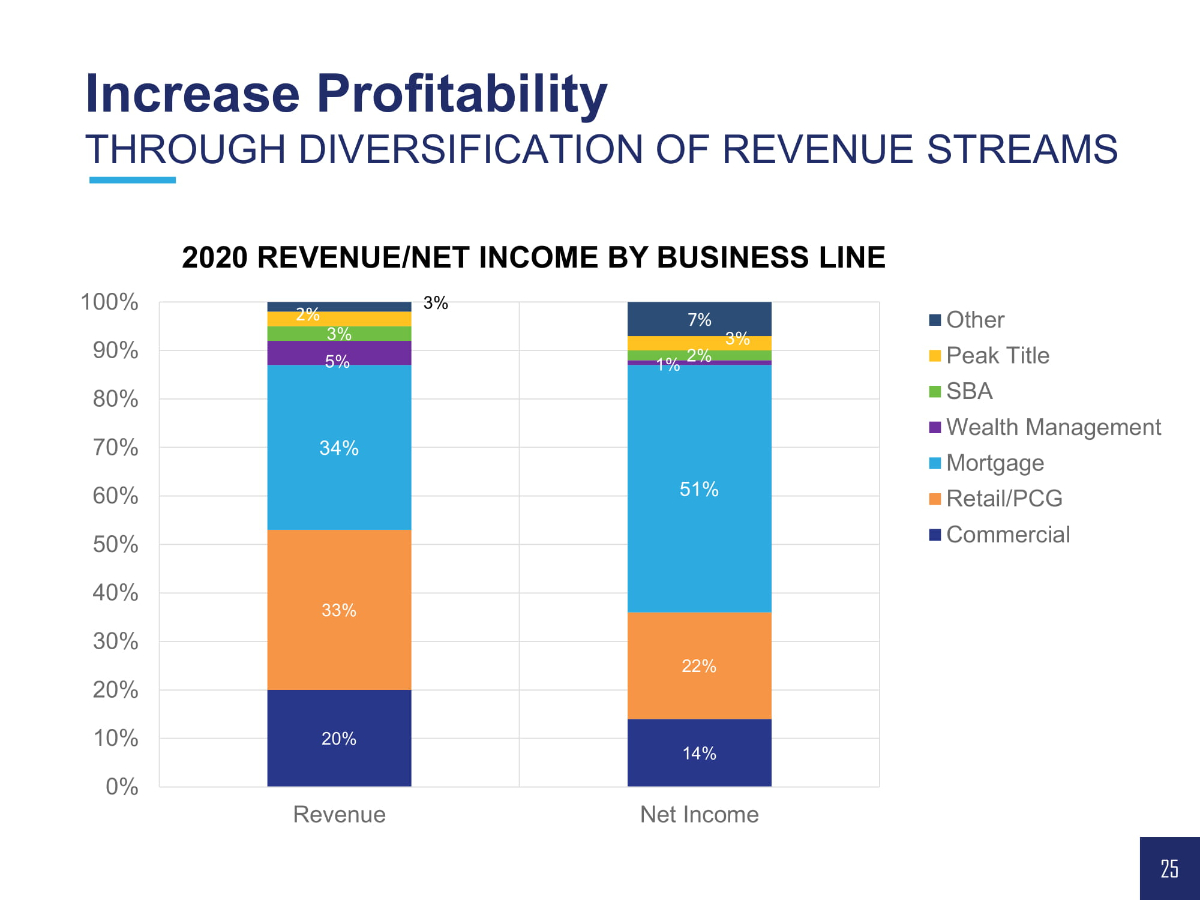
20% 14% 33% 22% 34% 51% 5% 1% 3% 2% 3% 3% 2% 7% 0% 10% 20% 30% 40% 50% 60% 70% 80% 90% 100% Revenue Net Income 2020 REVENUE/NET INCOME BY BUSINESS LINE Other Peak Title SBA Wealth Management Mortgage Retail/PCG Commercial Increase Profitability THROUGH DIVERSIFICATION OF REVENUE STREAMS 25

* Peer group consists of SNL 20 20 data for 65 publicly traded bank holding companies in the U.S. on a major exchange with assets between $500 million and $ 2.06 billion 0.0% 5.0% 10.0% 15.0% 20.0% 25.0% 30.0% 35.0% 40.0% 45.0% 50.0% 2016 2017 2018 2019 2020 PERCENTAGE NON - INTEREST INCOME/ REVENUE SBFG Peer Median* Peer 75th* Increase Profitability THROUGH DIVERSIFICATION OF REVENUE STREAMS 26
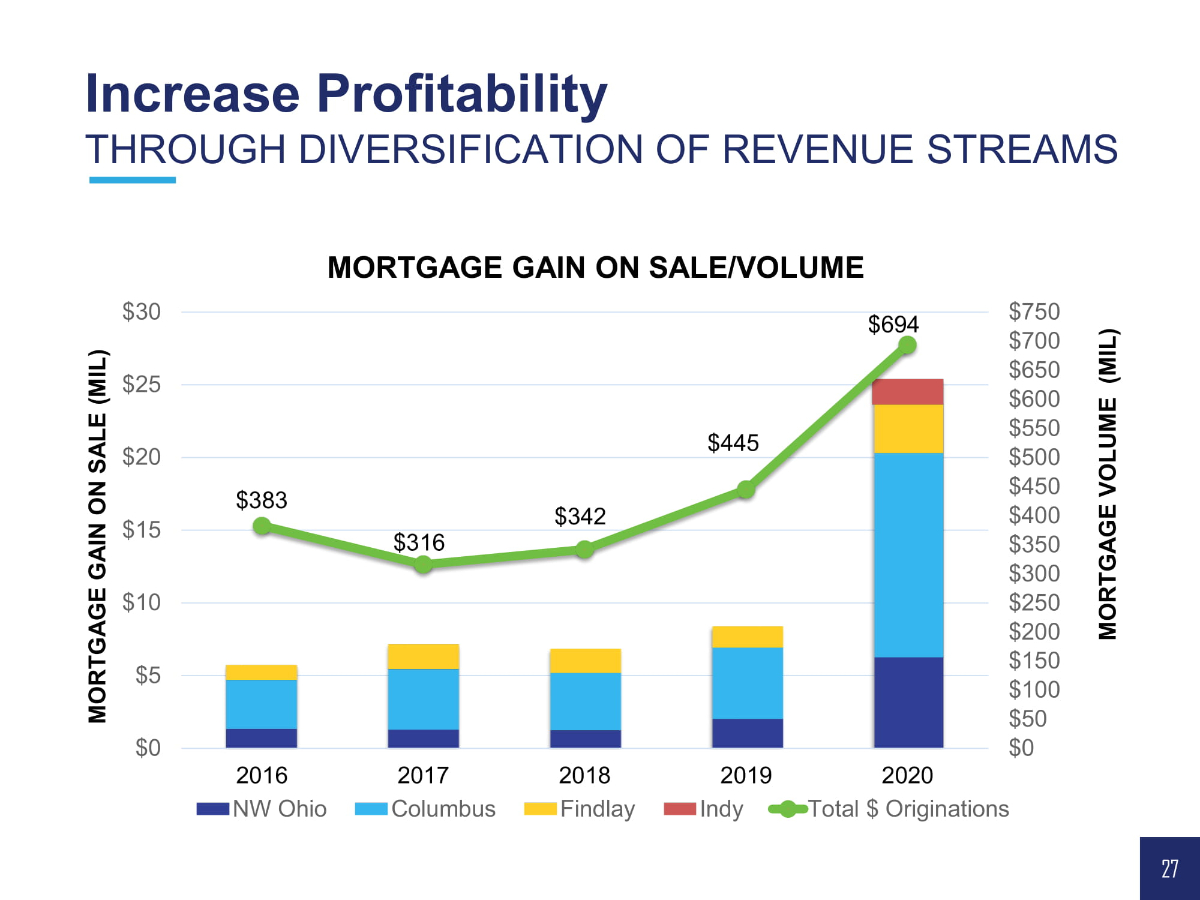
$383 $316 $342 $445 $694 $0 $50 $100 $150 $200 $250 $300 $350 $400 $450 $500 $550 $600 $650 $700 $750 $0 $5 $10 $15 $20 $25 $30 2016 2017 2018 2019 2020 MORTGAGE VOLUME (MIL) MORTGAGE GAIN ON SALE (MIL) MORTGAGE GAIN ON SALE/VOLUME NW Ohio Columbus Findlay Indy Total $ Originations Increase Profitability THROUGH DIVERSIFICATION OF REVENUE STREAMS 27
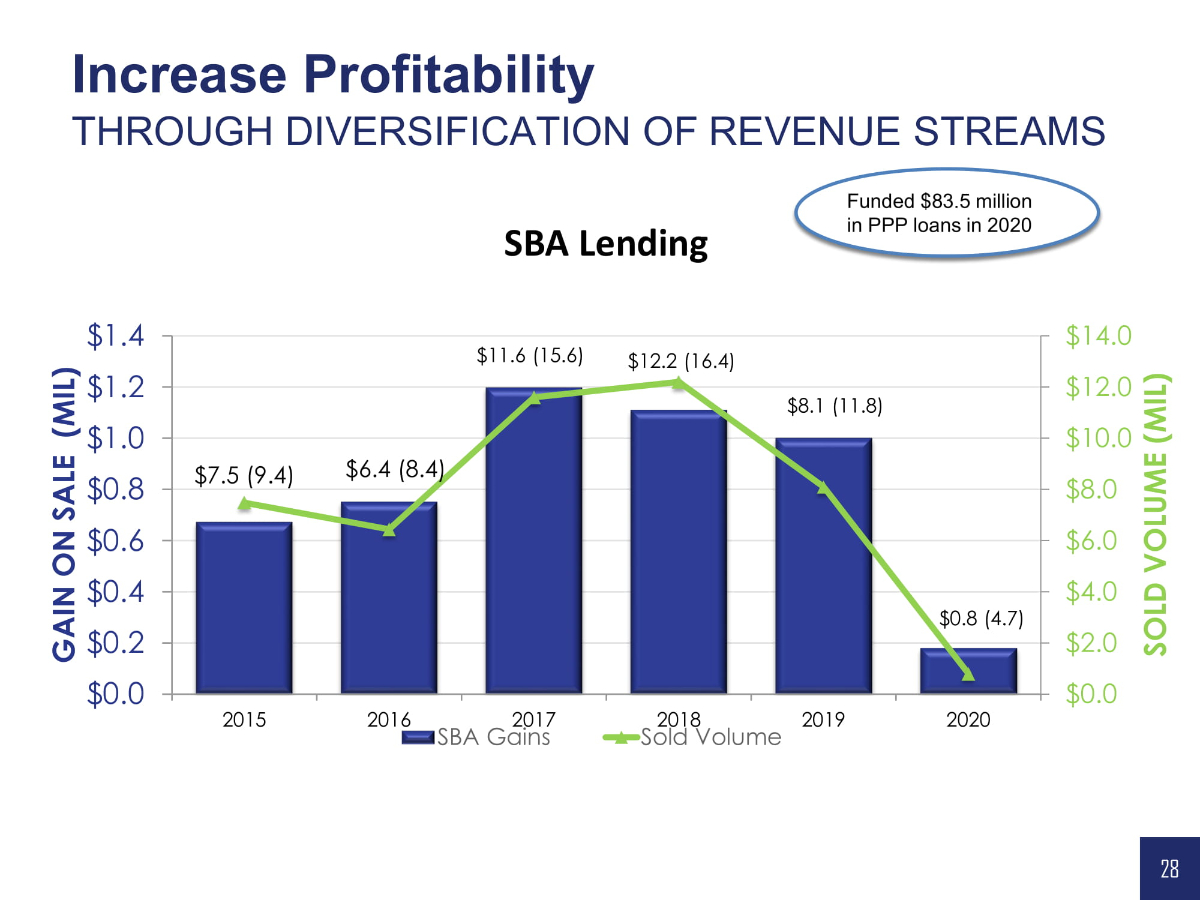
Increase Profitability THROUGH DIVERSIFICATION OF REVENUE STREAMS $7.5 (9.4) $6.4 (8.4) $11.6 (15.6) $12.2 (16.4) $8.1 (11.8) $0.8 (4.7) $0.0 $2.0 $4.0 $6.0 $8.0 $10.0 $12.0 $14.0 $0.0 $0.2 $0.4 $0.6 $0.8 $1.0 $1.2 $1.4 2015 2016 2017 2018 2019 2020 SOLD VOLUME (MIL) GAIN ON SALE (MIL) SBA Gains Sold Volume 1 7 28 Funded $83.5 million in PPP loans in 2020 SBA Lending

Increase Profitability THROUGH DIVERSIFICATION OF REVENUE STREAMS PAYCHECK PROTECTION PROGRAM 29 $67.0 $23.7 $16.5 $5.1 $0 $10 $20 $30 $40 $50 $60 $70 $80 $90 2020 2021 Millions Customers Prospects ~$5.0 Million in Fees
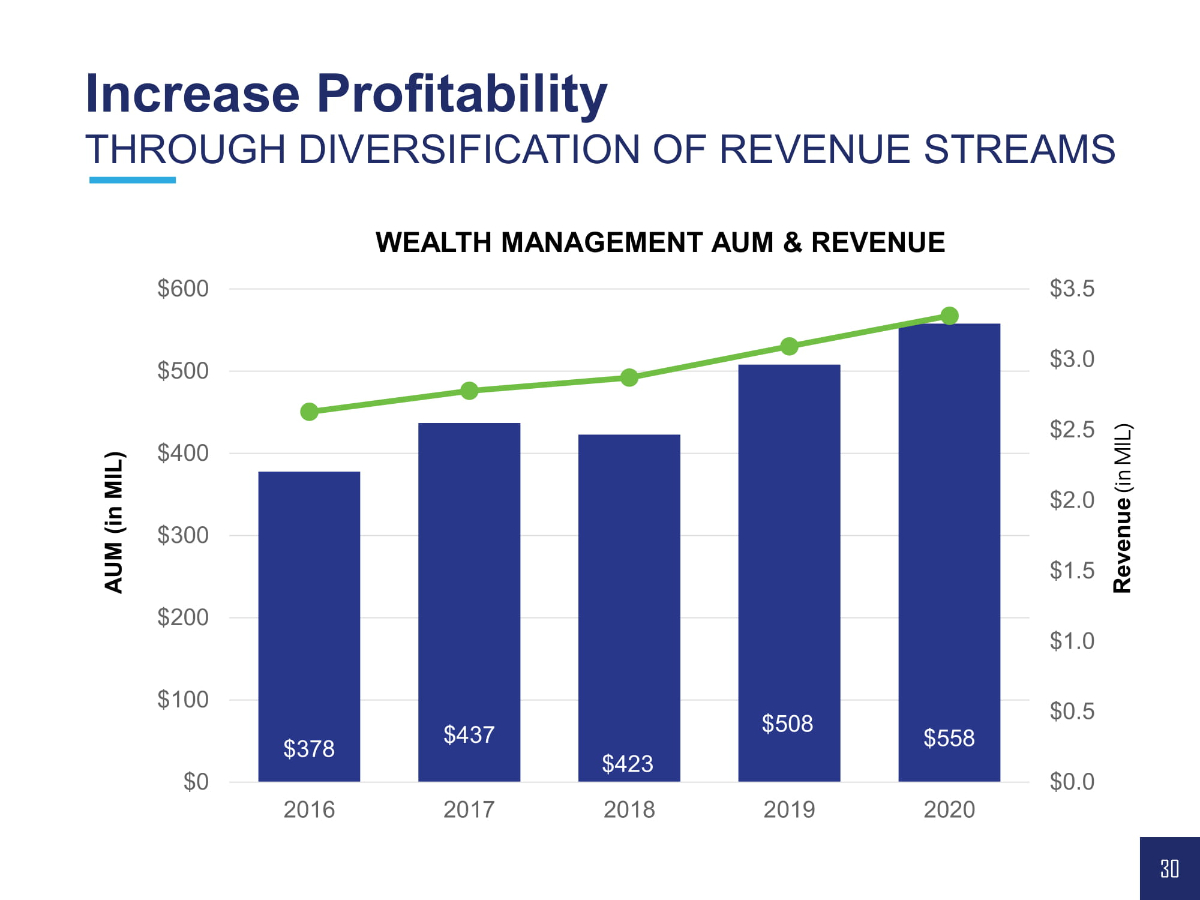
$378 $437 $423 $508 $558 $0.0 $0.5 $1.0 $1.5 $2.0 $2.5 $3.0 $3.5 $0 $100 $200 $300 $400 $500 $600 2016 2017 2018 2019 2020 AUM (in MIL) WEALTH MANAGEMENT AUM & REVENUE Revenue (in MIL) Increase Profitability THROUGH DIVERSIFICATION OF REVENUE STREAMS 30

67% 9% 11% 2% 5% 6% Mortgage Banking $20.3 Service Fees $2.8 Wealth Management $3.2 SBA/FSA $0.5 Other $1.4 Peak Title $1.9 20 20 NON - INTEREST INCOME $ 30.1 MILLION Non - Interest Income to Total Revenue at 46 % ( 88 th Percentile) Peer Median* 23 % Top Quartile* 32 % * Peer group consists of 2020 data for 65 publicly traded bank holding companies in the U.S. on a major exchange with assets between $500 million and $ 2.06 billion Increase Profitability THROUGH DIVERSIFICATION OF REVENUE STREAMS 31

Key Initiatives Become a Top - Decil e, Independent Financial Services Company Increase profitability through ongoing diversification of revenue streams Strengthen penetration in all markets served Expand product service utilization by new and existing customers Deliver gains in operational excellence Sustain asset quality 32
Scale Through Organic Growth Highlights 33 • Growing our Balance Sheet • Building Market Share • Acquiring scale through M&A - Edon

34 Strengthen Market Penetration IN ALL MARKETS SERVED -$25 $25 $75 $125 $175 $225 2016 2017 2018 2019 2020 Millions BALANCE SHEET GROWTH Loans Deposits
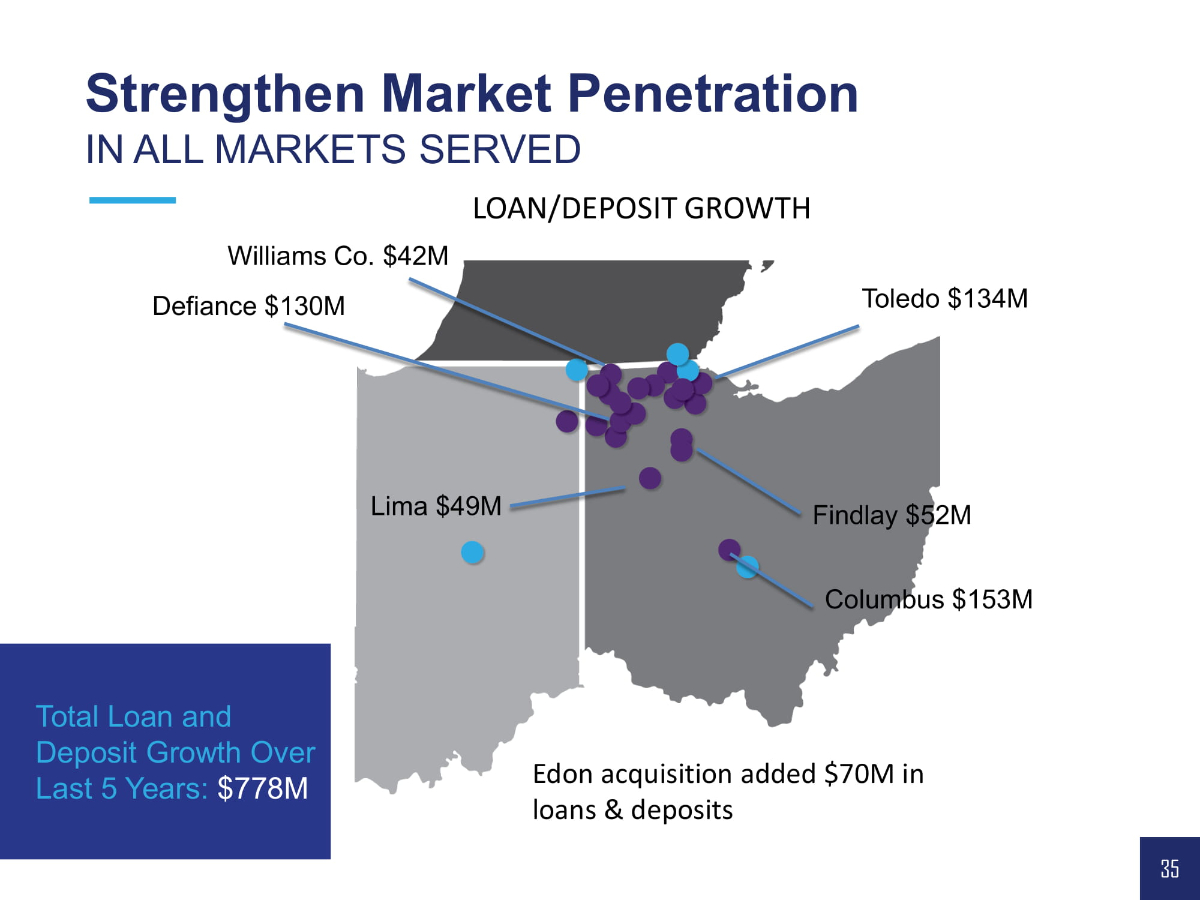
Toledo $134M Findlay $ 52 M Columbus $153M Williams Co. $42M Defiance $ 130 M Strengthen Market Penetration IN ALL MARKETS SERVED 35 Total Loan and Deposit Growth Over Last 5 Years: $778M Edon acquisition added $70M in loans & deposits LOAN/DEPOSIT GROWTH Lima $49M

Loans (Net) 69% Securities 12% Cash & Due 11% Other 8% Commercial RE 43% HELOC 5% 1 - 4 Family 20% Agriculture 6% C&I 23% Consumer & Other 3% LOAN PORTFOLIO = $ 873 MILLION Strengthen Market Penetration IN ALL MARKETS SERVED 36 Loan to Deposit December 2020 – 83% Top Quartile Performance TOTAL ASSETS = $1.26 BILLION
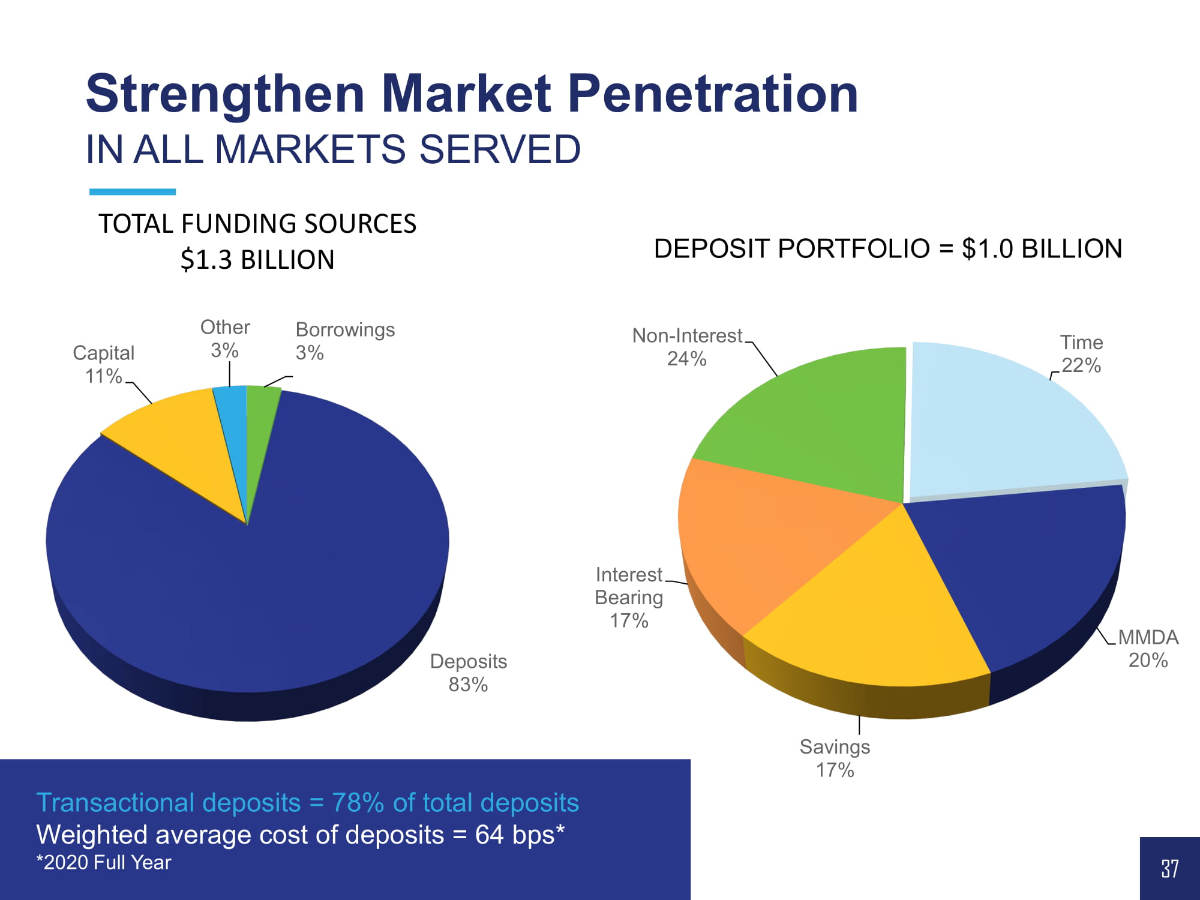
Borrowings 3% Deposits 83% Capital 11% Other 3% Time 22% MMDA 20% Savings 17% Interest Bearing 17% Non - Interest 24% DEPOSIT PORTFOLIO = $ 1.0 BILLION Strengthen Market Penetration IN ALL MARKETS SERVED 37 Transactional deposits = 78% of total deposits Weighted average cost of deposits = 64 bps* *2020 Full Year TOTAL FUNDING SOURCES $1.3 BILLION

Key Initiatives Become a Top - Decil e, Independent Financial Services Company Increase profitability through ongoing diversification of revenue streams Strengthen penetration in all markets served Expand product service utilization by new and existing customers Deliver gains in operational excellence Sustain asset quality 38
Added Scope Highlights • Regional Executive/Business Line Leadership • Customized Client Interaction • Defined Communication Channels • Referrals 39
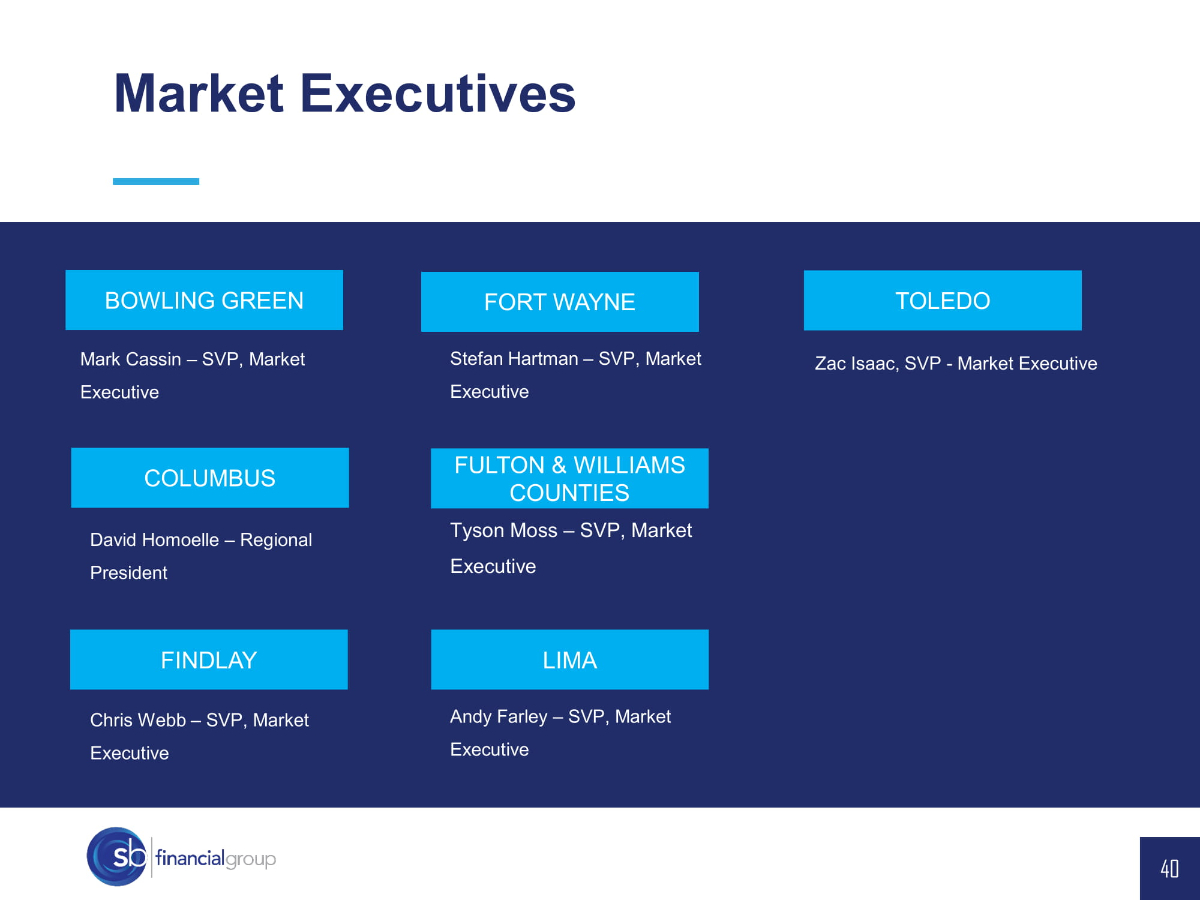
Market Executives BOWLING GREEN FULTON & WILLIAMS COUNTIES Mark Cassin – SVP, Market Executive TOLEDO Tyson Moss – SVP, Market Executive Chris Webb – SVP, Market Executive LIMA FINDLAY Andy Farley – SVP, Market Executive Stefan Hartman – SVP, Market Executive FORT WAYNE COLUMBUS David Homoelle – Regional President 40 Zac Isaac, SVP - Market Executive

Business Line Leadership RETAIL BANKING PRIVATE BANKING Nancy Rankin – VP, Retail Administration Manager MORTGAGE BANKING Michelle Zeedyk – VP, Director of Private Banking Mickey Cooper – SVP, Toledo Susan West – VP, Columbus Steve Watson – SVP, RRE Manager, Columbus, OH Pam Benedict – SVP, RRE Manager, NW Ohio/NE Indiana Rich Smith – SVP, RRE Manager, Indianapolis, IN PEAK TITLE Chris Jakyma – EVP, Chief Wealth Management Officer David Bell – EVP, Retirement Services COMMERCIAL WEALTH MANAGEMENT Jon Gathman – EVP, Senior Lender Commercial Lenders Lesley Parrett – VP, Treasury Management Brandon Gerken – SVP, SBA Lending Manger SBA Abby Waters – President 41

76,847 80,513 83,593 87,202 91,154 95,210 26,076 27,368 28,590 29,562 30,377 32,519 0 5,000 10,000 15,000 20,000 25,000 30,000 35,000 40,000 45,000 0 10,000 20,000 30,000 40,000 50,000 60,000 70,000 80,000 90,000 100,000 2015 2016 2017 2018 2019 2020 HOUSEHOLDS PRODUCTS & SERVICES HOUSEHOLDS, PRODUCTS & SERVICES Products & Services Households Increase in total number of products from 2015 to 2020 - 25 % Increase of households from 2015 to 2020 - 24% Expand Product Utilization BY NEW AND EXISTING CUSTOMERS 42

0 300 600 900 1,200 1,500 0 1,000 2,000 3,000 4,000 5,000 6,000 2010 2011 2012 2013 2014 2015 2016 2017 2018 2019 2020 IN - OFFICE TRANSACTIONS PER YEAR (000’S) ELECTRONIC TRANSACTIONS PER YEAR (MIL) ELECTRONIC TRANSACTIONS & IN - OFFICE TRANSACTIONS Electronic Transactions In-Store Transactions Acceleration of electronic transactions versus in - store transactions 92 % INCREASE SINCE 20 10 Expand Product Utilization BY NEW AND EXISTING CUSTOMERS 43
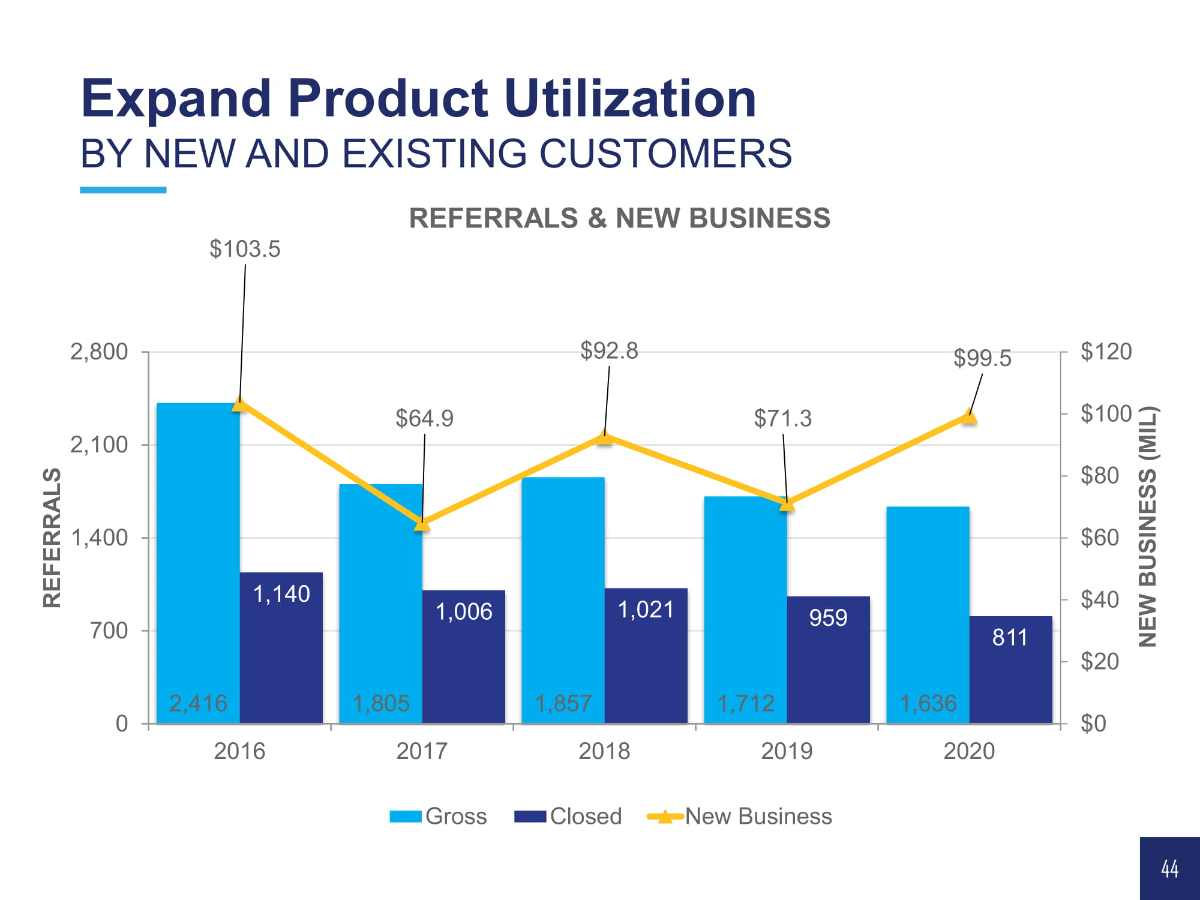
2,416 1,805 1,857 1,712 1,636 1,140 1,006 1,021 959 811 $103.5 $64.9 $92.8 $71.3 $99.5 $0 $20 $40 $60 $80 $100 $120 0 700 1,400 2,100 2,800 2016 2017 2018 2019 2020 NEW BUSINESS (MIL) REFERRALS REFERRALS & NEW BUSINESS Gross Closed New Business Expand Product Utilization BY NEW AND EXISTING CUSTOMERS 44
Key Initiatives Become a Top - Decil e, Independent Financial Services Company Increase profitability through ongoing diversification of revenue streams Strengthen penetration in all markets served Expand product service utilization by new and existing customers Deliver gains in operational excellence Sustain asset quality 45
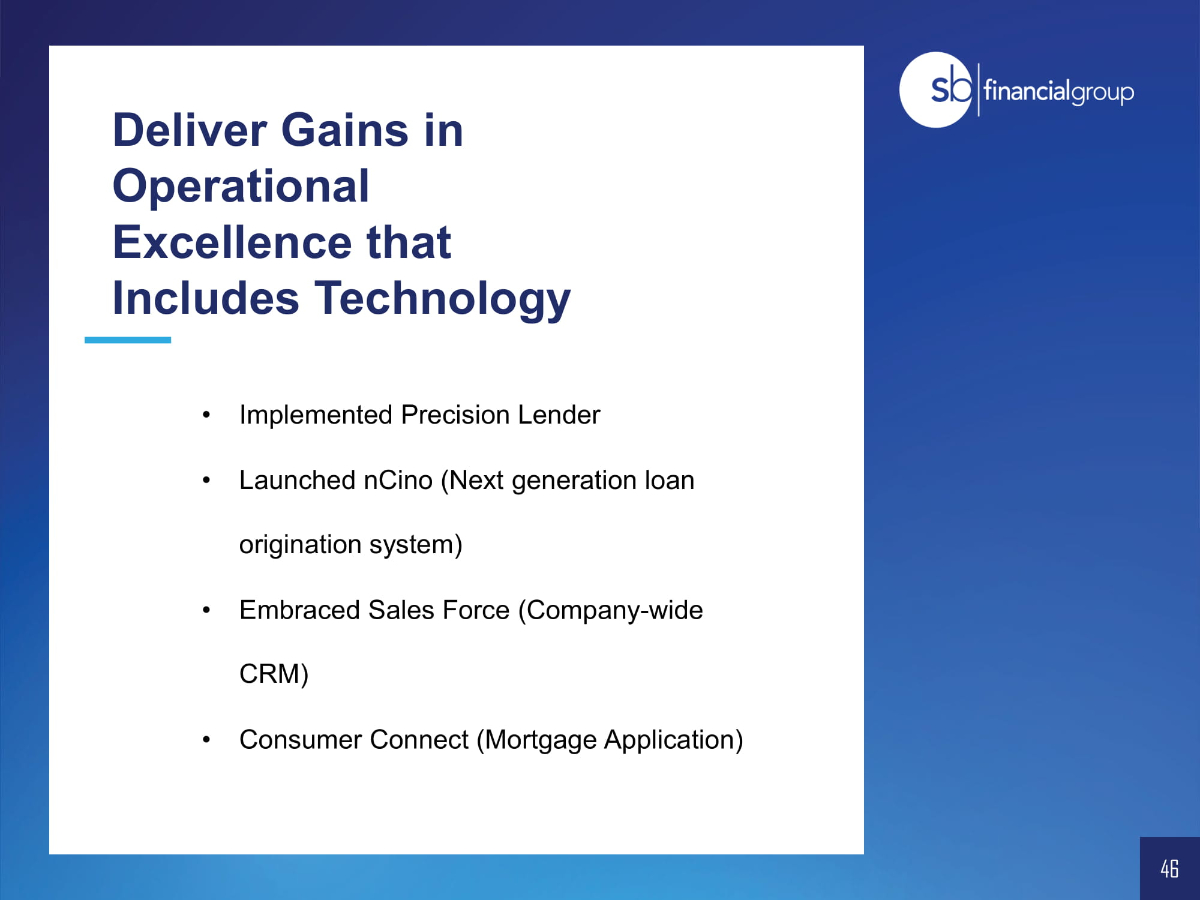
Deliver Gains in Operational Excellence that Includes Technology • Implemented Precision Lender • Launched nCino (Next generation loan origination system) • Embraced Sales Force (Company - wide CRM) • Consumer Connect (Mortgage Application) 46
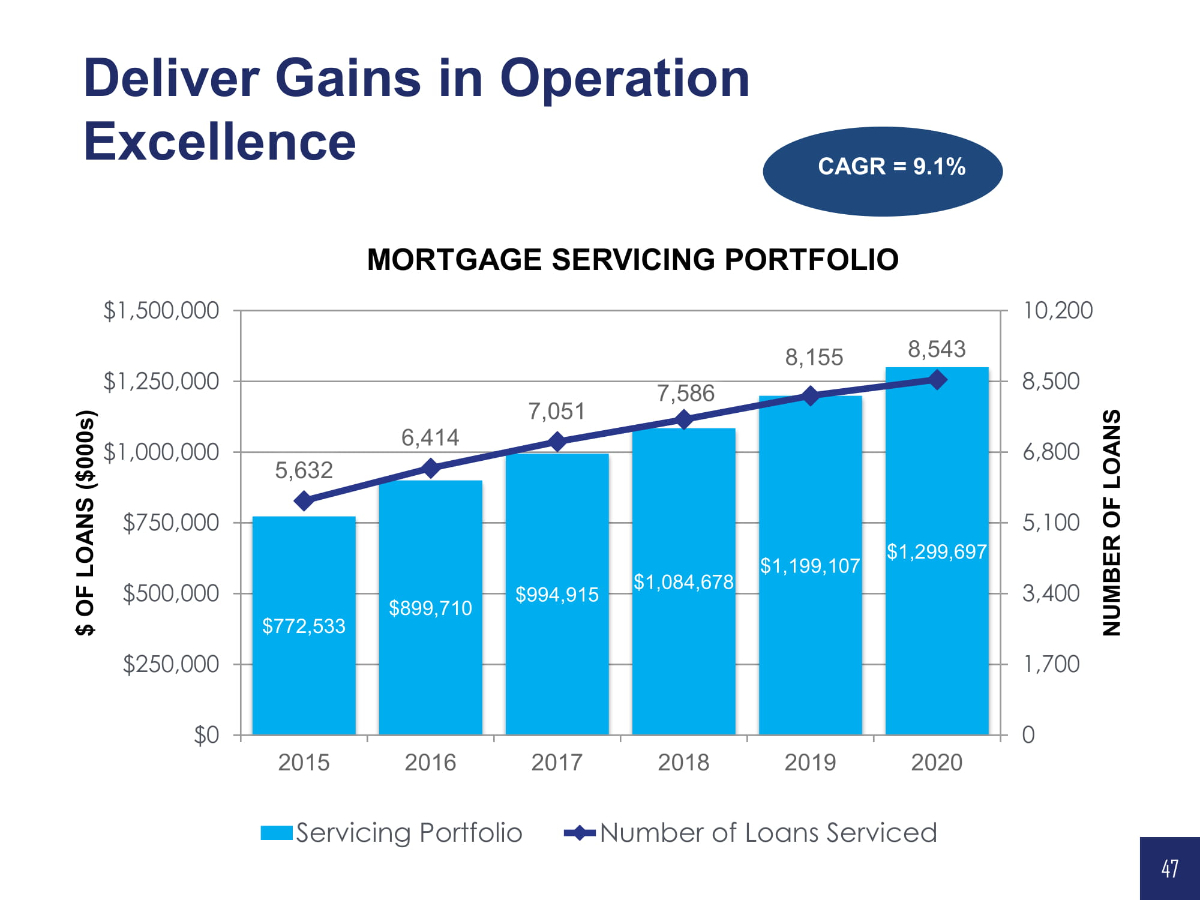
$772,533 $899,710 $994,915 $1,084,678 $1,199,107 $1,299,697 5,632 6,414 7,051 7,586 8,155 8,543 0 1,700 3,400 5,100 6,800 8,500 10,200 $0 $250,000 $500,000 $750,000 $1,000,000 $1,250,000 $1,500,000 2015 2016 2017 2018 2019 2020 NUMBER OF LOANS $ OF LOANS ($000s) MORTGAGE SERVICING PORTFOLIO Servicing Portfolio Number of Loans Serviced CAGR = 9.1 % Deliver Gains in Operation Excellence 47

Deliver Gains in Operation Excellence $0 $10,000 $20,000 $30,000 $40,000 $50,000 $60,000 $70,000 $80,000 $90,000 $100,000 $0 $100,000 $200,000 $300,000 $400,000 $500,000 $600,000 $700,000 $800,000 $900,000 2016 2017 2018 2019 2020 LOAN GROWTH ($000S) LOAN PRODUCTION BY TYPE ($000s) LOAN PRODUCTION & LOAN GROWTH COMMERCIAL MORTGAGE CONSUMER PPP LOAN GROWTH $570,631 $509,633 48 $522,316 $690,657 $944,877
Key Initiatives Become a Top - Decil e, Independent Financial Services Company Increase profitability through ongoing diversification of revenue streams Strengthen penetration in all markets served Expand product service utilization by new and existing customers Deliver gains in operational excellence Sustain asset quality 49

• Robust Loan - Review Process • Dynamic Loan - Approval Process • Portfolio Stress - Testing • Strong AQ Metrics Asset Quality Highlights 50

Sustain Asset Quality $153,306 $38,353 $28,032 $4,883 262 26 9 2 0 50 100 150 200 250 300 $0 $20,000 $40,000 $60,000 $80,000 $100,000 $120,000 $140,000 $160,000 $180,000 June 2020 September 2020 December 2020 March 2021 NUMBER OF LOANS LOAN BALANCES (000’s) FORBEARANCE HISTORY $ Amount Number of Loans 51 TD48
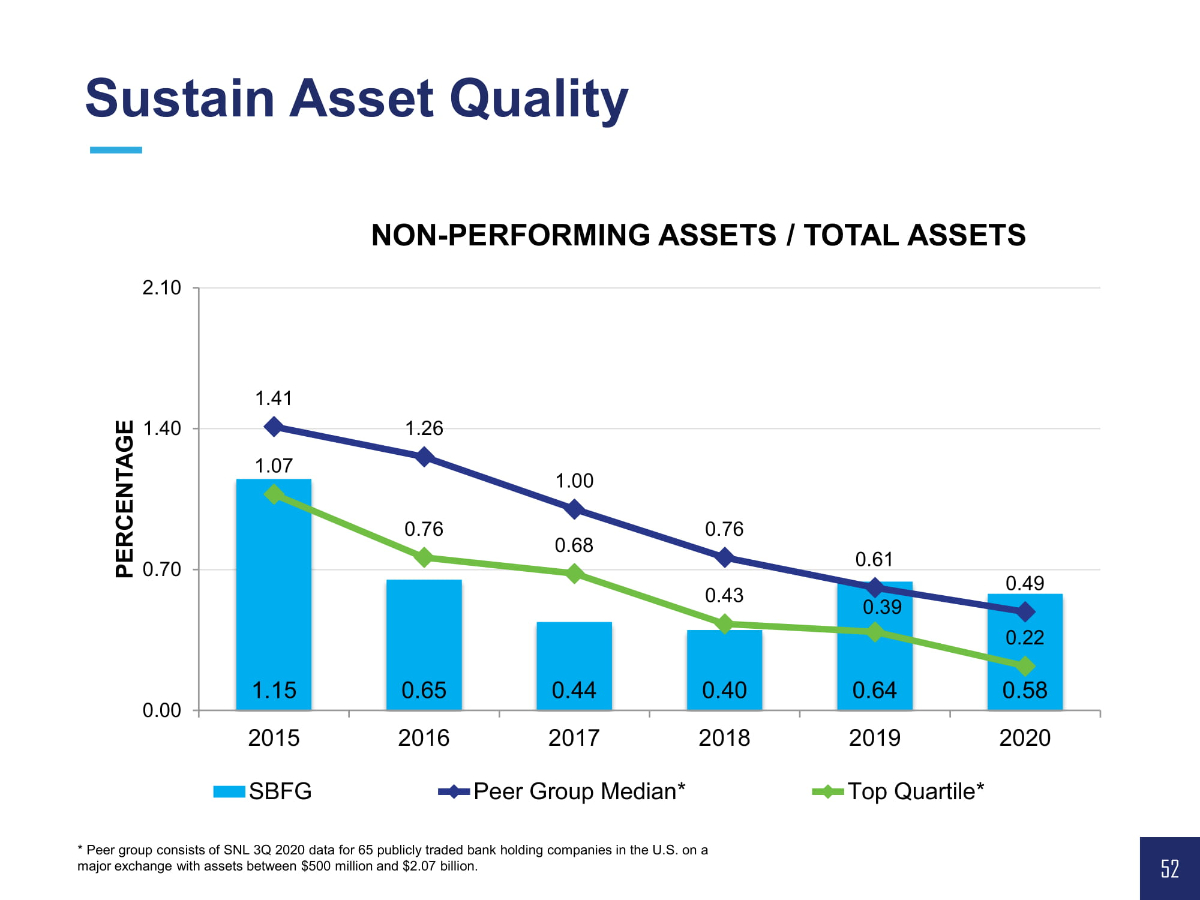
* Peer group consists of SNL 3Q 20 20 data for 65 publicly traded bank holding companies in the U.S. on a major exchange with assets between $500 million and $ 2.07 billion. 1.15 0.65 0.44 0.40 0.64 0.58 1.41 1.26 1.00 0.76 0.61 0.49 1.07 0.76 0.68 0.43 0.39 0.22 0.00 0.70 1.40 2.10 2015 2016 2017 2018 2019 2020 PERCENTAGE NON - PERFORMING ASSETS / TOTAL ASSETS SBFG Peer Group Median* Top Quartile* Sustain Asset Quality 52
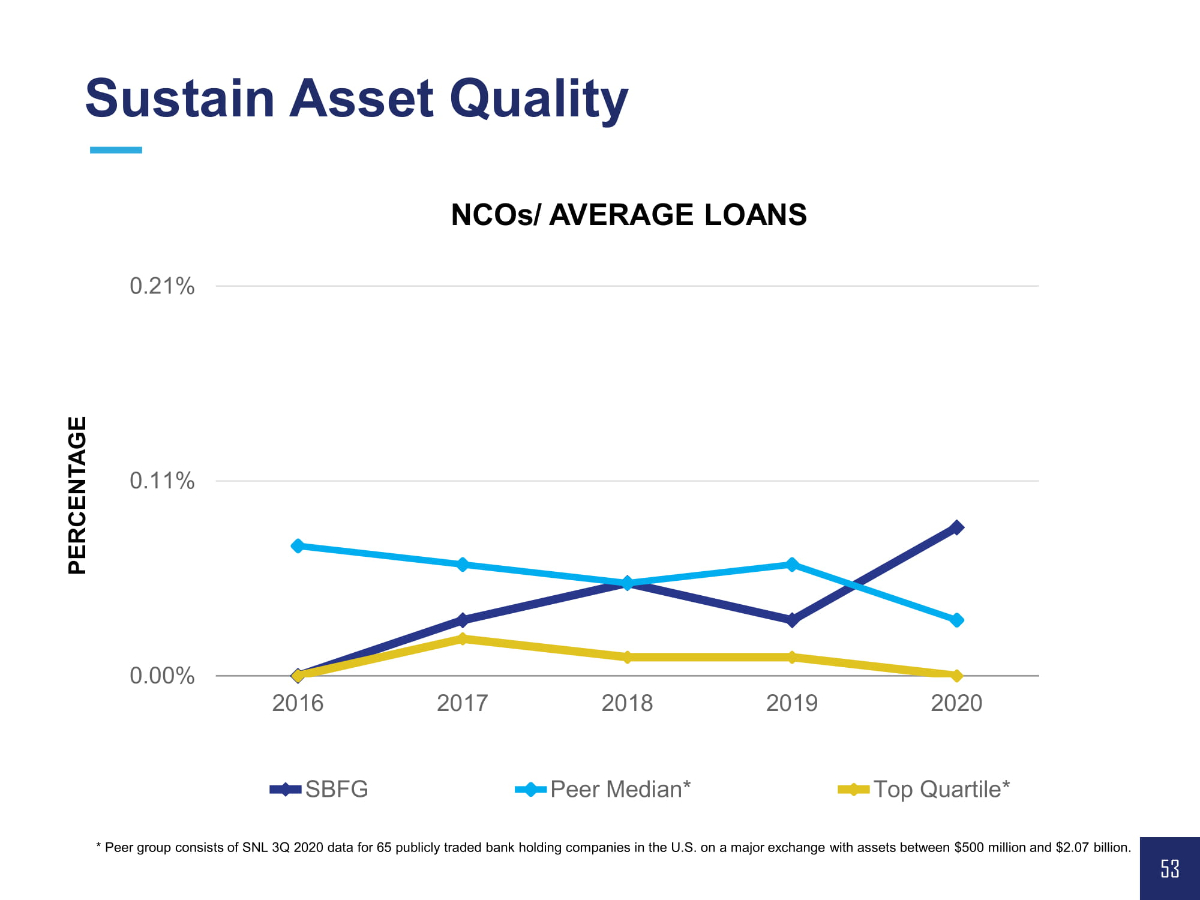
* Peer group consists of SNL 3Q 20 20 data for 65 publicly traded bank holding companies in the U.S. on a major exchange with assets between $500 million and $ 2.07 billion. 0.00% 0.11% 0.21% 2016 2017 2018 2019 2020 NCOs/ AVERAGE LOANS SBFG Peer Median* Top Quartile* PERCENTAGE Sustain Asset Quality 53
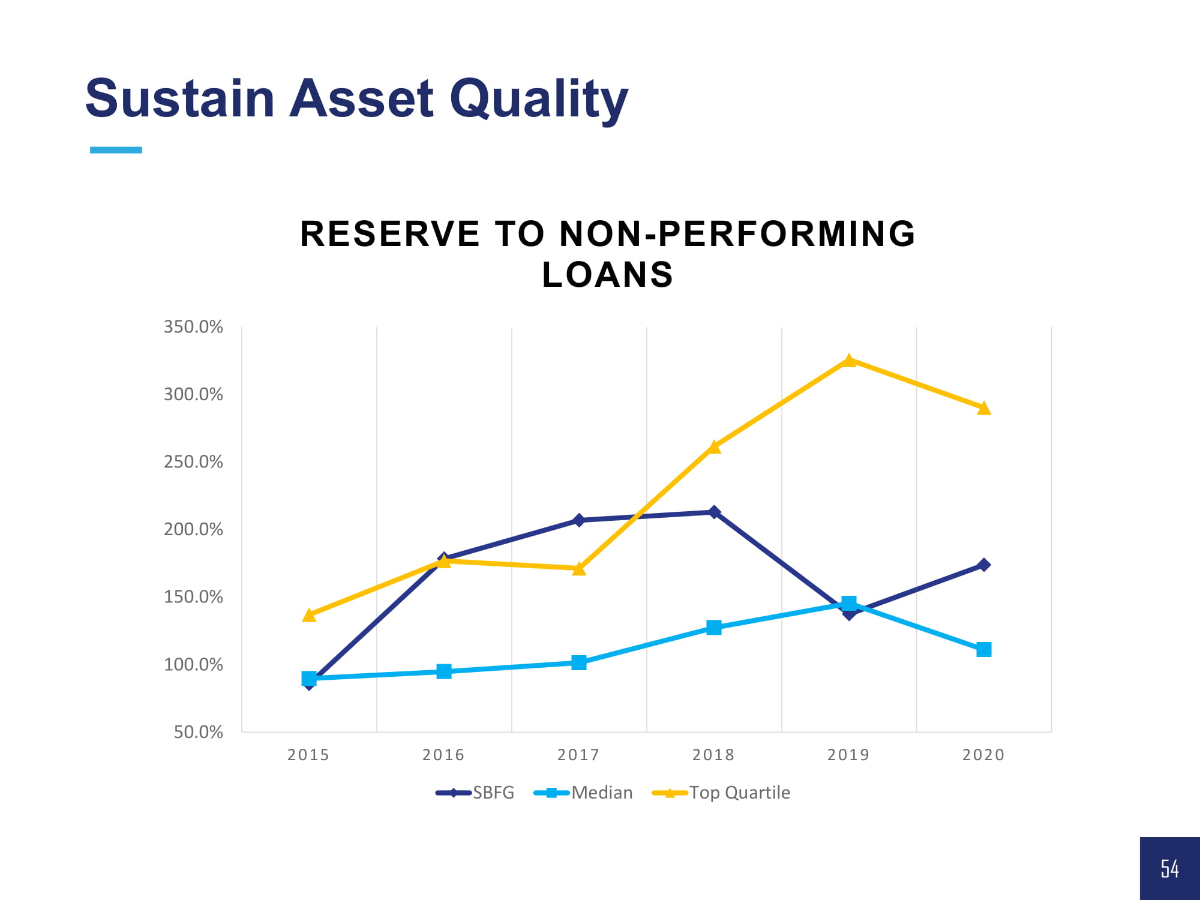
50.0% 100.0% 150.0% 200.0% 250.0% 300.0% 350.0% 2015 2016 2017 2018 2019 2020 RESERVE TO NON - PERFORMING LOANS SBFG Median Top Quartile Sustain Asset Quality 54

Sustain Asset Quality 55 0.00% 0.20% 0.40% 0.60% 0.80% 1.00% 1.20% 1.40% 1.60% $0.0 $2.0 $4.0 $6.0 $8.0 $10.0 $12.0 $14.0 2016 2017 2018 2019 2020 Millions LOAN LOSS RESERVE Dollars Percentage
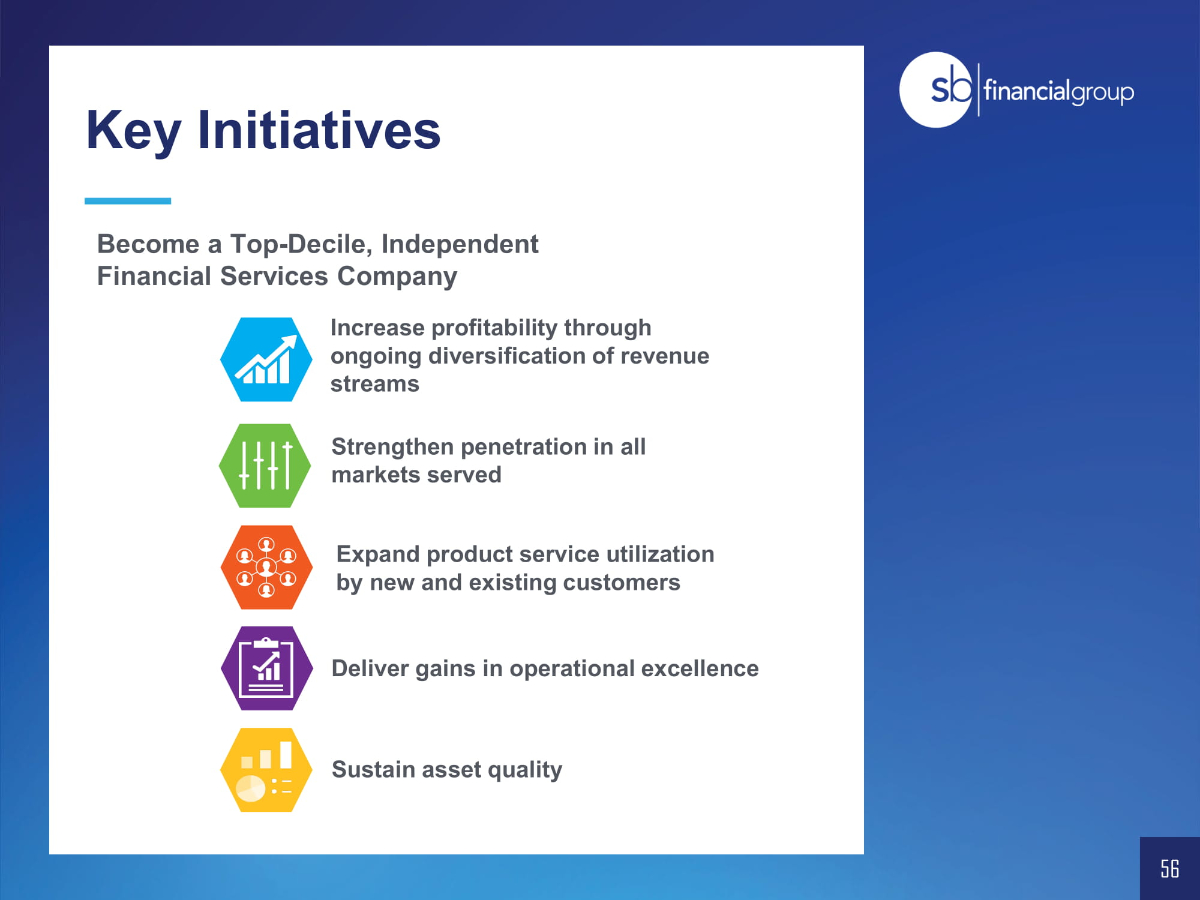
Key Initiatives Become a Top - Decil e, Independent Financial Services Company Increase profitability through ongoing diversification of revenue streams Strengthen penetration in all markets served Expand product service utilization by new and existing customers Deliver gains in operational excellence Sustain asset quality 56
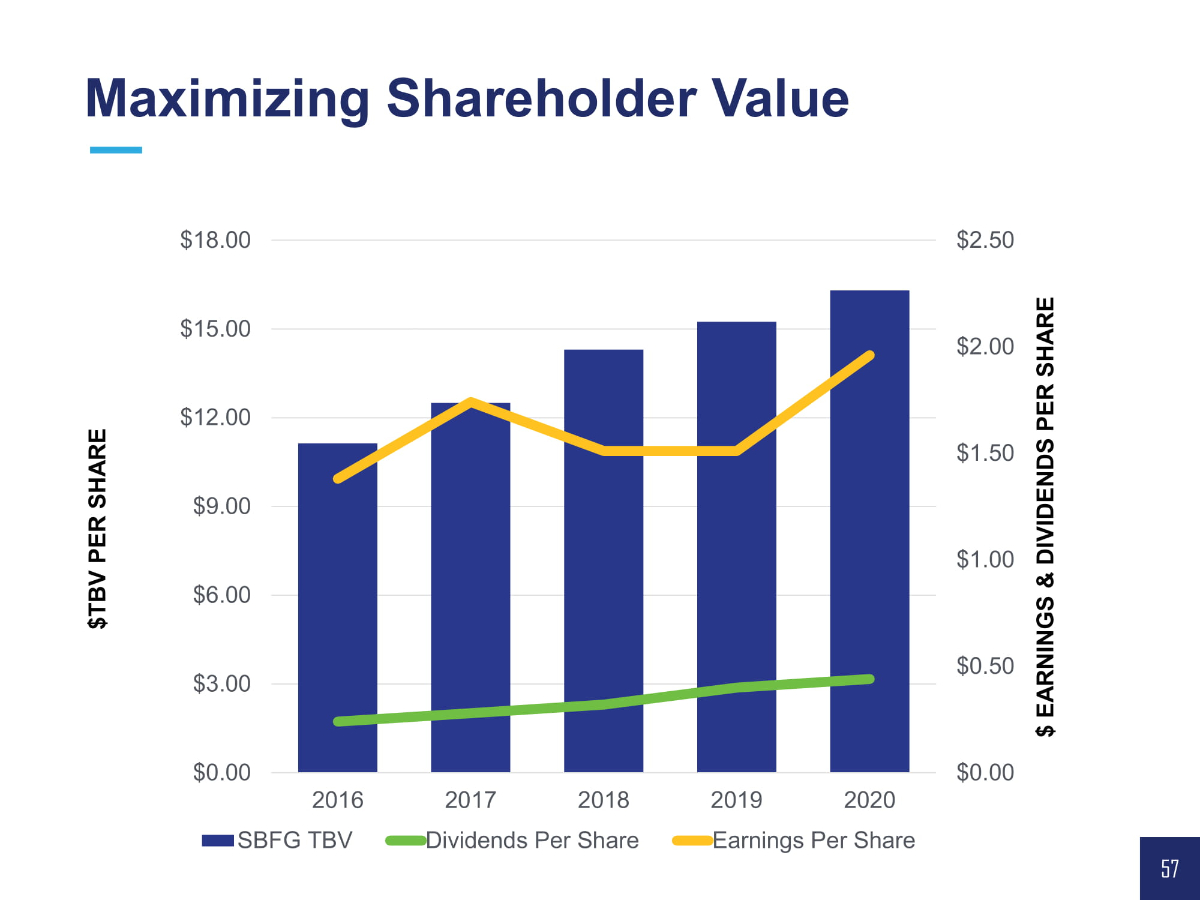
$0.00 $0.50 $1.00 $1.50 $2.00 $2.50 $0.00 $3.00 $6.00 $9.00 $12.00 $15.00 $18.00 2016 2017 2018 2019 2020 $ EARNINGS & DIVIDENDS PER SHARE $TBV PER SHARE SBFG TBV Dividends Per Share Earnings Per Share ONE - TIME TAX CUT IMPACT Maximizing Shareholder Value 57
Need a potential picture for a final pandemic statement to close 47

59 TD47