Exhibit 99.1
2022 A N N U A L M E E T I N G O F S H A R E H O L D E R S 1
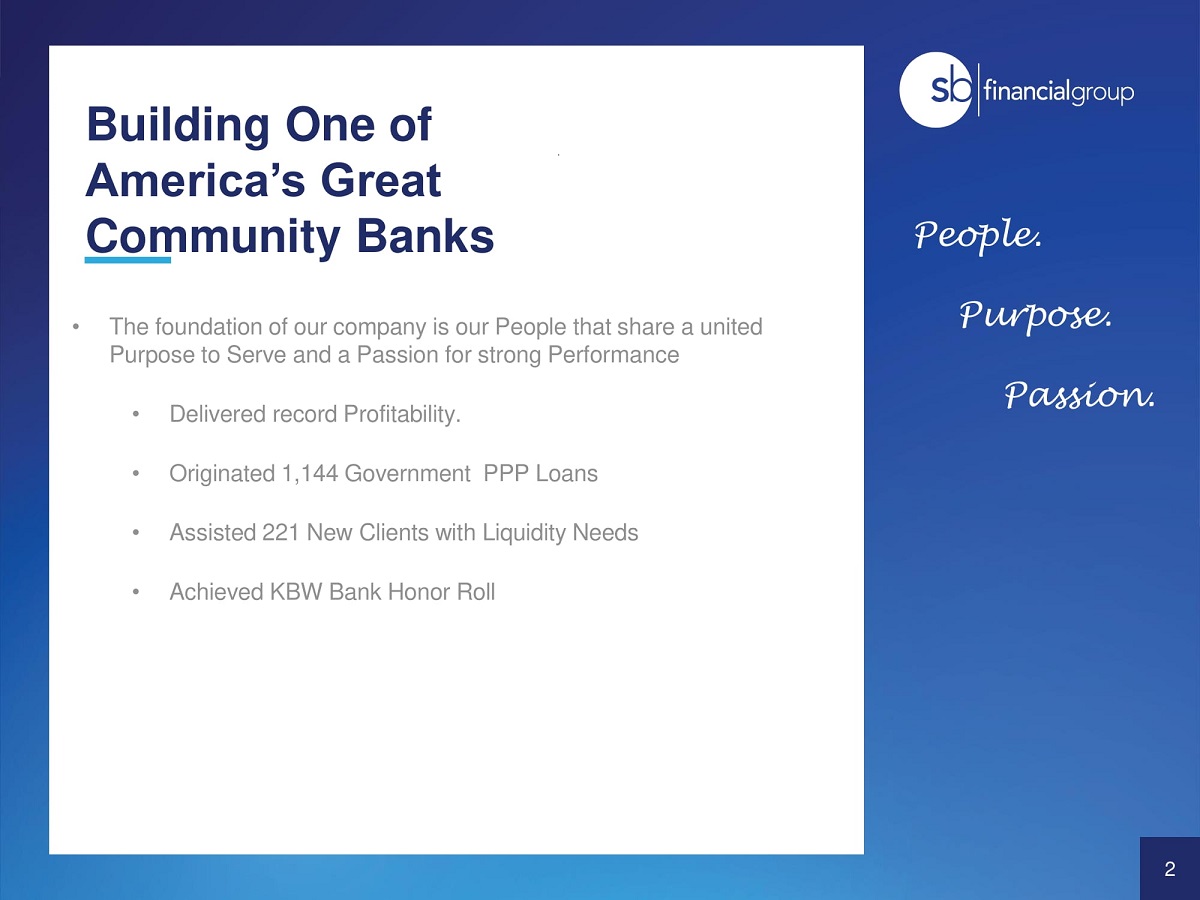
Building One of America’s Great Com munity Banks 2 • The foundation of our company is our People that share a united Purpose to Serve and a Passion for strong Performance • Delivered record Profitability. • Originated 1,144 Government PPP Loans • Assisted 221 New Clients with Liquidity Needs • Achieved KBW Bank Honor Roll People. Purpose. Passion.
2021 Business Overview 13
Safe Harbor Statement Certain statements within this document, which are not statements of historical fact, constitute forward - looking statements within the meaning of the Private Securities Litigation Reform Act of 1995. Forward - looking statements involve risks and uncertainties and actual results may differ materially from those predicted by the forward - looking statements. These risks and uncertainties include, but are not limited to the duration and scope of the COVID - 19 outbreak in the United States and the market areas in which SB Financial and its subsidiaries operate, including the impact to the state and local economies of prolonged shelter in place orders and the pandemic generally, risks and uncertainties inherent in the national and regional banking, insurance and mortgage industries, competitive factors specific to markets in which SB Financial Group and its subsidiaries operate, future interest rate levels, legislative and regulatory actions, capital market conditions, general economic conditions, geopolitical events, the loss of key personnel and other factors. Additional factors that could cause results to differ from those described above can be found in the Company’s Annual Report on Form 10 - K and documents subsequently filed by SB Financial Group with the Securities and Exchange Commission. Forward - looking statements speak only as of the date on which they are made, and SB Financial Group undertakes no obligation to update any forward - looking statement to reflect events or circumstances after the date on which the statement is made except as required by law. All subsequent written and oral forward - looking statements attributable to SB Financial Group or any person acting on its behalf are qualified by these cautionary statements. 14
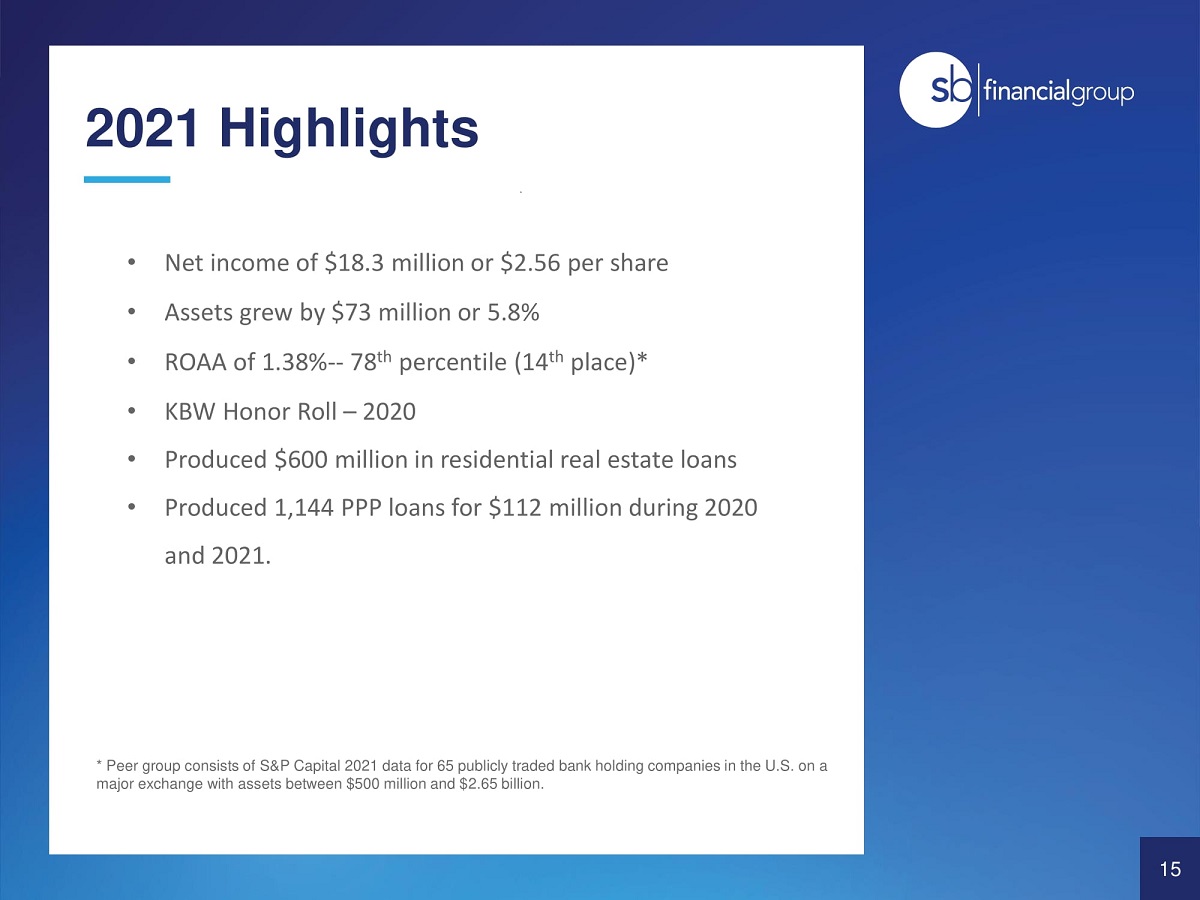
• Net income of $18.3 million or $2.56 per share • Assets grew by $73 million or 5.8% • ROAA of 1.38% - - 78 th percentile (14 th place)* • KBW Honor Roll – 2020 • Produced $600 million in residential real estate loans • Produced 1,144 PPP loans for $112 million during 2020 and 2021. 15 * Peer group consists of S&P Capital 2021 data for 65 publicly traded bank holding companies in the U.S. on a major exchange with assets between $500 million and $2.65 billion. 2021 Highlights
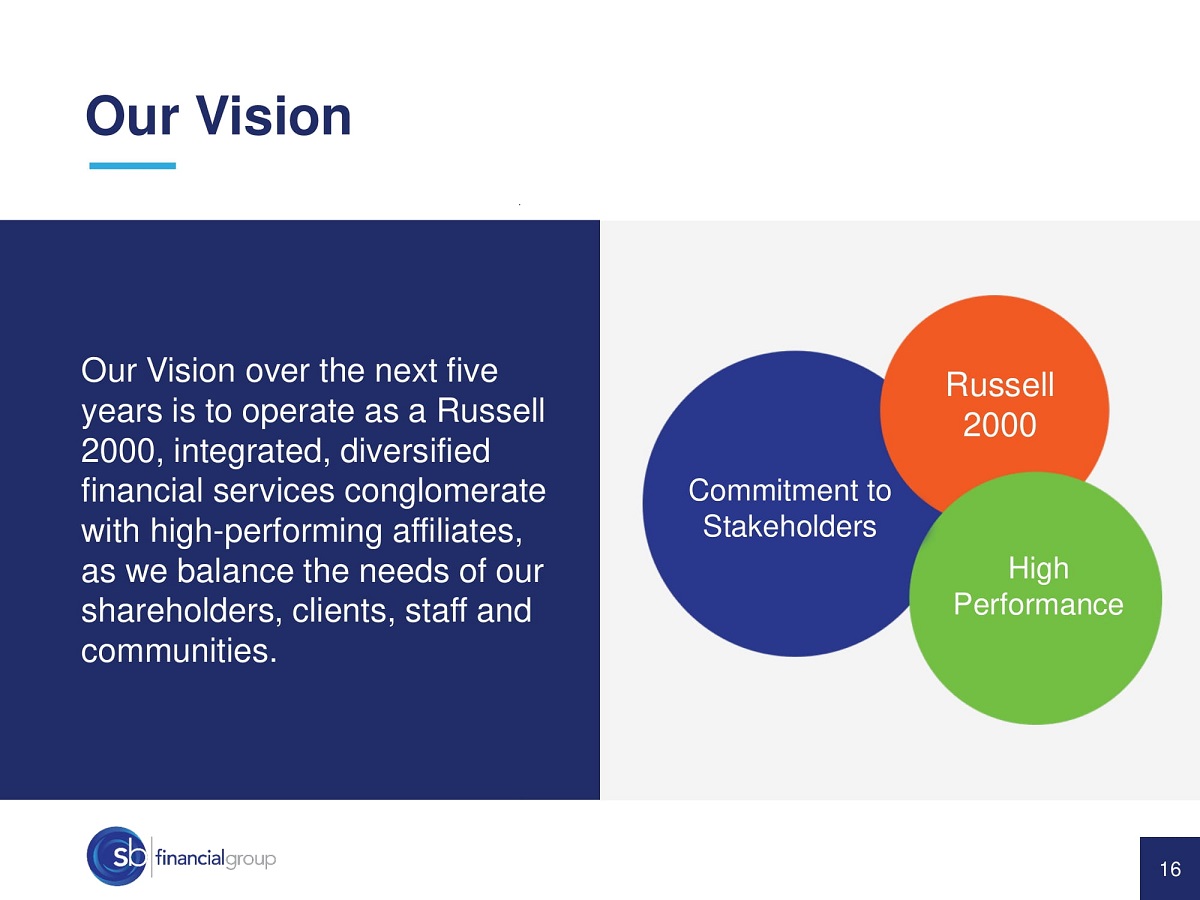
Our Vision over the next five years is to operate as a Russell 2000, integrated, diversified financial services conglomerate with high - performing affiliates, as we balance the needs of our shareholders, clients, staff and communities. Russell 2000 Commitment to Stakeholders High Performance Our Vision 16
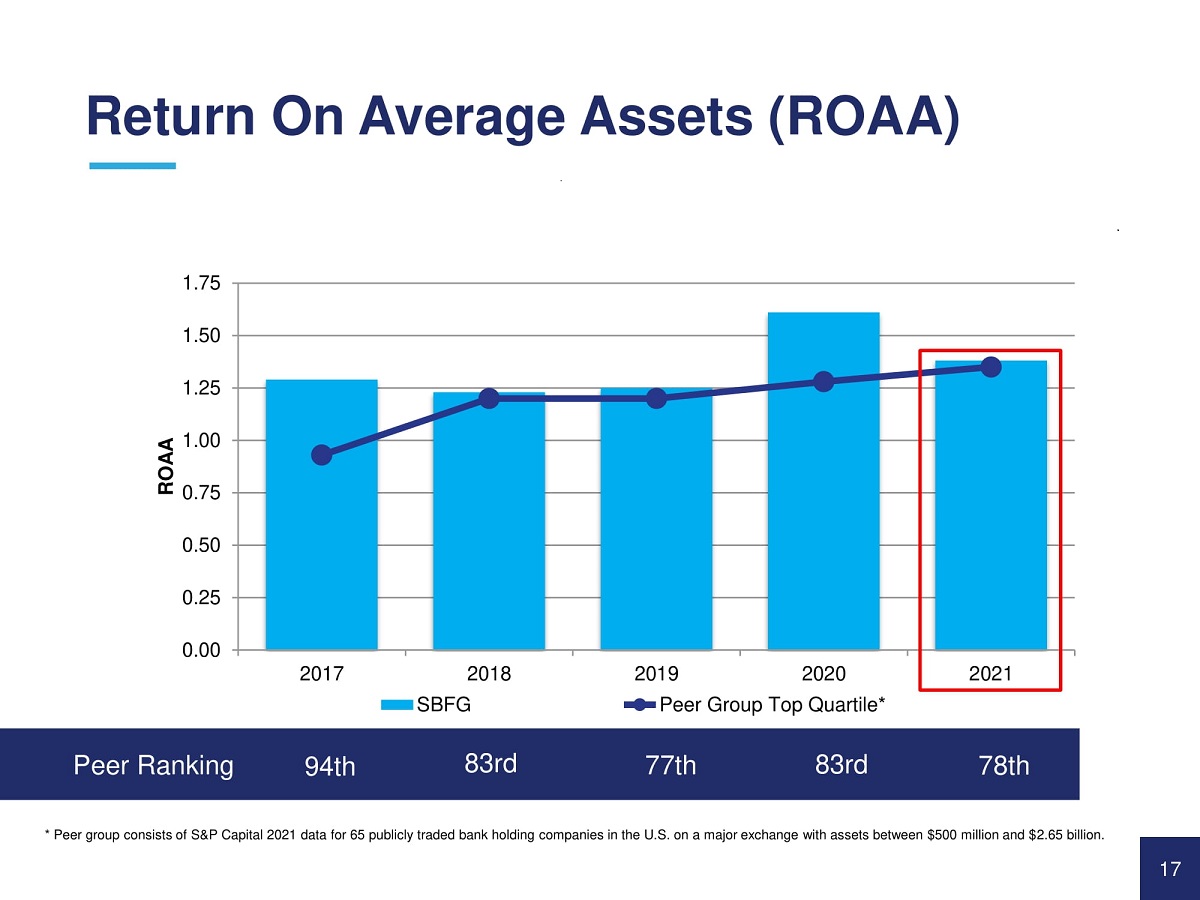
1.75 1.50 1.25 1.00 0.75 0.50 0.25 0.00 2017 2018 2021 ROAA SBFG 2019 2020 Peer Group Top Quartile* Peer Ranking 94th 83rd 77th 83rd 78th * Peer group consists of S&P Capital 2021 data for 65 publicly traded bank holding companies in the U.S. on a major exchange with assets between $500 million and $2.65 billion. Return On Average Assets (ROAA) 17
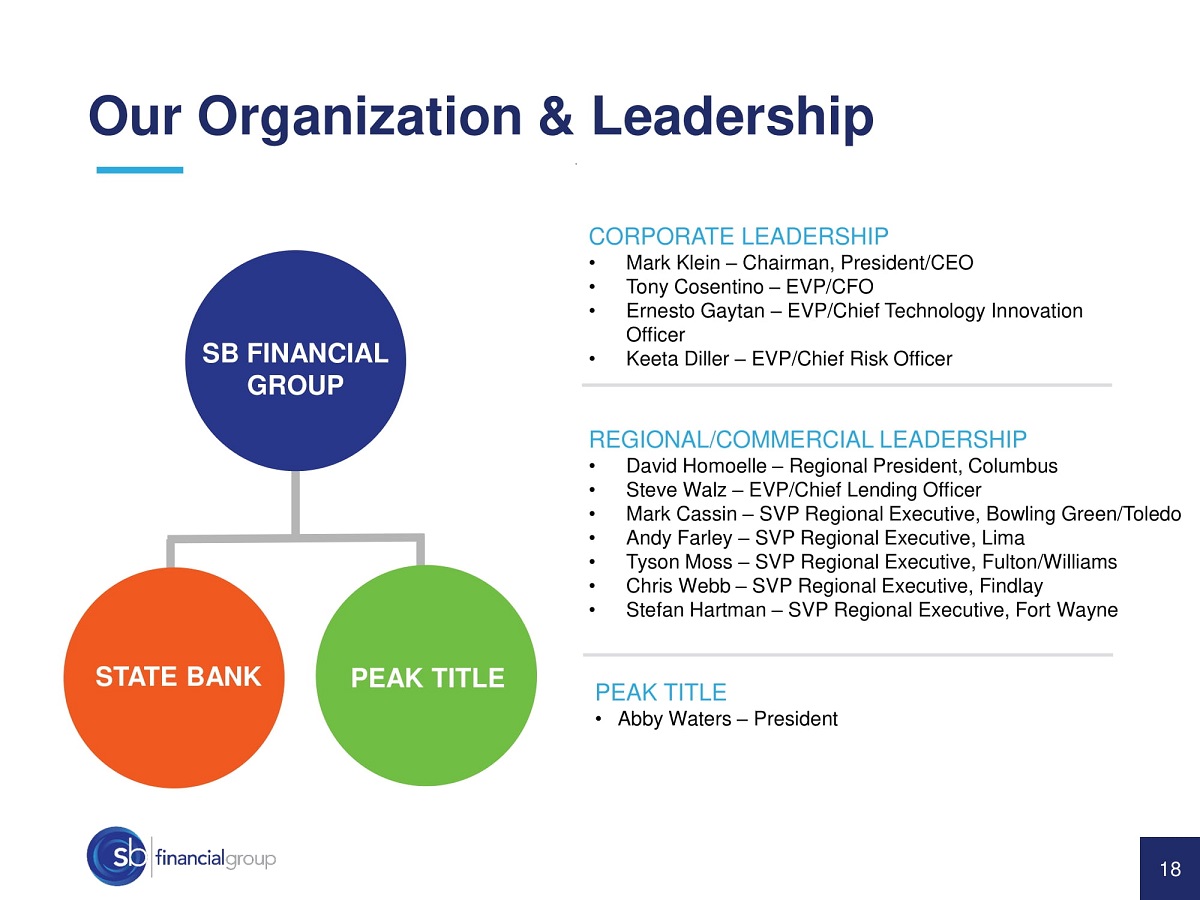
Our Organization & Leadership CORPORATE LEADERSHIP • Mark Klein – Chairman, President/CEO • Tony Cosentino – EVP/CFO • Ernesto Gaytan – EVP/Chief Technology Innovation Officer • Keeta Diller – EVP/Chief Risk Officer REGIONAL/COMMERCIAL LEADERSHIP • David Homoelle – Regional President, Columbus • Steve Walz – EVP/Chief Lending Officer • Mark Cassin – SVP Regional Executive, Bowling Green/Toledo • Andy Farley – SVP Regional Executive, Lima • Tyson Moss – SVP Regional Executive, Fulton/Williams • Chris Webb – SVP Regional Executive, Findlay • Stefan Hartman – SVP Regional Executive, Fort Wayne SB FINANCIAL GROUP STATE BANK PEAK TITLE • Abby Waters – President PEAK TITLE 18
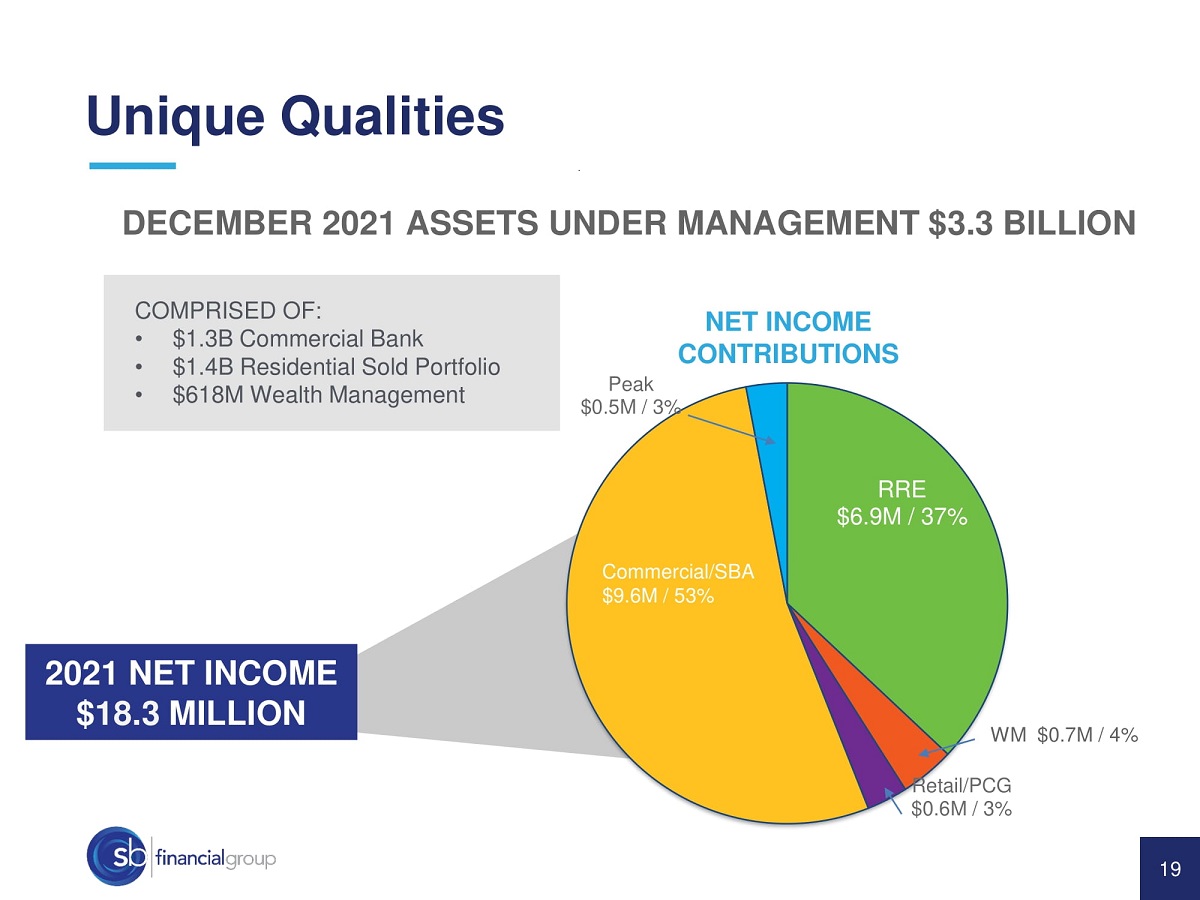
Retail/PCG $0.6M / 3% Peak $0.5M / 3% RRE $6.9M / 37% Commercial/SBA $9.6M / 53% WM $0.7M / 4% NET INCOME CONTRIBUTIONS 2021 NET INCOME $ 18.3 MILLION DECEMBER 2021 ASSETS UNDER MANAGEMENT $3.3 BILLION COMPRISED OF: • $1.3B Commercial Bank • $1.4B Residential Sold Portfolio • $618M Wealth Management Unique Qualities 19

Key Initiatives Become a Russell 2000, High - Performing Financial Services Conglomerate Increase profitability through ongoing diversification of revenue streams Strengthen penetration in all markets served Expand product service utilization by new and existing customers Deliver gains in operational excellence Sustain asset quality 20
Key Initiatives Become a Russell 2000, High - Performing Financial Services Conglomerate Increase profitability through ongoing diversification of revenue streams Strengthen penetration in all markets served Expand product service utilization by new and existing customers Deliver gains in operational excellence Sustain asset quality 21
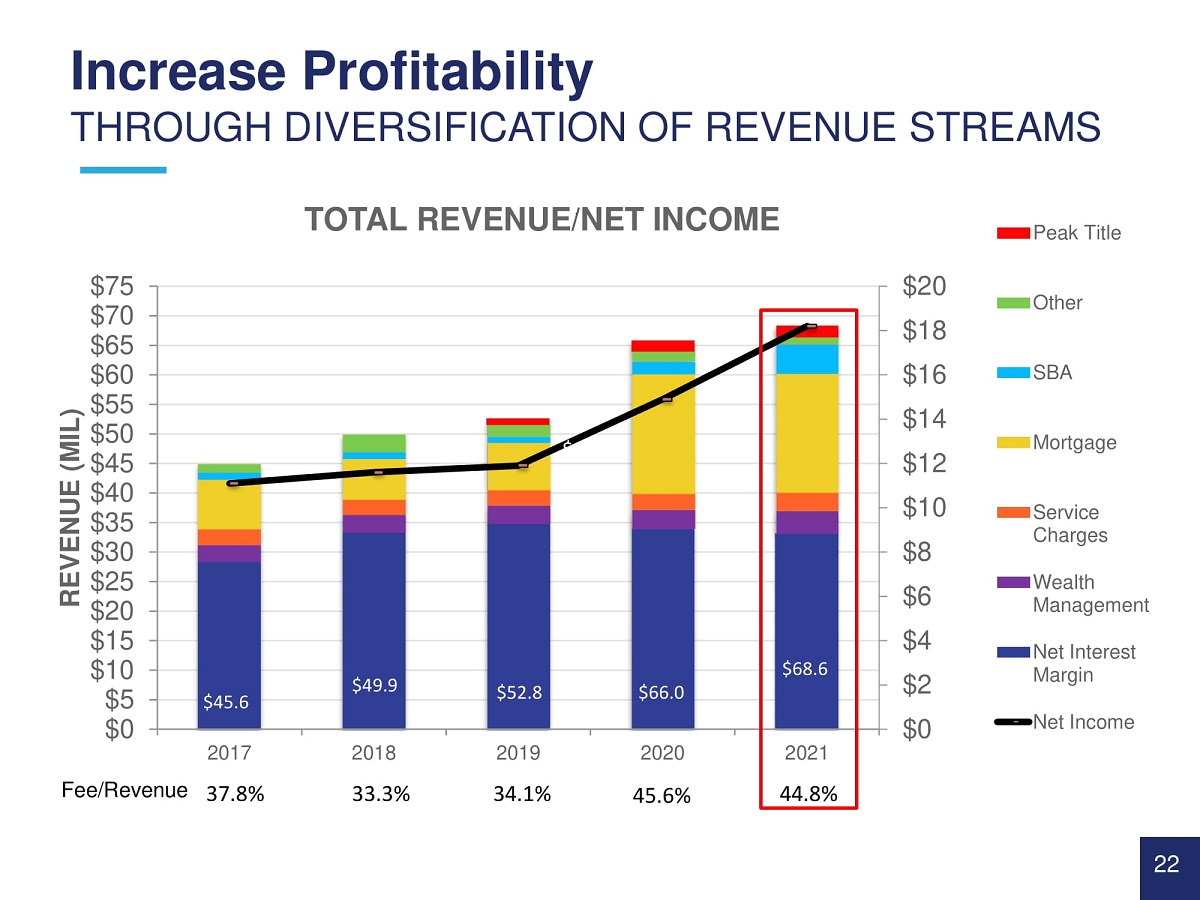
Increase Profitability THROUGH DIVERSIFICATION OF REVENUE STREAMS $20 $18 $16 $14 $12 $10 $8 $6 $4 $2 $0 $75 $70 $65 $60 $55 $50 $45 $40 $35 $30 $25 $20 $15 $10 $5 $0 2017 2018 2019 2020 2021 REVENUE (MIL) TOTAL REVENUE/NET INCOME Peak Title Other SBA Mortgage Service Charges Wealth Management Net Interest Margin Net Income $45.6 $52.8 $66.0 45.6% $68.6 Fee/Revenue 37.8% 33.3% 34.1% $49.9 $49.9 44.8% 22
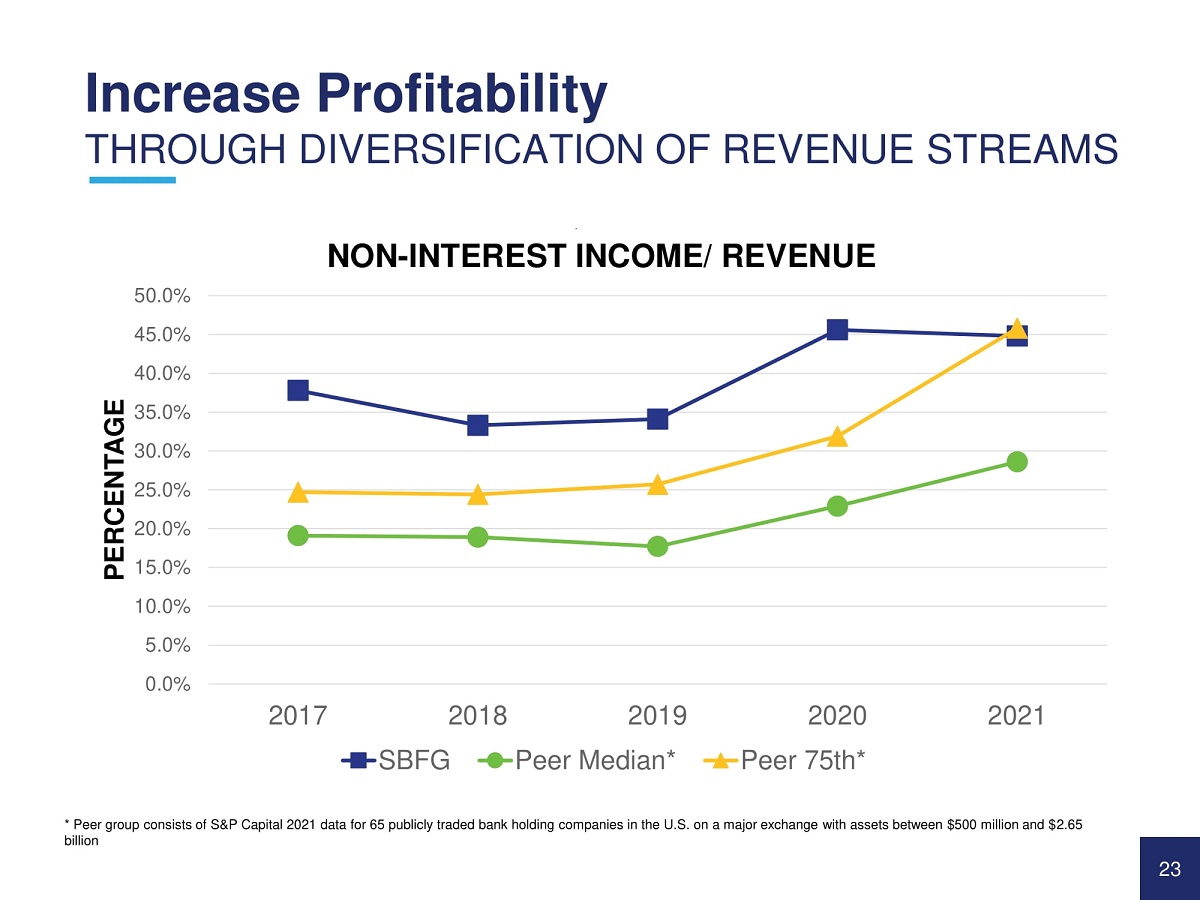
* Peer group consists of S&P Capital 2021 data for 65 publicly traded bank holding companies in the U.S. on a major exchange with assets between $500 million and $2.65 billion 50.0% 45.0% 40.0% 35.0% 30.0% 25.0% 20.0% 15.0% 10.0% 5.0% 0.0% 2017 2018 SBFG 2021 PERCENTAGE NON - INTEREST INCOME/ REVENUE 2019 Peer Median* 2020 Peer 75th* Increase Profitability THROUGH DIVERSIFICATION OF REVENUE STREAMS 23
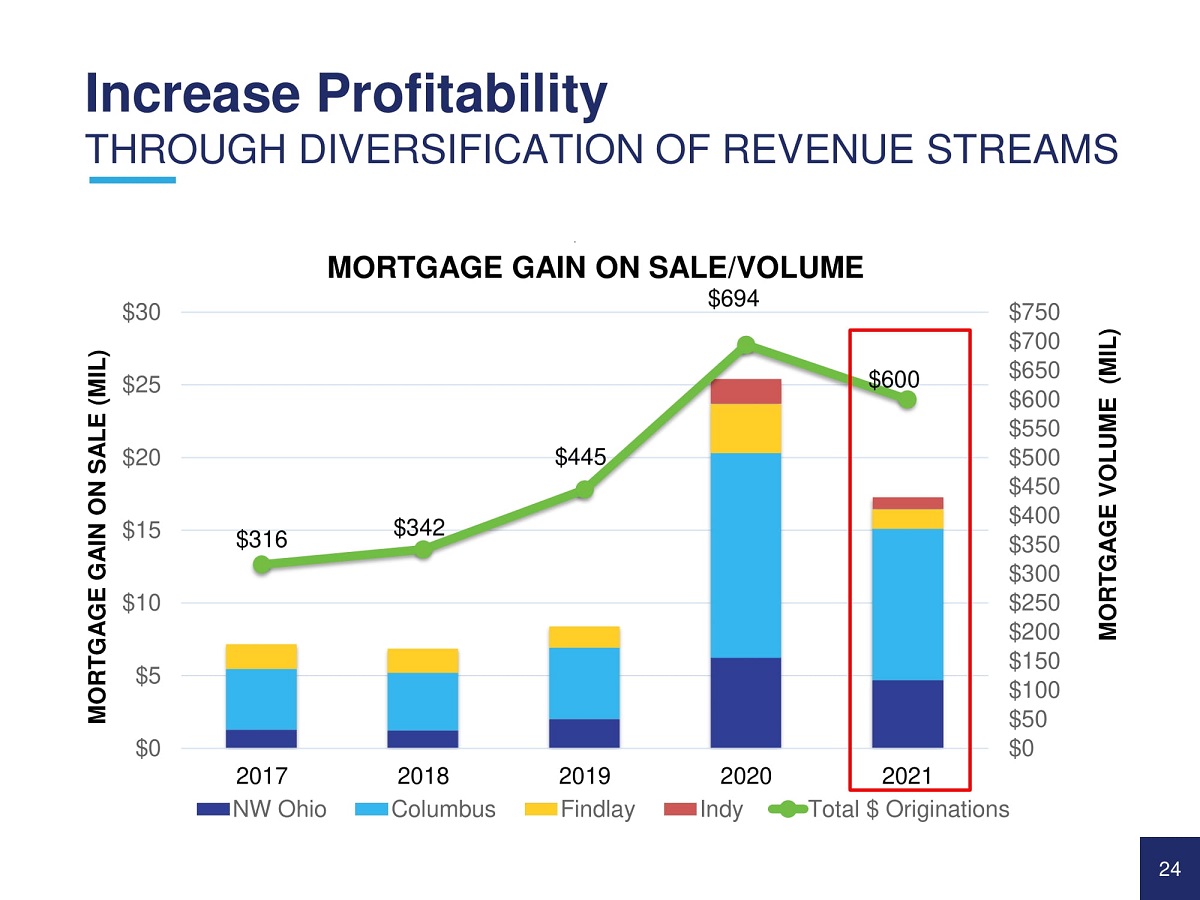
$316 $342 $445 MORTGAGE GAIN ON SALE/VOLUME $694 $600 $750 $700 $650 $600 $550 $500 $450 $400 $350 $300 $250 $200 $150 $100 $50 $0 $0 $5 $10 $15 $20 $25 $30 2017 2018 2019 2020 2021 MORTGAGE VOLUME (MIL) MORTGAGE GAIN ON SALE (MIL) NW Ohio Columbus Findlay Indy Total $ Originations Increase Profitability THROUGH DIVERSIFICATION OF REVENUE STREAMS 24
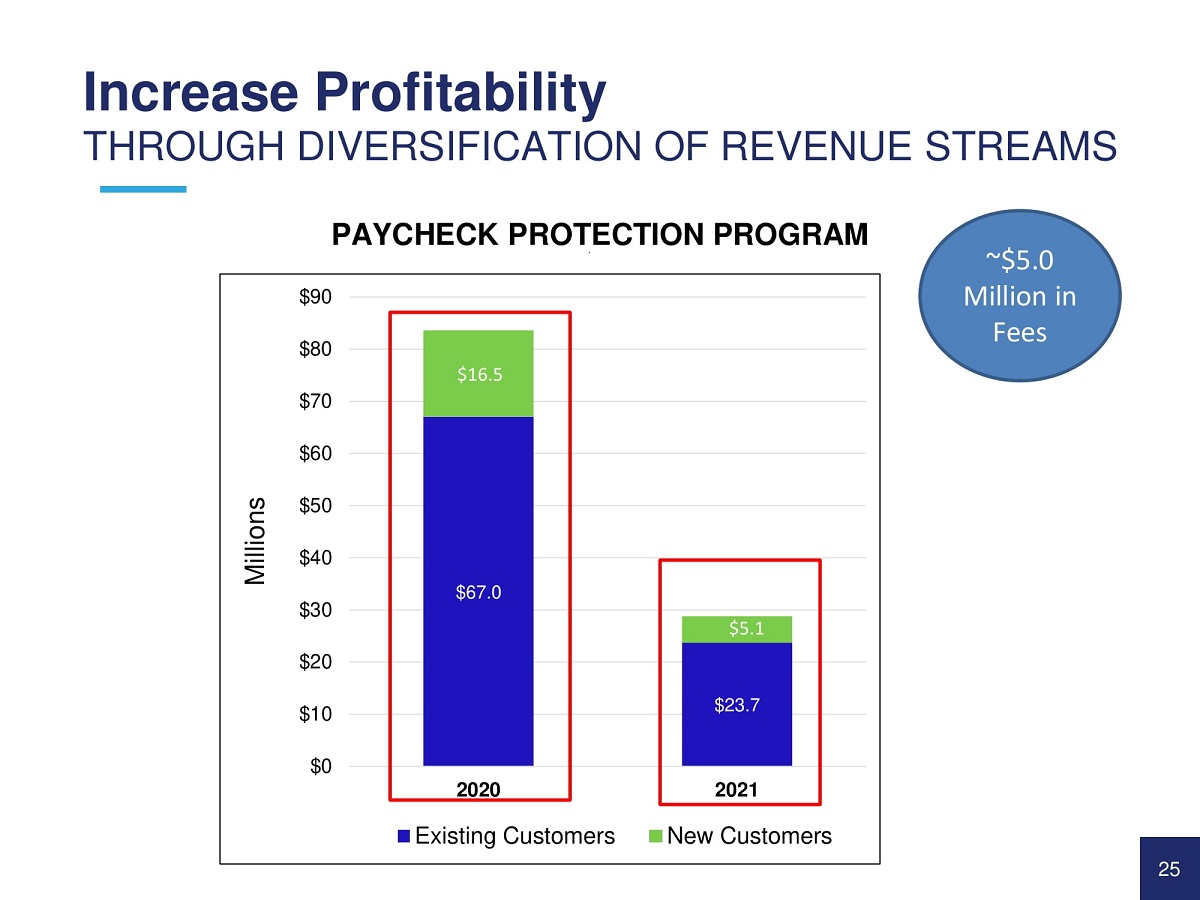
Increase Profitability THROUGH DIVERSIFICATION OF REVENUE STREAMS PAYCHECK PROTECTION PROGRAM $67.0 $23.7 $16.5 $5.1 $0 $20 $10 $70 $60 $50 $40 $30 $90 $80 2020 2021 Millions Existing Customers New Customers ~$5.0 Million in Fees 25
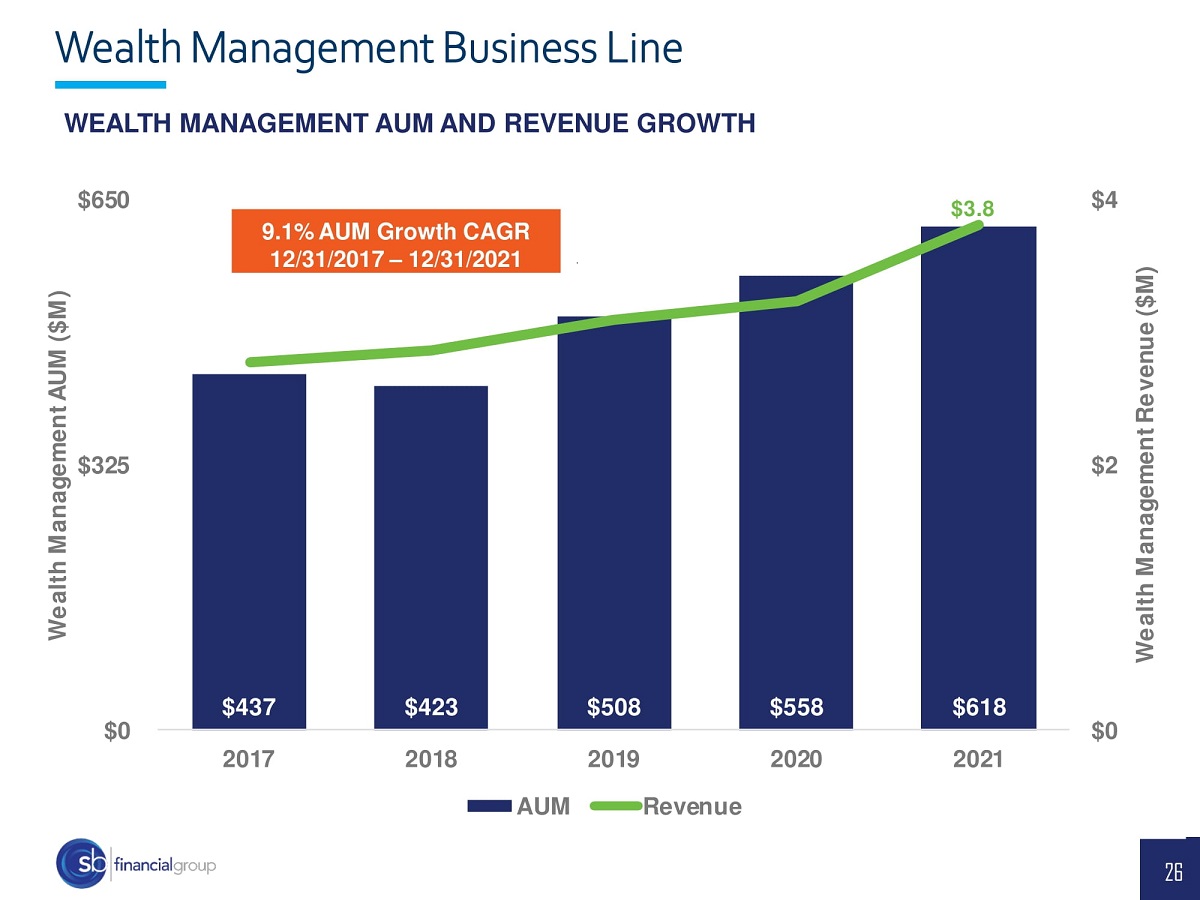
$437 $423 $508 $558 $618 $0 $2 $4 $0 $325 $650 2017 2018 2019 2020 2021 Wealth Management Revenue ($M) Wealth Management AUM ($M) AUM Revenue Wealth Management Business Line $3.8 WEALTH MANAGEMENT AUM AND REVENUE GROWTH 9.1% AUM Growth CAGR 12/31/2017 – 12/31/2021 26
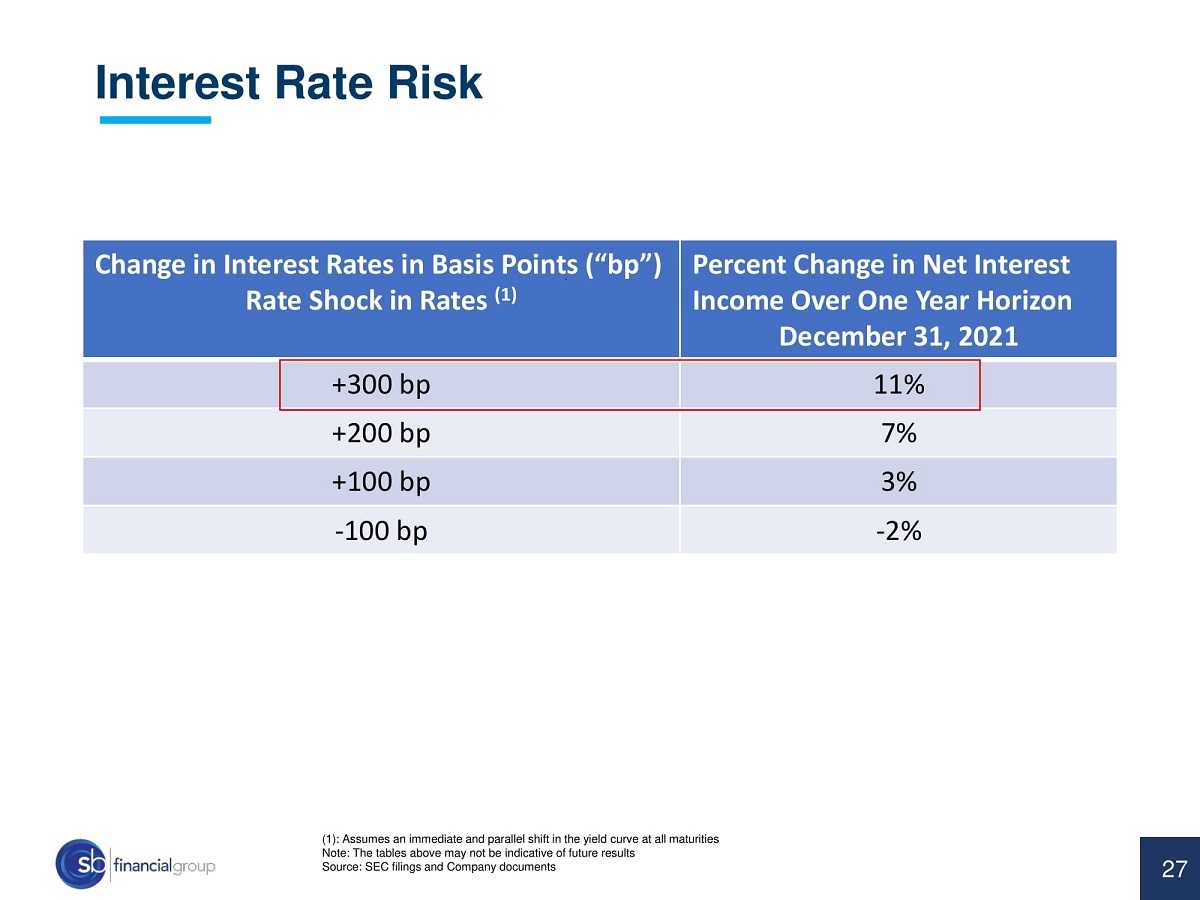
Change in Interest Rates in Basis Points (“bp”) Rate Shock in Rates (1) Percent Change in Net Interest Income Over One Year Horizon December 31, 2021 +300 bp 11% +200 bp 7% +100 bp 3% - 100 bp - 2% Interest Rate Risk (1): Assumes an immediate and parallel shift in the yield curve at all maturities Note: The tables above may not be indicative of future results Source: SEC filings and Company documents 27
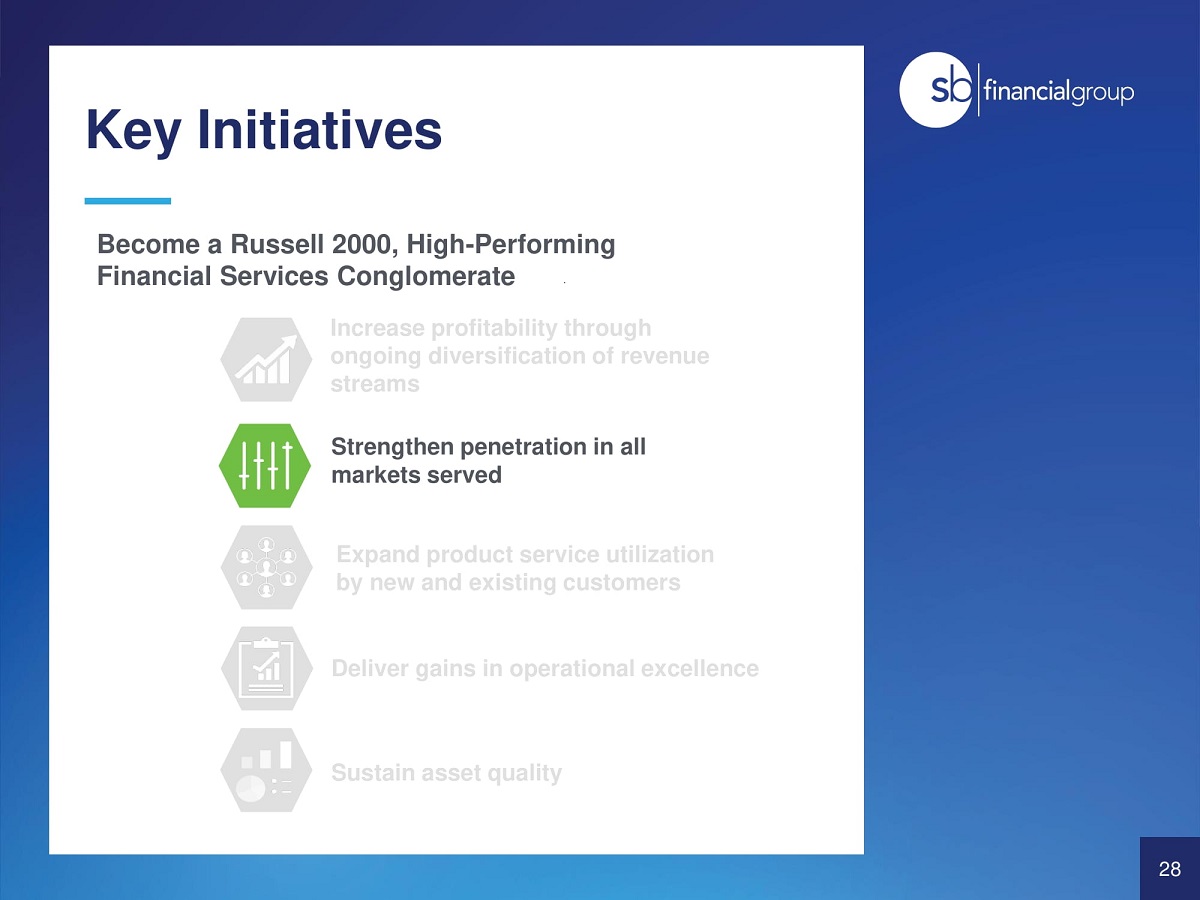
Key Initiatives Become a Russell 2000, High - Performing Financial Services Conglomerate Increase profitability through ongoing diversification of revenue streams Strengthen penetration in all markets served Expand product service utilization by new and existing customers Deliver gains in operational excellence Sustain asset quality 28
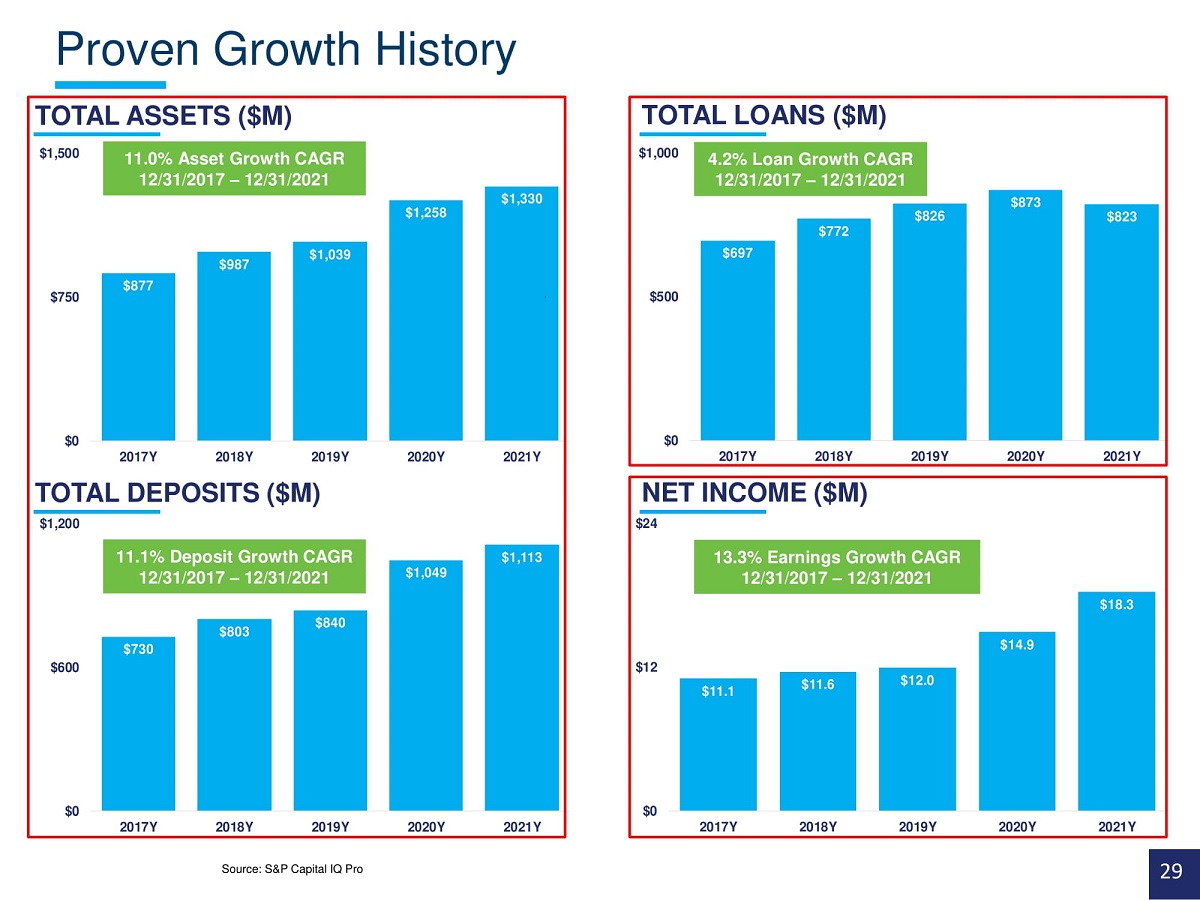
$0 $0 Proven Growth History TOTAL LOANS ($M) $1,000 4.2% Loan Growth CAGR 12/31/2017 – 12/31/2021 $826 $772 $697 $500 $873 $823 2017Y 2018Y 2019Y 2020Y 2021Y TOTAL ASSETS ($M) $1,500 11.0% Asset Growth CAGR 12/31/2017 – 12/31/2021 $1,330 $1,258 $987 $1,039 $877 $750 $0 2017Y 2018Y 2019Y 2020Y 2021Y TOTAL DEPOSITS ($M) $1,200 11.1% Deposit Growth CAGR $1,113 12/31/2017 – 12/31/2021 $1,049 $803 $840 $730 $600 $0 2017Y 2018Y 2019Y 2020Y 2021Y NET INCOME ($M) $24 13.3% Earnings Growth CAGR 12/31/2017 – 12/31/2021 $12 $11.1 $11.6 $12.0 $14.9 $18.3 2017Y 2018Y 2019Y 2020Y 2021Y Source: S&P Capital IQ Pro 29
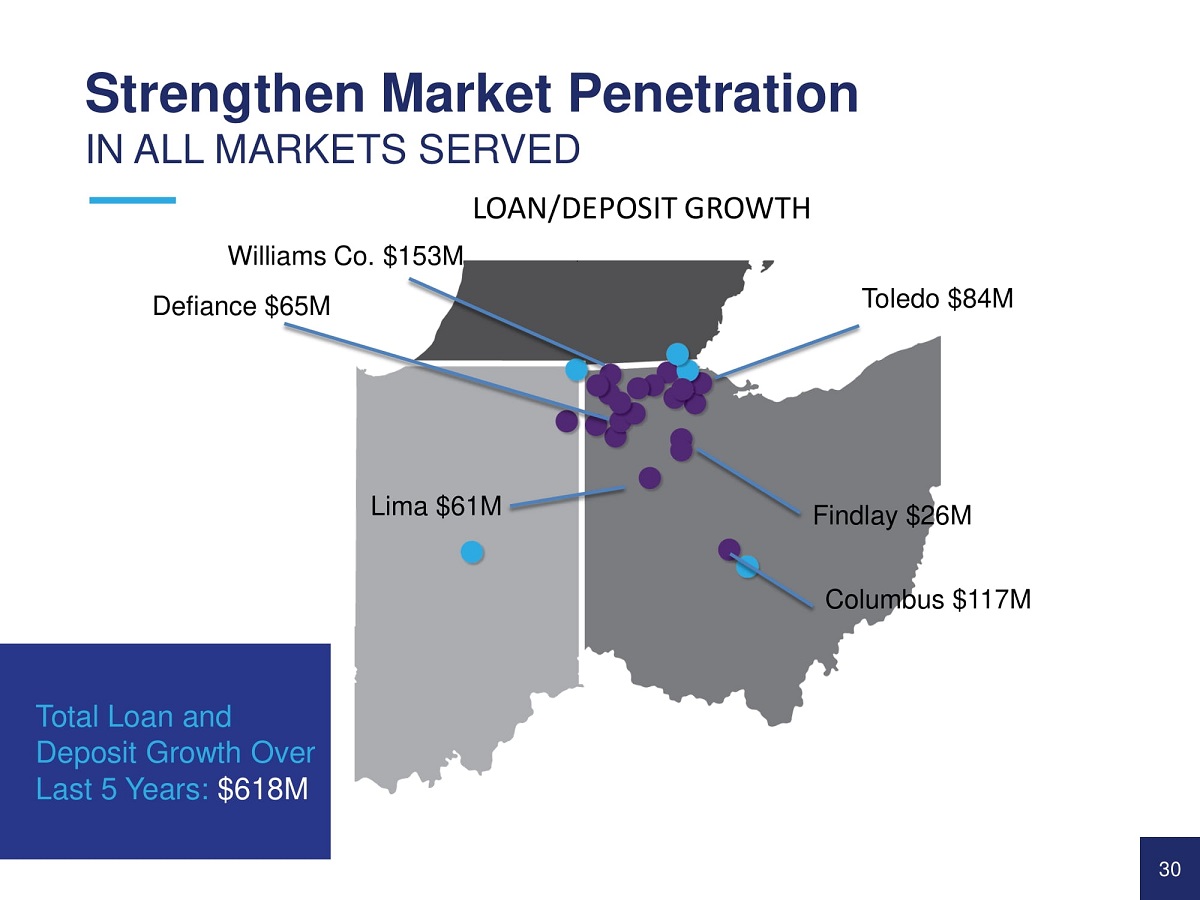
Toledo $84M Findlay $26M Columbus $117M Williams Co. $153M Defiance $65M Strengthen Market Penetration 30 Total Loan and Deposit Growth Over Last 5 Years: $618M IN ALL MARKETS SERVED LOAN/DEPOSIT GROWTH Lima $61M
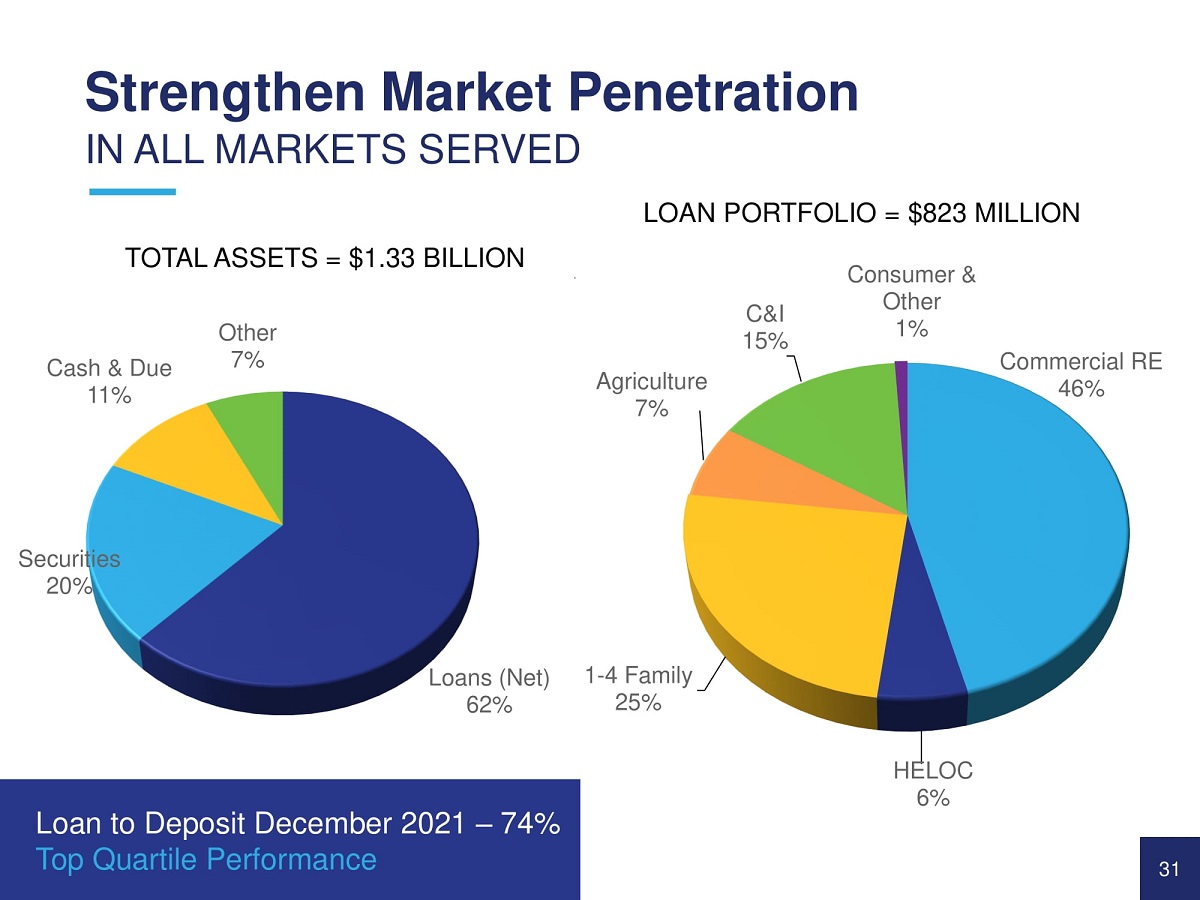
Loans (Net) 62% Securities 20% Cash & Due 11% Other 7% Commercial RE 46% HELOC 6% 1 - 4 Family 25% Agriculture 7% C&I 15% Consumer & Other 1% LOAN PORTFOLIO = $823 MILLION Strengthen Market Penetration IN ALL MARKETS SERVED 31 Loan to Deposit December 2021 – 74% Top Quartile Performance TOTAL ASSETS = $1.33 BILLION
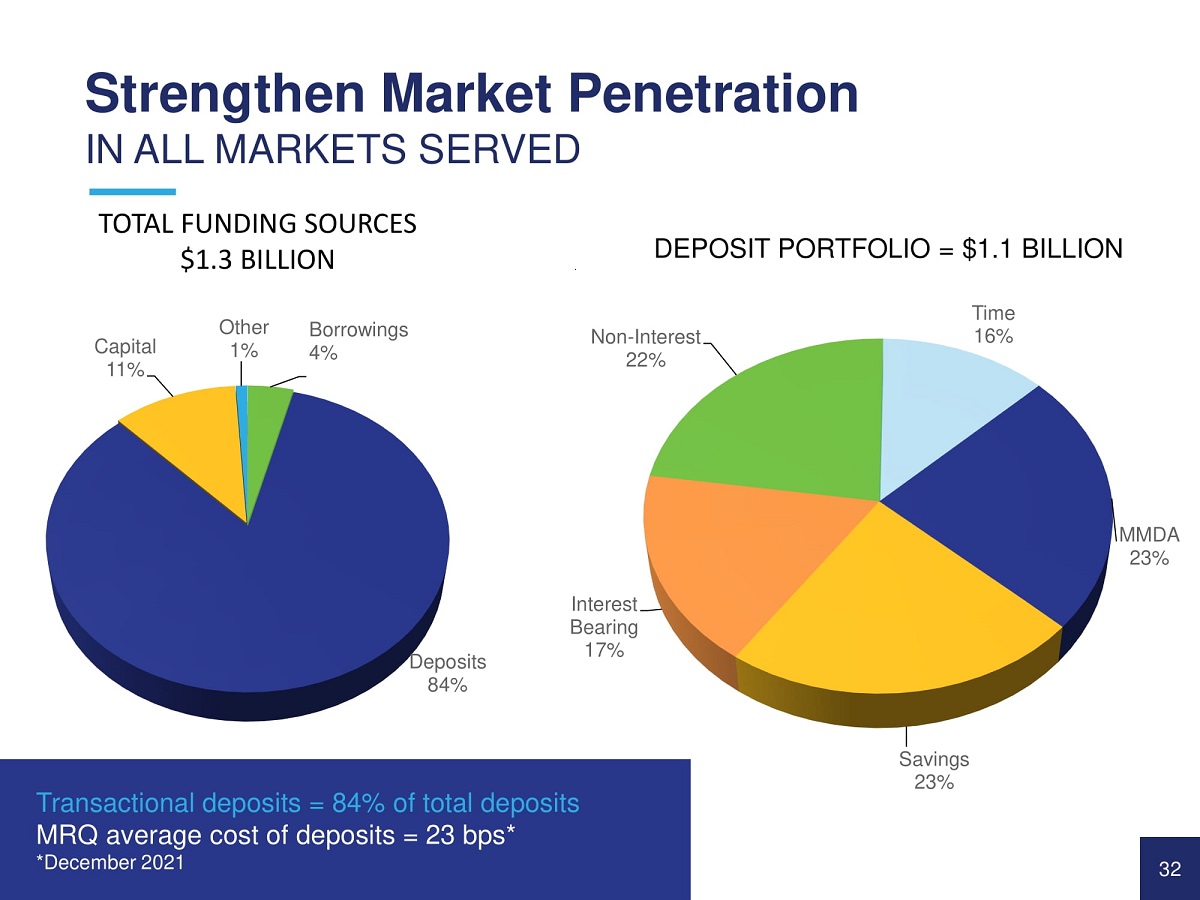
Borrowings 4% Deposits 84% Capital 11% Other 1% Time 16% MMDA 23% Savings 23% Interest Bearing 17% Non - Interest 22% DEPOSIT PORTFOLIO = $1.1 BILLION Strengthen Market Penetration IN ALL MARKETS SERVED 32 Transactional deposits = 84% of total deposits MRQ average cost of deposits = 23 bps* *December 2021 TOTAL FUNDING SOURCES $1.3 BILLION
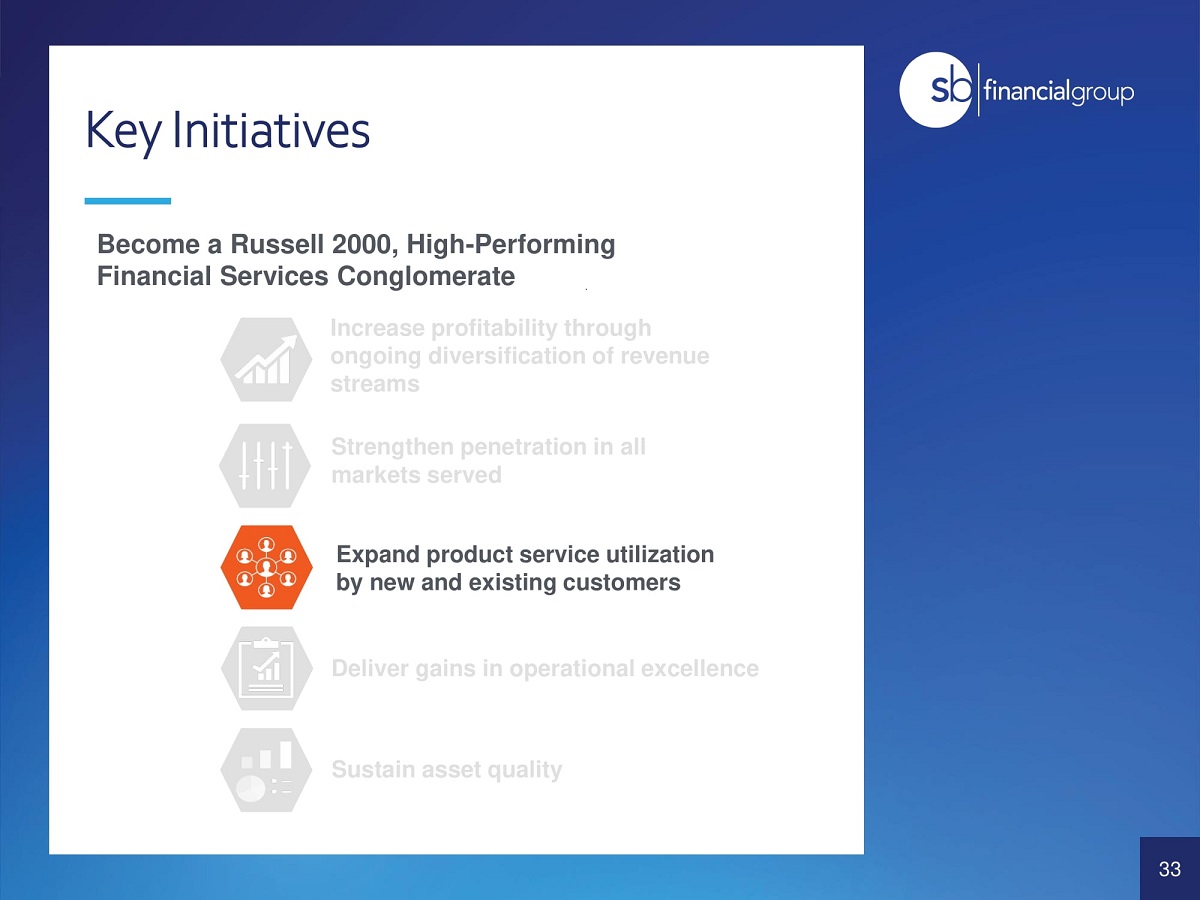
Key Initiatives Become a Russell 2000, High - Performing Financial Services Conglomerate Increase profitability through ongoing diversification of revenue streams Strengthen penetration in all markets served Expand product service utilization by new and existing customers Deliver gains in operational excellence Sustain asset quality 33
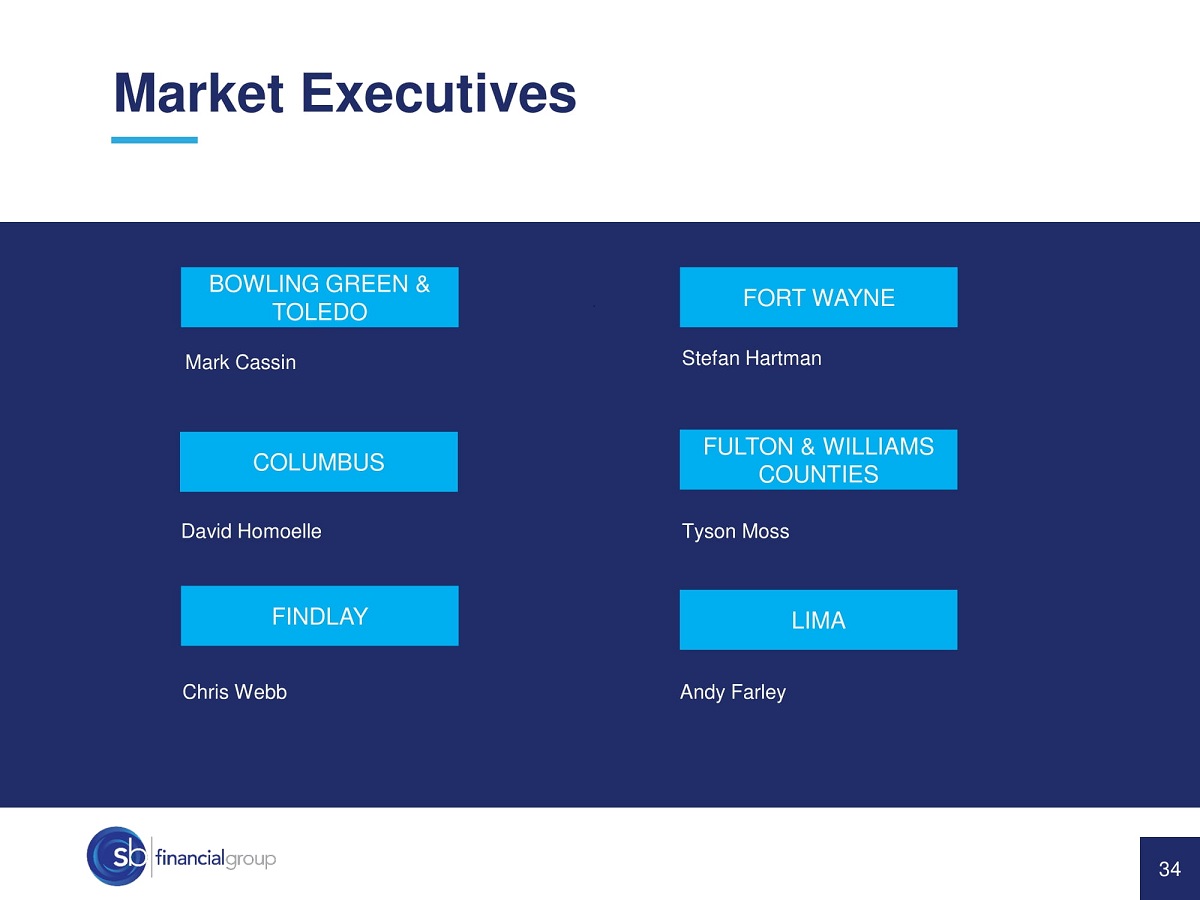
Market Executives BOWLING GREEN & TOLEDO FULTON & WILLIAMS COUNTIES Mark Cassin Tyson Moss Chris Webb LIMA FINDLAY Andy Farley Stefan Hartman FORT WAYNE COLUMBUS David Homoelle 34
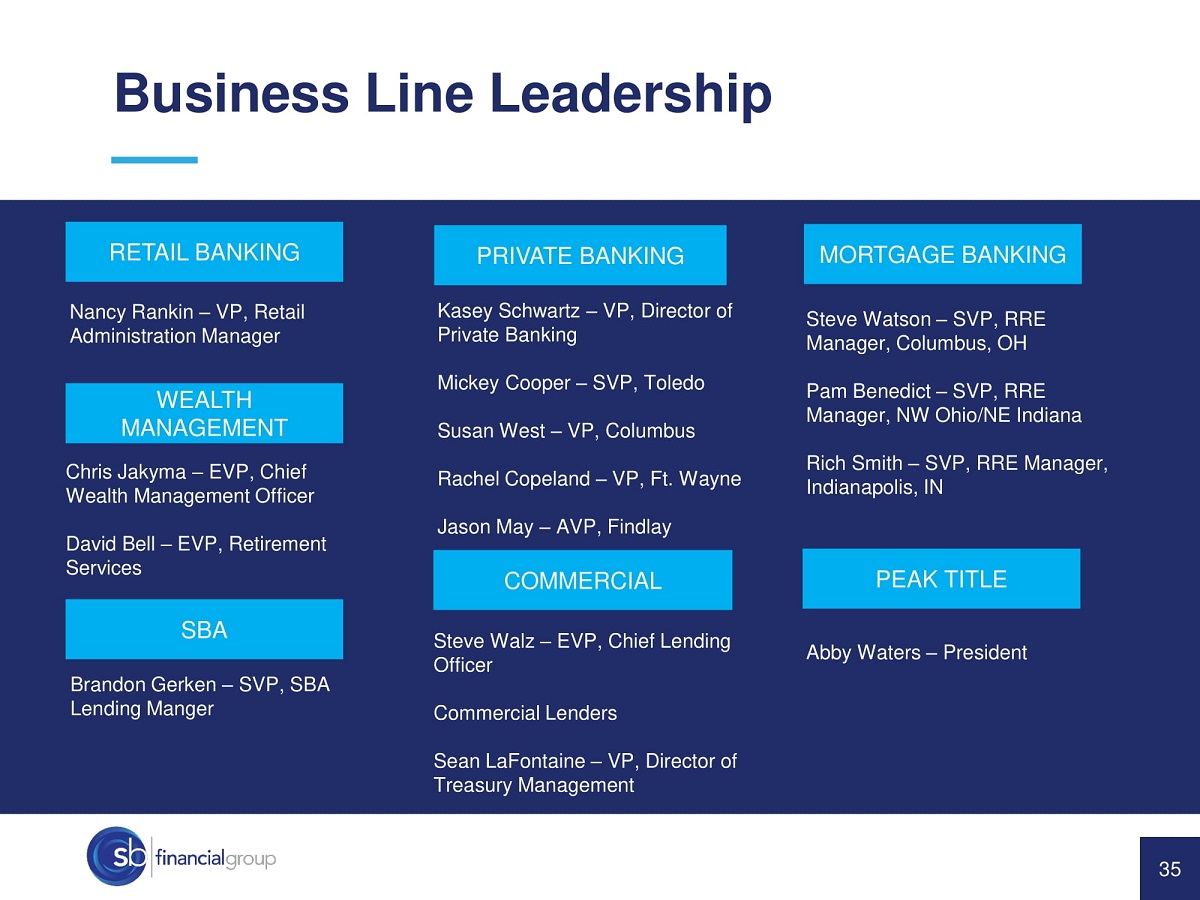
Business Line Leadership RETAIL BANKING PRIVATE BANKING Nancy Rankin – VP, Retail Administration Manager MORTGAGE BANKING Kasey Schwartz – VP, Director of Private Banking Mickey Cooper – SVP, Toledo Susan West – VP, Columbus Rachel Copeland – VP, Ft. Wayne Jason May – AVP, Findlay Steve Watson – SVP, RRE Manager, Columbus, OH Pam Benedict – SVP, RRE Manager, NW Ohio/NE Indiana Rich Smith – SVP, RRE Manager, Indianapolis, IN PEAK TITLE Chris Jakyma – EVP, Chief Wealth Management Officer David Bell – EVP, Retirement Services COMMERCIAL WEALTH MANAGEMENT Steve Walz – EVP, Chief Lending Officer Commercial Lenders Sean LaFontaine – VP, Director of Treasury Management Brandon Gerken – SVP, SBA Lending Manger SBA Abby Waters – President 35
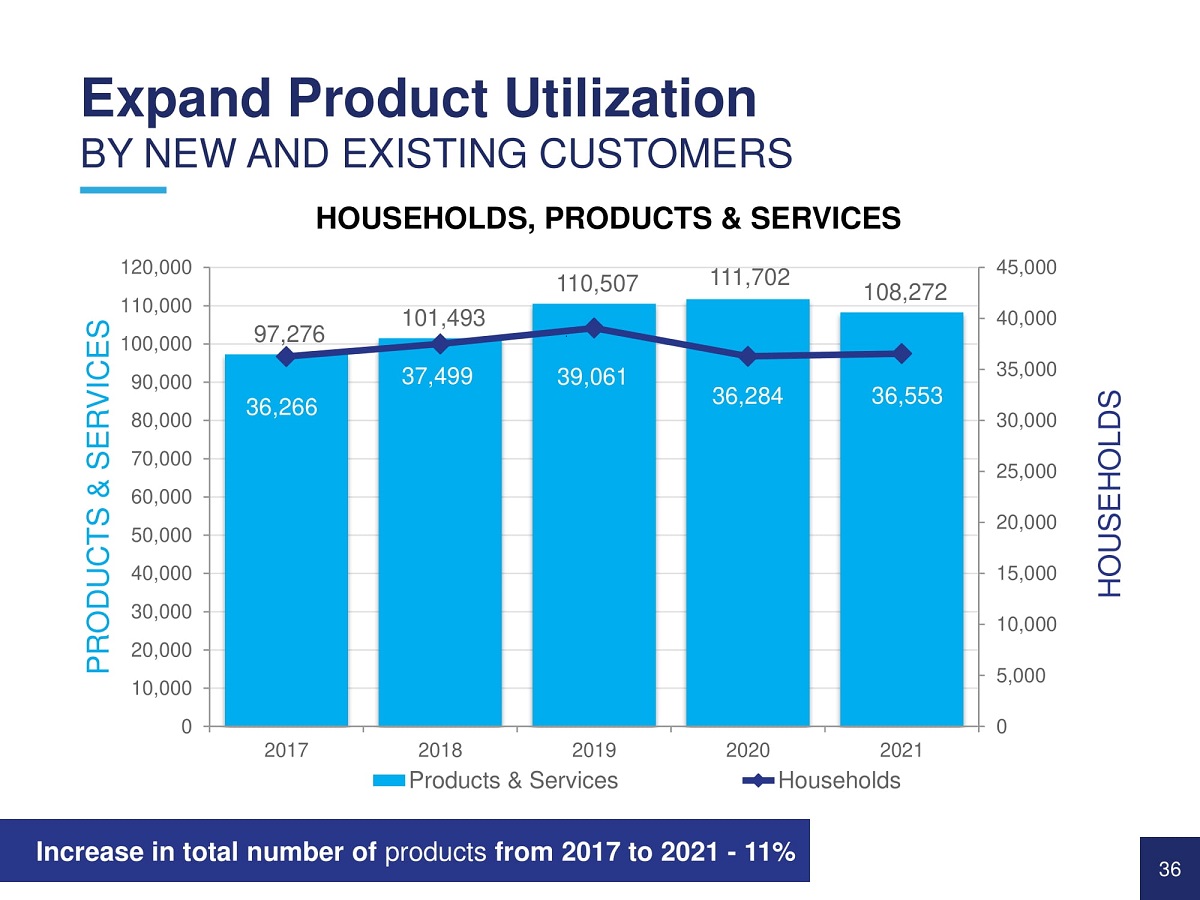
97,276 101,493 110,507 111,702 108,272 36,266 37,499 39,061 36,284 36,553 0 5,000 10,000 15,000 20,000 25,000 30,000 35,000 40,000 45,000 120,000 110,000 100,000 90,000 80,000 70,000 60,000 50,000 40,000 30,000 20,000 10,000 0 2017 2018 2019 Products & Services 2020 2021 Households HOUSEHOLDS PRODUCTS & SERVICES Increase in total number of products from 2017 to 2021 - 11% 36 Expand Product Utilization BY NEW AND EXISTING CUSTOMERS HOUSEHOLDS, PRODUCTS & SERVICES
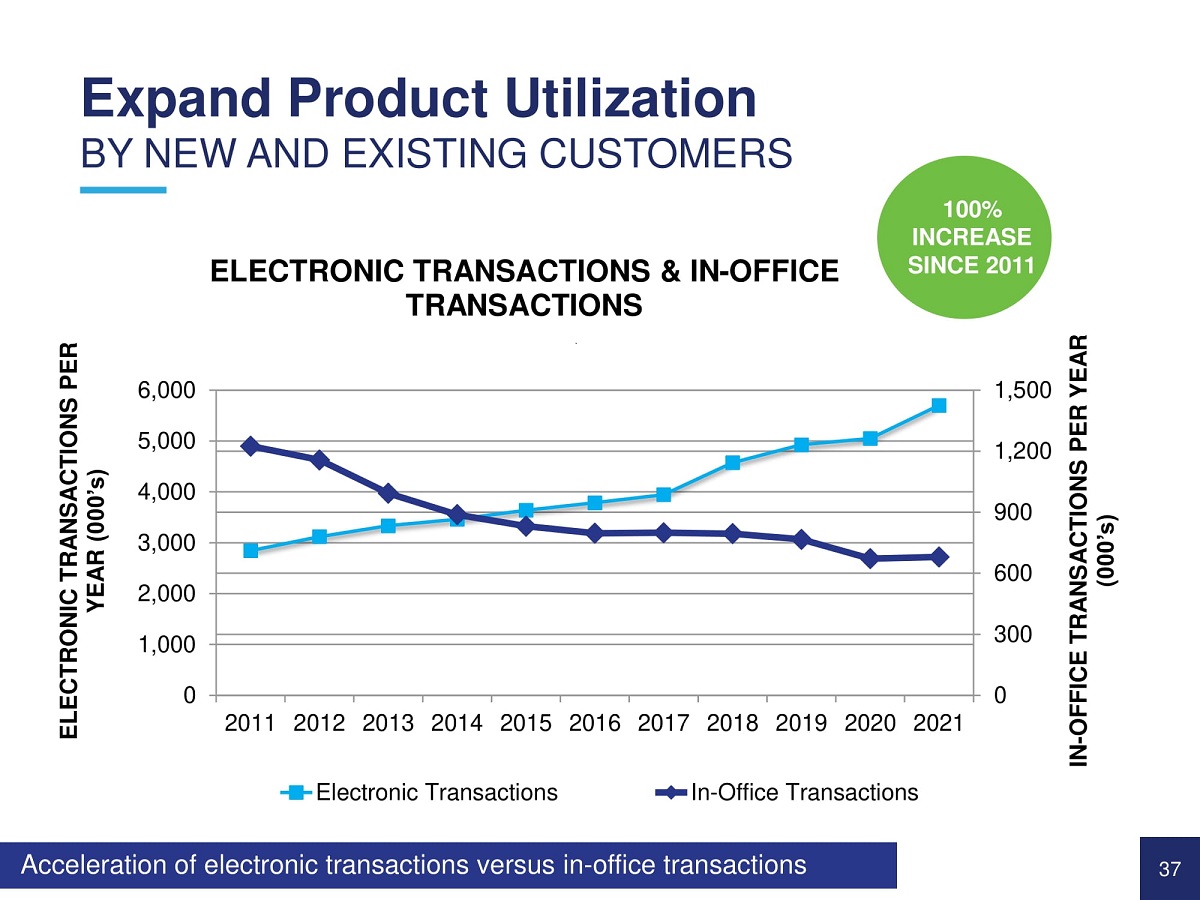
0 300 600 900 1,200 1,500 0 1,000 2,000 3,000 4,000 5,000 6,000 2011 2012 2013 2014 2015 2016 2017 2018 2019 2020 2021 IN - OFFICE TRANSACTIONS PER YEAR (000’s) ELECTRONIC TRANSACTIONS PER YEAR (000’s) ELECTRONIC TRANSACTIONS & IN - OFFICE TRANSACTIONS Electronic Transactions In - Office Transactions Acceleration of electronic transactions versus in - office transactions 100% INCREASE SINCE 2011 Expand Product Utilization BY NEW AND EXISTING CUSTOMERS 37
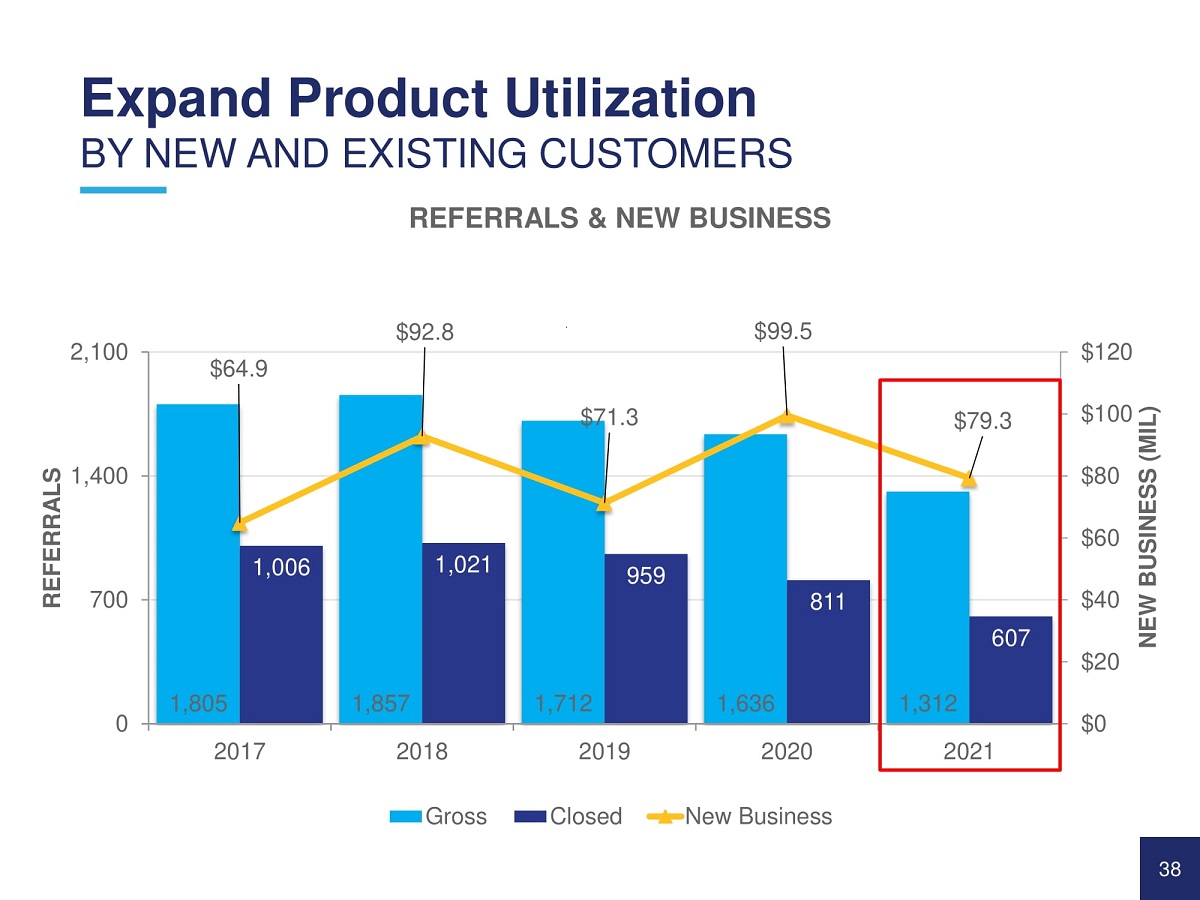
1,805 1,857 1,712 1,636 1,312 1,006 1,021 959 811 $64.9 $92.8 $71.3 $99.5 $79.3 607 $20 $0 $40 $60 $80 $100 $120 0 700 1,400 2,100 2017 2018 2019 2020 2021 NEW BUSINESS (MIL) REFERRALS Gross Closed New Business Expand Product Utilization BY NEW AND EXISTING CUSTOMERS REFERRALS & NEW BUSINESS 38
Key Initiatives Become a Russell 2000, High - Performing Financial Services Conglomerate Increase profitability through ongoing diversification of revenue streams Strengthen penetration in all markets served Expand product service utilization by new and existing customers Deliver gains in operational excellence Sustain asset quality 39
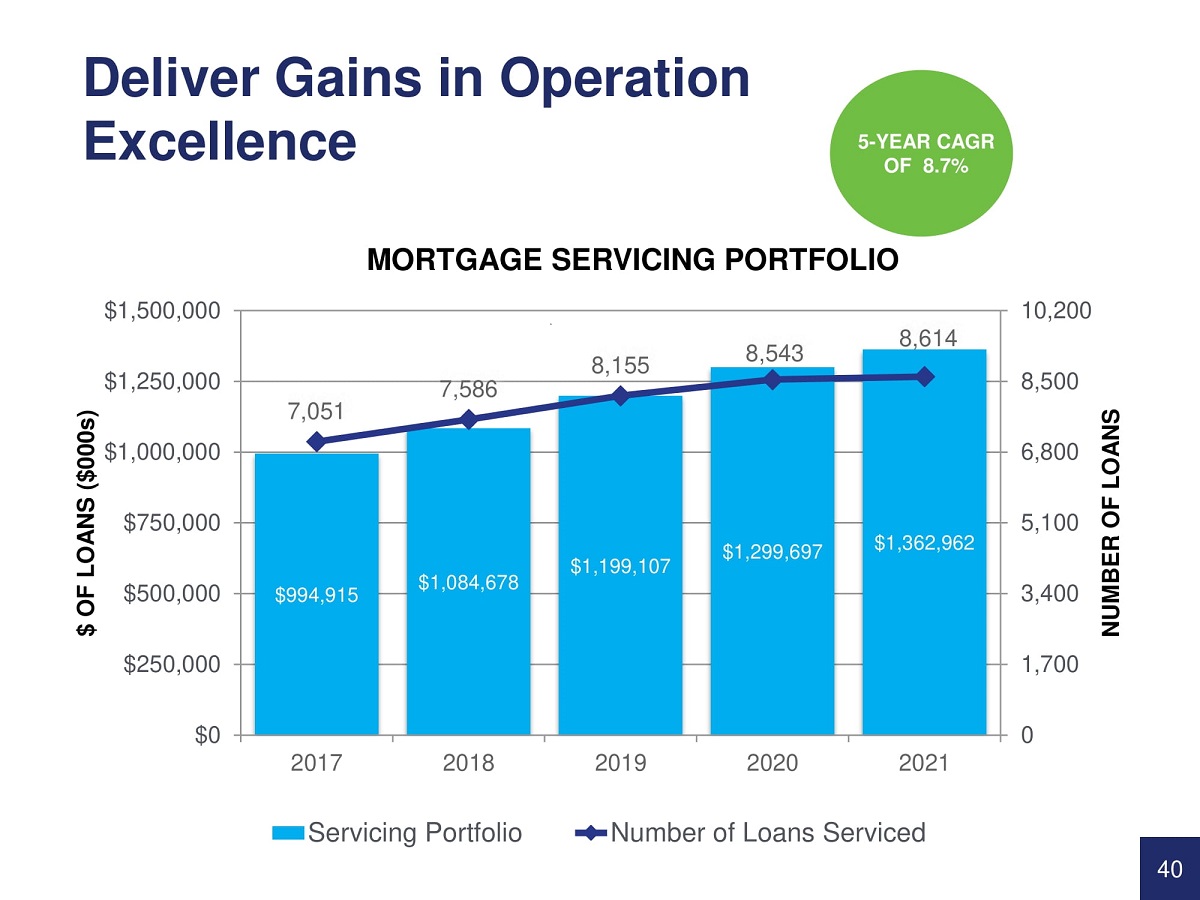
$994,915 $1,084,678 $1,199,107 $1,299,697 $1,362,962 7,051 7,586 8,155 8,543 8,614 0 1,700 3,400 5,100 6,800 8,500 10,200 $0 $250,000 $500,000 $750,000 $1,000,000 $1,250,000 $1,500,000 NUMBER OF LOANS $ OF LOANS ($000s) MORTGAGE SERVICING PORTFOLIO 2017 2018 Servicing Portfolio 2019 2020 2021 Number of Loans Serviced 5 - YEAR CAGR OF 8.7% 40 Deliver Gains in Operation Excellence
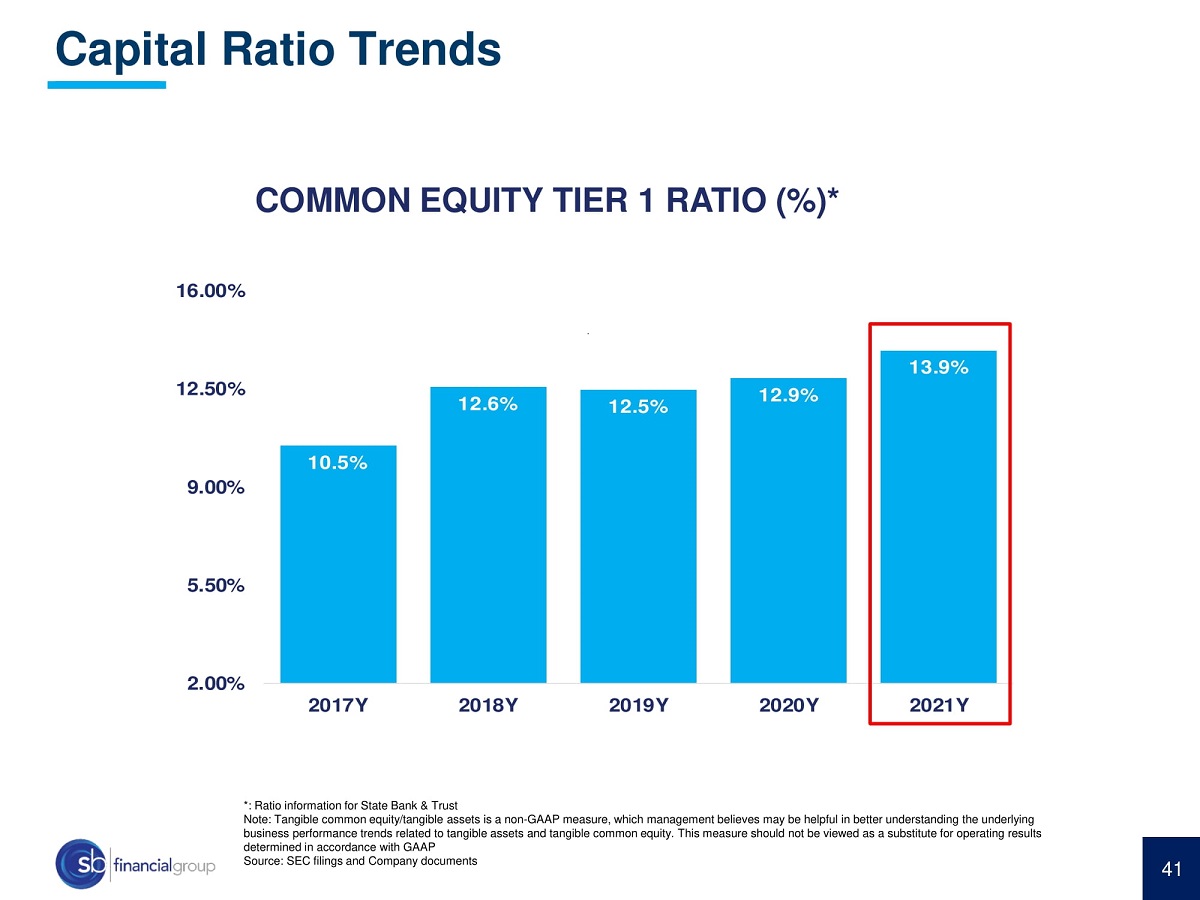
41 *: Ratio information for State Bank & Trust Note: Tangible common equity/tangible assets is a non - GAAP measure, which management believes may be helpful in better understanding the underlying business performance trends related to tangible assets and tangible common equity. This measure should not be viewed as a substitute for operating results determined in accordance with GAAP Source: SEC filings and Company documents Capital Ratio Trends COMMON EQUITY TIER 1 RATIO (%)* 12.6% 12.5% 12.9% 10.5% 13.9% 2017Y 2018Y 2019Y 2020Y 2021Y 2.00% 5.50% 9.00% 12.50% 16.00% 41

$7.28 $7.98 $10.39 $9.24 $11.59 $13.27 $15.39 $15.23 $16.30 $17.60 $0.99 $1.07 $1.06 $1.19 $1.38 $1.74 $1.51 $1.51 $1.96 $2.56 $0.00 $0.50 $1.00 $1.50 $2.00 $2.50 $3.00 $0.00 $2.00 $4.00 $6.00 $8.00 $10.00 $12.00 $14.00 $16.00 $18.00 $20.00 Earnings Per Share Tangible Book Value 2012 2013 2014 2015 2016 2017 2018 2019 2020 2021 TBV EPS TBV/EPS Performance Tax Change 42
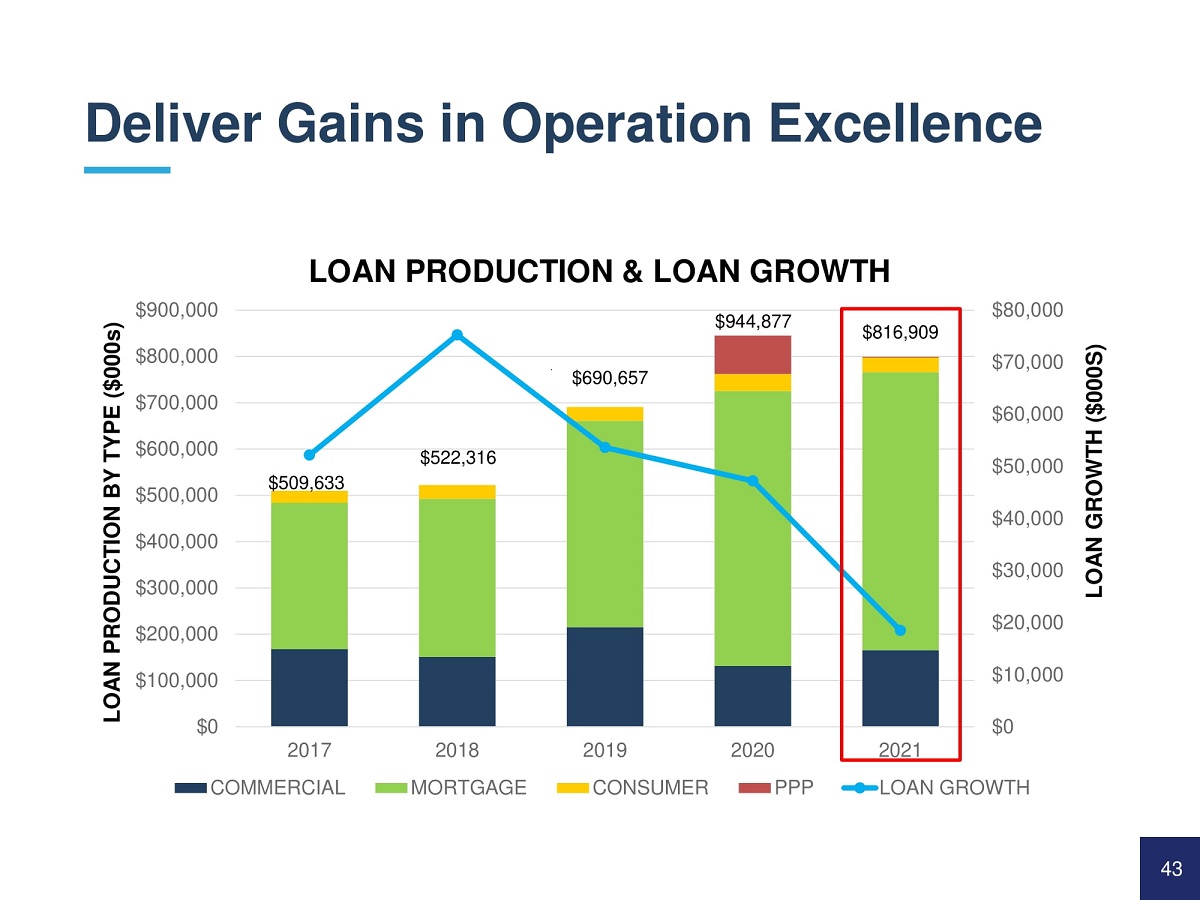
Deliver Gains in Operation Excellence $0 $10,000 $20,000 $30,000 $40,000 $50,000 $60,000 $70,000 $80,000 $0 $100,000 $200,000 $300,000 $400,000 $500,000 $600,000 $700,000 $800,000 $900,000 2017 2018 2019 2020 2021 LOAN GROWTH ($000S) LOAN PRODUCTION BY TYPE ($000s) LOAN PRODUCTION & LOAN GROWTH COMMERCIAL MORTGAGE CONSUMER PPP LOAN GROWTH $509,633 $522,316 $690,657 $944,877 $816,909 43
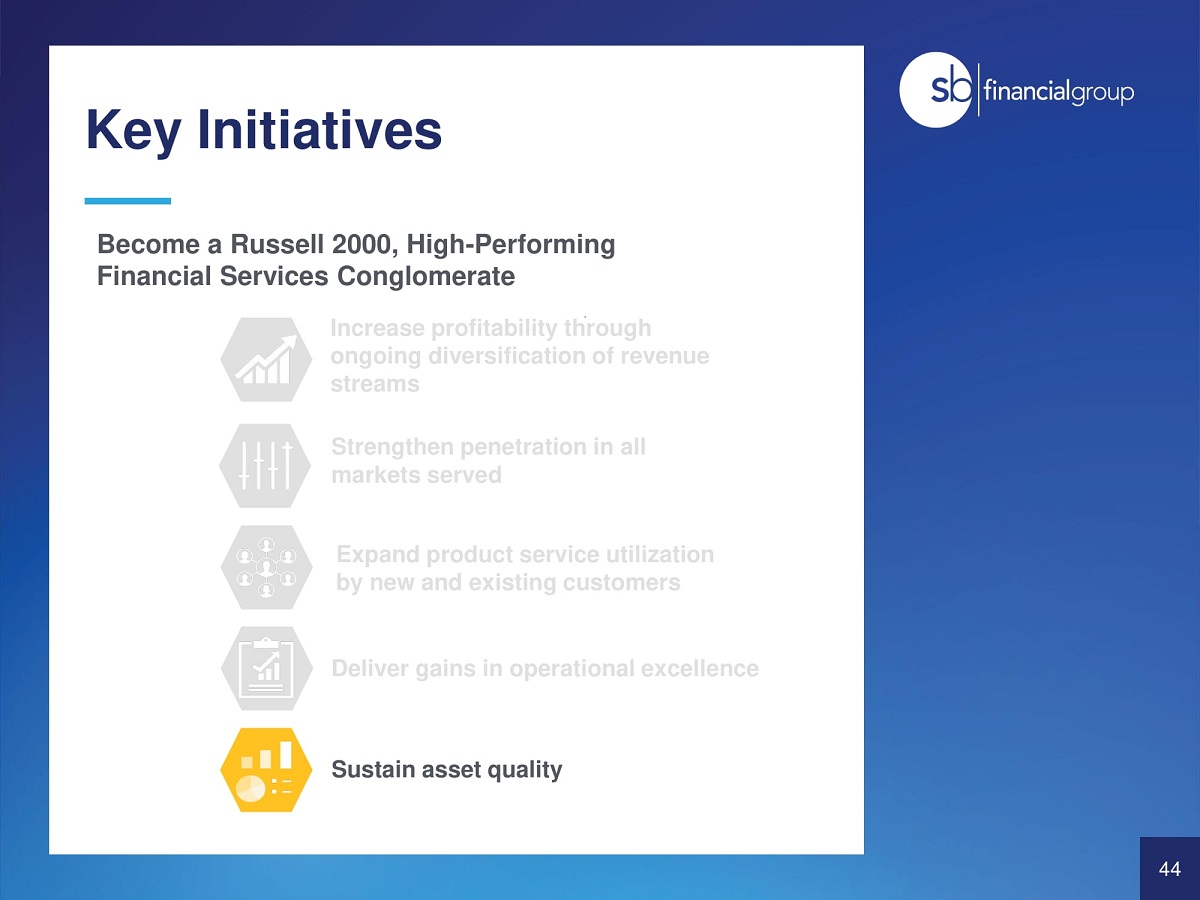
Key Initiatives Become a Russell 2000, High - Performing Financial Services Conglomerate Increase profitability through ongoing diversification of revenue streams Strengthen penetration in all markets served Expand product service utilization by new and existing customers Deliver gains in operational excellence Sustain asset quality 44
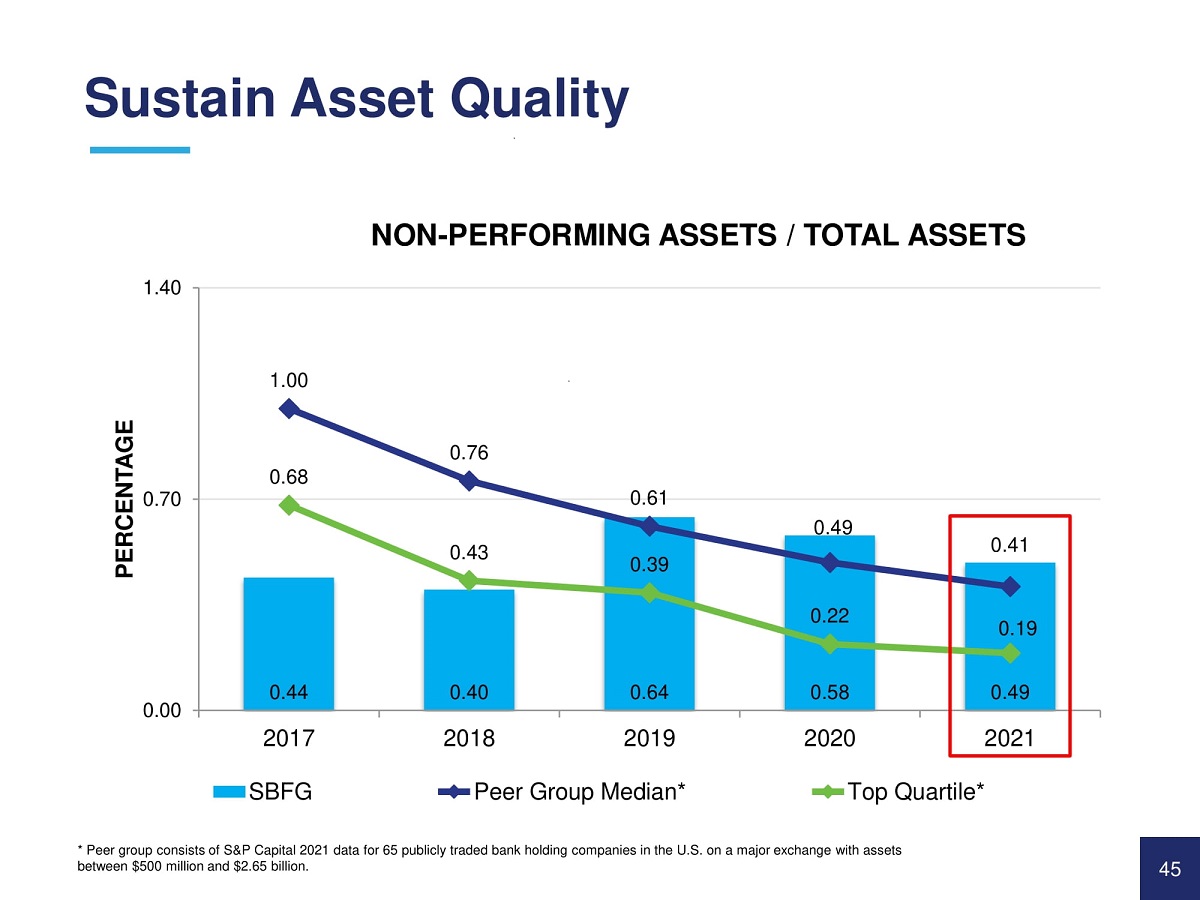
* Peer group consists of S&P Capital 2021 data for 65 publicly traded bank holding companies in the U.S. on a major exchange with assets between $500 million and $2.65 billion. 0.44 0.40 0.64 0.58 0.49 1.00 0.76 0.61 0.49 0.41 0.68 0.43 0.39 0.22 0.19 0.00 0.70 1.40 2017 PERCENTAGE NON - PERFORMING ASSETS / TOTAL ASSETS SBFG 2018 2019 Peer Group Median* 2020 2021 Top Quartile* Sustain Asset Quality 45
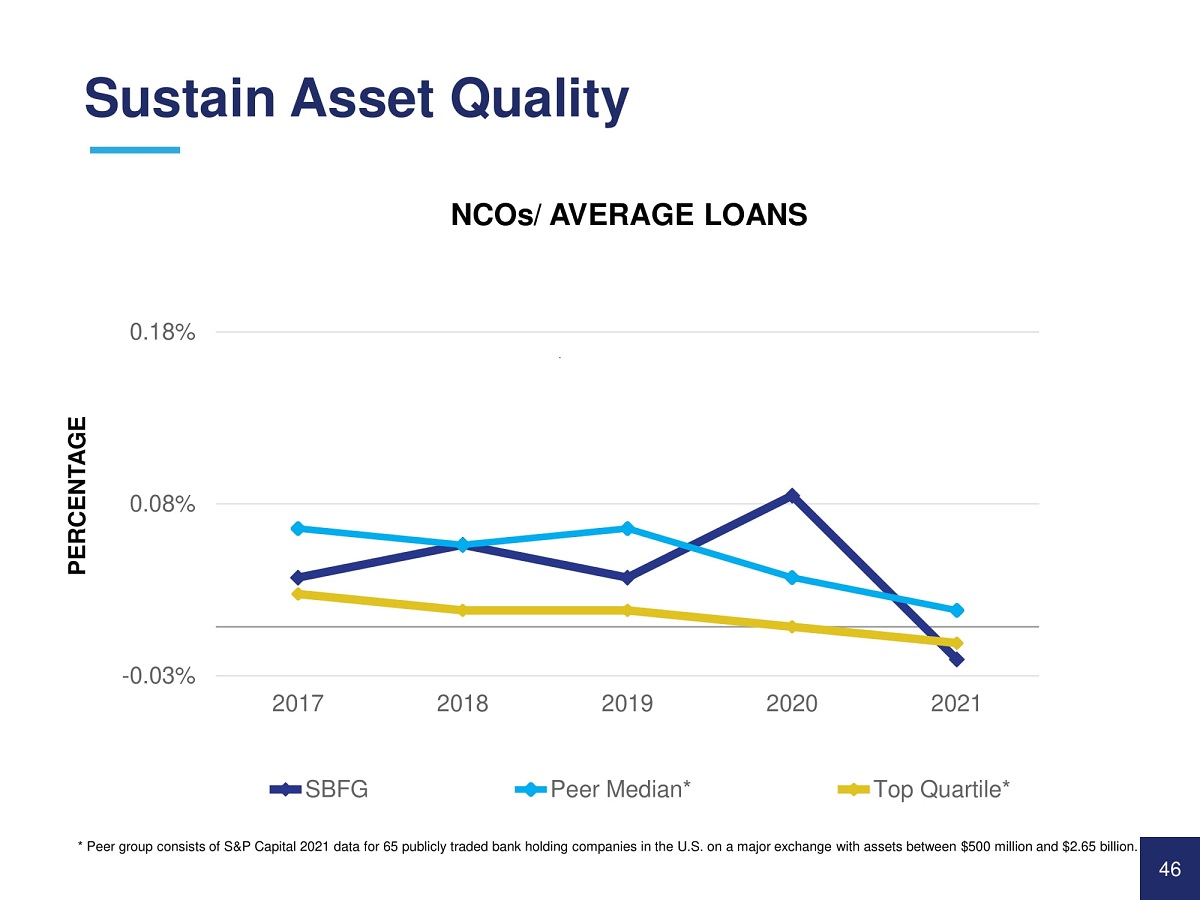
- 0.03% 0.08% 0.18% 2017 2018 2019 2020 2021 NCOs/ AVERAGE LOANS SBFG Peer Median* Top Quartile* * Peer group consists of S&P Capital 2021 data for 65 publicly traded bank holding companies in the U.S. on a major exchange with assets between $500 million and $2.65 billion. PERCENTAGE Sustain Asset Quality 46
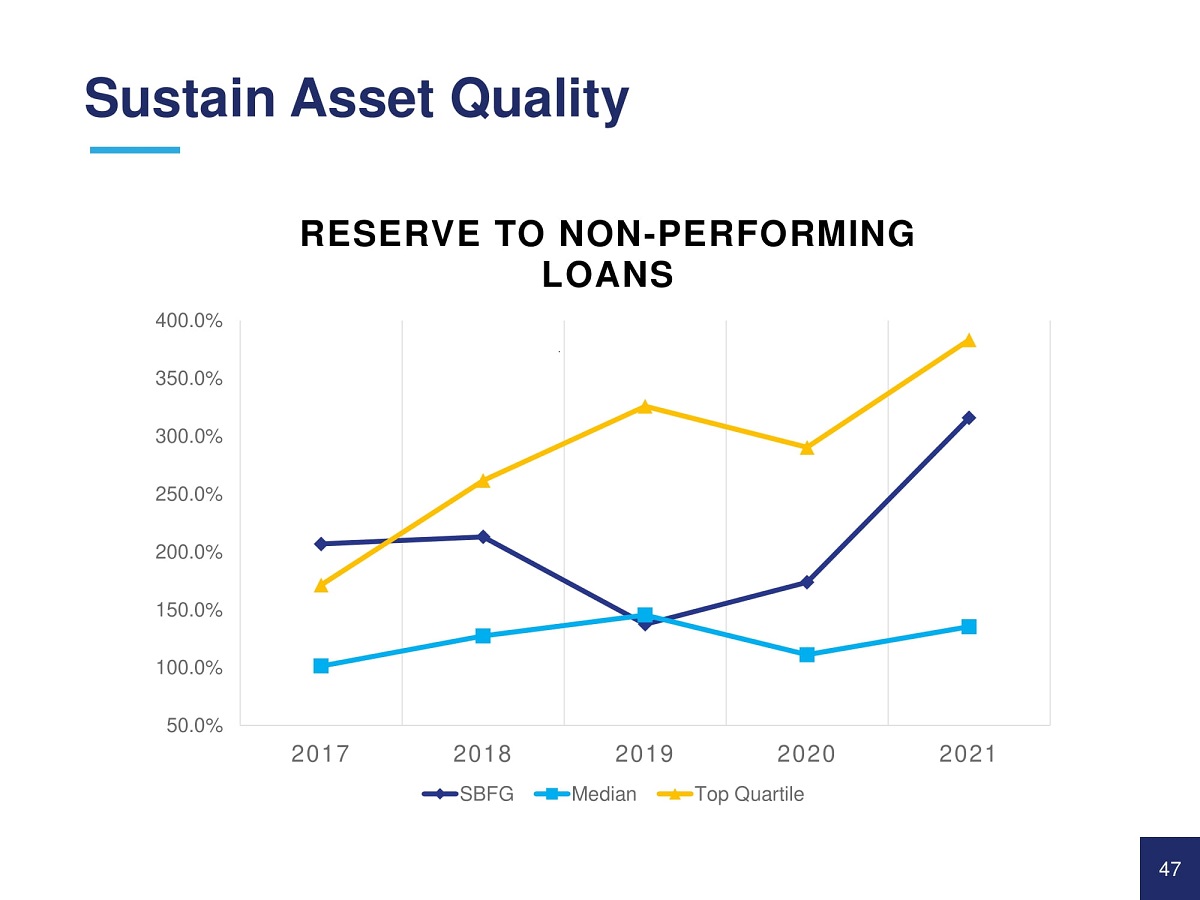
400.0% 350.0% 300.0% 250.0% 200.0% 150.0% 100.0% 50.0% 2017 2019 Median 2020 Top Quartile 2021 RESERVE TO NON - PERFORMING LOANS 2018 SBFG Sustain Asset Quality 47
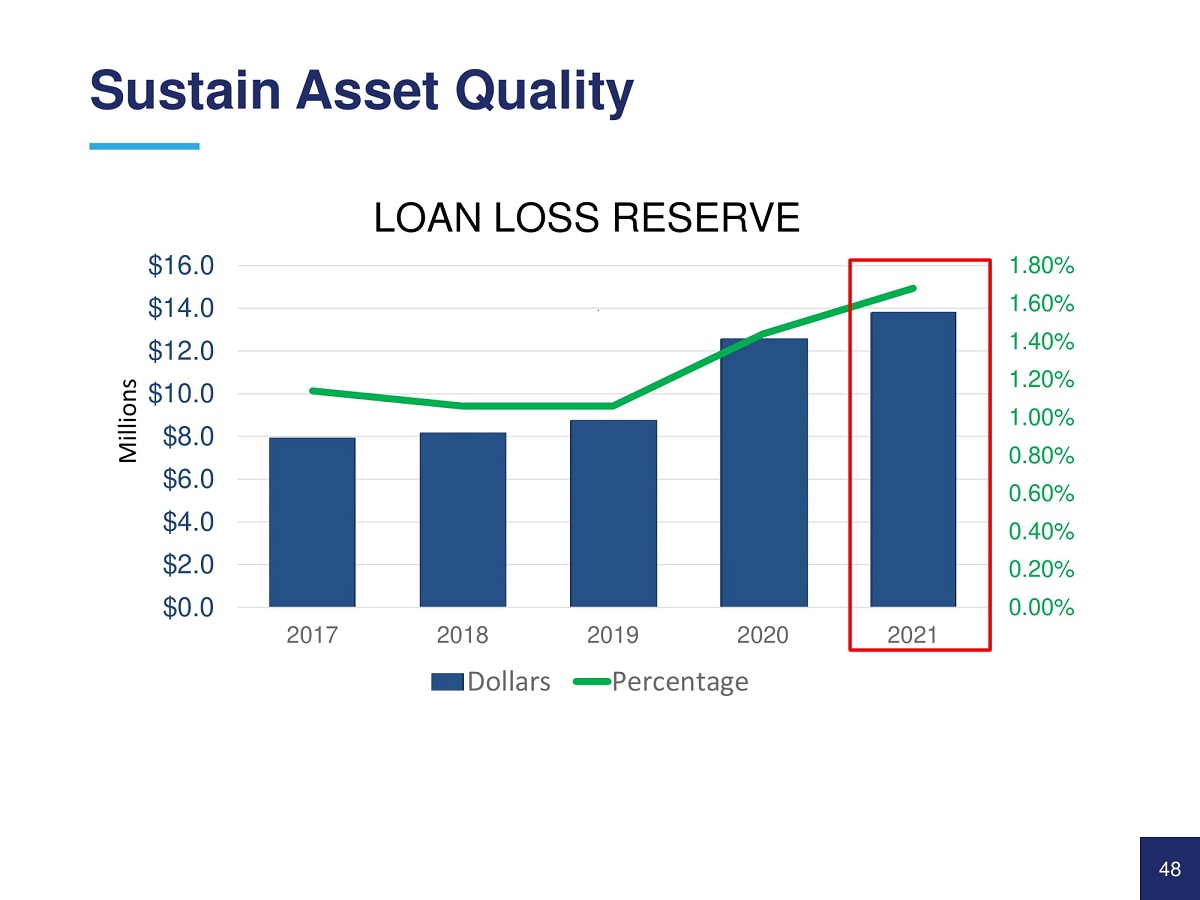
Sustain Asset Quality 1.80% 1.60% 1.40% 1.20% 1.00% 0.80% 0.60% 0.40% 0.20% 0.00% $16.0 $14.0 $12.0 $10.0 $8.0 $6.0 $4.0 $2.0 $0.0 2017 2018 2021 Millions LOAN LOSS RESERVE Dollars 2019 2020 Percentage 48
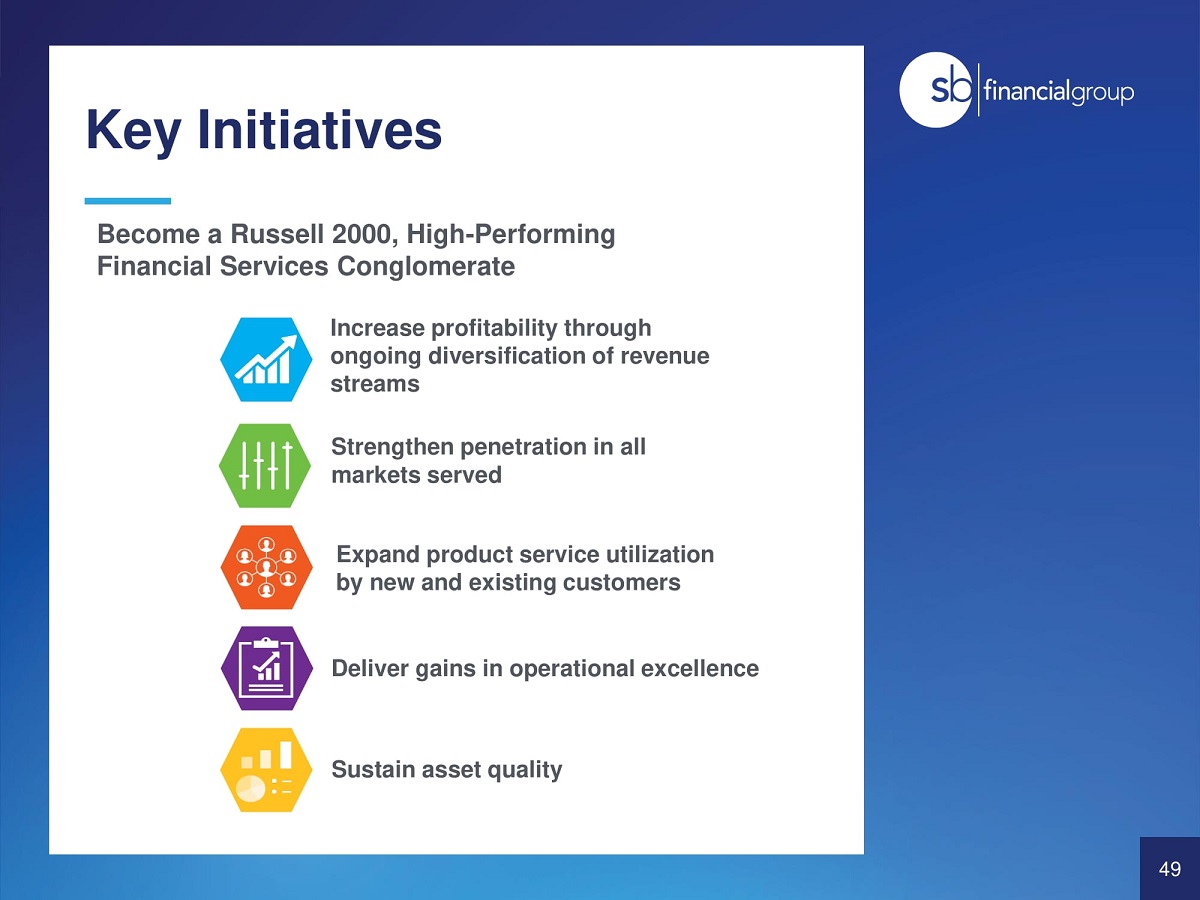
Key Initiatives Become a Russell 2000, High - Performing Financial Services Conglomerate Increase profitability through ongoing diversification of revenue streams Strengthen penetration in all markets served Expand product service utilization by new and existing customers Deliver gains in operational excellence Sustain asset quality 49
51