Exhibit 99.1
2023 ANNUAL SHAREHOLDER MEETING S B F I NA NCI A L G RO U P, I NC.

5

Safe Harbor Statement Certain statements within this document, which are not statements of historical fact, constitute forward - looking statements within the meaning of the Private Securities Litigation Reform Act of 1995. Forward - looking statements involve risks and uncertainties and actual results may differ materially from those predicted by the forward - looking statements. These risks and uncertainties include, but are not limited to, risks and uncertainties inherent in the national and regional banking, insurance and mortgage industries, economic and competitive factors specific to markets in which SB Financial Group and its subsidiaries operate, future interest rate levels, legislative and regulatory changes and actions, capital market conditions, general economic conditions such as inflation, recession and unemployment, instability in global economic conditions and geopolitical events, risks associated with fraud and cyber - security incidents, operational risk, the loss of key personnel and other factors. Additional factors that could cause results to differ from those described above can be found in the Company’s Annual Report on Form 10 - K and documents subsequently filed by SB Financial Group with the Securities and Exchange Commission. Forward - looking statements speak only as of the date on which they are made, and SB Financial Group undertakes no obligation to update any forward - looking statement to reflect events or circumstances after the date on which the statement is made except as required by law. All subsequent written and oral forward - looking statements attributable to SB Financial Group or any person acting on its behalf are qualified by these cautionary statements 6
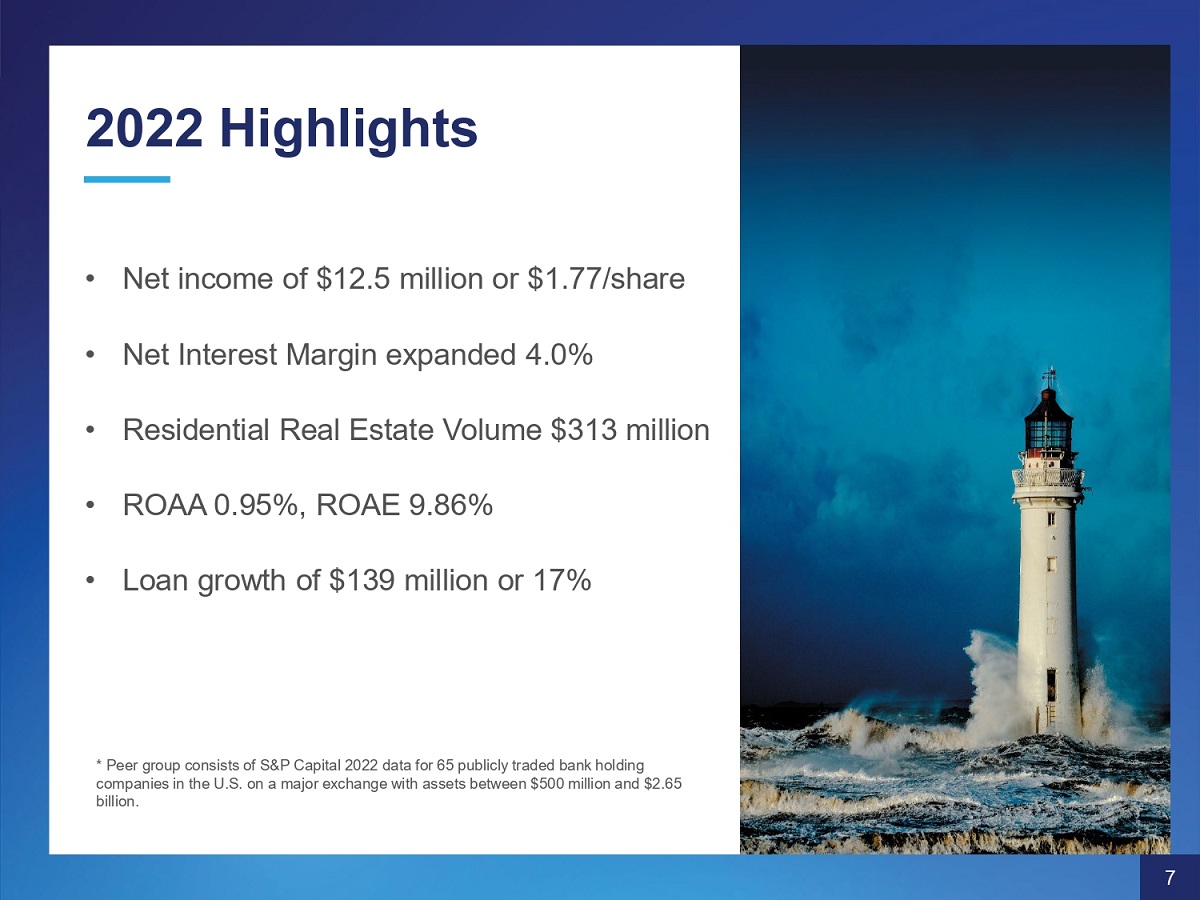
• Net income of $12.5 million or $1.77/share • Net Interest Margin expanded 4.0% • Residential Real Estate Volume $313 million • ROAA 0.95%, ROAE 9.86% • Loan growth of $139 million or 17% * Peer group consists of S&P Capital 2022 data for 65 publicly traded bank holding companies in the U.S. on a major exchange with assets between $500 million and $2.65 billion. 2022 Highlights 7
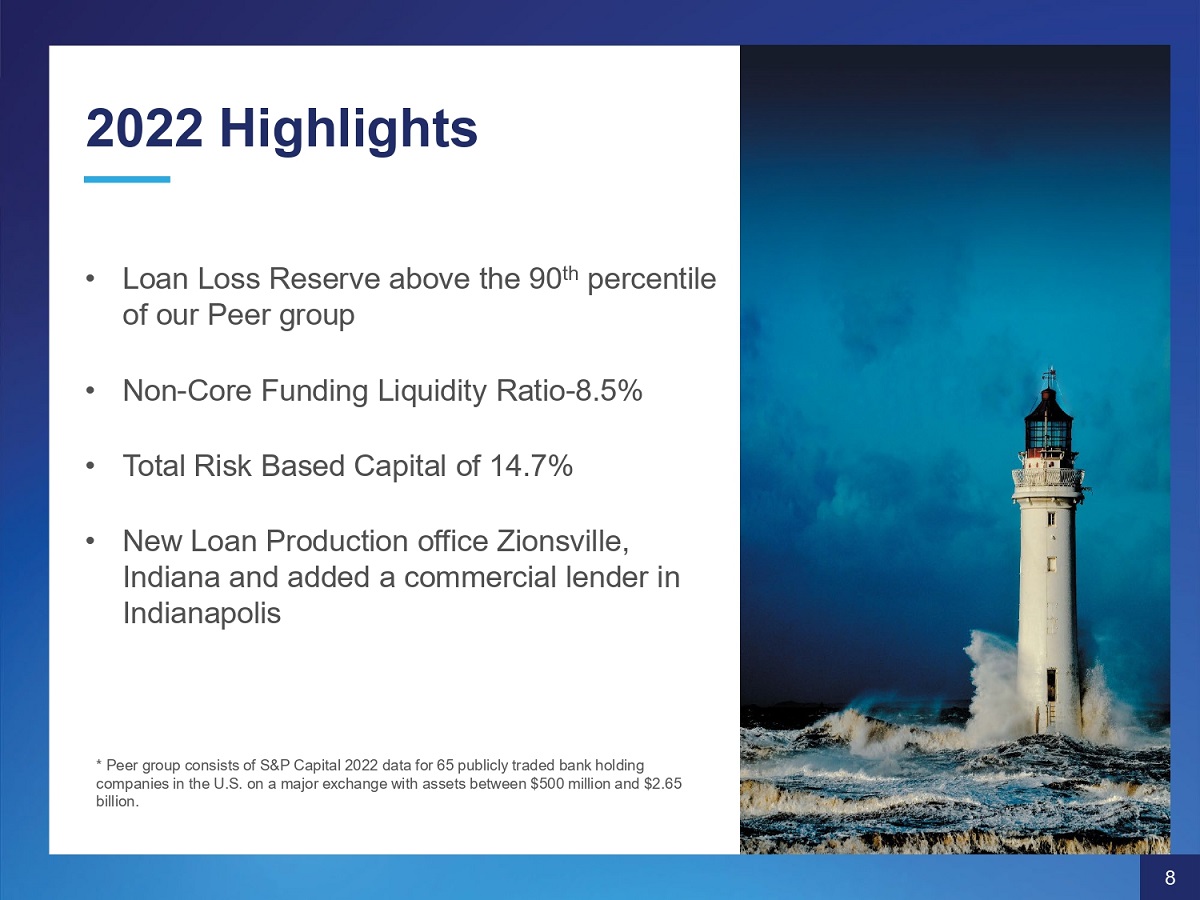
• Loan Loss Reserve above the 90 th percentile of our Peer group • Non - Core Funding Liquidity Ratio - 8.5% • Total Risk Based Capital of 14.7% • New Loan Production office Zionsville, Indiana and added a commercial lender in Indianapolis * Peer group consists of S&P Capital 2022 data for 65 publicly traded bank holding companies in the U.S. on a major exchange with assets between $500 million and $2.65 billion. 2022 Highlights 8
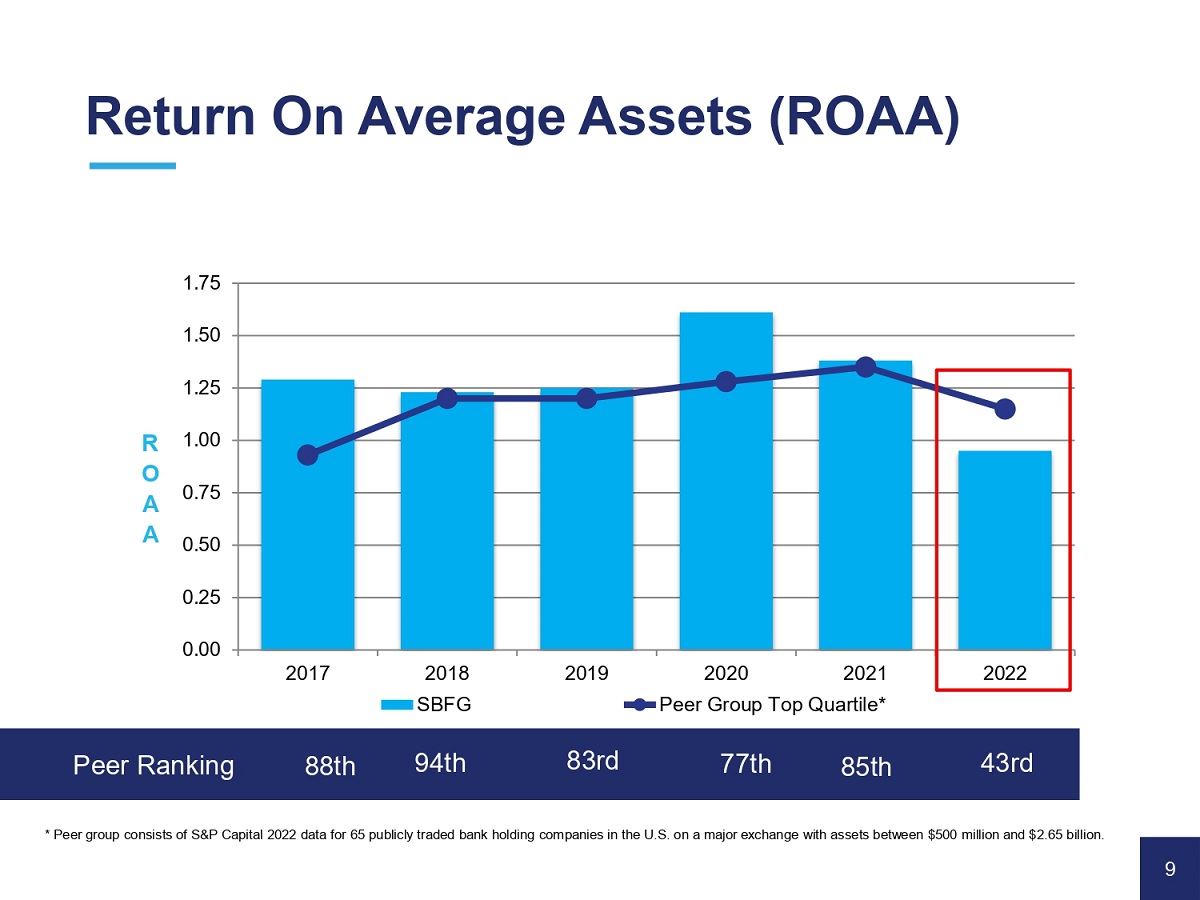
0.25 0.00 0.50 0.75 1.00 1.75 1.50 1.25 2017 2018 2019 2022 R O A A SBFG 2020 2021 Peer Group Top Quartile* * Peer group consists of S&P Capital 2022 data for 65 publicly traded bank holding companies in the U.S. on a major exchange with assets between $500 million and $2.65 billion. 83rd Peer Ranking 88th 94th 77th 85th 43rd Return On Average Assets (ROAA) 9
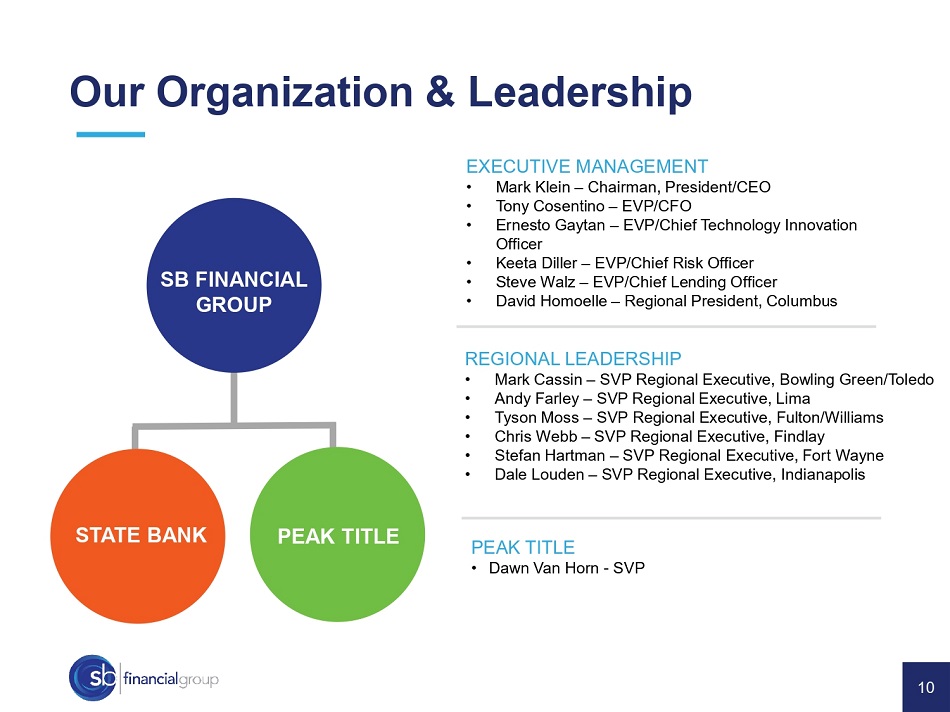
Our Organization & Leadership EXECUTIVE MANAGEMENT • Mark Klein – Chairman, President/CEO • Tony Cosentino – EVP/CFO • Ernesto Gaytan – EVP/Chief Technology Innovation Officer • Keeta Diller – EVP/Chief Risk Officer • Steve Walz – EVP/Chief Lending Officer • David Homoelle – Regional President, Columbus REGIONAL LEADERSHIP • Mark Cassin – SVP Regional Executive, Bowling Green/Toledo • Andy Farley – SVP Regional Executive, Lima • Tyson Moss – SVP Regional Executive, Fulton/Williams • Chris Webb – SVP Regional Executive, Findlay • Stefan Hartman – SVP Regional Executive, Fort Wayne • Dale Louden – SVP Regional Executive, Indianapolis SB FINANCIAL GROUP STATE BANK PEAK TITLE • Dawn Van Horn - SVP PEAK TITLE 10
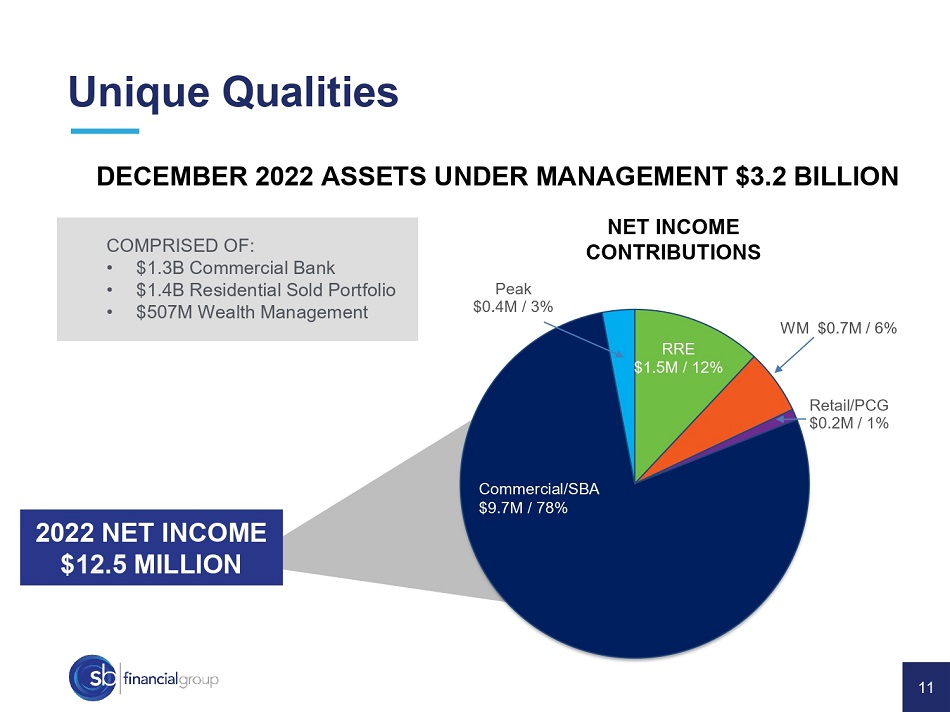
RRE $1.5M / 12% Retail/PCG $0.2M / 1% Peak $0.4M / 3% Commercial/SBA $9.7M / 78% WM $0.7M / 6% NET INCOME CONTRIBUTIONS 2022 NET INCOME $ 12.5 MILLION DECEMBER 2022 ASSETS UNDER MANAGEMENT $3.2 BILLION COMPRISED OF: • $1.3B Commercial Bank • $1.4B Residential Sold Portfolio • $507M Wealth Management Unique Qualities 11
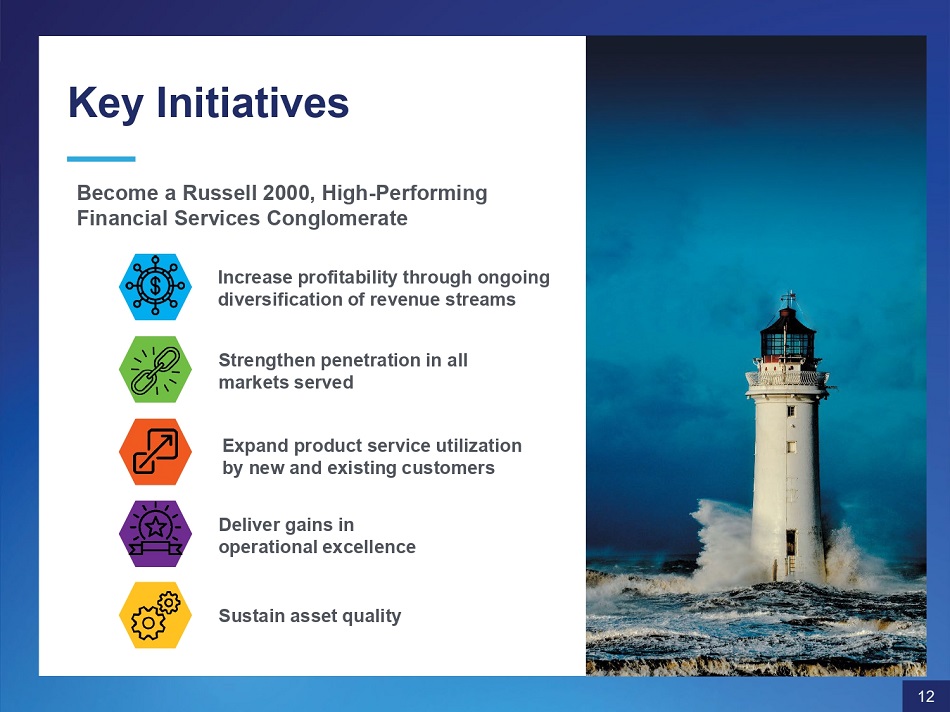
Key Initiatives Become a Russell 2000, High - Performing Financial Services Conglomerate Increase profitability through ongoing diversification of revenue streams Strengthen penetration in all markets served Expand product service utilization by new and existing customers Deliver gains in operational excellence Sustain asset quality 12
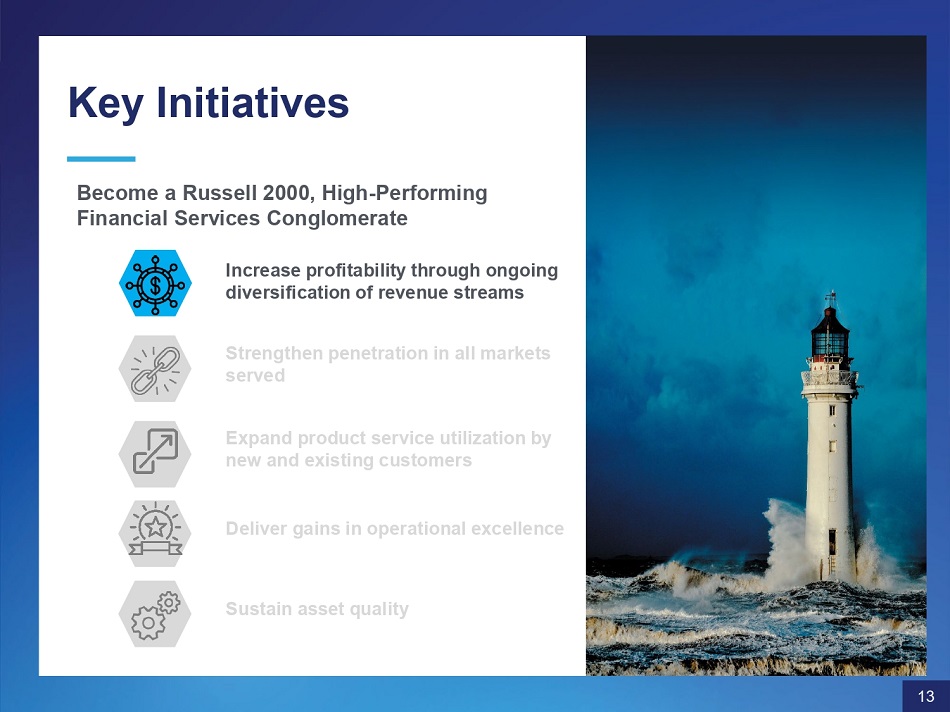
Key Initiatives Become a Russell 2000, High - Performing Financial Services Conglomerate Increase profitability through ongoing diversification of revenue streams Strengthen penetration in all markets served Expand product service utilization by new and existing customers Deliver gains in operational excellence Sustain asset quality 13
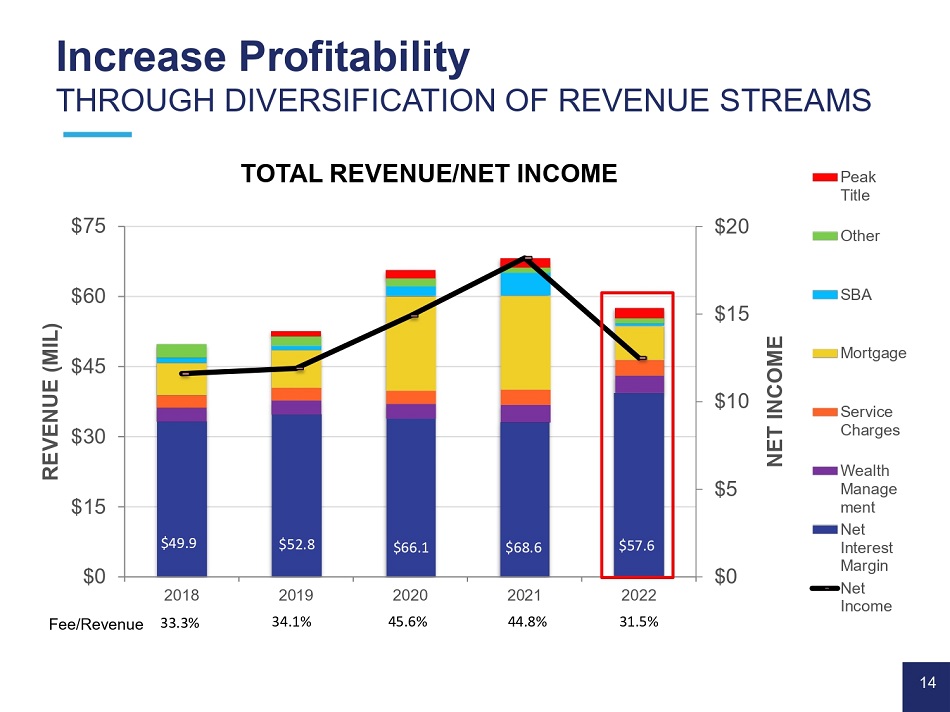
Increase Profitability THROUGH DIVERSIFICATION OF REVENUE STREAMS $0 $5 $10 $15 $20 $0 $15 $30 $45 $60 $75 2018 2019 2020 2021 2022 Fee/Revenue 33.3% 34.1% 45.6% 44.8% 31.5% NET INCOME REVENUE (MIL) TOTAL REVENUE/NET INCOME Peak Title Other SBA Mortgage Service Charges Wealth Manage ment Net Interest Margin Net Income $49.9 $66.1 $68.6 $57.6 $52.8 14

* Peer group consists of S&P Capital 2021 data for 65 publicly traded bank holding companies in the U.S. on a major exchange with assets between $500 million and $2.65 billion 50.0% 45.0% 40.0% 35.0% 30.0% 25.0% 20.0% 15.0% 10.0% 5.0% 0.0% 2018 2019 SBFG 2022 PERCENTAGE NON - INTEREST INCOME/ REVENUE 2020 Peer Median* 2021 Peer 75th* Increase Profitability THROUGH DIVERSIFICATION OF REVENUE STREAMS 15
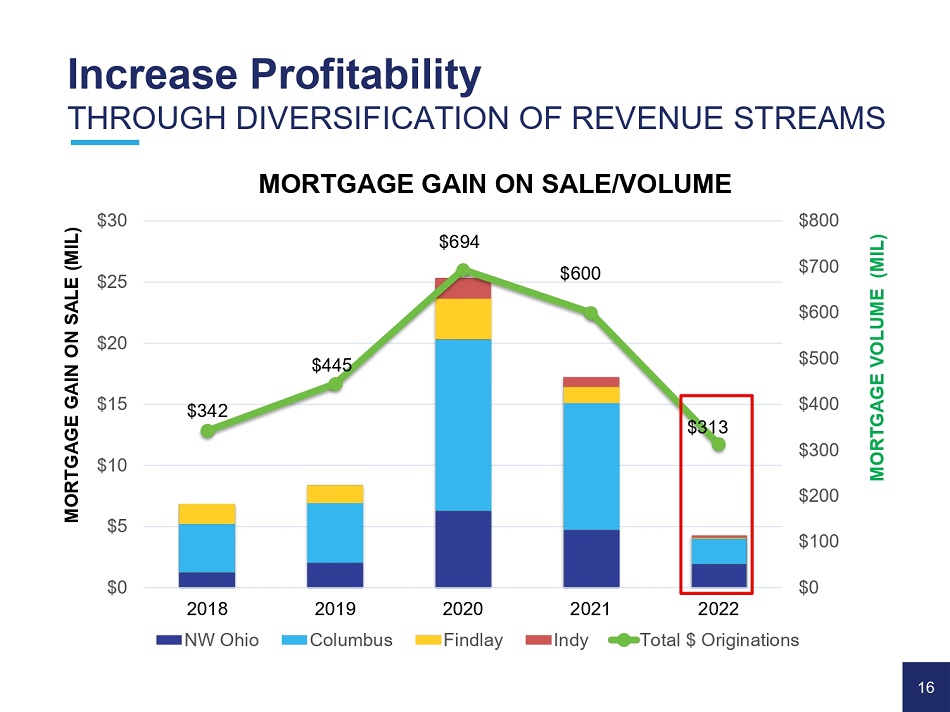
$342 $445 $694 $600 $313 $0 $100 $200 $300 $400 $500 $600 $700 $800 $0 $5 $10 $15 $20 $25 $30 2018 NW Ohio 2019 Columbus 2022 MORTGAGE VOLUME (MIL) MORTGAGE GAIN ON SALE (MIL) 2020 Findlay 2021 Indy Total $ Originations Increase Profitability THROUGH DIVERSIFICATION OF REVENUE STREAMS MORTGAGE GAIN ON SALE/VOLUME 16
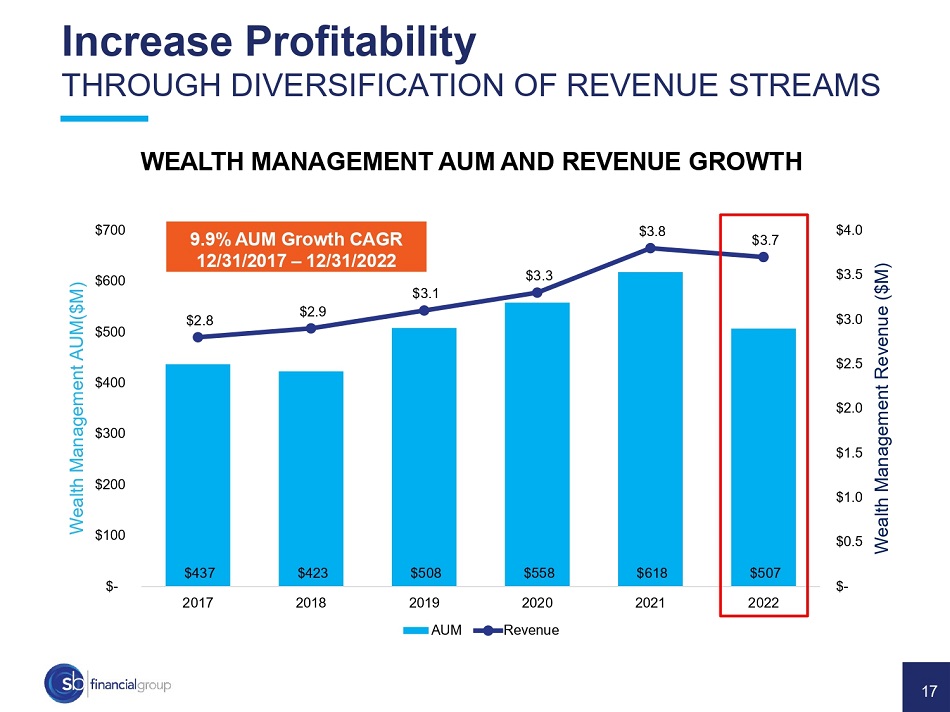
$437 $423 $508 $558 $618 $507 $2.8 $2.9 $3.1 $3.3 $3.8 $3.7 $ - $0.5 $1.0 $1.5 $2.0 $2.5 $3.0 $3.5 $4.0 $ - $100 $200 $300 $400 $500 $600 $700 2017 2018 2019 2020 2021 2022 Wealth Management Revenue ($M) Wealth Management AUM($M) AUM Revenue WEALTH MANAGEMENT AUM AND REVENUE GROWTH 9.9% AUM Growth CAGR 12/31/2017 – 12/31/2022 Increase Profitability THROUGH DIVERSIFICATION OF REVENUE STREAMS 17
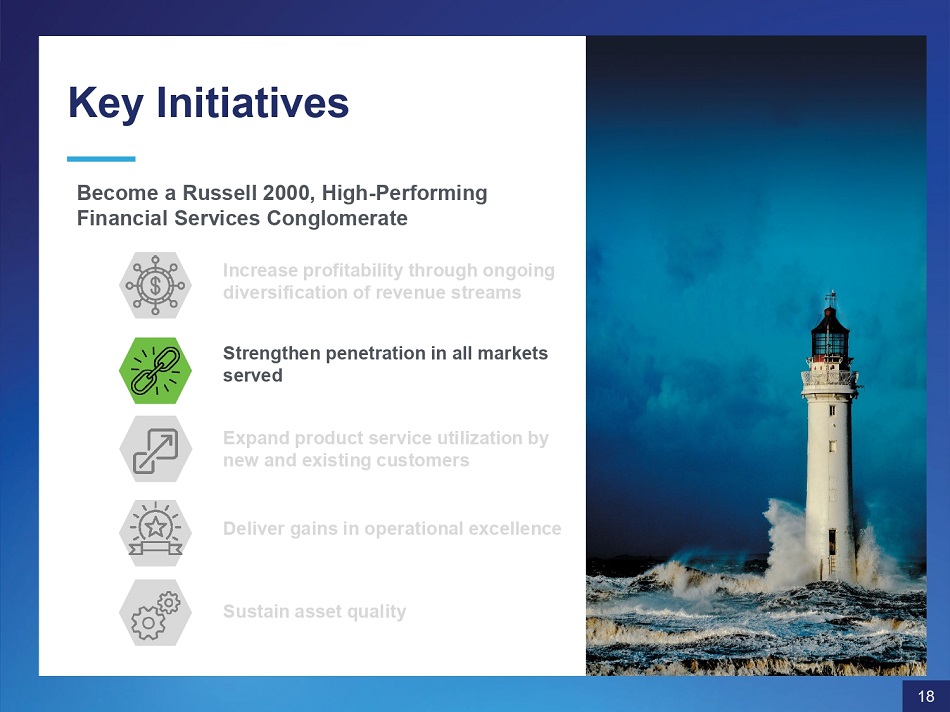
Key Initiatives Become a Russell 2000, High - Performing Financial Services Conglomerate Increase profitability through ongoing diversification of revenue streams Strengthen penetration in all markets served Expand product service utilization by new and existing customers Deliver gains in operational excellence Sustain asset quality 18
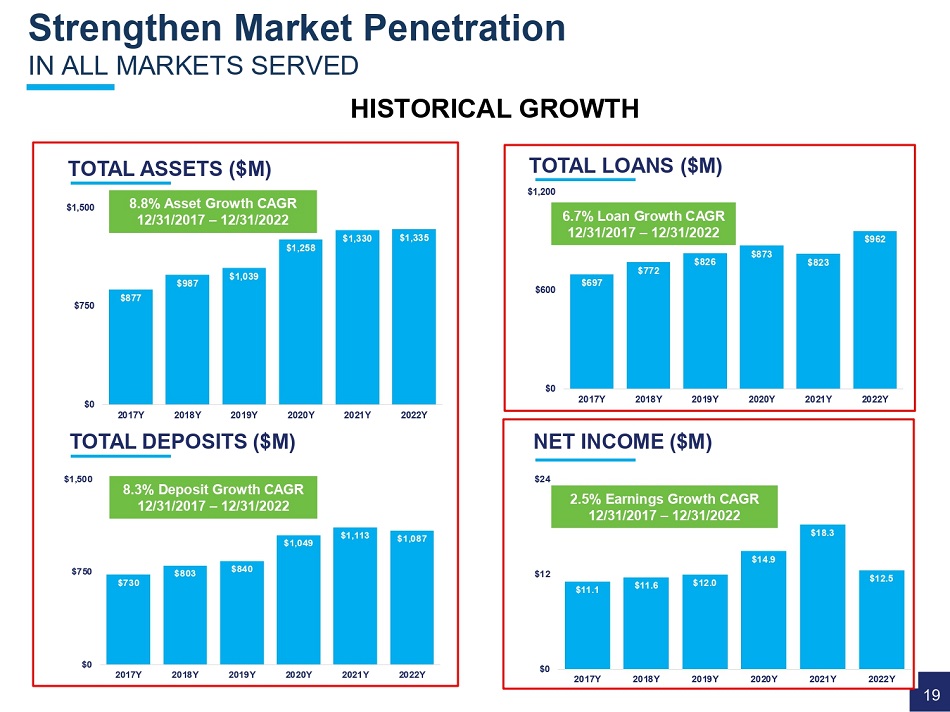
$11.1 $11.6 $12.0 $14.9 $18.3 $12.5 $0 $12 2017Y 2018Y 2019Y 2020Y 2021Y 2022Y NET INCOME ($M) $24 $730 $803 $840 $1,049 $1,113 $1,087 $0 $750 2017Y 2018Y 2019Y 2020Y 2021Y 2022Y $877 $987 $1,039 $1,258 $1,330 $1,335 $0 $750 TOTAL ASSETS ($M) $1,500 2017Y 2018Y 2019Y 2020Y 2021Y 2022Y TOTAL DEPOSITS ($M) $1,500 $697 $772 $826 $873 $823 $962 $0 $600 2017Y 2018Y 2019Y 2020Y 2021Y 2022Y TOTAL LOANS ($M) $1,200 8.8% Asset Growth CAGR 12/31/2017 – 12/31/2022 6.7% Loan Growth CAGR 12/31/2017 – 12/31/2022 8.3% Deposit Growth CAGR 12/31/2017 – 12/31/2022 2.5% Earnings Growth CAGR 12/31/2017 – 12/31/2022 Strengthen Market Penetration 19 IN ALL MARKETS SERVED HISTORICAL GROWTH
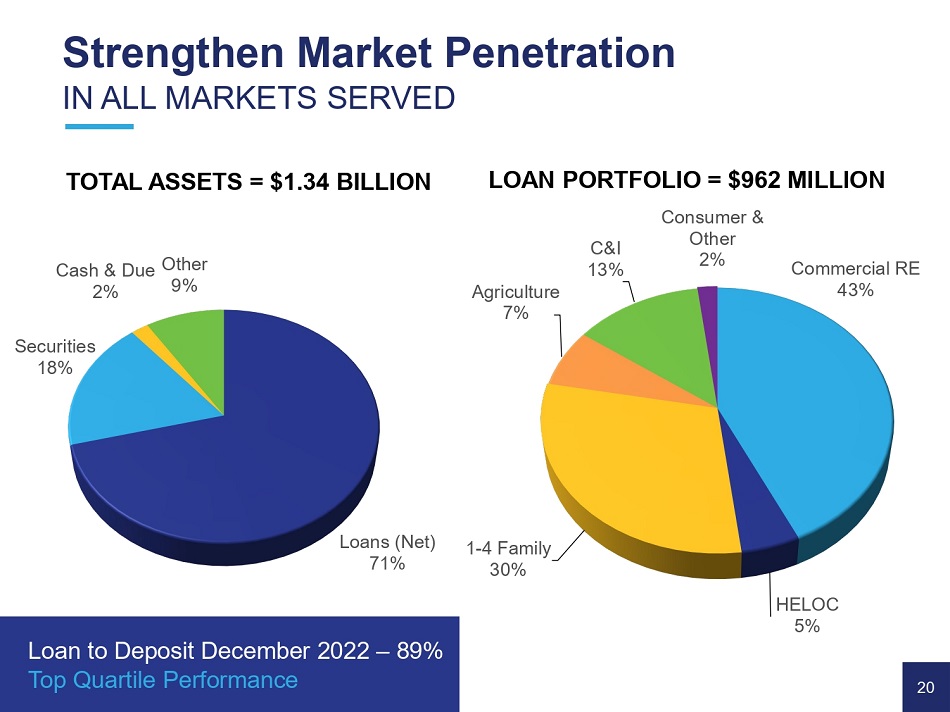
Loans (Net) 71% Securities 18% 2% Cash & Due Other 9% Commercial RE 43% HELOC 5% 1 - 4 Family 30% Agriculture 7% C&I 13% 2% LOAN PORTFOLIO = $962 MILLION Consumer & Other Strengthen Market Penetration IN ALL MARKETS SERVED 20 Loan to Deposit December 2022 – 89% Top Quartile Performance TOTAL ASSETS = $1.34 BILLION
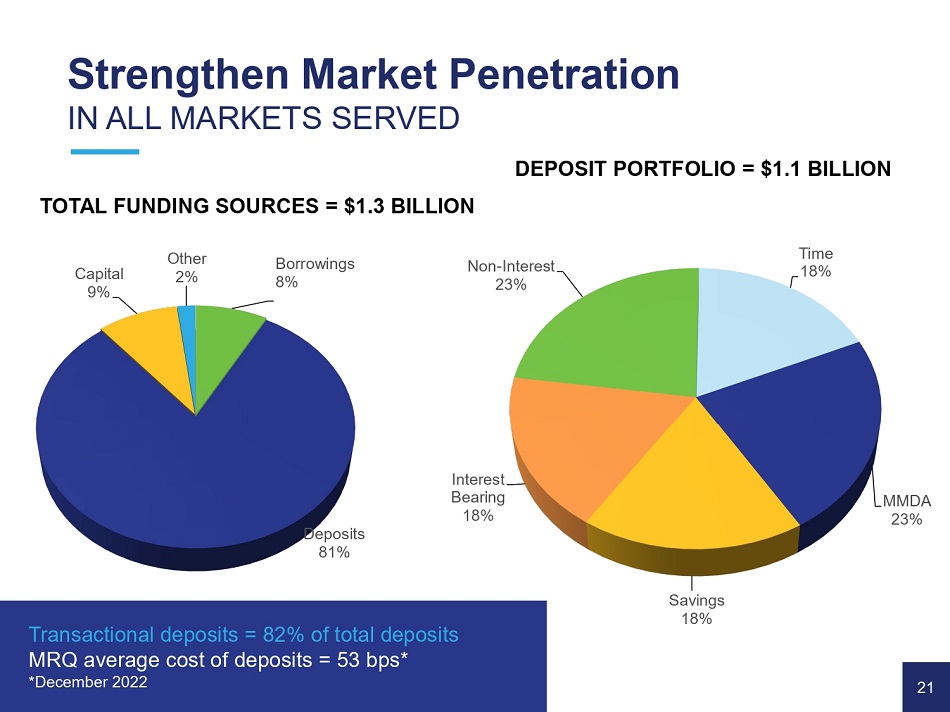
Borrowings 8% Deposits 81% Capital 9% Other 2% Time 18% MMDA 23% Savings 18% Interest Bearing 18% Non - Interest 23% Strengthen Market Penetration IN ALL MARKETS SERVED 21 Transactional deposits = 82% of total deposits MRQ average cost of deposits = 53 bps* *December 2022 DEPOSIT PORTFOLIO = $1.1 BILLION TOTAL FUNDING SOURCES = $1.3 BILLION
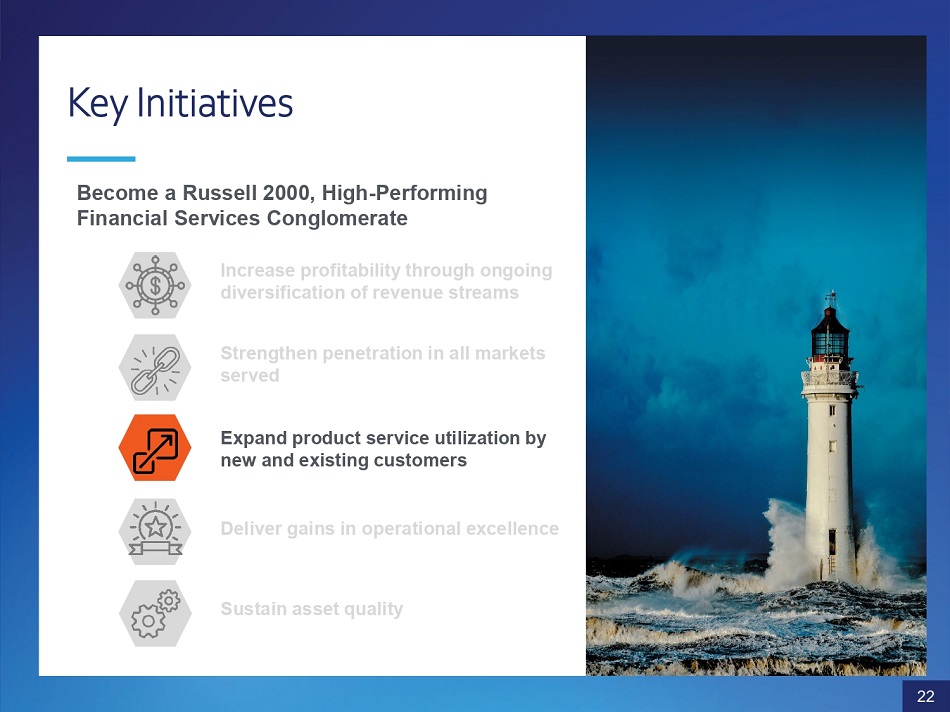
Key Initiatives Become a Russell 2000, High - Performing Financial Services Conglomerate Increase profitability through ongoing diversification of revenue streams Strengthen penetration in all markets served Expand product service utilization by new and existing customers Deliver gains in operational excellence Sustain asset quality 22
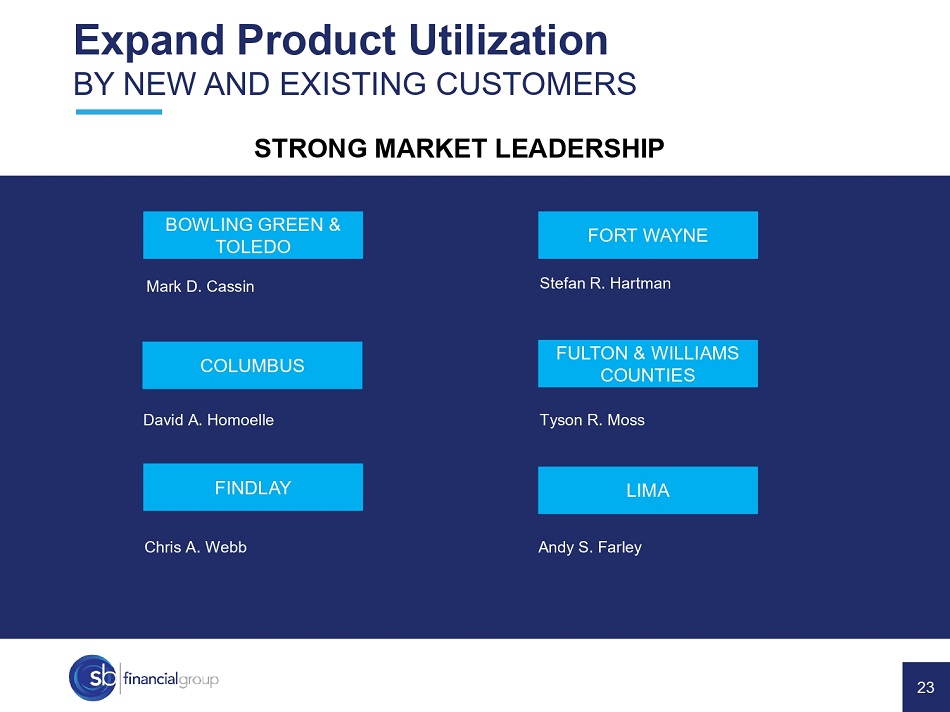
BOWLING GREEN & TOLEDO FULTON & WILLIAMS COUNTIES Mark D. Cassin Tyson R. Moss Chris A. Webb LIMA FINDLAY Andy S. Farley Stefan R. Hartman FORT WAYNE COLUMBUS David A. Homoelle 23 Expand Product Utilization BY NEW AND EXISTING CUSTOMERS STRONG MARKET LEADERSHIP
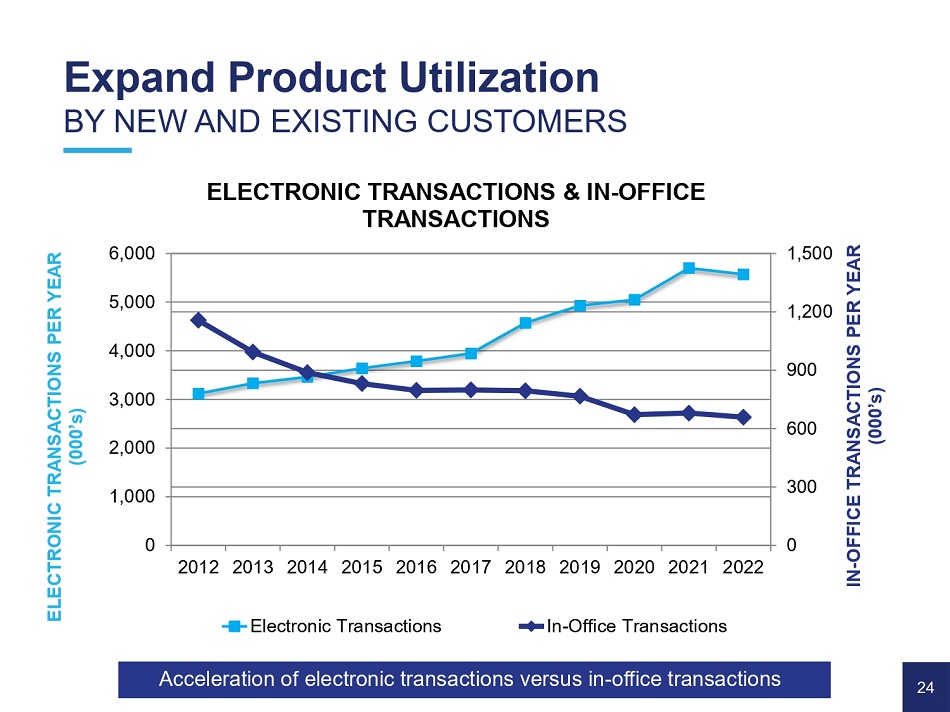
0 300 600 900 1,200 1,500 0 1,000 2,000 3,000 4,000 5,000 6,000 IN - OFFICE TRANSACTIONS PER YEAR (000’s) ELECTRONIC TRANSACTIONS PER YEAR (000’s) ELECTRONIC TRANSACTIONS & IN - OFFICE TRANSACTIONS 2012 2013 2014 2015 2016 2017 2018 2019 2020 2021 2022 Electronic Transactions In - Office Transactions Acceleration of electronic transactions versus in - office transactions Expand Product Utilization BY NEW AND EXISTING CUSTOMERS 24
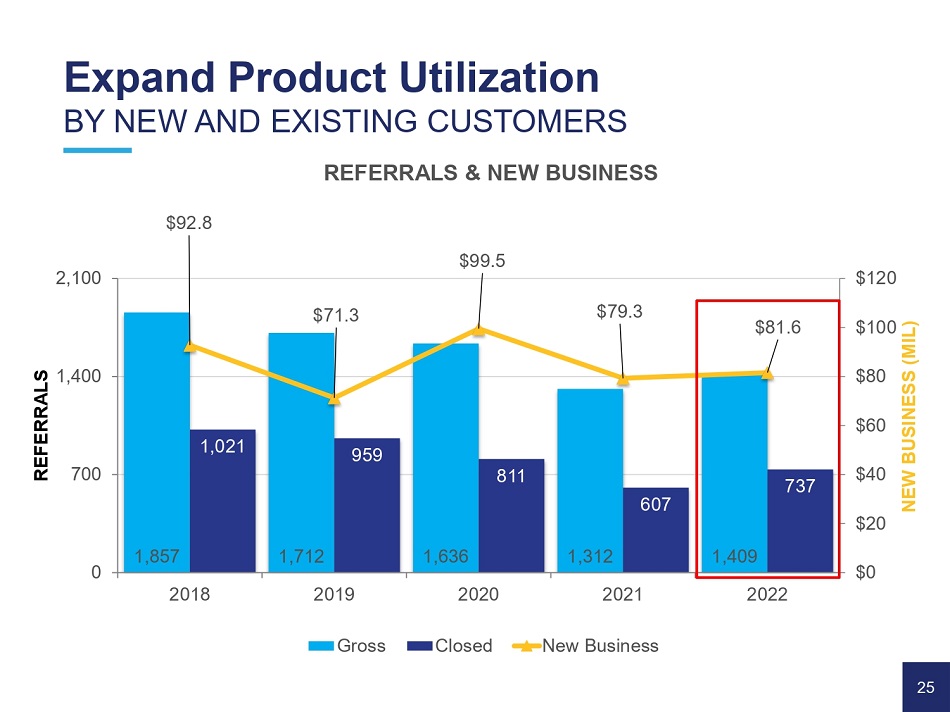
1,857 1,712 1,636 1,312 1,409 1,021 959 811 607 737 $71.3 $79.3 $81.6 $0 $20 $40 $60 $80 $100 $120 0 700 1,400 2,100 2018 2019 2020 2021 2022 NEW BUSINESS (MIL) REFERRALS Gross Closed New Business Expand Product Utilization BY NEW AND EXISTING CUSTOMERS REFERRALS & NEW BUSINESS $92.8 $99.5 25
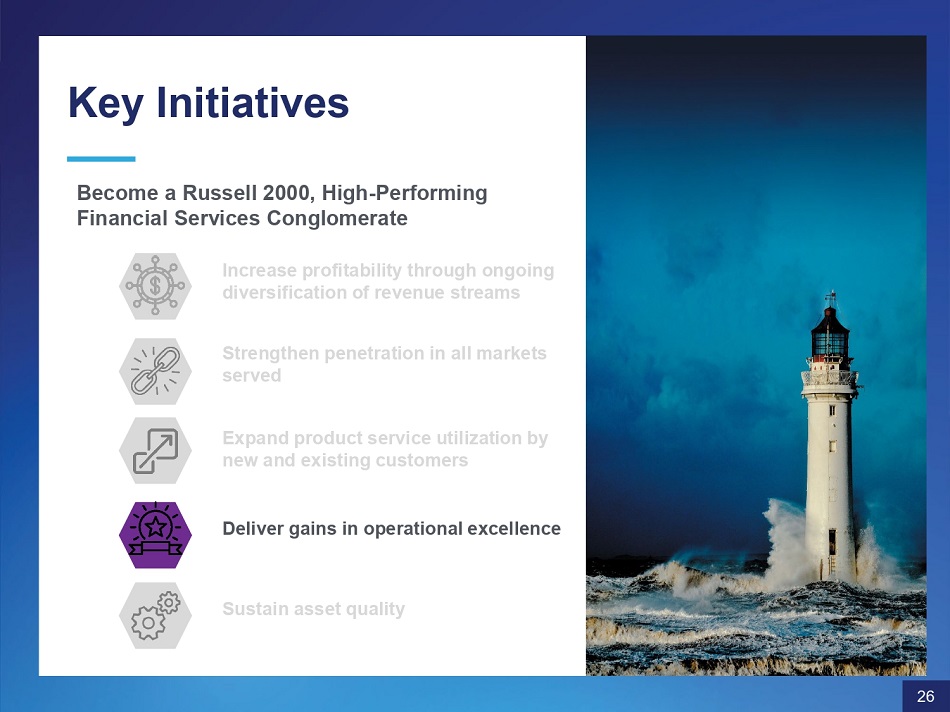
Key Initiatives Become a Russell 2000, High - Performing Financial Services Conglomerate Increase profitability through ongoing diversification of revenue streams Strengthen penetration in all markets served Expand product service utilization by new and existing customers Deliver gains in operational excellence Sustain asset quality 26
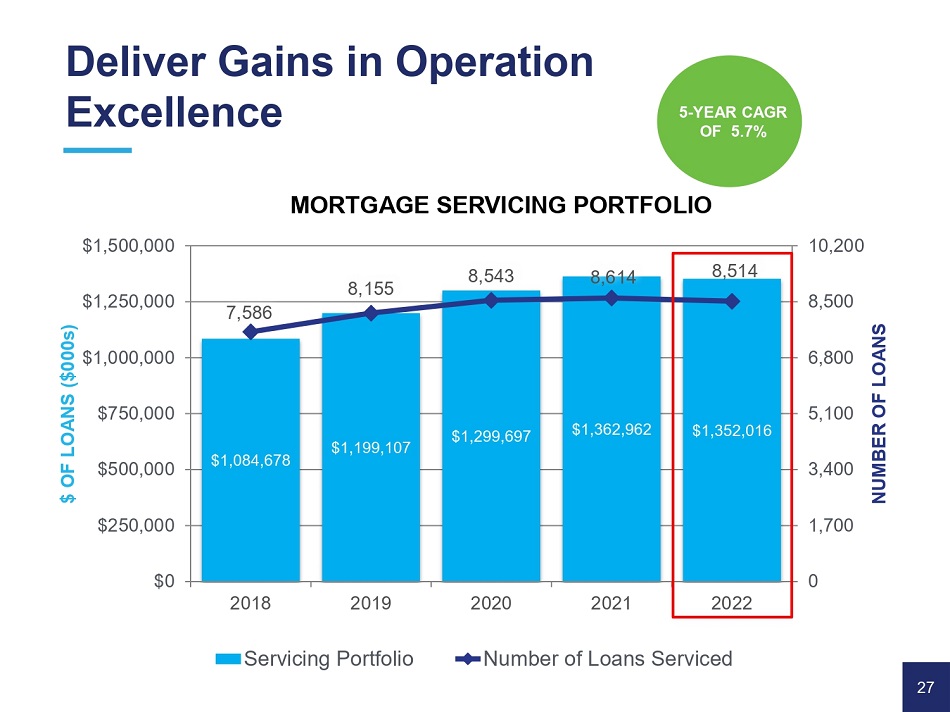
$1,084,678 $1,199,107 $1,299,697 $1,362,962 $1,352,016 7,586 8,155 8,543 8,614 8,514 0 1,700 3,400 5,100 6,800 8,500 10,200 $0 $250,000 $500,000 $750,000 $1,000,000 $1,250,000 $1,500,000 NUMBER OF LOANS $ OF LOANS ($000s) MORTGAGE SERVICING PORTFOLIO 2018 2019 Servicing Portfolio 2020 2021 2022 Number of Loans Serviced 5 - YEAR CAGR OF 5.7% Deliver Gains in Operation Excellence 27
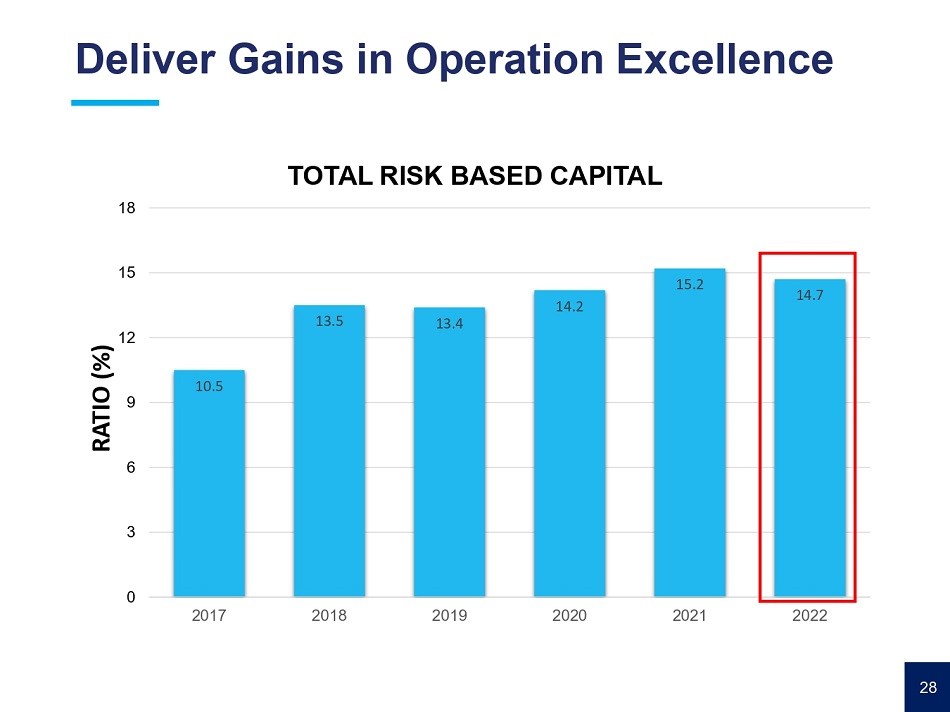
Deliver Gains in Operation Excellence 10.5 13.5 13.4 14.2 15.2 14.7 0 3 6 9 12 15 18 2017 2018 2019 2020 2021 2022 RATIO (%) TOTAL RISK BASED CAPITAL 28
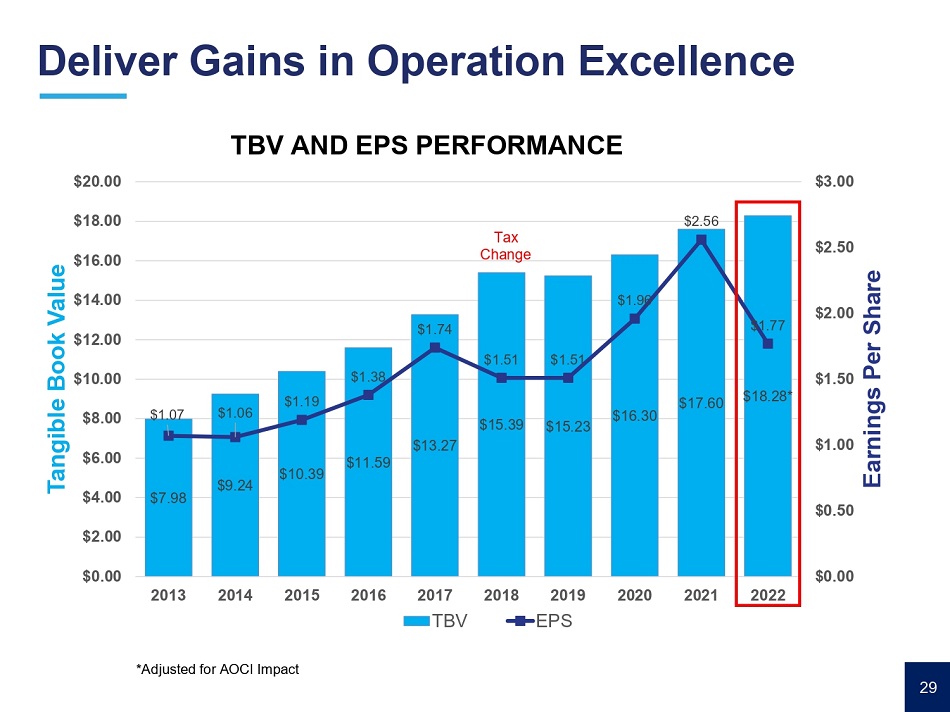
$7.98 $9.24 $10.39 $11.59 $13.27 $15.39 $15.23 $16.30 $17.60 $18.28* $1.07 $1.06 $1.19 $1.38 $1.74 $1.51 $1.51 $1.96 $2.56 $1.77 $0.00 $0.50 $1.00 $1.50 $2.00 $2.50 $3.00 $0.00 $2.00 $4.00 $6.00 $8.00 $10.00 $12.00 $14.00 $16.00 $18.00 $20.00 2013 2014 2015 2016 2017 2018 2019 2020 2021 2022 Earnings Per Share Tangible Book Value TBV EPS TBV AND EPS PERFORMANCE Tax Change *Adjusted for AOCI Impact Deliver Gains in Operation Excellence 29
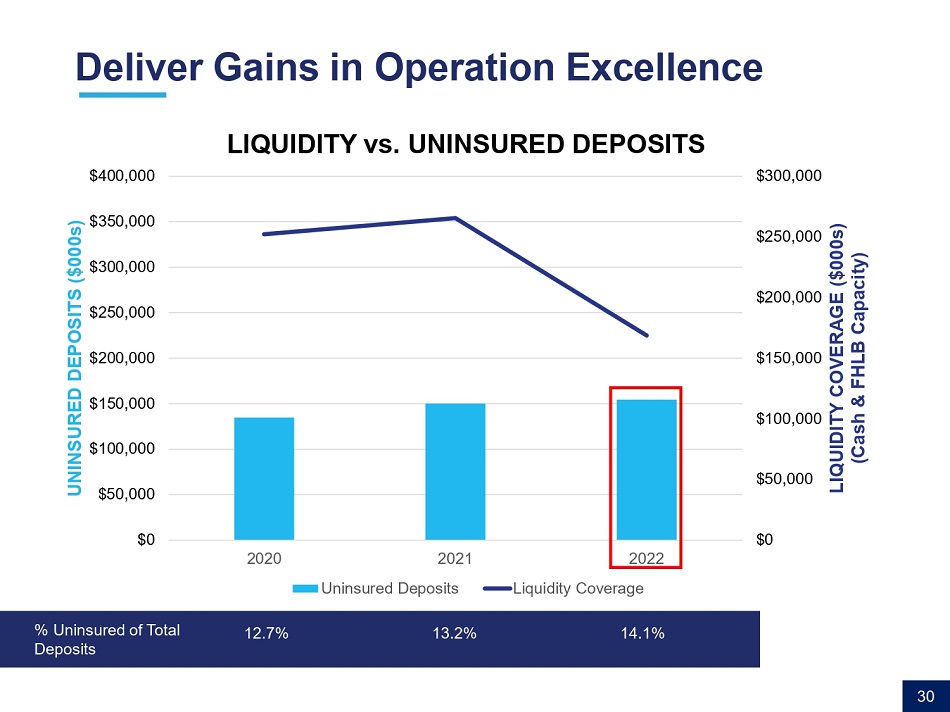
$0 $50,000 $100,000 $150,000 $200,000 $250,000 $300,000 $0 $50,000 $100,000 $150,000 $200,000 $250,000 $300,000 $350,000 $400,000 2020 2021 2022 LIQUIDITY COVERAGE ($000s) (Cash & FHLB Capacity) UNINSURED DEPOSITS ($000s) LIQUIDITY vs. UNINSURED DEPOSITS Uninsured Deposits Liquidity Coverage Deliver Gains in Operation Excellence % Uninsured of Total Deposits 12.7% 13.2% 14.1% 30
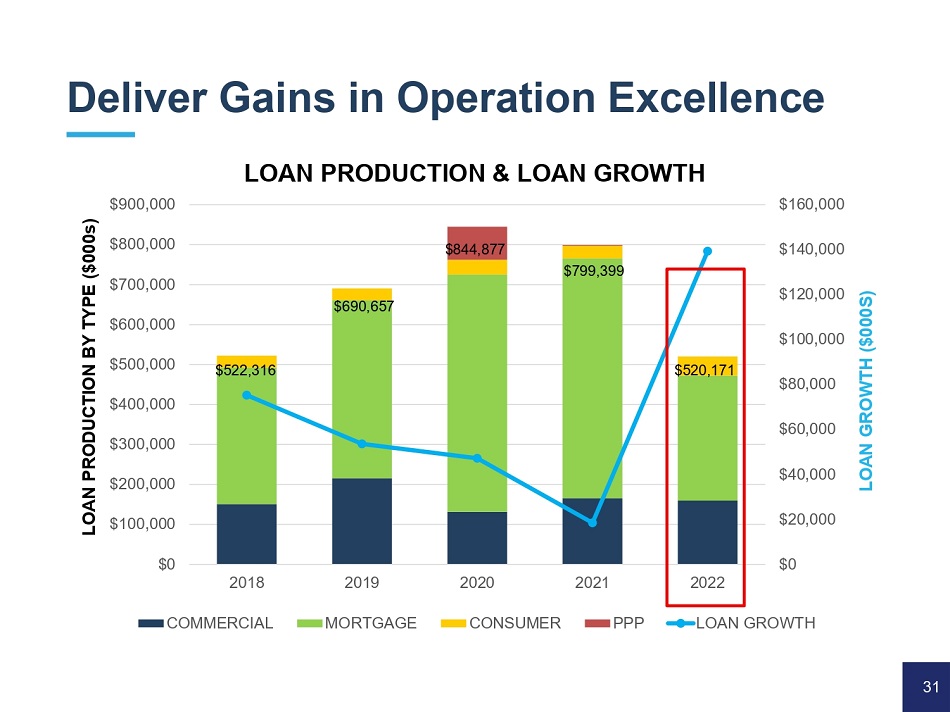
Deliver Gains in Operation Excellence $0 $20,000 $40,000 $60,000 $80,000 $100,000 $120,000 $140,000 $160,000 $0 $100,000 $200,000 $300,000 $400,000 $500,000 $600,000 $700,000 $800,000 $900,000 2018 2019 2020 2021 2022 LOAN GROWTH ($000S) LOAN PRODUCTION BY TYPE ($000s) LOAN PRODUCTION & LOAN GROWTH COMMERCIAL MORTGAGE CONSUMER PPP LOAN GROWTH 31 $522,316 $690,657 $844,877 $799,399 $520,171
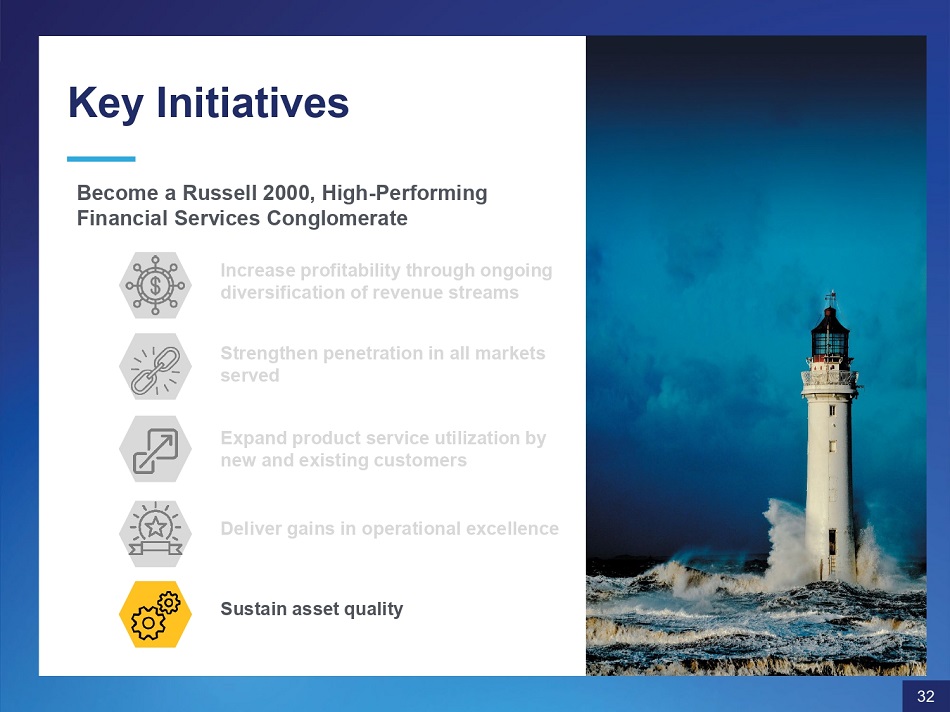
Key Initiatives Become a Russell 2000, High - Performing Financial Services Conglomerate Increase profitability through ongoing diversification of revenue streams Strengthen penetration in all markets served Expand product service utilization by new and existing customers Deliver gains in operational excellence Sustain asset quality 32
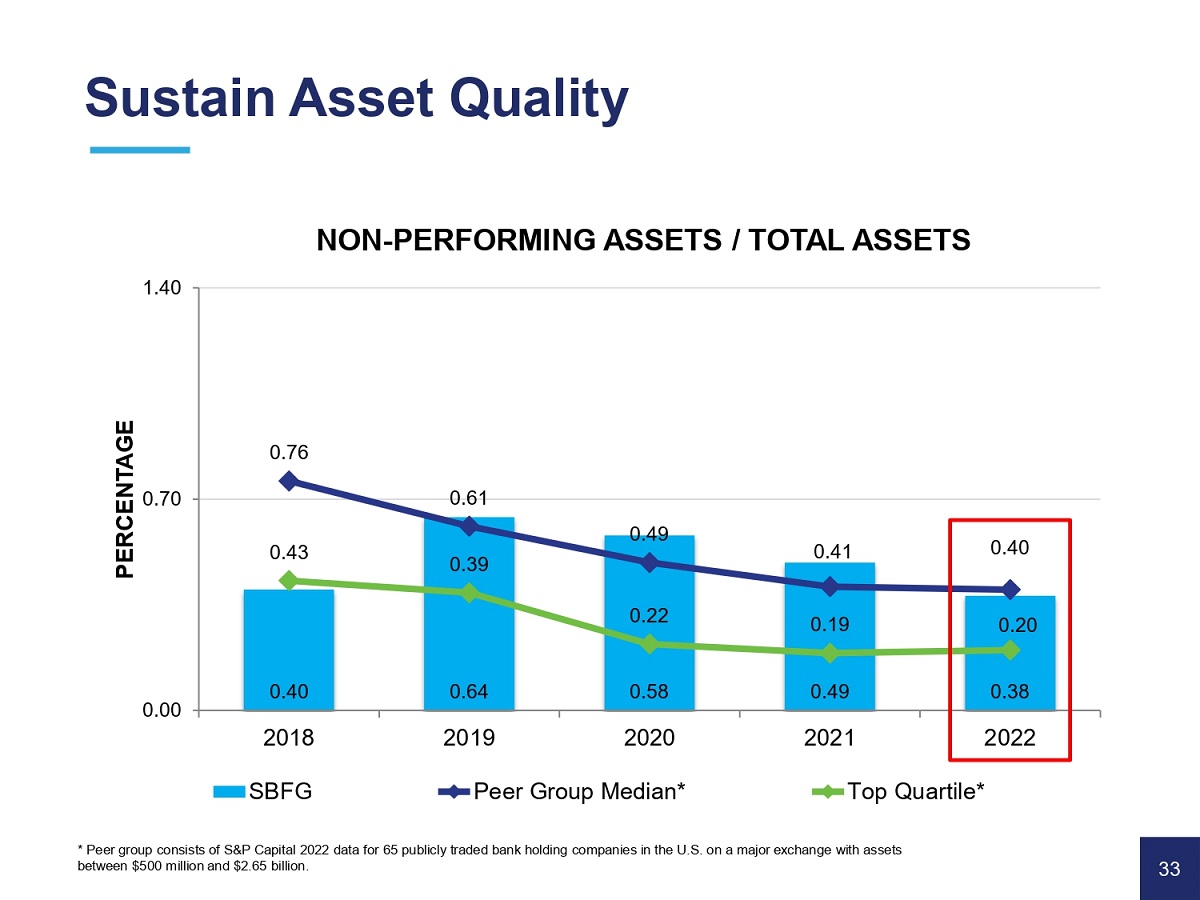
* Peer group consists of S&P Capital 2022 data for 65 publicly traded bank holding companies in the U.S. on a major exchange with assets between $500 million and $2.65 billion. 0.40 0.64 0.58 0.49 0.38 0.76 0.61 0.49 0.41 0.40 0.43 0.39 0.22 0.19 0.20 0.00 0.70 1.40 2018 PERCENTAGE NON - PERFORMING ASSETS / TOTAL ASSETS SBFG 2019 2020 Peer Group Median* 2021 2022 Top Quartile* Sustain Asset Quality 33

- 0.05% 0.00% 0.05% 0.10% 2018 2019 2020 2021 2022 NCOs/ AVERAGE LOANS SBFG Peer Median* Top Quartile* PERCENTAGE Sustain Asset Quality * Peer group consists of S&P Capital 2022 data for 65 publicly traded bank holding companies in the U.S. on a major exchange with assets between $500 million and $2.65 billion. 34
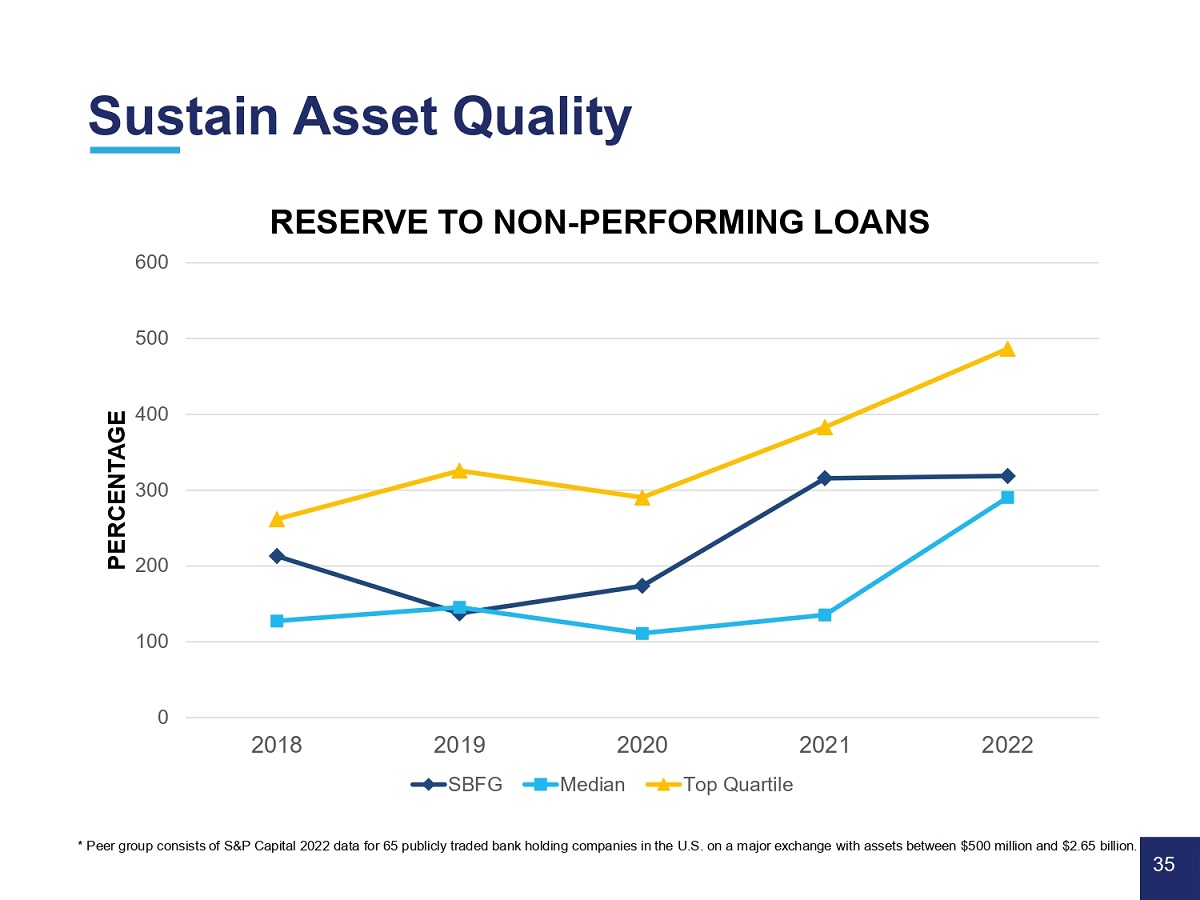
0 600 500 400 300 200 100 2018 2021 2022 PERCENTAGE RESERVE TO NON - PERFORMING LOANS 2019 SBFG 2020 Median Top Quartile * Peer group consists of S&P Capital 2022 data for 65 publicly traded bank holding companies in the U.S. on a major exchange with assets between $500 million and $2.65 billion. 35 Sus tain Asset Quality
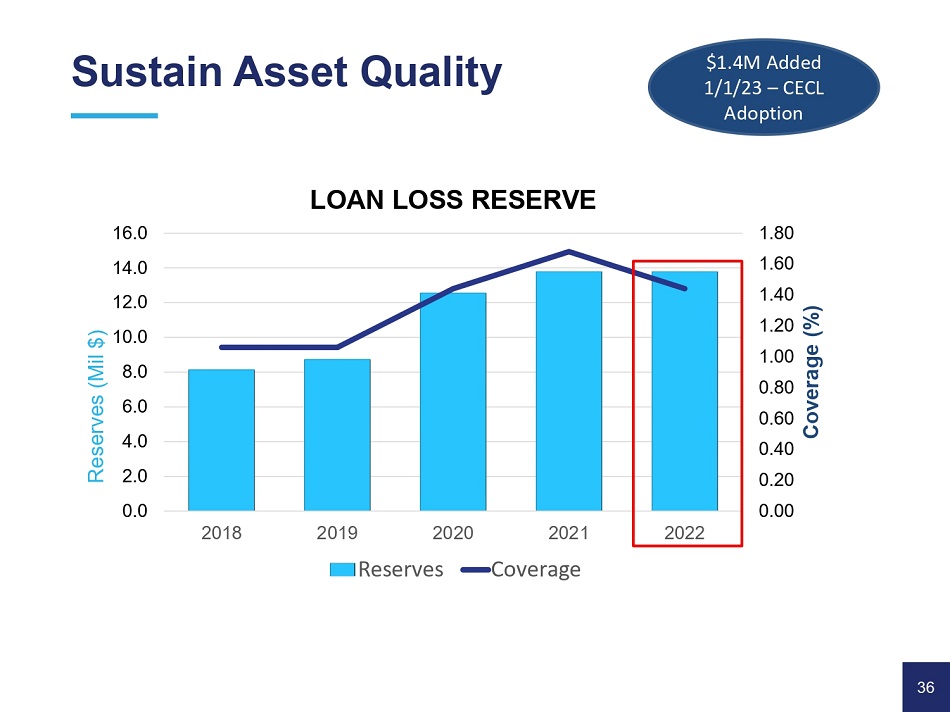
Sustain Asset Quality 1.80 1.60 1.40 1.20 1.00 0.80 0.60 0.40 0.20 0.00 16.0 14.0 12.0 10.0 8.0 6.0 4.0 2.0 0.0 2018 2019 2020 2021 2022 Coverage (%) Reserves (Mil $) LOAN LOSS RESERVE Reserves Coverage $1.4M Added 1/1/23 – CECL Adoption 36
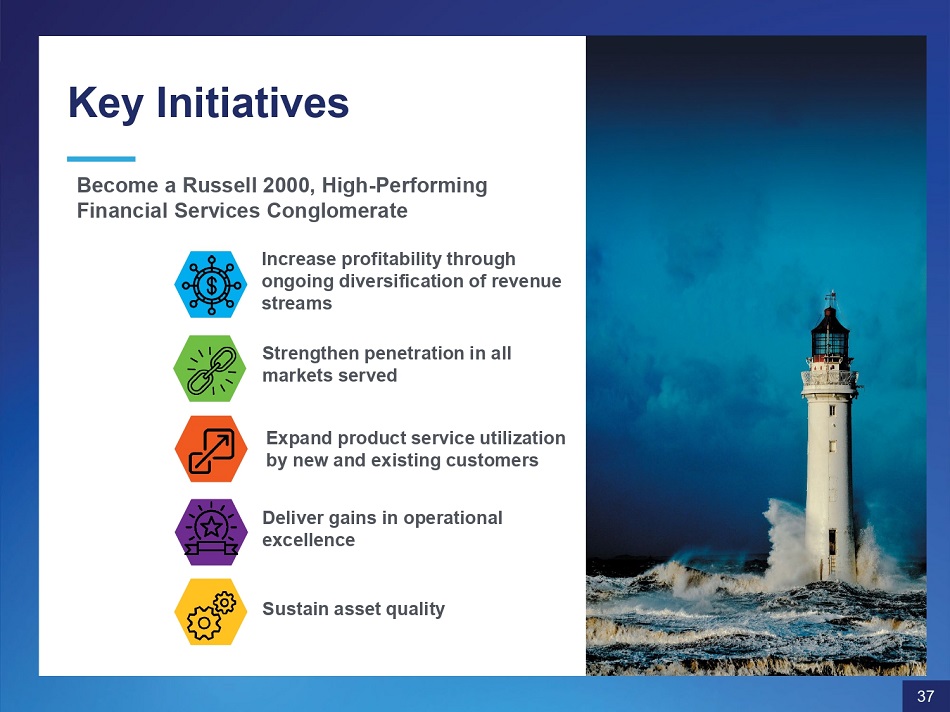
Key Initiatives Become a Russell 2000, High - Performing Financial Services Conglomerate Increase profitability through ongoing diversification of revenue streams Strengthen penetration in all markets served Expand product service utilization by new and existing customers Deliver gains in operational excellence Sustain asset quality 37
Thank you for joining us today! Board and Management