UNITED STATES
SECURITIES AND EXCHANGE COMMISSION
Washington, D.C. 20549
FORM N-CSR
CERTIFIED SHAREHOLDER REPORT OF REGISTERED MANAGEMENT
INVESTMENT COMPANIES
Investment Company Act file number 811-04297
VANECK FUNDS
(Exact name of registrant as specified in charter)
666 Third Avenue, New York, NY 10017
(Address of principal executive offices) (Zip code)
Van Eck Associates Corporation
666 Third Avenue, New York, NY 10017
(Name and address of agent for service)
Registrant’s telephone number, including area code: (212) 293-2000
Date of fiscal year end: DECEMBER 31
Date of reporting period: DECEMBER 31, 2019
| Item 1. | Report to Shareholders |
| | |
 | ANNUAL REPORT
December 31, 2019 |
VanEck Funds
CM Commodity Index Fund
Certain information contained in this report represents the opinion of the investment adviser and may change at any time. This information is not intended to be a forecast of future events, a guarantee of future results or investment advice. Current market conditions may not continue. Also, unless otherwise specifically noted, any discussion of the Fund’s holdings, the Fund’s performance, and the views of the investment adviser are as of December 31, 2019.
PRIVACY NOTICE
(unaudited)
| FACTS | WHAT DOES VAN ECK DO WITH YOUR
PERSONAL INFORMATION? |
| Why? | Financial companies choose how they share your personal information. Federal law gives consumers the right to limit some but not all sharing. Federal law also requires us to tell you how we collect, share, and protect your personal information. Please read this notice carefully to understand what we do. |
| What? | The types of personal information we collect and share depend on the product or service you have with us. This information can include: ■ Social Security number and account balances ■ assets and payment history ■ risk tolerance and transaction history |
| How? | All financial companies need to share customers’ personal information to run their everyday business. In the section below, we list the reasons financial companies can share their customers’ personal information; the reasons Van Eck chooses to share; and whether you can limit this sharing. |
Reasons we can share your personal
information | Does Van Eck share? | Can you limit this
sharing? |
| For our everyday business purposes— such as to process your transactions, maintain your account(s), respond to court orders and legal investigations, or report to credit bureaus | Yes | No |
| For our marketing purposes— to offer our products and services to you | Yes | No |
| For joint marketing with other financial companies | Yes | No |
| For our affiliates’ everyday business purposes— information about your transactions and experiences | Yes | No |
| For our affiliates’ everyday business purposes— information about your creditworthiness | No | We don’t share |
| For our affiliates to market to you | Yes | Yes |
| For nonaffiliates to market to you | No | We don’t share |
| To limit our sharing | Call us at 1-800-826-2333. Please note: If you are a new customer, we can begin sharing your information 30 days from the date we sent this notice. When you are no longer our customer, we continue to share your information as described in this notice. However, you can contact us at any time to limit our sharing. |
| Questions? | Call us at 1-800-826-2333. |
PRIVACY NOTICE
(unaudited) (continued)
| Who we are | |
| Who is providing this notice? | Van Eck Global, its affiliates and funds sponsored or managed by Van Eck (collectively “Van Eck”). |
| What we do | |
| How does Van Eck protect my personal information? | To protect your personal information from unauthorized access and use, we use security measures that comply with federal law. These measures include computer safeguards and secured files and buildings. |
| How does Van Eck collect my personal information? | We collect your personal information, for example, when you ■ open an account or give us your income information ■ provide employment information or give us your contact information ■ tell us about your investment or retirement portfolio We also collect your personal information from others, such as credit bureaus, affiliates, or other companies. |
| Why can’t I limit all sharing? | Federal law gives you the right to limit only ■ sharing for affiliates’ everyday business purposes—information about your creditworthiness ■ affiliates from using your information to market to you ■ sharing for nonaffiliates to market to you State laws and individual companies may give you additional rights to limit sharing. See below for more on your rights under state law. |
| What happens when I limit sharing for an account I hold jointly with someone else? | Your choices will apply to everyone on your account – unless you tell us otherwise |
| Definitions | |
| Affiliates | Companies related by common ownership or control. They can be financial and nonfinancial companies. ■ Our affiliates include companies with a Van Eck name such as Van Eck Securities Corporation and others such as Market Vectors Index Solutions GmbH. |
| Nonaffiliates | Companies not related by common ownership or control. They can be financial and nonfinancial companies. ■ Van Eck does not share with nonaffiliates so they can market to you. |
| Joint marketing | A formal agreement between nonaffiliated financial companies that together market financial products or services to you. ■ Our joint marketing partners include financial services companies |
| Other important information |
California Residents— In accordance with California law, we will not share information we collect about California residents with nonaffiliates except as permitted by law, such as with the consent of the customer or to service the customer’s accounts. We also will limit the sharing of information about you with our affiliates to the extent required by applicable California law. Vermont Residents— In accordance with Vermont law, we will not share information we collect about Vermont residents with nonaffiliates except as permitted by law, such as with the consent of the customer or to service the customer’s accounts. We will not share creditworthiness information about Vermont residents among Van Eck’s affiliates except with the authorization or consent of the Vermont resident. |
CM COMMODITY INDEX FUND
PRESIDENT’S LETTER
December 31, 2019 (unaudited)
Dear Shareholders:
The story for 2019 was simple and familiar — slower economic growth was combated by expansive monetary policy.
But first a comment on global growth: the two engines of the global economy, the U.S. and China, continue to move forward and we now have the prospect of at least some resolution of the trade dispute between them in the phase-one agreement. The latest economic statistics from China are steady and there are signs of “green shoots.” China’s services sector is expanding robustly and manufacturing is struggling, but not collapsing. My blog,China’s Economic Growth: Continuing Despite Headlines, shows this in two charts.
The biggest event in the markets last summer was the surge in bonds in Europe with negative interest rates. At the end of September, nearly $15 trillion worth of debt globally carried a negative yield.1Despite moves by the European Central Bank to stimulate, not only is the European economy slowing down, but there are also concerns about just how effective central bank actions are. Looking forward, therefore, I think investors should assess their hedge against central bank uncertainty by considering, for example, their gold allocations. While high interest rate environments tend to be tough for gold (it does not pay any yield), against negative interest rates, gold and other hedges against central bank impotence should be strongly considered.
We encourage you to stay in touch with us through the videos, email subscriptions and research blogs available on our website, www.vaneck.com. I have started my own email subscription where I share interesting research — you can sign up on www.vaneck.com. Should you have any questions regarding fund performance, please contact us at 800.826.2333 or visit ourwebsite.
CM COMMODITY INDEX FUND
PRESIDENT’S LETTER
(unaudited)(continued)
We sincerely thank you for investing in VanEck’s investment strategies. On the following pages, you will find a performance discussion and financial statements for the fund for the twelve month period ended December 31, 2019. As always, we value your continued confidence in us and look forward to helping you meet your investment goals in the future.

Jan F. van Eck
CEO and President
VanEck Funds
January 24, 2020
Investing involves substantial risk and high volatility, including possible loss of principal. An investor should consider the investment objective, risks, charges and expenses of the Funds carefully before investing. To obtain a prospectus and summary prospectus, which contain this and other information, call 800.826.2333 or visit vaneck.com. Please read the prospectus and summary prospectus carefully before investing.
| 1 | Financial Times: September was the busiest month ever for corporate debt issuance, September 30, 2019, https://www.ft.com/content/eef8234c-e3c0-11e9-b112-9624ec9edc59 |
MANAGEMENT DISCUSSION
December 31, 2019 (unaudited)
The CM (Constant Maturity) Commodity Index Fund (the “Fund”) gained 8.37% (Class A shares, excluding sales charge) for the 12 months ended December 31, 2019. The Fund’s benchmark, the UBS Bloomberg Constant Maturity Commodity Total Return Index (“CMCI”),1gained 9.82%.
CMCI, up 9.82%, outperformed the Bloomberg Commodity Index (“BCOM”),2at 7.69%, not least because of CMCI’s better roll yield,^which contributed. The S&P®GSCI Index (“SPGSCI”)3posted a gain of 17.63%, outperforming both the CMCI and BCOM because of its heavy energy weighting.
Market Review
Commodities recovered in 2019, reversing the sharp decline in the fourth quarter of 2018, and most commodity index products rose on the year after a strong fourth quarter rally triggered by the U.S./China trade talks which finally produced the outline of a phase-one agreement and a reduction of tariffs.
Global growth slowed most of the year on trade fears, but started to stabilize in the last quarter of 2019 as global central bank easing led by the Fed supported consumer and investor confidence. President Donald Trump’s political troubles, culminating in his impeachment by the U.S. House of Representatives, had almost no impact on markets, or the economy, but remain a risk as we enter the 2020 election cycle. There were several geopolitical events that generated some short-term volatility in commodity markets, for example, Iran’s attack on the Saudi Arabian oil facilities in September. The Iran/U.S. conflict now looks like it will become the headline geopolitical risk as we begin 2020.
Fund Review
All sectors represented in the CMCI, except for livestock, contributed positively to performance during the 12 month period, with the energy sector contributing the most.
The energy sector produced most of CMCI’s (and the Fund’s) returns for the year, rising almost 20% for the year. As mentioned earlier, most of the gains came in fourth quarter of 2019 on the U.S./China trade deal and have continued in early 2020 on Middle East tensions.
Industrial metals rose about 5% for the year. Again, like most markets, the improving trade outlook triggered a fourth quarter rally. Although the sector had mixed returns, the big gains in nickel and smaller gains in copper were partly offset by modest declines in aluminum, lead and zinc. Gold was strong all year as both falling global interest rates and global
CM COMMODITY INDEX FUND
MANAGEMENT DISCUSSION
(unaudited) (continued)
central banks’ aggressive easing triggered investor demand. The agriculture and livestock sectors were both almost unchanged for the year, with agriculture slightly up and livestock slightly down. However, both finished the year positively as the U.S./China trade deal improved the demand outlook for 2020.
During the 12 month period, the Fund continued to utilize commodity index-linked swaps as an effective means of gaining exposure to the CMC Index. While there are costs associated with the use of swaps, we continue to believe it is the most effective way of replicating the CMC Index’s commodity exposures and weights.
As we look ahead to 2020, commodities could be poised for strong gains. Supply fundamentals continue to improve slowly and the outlook for global growth is much better than it was a year ago. As growth outside the U.S. improves, we should see the U.S. dollar decline, adding support to commodity demand. Global central banks have aggressively eased monetary policy and the U.S./China trade situation is much improved. As always there are risks to global growth, Middle East tensions, U.S. politics (2020 election) and Brexit, to name a few. But as we start the year, commodities look attractive and could outperform other asset classes.
For more information or to access investment and market insights from the investment team, visit our web site, vaneck.com or subscribe to our commentaries.
As always, we value your continued confidence in us and look forward to helping you meet your investment goals in the future.
 | |  |
| | | |
| Roland Morris, Jr. | | Gregory Krenzer |
| Portfolio Manager | | Deputy Portfolio Manager |
Represents the opinions of the investment adviser. Past performance is no guarantee of future results. Not intended to be a forecast of future events, a guarantee of future results or investment advice. Current market conditions may not continue.
All indices are unmanaged and include the reinvestment of all dividends, but do not reflect the payment of transaction costs, advisory fees or expenses that are associated with an investment in the Fund. Certain indices may take into account withholding taxes.
An index’s performance is not illustrative of the Fund’s performance. Indices are not securities in which investments can be made.
| 1 | UBS Bloomberg Constant Maturity Commodity Total Return Index (CMCI) is a rules-based, composite benchmark index diversified across commodities futures contracts from various sectors. CMCI is comprised of futures contracts with maturities ranging from around three months to over three years for each commodity, depending on liquidity. |
| | |
| 2 | The Bloomberg Commodity Index (BCOM) is composed of futures contracts on physical commodities. |
| | |
| 3 | The S&P®GSCI Index (SPGSCI) is composed of futures contracts on physical commodities, with high energy concentration and limited diversification. SPGSCI buys and sells short-term futures contracts. |
| | |
| ^ | Roll yield is the amount of return generated during periods of backwardation, while negative roll yield refers to the amount of return lost during periods of contango. Roll yield is calculated as equal to [(1+Excess Return)/(1+Spot Return)]-1. “Backwardation” is the opposite of contango, and refers to a downward sloping term structure. |
Backwardation tends to occur in contracts and during periods when traders are concerned about scarcity of supplies. Thus, traders would rather have commodities in-hand now (spot) than in the future, and will pay for the privilege. “Contango” refers to an upward sloping term structure, in which indices that hold front-month contracts will incur a cost each time contracts expire and must be rolled to more expensive, longer-dated contracts. As contracts move closer to expiration, their value converges with spot prices. So, “contango cost” usually is measured by the difference between spot prices and front-month futures.
Commodities are assets that have tangible properties, such as oil, metals, and agriculture. Commodities and commodity-linked derivatives may be affected by overall market movements and other factors that affect the value of a particular industry or commodity such as weather, disease, embargoes or political or regulatory developments. The value of a commodity-linked derivative is generally based on price movements of a commodity, a commodity futures contract, a commodity index or other economic variables based on the commodity markets. Derivatives use leverage, which may exaggerate a loss. The Fund is subject to the risks associated with its investments in commodity-linked derivatives, risks of investing in wholly owned subsidiary, risk of tracking error, risks of aggressive investment techniques, leverage risk, derivatives risks, counterparty risks, non-diversification risk, credit risk, concentration risk and market risk. The use of commodity-linked derivatives such as swaps, commodity-linked structured notes and futures entails substantial risks, including risk of loss of a significant portion of their principal value, lack of a secondary market, increased volatility, correlation risk, liquidity risk, interest-rate risk, market risk, credit risk, valuation risk and tax risk. Gains and losses from speculative positions in derivatives may be much greater than the derivative’s cost. At any time, the risk of loss of any individual security held by the Fund could be significantly higher than 50% of the security’s value. Investment in commodity
CM COMMODITY INDEX FUND
MANAGEMENT DISCUSSION
(unaudited) (continued)
markets may not be suitable for all investors. The Fund’s investment in commodity-linked derivative instruments may subject the fund to greater volatility than investment in traditional securities. Please see the prospectus and summary prospectus for information on these and other risk considerations.
All investments involve the risk of loss.
PERFORMANCE COMPARISON
December 31, 2019 (unaudited)
This chart shows the value of a hypothetical $10,000 investment in the Fund since inception. The result is compared with the Fund’s benchmark. Performance of Class I and Class Y shares will vary from that of the Class A shares due to differences in class specific fees and any applicable sales charges. | | Hypothetical Growth of $10,000 (Since Inception: Class A) 
|
| | Class A | Class A | |
| Average Annual | Before | After Max | |
| Total Return (%) | Sales Charge | Sales Charge | Class I* |
| One Year | 8.37% | 2.18% | 8.55% |
| Five Year | (2.54%) | (3.69%) | (2.23)% |
| Life^ | (5.44%) | (6.06%) | (5.15%) |
| | | | |
Average Annual
Total Return (%) | Class Y* | CMCITR | |
| One Year | 8.73% | 9.82% | |
| Five Year | (2.27%) | (1.18%) | |
| Life^ | (5.19%) | (4.11%) | |
| | |
| * | Classes are not subject to a sales charge |
| ^ | Since December 31, 2010 (inception date of all share classes) |
CM COMMODITY INDEX FUND
PERFORMANCE COMPARISON
(unaudited) (continued)
The performance quoted represents past performance. Past performance is no guarantee of future results; current performance may be lower or higher than the performance data quoted.
Investment return and value of shares of the Fund will fluctuate so that an investor’s shares, when redeemed, may be worth more or less than their original cost. Performance information reflects temporary waivers of expenses and/or fees. Had the Fund incurred all expenses, investment returns would have been reduced. Fund returns assume that dividends and capital gains distributions have been reinvested in the Fund at NAV. These returns do not reflect the deduction of taxes that a shareholder would pay on Fund dividends and distributions or the redemption of Fund shares. Performance information current to the most recent month end is available by calling 800.826.2333 or by visiting vaneck.com.
All indices are unmanaged and include the reinvestment of all dividends, but do not reflect the payment of transaction costs, advisory fees or expenses that are associated with an investment in the Fund. Certain indices may take into account withholding taxes. An index’s performance is not illustrative of the Fund’s performance. Indices are not securities in which investments can be made.
UBS Bloomberg Constant Maturity Commodity Total Return Index (CMCITR) is a rules-based, composite benchmark index diversified across commodity components from various sectors, specifically energy, precious metals, industrial metals, agriculture and livestock (reflects no deduction for fees, expenses or taxes).
EXPLANATION OF EXPENSES
(unaudited)
As a shareholder of the Fund, you incur two types of costs: (1) transaction costs, including sales charges on purchase payments; and (2) ongoing costs, including management fees and other Fund expenses. This disclosure is intended to help you understand the ongoing costs (in dollars) of investing in the Fund and to compare these costs with the ongoing costs of investing in other mutual funds.
The disclosure is based on an investment of $1,000 invested at the beginning of the period and held for the entire period, July 1, 2019 to December 31, 2019.
Actual Expenses
The first line in the table below provides information about account values and actual expenses. You may use the information in this line, together with the amount you invested, to estimate the expenses that you paid over the period. Simply divide your account value by $1,000 (for example, an $8,600 account value divided by $1,000 = 8.6), then multiply the result by the number in the first line under the heading entitled “Expenses Paid During the Period.”
Hypothetical Example for Comparison Purposes
The second line in the table below provides information about hypothetical account values and hypothetical expenses based on the Fund’s actual expense ratio and an assumed rate of return of 5% per year before expenses, which is not the Fund’s actual return. The hypothetical account values and expenses may not be used to estimate the actual ending account balance or expenses you paid for the period. You may use this information to compare the ongoing costs of investing in the Fund and other funds. To do so, compare this 5% hypothetical example with the 5% hypothetical examples that appear in the shareholder reports of other funds.
Please note that the expenses shown in the table are meant to highlight your ongoing costs only and do not reflect any transactional costs, such as fees on purchase payments. Therefore, the second line of the table is useful in comparing ongoing costs only, and will not help you determine the relative costs of owning different funds. In addition, if these transactional costs were included, your costs would have been higher.
CM COMMODITY INDEX FUND
EXPLANATION OF EXPENSES
(unaudited) (continued)
| | | Beginning
Account Value
July 1, 2019 | Ending
Account Value
December 31,
2019 | Annualized
Expense Ratio
During Period | Expenses Paid
During the Period*
July 1, 2019 -
December 31,
2019 |
| Class A | Actual | $1,000.00 | $1,017.30 | 0.95% | $4.83 |
| | Hypothetical** | $1,000.00 | $1,020.42 | 0.95% | $4.84 |
| Class I | Actual | $1,000.00 | $1,020.40 | 0.65% | $3.31 |
| | Hypothetical** | $1,000.00 | $1,021.93 | 0.65% | $3.31 |
| Class Y | Actual | $1,000.00 | $1,019.60 | 0.70% | $3.56 |
| | Hypothetical** | $1,000.00 | $1,021.68 | 0.70% | $3.57 |
| | |
| * | Expenses are equal to the Fund’s annualized expense ratio (for the six months ended December 31, 2019), multiplied by the average account value over the period, multiplied by the number of days in the most recent fiscal half year divided by the number of the days in the fiscal year (to reflect the one-half year period). |
| | |
| ** | Assumes annual return of 5% before expenses |
CM COMMODITY INDEX FUND
CONSOLIDATED SCHEDULE OF INVESTMENTS
December 31, 2019
Principal
Amount | | | | | Value | |
| |
| SHORT-TERM INVESTMENTS: 99.1% |
| |
| United States Treasury Obligations: 95.9% |
| | | | | United States Treasury Bills | | | | |
| | $5,000,000 | | | 1.50%, 02/18/20 (a) | | $ | 4,990,000 | |
| | 40,000,000 | | | 1.50%, 03/12/20 | | | 39,883,528 | |
| | 9,000,000 | | | 1.51%, 03/26/20 (a) | | | 8,968,442 | |
| | 65,000,000 | | | 1.53%, 02/06/20 (a) † | | | 64,900,875 | |
| | 55,000,000 | | | 1.53%, 05/21/20 (a) | | | 54,674,622 | |
| | 7,000,000 | | | 1.53%, 05/28/20 (a) | | | 6,956,260 | |
| | 45,000,000 | | | 1.53%, 06/11/20 | | | 44,691,836 | |
| | 40,000,000 | | | 1.57%, 06/25/20 | | | 39,702,305 | |
| | 45,000,000 | | | 1.59%, 02/27/20 (a) | | | 44,886,713 | |
| | 50,000,000 | | | 1.60%, 04/16/20 (a) † | | | 49,779,403 | |
| | 40,000,000 | | | 1.64%, 04/09/20 (a) † | | | 39,834,462 | |
| | 50,000,000 | | | 1.74%, 01/02/20 (a) † | | | 49,997,583 | |
| | | | | | | | 449,266,029 | |
Number
of Shares | | | | | Value | |
| | | | | | | | | |
| Money Market Fund: 3.2% | | | | |
| | 15,122,537 | | | Invesco Treasury Portfolio – Institutional Class | | $ | 15,122,537 | |
Total Short-Term Investments
(Cost: $464,342,365) | | | 464,388,566 | |
| SHORT-TERM INVESTMENT HELD AS COLLATERAL FOR SECURITIES ON LOAN: 5.2% | | | | |
| | | | | |
Money Market Fund: 5.2%
(Cost: $24,712,151) | | | | |
| | 24,712,151 | | | State Street Navigator Securities Lending Government Money Market Portfolio | | | 24,712,151 | |
Total Investments: 104.3%
(Cost: $489,054,516) | | | 489,100,717 | |
| Liabilities in excess of other assets: (4.3)% | | | (20,374,401 | ) |
| NET ASSETS: 100.0% | | $ | 468,726,316 | |
Total Return Swap Contracts
Long Exposure
| Counterparty | | Referenced
Obligation | | Notional
Amount | | Rate paid
by the
Fund (b) | | Payment
Frequency | | Termination
Date | | Unrealized
Appreciation | | % of
Net
Assets |
| UBS | | UBS Bloomberg Constant Maturity Commodity Index
Total Return | | $466,564,000 | | 1.98% | | Monthly | | 01/22/20 | | | $3,602,327 | | | 0.8% |
Footnotes:
| (a) | All or a portion of these securities are segregated for swap collateral. Total value of securities segregated is $70,795,890. |
| (b) | The rate shown reflects the rate in effect at the reporting period: 3-Month T-Bill rate + 0.42%. |
| † | Security fully or partially on loan. Total market value of securities on loan is $105,369,695. |
See Notes to Consolidated Financial Statements
CM COMMODITY INDEX FUND
CONSOLIDATED SCHEDULE OF INVESTMENTS
(continued)
Summary of Investments by
Sector Excluding Collateral
for Securities Loaned | | % of
Investments | | Value |
| Government | | | | 96.7 | % | | | $ | 449,266,029 | |
| Money Market Fund | | | | 3.3 | | | | | 15,122,537 | |
| | | | | 100.0 | % | | | $ | 464,388,566 | |
The summary of inputs used to value the Fund’s investments as of December 31, 2019 is as follows:
| | | | | | Level 2 | | | Level 3 | | | |
| | | Level 1 | | | Significant | | | Significant | | | |
| | | Quoted | | | Observable | | | Unobservable | | | |
| | | Prices | | | Inputs | | | Inputs | | Value | |
| United States Treasury Obligations | | $ | — | | | $ | 449,266,029 | | | | $ | — | | | $ | 449,266,029 | |
| Money Market Funds | | | 39,834,688 | | | | — | | | | | — | | | | 39,834,688 | |
| Total | | $ | 39,834,688 | | | $ | 449,266,029 | | | | $ | — | | | $ | 489,100,717 | |
| Other Financial Instruments: | | | | | | | | | | | | | | | | | |
| Swap Contracts | | $ | — | | | $ | 3,602,327 | | | | $ | — | | | $ | 3,602,327 | |
See Notes to Consolidated Financial Statements
CM COMMODITY INDEX FUND
CONSOLIDATED STATEMENT OF ASSETS AND LIABILITIES
December 31, 2019
| Assets: | | | | |
| Investments, at value (Cost: $464,342,365) (1) | | $ | 464,388,566 | |
| Short-term investment held as collateral for securities loaned (2) | | | 24,712,151 | |
| Total return swap contracts, at value | | | 3,602,327 | |
| Cash | | | 569 | |
| Receivables: | | | | |
| Shares of beneficial interest sold | | | 2,401,293 | |
| Dividends and interest | | | 40,565 | |
| Prepaid expenses | | | 17,270 | |
| Total assets | | | 495,162,741 | |
| Liabilities: | | | | |
| Payables: | | | | |
| Collateral for securities loaned | | | 24,712,151 | |
| Shares of beneficial interest redeemed | | | 1,247,697 | |
| Due to Adviser | | | 125,369 | |
| Due to Distributor | | | 5,599 | |
| Deferred Trustee fees | | | 293,621 | |
| Accrued expenses | | | 51,988 | |
| Total liabilities | | | 26,436,425 | |
| NET ASSETS | | $ | 468,726,316 | |
| Class A Shares: | | | | |
| Net Assets | | $ | 26,932,169 | |
| Shares of beneficial interest outstanding | | | 5,846,206 | |
| Net asset value and redemption price per share | | $ | 4.61 | |
| Maximum offering price per share (Net asset value per share ÷ 94.25%) | | $ | 4.89 | |
| Class I Shares: | | | | |
| Net Assets | | $ | 195,269,510 | |
| Shares of beneficial interest outstanding | | | 41,468,570 | |
| Net asset value, offering and redemption price per share | | $ | 4.71 | |
| Class Y Shares: | | | | |
| Net Assets | | $ | 246,524,637 | |
| Shares of beneficial interest outstanding | | | 52,488,860 | |
| Net asset value, offering and redemption price per share | | $ | 4.70 | |
| Net Assets consist of: | | | | |
| Aggregate paid in capital | | $ | 510,554,702 | |
| Total distributable earnings (loss) | | | (41,828,386 | ) |
| | | $ | 468,726,316 | |
| (1) Value of securities on loan | | $ | 105,369,695 | |
| (2) Cost of short-term investment held as collateral for securities loaned | | $ | 24,712,151 | |
See Notes to Consolidated Financial Statements
CM COMMODITY INDEX FUND
CONSOLIDATED STATEMENT OF OPERATIONS
For the Year Ended December 31, 2019
| Income: | | | | |
| Dividends | | $ | 592,661 | |
| Interest | | | 10,097,630 | |
| Securities lending income | | | 8,348 | |
| Foreign taxes withheld | | | (24,623 | ) |
| Total income | | | 10,674,016 | |
| Expenses: | | | | |
| Management fees | | | 3,649,521 | |
| Distribution fees – Class A | | | 71,925 | |
| Transfer agent fees – Class A | | | 74,429 | |
| Transfer agent fees – Class I | | | 277,965 | |
| Transfer agent fees – Class Y | | | 419,002 | |
| Custodian fees | | | 27,684 | |
| Professional fees | | | 107,436 | |
| Registration fees – Class A | | | 24,051 | |
| Registration fees – Class I | | | 20,940 | |
| Registration fees – Class Y | | | 27,951 | |
| Reports to shareholders | | | 90,518 | |
| Insurance | | | 25,077 | |
| Trustees’ fees and expenses | | | 182,253 | |
| Other | | | 10,801 | |
| Total expenses | | | 5,009,553 | |
| Waiver of management fees | | | (1,645,687 | ) |
| Net expenses | | | 3,363,866 | |
| Net investment income | | | 7,310,150 | |
| Net realized gain on: | | | | |
| Investments | | | 923 | |
| Swap contracts | | | 13,742,736 | |
| Net realized gain | | | 13,743,659 | |
| Net change in net unrealized appreciation (depreciation) on: | | | | |
| Investments | | | 38,946 | |
| Swap contracts | | | 16,545,803 | |
| Net change in unrealized appreciation (depreciation) | | | 16,584,749 | |
| Net Increase in Net Assets Resulting from Operations | | $ | 37,638,558 | |
See Notes to Consolidated Financial Statements
CM COMMODITY INDEX FUND
CONSOLIDATED STATEMENT OF CHANGES IN NET ASSETS
| | | Year Ended
December 31,
2019 | | | Year Ended
December 31,
2018 | |
| Operations: | | | | | | | | |
| Net investment income | | $ | 7,310,150 | | | $ | 5,088,993 | |
| Net realized gain (loss) | | | 13,743,659 | | | | (38,959,661 | ) |
| Net change in unrealized appreciation (depreciation) | | | 16,584,749 | | | | (23,181,525 | ) |
| Net increase (decrease) in net assets resulting from operations | | | 37,638,558 | | | | (57,052,193 | ) |
| Distributions to shareholders: | | | | | | | | |
| Class A Shares | | | (223,974 | ) | | | (155,947 | ) |
| Class I Shares | | | (2,276,974 | ) | | | (1,874,989 | ) |
| Class Y Shares | | | (2,601,306 | ) | | | (1,671,466 | ) |
| Total distributions | | | (5,102,254 | ) | | | (3,702,402 | ) |
| Share transactions: | | | | | | | | |
| Proceeds from sale of shares | | | | | | | | |
| Class A Shares | | | 9,945,004 | | | | 20,394,798 | |
| Class I Shares | | | 106,661,636 | | | | 134,714,965 | |
| Class Y Shares | | | 74,346,188 | | | | 130,900,874 | |
| | | | 190,952,828 | | | | 286,010,637 | |
| Reinvestment of distributions | | | | | | | | |
| Class A Shares | | | 151,697 | | | | 119,745 | |
| Class I Shares | | | 970,897 | | | | 1,057,340 | |
| Class Y Shares | | | 2,573,715 | | | | 1,641,482 | |
| | | | 3,696,309 | | | | 2,818,567 | |
| Cost of shares redeemed | | | | | | | | |
| Class A Shares | | | (14,978,313 | ) | | | (9,623,579 | ) |
| Class I Shares | | | (140,738,163 | ) | | | (69,932,816 | ) |
| Class Y Shares | | | (66,236,967 | ) | | | (67,557,151 | ) |
| | | | (221,953,443 | ) | | | (147,113,546 | ) |
| Net increase (decrease) in net assets resulting from share transactions | | | (27,304,306 | ) | | | 141,715,658 | |
| Total increase in net assets | | | 5,231,998 | | | | 80,961,063 | |
| Net Assets: | | | | | | | | |
| Beginning of year | | | 463,494,318 | | | | 382,533,255 | |
| End of year | | $ | 468,726,316 | | | $ | 463,494,318 | |
See Notes to Consolidated Financial Statements
CM COMMODITY INDEX FUND
CONSOLIDATED FINANCIAL HIGHLIGHTS
For a share outstanding throughout each year:
| | | Class A |
| | | Year Ended December 31, |
| | | 2019 | | 2018 | | 2017 | | 2016 | | 2015 |
| Net asset value, beginning of year | | | | $4.29 | | | | | $4.87 | | | | | $4.76 | | | | | $4.55 | | | | | $6.09 | |
| Income from investment operations: | | | | | | | | | | | | | | | | | | | | | | | | | |
| Net investment income (loss) (b) | | | | 0.06 | | | | | 0.04 | | | | | (0.01 | ) | | | | (0.03 | ) | | | | (0.05 | ) |
| Net realized and unrealized gain (loss) on investments | | | | 0.30 | | | | | (0.60 | ) | | | | 0.32 | | | | | 0.71 | | | | | (1.49 | ) |
| Total from investment operations | | | | 0.36 | | | | | (0.56 | ) | | | | 0.31 | | | | | 0.68 | | | | | (1.54 | ) |
| Less distributions from: | | | | | | | | | | | | | | | | | | | | | | | | | |
| Net investment income | | | | (0.04 | ) | | | | (0.02 | ) | | | | (0.20 | ) | | | | (0.47 | ) | | | | — | |
| Net asset value, end of year | | | | $4.61 | | | | | $4.29 | | | | | $4.87 | | | | | $4.76 | | | | | $4.55 | |
| Total return (a) | | | | 8.37 | % | | | | (11.42 | )% | | | | 6.58 | % | | | | 15.01 | % | | | | (25.29 | )% |
| | | | | | | | | | | | | | | | | | | | | | | | | | |
| Ratios/Supplemental Data | | | | | | | | | | | | | | | | | | | | | | | | | |
| Net assets, end of year (000’s) | | $26,932 | | | $29,682 | | | $22,189 | | | $26,835 | | | $28,678 | |
| Ratio of gross expenses to average net assets | | | | 1.43 | % | | | | 1.39 | % | | | | 1.41 | % | | | | 1.31 | % | | | | 1.25 | % |
| Ratio of net expenses to average net assets | | | | 0.95 | % | | | | 0.95 | % | | | | 0.95 | % | | | | 0.95 | % | | | | 0.95 | % |
| Ratio of net expenses to average net assets, excluding interest expense | | | | 0.95 | % | | | | 0.95 | % | | | | 0.95 | % | | | | 0.95 | % | | | | 0.95 | % |
| Ratio of net investment income (loss) to average net assets | | | | 1.24 | % | | | | 0.88 | % | | | | (0.12 | )% | | | | (0.70 | )% | | | | (0.92 | )% |
| Portfolio turnover rate | | | | 0 | % | | | | 0 | % | | | | 0 | % | | | | 0 | % | | | | 0 | % |
| | | | | | | | | | | | | | | | | | | | | | | | | | |
| (a) | Total return is calculated assuming an initial investment made at the net asset value at the beginning of year, reinvestment of any dividends and distributions at net asset value on the dividend/distributions payment date and a redemption at the net asset value on the last day of the year. The return does not reflect the deduction of taxes that a shareholder would pay on Fund dividends/distributions or the redemption of Fund shares. |
| (b) | Calculated based upon average shares outstanding. |
See Notes to Consolidated Financial Statements
CM COMMODITY INDEX FUND
CONSOLIDATED FINANCIAL HIGHLIGHTS
For a share outstanding throughout each year:
| | | Class I |
| | | Year Ended December 31, |
| | | 2019 | | 2018 | | 2017 | | 2016 | | 2015 |
| Net asset value, beginning of year | | | | $4.39 | | | | | $4.98 | | | | | $4.86 | | | | | $4.63 | | | | | $6.16 | |
| Income from investment operations: | | | | | | | | | | | | | | | | | | | | | | | | | |
| Net investment income (loss) (b) | | | | 0.07 | | | | | 0.06 | | | | | 0.01 | | | | | (0.02 | ) | | | | (0.03 | ) |
| Net realized and unrealized gain (loss) on investments | | | | 0.30 | | | | | (0.61 | ) | | | | 0.32 | | | | | 0.72 | | | | | (1.50 | ) |
| Total from investment operations | | | | 0.37 | | | | | (0.55 | ) | | | | 0.33 | | | | | 0.70 | | | | | (1.53 | ) |
| Less distributions from: | | | | | | | | | | | | | | | | | | | | | | | | | |
| Net investment income | | | | (0.05 | ) | | | | (0.04 | ) | | | | (0.21 | ) | | | | (0.47 | ) | | | | — | |
| Net asset value, end of year | | | | $4.71 | | | | | $4.39 | | | | | $4.98 | | | | | $4.86 | | | | | $4.63 | |
| Total return (a) | | | | 8.55 | % | | | | (11.13 | )% | | | | 6.95 | % | | | | 15.18 | % | | | | (24.84 | )% |
| | | | | | | | | | | | | | | | | | | | | | | | | | |
| Ratios/Supplemental Data | | | | | | | | | | | | | | | | | | | | | | | | | |
| Net assets, end of year (000’s) | | $195,270 | | | $214,324 | | | $177,578 | | | $136,710 | | | $107,459 | |
| Ratio of gross expenses to average net assets | | | | 0.97 | % | | | | 0.90 | % | | | | 0.92 | % | | | | 0.91 | % | | | | 0.90 | % |
| Ratio of net expenses to average net assets | | | | 0.65 | % | | | | 0.65 | % | | | | 0.65 | % | | | | 0.65 | % | | | | 0.65 | % |
| Ratio of net expenses to average net assets, excluding interest expense | | | | 0.65 | % | | | | 0.65 | % | | | | 0.65 | % | | | | 0.65 | % | | | | 0.65 | % |
| Ratio of net investment income (loss) to average net assets | | | | 1.50 | % | | | | 1.19 | % | | | | 0.20 | % | | | | (0.39 | )% | | | | (0.62 | )% |
| Portfolio turnover rate | | | | 0 | % | | | | 0 | % | | | | 0 | % | | | | 0 | % | | | | 0 | % |
| | | | | | | | | | | | | | | | | | | | | | | | | | |
| (a) | Total return is calculated assuming an initial investment made at the net asset value at the beginning of year, reinvestment of any dividends and distributions at net asset value on the dividend/distributions payment date and a redemption at the net asset value on the last day of the year. The return does not reflect the deduction of taxes that a shareholder would pay on Fund dividends distributions or the redemption of Fund shares. |
| (b) | Calculated based upon average shares outstanding. |
See Notes to Consolidated Financial Statements
CM COMMODITY INDEX FUND
CONSOLIDATED FINANCIAL HIGHLIGHTS
For a share outstanding throughout each year:
| | | Class Y |
| | | Year Ended December 31, |
| | | 2019 | | 2018 | | 2017 | | 2016 | | 2015 |
| Net asset value, beginning of year | | | | $4.37 | | | | | $4.96 | | | | | $4.85 | | | | | $4.62 | | | | | $6.15 | |
| Income from investment operations: | | | | | | | | | | | | | | | | | | | | | | | | | |
| Net investment income (loss) (b) | | | | 0.07 | | | | | 0.06 | | | | | 0.01 | | | | | (0.02 | ) | | | | (0.04 | ) |
| Net realized and unrealized gain (loss) on investments | | | | 0.31 | | | | | (0.62 | ) | | | | 0.31 | | | | | 0.72 | | | | | (1.49 | ) |
| Total from investment operations | | | | 0.38 | | | | | (0.56 | ) | | | | 0.32 | | | | | 0.70 | | | | | (1.53 | ) |
| Less distributions from: | | | | | | | | | | | | | | | | | | | | | | | | | |
| Net investment income | | | | (0.05 | ) | | | | (0.03 | ) | | | | (0.21 | ) | | | | (0.47 | ) | | | | — | |
| Net asset value, end of year | | | | $4.70 | | | | | $4.37 | | | | | $4.96 | | | | | $4.85 | | | | | $4.62 | |
| Total return (a) | | | | 8.73 | % | | | | (11.23 | )% | | | | 6.71 | % | | | | 15.24 | % | | | | (24.88 | )% |
| | | | | | | | | | | | | | | | | | | | | | | | | | |
| Ratios/Supplemental Data | | | | | | | | | | | | | | | | | | | | | | | | | |
| Net assets, end of year (000’s) | | $246,525 | | | $219,489 | | | $182,766 | | | $135,589 | | | $83,425 | |
| Ratio of gross expenses to average net assets | | | | 1.04 | % | | | | 1.12 | % | | | | 0.97 | % | | | | 0.99 | % | | | | 1.00 | % |
| Ratio of net expenses to average net assets | | | | 0.70 | % | | | | 0.70 | % | | | | 0.70 | % | | | | 0.70 | % | | | | 0.70 | % |
| Ratio of net expenses to average net assets, excluding interest expense | | | | 0.70 | % | | | | 0.70 | % | | | | 0.70 | % | | | | 0.70 | % | | | | 0.70 | % |
| Ratio of net investment income (loss) to average net assets | | | | 1.53 | % | | | | 1.14 | % | | | | 0.15 | % | | | | (0.43 | )% | | | | (0.67 | )% |
| Portfolio turnover rate | | | | 0 | % | | | | 0 | % | | | | 0 | % | | | | 0 | % | | | | 0 | % |
| | | | | | | | | | | | | | | | | | | | | | | | | | |
| (a) | Total return is calculated assuming an initial investment made at the net asset value at the beginning of year, reinvestment of any dividends and distributions at net asset value on the dividend/distributions payment date and a redemption at the net asset value on the last day of the year. The return does not reflect the deduction of taxes that a shareholder would pay on Fund dividends/distributions or the redemption of Fund shares. |
| (b) | Calculated based upon average shares outstanding. |
See Notes to Consolidated Financial Statements
NOTES TO CONSOLIDATED FINANCIAL STATEMENTS
December 31, 2019
Note 1—Fund Organization—VanEck Funds (the “Trust”) is registered under the Investment Company Act of 1940, as amended, as an open-end management investment company. The Trust was organized as a Massachusetts business trust on April 3, 1985. The CM Commodity Index Fund (the “Fund”) is a diversified series of the Trust and seeks to track, before fees and expenses, the performance of the UBS Bloomberg Constant Maturity Commodity Total Return Index. The Fund may effect certain investments through the Commodities Series Fund I Subsidiary (the “Subsidiary”), a wholly-owned subsidiary. The Fund offers three classes of shares: Class A, I and Y Shares. Each share class represents an interest in the same portfolio of investments of the Fund and is substantially the same in all respects, except that the classes are subject to different distribution fees and sales charges. Class I and Y Shares are sold without a sales charge; Class A Shares are sold subject to a front-end sales charge. The Van Eck Absolute Return Advisers Corporation (the “Adviser”) is the investment adviser to the Fund and its Subsidiary.
Note 2—Significant Accounting Policies—The preparation of financial statements in conformity with U.S. generally accepted accounting principles (“GAAP”) requires management to make estimates and assumptions that affect the reported amounts and disclosures in the financial statements. Actual results could differ from those estimates.
The Fund is an investment company and follows accounting and reporting requirements of Accounting Standards Codification (“ASC”) 946Financial Services – Investment Companies.
The following is a summary of significant accounting policies followed by the Fund.
| A. | Security Valuation—The Fund values its investments in securities and other assets and liabilities at fair value daily. Fair value is the price that would be received to sell an asset or paid to transfer a liability in an orderly transaction between market participants on the measurement date. Debt securities are valued on the basis of evaluated prices furnished by an independent pricing service approved by the Fund’s Board of Trustees or provided by securities dealers. The pricing services may use valuation models or matrix pricing, which consider: (i) yield or price with respect to bonds that are considered comparable in characteristics such as rating, interest rate and maturity date and/or (ii) quotations from bond dealers to determine current value and are categorized as Level 2 in the fair value hierarchy (as described below). Short-term obligations with sixty days or less to maturity are valued at amortized cost, which with accrued interest |
CM COMMODITY INDEX FUND
NOTES TO CONSOLIDATED FINANCIAL STATEMENTS
(continued)
approximates fair value. Open-end mutual fund investments (including money market funds) are valued at their closing net asset value each business day and are categorized as Level 1 in the fair value hierarchy. Swap contracts are marked to market daily using either pricing vendor quotations, counterparty prices or model prices and the net change in value, if any, is regarded as an unrealized gain or loss and is categorized as Level 2 in the fair value hierarchy. The Pricing Committee of the Adviser provides oversight of the Fund’s valuation policies and procedures, which are approved by the Fund’s Board of Trustees. Among other things, these procedures allow the Fund to utilize independent pricing services, quotations from securities dealers, and other market sources to determine fair value. The Pricing Committee convenes regularly to review the fair value of financial instruments or other assets. If market quotations for a security or other asset are not readily available, or if the Adviser believes they do not otherwise reflect the fair value of a security or asset, the security or asset will be fair valued by the Pricing Committee in accordance with the Fund’s valuation policies and procedures. The Pricing Committee employs various methods for calibrating the valuation approaches utilized to determine fair value, including a regular review of key inputs and assumptions, periodic comparisons to valuations provided by other independent pricing services, transactional back-testing and disposition analysis.
Certain factors such as economic conditions, political events, market trends, the nature of and duration of any restrictions on disposition, trading in similar securities of the issuer or comparable issuers and security specific information are used to determine the fair value of these securities. Depending on the relative significance of valuation inputs, these securities may be classified either as Level 2 or Level 3 in the fair value hierarchy. The price which the Fund may realize upon sale of an investment may differ materially from the value presented in the Consolidated Schedule of Investments.
The Fund utilizes various methods to measure the fair value of its investments on a recurring basis which includes a hierarchy that prioritizes inputs to valuation methods used to measure fair value. The fair value hierarchy gives highest priority to unadjusted quoted prices in active markets for identical assets and liabilities (Level 1 measurements) and the lowest priority to unobservable inputs (Level 3 measurements). The inputs or methodologies used for valuing securities are not necessarily an indication of the risk associated with investing in those securities. The three levels of the fair value hierarchy are described below:
Level 1 – Quoted prices in active markets for identical securities.
Level 2 – Significant observable inputs (including quoted prices for similar securities, interest rates, prepayment speeds, credit risk, etc.).
Level 3 – Significant unobservable inputs (including the Fund’s own assumptions in determining the fair value of investments).
A summary of the inputs and the levels used to value the Fund’s investments are located in the Consolidated Schedule of Investments. Additionally, tables that reconcile the valuation of the Fund’s Level 3 investments and that present additional information about the valuation methodologies and unobservable inputs, if applicable, are located in the Consolidated Schedule of Investments.
| B. | Basis for Consolidation—The Commodities Series Fund I Subsidiary, a Cayman Islands exempted company, was incorporated on June 26, 2009. Consolidated financial statements of the Fund present the financial position and results of operations for the Fund and its wholly-owned Subsidiary. All interfund account balances and transactions between the parent and subsidiary have been eliminated in consolidation. As of December 31, 2019, the Fund held $94,101,495 in its Subsidiary, representing 20% of the Fund’s net assets. |
| C. | Federal Income Taxes—It is the Fund’s policy to comply with the provisions of the Internal Revenue Code (the “Code”) applicable to regulated investment companies and to distribute all of its net investment income and net realized capital gains, if any, to its shareholders. Therefore, no federal income tax provision is required. |
The wholly owned Subsidiary of the Fund is classified as a controlled foreign corporation (“CFC”) under the Code. For U.S. tax purposes, a CFC is not subject to U.S. income tax. However, as a wholly owned CFC, its net income and capital gains, to the extent of its earnings and profits, will be included each year in the Fund investment company taxable income. Net losses of the CFC cannot be deducted by the Fund in the current year, nor carried forward to offset taxable income in future years.
| D. | Dividends and Distributions to Shareholders—Dividends to shareholders from net investment income and distributions from net realized capital gains, if any, are declared and paid annually. Income dividends and capital gain distributions are determined in accordance with U.S. income tax regulations, which may differ from such amounts determined in accordance with GAAP. |
CM COMMODITY INDEX FUND
NOTES TO CONSOLIDATED FINANCIAL STATEMENTS
(continued)
| E. | Use of Derivative Instruments—The Fund may investment in derivative instruments, including, but not limited to, options, futures, swaps and forward foreign currency contracts. A derivative is an instrument whose value is derived from underlying assets, indices, reference rates or a combination of these factors. Derivative instruments may be privately negotiated contracts (often referred to as over-the-counter (“OTC”) derivatives) or they may be listed and traded on an exchange. Derivative contracts may involve future commitments to purchase or sell financial instruments or commodities at specified terms on a specified date, or to exchange interest payment streams or currencies based on a notional or contractual amount. Derivative instruments may involve a high degree of financial risk. The use of derivative instruments also involves the risk of loss if the investment adviser is incorrect in its expectation of the timing or level of fluctuations in securities prices, interest rates or currency prices. Investments in derivative instruments also include the risk of default by the counterparty, the risk that the investment may not be liquid and the risk that a small movement in the price of the underlying security or benchmark may result in a disproportionately large movement, unfavorable or favorable, in the price of the derivative instrument. GAAP requires enhanced disclosures about the Fund’s derivative instruments and hedging activities. Details of these disclosures are found below as well as in the Consolidated Schedule of Investments. |
Total Return Swaps—The Fund enters into total return swaps in order take a “long” position with respect to an underlying referenced asset. The Fund is subject to market price volatility of the underlying referenced asset. A total return swap involves commitments to pay interest in exchange for a market linked return based on a notional amount. To the extent that the total return of the security, group of securities or index underlying the transaction exceeds or falls short of the offsetting interest obligation, the Fund will receive a payment from or make a payment to the counterparty. Documentation governing the Fund’s swap transactions may contain provisions for early termination of a swap in the event the net assets of the Fund decline below specific levels set forth in the documentation (“net asset contingent features”). If these levels are triggered, the Fund’s counterparty has the right to terminate the swap and require the Fund to pay or receive a settlement amount in connection with the terminated swap transaction. The total return swap position held by the Fund at December 31, 2019 is reflected in the Fund’s Consolidated Schedule of Investments. The average monthly
notional amount was $486,781,846 during the year ended December 31, 2019.
At December 31, 2019, the Fund held the following derivatives (not designated as hedging instruments under GAAP):
| | Asset |
| | Derivatives |
| | Commodities |
| | Futures Risk |
| Swap contracts1 | $3,602,327 |
| 1 | Consolidated Statement of Assets and Liabilities location: Total return swap contracts, at value |
The impact of transactions in derivative instruments during the year ended December 31, 2019, was as follows:
| | Commodities |
| | Futures Risk |
| Realized gain: | |
| Swap contracts1 | $13,742,736 |
| | |
| Net change in unrealized appreciation (depreciation): | |
| Swap contracts2 | 16,545,803 |
| 1 | Consolidated Statement of Operations location: Net realized gain on swap contracts |
| 2 | Consolidated Statement of Operations location: Net change in unrealized appreciation (depreciation) on swap contracts |
| F. | Offsetting Assets and Liabilities—In the ordinary course of business, the Fund enters into transactions subject to enforceable master netting agreements or other similar agreements. Generally, the right of offset in those agreements allows the Fund to offset any exposure to a specific counterparty with any collateral received from or delivered to that counterparty based on the terms of the agreements. The Fund may pledge or receive cash and/or securities as collateral for derivative instruments and securities lending. Collateral held for derivative instruments at December 31, 2019 is presented in the Consolidated Schedule of Investments. |
For financial reporting purposes, the Fund presents securities lending assets and liabilities on a gross basis in the Consolidated Statement of Assets and Liabilities. Cash collateral held in the form of money market investments, if any, for securities loaned at December 31, 2019 is presented in the Consolidated Schedule of Investments and in the Consolidated Statement of Assets and Liabilities. Non-cash collateral is disclosed in Note 9 (Securities Lending).
CM COMMODITY INDEX FUND
NOTES TO CONSOLIDATED FINANCIAL STATEMENTS
(continued)
Additionally, the Fund presents derivatives instruments on a gross basis in the Consolidated Statement of Assets and Liabilities. The table below includes both gross and net information about the derivative instruments eligible for offset in the Consolidated Statement of Assets and Liabilities subject to master netting agreement or similar agreements, as well as financial collateral received or pledged (including cash collateral) as of December 31, 2019. The total amount of collateral reported, if any, is limited to the net amounts of financial assets and liabilities presented in the Consolidated Statement of Assets and Liabilities for the respective financial instruments. In general, collateral received or pledged exceeds the net amount of the unrealized gain/loss or market value of financial instruments.
| | | | | | | Net Amount | | | | |
| | | | | Gross | | of Assets | | | | |
| | | | | Amount | | Presented | | | | |
| | | | | Offset in the | | in the | | Financial | | |
| | | Gross | | Consolidated | | Consolidated | | Instruments | | |
| | | Amount of | | Statement of | | Statements | | and Cash | | |
| | | Recognized | | Assets and | | of Assets | | Collateral | | Net |
| | | Assets | | Liabilities | | and Liabilities | | Received | | Amount |
| Total return swap contracts | | $3,602,327 | | $— | | $3,602,327 | | $— | | $3,602,327 |
| G. | Other—Security transactions are accounted for on trade date. Realized gains and losses are determined based on the specific identification method. Dividend income is recorded on the ex-dividend date. Income, non-class specific expenses, gains and losses on investments are allocated to each class of shares based on its relative net assets. Expenses directly attributable to a specific class are charged to that class. |
The Fund earns interest income on uninvested cash balances held at the custodian bank, such amounts, if any, are presented as interest income in the Consolidated Statement of Operations.
In the normal course of business, the Fund enter into contracts that contain a variety of general indemnifications. The Fund’s maximum exposure under these agreements is unknown as this would involve future claims that may be made against the Fund that have not yet occurred. However, the investment adviser believes the risk of loss under these arrangements to be remote.
Note 3—Investment Management and Other Agreements—The Adviser receives a management fee, calculated daily and payable monthly based on an annual rate of 0.75% of the Fund’s average daily net assets.
The Adviser has agreed, until at least May 1, 2020, to waive management fees and assume expenses to prevent the Fund’s total annual operating expenses
(excluding acquired fund fees and expenses, interest expense, trading expenses, dividends and interest payments on securities sold short, taxes, and extraordinary expenses) from exceeding the expense limitations listed in the table below.
The current expense limitations and the amounts waived by the Adviser for the year ended December 31, 2019, are as follows:
| | | | | Waiver of |
| | | Expense | | Management |
| | | Limitation | | Fees |
| Class A | | | 0.95 | % | | $ | 138,527 | |
| Class I | | | 0.65 | | | | 731,370 | |
| Class Y | | | 0.70 | | | | 775,790 | |
For the year ended December 31, 2019, Van Eck Securities Corporation (the “Distributor”), and affiliate of the Adviser, received a total of $14,031 in sales loads relating to the sale of shares of the Fund, of which $12,434 was reallowed to broker/dealers and the remaining $1,597 was retained by the Distributor.
Certain officers of the Trust are officers, directors or stockholders of the Adviser and the Distributor.
State Street Bank and Trust Company is the Fund’s custodian and securities lending agent.
Note 4—12b-1 Plan of Distribution—Pursuant to a Rule 12b-1 Plan of Distribution (the “Plan”), the Fund is authorized to incur distribution expenses which will principally be payments to securities dealers who have sold shares and serviced shareholder accounts, and payments to the Distributor for reimbursement of other actual promotion and distribution expenses incurred by the Distributor on behalf of the Fund. The amount paid under the Plan in any one year is limited to 0.25% of average daily net assets for Class A Shares and is recorded as Distribution fees in the Consolidated Statement of Operations.
Note 5—Investments—During the year ended December 31, 2019, the Fund had no purchases and sales of investments, other than U.S. government securities and short-term obligations.
Note 6—Income Taxes—As of December 31, 2019, for Federal income tax purposes, the identified cost of investments owned, net unrealized appreciation (depreciation), gross unrealized appreciation, and gross unrealized depreciation of investments were as follows:
CM COMMODITY INDEX FUND
NOTES TO CONSOLIDATED FINANCIAL STATEMENTS
(continued)
| | | Gross | | Gross | | Net Unrealized |
| Cost of | | Unrealized | | Unrealized | | Appreciation |
| Investments | | Appreciation | | Depreciation | | (Depreciation) |
| $511,677,380 | | $26,448,747 | | $(45,421,692) | | $(18,972,945) |
At December 31, 2019, the components of accumulated earnings (deficit) on a tax basis, for the Fund, were as follows:
| | | | | | | | | Total |
| Undistributed | | Accumulated | | Other | | Unrealized | | Distributable |
| Ordinary | | Capital | | Temporary | | Appreciation | | Earnings |
| Income | | Losses | | Differences | | (Depreciation) | | (Loss) |
| $230,266 | | $(834) | | $(293,621) | | $(41,764,197) | | $(41,828,386) |
The tax character of dividends paid to shareholders were as follows:
| | | Year Ended | | Year Ended |
| | | December 31, 2019 | | December 31, 2018 |
| Ordinary income | | $5,102,254 | | $3,702,402 |
At December 31, 2019, the Fund had capital loss carryforwards available to offset future capital gains, as follows:
| | Short-Term |
| | Capital Losses |
| | with No Expiration |
| | $(834) |
Additionally, the Fund utilized $395 of its capital loss carryover available from prior years.
During the year ended December 31, 2019, as a result of permanent book to tax differences primarily due to differences in the treatment of income and realized gains from the Fund’s controlled foreign corporation subsidiary, the Fund incurred differences that affected net distributable earnings and aggregate paid in capital by the amounts in the table below. Net assets were not affected by these reclassifications.
| Increase | | |
| (Decrease) | | Increase |
| in Distributable | | (Decrease) |
| Earnings | | in Paid-in-Capital |
| $(15,921,955) | | $15,921,955 |
The Fund recognizes the tax benefits of uncertain tax positions only where the position is “more-likely-than-not” to be sustained assuming examination by applicable tax authorities. Management has analyzed the Fund’s tax positions, and has concluded that no liability for unrecognized tax benefits should be recorded related to uncertain tax positions taken on return filings for all open tax years. The Fund does not have exposure for additional years that might
still be open in certain foreign jurisdictions. Therefore, no provision for income tax is required in the Fund’s financial statements. However, the Fund is subject to foreign taxes on the appreciation in value of certain investments. The Fund provides for such taxes, if any, on both realized and unrealized appreciation.
The Fund recognizes interest and penalties, if any, related to uncertain tax positions as income tax expense in the Consolidated Statement of Operations. During the year ended December 31, 2019, the Fund did not incur any interest or penalties.
Note 7—Principal Risks—The Fund may invest in commodity-linked derivative instruments, including commodity index-linked notes, swap agreements, commodity futures contracts and options on futures contracts that provide economic exposure to the investment returns of the commodities markets. The use of derivatives presents risks different from, and possibly greater than, the risks associated with investing directly in traditional securities. Derivative strategies often involve leverage, which may exaggerate a loss, potentially causing the Fund to lose more money than it would have lost had it invested in the underlying security. The value of commodity-linked derivative instruments may be affected by overall market movements and other factors affecting the value of a particular industry or commodity, such as weather, disease, embargoes, or political and economic events and regulatory developments. Exposure to the commodities markets, such as precious metals, industrial metals, natural resources, and gas and other energy products, may subject the Fund to greater volatility than investments in traditional securities.
Changes in laws or government regulations by the United States and/or the Cayman Islands could adversely affect the operations of the Fund.
A more complete description of risks is included in the Fund’s Prospectus and Statement of Additional Information.
Note 8—Shareholder Transactions—Shares of beneficial interest issued, reinvested and redeemed (unlimited number of $0.001 par value shares authorized):
| | | Year Ended | | Year Ended |
| | | December 31, 2019 | | December 31, 2018 |
| Class A | | | | | | | | |
| Shares sold | | | 2,191,177 | | | | 4,381,056 | |
| Shares reinvested | | | 33,121 | | | | 27,719 | |
| Shares redeemed | | | (3,295,795 | ) | | | (2,045,237 | ) |
| Net increase (decrease) | | | (1,071,497 | ) | | | 2,363,538 | |
CM COMMODITY INDEX FUND
NOTES TO CONSOLIDATED FINANCIAL STATEMENTS
(continued)
| | | Year Ended | | Year Ended |
| | | December 31, 2019 | | December 31, 2018 |
| Class I | | | | | | | | |
| Shares sold | | | 22,942,274 | | | | 27,967,057 | |
| Shares reinvested | | | 207,456 | | | | 239,217 | |
| Shares redeemed | | | (30,555,856 | ) | | | (15,007,475 | ) |
| Net increase (decrease) | | | (7,406,126 | ) | | | 13,198,799 | |
| Class Y | | | | | | | | |
| Shares sold | | | 16,080,750 | | | | 27,277,400 | |
| Shares reinvested | | | 551,117 | | | | 373,064 | |
| Shares redeemed | | | (14,334,406 | ) | | | (14,282,920 | ) |
| Net increase | | | 2,297,461 | | | | 13,367,544 | |
Note 9—Securities Lending—To generate additional income, the Fund may lend its securities pursuant to a securities lending agreement with the securities lending agent. The Fund may lend up to 33% of its investments requiring that the loan be continuously collateralized by cash, cash equivalents, U.S. government securities, or any combination of cash and such securities at all times equal to at least 102% (105% for foreign securities) of the market value plus accrued interest on the securities loaned. Daily market fluctuations could cause the value of loaned securities to be more or less than the value of the collateral received. When this occurs, the collateral is adjusted and settled on the next business day. During the term of the loan, the Fund will continue to receive any dividends, interest or amounts equivalent thereto, on the securities loaned while receiving a fee from the borrower and/or earning interest on the investment of the cash collateral. Such fees and interest are shared with the securities lending agent under the terms of the securities lending agreement. Securities lending income is disclosed as such in the Consolidated Statement of Operations. The cash collateral is maintained on the Fund’s behalf by the lending agent and is invested in the State Street Navigator Securities Lending Government Money Market Portfolio. Non-cash collateral consists of U.S. Treasuries and U.S. Government Agency securities, and is not disclosed in the Fund’s Consolidated Schedule of Investments or Consolidated Statement of Assets and Liabilities as it is held by the agent on behalf of the Fund, and the Fund does not have the ability to re-hypothecate those securities. Loans are subject to termination at the option of the borrower or the Fund. Upon termination of the loan, the borrower will return to the Fund securities identical to the securities loaned. The Fund bears the risk of delay in recovery of, or even loss of rights in, the securities loaned should the borrower of the securities fail financially. The value of loaned securities and related cash collateral, if any, at December 31, 2019 is presented on a gross basis in the Consolidated Schedule of Investments and Consolidated Statement of Assets and Liabilities.
The following is a summary of the Fund’s securities on loan and related collateral as of December 31, 2019:
Market Value
of Securities
on Loan | | Cash
Collateral | | Non-Cash
Collateral | | Total Collateral |
| $105,369,695 | | $24,712,151 | | $82,810,538 | | $107,522,689 |
The following table presents money market fund investments held as collateral by type of security on loan as of December 31, 2019:
| | | Gross Amount of
Recognized Liabilities
for Securities Loaned
in the Statements of
Assets and Liabilities* |
| Equity Securities | | $24,712,151 |
* Remaining contractual maturity of the agreements: overnight and continuous
Note 10—Bank Line of Credit—The Trust participates with VanEck VIP Trust (collectively the “VE/VIP Funds”) in a $30 million committed credit facility (the “Facility”) to be utilized for temporary financing until the settlement of sales or purchases of portfolio securities, the repurchase or redemption of shares of the participating Fund and other temporary or emergency purposes. The participating VE/VIP Funds have agreed to pay commitment fees, pro rata, based on the unused but available balance. Interest is charged to the participating VE/VIP Funds at rates based on prevailing market rates in effect at the time of borrowings. During the year end December 31, 2019, the Fund had no outstanding borrowings under the Facility.
Note 11—Trustee Deferred Compensation Plan—The Trust has a Deferred Compensation Plan (the “Deferred Plan”) for Trustees under which the Trustees can elect to defer receipt of their trustee fees until retirement, disability or termination from the Board of Trustees. The fees otherwise payable to the participating Trustees are deemed invested in eligible shares of the VE/VIP Funds as directed by the Trustees.
The expense for the Deferred Plan is included in “Trustees’ fees and expenses” in the Consolidated Statement of Operations. The liability for the Deferred Plan is shown as “Deferred Trustee fees” in the Consolidated Statement of Assets and Liabilities.
Note 12—Recent Accounting Pronouncements—The Fund early adopted certain provisions of Accounting Standards Update No. 2018-13Disclosure Framework—Changes to the Disclosure Requirements for Fair Value Measurement(“ASU 2018-13”) that eliminate and modify certain disclosure
CM COMMODITY INDEX FUND
NOTES TO CONSOLIDATED FINANCIAL STATEMENTS
(continued)
requirements for fair value measurements. The adoption of certain provisions of ASU 2018-13 had no material effect on the financial statements and related disclosures. Management evaluated the additional requirements, not yet adopted, and they are not expected to have a material impact to the financial statements. Public companies will be required to disclose the range and weighted average of significant unobservable inputs for Level 3 fair value measurements. ASU 2018-13 is effective for fiscal years beginning after December 15, 2019 and for interim periods within those fiscal years.
Note 13—Subsequent Event Review—The Fund has evaluated subsequent events and transactions for potential recognition or disclosure through the date the financial statements were issued.
VANECK CM COMMODITY INDEX FUND
REPORT OF INDEPENDENT REGISTERED PUBLIC ACCOUNTING FIRM
To the Shareholders and the Board of Trustees of CM Commodity Index Fund
Opinion on the Financial Statements
We have audited the accompanying consolidated statement of assets and liabilities of CM Commodity Index Fund (the “Fund”) (one of the series constituting VanEck Funds (the “Trust”)), including the consolidated schedule of investments, as of December 31, 2019, and the related consolidated statement of operations for the year then ended, the consolidated statements of changes in net assets for each of the two years in the period then ended, the consolidated financial highlights for each of the five years in the period then ended and the related notes (collectively referred to as the “financial statements”). In our opinion, the financial statements present fairly, in all material respects, the consolidated financial position of CM Commodity Index Fund (one of the series constituting VanEck Funds) at December 31, 2019, the consolidated results of its operations for the year then ended, the consolidated changes in its net assets for each of the two years in the period then ended and its consolidated financial highlights for each of the five years in the period then ended, in conformity with U.S. generally accepted accounting principles.
Basis for Opinion
These financial statements are the responsibility of the Trust’s management. Our responsibility is to express an opinion on the Fund’s financial statements based on our audits. We are a public accounting firm registered with the Public Company Accounting Oversight Board (United States) (“PCAOB”) and are required to be independent with respect to the Trust in accordance with the U.S. federal securities laws and the applicable rules and regulations of the Securities and Exchange Commission and the PCAOB.
We conducted our audits in accordance with the standards of the PCAOB. Those standards require that we plan and perform the audit to obtain reasonable assurance about whether the financial statements are free of material misstatement, whether due to error or fraud. The Trust is not required to have, nor were we engaged to perform, an audit of the Trust’s internal control over financial reporting. As part of our audits, we are required to obtain an understanding of internal control over financial reporting, but not for the purpose of expressing an opinion on the effectiveness of the Trust’s internal control over financial reporting. Accordingly, we express no such opinion.
Our audits included performing procedures to assess the risks of material misstatement of the financial statements, whether due to error or fraud, and performing procedures that respond to those risks. Such procedures included examining, on a test basis, evidence regarding the amounts and disclosures in the financial statements. Our procedures included confirmation of securities owned as of December 31, 2019, by correspondence with the custodian and brokers. Our audits also included evaluating the accounting principles used and significant estimates made by management, as well as evaluating the overall presentation of the financial statements. We believe that our audits provide a reasonable basis for our opinion.

We have served as the auditor of one or more of the VanEck investment companies since 1999.
New York, New York
February 27, 2020
VANECK CM COMMODITY INDEX FUND
TAX INFORMATION
(unaudited)
The following information is provided with respect to the distributions paid during the taxable year ended December 31, 2019. Please consult your tax advisor for proper treatment of this information.
| Record Date: | 12/20/2019 | |
| Ex and Payable Date: | 12/23/2019 | |
| Ordinary Income Paid Per Share - Class A | $0.03870 | |
| Ordinary Income Paid Per Share - Class I | $0.05450 | |
| Ordinary Income Paid Per Share - Class Y | $0.05050 | |
| Qualified Dividend Income for Individuals | 0.00 | % |
| Dividends Qualifying for the Dividends Received Deduction for Corporations | 0.00 | % |
| Interest from Federal Obligations | 99.90 | % |
The interest from Federal obligations represents income derived from assets backed by the full faith and credit of the U.S. Government. State law varies as to what percentage of this dividend income is exempt from state income tax.
VANECK FUNDS
SPECIAL MEETING OF SHAREHOLDERS
October 11, 2019 (unaudited)
VANECK FUNDS
CM Commodity Index Fund
Emerging Markets Fund
Global Hard Assets Fund
International Investors Gold Fund
Unconstrained Emerging Markets Bond Fund
VanEck Morningstar Wide Moat Fund
VanEck NDR Managed Allocation Fund
A Special Meeting of Shareholders of VanEck Funds (the “Trust”) was held at the offices of the Trust, 666 Third Avenue, 9th Floor, New York, New York 10017 on October 11, 2019. The purpose of the meeting was to elect Trustees of the Trust. At the meeting, the following persons were elected by the shareholders to serve as Trustees of the Trust: Jon Lukomnik, Jane DiRenzo Pigott, R. Alastair Short, Richard D. Stamberger, Robert L. Stelzl, and Jan F. van Eck. No other business was transacted at the meeting.
The results of the voting at the meeting are as follows:
Proposal: To elect a Board of Trustees*:
| Name | For | Withheld |
| Jon Lukomnik | 239,074,404.179 | 1,973,903.626 |
| Jane DiRenzo Pigott | 239,734,349.197 | 1,313,958.608 |
| R. Alastair Short | 239,059,688.386 | 1,988,619.419 |
| Richard D. Stamberger | 239,110,733.308 | 1,937,574.497 |
| Robert L. Stelzl | 239,042,995.154 | 2,005,312.651 |
| Jan F. van Eck | 239,874,952.434 | 1,173,355.371 |
| Total Trust Shares Outstanding**: 327,471,673.186 |
| * | Results are for all series portfolios within the Trust. |
| ** | As of the record date. |
VANECK FUNDS
BOARD OF TRUSTEES AND OFFICERS
December 31, 2019 (unaudited)
Trustee Information
The Trustees of the Trust, their address, position with the Trust, age and principal occupations during the past five years, as of January 1, 2020, are set forth below:
Trustee’s Name,
Address(1)and
Year of Birth | | Position(s) Held With Trust,
Term of Office(2)and
Length of Time Served | | Principal Occupation(s)
During Past Five Years | | Number of
Portfolios
In Fund
Complex(3)
Overseen
By Trustee | | Other Directorships Held Outside The
Fund Complex(3)During The Past Five Years |
| | | | | | | | | |
| Independent Trustees: | | | | | | |
| | | | | | | | | |
Jon Lukomnik
1956 (A)(I) | | Trustee (since 2006) | | Managing Partner, Sinclair Capital LLC (consulting firm). Formerly, Executive Director, Investor Responsibility Research Center Institute. | | 11 | | Member of the Deloitte Audit Quality Advisory Committee; Chairman of the Advisory Committee of Legion Partners; Member of the Standing Advisory Group to the Public Company Accounting Oversight Board; Director of VanEck ICAV (an Irish UCITS); VanEck Vectors UCITS ETF plc (an Irish UCITS). Formerly, Director of VanEck (a Luxembourg UCITS); Chairman of the Board of the New York Classical Theatre. |
| | | | | | | | | |
Jane DiRenzo Pigott
1957 (I) | | Trustee (since 2007);
Chairperson of the Board (since 2020) | | Managing Director, R3 Group LLC (consulting firm). | | 11 | | Trustee of Northwestern University, Lyric Opera of Chicago and the Chicago Symphony Orchestra. Formerly, Director and Chair of Audit Committee of 3E Company (services relating to hazardous material safety); Director of MetLife Investment Funds, Inc. |
| | | | | | | | | |
R. Alastair Short
1953 (A)(I) | | Trustee (since 2004);
Chairperson of the Audit Committee (since 2006) | | President, Apex Capital Corporation (personal investment vehicle). | | 66 | | Chairman and Independent Director, EULAV Asset Management; Trustee, Kenyon Review; Trustee, Children’s Village. Formerly, Independent Director, Tremont offshore funds. |
Trustee’s Name,
Address(1)and
Year of Birth | | Position(s) Held With Trust,
Term of Office(2)and
Length of Time Served | | Principal Occupation(s)
During Past Five Years | | Number of
Portfolios
In Fund
Complex(3)
Overseen
By Trustee | | Other Directorships Held Outside The
Fund Complex(3)During The Past Five Years |
| | | | | | | | | |
Richard D. Stamberger
1959 (G)(I) | | Trustee (since 1995) | | President and CEO, SmartBrief, Inc. (business media company). | | 66 | | Director, Food and Friends, Inc. |
| | | | | | | | | |
Robert L. Stelzl
1945 (G)(I) | | Trustee (since 2007);
Chairperson of the Governance Committee (since 2017) | | Co-Trustee, the estate of Donald Koll; Trustee, Robert D. MacDonald Trust; Trustee, GH Insurance Trusts. Formerly, Trustee, Joslyn Family Trusts; President, Rivas Capital, Inc. (real estate property management services company). | | 11 | | Director, Brookfield Office Properties, Inc., Brookfield Residential Properties, Inc., Brookfield DTLA Fund Office Trust Investor, Inc., Brookfield Property Finance ULC and Brookfield Property Split Corp. |
| | | | | | | | | |
| Interested Trustee: | | | | | | |
| | | | | | | | | |
Jan F. van Eck(4)
1963 (I) | | Trustee (Since 2019);
Chairperson of the Investment Oversight Committee (since 2020); Chief Executive Officer and President (Since 2010) | | Director, President and Chief Executive Officer of Van Eck Associates Corporation (VEAC), Van Eck Absolute Return Advisers Corporation (VEARA) and Van Eck Securities Corporation (VESC); Officer and/or Director of other companies affiliated with VEAC and/or the Trust. | | 66 | | Director, National Committee on US China Relations. |
| (1) | The address for each Trustee and officer is 666 Third Avenue, 9th Floor, New York, New York 10017. |
| (2) | Trustee serves until resignation, death, retirement or removal. |
| (3) | The Fund Complex consists of VanEck Funds, VanEck VIP Trust and VanEck Vectors ETF Trust. |
| (4) | “Interested person” of the Trust within the meaning of the 1940 Act. Mr. van Eck is an officer of VEAC, VEARA and VESC. In addition, Mr. van Eck and members of his family own 100% of the voting stock of VEAC, which in turns owns 100% of the voting stock of each of VEARA and VESC. |
| (A) | Member of the Audit Committee. |
| (G) | Member of the Governance Committee. |
| (I) | Member of the Investment Oversight Committee. |
VANECK FUNDS
BOARD OF TRUSTEES AND OFFICERS
December 31, 2019 (unaudited) (continued)
Officer Information
The executive officers of the Trust, their age and address, the positions they hold with the Trust, their term of office and length of time served and their principal business occupations during the past five years are shown below:
Officer’s Name, Address(1)
And Year of Birth | | Position(s) Held With Trust | | Term of Office And
Length of Time Served(2) | | Principal Occupations During The Past Five Years |
| | | | | | | |
Matthew A. Babinsky,
1983 | | Assistant Vice President and Assistant Secretary | | Since 2016 | | Assistant Vice President, Assistant General Counsel and Assistant Secretary of VEAC, VEARA and VESC; Officer of other investment companies advised by VEAC and VEARA. Formerly, Associate, Clifford Chance US LLP. |
| | | | | | | |
Russell G. Brennan,
1964 | | Assistant Vice President and Assistant Treasurer | | Since 2008 | | Assistant Vice President of VEAC; Officer of other investment companies advised by VEAC and VEARA. |
| | | | | | | |
Charles T. Cameron,
1960 | | Vice President | | Since 1996 | | Portfolio Manager for VEAC; Officer and/or Portfolio Manager of other investment companies advised by VEAC and VEARA. Formerly, Director of Trading of VEAC. |
| | | | | | | |
John J. Crimmins,
1957 | | Vice President, Treasurer, Chief Financial Officer and Principal Accounting Officer | | Vice President, Chief Financial Officer and Principal Accounting Officer (since 2012); Treasurer (since 2009) | | Vice President of VEAC and VEARA; Officer of other investment companies advised by VEAC and VEARA. Formerly, Vice President of VESC. |
| | | | | | | |
F. Michael Gozzillo,
1965 | | Chief Compliance Officer | | Since 2018 | | Vice President and Chief Compliance Officer of VEAC and VEARA; Chief Compliance Officer of VESC; Officer of other investment companies advised by VEAC and VEARA. Formerly, Chief Compliance Officer of City National Rochdale, LLC and City National Rochdale Funds. |
| | | | | | | |
Laura Hamilton,
1977 | | Vice President | | Since 2019 | | Assistant Vice President of VEAC and VESC; Officer of other investment companies advised by VEAC and VEARA. Formerly, Operations Manager of Royce & Associates. |
Officer’s Name, Address(1)
And Year of Birth | | Position(s) Held With Trust | | Term of Office And
Length of Time Served(2) | | Principal Occupations During The Past Five Years |
| | | | | | | |
Laura I. Martínez,
1980 | | Vice President and Assistant Secretary | | Vice President (since 2016); Assistant Secretary (since 2008) | | Vice President, Associate General Counsel and Assistant Secretary of VEAC, VEARA and VESC; Officer of other investment companies advised by VEAC and VEARA. Formerly, Assistant Vice President of VEAC, VEARA and VESC. |
| | | | | | | |
James Parker,
1969 | | Assistant Treasurer | | Since 2014 | | Assistant Vice President of VEAC, Manager, Portfolio Administration of VEAC and VEARA; Officer of other investment companies advised by VEAC and VEARA. |
| | | | | | | |
Jonathan R. Simon,
1974 | | Senior Vice President; Secretary and Chief Legal Officer | | Senior Vice President (since 2016); Secretary and Chief Legal Officer (since 2014) | | Senior Vice President, General Counsel and Secretary of VEAC, VEARA and VESC; Officer and/or Director of other companies affiliated with VEAC and/or the Trust. Formerly, Vice President of VEAC, VEARA and VESC. |
| (1) | The address for each Executive Officer is 666 Third Avenue, 9th Floor, New York, NY 10017. |
| (2) | Officers are elected yearly by the Board. |
This report is intended for the Fund’s shareholders. It may not be distributed to prospective investors unless it is preceded or accompanied by the Fund’s prospectus and summary prospectus, which includes more complete information. Investing involves substantial risk and high volatility, including possible loss of principal. An investor should consider the investment objective, risks, and charges and expenses of the Fund carefully before investing. To obtain a prospectus and summary prospectus, which contains this and other information, call 800.826.2333 or visit vaneck.com. Please read the prospectus and summary prospectus carefully before investing.
Additional information about VanEck Funds (the “Trust”) Board of Trustees/Officers and a description of the policies and procedures the Trust uses to determine how to vote proxies relating to portfolio securities are provided in the Statement of Additional Information. The Statement of Additional Information and information regarding how the Trust voted proxies relating to portfolio securities during the most recent twelve month period ending June 30 is available, without charge, by calling 800.826.2333, or by visiting vaneck.com, or on the Securities and Exchange Commission’s website at https://www.sec.gov.
The Trust files its complete schedule of portfolio holdings with the Securities and Exchange Commission for the first and third quarters of each fiscal year on Form N-PORT. The Trust’s Form N-PORT filings are available on the Commission’s website at https://www.sec.gov and may be reviewed and copied at the Commission’s Public Reference Room in Washington, D.C. Information on the operation of the Public Reference Room may be obtained by calling 202.942.8090. The Fund’s complete schedule of portfolio holdings is also available by calling 800.826.2333 or by visiting vaneck.com.

| Investment Adviser: | Van Eck Associates Corporation | |
| Distributor: | Van Eck Securities Corporation | |
| | 666 Third Avenue, New York, NY 10017 | |
| | vaneck.com | |
| Account Assistance: | 800.544.4653 | CMCIAR |
 | ANNUAL REPORT
December 31, 2019 |
VanEck Funds
Emerging Markets Fund
Certain information contained in this report represents the opinion of the investment adviser and may change at any time. This information is not intended to be a forecast of future events, a guarantee of future results or investment advice. Current market conditions may not continue. Also, unless otherwise specifically noted, any discussion of the Fund’s holdings, the Fund’s performance, and the views of the investment adviser are as of December 31, 2019.
PRIVACY NOTICE
(unaudited)
| FACTS | WHAT DOES VAN ECK DO WITH YOUR
PERSONAL INFORMATION? |
| Why? | Financial companies choose how they share your personal information. Federal law gives consumers the right to limit some but not all sharing. Federal law also requires us to tell you how we collect, share, and protect your personal information. Please read this notice carefully to understand what we do. |
| What? | The types of personal information we collect and share depend on the product or service you have with us. This information can include: ■ Social Security number and account balances ■ assets and payment history ■ risk tolerance and transaction history |
| How? | All financial companies need to share customers’ personal information to run their everyday business. In the section below, we list the reasons financial companies can share their customers’ personal information; the reasons Van Eck chooses to share; and whether you can limit this sharing. |
Reasons we can share your personal
information | Does Van Eck share? | Can you limit this
sharing? |
| For our everyday business purposes— such as to process your transactions, maintain your account(s), respond to court orders and legal investigations, or report to credit bureaus | Yes | No |
| For our marketing purposes— to offer our products and services to you | Yes | No |
| For joint marketing with other financial companies | Yes | No |
| For our affiliates’ everyday business purposes— information about your transactions and experiences | Yes | No |
| For our affiliates’ everyday business purposes— information about your creditworthiness | No | We don’t share |
| For our affiliates to market to you | Yes | Yes |
| For nonaffiliates to market to you | No | We don’t share |
| To limit our sharing | Call us at 1-800-826-2333. Please note: If you are a new customer, we can begin sharing your information 30 days from the date we sent this notice. When you are no longer our customer, we continue to share your information as described in this notice. However, you can contact us at any time to limit our sharing. |
| Questions? | Call us at 1-800-826-2333. |
PRIVACY NOTICE
(unaudited) (continued)
| Who we are | |
| Who is providing this notice? | Van Eck Global, its affiliates and funds sponsored or managed by Van Eck (collectively “Van Eck”). |
| What we do | |
| How does Van Eck protect my personal information? | To protect your personal information from unauthorized access and use, we use security measures that comply with federal law. These measures include computer safeguards and secured files and buildings. |
| How does Van Eck collect my personal information? | We collect your personal information, for example, when you ■ open an account or give us your income information ■ provide employment information or give us your contact information ■ tell us about your investment or retirement portfolio We also collect your personal information from others, such as credit bureaus, affiliates, or other companies. |
| Why can’t I limit all sharing? | Federal law gives you the right to limit only ■ sharing for affiliates’ everyday business purposes—information about your creditworthiness ■ affiliates from using your information to market to you ■ sharing for nonaffiliates to market to you State laws and individual companies may give you additional rights to limit sharing. See below for more on your rights under state law. |
| What happens when I limit sharing for an account I hold jointly with someone else? | Your choices will apply to everyone on your account – unless you tell us otherwise |
| Definitions | |
| Affiliates | Companies related by common ownership or control. They can be financial and nonfinancial companies. ■ Our affiliates include companies with a Van Eck name such as Van Eck Securities Corporation and others such as Market Vectors Index Solutions GmbH. |
| Nonaffiliates | Companies not related by common ownership or control. They can be financial and nonfinancial companies. ■ Van Eck does not share with nonaffiliates so they can market to you. |
| Joint marketing | A formal agreement between nonaffiliated financial companies that together market financial products or services to you. ■ Our joint marketing partners include financial services companies |
| Other important information |
California Residents— In accordance with California law, we will not share information we collect about California residents with nonaffiliates except as permitted by law, such as with the consent of the customer or to service the customer’s accounts. We also will limit the sharing of information about you with our affiliates to the extent required by applicable California law. Vermont Residents— In accordance with Vermont law, we will not share information we collect about Vermont residents with nonaffiliates except as permitted by law, such as with the consent of the customer or to service the customer’s accounts. We will not share creditworthiness information about Vermont residents among Van Eck’s affiliates except with the authorization or consent of the Vermont resident. |
EMERGING MARKETS FUND
PRESIDENT’S LETTER
December 31, 2019 (unaudited)
Dear Shareholders:
The story for 2019 was simple and familiar—slower economic growth was combated by expansive monetary policy.
But first a comment on global growth: the two engines of the global economy, the U.S. and China, continue to move forward and we now have the prospect of at least some resolution of the trade dispute between them in the phase-one agreement. The latest economic statistics from China are steady and there are signs of “green shoots.” China’s services sector is expanding robustly and manufacturing is struggling, but not collapsing. My blog,China’s Economic Growth: Continuing Despite Headlines, shows this in two charts.
The biggest event in the markets last summer was the surge in bonds in Europe with negative interest rates. At the end of September, nearly $15 trillion worth of debt globally carried a negative yield.1Despite moves by the European Central Bank to stimulate, not only is the European economy slowing down, but there are also concerns about just how effective central bank actions are. Looking forward, therefore, I think investors should assess their hedge against central bank uncertainty by considering, for example, their gold allocations. While high interest rate environments tend to be tough for gold (it does not pay any yield), against negative interest rates, gold and other hedges against central bank impotence should be strongly considered.
We encourage you to stay in touch with us through the videos, email subscriptions and research blogs available on our website, www.vaneck.com. I have started my own email subscription where I share interesting research—you can sign up on www.vaneck.com. Should you have any questions regarding fund performance, please contact us at 800.826.2333 or visit ourwebsite.
EMERGING MARKETS FUND
PRESIDENT’S LETTER
(unaudited) (continued)
We sincerely thank you for investing in VanEck’s investment strategies. On the following pages, you will find a performance discussion and financial statements for the fund for the twelve month period ended December 31, 2019. As always, we value your continued confidence in us and look forward to helping you meet your investment goals in the future.

Jan F. van Eck
CEO and President
VanEck Funds
January 24, 2020
Investing involves substantial risk and high volatility, including possible loss of principal. An investor should consider the investment objective, risks, charges and expenses of the Funds carefully before investing. To obtain a prospectus and summary prospectus, which contain this and other information, call 800.826.2333 or visit vaneck.com. Please read the prospectus and summary prospectus carefully before investing.
| 1 | Financial Times: September was the busiest month ever for corporate debt issuance, September 30, 2019, https://www.ft.com/content/eef8234c-e3c0-11e9-b112-9624ec9edc59 |
MANAGEMENT’S DISCUSSION
December 31, 2019 (unaudited)
The Emerging Markets Fund (the “Fund”) gained 29.52% (Class A shares, excluding sales charge) for the 12 months ended December 31, 2019, significantly outperforming the MSCI Emerging Markets Investment Market Index (MSCI EM IMI),1which gained 17.65%.
Fund Review
Stock selection was the main contributor to the outperformance of the Fund relative to its benchmark. On a country level, stocks from China, India and Indonesia contributed the most to the Fund’s relative performance, while issuers from Taiwan, United Arab Emirates and Spain detracted the most. On a sector level, exposures in the financials, industrials and consumer staples sectors helped the Fund’s performance on a relative basis, whereas information technology, energy and real estate detracted the most.
The Fund’s top three contributing individual positions during 2019 were:
| 1) | Alibaba Group Holding(6.2% of Fund net assets*) is a leading Chinese e-commerce, cloud computing, digital media, entertainment and innovation company. We believe we have line of sight on fairly predictable growth momentum in its core businesses as well as a good understanding where and how current and future investment can leverage the current platform and enhance overall returns. In 2019, Alibaba continued to execute well and “fire on all cylinders.” This included not only its payment operations, but also its off-line businesses such as logistics. In addition, as the fourth quarter ended, people not only became more relaxed about China, but also had mildly better expectations for the economic growth. |
| | |
| 2) | A-Living Services(3.2% of Fund net assets*) is a top 10 property manager in China. The company primarily manages residential estates, charging fees for communal property management (e.g., security and landscaping) and for value-added services (e.g., 020, kindergarten space, elderly care and property sales). We invested in this company because: a) the company operates in a consolidating industry benefitting from increased urbanization and limited management contracts; b) it has experienced a recent, substantial increase in square meters under management from parent companies, M&A activity and third-party party business; and c) as the industry is consolidating, property management fees are expected to increase. In 2019, A-Living benefited from further recognition not only of the sustainability of its earnings and the good use to which it has been |
EMERGING MARKETS FUND
MANAGEMENT’S DISCUSSION
(unaudited) (continued)
| | putting its cash, but also the soundness of the industry in which it operates. The company continues to add property management projects, including through third-party acquisitions, and has confirmed that accretive M&A expands its opportunity set. It has, in addition, moved into public facilities management, e.g., that of museums. As a rider, as the company’s performance illustrated, the property market in China was doing fine during 2019. |
| | |
| 3) | Ping An Insurance (Group) of China(5.5% of Fund net assets*) is one of the world’s largest financial institutions and China’s second largest insurance company with businesses spanning across life insurance, casualty business and banking. The company’s structural growth thesis is the following: a) in addition to its core life insurance business, Ping An is developing a host of disruptive and technology-driven business lines; b) its tech business includes an AI-driven healthcare platform, an online distributor of retail investments and a private cloud for SMEs; and c) the company collects and compiles highly relevant financial and medical data primarily from its ancillary businesses, Lufax and Ping An Good Doctor, which are all impressive businesses in their own right, but also serve as highly effective customer acquisition funnels to Ping An’s core insurance business. In 2019, Ping An benefited from a better appreciation in the market of the underlying value proposition of the company’s core life insurance business. In addition, capitalizing, among other things, on its position in the field of info tech, there was good execution among other of the group’s businesses, e.g., consumer banking. |
The Fund’s three companies which detracted most during 2019 were:
| 1) | NMC Health(1.2% of Fund net assets*) is a leading private hospital group in the UAE, with a growing presence in new markets including Saudi Arabia and Oman. We have high conviction in this company because: a) it is well-positioned in an attractive sector offering structural growth driven by rising demand, insufficient supply and a favorable regulatory environment; b) the company has increasing capabilities in high-value verticals including IVF/fertility, cosmetic surgery and long-term care, which allow NMC to continue growing revenue per patient through ongoing integration of the specialized services into existing facilities; and 3) its strong revenue and earnings growth outlook on the back of a ramp-up in utilization rates as new facilities opened in recent years along with the integration of acquired assets which enables the company to capitalize on synergies and |
| | economies of scale driving margins higher. In 2019, NMC faced not only an attack from a short seller, but also aggressively promoted negative market views. |
| | |
| 2) | HUYA(0.6% of Fund net assets*) is a leading Chinese game live streaming platform, which is one of the only high-quality pure plays on the secular eSports opportunity. We invested in this company because: a) the eSports audience is expected to grow from 400 million to 700 million by the end of 2020; b) 80-85% of all domestic eSports events are broadcast on Huya and Douyu and the company has a huge base of content creators and broadcasters; and c) it is backed by Tencent. In 2019, HUYA suffered as it continued to face the prospect of increasing competition in the short-form video market. |
| | |
| 3) | Grupo Supervielle(sold by end of period) is a leading consumer lending bank in Argentina. The company’s structural growth thesis is the following: a) low penetration of the banking system in Argentina versus the region (approximately 16%) and also an opportunity for consolidation in the sector (approximately 77 players in the market); b) the bank has been on a growth trajectory, coupled with a successful acquisition and organic growth gaining a significant market share; and c) it is one of the leaders in consumer banking and SME-the country’s epicenter of growth opportunities. In 2019, Grupo Supervielle experienced pressure with loan growth declining and asset quality deteriorating due to the country’s macro situation and recent elections. The fundamentals of the bank were good, however the banking system in Argentina was negatively affected by high inflation and extremely high interest rates at the time. High inflation, coupled with low gross domestic product (GDP) growth prospects, hit the bank’s valuation and we made a decision to exit this position, given the ongoing uncertainty in the country. |
During the period under review, no single economic factor had an overriding impact on either emerging markets or the Fund. As the year drew to a close (and even before in some instances), both were impacted by a combination of a number of factors. Among the most important was growing economic stabilization as a result of increasing monetary stimulus from developed markets’ central banks (and, indeed, some emerging markets countries), together with both controlled and calibrated easing by the Chinese.
While it may not have dissipated, there has certainly been a diminution in the tail risk of geopolitical events. Whatever the eventual form of any
EMERGING MARKETS FUND
MANAGEMENT’S DISCUSSION
(unaudited) (continued)
preliminary trade deal concluded between the U.S. and China, it may be enough to provide both sides with an opportunity to claim some kind of victory. That said, however, any such deal is unlikely to solve the persistent longer-term problems. However, as things stood as the year drew to a close, it could be opined that “any deal is a good deal.”
For a full list of Fund holdings, please visit www.vaneck.com.
For more information or to access investment and market insights from the investment team, visit our web site or subscribe to our commentaries. To review timely updates related to the VanEck Emerging Markets Fund, please visit www.vaneck.com/blogs/emerging-markets-equity. To subscribe to VanEck’s emerging markets equity updates, please visitwww.vaneck.com/subscribe.
The Fund is subject to the risks associated with its investments in emerging markets securities, which tend to be more volatile and less liquid than securities traded in developed countries. The Fund’s investments in foreign securities involve risks related to adverse political and economic developments unique to a country or a region, currency fluctuations or controls, and the possibility of arbitrary action by foreign governments, including the takeover of property without adequate compensation or imposition of prohibitive taxation. The Fund is subject to risks associated with investments in derivatives, illiquid securities, and small- or mid-cap companies. The Fund is also subject to inflation risk, market risk, non-diversification risk, and leverage risk. Further, the Fund is subject to the risks associated with its investments in Chinese issuers, direct investments, emerging market securities which tends to be more volatile and less liquid than securities traded in developed countries, foreign currency transactions, foreign securities, other investment companies, Stock Connect, management, market, operational, sectors and small- and medium-capitalization companies risks. The Fund’s investments in foreign securities involve risks related to adverse political and economic developments unique to a country or a region, currency fluctuations or controls, and the possibility of arbitrary action by foreign governments, or political, economic or social instability. Please see the prospectus and summary prospectus for information on these and other risk considerations.
We appreciate your participation in the Emerging Markets Fund, and we look forward to helping you meet your investment goals in the future.
 | |  |
| | | |
| David Semple | | Angus Shillington |
| Portfolio Manager | | Deputy Portfolio Manager |
Represents the opinions of the investment adviser. Past performance is no guarantee of future results. Not intended to be a forecast of future events, a guarantee of future results or investment advice. Current market conditions may not continue.
| * | All Fund assets referenced are Total Net Assets as of December 31, 2019 |
All indices are unmanaged and include the reinvestment of all dividends, but do not reflect the payment of transaction costs, advisory fees or expenses that are associated with an investment in the Fund. Certain indices may take into account withholding taxes. An index’s performance is not illustrative of the Fund’s performance. Indices are not securities in which investments can be made.
| 1 | The MSCI Emerging Markets Investable Markets Index captures large, mid and small cap representation across emerging markets countries and covers approximately 99% of the free float adjusted market capitalization in each country. |
EMERGING MARKETS FUND
PERFORMANCE COMPARISON
December 31, 2019, (unaudited)
This chart shows the value of a hypothetical $10,000 investment in the Fund over the past 10 fiscal years. The result is compared with the Fund’s benchmark. Performance of Class C, Class I, and Class Y shares will vary from that of the Class A shares due to differences in class specific fees and any applicable sales charges. | | Hypothetical Growth of $10,000 (Ten Year: Class A) 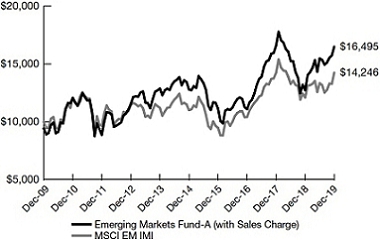
|
Average Annual
Total Return | | Class A
Before
Sales Charge | | Class A
After Maximum
Sales Charge | | Class C
Before
Sales Charge | | Class C
After Maximum
Sales Charge |
| One Year | | | 29.52 | % | | | 22.09 | % | | | 28.51 | % | | | 27.51 | % |
| Five Year | | | 5.22 | % | | | 3.98 | % | | | 4.39 | % | | | 4.39 | % |
| Ten Year | | | 5.75 | % | | | 5.13 | % | | | 4.91 | % | | | 4.91 | % |
| | | | | | | | | | | |
Average Annual
Total Return | | Class I* | | Class Y* | | MSCI EM IMI | | | | |
| One Year | | | 30.11 | % | | | 30.07 | % | | | 17.65 | % | | | | |
| Five Year | | | 5.74 | % | | | 5.64 | % | | | 5.30 | % | | | | |
| Ten Year | | | 6.27 | % | | | n/a | | | | 3.60 | % | | | | |
| Life^ (annualized) | | | n/a | | | | 5.66 | % | | | 3.29 | % | | | | |
| * | Classes are not subject to a sales charge |
| ^ | Class Y since April 30, 2010 |
The performance quoted represents past performance. Past performance does not guarantee future results; current performance may be lower or higher than the performance data quoted.
Investment return and value of shares of the Fund will fluctuate so that an investor’s shares, when redeemed, may be worth more or less than their original cost. Performance information reflects temporary waivers of expenses and/or fees, if any. Had the Fund incurred all expenses, investment returns would have been reduced. Fund returns assume that dividends and capital gains distributions have been reinvested in the Fund at NAV. These returns do not reflect the deduction of taxes that a shareholder would pay on Fund dividends and distributions or the redemption of Fund shares. Performance information current to the most recent month end is available by calling 800.826.2333 or by visiting vaneck.com.
All indices are unmanaged and include the reinvestment of all dividends, but do not reflect the payment of transaction costs, advisory fees or expenses that are associated with an investment in the Fund. Certain indices may take into account withholding taxes. An index’s performance is not illustrative of the Fund’s performance. Indices are not securities in which investments can be made.
The MSCI Emerging Markets Investable Markets Index captures large, mid and small cap representation across emerging markets countries and covers approximately 99% of the free float adjusted market capitalization in each country.
EMERGING MARKETS FUND
EXPLANATION OF EXPENSES
(unaudited)
As a shareholder of the Fund, you incur two types of costs: (1) transaction costs, including sales charges on purchase payments; and (2) ongoing costs, including management fees and other Fund expenses. This disclosure is intended to help you understand the ongoing costs (in dollars) of investing in the Fund and to compare these costs with the ongoing costs of investing in other mutual funds.
The disclosure is based on an investment of $1,000 invested at the beginning of the period and held for the entire period, July 1, 2019 to December 31, 2019.
Actual Expenses
The first line in the table below provides information about account values and actual expenses. You may use the information in this line, together with the amount you invested, to estimate the expenses that you paid over the period. Simply divide your account value by $1,000 (for example, an $8,600 account value divided by $1,000 = 8.6), then multiply the result by the number in the first line under the heading entitled “Expenses Paid During the Period.”
Hypothetical Example for Comparison Purposes
The second line in the table below provides information about hypothetical account values and hypothetical expenses based on the Fund’s actual expense ratio and an assumed rate of return of 5% per year before expenses, which is not the Fund’s actual return. The hypothetical account values and expenses may not be used to estimate the actual ending account balance or expenses you paid for the period. You may use this information to compare the ongoing costs of investing in the Fund and other funds. To do so, compare this 5% hypothetical example with the 5% hypothetical examples that appear in the shareholder reports of other funds.
Please note that the expenses shown in the table are meant to highlight your ongoing costs only and do not reflect any transactional costs, such as fees on purchase payments. Therefore, the second line of the table is useful in comparing ongoing costs only, and will not help you determine the relative costs of owning different funds. In addition, if these transactional costs were included, your costs would have been higher.
| | | Beginning
Account Value
July 1, 2019 | | Ending
Account Value
December 31,
2019 | | Annualized
Expense
Ratio During
Period | | Expenses Paid
During the Period*
July 1, 2019 -
December 31,
2019 |
| Class A | | | | | | | | | | | | | | | | |
| Actual | | $ | 1,000.00 | | | $ | 1,066.00 | | | | 1.52 | % | | $ | 7.92 | |
| Hypothetical** | | $ | 1,000.00 | | | $ | 1,017.49 | | | | 1.52 | % | | $ | 7.73 | |
| Class C | | | | | | | | | | | | | | | | |
| Actual | | $ | 1,000.00 | | | $ | 1,061.80 | | | | 2.31 | % | | $ | 12.00 | |
| Hypothetical** | | $ | 1,000.00 | | | $ | 1,013.51 | | | | 2.31 | % | | $ | 11.72 | |
| Class I | | | | | | | | | | | | | | | | |
| Actual | | $ | 1,000.00 | | | $ | 1,068.10 | | | | 1.00 | % | | $ | 5.21 | |
| Hypothetical** | | $ | 1,000.00 | | | $ | 1,020.16 | | | | 1.00 | % | | $ | 5.09 | |
| Class Y | | | | | | | | | | | | | | | | |
| Actual | | $ | 1,000.00 | | | $ | 1,068.20 | | | | 1.10 | % | | $ | 5.73 | |
| Hypothetical** | | $ | 1,000.00 | | | $ | 1,019.66 | | | | 1.10 | % | | $ | 5.60 | |
| Class Z | | | | | | | | | | | | | | | | |
| Actual*** | | $ | 1,000.00 | | | $ | 1,072.90 | | | | 0.90 | % | | $ | 2.71 | |
| Hypothetical** | | $ | 1,000.00 | | | $ | 1,020.67 | | | | 0.90 | % | | $ | 4.58 | |
| * | Expenses are equal to the Fund’s annualized expense ratio (for the six months ended December 31, 2019), multiplied by the average account value over the period, multiplied by the number of days in the most recent fiscal half year divided by the number of the days in the fiscal year (to reflect the one-half year period). |
| ** | Assumes annual return of 5% before expenses |
| *** | Expenses are equal to the Fund’s annualized expense ratio (for the period from September 16, 2019 (commencement of operations) to December 31, 2019) multiplied by the average account value over the period, multiplied by the number of days since the commencement of operations divided by the number of days in the fiscal year. |
EMERGING MARKETS FUND
SCHEDULE OF INVESTMENTS
December 31, 2019
Number
of Shares | | | | | Value | |
| | | | | | | |
| COMMON STOCKS: 95.7% |
| Brazil: 6.7% |
| | 4,861,300 | | | Fleury SA # | | $ | 37,040,930 | |
| | 7,545,400 | | | International Meal Co. Alimentacao SA # | | | 15,770,263 | |
| | 3,321,000 | | | IRB Brasil Resseguros SA # | | | 32,263,282 | |
| | 8,649,700 | | | Movida Participacoes SA # | | | 41,345,278 | |
| | 3,855,000 | | | Rumo SA * # | | | 25,093,596 | |
| | | | | | | | 151,513,349 | |
| China / Hong Kong: 33.4% |
| | 667,400 | | | Alibaba Group Holding Ltd. (ADR) * | | | 141,555,540 | |
| | 21,182,000 | | | A-Living Services Co. Ltd. Reg S 144A # | | | 73,092,949 | |
| | 2,976,000 | | | Anta Sports Products Ltd. # | | | 26,644,678 | |
| | 518,000 | | | Baozun, Inc. (ADR) * † | | | 17,156,160 | |
| | 86,000 | | | BeiGene Ltd. (ADR) * † | | | 14,255,360 | |
| | 6,527,000 | | | Beijing Enterprises Water Group Ltd. # | | | 3,301,273 | |
| | 8,365,994 | | | China Animal Healthcare Ltd. * #∞ | | | 228,574 | |
| | 3,850,000 | | | China Conch Venture Holdings Ltd. # | | | 16,793,343 | |
| | 18,284,000 | | | China Education Group Holdings Ltd. Reg S † # | 23,943,884 | |
| | 32,755,000 | | | Fu Shou Yuan International Group Ltd. # | | 27,745,763 | |
| | 3,831,000 | | | Galaxy Entertainment Group Ltd. # | | | 28,202,338 | |
| | 447,100 | | | GDS Holdings Ltd. (ADR) * | | | 23,061,418 | |
Number
of Shares | | | | | Value | |
| | | | | | | |
| China / Hong Kong: (continued) |
| | 783,000 | | | HUYA, Inc. (ADR) * † | | $ | 14,054,850 | |
| | 124,796 | | | Kweichow Moutai Co. Ltd. # | | | 21,237,443 | |
| | 100,000 | | | New Oriental Education & Technology Group, Inc. (ADR) * | | | 12,125,000 | |
| | 7,180,000 | | | Ping An Bank Co. Ltd. # | | | 16,988,420 | |
| | 2,115,000 | | | Ping An Healthcare and Technology Co. Ltd. Reg S 144A * † # | | | 15,436,732 | |
| | 10,479,000 | | | Ping An Insurance Group Co. of China Ltd. # | | | 124,002,834 | |
| | 1,517,000 | | | Shenzhou International Group Holdings Ltd. # | | | 22,171,052 | |
| | 2,147,500 | | | Tencent Holdings Ltd. # | | | 103,458,226 | |
| | 812,000 | | | Tencent Music Entertainment Group (ADR) * † | | | 9,532,880 | |
| | 1,499,500 | | | Wuxi Biologics Cayman, Inc. Reg S 144A * # | | | 18,991,828 | |
| | 369,973 | | | Yifeng Pharmacy Chain Co. Ltd. # | | | 3,892,742 | |
| | | | | | | | 757,873,287 | |
| Egypt: 2.2% |
| | 30,579,560 | | | Cleopatra Hospital * | | | 11,088,663 | |
| | 5,885,312 | | | Commercial International Bank Egypt SAE | | | 30,434,947 | |
| | 14,870,278 | | | Juhayna Food Industries | | | 7,967,875 | |
| | | | | | | | 49,491,485 | |
See Notes to Financial Statements
Number
of Shares | | | | | Value | |
| | | | | | | |
| Georgia: 1.4% |
| | 1,005,197 | | | Bank of Georgia Group Plc (GBP) # | | $ | 21,712,620 | |
| | 815,197 | | | Georgia Capital Plc (GBP) * | | | 9,955,846 | |
| | | | | | | | 31,668,466 | |
| Germany: 1.8% |
| | 513,000 | | | Delivery Hero SE Reg S 144A * # | | | 40,659,980 | |
| Hungary: 0.9% |
| | 397,000 | | | OTP Bank Nyrt # | | | 20,786,917 | |
| India: 10.8% |
| | 3,290,007 | | | Bandhan Bank Ltd. Reg S 144A # | | | 23,507,119 | |
| | 6,675,000 | | | Cholamandalam Investment and Finance Co. Ltd. # | | | 28,577,961 | |
| | 2,884,000 | | | HDFC Bank Ltd. # | | | 51,598,326 | |
| | 816,000 | | | HDFC Bank Ltd. (ADR) | | | 51,709,920 | |
| | 19,157,220 | | | Lemon Tree Hotels Ltd. Reg S 144A * | | | 17,150,155 | |
| | 1,300,000 | | | Oberoi Realty Ltd. # | | | 9,664,413 | |
| | 1,973,200 | | | Phoenix Mills Ltd. # | | | 22,896,931 | |
| | 800,000 | | | Reliance Industries Ltd. # | | | 16,991,534 | |
| | 1,344,000 | | | Titan Co. Ltd. # | | | 22,416,109 | |
| | | | | | | | 244,512,468 | |
| Indonesia: 2.5% |
| | 67,375,000 | | | Bank Rakyat Indonesia Tbk PT # | | | 21,325,929 | |
| | 113,200,000 | | | Bank Tabungan Pensiunan Nasional Syariah Tbk PT * # | | 34,631,576 | |
| | | | | | | | 55,957,505 | |
Number
of Shares | | | | | Value | |
| | | | | | | |
| Kenya: 0.8% |
| | 62,420,000 | | | Safaricom Plc | | $ | 19,461,983 | |
| Kuwait: 0.6% |
| | 1,481,090 | | | Human Soft Holding Co. KSC | | | 14,713,203 | |
| Malaysia: 1.2% |
| | 14,177,000 | | | Malaysia Airports Holdings Bhd # | | | 26,347,988 | |
| Mexico: 3.2% |
| | 7,422,247 | | | Qualitas Controladora SAB de CV | | | 31,263,136 | |
| | 5,052,000 | | | Regional SAB de CV | | | 28,322,729 | |
| | 8,049,000 | | | Unifin Financiera SAB de CV SOFOM ENR | | | 13,196,827 | |
| | | | | | | | 72,782,692 | |
| Netherlands: 2.4% |
| | 727,727 | | | Prosus NV * # | | | 54,464,215 | |
| Peru: 0.2% |
| | 21,000 | | | Credicorp Ltd. (USD) | | | 4,475,730 | |
| Philippines: 5.1% |
| | 52,122,700 | | | Ayala Land, Inc. # | | | 46,749,379 | |
| | 166,800,000 | | | Bloomberry Resorts Corp. # | | | 37,194,635 | |
| | 12,263,740 | | | International Container Terminal Services, Inc. # | | | 31,080,524 | |
| | | | | | | | 115,024,538 | |
| Poland: 0.4% |
| | 185,542 | | | Kruk SA † | | | 8,191,646 | |
| Russia: 3.3% |
| | 2,411,000 | | | Sberbank of Russia PJSC (ADR) # | | | 39,719,918 | |
| | 822,000 | | | Yandex NV (USD) * | | | 35,748,780 | |
| | | | | | | | 75,468,698 | |
See Notes to Financial Statements
EMERGING MARKETS FUND
SCHEDULE OF INVESTMENTS
(continued)
Number
of Shares | | | | | Value | |
| | | | | | | |
| Saudi Arabia: 0.1% |
| | 147,000 | | | Leejam Sports Co. JSC # | | $ | 3,176,213 | |
| South Africa: 2.7% |
| | 9,026,708 | | | Advtech Ltd. | | | 6,960,477 | |
| | 142,727 | | | Naspers Ltd. # | | | 23,356,831 | |
| | 21,069,810 | | | Transaction Capital Ltd. | | | 31,741,610 | |
| | | | | | | | 62,058,918 | |
| South Korea: 2.7% |
| | 236,000 | | | Douzone Bizon Co. Ltd. # | | | 16,497,763 | |
| | 101,000 | | | Koh Young Technology, Inc. # | | | 9,203,765 | |
| | 179,185 | | | Samsung SDI Co. Ltd. * † # | | | 36,502,356 | |
| | | | | | | | 62,203,884 | |
| Spain: 1.6% |
| | 1,501,367 | | | CIE Automotive SA # | | | 35,629,768 | |
| Switzerland: 0.5% |
| | 233,000 | | | Wizz Air Holdings Plc Reg S 144A (GBP) * # | | | 12,043,903 | |
| Taiwan: 2.3% |
| | 4,159,000 | | | Chroma ATE, Inc. # | | | 20,227,137 | |
| | 2,053,132 | | | Poya International Co. Ltd. # | | | 28,867,685 | |
| | 1,330,000 | | | TaiMed Biologics, Inc. * # | | | 4,393,968 | |
| | | | | | | | 53,488,790 | |
| Thailand: 2.4% |
| | 6,194,000 | | | CP ALL PCL # | | | 14,924,888 | |
| | 13,706,176 | | | Srisawad Corp. PCL (NVDR) # | | | 31,265,793 | |
| | 348,334 | | | Srisawad Corp. PCL-Foreign # | | | 794,601 | |
| | 12,765,000 | | | Thai Beverage PCL (SGD) # | | | 8,452,196 | |
| | | | | | | | 55,437,478 | |
Number
of Shares | | | | | Value | |
| | | | | | | |
| Turkey: 3.2% |
| | 3,102,147 | | | AvivaSA Emeklilik ve Hayat AS | | $ | 7,269,109 | |
| | 9,375,392 | | | MLP Saglik Hizmetleri AS Reg S 144A * # | | | 25,199,389 | |
| | 10,507,140 | | | Sok Marketler Ticaret AS * # | | | 18,997,612 | |
| | 4,794,000 | | | Tofas Turk Otomobil Fabrikasi AS # | | | 21,629,647 | |
| | | | | | | | 73,095,757 | |
| United Arab Emirates: 1.2% |
| | 1,125,000 | | | NMC Health Plc (GBP) # | | | 26,358,036 | |
| United Kingdom: 0.7% |
| | 7,544,000 | | | Helios Towers Plc * | | | 15,788,594 | |
| | 812,346 | | | Hirco Plc * #¥ | | | 0 | |
| | | | | | | | 15,788,594 | |
| United States: 1.2% |
| | 1,519,000 | | | Laureate Education, Inc. * | | | 26,749,590 | |
| Uruguay: 0.2% |
| | 2,100,797 | | | Biotoscana Investments SA (BDR) * # | | | 5,200,692 | |
Total Common Stocks
(Cost: $1,681,783,317) | | | 2,174,625,773 | |
| PREFERRED STOCKS: 1.3% |
Brazil: 1.3%
(Cost: $21,133,115) | | | | |
| | 3,064,890 | | | Itau Unibanco Holding SA, 4.73% # | | | 28,386,829 | |
MONEY MARKET FUND: 2.9%
(Cost: $66,930,972) |
| | 66,930,972 | | | Invesco Treasury Portfolio — Institutional Class | | | 66,930,972 | |
See Notes to Financial Statements
Number
of Shares | | | | | Value | |
| | | | | | | |
Total Investments Before Collateral for
Securities Loaned: 99.9%
(Cost: $1,769,847,404) | | $ | 2,269,943,574 | |
SHORT-TERM INVESTMENT HELD AS COLLATERAL FOR SECURITIES ON LOAN: 0.8%
(Cost: $16,698,642) |
| |
| Money Market Fund: 0.8% |
| | 16,698,642 | | | State Street Navigator Securities Lending Government Money Market Portfolio | | | 16,698,642 | |
Number
of Shares | | | Value | |
| | | | | | |
Total Investments: 100.7%
(Cost: $1,786,546,046) | | $ | 2,286,642,216 | |
| Liabilities in excess of other assets: (0.7)% | | | (15,069,974 | ) |
| NET ASSETS: 100.0% | | $ | 2,271,572,242 | |
Definitions:
| ADR | American Depositary Receipt |
| BDR | Brazilian Depositary Receipt |
| GBP | British Pound |
| NVDR | Non-Voting Depositary Receipt |
| SGD | Singapore Dollar |
| USD | United States Dollar |
Footnotes:
| * | Non-income producing |
| † | Security fully or partially on loan. Total market value of securities on loan is $54,948,462. |
| # | Security has been valued in good faith pursuant to guidelines established by the Board of Trustees. The aggregate value of fair valued securities is $1,599,080,574 which represents 70.4% of net assets. |
| ¥ | Security is valued using significant unobservable inputs that factor in discount for lack of marketability and is classified as Level 3 in the fair value hierarchy. |
| Reg S | Security was purchased pursuant to Regulation S under the Securities Act of 1933, which exempts from registration securities offered and sold outside of the United States. Such a security cannot be sold in the United States without either an effective registration statement filed pursuant to the Securities Act of 1933, or pursuant to an exemption from registration. |
| 144A | Security exempt from registration under Rule 144A of the Securities Act of 1933, as amended, or otherwise restricted. These securities may be resold in transactions exempt from registration, unless otherwise noted, and the value amounted to $226,082,055, or 10.0% of net assets. |
See Notes to Financial Statements
EMERGING MARKETS FUND
SCHEDULE OF INVESTMENTS
(continued)
Summary of Investments by
Sector Excluding Collateral
for Securities Loaned | | % of
Investments | | Value | |
| Communication Services | | | 8.7 | % | | $ | 198,045,313 | |
| Consumer Discretionary | | | 28.6 | | | | 648,283,186 | |
| Consumer Staples | | | 3.3 | | | | 75,472,756 | |
| Energy | | | 0.8 | | | | 16,991,534 | |
| Financials | | | 30.5 | | | | 692,123,625 | |
| Health Care | | | 7.0 | | | | 158,194,172 | |
| Industrials | | | 9.9 | | | | 225,797,581 | |
| Information Technology | | | 4.6 | | | | 105,492,439 | |
| Real Estate | | | 3.5 | | | | 79,310,723 | |
| Utilities | | | 0.1 | | | | 3,301,273 | |
| Money Market Fund | | | 3.0 | | | | 66,930,972 | |
| | | | 100.0 | % | | $ | 2,269,943,574 | |
The summary of inputs used to value the Fund’s investments as of December 31, 2019 is as follows:
| | | Level 1
Quoted
Prices | | | Level 2
Significant
Observable
Inputs | | | Level 3
Significant
Unobservable
Inputs | | Value | |
| Common Stocks | | | | | | | | | | | | | | | | | |
| Brazil | | $ | — | | | $ | 151,513,349 | | | | $ | — | | | $ | 151,513,349 | |
| China / Hong Kong | | | 231,741,208 | | | | 525,903,505 | | | | | 228,574 | | | | 757,873,287 | |
| Egypt | | | 49,491,485 | | | | — | | | | | — | | | | 49,491,485 | |
| Georgia | | | 9,955,846 | | | | 21,712,620 | | | | | — | | | | 31,668,466 | |
| Germany | | | — | | | | 40,659,980 | | | | | — | | | | 40,659,980 | |
| Hungary | | | — | | | | 20,786,917 | | | | | — | | | | 20,786,917 | |
| India | | | 68,860,075 | | | | 175,652,393 | | | | | — | | | | 244,512,468 | |
| Indonesia | | | — | | | | 55,957,505 | | | | | — | | | | 55,957,505 | |
| Kenya | | | 19,461,983 | | | | — | | | | | — | | | | 19,461,983 | |
| Kuwait | | | 14,713,203 | | | | — | | | | | — | | | | 14,713,203 | |
| Malaysia | | | — | | | | 26,347,988 | | | | | — | | | | 26,347,988 | |
| Mexico | | | 72,782,692 | | | | — | | | | | — | | | | 72,782,692 | |
| Netherlands | | | — | | | | 54,464,215 | | | | | — | | | | 54,464,215 | |
| Peru | | | 4,475,730 | | | | — | | | | | — | | | | 4,475,730 | |
| Philippines | | | — | | | | 115,024,538 | | | | | — | | | | 115,024,538 | |
| Poland | | | 8,191,646 | | | | — | | | | | — | | | | 8,191,646 | |
| Russia | | | 35,748,780 | | | | 39,719,918 | | | | | — | | | | 75,468,698 | |
| Saudi Arabia | | | — | | | | 3,176,213 | | | | | — | | | | 3,176,213 | |
| South Africa | | | 38,702,087 | | | | 23,356,831 | | | | | — | | | | 62,058,918 | |
| South Korea | | | — | | | | 62,203,884 | | | | | — | | | | 62,203,884 | |
| Spain | | | — | | | | 35,629,768 | | | | | — | | | | 35,629,768 | |
| Switzerland | | | — | | | | 12,043,903 | | | | | — | | | | 12,043,903 | |
| Taiwan | | | — | | | | 53,488,790 | | | | | — | | | | 53,488,790 | |
| Thailand | | | — | | | | 55,437,478 | | | | | — | | | | 55,437,478 | |
| Turkey | | | 7,269,109 | | | | 65,826,648 | | | | | — | | | | 73,095,757 | |
See Notes to Financial Statements
| | | Level 1
Quoted
Prices | | | Level 2
Significant
Observable
Inputs | | | Level 3
Significant
Unobservable
Inputs | | Value | |
| Common Stocks (continued) | | | | | | | | | | | | | | | | | |
| United Arab Emirates | | $ | — | | | $ | 26,358,036 | | | | $ | — | | | $ | 26,358,036 | |
| United Kingdom | | | 15,788,594 | | | | — | | | | | 0 | | | | 15,788,594 | |
| United States | | | 26,749,590 | | | | — | | | | | — | | | | 26,749,590 | |
| Uruguay | | | — | | | | 5,200,692 | | | | | — | | | | 5,200,692 | |
| Preferred Stocks* | | | — | | | | 28,386,829 | | | | | — | | | | 28,386,829 | |
| Money Market Fund | | | 83,629,614 | | | | — | | | | | — | | | | 83,629,614 | |
| Total | | $ | 687,561,642 | | | $ | 1,598,852,000 | | | | $ | 228,574 | | | $ | 2,286,642,216 | |
| * | See Schedule of Investments for geographic sector breakouts. |
See Notes to Financial Statements
EMERGING MARKETS FUND
STATEMENT OF ASSETS AND LIABILITIES
December 31, 2019
| Assets: | | | | |
| Investments, at value (Cost $1,769,847,404) (1) | | $ | 2,269,943,574 | |
| Short-term investment held as collateral for securities loaned (2) | | | 16,698,642 | |
| Cash | | | 717 | |
| Cash denominated in foreign currency, at value (Cost $100,078) | | | 99,952 | |
| Receivables: | | | | |
| Shares of beneficial interest sold | | | 6,091,250 | |
| Dividends and interest | | | 1,026,746 | |
| Prepaid expenses | | | 78,798 | |
| Other assets | | | 11,892 | |
| Total assets | | | 2,293,951,571 | |
| Liabilities: | | | | |
| Payables: | | | | |
| Collateral for securities loaned | | | 16,698,642 | |
| Shares of beneficial interest redeemed | | | 2,277,041 | |
| Due to Adviser | | | 1,144,879 | |
| Due to Distributor | | | 58,437 | |
| Deferred Trustee fees | | | 1,042,191 | |
| Accrued expenses | | | 1,158,139 | |
| Total liabilities | | | 22,379,329 | |
| NET ASSETS | | $ | 2,271,572,242 | |
| Class A Shares: | | | | |
| Net Assets | | $ | 137,985,308 | |
| Shares of beneficial interest outstanding | | | 7,653,758 | |
| Net asset value and redemption price per share | | $ | 18.03 | |
| Maximum offering price per share (Net asset value per share ÷ 94.25%) | | $ | 19.13 | |
| Class C Shares: | | | | |
| Net Assets | | $ | 36,541,800 | |
| Shares of beneficial interest outstanding | | | 2,281,586 | |
| Net asset value, offering and redemption price per share (Redemption may be subject to a contingent deferred sales charge within the first year of ownership) | | $ | 16.02 | |
| Class I Shares: | | | | |
| Net Assets | | $ | 804,199,541 | |
| Shares of beneficial interest outstanding | | | 42,297,101 | |
| Net asset value, offering and redemption price per share | | $ | 19.01 | |
| Class Y Shares: | | | | |
| Net Assets | | $ | 1,287,337,916 | |
| Shares of beneficial interest outstanding | | | 70,419,656 | |
| Net asset value, offering and redemption price per share | | $ | 18.28 | |
| Class Z Shares: | | | | |
| Net Assets | | $ | 5,507,677 | |
| Shares of beneficial interest outstanding | | | 289,407 | |
| Net asset value, offering and redemption price per share | | $ | 19.03 | |
See Notes to Financial Statements
| Net Assets consist of: | | | |
| Aggregate paid in capital | | $ | 1,871,683,003 | |
| Total distributable earnings (loss) | | | 399,889,239 | |
| | | $ | 2,271,572,242 | |
| (1) | Value of securities on loan | | $ | 54,948,462 | |
| (2) | Cost of short-term investment held as collateral for securities loaned | | $ | 16,698,642 | |
See Notes to Financial Statements
EMERGING MARKETS FUND
STATEMENT OF OPERATIONS
For the Year Ended December 31, 2019
| Income: | | | | |
| Dividends | | $ | 72,235,104 | |
| Interest | | | 9 | |
| Securities lending income | | | 610,174 | |
| Foreign taxes withheld | | | (3,424,871 | ) |
| Total income | | | 69,420,416 | |
| Expenses: | | | | |
| Management fees | | | 15,173,944 | |
| Distribution fees – Class A Shares | | | 323,983 | |
| Distribution fees – Class C Shares | | | 342,938 | |
| Transfer agent fees – Class A Shares | | | 219,935 | |
| Transfer agent fees – Class C Shares | | | 58,535 | |
| Transfer agent fees – Class I Shares | | | 517,744 | |
| Transfer agent fees – Class Y Shares | | | 1,001,070 | |
| Transfer agent fees – Class Z Shares | | | 103 | |
| Administration fees | | | 5,057,981 | |
| Custodian fees | | | 500,442 | |
| Professional fees | | | 125,092 | |
| Registration fees – Class A Shares | | | 36,847 | |
| Registration fees – Class C Shares | | | 22,915 | |
| Registration fees – Class I Shares | | | 39,787 | |
| Registration fees – Class Y Shares | | | 75,657 | |
| Registration fees – Class Z Shares | | | 1,779 | |
| Reports to shareholders | | | 170,511 | |
| Insurance | | | 83,267 | |
| Trustees’ fees and expenses | | | 630,844 | |
| Interest | | | 21,776 | |
| Other | | | 98,832 | |
| Total expenses | | | 24,503,982 | |
| Waiver of management fees | | | (1,981,311 | ) |
| Net expenses | | | 22,522,671 | |
| Net investment income | | | 46,897,745 | |
| Net realized gain (loss) on: | | | | |
| Investments | | | 2,224,057 | |
| Forward foreign currency contracts | | | (877 | ) |
| Foreign currency transactions and foreign denominated assets and liabilities | | | (872,690 | ) |
| Net realized gain | | | 1,350,490 | |
| Net change in unrealized appreciation (depreciation) on: | | | | |
| Investments (net of foreign taxes $578,512) | | | 465,480,556 | |
| Foreign currency transactions and foreign denominated assets and liabilities | | | 22,084 | |
| Net change in unrealized appreciation (depreciation) | | | 465,502,640 | |
| Net Increase in Net Assets Resulting from Operations | | $ | 513,750,875 | |
See Notes to Financial Statements
EMERGING MARKETS FUND
STATEMENT OF CHANGES IN NET ASSETS
| | | Year Ended
December 31,
2019 | | | Year Ended
December 31,
2018 | |
| Operations: | | | | | | | | |
| Net investment income | | $ | 46,897,745 | | | $ | 11,599,079 | |
| Net realized gain (loss) | | | 1,350,490 | | | | (48,628,664 | ) |
| Net change in unrealized appreciation (depreciation) | | | 465,502,640 | | | | (511,753,827 | ) |
| Net increase (decrease) in net assets resulting from operations | | | 513,750,875 | | | | (548,783,412 | ) |
| Distributions to shareholders: | | | | | | | | |
| Class A Shares | | | (2,113,075 | ) | | | (33,289 | ) |
| Class C Shares | | | (386,169 | ) | | | — | |
| Class I Shares | | | (15,617,402 | ) | | | (3,993,173 | ) |
| Class Y Shares | | | (24,783,532 | ) | | | (5,501,738 | ) |
| Class Z Shares | | | (103,112 | ) | | | — | |
| Total distributions | | | (43,003,290 | ) | | | (9,528,200 | ) |
| Share transactions: | | | | | | | | |
| Proceeds from sale of shares | | | | | | | | |
| Class A Shares | | | 41,022,415 | | | | 93,172,766 | |
| Class C Shares | | | 7,052,319 | | | | 15,584,890 | |
| Class I Shares | | | 243,585,686 | | | | 325,816,438 | |
| Class Y Shares | | | 400,353,524 | | | | 766,819,492 | |
| Class Z Shares | | | 5,235,982 | | | | — | |
| | | | 697,249,926 | | | | 1,201,393,586 | |
| Reinvestment of distributions | | | | | | | | |
| Class A Shares | | | 1,456,581 | | | | 22,145 | |
| Class C Shares | | | 293,284 | | | | — | |
| Class I Shares | | | 8,117,940 | | | | 2,350,099 | |
| Class Y Shares | | | 18,567,809 | | | | 4,103,389 | |
| Class Z Shares | | | 103,112 | | | | — | |
| | | | 28,538,726 | | | | 6,475,633 | |
| Cost of shares redeemed | | | | | | | | |
| Class A Shares | | | (53,367,607 | ) | | | (129,623,007 | ) |
| Class C Shares | | | (8,665,130 | ) | | | (13,704,735 | ) |
| Class I Shares | | | (193,051,638 | ) | | | (335,799,455 | ) |
| Class Y Shares | | | (300,173,014 | ) | | | (555,130,222 | ) |
| Class Z Shares | | | (49,517 | ) | | | — | |
| | | | (555,306,906 | ) | | | (1,034,257,419 | ) |
| Net increase in net assets resulting from share transactions | | | 170,481,746 | | | | 173,611,800 | |
| Total increase (decrease) in net assets | | | 641,229,331 | | | | (384,699,812 | ) |
| Net Assets: | | | | | | | | |
| Beginning of year | | | 1,630,342,911 | | | | 2,015,042,723 | |
| End of year | | $ | 2,271,572,242 | | | $ | 1,630,342,911 | |
See Notes to Financial Statements
EMERGING MARKETS FUND
FINANCIAL HIGHLIGHTS
For a share outstanding throughout each year:
| | | Class A | |
| | | Year Ended December 31, | |
| | | 2019 | | | 2018 | | | 2017 | | | 2016 | | | 2015 | |
| Net asset value, beginning of year | | $ | 14.14 | | | $ | 18.44 | | | $ | 12.33 | | | $ | 12.40 | | | $ | 14.24 | |
| Income from investment operations: | | | | | | | | | | | | | | | | | | | | |
| Net investment income | | | 0.31 | (b) | | | 0.03 | (b) | | | — | (b)(c) | | | 0.04 | | | | 0.02 | |
| Net realized and unrealized gain (loss) on investments | | | 3.86 | | | | (4.33 | ) | | | 6.13 | | | | (0.09 | ) | | | (1.86 | ) |
| Total from investment operations | | | 4.17 | | | | (4.30 | ) | | | 6.13 | | | | (0.05 | ) | | | (1.84 | ) |
| Less distributions from: | | | | | | | | | | | | | | | | | | | | |
| Net investment income | | | (0.28 | ) | | | — | (c) | | | (0.02 | ) | | | (0.02 | ) | | | — | (c) |
| Net asset value, end of year | | $ | 18.03 | | | $ | 14.14 | | | $ | 18.44 | | | $ | 12.33 | | | $ | 12.40 | |
| Total return (a) | | | 29.52 | % | | | (23.30 | )% | | | 49.70 | % | | | (0.43 | )% | | | (12.91 | )% |
| Ratios/Supplemental Data | | | | | | | | | | | | | | | | | | | | |
| Net assets, end of year (000’s) | | $ | 137,985 | | | $ | 117,928 | | | $ | 195,080 | | | $ | 116,083 | | | $ | 141,901 | |
| Ratio of gross expenses to average net assets | | | 1.53 | % | | | 1.50 | % | | | 1.47 | % | | | 1.53 | % | | | 1.46 | % |
| Ratio of net expenses to average net assets | | | 1.53 | % | | | 1.50 | % | | | 1.47 | % | | | 1.53 | % | | | 1.46 | % |
| Ratio of net expenses to average net assets, excluding interest expense | | | 1.53 | % | | | 1.50 | % | | | 1.47 | % | | | 1.53 | % | | | 1.46 | % |
| Ratio of net investment income (loss) to average net assets | | | 1.86 | % | | | 0.17 | % | | | (0.01 | )% | | | 0.25 | % | | | 0.20 | % |
| Portfolio turnover rate | | | 24 | % | | | 39 | % | | | 36 | % | | | 51 | % | | | 38 | % |
| (a) | Total return is calculated assuming an initial investment made at the net asset value at the beginning of year, reinvestment of any dividends and distributions at net asset value on the dividend/distributions payment date and a redemption at the net asset value on the last day of the year. The return does not reflect the deduction of taxes that a shareholder would pay on Fund dividends/distributions or the redemption of Fund shares. |
| (b) | Calculated based upon average shares outstanding. |
| (c) | Amount represents less than $0.005 per share. |
See Notes to Financial Statements
FINANCIAL HIGHLIGHTS
For a share outstanding throughout each year:
| | | Class C | |
| | | Year Ended December 31, | |
| | | 2019 | | | 2018 | | | 2017 | | | 2016 | | | 2015 | |
| Net asset value, beginning of year | | $ | 12.60 | | | $ | 16.55 | | | $ | 11.14 | | | $ | 11.30 | | | $ | 13.08 | |
| Income from investment operations: | | | | | | | | | | | | | | | | | | | | |
| Net investment income (loss) | | | 0.16 | (b) | | | (0.09 | )(b) | | | (0.12 | )(b) | | | (0.06 | ) | | | (0.07 | ) |
| Net realized and unrealized gain (loss) on investments | | | 3.43 | | | | (3.86 | ) | | | 5.53 | | | | (0.08 | ) | | | (1.71 | ) |
| Total from investment operations | | | 3.59 | | | | (3.95 | ) | | | 5.41 | | | | (0.14 | ) | | | (1.78 | ) |
| Less distributions from: | | | | | | | | | | | | | | | | | | | | |
| Net investment income | | | (0.17 | ) | | | — | | | | — | | | | (0.02 | ) | | | — | (c) |
| Net asset value, end of year | | $ | 16.02 | | | $ | 12.60 | | | $ | 16.55 | | | $ | 11.14 | | | $ | 11.30 | |
| Total return (a) | | | 28.51 | % | | | (23.87 | )% | | | 48.56 | % | | | (1.27 | )% | | | (13.60 | )% |
| Ratios/Supplemental Data | | | | | | | | | | | | | | | | | | | | |
| Net assets, end of year (000’s) | | $ | 36,542 | | | $ | 29,916 | | | $ | 38,736 | | | $ | 22,238 | | | $ | 27,438 | |
| Ratio of gross expenses to average net assets | | | 2.32 | % | | | 2.27 | % | | | 2.28 | % | | | 2.32 | % | | | 2.26 | % |
| Ratio of net expenses to average net assets | | | 2.32 | % | | | 2.27 | % | | | 2.28 | % | | | 2.32 | % | | | 2.26 | % |
| Ratio of net expenses to average net assets, excluding interest expense | | | 2.32 | % | | | 2.27 | % | | | 2.28 | % | | | 2.32 | % | | | 2.26 | % |
| Ratio of net investment income (loss) to average net assets | | | 1.12 | % | | | (0.57 | )% | | | (0.85 | )% | | | (0.52 | )% | | | (0.59 | )% |
| Portfolio turnover rate | | | 24 | % | | | 39 | % | | | 36 | % | | | 51 | % | | | 38 | % |
| (a) | Total return is calculated assuming an initial investment made at the net asset value at the beginning of year, reinvestment of any dividends and distributions at net asset value on the dividend/distributions payment date and a redemption at the net asset value on the last day of the year. The return does not reflect the deduction of taxes that a shareholder would pay on Fund dividends / distributions or the redemption of Fund shares. |
| (b) | Calculated based upon average shares outstanding. |
| (c) | Amount represents less than $0.005 per share |
See Notes to Financial Statements
EMERGING MARKETS FUND
FINANCIAL HIGHLIGHTS
For a share outstanding throughout each year:
| | | Class I | |
| | | Year Ended December 31, | |
| | | 2019 | | | 2018 | | | 2017 | | | 2016 | | | 2015 | |
| Net asset value, beginning of year | | $ | 14.90 | | | $ | 19.46 | | | $ | 13.00 | | | $ | 13.01 | | | $ | 14.86 | |
| Income from investment operations: | | | | | | | | | | | | | | | | | | | | |
| Net investment income | | | 0.43 | (b) | | | 0.12 | (b) | | | 0.07 | (b) | | | 0.07 | | | | 0.06 | |
| Net realized and unrealized gain (loss) on investments | | | 4.05 | | | | (4.58 | ) | | | 6.48 | | | | (0.06 | ) | | | (1.91 | ) |
| Total from investment operations | | | 4.48 | | | | (4.46 | ) | | | 6.55 | | | | 0.01 | | | | (1.85 | ) |
| Less distributions from: | | | | | | | | | | | | | | | | | | | | |
| Net investment income | | | (0.37 | ) | | | (0.10 | ) | | | (0.09 | ) | | | (0.02 | ) | | | — | (c) |
| Net asset value, end of year | | $ | 19.01 | | | $ | 14.90 | | | $ | 19.46 | | | $ | 13.00 | | | $ | 13.01 | |
| Total return (a) | | | 30.11 | % | | | (22.88 | )% | | | 50.40 | % | | | 0.05 | % | | | (12.44 | )% |
| Ratios/Supplemental Data | | | | | | | | | | | | | | | | | | | | |
| Net assets, end of year (000’s) | | $ | 804,200 | | | $ | 575,466 | | | $ | 773,952 | | | $ | 488,066 | | | $ | 274,309 | |
| Ratio of gross expenses to average net assets | | | 1.16 | % | | | 1.14 | % | | | 1.15 | % | | | 1.16 | % | | | 1.14 | % |
| Ratio of net expenses to average net assets | | | 1.00 | % | | | 1.00 | % | | | 1.00 | % | | | 1.00 | % | | | 1.00 | % |
| Ratio of net expenses to average net assets, excluding interest expense | | | 1.00 | % | | | 1.00 | % | | | 1.00 | % | | | 1.00 | % | | | 1.00 | % |
| Ratio of net investment income to average net assets | | | 2.46 | % | | | 0.68 | % | | | 0.45 | % | | | 0.76 | % | | | 0.64 | % |
| Portfolio turnover rate | | | 24 | % | | | 39 | % | | | 36 | % | | | 51 | % | | | 38 | % |
| (a) | Total return is calculated assuming an initial investment made at the net asset value at the beginning of year, reinvestment of any dividends and distributions at net asset value on the dividend/distributions payment date and a redemption at the net asset value on the last day of the year. The return does not reflect the deduction of taxes that a shareholder would pay on Fund dividends/distributions or the redemption of Fund shares. |
| (b) | Calculated based upon average shares outstanding. |
| (c) | Amount represents less than $0.005 per share |
See Notes to Financial Statements
FINANCIAL HIGHLIGHTS
For a share outstanding throughout each year:
| | | Class Y | |
| | | Year Ended December 31, | |
| | | 2019 | | | 2018 | | | 2017 | | | 2016 | | | 2015 | |
| Net asset value, beginning of year | | $ | 14.33 | | | $ | 18.73 | | | $ | 12.51 | | | $ | 12.53 | | | $ | 14.33 | |
| Income from investment operations: | | | | | | | | | | | | | | | | | | | | |
| Net investment income | | | 0.39 | (b) | | | 0.10 | (b) | | | 0.05 | (b) | | | 0.06 | | | | 0.06 | |
| Net realized and unrealized gain (loss) on investments | | | 3.92 | | | | (4.41 | ) | | | 6.24 | | | | (0.06 | ) | | | (1.86 | ) |
| Total from investment operations | | | 4.31 | | | | (4.31 | ) | | | 6.29 | | | | (0.00 | ) | | | (1.80 | ) |
| Less distributions from: | | | | | | | | | | | | | | | | | | | | |
| Net investment income | | | (0.36 | ) | | | (0.09 | ) | | | (0.07 | ) | | | (0.02 | ) | | | — | (c) |
| Net asset value, end of year | | $ | 18.28 | | | $ | 14.33 | | | $ | 18.73 | | | $ | 12.51 | | | $ | 12.53 | |
| Total return (a) | | | 30.07 | % | | | (23.03 | )% | | | 50.32 | % | | | (0.03 | )% | | | (12.55 | )% |
| Ratios/Supplemental Data | | | | | | | | | | | | | | | | | | | | |
| Net assets, end of year (000’s) | | $ | 1,287,338 | | | $ | 907,032 | | | $ | 1,007,275 | | | $ | 463,494 | | | $ | 259,517 | |
| Ratio of gross expenses to average net assets | | | 1.18 | % | | | 1.16 | % | | | 1.15 | % | | | 1.21 | % | | | 1.23 | % |
| Ratio of net expenses to average net assets | | | 1.10 | % | | | 1.10 | % | | | 1.10 | % | | | 1.10 | % | | | 1.10 | % |
| Ratio of net expenses to average net assets, excluding interest expense | | | 1.10 | % | | | 1.10 | % | | | 1.10 | % | | | 1.10 | % | | | 1.10 | % |
| Ratio of net investment income to average net assets | | | 2.32 | % | | | 0.59 | % | | | 0.32 | % | | | 0.65 | % | | | 0.58 | % |
| Portfolio turnover rate | | | 24 | % | | | 39 | % | | | 36 | % | | | 51 | % | | | 38 | % |
| (a) | Total return is calculated assuming an initial investment made at the net asset value at the beginning of year, reinvestment of any dividends and distributions at net asset value on the dividend/distributions payment date and a redemption at the net asset value on the last day of the year. The return does not reflect the deduction of taxes that a shareholder would pay on Fund dividends/distributions or the redemption of Fund shares. |
| (b) | Calculated based upon average shares outstanding. |
| (c) | Amount represents less than $0.005 per share |
See Notes to Financial Statements
EMERGING MARKETS FUND
FINANCIAL HIGHLIGHTS
For a share outstanding throughout each period:
| | | Class Z | |
| | | September 16,
2019 (a) through
December 31,
2019 | |
| Net asset value, beginning of period | | | $ | 18.08 | | |
| Income from investment operations: | | | | | | |
| Net investment (loss) | | | | (0.02 | )(b) | |
| Net realized and unrealized gain (loss) on investments | | | | 1.34 | | |
| Total from investment operations | | | | 1.32 | | |
| Less distributions from: | | | | | | |
| Net investment income | | | | (0.37 | ) | |
| Net asset value, end of year | | | $ | 19.03 | | |
| Total return (c) | | | | 7.29 | %(d) | |
| Ratios/Supplemental Data | | | | | | |
| Net assets, end of year (000’s) | | | $ | 5,508 | | |
| Ratio of gross expenses to average net assets | | | | 1.31 | %(e) | |
| Ratio of net expenses to average net assets | | | | 0.90 | %(e) | |
| Ratio of net expenses to average net assets, excluding interest expense | | | | 0.90 | %(e) | |
| Ratio of net investment loss to average net assets | | | | (0.27 | )%(e) | |
| Portfolio turnover rate | | | | 24 | %(d) | |
| (a) | Commencement of operations |
| (b) | Calculated based upon average shares outstanding. |
| (c) | Total return is calculated assuming an initial investment made at the net asset value at the beginning of period, reinvestment of any dividends and distributions at net asset value on the dividend/distributions payment date and a redemption at the net asset value on the last day of the period. The return does not reflect the deduction of taxes that a shareholder would pay on Fund dividends/distributions or the redemption of Fund shares. |
| (d) | Not annualized |
| (e) | Annualized |
See Notes to Financial Statements
EMERGING MARKETS FUND
NOTES TO FINANCIAL STATEMENTS
December 31, 2019
Note 1—Fund Organization—VanEck Funds (the “Trust”) is registered under the Investment Company Act of 1940, as amended, as an open-end management investment company. The Trust was organized as a Massachusetts business trust on April 3, 1985. The Emerging Markets Fund (the “Fund”) is a diversified series of the Trust and seeks long-term capital appreciation by investing primarily in equity securities in emerging markets around the world. The Fund currently offers five classes of shares: Class A, C, I, Y and Z Shares. Each share class represents an interest in the same portfolio of investments of the Fund and is substantially the same in all respects, except that the classes are subject to different distribution fees and sales charges. Class I, Y and Z Shares are sold without a sales charge; Class A Shares are sold subject to a front-end sales charge; and Class C Shares are sold with a contingent deferred sales charge.
Note 2—Significant Accounting Policies—The preparation of financial statements in conformity with U.S. generally accepted accounting principles (“GAAP”) requires management to make estimates and assumptions that affect the reported amounts and disclosures in the financial statements. Actual results could differ from those estimates.
The Funds are investment companies and follow accounting and reporting requirements of Accounting Standards Codification (“ASC”) 946Financial Services – Investment Companies.
The following is a summary of significant accounting policies followed by the Fund.
| A. | Security Valuation—The Fund values its investments in securities and other assets and liabilities at fair value daily. Fair value is the price that would be received to sell an asset or paid to transfer a liability in an orderly transaction between market participants on the measurement date. Securities traded on national exchanges are valued at the closing price on the markets in which the securities trade. Securities traded on the NASDAQ Stock Market LLC (“NASDAQ”) are valued at the NASDAQ official closing price. Over-the-counter securities not included on NASDAQ and listed securities for which no sale was reported are valued at the mean of the bid and ask prices. To the extent these securities are actively traded, they are categorized as Level 1 in the fair value hierarchy (described below). Certain foreign securities, whose values may be affected by market direction or events occurring before the Fund’s pricing time (4:00 p.m. Eastern Time) but after the last close of the securities’ primary market, are fair valued using a pricing service and are categorized as Level 2 in the fair value hierarchy. The pricing service, using methods approved by the Board of Trustees, |
EMERGING MARKETS FUND
NOTES TO FINANCIAL STATEMENTS
(continued)
considers the correlation of the trading patterns of the foreign security to intraday trading in the U.S. markets, based on indices of domestic securities and other appropriate indicators such as prices of relevant ADR’s and futures contracts. The Fund may also fair value securities in other situations, such as when a particular foreign market is closed but the Fund is open. Short-term obligations with sixty days or less to maturity are valued at amortized cost, which with accrued interest approximates fair value. Money market fund investments are valued at net asset value and are categorized as Level 1 in the fair value hierarchy. The Pricing Committee of Van Eck Associates Corporation (the “Adviser”) provides oversight of the Fund’s valuation policies and procedures, which are approved by the Fund’s Board of Trustees. Among other things, these procedures allow the Fund to utilize independent pricing services, quotations from securities dealers, and other market sources to determine fair value. The Pricing Committee convenes regularly to review the fair value of financial instruments or other assets. If market quotations for a security or other asset are not readily available, or if the Adviser believes they do not otherwise reflect the fair value of a security or asset, the security or asset will be fair valued by the Pricing Committee in accordance with the Fund’s valuation policies and procedures. The Pricing Committee employs various methods for calibrating the valuation approaches utilized to determine fair value, including a regular review of key inputs and assumptions, periodic comparisons to valuations provided by other independent pricing services, transactional back-testing and disposition analysis.
Certain factors such as economic conditions, political events, market trends, the nature of and duration of any restrictions on disposition, trading in similar securities of the issuer or comparable issuers and other security specific information are used to determine the fair value of these securities. Depending on the relative significance of valuation inputs, these securities may be classified either as Level 2 or Level 3 in the fair value hierarchy. The price which the Fund may realize upon sale of an investment may differ materially from the value presented in the Schedule of Investments.
The Fund utilizes various methods to measure the fair value of its investments on a recurring basis, which includes a hierarchy that prioritizes inputs to valuation methods used to measure fair value. The fair value hierarchy gives highest priority to unadjusted quoted prices in active markets for identical assets and liabilities (Level 1 measurements) and the lowest priority to unobservable inputs (Level 3 measurements). The inputs or methodologies used for valuing securities are not necessarily an indication
of the risk associated with investing in those securities. The three levels of the fair value hierarchy are described below:
| | Level 1 – | Quoted prices in active markets for identical securities. |
| | | |
| | Level 2 – | Significant observable inputs (including quoted prices for similar securities, interest rates, prepayment speeds, credit risk, etc.). |
| | | |
| | Level 3 – | Significant unobservable inputs (including the Fund’s own assumptions in determining the fair value of investments). |
A summary of the inputs and the levels used to value the Fund’s investments are located in the Schedule of Investments. Additionally, tables that reconcile the valuation of the Fund’s Level 3 investments and that present additional information about the valuation methodologies and unobservable inputs, if applicable, are located in the Schedule of Investments.
| B. | Federal Income Taxes—It is the Fund’s policy to comply with the provisions of the Internal Revenue Code applicable to regulated investment companies and to distribute all of its net investment income and net realized capital gains, if any, to its shareholders. Therefore, no federal income tax provision is required. |
| | |
| C. | Currency Translation—Assets and liabilities denominated in foreign currencies and commitments under foreign currency contracts are translated into U.S. dollars at the closing prices of such currencies each business day as quoted by one or more sources. Purchases and sales of investments are translated at the exchange rates prevailing when such investments are acquired or sold. Foreign denominated income and expenses are translated at the exchange rates prevailing when accrued. The portion of realized and unrealized gains and losses on investments that result from fluctuations in foreign currency exchange rates is not separately disclosed. Such amounts are included with the net realized and unrealized gains and losses on investment securities in the Statement of Operations. Recognized gains or losses attributable to foreign currency fluctuations on foreign currency denominated assets, other than investments and forward foreign currency contracts, and liabilities are recorded as net realized gain (loss) and net change in unrealized appreciation (depreciation) on foreign currency transactions and foreign denominated assets and liabilities in the Statement of Operations. |
| | |
| D. | Dividends and Distributions to Shareholders—Dividends to shareholders from net investment income and distributions from net realized capital gains, if any, are declared and paid annually. Income dividends and |
EMERGING MARKETS FUND
NOTES TO FINANCIAL STATEMENTS
(continued)
capital gain distributions are determined in accordance with U.S. income tax regulations, which may differ from such amounts determined in accordance with GAAP.
| E. | Restricted Securities—The Fund may invest in securities that are subject to legal or contractual restrictions on resale. These securities generally may be resold in transactions exempt from registration or to the public if the securities are registered. Disposal of these securities may involve time-consuming negotiations and expense, and prompt sale at an acceptable price may be difficult. Information regarding restricted securities, if any, is included at the end of the Fund’s Schedule of Investments. |
| | |
| F. | Use of Derivative Instruments—The Fund may invest in derivative instruments, including, but not limited to, options, futures, swaps and forward foreign currency contracts. A derivative is an instrument whose value is derived from underlying assets, indices, reference rates or a combination of these factors. Derivative instruments may be privately negotiated contracts (often referred to as over-the-counter (“OTC”) derivatives) or they may be listed and traded on an exchange. Derivative contracts may involve future commitments to purchase or sell financial instruments or commodities at specified terms on a specified date, or to exchange interest payment streams or currencies based on a notional or contractual amount. Derivative instruments may involve a high degree of financial risk. The use of derivative instruments also involves the risk of loss if the investment adviser is incorrect in its expectation of the timing or level of fluctuations in securities prices, interest rates or currency prices. Investments in derivative instruments also include the risk of default by the counterparty, the risk that the investment may not be liquid and the risk that a small movement in the price of the underlying security or benchmark may result in a disproportionately large movement, unfavorable or favorable, in the price of the derivative instrument. The Fund held no derivative instruments at December 31, 2019. |
Forward Foreign Currency Contracts—The Fund may buy and sell forward foreign currency contracts to settle purchases and sales of foreign denominated securities, gain currency exposure, or to hedge foreign denominated assets. Realized gains and losses from forward foreign currency contracts, if any, are included in net realized gain (loss) on forward foreign currency contracts in the Statement of Operations.
During the year ended December 31, 2019, the Fund held forward foreign current contracts for two of the twelve months. The average amounts purchased and sold (in U.S. dollars) were $1,106,735 and
$1,106,833 respectively. At December 31, 2019, the Fund held no forward foreign currency contracts.
The impact of transactions in derivatives instruments during the year ended December 31, 2019 was as follows:
| | Foreign
Currency Risk |
| Realized gain (loss): | |
| Foreign forward currency contracts1 | $(877) |
| 1 | Statement of Operations location: Net realized gain (loss) on forward foreign currency contracts. |
| G. | Offsetting Assets and Liabilities—In the ordinary course of business, the Fund enters into transactions subject to enforceable master netting or other similar agreements. Generally, the right of offset in those agreements allows the Fund to offset any exposure to a specific counterparty with any collateral received or delivered to that counterparty based on the terms of the agreements. The Fund may pledge or receive cash and/or securities as collateral for derivative instruments and securities lending. For financial reporting purposes, the Fund presents securities lending assets and liabilities on a gross basis in the Statements of Assets and Liabilities. Cash collateral held in the form of money market investments, if any, at December 31, 2019 is presented in the Schedule of Investments and in the Statement of Assets and Liabilities. Non-cash collateral is disclosed in Note 10 (Securities Lending). |
| | |
| H. | Other—Security transactions are accounted for on trade date. Dividend income is recorded on the ex-dividend date except that certain dividends from foreign securities are recognized upon notification of the ex-dividend date. Realized gains and losses are determined based on the specific identification method. |
Income, non-class specific expenses, gains and losses on investments are allocated to each class of shares based on its relative net assets. Expenses directly attributable to a specific class are charged to that class.
The Fund earns interest income on uninvested cash balances held at the custodian bank, such amounts, if any, are presented as interest income in the Statement of Operations.
In the normal course of business, the Fund enters into contracts that contain a variety of general indemnifications. The Fund’s maximum exposure under these agreements is unknown as this would involve future claims that may be made against the Fund that have not yet occurred. However, the adviser believes the risk of loss under these arrangements to be remote.
EMERGING MARKETS FUND
NOTES TO FINANCIAL STATEMENTS
(continued)
Note 3—Investment Management and Other Agreements—The Adviser is the investment adviser to the Fund. The Adviser receives a management fee, calculated daily and payable monthly based on annual rate of 0.75% of the Fund’s average daily net assets. The Adviser has agreed, until at least May 1, 2021, to waive management fees and assume expenses to prevent the Fund’s total annual operating expenses (excluding acquired fund fees and expenses, interest expense, trading expenses, dividends and interest payments on securities sold short, taxes and extraordinary expenses) from exceeding the expense limitations listed in the table below.
The current expense limitations and the amounts waived/assumed by the Adviser for the year ended December 31, 2019, are as follows:
| | | | | | Waiver of |
| | | Expense | | Management |
| | | Limitation | | Fees |
| Class A | | | 1.60 | % | | $ | — | |
| Class C | | | 2.50 | | | | — | |
| Class I | | | 1.00 | | | | 1,136,360 | |
| Class Y | | | 1.10 | | | | 841,369 | |
| Class Z | | | 0.90 | | | | 3,582 | |
The Adviser also performs accounting and administrative services for the Fund. The Adviser is paid a monthly fee at a rate of 0.25% of the average daily net assets. Administrative fees are included in expenses in the Statement of Operations.
For the year ended December 31, 2019, Van Eck Securities Corporation (the “Distributor”), an affiliate and wholly-owned subsidiary of the Adviser, received a total of $233,287 in sales loads relating to the sale of shares of the Fund, of which $213,079 was reallowed to broker/dealers and the remaining $20,208 was retained by the Distributor.
Certain officers of the Trust are officers, directors or stockholders of the Adviser and the Distributor.
State Street Bank and Trust Company is the Fund’s custodian and securities lending agent.
Note 4—12b-1 Plan of Distribution—Pursuant to a Rule 12b-1 Plan of Distribution (the “Plan”), the Fund is authorized to incur distribution expenses which will principally be payments to securities dealers who have sold shares and serviced shareholder accounts and payments to the Distributor, for reimbursement of other actual promotion and distribution expenses incurred by the Distributor on behalf of the Fund. The amount paid under the Plan in any one year is limited to 0.25% of average daily net assets for Class A Shares
and 1.00% of average daily net assets for Class C Shares, and is recorded as Distribution fees in the Statement of Operations.
Note 5—Investments—For the year ended December 31, 2019, the cost of purchases and proceeds from sales of investments, excluding U.S. Government securities and short-term obligations, aggregated $557,223,069 and $463,377,451, respectively.
Note 6—Income Taxes—As of December 31, 2019, for Federal income tax purposes, the identified cost, gross unrealized appreciation, gross unrealized depreciation and net unrealized appreciation (depreciation) of investments owned were as follows:
| | | Gross | | Gross | | Net Unrealized |
| Cost of | | Unrealized | | Unrealized | | Appreciation |
| Investments | | Appreciation | | Depreciation | | (Depreciation) |
| $1,794,142,249 | | $605,582,782 | | $(113,082,815) | | $492,499,967 |
At December 31, 2019, the components of accumulated distributable earnings (loss) on a tax basis, for the Fund, were as follows:
| Undistributed | | Accumulated | | Other | | Unrealized | | Total |
| Ordinary | | Capital | | Temporary | | Appreciation | | Distributable |
| Income | | Losses | | Differences | | (Depreciation) | | Earnings (Loss) |
| $3,993,605 | | $(94,985,451) | | $(1,042,189) | | $491,923,274 | | $399,889,239 |
The tax character of dividends paid to shareholders were as follows:
| | | Year Ended | | Year Ended |
| | | December 31, 2019 | | December 31, 2018 |
| Ordinary income | | $43,003,290 | | $9,528,200 |
At December 31, 2019, the Fund had capital loss carryforwards available to offset future capital gains, as follows:
Short-Term
Capital Losses
with No Expiration |
| $(94,985,451) |
During the year ended December 31, 2019, the Fund utilized $1,572,043 of capital loss carryovers from prior years.
Each year, the Fund assesses the need for any reclassifications due to permanent book to tax differences that affect distributable earnings / (losses) and aggregate paid in capital. Net assets are not affected by these reclassifications. During the year ended December 31, 2019, the Fund did not have any reclassifications.
The Fund recognizes the tax benefits of uncertain tax positions only where the position is “more-likely-than-not” to be sustained assuming examination by
EMERGING MARKETS FUND
NOTES TO FINANCIAL STATEMENTS
(continued)
applicable tax authorities. Management has analyzed the Fund’s tax positions, and has concluded that no liability for unrecognized tax benefits should be recorded related to uncertain tax positions taken on return filings for all open tax years. The Fund does not have exposure for additional years that might still be open in certain foreign jurisdictions. Therefore, no provision for income tax is required in the Fund’s financial statements. However, the Fund is subject to foreign taxes on the appreciation in value of certain investments. The Fund provides for such taxes, if any, on both realized and unrealized appreciation.
The Fund recognizes interest and penalties, if any, related to uncertain tax positions as income tax expense in the Statements of Operations. During the year ended December 31, 2019, the Fund did not incur any interest or penalties.
Note 7—Principal Risks—The Fund may purchase securities on foreign exchanges. Securities of foreign issuers involve special risks and considerations not typically associated with investing in U.S. issuers. These risks include devaluation of currencies, less reliable information about issuers, different securities transaction clearance and settlement practices, and future adverse political and economic developments and local/regional conflicts or natural or other disasters, such as recent coronavirus outbreak. These risks are heightened for investments in emerging market countries. Moreover, securities of many foreign issuers and their markets may be less liquid and their prices more volatile than those of comparable U.S. issuers.
A more complete description of risks is included in the Fund’s Prospectus and Statement of Additional Information.
Note 8—Shareholder Transactions—Shares of beneficial interest issued, reinvested and redeemed (unlimited number of $0.001 par value shares authorized):
| | | Year Ended | | Year Ended |
| | | December 31, | | December 31, |
| | | 2019 | | 2018 |
| Class A | | | | | | | | |
| Shares sold | | | 2,470,443 | | | | 5,413,363 | |
| Shares reinvested | | | 81,326 | | | | 1,606 | |
| Shares redeemed | | | (3,239,564) | | | | (7,650,448) | |
| Net decrease | | | (687,795) | | | | (2,235,479) | |
| Class C | | | | | | | | |
| Shares sold | | | 480,861 | | | | 991,780 | |
| Shares reinvested | | | 18,434 | | | | — | |
| Shares redeemed | | | (592,809) | | | | (957,025) | |
| Net increase (decrease) | | | (93,514) | | | | 34,755 | |
| | | Year Ended
December 31,
2019 | | Year Ended
December 31,
2018 |
| Class I | | | | | | | | |
| Shares sold | | | 14,288,287 | | | | 18,395,865 | |
| Shares reinvested | | | 429,748 | | | | 161,853 | |
| Shares redeemed | | | (11,054,918) | | | | (19,690,592) | |
| Net increase (decrease) | | | 3,663,117 | | | | (1,132,874) | |
| Class Y | | | | | | | | |
| Shares sold | | | 24,080,552 | | | | 44,253,297 | |
| Shares reinvested | | | 1,022,456 | | | | 293,518 | |
| Shares redeemed | | | (17,962,194) | | | | (35,055,475) | |
| Net increase | | | 7,140,814 | | | | 9,491,340 | |
| Class Z | | | | | | | | |
| Shares sold | | | 286,623 | | | | | |
| Shares reinvested | | | 5,456 | | | | | |
| Shares redeemed | | | (2,672) | | | | | |
| Net increase | | | 289,407 | | | | | |
Note 9—Bank Line of Credit—The Trust participates with VanEck VIP Funds (collectively the “VE/VIP Funds”) in a $30 million committed credit facility (the “Facility”) to be utilized for temporary financing until the settlement of sales or purchases of portfolio securities, the repurchase or redemption of shares of the Fund and other temporary or emergency purposes. The participating VE/VIP Funds have agreed to pay commitment fees, pro rata, based on the unused but available balance. Interest is charged to the VE/VIP Funds at rates based on prevailing market rates in effect at the time of borrowings. During the year ended December 31, 2019, the average daily loan balance during the 1 day period of which a loan was outstanding amounted to $6,067,918 and the average interest rate was 3.75%. At December 31, 2019, the Fund had no borrowings under the Facility.
Note 10—Securities Lending—To generate additional income, the Fund may lend its securities pursuant to a securities lending agreement with the securities lending agent. The Fund may lend up to 33% of its investments requiring that the loan be continuously collateralized by cash, cash equivalents, U.S. government securities, or any combination of cash and such securities at all times equal to at least 102% (105% for foreign securities) of the market value plus accrued interest on the securities loaned. Daily market fluctuations could cause the value of loaned securities to be more or less than the value of the collateral received. When this occurs, the collateral is adjusted and settled on the next business day. During the term of the loan, the Fund will continue to receive any dividends, interest or amounts equivalent thereto, on the
EMERGING MARKETS FUND
NOTES TO FINANCIAL STATEMENTS
(continued)
securities loaned while receiving a fee from the borrower and/or earning interest on the investment of the cash collateral. Such fees and interest are shared with the securities lending agent under the terms of the securities lending agreement. Securities lending income is disclosed as such in the Statement of Operations. The cash collateral is maintained on the Fund’s behalf by the lending agent and is invested in the State Street Navigator Securities Lending Government Money Market Portfolio. Non-cash collateral consists of U.S. Treasuries and U.S. Government Agency securities, and is not disclosed in the Fund’s Schedule of Investments or Statement of Assets and Liabilities as it is held by the agent on behalf of the Fund, and the Fund does not have the ability to re-hypothecate those securities. Loans are subject to termination at the option of the borrower or the Fund. Upon termination of the loan, the borrower will return to the Fund securities identical to the securities loaned. The Fund bear the risk of delay in recovery of, or even loss of rights in, the securities loaned should the borrower of the securities fail financially. The value of loaned securities and related cash collateral, if any, at December 31, 2019 is presented on a gross basis in the Schedule of Investments and Statement of Assets and Liabilities. The following is a summary of the Fund’s securities on loan and related collateral as of December 31, 2019:
Market Value
of Securities
on Loan | | Cash
Collateral | | Non-Cash
Collateral | | Total
Collateral |
| $54,948,462 | | $16,698,642 | | $41,122,935 | | $57,821,577 |
The following table presents money market fund investments held as collateral by type of security on loan as of December 31, 2019:
| | | Gross Amount of
Recognized Liabilities
for Securities Loaned
in the Statements of
Assets and Liabilities* |
| Equity Securities | | $16,698,642 |
| * | Remaining contractual maturity of the agreements: overnight and continuous. |
Note 11—Trustee Deferred Compensation Plan—The Trust has a Deferred Compensation Plan (the “Deferred Plan”) for Trustees under which the Trustees can elect to defer receipt of their trustee fees until retirement, disability or termination from the Board of Trustees. The fees otherwise payable to the participating Trustees are deemed invested eligible shares of the VE/VIP Funds as directed by the Trustees.
The expense for the Deferred Plan is included in “Trustees’ fees and expenses” on the Statement of Operations. The liability for the Deferred Plan is shown as “Deferred Trustee fees” on the Statement of Assets and Liabilities.
Note 12—Recent Accounting Pronouncements—The Fund early adopted certain provisions of Accounting Standards Update No. 2018-13Disclosure Framework—Changes to the Disclosure Requirements for Fair Value Measurement(“ASU 2018-13”) that eliminate and modify certain disclosure requirements for fair value measurements. The adoption of certain provisions of ASU 2018-13 had no material effect on the financial statements and related disclosures. Management evaluated the additional requirements, not yet adopted, and they are not expected to have a material impact to the financial statements. Public companies will be required to disclose the range and weighted average of significant unobservable inputs for Level 3 fair value measurements. ASU 2018-13 is effective for fiscal years beginning after December 15, 2019 and for interim periods within those fiscal years.
Note 13—Subsequent Event Review—The Fund has evaluated subsequent events and transactions for potential recognition or disclosure through the date the financial statements were issued.
EMERGING MARKETS FUND
REPORT OF INDEPENDENT REGISTERED PUBLIC ACCOUNTING FIRM
To the Shareholders and the Board of Trustees of Emerging Markets Fund
Opinion on the Financial Statements
We have audited the accompanying statement of assets and liabilities of Emerging Markets Fund (the “Fund”) (one of the series constituting VanEck Funds (the “Trust”)), including the schedule of investments, as of December 31, 2019, and the related statement of operations for the year then ended, the statements of changes in net assets for each of the two years in the period then ended, the financial highlights for each of the five years in the period then ended and the related notes (collectively referred to as the “financial statements”). In our opinion, the financial statements present fairly, in all material respects, the financial position of Emerging Markets Fund (one of the series constituting VanEck Funds) at December 31, 2019, the results of its operations for the year then ended, the changes in its net assets for each of the two years in the period then ended and its financial highlights for each of the five years in the period then ended, in conformity with U.S. generally accepted accounting principles.
Basis for Opinion
These financial statements are the responsibility of the Trust’s management. Our responsibility is to express an opinion on the Fund’s financial statements based on our audits. We are a public accounting firm registered with the Public Company Accounting Oversight Board (United States) (“PCAOB”) and are required to be independent with respect to the Trust in accordance with the U.S. federal securities laws and the applicable rules and regulations of the Securities and Exchange Commission and the PCAOB.
We conducted our audits in accordance with the standards of the PCAOB. Those standards require that we plan and perform the audit to obtain reasonable assurance about whether the financial statements are free of material misstatement, whether due to error or fraud. The Trust is not required to have, nor were we engaged to perform, an audit of the Trust’s internal control over financial reporting. As part of our audits, we are required to obtain an understanding of internal control over financial reporting, but not for the purpose of expressing an opinion on the effectiveness of the Trust’s internal control over financial reporting. Accordingly, we express no such opinion.
Our audits included performing procedures to assess the risks of material misstatement of the financial statements, whether due to error or fraud, and performing procedures that respond to those risks. Such procedures included examining, on a test basis, evidence regarding the amounts and disclosures in the financial statements. Our procedures included confirmation of securities owned as of December 31, 2019, by correspondence with the custodian and brokers. Our audits also included evaluating the accounting principles used and significant estimates made by management, as well as evaluating the overall presentation of the financial statements. We believe that our audits provide a reasonable basis for our opinion.

We have served as the auditor of one or more of the VanEck investment companies since 1999.
New York, New York
February 27, 2020
EMERGING MARKETS FUND
TAX INFORMATION
(unaudited)
The following information is provided with respect to the distributions paid during the taxable year ended December 31, 2019. Please consult your tax advisor for proper treatment of this information.
| Record Date: | | 12/20/2019 | |
| Payable Date: | | 12/23/2019 | |
| Ordinary Income Paid Per Share-Class A | | $ | 0.28200 | |
| Ordinary Income Paid Per Share-Class C | | | 0.17130 | |
| Ordinary Income Paid Per Share-Class I | | | 0.37430 | |
| Ordinary Income Paid Per Share-Class Y | | | 0.35700 | |
| Ordinary Income Paid Per Share-Class Z | | | 0.36640 | |
| | | | | |
| Qualfied Dividend Income for Individuals | | | 42.43% | * |
| | | | | |
| Dividends Qualifying for the Dividends Received Deduction for Corporations | | | — | * |
| | | | | |
| Interest from Federal Obligations | | | 0.72% | * |
| | | | | |
| Foreign Source Income | | | 99.09% | * |
| | | | | |
| Foreign Taxes Paid Per Share | | $ | 0.0282640 | |
The foreign taxes paid represent taxes incurred by the Fund on income received by the Fund from foreign sources. Foreign taxes paid may be included in taxable income with an offsetting deduction from gross income or may be taken as a credit for taxes paid to foreign governments.
| * | Expressed as a percentage of the ordinary income distribution grossed-up for foreign taxes. |
The interest from Federal obligations represents income derived from assets backed by the full faith and credit of the U.S. Government. State law varies as to what percentage of this dividend income is exempt from state income tax.
VANECK FUNDS
SPECIAL MEETING OF SHAREHOLDERS
October 11, 2019 (unaudited)
VANECK FUNDS
CM Commodity Index Fund
Emerging Markets Fund
Global Hard Assets Fund
International Investors Gold Fund
Unconstrained Emerging Markets Bond Fund
VanEck Morningstar Wide Moat Fund
VanEck NDR Managed Allocation Fund
A Special Meeting of Shareholders of VanEck Funds (the “Trust”) was held at the offices of the Trust, 666 Third Avenue, 9th Floor, New York, New York 10017 on October 11, 2019. The purpose of the meeting was to elect Trustees of the Trust. At the meeting, the following persons were elected by the shareholders to serve as Trustees of the Trust: Jon Lukomnik, Jane DiRenzo Pigott, R. Alastair Short, Richard D. Stamberger, Robert L. Stelzl, and Jan F. van Eck. No other business was transacted at the meeting.
The results of the voting at the meeting are as follows:
Proposal: To elect a Board of Trustees*:
| Name | For | Withheld |
| Jon Lukomnik | 239,074,404.179 | 1,973,903.626 |
| Jane DiRenzo Pigott | 239,734,349.197 | 1,313,958.608 |
| R. Alastair Short | 239,059,688.386 | 1,988,619.419 |
| Richard D. Stamberger | 239,110,733.308 | 1,937,574.497 |
| Robert L. Stelzl | 239,042,995.154 | 2,005,312.651 |
| Jan F. van Eck | 239,874,952.434 | 1,173,355.371 |
| Total Trust Shares Outstanding**: 327,471,673.186 |
| * | Results are for all series portfolios within the Trust. |
| ** | As of the record date. |
VANECK FUNDS
BOARD OF TRUSTEES AND OFFICERS
December 31, 2019 (unaudited)
Trustee Information
The Trustees of the Trust, their address, position with the Trust, age and principal occupations during the past five years, as of January 1, 2020, are set forth below:
Trustee’s Name,
Address(1)and
Year of Birth | | Position(s) Held With Trust,
Term of Office(2)and
Length of Time Served | | Principal Occupation(s)
During Past Five Years | | Number of
Portfolios
In Fund
Complex(3)
Overseen
By Trustee | | Other Directorships Held Outside The
Fund Complex(3)During The Past Five Years |
| | | | | | | | | |
| Independent Trustees: | | | | | | |
| | | | | | | | | |
Jon Lukomnik
1956 (A)(I) | | Trustee (since 2006) | | Managing Partner, Sinclair Capital LLC (consulting firm). Formerly, Executive Director, Investor Responsibility Research Center Institute. | | 11 | | Member of the Deloitte Audit Quality Advisory Committee; Chairman of the Advisory Committee of Legion Partners; Member of the Standing Advisory Group to the Public Company Accounting Oversight Board; Director of VanEck ICAV (an Irish UCITS); VanEck Vectors UCITS ETF plc (an Irish UCITS). Formerly, Director of VanEck (a Luxembourg UCITS); Chairman of the Board of the New York Classical Theatre. |
| | | | | | | | | |
Jane DiRenzo Pigott
1957 (I) | | Trustee (since 2007); Chairperson of the Board (since 2020) | | Managing Director, R3 Group LLC (consulting firm). | | 11 | | Trustee of Northwestern University, Lyric Opera of Chicago and the Chicago Symphony Orchestra. Formerly, Director and Chair of Audit Committee of 3E Company (services relating to hazardous material safety); Director of MetLife Investment Funds, Inc. |
| | | | | | | | | |
R. Alastair Short
1953 (A)(I) | | Trustee (since 2004); Chairperson of the Audit Committee (since 2006) | | President, Apex Capital Corporation (personal investment vehicle). | | 66 | | Chairman and Independent Director, EULAV Asset Management; Trustee, Kenyon Review; Trustee, Children’s Village. Formerly, Independent Director, Tremont offshore funds. |
VANECK FUNDS
BOARD OF TRUSTEES AND OFFICERS
December 31, 2019 (unaudited) (continued)
Trustee’s Name,
Address(1)and
Year of Birth | | Position(s) Held With Trust,
Term of Office(2)and
Length of Time Served | | Principal Occupation(s)
During Past Five Years | | Number of
Portfolios
In Fund
Complex(3)
Overseen
By Trustee | | Other Directorships Held Outside The
Fund Complex(3)During The Past Five Years |
| | | | | | | | | |
Richard D. Stamberger
1959 (G)(I) | | Trustee (since 1995) | | President and CEO, SmartBrief, Inc. (business media company). | | 66 | | Director, Food and Friends, Inc. |
| | | | | | | | | |
Robert L. Stelzl
1945 (G)(I) | | Trustee (since 2007); Chairperson of the Governance Committee (since 2017) | | Co-Trustee, the estate of Donald Koll; Trustee, Robert D. MacDonald Trust; Trustee, GH Insurance Trusts. Formerly, Trustee, Joslyn Family Trusts; President, Rivas Capital, Inc. (real estate property management services company). | | 11 | | Director, Brookfield Office Properties, Inc., Brookfield Residential Properties, Inc., Brookfield DTLA Fund Office Trust Investor, Inc., Brookfield Property Finance ULC and Brookfield Property Split Corp. |
| | | | | | | | | |
| Interested Trustee: | | | | | | | | |
| | | | | | | | | |
Jan F. van Eck(4)
1963 (I) | | Trustee (Since 2019); Chairperson of the Investment Oversight Committee (since 2020); Chief Executive Officer and President (Since 2010) | | Director, President and Chief Executive Officer of Van Eck Associates Corporation (VEAC), Van Eck Absolute Return Advisers Corporation (VEARA) and Van Eck Securities Corporation (VESC); Officer and/or Director of other companies affiliated with VEAC and/or the Trust. | | 66 | | Director, National Committee on US China Relations. |
| (1) | The address for each Trustee and officer is 666 Third Avenue, 9th Floor, New York, New York 10017. |
| (2) | Trustee serves until resignation, death, retirement or removal. |
| (3) | The Fund Complex consists of VanEck Funds, VanEck VIP Trust and VanEck Vectors ETF Trust. |
| (4) | “Interested person” of the Trust within the meaning of the 1940 Act. Mr. van Eck is an officer of VEAC, VEARA and VESC. In addition, Mr. van Eck and members of his family own 100% of the voting stock of VEAC, which in turns owns 100% of the voting stock of each of VEARA and VESC. |
| (A) | Member of the Audit Committee. |
| (G) | Member of the Governance Committee. |
| (I) | Member of the Investment Oversight Committee. |
Officer Information
The executive officers of the Trust, their age and address, the positions they hold with the Trust, their term of office and length of time served and their principal business occupations during the past five years are shown below:
Officer’s Name, Address(1)
And Year of Birth | | Position(s) Held With Trust | | Term of Office And
Length of Time Served(2) | | Principal Occupations During The Past Five Years |
| | | | | | | |
Matthew A. Babinsky,
1983 | | Assistant Vice President and Assistant Secretary | | Since 2016 | | Assistant Vice President, Assistant General Counsel and Assistant Secretary of VEAC, VEARA and VESC; Officer of other investment companies advised by VEAC and VEARA. Formerly, Associate, Clifford Chance US LLP. |
| | | | | | | |
Russell G. Brennan,
1964 | | Assistant Vice President and Assistant Treasurer | | Since 2008 | | Assistant Vice President of VEAC; Officer of other investment companies advised by VEAC and VEARA. |
| | | | | | | |
Charles T. Cameron,
1960 | | Vice President | | Since 1996 | | Portfolio Manager for VEAC; Officer and/or Portfolio Manager of other investment companies advised by VEAC and VEARA. Formerly, Director of Trading of VEAC. |
| | | | | | | |
John J. Crimmins,
1957 | | Vice President, Treasurer, Chief Financial Officer and Principal Accounting Officer | | Vice President, Chief Financial Officer and Principal Accounting Officer (since 2012); Treasurer (since 2009) | | Vice President of VEAC and VEARA; Officer of other investment companies advised by VEAC and VEARA. Formerly, Vice President of VESC. |
| | | | | | | |
F. Michael Gozzillo,
1965 | | Chief Compliance Officer | | Since 2018 | | Vice President and Chief Compliance Officer of VEAC and VEARA; Chief Compliance Officer of VESC; Officer of other investment companies advised by VEAC and VEARA. Formerly, Chief Compliance Officer of City National Rochdale, LLC and City National Rochdale Funds. |
| | | | | | | |
Laura Hamilton,
1977 | | Vice President | | Since 2019 | | Assistant Vice President of VEAC and VESC; Officer of other investment companies advised by VEAC and VEARA. Formerly, Operations Manager of Royce & Associates. |
VANECK FUNDS
BOARD OF TRUSTEES AND OFFICERS
December 31, 2019 (unaudited) (continued)
Officer’s Name, Address(1)
And Year of Birth | | Position(s) Held With Trust | | Term of Office And
Length of Time Served(2) | | Principal Occupations During The Past Five Years |
| | | | | | | |
Laura I. Martínez,
1980 | | Vice President and Assistant Secretary | | Vice President (since 2016); Assistant Secretary (since 2008) | | Vice President, Associate General Counsel and Assistant Secretary of VEAC, VEARA and VESC; Officer of other investment companies advised by VEAC and VEARA. Formerly, Assistant Vice President of VEAC, VEARA and VESC. |
| | | | | | | |
James Parker,
1969 | | Assistant Treasurer | | Since 2014 | | Assistant Vice President of VEAC, Manager, Portfolio Administration of VEAC and VEARA; Officer of other investment companies advised by VEAC and VEARA. |
| | | | | | | |
Jonathan R. Simon,
1974 | | Senior Vice President; Secretary and Chief Legal Officer | | Senior Vice President (since 2016); Secretary and Chief Legal Officer (since 2014) | | Senior Vice President, General Counsel and Secretary of VEAC, VEARA and VESC; Officer and/or Director of other companies affiliated with VEAC and/or the Trust. Formerly, Vice President of VEAC, VEARA and VESC. |
| (1) | The address for each Executive Officer is 666 Third Avenue, 9th Floor, New York, NY 10017. |
| (2) | Officers are elected yearly by the Board. |
This report is intended for the Fund’s shareholders. It may not be distributed to prospective investors unless it is preceded or accompanied by the Fund’s prospectus and summary prospectus, which includes more complete information. Investing involves substantial risk and high volatility, including possible loss of principal. An investor should consider the investment objective, risks, and charges and expenses of the Fund carefully before investing. To obtain a prospectus and summary prospectus, which contains this and other information, call 800.826.2333 or visit vaneck.com. Please read the prospectus and summary prospectus carefully before investing.
Additional information about VanEck Funds (the “Trust”) Board of Trustees/Officers and a description of the policies and procedures the Trust uses to determine how to vote proxies relating to portfolio securities are provided in the Statement of Additional Information. The Statement of Additional Information and information regarding how the Trust voted proxies relating to portfolio securities during the most recent twelve month period ending June 30 is available, without charge, by calling 800.826.2333, or by visiting vaneck.com, or on the Securities and Exchange Commission’s website at https://www.sec.gov.
The Trust files its complete schedule of portfolio holdings with the Securities and Exchange Commission for the first and third quarters of each fiscal year on Form N-PORT. The Trust’s Form N-PORT filings are available on the Commission’s website at https://www.sec.gov and may be reviewed and copied at the Commission’s Public Reference Room in Washington, D.C. Information on the operation of the Public Reference Room may be obtained by calling 202.942.8090. The Fund’s complete schedule of portfolio holdings is also available by calling 800.826.2333 or by visiting vaneck.com.

| Investment Adviser: | Van Eck Associates Corporation | |
| Distributor: | Van Eck Securities Corporation
666 Third Avenue, New York, NY 10017
vaneck.com | |
| Account Assistance: | 800.544.4653 | EMEAR |
 | ANNUAL REPORT December 31, 2019 |
VanEck Funds
Global Hard Assets Fund
International Investors Gold Fund
Certain information contained in this report represents the opinion of the investment adviser and may change at any time. This information is not intended to be a forecast of future events, a guarantee of future results or investment advice. Current market conditions may not continue. Also, unless otherwise specifically noted, any discussion of the Funds’ holdings, the Funds’ performance, and the views of the investment adviser are as of December 31, 2019.
PRIVACY NOTICE
(unaudited)
| FACTS | WHAT DOES VAN ECK DO WITH YOUR
PERSONAL INFORMATION? |
| Why? | Financial companies choose how they share your personal information. Federal law gives consumers the right to limit some but not all sharing. Federal law also requires us to tell you how we collect, share, and protect your personal information. Please read this notice carefully to understand what we do. |
| What? | The types of personal information we collect and share depend on the product or service you have with us. This information can include: ■ Social Security number and account balances ■ assets and payment history ■ risk tolerance and transaction history |
| How? | All financial companies need to share customers’ personal information to run their everyday business. In the section below, we list the reasons financial companies can share their customers’ personal information; the reasons Van Eck chooses to share; and whether you can limit this sharing. |
Reasons we can share your personal
information | Does Van Eck share? | Can you limit this
sharing? |
| For our everyday business purposes— such as to process your transactions, maintain your account(s), respond to court orders and legal investigations, or report to credit bureaus | Yes | No |
| For our marketing purposes— to offer our products and services to you | Yes | No |
| For joint marketing with other financialcompanies | Yes | No |
| For our affiliates’ everyday businesspurposes— information about your transactions and experiences | Yes | No |
| For our affiliates’ everyday businesspurposes— information about your creditworthiness | No | We don’t share |
| For our affiliates to market to you | Yes | Yes |
| For nonaffiliates to market to you | No | We don’t share |
| To limit our sharing | Call us at 1-800-826-2333. Please note: |
If you are a new customer, we can begin sharing your information 30 days from the date we sent this notice. When you are no longer our customer, we continue to share your information as described in this notice. However, you can contact us at any time to limit our sharing. |
| Questions? | Call us at 1-800-826-2333. |
PRIVACY NOTICE
(unaudited) (continued)
| Who we are | |
| Who is providing this notice? | Van Eck Global, its affiliates and funds sponsored or managed by Van Eck (collectively “Van Eck”). |
| What we do | |
| How does Van Eck protect my personal information? | To protect your personal information from unauthorized access and use, we use security measures that comply with federal law. These measures include computer safeguards and secured files and buildings. |
| How does Van Eck collect my personal information? | We collect your personal information, for example, when you ■ open an account or give us your income information ■ provide employment information or give us your contact information ■ tell us about your investment or retirement portfolio We also collect your personal information from others, such as credit bureaus, affiliates, or other companies. |
| Why can’t I limit all sharing? | Federal law gives you the right to limit only ■ sharing for affiliates’ everyday business purposes—information about your creditworthiness ■ affiliates from using your information to market to you ■ sharing for nonaffiliates to market to you State laws and individual companies may give you additional rights to limit sharing. See below for more on your rights under state law. |
| What happens when I limit sharing for an account I hold jointly with someone else? | Your choices will apply to everyone on your account – unless you tell us otherwise |
| Definitions | |
| Affiliates | Companies related by common ownership or control. They can be financial and nonfinancial companies. ■ Our affiliates include companies with a Van Eck name such as Van Eck Securities Corporation and others such as Market Vectors Index Solutions GmbH. |
| Nonaffiliates | Companies not related by common ownership or control. They can be financial and nonfinancial companies. ■ Van Eck does not share with nonaffiliates so they can market to you. |
| Joint marketing | A formal agreement between nonaffiliated financial companies that together market financial products or services to you. ■ Our joint marketing partners include financial services companies |
| Other important information |
California Residents— In accordance with California law, we will not share information we collect about California residents with nonaffiliates except as permitted by law, such as with the consent of the customer or to service the customer’s accounts. We also will limit the sharing of information about you with our affiliates to the extent required by applicable California law. Vermont Residents— In accordance with Vermont law, we will not share information we collect about Vermont residents with nonaffiliates except as permitted by law, such as with the consent of the customer or to service the customer’s accounts. We will not share creditworthiness information about Vermont residents among Van Eck’s affiliates except with the authorization or consent of the Vermont resident. |
VANECK FUNDS
PRESIDENT’S LETTER
December 31, 2019 (unaudited)
Dear Shareholders:
The story for 2019 was simple and familiar—slower economic growth was combated by expansive monetary policy.
But first a comment on global growth: the two engines of the global economy, the U.S. and China, continue to move forward and we now have the prospect of at least some resolution of the trade dispute between them in the phase-one agreement. The latest economic statistics from China are steady and there are signs of “green shoots.” China’s services sector is expanding robustly and manufacturing is struggling, but not collapsing. My blog,China’s Economic Growth: Continuing Despite Headlines, shows this in two charts.
The biggest event in the markets last summer was the surge in bonds in Europe with negative interest rates. At the end of September, nearly $15 trillion worth of debt globally carried a negative yield.1Despite moves by the European Central Bank to stimulate, not only is the European economy slowing down, but there are also concerns about just how effective central bank actions are. Looking forward, therefore, I think investors should assess their hedge against central bank uncertainty by considering, for example, their gold allocations. While high interest rate environments tend to be tough for gold (it does not pay any yield), against negative interest rates, gold and other hedges against central bank impotence should be strongly considered.
We encourage you to stay in touch with us through the videos, email subscriptions and research blogs available on our website, www.vaneck.com. I have started my own email subscription where I share interesting research—you can sign up on www.vaneck.com. Should you have any questions regarding fund performance, please contact us at 800.826.2333 or visit ourwebsite.
VANECK FUNDS
PRESIDENT’S LETTER
(unaudited) (continued)
We sincerely thank you for investing in VanEck’s investment strategies. On the following pages, you will find a performance discussion and financial statements for the fund for the twelve month period ended December 31, 2019. As always, we value your continued confidence in us and look forward to helping you meet your investment goals in the future.

Jan F. van Eck
CEO and President
VanEck Funds
January 24, 2020
Investing involves substantial risk and high volatility, including possible loss of principal. An investor should consider the investment objective, risks, charges and expenses of the Funds carefully before investing. To obtain a prospectus and summary prospectus, which contain this and other information, call 800.826.2333 or visit vaneck.com. Please read the prospectus and summary prospectus carefully before investing.
| 1 | Financial Times: September was the busiest month ever for corporate debt issuance, September 30, 2019, https://www.ft.com/content/eef8234c-e3c0-11e9-b112-9624ec9edc59 |
GLOBAL HARD ASSETS FUND
MANAGEMENT DISCUSSION
December 31, 2019 (unaudited)
The Global Hard Assets Fund (the “Fund”) gained 11.64% (Class A shares, excluding sales charge) for the 12 months ended December 31, 2019, underperforming the S&P®North American Natural Resources Sector Index (SPGINRTR)1which gained 17.63%. The most significant impact on the natural resources market and the Fund stemmed from continuing concerns around trade and how they weighed on global growth. In addition, fears around a slowdown in growth in China and a strong U.S. led to less than ideal conditions in emerging markets. In the second half of the year, these were joined by concerns both around Brexit (and what it might mean for an already weak Europe) and political events in the U.S.
Market Review
The biggest takeaway for crude oil and energy stocks was that, on the one hand, the price of crude oil rose during the year, West Texas Intermediate (WTI) was up over 34% and, on the other hand, the performance of energy equities was disappointing. Despite the fact that any lasting effect on the price of oil due to the September attacks on both Saudi Arabia’s largest oil-processing center at Abqaiq and its Khurais oil field appeared to be minimal, crude oil prices firmed on the back of a number of other developments in the market during the year, including “OPEC+” quota cuts and the huge Saudi Aramco IPO in early December. (We believe we shall see further positive ramifications of this offering in 2020.) In addition, oil consumption in the fourth quarter of 2019 was forecast by U.S. Energy Information Administration to hit an all-time record high of 101.6 million barrels per day (mbd), over 1 mbd greater than in 2018.2Despite increasing evidence of the effectiveness of capital discipline (optimizing cash generation from current operations) and with the industry starting to deliver free cash flow, energy stocks continued to languish.
We also saw some further consolidation within the shale oil and gas exploration and production space during the year. Of particular note was the completion, in early-August, of Occidental Petroleum Corporation’s purchase of Anadarko Petroleum Corporation in a deal that was seen as further diversifying Occidental’s asset base. In another example, on October 14, in a deal seen as enhancing 2020 free cash flow and bolting on further acreage, Parsley Energy Inc. (4.2% of Fund net assets*) announced its acquisition of Jagged Peak Energy in all-stock transaction. In mid-December, as it sought to add acreage in the Delaware region of the field, Permian basin operator WPX Energy, Inc. (1.9% of Fund net
GLOBAL HARD ASSETS FUND
MANAGEMENT DISCUSSION
(unaudited) (continued)
assets*) announced it would purchase privately held Denver-based Felix Energy in a $2.5 billion deal.3Because of the deal, WPX Energy was able not only to initiate a dividend, but also to accelerate financial metrics.
After a volatile year, copper and aluminum finished the year somewhat stronger on the back of some alleviation of trade and geopolitical concerns. However, while, on the year, copper was up very slightly, 3.50%, aluminum ended the year down 1.95%. Nickel rallied significantly during 2019 (driven in particular by a reconfirmation by the Indonesian government of its restrictive export policy), to end up 31.20% on the year. Lead and zinc were, however, down on the year: 4.65% and 7.90% respectively.
In 2019, with the shift in the U.S. Federal Reserve’s policies and its funding rates, the interest environment became very favorable for gold. Real interest rates turned negative and such rates are nearly always a positive environment for gold. In addition, gold’s rise against most currencies in 2019 underlined rising risks, both financially and geopolitically, across the world.
As the industry appeared to consolidate further, in the fourth quarter of the year we also witnessed an unprecedented level of mergers and acquisitions (M&A) activity among gold mining companies. In November and December alone, announcements were made of seven M&A deals (involving 12 companies). Four of the deals were asset sales, with mid-tier companies buying non-core mining properties located in Canada, Australia and Senegal. The other three deals were mergers or acquisitions, each with a different structure.
Among other things, grains were negatively impacted by restrictions resulting from the trade stand-off. However, less than ideal weather during the overall planting and growing season provided some support for prices. On the fertilizer front, because of the weather, applications were way down on the year. That said, this bodes well for applications in 2020. However, while there has been oversupply (particularly of potash), the industry has responded, somewhat surprisingly, by shuttering some production. The nitrogen market, though, remains stable.
The energy transition continued, and distinctively changed pace during 2019, with everyone from integrated oil majors to the largest diversified mining companies implementing targeted strategies towards mitigating environmental impacts. We have, in addition, seen further investment in sustainably profitable alternative energy businesses.
Fund Review
Three key aspects that contributed to underperformance of the Fund relative to its benchmark were: significantly underweight positions and underperformance in the strongly performing oil and gas storage and transportation sub-industry (exposure to which remains, essentially, an interest rate “play”); overweight positions and underperformance in the oil and gas exploration and production sub-industry; and significantly underweight positions and underperformance in the oil and gas refining and marketing subindustries.
The sub-industries that made the strongest relative positive contributions were: gold; semiconductor equipment (solar energy); and packaged food and meat (to which the benchmark had no exposure).
The Fund’s top three performing individual positions were: semiconductor equipment company SolarEdge Technologies (3.0% of Fund net assets*), whose excellent performance was driven by strong global solar inverter demand and excellent cost control; gold mining company Barrick Gold (5.8% of Fund net assets*) for whom the integration with Randgold went well during 2019, following the completion of its merger at the very start of the year; and Agnico Eagle Mines (4.1% of Fund net assets*) which saw the successful start-ups of its Meliadine and Amaruq gold mines in Canada’s Nunavut territory.
The Fund’s three weakest performing companies were oil and gas exploration and production company Encana (1.9% of Fund net assets*), oil and gas storage and transport company Golar LNG (1.4% of Fund net assets*) and diversified metals and mining company Glencore (sold during the year). While Encana failed to dispel concerns about both its acquisition of Newfield and the sustainability of reserves in one of its key areas, the SCOOP/STACK in Oklahoma, for Golar, underperformance resulted from investor fatigue around the slow pace in recognizing cash flows as customer contracts (all already with long lead times) were pushed out because of the lack of urgency in securing capacity in a low gas price environment. The Fund exited its position in Glencore because of increased governance concerns after the announcement of a bribery investigation by U.K.’s Serious Fraud Office (SFO).
As a team staffed with former geologist and engineers, we have and will continue to emphasize a bottom-up investment approach—seeking to identify natural resource companies that we believe have the highest quality management teams and assets, trade at a significant discount to
GLOBAL HARD ASSETS FUND
MANAGEMENT DISCUSSION
(unaudited) (continued)
their intrinsic value and their peers, and that are well-positioned to deliver shareholder value over the long run.
For a full list of fund holdings, please visit www.vaneck.com. For more information or to access investment and market insights from the investment team, visit our web site or subscribe to our commentaries. To review timely updates related to the VanEck Global Hard Assets Fund, please visit www.vaneck.com/blogs/natural-resources. To subscribe to VanEck’s natural resources and commodities updates, please visit www.vaneck.com/subscribe.
As always, we value your continued confidence in us and look forward to helping you meet your investment goals in the future.
 | |  |
Shawn Reynolds
Portfolio Manager | | Charles T. Cameron
Deputy Portfolio Manager |
The Fund is subject to risks associated with concentrating its investments in Canadian issuers, commodities and commodity-linked derivatives, commodities and commodity-linked derivatives tax, derivatives, direct investments, emerging market securities, foreign currency transactions, foreign securities, other investment companies, management, market, operational, small- and medium-capitalization companies and hard assets sectors risks, including, precious metals and natural resources, that can be significantly affected by events relating to these industries, including international political and economic developments, inflation, and other factors. The Fund’s portfolio securities may experience substantial price fluctuations as a result of these factors, and may move independently of the trends of industrialized companies. The Fund’s investments in foreign securities involve risks related to adverse political and economic developments unique to a country or a region, currency fluctuations or controls, and the possibility of arbitrary action by foreign governments, including the takeover of property without adequate compensation or imposition of prohibitive taxation. Please see the prospectus and summary prospectus for information on these and other risk considerations.
Represents the opinions of the investment adviser. Past performance is no guarantee of future results. Not intended to be a forecast of future events, a guarantee of future results or investment advice. Current market conditions may not continue.
*All Fund assets referenced are Total Net Assets as of December 31, 2019.
All indices are unmanaged and include the reinvestment of all dividends, but do not reflect the payment of transaction costs, advisory fees or expenses that are associated with an investment in the Fund. Certain indices may take into account withholding taxes. An index’s performance is not illustrative of the Fund’s performance. Indices are not securities in which investments can be made.
All investments involve the risk of loss.
| 1 | S&P®North American Natural Resources Sector (SPGINRTR) Index includes mining, energy, paper and forest products, and plantation-owning companies, but excludes the chemicals industry and steel sub-industry. |
| | |
| 2 | U.S. Energy Information Administration:Short-Term Energy Outlook (STEO),December 2019, https://www.eia.gov/outlooks/steo/pdf/steo_full.pdf |
| | |
| 3 | Reuters:WPX Energy expands in Delaware basin with $2.5 billion Felix deal,December 16, 2019, https://www.reuters.com/article/us-felix-energy-m-a-wpx-energy/wpx-energy-to-buy-delaware-basin-operator-felix-in-25-billion-deal-idUSKBN1YK14N |
INTERNATIONAL INVESTORS GOLD FUND
MANAGEMENT DISCUSSION
December 31, 2019 (unaudited)
The International Investors Gold Fund (the “Fund”) gained 38.03% (Class A shares, excluding sales charge) during the 12 months ended December 31, 2019, slightly underperforming the NYSE Arca Gold Miners Index1(GDMNTR) which posted returns of 40.89% during the same period. The smaller cap gold mining stocks, as represented by the MVIS Global Junior Gold Miners Index2(MVGDXJTR) gained 42.18%.
Market Review
In 2019, the gold market was positively impacted, on the one hand, by fears around global growth and the continuing trade dispute between the U.S. and China and, on the other hand, by the policy shifts of central banks around the world, in particular the U.S. Federal Reserve (Fed), toward a more accommodative stance. In June, the gold price experienced a significant and possibly historic breakout, blowing through two formidable technical barriers: the first was $1,365 an ounce on June 20; followed by $1,400 on June 21. The Fed kicked off the global easing cycle, as expected, on July 31 with its first interest rate cut since 2008. In August, gold’s rally continued as markets reacted to retaliatory threats and actions between the United States and China. Gold advanced to a six-year high of $1,557 on September 4. The gold price found support on September 12 when the European Central Bank cut deposit rates to -0.5% and announced that it would start buying $22 billion worth of debt beginning in November to try to avoid a eurozone recession. The gold market showed resilience until September 30, when U.S. dollar strength seemed to overwhelm the metal. Gold fell, entering what we view as an interim correction, consolidating its 2019 gains and trading in a narrow range between $1,450 and $1,520 per ounce during the last quarter of 2019.
The gold market appears resilient given the lack of strong catalysts lately. Although many measures of the U.S. economy have deteriorated, third quarter gross domestic product (GDP) growth, while anemic, came in above expectations and unemployment remains at historic lows. Nonetheless, we believe the potential for systemic financial stress is keeping the gold price elevated as a safe haven asset. Gold closed at $1,517.27 per ounce on December 31, recording an annual gain of $234.78 (18.31%).
Fund Review
At the end of December 2019, the Fund was almost fully invested in equities, with cash holdings representing 0.8% of net assets. The Fund held no gold bullion at the end of the period under review. The Fund
underperformed the benchmark by 2.86% largely due to positions in several majors. South African majors AngloGold Ashanti (1.7% of Fund net assets) and Gold Fields (0.6% of Fund net assets) performed well for the benchmark, however, the Fund has historically underweighted or avoided South African stocks due to elevated levels of operating, political, and social risk. Also, Mexican silver major Fresnillo (sold by the Fund during the period) underperformed due to geologic and operating issues that we believe may persist. As a result the Fund has exited its position.
The Fund’s top holding, Kirkland Lake (8.6% of Fund net assets†) was able to continue its outperformance (+69.6%) despite share price weakness in the fourth quarter brought on by its announced agreement to acquire Detour Gold in an all-stock deal. This acquisition will see the company join the ranks of the senior producers with pro forma 2019 production targeted at more than 1.5 million ounces of gold.
The Fund’s top junior holding, Continental Gold (2.2% of Fund net assets†) entered into an agreement to be acquired by Zijin Mining in an all-cash offer, propelling Continental’s share price to post a yearly gain of 150.0%. Continental’s Buritica mine in Colombia is expected to commence production in 2020.
Our largest Australian producer Evolution Mining (4.1% of Fund net assets†) underperformed (up 4.9% during 2019). The company reported slightly weaker than expected Q3 operating results, and increased its financial year 2020 cost guidance slightly, although its production guidance was unchanged. The company entered an agreement to purchase the Red Lake gold complex in Canada from Newmont (5.0% of Fund net assets†), which we view positively. However, the market tends to price in shorter-term risk for these transactions, resulting in weaker relative performance for the asset-acquiring company. Evolution Mining continues to be one of our preferred gold companies.
Access investment and market insights from VanEck’s investment professionals by subscribing to our commentaries. To subscribe to the gold and precious metals update, please visit vaneck.com/subscription.
We appreciate your continued investment in the International Investors Gold Fund, and we look forward to helping you meet your investment goals in the future.
The Fund is subject to the risks associated with concentrating its assets in the gold industry, which can be significantly affected by international
INTERNATIONAL INVESTORS GOLD FUND
MANAGEMENT DISCUSSION
(unaudited) (continued)
economic, monetary and political developments. The Fund’s overall portfolio may decline in value due to developments specific to the gold industry. The Fund’s investments in foreign securities involve risks related to adverse political and economic developments unique to a country or a region, currency fluctuations or controls, and the possibility of arbitrary action by foreign governments, including the takeover of property without adequate compensation or imposition of prohibitive taxation. The Fund is subject to risks associated with investments in derivatives, commodity linked instruments, illiquid securities, and small- or mid-cap companies.
The Fund is also subject to inflation risk, market risk, non-diversification risk, leverage risk, and risks of investments in a wholly owned subsidiary. Please see the prospectus and summary prospectus for information on these and other risk considerations.
 | |  |
Joseph M. Foster
Portfolio Manager | | Imaru Casanova
Deputy Portfolio Manager |
Represents the opinions of the investment adviser. Past performance is no guarantee of future results. Not intended to be a forecast of future events, a guarantee of future results or investment advice. Current market conditions may not continue.
| † | All Fund assets referenced are Total Net Assets as of December 31, 2019. |
All indices listed are unmanaged indices and include the reinvestment of all dividends, but do not reflect the payment of transaction costs, advisory fees or expenses that are associated with an investment in the Fund. Certain indices may take into account withholding taxes. An index’s performance is not illustrative of the Fund’s performance. Indices are not securities in which investments can be made.
| 1 | NYSE Arca Gold Miners (GDMNTR) Index is a market capitalization-weighted index comprised of publicly traded companies involved primarily in the mining for gold. |
| | |
| 2 | MVIS Global Junior Gold Miners Index (MVGDXJTR) is a rules-based, modified market capitalization-weighted, float-adjusted index comprised of a global universe of publicly traded small- and medium-capitalization companies that generate at least 50% of their revenues from gold and/or silver mining, hold real property that has the potential to produce at least 50% of the company’s revenue from gold or silver mining when developed, or primarily invest in gold or silver. |
GLOBAL HARD ASSETS FUND
PERFORMANCE COMPARISON
December 31, 2019 (unaudited)
This chart shows the value of a hypothetical $10,000 investment in the Fund over the past 10 years. The result is compared with the Fund’s benchmark, and a broad-based market index. Performance of Class C, Class I, and Class Y shares will vary from that of the Class A shares due to differences in class specific fees and any applicable sales charges. | | Hypothetical Growth of $10,000 (Ten Year: Class A) 
|
Average Annual
Total Return | | Class A
Before
Sales Charge | | Class A
After Maximum
Sales Charge | | Class C
Before
Sales Charge | | Class C
After Maximum
Sales Charge |
| One Year | | | 11.64 | % | | | 5.20 | % | | | 10.67 | % | | | 9.67 | % |
| Five Year | | | (5.83 | )% | | | (6.93 | )% | | | (6.58 | )% | | | (6.58 | )% |
| Ten Year | | | (3.16 | )% | | | (3.73 | )% | | | (3.93 | )% | | | (3.93 | )% |
| | | | | | | | | | | | | | | | | |
Average Annual
Total Return | | Class I* | | Class Y* | | SPGINRTR | | MSCI ACWI |
| One Year | | | 12.06 | % | | | 11.88 | % | | | 17.63 | % | | | 27.30 | % |
| Five Year | | | (5.45 | )% | | | (5.60 | )% | | | (1.41 | )% | | | 9.00 | % |
| Ten Year | | | (2.78 | )% | | | n/a | | | | 1.39 | % | | | 9.37 | % |
| Life^(annualized) | | | n/a | | | | (3.69 | )% | | | 0.84 | % | | | 9.32 | % |
| * | Classes are not subject to a sales charge |
| ^ | Since April 30, 2010 (Class Y) |
GLOBAL HARD ASSETS FUND
PERFORMANCE COMPARISON
(unaudited) (continued)
The performance quoted represents past performance. Past performance does not guarantee of future results; current performance may be lower or higher than the performance data quoted.
Investment return and value of shares of the Fund will fluctuate so that an investor’s shares, when redeemed, may be worth more or less than their original cost. Performance information reflects temporary waivers of expenses and/or fees. Had the Fund incurred all expenses, investment returns would have been reduced. Fund returns assume that dividends and capital gains distributions have been reinvested in the Fund at NAV. These returns do not reflect the deduction of taxes that a shareholder would pay on Fund dividends and distributions or the redemption of Fund shares. Performance information current to the most recent month end is available by calling 800.826.2333 or by visiting vaneck.com.
All indices are unmanaged and include the reinvestment of all dividends, but do not reflect the payment of transaction costs, advisory fees or expenses that are associated with an investment in the Fund. Certain indices may take into account withholding taxes. An index’s performance is not illustrative of the Fund’s performance. Indices are not securities in which investments can be made. Results reflect past performance and do not guarantee future results.
S&P®North American Natural Resources Sector Index (SPGINRTR) represents U.S. traded securities that are classified under the GICS®energy and materials sector excluding the chemicals industry and steel sub-industry (reflects no deduction for fees, expenses or taxes).
MSCI All Country World Index (MSCI ACWI) represents large- and mid-cap companies across developed and emerging market countries (reflects no deduction for fees, expenses or taxes).
INTERNATIONAL INVESTORS GOLD FUND
PERFORMANCE COMPARISON
December 31, 2019 (unaudited)
This chart shows the value of a hypothetical $10,000 investment in the Fund over the past 10 years. The result is compared with the Fund’s benchmark, and a broad-based market index. Performance of Class C, Class I, and Class Y shares will vary from that of the Class A shares due to differences in class specific fees and any applicable sales charges. | | Hypothetical Growth of $10,000 (Ten Year: Class A) 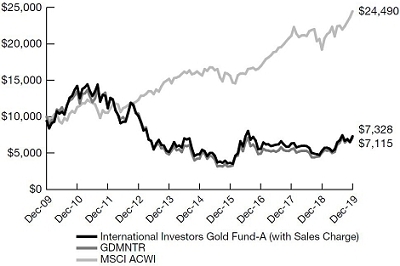
|
Average Annual
Total Return | | Class A
Before
Sales Charge | | Class A
After Maximum
Sales Charge | | Class C
Before
Sales Charge | | Class C
After Maximum
Sales Charge |
| One Year | | | 38.03 | % | | | 30.04 | % | | | 37.12 | % | | | 36.12 | % |
| Five Year | | | 8.63 | % | | | 7.35 | % | | | 7.80 | % | | | 7.80 | % |
| Ten Year | | | (2.49 | )% | | | (3.06 | )% | | | (3.22 | )% | | | (3.22 | )% |
| | | | | | | | | | | | | | | | | |
Average Annual
Total Return | | Class I* | | Class Y* | | GDMNTR | | MSCI ACWI |
| One Year | | | 38.61 | % | | | 38.52 | % | | | 40.89 | % | | | 27.30 | % |
| Five Year | | | 9.09 | % | | | 8.99 | % | | | 10.84 | % | | | 9.00 | % |
| Ten Year | | | (2.10 | )% | | | n/a | | | | (3.35 | )% | | | 9.37 | % |
| Life^(annualized) | | | n/a | | | | (3.62 | )% | | | (4.39 | )% | | | 9.32 | % |
| * | Classes are not subject to a sales charge |
| ^ | Since April 30, 2010 (Class Y) |
INTERNATIONAL INVESTORS GOLD FUND
PERFORMANCE COMPARISON
(unaudited) (continued)
The performance quoted represents past performance. Past performance does not guarantee future results; current performance may be lower or higher than the performance data quoted.
Investment return and value of shares of the Fund will fluctuate so that an investor’s shares, when redeemed, may be worth more or less than their original cost. Performance information reflects temporary waivers of expenses and/or fees. Had the Fund incurred all expenses, investment returns would have been reduced. Fund returns assume that dividends and capital gains distributions have been reinvested in the Fund at NAV. These returns do not reflect the deduction of taxes that a shareholder would pay on Fund dividends and distributions or the redemption of Fund shares. Performance information current to the most recent month end is available by calling 800.826.2333 or by visiting vaneck.com.
All indices are unmanaged and include the reinvestment of all dividends, but do not reflect the payment of transaction costs, advisory fees or expenses that are associated with an investment in the Fund. Certain indices may take into account withholding taxes. An index’s performance is not illustrative of the Fund’s performance. Indices are not securities in which investments can be made.
NYSE Arca Gold Miners Index (GDMNTR) is a modified market capitalization-weighted index comprised of publicly traded companies involved primarily in the mining for gold (reflects no deduction for fees, expenses or taxes except withholding taxes).
MSCI All Country World Index (MSCI ACWI) represents large- and mid-cap companies across developed and emerging market countries (reflects no deduction for fees, expenses or taxes except withholding taxes).
VANECK FUNDS
EXPLANATION OF EXPENSES
(unaudited)
As a shareholder of a Fund, you incur two types of costs: (1) transaction costs, including sales charges on purchase payments; and (2) ongoing costs, including management fees and other fund expenses. This disclosure is intended to help you understand the ongoing costs (in dollars) of investing in your Fund and to compare these costs with the ongoing costs of investing in other mutual funds.
The disclosure is based on an investment of $1,000 invested at the beginning of the period and held for the entire period, July 1, 2019 to December 31, 2019.
Actual Expenses
The first line in the table below provides information about account values and actual expenses. You may use the information in this line, together with the amount you invested, to estimate the expenses that you paid over the period. Simply divide your account value by $1,000 (for example, an $8,600 account value divided by $1,000 = 8.6), then multiply the result by the number in the first line under the heading entitled “Expenses Paid During the Period.”
Hypothetical Example for Comparison Purposes
The second line in the table below provides information about hypothetical account values and hypothetical expenses based on your Fund’s actual expense ratio and an assumed rate of return of 5% per year before expenses, which is not the Fund’s actual return. The hypothetical account values and expenses may not be used to estimate the actual ending account balance or expenses you paid for the period. You may use this information to compare the ongoing costs of investing in your Fund and other funds. To do so, compare this 5% hypothetical example with the 5% hypothetical examples that appear in the shareholder reports of other funds.
Please note that the expenses shown in the table are meant to highlight your ongoing costs only and do not reflect any transactional costs, such as fees on purchase payments. Therefore, the second line of the table is useful in comparing ongoing costs only, and will not help you determine the relative costs of owning different funds. In addition, if these transactional costs were included, your costs would have been higher.
VANECK FUNDS
EXPLANATION OF EXPENSES
(unaudited) (continued)
| | | | | Beginning
Account Value
July 1, 2019 | | Ending
Account Value
December 31,
2019 | | Annualized
Expense Ratio
During Period | | Expenses Paid
During the Period*
July 1, 2019 -
December 31,
2019 |
| Global Hard Assets Fund |
| Class A | | Actual | | $ | 1,000.00 | | | $ | 991.90 | | | | 1.39 | % | | $ | 6.98 | |
| | | Hypothetical** | | $ | 1,000.00 | | | $ | 1,018.20 | | | | 1.39 | % | | $ | 7.07 | |
| Class C | | Actual | | $ | 1,000.00 | | | $ | 987.80 | | | | 2.21 | % | | $ | 11.07 | |
| | | Hypothetical** | | $ | 1,000.00 | | | $ | 1,014.12 | | | | 2.21 | % | | $ | 11.22 | |
| Class I | | Actual | | $ | 1,000.00 | | | $ | 993.70 | | | | 0.96 | % | | $ | 4.82 | |
| | | Hypothetical** | | $ | 1,000.00 | | | $ | 1,020.37 | | | | 0.96 | % | | $ | 4.89 | |
| Class Y | | Actual | | $ | 1,000.00 | | | $ | 992.90 | | | | 1.14 | % | | $ | 5.73 | |
| | | Hypothetical** | | $ | 1,000.00 | | | $ | 1,019.46 | | | | 1.14 | % | | $ | 5.80 | |
| |
| International Investors Gold Fund |
| Class A | | Actual | | $ | 1,000.00 | | | $ | 1,131.70 | | | | 1.45 | % | | $ | 7.79 | |
| | | Hypothetical** | | $ | 1,000.00 | | | $ | 1,017.90 | | | | 1.45 | % | | $ | 7.38 | |
| Class C | | Actual | | $ | 1,000.00 | | | $ | 1,128.20 | | | | 2.20 | % | | $ | 11.80 | |
| | | Hypothetical** | | $ | 1,000.00 | | | $ | 1,014.12 | | | | 2.20 | % | | $ | 11.17 | |
| Class I | | Actual | | $ | 1,000.00 | | | $ | 1,134.70 | | | | 1.00 | % | | $ | 5.38 | |
| | | Hypothetical** | | $ | 1,000.00 | | | $ | 1,020.16 | | | | 1.00 | % | | $ | 5.09 | |
| Class Y | | Actual | | $ | 1,000.00 | | | $ | 1,134.30 | | | | 1.10 | % | | $ | 5.92 | |
| | | Hypothetical** | | $ | 1,000.00 | | | $ | 1,019.66 | | | | 1.10 | % | | $ | 5.60 | |
| * | Expenses are equal to the Fund’s annualized expense ratio (for the six months ended December 31, 2019), multiplied by the average account value over the period, multiplied by the number of days in the most recent fiscal half year divided by the number of the days in the fiscal year (to reflect the one-half year period). |
| | |
| ** | Assumes annual return of 5% before expenses |
GLOBAL HARD ASSETS FUND
SCHEDULE OF INVESTMENTS
December 31, 2019
Number
of Shares | | | | | Value | |
| | | | | | | |
| COMMON STOCKS: 96.9% | | | | |
| | | | | |
| Bermuda: 1.4% | | | |
| | 671,700 | | | Golar LNG Ltd. (USD) † | | $ | 9,551,574 | |
| Canada: 24.1% | | | | |
| | 469,206 | | | Agnico-Eagle Mines Ltd. (USD) | | | 28,907,782 | |
| | 2,192,145 | | | Barrick Gold Corp. (USD) | | | 40,751,975 | |
| | 2,935,384 | | | Encana Corp. (USD) † | | | 13,766,951 | |
| | 2,711,400 | | | First Quantum Minerals Ltd. | | | 27,499,240 | |
| | 2,264,500 | | | Kinross Gold Corp. (USD) * | | | 10,733,730 | |
| | 1,270,600 | | | Lundin Mining Corp. † | | | 7,592,974 | |
| | 505,271 | | | Nutrien Ltd. (USD) | | | 24,207,534 | |
| | 939,100 | | | Teck Resources Ltd. (USD) | | | 16,312,167 | |
| | | | | | | | 169,772,353 | |
| Cayman Islands: 0.4% | | | | |
| | 309,200 | | | Alussa Energy Acquisition Corp. (USD) * | | | 3,116,736 | |
| Israel: 3.0% | | | | |
| | 222,000 | | | SolarEdge Technologies, Inc. (USD) * | | | 21,109,980 | |
| Netherlands: 1.3% | | | | |
| | 157,100 | | | Royal Dutch Shell Plc (ADR) † | | | 9,421,287 | |
| United Kingdom: 7.5% | | | | |
| | 934,800 | | | Anglo American Plc # | | | 26,854,854 | |
| | 436,000 | | | Rio Tinto Plc (ADR) † | | | 25,880,960 | |
| | | | | | | | 52,735,814 | |
| United States: 59.2% | | | | |
| | 183,100 | | | Brigham Minerals, Inc. | | | 3,925,664 | |
| | 119,600 | | | Bunge Ltd. | | | 6,882,980 | |
Number
of Shares | | | | | Value | |
| | | | | | | | | |
| United States: (continued) | | | | |
| | 454,100 | | | Cabot Oil & Gas Corp. | | $ | 7,905,881 | |
| | 579,500 | | | CF Industries Holdings, Inc. | | | 27,665,330 | |
| | 116,034 | | | Chart Industries, Inc. * | | | 7,831,135 | |
| | 172,300 | | | Chevron Corp. | | | 20,763,873 | |
| | 142,000 | | | Cimarex Energy Co. | | | 7,453,580 | |
| | 835,300 | | | CNX Resources Corp. * | | | 7,392,405 | |
| | 267,982 | | | Concho Resources, Inc. | | | 23,467,184 | |
| | 245,066 | | | Corteva, Inc. | | | 7,244,151 | |
| | 303,968 | | | Diamondback Energy, Inc. | | | 28,226,468 | |
| | 44,666 | | | Dow, Inc. | | | 2,444,570 | |
| | 44,666 | | | DuPont de Nemours, Inc. | | | 2,867,557 | |
| | 189,600 | | | EOG Resources, Inc. | | | 15,880,896 | |
| | 574,291 | | | Hannon Armstrong Sustainable Infrastructure Capital, Inc. † | | | 18,480,684 | |
| | 50,500 | | | IPG Photonics Corp. * † | | | 7,318,460 | |
| | 222,000 | | | Kirby Corp. * | | | 19,875,660 | |
| | 303,400 | | | Louisiana-Pacific Corp. | | | 9,001,878 | |
| | 683,755 | | | Newmont Mining Corp. | | | 29,709,155 | |
| | 134,600 | | | Ormat Technologies, Inc. | | | 10,030,392 | |
| | 1,563,200 | | | Parsley Energy, Inc. | | | 29,560,112 | |
| | 386,300 | | | PBF Energy, Inc. | | | 12,118,231 | |
| | 373,300 | | | PDC Energy, Inc. * | | | 9,769,261 | |
| | 186,700 | | | Pioneer Natural Resources Co. | | | 28,260,779 | |
| | 397,800 | | | ProPetro Holding Corp. * | | | 4,475,250 | |
| | 180,990 | | | Solaris Oilfield Infrastructure, Inc. † | | | 2,533,860 | |
| | 258,000 | | | Steel Dynamics, Inc. | | | 8,782,320 | |
See Notes to Financial Statements
GLOBAL HARD ASSETS FUND
SCHEDULE OF INVESTMENTS
(continued)
Number
of Shares | | | | | Value | |
| | | | | | | |
| United States: (continued) | | | | |
| | 998,400 | | | Sunrun, Inc. * † | | $ | 13,787,904 | |
| | 689,000 | | | Transocean Ltd. * † | | | 4,740,320 | |
| | 192,400 | | | Tyson Foods, Inc. | | | 17,516,096 | |
| | 323,600 | | | Viper Energy Partners LP | | | 7,979,976 | |
| | 992,400 | | | WPX Energy, Inc. * | | | 13,635,576 | |
| | | | | | | | 417,527,588 | |
Total Common Stocks
(Cost: $517,977,705) | | | 683,235,332 | |
MONEY MARKET FUND: 3.7%
(Cost: $26,082,615) | | | | |
| | 26,082,616 | | | Invesco Treasury Portfolio – Institutional Class | | | 26,082,615 | |
Total Investments Before Collateral for
Securities Loaned: 100.6%
(Cost: $544,060,320) | | | 709,317,947 | |
Number
of Shares | | | | | Value | |
| | | | | | | | | |
SHORT-TERM INVESTMENT HELD AS COLLATERAL FOR
SECURITIES ON LOAN: 0.0% | | |
| | | | | |
Money Market Fund: 0.0%
(Cost: $202,752) | | | | |
| | 202,752 | | | State Street Navigator Securities Lending Government Money Market Portfolio | | $ | 202,752 | |
Total Investments: 100.6%
(Cost: $544,263,072) | | | 709,520,699 | |
| Liabilities in excess of other assets: (0.6)% | | | (4,368,639 | ) |
| NET ASSETS: 100.0% | | $ | 705,152,060 | |
| Definitions: |
| ADR | American Depositary Receipt |
| USD | United States Dollar |
| | |
| Footnotes: |
| * | Non-income producing |
| † | Security fully or partially on loan. Total market value of securities on loan is $68,448,004. |
| # | Security has been valued in good faith pursuant to guidelines established by the Board of Trustees. The aggregate value of fair valued securities is $26,854,854 which represents 3.8% of net assets. |
See Notes to Financial Statements
Summary of Investments by
Sector Excluding Collateral
for Securities Loaned | | % of Investments | | Value | |
| Consumer Staples | | | | 3.4 | % | | $ | 24,399,076 | |
| Energy | | | | 37.2 | | | | 263,945,864 | |
| Industrials | | | | 5.9 | | | | 41,494,699 | |
| Information Technology | | | | 4.0 | | | | 28,428,440 | |
| Materials | | | | 41.8 | | | | 296,456,177 | |
| Real Estate | | | | 2.6 | | | | 18,480,684 | |
| Utilities | | | | 1.4 | | | | 10,030,392 | |
| Money Market Fund | | | | 3.7 | | | | 26,082,615 | |
| | | | | 100.0 | % | | $ | 709,317,947 | |
The summary of inputs used to value the Fund’s investments as of December 31, 2019 is as follows:
| | | Level 1
Quoted
Prices | | | Level 2
Significant
Observable
Inputs | | | Level 3
Significant
Unobservable
Inputs | | Value | |
| Common Stocks | | | | | | | | | | | | | | | | | |
| Bermuda | | $ | 9,551,574 | | | $ | — | | | | $ | — | | | $ | 9,551,574 | |
| Canada | | | 169,772,353 | | | | — | | | | | — | | | | 169,772,353 | |
| Cayman Islands | | | 3,116,736 | | | | — | | | | | — | | | | 3,116,736 | |
| Israel | | | 21,109,980 | | | | — | | | | | — | | | | 21,109,980 | |
| Netherlands | | | 9,421,287 | | | | — | | | | | — | | | | 9,421,287 | |
| United Kingdom | | | 25,880,960 | | | | 26,854,854 | | | | | — | | | | 52,735,814 | |
| United States | | | 417,527,588 | | | | — | | | | | — | | | | 417,527,588 | |
| Money Market Funds | | | 26,285,367 | | | | — | | | | | — | | | | 26,285,367 | |
| Total | | $ | 682,665,845 | | | $ | 26,854,854 | | | | $ | — | | | $ | 709,520,699 | |
See Notes to Financial Statements
INTERNATIONAL INVESTORS GOLD FUND
CONSOLIDATED SCHEDULE OF INVESTMENTS
December 31, 2019
Number
of Shares | | | | | Value | |
| | | | | |
| COMMON STOCKS: 98.4% | | | | |
| | | | | |
| Australia: 19.2% | | | | |
| | 26,099,415 | | | Bellevue Gold Ltd. * # | | $ | 9,816,780 | |
| | 20,068,720 | | | Cardinal Resources Ltd. * | | | 4,224,967 | |
| | 11,164,287 | | | Evolution Mining Ltd. # | | | 29,679,517 | |
| | 20,358,805 | | | Gold Road Resources Ltd. * # | | | 19,061,279 | |
| | 733,625 | | | Newcrest Mining Ltd. # | | | 15,493,406 | |
| | 3,342,300 | | | Northern Star Resources Ltd. # | | | 26,340,202 | |
| | 3,949,057 | | | OceanaGold Corp. (CAD) | | | 7,754,877 | |
| | 6,255,748 | | | Saracen Mineral Holdings Ltd. * # | | | 14,507,423 | |
| | 42,277,400 | | | West African Resources Ltd. * # | | | 12,724,349 | |
| | | | | | | | 139,602,800 | |
| Canada: 69.5% | | | | |
| | 679,600 | | | Agnico-Eagle Mines Ltd. (USD) † | | | 41,870,156 | |
| | 2,282,914 | | | Alamos Gold, Inc. (USD) | | | 13,743,142 | |
| | 1,008,885 | | | Auryn Resources, Inc. * † | | | 1,456,747 | |
| | 13,564,636 | | | B2Gold Corp. (USD) † | | | 54,394,190 | |
| | 2,763,100 | | | Barrick Gold Corp. (USD) | | | 51,366,029 | |
| | 1,857,800 | | | Bear Creek Mining Corp. * † | | | 3,920,043 | |
| | 667,000 | | | Bear Creek Mining Corp. (USD) * | | | 1,413,306 | |
| | 948,000 | | | Bear Creek Mining Corp. (USD) * ø | | | 2,008,717 | |
| | 3,784,730 | | | Bonterra Resources, Inc. * † | | | 6,557,809 | |
| | 4,424,800 | | | Columbus Gold Corp. * | | | 545,199 | |
| | 3,842,640 | | | Continental Gold, Inc. * | | | 15,831,600 | |
Number
of Shares | | | | | Value | |
| | | | | |
| Canada: (continued) | | | | |
| | 6,775,859 | | | Corvus Gold, Inc. ‡ * † | | $ | 11,218,742 | |
| | 425,200 | | | Detour Gold Corp. * | | | 8,231,896 | |
| | 3,456,200 | | | Eastmain Resources, Inc. * † | | | 279,466 | |
| | 1,839,000 | | | Eastmain Resources, Inc. (USD) * # ø | | | 164,958 | |
| | 481,000 | | | Eastmain Resources, Inc. (USD) * # | | | 43,146 | |
| | 1,068,400 | | | Equinox Gold Corp. (USD) * † | | | 8,226,680 | |
| | 3,033,227 | | | First Mining Gold Corp. * † | | | 595,643 | |
| | 4,470,444 | | | Gold Standard Ventures Corp. (USD) * | | | 3,826,700 | |
| | 4,434,700 | | | Kinross Gold Corp. (USD) * | | | 21,020,478 | |
| | 1,420,184 | | | Kirkland Lake Gold Ltd. (USD) | | | 62,587,509 | |
| | 3,840,129 | | | Leagold Mining Corp. * † | | | 9,551,898 | |
| | 18,683,482 | | | Liberty Gold Corp. ‡ * † | | | 15,682,873 | |
| | 3,166,000 | | | Liberty Gold Corp. ‡ * # ø | | | 2,603,383 | |
| | 742,500 | | | Lundin Gold, Inc. * | | | 4,763,024 | |
| | 3,509,000 | | | Marathon Gold Corp. * # ø | | | 4,500,508 | |
| | 70,000 | | | Marathon Gold Corp. * † | | | 91,641 | |
| | 2,614,200 | | | Midas Gold Corp. * † | | | 1,268,296 | |
| | 3,188,400 | | | Nighthawk Gold Corp. * † | | | 1,276,784 | |
| | 542,600 | | | NovaGold Resources, Inc. (USD) * | | | 4,861,696 | |
| | 3,375,000 | | | Orezone Gold Corp. * # | | | 1,715,375 | |
See Notes to Financial Statements
Number
of Shares | | | | | Value | |
| | | | | |
| Canada: (continued) | | | | |
| | 9,083,675 | | | Orezone Gold Corp. * | | $ | 4,616,861 | |
| | 363,900 | | | Osisko Gold Royalties Ltd. (USD) | | | 3,533,469 | |
| | 5,102,100 | | | Osisko Mining, Inc. * † | | | 15,912,753 | |
| | 3,601,100 | | | Otis Gold Corp. * | | | 346,646 | |
| | 2,183,900 | | | Premier Gold Mines Ltd. * | | | 3,313,144 | |
| | 873,600 | | | Pretium Resources, Inc. (USD) * | | | 9,723,168 | |
| | 3,612,000 | | | Probe Metals, Inc. * | | | 3,198,799 | |
| | 15,825,100 | | | Pure Gold Mining, Inc. * † | | | 9,871,265 | |
| | 8,976,056 | | | Rio2 Ltd. * | | | 2,764,947 | |
| | 8,717,500 | | | Sabina Gold and Silver Corp. * | | | 12,889,454 | |
| | 4,380,307 | | | Semafo, Inc. * | | | 9,107,719 | |
| | 829,400 | | | SSR Mining, Inc. (USD) * | | | 15,974,244 | |
| | 1,192,800 | | | TMAC Resources, Inc. Reg S * | | | 3,472,168 | |
| | 1,124,086 | | | Wheaton Precious Metals Corp. (USD) | | | 33,441,558 | |
| | 5,374,109 | | | Yamana Gold, Inc. (USD) | | | 21,227,730 | |
| | | | | | | | 505,011,559 | |
| Monaco: 0.5% | | | | |
| | 197,079 | | | Endeavour Mining Corp. (CAD) * | | | 3,722,882 | |
| South Africa: 2.4% | | | | |
| | 564,300 | | | AngloGold Ashanti Ltd. (ADR) | | | 12,606,462 | |
| | 671,800 | | | Gold Fields Ltd. (ADR) | | | 4,433,880 | |
| | | | | | | | 17,040,342 | |
| United States: 6.8% | | | | |
| | 2,160,000 | | | Argonaut Gold, Inc. (CAD) * ø | | | 3,243,618 | |
Number
of Shares | | | | | Value | |
| | | | | | | | | |
| United States: (continued) | | | | |
| | 835,876 | | | Newmont Mining Corp. | | $ | 36,318,812 | |
| | 80,800 | | | Royal Gold, Inc. | | | 9,877,800 | |
| | | | | | | | 49,440,230 | |
Total Common Stocks
(Cost: $390,459,825) | | | 714,817,813 | |
| | | | | |
| WARRANTS: 0.8% | | | | |
| | | | | |
| Canada: 0.8% | | | | |
| | 2,072,000 | | | Alio Gold, Inc. (CAD 3.44, expiring 01/22/20) * # ∞ | | | 0 | |
| | 1,503,000 | | | Allegiant Gold Ltd. (CAD 1.20, expiring 01/30/20) * # ø ∞ | | | 0 | |
| | 352,000 | | | Bonterra Resources, Inc. (CAD 3.10, expiring 08/20/21) * # ø ∞ | | | 89,454 | |
| | 938,434 | | | Leagold Mining Corp. (CAD 3.70, expiring 05/24/20) * # ∞ | | | 168,023 | |
| | 10,822,000 | | | Liberty Gold Corp. (CAD 0.60, expiring 10/02/21) ‡ * # ∞ | | | 3,750,260 | |
| | 1,754,500 | | | Marathon Gold Corp. (CAD 1.60, expiring 09/30/21) * # ø ∞ | | | 486,404 | |
| | 1,975,000 | | | Probe Metals, Inc. (CAD 1.45, expiring 06/19/20) * # ∞ | | | 91,256 | |
| | 5,058,500 | | | Pure Gold Mining, Inc. (CAD 0.85, expiring 05/24/20) * # ∞ | | | 262,946 | |
| | 3,172,500 | | | Pure Gold Mining, Inc. (CAD 0.85, expiring 07/18/22) * # ∞ | | | 513,053 | |
Total Warrants
(Cost: $1,963,870) | | | 5,361,396 | |
See Notes to Financial Statements
INTERNATIONAL INVESTORS GOLD FUND
CONSOLIDATED SCHEDULE OF INVESTMENTS
(continued)
Number
of Shares | | | | | Value | |
| | | | | | | | | |
MONEY MARKET FUND: 0.8%
(Cost: $5,816,246) | | | | |
| | 5,816,246 | | | Invesco Treasury Portfolio – Institutional Class | | $ | 5,816,246 | |
Total Investments BeforeCollateral for
Securities Loaned: 100.0%
(Cost: $398,239,941) | | | 725,995,455 | |
Number
of Shares | | | | | Value | |
| | | | | | | | | |
| SHORT-TERM INVESTMENTHELD AS COLLATERAL FORSECURITIES ON LOAN: 0.3% | | | | |
| | | | | |
Money Market Fund: 0.3%
(Cost: $2,408,735) | | | | |
| | 2,408,735 | | | State Street Navigator Securities Lending Government Money Market Portfolio | | $ | 2,408,735 | |
Total Investments: 100.3%
(Cost: $400,648,676) | | | 728,404,190 | |
| Liabilities in excessof other assets: (0.3)% | | | (2,029,281 | ) |
| NET ASSETS: 100.0% | | $ | 726,374,909 | |
| Definitions: |
| ADR | American Depositary Receipt |
| CAD | Canadian Dollar |
| USD | United States Dollar |
| | |
| Footnotes: |
| ‡ | Affiliated issuer – as defined under the Investment Company Act of 1940. |
| * | Non-income producing |
| † | Security fully or partially on loan. Total market value of securities on loan is $6,021,212. |
| # | Security has been valued in good faith pursuant to guidelines established by the Board of Trustees. The aggregate value of fair valued securities is $142,011,722 which represents 19.6% of net assets. |
| Ø | Restricted Security – the aggregate value of restricted securities is $13,097,042, or 1.8% of net assets. |
| ∞ | Security is valued using pricing models and significant unobservable inputs that factor in volatility and discount for lack of marketability |
| Reg S | Security was purchased pursuant to Regulation S under the Securities Act of 1933, which exempts from registration securities offered and sold outside of the United States. Such a security cannot be sold in the United States without either an effective registration statement filed pursuant to the Securities Act of 1933, or pursuant to an exemption from registration. |
See Notes to Financial Statements
Restricted securities held by the Fund as of December 31, 2019 are as follows:
| Security | | Acquisition
Date | | Number of
Shares | | | | Acquisition
Cost | | | Value | | | % of
Net Assets |
| Allegiant Gold Ltd. Warrants | | 11/20/2017 | | | 1,503,000 | | | $ | 0 | | | $ | 0 | | | | 0.0 | % |
| Argonaut Gold, Inc. | | 11/13/2009 | | | 2,160,000 | | | | 10,383,442 | | | | 3,243,618 | | | | 0.4 | |
| Bear Creek Mining Corp. (USD) | | 08/15/2015 | | | 948,000 | | | | 2,865,267 | | | | 2,008,717 | | | | 0.3 | |
| Bonterra Resources, Inc. Warrants | | 08/16/2019 | | | 352,000 | | | | 144,120 | | | | 89,454 | | | | 0.0 | |
| Eastmain Resources, Inc. | | 06/13/2008 | | | 1,839,000 | | | | 2,503,501 | | | | 164,958 | | | | 0.0 | |
| Liberty Gold Corp. | | 09/06/2019 | | | 3,166,000 | | | | 1,320,918 | | | | 2,603,383 | | | | 0.4 | |
| Marathon Gold Corp. | | 09/26/2019 | | | 3,509,000 | | | | 3,295,167 | | | | 4,500,508 | | | | 0.6 | |
| Marathon Gold Corp. Warrants | | 09/26/2019 | | | 1,754,500 | | | | 194,009 | | | | 486,404 | | | | 0.1 | |
| | | | | | | | | $ | 20,706,424 | | | $ | 13,097,042 | | | | 1.8 | % |
Summary of Investments by
Sector Excluding Collateral
for Securities Loaned | | % of Investments | | Value | |
| Diversified Metals & Mining | | | | 0.3 | % | | $ | 1,944,317 | |
| Gold | | | | 91.1 | | | | 661,538,515 | |
| Precious Metals & Minerals | | | | 3.2 | | | | 23,254,819 | |
| Silver | | | | 4.6 | | | | 33,441,558 | |
| Money Market Fund | | | | 0.8 | | | | 5,816,246 | |
| | | | | 100.0 | % | | $ | 725,995,455 | |
See Notes to Financial Statements
INTERNATIONAL INVESTORS GOLD FUND
CONSOLIDATED SCHEDULE OF INVESTMENTS
(continued)
A summary of the Fund’s transactions in securities of affiliates for the year ended December 31, 2019 is set forth below:
| Affiliates | | Value
12/31/18 | | | Purchases | | | Sales
Proceeds | | | Realized
Gain
(Loss) | | | Dividend
Income | | | Net Change in
Unrealized
Appreciation
(Depreciation) | | | Value
12/31/19 | |
| Bonterra Resources, Inc. | | $ | 4,717,720 | | | $ | 3,493,671 | | | $ | (619,831 | ) | | $ | (660,553 | ) | | $ | — | | | $ | (373,198 | ) | | $ | — | (a) |
| Cardinal Resources Ltd. | | | 6,016,746 | | | | 208,677 | | | | (133,883 | ) | | | (86,268 | ) | | | — | | | | (1,780,305 | ) | | | — | (a) |
| Corvus Gold, Inc. | | | 13,494,316 | | | | 399,211 | | | | (827,695 | ) | | | 109,115 | | | | — | | | | (1,956,205 | ) | | | 11,218,742 | |
| Liberty Gold Corp. | | | 4,661,299 | | | | 440,104 | | | | (726,883 | ) | | | (559,776 | ) | | | — | | | | 11,868,129 | | | | 15,682,873 | |
| Liberty Gold Corp. ø | | | — | | | | 1,320,918 | | | | — | | | | — | | | | — | | | | 1,282,465 | | | | 2,603,383 | |
| Liberty Gold Corp. Warrant | | | 297,264 | | | | — | | | | — | | | | — | | | | — | | | | 3,452,996 | | | | 3,750,260 | |
| Rio2 Ltd. | | | 3,335,689 | | | | 125,276 | | | | (305,614 | ) | | | (652,021 | ) | | | — | | | | 261,617 | | | | — | (a) |
| | | $ | 32,523,034 | | | $ | 5,987,857 | | | $ | (2,613,906 | ) | | $ | (1,849,503 | ) | | $ | — | | | $ | 12,755,499 | | | $ | 33,255,258 | |
| (a) | Security held by the Fund, however not classified as an affiliate at the end of the reporting period. |
| ø | Restricted security |
The summary of inputs used to value the Fund’s investments as of December 31, 2019 is as follows:
| | | Level 1
Quoted
Prices | | | Level 2
Significant
Observable
Inputs | | | Level 3
Significant
Unobservable
Inputs | | | Value | |
| Common Stocks | | | | | | | | | | | | | | | | |
| Australia | | $ | 11,979,844 | | | $ | 127,622,956 | | | $ | — | | | $ | 139,602,800 | |
| Canada | | | 495,984,189 | | | | 9,027,370 | | | | — | | | | 505,011,559 | |
| Monaco | | | 3,722,882 | | | | — | | | | — | | | | 3,722,882 | |
| South Africa | | | 17,040,342 | | | | — | | | | — | | | | 17,040,342 | |
| United States | | | 49,440,230 | | | | — | | | | — | | | | 49,440,230 | |
| Warrants | | | | | | | | | | | | | | | | |
| Canada | | | — | | | | — | | | | 5,361,396 | | | | 5,361,396 | |
| Money Market Funds | | | 8,224,981 | | | | — | | | | — | | | | 8,224,981 | |
| Total | | $ | 586,392,468 | | | $ | 136,650,326 | | | $ | 5,361,396 | | | $ | 728,404,190 | |
See Notes to Financial Statements
GLOBAL HARD ASSETS FUND
STATEMENT OF ASSETS AND LIABILITIES
December 31, 2019
| Assets: | | | |
| Investments, at value (Cost $544,060,320) (1) | | $ | 709,317,947 | |
| Short-term investment held as collateral for securities loaned (2) | | | 202,752 | |
| Cash | | | 87,190 | |
| Receivables: | | | | |
| Shares of beneficial interest sold | | | 1,122,962 | |
| Dividends and interest | | | 572,344 | |
| Prepaid expenses | | | 36,908 | |
| Other assets | | | 26,237 | |
| Total assets | | | 711,366,340 | |
| Liabilities: | | | | |
| Payables: | | | | |
| Investments purchased | | | 385,257 | |
| Collateral for securities loaned | | | 202,752 | |
| Shares of beneficial interest redeemed | | | 3,670,893 | |
| Due to Adviser | | | 443,756 | |
| Due to Distributor | | | 35,456 | |
| Deferred Trustee fees | | | 830,657 | |
| Accrued expenses | | | 645,509 | |
| Total liabilities | | | 6,214,280 | |
| NET ASSETS | | $ | 705,152,060 | |
| Net Assets consist of: | | | | |
| Aggregate paid in capital | | $ | 1,653,302,993 | |
| Total distributable earnings (loss) | | | (948,150,933 | ) |
| | | $ | 705,152,060 | |
| (1) | Value of securities on loan | | $ | 68,448,004 | |
| (2) | Cost of short-term investment held as collateral for securities loaned | | $ | 202,752 | |
See Notes to Financial Statements
GLOBAL HARD ASSETS FUND
STATEMENT OF ASSETS AND LIABILITIES
(continued)
| Class A Shares: | | | |
| Net Assets | | $ | 118,028,697 | |
| Shares of beneficial interest outstanding | | | 4,158,092 | |
| Net asset value and redemption price per share | | $ | 28.39 | |
| Maximum offering price per share (Net asset value per share ÷ 94.25%) | | $ | 30.12 | |
| Class C Shares: | | | | |
| Net Assets | | $ | 12,698,489 | |
| Shares of beneficial interest outstanding | | | 523,250 | |
| (Redemption may be subject to a contingent deferred sales charge within the first year of ownership) | | $ | 24.27 | |
| Class I Shares: | | | | |
| Net Assets | | $ | 459,785,719 | |
| Shares of beneficial interest outstanding | | | 15,457,883 | |
| Net asset value, offering and redemption price per share | | $ | 29.74 | |
| Class Y Shares: | | | | |
| Net Assets | | $ | 114,639,155 | |
| Shares of beneficial interest outstanding | | | 3,963,132 | |
| Net asset value, offering and redemption price per share | | $ | 28.93 | |
See Notes to Financial Statements
INTERNATIONAL INVESTORS GOLD FUND
CONSOLIDATED STATEMENT OF ASSETS AND LIABILITIES
December 31, 2019
| Assets: | | | |
| Unaffiliated issuers (Cost $383,359,885) | | $ | 692,740,197 | |
| Affiliated issuers (Cost $14,880,056) | | | 33,255,258 | |
| Short-term investment held as collateral for securities loaned (2) | | | 2,408,735 | |
| Cash | | | 214 | |
| Cash denominated in foreign currency, at value (Cost $19,493) | | | 19,468 | |
| Receivables: | | | | |
| Investments sold | | | 5,950,044 | |
| Shares of beneficial interest sold | | | 904,146 | |
| Dividends and interest | | | 151,742 | |
| Prepaid expenses | | | 69,199 | |
| Other assets | | | 12,602 | |
| Total assets | | | 735,511,605 | |
| Liabilities: | | | | |
| Payables: | | | | |
| Investments purchased | | | 5,197,346 | |
| Collateral for securities loaned | | | 2,408,735 | |
| Shares of beneficial interest redeemed | | | 443,689 | |
| Due to Adviser | | | 321,878 | |
| Due to Distributor | | | 85,377 | |
| Deferred Trustee fees | | | 367,072 | |
| Accrued expenses | | | 312,599 | |
| Total liabilities | | | 9,136,696 | |
| NET ASSETS | | $ | 726,374,909 | |
| Net Assets consist of: | | | | |
| Aggregate paid in capital | | $ | 875,081,609 | |
| Total distributable earnings (loss) | | | (148,706,700 | ) |
| | | $ | 726,374,909 | |
| (1) | Value of securities on loan | | $ | 6,021,212 | |
| (2) | Cost of short-term investment held as collateral for securities loaned | | $ | 2,408,735 | |
See Notes to Financial Statements
INTERNATIONAL INVESTORS GOLD FUND
CONSOLIDATED STATEMENT OF ASSETS AND LIABILITIES
(continued)
| Class A Shares: | | | |
| Net Assets | | $ | 276,742,726 | |
| Shares of beneficial interest outstanding | | | 27,243,436 | |
| Net asset value and redemption price per share | | $ | 10.16 | |
| Maximum offering price per share (Net asset value per share ÷ 94.25%) | | $ | 10.78 | |
| Class C Shares: | | | | |
| Net Assets | | $ | 38,263,532 | |
| Shares of beneficial interest outstanding | | | 4,364,836 | |
| (Redemption may be subject to a contingent deferred sales charge within the first year of ownership) | | $ | 8.77 | |
| Class I Shares: | | | | |
| Net Assets | | $ | 235,795,829 | |
| Shares of beneficial interest outstanding | | | 17,703,701 | |
| Net asset value, offering and redemption price per share | | $ | 13.32 | |
| Class Y Shares: | | | | |
| Net Assets | | $ | 175,572,822 | |
| Shares of beneficial interest outstanding | | | 16,889,138 | |
| Net asset value, offering and redemption price per share | | $ | 10.40 | |
See Notes to Financial Statements
GLOBAL HARD ASSETS FUND
STATEMENT OF OPERATIONS
For the Year Ended December 31, 2019
| Income: | | | |
| Dividends | | $ | 22,070,332 | |
| Securities lending income | | | 11,908 | |
| Foreign taxes withheld | | | (407,113 | ) |
| Total income | | | 21,675,127 | |
| Expenses: | | | | |
| Management fees | | | 10,887,700 | |
| Distribution fees – Class A | | | 456,419 | |
| Distribution fees – Class C | | | 191,564 | |
| Transfer agent fees – Class A | | | 527,770 | |
| Transfer agent fees – Class C | | | 59,166 | |
| Transfer agent fees – Class I | | | 286,329 | |
| Transfer agent fees – Class Y | | | 270,650 | |
| Custodian fees | | | 35,535 | |
| Professional fees | | | 88,454 | |
| Registration fees – Class A | | | 19,266 | |
| Registration fees – Class C | | | 15,621 | |
| Registration fees – Class I | | | 12,650 | |
| Registration fees – Class Y | | | 21,920 | |
| Reports to shareholders | | | 144,644 | |
| Insurance | | | 82,687 | |
| Trustees’ fees and expenses | | | 83,572 | |
| Interest | | | 9,980 | |
| Other | | | 38,839 | |
| Total expenses | | | 13,232,766 | |
| Waiver of management fees | | | (1,609,168 | ) |
| Net expenses | | | 11,623,598 | |
| Net investment income | | | 10,051,529 | |
| Net realized loss on: | | | | |
| Investments sold | | | (56,266,827 | ) |
| Foreign currency transactions and foreign denominated assets and liabilities | | | (35,413 | ) |
| Net realized loss | | | (56,302,240 | ) |
| Net change in unrealized appreciation (depreciation) on: | | | | |
| Investments | | | 176,349,753 | |
| Foreign currency transactions and foreign denominated assets and liabilities | | | 895 | |
| Net change in unrealized appreciation (depreciation) | | | 176,350,648 | |
| Net Increase in Net Assets Resulting from Operations | | $ | 130,099,937 | |
See Notes to Financial Statements
INTERNATIONAL INVESTORS GOLD FUND
CONSOLIDATED STATEMENT OF OPERATIONS
For the Year Ended December 31, 2019
| Income: | | | |
| Dividends – unaffiliated issuers | | $ | 5,624,904 | |
| Securities lending income | | | 23,210 | |
| Foreign taxes withheld | | | (297,731 | ) |
| Total income | | | 5,350,383 | |
| Expenses: | | | | |
| Management fees | | | 4,679,595 | |
| Distribution fees – Class A | | | 585,196 | |
| Distribution fees – Class C | | | 349,297 | |
| Transfer agent fees – Class A | | | 399,799 | |
| Transfer agent fees – Class C | | | 68,407 | |
| Transfer agent fees – Class I | | | 68,996 | |
| Transfer agent fees – Class Y | | | 140,857 | |
| Administration fees | | | 1,607,671 | |
| Custodian fees | | | 49,873 | |
| Professional fees | | | 124,574 | |
| Registration fees – Class A | | | 50,555 | |
| Registration fees – Class C | | | 21,569 | |
| Registration fees – Class I | | | 21,174 | |
| Registration fees – Class Y | | | 22,458 | |
| Reports to shareholders | | | 75,542 | |
| Insurance | | | 31,711 | |
| Trustees’ fees and expenses | | | 176,097 | |
| Interest | | | 19,560 | |
| Other | | | 3,017 | |
| Total expenses | | | 8,495,948 | |
| Waiver of management fees | | | (434,045 | ) |
| Net expenses | | | 8,061,903 | |
| Net investment loss | | | (2,711,520 | ) |
| Net realized gain (loss) on: | | | | |
| Investments sold – unaffiliated issuers | | | 38,482,659 | |
| Investments sold – affiliated issuers | | | (1,849,503 | ) |
| Foreign currency transactions and foreign denominated assets and liabilities | | | (49,426 | ) |
| Net realized gain | | | 36,583,730 | |
| Net change in unrealized appreciation (depreciation) on: | | | | |
| Investments – unaffiliated issuers | | | 161,272,904 | |
| Investments – affiliated issuers | | | 12,755,499 | |
| Foreign currency transactions and foreign denominated assets and liabilities | | | (2,564 | ) |
| Net change in unrealized appreciation (depreciation) | | | 174,025,839 | |
| Net Increase in Net Assets Resulting from Operations | | $ | 207,898,049 | |
See Notes to Financial Statements
GLOBAL HARD ASSETS FUND
STATEMENT OF CHANGES IN NET ASSETS
| | | Year Ended | | | Year Ended | |
| | | December 31, | | | December 31, | |
| | | 2019 | | | 2018 | |
| Operations: | | | | | | | | |
| Net investment income | | $ | 10,051,529 | | | $ | 3,450,931 | |
| Net realized loss | | | (56,302,240 | ) | | | (116,918,728 | ) |
| Net change in unrealized appreciation (depreciation) | | | 176,350,648 | | | | (487,219,330 | ) |
| Net increase (decrease) in net assets resulting from operations | | | 130,099,937 | | | | (600,687,127 | ) |
| Distributions to shareholders: | | | | | | | | |
| Dividends and distributions | | | | | | | | |
| Class A Shares | | | (1,068,731 | ) | | | — | |
| Class I Shares | | | (6,872,458 | ) | | | (2,984,993 | ) |
| Class Y Shares | | | (1,459,189 | ) | | | (125,862 | ) |
| | | | (9,400,378 | ) | | | (3,110,855 | ) |
| Return of capital | | | | | | | | |
| Class I Shares | | | — | | | | (392,132 | ) |
| Class Y Shares | | | — | | | | (16,534 | ) |
| | | | — | | | | (408,666 | |
| Total distributions | | | (9,400,378 | ) | | | (3,519,521 | ) |
| Share transactions: | | | | | | | | |
| Proceeds from sale of shares | | | | | | | | |
| Class A Shares | | | 39,012,738 | | | | 65,747,511 | |
| Class C Shares | | | 1,149,524 | | | | 4,288,439 | |
| Class I Shares | | | 96,072,356 | | | | 242,566,267 | |
| Class Y Shares | | | 38,073,699 | | | | 107,474,906 | |
| | | | 174,308,317 | | | | 420,077,123 | |
| Reinvestment of distributions | | | | | | | | |
| Class A Shares | | | 946,857 | | | | — | |
| Class I Shares | | | 4,097,289 | | | | 2,477,008 | |
| Class Y Shares | | | 1,200,753 | | | | 109,108 | |
| | | | 6,244,899 | | | | 2,586,116 | |
| Cost of shares redeemed | | | | | | | | |
| Class A Shares | | | (130,386,934 | ) | | | (134,970,892 | ) |
| Class C Shares | | | (14,978,279 | ) | | | (21,981,838 | ) |
| Class I Shares | | | (673,893,782 | ) | | | (438,210,014 | ) |
| Class Y Shares | | | (107,282,301 | ) | | | (130,152,964 | ) |
| | | | (926,541,296 | ) | | | (725,315,708 | ) |
| Net decrease in net assets resulting from share transactions | | | (745,988,080 | ) | | | (302,652,469 | ) |
| Total decrease in net assets | | | (625,288,521 | ) | | | (906,859,117 | ) |
| Net Assets: | | | | | | | | |
| Beginning of year | | | 1,330,440,581 | | | | 2,237,299,698 | |
| End of year | | $ | 705,152,060 | | | $ | 1,330,440,581 | |
See Notes to Financial Statements
INTERNATIONAL INVESTORS GOLD FUND
CONSOLIDATED STATEMENT OF CHANGES IN NET ASSETS
| | | Year Ended | | | Year Ended | |
| | | December 31, | | | December 31, | |
| | | 2019 | | | 2018 | |
| Operations: | | | | | | | | |
| Net investment loss | | $ | (2,711,520 | ) | | $ | (2,028,356 | ) |
| Net realized gain (loss) | | | 36,583,730 | | | | (49,162,504 | ) |
| Net change in unrealized appreciation (depreciation) | | | 174,025,839 | | | | (66,365,319 | ) |
| Net increase (decrease) in net assets resulting from operations | | | 207,898,049 | | | | (117,556,179 | ) |
| Distributions to shareholders: | | | | | | | | |
| Class A Shares | | | (9,849,753 | ) | | | (5,633,199 | ) |
| Class C Shares | | | (1,317,826 | ) | | | (1,028,314 | ) |
| Class I Shares | | | (7,155,874 | ) | | | (5,239,779 | ) |
| Class Y Shares | | | (6,678,146 | ) | | | (2,902,125 | ) |
| Total distributions | | | (25,001,599 | ) | | | (14,803,417 | ) |
| Share transactions: | | | | | | | | |
| Proceeds from sale of shares | | | | | | | | |
| Class A Shares | | | 50,069,816 | | | | 43,277,880 | |
| Class C Shares | | | 8,100,556 | | | | 6,696,781 | |
| Class I Shares | | | 47,714,765 | | | | 59,060,559 | |
| Class Y Shares | | | 81,877,463 | | | | 88,491,475 | |
| | | | 187,762,600 | | | | 197,526,695 | |
| Reinvestment of dividends | | | | | | | | |
| Class A Shares | | | 8,768,963 | | | | 4,962,007 | |
| Class C Shares | | | 1,199,886 | | | | 912,185 | |
| Class I Shares | | | 6,386,262 | | | | 4,748,584 | |
| Class Y Shares | | | 5,639,172 | | | | 2,428,683 | |
| | | | 21,994,283 | | | | 13,051,459 | |
| Cost of shares redeemed | | | | | | | | |
| Class A Shares | | | (46,995,972 | ) | | | (82,920,081 | ) |
| Class C Shares | | | (12,381,938 | ) | | | (14,920,603 | ) |
| Class I Shares | | | (135,344,405 | ) | | | (54,266,025 | ) |
| Class Y Shares | | | (53,811,628 | ) | | | (57,998,785 | ) |
| | | | (248,533,943 | ) | | | (210,105,494 | ) |
| Net increase (decrease) in net assets resulting from share transactions | | | (38,777,060 | ) | | | 472,660 | |
| Total increase (decrease) in net assets | | | 144,119,390 | | | | (131,886,936 | ) |
| Net Assets: | | | | | | | | |
| Beginning of year | | | 582,255,519 | | | | 714,142,455 | |
| End of year | | $ | 726,374,909 | | | $ | 582,255,519 | |
See Notes to Financial Statements
GLOBAL HARD ASSETS FUND
FINANCIAL HIGHLIGHTS
For a share outstanding throughout each year:
| | | Class A | |
| | | Year Ended December 31, | |
| | | 2019 | | 2018 | | 2017 | | 2016 | | 2015 | |
| Net asset value, beginning of year | | | $ | 25.66 | | | | $ | 36.32 | | | | $ | 36.87 | | | | $ | 25.76 | | | | $ | 38.89 | | |
| Income from investment operations: | | | | | | | | | | | | | | | | | | | | | | | | | | |
| Net investment income (loss) | | | | 0.17 | (b) | | | | (0.05 | )(b) | | | | (0.17 | )(b) | | | | (0.20 | ) | | | | 0.05 | (b) | |
| Net realized and unrealized gain (loss) on investments | | | | 2.81 | | | | | (10.61 | ) | | | | (0.38 | ) | | | | 11.32 | | | | | (13.05 | ) | |
| Total from investment operations | | | | 2.98 | | | | | (10.66 | ) | | | | (0.55 | ) | | | | 11.12 | | | | | (13.00 | ) | |
| Less distributions from: | | | | | | | | | | | | | | | | | | | | | | | | | | |
| Net investment income | | | | (0.25 | ) | | | | — | | | | | — | | | | | (0.01 | ) | | | | (0.13 | ) | |
| Net asset value, end of year | | | $ | 28.39 | | | | $ | 25.66 | | | | $ | 36.32 | | | | $ | 36.87 | | | | $ | 25.76 | | |
| Total return (a) | | | | 11.64 | % | | | | (29.35 | )% | | | | (1.49 | )% | | | | 43.17 | % | | | | (33.42 | )% | |
| Ratios/Supplemental Data | | | | | | | | | | | | | | | | | | | | | | | | | | |
| Net assets, end of year (000’s) | | $118,029 | | | $194,180 | | | $349,066 | | | $418,616 | | | $321,875 | | |
| Ratio of gross expenses to average net assets | | | | 1.60 | % | | | | 1.59 | % | | | | 1.53 | % | | | | 1.50 | % | | | | 1.36 | % | |
| Ratio of net expenses to average net assets | | | | 1.38 | % | | | | 1.38 | % | | | | 1.38 | % | | | | 1.38 | % | | | | 1.36 | % | |
| Ratio of net expenses to average net assets, excluding interest expense | | | | 1.38 | % | | | | 1.38 | % | | | | 1.38 | % | | | | 1.38 | % | | | | 1.36 | % | |
| Ratio of net investment income (loss) to average net assets | | | | 0.63 | % | | | | (0.15 | )% | | | | (0.50 | )% | | | | (0.56 | )% | | | | 0.14 | % | |
| Portfolio turnover rate | | | | 33 | % | | | | 16 | % | | | | 17 | % | | | | 36 | % | | | | 26 | % | |
| | |
| (a) | Total return is calculated assuming an initial investment made at the net asset value at the beginning of year, reinvestment of any dividends and distributions at net asset value on the dividend/distributions payment date and a redemption at the net asset value on the last day of the year. The return does not reflect the deduction of taxes that a shareholder would pay on Fund dividends/distributions or the redemption of Fund shares. |
| (b) | Calculated based upon average shares outstanding. |
See Notes to Financial Statements
GLOBAL HARD ASSETS FUND
FINANCIAL HIGHLIGHTS
For a share outstanding throughout each year:
| | | Class C | |
| | | Year Ended December 31, | |
| | | 2019 | | 2018 | | 2017 | | 2016 | | 2015 | |
| Net asset value, beginning of year | | | $ | 21.93 | | | | $ | 31.28 | | | | $ | 32.00 | | | | $ | 22.53 | | | | $ | 34.32 | | |
| Income from investment operations: | | | | | | | | | | | | | | | | | | | | | | | | | | |
| Net investment loss | | | | (0.05 | )(b) | | | | (0.29 | )(b) | | | | (0.39 | )(b) | | | | (0.42 | ) | | | | (0.21 | )(b) | |
| Net realized and unrealized gain (loss) on investments | | | | 2.39 | | | | | (9.06 | ) | | | | (0.33 | ) | | | | 9.90 | | | | | (11.45 | ) | |
| Total from investment operations | | | | 2.34 | | | | | (9.35 | ) | | | | (0.72 | ) | | | | 9.48 | | | | | (11.66 | ) | |
| Less distributions from: | | | | | | | | | | | | | | | | | | | | | | | | | | |
| Net investment income | | | | — | | | | | — | | | | | — | | | | | (0.01 | ) | | | | (0.13 | ) | |
| Net asset value, end of year | | | $ | 24.27 | | | | $ | 21.93 | | | | $ | 31.28 | | | | $ | 32.00 | | | | $ | 22.53 | | |
| Total return (a) | | | | 10.67 | % | | | | (29.89 | )% | | | | (2.25 | )% | | | | 42.08 | % | | | | (33.96 | )% | |
| Ratios/Supplemental Data | | | | | | | | | | | | | | | | | | | | | | | | | | |
| Net assets, end of year (000’s) | | $12,698 | | | $24,454 | | | $53,893 | | | $94,488 | | | $88,945 | | |
| Ratio of gross expenses to average net assets | | | | 2.44 | % | | | | 2.32 | % | | | | 2.19 | % | | | | 2.15 | % | | | | 2.16 | % | |
| Ratio of net expenses to average net assets | | | | 2.20 | % | | | | 2.20 | % | | | | 2.19 | % | | | | 2.15 | % | | | | 2.16 | % | |
| Ratio of net expenses to average net assets, excluding interest expense | | | | 2.20 | % | | | | 2.20 | % | | | | 2.19 | % | | | | 2.15 | % | | | | 2.16 | % | |
| Ratio of net investment loss to average net assets | | | | (0.19 | )% | | | | (0.98 | )% | | | | (1.33 | )% | | | | (1.30 | )% | | | | (0.67 | )% | |
| Portfolio turnover rate | | | | 33 | % | | | | 16 | % | | | | 17 | % | | | | 36 | % | | | | 26 | % | |
| | |
| (a) | Total return is calculated assuming an initial investment made at the net asset value at the beginning of year, reinvestment of any dividends and distributions at net asset value on the dividend/distributions payment date and a redemption at the net asset value on the last day of the year. The return does not reflect the deduction of taxes that a shareholder would pay on Fund dividends/distributions or the redemption of Fund shares. |
| (b) | Calculated based upon average shares outstanding. |
See Notes to Financial Statements
GLOBAL HARD ASSETS FUND
FINANCIAL HIGHLIGHTS
For a share outstanding throughout each year:
| | | Class I | |
| | | Year Ended December 31, | |
| | | 2019 | | 2018 | | 2017 | | 2016 | | 2015 | |
| Net asset value, beginning of year | | | $ | 26.94 | | | | $ | 38.10 | | | | $ | 38.51 | | | | $ | 26.80 | | | | $ | 40.31 | | |
| Income from investment operations: | | | | | | | | | | | | | | | | | | | | | | | | | | |
| Net investment income (loss) | | | | 0.30 | (b) | | | | 0.10 | (b) | | | | (0.03 | )(b) | | | | (0.06 | ) | | | | 0.18 | (b) | |
| Net realized and unrealized gain (loss) on investments | | | | 2.94 | | | | | (11.17 | ) | | | | (0.38 | ) | | | | 11.78 | | | | | (13.56 | ) | |
| Total from investment operations | | | | 3.24 | | | | | (11.07 | ) | | | | (0.41 | ) | | | | 11.72 | | | | | (13.38 | ) | |
| Less dividends and distributions from: | | | | | | | | | | | | | | | | | | | | | | | | | | |
| Net investment income | | | | (0.44 | ) | | | | (0.08 | ) | | | | — | | | | | (0.01 | ) | | | | (0.13 | ) | |
| Return of capital | | | | — | | | | | (0.01 | ) | | | | — | | | | | — | | | | | — | | |
| Total dividends and distributions | | | | (0.44 | ) | | | | (0.09 | ) | | | | — | | | | | (0.01 | ) | | | | (0.13 | ) | |
| Net asset value, end of year | | | $ | 29.74 | | | | $ | 26.94 | | | | $ | 38.10 | | | | $ | 38.51 | | | | $ | 26.80 | | |
| Total return (a) | | | | 12.06 | % | | | | (29.04 | )% | | | | (1.06 | )% | | | | 43.73 | % | | | | (33.18 | )% | |
| Ratios/Supplemental Data | | | | | | | | | | | | | | | | | | | | | | | | | | |
| Net assets, end of year (000’s) | | $459,786 | | | $944,775 | | | $1,563,581 | | | $1,629,778 | | | $1,307,353 | | |
| Ratio of gross expenses to average net assets | | | | 1.09 | % | | | | 1.06 | % | | | | 1.06 | % | | | | 1.05 | % | | | | 1.04 | % | |
| Ratio of net expenses to average net assets | | | | 0.95 | % | | | | 0.95 | % | | | | 0.97 | % | | | | 1.00 | % | | | | 1.00 | % | |
| Ratio of net expenses to average net assets, excluding interest expense | | | | 0.95 | % | | | | 0.95 | % | | | | 0.97 | % | | | | 1.00 | % | | | | 1.00 | % | |
| Ratio of net investment income (loss) to average net assets | | | | 1.05 | % | | | | 0.29 | % | | | | (0.08 | )% | | | | (0.17 | )% | | | | 0.50 | % | |
| Portfolio turnover rate | | | | 33 | % | | | | 16 | % | | | | 17 | % | | | | 36 | % | | | | 26 | % | |
| | |
| (a) | Total return is calculated assuming an initial investment made at the net asset value at the beginning of year, reinvestment of any dividends and distributions at net asset value on the dividend/distributions payment date and a redemption at the net asset value on the last day of the year. The return does not reflect the deduction of taxes that a shareholder would pay on Fund dividends/distributions or the redemption of Fund shares. |
| (b) | Calculated based upon average shares outstanding. |
See Notes to Financial Statements
GLOBAL HARD ASSETS FUND
FINANCIAL HIGHLIGHTS
For a share outstanding throughout each year:
| | | Class Y | |
| | | Year Ended December 31, | |
| | | 2019 | | 2018 | | 2017 | | 2016 | | 2015 | |
| Net asset value, beginning of year | | | $ | 26.19 | | | | $ | 37.01 | | | | $ | 37.47 | | | | $ | 26.11 | | | | $ | 39.33 | | |
| Income from investment operations: | | | | | | | | | | | | | | | | | | | | | | | | | | |
| Net investment income (loss) | | | | 0.24 | (b) | | | | 0.04 | (b) | | | | (0.08 | )(b) | | | | (0.10 | ) | | | | 0.13 | (b) | |
| Net realized and unrealized gain (loss) on investments | | | | 2.87 | | | | | (10.84 | ) | | | | (0.38 | ) | | | | 11.47 | | | | | (13.22 | ) | |
| Total from investment operations | | | | 3.11 | | | | | (10.80 | ) | | | | (0.46 | ) | | | | 11.37 | | | | | (13.09 | ) | |
| Less dividends and distributions from: | | | | | | | | | | | | | | | | | | | | | | | | | | |
| Net investment income | | | | (0.37 | ) | | | | (0.02 | ) | | | | — | | | | | (0.01 | ) | | | | (0.13 | ) | |
| Return of capital | | | | — | | | | | — | (c) | | | | — | | | | | — | | | | | — | | |
| Total dividends and distributions | | | | (0.37 | ) | | | | (0.02 | ) | | | | — | | | | | (0.01 | ) | | | | (0.13 | ) | |
| Net asset value, end of year | | | $ | 28.93 | | | | $ | 26.19 | | | | $ | 37.01 | | | | $ | 37.47 | | | | $ | 26.11 | | |
| Total return (a) | | | | 11.88 | % | | | | (29.17 | )% | | | | (1.23 | )% | | | | 43.55 | % | | | | (33.27 | )% | |
| Ratios/Supplemental Data | | | | | | | | | | | | | | | | | | | | | | | | | | |
| Net assets, end of year (000’s) | | $114,639 | | | $167,032 | | | $270,760 | | | $312,113 | | | $228,335 | | |
| Ratio of gross expenses to average net assets | | | | 1.24 | % | | | | 1.20 | % | | | | 1.16 | % | | | | 1.19 | % | | | | 1.15 | % | |
| Ratio of net expenses to average net assets | | | | 1.13 | % | | | | 1.13 | % | | | | 1.13 | % | | | | 1.13 | % | | | | 1.13 | % | |
| Ratio of net expenses to average net assets, excluding interest expense | | | | 1.13 | % | | | | 1.13 | % | | | | 1.13 | % | | | | 1.13 | % | | | | 1.13 | % | |
| Ratio of net investment income (loss) to average net assets | | | | 0.85 | % | | | | 0.11 | % | | | | (0.25 | )% | | | | (0.30 | )% | | | | 0.37 | % | |
| Portfolio turnover rate | | | | 33 | % | | | | 16 | % | | | | 17 | % | | | | 36 | % | | | | 26 | % | |
| | |
| (a) | Total return is calculated assuming an initial investment made at the net asset value at the beginning of year, reinvestment of any dividends and distributions at net asset value on the dividend/distributions payment date and a redemption at the net asset value on the last day of the year. The return does not reflect the deduction of taxes that a shareholder would pay on Fund dividends/distributions or the redemption of Fund shares. |
| (b) | Calculated based upon average shares outstanding. |
| (c) | Amount represents less than $0.005 per share. |
See Notes to Financial Statements
INTERNATIONAL INVESTORS GOLD FUND
CONSOLIDATED FINANCIAL HIGHLIGHTS
For a share outstanding throughout each year:
| | | Class A | |
| | | Year Ended December 31, | |
| | | 2019 | | 2018 | | 2017 | | 2016 | | 2015 | |
| Net asset value, beginning of year | | | $ | 7.65 | | | | $ | 9.38 | | | | $ | 8.62 | | | | $ | 6.03 | | | | $ | 8.00 | | |
| Income from investment operations: | | | | | | | | | | | | | | | | | | | | | | | | | | |
| Net investment loss (a) | | | | (0.06 | ) | | | | (0.04 | ) | | | | (0.09 | ) | | | | (0.09 | ) | | | | (0.04 | ) | |
| Net realized and unrealized gain (loss) on investments | | | | 2.94 | | | | | (1.47 | ) | | | | 1.20 | | | | | 3.23 | | | | | (1.93 | ) | |
| Total from investment operations | | | | 2.88 | | | | | (1.51 | ) | | | | 1.11 | | | | | 3.14 | | | | | (1.97 | ) | |
| Less distributions from: | | | | | | | | | | | | | | | | | | | | | | | | | | |
| Net investment income | | | | (0.37 | ) | | | | (0.22 | ) | | | | (0.35 | ) | | | | (0.55 | ) | | | | — | | |
| Net asset value, end of year | | | $ | 10.16 | | | | $ | 7.65 | | | | $ | 9.38 | | | | $ | 8.62 | | | | $ | 6.03 | | |
| Total return (b) | | | | 38.03 | % | | | | (15.99 | )% | | | | 13.03 | % | | | | 53.12 | % | | | | (24.63 | )% | |
| Ratios/Supplemental Data | | | | | | | | | | | | | | | | | | | | | | | | | | |
| Net assets, end of year (000’s) | | $276,743 | | | $200,402 | | | $285,679 | | | $285,208 | | | $204,987 | | |
| Ratio of gross expenses to average net assets | | | | 1.49 | % | | | | 1.47 | % | | | | 1.43 | % | | | | 1.35 | % | | | | 1.43 | % | |
| Ratio of net expenses to average net assets | | | | 1.45 | % | | | | 1.45 | % | | | | 1.43 | % | | | | 1.35 | % | | | | 1.43 | % | |
| Ratio of net expenses to average net assets, excluding interest expense | | | | 1.45 | % | | | | 1.45 | % | | | | 1.43 | % | | | | 1.35 | % | | | | 1.43 | % | |
| Ratio of net investment loss to average net assets | | | | (0.63 | )% | | | | (0.51 | )% | | | | (0.93 | )% | | | | (0.89 | )% | | | | (0.54 | )% | |
| Portfolio turnover rate | | | | 21 | % | | �� | | 35 | % | | | | 32 | % | | | | 28 | % | | | | 45 | % | |
| | |
| (a) | Calculated based upon average shares outstanding. |
| (b) | Total return is calculated assuming an initial investment made at the net asset value at the beginning of year, reinvestment of any dividends and distributions at net asset value on the dividend/distributions payment date and a redemption at the net asset value on the last day of the year. The return does not reflect the deduction of taxes that a shareholder would pay on Fund dividends/distributions or the redemption of Fund shares. |
See Notes to Financial Statements
INTERNATIONAL INVESTORS GOLD FUND
CONSOLIDATED FINANCIAL HIGHLIGHTS
For a share outstanding throughout each year:
| | | Class C | |
| | | Year Ended December 31, | |
| | | 2019 | | 2018 | | 2017 | | 2016 | | 2015 | |
| Net asset value, beginning of year | | | $ | 6.64 | | | | $ | 8.25 | | | | $ | 7.61 | | | | $ | 5.41 | | | | $ | 7.24 | | |
| Income from investment operations: | | | | | | | | | | | | | | | | | | | | | | | | | | |
| Net investment loss (a) | | | | (0.11 | ) | | | | (0.09 | ) | | | | (0.14 | ) | | | | (0.15 | ) | | | | (0.09 | ) | |
| Net realized and unrealized gain (loss) on investments | | | | 2.55 | | | | | (1.30 | ) | | | | 1.06 | | | | | 2.90 | | | | | (1.74 | ) | |
| Total from investment operations | | | | 2.44 | | | | | (1.39 | ) | | | | 0.92 | | | | | 2.75 | | | | | (1.83 | ) | |
| Less distributions from: | | | | | | | | | | | | | | | | | | | | | | | | | | |
| Net investment income | | | | (0.31 | ) | | | | (0.22 | ) | | | | (0.28 | ) | | | | (0.55 | ) | | | | — | | |
| Net asset value, end of year | | | $ | 8.77 | | | | $ | 6.64 | | | | $ | 8.25 | | | | $ | 7.61 | | | | $ | 5.41 | | |
| Total return (b) | | | | 37.12 | % | | | | (16.73 | )% | | | | 12.24 | % | | | | 52.00 | % | | | | (25.28 | )% | |
| Ratios/Supplemental Data | | | | | | | | | | | | | | | | | | | | | | | | | | |
| Net assets, end of year (000’s) | | $38,264 | | | $31,889 | | | $47,452 | | | $50,632 | | | $32,556 | | |
| Ratio of gross expenses to average net assets | | | | 2.31 | % | | | | 2.27 | % | | | | 2.21 | % | | | | 2.10 | % | | | | 2.22 | % | |
| Ratio of net expenses to average net assets | | | | 2.20 | % | | | | 2.20 | % | | | | 2.20 | % | | | | 2.10 | % | | | | 2.20 | % | |
| Ratio of net expenses to average net assets, excluding interest expense | | | | 2.20 | % | | | | 2.20 | % | | | | 2.20 | % | | | | 2.10 | % | | | | 2.20 | % | |
| Ratio of net investment loss to average net assets | | | | (1.36 | )% | | | | (1.25 | )% | | | | (1.70 | )% | | | | (1.65 | )% | | | | (1.31 | )% | |
| Portfolio turnover rate | | | | 21 | % | | | | 35 | % | | | | 32 | % | | | | 28 | % | | | | 45 | % | |
| | |
| (a) | Calculated based upon average shares outstanding. |
| (b) | Total return is calculated assuming an initial investment made at the net asset value at the beginning of year, reinvestment of any dividends and distributions at net asset value on the dividend/distributions payment date and a redemption at the net asset value on the last day of the year. The return does not reflect the deduction of taxes that a shareholder would pay on Fund dividends/distributions or the redemption of Fund shares. |
See Notes to Financial Statements
INTERNATIONAL INVESTORS GOLD FUND
CONSOLIDATED FINANCIAL HIGHLIGHTS
For a share outstanding throughout each year:
| | | Class I | |
| | | Year Ended December 31, | |
| | | 2019 | | 2018 | | 2017 | | 2016 | | 2015 | |
| Net asset value, beginning of year | | | $ | 9.93 | | | | $ | 12.05 | | | | $ | 10.97 | | | | $ | 7.54 | | | | $ | 9.95 | | |
| Income from investment operations: | | | | | | | | | | | | | | | | | | | | | | | | | | |
| Net investment loss (a) | | | | (0.02 | ) | | | | (0.01 | ) | | | | (0.06 | ) | | | | (0.06 | ) | | | | (0.01 | ) | |
| Net realized and unrealized gain (loss) on investments | | | | 3.82 | | | | | (1.89 | ) | | | | 1.54 | | | | | 4.04 | | | | | (2.40 | ) | |
| Total from investment operations | | | | 3.80 | | | | | (1.90 | ) | | | | 1.48 | | | | | 3.98 | | | | | (2.41 | ) | |
| Less distributions from: | | | | | | | | | | | | | | | | | | | | | | | | | | |
| Net investment income | | | | (0.41 | ) | | | | (0.22 | ) | | | | (0.40 | ) | | | | (0.55 | ) | | | | — | | |
| Net asset value, end of year | | | $ | 13.32 | | | | $ | 9.93 | | | | $ | 12.05 | | | | $ | 10.97 | | | | $ | 7.54 | | |
| Total return (b) | | | | 38.61 | % | | | | (15.69 | )% | | | | 13.56 | % | | | | 53.63 | % | | | | (24.22 | )% | |
| Ratios/Supplemental Data | | | | | | | | | | | | | | | | | | | | | | | | | | |
| Net assets, end of year (000’s) | | $235,796 | | | $243,901 | | | $284,621 | | | $183,511 | | | $191,444 | | |
| Ratio of gross expenses to average net assets | | | | 1.09 | % | | | | 1.06 | % | | | | 1.04 | % | | | | 1.01 | % | | | | 1.07 | % | |
| Ratio of net expenses to average net assets | | | | 1.00 | % | | | | 1.00 | % | | | | 1.00 | % | | | | 1.00 | % | | | | 1.00 | % | |
| Ratio of net expenses to average net assets, excluding interest expense | | | | 1.00 | % | | | | 1.00 | % | | | | 1.00 | % | | | | 1.00 | % | | | | 1.00 | % | |
| Ratio of net investment loss to average net assets | | | | (0.16 | )% | | | | (0.06 | )% | | | | (0.51 | )% | | | | (0.52 | )% | | | | (0.13 | )% | |
| Portfolio turnover rate | | | | 21 | % | | | | 35 | % | | | | 32 | % | | | | 28 | % | | | | 45 | % | |
| | |
| (a) | Calculated based upon average shares outstanding. |
| (b) | Total return is calculated assuming an initial investment made at the net asset value at the beginning of year, reinvestment of any dividends and distributions at net asset value on the dividend/distributions payment date and a redemption at the net asset value on the last day of the year. The return does not reflect the deduction of taxes that a shareholder would pay on Fund dividends/distributions or the redemption of Fund shares. |
See Notes to Financial Statements
INTERNATIONAL INVESTORS GOLD FUND
CONSOLIDATED FINANCIAL HIGHLIGHTS
For a share outstanding throughout each year:
| | | Class Y | |
| | | Year Ended December 31, | |
| | | 2019 | | 2018 | | 2017 | | 2016 | | 2015 | |
| Net asset value, beginning of year | | | $ | 7.82 | | | | $ | 9.55 | | | | $ | 8.78 | | | | $ | 6.12 | | | | $ | 8.08 | | |
| Income from investment operations: | | | | | | | | | | | | | | | | | | | | | | | | | | |
| Net investment loss (a) | | | | (0.03 | ) | | | | (0.01 | ) | | | | (0.06 | ) | | | | (0.07 | ) | | | | (0.02 | ) | |
| Net realized and unrealized gain (loss) on investments | | | | 3.01 | | | | | (1.50 | ) | | | | 1.22 | | | | | 3.28 | | | | | (1.94 | ) | |
| Total from investment operations | | | | 2.98 | | | | | (1.51 | ) | | | | 1.16 | | | | | 3.21 | | | | | (1.96 | ) | |
| Less distributions from: | | | | | | | | | | | | | | | | | | | | | | | | | | |
| Net investment income | | | | (0.40 | ) | | | | (0.22 | ) | | | | (0.39 | ) | | | | (0.55 | ) | | | | — | | |
| Net asset value, end of year | | | $ | 10.40 | | | | $ | 7.82 | | | | $ | 9.55 | | | | $ | 8.78 | | | | $ | 6.12 | | |
| Total return (b) | | | | 38.52 | % | | | | (15.71 | )% | | | | 13.29 | % | | | | 53.49 | % | | | | (24.26 | )% | |
| Ratios/Supplemental Data | | | | | | | | | | | | | | | | | | | | | | | | | | |
| Net assets, end of year (000’s) | | $175,573 | | | $106,064 | | | $96,390 | | | $75,361 | | | $28,084 | | |
| Ratio of gross expenses to average net assets | | | | 1.17 | % | | | | 1.18 | % | | | | 1.16 | % | | | | 1.11 | % | | | | 1.21 | % | |
| Ratio of net expenses to average net assets | | | | 1.10 | % | | | | 1.10 | % | | | | 1.10 | % | | | | 1.10 | % | | | | 1.10 | % | |
| Ratio of net expenses to average net assets, excluding interest expense | | | | 1.10 | % | | | | 1.10 | % | | | | 1.10 | % | | | | 1.10 | % | | | | 1.10 | % | |
| Ratio of net investment loss to average net assets | | | | (0.29 | )% | | | | (0.17 | )% | | | | (0.60 | )% | | | | (0.66 | )% | | | | (0.21 | )% | |
| Portfolio turnover rate | | | | 21 | % | | | | 35 | % | | | | 32 | % | | | | 28 | % | | | | 45 | % | |
| | |
| (a) | Calculated based upon average shares outstanding. |
| (b) | Total return is calculated assuming an initial investment made at the net asset value at the beginning of year, reinvestment of any dividends and distributions at net asset value on the dividend/distributions payment date and a redemption at the net asset value on the last day of the year. The return does not reflect the deduction of taxes that a shareholder would pay on Fund dividends/distributions or the redemption of Fund shares. |
See Notes to Financial Statements
VANECK FUNDS
NOTES TO FINANCIAL STATEMENTS
December 31, 2019
Note 1—Fund Organization—VanEck Funds (the “Trust”) is registered under the Investment Company Act of 1940, as amended, as an open-end management investment company. The Trust was organized as a Massachusetts business trust on April 3, 1985. These financial statements relate only to the following investment portfolios: Global Hard Assets Fund and International Investors Gold Fund (collectively the “Funds” and each a “Fund”). The International Investors Gold Fund is classified as a non-diversified fund and may effect certain investments through the Gold Series Fund I Subsidiary, (a wholly-owned “Subsidiary”). The Global Hard Assets Fund is classified as a diversified fund and seeks long-term capital appreciation by investing primarily in hard asset securities. The International Investors Gold Fund seeks long-term capital appreciation by investing in common stocks of gold-mining companies or directly in gold bullion and other metals. Each of the Funds is authorized to issue various classes of shares. Each share class represents an interest in the same portfolio of investments of the respective Fund and is substantially the same in all respects, except that the classes are subject to different distribution fees and sales charges. Class I and Y Shares are sold without a sales charge; Class A Shares are sold subject to a front-end sales charge; and Class C Shares are sold with a contingent deferred sales charge.
Note 2—Significant Accounting Policies—The preparation of financial statements in conformity with U.S. generally accepted accounting principles (“GAAP”) requires management to make estimates and assumptions that affect the reported amounts and disclosures in the financial statements. Actual results could differ from those estimates.
The Funds are investment companies and follow accounting and reporting requirements of Accounting Standards Codification (“ASC”) 946,Financial Services – Investment Companies.
The following is a summary of significant accounting policies followed by the Funds.
| A. | Security Valuation—The Funds value their investments in securities and other assets and liabilities at fair value daily. Fair value is the price that would be received to sell an asset or paid to transfer a liability in an orderly transaction between market participants on the measurement date. Securities traded on national exchanges are valued at the closing price on the markets in which the securities trade. Securities traded on the NASDAQ Stock Market LLC (“NASDAQ”) are valued at the NASDAQ official closing price. Over-the-counter securities not included on NASDAQ and listed securities for which no sales was reported are valued at the mean of the bid and ask prices. To the extent these securities are actively traded they |
VANECK FUNDS
NOTES TO FINANCIAL STATEMENTS
(continued)
| | are categorized as Level 1 in the fair value hierarchy (as described below). Certain foreign securities, whose values may be affected by market direction or events occurring before the Funds’ pricing time (4:00 p.m. Eastern Time) but after the last close of the securities’ primary market, are fair valued using a pricing service and are categorized as Level 2 in the fair value hierarchy. The pricing service, using methods approved by the Board of Trustees, considers the correlation of the trading patterns of the foreign security to intraday trading in the U.S. markets, based on indices of domestic securities and other appropriate indicators such as prices of relevant ADR’s and futures contracts. The Funds may also fair value securities in other situations, such as, when a particular foreign market is closed but the Funds are open. Short-term obligations with sixty days or less to maturity are valued at amortized cost, which with accrued interest approximates fair value. Open-end mutual fund investments (including money market funds) are valued at their closing net asset value each business day and are categorized as Level 1 in the fair value hierarchy. Forward foreign currency contracts are valued at the spot currency rate plus an amount (“points”), which reflects the differences in interest rates between the U.S. and foreign markets and is categorized as Level 2 in the fair value hierarchy. The Pricing Committee of Van Eck Associates Corporation (the “Adviser”) provides oversight of the Funds’ valuation policies and procedures, which are approved by the Board of Trustees. Among other things, these procedures allow the Funds to utilize independent pricing services, quotations from securities dealers, and other market sources to determine fair value. The Pricing Committee convenes regularly to review the fair value of financial instruments or other assets. If market quotations for a security or other asset are not readily available, or if the Adviser believes they do not otherwise reflect the fair value of a security or asset, the security or asset will be fair valued by the Pricing Committee in accordance with the Funds’ valuation policies and procedures. The Pricing Committee employs various methods for calibrating the valuation approaches utilized to determine fair value, including a regular review of key inputs and assumptions, periodic comparisons to valuations provided by other independent pricing services, transactional back-testing and disposition analysis. |
| | |
| | Certain factors such as economic conditions, political events, market trends, the nature of and duration of any restrictions on disposition, trading in similar securities of the issuer or comparable issuers and security specific information are used to determine the fair value of these securities. Depending on the relative significance of valuation inputs, these securities may be classified either as Level 2 or Level 3 in the fair value hierarchy. The |
| | price which the Funds may realize upon sale of an investment may differ materially from the value presented in the Schedules of Investments. |
| | |
| | The Funds utilize various methods to measure the fair value of its investments on a recurring basis which includes a hierarchy that prioritizes inputs to valuation methods used to measure fair value. The fair value hierarchy gives highest priority to unadjusted quoted prices in active markets for identical assets and liabilities (Level 1 measurements) and the lowest priority to unobservable inputs (Level 3 measurements). The inputs or methodologies used for valuing securities are not necessarily an indication of the risk associated with investing in those securities. The three levels of the fair value hierarchy are described below: |
| | |
| | Level 1 – Quoted prices in active markets for identical securities. |
| | |
| | Level 2 – Significant observable inputs (including quoted prices for similar securities, interest rates, prepayment speeds, credit risk, etc.). |
| | |
| | Level 3 – Significant unobservable inputs (including each Fund’s own assumptions in determining the fair value of investments). |
| | |
| | A summary of the inputs and the levels used to value each Fund’s investments are located in the Schedules of Investments. Additionally, tables that reconcile the valuation of each Fund’s Level 3 investments, and that present additional information about the valuation methodologies and unobservable inputs into those Level 3 investments, if applicable, are located in the Schedules of Investments. |
| | |
| B. | Basis for Consolidation—The Gold Series Fund I Subsidiary, a Cayman Islands exempted company, was incorporated on November 7, 2011. Consolidated financial statements of the International Investors Gold Fund, present the financial position and results of operation for the Fund and its wholly-owned Subsidiary. All interfund account balances and transactions between parent and subsidiary have been eliminated in consolidation. As of December 31, 2019, the International Investors Gold Fund held $29,089 in its Subsidiary, representing less than 0.01% of the Fund’s net assets. |
| | |
| C. | Federal Income Taxes—It is each Fund’s policy to comply with the provisions of the U.S. Internal Revenue Code (the “Code”) applicable to regulated investment companies and to distribute all of its net investment income and net realized capital gains, if any, to its shareholders. Therefore, no federal income tax provision is required. |
| | |
| | The Subsidiary of the International Investors Gold Fund is classified as a controlled foreign corporation (“CFC”) under the Code. For U.S. tax purposes, a CFC is not subject to U.S. income tax. However, as a wholly |
VANECK FUNDS
NOTES TO FINANCIAL STATEMENTS
(continued)
| | owned CFC, its net income and capital gains, to the extent of its earnings and profits, will be included each year in the Fund investment company taxable income. Net losses of the CFC cannot be deducted by the Fund in the current year, nor carried forward to offset taxable income in future years. |
| | |
| D. | Currency Translation—Assets and liabilities denominated in foreign currencies and commitments under foreign currency contracts are translated into U.S. dollars at the closing prices of such currencies each business day as quoted by one or more sources. Purchases and sales of investments are translated at the exchange rates prevailing when such investments are acquired or sold. Foreign denominated income and expenses are translated at the exchange rates prevailing when accrued. The portion of realized and unrealized gains and losses on investments that result from fluctuations in foreign currency exchange rates is not separately disclosed. Such amounts are included with the net realized and unrealized gains and losses on investment securities in the Statement of Operations. Recognized gains or losses attributable to foreign currency fluctuations on foreign currency denominated assets, other than investments and forward foreign currency contracts, and liabilities are recorded as net realized gain (loss) and net change in unrealized appreciation (depreciation) on foreign currency transactions and foreign denominated assets and liabilities in the Statement of Operations. |
| | |
| E. | Dividends and Distributions to Shareholders—Dividends to shareholders from net investment income and distributions from net realized capital gains, if any, are declared and paid annually. Income dividends and capital gain distributions are determined in accordance with U.S. income tax regulations, which may differ from such amounts determined in accordance with GAAP. |
| | |
| F. | Restricted Securities—The Funds may invest in securities that are subject to legal or contractual restrictions on resale. These securities generally may be resold in transactions exempt from registration or to the public if the securities are registered. Disposal of these securities may involve time-consuming negotiations and expense, and prompt sale at an acceptable price may be difficult. Information regarding restricted securities is included at the end of each Fund’s Schedule of Investments. |
| | |
| G. | Use of Derivative Instruments—The Funds may invest in derivative instruments, including, but not limited to, options, futures, swaps and forward foreign currency contracts. A derivative is an instrument whose value is derived from underlying assets, indices, reference rates or a combination of these factors. Derivative instruments may be privately |
| | negotiated contracts (often referred to as over-the-counter (“OTC”) derivatives) or they may be listed and traded on an exchange. Derivative contracts may involve future commitments to purchase or sell financial instruments or commodities at specified terms on a specified date, or to exchange interest payment streams or currencies based on a notional or contractual amount. Derivative instruments may involve a high degree of financial risk. The use of derivative instruments also involves the risk of loss if the investment adviser is incorrect in its expectation of the timing or level of fluctuations in securities prices, interest rates or currency prices. Investments in derivative instruments also include the risk of default by the counterparty, the risk that the investment may not be liquid and the risk that a small movement in the price of the underlying security or benchmark may result in a disproportionately large movement, unfavorable or favorable, in the price of the derivative instrument. During the year ended December 31, 2019, the Funds held no derivative instruments. |
| | |
| H. | Offsetting Assets and Liabilities—In the ordinary course of business, the Funds enter into transactions subject to enforceable master netting agreements or other similar agreements. Generally, the right of setoff in those agreements allows the Funds to offset any exposure to a specific counterparty with any collateral received or delivered to that counterparty based on the terms of the agreements. The Funds may pledge or receive cash and/or securities as collateral for derivative instruments and securities lending. For financial reporting purposes, the Funds present securities lending assets and liabilities on a gross basis in the Statements of Assets and Liabilities. Cash collateral held in the form of money market investments, if any, at December 31, 2019 is disclosed in the Schedules of Investments and in the Statements of Assets and Liabilities. Non-cash collateral is disclosed in Note 9 (Securities Lending). |
| | |
| I. | Other—Security transactions are accounted for on trade date. Realized gains and losses are determined based on the specific identification method. Dividend income is recorded on the ex-dividend date except that certain dividends from foreign securities are recognized upon notification of the ex-dividend date. Income, non-class specific expenses, gains and losses on investments are allocated to each class of shares based upon the relative net assets. Expenses directly attributable to a specific class are charged to that class. |
| | |
| | The Funds earn interest income on uninvested cash balances held at the custodian bank, such amounts, if any, are presented as interest income in the Statements of Operations. |
VANECK FUNDS
NOTES TO FINANCIAL STATEMENTS
(continued)
In the normal course of business, the Funds enter into contracts that contain a variety of general indemnifications. The Funds’ maximum exposure under these agreements is unknown as this would involve future claims that may be made against the Funds that have not yet occurred. However, the Adviser believes the risk of loss under these arrangements to be remote.
Note 3—Investment Management and Other Agreements—The Adviser is the investment adviser to the Global Hard Assets Fund and International Investors Gold Fund.
The Adviser receives a management fee, calculated daily and payable monthly based on the Funds’ average daily net assets:
| Fund | Annual Rate |
| Global Hard Assets Fund | 1.00% of the first $2.5 billion and 0.90% thereafter |
| International Investors Gold Fund | 0.75% of the first $500 million, 0.65% on the next $250 million and 0.50% thereafter |
The Adviser has agreed, until at least May 1, 2021, to waive management fees and assume expenses to prevent the Funds’ total annual operating expenses (excluding acquired fund fees and expenses, interest expense, trading expenses, dividends and interest payments on securities sold short, taxes and extraordinary expenses) from exceeding the expense limitations listed in the table below.
The current expense limitations and the amounts waived by the Adviser for the year ended December 31, 2019, are as follows:
| | | Expense
Limitations | | Waiver of
Management
Fees |
| Global Hard Assets Fund | | | | |
| Class A | | | 1.38 | % | | $ | 391,678 | |
| Class C | | | 2.20 | | | | 45,860 | |
| Class I | | | 0.95 | | | | 1,003,990 | |
| Class Y | | | 1.13 | | | | 167,640 | |
| International Investors Gold Fund | | | | | | | | |
| Class A | | | 1.45 | % | | $ | 97,588 | |
| Class C | | | 2.20 | | | | 37,803 | |
| Class I | | | 1.00 | | | | 207,006 | |
| Class Y | | | 1.10 | | | | 91,648 | |
The Adviser also performs accounting and administrative services for the International Investors Gold Fund. The Adviser is paid a monthly fee at a rate of 0.25% per year on the first $750 million of the average daily net assets of the Fund and 0.20% per year of the average daily net assets in excess of $750 million. Administrative fees are included in expenses in the Statement of Operations.
For the year ended December 31, 2019, Van Eck Securities Corporation (the “Distributor”), an affiliate of the Adviser, received sales loads of $82,590 from Global Hard Assets Fund and $546,218 from International Investors Gold Fund relating to the sale of shares of the Funds, of which $71,655 and $491,289, respectively, were reallowed to broker/dealers and the remaining $10,935 and $54,928, respectively, were retained by the Distributor.
Certain officers of the Trust are officers, directors or stockholders of the Adviser and the Distributor.
Note 4—Investments—The cost of purchases and proceeds from sales of investments, excluding short-term investments, for the year ended December 31, 2019 were as follows:
| Fund | | Cost of
Investments
Purchased | | Proceeds from
Investments
Sold |
| Global Hard Assets Fund | | $ | 341,033,346 | | | | $1,049,418,863 | |
| International Investors Gold Fund | | | 135,943,975 | | | | 205,364,860 | |
Note 5—Income Taxes—As of December 31, 2019, for Federal income tax purposes, the identified cost, gross unrealized appreciation, gross unrealized depreciation and net unrealized appreciation (depreciation) of investments owned were as follows:
| | Tax Cost of
Investments | | Gross
Unrealized
Appreciation | | Gross
Unrealized
Depreciation | | Net Unrealized
Appreciation
(Depreciation) |
| Global Hard Assets Fund | $567,049,313 | | $212,427,758 | | $(69,956,372) | | $142,471,386 |
| International Investors Gold Fund | 484,155,618 | | 283,102,805 | | (38,854,233) | | 244,248,572 |
At December 31, 2019, the components of total distributable earnings (loss) on a tax basis, for each Fund, were as follows:
| | | Undistributed
Ordinary
Income | | Accumulated
Capital
Losses | | Other
Temporary
Differences | | Unrealized
Appreciation
(Depreciation) | | Total
Distributable
Earnings (Loss) |
| Global Hard Assets Fund | | $ 1,260,780 | | $(1,091,052,442) | | $(830,657) | | $142,471,386 | | $(948,150,933) |
| International Investors Gold Fund | | 24,544,377 | | (417,212,234) | | (367,073) | | 244,328,230 | | (148,706,700) |
The tax character of dividends paid to shareholders were as follows:
VANECK FUNDS
NOTES TO FINANCIAL STATEMENTS
(continued)
| | | Year Ended
December 31,
2019 | | Year Ended
December 31, 2018 |
| | | Ordinary
Income | | Ordinary
Income | | Return of
Capital |
| Global Hard Assets Fund | | $ | 9,400,378 | | | $ | 3,110,855 | | | $ | 408,666 | |
| International Investors Gold Fund | | | 25,001,599 | | | | 14,803,417 | | | | — | |
At December 31, 2019, each Fund had capital loss carryforwards available to offset future capital gains, as follows:
| | | Short-Term
Capital Losses
with No
Expiration | | Long-Term
Capital Losses
with No
Expiration | | Total |
| Global Hard Assets Fund | | $(105,512,193) | | $(985,540,249) | | $(1,091,052,442) |
| International Investors Gold Fund | | (109,644,314) | | (307,567,920) | | (417,212,234) |
Additionally, International Investors Gold Fund utilized $23,947,437 of its capital loss carryover available from prior years.
During the year ended December 31, 2019, as a result of permanent book to tax differences due to losses from the investment in a controlled foreign corporation, the Funds incurred differences that affected distributable earnings and aggregate paid in capital by the amounts in the table below. Net assets were not affected by these reclassifications.
| | | Increase
(Decrease)
in Distributable
Earnings | | Increase
(Decrease)
in Aggregate
Paid in Capital |
| Global Hard Assets Fund | | $ | — | | | $ | — | |
| International Investors Gold Fund | | | 3,482 | | | | (3,482 | ) |
The Funds recognize the tax benefits of uncertain tax positions only where the position is “more-likely-than-not” to be sustained assuming examination by applicable tax authorities. Management has analyzed the Funds’ tax positions, and has concluded that no liability for unrecognized tax benefits should be recorded related to uncertain tax positions taken on return filings for all open tax years. The Funds do not have exposure for additional years that might still be open in certain foreign jurisdictions. Therefore, no provision for income tax is required in the Funds’ financial statements. However, the Funds are subject to foreign taxes on the appreciation in value of certain investments. The Funds provide for such taxes, if any, on both realized and unrealized appreciation.
The Funds recognize interest and penalties, if any, related to uncertain tax positions as income tax expense in the Statements of Operations. During
the year ended December 31, 2019, the Funds did not incur any interest or penalties.
Note 6—Principal Risks—The Funds may purchase securities on foreign exchanges. Securities of foreign issuers involve special risks and considerations not typically associated with investing in U.S. issuers. These risks include devaluation of currencies, less reliable information about issuers, different securities transaction clearance and settlement practices, and future adverse political and economic developments. These risks are heightened for investments in emerging market countries. Moreover, securities of many foreign issuers and their markets may be less liquid and their prices more volatile than those of comparable U.S. issuers. Changes in laws or government regulation by the United States and/or the Cayman Islands could adversely affect the operations of the Funds. The Global Hard Assets Fund and the International Investors Gold Fund may concentrate their investments in companies which are significantly engaged in the exploration, development, production and distribution of gold and other natural resources such as strategic and other metals, minerals, forest products, oil, natural gas and coal and by investing in gold bullion and coins. In addition, the International Investors Gold Fund may invest up to 25% of its net assets in gold and silver coins, gold, silver, platinum and palladium bullion and exchange traded funds that invest in such coins and bullion and derivatives on the foregoing. Since the Funds may so concentrate, they may be subject to greater risks and market fluctuations than other more diversified portfolios. The production and marketing of gold and other natural resources may be affected by actions and changes in governments. In addition, gold and natural resources may be cyclical in nature.
A more complete description of risks is included in the Funds’ Prospectus and Statement of Additional Information.
Note 7—12b-1 Plans of Distribution—Pursuant to Rule 12b-1 Plan of Distribution (the “Plan”), the Funds are authorized to incur distribution expenses which will principally be payments to securities dealers who have sold shares and serviced shareholder accounts and payments to the Distributor, for reimbursement of other actual promotion and distribution expenses incurred by the Distributor on behalf of the Funds. The amount paid under the Plan in any one year is limited to 0.25% of average daily net assets for Class A Shares and 1.00% of average daily net assets for Class C Shares, and is recorded as Distribution fees in the Statement of Operations.
Note 8—Shareholder Transactions—Shares of beneficial interest issued, reinvested and redeemed (unlimited number of $0.001 par value shares authorized):
VANECK FUNDS
NOTES TO FINANCIAL STATEMENTS
(continued)
| | | Global Hard Assets Fund | | International Investors
Gold Fund |
| | | Year Ended
December 31,
2019 | | Year Ended
December 31,
2018 | | Year Ended
December 31,
2019 | | Year Ended
December 31,
2018 |
| Class A | | | | | | | | | | | | | | | | |
| Shares sold | | | 1,432,075 | | | | 1,994,668 | | | | 5,324,648 | | | | 5,155,820 | |
| Shares reinvested | | | 33,841 | | | | — | | | | 925,972 | | | | 680,663 | |
| Shares redeemed | | | (4,873,897 | ) | | | (4,038,493 | ) | | | (5,206,160 | ) | | | (10,085,024 | ) |
| Net increase (decrease) | | | (3,407,981 | ) | | | (2,043,825 | ) | | | 1,044,460 | | | | (4,248,541 | ) |
| Class C | | | | | | | | | | | | | | | | |
| Shares sold | | | 49,499 | | | | 148,481 | | | | 978,646 | | | | 942,608 | |
| Shares reinvested | | | — | | | | — | | | | 146,865 | | | | 143,878 | |
| Shares redeemed | | | (641,495 | ) | | | (755,974 | ) | | | (1,559,707 | ) | | | (2,040,789 | ) |
| Net decrease | | | (591,996 | ) | | | (607,493 | ) | | | (434,196 | ) | | | (954,303 | ) |
| Class I | | | | | | | | | | | | | | | | |
| Shares sold | | | 3,313,712 | | | | 6,886,782 | | | | 4,370,514 | | | | 5,997,035 | |
| Shares reinvested | | | 138,743 | | | | 95,233 | | | | 514,192 | | | | 501,435 | |
| Shares redeemed | | | (23,059,920 | ) | | | (12,952,129 | ) | | | (11,740,960 | ) | | | (5,567,948 | ) |
| Net increase (decrease) | | | (19,606,465 | ) | | | (5,970,114 | ) | | | (6,856,254 | ) | | | 930,522 | |
| Class Y | | | | | | | | | | | | | | | | |
| Shares sold | | | 1,359,163 | | | | 3,050,944 | | | | 8,519,083 | | | | 10,301,007 | |
| Shares reinvested | | | 42,117 | | | | 4,314 | | | | 581,958 | | | | 325,561 | |
| Shares redeemed | | | (3,815,058 | ) | | | (3,994,017 | ) | | | (5,772,186 | ) | | | (7,154,659 | ) |
| Net increase (decrease) | | | (2,413,778 | ) | | | (938,759 | ) | | | 3,328,855 | | | | 3,471,909 | |
Note 9—Securities Lending—To generate additional income, each of the Funds may lend its securities pursuant to a securities lending agreement with the securities lending agent. Each Fund may lend up to 33% of its investments requiring that the loan be continuously collateralized by cash, cash equivalents, U.S. government securities, or any combination of cash and such securities at all times equal to at least 102% (105% for foreign securities) of the market value plus accrued interest on the securities loaned. Daily market fluctuations could cause the value of loaned securities to be more or less than the value of the collateral received. When this occurs, the collateral is adjusted and settled on the next business day. During the term of the loan, the Funds will continue to receive any dividends, interest or amounts equivalent thereto, on the securities loaned while receiving a fee from the borrower and/or earning interest on the investment of the cash collateral. Such fees and interest are shared with the securities lending agent under the terms of the securities lending agreement. Securities lending income is disclosed as such in the Statements of Operations. The cash collateral is maintained on the Funds’ behalf by the lending agent and is invested in the State Street Navigator Securities Lending
Government Money Market Portfolio. Non-cash collateral consists of U.S. Treasuries and U.S. Government Agency securities, and is not disclosed in the Funds’ Schedules of investments or Statements of Assets and Liabilities as it is held by the agent on behalf of the Funds, and the Funds do not have the ability to re-hypothecate those securities. Loans are subject to termination at the option of the borrower or the Funds. Upon termination of the loan, the borrower will return to the Fund securities identical to the securities loaned. The Funds bear the risk of delay in recovery of, or even loss of rights in, the securities loaned should the borrower of the securities fail financially. The value of loaned securities and related cash collateral, if any, at December 31, 2019 is presented on a gross basis in the Schedules of Investments and Statements of Assets and Liabilities. The following is a summary of the Funds’ securities on loan and related collateral as of December 31, 2019:
| Fund | | Market Value
of Securities
on Loan | | Cash
Collateral | | Non-Cash
Collateral | | Total Collateral |
| Global Hard Assets Fund | | $ | 68,448,004 | | | $ | 202,752 | | | $ | 70,416,627 | | | $ | 70,619,379 | |
| International Investors Gold Fund | | | 6,021,212 | | | | 2,408,735 | | | | 3,984,004 | | | | 6,392,739 | |
The following table presents money market fund investments held as collateral by type of security on loan as of December 31, 2019:
| | | Gross Amount of Recognized Liabilities
for Securities Loaned
in the Statements of
Assets and Liabilities* | |
| Fund | | Equity Securities | |
| Global Hard Assets Fund | | $ | 202,752 | | |
| International Investors Gold Fund | | | 2,408,735 | | |
| * | Remaining contractual maturity of the agreements: overnight and continuous |
Note 10—Bank Line of Credit—The Trust participates with VanEck VIP Trust (another registered investment company managed by Adviser) (the “VE/VIP Funds”) in a $30 million committed credit facility (the “Facility”) to be utilized for temporary financing until the settlement of sales or purchases of portfolio securities, the repurchase or redemption of shares of the participating Funds and other temporary or emergency purposes. The participating VE/VIP Funds have agreed to pay commitment fees, pro rata, based on the unused but available balance. Interest is charged to the participating VE/VIP Funds at rates based on prevailing market rates in effect at the time of borrowings. During the
VANECK FUNDS
NOTES TO FINANCIAL STATEMENTS
(continued)
year ended December 31, 2019, the Funds borrowed under this Facility as follows:
| Fund | | Days
Outstanding | | Average Daily
Loan Balance | | Average
Interest Rate |
| Global Hard Assets Fund | | | 4 | | | $ | 22,851,873 | | | | 3.67 | % |
| International Investors Gold Fund | | | 14 | | | | 7,574,095 | | | | 3.45 | |
As of December 31, the Funds had no outstanding borrowings under the Facility.
Note 11—Trustee Deferred Compensation Plan—The Trust has a Deferred Compensation Plan (the “Deferred Plan”) for Trustees under which the Trustees can elect to defer receipt of their trustee fees until retirement, disability or termination from the Board of Trustees. The fees otherwise payable to the participating Trustees are deemed invested in shares of eligible funds of the Trust and the VanEck Funds (another registered investment company managed by the Adviser) as directed by the Trustees.
The expense for the Deferred Plan is included in “Trustees’ fees and expenses” in the Statement of Operations. The liability for the Deferred Plan is shown as “Deferred Trustee fees” on the Statement of Assets and Liabilities.
Note 12—Recent Accounting Pronouncements—The Funds early adopted certain provisions of Accounting Standards Update No. 2018-13 Disclosure Framework—Changes to the Disclosure Requirements for Fair Value Measurement(“ASU 2018-13”) that eliminate and modify certain disclosure requirements for fair value measurements. The adoption of certain provisions of ASU 2018-13 had no material effect on the financial statements and related disclosures. Management evaluated the additional requirements, not yet adopted, and they are not expected to have a material impact to the financial statements. Public companies will be required to disclose the range and weighted average of significant unobservable inputs for Level 3 fair value measurements. ASU 2018-13 is effective for fiscal years beginning after December 15, 2019 and for interim periods within those fiscal years.
Note 13—Subsequent Event Review—The Funds have evaluated subsequent events and transactions for potential recognition or disclosure through the date the financial statements were issued.
VANECK FUNDS
REPORT OF INDEPENDENT REGISTERED PUBLIC ACCOUNTING FIRM
To the Shareholders and the Board of Trustees of Global Hard Assets Fund and International Investors Gold Fund
Opinion on the Financial Statements
We have audited the accompanying statements of assets and liabilities (consolidated as it relates to International Investors Gold Fund) of Global Hard Assets Fund and International Investors Gold Fund (collectively referred to as the “Funds”) (two of the series constituting VanEck Funds (the “Trust”)), including the schedules of investments (consolidated as it relates to International Investors Gold Fund), as of December 31, 2019, and the related statements of operations (consolidated as it relates to International Investors Gold Fund) for the year then ended, the statements of changes in net assets (consolidated as it relates to International Investors Gold Fund) for each of the two years in the period then ended, the financial highlights (consolidated as it relates to International Investors Gold Fund) for each of the five years in the period then ended and the related notes (collectively referred to as the “financial statements”). In our opinion, the financial statements present fairly, in all material respects, the financial position (consolidated as it relates to International Investors Gold Fund) of Global Hard Assets Fund and International Investors Gold Fund (two of the series constituting VanEck Funds) at December 31, 2019, the results of their operations (consolidated as it relates to International Investors Gold Fund) for the year then ended, the changes in their net assets (consolidated as it relates to International Investors Gold Fund) for each of the two years in the period then ended and their financial highlights (consolidated as it relates to International Investors Gold Fund) for each of the five years in the period then ended, in conformity with U.S. generally accepted accounting principles.
Basis for Opinion
These financial statements are the responsibility of the Trust’s management. Our responsibility is to express an opinion on each of the Fund’s financial statements based on our audits. We are a public accounting firm registered with the Public Company Accounting Oversight Board (United States) (“PCAOB”) and are required to be independent with respect to the Trust in accordance with the U.S. federal securities laws and the applicable rules and regulations of the Securities and Exchange Commission and the PCAOB.
We conducted our audits in accordance with the standards of the PCAOB. Those standards require that we plan and perform the audit to obtain reasonable assurance about whether the financial statements are free of material misstatement, whether due to error or fraud. The Trust is not required to have, nor were we engaged to perform, an audit of the Trust’s internal control over financial reporting. As part of our audits, we are required to obtain an understanding of internal control over financial reporting, but not for the purpose of expressing an opinion on the effectiveness of the Trust’s internal control over financial reporting. Accordingly, we express no such opinion.
Our audits included performing procedures to assess the risks of material misstatement of the financial statements, whether due to error or fraud, and performing procedures that respond to those risks. Such procedures included examining, on a test basis, evidence regarding the amounts and disclosures in the financial statements. Our procedures included confirmation of securities owned as of December 31, 2019, by correspondence with the custodian and brokers or by other appropriate auditing procedures where replies from brokers were not received. Our audits also included evaluating the accounting principles used and significant estimates made by management, as well as evaluating the overall presentation of the financial statements. We believe that our audits provide a reasonable basis for our opinion.

We have served as the auditor of one or more of the VanEck investment companies since 1999.
New York, New York
February 27, 2020
VANECK FUNDS
TAX INFORMATION
(unaudited)
The following information is provided with respect to the distributions paid during the taxable year ended December 31, 2019. Please consult your tax advisor for proper treatment of this information.
| GLOBAL HARD ASSETS FUND | | | |
| Record Date: | | 12/20/2019 | |
| Payable Date: | | 12/23/2019 | |
| | | | |
| Ordinary Income Paid Per Share-Class A | | $0.2525 | |
| Ordinary Income Paid Per Share-Class C | | — | |
| Ordinary Income Paid Per Share-Class I | | 0.4424 | |
| Ordinary Income Paid Per Share-Class Y | | 0.3657 | |
| | | | |
| Qualified Dividend Income for Individuals | | 100.00% | |
| | | | |
| Dividends Qualifying for the Dividends Received Deduction for Corporations | | 72.98% | |
| | | | |
| Interest from Federal Obligations | | 2.10% | |
The interest from Federal obligations represents income derived from assets backed by the full faith and credit of the U.S. Government. State law varies as to what percentage of this dividend income is exempt from state income tax.
| INTERNATIONAL INVESTORS GOLD | | | |
| Record Date: | 12/20/2019 | |
| Payable Date: | 12/23/2019 | |
| | | | |
| Ordinary Income Paid Per Share-Class A | $ | 0.3718 | |
| Ordinary Income Paid Per Share-Class C | | 0.3122 | |
| Ordinary Income Paid Per Share-Class I | | 0.4139 | |
| Ordinary Income Paid Per Share-Class Y | | 0.4028 | |
| | | | |
| Qualified Dividend Income for Individuals | | 18.99% | * |
| | | | |
| Dividends Qualifying for the Dividends Received Deduction for Corporations | | 5.20% | * |
| | | | |
| Interest from Federal Obligations | | 0.18% | |
| | | | |
| Foreign Source Income | | 10.87% | * |
| | | | |
| Foreign Taxes Paid Per Share | $ | 0.0046100 | |
The interest from Federal obligations represents income derived from assets backed by the full faith and credit of the U.S. Government. State law varies as to what percentage of this dividend income is exempt from state income tax.
The foreign taxes paid represent taxes incurred by the Fund on income received by the Fund from foreign sources. Foreign taxes paid may be included in taxable income with an offsetting deduction from gross income or may be taken as a credit for taxes paid to foreign governments.
| * | Expressed as a percentage of the ordinary income distribution grossed-up for foreign taxes. |
VANECK FUNDS
SPECIAL MEETING OF SHAREHOLDERS
October 11, 2019 (unaudited)
VANECK FUNDS
CM Commodity Index Fund
Emerging Markets Fund
Global Hard Assets Fund
International Investors Gold Fund
Unconstrained Emerging Markets Bond Fund
VanEck Morningstar Wide Moat Fund
VanEck NDR Managed Allocation Fund
A Special Meeting of Shareholders of VanEck Funds (the “Trust”) was held at the offices of the Trust, 666 Third Avenue, 9th Floor, New York, New York 10017 on October 11, 2019. The purpose of the meeting was to elect Trustees of the Trust. At the meeting, the following persons were elected by the shareholders to serve as Trustees of the Trust: Jon Lukomnik, Jane DiRenzo Pigott, R. Alastair Short, Richard D. Stamberger, Robert L. Stelzl, and Jan F. van Eck. No other business was transacted at the meeting.
The results of the voting at the meeting are as follows:
Proposal: To elect a Board of Trustees*:
| Name | | For | | | Withheld |
| Jon Lukomnik | | 239,074,404.179 | | | 1,973,903.626 |
| Jane DiRenzo Pigott | | 239,734,349.197 | | | 1,313,958.608 |
| R. Alastair Short | | 239,059,688.386 | | | 1,988,619.419 |
| Richard D. Stamberger | | 239,110,733.308 | | | 1,937,574.497 |
| Robert L. Stelzl | | 239,042,995.154 | | | 2,005,312.651 |
| Jan F. van Eck | | 239,874,952.434 | | | 1,173,355.371 |
| Total Trust Shares Outstanding**: 327,471,673.186 |
| * | Results are for all series portfolios within the Trust. |
| ** | As of the record date. |
VANECK FUNDS
BOARD OF TRUSTEES AND OFFICERS
December 31, 2019 (unaudited)
Trustee Information
The Trustees of the Trust, their address, position with the Trust, age and principal occupations during the past five years, as of January 1, 2020, are set forth below:
Trustee’s Name,
Address(1)and
Year of Birth | | Position(s) Held With Trust,
Term of Office(2)and
Length of Time Served | | Principal Occupation(s)
During Past Five Years | | Number of
Portfolios
In Fund
Complex(3)
Overseen
By Trustee | | Other Directorships Held Outside The
Fund Complex(3)During The Past Five Years |
| | | | | | | | | |
| Independent Trustees: | | | | | | |
| | | | | | | |
Jon Lukomnik
1956 (A)(I) | | Trustee (since 2006) | | Managing Partner, Sinclair Capital LLC (consulting firm). Formerly, Executive Director, Investor Responsibility Research Center Institute. | | 11 | | Member of the Deloitte Audit Quality Advisory Committee; Chairman of the Advisory Committee of Legion Partners; Member of the Standing Advisory Group to the Public Company Accounting Oversight Board; Director of VanEck ICAV (an Irish UCITS); VanEck Vectors UCITS ETF plc (an Irish UCITS). Formerly, Director of VanEck (a Luxembourg UCITS); Chairman of the Board of the New York Classical Theatre. |
| | | | | | | | | |
Jane DiRenzo Pigott
1957 (I) | | Trustee (since 2007); Chairperson of the Board
(since 2020) | | Managing Director, R3 Group LLC (consulting firm). | | 11 | | Trustee of Northwestern University, Lyric Opera of Chicago and the Chicago Symphony Orchestra. Formerly, Director and Chair of Audit Committee of 3E Company (services relating to hazardous material safety); Director of MetLife Investment Funds, Inc. |
R. Alastair Short
1953 (A)(I) | | Trustee (since 2004); Chairperson of the Audit Committee (since 2006) | | President, Apex Capital Corporation (personal investment vehicle). | | 66 | | Chairman and Independent Director, EULAV Asset Management; Trustee, Kenyon Review; Trustee, Children’s Village. Formerly, Independent Director, Tremont offshore funds. |
| | | | | | | | | |
Richard D. Stamberger
1959 (G)(I) | | Trustee (since 1995) | | President and CEO, SmartBrief, Inc. (business media company). | | 66 | | Director, Food and Friends, Inc. |
| | | | | | | | | |
Robert L. Stelzl
1945 (G)(I) | | Trustee (since 2007); Chairperson of the Governance Committee (since 2017) | | Co-Trustee, the estate of Donald Koll; Trustee, Robert D. MacDonald Trust; Trustee, GH Insurance Trusts. Formerly, Trustee, Joslyn Family Trusts; President, Rivas Capital, Inc. (real estate property management services company). | | 11 | | Director, Brookfield Office Properties, Inc., Brookfield Residential Properties, Inc., Brookfield DTLA Fund Office Trust Investor, Inc., Brookfield Property Finance ULC and Brookfield Property Split Corp. |
| | | | | | | | | |
| Interested Trustee: | | | | | | |
| | | | | | | |
Jan F. van Eck(4)
1963 (I) | | Trustee (Since 2019); Chairperson of the Investment Oversight Committee (since 2020); Chief Executive Officer and President (Since 2010) | | Director, President and Chief Executive Officer of Van Eck Associates Corporation (VEAC), Van Eck Absolute Return Advisers Corporation (VEARA) and Van Eck Securities Corporation (VESC); Officer and/or Director of other companies affiliated with VEAC and/or the Trust. | | 66 | | Director, National Committee on US China Relations. |
| (1) | The address for each Trustee and officer is 666 Third Avenue, 9th Floor, New York, New York 10017. |
| (2) | Trustee serves until resignation, death, retirement or removal. |
| (3) | The Fund Complex consists of VanEck Funds, VanEck VIP Trust and VanEck Vectors ETF Trust. |
| (4) | “Interested person” of the Trust within the meaning of the 1940 Act. Mr. van Eck is an officer of VEAC, VEARA and VESC. In addition, Mr. van Eck and members of his family own 100% of the voting stock of VEAC, which in turns owns 100% of the voting stock of each of VEARA and VESC. |
| (A) | Member of the Audit Committee. |
| (G) | Member of the Governance Committee. |
| (I) | Member of the Investment Oversight Committee. |
VANECK FUNDS
BOARD OF TRUSTEES AND OFFICERS
December 31, 2019 (unaudited) (continued)
Officer Information
The executive officers of the Trust, their age and address, the positions they hold with the Trust, their term of office and length of time served and their principal business occupations during the past five years are shown below:
Officer’s Name, Address(1)
And Year of Birth | | Position(s) Held With Trust | | Term of Office And
Length of Time Served(2) | | Principal Occupations During The Past Five Years |
| | | | | | | |
Matthew A. Babinsky,
1983 | | Assistant Vice President and Assistant Secretary | | Since 2016 | | Assistant Vice President, Assistant General Counsel and Assistant Secretary of VEAC, VEARA and VESC; Officer of other investment companies advised by VEAC and VEARA. Formerly, Associate, Clifford Chance US LLP. |
| | | | | | | |
Russell G. Brennan,
1964 | | Assistant Vice President and Assistant Treasurer | | Since 2008 | | Assistant Vice President of VEAC; Officer of other investment companies advised by VEAC and VEARA. |
| | | | | | | |
Charles T. Cameron,
1960 | | Vice President | | Since 1996 | | Portfolio Manager for VEAC; Officer and/or Portfolio Manager of other investment companies advised by VEAC and VEARA. Formerly, Director of Trading of VEAC. |
| | | | | | | |
John J. Crimmins,
1957 | | Vice President, Treasurer, Chief Financial Officer and Principal Accounting Officer | | Vice President, Chief Financial Officer and Principal Accounting Officer (since 2012); Treasurer (since 2009) | | Vice President of VEAC and VEARA; Officer of other investment companies advised by VEAC and VEARA. Formerly, Vice President of VESC. |
| | | | | | | |
F. Michael Gozzillo,
1965 | | Chief Compliance Officer | | Since 2018 | | Vice President and Chief Compliance Officer of VEAC and VEARA; Chief Compliance Officer of VESC; Officer of other investment companies advised by VEAC and VEARA. Formerly, Chief Compliance Officer of City National Rochdale, LLC and City National Rochdale Funds. |
Laura Hamilton,
1977 | | Vice President | | Since 2019 | | Assistant Vice President of VEAC and VESC; Officer of other investment companies advised by VEAC and VEARA. Formerly, Operations Manager of Royce & Associates. |
| | | | | | | |
Laura I. Martínez,
1980 | | Vice President and Assistant Secretary | | Vice President (since 2016); Assistant Secretary (since 2008) | | Vice President, Associate General Counsel and Assistant Secretary of VEAC, VEARA and VESC; Officer of other investment companies advised by VEAC and VEARA. Formerly, Assistant Vice President of VEAC, VEARA and VESC. |
| | | | | | | |
James Parker,
1969 | | Assistant Treasurer | | Since 2014 | | Assistant Vice President of VEAC, Manager, Portfolio Administration of VEAC and VEARA; Officer of other investment companies advised by VEAC and VEARA. |
| | | | | | | |
Jonathan R. Simon,
1974 | | Senior Vice President; Secretary and Chief Legal Officer | | Senior Vice President (since 2016); Secretary and Chief Legal Officer (since 2014) | | Senior Vice President, General Counsel and Secretary of VEAC, VEARA and VESC; Officer and/or Director of other companies affiliated with VEAC and/or the Trust. Formerly, Vice President of VEAC, VEARA and VESC. |
| (1) | The address for each Executive Officer is 666 Third Avenue, 9th Floor, New York, NY 10017. |
| (2) | Officers are elected yearly by the Board. |
This report is intended for the Funds’ shareholders. It may not be distributed to prospective investors unless it is preceded or accompanied by the Funds’ prospectus and summary prospectus, which includes more complete information. Investing involves substantial risk and high volatility, including possible loss of principal. An investor should consider the investment objective, risks, and charges and expenses of the Funds carefully before investing. To obtain a prospectus, which contains this and other information, call 800.826.2333 or visit vaneck.com. Please read the prospectus and summary prospectus carefully before investing.
Additional information about VanEck Funds (the “Trust”) Board of Trustees/Officers and a description of the policies and procedures the Trust uses to determine how to vote proxies relating to portfolio securities are provided in the Statement of Additional Information. The Statement of Additional Information and information regarding how the Trust voted proxies relating to portfolio securities during the most recent twelve month period ending June 30 is available, without charge, by calling 800.826.2333, or by visiting vaneck.com, or on the Securities and Exchange Commission’s website at https://www.sec.gov.
The Trust files its complete schedule of portfolio holdings with the Securities and Exchange Commission for the first and third quarters of each fiscal year on Form N-PORT. The Trust’s Form N-PORT filings are available on the Commission’s website at https://www.sec.gov and may be reviewed and copied at the Commission’s Public Reference Room in Washington, D.C. Information on the operation of the Public Reference Room may be obtained by calling 202.942.8090. The Fund’s complete schedule of portfolio holdings is also available by calling 800.826.2333 or by visiting vaneck.com.

| Investment Adviser: | Van Eck Associates Corporation | |
| Distributor: | Van Eck Securities Corporation | |
| | 666 Third Avenue, New York, NY 10017 | |
| | vaneck.com | |
| Account Assistance: | 800.544.4653 | GHAIIGAR |
 | ANNUAL REPORT
December 31, 2019 |
VanEck Funds
Unconstrained Emerging Markets Bond Fund
Certain information contained in this report represents the opinion of the investment adviser and may change at any time. This information is not intended to be a forecast of future events, a guarantee of future results or investment advice. Current market conditions may not continue. Also, unless otherwise specifically noted, any discussion of the Fund’s holdings, the Fund’s performance, and the views of the investment adviser are as of December 31, 2019.
PRIVACY NOTICE
(unaudited)
| FACTS | WHAT DOES VAN ECK DO WITH YOUR
PERSONAL INFORMATION? |
| Why? | Financial companies choose how they share your personal information. Federal law gives consumers the right to limit some but not all sharing. Federal law also requires us to tell you how we collect, share, and protect your personal information. Please read this notice carefully to understand what we do. |
| What? | The types of personal information we collect and share depend on the product or service you have with us. This information can include: ■ Social Security number and account balances ■ assets and payment history ■ risk tolerance and transaction history |
| How? | All financial companies need to share customers’ personal information to run their everyday business. In the section below, we list the reasons financial companies can share their customers’ personal information; the reasons Van Eck chooses to share; and whether you can limit this sharing. |
Reasons we can share your personal
information | Does Van Eck share? | Can you limit this
sharing? |
| For our everyday business purposes— such as to process your transactions, maintain your account(s), respond to court orders and legal investigations, or report to credit bureaus | Yes | No |
| For our marketing purposes— to offer our products and services to you | Yes | No |
| For joint marketing with other financial companies | Yes | No |
| For our affiliates’ everyday businesspurposes— information about your transactions and experiences | Yes | No |
| For our affiliates’ everyday businesspurposes— information about your creditworthiness | No | We don’t share |
| For our affiliates to market to you | Yes | Yes |
| For nonaffiliates to market to you | No | We don’t share |
| To limit our sharing | Call us at 1-800-826-2333. Please note: If you are a new customer, we can begin sharing your information 30 days from the date we sent this notice. When you are no longer our customer, we continue to share your information as described in this notice. |
| | However, you can contact us at any time to limit our sharing. |
| Questions? | Call us at 1-800-826-2333. |
PRIVACY NOTICE
(unaudited) (continued)
| Who we are |
| Who is providing this notice? | Van Eck Global, its affiliates and funds sponsored or managed by Van Eck (collectively “Van Eck”). |
| What we do |
| How does Van Eck protect my personal information? | To protect your personal information from unauthorized access and use, we use security measures that comply with federal law. These measures include computer safeguards and secured files and buildings. |
| How does Van Eck collect my personal information? | We collect your personal information, for example, when you ■ open an account or give us your income information ■ provide employment information or give us your contact information ■ tell us about your investment or retirement portfolio We also collect your personal information from others, such as credit bureaus, affiliates, or other companies. |
| Why can’t I limit all sharing? | Federal law gives you the right to limit only ■ sharing for affiliates’ everyday business purposes—information about your creditworthiness ■ affiliates from using your information to market to you ■ sharing for nonaffiliates to market to you State laws and individual companies may give you additional rights to limit sharing. See below for more on your rights under state law. |
| What happens when I limit sharing for an account I hold jointly with someone else? | Your choices will apply to everyone on your account – unless you tell us otherwise |
| Definitions |
| Affiliates | Companies related by common ownership or control. They can be financial and nonfinancial companies. ■ Our affiliates include companies with a Van Eck name such as Van Eck Securities Corporation and others such as Market Vectors Index Solutions GmbH. |
| Nonaffiliates | Companies not related by common ownership or control. They can be financial and nonfinancial companies. ■ Van Eck does not share with nonaffiliates so they can market to you. |
| Joint marketing | A formal agreement between nonaffiliated financial companies that together market financial products or services to you. ■ Our joint marketing partners include financial services companies |
| Other important information |
California Residents— In accordance with California law, we will not share information we collect about California residents with nonaffiliates except as permitted by law, such as with the consent of the customer or to service the customer’s accounts. We also will limit the sharing of information about you with our affiliates to the extent required by applicable California law. Vermont Residents— In accordance with Vermont law, we will not share information we collect about Vermont residents with nonaffiliates except as permitted by law, such as with the consent of the customer or to service the customer’s accounts. We will not share creditworthiness information about Vermont residents among Van Eck’s affiliates except with the authorization or consent of the Vermont resident. |
UNCONSTRAINED EMERGING MARKETS BOND FUND
PRESIDENT’S LETTER
December 31, 2019 (unaudited)
Dear Shareholders:
The story for 2019 was simple and familiar—slower economic growth was combated by expansive monetary policy.
But first a comment on global growth: the two engines of the global economy, the U.S. and China, continue to move forward and we now have the prospect of at least some resolution of the trade dispute between them in the phase-one agreement. The latest economic statistics from China are steady and there are signs of “green shoots.” China’s services sector is expanding robustly and manufacturing is struggling, but not collapsing. My blog,China’s Economic Growth: Continuing Despite Headlines, shows this in two charts.
The biggest event in the markets last summer was the surge in bonds in Europe with negative interest rates. At the end of September, nearly $15 trillion worth of debt globally carried a negative yield.1Despite moves by the European Central Bank to stimulate, not only is the European economy slowing down, but there are also concerns about just how effective central bank actions are. Looking forward, therefore, I think investors should assess their hedge against central bank uncertainty by considering, for example, their gold allocations. While high interest rate environments tend to be tough for gold (it does not pay any yield), against negative interest rates, gold and other hedges against central bank impotence should be strongly considered.
We encourage you to stay in touch with us through the videos, email subscriptions and research blogs available on our website, www.vaneck.com. I have started my own email subscription where I share interesting research—you can sign up on www.vaneck.com. Should you have any questions regarding fund performance, please contact us at 800.826.2333 or visit ourwebsite.
UNCONSTRAINED EMERGING MARKETS BOND FUND
PRESIDENT’S LETTER
(unaudited) (continued)
We sincerely thank you for investing in VanEck’s investment strategies. On the following pages, you will find a performance discussion and financial statements for the fund for the twelve month period ended December 31, 2019. As always, we value your continued confidence in us and look forward to helping you meet your investment goals in the future.

Jan F. van Eck
CEO and President
VanEck Funds
January 24, 2020
Investing involves substantial risk and high volatility, including possible loss of principal. An investor should consider the investment objective, risks, charges and expenses of the Funds carefully before investing. To obtain a prospectus and summary prospectus, which contain this and other information, call 800.826.2333 or visit vaneck.com. Please read the prospectus and summary prospectus carefully before investing.
| 1 | Financial Times: September was the busiest month ever for corporate debt issuance, September 30, 2019, https://www.ft.com/content/eef8234c-e3c0-11e9-b112-9624ec9edc59 |
MANAGEMENT DISCUSSION
December 31, 2019 (unaudited)
The Unconstrained Emerging Markets Bond Fund (the “Fund”) gained 12.61% (Class A shares, excluding sales charge) over the 12 month period ended December 31, 2019, while the Fund’s benchmark — a blended index consisting of 50% J.P. Morgan Emerging Markets Bond Index Global Diversified Index1(EMBI) and 50% J.P. Morgan Government Bond Index Emerging Markets Global Diversified Index2(GBI-EM) —gained 14.31% over the same period. (The EMBI gained 15.04% and the GBI-EM gained 13.47%.) The Fund gradually increased its local currency exposure during 2019, but kept it below 50%. Fund duration was generally lower than that of the benchmarks. The Fund’s underperformance in 2019 was due to low, or no, ownership of Mexico, Indonesia, Thailand, Colombia and Turkey.
Market Review
Emerging markets (EM) debt’s strong overall performance in 2019 was based on the steady, strong performance of hard currency debt (EMBI) combined with a more a volatile path for local currency debt (GBI-EM), though both ended the year near highs. Hard currency debt was anchored by steadily declining U.S. Treasury yields. Local currency debt ultimately benefited from these lower yields, but was buffeted by currency weakness due to escalations of trade tension between the U.S. and China.
The big drivers of EM debt markets for 2019 were lower U.S. interest rates and trade tension between the U.S. and China. The year saw U.S. 10-year yields decline by around 70bps to approximately 1.9% by year-end. This drove all fixed income asset classes higher, including strong returns for investment grade bonds. These lower yields were due to higher uncertainty, and high-rated bonds did very well relative to lower-rated bonds. Because China’s currency is so central to anchoring EM currencies and because Chinese demand is so central to commodity imports, developments on the trade front were closely watched by EM debt markets. Setbacks were generally met with weaker EM currencies. Nonetheless, as the trade narrative for 2019 increasingly became one of eventual agreement, EM currencies were ultimately able to stabilize.
Another big driver for EM debt markets in 2019 was Argentina, which saw the imposition of capital controls that effectively shut the country’s local currency bond market and a collapse in hard currency bond prices as default risk rose. By the end of 2019, it was hard to see broader evidence
UNCONSTRAINED EMERGING MARKETS BOND FUND
MANAGEMENT DISCUSSION
(unaudited) (continued)
of this Argentine dislocation, but its initial impact in the second quarter was serious, particularly for the peso. Capital controls resulted in local currency bonds being excluded from the GBI-EM. Also, the Fitch rating agency briefly and mistakenly assigned a “selective default” rating on Argentina’s foreign-law hard currency bonds, forcing sales by European pension funds which are not allowed to hold such bonds (the rating action was eventually reversed). By the end of 2019, though, a newly-elected government was finally inaugurated and formed a cabinet, which turned out to be more market-friendly than had been priced in and there turned out to be almost no lasting contagion to broader EM markets.
Fund Review
In 2019, Ukraine and Brazil, followed by Venezuela, El Salvador, Belarus and Peru contributed most to the Fund’s performance. Ukraine was by far the largest contributor (contributing over 2% to Fund performance). The Fund was invested in corporate and sovereign bonds in hard currency, as well as in local currency government bonds. Ukraine’s performance was driven by a newly elected government that implemented an extremely aggressive reform program and which appears to be negotiating peace with neighboring Russia. For the second large contributor, Brazil, the Fund was also invested in corporate and sovereign bonds in hard currency, as well as in local currency government bonds. Here, too, asset prices were boosted by the successful implementation of pension reform by a newly-elected government, as well as ongoing reform and growth momentum. Ukraine and Brazil’s contributions highlight the Fund’s preference for uncorrelated exposures based on country-specific drivers.
We should provide a brief note on Argentina, given its importance to the overall market for a portion of 2019, as well as the Fund’s large exposure to country. In 2019, the Fund had a significant overweight exposure to Argentina. We tactically reduced this exposure before the acute selloff in July and August of 2019, but still maintained an overweight after this tactical reduction. Following the acute selloff, though, the Fund increased its exposure. By the end of 2019, Argentina’s policy became clearer and more market-friendly than many had anticipated, boosting bond prices. Despite its large exposure for the year, the Fund lost just under 1.25% in Argentina for 2019, while the 50/50 benchmark had much smaller allocations to Argentina and lost approximately 1.5%.
During the year, the Fund took forward positions in a number of currencies that permitted long positions in securities. Forward positions in the Chilean peso, Korean won and South African rand contributed positively to the Fund’s performance. Forward positions in the Euro, Thailand baht, Mexican peso, Turkish lira and Brazilian real detracted. Forwards as a whole slightly reduced the Fund’s positive performance for the period.
The Fund’s underperformance was due to not owning some countries that exhibited very strong performance. Although the Fund had exposure to Mexico in 2019, it was underweight local currency Mexican bonds that did exceptionally well. The same was true for Indonesia. Turkey also did very well in 2019, but the Fund continues to avoid exposure to the country due to what we see as yet-unrealized risks. One could also argue that the Fund lost by not investing in Russia in 2019. However, the Fund had exposure to Ukraine and Belarus as quasi-proxies, which more than compensated for Russia’s missed gains.
For more information or to access investment and market insights, visit our web site or subscribe to our commentaries. To review timely updates related to emerging markets bonds, please visit www.vaneck.com/blogs/emerging-markets-bonds. To subscribe to VanEck’s emerging markets bonds updates, please visit www.vaneck.com/subscribe.
We thoroughly appreciate your participation in the Unconstrained Emerging Markets Bond Fund, and we look forward to helping you meet your investment goals in the future.
The Fund is subject to risks associated with its investments in emerging markets debt securities. Investing in foreign denominated and/or domiciled securities may involve heightened risk due to currency fluctuations, and economic and political risks, which may be enhanced in emerging markets. As the Fund may invest in securities denominated in foreign currencies and some of the income received by the Fund will be in foreign currencies, changes in currency exchange rates may negatively impact the Fund’s return. Derivatives may involve certain costs and risks such as liquidity, interest rate, market, credit, management and the risk that a position could credit risk, counterparty risk, interest rate risk, sovereign debt risk, tax risk, hedging risk, non-diversification risk, and risks
UNCONSTRAINED EMERGING MARKETS BOND FUND
MANAGEMENT DISCUSSION
(unaudited) (continued)
associated with noninvestment grade securities. Please see the prospectus and summary prospectus for information on these and other risk considerations.
 | |  |
| | | |
| Eric Fine | | David Austerweil |
| Portfolio Manager | | Deputy Portfolio Manager |
Represents the opinions of the investment adviser. Past performance is no guarantee of future results. Not intended to be a forecast of future events, a guarantee of future results or investment advice. Current market conditions may not continue.
All indices are unmanaged and include the reinvestment of all dividends, but do not reflect the payment of transaction costs, advisory fees or expenses that are associated with an investment in the Fund. Certain indices may take into account withholding taxes.
An index’s performance is not illustrative of the Fund’s performance. Indices are not securities in which investments can be made.
| 1 | J.P. Morgan Emerging Markets Bond Index Global Diversified Index (EMBI) tracks returns for actively traded external debt instruments in emerging markets, and is also J.P. Morgan’s most liquid U.S. dollar emerging markets debt benchmark. |
| | |
| 2 | J.P. Morgan Government Bond Index-Emerging Markets Global Diversified Index (GBIEM) tracks local currency bonds issued by emerging markets governments. |
PERFORMANCE COMPARISON
December 31, 2019 (unaudited)
This chart shows the value of a hypothetical $10,000 investment in the Fund since inception. The result is compared with the Fund’s benchmark and broad-based market indices. Performance of Class C, Class I, and Class Y shares will vary from that of the Class A shares due to differences in class specific fees and any applicable sales charges. | | Hypothetical Growth of $10,000 (Since Inception: Class A)  |
On May 1, 2015 the Unconstrained Emerging Markets Bond Fund changed its primary benchmark from the GBI-EM to the blended benchmark of 50% EMBI and 50% GBI-EM to reflect the unconstrained long-only nature of the Fund.
Average Annual
Total Return (%) | | Class A
Before
Sales Charge | | Class A
After Maximum
Sales Charge | | Class C
Before
Sales Charge | | Class C
After Maximum
Sales Charge |
| One Year | | | 12.61 | % | | | 6.05 | % | | | 12.10 | % | | | 11.10 | % |
| Five Year | | | 1.53 | % | | | 0.33 | % | | | 0.85 | % | | | 0.85 | % |
| Life^ (annualized) | | | 2.04 | % | | | 1.23 | % | | | 1.33 | % | | | 1.33 | % |
Average Annual
Total Return (%) | | Class I* | | Class Y* | | 50% EMBI/
50% GBI-EM | |
| One Year | | | 13.09 | % | | | 13.05 | % | | | 14.31 | % | |
| Five Year | | | 1.86 | % | | | 1.78 | % | | | 4.57 | % | |
| Life^ (annualized) | | | 2.33 | % | | | 2.27 | % | | | 3.30 | % | |
| | | | | | | | | | | | | | |
Average Annual
Total Returns (%) | | GBI-EM | | EMBI | | | | | |
| One Year | | | 13.47 | % | | | 15.04 | % | | | | | |
| Five Year | | | 2.78 | % | | | 6.24 | % | | | | | |
| Life^ (annualized) | | | 1.02 | % | | | 5.51 | % | | | | | |
| * | Classes are not subject to a sales charge |
| ^ | Since July 9, 2012 (inception date for all share classes) |
UNCONSTRAINED EMERGING MARKETS BOND FUND
PERFORMANCE COMPARISON
(unaudited) (continued)
The performance quoted represents past performance. Past performance does not guarantee future results; current performance may be lower or higher than the performance data quoted.
Investment return and value of shares of the Fund will fluctuate so that an investor’s shares, when redeemed, may be worth more or less than their original cost. Performance information reflects temporary waivers of expenses and/or fees, if any. Had the Fund incurred all expenses, investment returns would have been reduced. Fund returns assume that dividends and capital gains distributions have been reinvested in the Fund at NAV. These returns do not reflect the deduction of taxes that a shareholder would pay on Fund dividends and distributions or the redemption of Fund shares. Performance information current to the most recent month end is available by calling 800.826.2333 or by visiting vaneck.com.
All indices are unmanaged and include the reinvestment of all dividends, but do not reflect the payment of transaction costs, advisory fees or expenses that are associated with an investment in the Fund. Certain indices may take into account withholding taxes. An index’s performance is not illustrative of the Fund’s performance. Indices are not securities in which investments can be made.
The 50/50 benchmark Index is a blended index consisting of 50% J.P Morgan Emerging Markets Bond Index (EMBI) Global Diversified and 50% J.P. Morgan Government Bond Index-Emerging Markets Global Diversified (GBI-EM) (reflects no deduction for fees, expenses or taxes).
The J.P. Morgan Government Bond Index-Emerging Markets Global Diversified Index tracks local currency bonds issued by Emerging Markets governments (reflects no deduction for fees, expenses or taxes).
J.P Morgan Emerging Markets Bond Index Global Diversified Index tracks returns for actively traded external debt instruments in emerging markets, and is also J.P. Morgan’s most liquid U.S-dollar emerging markets debt benchmark (reflects no deduction for fees, expenses or taxes).
EXPLANATION OF EXPENSES
(unaudited)
As a shareholder of the Fund, you incur two types of costs: (1) transaction costs, including sales charges on purchase payments; and (2) ongoing costs, including management fees and other Fund expenses. This disclosure is intended to help you understand the ongoing costs (in dollars) of investing in the Fund and to compare these costs with the ongoing costs of investing in other mutual funds.
The disclosure is based on an investment of $1,000 invested at the beginning of the period and held for the entire period, July 1, 2019 to December 31, 2019.
Actual Expenses
The first line in the table below provides information about account values and actual expenses. You may use the information in this line, together with the amount you invested, to estimate the expenses that you paid over the period. Simply divide your account value by $1,000 (for example, an $8,600 account value divided by $1,000 = 8.6), then multiply the result by the number in the first line under the heading entitled “Expenses Paid During the Period.”
Hypothetical Example for Comparison Purposes
The second line in the table below provides information about hypothetical account values and hypothetical expenses based on the Fund’s actual expense ratio and an assumed rate of return of 5% per year before expenses, which is not the Fund’s actual return. The hypothetical account values and expenses may not be used to estimate the actual ending account balance or expenses you paid for the period. You may use this information to compare the ongoing costs of investing in the Fund and other funds. To do so, compare this 5% hypothetical example with the 5% hypothetical examples that appear in the shareholder reports of other funds.
Please note that the expenses shown in the table are meant to highlight your ongoing costs only and do not reflect any transactional costs, such as fees on purchase payments. Therefore, the second line of the table is useful in comparing ongoing costs only, and will not help you determine the relative costs of owning different funds. In addition, if these transactional costs were included, your costs would have been higher.
UNCONSTRAINED EMERGING MARKETS BOND FUND
EXPLANATION OF EXPENSES
(unaudited) (continued)
| | | Beginning
Account Value
July 1, 2019 | | Ending
Account Value
December 31,
2019 | | Annualized
Expense
Ratio
During Period | | Expenses Paid
During the Period*
July 1, 2019 -
December 31,
2019 |
| Class A | | | | | | | | |
| Actual | | $1,000.00 | | $1,026.80 | | 1.25% | | $6.39 |
| Hypothetical** | | $1,000.00 | | $1,018.90 | | 1.25% | | $6.36 |
| Class C | | | | | | | | |
| Actual | | $1,000.00 | | $1,022.90 | | 1.95% | | $9.94 |
| Hypothetical** | | $1,000.00 | | $1,015.38 | | 1.95% | | $9.91 |
| Class I | | | | | | | | |
| Actual | | $1,000.00 | | $1,028.40 | | 0.95% | | $4.86 |
| Hypothetical** | | $1,000.00 | | $1,020.42 | | 0.95% | | $4.84 |
| Class Y | | | | | | | | |
| Actual | | $1,000.00 | | $1,027.80 | | 1.00% | | $5.11 |
| Hypothetical** | | $1,000.00 | | $1,020.16 | | 1.00% | | $5.09 |
| * | Expenses are equal to the Fund’s annualized expense ratio (for the six months ended December 31, 2019), multiplied by the average account value over the period, multiplied by the number of days in the most recent fiscal half year divided by the number of the days in the fiscal year (to reflect the one-half year period). |
| | |
| ** | Assumes annual return of 5% before expenses |
UNCONSTRAINED EMERGING MARKETS BOND FUND
SCHEDULE OF INVESTMENTS
December 31, 2019
Principal
Amount | | | | | Value | |
| | | | | | | | | |
| CORPORATE BONDS: 22.4% |
| Argentina: 1.9% |
| USD | 362,000 | | | Cia General de Combustibles SA Reg S
9.50%, 11/07/21 | | $ | 303,320 | |
| | 53,000 | | | IRSA Inversiones y Representaciones SA Reg S
11.50%, 07/20/20 | | | 52,470 | |
| | 180,000 | | | IRSA Propiedades Comerciales SA Reg S
8.75%, 03/23/23 | | | 160,785 | |
| | | | | | | | 516,575 | |
| Cayman Islands: 2.4% |
| | | | | CAR, Inc. Reg S | | | | |
| | 176,000 | | | 6.00%, 02/11/21 | | | 163,710 | |
| CNY | 1,000,000 | | | 6.50%, 04/04/21 | | | 132,076 | |
| USD | 41,000 | | | 8.88%, 05/10/22 | | | 37,342 | |
| | 304,000 | | | NagaCorp. Ltd. 144A
9.38%, 05/21/21 | | | 322,703 | |
| | | | | | | | 655,831 | |
| Georgia: 1.3% |
| | 333,000 | | | TBC Bank JSC 144A
5.75%, 06/19/24 | | | 344,672 | |
| Indonesia: 1.2% |
| | 333,000 | | | Chandra Asri Petrochemical Tbk PT Reg S
4.95%, 11/08/24 | | | 327,566 | |
| Ireland: 2.4% |
| | 300,000 | | | Aragvi Finance International DAC 144A
12.00%, 04/09/24 | | | 321,000 | |
| | 302,000 | | | Eurotorg LLC via Bonitron DAC 144A
8.75%, 10/30/22 | | | 322,687 | |
| | | | | | | | 643,687 | |
| Luxembourg: 2.5% |
| | 312,000 | | | CSN Resources SA 144A
7.63%, 04/17/26 † | | | 332,856 | |
| | 369,000 | | | Puma International Financing SA Reg S
5.00%, 01/24/26 | | | 347,223 | |
| | | | | | | | 680,079 | |
| Mexico: 0.5% |
| | 380,000 | | | Corp. GEO SAB de CV Reg S
9.25%, 06/30/20 (d) * ∞ | | | 6 | |
| | 140,000 | | | Cydsa SAB de CV 144A
6.25%, 10/04/27 | | | 144,250 | |
| | | | | | | | 144,256 | |
See Notes to Financial Statements
UNCONSTRAINED EMERGING MARKETS BOND FUND
SCHEDULE OF INVESTMENTS
(continued)
Principal
Amount | | | | | Value | |
| | | | | | | | | |
| Mongolia: 1.0% |
| | 315,000 | | | Mongolian Mining Corp./Energy Resources LLC 144A
9.25%, 04/15/24 | | $ | 287,718 | |
| Netherlands: 3.4% |
| | | | | IHS Netherlands Holdco BV 144A | | | | |
| | 86,000 | | | 7.13%, 03/18/25 | | | 90,902 | |
| | 255,000 | | | 8.00%, 09/18/27 | | | 271,817 | |
| | 325,000 | | | Mong Duong Finance Holdings BV 144A
5.13%, 05/07/29 | | | 333,531 | |
| | 212,989 | | | MV24 Capital BV 144A
6.75%, 06/01/34 | | | 225,374 | |
| | | | | | | | 921,624 | |
| Nigeria: 1.1% |
| | 301,000 | | | Seplat Petroleum Development Co. Plc 144A
9.25%, 04/01/23 | | | 315,351 | |
| Norway: 1.1% |
| | 300,000 | | | DNO ASA Reg S 144A
8.75%, 05/31/23 | | | 306,750 | |
| Singapore: 1.2% |
| | 309,000 | | | Medco Oak Tree Pte Ltd. 144A
7.38%, 05/14/26 | | | 315,410 | |
| United Arab Emirates: 1.4% |
| | 370,000 | | | ADES International Holding Plc 144A
8.63%, 04/24/24 | | | 385,725 | |
| United Kingdom: 1.0% |
| | 160,000 | | | Tullow Oil Plc 144A
7.00%, 03/01/25 † | | | 135,090 | |
| | 172,000 | | | Tullow Oil Plc Reg S
7.00%, 03/01/25 | | | 145,221 | |
| | | | | | | | 280,311 | |
Total Corporate Bonds
(Cost: $6,153,063) | | 6,125,555 | |
| FOREIGN GOVERNMENT OBLIGATIONS: 75.4% |
| Angola: 4.2% |
| | | | | Angolan Government International Bonds 144A | | | | |
| | 352,000 | | | 8.00%, 11/26/29 † | | | 376,541 | |
| | 705,000 | | | 9.13%, 11/26/49 † | | | 756,134 | |
| | | | | | | | 1,132,675 | |
See Notes to Financial Statements
Principal
Amount | | | | | Value | |
| | | | | | | | | |
| Argentina: 9.1% |
| CHF | 830,000 | | | Argentine Republic Government International Bond Reg S
3.38%, 10/12/20 | | $ | 510,238 | |
| | | | | Argentine Republic Government International Bonds | | | | |
| USD | 577,000 | | | 5.63%, 01/26/22 | | | 300,220 | |
| | 2,721,000 | | | 6.88%, 04/22/21 | | | 1,477,231 | |
| | | | | Provincia de Buenos Aires Reg S | | | | |
| | 499 | | | 4.00%, 05/15/35 (s) | | | 203 | |
| | 397,000 | | | 9.95%, 06/09/21 | | | 193,537 | |
| | | | | | | | 2,481,429 | |
| Azerbaijan: 3.1% |
| | 763,000 | | | Republic of Azerbaijan International Bond 144A
5.13%, 09/01/29 | | | 833,195 | |
| Belarus: 4.9% |
| | | | | Development Bank of the Republic of Belarus JSC 144A | | | | |
| | 82,000 | | | 6.75%, 05/02/24 | | | 86,520 | |
| BYN | 400,000 | | | 12.00%, 05/15/22 | | | 191,503 | |
| USD | 408,000 | | | Republic of Belarus International Bond 144A
6.20%, 02/28/30 | | | 434,457 | |
| | 581,000 | | | Republic of Belarus International Bond Reg S
6.88%, 02/28/23 | | | 621,160 | |
| | | | | | | | 1,333,640 | |
| Brazil: 4.4% |
| | | | | Brazil Notas do Tesouro Nacional, Series F | | | | |
| BRL | 3,186,000 | | | 10.00%, 01/01/27 | | | 932,140 | |
| | 914,000 | | | 10.00%, 01/01/29 | | | 274,590 | |
| | | | | | | | 1,206,730 | |
| Chile: 3.3% |
| CLP | 600,000,000 | | | Bonos de la Tesoreria de la Republica de Chile Reg S 144A
4.70%, 09/01/30 | | | 909,508 | |
| Czech Republic: 2.9% |
| CZK | 16,450,000 | | | Czech Republic Government Bond
2.75%, 07/23/29 | | | 799,304 | |
| Dominican Republic: 2.1% |
| DOP | 7,700,000 | | | Dominican Republic International Bond 144A
9.75%, 06/05/26 | | | 149,338 | |
| | 22,350,000 | | | Dominican Republic International Bond Reg S
8.90%, 02/15/23 | | | 421,471 | |
| | | | | | | | 570,809 | |
See Notes to Financial Statements
UNCONSTRAINED EMERGING MARKETS BOND FUND
SCHEDULE OF INVESTMENTS
(continued)
Principal
Amount | | | | | Value | |
| | | | | | | | | |
| El Salvador: 6.5% |
| | | | | El Salvador Government International Bonds Reg S | | | | |
| USD | 151,000 | | | 5.88%, 01/30/25 | | $ | 159,556 | |
| | 524,000 | | | 7.65%, 06/15/35 † | | | 599,160 | |
| | 358,000 | | | 8.25%, 04/10/32 | | | 427,487 | |
| | 488,000 | | | 8.63%, 02/28/29 | | | 586,990 | |
| | | | | | | | 1,773,193 | |
| Indonesia: 4.9% |
| | | | | Indonesia Treasury Bonds | | | | |
| IDR | 12,443,000,000 | | | 8.25%, 05/15/29 | | | 968,237 | |
| | 4,862,000,000 | | | 8.38%, 03/15/34 | | | 375,616 | |
| | | | | | | | 1,343,853 | |
| Laos: 1.0% |
| USD | 280,000 | | | Lao People’s Democratic Republic International Bond 144A
6.88%, 06/30/21 | | | 275,800 | |
| Malaysia: 3.0% |
| MYR | 3,314,000 | | | Malaysia Government Bond
3.48%, 06/14/24 | | | 819,766 | |
| Mexico: 6.0% |
| | | | | Petroleos Mexicanos | | | | |
| USD | 737,000 | | | 6.63%, 06/15/35 | | | 757,588 | |
| MXN | 16,620,000 | | | 7.47%, 11/12/26 | | | 773,195 | |
| USD | 86,000 | | | Petroleos Mexicanos 144A
6.49%, 01/23/27 | | | 91,612 | |
| | | | | | | | 1,622,395 | |
| South Africa: 7.2% |
| | | | | Republic of South Africa Government Bonds | | | | |
| ZAR | 14,838,000 | | | 8.00%, 01/31/30 | | | 989,690 | |
| | 12,205,000 | | | 10.50%, 12/21/26 | | | 975,479 | |
| | | | | | | | 1,965,169 | |
| Ukraine: 4.1% |
| | | | | | | | | |
| UAH | 11,526,000 | | | Ukraine Government Bond
17.00%, 05/11/22 | | | 527,814 | |
| USD | 58,000 | | | Ukraine Government International Bond 144A
7.38%, 09/25/32 | | | 62,015 | |
| | 500,000 | | | Ukraine Government International Bond Reg S
7.38%, 09/25/32 | | | 534,608 | |
| | | | | | | | 1,124,437 | |
| United Kingdom: 1.9% |
| UAH | 11,900,000 | | | Ukreximbank Via Biz Finance Plc Reg S
16.50%, 03/02/21 | | | 508,579 | |
See Notes to Financial Statements
Principal
Amount | | | | | Value | |
| | | | | | | | | |
| Uruguay: 6.8% |
| | | | | Uruguay Government International Bonds Reg S | | | | |
| UYU | 51,811,000 | | | 8.50%, 03/15/28 | | $ | 1,201,049 | |
| | 25,142,000 | | | 9.88%, 06/20/22 | | | 664,071 | |
| | | | | | | | 1,865,120 | |
Total Foreign Government Obligations
(Cost: $20,082,952) | | | 20,565,602 | |
| | | | | | | | | |
Number
of Shares | | | | | | | |
| |
| COMMON STOCK: 0.0% |
Mexico: 0.0%
(Cost: $0) |
| | 10,247 | | | Corp. GEO SAB de CV * # ∞ | | | 0 | |
| | | | | | | | | |
MONEY MARKET FUND: 1.8%
(Cost: $495,998) | | | | |
| | 495,998 | | | Invesco Treasury Portfolio – Institutional Class | | | 495,998 | |
Total Investments Before Collateral for Securities Loaned: 99.6%
(Cost: $26,732,013) | | | 27,187,155 | |
SHORT-TERM INVESTMENTS HELD AS COLLATERAL FOR SECURITIES ON LOAN: 4.0%
(Cost: $1,094,265) | | | | |
| Money Market Fund: 4.0% |
| | 1,094,265 | | | State Street Navigator Securities Lending Government Money Market Portfolio | | | 1,094,265 | |
Total Investments: 103.6%
(Cost: $27,826,278) | | | 28,281,420 | |
| Liabilities in excess of other assets: (3.6)% | | | (985,882 | ) |
| NET ASSETS: 100.0% | | $ | 27,295,538 | |
See Notes to Financial Statements
UNCONSTRAINED EMERGING MARKETS BOND FUND
SCHEDULE OF INVESTMENTS
(continued)
Definitions:
| BRL | Brazilian Real |
| BYN | Belarusian Ruble |
| CHF | Swiss Franc |
| CLP | Chilean Peso |
| CNY | Chinese Yuan |
| CZK | Czech Koruna |
| DOP | Dominican Peso |
| IDR | Indonesian Rupiah |
| MXN | Mexican Peso |
| MYR | Malaysian Ringgit |
| UAH | Ukrainian Hryvnia |
| USD | United States Dollar |
| UYU | Uruguayan Peso |
| ZAR | South African Rand |
Footnotes:
| (d) | Security in default of coupon payment |
| (s) | Step Bond – the rate shown reflects the rate in effect at the end of the reporting period. Coupon adjusts periodically based upon a predetermined schedule. |
| * | Non-income producing |
| ∞ | Security is valued using significant unobservable inputs that factor in discount for lack of marketability and is classified as Level 3 in the fair value hierarchy. |
| † | Security fully or partially on loan. Total market value of securities on loan is $2,087,218. |
| # | Security has been valued in good faith pursuant to guidelines established by the Board of Trustees. The aggregate value of fair valued securities is $0 which represents 0.0% of net assets. |
| Reg S | Security was purchased pursuant to Regulation S under the Securities Act of 1933, which exempts from registration securities offered and sold outside of the United States. Such a security cannot be sold in the United States without either an effective registration statement filed pursuant to the Securities Act of 1933, or pursuant to an exemption from registration. |
| 144A | Security exempt from registration under Rule 144A of the Securities Act of 1933, as amended, or otherwise restricted. These securities may be resold in transactions exempt from registration, unless otherwise noted, and the value amounted to $8,634,994, or 31.6% of net assets. |
See Notes to Financial Statements
Summary of Investments by
Sector Excluding Collateral
for Securities Loaned | | | % of Investments | | Value | |
| Basic Materials | | | | 3.0 | % | | $ | 804,672 | |
| Consumer, Cyclical | | | | 2.4 | | | | 645,390 | |
| Consumer, Non-cyclical | | | | 1.2 | | | | 333,128 | |
| Energy | | | | 10.2 | | | | 2,767,182 | |
| Financial | | | | 3.2 | | | | 878,927 | |
| Government | | | | 75.7 | | | | 20,565,602 | |
| Industrial | | | | 1.3 | | | | 362,725 | |
| Utilities | | | | 1.2 | | | | 333,531 | |
| Money Market Fund | | | | 1.8 | | | | 495,998 | |
| | | | | 100.0 | % | | $ | 27,187,155 | |
The summary of inputs used to value the Fund’s investments as of December 31, 2019 is as follows:
| | | Level 1
Quoted
Prices | | | Level 2
Significant
Observable
Inputs | | | Level 3
Significant
Unobservable
Inputs | | Value | |
| Corporate Bonds* | | $ | — | | | $ | 6,125,549 | | | | $ | 6 | | | $ | 6,125,555 | |
| Foreign Government Obligations* | | | — | | | | 20,565,602 | | | | | — | | | | 20,565,602 | |
| Common Stocks* | | | — | | | | — | | | | | 0 | | | | 0 | |
| Money Market Funds | | | 1,590,263 | | | | — | | | | | — | | | | 1,590,263 | |
| Total | | $ | 1,590,263 | | | $ | 26,691,151 | | | | $ | 6 | | | $ | 28,281,420 | |
* See Schedule of Investments for geographic sector breakouts.
See Notes to Financial Statements
UNCONSTRAINED EMERGING MARKETS BOND FUND
STATEMENT OF ASSETS AND LIABILITIES
December 31, 2019
| Assets: | | | | |
| Investments, at value (Cost $26,732,013) (1) | | $ | 27,187,155 | |
| Short-term investment held as collateral for securities loaned (2) | | | 1,094,265 | |
| Cash | | | 602,195 | |
| Cash denominated in foreign currency, at value (Cost $24) | | | 21 | |
| Receivables: | | | | |
| Investments sold | | | 854,267 | |
| Shares of beneficial interest sold | | | 45 | |
| Due from Adviser | | | 14,115 | |
| Dividends and interest | | | 489,614 | |
| Prepaid expenses | | | 3,123 | |
| Total assets | | | 30,244,800 | |
| Liabilities: | | | | |
| Payables: | | | | |
| Investments purchased | | | 1,703,915 | |
| Collateral for securities loaned | | | 1,094,265 | |
| Shares of beneficial interest redeemed | | | 11,143 | |
| Due to Distributor | | | 2,195 | |
| Deferred Trustee fees | | | 13,267 | |
| Accrued expenses | | | 124,477 | |
| Total liabilities | | | 2,949,262 | |
| NET ASSETS | | $ | 27,295,538 | |
| Class A Shares: | | | | |
| Net Assets | | $ | 4,859,644 | |
| Shares of beneficial interest outstanding | | | 754,468 | |
| Net asset value and redemption price per share | | $ | 6.44 | |
| Maximum offering price per share (Net asset value per share ÷ 94.25%) | | $ | 6.83 | |
| Class C Shares: | | | | |
| Net Assets | | $ | 1,351,045 | |
| Shares of beneficial interest outstanding | | | 217,013 | |
| sales charge within the first year of ownership) | | $ | 6.23 | |
| Class I Shares: | | | | |
| Net Assets | | $ | 18,092,306 | |
| Shares of beneficial interest outstanding | | | 2,772,244 | |
| Net asset value, offering and redemption price per share | | $ | 6.53 | |
| Class Y Shares: | | | | |
| Net Assets | | $ | 2,992,543 | |
| Shares of beneficial interest outstanding | | | 461,195 | |
| Net asset value, offering and redemption price per share | | $ | 6.49 | |
| Net Assets consist of: | | | | |
| Aggregate paid in capital | | $ | 59,434,644 | |
| Total distributable earnings (loss) | | | (32,139,106 | ) |
| | | $ | 27,295,538 | |
(1) Value of securities on loan | | $ | 2,087,218 | |
(2) Cost of short-term investment held as collateral for securities loaned | | $ | 1,094,265 | |
See Notes to Financial Statements
UNCONSTRAINED EMERGING MARKETS BOND FUND
STATEMENT OF OPERATIONS
For the Year Ended December 31, 2019
| Income: | | | | |
| Dividends | | $ | 14,594 | |
| Interest | | | 1,753,383 | |
| Securities lending income | | | 185 | |
| Foreign taxes withheld | | | (11,087 | ) |
| Total income | | | 1,757,075 | |
| Expenses: | | | | |
| Management fees | | | 158,547 | |
| Distribution fees – Class A | | | 12,383 | |
| Distribution fees – Class C | | | 15,307 | |
| Transfer agent fees – Class A | | | 18,968 | |
| Transfer agent fees – Class C | | | 15,233 | |
| Transfer agent fees – Class I | | | 21,596 | |
| Transfer agent fees – Class Y | | | 18,175 | |
| Custodian fees | | | 22,231 | |
| Professional fees | | | 106,567 | |
| Registration fees – Class A | | | 19,379 | |
| Registration fees – Class C | | | 17,753 | |
| Registration fees – Class I | | | 17,916 | |
| Registration fees – Class Y | | | 17,753 | |
| Reports to shareholders | | | 28,422 | |
| Insurance | | | 4,040 | |
| Trustees’ fees and expenses | | | 13,923 | |
| Interest | | | 2,694 | |
| Other | | | 3,314 | |
| Total expenses | | | 514,201 | |
| Waiver of management fees | | | (158,547 | ) |
| Expenses assumed by the Adviser | | | (132,517 | ) |
| Net expenses | | | 223,137 | |
| Net investment income | | | 1,533,938 | |
| Net realized gain (loss) on: | | | | |
| Investments (net of foreign taxes of $9,945) | | | 415,782 | |
| Forward foreign currency contracts | | | (104,475 | ) |
| Foreign currency transactions and foreign denominated assets and liabilities | | | 6,035 | |
| Net realized gain | | | 317,342 | |
| Net change in net unrealized appreciation (depreciation) on: | | | | |
| Investments (net of foreign taxes of $(1,847)) | | | 764,626 | |
| Foreign currency transactions and foreign denominated assets and liabilities | | | 4,119 | |
| Net change in unrealized appreciation | | | 768,745 | |
| Net Increase in Net Assets Resulting from Operations | | $ | 2,620,025 | |
See Notes to Financial Statements
UNCONSTRAINED EMERGING MARKETS BOND FUND
STATEMENT OF CHANGES IN NET ASSETS
| | | Year Ended | | | Year Ended | |
| | | December 31, | | | December 31, | |
| | | 2019 | | | 2018 | |
| Operations: | | | | | | | | |
| Net investment income | | $ | 1,533,938 | | | $ | 2,152,000 | |
| Net realized gain (loss) | | | 317,342 | | | | (3,628,928 | ) |
| Net change in unrealized appreciation (depreciation) | | | 768,745 | | | | (1,085,060 | ) |
| Net increase (decrease) in net assets resulting from operations | | | 2,620,025 | | | | (2,561,988 | ) |
| Distributions to shareholders: | | | | | | | | |
| Dividends and distributions | | | | | | | | |
| Class A Shares | | | (309,887 | ) | | | — | |
| Class C Shares | | | (72,171 | ) | | | — | |
| Class I Shares | | | (682,018 | ) | | | — | |
| Class Y Shares | | | (255,827 | ) | | | — | |
| | | | (1,319,903 | ) | | | — | |
| Return of capital | | | | | | | | |
| Class A Shares | | | (48,145 | ) | | | (345,906 | ) |
| Class C Shares | | | (11,279 | ) | | | (107,070 | ) |
| Class I Shares | | | (105,823 | ) | | | (1,437,225 | ) |
| Class Y Shares | | | (39,677 | ) | | | (471,089 | ) |
| | | | (204,924 | ) | | | (2,361,290 | |
| Total distributions | | | (1,524,827 | ) | | | (2,361,290 | ) |
| Share transactions: | | | | | | | | |
| Proceeds from sale of shares | | | | | | | | |
| Class A Shares | | | 371,024 | | | | 369,249 | |
| Class C Shares | | | 63,956 | | | | 161,154 | |
| Class I Shares | | | 11,844,011 | | | | 656,158 | |
| Class Y Shares | | | 379,439 | | | | 1,075,717 | |
| | | | 12,658,430 | | | | 2,262,278 | |
| Reinvestment of distributions | | | | | | | | |
| Class A Shares | | | 244,264 | | | | 212,528 | |
| Class C Shares | | | 78,870 | | | | 87,344 | |
| Class I Shares | | | 437,701 | | | | 193,474 | |
| Class Y Shares | | | 269,145 | | | | 365,743 | |
| | | | 1,029,980 | | | | 859,089 | |
| Cost of shares redeemed | | | | | | | | |
| Class A Shares | | | (774,377 | ) | | | (888,235 | ) |
| Class C Shares | | | (461,704 | ) | | | (856,227 | ) |
| Class I Shares | | | (4,675,997 | ) | | | (16,135,572 | ) |
| Class Y Shares | | | (2,777,328 | ) | | | (7,653,625 | ) |
| | | | (8,689,406 | ) | | | (25,533,659 | ) |
| Net increase (decrease) in net assets resulting from share transactions | | | 4,999,004 | | | | (22,412,292 | ) |
| Total increase (decrease) in net assets | | | 6,094,202 | | | | (27,335,570 | ) |
| Net Assets: | | | | | | | | |
| Beginning of year | | | 21,201,336 | | | | 48,536,906 | |
| End of year | | $ | 27,295,538 | | | $ | 21,201,336 | |
See Notes to Financial Statements
UNCONSTRAINED EMERGING MARKETS BOND FUND
FINANCIAL HIGHLIGHTS
For a share outstanding throughout each year:
| | | Class A |
| | | Year Ended December 31, |
| | | 2019 | | 2018 | | 2017 | | 2016 | | 2015 |
| Net asset value, beginning of year | | | $ | 6.15 | | | | $ | 7.00 | | | | $ | 6.77 | | | | $ | 6.64 | | | | $ | 8.18 | |
| Income from investment operations: | | | | | | | | | | | | | | | | | | | | | | | | | |
| Net investment income | | | | 0.47 | (b) | | | | 0.38 | (b) | | | | 0.49 | (b) | | | | 0.25 | | | | | 0.45 | |
| Net realized and unrealized gain (loss) on investments | | | | 0.28 | | | | | (0.81 | ) | | | | 0.29 | | | | | 0.15 | | | | | (1.53 | ) |
| Total from investment operations | | | | 0.75 | | | | | (0.43 | ) | | | | 0.78 | | | | | 0.40 | | | | | (1.08 | ) |
| Less dividends and distributions from: | | | | | | | | | | | | | | | | | | | | | | | | | |
| Net investment income | | | | (0.40 | ) | | | | — | | | | | (0.55 | ) | | | | (0.16 | ) | | | | — | |
| Return of capital | | | | (0.06 | ) | | | | (0.42 | ) | | | | — | | | | | (0.11 | ) | | | | (0.46 | ) |
| Total dividends and distributions | | | | (0.46 | ) | | | | (0.42 | ) | | | | (0.55 | ) | | | | (0.27 | ) | | | | (0.46 | ) |
| Net asset value, end of year | | | $ | 6.44 | | | | $ | 6.15 | | | | $ | 7.00 | | | | $ | 6.77 | | | | $ | 6.64 | |
| Total return (a) | | | | 12.61 | % | | | | (6.39 | )% | | | | 11.68 | % | | | | 6.06 | % | | | | (13.60 | )% |
| Ratios/Supplemental Data | | | | | | | | | | | | | | | | | | | | | | | | | |
| Net assets, end of year (000’s) | | | $4,860 | | | | $4,793 | | | | $5,821 | | | | $8,657 | | | | $11,763 | |
| Ratio of gross expenses to average net assets | | | | 2.69 | % | | | | 2.05 | % | | | | 1.71 | % | | | | 1.68 | % | | | | 1.44 | % |
| Ratio of net expenses to average net assets | | | | 1.26 | % | | | | 1.26 | % | | | | 1.26 | % | | | | 1.25 | % | | | | 1.25 | % |
| Ratio of net expenses to average net assets, excluding interest expense | | | | 1.25 | % | | | | 1.25 | % | | | | 1.25 | % | | | | 1.25 | % | | | | 1.25 | % |
| Ratio of net investment income to average net assets | | | | 7.37 | % | | | | 5.78 | % | | | | 7.02 | % | | | | 3.70 | % | | | | 5.63 | % |
| Portfolio turnover rate | | | | 302 | % | | | | 269 | % | | | | 568 | % | | | | 546 | % | | | | 605 | % |
| (a) | Total return is calculated assuming an initial investment made at the net asset value at the beginning of year, reinvestment of any dividends and distributions at net asset value on the dividend/distributions payment date and a redemption at the net asset value on the last day of the year. The return does not reflect the deduction of taxes that a shareholder would pay on Fund dividends/distributions or the redemption of Fund shares. |
| (b) | Calculated based upon average shares outstanding. |
See Notes to Financial Statements
UNCONSTRAINED EMERGING MARKETS BOND FUND
FINANCIAL HIGHLIGHTS
For a share outstanding throughout each year:
| | | Class C |
| | | Year Ended December 31, |
| | | 2019 | | 2018 | | 2017 | | 2016 | | 2015 |
| Net asset value, beginning of year | | | $ | 5.88 | | | | $ | 6.68 | | | | $ | 6.53 | | | | $ | 6.45 | | | | $ | 8.02 | |
| Income from investment operations: | | | | | | | | | | | | | | | | | | | | | | | | | |
| Net investment income | | | | 0.41 | (b) | | | | 0.32 | (b) | | | | 0.43 | (b) | | | | 0.21 | | | | | 0.37 | |
| Net realized and unrealized gain (loss) on investments | | | | 0.29 | | | | | (0.79 | ) | | | | 0.27 | | | | | 0.14 | | | | | (1.48 | ) |
| Total from investment operations | | | | 0.70 | | | | | (0.47 | ) | | | | 0.70 | | | | | 0.35 | | | | | (1.11 | ) |
| Less dividends and distributions from: | | | | | | | | | | | | | | | | | | | | | | | | | |
| Net investment income | | | | (0.30 | ) | | | | — | | | | | (0.55 | ) | | | | (0.16 | ) | | | | — | |
| Return of capital | | | | (0.05 | ) | | | | (0.33 | ) | | | | — | | | | | (0.11 | ) | | | | (0.46 | ) |
| Total dividends and distributions | | | | (0.35 | ) | | | | (0.33 | ) | | | | (0.55 | ) | | | | (0.27 | ) | | | | (0.46 | ) |
| Net asset value, end of year | | | $ | 6.23 | | | | $ | 5.88 | | | | $ | 6.68 | | | | $ | 6.53 | | | | $ | 6.45 | |
| Total return (a) | | | | 12.10 | % | | | | (7.15 | )% | | | | 10.86 | % | | | | 5.45 | % | | | | (14.26 | )% |
| Ratios/Supplemental Data | | | | | | | | | | | | | | | | | | | | | | | | | |
| Net assets, end of year (000’s) | | | $1,351 | | | | $1,582 | | | | $2,447 | | | | $2,723 | | | | $3,669 | |
| Ratio of gross expenses to average net assets | | | | 4.82 | % | | | | 3.53 | % | | | | 3.38 | % | | | | 3.01 | % | | | | 2.68 | % |
| Ratio of net expenses to average net assets | | | | 1.96 | % | | | | 1.96 | % | | | | 1.96 | % | | | | 1.95 | % | | | | 1.95 | % |
| Ratio of net expenses to average net assets, excluding interest expense | | | | 1.95 | % | | | | 1.95 | % | | | | 1.95 | % | | | | 1.95 | % | | | | 1.95 | % |
| Ratio of net investment income to average net assets | | | | 6.61 | % | | | | 5.01 | % | | | | 6.38 | % | | | | 3.20 | % | | | | 4.93 | % |
| Portfolio turnover rate | | | | 302 | % | | | | 269 | % | | | | 568 | % | | | | 546 | % | | | | 605 | % |
| (a) | Total return is calculated assuming an initial investment made at the net asset value at the beginning of year, reinvestment of any dividends and distributions at net asset value on the dividend/distributions payment date and a redemption at the net asset value on the last day of the year. The return does not reflect the deduction of taxes that a shareholder would pay on Fund dividends/distributions or the redemption of Fund shares. |
| (b) | Calculated based upon average shares outstanding. |
See Notes to Financial Statements
UNCONSTRAINED EMERGING MARKETS BOND FUND
FINANCIAL HIGHLIGHTS
For a share outstanding throughout each year:
| | | Class I |
| | | Year Ended December 31, |
| | | 2019 | | 2018 | | 2017 | | 2016 | | 2015 |
| Net asset value, beginning of year | | | $ | 6.25 | | | | $ | 7.13 | | | | $ | 6.87 | | | | $ | 6.71 | | | | $ | 8.23 | |
| Income from investment operations: | | | | | | | | | | | | | | | | | | | | | | | | | |
| Net investment income | | | | 0.53 | (b) | | | | 0.40 | (b) | | | | 0.51 | (b) | | | | 0.31 | | | | | 0.47 | |
| Net realized and unrealized gain (loss) on investments | | | | 0.27 | | | | | (0.83 | ) | | | | 0.30 | | | | | 0.12 | | | | | (1.53 | ) |
| Total from investment operations | | | | 0.80 | | | | | (0.43 | ) | | | | 0.81 | | | | | 0.43 | | | | | (1.06 | ) |
| Less dividends and distributions from: | | | | | | | | | | | | | | | | | | | | | | | | | |
| Net investment income | | | | (0.45 | ) | | | | — | | | | | (0.55 | ) | | | | (0.16 | ) | | | | — | |
| Return of capital | | | | (0.07 | ) | | | | (0.45 | ) | | | | — | | | | | (0.11 | ) | | | | (0.46 | ) |
| Total dividends and distributions | | | | (0.52 | ) | | | | (0.45 | ) | | | | (0.55 | ) | | | | (0.27 | ) | | | | (0.46 | ) |
| Net asset value, end of year | | | $ | 6.53 | | | | $ | 6.25 | | | | $ | 7.13 | | | | $ | 6.87 | | | | $ | 6.71 | |
| Total return (a) | | | | 13.09 | % | | | | (6.21 | )% | | | | 11.96 | % | | | | 6.45 | % | | | | (13.27 | )% |
| Ratios/Supplemental Data | | | | | | | | | | | | | | | | | | | | | | | | | |
| Net assets, end of year (000’s) | | | $18,092 | | | | $9,902 | | | | $28,261 | | | | $82,960 | | | | $130,494 | |
| Ratio of gross expenses to average net assets | | | | 2.18 | % | | | | 1.33 | % | | | | 1.06 | % | | | | 0.96 | % | | | | 0.94 | % |
| Ratio of net expenses to average net assets | | | | 0.96 | % | | | | 0.96 | % | | | | 0.96 | % | | | | 0.95 | % | | | | 0.94 | % |
| Ratio of net expenses to average net assets, excluding interest expense | | | | 0.95 | % | | | | 0.95 | % | | | | 0.95 | % | | | | 0.95 | % | | | | 0.94 | % |
| Ratio of net investment income to average net assets | | | | 8.27 | % | | | | 5.91 | % | | | | 7.08 | % | | | | 4.37 | % | | | | 6.27 | % |
| Portfolio turnover rate | | | | 302 | % | | | | 269 | % | | | | 568 | % | | | | 546 | % | | | | 605 | % |
| (a) | Total return is calculated assuming an initial investment made at the net asset value at the beginning of year, reinvestment of any dividends and distributions at net asset value on the dividend/distributions payment date and a redemption at the net asset value on the last day of the year. The return does not reflect the deduction of taxes that a shareholder would pay on Fund dividends/distributions or the redemption of Fund shares. |
| (b) | Calculated based upon average shares outstanding. |
See Notes to Financial Statements
UNCONSTRAINED EMERGING MARKETS BOND FUND
FINANCIAL HIGHLIGHTS
For a share outstanding throughout each year:
| | | Class Y |
| | | Year Ended December 31, |
| | | 2019 | | 2018 | | 2017 | | 2016 | | 2015 |
| Net asset value, beginning of year | | | $ | 6.23 | | | | $ | 7.10 | | | | $ | 6.84 | | | | $ | 6.69 | | | | $ | 8.22 | |
| Income from investment operations: | | | | | | | | | | | | | | | | | | | | | | | | | |
| Net investment income | | | | 0.47 | (b) | | | | 0.39 | (b) | | | | 0.51 | (b) | | | | 0.29 | | | | | 0.48 | |
| Net realized and unrealized gain (loss) on investments | | | | 0.32 | | | | | (0.82 | ) | | | | 0.30 | | | | | 0.13 | | | | | (1.55 | ) |
| Total from investment operations | | | | 0.79 | | | | | (0.43 | ) | | | | 0.81 | | | | | 0.42 | | | | | (1.07 | ) |
| Less dividends and distributions from: | | | | | | | | | | | | | | | | | | | | | | | | | |
| Net investment income | | | | (0.46 | ) | | | | — | | | | | (0.55 | ) | | | | (0.16 | ) | | | | — | |
| Return of capital | | | | (0.07 | ) | | | | (0.44 | ) | | | | — | | | | | (0.11 | ) | | | | (0.46 | ) |
| Total dividends and distributions | | | | (0.53 | ) | | | | (0.44 | ) | | | | (0.55 | ) | | | | (0.27 | ) | | | | (0.46 | ) |
| Net asset value, end of year | | | $ | 6.49 | | | | $ | 6.23 | | | | $ | 7.10 | | | | $ | 6.84 | | | | $ | 6.69 | |
| Total return (a) | | | | 13.05 | % | | | | (6.30 | )% | | | | 12.01 | % | | | | 6.32 | % | | | | (13.41 | )% |
| Ratios/Supplemental Data | | | | | | | | | | | | | | | | | | | | | | | | | |
| Net assets, end of year (000’s) | | | $ | 2,993 | | | | $ | 4,924 | | | | $ | 12,008 | | | | $ | 22,970 | | | | $ | 22,505 | |
| Ratio of gross expenses to average net assets | | | | 2.60 | % | | | | 1.65 | % | | | | 1.30 | % | | | | 1.19 | % | | | | 1.07 | % |
| Ratio of net expenses to average net assets | | | | 1.02 | % | | | | 1.01 | % | | | | 1.01 | % | | | | 1.00 | % | | | | 1.00 | % |
| Ratio of net expenses to average net assets, excluding interest expense | | | | 1.00 | % | | | | 1.00 | % | | | | 1.00 | % | | | | 1.00 | % | | | | 1.00 | % |
| Ratio of net investment income to average net assets | | | | 7.34 | % | | | | 5.83 | % | | | | 7.15 | % | | | | 4.12 | % | | | | 6.08 | % |
| Portfolio turnover rate | | | | 302 | % | | | | 269 | % | | | | 568 | % | | | | 546 | % | | | | 605 | % |
| (a) | Total return is calculated assuming an initial investment made at the net asset value at the beginning of year, reinvestment of any dividends and distributions at net asset value on the dividend/distributions payment date and a redemption at the net asset value on the last day of the year. The return does not reflect the deduction of taxes that a shareholder would pay on Fund dividends/distributions or the redemption of Fund shares. |
| (b) | Calculated based upon average shares outstanding. |
See Notes to Financial Statements
UNCONSTRAINED EMERGING MARKETS BOND FUND
NOTES TO FINANCIAL STATEMENTS
December 31, 2019
Note 1—Fund Organization—VanEck Funds (the “Trust”) is registered under the Investment Company Act of 1940, as amended, as an open-end management investment company. The Trust was organized as a Massachusetts business trust on April 3, 1985. The Unconstrained Emerging Markets Bond Fund (the “Fund”) is a non-diversified series of the Trust and seeks total return, consisting of income and capital appreciation by investing primarily in emerging market debt securities. The Fund currently offers four classes of shares: Class A, C, I and Y shares. Each share class represents an interest in the same portfolio of investments of the Fund and is substantially the same in all respects, except that the classes are subject to different distribution fees and sales charges. Class I and Y Shares are sold without a sales charge; Class A Shares are sold subject to a front-end sales charge; and Class C Shares are sold with a contingent deferred sales charge.
Note 2—Significant Accounting Policies—The preparation of financial statements in conformity with U.S. generally accepted accounting principles (“GAAP”) requires management to make estimates and assumptions that affect the reported amounts and disclosures in the financial statements. Actual results could differ from those estimates.
The Fund is an investment company and follows accounting and reporting requirements of Accounting Standards Codification (“ASC”) 946Financial Services – Investment Companies.
The following is a summary of significant accounting policies followed by the Fund.
| A. | Security Valuation—The Fund values its investments in securities and other assets and liabilities at fair value daily. Fair value is the price that would be received to sell an asset or paid to transfer a liability in an orderly transaction between market participants on the measurement date. Debt securities are valued on the basis of evaluated prices furnished by an independent pricing service approved by the Fund’s Board of Trustees or provided by securities dealers. The pricing services may use valuation models or matrix pricing, which consider: (i) yield or price with respect to bonds that are considered comparable in characteristics such as rating, interest rate and maturity date and/or (ii) quotations from bond dealers to determine current value and are categorized as Level 2 in the fair value hierarchy (described below). Short-term obligations with sixty days or less to maturity are valued at amortized cost, which with accrued interest approximates fair value. Money market fund investments are valued at net asset value and are categorized as Level 1 in the fair value hierarchy. Forward foreign currency contracts are valued at the spot currency rate |
UNCONSTRAINED EMERGING MARKETS BOND FUND
NOTES TO FINANCIAL STATEMENTS
(continued)
| | plus an amount (“points”), which reflects the differences in interest rates between the U.S. and foreign markets and are categorized as Level 2 in the fair value hierarchy. Securities traded on national exchanges are valued at the closing price on the markets in which the securities trade. Securities traded on the NASDAQ Stock Market LLC (“NASDAQ”) are valued at the NASDAQ official closing price. Over-the-counter securities not included on NASDAQ and listed securities for which no sale was reported are valued at the mean of the bid and ask prices. To the extent these securities are actively traded they are categorized as Level 1 in the fair value hierarchy. The Pricing Committee of Van Eck Associates Corporation (the “Adviser”) provides oversight of the Fund’s valuation policies and procedures, which are approved by the Fund’s Board of Trustees. Among other things, these procedures allow the Fund to utilize independent pricing services, quotations from securities dealers, and other market sources to determine fair value. The Pricing Committee convenes regularly to review the fair value of financial instruments or other assets. If market quotations for a security or other asset are not readily available, or if the Adviser believes they do not otherwise reflect the fair value of a security or asset, the security or asset will be fair valued by the Pricing Committee in accordance with the Fund’s valuation policies and procedures. The Pricing Committee employs various methods for calibrating the valuation approaches utilized to determine fair value, including a regular review of key inputs and assumptions, periodic comparisons to valuations provided by other independent pricing services, transactional back-testing and disposition analysis. |
| | |
| | Certain factors such as economic conditions, political events, market trends, the nature of and duration of any restrictions on disposition, trading in similar securities of the issuer or comparable issuers and other security specific information are used to determine the fair value of these securities. Depending on the relative significance of valuation inputs, these securities may be classified either as Level 2 or Level 3 in the fair value hierarchy. The price which the Fund may realize upon sale of an investment may differ materially from the value presented in the Schedule of Investments. |
| | |
| | The Fund utilizes various methods to measure the fair value of its investments on a recurring basis, which includes a hierarchy that prioritizes inputs to valuation methods used to measure fair value. The fair value hierarchy gives highest priority to unadjusted quoted prices in active markets for identical assets and liabilities (Level 1 measurements) and the lowest priority to unobservable inputs (Level 3 measurements). The inputs or methodologies used for valuing securities are not necessarily an indication |
| | of the risk associated with investing in those securities. The three levels of the fair value hierarchy are described below: |
| | |
| | Level 1 – Quoted prices in active markets for identical securities. |
| | |
| | Level 2 – Significant observable inputs (including quoted prices for similar securities, interest rates, prepayment speeds, credit risk, etc.). |
| | |
| | Level 3 – Significant unobservable inputs (including the Fund’s own assumptions in determining the fair value of investments). |
| | |
| | A summary of the inputs and the levels used to value the Fund’s investments are located in the Schedule of Investments. Additionally, tables that reconcile the valuation of the Fund’s Level 3 investments and that present additional information about the valuation methodologies and unobservable inputs, if applicable, are located in the Schedule of Investments. |
| | |
| B. | Federal Income Taxes—It is the Fund’s policy to comply with the provisions of the U.S. Internal Revenue Code (the “Code”) applicable to regulated investment companies and to distribute all of its net investment income and net realized capital gains, if any, to its shareholders. Therefore, no federal income tax provision is required. |
| | |
| C. | Currency Translation—Assets and liabilities denominated in foreign currencies and commitments under foreign currency contracts are translated into U.S. dollars at the closing prices of such currencies each business day as quoted by one or more sources. Purchases and sales of investments are translated at the exchange rates prevailing when such investments are acquired or sold. Foreign denominated income and expenses are translated at the exchange rates prevailing when accrued. The portion of realized and unrealized gains and losses on investments that result from fluctuations in foreign currency exchange rates is not separately disclosed in the financial statements. Such amounts are included with the net realized and unrealized gains and losses on investment securities in the Statement of Operations. Recognized gains or losses attributable to foreign currency fluctuations on foreign currency denominated assets, other than investments and forward foreign currency contracts, and liabilities are recorded as net realized gain (loss) and net change in unrealized appreciation (depreciation) on foreign currency transactions and foreign denominated assets and liabilities in the Statement of Operations. |
| | |
| D. | Dividends and Distributions to Shareholders—Dividends to shareholders from net investment income, if any, are declared and paid at least monthly. Distributions from net realized capital gains, if any, generally |
UNCONSTRAINED EMERGING MARKETS BOND FUND
NOTES TO FINANCIAL STATEMENTS
(continued)
| | are declared and paid annually. Income dividends and capital gain distributions are determined in accordance with U.S. income tax regulations, which may differ from such amounts determined in accordance with GAAP. |
| | |
| E. | Use of Derivative Instruments—The Fund may investment in derivative instruments, including, but not limited to, options, futures, swaps and forward foreign currency contracts. A derivative is an instrument whose value is derived from underlying assets, indices, reference rates or a combination of these factors. Derivative instruments may be privately negotiated contracts (often referred to as over-the-counter (“OTC”) derivatives) or they may be listed and traded on an exchange. Derivative contracts may involve future commitments to purchase or sell financial instruments or commodities at specified terms on a specified date, or to exchange interest payment streams or currencies based on a notional or contractual amount. Derivative instruments may involve a high degree of financial risk. The use of derivative instruments also involves the risk of loss if the investment adviser is incorrect in its expectation of the timing or level of fluctuations in securities prices, interest rates or currency prices. Investments in derivative instruments also include the risk of default by the counterparty, the risk that the investment may not be liquid and the risk that a small movement in the price of the underlying security or benchmark may result in a disproportionately large movement, unfavorable or favorable, in the price of the derivative instrument. GAAP requires enhanced disclosures about the Fund’s derivative instruments and hedging activities. Details of this disclosure are found below as well as in the Schedule of Investments. The Fund held no derivative instruments at December 31, 2019. |
| | | Forward Foreign Currency Contracts—The Fund may buy and sell forward foreign currency contracts to settle purchases and sales of foreign denominated securities, gain currency exposure or to hedge foreign denominated assets. Realized gains and losses from forward foreign currency contracts, if any, are included in realized gain (loss) on forward foreign currency contracts, foreign currency transactions and foreign denominated assets and liabilities in the Statement of Operations. During the year ended December 31, 2019, the Fund held forward foreign currency contracts for 12 months. The average amount purchased and sold (in U.S. dollars) were $385,144 and $385,936, respectively. At December 31, 2019, the Fund held no forward foreign currency contracts. |
| | The impact of transactions in derivatives instruments during the year ended December 31, 2019 was as follows: |
| | | Foreign
Currency Risk |
| Realized gain (loss): | | |
| Foreign forward currency contracts1 | | $ | (104,475 | ) |
| 1 | Statement of Operations location: Net realized gain (loss) on forward foreign currency contracts |
| F. | Offsetting Assets and Liabilities—In the ordinary course of business, the Fund enters into transactions subject to enforceable master netting or other similar agreements. Generally, the right of offset in those agreements allows the Fund to offset any exposure to a specific counterparty with any collateral received or delivered to that counterparty based on the terms of the agreements. The Fund may pledge or receive cash and/or securities as collateral for derivative instruments and securities lending. For financial reporting purposes, the Fund presents securities lending assets and liabilities on a gross basis in the Statement of Assets and Liabilities. Cash collateral held in the form of money market investments, if any, at December 31, 2019 is presented in the Schedule of Investments and in the Statement of Assets and Liabilities. Non-cash collateral is disclosed in Note 9 (Securities Lending). |
| | |
| G. | Other—Security transactions are accounted for on trade date. Dividend income is recorded on the ex-dividend date except that certain dividends from foreign securities are recognized upon notification of the ex-dividend date. Interest income, including amortization of premiums and discounts, is accrued as earned. Realized gains and losses are determined based on the specific identification method. |
| | |
| | The Fund earns interest income on uninvested cash balances held at the custodian bank, such amounts, if any, are presented as interest income on the Statement of Operations. |
| | |
| | Income, non-class specific expenses, gains and losses on investments are allocated to each class of shares based on its relative net assets. Expenses directly attributable to a specific class are charged to that class. |
| | |
| | In the normal course of business, the Fund enters into contracts that contain a variety of general indemnifications. The Fund’s maximum exposure under these agreements is unknown as this would involve future claims that may be made against the Fund that have not yet occurred. However, the Adviser believes the risk of loss under these arrangements to be remote. |
UNCONSTRAINED EMERGING MARKETS BOND FUND
NOTES TO FINANCIAL STATEMENTS
(continued)
Note 3—Investment Management and Other Agreements—The Adviser is the investment adviser to the Fund. The Adviser receives a management fee, calculated daily and payable monthly based on an annual rate of 0.80% of the first $1.5 billion of average daily net assets and 0.75% of the average daily net assets in excess of $1.5 billion. The Adviser has agreed, until at least May 1, 2020, to waive management fees and/or pay Fund expenses to prevent the Fund’s annual operating expenses (excluding acquired fund fees and expenses, interest expense, trading expenses, dividends and interest payments on securities sold short, taxes and extraordinary expenses) from exceeding expense limitations listed in the table below.
The current expense limitations and the amounts waived by the Adviser for the year ended December 31, 2019, are as follows:
| | | Expense
Limitation | | Waiver of
Management
Fees | | Expenses
Assumed by
the Adviser |
| Class A | | | 1.25 | % | | $ | 39,623 | | | $ | 30,930 | |
| Class C | | | 1.95 | | | | 12,236 | | | | 31,418 | |
| Class I | | | 0.95 | | | | 76,028 | | | | 40,259 | |
| Class Y | | | 1.00 | | | | 30,660 | | | | 29,910 | |
For the year ended December 31, 2019, Van Eck Securities Corporation (the “Distributor”), an affiliate and wholly-owned subsidiary of the Adviser, received a total of $3,686 in sales loads relating to the sale of shares of the Fund, of which $3,240 was reallowed to broker/dealers and the remaining $446 was retained by the Distributor.
Certain officers of the Trust are officers, directors or stockholders of the Adviser and the Distributor.
State Street Bank and Trust Company is the Fund’s custodian and securities lending agent.
Note 4—12b-1 Plan of Distribution—Pursuant to a Rule 12b-1 Plan of Distribution (the “Plan”), the Fund is authorized to incur distribution expenses which will principally be payments to securities dealers who have sold shares and serviced shareholder accounts and payments to the Distributor, for reimbursement of other actual promotion and distribution expenses incurred by the Distributor on behalf of the Fund. The amount paid under the Plan in any one year is limited to 0.25% of average daily net assets for Class A Shares and 1.00% of average daily net assets for Class C Shares, and is recorded as Distribution fees in the Statement of Operations.
Note 5—Investments—For the year ended December 31, 2019, the cost of purchases and proceeds from sales of investments, excluding U.S.
Government securities and short-term obligations, aggregated $62,881,919 and $58,803,422, respectively.
Note 6—Income Taxes—As of December 31, 2019, for Federal income tax purposes, the identified cost, gross unrealized appreciation, gross unrealized depreciation and net unrealized appreciation (depreciation) of investments were as follows:
Cost of
Investments | | Gross
Unrealized
Appreciation | | Gross
Unrealized
Depreciation | | Net Unrealized
Appreciation
(Depreciation) |
| $27,840,890 | | $1,050,126 | | $(609,596) | | $440,530 |
At December 31, 2019, the components of accumulated distributable earnings (loss) on a tax basis, for the Fund, were as follows:
Undistributed
Ordinary
Income | | Accumulated
Capital
Losses | | Qualified
Late Year
Loss
Deferred* | | Other
Temporary
Differences | | Unrealized
Appreciation
(Depreciation) | | Total
Distributable
Earnings (Loss) |
| $— | | $ (32,520,064) | | $(43,609) | | $(13,268) | | $437,835 | | $(32,139,106) |
| * | Qualified late year losses incurred after October 31, 2019 are deemed to arise on January 1, 2020. |
The tax character of dividends paid to shareholders were as follows:
| | | Year Ended
December 31,
2019 | | Year Ended
December 31,
2018 |
| Ordinary income | | | $ | 1,319,903 | | | | $ | — | |
| Return of Capital | | | | 204,924 | | | | | 2,361,290 | |
| Total | | | $ | 1,524,827 | | | | $ | 2,361,290 | |
At December 31, 2019, the Fund had capital loss carryforwards available to offset future capital gains, as follows:
Short-Term
Capital Losses
with No Expiration | | Long-Term
Capital Losses
with No Expiration | | Total |
| $(31,683,824) | | $(836,240) | | $(32,520,064) |
During the year ended December 31, 2019, the Fund utilized $409,079 of capital loss carryovers available from prior years.
During the year ended December 31, 2019, as a result of permanent book to tax differences due to an overdistribution, the Fund incurred differences that affected distributable earnings and aggregate paid in capital by the amounts in the table below. Net assets were not affected by these reclassifications.
UNCONSTRAINED EMERGING MARKETS BOND FUND
NOTES TO FINANCIAL STATEMENTS
(continued)
Increase
(Decrease)
in Distributable
Earnings | | Increase
(Decrease)
in Aggregate
Paid in Capital |
| $4,328 | | $(4,328) |
The Fund recognizes the tax benefits of uncertain tax positions only where the position is “more-likely-than-not” to be sustained assuming examination by applicable tax authorities. Management has analyzed the Fund’s tax positions, and has concluded that no liability for unrecognized tax benefits should be recorded related to uncertain tax positions taken on return filings for all open tax years. The Fund does not have exposure for additional years that might still be open in certain foreign jurisdictions. Therefore, no provision for income tax is required in the Fund’s financial statements. However, the Fund is subject to foreign taxes on the appreciation in value of certain investments. The Fund provides for such taxes, if any, on both realized and unrealized appreciation.
The Fund recognizes interest and penalties, if any, related to uncertain tax positions as income tax expense in the Statements of Operations. During the year ended December 31, 2019, the Fund did not incur any interest or penalties.
Note 7—Principal Risks—The Fund may purchase securities on foreign exchanges. Securities of foreign issuers involve special risks and considerations not typically associated with investing in U.S. issuers. These risks include devaluation of currencies, less reliable information about issuers, different securities transaction clearance and settlement practices, and future adverse political and economic developments. These risks are heightened for investments in emerging market countries. Moreover, securities of many foreign issuers and their markets may be less liquid and their prices more volatile than those of comparable U.S. issuers. The Fund may invest in debt securities which are rated below investment grade by rating agencies. Such securities involve more risk of default than higher rated securities and are subject to greater price variability.
A more complete description of risks is included in the Fund’s prospectus and Statement of Additional Information.
Note 8—Shareholder Transactions—Shares of beneficial interest issued, reinvested and redeemed (unlimited number of $0.001 par value shares authorized):
| | | Year Ended
December 31,
2019 | | Year Ended
December 31,
2018 |
| Class A | | | | | | | | | | |
| Shares sold | | | | 57,194 | | | | | 55,123 | |
| Shares reinvested | | | | 38,282 | | | | | 32,416 | |
| Shares redeemed | | | | (121,025 | ) | | | | (138,727 | ) |
| Net decrease | | | | (25,549 | ) | | | | (51,188 | ) |
| | | | | | | | | | | |
| Class C | | | | | | | | | | |
| Shares sold | | | | 10,309 | | | | | 27,080 | |
| Shares reinvested | | | | 12,868 | | | | | 13,956 | |
| Shares redeemed | | | | (75,007 | ) | | | | (138,265 | ) |
| Net decrease | | | | (51,830 | ) | | | | (97,229 | ) |
| | | | | | | | | | | |
| Class I | | | | | | | | | | |
| Shares sold | | | | 1,854,725 | | | | | 98,335 | |
| Shares reinvested | | | | 68,119 | | | | | 28,716 | |
| Shares redeemed | | | | (734,705 | ) | | | | (2,505,934 | ) |
| Net increase (decrease) | | | | 1,188,139 | | | | | (2,378,883 | ) |
| | | | | | | | | | | |
| Class Y | | | | | | | | | | |
| Shares sold | | | | 58,030 | | | | | 156,095 | |
| Shares reinvested | | | | 41,712 | | | | | 54,737 | |
| Shares redeemed | | | | (428,751 | ) | | | | (1,112,357 | ) |
| Net decrease | | | | (329,009 | ) | | | | (901,525 | ) |
Note 9—Securities Lending—To generate additional income, the Fund may lend its securities pursuant to a securities lending agreement with the securities lending agent. The Fund may lend up to 33% of its investments requiring that the loan be continuously collateralized by cash, cash equivalents, U.S. government securities, or any combination of cash and such securities at all times equal to at least 102% (105% for foreign securities) of the market value plus accrued interest on the securities loaned. Daily market fluctuations could cause the value of loaned securities to be more or less than the value of the collateral received. When this occurs, the collateral is adjusted and settled on the next business day. During the term of the loan, the Fund will continue to receive any dividends, interest or amounts equivalent thereto, on the securities loaned while receiving a fee from the borrower and/or earning interest on the investment of the cash collateral. Such fees and interest are shared with the securities lending agent under the terms of the securities lending agreement. Securities lending income is disclosed as such in the Statement of Operations. The cash collateral is maintained on the Fund’s behalf by the lending agent
UNCONSTRAINED EMERGING MARKETS BOND FUND
NOTES TO FINANCIAL STATEMENTS
(continued)
and is invested in the State Street Navigator Securities Lending Government Money Market Portfolio. Non-cash collateral consists of U.S. Treasuries and U.S. Government Agency securities, and is not disclosed in the Fund’s Schedule of Investments or Statement of Assets and Liabilities as it is held by the agent on behalf of the Fund, and the Fund does not have the ability to re-hypothecate those securities. Loans are subject to termination at the option of the borrower or the Fund. Upon termination of the loan, the borrower will return to the Fund securities identical to the securities loaned. The Fund bear the risk of delay in recovery of, or even loss of rights in, the securities loaned should the borrower of the securities fail financially. The value of loaned securities and related cash collateral, if any, at December 31, 2019 is presented on a gross basis in the Schedule of Investments and Statement of Assets and Liabilities. The following is a summary of the Fund’s securities on loan and related collateral as of December 31, 2019:
Market Value
of Securities
on Loan | | Cash
Collateral | | Non-Cash
Collateral | | Total Collateral |
| $2,087,218 | | $1,094,265 | | $1,040,565 | | $2,134,830 |
The following table presents money market fund investments held as collateral by type of security on loan as of December 31, 2019:
| | | Gross Amount of
Recognized Liabilities
for Securities Loaned
in the Statements of
Assets and Liabilities* |
| Equity Securities | | $1,094,265 |
| * | Remaining contractual maturity of the agreements: overnight and continuous |
Note 10—Bank Line of Credit—The Trust participates with VanEck VIP Funds (collectively the “VE/VIP Funds”) in a $30 million committed credit facility (the “Facility”) to be utilized for temporary financing until the settlement of sales or purchases of portfolio securities, the repurchase or redemption of shares of the participating Fund and other temporary or emergency purposes. The participating VE/VIP Funds have agreed to pay commitment fees, pro rata, based on the unused but available balance. Interest is charged to the participating VE/VIP Funds at rates based on prevailing market rates in effect at the time of borrowings. During the year ended December 31, 2019, the average daily loan balance during the eleven day period for which a loan was outstanding amounted to $1,145,803 and the average interest rate was 3.73%. At December 31, 2019, the Fund had no outstanding borrowings under the Facility.
Note 11—Trustee Deferred Compensation Plan—The Trust has a Deferred Compensation Plan (the “Deferred Plan”) for Trustees under which the Trustees can elect to defer receipt of their trustee fees until retirement, disability or termination from the Board of Trustees. The fees otherwise payable to the participating Trustees are deemed invested in eligible shares of the VE/VIP Funds as directed by the Trustees.
The expense for the Deferred Plan is included in “Trustees’ fees and expenses” on the Statement of Operations. The liability for the Deferred Plan is shown as “Deferred Trustee fees” on the Statement of Assets and Liabilities.
Note 12—Recent Accounting Pronouncements—The Fund early adopted certain provisions of Accounting Standards Update No. 2018-13Disclosure Framework—Changes to the Disclosure Requirements for Fair Value Measurement(“ASU 2018-13”) that eliminate and modify certain disclosure requirements for fair value measurements. The adoption of certain provisions of ASU 2018-13 had no material effect on the financial statements and related disclosures. Management evaluated the additional requirements, not yet adopted, and they are not expected to have a material impact to the financial statements. Public companies will be required to disclose the range and weighted average of significant unobservable inputs for Level 3 fair value measurements. ASU 2018-13 is effective for fiscal years beginning after December 15, 2019 and for interim periods within those fiscal years.
Effective January 1, 2019, the Fund adopted Accounting Standards Update ASU 2017-08,Receivables—Nonrefundable Fees and Other Costs (Subtopic 310-20): Premium Amortization on Purchased Callable Debt Securities(the “ASU 2017-08”), that shortened the amortization period for certain purchased callable debt securities held at premium to the earliest call date. The new guidance has not changed the accounting for purchased callable debt securities held at a discount. Based on management’s evaluation, the adoption of the ASU 2017-08 had no material effect on the financial statements and related disclosures.
Note 13—Subsequent Event Review—The Fund has evaluated subsequent events and transactions for potential recognition or disclosure through the date the financial statements were issued.
UNCONSTRAINED EMERGING MARKETS BOND FUND
REPORT OF INDEPENDENT REGISTERED PUBLIC ACCOUNTING FIRM
To the Shareholders and the Board of Trustees of Unconstrained Emerging Markets Bond Fund
Opinion on the Financial Statements
We have audited the accompanying statement of assets and liabilities of Unconstrained Emerging Markets Bond Fund (the “Fund”) (one of the series constituting VanEck Funds (the “Trust”)), including the schedule of investments, as of December 31, 2019, and the related statement of operations for the year then ended, the statements of changes in net assets for each of the two years in the period then ended, the financial highlights for each of the five years in the period then ended and the related notes (collectively referred to as the “financial statements”). In our opinion, the financial statements present fairly, in all material respects, the financial position of Unconstrained Emerging Markets Bond Fund (one of the series constituting VanEck Funds) at December 31, 2019, the results of its operations for the year then ended, the changes in its net assets for each of the two years in the period then ended and its financial highlights for each of the five years in the period then ended, in conformity with U.S. generally accepted accounting principles.
Basis for Opinion
These financial statements are the responsibility of the Trust’s management. Our responsibility is to express an opinion on the Fund’s financial statements based on our audits. We are a public accounting firm registered with the Public Company Accounting Oversight Board (United States) (“PCAOB”) and are required to be independent with respect to the Trust in accordance with the U.S. federal securities laws and the applicable rules and regulations of the Securities and Exchange Commission and the PCAOB.
We conducted our audits in accordance with the standards of the PCAOB. Those standards require that we plan and perform the audit to obtain reasonable assurance about whether the financial statements are free of material misstatement, whether due to error or fraud. The Trust is not required to have, nor were we engaged to perform, an audit of the Trust’s internal control over financial reporting. As part of our audits, we are required to obtain an understanding of internal control over financial reporting, but not for the purpose of expressing an opinion on the effectiveness of the Trust’s internal control over financial reporting. Accordingly, we express no such opinion.
Our audits included performing procedures to assess the risks of material misstatement of the financial statements, whether due to error or fraud, and performing procedures that respond to those risks. Such procedures included examining, on a test basis, evidence regarding the amounts and disclosures in the financial statements. Our procedures included confirmation of securities owned as of December 31, 2019, by correspondence with the custodian and brokers or by other appropriate auditing procedures where replies from brokers were not received. Our audits also included evaluating the accounting principles used and significant estimates made by management, as well as evaluating the overall presentation of the financial statements. We believe that our audits provide a reasonable basis for our opinion.

We have served as the auditor of one or more of the VanEck investment companies since 1999.
New York, New York
February 27, 2020
UNCONSTRAINED EMERGING MARKETS BOND FUND
TAX INFORMATION
(unaudited)
A portion of the distributions paid by the Fund during the year ended December 31, 2019 were a return of capital. A return of capital is not considered taxable income to shareholders. Pursuant to IRC Section 301(c), the portion of a distribution which is a dividend (as defined under IRC Section 316) is includable in gross income while the portion of the distribution which is not a dividend shall be applied against and reduces the adjusted basis of the stock. Accordingly, shareholders who received these distributions should not include these amounts in taxable income, but instead pursuant to Internal Revenue Code Sections 301(c)(2) and 1016(a)(4), should treat them as a reduction of the cost basis of the applicable shares upon which these distributions were paid. Please consult your tax advisor for proper treatment of this information.
| Class A | | CUSIP | | Ticker
Symbol | | Payable
Date | | Income
Dividends | | Foreign
Tax
Paid
Note (1) | | Total
Ordinary
Income
Dividends | | Ordinary
Income
as a % of
Total
Distribution
Including
Foreign
Tax Credit | | Return
of Capital
(Non
Dividend)
Distribution | | Return of
Capital
as a % of
Total
Distribution
Including
Foreign
Tax Credit | | Total
Distribution
Per Share
Including
Foreign
Tax Credit |
| | | 921075271 | | EMBAX | | 01/23/2019 | | | 0.034682 | | | | 0.000564 | | | | 0.035246 | | | | 86.46 | % | | | 0.005518 | | | | 13.54 | % | | | 0.040764 | |
| | | 921075271 | | EMBAX | | 02/21/2019 | | | 0.016649 | | | | 0.000283 | | | | 0.016932 | | | | 86.46 | % | | | 0.002651 | | | | 13.54 | % | | | 0.019583 | |
| | | 921075271 | | EMBAX | | 03/22/2019 | | | 0.026225 | | | | 0.000445 | | | | 0.026670 | | | | 86.46 | % | | | 0.004175 | | | | 13.54 | % | | | 0.030845 | |
| | | 921075271 | | EMBAX | | 04/23/2019 | | | 0.020356 | | | | 0.000367 | | | | 0.020723 | | | | 86.46 | % | | | 0.003244 | | | | 13.54 | % | | | 0.023967 | |
| | | 921075271 | | EMBAX | | 05/23/2019 | | | 0.032863 | | | | 0.000588 | | | | 0.033451 | | | | 86.46 | % | | | 0.005237 | | | | 13.54 | % | | | 0.038688 | |
| | | 921075271 | | EMBAX | | 06/21/2019 | | | 0.031568 | | | | 0.000576 | | | | 0.032144 | | | | 86.46 | % | | | 0.005032 | | | | 13.54 | % | | | 0.037176 | |
| | | 921075271 | | EMBAX | | 07/23/2019 | | | 0.033550 | | | | 0.000621 | | | | 0.034171 | | | | 86.46 | % | | | 0.005350 | | | | 13.54 | % | | | 0.039521 | |
| | | 921075271 | | EMBAX | | 08/23/2019 | | | 0.036328 | | | | 0.000539 | | | | 0.036867 | | | | 86.46 | % | | | 0.005772 | | | | 13.54 | % | | | 0.042639 | |
| | | 921075271 | | EMBAX | | 09/23/2019 | | | 0.035805 | | | | 0.000570 | | | | 0.036375 | | | | 86.46 | % | | | 0.005695 | | | | 13.54 | % | | | 0.042070 | |
| | | 921075271 | | EMBAX | | 10/23/2019 | | | 0.040807 | | | | 0.000666 | | | | 0.041473 | | | | 86.46 | % | | | 0.006493 | | | | 13.54 | % | | | 0.047966 | |
| | | 921075271 | | EMBAX | | 11/21/2019 | | | 0.042533 | | | | 0.000693 | | | | 0.043226 | | | | 86.46 | % | | | 0.006767 | | | | 13.54 | % | | | 0.049993 | |
| | | 921075271 | | EMBAX | | 12/23/2019 | | | 0.049608 | | | | 0.000805 | | | | 0.050413 | | | | 86.46 | % | | | 0.007892 | | | | 13.54 | % | | | 0.058305 | |
| Class A—Total | | | | | | | | $ | 0.400973 | | | | 0.006717 | | | $ | 0.407690 | | | | 86.46 | % | | $ | 0.063827 | | | | 13.54 | % | | $ | 0.471517 | |
UNCONSTRAINED EMERGING MARKETS BOND FUND
TAX INFORMATION
(unaudited) (continued)
| Class C | | CUSIP | | Ticker
Symbol | | Payable
Date | | Income
Dividends | | Foreign
Tax
Paid
Note (1) | | Total
Ordinary
Income
Dividends | | Ordinary
Income
as a % of
Total
Distribution
Including
Foreign
Tax Credit | | Return
of Capital
(Non
Dividend)
Distribution | | Return of
Capital
as a % of
Total
Distribution
Including
Foreign
Tax Credit | | Total
Distribution
Per Share
Including
Foreign
Tax Credit |
| | | 921075263 | | EMBCX | | 01/23/2019 | | | 0.032002 | | | | 0.000564 | | | | 0.032566 | | | | 86.46 | % | | | 0.005098 | | | | 13.54 | % | | | 0.037664 | |
| | | 921075263 | | EMBCX | | 02/21/2019 | | | 0.010597 | | | | 0.000283 | | | | 0.010880 | | | | 86.46 | % | | | 0.001703 | | | | 13.54 | % | | | 0.012583 | |
| | | 921075263 | | EMBCX | | 03/22/2019 | | | 0.016973 | | | | 0.000445 | | | | 0.017418 | | | | 86.46 | % | | | 0.002727 | | | | 13.54 | % | | | 0.020145 | |
| | | 921075263 | | EMBCX | | 04/23/2019 | | | 0.005743 | | | | 0.000367 | | | | 0.006110 | | | | 86.46 | % | | | 0.000957 | | | | 13.54 | % | | | 0.007067 | |
| | | 921075263 | | EMBCX | | 05/23/2019 | | | 0.016867 | | | | 0.000588 | | | | 0.017455 | | | | 86.46 | % | | | 0.002733 | | | | 13.54 | % | | | 0.020188 | |
| | | 921075263 | | EMBCX | | 06/21/2019 | | | 0.012113 | | | | 0.000576 | | | | 0.012689 | | | | 86.46 | % | | | 0.001987 | | | | 13.54 | % | | | 0.014676 | |
| | | 921075263 | | EMBCX | | 07/23/2019 | | | 0.009168 | | | | 0.000621 | | | | 0.009789 | | | | 86.46 | % | | | 0.001532 | | | | 13.54 | % | | | 0.011321 | |
| | | 921075263 | | EMBCX | | 08/23/2019 | | | 0.036242 | | | | 0.000539 | | | | 0.036781 | | | | 86.46 | % | | | 0.005758 | | | | 13.54 | % | | | 0.042539 | |
| | | 921075263 | | EMBCX | | 09/23/2019 | | | 0.034076 | | | | 0.000570 | | | | 0.034646 | | | | 86.46 | % | | | 0.005424 | | | | 13.54 | % | | | 0.040070 | |
| | | 921075263 | | EMBCX | | 10/23/2019 | | | 0.037694 | | | | 0.000666 | | | | 0.038360 | | | | 86.46 | % | | | 0.006006 | | | | 13.54 | % | | | 0.044366 | |
| | | 921075263 | | EMBCX | | 11/21/2019 | | | 0.039507 | | | | 0.000693 | | | | 0.040200 | | | | 86.46 | % | | | 0.006293 | | | | 13.54 | % | | | 0.046493 | |
| | | 921075263 | | EMBCX | | 12/23/2019 | | | 0.046408 | | | | 0.000805 | | | | 0.047213 | | | | 86.46 | % | | | 0.007392 | | | | 13.54 | % | | | 0.054605 | |
| Class C—Total | | | | | | | | $ | 0.297390 | | | | 0.006717 | | | $ | 0.304107 | | | | 86.46 | % | | $ | 0.047610 | | | | 13.54 | % | | $ | 0.351717 | |
| Class I | | CUSIP | | Ticker
Symbol | | Payable
Date | | Income
Dividends | | Foreign
Tax
Paid
Note (1) | | Total
Ordinary
Income
Dividends | | Ordinary
Income
as a % of
Total
Distribution
Including
Foreign
Tax Credit | | Return
of Capital
(Non
Dividend)
Distribution | | Return of
Capital
as a % of
Total
Distribution
Including
Foreign
Tax Credit | | Total
Distribution
Per Share
Including
Foreign
Tax Credit |
| | | 921075255 | | EMBUX | | 01/23/2019 | | | 0.036325 | | | | 0.000564 | | | | 0.036889 | | | | 86.46 | % | | | 0.005775 | | | | 13.54 | % | | | 0.042664 | |
| | | 921075255 | | EMBUX | | 02/21/2019 | | | 0.019675 | | | | 0.000283 | | | | 0.019958 | | | | 86.46 | % | | | 0.003125 | | | | 13.54 | % | | | 0.023083 | |
| | | 921075255 | | EMBUX | | 03/22/2019 | | | 0.030548 | | | | 0.000445 | | | | 0.030993 | | | | 86.46 | % | | | 0.004852 | | | | 13.54 | % | | | 0.035845 | |
| | | 921075255 | | EMBUX | | 04/23/2019 | | | 0.027100 | | | | 0.000367 | | | | 0.027467 | | | | 86.46 | % | | | 0.004300 | | | | 13.54 | % | | | 0.031767 | |
| | | 921075255 | | EMBUX | | 05/23/2019 | | | 0.040731 | | | | 0.000588 | | | | 0.041319 | | | | 86.46 | % | | | 0.006469 | | | | 13.54 | % | | | 0.047788 | |
| | | 921075255 | | EMBUX | | 06/21/2019 | | | 0.040733 | | | | 0.000576 | | | | 0.041309 | | | | 86.46 | % | | | 0.006467 | | | | 13.54 | % | | | 0.047776 | |
| | | 921075255 | | EMBUX | | 07/23/2019 | | | 0.045050 | | | | 0.000621 | | | | 0.045671 | | | | 86.46 | % | | | 0.007150 | | | | 13.54 | % | | | 0.052821 | |
| | | 921075255 | | EMBUX | | 08/23/2019 | | | 0.032005 | | | | 0.000539 | | | | 0.032544 | | | | 86.46 | % | | | 0.005095 | | | | 13.54 | % | | | 0.037639 | |
| | | 921075255 | | EMBUX | | 09/23/2019 | | | 0.035892 | | | | 0.000570 | | | | 0.036462 | | | | 86.46 | % | | | 0.005708 | | | | 13.54 | % | | | 0.042170 | |
| | | 921075255 | | EMBUX | | 10/23/2019 | | | 0.042191 | | | | 0.000666 | | | | 0.042857 | | | | 86.46 | % | | | 0.006709 | | | | 13.54 | % | | | 0.049566 | |
| | | 921075255 | | EMBUX | | 11/21/2019 | | | 0.043830 | | | | 0.000693 | | | | 0.044523 | | | | 86.46 | % | | | 0.006970 | | | | 13.54 | % | | | 0.051493 | |
| | | 921075255 | | EMBUX | | 12/23/2019 | | | 0.050818 | | | | 0.000805 | | | | 0.051623 | | | | 86.46 | % | | | 0.008082 | | | | 13.54 | % | | | 0.059705 | |
| Class I—Total | | | | | | | | $ | 0.444897 | | | | 0.006717 | | | $ | 0.451614 | | | | 86.46 | % | | $ | 0.070703 | | | | 13.54 | % | | $ | 0.522317 | |
UNCONSTRAINED EMERGING MARKETS BOND FUND
TAX INFORMATION
(unaudited) (continued)
| Class Y | | CUSIP | | Ticker
Symbol | | Payable
Date | | Income
Dividends | | Foreign
Tax
Paid
Note (1) | | Total
Ordinary
Income
Dividends | | Ordinary
Income
as a % of
Total
Distribution
Including
Foreign
Tax Credit | | Return
of Capital
(Non
Dividend)
Distribution | | Return of
Capital
as a % of
Total
Distribution
Including
Foreign
Tax Credit | | Total
Distribution
Per Share
Including
Foreign
Tax Credit |
| | | 921075248 | | EMBYX | | 01/23/2019 | | | 0.035720 | | | | 0.000564 | | | | 0.036284 | | | | 86.46 | % | | | 0.005680 | | | | 13.54 | % | | | 0.041964 | |
| | | 921075248 | | EMBYX | | 02/21/2019 | | | 0.018811 | | | | 0.000283 | | | | 0.019094 | | | | 86.46 | % | | | 0.002989 | | | | 13.54 | % | | | 0.022083 | |
| | | 921075248 | | EMBYX | | 03/22/2019 | | | 0.029770 | | | | 0.000445 | | | | 0.030215 | | | | 86.46 | % | | | 0.004730 | | | | 13.54 | % | | | 0.034945 | |
| | | 921075248 | | EMBYX | | 04/23/2019 | | | 0.025889 | | | | 0.000367 | | | | 0.026256 | | | | 86.46 | % | | | 0.004111 | | | | 13.54 | % | | | 0.030367 | |
| | | 921075248 | | EMBYX | | 05/23/2019 | | | 0.045487 | | | | 0.000588 | | | | 0.046075 | | | | 86.46 | % | | | 0.007213 | | | | 13.54 | % | | | 0.053288 | |
| | | 921075248 | | EMBYX | | 06/21/2019 | | | 0.045748 | | | | 0.000576 | | | | 0.046324 | | | | 86.46 | % | | | 0.007252 | | | | 13.54 | % | | | 0.053576 | |
| | | 921075248 | | EMBYX | | 07/23/2019 | | | 0.049546 | | | | 0.000621 | | | | 0.050167 | | | | 86.46 | % | | | 0.007854 | | | | 13.54 | % | | | 0.058021 | |
| | | 921075248 | | EMBYX | | 08/23/2019 | | | 0.031746 | | | | 0.000539 | | | | 0.032285 | | | | 86.46 | % | | | 0.005054 | | | | 13.54 | % | | | 0.037339 | |
| | | 921075248 | | EMBYX | | 09/23/2019 | | | 0.035805 | | | | 0.000570 | | | | 0.036375 | | | | 86.46 | % | | | 0.005695 | | | | 13.54 | % | | | 0.042070 | |
| | | 921075248 | | EMBYX | | 10/23/2019 | | | 0.041931 | | | | 0.000666 | | | | 0.042597 | | | | 86.46 | % | | | 0.006669 | | | | 13.54 | % | | | 0.049266 | |
| | | 921075248 | | EMBYX | | 11/21/2019 | | | 0.043657 | | | | 0.000693 | | | | 0.044350 | | | | 86.46 | % | | | 0.006943 | | | | 13.54 | % | | | 0.051293 | |
| | | 921075248 | | EMBYX | | 12/23/2019 | | | 0.050645 | | | | 0.000805 | | | | 0.051450 | | | | 86.46 | % | | | 0.008055 | | | | 13.54 | % | | | 0.059505 | |
| Class Y—Total | | | | | | | | $ | 0.454754 | | | | 0.006717 | | | $ | 0.461471 | | | | 86.46 | % | | $ | 0.072246 | | | | 13.54 | % | | $ | 0.533717 | |
| (1) | This column shows the foreign tax credits per share. 100% of the Fund’s income is derived from foreign sources. The foreign source income may have taxes associated with it that were paid by the Fund to various foreign jurisdictions. This Fund has qualified to “pass-through” the foreign taxes and foreign source income to their shareholders. Accordingly, you may either deduct your portion of the taxes in computing your taxable income or take a credit for such taxes against your tax liability. These deductions or credits may be subject to limitations under the tax law. The information provided is to assist you in computing your foreign tax credit. |
VANECK FUNDS
SPECIAL MEETING OF SHAREHOLDERS
October 11, 2019 (unaudited)
VANECK FUNDS
CM Commodity Index Fund
Emerging Markets Fund
Global Hard Assets Fund
International Investors Gold Fund
Unconstrained Emerging Markets Bond Fund
VanEck Morningstar Wide Moat Fund
VanEck NDR Managed Allocation Fund
A Special Meeting of Shareholders of VanEck Funds (the “Trust”) was held at the offices of the Trust, 666 Third Avenue, 9th Floor, New York, New York 10017 on October 11, 2019. The purpose of the meeting was to elect Trustees of the Trust. At the meeting, the following persons were elected by the shareholders to serve as Trustees of the Trust: Jon Lukomnik, Jane DiRenzo Pigott, R. Alastair Short, Richard D. Stamberger, Robert L. Stelzl, and Jan F. van Eck. No other business was transacted at the meeting.
The results of the voting at the meeting are as follows:
Proposal: To elect a Board of Trustees*:
| Name | For | Withheld |
| Jon Lukomnik | 239,074,404.179 | 1,973,903.626 |
| Jane DiRenzo Pigott | 239,734,349.197 | 1,313,958.608 |
| R. Alastair Short | 239,059,688.386 | 1,988,619.419 |
| Richard D. Stamberger | 239,110,733.308 | 1,937,574.497 |
| Robert L. Stelzl | 239,042,995.154 | 2,005,312.651 |
| Jan F. van Eck | 239,874,952.434 | 1,173,355.371 |
| Total Trust Shares Outstanding**: 327,471,673.186 |
| * | Results are for all series portfolios within the Trust. |
| ** | As of the record date. |
VANECK FUNDS
BOARD OF TRUSTEES AND OFFICERS
December 31, 2019 (unaudited)
Trustee Information
The Trustees of the Trust, their address, position with the Trust, age and principal occupations during the past five years, as of January 1, 2020, are set forth below:
Trustee’s Name,
Address(1)and
Year of Birth | | Position(s) Held With Trust,
Term of Office(2)and
Length of Time Served | | Principal Occupation(s)
During Past Five Years | | Number of
Portfolios
In Fund
Complex(3)
Overseen
By Trustee | | Other Directorships Held Outside The
Fund Complex(3)During The Past Five Years |
| | | | | | | | | |
| Independent Trustees: | | | | | | |
| | | | | | | | | |
Jon Lukomnik
1956 (A)(I) | | Trustee (since 2006) | | Managing Partner, Sinclair Capital LLC (consulting firm). Formerly, Executive Director, Investor Responsibility Research Center Institute. | | 11 | | Member of the Deloitte Audit Quality Advisory Committee; Chairman of the Advisory Committee of Legion Partners; Member of the Standing Advisory Group to the Public Company Accounting Oversight Board; Director of VanEck ICAV (an Irish UCITS); VanEck Vectors UCITS ETF plc (an Irish UCITS). Formerly, Director of VanEck (a Luxembourg UCITS); Chairman of the Board of the New York Classical Theatre. |
| | | | | | | | | |
Jane DiRenzo Pigott
1957 (I) | | Trustee (since 2007); Chairperson of the Board (since 2020) | | Managing Director, R3 Group LLC (consulting firm). | | 11 | | Trustee of Northwestern University, Lyric Opera of Chicago and the Chicago Symphony Orchestra. Formerly, Director and Chair of Audit Committee of 3E Company (services relating to hazardous material safety); Director of MetLife Investment Funds, Inc. |
| | | | | | | | | |
R. Alastair Short
1953 (A)(I) | | Trustee (since 2004); Chairperson of the Audit Committee (since 2006) | | President, Apex Capital Corporation (personal investment vehicle). | | 66 | | Chairman and Independent Director, EULAV Asset Management; Trustee, Kenyon Review; Trustee, Children’s Village. Formerly, Independent Director, Tremont offshore funds. |
Trustee’s Name,
Address(1)and
Year of Birth | | Position(s) Held With Trust,
Term of Office(2)and
Length of Time Served | | Principal Occupation(s)
During Past Five Years | | Number of
Portfolios
In Fund
Complex(3)
Overseen
By Trustee | | Other Directorships Held Outside The
Fund Complex(3)During The Past Five Years |
| | | | | | | | | |
Richard D. Stamberger
1959 (G)(I) | | Trustee (since 1995) | | President and CEO, SmartBrief, Inc. (business media company). | | 66 | | Director, Food and Friends, Inc. |
| | | | | | | | | |
Robert L. Stelzl
1945 (G)(I) | | Trustee (since 2007); Chairperson of the Governance Committee (since 2017) | | Co-Trustee, the estate of Donald Koll; Trustee, Robert D. MacDonald Trust; Trustee, GH Insurance Trusts. Formerly, Trustee, Joslyn Family Trusts; President, Rivas Capital, Inc. (real estate property management services company). | | 11 | | Director, Brookfield Office Properties, Inc., Brookfield Residential Properties, Inc., Brookfield DTLA Fund Office Trust Investor, Inc., Brookfield Property Finance ULC and Brookfield Property Split Corp. |
| | | | | | | | | |
| Interested Trustee: | | | | | | | | |
| | | | | | | | | |
Jan F. van Eck(4)
1963 (I) | | Trustee (Since 2019); Chairperson of the Investment Oversight Committee (since 2020); Chief Executive Officer and President (Since 2010) | | Director, President and Chief Executive Officer of Van Eck Associates Corporation (VEAC), Van Eck Absolute Return Advisers Corporation (VEARA) and Van Eck Securities Corporation (VESC); Officer and/or Director of other companies affiliated with VEAC and/or the Trust. | | 66 | | Director, National Committee on US China Relations. |
| (1) | The address for each Trustee and officer is 666 Third Avenue, 9th Floor, New York, New York 10017. |
| (2) | Trustee serves until resignation, death, retirement or removal. |
| (3) | The Fund Complex consists of VanEck Funds, VanEck VIP Trust and VanEck Vectors ETF Trust. |
| (4) | “Interested person” of the Trust within the meaning of the 1940 Act. Mr. van Eck is an officer of VEAC, VEARA and VESC. In addition, Mr. van Eck and members of his family own 100% of the voting stock of VEAC, which in turns owns 100% of the voting stock of each of VEARA and VESC. |
| (A) | Member of the Audit Committee. |
| (G) | Member of the Governance Committee. |
| (I) | Member of the Investment Oversight Committee. |
VANECK FUNDS
BOARD OF TRUSTEES AND OFFICERS
December 31, 2019 (unaudited) (continued)
Officer Information
The executive officers of the Trust, their age and address, the positions they hold with the Trust, their term of office and length of time served and their principal business occupations during the past five years are shown below:
Officer’s Name, Address(1)
And Year of Birth | | Position(s) Held With Trust | | Term of Office And
Length of Time Served(2) | | Principal Occupations During The Past Five Years |
| | | | | | | |
Matthew A. Babinsky,
1983 | | Assistant Vice President and Assistant Secretary | | Since 2016 | | Assistant Vice President, Assistant General Counsel and Assistant Secretary of VEAC, VEARA and Van Eck Securities Corporation (VESC); Officer of other investment companies advised by VEAC and VEARA. Formerly, Associate, Clifford Chance US LLP. |
| | | | | | | |
Russell G. Brennan,
1964 | | Assistant Vice President and Assistant Treasurer | | Since 2008 | | Assistant Vice President of VEAC; Officer of other investment companies advised by VEAC and VEARA. |
| | | | | | | |
Charles T. Cameron,
1960 | | Vice President | | Since 1996 | | Portfolio Manager for VEAC; Officer and/or Portfolio Manager of other investment companies advised by VEAC and VEARA. Formerly, Director of Trading of VEAC. |
| | | | | | | |
John J. Crimmins,
1957 | | Vice President, Treasurer, Chief Financial Officer and Principal Accounting Officer | | Vice President, Chief Financial Officer and Principal Accounting Officer (since 2012); Treasurer (since 2009) | | Vice President of VEAC and VEARA; Officer of other investment companies advised by VEAC and VEARA. Formerly, Vice President of VESC. |
| | | | | | | |
F. Michael Gozzillo,
1965 | | Chief Compliance Officer | | Since 2018 | | Vice President and Chief Compliance Officer of VEAC and VEARA; Chief Compliance Officer of VESC; Officer of other investment companies advised by VEAC and VEARA. Formerly, Chief Compliance Officer of City National Rochdale, LLC and City National Rochdale Funds. |
| | | | | | | |
Laura Hamilton,
1977 | | Vice President | | Since 2019 | | Assistant Vice President of VEAC and VESC; Officer of other investment companies advised by VEAC and VEARA. Formerly, Operations Manager of Royce & Associates. |
Officer’s Name, Address(1)
And Year of Birth | | Position(s) Held With Trust | | Term of Office And
Length of Time Served(2) | | Principal Occupations During The Past Five Years |
| | | | | | | |
Laura I. Martínez,
1980 | | Vice President and Assistant Secretary | | Vice President (since 2016); Assistant Secretary (since 2008) | | Vice President, Associate General Counsel and Assistant Secretary of VEAC, VEARA and VESC; Officer of other investment companies advised by VEAC and VEARA. Formerly, Assistant Vice President of VEAC, VEARA and VESC. |
| | | | | | | |
James Parker,
1969 | | Assistant Treasurer | | Since 2014 | | Assistant Vice President of VEAC, Manager, Portfolio Administration of VEAC and VEARA; Officer of other investment companies advised by VEAC and VEARA. |
| | | | | | | |
Jonathan R. Simon,
1974 | | Senior Vice President; Secretary and Chief Legal Officer | | Senior Vice President (since 2016); Secretary and Chief Legal Officer (since 2014) | | Senior Vice President, General Counsel and Secretary of VEAC, VEARA and VESC; Officer and/or Director of other companies affiliated with VEAC and/or the Trust. Formerly, Vice President of VEAC, VEARA and VESC. |
| (1) | The address for each Executive Officer is 666 Third Avenue, 9th Floor, New York, NY 10017. |
| (2) | Officers are elected yearly by the Board. |
This report is intended for the Fund’s shareholders. It may not be distributed to prospective investors unless it is preceded or accompanied by the Fund’s prospectus and summary prospectus, which includes more complete information. Investing involves substantial risk and high volatility, including possible loss of principal. An investor should consider the investment objective, risks, and charges and expenses of the Fund carefully before investing. To obtain a prospectus and summary prospectus, which contains this and other information, call 800.826.2333 or visit vaneck.com. Please read the prospectus and summary prospectus carefully before investing.
Additional information about VanEck Funds (the “Trust”) Board of Trustees/Officers and a description of the policies and procedures the Trust uses to determine how to vote proxies relating to portfolio securities are provided in the Statement of Additional Information. The Statement of Additional Information and information regarding how the Trust voted proxies relating to portfolio securities during the most recent twelve month period ending June 30 is available, without charge, by calling 800.826.2333, or by visiting vaneck.com, or on the Securities and Exchange Commission’s website at https://www.sec.gov.
The Trust files its complete schedule of portfolio holdings with the Securities and Exchange Commission for the first and third quarters of each fiscal year on Form N-PORT. The Trust’s Form N-PORT filings are available on the Commission’s website at https://www.sec.gov and may be reviewed and copied at the Commission’s Public Reference Room in Washington, D.C. Information on the operation of the Public Reference Room may be obtained by calling 202.942.8090. The Fund’s complete schedule of portfolio holdings is also available by calling 800.826.2333 or by visiting vaneck.com.

| Investment Adviser: | Van Eck Associates Corporation | |
| Distributor: | Van Eck Securities Corporation | |
| | 666 Third Avenue, New York, NY 10017 | |
| | vaneck.com | |
| Account Assistance: | 800.544.4653 | UEMBAR |
 | ANNUAL REPORT
December 31, 2019 |
VanEck Funds
VanEck Morningstar Wide Moat Fund
Certain information contained in this report represents the opinion of the investment adviser and may change at any time. This information is not intended to be a forecast of future events, a guarantee of future results or investment advice. Current market conditions may not continue. Also, unless otherwise specifically noted, any discussion of the Fund’s holdings, the Fund’s performance, and the views of the investment adviser are as of December 31, 2019.
PRIVACY NOTICE
(unaudited)
| FACTS | WHAT DOES VAN ECK DO WITH YOUR
PERSONAL INFORMATION? |
| Why? | Financial companies choose how they share your personal information. Federal law gives consumers the right to limit some but not all sharing. Federal law also requires us to tell you how we collect, share, and protect your personal information. Please read this notice carefully to understand what we do. |
| What? | The types of personal information we collect and share depend on the product or service you have with us. This information can include: ■ Social Security number and account balances ■ assets and payment history ■ risk tolerance and transaction history |
| How? | All financial companies need to share customers’ personal information to run their everyday business. In the section below, we list the reasons financial companies can share their customers’ personal information; the reasons Van Eck chooses to share; and whether you can limit this sharing. |
Reasons we can share your personal
information | Does Van Eck share? | Can you limit this
sharing? |
| For our everyday business purposes—such as to process your transactions, maintain your account(s), respond to court orders and legal investigations, or report to credit bureaus | Yes | No |
| For our marketing purposes— to offer our products and services to you | Yes | No |
| For joint marketing with other financial companies | Yes | No |
| For our affiliates’ everyday business purposes— information about your transactions and experiences | Yes | No |
| For our affiliates’ everyday business purposes— information about your creditworthiness | No | We don’t share |
| For our affiliates to market to you | Yes | Yes |
| For nonaffiliates to market to you | No | We don’t share |
| To limit our sharing | Call us at 1-800-826-2333. Please note: If you are a new customer, we can begin sharing your information 30 days from the date we sent this notice. When you are no longer our customer, we continue to share your information as described in this notice. However, you can contact us at any time to limit our sharing. |
| Questions? | Call us at 1-800-826-2333. |
PRIVACY NOTICE
(unaudited) (continued)
| Who we are | |
| Who is providing this notice? | Van Eck Global, its affiliates and funds sponsored or managed by Van Eck (collectively “Van Eck”). |
| What we do | |
| How does Van Eck protect my personal information? | To protect your personal information from unauthorized access and use, we use security measures that comply with federal law. These measures include computer safeguards and secured files and buildings. |
| How does Van Eck collect my personal information? | We collect your personal information, for example, when you ■open an account or give us your income information ■provide employment information or give us your contact information ■tell us about your investment or retirement portfolio We also collect your personal information from others, such as credit bureaus, affiliates, or other companies. |
| Why can’t I limit all sharing? | Federal law gives you the right to limit only ■sharing for affiliates’ everyday business purposes—information about your creditworthiness ■affiliates from using your information to market to you ■sharing for nonaffiliates to market to you State laws and individual companies may give you additional rights to limit sharing. See below for more on your rights under state law. |
| What happens when I limit sharing for an account I hold jointly with someone else? | Your choices will apply to everyone on your account – unless you tell us otherwise |
| Definitions | |
| Affiliates | Companies related by common ownership or control. They can be financial and nonfinancial companies. ■Our affiliates include companies with a Van Eck name such as Van Eck Securities Corporation and others such as Market Vectors Index Solutions GmbH. |
| Nonaffiliates | Companies not related by common ownership or control. They can be financial and nonfinancial companies. ■Van Eck does not share with nonaffiliates so they can market to you. |
| Joint marketing | A formal agreement between nonaffiliated financial companies that together market financial products or services to you. ■Our joint marketing partners include financial services companies |
| Other important information | |
| California Residents— In accordance with California law, we will not share information we collect about California residents with nonaffiliates except as permitted by law, such as with the consent of the customer or to service the customer’s accounts. We also will limit the sharing of information about you with our affiliates to the extent required by applicable California law. |
| Vermont Residents— In accordance with Vermont law, we will not share information we collect about Vermont residents with nonaffiliates except as permitted by law, such as with the consent of the customer or to service the customer’s accounts. We will not share creditworthiness information about Vermont residents among Van Eck’s affiliates except with the authorization or consent of the Vermont resident. |
VANECK MORNINGSTAR WIDE MOAT FUND
PRESIDENT’S LETTER
December 31, 2019 (unaudited)
Dear Shareholders:
The story for 2019 was simple and familiar—slower economic growth was combated by expansive monetary policy.
But first a comment on global growth: the two engines of the global economy, the U.S. and China, continue to move forward and we now have the prospect of at least some resolution of the trade dispute between them in the phase-one agreement. The latest economic statistics from China are steady and there are signs of “green shoots.” China’s services sector is expanding robustly and manufacturing is struggling, but not collapsing. My blog,China’s Economic Growth: Continuing Despite Headlines, shows this in two charts.
The biggest event in the markets last summer was the surge in bonds in Europe with negative interest rates. At the end of September, nearly $15 trillion worth of debt globally carried a negative yield.1Despite moves by the European Central Bank to stimulate, not only is the European economy slowing down, but there are also concerns about just how effective central bank actions are. Looking forward, therefore, I think investors should assess their hedge against central bank uncertainty by considering, for example, their gold allocations. While high interest rate environments tend to be tough for gold (it does not pay any yield), against negative interest rates, gold and other hedges against central bank impotence should be strongly considered.
We encourage you to stay in touch with us through the videos, email subscriptions and research blogs available on our website, www.vaneck.com. I have started my own email subscription where I share interesting research—you can sign up on www.vaneck.com. Should you have any questions regarding fund performance, please contact us at 800.826.2333 or visit ourwebsite.
VANECK MORNINGSTAR WIDE MOAT FUND
PRESIDENT’S LETTER
(unaudited) (continued)
We sincerely thank you for investing in VanEck’s investment strategies. On the following pages, you will find a performance discussion and financial statements for the fund for the twelve month period ended December 31, 2019. As always, we value your continued confidence in us and look forward to helping you meet your investment goals in the future.

Jan F. van Eck
CEO and President
VanEck Funds
January 24, 2020
Investing involves substantial risk and high volatility, including possible loss of principal. An investor should consider the investment objective, risks, charges and expenses of the Funds carefully before investing. To obtain a prospectus and summary prospectus, which contain this and other information, call 800.826.2333 or visit vaneck.com. Please read the prospectus and summary prospectus carefully before investing.
| 1 | Financial Times: September was the busiest month ever for corporate debt issuance, September 30, 2019, https://www.ft.com/content/eef8234c-e3c0-11e9-b112-9624ec9edc59 |
MANAGEMENT DISCUSSION
December 31, 2019 (unaudited)
The VanEck Morningstar Wide Moat Fund (the “Fund”) returned 35.02% (Class Z shares) for the 12 month period ended December 31, 2019. The Fund’s positioning allowed it to outperform the broad U.S. stock market as represented by the S&P 500 Index1which posted a 31.49% return.
The Fund seeks to replicate as closely as possible, before fees and expenses, the price and yield performance of the Morningstar®Wide Moat Focus IndexSM(MWMFTR, the “Index”),2which is intended to track the overall performance of attractively priced companies with sustainable competitive advantages according to Morningstar’s equity research team.
For the period, the Index returned 35.65%.
| • | The Index contains at least 40 attractively priced U.S. companies with sustainable competitive advantages, or “moats” |
| • | Morningstar equity analysts use a rigorous proprietary process to determine if a company has an economic moat, which may allow them to earn above average returns on capital over a long period of time |
| • | Companies included in the Index are also determined to be trading at attractive prices relative to Morningstar’s estimate of fair value |
Fund Review
59 companies contributed positively to the Fund’s returns in 2019 while only four companies detracted from performance for the period.
Information technology, followed by healthcare and consumer staples, were the greatest contributing sectors to the Fund’s returns. A single sector, energy, detracted from returns and then only minimally.
Of stocks, the top five performers were: KLA Corporation, Applied Materials, Inc., Facebook, Inc., The Western Union Company and Microchip Technology Inc.
The bottom five performers were: Core Laboratories N.V., Cheniere Energy, Inc., Veeva Systems Inc., Pfizer Inc. and Harley-Davidson, Inc.
Access investment and market insights from VanEck’s investment professionals by subscribing to our blogs. To subscribe to the Moat Investing updates, please visit vaneck.com/subscription.
An investment in the Fund may be subject to risks which include, among others, investing in the healthcare, consumer discretionary, industrials, information technology and financial services sectors, medium-capitalization companies, equity securities, market, operational, high
VANECK MORNINGSTAR WIDE MOAT FUND
MANAGEMENT DISCUSSION
(unaudited) (continued)
portfolio turnover, index tracking, replication management, non-diversified, and concentration risks, which may make these investments volatile in price or difficult to trade. Medium-capitalization companies may be subject to elevated risks. The Fund’s assets may be concentrated in a particular sector and may be subject to more risk than investments in a diverse group of sectors. Please see the prospectus and summary prospectus for information on these and other risk considerations.
We appreciate your participation in the VanEck Morningstar Wide Moat Fund, and we look forward to helping you meet your investment goals in the future.
 | |  |
| | | |
Peter H. Liao
Portfolio Manager | | Gregory F. Krenzer
Deputy Portfolio Manager |
Represents the opinions of the investment adviser. Past performance is no guarantee of future results. Not intended to be a forecast of future events, a guarantee of future results or investment advice. Current market conditions may not continue.
All indices listed are unmanaged indices and include the reinvestment of all dividends, but do not reflect the payment of transaction costs, advisory fees or expenses that are associated with an investment in the Fund. Certain indices may take into account withholding taxes. An index’s performance is not illustrative of the Fund’s performance. Indices are not securities in which investments can be made.
| 1 | S&P 500®Index: consists of 500 widely held common stocks covering the leading industries of the U.S. economy (reflects no deduction for fees, expenses or taxes). |
| | |
| 2 | Morningstar®Wide Moat Focus IndexSM(MWMFTR) is a rules-based, equal-weighted index intended to offer exposure to companies that Morningstar, Inc. determines have sustainable competitive advantages based on a proprietary methodology that considers quantitative and qualitative factors (“wide moat companies”) (reflects no deduction for fees, expenses or taxes). |
VANECK MORNINGSTAR WIDE MOAT FUND
PERFORMANCE COMPARISON
December 31, 2019 (unaudited)
This chart shows the value of a hypothetical $10,000 investment in the Fund since inception. The result is compared with the Fund’s benchmark and a broad-based market index. Performance of Class I shares will vary from that of the Class Z shares due to differences in class specific fees and any applicable sales charges. | | Hypothetical Growth of $10,000 (Since Inception: Class Z) 
|
Average Annual
Total Return | | Class I* | | Class Z* | | MWMFTR | | S&P 500 |
| One Year | | | 34.80 | % | | | 35.02 | % | | | 35.65 | % | | | 31.49 | % |
| Life^ (annualized) | | | 17.41 | % | | | 17.55 | % | | | 18.14 | % | | | 13.05 | % |
| * | Classes are not subject to a sales charge |
| ^ | Since November 6, 2017 (inception date for all share classes) |
The performance quoted represents past performance. Past performance does not guarantee future results; current performance may be lower or higher than the performance data quoted.
Investment return and value of shares of the Fund will fluctuate so that an investor’s shares, when redeemed, may be worth more or less than their original cost. Performance information reflects temporary waivers of expenses and/or fees. Had the Fund incurred all expenses, investment returns would have been reduced. Fund returns assume that dividends and capital gains distributions have been reinvested in the Fund at NAV. These returns do not reflect the deduction of taxes that a shareholder would pay on Fund dividends and distributions or the redemption of Fund shares. Performance information current to the most recent month end is available by calling 800.826.2333 or by visiting vaneck.com.
All indices are unmanaged and include the reinvestment of all dividends, but do not reflect the payment of transaction costs, advisory fees or expenses that are associated with an investment in the Fund. Certain indices may take into account withholding taxes. An index’s performance is not illustrative of the Fund’s performance. Indices are not securities in which investments can be made.
VANECK MORNINGSTAR WIDE MOAT FUND
PERFORMANCE COMPARISON
(unaudited) (continued)
Morningstar®Wide Moat Focus Index (MWMFTR) is a rules-based index intended to offer exposure to companies that the Index Provider determines have sustainable competitive advantages based on a proprietary methodology that considers quantitative and qualitative factors (“wide moat companies”) (reflects no deduction for fees, expenses or taxes).
S&P 500®Index (S&P 500) consists of 500 widely held common stocks, covering four broad sectors (industrials, utilities, financial and transportation).
VANECK MORNINGSTAR WIDE MOAT FUND
EXPLANATION OF EXPENSES
(unaudited)
As a shareholder of the Fund, you incur two types of costs: (1) transaction costs, including sales charges on purchase payments; and (2) ongoing costs, including management fees and other Fund expenses. This disclosure is intended to help you understand the ongoing costs (in dollars) of investing in the Fund and to compare these costs with the ongoing costs of investing in other mutual funds.
The disclosure is based on an investment of $1,000 invested at the beginning of the period and held for the entire period, July 1, 2019 to December 31, 2019.
Actual Expenses
The first line in the table below provides information about account values and actual expenses. You may use the information in this line, together with the amount you invested, to estimate the expenses that you paid over the period. Simply divide your account value by $1,000 (for example, an $8,600 account value divided by $1,000 = 8.6), then multiply the result by the number in the first line under the heading entitled “Expenses Paid During the Period.”
Hypothetical Example for Comparison Purposes
The second line in the table below provides information about hypothetical account values and hypothetical expenses based on the Fund’s actual expense ratio and an assumed rate of return of 5% per year before expenses, which is not the Fund’s actual return. The hypothetical account values and expenses may not be used to estimate the actual ending account balance or expenses you paid for the period. You may use this information to compare the ongoing costs of investing in the Fund and other funds. To do so, compare this 5% hypothetical example with the 5% hypothetical examples that appear in the shareholder reports of other funds.
Please note that the expenses shown in the table are meant to highlight your ongoing costs only and do not reflect any transactional costs, such as fees on purchase payments. Therefore, the second line of the table is useful in comparing ongoing costs only, and will not help you determine the relative costs of owning different funds. In addition, if these transactional costs were included, your costs would have been higher.
VANECK MORNINGSTAR WIDE MOAT FUND
EXPLANATION OF EXPENSES
(unaudited) (continued)
| | | Beginning
Account Value
July 1, 2019 | | Ending
Account Value
December 31,
2019 | | Annualized
Expense Ratio
During Period | | Expenses Paid
During the Period*
July 1, 2019 -
December 31,
2019 |
| Class I | | | | | | | | | | | | | | | | |
| Actual | | $ | 1,000.00 | | | $ | 1,154.60 | | | | 0.59 | % | | $ | 3.20 | |
| Hypothetical** | | $ | 1,000.00 | | | $ | 1,022.23 | | | | 0.59 | % | | $ | 3.01 | |
| Class Z | | | | | | | | | | | | | | | | |
| Actual | | $ | 1,000.00 | | | $ | 1,155.70 | | | | 0.49 | % | | $ | 2.66 | |
| Hypothetical** | | $ | 1,000.00 | | | $ | 1,022.74 | | | | 0.49 | % | | $ | 2.50 | |
| * | Expenses are equal to the Fund’s annualized expense ratio (for the six months ended December 31, 2019), multiplied by the average account value over the period, multiplied by the number of days in the most recent fiscal half year divided by the number of the days in the fiscal year (to reflect the one-half year period). |
| ** | Assumes annual return of 5% before expenses |
VANECK MORNINGSTAR WIDE MOAT FUND
SCHEDULE OF INVESTMENTS
December 31, 2019
Number
of Shares | | | | | Value | |
| | | | | |
| COMMON STOCKS: 100.0% | | | | |
| | | | | |
| Banks: 2.5% | | | | |
| | 4,197 | | | Wells Fargo & Co. | | $ | 225,799 | |
| Capital Goods: 11.2% | | | | |
| | 1,557 | | | Caterpillar, Inc. | | | 229,938 | |
| | 3,006 | | | Emerson Electric Co. | | | 229,238 | |
| | 1,164 | | | General Dynamics Corp. | | | 205,271 | |
| | 505 | | | Raytheon Co. | | | 110,969 | |
| | 1,493 | | | United Technologies Corp. | | | 223,592 | |
| | | | | | | | 999,008 | |
| Consumer Durables & Apparel: 5.2% | | | | |
| | 2,312 | | | NIKE, Inc. | | | 234,229 | |
| | 2,250 | | | Polaris Industries, Inc. | | | 228,825 | |
| | | | | | | | 463,054 | |
| Consumer Services: 2.4% | | | | |
| | 402 | | | Domino’s Pizza, Inc. | | | 118,100 | |
| | 490 | | | McDonald’s Corp. | | | 96,829 | |
| | | | | | | | 214,929 | |
| Diversified Financials: 10.2% | | | | |
| | 984 | | | Berkshire Hathaway, Inc. * | | | 222,876 | |
| | 453 | | | BlackRock, Inc. | | | 227,723 | |
| | 1,698 | | | State Street Corp. | | | 134,312 | |
| | 890 | | | T. Rowe Price Group, Inc. | | | 108,438 | |
| | 4,595 | | | The Charles Schwab Corp. | | | 218,538 | |
| | | | | | | | 911,887 | |
| Energy: 4.2% | | | | |
| | 3,398 | | | Cheniere Energy, Inc. * | | | 207,516 | |
| | 4,566 | | | Core Laboratories NV | | | 172,001 | |
| | | | | | | | 379,517 | |
| Food, Beverage & Tobacco: 7.7% | | | | |
| | 4,686 | | | Altria Group, Inc. | | | 233,878 | |
| | 3,283 | | | Kellogg Co. | | | 227,052 | |
| | 2,720 | | | Philip Morris International, Inc. | | | 231,445 | |
| | | | | | | | 692,375 | |
Number
of Shares | | | | | Value | |
| | | | | | | | | |
| Health Care Equipment & Services: 9.8% | | | | |
| | 1,503 | | | Cerner Corp. | | $ | 110,305 | |
| | 1,901 | | | Medtronic Plc | | | 215,668 | |
| | 439 | | | UnitedHealth Group, Inc. | | | 129,057 | |
| | 1,461 | | | Veeva Systems, Inc. * | | | 205,504 | |
| | 1,461 | | | Zimmer Biomet Holdings, Inc. | | | 218,682 | |
| | | | | | | | 879,216 | |
| Materials: 3.9% | | | | |
| | 3,690 | | | Compass Minerals International, Inc.† | | | 224,942 | |
| | 4,196 | | | Corteva, Inc. | | | 124,034 | |
| | | | | | | | 348,976 | |
| Media & Entertainment: 5.0% | | | | |
| | 2,614 | | | Comcast Corp. | | | 117,552 | |
| | 1,079 | | | Facebook, Inc. * | | | 221,465 | |
| | 2,251 | | | John Wiley & Sons, Inc. | | | 109,219 | |
| | | | | | | | 448,236 | |
| Pharmaceuticals / Biotechnology: 14.1% | | | | |
| | 521 | | | Amgen, Inc. | | | 125,597 | |
| | 813 | | | Biogen, Inc. * | | | 241,242 | |
| | 3,780 | | | Bristol-Myers Squibb Co. | | | 242,638 | |
| | 3,150 | | | Gilead Sciences, Inc. | | | 204,687 | |
| | 2,442 | | | Merck & Co., Inc. | | | 222,100 | |
| | 5,691 | | | Pfizer, Inc. | | | 222,973 | |
| | | | | | | | 1,259,237 | |
| Retailing: 2.5% | | | | |
| | 119 | | | Amazon.com, Inc. * | | | 219,893 | |
| Semiconductor: 7.8% | | | | |
| | 1,862 | | | Applied Materials, Inc. | | | 113,656 | |
| | 3,931 | | | Intel Corp. | | | 235,270 | |
| | 658 | | | KLA-Tencor Corp. | | | 117,236 | |
| | 2,230 | | | Microchip Technology, Inc.† | | | 233,526 | |
| | | | | | | | 699,688 | |
See Notes to Financial Statements
VANECK MORNINGSTAR WIDE MOAT FUND
SCHEDULE OF INVESTMENTS
(continued)
Number
of Shares | | | | | Value | |
| | | | | | | | | |
| Software & Services: 9.9% | | | | |
| | 1,393 | | | Blackbaud, Inc. | | $ | 110,883 | |
| | 1,956 | | | Guidewire Software, Inc. * | | | 214,710 | |
| | 733 | | | Microsoft Corp. | | | 115,594 | |
| | 1,364 | | | Salesforce.com, Inc. * | | | 221,841 | |
| | 789 | | | ServiceNow, Inc. * | | | 222,750 | |
| | | | | | | | 885,778 | |
| Transportation: 1.2% | | | | |
| | 1,533 | | | CSX Corp. | | | 110,928 | |
| Utilities: 2.4% | | | | |
| | 2,615 | | | Dominion Energy, Inc. | | | 216,574 | |
Total Common Stocks
(Cost: $8,140,269) | | | 8,955,095 | |
Number
of Shares | | | | | Value | |
| | | | | | | | | |
MONEY MARKET FUND: 3.9%
(Cost: $352,106) | | | | |
| | 352,106 | | | Invesco Treasury Portfolio-Institutional Class | | $ | 352,106 | |
Total Investments: 103.9%
(Cost: $8,492,375) | | | 9,307,201 | |
| Liabilities in excess of other assets: (3.9)% | | | (350,989 | ) |
| NET ASSETS: 100.0% | | $ | 8,956,212 | |
Footnotes:
| * | Non-income producing |
| † | Security fully or partially on loan. Total market value of securities on loan is $118,135. |
Summary of
Investments by Sector | | | % of
Investments | | Value | |
| Communication Services | | | | 4.8 | % | | $ | 448,236 | |
| Consumer Discretionary | | | | 9.7 | | | | 897,876 | |
| Consumer Staples | | | | 7.4 | | | | 692,375 | |
| Energy | | | | 4.1 | | | | 379,517 | |
| Financials | | | | 12.2 | | | | 1,137,686 | |
| Health Care | | | | 23.0 | | | | 2,138,453 | |
| Industrials | | | | 11.9 | | | | 1,109,936 | |
| Information Technology | | | | 17.0 | | | | 1,585,466 | |
| Materials | | | | 3.8 | | | | 348,976 | |
| Utilities | | | | 2.3 | | | | 216,574 | |
| Money Market Fund | | | | 3.8 | | | | 352,106 | |
| | | | | 100.0 | % | | $ | 9,307,201 | |
The summary of inputs used to value the Fund’s investments as of December 31, 2019 is as follows:
| | | Level 1
Quoted
Prices | | | Level 2
Significant
Observable
Inputs | | Level 3
Significant
Unobservable
Inputs | | Value | |
| Common Stocks* | | $ | 8,955,095 | | | | $ | — | | | | $ | — | | | $ | 8,955,095 | |
| Money Market Fund | | | 352,106 | | | | | — | | | | | — | | | | 352,106 | |
| Total | | $ | 9,307,201 | | | | $ | — | | | | $ | — | | | $ | 9,307,201 | |
| * | See Schedule of Investments for industry breakouts. |
See Notes to Financial Statements
VANECK MORNINGSTAR WIDE MOAT FUND
STATEMENT OF ASSETS AND LIABILITIES
December 31, 2019
| Assets: | | | |
| Investments, at value (Cost $8,492,375) (1) | | $ | 9,307,201 | |
| Receivables: | | | | |
| Shares of beneficial interest sold | | | 462 | |
| Due from Adviser | | | 23,344 | |
| Dividends and interest | | | 10,133 | |
| Prepaid expenses | | | 2,889 | |
| Total assets | | | 9,344,029 | |
| Liabilities: | | | | |
| Payables: | | | | |
| Investments securities purchased | | | 317,827 | |
| Deferred Trustee fees | | | 3,894 | |
| Accrued expenses | | | 66,096 | |
| Total liabilities | | | 387,817 | |
| NET ASSETS | | $ | 8,956,212 | |
| Class I Shares: | | | | |
| Net Assets | | $ | 1,412,414 | |
| Shares of beneficial interest outstanding | | | 48,485 | |
| Net asset value, offering and redemption price per share | | $ | 29.13 | |
| Class Z Shares: | | | | |
| Net Assets | | $ | 7,543,798 | |
| Shares of beneficial interest outstanding | | | 262,282 | |
| Net asset value, offering and redemption price per share | | $ | 28.76 | |
| Net Assets consist of: | | | | |
| Aggregate paid in capital | | $ | 7,692,349 | |
| Total distributable earnings (loss) | | | 1,263,863 | |
| | | $ | 8,956,212 | |
| (1) Value of securities on loan | | $ | 118,135 | |
See Notes to Financial Statements
VANECK MORNINGSTAR WIDE MOAT FUND
STATEMENT OF OPERATIONS
For the Year Ended December 31, 2019
| Income: | | | | |
| Dividends | | $ | 165,820 | |
| Securities lending income | | | 208 | |
| Foreign taxes withheld | | | (452 | ) |
| Total income | | | 165,576 | |
| Expenses: | | | | |
| Management fees | | | 32,052 | |
| Transfer agent fees – Class I | | | 13,250 | |
| Transfer agent fees – Class Z | | | 13,916 | |
| Custodian fees | | | 19,499 | |
| Professional fees | | | 90,911 | |
| Registration fees – Class I | | | 21,406 | |
| Registration fees – Class Z | | | 22,552 | |
| Reports to shareholders | | | 16,832 | |
| Insurance | | | 3,001 | |
| Trustees’ fees and expenses | | | 6,127 | |
| Interest | | | 75 | |
| Other | | | 2,423 | |
| Total expenses | | | 242,044 | |
| Waiver of management fees | | | (32,052 | ) |
| Expenses assumed by the Adviser | | | (173,759 | ) |
| Net expenses | | | 36,233 | |
| Net investment income | | | 129,343 | |
| Net realized gain on: | | | | |
| Investments | | | 846,875 | |
| Net change in unrealized appreciation (depreciation) on: | | | | |
| Investments | | | 1,110,141 | |
| Net Increase in Net Assets Resulting from Operations | | $ | 2,086,359 | |
See Notes to Financial Statements
VANECK MORNINGSTAR WIDE MOAT FUND
STATEMENT OF CHANGES IN NET ASSETS
| | | Year Ended
December 31,
2019 | | | Year Ended
December 31,
2018 | |
| Operations: | | | | | | | | |
| Net investment income | | $ | 129,343 | | | $ | 108,949 | |
| Net realized gain | | | 846,875 | | | | 376,138 | |
| Net change in unrealized appreciation (depreciation) | | | 1,110,141 | | | | (551,198 | ) |
| Net increase (decrease) in net assets resulting from operations | | | 2,086,359 | | | | (66,111 | ) |
| Distributions to shareholders: | | | | | | | | |
| Class I Shares | | | (138,185 | ) | | | (90,450 | ) |
| Class Z Shares | | | (415,673 | ) | | | (406,218 | ) |
| Total distributions | | | (553,858 | ) | | | (496,668 | ) |
| Share transactions: | | | | | | | | |
| Proceeds from sale of shares | | | | | | | | |
| Class Z Shares | | | 5,443,232 | | | | 744,750 | |
| Reinvestment of distributions | | | | | | | | |
| Class I Shares | | | 138,185 | | | | 90,450 | |
| Class Z Shares | | | 415,673 | | | | 406,218 | |
| | | | 553,858 | | | | 496,668 | |
| Cost of shares redeemed | | | | | | | | |
| Class Z Shares | | | (4,307,538 | ) | | | (252,780 | ) |
| Net increase in net assets resulting from share transactions | | | 1,689,552 | | | | 988,638 | |
| Total increase in net assets | | | 3,222,053 | | | | 425,859 | |
| Net Assets: | | | | | | | | |
| Beginning of year | | | 5,734,159 | | | | 5,308,300 | |
| End of year | | $ | 8,956,212 | | | $ | 5,734,159 | |
See Notes to Financial Statements
VANECK MORNINGSTAR WIDE MOAT FUND
FINANCIAL HIGHLIGHTS
For a share outstanding throughout each period:
| | | Class I |
| | | Year Ended December 31, |
| | | 2019 | | 2018 | | 2017(a) |
| Net asset value, beginning of period | | | $ | 23.94 | | | | $ | 26.63 | | | | $ | 25.15 | |
| Income from investment operations: | | | | | | | | | | | | | | | |
| Net investment income (b) | | | | 0.49 | | | | | 0.49 | | | | | 0.07 | |
| Net realized and unrealized gain (loss) on investments | | | | 7.86 | | | | | (0.91 | ) | | | | 1.48 | |
| Total from investment operations | | | | 8.35 | | | | | (0.42 | ) | | | | 1.55 | |
| Less dividends and distributions from: | | | | | | | | | | | | | | | |
| Net investment income | | | | (0.46 | ) | | | | (0.48 | ) | | | | (0.07 | ) |
| Net realized capital gains | | | | (2.70 | ) | | | | (1.79 | ) | | | | — | |
| Total dividends and distributions | | | | (3.16 | ) | | | | (2.27 | ) | | | | (0.07 | ) |
| Net asset value, end of period | | | $ | 29.13 | | | | $ | 23.94 | | | | $ | 26.63 | |
| Total return (c) | | | | 34.80 | % | | | | (1.30 | )% | | | | 6.15 | %(d) |
| Ratios/Supplemental Data | | | | | | | | | | | | | | | |
| Net assets, end of period (000’s) | | | $ | 1,412 | | | | $ | 1,048 | | | | $ | 1,062 | |
| Ratio of gross expenses to average net assets | | | | 5.21 | % | | | | 3.42 | % | | | | 16.25 | %(e) |
| Ratio of net expenses to average net assets | | | | 0.59 | % | | | | 0.59 | % | | | | 0.59 | %(e) |
| Ratio of net expenses to average net assets, excluding interest expense | | | | 0.59 | % | | | | 0.59 | % | | | | 0.59 | %(e) |
| Ratio of net investment income to average net assets | | | | 1.72 | % | | | | 1.79 | % | | | | 1.89 | %(e) |
| Portfolio turnover rate | | | | 108 | % | | | | 76 | % | | | | 10 | %(d) |
| (a) | For the period November 06, 2017 (commencement of operations) through December 31, 2017. |
| (b) | Calculated based upon average shares outstanding. |
| (c) | Total return is calculated assuming an initial investment made at the net asset value at the beginning of period, reinvestment of any dividends and distributions at net asset value on the dividend/distributions payment date and a redemption at the net asset value on the last day of the period. The return does not reflect the deduction of taxes that a shareholder would pay on Fund dividends/distributions or the redemption of Fund shares. |
| (d) | Not annualized. |
| (e) | Annualized. |
See Notes to Financial Statements
VANECK MORNINGSTAR WIDE MOAT FUND
FINANCIAL HIGHLIGHTS
For a share outstanding throughout each period:
| | | Class Z |
| | | Year Ended December 31, |
| | | 2019 | | 2018 | | 2017(a) |
| Net asset value, beginning of period | | | $ | 23.95 | | | | $ | 26.63 | | | | $ | 25.15 | |
| Income from investment operations: | | | | | | | | | | | | | | | |
| Net investment income (b) | | | | 0.52 | | | | | 0.50 | | | | | 0.08 | |
| Net realized and unrealized gain (loss) on investments | | | | 7.89 | | | | | (0.90 | ) | | | | 1.47 | |
| Total from investment operations | | | | 8.41 | | | | | (0.40 | ) | | | | 1.55 | |
| Less dividends and distributions from: | | | | | | | | | | | | | | | |
| Net investment income | | | | (0.90 | ) | | | | (0.49 | ) | | | | (0.07 | ) |
| Net realized capital gains | | | | (2.70 | ) | | | | (1.79 | ) | | | | — | |
| Total dividends and distributions | | | | (3.60 | ) | | | | (2.28 | ) | | | | (0.07 | ) |
| Net asset value, end of period | | | $ | 28.76 | | | | $ | 23.95 | | | | $ | 26.63 | |
| Total return (c) | | | | 35.02 | % | | | | (1.22 | )% | | | | 6.17 | %(d) |
| Ratios/Supplemental Data | | | | | | | | | | | | | | | |
| Net assets, end of year (000’s) | | | $ | 7,544 | | | | $ | 4,686 | | | | $ | 4,247 | |
| Ratio of gross expenses to average net assets | | | | 3.02 | % | | | | 2.16 | % | | | | 13.17 | %(e) |
| Ratio of net expenses to average net assets | | | | 0.49 | % | | | | 0.49 | % | | | | 0.49 | %(e) |
| Ratio of net expenses to average net assets, excluding interest expense | | | | 0.49 | % | | | | 0.49 | % | | | | 0.49 | %(e) |
| Ratio of net investment income to average net assets | | | | 1.83 | % | | | | 1.90 | % | | | | 1.99 | %(e) |
| Portfolio turnover rate | | | | 108 | % | | | | 76 | % | | | | 10 | %(d) |
| (a) | For the period November 06, 2017 (commencement of operations) through December 31, 2017. |
| (b) | Calculated based upon average shares outstanding. |
| (c) | Total return is calculated assuming an initial investment made at the net asset value at the beginning of period, reinvestment of any dividends and distributions at net asset value on the dividend/distributions payment date and a redemption at the net asset value on the last day of the period. The return does not reflect the deduction of taxes that a shareholder would pay on Fund dividends/distributions or the redemption of Fund shares. |
| (d) | Not annualized. |
| (e) | Annualized. |
See Notes to Financial Statements
VANECK MORNINGSTAR WIDE MOAT FUND
NOTES TO FINANCIAL STATEMENTS
December 31, 2019
Note 1—Fund Organization—Van Eck Funds (the “Trust”) is registered under the Investment Company Act of 1940, as amended, as an open-end management investment company. The Trust was organized as a Massachusetts business trust on April 3, 1985. The VanEck Morningstar Wide Moat Fund (the “Fund”) is a non-diversified series of the Trust and seeks to replicate as closely as possible, before fees and expenses, the price and yield performance of the Morningstar Wide Moat Focus Index. The Fund currently offers two classes of shares: Class I Shares and Class Z Shares. Each share class represents an interest in the same portfolio of investments of the Fund.
Note 2—Significant Accounting Policies—The preparation of financial statements in conformity with U.S. generally accepted accounting principles (“GAAP”) requires management to make estimates and assumptions that affect the reported amounts and disclosures in the financial statements. Actual results could differ from those estimates.
The Fund is an investment company and follows accounting and reporting requirements of Accounting Standards Codification (“ASC”) 946Financial Services — Investment Companies.
The following is a summary of significant accounting policies followed by the Fund.
| A. | Security Valuation—The Fund values its investments in securities and other assets and liabilities at fair value daily. Fair value is the price that would be received to sell an asset or paid to transfer a liability in an orderly transaction between market participants on the measurement date. Securities traded on national exchanges are valued at the closing price on the market in which the securities trade. Securities traded on the NASDAQ Stock Market LLC (“NASDAQ”) are valued at the NASDAQ official closing price. Over-the-counter securities not included on NASDAQ and listed securities for which no sale was reported are valued at the mean of the bid and ask prices. To the extent these securities are actively traded they are categorized as Level 1 in the fair value hierarchy (as described below). Short-term obligations with sixty days or less to maturity are valued at amortized cost, which with accrued interest approximates fair value. Money market fund investments are valued at net asset value and are categorized as Level 1 in the fair value hierarchy. The Pricing Committee of Van Eck Associates Corporation (the “Adviser”) provides oversight of the Fund’s valuation policies and procedures, which are approved by the Fund’s Board of Trustees. Among other things, these procedures allow the Fund to utilize independent pricing services, quotations from securities dealers, and other market sources to determine fair value. The Pricing Committee convenes |
| | regularly to review the fair value of financial instruments or other assets. If market quotations for a security or other asset are not readily available, or if the Adviser believes they do not otherwise reflect the fair value of a security or asset, the security or asset will be fair valued by the Pricing Committee in accordance with the Fund’s valuation policies and procedures. The Pricing Committee employs various methods for calibrating the valuation approaches utilized to determine fair value, including a regular review of key inputs and assumptions, periodic comparisons to valuations provided by other independent pricing services, transactional back-testing and disposition analysis. |
| | |
| | Certain factors such as economic conditions, political events, market trends, the nature of and duration of any restrictions on disposition, trading in similar securities of the issuer or comparable issuers and other security specific information are used to determine the fair value of these securities. Depending on the relative significance of valuation inputs, these securities may be classified either as Level 2 or Level 3 in the fair value hierarchy. The price which the Fund may realize upon sale of an investment may differ materially from the value presented on the Schedule of Investments. |
| | |
| | The Fund utilizes various methods to measure the fair value of its investments on a recurring basis, which includes a hierarchy that prioritizes inputs to valuation methods used to measure fair value. The fair value hierarchy gives highest priority to unadjusted quoted prices in active markets for identical assets and liabilities (Level 1 measurements) and the lowest priority to unobservable inputs (Level 3 measurements). The inputs or methodologies used for valuing securities are not necessarily an indication of the risk associated with investing in those securities. The three levels of the fair value hierarchy are described below: |
| | Level 1 – | Quoted prices in active markets for identical securities. |
| | | |
| | Level 2 – | Significant observable inputs (including quoted prices for similar securities, interest rates, prepayment speeds, credit risk, etc.). |
| | | |
| | Level 3 – | Significant unobservable inputs (including the Fund’s own assumptions in determining the fair value of investments). |
| | A summary of the inputs and the levels used to value the Fund’s investments are located in the Schedule of Investments. Additionally, tables that reconcile the valuation of the Fund’s Level 3 investments and that present additional information about the valuation methodologies and unobservable inputs, if applicable, are located in the Schedule of Investments. |
VANECK MORNINGSTAR WIDE MOAT FUND
NOTES TO FINANCIAL STATEMENTS
(continued)
| B. | Federal Income Taxes—It is the Fund’s policy to comply with the provisions of the Internal Revenue Code applicable to regulated investment companies and to distribute all of its net investment income and net realized capital gains, if any, to its shareholders. Therefore, no federal income tax provision is required. |
| | |
| C. | Dividends and Distributions to Shareholders—Dividends to shareholders from net investment income and distributions from net realized capital gains, if any, are declared and paid annually. Income dividends and capital gain distributions are determined in accordance with U.S. income tax regulations, which may differ from such amounts determined in accordance with GAAP. |
| | |
| D. | Offsetting Assets and Liabilities—In the ordinary course of business, the Fund enters into transactions subject to enforceable master netting or other similar agreements. Generally, the right of offset in those agreements allows the Fund to offset any exposure to a specific counterparty with any collateral received or delivered to that counterparty based on the terms of the agreements. The Fund may pledge or receive cash and/or securities as collateral for derivative instruments and securities lending. For financial reporting purposes, the Fund presents securities lending assets and liabilities on a gross basis in the Statement of Assets and Liabilities. Cash collateral held in the form of money market investments, if any, at December 31, 2019 is presented in the Schedule of Investments and in the Statement of Assets and Liabilities. Non-cash collateral is disclosed in Note 8 (Securities Lending). |
| | |
| E. | Other—Security transactions are accounted for on trade date. Dividend income is recorded on the ex-dividend date except that certain dividends from foreign securities are recognized upon notification of the ex-dividend date. Realized gains and losses are determined based on the specific identification method. |
| | |
| | Income, non-class specific expenses, gains and losses on investments are allocated to each class of shares based on its relative net assets. Expenses directly attributable to a specific class are charged to that class. |
| | |
| | The Fund earns interest income on uninvested cash balances held at the custodian bank, such amounts, if any, are presented as interest income in the Statement of Operations. |
| | |
| | In the normal course of business, the Fund enters into contracts that contain a variety of general indemnifications. The Fund’s maximum exposure under these agreements is unknown as this would involve future claims that may be made against the Fund that have not yet occurred. However, the Adviser believes the risk of loss under these arrangements to be remote. |
Note 3—Investment Management and Other Agreements—The Adviser is the investment adviser to the Fund. The Adviser receives a management fee, calculated daily and payable monthly based on annual rate of 0.45% of the Fund’s average daily net assets. The Adviser has agreed, until at least May 1, 2020, to waive management fees and assume expenses to prevent the Fund’s total annual operating expenses (excluding acquired fund fees and expenses, interest expense, trading expenses, dividend and interest payments on securities sold short, taxes and extraordinary expenses) from exceeding the expense limitations listed in the table below.
The current expense limitations and the amounts waived/assumed by the Adviser for the year ended December 31, 2019, are as follows:
| | | Expense
Limitations | | Waiver of
Management
Fees | | Expenses
Assumed by
the Adviser |
| Class I | | | | 0.59 | % | | | $ | 5,570 | | | | $ | 51,594 | |
| Class Z | | | | 0.49 | | | | | 26,482 | | | | | 122,165 | |
Van Eck Securities Corporation (the “Distributor”), an affiliate of the Adviser, acts as the Fund’s distributor. Certain officers and trustees of the Trust are officers, directors or stockholders of the Adviser and Distributor.
State Street Bank and Trust Company is the Fund’s custodian and securities lending agent.
Note 4—Investments—For the year ended December 31, 2019, the cost of purchases and proceeds from sales of investments, excluding U.S. government securities and short-term obligations, aggregated $9,031,536 and $7,761,844, respectively.
Note 5—Income Taxes—As of December 31, 2019, for Federal income tax purposes, the identified cost of investments owned, net unrealized appreciation (depreciation), gross unrealized appreciation, and gross unrealized depreciation of investments were as follows:
Cost of
Investments | | Gross
Unrealized
Appreciation | | Gross
Unrealized
Depreciation | | Net Unrealized
Appreciation
(Depreciation) |
| $8,606,147 | | $912,805 | | $(211,751) | | $701,054 |
At December 31, 2019, the components of accumulated earnings (deficit) on a tax basis, for the Fund, were as follows:
Undistributed
Ordinary
Income | | Other
Temporary
Differences | | Undistributed
Long-Term
Capital Gains | | Unrealized
Appreciation
(Depreciation) | | Total
Distributable
Earnings |
| $ 354,746 | | $ (3,891) | | $ 211,954 | | $ 701,054 | | $ 1,263,863 |
VANECK MORNINGSTAR WIDE MOAT FUND
NOTES TO FINANCIAL STATEMENTS
(continued)
The tax character of dividends paid to shareholders were as follows:
| | | Year Ended
December 31,
2019 | | Year Ended
December 31,
2018 |
| Ordinary income * | | | $ | 293,461 | | | | $ | 496,668 | |
| Long-term Capital Gains | | | | 260,397 | | | | | — | |
| Total Dividends Paid | | | $ | 553,858 | | | | $ | 496,668 | |
| * | Includes Short-Term Capital Gains |
Each year, the Fund assesses the need for any reclassifications due to permanent book to tax differences that affect distributable earnings / (losses) and aggregate paid in capital. Net assets are not affected by these reclassifications. During the year ended December 31, 2019, the Fund did not have any reclassifications.
The Fund recognizes the tax benefits of uncertain tax positions only where the position is “more-likely-than-not” to be sustained assuming examination by applicable tax authorities. Management has analyzed the Fund’s tax positions, and has concluded that no liability for unrecognized tax benefits should be recorded related to uncertain tax positions taken on return filings for all open tax years.
The Fund recognizes interest and penalties, if any, related to uncertain tax positions as income tax expense in the Statement of Operations. During the year ended December 31, 2019, the Fund did not incur any interest or penalties.
Note 6—Principal Risks—The Fund is classified as non-diversified under the Investment Company Act of 1940, as amended. Therefore, the Fund may invest a relatively high percentage of its assets in a smaller number of issuers or may invest a larger proportion of its assets in a single issuer. As a result, the gains and losses on a single investment may have a greater impact on the Fund’s net asset value and may make the Fund more volatile than more diversified funds.
The value of the equity securities held by the Fund may fall due to general market and economic conditions, perceptions regarding the markets in which the issuers of securities held by the Fund participate, or factors relating to specific issuers in which the Fund invests. While broad market measures of equity securities have historically generated higher average returns than fixed income securities, equity securities have generally also experienced significantly more volatility in those returns.
Competitive advantages for wide moat companies may erode in a relatively short period of time due to changes in laws and regulations, intellectual property rights, economic and political conditions, and technological developments, among other reasons.
At December 31, 2019, the Distributor owned approximately 100% of Class I Shares and 75% of Class Z Shares.
A more complete description of risks is included in the Fund’s Prospectus and Statement of Additional Information.
Note 7—Shareholder Transactions—Shares of beneficial interest issued, reinvested and redeemed (unlimited number of $0.001 par value shares authorized):
| | | Year Ended
December 31, 2019 | | Year Ended
December 31, 2018 |
| Class I | | | | | | | | |
| Shares reinvested | | | 4,720 | | | | 3,902 | |
| Class Z | | | | | | | | |
| Shares sold | | | 190,632 | | | | 27,662 | |
| Shares reinvested | | | 14,378 | | | | 17,509 | |
| Shares redeemed | | | (138,368 | ) | | | (9,008 | ) |
| Net increase | | | 66,642 | | | | 36,163 | |
Note 8—Securities Lending—To generate additional income, the Fund may lend its securities pursuant to a securities lending agreement with the securities lending agent. The Fund may lend up to 33% of its investments requiring that the loan be continuously collateralized by cash, cash equivalents, U.S. government securities, or any combination of cash and such securities at all times equal to at least 102% (105% for foreign securities) of the market value plus accrued interest on the securities loaned. Daily market fluctuations could cause the value of loaned securities to be more or less than the value of the collateral received. When this occurs, the collateral is adjusted and settled on the next business day. During the term of the loan, the Fund will continue to receive any dividends, interest or amounts equivalent thereto, on the securities loaned while receiving a fee from the borrower and/or earning interest on the investment of the cash collateral. Such fees and interest are shared with the securities lending agent under the terms of the securities lending agreement. Securities lending income is disclosed as such in the Statement of Operations. The cash collateral is maintained on the Fund’s behalf by the lending agent and is invested in the State Street Navigator Securities Lending Government Money Market Portfolio. Non-cash collateral consists of U.S. Treasuries and U.S. Government Agency securities, and is not disclosed in the Fund’s
VANECK MORNINGSTAR WIDE MOAT FUND
NOTES TO FINANCIAL STATEMENTS
(continued)
Schedule of Investments or Statement of Assets and Liabilities as it is held by the agent on behalf of the Fund, and the Fund does not have the ability to re-hypothecate those securities. Loans are subject to termination at the option of the borrower or the Fund. Upon termination of the loan, the borrower will return to the Fund securities identical to the securities loaned. The Fund bears the risk of delay in recovery of, or even loss of rights in, the securities loaned should the borrower of the securities fail financially. The value of loaned securities and related cash collateral, if any, at December 31, 2019 is presented on a gross basis in the Schedule of Investments and Statement of Assets and Liabilities. The following is a summary of the Fund’s securities on loan and related collateral as of December 31, 2019:
Market Value
of Securities
on Loan | | Cash
Collateral | | Non-Cash
Collateral | | Total Collateral |
| $118,135 | | $ — | | $120,856 | | $120,856 |
Note 9—Bank Line of Credit—The Trust participates with VanEck VIP Funds (collectively the “VE/VIP Funds”) in a $30 million committed credit facility (the “Facility”) to be utilized for temporary financing until the settlement of sales or purchases of portfolio securities, the repurchase or redemption of shares of the participating Fund and other temporary or emergency purposes. The participating VE/VIP Funds have agreed to pay commitment fees, pro rata, based on the unused but available balance. Interest is charged to the participating VE/VIP Funds at rates based on prevailing market rates in effect at the time of borrowings. During the year ended December 31, 2019, the average daily loan balance during the seven day period for which a loan was outstanding amounted to $104,155 and the average interest rate was 3.70%. At December 31, 2019 the Fund had no outstanding borrowings under the Facility.
Note 10—Trustee Deferred Compensation Plan—The Trust has a Deferred Compensation Plan (the “Deferred Plan”) for Trustees under which the Trustees can elect to defer receipt of their trustee fees until retirement, disability or termination from the Board of Trustees. The fees otherwise payable to the participating Trustees are deemed invested eligible in shares of the VE/VIP Funds as directed by the Trustees.
The expense for the Deferred Plan is included in “Trustees’ fees and expenses” on the Statement of Operations. The liability for the Deferred Plan is shown as “Deferred Trustee fees” on the Statement of Assets and Liabilities.
Note 11—Recent Accounting Pronouncements—The Fund early adopted certain provisions of Accounting Standards Update No. 2018-13Disclosure Framework — Changes to the Disclosure Requirements for Fair Value Measurement(“ASU 2018-13”) that eliminate and modify certain disclosure requirements for fair value measurements. The adoption of certain provisions of ASU 2018-13 had no material effect on the financial statements and related disclosures. Management evaluated the additional requirements, not yet adopted, and they are not expected to have a material impact to the financial statements. Public companies will be required to disclose the range and weighted average of significant unobservable inputs for Level 3 fair value measurements. ASU 2018-13 is effective for fiscal years beginning after December 15, 2019 and for interim periods within those fiscal years.
Note 12—Subsequent Event Review—The Fund has evaluated subsequent events and transactions for potential recognition or disclosure through the date the financial statements were issued.
VANECK MORNINGSTAR WIDE MOAT FUND
REPORT OF INDEPENDENT REGISTERED PUBLIC ACCOUNTING FIRM
To the Shareholders and the Board of Trustees of VanEck Morningstar Wide Moat Fund
Opinion on the Financial Statements
We have audited the accompanying statement of assets and liabilities of VanEck Morningstar Wide Moat Fund (the “Fund”) (one of the series constituting VanEck Funds (the “Trust”)), including the schedule of investments, as of December 31, 2019, and the related statement of operations for the year then ended, the statements of changes in net assets for each of the two years in the period then ended, the financial highlights for each of the two years in the period ended December 31, 2019 and the period from November 6, 2017 (commencement of operations) through December 31, 2017 and the related notes (collectively referred to as the “financial statements”). In our opinion, the financial statements present fairly, in all material respects, the financial position of VanEck Morningstar Wide Moat Fund (one of the series constituting VanEck Funds) at December 31, 2019, the results of its operations for the year then ended, the changes in its net assets for each of the two years in the period then ended and its financial highlights for each of the two years in the period ended December 31, 2019 and the period from November 6, 2017 (commencement of operations) through December 31, 2017, in conformity with U.S. generally accepted accounting principles.
Basis for Opinion
These financial statements are the responsibility of the Trust’s management. Our responsibility is to express an opinion on the Fund’s financial statements based on our audits. We are a public accounting firm registered with the Public Company Accounting Oversight Board (United States) (“PCAOB”) and are required to be independent with respect to the Trust in accordance with the U.S. federal securities laws and the applicable rules and regulations of the Securities and Exchange Commission and the PCAOB.
We conducted our audits in accordance with the standards of the PCAOB. Those standards require that we plan and perform the audit to obtain reasonable assurance about whether the financial statements are free of material misstatement, whether due to error or fraud. The Trust is not required to have, nor were we engaged to perform, an audit of the Trust’s internal control over financial reporting. As part of our audits, we are required to obtain an understanding of internal control over financial reporting, but not for the purpose of expressing an opinion on the effectiveness of the Trust’s internal control over financial reporting. Accordingly, we express no such opinion.
Our audits included performing procedures to assess the risks of material misstatement of the financial statements, whether due to error or fraud, and performing procedures that respond to those risks. Such procedures included examining, on a test basis, evidence regarding the amounts and disclosures in the financial statements. Our procedures included confirmation of securities owned as of December 31, 2019, by correspondence with the custodian and brokers or by other appropriate auditing procedures where replies from brokers were not received. Our audits also included evaluating the accounting principles used and significant estimates made by management, as well as evaluating the overall presentation of the financial statements. We believe that our audits provide a reasonable basis for our opinion.

We have served as the auditor of one or more of the VanEck investment companies since 1999.
New York, New York
February 27, 2020
VANECK MORNINGSTAR WIDE MOAT FUND
TAX INFORMATION
(unaudited)
The following information is provided with respect to the distributions paid during the taxable year ended December 31, 2019. Please consult your tax advisor for proper treatment of this information.
| Record Date: | | | 12/20/2019 | |
| Payable Date: | | | 12/23/2019 | |
| Ordinary Income Paid Per Share - Class I | | | $1.523700 | |
| Ordinary Income Paid Per Share - Class Z | | | 1.961300 | |
| Long-Term Capital Gain - Class I | | | 1.633700 | |
| Long-Term Capital Gain - Class Z | | | 1.633700 | |
| Qualfied Dividend Income for Individuals | | | 23.81% | |
| Dividends Qualifying for the Dividends Received Deduction for Corporations | | | 22.74% | |
| Information for Non-U.S. Shareholders | | | | |
| Record Date: | | | 12/20/2019 | |
| Payable Date: | | | 12/23/2019 | |
| Qualified Short-Term Capital Gains - Class I | | | $0.253905 | |
| Qualified Short-Term Capital Gains - Class Z | | | 0.253905 | |
Qualified Interest Income (“QII”) and Qualified Short-Term Capital Gains (“QSTG”) distributions may be exempt from United States withholding tax when distributed to non-U.S. shareholders with proper documentation.
VANECK FUNDS
SPECIAL MEETING OF SHAREHOLDERS
October 11, 2019 (unaudited)
VANECK FUNDS
CM Commodity Index Fund
Emerging Markets Fund
Global Hard Assets Fund
International Investors Gold Fund
Unconstrained Emerging Markets Bond Fund
VanEck Morningstar Wide Moat Fund
VanEck NDR Managed Allocation Fund
A Special Meeting of Shareholders of VanEck Funds (the “Trust”) was held at the offices of the Trust, 666 Third Avenue, 9th Floor, New York, New York 10017 on October 11, 2019. The purpose of the meeting was to elect Trustees of the Trust. At the meeting, the following persons were elected by the shareholders to serve as Trustees of the Trust: Jon Lukomnik, Jane DiRenzo Pigott, R. Alastair Short, Richard D. Stamberger, Robert L. Stelzl, and Jan F. van Eck. No other business was transacted at the meeting.
The results of the voting at the meeting are as follows:
Proposal: To elect a Board of Trustees*:
| Name | | For | | | Withheld |
| Jon Lukomnik | | 239,074,404.179 | | | 1,973,903.626 |
| Jane DiRenzo Pigott | | 239,734,349.197 | | | 1,313,958.608 |
| R. Alastair Short | | 239,059,688.386 | | | 1,988,619.419 |
| Richard D. Stamberger | | 239,110,733.308 | | | 1,937,574.497 |
| Robert L. Stelzl | | 239,042,995.154 | | | 2,005,312.651 |
| Jan F. van Eck | | 239,874,952.434 | | | 1,173,355.371 |
| Total Trust Shares Outstanding**: 327,471,673.186 |
| * | Results are for all series portfolios within the Trust. |
| ** | As of the record date. |
VANECK FUNDS
BOARD OF TRUSTEES AND OFFICERS
December 31, 2019 (unaudited)
Trustee Information
The Trustees of the Trust, their address, position with the Trust, age and principal occupations during the past five years, as of January 1, 2020, are set forth below:
Trustee’s Name,
Address(1)and
Year of Birth | | Position(s) Held With Trust,
Term of Office(2)and
Length of Time Served | | Principal Occupation(s)
During Past Five Years | | Number of
Portfolios
In Fund
Complex(3)
Overseen
By Trustee | | Other Directorships Held Outside The
Fund Complex(3)During The Past Five Years |
| | | | | | | | | |
| Independent Trustees: | | | | | | |
| | | | | | | |
Jon Lukomnik
1956 (A)(I) | | Trustee (since 2006) | | Managing Partner, Sinclair Capital LLC (consulting firm). Formerly, Executive Director, Investor Responsibility Research Center Institute. | | 11 | | Member of the Deloitte Audit Quality Advisory Committee; Chairman of the Advisory Committee of Legion Partners; Member of the Standing Advisory Group to the Public Company Accounting Oversight Board; Director of VanEck ICAV (an Irish UCITS); VanEck Vectors UCITS ETF plc (an Irish UCITS). Formerly, Director of VanEck (a Luxembourg UCITS); Chairman of the Board of the New York Classical Theatre. |
| | | | | | | | | |
Jane DiRenzo Pigott
1957 (I) | | Trustee (since 2007); Chairperson of the Board (since 2020) | | Managing Director, R3 Group LLC (consulting firm). | | 11 | | Trustee of Northwestern University, Lyric Opera of Chicago and the Chicago Symphony Orchestra. Formerly, Director and Chair of Audit Committee of 3E Company (services relating to hazardous material safety); Director of MetLife Investment Funds, Inc. |
| | | | | | | | | |
R. Alastair Short
1953 (A)(I) | | Trustee (since 2004); Chairperson of the Audit Committee (since 2006) | | President, Apex Capital Corporation (personal investment vehicle). | | 66 | | Chairman and Independent Director, EULAV Asset Management; Trustee, Kenyon Review; Trustee, Children’s Village. Formerly, Independent Director, Tremont offshore funds. |
VANECK FUNDS
BOARD OF TRUSTEES AND OFFICERS
December 31, 2019 (unaudited) (continued)
Trustee’s Name,
Address(1)and
Year of Birth | | Position(s) Held With Trust,
Term of Office(2)and
Length of Time Served | | Principal Occupation(s)
During Past Five Years | | Number of
Portfolios
In Fund
Complex(3)
Overseen
By Trustee | | Other Directorships Held Outside The
Fund Complex(3)During The Past Five Years |
| | | | | | | | | |
Richard D. Stamberger
1959 (G) (I) | | Trustee (since 1995); | | President and CEO, SmartBrief, Inc. (business media company). | | 66 | | Director, Food and Friends, Inc. |
| | | | | | | | | |
Robert L. Stelzl
1945 (G) (I) | | Trustee (since 2007); Chairperson of the Governance Committee (since 2017) | | Co-Trustee, the estate of Donald Koll; Trustee, Robert D. MacDonald Trust; Trustee, GH Insurance Trusts. Formerly, Trustee, Joslyn Family Trusts; President, Rivas Capital, Inc. (real estate property management services company). | | 11 | | Director, Brookfield Office Properties, Inc., Brookfield Residential Properties, Inc., Brookfield DTLA Fund Office Trust Investor, Inc., Brookfield Property Finance ULC and Brookfield Property Split Corp. |
| | | | | | | | | |
| Interested Trustee: | | | | | | |
Jan F. van Eck(4)
1963 (I) | | Trustee (Since 2019); Chairperson of the Investment Oversight Committee (since 2020); Chief Executive Officer and President (Since 2010) | | Director, President and Chief Executive Officer of Van Eck Associates Corporation (VEAC), Van Eck Absolute Return Advisers Corporation (VEARA) and Van Eck Securities Corporation (VESC); Officer and/or Director of other companies affiliated with VEAC and/or the Trust. | | 66 | | Director, National Committee on US China Relations. |
| (1) | The address for each Trustee and officer is 666 Third Avenue, 9th Floor, New York, New York 10017. |
| (2) | Trustee serves until resignation, death, retirement or removal. |
| (3) | The Fund Complex consists of VanEck Funds, VanEck VIP Trust and VanEck Vectors ETF Trust. |
| (4) | “Interested person” of the Trust within the meaning of the 1940 Act. Mr. van Eck is an officer of VEAC, VEARA and VESC. In addition, Mr. van Eck and members of his family own 100% of the voting stock of VEAC, which in turns owns 100% of the voting stock of each of VEARA and VESC. |
| (A) | Member of the Audit Committee. |
| (G) | Member of the Governance Committee. |
| (I) | Member of the Investment Oversight Committee |
Officer Information
The executive officers of the Trust, their age and address, the positions they hold with the Trust, their term of office and length of time served and their principal business occupations during the past five years are shown below:
Officer’s Name, Address(1)
And Year of Birth | | Position(s) Held With Trust | | Term of Office And
Length of Time Served(2) | | Principal Occupations During The Past Five Years |
| | | | | | | |
Matthew A. Babinsky,
1983 | | Assistant Vice President and Assistant Secretary | | Since 2016 | | Assistant Vice President, Assistant General Counsel and Assistant Secretary of VEAC, VEARA and VESC; Officer of other investment companies advised by VEAC and VEARA. Formerly, Associate, Clifford Chance US LLP. |
| | | | | | | |
Russell G. Brennan,
1964 | | Assistant Vice President and Assistant Treasurer | | Since 2008 | | Assistant Vice President of VEAC; Officer of other investment companies advised by VEAC and VEARA. |
| | | | | | | |
Charles T. Cameron,
1960 | | Vice President | | Since 1996 | | Portfolio Manager for VEAC; Officer and/or Portfolio Manager of other investment companies advised by VEAC and VEARA. Formerly, Director of Trading of VEAC. |
| | | | | | | |
John J. Crimmins,
1957 | | Vice President, Treasurer, Chief Financial Officer and Principal Accounting Officer | | Vice President, Chief Financial Officer and Principal Accounting Officer (since 2012); Treasurer (since 2009) | | Vice President of VEAC and VEARA; Officer of other investment companies advised by VEAC and VEARA. Formerly, Vice President of VESC. |
| | | | | | | |
F. Michael Gozzillo,
1965 | | Chief Compliance Officer | | Since 2018 | | Vice President and Chief Compliance Officer of VEAC and VEARA; Chief Compliance Officer of VESC; Officer of other investment companies advised by VEAC and VEARA. Formerly, Chief Compliance Officer of City National Rochdale, LLC and City National Rochdale Funds. |
| | | | | | | |
Laura Hamilton,
1977 | | Vice President | | Since 2019 | | Assistant Vice President of VEAC and VESC; Officer of other investment companies advised by VEAC and VEARA. Formerly, Operations Manager of Royce & Associates. |
| | | | | | | |
Laura I. Martínez,
1980 | | Vice President and Assistant Secretary | | Vice President (since 2016); Assistant Secretary (since 2008) | | Vice President, Associate General Counsel and Assistant Secretary of VEAC, VEARA and VESC; Officer of other investment companies advised by VEAC and VEARA. Formerly, Assistant Vice President of VEAC, VEARA and VESC. |
VANECK FUNDS
BOARD OF TRUSTEES AND OFFICERS
December 31, 2019 (unaudited) (continued)
Officer’s Name, Address(1)
And Year of Birth | | Position(s) Held With Trust | | Term of Office And
Length of Time Served(2) | | Principal Occupations During The Past Five Years |
| | | | | | | |
James Parker,
1969 | | Assistant Treasurer | | Since 2014 | | Assistant Vice President of VEAC, Manager, Portfolio Administration of VEAC and VEARA; Officer of other investment companies advised by VEAC and VEARA. |
| | | | | | | |
Jonathan R. Simon,
1974 | | Senior Vice President; Secretary and Chief Legal Officer | | Senior Vice President (since 2016); Secretary and Chief Legal Officer (since 2014) | | Senior Vice President, General Counsel and Secretary of VEAC, VEARA and VESC; Officer and/or Director of other companies affiliated with VEAC and/or the Trust. Formerly, Vice President of VEAC, VEARA and VESC. |
| (1) | The address for each Executive Officer is 666 Third Avenue, 9th Floor, New York, NY 10017. |
| (2) | Officers are elected yearly by the Board. |
This report is intended for the Fund’s shareholders. It may not be distributed to prospective investors unless it is preceded or accompanied by the Fund’s prospectus and summary prospectus, which includes more complete information. Investing involves substantial risk and high volatility, including possible loss of principal. An investor should consider the investment objective, risks, and charges and expenses of the Fund carefully before investing. To obtain a prospectus and summary prospectus, which contains this and other information, call 800.826.2333 or visit vaneck.com. Please read the prospectus and summary prospectus carefully before investing.
Additional information about VanEck Funds (the “Trust”) Board of Trustees/Officers and a description of the policies and procedures the Trust uses to determine how to vote proxies relating to portfolio securities are provided in the Statement of Additional Information. The Statement of Additional Information and information regarding how the Trust voted proxies relating to portfolio securities during the most recent twelve month period ending June 30 is available, without charge, by calling 800.826.2333, or by visiting vaneck.com, or on the Securities and Exchange Commission’s website at https://www.sec.gov.
The Trust files its complete schedule of portfolio holdings with the Securities and Exchange Commission for the first and third quarters of each fiscal year on Form N-PORT. The Trust’s Form N-PORT filings are available on the Commission’s website at https://www.sec.gov and may be reviewed and copied at the Commission’s Public Reference Room in Washington, D.C. Information on the operation of the Public Reference Room may be obtained by calling 202.942.8090. The Fund’s complete schedule of portfolio holdings is also available by calling 800.826.2333 or by visiting vaneck.com.

| Investment Adviser: | Van Eck Associates Corporation | |
| Distributor: | Van Eck Securities Corporation | |
| | 666 Third Avenue, New York, NY 10017 | |
| | vaneck.com | |
| Account Assistance: | 800.544.4653 | MWMAR |
 | ANNUAL REPORT
December 31, 2019 |
VanEck Funds
VanEck NDR Managed Allocation Fund
Certain information contained in this report represents the opinion of the investment adviser and may change at any time. This information is not intended to be a forecast of future events, a guarantee of future results or investment advice. Current market conditions may not continue. Also, unless otherwise specifically noted, any discussion of the Fund’s holdings, the Fund’s performance, and the views of the investment adviser are as of December 31, 2019.
PRIVACY NOTICE
(unaudited)
| FACTS | WHAT DOES VAN ECK DO WITH YOUR
PERSONAL INFORMATION? |
| Why? | Financial companies choose how they share your personal information. Federal law gives consumers the right to limit some but not all sharing. Federal law also requires us to tell you how we collect, share, and protect your personal information. Please read this notice carefully to understand what we do. |
| What? | The types of personal information we collect and share depend on the product or service you have with us. This information can include: ■ Social Security number and account balances ■ assets and payment history ■ risk tolerance and transaction history |
| How? | All financial companies need to share customers’ personal information to run their everyday business. In the section below, we list the reasons financial companies can share their customers’ personal information; the reasons Van Eck chooses to share; and whether you can limit this sharing. |
Reasons we can share your personal
information | Does Van Eck share? | Can you limit this
sharing? |
| For our everyday business purposes— such as to process your transactions, maintain your account(s), respond to court orders and legal investigations, or report to credit bureaus | Yes | No |
| For our marketing purposes— to offer our products and services to you | Yes | No |
| For joint marketing with other financialcompanies | Yes | No |
| For our affiliates’ everyday businesspurposes— information about your transactions and experiences | Yes | No |
| For our affiliates’ everyday businesspurposes— information about your creditworthiness | No | We don’t share |
| For our affiliates to market to you | Yes | Yes |
| For nonaffiliates to market to you | No | We don’t share |
| To limit our sharing | Call us at 1-800-826-2333. Please note: If you are a new customer, we can begin sharing your information 30 days from the date we sent this notice. When you are no longer our customer, we continue to share your information as described in this notice. However, you can contact us at any time to limit our sharing. |
| Questions? | Call us at 1-800-826-2333. |
PRIVACY NOTICE
(unaudited) (continued)
| Who we are |
| Who is providing this notice? | Van Eck Global, its affiliates and funds sponsored or managed by Van Eck (collectively “Van Eck”). |
| What we do |
| How does Van Eck protect my personal information? | To protect your personal information from unauthorized access and use, we use security measures that comply with federal law. These measures include computer safeguards and secured files and buildings. |
| How does Van Eck collect my personal information? | We collect your personal information, for example, when you ■ open an account or give us your income information ■ provide employment information or give us your contact information ■ tell us about your investment or retirement portfolio We also collect your personal information from others, such as credit bureaus, affiliates, or other companies. |
| Why can’t I limit all sharing? | Federal law gives you the right to limit only ■ sharing for affiliates’ everyday business purposes—information about your creditworthiness ■ affiliates from using your information to market to you ■ sharing for nonaffiliates to market to you State laws and individual companies may give you additional rights to limit sharing. See below for more on your rights under state law. |
| What happens when I limit sharing for an account I hold jointly with someone else? | Your choices will apply to everyone on your account – unless you tell us otherwise |
| Definitions |
| Affiliates | Companies related by common ownership or control. They can be financial and nonfinancial companies. ■ Our affiliates include companies with a Van Eck name such as Van Eck Securities Corporation and others such as Market Vectors Index Solutions GmbH. |
| Nonaffiliates | Companies not related by common ownership or control. They can be financial and nonfinancial companies. ■ Van Eck does not share with nonaffiliates so they can market to you. |
| Joint marketing | A formal agreement between nonaffiliated financial companies that together market financial products or services to you. ■ Our joint marketing partners include financial services companies |
| Other important information |
| California Residents— In accordance with California law, we will not share information we collect about California residents with nonaffiliates except as permitted by law, such as with the consent of the customer or to service the customer’s accounts. We also will limit the sharing of information about you with our affiliates to the extent required by applicable California law. |
| Vermont Residents— In accordance with Vermont law, we will not share information we collect about Vermont residents with nonaffiliates except as permitted by law, such as with the consent of the customer or to service the customer’s accounts. We will not share creditworthiness information about Vermont residents among Van Eck’s affiliates except with the authorization or consent of the Vermont resident. |
VANECK NDR MANAGED ALLOCATION FUND
PRESIDENT’S LETTER
December 31, 2019 (unaudited)
Dear Shareholders:
The story for 2019 was simple and familiar—slower economic growth was combated by expansive monetary policy.
But first a comment on global growth: the two engines of the global economy, the U.S. and China, continue to move forward and we now have the prospect of at least some resolution of the trade dispute between them in the phase-one agreement. The latest economic statistics from China are steady and there are signs of “green shoots.” China’s services sector is expanding robustly and manufacturing is struggling, but not collapsing. My blog,China’s Economic Growth: Continuing Despite Headlines, shows this in two charts.
The biggest event in the markets last summer was the surge in bonds in Europe with negative interest rates. At the end of September, nearly $15 trillion worth of debt globally carried a negative yield.1Despite moves by the European Central Bank to stimulate, not only is the European economy slowing down, but there are also concerns about just how effective central bank actions are. Looking forward, therefore, I think investors should assess their hedge against central bank uncertainty by considering, for example, their gold allocations. While high interest rate environments tend to be tough for gold (it does not pay any yield), against negative interest rates, gold and other hedges against central bank impotence should be strongly considered.
We encourage you to stay in touch with us through the videos, email subscriptions and research blogs available on our website, www.vaneck.com. I have started my own email subscription where I share interesting research—you can sign up on www.vaneck.com. Should you have any questions regarding fund performance, please contact us at 800.826.2333 or visit ourwebsite.
VANECK NDR MANAGED ALLOCATION FUND
PRESIDENT’S LETTER
(unaudited) (continued)
We sincerely thank you for investing in VanEck’s investment strategies. On the following pages, you will find a performance discussion and financial statements for the fund for the twelve month period ended December 31, 2019. As always, we value your continued confidence in us and look forward to helping you meet your investment goals in the future.

Jan F. van Eck
CEO and President
VanEck Funds
January 24, 2020
Investing involves substantial risk and high volatility, including possible loss of principal. An investor should consider the investment objective, risks, charges and expenses of the Funds carefully before investing. To obtain a prospectus and summary prospectus, which contain this and other information, call 800.826.2333 or visit vaneck.com. Please read the prospectus and summary prospectus carefully before investing.
| 1 | Financial Times: September was the busiest month ever for corporate debt issuance, September 30, 2019, https://www.ft.com/content/eef8234c-e3c0-11e9-b112-9624ec9edc59 |
MANAGEMENT DISCUSSION
December 31, 2019 (unaudited)
The VanEck NDR Managed Allocation Fund (the Fund) returned 11.21% (Class A shares, excluding sales charge) for the 12 months ending December 31, 2019. Over this period, the Fund underperformed its benchmark,1comprised of 60% MSCI AC World Daily TR Gross USD Index (MSCI All Country World Index) and 40% Bloomberg Barclays US Aggregate Total Return Value Unhedged USD Index (Bloomberg Barclays US Aggregate Bond Index), which returned 19.81%.
2019 was a challenging year for the Fund. Due to the Fund’s reliance on technical indicators, it has a momentum bias. One drawback to momentum-style investing is that, during transitioning periods of risk, it can be vulnerable to whipsaws. A whipsaw occurs when an investor takes a directional position only to have the markets abruptly turn in the opposite direction. This can result in the investor taking the loss, missing the rebound and, as a result, lagging the market. This happened twice in 2019.
The first whipsaw occurred at the beginning of the year. The Fund was underweight equities, with an allocation of approximately 30%, in January and February, based on: slowing economic growth; weak earnings growth; and bearish technical indicators. At that time risk was high following the dramatic correction in the fourth quarter of 2018. This led to its underperformance in both months and, consequently, its underperformance in the first quarter.
In March, the Fund increased its equity exposure to 60%, based on decreased levels of risk in the market. This helped performance as the market continued higher in both March and April.
The second whipsaw occurred in May and June. Going into May, the Fund increased its equity allocation to 72%, and reduced its bond allocation to 28%, only for the escalation of the trade war between the U.S. and China to act as a catalyst for the resurgence of risk in the market and for global equities to plunge. Then, with the Fund having reduced its stock allocation to 34% (and increased its bond allocation to 66%) going into June, the market proceeded to rally, based both on optimism over a truce in the trade war with China and hopes of interest rate cuts from the U.S. Federal Reserve. This led to the Fund underperforming its benchmark.
The Fund was then moderately underweight stocks in both September and October, which detracted from relative performance, and moderately overweight stocks in November and December, which contributed to relative performance.
VANECK NDR MANAGED ALLOCATION FUND
MANAGEMENT DISCUSSION
(unaudited) (continued)
While we were disappointed in how the Fund navigated in 2019, we remain confident that the Fund will capture much of the market’s upside, while being able to protect investors during both prolonged and extreme drawdowns. Short-term events, especially when associated with either geopolitical events or monetary policy actions, like those we experienced in May and June, are much harder to protect against (and benefit from).
Outlook
We are strong advocates of a dynamic approach to asset allocation. It has been about a decade since the Global Financial Crisis and it has been a fantastic period to be an investor. Since March 9, 2009, the S&P 500®Index has returned an annualized 17.19%. There have also been few market corrections and all of them recovered quickly.
History teaches us that bull markets do not last forever. Risks are present at all points in the market cycle, but become exacerbated in the final stages. It is for this reason that we believe that our case for a risk-focused approach to asset allocation is that much stronger.
The Fund uses a Ned Davis Research model that is based on a comprehensive set of indicators which interpret objective market data to measure risk. For us, following the data provides clarity. It allows us to remain grounded when others may not be: no emotion, no subjectivity. Over the long run, we believe this approach will benefit our shareholders and expect underperformance relative to the benchmark to be the exception rather than the norm.
Access investment and market insights from VanEck’s investment professionals by subscribing to our commentaries. To subscribe to the asset allocation update, please visit vaneck.com/subscription.
All mutual funds are subject to market risk, including possible loss of principal. Because the Fund is a “fund-of-funds,” an investor will indirectly bear the principal risks of the exchange-traded products in which it invests, including but not limited to, risks associated with smaller companies, foreign securities, emerging markets, debt securities, commodities, and derivatives. The Fund will bear its share of the fees and expenses of the exchange-traded products. Consequently, an investment in the Fund entails more direct and indirect expenses than a direct investment in an exchange-traded product. Because the Fund invests in exchange-traded products, it is subject to additional risks that do not apply to conventional mutual funds, including the risks that the market price of an exchange-traded product’s shares may be higher or lower
than the value of its underlying assets, there may be a lack of liquidity in the shares of the exchange-traded product, or trading may be halted by the exchange on which they trade. Principal risks of investing in foreign securities include changes in currency rates, foreign taxation and differences in auditing and other financial standards. Debt securities may be subject to credit risk and interest rate risk. Investments in debt securities typically decrease in value when interest rates rise. Because Van Eck Associates Corporation relies heavily on third-party quantitative models, the Fund is also subject to model and data risk. For a description of these and other risk considerations, please refer to the Fund’s prospectus and summary prospectus, which should be read carefully before you invest.
We appreciate your investment in the VanEck NDR Managed Allocation Fund, and we look forward to helping you meet your investment goals in the future.
 | |  |
| David Schassler | | John Lau |
| Portfolio Manager | | Deputy Portfolio Manager |
Represents the opinions of the investment adviser. Past performance is no guarantee of future results. Not intended to be a forecast of future events, a guarantee of future results or investment advice. Current market conditions may not continue.
All indices are unmanaged and include the reinvestment of all dividends, but do not reflect the payment of transaction costs, advisory fees or expenses that are associated with an investment in the Fund. Certain indices may take into account withholding taxes. An index’s performance is not illustrative of the Fund’s performance. Indices are not securities in which investments can be made.
| 1 | The Fund’s benchmark is a blended index consisting of 60% MSCI AC World Daily TR Gross USD Index (MSCI All Country World Index) and 40% Bloomberg Barclays US Aggregate Total Return Value Unhedged USD Index (Bloomberg Barclays US Aggregate Bond Index). The ACWI represents large- and mid-cap companies across developed and emerging market countries. The Bloomberg Barclays US Aggregate Bond Index is a broad-based benchmark that measures the performance of the investment grade, U.S. dollar-denominated, fixed-rate taxable bond market. |
VANECK NDR MANAGED ALLOCATION FUND
PERFORMANCE COMPARISON
December 31, 2019 (unaudited)
This chart shows the value of a hypothetical $10,000 investment since inception. The result is compared with the Fund’s benchmark, and may include a broad-based market index. Performance of Class I and Class Y shares will vary from that of the Class A shares due to differences in class specific fees and any applicable sales charges. | | Hypothetical Growth of $10,000 (Since Inception: Class A)
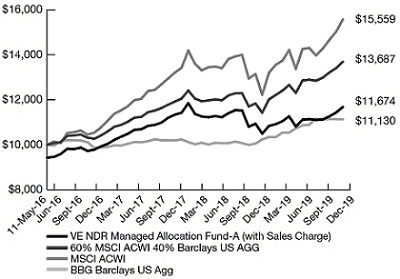 |
| | | |
Average Annual
Total Return | | Class A
Before
Sales Charge | | Class A
After Maximum
Sales Charge | | Class I* |
| One Year | | | 11.21 | % | | | 4.81 | % | | | 11.53 | % |
| Life^ (annualized) | | | 6.05 | % | | | 4.34 | % | | | 6.36 | % |
| | | | | | | | | | | | | |
Average Annual
Total Return | | Class Y* | | 60% MSCI ACWI/
40% BB US
Agg Bond | | BBG
Barclays
US Agg | | MSCI
ACWI |
| One Year | | | 11.49 | % | | | 19.81 | % | | | 8.72 | % | | | 27.30 | % |
| Life^ (annualized) | | | 6.31 | % | | | 9.00 | % | | | 2.98 | % | | | 12.91 | % |
| | | | | | | | | | | | | | | | | |
| * | Classes are not subject to a sales charge |
| ^ | Since May 11, 2016 (inception date for all share classes) |
The performance quoted represents past performance. Past performance does not guarantee future results; current performance may be lower or higher than the performance data quoted.
Investment return and value of shares of the Fund will fluctuate so that an investor’s shares, when redeemed, may be worth more or less than their original cost. Performance information reflects temporary waivers of expenses and/or fees. Had the Fund incurred all expenses, investment returns would have been reduced. Fund returns assume that dividends and capital gains distributions have been reinvested in the Fund at NAV. These returns do not reflect the deduction of taxes that a shareholder would pay on Fund dividends and distributions or the redemption of Fund shares. Performance information current to the most recent month end is available by calling 800.826.2333 or by visiting vaneck.com.
All indices are unmanaged and include the reinvestment of all dividends, but do not reflect the payment of transaction costs, advisory fees or expenses that are associated with an investment in the Fund. Certain indices may take into account withholding taxes. An index’s performance is not illustrative of the Fund’s performance. Indices are not securities in which investments can be made.
The 60/40 benchmark index is a blended index consisting of 60% MSCI All Country World Index (ACWI) and 40% Bloomberg Barclays US Aggregate Bond Index. MSCI ACWI captures large- and mid-capitalization representation across Developed Markets (DM) and Emerging Markets (EM) countries and covers approximately 85% of the global investable equity opportunity set. The MSCI ACWI is a gross return index which reinvests as much as possible of a company’s gross dividend distributions (reflects no deduction for fees, expenses or taxes). Bloomberg Barclays US Aggregate Bond Index is a broad-based benchmark that measures the investment grade, U.S. dollar-denominated, fixed-rate taxable bond market. This includes U.S. Treasuries, government-related and corporate securities, mortgage-backed securities, asset-backed securities, and collateralized mortgage-backed securities (reflects no deduction for fees, expenses or taxes).
VANECK NDR MANAGED ALLOCATION FUND
EXPLANATION OF EXPENSES
(unaudited)
As a shareholder of the Fund, you incur two types of costs: (1) transaction costs, including sales charges on purchase payments; and (2) ongoing costs, including management fees and other Fund expenses. This disclosure is intended to help you understand the ongoing costs (in dollars) of investing in the Fund and to compare these costs with the ongoing costs of investing in other mutual funds.
The disclosure is based on an investment of $1,000 invested at the beginning of the period and held for the entire period, July 1, 2019 to December 31, 2019.
Actual Expenses
The first line in the table below provides information about account values and actual expenses. You may use the information in this line, together with the amount you invested, to estimate the expenses that you paid over the period. Simply divide your account value by $1,000 (for example, an $8,600 account value divided by $1,000 = 8.6), then multiply the result by the number in the first line under the heading entitled “Expenses Paid During the Period.”
Hypothetical Example for Comparison Purposes
The second line in the table below provides information about hypothetical account values and hypothetical expenses based on the Fund’s actual expense ratio and an assumed rate of return of 5% per year before expenses, which is not the Fund’s actual return. The hypothetical account values and expenses may not be used to estimate the actual ending account balance or expenses you paid for the period. You may use this information to compare the ongoing costs of investing in the Fund and other funds. To do so, compare this 5% hypothetical example with the 5% hypothetical examples that appear in the shareholder reports of other funds.
Please note that the expenses shown in the table are meant to highlight your ongoing costs only and do not reflect any transactional costs, such as fees on purchase payments. Therefore, the second line of the table is useful in comparing ongoing costs only, and will not help you determine the relative costs of owning different funds. In addition, if these transactional costs were included, your costs would have been higher.
| | | | | |
| | Beginning
Account
Value
July 1, 2019 | Ending
Account Value
December 31,
2019 | Annualized
Expense
Ratio During
Period | Expenses Paid
During the Period*
July 1, 2019 -
December 31,
2019 |
| Class A | | | | |
| Actual | $1,000.00 | $1,050.30 | 1.15% | $5.94 |
| Hypothetical** | $1,000.00 | $1,019.41 | 1.15% | $5.85 |
| Class I | | | | |
| Actual | $1,000.00 | $1,051.80 | 0.85% | $4.40 |
| Hypothetical** | $1,000.00 | $1,020.92 | 0.85% | $4.33 |
| Class Y | | | | |
| Actual | $1,000.00 | $1,051.60 | 0.90% | $4.65 |
| Hypothetical** | $1,000.00 | $1,020.67 | 0.90% | $4.58 |
| * | Expenses are equal to the Fund’s annualized expense ratio (for the six months ended December 31, 2019), multiplied by the average account value over the period, multiplied by the number of days in the most recent fiscal half year divided by the number of the days in the fiscal year (to reflect the one-half year period). |
| | |
| ** | Assumes annual return of 5% before expenses |
VANECK NDR MANAGED ALLOCATION FUND
SCHEDULE OF INVESTMENTS
December 31, 2019
Number
of Shares | | | | | Value | |
| | | | | | | | | |
| EXCHANGE TRADED FUNDS: 100.5% (a) |
| | 47,443 | | | iShares Barclays Aggregate Bond Fund | | $ | 5,331,170 | |
| | 52,445 | | | iShares MSCI Eurozone ETF | | | 2,198,494 | |
| | 16,494 | | | iShares MSCI Pacific ex Japan ETF† | | | 763,672 | |
| | 4,271 | | | iShares MSCI South Korea Capped ETF | | | 265,614 | |
| | 13,496 | | | iShares MSCI Switzerland Capped ETF | | | 548,477 | |
| | 24,997 | | | iShares MSCI United Kingdom ETF† | | | 852,398 | |
| | 40,257 | | | iShares Russell 1000 Growth Index Fund | | | 7,082,012 | |
| | 59,546 | | | iShares Russell 1000 Value ETF† | | | 8,126,838 | |
| | 8,891 | | | iShares Russell 2000 Growth ETF† | | | 1,904,630 | |
| | 17,290 | | | iShares Russell 2000 Value ETF | | | 2,223,148 | |
Number
of Shares | | | | | Value | |
| | | | | | | |
| EXCHANGE TRADED FUNDS: (continued) |
| | 108,232 | | | JPMorgan BetaBuilders Japan ETF | | $ | 2,656,013 | |
| | 45,146 | | | Vanguard FTSE Emerging Markets ETF | | | 2,007,643 | |
| | 63,613 | | | Vanguard Total Bond Market ETF | | | 5,334,586 | |
| | | | | | | | | |
Total Exchange Traded Funds
(Cost: $34,704,919) | | | 39,294,695 | |
| SHORT-TERM INVESTMENT HELD AS COLLATERAL FOR SECURITIES ON LOAN: 6.4% |
| |
Money Market Fund: 6.4%
(Cost: $2,524,666) | | | | |
| | 2,524,666 | | | State Street Navigator Securities Lending Government Money Market Portfolio | | | 2,524,666 | |
Total Investments: 106.9%
(Cost: $37,229,585) | | | 41,819,361 | |
| Liabilities in excess of other assets: (6.9)% | | | (2,711,595 | ) |
| NET ASSETS: 100.0% | | $ | 39,107,766 | |
Footnotes:
| (a) | Each underlying fund’s shareholder reports and registration documents are available free of charge on the SEC’s website at https://www.sec.gov/ |
| † | Security fully or partially on loan. Total market value of securities on loan is $4,352,621. |
Summary of Investments by
Sector Excluding Collateral
for Securities Loaned | | | % of
Investments | | Value |
| Exchange Traded Funds | | | | 100.0 | % | | | $ | 39,294,695 | |
The summary of inputs used to value the Fund’s investments as of December 31, 2019 is as follows:
| | | Level 1
Quoted
Prices | | Level 2
Significant
Observable
Inputs | | Level 3
Significant
Unobservable
Inputs | | Value | |
| Exchange Traded Funds | | $ | 39,294,695 | | | $ | — | | | | $ | — | | | $ | 39,294,695 | |
| Money Market Fund | | | 2,524,666 | | | | — | | | | | — | | | | 2,524,666 | |
| Total | | $ | 41,819,361 | | | $ | — | | | | $ | — | | | $ | 41,819,361 | |
See Notes to Financial Statements
VANECK NDR MANAGED ALLOCATION FUND
STATEMENT OF ASSETS AND LIABILITIES
December 31, 2019
| Assets: | | |
| Investments, at value (Cost $34,704,919) (1) | | $ | 39,294,695 | |
| Short-term investment held as collateral for securities loaned (2) | | | 2,524,666 | |
| Receivables: | | | | |
| Shares of beneficial interest sold | | | 3,707 | |
| Due from Adviser | | | 1,765 | |
| Dividends and interest | | | 1,492 | |
| Prepaid expenses | | | 3,189 | |
| Total assets | | | 41,829,514 | |
| Liabilities: | | | | |
| Payables: | | | | |
| Collateral for securities loaned | | | 2,524,666 | |
| Shares of beneficial interest redeemed | | | 20,992 | |
| Due to custodian | | | 71,577 | |
| Due to Distributor | | | 3,008 | |
| Deferred Trustee fees | | | 28,706 | |
| Accrued expenses | | | 72,799 | |
| Total liabilities | | | 2,721,748 | |
| NET ASSETS | | $ | 39,107,766 | |
| Class A Shares: | | | | |
| Net Assets | | $ | 14,270,845 | |
| Shares of beneficial interest outstanding | | | 490,783 | |
| Net asset value and redemption price per share | | $ | 29.08 | |
| Maximum offering price per share (Net asset value per share ÷ 94.25%) | | $ | 30.85 | |
| Class I Shares: | | | | |
| Net Assets | | $ | 14,919,549 | |
| Shares of beneficial interest outstanding | | | 511,219 | |
| Net asset value, offering and redemption price per share | | $ | 29.18 | |
| Class Y Shares: | | | | |
| Net Assets | | $ | 9,917,372 | |
| Shares of beneficial interest outstanding | | | 340,103 | |
| Net asset value, offering and redemption price per share | | $ | 29.16 | |
| Net Assets consist of: | | | | |
| Aggregate paid in capital | | $ | 37,559,823 | |
| Total distributable earnings (loss) | | | 1,547,943 | |
| | | $ | 39,107,766 | |
| (1) Value of securities on loan | | $ | 4,352,621 | |
| (2) Cost of short-term investment held as collateral for securities loaned | | $ | 2,524,666 | |
See Notes to Financial Statements
VANECK NDR MANAGED ALLOCATION FUND
STATEMENT OF OPERATIONS
For the Year Ended December 31, 2019
| Income: | | | | |
| Dividends | | $ | 991,436 | |
| Securities lending income | | | 3,152 | |
| Total income | | | 994,588 | |
| Expenses: | | | | |
| Management fees | | | 321,676 | |
| Distribution fees – Class A Shares | | | 35,771 | |
| Transfer agent fees – Class A Shares | | | 30,974 | |
| Transfer agent fees – Class I Shares | | | 21,638 | |
| Transfer agent fees – Class Y Shares | | | 22,917 | |
| Custodian fees | | | 18,393 | |
| Professional fees | | | 100,838 | |
| Registration fees – Class A Shares | | | 19,868 | |
| Registration fees – Class I Shares | | | 19,984 | |
| Registration fees – Class Y Shares | | | 20,331 | |
| Reports to shareholders | | | 27,295 | |
| Insurance | | | 4,028 | |
| Trustees’ fees and expenses | | | 29,436 | |
| Interest | | | 2,459 | |
| Other | | | 3,599 | |
| Total expenses | | | 679,207 | |
| Waiver of management fees | | | (286,769 | ) |
| Net expenses | | | 392,438 | |
| Net investment income | | | 602,150 | |
| Net realized (loss) on: | | | | |
| Investments | | | (1,505,995 | ) |
| Net change in net unrealized appreciation (depreciation) on: | | | | |
| Investments | | | 5,293,668 | |
| Net Increase in Net Assets Resulting from Operations | | $ | 4,389,823 | |
See Notes to Financial Statements
VANECK NDR MANAGED ALLOCATION FUND
STATEMENT OF CHANGES IN NET ASSETS
| | | Year Ended
December 31,
2019 | | | Year Ended
December 31,
2018 | |
| Operations: | | | | | | |
| Net investment income | | $ | 602,150 | | | $ | 572,748 | |
| Net realized loss | | | (1,505,995 | ) | | | (1,562,376 | ) |
| Net change in unrealized appreciation (depreciation) | | | 5,293,668 | | | | (2,915,087 | ) |
| Net increase (decrease) in net assets resulting from operations | | | 4,389,823 | | | | (3,904,715 | ) |
| Distributions to shareholders: | | | | | | | | |
| Class A Shares | | | (210,396 | ) | | | (209,270 | ) |
| Class I Shares | | | (265,192 | ) | | | (215,860 | ) |
| Class Y Shares | | | (174,528 | ) | | | (312,720 | ) |
| Total distributions | | | (650,116 | ) | | | (737,850 | ) |
| Share transactions: | | | | | | | | |
| Proceeds from sale of shares | | | | | | | | |
| Class A Shares | | | 3,410,772 | | | | 12,868,755 | |
| Class I Shares | | | 3,172,444 | | | | 4,033,923 | |
| Class Y Shares | | | 493,367 | | | | 15,849,854 | |
| | | | 7,076,583 | | | | 32,752,532 | |
| Reinvestment of distributions | | | | | | | | |
| Class A Shares | | | 210,032 | | | | 204,226 | |
| Class I Shares | | | 265,192 | | | | 215,860 | |
| Class Y Shares | | | 164,288 | | | | 259,452 | |
| | | | 639,512 | | | | 679,538 | |
| Cost of shares redeemed | | | | | | | | |
| Class A Shares | | | (5,381,718 | ) | | | (6,820,488 | ) |
| Class I Shares | | | (2,171,299 | ) | | | (3,273,417 | ) |
| Class Y Shares | | | (11,221,993 | ) | | | (8,176,894 | ) |
| | | | (18,775,010 | ) | | | (18,270,799 | ) |
| Net increase (decrease) in net assets resulting from share transactions | | | (11,058,915 | ) | | | 15,161,271 | |
| Total increase (decrease) in net assets | | | (7,319,208 | ) | | | 10,518,706 | |
| Net Assets: | | | | | | | | |
| Beginning of year | | | 46,426,974 | | | | 35,908,268 | |
| End of year | | $ | 39,107,766 | | | $ | 46,426,974 | |
See Notes to Financial Statements
VANECK NDR MANAGED ALLOCATION FUND
FINANCIAL HIGHLIGHTS
For a share outstanding throughout each period:
| | | | Class A |
| | | | Year Ended December 31, |
| | | | 2019 | | | | 2018 | | | | 2017 | | | | 2016(a) |
| Net asset value, beginning of period | | | | $26.54 | | | | | | $29.31 | | | | | | $25.97 | | | | | | $25.15 | |
| Income from investment operations: | | | | | | | | | | | | | | | | | | | | | | | |
| Net investment income | | | | 0.38 | (c) | | | | | 0.34 | (c) | | | | | 0.22 | (c) | | | | | 0.20 | |
| Net realized and unrealized gain (loss) on investments | | | | 2.59 | | | | | | (2.73 | ) | | | | | 3.71 | | | | | | 1.12 | |
| Total from investment operations | | | | 2.97 | | | | | | (2.39 | ) | | | | | 3.93 | | | | | | 1.32 | |
| Less dividends and distributions from: | | | | | | | | | | | | | | | | | | | | | | | |
| Net investment income | | | | (0.43 | ) | | | | | (0.23 | ) | | | | | (0.16 | ) | | | | | (0.25 | ) |
| Net realized gains | | | | — | | | | | | (0.15 | ) | | | | | (0.43 | ) | | | | | (0.25 | ) |
| Total dividends and distributions | | | | (0.43 | ) | | | | | (0.38 | ) | | | | | (0.59 | ) | | | | | (0.50 | ) |
| Net asset value, end of period | | | | $29.08 | | | | | | $26.54 | | | | | | $29.31 | | | | | | $25.97 | |
| Total return (b) | | | | 11.21 | % | | | | | (8.13 | )% | | | | | 15.15 | % | | | | | 5.27 | %(d) |
| Ratios/Supplemental Data | | | | | | | | | | | | | | | | | | | | | | | |
| Net assets, end of period (000’s) | | | $14,271 | | | | | $14,710 | | | | | $10,006 | | | | $3,724 | |
| Ratio of gross expenses to average net assets (f) | | | | 1.87 | % | | | | | 1.62 | % | | | | | 2.09 | % | | | | | 2.67 | %(e) |
| Ratio of net expenses to average net assets (f) | | | | 1.16 | % | | | | | 1.15 | % | | | | | 1.15 | % | | | | | 1.15 | %(e) |
| Ratio of net expenses to average net assets, excluding interest expense (f) | | | | 1.15 | % | | | | | 1.15 | % | | | | | 1.15 | % | | | | | 1.15 | %(e) |
| Ratio of net investment income to average net assets (f) | | | | 1.35 | % | | | | | 1.16 | % | | | | | 0.79 | % | | | | | 1.79 | %(e) |
| Portfolio turnover rate | | | | 193 | % | | | | | 202 | % | | | | | 229 | % | | | | | 140 | %(d) |
| (a) | For the period May 11, 2016 (commencement of operations) through December 31, 2016. |
| (b) | Total return is calculated assuming an initial investment made at the net asset value at the beginning of period, reinvestment of any dividends and distributions at net asset value on the dividend/distributions payment date and a redemption at the net asset value on the last day of the period. The return does not reflect the deduction of taxes that a shareholder would pay on Fund dividends/distributions or the redemption of Fund shares. |
| (c) | Calculated based upon average shares outstanding. |
| (d) | Not annualized. |
| (e) | Annualized. |
| (f) | The ratios presented do not reflect the Fund’s proportionate share of income and expenses from the Fund’s investment in underlying funds. |
See Notes to Financial Statements
VANECK NDR MANAGED ALLOCATION FUND
FINANCIAL HIGHLIGHTS
For a share outstanding throughout each period:
| | | | Class I |
| | | | Year Ended December 31, |
| | | | 2019 | | | | 2018 | | | | 2017 | | | | 2016(a) |
| Net asset value, beginning of period | | | | $26.63 | | | | | | $29.41 | | | | | | $26.02 | | | | | | $25.15 | |
| Income from investment operations: | | | | | | | | | | | | | | | | | | | | | | | |
| Net investment income | | | | 0.47 | (c) | | | | | 0.38 | (c) | | | | | 0.35 | (c) | | | | | 0.30 | |
| Net realized and unrealized gain (loss) on investments | | | | 2.60 | | | | | | (2.70 | ) | | | | | 3.67 | | | | | | 1.07 | |
| Total from investment operations | | | | 3.07 | | | | | | (2.32 | ) | | | | | 4.02 | | | | | | 1.37 | |
| Less dividends and distributions from: | | | | | | | | | | | | | | | | | | | | | | | |
| Net investment income | | | | (0.52 | ) | | | | | (0.31 | ) | | | | | (0.20 | ) | | | | | (0.25 | ) |
| Net realized gains | | | | — | | | | | | (0.15 | ) | | | | | (0.43 | ) | | | | | (0.25 | ) |
| Total dividends and distributions | | | | (0.52 | ) | | | | | (0.46 | ) | | | | | (0.63 | ) | | | | | (0.50 | ) |
| Net asset value, end of period | | | | $29.18 | | | | | | $26.63 | | | | | | $29.41 | | | | | | $26.02 | |
| Total return (b) | | | | 11.53 | % | | | | | (7.85 | )% | | | | | 15.48 | % | | | | | 5.47 | %(d) |
| Ratios/Supplemental Data | | | | | | | | | | | | | | | | | | | | | | | |
| Net assets, end of period (000’s) | | | $14,920 | | | | | $12,371 | | | | | $12,741 | | | | | $3,285 | |
| Ratio of gross expenses to average net assets (f) | | | | 1.55 | % | | | | | 1.36 | % | | | | | 1.79 | % | | | | | 2.40 | %(e) |
| Ratio of net expenses to average net assets (f) | | | | 0.86 | % | | | | | 0.85 | % | | | | | 0.85 | % | | | | | 0.85 | %(e) |
| Ratio of net expenses to average net assets, excluding interest expense (f) | | | | 0.85 | % | | | | | 0.85 | % | | | | | 0.85 | % | | | | | 0.85 | %(e) |
| Ratio of net investment income to average net assets (f) | | | | 1.66 | % | | | | | 1.33 | % | | | | | 1.23 | % | | | | | 1.95 | %(e) |
| Portfolio turnover rate | | | | 193 | % | | | | | 202 | % | | | | | 229 | % | | | | | 140 | %(d) |
| (a) | For the period May 11, 2016 (commencement of operations) through December 31, 2016. |
| (b) | Total return is calculated assuming an initial investment made at the net asset value at the beginning of period, reinvestment of any dividends and distributions at net asset value on the dividend/distributions payment date and a redemption at the net asset value on the last day of the period. The return does not reflect the deduction of taxes that a shareholder would pay on Fund dividends/distributions or the redemption of Fund shares. |
| (c) | Calculated based upon average shares outstanding. |
| (d) | Not annualized. |
| (e) | Annualized. |
| (f) | The ratios presented do not reflect the Fund’s proportionate share of income and expenses from the Fund’s investment in underlying funds. |
See Notes to Financial Statements
VANECK NDR MANAGED ALLOCATION FUND
FINANCIAL HIGHLIGHTS
For a share outstanding throughout each period:
| | | | Class Y |
| | | | Year Ended December 31, |
| | | | 2019 | | | | 2018 | | | | 2017 | | | | 2016(b) |
| Net asset value, beginning of period | | | | $26.62 | | | | | | $29.39 | | | | | | $26.01 | | | | | | $25.15 | |
| Income from investment operations: | | | | | | | | | | | | | | | | | | | | | | | |
| Net investment income | | | | 0.41 | (c) | | | | | 0.39 | (c) | | | | | 0.36 | (c) | | | | | 0.27 | |
| Net realized and unrealized gain (loss) on investments | | | | 2.65 | | | | | | (2.72 | ) | | | | | 3.65 | | | | | | 1.09 | |
| Total from investment operations | | | | 3.06 | | | | | | (2.33 | ) | | | | | 4.01 | | | | | | 1.36 | |
| Less dividends and distributions from: | | | | | | | | | | | | | | | | | | | | | | | |
| Net investment income | | | | (0.52 | ) | | | | | (0.29 | ) | | | | | (0.20 | ) | | | �� | | (0.25 | ) |
| Net realized gains | | | | — | | | | | | (0.15 | ) | | | | | (0.43 | ) | | | | | (0.25 | ) |
| Total dividends and distributions | | | | (0.52 | ) | | | | | (0.44 | ) | | | | | (0.63 | ) | | | | | (0.50 | ) |
| Net asset value, end of period | | | | $29.16 | | | | | | $26.62 | | | | | | $29.39 | | | | | | $26.01 | |
| Total return (a) | | | | 11.49 | % | | | | | (7.90 | )% | | | | | 15.45 | % | | | | | 5.43 | %(d) |
| Ratios/Supplemental Data | | | | | | | | | | | | | | | | | | | | | | | |
| Net assets, end of period (000’s) | | | $9,917 | | | | | $19,346 | | | | | $13,161 | | | | $1,848 | |
| Ratio of gross expenses to average net assets (f) | | | | 1.64 | % | | | | | 1.33 | % | | | | | 1.75 | % | | | | | 2.90 | %(e) |
| Ratio of net expenses to average net assets (f) | | | | 0.91 | % | | | | | 0.90 | % | | | | | 0.90 | % | | | | | 0.90 | %(e) |
| Ratio of net expenses to average net assets, excluding interest expense (f) | | | | 0.90 | % | | | | | 0.90 | % | | | | | 0.90 | % | | | | | 0.90 | %(e) |
| Ratio of net investment income to average net assets (f) | | | | 1.48 | % | | | | | 1.36 | % | | | | | 1.25 | % | | | | | 2.12 | %(e) |
| Portfolio turnover rate | | | | 193 | % | | | | | 202 | % | | | | | 229 | % | | | | | 140 | %(d) |
| (a) | Total return is calculated assuming an initial investment made at the net asset value at the beginning of period, reinvestment of any dividends and distributions at net asset value on the dividend/distributions payment date and a redemption at the net asset value on the last day of the period. The return does not reflect the deduction of taxes that a shareholder would pay on Fund dividends/distributions or the redemption of Fund shares. |
| (b) | For the period May 11, 2016 (commencement of operations) through December 31, 2016. |
| (c) | Calculated based upon average shares outstanding. |
| (d) | Not annualized. |
| (e) | Annualized. |
| (f) | The ratios presented do not reflect the Fund’s proportionate share of income and expenses from the Fund’s investment in underlying funds. |
See Notes to Financial Statements
VANECK NDR MANAGED ALLOCATION FUND
NOTES TO FINANCIAL STATEMENTS
December 31, 2019
Note 1—Fund Organization—Van Eck Funds (the “Trust”) is registered under the Investment Company Act of 1940, as amended, as an open-end management investment company. The Trust was organized as a Massachusetts business trust on April 3, 1985. The VanEck NDR Managed Allocation Fund (the “Fund”) is a diversified series of the Trust and seeks to achieve its investment objective by investing in exchange traded products using a customized version of a global tactical asset allocation model developed by Ned Davis Research, Inc. The Fund currently offers three classes of shares: Class A, I and Y Shares. Each share class represents an interest in the same portfolio of investments of the Fund and is substantially the same in all respects, except that the classes are subject to different distribution fees and sales charges. Class I and Y Shares are sold without a sales charge; Class A Shares are sold subject to a front-end sales charge.
Note 2—Significant Accounting Policies—The preparation of financial statements in conformity with U.S. generally accepted accounting principles (“GAAP”) requires management to make estimates and assumptions that affect the reported amounts and disclosures in the financial statements. Actual results could differ from those estimates.
The Fund is an investment company and follows accounting and reporting requirements of Accounting Standards Codification (“ASC”) 946Financial Services – Investment Companies.
The following is a summary of significant accounting policies followed by the Fund.
| A. | Security Valuation—The Fund values its investments in securities and other assets and liabilities at fair value daily. Fair value is the price that would be received to sell an asset or paid to transfer a liability in an orderly transaction between market participants on the measurement date. Securities traded on national exchanges are valued at the closing prices on the markets in which the securities trade. Securities traded on the NASDAQ Stock Market LLC (“NASDAQ”) are valued at the NASDAQ official closing price. Over-the-counter securities not included on NASDAQ and listed securities for which no sale was reported are valued at the mean of the bid and ask prices. To the extent these securities are actively traded they are categorized as Level 1 in the fair value hierarchy (described below). Short-term obligations with sixty days or less to maturity are valued at amortized cost, which with accrued interest approximates fair value. Open-end mutual fund investments (including money market funds) are valued at their closing net asset value each business day and are categorized as Level 1 in the fair value hierarchy. The Pricing Committee of Van Eck Associates Corporation (the “Adviser”) |
VANECK NDR MANAGED ALLOCATION FUND
NOTES TO FINANCIAL STATEMENTS
(continued)
| | provides oversight of the Fund’s valuation policies and procedures, which are approved by the Fund’s Board of Trustees. Among other things, these procedures allow the Fund to utilize independent pricing services, quotations from securities dealers, and other market sources to determine fair value. The Pricing Committee convenes regularly to review the fair value of financial instruments or other assets. If market quotations for a security or other asset are not readily available, or if the Adviser believes they do not otherwise reflect the fair value of a security or asset, the security or asset will be fair valued by the Pricing Committee in accordance with the Fund’s valuation policies and procedures. The Pricing Committee employs various methods for calibrating the valuation approaches utilized to determine fair value, including a regular review of key inputs and assumptions, periodic comparisons to valuations provided by other independent pricing services, transactional back-testing and disposition analysis. |
| | |
| | Certain factors such as economic conditions, political events, market trends, the nature of and duration of any restrictions on disposition, trading in similar securities of the issuer or comparable issuers and other security specific information are used to determine the fair value of these securities. Depending on the relative significance of valuation inputs, these securities may be classified either as Level 2 or Level 3 in the fair value hierarchy. The price which the Fund may realize upon sale of an investment may differ materially from the value presented on the Schedule of Investments. |
| | |
| | The Fund utilizes various methods to measure the fair value of its investments on a recurring basis, which includes a hierarchy that prioritizes inputs to valuation methods used to measure fair value. The fair value hierarchy gives highest priority to unadjusted quoted prices in active markets for identical assets and liabilities (Level 1 measurements) and the lowest priority to unobservable inputs (Level 3 measurements). The inputs or methodologies used for valuing securities are not necessarily an indication of the risk associated with investing in those securities. The three levels of the fair value hierarchy are described below: |
| Level 1 – | Quoted prices in active markets for identical securities. |
| | |
| Level 2 – | Significant observable inputs (including quoted prices for similar securities, interest rates, prepayment speeds, credit risk, etc.). |
| | |
| Level 3 – | Significant unobservable inputs (including the Fund’s own assumptions in determining the fair value of investments). |
| | A summary of the inputs and the levels used to value the Fund’s investments are located in the Schedule of Investments. Additionally, tables that reconcile the valuation of the Fund’s Level 3 investments and that present additional |
| | information about the valuation methodologies and unobservable inputs, if applicable, are located in the Schedule of Investments. |
| | |
| B. | Federal Income Taxes—It is the Fund’s policy to comply with the provisions of the Internal Revenue Code applicable to regulated investment companies and to distribute all of its net investment income and net realized capital gains, if any, to its shareholders. Therefore, no federal income tax provision is required. |
| | |
| C. | Dividends and Distributions to Shareholders—Dividends to shareholders from net investment income and distributions from net realized capital gains, if any, are declared and paid annually. Income dividends and capital gain distributions are determined in accordance with U.S. income tax regulations, which may differ from such amounts determined in accordance with GAAP. |
| | |
| D. | Offsetting Assets and Liabilities—In the ordinary course of business, the Fund enters into transactions subject to enforceable master netting or other similar agreements. Generally, the right of offset in those agreements allows the Fund to offset any exposure to a specific counterparty with any collateral received or delivered to that counterparty based on the terms of the agreements. The Fund may pledge or receive cash and/or securities as collateral for derivative instruments and securities lending. For financial reporting purposes, the Fund presents securities lending assets and liabilities on a gross basis in the Statement of Assets and Liabilities. Cash collateral held in the form of money market investments, if any, at December 31, 2019 is presented in the Schedule of Investments and in the Statement of Assets and Liabilities. Non-cash collateral is disclosed in Note 9 (Securities Lending). |
| | |
| E. | Other—Security transactions are accounted for on trade date. Dividend income is recorded on the ex-dividend date. Realized gains and losses are determined based on the specific identification method. |
| | |
| | Income, non-class specific expenses, gains and losses on investments are allocated to each class of shares based on its relative net assets. Expenses directly attributable to a specific class are charged to that class. |
| | |
| | The Fund earns interest income on uninvested cash balances held at the custodian bank, such amounts, if any, are presented as interest income in the Statement of Operations. |
| | |
| | In the normal course of business, the Fund enters into contracts that contain a variety of general indemnifications. The Fund’s maximum exposure under these agreements is unknown as this would involve future claims that may |
VANECK NDR MANAGED ALLOCATION FUND
NOTES TO FINANCIAL STATEMENTS
(continued)
| | be made against the Fund that have not yet occurred. However, the Adviser believes the risk of loss under these arrangements to be remote. |
Note 3—Investment Management and Other Agreements—The Adviser is the investment adviser to the Fund. The Adviser receives a management fee, calculated daily and payable monthly based on annual rate of 0.80% of the Fund’s average daily net assets. The Adviser has agreed, until at least May 1, 2020, to waive management fees and assume expenses to prevent the Fund’s total annual operating expenses (excluding acquired fund fees and expenses, interest expense, trading expenses, dividend and interest payments on securities sold short, taxes and extraordinary expenses) from exceeding the expense limitations listed in the table below.
The current expense limitations and the amounts waived/assumed by the Adviser for the year ended December 31, 2019, are as follows:
| | | Expense
Limitations | | Waiver of
Management
Fees |
| Class A | | | 1.15 | % | | | $102,344 | |
| Class I | | | 0.85 | | | | 102,302 | |
| Class Y | | | 0.90 | | | | 82,123 | |
For the year ended December 31, 2019, Van Eck Securities Corporation (the “Distributor”), an affiliate of the Adviser, received a total of $2,841 in sales loads relating to the sale of shares of the Fund, of which $2,509 was reallowed to broker/dealers and the remaining $332 was retained by the Distributor.
Certain officers of the Trust are officers, directors or stockholders of the Adviser and the Distributor.
State Street Bank and Trust Company is the Fund’s custodian and securities lending agent.
Note 4—12b-1 Plan of Distribution—Pursuant to a Rule 12b-1 Plan of Distribution (the “Plan”), the Fund is authorized to incur distribution expenses which will principally be payments to securities dealers who have sold shares and serviced shareholder accounts, and payments to the Distributor for reimbursement of other actual promotion and distribution expenses incurred by the Distributor on behalf of the Fund. The amount paid under the Plan in any one year is limited to 0.25% of average daily net assets for Class A Shares and is recorded as Distribution fees in the Statement of Operations.
Note 5—Investments—For the year ended December 31, 2019, the cost of purchases and proceeds from sales of investments, excluding U.S. government securities and short-term obligations, aggregated $77,874,320 and $88,165,328, respectively.
Note 6—Income Taxes—As of December 31, 2019, for Federal income tax purposes, the identified cost of investments owned, net unrealized appreciation (depreciation), gross unrealized appreciation, and gross unrealized depreciation of investments were as follows:
Tax Cost of
Investments | | Gross
Unrealized
Appreciation | | Gross
Unrealized
Depreciation | | Net Unrealized
Appreciation
(Depreciation) |
| $37,888,573 | | $4,605,841 | | $(675,053) | | $3,930,788 |
At December 31, 2019, the components of accumulated earnings (deficit) on a tax basis, for each Fund, were as follows:
Undistributed
Ordinary
Income | | Accumulated
Capital
Losses | | Other
Temporary
Differences | | Unrealized
Appreciation
(Depreciation) | | Total |
| $85,288 | | $(2,439,444) | | $(28,689) | | $3,930,788 | | $1,547,943 |
The tax character of dividends paid to shareholders during the years ended December 31, 2019 and December 31, 2018 were as follows:
| | | | Year Ended
December 31,
2019 | | | Year Ended
December 31,
2018* | |
| Ordinary income | | | $650,116 | | | $737,850 | |
| * | Includes short-term capital gains |
At December 31, 2019, the Fund had capital loss carryforwards available to offset future capital gains, as follows:
Short-Term
Capital Losses
with No Expiration | | Long-Term
Capital Losses
with No Expiration | | Total |
| $(2,034,354) | | $(405,090) | | $(2,439,444) |
Each year, the Fund assesses the need for any reclassifications due to permanent book to tax differences that affect distributable earnings / (losses) and aggregate paid in capital. Net assets are not affected by these reclassifications. During the year ended December 31, 2019, the Fund did not have any reclassifications.
The Fund recognizes the tax benefits of uncertain tax positions only where the position is “more-likely-than-not” to be sustained assuming examination by applicable tax authorities. Management has analyzed the Fund’s tax positions, and has concluded that no liability for unrecognized tax benefits should be recorded related to uncertain tax positions taken on return filings for all open tax years.
The Fund recognizes interest and penalties, if any, related to uncertain tax positions as income tax expense in the Statements of Operations. During the
VANECK NDR MANAGED ALLOCATION FUND
NOTES TO FINANCIAL STATEMENTS
(continued)
year ended December 31, 2019, the Fund did not incur any interest or penalties.
Note 7—Principal Risks—The Fund may concentrate its investments in exchange traded products that invest directly in, or have exposure to, equity and debt securities, as well as other asset categories such as commodities and derivative instruments. Such investments may subject the exchange traded product to greater volatility than investments in traditional securities. The Fund may indirectly own foreign securities. Securities of foreign issuers involve special risks and considerations not typically associated with investing in U.S. issuers. These risks include devaluation of currencies, less reliable information about issuers, different securities transaction clearance and settlement practices, and future adverse political and economic developments. These risks are heightened for investments in emerging market countries. Moreover, securities of many foreign issuers and their markets may be less liquid and their prices more volatile than those of comparable U.S. issuers. The Fund may invest directly or indirectly in debt securities which are rated below investment grade by rating agencies. Such securities involve more risk of default than higher rated securities and are subject to greater price variability.
At December 31, 2019, the Adviser owned approximately 23% of Class A, 46% of Class I, and 38% of Class Y.
A more complete description of risks is included in the Fund’s Prospectus and Statement of Additional Information.
Note 8—Shareholder Transactions—Shares of beneficial interest issued, reinvested and redeemed (unlimited number of $0.001 par value shares authorized):
| | | Year Ended
December 31, 2019 | | Year Ended
December 31, 2018 |
| Class A | | | | | | | | |
| Shares sold | | | 122,052 | | | | 441,160 | |
| Shares reinvested | | | 7,230 | | | | 7,849 | |
| Shares redeemed | | | (192,847 | ) | | | (236,079 | ) |
| Net increase (decrease) | | | (63,565 | ) | | | 212,930 | |
| Class I | | | | | | | | |
| Shares sold | | | 114,166 | | | | 139,013 | |
| Shares reinvested | | | 9,097 | | | | 8,267 | |
| Shares redeemed | | | (76,645 | ) | | | (115,906 | ) |
| Net increase | | | 46,618 | | | | 31,374 | |
| | | Year Ended
December 31, 2019 | | Year Ended
December 31, 2018 |
| Class Y | | | | | | | | |
| Shares sold | | | 17,709 | | | | 551,616 | |
| Shares reinvested | | | 5,640 | | | | 9,941 | |
| Shares redeemed | | | (410,085 | ) | | | (282,614 | ) |
| Net increase (decrease) | | | (386,736 | ) | | | 278,943 | |
Note 9—Securities Lending—To generate additional income, the Fund may lend its securities pursuant to a securities lending agreement with the securities lending agent. The Fund may lend up to 33% of its investments requiring that the loan be continuously collateralized by cash, cash equivalents, U.S. government securities, or any combination of cash and such securities at all times equal to at least 102% (105% for foreign securities) of the market value plus accrued interest on the securities loaned. Daily market fluctuations could cause the value of loaned securities to be more or less than the value of the collateral received. When this occurs, the collateral is adjusted and settled on the next business day. During the term of the loan, the Fund will continue to receive any dividends, interest or amounts equivalent thereto, on the securities loaned while receiving a fee from the borrower and/or earning interest on the investment of the cash collateral. Such fees and interest are shared with the securities lending agent under the terms of the securities lending agreement. Securities lending income is disclosed as such in the Statement of Operations. The cash collateral is maintained on the Fund’s behalf by the lending agent and is invested in the State Street Navigator Securities Lending Government Money Market Portfolio. Non-cash collateral consists of U.S. Treasuries and U.S. Government Agency securities, and is not disclosed in the Fund’s Schedule of Investments or Statement of Assets and Liabilities as it is held by the agent on behalf of the Fund, and the Fund does not have the ability to re-hypothecate those securities. Loans are subject to termination at the option of the borrower or the Fund. Upon termination of the loan, the borrower will return to the Fund securities identical to the securities loaned. The Fund bear the risk of delay in recovery of, or even loss of rights in, the securities loaned should the borrower of the securities fail financially. The value of loaned securities and related cash collateral, if any, at December 31, 2019 is presented on a gross basis in the Schedule of Investments and Statement of Assets and Liabilities. The following is a summary of the Fund’s securities on loan and related collateral as of December 31, 2019:
Market Value
of Securities
on Loan | | Cash
Collateral | | Non-Cash
Collateral | | Total Collateral |
| $4,352,621 | | $2,524,666 | | $1,933,068 | | $4,457,734 |
VANECK NDR MANAGED ALLOCATION FUND
NOTES TO FINANCIAL STATEMENTS
(continued)
The following table presents money market fund investments held as collateral by type of security on loan as of December 31, 2019:
| | Gross Amount of
Recognized Liabilities
for Securities Loaned
in the Statements of
Assets and Liabilities* |
| Equity Securities | $2,524,666 |
| * | Remaining contractual maturity of the agreements: overnight and continuous |
Note 10—Bank Line of Credit—The Trust participates with VanEck VIP Funds (collectively the “VE/VIP Funds”) in a $30 million committed credit facility (the “Facility”) to be utilized for temporary financing until the settlement of sales or purchases of portfolio securities, the repurchase or redemption of shares of the participating Fund and other temporary or emergency purposes. The participating VE/VIP Funds have agreed to pay commitment fees, pro rata, based on the unused but available balance. Interest is charged to the participating VE/VIP Funds at rates based on prevailing market rates in effect at the time of borrowings. During the year ended December 31, 2019, the average daily loan balance during the 44 day period for which a loan was outstanding amounted to $498,678 and the average interest rate was 3.59%. At December 31, 2019, the Fund had no outstanding borrowings under the Facility.
Note 11—Trustee Deferred Compensation Plan—The Trust has a Deferred Compensation Plan (the “Deferred Plan”) for Trustees under which the Trustees can elect to defer receipt of their trustee fees until retirement, disability or termination from the Board of Trustees. The fees otherwise payable to the participating Trustees are deemed invested eligible shares of the VE/VIP Funds as directed by the Trustees.
The expense for the Deferred Plan is included in “Trustees’ fees and expenses” on the Statement of Operations. The liability for the Deferred Plan is shown as “Deferred Trustee fees” on the Statement of Assets and Liabilities.
Note 12—Recent Accounting Pronouncements—The Fund early adopted certain provisions of Accounting Standards Update No. 2018-13Disclosure Framework—Changes to the Disclosure Requirements for Fair Value Measurement(“ASU 2018-13”) that eliminate and modify certain disclosure requirements for fair value measurements. The adoption of certain provisions of the ASU 2018-13 had no material effect on financial statements and related disclosures. Management evaluated the additional requirements, not yet adopted, and they are not expected to have a material impact to the financial
statements. Public companies will be required to disclose the range and weighted average of significant unobservable inputs for Level 3 fair value measurements. ASU 2018-13 is effective for fiscal years beginning after 15 December 2019 and for interim periods within those fiscal years.
Note 13—Subsequent Event Review—The Fund has evaluated subsequent events and transactions for potential recognition or disclosure through the date the financial statements were issued.
VANECK NDR MANAGED ALLOCATION FUND
REPORT OF INDEPENDENT REGISTERED PUBLIC ACCOUNTING FIRM
To the Shareholders and the Board of Trustees of VanEck NDR Managed Allocation Fund
Opinion on the Financial Statements
We have audited the accompanying statement of assets and liabilities of VanEck NDR Managed Allocation Fund (the “Fund”) (one of the series constituting VanEck Funds (the “Trust”)), including the schedule of investments, as of December 31, 2019, and the related statement of operations for the year then ended, the statements of changes in net assets for each of the two years in the period then ended, the financial highlights for each of the three years in the period ended December 31, 2019 and the period from May 11, 2016 (commencement of operations) through December 31, 2016 and the related notes (collectively referred to as the “financial statements”). In our opinion, the financial statements present fairly, in all material respects, the financial position of VanEck NDR Managed Allocation Fund (one of the series constituting VanEck Funds) at December 31, 2019, the results of its operations for the year then ended, the changes in its net assets for each of the two years in the period then ended and its financial highlights for each of the three years in the period ended December 31, 2019 and the period from May 11, 2016 (commencement of operations) through December 31, 2016, in conformity with U.S. generally accepted accounting principles.
Basis for Opinion
These financial statements are the responsibility of the Trust’s management. Our responsibility is to express an opinion on the Fund’s financial statements based on our audits. We are a public accounting firm registered with the Public Company Accounting Oversight Board (United States) (“PCAOB”) and are required to be independent with respect to the Trust in accordance with the U.S. federal securities laws and the applicable rules and regulations of the Securities and Exchange Commission and the PCAOB.
We conducted our audits in accordance with the standards of the PCAOB. Those standards require that we plan and perform the audit to obtain reasonable assurance about whether the financial statements are free of material misstatement, whether due to error or fraud. The Trust is not required to have, nor were we engaged to perform, an audit of the Trust’s internal control over financial reporting. As part of our audits, we are required to obtain an understanding of internal control over financial reporting, but not for the purpose of expressing an opinion on the effectiveness of the Trust’s internal control over financial reporting. Accordingly, we express no such opinion.
Our audits included performing procedures to assess the risks of material misstatement of the financial statements, whether due to error or fraud, and performing procedures that respond to those risks. Such procedures included examining, on a test basis, evidence regarding the amounts and disclosures in the financial statements. Our procedures included confirmation of securities owned as of December 31, 2019, by correspondence with the custodian and brokers. Our audits also included evaluating the accounting principles used and significant estimates made by management, as well as evaluating the overall presentation of the financial statements. We believe that our audits provide a reasonable basis for our opinion.

We have served as the auditor of one or more of the VanEck investment companies since 1999.
New York, New York
February 27, 2020
VANECK NDR MANAGED ALLOCATION FUND
TAX INFORMATION
(unaudited)
The following information is provided with respect to the distributions paid during the taxable year ended December 31, 2019. Please consult your tax advisor for proper treatment of this information.
| Record Date: | | 12/20/2019 | |
| Payable Date: | | 12/23/2019 | |
| Ordinary Income Paid Per Share-Class A | | | $0.434300 | |
| Ordinary Income Paid Per Share-Class I | | | 0.521100 | |
| Ordinary Income Paid Per Share-Class Y | | | 0.517000 | |
| Qualified Dividend Income for Individuals | | | 56.39 | %* |
| Dividends Qualifying for the Dividends Received Deduction for Corporations | | | 35.98 | %* |
| Interest from Federal Obligations | | | 16.22 | %* |
| Foreign Source Income | | | 24.27 | %* |
| Foreign Taxes Paid Per Share | | | $0.009180 | |
The interest from Federal obligations represents income derived from assets backed by the full faith and credit of the U.S. Government. State law varies as to what percentage of this dividend income is exempt from state income tax.
The foreign taxes paid represent taxes incurred by the Fund on income received by the Fund from foreign sources. Foreign taxes paid may be included in taxable income with an offsetting deduction from gross income or may be taken as a credit for taxes paid to foreign governments.
| * | Expressed as a percentage of the ordinary income distribution grossed-up for foreign taxes. |
VANECK FUNDS
SPECIAL MEETING OF SHAREHOLDERS
October 11, 2019 (unaudited)
VANECK FUNDS
CM Commodity Index Fund
Emerging Markets Fund
Global Hard Assets Fund
International Investors Gold Fund
Unconstrained Emerging Markets Bond Fund
VanEck Morningstar Wide Moat Fund
VanEck NDR Managed Allocation Fund
A Special Meeting of Shareholders of VanEck Funds (the “Trust”) was held at the offices of the Trust, 666 Third Avenue, 9th Floor, New York, New York 10017 on October 11, 2019. The purpose of the meeting was to elect Trustees of the Trust. At the meeting, the following persons were elected by the shareholders to serve as Trustees of the Trust: Jon Lukomnik, Jane DiRenzo Pigott, R. Alastair Short, Richard D. Stamberger, Robert L. Stelzl, and Jan F. van Eck. No other business was transacted at the meeting.
The results of the voting at the meeting are as follows:
Proposal: To elect a Board of Trustees*:
| Name | | For | | Withheld |
| Jon Lukomnik | | 239,074,404.179 | | 1,973,903.626 |
| Jane DiRenzo Pigott | | 239,734,349.197 | | 1,313,958.608 |
| R. Alastair Short | | 239,059,688.386 | | 1,988,619.419 |
| Richard D. Stamberger | | 239,110,733.308 | | 1,937,574.497 |
| Robert L. Stelzl | | 239,042,995.154 | | 2,005,312.651 |
| Jan F. van Eck | | 239,874,952.434 | | 1,173,355.371 |
| Total Trust Shares Outstanding**: 327,471,673.186 |
| * | Results are for all series portfolios within the Trust. |
| ** | As of the record date. |
VANECK FUNDS
BOARD OF TRUSTEES AND OFFICERS
December 31, 2019 (unaudited)
Trustee Information
The Trustees of the Trust, their address, position with the Trust, age and principal occupations during the past five years, as of January 1, 2020, are set forth below:
Trustee’s Name,
Address(1)and
Year of Birth | | Position(s) Held With Trust,
Term of Office(2)and
Length of Time Served | | Principal Occupation(s)
During Past Five Years | | Number of
Portfolios
In Fund
Complex(3)
Overseen
By Trustee | | Other Directorships Held Outside The
Fund Complex(3)During The Past Five Years |
| | | | | | | | | |
| Independent Trustees: | | | | | | |
| | | | | | | |
Jon Lukomnik
1956 (A)(I) | | Trustee (since 2006) | | Managing Partner, Sinclair Capital LLC (consulting firm). Formerly, Executive Director, Investor Responsibility Research Center Institute. | | 11 | | Member of the Deloitte Audit Quality Advisory Committee; Chairman of the Advisory Committee of Legion Partners; Member of the Standing Advisory Group to the Public Company Accounting Oversight Board; Director of VanEck ICAV (an Irish UCITS); VanEck Vectors UCITS ETF plc (an Irish UCITS). Formerly, Director of VanEck (a Luxembourg UCITS); Chairman of the Board of the New York Classical Theatre. |
| | | | | | | | | |
Jane DiRenzo Pigott
1957 (I) | | Trustee (since 2007); Chairperson of the Board (since 2020) | | Managing Director, R3 Group LLC (consulting firm). | | 11 | | Trustee of Northwestern University, Lyric Opera of Chicago and the Chicago Symphony Orchestra. Formerly, Director and Chair of Audit Committee of 3E Company (services relating to hazardous material safety); Director of MetLife Investment Funds, Inc. |
| | | | | | | | | |
R. Alastair Short
1953 (A)(I) | | Trustee (since 2004); Chairperson of the Audit Committee (since 2006) | | President, Apex Capital Corporation (personal investment vehicle). | | 66 | | Chairman and Independent Director, EULAV Asset Management; Trustee, Kenyon Review; Trustee, Children’s Village. Formerly, Independent Director, Tremont offshore funds. |
VANECK FUNDS
BOARD OF TRUSTEES AND OFFICERS
December 31, 2019 (unaudited) (continued)
Trustee’s Name,
Address(1)and
Year of Birth | | Position(s) Held With Trust,
Term of Office(2)and
Length of Time Served | | Principal Occupation(s)
During Past Five Years | | Number of
Portfolios
In Fund
Complex(3)
Overseen
By Trustee | | Other Directorships Held Outside The
Fund Complex(3)During The Past Five Years |
| | | | | | | | | |
Richard D. Stamberger
1959 (G)(I) | | Trustee (since 1995) | | President and CEO, SmartBrief, Inc. (business media company). | | 66 | | Director, Food and Friends, Inc. |
| | | | | | | | | |
Robert L. Stelzl
1945 (G)(I) | | Trustee (since 2007); Chairperson of the Governance Committee (since 2017) | | Co-Trustee, the estate of Donald Koll; Trustee, Robert D. MacDonald Trust; Trustee, GH Insurance Trusts. Formerly, Trustee, Joslyn Family Trusts; President, Rivas Capital, Inc. (real estate property management services company). | | 11 | | Director, Brookfield Office Properties, Inc., Brookfield Residential Properties, Inc., Brookfield DTLA Fund Office Trust Investor, Inc., Brookfield Property Finance ULC and Brookfield Property Split Corp. |
| | | | | | | | | |
| Interested Trustee: | | | | | | |
| | | | | | | |
Jan F. van Eck(4)
1963 (I) | | Trustee (Since 2019); Chairperson of the Investment Oversight Committee (since 2020); Chief Executive Officer and President (Since 2010) | | Director, President and Chief Executive Officer of Van Eck Associates Corporation (VEAC), Van Eck Absolute Return Advisers Corporation (VEARA) and Van Eck Securities Corporation (VESC); Officer and/or Director of other companies affiliated with VEAC and/or the Trust. | | 66 | | Director, National Committee on US China Relations. |
| (1) | The address for each Trustee and officer is 666 Third Avenue, 9th Floor, New York, New York 10017. |
| (2) | Trustee serves until resignation, death, retirement or removal. |
| (3) | The Fund Complex consists of VanEck Funds, VanEck VIP Trust and VanEck Vectors ETF Trust. |
| (4) | “Interested person” of the Trust within the meaning of the 1940 Act. Mr. van Eck is an officer of VEAC, VEARA and VESC. In addition, Mr. van Eck and members of his family own 100% of the voting stock of VEAC, which in turns owns 100% of the voting stock of each of VEARA and VESC. |
| (A) | Member of the Audit Committee. |
| (G) | Member of the Governance Committee. |
| (I) | Member of the Investment Oversight Committee. |
Officer Information
The executive officers of the Trust, their age and address, the positions they hold with the Trust, their term of office and length of time served and their principal business occupations during the past five years are shown below:
Officer’s Name, Address(1)
And Year of Birth | | Position(s) Held With Trust | | Term of Office And
Length of Time Served(2) | | Principal Occupations During The Past Five Years |
| | | | | | | |
Matthew A. Babinsky,
1983 | | Assistant Vice President and Assistant Secretary | | Since 2016 | | Assistant Vice President, Assistant General Counsel and Assistant Secretary of VEAC, VEARA and VESC; Officer of other investment companies advised by VEAC and VEARA. Formerly, Associate, Clifford Chance US LLP. |
| | | | | | | |
Russell G. Brennan,
1964 | | Assistant Vice President and Assistant Treasurer | | Since 2008 | | Assistant Vice President of VEAC; Officer of other investment companies advised by VEAC and VEARA. |
| | | | | | | |
Charles T. Cameron,
1960 | | Vice President | | Since 1996 | | Portfolio Manager for VEAC; Officer and/or Portfolio Manager of other investment companies advised by VEAC and VEARA. Formerly, Director of Trading of VEAC. |
| | | | | | | |
John J. Crimmins,
1957 | | Vice President, Treasurer, Chief Financial Officer and Principal Accounting Officer | | Vice President, Chief Financial Officer and Principal Accounting Officer (since 2012); Treasurer (since 2009) | | Vice President of VEAC and VEARA; Officer of other investment companies advised by VEAC and VEARA. Formerly, Vice President of VESC. |
| | | | | | | |
F. Michael Gozzillo,
1965 | | Chief Compliance Officer | | Since 2018 | | Vice President and Chief Compliance Officer of VEAC and VEARA; Chief Compliance Officer of VESC; Officer of other investment companies advised by VEAC and VEARA. Formerly, Chief Compliance Officer of City National Rochdale, LLC and City National Rochdale Funds. |
| | | | | | | |
Laura Hamilton,
1977 | | Vice President | | Since 2019 | | Assistant Vice President of VEAC and VESC; Officer of other investment companies advised by VEAC and VEARA. Formerly, Operations Manager of Royce & Associates. |
VANECK FUNDS
BOARD OF TRUSTEES AND OFFICERS
December 31, 2019 (unaudited) (continued)
Officer’s Name, Address(1)
And Year of Birth | | Position(s) Held With Trust | | Term of Office And
Length of Time Served(2) | | Principal Occupations During The Past Five Years |
| | | | | | | |
Laura I. Martínez,
1980 | | Vice President and Assistant Secretary | | Vice President (since 2016); Assistant Secretary (since 2008) | | Vice President, Associate General Counsel and Assistant Secretary of VEAC, VEARA and VESC; Officer of other investment companies advised by VEAC and VEARA. Formerly, Assistant Vice President of VEAC, VEARA and VESC. |
| | | | | | | |
James Parker,
1969 | | Assistant Treasurer | | Since 2014 | | Assistant Vice President of VEAC, Manager, Portfolio Administration of VEAC and VEARA; Officer of other investment companies advised by VEAC and VEARA. |
| | | | | | | |
Jonathan R. Simon,
1974 | | Senior Vice President; Secretary and Chief Legal Officer | | Senior Vice President (since 2016); Secretary and Chief Legal Officer (since 2014) | | Senior Vice President, General Counsel and Secretary of VEAC, VEARA and VESC; Officer and/or Director of other companies affiliated with VEAC and/or the Trust. Formerly, Vice President of VEAC, VEARA and VESC. |
| (1) | The address for each Executive Officer is 666 Third Avenue, 9th Floor, New York, NY 10017. |
| (2) | Officers are elected yearly by the Board. |
This report is intended for the Fund’s shareholders. It may not be distributed to prospective investors unless it is preceded or accompanied by the Fund’s prospectus and summary prospectus, which includes more complete information. Investing involves substantial risk and high volatility, including possible loss of principal. An investor should consider the investment objective, risks, and charges and expenses of the Fund carefully before investing. To obtain a prospectus and summary prospectus, which contains this and other information, call 800.826.2333 or visit vaneck.com. Please read the prospectus and summary prospectus carefully before investing.
Additional information about VanEck Funds (the “Trust”) Board of Trustees/Officers and a description of the policies and procedures the Trust uses to determine how to vote proxies relating to portfolio securities are provided in the Statement of Additional Information. The Statement of Additional Information and information regarding how the Trust voted proxies relating to portfolio securities during the most recent twelve month period ending June 30 is available, without charge, by calling 800.826.2333, or by visiting vaneck.com, or on the Securities and Exchange Commission’s website at https://www.sec.gov.
The Trust files its complete schedule of portfolio holdings with the Securities and Exchange Commission for the first and third quarters of each fiscal year on Form N-PORT. The Trust’s Form N-PORT filings are available on the Commission’s website at https://www.sec.gov and may be reviewed and copied at the Commission’s Public Reference Room in Washington, D.C. Information on the operation of the Public Reference Room may be obtained by calling 202.942.8090. The Fund’s complete schedule of portfolio holdings is also available by calling 800.826.2333 or by visiting vaneck.com.

| Investment Adviser: | Van Eck Associates Corporation | |
| Distributor: | Van Eck Securities Corporation
666 Third Avenue, New York, NY 10017
vaneck.com | |
| Account Assistance: | 800.544.4653 | NDRAR |
| (a) | The Registrant has adopted a code of ethics (the “Code of Ethics”) that applies to the principal executive officer, principal financial officer, principal accounting officer or controller, or persons performing similar functions. |
| | |
| (b) | The Registrant’s code of ethics is reasonably described in this Form N-CSR. |
| | |
| (c) | The Registrant has not amended its Code of Ethics during the period covered by the shareholder report presented in Item 1 hereto. |
| | |
| (d) | The Registrant has not granted a waiver or an implicit waiver from a provision of its Code of Ethics during the period covered by the shareholder report presented in Item 1 hereto. |
| | |
| (e) | Not applicable. |
| | |
| (f) | The Registrant’s Code of Ethics is attached as an Exhibit hereto. |
| Item 3. | AUDIT COMMITTEE FINANCIAL EXPERT. |
The Registrant’s Board of Trustees has determined that R. Alastair Short, member of the Audit Committee, is an “audit committee financial expert” and “independent” as such terms are defined in the instructions to Form N-CSR Item 3(a)(2).
| Item 4. | PRINCIPAL ACCOUNTANT FEES AND SERVICES. |
The principal accountant fees disclosed in Item 4(a), 4(b), 4(c), 4(d) and 4(g) are for the Funds of the Registrant for which the fiscal year end is December 31.
| (a) | Audit Fees. The aggregate Audit Fees of Ernst & Young for professional services billed for the audits of the financial statements, or services that are normally provided in connection with statutory and regulatory filings or engagements for the fiscal years ended December 31, 2019 and December 31, 2018, were $265,810 and $260,810, respectively. |
| | |
| (b) | Audit-Related Fees. Not applicable. |
| | |
| (c) | Tax Fees. The aggregate Tax Fees of Ernst & Young for professional services billed for the review of Federal, state and excise tax returns and other tax compliance consultations for the fiscal years ended December 31, 2019 and December 31, 2018, were $65,957 and $84,568, respectively. |
| | |
| (d) | All Other Fees |
| | |
| | None. |
| | |
| (e) | The Audit Committee will pre-approve all audit and non-audit services, to be provided to the Funds, by the independent accountants as required by Section 10A of the Securities Exchange Act of 1934. The Audit Committee has authorized the Chairman of the Audit Committee to approve, between meeting dates, appropriate non-audit services. |
| | |
| | The Audit Committee after considering all factors, including a review of independence issues, will recommend to the Board of Trustees the independent auditors to be selected to audit the financial statements of the Funds. |
| (f) | Not applicable. |
| | |
| (g) | Not applicable. |
| | |
| (h) | Not applicable. |
| Item 5. | AUDIT COMMITTEE OF LISTED REGISTRANTS. |
The Registrant’s Board has an Audit Committee established in accordance with Section 3(a)(58)(A) of the Exchange Act (15 U.S.C. 78c(a)(58)(A)) consisting of two Independent Trustees. Jon Lukomnik and Alastair Short currently serve as members of the Audit Committee. Mr. Short is the Chairman of the Audit Committee.
| Item 6. | SCHEDULE OF INVESTMENTS. |
| | Information included in Item 1. |
| Item 7. | DISCLOSURE OF PROXY VOTING POLICIES AND PROCEDURES FOR CLOSED-END MANAGEMENT INVESTMENT COMPANIES. |
| Item 8. | PORTFOLIO MANAGER OF CLOSED-END MANAGEMENT INVESTMENT COMPANIES. |
| Item 9. | PURCHASE OF EQUITY SECURITIES BY CLOSED-END MANAGEMENT INVESTMENT COMPANY AND AFFILIATED PURCHASERS. |
| Item 10. | SUBMISSION OF MATTERS TO A VOTE OF SECURITY HOLDERS. |
| Item 11. | CONTROLS AND PROCEDURES. |
| (a) | The registrant’s principal executive and principal financial officers, or persons performing similar functions, have concluded that the registrant’s disclosure controls and procedures (as defined in Rule 30a-3(c) under the Investment Company Act of 1940, as amended (the “1940 Act”) (17 CFR 270.30a-3 (c)) are effective, as of a date within 90 days of the filing date of the report that includes the disclosure required by this paragraph, based on their evaluation of these controls and procedures required by Rule 30a-3(b) under the 1940 Act (17 CFR 270.30a-3(b)) and Rules 13a-15(b) or 15d-15(b) under the Securities Exchange Act of 1934, as amended (17 CFR 240.13a-15(b) or 240.15d-15 (b)). |
| | |
| (b) | There were no changes in the registrant’s internal control over financial reporting (as defined in Rule 30a-3(d) under the 1940 Act (17 CFR 270.30a(d)) that occurred during the period covered by this report that has materially affected, or is reasonably likely to materially affect, the registrant’s internal control over financial reporting. |
| Item 12. | DISCLOSURE OF SECURITIES LENDING ACTIVITIES FOR CLOSED-END MANAGEMENT INVESTMENT COMPANIES. |
| (a) | Not applicable. |
| | |
| (b) | Not applicable. |
SIGNATURES
Pursuant to the requirements of the Securities Exchange Act of 1934 and the Investment Company Act of 1940, the registrant has duly caused this report to be signed on its behalf by the undersigned, thereunto duly authorized.
(Registrant) VanEck Funds
| By (Signature and Title) | /s/ John J. Crimmins, Treasurer and CFO | |
Date March 9, 2020
Pursuant to the requirements of the Securities Exchange Act of 1934 and the Investment Company Act of 1940, this report has been signed below by the following persons on behalf of the registrant and in the capacities and on the dates indicated.
| By (Signature and Title) | /s/ Jan F. van Eck, CEO | |
DateMarch 9, 2020
| By (Signature and Title) | /s/ John J. Crimmins, Treasurer and CFO | |
DateMarch 9, 2020