UNITED STATES
SECURITIES AND EXCHANGE COMMISSION
Washington, D.C. 20549
FORM N-CSR
CERTIFIED SHAREHOLDER REPORT OF REGISTERED MANAGEMENT
INVESTMENT COMPANIES
Investment Company Act file number 811-04297
VANECK FUNDS
(Exact name of registrant as specified in charter)
666 Third Avenue, New York, NY 10017
(Address of principal executive offices) (Zip code)
Van Eck Associates Corporation
666 Third Avenue, New York, NY 10017
(Name and address of agent for service)
Registrant’s telephone number, including area code: (212) 293-2000
Date of fiscal year end: DECEMBER 31
Date of reporting period: DECEMBER 31, 2021
| Item 1. | REPORTS TO SHAREHOLDERS. |
 | ANNUAL REPORT
December 31, 2021 |
VanEck Funds
CM Commodity Index Fund
Emerging Markets Bond Fund
Emerging Markets Fund
Environmental Sustainability Fund
Global Resources Fund
International Investors Gold Fund
VanEck Morningstar Wide Moat Fund
VanEck NDR Managed Allocation Fund
Certain information contained in this report represents the opinion of the investment adviser which may change at any time. This information is not intended to be a forecast of future events, a guarantee of future results or investment advice. Current market conditions may not continue. The information contained herein regarding each index has been provided by the relevant index provider. Also, unless otherwise specifically noted, any discussion of the Funds’ holdings, the Funds’ performance, and the views of the investment adviser are as of December 31, 2021.
PRIVACY NOTICE
(unaudited)
| FACTS | WHAT DOES VANECK DO WITH YOUR PERSONAL
INFORMATION? |
| Why? | Financial companies choose how they share your personal information. Federal law gives consumers the right to limit some but not all sharing. Federal law also requires us to tell you how we collect, share, and protect your personal information. Please read this notice carefully to understand what we do. |
| What? | The types of personal information we collect and share depend on the product or service you have with us. This information can include: ■ Social Security number and account balances ■ assets and payment history ■ risk tolerance and transaction history |
| How? | All financial companies need to share customers’ personal information to run their everyday business. In the section below, we list the reasons financial companies can share their customers’ personal information; the reasons VanEck chooses to share; and whether you can limit this sharing. |
| Reasons we can share your personal information | Does VanEck share? | Can you limit this sharing? |
| For our everyday business purposes — such as to process your transactions, maintain your account(s), respond to court orders and legal investigations, or report to credit bureaus | Yes | No |
| For our marketing purposes— to offer our products and services to you | Yes | No |
| For joint marketing with other financial companies | Yes | No |
| For our affiliates’ everyday business purposes— information about your transactions and experiences | Yes | No |
| For our affiliates’ everyday business purposes— information about your creditworthiness | No | We don’t share |
| For our affiliates to market to you | Yes | Yes |
| For our nonaffiliates to market to you | No | We don’t share |
To limit our
sharing | Call us at 1-800-826-2333. Please note: If you are a new customer, we can begin sharing your information 30 days from the date we sent this notice. When you are no longer our customer, we continue to share your information as described in this notice. However, you can contact us at any time to limit our sharing. |
| Questions? | Call us at 1-800-826-2333. |
| | |
| Who we are |
| Who is providing this notice? | Van Eck Associates Corporation (“VEAC”), Van Eck Absolute Return Advisers Corporation (“VEARA”) and Van Eck Securities Corporation, and funds sponsored by VEAC or VEARA (collectively, “VanEck”). |
| What we do |
| How does VanEck protect my personal information? | To protect your personal information from unauthorized access and use, we use security measures that comply with federal law. These measures include computer safeguards and secured files and buildings. |
| How does VanEck collect my information | We collect your personal information, for example, when you ■ open an account or give us your income information ■ provide employment information or give us your contact information ■ tell us about your investment or retirement portfolio We also collect your personal information from others, such as credit bureaus, affiliates, or other companies. |
| Why can’t I limit all sharing? | Federal law gives you the right to limit only ■ sharing for affiliates’ everyday business purposes—information about your creditworthiness ■ affiliates from using your information to market to you ■ sharing for nonaffiliates to market to you State laws and individual companies may give you additional rights to limit sharing. See below for more on your rights under state law. |
| What happens when I limit sharing for an account I hold jointly with someone else? | Your choices will apply to everyone on your account—unless you tell us. |
| Definitions |
| Affiliates | Companies related by common ownership or control. They can be financial and nonfinancial companies. ■ Our affiliates include companies with a VanEck name such as VanEck |
| Nonaffiliates | Companies not related by common ownership or control. They can be financial and nonfinancial companies. ■ VanEck does not share with nonaffiliates so they can market to you. |
| Joint marketing | A formal agreement between nonaffiliated financial companies that together market financial products or services to you. ■ Our joint marketing partners include financial services companies. |
PRIVACY NOTICE
(unaudited) (continued)
| Other important information |
| California Residents—In accordance with California law, we will not share information we collect about California residents with nonaffiliates except as permitted by law, such as with the consent of the customer or to service the customer’s accounts. We also will limit the sharing of information about you with our affiliates to the extent required by applicable California law. |
| Vermont Residents—In accordance with Vermont law, we will not share information we collect about Vermont residents with nonaffiliates except as permitted by law, such as with the consent of the customer or to service the customer’s accounts. We will not share creditworthiness information about Vermont residents among VanEck’s affiliates except with the authorization or consent of the Vermont resident. |
VANECK FUNDS
PRESIDENT’S LETTER
December 31, 2021 (unaudited)
Dear Fellow Shareholders:
This letter addresses two topics: a review of the markets today and, second, two multi-year themes.
The Economy
In 2021, the year began with the global economy hurtling forward like a car at top speed. But in the fall, the Fed started reducing its stimulative policies, especially as inflation statistics hit multi-decade highs.
As this point, the markets face several points of uncertainty. The most important concern is: will the Fed “hit the brakes” too hard as it reduces stimulus measures? But also, since China has been a large driver of global growth over the past 20 years, how long will China’s slow-down last and how deep will it be? Will Chinese policymakers stimulate the economy if growth slows too much?
“Net net”, I think our economy and markets can handle the withdrawal of Fed stimulus. While market returns may underwhelm in 2022, there is no reason to sell and try to time the market.
I expect that inflation will persist because I believe that deflation over the past 20 years was primarily driven by the supply shock as China joined the world economy. As a counter-example, there was inflation in the 1970s, and do we think there was no technology applied in that decade?
We are still debating whether we have an inflation problem. And I continue to believe that only later this year will we know whether we have permanent inflation—after all the COVID-19 distortions are behind us.
It is true that we are talking about supply chain issues and labor market issues longer than the transitory camp would like. But, while commodity price inflation matters, the real concern about inflation and financial markets is wage inflation, since this tends to be longer-lasting and may affect long-term interest rates. I believe that the tight labor conditions we have today will persist, even as the economy slows down.
If inflation doesn’t push rates higher, I don’t think the Fed will hit the brakes too hard by raising rates further than they have already indicated. Toward the end of last year, Bank of America released a research note1 that said over half of the S&P 500® Index’s returns in the past decade can be attributed to the Fed’s balance sheet expansion, rather than earnings. We live in an era in which the Fed has an eye on the financial markets. We still see little reason why that would change.
As to China, at the end of December 2021, the official purchasing managers’ indices (PMIs), our favorite indicators, showed signs of improvement for the second month in a row. This was a welcome development. But multiple growth headwinds remain: the small companies’ PMI sinking to 46.5 (the lowest since February 2020) was a firm reminder that the dovish policy tilt is justified, with more targeted support expected in the coming months. Despite this, though, we think policy makers have all the tools, including liquidity moves, to avoid a crash.
Multi-Year Investment Themes
So what to do in your portfolio? We continue to focus on two multi-year investment themes.
The first theme is the energy transition away from fossil fuels. We see this not only as being driven by government policy, but also by innovation in the private sector. In our resources portfolios, we’re looking for disruptive companies in the sectors that need to be more energy efficient. One is agriculture (which emits about as much CO2 as the energy sector). AgTech businesses are embracing technology to modernize agriculture, leading to higher crop yields, safer crop chemicals and other innovations in food production to provide healthy diets for the world’s growing population.
As the economy grows and demand for commodities grows, increasing supply has become harder. This is in part due to environmental, social and governance (ESG) policies in place, causing “greenflation” and
VANECK FUNDS
PRESIDENT’S LETTER
(unaudited) (continued)
a multi-year trend of price pressure. Finding supply sources like new copper, lithium or gold mines is harder because of, to a certain extent, the environmental impact of these activities. I think this supply issue will continue to underpin commodity prices, and this is why I believe that commodity equities remain an interesting investment that people should have in their portfolios.
The second theme is the use of blockchain in a large variety of industries, but especially finance and entertainment. And especially in the field of “smart contracts.” New open source database technology is enabling incredibly rapid adoption and at much lower cost than traditional companies using prior generation technology. The fintech revolution that goes hand in hand with crypto is something we find really exciting. Of course there are some over-valued companies, but we think it’s another interesting multi-year trend that investors should consider.
We thank you for investing in VanEck’s investment strategies. On the following pages, you will find a performance discussion and financial statements for each the funds for the 12 month period ended December 31, 2021. As always, we value your continued confidence in us and look forward to helping you meet your investment goals in the future.

Jan F. van Eck
CEO and President
VanEck Funds
January 19, 2022
PS The investing outlook can change suddenly, as it certainly did in 2021. To get our quarterly investment outlooks, please subscribe to “VanEck News & Insights”. Should you have any questions regarding fund performance, please contact us at 800.826.2333 or visit our website.
1Source: Bloomberg, https://www.bloomberg.com/news/articles/2021-09-08/bofa-s-subramanian-dumps-dire-stock-call-to-catch-up-with-rally
CM COMMODITY INDEX FUND
MANAGEMENT DISCUSSION
December 31, 2021 (unaudited)
The CM (Constant Maturity) Commodity Index Fund (the “Fund”) gained 32.96% (Class A shares, excluding sales charge) for the 12 months ended December 31, 2021. The Fund underperformed by 1.92% the UBS Bloomberg Constant Maturity Commodity Total Return Index (the “CMCITR” or “Index”),1 which posted a gain of 34.88%.
During the 12 month period, the Fund continued to utilize commodity index-linked swaps as an effective means of gaining exposure to its benchmark the UBS Bloomberg Constant Maturity Commodity Total Return Index. While there are costs associated with the use of swaps, we continue to believe it is the most effective way of replicating CMCITR’s commodity exposures and weights.
Market Review
2021 was a very strong year for commodity index products producing the best returns since 2009. Several macroeconomic forces constrained supply and supported continued strong demand. Some of these trends are contributing to the inflationary pressures which may to persist for the long term.
Energy was the best performing sector for CMCITR, rising almost 60% for the year. U.S. unleaded gasoline rallied 67%, WTI crude oil over 61%, Brent crude oil over 56% and U.S. natural gas 53%. OPEC+ remained disciplined all year, balancing supply with the rising demand. Despite the continued COVID-19 disruptions, demand globally rebounded throughout the year. Longer term, continued lack of investment in new traditional energy production could keep supply constrained for many years. While investment is shifting away from traditional energy as the world transitions to cleaner renewable energy sources, all energy prices are likely to continue rising. CMCITR’s positioning along the forward curve provided extra roll yield vs BCOM in both WTI and Brent crude oil. Additionally CMCITR’s monthly rebalancing added to returns in U.S. natural gas vs BCOM when prices spiked in the late-summer/early-fall.
The CMCITR Agriculture sector finished the year up nearly 29% on strong gains in most commodities. Corn rising over 39% provided most of the index gains, but coffee up nearly 63% and soybean oil up over 56% also contributed. Weather in South America, coupled with low global inventories and strong demand from China, pushed prices higher. Low inventories and strong demand should continue to keep prices strong, additionally, rising costs for seeds, fertilizer and fuel will add to the cost of production.
For CMCITR, the Industrial Metals sector was also very strong, rising over 28%. CMCITR’s higher exposure vs BCOM contributed to the relative outperformance. Aluminum rose over 36% and copper was up over 25% for the year. Supply challenges contributed to the rising prices, COVID-19 and labor problems limited output most of the year. Some of these problems will persist in 2022 and rising demand longer term from the energy transition story could make this sector a star performer for many years.
CMCITR’s Livestock sector rose over 18%, led by hog prices, which were up over 30% and cattle prices rose 10%. Rising input costs and government regulations could keep livestock prices rising again in 2022.
Precious Metals was the worst performing CMCITR sector, declining over 5%, led by silver—down over 12%. Gold prices also fell for the year, down over 4%. CMCITR’s lower exposure to precious metals vs BCOM also contributed to relative outperformance.
Commodities finished the year on the highs and the outlook for 2022 is good, but there could be some risk early in the year if the U.S. economy losses momentum from the U.S. Fed monetary tightening and less fiscal support.
Fund Review
Over the 12 month period under review, CMCITR gained 34.88%, outperforming BCOM, which gained 27.11% and underperforming the S&P® GSCI Index (“SPGSCI”) 3, which gained 40.35%. CMCITR’s performance relative to both BCOM and SPGSCI was driven largely by constituent commodity exposure in the energy sector—outperformance relative to the former and underperformance relative to the latter. On an index level, employment of its constant maturity methodology allowed CMCITR to benefit more than either other index from the positive impact of roll yield.
CM COMMODITY INDEX FUND
MANAGEMENT DISCUSSION (unaudited) (continued)
Four out of five sectors represented in CMCITR contributed positive returns over the 12 month period, with only the precious metals sector detracting from performance. Of the positively performing sectors, energy contributed the most and livestock the least.
Supply chain challenges from COVID-19 will most likely ease this year, but rising wages and housing costs are likely to last. Inflation has become persistent and could be difficult to contain. Rising geopolitical risk will also add to inflationary pressures. The U.S./China conflict will impact global trade, reversing decades of globalization. On-shoring of production will raise costs globally, adding to long-term inflation pressures. Finally energy transition is likely to keep all energy prices rising for the long term.
Another very important change in the outlook for commodity index products has been the shift in many forward curves from contango to backwardation. As commodities rallied in 2021, several forward curves provided positive roll yield due to tightness in the spot market supply. For many index products this provided positive roll yield for the year, adding to the positive annual returns.
There are some risks to the demand outlook in the near term. Global central banks have been shifting monetary policy. Emerging markets countries started raising rates last year to contain inflation and developed markets countries are starting to shift policy this year. Most importantly the U.S. Federal Reserve (“Fed”) is tightening monetary policy and U.S. fiscal support has peaked. Rising U.S. interest rates and waning fiscal support could lead to a weakening U.S. economy and a softer demand outlook. Longer term, the Fed is unlikely to be able to contain inflation because of its focus on financial stability and full employment will limit its ability to raise rates.
With supply constraints likely to last for several years, inflation and rising commodities prices could last for five years or longer.
For more information or to access investment and market insights from the investment team, visit our web site, vaneck.com or subscribe to our commentaries.
As always, we value your continued confidence in us and look forward to helping you meet your investment goals in the future.
 | |  |
Roland Morris, Jr.
Portfolio Manager | | Gregory Krenzer
Deputy Portfolio Manager |
Represents the opinions of the investment adviser. Past performance is no guarantee of future results. Not intended to be a forecast of future events, a guarantee of future results or investment advice. Current market conditions may not continue.
All indices are unmanaged and include the reinvestment of all dividends, but do not reflect the payment of transaction costs, advisory fees or expenses that are associated with an investment in the Fund. Certain indices may take into account withholding taxes
An index’s performance is not illustrative of the Fund’s performance. Indices are not securities in which investments can be made
| 1 | UBS Bloomberg Constant Maturity Commodity Total Return Index (CMCITR) is a rules-based, composite benchmark index. CMCITR is comprised of diversified commodities futures contracts with maturities ranging from around three months to over three years for each commodity, depending on liquidity. |
| 2 | The S&P® GSCI Index (SPGSCI) is composed of futures contracts on physical commodities, with high energy concentration and limited diversification. SPGSCI buys and sells short-term futures contracts. |
| 3 | The Bloomberg Commodity Index (BCOM) is composed of futures contracts on physical commodities covering specific sectors. Commodity weightings are based on production and liquidity, subject to weighting restrictions applied annually such that no related group of commodities constitutes more than 33% of the index and no single commodity constitutes more than 15%. |
EMERGING MARKETS BOND FUND
MANAGEMENT DISCUSSION
December 31, 2021 (unaudited)
The VanEck Emerging Markets Bond Fund (the “Fund”) lost 4.57% (Class A shares, excluding sales charge) for the 12 month period ending December 31, 2021. The Fund outperformed its benchmark—a blended index consisting of 50% J.P. Morgan Emerging Markets Bond Index (EMBI) Global Diversified Index1 and 50% J.P. Morgan Government Bond Index Emerging Markets (GBI-EM) Global Diversified Index2—lost 5.30% (the EMBI [hard currency] lost 1.80% and the GBI-EM [local currency] lost 8.75% during the period).
On a country basis, outperformance was driven by investments in Ecuador, Zambia, Mexico and Ghana. These outperformances were based on bottom-up factors that were largely uncorrelated with the big global macroeconomic risks. Ecuador saw a very market-friendly presidential election that resulted in an IMF program. In Zambia, the Fund was exposed to very high-yielding local currency bonds and saw yields decline and the currency strengthen, also based on a market-friendly election for a government pursuing an IMF program. In Mexico, the Fund is mainly invested in the bonds of state owned Pemex, which pays much higher yields than Mexico itself, but which we believe is essentially backed by Mexico. In other words, the thesis was simply of continued government support for Pemex, not correlated with global macro phenomena. Finally, Ghana was due largely to a small position in a distressed corporate credit (an oil producer), clearly uncorrelated with broader global trends. Of our detractors, we would note that China was our biggest detractor, but we see the story as not over yet. The Fund started accumulating collapsing property sector bonds in the fourth quarter of 2021 and continued buying into early 2022. That sector continued to sell off as the Fund was buying, but that is not uncommon for repricings like this one. In Chile, the team simply missed surprise moves to a constitutional convention that could see significantly higher fiscal spending and early pension withdrawals that led to USD purchasing. In El Salvador, the team accumulated bonds in the fourth quarter of 2021 and thinks the thesis hasn’t yet had time to play out. Nonetheless, the government has made no real progress mending fences with the U.S. and an IMF program remains elusive.
Market Review
2021 started as a story of rising rates and growth and ended as a story of rising rates and inflation. The U.S. Consumer Price Index (“CPI”) started 2021 with inflation below 1.40% and ended the year with 7.0% inflation. U.S. interest rates (10-year Treasury bonds) rose from nearly 1.0% to around 1.71% at the start of January 2022. However, it is more informative to note that the first part of 2021 also saw a big rates selloff to 1.74% that was driven by growth without serious inflation risks. Rates subsequently rallied back to around 1.31% (throughout July 2021). Starting in August, though, rates resumed their rise, but the context and economic driver was rising inflation.
This distinction—whether rising rates are due to growth or due to inflation—had important asset price implications. The beginning of the year saw hope and strength in emerging markets foreign currencies (“EMFX”), as a global synchronized recovery boosted commodity prices and supported some emerging markets (“EM”) currencies early in the year. However, when inflation became the driver, EM local currency suffered. This gave us the year’s returns in asset prices for 2021. EM local debt was down 8.75% for the year, while USD-denominated sovereign debt was up 4.76%. This is similar to the behavior of U.S. equities—a strong start to the year driven by growth, despite rising rates, that ended on a weak note driven by inflation and rising rates.
It is worth noting that EMFX weakness came despite commodity price strength that would normally have been considered supportive. One key reason is that a number of countries that happened to have big representation in the local currency indices faced country-specific risks. Colombia, Chile and Peru each faced surprising political developments that had direct market implications. Brazil is always on the verge of a “doom-loop” due to its precarious fiscal situation and proved it again in 2021. Turkey’s heterodox policies came home to roost. Additional reasons for the divergence between commodity prices and EMFX include the fact that EM countries generally tightened policy before the developed markets. This is a very good policy and sets us up for strength in the future. Keep in mind that higher rates combined with strong commodity prices meant these EM economies saw their external accounts boosted yet again. This is a big support for the credit quality of EM hard currency debt. But, until the rate rises stop, hikes will be a headwind to the upside in EM local currency bonds.
EMERGING MARKETS BOND FUND
MANAGEMENT DISCUSSION (unaudited) (continued)
During the 12-month period, the Fund took forward positions in a number of currencies that detracted from performance, and had a slight negative impact on the Fund’s performance for the period.
For more information or to access investment and market insights, visit our web site or subscribe to our commentaries. To review timely updates related to emerging markets bonds and to subscribe to our updates, please visit https://www.vaneck.com/us/en/blogs/emerging-markets-bonds/.
We thoroughly appreciate your participation in the Emerging Markets Bond Fund, and we look forward to helping you meet your investment goals in the future.
 | |  |
Eric Fine
Portfolio Manager | | David Austerweil
Deputy Portfolio Manager |
Represents the opinions of the investment adviser. Past performance is no guarantee of future results. Not intended to be a forecast of future events, a guarantee of future results or investment advice. Current market conditions may not continue.
All indices are unmanaged and include the reinvestment of all dividends, but do not reflect the payment of transaction costs, advisory fees or expenses that are associated with an investment in the Fund. Certain indices may take into account withholding taxes. An index’s performance is not illustrative of the Fund’s performance. Indices are not securities in which investments can be made.
| 1 | J.P. Morgan Emerging Markets Bond Index (EMBI) Global Diversified Index tracks returns for actively traded external debt instruments in emerging markets, and is also J.P. Morgan’s most liquid U.S. dollar emerging markets debt benchmark. |
| 2 | J.P. Morgan Government Bond-Emerging Markets Index (GBI-EM) Global Diversified Index tracks local currency bonds issued by emerging markets governments. |
EMERGING MARKETS FUND
MANAGEMENT DISCUSSION
December 31, 2021 (unaudited)
The Emerging Markets Fund (the “Fund”) lost 12.15% (Class A shares, excluding sales charge) for the 12 months ended December 31, 2021, underperforming the MSCI Emerging Markets Investment Market Index (MSCI EM IMI) 1, which lost 0.28%.
Fund Review
Swift, shifting market sentiment, shaped by the impact of inflation, the timing of normalization as new variants spread globally, and ongoing regulation concerns in China, ultimately had ramifications on stock selection leading to relative underperformance. As the year progressed, investors’ reaction to these forces swung decisively from aggressive growth to value, leaving our structural growth at a reasonable price names unappreciated and overlooked. On a sector level, information technology, consumer discretionary and healthcare detracted from the Fund on a relative basis. On a country level, Kazakhstan, Georgia and the Philippines contributed to relative performance, whereas China, India and the Taiwan region detracted.
The Fund’s top three contributing individual positions during 2021 were:
MediaTek Inc. (4.0% of Fund net assets*), principally involved in the design, manufacturing and distribution of multimedia integrated circuit chipsets, benefitted from industry tailwinds in its products designed for both the mobile and non-mobile sectors. During the year, the company gained market share from capacity-constrained competitors and successfully targeted customers benefitting from Huawei’s issues with the U.S. administration. Product momentum is expected to be strong.
International Container Terminal Services, Inc. (“ICTSI”) (2.6% of Fund net assets*) has become a leading operator, innovator and pioneer in its field of acquiring, developing and operating freight ports and terminals worldwide. The company has a long track record in acquiring terminals and adding substantial value by enhancing its efficiency. The management’s knowledge, skills and expertise also enable them to navigate and operate in different political and economic environments, giving them unique exposure to the long-term structural growth trends in non-G7 trade growth trends. The strong performance over the year further reiterates the non-cyclical nature of this business as global trade normalizes in the post-COVID-19 environment.
Transaction Capital Ltd. (1.3% of Fund net assets*) is a niche financial services company in South Africa with leading positions in its micro-lending and debt collection divisions. During the year, the company outperformed, as lending growth picked up and previous concerns around further asset quality deterioration and provisioning started easing coming out of 2020. Transaction Capital also acquired a 75% stake in WeBuyCars, a used car sales platform with a growing e-commerce presence in South Africa, which opens up new verticals for growth and further improves the outlook for the company.
The Fund’s three weakest performing companies during 2021 were:
A-Living Smart City Services Co., Ltd. (1.3% of Fund net assets*) is a top property manager in China, primarily (but not exclusively) focused on residential property management. The company’s structural growth themes include the following: M&A, benefitting from increased urbanization and limited management contracts, deeper penetration of existing customers with value-added services and expansion into non-residential areas and government contracts. During the year, the company was negatively impacted by the ongoing regulatory upheaval in China, the stock price valuation has contracted, but we have not seen any reason to materially reduce forecasted earning power or growth trajectory.
Alibaba Health Information Technology Ltd. (0.1% of Fund net assets*) is an integrated healthcare information and content service provider in China. The company’s share price languished in the second quarter of the company’s 2021 financial year, as revenue slowed down to 53% in the second half of the 2021 from 74% in the first half of the 2021 due to a high base effect. In addition, the market reacted negatively to management’s conservative gross profit margin guidance, which will likely be capped in the near term due to a product mix shift towards prescription drug sales. We are encouraged by management’s move as they are prioritizing long-term sustainable growth by sacrificing near-term profit growth to go after the online prescription drug market which is very large and underpenetrated with high barriers to entry.
EMERGING MARKETS FUND
MANAGEMENT DISCUSSION (unaudited) (continued)
LG Chem Ltd. (“LGC”) (2.7% of Fund net assets*) is an example of a global electric vehicle (“EV”) battery leader the Fund is invested in. The Korean EV battery sector has underperformed since mid-August. We attribute this underperformance to: i) weaker-than-expected sales resulting from semiconductor shortages; ii) competition from alternative battery chemistries, namely lithium iron phosphate (“LFP”) batteries; and iii) anticipation of LG Energy Solution’s IPO which is driving retail investors out of LG Chem.
Market Review
During the period under review, overall optimism about the prospects for the asset class gave way to underlying debate and concern on certain key topics such as normalization, inflation and regulation.
Normalization
Domestic restrictions have followed different paths across emerging markets (“EM”), with China/LatAm now at quite low levels. Rapidly rising immunity should reduce the health consequences of future COVID-19 waves. In part, this is driven by a significant increase in the rate of vaccination in emerging markets. Availability of vaccines and actual vaccination rates have generally surpassed expectations. Looking forward, we have cautious optimism that the worst fears for the new variant will not materialize. Periodic restrictions to economic activity will likely feature along a bumpy road to normalization
Inflation
While global growth has been impressive, driven by a cocktail of year-over-year comparisons, near-normal mobility in the U.S. and continued super-relaxed monetary and fiscal policies, it has not been without challenges. Supply chains were somewhat stretched and vulnerable and previous underinvestment in commodities was coming home to roost in an environment of rapidly accelerating demand. Looking forward, a normalizing supply chain meeting more moderate demand for consumer goods and persistent digitization are amongst the reasons why we are less concerned about strongly persistent inflation in the medium term. Emerging markets are generally in better shape with regards to inflation (with notable exceptions), in part because of a higher food weighting in the Consumer Price Index (“CPI”) basket.
Regulation
The shifting landscape of regulatory action and property angst in China were widely discussed, but not always understood. Indeed, many regulations will ultimately create a better endpoint for fairer, more sustainable industries, but the journey can be arduous and uncertain. Investors do not like uncertainty. Looking forward, we see very significant signs of a policy change in favor of a pro-growth phase in China and that the effect of heightened regulatory tightening that scared and confused the markets is diminishing.
For more information or to access investment and market insights from the investment team, visit our web site or subscribe to our commentaries. To review timely updates related to the VanEck Emerging Markets Fund, please visit www.vaneck.com/blogs/emerging-markets-equity. To subscribe to VanEck’s emerging markets equity updates, please contact us at 800.826.2333 or visit www.vaneck.com/subscribe to register.
We appreciate your participation in the Emerging Markets Fund, and we look forward to helping you meet your investment goals in the future.
 | |  |
David Semple
Portfolio Manager | | Angus Shillington
Deputy Portfolio Manager |
Represents the opinions of the investment adviser. Past performance is no guarantee of future results. Not intended to be a forecast of future events, a guarantee of future results or investment advice. Current market conditions may not continue.
| * | All Fund assets referenced are Total Net Assets as of December 31, 2021. |
All indices are unmanaged and include the reinvestment of all dividends, but do not reflect the payment of transaction costs, advisory fees or expenses that are associated with an investment in the Fund. Certain indices may take into account withholding taxes. An index’s performance is not illustrative of the Fund’s performance. Indices are not securities in which investments can be made.
| 1 | The MSCI Emerging Markets Investable Markets Index captures large-, mid- and small-cap representation across emerging markets countries and covers approximately 99% of the free float adjusted market capitalization in each country |
GLOBAL RESOURCES FUND
MANAGEMENT DISCUSSION
December 31, 2021 (unaudited)
The Global Resources Fund (the Fund) gained 18.61% (Class A shares, excluding sales charge) for the 12 months ended December 31, 2021, underperforming the S&P ® North American Natural Resources Sector Index (SPGINRTR), 1 which gained 39.95%. Where the Fund’s overweight positioning within renewable and alternative energy—and subsequent underweight positioning within oil and gas—was the largest relative driver of outperformance versus the benchmark in 2020, this year, the opposite held true.
2021 wound up being a year marked with stronger-than-anticipated gains across a variety of the more traditional resources sectors and, in particular, within the traditional energy space where crude oil and natural gas prices notched multi-year highs on strong rebounds in demand. Base and industrial metals as well as many agriculture sub-sectors also contributed to resource portfolios, broadly, as underlying commodity prices strengthened steadily throughout the year.
Renewable and alternative energy companies, on the other hand, faced myriad headwinds including supply chain logistics issues, rising materials costs and stalled policy initiatives. All these factors, when combined and for most companies in the space, created a significant drag on underlying share prices and adversely affected the Fund.
Market Review
Over 2021, U.S. unemployment rates continued to fall, its economy strengthened and, by the fourth quarter, it had strengthened enough that even the Fed’s monetary policy is set to change in 2022. The year was, in particular, marked by the change in sentiment around inflation. While the first half of the year was dominated by considerations around the possible appearance and risk of inflation, the second half was marked by inflation being acknowledged as an actual state of affairs, with “transitory” no longer the operative word.
In China, earlier in the year, the unpredictability of the political climate will continue to slow the economy, but we actually started to see both fiscal and monetary easing in the second half of the year which we think will continue and accelerate into 2022.
Crude Oil
In the first half of the year, crude oil, with prices rising inexorably and U.S. weekly gasoline demand rising, was the dominating factor of the reopening trade. In the second half of the year, we saw the steady march upward continue, with crude oil prices peaking at the end of October and into early November. At the start of the year, estimates for global demand were some 94 million barrels per day. By the end of June, this figure looked to be in the region of 96 million barrels and, by the end of the year, some estimates had it at 99 million barrels per day: a significant change over the 12-month period.
On a global basis, inventories of energy in general, e.g. crude products, coal and natural gas, continued to fall throughout the year, tightening up the physical market. Evidence of this can be found not only in the current situation around natural gas shortages in Europe, but also the pressure on coal and natural gas prices in China.
During the first half of the year, OPEC+ appeared to be on a “glide path”, gradually bringing production back. As with the group’s discipline (and its response, neither one way nor the other, to demands from governments to raise (or reduce) production), this continued into the year’s second half. In contrast with 2021, the year was marked by quite a notable “solidity” within OPEC+.
Gold
The price of gold remained pretty much range-bound during 2021, pivoting around $1,800 per ounce over the second half of the year. Throughout the year, it appeared to be caught (and bounced back and forth) between anticipation of the U.S. Fed raising rates and higher inflation numbers and more negative real rates—with neither dominant.
Energy Transition Metals
Demand, and prices, for industrial metals remained high over the year, not least because of inflationary pressures, as they did for energy transition metals, including cobalt, copper, nickel and rare earth metals. The physical markets continued to tighten in energy transition metals, with most displaying a seemingly inexorable rise over the long-term. Although retreating from the highs they saw in the late second quarter, prices still remained at elevated levels relative to those over the last several years. Nickel, for example, finished the year close to its 52-week high.
Grains and Fertilizers
Grain, fertilizer and, indeed, food, prices and their associated equities, were very strong throughout the year, albeit volatile. Having been affected quite strongly by high energy prices during the year, including sporadic shut downs by producers in both China and Europe, the prices of most fertilizers and fertilizer company stocks finished the year close to their all-time highs.
Alternative Energy
Following an exceptional 2020 and, subject as they were going into 2021 to both high expectations and valuations, alternative energy equities suffered from a malaise during the most of the year. We still believe that the energy transition (and alternative energy) should be seen as being more like a marathon than a baseball game—in which progress is measured by miles instead of innings. If 2020 was “Mile 1” with participants “fresh out of the gate” (to mix metaphors), then we are now in “Mile 2”, with the associated realization that there is a long way to go yet. For us, we still see those companies with businesses that are robust, resilient and disciplined as being those that will last the course.
We continued to see further national and international moves towards “Net Zero” targets at both company and government levels. And while, for some, the expectations for the 26th UN Climate Change Conference (COP 26) in Glasgow, Scotland, at the beginning of November may have been high, ours were more tempered. Perhaps sadly, we appear to have been right.
Fund Review
In terms of absolute performance, the strongest positive contributions came from positions in the oil and gas exploration and production, copper and fertilizers and agricultural chemicals sub-industries. The greatest negative contributions were ascribable to positions in gold and renewable energy. Versus the S&P North American Natural Resources Sector Index, while our overweight positioning in both copper and fertilizers and agricultural chemicals led to outperformance, our underweight positioning in the integrated oil and gas and oil and gas storage and transportation sub-industries led to the Fund’s most significant relative underperformance for the year.
The Fund’s top three contributing individual positions were: diversified mining company, Freeport-McMoRan, Inc. (4.3% of Fund net assets*) and oil and gas exploration and production (“E&P”) companies Devon Energy Corp. (3.3% of Fund net assets*) and Diamondback Energy, Inc. (3.4% of Fund net assets*).
Freeport-McMoRan, Inc. together with Devon Energy, Corp. and Diamondback Energy, Inc. benefited from the strengths of copper and crude oil prices respectively. However, as leaders in their respective industries, they also benefited from the tight capital discipline they continued to exercise, each generating strong free cash flow. For Freeport-McMoRan, Inc., as it reaped the rewards of its multi-year restructuring of operations, this enabled it to increase further its financial strength. For the two E&P companies it enabled them to focus on the return of capital to shareholders.
The Fund’s three weakest contributing companies were: solar energy company, Sunrun Inc. (2.1% of Fund net assets*), financial company and climate solutions provider, Hannon Armstrong Sustainable Infrastructure Capital, Inc. (3.5% of Fund net assets*) and solar inverter manufacturer, SolarEdge Technologies, Inc. (3.1% of Fund net assets*). During the year, all three companies continued to suffer from the malaise that hit
GLOBAL RESOURCES FUND
MANAGEMENT DISCUSSION (unaudited) (continued)
renewable energy companies off the back of an exceptional 2020. In addition, structural growth stories also remained challenged during the second half of the year.
As a team staffed with former geologists and engineers, we have and will continue to emphasize a bottom up investment approach—seeking to identify natural resource companies that we believe have the highest quality management teams and assets, trade at a significant discount to their intrinsic value and their peers, and that are well-positioned to deliver shareholder value over the long run.
As always, we value your continued confidence in us and look forward to helping you meet your investment goals in the future.
For more information or to access investment and timely market insights from the investment team, visit our website and subscribe to our commentaries.
 | |  |
Shawn Reynolds
Portfolio Manager | | Charles T. Cameron
Deputy Portfolio Manager |
Represents the opinions of the investment adviser. Past performance is no guarantee of future results. Not intended to be a forecast of future events, a guarantee of future results or investment advice. Current market conditions may not continue.
| * | All Fund assets referenced are Total Net Assets as of December 31, 2021. |
All indices are unmanaged and include the reinvestment of all dividends, but do not reflect the payment of transaction costs, advisory fees or expenses that are associated with an investment in the Fund. Certain indices may take into account withholding taxes. An index’s performance is not illustrative of the Fund’s performance. Indices are not securities in which investments can be made.
| 1 | S&P® North American Natural Resources Sector (SPGINRTR) Index includes mining, energy, paper and forest products, and plantation-owning companies, but excludes the chemicals industry and steel sub-industry |
INTERNATIONAL INVESTORS GOLD FUND
MANAGEMENT DISCUSSION
Decemberr 31, 2021 (unaudited)
Dear Shareholder:
The VanEck International Investors Gold Fund (the “Fund”) declined 14.30% (Class A shares, excluding sales charge) during the twelve months ended December 31, 2021, underperforming the NYSE Arca Gold Miners Index1 (GDMNTR) which posted a loss of 9.37% during the same period.
The Fund’s overweight (relative to the benchmark) position in small-cap, junior companies was a detractor in 2021. In the third quarter of 2021, we took a modest defensive positioning by trimming junior exposure, adding gold bullion and increasing our cash. In the longer term, we expect that our ability to pick winners in the junior gold mining sector should be a significant source of Fund outperformance. The high quality, small-cap companies become acquisition targets for the larger companies. Such transactions generally come with handsome takeover price premiums, generating substantial returns for the shareholders of the target company. In 2021, two of the Fund’s junior holdings Great Bear Resources and Corvus Gold became such targets.
The mid-tiers and small-cap gold mining stocks, as represented by the MVIS Global Junior Gold Miners Index2 (MVGDXJTR) recorded a loss of 20.99%.
Gold Sector Overview
Gold started the year strong, rising to a 2021 year high of $1,959 on January 5, which coincided with fresh lows for the U.S. Dollar Index (DXY).3 However, expectations for trillions of U.S. dollars in fiscal spending for pandemic relief, infrastructure and green initiatives, combined with encouraging vaccination progress and fiscal relief boosted consumer sentiment. An optimistic economic outlook in the first quarter drove interest rates higher, allowing the U.S. dollar to strengthen, pushing gold prices down. Gold fell to a year low of $1,677 on March 8. May was the first month that excessive inflation was reported in the economic statistics and gold responded nicely. The Consumer Price Index (CPI) for April surprised the market with a 4.2% annual increase, followed by a higher than expected 5.0% increase in the May CPI. This propelled gold up to $1,900 once again.
Gold’s second quarter rally came to an abrupt end on June 16, following the Federal Open Market Committee (FOMC) announcement for its June 15-16 meeting. The possibility floated of an accelerated rate hike schedule, combined with talks about reducing quantitative easing caught markets by surprise, causing strong moves across most asset classes. In spite of these potential reactions, the Fed continued to view inflationary pressures as transitory. This outlook propelled the U.S. dollar and caused gold to trade below multiple technical support levels. Gold had been trading range-bound around the $1,800 per ounce level, but a so-called “flash crash” during Asian trading hours on August 8 drove it down $60 in a matter of minutes, with it trading as low as $1,690.61 per ounce. Gold managed to climb back above $1,800 per ounce, supported by mounting concern around the impact on growth of the COVID-19 Delta variant.
The gold market spent the rest of the year trying to assess and price-in two different forces: the risk that a tighter Fed policy presents to the economy; and inflation, is it transitory or more persistent and can the Fed combat it? Gold clearly responded to inflationary pressures. However, this was offset by a belief in the market that tighter Fed policies will corral inflation and that the economy is robust enough to withstand higher rates. For example, the headline consumer price index (CPI) climbed from 5.4% to 6.2% from September to October—the fastest pace since 1990. The news, released on November 10, renewed concerns around inflation and gold traded as high as $1,877.15 on November 16. However, following the November 22 nomination of Jerome Powell as Fed chair, and current governor Lael Brainard for vice chair, gold fell over $40 to below $1,800, as these appointments were viewed as positive to the broader markets and the economy. Then, in December, the metal dropped to $1,753 following the FOMC meeting in which the Fed set the stage to begin increasing rates as early as next spring 2022 in order fight rising inflation. However, the selling pressure quickly dissipated and gold rallied to the $1,800 level the following day. Gold’s resilience suggests the Fed might have a tough time in its battle with inflation. Gold closed at $1,829.20 on December 31, 2021, posting a $69.16 (3.64%) loss for the year.
INTERNATIONAL INVESTORS GOLD FUND
MANAGEMENT DISCUSSION (unaudited) (continued)
High gold prices but weak gold stock prices proved to be a boom for the gold companies and a bust for investors. The industry is financially healthy and able to return capital to shareholders in the form of dividends and stock buybacks. However, gold is the primary driver of gold stocks and when sentiment towards gold is low, there is little interest in them. As a result, the NYSE Arca Gold Miners Index declined 9.37% and the MVIS Global Junior Gold Miners Index fell 20.99%. Junior stocks have a tougher time in a weak market and tax-loss selling brought additional pressure late in the year. The underperformance has driven valuations to historic lows, so any pickup in the gold price should bode well for gold stocks.
Fund Review
In the second half of the year, in response to continued gold price consolidation and its amplified impact on the gold equities, the Fund increased its cash allocation and established exposure to gold bullion. At the end of December 2021, cash holdings represented 4.92% of net assets; holdings in gold bullion exchange traded products accounted for 5.11% of net assets; and the balance was invested in precious metals equities.
Newmont (6.8% of Fund net assets*), which is a top holding for the Fund, and Franco Nevada (0.4% of Fund net assets*), both had strong relative performance during the year. Newmont outperformed, gaining 7.42% during the year. The outperformance comes despite the company facing COVID-19-related interruptions and other operational challenges in 2021, which we think speaks to the company’s position as an industry leader and its ability to create value. The company is well run, with high quality assets and a sound business strategy that has delivered strong shareholder returns in the form of dividends and share buy backs. We expect Newmont’s leadership, combined with solid operational and financial results, should continue to attract investor interest in its shares.
Royalty and streaming company Wheaton Precious Metals (5.1% of Fund net assets*) also outperformed (+4.22%). The company’s robust business model and good track record continues to attract investors. In an environment of range-bound gold prices, as 2021 proved to be, the streaming and royalty companies tend to be viewed as a safer gold investment vehicle, with lower share price downside risk relative to the producers, but retaining some of the equity leverage to potentially outperform the metal.
Our top junior position, West African Resources (3.2% of Fund net assets*) was a strong outperformer in 2021 (+19.47%). West African continued a very successful ramp up of its Sanbrado mine in Burkina Faso, with gold production consistently increasing every quarter and total production for 2021 exceeding guidance. In addition, the company released good drill results at Sanbrado and at its feasibility stage Toega project, and in November completed the acquisition of neighboring Kiaka gold project, further enhancing the company’s growth profile.
The Fund also held significant positions in several smaller-cap companies that are not members of the benchmark. As a group, the smaller companies underperformed and this negatively impacted the Fund’s performance during the period. Junior developer Sabina Gold & Silver Corp. (1.2% of Fund net assets*) and junior producer Pure Gold (0.6% of Fund net assets*) were two significant detractors from the Fund’s performance. The Fund held an overweight position in mid-tier producer B2Gold (5.3% of Fund net assets†), which also pushed down returns relative to the benchmark during the year.
B2Gold (5.3% of Fund net assets*) underperformed (-27.01%), despite better than expected operating results that led to a full-year production guidance increase. Most of the underperformance came in the first half of the year, after B2Gold shares were impacted by political instability in Mali and the company commenced arbitration proceedings against the Mali government after being denied an exploration permit in the Fekola region. The company operated without interruptions and the permit denial did not have any negative impacts on the Fekola mine plan, but the market priced in higher risk for the stock. Our long-term outlook for B2Gold is unchanged, as the fundamentals of the company remain robust. Its shares should begin to reflect this outlook. The company announced in December that it has reached an agreement with the government of Mali, which will grant B2Gold a permit to explore the same area covered by the previously denied permit.
Among the junior companies, Pure Gold (0.6% of Fund net assets*) underperformed (-73.00%). The company encountered some operational mining challenges that negatively impacted production during the year.
Recent management changes should help rectify these issues, and early signs show positive results. We look forward to upcoming reports to assess the progress the new leadership has made in overcoming these challenges and improving the mine’s performance.
Access investment and market insights from VanEck’s investment professionals by subscribing to our commentaries. To subscribe to the gold and precious metals update, please https://www.vaneck.com/subscribe
We appreciate your continued investment in the International Investors Gold Fund, and we look forward to helping you meet your investment goals in the future.
 | |  |
Joseph M. Foster
Portfolio Manager | | Imaru Casanova
Deputy Portfolio Manager |
Represents the opinions of the investment adviser. Past performance is no guarantee of future results. Not intended to be a forecast of future events, a guarantee of future results or investment advice. Current market conditions may not continue.
| * | All Fund assets referenced are Total Net Assets as of December 31, 2021. |
All indices listed are unmanaged indices and include the reinvestment of all dividends, but do not reflect the payment of transaction costs, advisory fees or expenses that are associated with an investment in the Fund. Certain indices may take into account withholding taxes. An index’s performance is not illustrative of the Fund’s performance. Indices are not securities in which investments can be made.
| 1 | NYSE Arca Gold Miners (GDMNTR) Index is a market capitalization-weighted index comprised of publicly traded companies involved primarily in the mining for gold. |
| 2 | MVIS Global Junior Gold Miners Index (MVGDXJTR) is a rules-based, modified market capitalization-weighted, float-adjusted index comprised of a global universe of publicly traded small- and medium-capitalization companies that generate at least 50% of their revenues from gold and/or silver mining, hold real property that has the potential to produce at least 50% of the company’s revenue from gold or silver mining when developed, or primarily invest in gold or silver. |
| 3 | U.S. Dollar Index (DXY) indicates the general international value of the U.S. dollar. The DXY does this by averaging the exchange rates between the U.S. dollar and six major world currencies: Euro, Japanese yen, Pound sterling, Canadian dollar, Swedish kroner, and Swiss franc. |
MORNINGSTAR WIDE MOAT FUND
MANAGEMENT DISCUSSION
December 31, 2021 (unaudited)
The VanEck Morningstar Wide Moat Fund (the “Fund”) returned 24.15% (Class Z shares) for the 12 month period ended December 31, 2021. The Fund underperformed the broad U.S. stock market as represented by the S&P 500® Index 1 which posted a 28.71% return.
For the period, the Morningstar® Wide Moat Focus IndexSM (the “Index”) 2 returned 24.10%.
Fund Review
Information technology, followed by Financials and Industrials, were the top contributing sectors to the Fund’s return. While no sectors detracted from returns, the Materials and Utilities sectors contributed the least.
The top five individual stock performance contributors were: Cheniere Energy Inc. (2.6% of Fund net assets*), Wells Fargo & Co. (2.5% of Fund net assets*), Alphabet Inc. (2.5% of Fund net assets*), Pfizer Inc. (no longer held by the fund) and Microsoft Corp. (2.6% of Fund net assets*). Cheniere Energy Inc. (“Cheniere”), the Fund’s top contributor, benefited from a broad energy market recovery in 2021. Operating in the midstream liquefied natural gas (LNG) market, Cheniere has developed a competitive advantage from its long-term take-or-pay contracts with customers. These position the company as a pure toll-taker with limited commodity price risk. The extremely tight LNG markets benefited Cheniere throughout the year as customers in Europe and China competed for supply leaving Cheniere trading at close to Morningstar’s fair value estimate.
The bottom five performance contributors were: Zimmer Biomet Holdings Inc. (2.3% of Fund net assets*), Compass Minerals International Inc. (2.2% of Fund net assets*), The Western Union Co. (2.3% of Fund net assets*), Medtronic PLC (2.1% of Fund net assets*) and Boeing Co. (2.3% of Fund net assets*). The Fund’s top detractor from performance, Zimmer Biomet Holdings Inc., is a market leader in joint replacement implants. The company has struggled through the global pandemic as elective surgeries have been delayed or cancelled altogether. However, the Morningstar Equity Research Team remains confident in its optimistic long-term growth projections for Zimmer Biomet Holding Inc.
Please access investment and market insights from VanEck’s investment professionals by subscribing to our blogs. To learn more about Moat Investing and to read our Moat Investing insights, visit our website and subscribe to our Moat Investing updates.
We appreciate your participation in the VanEck Morningstar Wide Moat Fund, and we look forward to helping you meet your investment goals in the future.
 | |  |
Peter H. Liao
Portfolio Manager | | Gregory F. Krenzer
Deputy Portfolio Manager |
Represents the opinions of the investment adviser. Past performance is no guarantee of future results. Not intended to be a forecast of future events, a guarantee of future results or investment advice. Current market conditions may not continue.
All indices listed are unmanaged indices and include the reinvestment of all dividends, but do not reflect the payment of transaction costs, advisory fees or expenses that are associated with an investment in the Fund. Certain indices may take into account withholding taxes. An index’s performance is not illustrative of the Fund’s performance. Indices are not securities in which investments can be made.
| * | All Fund assets referenced are Total Net Assets as of December 31, 2021. |
| | |
| 1 | S&P 500® Index: consists of 500 widely held common stocks covering the leading industries of the U.S. economy (reflects no deduction for fees, expenses or taxes). |
| 2 | Morningstar® Wide Moat Focus IndexSM (MWMFTR) is a rules-based, equal-weighted index intended to offer exposure to companies that Morningstar, Inc. determines have sustainable competitive advantages based on a proprietary methodology that considers quantitative and qualitative factors (“wide moat companies”) (reflects no deduction for fees, expenses or taxes). |
NDR MANAGED ALLOCATION FUND
MANAGEMENT DISCUSSION
December 31, 2021 (unaudited)
The VanEck NDR Managed Allocation Fund (the “Fund”) gained 11.30% (Class A shares, excluding sales charge) for the 12 months ending December 31, 2021. It outperformed its benchmark, 1 comprised of 60% MSCI AC World Daily TR Gross USD Index (MSCI All Country World Index) and 40% Bloomberg Barclays US Aggregate Total Return Value Unhedged USD Index (Bloomberg Barclays US Aggregate Bond Index), which returned 10.52%.
The Fund was correctly positioned to benefit from the continuation of the bull market with an average equity overweight of 17%. This worked well as the Fund’s equity allocation returned +17.87% versus the -1.82% return for its bond allocation. Within equities, the Fund was most overweight the U.S. This also helped relative performance, as the U.S. equity allocation returned +23.36% and outpaced the MSCI All Country World Index, which returned +18.54%. The equity allocation within the U.S. detracted from relative performance and lagged the Russell 3000 Total Return Index, which returned +25.66%. The relative underperformance was due to the Fund’s market cap and style positioning.
The NDR Managed Allocation Fund will be closed in 2022. We thank you for your investment in the Fund and wish you a happy and healthy New Year.
 | |  |
David Schassler
Portfolio Manager | | John Lau
Deputy Portfolio Manager |
Represents the opinions of the investment adviser. Past performance is no guarantee of future results. Not intended to be a forecast of future events, a guarantee of future results or investment advice. Current market conditions may not continue.
All indices are unmanaged and include the reinvestment of all dividends, but do not reflect the payment of transaction costs, advisory fees or expenses that are associated with an investment in the Fund. Certain indices may take into account withholding taxes. An index’s performance is not illustrative of the Fund’s performance. Indices are not securities in which investments can be made.
| 1 | The Fund’s benchmark is a blended index consisting of 60% MSCI AC World Daily TR Gross USD Index (MSCI All Country World Index) and 40% Bloomberg Barclays US Aggregate Total Return Value Unhedged USD Index (Bloomberg Barclays US Aggregate Bond Index). The ACWI represents large- and mid-cap companies across developed and emerging market countries. The Bloomberg Barclays US Aggregate Bond Index is a broad-based benchmark that measures the performance of the investment grade, U.S. dollar-denominated, fixed-rate taxable bond market. |
CM COMMODITY INDEX FUND
PERFORMANCE COMPARISON
December 31, 2021 (unaudited)
Average Annual
Total Return | | Class A
Before
Sales Charge | | Class A
After Maximum
Sales Charge | | Class I* | | Class Y* | | CMCITR |
| One Year | | 32.96% | | 25.31% | | 33.07% | | 33.14% | | 34.88% |
| Five Year | | 6.58% | | 5.33% | | 6.86% | | 6.79% | | 8.02% |
| Ten Year | | (1.22)% | | (1.81)% | | (0.94)% | | (0.98)% | | 0.16% |
| | | | | | | | | | �� | | | | | | |
| * | Class is not subject to a sales charge |
| Hypothetical Growth of $10,000 (Ten Year: Class A - with sales charge) |
| | | |
This chart shows the value of a hypothetical $10,000 investment in the Fund over the past ten years. The result is compared with the Fund’s benchmark. Performance of Class I and Class Y shares will vary from that of the Class A shares due to differences in class specific fees and any applicable sales charges. | | 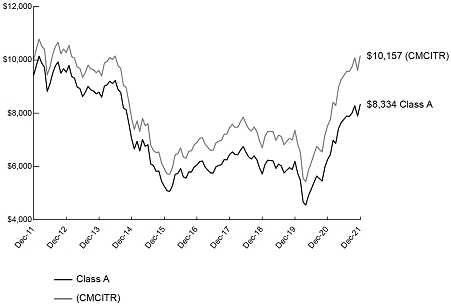 |
The performance quoted represents past performance. Past performance is no guarantee of future results; current performance may be lower or higher than the performance data quoted.
See “About Fund Performance” on page 27 for more information.
UBS Bloomberg Constant Maturity Commodity Total Return Index (CMCITR) is a rules-based, composite benchmark index diversified across commodity components from various sectors, specifically energy, precious metals, industrial metals, agriculture and livestock (reflects no deduction for fees, expenses or taxes).
EMERGING MARKETS BOND FUND
PERFORMANCE COMPARISON
December 31, 2021 (unaudited)
Average
Annual
Total Return | | Class A
Before
Sales Charge | | Class A
After Maximum
Sales Charge | | Class I* |
| One Year | | (4.57)% | | (10.06)% | | (4.30)% |
| Five Year | | 4.59% | | 3.36% | | 4.87% |
| Life^ | | 2.26% | | 1.62% | | 2.55% |
| | | | | | | | | | |
Average
Annual
Total Return | | Class Y* | | 50% EMBI
50% GBI-EM | | GBI-EM | | EMBI |
| One Year^ | | (4.33)% | | (5.30)% | | (8.75)% | | (1.80)% |
| Five Year^ | | 4.83% | | 3.79% | | 2.82% | | 4.65% |
| Life^ | | 2.49% | | 2.44% | | 0.11% | | 4.69% |
| | | | | | | | | | | | | |
| * | Class is not subject to a sales charge |
| | |
| ^ | Since July 9, 2012 (inception date for all share classes). |
| Hypothetical Growth of $10,000 (Since Inception: Class A – with sales charge) |
| | | |
This chart shows the value of a hypothetical $10,000 investment in the Fund since inception. The result is compared with the Fund’s benchmark, and a broad-based market index. Performance of Class I, and Class Y shares will vary from that of the Class A shares due to differences in class specific fees and any applicable sales charges. | |  |
The performance quoted represents past performance. Past performance is no guarantee of future results; current performance may be lower or higher than the performance data quoted.
See “About Fund Performance” on page 27 for more information.
The 50/50 benchmark Index (50% EMBI/50% GBI-EM) is a blended index consisting of 50% J.P. Morgan Emerging Markets Bond Index (EMBI) Global Diversified Index and 50% J.P. Morgan Government Bond Index Emerging Markets Global Diversified Index (reflects no deduction for fees, expenses or taxes).
The J.P. Morgan Government Bond Index-Emerging Markets Global Diversified Index tracks local currency bonds issued by Emerging Markets governments (reflects no deduction for fees, expenses or taxes).
J.P. Morgan Emerging Markets Bond Index Global Diversified Index tracks returns for actively traded external debt instruments in emerging markets, and is also J.P. Morgan’s most liquid U.S-dollar emerging markets debt benchmark (reflects no deduction for fees, expenses or taxes).
EMERGING MARKETS FUND
PERFORMANCE COMPARISON
December 31, 2021 (unaudited)
Average
Annual
Total Return | | Class A
Before
Sales Charge | | Class A
After Maximum
Sales Charge | | Class C
Before
Sales Charge | | Class C
After Maximum
Sales Charge |
| One Year | | (12.15)% | | (17.20)% | | (12.87)% | | (13.67)% |
| Five Year | | 8.75% | | 7.47% | | 7.90% | | 7.90% |
| Ten Year | | 6.64% | | 6.01% | | 5.77% | | 5.77% |
| | | | | | | | | | | | | |
Average
Annual
Total Return | | Class I* | | Class Y* | | Class Z* | | MSCI EM IMI |
| One Year | | (11.76)% | | (11.84)% | | (11.66)% | | (0.28)% |
| Five Year | | 9.27% | | 9.17% | | n/a | | 10.06% |
| Ten Year | | 7.15% | | 7.00% | | n/a | | 5.71% |
| Life^ | | n/a | | n/a | | 4.65% | | n/a |
| | | | | | | | | | | | | |
| * | Class is not subject to a sales charge |
| ^ | Class Z since September 16, 2019 |
| Hypothetical Growth of $10,000 (Ten Year: Class A – with sales charge) |
| | | |
This chart shows the value of a hypothetical $10,000 investment in the Fund over the past 10 fiscal years. The result is compared with the Fund’s benchmark. Performance of Class C, Class I, and Class Y shares will vary from that of the Class A shares due to differences in class specific fees and any applicable sales charges. | | 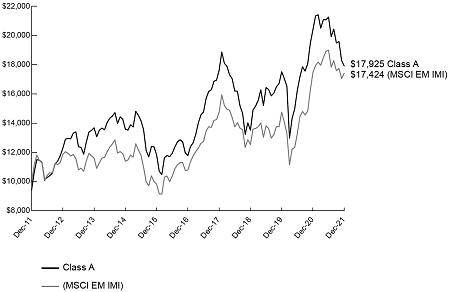 |
The performance quoted represents past performance. Past performance is no guarantee of future results; current performance may be lower or higher than the performance data quoted.
See “About Fund Performance” on page 27 for more information.
The MSCI Emerging Markets Investable Market Index (MSCI EM IMI) captures large, mid and small cap representation across emerging markets countries. The index covers approximately 99% of the free float-adjusted market capitalization in each country.
GLOBAL RESOURCES FUND
PERFORMANCE COMPARISON
December 31, 2021 (unaudited)
Average
Annual
Total Return | | Class A
Before
Sales Charge | | Class A
After Maximum
Sales Charge | | Class C
Before
Sales Charge | | Class C
After Maximum
Sales Charge |
| One Year | | 18.61% | | 11.79% | | 17.67% | | 16.67% |
| Five Year | | 1.81% | | 0.61% | | 0.99% | | 0.99% |
| Ten Year | | (0.47)% | | (1.06)% | | (1.27)% | | (1.27)% |
| | | | | | | | | | | | | |
Average
Annual
Total Return | | Class I* | | Class Y* | | SPGINRTR | | MSCI ACWI |
| One Year | | 19.12% | | 18.92% | | 39.95% | | 19.04% |
| Five Year | | 2.25% | | 2.06% | | 1.27% | | 14.97% |
| Ten Year | | (0.07)% | | (0.23)% | | 1.27% | | 12.44% |
| | | | | | | | | | | | | |
| * | Class is not subject to a sales charge |
| Hypothetical Growth of $10,000 (Ten Year: Class A – with sales charge) |
| | | |
This chart shows the value of a hypothetical $10,000 investment in the Fund over the past 10 years. The result is compared with the Fund’s benchmark, and a broad-based market index. Performance of Class C, Class I, and Class Y shares will vary from that of the Class A shares due to differences in class specific fees and any applicable sales charges. | | 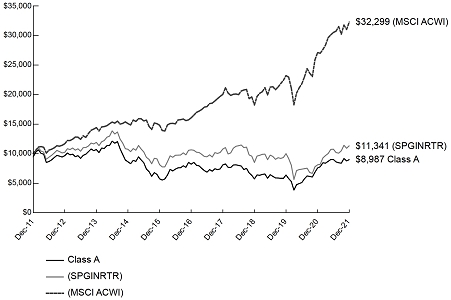 |
The performance quoted represents past performance. Past performance is no guarantee of future results; current performance may be lower or higher than the performance data quoted.
See “About Fund Performance” on page 27 for more information.
S&P® North American Natural Resources Sector Index (SPGINRTR) represents U.S. traded securities that are classified under the GICS® energy and materials sector excluding the chemicals industry and steel sub-industry (reflects no deduction for fees, expenses or taxes).
MSCI All Country World Index (MSCI ACWI) captures large- and mid-cap representation across both developed and emerging markets countries (reflects no deduction for fees, expenses or taxes except withholding taxes).
INTERNATIONAL INVESTORS GOLD FUND
PERFORMANCE COMPARISON
December 31, 2021 (unaudited)
Average
Annual
Total Return | | Class A
Before
Sales Charge | | Class A
After Maximum
Sales Charge | | Class C
Before
Sales Charge | | Class C
After Maximum
Sales Charge |
| One Year | | (14.30)% | | (19.23)% | | (14.89)% | | (15.68)% |
| Five Year | | 9.69% | | 8.40% | | 8.88% | | 8.88% |
| Ten Year | | (2.27)% | | (2.85)% | | (3.00)% | | (3.00)% |
| | | | | | | | | | | | | |
Average
Annual
Total Return | | Class I* | | Class Y* | | GDMNTR | | MSCI ACWI |
| One Year | | (13.94)% | | (14.02)% | | (9.37)% | | 19.04% |
| Five Year | | 10.14% | | 10.01% | | 10.10% | | 14.97% |
| Ten Year | | (1.86)% | | (1.98)% | | (3.50)% | | 12.44% |
| | | | | | | | | | | | | |
| * | Class is not subject to a sales charge |
| Hypothetical Growth of $10,000 (Ten Year: Class A - with sales charge) |
| | | |
This chart shows the value of a hypothetical $10,000 investment in the Fund over the past 10 years. The result is compared with the Fund’s benchmark, and a broad-based market index. Performance of Class C, Class I, and Class Y shares will vary from that of the Class A shares due to differences in class specific fees and any applicable sales charges. | | 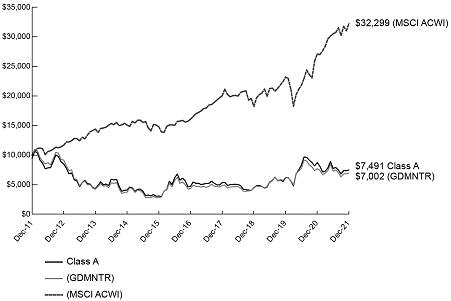 |
The performance quoted represents past performance. Past performance is no guarantee of future results; current performance may be lower or higher than the performance data quoted.
See “About Fund Performance” on page 27 for more information.
NYSE Arca Gold Miners (GDMNTR) Index is a market capitalization-weighted index comprised of publicly traded companies involved primarily in the mining for gold (reflects no deduction for fees, expenses or taxes except withholding taxes).
MSCI All Country World Index (MSCI ACWI) captures large- and mid-cap representation across both developed and emerging markets countries (reflects no deduction for fees, expenses or taxes except withholding taxes).
MORNINGSTAR WIDE MOAT FUND
PERFORMANCE COMPARISON
December 31, 2021 (unaudited)
Average Annual
Total Return | | Class I* | | Class Z* | | MWMFTR | | SPTR |
| One Year | | 24.04% | | 24.15% | | 24.81% | | 28.71% |
| Life^ (annualized) | | 18.18% | | 18.31% | | 18.96% | | 17.94% |
| | | | | | | | | | | | | |
| * | Class is not subject to a sales charge |
| | |
| ^ | Since November 6, 2017 (inception date for all share classes). |
| Hypothetical Growth of $10,000 (Since Inception: Class Z) |
| | | |
This chart shows the value of a hypothetical $10,000 investment in the Fund since inception. The result is compared with the Fund’s benchmark, and a broad-based market index. Performance of Class I shares will vary from that of the Class Z shares due to differences in class specific fees and any applicable sales charges. | | 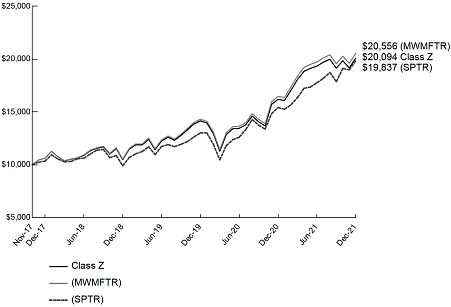 |
The performance quoted represents past performance. Past performance is no guarantee of future results; current performance may be lower or higher than the performance data quoted.
See “About Fund Performance” on page 27 for more information.
Morningstar® Wide Moat Focus Index (MWMFTR) is a rules-based index intended to offer exposure to companies that the Index Provider determines have sustainable competitive advantages based on a proprietary methodology that considers quantitative and qualitative factors (“wide moat companies”) (reflects no deduction for fees, expenses or taxes).
S&P 500® Index (SPTR) consists of 500 widely held common stocks, covering four broad sectors (industrials, utilities, financial and transportation).
NDR MANAGED ALLOCATION FUND
PERFORMANCE COMPARISON
December 31, 2021 (unaudited)
Average
Annual
Total Return | | Class A
Before
Sales Charge | | Class A
After Maximum
Sales Charge | | Class I* |
| One Year | | 11.30% | | 4.90% | | 11.66% |
| Five Year | | 7.24% | | 5.98% | | 7.57% |
| Life^ | | 7.37% | | 6.25% | | 7.69% |
| | | | | | | | | | |
Average
Annual
Total Return | | Class Y* | | 60% MSCI
40% BB US | | LBUSTRUU | | MSCI ACWI |
| One Year^ | | 11.59% | | 10.52% | | (1.54)% | | 19.04% |
| Five Year^ | | 7.51% | | 10.57% | | 3.57% | | 14.97% |
| Life^ | | 7.64% | | 10.10% | | 2.95% | | 14.66% |
| | | | | | | | | | | | | |
| * | Class is not subject to a sales charge |
| | |
| ^ | Since May 11, 2016 (inception date for all share classes). |
| Hypothetical Growth of $10,000 (Since Inception: Class A – with sales charge) |
| | | |
This chart shows the value of a hypothetical $10,000 investment in the Fund since inception. The result is compared with the Fund’s benchmark, and a broad-based market index.
Performance of Class I and Class Y shares will vary from that of the Class A shares due to differences in class specific fees and any applicable sales charges. | |  |
The performance quoted represents past performance. Past performance is no guarantee of future results; current performance may be lower or higher than the performance data quoted.
See “About Fund Performance” on page 27 for more information.
The 60/40 benchmark index (60% MSCI/40% BB US) is a blended index consisting of 60% MSCI All Country World Index (MSCI ACWI) and 40% Bloomberg Barclays US Aggregate Bond Index (LBUSTRUU). MSCI ACWI captures large- and mid-capitalization representation across Developed Markets (DM) and Emerging Markets (EM) countries and covers approximately 85% of the global investable equity opportunity set. The MSCI ACWI is a gross return index which reinvests as much as possible of a company’s gross dividend distributions (reflects no deduction for fees, expenses or taxes). Bloomberg Barclays US Aggregate Bond Index is a broad-based benchmark that measures the investment grade, U.S. dollar-denominated, fixed-rate taxable bond market. This includes U.S. Treasuries, government-related and corporate securities, mortgage-backed securities, asset-backed securities, and collateralized mortgage-backed securities (reflects no deduction for fees, expenses or taxes).
VANECK FUNDS
ABOUT FUND PERFORMANCE
(unaudited)
The performance data quoted represents past performance. Past performance is not a guarantee of future results. Performance information for each Fund may reflect temporary waivers of expenses and/or fees. Had each Fund incurred all expenses, investment returns would have been reduced. These returns do not reflect the deduction of taxes that a shareholder would pay on Fund dividends and distributions or the sale of Fund shares.
Investment return and value of the shares of each Fund will fluctuate so that an investor’s shares, when sold, may be worth more or less than their original cost. Performance may be lower or higher than performance data quoted. Fund returns reflect reinvestment of dividends and capital gains distributions. Performance current to the most recent month-end is available by calling 800.826.2333 or by visiting vaneck.com.
Index returns assume the reinvestment of all income and do not reflect any management fees or brokerage expenses associated with Fund returns. Certain indices may take into account withholding taxes. Investors cannot invest directly in the Index. Returns for actual Fund investors may differ from what is shown because of differences in timing, the amount invested and fees and expenses.
The CM Commodity Index Fund index is published by Bloomberg Finance L.P (Bloomberg). The Emerging Markets Fund index is published by MSCI Inc. (MSCI). The Global Resources Fund index is published by S&P®. The International Investors Gold Fund index is published by ICE Data Indices, LLC (ICE Data). The Emerging Markets Bond Fund index is published by J.P. Morgan. The Morningstar Wide Moat Fund index is published by Morningstar. The NDR Managed Allocation Fund index is published by MSCI and Bloomberg.
Bloomberg, MSCI, S&P, ICE Data, J.P. Morgan, and Morningstar are referred to herein as the “Index Providers”. The Index Providers do not sponsor, endorse, or promote the Funds and bear no liability with respect to the Funds or any security.
VANECK FUNDS
EXPLANATION OF EXPENSES
(unaudited)
As a shareholder of a Fund, you incur two types of costs: (1) transaction costs, including sales charges on purchase payments; and (2) ongoing costs, including management fees and other Fund expenses. This disclosure is intended to help you understand the ongoing costs (in dollars) of investing in a Fund and to compare these costs with the ongoing costs of investing in other mutual funds.
The disclosure is based on an investment of $1,000 invested at the beginning of the period and held for the entire period, July 1, 2021 to December 31, 2021.
Actual Expenses
The first line in the table below provides information about account values and actual expenses. You may use the information in this line, together with the amount you invested, to estimate the expenses that you paid over the period. Simply divide your account value by $1,000 (for example, an $8,600 account value divided by $1,000 = 8.6), then multiply the result by the number in the first line under the heading entitled “Expenses Paid During the Period.”
Hypothetical Example for Comparison Purposes
The second line in the table below provides information about hypothetical account values and hypothetical expenses based on the Fund’s actual expense ratio and an assumed rate of return of 5% per year before expenses, which is not the Fund’s actual return. The hypothetical account values and expenses may not be used to estimate the actual ending account balance or expenses you paid for the period. You may use this information to compare the ongoing costs of investing in your Fund and other funds. To do so, compare this 5% hypothetical example with the 5% hypothetical examples that appear in the shareholder reports of other funds.
Please note that the expenses shown in the table are meant to highlight your ongoing costs only and do not reflect any transactional costs, such as fees on purchase payments. Therefore, the second line of the table is useful in comparing ongoing costs only, and will not help you determine the relative costs of owning different funds. In addition, if these transactional costs were included, your costs would have been higher.
| | | Beginning
Account
Value
July 1, 2021 | | Ending
Account
Value
December 31,
2021 | | Annualized
Expense
Ratio
During Period | | Expenses Paid
During the Period
July 1, 2021 -
December 31,
2021(a) |
| CM Commodity Index Fund | | | | | | | | |
| Class A | | | | | | | | |
| Actual | | $1,000.00 | | $1,071.90 | | 0.95% | | $4.96 |
| Hypothetical(b) | | $1,000.00 | | $1,020.42 | | 0.95% | | $4.84 |
| Class I | | | | | | | | |
| Actual | | $1,000.00 | | $1,072.60 | | 0.65% | | $3.40 |
| Hypothetical(b) | | $1,000.00 | | $1,021.93 | | 0.65% | | $3.31 |
| Class Y | | | | | | | | |
| Actual | | $1,000.00 | | $1,072.40 | | 0.70% | | $3.66 |
| Hypothetical(b) | | $1,000.00 | | $1,021.68 | | 0.70% | | $3.57 |
| Emerging Markets Bond Fund | | | | | | | | |
| Class A | | | | | | | | |
| Actual | | $1,000.00 | | $953.00 | | 1.31% | | $6.45 |
| Hypothetical(b) | | $1,000.00 | | $1,018.60 | | 1.31% | | $6.67 |
| Class I | | | | | | | | |
| Actual | | $1,000.00 | | $954.20 | | 0.97% | | $4.78 |
| Hypothetical(b) | | $1,000.00 | | $1,020.32 | | 0.97% | | $4.94 |
| Class Y | | | | | | | | |
| Actual | | $1,000.00 | | $954.40 | | 1.06% | | $5.22 |
| Hypothetical(b) | | $1,000.00 | | $1,019.86 | | 1.06% | | $5.40 |
| Emerging Markets Fund | | | | | | | | |
| Class A | | | | | | | | |
| Actual | | $1,000.00 | | $842.70 | | 1.48% | | $6.87 |
| Hypothetical(b) | | $1,000.00 | | $1,017.74 | | 1.48% | | $7.53 |
| Class C | | | | | | | | |
| Actual | | $1,000.00 | | $839.00 | | 2.29% | | $10.61 |
| Hypothetical(b) | | $1,000.00 | | $1,013.66 | | 2.29% | | $11.62 |
| Class I | | | | | | | | |
| Actual | | $1,000.00 | | $844.80 | | 1.00% | | $4.65 |
| Hypothetical(b) | | $1,000.00 | | $1,020.16 | | 1.00% | | $5.09 |
| Class Y | | | | | | | | |
| Actual | | $1,000.00 | | $844.40 | | 1.10% | | $5.11 |
| Hypothetical(b) | | $1,000.00 | | $1,019.66 | | 1.10% | | $5.60 |
| Class Z | | | | | | | | |
| Actual | | $1,000.00 | | $845.40 | | 0.90% | | $4.19 |
| Hypothetical(b) | | $1,000.00 | | $1,020.67 | | 0.90% | | $4.58 |
| Environmental Sustainability Fund | | | | | | | | |
| Class A | | | | | | | | |
| Actual (c) | | $1,000.00 | | $969.60 | | 1.26% | | $5.81 |
| Hypothetical(b) | | $1,000.00 | | $1,018.85 | | 1.26% | | $6.41 |
| Class I | | | | | | | | |
| Actual (c) | | $1,000.00 | | $971.20 | | 0.96% | | $4.43 |
| Hypothetical(b) | | $1,000.00 | | $1,020.37 | | 0.96% | | $4.89 |
| Class Y | | | | | | | | |
| Actual (c) | | $1,000.00 | | $970.80 | | 1.06% | | $4.89 |
| Hypothetical(b) | | $1,000.00 | | $1,019.86 | | 1.06% | | $5.40 |
VANECK FUNDS
EXPLANATION OF EXPENSES
(unaudited) (continued)
| | | Beginning
Account
Value
July 1, 2021 | | Ending
Account
Value
December 31,
2021 | | Annualized
Expense
Ratio
During Period | | Expenses Paid
During the Period
July 1, 2021 -
December 31,
2021(a) |
| Global Resources Fund | | | | | | | | |
| Class A | | | | | | | | |
| Actual | | $1,000.00 | | $997.10 | | 1.38% | | $6.95 |
| Hypothetical(b) | | $1,000.00 | | $1,018.25 | | 1.38% | | $7.02 |
| Class C | | | | | | | | |
| Actual | | $1,000.00 | | $993.20 | | 2.20% | | $11.05 |
| Hypothetical(b) | | $1,000.00 | | $1,014.12 | | 2.20% | | $11.17 |
| Class I | | | | | | | | |
| Actual | | $1,000.00 | | $999.30 | | 0.95% | | $4.79 |
| Hypothetical(b) | | $1,000.00 | | $1,020.42 | | 0.95% | | $4.84 |
| Class Y | | | | | | | | |
| Actual | | $1,000.00 | | $998.40 | | 1.13% | | $5.69 |
| Hypothetical(b) | | $1,000.00 | | $1,019.51 | | 1.13% | | $5.75 |
| International Investors Gold Fund | | | | | | | | |
| Class A | | | | | | | | |
| Actual | | $1,000.00 | | $967.10 | | 1.36% | | $6.74 |
| Hypothetical(b) | | $1,000.00 | | $1,018.35 | | 1.36% | | $6.92 |
| Class C | | | | | | | | |
| Actual | | $1,000.00 | | $964.10 | | 2.16% | | $10.69 |
| Hypothetical(b) | | $1,000.00 | | $1,014.32 | | 2.16% | | $10.97 |
| Class I | | | | | | | | |
| Actual | | $1,000.00 | | $969.90 | | 1.00% | | $4.97 |
| Hypothetical(b) | | $1,000.00 | | $1,020.16 | | 1.00% | | $5.09 |
| Class Y | | | | | | | | |
| Actual | | $1,000.00 | | $969.80 | | 1.08% | | $5.36 |
| Hypothetical(b) | | $1,000.00 | | $1,019.76 | | 1.08% | | $5.50 |
| VanEck Morningstar Wide Moat Fund | | | | | | | | |
| Class I | | | | | | | | |
| Actual | | $1,000.00 | | $1,038.80 | | 0.59% | | $3.03 |
| Hypothetical(b) | | $1,000.00 | | $1,022.23 | | 0.59% | | $3.01 |
| Class Z | | | | | | | | |
| Actual | | $1,000.00 | | $1,039.30 | | 0.49% | | $2.52 |
| Hypothetical(b) | | $1,000.00 | | $1,022.74 | | 0.49% | | $2.50 |
| VanEck NDR Managed Allocation Fund | | | | | | | | |
| Class A | | | | | | | | |
| Actual | | $1,000.00 | | $1,019.80 | | 1.15% | | $5.85 |
| Hypothetical(b) | | $1,000.00 | | $1,019.41 | | 1.15% | | $5.85 |
| Class I | | | | | | | | |
| Actual | | $1,000.00 | | $1,021.30 | | 0.85% | | $4.33 |
| Hypothetical(b) | | $1,000.00 | | $1,020.92 | | 0.85% | | $4.33 |
| Class Y | | | | | | | | |
| Actual | | $1,000.00 | | $1,021.00 | | 0.90% | | $4.58 |
| Hypothetical(b) | | $1,000.00 | | $1,020.67 | | 0.90% | | $4.58 |
| (a) | Expenses are equal to the Fund’s annualized expense ratio (for the six months ended December 31, 2021), multiplied by the average account value over the period, multiplied by the number of days in the most recent fiscal half year divided by the number of the days in the fiscal year (to reflect the one-half year period). |
| (b) | Assumes annual return of 5% before expenses |
| (c) | Expenses are equal to the Fund’s annualized expense ratio (for the period from July 14, 2021 (commencement of operations) to December 31, 2021) multiplied by the average account value over the period, multiplied by the number of days since the commencement of operations divided by the number of days in the fiscal year. |
CM COMMODITY INDEX FUND
CONSOLIDATED SCHEDULE OF INVESTMENTS
December 31, 2021
| | | Par
(000’s) | | | Value | |
| Short-Term Investments: 99.1% | | | | | | | | |
| United States Treasury Obligations: 95.2% | | | | | | | | |
| United States Treasury Bills | | | | | | | | |
| 0.00%, 01/25/22 | | $ | 25,000 | | | $ | 24,999,790 | |
| 0.00%, 02/01/22 (a) | | | 30,000 | | | | 29,999,517 | |
| 0.00%, 02/15/22 (a) | | | 30,000 | | | | 29,999,194 | |
| 0.00%, 04/19/22 | | | 50,000 | | | | 49,990,430 | |
| 0.00%, 04/26/22 | | | 60,000 | | | | 59,986,817 | |
| 0.01%, 01/20/22 (a) | | | 30,000 | | | | 29,999,248 | |
| 0.01%, 01/27/22 (a) | | | 45,000 | | | | 44,998,537 | |
| 0.01%, 03/08/22 | | | 35,000 | | | | 34,997,200 | |
| 0.01%, 03/10/22 (a) | | | 50,000 | | | | 49,996,562 | |
| 0.04%, 02/24/22 (a) | | | 50,000 | | | | 49,996,115 | |
| 0.05%, 02/03/22 (a) | | | 35,000 | | | | 34,998,556 | |
| 0.05%, 02/10/22 (a) | | | 50,000 | | | | 49,997,500 | |
| 0.05%, 02/17/22 (a) | | | 40,000 | | | | 39,997,651 | |
| 0.05%, 03/03/22 (a) | | | 50,000 | | | | 49,996,517 | |
| 0.05%, 03/24/22 (a) | | | 45,000 | | | | 44,994,900 | |
| | | | | | | | 624,948,534 | |
| | | Number
of Shares | | | Value | |
| Money Market Fund: 3.9% | | | | | | | | |
| Invesco Treasury Portfolio - Institutional Class | | | 25,677,075 | | | $ | 25,677,075 | |
Total Investments Before Collateral for Securities Loaned: 99.1%
(Cost: $650,616,681) | | | | | | | 650,625,609 | |
| | | | | | | | | |
SHORT-TERM INVESTMENT HELD AS COLLATERAL FOR SECURITIES ON LOAN: 0.0%
(Cost: $151) | | | | | | | | |
| Money Market Fund: 0.0% | | | | | | | | |
| State Street Navigator Securities Lending Government Money Market Portfolio | | | 151 | | | | 151 | |
Total Short-Term Investments: 99.1%
(Cost: $650,616,832) | | | | | | | 650,625,760 | |
| Other assets less liabilities: 0.9% | | | | | | | 5,744,000 | |
| NET ASSETS: 100.0% | | | | | | $ | 656,369,760 | |
Total Return Swap Contracts
Long Exposure
| | | Reference | | Notional | | Rate paid by | | Payment | | Termination | | Unrealized | | % of Net |
| Counterparty | | Obligation | | Amount | | the Fund (b) | | Frequency | | Date | | Appreciation | | Assets |
| UBS | | UBS Bloomberg Constant Maturity Index Total Return | | $652,613,000 | | 0.49% | | Monthly | | 01/19/22 | | $6,078,183 | | 0.9% |
Footnotes:
| (a) | All or a portion of these securities are segregated for swap collateral. Total value of securities segregated is $121,993,548. |
| (b) | The rate shown reflects the rate in effect at the end of the reporting period: 3-Month T-Bill rate + 0.40%. |
Summary of Investments by Sector
Excluding Collateral for Securities Loaned | | % of
Investments | | Value | |
| Government Activity | | | 96.1 | % | | $ | 624,948,534 | |
| Money Market Fund | | | 3.9 | | | | 25,677,075 | |
| | | | 100.0 | % | | $ | 650,625,609 | |
The summary of inputs used to value the Fund’s investments as of December 31, 2021 is as follows:
| | | Level 1
Quoted
Prices | | | Level 2
Significant
Observable
Inputs | | | Level 3
Significant
Unobservable
Inputs | | | Value | |
| United States Treasury Obligations | | $ | — | | | $ | 624,948,534 | | | $ | — | | | $ | 624,948,534 | |
| Money Market Funds | | | 25,677,226 | | | | — | | | | — | | | | 25,677,226 | |
| Total Investments | | $ | 25,677,226 | | | $ | 624,948,534 | | | $ | — | | | $ | 650,625,760 | |
| Other Financial Instruments: | | | | | | | | | | | | | | | | |
| Total Return Swap Contracts | | $ | — | | | $ | 6,078,183 | | | $ | — | | | $ | 6,078,183 | |
See Notes to Financial Statements
EMERGING MARKETS BOND FUND
SCHEDULE OF INVESTMENTS
December 31, 2021
| | | | | Par
(000’s) | | | Value | |
| CORPORATE BONDS: 40.5% | | | | | | | | | | |
| Argentina: 1.6% | | | | | | | | | | |
YPF SA 144A
4.00%, 02/12/26 (s) | | USD | | | 73 | | | $ | 57,947 | |
YPF SA Reg S
8.50%, 07/28/25 | | USD | | | 244 | | | | 183,612 | |
| | | | | | | | | | 241,559 | |
| Bahrain: 0.5% | | | | | | | | | | |
Oil and Gas Holding Co. BSCC Reg S
7.50%, 10/25/27 | | USD | | | 71 | | | | 77,052 | |
| Brazil: 2.7% | | | | | | | | | | |
Atento Luxco 1 SA 144A
8.00%, 02/10/26 | | USD | | | 142 | | | | 151,853 | |
CSN Inova Ventures Reg S
6.75%, 01/28/28 | | USD | | | 100 | | | | 105,197 | |
Suzano Austria GmbH
6.00%, 01/15/29 † | | USD | | | 128 | | | | 148,352 | |
| | | | | | | | | | 405,402 | |
| Cayman Islands: 1.7% | | | | | | | | | | |
DP World Crescent Ltd. Reg S
3.88%, 07/18/29 | | USD | | | 236 | | | | 252,107 | |
| Chile: 1.8% | | | | | | | | | | |
Cencosud SA Reg S
4.38%, 07/17/27 | | USD | | | 100 | | | | 107,226 | |
Colbun SA 144A
3.15%, 01/19/32 | | USD | | | 58 | | | | 57,474 | |
Empresa Nacional del Petroleo Reg S
5.25%, 11/06/29 | | USD | | | 96 | | | | 103,800 | |
| | | | | | | | | | 268,500 | |
| China: 1.0% | | | | | | | | | | |
China Evergrande Group Reg S
8.25%, 03/23/22 | | USD | | | 331 | | | | 64,545 | |
Kaisa Group Holdings Ltd. Reg S
8.50%, 06/30/22 | | USD | | | 317 | | | | 84,797 | |
| | | | | | | | | | 149,342 | |
| Colombia: 1.7% | | | | | | | | | | |
Colombia Telecomunicaciones SA ESP Reg S
4.95%, 07/17/30 | | USD | | | 110 | | | | 109,341 | |
Ecopetrol SA
4.62%, 11/02/31 | | USD | | | 37 | | | | 36,038 | |
Promigas SA ESP / Gases del Pacifico SAC Reg S
3.75%, 10/16/29 | | USD | | | 120 | | | | 117,957 | |
| | | | | | | | | | 263,336 | |
| Cyprus: 0.1% | | | | | | | | | | |
MHP Lux SA Reg S
6.25%, 09/19/29 | | USD | | | 14 | | | | 13,272 | |
| Georgia: 0.8% | | | | | | | | | | |
Georgia Global Utilities JSC 144A
7.75%, 07/30/25 | | USD | | | 115 | | | | 121,891 | |
| | | | | Par
(000’s) | | | Value | |
| Hong Kong: 0.6% | | | | | | | | | | |
Shimao Group Holdings Ltd. Reg S
5.60%, 07/15/26 | | USD | | | 137 | | | $ | 84,940 | |
| India: 1.0% | | | | | | | | | | |
Periama Holdings LLC Reg S
5.95%, 04/19/26 | | USD | | | 138 | | | | 147,264 | |
| Indonesia: 3.0% | | | | | | | | | | |
Pertamina Persero PT Reg S
6.00%, 05/03/42 | | USD | | | 130 | | | | 159,198 | |
Perusahaan Perseroan Persero PT Perusahaan Listrik Negara Reg S
6.15%, 05/21/48 | | USD | | | 126 | | | | 155,663 | |
Star Energy Geothermal Wayang Windu Ltd. Reg S
6.75%, 04/24/33 | | USD | | | 133 | | | | 146,217 | |
| | | | | | | | | | 461,078 | |
| Ireland: 1.0% | | | | | | | | | | |
Aragvi Finance International DAC 144A
8.45%, 04/29/26 | | USD | | | 145 | | | | 149,153 | |
| Kazakhstan: 1.4% | | | | | | | | | | |
Development Bank of Kazakhstan JSC 144A
10.95%, 05/06/26 | | KZT | | | 93,500 | | | | 214,264 | |
| Luxembourg: 1.1% | | | | | | | | | | |
MC Brazil Downstream Trading SARL 144A
7.25%, 06/30/31 | | USD | | | 173 | | | | 172,516 | |
| Malaysia: 2.1% | | | | | | | | | | |
| Petronas Capital Ltd. Reg S | | | | | | | | | | |
| 2.48%, 01/28/32 † | | USD | | | 238 | | | | 239,078 | |
| 3.50%, 04/21/30 | | USD | | | 80 | | | | 86,640 | |
| | | | | | | | | | 325,718 | |
| Mexico: 4.8% | | | | | | | | | | |
Corp. GEO SAB de CV Reg S
9.25%, 06/30/20 (d) | | USD | | | 380 | | | | 8 | |
| Petroleos Mexicanos | | | | | | | | | | |
| 6.49%, 01/23/27 | | USD | | | 236 | | | | 252,026 | |
| 6.62%, 06/15/35 | | USD | | | 179 | | | | 172,287 | |
| 6.88%, 08/04/26 | | USD | | | 207 | | | | 227,875 | |
| 7.69%, 01/23/50 | | USD | | | 80 | | | | 77,358 | |
| | | | | | | | | | 729,554 | |
| Nigeria: 0.7% | | | | | | | | | | |
SEPLAT Energy Plc 144A
7.75%, 04/01/26 | | USD | | | 102 | | | | 102,102 | |
| Norway: 0.3% | | | | | | | | | | |
DNO ASA 144A Reg S
7.88%, 09/09/26 | | USD | | | 50 | | | | 51,500 | |
| Qatar: 1.5% | | | | | | | | | | |
Qatar Energy 144A
2.25%, 07/12/31 | | USD | | | 238 | | | | 236,358 | |
| Saudi Arabia: 2.4% | | | | | | | | | | |
| Dar Al-Arkan Sukuk Co. Ltd. Reg S | | | | | | | | | | |
See Notes to Financial Statements
| | | | | Par
(000’s) | | | Value | |
| Saudi Arabia (continued) | | | | | | | | | | |
| 6.75%, 02/15/25 | | USD | | | 140 | | | $ | 145,897 | |
Saudi Arabian Oil Co. 144A
4.25%, 04/16/39 | | USD | | | 198 | | | | 223,709 | |
| | | | | | | | | | 369,606 | |
| Singapore: 0.9% | | | | | | | | | | |
SingTel Group Treasury Pte Ltd. Reg S
2.38%, 08/28/29 | | USD | | | 140 | | | | 143,727 | |
| South Africa: 1.8% | | | | | | | | | | |
Eskom Holdings SOC Ltd. 144A
8.45%, 08/10/28 | | USD | | | 254 | | | | 274,353 | |
| South Korea: 1.0% | | | | | | | | | | |
LG Chem Ltd. Reg S
2.38%, 07/07/31 | | USD | | | 159 | | | | 156,769 | |
| Taiwan: 0.5% | | | | | | | | | | |
TSMC Global Ltd. Reg S
2.25%, 04/23/31 | | USD | | | 73 | | | | 72,467 | |
| Thailand: 1.0% | | | | | | | | | | |
GC Treasury Center Co. Ltd. Reg S
2.98%, 03/18/31 | | USD | | | 42 | | | | 42,529 | |
PTTEP Treasury Center Co. Ltd. Reg S
2.59%, 06/10/27 | | USD | | | 107 | | | | 109,187 | |
| | | | | | | | | | 151,716 | |
| United Arab Emirates: 1.0% | | | | | | | | | | |
Alpha Star Holding III Ltd. Reg S
6.25%, 04/20/22 | | USD | | | 151 | | | | 151,982 | |
| United Kingdom: 0.8% | | | | | | | | | | |
AngloGold Ashanti Holdings Plc
3.38%, 11/01/28 | | USD | | | 119 | | | | 118,005 | |
| United States: 0.9% | | | | | | | | | | |
AES Panama Generation Holdings SRL Reg S
4.38%, 05/31/30 | | USD | | | 133 | | | | 138,692 | |
| Uzbekistan: 0.8% | | | | | | | | | | |
Uzauto Motors AJ 144A
4.85%, 05/04/26 | | USD | | | 130 | | | | 126,046 | |
Total Corporate Bonds
(Cost: $6,366,158) | | | | | | | | | 6,170,271 | |
| | | | | | | | | | | |
| GOVERNMENT OBLIGATIONS: 54.5% | | | | | | | | | | |
| Angola: 0.5% | | | | | | | | | | |
Angolan Government International Bond 144A
9.50%, 11/12/25 | | USD | | | 76 | | | | 81,582 | |
| Argentina: 0.9% | | | | | | | | | | |
Argentine Republic Government International Bond
2.50%, 07/09/41 (s) | | USD | | | 374 | | | | 132,583 | |
| Provincia de Buenos Aires Reg S | | | | | | | | | | |
| 3.50%, 09/01/37 (s) | | USD | | | 0 | (a) | | | 166 | |
| | | | | Par
(000’s) | | | Value | |
| Argentina (continued) | | | | | | | | | | |
| 3.90%, 09/01/37 (s) | | USD | | | 0 | (a) | | $ | 32 | |
| | | | | | | | | | 132,781 | |
| Armenia: 0.2% | | | | | | | | | | |
Republic of Armenia Treasury Bonds
8.00%, 10/29/31 | | AMD | | | 17,610 | | | | 32,332 | |
| Azerbaijan: 0.7% | | | | | | | | | | |
Republic of Azerbaijan International Bond Reg S
3.50%, 09/01/32 | | USD | | | 104 | | | | 105,525 | |
| Bolivia: 0.1% | | | | | | | | | | |
Bolivian Government International Bond Reg S
4.50%, 03/20/28 | | USD | | | 24 | | | | 22,080 | |
| Brazil: 4.6% | | | | | | | | | | |
Brazil Notas do Tesouro Nacional, Series F
10.00%, 01/01/23 | | BRL | | | 1,404 | | | | 236,076 | |
| Brazilian Government International Bond | | | | | | | | | | |
| 4.62%, 01/13/28 | | USD | | | 331 | | | | 346,208 | |
| 5.62%, 01/07/41 † | | USD | | | 112 | | | | 114,636 | |
| | | | | | | | | | 696,920 | |
| Colombia: 1.6% | | | | | | | | | | |
| Colombia Government International Bond | | | | | | | | | | |
| 3.12%, 04/15/31 | | USD | | | 150 | | | | 134,922 | |
| 5.20%, 05/15/49 | | USD | | | 58 | | | | 53,490 | |
| 6.12%, 01/18/41 | | USD | | | 53 | | | | 54,690 | |
| | | | | | | | | | 243,102 | |
| Costa Rica: 0.4% | | | | | | | | | | |
Costa Rica Government International Bond Reg S
6.12%, 02/19/31 | | USD | | | 54 | | | | 54,675 | |
| Czech Republic: 1.9% | | | | | | | | | | |
Czech Republic Government Bond
1.20%, 03/13/31 | | CZK | | | 5,600 | | | | 221,059 | |
Czech Republic Government Bond Reg S
0.95%, 05/15/30 | | CZK | | | 1,680 | | | | 65,668 | |
| | | | | | | | | | 286,727 | |
| Dominican Republic: 1.4% | | | | | | | | | | |
Dominican Republic International Bond Reg S
6.85%, 01/27/45 | | USD | | | 196 | | | | 216,580 | |
| Ecuador: 2.5% | | | | | | | | | | |
Ecuador Government International Bond 144A
5.00%, 07/31/30 (s) | | USD | | | 179 | | | | 148,794 | |
Ecuador Government International Bond Reg S
5.00%, 07/31/30 (s) | | USD | | | 278 | | | | 231,087 | |
| | | | | | | | | | 379,881 | |
See Notes to Financial Statements
EMERGING MARKETS BOND FUND
SCHEDULE OF INVESTMENTS
(continued)
| | | | | Par
(000’s) | | | Value | |
| Egypt: 1.3% | | | | | | | | | | |
Egypt Government International Bond Reg S
8.88%, 05/29/50 | | USD | | | 214 | | | $ | 194,911 | |
| El Salvador: 1.9% | | | | | | | | | | |
| El Salvador Government International Bond Reg S | | | | | | | | | | |
| 5.88%, 01/30/25 | | USD | | | 118 | | | | 74,341 | |
| 7.12%, 01/20/50 | | USD | | | 67 | | | | 36,851 | |
| 8.62%, 02/28/29 | | USD | | | 113 | | | | 69,496 | |
| 9.50%, 07/15/52 | | USD | | | 182 | | | | 111,477 | |
| | | | | | | | | | 292,165 | |
| Gabon: 0.2% | | | | | | | | | | |
Gabon Government International Bond 144A
6.95%, 06/16/25 | | USD | | | 28 | | | | 29,149 | |
| Georgia: 0.8% | | | | | | | | | | |
Georgia Treasury Bond
8.00%, 02/04/23 | | GEL | | | 404 | | | | 129,357 | |
| Ghana: 0.7% | | | | | | | | | | |
Ghana Government International Bond 144A
8.62%, 04/07/34 | | USD | | | 135 | | | | 110,124 | |
| Guatemala: 0.4% | | | | | | | | | | |
Guatemala Government Bond Reg S
4.50%, 05/03/26 | | USD | | | 56 | | | | 59,081 | |
| Hungary: 1.4% | | | | | | | | | | |
Hungary Government International Bond 144A
2.12%, 09/22/31 † | | USD | | | 223 | | | | 219,917 | |
| Israel: 1.8% | | | | | | | | | | |
Israel Government Bond
1.50%, 05/31/37 | | ILS | | | 517 | | | | 159,363 | |
Israel Government International Bond
4.50%, 01/30/43 | | USD | | | 92 | | | | 118,082 | |
| | | | | | | | | | 277,445 | |
| Jamaica: 0.4% | | | | | | | | | | |
Jamaica Government International Bond
7.88%, 07/28/45 | | USD | | | 40 | | | | 55,550 | |
| Jordan: 0.3% | | | | | | | | | | |
Jordan Government International Bond Reg S
4.95%, 07/07/25 | | USD | | | 40 | | | | 41,422 | |
| Kazakhstan: 0.2% | | | | | | | | | | |
Kazakhstan Government Bond
10.40%, 05/19/27 | | KZT | | | 10,000 | | | | 23,166 | |
| Kenya: 0.4% | | | | | | | | | | |
Republic of Kenya Government International Bond 144A
7.00%, 05/22/27 | | USD | | | 52 | | | | 55,040 | |
| | | | | Par
(000’s) | | | Value | |
| Kuwait: 0.6% | | | | | | | | | | |
Kuwait International Government Bond Reg S
3.50%, 03/20/27 | | USD | | | 87 | | | $ | 94,913 | |
| Malaysia: 3.1% | | | | | | | | | | |
Malaysia Government Bond
3.48%, 06/14/24 | | MYR | | | 1,920 | | | | 468,149 | |
| Oman: 1.6% | | | | | | | | | | |
| Oman Government International Bond 144A | | | | | | | | | | |
| 6.25%, 01/25/31 | | USD | | | 163 | | | | 178,512 | |
| 7.38%, 10/28/32 | | USD | | | 57 | | | | 66,575 | |
| | | | | | | | | | 245,087 | |
| Pakistan: 0.3% | | | | | | | | | | |
Pakistan Government International Bond 144A
7.38%, 04/08/31 | | USD | | | 42 | | | | 41,806 | |
| Paraguay: 0.4% | | | | | | | | | | |
Paraguay Government International Bond Reg S
4.95%, 04/28/31 | | USD | | | 52 | | | | 58,565 | |
| Peru: 1.6% | | | | | | | | | | |
Peru Government International Bond Reg S
5.40%, 08/12/34 | | PEN | | | 800 | | | | 183,007 | |
Peruvian Government International Bond Reg S
6.90%, 08/12/37 | | PEN | | | 250 | | | | 63,798 | |
| | | | | | | | | | 246,805 | |
| Philippines: 3.0% | | | | | | | | | | |
| Philippine Government International Bond | | | | | | | | | | |
| 3.90%, 11/26/22 | | PHP | | | 9,924 | | | | 194,382 | |
| 6.25%, 01/14/36 | | PHP | | | 12,044 | | | | 264,131 | |
| | | | | | | | | | 458,513 | |
| Poland: 1.5% | | | | | | | | | | |
Republic of Poland Government Bond
0.25%, 10/25/26 | | PLN | | | 1,058 | | | | 221,150 | |
| Qatar: 1.7% | | | | | | | | | | |
| Qatar Government International Bond 144A | | | | | | | | | | |
| 3.25%, 06/02/26 | | USD | | | 81 | | | | 86,365 | |
| 4.62%, 06/02/46 | | USD | | | 61 | | | | 77,288 | |
Qatar Government International Bond Reg S
3.25%, 06/02/26 | | USD | | | 93 | | | | 99,159 | |
| | | | | | | | | | 262,812 | |
| Romania: 0.7% | | | | | | | | | | |
Romania Government Bond
3.25%, 06/24/26 | | RON | | | 485 | | | | 105,013 | |
| Saudi Arabia: 1.5% | | | | | | | | | | |
| Saudi Government International Bond 144A | | | | | | | | | | |
| 3.25%, 11/17/51 | | USD | | | 198 | | | | 195,649 | |
| 5.00%, 04/17/49 | | USD | | | 32 | | | | 40,676 | |
| | | | | | | | | | 236,325 | |
See Notes to Financial Statements
| | | | | Par
(000’s) | | | Value | |
| Senegal: 0.3% | | | | | | | | | | |
Senegal Government International Bond 144A
6.25%, 05/23/33 | | USD | | | 42 | | | $ | 43,334 | |
| Singapore: 0.5% | | | | | | | | | | |
Singapore Government Bond
3.50%, 03/01/27 | | SGD | | | 100 | | | | 81,711 | |
| South Africa: 1.6% | | | | | | | | | | |
| Republic of South Africa Government International Bond | | | | | | | | | | |
| 5.75%, 09/30/49 | | USD | | | 148 | | | | 142,709 | |
| 6.25%, 03/08/41 | | USD | | | 97 | | | | 103,126 | |
| | | | | | | | | | 245,835 | |
| South Korea: 0.9% | | | | | | | | | | |
Export-Import Bank of Korea
0.62%, 02/09/26 | | USD | | | 138 | | | | 133,552 | |
| Sri Lanka: 2.0% | | | | | | | | | | |
Sri Lanka Government International Bond Reg S
5.88%, 07/25/22 † | | USD | | | 454 | | | | 309,742 | |
| Thailand: 1.5% | | | | | | | | | | |
| Thailand Government Bond | | | | | | | | | | |
| 0.95%, 06/17/25 | | THB | | | 4,000 | | | | 119,875 | |
| 2.88%, 12/17/28 | | THB | | | 3,420 | | | | 110,312 | |
| | | | | | | | | | 230,187 | |
| Ukraine: 1.3% | | | | | | | | | | |
Ukraine Government Bond
10.00%, 08/23/23 | | UAH | | | 5,600 | | | | 198,220 | |
| United Arab Emirates: 1.4% | | | | | | | | | | |
Emirate of Dubai Government International Bonds Reg S
3.90%, 09/09/50 | | USD | | | 165 | | | | 158,606 | |
United Arab Emirates International Government Bond 144A
2.00%, 10/19/31 | | USD | | | 52 | | | | 51,969 | |
| | | | | | | | | | 210,575 | |
| Uruguay: 1.2% | | | | | | | | | | |
| Uruguay Government International Bond | | | | | | | | | | |
| | | | | Par
(000’s) | | | Value | |
| Uruguay (continued) | | | | | | | | | | |
| 8.25%, 05/21/31 | | UYU | | | 3,043 | | | $ | 65,837 | |
Uruguay Government International Bond Reg S
8.50%, 03/15/28 | | UYU | | | 4,951 | | | | 110,395 | |
| | | | | | | | | | 176,232 | |
| Uzbekistan: 0.7% | | | | | | | | | | |
Republic of Uzbekistan International Bond 144A
14.00%, 07/19/24 | | UZS | | | 1,150,000 | | | | 107,988 | |
| Zambia: 2.5% | | | | | | | | | | |
| Zambia Government Bond | | | | | | | | | | |
| 13.00%, 01/25/31 | | ZMW | | | 7,765 | | | | 300,528 | |
| 13.00%, 09/20/31 | | ZMW | | | 470 | | | | 17,912 | |
| 14.00%, 05/31/36 | | ZMW | | | 1,520 | | | | 56,431 | |
| | | | | | | | | | 374,871 | |
Total Government Obligations
(Cost: $8,422,354) | | | | | | | | | 8,290,897 | |
| | | | | | | | | | | |
| | | | | Number
of Shares | | | | |
MONEY MARKET FUND: 3.9%
(Cost: $596,641) | | | | | | | | | | |
| Invesco Treasury Portfolio-Institutional Class | | | | | 596,641 | | | | 596,641 | |
| | | | | | | | | | | |
Total Investments Before Collateral for Securities Loaned: 98.9%
(Cost: $15,385,153) | | | | | | | | | 15,057,809 | |
| | | | | | | | | | | |
SHORT-TERM INVESTMENT HELD AS COLLATERAL FOR SECURITIES ON LOAN: 3.7%
(Cost: $568,095) | | | | | | | | | | |
| Money Market Fund: 3.7% | | | | | | | | | | |
| State Street Navigator Securities Lending Government Money Market Portfolio | | | | | 568,095 | | | | 568,095 | |
Total Investments: 102.6%
(Cost: $15,953,248) | | | | | | | | | 15,625,904 | |
| Liabilities in excess of other assets: (2.6)% | | | | | | | | | (391,480) | |
| NET ASSETS: 100.0% | | | | | | | | $ | 15,234,424 | |
See Notes to Financial Statements
EMERGING MARKETS BOND FUND
SCHEDULE OF INVESTMENTS
(continued)
Definitions:
| AMD | Armenian Dram |
| BRL | Brazilian Real |
| CZK | Czech Koruna |
| GEL | Georgian Lari |
| ILS | Israeli Shekel |
| KZT | Kazakhstan Tenge |
| MYR | Malaysian Ringgit |
| PEN | Peruvian Nuevo Sol |
| PHP | Philippine Peso |
| PLN | Polish Zloty |
| RON | Romanian Leu |
| SGD | Singapore Dollar |
| THB | Thai Baht |
| UAH | Ukrainian Hryvnia |
| USD | United States Dollar |
| UYU | Uruguayan Peso |
| UZS | Uzbekistani Som |
| ZMW | Zambian Kwacha |
Footnotes:
| (s) | The rate shown reflects the rate in effect at the end of the reporting period. Coupon adjusts periodically based upon a predetermined schedule |
| † | Security fully or partially on loan. Total market value of securities on loan is $1,031,725. |
| (d) | Security in default |
| (a) | Amount is less than 1,000 |
| Reg S | Security was purchased pursuant to Regulation S under the Securities Act of 1933, which exempts from registration securities offered and sold outside of the United States. Such a security cannot be sold in the United States without either an effective registration statement filed pursuant to the Securities Act of 1933, or pursuant to an exemption from registration. |
| 144A | Security exempt from registration under Rule 144A of the Securities Act of 1933, as amended, or otherwise restricted. These securities may be resold in transactions exempt from registration, unless otherwise noted, and the value amounted $3,473,934, or 22.8% of net assets. |
Summary of Investments by Sector
Excluding Collateral for Securities Loaned | | % of
Investments | | Value | |
| Basic Materials | | | 4.8 | % | | $ | 718,115 | |
| Consumer Cyclicals | | | 0.8 | | | | 126,046 | |
| Consumer Non-Cyclicals | | | 0.8 | | | | 120,498 | |
| Energy | | | 15.4 | | | | 2,318,715 | |
| Financials | | | 8.6 | | | | 1,288,940 | |
| Government Activity | | | 55.1 | | | | 8,290,897 | |
| Industrials | | | 2.1 | | | | 321,669 | |
| Real Estate | | | 1.1 | | | | 169,738 | |
| Technology | | | 1.4 | | | | 216,194 | |
| Utilities | | | 5.9 | | | | 890,356 | |
| Money Market Fund | | | 4.0 | | | | 596,641 | |
| | | | 100.0 | % | | $ | 15,057,809 | |
The summary of inputs used to value the Fund’s investments as of December 31, 2021 is as follows:
| | | Level 1
Quoted
Prices | | | Level 2
Significant
Observable
Inputs | | | Level 3
Significant
Unobservable
Inputs | | | Value | |
| Corporate Bonds * | | $ | — | | | $ | 6,170,271 | | | $ | — | | | $ | 6,170,271 | |
| Government Obligations * | | | — | | | | 8,290,897 | | | | — | | | | 8,290,897 | |
| Money Market Funds | | | 1,164,736 | | | | — | | | | — | | | | 1,164,736 | |
| Total Investments | | $ | 1,164,736 | | | $ | 14,461,168 | | | $ | — | | | $ | 15,625,904 | |
| * | See Schedule of Investments for geographic sector breakouts. |
See Notes to Financial Statements
EMERGING MARKETS FUND
SCHEDULE OF INVESTMENTS
December 31, 2021
| | | Number
of Shares | | | Value | |
| COMMON STOCKS: 96.0% | | | | | | | | |
| Argentina: 3.1% | | | | | | | | |
| MercadoLibre, Inc. (USD) * | | | 50,170 | | | $ | 67,649,228 | |
| Brazil: 5.7% | | | | | | | | |
| Fleury SA # | | | 4,849,300 | | | | 15,623,767 | |
| Infracommerce CXAAS SA # * | | | 2,271,600 | | | | 7,101,178 | |
| JSL SA # | | | 13,446,500 | | | | 18,096,157 | |
| Locaweb Servicos de Internet SA 144A # * | | | 4,332,300 | | | | 10,051,056 | |
| Movida Participacoes SA # * | | | 7,602,900 | | | | 21,462,573 | |
| Rede D’Or Sao Luiz SA 144A # | | | 2,123,700 | | | | 17,057,419 | |
| Vamos Locacao de Caminhoes Maquinas e Equipamentos SA # | | | 13,658,600 | | | | 29,158,840 | |
| Vasta Platform Ltd. (USD) * † ‡ | | | 949,496 | | | | 4,016,368 | |
| Westwing Comercio Varejista Ltda # * | | | 3,766,100 | | | | 2,358,633 | |
| | | | | | | | 124,925,991 | |
| China: 26.3% | | | | | | | | |
| Alibaba Health Information Technology Ltd. (HKD) # * | | | 2,288,000 | | | | 1,937,843 | |
| A-Living Smart City Services Co. Ltd. (HKD) 144A # | | | 16,533,000 | | | | 28,244,747 | |
| China Animal Healthcare Ltd. (HKD) # *∞ | | | 8,365,994 | | | | 1 | |
| China Conch Venture Holdings Ltd. (HKD) # | | | 2,031,000 | | | | 9,934,102 | |
| China Education Group Holdings Ltd. (HKD) # | | | 36,058,000 | | | | 58,594,459 | |
| China Feihe Ltd. (HKD) 144A # | | | 10,164,000 | | | | 13,637,043 | |
| Fu Shou Yuan International Group Ltd. (HKD) # | | | 23,211,000 | | | | 18,241,229 | |
| GDS Holdings Ltd. (HKD) # * | | | 3,697,600 | | | | 21,420,972 | |
| Meituan (HKD) 144A # * | | | 335,500 | | | | 9,701,812 | |
| NetEase, Inc. (HKD) # | | | 1,357,400 | | | | 27,444,766 | |
| Pharmaron Beijing Co. Ltd. (HKD) 144A # | | | 1,602,000 | | | | 24,739,136 | |
| Ping An Bank Co. Ltd. # | | | 10,076,583 | | | | 26,052,154 | |
| Prosus NV (EUR) # | | | 947,647 | | | | 78,488,865 | |
| Qingdao TGOOD Electric Co. Ltd. # | | | 4,535,310 | | | | 17,693,625 | |
| Shandong Head Co. Ltd. # * | | | 1,038,575 | | | | 10,024,285 | |
| Shanghai Baosight Software Co. Ltd. # | | | 4,273,006 | | | | 40,768,117 | |
| Sungrow Power Supply Co. Ltd. # | | | 605,824 | | | | 13,864,349 | |
| Tencent Holdings Ltd. (HKD) # | | | 882,800 | | | | 51,512,353 | |
| Topsports International Holdings Ltd. (HKD) 144A # | | | 21,041,000 | | | | 21,311,054 | |
| Wuxi Biologics Cayman, Inc. (HKD) 144A # * | | | 2,387,000 | | | | 28,259,440 | |
| Wuxi Shangji Automation Co. Ltd. # | | | 263,482 | | | | 6,897,350 | |
| Yifeng Pharmacy Chain Co. Ltd. # | | | 3,843,269 | | | | 33,218,142 | |
| Yum China Holdings, Inc. (HKD) # | | | 528,950 | | | | 25,980,145 | |
| Zai Lab Ltd. (HKD) # * | | | 183,700 | | | | 11,712,641 | |
| | | | | | | | 579,678,630 | |
| | | Number
of Shares | | | Value | |
| Egypt: 2.6% | | | | | | | | |
| Cleopatra Hospital * | | | 52,387,115 | | | $ | 16,339,711 | |
| Commercial International Bank Egypt SAE # * | | | 8,839,082 | | | | 29,748,698 | |
| Fawry for Banking & Payment Technology Services SAE # * | | | 9,776,401 | | | | 7,976,669 | |
| Juhayna Food Industries # * | | | 5,355,840 | | | | 2,611,146 | |
| | | | | | | | 56,676,224 | |
| Georgia: 1.7% | | | | | | | | |
| Bank of Georgia Group Plc (GBP) | | | 1,332,197 | | | | 30,077,296 | |
| Georgia Capital Plc (GBP) # * | | | 783,997 | | | | 7,530,184 | |
| | | | | | | | 37,607,480 | |
| Germany: 2.2% | | | | | | | | |
| Delivery Hero SE 144A # * | | | 435,700 | | | | 48,227,865 | |
| Hungary: 1.1% | | | | | | | | |
| OTP Bank Nyrt # * | | | 491,400 | | | | 25,057,120 | |
| India: 12.0% | | | | | | | | |
| Cholamandalam Investment and Finance Co. Ltd. # | | | 3,533,500 | | | | 24,634,490 | |
| HDFC Bank Ltd. # | | | 3,018,000 | | | | 59,812,623 | |
| HDFC Bank Ltd. (ADR) | | | 751,000 | | | | 48,867,570 | |
| Oberoi Realty Ltd. # * | | | 1,445,400 | | | | 16,672,095 | |
| Phoenix Mills Ltd. # | | | 1,265,800 | | | | 16,769,305 | |
| Reliance Industries Ltd. # | | | 3,052,866 | | | | 96,993,427 | |
| | | | | | | | 263,749,510 | |
| Indonesia: 2.0% | | | | | | | | |
| Bank BTPN Syariah Tbk PT # | | | 176,500,000 | | | | 44,326,617 | |
| Kazakhstan: 2.0% | | | | | | | | |
| Kaspi.kz JSC (USD) (GDR) | | | 373,540 | | | | 43,330,640 | |
| Kenya: 0.1% | | | | | | | | |
| Safaricom Plc # | | | 6,669,400 | | | | 2,236,779 | |
| Kuwait: 0.5% | | | | | | | | |
| Humansoft Holding Co. KSC | | | 995,490 | | | | 10,615,048 | |
| Mexico: 2.5% | | | | | | | | |
| Qualitas Controladora SAB de CV † | | | 3,805,558 | | | | 19,266,154 | |
| Regional SAB de CV | | | 6,806,900 | | | | 35,301,932 | |
| | | | | | | | 54,568,086 | |
| Philippines: 3.4% | | | | | | | | |
| Bloomberry Resorts Corp. # * | | | 131,898,200 | | | | 16,299,190 | |
| International Container Terminal Services, Inc. | | | 14,853,240 | | | | 58,256,567 | |
| | | | | | | | 74,555,757 | |
| Poland: 0.6% | | | | | | | | |
| InPost SA (EUR) # * | | | 1,152,300 | | | | 13,837,624 | |
| Russia: 5.5% | | | | | | | | |
| Detsky Mir PJSC 144A # | | | 11,544,900 | | | | 19,137,449 | |
| Fix Price Group Ltd. (USD) (GDR) † | | | 3,811,800 | | | | 28,779,090 | |
| Sberbank of Russia PJSC (ADR) # | | | 3,240,000 | | | | 51,985,774 | |
| Yandex NV (USD) * | | | 358,700 | | | | 21,701,350 | |
| | | | | | | | 121,603,663 | |
| South Africa: 1.3% | | | | | | | | |
| Transaction Capital Ltd. # | | | 9,716,596 | | | | 27,532,514 | |
See Notes to Financial Statements
EMERGING MARKETS FUND
SCHEDULE OF INVESTMENTS
(continued)
| | | Number
of Shares | | | Value | |
| South Korea: 5.9% | | | | | | | | |
| Doosan Fuel Cell Co. Ltd. # * † | | | 395,260 | | | $ | 15,929,542 | |
| LG Chem Ltd. # * | | | 114,210 | | | | 59,042,187 | |
| NAVER Corp. # * | | | 149,450 | | | | 47,438,617 | |
| Samsung SDI Co. Ltd. # * | | | 15,290 | | | | 8,409,070 | |
| | | | | | | | 130,819,416 | |
| Taiwan: 13.5% | | | | | | | | |
| Chroma ATE, Inc. # | | | 2,715,000 | | | | 19,579,618 | |
| MediaTek, Inc. # | | | 2,053,000 | | | | 88,093,217 | |
| Poya International Co. Ltd. # | | | 1,759,156 | | | | 26,957,126 | |
| Sea Ltd. (ADR) * | | | 134,150 | | | | 30,010,697 | |
| Taiwan Semiconductor Manufacturing Co. Ltd. # | | | 5,262,000 | | | | 116,400,673 | |
| Wiwynn Corp. # | | | 424,000 | | | | 17,054,338 | |
| | | | | | | | 298,095,669 | |
| Tanzania: 1.6% | | | | | | | | |
| Helios Towers Plc (GBP) * † | | | 15,357,647 | | | | 35,754,229 | |
| Turkey: 2.4% | | | | | | | | |
| Agesa Hayat ve Emeklilik AS | | | 3,102,147 | �� | | | 4,811,857 | |
| MLP Saglik Hizmetleri AS 144A * ‡ | | | 10,730,392 | | | | 24,220,236 | |
| Sok Marketler Ticaret AS | | | 11,860,809 | | | | 11,395,486 | |
| Tofas Turk Otomobil Fabrikasi AS | | | 2,259,100 | | | | 12,927,196 | |
| | | | | | | | 53,354,775 | |
| United Kingdom: 0.0% | | | | | | | | |
| Hirco Plc # *∞ | | | 812,346 | | | | 1 | |
Total Common Stocks
(Cost: $1,813,789,216) | | | | | | | 2,114,202,866 | |
| | | Number
of Shares | | | Value | |
| PREFERRED SECURITIES: 3.9% | | | | | | | | |
| Brazil: 0.4% | | | | | | | | |
| Raizen SA, # * | | | 7,934,000 | | | $ | 9,136,772 | |
| South Korea: 3.5% | | | | | | | | |
| Samsung Electronics Co. Ltd., # | | | 1,284,830 | | | | 76,814,408 | |
Total Preferred Securities
(Cost: $90,244,029) | | | | | | | 85,951,180 | |
| | | | | | | | | |
MONEY MARKET FUND: 1.0%
(Cost: $21,996,944) | | | | | | | | |
| Invesco Treasury Portfolio - Institutional Class | | | 21,996,944 | | | | 21,996,944 | |
| | | | | | | | | |
Total Investments Before Collateral for Securities Loaned: 100.9%
(Cost: $1,926,030,189) | | | | | | | 2,222,150,990 | |
| | | | | | | | | |
SHORT-TERM INVESTMENT HELD AS COLLATERAL FOR SECURITIES ON LOAN: 0.0%
(Cost: $940,250) | | | | | | | | |
| Money Market Fund: 0.0% | | | | | | | | |
| State Street Navigator Securities Lending Government Money Market Portfolio | | | 940,250 | | | | 940,250 | |
Total Investments: 100.9%
(Cost: $1,926,970,439) | | | | | | | 2,223,091,240 | |
| Liabilities in excess of other assets: (0.9)% | | | | | | | (20,834,870) | |
| NET ASSETS: 100.0% | | | | | | $ | 2,202,256,370 | |
| Definitions: |
| ADR | American Depositary Receipt |
| EUR | Euro |
| GBP | British Pound |
| GDR | Global Depositary Receipt |
| HKD | Hong Kong Dollar |
| SGD | Singapore Dollar |
| USD | United States Dollar |
| Footnotes: |
| * | Non-income producing |
| # | Security has been valued in good faith pursuant to guidelines established by the Board of Trustees. The aggregate value of fair valued securities is $1,696,833,391 which represents 77.0% of net assets. |
| † | Security fully or partially on loan. Total market value of securities on loan is $17,674,230. |
| ‡ | Affiliated issuer – as defined under the Investment Company Act of 1940. |
| ∞ | Security is valued using significant unobservable inputs that factor in discount for lack of marketability and is classified as Level 3 in the fair value hierarchy |
| | |
| 144A | Security exempt from registration under Rule 144A of the Securities Act of 1933, as amended, or otherwise restricted. These securities may be resold in transactions exempt from registration, unless otherwise noted, and the value amounted $244,587,257, or 11.1% of net assets. |
See Notes to Financial Statements
Summary of Investments by Sector
Excluding Collateral for Securities Loaned | | % of
Investments | | Value | |
| Communication Services | | | 10.0 | % | | $ | 223,199,968 | |
| Consumer Discretionary | | | 20.2 | | | | 449,284,757 | |
| Consumer Staples | | | 2.7 | | | | 60,861,815 | |
| Energy | | | 4.8 | | | | 106,130,199 | |
| Financials | | | 19.6 | | | | 435,004,984 | |
| Health Care | | | 6.3 | | | | 139,890,195 | |
| Industrials | | | 9.2 | | | | 205,130,729 | |
| Information Technology | | | 20.3 | | | | 449,898,779 | |
| Materials | | | 3.1 | | | | 69,066,473 | |
| Real Estate | | | 2.8 | | | | 61,686,147 | |
| Money Market Fund | | | 1.0 | | | | 21,996,944 | |
| | | | 100.0 | % | | $ | 2,222,150,990 | |
Transactions in securities of affiliates for the period ended December 31, 2021:
| | | Value
12/31/2020 | | | Purchases | | | Sales
Proceeds | | | Realized Gain
(Loss) | | | Dividend
Income | | | Net Change in
Unrealized
Appreciation
(Depreciation) | | | Value
12/31/2021 | |
| MLP Saglik Hizmetleri AS | | | $–(a) | | | $ | 4,041,170 | | | $ | – | | | $ | – | | | $ | – | | | $ | (4,785,694 | ) | | $ | 24,220,236 | |
| Vasta Platform Ltd. | | | –(a) | | | | 2,590,887 | | | | (134,306 | ) | | | (553,679 | ) | | | – | | | | (9,679,326 | ) | | | 4,016,368 | |
| | | | $– | | | $ | 6,632,057 | | | $ | (134,306 | ) | | $ | (553,679 | ) | | $ | – | | | $ | (14,465,020 | ) | | $ | 28,236,604 | |
| (a) | Security held by the Fund, however not classified as an affiliate at the beginning of the reporting period. |
See Notes to Financial Statements
EMERGING MARKETS FUND
SCHEDULE OF INVESTMENTS
(continued)
The summary of inputs used to value the Fund’s investments as of December 31, 2021 is as follows:
| | | Level 1
Quoted
Prices | | | Level 2
Significant
Observable
Inputs | | | Level 3
Significant
Unobservable
Inputs | | | Value | |
| Common Stocks | | | | | | | | | | | | | | | | |
| Argentina | | $ | 67,649,228 | | | $ | — | | | $ | — | | | $ | 67,649,228 | |
| Brazil | | | 4,016,368 | | | | 120,909,623 | | | | — | | | | 124,925,991 | |
| China | | | — | | | | 579,678,629 | | | | 1 | | | | 579,678,630 | |
| Egypt | | | 16,339,711 | | | | 40,336,513 | | | | — | | | | 56,676,224 | |
| Georgia | | | 30,077,296 | | | | 7,530,184 | | | | — | | | | 37,607,480 | |
| Germany | | | — | | | | 48,227,865 | | | | — | | | | 48,227,865 | |
| Hungary | | | — | | | | 25,057,120 | | | | — | | | | 25,057,120 | |
| India | | | 48,867,570 | | | | 214,881,940 | | | | — | | | | 263,749,510 | |
| Indonesia | | | — | | | | 44,326,617 | | | | — | | | | 44,326,617 | |
| Kazakhstan | | | 43,330,640 | | | | — | | | | — | | | | 43,330,640 | |
| Kenya | | | — | | | | 2,236,779 | | | | — | | | | 2,236,779 | |
| Kuwait | | | 10,615,048 | | | | — | | | | — | | | | 10,615,048 | |
| Mexico | | | 54,568,086 | | | | — | | | | — | | | | 54,568,086 | |
| Philippines | | | 58,256,567 | | | | 16,299,190 | | | | — | | | | 74,555,757 | |
| Poland | | | — | | | | 13,837,624 | | | | — | | | | 13,837,624 | |
| Russia | | | 50,480,440 | | | | 71,123,223 | | | | — | | | | 121,603,663 | |
| South Africa | | | — | | | | 27,532,514 | | | | — | | | | 27,532,514 | |
| South Korea | | | — | | | | 130,819,416 | | | | — | | | | 130,819,416 | |
| Taiwan | | | 30,010,697 | | | | 268,084,972 | | | | — | | | | 298,095,669 | |
| Tanzania | | | 35,754,229 | | | | — | | | | — | | | | 35,754,229 | |
| Turkey | | | 53,354,775 | | | | — | | | | — | | | | 53,354,775 | |
| United Kingdom | | | — | | | | — | | | | 1 | | | | 1 | |
| Preferred Securities * | | | — | | | | 85,951,180 | | | | — | | | | 85,951,180 | |
| Money Market Funds | | | 22,937,194 | | | | — | | | | — | | | | 22,937,194 | |
| Total Investments | | $ | 526,257,849 | | | $ | 1,696,833,389 | | | $ | 2 | | | $ | 2,223,091,240 | |
| * | See Schedule of Investments for geographic sector breakouts. |
See Notes to Financial Statements
VANECK ENVIRONMENTAL SUSTAINABILITY FUND
SCHEDULE OF INVESTMENTS
December 31, 2021
| | | Number
of Shares | | | Value | |
| COMMON STOCKS: 93.0% | | | | | | | | |
| Australia: 4.0% | | | | | | | | |
| Allkem Ltd. # * | | | 13,371 | | | $ | 101,426 | |
| Ecograf Ltd. # * | | | 86,700 | | | | 42,599 | |
| Piedmont Lithium, Inc. (USD) * | | | 1,200 | | | | 62,952 | |
| | | | | | | | 206,977 | |
| Canada: 1.4% | | | | | | | | |
| Ballard Power Systems, Inc. (USD) * † | | | 1,900 | | | | 23,864 | |
| Burcon NutraScience Corp. * † | | | 3,000 | | | | 3,534 | |
| Euro Manganese, Inc. (AUD) # * | | | 92,600 | | | | 33,373 | |
| Farmers Edge, Inc. * | | | 790 | | | | 1,974 | |
| Maple Leaf Foods, Inc. | | | 380 | | | | 8,790 | |
| | | | | | | | 71,535 | |
| China: 4.5% | | | | | | | | |
| BYD Co. Ltd. (HKD) # | | | 5,000 | | | | 169,122 | |
| Flat Glass Group Co. Ltd. (HKD) # † | | | 12,000 | | | | 61,088 | |
| | | | | | | | 230,210 | |
| Denmark: 5.0% | | | | | | | | |
| Novozymes A/S # | | | 760 | | | | 62,403 | |
| Orsted AS 144A # | | | 840 | | | | 107,576 | |
| Vestas Wind Systems A/S # | | | 2,800 | | | | 85,274 | |
| | | | | | | | 255,253 | |
| Finland: 2.1% | | | | | | | | |
| Neste Oyj # | | | 2,200 | | | | 108,275 | |
| France: 3.8% | | | | | | | | |
| Cie de Saint-Gobain # | | | 440 | | | | 30,952 | |
| Engie SA # | | | 6,800 | | | | 100,677 | |
| Legrand SA # | | | 520 | | | | 60,903 | |
| | | | | | | | 192,532 | |
| Germany: 3.9% | | | | | | | | |
| Infineon Technologies AG # | | | 4,200 | | | | 193,361 | |
| Isle of Man: 0.1% | | | | | | | | |
| Agronomics Ltd. * | | | 14,600 | | | | 4,446 | |
| Israel: 0.0% | | | | | | | | |
| Else Nutrition Holdings, Inc. (CAD) * | | | 2,200 | | | | 1,983 | |
| Italy: 1.2% | | | | | | | | |
| Enel SpA # | | | 7,600 | | | | 60,770 | |
| Japan: 3.3% | | | | | | | | |
| FANUC Corp. # | | | 200 | | | | 42,512 | |
| Keyence Corp. # | | | 200 | | | | 125,752 | |
| | | | | | | | 168,264 | |
| Norway: 4.0% | | | | | | | | |
| FREYR Battery SA (USD) * | | | 17,500 | | | | 195,649 | |
| South Korea: 3.0% | | | | | | | | |
| LG Chem Ltd. # * | | | 130 | | | | 67,205 | |
| Samsung SDI Co. Ltd. # * | | | 160 | | | | 87,996 | |
| | | | | | | | 155,201 | |
| Spain: 1.6% | | | | | | | | |
| Avangrid, Inc. (USD) | | | 950 | | | | 47,386 | |
| Soltec Power Holdings SA * | | | 4,800 | | | | 33,827 | |
| | | | | | | | 81,213 | |
| Sweden: 3.2% | | | | | | | | |
| Atlas Copco AB # | | | 2,100 | | | | 145,112 | |
| | | Number
of Shares | | | Value | |
| Sweden (continued) | | | | | | | | |
| Oatly Group AB (ADR) * | | | 1,600 | | | $ | 12,736 | |
| | | | | | | | 157,848 | |
| United States: 51.9% | | | | | | | | |
| Amyris, Inc. * | | | 990 | | | | 5,356 | |
| Ball Corp. | | | 1,100 | | | | 105,897 | |
| Benson Hill, Inc. * | | | 4,500 | | | | 32,805 | |
| Beyond Meat, Inc. * | | | 340 | | | | 22,154 | |
| Bloom Energy Corp. * † | | | 1,900 | | | | 41,667 | |
| Bunge Ltd. | | | 970 | | | | 90,559 | |
| Cognex Corp. | | | 900 | | | | 69,984 | |
| Darling Ingredients, Inc. * | | | 1,100 | | | | 76,219 | |
| Deere & Co. | | | 350 | | | | 120,012 | |
| Enphase Energy, Inc. * | | | 640 | | | | 117,082 | |
| EVgo, Inc. * † | | | 8,000 | | | | 79,520 | |
| Fluence Energy, Inc. * | | | 230 | | | | 8,179 | |
| Generac Holdings, Inc. * | | | 310 | | | | 109,095 | |
| Hannon Armstrong Sustainable Infrastructure Capital, Inc. | | | 3,100 | | | | 164,672 | |
| John Bean Technologies Corp. | | | 110 | | | | 16,892 | |
| Lindsay Corp. | | | 150 | | | | 22,800 | |
| MP Materials Corp. * | | | 1,200 | | | | 54,504 | |
| NextEra Energy Partners LP | | | 730 | | | | 61,612 | |
| Ormat Technologies, Inc. † | | | 1,500 | | | | 118,950 | |
| Pentair Plc | | | 990 | | | | 72,300 | |
| Plug Power, Inc. * † | | | 1,300 | | | | 36,699 | |
| Quanta Services, Inc. | | | 1,200 | | | | 137,592 | |
| Republic Services, Inc. | | | 690 | | | | 96,221 | |
| SolarEdge Technologies, Inc. * | | | 360 | | | | 101,005 | |
| Stem, Inc. * † | | | 4,900 | | | | 92,953 | |
| Sunnova Energy International, Inc. * | | | 2,800 | | | | 78,176 | |
| Sunrun, Inc. * | | | 2,700 | | | | 92,610 | |
| Tattooed Chef, Inc. * | | | 370 | | | | 5,750 | |
| Teradyne, Inc. | | | 430 | | | | 70,318 | |
| Tesla, Inc. * | | | 190 | | | | 200,787 | |
| TPI Composites, Inc. * | | | 2,500 | | | | 37,400 | |
| Trimble, Inc. * | | | 1,800 | | | | 156,942 | |
| TuSimple Holdings, Inc. * | | | 640 | | | | 22,944 | |
| Xylem, Inc. | | | 1,000 | | | | 119,920 | |
| | | | | | | | 2,639,576 | |
Total Common Stocks
(Cost: $4,862,057) | | | | | | | 4,723,093 | |
| | | | | | | | | |
MASTER LIMITED PARTNERSHIP: 0.8%
(Cost: $45,048) | | | | | | | | |
| Canada: 0.8% | | | | | | | | |
| Brookfield Renewable Partners LP (USD) | | | 1,200 | | | | 42,948 | |
See Notes to Financial Statements
VANECK ENVIRONMENTAL SUSTAINABILITY FUND
SCHEDULE OF INVESTMENTS
(continued)
| | | Number
of Shares | | | Value | |
MONEY MARKET FUND: 7.7%
(Cost: $390,680) | | | | | | | | |
| Invesco Treasury Portfolio - Institutional Class | | | 390,680 | | | $ | 390,680 | |
| | | | | | | | | |
Total Investments Before Collateral for Securities Loaned: 101.5%
(Cost: $5,297,785) | | | | | | | 5,156,721 | |
| | | Number
of Shares | | | Value | |
SHORT-TERM INVESTMENT HELD AS COLLATERAL FOR SECURITIES ON LOAN: 1.8%
(Cost: $92,522) | | | | | | | | |
| Money Market Fund: 1.8% | | | | | | | | |
| State Street Navigator Securities Lending Government Money Market Portfolio | | | 92,522 | | | $ | 92,522 | |
Total Investments: 103.3%
(Cost: $5,390,307) | | | | | | | 5,249,243 | |
| Liabilities in excess of other assets: (3.3)% | | | | | | | (168,527) | |
| NET ASSETS: 100.0% | | | | | | $ | 5,080,716 | |
| Definitions: |
| ADR | American Depositary Receipt |
| AUD | Australia Dollar |
| CAD | Canadian Dollar |
| HKD | Hong Kong Dollar |
| USD | United States Dollar |
| Footnotes: |
| # | Security has been valued in good faith pursuant to guidelines established by the Board of Trustees. The aggregate value of fair valued securities is $1,686,376 which represents 33.2% of net assets. |
| * | Non-income producing |
| † | Security fully or partially on loan. Total market value of securities on loan is $379,878. |
| | |
| 144A | Security exempt from registration under Rule 144A of the Securities Act of 1933, as amended, or otherwise restricted. These securities may be resold in transactions exempt from registration, unless otherwise noted, and the value amounted $107,576, or 2.1% of net assets. |
Summary of Investments by Sector
Excluding Collateral for Securities Loaned | | % of
Investments | | Value | |
| Consumer Discretionary | | | 8.7 | % | | $ | 449,430 | |
| Consumer Staples | | | 4.9 | | | | 250,996 | |
| Energy | | | 2.1 | | | | 108,275 | |
| Financials | | | 3.3 | | | | 169,118 | |
| Industrials | | | 31.9 | | | | 1,645,377 | |
| Information Technology | | | 19.0 | | | | 985,501 | |
| Materials | | | 10.5 | | | | 539,249 | |
| Utilities | | | 12.0 | | | | 618,095 | |
| Money Market Fund | | | 7.6 | | | | 390,680 | |
| | | | 100.0 | % | | $ | 5,156,721 | |
See Notes to Financial Statements
The summary of inputs used to value the Fund’s investments as of December 31, 2021 is as follows:
| | | Level 1
Quoted
Prices | | | Level 2
Significant
Observable
Inputs | | | Level 3
Significant
Unobservable
Inputs | | | Value | |
| Common Stocks | | | | | | | | | | | | | | | | |
| Australia | | $ | 62,952 | | | $ | 144,025 | | | $ | — | | | $ | 206,977 | |
| Canada | | | 38,162 | | | | 33,373 | | | | — | | | | 71,535 | |
| China | | | — | | | | 230,210 | | | | — | | | | 230,210 | |
| Denmark | | | — | | | | 255,253 | | | | — | | | | 255,253 | |
| Finland | | | — | | | | 108,275 | | | | — | | | | 108,275 | |
| France | | | — | | | | 192,532 | | | | — | | | | 192,532 | |
| Germany | | | — | | | | 193,361 | | | | — | | | | 193,361 | |
| Isle of Man | | | 4,446 | | | | — | | | | — | | | | 4,446 | |
| Israel | | | 1,983 | | | | — | | | | — | | | | 1,983 | |
| Italy | | | — | | | | 60,770 | | | | — | | | | 60,770 | |
| Japan | | | — | | | | 168,264 | | | | — | | | | 168,264 | |
| Norway | | | 195,649 | | | | — | | | | — | | | | 195,649 | |
| South Korea | | | — | | | | 155,201 | | | | — | | | | 155,201 | |
| Spain | | | 81,213 | | | | — | | | | — | | | | 81,213 | |
| Sweden | | | 12,736 | | | | 145,112 | | | | — | | | | 157,848 | |
| United States | | | 2,639,576 | | | | — | | | | — | | | | 2,639,576 | |
| Master Limited Partnership * | | | 42,948 | | | | — | | | | — | | | | 42,948 | |
| Money Market Funds | | | 483,202 | | | | — | | | | — | | | | 483,202 | |
| Total Investments | | $ | 3,562,867 | | | $ | 1,686,376 | | | $ | — | | | $ | 5,249,243 | |
| * | See Schedule of Investments for geographic sector breakouts. |
See Notes to Financial Statements
GLOBAL RESOURCES FUND
SCHEDULE OF INVESTMENTS
December 31, 2021
| | | Number
of Shares | | | Value | |
| COMMON STOCKS: 98.1% | | | | | | | | |
| Australia: 2.6% | | | | | | | | |
| Allkem Ltd. # * | | | 252,149 | | | $ | 1,912,696 | |
| Ecograf Ltd. # * † | | | 1,428,881 | | | | 702,068 | |
| Piedmont Lithium, Inc. (USD) * | | | 79,600 | | | | 4,175,816 | |
| Rio Tinto Plc (ADR) † | | | 205,000 | | | | 13,722,700 | |
| | | | | | | | 20,513,280 | |
| Brazil: 2.0% | | | | | | | | |
| Vale SA (ADR) | | | 662,400 | | | | 9,286,848 | |
| Yara International ASA (NOK) # | | | 121,500 | | | | 6,125,810 | |
| | | | | | | | 15,412,658 | |
| British Virgin Islands: 0.1% | | | | | | | | |
| Talon Metals Corp. (CAD) * † | | | 1,533,600 | | | | 739,552 | |
| Canada: 10.4% | | | | | | | | |
| Agnico Eagle Mines Ltd. (USD) | | | 269,706 | | | | 14,332,177 | |
| B2Gold Corp. (USD) | | | 1,211,600 | | | | 4,761,588 | |
| Barrick Gold Corp. (USD) | | | 728,745 | | | | 13,846,155 | |
| Euro Manganese, Inc. (AUD) # * | | | 2,075,372 | | | | 747,961 | |
| Kinross Gold Corp. (USD) | | | 1,656,700 | | | | 9,625,427 | |
| Kirkland Lake Gold Ltd. (USD) † | | | 184,398 | | | | 7,735,496 | |
| Nouveau Monde Graphite, Inc. (USD) * † | | | 175,800 | | | | 1,228,842 | |
| Nutrien Ltd. (USD) | | | 392,471 | | | | 29,513,819 | |
| | | | | | | | 81,791,465 | |
| Chile: 1.7% | | | | | | | | |
| Lundin Mining Corp. (CAD) | | | 1,673,800 | | | | 13,073,358 | |
| Finland: 0.7% | | | | | | | | |
| Neste Oyj # | | | 113,400 | | | | 5,581,068 | |
| Norway: 3.5% | | | | | | | | |
| Equinor ASA (ADR) | | | 698,600 | | | | 18,394,138 | |
| FREYR Battery SA (USD) * † | | | 455,400 | | | | 5,091,372 | |
| FREYR Battery SA (USD) * ø | | | 350,000 | | | | 3,913,000 | |
| | | | | | | | 27,398,510 | |
| South Africa: 5.4% | | | | | | | | |
| Anglo American Plc (GBP) # | | | 653,100 | | | | 26,863,452 | |
| Sibanye Stillwater Ltd. (ADR) † | | | 1,243,000 | | | | 15,587,220 | |
| | | | | | | | 42,450,672 | |
| Spain: 0.1% | | | | | | | | |
| Soltec Power Holdings SA * † | | | 118,600 | | | | 835,811 | |
| United Kingdom: 0.9% | | | | | | | | |
| Endeavour Mining Plc (CAD) | | | 332,400 | | | | 7,286,811 | |
| United States: 66.6% | | | | | | | | |
| Baker Hughes Co. | | | 222,900 | | | | 5,362,974 | |
| Benson Hill, Inc. * | | | 308,000 | | | | 2,245,320 | |
| Benson Hill, Inc. * ø | | | 190,000 | | | | 1,387,000 | |
| Bunge Ltd. | | | 255,500 | | | | 23,853,480 | |
| ChampionX Corp. * | | | 330,200 | | | | 6,673,342 | |
| Chart Industries, Inc. * | | | 89,834 | | | | 14,327,625 | |
| Chevron Corp. | | | 134,600 | | | | 15,795,310 | |
| ConocoPhillips | | | 256,641 | | | | 18,524,347 | |
| Corteva, Inc. | | | 373,866 | | | | 17,676,384 | |
| Coterra Energy, Inc. | | | 1,071,932 | | | | 20,366,708 | |
| Darling Ingredients, Inc. * | | | 115,900 | | | | 8,030,711 | |
| Devon Energy Corp. | | | 587,932 | | | | 25,898,405 | |
| Diamondback Energy, Inc. | | | 244,468 | | | | 26,365,874 | |
| Enphase Energy, Inc. * | | | 27,100 | | | | 4,957,674 | |
| EQT Corp. * | | | 727,600 | | | | 15,868,956 | |
| | | Number
of Shares | | | Value | |
| United States (continued) | | | | | | | | |
| ESS Tech, Inc. * ø | | | 190,000 | | | $ | 2,171,700 | |
| EVgo, Inc. * ø | | | 308,000 | | | | 3,046,120 | |
| Fluence Energy, Inc. * | | | 34,400 | | | | 1,223,264 | |
| FMC Corp. | | | 140,400 | | | | 15,428,556 | |
| Freeport-McMoRan, Inc. | | | 811,500 | | | | 33,863,895 | |
| Hannon Armstrong Sustainable Infrastructure Capital, Inc. † | | | 523,091 | | | | 27,786,594 | |
| IPG Photonics Corp. * | | | 62,200 | | | | 10,707,108 | |
| Kirby Corp. * | | | 119,700 | | | | 7,112,574 | |
| Liberty Oilfield Services, Inc. * | | | 934,050 | | | | 9,060,285 | |
| Louisiana-Pacific Corp. | | | 134,000 | | | | 10,498,900 | |
| Mosaic Co. | | | 230,500 | | | | 9,056,345 | |
| MP Materials Corp. * | | | 251,400 | | | | 11,418,588 | |
| Newmont Corp. | | | 321,455 | | | | 19,936,639 | |
| Ormat Technologies, Inc. † | | | 134,600 | | | | 10,673,780 | |
| Pioneer Natural Resources Co. | | | 180,288 | | | | 32,790,781 | |
| SolarEdge Technologies, Inc. * | | | 85,600 | | | | 24,016,792 | |
| Solaris Oilfield Infrastructure, Inc. | | | 592,300 | | | | 3,879,565 | |
| Solid Power, Inc. ø | | | 85,000 | | | | 742,900 | |
| Stem, Inc. * ø | | | 362,000 | | | | 6,870,760 | |
| Stem, Inc. * † | | | 600,732 | | | | 11,395,886 | |
| Sunrun, Inc. * † | | | 471,100 | | | | 16,158,730 | |
| TuSimple Holdings, Inc. * | | | 99,630 | | | | 3,571,736 | |
| Tyson Foods, Inc. | | | 190,100 | | | | 16,569,116 | |
| Union Pacific Corp. | | | 24,200 | | | | 6,096,706 | |
| Valero Energy Corp. | | | 278,000 | | | | 20,880,580 | |
| | | | | | | | 522,292,010 | |
| Zambia: 4.1% | | | | | | | | |
| First Quantum Minerals Ltd. (CAD) | | | 1,328,700 | | | | 31,795,525 | |
Total Common Stocks
(Cost: $488,282,198) | | | | | | | 769,170,720 | |
| | | | | | | | | |
| WARRANTS: 0.1% | | | | | | | | |
| Norway: 0.1% | | | | | | | | |
| FREYR Battery SA, USD 11.50, exp. 09/01/27 | | | 120,350 | | | | 445,295 | |
| United States: 0.0% | | | | | | | | |
| Benson Hill, Inc., USD 11.50, exp. 12/24/25 | | | 74,875 | | | | 92,096 | |
Total Warrants
(Cost: $216,758) | | | | | | | 537,391 | |
| | | | | | | | | |
MONEY MARKET FUND: 2.2%
(Cost: $16,977,659) | | | | | | | | |
| Invesco Treasury Portfolio - Institutional Class | | | 16,977,659 | | | | 16,977,659 | |
| | | | | | | | | |
Total Investments Before Collateral for Securities Loaned: 100.4%
(Cost: $505,476,615) | | | | | | | 786,685,770 | |
See Notes to Financial Statements
| | | Number
of Shares | | | Value | |
SHORT-TERM INVESTMENT HELD AS COLLATERAL FOR SECURITIES ON LOAN: 1.7%
(Cost: $13,227,690) | | | | | | | | |
| Money Market Fund: 1.7% | | | | | | | | |
| State Street Navigator Securities Lending Government Money Market Portfolio | | | 13,227,690 | | | $ | 13,227,690 | |
Total Investments: 102.1%
(Cost: $518,704,305) | | | | | | | 799,913,460 | |
| Liabilities in excess of other assets: (2.1)% | | | | | | | (16,255,353) | |
| NET ASSETS: 100.0% | | | | | | $ | 783,658,107 | |
| Definitions: |
| ADR | American Depositary Receipt |
| AUD | Australia Dollar |
| CAD | Canadian Dollar |
| GBP | British Pound |
| NOK | Norwegian Krone |
| USD | United States Dollar |
| Footnotes: |
| # | Security has been valued in good faith pursuant to guidelines established by the Board of Trustees. The aggregate value of fair valued securities is $41,933,055 which represents 5.4% of net assets. |
| * | Non-income producing |
| † | Security fully or partially on loan. Total market value of securities on loan is $58,015,233. |
| Ø | Restricted Security – the aggregate value of restricted securities is $18,131,480, or 2.3% of net assets |
Restricted securities held by the Fund as of December 31, 2021 are as follows:
| Security | | Acquisition
Date | | Number of
Shares | | Acquisition
Cost | | | Value | | | % of
Net Assets | |
| Benson Hill, Inc. | | 09/29/2021 | | 190,000 | | $ | 1,900,000 | | | $ | 1,387,000 | | | | 0.2 | % | |
| ESS Tech, Inc. | | 10/08/2021 | | 190,000 | | | 1,900,000 | | | | 2,171,700 | | | | 0.3 | % | |
| EVgo, Inc. | | 06/30/2021 | | 308,000 | | | 3,080,000 | | | | 3,046,120 | | | | 0.4 | % | |
| FREYR Battery SA | | 07/06/2021 | | 350,000 | | | 3,500,000 | | | | 3,913,000 | | | | 0.5 | % | |
| Solid Power, Inc. | | 12/08/2021 | | 85,000 | | | 850,000 | | | | 742,900 | | | | 0.1 | % | |
| Stem, Inc. | | 04/28/2021 | | 362,000 | | | 3,620,000 | | | | 6,870,760 | | | | 0.8 | % | |
| | | | | | | $ | 14,850,000 | | | $ | 18,131,480 | | | | 2.3 | % | |
Summary of Investments by Sector
Excluding Collateral for Securities Loaned | | % of
Investments | | Value | |
| Consumer Cyclical | | | 0.4 | % | | $ | 3,046,120 | |
| Consumer Staples | | | 6.4 | | | | 50,790,723 | |
| Energy | | | 28.7 | | | | 225,442,333 | |
| Financials | | | 3.5 | | | | 27,786,594 | |
| Industrials | | | 10.2 | | | | 79,957,359 | |
| Information Technology | | | 5.1 | | | | 39,681,574 | |
| Materials | | | 42.2 | | | | 332,329,628 | |
| Utilities | | | 1.3 | | | | 10,673,780 | |
| Money Market Fund | | | 2.2 | | | | 16,977,659 | |
| | | | 100.0 | % | | $ | 786,685,770 | |
See Notes to Financial Statements
GLOBAL RESOURCES FUND
SCHEDULE OF INVESTMENTS
(continued)
The summary of inputs used to value the Fund’s investments as of December 31, 2021 is as follows:
| | | Level 1
Quoted
Prices | | | Level 2
Significant
Observable
Inputs | | | Level 3
Significant
Unobservable
Inputs | | | Value | |
| Common Stocks | | | | | | | | | | | | | | | | |
| Australia | | $ | 17,898,516 | | | $ | 2,614,764 | | | $ | — | | | $ | 20,513,280 | |
| Brazil | | | 9,286,848 | | | | 6,125,810 | | | | — | | | | 15,412,658 | |
| British Virgin Islands | | | 739,552 | | | | — | | | | — | | | | 739,552 | |
| Canada | | | 81,043,504 | | | | 747,961 | | | | — | | | | 81,791,465 | |
| Chile | | | 13,073,358 | | | | — | | | | — | | | | 13,073,358 | |
| Finland | | | — | | | | 5,581,068 | | | | — | | | | 5,581,068 | |
| Norway | | | 27,398,510 | | | | — | | | | — | | | | 27,398,510 | |
| South Africa | | | 15,587,220 | | | | 26,863,452 | | | | — | | | | 42,450,672 | |
| Spain | | | 835,811 | | | | — | | | | — | | | | 835,811 | |
| United Kingdom | | | 7,286,811 | | | | — | | | | — | | | | 7,286,811 | |
| United States | | | 522,292,010 | | | | — | | | | — | | | | 522,292,010 | |
| Zambia | | | 31,795,525 | | | | — | | | | — | | | | 31,795,525 | |
| Warrants * | | | 537,391 | | | | — | | | | — | | | | 537,391 | |
| Money Market Funds | | | 30,205,349 | | | | — | | | | — | | | | 30,205,349 | |
| Total Investments | | $ | 757,980,405 | | | $ | 41,933,055 | | | $ | — | | | $ | 799,913,460 | |
| * | See Schedule of Investments for geographic sector breakouts. |
See Notes to Financial Statements
INTERNATIONAL INVESTORS GOLD FUND
CONSOLIDATED SCHEDULE OF INVESTMENTS
December 31, 2021
| | | Number
of Shares | | | Value | |
| COMMON STOCKS: 90.4% | | | | | | | | |
| Australia: 16.4% | | | | | | | | |
| Bellevue Gold Ltd. # * | | | 36,929,813 | | | $ | 22,776,138 | |
| De Grey Mining Ltd. # * † | | | 10,771,722 | | | | 9,571,789 | |
| Emerald Resources NL # * | | | 8,103,636 | | | | 6,367,464 | |
| Evolution Mining Ltd. # | | | 11,850,687 | | | | 35,158,468 | |
| Northern Star Resources Ltd. # | | | 3,995,300 | | | | 27,477,066 | |
| Predictive Discovery Ltd. # * † | | | 66,813,319 | | | | 12,413,154 | |
| West African Resources Ltd. # * | | | 28,554,240 | | | | 27,544,136 | |
| | | | | | | | 141,308,215 | |
| Brazil: 7.9% | | | | | | | | |
| Wheaton Precious Metals Corp. (USD) | | | 1,025,286 | | | | 44,015,528 | |
| Yamana Gold, Inc. (USD) | | | 5,607,209 | | | | 23,662,422 | |
| | | | | | | | 67,677,950 | |
| Canada: 49.6% | | | | | | | | |
Agnico Eagle Mines Ltd.
(USD) | | | 619,700 | | | | 32,930,858 | |
| Alamos Gold, Inc. (USD) | | | 1,978,814 | | | | 15,217,080 | |
| Argonaut Gold, Inc. * | | | 2,174,822 | | | | 4,126,308 | |
| B2Gold Corp. (USD) | | | 11,512,836 | | | | 45,245,446 | |
| Barrick Gold Corp. (USD) | | | 2,247,400 | | | | 42,700,600 | |
| Bear Creek Mining Corp. * | | | 2,737,800 | | | | 2,640,512 | |
| Bear Creek Mining Corp. # * ø | | | 948,000 | | | | 921,807 | |
| Benchmark Metals, Inc. * † ‡ ø | | | 9,185,099 | | | | 7,842,134 | |
| Benchmark Metals, Inc. # ‡ ø | | | 1,278,000 | | | | 1,025,370 | |
| Bonterra Resources, Inc. * | | | 4,278,931 | | | | 4,329,840 | |
| Equinox Gold Corp. (USD) * | | | 2,495,903 | | | | 16,872,304 | |
| Franco-Nevada Corp. (USD) | | | 24,900 | | | | 3,443,421 | |
| G Mining Ventures Corp. * † ‡ | | | 10,281,966 | | | | 6,746,537 | |
| Galway Metals, Inc. * † ‡ | | | 11,480,400 | | | | 5,536,222 | |
| GoGold Resources, Inc. # * ø | | | 2,725,643 | | | | 6,528,873 | |
| GoGold Resources, Inc. * | | | 3,363,418 | | | | 8,056,569 | |
Gold Standard Ventures Corp.
(USD) * | | | 4,172,422 | | | | 1,848,800 | |
| Goldsource Mines, Inc. * † ‡ | | | 4,314,354 | | | | 2,933,195 | |
| Kinross Gold Corp. (USD) | | | 7,716,400 | | | | 44,832,284 | |
| Kirkland Lake Gold Ltd. (USD) | | | 738,448 | | | | 30,977,894 | |
| Liberty Gold Corp. * ‡ ø | | | 10,822,000 | | | | 8,298,623 | |
| Liberty Gold Corp. * ‡ | | | 21,154,114 | | | | 16,221,579 | |
| Lundin Gold, Inc. * | | | 468,600 | | | | 3,860,083 | |
| Marathon Gold Corp. * | | | 6,270,000 | | | | 16,059,765 | |
| Nighthawk Gold Corp. * † | | | 3,298,000 | | | | 2,111,846 | |
| O3 Mining, Inc. * † | | | 1,807,700 | | | | 2,929,590 | |
| Orezone Gold Corp. * † | | | 15,456,607 | | | | 14,662,974 | |
| Osisko Mining, Inc. * | | | 5,120,096 | | | | 15,421,610 | |
| Pretium Resources, Inc. (USD) * | | | 822,500 | | | | 11,589,025 | |
| Probe Metals, Inc. * | | | 3,434,223 | | | | 5,185,474 | |
| Pure Gold Mining, Inc. * | | | 3,990,951 | | | | 2,145,418 | |
| Pure Gold Mining, Inc. # * ø | | | 5,058,500 | | | | 2,719,301 | |
| Rhyolite Resources Ltd. # ∞ ø | | | 4,112,000 | | | | 2,729,631 | |
| Sabina Gold & Silver Corp. * | | | 9,123,814 | | | | 10,458,540 | |
| Silver Tiger Metals, Inc. * | | | 5,982,500 | | | | 3,357,900 | |
| Skeena Resources Ltd. * | | | 396,550 | | | | 4,128,672 | |
| SSR Mining, Inc. (USD) † | | | 942,100 | | | | 16,675,170 | |
| Wallbridge Mining Co. Ltd. * | | | 9,103,200 | | | | 2,878,596 | |
| | | | | | | | 426,189,851 | |
| Chile: 0.5% | | | | | | | | |
| Rio2 Ltd. (CAD) * | | | 8,493,556 | | | | 4,297,305 | |
| | | Number
of Shares | | | Value | |
| South Africa: 3.0% | | | | | | | | |
| Gold Fields Ltd. (ADR) | | | 2,360,700 | | | $ | 25,944,093 | |
| Turkey: 0.5% | | | | | | | | |
| Eldorado Gold Corp. (USD) * | | | 454,500 | | | | 4,249,575 | |
| United Kingdom: 4.9% | | | | | | | | |
| Endeavour Mining Plc (CAD) | | | 1,937,579 | | | | 42,475,249 | |
| United States: 7.6% | | | | | | | | |
| Gatos Silver, Inc. * | | | 491,366 | | | | 5,100,379 | |
| Newmont Corp. | | | 948,376 | | | | 58,818,279 | |
| Perpetua Resources Corp. (CAD) * † | | | 247,520 | | | | 1,179,925 | |
| | | | | | | | 65,098,583 | |
Total Common Stocks
(Cost: $434,769,060) | | | | | | | 777,240,821 | |
| | | | | | | | | |
| WARRANTS: 0.2% | | | | | | | | |
| Canada: 0.2% | | | | | | | | |
| Benchmark Metals, Inc., | | | | | | | | |
| CAD 1.80, exp. 09/18/22 # * ఠ| | | 2,395,000 | | | | 105,649 | |
Benchmark Metals, Inc.,
CAD 1.55, exp. 12/09/23 # * ‡ ø | | | 639,000 | | | | 155,033 | |
Goldsource Mines, Inc.,
CAD 1.40, exp. 05/20/23 # *∞ | | | 21,571,772 | | | | 285,475 | |
Nighthawk Gold Corp.,
CAD 1.50, exp. 07/07/23 # *∞ | | | 1,649,000 | | | | 109,112 | |
O3 Mining, Inc.,
CAD 3.25, exp. 06/18/22 # *∞ | | | 694,450 | | | | 5,106 | |
Osisko Mining, Inc.,
CAD 5.25, exp. 06/23/22 # *∞ | | | 357,198 | | | | 57,775 | |
PG Mining Ventures Corp.,
CAD 0.80, exp. 05/20/22 # *∞ | | | 5,140,983 | | | | 680,344 | |
Pure Gold Mining, Inc.,
USD 0.85, exp. 07/18/22 # *∞ | | | 3,172,500 | | | | 186,595 | |
| | | | | | | | | |
Total Warrants
(Cost: $3,657,433) | | | | | | | 1,585,089 | |
| | | | | | | | | |
EXCHANGE TRADED FUND: 5.1% (a)
(Cost: $43,555,913) | | | | | | | | |
| United States: 5.1% | | | | | | | | |
| SPDR Gold Shares * | | | 258,000 | | | | 44,107,680 | |
| | | | | | | | | |
MONEY MARKET FUND: 4.2%
(Cost: $36,070,500) | | | | | | | | |
| Invesco Treasury Portfolio - Institutional Class | | | 36,070,500 | | | | 36,070,500 | |
| | | | | | | | | |
Total Investments Before Collateral for Securities Loaned: 99.9%
(Cost: $518,052,906) | | | | | | | 859,004,090 | |
See Notes to Financial Statements
INTERNATIONAL INVESTORS GOLD FUND
CONSOLIDATED SCHEDULE OF INVESTMENTS
(continued)
| | | Number
of Shares | | | Value | |
SHORT-TERM INVESTMENT HELD AS COLLATERAL FOR SECURITIES ON LOAN: 0.3%
(Cost: $2,635,122) | |
| Money Market Fund: 0.3% | | | | | | | | |
| State Street Navigator Securities Lending Government Money Market Portfolio | | | 2,635,122 | | | $ | 2,635,122 | |
Total Investments: 100.2%
(Cost: $520,688,028) | | | | | | | 861,639,212 | |
| Liabilities in excess of other assets: (0.2)% | | | | | | | (1,693,763) | |
| NET ASSETS: 100.0% | | | | | | $ | 859,945,449 | |
| Definitions: |
| ADR | American Depositary Receipt |
| CAD | Canadian Dollar |
| USD | United States Dollar |
| Footnotes: |
| # | Security has been valued in good faith pursuant to guidelines established by the Board of Trustees. The aggregate value of fair valued securities is $156,818,286 which represents 18.2% of net assets. |
| * | Non-income producing |
| † | Security fully or partially on loan. Total market value of securities on loan is $4,030,754. |
| ø | Restricted Security – the aggregate value of restricted securities is $30,220,772, or 3.5% of net assets |
| ‡ | Affiliated issuer – as defined under the Investment Company Act of 1940. |
| ∞ | Security is valued using pricing models and significant unobservable inputs that factor in volatility and discount for lack of marketability and is classified as Level 3 in the fair value hierarchy. |
| (a) | The underlying fund’s shareholder reports and registration documents are available free of charge on the SEC’s website at https://www. sec.gov. |
Restricted securities held by the Fund as of December 31, 2021 are as follows:
| Security | | Acquisition
Date | | Number of
Shares | | | Acquisition
Cost | | | Value | | | % of
Net Assets |
| Bear Creek Mining Corp. | | 08/15/2015 | | | 948,000 | | | $ | 2,865,267 | | | $ | 921,807 | | | | 0.1% | |
| Benchmark Metals, Inc. | | 11/16/2021 | | | 1,278,000 | | | | 945,510 | | | | 1,025,370 | | | | 0.1% | |
| Benchmark Metals, Inc. | | 09/21/2020 | | | 9,185,099 | | | | 8,730,836 | | | | 7,842,134 | | | | 0.9% | |
| Benchmark Metals, Inc. * | | 11/16/2021 | | | 639,000 | | | | 71,359 | | | | 155,033 | | | | 0.0% | |
| GoGold Resources, Inc. | | 08/31/2020 | | | 2,725,643 | | | | 2,002,864 | | | | 6,528,873 | | | | 0.8% | |
| Liberty Gold Corp. | | 10/04/2021 | | | 10,822,000 | | | | 5,138,855 | | | | 8,298,624 | | | | 1.0% | |
| Pure Gold Mining, Inc. | | 05/21/2020 | | | 5,058,500 | | | | 3,571,215 | | | | 2,719,301 | | | | 0.3% | |
| Rhyolite Resources Ltd. | | 12/09/2021 | | | 4,112,000 | | | | 2,846,122 | | | | 2,729,631 | | | | 0.3% | |
| | | | | | | | | $ | 26,172,028 | | | $ | 30,220,773 | | | | 3.5% | |
Summary of Investments by Sector
Excluding Collateral for Securities Loaned | | % of
Investments | | Value | |
| Diversified Metals & Mining | | | 2.4 | % | | $ | 21,027,173 | |
| Gold | | | 88.9 | | | | 763,442,560 | |
| Precious Metals & Minerals | | | 2.6 | | | | 21,949,009 | |
| Silver | | | 1.9 | | | | 16,514,848 | |
| Money Market Fund | | | 4.2 | | | | 36,070,500 | |
| | | | 100.0 | % | | $ | 859,004,090 | |
See Notes to Financial Statements
Transactions in securities of affiliates for the period ended December 31, 2021:
| | | Value
12/31/2020 | | | Purchases | | Sales
Proceeds | | Realized Gain
(Loss) | | Dividend
Income | | Net Change in
Unrealized
Appreciation
(Depreciation) | | Value
12/31/2021 |
| Benchmark Metals, Inc.* | | | $–(a) | | | $ | – | | | $ | – | | | $ | – | | | $ | – | | | $ | (716,768 | ) | | $ | 105,649 | |
| Benchmark Metals, Inc.ø | | | –(a) | | | | 5,329,229 | | | | (381,654 | ) | | | (184,623 | ) | | | – | | | | (1,314,790 | ) | | | 7,842,134 | |
| Benchmark Metals, Inc.ø | | | – | | | | 945,510 | | | | – | | | | – | | | | – | | | | 79,860 | | | | 1,025,370 | |
| Benchmark Metals, Inc.*ø | | | – | | | | 71,359 | | | | – | | | | – | | | | – | | | | 83,674 | | | | 155,033 | |
| Corvus Gold, Inc. | | | 17,891,855 | | | | 5,738,282 | | | | (30,451,662 | ) | | | 15,839,003 | | | | – | | | | (9,017,478 | ) | | | – | |
| G Mining Ventures Corp. | | | – | | | | 2,849,704 | | | | – | | | | – | | | | – | | | | 3,896,833 | | | | 6,746,537 | |
| Galway Metals, Inc. | | | –(a) | | | | 3,572,221 | | | | (112,119 | ) | | | (58,814 | ) | | | – | | | | (4,377,727 | ) | | | 5,536,222 | |
| Goldsource Mines, Inc. | | | – | | | | 3,071,444 | | | | – | | | | – | | | | – | | | | (138,249 | ) | | | 2,933,195 | |
| Liberty Gold Corp.* | | | 9,692,104 | | | | – | | | | (5,138,855 | ) | | | – | | | | – | | | | (4,553,249 | ) | | | – | |
| Liberty Gold Corp. | | | 34,226,388 | | | | – | | | | (4,397,196 | ) | | | 1,216,250 | | | | – | | | | (14,823,863 | ) | | | 16,221,579 | |
| Liberty Gold Corp.ø | | | – | | | | 5,138,855 | | | | – | | | | – | | | | – | | | | 3,159,768 | | | | 8,298,623 | |
| Orezone Gold Corp. | | | 11,191,133 | | | | 2,360,839 | | | | (358,210 | ) | | | 65,628 | | | | – | | | | 1,403,584 | | | | –(b) | |
| West African Resources Ltd. | | | 37,833,807 | | | | – | | | | (16,771,928 | ) | | | 11,118,037 | | | | – | | | | (4,635,780 | ) | | | –(b) | |
| | | $ | 110,835,287 | | | $ | 29,077,443 | | | $ | (57,611,624 | ) | | $ | 27,995,481 | | | $ | – | | | $ | (30,954,185 | ) | | $ | 48,864,342 | |
| Footnotes: |
| * | Warrants |
| (a) | Security held by the Fund, however not classified as an affiliate at the beginning of the reporting period. |
| ø | Restricted Security. |
| (b) | Security held by the Fund, however not classified as an affiliate at the end of the reporting period. |
The summary of inputs used to value the Fund’s investments as of December 31, 2021 is as follows:
| | | Level 1
Quoted
Prices | | | Level 2
Significant
Observable
Inputs | | | Level 3
Significant
Unobservable
Inputs | | | Value | |
| Common Stocks | | | | | | | | | | | | | | | | |
| Australia | | $ | — | | | $ | 141,308,215 | | | $ | — | | | $ | 141,308,215 | |
| Brazil | | | 67,677,950 | | | | — | | | | — | | | | 67,677,950 | |
| Canada | | | 412,264,869 | | | | 11,195,351 | | | | 2,729,631 | | | | 426,189,851 | |
| Chile | | | 4,297,305 | | | | — | | | | — | | | | 4,297,305 | |
| South Africa | | | 25,944,093 | | | | — | | | | — | | | | 25,944,093 | |
| Turkey | | | 4,249,575 | | | | — | | | | — | | | | 4,249,575 | |
| United Kingdom | | | 42,475,249 | | | | — | | | | — | | | | 42,475,249 | |
| United States | | | 65,098,583 | | | | — | | | | — | | | | 65,098,583 | |
| Warrants | | | | | | | | | | | | | | | | |
| Canada | | | — | | | | 155,033 | | | | 1,430,056 | | | | 1,585,089 | |
| Exchange Traded Fund | | | 44,107,680 | | | | — | | | | — | | | | 44,107,680 | |
| Money Market Funds | | | 38,705,622 | | | | — | | | | — | | | | 38,705,622 | |
| Total Investments | | $ | 704,820,926 | | | $ | 152,658,599 | | | $ | 4,159,687 | | | $ | 861,639,212 | |
See Notes to Financial Statements
VANECK MORNINGSTAR WIDE MOAT FUND
SCHEDULE OF INVESTMENTS
December 31, 2021
| | | Number
of Shares | | | Value | |
| COMMON STOCKS: 100.0% | | | | | | | | |
| Banks: 2.5% | | | | | | | | |
| Wells Fargo & Co. | | | 9,530 | | | $ | 457,249 | |
| Capital Goods: 11.1% | | | | | | | | |
| Boeing Co. * | | | 2,122 | | | | 427,201 | |
| Emerson Electric Co. | | | 4,786 | | | | 444,954 | |
| Honeywell International, Inc. | | | 1,109 | | | | 231,238 | |
| Lockheed Martin Corp. | | | 1,323 | | | | 470,207 | |
| Raytheon Technologies Corp. | | | 2,659 | | | | 228,834 | |
| Roper Technologies, Inc. | | | 484 | | | | 238,060 | |
| | | | | | | | 2,040,494 | |
| Commercial & Professional Services: 2.6% | | | | | | | | |
| Equifax, Inc. | | | 1,601 | | | | 468,757 | |
| Consumer Durables & Apparel: 2.4% | | | | | | | | |
| Polaris, Inc. | | | 3,917 | | | | 430,517 | |
| Diversified Financials: 2.6% | | | | | | | | |
| Berkshire Hathaway, Inc. * | | | 1,619 | | | | 484,081 | |
| Energy: 2.6% | | | | | | | | |
| Cheniere Energy, Inc. | | | 4,773 | | | | 484,078 | |
| Food, Beverage & Tobacco: 14.1% | | | | | | | | |
| Altria Group, Inc. | | | 9,735 | | | | 461,342 | |
| Campbell Soup Co. | | | 10,560 | | | | 458,937 | |
| Constellation Brands, Inc. | | | 2,013 | | | | 505,203 | |
| Kellogg Co. | | | 7,269 | | | | 468,269 | |
| Philip Morris International, Inc. | | | 4,752 | | | | 451,440 | |
| The Coca-Cola Co. | | | 4,125 | | | | 244,241 | |
| | | | | | | | 2,589,432 | |
| Health Care Equipment & Services: 6.6% | | | | | | | | |
| Medtronic Plc | | | 3,756 | | | | 388,558 | |
| Veeva Systems, Inc. * | | | 1,571 | | | | 401,359 | |
| Zimmer Biomet Holdings, Inc. | | | 3,291 | | | | 418,089 | |
| | | | | | | | 1,208,006 | |
| Materials: 4.8% | | | | | | | | |
| Compass Minerals International, Inc. | | | 7,854 | | | | 401,182 | |
| Corteva, Inc. | | | 10,065 | | | | 475,873 | |
| | | | | | | | 877,055 | |
| Media & Entertainment: 7.4% | | | | | | | | |
| Alphabet, Inc. * | | | 156 | | | | 451,938 | |
| Comcast Corp. | | | 4,636 | | | | 233,330 | |
| Meta Platforms, Inc. * | | | 1,291 | | | | 434,228 | |
| Walt Disney Co. * | | | 1,480 | | | | 229,237 | |
| | | | | | | | 1,348,733 | |
| | | Number
of Shares | | | Value | |
| Pharmaceuticals, Biotechnology & Life Sciences: 9.9% | | | | | | | | |
| Biogen, Inc. * | | | 1,693 | | | $ | 406,185 | |
| Bristol-Myers Squibb Co. | | | 7,589 | | | | 473,174 | |
| Gilead Sciences, Inc. | | | 6,403 | | | | 464,922 | |
| Merck & Co., Inc. | | | 6,207 | | | | 475,704 | |
| | | | | | | | 1,819,985 | |
| Retailing: 3.8% | | | | | | | | |
| Amazon.com, Inc. * | | | 130 | | | | 433,464 | |
| MercadoLibre, Inc. (USD) * | | | 187 | | | | 252,151 | |
| | | | | | | | 685,615 | |
| Semiconductors & Semiconductor Equipment: 6.6% | | | | | | | | |
| Intel Corp. | | | 8,609 | | | | 443,363 | |
| KLA Corp. | | | 607 | | | | 261,077 | |
| Lam Research Corp. | | | 366 | | | | 263,209 | |
| Microchip Technology, Inc. | | | 2,851 | | | | 248,208 | |
| | | | | | | | 1,215,857 | |
| Software & Services: 18.9% | | | | | | | | |
| Aspen Technology, Inc. * | | | 3,293 | | | | 501,195 | |
| Blackbaud, Inc. * | | | 6,083 | | | | 480,435 | |
| Guidewire Software, Inc. * | | | 3,786 | | | | 429,824 | |
| Microsoft Corp. | | | 1,430 | | | | 480,938 | |
| Salesforce.com, Inc. * | | | 1,720 | | | | 437,104 | |
| ServiceNow, Inc. * | | | 341 | | | | 221,346 | |
| Tyler Technologies, Inc. * | | | 905 | | | | 486,845 | |
| Western Union Co. | | | 23,440 | | | | 418,170 | |
| | | | | | | | 3,455,857 | |
| Transportation: 1.5% | | | | | | | | |
| CH Robinson Worldwide, Inc. | | | 2,547 | | | | 274,134 | |
| Utilities: 2.6% | | | | | | | | |
| Dominion Energy, Inc. | | | 6,078 | | | | 477,488 | |
Total Common Stocks
(Cost: $15,753,550) | | | | | | | 18,317,338 | |
| | | | | | | | | |
MONEY MARKET FUND: 0.3%
(Cost: $46,021) | | | | | | | | |
| Invesco Treasury Portfolio - Institutional Class | | | 46,021 | | | | 46,021 | |
| | | | | | | | | |
Total Investments: 100.3%
(Cost: $15,799,571) | | | | | | | 18,363,359 | |
| Liabilities in excess of other assets: (0.3)% | | | | | | | (47,185) | |
| NET ASSETS: 100.0% | | | | | | $ | 18,316,174 | |
| Definitions: |
| USD | United States Dollar |
| Footnotes: |
| * | Non-income producing |
See Notes to Financial Statements
| Summary of Investments by Sector | | % of
Investments | | Value | |
| Communication Services | | | 7.4 | % | | $ | 1,348,733 | |
| Consumer Discretionary | | | 6.0 | | | | 1,116,132 | |
| Consumer Staples | | | 14.1 | | | | 2,589,432 | |
| Energy | | | 2.6 | | | | 484,078 | |
| Financials | | | 5.1 | | | | 941,330 | |
| Health Care | | | 16.5 | | | | 3,027,991 | |
| Industrials | | | 15.2 | | | | 2,783,385 | |
| Information Technology | | | 25.4 | | | | 4,671,714 | |
| Materials | | | 4.8 | | | | 877,055 | |
| Utilities | | | 2.6 | | | | 477,488 | |
| Money Market Fund | | | 0.3 | | | | 46,021 | |
| | | | 100.0 | % | | $ | 18,363,359 | |
The summary of inputs used to value the Fund’s investments as of December 31, 2021 is as follows:
| | | Level 1
Quoted
Prices | | | Level 2
Significant
Observable
Inputs | | | Level 3
Significant
Unobservable
Inputs | | | Value | |
| Common Stocks * | | $ | 18,317,338 | | | $ | — | | | $ | — | | | $ | 18,317,338 | |
| Money Market Fund | | | 46,021 | | | | — | | | | — | | | | 46,021 | |
| Total Investments | | $ | 18,363,359 | | | $ | — | | | $ | — | | | $ | 18,363,359 | |
| * | See Schedule of Investments for industry sector breakouts. |
See Notes to Financial Statements
VANECK NDR MANAGED ALLOCATION FUND
SCHEDULE OF INVESTMENTS
December 31, 2021
| | | Number
of Shares | | | Value | |
| EXCHANGE TRADED FUNDS: 96.6% (a) | | | | | | | | |
| iShares Core MSCI Emerging Markets ETF | | | 18,765 | | | $ | 1,123,273 | |
| iShares Core U.S. Aggregate Bond ETF | | | 36,293 | | | | 4,140,305 | |
| iShares MSCI Canada ETF † | | | 19,327 | | | | 742,737 | |
| iShares MSCI Eurozone ETF † | | | 59,273 | | | | 2,904,970 | |
| iShares MSCI South Korea ETF | | | 671 | | | | 52,251 | |
| iShares MSCI Switzerland ETF † | | | 14,434 | | | | 761,105 | |
| iShares MSCI United Kingdom ETF † | | | 7,397 | | | | 245,136 | |
| iShares Russell 1000 Growth ETF | | | 22,110 | | | | 6,756,595 | |
| iShares Russell 1000 Value ETF | | | 48,965 | | | | 8,222,691 | |
| iShares Russell 2000 Growth ETF | | | 4,170 | | | | 1,222,019 | |
| iShares Russell 2000 Value ETF † | | | 9,551 | | | | 1,585,944 | |
| JPMorgan BetaBuilders Japan ETF | | | 28,943 | | | | 1,594,180 | |
| Vanguard FTSE Emerging Markets ETF † | | | 8,335 | | | | 412,249 | |
| Vanguard Total Bond Market ETF | | | 48,777 | | | | 4,133,851 | |
Total Exchange Traded Funds
(Cost: $26,541,265) | | | | | | | 33,897,306 | |
| | | Number
of Shares | | | Value | |
MONEY MARKET FUND: 4.0%
(Cost: $1,398,630) | | | | | | | | |
| Invesco Treasury Portfolio - Institutional Class | | | 1,398,630 | | | $ | 1,398,630 | |
| | | | | | | | | |
Total Investments Before Collateral for Securities Loaned: 100.6%
(Cost: $27,939,895) | | | | | | | 35,295,936 | |
| | | | | | | | | |
SHORT-TERM INVESTMENT HELD AS COLLATERAL FOR SECURITIES ON LOAN: 7.1%
(Cost: $2,483,454) | | | | | |
| Money Market Fund: 7.1% | | | | | | | | |
| State Street Navigator Securities Lending Government Money Market Portfolio | | | 2,483,454 | | | | 2,483,454 | |
Total Investments: 107.7% (Cost: $30,423,349) | | | | | | | 37,779,390 | |
| Liabilities in excess of other assets: (7.7)% | | | | | | | (2,716,525) | |
| NET ASSETS: 100.0% | | | | | | $ | 35,062,865 | |
| Footnotes: |
| (a) | Each underlying fund’s shareholder reports and registration documents are available free of charge on the SEC’s website at https://www.sec.gov. |
| † | Security fully or partially on loan. Total market value of securities on loan is $6,319,383. |
Summary of Investments by Sector
Excluding Collateral for Securities Loaned | | % of
Investments | | Value | |
| Exchange Traded Fund | | | 96.0 | % | | $ | 33,897,306 | |
| Money Market Fund | | | 4.0 | | | | 1,398,630 | |
| | | | 100.0 | % | | $ | 35,295,936 | |
The summary of inputs used to value the Fund’s investments as of December 31, 2021 is as follows:
| | | Level 1
Quoted
Prices | | | Level 2
Significant
Observable
Inputs | | | Level 3
Significant
Unobservable
Inputs | | | Value | |
| Exchange Traded Funds | | $ | 33,897,306 | | | $ | — | | | $ | — | | | $ | 33,897,306 | |
| Money Market Funds | | | 3,882,084 | | | | — | | | | — | | | | 3,882,084 | |
| Total Investments | | $ | 37,779,390 | | | $ | — | | | $ | — | | | $ | 37,779,390 | |
See Notes to Financial Statements
VANECK FUNDS
STATEMENTS OF ASSETS AND LIABILITIES
December 31, 2021
| | | CM Commodity
Index Fund (a) | | Emerging
Markets Bond
Fund | | Emerging
Markets Fund | | Environmental
Sustainability
Fund |
| Assets: | | | | | | | | | | | | | | | | |
| Investments, at value (1) | | | | | | | | | | | | | | | | |
| Unaffiliated issuers (2) | | $ | 650,625,609 | | | $ | 15,057,809 | | | $ | 2,193,914,386 | | | $ | 5,156,721 | |
| Affiliated issuers (3) | | | — | | | | — | | | | 28,236,604 | | | | — | |
| Short-term investments held as collateral for securities loaned (4) | | | 151 | | | | 568,095 | | | | 940,250 | | | | 92,522 | |
| Total return swap contracts, at value | | | 6,078,183 | | | | — | | | | — | | | | — | |
| Cash | | | 740,198 | | | | — | | | | — | | | | 326 | |
| Cash denominated in foreign currency, at value (5) | | | — | | | | 91,006 | | | | 3,120,982 | | | | 46 | |
| Receivables: | | | | | | | | | | | | | | | | |
| Investment securities sold | | | — | | | | 378,699 | | | | 12,280,004 | | | | — | |
| Shares of beneficial interest sold | | | 2,080,858 | | | | — | | | | 7,914,744 | | | | — | |
| Due from Adviser | | | — | | | | 15,344 | | | | — | | | | 15,129 | |
| Dividends and interest | | | 2,491 | | | | 280,450 | | | | 1,902,330 | | | | 2,582 | |
| Prepaid expenses | | | 14,754 | | | | 2,999 | | | | 64,826 | | | | — | |
| Total assets | | | 659,542,244 | | | | 16,394,402 | | | | 2,248,374,126 | | | | 5,267,326 | |
| Liabilities: | | | | | | | | | | | | | | | | |
| Payables: | | | | | | | | | | | | | | | | |
| Investment securities purchased | | | — | | | | 46,375 | | | | — | | | | — | |
| Shares of beneficial interest redeemed | | | 2,371,346 | | | | 55,084 | | | | 35,951,992 | | | | — | |
| Collateral for securities loaned | | | 151 | | | | 568,095 | | | | 940,250 | | | | 92,522 | |
| Due to Adviser | | | 248,961 | | | | — | | | | 1,218,560 | | | | — | |
| Due to custodian | | | — | | | | 332,324 | | | | — | | | | — | |
| Due to Distributor | | | 6,497 | | | | 1,368 | | | | 49,618 | | | | 210 | |
| Deferred Trustee fees | | | 361,490 | | | | 20,584 | | | | 1,775,930 | | | | 186 | |
| Accrued expenses | | | 184,039 | | | | 136,148 | | | | 6,181,406 | | | | 93,692 | |
| Total liabilities | | | 3,172,484 | | | | 1,159,978 | | | | 46,117,756 | | | | 186,610 | |
| NET ASSETS | | $ | 656,369,760 | | | $ | 15,234,424 | | | $ | 2,202,256,370 | | | $ | 5,080,716 | |
| Net Assets consist of: | | | | | | | | | | | | | | | | |
| Aggregate paid in capital | | $ | 840,602,774 | | | $ | 48,354,202 | | | $ | 1,928,353,484 | | | $ | 5,235,913 | |
| Total distributable earnings (loss) | | | (184,233,014) | | | | (33,119,778) | | | | 273,902,886 | | | | (155,197) | |
| NET ASSETS | | $ | 656,369,760 | | | $ | 15,234,424 | | | $ | 2,202,256,370 | | | $ | 5,080,716 | |
| (1) | Value of securities on loan | | $ | — | | | $ | 1,031,725 | | | $ | 17,674,230 | | | $ | 379,878 | |
| (2) | Cost of investments - Unaffiliated issuers | | $ | 650,616,681 | | | $ | 15,385,153 | | | $ | 1,879,362,300 | | | $ | 5,297,785 | |
| (3) | Cost of investments - Affiliated issuers | | $ | — | | | $ | — | | | $ | 46,667,889 | | | $ | — | |
| (4) | Cost of short-term investments held as collateral for securities loaned | | $ | 151 | | | $ | 568,095 | | | $ | 940,250 | | | $ | 92,522 | |
| (5) | Cost of cash denominated in foreign currency | | $ | — | | | $ | 94,920 | | | $ | 3,114,734 | | | $ | 46 | |
See Notes to Financials
VANECK FUNDS
STATEMENTS OF ASSETS AND LIABILITIES
December 31, 2021 (continued)
| | | CM Commodity
Index Fund (a) | | Emerging
Markets Bond
Fund | | Emerging
Markets Fund | | Environmental
Sustainability
Fund |
| Class A Shares: | | | | | | | | | | | | | | | | |
| Net Assets | | $ | 30,967,194 | | | $ | 6,219,004 | | | $ | 129,715,991 | | | $ | 990,703 | |
| Shares of beneficial interest outstanding | | | 6,137,491 | | | | 1,025,348 | | | | 7,622,832 | | | | 40,863 | |
| Net asset value and redemption price per share | | $ | 5.05 | | | $ | 6.07 | | | $ | 17.02 | | | $ | 24.24 | |
| Maximum offering price per share (Net asset value per share ÷ 94.25%) | | $ | 5.35 | | | $ | 6.44 | | | $ | 18.06 | | | $ | 25.72 | |
| Class C Shares: | | | | | | | | | | | | | | | | |
| Net Assets | | | N/A | | | | N/A | | | $ | 24,117,974 | | | | N/A | |
| Shares of beneficial interest outstanding | | | N/A | | | | N/A | | | | 1,640,657 | | | | N/A | |
| Net asset value and redemption price per share (Redemption may be subject to a contingent deferred sales charge within one year of ownership) | | | N/A | | | | N/A | | | $ | 14.70 | | | | N/A | |
| Class I Shares: | | | | | | | | | | | | | | | | |
| Net Assets | | $ | 295,436,554 | | | $ | 5,515,634 | | | $ | 899,742,673 | | | $ | 2,148,610 | |
| Shares of beneficial interest outstanding | | | 56,768,154 | | | | 896,990 | | | | 49,552,050 | | | | 88,497 | |
| Net asset value and redemption price per share | | $ | 5.20 | | | $ | 6.15 | | | $ | 18.16 | | | $ | 24.28 | |
| Class Y Shares: | | | | | | | | | | | | | | | | |
| Net Assets | | $ | 329,966,012 | | | $ | 3,499,786 | | | $ | 1,085,748,730 | | | $ | 1,941,403 | |
| Shares of beneficial interest outstanding | | | 63,645,497 | | | | 572,010 | | | | 62,440,813 | | | | 80,000 | |
| Net asset value and redemption price per share | | $ | 5.18 | | | $ | 6.12 | | | $ | 17.39 | | | $ | 24.27 | |
| Class Z Shares: | | | | | | | | | | | | | | | | |
| Net Assets | | | N/A | | | | N/A | | | $ | 62,931,002 | | | | N/A | |
| Shares of beneficial interest outstanding | | | N/A | | | | N/A | | | | 3,458,850 | | | | N/A | |
| Net asset value and redemption price per share | | | N/A | | | | N/A | | | $ | 18.19 | | | | N/A | |
| | | | | | | | | | | | | | | | | |
| (a) | Consolidated Statement of Assets and Liabilities | | | | | | | | | | | | | | | | |
See Notes to Financials
VANECK FUNDS
STATEMENTS OF ASSETS AND LIABILITIES
December 31, 2021
| | | Global
Resources
Fund | | International
Investors Gold
Fund (a) | | VanEck
Morningstar
Wide Moat
Fund | | VanEck NDR
Managed
Allocation
Fund |
| Assets: | | | | | | | | | | | | | | | | |
| Investments, at value (1) | | | | | | | | | | | | | | | | |
| Unaffiliated issuers (2) | | $ | 786,685,770 | | | $ | 810,139,748 | | | $ | 18,363,359 | | | $ | 35,295,936 | |
| Affiliated issuers (3) | | | — | | | | 48,864,342 | | | | — | | | | — | |
| Short-term investments held as collateral for securities loaned (4) | | | 13,227,690 | | | | 2,635,122 | | | | — | | | | 2,483,454 | |
| Cash | | | — | | | | 64,103 | | | | — | | | | — | |
| Cash denominated in foreign currency, at value (5) | | | 1,859 | | | | 10 | | | | — | | | | — | |
| Receivables: | | | | | | | | | | | | | | | | |
| Investment securities sold | | | — | | | | 622,333 | | | | — | | | | — | |
| Shares of beneficial interest sold | | | 623,596 | | | | 4,677,826 | | | | 338 | | | | — | |
| Due from Adviser | | | — | | | | — | | | | 11,855 | | | | — | |
| Dividends and interest | | | 632,363 | | | | 318,518 | | | | 23,783 | | | | 10,481 | |
| Prepaid expenses | | | 39,754 | | | | 77,236 | | | | 2,969 | | | | 2,999 | |
| Total assets | | | 801,211,032 | | | | 867,399,238 | | | | 18,402,304 | | | | 37,792,870 | |
| Liabilities: | | | | | | | | | | | | | | | | |
| Payables: | | | | | | | | | | | | | | | | |
| Investment securities purchased | | | — | | | | 2,096 | | | | — | | | | — | |
| Shares of beneficial interest redeemed | | | 2,230,638 | | | | 3,402,785 | | | | — | | | | 126,823 | |
| Collateral for securities loaned | | | 13,227,690 | | | | 2,635,122 | | | | — | | | | 2,483,454 | |
| Due to Adviser | | | 557,436 | | | | 480,467 | | | | — | | | | 4,326 | |
| Due to Distributor | | | 43,465 | | | | 103,895 | | | | — | | | | 2,042 | |
| Deferred Trustee fees | | | 520,047 | | | | 577,105 | | | | 7,587 | | | | 28,608 | |
| Accrued expenses | | | 973,649 | | | | 252,319 | | | | 78,543 | | | | 84,752 | |
| Total liabilities | | | 17,552,925 | | | | 7,453,789 | | | | 86,130 | | | | 2,730,005 | |
| NET ASSETS | | $ | 783,658,107 | | | $ | 859,945,449 | | | $ | 18,316,174 | | | $ | 35,062,865 | |
| Net Assets consist of: | | | | | | | | | | | | | | | | |
| Aggregate paid in capital | | $ | 1,576,805,130 | | | $ | 971,649,104 | | | $ | 15,454,110 | | | $ | 28,114,298 | |
| Total distributable earnings (loss) | | | (793,147,023) | | | | (111,703,655) | | | | 2,862,064 | | | | 6,948,567 | |
| NET ASSETS | | $ | 783,658,107 | | | $ | 859,945,449 | | | $ | 18,316,174 | | | $ | 35,062,865 | |
| (1) | Value of securities on loan | | $ | 58,015,233 | | | $ | 4,030,754 | | | $ | — | | | $ | 6,319,383 | |
| (2) | Cost of investments - Unaffiliated issuers | | $ | 505,476,615 | | | $ | 483,434,699 | | | $ | 15,799,571 | | | $ | 27,939,895 | |
| (3) | Cost of investments - Affiliated issuers | | $ | — | | | $ | 34,618,207 | | | $ | — | | | $ | — | |
| (4) | Cost of short-term investments held as collateral for securities loaned | | $ | 13,227,690 | | | $ | 2,635,122 | | | $ | — | | | $ | 2,483,454 | |
| (5) | Cost of cash denominated in foreign currency | | $ | 1,831 | | | $ | 10 | | | $ | — | | | $ | — | |
See Notes to Financials
VANECK FUNDS
STATEMENTS OF ASSETS AND LIABILITIES
December 31, 2021 (continued)
| | | Global
Resources
Fund | | International
Investors Gold
Fund (a) | | VanEck
Morningstar
Wide Moat
Fund | | VanEck NDR
Managed
Allocation
Fund |
| Class A Shares: | | | | | | | | | | | | | | | | |
| Net Assets | | $ | 152,139,100 | | | $ | 302,173,532 | | | | N/A | | | $ | 9,563,270 | |
| Shares of beneficial interest outstanding | | | 3,879,759 | | | | 29,291,319 | | | | N/A | | | | 279,256 | |
| Net asset value and redemption price per share | | $ | 39.21 | | | $ | 10.32 | | | | N/A | | | $ | 34.25 | |
| Maximum offering price per share (Net asset value per share ÷ 94.25%) | | $ | 41.60 | | | $ | 10.95 | | | | N/A | | | $ | 36.34 | |
| Class C Shares: | | | | | | | | | | | | | | | | |
| Net Assets | | $ | 13,925,615 | | | $ | 48,991,683 | | | | N/A | | | | N/A | |
| Shares of beneficial interest outstanding | | | 418,444 | | | | 5,737,629 | | | | N/A | | | | N/A | |
| Net asset value and redemption price per share (Redemption may be subject to a contingent deferred sales charge within one year of ownership) | | $ | 33.28 | | | $ | 8.54 | | | | N/A | | | | N/A | |
| Class I Shares: | | | | | | | | | | | | | | | | |
| Net Assets | | $ | 386,458,049 | | | $ | 202,916,104 | | | $ | 3,727,691 | | | $ | 13,229,301 | |
| Shares of beneficial interest outstanding | | | 9,386,342 | | | | 14,270,031 | | | | 111,251 | | | | 384,794 | |
| Net asset value and redemption price per share | | $ | 41.17 | | | $ | 14.22 | | | $ | 33.51 | | | $ | 34.38 | |
| Class Y Shares: | | | | | | | | | | | | | | | | |
| Net Assets | | $ | 231,135,343 | | | $ | 305,864,130 | | | | N/A | | | $ | 12,270,294 | |
| Shares of beneficial interest outstanding | | | 5,778,776 | | | | 28,758,107 | | | | N/A | | | | 356,880 | |
| Net asset value and redemption price per share | | $ | 40.00 | | | $ | 10.64 | | | | N/A | | | $ | 34.38 | |
| Class Z Shares: | | | | | | | | | | | | | | | | |
| Net Assets | | | N/A | | | | N/A | | | $ | 14,588,483 | | | | N/A | |
| Shares of beneficial interest outstanding | | | N/A | | | | N/A | | | | 441,556 | | | | N/A | |
| Net asset value and redemption price per share | | | N/A | | | | N/A | | | $ | 33.04 | | | | N/A | |
| | | | | | | | | | | | | | | | | |
| (a) | Consolidated Statement of Assets and Liabilities | | | | | | | | | | | | | | | | |
See Notes to Financials
VANECK FUNDS
STATEMENTS OF OPERATIONS
For the Year Ended December 31, 2021
| | | CM Commodity
Index Fund (a) | | Emerging
Markets Bond
Fund | | Emerging
Markets Fund | | Environmental
Sustainability
Fund (e) |
| Income: | | | | | | | | | | | | | | | | |
| Dividends - unaffiliated issuers | | $ | 3,148 | | | $ | 97 | | | $ | 40,022,837 | | | $ | 11,576 | |
| Interest | | | 283,392 | | | | 1,640,609 | | | | — | | | | — | |
| Securities lending income | | | 33,023 | | | | 1,320 | | | | 532,682 | | | | 1,171 | |
| Foreign taxes withheld | | | — | | | | (13,797 | ) | | | (4,428,328 | ) | | | (909 | ) |
| Total income | | | 319,563 | | | | 1,628,229 | | | | 36,127,191 | | | | 11,838 | |
| Expenses: | | | | | | | | | | | | | | | | |
| Management fees | | | 4,548,328 | | | | 216,678 | | | | 21,335,483 | | | | 17,772 | |
| Distribution fees – Class A | | | 76,791 | | | | 17,237 | | | | 388,355 | | | | 1,181 | |
| Distribution fees – Class C | | | — | | | | — | | | | 319,906 | | | | — | |
| Transfer agent fees – Class A | | | 82,877 | | | | 20,083 | | | | 205,493 | | | | 9 | |
| Transfer agent fees – Class C | | | — | | | | — | | | | 52,195 | | | | — | |
| Transfer agent fees – Class I | | | 280,850 | | | | 29,665 | | | | 1,011,156 | | | | 7 | |
| Transfer agent fees – Class Y | | | 481,253 | | | | 18,614 | | | | 936,740 | | | | 18 | |
| Transfer agent fees – Class Z | | | — | | | | — | | | | 13,992 | | | | — | |
| Administration fees | | | — | | | | — | | | | 7,111,828 | | | | — | |
| Custodian fees | | | 26,402 | | | | 27,610 | | | | 747,500 | | | | 13,211 | |
| Professional fees | | | 103,526 | | | | 121,786 | | | | 131,939 | | | | 63,669 | |
| Registration fees – Class A | | | 17,925 | | | | 16,926 | | | | 21,342 | | | | 7,932 | |
| Registration fees – Class C | | | — | | | | — | | | | 12,494 | | | | — | |
| Registration fees – Class I | | | 18,678 | | | | 16,288 | | | | 28,022 | | | | 6,670 | |
| Registration fees – Class Y | | | 21,568 | | | | 16,920 | | | | 114,191 | | | | 6,670 | |
| Registration fees – Class Z | | | — | | | | — | | | | 13,261 | | | | — | |
| Reports to shareholders | | | 49,944 | | | | 19,832 | | | | 59,782 | | | | 11,998 | |
| Insurance | | | 32,465 | | | | 6,214 | | | | 86,821 | | | | — | |
| Trustees’ fees and expenses | | | 80,517 | | | | 3,446 | | | | 345,817 | | | | 4,109 | |
| Interest | | | 3,559 | | | | 4,696 | | | | 19,825 | | | | — | |
| Other | | | 5,293 | | | | 4,791 | | | | 44,039 | | | | 1,733 | |
| Total expenses | | | 5,829,976 | | | | 540,786 | | | | 33,000,181 | | | | 134,979 | |
| Waiver of management fees | | | (1,647,713 | ) | | | (213,060 | ) | | | (2,172,992 | ) | | | (17,772 | ) |
| Expenses assumed by the Adviser | | | — | | | | (43,031 | ) | | | — | | | | (92,153 | ) |
| Net expenses | | | 4,182,263 | | | | 284,695 | | | | 30,827,189 | | | | 25,054 | |
| Net investment income (loss) | | | (3,862,700 | ) | | | 1,343,534 | | | | 5,300,002 | | | | (13,216 | ) |
| Net realized gain (loss) on: | | | | | | | | | | | | | | | | |
| Investments - unaffiliated issuers | | | 1,344 | | | | (1,011,202 | ) (b) | | | 222,159,595 | | | | — | |
| Investments - affiliated issuers | | | — | | | | — | | | | (553,679 | ) | | | — | |
| Swap contracts | | | 165,025,653 | | | | — | | | | — | | | | — | |
| Forward foreign currency contracts | | | — | | | | (52,094 | ) | | | — | | | | — | |
| Foreign currency transactions and foreign denominated assets and liabilities | | | — | | | | (52,502 | ) | | | (1,246,749 | ) | | | (918 | ) |
| Net realized gain (loss) | | | 165,026,997 | | | | (1,115,798 | ) | | | 220,359,167 | | | | (918 | ) |
| Net change in unrealized appreciation (depreciation) on: | | | | | | | | | | | | | | | | |
| Investments - unaffiliated issuers | | | (8,393 | ) | | | (1,349,564 | ) (c) | | | (546,869,765 | ) (d) | | | (141,063 | ) |
| Investments - affiliated issuers | | | — | | | | — | | | | (14,465,020 | ) | | | — | |
| Swap contracts | | | (1,730,309 | ) | | | — | | | | — | | | | — | |
| Forward foreign currency contracts | | | — | | | | 20,185 | | | | — | | | | — | |
| Foreign currency transactions and foreign denominated assets and liabilities | | | — | | | | (11,618 | ) | | | (3,391 | ) | | | — | |
| Net change in unrealized appreciation (depreciation) | | | (1,738,702 | ) | | | (1,340,997 | ) | | | (561,338,176 | ) | | | (141,063 | ) |
| Net Increase (Decrease) in Net Assets Resulting from Operations | | $ | 159,425,595 | | | $ | (1,113,261 | ) | | $ | (335,679,007 | ) | | $ | (155,197 | ) |
| (a) | Consolidated Statement of Operations |
| (b) | Net of foreign taxes of $3,716 |
| (c) | Net of foreign taxes of $10,306 |
See Notes to Financial Statements
VANECK FUNDS
STATEMENTS OF OPERATIONS
For the Year Ended December 31, 2021 (continued)
| (d) | Net of foreign taxes of $2,880,252 |
| (e) | For the period July 14, 2021 (commence of operations) through December 31, 2021. |
See Notes to Financial Statements
VANECK FUNDS
STATEMENTS OF OPERATIONS
For the Year Ended December 31, 2021
| | | Global
Resources Fund | | International
Investors Gold
Fund (a) | | VanEck
Morningstar
Wide Moat
Fund | | VanEck NDR
Managed
Allocation Fund |
| Income: | | | | | | | | | | | | | | | | |
| Dividends - unaffiliated issuers | | $ | 19,006,395 | | | $ | 13,841,874 | | | $ | 281,036 | | | $ | 607,977 | |
| Securities lending income | | | 1,159,201 | | | | 71,265 | | | | 10 | | | | 52,004 | |
| Foreign taxes withheld | | | (910,764 | ) | | | (1,203,942 | ) | | | — | | | | — | |
| Total income | | | 19,254,832 | | | | 12,709,197 | | | | 281,046 | | | | 659,981 | |
| Expenses: | | | | | | | | | | | | | | | | |
| Management fees | | | 7,263,373 | | | | 6,356,810 | | | | 73,458 | | | | 288,563 | |
| Distribution fees – Class A | | | 364,605 | | | | 830,302 | | | | — | | | | 25,601 | |
| Distribution fees – Class C | | | 114,472 | | | | 538,402 | | | | — | | | | — | |
| Transfer agent fees – Class A | | | 267,124 | | | | 441,807 | | | | — | | | | 24,058 | |
| Transfer agent fees – Class C | | | 35,981 | | | | 76,678 | | | | — | | | | — | |
| Transfer agent fees – Class I | | | 243,893 | | | | 144,206 | | | | 14,270 | | | | 18,150 | |
| Transfer agent fees – Class Y | | | 258,550 | | | | 340,618 | | | | — | | | | 25,275 | |
| Transfer agent fees – Class Z | | | — | | | | — | | | | 13,009 | | | | — | |
| Administration fees | | | — | | | | 2,267,724 | | | | — | | | | — | |
| Custodian fees | | | 32,829 | | | | 46,500 | | | | 17,336 | | | | 15,659 | |
| Professional fees | | | 107,679 | | | | 117,482 | | | | 111,038 | | | | 99,836 | |
| Registration fees – Class A | | | 14,637 | | | | 18,345 | | | | — | | | | 17,098 | |
| Registration fees – Class C | | | 18,758 | | | | 17,661 | | | | — | | | | — | |
| Registration fees – Class I | | | 20,629 | | | | 20,281 | | | | 17,960 | | | | 17,087 | |
| Registration fees – Class Y | | | 31,502 | | | | 31,439 | | | | — | | | | 17,089 | |
| Registration fees – Class Z | | | — | | | | — | | | | 18,560 | | | | — | |
| Reports to shareholders | | | 9,582 | | | | 62,147 | | | | 8,524 | | | | 16,284 | |
| Insurance | | | 33,713 | | | | 50,080 | | | | 6,049 | | | | 6,308 | |
| Trustees’ fees and expenses | | | 93,069 | | | | 94,448 | | | | 1,846 | | | | 4,562 | |
| Interest | | | 10,847 | | | | 12,742 | | | | 97 | | | | 783 | |
| Other | | | 3,008 | | | | 5,105 | | | | 1,062 | | | | 2,408 | |
| Total expenses | | | 8,924,251 | | | | 11,472,777 | | | | 283,209 | | | | 578,761 | |
| Waiver of management fees | | | (878,369 | ) | | | (59,592 | ) | | | (73,458 | ) | | | (234,986 | ) |
| Expenses assumed by the Adviser | | | — | | | | — | | | | (126,128 | ) | | | — | |
| Net expenses | | | 8,045,882 | | | | 11,413,185 | | | | 83,623 | | | | 343,775 | |
| Net investment income | | | 11,208,950 | | | | 1,296,012 | | | | 197,423 | | | | 316,206 | |
| Net realized gain (loss) on: | | | | | | | | | | | | | | | | |
| Investments - unaffiliated issuers | | | 60,249,865 | | | | 54,246,879 | | | | 2,171,939 | | | | 2,503,873 | |
| Investments - affiliated issuers | | | — | | | | 27,995,481 | | | | — | | | | — | |
| Forward foreign currency contracts | | | — | | | | (82,027 | ) | | | — | | | | — | |
| Foreign currency transactions and foreign denominated assets and liabilities | | | (21,192 | ) | | | (4,292 | ) | | | — | | | | — | |
| Net realized gain | | | 60,228,673 | | | | 82,156,041 | | | | 2,171,939 | | | | 2,503,873 | |
| Net change in unrealized appreciation (depreciation) on: | | | | | | | | | | | | | | | | |
| Investments - unaffiliated issuers | | | 41,663,043 | | | | (206,311,055 | ) | | | 865,496 | | | | 1,115,390 | |
| Investments - affiliated issuers | | | — | | | | (30,954,185 | ) | | | — | | | | — | |
| Swap contracts | | | — | | | | — | | | | — | | | | — | |
| Derivative contracts - PIPE | | | (2,648,246 | ) | | | — | | | | — | | | | — | |
| Forward foreign currency contracts | | | — | | | | (2,096 | ) | | | — | | | | — | |
| Foreign currency transactions and foreign denominated assets and liabilities | | | 28 | | | | 1,839 | | | | — | | | | — | |
| Net change in unrealized appreciation (depreciation) | | | 39,014,825 | | | | (237,265,497 | ) | | | 865,496 | | | | 1,115,390 | |
| Net Increase (Decrease) in Net Assets Resulting from Operations | | $ | 110,452,448 | | | $ | (153,813,444 | ) | | $ | 3,234,858 | | | $ | 3,935,469 | |
| | | | | | | | | | | | | | | | | |
| (a) | Consolidated Statement of Operations | | | | | | | | | | | | | | | | |
See Notes to Financial Statements
VANECK FUNDS
STATEMENTS OF CHANGES IN NET ASSETS
| | | CM Commodity Index Fund (a) | | | Emerging Markets Bond Fund | |
| | | Year Ended
December 31,
2021 | | | Year Ended
December 31,
2020 | | | Year Ended
December 31,
2021 | | | Year Ended
December 31,
2020 | |
| Operations: | | | | | | | | | | | | | | | | |
| Net investment income (loss) | | $ | (3,862,700) | | | $ | (51,883) | | | $ | 1,343,534 | | | $ | 1,789,170 | |
| Net realized gain (loss) | | | 165,026,997 | | | | (10,714,228) | | | | (1,115,798) | | | | 83,718 | |
| Net change in unrealized appreciation (depreciation) | | | (1,738,702) | | | | 4,177,400 | | | | (1,340,997) | | | | 557,146 | |
| Net increase (decrease) in net assets resulting from operations | | | 159,425,595 | | | | (6,588,711) | | | | (1,113,261) | | | | 2,430,034 | |
| Distributions to shareholders: | | | | | | | | | | | | | | | | |
| Distributable earnings | | | | | | | | | | | | | | | | |
| Class A | | | (5,800,616) | | | | (5,801) | | | | (249,486) | | | | (276,192) | |
| Class C | | | — | | | | — | | | | — | | | | (29,012) | |
| Class I | | | (61,767,261) | | | | (47,923) | | | | (615,619) | | | | (858,065) | |
| Class Y | | | (61,740,961) | | | | (52,107) | | | | (136,469) | | | | (132,602) | |
| | | | (129,308,838) | | | | (105,831) | | | | (1,001,574) | | | | (1,295,871) | |
| Return of capital | | | | | | | | | | | | | | | | |
| Class A | | | — | | | | — | | | | (85,588) | | | | (102,543) | |
| Class C | | | — | | | | — | | | | — | | | | (10,781) | |
| Class I | | | — | | | | — | | | | (210,943) | | | | (318,475) | |
| Class Y | | | — | | | | — | | | | (46,781) | | | | (49,220) | |
| | | | — | | | | — | | | | (343,312) | | | | (481,019) | |
| Total distributions | | | (129,308,838) | | | | (105,831) | | | | (1,344,886) | | | | (1,776,890) | |
| Share transactions: | | | | | | | | | | | | | | | | |
| Proceeds from sale of shares | | | | | | | | | | | | | | | | |
| Class A | | | 21,478,801 | | | | 9,775,832 | | | | 758,458 | | | | 2,643,280 | |
| Class C | | | — | | | | — | | | | — | | | | 175 | |
| Class I | | | 138,696,288 | | | | 71,601,599 | | | | 5,268,185 | | | | 950,590 | |
| Class Y | | | 117,115,980 | | | | 101,181,519 | | | | 2,455,263 | | | | 1,561,350 | |
| | | | 277,291,069 | | | | 182,558,950 | | | | 8,481,906 | | | | 5,155,395 | |
| Reinvestment of distributions | | | | | | | | | | | | | | | | |
| Class A | | | 3,173,631 | | | | 3,015 | | | | 262,837 | | | | 281,564 | |
| Class C | | | — | | | | — | | | | — | | | | 37,532 | |
| Class I | | | 24,100,787 | | | | 19,161 | | | | 777,962 | | | | 978,332 | |
| Class Y | | | 59,931,059 | | | | 50,150 | | | | 180,507 | | | | 176,983 | |
| | | | 87,205,477 | | | | 72,326 | | | | 1,221,306 | | | | 1,474,411 | |
| Cost of shares redeemed | | | | | | | | | | | | | | | | |
| Class A | | | (18,588,814) | | | | (14,368,676) | | | | (1,185,321) | | | | (1,298,307) | |
| Class C | | | — | | | | — | | | | — | | | | (1,133,647) | |
| Class I | | | (75,471,954) | | | | (73,108,873) | | | | (14,922,512) | | | | (4,487,128) | |
| Class Y | | | (68,523,320) | | | | (132,844,956) | | | | (1,641,988) | | | | (1,920,226) | |
| | | | (162,584,088) | | | | (220,322,505) | | | | (17,749,821) | | | | (8,839,308) | |
| Net increase (decrease) in net assets resulting from share transactions | | | 201,912,458 | | | | (37,691,229) | | | | (8,046,609) | | | | (2,209,502) | |
| Total increase (decrease) in net assets | | | 232,029,215 | | | | (44,385,771) | | | | (10,504,756) | | | | (1,556,358) | |
| Net Assets: | | | | | | | | | | | | | | | | |
| Beginning of year | | | 424,340,545 | | | | 468,726,316 | | | | 25,739,180 | | | | 27,295,538 | |
| End of year | | $ | 656,369,760 | | | $ | 424,340,545 | | | $ | 15,234,424 | | | $ | 25,739,180 | |
| | | | | | | | | | | | | | | | | |
| (a) | Consolidated Statement of Changes in Net Assets | | | | | | | | | | | | | | | | |
See Notes to Financial Statements
VANECK FUNDS
STATEMENTS OF CHANGES IN NET ASSETS
| | | Emerging Markets Fund | | | Environmental
Sustainability
Fund | |
| | | Year Ended
December 31,
2021 | | | Year Ended
December 31,
2020 | | | Period
Ended
December 31,
2021 (a) | |
| Operations: | | | | | | | | | | | | |
| Net investment income (loss) | | $ | 5,300,002 | | | $ | (2,312,371) | | | $ | (13,216) | |
| Net realized gain (loss) | | | 220,359,167 | | | | 31,043,674 | | | | (918) | |
| Net change in unrealized appreciation (depreciation) | | | (561,338,176) | | | | 352,414,923 | | | | (141,063) | |
| Net increase (decrease) in net assets resulting from operations | | | (335,679,007) | | | | 381,146,226 | | | | (155,197) | |
| Distributions to shareholders: | | | | | | | | | | | | |
| Distributable earnings | | | | | | | | | | | | |
| Class A | | | (9,871,905) | | | | (234,189) | | | | — | |
| Class C | | | (2,124,371) | | | | (56,153) | | | | — | |
| Class I | | | (67,127,954) | | | | (1,629,360) | | | | — | |
| Class Y | | | (84,065,845) | | | | (1,971,153) | | | | — | |
| Class Z | | | (6,888,866) | | | | (99,892) | | | | — | |
| Total distributions | | | (170,078,941) | | | | (3,990,747) | | | | — | |
| Share transactions: | | | | | | | | | | | | |
| Proceeds from sale of shares | | | | | | | | | | | | |
| Class A | | | 40,550,260 | | | | 55,174,949 | | | | 1,022,249 | |
| Class C | | | 5,279,815 | | | | 3,799,106 | | | | — | |
| Class I | | | 284,123,037 | | | | 420,458,387 | | | | 2,223,400 | |
| Class Y | | | 335,031,324 | | | | 377,459,634 | | | | 2,000,000 | |
| Class Z | | | 60,322,642 | | | | 66,306,927 | | | | — | |
| | | | 725,307,078 | | | | 923,199,003 | | | | 5,245,649 | |
| Reinvestment of distributions | | | | | | | | | | | | |
| Class A | | | 6,775,661 | | | | 162,569 | | | | — | |
| Class C | | | 1,823,736 | | | | 46,507 | | | | — | |
| Class I | | | 50,180,300 | | | | 1,041,802 | | | | — | |
| Class Y | | | 61,262,882 | | | | 1,461,424 | | | | — | |
| Class Z | | | 4,430,688 | | | | 99,882 | | | | — | |
| | | | 124,473,267 | | | | 2,812,184 | | | | — | |
| Cost of shares redeemed | | | | | | | | | | | | |
| Class A | | | (45,869,125) | | | | (60,707,321) | | | | — | |
| Class C | | | (9,634,234) | | | | (11,226,109) | | | | — | |
| Class I | | | (387,481,276) | | | | (235,067,968) | | | | (9,736) | |
| Class Y | | | (416,173,420) | | | | (483,905,594) | | | | — | |
| Class Z | | | (53,990,808) | | | | (12,449,080) | | | | — | |
| | | | (913,148,863) | | | | (803,356,072) | | | | (9,736) | |
| Net increase (decrease) in net assets resulting from share transactions | | | (63,368,518) | | | | 122,655,115 | | | | 5,235,913 | |
| Total increase (decrease) in net assets | | | (569,126,466) | | | | 499,810,594 | | | | 5,080,716 | |
| Net Assets: | | | | | | | | | | | | |
| Beginning of period | | | 2,771,382,836 | | | | 2,271,572,242 | | | | — | |
| End of period | | $ | 2,202,256,370 | | | $ | 2,771,382,836 | | | $ | 5,080,716 | |
| | | | | | | | | | | | | | |
| (a) | For the period July 14, 2021 (commencement of operations) through December 31, 2021. | | | | | | | | |
See Notes to Financial Statements
VANECK FUNDS
STATEMENTS OF CHANGES IN NET ASSETS
| | | Global Resources Fund | | | International Investors Gold Fund (a) | |
| | | Year Ended
December 31,
2021 | | | Year Ended
December 31,
2020 | | | Year Ended
December 31,
2021 | | | Year Ended
December 31,
2020 | |
| Operations: | | | | | | | | | | | | | | | | |
| Net investment income (loss) | | $ | 11,208,950 | | | $ | 4,298,911 | | | $ | 1,296,012 | | | $ | (2,838,996) | |
| Net realized gain (loss) | | | 60,228,673 | | | | (19,681,385) | | | | 82,156,041 | | | | 51,185,486 | |
| Net change in unrealized appreciation (depreciation) | | | 39,014,825 | | | | 76,936,731 | | | | (237,265,497) | | | | 250,464,147 | |
| Net increase (decrease) in net assets resulting from operations | | | 110,452,448 | | | | 61,554,257 | | | | (153,813,444) | | | | 298,810,637 | |
| Distributions to shareholders: | | | | | | | | | | | | | | | | |
| Distributable earnings | | | | | | | | | | | | | | | | |
| Class A | | | (2,039,281) | | | | (563,388) | | | | (18,511,931) | | | | (40,047,399) | |
| Class C | | | (138,187) | | | | — | | | | (3,578,843) | | | | (7,471,726) | |
| Class I | | | (6,436,980) | | | | (3,069,721) | | | | (9,223,996) | | | | (20,393,938) | |
| Class Y | | | (3,587,055) | | | | (868,161) | | | | (18,289,889) | | | | (42,091,347) | |
| Total distributions | | | (12,201,503) | | | | (4,501,270) | | | | (49,604,659) | | | | (110,004,410) | |
| Share transactions: | | | | | | | | | | | | | | | | |
| Proceeds from sale of shares | | | | | | | | | | | | | | | | |
| Class A | | | 57,098,992 | | | | 13,805,647 | | | | 63,057,794 | | | | 82,083,937 | |
| Class C | | | 7,043,962 | | | | 1,445,447 | | | | 10,072,112 | | | | 23,518,342 | |
| Class I | | | 87,147,555 | | | | 28,501,501 | | | | 45,839,033 | | | | 72,231,463 | |
| Class Y | | | 167,367,141 | | | | 42,521,621 | | | | 180,595,635 | | | | 279,336,107 | |
| | | | 318,657,650 | | | | 86,274,216 | | | | 299,564,574 | | | | 457,169,849 | |
| Reinvestment of distributions | | | | | | | | | | | | | | | | |
| Class A | | | 1,755,355 | | | | 504,030 | | | | 16,652,577 | | | | 35,904,293 | |
| Class C | | | 125,014 | | | | — | | | | 3,442,380 | | | | 7,127,381 | |
| Class I | | | 3,144,316 | | | | 1,379,608 | | | | 9,082,987 | | | | 20,074,872 | |
| Class Y | | | 3,023,564 | | | | 736,249 | | | | 15,095,142 | | | | 35,662,789 | |
| | | | 8,048,249 | | | | 2,619,887 | | | | 44,273,086 | | | | 98,769,335 | |
| Cost of shares redeemed | | | | | | | | | | | | | | | | |
| Class A | | | (31,560,477) | | | | (36,334,098) | | | | (82,011,326) | | | | (91,537,403) | |
| Class C | | | (5,657,725) | | | | (4,243,883) | | | | (14,775,751) | | | | (14,344,724) | |
| Class I | | | (118,113,635) | | | | (165,145,995) | | | | (53,598,551) | | | | (157,179,171) | |
| Class Y | | | (82,448,228) | | | | (48,893,846) | | | | (189,871,204) | | | | (148,276,298) | |
| | | | (237,780,065) | | | | (254,617,822) | | | | (340,256,832) | | | | (411,337,596) | |
| Net increase (decrease) in net assets resulting from share transactions | | | 88,925,834 | | | | (165,723,719) | | | | 3,580,828 | | | | 144,601,588 | |
| Total increase (decrease) in net assets | | | 187,176,779 | | | | (108,670,732) | | | | (199,837,275) | | | | 333,407,815 | |
| Net Assets: | | | | | | | | | | | | | | | | |
| Beginning of year | | | 596,481,328 | | | | 705,152,060 | | | | 1,059,782,724 | | | | 726,374,909 | |
| End of year | | $ | 783,658,107 | | | $ | 596,481,328 | | | $ | 859,945,449 | | | $ | 1,059,782,724 | |
| | | | | | | | | | | | | | | | | |
| (a) | Consolidated Statement of Changes in Net Assets | | | | | | | | | | | | | | | | |
See Notes to Financial Statements
VANECK FUNDS
STATEMENTS OF CHANGES IN NET ASSETS
| | | VanEck Morningstar Wide Moat Fund | | | VanEck NDR Managed Allocation
Fund | |
| | | Year Ended
December 31,
2021 | | | Year Ended
December 31,
2020 | | | Year Ended
December 31,
2021 | | | Year Ended
December 31,
2020 | |
| Operations: | | | | | | | | | | | | | | | | |
| Net investment income | | $ | 197,423 | | | $ | 161,578 | | | $ | 316,206 | | | $ | 388,302 | |
| Net realized gain | | | 2,171,939 | | | | 422,527 | | | | 2,503,873 | | | | 400,179 | |
| Net change in unrealized appreciation (depreciation) | | | 865,496 | | | | 883,466 | | | | 1,115,390 | | | | 1,650,872 | |
| Net increase in net assets resulting from operations | | | 3,234,858 | | | | 1,467,571 | | | | 3,935,469 | | | | 2,439,353 | |
| Distributions to shareholders: | | | | | | | | | | | | | | | | |
| Distributable earnings | | | | | | | | | | | | | | | | |
| Class A | | | — | | | | — | | | | (129,107) | | | | (116,367) | |
| Class I | | | (463,559) | | | | (128,851) | | | | (228,659) | | | | (179,157) | |
| Class Y | | | — | | | | — | | | | (191,355) | | | | (129,553) | |
| Class Z | | | (1,730,676) | | | | (781,142) | | | | — | | | | — | |
| Total distributions | | | (2,194,235) | | | | (909,993) | | | | (549,121) | | | | (425,077) | |
| Share transactions: | | | | | | | | | | | | | | | | |
| Proceeds from sale of shares | | | | | | | | | | | | | | | | |
| Class A | | | — | | | | — | | | | 753,500 | | | | 1,495,194 | |
| Class I | | | 541,543 | | | | 1,076,447 | | | | 237,013 | | | | 1,043,432 | |
| Class Y | | | — | | | | — | | | | 3,721,428 | | | | 3,935,994 | |
| Class Z | | | 2,405,227 | | | | 2,720,593 | | | | — | | | | — | |
| | | | 2,946,770 | | | | 3,797,040 | | | | 4,711,941 | | | | 6,474,620 | |
| Reinvestment of distributions | | | | | | | | | | | | | | | | |
| Class A | | | — | | | | — | | | | 128,918 | | | | 116,178 | |
| Class I | | | 463,559 | | | | 128,851 | | | | 228,658 | | | | 179,157 | |
| Class Y | | | — | | | | — | | | | 191,262 | | | | 127,111 | |
| Class Z | | | 1,730,676 | | | | 781,142 | | | | — | | | | — | |
| | | | 2,194,235 | | | | 909,993 | | | | 548,838 | | | | 422,446 | |
| Cost of shares redeemed | | | | | | | | | | | | | | | | |
| Class A | | | — | | | | — | | | | (3,973,082) | | | | (4,889,037) | |
| Class I | | | (204,057) | | | | (1,256) | | | | (2,497,318) | | | | (3,101,577) | |
| Class Y | | | — | | | | — | | | | (3,924,890) | | | | (3,217,466) | |
| Class Z | | | (608,647) | | | | (1,272,317) | | | | — | | | | — | |
| | | | (812,704) | | | | (1,273,573) | | | | (10,395,290) | | | | (11,208,080) | |
| Net increase (decrease) in net assets resulting from share transactions | | | 4,328,301 | | | | 3,433,460 | | | | (5,134,511) | | | | (4,311,014) | |
| Total increase (decrease) in net assets | | | 5,368,924 | | | | 3,991,038 | | | | (1,748,163) | | | | (2,296,738) | |
| Net Assets: | | | | | | | | | | | | | | | | |
| Beginning of year | | | 12,947,250 | | | | 8,956,212 | | | | 36,811,028 | | | | 39,107,766 | |
| End of year | | | $ | 18,316,174 | | | $ | 12,947,250 | | | $ | 35,062,865 | | | $ | 36,811,028 | |
See Notes to Financial Statements
CM COMMODITY INDEX FUND
CONSOLIDATED FINANCIAL HIGHLIGHTS
For a share outstanding throughout each year:
| | | Class A |
| | | | Year Ended December 31, | |
| | | | 2021 | | | 2020 | | | 2019 | | | 2018 | | | 2017 | |
| | | | | | | | | | | | | | | | | | | | | | |
| Net asset value, beginning of year | | | | $4.66 | | | | $4.61 | | | | $4.29 | | | | $4.87 | | | | $4.76 | |
| Net investment income (loss) (a) | | | | (0.05 | ) | | | (0.01 | ) | | | 0.06 | | | | 0.04 | | | | (0.01 | ) |
| Net realized and unrealized gain (loss) on investments | | | | 1.57 | | | | 0.06 | (b) | | | 0.30 | | | | (0.60 | ) | | | 0.32 | |
| Total from investment operations | | | | 1.52 | | | | 0.05 | | | | 0.36 | | | | (0.56 | ) | | | 0.31 | |
| Distributions from: | | | | | | | | | | | | | | | | | | | | | |
| Net investment income | | | | (1.13 | ) | | | — | (c) | | | (0.04 | ) | | | (0.02 | ) | | | (0.20 | ) |
| Net asset value, end of year | | | | $5.05 | | | | $4.66 | | | | $4.61 | | | | $4.29 | | | | $4.87 | |
| Total return (d) | | | | 32.96 | % | | | 1.11 | % | | | 8.37 | % | | | (11.42 | )% | | | 6.58 | % |
| Ratios to average net assets | | | | | | | | | | | | | | | | | | | | | |
| Gross expenses | | | | 1.38 | % | | | 1.41 | % | | | 1.43 | % | | | 1.39 | % | | | 1.41 | % |
| Net expenses | | | | 0.95 | % | | | 0.95 | % | | | 0.95 | % | | | 0.95 | % | | | 0.95 | % |
| Net investment income (loss) | | | | (0.91 | )% | | | (0.28 | )% | | | 1.24 | % | | | 0.88 | % | | | (0.12 | )% |
| Supplemental data | | | | | | | | | | | | | | | | | | | | | |
| Net assets, end of year (in millions) | | | | $31 | | | | $22 | | | | $27 | | | | $30 | | | | $22 | |
| Portfolio turnover rate | | | | — | % | | | — | % | | | — | % | | | — | % | | | — | % |
| (a) | Calculated based upon average shares outstanding |
| (b) | The amount shown does not correspond with the aggregate net gain (loss) on investments for the period due to the timing of sales and repurchase of shares in relation to fluctuating market values of the investments of the Fund. |
| (c) | Amount represents less than $0.005 per share. |
| (d) | Returns include adjustments in accordance with U.S. Generally Accepted Accounting Principles. Net asset values and returns for financial reporting purposes may differ from those for shareholder transactions. |
See Notes to Financial Statements
CM COMMODITY INDEX FUND
CONSOLIDATED FINANCIAL HIGHLIGHTS
For a share outstanding throughout each year:
| | | Class I |
| | | | Year Ended December 31, | |
| | | | 2021 | | | 2020 | | | 2019 | | | 2018 | | | 2017 | |
| | | | | | | | | | | | | | | | | | | | | | |
| Net asset value, beginning of year | | | | $4.78 | | | | $4.71 | | | | $4.39 | | | | $4.98 | | | | $4.86 | |
| Net investment income (loss) (a) | | | | (0.04 | ) | | | — | | | | 0.07 | | | | 0.06 | | | | 0.01 | |
| Net realized and unrealized gain (loss) on investments | | | | 1.61 | | | | 0.07 | (b) | | | 0.30 | | | | (0.61 | ) | | | 0.32 | |
| Total from investment operations | | | | 1.57 | | | | 0.07 | | | | 0.37 | | | | (0.55 | ) | | | 0.33 | |
| Distributions from: | | | | | | | | | | | | | | | | | | | | | |
| Net investment income | | | | (1.15 | ) | | | — | (c) | | | (0.05 | ) | | | (0.04 | ) | | | (0.21 | ) |
| Net asset value, end of year | | | | $5.20 | | | | $4.78 | | | | $4.71 | | | | $4.39 | | | | $4.98 | |
| Total return (d) | | | | 33.07 | % | | | 1.51 | % | | | 8.55 | % | | | (11.13 | )% | | | 6.95 | % |
| Ratios to average net assets | | | | | | | | | | | | | | | | | | | | | |
| Gross expenses | | | | 0.90 | % | | | 0.93 | % | | | 0.97 | % | | | 0.90 | % | | | 0.92 | % |
| Net expenses | | | | 0.65 | % | | | 0.65 | % | | | 0.65 | % | | | 0.65 | % | | | 0.65 | % |
| Net investment income (loss) | | | | (0.61 | )% | | | (0.10 | )% | | | 1.50 | % | | | 1.19 | % | | | 0.20 | % |
| Supplemental data | | | | | | | | | | | | | | | | | | | | | |
| Net assets, end of year (in millions) | | | | $295 | | | | $193 | | | | $195 | | | | $214 | | | | $178 | |
| Portfolio turnover rate | | | | — | % | | | — | % | | | — | % | | | — | % | | | — | % |
| (a) | Calculated based upon average shares outstanding |
| (b) | The amount shown does not correspond with the aggregate net gain (loss) on investments for the period due to the timing of sales and repurchase of shares in relation to fluctuating market values of the investments of the Fund. |
| (c) | Amount represents less than $0.005 per share. |
| (d) | Returns include adjustments in accordance with U.S. Generally Accepted Accounting Principles. Net asset values and returns for financial reporting purposes may differ from those for shareholder transactions. |
See Notes to Financial Statements
CM COMMODITY INDEX FUND
CONSOLIDATED FINANCIAL HIGHLIGHTS
For a share outstanding throughout each year:
| | | Class Y |
| | | | Year Ended December 31, | |
| | | | 2021 | | | 2020 | | | 2019 | | | 2018 | | | 2017 | |
| | | | | | | | | | | | | | | | | | | | | | |
| Net asset value, beginning of year | | | | $4.76 | | | | $4.70 | | | | $4.37 | | | | $4.96 | | | | $4.85 | |
| Net investment income (loss) (a) | | | | (0.04 | ) | | | — | | | | 0.07 | | | | 0.06 | | | | 0.01 | |
| Net realized and unrealized gain (loss) on investments | | | | 1.61 | | | | 0.06 | (b) | | | 0.31 | | | | (0.62 | ) | | | 0.31 | |
| Total from investment operations | | | | 1.57 | | | | 0.06 | | | | 0.38 | | | | (0.56 | ) | | | 0.32 | |
| Distributions from: | | | | | | | | | | | | | | | | | | | | | |
| Net investment income | | | | (1.15 | ) | | | — | (c) | | | (0.05 | ) | | | (0.03 | ) | | | (0.21 | ) |
| Net asset value, end of year | | | | $5.18 | | | | $4.76 | | | | $4.70 | | | | $4.37 | | | | $4.96 | |
| Total return (d) | | | | 33.14 | % | | | 1.30 | % | | | 8.73 | % | | | (11.23 | )% | | | 6.71 | % |
| Ratios to average net assets | | | | | | | | | | | | | | | | | | | | | |
| Gross expenses | | | | 0.98 | % | | | 1.03 | % | | | 1.04 | % | | | 1.12 | % | | | 0.97 | % |
| Net expenses | | | | 0.70 | % | | | 0.70 | % | | | 0.70 | % | | | 0.70 | % | | | 0.70 | % |
| Net investment income (loss) | | | | (0.64 | )% | | | —% | | | | 1.53 | % | | | 1.14 | % | | | 0.15 | % |
| Supplemental data | | | | | | | | | | | | | | | | | | | | | |
| Net assets, end of year (in millions) | | | | $330 | | | | $209 | | | | $247 | | | | $219 | | | | $183 | |
| Portfolio turnover rate | | | | — | % | | | — | % | | | — | % | | | — | % | | | — | % |
| (a) | Calculated based upon average shares outstanding |
| (b) | The amount shown does not correspond with the aggregate net gain (loss) on investments for the period due to the timing of sales and repurchase of shares in relation to fluctuating market values of the investments of the Fund. |
| (c) | Amount represents less than $0.005 per share. |
| (d) | Returns include adjustments in accordance with U.S. Generally Accepted Accounting Principles. Net asset values and returns for financial reporting purposes may differ from those for shareholder transactions. |
See Notes to Financial Statements
VANECK EMERGING MARKETS BOND FUND
FINANCIAL HIGHLIGHTS
For a share outstanding throughout each year:
| | | Class A |
| | | | Year Ended December 31, | |
| | | | 2021 | | | 2020 | | | 2019 | | | 2018 | | | 2017 | |
| | | | | | | | | | | | | | | | | | | | | | |
| Net asset value, beginning of year | | | | $6.67 | | | | $6.44 | | | | $6.15 | | | | $7.00 | | | | $6.77 | |
| Net investment income (a) | | | | 0.31 | | | | 0.39 | | | | 0.47 | | | | 0.38 | | | | 0.49 | |
| Net realized and unrealized gain (loss) on investments | | | | (0.60 | ) | | | 0.26 | | | | 0.28 | | | | (0.81 | ) | | | 0.29 | |
| Total from investment operations | | | | (0.29 | ) | | | 0.65 | | | | 0.75 | | | | (0.43 | ) | | | 0.78 | |
| Distributions from: | | | | | | | | | | | | | | | | | | | | | |
| Net investment income | | | | (0.23 | ) | | | (0.31 | ) | | | (0.40 | ) | | | — | | | | (0.55 | ) |
| Return of capital | | | | (0.08 | ) | | | (0.11 | ) | | | (0.06 | ) | | | (0.42 | ) | | | — | |
| Total distributions | | | | (0.31 | ) | | | (0.42 | ) | | | (0.46 | ) | | | (0.42 | ) | | | (0.55 | ) |
| Net asset value, end of year | | | | $6.07 | | | | $6.67 | | | | $6.44 | | | | $6.15 | | | | $7.00 | |
| Total return (b) | | | | (4.43 | )% | | | 11.24 | % | | | 12.61 | % | | | (6.39 | )% | | | 11.68 | % |
| Ratios to average net assets | | | | | | | | | | | | | | | | | | | | | |
| Gross expenses | | | | 2.33 | % | | | 2.30 | % | | | 2.69 | % | | | 2.05 | % | | | 1.71 | % |
| Net expenses | | | | 1.28 | % | | | 1.25 | % | | | 1.26 | % | | | 1.26 | % | | | 1.26 | % |
| Net expenses excluding interest expense | | | | 1.25 | % | | | 1.25 | % | | | 1.25 | % | | | 1.25 | % | | | 1.25 | % |
| Net investment income | | | | 4.81 | % | | | 6.40 | % | | | 7.37 | % | | | 5.78 | % | | | 7.02 | % |
| Supplemental data | | | | | | | | | | | | | | | | | | | | | |
| Net assets, end of year (in millions) | | | | $6 | | | | $7 | | | | $5 | | | | $5 | | | | $6 | |
| Portfolio turnover rate | | | | 218 | % | | | 253 | % | | | 302 | % | | | 269 | % | | | 568 | % |
| (a) | Calculated based upon average shares outstanding |
| (b) | Returns include adjustments in accordance with U.S. Generally Accepted Accounting Principles. Net asset values and returns for financial reporting purposes may differ from those for shareholder transactions. |
See Notes to Financial Statements
VANECK EMERGING MARKETS BOND FUND
FINANCIAL HIGHLIGHTS
For a share outstanding throughout each year:
| | | Class I |
| | | | Year Ended December 31, | |
| | | | 2021 | | | 2020 | | | 2019 | | | 2018 | | | 2017 | |
| | | | | | | | | | | | | | | | | | | | | | |
| Net asset value, beginning of year | | | | $6.77 | | | | $6.53 | | | | $6.25 | | | | $7.13 | | | | $6.87 | |
| Net investment income (a) | | | | 0.33 | | | | 0.45 | | | | 0.53 | | | | 0.40 | | | | 0.51 | |
| Net realized and unrealized gain (loss) on investments | | | | (0.61 | ) | | | 0.23 | | | | 0.27 | | | | (0.83 | ) | | | 0.30 | |
| Total from investment operations | | | | (0.28 | ) | | | 0.68 | | | | 0.80 | | | | (0.43 | ) | | | 0.81 | |
| Distributions from: | | | | | | | | | | | | | | | | | | | | | |
| Net investment income | | | | (0.25 | ) | | | (0.32 | ) | | | (0.45 | ) | | | — | | | | (0.55 | ) |
| Return of capital | | | | (0.09 | ) | | | (0.12 | ) | | | (0.07 | ) | | | (0.45 | ) | | | — | |
| Total distributions | | | | (0.34 | ) | | | (0.44 | ) | | | (0.52 | ) | | | (0.45 | ) | | | (0.55 | ) |
| Net asset value, end of year | | | | $6.15 | | | | $6.77 | | | | $6.53 | | | | $6.25 | | | | $7.13 | |
| Total return (b) | | | | (4.30 | )% | | | 11.60 | % | | | 13.09 | % | | | (6.21 | )% | | | 11.96 | % |
| Ratios to average net assets | | | | | | | | | | | | | | | | | | | | | |
| Gross expenses | | | | 1.74 | % | | | 1.73 | % | | | 2.18 | % | | | 1.33 | % | | | 1.06 | % |
| Net expenses | | | | 0.96 | % | | | 0.95 | % | | | 0.96 | % | | | 0.96 | % | | | 0.96 | % |
| Net expenses excluding interest expense | | | | 0.95 | % | | | 0.95 | % | | | 0.95 | % | | | 0.95 | % | | | 0.95 | % |
| Net investment income | | | | 5.01 | % | | | 7.31 | % | | | 8.27 | % | | | 5.91 | % | | | 7.08 | % |
| Supplemental data | | | | | | | | | | | | | | | | | | | | | |
| Net assets, end of year (in millions) | | | | $6 | | | | $16 | | | | $18 | | | | $10 | | | | $28 | |
| Portfolio turnover rate | | | | 218 | % | | | 253 | % | | | 302 | % | | | 269 | % | | | 568 | % |
| (a) | Calculated based upon average shares outstanding |
| (b) | Returns include adjustments in accordance with U.S. Generally Accepted Accounting Principles. Net asset values and returns for financial reporting purposes may differ from those for shareholder transactions. |
See Notes to Financial Statements
VANECK EMERGING MARKETS BOND FUND
FINANCIAL HIGHLIGHTS
For a share outstanding throughout each year:
| | | Class Y |
| | | | Year Ended December 31, | |
| | | | 2021 | | | 2020 | | | 2019 | | | 2018 | | | 2017 | |
| | | | | | | | | | | | | | | | | | | | | | |
| Net asset value, beginning of year | | | | $6.73 | | | | $6.49 | | | | $6.23 | | | | $7.10 | | | | $6.84 | |
| Net investment income (a) | | | | 0.32 | | | | 0.46 | | | | 0.47 | | | | 0.39 | | | | 0.51 | |
| Net realized and unrealized gain (loss) on investments | | | | (0.60 | ) | | | 0.22 | | | | 0.32 | | | | (0.82 | ) | | | 0.30 | |
| Total from investment operations | | | | (0.28 | ) | | | 0.68 | | | | 0.79 | | | | (0.43 | ) | | | 0.81 | |
| Distributions from: | | | | | | | | | | | | | | | | | | | | | |
| Net investment income | | | | (0.25 | ) | | | (0.32 | ) | | | (0.46 | ) | | | — | | | | (0.55 | ) |
| Return of capital | | | | (0.08 | ) | | | (0.12 | ) | | | (0.07 | ) | | | (0.44 | ) | | | — | |
| Total distributions | | | | (0.33 | ) | | | (0.44 | ) | | | (0.53 | ) | | | (0.44 | ) | | | (0.55 | ) |
| Net asset value, end of year | | | | $6.12 | | | | $6.73 | | | | $6.49 | | | | $6.23 | | | | $7.10 | |
| Total return (b) | | | | (4.33 | )% | | | 11.59 | % | | | 13.05 | % | | | (6.30 | )% | | | 12.01 | % |
| Ratios to average net assets | | | | | | | | | | | | | | | | | | | | | |
| Gross expenses | | | | 2.51 | % | | | 2.78 | % | | | 2.60 | % | | | 1.65 | % | | | 1.30 | % |
| Net expenses | | | | 1.03 | % | | | 1.00 | % | | | 1.02 | % | | | 1.01 | % | | | 1.01 | % |
| Net expenses excluding interest expense | | | | 1.00 | % | | | 1.00 | % | | | 1.00 | % | | | 1.00 | % | | | 1.00 | % |
| Net investment income | | | | 4.99 | % | | | 7.42 | % | | | 7.34 | % | | | 5.83 | % | | | 7.15 | % |
| Supplemental data | | | | | | | | | | | | | | | | | | | | | |
| Net assets, end of year (in millions) | | | | $3 | | | | $3 | | | | $3 | | | | $5 | | | | $12 | |
| Portfolio turnover rate | | | | 218 | % | | | 253 | % | | | 302 | % | | | 269 | % | | | 568 | % |
| (a) | Calculated based upon average shares outstanding |
| (b) | Returns include adjustments in accordance with U.S. Generally Accepted Accounting Principles. Net asset values and returns for financial reporting purposes may differ from those for shareholder transactions. |
See Notes to Financial Statements
VANECK EMERGING MARKETS FUND
FINANCIAL HIGHLIGHTS
For a share outstanding throughout each year:
| | | Class A |
| | | | Year Ended December 31, | |
| | | | 2021 | | | 2020 | | | 2019 | | | 2018 | | | 2017 | |
| | | | | | | | | | | | | | | | | | | | | | |
| Net asset value, beginning of year | | | | $20.96 | | | | $18.03 | | | | $14.14 | | | | $18.44 | | | | $12.33 | |
| Net investment income (loss) (a) | | | | (0.04 | ) | | | (0.08 | ) | | | 0.31 | | | | 0.03 | | | | — | (b) |
| Net realized and unrealized gain (loss) on investments | | | | (2.52 | ) | | | 3.04 | | | | 3.86 | | | | (4.33 | ) | | | 6.13 | |
| Total from investment operations | | | | (2.56 | ) | | | 2.96 | | | | 4.17 | | | | (4.30 | ) | | | 6.13 | |
| Distributions from: | | | | | | | | | | | | | | | | | | | | | |
| Net investment income | | | | — | | | | (0.03 | ) | | | (0.28 | ) | | | — | (b) | | | (0.02 | ) |
| Net realized capital gains | | | | (1.38 | ) | | | — | | | | — | | | | — | | | | — | |
| Total distributions | | | | (1.38 | ) | | | (0.03 | ) | | | (0.28 | ) | | | — | | | | (0.02 | ) |
| Net asset value, end of year | | | | $17.02 | | | | $20.96 | | | | $18.03 | | | | $14.14 | | | | $18.44 | |
| Total return (c) | | | | (12.15 | )% | | | 16.43 | % | | | 29.52 | % | | | (23.30 | )% | | | 49.70 | % |
| Ratios to average net assets | | | | | | | | | | | | | | | | | | | | | |
| Expenses | | | | 1.45 | % | | | 1.47 | % | | | 1.53 | % | | | 1.50 | % | | | 1.47 | % |
| Net investment income (loss) | | | | (0.19 | )% | | | (0.47 | )% | | | 1.86 | % | | | 0.17 | % | | | (0.01 | )% |
| Supplemental data | | | | | | | | | | | | | | | | | | | | | |
| Net assets, end of year (in millions) | | | | $130 | | | | $157 | | | | $138 | | | | $118 | | | | $195 | |
| Portfolio turnover rate | | | | 38 | % | | | 30 | % | | | 24 | % | | | 39 | % | | | 36 | % |
| (a) | Calculated based upon average shares outstanding |
| (b) | Amount represents less than $0.005 per share. |
| (c) | Returns include adjustments in accordance with U.S. Generally Accepted Accounting Principles. Net asset values and returns for financial reporting purposes may differ from those for shareholder transactions. |
See Notes to Financial Statements
VANECK EMERGING MARKETS FUND
FINANCIAL HIGHLIGHTS
For a share outstanding throughout each year:
| | | Class C |
| | | | Year Ended December 31, | |
| | | | 2021 | | | 2020 | | | 2019 | | | 2018 | | | 2017 | |
| | | | | | | | | | | | | | | | | | | | | | |
| Net asset value, beginning of year | | | | $18.47 | | | | $16.02 | | | | $12.60 | | | | $16.55 | | | | $11.14 | |
| Net investment income (loss) (a) | | | | (0.18 | ) | | | (0.19 | ) | | | 0.16 | | | | (0.09 | ) | | | (0.12 | ) |
| Net realized and unrealized gain (loss) on investments | | | | (2.21 | ) | | | 2.67 | | | | 3.43 | | | | (3.86 | ) | | | 5.53 | |
| Total from investment operations | | | | (2.39 | ) | | | 2.48 | | | | 3.59 | | | | (3.95 | ) | | | 5.41 | |
| Distributions from: | | | | | | | | | | | | | | | | | | | | | |
| Net investment income | | | | — | | | | (0.03 | ) | | | (0.17 | ) | | | — | | | | — | |
| Net realized capital gains | | | | (1.38 | ) | | | — | | | | — | | | | — | | | | — | |
| Total distributions | | | | (1.38 | ) | | | (0.03 | ) | | | (0.17 | ) | | | — | | | | — | |
| Net asset value, end of year | | | | $14.70 | | | | $18.47 | | | | $16.02 | | | | $12.60 | | | | $16.55 | |
| Total return (b) | | | | (12.87 | )% | | | 15.49 | % | | | 28.51 | % | | | (23.87 | )% | | | 48.56 | % |
| Ratios to average net assets | | | | | | | | | | | | | | | | | | | | | |
| Expenses | | | | 2.25 | % | | | 2.27 | % | | | 2.32 | % | | | 2.27 | % | | | 2.28 | % |
| Net investment income (loss) | | | | (0.98 | )% | | | (1.25 | )% | | | 1.12 | % | | | (0.57 | )% | | | (0.85 | )% |
| Supplemental data | | | | | | | | | | | | | | | | | | | | | |
| Net assets, end of year (in millions) | | | | $24 | | | | $33 | | | | $37 | | | | $30 | | | | $39 | |
| Portfolio turnover rate | | | | 38 | % | | | 30 | % | | | 24 | % | | | 39 | % | | | 36 | % |
| (a) | Calculated based upon average shares outstanding |
| (b) | Returns include adjustments in accordance with U.S. Generally Accepted Accounting Principles. Net asset values and returns for financial reporting purposes may differ from those for shareholder transactions. |
See Notes to Financial Statements
VANECK EMERGING MARKETS FUND
FINANCIAL HIGHLIGHTS
For a share outstanding throughout each year:
| | | Class I |
| | | | Year Ended December 31, | |
| | | | 2021 | | | 2020 | | | 2019 | | | 2018 | | | 2017 | |
| | | | | | | | | | | | | | | | | | | | | | |
| Net asset value, beginning of year | | | | $22.21 | | | | $19.01 | | | | $14.90 | | | | $19.46 | | | | $13.00 | |
| Net investment income (a) | | | | 0.06 | | | | — | (b) | | | 0.43 | | | | 0.12 | | | | 0.07 | |
| Net realized and unrealized gain (loss) on investments | | | | (2.69 | ) | | | 3.23 | | | | 4.05 | | | | (4.58 | ) | | | 6.48 | |
| Total from investment operations | | | | (2.63 | ) | | | 3.23 | | | | 4.48 | | | | (4.46 | ) | | | 6.55 | |
| Distributions from: | | | | | | | | | | | | | | | | | | | | | |
| Net investment income | | | | (0.04 | ) | | | (0.03 | ) | | | (0.37 | ) | | | (0.10 | ) | | | (0.09 | ) |
| Net realized capital gains | | | | (1.38 | ) | | | — | | | | — | | | | — | | | | — | |
| Total distributions | | | | (1.42 | ) | | | (0.03 | ) | | | (0.37 | ) | | | (0.10 | ) | | | (0.09 | ) |
| Net asset value, end of year | | | | $18.16 | | | | $22.21 | | | | $19.01 | | | | $14.90 | | | | $19.46 | |
| Total return (c) | | | | (11.76 | )% | | | 17.00 | % | | | 30.11 | % | | | (22.88 | )% | | | 50.40 | % |
| Ratios to average net assets | | | | | | | | | | | | | | | | | | | | | |
| Gross expenses | | | | 1.14 | % | | | 1.12 | % | | | 1.16 | % | | | 1.14 | % | | | 1.15 | % |
| Net expenses | | | | 1.00 | % | | | 1.00 | % | | | 1.00 | % | | | 1.00 | % | | | 1.00 | % |
| Net investment income (loss) | | | | 0.28 | % | | | (0.02 | )% | | | 2.46 | % | | | 0.68 | % | | | 0.45 | % |
| Supplemental data | | | | | | | | | | | | | | | | | | | | | |
| Net assets, end of year (in millions) | | | | $900 | | | | $1,158 | | | | $804 | | | | $575 | | | | $774 | |
| Portfolio turnover rate | | | | 38 | % | | | 30 | % | | | 24 | % | | | 39 | % | | | 36 | % |
| (a) | Calculated based upon average shares outstanding |
| (b) | Amount represents less than $0.005 per share. |
| (c) | Returns include adjustments in accordance with U.S. Generally Accepted Accounting Principles. Net asset values and returns for financial reporting purposes may differ from those for shareholder transactions. |
See Notes to Financial Statements
VANECK EMERGING MARKETS FUND
FINANCIAL HIGHLIGHTS
For a share outstanding throughout each year:
| | | Class Y |
| | | | Year Ended December 31, | |
| | | | 2021 | | | 2020 | | | 2019 | | | 2018 | | | 2017 | |
| | | | | | | | | | | | | | | | | | | | | | |
| Net asset value, beginning of year | | | | $21.33 | | | | $18.28 | | | | $14.33 | | | | $18.73 | | | | $12.51 | |
| Net investment income (loss) (a) | | | | 0.03 | | | | (0.02 | ) | | | 0.39 | | | | 0.10 | | | | 0.05 | |
| Net realized and unrealized gain (loss) on investments | | | | (2.57 | ) | | | 3.10 | | | | 3.92 | | | | (4.41 | ) | | | 6.24 | |
| Total from investment operations | | | | (2.54 | ) | | | 3.08 | | | | 4.31 | | | | (4.31 | ) | | | 6.29 | |
| Distributions from: | | | | | | | | | | | | | | | | | | | | | |
| Net investment income | | | | (0.02 | ) | | | (0.03 | ) | | | (0.36 | ) | | | (0.09 | ) | | | (0.07 | ) |
| Net realized capital gains | | | | (1.38 | ) | | | — | | | | — | | | | — | | | | — | |
| Total distributions | | | | (1.40 | ) | | | (0.03 | ) | | | (0.36 | ) | | | (0.09 | ) | | | (0.07 | ) |
| Net asset value, end of year | | | | $17.39 | | | | $21.33 | | | | $18.28 | | | | $14.33 | | | | $18.73 | |
| Total return (b) | | | | (11.84 | )% | | | 16.86 | % | | | 30.07 | % | | | (23.03 | )% | | | 50.32 | % |
| Ratios to average net assets | | | | | | | | | | | | | | | | | | | | | |
| Gross expenses | | | | 1.13 | % | | | 1.14 | % | | | 1.18 | % | | | 1.16 | % | | | 1.15 | % |
| Net expenses | | | | 1.10 | % | | | 1.10 | % | | | 1.10 | % | | | 1.10 | % | | | 1.10 | % |
| Net investment income (loss) | | | | 0.16 | % | | | (0.10 | )% | | | 2.32 | % | | | 0.59 | % | | | 0.32 | % |
| Supplemental data | | | | | | | | | | | | | | | | | | | | | |
| Net assets, end of year (in millions) | | | | $1,086 | | | | $1,350 | | | | $1,287 | | | | $907 | | | | $1,007 | |
| Portfolio turnover rate | | | | 38 | % | | | 30 | % | | | 24 | % | | | 39 | % | | | 36 | % |
| (a) | Calculated based upon average shares outstanding |
| (b) | Returns include adjustments in accordance with U.S. Generally Accepted Accounting Principles. Net asset values and returns for financial reporting purposes may differ from those for shareholder transactions. |
See Notes to Financial Statements
VANECK EMERGING MARKETS FUND
FINANCIAL HIGHLIGHTS
For a share outstanding throughout each period:
| | | Class Z |
| | | | | | | | | | Period | |
| | | | | | | | | | Ended | |
| | | | Year Ended December 31, | | | December | |
| | | | 2021 | | | 2020 | | | 31, 2019(a) | |
| | | | | | | | | | | | | | |
| Net asset value, beginning of period | | | | $22.25 | | | | $19.03 | | | | $18.08 | |
| Net investment income (loss) (b) | | | | 0.07 | | | | (0.02 | ) | | | (0.02 | ) |
| Net realized and unrealized gain (loss) on investments | | | | (2.69 | ) | | | 3.27 | | | | 1.34 | |
| Total from investment operations | | | | (2.62 | ) | | | 3.25 | | | | 1.32 | |
| Distributions from: | | | | | | | | | | | | | |
| Net investment income | | | | (0.06 | ) | | | (0.03 | ) | | | (0.37 | ) |
| Net realized capital gains | | | | (1.38 | ) | | | — | | | | — | |
| Total distributions | | | | (1.44 | ) | | | (0.03 | ) | | | (0.37 | ) |
| Net asset value, end of period | | | | $18.19 | | | | $22.25 | | | | $19.03 | |
| Total return (c) | | | | (11.71 | )% | | | 17.09 | % | | | 7.29 | %(d) |
| Ratios to average net assets | | | | | | | | | | | | | |
| Gross expenses | | | | 1.08 | % | | | 1.13 | % | | | 1.31 | %(e) |
| Net expenses | | | | 0.90 | % | | | 0.90 | % | | | 0.90 | %(e) |
| Net investment income (loss) | | | | 0.33 | % | | | (0.12 | )% | | | (0.27 | )%(e) |
| Supplemental data | | | | | | | | | | | | | |
| Net assets, end of period (in millions) | | | | $63 | | | | $74 | | | | $6 | |
| Portfolio turnover rate | | | | 38 | % | | | 30 | % | | | 24 | %(d) |
| (a) | For the period September 16, 2019 (commencement of operations) through December 31, 2019. |
| (b) | Calculated based upon average shares outstanding |
| (c) | Returns include adjustments in accordance with U.S. Generally Accepted Accounting Principles. Net asset values and returns for financial reporting purposes may differ from those for shareholder transactions. |
| (d) | Not Annualized |
| (e) | Annualized |
See Notes to Financial Statements
VANECK ENVIRONMENTAL SUSTAINABILITY FUND
FINANCIAL HIGHLIGHTS
For a share outstanding throughout each period:
| | | Class A | |
| | | Period
Ended
December
31, 2021(a) | |
| | | | |
| Net asset value, beginning of period | | | $25.00 | |
| Net investment loss (b) | | | (0.09 | ) |
| Net realized and unrealized (loss) on investments | | | (0.67 | ) |
| Total from investment operations | | | (0.76 | ) |
| Net asset value, end of period | | | $24.24 | |
| Total return (c) | | | (3.04 | )%(d) |
| Ratios to average net assets | | | | |
| Gross expenses | | | 6.68 | %(e) |
| Net expenses | | | 1.26 | %(e) |
| Net expenses excluding interest expense and taxes | | | 1.25 | %(e) |
| Net investment loss | | | (0.76 | )%(e) |
| Supplemental data | | | | |
| Net assets, end of period (in millions) | | | $1 | |
| Portfolio turnover rate | | | — | %(d) |
| (a) | For the period July 14, 2021 (commencement of operations) through December 31, 2021. |
| (b) | Calculated based upon average shares outstanding |
| (c) | Returns include adjustments in accordance with U.S. Generally Accepted Accounting Principles. Net asset values and returns for financial reporting purposes may differ from those for shareholder transactions. |
| (d) | Not Annualized |
| (e) | Annualized |
See Notes to Financial Statements
VANECK ENVIRONMENTAL SUSTAINABILITY FUND
FINANCIAL HIGHLIGHTS
For a share outstanding throughout each period:
| | | Class I | |
| | | Period
Ended
December
31, 2021(a) | |
| | | | |
| Net asset value, beginning of period | | | $25.00 | |
| Net investment loss (b) | | | (0.05 | ) |
| Net realized and unrealized (loss) on investments | | | (0.67 | ) |
| Total from investment operations | | | (0.72 | ) |
| Net asset value, end of period | | | $24.28 | |
| Total return (c) | | | (2.88 | )%(d) |
| Ratios to average net assets | | | | |
| Gross expenses | | | 5.45 | %(e) |
| Net expenses | | | 0.96 | %(e) |
| Net expenses excluding interest expense and taxes | | | 0.95 | %(e) |
| Net investment loss | | | (0.46 | )%(e) |
| Supplemental data | | | | |
| Net assets, end of period (in millions) | | | $2 | |
| Portfolio turnover rate | | | — | %(d) |
| (a) | For the period July 14, 2021 (commencement of operations) through December 31, 2021. |
| (b) | Calculated based upon average shares outstanding |
| (c) | Returns include adjustments in accordance with U.S. Generally Accepted Accounting Principles. Net asset values and returns for financial reporting purposes may differ from those for shareholder transactions. |
| (d) | Not Annualized |
| (e) | Annualized |
See Notes to Financial Statements
VANECK ENVIRONMENTAL SUSTAINABILITY FUND
FINANCIAL HIGHLIGHTS
For a share outstanding throughout each period:
| | | Class Y | |
| | | Period
Ended
December
31, 2021(a) | |
| | | | |
| Net asset value, beginning of period | | | $25.00 | |
| Net investment loss (b) | | | (0.07 | ) |
| Net realized and unrealized (loss) on investments | | | (0.66 | ) |
| Total from investment operations | | | (0.73 | ) |
| Net asset value, end of period | | | $24.27 | |
| Total return (c) | | | (2.92 | )%(d) |
| Ratios to average net assets | | | | |
| Gross expenses | | | 5.45 | %(e) |
| Net expenses | | | 1.06 | %(e) |
| Net expenses excluding interest expense and taxes | | | 1.05 | %(e) |
| Net investment loss | | | (0.56 | )%(e) |
| Supplemental data | | | | |
| Net assets, end of period (in millions) | | | $2 | |
| Portfolio turnover rate | | | — | %(d) |
| (a) | For the period July 14, 2021 (commencement of operations) through December 31, 2021. |
| (b) | Calculated based upon average shares outstanding |
| (c) | Returns include adjustments in accordance with U.S. Generally Accepted Accounting Principles. Net asset values and returns for financial reporting purposes may differ from those for shareholder transactions. |
| (d) | Not Annualized |
| (e) | Annualized |
See Notes to Financial Statements
VANECK GLOBAL RESOURCES FUND
FINANCIAL HIGHLIGHTS
For a share outstanding throughout each year:
| | | Class A |
| | | | Year Ended December 31, | |
| | | | 2021 | | | 2020 | | | 2019 | | | 2018 | | | 2017 | |
| | | | | | | | | | | | | | | | | |
| Net asset value, beginning of year | | | | $33.51 | | | | $28.39 | | | | $25.66 | | | | $36.32 | | | | $36.87 | |
| Net investment income (loss) (a) | | | | 0.50 | | | | 0.13 | | | | 0.17 | | | | (0.05 | ) | | | (0.17 | ) |
| Net realized and unrealized gain (loss) on investments | | | | 5.73 | | | | 5.17 | | | | 2.81 | | | | (10.61 | ) | | | (0.38 | ) |
| Total from investment operations | | | | 6.23 | | | | 5.30 | | | | 2.98 | | | | (10.66 | ) | | | (0.55 | ) |
| Distributions from: | | | | | | | | | | | | | | | | | | | | | |
| Net investment income | | | | (0.53 | ) | | | (0.18 | ) | | | (0.25 | ) | | | — | | | | — | |
| Net asset value, end of year | | | | $39.21 | | | | $33.51 | | | | $28.39 | | | | $25.66 | | | | $36.32 | |
| Total return (b) | | | | 18.61 | % | | | 18.68 | % | | | 11.64 | % | | | (29.35 | )% | | | (1.49 | )% |
| Ratios to average net assets | | | | | | | | | | | | | | | | | | | | | |
| Gross expenses | | | | 1.48 | % | | | 1.62 | % | | | 1.60 | % | | | 1.59 | % | | | 1.53 | % |
| Net expenses | | | | 1.38 | % | | | 1.38 | % | | | 1.38 | % | | | 1.38 | % | | | 1.38 | % |
| Net investment income (loss) | | | | 1.29 | % | | | 0.53 | % | | | 0.63 | % | | | (0.15 | )% | | | (0.50 | )% |
| Supplemental data | | | | | | | | | | | | | | | | | | | | | |
| Net assets, end of year (in millions) | | | | $152 | | | | $106 | | | | $118 | | | | $194 | | | | $349 | |
| Portfolio turnover rate | | | | 28 | % | | | 37 | % | | | 33 | % | | | 16 | % | | | 17 | % |
| (a) | Calculated based upon average shares outstanding |
| (b) | Returns include adjustments in accordance with U.S. Generally Accepted Accounting Principles. Net asset values and returns for financial reporting purposes may differ from those for shareholder transactions. |
See Notes to Financial Statements
VANECK GLOBAL RESOURCES FUND
FINANCIAL HIGHLIGHTS
For a share outstanding throughout each year:
| | | | Class C |
| | | | Year Ended December 31, | |
| | | | 2021 | | | 2020 | | | 2019 | | | 2018 | | | 2017 | |
| | | | | | | | | | | | | | | | | |
| Net asset value, beginning of year | | | | $28.57 | | | | $24.27 | | | | $21.93 | | | | $31.28 | | | | $32.00 | |
| Net investment income (loss) (a) | | | | 0.15 | | | | (0.06 | ) | | | (0.05 | ) | | | (0.29 | ) | | | (0.39 | ) |
| Net realized and unrealized gain (loss) on investments | | | | 4.90 | | | | 4.36 | | | | 2.39 | | | | (9.06 | ) | | | (0.33 | ) |
| Total from investment operations | | | | 5.05 | | | | 4.30 | | | | 2.34 | | | | (9.35 | ) | | | (0.72 | ) |
| Distributions from: | | | | | | | | | | | | | | | | | | | | | |
| Net investment income | | | | (0.34 | ) | | | — | | | | — | | | | — | | | | — | |
| Net asset value, end of year | | | | $33.28 | | | | $28.57 | | | | $24.27 | | | | $21.93 | | | | $31.28 | |
| Total return (b) | | | | 17.67 | % | | | 17.72 | % | | | 10.67 | % | | | (29.89 | )% | | | (2.25 | )% |
| Ratios to average net assets | | | | | | | | | | | | | | | | | | | | | |
| Gross expenses | | | | 2.52 | % | | | 2.65 | % | | | 2.44 | % | | | 2.32 | % | | | 2.19 | % |
| Net expenses | | | | 2.20 | % | | | 2.20 | % | | | 2.20 | % | | | 2.20 | % | | | 2.19 | % |
| Net investment income (loss) | | | | 0.45 | % | | | (0.27 | )% | | | (0.19 | )% | | | (0.98 | )% | | | (1.33 | )% |
| Supplemental data | | | | | | | | | | | | | | | | | | | | | |
| Net assets, end of year (in millions) | | | | $14 | | | | $11 | | | | $13 | | | | $24 | | | | $54 | |
| Portfolio turnover rate | | | | 28 | % | | | 37 | % | | | 33 | % | | | 16 | % | | | 17 | % |
| (a) | Calculated based upon average shares outstanding |
| (b) | Returns include adjustments in accordance with U.S. Generally Accepted Accounting Principles. Net asset values and returns for financial reporting purposes may differ from those for shareholder transactions. |
See Notes to Financial Statements
VANECK GLOBAL RESOURCES FUND
FINANCIAL HIGHLIGHTS
For a share outstanding throughout each year:
| | | Class I |
| | | | Year Ended December 31, | |
| | | | 2021 | | | 2020 | | | 2019 | | | 2018 | | | 2017 | |
| | | | | | | | | | | | | | | | | |
| Net asset value, beginning of year | | | | $35.15 | | | | $29.74 | | | | $26.94 | | | | $38.10 | | | | $38.51 | |
| Net investment income (loss) (a) | | | | 0.67 | | | | 0.26 | | | | 0.30 | | | | 0.10 | | | | (0.03 | ) |
| Net realized and unrealized gain (loss) on investments | | | | 6.04 | | | | 5.45 | | | | 2.94 | | | | (11.17 | ) | | | (0.38 | ) |
| Total from investment operations | | | | 6.71 | | | | 5.71 | | | | 3.24 | | | | (11.07 | ) | | | (0.41 | ) |
| Distributions from: | | | | | | | | | | | | | | | | | | | | | |
| Net investment income | | | | (0.69 | ) | | | (0.30 | ) | | | (0.44 | ) | | | (0.08 | ) | | | — | |
| Return of capital | | | | — | | | | — | | | | — | | | | (0.01 | ) | | | — | |
| Total distributions | | | | (0.69 | ) | | | (0.30 | ) | | | (0.44 | ) | | | (0.09 | ) | | | — | |
| Net asset value, end of year | | | | $41.17 | | | | $35.15 | | | | $29.74 | | | | $26.94 | | | | $38.10 | |
| Total return (b) | | | | 19.12 | % | | | 19.23 | % | | | 12.06 | % | | | (29.04 | )% | | | (1.06 | )% |
| Ratios to average net assets | | | | | | | | | | | | | | | | | | | | | |
| Gross expenses | | | | 1.11 | % | | | 1.14 | % | | | 1.09 | % | | | 1.06 | % | | | 1.06 | % |
| Net expenses | | | | 0.95 | % | | | 0.95 | % | | | 0.95 | % | | | 0.95 | % | | | 0.97 | % |
| Net investment income (loss) | | | | 1.66 | % | | | 0.98 | % | | | 1.05 | % | | | 0.29 | % | | | (0.08 | )% |
| Supplemental data | | | | | | | | | | | | | | | | | | | | | |
| Net assets, end of year (in millions) | | | | $386 | | | | $358 | | | | $460 | | | | $945 | | | | $1,564 | |
| Portfolio turnover rate | | | | 28 | % | | | 37 | % | | | 33 | % | | | 16 | % | | | 17 | % |
| (a) | Calculated based upon average shares outstanding |
| (b) | Returns include adjustments in accordance with U.S. Generally Accepted Accounting Principles. Net asset values and returns for financial reporting purposes may differ from those for shareholder transactions. |
See Notes to Financial Statements
VANECK GLOBAL RESOURCES FUND
FINANCIAL HIGHLIGHTS
For a share outstanding throughout each year:
| | | Class Y |
| | | | Year Ended December 31, | |
| | | | 2021 | | | 2020 | | | 2019 | | | 2018 | | | 2017 | |
| | | | | | | | | | | | | | | | | |
| Net asset value, beginning of year | | | | $34.17 | | | | $28.93 | | | | $26.19 | | | | $37.01 | | | | $37.47 | |
| Net investment income (loss) (a) | | | | 0.62 | | | | 0.20 | | | | 0.24 | | | | 0.04 | | | | (0.08 | ) |
| Net realized and unrealized gain (loss) on investments | | | | 5.83 | | | | 5.29 | | | | 2.87 | | | | (10.84 | ) | | | (0.38 | ) |
| Total from investment operations | | | | 6.45 | | | | 5.49 | | | | 3.11 | | | | (10.80 | ) | | | (0.46 | ) |
| Distributions from: | | | | | | | | | | | | | | | | | | | | | |
| Net investment income | | | | (0.62 | ) | | | (0.25 | ) | | | (0.37 | ) | | | (0.02 | ) | | | — | |
| Return of capital | | | | — | | | | — | | | | — | | | | — | (b) | | | — | |
| Total distributions | | | | (0.62 | ) | | | (0.25 | ) | | | (0.37 | ) | | | (0.02 | ) | | | — | |
| Net asset value, end of year | | | | $40.00 | | | | $34.17 | | | | $28.93 | | | | $26.19 | | | | $37.01 | |
| Total return (c) | | | | 18.92 | % | | | 18.99 | % | | | 11.88 | % | | | (29.17 | )% | | | (1.23 | )% |
| Ratios to average net assets | | | | | | | | | | | | | | | | | | | | | |
| Gross expenses | | | | 1.18 | % | | | 1.29 | % | | | 1.24 | % | | | 1.20 | % | | | 1.16 | % |
| Net expenses | | | | 1.13 | % | | | 1.13 | % | | | 1.13 | % | | | 1.13 | % | | | 1.13 | % |
| Net investment income (loss) | | | | 1.56 | % | | | 0.76 | % | | | 0.85 | % | | | 0.11 | % | | | (0.25 | )% |
| Supplemental data | | | | | | | | | | | | | | | | | | | | | |
| Net assets, end of year (in millions) | | | | $231 | | | | $122 | | | | $115 | | | | $167 | | | | $271 | |
| Portfolio turnover rate | | | | 28 | % | | | 37 | % | | | 33 | % | | | 16 | % | | | 17 | % |
| (a) | Calculated based upon average shares outstanding |
| (b) | Amount represents less than $0.005 per share. |
| (c) | Returns include adjustments in accordance with U.S. Generally Accepted Accounting Principles. Net asset values and returns for financial reporting purposes may differ from those for shareholder transactions. |
See Notes to Financial Statements
VANECK INTERNATIONAL INVESTORS GOLD FUND
FINANCIAL HIGHLIGHTS
For a share outstanding throughout each year:
| | | Class A |
| | | | Year Ended December 31, | |
| | | | 2021 | | | 2020 | | | 2019 | | | 2018 | | | 2017 | |
| | | | | | | | | | | | | | | | | |
| Net asset value, beginning of year | | | | $12.82 | | | | $10.16 | | | | $7.65 | | | | $9.38 | | | | $8.62 | |
| Net investment loss (a) | | | | — | (b) | | | (0.06 | ) | | | (0.06 | ) | | | (0.04 | ) | | | (0.09 | ) |
| Net realized and unrealized gain (loss) on investments | | | | (1.84 | ) | | | 4.22 | | | | 2.94 | | | | (1.47 | ) | | | 1.20 | |
| Total from investment operations | | | | (1.84 | ) | | | 4.16 | | | | 2.88 | | | | (1.51 | ) | | | 1.11 | |
| Distributions from: | | | | | | | | | | | | | | | | | | | | | |
| Net investment income | | | | (0.66 | ) | | | (1.50 | ) | | | (0.37 | ) | | | (0.22 | ) | | | (0.35 | ) |
| Net asset value, end of year | | | | $10.32 | | | | $12.82 | | | | $10.16 | | | | $7.65 | | | | $9.38 | |
| Total return (c) | | | | (14.22 | )% | | | 41.39 | % | | | 38.03 | % | | | (15.99 | )% | | | 13.03 | % |
| Ratios to average net assets | | | | | | | | | | | | | | | | | | | | | |
| Gross expenses | | | | 1.34 | %(d) | | | 1.34 | % | | | 1.49 | % | | | 1.47 | % | | | 1.43 | % |
| Net expenses | | | | 1.34 | %(d) | | | 1.34 | % | | | 1.45 | % | | | 1.45 | % | | | 1.43 | % |
| Net investment loss | | | | — | %(d) | | | (0.45 | )% | | | (0.63 | )% | | | (0.51 | )% | | | (0.93 | )% |
| Supplemental data | | | | | | | | | | | | | | | | | | | | | |
| Net assets, end of year (in millions) | | | | $302 | | | | $378 | | | | $277 | | | | $200 | | | | $286 | |
| Portfolio turnover rate | | | | 23 | % | | | 32 | % | | | 21 | % | | | 35 | % | | | 32 | % |
| (a) | Calculated based upon average shares outstanding |
| (b) | Amount represents less than $0.005 per share. |
| (c) | Returns include adjustments in accordance with U.S. Generally Accepted Accounting Principles. Net asset values and returns for financial reporting purposes may differ from those for shareholder transactions. |
| (d) | The ratios presented do not reflect the Fund’s proportionate share of income and expenses from the Fund’s investment in underlying funds. |
See Notes to Financial Statements
VANECK INTERNATIONAL INVESTORS GOLD FUND
FINANCIAL HIGHLIGHTS
For a share outstanding throughout each year:
| | | Class C |
| | | | Year Ended December 31, | |
| | | | 2021 | | | 2020 | | | 2019 | | | 2018 | | | 2017 | |
| | | | | | | | | | | | | | | | | |
| Net asset value, beginning of year | | | | $10.83 | | | | $8.77 | | | | $6.64 | | | | $8.25 | | | | $7.61 | |
| Net investment loss (a) | | | | (0.08 | ) | | | (0.13 | ) | | | (0.11 | ) | | | (0.09 | ) | | | (0.14 | ) |
| Net realized and unrealized gain (loss) on investments | | | | (1.55 | ) | | | 3.62 | | | | 2.55 | | | | (1.30 | ) | | | 1.06 | |
| Total from investment operations | | | | (1.63 | ) | | | 3.49 | | | | 2.44 | | | | (1.39 | ) | | | 0.92 | |
| Distributions from: | | | | | | | | | | | | | | | | | | | | | |
| Net investment income | | | | (0.66 | ) | | | (1.43 | ) | | | (0.31 | ) | | | (0.22 | ) | | | (0.28 | ) |
| Net asset value, end of year | | | | $8.54 | | | | $10.83 | | | | $8.77 | | | | $6.64 | | | | $8.25 | |
| Total return (b) | | | | (14.89 | )% | | | 40.31 | % | | | 37.12 | % | | | (16.73 | )% | | | 12.24 | % |
| Ratios to average net assets | | | | | | | | | | | | | | | | | | | | | |
| Gross expenses | | | | 2.13 | %(c) | | | 2.12 | % | | | 2.31 | % | | | 2.27 | % | | | 2.21 | % |
| Net expenses | | | | 2.13 | %(c) | | | 2.12 | % | | | 2.20 | % | | | 2.20 | % | | | 2.20 | % |
| Net investment loss | | | | (0.79 | )%(c) | | | (1.21 | )% | | | (1.36 | )% | | | (1.25 | )% | | | (1.70 | )% |
| Supplemental data | | | | | | | | | | | | | | | | | | | | | |
| Net assets, end of year (in millions) | | | | $49 | | | | $63 | | | | $38 | | | | $32 | | | | $47 | |
| Portfolio turnover rate | | | | 23 | % | | | 32 | % | | | 21 | % | | | 35 | % | | | 32 | % |
| (a) | Calculated based upon average shares outstanding |
| (b) | Returns include adjustments in accordance with U.S. Generally Accepted Accounting Principles. Net asset values and returns for financial reporting purposes may differ from those for shareholder transactions. |
| (c) | The ratios presented do not reflect the Fund’s proportionate share of income and expenses from the Fund’s investment in underlying funds. |
See Notes to Financial Statements
VANECK INTERNATIONAL INVESTORS GOLD FUND
FINANCIAL HIGHLIGHTS
For a share outstanding throughout each year:
| | | Class I |
| | | | Year Ended December 31, | |
| | | | 2021 | | | 2020 | | | 2019 | | | 2018 | | | 2017 | |
| | | | | | | | | | | | | | | | | |
| Net asset value, beginning of year | | | | $17.31 | | | | $13.32 | | | | $9.93 | | | | $12.05 | | | | $10.97 | |
| Net investment income (loss) (a) | | | | 0.05 | | | | (0.02 | ) | | | (0.02 | ) | | | (0.01 | ) | | | (0.06 | ) |
| Net realized and unrealized gain (loss) on investments | | | | (2.48 | ) | | | 5.55 | | | | 3.82 | | | | (1.89 | ) | | | 1.54 | |
| Total from investment operations | | | | (2.43 | ) | | | 5.53 | | | | 3.80 | | | | (1.90 | ) | | | 1.48 | |
| Distributions from: | | | | | | | | | | | | | | | | | | | | | |
| Net investment income | | | | (0.66 | ) | | | (1.54 | ) | | | (0.41 | ) | | | (0.22 | ) | | | (0.40 | ) |
| Net asset value, end of year | | | | $14.22 | | | | $17.31 | | | | $13.32 | | | | $9.93 | | | | $12.05 | |
| Total return (b) | | | | (13.94 | )% | | | 41.88 | % | | | 38.61 | % | | | (15.69 | )% | | | 13.56 | % |
| Ratios to average net assets | | | | | | | | | | | | | | | | | | | | | |
| Gross expenses | | | | 1.03 | %(c) | | | 1.02 | % | | | 1.09 | % | | | 1.06 | % | | | 1.04 | % |
| Net expenses | | | | 1.00 | %(c) | | | 1.00 | % | | | 1.00 | % | | | 1.00 | % | | | 1.00 | % |
| Net investment income (loss) | | | | 0.34 | %(c) | | | (0.12 | )% | | | (0.16 | )% | | | (0.06 | )% | | | (0.51 | )% |
| Supplemental data | | | | | | | | | | | | | | | | | | | | | |
| Net assets, end of year (in millions) | | | | $203 | | | | $244 | | | | $236 | | | | $244 | | | | $285 | |
| Portfolio turnover rate | | | | 23 | % | | | 32 | % | | | 21 | % | | | 35 | % | | | 32 | % |
| (a) | Calculated based upon average shares outstanding |
| (b) | Returns include adjustments in accordance with U.S. Generally Accepted Accounting Principles. Net asset values and returns for financial reporting purposes may differ from those for shareholder transactions. |
| (c) | The ratios presented do not reflect the Fund’s proportionate share of income and expenses from the Fund’s investment in underlying funds. |
See Notes to Financial Statements
VANECK INTERNATIONAL INVESTORS GOLD FUND
FINANCIAL HIGHLIGHTS
For a share outstanding throughout each year:
| | | Class Y |
| | | | Year Ended December 31, | |
| | | | 2021 | | | 2020 | | | 2019 | | | 2018 | | | 2017 | |
| | | | | | | | | | | | | | | | | |
| Net asset value, beginning of year | | | | $13.15 | | | | $10.40 | | | | $7.82 | | | | $9.55 | | | | $8.78 | |
| Net investment income (loss) (a) | | | | 0.03 | | | | (0.02 | ) | | | (0.03 | ) | | | (0.01 | ) | | | (0.06 | ) |
| Net realized and unrealized gain (loss) on investments | | | | (1.88 | ) | | | 4.31 | | | | 3.01 | | | | (1.50 | ) | | | 1.22 | |
| Total from investment operations | | | | (1.85 | ) | | | 4.29 | | | | 2.98 | | | | (1.51 | ) | | | 1.16 | |
| Distributions from: | | | | | | | | | | | | | | | | | | | | | |
| Net investment income | | | | (0.66 | ) | | | (1.54 | ) | | | (0.40 | ) | | | (0.22 | ) | | | (0.39 | ) |
| Net asset value, end of year | | | | $10.64 | | | | $13.15 | | | | $10.40 | | | | $7.82 | | | | $9.55 | |
| Total return (b) | | | | (13.94 | )% | | | 41.68 | % | | | 38.52 | % | | | (15.71 | )% | | | 13.29 | % |
| Ratios to average net assets | | | | | | | | | | | | | | | | | | | | | |
| Gross expenses | | | | 1.06 | %(c) | | | 1.05 | % | | | 1.17 | % | | | 1.18 | % | | | 1.16 | % |
| Net expenses | | | | 1.06 | %(c) | | | 1.05 | % | | | 1.10 | % | | | 1.10 | % | | | 1.10 | % |
| Net investment income (loss) | | | | 0.29 | %(c) | | | (0.12 | )% | | | (0.29 | )% | | | (0.17 | )% | | | (0.60 | )% |
| Supplemental data | | | | | | | | | | | | | | | | | | | | | |
| Net assets, end of year (in millions) | | | | $306 | | | | $375 | | | | $176 | | | | $106 | | | | $96 | |
| Portfolio turnover rate | | | | 23 | % | | | 32 | % | | | 21 | % | | | 35 | % | | | 32 | % |
| (a) | Calculated based upon average shares outstanding |
| (b) | Returns include adjustments in accordance with U.S. Generally Accepted Accounting Principles. Net asset values and returns for financial reporting purposes may differ from those for shareholder transactions. |
| (c) | The ratios presented do not reflect the Fund’s proportionate share of income and expenses from the Fund’s investment in underlying funds. |
See Notes to Financial Statements
VANECK MORNINGSTAR WIDE MOAT FUND
FINANCIAL HIGHLIGHTS
For a share outstanding throughout each period:
| | | | Class I | |
| | | | Year Ended December 31, | | | Period
Ended
December | |
| | | | 2021 | | | 2020 | | | 2019 | | | 2018 | | | 31, 2017(a) | |
| | | | | | | | | | | | | | | | | |
| Net asset value, beginning of period | | | | $30.70 | | | | $29.13 | | | | $23.94 | | | | $26.63 | | | | $25.15 | |
| Net investment income (b) | | | | 0.40 | | | | 0.47 | | | | 0.49 | | | | 0.49 | | | | 0.07 | |
| Net realized and unrealized gain (loss) on investments | | | | 6.92 | | | | 3.63 | | | | 7.86 | | | | (0.91 | ) | | | 1.48 | |
| Total from investment operations | | | | 7.32 | | | | 4.10 | | | | 8.35 | | | | (0.42 | ) | | | 1.55 | |
| Distributions from: | | | | | | | | | | | | | | | | | | | | | |
| Net investment income | | | | (0.38 | ) | | | (0.48 | ) | | | (0.46 | ) | | | (0.48 | ) | | | (0.07 | ) |
| Net realized capital gains | | | | (4.13 | ) | | | (2.05 | ) | | | (2.70 | ) | | | (1.79 | ) | | | — | |
| Total distributions | | | | (4.51 | ) | | | (2.53 | ) | | | (3.16 | ) | | | (2.27 | ) | | | (0.07 | ) |
| Net asset value, end of period | | | | $33.51 | | | | $30.70 | | | | $29.13 | | | | $23.94 | | | | $26.63 | |
| Total return (c) | | | | 24.04 | % | | | 14.18 | % | | | 34.80 | % | | | (1.30 | )% | | | 6.15 | %(d) |
| Ratios to average net assets | | | | | | | | | | | | | | | | | | | | | |
| Gross expenses | | | | 2.26 | % | | | 4.28 | % | | | 5.21 | % | | | 3.42 | % | | | 16.25 | %(e) |
| Net expenses | | | | 0.59 | % | | | 0.59 | % | | | 0.59 | % | | | 0.59 | % | | | 0.59 | %(e) |
| Net investment income | | | | 1.13 | % | | | 1.65 | % | | | 1.72 | % | | | 1.79 | % | | | 1.89 | %(e) |
| Supplemental data | | | | | | | | | | | | | | | | | | | | | |
| Net assets, end of period (in millions) | | | | $4 | | | | $3 | | | | $1 | | | | $1 | | | | $1 | |
| Portfolio turnover rate | | | | 59 | % | | | 64 | % | | | 108 | % | | | 76 | % | | | 10 | %(d) |
| (a) | For the period November 7, 2017 (commencement of operations) through December 31, 2017. |
| (b) | Calculated based upon average shares outstanding |
| (c) | Returns include adjustments in accordance with U.S. Generally Accepted Accounting Principles. Net asset values and returns for financial reporting purposes may differ from those for shareholder transactions. |
| (d) | Not Annualized |
| (e) | Annualized |
See Notes to Financial Statements
VANECK MORNINGSTAR WIDE MOAT FUND
FINANCIAL HIGHLIGHTS
For a share outstanding throughout each period:
| | | | Class Z | |
| | | | Year Ended December 31, | | | Period
Ended
December | |
| | | | 2021 | | | 2020 | | | 2019 | | | 2018 | | | 31, 2017(a) | |
| | | | | | | | | | | | | | | | | |
| Net asset value, beginning of period | | | | $30.32 | | | | $28.76 | | | | $23.95 | | | | $26.63 | | | | $25.15 | |
| Net investment income (b) | | | | 0.44 | | | | 0.49 | | | | 0.52 | | | | 0.50 | | | | 0.08 | |
| Net realized and unrealized gain (loss) on investments | | | | 6.82 | | | | 3.59 | | | | 7.89 | | | | (0.90 | ) | | | 1.47 | |
| Total from investment operations | | | | 7.26 | | | | 4.08 | | | | 8.41 | | | | (0.40 | ) | | | 1.55 | |
| Distributions from: | | | | | | | | | | | | | | | | | | | | | |
| Net investment income | | | | (0.41 | ) | | | (0.47 | ) | | | (0.90 | ) | | | (0.49 | ) | | | (0.07 | ) |
| Net realized capital gains | | | | (4.13 | ) | | | (2.05 | ) | | | (2.70 | ) | | | (1.79 | ) | | | — | |
| Total distributions | | | | (4.54 | ) | | | (2.52 | ) | | | (3.60 | ) | | | (2.28 | ) | | | (0.07 | ) |
| Net asset value, end of period | | | | $33.04 | | | | $30.32 | | | | $28.76 | | | | $23.95 | | | | $26.63 | |
| Total return (c) | | | | 24.15 | % | | | 14.31 | % | | | 35.02 | % | | | (1.22 | )% | | | 6.17 | %(d) |
| Ratios to average net assets | | | | | | | | | | | | | | | | | | | | | |
| Gross expenses | | | | 1.59 | % | | | 2.48 | % | | | 3.02 | % | | | 2.16 | % | | | 13.17 | %(e) |
| Net expenses | | | | 0.49 | % | | | 0.49 | % | | | 0.49 | % | | | 0.49 | % | | | 0.49 | %(e) |
| Net investment income | | | | 1.23 | % | | | 1.74 | % | | | 1.83 | % | | | 1.90 | % | | | 1.99 | %(e) |
| Supplemental data | | | | | | | | | | | | | | | | | | | | | |
| Net assets, end of period (in millions) | | | | $15 | | | | $10 | | | | $8 | | | | $5 | | | | $4 | |
| Portfolio turnover rate | | | | 59 | % | | | 64 | % | | | 108 | % | | | 76 | % | | | 10 | %(d) |
| (a) | For the period November 7, 2017 (commencement of operations) through December 31, 2017. |
| (b) | Calculated based upon average shares outstanding |
| (c) | Returns include adjustments in accordance with U.S. Generally Accepted Accounting Principles. Net asset values and returns for financial reporting purposes may differ from those for shareholder transactions. |
| (d) | Not Annualized |
| (e) | Annualized |
See Notes to Financial Statements
VANECK NDR MANAGED ALLOCATION FUND
FINANCIAL HIGHLIGHTS
For a share outstanding throughout each year:
| | | | Class A | |
| | | | Year Ended December 31, | |
| | | | 2021 | | | 2020 | | | 2019 | | | 2018 | | | 2017 | |
| | | | | | | | | | | | | | | | | |
| Net asset value, beginning of year | | | | $31.19 | | | | $29.08 | | | | $26.54 | | | | $29.31 | | | | $25.97 | |
| Net investment income (a) | | | | 0.21 | | | | 0.26 | | | | 0.38 | | | | 0.34 | | | | 0.22 | |
| Net realized and unrealized gain (loss) on investments | | | | 3.31 | | | | 2.16 | | | | 2.59 | | | | (2.73 | ) | | | 3.71 | |
| Total from investment operations | | | | 3.52 | | | | 2.42 | | | | 2.97 | | | | (2.39 | ) | | | 3.93 | |
| Distributions from: | | | | | | | | | | | | | | | | | | | | | |
| Net investment income | | | | (0.27 | ) | | | (0.31 | ) | | | (0.43 | ) | | | (0.23 | ) | | | (0.16 | ) |
| Net realized capital gains | | | | (0.19 | ) | | | — | | | | — | | | | (0.15 | ) | | | (0.43 | ) |
| Total distributions | | | | (0.46 | ) | | | (0.31 | ) | | | (0.43 | ) | | | (0.38 | ) | | | (0.59 | ) |
| Net asset value, end of year | | | | $34.25 | | | | $31.19 | | | | $29.08 | | | | $26.54 | | | | $29.31 | |
| Total return (b) | | | | 11.30 | % | | | 8.35 | % | | | 11.21 | % | | | (8.13 | )% | | | 15.15 | % |
| Ratios to average net assets | | | | | | | | | | | | | | | | | | | | | |
| Gross expenses (c) | | | | 1.86 | % | | | 1.86 | % | | | 1.87 | % | | | 1.62 | % | | | 2.09 | % |
| Net expenses (c) | | | | 1.15 | % | | | 1.15 | % | | | 1.16 | % | | | 1.15 | % | | | 1.15 | % |
| Net expenses excluding interest expense (c) | | | | 1.15 | % | | | 1.15 | % | | | 1.15 | % | | | 1.15 | % | | | 1.15 | % |
| Net investment income (c) | | | | 0.63 | % | | | 0.92 | % | | | 1.35 | % | | | 1.16 | % | | | 0.79 | % |
| Supplemental data | | | | | | | | | | | | | | | | | | | | | |
| Net assets, end of year (in millions) | | | | $10 | | | | $12 | | | | $14 | | | | $15 | | | | $10 | |
| Portfolio turnover rate | | | | 90 | % | | | 164 | % | | | 193 | % | | | 202 | % | | | 229 | % |
| (a) | Calculated based upon average shares outstanding |
| (b) | Returns include adjustments in accordance with U.S. Generally Accepted Accounting Principles. Net asset values and returns for financial reporting purposes may differ from those for shareholder transactions. |
| (c) | The ratios presented do not reflect the Fund’s proportionate share of income and expenses from the Fund’s investment in underlying funds. |
See Notes to Financial Statements
VANECK NDR MANAGED ALLOCATION FUND
FINANCIAL HIGHLIGHTS
For a share outstanding throughout each year:
| | | | Class I | |
| | | | Year Ended December 31, | |
| | | | 2021 | | | 2020 | | | 2019 | | | 2018 | | | 2017 | |
| | | | | | | | | | | | | | | | | |
| Net asset value, beginning of year | | | | $31.30 | | | | $29.18 | | | | $26.63 | | | | $29.41 | | | | $26.02 | |
| Net investment income (a) | | | | 0.33 | | | | 0.36 | | | | 0.47 | | | | 0.38 | | | | 0.35 | |
| Net realized and unrealized gain (loss) on investments | | | | 3.31 | | | | 2.17 | | | | 2.60 | | | | (2.70 | ) | | | 3.67 | |
| Total from investment operations | | | | 3.64 | | | | 2.53 | | | | 3.07 | | | | (2.32 | ) | | | 4.02 | |
| Distributions from: | | | | | | | | | | | | | | | | | | | | | |
| Net investment income | | | | (0.37 | ) | | | (0.41 | ) | | | (0.52 | ) | | | (0.31 | ) | | | (0.20 | ) |
| Net realized capital gains | | | | (0.19 | ) | | | — | | | | — | | | | (0.15 | ) | | | (0.43 | ) |
| Total distributions | | | | (0.56 | ) | | | (0.41 | ) | | | (0.52 | ) | | | (0.46 | ) | | | (0.63 | ) |
| Net asset value, end of year | | | | $34.38 | | | | $31.30 | | | | $29.18 | | | | $26.63 | | | | $29.41 | |
| Total return (b) | | | | 11.66 | % | | | 8.67 | % | | | 11.53 | % | | | (7.85 | )% | | | 15.48 | % |
| Ratios to average net assets | | | | | | | | | | | | | | | | | | | | | |
| Gross expenses (c) | | | | 1.46 | % | | | 1.51 | % | | | 1.55 | % | | | 1.36 | % | | | 1.79 | % |
| Net expenses (c) | | | | 0.85 | % | | | 0.85 | % | | | 0.86 | % | | | 0.85 | % | | | 0.85 | % |
| Net expenses excluding interest expense (c) | | | | 0.85 | % | | | 0.85 | % | | | 0.85 | % | | | 0.85 | % | | | 0.85 | % |
| Net investment income (c) | | | | 0.98 | % | | | 1.26 | % | | | 1.66 | % | | | 1.33 | % | | | 1.23 | % |
| Supplemental data | | | | | | | | | | | | | | | | | | | | | |
| Net assets, end of year (in millions) | | | | $13 | | | | $14 | | | | $15 | | | | $12 | | | | $13 | |
| Portfolio turnover rate | | | | 90 | % | | | 164 | % | | | 193 | % | | | 202 | % | | | 229 | % |
| (a) | Calculated based upon average shares outstanding |
| (b) | Returns include adjustments in accordance with U.S. Generally Accepted Accounting Principles. Net asset values and returns for financial reporting purposes may differ from those for shareholder transactions. |
| (c) | The ratios presented do not reflect the Fund’s proportionate share of income and expenses from the Fund’s investment in underlying funds. |
See Notes to Financial Statements
VANECK NDR MANAGED ALLOCATION FUND
FINANCIAL HIGHLIGHTS
For a share outstanding throughout each year:
| | | | Class Y | |
| | | | Year Ended December 31, | |
| | | | 2021 | | | 2020 | | | 2019 | | | 2018 | | | 2017 | |
| | | | | | | | | | | | | | | | | |
| Net asset value, beginning of year | | | | $31.30 | | | $ | 29.16 | | | $ | 26.62 | | | $ | 29.39 | | | $ | 26.01 | |
| Net investment income (a) | | | | 0.33 | | | | 0.36 | | | | 0.41 | | | | 0.39 | | | | 0.36 | |
| Net realized and unrealized gain (loss) on investments | | | | 3.29 | | | | 2.14 | | | | 2.65 | | | | (2.72 | ) | | | 3.65 | |
| Total from investment operations | | | | 3.62 | | | | 2.50 | | | | 3.06 | | | | (2.33 | ) | | | 4.01 | |
| Distributions from: | | | | | | | | | | | | | | | | | | | | | |
| Net investment income | | | | (0.35 | ) | | | (0.36 | ) | | | (0.52 | ) | | | (0.29 | ) | | | (0.20 | ) |
| Net realized capital gains | | | | (0.19 | ) | | | — | | | | — | | | | (0.15 | ) | | | (0.43 | ) |
| Total distributions | | | | (0.54 | ) | | | (0.36 | ) | | | (0.52 | ) | | | (0.44 | ) | | | (0.63 | ) |
| Net asset value, end of year | | | | $34.38 | | | $ | 31.30 | | | $ | 29.16 | | | $ | 26.62 | | | $ | 29.39 | |
| Total return (b) | | | | 11.59 | % | | | 8.61 | % | | | 11.49 | % | | | (7.90 | )% | | | 15.45 | % |
| Ratios to average net assets | | | | | | | | | | | | | | | | | | | | | |
| Gross expenses (c) | | | | 1.56 | % | | | 1.67 | % | | | 1.64 | % | | | 1.33 | % | | | 1.75 | % |
| Net expenses (c) | | | | 0.90 | % | | | 0.90 | % | | | 0.91 | % | | | 0.90 | % | | | 0.90 | % |
| Net expenses excluding interest expense (c) | | | | 0.90 | % | | | 0.90 | % | | | 0.90 | % | | | 0.90 | % | | | 0.90 | % |
| Net investment income (c) | | | | 0.97 | % | | | 1.25 | % | | | 1.48 | % | | | 1.36 | % | | | 1.25 | % |
| Supplemental data | | | | | | | | | | | | | | | | | | | | | |
| Net assets, end of year (in millions) | | | | $12 | | | | $11 | | | | $10 | | | | $19 | | | | $13 | |
| Portfolio turnover rate | | | | 90 | % | | | 164 | % | | | 193 | % | | | 202 | % | | | 229 | % |
| (a) | Calculated based upon average shares outstanding |
| (b) | Returns include adjustments in accordance with U.S. Generally Accepted Accounting Principles. Net asset values and returns for financial reporting purposes may differ from those for shareholder transactions. |
| (c) | The ratios presented do not reflect the Fund’s proportionate share of income and expenses from the Fund’s investment in underlying funds. |
See Notes to Financial Statements
VANECK FUNDS
NOTES TO FINANCIAL STATEMENTS
December 31, 2021
Note 1—Fund Organization—VanEck Funds (the “Trust”) is registered under the Investment Company Act of 1940, as amended, as an open-end management investment company. The Trust was organized as a Massachusetts business trust on April 3, 1985. These financial statements relate to the investment portfolios listed in the diversification table below (each a “Fund” and, collectively, the “Funds”).
| Fund | Diversification Classification |
| | |
| CM Commodity Index Fund | Diversified |
| Emerging Markets Bond Fund | Non-Diversified |
| Emerging Markets Fund | Diversified |
| Environmental Sustainability Fund | Non-Diversified |
| Global Resources Fund | Diversified |
| International Investors Gold Fund | Non-Diversified |
| VanEck Morningstar Wide Moat Fund | Diversified |
| VanEck NDR Managed Allocation Fund | Diversified |
The CM Commodity Index Fund seeks to track, before fees and expenses, the performance of the UBS Bloomberg Constant Maturity Commodity Total Return Index. The Emerging Markets Bond Fund seeks total return, consisting of income and capital appreciation by investing primarily in emerging market debt securities. The Emerging Markets Fund seeks long-term capital appreciation by investing primarily in equity securities in emerging markets around the world. The Environmental Sustainability Fund seeks long-term capital appreciation by investing primarily in equity securities of companies operating in environmental sustainability markets. The Global Resources Fund seeks long-term capital appreciation by investing primarily in hard asset securities. The International Investors Gold Fund seeks long-term capital appreciation by investing in common stocks of gold-mining companies or directly in gold bullion and other metals. The VanEck Morningstar Wide Moat Fund seeks to replicate as closely as possible, before fees and expenses, the price and yield performance of the Morningstar Wide Moat Focus Index. The VanEck NDR Managed Allocation Fund seeks to achieve its investment objective by investing in exchange traded products using a customized version of a global tactical asset allocation model developed by Ned Davis Research, Inc.
Each of the Funds is authorized to issue various classes of shares. Each share class represents an interest in the same portfolio of investments of the respective Fund and is substantially the same in all respects, except that the classes are subject to different distribution fees and sales charges. Class I, Y and Z Shares are sold without a sales charge; Class A Shares are sold subject to a front-end sales charge; and Class C Shares are sold with a contingent deferred sales charge.
Note 2—Significant Accounting Policies—The preparation of financial statements in conformity with U.S. generally accepted accounting principles (“GAAP”) requires management to make estimates and assumptions that affect the reported amounts and disclosures in the financial statements. Actual results could differ from those estimates.
The Funds are investment companies and follow accounting and reporting requirements of Accounting Standards Codification (“ASC”) 946, Financial Services-Investment Companies.
The following summarizes the Funds’ significant accounting policies.
| A. | Security Valuation—The Funds value their investments in securities and other assets and liabilities at fair value daily. Fair value is the price that would be received to sell an asset or paid to transfer a liability in an orderly transaction between market participants on the measurement date. Securities traded on national exchanges are valued at the closing price on the markets in which the securities trade. Securities traded on the NASDAQ Stock Market LLC (“NASDAQ”) are valued at the NASDAQ official closing price. Over-the-counter securities not included on NASDAQ and listed securities for which no sale was reported are valued at the mean of the bid and ask prices. To the extent these securities are actively traded they are categorized as Level 1 in the fair value hierarchy (described below). Certain foreign securities, whose values may be affected by market direction or events occurring before the Funds’ pricing time (4:00 p.m. Eastern Time) but after the last close of the securities’ primary market, are fair valued using a pricing service and are categorized as Level 2 in the fair value hierarchy. The pricing service, using |
VANECK FUNDS
NOTES TO FINANCIAL STATEMENTS
(continued)
| | methods approved by the Board of Trustees, considers the correlation of the trading patterns of the foreign security to intraday trading in the U.S. markets, based on indices of domestic securities and other appropriate indicators such as prices of relevant ADR’s and futures contracts. The Funds may also fair value securities in other situations, such as, when a particular foreign market is closed but the Funds are open. Debt securities are valued on the basis of evaluated prices furnished by an independent pricing service approved by the Funds’ Board of Trustees or provided by securities dealers. The pricing services may use valuation models or matrix pricing, which consider: (i) yield or price with respect to bonds that are considered comparable in characteristics such as rating, interest rate and maturity date and or (ii) quotations from bond dealers to determine current value and are categorized as Level 2 in the fair value hierarchy. Short-term debt securities with sixty days or less to maturity are valued at amortized cost, which with accrued interest approximates fair value. Private investments in public equity are valued based on the underlying stock price and may consider the volatility of the underlying stock price as a significant unobservable input in fair value measurement. Non-exchange traded warrants of publicly traded companies are generally valued using the Black-Scholes model, which incorporates both observable and unobservable inputs. Open-end mutual fund investments (including money market funds) are valued at their net asset value each business day and are categorized as Level 1 in the fair value hierarchy. Forward foreign currency contracts are valued at the spot currency rate plus an amount (“points”), which reflects the differences in interest rates between the U.S. and foreign markets and are categorized as Level 2 in the fair value hierarchy. Swap contracts are marked to market daily using either pricing vendor quotations, counterparty prices or model prices and the net change in value, if any, is regarded as an unrealized gain or loss and is categorized as Level 2 in the fair value hierarchy. The Pricing Committee of the Van Eck Associate Corporation (“VEAC”) and Van Eck Absolute Return Advisers Corporation (“VEARA”) (VEAC and VEARA, collectively referred to as the “Adviser”) provides oversight of the Funds’ valuation policies and procedures, which are approved by the Funds’ Board of Trustees. Among other things, these procedures allow the Funds to utilize independent pricing services, quotations from securities dealers, and other market sources to determine fair value. The Pricing Committee convenes regularly to review the fair value of financial instruments or other assets. If market quotations for a security or other asset are not readily available, or if the Adviser believes it does not otherwise reflect the fair value of a security or asset, the security or asset will be fair valued by the Pricing Committee in accordance with the Funds’ valuation policies and procedures. The Pricing Committee employs various methods for calibrating the valuation approaches utilized to determine fair value, including a regular review of key inputs and assumptions, periodic comparisons to valuations provided by other independent pricing services, transactional back-testing and disposition analysis. |
| | |
| | Certain factors such as economic conditions, political events, market trends, the nature of and duration of any restrictions on disposition, trading in similar securities of the issuer or comparable issuers and other security specific information are used to determine the fair value of these securities. Depending on the relative significance of valuation inputs, these securities may be categorized either as Level 2 or Level 3 in the fair value hierarchy. The price which the Funds may realize upon sale of an investment may differ materially from the value presented in the Schedules of Investments. |
| | |
| | The Funds utilize various methods to measure the fair value of their investments on a recurring basis, which includes a hierarchy that prioritizes inputs to valuation methods used to measure fair value. The fair value hierarchy gives highest priority to unadjusted quoted prices in active markets for identical assets and liabilities (Level 1 measurements) and the lowest priority to unobservable inputs (Level 3 measurements). The inputs or methodologies used for valuing securities are not necessarily an indication of the risk associated with investing in those securities. The three levels of the fair value hierarchy are described below: |
| | |
| | Level 1 — Quoted prices in active markets for identical securities. |
| | |
| | Level 2 — Significant observable inputs (including quoted prices for similar securities, interest rates, prepayment speeds, credit risk, etc.). |
| | Level 3 — Significant unobservable inputs (including each Fund’s own assumptions in determining the fair value of investments). |
| | |
| | A summary of the inputs and the levels used to value the Funds’ investments are located in the Schedules of Investments. Additionally, tables that reconcile the valuation of the Funds’ Level 3 investments and that present additional information about valuation methodologies and unobservable inputs, if applicable, are located in the Schedules of Investments. |
| | |
| B. | Basis for Consolidation—The CM Commodity Index Fund and International Investors Gold Fund may effect certain investments through the Commodities Series Fund I Subsidiary, and Gold Series Fund I Subsidiary, respectively, Cayman Islands exempted companies (collectively the “Subsidiaries” and each a wholly-owned “Subsidiary”). The consolidated financial statements of the CM Commodity Index Fund and the International Investors Gold Fund present the financial position and results of operations for the Funds, and their wholly owned Subsidiaries. All interfund account balances and transactions between parent and subsidiary have been eliminated in consolidation. As of December 31, 2021, the CM Commodity Index Fund and International Investors Gold Fund held $138,802,755 and $44,171,483 in their Subsidiaries, representing 21% and 5% of the Funds’ net assets, respectively. |
| | |
| C. | Federal Income Taxes—It is each Fund’s policy to comply with the provisions of the Internal Revenue Code applicable to regulated investment companies and to distribute all of its net investment income to its shareholders. Therefore, no federal income tax provision is required. |
| | |
| | The wholly owned Subsidiaries are classified as controlled foreign corporations (“CFC”) under the Code. For U.S. tax purposes, a CFC is not subject to U.S. income tax. However, as a wholly owned CFC, its net income and capital gains, to the extent of its earnings and profits, will be included each year in the Funds’ investment company taxable income. Net losses of the CFC cannot be deducted by the Funds in the current year, nor carried forward to offset taxable income in future years. |
| | |
| D. | Distributions to Shareholders—Dividends to shareholders from net investment income and distributions from net realized capital gains, if any, are declared and paid annually (except for dividends from net investment income from Emerging Markets Bond Fund which are declared and paid monthly). Income dividends and capital gain distributions are determined in accordance with U.S. income tax regulations, which may differ from such amounts determined in accordance with GAAP. |
| | |
| E. | Currency Translation—Assets and liabilities denominated in foreign currencies and commitments under foreign currency contracts are translated into U.S. dollars at the closing prices of such currencies each business day as quoted by one or more sources. Purchases and sales of investments are translated at the exchange rates prevailing when such investments are acquired or sold. Foreign denominated income and expenses are translated at the exchange rates prevailing when accrued. The portion of realized and unrealized gains and losses on investments that result from fluctuations in foreign currency exchange rates is not separately disclosed in the financial statements. Such amounts are included with the net realized and unrealized gains and losses on investment securities in the Statements of Operations. Recognized gains or losses attributable to foreign currency fluctuations on foreign currency denominated assets, other than investments, and liabilities are recorded as net realized gain (loss) and net change in unrealized appreciation (depreciation) on foreign currency transactions and foreign denominated assets and liabilities in the Statements of Operations. |
| | |
| F. | Restricted Securities—The Funds may invest in securities that are subject to legal or contractual restrictions on resale. These securities generally may be resold in transactions exempt from registration or to the public if the securities are registered. Disposal of these securities may involve time-consuming negotiations and expense, and prompt sale at an acceptable price may be difficult. Information regarding restricted securities, if any, is included at the end of each Fund’s Schedule of Investments. |
| | |
| G. | Use of Derivative Instruments—The Funds may invest in derivative instruments, including, but not limited to, options, futures, swaps and forward foreign currency contracts. A derivative is an instrument whose value is derived from underlying assets, indices, reference rates or a combination of these |
VANECK FUNDS
NOTES TO FINANCIAL STATEMENTS
(continued)
| | factors. Derivative instruments may be privately negotiated contracts (often referred to as over-the-counter (“OTC”) derivatives) or they may be listed and traded on an exchange. Derivative contracts may involve future commitments to purchase or sell financial instruments or commodities at specified terms on a specified date, or to exchange interest payment streams or currencies based on a notional or contractual amount. Derivative instruments may involve a high degree of financial risk. The use of derivative instruments also involves the risk of loss if the investment adviser is incorrect in its expectation of the timing or level of fluctuations in securities prices, interest rates or currency prices. Investments in derivative instruments also include the risk of default by the counterparty, the risk that the investment may not be liquid and the risk that a small movement in the price of the underlying security or benchmark may result in a disproportionately large movement, unfavorable or favorable, in the price of the derivative instrument. GAAP requires enhanced disclosures about the Funds’ derivative instruments and hedging activities. Details of this disclosure are found below as well as in the Schedule of Investments. |
| | |
| | Total Return Swaps—The CM Commodity Index Fund enters into total return swaps in order take a “long” position with respect to an underlying referenced asset. The Fund is subject to market price volatility of the underlying referenced asset. A total return swap involves commitments to pay interest in exchange for a market linked return based on a notional amount. To the extent that the total return of the security, group of securities or index underlying the transaction exceeds or falls short of the offsetting interest obligation, the Fund will receive a payment from or make a payment to the counterparty. Documentation governing the Fund’s swap transactions may contain provisions for early termination of a swap in the event the net assets of the Fund decline below specific levels set forth in the documentation (“net asset contingent features”). If these levels are triggered, the Fund’s counterparty has the right to terminate the swap and require the Fund to pay or receive a settlement amount in connection with the terminated swap transaction. The total return swap position held by the CM Commodity Index Fund at December 31, 2021 is reflected in the Fund’s Consolidated Schedule of Investments. |
| | |
| | During the year ending in December 31, 2021, the CM Commodity Index Fund held swap contracts for twelve months with an average monthly notional amount of $610,472,250. |
| | |
| | Forward Foreign Currency Contracts—The Funds may buy and sell forward foreign currency contracts to settle purchases and sales of foreign denominated securities, gain currency exposure or to hedge foreign denominated assets. Realized gains and losses from forward foreign currency contracts, if any, are included in realized gain (loss) on forward foreign currency contracts in the Statements of Operations. During the year ending in December 31, 2021, the Emerging Market Bond Fund held forward foreign currency contracts for six months. The average amount purchased and sold (in U.S. dollars) was $342,665 and $347,936, respectively. The Emerging Markets Fund held forward foreign currency contracts for one month during the year, and the average amount purchased and sold (in U.S. dollars) was $1,614,836 and $1,613,540, respectively. The International Investors Gold Fund held forward foreign currency contracts for six months during the year, and the average amount purchased and sold (in U.S. dollars) was $3,029,985 and $3,041,703, respectively. Forward foreign currency contracts held at December 31, 2021, if any, are reflected in the Schedule of Open Forward Foreign Currency Contracts in the Funds’ Schedules of Investments. |
| | |
| | Private Investment in Public Equity (PIPE)—Certain funds may acquire equity securities of an issuer that are issued through a private investment in public equity transaction, including on a when-issued basis. PIPE transactions typically involve the purchase of securities directly from a publicly traded company or its affiliates in a private placement transaction, typically at a discount to the market price of the company’s securities. The Global Resources Fund’s PIPE investments during the year ended December 31, 2021, represented unfunded subscription agreements in a private investment in public equity. The Fund generally segregated an amount of cash or high quality securities equal to the amount of its commitment to purchase the when-issued securities. On the settlement date, the PIPE investment was converted to common stock of the underlying equity position and the cost was recorded at the contractual trade settlement amount. |
At December 31, 2021, the Global Resources Fund had no open derivative contracts. During the year ended December 31, 2021, the average notional amount of PIPE positions held by the fund was $7,425,000.
At December 31, 2021, the following Funds held derivatives (not designated as hedging instruments under GAAP):
| | | Asset
Derivatives |
| | | Commodities
Futures Risk |
| CM Commodity Index Fund | | | | |
| Swap contracts1 | | $ | 6,078,183 | |
| 1 | Statements of Assets and Liabilities location: Total return swap contracts, at value |
The impact of transactions in derivative instruments during the year ended December 31, 2021, was as follows:
| | | Commodities
Futures Risk | | Equity Risk | | Foreign
Currency Risk |
| CM Commodity Index Fund | | | | | | | | | | | | |
| Realized gain (loss): | | | | | | | | | | | | |
| Swap contracts1 | | $ | 165,025,653 | | | $ | — | | | $ | — | |
| Net change in unrealized appreciation (depreciation): | | | | | | | | | | | | |
| Swap contracts2 | | | (1,730,309 | ) | | | — | | | | — | |
| Emerging Markets Bond Fund | | | | | | | | | | | | |
| Realized gain (loss): | | | | | | | | | | | | |
| Forward foreign currency contracts3 | | | — | | | | — | | | | (52,094 | ) |
| Net change in unrealized appreciation (depreciation): | | | | | | | | | | | | |
| Forward foreign currency contracts4 | | | — | | | | — | | | | 20,185 | |
| Global Resources Fund | | | | | | | | | | | | |
| Net change in unrealized appreciation (depreciation): | | | | | | | | | | | | |
| Derivative contracts – PIPE5 | | | — | | | | (2,648,246 | ) | | | — | |
| International Investors Gold Fund | | | | | | | | | | | | |
| Realized gain (loss): | | | | | | | | | | | | |
| Forward foreign currency contracts3 | | | — | | | | — | | | | (82,027 | ) |
| Net change in unrealized appreciation (depreciation): | | | | | | | | | | | | |
| Forward foreign currency contracts4 | | | — | | | | — | | | | (2,096 | ) |
| | | | | | | | | | | | | |
| 1 | Statements of Operations location: Net realized gain (loss) on Swap contracts |
| 2 | Statements of Operations location: Net change in unrealized appreciation (depreciation) on Swap contracts |
| 3 | Statements of Operations location: Net realized gain (loss) on forward foreign currency contracts |
| 4 | Statements of Operations location: Net change in unrealized appreciation (depreciation) on forward foreign currency contracts |
| 5 | Statements of Operations location: Net change in unrealized appreciation (depreciation) on Derivative contracts - PIPE |
| | |
| F. | Offsetting Assets and Liabilities—In the ordinary course of business, the Funds enter into transactions subject to enforceable master netting or other similar agreements. Generally, the right of offset in those agreements allows the Funds to offset any exposure to a specific counterparty with any collateral received or delivered to that counterparty based on the terms of the agreements. The Funds may pledge or receive cash and or securities as collateral for derivative instruments and securities lending. For financial reporting purposes, the Funds present securities lending assets and liabilities on a gross basis in the Statements of Assets and Liabilities. Cash collateral held in the form of money market fund investments, if any, at December 31, 2021 is presented in the Schedules of Investments and in the Statements of Assets and Liabilities. Non-cash collateral is disclosed in Note 9 (Securities Lending). |
VANECK FUNDS
NOTES TO FINANCIAL STATEMENTS
(continued)
| | The table below presents both gross and net information about the derivative instruments eligible for offset in the Statements of Assets and Liabilities subject to a master netting or similar agreements, as well as financial collateral received or pledged (including cash collateral) as of December 31, 2021. The total amount of collateral reported, if any, is limited to the net amounts of financial assets and liabilities presented in the Statements of Assets and Liabilities for the respective financial instruments. In general, collateral received or pledged exceeds the net amount of the unrealized gain/loss or market value of financial instruments. |
| | |
| | | Gross
Amounts of
Recognized
Assets | | | Gross
Amounts
Offset in the
Statement
of Assets
and
Liabilities | | | Net Amounts
of Assets
Presented
in the
Statements
of Assets and
Liabilities | | | Financial
Instruments
and Cash
Collateral
Received | | | Net Amount | |
| CM Commodity Index Fund | | | | | | | | | | | | | | | |
| Total return swap contracts | | $ | 6,078,183 | | | | $— | | | $ | 6,078,183 | | | | $— | | | $ | 6,078,183 | |
| | | | | | | | | | | | | | | | | | | | | |
| G. | Other—Security transactions are accounted for on trade date. Realized gains and losses are determined based on the specific identification method. Interest income, including amortization of premiums and discounts, is accrued as earned. Dividend income is recorded on the ex-dividend date except that certain dividends from foreign securities are recognized upon notification of the ex-dividend date. |
| | |
| | Income, non-class specific expenses, gains and losses on investments are allocated to each class of shares based upon the relative net assets. Expenses directly attributable to a specific class are charged to that class. |
| | |
| | The Funds earn interest income on uninvested cash balances held at the custodian bank. Such amounts, if any, are presented as interest income in the Statements of Operations. |
| | |
| | In the normal course of business, the Funds enter into contracts that contain a variety of general indemnifications. The Funds’ maximum exposure under these agreements is unknown as this would involve future claims that may be made against the Funds that have not yet occurred. However, the Adviser believes the risk of loss under these arrangements to be remote. |
| | |
Note 3—Investment Management and Other Agreements—VEAC is the investment adviser to the Emerging Markets Bond Fund, Emerging Markets Fund, Environmental Sustainability, Global Resources Fund, International Investors Gold Fund, VanEck Morningstar Wide Moat Fund and VanEck NDR Managed Allocation Fund. VEARA is the investment adviser to the CM Commodity Index Fund and its Subsidiary. VEARA is a wholly-owned subsidiary of VEAC. The Adviser receives a management fee, calculated daily and payable monthly based on the Funds’ average daily net assets, as follows:
| Fund | | Annual Rate |
| | | |
| CM Commodity Index Fund | | 0.75% |
| Emerging Markets Bond Fund | | 0.80% of the first $1.5 billion and 0.75% thereafter |
| Emerging Markets Fund | | 0.75% |
| Environmental Sustainability Fund | | 0.75% |
| Global Resources Fund | | 1.00% of the first $2.5 billion and 0.90% thereafter |
| International Investors Gold Fund | | 0.75% of the first $500 million, 0.65% of the next $250 million and 0.50% thereafter |
| VanEck Morningstar Wide Moat Fund | | 0.45% |
| VanEck NDR Managed Allocation Fund | | 0.80% |
The Advisers have agreed, until at least May 1, 2022, to waive management fees and assume expenses to prevent the Funds’ total annual operating expenses (excluding acquired fund fees and expenses, interest expense, trading expenses, dividends and interest payments on securities sold short, taxes and extraordinary expenses) from exceeding the expense limitations listed in the table below.
The current expense limitations and the amounts waived/assumed by the Adviser for the year ending in December 31, 2021, are as follows:
| Fund | | Expense
Limitations | | Waiver of
Management
Fees | | Expenses
Assumed
by the
Adviser |
| | | | | | | |
| CM Commodity Index Fund | | | | | | | | | | | | |
| Class A | | | 0.95 | % | | $ | 130,938 | | | $ | — | |
| Class I | | | 0.65 | | | | 735,039 | | | | — | |
| Class Y | | | 0.70 | | | | 781,736 | | | | — | |
| Emerging Markets Bond Fund | | | | | | | | | | | | |
| Class A | | | 1.25 | | | | 55,121 | | | | 17,773 | |
| Class I | | | 0.95 | | | | 128,510 | | | | — | |
| Class Y | | | 1.00 | | | | 29,429 | | | | 25,258 | |
| Emerging Markets Fund | | | | | | | | | | | | |
| Class A | | | 1.60 | | | | — | | | | — | |
| Class C | | | 2.50 | | | | — | | | | — | |
| Class I | | | 1.00 | | | | 1,635,456 | | | | — | |
| Class Y | | | 1.10 | | | | 368,321 | | | | — | |
| Class Z | | | 0.90 | | | | 169,215 | | | | — | |
| Environmental Sustainability Fund | | | | | | | | | | | | |
| Class A | | | 1.25 | | | | 3,544 | | | | 22,063 | |
| Class I | | | 0.95 | | | | 7,174 | | | | 35,801 | |
| Class Y | | | 1.05 | | | | 7,054 | | | | 34,288 | |
| Global Resources Fund | | | | | | | | | | | | |
| Class A | | | 1.38 | | | | 147,495 | | | | — | |
| Class C | | | 2.20 | | | | 36,243 | | | | — | |
| Class I | | | 0.95 | | | | 589,862 | | | | — | |
| Class Y | | | 1.13 | | | | 104,769 | | | | — | |
| International Investors Gold Fund | | | | | | | | | | | | |
| Class A | | | 1.45 | | | | — | | | | — | |
| Class C | | | 2.20 | | | | — | | | | — | |
| Class I | | | 1.00 | | | | 59,592 | | | | — | |
| Class Y | | | 1.10 | | | | — | | | | — | |
| VanEck Morningstar Wide Moat Fund | | | | | | | | | | | | |
| Class I | | | 0.59 | | | | 15,776 | | | | 42,816 | |
| Class Z | | | 0.49 | | | | 57,682 | | | | 83,312 | |
| VanEck NDR Managed Allocation Fund | | | | | | | | | | | | |
| Class A | | | 1.15 | | | | 72,215 | | | | — | |
| Class I | | | 0.85 | | | | 84,599 | | | | — | |
| Class Y | | | 0.90 | | | | 78,172 | | | | — | |
The Adviser also performs accounting and administrative services for the Emerging Markets Fund and International Investors Gold Fund. The Adviser is paid a monthly fee at a rate of 0.25% of the average daily net assets for Emerging Markets Fund, and for International Investors Gold Fund at the rate of 0.25% per year on the first $750 million of the average daily net assets of the Fund and 0.20% per year of the average daily net assets in excess of $750 million. Administrative fees are included in expenses in the Statements of Operations.
For the year ended December 31, 2021, Van Eck Securities Corporation (the “Distributor”), and affiliate of the Adviser, received a total of $1,257,018 in sales loads relating to the sale of shares of the Funds, of which $1,140,715 was reallowed to broker/dealers and the remaining $116,303 was retained by the Distributor.
Certain officers of the Trust are officers, directors or stockholders of the Adviser and the Distributor.
At December 31, 2021, the Distributor owned approximately 98% of Class A, 90% of Class I and 100% Class Y of VanEck Environmental Sustainability Fund, 54% of Class I Shares and 55% of Class Z Shares of VanEck
VANECK FUNDS
NOTES TO FINANCIAL STATEMENTS
(continued)
Morningstar Wide Moat Fund, and the Adviser owned approximately 41% of Class A, 63% of Class I, and 37% of Class Y of VanEck NDR Managed Allocation Fund.
Note 4—Investments—For the year ending in December 31, 2021, the cost of purchases and proceeds from sales of investments, excluding U.S. Government securities and short-term investments, were as follows:
| Fund | | Purchases | | Sales |
| Emerging Markets Bond Fund | | $ | 64,152,196 | | | $ | 72,808,407 | |
| Emerging Markets Fund | | | 1,043,496,833 | | | | 1,228,896,846 | |
| Environmental Sustainability Fund | | | 4,909,179 | | | | – | |
| Global Resources Fund | | | 272,233,841 | | | | 192,592,576 | |
| International Investors Gold Fund | | | 208,728,114 | | | | 298,479,935 | |
| VanEck Morningstar Wide Moat Fund | | | 11,803,330 | | | | 9,476,548 | |
| VanEck NDR Managed Allocation Fund | | | 32,151,500 | | | | 38,651,465 | |
During the year ended December 31, 2021, the International Investors Gold Fund engaged in sales of investments to funds or other accounts that are managed by the Adviser (or an affiliate of the Adviser). These transactions complied with Rule 17a-7 under the Act and aggregated to $ 5,790,726. The Fund recognized realized gain of $ 2,329,320 related to these transactions.
Note 5—Income Taxes—As of December 31, 2021, for Federal income tax purposes, the identified cost, gross unrealized appreciation, gross unrealized depreciation and net unrealized appreciation (depreciation) of investments were as follows:
| Fund | | Tax Cost of
Investments | | | Gross
Unrealized
Appreciation | | | Gross
Unrealized
Depreciation | | | Net Unrealized
Appreciation
(Depreciation) | |
| CM Commodity Index Fund | | | $ | 526,503,743 | | | | $ | 130,904,125 | | | | | $– | | | | $ | 130,904,125 | |
| Emerging Markets Bond Fund | | | | 16,087,160 | | | | | 406,035 | | | | | (867,291) | | | | | (461,256) | |
| Emerging Markets Fund | | | | 1,937,453,451 | | | | | 528,929,915 | | | | | (243,292,126) | | | | | 285,637,789 | |
| Environmental Sustainability Fund | | | | 5,424,210 | | | | | 367,423 | | | | | (542,390) | | | | | (174,967) | |
| Global Resources Fund | | | | 528,873,358 | | | | | 300,305,997 | | | | | (29,265,895) | | | | | 271,040,102 | |
| International Investors Gold Fund | | | | 618,860,522 | | | | | 278,263,971 | | | | | (35,485,281) | | | | | 242,778,690 | |
| VanEck Morningstar Wide Moat Fund | | | | 15,966,892 | | | | | 2,929,956 | | | | | (533,489) | | | | | 2,396,467 | |
| VanEck NDR Managed Allocation Fund | | | | 30,727,589 | | | | | 7,511,477 | | | | | (459,676) | | | | | 7,051,801 | |
At December 31, 2021, the components of accumulated distributable earnings (loss) on a tax basis, for each Fund were as follows:
| Fund | | Undistributed
Ordinary
Income | | Accumulated
Capital Losses/
Undistributed
Capital Gains | | Qualified
Late-Year
Losses* | | Other
Temporary
Differences | | Unrealized
Appreciation
(Depreciation) | | Total
Distributable
Earnings (Loss) |
| CM Commodity Index Fund | | | $– | | | | $– | | | | $– | | | $ | (190,320,241) | | | $ | 6,087,227 | | | $ | (184,233,014) | |
| Emerging Markets Bond Fund | | | – | | | | (32,528,163) | | | | (105,714) | | | | (20,585) | | | | (465,316) | | | | (33,119,778) | |
| Emerging Markets Fund | | | 553,903 | | | | – | | | | (4,988,298) | | | | (1,775,930) | | | | 280,113,211 | | | | 273,902,886 | |
| Environmental Sustainability Fund | | | 19,955 | | | | – | | | | – | | | | (186) | | | | (174,966) | | | | (155,197) | |
| Global Resources Fund | | | 1,180,594 | | | | (1,064,847,677) | | | | – | | | | (520,070) | | | | 271,040,130 | | | | (793,147,023) | |
| International Investors Gold Fund | | | – | | | | (354,060,863) | | | | – | | | | (577,105) | | | | 242,934,313 | | | | (111,703,655) | |
| VanEck Morningstar Wide Moat Fund | | | 333,963 | | | | 139,223 | | | | – | | | | (7,588) | | | | 2,396,466 | | | | 2,862,064 | |
| VanEck NDR Managed Allocation Fund | | | 10,171 | | | | – | | | | (84,794) | | | | (28,607) | | | | 7,051,797 | | | | 6,948,567 | |
| * | Qualified late year losses incurred after October 31, 2021 are deemed to arise on the January 1, 2022. |
The tax character of dividends paid to shareholders were as follows:
| | | 2021 | | | 2020 |
| Fund | | Ordinary
Income** | | | Long-Term
Capital Gains | | | Return
of Capital | | | Ordinary
Income** | | | Long-Term
Capital Gains | | | Return
of Capital | |
| CM Commodity Index Fund | | $ | 129,308,838 | | | | $– | | | | $– | | | | $105,831 | | | | $– | | | | $– | |
| Emerging Markets Bond Fund | | | 1,001,574 | | | | – | | | | 343,312 | | | | 1,295,871 | | | | – | | | | 481,019 | |
| Emerging Markets Fund | | | 3,609,177 | | | | 166,469,764 | | | | – | | | | 3,990,747 | | | | – | | | | – | |
| Global Resources Fund | | | 12,201,503 | | | | – | | | | – | | | | 4,501,270 | | | | – | | | | – | |
| International Investors Gold Fund | | | 49,604,659 | | | | – | | | | – | | | | 110,004,410 | | | | – | | | | – | |
| VanEck Morningstar Wide Moat Fund | | | 1,341,043 | | | | 853,192 | | | | – | | | | 518,862 | | | | 391,131 | | | | – | |
| VanEck NDR Managed Allocation Fund | | | 350,081 | | | | 199,040 | | | | – | | | | 425,077 | | | | – | | | | – | |
| | | | | | | | | | | | | | | | | | | | | | | | | |
| ** | Includes Short-Term Capital Gains, if any. |
At December 31, 2021, the Funds had capital loss carryforwards available to offset future capital gains, as follows:
| Fund | | Short-Term
Capital Losses
with No Expiration | | Long-Term
Capital Losses
with No Expiration | | Total |
| Emerging Markets Bond Fund | | | $ | (31,717,319 | ) | | | $ | (810,844 | ) | | | $ | (32,528,163 | ) |
| Global Resources Fund | | | | (111,849,219 | ) | | | | (952,998,458 | ) | | | | (1,064,847,677 | ) |
| International Investors Gold Fund | | | | (110,128,009 | ) | | | | (243,932,854 | ) | | | | (354,060,863 | ) |
Additionally, Emerging Markets, Global Resources, International Investors Gold and NDR Managed Allocation Funds utilized $62,723,607 $60,010,118, $37,386,321 and $2,097,533, of their capital loss carryover available from prior years.
During the year ended December 31, 2021, as a result of permanent book to tax differences primarily due to undistributed earnings attributable to the redemption of shares, tax net operating losses and differences in the treatment of income and realized gains from controlled foreign corporation subsidiaries, the Funds incurred differences that affected distributable earnings and aggregate paid in capital by the amounts in the table below. Net assets were not affected by these reclassifications.
| Fund | | Increase
(Decrease)
in Total Distributable
Earnings (Loss) | | Increase
(Decrease)
in Aggregate
Paid in Capital |
| CM Commodity Index Fund | | | $ | (176,420,855 | ) | | | $ | 176,420,855 | |
| Emerging Markets Fund | | | | (2,130 | ) | | | | 2,130 | |
| International Investors Gold Fund | | | | 51,610,342 | | | | | (51,610,342 | ) |
For the year ended December 31, 2021, Emerging Market Bond Fund’s net realized losses from foreign currency translations were $320,904.
The Funds recognize the tax benefits of uncertain tax positions only where the position is “more-likely-than-not” to be sustained assuming examination by applicable tax authorities. Management has analyzed the Funds’ tax positions, and has concluded that no liability for unrecognized tax benefits should be recorded related to uncertain tax positions taken on return filings for all open tax years. The Funds do not have exposure for additional years that might still be open in certain foreign jurisdictions. Therefore, no provision
VANECK FUNDS
NOTES TO FINANCIAL STATEMENTS
(continued)
for income tax is required in the Funds’ financial statements. However, the Funds are subject to foreign taxes on the appreciation in value of certain investments. The Funds provide for such taxes on both realized and unrealized appreciation.
The Funds recognize interest and penalties, if any, related to uncertain tax positions as income tax expense in the Statements of Operations. During the year ending in December 31, 2021, the Funds did not incur any interest or penalties.
Note 6—Principal Risks—Non-diversified funds generally hold securities of fewer issuers than diversified funds (See Note 1) and may be more susceptible to the risks associated with these particular issuers, or to a single economic, political or regulatory occurrence affecting these issuers. The Funds may purchase securities on foreign exchanges. Securities of foreign issuers involve special risks and considerations not typically associated with investing in U.S. issuers. These risks include devaluation of currencies, currency controls, less reliable information about issuers, different securities transaction clearance and settlement practices, future adverse economic developments and political conflicts, or natural or other disasters, such as the recent coronavirus outbreak. Additionally, certain Funds may invest in securities of emerging market issuers, which are exposed to a number of risks that may make these investments volatile in price or difficult to trade. Political risks may include unstable governments, nationalization, restrictions on foreign ownership, laws that prevent investors from getting their money out of a country, sanctions and investment restrictions and legal systems that do not protect property risks as well as the laws of the United States. These and other factors can make emerging market securities more volatile and potentially less liquid than securities issued in more developed markets. Certain securities of Chinese issuers are, or may in the future become restricted, and the Fund may be forced to sell such restricted securities and incur a loss. As a result of events involving Russia, the United States and European Union, have in the past, and may in the future, impose sanctions on certain Russian individuals and companies, which may adversely affect the value and liquidity of the Russian-related issuers’ held by the Funds.
The CM Commodity Index Fund may invest in commodity-linked derivative instruments, including commodity index-linked notes, swap agreements, commodity futures contracts and options on futures contracts that provide economic exposure to the investment returns of the commodities markets. The use of derivatives presents risks different from, and possibly greater than, the risks associated with investing directly in traditional securities. Derivative strategies often involve leverage, which may exaggerate a loss, potentially causing the Fund to lose more money than it would have lost had it invested in the underlying security. The value of commodity-linked derivative instruments may be affected by overall market movements and other factors affecting the value of a particular industry or commodity, such as weather, disease, embargoes, or political and economic events and regulatory developments. Exposure to the commodities markets, such as precious metals, industrial metals, gas and other energy products and natural resources, may subject the Fund to greater volatility than investments in traditional securities. Changes in laws or government regulations by the United States and/or the Cayman Islands could adversely affect the operations of the Fund.
The Global Resources Fund and International Investors Gold Fund may concentrate their investments in companies which are significantly engaged in the exploration, development, production and distribution of gold and other natural resources such as strategic and other metals, minerals, forest products, oil, natural gas and coal and by investing in gold bullion and coins. In addition, the International Investors Gold Fund may invest up to 25% of its net assets in gold and silver gold, silver, platinum and palladium bullion and exchange traded funds that invest in such coins and bullion and derivatives on the foregoing. Since the Funds may so concentrate, they may be subject to greater risks and market fluctuations than other more diversified portfolios. The production and marketing of gold and other natural resources may be affected by actions and changes in governments. In addition, gold and natural resources may be cyclical in nature.
Special Purpose Acquisition Companies: Certain Funds may invest in stock, warrants, and other securities of special purpose acquisition companies (SPACs) or similar special purpose entities. A SPAC is typically a publicly traded company that raises investment capital via an initial public offering (IPO) for the purpose of acquiring the equity securities of one or more existing companies (or interests therein) via merger,
combination, acquisition or other similar transactions. The Funds may acquire an interest in a SPAC in an IPO or a secondary market transaction. Unless and until an acquisition is completed, a SPAC generally invests its assets (less a portion retained to cover expenses) in U.S. government securities, money market securities and cash. To the extent the SPAC is invested in cash or similar securities, this may negatively affect the Funds’ performance. Because SPACs and similar entities are in essence blank check companies without operating history or ongoing business other than seeking acquisitions, the value of their securities is particularly dependent on the ability of the entity’s management to identify and complete a profitable acquisition. There is no guarantee that the SPACs in which a Fund invests will complete an acquisition or that any acquisitions that are completed will be profitable. Some SPACs may pursue acquisitions only within certain industries or regions, which may increase the volatility of their prices. In addition, these securities, which are typically traded in the over-the-counter market, may be considered illiquid and/or be subject to restrictions on resale. Other risks of investing in SPACs include that a significant portion of the monies raised by the SPAC may be expended during the search for a target transaction; an attractive transaction may not be identified at all (or any requisite approvals may not be obtained) and the SPAC may dissolve and be required to return any remaining monies to shareholders, causing a Fund to incur the opportunity cost of missed investment opportunities the Funds otherwise could have benefited from; a transaction once identified or effected may prove unsuccessful and an investment in the SPAC may lose value; the warrants or other rights with respect to the SPAC held by a Fund may expire worthless or may be repurchased or retired by the SPAC at an unfavorable price; and an investment in a SPAC may be diluted by additional later offerings of interests in the SPAC or by other investors exercising existing rights to purchase shares of the SPAC. In addition, a SPAC target company may have limited operating experience, a smaller size, limited product lines, markets, distribution channels and financial and managerial resources. Investing in the securities of smaller companies involves greater risk, and portfolio price volatility.
Private Investment in Public Equity: Certain Funds may acquire equity securities of an issuer that are issued through a private investment in public equity (PIPE) transaction, including on a when-issued basis. PIPE transactions typically involve the purchase of securities directly from a publicly traded company or its affiliates in a private placement transaction, including in a SPAC, typically at a discount to the market price of the company’s securities. There is a risk that if the market price of the securities drops below a set threshold, the company may have to issue additional stock at a significantly reduced price, which may dilute the value of a Fund’s investment. Shares in PIPEs generally are not registered with the SEC until after a certain time period from the date the private sale is completed. This restricted period can last many months. Until the public registration process is completed, PIPEs are restricted as to resale and a Fund cannot freely trade the securities. Generally, such restrictions cause the PIPEs to be illiquid during this time. PIPEs may contain provisions that the issuer will pay specified financial penalties to the holder if the issuer does not publicly register the restricted equity securities within a specified period of time, but there is no assurance that the restricted equity securities will be publicly registered, or that the registration will remain in effect.
The VanEck NDR Managed Allocation Fund may concentrate its investments in exchange traded products that invest directly in, or have exposure to, equity and debt securities, as well as other asset categories such as commodities and derivative instruments. Such investments may subject the exchange traded product to greater volatility than investments in traditional securities.
The respiratory disease caused by a novel coronavirus, which has spread internationally and declared as a pandemic by the World Health Organization, has resulted in closing borders, quarantines, disruptions to supply chains and customer activity, loss of life, as well as general concern and uncertainty. The coronavirus has already negatively impacted the economies of many nations, individual companies, and the market. This pandemic is expected to have a continued impact in ways that cannot necessarily be foreseen presently.
A more complete description of risks is included in each Fund’s Prospectus and Statement of Additional Information.
Note 7—12b-1 Plan of Distribution— Pursuant to a Rule 12b-1 Plan of Distribution (the “Plan”), the Funds are authorized to incur distribution expenses which will principally be payments to securities dealers who have sold shares and serviced shareholder accounts, and payments to the Distributor for reimbursement
VANECK FUNDS
NOTES TO FINANCIAL STATEMENTS
(continued)
of other actual promotion and distribution expenses incurred by the Distributor on behalf of the Funds. The amount paid under the Plan in any one year is limited to 0.25% of average daily net assets for Class A Shares and 1.00% of average daily net assets for Class C Shares, and is recorded as Distribution fees in the Statements of Operations.
Note 8—Shareholder Transactions—Shares of beneficial interest issued, reinvested and redeemed (unlimited number of $0.001 par value shares authorized):
| | | CM Commodity Index Fund | | | Emerging Markets Bond Fund | |
| | | Year Ended
December 31, 2021 | | | Year Ended
December 31, 2020 | | | Year Ended
December 31, 2021 | | | Year Ended
December 31, 2020 | |
| Class A: | | | | | | | | | | | | | | | | |
| Shares sold | | | 3,957,684 | | | | 2,429,576 | | | | 116,452 | | | | 465,521 | |
| Shares reinvested | | | 634,726 | | | | 660 | | | | 41,102 | | | | 47,211 | |
| Shares redeemed | | | (3,277,047 | ) | | | (3,454,314 | ) | | | (185,793 | ) | | | (213,613 | ) |
| Net increase (decrease) | | | 1,315,363 | | | | (1,024,078 | ) | | | (28,239 | ) | | | 299,119 | |
| Class C: | | | | | | | | | | | | | | | | |
| Shares sold | | | N/A | | | | N/A | | | | N/A | | | | 32 | |
| Shares reinvested | | | N/A | | | | N/A | | | | N/A | | | | 6,775 | |
| Shares redeemed | | | N/A | | | | N/A | | | | N/A | | | | (223,820 | ) |
| Net decrease | | | N/A | | | | N/A | | | | N/A | | | | (217,013 | ) |
| Class I: | | | | | | | | | | | | | | | | |
| Shares sold | | | 25,072,665 | | | | 17,190,904 | | | | 787,924 | | | | 147,056 | |
| Shares reinvested | | | 4,670,695 | | | | 4,095 | | | | 119,234 | | | | 163,123 | |
| Shares redeemed | | | (13,382,771 | ) | | | (18,256,004 | ) | | | (2,356,297 | ) | | | (736,294 | ) |
| Net increase (decrease) | | | 16,360,589 | | | | (1,061,005 | ) | | | (1,449,139 | ) | | | (426,115 | ) |
| Class Y: | | | | | | | | | | | | | | | | |
| Shares sold | | | 20,267,553 | | | | 25,082,974 | | | | 376,300 | | | | 245,055 | |
| Shares reinvested | | | 11,659,739 | | | | 10,739 | | | | 28,026 | | | | 29,313 | |
| Shares redeemed | | | (12,145,676 | ) | | | (33,718,692 | ) | | | (252,627 | ) | | | (315,252 | ) |
| Net increase (decrease) | | | 19,781,616 | | | | (8,624,979 | ) | | | 151,699 | | | | (40,884 | ) |
| | | | | | | | | | | | | | | | | |
| | | Emerging Markets Fund | | | Environmental
Sustainability Fund | | | | |
| | | Year Ended
December 31, 2021 | | | Year Ended
December 31, 2020 | | | Period Ended
December 31, 2021 | | | | |
| Class A: | | | | | | | | | | | | |
| Shares sold | | | 1,961,219 | | | | 3,330,424 | | | | 40,863 | | | | | |
| Shares reinvested | | | 402,834 | | | | 7,950 | | | | — | | | | | |
| Shares redeemed | | | (2,218,073 | ) | | | (3,515,280 | ) | | | — | | | | | |
| Net increase (decrease) | | | 145,980 | | | | (176,906 | ) | | | 40,863 | | | | | |
| Class C: | | | | | | | | | | | | | | | | |
| Shares sold | | | 279,495 | | | | 245,703 | | | | N/A | | | | | |
| Shares reinvested | | | 125,429 | | | | 2,579 | | | | N/A | | | | | |
| Shares redeemed | | | (537,501 | ) | | | (756,634 | ) | | | N/A | | | | | |
| Net decrease | | | (132,577 | ) | | | (508,352 | ) | | | N/A | | | | | |
| Class I: | | | | | | | | | | | | | | | | |
| Shares sold | | | 12,493,340 | | | | 23,768,703 | | | | 88,900 | | | | | |
| Shares reinvested | | | 2,795,560 | | | | 48,076 | | | | — | | | | | |
| Shares redeemed | | | (17,902,220 | ) | | | (13,948,510 | ) | | | (403 | ) | | | | |
| Net increase (decrease) | | | (2,613,320 | ) | | | 9,868,269 | | | | 88,497 | | | | | |
| Class Y: | | | | | | | | | | | | | | | | |
| Shares sold | | | 15,784,983 | | | | 21,744,051 | | | | 80,000 | | | | | |
| Shares reinvested | | | 3,563,867 | | | | 70,227 | | | | ��� | | | | | |
| Shares redeemed | | | (20,196,116 | ) | | | (28,945,856 | ) | | | — | | | | | |
| Net increase (decrease) | | | (847,266 | ) | | | (7,131,578 | ) | | | 80,000 | | | | | |
| Class Z: | | | | | | | | | | | | | | | | |
| Shares sold | | | 2,639,044 | | | | 3,665,787 | | | | N/A | | | | | |
| Shares reinvested | | | 246,286 | | | | 4,601 | | | | N/A | | | | | |
| Shares redeemed | | | (2,734,775 | ) | | | (651,499 | ) | | | N/A | | | | | |
| Net increase | | | 150,555 | | | | 3,018,889 | | | | N/A | | | | | |
| | | Global Resources Fund | | | International Investors Gold Fund | |
| | | Year Ended
December 31, 2021 | | | Year Ended
December 31, 2020 | | | Year Ended
December 31, 2021 | | | Year Ended
December 31, 2020 | |
| Class A: | | | | | | | | | | | | | | | | |
| Shares sold | | | 1,502,062 | | | | 552,487 | | | | 5,461,170 | | | | 6,447,284 | |
| Shares reinvested | | | 45,405 | | | | 15,418 | | | | 1,655,334 | | | | 2,886,195 | |
| Shares redeemed | | | (824,102 | ) | | | (1,569,603 | ) | | | (7,283,146 | ) | | | (7,118,954 | ) |
| Net increase (decrease) | | | 723,365 | | | | (1,001,698 | ) | | | (166,642 | ) | | | 2,214,525 | |
| Class C: | | | | | | | | | | | | | | | | |
| Shares sold | | | 214,843 | | | | 61,748 | | | | 1,034,911 | | | | 2,076,220 | |
| Shares reinvested | | | 3,809 | | | | N/A | | | | 413,251 | | | | 678,152 | |
| Shares redeemed | | | (181,846 | ) | | | (203,360 | ) | | | (1,520,224 | ) | | | (1,309,517 | ) |
| Net increase (decrease) | | | 36,806 | | | | (141,612 | ) | | | (72,062 | ) | | | 1,444,855 | |
| Class I: | | | | | | | | | | | | | | | | |
| Shares sold | | | 2,134,840 | | | | 1,099,699 | | | | 2,994,686 | | | | 4,573,469 | |
| Shares reinvested | | | 77,465 | | | | 40,234 | | | | 654,866 | | | | 1,194,933 | |
| Shares redeemed | | | (3,007,266 | ) | | | (6,416,512 | ) | | | (3,493,744 | ) | | | (9,357,880 | ) |
| Net increase (decrease) | | | (794,961 | ) | | | (5,276,579 | ) | | | 155,808 | | | | (3,589,478 | ) |
| Class Y: | | | | | | | | | | | | | | | | |
| Shares sold | | | 4,260,547 | | | | 1,610,844 | | | | 15,460,624 | | | | 20,374,061 | |
| Shares reinvested | | | 76,682 | | | | 22,090 | | | | 1,455,685 | | | | 792,701 | |
| Shares redeemed | | | (2,127,574 | ) | | | (2,026,944 | ) | | | (16,672,274 | ) | | | (11,541,828 | ) |
| Net increase (decrease) | | | 2,209,655 | | | | (394,010 | ) | | | 244,035 | | | | 11,624,934 | |
| | | | | | | | | | | | | | | | | |
| | | VanEck Morningstar Wide Moat Fund | | | VanEck NDR Managed Allocation Fund | |
| | | Year Ended
December 31, 2021 | | | Year Ended
December 31, 2020 | | | Year Ended
December 31, 2021 | | | Year Ended
December 31, 2020 | |
| Class A: | | | | | | | | | | | | | | | | |
| Shares sold | | | N/A | | | | N/A | | | | 22,243 | | | | 53,434 | |
| Shares reinvested | | | N/A | | | | N/A | | | | 3,797 | | | | 3,775 | |
| Shares redeemed | | | N/A | | | | N/A | | | | (120,064 | ) | | | (174,712 | ) |
| Net decrease | | | N/A | | | | N/A | | | | (94,024 | ) | | | (117,503 | ) |
| Class I: | | | | | | | | | | | | | | | | |
| Shares sold | | | 15,197 | | | | 35,438 | | | | 7,006 | | | | 37,266 | |
| Shares reinvested | | | 14,035 | | | | 4,258 | | | | 6,709 | | | | 5,798 | |
| Shares redeemed | | | (6,120 | ) | | | (42 | ) | | | (74,253 | ) | | | (108,952 | ) |
| Net increase (decrease) | | | 23,112 | | | | 39,654 | | | | (60,538 | ) | | | (65,888 | ) |
| Class Y: | | | | | | | | | | | | | | | | |
| Shares sold | | | N/A | | | | N/A | | | | 108,341 | | | | 130,008 | |
| Shares reinvested | | | N/A | | | | N/A | | | | 5,610 | | | | 4,114 | |
| Shares redeemed | | | N/A | | | | N/A | | | | (115,780 | ) | | | (115,516 | ) |
| Net increase (decrease) | | | N/A | | | | N/A | | | | (1,829 | ) | | | 18,606 | |
| Class Z: | | | | | | | | | | | | | | | | |
| Shares sold | | | 68,420 | | | | 98,466 | | | | N/A | | | | N/A | |
| Shares reinvested | | | 53,153 | | | | 26,143 | | | | N/A | | | | N/A | |
| Shares redeemed | | | (17,757 | ) | | | (49,151 | ) | | | N/A | | | | N/A | |
| Net increase | | | 103,816 | | | | 75,458 | | | | N/A | | | | N/A | |
Note 9—Securities Lending—To generate additional income, each of the Funds may lend its securities pursuant to a securities lending agreement with the securities lending agent. Each Fund may lend up to 33% of its investments requiring that the loan be continuously collateralized by cash, cash equivalents, U.S. government securities, or any combination of cash and such securities at all times equal to at least 102% (105% for foreign securities) of the market value of securities loaned. Daily market fluctuations could cause the value of loaned securities to be more or less than the value of the collateral received. When this occurs, the collateral is adjusted and settled on the next business day. During the term of the loan, the Funds will continue to receive any dividends, interest or amounts equivalent thereto, on the securities loaned while
VANECK FUNDS
NOTES TO FINANCIAL STATEMENTS
(continued)
receiving a fee from the borrower and or earning interest on the investment of the cash collateral. Such fees and interest are shared with the securities lending agent under the terms of the securities lending agreement. Securities lending income is disclosed as such in the Statements of Operations. Cash collateral is maintained on the Funds’ behalf by the lending agent and is invested in the State Street Navigator Securities Lending Government Money Market Portfolio. Non-cash collateral consists of U.S. Treasuries and U.S. Government Agency securities, and is not disclosed in the Funds’ Schedules of Investments or Statements of Assets and Liabilities as it is held by the agent on behalf of the Funds. The Funds do not have the ability to re-hypothecate those securities. Loans are subject to termination at the option of the borrower or the Funds. Upon termination of the loan, the borrower will return to the Fund securities identical to the securities loaned. The Funds bear the risk of delay in recovery of, or even loss of rights in, the securities loaned should the borrower of the securities fail financially. The value of loaned securities and related cash collateral, if any, at December 31, 2021, is presented on a gross basis in the Schedules of Investments and Statements of Assets and Liabilities. The following is a summary of the Funds’ securities on loan and related collateral as of December 31, 2021:
| Fund | | Market Value
of Securities
on Loan | | Cash
Collateral | | Non-Cash
Collateral | | Total
Collateral |
| CM Commodity Index Fund | | $ | – | | | $ | 151 | | | $ | – | | | $ | 151 | |
| Emerging Markets Bond Fund | | | 1,031,725 | | | | 568,095 | | | | 500,817 | | | | 1,068,912 | |
| Emerging Markets Fund | | | 17,674,230 | | | | 940,250 | | | | 17,411,369 | | | | 18,351,619 | |
| Environmental Sustainability Fund | | | 379,878 | | | | 92,522 | | | | 311,488 | | | | 404,010 | |
| Global Resources Fund | | | 58,015,233 | | | | 13,227,690 | | | | 46,396,449 | | | | 59,624,139 | |
| International Investors Gold Fund | | | 4,030,754 | | | | 2,635,122 | | | | 1,563,117 | | | | 4,198,239 | |
| VanEck NDR Managed Allocation Fund | | | 6,319,383 | | | | 2,483,454 | | | | 3,974,260 | | | | 6,457,714 | |
The following table presents money market fund investments held as collateral by type of security on loan as of December 31, 2021:
| | | Gross Amount of
Recognized Liabilities
for Securities Lending
Transactions* in the
Statements of Assets
and Liabilities |
| Fund | | Equity Securities |
| CM Commodity Index Fund | | | $ | 151 | |
| Emerging Markets Bond Fund | | | | 568,095 | |
| Emerging Markets Fund | | | | 940,250 | |
| Environmental Sustainability Fund | | | | 92,522 | |
| Global Resources Fund | | | | 13,227,690 | |
| International Investors Gold Fund | | | | 2,635,122 | |
| VanEck NDR Managed Allocation Fund | | | | 2,483,454 | |
| | |
| * | Remaining contractual maturity: overnight and continuous |
Note 10—Bank Line of Credit—The Trust participates with VanEck VIP Trust (another registered investment company managed by Adviser) (the “VE/VIP Funds”) in a $30 million committed credit facility (the “Facility”) to be utilized for temporary financing until the settlement of sales or purchases of portfolio securities, the repurchase or redemption of shares of the participating Funds and other temporary or emergency purposes. The participating VE/VIP Funds have agreed to pay commitment fees, pro rata, based on the unused but available balance. Interest is charged to the participating VE/VIP Funds at rates based on prevailing market
rates in effect at the time of borrowings. During the year ending in December 31, 2021, the following Funds borrowed under this Facility:
| Fund | | Days
Outstanding | | | Average
Daily
Loan Balance | | | Average
Interest Rate |
| Emerging Markets Bond Fund | | | 2 | | | | $174,009 | | | | 1.34 | % |
| Emerging Markets Fund | | | 1 | | | | 3,959,031 | | | | 1.45 | |
| Global Resources Fund | | | 5 | | | | 3,913,170 | | | | 1.37 | |
| International Investors Gold Fund | | | 5 | | | | 2,499,573 | | | | 1.39 | |
| VanEck NDR Managed Allocation Fund | | | 31 | | | | 346,629 | | | | 1.39 | |
Outstanding loan balances as of December 31, 2021, if any, are reflected in the Statements of Assets and Liabilities.
Note 11—Trustee Deferred Compensation Plan—The Trust has a Deferred Compensation Plan (the “Deferred Plan”) for Trustees under which the Trustees can elect to defer receipt of their trustee fees until retirement, disability or termination from the Board of Trustees. The fees otherwise payable to the participating Trustees are deemed invested in shares of eligible Funds of the Trust, or other registered investment companies managed by the Adviser, which include VanEck ETF Trust and VanEck VIP Trust, as directed by the Trustees.
The expense of the Deferred Plan is included in “Trustees’ fees and expenses” on the Statements of Operations. The liability for the Deferred Plan is shown as “Deferred Trustees’ fees” in the Statements of Assets and Liabilities.
Note 12—Subsequent Event Review—The Funds have evaluated events and transactions for potential recognition or disclosure through the date the financial statements were issued.
On December 15, 2021, the Board of Trustees of VanEck Funds approved a plan to liquidate the VanEck NDR Managed Allocation Fund on January 19, 2022. The Fund liquidated on January 19, 2022.
VANECK FUNDS
REPORT OF INDEPENDENT REGISTERED PUBLIC ACCOUNTING FIRM
To the Shareholders of CM Commodity Index Fund, Emerging Markets Bond Fund, Emerging Markets Fund, Environmental Sustainability Fund, Global Resources Fund, International Investors Gold Fund, VanEck Morningstar Wide Moat Fund and VanEck NDR Managed Allocation Fund and the Board of Trustees of VanEck Funds.
Opinion on the Financial Statements
We have audited the accompanying statements of assets and liabilities (consolidated as it relates to CM Commodity Index Fund and International Investors Gold Fund) of CM Commodity Index Fund, Emerging Markets Bond Fund, Emerging Markets Fund, Environmental Sustainability Fund, Global Resources Fund, International Investors Gold Fund, VanEck Morningstar Wide Moat Fund and VanEck NDR Managed Allocation Fund (collectively referred to as the “Funds”) (eight of the funds constituting VanEck Funds (the “Trust”)), including the schedules of investments (consolidated as it relates to CM Commodity Index Fund and International Investors Gold Fund), as of December 31, 2021, and the related statements of operations (consolidated as it relates to CM Commodity Index Fund and International Investors Gold Fund), changes in net assets (consolidated as it relates to CM Commodity Index Fund and International Investors Gold Fund), and the financial highlights (consolidated as it relates to CM Commodity Index Fund and International Investors Gold Fund) for each of the periods indicated in the table below and the related notes (collectively referred to as the “financial statements”). In our opinion, the financial statements present fairly, in all material respects, the financial position (consolidated as it relates to CM Commodity Index Fund and International Investors Gold Fund) of each of the Funds (eight of the funds constituting VanEck Funds) at December 31, 2021, and the results of their operations (consolidated as it relates to CM Commodity Index Fund and International Investors Gold Fund), changes in their net assets (consolidated as it relates to CM Commodity Index Fund and International Investors Gold Fund) and financial highlights (consolidated as it relates to CM Commodity Index Fund and International Investors Gold Fund) for each of the periods indicated in the table below, in conformity with U.S. generally accepted accounting principles.
Individual fund constituting
the VanEck Funds | | Statement of
Operations | | Statements of Changes in Net
Assets | | Financial Highlights |
CM Commodity Index Fund
Emerging Markets Bond Fund
Emerging Markets Fund
Global Resources Fund
International Investors Gold Fund
VanEck NDR Managed Allocation Fund | | For the year ended December 31, 2021 | | For each of the two years in the period ended December 31, 2021 | | For each of the five years in the period ended December 31, 2021 |
| VanEck Morningstar Wide Moat Fund | | For the year ended December 31, 2021 | | For each of the two years in the period ended December 31, 2021 | | For each of the four years in the period ended December 31, 2021 and the period from November 7, 2017 (commencement of operations) through December 31, 2021 |
| Environmental Sustainability Fund | | For the period July 14, 2021 (commencement of operations) through December 31, 2021 | | For the period July 14, 2021 (commencement of operations) through December 31, 2021 | | For the period July 14, 2021 (commencement of operations) through December 31, 2021 |
Basis for Opinion
These financial statements are the responsibility of the Trust’s management. Our responsibility is to express an opinion on each of the Funds’ financial statements based on our audits. We are a public accounting firm registered with the Public Company Accounting Oversight Board (United States) (“PCAOB”) and are required
to be independent with respect to the Trust in accordance with the U.S. federal securities laws and the applicable rules and regulations of the Securities and Exchange Commission and the PCAOB.
We conducted our audits in accordance with the standards of the PCAOB. Those standards require that we plan and perform the audits to obtain reasonable assurance about whether the financial statements are free of material misstatement, whether due to error or fraud. The Trust is not required to have, nor were we engaged to perform, an audit of the Trust’s internal control over financial reporting. As part of our audits, we are required to obtain an understanding of internal control over financial reporting, but not for the purpose of expressing an opinion on the effectiveness of the Trust’s internal control over financial reporting. Accordingly, we express no such opinion.
Our audits included performing procedures to assess the risks of material misstatement of the financial statements, whether due to error or fraud, and performing procedures that respond to those risks. Such procedures included examining, on a test basis, evidence regarding the amounts and disclosures in the financial statements. Our procedures included confirmation of securities owned as of December 31, 2021, by correspondence with the custodian and brokers or by other appropriate auditing procedures where replies from brokers were not received. Our audits also included evaluating the accounting principles used and significant estimates made by management, as well as evaluating the overall presentation of the financial statements. We believe that our audits provide a reasonable basis for our opinion.

We have served as the auditor of one or more of the VanEck investment companies since 1999.
New York, New York
February 28, 2022
VANECK FUNDS
APPROVAL OF ADVISORY AGREEMENT
December 31, 2021 (unaudited)
EMERGING MARKETS LEADERS FUND
(the “New Fund”)
The Investment Company Act of 1940, as amended (the “1940 Act”), provides, in substance, that an investment advisory agreement between a fund and its investment adviser may be entered into only if it is approved, and may continue in effect from year to year after an initial two-year period only if it is approved by the fund’s board of trustees, including by a vote of a majority of the trustees who are not “interested persons” of the fund as defined in the 1940 Act (the “Independent Trustees”), at a meeting called for the purpose of considering such approval. On June 23, 2021, the Board of Trustees (the “Board”) of VanEck Funds (the “Trust”), including a majority of the Independent Trustees, voted to enter into an Advisory Agreement (the “Advisory Agreement”) between the New Fund and its investment adviser, Van Eck Associates Corporation (together with its affiliated companies, the “Adviser”). Information regarding the material factors considered and related conclusions reached by the Board in approving the New Fund’s Advisory Agreement is set forth below.
In considering the approval of the Advisory Agreement, the Board took into consideration its overall knowledge of the business and operations of the Adviser, which it obtained over time through its oversight of other mutual funds advised by the Adviser. The Independent Trustees were advised by independent legal counsel during the contract approval process, and met with independent legal counsel in executive session outside the presence of management. The Board considered, among other things, the following:
| ■ | Information about the overall organization of the Adviser and the Adviser’s short-term and long-term business plans with respect to its mutual fund operations and other lines of business; |
| | |
| ■ | The financial position of the Adviser; |
| | |
| ■ | A description of the Advisory Agreement and descriptions of the services to be provided by the Adviser thereunder; |
| | |
| ■ | Information regarding the qualifications, education and experience of the investment professionals responsible for portfolio management, investment research and trading activities for the New Fund, the structure of their compensation and the resources available to support these activities; |
| | |
| ■ | A report comparing the proposed management fees and non-investment management expenses of the New Fund with those of other funds with similar investment strategies managed by other investment advisers; |
| | |
| ■ | Information concerning the Adviser’s compliance program; |
| | |
| ■ | Information with respect to the Adviser’s brokerage practices; |
| | |
| ■ | Information regarding the procedures to be used by the Adviser in monitoring the valuation of portfolio securities; |
| | |
| ■ | Information regarding how the Adviser safeguards the confidentiality and integrity of its data and files, cybersecurity, overall business continuity and other operational matters; |
| | |
| ■ | Information regarding the Adviser’s policies and practices with respect to personal investing by the Adviser and its employees, including reports regarding the administration of the Adviser’s code of ethics and the Adviser’s policy with respect to investments in the New Fund by the Adviser’s investment personnel; |
| | |
| ■ | Information regarding the Adviser’s role as the administrator of the Trust’s liquidity risk management program; |
| | |
| ■ | Information regarding the nature, quality, extent and cost of the investment management, administrative and other non-investment management services to be provided by the Adviser; |
| ■ | Information regarding the nature, quality and extent of the services to be performed by the Adviser in interfacing with, and monitoring the services performed by, third parties, such as the New Fund’s custodian, transfer agent, sub-transfer agents and independent auditor, and the Adviser’s commitment and efforts to review the quality and pricing of third party service providers to the New Fund with a view to reducing non-management expenses of the New Fund; and |
| | |
| ■ | Information regarding the terms of the Advisory Agreement and the services to be performed thereunder. |
Performance. The Board did not consider performance results for the New Fund because the New Fund has not yet commenced operations.
Fees and Expenses. The Board noted that the management fee for the New Fund is in line with the average annual management fees for the New Fund’s peer group of other actively managed, open-end mutual funds who invest broadly across various environmental sustainability markets. The Board considered the reasonableness of the fees and considered the fees in comparison to other funds with similar investment emerging markets strategies managed by other investment advisers. The Board concluded that the advisory fees to be charged to the New Fund would be reasonable.
Profitability and Economies of Scale. The Board did not specifically consider the profitability of the Adviser with respect to the management of the New Fund, as the New Fund had not yet commenced operations. The Board also did not specifically consider the extent to which benefits from economies of scale will be realized by the Adviser and shared with the New Fund as the assets under management grow, although such matters are expected to be considered in the future.
Conclusion. In determining the material factors to be considered in evaluating the Advisory Agreement for the Fund and the weight to be given to such factors, the members of the Board relied upon their own business judgment, with the advice of independent legal counsel. The Board did not consider any single factor as controlling in determining whether to approve the continuation of the Advisory Agreement and each member of the Board may have placed varying emphasis on particular factors in reaching a conclusion. Moreover, this summary description does not necessarily identify all of the factors considered or conclusions reached by the Board. Based on its consideration of the foregoing factors and conclusions, and such other factors and conclusions as it deemed relevant, the Board unanimously approved entering into the Advisory Agreement for the New Fund for an initial two-year period.
VANECK FUNDS
TAX INFORMATION
(unaudited)
The following information is provided with respect to the distributions paid during the taxable year ended December 31, 2021. Please consult your tax advisor for proper treatment of this information.
| Fund | | Ordinary
Income
Amount Paid
Per Share | | Return of
Capital Per
Share | | Qualified
Dividend
Income for
Individuals* | | Dividends
Qualifying
for the Dividend
Received
Deduction
for
Corporations* |
| CM Commodity Index Fund | | | | | | | | | |
| Class A | | $1.13440 | | $— | | —% | | —% | |
| Class I | | 1.15170 | | — | | — | | — | |
| Class Y | | 1.14870 | | — | | — | | — | |
| Emerging Markets Bond Fund | | | | | | | | | |
| Class A | | 0.23349 | | 0.08011 | | — | | — | |
| Class I | | 0.25205 | | 0.08636 | | — | | — | |
| Class Y | | 0.24426 | | 0.08374 | | — | | — | |
| Emerging Markets Fund | | | | | | | | | |
| Class I | | 0.04430 | | — | | 100.00 | | 2.81 | |
| Class Y | | 0.02030 | | — | | 100.00 | | 2.81 | |
| Class Z | | 0.06130 | | — | | 100.00 | | 2.81 | |
| Global Resources Fund | | | | | | | | | |
| Class A | | 0.52780 | | — | | 100.00 | | 65.96 | |
| Class C | | 0.33500 | | — | | 100.00 | | 65.96 | |
| Class I | | 0.69170 | | — | | 100.00 | | 65.96 | |
| Class Y | | 0.62450 | | — | | 100.00 | | 65.96 | |
| Fund | | Foreign Source
Income* | | Foreign Taxes
Paid Per
Share** | | Long-Term
Capital
Gain Per
Share | | Federal
Obligation
Interest
*** |
| CM Commodity Index Fund | | | | | | | | | |
| Class A | | —% | | $— | | $— | | 0.17 | % |
| Class I | | — | | — | | — | | 0.17 | |
| Class Y | | — | | — | | — | | 0.17 | |
| Emerging Markets Bond Fund | | | | | | | | | |
| Class A | | 100.00 | | 0.004289 | | — | | — | |
| Class I | | 100.00 | | 0.004289 | | — | | — | |
| Class Y | | 100.00 | | 0.004289 | | — | | — | |
| Emerging Markets Fund | | | | | | | | | |
| Class A | | — | | — | | 1.377400 | | 0.01 | |
| Class C | | — | | — | | 1.377400 | | 0.01 | |
| Class I | | 100.00 | | 0.039356 | | 1.377400 | | 0.01 | |
| Class Y | | 100.00 | | 0.039356 | | 1.377400 | | 0.01 | |
| Class Z | | 100.00 | | 0.039356 | | 1.377400 | | 0.01 | |
| Global Resources Fund | | | | | | | | | |
| Class A | | — | | — | | — | | 0.03 | |
| Class C | | — | | — | | — | | 0.03 | |
| Class I | | — | | — | | — | | 0.03 | |
| Class Y | | — | | — | | — | | 0.03 | |
* Expressed as a percentage of the cash distribution grossed up for foreign taxes.
** The foreign taxes paid represent taxes incurred by the Fund on income received by the Fund from foreign sources. Foreign taxes paid may be included in taxable income with an offsetting deduction from gross income or may be taken as a credit for taxes paid to foreign governments.
*** The interest from Federal obligations represents income derived from assets backed by the full faith and credit of the U.S.
Government. State law varies as to what percentage of this dividend is exempt from state income tax.
| Fund | | Ordinary
Income
Amount Paid
Per Share | | Qualified
Dividend
Income for
Individuals* | | Dividends
Qualifying
for the Dividend
Received
Deduction
for
Corporations* | | | | |
| International Investors Gold Fund | | | | | | | | | | | | |
| Class A | | $0.66030 | | 6.16 | % | | 0.89 | % | | | | |
| Class C | | 0.66030 | | 6.16 | | | 0.89 | | | | | |
| Class I | | 0.66030 | | 6.16 | | | 0.89 | | | | | |
| Class Y | | 0.66030 | | 6.16 | | | 0.89 | | | | | |
| VanEck Morningstar Wide Moat Fund | | | | | | | | | | | | |
| Class I | | 0.37880 | | 24.27 | | | 23.56 | | | | | |
| Class Z | | 0.40900 | | 24.27 | | | 23.56 | | | | | |
| VanEck NDR Managed Allocation Fund | | | | | | | | | | | | |
| Class A | | 0.26940 | | 83.69 | | | 3.98 | | | | | |
| Class I | | 0.37160 | | 83.69 | | | 3.98 | | | | | |
| Class Y | | 0.35160 | | 83.69 | | | 3.98 | | | | | |
| | | | | | | | | | | | | |
| Fund | | Foreign Source Income* | | Foreign Taxes Paid Per Share** | | | Section 199A Qualified Business Income Per Share | | Long-Term
Capital
Gain Per
Share | | Federal
Obligation
Interest
*** |
| International Investors Gold Fund | | | | | | | | | | | | |
| Class A | | —% | | $— | | | $— | | $— | | 0.02 | % |
| Class C | | — | | — | | | — | | — | | 0.02 | |
| Class I | | — | | — | | | — | | — | | 0.02 | |
| Class Y | | — | | — | | | — | | — | | 0.02 | |
| VanEck Morningstar Wide Moat Fund | | | | | | | | | | | | |
| Class I | | — | | — | | | — | | 1.761100 | | — | |
| Class Z | | — | | — | | | — | | 1.761100 | | — | |
| VanEck NDR Managed Allocation Fund | | | | | | | | | | | | |
| Class A | | 2.67 | | 0.012305 | | | 0.000318 | | 0.191800 | | 8.11 | |
| Class I | | 2.67 | | 0.012305 | | | 0.000438 | | 0.191800 | | 8.11 | |
| Class Y | | 2.67 | | 0.012305 | | | 0.000415 | | 0.191800 | | 8.11 | |
* Expressed as a percentage of the cash distribution grossed up for foreign taxes.
** The foreign taxes paid represent taxes incurred by the Fund on income received by the Fund from foreign sources. Foreign taxes paid may be included in taxable income with an offsetting deduction from gross income or may be taken as a credit for taxes paid to foreign governments.
*** The interest from Federal obligations represents income derived from assets backed by the full faith and credit of the U.S. Government. State law varies as to what percentage of this dividend is exempt from state income tax.
Additionally, VanEck Morningstar Wide Moat Fund paid short-term capital gains of $2.36550 per share that represents Qualified Short-Term Capital Gains (“QSTG”) which may be exempt from United States withholding tax when distributed to non-U.S. shareholders with proper documentation.
VANECK FUNDS
BOARD OF TRUSTEES AND OFFICERS
December 31, 2021 (unaudited)
Name, Address1
and Year of Birth | | Position(s)
Held with
the Trust | | Term of
Office2 and
Length of
Time Served | | Principal Occupation(s)
During Past Five Years | | Number of
Portfolios
in Fund
Complex3
Overseen | | Other Directorships Held
By Trustee During Past Five Years |
| Independent Trustees | | | | | | | | |
| | | | | | | | | |
| Jon Lukomnik 1956 (A)(G)(I) | | Trustee
Chairperson of the Audit Committee | | Since 2006
Since 2021 | | Managing Partner, Sinclair Capital LLC (consulting firm). Formerly, Executive Director, Investor Responsibility Research Center Institute; Pembroke Visiting Professor of International Finance, Judge Business School, Cambridge. | | 12 | | Member of the Deloitte Audit Quality Advisory Committee; Director, The Shareholder Commons; Director of VanEck ICAV (an Irish UCITS); VanEck Vectors UCITS ETF plc (an Irish UCITS). Formerly, Director of VanEck (a Luxembourg UCITS); Member of the Standing Advisory Group to the Public Company Accounting Oversight Board; Chairman of the Advisory Committee of Legion Partners. |
| | | | | | | | | | | |
| Jane DiRenzo Pigott 1957(A)(G)(I) | | Trustee
Chairperson of the Board | | Since 2007
Since 2020 | | Managing Director, R3 Group LLC (consulting firm). | | 12 | | Trustee of Northwestern University, Lyric Opera of Chicago and the Chicago Symphony Orchestra. Formerly, Director and Chair of Audit Committee of 3E Company (services relating to hazardous material safety); Director of MetLife Investment Funds, Inc. |
| | | | | | | | | | | |
| R. Alastair Short 1953 (A)(G)(I) | | Trustee | | Since 2004 | | President, Apex Capital Corporation (personal investment vehicle). | | 74 | | Chairman and Independent Director, EULAV Asset Management; Lead Independent Director, Total Fund Solution; Independent Director, Contingency Capital, LLC; Trustee, Kenyon Review; Trustee, Children’s Village. Formerly, Independent Director, Tremont offshore funds. |
| | | | | | | | | | | |
Richard D. Stamberger
1959 (A)(G)(I) | | Trustee
Chairperson of the Governance Committee | | Since 1995
Since 2022 | | Senior Vice President, B2B, Future Plc (global media company). Formerly, President, CEO and co- founder, SmartBrief, Inc. | | 74 | | Director, Food and Friends, Inc. |
| | | | | | | | | | | |
| Interested Trustee | | | | | | | | |
| | | | | | | | | |
| Jan F. van Eck(4) 1963 (I) | | Trustee
Chairperson of
the Investment
Oversight Committee
Chief Executive Officer and President | | Since 2019
Since 2020
Since 2010 | | Director, President and Chief Executive Officer of Van Eck Associates Corporation (VEAC), Van Eck Absolute Return Advisers Corporation (VEARA) and Van Eck Securities Corporation (VESC); Officer and/or Director of other companies affiliated with VEAC and/or the Trust. | | 74 | | Director, National Committee on US-China Relations. |
(1) The address for each Trustee and officer is 666 Third Avenue, 9th Floor, New York, New York 10017.
(2) Trustee serves until resignation, death, retirement or removal.
(3) The Fund Complex consists of VanEck Funds, VanEck VIP Trust and VanEck ETF Trust.
(4) “Interested person” of the Trust within the meaning of the 1940 Act. Mr. van Eck is an officer of VEAC, VEARA and VESC. In addition, Mr. van Eck and members of his family own 100% of the voting stock of VEAC, which in turns owns 100% of the voting stock of each of VEARA and VESC.
(A) Member of the Audit Committee.
(G) Member of the Governance Committee.
(I) Member of the Investment Oversight Committee
The executive officers of the Trust, their age and address, the positions they hold with the Trust, their term of office and length of time served and their principal business occupations during the past five years are shown below:
Officer’s Name,
Address1 and
Year of Birth | | Position(s)
Held with
the Trust | | Term of Office2
And Length of
Time Served | | Principal Occupation(s) During Past Five Years |
| Officer Information | | | | |
| | | | | |
| Matthew A. Babinsky, 1983 | | Assistant Vice President and Assistant Secretary | | Since 2016 | | Assistant Vice President, Assistant General Counsel and Assistant Secretary of VEAC, VEARA and VESC; Officer of other investment companies advised by VEAC and VEARA. Formerly, Associate, Clifford Chance US LLP. |
| | | | | | | |
| Russell G. Brennan, 1964 | | Assistant Vice President and Assistant Treasurer | | Since 2008 | | Assistant Vice President of VEAC; Officer of other investment companies advised by VEAC and VEARA. |
| | | | | | | |
| Charles T. Cameron, 1960 | | Vice President | | Since 1996 | | Portfolio Manager of VEAC; Officer and/or Portfolio Manager of other investment companies advised by VEAC and VEARA. Formerly, Director of Trading of VEAC. |
| | | | | | | |
| John J. Crimmins, 1957 | | Vice President, Treasurer, Chief Financial Officer and Principal Accounting Officer | | Vice President, Chief Financial Officer and Principal Accounting Officer (Since 2012); Treasurer (Since 2009) | | Vice President of VEAC and VEARA; Officer of other investment companies advised by VEAC and VEARA. Formerly, Vice President of VESC. |
| | | | | | | |
| F. Michael Gozzillo, 1965 | | Chief Compliance Officer | | Since 2018 | | Vice President and Chief Compliance Officer of VEAC and VEARA; Chief Compliance Officer of VESC; Officer of other investment companies advised by VEAC and VEARA. Formerly, Chief Compliance Officer of City National Rochdale, LLC and City National Rochdale Funds. |
| | | | | | | |
| Laura Hamilton, 1977 | | Vice President | | Since 2019 | | Assistant Vice President of VEAC and VESC; Officer of other investment companies advised by VEAC and VEARA. Formerly, Operations Manager of Royce & Associates. |
| | | | | | | |
| Laura I. Martínez, 1980 | | Vice President and Assistant Secretary | | Vice President (Since 2016); Assistant Secretary (Since 2008) | | Vice President, Associate General Counsel and Assistant Secretary of VEAC, VEARA and VESC; Officer of other investment companies advised by VEAC and VEARA. Formerly, Assistant Vice President of VEAC, VEARA and VESC. |
| | | | | | | |
| James Parker, 1969 | | Assistant Treasurer | | Since 2014 | | Assistant Vice President of VEAC; Manager, Portfolio Administration of VEAC and VEARA. Officer of other investment companies advised by VEAC and VEARA. |
| | | | | | | |
| Jonathan R. Simon, 1974 | | Senior Vice President, Secretary and Chief Legal Officer | | Senior Vice President (Since 2016); Secretary and Chief Legal Officer (since 2014) | | Senior Vice President, General Counsel and Secretary of VEAC, VEARA and VESC; Officer and/or Director of other companies affiliated with VEAC and/or the Trust. Formerly, Vice President of VEAC, VEARA and VESC. |
| | | | | | | |
| Andrew Tilzer, 1972 | | Assistant Vice President | | Since 2021 | | Vice President of Portfolio Administration of VEAC. Formerly, Assistant Vice President, Portfolio Operations of VEAC. |
(1) The address for each Executive Officer is 666 Third Avenue, 9th Floor, New York, NY 10017.
(2) Officers are elected yearly by the Board.
This report is intended for the Funds’ shareholders. It may not be distributed to prospective investors unless it is preceded or accompanied by the Funds’ prospectus, which includes more complete information. Investing involves substantial risk and high volatility, including possible loss of principal. An investor should consider the investment objective, risks, and charges and expenses of the Funds carefully before investing. To obtain a prospectus, which contains this and other information, call 800.826.2333 or visit vaneck.com. Please read the prospectus carefully before investing.
Additional information about the VanEck Funds (the “Trust”) Board of Trustees/Officers and a description of the policies and procedures the Trust uses to determine how to vote proxies relating to portfolio securities are provided in the Statement of Additional Information. The Statement of Additional Information and information regarding how the Trust voted proxies relating to portfolio securities during the most recent twelve month period ending June 30 is available, without charge, by calling 800.826.2333, or by visiting vaneck.com, or on the Securities and Exchange Commission’s website at https://www.sec.gov.
The Trust files its complete schedule of portfolio holdings with the Securities and Exchange Commission for the first and third quarters of each fiscal year on Form N-PORT. The Trust’s Form N-PORT filings are available on the Commission’s website at http://www.sec.gov and may be reviewed and copied at the Commission’s Public Reference Room in Washington, D.C. Information on the operation of the Public Reference Room may be obtained by calling 202.942.8090. The Funds’ complete schedules of portfolio holdings are also available by calling 800.826.2333 or by visiting vaneck.com.

| | | |
| Investment Adviser: | VanEck Associates Corporation | |
| Distributor: | VanEck Securities Corporation
666 Third Avenue, New York, NY 10017
vaneck.com | |
| Account Assistance: | 800.544.4653 | VEFUNDAR |
| (a) | The Registrant has adopted a code of ethics (the “Code of Ethics”) that applies to the principal executive officer, principal financial officer, principal accounting officer or controller, or persons performing similar functions. |
| | |
| (b) | The Registrant’s code of ethics is reasonably described in this Form N-CSR. |
| | |
| (c) | The Registrant has not amended its Code of Ethics during the period covered by the shareholder report presented in Item 1 hereto. |
| | |
| (d) | The Registrant has not granted a waiver or an implicit waiver from a provision of its Code of Ethics during the period covered by the shareholder report presented in Item 1 hereto. |
| | |
| (e) | Not applicable. |
| | |
| (f) | The Registrant’s Code of Ethics is attached as an Exhibit hereto. |
| Item 3. | AUDIT COMMITTEE FINANCIAL EXPERT. |
The Registrant’s Board of Trustees has determined that Jane Pigott and Jon Lukomnik, members of the Audit Committee, are “audit committee financial experts” and “independent” as such terms are defined in the instructions to Form N-CSR Item 3(a)(2).
| Item 4. | PRINCIPAL ACCOUNTANT FEES AND SERVICES. |
The principal accountant fees disclosed in Item 4(a), 4(b), 4(c), 4(d) and 4(g) are for the Funds of the Registrant for which the fiscal year end is December 31.
| (a) | Audit Fees. The aggregate Audit Fees of Ernst & Young for professional services billed for the audits of the financial statements, or services that are normally provided in connection with statutory and regulatory filings or engagements for the fiscal years ended December 31, 2021 and December 31, 2020, were $313,330 and $269,330, respectively. |
| | |
| (b) | Audit-Related Fees. Not applicable. |
| | |
| (c) | Tax Fees. The aggregate Tax Fees of Ernst & Young for professional services billed for the review of Federal, state and excise tax returns and other tax compliance consultations for the fiscal years ended December 31, 2021 and December 31, 2020, were $69,937 and $71,343, respectively. |
| | |
| (d) | All Other Fees |
| | |
| | None. |
| | |
| (e) | The Audit Committee will pre-approve all audit and non-audit services, to be provided to the Funds, by the independent accountants as required by Section 10A of the Securities Exchange Act of 1934. The Audit Committee has authorized the Chairman of the Audit Committee to approve, between meeting dates, appropriate non-audit services. |
| | |
| | The Audit Committee after considering all factors, including a review of independence issues, will recommend to the Board of Trustees the independent auditors to be selected to audit the financial statements of the Funds. |
| (f) | Not applicable. |
| | |
| (g) | Not applicable. |
| | |
| (h) | Not applicable. |
| Item 5. | AUDIT COMMITTEE OF LISTED REGISTRANTS. |
The Registrant’s Board has an Audit Committee established in accordance with Section 3(a)(58)(A) of the Exchange Act (15 U.S.C. 78c(a)(58)(A)) consisting of two Independent Trustees. Jon Lukomnik and Jane Pigott currently serve as members of the Audit Committee. Mr. Lukomnik is the Chairman of the Audit Committee.
Effective January 1, 2022, R. Alastair Short and Richard D. Stamberger were appointed to the Audit Committee.
| Item 6. | SCHEDULE OF INVESTMENTS. |
| | Information included in Item 1. |
| Item 7. | DISCLOSURE OF PROXY VOTING POLICIES AND PROCEDURES FOR CLOSED-END MANAGEMENT INVESTMENT COMPANIES. |
| Item 8. | PORTFOLIO MANAGER OF CLOSED-END MANAGEMENT INVESTMENT COMPANIES. |
| Item 9. | PURCHASE OF EQUITY SECURITIES BY CLOSED-END MANAGEMENT INVESTMENT COMPANY AND AFFILIATED PURCHASERS. |
| Item 10. | SUBMISSION OF MATTERS TO A VOTE OF SECURITY HOLDERS. |
| Item 11. | CONTROLS AND PROCEDURES. |
| (a) | The registrant’s principal executive and principal financial officers, or persons performing similar functions, have concluded that the registrant’s disclosure controls and procedures (as defined in Rule 30a-3(c) under the Investment Company Act of 1940, as amended (the “1940 Act”) (17 CFR 270.30a-3 (c)) are effective, as of a date within 90 days of the filing date of the report that includes the disclosure required by this paragraph, based on their evaluation of these controls and procedures required by Rule 30a-3(b) under the 1940 Act (17 CFR 270.30a-3(b)) and Rules 13a-15(b) or 15d-15(b) under the Securities Exchange Act of 1934, as amended (17 CFR 240.13a-15(b) or 240.15d-15 (b)). |
| | |
| (b) | There were no changes in the registrant’s internal control over financial reporting (as defined in Rule 30a-3(d) under the 1940 Act (17 CFR 270.30a(d)) that occurred during the period covered by this report that has materially affected, or is reasonably likely to materially affect, the registrant’s internal control over financial reporting. |
| Item 12. | DISCLOSURE OF SECURITIES LENDING ACTIVITIES FOR CLOSED-END MANAGEMENT INVESTMENT COMPANIES. |
| (a) | Not applicable. |
| | |
| (b) | Not applicable. |
SIGNATURES
Pursuant to the requirements of the Securities Exchange Act of 1934 and the Investment Company Act of 1940, the registrant has duly caused this report to be signed on its behalf by the undersigned, thereunto duly authorized.
(Registrant) VanEck Funds
| By (Signature and Title) | /s/ John J. Crimmins, Treasurer and CFO | |
Date March 10, 2022
Pursuant to the requirements of the Securities Exchange Act of 1934 and the Investment Company Act of 1940, this report has been signed below by the following persons on behalf of the registrant and in the capacities and on the dates indicated.
| By (Signature and Title) | /s/ Jan F. van Eck, CEO | |
Date March 10, 2022
| By (Signature and Title) | /s/ John J. Crimmins, Treasurer and CFO | |
Date March 10, 2022