The Fund invests in fixed income securities whose value is derived from an underlying pool of mortgages or consumer loans. The value of these securities is sensitive to changes in economic conditions, including delinquencies and/or defaults, and may be adversely affected by shifts in the market’s perception of the issuers and changes in interest rates. Investors receive principal and interest payments as the underlying mortgages and consumer loans are paid back. Some of these securities are collateralized mortgage obligations (CMOs). CMOs are debt securities issued by U.S. government agencies or by financial institutions and other mortgage lenders, which are collateralized by a pool of mortgages held under an indenture. Prepayment of mortgages may shorten the stated maturity of the obligation and can result in a loss of premium, if any has been paid. Certain of these securities may be stripped (securities which provide only the principal or interest feature of the underlying security). The yield to maturity on an interest-only CMO is extremely sensitive not only to changes in prevailing interest rates, but also to the rate of principal payments (including prepayments) on the related underlying mortgage assets. A rapid rate of principal payments may have a material adverse effect on the Fund’s yield to maturity. If the underlying mortgage assets experience greater than anticipated prepayments of principal, the Fund may fail to fully recoup its initial investment in these securities even if the securities are rated in the highest rating categories.
The Fund may invest up to 15% of its net assets in illiquid securities, which may include securities with contractual restrictions on resale, securities exempt from registration under Rule 144A of the Securities Act of 1933, as amended, and other securities which may not be readily marketable. The relative illiquidity of these securities may impair the Fund from disposing of them in a timely manner and at a fair price when it is necessary or desirable to do so. While maintaining oversight, the Fund’s Board has delegated to DMC the day-to-day functions of determining whether individual securities are liquid for purposes of the Fund’s limitation on investments in illiquid assets. Securities eligible for resale pursuant to Rule 144A, which are determined to be liquid, are not subject to the Fund’s 15% limit on investments in illiquid securities. Rule 144A and illiquid securities have been identified on the statement of net assets.
The Fund enters into contracts in the normal course of business that contain a variety of indemnifications. The Fund’s maximum exposure under these arrangements is unknown. However, the Fund has not had prior claims or losses pursuant to these contracts. Management has reviewed the Fund’s existing contracts and expects the risk of loss to be remote.
On August 18, 2009, Lincoln National Corporation and Macquarie Group (“Macquarie”) entered into an agreement pursuant to which Delaware Investments, including DMC, DDLP and DSC, will be acquired by Macquarie, an Australia-based global provider of banking, financial, advisory, investment and funds management services (the “Transaction”). Upon completion of the Transaction, DMC, DDLP and DSC will be wholly-owned subsidiaries of Macquarie.
The Transaction will result in a change of control of DMC which, in turn, will cause the termination of the investment advisory agreement between DMC and the Fund. As a result, a Special Meeting of Shareholders (the “Meeting”) of the Fund will be scheduled for the purpose of asking shareholders to approve a new investment advisory agreement between DMC and the Fund (the “New Agreement”). If approved by shareholders, the New Agreement will take effect upon the closing of the Transaction, which is currently anticipated to occur in the fourth quarter of 2009. Shareholders of the Fund will receive proxy materials including more detailed information about the Meeting, the Transaction and the proposed New Agreement.
Amendment to Investment Advisory Fee — In addition to the expense cap described in footnote 2, effective September 11, 2009, DMC has agreed to voluntarily waive all or a portion of its investment advisory fees and/or pay/reimburse expenses (excluding any 12b-1 plan expenses, taxes, interest, inverse floater program expenses, brokerage fees, certain insurance costs, and nonroutine expenses) in order to prevent total annual fund operating expenses from exceeding, in an aggregate amount, 0.75% of the Fund’s average daily net assets until such time as the voluntary expense cap is discontinued. These fee waivers and expense reimbursements apply only to expenses paid directly by the Fund, and may be discontinued at any time because they are voluntary.
Effective July 31, 2009, the Fund adopted Financial Accounting Standards Board Statement of Financial Accounting Standards No. 165, Subsequent Events (FAS 165). In accordance with FAS 165, management has evaluated whether any events or transactions occurred subsequent to July 31, 2009 through September 21, 2009, the date of issuance of the Fund’s financial statements, and determined that there were no material events or transactions other than those already disclosed that would require recognition or disclosure in the Fund’s financial statements.
13. Tax Information (Unaudited)
The information set forth below is for the Fund’s fiscal year as required by federal income tax laws. Shareholders, however, must report distributions on a calendar year basis for income tax purposes, which may include distributions for portions of two fiscal years of a fund. Accordingly, the information needed by shareholders for income tax purposes will be sent to them in January of each year. Please consult your tax advisor for proper treatment of this information.
For the fiscal year ended July 31, 2009, the Fund designates distributions paid during the year as follows:
| (A) Long-Term Capital Gains Distributions (Tax Basis) | — |
| (B) Ordinary Income Distributions* (Tax Basis) | 100 | % |
| Total Distributions (Tax Basis) | 100 | % |
(A) and (B) are based on a percentage of the Fund’s total distributions.
For the fiscal year ended July 31, 2009, certain dividends paid by the Fund may be subject to a maximum tax rate of 15%, as provided for by the Jobs and Growth Tax Relief Reconciliation Act of 2003. The Fund intends to designate up to a maximum amount of $51,533 to be taxed at a maximum rate of 15%. Complete information will be computed and reported in conjunction with your 2009 Form 1099-DIV.
*For the fiscal year ended July 31, 2009, certain ordinary income paid by the Fund, determined to be Qualified Interest Income may be subject to relief from U.S. withholding for foreign shareholders, as provided by the American Jobs Creation Act of 2004. For the fiscal year ended July 31, 2009, the Fund has designated maximum Qualified Interest Income distributions of $4,207,497.
67
Report of independent
registered public accounting firm
To the Shareholders and Board of Trustees
Delaware Group Government Fund — Delaware Core Plus Bond Fund
We have audited the accompanying statement of net assets of Delaware Core Plus Bond Fund (one of the series constituting Delaware Group Government Fund) (the “Fund”) as of July 31, 2009, and the related statement of operations for the year then ended, the statements of changes in net assets for each of the two years in the period then ended, and the financial highlights for each of the five years in the period then ended. These financial statements and financial highlights are the responsibility of the Fund’s management. Our responsibility is to express an opinion on these financial statements and financial highlights based on our audits.
We conducted our audits in accordance with the standards of the Public Company Accounting Oversight Board (United States). Those standards require that we plan and perform the audit to obtain reasonable assurance about whether the financial statements and financial highlights are free of material misstatement. We were not engaged to perform an audit of the Fund’s internal control over financial reporting. Our audits included consideration of internal control over financial reporting as a basis for designing audit procedures that are appropriate in the circumstances, but not for the purpose of expressing an opinion on the effectiveness of the Fund’s internal control over financial reporting. Accordingly, we express no such opinion. An audit also includes examining, on a test basis, evidence supporting the amounts and disclosures in the financial statements and financial highlights, assessing the accounting principles used and significant estimates made by management, and evaluating the overall financial statement presentation. Our procedures included confirmation of securities owned as of July 31, 2009 by correspondence with the custodian and brokers or by other appropriate auditing procedures where replies from brokers were not received. We believe that our audits provide a reasonable basis for our opinion.
In our opinion, the financial statements and financial highlights referred to above present fairly, in all material respects, the financial position of the Delaware Core Plus Bond Fund series of Delaware Group Government Fund at July 31, 2009, the results of its operations for the year then ended, the changes in its net assets for each of the two years in the period then ended, and its financial highlights for each of the five years in the period then ended, in conformity with U.S. generally accepted accounting principles.

Philadelphia, Pennsylvania
September 21, 2009
68
Other Fund information
(Unaudited)
Delaware Core Plus Bond Fund
Board Consideration of Delaware Core Plus Bond Fund Investment Advisory Agreement
At a meeting held on May 19-21, 2009 (the “Annual Meeting”), the Board of Trustees (the “Board”), including a majority of disinterested or independent Trustees, approved the renewal of the Investment Advisory Agreement for the Delaware Core Plus Bond Fund (the “Fund”). In making its decision, the Board considered information furnished specifically in connection with the renewal of the Investment Advisory Agreement with Delaware Management Company (“DMC”), which included materials provided by DMC and its affiliates (“Delaware Investments”) concerning, among other things, the nature, extent and quality of services provided to the Fund, the costs of such services to the Fund, economies of scale and the financial condition and profitability of Delaware Investments. Reference was made to information furnished at regular quarterly Board meetings, including reports detailing Fund performance, investment strategies and expenses, as well as information prepared specifically in connection with the renewal of the investment advisory and sub-advisory contracts. In addition, in connection with the Annual Meeting, reports were provided in February 2009 and included independent historical and comparative reports prepared by Lipper Inc. (“Lipper”), an independent statistical compilation organization. The Lipper reports compared the Fund’s investment performance and expenses with those of other comparable mutual funds. The independent Trustees reviewed and discussed the Lipper reports with counsel to the independent Trustees. The Board requested and received information regarding DMC’s policy with respect to advisory fee levels and its breakpoint philosophy; the structure of portfolio manager compensation; the investment manager’s profitability; and any constraints or limitations on the availability of securities in certain investment styles which had in the past year inhibited, or which were likely in the future to inhibit, DMC’s ability to invest fully in accordance with Fund policies.
In considering information relating to the approval of the Fund’s advisory agreement, the independent Trustees received assistance and advice from and met separately with counsel to the independent Trustees. Although the Board gave attention to all information furnished, the following discussion identifies, under separate headings, the primary factors taken into account by the Board during its contract renewal considerations.
Nature, Extent and Quality of Service. The Board considered the services provided by Delaware Investments to the Fund and its shareholders. In reviewing the nature, extent and quality of services, the Board considered reports furnished to it throughout the year, which covered matters such as the relative performance of the Fund, compliance of portfolio managers with the investment policies, strategies and restrictions for the Fund, compliance by DMC and Delaware Distributors, L.P. (together, “Management”) personnel with the Code of Ethics adopted throughout the Delaware Investments Family of Funds complex and adherence to fair value pricing procedures as established by the Board. The Board was pleased with the current staffing of the Fund’s investment advisor and the emphasis placed on research in the investment process. The Board gave favorable consideration to DMC’s efforts to control expenditures while maintaining service levels committed to fund matters. The Board also considered the transfer agent and shareholder services provided to Fund shareholders by DMC’s affiliate, Delaware Service
69
Other Fund information
(Unaudited)
Delaware Core Plus Bond Fund
Board Consideration of Delaware Core Plus Bond Fund Investment Advisory Agreement (continued)
Company, Inc. (“DSC”), noting DSC’s high level of service. The Board noted that Management finished upgrading investment accounting functions through outsourcing to improve the quality and lower the cost of delivering investment accounting services to the Fund. The Board once again noted the benefits provided to Fund shareholders through each shareholder’s ability to exchange an investment in one Delaware Investments fund for the same class of shares in another Delaware Investments fund without a sales charge, to reinvest Fund dividends into additional shares of the Fund or into additional shares of other Delaware Investments funds and the privilege to combine holdings in other Delaware Investments funds to obtain a reduced sales charge. The Board was satisfied with the nature, extent and quality of the overall services provided by Delaware Investments.
Investment Performance. The Board placed significant emphasis on the investment performance of the Fund in view of its importance to shareholders. Although the Board gave appropriate consideration to performance reports and discussions with portfolio managers at Board meetings throughout the year, the Board gave particular weight to the Lipper reports furnished for the Annual Meeting. The Lipper reports prepared for the Fund showed the investment performance of its Class A shares in comparison to a group of similar funds as selected by Lipper (the “Performance Universe”). A fund with the best performance ranked first, and a fund with the poorest performance ranked last. The highest/best performing 25% of funds in the Performance Universe make up the first quartile; the next 25%, the second quartile; the next 25%, the third quartile; and the poorest/worst performing 25% of funds in the Performance Universe make up the fourth quartile. Comparative annualized performance for the Fund was shown for the past one-, three-, five- and ten-year periods ended December 31, 2008. The Board’s objective is that the Fund’s performance for the periods considered be at or above the median of its Performance Universe. The following paragraph summarizes the performance results for the Fund and the Board’s view of such performance.
The Performance Universe for the Fund consisted of the Fund and all retail and institutional intermediate investment-grade debt funds as selected by Lipper. The Lipper report comparison showed that the Fund’s total return for the one-, three- and five-year periods was in the second quartile of its Performance Universe. Although the Fund’s total return for the ten-year period was in the third quartile, the Board was satisfied with the recent performance.
Comparative Expenses. The Board considered expense comparison data for the Delaware Investments Family of Funds. Management provided the Board with information on pricing levels and fee structures for the Fund as of October 31, 2008 and, for comparative funds, information as of their respective fiscal year end occurring on or before August 31, 2008. The Board also focused on the comparative analysis of effective management fees and total expense ratios of the Fund versus effective management fees and expense ratios of a group of similar funds as selected by Lipper (the “Expense Group”). In reviewing comparative costs, the Fund’s contractual management fee and the actual management fee incurred by
70
the Fund were compared with the contractual management fees (assuming all funds in the Expense Group were similar in size to the Fund) and actual management fees (as reported by each fund) within the Expense Group, taking into account any applicable breakpoints and fee waivers. The Fund’s total expenses were also compared with those of its Expense Group. The Lipper total expenses, for comparative consistency, were shown by Lipper for Class A shares and comparative total expenses including 12b-1 and non 12b-1 service fees. The Board considered fees paid to Delaware Investments for nonmanagement services. The Board’s objective is to limit the Fund’s total expense ratio to be competitive with that of the Expense Group. The following paragraph summarizes the expense results for the Fund and the Board’s view of such expenses.
The expense comparisons for the Fund showed that its actual management fee was in the quartile with the lowest expenses of its Expense Group and its total expenses were in the quartile with the second lowest expenses of its Expense Group. The Board was satisfied with the management fee and total expenses of the Fund in comparison to those of its Expense Group as shown in the Lipper report.
Management Profitability. The Board considered the level of profits realized by Delaware Investments in connection with the operation of the Fund. In this respect, the Board reviewed the Investment Management Profitability Analysis that addressed the overall profitability of Delaware Investments’ business in providing management and other services to each of the individual funds and the Delaware Investments Family of Funds as a whole. Specific attention was given to the methodology followed in allocating costs for the purpose of determining profitability. Management stated that the level of profits of Delaware Investments, to a certain extent, reflect recent operational cost savings and efficiencies initiated by Delaware Investments. The Board considered Delaware Investments’ efforts to improve services provided to fund shareholders and to meet additional regulatory and compliance requirements resulting from recent industry-wide Securities and Exchange Commission initiatives. The Board also considered the extent to which Delaware Investments might derive ancillary benefits from fund operations, including the potential for procuring additional business as a result of the prestige and visibility associated with its role as service provider to the Delaware Investments Family of Funds and the benefits from allocation of fund brokerage to improve trading efficiencies. The Board found that the management fees were reasonable in light of the services rendered and the level of profitability of Delaware Investments.
Economies of Scale. The Trustees considered whether economies of scale are realized by Delaware Investments as the Fund’s assets increase and the extent to which any economies of scale are reflected in the level of management fees charged. The Trustees reviewed the standardized advisory fee pricing and structure, approved by the Board and shareholders, which includes breakpoints. Breakpoints in the advisory fee occur when the advisory fee rate is reduced on assets in excess of specified levels. Breakpoints result in a lower advisory fee than would otherwise be the case on all assets when the asset levels specified are exceeded. The Board noted that the fee under
71
Other Fund information
(Unaudited)
Delaware Core Plus Bond Fund
Board Consideration of Delaware Core Plus Bond Fund Investment Advisory Agreement (continued)
the Fund’s management contract fell within the standard structure. Although the Fund has not reached a size at which it can take advantage of breakpoints, the Board recognized that the fee was structured so that when the Fund grows, economies of scale may be shared.
Fund management
Paul Grillo, CFA
Senior Vice President, Co-Chief Investment Officer — Total Return Fixed Income Strategy
Paul Grillo is a member of the firm’s taxable fixed income portfolio management team with primary responsibility for portfolio construction and strategic asset allocation. He is also a member of the firm’s asset allocation committee, which is responsible for building and managing multi-asset class portfolios. He joined Delaware Investments in 1992 as a mortgage-backed and asset-backed securities analyst, assuming portfolio management responsibilities in the mid-1990s. Grillo serves as co-lead portfolio manager for the firm’s Diversified Income products and has been influential in the growth and distribution of the firm’s multisector strategies. Prior to joining Delaware Investments, Grillo served as a mortgage strategist and trader at Dreyfus Corporation. He also worked as a mortgage strategist and portfolio manager at Chemical Investment Group and as a financial analyst at Chemical Bank. Grillo holds a bachelor’s degree in business management from North Carolina State University and an MBA with a concentration in finance from Pace University.
Thomas H. Chow, CFA
Senior Vice President, Senior Portfolio Manager
Thomas H. Chow is a member of the firm’s taxable fixed income portfolio management team, with primary responsibility for portfolio construction and strategic asset allocation in investment grade credit exposures. He is the lead portfolio manager for Delaware Corporate Bond Fund and Delaware Extended Duration Bond Fund, as well as several institutional mandates. His experience includes significant exposure to asset liability management strategies and credit risk opportunities. Prior to joining Delaware Investments in 2001 as a portfolio manager working on the Lincoln General Account, he was a trader of high grade and high yield securities, and was involved in the portfolio management of collateralized bond obligations (CBOs) and insurance portfolios at SunAmerica/AIG from 1997 to 2001. Before that, he was an analyst, trader, and portfolio manager at Conseco Capital Management from 1989 to 1997. Chow received a bachelor’s degree in business analysis from Indiana University, and he is a Fellow of Life Management Institute.
72
Roger A. Early, CPA, CFA, CFP
Senior Vice President, Co-Chief Investment Officer — Total Return Fixed Income Strategy
Roger A. Early rejoined Delaware Investments in March 2007 as a member of the firm’s taxable fixed income portfolio management team, with primary responsibility for portfolio construction and strategic asset allocation. During his previous time at the firm, from 1994 to 2001, he was a senior portfolio manager in the same area, and he left Delaware Investments as head of its U.S. investment grade fixed income group. In recent years, Early was a senior portfolio manager at Chartwell Investment Partners and Rittenhouse Financial and served as the chief investment officer for fixed income at Turner Investments. Prior to joining Delaware Investments in 1994, he worked for more than 10 years at Federated Investors where he managed more than $25 billion in mutual fund and institutional portfolios in the short-term and investment grade markets. He left the firm as head of institutional fixed income management. Earlier in his career, he held management positions with the Federal Reserve Bank, PNC Financial, Touche Ross, and Rockwell International. Early earned his bachelor’s degree in economics from The Wharton School of the University of Pennsylvania and an MBA with concentrations in finance and accounting from the University of Pittsburgh. He is a member of the CFA Society of Philadelphia.
Kevin P. Loome, CFA
Senior Vice President, Senior Portfolio Manager, Head of High Yield Investments
Kevin P. Loome is head of the High Yield fixed income team, responsible for portfolio construction and strategic asset allocation of all high yield fixed income assets. Prior to joining Delaware Investments in August 2007 in his current position, Loome spent 11 years at T. Rowe Price, starting as an analyst and leaving the firm as a portfolio manager. He began his career with Morgan Stanley as a corporate finance analyst in the New York and London offices. Loome received his bachelor’s degree in commerce from the University of Virginia and earned an MBA from the Tuck School of Business at Dartmouth.
73
Board of trustees/directors and officers addendum
Delaware Investments® Family of Funds
A mutual fund is governed by a Board of Trustees/Directors (“Trustees”), which has oversight responsibility for the management of a fund’s business affairs. Trustees establish procedures and oversee and review the performance of the investment manager, the distributor, and others who perform services for the fund. The independent fund trustees, in particular, are advocates
| Name, Address, | | Position(s) | | Length of |
| and Birth Date | | Held with Fund(s) | | Time Served |
| Interested Trustees | | | | |
| | | | |
| Patrick P. Coyne1 | | Chairman, President, | | Chairman and Trustee |
| 2005 Market Street | | Chief Executive Officer, | | since August 16, 2006 |
| Philadelphia, PA 19103 | | and Trustee | | |
| April 1963 | | | | President and |
| | | | Chief Executive Officer |
| | | | since August 1, 2006 |
| |
| |
| |
| |
| |
| |
| |
| |
| |
| |
| |
| |
| Independent Trustees | | | | |
| | | | |
| Thomas L. Bennett | | Trustee | | Since March 2005 |
| 2005 Market Street | | | | |
| Philadelphia, PA 19103 | | | | |
| October 1947 | | | | |
| |
| |
| |
| |
| |
| |
| |
| |
| |
| |
| |
1 Patrick P. Coyne is considered to be an “Interested Trustee” because he is an executive officer of the Fund’s(s’) investment advisor.
74
for shareholder interests. Each trustee has served in that capacity since he or she was elected to or appointed to the Board of Trustees, and will continue to serve until his or her retirement or the election of a new trustee in his or her place. The following is a list of the Trustees and Officers with certain background and related information.
| | Number of Portfolios in | | |
| Principal Occupation(s) | | Fund Complex Overseen | | Other Directorships |
| During Past 5 Years | | by Trustee or Officer | | Held by Trustee or Officer |
| | | | |
| | | | |
| Patrick P. Coyne has served in | | 80 | | Director |
| various executive capacities | | | | Kaydon Corp. |
| at different times at | | | | (July 2007–Present) |
| Delaware Investments.2 | | | | |
| | | | Board of Governors Member |
| | | | Investment Company |
| | | | Institute (ICI) |
| | | | (2007–Present) |
| | | | |
| | | | Member of Investment Committee |
| | | | Cradle of Liberty Council, BSA |
| | | | (November 2007–Present) |
| | | | |
| | | | Finance Committee Member |
| | | | St. John Vianney |
| | | | Roman Catholic Church |
| | | | (2007–Present) |
| | | | |
| | | | |
| | | | |
| Private Investor | | 80 | | Director |
| (March 2004–Present) | | | | Bryn Mawr Bank Corp. (BMTC) |
| | | | (April 2007–Present) |
| Investment Manager | | | | |
| Morgan Stanley & Co. | | | | Chairman of |
| (January 1984–March 2004) | | | | Investment Committee |
| | | | Pennsylvania Academy of |
| | | | Fine Arts (2007–Present) |
| | | | Trustee (2004–Present) |
| |
2 Delaware Investments is the marketing name for Delaware Management Holdings, Inc. and its subsidiaries, including the Fund’s(s’) investment advisor, principal underwriter, and its transfer agent.
75
Board of trustees/directors and officers addendum
Delaware Investments® Family of Funds
| Name, Address, | Position(s) | Length of |
| and Birth Date | Held with Fund(s) | Time Served |
| Independent Trustees (continued) | | |
| | | |
| Thomas L. Bennett | | |
| (continued) | | |
| |
| |
| |
| |
| |
| John A. Fry | Trustee | Since January 2001 |
| 2005 Market Street | | |
| Philadelphia, PA 19103 | | |
| May 1960 | | |
| | | |
| | | |
| | | |
| |
| Anthony D. Knerr | Trustee | Since April 1990 |
| 2005 Market Street | | |
| Philadelphia, PA 19103 | | |
| December 1938 | | |
| |
| |
| Lucinda S. Landreth | Trustee | Since March 2005 |
| 2005 Market Street | | |
| Philadelphia, PA 19103 | | |
| June 1947 | | |
| |
| Ann R. Leven | Trustee | Since October 1989 |
| 2005 Market Street | | |
| Philadelphia, PA 19103 | | |
| November 1940 | | |
| |
| Thomas F. Madison | Trustee | Since May 19973 |
| 2005 Market Street | | |
| Philadelphia, PA 19103 | | |
| February 1936 | | |
| |
| |
| |
3 In 1997, several funds managed by Voyageur Fund Managers, Inc. (the “Voyageur Funds”) were incorporated into the Delaware Investments Family of Funds. Mr. Madison served as a director of the Voyageur Funds from 1993 until 1997.
76
| | Number of Portfolios in | | |
| Principal Occupation(s) | | Fund Complex Overseen | | Other Directorships |
| During Past 5 Years | | by Trustee or Officer | | Held by Trustee or Officer |
| |
| | | | | |
| | | | Investment Committee and |
| | | | Governance Committee |
| | | | Member |
| | | | Pennsylvania Horticultural |
| | | | Society |
| | | | (February 2006–Present) |
| |
| President | | 80 | | Director |
| Franklin & Marshall College | | | | Community Health Systems |
| (June 2002–Present) | | | | |
| | | | Director |
| Executive Vice President | | | | Ecore International |
| University of Pennsylvania | | | | |
| (April 1995–June 2002) | | | | |
| |
| Founder and | | 80 | | None |
| Managing Director | | | | |
| Anthony Knerr & Associates | | | | |
| (Strategic Consulting) | | | | |
| (1990–Present) | | | | |
| |
| Chief Investment Officer | | 80 | | None |
| Assurant, Inc. (Insurance) | | | | |
| (2002–2004) | | | | |
| |
| |
| Consultant | | 80 | | None |
| ARL Associates | | | | |
| (Financial Planning) | | | | |
| (1983–Present) | | | | |
| |
| President and | | 80 | | Director and Chair of |
| Chief Executive Officer | | | | Compensation Committee, |
| MLM Partners, Inc. | | | | Governance Committee |
| (Small Business Investing | | | | Member |
| and Consulting) | | | | CenterPoint Energy |
| (January 1993–Present) | | | | |
| |
77
Board of trustees/directors and officers addendum
Delaware Investments® Family of Funds
| Name, Address, | | Position(s) | | Length of |
| and Birth Date | | Held with Fund(s) | | Time Served |
| Independent Trustees (continued) | | | | |
| |
| Thomas F. Madison | | | | |
| (continued) | | | | |
| |
| |
| |
| |
| |
| |
| |
| |
| |
| |
| |
| |
| |
| |
| |
| |
| |
| |
| |
| |
| Janet L. Yeomans | | Trustee | | Since April 1999 |
| 2005 Market Street | | | | |
| Philadelphia, PA 19103 | | | | |
| July 1948 | | | | |
| |
| |
| |
| |
| J. Richard Zecher | | Trustee | | Since March 2005 |
| 2005 Market Street | | | | |
| Philadelphia, PA 19103 | | | | |
| July 1940 | | | | |
| | | | | |
| | | | | |
| | | | | |
| | | | | |
| | | | | |
| |
78
| Number of Portfolios in | |
| Principal Occupation(s) | Fund Complex Overseen | Other Directorships |
| During Past 5 Years | by Trustee or Officer | Held by Trustee or Officer |
| |
| | |
| | Lead Director and Chair of |
| | Audit and Governance |
| | Committees, Member of |
| | Compensation Committee |
| | Digital River, Inc. |
| | |
| | Director and Chair of |
| | Governance Committee, |
| | Audit Committee |
| | Member |
| | Rimage Corporation |
| | |
| | Director and Chair of |
| | the Compensation Committee |
| | Spanlink Communications |
| | |
| | Lead Director and Member of |
| | Compensation and |
| | Governance Committees |
| | Valmont Industries, Inc. |
| |
| Vice President and Treasurer | 80 | Director |
| (January 2006–Present) | | Okabena Company |
| Vice President — Mergers & Acquisitions | | |
| (January 2003–January 2006), and | | |
| Vice President | | |
| (July 1995–January 2003) | | |
| 3M Corporation | | |
| |
| Founder | 80 | Director and Audit |
| Investor Analytics | | Committee Member |
| (Risk Management) | | Investor Analytics |
| (May 1999–Present) | | |
| |
| Founder | | |
| Sutton Asset Management | | |
| (Hedge Fund) | | |
| (September 1996–Present) | | |
| |
79
Board of trustees/directors and officers addendum
Delaware Investments® Family of Funds
| Name, Address, | | Position(s) | | Length of |
| and Birth Date | | Held with Fund(s) | | Time Served |
| Officers | | | | |
| | | | | |
| David F. Connor | | Vice President, | | Vice President since |
| 2005 Market Street | | Deputy General | | September 2000 |
| Philadelphia, PA 19103 | | Counsel, and Secretary | | and Secretary since |
| December 1963 | | | | October 2005 |
| |
| |
| Daniel V. Geatens | | Vice President | | Treasurer |
| 2005 Market Street | | and Treasurer | | since October 25, 2007 |
| Philadelphia, PA 19103 | | | | |
| October 1972 | | | | |
| |
| David P. O’Connor | | Senior Vice President, | | Senior Vice President, |
| 2005 Market Street | | General Counsel, | | General Counsel, and |
| Philadelphia, PA 19103 | | and Chief Legal Officer | | Chief Legal Officer |
| February 1966 | | | | since October 2005 |
| |
| Richard Salus | | Senior Vice President | | Chief Financial Officer |
| 2005 Market Street | | and Chief Financial Officer | | since November 2006 |
| Philadelphia, PA 19103 | | | | |
| October 1963 | | | | |
| |
4 David F. Connor, Daniel V. Geatens, David P. O’Connor, and Richard Salus serve in similar capacities for the six portfolios of the Optimum Fund Trust, which have the same investment advisor, principal underwriter, and transfer agent as the registrant.
80
| | Number of Portfolios in | | |
| Principal Occupation(s) | | Fund Complex Overseen | | Other Directorships |
| During Past 5 Years | | by Trustee or Officer | | Held by Trustee or Officer |
| |
| |
| David F. Connor has served as | | 80 | | None4 |
| Vice President and Deputy | | | | |
| General Counsel of | | | | |
| Delaware Investments | | | | |
| since 2000. | | | | |
| |
| Daniel V. Geatens has served | | 80 | | None4 |
| in various capacities at | | | | |
| different times at | | | | |
| Delaware Investments. | | | | |
| |
| David P. O’Connor has served in | | 80 | | None4 |
| various executive and legal | | | | |
| capacities at different times | | | | |
| at Delaware Investments. | | | | |
| |
| Richard Salus has served in | | 80 | | None4 |
| various executive capacities | | | | |
| at different times at | | | | |
| Delaware Investments. | | | | |
| |
The Statement of Additional Information for the Fund(s) includes additional information about the Trustees and Officers and is available, without charge, upon request by calling 800 523-1918.
81
About the organization
Board of trustees | | | |
| | | | |
Patrick P. Coyne
Chairman, President, and
Chief Executive Officer
Delaware Investments®
Family of Funds
Philadelphia, PA Thomas L. Bennett
Private Investor
Rosemont, PA John A. Fry
President
Franklin & Marshall
College
Lancaster, PA | Anthony D. Knerr
Founder and Managing
Director
Anthony Knerr &
Associates
New York, NY Lucinda S. Landreth
Former Chief Investment
Officer
Assurant, Inc.
Philadelphia, PA | Ann R. Leven
Consultant
ARL Associates
New York, NY Thomas F. Madison
President and
Chief Executive Officer
MLM Partners, Inc.
Minneapolis, MN | Janet L. Yeomans
Vice President and
Treasurer
3M Corporation
St. Paul, MN J. Richard Zecher
Founder
Investor Analytics
Scottsdale, AZ |
| | | | |
| Affiliated officers | | | |
| | | | |
David F. Connor
Vice President, Deputy
General Counsel, and
Secretary
Delaware Investments
Family of Funds
Philadelphia, PA | Daniel V. Geatens
Vice President and
Treasurer
Delaware Investments
Family of Funds
Philadelphia, PA | David P. O’Connor
Senior Vice President,
General Counsel,
and Chief Legal Officer
Delaware Investments
Family of Funds
Philadelphia, PA | Richard Salus
Senior Vice President and
Chief Financial Officer
Delaware Investments
Family of Funds
Philadelphia, PA |
This annual report is for the information of Delaware Core Plus Bond Fund shareholders, but it may be used with prospective investors when preceded or accompanied by a current prospectus for Delaware Core Plus Bond Fund and the Delaware Investments Fund profile for the most recently completed calendar quarter. These documents are available at www.delawareinvestments.com. The prospectus sets forth details about charges, expenses, investment objectives, and operating policies of the investment company. You should read the prospectus carefully before you invest. The figures in this report represent past results that are not a guarantee of future results. The return and principal value of an investment in the investment company will fluctuate so that shares, when redeemed, may be worth more or less than their original cost. |
Delaware Investments is the marketing name of Delaware Management Holdings, Inc. and its subsidiaries. The Fund files its complete schedule of portfolio holdings with the Securities and Exchange Commission for the first and third quarters of each fiscal year on Form N-Q. The Fund’s Forms N-Q, as well as a description of the policies and procedures that the Fund uses to determine how to vote proxies (if any) relating to portfolio securities are available without charge (i) upon request, by calling 800 523-1918; and (ii) on the Commission’s Web site at www.sec.gov. In addition, a description of the policies and procedures that the Fund uses to determine how to vote proxies (if any) relating to portfolio securities and the Fund’s Schedule of Investments are available without charge on the Fund’s Web site at www.delawareinvestments.com. The Fund’s Forms N-Q may be reviewed and copied at the Commission’s Public Reference Room in Washington, D.C.; information on the operation of the Public Reference Room may be obtained by calling 800 SEC-0330. Information (if any) regarding how the Fund voted proxies relating to portfolio securities during the most recently disclosed 12-month period ended June 30 is available without charge (i) through the Fund’s Web site at www.delawareinvestments.com; and (ii) on the Commission’s Web site at www.sec.gov. |
82
| |
| |
 | 
|
 |
| | |
| | |
Annual report Delaware Inflation Protected Bond Fund July 31, 2009 Fixed income mutual fund |
This annual report is for the information of Delaware Inflation Protected Bond Fund shareholders, but it may be used with prospective investors when preceded or accompanied by a current prospectus for Delaware Inflation Protected Bond Fund. The figures in the annual report for Delaware Inflation Protected Bond Fund represent past results, which are not a guarantee of future results. The return and principal value of an investment in the investment company will fluctuate so that shares, when redeemed, may be worth more or less than their original cost. Current performance may be higher or lower than the performance data quoted. You should consider the investment objectives, risks, charges, and expenses of the investment company carefully before investing. The Delaware Inflation Protected Bond Fund prospectus contains this and other important information about the investment company. Prospectuses for all open-end funds in the Delaware Investments® Family of Funds are available from your financial advisor, online at www.delawareinvestments.com, or by phone at 800 523-1918. Please read the prospectus carefully before you invest or send money. |
You can obtain shareholder reports and prospectuses online instead of in the mail.
Visit www.delawareinvestments.com/edelivery. |
Experience Delaware Investments
Delaware Investments is committed to the pursuit of consistently superior asset management and unparalleled client service. We believe in our investment processes, which seek to deliver consistent results, and in convenient services that help add value for our clients.
If you are interested in learning more about creating an investment plan, contact your financial advisor.
You can learn more about Delaware Investments or obtain a prospectus for Delaware Inflation Protected Bond Fund at www.delawareinvestments.com.
Manage your investments online |
- 24-hour access to your account information
- Obtain share prices
- Check your account balance and recent transactions
- Request statements or literature
- Make purchases and redemptions
|
Contact information
Investment manager
Delaware Management Company, a series of Delaware Management Business Trust
National distributor
Delaware Distributors, L.P.
Financial intermediary wholesaler
Lincoln Financial Distributors, L.P.
Shareholder servicing, dividend disbursing, and transfer agent
Delaware Service Company, Inc.
Mailing address
2005 Market Street
Philadelphia, PA 19103-7094
Shareholder assistance by phone
800 523-1918, weekdays from 8 a.m. to 7 p.m. Eastern time
For securities dealers and financial institutions representatives only
800 362-7500
Table of contents | |
| Portfolio management review | 1 |
| Performance summary | 4 |
| Disclosure of Fund expenses | 8 |
| Security type and credit quality breakdown | 10 |
| Statement of net assets | 11 |
| Statement of operations | 20 |
| Statements of changes in net assets | 22 |
| Financial highlights | 24 |
| Notes to financial statements | 32 |
| Report of independent registered public accounting firm | 49 |
| Other Fund information | 50 |
| Board of trustees/directors and officers addendum | 54 |
| About the organization | 62 |
Views expressed herein are current as of July 31, 2009, and are subject to change.
Funds are not FDIC insured and are not guaranteed. It is possible to lose the principal amount invested.
Mutual fund advisory services provided by Delaware Management Company, a series of Delaware Management Business Trust, which is a registered investment advisor. Delaware Investments is the marketing name of Delaware Management Holdings, Inc. and its subsidiaries. Lincoln Financial Group is the marketing name for Lincoln National Corporation and its affiliates.
© 2009 Delaware Distributors, L.P.
All third-party trademarks cited are the property of their respective owners.
| Portfolio management review | |
| Delaware Inflation Protected Bond Fund | Aug. 11, 2009 |
| Performance preview (for the period ended July 31, 2009) | | | | |
| Delaware Inflation Protected Bond Fund (Class A shares) | | 1-year return | | +1.12% |
| Barclays Capital U.S. Treasury Inflation-Protected Securities (TIPS) Index, formerly Lehman Brothers U.S. Treasury Inflation-Protected (TIPS) Index (benchmark) | | 1-year return | | -0.54% |
Past performance is not a guarantee of future results.
For complete, annualized performance for Delaware Inflation Protected Bond Fund, please see the table on page 4.
The performance of Class A shares excludes the applicable sales charge and reflects the reinvestment of all distributions. |
The fiscal year ended July 31, 2009, was a time of extraordinary volatility across virtually all financial markets. The period began with inflation ranking as one of many investors’ most pressing concerns. Commodities central to industry, agriculture, and economic sectors were richly priced, in part because of robust demand from emerging markets such as China and India.
However, during the last five months of 2008, U.S. economic growth reversed abruptly, turning significantly negative. As the flow of credit dried up, tapped-out consumers slashed their spending. Meanwhile, the credit crisis that had started in the subprime mortgage market spread like wildfire, engulfing such marquee financial companies as Merrill Lynch, Washington Mutual, Wachovia, American International Group (AIG), Fannie Mae, Freddie Mac, and Lehman Brothers, the last of which was forced to declare bankruptcy in September 2008. Lehman’s bankruptcy accelerated the economic downturn and heightened the sense of panic already gripping the financial markets. In December, the National Bureau of Economic Research declared that the U.S. economy was in recession during 2008.
As the U.S. economy slumped and economies in other developed nations followed suit, investors’ outlook for inflation shifted dramatically. At the beginning of the period,
The fiscal year ended July 31, 2009, was a time of extraordinary volatility across virtually all financial markets.
- The period began with inflation ranking as one of many investors’ most pressing concerns.
- However, during the last five months of 2008, U.S. economic growth reversed abruptly, turning significantly negative.
- During the first calendar quarter of 2009, many deflationary fears were replaced by hopeful statements about the economy and expectations of inflation growth stemming from the significant amounts of liquidity being pumped into the financial system.
Data for this portfolio management review were provided by Bloomberg unless otherwise noted. | | 1 |
Portfolio management review
Delaware Inflation Protected Bond Fund
the prices of Treasury inflation-protected securities (TIPS) reflected an expected inflation rate of somewhere between 3% and 5%.
By the end of 2008, the TIPS market was anticipating an extended period of deflation, or declining prices. The shift to a deflationary outlook was reflected in negative returns both for the Fund and its benchmark during the final five months of 2008. These losses occurred despite sharply falling yields in the Treasury market, which were spurred by a flight to quality and which, on balance, tend to be advantageous for fixed income investments. During this turn of events, the yields of short-term TIPS actually exceeded those of comparable Treasurys for a brief time, a relatively rare occurrence.
The new year ushered in a much friendlier environment for TIPS. A massive fiscal stimulus program signed into law by President Obama in February, coupled with the Federal Reserve Board commitment to keeping short-term interest rates historically low, and a variety of government initiatives designed to restore liquidity and boost confidence in the financial markets, resulted in renewed investor willingness to accept risk. Beginning in March 2009, stocks embarked on a sustained rally, while in the fixed income markets, credit spreads — which reflect the premium anticipated for the increased risk of non-Treasury investments — narrowed substantially. At the same time, many deflationary fears were replaced by hopeful statements about the economy and expectations of inflation growth stemming from the significant amounts of liquidity being pumped into the financial system. This shift was beneficial to the TIPS market, producing positive returns for our benchmark and the Fund during the first seven months of 2009, even in the face of rising yields in the Treasury market.
Fund performance
For its fiscal year ended July 31, 2009, Delaware Inflation Protected Bond Fund returned +1.12% for Class A shares at net asset value and -3.44% at maximum offer price. Both figures reflect all distributions reinvested. During the same period, the Fund’s benchmark, the Barclays Capital U.S. TIPS Index, returned -0.54% (source: Barclays Capital). For the complete, annualized performance of the Fund, please see the table on page 4.
Our decision to overweight longer-maturity TIPS benefited the Fund’s results relative to our benchmark early in the period. This same position later hurt Fund performance when deflationary expectations gave way to renewed fears of inflation, particularly during the first quarter of 2009. This change took place because investors continued to look for inflationary conditions over the longer term even while their short-term outlook called for deflation. Consequently, longer-maturity TIPS held up better when TIPS prices were falling; longer-maturity TIPS did not gain nearly as much during the substantial first-quarter rally. Our overweight position in longer-maturity TIPS was the greatest detractor to the Fund’s return as compared with the benchmark. The single most significant factor holding back the Fund’s results during the rally was our relative underweight in shorter-maturity TIPS during that rally.
Alternatively, Fund performance benefited from some of our allocation decisions among non-TIPS asset classes. At the beginning of the period, for example, roughly 20% of the Fund’s assets was jointly allocated to Treasury securities and agency securities. These positions aided the Fund’s performance during the latter part of 2008, as sharply falling Treasury yields caused their prices
2
to soar. Near the end of 2008, with the yields of investment grade corporate bonds approaching double digits, we sold most of our Treasury and agency positions and shifted that capital into the corporate sector due to the historic valuations we believed existed at that time. That shift proved to be a timely decision, as bond yields in the corporate sector fell, and prices subsequently surged higher when investors’ confidence in corporate balance sheets and earnings prospects recovered.
Inflation on the near-term horizon?
At the end of the fiscal year, in our view, many investors began to presume that the huge amount of money being used to stimulate the U.S. economy and bail out troubled corporations would produce higher inflation in relatively short order. We believe these concerns about inflation could be somewhat premature. Over the longer term, when economies here and in other developed nations begin to regain traction, inflation could indeed become a problem. As of the end of the reporting period, however, U.S. unemployment was approaching 10% and was still climbing. The demand for goods and services also was considerably short of the nation’s productive capacity. These conditions (high unemployment and a production gap) do not typically correlate with inflation. As a result, we believe inflationary pressures in the United States could remain relatively subdued for longer than many investors expect.
Prior to the current recession, many U.S. consumers seemed to spend freely, relying on rising home and stock prices to fund their purchases and running up a substantial amount of debt. As a result of the current credit crisis and the accompanying crash in both home and stock prices, consumers have retrenched in a major way. Savings rates have increased notably and spending remains muted as consumers attempt to pay down debt and stockpile cash. In our view, this situation is not likely to change significantly anytime soon. As a result, we believe that the prices of short-term TIPS may have gotten ahead of themselves and that the longer end of the TIPS market offers better value.
Given the entrenched nature of inflation in the U.S. economy since World War II, we remain convinced that most portfolios may generally benefit from an allocation to TIPS as a way to hedge against potential longer-term inflationary pressures.
3
| Performance summary | |
| Delaware Inflation Protected Bond Fund | July 31, 2009 |
The performance data quoted represent past performance; past performance does not guarantee future results. Investment return and principal value will fluctuate so your shares, when redeemed, may be worth more or less than their original cost. Please obtain the performance data for the most recent month end by calling 800 523-1918 or visiting our Web site at www.delawareinvestments.com/performance. Current performance may be lower or higher than the performance data quoted.
You should consider the investment objectives, risks, charges, and expenses of the investment company carefully before investing. The Delaware Inflation Protected Bond Fund prospectus contains this and other important information about the investment company. Please request a prospectus through your financial advisor or by calling 800 523-1918 or visiting our Web site at www.delawareinvestments.com. Read the prospectus carefully before you invest or send money.
A rise or fall in interest rates can have a significant impact on bond prices and the net asset value (NAV) of the Fund. Funds that invest in bonds can lose their value as interest rates rise, and an investor can lose principal. Interest payments on inflation-protected debt securities will vary as the principal and/or interest is adjusted for inflation.
| Fund performance | Average annual total returns through July 31, 2009 |
| 1 year | | 3 years | | Lifetime |
| Class A (Est. Dec. 1, 2004) | | | | | |
| Excluding sales charge | +1.12% | | +5.69% | | +4.57% |
| Including sales charge | -3.44% | | +4.08% | | +3.55% |
| Class B (Est. Dec. 1, 2004) | | | | | |
| Excluding sales charge | +0.39% | | +4.90% | | +3.86% |
| Including sales charge | -3.55% | | +4.22% | | +3.58% |
| Class C (Est. Dec. 1, 2004) | | | | | |
| Excluding sales charge | +0.39% | | +4.90% | | +3.86% |
| Including sales charge | -0.60% | | +4.90% | | +3.86% |
| Institutional Class (Est. Dec. 1, 2004) | | | | | |
| Excluding sales charge | +1.36% | | +5.95% | | +4.81% |
| Including sales charge | +1.36% | | +5.95% | | +4.81% |
Returns reflect the reinvestment of all distributions and any applicable sales charges as noted in the following paragraphs.
Performance for Class B and C shares, excluding sales charges, assumes either that contingent deferred sales charges did not apply or that the investment was not redeemed.
Expense limitations were in effect for certain classes during the periods shown in the Fund performance chart and in the “Performance of a $10,000 investment” chart. The current expenses for each class are listed on the “Fund expenses” chart. (Note that all charts and graphs referred to in the “Performance summary” section of this report are found on pages 4 through 6.) Performance would have been lower had the expense limitations not been in effect.
4
The Fund offers Class A, B, C, and Institutional Class shares. Class A shares are sold with a maximum front-end sales charge of up to 4.50%, and have an annual distribution and service fee of up to 0.25% of average daily net assets.
Class B shares may be purchased only through dividend reinvestment and certain permitted exchanges as described in the prospectus. Please see the prospectus for additional information on Class B purchase and sales charges. Class B shares have a contingent deferred sales charge that declines from 4.00% to zero depending on the period of time the shares are held.
Class B shares will automatically convert to Class A shares on a quarterly basis approximately eight years after purchase. They are also subject to an annual distribution and service fee of up to 1.00% of average daily net assets.
Class C shares are sold with a contingent deferred sales charge of 1.00% if redeemed during the first 12 months. They are also subject to an annual distribution and service fee of 1.00% of average daily net assets.
Institutional Class shares were first made available Dec. 1, 2004, and are available without sales or asset-based distribution charges only to certain eligible institutional accounts.
Inflation-protected debt securities tend to react to changes in interest rates, and the expected impact of inflation on interest rates. In general, the price of an inflation-protected debt security can fall when interest rates fall and rise when interest rates rise. Interest payments on inflation-protected debt securities will vary as the principal and/or interest is adjusted for inflation. The Fund may experience portfolio turnover in excess of 100%, which could result in higher transaction costs and tax liability for investors.
The Fund may invest in derivatives, which may involve additional expenses and are subject to risk, including the risk that an underlying security or securities index moves in the opposite direction from what the portfolio manager anticipated. A derivative transaction depends upon the counterparties’ ability to fulfill their contractual obligations.
The “Fund performance” table and the “Performance of a $10,000 investment” graph do not reflect the deduction of taxes the shareholder would pay on Fund distributions or redemptions of Fund shares.
The Fund’s expense ratios, as described in the most recent prospectus, are disclosed in the following “Fund expense ratios” table. Delaware Investments has agreed to reimburse certain expenses and/or waive certain fees from Dec. 1, 2008, through Nov. 30, 2009. Please see the most recent prospectus for additional information on these fee waivers and/or reimbursements.
| Fund expense ratios | Class A | | Class B | | Class C | | Institutional Class |
| Total annual operating expenses | 0.94% | | 1.69% | | 1.69% | | 0.69% |
| (without fee waivers) | | | | | | | |
| Net expenses | 0.75% | | 1.50% | | 1.50% | | 0.50% |
| (including fee waivers, if any) | | | | | | | |
| Type of waiver | Contractual | | Contractual | | Contractual | | Contractual |
5
Performance summary
Delaware Inflation Protected Bond Fund
Performance of a $10,000 investment
Average annual total returns from Dec. 1, 2004 (Fund’s inception), through July 31, 2009
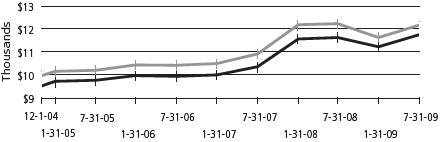
| For period beginning Dec. 1, 2004, through July 31, 2009 | Starting value | Ending value |
| | Barclays Capital U.S. Treasury Inflation-Protected Securities (TIPS) Index | $10,000 | $12,172 |
| | Delaware Inflation Protected Bond Fund — Class A shares | $9,550 | $11,766 |
The chart assumes $10,000 invested in the Fund on Dec. 1, 2004, and includes the effect of a 4.50% front-end sales charge and the reinvestment of all distributions. Please note additional details on these fees in the “Performance summary” section of this report, which includes pages 4 through 6.
The chart also assumes $10,000 invested in the Barclays Capital U.S. TIPS Index as of Dec. 1, 2004. The Barclays Capital U.S. TIPS Index, formerly the Lehman Brothers U.S. TIPS Index, measures the total return performance of the market for inflation-protected securities issued by the U.S. Treasury.
An index is unmanaged and does not reflect the costs of operating a mutual fund, such as the costs of buying, selling, and holding securities. You cannot invest directly in an index.
Performance of other Fund classes will vary due to different charges and expenses.
The “Fund performance” chart and the “Performance of a $10,000 investment” graph do not reflect the deduction of taxes the shareholder would pay on Fund distributions or redemptions of Fund shares.
| Stock symbols and CUSIP numbers |
| | | Nasdaq symbols | | CUSIPs | |
| Class A | | | DIPAX | | | 246094882 | |
| Class B | | | DIPBX | | | 246094874 | |
| Class C | | | DIPCX | | | 246094866 | |
| Institutional Class | | | DIPIX | | | 246094858 | |
6
Disclosure of Fund expenses
For the period February 1, 2009 to July 31, 2009
As a shareholder of the Fund, you incur two types of costs: (1) transaction costs, including sales charges (loads) on purchase payments, reinvested dividends, or other distributions; redemption fees; and exchange fees; and (2) ongoing costs, including management fees; distribution and/or service (12b-1) fees; and other Fund expenses. This example is intended to help you understand your ongoing costs (in dollars) of investing in the Fund and to compare these costs with the ongoing costs of investing in other mutual funds.
The example is based on an investment of $1,000 invested at the beginning of the period and held for the entire period February 1, 2009 to July 31, 2009.
Actual expenses
The first section of the table shown, “Actual Fund Return,” provides information about actual account values and actual expenses. You may use the information in this section of the table, together with the amount you invested, to estimate the expenses that you paid over the period. Simply divide your account value by $1,000 (for example, an $8,600 account value divided by $1,000 = 8.6), then multiply the result by the number in the first section under the heading entitled “Expenses Paid During Period” to estimate the expenses you paid on your account during this period.
Hypothetical example for comparison purposes
The second section of the table shown, “Hypothetical 5% Return,” provides information about hypothetical account values and hypothetical expenses based on the Fund’s actual expense ratio and an assumed rate of return of 5% per year before expenses, which is not the Fund’s actual return. The hypothetical account values and expenses may not be used to estimate the actual ending account balance or expenses you paid for the period. You may use this information to compare the ongoing costs of investing in the Fund and other funds. To do so, compare this 5% hypothetical example with the 5% hypothetical examples that appear in the shareholder reports of the other funds.
Please note that the expenses shown in the table are meant to highlight your ongoing costs only and do not reflect any transactional costs, such as sales charges (loads), redemption fees, or exchange fees. Therefore, the second section of the table is useful in comparing ongoing costs only, and will not help you determine the relative total costs of owning different funds. In addition, if these transactional costs were included, your costs would have been higher. The Fund’s expenses shown in the table reflect fee waivers in effect. The expenses shown in the table assume reinvestment of all dividends and distributions.
8
Delaware Inflation Protected Bond Fund
Expense analysis of an investment of $1,000
| | Beginning | | Ending | | | | Expenses |
| | Account Value | | Account Value | | Annualized | | Paid During Period |
| | 2/1/09 | | 7/31/09 | | Expense Ratio | | 2/1/09 to 7/31/09* |
| Actual Fund return |
| Class A | | $1,000.00 | | $1,046.70 | | 0.75% | | $3.81 | |
| Class B | | 1,000.00 | | 1,042.70 | | 1.50% | | 7.60 | |
| Class C | | 1,000.00 | | 1,042.70 | | 1.50% | | 7.60 | |
| Institutional Class | | 1,000.00 | | 1,047.70 | | 0.50% | | 2.54 | |
| Hypothetical 5% return (5% return before expenses) |
| Class A | | $1,000.00 | | $1,021.08 | | 0.75% | | $3.76 | |
| Class B | | 1,000.00 | | 1,017.36 | | 1.50% | | 7.50 | |
| Class C | | 1,000.00 | | 1,017.36 | | 1.50% | | 7.50 | |
| Institutional Class | | 1,000.00 | | 1,022.32 | | 0.50% | | 2.51 | |
*“Expenses Paid During Period” are equal to the Fund’s annualized expense ratio, multiplied by the average account value over the period, multiplied by 181/365 (to reflect the one-half year period).
9
| Security type and credit quality breakdown | |
| Delaware Inflation Protected Bond Fund | As of July 31, 2009 |
Sector designations may be different than the sector designations presented in other Fund materials. The sector designations may represent the investment manager’s internal sector classifications, which may result in the sector designations for one Fund being different than another Fund’s sector designations.
| Security type | Percentage of net assets |
| Agency Asset-Backed Security | 0.00 | % |
| Agency Mortgage-Backed Security | 0.00 | % |
| Commercial Mortgage-Backed Security | 0.20 | % |
| Corporate Bonds | 17.44 | % |
| Banking | 2.23 | % |
| Basic Industry | 0.92 | % |
| Brokerage | 0.88 | % |
| Capital Goods | 0.49 | % |
| Communications | 4.45 | % |
| Consumer Cyclical | 1.32 | % |
| Consumer Non-Cyclical | 2.36 | % |
| Electric | 0.72 | % |
| Energy | 1.83 | % |
| Financials | 1.68 | % |
| Insurance | 0.56 | % |
| Foreign Agency | 0.05 | % |
| Non-Agency Asset-Backed Securities | 0.18 | % |
| Non-Agency Collateralized Mortgage Obligations | 0.03 | % |
| U.S. Treasury Obligations | 80.25 | % |
| Discount Note | 0.32 | % |
| Total Value of Securities | 98.47 | % |
| Receivables and Other Assets Net of Liabilities | 1.53 | % |
| Total Net Assets | 100.00 | % |
| Credit quality breakdown (as a % of fixed income investments)* | | |
| AAA | 82.27 | % |
| AA | 1.32 | % |
| A | 3.81 | % |
| BBB | 3.72 | % |
| BB | 6.57 | % |
| B | 1.74 | % |
| CCC | 0.57 | % |
| Total | 100.00 | % |
*Bond ratings are determined by independent, nationally recognized statistical rating organizations. |
10
| Statement of net assets | |
| Delaware Inflation Protected Bond Fund | July 31, 2009 |
| | Principal amount | | Value (U.S. $) |
| Agency Asset-Backed Security – 0.00% | | | | | | | |
| | Fannie Mae Whole Loan Series | | | | | | | |
| 2001-W2 AS5 6.473% 10/25/31 | | $ | 6,128 | | | $ | 6,100 |
| Total Agency Asset-Backed Security | | | | | | | |
| | (cost $6,113) | | | | | | | 6,100 |
| | | | | | | | |
| Agency Mortgage-Backed Security – 0.00% | | | | | | | |
| Freddie Mac S.F. 30 yr 8.00% 5/1/31 | | | 3,895 | | | | 4,402 |
| Total Agency Mortgage-Backed Security | | | | | | | |
| (cost $4,207) | | | | | | | 4,402 |
| | | | | | | | |
| Commercial Mortgage-Backed Security – 0.20% | | | | | | | |
| # | Crown Castle Towers Series 2006-1A B 144A | | | | | | | |
| 5.362% 11/15/36 | | | 450,000 | | | | 441,000 |
| Total Commercial Mortgage-Backed Security | | | | | | | |
| (cost $373,500) | | | | | | | 441,000 |
| | | | | | | | |
| Corporate Bonds – 17.44% | | | | | | | |
| Banking – 2.23% | | | | | | | |
| Bank of America 5.30% 3/15/17 | | | 1,000,000 | | | | 912,116 |
| JPMorgan Chase Capital XXV 6.80% 10/1/37 | | | 265,000 | | | | 242,968 |
| ·# | Rabobank Nederland 144A 11.00% 12/29/49 | | | 1,035,000 | | | | 1,208,976 |
| · | USB Capital IX 6.189% 10/29/49 | | | 2,360,000 | | | | 1,688,013 |
| · | Wells Fargo Capital XIII 7.70% 12/29/49 | | | 1,000,000 | | | | 870,659 |
| | | | | | | | 4,922,732 |
| Basic Industry – 0.92% | | | | | | | |
| ArcelorMittal 6.125% 6/1/18 | | | 1,000,000 | | | | 967,465 |
| Freeport-McMoRan Copper & Gold 8.375% 4/1/17 | | | 235,000 | | | | 249,453 |
| # | Georgia-Pacific 144A 8.25% 5/1/16 | | | 220,000 | | | | 228,800 |
| # | Teck Resources 144A | | | | | | | |
| 10.25% 5/15/16 | | | 130,000 | | | | 147,875 |
| 10.75% 5/15/19 | | | 375,000 | | | | 438,281 |
| | | | | | | | 2,031,874 |
11
Statement of net assets
Delaware Inflation Protected Bond Fund
| | | Principal amount | | Value (U.S. $) |
| Corporate Bonds (continued) | | | | | | | |
| Brokerage – 0.88% | | | | | | | |
| LaBranche 11.00% 5/15/12 | | $ | 575,000 | | | $ | 533,313 |
| Morgan Stanley | | | | | | | |
| ·1.463% 3/5/18 | | | 500,000 | | | | 398,750 |
| 5.375% 10/15/15 | | | 1,000,000 | | | | 1,003,595 |
| | | | | | | | 1,935,658 |
| Capital Goods – 0.49% | | | | | | | |
| Allied Waste North America 5.75% 2/15/11 | | | 634,000 | | | | 657,222 |
| Graphic Packaging International 9.50% 8/15/13 | | | 210,000 | | | | 210,263 |
| # | Owens-Brockway Glass Container 144A | | | | | | | |
| 7.375% 5/15/16 | | | 210,000 | | | | 208,950 |
| | | | | | | | 1,076,435 |
| Communications – 4.45% | | | | | | | |
| American Tower 7.125% 10/15/12 | | | 590,000 | | | | 601,800 |
| AT&T Wireless 8.125% 5/1/12 | | | 865,000 | | | | 982,551 |
| Cincinnati Bell 7.00% 2/15/15 | | | 245,000 | | | | 233,363 |
| Citizens Utilities 7.125% 3/15/19 | | | 615,000 | | | | 570,413 |
| # | Cricket Communications 144A 7.75% 5/15/16 | | | 350,000 | | | | 350,000 |
| Crown Castle International 9.00% 1/15/15 | | | 625,000 | | | | 663,281 |
| CSC Holdings | | | | | | | |
| 6.75% 4/15/12 | | | 590,000 | | | | 590,000 |
| #144A 8.50% 4/15/14 | | | 56,000 | | | | 57,960 |
| EchoStar DBS 7.125% 2/1/16 | | | 650,000 | | | | 633,750 |
| Inmarsat Finance II 10.375% 11/15/12 | | | 620,000 | | | | 651,000 |
| Intelsat Jackson Holdings 11.25% 6/15/16 | | | 90,000 | | | | 96,300 |
| # | Interpublic Group 144A 10.00% 7/15/17 | | | 215,000 | | | | 225,750 |
| # | Qwest 144A 8.375% 5/1/16 | | | 205,000 | | | | 211,150 |
| Sprint Capital 8.375% 3/15/12 | | | 854,000 | | | | 868,945 |
| Telecom Italia Capital 5.25% 10/1/15 | | | 1,000,000 | | | | 1,019,615 |
| Time Warner Cable | | | | | | | |
| 6.75% 7/1/18 | | | 120,000 | | | | 133,605 |
| 7.50% 4/1/14 | | | 650,000 | | | | 741,746 |
| # | Videotron 144A 9.125% 4/15/18 | | | 315,000 | | | | 328,388 |
| # | Wind Acquisition Finance 144A 11.75% 7/15/17 | | | 825,000 | | | | 886,875 |
| | | | | | | | 9,846,492 |
12
| | | Principal amount | | Value (U.S. $) |
| Corporate Bonds (continued) | | | | | | | |
| Consumer Cyclical – 1.32% | | | | | | | |
| Ford Motor Credit 8.00% 6/1/14 | | $ | 1,250,000 | | | $ | 1,155,674 |
| Goodyear Tire & Rubber 10.50% 5/15/16 | | | 260,000 | | | | 280,150 |
| # | Invista 144A 9.25% 5/1/12 | | | 175,000 | | | | 168,875 |
| | Macy’s Retail Holdings | | | | | | | |
| 8.875% 7/15/15 | | | 105,000 | | | | 108,866 |
| 10.625% 11/1/10 | | | 700,000 | | | | 714,373 |
| # | MGM MIRAGE 144A | | | | | | | |
| 10.375% 5/15/14 | | | 80,000 | | | | 86,200 |
| 11.125% 11/15/17 | | | 105,000 | | | | 116,025 |
| 13.00% 11/15/13 | | | 155,000 | | | | 175,538 |
| Ryland Group 8.40% 5/15/17 | | | 120,000 | | | | 118,200 |
| | | | | | | | 2,923,901 |
| Consumer Non-Cyclical – 2.36% | | | | | | | |
| # | Anheuser-Busch InBev Worldwide 144A | | | | | | | |
| 7.20% 1/15/14 | | | 800,000 | | | | 890,018 |
| ARAMARK 8.50% 2/1/15 | | | 465,000 | | | | 470,813 |
| # | Bio-Rad Laboratories 144A 8.00% 9/15/16 | | | 110,000 | | | | 112,750 |
| Community Health Systems 8.875% 7/15/15 | | | 835,000 | | | | 864,225 |
| Corrections Corporation of America 7.75% 6/1/17 | | | 220,000 | | | | 221,650 |
| HCA 9.25% 11/15/16 | | | 870,000 | | | | 909,150 |
| Inverness Medical Innovations 9.00% 5/15/16 | | | 205,000 | | | | 205,513 |
| Quest Diagnostics 5.45% 11/1/15 | | | 1,000,000 | | | | 988,689 |
| Select Medical 7.625% 2/1/15 | | | 105,000 | | | | 91,350 |
| SUPERVALU 7.50% 11/15/14 | | | 480,000 | | | | 466,800 |
| | | | | | | | 5,220,958 |
| Electric – 0.72% | | | | | | | |
| # | AES 144A 8.75% 5/15/13 | | | 285,000 | | | | 292,125 |
| # | Calpine Construction Finance 144A 8.00% 6/1/16 | | | 315,000 | | | | 318,150 |
| Illinois Power 9.75% 11/15/18 | | | 10,000 | | | | 12,022 |
| IPALCO Enterprises 8.125% 11/14/11 | | | 45,000 | | | | 46,463 |
| w | Mirant Mid Atlantic Pass Through Trust A | | | | | | | |
| 8.625% 6/30/12 | | | 486,437 | | | | 491,300 |
| NRG Energy 7.375% 2/1/16 | | | 455,000 | | | | 441,350 |
| | | | | | | | 1,601,410 |
13
Statement of net assets
Delaware Inflation Protected Bond Fund
| | | Principal amount | | Value (U.S. $) |
| Corporate Bonds (continued) | | | | | | | |
| Energy – 1.83% | | | | | | | |
| Chesapeake Energy 9.50% 2/15/15 | | $ | 855,000 | | | $ | 911,643 |
| El Paso 7.00% 6/15/17 | | | 425,000 | | | | 410,465 |
| Enterprise Products Operating 9.75% 1/31/14 | | | 270,000 | | | | 324,149 |
| Kinder Morgan Energy Partners | | | | | | | |
| 5.95% 2/15/18 | | | 100,000 | | | | 104,029 |
| 9.00% 2/1/19 | | | 120,000 | | | | 146,376 |
| Massey Energy 6.875% 12/15/13 | | | 960,000 | | | | 931,199 |
| Noble Energy 8.25% 3/1/19 | | | 615,000 | | | | 730,682 |
| PetroHawk Energy 9.125% 7/15/13 | | | 140,000 | | | | 145,950 |
| Range Resources 8.00% 5/15/19 | | | 235,000 | | | | 240,288 |
| Talisman Energy 7.75% 6/1/19 | | | 80,000 | | | | 93,736 |
| | | | | | | | 4,038,517 |
| Financials – 1.68% | | | | | | | |
| Capital One Bank 8.80% 7/15/19 | | | 1,045,000 | | | | 1,135,417 |
| | FTI Consulting 7.625% 6/15/13 | | | 615,000 | | | | 616,538 |
| General Electric Capital 5.625% 9/15/17 | | | 1,000,000 | | | | 1,010,209 |
| International Lease Finance | | | | | | | |
| 5.625% 9/20/13 | | | 625,000 | | | | 436,536 |
| 5.875% 5/1/13 | | | 375,000 | | | | 261,362 |
| 6.625% 11/15/13 | | | 370,000 | | | | 256,360 |
| | | | | | | | 3,716,422 |
| Insurance – 0.56% | | | | | | | |
| MetLife 6.817% 8/15/18 | | | 750,000 | | | | 804,365 |
| # | Metropolitan Life Global Funding I 144A | | | | | | | |
| 5.125% 4/10/13 | | | 170,000 | | | | 173,469 |
| · | Prudential Financial 0.62% 6/10/15 | | | 400,000 | | | | 267,688 |
| | | | | | | | 1,245,522 |
| Total Corporate Bonds (cost $35,567,761) | | | | | | | 38,559,921 |
| | | | | | | | |
| Foreign Agency – 0.05%D | | | | | | | |
| Republic of Korea – 0.05% | | | | | | | |
| Korea Development Bank 5.30% 1/17/13 | | | 120,000 | | | | 118,848 |
| Total Foreign Agency (cost $120,743) | | | | | | | 118,848 |
14
| | | Principal amount | | Value (U.S. $) |
| Non-Agency Asset-Backed Securities – 0.18% | | | | | | | |
| Caterpillar Financial Asset Trust | | | | | | | |
| Series 2007-A A3A 5.34% 6/25/12 | | $ | 63,723 | | | $ | 65,066 |
| | Series 2008-A A3 4.94% 4/25/14 | | | 150,000 | | | | 150,330 |
| · | Ford Credit Auto Owner Trust | | | | | | | |
| Series 2008-A A3B 1.088% 4/15/12 | | | 150,000 | | | | 149,814 |
| John Deere Owner Trust | | | | | | | |
| Series 2007-A A3 5.04% 7/15/11 | | | 21,797 | | | | 21,928 |
| Total Non-Agency Asset-Backed Securities | | | | | | | |
| (cost $371,798) | | | | | | | 387,138 |
| | | | | | | | | |
| Non-Agency Collateralized Mortgage Obligations – 0.03% | | | | | | | |
| · | Bank of America Mortgage Securities | | | | | | | |
| Series 2002-K 2A1 4.683% 10/20/32 | | | 8,055 | | | | 7,266 |
| · | Wells Fargo Mortgage Backed Securities Trust | | | | | | | |
| Series 2004-EE 3A1 4.474% 12/25/34 | | | 64,529 | | | | 60,833 |
| Total Non-Agency Collateralized Mortgage | | | | | | | |
| Obligations (cost $71,092) | | | | | | | 68,099 |
| | | | | | | | | |
| U.S. Treasury Obligations – 80.25% | | | | | | | |
| U.S. Treasury Inflation Index Bond 2.375% 1/15/25 | | | 17,936,919 | | | | 18,329,289 |
| U.S. Treasury Inflation Index Notes | | | | | | | |
| ¥1.625% 1/15/15 | | | 31,023,612 | | | | 30,946,053 |
| 2.00% 1/15/14 | | | 15,549,535 | | | | 15,875,111 |
| 2.00% 7/15/14 | | | 10,664,582 | | | | 10,887,877 |
| 2.00% 1/15/16 | | | 32,755,392 | | | | 33,308,139 |
| 2.375% 1/15/17 | | | 19,406,235 | | | | 20,291,644 |
| 3.00% 7/15/12 | | | 19,744,206 | | | | 20,873,338 |
| 3.375% 1/15/12 | | | 17,656,211 | | | | 18,726,619 |
| 3.50% 1/15/11 | | | 4,054,842 | | | | 4,230,976 |
| U.S. Treasury Notes | | | | | | | |
| 2.625% 7/31/14 | | | 2,210,000 | | | | 2,220,195 |
| 3.125% 5/15/19 | | | 1,820,000 | | | | 1,764,259 |
| Total U.S. Treasury Obligations | | | | | | | |
| (cost $170,250,000) | | | | | | | 177,453,500 |
15
Statement of net assets
Delaware Inflation Protected Bond Fund
| Principal amount | | Value (U.S. $) | |
| ¹Discount Note – 0.32% | | | | | | | | |
| Federal Home Loan Bank 0.09% 8/3/09 | | $ | 717,006 | | | $ | 717,002 | |
| Total Discount Note (cost $717,002) | | | | | | | 717,002 | |
| | | | | | | | | |
| Total Value of Securities – 98.47% | | | | | | | | |
| (cost $207,482,216) | | | | | | | 217,756,010 | |
| Receivables and Other Assets | | | | | | | | |
| Net of Liabilities – 1.53% | | | | | | | 3,385,021 | |
| Net Assets Applicable to 21,947,478 | | | | | | | | |
| Shares Outstanding – 100.00% | | | | | | $ | 221,141,031 | |
| | | | | | | | | |
| Net Asset Value – Delaware Inflation Protected Bond Fund | | | | | | | | |
| Class A ($83,771,559 / 8,312,339 Shares) | | | | | | | | $10.08 | |
| Net Asset Value – Delaware Inflation Protected Bond Fund | | | | | | | | |
| Class B ($1,886,029 / 188,302 Shares) | | | | | | | | $10.02 | |
| Net Asset Value – Delaware Inflation Protected Bond Fund | | | | | | | | |
| Class C ($40,351,767 / 4,027,834 Shares) | | | | | | | | $10.02 | |
| Net Asset Value – Delaware Inflation Protected Bond Fund | | | | | | | | |
| Institutional Class ($95,131,676 / 9,419,003 Shares) | | | | | | | | $10.10 | |
| | | | | | | | | |
| Components of Net Assets at July 31, 2009: | | | | | | | | |
| Shares of beneficial interest (unlimited authorization – no par) | | | | | | $ | 219,214,431 | |
| Distributions in excess of net investment income | | | | | | | (478,368 | ) |
| Accumulated net realized loss on investments | | | | | | | (8,390,435 | ) |
| Net unrealized appreciation of investments and foreign currencies | | | | 10,795,403 | |
| Total net assets | | | | | | $ | 221,141,031 | |
16
| | |
| · | Variable rate security. The rate shown is the rate as of July 31, 2009. |
| D | Securities have been classified by country of origin. |
| w | Pass Through Agreement. Security represents the contractual right to receive a proportionate amount of underlying payments due to the counterparty pursuant to various agreements related to the rescheduling of obligations and the exchange of certain notes. |
| ¥ | Fully or partially pledged as collateral for financial futures contracts. |
| # | Security exempt from registration under Rule 144A of the Securities Act of 1933, as amended. At July 31, 2009, the aggregate amount of Rule 144A securities was $7,067,155, which represented 3.20% of the Fund’s net assets. See Note 10 in “Notes to financial statements.” |
| ¹ | The rate shown is the effective yield at the time of purchase. |
Summary of abbreviations:
CPI — Consumer Price Index
S.F. — Single Family
yr — Year
| Net Asset Value and Offering Price Per Share – | | | |
| Delaware Inflation Protected Bond Fund | | | |
| Net asset value Class A (A) | | $ | 10.08 |
| Sales charge (4.50% of offering price) (B) | | | 0.47 |
| Offering price | | $ | 10.55 |
| (A) | Net asset value per share, as illustrated, is the amount which would be paid upon redemption or repurchase of shares. |
| (B) | See the current prospectus for purchases of $100,000 or more. |
17
Statement of net assets
Delaware Inflation Protected Bond Fund
| |
| The following financial futures contracts and swap contracts were outstanding at July 31, 2009: |
Financial Futures Contracts1
| | | | | | | | | | Unrealized |
| Contracts to Buy | | | Notional Cost | | Notional Value | | Expiration Date | | Appreciation |
| 126 U.S. Treasury 10 yr Notes | | $ | 14,681,200 | | $ | 14,777,437 | | 9/21/09 | | | $ | 96,237 |
| 204 U.S. Long Bond | | | 23,921,016 | | | 24,276,000 | | 9/21/09 | | | | 354,984 |
| | $ | 38,602,216 | | | | | | | | $ | 451,221 |
Swap Contracts1
Inflation Swap Contracts
| | | | | | | | Unrealized |
| Notional Value | | | Expiration Date | | Description | | Appreciation |
| $ | 2,600,000 | | | 4/22/14 | | Agreement with Barclays to receive the notional amount multiplied by the non-revised CPI and to pay the notional amount multiplied by the fixed rate of 1.56%. | | | $ | 2,077 |
| | 1,300,000 | | | 1/7/19 | | Agreement with Barclays to receive the notional amount multiplied by the non-revised CPI and to pay the notional amount multiplied by the fixed rate of 1.60%. | | | | 68,034 |
| $ | 3,900,000 | | | | | | | | $ | 70,111 |
The use of financial futures contracts and swap contracts involves elements of market risk and risks in excess of the amount recognized in the financial statements. The notional values presented above represent the Fund’s total exposure in such contracts, whereas only the net unrealized appreciation (depreciation) is reflected in the Fund’s net assets.
1See Note 8 in ”Notes to financial statements.”
See accompanying notes
18
| Statement of operations | |
| Delaware Inflation Protected Bond Fund | Year Ended July 31, 2009 |
| Investment Income: | | | | | | | |
| Interest | | $ | 3,213,283 | | | | |
| Dividends | | | 76,396 | | | | |
| Securities lending income | | | 1,946 | | $ | 3,291,625 | |
| | | | | | | | |
| Expenses: | | | | | | | |
| Management fees | | | 732,058 | | | | |
| Distribution expenses – Class A | | | 127,105 | | | | |
| Distribution expenses – Class B | | | 20,399 | | | | |
| Distribution expenses – Class C | | | 234,522 | | | | |
| Dividend disbursing and transfer agent fees and expenses | | | 112,499 | | | | |
| Registration fees | | | 67,573 | | | | |
| Accounting and administration expenses | | | 65,072 | | | | |
| Legal fees | | | 55,891 | | | | |
| Reports and statements to shareholders | | | 30,817 | | | | |
| Audit and tax | | | 24,413 | | | | |
| Trustees’ fees | | | 11,219 | | | | |
| Custodian fees | | | 8,699 | | | | |
| Pricing fees | | | 4,512 | | | | |
| Insurance fees | | | 4,385 | | | | |
| Consulting fees | | | 2,499 | | | | |
| Trustees’ expenses | | | 876 | | | | |
| Dues and services | | | 591 | | | 1,503,130 | |
| Less fees waived | | | | | | (306,263 | ) |
| Less expense paid indirectly | | | | | | (587 | ) |
| Total operating expenses | | | | | | 1,196,280 | |
| Net Investment Income | | | | | | 2,095,345 | |
20
| Net Realized and Unrealized Gain (Loss) on Investments | | | | |
| and Foreign Currencies: | | | | |
| Net realized gain (loss) on: | | | | |
| Investments | | $ | (6,433,739 | ) |
| Futures contracts | | | (1,287,720 | ) |
| Foreign currencies | | | (79,844 | ) |
| Written options | | | (1,433,003 | ) |
| Net realized loss | | | (9,234,306 | ) |
| Net change in unrealized appreciation/depreciation of | | | | |
| investments and foreign currencies | | | 9,988,753 | |
| Net Realized and Unrealized Gain on Investments | | | | |
| and Foreign Currencies | | | 754,447 | |
| | | | | |
| Net Increase in Net Assets Resulting from Operations | | $ | 2,849,792 | |
See accompanying notes
21
Statements of changes in net assets
Delaware Inflation Protected Bond Fund
| | Year Ended |
| | 7/31/09 | | | 7/31/08 |
| Increase (Decrease) in Net Assets from Operations: | | | | | | | | |
| Net investment income | | $ | 2,095,345 | | | $ | 4,561,695 | |
| Net realized gain (loss) on investments and | | | | | | | | |
| foreign currencies | | | (9,234,306 | ) | | | 1,309,010 | |
| Net change in unrealized appreciation/depreciation | | | | | | | | |
| of investments and foreign currencies | | | 9,988,753 | | | | 1,138,284 | |
| Net increase in net assets resulting from operations | | | 2,849,792 | | | | 7,008,989 | |
| | | | | | | | | |
| Dividends and Distributions to Shareholders from: | | | | | | | | |
| Net investment income: | | | | | | | | |
| Class A | | | (349,273 | ) | | | (552,967 | ) |
| Class B | | | (24,174 | ) | | | (54,884 | ) |
| Class C | | | (125,162 | ) | | | (183,171 | ) |
| Institutional Class | | | (1,258,122 | ) | | | (3,803,243 | ) |
| | | | | | | | | |
| Net realized gain on investments: | | | | | | | | |
| Class A | | | (237,138 | ) | | | — | |
| Class B | | | (11,734 | ) | | | — | |
| Class C | | | (117,172 | ) | | | — | |
| Institutional Class | | | (454,453 | ) | | | — | |
| | | (2,577,228 | ) | | | (4,594,265 | ) |
| | | | | | | | | |
| Capital Share Transactions: | | | | | | | | |
| Proceeds from shares sold: | | | | | | | | |
| Class A | | | 93,510,828 | | | | 19,762,799 | |
| Class B | | | 967,035 | | | | 1,999,077 | |
| Class C | | | 38,614,188 | | | | 8,510,644 | |
| Institutional Class | | | 60,824,235 | | | | 54,879,037 | |
| | | | | | | | | |
| Net asset value of shares issued upon reinvestment | | | | | | | | |
| of dividends and distributions: | | | | | | | | |
| Class A | | | 487,920 | | | | 484,136 | |
| Class B | | | 32,934 | | | | 49,414 | |
| Class C | | | 218,538 | | | | 158,697 | |
| Institutional Class | | | 1,712,232 | | | | 3,803,243 | |
| | | 196,367,910 | | | | 89,647,047 | |
22
| | Year Ended |
| | 7/31/09 | | 7/31/08 |
| Capital Share Transactions (continued): | | | | | | | | |
| Cost of shares repurchased: | | | | | | | | |
| Class A | | $ | (30,679,404 | ) | | $ | (2,807,287 | ) |
| Class B | | | (1,108,255 | ) | | | (477,773 | ) |
| Class C | | | (8,335,904 | ) | | | (509,920 | ) |
| Institutional Class | | | (56,612,572 | ) | | | (11,461,343 | ) |
| | | (96,736,135 | ) | | | (15,256,323 | ) |
| Increase in net assets derived from capital share transactions | | | 99,631,775 | | | | 74,390,724 | |
| Net Increase in Net Assets | | | 99,904,339 | | | | 76,805,448 | |
| | | | | | | | | |
| Net Assets: | | | | | | | | |
| Beginning of year | | | 121,236,692 | | | | 44,431,244 | |
| End of year (including undistributed (distributions in | | | | | | | | |
| excess of) net investment income of $(478,368) | | | | | | | | |
| and $236,731, respectively) | | $ | 221,141,031 | | | $ | 121,236,692 | |
See accompanying notes
23
Financial highlights
Delaware Inflation Protected Bond Fund Class A
Selected data for each share of the Fund outstanding throughout each period were as follows:
| Net asset value, beginning of period |
| |
| Income (loss) from investment operations: |
| Net investment income2 |
| Net realized and unrealized gain (loss) on investments |
| and foreign currencies |
| Total from investment operations |
| |
| Less dividends and distributions from: |
| Net investment income |
| Net realized gain on investments |
| Total dividends and distributions |
| |
| Net asset value, end of period |
| |
| Total return3 |
| |
| Ratios and supplemental data: |
| Net assets, end of period (000 omitted) |
| Ratio of expenses to average net assets |
| Ratio of expenses to average net assets |
| prior to fees waived and expense paid indirectly |
| Ratio of net investment income to average net assets |
| Ratio of net investment income to average net assets |
| prior to fees waived and expense paid indirectly |
| Portfolio turnover |
1 Date of commencement of operations; ratios and portfolio turnover have been annualized and total return has not been annualized. |
2 The average shares outstanding method has been applied for per share information. |
3 Total investment return is based on the change in net asset value of a share during the period and assumes reinvestment of dividends and distributions at net asset value and does not reflect the impact of a sales charge. Total investment return reflects waivers by the manager and distributor, as applicable. Performance would have been lower had the waivers not been in effect. |
See accompanying notes
24
| | | | | | | | | | | | | 12/1/041 | | |
| Year Ended | | to | | |
| 7/31/09 | | | 7/31/08 | | | 7/31/07 | | | 7/31/06 | | | 7/31/05 | | |
| $10.160 | | | $9.520 | | | $9.540 | | | $9.920 | | | $10.000 | | |
| | | | | | | | | | | | | | | | |
| | | | | | | | | | | | | | | | |
| 0.124 | | | 0.569 | | | 0.426 | | | 0.576 | | | 0.332 | | |
| | | | | | | | | | | | | | | | |
| (0.014 | ) | | 0.576 | | | (0.040 | ) | | (0.408 | ) | | (0.075 | ) | |
| 0.110 | | | 1.145 | | | 0.386 | | | 0.168 | | | 0.257 | | |
| | | | | | | | | | | | | | | | |
| | | | | | | | | | | | | | | | |
| (0.133 | ) | | (0.505 | ) | | (0.406 | ) | | (0.531 | ) | | (0.337 | ) | |
| (0.057 | ) | | — | | | — | | | (0.017 | ) | | — | | |
| (0.190 | ) | | (0.505 | ) | | (0.406 | ) | | (0.548 | ) | | (0.337 | ) | |
| | | | | | | | | | | | | | | | |
| $10.080 | | | $10.160 | | | $9.520 | | | $9.540 | | | $9.920 | | |
| | | | | | | | | | | | | | | | |
| 1.12% | | | 12.13% | | | 4.13% | | | 1.75% | | | 2.55% | | |
| | | | | | | | | | | | | | | | |
| | | | | | | | | | | | | | | | |
| $83,771 | | | $19,624 | | | $2,329 | | | $4,276 | | | $2,676 | | |
| 0.75% | | | 0.75% | | | 0.76% | | | 0.75% | | | 0.61% | | |
| | | | | | | | | | | | | | | | |
| 0.94% | | | 0.94% | | | 1.10% | | | 1.24% | | | 3.51% | | |
| 1.27% | | | 5.58% | | | 4.46% | | | 5.96% | | | 4.95% | | |
| | | | | | | | | | | | | | | | |
| 1.08% | | | 5.39% | | | 4.12% | | | 5.47% | | | 2.05% | | |
| 188% | | | 178% | | | 553% | | | 294% | | | 360% | | |
25
Financial highlights
Delaware Inflation Protected Bond Fund Class B
Selected data for each share of the Fund outstanding throughout each period were as follows:
| Net asset value, beginning of period |
| |
| Income (loss) from investment operations: |
| Net investment income2 |
| Net realized and unrealized gain (loss) on investments |
| and foreign currencies |
| Total from investment operations |
| |
| Less dividends and distributions from: |
| Net investment income |
| Net realized gain on investments |
| Total dividends and distributions |
| |
| Net asset value, end of period |
| |
| Total return3 |
| |
| Ratios and supplemental data: |
| Net assets, end of period (000 omitted) |
| Ratio of expenses to average net assets |
| Ratio of expenses to average net assets |
| prior to fees waived and expense paid indirectly |
| Ratio of net investment income to average net assets |
| Ratio of net investment income to average net assets |
| prior to fees waived and expense paid indirectly |
| Portfolio turnover |
1 Date of commencement of operations; ratios and portfolio turnover have been annualized and total return has not been annualized.
2 The average shares outstanding method has been applied for per share information.
3 Total investment return is based on the change in net asset value of a share during the period and assumes reinvestment of dividends and distributions at net asset value and does not reflect the impact of a sales charge. Total investment return reflects waivers by the manager and distributor, as applicable. Performance would have been lower had the waivers not been in effect.
See accompanying notes
26
| | | | | | | | | | | | | 12/1/041 | | |
| Year Ended | | to | | |
| 7/31/09 | | | 7/31/08 | | | 7/31/07 | | | 7/31/06 | | | 7/31/05 | | |
| | $10.160 | | | $9.520 | | | $9.540 | | | $9.920 | | | $10.000 | | |
| | | | | | | | | | | | | | | | |
| | | | | | | | | | | | | | | | |
| 0.051 | | | 0.491 | | | 0.354 | | | 0.503 | | | 0.313 | | |
| | | | | | | | | | | | | | | | |
| (0.014 | ) | | 0.574 | | | (0.039 | ) | | (0.410 | ) | | (0.074 | ) | |
| 0.037 | | | 1.065 | | | 0.315 | | | 0.093 | | | 0.239 | | |
| | | | | | | | | | | | | | | | |
| | | | | | | | | | | | | | | | |
| (0.120 | ) | | (0.425 | ) | | (0.335 | ) | | (0.456 | ) | | (0.319 | ) | |
| (0.057 | ) | | — | | | — | | | (0.017 | ) | | — | | |
| (0.177 | ) | | (0.425 | ) | | (0.335 | ) | | (0.473 | ) | | (0.319 | ) | |
| | | | | | | | | | | | | | | | |
| | $10.020 | | | $10.160 | | | $9.520 | | | $9.540 | | | $9.920 | | |
| | | | | | | | | | | | | | | | |
| 0.39% | | | 11.25% | | | 3.37% | | | 0.97% | | | 2.37% | | |
| | | | | | | | | | | | | | | | |
| | | | | | | | | | | | | | | | |
| | $1,886 | | | $2,032 | | | $463 | | | $1,381 | | | $544 | | |
| 1.50% | | | 1.50% | | | 1.51% | | | 1.50% | | | 0.88% | | |
| | | | | | | | | | | | | | | | |
| 1.69% | | | 1.69% | | | 1.85% | | | 1.99% | | | 4.25% | | |
| 0.52% | | | 4.83% | | | 3.71% | | | 5.21% | | | 4.68% | | |
| | | | | | | | | | | | | | | | |
| 0.33% | | | 4.64% | | | 3.37% | | | 4.72% | | | 1.31% | | |
| 188% | | | 178% | | | 553% | | | 294% | | | 360% | | |
27
Financial highlights
Delaware Inflation Protected Bond Fund Class C
Selected data for each share of the Fund outstanding throughout each period were as follows:
| Net asset value, beginning of period |
| |
| Income (loss) from investment operations: |
| Net investment income2 |
| Net realized and unrealized gain (loss) on investments |
| and foreign currencies |
| Total from investment operations |
| |
| Less dividends and distributions from: |
| Net investment income |
| Net realized gain on investments |
| Total dividends and distributions |
| |
| Net asset value, end of period |
| |
| Total return3 |
| |
| Ratios and supplemental data: |
| Net assets, end of period (000 omitted) |
| Ratio of expenses to average net assets |
| Ratio of expenses to average net assets |
| prior to fees waived and expense paid indirectly |
| Ratio of net investment income to average net assets |
| Ratio of net investment income to average net assets |
| prior to fees waived and expense paid indirectly |
| Portfolio turnover |
1 Date of commencement of operations; ratios and portfolio turnover have been annualized and total return has not been annualized.
2 The average shares outstanding method has been applied for per share information.
3 Total investment return is based on the change in net asset value of a share during the period and assumes reinvestment of dividends and distributions at net asset value and does not reflect the impact of a sales charge. Total investment return reflects waivers by the manager and distributor, as applicable. Performance would have been lower had the waivers not been in effect.
See accompanying notes
28
| | | | | | | | | | | | | 12/1/041 | | |
| Year Ended | | to | | |
| 7/31/09 | | | 7/31/08 | | | 7/31/07 | | | 7/31/06 | | | 7/31/05 | | |
| $10.160 | | | $9.520 | | | $9.540 | | | $9.920 | | | $10.000 | | |
| | | | | | | | | | | | | | | | |
| | | | | | | | | | | | | | | | |
| 0.051 | | | 0.492 | | | 0.354 | | | 0.504 | | | 0.314 | | |
| | | | | | | | | | | | | | | | |
| (0.014 | ) | | 0.573 | | | (0.039 | ) | | (0.411 | ) | | (0.075 | ) | |
| 0.037 | | | 1.065 | | | 0.315 | | | 0.093 | | | 0.239 | | |
| | | | | | | | | | | | | | | | |
| | | | | | | | | | | | | | | | |
| (0.120 | ) | | (0.425 | ) | | (0.335 | ) | | (0.456 | ) | | (0.319 | ) | |
| (0.057 | ) | | — | | | — | | | (0.017 | ) | | — | | |
| | (0.177 | ) | | (0.425 | ) | | (0.335 | ) | | (0.473 | ) | | (0.319 | ) | |
| | | | | | | | | | | | | | | | |
| $10.020 | | | $10.160 | | | $9.520 | | | $9.540 | | | $9.920 | | |
| | | | | | | | | | | | | | | | |
| 0.39% | | | 11.25% | | | 3.37% | | | 0.97% | | | 2.37% | | |
| | | | | | | | | | | | | | | | |
| | | | | | | | | | | | | | | | |
| $40,352 | | | $9,169 | | | $1,095 | | | $1,622 | | | $530 | | |
| 1.50% | | | 1.50% | | | 1.51% | | | 1.50% | | | 0.87% | | |
| | | | | | | | | | | | | | | | |
| 1.69% | | | 1.69% | | | 1.85% | | | 1.99% | | | 4.25% | | |
| 0.52% | | | 4.83% | | | 3.71% | | | 5.21% | | | 4.69% | | |
| | | | | | | | | | | | | | | | |
| 0.33% | | | 4.64% | | | 3.37% | | | 4.72% | | | 1.31% | | |
| 188% | | | 178% | | | 553% | | | 294% | | | 360% | | |
29
Financial highlights
Delaware Inflation Protected Bond Fund Institutional Class
Selected data for each share of the Fund outstanding throughout each period were as follows:
| Net asset value, beginning of period |
| |
| Income (loss) from investment operations: |
| Net investment income2 |
| Net realized and unrealized gain (loss) on investments |
| and foreign currencies |
| Total from investment operations |
| |
| Less dividends and distributions from: |
| Net investment income |
| Net realized gain on investments |
| Total dividends and distributions |
| |
| Net asset value, end of period |
| |
| Total return3 |
| |
| Ratios and supplemental data: |
| Net assets, end of period (000 omitted) |
| Ratio of expenses to average net assets |
| Ratio of expenses to average net assets |
| prior to fees waived and expense paid indirectly |
| Ratio of net investment income to average net assets |
| Ratio of net investment income to average net assets |
| prior to fees waived and expense paid indirectly |
| Portfolio turnover |
1 Date of commencement of operations; ratios and portfolio turnover have been annualized and total return has not been annualized.
2 The average shares outstanding method has been applied for per share information.
3 Total investment return is based on the change in net asset value of a share during the period and assumes reinvestment of dividends and distributions at net asset value. Total investment return reflects a waiver by the manager. Performance would have been lower had the waiver not been in effect.
See accompanying notes
30
| | | | | | | | | | | | | 12/1/041 | | |
| Year Ended | | to | | |
| 7/31/09 | | | 7/31/08 | | | 7/31/07 | | | 7/31/06 | | | 7/31/05 | | |
| $10.160 | | | $9.530 | | | $9.540 | | | $9.920 | | | $10.000 | | |
| | | | | | | | | | | | | | | | |
| | | | | | | | | | | | | | | | |
| 0.148 | | | 0.594 | | | 0.450 | | | 0.600 | | | 0.339 | | |
| | | | | | | | | | | | | | | | |
| (0.014 | ) | | 0.567 | | | (0.030 | ) | | (0.409 | ) | | (0.076 | ) | |
| 0.134 | | | 1.161 | | | 0.420 | | | 0.191 | | | 0.263 | | |
| | | | | | | | | | | | | | | | |
| | | | | | | | | | | | | | | | |
| (0.137 | ) | | (0.531 | ) | | (0.430 | ) | | (0.554 | ) | | (0.343 | ) | |
| (0.057 | ) | | — | | | — | | | (0.017 | ) | | — | | |
| (0.194 | ) | | (0.531 | ) | | (0.430 | ) | | (0.571 | ) | | (0.343 | ) | |
| | | | | | | | | | | | | | | | |
| $10.100 | | | $10.160 | | | $9.530 | | | $9.540 | | | $9.920 | | |
| | | | | | | | | | | | | | | | |
| 1.36% | | | 12.30% | | | 4.50% | | | 1.99% | | | 2.61% | | |
| | | | | | | | | | | | | | | | |
| | | | | | | | | | | | | | | | |
| $95,132 | | | $90,412 | | | $40,544 | | | $29,683 | | | $2,052 | | |
| 0.50% | | | 0.50% | | | 0.51% | | | 0.50% | | | 0.50% | | |
| | | | | | | | | | | | | | | | |
| 0.69% | | | 0.69% | | | 0.85% | | | 0.99% | | | 3.26% | | |
| 1.52% | | | 5.83% | | | 4.71% | | | 6.21% | | | 5.07% | | |
| | | | | | | | | | | | | | | | |
| 1.33% | | | 5.64% | | | 4.37% | | | 5.72% | | | 2.31% | | |
| 188% | | | 178% | | | 553% | | | 294% | | | 360% | | |
31
| Notes to financial statements | |
| Delaware Inflation Protected Bond Fund | July 31, 2009 |
Delaware Group® Government Fund (Trust) is organized as a Delaware statutory trust and offers two Series: Delaware Core Plus Bond Fund and Delaware Inflation Protected Bond Fund. These financial statements and the related notes pertain to Delaware Inflation Protected Bond Fund (Fund). The Trust is an open-end investment company. The Fund is considered diversified under the Investment Company Act of 1940, as amended, and offers Class A, Class B, Class C, and Institutional Class shares. Class A shares are sold with a maximum front-end sales charge of up to 4.50%. Class A share purchases of $1,000,000 or more will incur a contingent deferred sales charge (CDSC) of 1% if redeemed during the first year and 0.50% during the second year, provided that Delaware Distributors, L.P. (DDLP) paid a financial advisor a commission on the purchase of those shares. Class B shares may be purchased only through dividend reinvestment and certain permitted exchanges. Prior to June 1, 2007, Class B shares were sold with a CDSC that declined from 4% to zero depending upon the period of time the shares were held. Class B shares will automatically convert to Class A shares on a quarterly basis approximately eight years after purchase. Class C shares are sold with a CDSC of 1%, if redeemed during the first twelve months. Institutional Class shares are not subject to a sales charge and are offered for sale exclusively to certain eligible investors.
The investment objective of the Fund is to seek to provide inflation protection and current income.
1. Significant Accounting Policies
The following accounting policies are in accordance with U.S. generally accepted accounting principles and are consistently followed by the Fund.
Security Valuation — Securities listed on a foreign exchange are valued at the last quoted sales price on the valuation date. U.S. government and agency securities are valued at the mean between the bid and ask prices. Other debt securities, credit default swap (CDS) contracts and interest rate swap contracts are valued by an independent pricing service or broker. To the extent current market prices are not available, the pricing service may take into account developments related to the specific security, as well as transactions in comparable securities. Investment companies are valued at net asset value per share. Foreign currency exchange contracts are valued at the mean between the bid and ask prices. Interpolated values are derived when the settlement date of the contract is an interim date for which quotations are not available. Financial futures contracts and options on futures contracts are valued at the daily quoted settlement prices. Exchange-traded options are valued at the last reported sale price or, if no sales are reported, at the mean between the last reported bid and ask prices. Generally, other securities and assets for which market quotations are not readily available are valued at fair value as determined in good faith under the direction of the Fund’s Board of Trustees (Board). In determining whether market quotations are readily available or fair valuation will be used, various factors will be taken into consideration, such as market closures or suspension of trading in a security. The Fund may use fair value pricing more frequently for securities traded primarily in non-U.S. markets because, among other things, most foreign markets close well before the Fund values its securities at 4:00 p.m. Eastern time. The
32
earlier close of these foreign markets gives rise to the possibility that significant events, including broad market moves, government actions or pronouncements, aftermarket trading, or news events may have occurred in the interim. To account for this, the Fund may frequently value foreign securities using fair value prices based on third-party vendor modeling tools (international fair value pricing).
Federal Income Taxes — No provision for federal income taxes has been made as the Fund intends to continue to qualify for federal income tax purposes as a regulated investment company under Subchapter M of the Internal Revenue Code of 1986, as amended, and make the requisite distributions to shareholders. The Fund evaluates tax positions taken or expected to be taken in the course of preparing the Fund’s tax returns to determine whether the tax positions are “more-likely-than-not” of being sustained by the applicable tax authority. Tax positions not deemed to meet the more-likely-than-not threshold are recorded as a tax benefit or expense in the current year. Management has analyzed the Fund’s tax positions taken on federal income tax returns for all open tax years (tax years ended July 31, 2006–July 31, 2009), and has concluded that no provision for federal income tax is required in the Fund’s financial statements.
Class Accounting — Investment income, common expenses and realized and unrealized gain (loss) on investments are allocated to the various classes of the Fund on the basis of daily net assets of each class. Distribution expenses relating to a specific class are charged directly to that class.
Repurchase Agreements — The Fund may invest in a pooled cash account along with other members of the Delaware Investments® Family of Funds pursuant to an exemptive order issued by the Securities and Exchange Commission. The aggregate daily balance of the pooled cash account is invested in repurchase agreements secured by obligations of the U.S. government. The respective collateral is held by the Fund’s custodian bank until the maturity of the respective repurchase agreements. Each repurchase agreement is at least 102% collateralized. However, in the event of default or bankruptcy by the counterparty to the agreement, realization of the collateral may be subject to legal proceedings. At July 31, 2009, the Fund held no investments in repurchase agreements.
Foreign Currency Transactions — Transactions denominated in foreign currencies are recorded at the prevailing exchange rates on the valuation date. The value of all assets and liabilities denominated in foreign currencies is translated into U.S. dollars at the exchange rate of such currencies against the U.S. dollar daily. Transaction gains or losses resulting from changes in exchange rates during the reporting period or upon settlement of the foreign currency transaction are reported in operations for the current period. The Fund isolates that portion of realized gains and losses on investments in debt securities which is due to changes in foreign exchange rates from that which is due to changes in market prices of debt securities. The Fund reports certain foreign currency related transactions as components of realized gains (losses) for financial reporting purposes, whereas such components are treated as ordinary income (loss) for federal income tax purposes.
33
Notes to financial statements
Delaware Inflation Protected Bond Fund
1. Significant Accounting Policies (continued)
Use of Estimates — The preparation of financial statements in conformity with U.S. generally accepted accounting principles requires management to make estimates and assumptions that affect the reported amounts of assets and liabilities at the date of the financial statements and the reported amounts of revenues and expenses during the reporting period. Actual results could differ from those estimates.
Other — Expenses directly attributable to the Fund are charged directly to the Fund. Other expenses common to various funds within the Delaware Investments® Family of Funds are generally allocated amongst such funds on the basis of average net assets. Management fees and some other expenses are paid monthly. Security transactions are recorded on the date the securities are purchased or sold (trade date) for financial reporting purposes. Costs used in calculating realized gains and losses on the sale of investment securities are those of the specific securities sold. Dividend income is recorded on the ex-dividend date and interest income is recorded on the accrual basis. Discounts and premiums are amortized to interest income over the lives of the respective securities. Realized gains (losses) on paydowns of mortgage- and asset-backed securities are classified as interest income. The Fund declares and pays dividends from net investment income monthly and distributions from net realized gain on investments, if any, annually.
The Fund may receive earnings credits from its custodian when positive cash balances are maintained, which are used to offset custody fees. The expense paid under this arrangement is included in custodian fees on the statement of operations with the corresponding expense offset shown as “expense paid indirectly.”
2. Investment Management, Administration Agreements and Other Transactions with Affiliates
In accordance with the terms of its investment management agreement, the Fund pays Delaware Management Company (DMC), a series of Delaware Management Business Trust and the investment manager, an annual fee which is calculated daily at the rate of 0.45% on the first $500 million of average daily net assets of the Fund, 0.40% on the next $500 million, 0.35% on the next $1.5 billion, and 0.30% on average daily net assets in excess of $2.5 billion.
DMC has contractually agreed to waive that portion, if any, of its management fee and reimburse the Fund to the extent necessary to ensure that total annual operating expenses (excluding any 12b-1 plan expenses, taxes, interest, inverse floater program expenses, brokerage fees, short sale and dividend interest expenses, certain insurance costs, and nonroutine expenses or costs including, but not limited to, those relating to reorganizations, litigation, conducting shareholder meetings, and liquidations (collectively, nonroutine expenses)), do not exceed 0.50% of average daily net assets of the Fund through November 30, 2009. For purposes of this waiver and reimbursement, nonroutine expenses may also include such additional costs and expenses as may be agreed upon from time to time by the Fund’s Board and DMC. This expense waiver and reimbursement applies only to expenses paid directly by the Fund.
34
Delaware Service Company, Inc. (DSC), an affiliate of DMC, provides fund accounting and financial administration oversight services to the Fund. For these services, the Fund pays DSC fees based on the aggregate daily net assets of the Delaware Investments® Family of Funds at the following annual rate: 0.0050% of the first $30 billion; 0.0045% of the next $10 billion; 0.0040% of the next $10 billion; and 0.0025% of aggregate average daily net assets in excess of $50 billion. The fees payable to DSC under the service agreement described above are allocated among all Funds in the Delaware Investments® Family of Funds on a relative net asset value basis. For the year ended July 31, 2009, the Fund was charged $8,134 for these services.
DSC also provides dividend disbursing and transfer agency services. The Fund pays DSC a monthly fee based on the number of shareholder accounts for dividend disbursing and transfer agent services.
Pursuant to a distribution agreement and distribution plan, the Fund pays DDLP, the distributor and an affiliate of DMC, an annual distribution and service fee not to exceed 0.25% of the average daily net assets of the Class A shares, 1.00% of the average daily net assets of the Class B and C shares. Institutional Class shares pay no distribution and service expenses.
At July 31, 2009, the Fund had liabilities payable to affiliates as follows:
| Investment management fee payable to DMC | | $ | 32,032 |
| Dividend disbursing, transfer agent and fund accounting | | | |
| oversight fees and other expenses payable to DSC | | | 13,640 |
| Distribution fees payable to DDLP | | | 51,228 |
| Other expenses payable to DMC and affiliates* | | | 2,466 |
*DMC, as part of its administrative services, pays operating expenses on behalf of the Fund and is reimbursed on a periodic basis. Such expenses include items such as printing of shareholder reports, fees for audit, legal and tax services, registration fees and trustees’ fees.
As provided in the investment management agreement, the Fund bears the cost of certain legal and tax services, including internal legal and tax services provided to the Fund by DMC and/or its affiliates’ employees. For the year ended July 31, 2009, the Fund was charged $14,073 for internal legal and tax services provided by DMC and/or its affiliates’ employees.
For the year ended July 31, 2009, DDLP earned $ 57,232 for commissions on sales of the Fund’s Class A shares. For the year ended July 31, 2009, DDLP received gross CDSC commissions of $ 0, $3,360 and $16,779 on redemption of the Fund’s Class A, Class B and Class C shares, respectively, and these commissions were entirely used to offset up-front commissions previously paid by DDLP to broker/dealers on sales of those shares.
Trustees’ fees include expenses accrued by the Fund for each Trustee’s retainer and meeting fees. Certain officers of DMC, DSC and DDLP are officers and/or Trustees of the Trust. These officers and Trustees are paid no compensation by the Fund.
35
Notes to financial statements
Delaware Inflation Protected Bond Fund
3. Investments
For the year ended July 31, 2009, the Fund made purchases of $ 49,715,742 and sales of $ 13,296,928 of investment securities other than U.S. government securities and short-term investments. For the year ended July 31, 2009, the Fund made purchases of $ 343,080,144 and sales of $ 276,984,081 of long-term U.S. government securities.
At July 31, 2009, the cost of investments for federal income tax purposes was $207,355,693. At July 31, 2009, the net unrealized appreciation was $10,400,317, of which $10,763,936 related to unrealized appreciation of investments and $363,619 related to unrealized depreciation of investments.
The Fund applies Financial Accounting Standards No. 157, Fair Value Measurements (FAS 157). FAS 157 defines fair value as the price that the Fund would receive to sell an asset or pay to transfer a liability in an orderly transaction between market participants at the measurement date under current market conditions. FAS 157 also establishes a framework for measuring fair value, and a three level hierarchy for fair value measurements based upon the transparency of inputs to the valuation of an asset or liability. Inputs may be observable or unobservable and refer broadly to the assumptions that market participants would use in pricing the asset or liability. Observable inputs reflect the assumptions market participants would use in pricing the asset or liability based on market data obtained from sources independent of the reporting entity. Unobservable inputs reflect the reporting entity’s own assumptions about the assumptions that market participants would use in pricing the asset or liability developed based on the best information available under the circumstances. The Fund’s investment in its entirety is assigned a level based upon the observability of the inputs which are significant to the overall valuation. The three-tier hierarchy of inputs is summarized below.
Level 1 – inputs are quoted prices in active markets
Level 2 – inputs are observable, directly or indirectly
Level 3 – inputs are unobservable and reflect assumptions on the part of the reporting entity
The following table summarizes the valuation of the Fund’s investments by the FAS 157 fair value hierarchy levels as of July 31, 2009:
| | Level 1 | | Level 2 | | Total |
| Agency, Asset-Backed & | | | | | | | | | |
| Mortgage-Backed Securities | | $ | — | | $ | 906,739 | | $ | 906,739 |
| Corporate Debt | | | — | | | 38,559,921 | | | 38,559,921 |
| Foreign Debt | | | — | | | 118,848 | | | 118,848 |
| U.S. Treasury Obligations | | | 177,453,500 | | | — | | | 177,453,500 |
| Short-Term | | | — | | | 717,002 | | | 717,002 |
| Total | | $ | 177,453,500 | | $ | 40,302,510 | | $ | 217,756,010 |
| | | | | | | | | | |
| Derivatives | | $ | — | | $ | 521,332 | | $ | 521,332 |
There were no Level 3 securities at the beginning or end of the period.
36
4. Dividend and Distribution Information
Income and long-term capital gain distributions are determined in accordance with federal income tax regulations, which may differ from U.S. generally accepted accounting principles. Additionally, distributions from net gains on foreign currency transactions and net short-term gains on sales of investment securities are treated as ordinary income for federal income tax purposes. The tax character of dividends and distributions paid during the years ended July 31, 2009 and 2008 was as follows:
| | | Year Ended |
| | | 7/31/09 | | 7/31/08 |
| Ordinary income | | $ | 2,428,904 | | $ | 4,594,265 |
| Long-term capital gain | | | 148,324 | | | — |
| Total | | $ | 2,577,228 | | $ | 4,594,265 |
5. Components of Net Assets on a Tax Basis
As of July 31, 2009, the components of net assets on a tax basis were as follows:
| Shares of beneficial interest | $ | 219,214,431 | |
| Undistributed ordinary income | | 868,758 | |
| Post-October losses | | (5,534,637 | ) |
| Capital loss carryforwards | | (1,125,650 | ) |
| Other temporary differences | | (2,752,576 | ) |
| Unrealized appreciation on investments | | | |
| and foreign currencies | | 10,470,705 | |
| Net Assets | $ | 221,141,031 | |
The differences between book basis and tax basis components of net assets are primarily attributable to tax deferral of losses on wash sales, mark-to-market of financial futures contracts, tax treatment of U.S. Treasury Inflation Index Securities, tax deferral of losses on straddles and tax treatment of market discount and premium on debt instruments.
Post-October losses represent losses realized on investment transactions from November 1, 2008 through July 31, 2009 that, in accordance with federal income tax regulations, the Fund has elected to defer and treat as having arisen in the following fiscal year.
For financial reporting purposes, capital accounts are adjusted to reflect the tax character of permanent book/tax differences. Reclassifications are primarily due to tax treatment of gain (loss) on foreign currency transactions, paydowns of mortgage- and asset-backed securities and dividends and distributions. Results of operations and net assets were not affected by these reclassifications. For the year ended July 31, 2009, the Fund recorded the following reclassifications.
37
Notes to financial statements
Delaware Inflation Protected Bond Fund
5. Components of Net Assets on a Tax Basis (continued)
| Distributions in excess of net investment income | $ | (1,053,713 | ) |
| Accumulated net realized loss | | 1,225,810 | |
| Paid-in capital | | (172,097 | ) |
For federal income tax purposes, capital loss carryforwards may be carried forward and applied against future capital gains. Capital loss carryforwards remaining at July 31, 2009 will expire as follows: $1,125,650 expires in 2017.
6. Capital Shares
Transactions in capital shares were as follows:
| | Year Ended |
| | 7/31/09 | | 7/31/08 |
| Shares sold: | | | | | |
| Class A | 9,529,971 | | | 1,915,059 | |
| Class B | 99,422 | | | 192,916 | |
| Class C | 3,964,894 | | | 822,225 | |
| Institutional Class | 6,241,103 | | | 5,390,239 | |
| | | | | | |
| Shares issued upon reinvestment of dividends and distributions: | | | | | |
| Class A | 49,441 | | | 47,287 | |
| Class B | 3,320 | | | 4,828 | |
| Class C | 22,221 | | | 15,494 | |
| Institutional Class | 171,878 | | | 372,380 | |
| | 20,082,250 | | | 8,760,428 | |
| | | | | | |
| Shares repurchased: | | | | | |
| Class A | (3,199,126 | ) | | (274,843 | ) |
| Class B | (114,404 | ) | | (46,431 | ) |
| Class C | (861,507 | ) | | (50,425 | ) |
| Institutional Class | (5,893,085 | ) | | (1,119,727 | ) |
| | (10,068,122 | ) | | (1,491,426 | ) |
| Net increase | 10,014,128 | | | 7,269,002 | |
For the years ended July 31, 2009 and 2008, 23,875 Class B shares were converted to 23,824 Class A shares valued at $ 234,437 and 17,868 Class B shares were converted to 17,866 Class A shares valued at $184,768, respectively. The respective amounts are included in Class B redemptions and Class A subscriptions in the table above and the statements of changes in net assets.
38
7. Line of Credit
The Fund, along with certain other funds in the Delaware Investments® Family of Funds (Participants), was a participant in a $225,000,000 revolving line of credit with The Bank of New York Mellon (BNY Mellon) to be used for temporary or emergency purposes as an additional source of liquidity to fund redemptions of investor shares. Under the agreement, the Participants were charged an annual commitment fee, which was allocated across the Participants on the basis of each Participant’s allocation of the entire facility. Participants were permitted to borrow up to a maximum of one third of their net assets under the agreement. The agreement expired on November 18, 2008.
Effective November 18, 2008, the Fund, along with the other Participants, entered into an amendment to the agreement with BNY Mellon for a $35,000,000 revolving line of credit. The agreement, as amended, is to be used as described above and operates in substantially the same manner as the original agreement. The agreement, as amended, expires on November 17, 2009. The Fund had no amounts outstanding as of July 31, 2009, or at any time during the year then ended.
8. Derivatives
The Fund applies Financial Accounting Standards No. 161, Disclosures about Derivative Instruments and Hedging Activities (FAS 161). FAS 161 is intended to improve financial reporting about derivative instruments by requiring enhanced disclosures that enable investors to understand: 1) how and why an entity uses derivatives, 2) how they are accounted for, and 3) how they affect an entity’s results of operations and financial position.
Foreign Currency Exchange Contracts — The Fund may enter into foreign currency exchange contracts and foreign cross currency exchange contracts as a way of managing foreign exchange rate risk. The Fund may enter into these contracts to fix the U.S. dollar value of a security that it has agreed to buy or sell for the period between the date the trade was entered into and the date the security is delivered and paid for. The Fund may also use these contracts to hedge the U.S. dollar value of securities it already owns that are denominated in foreign currencies. The change in value is recorded as an unrealized gain or loss. When the contract is closed, a realized gain or loss is recorded equal to the difference between the value of the contract at the time it was opened and the value at the time it was closed.
The use of foreign currency exchange contracts and foreign cross currency exchange contracts does not eliminate fluctuations in the underlying prices of the securities, but does establish a rate of exchange that can be achieved in the future. Although foreign currency exchange contracts and foreign cross currency exchange contracts limit the risk of loss due to a decline in the value of the hedged currency, they also limit any potential gain that might result should the value of the currency increase. In addition, the Fund could be exposed to risks if the counterparties to the contracts are unable to meet the terms of their contracts. The Fund’s maximum risk of loss from counterparty credit risk is the value of its currency exchanged with the counterparty. The risk is generally mitigated by having a netting arrangement between the Fund and the counterparty and by the posting of collateral by the counterparty to the Fund to cover the Fund’s exposure to the counterparty. No foreign currency exchange contracts were outstanding at July 31, 2009.
39
Notes to financial statements
Delaware Inflation Protected Bond Fund
8. Derivatives (continued)
Financial Futures Contracts — The Fund may use futures in the normal course of pursuing its investment objectives. The Fund may invest in financial futures contracts to hedge its existing portfolio securities against fluctuations in fair value caused by changes in prevailing market interest rates. Upon entering into a financial futures contract, the Fund deposits cash or pledges U.S. government securities to a broker, equal to the minimum “initial margin” requirements of the exchange on which the contract is traded. Subsequent payments are received from the broker or paid to the broker each day, based on the daily fluctuation in the market value of the contract. These receipts or payments are known as “variation margin” and are recorded daily by the Fund as unrealized gains or losses until the contracts are closed. When the contracts are closed, the Fund records a realized gain or loss equal to the difference between the value of the contract at the time it was opened and the value at the time it was closed. Risks of entering into financial futures contracts include potential imperfect correlation between the financial futures contracts and the underlying securities and the possibility of an illiquid secondary market for these instruments. When investing in futures, there is minimal counterparty credit risk to a Fund because futures are exchange traded and the exchange’s clearinghouse, as counterparty to all exchange traded futures, guarantees against default.
Written Options — During the year ended July 31, 2009, the Fund entered into options contracts in the normal course of pursuing its investment objectives. The Fund may write options contracts for any number of reasons, including: to manage the Fund’s exposure to changes in securities prices and foreign currencies; as an efficient means of adjusting the Fund’s overall exposure to certain markets; in an effort to enhance income; to protect the value of portfolio securities; and as a cash management tool. The Fund may write calls or puts on securities, financial indices, and foreign currencies. When the Fund writes an option, a premium is received and a liability is recorded and adjusted on a daily basis to reflect the current market value of the options written. Premiums received from writing options that expire unexercised are treated by the Fund on the expiration date as realized gains. The difference between the premium received and the amount paid on effecting a closing purchase transaction, including brokerage commissions, is treated as realized gain or loss. If a call option is exercised, the premium is added to the proceeds from the sale of the underlying security in determining whether the Fund has a realized gain or loss. If a put option is exercised, the premium reduces the cost basis of the securities purchased by the Fund. The Fund, as writer of an option, bears the market risk of an unfavorable change in the price of the security underlying the written option. When writing options, the Fund is subject to minimal counterparty risk.
Transactions in written options during the year ended July 31, 2009 for the Fund were as follows:
| | Number of contracts | | Premiums |
| Options outstanding at July 31, 2008 | | 175 | | | | $ | 99,467 | |
| Options written | | 1,083 | | | | | 712,070 | |
| Options terminated in closing purchase transactions | | (1,258 | ) | | | | (811,537 | ) |
| Options outstanding at July 31, 2009 | | — | | | | $ | — | |
40
Swap Contracts — The Fund may enter into interest rate swap contracts, index swap contracts, inflation swap contracts and CDS contracts in the normal course of pursuing its investment objectives. The Fund may use interest rate swaps to adjust the Fund’s sensitivity to interest rates or to hedge against changes in interest rates. Index swaps may be used to gain exposure to markets that the Fund invests in, such as the corporate bond market. The Fund may also use index swaps as a substitute for futures or options contracts if such contracts are not directly available to the Fund on favorable terms. The Fund may use inflation swaps to hedge the inflation risk in nominal bonds, thereby creating synthetic inflation-indexed bonds. The Fund may enter into CDS contracts in order to hedge against a credit event, to enhance total return or to gain exposure to certain securities or markets.
Interest Rate Swaps. An interest rate swap involves payments received by the Fund from another party based on a variable or floating interest rate, in return for making payments based on a fixed interest rate. An interest rate swap can also work in reverse with the Fund receiving payments based on a fixed interest rate and making payments based on a variable or floating interest rate. Interest rate swaps may be used to adjust the Fund’s sensitivity to interest rates or to hedge against changes in interest rates. Periodic payments on such contracts are accrued daily and recorded as unrealized appreciation/depreciation on swap contracts. Upon periodic payment/receipt or termination of the contract, such amounts are recorded as realized gains or losses on swap contracts. The Fund’s maximum risk of loss from counterparty credit risk is the discounted net value of the cash flows to be received from/paid to the counterparty over the interest rate swap contract’s remaining life, to the extent that the amount is positive. This risk is mitigated by having a netting arrangement between the Fund and the counterparty and by the posting of collateral by the counterparty to the Fund to cover the Fund’s exposure to the counterparty.
Index Swaps. Index swaps involve commitments to pay interest in exchange for a market linked return based on a notional amount. To the extent the total return of the security, instrument or basket of instruments underlying the transaction exceeds the offsetting interest obligation, the Fund will receive a payment from the counterparty. To the extent the total return of the security, instrument or basket of instruments underlying the transaction falls short of the offsetting interest obligation, the Fund will make a payment to the counterparty. The change in value of swap contracts outstanding, if any, is recorded as unrealized appreciation or depreciation daily. A realized gain or loss is recorded on maturity or termination of the swap contract. The Fund’s maximum risk of loss from counterparty credit risk is the discounted net value of the cash flows to be received from/paid to the counterparty over the index swap contract’s remaining life, to the extent that the amount is positive. This risk is mitigated by having a netting arrangement between the Fund and the counterparty and by the posting of collateral by the counterparty to the Fund to cover the Fund’s exposure to the counterparty.
Inflation Swaps. Inflation swaps agreements involve commitments to pay a regular stream of inflation-indexed cash payments in exchange for receiving a stream of nominal interest payments (or vice versa), where both payment streams are based on notional amounts. The nominal interest payments may be based on either a fixed interest rate or variable interest rate such as the
41
Notes to financial statements
Delaware Inflation Protected Bond Fund
8. Derivatives (continued)
London Interbank Offered Rate (LIBOR). The change in value of swap contracts outstanding, if any, is recorded as unrealized appreciation or depreciation daily. A realized gain or loss is recorded on maturity or termination of the swap contract. The Fund’s maximum risk of loss from counterparty credit risk is the discounted net value of the cash flows to be received from/paid to the counterparty over the inflation swap contract’s remaining life, to the extent that the amount is positive. This risk is mitigated by having a netting arrangement between the Fund and the counterparty and by the posting of collateral by the counterparty to the Fund to cover the Fund’s exposure to the counterparty.
Credit Default Swaps. A CDS contract is a risk-transfer instrument through which one party (purchaser of protection) transfers to another party (seller of protection) the financial risk of a credit event (as defined in the CDS agreement), as it relates to a particular reference security or basket of securities (such as an index). In exchange for the protection offered by the seller of protection, the purchaser of protection agrees to pay the seller of protection a periodic amount at a stated rate that is applied to the notional amount of the CDS contract. In addition, an upfront payment may be made or received by the Fund in connection with an unwinding or assignment of a CDS contract. Upon the occurrence of a credit event, the seller of protection would pay the par (or other agreed-upon) value of the referenced security (or basket of securities) to the counterparty.
During the year ended July 31, 2009, the Fund did not enter into any CDS contracts as a purchaser or seller of protection. Periodic payments on such contracts are accrued daily and recorded as unrealized losses (gains) on swap contracts. Upon payment, such amounts are recorded as realized losses (gains) on swap contracts. Upfront payments made or received in connection with CDS contracts are amortized over the expected life of the CDS contracts as unrealized losses (gains) on swap contracts. The change in value of CDS contracts is recorded as unrealized appreciation or depreciation daily. A realized gain or loss is recorded upon a credit event (as defined in the CDS agreement) or the maturity or termination of the agreement.
Credit default swaps may involve greater risks than if the Fund had invested in the referenced obligation directly. Credit default swaps are subject to general market risk, liquidity risk, counterparty risk and credit risk. The Fund’s maximum risk of loss from counterparty credit risk, either as the seller of protection or the buyer of protection, is the fair value of the contract. This risk is mitigated by having a netting arrangement between the Fund and the counterparty and by the posting of collateral by the counterparty to the Fund to cover the Fund’s exposure to the counterparty.
42
Swaps Generally. Because there is no organized market for swap contracts, the value of open swaps may differ from that which would be realized in the event the Fund terminated its position in the agreement. Risks of entering into these contracts include the potential inability of the counterparty to meet the terms of the contracts. This type of risk is generally limited to the amount of favorable movement in the value of the underlying security, instrument or basket of instruments, if any, at the day of default. Risks also arise from potential losses from adverse market movements and such losses could exceed the unrealized amounts shown on the statements of net assets.
Fair values of derivative instruments as of July 31, 2009 were as follows:
| | | Asset Derivatives | | Liability Derivatives |
| | | Statement of Net | | | | Statement of Net | | | | | |
| | | Assets Location | | Fair Value | | Assets Location | | Fair Value |
| Foreign exchange contracts | | | | | | | | | | | | |
| (Currency) | | Liabilities net of | | | | | Liabilities net of | | | | | |
| | | receivables and | | | | | receivables and | | | | | |
| | | other assets | | $ | — | | other assets | | | $ | — | |
| Interest rate contracts | | | | | | | | | | | | |
| (Futures) | | Liabilities net of | | | | | Liabilities net of | | | | | |
| | | receivables and | | | | | receivables and | | | | | |
| | | other assets | | | 451,221 | | other assets | | | | — | |
| Credit contracts | | | | | | | | | | | | |
| (Swaps) | | Liabilities net of | | | | | Liabilities net of | | | | | |
| | | receivables and | | | | | receivables and | | | | | |
| | | other assets | | | 70,111 | | other assets | | | | — | |
| Total | | | | $ | 521,332 | | | | | $ | — | |
43
Notes to financial statements
Delaware Inflation Protected Bond Fund
8. Derivatives (continued)
The effect of derivative instruments on the Statement of operations for the year ended July 31, 2009 was as follows:
| | | | | Change in Unrealized |
| | | Realized Gain | | Appreciation |
| | | or Loss on | | or Depreciation |
| Location of Gain or Loss on | | Derivatives | | on Derivatives |
| Derivatives Recognized in | | Recognized in | | Recognized in |
| Income | | Income | | Income |
| Foreign exchange contracts | | | | | | | | | | |
| (Currency) | Net realized and | | | | | | | | | |
| unrealized gain (loss) | | | | | | | | | |
| on investments and | | | | | | | | | |
| foreign currencies from | | | | | | | | | |
| foreign currencies | | $ | (79,844 | ) | | | $ | 35,265 | |
| Interest rate contracts | | | | | | | | | | |
| (Futures, Written Options) | Net realized and | | | | | | | | | |
| unrealized gain (loss) | | | | | | | | | |
| on investments and | | | | | | | | | |
| foreign currencies from | | | | | | | | | |
| futures contracts and | | | | | | | | | |
| written options | | | (2,720,723 | ) | | | | 268,856 | |
| Credit contracts | | | | | | | | | | |
| (Swaps) | Net realized and | | | | | | | | | |
| unrealized gain on | | | | | | | | | |
| investments and foreign | | | | | | | | | |
| currencies from swap | | | | | | | | | |
| contracts | | | — | | | | | 70,111 | |
| Total | | | $ | (2,800,567 | ) | | | $ | 374,232 | |
44
9. Securities Lending
The Fund, along with other funds in the Delaware Investments® Family of Funds, may lend its securities pursuant to a security lending agreement (Lending Agreement) with BNY Mellon. With respect to each loan, if the aggregate market value of securities collateral held plus cash collateral received on any business day is less than the aggregate market value of the securities which are the subject of such loan, the borrower will be notified to provide additional collateral not less than the applicable collateral requirements. Cash collateral received is generally invested in the Mellon GSL DBT II Collateral Fund (Collective Trust) established by BNY Mellon for the purpose of investment on behalf of clients participating in its securities lending programs. The Collective Trust may invest in fixed income securities, with a weighted average maturity not to exceed 90 days, rated in one of the top three tiers by Standard & Poor’s Ratings Group (S&P) or Moody’s Investors Service, Inc. (Moody’s) or repurchase agreements collateralized by such securities. The Collective Trust seeks to maintain a net asset value per unit of $1.00, but there can be no assurance that it will always be able to do so. At July 31, 2009, the Collective Trust held only cash and assets with a maturity of one business day or less (Cash/Overnight Assets). The Fund may incur investment losses as a result of investing securities lending collateral in the Collective Trust. This could occur if an investment in the Collective Trust defaulted or if it were necessary to liquidate assets in the Collective Trust to meet returns on outstanding security loans at a time when the Collective Trust’s net asset value per unit was less than $1.00. Under those circumstances, the Fund may not receive an amount from the Collective Trust that is equal in amount to the collateral the Fund would be required to return to the borrower of the securities and the Fund would be required to make up for this shortfall. Effective April 20, 2009, BNY Mellon transferred the assets of the Collective Trust other than the Cash/Overnight Assets to the BNY Mellon SL DBT II Liquidating Fund (Liquidating Fund), effectively bifurcating the collateral investment pool. The Fund’s exposure to the Liquidating Fund is expected to decrease as the Liquidating Fund’s assets mature or are sold. In October 2008, BNY Mellon transferred certain distressed securities from the Collective Trust into the Mellon GSL Reinvestment Trust II. The Fund can also accept U.S. government securities and letters of credit (non-cash collateral) in connection with securities loans. In the event of default or bankruptcy by the lending agent, realization and/or retention of the collateral may be subject to legal proceedings. In the event the borrower fails to return loaned securities and the collateral received is insufficient to cover the value of the loaned securities and provided such collateral shortfall is not the result of investment losses, the lending agent has agreed to pay the amount of the shortfall to the Fund, or at the discretion of the lending agent, replace the loaned securities. The Fund continues to record dividends or interest, as applicable, on the securities loaned and is subject to change in value of the securities loaned that may occur during the term of the loan. The Fund has the right under the Lending Agreement to recover the securities from the borrower on demand. With respect to security loans collateralized by non-cash collateral, the Fund receives loan premiums paid by the borrower. With respect to security loans collateralized by cash collateral, the earnings from the collateral investments are shared among the Fund, the security lending agent and the borrower. The Fund records security lending income net of allocations to the security lending agent and the borrower. The Fund had no securities out on loan as of July 31, 2009.
45
Notes to financial statements
Delaware Inflation Protected Bond Fund
10. Credit and Market Risk
The Fund primarily invests in inflation protected debt securities whose principal and/or interest payments are adjusted for inflation, unlike traditional debt securities that make fixed principal and interest payments. Under normal circumstances, the Fund will invest at least 80% of its net assets in inflation protected debt securities issued by the U.S. government, its agencies or instrumentalities, foreign governments and corporations, which may include synthetic investments such as options, forwards, futures contracts, or swap agreements that, when combined with non-inflation indexed bonds, have economic characteristics similar to inflation-indexed bonds.
Some countries in which the Fund may invest require governmental approval for the repatriation of investment income, capital or the proceeds of sales of securities by foreign investors. In addition, if there is deterioration in a country’s balance of payments or for other reasons, a country may impose temporary restrictions on foreign capital remittances abroad. The securities exchanges of certain foreign markets are substantially smaller, less liquid and more volatile than the major securities markets in the United States. Consequently, acquisition and disposition of securities by the Fund may be inhibited.
The Fund may invest up to 10% of its net assets in high yield fixed income securities, which carry ratings of BB or lower by S&P and/or Ba or lower by Moody’s. Investments in these higher yielding securities are generally accompanied by a greater degree of credit risk than higher rated securities. Additionally, lower rated securities may be more susceptible to adverse economic and competitive industry conditions than investment grade securities.
The Fund invests in fixed income securities whose value is derived from an underlying pool of mortgages or consumer loans. The value of these securities is sensitive to changes in economic conditions, including delinquencies and/or defaults, and may be adversely affected by shifts in the market’s perception of the issuers and changes in interest rates. Investors receive principal and interest payments as the underlying mortgages and consumer loans are paid back. Prepayment of mortgages may shorten the stated maturity of the obligations and can result in a loss of premium, if any has been paid. Some of these securities are collateralized mortgage obligations (CMOs). CMOs are debt securities issued by U.S. government agencies or by financial institutions and other mortgage lenders, which are collateralized by a pool of mortgages held under an indenture. Prepayment of mortgages may shorten the stated maturity of the obligations and can result in a loss of premium, if any has been paid. Certain of these securities may be stripped (securities which provide only the principal or interest feature of the underlying security). The yield to maturity on an interest-only CMO is extremely sensitive not only to changes in prevailing interest rates, but also to the rate of principal payments (including prepayments) on the related underlying mortgage assets. A rapid rate of principal payments may have a material adverse effect on the Fund’s yield to maturity. If the underlying mortgage assets experience greater than anticipated prepayments of principal, the Fund may fail to fully recoup its initial investment in these securities even if the securities are rated in the highest rating categories.
46
The Fund may invest up to 15% of its net assets in illiquid securities, which may include securities with contractual restrictions on resale, securities exempt from registration under Rule 144A of the Securities Act of 1933, as amended, and other securities which may not be readily marketable. The relative illiquidity of these securities may impair the Fund from disposing of them in a timely manner and at a fair price when it is necessary or desirable to do so. While maintaining oversight, the Fund’s Board has delegated to DMC the day-to-day functions of determining whether individual securities are liquid for purposes of the Fund’s limitation on investments in illiquid assets. Securities eligible for resale pursuant to Rule 144A, which are determined to be liquid, are not subject to the Fund’s 15% limit on investments in illiquid securities. As of July 31, 2009, no securities have been determined to be illiquid under the Fund’s Liquidity Procedures. Rule 144A securities have been identified on the statement of net assets.
11. Contractual Obligations
The Fund enters into contracts in the normal course of business that contain a variety of indemnifications. The Fund’s maximum exposure under these arrangements is unknown. However, the Fund has not had prior claims or losses pursuant to these contracts. Management has reviewed the Fund’s existing contracts and expects the risk of loss to be remote.
12. Subsequent Events
On August 18, 2009, Lincoln National Corporation and Macquarie Group (Macquarie) entered into an agreement pursuant to which Delaware Investments, including DMC, DDLP, and DSC, will be acquired by Macquarie, an Australia-based global provider of banking, financial, advisory, investment and funds management services (the Transaction). Upon completion of the Transaction, DMC, DDLP and DSC will be wholly owned subsidiaries of Macquarie.
The Transaction will result in a change of control of DMC which, in turn, will cause the termination of the investment advisory agreement between DMC and the Fund. As a result, a Special Meeting of Shareholders (the Meeting) of the Fund will be scheduled for the purpose of asking shareholders to approve a new investment advisory agreement between DMC and the Fund (the New Agreement). If approved by shareholders, the New Agreement will take effect upon the closing of the Transaction, which is currently anticipated to occur in the fourth quarter of 2009. Shareholders of the Fund will receive proxy materials including more detailed information about the Meeting, the Transaction and the proposed New Agreement.
Effective July 31, 2009, the Fund adopted Financial Accounting Standards Board Statement of Financial Accounting Standards No. 165, Subsequent Events (FAS 165). In accordance with FAS 165, management has evaluated whether any events or transactions occurred subsequent to July 31, 2009 through September 21, 2009, the date of issuance of the Fund’s financial statements, and determined that there were no material events or transactions other than those already disclosed that would require recognition or disclosure in the Fund’s financial statements.
47
Notes to financial statements
Delaware Inflation Protected Bond Fund
13. Tax Information (Unaudited)
The information set forth below is for the Fund’s fiscal year as required by federal laws. Shareholders, however, must report distributions on a calendar year basis for income tax purposes, which may include distributions for portions of two fiscal years of a fund. Accordingly, the information needed by shareholders for income tax purposes will be sent to them in January of each year. Please consult your tax advisor for proper treatment of this information.
For the fiscal year ended July 31, 2009, the Fund designates distributions paid during the year as follows:
| (A) | Long-Term Capital Gains Distributions (Tax Basis) | 6 | % |
| (B) | Ordinary Income Distributions (Tax Basis) | 94 | % |
| Total Distributions (Tax Basis) | 100 | % |
(A) and (B) are based on a percentage of the Fund’s total distributions.
48
Report of independent
registered public accounting firm
To the Shareholders and Board of Trustees
Delaware Group® Government Fund — Delaware Inflation Protected Bond Fund
We have audited the accompanying statement of net assets of Delaware Inflation Protected Bond Fund (one of the series constituting Delaware Group Government Fund) (the “Fund”) as of July 31, 2009, and the related statement of operations for the year then ended, the statements of changes in net assets for each of the two years in the period then ended, and the financial highlights for each of the four years in the period then ended and for the period December 1, 2004 (commencement of operations) through July 31, 2005. These financial statements and financial highlights are the responsibility of the Fund’s management. Our responsibility is to express an opinion on these financial statements and financial highlights based on our audits.
We conducted our audits in accordance with the standards of the Public Company Accounting Oversight Board (United States). Those standards require that we plan and perform the audit to obtain reasonable assurance about whether the financial statements and financial highlights are free of material misstatement. We were not engaged to perform an audit of the Fund’s internal control over financial reporting. Our audits included consideration of internal control over financial reporting as a basis for designing audit procedures that are appropriate in the circumstances, but not for the purpose of expressing an opinion on the effectiveness of the Fund’s internal control over financial reporting. Accordingly, we express no such opinion. An audit also includes examining, on a test basis, evidence supporting the amounts and disclosures in the financial statements and financial highlights, assessing the accounting principles used and significant estimates made by management, and evaluating the overall financial statement presentation. Our procedures included confirmation of securities owned as of July 31, 2009 by correspondence with the custodian and brokers or by other appropriate auditing procedures where replies from brokers were not received. We believe that our audits provide a reasonable basis for our opinion.
In our opinion, the financial statements and financial highlights referred to above present fairly, in all material respects, the financial position of the Delaware Inflation Protected Bond Fund series of Delaware Group Government Fund at July 31, 2009, the results of its operations for the year then ended, the changes in its net assets for each of the two years in the period then ended, and its financial highlights for each of the four years in the period then ended and for the period December 1, 2004 (commencement of operations) through July 31, 2005, in conformity with U.S. generally accepted accounting principles.

Philadelphia, Pennsylvania
September 21, 2009
49
Other Fund information
(Unaudited)
Delaware Inflation Protected Bond Fund
Board Consideration of Delaware Inflation Protected Bond Fund Investment Advisory Agreement
At a meeting held on May 19–21, 2009 (the “Annual Meeting”), the Board of Trustees (the “Board”), including a majority of disinterested or independent Trustees, approved the renewal of the Investment Advisory Agreement for the Delaware Inflation Protected Bond Fund (the “Fund”). In making its decision, the Board considered information furnished specifically in connection with the renewal of the Investment Advisory Agreement with Delaware Management Company (“DMC”), which included materials provided by DMC and its affiliates (“Delaware Investments”) concerning, among other things, the nature, extent and quality of services provided to the Fund, the costs of such services to the Fund, economies of scale and the financial condition and profitability of Delaware Investments. Reference was made to information furnished at regular quarterly Board meetings, including reports detailing Fund performance, investment strategies and expenses, as well as information prepared specifically in connection with the renewal of the investment advisory and sub-advisory contracts. In addition, in connection with the Annual Meeting, reports were provided in February 2009 and included independent historical and comparative reports prepared by Lipper Inc. (“Lipper”), an independent statistical compilation organization. The Lipper reports compared the Fund’s investment performance and expenses with those of other comparable mutual funds. The independent Trustees reviewed and discussed the Lipper reports with counsel to the independent Trustees. The Board requested and received information regarding DMC’s policy with respect to advisory fee levels and its breakpoint philosophy; the structure of portfolio manager compensation; the investment manager’s profitability; and any constraints or limitations on the availability of securities in certain investment styles which had in the past year inhibited, or which were likely in the future to inhibit, DMC’s ability to invest fully in accordance with Fund policies.
In considering information relating to the approval of the Fund’s advisory agreement, the independent Trustees received assistance and advice from and met separately with counsel to the independent Trustees. Although the Board gave attention to all information furnished, the following discussion identifies, under separate headings, the primary factors taken into account by the Board during its contract renewal considerations.
Nature, Extent and Quality of Service. The Board considered the services provided by Delaware Investments to the Fund and its shareholders. In reviewing the nature, extent and quality of services, the Board considered reports furnished to it throughout the year, which covered matters such as the relative performance of the Fund, compliance of portfolio managers with the investment policies, strategies and restrictions for the Fund, compliance by DMC and Delaware Distributors, L.P. (together, “Management”) personnel with the Code of Ethics adopted throughout the Delaware Investments® Family of Funds complex and adherence to fair value pricing procedures as established by the Board. The Board was pleased with the current staffing of the Fund’s investment advisor and the emphasis placed on research in the investment process. The Board gave favorable consideration to DMC’s efforts to control expenditures
50
while maintaining service levels committed to fund matters. The Board also considered the transfer agent and shareholder services provided to Fund shareholders by DMC’s affiliate, Delaware Service Company, Inc. (“DSC”), noting DSC’s high level of service. The Board noted that Management finished upgrading investment accounting functions through outsourcing to improve the quality and lower the cost of delivering investment accounting services to the Fund. The Board once again noted the benefits provided to Fund shareholders through each shareholder’s ability to exchange an investment in one Delaware Investments® fund for the same class of shares in another Delaware Investments fund without a sales charge, to reinvest Fund dividends into additional shares of the Fund or into additional shares of other Delaware Investments funds and the privilege to combine holdings in other Delaware Investments funds to obtain a reduced sales charge. The Board was satisfied with the nature, extent and quality of the overall services provided by Delaware Investments.
Investment Performance. The Board placed significant emphasis on the investment performance of the Fund in view of its importance to shareholders. Although the Board gave appropriate consideration to performance reports and discussions with portfolio managers at Board meetings throughout the year, the Board gave particular weight to the Lipper reports furnished for the Annual Meeting. The Lipper reports prepared for the Fund showed the investment performance of its Class A shares in comparison to a group of similar funds as selected by Lipper (the “Performance Universe”). A fund with the best performance ranked first, and a fund with the poorest performance ranked last. The highest/best performing 25% of funds in the Performance Universe make up the first quartile; the next 25%, the second quartile; the next 25%, the third quartile; and the poorest/worst performing 25% of funds in the Performance Universe make up the fourth quartile. Comparative annualized performance for the Fund was shown for the past one- and three-year periods ended December 31, 2008. The Board’s objective is that the Fund’s performance for the periods considered be at or above the median of its Performance Universe. The following paragraph summarizes the performance results for the Fund and the Board’s view of such performance.
The Performance Universe for the Fund consisted of the Fund and all retail and institutional TIPS funds as selected by Lipper. The Lipper report comparison showed that the Fund’s total return for the one- and three-year periods was in the first quartile of its Performance Universe. The Board was satisfied with performance.
Comparative Expenses. The Board considered expense comparison data for the Delaware Investments Family of Funds. Management provided the Board with information on pricing levels and fee structures for the Fund as of October 31, 2008 and, for comparative funds, information as of their respective fiscal year end occurring on or before August 31, 2008. The Board also focused on the comparative analysis of effective management fees and total expense ratios of the Fund versus effective management fees and expense ratios of a group of similar funds as selected by Lipper (the “Expense Group”). In reviewing comparative costs, the Fund’s contractual
51
Other Fund information
(Unaudited)
Delaware Inflation Protected Bond Fund
Board Consideration of Delaware Inflation Protected Bond Fund Investment Advisory Agreement (continued)
management fee and the actual management fee incurred by the Fund were compared with the contractual management fees (assuming all funds in the Expense Group were similar in size to the Fund) and actual management fees (as reported by each fund) within the Expense Group, taking into account any applicable breakpoints and fee waivers. The Fund’s total expenses were also compared with those of its Expense Group. The Lipper total expenses, for comparative consistency, were shown by Lipper for Class A shares and comparative total expenses including 12b-1 and non 12b-1 service fees. The Board considered fees paid to Delaware Investments for nonmanagement services. The Board’s objective is to limit the Fund’s total expense ratio to be competitive with that of the Expense Group. The following paragraph summarizes the expense results for the Fund and the Board’s view of such expenses.
The expense comparisons for the Fund showed that its actual management fee and total expenses were in the quartile with the lowest expenses of its Expense Group. The Board was satisfied with the management fee and total expenses of the Fund in comparison to those of its Expense Group as shown in the Lipper report.
Management Profitability. The Board considered the level of profits realized by Delaware Investments in connection with the operation of the Fund. In this respect, the Board reviewed the Investment Management Profitability Analysis that addressed the overall profitability of Delaware Investments’ business in providing management and other services to each of the individual funds and the Delaware Investments® Family of Funds as a whole. Specific attention was given to the methodology followed in allocating costs for the purpose of determining profitability. Management stated that the level of profits of Delaware Investments, to a certain extent, reflect recent operational cost savings and efficiencies initiated by Delaware Investments. The Board considered Delaware Investments’ efforts to improve services provided to fund shareholders and to meet additional regulatory and compliance requirements resulting from recent industry-wide Securities and Exchange Commission initiatives. The Board also considered the extent to which Delaware Investments might derive ancillary benefits from fund operations, including the potential for procuring additional business as a result of the prestige and visibility associated with its role as service provider to the Delaware Investments Family of Funds and the benefits from allocation of fund brokerage to improve trading efficiencies. The Board found that the management fees were reasonable in light of the services rendered and the level of profitability of Delaware Investments.
Economies of Scale. The Trustees considered whether economies of scale are realized by Delaware Investments as the Fund’s assets increase and the extent to which any economies of scale are reflected in the level of management fees charged. The Trustees reviewed the standardized advisory fee pricing and structure, approved by the Board and shareholders, which includes breakpoints. Breakpoints in the advisory fee occur when the advisory fee rate is reduced on assets in excess of specified levels. Breakpoints result in a lower advisory fee than would otherwise be the case on all assets when the asset levels specified are exceeded. The Board noted that the fee
52
under the Fund’s management contract did not fall within the standard structure. Management explained that, due to the Fund’s strategic positioning as a risk-averse product, Management believes that the Fund’s pricing structure should be more in line with those of Delaware’s money market products. Although the Fund has not reached a size at which it can take advantage of breakpoints, the Board recognized that the fee was structured so that if the Fund grows, economies of scale may be shared.
Fund management
Roger A. Early, CPA, CFA, CFP
Senior Vice President, Co-Chief Investment Officer – Total Return Fixed Income Strategy
Roger A. Early rejoined Delaware Investments in March 2007 as a member of the firm’s taxable fixed income portfolio management team, with primary responsibility for portfolio construction and strategic asset allocation. During his previous time at the firm, from 1994 to 2001, he was a senior portfolio manager in the same area, and he left Delaware Investments as head of its U.S. investment grade fixed income group. In recent years, Early was a senior portfolio manager at Chartwell Investment Partners and Rittenhouse Financial and served as the chief investment officer for fixed income at Turner Investments. Prior to joining Delaware Investments in 1994, he worked for more than 10 years at Federated Investors where he managed more than $25 billion in mutual fund and institutional portfolios in the short-term and investment grade markets. He left the firm as head of institutional fixed income management. Earlier in his career, he held management positions with the Federal Reserve Bank, PNC Financial, Touche Ross, and Rockwell International. Early earned his bachelor’s degree in economics from The Wharton School of the University of Pennsylvania and an MBA with concentrations in finance and accounting from the University of Pittsburgh. He is a member of the CFA Society of Philadelphia.
Paul Grillo, CFA
Senior Vice President, Co-Chief Investment Officer – Total Return Fixed Income Strategy
Paul Grillo is a member of the firm’s taxable fixed income portfolio management team with primary responsibility for portfolio construction and strategic asset allocation. He is also a member of the firm’s asset allocation committee, which is responsible for building and managing multi-asset class portfolios. He joined Delaware Investments in 1992 as a mortgage-backed and asset-backed securities analyst, assuming portfolio management responsibilities in the mid-1990s. Grillo serves as co-lead portfolio manager for the firm’s Diversified Income products and has been influential in the growth and distribution of the firm’s multisector strategies. Prior to joining Delaware Investments, Grillo served as a mortgage strategist and trader at Dreyfus Corporation. He also worked as a mortgage strategist and portfolio manager at Chemical Investment Group and as a financial analyst at Chemical Bank. Grillo holds a bachelor’s degree in business management from North Carolina State University and an MBA with a concentration in finance from Pace University.
53
Board of trustees/directors and officers addendum
Delaware Investments® Family of Funds
A mutual fund is governed by a Board of Trustees/Directors (“Trustees”), which has oversight responsibility for the management of a fund’s business affairs. Trustees establish procedures and oversee and review the performance of the investment manager, the distributor, and others who perform services for the fund. The independent fund trustees, in particular, are advocates
| Name, Address, | | Position(s) | | Length of |
| and Birth Date | | Held with Fund(s) | | Time Served |
| Interested Trustees | | | | |
| |
| Patrick P. Coyne1 | | Chairman, President, | | Chairman and Trustee |
| 2005 Market Street | | Chief Executive Officer, | | since August 16, 2006 |
| Philadelphia, PA 19103 | | and Trustee | | |
| April 1963 | | | | President and |
| | | | Chief Executive Officer |
| | | | since August 1, 2006 |
| |
| |
| |
| |
| |
| |
| |
| |
| |
| |
| |
| |
| Independent Trustees | | | | |
| |
| Thomas L. Bennett | | Trustee | | Since March 2005 |
| 2005 Market Street | | | | |
| Philadelphia, PA 19103 | | | | |
| October 1947 | | | | |
| |
| |
| |
| |
| |
| |
| |
| |
| |
| |
| |
1 Patrick P. Coyne is considered to be an “Interested Trustee” because he is an executive officer of the Fund’s(s’) investment advisor.
54
for shareholder interests. Each trustee has served in that capacity since he or she was elected to or appointed to the Board of Trustees, and will continue to serve until his or her retirement or the election of a new trustee in his or her place. The following is a list of the Trustees and Officers with certain background and related information.
| | Number of Portfolios in | | |
| Principal Occupation(s) | | Fund Complex Overseen | | Other Directorships |
| During Past 5 Years | | by Trustee or Officer | | Held by Trustee or Officer |
| |
| |
| Patrick P. Coyne has served in | | 80 | | Director |
| various executive capacities | | | | Kaydon Corp. |
| at different times at | | | | (July 2007–Present) |
| Delaware Investments.2 | | | | |
| | | | Board of Governors Member |
| | | | Investment Company |
| | | | Institute (ICI) |
| | | | (2007–Present) |
| |
| | | | Member of Investment Committee |
| | | | Cradle of Liberty Council, BSA |
| | | | (November 2007–Present) |
| |
| | | | Finance Committee Member |
| | | | St. John Vianney |
| | | | Roman Catholic Church |
| | | | (2007–Present) |
| | | | | |
| |
| |
| Private Investor | | 80 | | Director |
| (March 2004–Present) | | | | Bryn Mawr Bank Corp. (BMTC) |
| | | | | (April 2007–Present) |
| Investment Manager | | | | |
| Morgan Stanley & Co. | | | | Chairman of |
| (January 1984–March 2004) | | | | Investment Committee |
| | | | Pennsylvania Academy of |
| | | | Fine Arts (2007–Present) |
| | | | Trustee (2004–Present) |
| |
2 Delaware Investments is the marketing name for Delaware Management Holdings, Inc. and its subsidiaries, including the Fund’s(s’) investment advisor, principal underwriter, and its transfer agent.
55
Board of trustees/directors and officers addendum
Delaware Investments® Family of Funds
| Name, Address, | | Position(s) | | Length of |
| and Birth Date | | Held with Fund(s) | | Time Served |
| Independent Trustees (continued) | | | | |
| |
| Thomas L. Bennett | | | | |
| (continued) | | | | |
| |
| |
| |
| |
| |
| John A. Fry | | Trustee | | Since January 2001 |
| 2005 Market Street | | | | |
| Philadelphia, PA 19103 | | | | |
| May 1960 | | | | |
| |
| |
| |
| |
| Anthony D. Knerr | | Trustee | | Since April 1990 |
| 2005 Market Street | | | | |
| Philadelphia, PA 19103 | | | | |
| December 1938 | | | | |
| |
| |
| Lucinda S. Landreth | | Trustee | | Since March 2005 |
| 2005 Market Street | | | | |
| Philadelphia, PA 19103 | | | | |
| June 1947 | | | | |
| |
| Ann R. Leven | | Trustee | | Since October 1989 |
| 2005 Market Street | | | | |
| Philadelphia, PA 19103 | | | | |
| November 1940 | | | | |
| |
| Thomas F. Madison | | Trustee | | Since May 19973 |
| 2005 Market Street | | | | |
| Philadelphia, PA 19103 | | | | |
| February 1936 | | | | |
| | | | | |
| | | | | |
| |
3 In 1997, several funds managed by Voyageur Fund Managers, Inc. (the “Voyageur Funds”) were incorporated into the Delaware Investments Family of Funds. Mr. Madison served as a director of the Voyageur Funds from 1993 until 1997.
56
| | Number of Portfolios in | | |
| Principal Occupation(s) | | Fund Complex Overseen | | Other Directorships |
| During Past 5 Years | | by Trustee or Officer | | Held by Trustee or Officer |
| |
| |
| | | | Investment Committee and |
| | | | Governance Committee |
| | | | Member |
| | | | Pennsylvania Horticultural |
| | | | Society |
| | | | (February 2006–Present) |
| |
| President | | 80 | | Director |
| Franklin & Marshall College | | | | Community Health Systems |
| (June 2002–Present) | | | | |
| | | | Director |
| Executive Vice President | | | | Ecore International |
| University of Pennsylvania | | | | |
| (April 1995–June 2002) | | | | |
| |
| Founder and | | 80 | | None |
| Managing Director | | | | |
| Anthony Knerr & Associates | | | | |
| (Strategic Consulting) | | | | |
| (1990–Present) | | | | |
| |
| Chief Investment Officer | | 80 | | None |
| Assurant, Inc. (Insurance) | | | | |
| (2002–2004) | | | | |
| |
| |
| Consultant | | 80 | | None |
| ARL Associates | | | | |
| (Financial Planning) | | | | |
| (1983–Present) | | | | |
| |
| President and | | 80 | | Director and Chair of |
| Chief Executive Officer | | | | Compensation Committee, |
| MLM Partners, Inc. | | | | Governance Committee |
| (Small Business Investing | | | | Member |
| and Consulting) | | | | CenterPoint Energy |
| (January 1993–Present) | | | | |
| |
57
Board of trustees/directors and officers addendum
Delaware Investments® Family of Funds
| Name, Address, | | Position(s) | | Length of |
| and Birth Date | | Held with Fund(s) | | Time Served |
| Independent Trustees (continued) | | | | |
| |
| Thomas F. Madison | | | | |
| (continued) | | | | |
| |
| |
| |
| |
| |
| |
| |
| |
| |
| |
| |
| |
| |
| |
| |
| |
| |
| |
| |
| |
| Janet L. Yeomans | | Trustee | | Since April 1999 |
| 2005 Market Street | | | | |
| Philadelphia, PA 19103 | | | | |
| July 1948 | | | | |
| |
| |
| |
| |
| J. Richard Zecher | | Trustee | | Since March 2005 |
| 2005 Market Street | | | | |
| Philadelphia, PA 19103 | | | | |
| July 1940 | | | | |
| | | | | |
| | | | | |
| | | | | |
| | | | | |
| | | | | |
| |
58
| | Number of Portfolios in | | |
| Principal Occupation(s) | | Fund Complex Overseen | | Other Directorships |
| During Past 5 Years | | by Trustee or Officer | | Held by Trustee or Officer |
| |
| |
| | | | Lead Director and Chair of |
| | | | Audit and Governance |
| | | | Committees, Member of |
| | | | Compensation Committee |
| | | | Digital River, Inc. |
| |
| | | | Director and Chair of |
| | | | Governance Committee, |
| | | | Audit Committee |
| | | | Member |
| | | | Rimage Corporation |
| |
| | | | Director and Chair of |
| | | | the Compensation Committee |
| | | | Spanlink Communications |
| |
| | | | Lead Director and Member of |
| | | | Compensation and |
| | | | Governance Committees |
| | | | Valmont Industries, Inc. |
| |
| Vice President and Treasurer | | 80 | | Director |
| (January 2006–Present) | | | | Okabena Company |
| Vice President — Mergers & Acquisitions | | | | |
| (January 2003–January 2006), and | | | | |
| Vice President | | | | |
| (July 1995–January 2003) | | | | |
| 3M Corporation | | | | |
| |
| Founder | | 80 | | Director and Audit |
| Investor Analytics | | | | Committee Member |
| (Risk Management) | | | | Investor Analytics |
| (May 1999–Present) | | | | |
| | | | | |
| Founder | | | | |
| Sutton Asset Management | | | | |
| (Hedge Fund) | | | | |
| (September 1996–Present) | | | | |
| |
59
Board of trustees/directors and officers addendum
Delaware Investments® Family of Funds
| Name, Address, | | Position(s) | | Length of |
| and Birth Date | | Held with Fund(s) | | Time Served |
| Officers | | | | |
| | | | | |
| David F. Connor | | Vice President, | | Vice President since |
| 2005 Market Street | | Deputy General | | September 2000 |
| Philadelphia, PA 19103 | | Counsel, and Secretary | | and Secretary since |
| December 1963 | | | | October 2005 |
| |
| |
| Daniel V. Geatens | | Vice President | | Treasurer |
| 2005 Market Street | | and Treasurer | | since October 25, 2007 |
| Philadelphia, PA 19103 | | | | |
| October 1972 | | | | |
| |
| David P. O’Connor | | Senior Vice President, | | Senior Vice President, |
| 2005 Market Street | | General Counsel, | | General Counsel, and |
| Philadelphia, PA 19103 | | and Chief Legal Officer | | Chief Legal Officer |
| February 1966 | | | | since October 2005 |
| |
| Richard Salus | | Senior Vice President | | Chief Financial Officer |
| 2005 Market Street | | and Chief Financial Officer | | since November 2006 |
| Philadelphia, PA 19103 | | | | |
| October 1963 | | | | |
| |
4 David F. Connor, Daniel V. Geatens, David P. O’Connor, and Richard Salus serve in similar capacities for the six portfolios of the Optimum Fund Trust, which have the same investment advisor, principal underwriter, and transfer agent as the registrant.
60
| | Number of Portfolios in | | |
| Principal Occupation(s) | | Fund Complex Overseen | | Other Directorships |
| During Past 5 Years | | by Trustee or Officer | | Held by Trustee or Officer |
| |
| |
| David F. Connor has served as | | 80 | | None4 |
| Vice President and Deputy | | | | |
| General Counsel of | | | | |
| Delaware Investments | | | | |
| since 2000. | | | | |
| |
| Daniel V. Geatens has served | | 80 | | None4 |
| in various capacities at | | | | |
| different times at | | | | |
| Delaware Investments. | | | | |
| |
| David P. O’Connor has served in | | 80 | | None4 |
| various executive and legal | | | | |
| capacities at different times | | | | |
| at Delaware Investments. | | | | |
| |
| Richard Salus has served in | | 80 | | None4 |
| various executive capacities | | | | |
| at different times at | | | | |
| Delaware Investments. | | | | |
| |
The Statement of Additional Information for the Fund(s) includes additional information about the Trustees and Officers and is available, without charge, upon request by calling 800 523-1918.
61
About the organization
Board of trustees | | | |
| | | | |
Patrick P. Coyne
Chairman, President, and
Chief Executive Officer
Delaware Investments®
Family of Funds
Philadelphia, PA Thomas L. Bennett
Private Investor
Rosemont, PA John A. Fry
President
Franklin & Marshall
College
Lancaster, PA | Anthony D. Knerr
Founder and Managing
Director
Anthony Knerr &
Associates
New York, NY Lucinda S. Landreth
Former Chief Investment
Officer
Assurant, Inc.
Philadelphia, PA | Ann R. Leven
Consultant
ARL Associates
New York, NY Thomas F. Madison
President and
Chief Executive Officer
MLM Partners, Inc.
Minneapolis, MN | Janet L. Yeomans
Vice President and
Treasurer
3M Corporation
St. Paul, MN J. Richard Zecher
Founder
Investor Analytics
Scottsdale, AZ |
| | | | |
| Affiliated officers | | | |
| | | | |
David F. Connor
Vice President, Deputy
General Counsel, and
Secretary
Delaware Investments
Family of Funds
Philadelphia, PA | Daniel V. Geatens
Vice President and
Treasurer
Delaware Investments
Family of Funds
Philadelphia, PA | David P. O’Connor
Senior Vice President,
General Counsel,
and Chief Legal Officer
Delaware Investments
Family of Funds
Philadelphia, PA | Richard Salus
Senior Vice President and
Chief Financial Officer
Delaware Investments
Family of Funds
Philadelphia, PA |
This annual report is for the information of Delaware Inflation Protected Bond Fund shareholders, but it may be used with prospective investors when preceded or accompanied by a current prospectus for Delaware Inflation Protected Bond Fund and the Delaware Investments Fund profile for the most recently completed calendar quarter. These documents are available at www.delawareinvestments.com. The prospectus sets forth details about charges, expenses, investment objectives, and operating policies of the investment company. You should read the prospectus carefully before you invest. The figures in this report represent past results that are not a guarantee of future results. The return and principal value of an investment in the investment company will fluctuate so that shares, when redeemed, may be worth more or less than their original cost. |
Delaware Investments is the marketing name of Delaware Management Holdings, Inc. and its subsidiaries. The Fund files its complete schedule of portfolio holdings with the Securities and Exchange Commission for the first and third quarters of each fiscal year on Form N-Q. The Fund’s Forms N-Q, as well as a description of the policies and procedures that the Fund uses to determine how to vote proxies (if any) relating to portfolio securities are available without charge (i) upon request, by calling 800 523-1918; and (ii) on the Commission’s Web site at www.sec.gov. In addition, a description of the policies and procedures that the Fund uses to determine how to vote proxies (if any) relating to portfolio securities and the Fund’s Schedule of Investments are available without charge on the Fund’s Web site at www.delawareinvestments.com. The Fund’s Forms N-Q may be reviewed and copied at the Commission’s Public Reference Room in Washington, D.C.; information on the operation of the Public Reference Room may be obtained by calling 800 SEC-0330. Information (if any) regarding how the Fund voted proxies relating to portfolio securities during the most recently disclosed 12-month period ended June 30 is available without charge (i) through the Fund’s Web site at www.delawareinvestments.com; and (ii) on the Commission’s Web site at www.sec.gov. |
62
Item 2. Code of Ethics
The registrant has adopted a code of ethics that applies to the registrant’s principal executive officer, principal financial officer, principal accounting officer or controller, or persons performing similar functions, regardless of whether these individuals are employed by the registrant or a third party. A copy of the registrant’s Code of Business Ethics has been posted on the Delaware Investments Internet Web site at www.delawareinvestments.com. Any amendments to the Code of Business Ethics, and information on any waiver from its provisions granted by the registrant, will also be posted on this Web site within five business days of such amendment or waiver and will remain on the Web site for at least 12 months.
Item 3. Audit Committee Financial Expert
The registrant’s Board of Trustees/Directors has determined that each member of the registrant’s Audit Committee is an audit committee financial expert, as defined below. For purposes of this item, an “audit committee financial expert” is a person who has the following attributes:
a. An understanding of generally accepted accounting principles and financial statements;
b. The ability to assess the general application of such principles in connection with the accounting for estimates, accruals, and reserves;
c. Experience preparing, auditing, analyzing, or evaluating financial statements that present a breadth and level of complexity of accounting issues that are generally comparable to the breadth and complexity of issues that can reasonably be expected to be raised by the registrant’s financial statements, or experience actively supervising one or more persons engaged in such activities;
d. An understanding of internal controls and procedures for financial reporting; and
e. An understanding of audit committee functions.
An “audit committee financial expert” shall have acquired such attributes through:
a. Education and experience as a principal financial officer, principal accounting officer, controller, public accountant, or auditor or experience in one or more positions that involve the performance of similar functions;
b. Experience actively supervising a principal financial officer, principal accounting officer, controller, public accountant, auditor, or person performing similar functions;
c. Experience overseeing or assessing the performance of companies or public accountants with respect to the preparation, auditing, or evaluation of financial statements; or
d. Other relevant experience.
The registrant’s Board of Trustees/Directors has also determined that each member of the registrant’s Audit Committee is independent. In order to be “independent” for purposes of this item, the Audit Committee member may not: (i) other than in his or her capacity as a member of the Board of Trustees/Directors or any committee thereof, accept directly or indirectly any consulting, advisory or other compensatory fee from the issuer; or (ii) be an “interested person” of the registrant as defined in Section 2(a)(19) of the Investment Company Act of 1940.
The names of the audit committee financial experts on the registrant’s Audit Committee are set forth below:
Thomas L. Bennett 1
John A. Fry
Thomas F. Madison
J. Richard Zecher
Item 4. Principal Accountant Fees and Services
(a) Audit fees.
The aggregate fees billed for services provided to the registrant by its independent auditors for the audit of the registrant’s annual financial statements and for services normally provided by the independent auditors in connection with statutory and regulatory filings or engagements were $32,800 for the fiscal year ended July 31, 2009.
_______________________
1 The instructions to Form N-CSR require disclosure on the relevant experience of persons who qualify as audit committee financial experts based on “other relevant experience.” The Board of Trustees/Directors has determined that Mr. Bennett qualifies as an audit committee financial expert by virtue of his education, Chartered Financial Analyst designation, and his experience as a credit analyst, portfolio manager and the manager of other credit analysts and portfolio managers.
The aggregate fees billed for services provided to the registrant by its independent auditors for the audit of the registrant’s annual financial statements and for services normally provided by the independent auditors in connection with statutory and regulatory filings or engagements were $26,600 for the fiscal year ended July 31, 2008.
(b) Audit-related fees.
The aggregate fees billed by the registrant’s independent auditors for services relating to the performance of the audit of the registrant’s financial statements and not reported under paragraph (a) of this Item were $0 for the fiscal year ended July 31, 2009.
The aggregate fees billed by the registrant’s independent auditors for services relating to the performance of the audit of the financial statements of the registrant’s investment adviser and other service providers under common control with the adviser and that relate directly to the operations or financial reporting of the registrant were $19,074 for the registrant’s fiscal year ended July 31, 2009. The percentage of these fees relating to services approved by the registrant’s Audit Committee pursuant to the de minimis exception from the pre-approval requirement in Rule 2-01(c)(7)(i)(C) of Regulation S-X was 0%. These audit-related services were as follows: issuance of report concerning transfer agent's system of internal accounting control pursuant to Rule 17Ad-13 of the Securities Exchange Act.
The aggregate fees billed by the registrant’s independent auditors for services relating to the performance of the audit of the registrant’s financial statements and not reported under paragraph (a) of this Item were $0 for the fiscal year ended July 31, 2008.
The aggregate fees billed by the registrant’s independent auditors for services relating to the performance of the audit of the financial statements of the registrant’s investment adviser and other service providers under common control with the adviser and that relate directly to the operations or financial reporting of the registrant were $19,074 for the registrant’s fiscal year ended July 31, 2008. The percentage of these fees relating to services approved by the registrant’s Audit Committee pursuant to the de minimis exception from the pre-approval requirement in Rule 2-01(c)(7)(i)(C) of Regulation S-X was 0%. These audit-related services were as follows: issuance of report concerning transfer agent's system of internal accounting control pursuant to Rule 17Ad-13 of the Securities Exchange Act.
(c) Tax fees.
The aggregate fees billed by the registrant’s independent auditors for tax-related services provided to the registrant were $9,000 for the fiscal year ended July 31, 2009. The percentage of these fees relating to services approved by the registrant’s Audit Committee pursuant to the de minimis exception from the pre-approval requirement in Rule 2-01(c)(7)(i)(C) of Regulation S-X was 0%. These tax-related services were as follows: review of income tax returns and review of annual excise distribution calculations.
The aggregate fees billed by the registrant’s independent auditors for tax-related services provided to the registrant’s investment adviser and other service providers under common control with the adviser and that relate directly to the operations or financial reporting of the registrant were $0 for the registrant’s fiscal year ended July 31, 2009.
The aggregate fees billed by the registrant’s independent auditors for tax-related services provided to the registrant were $6,700 for the fiscal year ended July 31, 2008. The percentage of these fees relating to services approved by the registrant’s Audit Committee pursuant to the de minimis exception from the pre-approval requirement in Rule 2-01(c)(7)(i)(C) of Regulation S-X was 0%. These tax-related services were as follows: review of income tax returns and review of annual excise distribution calculations.
The aggregate fees billed by the registrant’s independent auditors for tax-related services provided to the registrant’s adviser and other service providers under common control with the adviser and that relate directly to the operations or financial reporting of the registrant were $0 for the registrant’s fiscal year ended July 31, 2008.
(d) All other fees.
The aggregate fees billed for all services provided by the independent auditors to the registrant other than those set forth in paragraphs (a), (b) and (c) of this Item were $0 for the fiscal year ended July 31, 2009.
The aggregate fees billed for all services other than those set forth in paragraphs (b) and (c) of this Item provided by the registrant’s independent auditors to the registrant’s adviser and other service providers under common control with the adviser and that relate directly to the operations or financial reporting of the registrant were $0 for the registrant’s fiscal year ended July 31, 2009.
The aggregate fees billed for all services provided by the independent auditors to the registrant other than those set forth in paragraphs (a), (b) and (c) of this Item were $0 for the fiscal year ended July 31, 2008.
The aggregate fees billed for all services other than those set forth in paragraphs (b) and (c) of this Item provided by the registrant’s independent auditors to the registrant’s adviser and other service providers under common control with the adviser and that relate directly to the operations or financial reporting of the registrant were $0 for the registrant’s fiscal year ended July 31, 2008.
(e) The registrant’s Audit Committee has established pre-approval policies and procedures as permitted by Rule 2-01(c)(7)(i)(B) of Regulation S-X (the “Pre-Approval Policy”) with respect to services provided by the registrant’s independent auditors. Pursuant to the Pre-Approval Policy, the Audit Committee has pre-approved the services set forth in the table below with respect to the registrant up to the specified fee limits. Certain fee limits are based on aggregate fees to the registrant and other registrants within the Delaware Investments Family of Funds.
| Service | Range of Fees |
| Audit Services | |
| Statutory audits or financial audits for new Funds | up to $25,000 per Fund |
| Services associated with SEC registration statements (e.g., Form N-1A, Form N-14, etc.), periodic reports and other documents filed with the SEC or other documents issued in connection with securities offerings (e.g., comfort letters for closed-end Fund offerings, consents), and assistance in responding to SEC comment letters | up to $10,000 per Fund |
| Consultations by Fund management as to the accounting or disclosure treatment of transactions or events and/or the actual or potential impact of final or proposed rules, standards or interpretations by the SEC, FASB, or other regulatory or standard-setting bodies (Note: Under SEC rules, some consultations may be considered “audit-related services” rather than “audit services”) | up to $25,000 in the aggregate |
| Audit-Related Services | |
| Consultations by Fund management as to the accounting or disclosure treatment of transactions or events and /or the actual or potential impact of final or proposed rules, standards or interpretations by the SEC, FASB, or other regulatory or standard-setting bodies (Note: Under SEC rules, some consultations may be considered “audit services” rather than “audit-related services”) | up to $25,000 in the aggregate |
| Tax Services | |
| U.S. federal, state and local and international tax planning and advice (e.g., consulting on statutory, regulatory or administrative developments, evaluation of Funds’ tax compliance function, etc.) | up to $25,000 in the aggregate |
| U.S. federal, state and local tax compliance (e.g., excise distribution reviews, etc.) | up to $5,000 per Fund |
| Review of federal, state, local and international income, franchise and other tax returns | up to $5,000 per Fund |
Under the Pre-Approval Policy, the Audit Committee has also pre-approved the services set forth in the table below with respect to the registrant’s investment adviser and other entities controlling, controlled by or under common control with the investment adviser that provide ongoing services to the registrant (the “Control Affiliates”) up to the specified fee limit. This fee limit is based on aggregate fees to the investment adviser and its Control Affiliates.
| Service | Range of Fees |
| Non-Audit Services | |
| Services associated with periodic reports and other documents filed with the SEC and assistance in responding to SEC comment letters | up to $10,000 in the aggregate |
The Pre-Approval Policy requires the registrant’s independent auditors to report to the Audit Committee at each of its regular meetings regarding all services initiated since the last such report was rendered, including those services authorized by the Pre-Approval Policy.
(f) Not applicable.
(g) The aggregate non-audit fees billed by the registrant’s independent auditors for services rendered to the registrant and to its investment adviser and other service providers under common control with the adviser were $208,714 and $261,062 for the registrant’s fiscal years ended July 31, 2009 and July 31, 2008, respectively.
(h) In connection with its selection of the independent auditors, the registrant’s Audit Committee has considered the independent auditors’ provision of non-audit services to the registrant’s investment adviser and other service providers under common control with the adviser that were not required to be pre-approved pursuant to Rule 2-01(c)(7)(ii) of Regulation S-X. The Audit Committee has determined that the independent auditors’ provision of these services is compatible with maintaining the auditors’ independence.
Item 5. Audit Committee of Listed Registrants
Not applicable.
Item 6. Investments
(a) Included as part of report to shareholders filed under Item 1 of this Form N-CSR.
(b) Divestment of securities in accordance with Section 13(c) of the Investment Company Act of 1940.
Not applicable.
Item 7. Disclosure of Proxy Voting Policies and Procedures for Closed-End Management Investment Companies
Not applicable.
Item 8. Portfolio Managers of Closed-End Management Investment Companies
Not applicable.
Item 9. Purchases of Equity Securities by Closed-End Management Investment Company and Affiliated Purchasers
Not applicable.
Item 10. Submission of Matters to a Vote of Security Holders
Not applicable.
Item 11. Controls and Procedures
The registrant’s principal executive officer and principal financial officer have evaluated the registrant’s disclosure controls and procedures within 90 days of the filing of this report and have concluded that they are effective in providing reasonable assurance that the information required to be disclosed by the registrant in its reports or statements filed under the Securities Exchange Act of 1934 is recorded, processed, summarized and reported within the time periods specified in the rules and forms of the Securities and Exchange Commission.
There were no significant changes in the registrant’s internal control over financial reporting that occurred during the second fiscal quarter of the period covered by the report to stockholders included herein (i.e., the registrant’s fourth fiscal quarter) that have materially affected, or are reasonably likely to materially affect, the registrant’s internal control over financial reporting.
Item 12. Exhibits
| (a) | (1) Code of Ethics |
| |
| Not applicable. |
| |
| (2) Certifications of Principal Executive Officer and Principal Financial Officer pursuant to Rule 30a-2 under the Investment Company Act of 1940 are attached hereto as Exhibit 99.CERT. |
| |
| (3) Written solicitations to purchase securities pursuant to Rule 23c-1 under the Securities Exchange Act of 1934. |
| |
| Not applicable. |
| | |
| (b) | Certifications pursuant to Section 906 of the Sarbanes-Oxley Act of 2002 are furnished herewith as Exhibit 99.906CERT. |
SIGNATURES
Pursuant to the requirements of the Securities Exchange Act of 1934 and the Investment Company Act of 1940, the registrant has duly caused this report to be signed on its behalf, by the undersigned, thereunto duly authorized.
Name of Registrant: DELAWARE GROUP® GOVERNMENT FUND
| PATRICK P. COYNE |
| By: | Patrick P. Coyne |
| Title: | Chief Executive Officer |
| Date: | October 2, 2009 |
Pursuant to the requirements of the Securities Exchange Act of 1934 and the Investment Company Act of 1940, this report has been signed below by the following persons on behalf of the registrant and in the capacities and on the dates indicated.
| PATRICK P. COYNE |
| By: | Patrick P. Coyne |
| Title: | Chief Executive Officer |
| Date: | October 2, 2009 |
| RICHARD SALUS |
| By: | Richard Salus |
| Title: | Chief Financial Officer |
| Date: | October 2, 2009 |