UNITED STATES SECURITIES AND EXCHANGE COMMISSION
Washington, D.C. 20549
FORM N-CSR
CERTIFIED SHAREHOLDER REPORT OF REGISTERED MANAGEMENT
INVESTMENT COMPANIES
| Investment Company Act file number: | 811-04304 |
| | |
| Exact name of registrant as specified in charter: | Delaware Group® Government Fund |
| | |
| Address of principal executive offices: | 2005 Market Street |
| | Philadelphia, PA 19103 |
| | |
| Name and address of agent for service: | David F. Connor, Esq. |
| | 2005 Market Street |
| | Philadelphia, PA 19103 |
| | |
| Registrant’s telephone number, including area code: | (800) 523-1918 |
| | |
| Date of fiscal year end: | July 31 |
| | |
| Date of reporting period: | July 31, 2010 |
Item 1. Reports to Stockholders

Annual report Delaware Core Plus Bond Fund July 31, 2010 Fixed income mutual fund |
This annual report is for the information of Delaware Core Plus Bond Fund shareholders, but it may be used with prospective investors when preceded or accompanied by a current prospectus for Delaware Core Plus Bond Fund. The figures in the annual report for Delaware Core Plus Bond Fund represent past results, which are not a guarantee of future results. The return and principal value of an investment in the Fund will fluctuate so that shares, when redeemed, may be worth more or less than their original cost. Current performance may be higher or lower than the performance data quoted.
You should consider the investment objectives, risks, charges, and expenses of the Fund carefully before investing. The Delaware Core Plus Bond Fund prospectus contains this and other important information about the Fund. Prospectuses for all open-end funds in the Delaware Investments® Family of Funds are available from your financial advisor, online at www.delawareinvestments.com, or by phone at 800 523-1918. Please read the prospectus carefully before you invest or send money.
|
You can obtain shareholder reports and prospectuses online instead of in the mail.
Visit www.delawareinvestments.com/edelivery. |
Experience Delaware Investments
Delaware Investments is committed to the pursuit of consistently superior asset management and unparalleled client service. We believe in our investment processes, which seek to deliver consistent results, and in convenient services that help add value for our clients.
If you are interested in learning more about creating an investment plan, contact your financial advisor.
You can learn more about Delaware Investments or obtain a prospectus for Delaware Core Plus Bond Fund at www.delawareinvestments.com.
Manage your investments online
- 24-hour access to your account information
- Obtain share prices
- Check your account balance and recent transactions
- Request statements or literature
- Make purchases and redemptions
Delaware Management Holdings, Inc., and its subsidiaries (collectively known by the marketing name of Delaware Investments) are wholly owned subsidiaries of Macquarie Group Limited, a global provider of banking, financial, advisory, investment and funds management services.
Investments in Delaware Core Plus Bond Fund are not and will not be deposits with or liabilities of Macquarie Bank Limited ABN 46 008 583 542 and its holding companies, including their subsidiaries or related companies (Macquarie Group), and are subject to investment risk, including possible delays in repayment and loss of income and capital invested. No Macquarie Group company guarantees or will guarantee the performance of the Fund, the repayment of capital from the Fund, or any particular rate of return.
| Table of contents | |
| Portfolio management review | 1 |
| Performance summary | 4 |
| Disclosure of Fund expenses | 8 |
| Security type | 10 |
| Statement of net assets | 12 |
| Statement of assets and liabilities | 35 |
| Statement of operations | 36 |
| Statements of changes in net assets | 38 |
| Financial highlights | 40 |
| Notes to financial statements | 50 |
| Report of independent registered | |
| public accounting firm | 67 |
| Other Fund information | 68 |
| Board of trustees/directors and | |
| officers addendum | 70 |
| About the organization | 80 |
Unless otherwise noted, views expressed herein are current as of July 31, 2010, and are subject to change.
Funds are not FDIC insured and are not guaranteed. It is possible to lose the principal amount invested.
Mutual fund advisory services provided by Delaware Management Company, a series of Delaware Management Business Trust, which is a registered investment advisor. Delaware Investments, a member of Macquarie Group, refers to Delaware Management Holdings, Inc. and its subsidiaries, including the Fund’s distributor, Delaware Distributors, L.P. Macquarie Group refers to Macquarie Group Limited and its subsidiaries and affiliates worldwide.
© 2010 Delaware Management Holdings, Inc.
All third-party trademarks cited are the property of their respective owners.
| Portfolio management review |
| Delaware Core Plus Bond Fund | Aug. 10, 2010 |
| Performance preview (for the period ended July 31, 2010) |
| Delaware Core Plus Bond Fund (Class A shares) | | 1-year return | | +13.03% |
| Barclays Capital U.S. Aggregate Index (benchmark) | | 1-year return | | +8.91% |
Past performance does not guarantee future results.
For complete, annualized performance for Delaware Core Plus Bond Fund, please see the table on page 4.
The performance of Class A shares excludes the applicable sales charge and reflects the reinvestment of all distributions.
Index performance returns do not reflect any management fees, transaction costs, or expenses. Indices are unmanaged and one cannot invest directly in an index.
The fiscal year began on a somewhat hopeful note, with capital markets reopening on the heels of the subprime debt crisis. Companies were generally able to refinance upcoming debt maturities, reducing the possibility of default that hung over debt markets in the first two quarters of 2009. Many investors were quick to take advantage of this and other positive news, as the economy moved into a tentative recovery, with employment and home sales figures showing some signs of improvement. The second half of the fiscal year brought less encouraging economic news, however, and many investors were quick to retreat from riskier investments.
Fund performance
Delaware Core Plus Bond Fund Class A shares returned +13.03% at net asset value and +7.93% at maximum offer price (both returns include distributions reinvested) for the fiscal year ended July 31, 2010. For the same period, the Fund’s benchmark, the Barclays Capital U.S. Aggregate Index, advanced +8.91%. For complete annualized performance for Delaware Core Plus Bond Fund, please see the table on page 4.
A strong beginning, a shakier end
Financial markets showed improvement during the first portion of the fiscal year, though economic indicators were mixed. Banks began to rebound from their
As economic conditions turned more volatile, it is important to note that we attempted to upgrade the quality of our holdings within both the investment grade and high yield sectors. This decision was beneficial overall, though our allocation to the high yield sector took back some of the strong returns it had generated earlier in the fiscal period.
1
Portfolio management review
Delaware Core Plus Bond Fund
losses, largely passing stress tests and capital evaluations. As mentioned above, corporations were generally able to refinance debt, and default rates dropped as a result, particularly in the high yield sector, declining to between 5% and 6% from highs near 13% in 2009. They are expected to hover near 3% in 2011 (Source: Moody’s).
Beginning in April 2010, however, investors seemed to turn their attention to what many economists believed were structural debt problems within certain euro zone governments — problems that could potentially create a drag on a nascent economic recovery across the developed world. The European Union, in conjunction with the International Monetary Fund, eventually backed a massive rescue fund for euro zone members, but not before investor sentiment turned sour. Greece bore the brunt of investor concern, as investors demanded upward of 1,000 basis points (or 10 percentage points) of protection against default in the credit derivative swap market. Investors also demanded risk premiums from Portuguese, Italian, Irish, and Spanish government bonds.
More broadly, however, the debt concerns in Europe resulted in a global flight to quality that generated intense demand for Treasury securities. Though we began the fiscal period with the belief that rising Treasury rates could become a potential cause for concern, yields on 10-year Treasury securities declined significantly after peaking in April 2010. In turn, yields on non-Treasury spread product rose as investors navigated increasingly fragile economic conditions. (It’s important to remember that bond yields move in the opposite direction of prices.)
Within the Fund
Broadly speaking, we began the Fund’s fiscal year attempting to participate in the rally that carried over from the end of the previous fiscal period. During this time, our allocations to cyclical sectors within the investment grade and high yield corporate bond sectors contributed significantly to the Fund’s return.
The Fund generally benefited from strong security selection across nearly all investment grade industries during the period. Our emphasis on BBB- and A-rated issues and in financials particularly added to the Fund’s performance over the fiscal year. Among the Fund’s high yield allocation, we generally attempted to take advantage of snap-back rallies in sectors that we believed had sustained the most damage during the preceding fiscal year. Specifically, we took large overweight positions in CCC- and B-rated bonds within economically sensitive cyclical sectors such as basic materials. Meanwhile, we underweighted higher-rated BB securities and bonds from defensive industries such as energy, healthcare, and utilities. Those credit and sector allocation decisions also contributed to the Fund’s relative performance during the fiscal year.
As economic conditions turned more volatile, however, it is important to note that we attempted to upgrade the quality of our holdings within both the investment grade and high yield sectors. This decision was beneficial overall, though our allocation to the high yield sector took back some of the strong returns it had generated earlier in the fiscal period.
2
In contrast, our underweight position in Treasury securities ultimately detracted from performance versus the benchmark index. While the underweight helped relative performance early in the fiscal year (as investors generally shunned low-yielding Treasurys in favor of riskier securities), Treasurys advanced later in the period on the back of strong demand, as noted above.
Other detractors from the Fund’s relative performance came from overweights in asset-backed securities and commercial mortgage-backed securities (particularly during the latter parts of the period). This happened despite the Fund’s bias toward higher-quality commercial mortgage-backed securities.
Although the global economic outlook is uncertain, we believe that our in-depth, fundamentals-based debt selection process has uncovered many positive stories, and should allow us to successfully steer the Fund through events that we believe could continue to test global economies and financial markets in the coming quarters.
3
| Performance summary |
| Delaware Core Plus Bond Fund | July 31, 2010 |
The performance data quoted represent past performance; past performance does not guarantee future results. Investment return and principal value will fluctuate so your shares, when redeemed, may be worth more or less than their original cost. Please obtain the performance data current for the most recent month end by calling 800 523-1918 or visiting our Web site at www.delawareinvestments.com/performance. Current performance may be lower or higher than the performance data quoted.
You should consider the investment objectives, risks, charges, and expenses of the investment company carefully before investing. The Delaware Core Plus Bond Fund prospectus contains this and other important information about the investment company. Please request a prospectus through your financial advisor or by calling 800 523-1918 or visiting our Web site at www.delawareinvestments.com. Read the prospectus carefully before you invest or send money.
| Fund performance | | Average annual total returns through July 31, 2010 |
| | | 1 year | | 5 years | | 10 years | | Lifetime |
| Class A (Est. Aug. 16, 1985) | | | | | | | | | | |
| Excluding sales charge | | | +13.03% | | | +6.40% | | +6.38% | | n/a |
| Including sales charge | | | +7.93% | | | +5.43% | | +5.89% | | n/a |
| Class B (Est. May 2, 1994) | | | | | | | | | | |
| Excluding sales charge | | | +12.19% | | | +5.62% | | +5.75% | | n/a |
| Including sales charge | | | +8.19% | | | +5.38% | | +5.75% | | n/a |
| Class C (Est. Nov. 29, 1995) | | | | | | | | | | |
| Excluding sales charge | | | +12.32% | | | +5.65% | | +5.62% | | n/a |
| Including sales charge | | | +11.32% | | | +5.65% | | +5.62% | | n/a |
| Class R (Est. June 2, 2003) | | | | | | | | | | |
| Excluding sales charge | | | +12.87% | | | +6.17% | | n/a | | +4.83% |
| Including sales charge | | | +12.87% | | | +6.17% | | n/a | | +4.83% |
| Institutional Class (Est. June 1, 1992) | | | | | | | | | | |
| Excluding sales charge | | | +13.30% | | | +6.70% | | +6.69% | | n/a |
| Including sales charge | | | +13.30% | | | +6.70% | | +6.69% | | n/a |
Returns reflect the reinvestment of all distributions and any applicable sales charges as noted in the following paragraphs.
Performance for Class B and C shares, excluding sales charges, assumes either that contingent deferred sales charges did not apply or that the investment was not redeemed.
Expense limitations were in effect for certain classes during the periods shown in the “Fund performance” chart and in the “Performance of a $10,000 investment” chart. The current expenses for each class are listed on the “Fund expense ratios” chart. (Note that all charts and graphs referred to in the “Performance summary” section of this report are found on pages 4 through 7.) Performance would have been lower had the expense limitations not been in effect.
4
The Fund offers Class A, B, C, R, and Institutional Class shares.
Class A shares are sold with a maximum front-end sales charge of up to 4.50%, and have an annual distribution and service fee of up to 0.30% of average daily net assets. This fee has been contractually limited to 0.25% of average daily net assets from Dec. 1, 2009, through Nov. 30, 2010.
The Board of Trustees has adopted a formula for calculating 12b-1 fees for the Fund’s Class A shares that went into effect on June 1, 1992. The total 12b-1 fees to be paid by Class A shareholders of the Fund will be the sum of 0.10% of the average daily net assets representing shares that were acquired prior to June 1, 1992, and 0.30% of the average daily net assets representing shares that were acquired on or after June 1, 1992. All Class A shareholders will bear 12b-1 fees at the same rate, the blended rate based upon the allocation of the 0.10% and 0.30% rates described above.
Class B shares may only be purchased through dividend reinvestment and certain permitted exchanges as described in the prospectus. Please see the prospectus for additional information on Class B purchase and sales charges. Class B shares have a contingent deferred sales charge that declines from 4.00% to zero depending on the period of time the shares are held.
Class B shares will automatically convert to Class A shares on a quarterly basis approximately eight years after purchase. They are also subject to an annual distribution and service fee of up to 1.00% of average daily net assets.
Ten-year performance figures for Class B shares reflect conversion to Class A shares after approximately eight years.
Class C shares are sold with a contingent deferred sales charge of 1.00% if redeemed during the first 12 months. They are also subject to an annual distribution and service fee of up to 1.00% of average daily net assets.
Class R shares are available only for certain retirement plan products. They are sold without a sales charge and have an annual distribution and service fee of up to 0.60% of average daily net assets, which has been limited contractually to 0.50% from Dec. 1, 2009, through Nov. 30, 2010.
Institutional Class shares are available without sales or asset-based distribution charges only to certain eligible institutional accounts.
The “Fund performance” table and the “Performance of a $10,000 investment” graph do not reflect the deduction of taxes the shareholder would pay on Fund distributions or redemptions of Fund shares.
Fixed income securities and bond funds can lose value, and investors can lose principal, as interest rates rise. They also may be affected by economic conditions that hinder an issuer’s ability to make interest and principal payments on its debt.
The Fund may also be subject to prepayment risk, the risk that the principal of a fixed income security that is held by the Fund may be prepaid prior to maturity, potentially forcing the Fund to reinvest that money at a lower interest rate.
High yielding, noninvestment grade bonds (junk bonds) involve higher risk than investment grade bonds. The high yield secondary market is particularly susceptible to liquidity problems when institutional investors, such as mutual funds and certain
5
Performance summary
Delaware Core Plus Bond Fund
other financial institutions, temporarily stop buying bonds for regulatory, financial, or other reasons. In addition, a less liquid secondary market makes it more difficult for the Fund to obtain precise valuations of the high yield securities in its portfolio.
The Fund may invest in derivatives, which may involve additional expenses and are subject to risk, including the risk that an underlying security or securities index moves in the opposite direction from what the portfolio manager anticipated. A derivative transaction depends upon the counterparties’ ability to fulfill their contractual obligations.
International investments entail risks not ordinarily associated with U.S. investments including fluctuation in currency values, differences in accounting principles, or economic or political instability in other nations. Investing in emerging markets can be riskier than investing in established foreign markets due to increased volatility and lower trading volume.
The Fund may experience portfolio turnover in excess of 100%, which could result in higher transaction costs and tax liability.
If and when we invest in forward foreign currency contracts or use other investments to hedge against currency risks, the Fund will be subject to special risks, including counterparty risk.
The Fund’s expense ratios, as described in the most recent prospectus, are disclosed in the following “Fund expense ratios” chart. Delaware Investments has agreed to (1) voluntarily waive all or a portion of its investment advisory fees and/or reimburse certain expenses (excluding certain expenses) to prevent total annual fund operating expenses from exceeding 0.65% of the Fund’s average daily net assets from Dec. 1, 2009, until the voluntary cap is discontinued; and (2) contractually limit the Class A and R shares distribution and service fees from Dec. 1, 2009, through Nov. 30, 2010 to 0.25% and 0.50%, respectively. Please see the most recent prospectus and any applicable supplement(s) for additional information on these fee waivers and/or reimbursements.
| Fund expense ratios | Class A | | Class B | | Class C | | Class R | | Institutional Class |
| Total annual operating expenses | 1.32% | | 2.02% | | 2.02% | | 1.62% | | 1.02% |
| (without fee waivers) | | | | | | | | | |
| Net expenses | 0.90% | | 1.65% | | 1.65% | | 1.15% | | 0.65% |
| (including fee waivers, if any) | | | | | | | | | |
| Type of waiver | Contractual | | Voluntary | | Voluntary | | Contractual | | Voluntary |
| | and voluntary | | | | | | and voluntary | | |
6
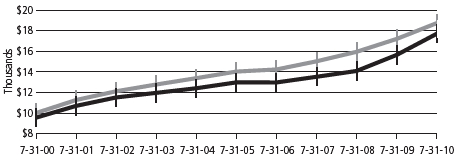
Performance of a $10,000 investment
Average annual total returns from July 31, 2000, through July 31, 2010
| For period beginning July 31, 2000, through July 31, 2010 | Starting value | Ending value |
| | Barclays Capital U.S. Aggregate Index | $10,000 | $18,742 |
| | Delaware Core Plus Bond Fund — Class A Shares | $9,550 | $17,707 |
The chart assumes $10,000 invested in the Fund on July 31, 2000, and includes the effect of a 4.50% front-end sales charge and the reinvestment of all distributions. Please note additional details on these fees in the “Performance summary” section of this report, which includes pages 4 through 7.
The chart also assumes $10,000 invested in the Barclays Capital U.S. Aggregate Index as of July 31, 2000.
The Barclays Capital U.S. Aggregate Index is a broad composite of more than 8,000 securities that tracks the investment grade domestic bond market.
Index performance returns do not reflect any management fees, transaction costs or expenses. Indices are unmanaged and one cannot invest directly in an index. Past performance is not a guarantee of future results.
Performance of other Fund classes will vary due to different charges and expenses.
The “Fund performance” chart and the “Performance of a $10,000 investment” graph do not reflect the deduction of taxes shareholders would pay on Fund distributions or redemptions of Fund shares.
| | | Nasdaq symbols | | CUSIPs | |
| Class A | | | DEGGX | | | 246094205 | |
| Class B | | | DEGBX | | | 246094601 | |
| Class C | | | DUGCX | | | 246094700 | |
| Class R | | | DUGRX | | | 246094809 | |
| Institutional Class | | | DUGIX | | | 246094502 | |
7
Disclosure of Fund expenses
For the six-months period February 1, 2010 to July 31, 2010
As a shareholder of the Fund, you incur two types of costs: (1) transaction costs, including sales charges (loads) on purchase payments, reinvested dividends, or other distributions; redemption fees; and exchange fees; and (2) ongoing costs, including management fees; distribution and/or service (12b-1) fees; and other Fund expenses. This example is intended to help you understand your ongoing costs (in dollars) of investing in the Fund and to compare these costs with the ongoing costs of investing in other mutual funds.
The example is based on an investment of $1,000 invested at the beginning of the period and held for the entire six-months period from February 1, 2010 to July 31, 2010.
Actual expenses
The first section of the table shown, “Actual Fund return,” provides information about actual account values and actual expenses. You may use the information in this section of the table, together with the amount you invested, to estimate the expenses that you paid over the period. Simply divide your account value by $1,000 (for example, an $8,600 account value divided by $1,000 = 8.6), then multiply the result by the number in the first section under the heading entitled “Expenses Paid During Period” to estimate the expenses you paid on your account during this period.
Hypothetical example for comparison purposes
The second section of the table shown, “Hypothetical 5% return,” provides information about hypothetical account values and hypothetical expenses based on the Fund’s actual expense ratio and an assumed rate of return of 5% per year before expenses, which is not the Fund’s actual return. The hypothetical account values and expenses may not be used to estimate the actual ending account balance or expenses you paid for the period. You may use this information to compare the ongoing costs of investing in the Fund and other funds. To do so, compare this 5% hypothetical example with the 5% hypothetical examples that appear in the shareholder reports of the other funds.
Please note that the expenses shown in the table are meant to highlight your ongoing costs only and do not reflect any transactional costs, such as sales charges (loads), redemption fees, or exchange fees. Therefore, the second section of the table is useful in comparing ongoing costs only, and will not help you determine the relative total costs of owning different funds. In addition, if these transactional costs were included, your costs would have been higher. The Fund’s expenses shown in the table reflect fee waivers in effect. The expenses shown in the table assume reinvestment of all dividends and distributions.
8
Delaware Core Plus Bond Fund
Expense analysis of an investment of $1,000
| | | Beginning | | Ending | | | | Expenses |
| | | Account Value | | Account Value | | Annualized | | Paid During Period |
| | | 2/1/10 | | 7/31/10 | | Expense Ratio | | 2/1/10 to 7/31/10* |
| Actual Fund return | | | | | | | | | | | |
| Class A | | $1,000.00 | | | $1,049.80 | | | 0.90% | | $4.57 | |
| Class B | | 1,000.00 | | | 1,045.90 | | | 1.65% | | 8.37 | |
| Class C | | 1,000.00 | | | 1,045.90 | | | 1.65% | | 8.37 | |
| Class R | | 1,000.00 | | | 1,048.40 | | | 1.15% | | 5.84 | |
| Institutional Class | | 1,000.00 | | | 1,051.10 | | | 0.65% | | 3.30 | |
| Hypothetical 5% return (5% return before expenses) | | | | | | |
| Class A | | $1,000.00 | | | $1,020.33 | | | 0.90% | | $4.51 | |
| Class B | | 1,000.00 | | | 1,016.61 | | | 1.65% | | 8.25 | |
| Class C | | 1,000.00 | | | 1,016.61 | | | 1.65% | | 8.25 | |
| Class R | | 1,000.00 | | | 1,019.09 | | | 1.15% | | 5.76 | |
| Institutional Class | | 1,000.00 | | | 1,021.57 | | | 0.65% | | 3.26 | |
*“Expenses Paid During Period” are equal to the Fund’s annualized expense ratio, multiplied by the average account value over the period, multiplied by 181/365 (to reflect the one-half year period).
9
| Security type | |
| Delaware Core Plus Bond Fund | As of July 31, 2010 |
Sector designations may be different than the sector designations presented in other Fund materials. The sector designations may represent the investment manager’s internal sector classifications, which may result in the sector designations for one fund being different than another fund’s sector designations.
| Security type | Percentage of net assets |
| Agency Collateralized Mortgage Obligations | 2.43 | % |
| Agency Mortgage-Backed Securities | 15.47 | % |
| Commercial Mortgage-Backed Securities | 8.41 | % |
| Convertible Bonds | 0.56 | % |
| Corporate Bonds | 39.19 | % |
| Banking | 6.10 | % |
| Basic Industries | 2.54 | % |
| Brokerage | 1.18 | % |
| Capital Goods | 1.12 | % |
| Communications | 7.65 | % |
| Consumer Cyclical | 1.22 | % |
| Consumer Non-Cyclical | 6.22 | % |
| Electric | 3.47 | % |
| Energy | 4.22 | % |
| Finance Companies | 2.14 | % |
| Insurance | 0.21 | % |
| Natural Gas | 1.55 | % |
| Real Estate | 0.77 | % |
| Technology | 0.53 | % |
| Transportation | 0.27 | % |
| Non-Agency Asset-Backed Securities | 8.39 | % |
| Non-Agency Collateralized Mortgage Obligations | 1.42 | % |
| Regional Agencies | 0.80 | % |
| Regional Authorities | 0.65 | % |
| Senior Secured Loans | 2.05 | % |
| Sovereign Agencies | 1.36 | % |
| Sovereign Debt | 3.59 | % |
| Supranational Banks | 1.36 | % |
| U.S. Treasury Obligations | 7.58 | % |
| Preferred Stock | 0.27 | % |
10
| Security type | Percentage of net assets |
| Discount Note | 15.38 | % |
| Securities Lending Collateral | 0.67 | % |
| Total Value of Securities | 109.58 | % |
| Obligation to Return Securities Lending Collateral | (0.69 | %) |
| Liabilities Net of Receivables and Other Assets | (8.89 | %) |
| Total Net Assets | 100.00 | % |
11
| Statement of net assets | |
| Delaware Core Plus Bond Fund | July 31, 2010 |
| | | Principal amount° | | Value (U.S. $) |
| Agency Collateralized Mortgage Obligations – 2.43% | | | | | | | |
| | Fannie Mae Grantor Trust | | | | | | | |
| | Series 2001-T10 A1 7.00% 12/25/41 | USD | | 174,026 | | | $ | 195,398 |
| | Series 2002-T1 A2 7.00% 11/25/31 | | | 94,300 | | | | 106,352 |
| | Fannie Mae Interest Strip | | | | | | | |
| | Series 35-2 12.00% 7/1/18 | | | 53,903 | | | | 66,118 |
| | Series J-1 7.00% 11/1/10 | | | 2 | | | | 2 |
| | Fannie Mae REMICs | | | | | | | |
| | Series 1988-15 A 9.00% 6/25/18 | | | 887 | | | | 1,017 |
| | Series 1996-46 ZA 7.50% 11/25/26 | | | 114,942 | | | | 128,470 |
| | Series 2002-83 GH 5.00% 12/25/17 | | | 465,000 | | | | 510,867 |
| | Fannie Mae Whole Loan | | | | | | | |
| | Series 2002-W1 2A 7.50% 2/25/42 | | | 98,428 | | | | 113,592 |
| | Freddie Mac REMICs | | | | | | | |
| | Series 2557 WE 5.00% 1/15/18 | | | 300,000 | | | | 330,942 |
| | Series 2662 MA 4.50% 10/15/31 | | | 137,768 | | | | 145,047 |
| | Series 3131 MC 5.50% 4/15/33 | | | 200,000 | | | | 217,404 |
| | Series 3173 PE 6.00% 4/15/35 | | | 325,000 | | | | 355,789 |
| | Series 3337 PB 5.50% 7/15/30 | | | 215,000 | | | | 222,930 |
| w | Freddie Mac Structured Pass Through Securities | | | | | | | |
| | Series T-42 A5 7.50% 2/25/42 | | | 36,890 | | | | 42,256 |
| Total Agency Collateralized Mortgage Obligations | | | | | | | |
| | (cost $2,256,734) | | | | | | | 2,436,184 |
| | |
| Agency Mortgage-Backed Securities – 15.47% | | | | | | | |
| | Fannie Mae 10.50% 6/1/30 | | | 11,130 | | | | 13,008 |
| • | Fannie Mae ARM | | | | | | | |
| | 5.001% 8/1/35 | | | 223,371 | | | | 237,635 |
| | 5.122% 11/1/35 | | | 112,509 | | | | 119,642 |
| | 6.216% 7/1/36 | | | 267,753 | | | | 287,185 |
| | Fannie Mae S.F. 15 yr | | | | | | | |
| | 5.00% 5/1/21 | | | 212,874 | | | | 229,096 |
| | 8.00% 10/1/16 | | | 107,760 | | | | 117,788 |
| | Fannie Mae S.F. 15 yr TBA | | | | | | | |
| | 4.00% 8/1/25 | | | 1,100,000 | | | | 1,150,358 |
| | 4.50% 8/1/25 | | | 600,000 | | | | 635,719 |
| | Fannie Mae S.F. 20 yr 5.50% 8/1/28 | | | 803,270 | | | | 867,572 |
12
| | | Principal amount° | | Value (U.S. $) |
| Agency Mortgage-Backed Securities (continued) | | | | | | | |
| | Fannie Mae S.F. 30 yr | | | | | | | |
| | 5.00% 12/1/36 to 2/1/38 | USD | | 951,007 | | | $ | 1,015,521 |
| | 6.00% 11/1/37 | | | 616,745 | | | | 670,909 |
| | 8.00% 2/1/30 | | | 21,976 | | | | 25,521 |
| | 10.00% 7/1/20 to 2/1/25 | | | 198,277 | | | | 222,767 |
| | Fannie Mae S.F. 30 yr TBA | | | | | | | |
| | 4.00% 8/1/40 | | | 1,470,000 | | | | 1,506,520 |
| | 4.50% 8/1/40 | | | 2,465,000 | | | | 2,568,221 |
| | 5.00% 8/1/40 | | | 580,000 | | | | 616,069 |
| | 6.00% 8/1/40 | | | 1,495,000 | | | | 1,623,943 |
| • | Freddie Mac ARM | | | | | | | |
| | 5.672% 7/1/36 | | | 83,808 | | | | 88,181 |
| | 5.791% 10/1/36 | | | 229,299 | | | | 244,523 |
| | Freddie Mac S.F. 15 yr | | | | | | | |
| | 4.50% 7/1/24 | | | 488,525 | | | | 518,061 |
| | 5.00% 6/1/18 to 1/1/24 | | | 244,265 | | | | 261,847 |
| | 5.50% 8/1/23 | | | 161,308 | | | | 174,350 |
| | Freddie Mac S.F. 30 yr | | | | | | | |
| | 8.00% 5/1/31 | | | 155,376 | | | | 179,224 |
| | 10.00% 1/1/19 | | | 14,017 | | | | 16,036 |
| | 11.50% 6/1/15 to 3/1/16 | | | 36,862 | | | | 42,625 |
| | Freddie Mac S.F. 30 yr TBA | | | | | | | |
| | 5.00% 8/1/40 | | | 1,300,000 | | | | 1,380,437 |
| | 6.00% 8/1/40 | | | 210,000 | | | | 228,080 |
| | GNMA I GPM | | | | | | | |
| | 11.00% 3/15/13 | | | 10,216 | | | | 10,295 |
| | 12.25% 3/15/14 | | | 6,557 | | | | 6,615 |
| | GNMA I S.F. 15 yr 6.50% 7/15/14 | | | 45,711 | | | | 49,765 |
| | GNMA I S.F. 30 yr | | | | | | | |
| | 7.50% 1/15/32 | | | 17,425 | | | | 20,113 |
| | 8.00% 5/15/30 | | | 13,849 | | | | 16,283 |
| | 9.50% 10/15/19 to 3/15/23 | | | 46,993 | | | | 54,477 |
| | 10.00% 9/15/18 | | | 9,760 | | | | 10,895 |
| | 11.00% 8/15/15 to 9/15/15 | | | 15,017 | | | | 15,283 |
| | 11.50% 7/15/15 | | | 3,167 | | | | 3,192 |
| | 12.00% 2/15/13 to 11/15/15 | | | 92,181 | | | | 96,513 |
| | 12.50% 11/15/13 to 1/15/16 | | | 33,378 | | | | 34,743 |
| | GNMA II GPM 10.75% 3/20/16 | | | 5,753 | | | | 5,796 |
13
Statement of net assets
Delaware Core Plus Bond Fund
| | | Principal amount° | | Value (U.S. $) |
| Agency Mortgage-Backed Securities (continued) | | | | | | | |
| | GNMA II S.F. 30 yr | | | | | | | |
| | 7.50% 9/20/30 | USD | | 24,544 | | | $ | 28,220 |
| | 8.00% 6/20/30 | | | 13,179 | | | | 15,442 |
| | 10.00% 11/20/15 to 6/20/21 | | | 34,702 | | | | 40,403 |
| | 10.50% 3/20/16 to 2/20/21 | | | 57,860 | | | | 65,282 |
| | 11.00% 5/20/15 to 7/20/19 | | | 1,101 | | | | 1,110 |
| | 12.00% 3/20/14 to 5/20/15 | | | 6,267 | | | | 6,920 |
| | 12.50% 10/20/13 to 7/20/15 | | | 26,767 | | | | 28,646 |
| Total Agency Mortgage-Backed Securities | | | | | | | |
| | (cost $15,230,960) | | | | | | | 15,550,831 |
| | |
| Commercial Mortgage-Backed Securities – 8.41% | | | | | | | |
| # | American Tower Trust Series 2007-1A AFX | | | | | | | |
| | 144A 5.42% 4/15/37 | | | 300,000 | | | | 327,852 |
| | Bank of America Commercial | | | | | | | |
| | Mortgage Securities | | | | | | | |
| | •Series 2004-3 A5 5.412% 6/10/39 | | | 160,000 | | | | 171,753 |
| | Series 2004-5 A3 4.561% 11/10/41 | | | 450,000 | | | | 460,052 |
| | •Series 2005-1 A5 5.147% 11/10/42 | | | 80,000 | | | | 86,143 |
| | •Series 2005-6 A4 5.178% 9/10/47 | | | 40,000 | | | | 43,624 |
| | •Series 2006-2 A4 5.738% 5/10/45 | | | 115,000 | | | | 124,280 |
| | Series 2006-4 A4 5.634% 7/10/46 | | | 200,000 | | | | 210,434 |
| | Bear Stearns Commercial Mortgage Securities | | | | | | | |
| | Series 2005-PW10 A4 5.405% 12/11/40 | | | 890,000 | | | | 962,325 |
| | Series 2005-PW10 AM 5.449% 12/11/40 | | | 335,000 | | | | 330,363 |
| | •Series 2005-T20 A4A 5.149% 10/12/42 | | | 350,000 | | | | 380,517 |
| | •Series 2006-PW12 A4 5.723% 9/11/38 | | | 55,000 | | | | 59,930 |
| | Series 2006-PW14 A4 5.201% 12/11/38 | | | 300,000 | | | | 315,995 |
| | Series 2007-PW15 A4 5.331% 2/11/44 | | | 330,000 | | | | 332,241 |
| w | Commercial Mortgage Pass Through Certificates | | | | | | | |
| | Series 2005-C6 A5A 5.116% 6/10/44 | | | 210,000 | | | | 225,875 |
| •# | Credit Suisse First Boston Mortgage Securities | | | | | | | |
| | Series 2001-SPGA A2 144A 6.515% 8/13/18 | | | 255,000 | | | | 265,278 |
| • | Credit Suisse Mortgage Capital Certificates | | | | | | | |
| | Series 2006-C1 AAB 5.549% 2/15/39 | | | 115,000 | | | | 121,845 |
| | Goldman Sachs Mortgage Securities II | | | | | | | |
| | Series 2004-GG2 A6 5.396% 8/10/38 | | | 405,000 | | | | 432,952 |
| | Series 2005-GG4 A4A 4.751% 7/10/39 | | | 600,000 | | | | 634,955 |
| | Series 2006-GG6 A4 5.553% 4/10/38 | | | 685,000 | | | | 726,198 |
14
| | | Principal amount° | | Value (U.S. $) |
| Commercial Mortgage-Backed Securities (continued) | | | | | | | |
| | Greenwich Capital Commercial Funding | | | | | | | |
| | Series 2004-GG1 A7 5.317% 6/10/36 | USD | | 85,000 | | | $ | 92,065 |
| | Series 2005-GG5 A5 5.224% 4/10/37 | | | 140,000 | | | | 147,626 |
| | JPMorgan Chase Commercial | | | | | | | |
| | Mortgage Securities | | | | | | | |
| | Series 2002-C2 A2 5.05% 12/12/34 | | | 200,000 | | | | 212,024 |
| | Series 2005-LDP4 A4 4.918% 10/15/42 | | | 150,000 | | | | 159,570 |
| | •Series 2005-LDP5 A4 5.195% 12/15/44 | | | 100,000 | | | | 108,544 |
| | Lehman Brothers-UBS Commercial Mortgage | | | | | | | |
| | Trust Series 2004-C1 A4 4.568% 1/15/31 | | | 180,000 | | | | 187,641 |
| | Merrill Lynch Mortgage Trust | | | | | | | |
| | Series 2005-CIP1 A2 4.96% 7/12/38 | | | 160,296 | | | | 164,010 |
| | Morgan Stanley Capital I | | | | | | | |
| | Series 2005-HQ6 A4A 4.989% 8/13/42 | | | 492,000 | | | | 527,472 |
| | •Series 2007-T27 A4 5.649% 6/11/42 | | | 475,000 | | | | 511,161 |
| # | OBP Depositor Trust | | | | | | | |
| | Series 2010-OBP A 144A 4.646% 7/15/45 | | | 120,000 | | | | 124,859 |
| Total Commercial Mortgage-Backed Securities | | | | | | | |
| | (cost $7,204,069) | | | | | | | 8,447,584 |
| |
| Convertible Bonds – 0.56% | | | | | | | |
| Φ | Hologic 2.00% exercise price $38.59, | | | | | | | |
| | expiration date 12/15/37 | | | 170,000 | | | | 150,663 |
| | Linear Technology 3.00% exercise price $45.36, | | | | | | | |
| | expiration date 5/1/27 | | | 225,000 | | | | 228,937 |
| * | Transocean 1.50% exercise price $168.61, | | | | | | | |
| | expiration date 12/15/37 | | | 195,000 | | | | 180,375 |
| Total Convertible Bonds (cost $530,798) | | | | | | | 559,975 |
| |
| Corporate Bonds – 39.19% | | | | | | | |
| Banking – 6.10% | | | | | | | |
| # | Achmea Hypotheekbank 144A 3.20% 11/3/14 | | | 115,000 | | | | 120,303 |
| | BB&T 5.25% 11/1/19 | | | 462,000 | | | | 480,992 |
| @# | CoBank 144A 7.875% 4/16/18 | | | 250,000 | | | | 284,846 |
| | Export-Import Bank of Korea | | | | | | | |
| | 5.875% 1/14/15 | | | 100,000 | | | | 111,011 |
| | *#144A 5.25% 2/10/14 | | | 225,000 | | | | 242,501 |
| | JPMorgan Chase 4.40% 7/22/20 | | | 200,000 | | | | 200,883 |
| | JPMorgan Chase Bank 6.00% 10/1/17 | | | 250,000 | | | | 281,392 |
15
Statement of net assets
Delaware Core Plus Bond Fund
| | | Principal amount° | | Value (U.S. $) |
| Corporate Bonds (continued) | | | | | | | |
| Banking (continued) | | | | | | | |
| | JPMorgan Chase Capital XXV 6.80% 10/1/37 | USD | | 381,000 | | | $ | 388,965 |
| | KeyBank 5.80% 7/1/14 | | | 250,000 | | | | 272,127 |
| | KFW 10.00% 5/15/12 | BRL | | 290,000 | | | | 167,401 |
| | Korea Development Bank 8.00% 1/23/14 | USD | | 295,000 | | | | 345,357 |
| # | NIBC Bank 144A 2.80% 12/2/14 | | | 390,000 | | | | 398,387 |
| | PNC Bank 6.875% 4/1/18 | | | 250,000 | | | | 285,743 |
| | PNC Funding | | | | | | | |
| | 5.125% 2/8/20 | | | 210,000 | | | | 222,897 |
| | 5.25% 11/15/15 | | | 225,000 | | | | 243,603 |
| •# | Rabobank 144A 11.00% 12/29/49 | | | 325,000 | | | | 411,620 |
| | Silicon Valley Bank 5.70% 6/1/12 | | | 250,000 | | | | 260,711 |
| | U.S. Bank North America 4.95% 10/30/14 | | | 250,000 | | | | 274,322 |
| • | USB Capital IX 6.189% 4/15/49 | | | 395,000 | | | | 307,863 |
| | Wachovia | | | | | | | |
| | 5.25% 8/1/14 | | | 65,000 | | | | 69,637 |
| | 5.625% 10/15/16 | | | 290,000 | | | | 318,460 |
| • | Wells Fargo Capital XIII 7.70% 12/29/49 | | | 240,000 | | | | 247,200 |
| | Zions Bancorporation | | | | | | | |
| | 5.50% 11/16/15 | | | 150,000 | | | | 135,321 |
| | 7.75% 9/23/14 | | | 55,000 | | | | 57,113 |
| | | | | | | | | 6,128,655 |
| Basic Industries – 2.54% | | | | | | | |
| | Alcoa 6.15% 8/15/20 | | | 130,000 | | | | 131,988 |
| | ArcelorMittal 9.85% 6/1/19 | | | 125,000 | | | | 161,761 |
| | CF Industries 7.125% 5/1/20 | | | 100,000 | | | | 107,000 |
| | Cytec Industries 8.95% 7/1/17 | | | 225,000 | | | | 276,945 |
| | Dow Chemical 8.55% 5/15/19 | | | 255,000 | | | | 318,979 |
| | Hexion Finance Escrow 8.875% 2/1/18 | | | 160,000 | | | | 155,000 |
| | International Paper 9.375% 5/15/19 | | | 375,000 | | | | 488,368 |
| | NewPage 11.375% 12/31/14 | | | 95,000 | | | | 88,469 |
| | Reliance Steel & Aluminum 6.85% 11/15/36 | | | 116,000 | | | | 111,420 |
| | Teck Resources | | | | | | | |
| | 9.75% 5/15/14 | | | 145,000 | | | | 176,403 |
| | 10.25% 5/15/16 | | | 105,000 | | | | 127,193 |
| | 10.75% 5/15/19 | | | 120,000 | | | | 150,082 |
| | Vale Overseas | | | | | | | |
| | 6.875% 11/21/36 | | | 160,000 | | | | 177,263 |
| | 6.875% 11/10/39 | | | 75,000 | | | | 83,055 |
| | | | | | | | | 2,553,926 |
16
| | | Principal amount° | | Value (U.S. $) |
| Corporate Bonds (continued) | | | | | | | |
| Brokerage – 1.18% | | | | | | | |
| • | Bear Stearns 5.267% 12/7/12 | AUD | | 200,000 | | | $ | 177,525 |
| | E Trade Financial PIK 12.50% 11/30/17 | USD | | 50,000 | | | | 56,500 |
| | Goldman Sachs Group | | | | | | | |
| | 3.70% 8/1/15 | | | 80,000 | | | | 80,662 |
| | 5.375% 3/15/20 | | | 360,000 | | | | 371,253 |
| | Jefferies Group | | | | | | | |
| | 6.25% 1/15/36 | | | 40,000 | | | | 35,529 |
| | 6.45% 6/8/27 | | | 275,000 | | | | 261,050 |
| | Lazard Group | | | | | | | |
| | 6.85% 6/15/17 | | | 162,000 | | | | 167,917 |
| | 7.125% 5/15/15 | | | 34,000 | | | | 36,346 |
| | | | | | | | | 1,186,782 |
| Capital Goods – 1.12% | | | | | | | |
| | Allied Waste North America | | | | | | | |
| | 6.875% 6/1/17 | | | 130,000 | | | | 143,685 |
| | 7.125% 5/15/16 | | | 215,000 | | | | 232,476 |
| | L-3 Communications 4.75% 7/15/20 | | | 315,000 | | | | 322,471 |
| # | Meccanica Holdings USA 144A 6.25% 7/15/19 | | | 180,000 | | | | 190,318 |
| | Thermo Fisher Scientific | | | | | | | |
| | 3.20% 5/1/15 | | | 200,000 | | | | 210,134 |
| | 4.70% 5/1/20 | | | 25,000 | | | | 27,496 |
| | | | | | | | | 1,126,580 |
| Communications – 7.65% | | | | | | | |
| | American Tower 7.00% 10/15/17 | | | 220,000 | | | | 252,725 |
| | AT&T 6.50% 9/1/37 | | | 455,000 | | | | 519,928 |
| *# | Charter Communications Operating Capital 144A | | | | | | | |
| | 10.875% 9/15/14 | | | 85,000 | | | | 95,625 |
| | Cisco Systems 4.45% 1/15/20 | | | 510,000 | | | | 547,193 |
| | Citizens Communications 7.125% 3/15/19 | | | 145,000 | | | | 147,900 |
| | Comcast 5.90% 3/15/16 | | | 450,000 | | | | 516,896 |
| # | Cox Communications 144A | | | | | | | |
| | 6.25% 6/1/18 | | | 95,000 | | | | 108,585 |
| | 6.45% 12/1/36 | | | 85,000 | | | | 93,814 |
| | 6.95% 6/1/38 | | | 100,000 | | | | 116,782 |
| * | Cricket Communications 9.375% 11/1/14 | | | 150,000 | | | | 155,813 |
| # | Crown Castle Towers 144A 4.883% 8/15/20 | | | 145,000 | | | | 146,269 |
| | CSC Holdings 8.50% 6/15/15 | | | 135,000 | | | | 145,969 |
| | DirecTV Holdings 7.625% 5/15/16 | | | 610,000 | | | | 677,898 |
17
Statement of net assets
Delaware Core Plus Bond Fund
| | | Principal amount° | | Value (U.S. $) |
| Corporate Bonds (continued) | | | | | | | |
| Communications (continued) | | | | | | | |
| # | GXS Worldwide 144A 9.75% 6/15/15 | USD | | 135,000 | | | $ | 130,275 |
| # | Inmarsat Finance 144A 7.375% 12/1/17 | | | 100,000 | | | | 103,000 |
| | Intelsat Bermuda 11.25% 2/4/17 | | | 135,000 | | | | 143,775 |
| # | NBC Universal 144A 5.15% 4/30/20 | | | 470,000 | | | | 500,520 |
| | Nielsen Finance 11.625% 2/1/14 | | | 85,000 | | | | 95,838 |
| * | PAETEC Holding 8.875% 6/30/17 | | | 95,000 | | | | 98,681 |
| | Qwest 8.375% 5/1/16 | | | 295,000 | | | | 337,038 |
| | Rogers Communications | | | | | | | |
| | 6.68% 11/4/39 | CAD | | 40,000 | | | | 41,960 |
| | 7.50% 3/15/15 | USD | | 110,000 | | | | 133,118 |
| | Shaw Communication 6.75% 11/9/39 | CAD | | 109,000 | | | | 109,187 |
| | Sprint Nextel 6.00% 12/1/16 | USD | | 160,000 | | | | 151,600 |
| | Telecom Italia Capital | | | | | | | |
| | 5.25% 10/1/15 | | | 370,000 | | | | 390,074 |
| | 6.175% 6/18/14 | | | 225,000 | | | | 244,721 |
| | Telefonica Emisiones | | | | | | | |
| | 3.729% 4/27/15 | | | 105,000 | | | | 107,779 |
| | 5.134% 4/27/20 | | | 80,000 | | | | 84,200 |
| | Telesat Canada 11.00% 11/1/15 | | | 115,000 | | | | 132,250 |
| | Time Warner Cable 8.25% 4/1/19 | | | 330,000 | | | | 415,142 |
| | Verizon Communications | | | | | | | |
| | 6.40% 2/15/38 | | | 115,000 | | | | 130,625 |
| | 7.35% 4/1/39 | | | 45,000 | | | | 56,997 |
| | #Videotron 144A 7.125% 1/15/20 | CAD | | 142,000 | | | | 140,902 |
| | #Vivendi 144A | | | | | | | |
| | 5.75% 4/4/13 | USD | | 290,000 | | | | 312,598 |
| | 6.625% 4/4/18 | | | 177,000 | | | | 199,533 |
| | #Wind Acquisition Finance 144A 11.75% 7/15/17 | | | 95,000 | | | | 101,413 |
| | | | | | | | | 7,686,623 |
| Consumer Cyclical – 1.22% | | | | | | | |
| w# | CVS Pass Through Trust 144A 8.353% 7/10/31 | | | 216,321 | | | | 261,747 |
| | Ford Motor Credit 7.25% 10/25/11 | | | 145,000 | | | | 149,910 |
| | International Game Technology 5.50% 6/15/20 | | | 105,000 | | | | 109,580 |
| | Macy’s Retail Holdings 5.90% 12/1/16 | | | 119,000 | | | | 122,570 |
| | MGM Mirage | | | | | | | |
| | 10.375% 5/15/14 | | | 30,000 | | | | 33,300 |
| | 11.125% 11/15/17 | | | 35,000 | | | | 39,900 |
| | *13.00% 11/15/13 | | | 55,000 | | | | 64,350 |
18
| | | | Principal amount° | | Value (U.S. $) |
| Corporate Bonds (continued) | | | | | | | | |
| Consumer Cyclical (continued) | | | | | | | | |
| * | Sally Holdings 10.50% 11/15/16 | | USD | | 80,000 | | | $ | 87,600 |
| | Wal-Mart Stores 3.625% 7/8/20 | | | | 360,000 | | | | 362,509 |
| | | | | | | | | | 1,231,466 |
| | | | | | | | | | |
| Consumer Non-Cyclical – 6.22% | | | | | | | | |
| | Abbott Laboratories 4.125% 5/27/20 | | | | 465,000 | | | | 493,511 |
| | Amgen 4.50% 3/15/20 | | | | 60,000 | | | | 64,937 |
| # | Anheuser-Busch InBev Worldwide 144A | | | | | | | | |
| | 5.00% 4/15/20 | | | | 390,000 | | | | 419,601 |
| | Baxter International 4.50% 8/15/19 | | | | 325,000 | | | | 351,675 |
| # | Brambles USA 144A | | | | | | | | |
| | 3.95% 4/1/15 | | | | 90,000 | | | | 92,210 |
| | 5.35% 4/1/20 | | | | 90,000 | | | | 93,890 |
| | CareFusion 6.375% 8/1/19 | | | | 370,000 | | | | 428,099 |
| | Covidien International Finance 4.20% 6/15/20 | | | | 475,000 | | | | 494,380 |
| | General Mills 5.65% 2/15/19 | | | | 180,000 | | | | 206,396 |
| # | Genzyme 144A | | | | | | | | |
| | 3.625% 6/15/15 | | | | 70,000 | | | | 73,666 |
| | 5.00% 6/15/20 | | | | 190,000 | | | | 206,402 |
| | HCA PIK 9.625% 11/15/16 | | | | 91,000 | | | | 98,508 |
| | Hospira 6.40% 5/15/15 | | | | 380,000 | | | | 434,844 |
| | Kraft Foods 5.375% 2/10/20 | | | | 255,000 | | | | 279,457 |
| | Life Technologies | | | | | | | | |
| | 4.40% 3/1/15 | | | | 20,000 | | | | 20,992 |
| | 6.00% 3/1/20 | | | | 310,000 | | | | 342,407 |
| | Medco Health Solutions 7.125% 3/15/18 | | | | 330,000 | | | | 395,300 |
| # | Mylan 144A 7.625% 7/15/17 | | | | 95,000 | | | | 101,413 |
| | Pfizer 6.20% 3/15/19 | | | | 325,000 | | | | 392,849 |
| # | Roche Holdings 144A 6.00% 3/1/19 | | | | 505,000 | | | | 596,786 |
| | St. Jude Medical 4.875% 7/15/19 | | | | 60,000 | | | | 66,265 |
| | Yale University 2.90% 10/15/14 | | | | 250,000 | | | | 263,431 |
| | Zimmer Holdings 4.625% 11/30/19 | | | | 320,000 | | | | 338,356 |
| | | | | | | | | | 6,255,375 |
| Electric – 3.47% | | | | | | | | |
| # | American Transmission Systems 144A | | | | | | | | |
| | 5.25% 1/15/22 | | | | 155,000 | | | | 163,432 |
| # | Centrais Eletricas Brasileiras 144A | | | | | | | | |
| | 6.875% 7/30/19 | | | | 300,000 | | | | 342,000 |
19
Statement of net assets
Delaware Core Plus Bond Fund
| | | | Principal amount° | | Value (U.S. $) |
| Corporate Bonds (continued) | | | | | | | | |
| Electric (continued) | | | | | | | | |
| | CMS Energy | | | | | | | | |
| | 6.55% 7/17/17 | | USD | | 115,000 | | | $ | 119,737 |
| | 8.75% 6/15/19 | | | | 30,000 | | | | 34,407 |
| | Commonwealth Edison | | | | | | | | |
| | 4.00% 8/1/20 | | | | 300,000 | | | | 307,409 |
| | 5.80% 3/15/18 | | | | 30,000 | | | | 34,550 |
| | Duke Energy Carolinas 4.30% 6/15/20 | | | | 370,000 | | | | 396,669 |
| | Duke Energy Indiana 3.75% 7/15/20 | | | | 60,000 | | | | 61,139 |
| | Florida Power 5.65% 6/15/18 | | | | 160,000 | | | | 185,465 |
| | Illinois Power 9.75% 11/15/18 | | | | 469,000 | | | | 617,279 |
| | Indiana Michigan Power 7.00% 3/15/19 | | | | 70,000 | | | | 83,861 |
| | Jersey Central Power & Light 5.625% 5/1/16 | | | | 75,000 | | | | 82,110 |
| | MidAmerican Funding 6.75% 3/1/11 | | | | 102,000 | | | | 105,494 |
| | PacifiCorp 5.50% 1/15/19 | | | | 220,000 | | | | 253,985 |
| | Pennsylvania Electric 5.20% 4/1/20 | | | | 300,000 | | | | 316,718 |
| | PPL Electric Utilities 7.125% 11/30/13 | | | | 130,000 | | | | 152,913 |
| | Public Service of Oklahoma 5.15% 12/1/19 | | | | 215,000 | | | | 230,922 |
| | | | | | | | | | 3,488,090 |
| Energy – 4.22% | | | | | | | | |
| | Chesapeake Energy 9.50% 2/15/15 | | | | 95,000 | | | | 107,113 |
| • | Enbridge Energy Partners 8.05% 10/1/37 | | | | 135,000 | | | | 133,167 |
| | Energy Transfer Partners 9.70% 3/15/19 | | | | 235,000 | | | | 296,205 |
| | EOG Resources 2.95% 6/1/15 | | | | 190,000 | | | | 196,292 |
| | Nexen 7.50% 7/30/39 | | | | 265,000 | | | | 329,968 |
| | Noble Energy 8.25% 3/1/19 | | | | 260,000 | | | | 324,825 |
| | Noble Holding International | | | | | | | | |
| | 4.90% 8/1/20 | | | | 145,000 | | | | 151,862 |
| | 6.20% 8/1/40 | | | | 70,000 | | | | 75,618 |
| | Petrobras International Finance | | | | | | | | |
| | 5.75% 1/20/20 | | | | 277,000 | | | | 295,884 |
| | 5.875% 3/1/18 | | | | 45,000 | | | | 48,777 |
| | PetroHawk Energy 10.50% 8/1/14 | | | | 90,000 | | | | 100,800 |
| | Plains All American Pipeline 8.75% 5/1/19 | | | | 200,000 | | | | 249,581 |
| | Pride International 8.50% 6/15/19 | | | | 240,000 | | | | 269,400 |
| | Range Resources 8.00% 5/15/19 | | | | 95,000 | | | | 102,363 |
| # | SEMCO Energy 144A 5.15% 4/21/20 | | | | 280,000 | | | | 299,131 |
| | Total Capital 4.45% 6/24/20 | | | | 385,000 | | | | 408,652 |
20
| | | | Principal amount° | | Value (U.S. $) |
| Corporate Bonds (continued) | | | | | | | | |
| Energy (continued) | | | | | | | | |
| | Transocean 6.80% 3/15/38 | | USD | | 70,000 | | | $ | 63,178 |
| * | Weatherford International 9.625% 3/1/19 | | | | 270,000 | | | | 342,446 |
| # | Woodside Finance 144A | | | | | | | | |
| | 4.50% 11/10/14 | | | | 95,000 | | | | 99,029 |
| | 8.125% 3/1/14 | | | | 300,000 | | | | 347,085 |
| | | | | | | | | | 4,241,376 |
| Finance Companies – 2.14% | | | | | | | | |
| # | CDP Financial 144A | | | | | | | | |
| | 4.40% 11/25/19 | | | | 280,000 | | | | 292,340 |
| | 5.60% 11/25/39 | | | | 250,000 | | | | 272,028 |
| | City National Capital Trust I 9.625% 2/1/40 | | | | 190,000 | | | | 201,778 |
| # | ERAC USA Finance 144A 5.25% 10/1/20 | | | | 90,000 | | | | 92,426 |
| | General Electric Capital 6.00% 8/7/19 | | | | 785,000 | | | | 870,443 |
| •# | ILFC E-Capital Trust II 144A 6.25% 12/21/65 | | | | 210,000 | | | | 143,850 |
| # | International Lease Finance 144A | | | | | | | | |
| | 8.75% 3/15/17 | | | | 275,000 | | | | 281,188 |
| | | | | | | | | | 2,154,053 |
| Insurance – 0.21% | | | | | | | | |
| | MetLife 6.817% 8/15/18 | | | | 15,000 | | | | 17,238 |
| | Prudential Financial 3.875% 1/14/15 | | | | 185,000 | | | | 190,654 |
| =@‡w# | Twin Reefs Pass Through Trust 144A | | | | | | | | |
| | 0.00% 12/31/49 | | | | 200,000 | | | | 0 |
| | | | | | | | | | 207,892 |
| Natural Gas – 1.55% | | | | | | | | |
| | Enterprise Products Operating | | | | | | | | |
| | 5.20% 9/1/20 | | | | 170,000 | | | | 182,476 |
| | •7.034% 1/15/68 | | | | 70,000 | | | | 66,945 |
| | 9.75% 1/31/14 | | | | 230,000 | | | | 281,459 |
| | Kinder Morgan Energy Partners | | | | | | | | |
| | 6.55% 9/15/40 | | | | 40,000 | | | | 44,217 |
| | 9.00% 2/1/19 | | | | 215,000 | | | | 279,383 |
| # | Midcontinent Express Pipeline 144A | | | | | | | | |
| | 5.45% 9/15/14 | | | | 180,000 | | | | 190,327 |
| | 6.70% 9/15/19 | | | | 220,000 | | | | 234,086 |
| # | Rockies Express Pipeline 144A | | | | | | | | |
| | 5.625% 4/15/20 | | | | 50,000 | | | | 48,683 |
| • | TransCanada PipeLines 6.35% 5/15/67 | | | | 250,000 | | | | 227,804 |
| | | | | | | | | | 1,555,380 |
21
Statement of net assets
Delaware Core Plus Bond Fund
| | | | Principal amount° | | Value (U.S. $) |
| Corporate Bonds (continued) | | | | | | | | |
| Real Estate – 0.77% | | | | | | | | |
| | Developers Diversified Realty 9.625% 3/15/16 | | USD | | 150,000 | | | $ | 164,478 |
| # | Digital Realty Trust 144A 5.875% 2/1/20 | | | | 95,000 | | | | 97,488 |
| | ProLogis | | | | | | | | |
| | 6.25% 3/15/17 | | | | 130,000 | | | | 125,993 |
| | 7.375% 10/30/19 | | | | 150,000 | | | | 147,495 |
| | Regency Centers 5.875% 6/15/17 | | | | 95,000 | | | | 101,178 |
| •# | USB Realty 144A 6.091% 12/22/49 | | | | 200,000 | | | | 141,500 |
| | | | | | | | | | 778,132 |
| Technology – 0.53% | | | | | | | | |
| | National Semiconductor | | | | | | | | |
| | 3.95% 4/15/15 | | | | 70,000 | | | | 72,162 |
| | 6.60% 6/15/17 | | | | 120,000 | | | | 135,585 |
| # | Oracle 144A 3.875% 7/15/20 | | | | 315,000 | | | | 322,849 |
| | | | | | | | | | 530,596 |
| Transportation – 0.27% | | | | | | | | |
| | Burlington Northern Santa Fe 4.70% 10/1/19 | | | | 250,000 | | | | 267,554 |
| | | | | | | | | | 267,554 |
| Total Corporate Bonds (cost $37,286,049) | | | | | | | | 39,392,480 |
| | | | | | | | | | |
| Non-Agency Asset-Backed Securities – 8.39% | | | | | | | | |
| | Ally Auto Receivables Trust | | | | | | | | |
| | Series 2010-2 A3 1.38% 7/15/14 | | | | 75,000 | | | | 75,569 |
| •# | Ally Master Owner Trust | | | | | | | | |
| | Series 2010-1 A 144A 2.091% 1/15/15 | | | | 140,000 | | | | 142,437 |
| • | American Express Issuance Trust | | | | | | | | |
| | Series 2005-2 A 0.411% 8/15/13 | | | | 400,000 | | | | 398,403 |
| •# | American Home Mortgage Advance Trust | | | | | | | | |
| | Series 2009-ADV3 A1 144A | | | | | | | | |
| | 2.297% 10/6/21 | | | | 140,000 | | | | 139,902 |
| # | Bank of America Auto Trust | | | | | | | | |
| | Series 2009-3A A4 144A 2.67% 12/15/16 | | | | 260,000 | | | | 269,171 |
| • | Bank of America Credit Card Trust | | | | | | | | |
| | Series 2007-A9 A9 0.381% 11/17/14 | | | | 90,000 | | | | 89,590 |
| | Series 2008-A5 A5 1.541% 12/16/13 | | | | 905,000 | | | | 913,303 |
| | Series 2010-A1 A1 0.641% 9/15/15 | | | | 300,000 | | | | 299,649 |
| | Capital Auto Receivables Asset Trust | | | | | | | | |
| | Series 2008-1 A3A 3.86% 8/15/12 | | | | 51,707 | | | | 52,436 |
22
| | | | Principal amount° | | Value (U.S. $) |
| Non-Agency Asset-Backed Securities (continued) | | | | | | | | |
| | Capital One Multi-Asset Execution Trust | | | | | | | | |
| | •Series 2006-A7 A7 0.371% 3/17/14 | | USD | | 100,000 | | | $ | 99,823 |
| | •Series 2007-A4 A4 0.371% 3/16/15 | | | | 800,000 | | | | 795,056 |
| | Series 2007-A7 A7 5.75% 7/15/20 | | | | 380,000 | | | | 443,025 |
| | Series 2008-A3 A3 5.05% 2/15/16 | | | | 305,000 | | | | 335,403 |
| @ | Centex Home Equity | | | | | | | | |
| | Series 2005-D AF4 5.27% 10/25/35 | | | | 28,002 | | | | 27,883 |
| • | Chase Issuance Trust | | | | | | | | |
| | Series 2009-A2 A2 1.891% 4/15/14 | | | | 260,000 | | | | 265,653 |
| # | CIT Equipment Collateral | | | | | | | | |
| | Series 2009-VT1 A3 144A 3.07% 8/15/16 | | | | 130,000 | | | | 131,493 |
| | Citibank Credit Card Issuance Trust | | | | | | | | |
| | Series 2007-A3 A3 6.15% 6/15/39 | | | | 165,000 | | | | 205,908 |
| | •Series 2009-A1 A1 2.091% 3/17/14 | | | | 185,000 | | | | 189,564 |
| # | Citibank Omni Master Trust 2009-A13 A13 144A | | | | | | | | |
| | 5.35% 8/15/18 | | | | 250,000 | | | | 272,397 |
| | Citicorp Residential Mortgage Securities | | | | | | | | |
| | Series 2006-3 A5 5.948% 11/25/36 | | | | 300,000 | | | | 240,460 |
| | CNH Equipment Trust | | | | | | | | |
| | •Series 2007-A A4 0.381% 9/17/12 | | | | 27,729 | | | | 27,702 |
| | Series 2008-A A3 4.12% 5/15/12 | | | | 16,929 | | | | 17,011 |
| | Series 2008-A A4A 4.93% 8/15/14 | | | | 145,000 | | | | 150,155 |
| | Series 2009-C A3 1.85% 12/16/13 | | | | 60,000 | | | | 60,782 |
| | Series 2009-C A4 3.00% 8/17/15 | | | | 175,000 | | | | 182,856 |
| | Series 2010-A A4 2.49% 1/15/16 | | | | 225,000 | | | | 231,827 |
| | Daimler Chrysler Auto Trust | | | | | | | | |
| | Series 2008-B A3A 4.71% 9/10/12 | | | | 91,160 | | | | 92,701 |
| | Discover Card Master Trust | | | | | | | | |
| | Series 2007-A1 A1 5.65% 3/16/20 | | | | 190,000 | | | | 221,350 |
| | Series 2008-A4 A4 5.65% 12/15/15 | | | | 200,000 | | | | 224,220 |
| # | Dunkin Securitization | | | | | | | | |
| | Series 2006-1 A2 144A 5.779% 6/20/31 | | | | 200,000 | | | | 195,370 |
| # | Ford Credit Auto Lease Trust | | | | | | | | |
| | Series 2010-A A2 144A 1.04% 3/15/13 | | | | 250,000 | | | | 250,473 |
| • | Ford Credit Floorplan Master Owner Trust | | | | | | | | |
| | Series 2009-2 A 1.891% 9/15/14 | | | | 100,000 | | | | 101,728 |
| | #Series 2010-1 A 144A 1.991% 12/15/14 | | | | 165,000 | | | | 168,375 |
| | General Electric Capital Credit Card Master | | | | | | | | |
| | Note Trust Series 2009-3 A | | | | | | | | |
| | 2.54% 9/15/14 | | | | 135,000 | | | | 137,342 |
23
Statement of net assets
Delaware Core Plus Bond Fund
| | | | | Principal amount° | | Value (U.S. $) |
| Non-Agency Asset-Backed Securities (continued) | | | | | | | | |
| •# | Golden Credit Card Trust | | | | | | | | |
| | Series 2008-3 A 144A 1.341% 7/15/17 | | USD | | 150,000 | | | $ | 151,125 |
| | Harley Davidson Motorcycle Trust | | | | | | | | |
| | #Series 2006-1 A2 144A 5.04% 10/15/12 | | | | 28,670 | | | | 29,051 |
| | Series 2008-1 A4 4.90% 12/15/13 | | | | 125,000 | | | | 131,151 |
| | Series 2009-4 A3 1.87% 2/15/14 | | | | 100,000 | | | | 101,340 |
| | Hyundai Auto Receivables Trust | | | | | | | | |
| | Series 2007-A A3A 5.04% 1/17/12 | | | | 11,065 | | | | 11,138 |
| | Series 2008-A A3 4.93% 12/17/12 | | | | 129,224 | | | | 132,927 |
| | John Deere Owner Trust | | | | | | | | |
| | Series 2010-A A4 2.13% 10/17/16 | | | | 155,000 | | | | 158,717 |
| • | MBNA Credit Card Master Note Trust | | | | | | | | |
| | Series 2005-A2 A2 0.421% 10/15/14 | | | | 50,000 | | | | 49,821 |
| • | Merrill Auto Trust Securitization | | | | | | | | |
| | Series 2007-1 A4 0.401% 12/15/13 | | | | 62,895 | | | | 62,630 |
| | World Omni Auto Receivables Trust | | | | | | | | |
| | Series 2008-A A3A 3.94% 10/15/12 | | | | 61,609 | | | | 62,535 |
| | World Omni Automobile Lease Securitization | | | | | | | | |
| | Trust Series 2009-A A3 1.65% 2/15/13 | | | | 95,000 | | | | 95,868 |
| Total Non-Agency Asset-Backed Securities | | | | | | | | |
| | (cost $8,258,407) | | | | | | | | 8,435,320 |
| | | | | | | | | | |
| Non-Agency Collateralized Mortgage Obligations – 1.42% | | | | | | | | |
| | American Home Mortgage Investment Trust | | | | | | | | |
| | Series 2005-2 5A1 5.064% 9/25/35 | | | | 22,161 | | | | 19,526 |
| | Bank of America Alternative Loan Trust | | | | | | | | |
| | Series 2004-10 1CB1 6.00% 11/25/34 | | | | 24,558 | | | | 24,435 |
| | Series 2005-5 2CB1 6.00% 6/25/35 | | | | 2,574 | | | | 1,959 |
| •@ | Bank of America Funding | | | | | | | | |
| | Series 2006-H 1A2 3.169% 9/20/46 | | | | 7,313 | | | | 859 |
| | Citicorp Mortgage Securities | | | | | | | | |
| | Series 2006-4 3A1 5.50% 8/25/21 | | | | 74,063 | | | | 72,643 |
| @w | Countrywide Home Loan Mortgage Pass | | | | | | | | |
| | Through Trust Series 2006-17 A5 | | | | | | | | |
| | 6.00% 12/25/36 | | | | 33,668 | | | | 29,768 |
| | First Horizon Asset Securities | | | | | | | | |
| | Series 2006-3 1A11 6.25% 11/25/36 | | | | 267,722 | | | | 260,571 |
| •# | GSMPS Mortgage Loan Trust 144A | | | | | | | | |
| | Series 1998-2 A 7.75% 5/19/27 | | | | 118,007 | | | | 118,103 |
| | Series 1999-3 A 8.00% 8/19/29 | | | | 253,924 | | | | 255,248 |
24
| | | | Principal amount° | | Value (U.S. $) |
| Non-Agency Collateralized Mortgage Obligations (continued) | | | | | | | | |
| • | JPMorgan Mortgage Trust | | | | | | | | |
| | Series 2007-A1 7A4 5.294% 7/25/35 | | USD | | 466,767 | | | $ | 189,710 |
| | Lehman Mortgage Trust | | | | | | | | |
| | Series 2005-2 2A3 5.50% 12/25/35 | | | | 113,120 | | | | 103,708 |
| # | MASTR Reperforming Loan Trust | | | | | | | | |
| | Series 2005-1 1A5 144A 8.00% 8/25/34 | | | | 207,528 | | | | 206,827 |
| w | Washington Mutual Alternative Mortgage | | | | | | | | |
| | Pass Through Certificates | | | | | | | | |
| | Series 2005-1 5A2 6.00% 3/25/35 | | | | 157,819 | | | | 105,120 |
| • | Wells Fargo Mortgage Backed Securities Trust | | | | | | | | |
| | Series 2005-AR16 2A1 2.997% 10/25/35 | | | | 7,631 | | | | 7,091 |
| | Series 2006-AR5 2A1 5.482% 4/25/36 | | | | 41,920 | | | | 34,673 |
| Total Non-Agency Collateralized | | | | | | | | |
| | Mortgage Obligations (cost $1,798,413) | | | | | | | | 1,430,241 |
| | | | | | | | | |
| Regional Agencies – 0.80%Δ | | | | | | | | |
| Australia – 0.80% | | | | | | | | |
| | New South Wales Treasury 6.00% 5/1/20 | | AUD | | 794,000 | | | | 731,883 |
| | Queensland Treasury 6.00% 6/14/21 | | AUD | | 76,000 | | | | 69,935 |
| Total Regional Agencies (cost $774,471) | | | | | | | | 801,818 |
| | | | | | | | | |
| Regional Authorities – 0.65%Δ | | | | | | | | |
| Canada – 0.65% | | | | | | | | |
| | Province of British Columbia Canada | | | | | | | | |
| | 2.85% 6/15/15 | | USD | | 105,000 | | | | 110,452 |
| | Province of Manitoba Canada | | | | | | | | |
| | 2.625% 7/15/15 | | | | 50,000 | | | | 52,036 |
| | Province of Nova Scotia Canada | | | | | | | | |
| | 2.375% 7/21/15 | | | | 195,000 | | | | 197,680 |
| * | Province of Ontario Canada 4.40% 4/14/20 | | | | 140,000 | | | | 151,570 |
| | Province of Quebec Canada | | | | | | | | |
| | 4.50% 12/1/19 | | CAD | | 19,000 | | | | 19,364 |
| | 4.875% 5/5/14 | | USD | | 110,000 | | | | 121,881 |
| Total Regional Authorities (cost $630,854) | | | | | | | | 652,983 |
25
Statement of net assets
Delaware Core Plus Bond Fund
| | | | Principal amount° | | Value (U.S. $) |
| «Senior Secured Loans – 2.05% | | | | | | | | |
| | ATI Holdings Term Tranche Loan 7.00% 2/18/16 | | USD | | 184,538 | | | $ | 179,693 |
| | Chester Downs & Marina Term Tranche Loan | | | | | | | | |
| | 12.375% 12/31/16 | | | | 108,531 | | | | 109,481 |
| | Energy Future Holdings Term Tranche Loan B2 | | | | | | | | |
| | 3.729% 10/10/14 | | | | 329,042 | | | | 257,571 |
| | Ford Motor Term Tranche Loan B | | | | | | | | |
| | 3.258% 12/15/13 | | | | 439,431 | | | | 428,682 |
| | Knology Term Tranche Loan 3.783% 6/2/14 | | | | 253,719 | | | | 248,010 |
| | Level 3 Communications Term Tranche Loan B | | | | | | | | |
| | 11.50% 3/13/14 | | | | 185,000 | | | | 201,073 |
| | Nuveen Investment 2nd Lien Term Tranche Loan | | | | | | | | |
| | 12.50% 7/9/15 | | | | 85,000 | | | | 94,138 |
| | Rental Services 2nd Lien Term Tranche Loan | | | | | | | | |
| | 3.817% 10/7/13 | | | | 185,000 | | | | 176,098 |
| | Rockwood Specialties Group Term Tranche Loan H | | | | | | | | |
| | 6.00% 5/15/14 | | | | 230,331 | | | | 232,203 |
| | TASC Term Tranche Loan B 5.75% 12/19/14 | | | | 134,325 | | | | 134,929 |
| Total Senior Secured Loans (cost $1,980,357) | | | | | | | | 2,061,878 |
| | | | | | | | | |
| Sovereign Agencies – 1.36%Δ | | | | | | | | |
| Canada – 0.06% | | | | | | | | |
| | Export Development Canada 2.25% 5/28/15 | | | | 55,000 | | | | 56,490 |
| | | | | | | | | | 56,490 |
| Norway – 0.96% | | | | | | | | |
| | Eksportfinans | | | | | | | | |
| | 3.00% 11/17/14 | | | | 190,000 | | | | 198,720 |
| | 5.50% 5/25/16 | | | | 455,000 | | | | 522,202 |
| # | Kommunalbanken 144A 2.75% 5/5/15 | | | | 234,000 | | | | 241,356 |
| | | | | | | | | | 962,278 |
| Republic of Korea – 0.10% | | | | | | | | |
| # | Korea Expressway 144A 4.50% 3/23/15 | | | | 100,000 | | | | 104,429 |
| | | | | | | | | | 104,429 |
| Sweden – 0.24% | | | | | | | | |
| | Svensk Exportkredit 3.25% 9/16/14 | | | | 230,000 | | | | 242,236 |
| | | | | | | | | | 242,236 |
| Total Sovereign Agencies (cost $1,319,299) | | | | | | | | 1,365,433 |
26
| | | | Principal amount° | | Value (U.S. $) |
| Sovereign Debt – 3.59%Δ | | | | | | | | |
| Australia – 0.92% | | | | | | | | |
| | Australia Government Bonds | | | | | | | | |
| | 4.50% 4/15/20 | | AUD | | 797,000 | | | $ | 682,590 |
| | 6.00% 2/15/17 | | AUD | | 250,000 | | | | 238,780 |
| | | | | | | | | | 921,370 |
| Brazil – 0.05% | | | | | | | | |
| | Federal Republic of Brazil | | | | | | | | |
| | 11.00% 8/17/40 | | USD | | 36,000 | | | | 49,284 |
| | | | | | | | | | 49,284 |
| Canada – 0.38% | | | | | | | | |
| | Canadian Government Bond | | | | | | | | |
| | 2.50% 6/1/15 | | CAD | | 390,000 | | | | 383,167 |
| | | | | | | | | | 383,167 |
| Indonesia – 1.05% | | | | | | | | |
| | Indonesia Treasury Bonds | | | | | | | | |
| | 9.50% 6/15/15 | | IDR | | 1,180,000,000 | | | | 143,406 |
| | 9.50% 7/15/23 | | IDR | | 400,000 | | | | 48,503 |
| | 10.50% 8/15/30 | | IDR | | 1,180,000,000 | | | | 148,268 |
| | 10.75% 5/15/16 | | IDR | | 1,521,000,000 | | | | 195,708 |
| | 11.00% 11/15/20 | | IDR | | 2,724,000,000 | | | | 370,422 |
| | 12.80% 6/15/21 | | IDR | | 1,000,000,000 | | | | 150,006 |
| | | | | | | | | | 1,056,313 |
| Norway – 1.06% | | | | | | | | |
| | Norway Government Bonds | | | | | | | | |
| | 4.25% 5/19/17 | | NOK | | 1,280,000 | | | | 229,807 |
| | 4.50% 5/22/19 | | NOK | | 2,777,000 | | | | 508,328 |
| | 5.00% 5/15/15 | | NOK | | 1,825,000 | | | | 333,850 |
| | | | | | | | | | 1,071,985 |
| Russia – 0.07% | | | | | | | | |
| | Russia-Eurobond 7.50% 3/31/30 | | USD | | 59,800 | | | | 69,500 |
| | | | | | | | | | 69,500 |
| Turkey – 0.06% | | | | | | | | |
| | Republic of Turkey 6.875% 3/17/36 | | | | 55,000 | | | | 59,813 |
| | | | | | | | | | 59,813 |
| Total Sovereign Debt (cost $3,359,326) | | | | | | | | 3,611,432 |
27
Statement of net assets
Delaware Core Plus Bond Fund
| | | | Principal amount° | | Value (U.S. $) |
| Supranational Banks – 1.36% | | | | | | | | |
| | Asian Development Bank 2.75% 5/21/14 | | USD | | 335,000 | | | $ | 351,664 |
| | European Investment Bank | | | | | | | | |
| | 6.125% 1/23/17 | | AUD | | 119,000 | | | | 109,234 |
| | 9.00% 12/21/18 | | ZAR | | 900,000 | | | | 128,132 |
| | Inter-American Development Bank | | | | | | | | |
| | 2.25% 7/15/15 | | USD | | 150,000 | | | | 153,491 |
| | 5.375% 5/27/14 | | AUD | | 232,000 | | | | 211,094 |
| | International Bank for | | | | | | | | |
| | Reconstruction & Development | | | | | | | | |
| | 2.375% 5/26/15 | | USD | | 185,000 | | | | 191,373 |
| | 5.75% 10/21/19 | | AUD | | 128,000 | | | | 116,266 |
| | Nordic Investment Bank 2.50% 7/15/15 | | USD | | 105,000 | | | | 108,101 |
| Total Supranational Banks (cost $1,278,303) | | | | | | | | 1,369,355 |
| | | | | | | | | |
| U.S. Treasury Obligations – 7.58% | | | | | | | | |
| ¥ | U.S. Treasury Bond 4.625% 2/15/40 | | | | 190,000 | | | | 211,316 |
| ¥ | U.S. Treasury Inflation Index Note | | | | | | | | |
| | 1.625% 1/15/15 | | | | 868,391 | | | | 919,952 |
| | U.S. Treasury Notes | | | | | | | | |
| | 1.00% 7/15/13 | | | | 1,209,000 | | | | 1,215,330 |
| | *1.875% 6/30/15 | | | | 2,240,000 | | | | 2,273,425 |
| | *3.50% 5/15/20 | | | | 2,850,000 | | | | 2,993,404 |
| Total U.S. Treasury Obligations (cost $7,463,577) | | | | | | | | 7,613,427 |
| | | | | | | | |
| | | | Number of shares | | | | |
| Preferred Stock – 0.27% | | | | | | | | |
| • | PNC Financial Services Group 8.25% | | | | 260,000 | | | | 272,276 |
| Total Preferred Stock (cost $254,259) | | | | | | | | 272,276 |
| | | | | | | | |
| | | | Principal amount° | | | | |
| ≠Discount Note – 15.38% | | | | | | | | |
| | Federal Home Loan Bank 0.06% 8/2/10 | | USD | | 15,457,080 | | | | 15,457,055 |
| Total Discount Note (cost $15,457,055) | | | | | | | | 15,457,055 |
| | | | | | | | | |
| Total Value of Securities Before Securities | | | | | | | | |
| | Lending Collateral – 108.91% (cost $105,082,931) | | | | | | | | 109,458,272 |
28
| | Number of shares | | Value (U.S. $) | |
| Securities Lending Collateral** – 0.67% | | | | | |
| Investment Companies | | | | | |
| BNY Mellon Securities Lending Overnight Fund | 646,581 | | $ | 646,581 | |
| BNY Mellon SL DBT II Liquidating Fund | 28,141 | | | 27,623 | |
| @†Mellon GSL Reinvestment Trust II | 13,372 | | | 568 | |
| Total Securities Lending Collateral (cost $688,094) | | | | 674,772 | |
| |
| Total Value of Securities – 109.58% | | | | | |
| (cost $105,771,025) | | | | 110,133,044 | © |
| Obligation to Return Securities | | | | | |
| Lending Collateral** – (0.69%) | | | | (688,094 | ) |
| Liabilities Net of Receivables and | | | | | |
| Other Assets – (8.89%) | | | | (8,937,361 | ) |
| Net Assets Applicable to 12,227,388 | | | | | |
| Shares Outstanding – 100.00% | | | $ | 100,507,589 | |
| |
| Net Asset Value – Delaware Core Plus Bond Fund | | | | | |
| Class A ($72,618,511 / 8,838,126 Shares) | | | | | $8.22 | |
| Net Asset Value – Delaware Core Plus Bond Fund | | | | | |
| Class B ($3,197,200 / 389,150 Shares) | | | | | $8.22 | |
| Net Asset Value – Delaware Core Plus Bond Fund | | | | | |
| Class C ($10,021,517 / 1,218,273 Shares) | | | | | $8.23 | |
| Net Asset Value – Delaware Core Plus Bond Fund | | | | | |
| Class R ($6,030,727 / 731,621 Shares) | | | | | $8.24 | |
| Net Asset Value – Delaware Core Plus Bond Fund | | | | | |
| Institutional Class ($8,639,634 / 1,050,218 Shares) | | | | | $8.23 | |
| | | | | | |
| Components of Net Assets at July 31, 2010: | | | | | |
| Shares of beneficial interest (unlimited authorization – no par) | | | $ | 104,023,516 | |
| Undistributed net investment income | | | | 1,179,193 | |
| Accumulated net realized loss on investments | | | | (8,898,320 | ) |
| Net unrealized appreciation of investments and foreign currencies | | | 4,203,200 | |
| Total net assets | | | $ | 100,507,589 | |
29
Statement of net assets
Delaware Core Plus Bond Fund
°Principal amount is stated in the currency in which each security is denominated.
AUD — Australian Dollar
BRL — Brazilian Real
CAD — Canadian Dollar
EUR — European Monetary Unit
IDR — Indonesia Rupiah
MXN — Mexican Peso
MYR — Malaysian Ringgit
NOK — Norwegian Kroner
NZD — New Zealand Dollar
TRY — Turkish Lira
USD — United States Dollar
ZAR — South African Rand
| • | Variable rate security. The rate shown is the rate as of July 31, 2010. Interest rates reset periodically. |
| ¹ | The rate shown is the effective yield at the time of purchase. |
| * | Fully or partially on loan. |
| ** | See Note 9 in ”Notes to financial statements.” |
| © | Includes $673,851 of securities loaned. |
| ¥ | Fully or partially pledged as collateral for financial futures contracts. |
| w | Pass Through Agreement. Security represents the contractual right to receive a proportionate amount of underlying payments due to the counterparty pursuant to various agreements related to the rescheduling of obligations and the exchange of certain notes. |
| Φ | Step coupon bond. Coupon increases or decreases periodically based on a predetermined schedule. Stated rate in effect at July 31, 2010. |
| # | Security exempt from registration under Rule 144A of the Securities Act of 1933, as amended. At July 31, 2010, the aggregate amount of Rule 144A securities was $12,304,194, which represented 12.24% of the Fund’s net assets. See Note 10 in “Notes to financial statements.” |
| @ | Illiquid security. At July 31, 2010, the aggregate amount of illiquid securities was $343,924, which represented 0.34% of the Fund’s net assets. See Note 10 in “Notes to financial statements.” |
| = | Security is being fair valued in accordance with the Fund’s fair valuation policy. At July 31, 2010, the aggregate amount of fair valued securities was $0, which represented 0.00% of the Fund’s net assets. See Note 1 in “Notes to financial statements.” |
30
| |
| † | Non income producing security. |
| ‡ | Non income producing security. Security is currently in default. |
| Δ | Securities have been classified by country of origin. |
| « | Senior Secured Loans generally pay interest at rates which are periodically redetermined by reference to a base lending rate plus a premium. These base lending rates are generally: (i) the prime rate offered by one or more United States banks, (ii) the lending rate offered by one or more European banks such as the London Inter-Bank Offered Rate (LIBOR), and (iii) the certificate of deposit rate. Senior Secured Loans may be subject to restrictions on resale. Stated rate in effect at July 31, 2010. |
Summary of abbreviations:
ARM — Adjustable Rate Mortgage
BCLY — Barclays
BOA — Bank of America Securities
CDS — Credit Default Swap
CITI — Citigroup
CMB — Chase Manhattan Bank
EM — Emerging Markets
GMC — Goldman Sachs & Co.
GNMA — Government National Mortgage Association
GPM — Graduated Payment Mortgage
GSMPS — Goldman Sachs Reperforming Mortgage Securities
HKSB — Hong Kong Shanghai Bank
HY — High Yield
MASTR — Mortgage Asset Securitization Transactions, Inc.
MSC — Morgan Stanley & Co.
PIK — Pay-in-kind
REMIC — Real Estate Mortgage Investment Conduit
S.F. — Single Family
TBA — To be announced
yr — Year
| Net Asset Value and Offering Price Per Share – | | |
| Delaware Core Plus Bond Fund | | |
| Net asset value Class A (A) | $ | 8.22 |
| Sales charge (4.50% of offering price) (B) | | 0.39 |
| Offering price | $ | 8.61 |
| (A) | | Net asset value per share, as illustrated, is the amount which would be paid upon redemption or repurchase of shares. |
| (B) | | See the current prospectus for purchases of $100,000 or more. |
31
Statement of net assets
Delaware Core Plus Bond Fund
1The following foreign currency exchange contracts, financial futures contracts and swap contracts were outstanding at July 31, 2010:
Foreign Currency Exchange Contracts
| | | | | | | | | | | | | Unrealized |
| | | Contracts to | | | | | | | | Appreciation |
| Counterparty | | Receive (Deliver) | | In Exchange For | | Settlement Date | | (Depreciation) |
| HKSB | | AUD | (51,523 | ) | | USD | 46,328 | | | 9/15/10 | | $ | (12 | ) |
| CITI | | AUD | (63,407 | ) | | USD | 56,843 | | | 9/15/10 | | | (184 | ) |
| BOA | | AUD | (575,698 | ) | | USD | 516,867 | | | 9/15/10 | | | (914 | ) |
| MSC | | AUD | (1,482,183) | | | USD | 1,328,821 | | | 9/15/10 | | | (4,252 | ) |
| CMB | | BRL | 346,998 | | | USD | (194,560 | ) | | 9/15/10 | | | 676 | |
| BOA | | BRL | 340,197 | | | USD | (190,961 | ) | | 9/15/10 | | | 449 | |
| BCLY | | BRL | (636,619 | ) | | USD | 356,490 | | | 9/15/10 | | | (1,700 | ) |
| GMC | | CAD | 98,030 | | | USD | (94,757 | ) | | 9/15/10 | | | 546 | |
| MSC | | CAD | (21,585 | ) | | USD | 20,829 | | | 9/15/10 | | | (156 | ) |
| BCLY | | CAD | (127,812 | ) | | USD | 123,418 | | | 9/15/10 | | | (838 | ) |
| BOA | | CAD | (249,117 | ) | | USD | 240,553 | | | 9/15/10 | | | (1,634 | ) |
| MSC | | EUR | 346,165 | | | USD | (449,292 | ) | | 9/15/10 | | | 1,808 | |
| BOA | | EUR | (47,216 | ) | | USD | 61,375 | | | 9/15/10 | | | (154 | ) |
| HKSB | | EUR | (81,148 | ) | | USD | 105,561 | | | 9/15/10 | | | (185 | ) |
| BOA | | MXN | 899,655 | | | USD | (70,825 | ) | | 9/15/10 | | | (104 | ) |
| MSC | | MXN | 602,921 | | | USD | (47,319 | ) | | 9/15/10 | | | 76 | |
| CMB | | MYR | 795,026 | | | USD | (249,209 | ) | | 9/15/10 | | | (258 | ) |
| GMC | | MYR | 505,126 | | | USD | (158,337 | ) | | 9/15/10 | | | (164 | ) |
| MSC | | MYR | (773,922 | ) | | USD | 242,601 | | | 9/15/10 | | | 259 | |
| HKSB | | NOK | (246,740 | ) | | USD | 39,965 | | | 9/15/10 | | | (545 | ) |
| MSC | | NOK | (771,701 | ) | | USD | 124,982 | | | 9/15/10 | | | (1,715 | ) |
| GMC | | NOK | (1,693,299 | ) | | USD | 273,872 | | | 9/15/10 | | | (4,133 | ) |
| BOA | | NOK | (2,526,718 | ) | | USD | 409,716 | | | 9/15/10 | | | (5,119 | ) |
| CMB | | NZD | 4,119 | | | USD | (3,007 | ) | | 9/15/10 | | | (29 | ) |
| HKSB | | TRY | 45,732 | | | USD | (30,000 | ) | | 9/15/10 | | | 87 | |
| HKSB | | ZAR | (975,198 | ) | | USD | 132,096 | | | 9/15/10 | | | (478 | ) |
| | | | | | | | | | | | | $ | (18,673 | ) |
32
| |
| Financial Futures Contracts | |
| | | | | | | | | | | | Unrealized |
| Contracts to Sell | Notional Cost | | Notional Value | | Expiration Date | | Appreciation |
| 8 U.S. Treasury 5 yr Notes | $ | 936,497 | | | $ | 958,625 | | | 9/30/10 | | $ | 22,128 | |
| 17 U.S. Treasury 10 yr Notes | | 2,048,863 | | | | 2,104,813 | | | 9/30/10 | | | 55,950 | |
| 11 U.S. Ultra Bond | | | 1,468,740 | | | | 1,487,750 | | | 9/21/10 | | | | 19,010 | |
| | | $ | 4,454,100 | | | | | | | | | | $ | 97,088 | |
Swap Contracts
CDS Contracts
| | | | | | Annual | | | | Unrealized |
| Swap Counterparty & | | | | | Protection | | Termination | | Appreciation |
| Referenced Obligation | Notional Value | | Payments | | Date | | (Depreciation) |
| Protection Purchased: | | | | | | | | | | | | |
| Bank of America Securities | | | | | | | | | | | | |
| CDX.NA.HY.14 | $ | 805,000 | | | 5.00 | % | | 6/20/15 | | $ | (31,302 | ) |
| Barclays | | | | | | | | | | | | |
| CDX.NA.HY.14 | | 810,000 | | | 5.00 | % | | 6/20/15 | | | (10,676 | ) |
| ITRAXX Europe Subordinate | | | | | | | | | | | | |
| Financials 13.1 5 yr CDS | | 1,020,000 | | | 1.00 | % | | 6/20/15 | | | (17,403 | ) |
| Kingdom of Spain 5 yr CDS | | 240,000 | | | 1.00 | % | | 3/20/15 | | | 5,298 | |
| Citigroup Global Markets | | | | | | | | | | | | |
| CDX.NA.HY.14 | | 950,000 | | | 5.00 | % | | 6/20/15 | | | (21,651 | ) |
| Goldman Sachs | | | | | | | | | | | | |
| CDX.NA.HY.14 | | 1,060,000 | | | 5.00 | % | | 6/20/15 | | | (7,800 | ) |
| JPMorgan Securities | | | | | | | | | | | | |
| CDX.EM.13 | | 197,000 | | | 5.00 | % | | 6/20/15 | | | (2,577 | ) |
| CDX.NA.HY.14 | | 275,000 | | | 5.00 | % | | 6/20/15 | | | (5,715 | ) |
| Donnelley (R.R.) & Sons 5 yr CDS | | 600,000 | | | 5.00 | % | | 6/20/14 | | | (84,790 | ) |
| ITRAXX Europe Subordinate | | | | | | | | | | | | |
| Financials 13.1 5 yr CDS | | 700,000 | | | 1.00 | % | | 6/20/15 | | | (28,194 | ) |
| Penney (J.C.) 5 yr CDS | | 310,000 | | | 1.00 | % | | 3/20/15 | | | 6,379 | |
| Portuguese Republic 5 yr CDS | | 156,000 | | | 1.00 | % | | 6/20/15 | | | 5,254 | |
| Sunoco 5 yr CDS | | 155,000 | | | 1.00 | % | | 3/20/15 | | | 4,296 | |
| Viacom 5 yr CDS | | 250,000 | | | 1.00 | % | | 9/20/15 | | | (1,291 | ) |
| Morgan Stanley | | | | | | | | | | | | |
| CDX.NA.HY.14 | | | 490,000 | | | 5.00 | % | | 6/20/15 | | | | (17,426 | ) |
| | | $ | 8,018,000 | | | | | | | | | $ | (207,598 | ) |
33
Statement of net assets
Delaware Core Plus Bond Fund
| |
| Swap Contracts (continued) |
| | | | | | Annual | | | | Unrealized |
| Swap Counterparty & | | | | | Protection | | Termination | | Appreciation |
| Referenced Obligation | Notional Value | | Payments | | Date | | (Depreciation) |
| Protection Sold/Moody’s Rating: | | | | | | | | | | | | |
| Citigroup Global Markets | | | | | | | | | | | | |
| MetLife 5 yr CDS/A3 | $ | 80,000 | | | 5.00 | % | | 9/20/14 | | $ | 1,456 | |
| JPMorgan Securities | | | | | | | | | | | | |
| Comcast 5 yr CDS/Baa1 | | 250,000 | | | 1.00 | % | | 9/20/15 | | | 1,995 | |
| MetLife 5 yr CDS/A3 | | 415,000 | | | 1.00 | % | | 12/20/14 | | | (5,644 | ) |
| Valero Energy 5 yr CDS/Baa2 | | | 155,000 | | | 1.00 | % | | 3/20/15 | | | | (271 | ) |
| | | $ | 900,000 | | | | | | | | | $ | (2,464 | ) |
| Total | | | | | | | | | | | $ | (210,062 | ) |
The use of foreign currency exchange contracts, financial futures contracts and swap contracts involves elements of market risk and risks in excess of the amounts recognized in the financial statements. The notional values presented above represent the Fund’s total exposure in such contracts, whereas only the net unrealized appreciation (depreciation) is reflected in the Fund’s net assets.
1See Note 8 in ”Notes to financial statements.”
See accompanying Notes, which are an integral part of the financial statements.
34
| Statement of assets and liabilities |
| Delaware Core Plus Bond Fund | Year Ended July 31, 2010 |
| Assets: | | |
| Investments, at value1 | $ | 94,001,217 |
| Short-term investments, at value | | 15,457,055 |
| Short-term investments held as collateral for loaned securities, at value | | 674,772 |
| Cash | | 100,239 |
| Restricted cash | | 146,385 |
| Foreign currencies, at value | | 119,753 |
| Receivables for fund shares sold | | 67,644 |
| Receivables for securities sold | | 5,106,444 |
| Foreign currency contracts, at value | | 389 |
| Interest receivable | | 850,372 |
| Securities lending income receivable | | 74 |
| Credit default swap contracts, at value | | |
| (including up front payments received $314,980) | | 104,918 |
| Variation margin receivable on futures contracts | | 41,281 |
| Total assets | | 116,670,543 |
| |
| Liabilities: | | |
| Payables for securities purchased | | 15,075,700 |
| Payables for fund shares redeemed | | 151,919 |
| Foreign currency contracts, at value | | 19,062 |
| Obligation to return securities lending collateral | | 688,094 |
| Annual protection payments on credit default swaps | | 31,409 |
| Distributions payable | | 71,496 |
| Due to manager and affiliates | | 50,135 |
| Other accrued expenses | | 75,139 |
| Total liabilities | | 16,162,954 |
| |
| Total Net Assets | $ | 100,507,589 |
| |
| Investments, at cost | $ | 89,626,065 |
| Short-term investments, at cost | | 15,457,055 |
| Short-term investments held as collateral for loaned securities, at cost | | 688,094 |
| Foreign currencies, at cost | | 117,910 |
| 1including securities on loan | | 673,851 |
See accompanying Notes, which are an integral part of the financial statements.
35
| Statement of operations | |
| Delaware Core Plus Bond Fund | Year Ended July 31, 2010 |
| Investment Income: | | | | | | | | |
| Interest | | $ | 4,993,995 | | | | | |
| Dividends | | | 28,920 | | | | | |
| Securities lending income | | | 2,728 | | | | | |
| Foreign tax withheld | | | (5,310 | ) | | $ | 5,020,333 | |
| |
| Expenses: | | | | | | | | |
| Management fees | | | 500,852 | | | | | |
| Distribution expenses – Class A | | | 207,796 | | | | | |
| Distribution expenses – Class B | | | 37,730 | | | | | |
| Distribution expenses – Class C | | | 77,389 | | | | | |
| Distribution expenses – Class R | | | 24,374 | | | | | |
| Dividend disbursing and transfer agent fees and expenses | | | 199,482 | | | | | |
| Registration fees | | | 71,378 | | | | | |
| Reports and statements to shareholders | | | 42,129 | | | | | |
| Accounting and administration expenses | | | 36,266 | | | | | |
| Pricing fees | | | 28,400 | | | | | |
| Custodian fees | | | 16,776 | | | | | |
| Audit and tax | | | 15,925 | | | | | |
| Legal fees | | | 12,631 | | | | | |
| Dues and services | | | 9,096 | | | | | |
| Trustees’ fees | | | 5,221 | | | | | |
| Insurance fees | | | 2,890 | | | | | |
| Consulting fees | | | 1,310 | | | | | |
| Trustees’ expenses | | | 375 | | | | 1,290,020 | |
| Less fees waived | | | | | | | (341,544 | ) |
| Less waived distribution expenses – Class A | | | | | | | (34,632 | ) |
| Less waived distribution expenses – Class R | | | | | | | (4,048 | ) |
| Less expense paid indirectly | | | | | | | (115 | ) |
| Total operating expenses | | | | | | | 909,681 | |
| Net Investment Income | | | | | | | 4,110,652 | |
36
| Net Realized and Unrealized Gain (Loss) on Investments | | | |
| and Foreign Currencies: | | | |
| Net realized gain (loss) on: | | | |
| Investments | $ | 5,037,141 | |
| Futures contracts | | (60,358 | ) |
| Swap contracts | | (67,879 | ) |
| Foreign currencies | | 45,219 | |
| Net realized gain | | 4,954,123 | |
| Net change in unrealized appreciation/depreciation of | | | |
| investments and foreign currencies | | 1,839,607 | |
| Net Realized and Unrealized Gain on Investments | | | |
| and Foreign Currencies | | 6,793,730 | |
| |
| Net Increase in Net Assets Resulting from Operations | $ | 10,904,382 | |
See accompanying Notes, which are an integral part of the financial statements.
37
Statements of changes in net assets
Delaware Core Plus Bond Fund
| | | Year Ended |
| | | 7/31/10 | | 7/31/09 |
| Increase (Decrease) in Net Assets from Operations: | | | | | | | | |
| Net investment income | | $ | 4,110,652 | | | $ | 3,888,619 | |
| Net realized gain (loss) on investments | | | 4,954,123 | | | | (1,960,979 | ) |
| Net change in unrealized appreciation/depreciation of | | | | | | | | |
| investments and foreign currencies | | | 1,839,607 | | | | 5,172,150 | |
| Net increase in net assets resulting from operations | | | 10,904,382 | | | | 7,099,790 | |
| |
| Dividends and Distributions to Shareholders from: | | | | | | | | |
| Net investment income: | | | | | | | | |
| Class A | | | (3,232,187 | ) | | | (3,256,911 | ) |
| Class B | | | (149,725 | ) | | | (269,913 | ) |
| Class C | | | (295,498 | ) | | | (260,012 | ) |
| Class R | | | (171,993 | ) | | | (10,191 | ) |
| Institutional Class | | | (293,980 | ) | | | (410,470 | ) |
| | | | (4,143,383 | ) | | | (4,207,497 | ) |
| |
| Capital Share Transactions: | | | | | | | | |
| Proceeds from shares sold: | | | | | | | | |
| Class A | | | 15,684,077 | | | | 12,588,852 | |
| Class B | | | 219,426 | | | | 514,698 | |
| Class C | | | 5,398,787 | | | | 1,995,501 | |
| Class R | | | 6,133,846 | | | | 154,475 | |
| Institutional Class | | | 12,178,149 | | | | 576,244 | |
| |
| Net asset value of shares issued upon reinvestment | | | | | | | | |
| of dividends and distributions: | | | | | | | | |
| Class A | | | 2,412,416 | | | | 2,395,751 | |
| Class B | | | 102,930 | | | | 205,283 | |
| Class C | | | 207,879 | | | | 207,882 | |
| Class R | | | 155,838 | | | | 9,993 | |
| Institutional Class | | | 261,515 | | | | 323,151 | |
| | | | 42,754,863 | | | | 18,971,830 | |
38
| | | Year Ended |
| | | 7/31/10 | | 7/31/09 |
| Capital Share Transactions (continued): | | | | | | | | |
| Cost of shares repurchased: | | | | | | | | |
| Class A | | $ | (15,418,790 | ) | | $ | (11,835,587 | ) |
| Class B | | | (1,913,917 | ) | | | (3,823,170 | ) |
| Class C | | | (1,970,515 | ) | | | (2,266,898 | ) |
| Class R | | | (736,001 | ) | | | (44,875 | ) |
| Institutional Class | | | (7,469,683 | ) | | | (41,228,413 | ) |
| | | | (27,508,906 | ) | | | (59,198,943 | ) |
| Increase (decrease) in net assets derived from | | | | | | | | |
| capital share transactions | | | 15,245,957 | | | | (40,227,113 | ) |
| Net Increase (Decrease) in Net Assets | | | 22,006,956 | | | | (37,334,820 | ) |
| | | | | | | | | |
| Net Assets: | | | | | | | | |
| Beginning of year | | | 78,500,633 | | | | 115,835,453 | |
| End of year (including undistributed net investment | | | | | | | | |
| income of $1,179,193 and $1,067,809, respectively) | | $ | 100,507,589 | | | $ | 78,500,633 | |
See accompanying Notes, which are an integral part of the financial statements.
39
Financial highlights
Delaware Core Plus Bond Fund Class A
Selected data for each share of the Fund outstanding throughout each period were as follows:
| Net asset value, beginning of period |
| |
| Income (loss) from investment operations: |
| Net investment income1 |
| Net realized and unrealized gain (loss) on investments and foreign currencies |
| Total from investment operations |
| |
| Less dividends and distributions from: |
| Net investment income |
| Total dividends and distributions |
| |
| Net asset value, end of period |
| |
| Total return2 |
| |
| Ratios and supplemental data: |
| Net assets, end of period (000 omitted) |
| Ratio of expenses to average net assets |
| Ratio of expenses to average net assets |
| prior to fees waived and expense paid indirectly |
| Ratio of net investment income to average net assets |
| Ratio of net investment income to average net assets |
| prior to fees waived and expense paid indirectly |
| Portfolio turnover |
1 The average shares outstanding method has been applied for per share information for the years ended July 31, 2010, 2009 and 2008.
2 Total investment return is based on the change in net asset value of a share during the period and assumes reinvestment of dividends and distributions at net asset value and does not reflect the impact of a sales charge. Total investment return during some of the periods shown reflects waivers by the manager and distributor. Performance would have been lower had the waivers not been in effect.
See accompanying Notes, which are an integral part of the financial statements.
40
| | Year Ended | |
| | 7/31/10 | | | 7/31/09 | | | 7/31/08 | | | 7/31/07 | | | 7/31/06 | | |
| | $7.620 | | | $7.260 | | | $7.310 | | | $7.330 | | | $7.670 | | |
| | | | | | | | | | | | | | | | |
| | | | | | | | | | | | | | | | |
| | 0.366 | | | 0.367 | | | 0.332 | | | 0.305 | | | 0.280 | | |
| | 0.606 | | | 0.395 | | | (0.038 | ) | | 0.015 | | | (0.285 | ) | |
| | 0.972 | | | 0.762 | | | 0.294 | | | 0.320 | | | (0.005 | ) | |
| | | | | | | | | | | | | | | | |
| | | | | | | | | | | | | | | | |
| | (0.372 | ) | | (0.402 | ) | | (0.344 | ) | | (0.340 | ) | | (0.335 | ) | |
| | (0.372 | ) | | (0.402 | ) | | (0.344 | ) | | (0.340 | ) | | (0.335 | ) | |
| | | | | | | | | | | | | | | | |
| | $8.220 | | | $7.620 | | | $7.260 | | | $7.310 | | | $7.330 | | |
| | | | | | | | | | | | | | | | |
| | 13.03% | | | 11.13% | | | 4.18% | | | 4.40% | | | (0.05% | ) | |
| | | | | | | | | | | | | | | | |
| | | | | | | | | | | | | | | | |
| | $72,618 | | | $64,746 | | | $58,485 | | | $64,620 | | | $76,888 | | |
| | 0.91% | | | 0.98% | | | 0.95% | | | 1.02% | | | 1.05% | | |
| | | | | | | | | | | | | | | | |
| | 1.34% | | | 1.32% | | | 1.24% | | | 1.30% | | | 1.22% | | |
| | 4.60% | | | 5.20% | | | 4.47% | | | 4.11% | | | 3.75% | | |
| | | | | | | | | | | | | | | | |
| | 4.17% | | | 4.86% | | | 4.18% | | | 3.83% | | | 3.58% | | |
| | 264% | | | 244% | | | 331% | | | 338% | | | 260% | | |
41
Financial highlights
Delaware Core Plus Bond Fund Class B
Selected data for each share of the Fund outstanding throughout each period were as follows:
| Net asset value, beginning of period |
| |
| Income (loss) from investment operations: |
| Net investment income1 |
| Net realized and unrealized gain (loss) on investments and foreign currencies |
| Total from investment operations |
| |
| Less dividends and distributions from: |
| Net investment income |
| Total dividends and distributions |
| |
| Net asset value, end of period |
| |
| Total return2 |
| |
| Ratios and supplemental data: |
| Net assets, end of period (000 omitted) |
| Ratio of expenses to average net assets |
| Ratio of expenses to average net assets |
| prior to fees waived and expense paid indirectly |
| Ratio of net investment income to average net assets |
| Ratio of net investment income to average net assets |
| prior to fees waived and expense paid indirectly |
| Portfolio turnover |
1 The average shares outstanding method has been applied for per share information for the years ended July 31, 2010, 2009 and 2008.
2 Total investment return is based on the change in net asset value of a share during the period and assumes reinvestment of dividends and distributions at net asset value and does not reflect the impact of a sales charge. Total investment return during all of the periods shown reflects a waiver by the manager. Performance would have been lower had the waiver not been in effect.
See accompanying Notes, which are an integral part of the financial statements.
42
| | Year Ended | |
| | 7/31/10 | | | 7/31/09 | | | 7/31/08 | | | 7/31/07 | | | 7/31/06 | | |
| | $7.620 | | | $7.260 | | | $7.310 | | | $7.330 | | | $7.670 | | |
| | | | | | | | | | | | | | | | |
| | | | | | | | | | | | | | | | |
| | 0.305 | | | 0.314 | | | 0.276 | | | 0.251 | | | 0.228 | | |
| | 0.608 | | | 0.396 | | | (0.038 | ) | | 0.015 | | | (0.285 | ) | |
| | 0.913 | | | 0.710 | | | 0.238 | | | 0.266 | | | (0.057 | ) | |
| | | | | | | | | | | | | | | | |
| | | | | | | | | | | | | | | | |
| | (0.313 | ) | | (0.350 | ) | | (0.288 | ) | | (0.286 | ) | | (0.283 | ) | |
| | (0.313 | ) | | (0.350 | ) | | (0.288 | ) | | (0.286 | ) | | (0.283 | ) | |
| | | | | | | | | | | | | | | | |
| | $8.220 | | | $7.620 | | | $7.260 | | | $7.310 | | | $7.330 | | |
| | | | | | | | | | | | | | | | |
| | 12.19% | | | 10.31% | | | 3.40% | | | 3.65% | | | (0.74% | ) | |
| | | | | | | | | | | | | | | | |
| | | | | | | | | | | | | | | | |
| | $3,197 | | | $4,494 | | | $7,472 | | | $10,922 | | | $15,926 | | |
| | 1.66% | | | 1.73% | | | 1.70% | | | 1.74% | | | 1.75% | | |
| | | | | | | | | | | | | | | | |
| | 2.04% | | | 2.02% | | | 1.94% | | | 2.00% | | | 1.92% | | |
| | 3.85% | | | 4.45% | | | 3.72% | | | 3.39% | | | 3.05% | | |
| | | | | | | | | | | | | | | | |
| | 3.47% | | | 4.16% | | | 3.48% | | | 3.13% | | | 2.88% | | |
| | 264% | | | 244% | | | 331% | | | 338% | | | 260% | | |
43
Financial highlights
Delaware Core Plus Bond Fund Class C
Selected data for each share of the Fund outstanding throughout each period were as follows:
| Net asset value, beginning of period |
| |
| Income (loss) from investment operations: |
| Net investment income1 |
| Net realized and unrealized gain (loss) on investments and foreign currencies |
| Total from investment operations |
| |
| Less dividends and distributions from: |
| Net investment income |
| Total dividends and distributions |
| |
| Net asset value, end of period |
| |
| Total return2 |
| |
| Ratios and supplemental data: |
| Net assets, end of period (000 omitted) |
| Ratio of expenses to average net assets |
| Ratio of expenses to average net assets |
| prior to fees waived and expense paid indirectly |
| Ratio of net investment income to average net assets |
| Ratio of net investment income to average net assets |
| prior to fees waived and expense paid indirectly |
| Portfolio turnover |
1 The average shares outstanding method has been applied for per share information for the years ended July 31, 2010, 2009 and 2008.
2 Total investment return is based on the change in net asset value of a share during the period and assumes reinvestment of dividends and distributions at net asset value and does not reflect the impact of a sales charge. Total investment return during all of the periods shown reflects a waiver by the manager. Performance would have been lower had the waiver not been in effect.
See accompanying Notes, which are an integral part of the financial statements.
44
| | Year Ended | |
| | 7/31/10 | | | 7/31/09 | | | 7/31/08 | | | 7/31/07 | | | 7/31/06 | | |
| | $7.620 | | | $7.260 | | | $7.310 | | | $7.330 | | | $7.670 | | |
| | | | | | | | | | | | | | | | |
| | | | | | | | | | | | | | | | |
| | 0.307 | | | 0.314 | | | 0.276 | | | 0.251 | | | 0.228 | | |
| | 0.616 | | | 0.396 | | | (0.038 | ) | | 0.015 | | | (0.285 | ) | |
| | 0.923 | | | 0.710 | | | 0.238 | | | 0.266 | | | (0.057 | ) | |
| | | | | | | | | | | | | | | | |
| | | | | | | | | | | | | | | | |
| | (0.313 | ) | | (0.350 | ) | | (0.288 | ) | | (0.286 | ) | | (0.283 | ) | |
| | (0.313 | ) | | (0.350 | ) | | (0.288 | ) | | (0.286 | ) | | (0.283 | ) | |
| | | | | | | | | | | | | | | | |
| | $8.230 | | | $7.620 | | | $7.260 | | | $7.310 | | | $7.330 | | |
| | | | | | | | | | | | | | | | |
| | 12.32% | | | 10.31% | | | 3.40% | | | 3.65% | | | (0.74% | ) | |
| | | | | | | �� | | | | | | | | | |
| | | | | | | | | | | | | | | | |
| | $10,022 | | | $5,813 | | | $5,594 | | | $5,243 | | | $5,747 | | |
| | 1.66% | | | 1.73% | | | 1.70% | | | 1.74% | | | 1.75% | | |
| | | | | | | | | | | | | | | | |
| | 2.04% | | | 2.02% | | | 1.94% | | | 2.00% | | | 1.92% | | |
| | 3.85% | | | 4.45% | | | 3.72% | | | 3.39% | | | 3.05% | | |
| | | | | | | | | | | | | | | | |
| | 3.47% | | | 4.16% | | | 3.48% | | | 3.13% | | | 2.88% | | |
| | 264% | | | 244% | | | 331% | | | 338% | | | 260% | | |
45
Financial highlights
Delaware Core Plus Bond Fund Class R
Selected data for each share of the Fund outstanding throughout each period were as follows:
| Net asset value, beginning of period |
| |
| Income (loss) from investment operations: |
| Net investment income1 |
| Net realized and unrealized gain (loss) on investments and foreign currencies |
| Total from investment operations |
| |
| Less dividends and distributions from: |
| Net investment income |
| Total dividends and distributions |
| |
| Net asset value, end of period |
| |
| Total return2 |
| |
| Ratios and supplemental data: |
| Net assets, end of period (000 omitted) |
| Ratio of expenses to average net assets |
| Ratio of expenses to average net assets |
| prior to fees waived and expense paid indirectly |
| Ratio of net investment income to average net assets |
| Ratio of net investment income to average net assets |
| prior to fees waived and expense paid indirectly |
| Portfolio turnover |
1 The average shares outstanding method has been applied for per share information for the years ended July 31, 2010, 2009 and 2008.
2 Total investment return is based on the change in net asset value of a share during the period and assumes reinvestment of dividends and distributions at net asset value. Total investment return during all of the periods shown reflects waivers by the manager and distributor. Performance would have been lower had the waivers not been in effect.
See accompanying Notes, which are an integral part of the financial statements.
46
| | Year Ended | |
| | 7/31/10 | | | 7/31/09 | | | 7/31/08 | | | 7/31/07 | | | 7/31/06 | | |
| | $7.630 | | | $7.260 | | | $7.310 | | | $7.340 | | | $7.680 | | |
| | | | | | | | | | | | | | | | |
| | | | | | | | | | | | | | | | |
| | 0.350 | | | 0.349 | | | 0.313 | | | 0.289 | | | 0.265 | | |
| | 0.613 | | | 0.406 | | | (0.037 | ) | | 0.005 | | | (0.285 | ) | |
| | 0.963 | | | 0.755 | | | 0.276 | | | 0.294 | | | (0.020 | ) | |
| | | | | | | | | | | | | | | | |
| | | | | | | | | | | | | | | | |
| | (0.353 | ) | | (0.385 | ) | | (0.326 | ) | | (0.324 | ) | | (0.320 | ) | |
| | (0.353 | ) | | (0.385 | ) | | (0.326 | ) | | (0.324 | ) | | (0.320 | ) | |
| | | | | | | | | | | | | | �� | | |
| | $8.240 | | | $7.630 | | | $7.260 | | | $7.310 | | | $7.340 | | |
| | | | | | | | | | | | | | | | |
| | 12.87% | | | 11.00% | | | 3.92% | | | 4.02% | | | (0.25% | ) | |
| | | | | | | | | | | | | | | | |
| | | | | | | | | | | | | | | | |
| | $6,031 | | | $235 | | | $93 | | | $206 | | | $323 | | |
| | 1.16% | | | 1.23% | | | 1.20% | | | 1.24% | | | 1.25% | | |
| | | | | | | | | | | | | | | | |
| | 1.64% | | | 1.62% | | | 1.54% | | | 1.60% | | | 1.52% | | |
| | 4.35% | | | 4.95% | | | 4.22% | | | 3.89% | | | 3.55% | | |
| | | | | | | | | | | | | | | | |
| | 3.87% | | | 4.56% | | | 3.88% | | | 3.53% | | | 3.28% | | |
| | 264% | | | 244% | | | 331% | | | 338% | | | 260% | | |
47
Financial highlights
Delaware Core Plus Bond Fund Institutional Class
Selected data for each share of the Fund outstanding throughout each period were as follows:
| Net asset value, beginning of period |
| |
| Income (loss) from investment operations: |
| Net investment income1 |
| Net realized and unrealized gain (loss) on investments and foreign currencies |
| Total from investment operations |
| |
| Less dividends and distributions from: |
| Net investment income |
| Total dividends and distributions |
| |
| Net asset value, end of period |
| |
| Total return2 |
| |
| Ratios and supplemental data: |
| Net assets, end of period (000 omitted) |
| Ratio of expenses to average net assets |
| Ratio of expenses to average net assets |
| prior to fees waived and expense paid indirectly |
| Ratio of net investment income to average net assets |
| Ratio of net investment income to average net assets |
| prior to fees waived and expense paid indirectly |
| Portfolio turnover |
1 The average shares outstanding method has been applied for per share information for the years ended July 31, 2010, 2009 and 2008.
2 Total investment return is based on the change in net asset value of a share during the period and assumes reinvestment of dividends and distributions at net asset value. Total investment return during all of the periods shown reflects a waiver by the manager. Performance would have been lower had the waiver not been in effect.
See accompanying Notes, which are an integral part of the financial statements.
48
| | Year Ended | |
| | 7/31/10 | | | 7/31/09 | | | 7/31/08 | | | 7/31/07 | | | 7/31/06 | |
| | $7.630 | | | $7.260 | | | $7.310 | | | $7.330 | | | $7.670 | |
| | |
| | | | | | | | | | | | | | | |
| | 0.388 | | | 0.384 | | | 0.350 | | | 0.325 | | | 0.303 | |
| | 0.605 | | | 0.406 | | | (0.037 | ) | | 0.015 | | | (0.285 | ) |
| | 0.993 | | | 0.790 | | | 0.313 | | | 0.340 | | | 0.018 | |
| | |
| | | | | | | | | | | | | | | |
| | (0.393 | ) | | (0.420 | ) | | (0.363 | ) | | (0.360 | ) | | (0.358 | ) |
| | (0.393 | ) | | (0.420 | ) | | (0.363 | ) | | (0.360 | ) | | (0.358 | ) |
| | | | | | | | | | | | | | | |
| | $8.230 | | | $7.630 | | | $7.260 | | | $7.310 | | | $7.330 | |
| | | | | | | | | | | | | | | |
| | 13.30% | | | 11.55% | | | 4.44% | | | 4.69% | | | 0.25% | |
| | |
| | | | | | | | | | | | | | | |
| | $8,640 | | | $3,213 | | | $44,191 | | | $30,693 | | | $27,222 | |
| | 0.66% | | | 0.73% | | | 0.70% | | | 0.74% | | | 0.75% | |
| | | | | | | | | | | | | | | |
| | 1.04% | | | 1.02% | | | 0.94% | | | 1.00% | | | 0.92% | |
| | 4.85% | | | 5.45% | | | 4.72% | | | 4.39% | | | 4.05% | |
| | | | | | | | | | | | | | | |
| | 4.47% | | | 5.16% | | | 4.48% | | | 4.13% | | | 3.88% | |
| | 264% | | | 244% | | | 331% | | | 338% | | | 260% | |
49
| Notes to financial statements |
| Delaware Core Plus Bond Fund | July 31, 2010 |
Delaware Group® Government Fund (Trust) is organized as a Delaware statutory trust and offers two Series: Delaware Core Plus Bond Fund and Delaware Inflation Protected Bond Fund. These financial statements and the related notes pertain to Delaware Core Plus Bond Fund (Fund). The Trust is an open-end investment company. The Fund is considered diversified under the Investment Company Act of 1940, as amended, and offers Class A, Class B, Class C, Class R and Institutional Class shares. Class A shares are sold with a maximum front-end sales charge of up to 4.50%. Class A share purchases of $1,000,000 or more will incur a contingent deferred sales charge (CDSC) of 1% if redeemed during the first year and 0.50% during the second year, provided that Delaware Distri butors, L.P. (DDLP) paid a financial advisor a commission on the purchase of those shares. Class B shares may only be purchased through dividend reinvestment and certain permitted exchanges. Prior to June 1, 2007, Class B shares were sold with a CDSC that declined from 4% to zero depending upon the period of time the shares were held. Class B shares will automatically convert to Class A shares on a quarterly basis approximately eight years after purchase. Class C shares are sold with a CDSC of 1%, if redeemed during the first 12 months. Class R and Institutional Class shares are not subject to a sales charge and are offered for sale exclusively to certain eligible investors.
The investment objective of the Fund is to seek maximum long-term total return, consistent with reasonable risk.
1. Significant Accounting Policies
The following accounting policies are in accordance with U.S. generally accepted accounting principles (U.S. GAAP) and are consistently followed by the Fund.
Security Valuation — Securities listed on a foreign exchange are valued at the last quoted sales price on the valuation date. Short-term debt securities are valued at market value. U.S. government and agency securities are valued at the mean between the bid and ask prices. Other debt securities, credit default swap (CDS) contracts and interest rate swap contracts are valued by an independent pricing service or broker. To the extent current market prices are not available, the pricing service may take into account developments related to the specific security, as well as transactions in comparable securities. Investment companies are valued at net asset value per share. Foreign currency exchange contracts are valued at the mean between the bid and ask prices. Interpolated values are derived when the settlement date of the contract is an interim date for which quotations are not available. Financial futures contracts and options on futures contracts are valued at the daily quoted settlement prices. Generally, other securities and assets for which market quotations are not readily available are valued at fair value as determined in good faith under the direction of the Fund’s Board of Trustees (Board). In determining whether market quotations are readily available or fair valuation will be used, various factors will be taken into consideration, such as market closures or suspension of trading in a security. The Fund may use fair value pricing more frequently for securities traded primarily in non-U.S. markets because, among other things, most foreign markets close well before the Fund values its securities at 4:00 p.m. Eastern time. The earlier close of these foreign markets gives rise to
50
the possibility that significant events, including broad market moves, government actions or pronouncements, aftermarket trading, or news events may have occurred in the interim. To account for this, the Fund may frequently value foreign securities using fair value prices based on third-party vendor modeling tools (international fair value pricing).
Federal Income Taxes — No provision for federal income taxes has been made as the Fund intends to continue to qualify for federal income tax purposes as a regulated investment company under Subchapter M of the Internal Revenue Code of 1986, as amended, and make the requisite distributions to shareholders. The Fund evaluates tax positions taken or expected to be taken in the course of preparing the Fund’s tax returns to determine whether the tax positions are “more-likely-than-not” of being sustained by the applicable tax authority. Tax positions not deemed to meet the more-likely-than-not threshold are recorded as a tax benefit or expense in the current year. Management has analyzed the Fund’s tax positions taken on federal income tax returns for all open tax years (July 31, 2007 – July 31, 2010), and has concluded that no provision for federal income tax is required in the Fund’s financial statements.
Class Accounting — Investment income and common expenses are allocated to the various classes of the Fund on the basis of “settled shares” of each class in relation to the net assets of the Fund. Realized and unrealized gain (loss) on investments are allocated to the various classes of the Fund on the basis of daily net assets of each class. Distribution expenses relating to a specific class are charged directly to that class.
Repurchase Agreements — The Fund may invest in a pooled cash account along with other members of the Delaware Investments® Family of Funds pursuant to an exemptive order issued by the Securities and Exchange Commission. The aggregate daily balance of the pooled cash account is invested in repurchase agreements secured by obligations of the U.S. government. The respective collateral is held by the Fund’s custodian bank until the maturity of the respective repurchase agreements. Each repurchase agreement is at least 102% collateralized. However, in the event of default or bankruptcy by the counterparty to the agreement, realization of the collateral may be subject to legal proceedings. At July 31, 2010, the Fund held no investments in repurchase agreements.
To Be Announced Trades — The Fund may contract to purchase securities for a fixed price at a transaction date beyond the customary settlement period (i.e., “when issued,” “delayed delivery,” “forward commitment,” or “TBA transactions”) consistent with the Fund’s ability to manage its investment portfolio and meet redemption requests. These transactions involve a commitment by the Fund to purchase securities for a predetermined price or yield with payment and delivery taking place more than three days in the future, or after a period longer than the customary settlement period for that type of sec urity. No interest will be earned by the Fund on such purchases until the securities are delivered; however the market value may change prior to delivery.
51
Notes to financial statements
Delaware Core Plus Bond Fund
1. Significant Accounting Policies (continued)
Foreign Currency Transactions — Transactions denominated in foreign currencies are recorded at the prevailing exchange rates on the valuation date in accordance with the Fund’s prospectus. The value of all assets and liabilities denominated in foreign currencies is translated into U.S. dollars at the exchange rate of such currencies against the U.S. dollar daily. Transaction gains or losses resulting from changes in exchange rates during the reporting period or upon settlement of the foreign currency transaction are reported in operations for the current period. The Fund isolates that portion of realized gains and losses on investments in debt securities which is due to changes in foreign exchange rates from that which are due to changes in market prices of debt securities. The Fund reports certain foreign currency related transactions as components of realized gains (losses) for financial reporting purposes, whereas such components are treated as ordinary income (loss) for federal income tax purposes.
Use of Estimates — The preparation of financial statements in conformity with U.S. GAAP requires management to make estimates and assumptions that affect the reported amounts of assets and liabilities and disclosure of contingent assets and liabilities at the date of the financial statements and the reported amounts of revenues and expenses during the reporting period. Actual results could differ from those estimates and such differences could be material.
Other — Expenses directly attributable to the Fund are charged directly to the Fund. Other expenses common to various funds within the Delaware Investments® Family of Funds are generally allocated amongst such funds on the basis of average net assets. Management fees and some other expenses are paid monthly. Security transactions are recorded on the date the securities are purchased or sold (trade date) for financial reporting purposes. Costs used in calculating realized gains and losses on the sale of investment securities are those of the specific securities sold. Dividend income is recorded on the ex-dividend date and interest income is recorded on the accrual basis. Discounts and premiums on non-convertible bonds are amortized to interest income over the lives of the respective securities. Realized gains (losses) on paydowns of mortgage- and asset-backed securities are classified as interest income. The Fund declares dividends daily from net investment income and pays such dividends monthly and declares and pays distributions from net realized gain on investments, if any, annually. Such dividends and distributions, if any, are recorded on the ex-dividend date.
The Fund may receive earnings credits from its custodian when positive cash balances are maintained, which are used to offset custody fees. There were no earnings credits for the year ended July 31, 2010.
The Fund may receive earnings credits from its transfer agent when positive cash balances are maintained, which may be used to offset transfer agent fees. For the year ended July 31, 2010, the Fund earned $115 under this agreement.
52
2. Investment Management, Administration Agreements and Other Transactions with Affiliates
In accordance with the terms of its investment management agreement, the Fund pays Delaware Management Company (DMC), a Series of Delaware Management Business Trust and the investment manager, an annual fee which is calculated daily at the rate of 0.55% on the first $500 million of average daily net assets of the Fund, 0.50% on the next $500 million, 0.45% on the next $1.5 billion, and 0.425% on average daily net assets in excess of $2.5 billion.
Effective December 1, 2009, DMC has voluntarily agreed to waive that portion, if any, of its management fee and/or pay/reimburse the Fund to the extent necessary to ensure that total annual operating expenses (excluding any 12b-1 plan expenses, taxes, interest, inverse floater program expenses, short sale and dividend interest expenses, brokerage fees, certain insurance costs, and nonroutine expenses or costs including, but not limited to, those relating to reorganizations, litigation, conducting shareholder meetings, and liquidations), do not exceed 0.65% of average daily net assets of the Fund until such time as the voluntary expense cap is discontinued. These fee waivers and expense reimbursements apply only to expenses paid directly by the Fund, and may be discontinued at any time because they are voluntary. For purposes of this waiver and reimbursement, nonroutine expenses may also include such additional costs and expenses, as may be agreed upon from time to time by the Fund’s Board and DMC. Prior to December 1, 2009, DMC had contractually agreed to waive that portion, if any, of its management fee and/or pay/reimburse the Fund to the extent necessary to ensure that total annual operating expenses (excluding any 12b-1 plan expenses, taxes, interest, inverse floater program expenses, brokerage fees, certain insurance costs, and nonroutine expenses), did not exceed 0.75% of average daily net assets of the Fund through November 30, 2009. In addition to the expense cap, effective September 11, 2009 until November 30, 2009, DMC had voluntarily agreed to waive all or a portion of its investment advisory fees and/or pay/reimburse expenses (excluding any 12b-1 plan expenses, taxes, interest, inverse floater program expenses, brokerage fees, certain insurance costs, and nonroutine expenses) in order to prevent total annual fund operating expenses from exceeding, in an aggregate amount, 0.65% of the Fund’s average daily net assets.
Delaware Service Company, Inc. (DSC), an affiliate of DMC, provides fund accounting and financial administration oversight services to the Fund. For these services, the Fund pays DSC fees based on the aggregate daily net assets of the Delaware Investments® Family of Funds at the following annual rate: 0.0050% of the first $30 billion; 0.0045% of the next $10 billion; 0.0040% of the next $10 billion; and 0.0025% of aggregate average daily net assets in excess of $50 billion. The fees payable to DSC under the service agreement described above are allocated among all Funds in the Delaware Investments® Family of Funds on a relative net asset value basis. For the year ended July 31, 2010, the Fund was charged $4,553 for these services.
DSC also provides dividend disbursing and transfer agency services. The Fund pays DSC a monthly fee based on the number of shareholder accounts for dividend disbursing and transfer agent services.
53
Notes to financial statements
Delaware Core Plus Bond Fund
2. Investment Management, Administration Agreements and Other Transactions with Affiliates (continued)
Pursuant to a distribution agreement and distribution plan, the Fund pays DDLP, the distributor and an affiliate of DMC, an annual distribution and service fee not to exceed 0.30% of the average daily net assets of the Class A shares, 1.00% of the average daily net assets of the Class B and C shares and 0.60% of the average daily net assets of Class R shares. Institutional Class shares pay no distribution and service expenses. DDLP has contracted to waive distribution and service fees of Class A and Class R shares from exceeding 0.25% and 0.50%, respectively, of average daily net assets.
The Board has adopted a formula for calculating 12b-1 plan fees for the Fund’s Class A shares that went into effect on June 1, 1992. The total 12b-1 fees to be paid by Class A shareholders of the Fund will be the sum of 0.10% of the average daily net assets representing shares that were acquired prior to June 1, 1992 and 0.30% of the average daily net assets representing shares that were acquired on or after June 1, 1992. All Class A shareholders will bear 12b-1 fees at the same rate, the blended rate based upon the allocation of the 0.10% and 0.30% rates described above. The contractual waiver is applied to the shares of the Fund that were acquired on or after June 1, 1992 in calculating the applicable 12b-1 fee rate.
At July 31, 2010, the Fund had liabilities payable to affiliates as follows:
| Investment management fee payable to DMC | $ | 8,309 |
| Dividend disbursing, transfer agent and fund accounting | | |
| oversight fees and other expenses payable to DSC | | 6,437 |
| Distribution fees payable to DDLP | | 28,701 |
| Other expenses payable to DMC and affiliates* | | 6,688 |
| * | DMC, as part of its administrative services, pays operating expenses on behalf of the Fund and is reimbursed on a periodic basis. Such expenses include items such as printing of shareholder reports, fees for audit, legal and tax services, registration fees and trustees’ fees. |
As provided in the investment management agreement, the Fund bears the cost of certain legal and tax services, including internal legal and tax services provided to the Fund by DMC and/or its affiliates’ employees. For the year ended July 31, 2010, the Fund was charged $4,054 for internal legal and tax services provided by DMC and/or its affiliates’ employees.
For the year ended July 31, 2010, DDLP earned $13,076 for commissions on sales of the Fund’s Class A shares. For the year ended July 31, 2010, DDLP received gross CDSC commissions of $0, $1,009 and $711 on redemption of the Fund’s Class A, Class B and Class C shares, respectively, and these commissions were entirely used to offset up-front commissions previously paid by DDLP to broker-dealers on sales of those shares.
54
Trustees’ fees include expenses accrued by the Fund for each Trustee’s retainer and meeting fees. Certain officers of DMC, DSC and DDLP are officers and/or Trustees of the Trust. These officers and Trustees are paid no compensation by the Fund.
3. Investments
For the year ended July 31, 2010, the Fund made purchases of $170,871,110 and sales of $168,208,185 of investment securities other than U.S. government securities and short-term investments. For the year ended July 31, 2010, the Fund made purchases of $65,993,211 and sales of $60,780,821 of long-term U.S. government securities.
At July 31, 2010, the cost of investments for federal income tax purposes was $106,041,677. At July 31, 2010, the net unrealized appreciation was $4,091,367, of which $4,941,839 related to unrealized appreciation of investments and $850,472 related to unrealized depreciation of investments.
U.S. GAAP defines fair value as the price that the Fund would receive to sell an asset or pay to transfer a liability in an orderly transaction between market participants at the measurement date under current market conditions. A three level hierarchy for fair value measurements has been established based upon the transparency of inputs to the valuation of an asset or liability. Inputs may be observable or unobservable and refer broadly to the assumptions that market participants would use in pricing the asset or liability. Observable inputs reflect the assumptions market participants would use in pricing the asset or liability based on market data obtained from sources independent of the reporting entity. Unobservable inputs reflect the reporting entity’s own assumptions about the assumptions that market participants would use in pricing the asset or liability developed based on the best information available under the circumstance s. The Fund’s investment in its entirety is assigned a level based upon the observability of the inputs which are significant to the overall valuation. The three level hierarchy of inputs is summarized below.
| Level 1 – | inputs are quoted prices in active markets for identical investments |
| | |
| Level 2 – | other observable inputs (including, but not limited to: quoted prices for similar assets or liabilities in markets that are active, quoted prices for identical or similar assets or liabilities in markets that are not active, inputs other than quoted prices that are observable for the assets or liabilities (such as interest rates, yield curves, volatilities, prepayment speeds, loss severities, credit risks and default rates) or other market-corroborated inputs) |
| | |
| Level 3 – | inputs are significant unobservable inputs (including the Fund’s own assumptions used to determine the fair value of investments) |
55
Notes to financial statements
Delaware Core Plus Bond Fund
3. Investments (continued)
The following table summarizes the valuation of the Fund’s investments by fair value hierarchy levels as of July 31, 2010:
| | | Level 1 | | Level 2 | | Level 3 | | Total |
| Agency, Asset-Backed & | | | | | | | | | | | | | | |
| Mortgage-Backed Securities | | $ | — | | $ | 36,024,175 | | | $ | 275,985 | | $ | 36,300,160 | |
| Corporate Debt | | | — | | | 41,873,432 | | | | 140,901 | | | 42,014,333 | |
| Foreign Debt | | | — | | | 7,647,530 | | | | 153,491 | | | 7,801,021 | |
| Securities Lending Collateral | | | — | | | 674,204 | | | | 568 | | | 674,772 | |
| Short-Term | | | — | | | 15,457,055 | | | | — | | | 15,457,055 | |
| U.S. Treasury Obligations | | | — | | | 7,613,427 | | | | — | | | 7,613,427 | |
| Preferred Stock | | | — | | | 272,276 | | | | — | | | 272,276 | |
| Total | | $ | — | | $ | 109,562,099 | | | $ | 570,945 | | $ | 110,133,044 | |
| |
| Foreign Currency | | | | | | | | | | | | | | |
| Exchange Contracts | | $ | — | | $ | (18,673 | ) | | $ | — | | $ | (18,673 | ) |
| Futures Contracts | | $ | 97,088 | | $ | — | | | $ | — | | $ | 97,088 | |
| Swap Contracts | | $ | — | | $ | (210,062 | ) | | $ | — | | $ | (210,062 | ) |
The following is a reconciliation of investments in which significant unobservable inputs (Level 3) were used in determining fair value:
| | | | | | | Agency, Asset- | | | | | | | | | | | | | |
| | | | | | | Backed and | | | | | | | | | | | | | |
| | | | | | | Mortgage- | | | | | | | | | | Securities |
| | | | | | | Backed | | Corporate | | | | | | Lending |
| | | Total | | Securities | | Debt | | Foreign Debt | | Collateral |
| Balance as of 7/31/09 | | $ | 1,094,456 | | | $ | 561,606 | | | $ | 105,451 | | | $ | 427,398 | | | | $ | 1 | |
| Net realized gain (loss) | | | (91,632 | ) | | | (123,814 | ) | | | 13,600 | | | | 18,582 | | | | | — | |
| Net change in unrealized | | | | | | | | | | | | | | | | | | | | | |
| appreciation/depreciation | | | 73,417 | | | | 268,774 | | | | (201,772 | ) | | | 5,848 | | | | | 567 | |
| Purchases | | | 407,090 | | | | 119,999 | | | | 137,952 | | | | 149,139 | | | | | — | |
| Sales | | | (983,903 | ) | | | (421,377 | ) | | | (115,050 | ) | | | (447,476 | ) | | | | — | |
| Transfers into Level 3 | | | 200,720 | | | | — | | | | 200,720 | | | | — | | | | | — | |
| Transfers out of Level 3 | | | (129,203 | ) | | | (129,203 | ) | | | — | | | | — | | | | | — | |
| Balance as of 7/31/10 | | $ | 570,945 | | | $ | 275,985 | | | $ | 140,901 | | | $ | 153,491 | | | | $ | 568 | |
| | |
| Net change in unrealized | | | | | | | | | | | | | | | | | | | | | |
| appreciation/depreciation | | | | | | | | | | | | | | | | | | | | | |
| from investments still held | | | | | | | | | | | | | | | | | | | | | |
| as of 7/31/10 | | $ | (182,566 | ) | | $ | 10,286 | | | $ | (197,771 | ) | | $ | 4,352 | | | | $ | 567 | |
56
In January 2010, the FASB issued an Accounting Standards Update, Improving Disclosures about Fair Value Measurements, which introduced new disclosure requirements and clarified certain existing disclosure requirements around fair value measurements currently presented above. The new disclosures and clarifications of existing disclosures are generally effective for the Fund’s fiscal year ending July 31, 2011 and interim periods therein. During the fiscal year ended July 31, 2010, the Fund made transfers out of Level 1 investments and into Level 2 investments in the amount of $646,581, based on management’s decision to classify the BNY Mellon Securities Lending Overnight Fund as a Level 2 investment. Management has classified the BNY Mellon Securities Lending Overnight Fund as a Level 2 investment because the price is not quoted in an active market or listed on a public exchange. The BNY Mellon Securities Lending Overnight Fund i s priced daily for investors in the Fund. During the year ended July 31, 2010, transfers out of Level 3 investments into Level 2 investments were made in the amount of $129,203 for the Fund. This was due to the Fund’s pricing vendor being able to supply a matrix price for an investment that had been utilizing a broker quoted price.
4. Dividend and Distribution Information
Income and long-term capital gain distributions are determined in accordance with federal income tax regulations, which may differ from U.S. GAAP. Additionally, distributions from net gains on foreign currency transactions and net short-term gains on sales of investment securities are treated as ordinary income for federal income tax purposes. The tax character of dividends and distributions paid during the years ended July 31, 2010 and 2009 was as follows:
| | | Year Ended |
| | | 7/31/10 | | 7/31/09 |
| Ordinary income | | $ | 4,143,383 | | $ | 4,207,497 |
5. Components of Net Assets on a Tax Basis
As of July 31, 2010, the components of net assets on a tax basis were as follows:
| Shares of beneficial interest | $ | 104,023,516 | |
| Undistributed ordinary income | | 1,123,815 | |
| Distributions payable | | (71,496 | ) |
| Post-October currency losses | | (25,337 | ) |
| Capital loss carryforwards | | (8,380,730 | ) |
| Other temporary differences | | (257,549 | ) |
| Unrealized appreciation on investments, | | | |
| swap contracts and foreign currencies | | 4,095,370 | |
| Net assets | $ | 100,507,589 | |
The differences between book basis and tax basis components of the net assets are primarily attributable to tax deferral of losses on wash sales, mark-to-market of futures contracts, mark-to-market of foreign currency contracts, tax treatment of CDS contracts, tax deferral of losses on straddle and tax treatment of market discount and premium on debt instruments.
Post-October losses represent losses realized on foreign currencies transactions from November 1, 2009 through July 31, 2010 that, in accordance with federal income tax regulations, the Fund has elected to defer and treat as having arisen in the following year.
57
Notes to financial statements
Delaware Core Plus Bond Fund
5. Components of Net Assets on a Tax Basis (continued)
For financial reporting purposes, capital accounts are adjusted to reflect the tax character of permanent book/tax differences. Reclassifications are primarily due to tax treatment of gain (loss) on foreign currency transactions, market discount and premium on certain debt instruments, paydowns of mortgage- and asset-backed securities and tax treatment of CDS contracts. Results of operations and net assets were not affected by these reclassifications. For the year ended July 31, 2010, the Fund recorded the following reclassifications:
| Undistributed net investment income | $ | 144,115 | |
| Accumulated net realized gain | | (144,115 | ) |
For federal income tax purposes, capital loss carryforwards may be carried forward and applied against future capital gains. $4,531,408 was utilized in 2010. Capital loss carryforwards remaining at July 31, 2010 will expire as follows: $1,166,914 expires in 2014; $2,664,816 expires in 2015; $2,286,574 expires in 2016 and $2,262,426 expires in 2017.
6. Capital Shares
Transactions in capital shares were as follows:
| | | Year Ended |
| | | 7/31/10 | | 7/31/09 |
| Shares sold: | | | | | | |
| Class A | | 1,967,658 | | | 1,785,177 | |
| Class B | | 27,391 | | | 72,659 | |
| Class C | | 676,367 | | | 285,916 | |
| Class R | | 773,215 | | | 22,572 | |
| Institutional Class | | 1,526,581 | | | 80,103 | |
| |
| Shares issued upon reinvestment of dividends and distributions: | | | | | | |
| Class A | | 303,563 | | | 341,447 | |
| Class B | | 12,994 | | | 29,385 | |
| Class C | | 26,092 | | | 29,633 | |
| Class R | | 19,345 | | | 1,419 | |
| Institutional Class | | 32,777 | | | 45,251 | |
| | | 5,365,983 | | | 2,693,562 | |
| |
| Shares repurchased: | | | | | | |
| Class A | | (1,932,409 | ) | | (1,685,046 | ) |
| Class B | | (241,282 | ) | | (541,744 | ) |
| Class C | | (246,782 | ) | | (323,622 | ) |
| Class R | | (91,736 | ) | | (6,054 | ) |
| Institutional Class | | (930,354 | ) | | (5,792,288 | ) |
| | | (3,442,563 | ) | | (8,348,754 | ) |
| Net increase (decrease) | | 1,923,420 | | | (5,655,192 | ) |
58
For the years ended July 31, 2010 and 2009, 158,871 Class B shares were converted to 158,871 Class A shares valued at $1,260,404 and 194,938 Class B shares were converted to 194,910 Class A shares valued at $1,374,037, respectively. The respective amounts are included in Class B redemptions and Class A subscriptions in the table above and the statements of changes in net assets.
7. Line of Credit
The Fund, along with certain other funds in the Delaware Investments® Family of Funds (Participants), participates in a $35,000,000 revolving line of credit with The Bank of New York Mellon (BNY Mellon) to be used for temporary or emergency purposes as an additional source of liquidity to fund redemptions of investor shares. Under the agreement, the Participants are charged an annual commitment fee, which is allocated across the Participants on the basis of each Participant’s allocation of the entire facility. The Participants may borrow up to a maximum of one third of their net assets under the agreement. The agreement expires on November 16, 2010. The Fund had no amounts outstanding as of July 31, 2010 or at any time during the year then ended.
8. Derivatives
U.S. GAAP requires enhanced disclosures that enable investors to understand: 1) how and why an entity uses derivatives; 2) how they are accounted for; and 3) how they affect an entity’s results of operations and financial position.
Foreign Currency Exchange Contracts — The Fund may enter into foreign currency exchange contracts as a way of managing foreign exchange rate risk. The Fund may enter into these contracts to fix the U.S. dollar value of a security that it has agreed to buy or sell for the period between the date the trade was entered into and the date the security is delivered and paid for. The Fund may also use these contracts to hedge the U.S. dollar value of securities it already owns that are denominated in foreign currencies. The change in value is recorded as an unrealized gain or loss. When the contract is closed, a realized gain or loss is recorded equal to the difference between the value of the contract at the time it was opened and the value at the time it was closed.
The use of foreign currency exchange contracts does not eliminate fluctuations in the underlying prices of the securities, but does establish a rate of exchange that can be achieved in the future. Although foreign currency exchange contracts limit the risk of loss due to a decline in the value of the hedged currency, they also limit any potential gain that might result should the value of the currency increase. In addition, the Fund could be exposed to risks if the counterparties to the contracts are unable to meet the terms of their contracts. The Fund’s maximum risk of loss from counterparty credit risk is the value of its currency exchanged with the counterparty. The risk is generally mitigated by having a netting arrangement between the Fund and the counterparty and by the posting of collateral by the counterparty to the Fund to cover the Fund’s exposure to the counterparty.
59
Notes to financial statements
Delaware Core Plus Bond Fund
8. Derivatives (continued)
Futures Contracts — A futures contract is an agreement in which the writer (or seller) of the contract agrees to deliver to the buyer an amount of cash or securities equal to a specific dollar amount times the difference between the value of a specific security or index at the close of the last trading day of the contract and the price at which the agreement is made. The Fund may use futures in the normal course of pursuing its investment objective. The Fund may invest in financial futures contracts to hedge its existing portfolio securities against fluctuations in fair value caused by changes in prevailing market interest rates. Upon entering into a futures contract, the Fund deposits cash or pledges U.S. government securities to a broker, equal to the minimum “initial margin” requirements of the exchange on which the contract is traded. Subsequent payments are received from the broker or paid to the broker each day, based on the daily fluctuation in the market value of the contract. These receipts or payments are known as “variation margin” and are recorded daily by the Fund as unrealized gains or losses until the contracts are closed. When the contracts are closed, the Fund records a realized gain or loss equal to the difference between the value of the contract at the time it was opened and the value at the time it was closed. Risks of entering into futures contracts include potential imperfect correlation between the futures contracts and the underlying securities and the possibility of an illiquid secondary market for these instruments. When investing in futures, there is minimal counterparty credit risk to the Fund because futures are exchange-traded and the exchange’s clearinghouse, as counterparty to all exchange-traded futures, guarantees against default.
Swap Contracts — The Fund may enter into interest rate swap contracts, index swap contracts and CDS contracts in the normal course of pursuing their investment objectives. The Fund may use interest rate swaps to adjust the Fund’s sensitivity to interest rates or to hedge against changes in interest rates. Index swaps may be used to gain exposure to markets that the Fund invests in, such as the corporate bond market. The Fund may also use index swaps as a substitute for futures or options contracts if such contracts are not directly available to the Fund on favorable terms. The Fund may enter into CDS contracts in order to hedge against a credit event, to enhance total return or to gain exposure to certain securities or markets.
Interest Rate Swaps. An interest rate swap contract is an exchange of interest rates between counterparties. In one instance, an interest rate swap involves payments received by the Fund from another party based on a variable or floating interest rate, in return for making payments based on a fixed interest rate. An interest rate swap can also work in reverse with the Fund receiving payments based on a fixed interest rate and making payments based on a variable or floating interest rate. Interest rate swaps may be used to adjust the Fund’s sensitivity to interest rates or to hedge against changes in interest rates. Periodic payments on such contracts are accrued daily and recorded as unrealized appreciation/depreciation on swap contracts. Upon periodic payment/ receipt or termination of the contract, such amounts are recorded as realized gains or losses on swap contracts. The Fund’s maximum risk of loss from counterparty credit risk is the discounted net value of the cash flows to be received from/paid to the counterparty over the interest rate swap
60
contract’s remaining life, to the extent that the amount is positive. This risk is mitigated by having a netting arrangement between the Fund and the counterparty and by the posting of collateral by the counterparty to the Fund to cover the Fund’s exposure to the counterparty.
Index Swaps. Index swaps involve commitments to pay interest in exchange for a market linked return based on a notional amount. To the extent the total return of the security, instrument or basket of instruments underlying the transaction exceeds the offsetting interest obligation, the Fund will receive a payment from the counterparty. To the extent the total return of the security, instrument or basket of instruments underlying the transaction falls short of the offsetting interest obligation, the Fund will make a payment to the counterparty. The change in value of swap contracts outstanding, if any, is recorded as unrealized appreciation or depreciation daily. A realized gain or loss is recorded on maturity or termination of the swap contract. The Fund’s maximum risk of loss from counterparty credit risk is the discounted net value of the cash flows to be received from/paid to the counterparty over the index swap contract’s r emaining life, to the extent that the amount is positive. This risk is mitigated by having a netting arrangement between the Fund and the counterparty and by the posting of collateral by the counterparty to the Fund to cover the Fund’s exposure to the counterparty.
Credit Default Swaps. A CDS contract is a risk-transfer instrument through which one party (purchaser of protection) transfers to another party (seller of protection) the financial risk of a credit event (as defined in the CDS agreement), as it relates to a particular referenced security or basket of securities (such as an index). In exchange for the protection offered by the seller of protection, the purchaser of protection agrees to pay the seller of protection a periodic amount at a stated rate that is applied to the notional amount of the CDS contract. In addition, an upfront payment may be made or received by the Fund in connection with an unwinding or assignment of a CDS contract. Upon the occurrence of a credit event, the seller of protection would pay the par (or other agreed-upon) value of the referenced security (or basket of securities) to the counterparty. Credit events generally include, among others, bankruptcy, failure to pa y, and obligation default.
During the year ended July 31, 2010, the Fund entered into CDS contracts as a purchaser and seller of protection. Periodic payments (receipts) on such contracts are accrued daily and recorded as unrealized losses (gains) on swap contracts. Upon payment (receipt), such amounts are recorded as realized losses (gains) on swap contracts. Upfront payments made or received in connection with CDS contracts are amortized over the expected life of the CDS contracts as unrealized losses (gains) on swap contracts. The change in value of CDS contracts is recorded as unrealized appreciation or depreciation daily. A realized gain or loss is recorded upon a credit event (as defined in the CDS agreement) or the maturity or termination of the agreement. At July 31, 2010, the aggregate unrealized depreciation of credit default swaps was $210,062. The Fund had posted $146,385 as cash collateral, for certain open derivatives, which is presented as restricted cash on the statement of assets and liabilities. If a credit event had occurred for all swap transactions where collateral posting was required as of July 31, 2010, the swaps’ credit-risk-related contingent features would have been triggered and the Fund would have been required to pay $7,118,000 less the value of the contracts’ related reference obligations.
61
Notes to financial statements
Delaware Core Plus Bond Fund
8. Derivatives (continued)
As disclosed in the footnotes to the statement of net assets, at July 31, 2010, the notional value of the protection sold was $900,000, which reflects the maximum potential amount the Fund would have been required to make as a seller of credit protection if a credit event had occurred. The quoted market prices and resulting market values for credit default swap agreements on securities and credit indices serve as an indicator of the current status of the payment/performance risk and represent the likelihood of an expected liability (or profit) for the credit derivative if the swap agreement had been closed/sold as of the period end. Increasing market values, in absolute terms when compared to the notional amount of the swap, represent a deterioration of the reference entity’s credit soundness and a greater likelihood or risk of default or other credit event occurring as defined under the terms of the agreement. At July 31, 2010, the net unrealized depreciation of the protection sold was $2,464.
Credit default swaps may involve greater risks than if the Fund had invested in the referenced obligation directly. Credit default swaps are subject to general market risk, liquidity risk, counterparty risk and credit risk. The Fund’s maximum risk of loss from counterparty credit risk, either as the seller of protection or the buyer of protection, is the fair value of the contract. This risk is mitigated by having a netting arrangement between the Fund and the counterparty and by the posting of collateral by the counterparty to the Fund to cover the Fund’s exposure to the counterparty.
Swaps Generally. Because there is no organized market for swap contracts, the value of open swaps may differ from that which would be realized in the event each Fund terminated its position in the agreement. Risks of entering into these contracts include the potential inability of the counterparty to meet the terms of the contracts. This type of risk is generally limited to the amount of favorable movement in the value of the underlying security, instrument or basket of instruments, if any, at the day of default. Risks also arise from potential losses from adverse market movements and such losses could exceed the unrealized amounts shown on the statement of net assets.
Fair values of derivative instruments as of July 31, 2010 were as follows:
| | Asset Derivatives | | Liability Derivatives |
| | Statement of Assets | | | | | Statement of Assets | | | | |
| | and Liabilities Location | | Fair Value | | and Liabilities Location | | Fair Value |
| Foreign exchange contracts | | | | | | | | | | |
| (Forward Currency Contracts) | Receivables | | $ | 389 | | Payables | | $ | (19,062 | ) |
| Interest rate contracts | | | | | | | | | | |
| (Futures) | Receivables | | | 97,088 | | Payables | | | — | |
| Credit contracts | | | | | | | | | | |
| (Swaps) | Receivables | | | — | | Payables | | | (210,062 | ) |
| Total | | | $ | 97,477 | | | | $ | (229,124 | ) |
62
The effect of derivative instruments on the statement of operations for the year ended July 31, 2010 was as follows:
| | | | | | | | | Change in Unrealized |
| | | | | Realized Gain | | Appreciation |
| | | | | or Loss on | | or Depreciation |
| | | Location of Gain or Loss on | | Derivatives | | on Derivatives |
| | | Derivatives Recognized in | | Recognized in | | Recognized in |
| | | Income | | Income | | Income |
Foreign exchange contracts
(Forward Currency Contracts) | | Net realized gain on foreign currency contracts/net change in unrealized appreciation/depreciation of investments and foreign currencies | | $ | 34,649 | | | | $ | (62,562 | ) |
Interest rate contracts
(Futures) | | Net realized loss on futures contracts/net change in unrealized appreciation/depreciation of investments and foreign currencies | | | (60,358 | ) | | | | 112,996 | |
Credit contracts
(Swaps) | | Net realized loss on swap contracts/net change in unrealized appreciation/depreciation of investments and foreign currencies | | | (67,879 | ) | | | | (130,022 | ) |
| Total | | | | $ | (93,588 | ) | | | $ | (79,588 | ) |
9. Securities Lending
The Fund, along with other funds in the Delaware Investments® Family of Funds, may lend its securities pursuant to a security lending agreement (Lending Agreement) with BNY Mellon. With respect to each loan, if on any business day the aggregate market value of securities collateral plus cash collateral held is less than the aggregate market value of the securities which are the subject of such loan, the borrower will be notified to provide additional collateral by the end of the following business day which, together with the collateral already held, will not be less than the applicable collateral requirements for such security loan. If the aggregate market value of securities collateral and cash collateral held with respect to a security loan exceeds the ap plicable collateral requirement, upon request of the borrower BNY Mellon must return enough collateral to the borrower by the end of the following business day to reduce the value of the remaining collateral to the applicable
63
Notes to financial statements
Delaware Core Plus Bond Fund
9. Securities Lending (continued)
collateral requirement for such security loan. As a result of the foregoing, the value of the collateral held with respect to a loaned security may be temporarily more or less than the value of the security on loan.
Cash collateral received is generally invested in the BNY Mellon Securities Lending Overnight Fund (the “Collective Trust”) established by BNY Mellon for the purpose of investment on behalf of clients participating in its securities lending programs. The Collective Trust may invest in U.S. government securities and high quality corporate debt, asset-backed and other money market securities and in repurchase agreements collateralized by such securities, provided that the Collective Trust will only hold such assets with a maturity of one business day or less (“Overnight Assets”). The Collective Trust seeks to maintain a net asset value per unit of $1.00, but there can be no assurance that it will always be able to do so. The Fund may incur investment losses as a result of investing securities lending collateral in the Collective Trust or another collateral investment pool. This could occur if an investment in a collat eral investment pool defaulted or if it were necessary to liquidate assets in the collateral investment pool to meet returns on outstanding security loans at a time when the collateral investment pool’s net asset value per unit was less than $1.00. Under those circumstances, the Fund may not receive an amount from the collateral investment pool that is equal in amount to the collateral the Fund would be required to return to the borrower of the securities and the Fund would be required to make up for this shortfall. Effective April 20, 2009, BNY Mellon transferred the assets of the Fund’s previous collateral investment pool other than cash and Overnight Assets to the BNY Mellon SL DBT II Liquidating Fund (the “Liquidating Fund”), effectively bifurcating the previous collateral investment pool. The Fund’s exposure to the Liquidating Fund is expected to decrease as the Liquidating Fund’s assets mature or are sold. In October 2008, BNY Mellon transferred certain distressed se curities from the previous collateral investment pool into the Mellon GSL Reinvestment Trust II. The Fund can also accept U.S. government securities and letters of credit (non-cash collateral) in connection with securities loans. In the event of default or bankruptcy by the lending agent, realization and/ or retention of the collateral may be subject to legal proceedings. In the event the borrower fails to return loaned securities and the collateral received is insufficient to cover the value of the loaned securities and provided such collateral shortfall is not the result of investment losses, the lending agent has agreed to pay the amount of the shortfall to the Fund, or at the discretion of the lending agent, replace the loaned securities. The Fund continues to record dividends or interest, as applicable, on the securities loaned and are subject to change in value of the securities loaned that may occur during the term of the loan. The Fund has the right under the Lending Agreement to recover the securiti es from the borrower on demand. With respect to security loans collateralized by cash collateral, the earnings from the collateral investments are shared among the Fund, the security lending agent and the borrower. The Fund records security lending income net of allocations to the security lending agent and the borrower.
At July 31, 2010, the value of the securities on loan was $673,851, for which cash collateral was received and invested in accordance with the Lending Agreement. At July 31, 2010, the value of invested collateral was $674,772. Such investments are presented on the statement of net assets under the caption “Securities Lending Collateral.”
64
10. Credit and Market Risk
The Fund may invest up to 20% of its net assets in high yield fixed income securities, which carry ratings of BB or lower by S&P and/or Ba or lower by Moody’s. Investments in these higher yielding securities are generally accompanied by a greater degree of credit risk than higher rated securities. Additionally, lower rated securities may be more susceptible to adverse economic and competitive industry conditions than investment grade securities.
The Fund invests in fixed income securities whose value is derived from an underlying pool of mortgages or consumer loans. The value of these securities is sensitive to changes in economic conditions, including delinquencies and/or defaults, and may be adversely affected by shifts in the market’s perception of the issuers and changes in interest rates. Investors receive principal and interest payments as the underlying mortgages and consumer loans are paid back. Some of these securities are collateralized mortgage obligations (CMOs). CMOs are debt securities issued by U.S. government agencies or by financial institutions and other mortgage lenders, which are collateralized by a pool of mortgages held under an indenture. Prepayment of mortgages may shorten the stated maturity of the obligation and can result in a loss of premium, if any has been paid. Certain of these securities may be stripped (securities which provide only the princ ipal or interest feature of the underlying security). The yield to maturity on an interest-only CMO is extremely sensitive not only to changes in prevailing interest rates, but also to the rate of principal payments (including prepayments) on the related underlying mortgage assets. A rapid rate of principal payments may have a material adverse effect on the Fund’s yield to maturity. If the underlying mortgage assets experience greater than anticipated prepayments of principal, the Fund may fail to fully recoup its initial investment in these securities even if the securities are rated in the highest rating categories.
The Fund may invest up to 15% of its net assets in illiquid securities, which may include securities with contractual restrictions on resale, securities exempt from registration under Rule 144A of the Securities Act of 1933, as amended, and other securities which may not be readily marketable. The relative illiquidity of these securities may impair the Fund from disposing of them in a timely manner and at a fair price when it is necessary or desirable to do so. While maintaining oversight, the Fund’s Board has delegated to DMC the day-to-day functions of determining whether individual securities are liquid for purposes of the Fund’s limitation on investments in illiquid assets. Securities eligible for resale pursuant to Rule 144A, which are determined to be liquid, are not subject to the Fund’s 15% limit on investments in illiquid securities. Rule 144A and illiquid securities have been identified on the statement of net a ssets.
11. Contractual Obligations
The Fund enters into contracts in the normal course of business that contain a variety of indemnifications. The Fund’s maximum exposure under these arrangements is unknown. However, the Fund has not had prior claims or losses pursuant to these contracts. Management has reviewed the Fund’s existing contracts and expects the risk of loss to be remote.
65
Notes to financial statements
Delaware Core Plus Bond Fund
12. Subsequent Events
Management has determined no material events or transactions occurred subsequent to July 31, 2010 that would require recognition or disclosure in the Fund’s financial statements.
13. Tax Information (Unaudited)
The information set forth below is for the Fund’s fiscal year as required by federal income tax laws. Shareholders, however, must report distributions on a calendar year basis for income tax purposes, which may include distributions for portions of two fiscal years of a fund. Accordingly, the information needed by shareholders for income tax purposes will be sent to them in January of each year. Please consult your tax advisor for proper treatment of this information.
For the fiscal year ended July 31, 2010, the Fund designates distributions paid during the year as follows:
| (A) Ordinary Income Distributions* (Tax Basis) | 100% |
(A) is based on a percentage of the Fund’s total distributions.
*For the fiscal year ended July 31, 2010, certain dividends paid by the Fund may be subject to a maximum tax rate of 15%, as provided for by the Jobs and Growth Tax Relief Reconciliation Act of 2003. The Fund intends to designate up to a maximum amount of $4,143,383 to be taxed at a maximum rate of 15%. Complete information will be computed and reported in conjunction with your 2009 Form 1099-DIV.
66
Report of independent
registered public accounting firm
To the Board of Trustees of Delaware Group® Government Fund and the
Shareholders of Delaware Core Plus Bond Fund:
In our opinion, the accompanying statement of net assets, statement of assets and liabilities and the related statements of operations and of changes in net assets and the financial highlights present fairly, in all material respects, the financial position of Delaware Core Plus Bond Fund (one of the series constituting Delaware Group Government Fund, hereafter referred to as the “Fund”) at July 31, 2010, and the results of its operations, the changes in its net assets and the financial highlights for the year then ended, in conformity with accounting principles generally accepted in the United States of America. These financial statements and financial highlights (hereafter referred to as “financial statements”) are the responsibility of the Fund’s management; our responsibility is to express an opinion on these financial statements based on our audit. We conducted our audit of these financial statements in a ccordance with the standards of the Public Company Accounting Oversight Board (United States). Those standards require that we plan and perform the audit to obtain reasonable assurance about whether the financial statements are free of material misstatement. An audit includes examining, on a test basis, evidence supporting the amounts and disclosures in the financial statements, assessing the accounting principles used and significant estimates made by management, and evaluating the overall financial statement presentation. We believe that our audit, which included confirmation of securities at July 31, 2010 by correspondence with the custodian and brokers, provides a reasonable basis for our opinion. The statement of changes in net assets for the year ended July 31, 2009 and the financial highlights for each of the four years in the period ended July 31, 2009 were audited by other independent accountants whose report dated September 21, 2009 expressed an unqualified opinion on those statements.
PricewaterhouseCoopers LLP
Philadelphia, Pennsylvania
September 22, 2010
67
Other Fund information
(Unaudited)
Delaware Core Plus Bond Fund
Proxy Results
At Joint Special Meetings of Shareholders of Delaware Group® Government Fund (the “Trust”), on behalf of Delaware Core Plus Bond Fund (the “Fund”), the shareholders of the Fund voted to (i) elect a Board of Trustees for the Trust at a meeting held on November 12, 2009 and reconvened to March 16, 2010; and to (ii) approve a new investment advisory agreement for the Fund at a meeting held on November 12, 2009. At the meeting, the following people were elected to serve as Independent Trustees: Thomas L. Bennett, John A. Fry, Anthony D. Knerr, Lucinda S. Landreth, Ann R. Leven, Thomas F. Madison, Janet L. Yeomans, and J. Richard Zecher. In addition, Patrick P. Coyne was elected to serve as an Interested Trustee.
The following proposals were submitted for a vote of the shareholders:
1. To elect a Board of Trustees for the Trust.
| | | | | % of | | % of | | | | % of | | % of |
| | | | | Outstanding | | Shares | | | | Outstanding | | Shares |
| | | Shares Voted For | | Shares | | Voted | | Shares Withheld | | Shares | | Voted |
| Thomas L. Bennett | | 26,769,523.974 | | 77.228 | | 97.946 | | 561,363.749 | | 1.619 | | 2.054 |
| Patrick P. Coyne | | 26,767,135.736 | | 77.221 | | 97.937 | | 563,751.987 | | 1.626 | | 2.063 |
| John A. Fry | | 26,767,954.014 | | 77.223 | | 97.940 | | 562,933.709 | | 1.624 | | 2.060 |
| Anthony D. Knerr | | 26,656,002.943 | | 76.900 | | 97.531 | | 674,884.780 | | 1.947 | | 2.469 |
| Lucinda S. Landreth | | 26,758,749.280 | | 77.197 | | 97.907 | | 572,138.443 | | 1.650 | | 2.093 |
| Ann R. Leven | | 26,756,297.645 | | 77.190 | | 97.898 | | 574,590.078 | | 1.657 | | 2.102 |
| Thomas F. Madison | | 26,647,346.956 | | 76.875 | | 97.499 | | 683,540.767 | | 1.972 | | 2.501 |
| Janet L. Yeomans | | 26,758,703.037 | | 77.197 | | 97.906 | | 572,184.686 | | 1.650 | | 2.094 |
| J. Richard Zecher | | 26,765,469.038 | | 77.216 | | 97.931 | | 565,418.685 | | 1.631 | | 2.069 |
| 2. | | To approve a new investment advisory agreement between the Trust, on behalf of the Fund, and Delaware Management Company. |
| |
| Shares Voted For | 4,528,633.154 |
| Percentage of Outstanding Shares | 43.477% |
| Percentage of Shares Voted | 78.274% |
| Shares Voted Against | 85,975.413 |
| Percentage of Outstanding Shares | 0.825% |
| Percentage of Shares Voted | 1.486% |
| Shares Abstained | 206,655.159 |
| Percentage of Outstanding Shares | 1.984% |
| Percentage of Shares Voted | 3.572% |
| Broker Non-Votes | 964,323.181 |
68
Change in Independent Registered Public Accounting Firm
Due to independence matters under the Securities and Exchange Commission’s auditor independence rules relating to the January 4, 2010 acquisition of Delaware Investments (including DMC, DDLP and DSC) by Macquarie Group, Ernst & Young LLP (E&Y) has resigned as the independent registered public accounting firm for Delaware Group® Government Fund (the Trust) effective May 20, 2010. At a meeting held on May 20, 2010, the Board of Trustees of the Trust, upon recommendation of the Audit Committee, selected PricewaterhouseCoopers LLP (PwC) to serve as the independent registered public accounting firm for the Trust for the fiscal year ending July 31, 2010. During the fiscal years ended July 31, 2009 and 2008, E&Y’s audit reports on the financial statements of the Fund did not contain any adverse opinion or disclaimer of opinion, nor were they qualified or modified as to uncertainty, audit scope, or accounting principles. In addition, there were no disagreements between the Trust and E&Y on accounting principles, financial statements disclosures or audit scope, which, if not resolved to the satisfaction of E&Y, would have caused them to make reference to the disagreement in their reports. Neither the Trust nor anyone on its behalf has consulted with PwC at any time prior to their selection with respect to the application of accounting principles to a specified transaction, either completed or proposed or the type of audit opinion that might be rendered on the Fund’s financial statements.
69
Board of trustees/directors and officers addendum
Delaware Investments® Family of Funds
A mutual fund is governed by a Board of Trustees/Directors (“Trustees”), which has oversight responsibility for the management of a fund’s business affairs. Trustees establish procedures and oversee and review the performance of the investment manager, the distributor, and others who perform services for the fund. The independent fund trustees, in particular, are advocates
| Name, Address, | | Position(s) | | Length of |
| and Birth Date | | Held with Fund(s) | | Time Served |
| Interested Trustees |
| | | | | |
| Patrick P. Coyne1 | | Chairman, President, | | Chairman and Trustee |
| 2005 Market Street | | Chief Executive Officer, | | since August 16, 2006 |
| Philadelphia, PA 19103 | | and Trustee | | |
| April 1963 | | | | President and |
| | | | | Chief Executive Officer |
| | | | | since August 1, 2006 |
| | | | | |
| | | | | |
| | | | | |
| | | | | |
| | | | | |
| | | | | |
| | | | | |
| | | | | |
| | | | | |
| | | | | |
| | | | | |
| | | | | |
| | | | | |
1 Patrick P. Coyne is considered to be an “Interested Trustee” because he is an executive officer of the Fund’s(s’) investment advisor.
70
for shareholder interests. Each trustee has served in that capacity since he or she was elected to or appointed to the Board of Trustees, and will continue to serve until his or her retirement or the election of a new trustee in his or her place. The following is a list of the Trustees and Officers with certain background and related information.
| | | Number of Portfolios in | | |
| Principal Occupation(s) | | Fund Complex Overseen | | Other Directorships |
| During Past 5 Years | | by Trustee or Officer | | Held by Trustee or Officer |
| | | | | |
| | | | | |
| Patrick P. Coyne has served in | | 81 | | Director |
| various executive capacities | | | | Kaydon Corp. |
| at different times at | | | | |
| Delaware Investments.2 | | | | Board of Governors Member |
| | | | | Investment Company |
| | | | | Institute (ICI) |
| | | | | |
| | | | | Finance Committee Member |
| | | | | St. John Vianney Roman |
| | | | | Catholic Church |
| | | | | |
| | | | | Board of Trustees |
| | | | | Agnes Irwin School |
| | | | | |
| | | | | Member of Investment |
| | | | | Committee |
| | | | | Cradle of Liberty Council, |
| | | | | BSA |
| | | | | (2007 – 2010) |
2 Delaware Investments is the marketing name for Delaware Management Holdings, Inc. and its subsidiaries, including the Fund’s(s’) investment advisor, principal underwriter, and its transfer agent.
71
Board of trustees/directors and officers addendum
Delaware Investments® Family of Funds
| Name, Address, | | Position(s) | | Length of |
| and Birth Date | | Held with Fund(s) | | Time Served |
| Independent Trustees |
| | | | | |
| Thomas L. Bennett | | Trustee | | Since March 2005 |
| 2005 Market Street | | | | |
| Philadelphia, PA 19103 | | | | |
| October 1947 | | | | |
| | | | | |
| | | | | |
| | | | | |
| | | | | |
| | | | | |
| | | | | |
| | | | | |
| | | | | |
| | | | | |
| | | | | |
| John A. Fry | | Trustee | | Since January 2001 |
| 2005 Market Street | | | | |
| Philadelphia, PA 19103 | | | | |
| May 1960 | | | | |
| | | | | |
| | | | | |
| | | | | |
| | | | | |
| | | | | |
| | | | | |
| | | | | |
| | | | | |
| Anthony D. Knerr | | Trustee | | Since April 1990 |
| 2005 Market Street | | | | |
| Philadelphia, PA 19103 | | | | |
| December 1938 | | | | |
| | | | | |
| | | | | |
| Lucinda S. Landreth | | Trustee | | Since March 2005 |
| 2005 Market Street | | | | |
| Philadelphia, PA 19103 | | | | |
| June 1947 | | | | |
| | | | | |
72
| | | Number of Portfolios in | | |
| Principal Occupation(s) | | Fund Complex Overseen | | Other Directorships |
| During Past 5 Years | | by Trustee or Officer | | Held by Trustee or Officer |
| | | | | |
| | | | | |
| Private Investor | | 81 | | Director |
| (March 2004–Present) | | | | Bryn Mawr Bank Corp. (BMTC) |
| | | | | |
| Investment Manager | | | | Chairman of Investment |
| Morgan Stanley & Co. | | | | Committee |
| (January 1984–March 2004) | | | | Pennsylvania Academy of |
| | | | | Fine Arts |
| | | | | |
| | | | | Investment Committee and |
| | | | | Governance Committee |
| | | | | Member |
| | | | | Pennsylvania Horticultural |
| | | | | Society |
| | | | | |
| President | | 81 | | Director |
| Drexel University | | | | Community Health Systems |
| (August 2010–Present) | | | | |
| | | | | Director — Ecore |
| President | | | | International |
| Franklin & Marshall College | | | | (2009-2010) |
| (July 2002–July 2010) | | | | |
| | | | | Director — Allied |
| Executive Vice President | | | | Barton Securities Holdings |
| University of Pennsylvania | | | | (2005 to 2008) |
| (April 1995–June 2002) | | | | |
| | | | | |
| Founder and | | 81 | | None |
| Managing Director | | | | |
| Anthony Knerr & Associates | | | | |
| (Strategic Consulting) | | | | |
| (1990–Present) | | | | |
| | | | | |
| Chief Investment Officer | | 81 | | None |
| Assurant, Inc. (Insurance) | | | | |
| (2002–2004) | | | | |
| | | | | |
| | | | | |
73
Board of trustees/directors and officers addendum
Delaware Investments® Family of Funds
| Name, Address, | | Position(s) | | Length of |
| and Birth Date | | Held with Fund(s) | | Time Served |
| Independent Trustees (continued) |
| | | | | |
| Ann R. Leven | | Trustee | | Since October 1989 |
| 2005 Market Street | | | | |
| Philadelphia, PA 19103 | | | | |
| November 1940 | | | | |
| | | | | |
| | | | | |
| | | | | |
| | | | | |
| | | | | |
| | | | | |
| Thomas F. Madison | | Trustee | | Since May 19973 |
| 2005 Market Street | | | | |
| Philadelphia, PA 19103 | | | | |
| February 1936 | | | | |
| | | | | |
| | | | | |
| | | | | |
| | | | | |
| | | | | |
| | | | | |
| | | | | |
| | | | | |
| | | | | |
| | | | | |
| | | | | |
| | | | | |
| | | | | |
| | | | | |
| | | | | |
| | | | | |
| | | | | |
| | | | | |
| | | | | |
| | | | | |
| | | | | |
| | | | | |
| | | | | |
| | | | | |
3 In 1997, several funds managed by Voyageur Fund Managers, Inc. (the “Voyageur Funds”) were incorporated into the Delaware Investments Family of Funds. Mr. Madison served as a director of the Voyageur Funds from 1993 until 1997.
74
| | | Number of Portfolios in | | |
| Principal Occupation(s) | | Fund Complex Overseen | | Other Directorships |
| During Past 5 Years | | by Trustee or Officer | | Held by Trustee or Officer |
| | | | | |
| | | | | |
| Consultant | | 81 | | Director and Audit |
| ARL Associates | | | | Committee Chair – |
| (Financial Planning) | | | | Systemax Inc. |
| (1983–Present) | | | | (2001 – 2009) |
| | | | | |
| | | | | Director and Audit |
| | | | | Committee Chairperson – |
| | | | | Andy Warhol Foundation |
| | | | | (1999 – 2007) |
| | | | | |
| President and | | 81 | | Director and Chair of |
| Chief Executive Officer | | | | Compensation Committee, |
| MLM Partners, Inc. | | | | Governance Committee |
| (Small Business Investing | | | | Member |
| and Consulting) | | | | CenterPoint Energy |
| (January 1993–Present) | | | | |
| | | | | Lead Director and Chair of |
| | | | | Audit and Governance |
| | | | | Committees, Member of |
| | | | | Compensation Committee |
| | | | | Digital River, Inc. |
| | | | | |
| | | | | Director and Chair of |
| | | | | Governance Committee, |
| | | | | Audit Committee |
| | | | | Member |
| | | | | Rimage Corporation |
| | | | | |
| | | | | Director and Chair of |
| | | | | Compensation Committee |
| | | | | Spanlink Communications |
| | | | | |
| | | | | Lead Director and Member of |
| | | | | Compensation and |
| | | | | Governance Committees |
| | | | | Valmont Industries, Inc. |
| | | | | (1987 – 2010) |
| | | | | |
75
Board of trustees/directors and officers addendum
Delaware Investments® Family of Funds
| Name, Address, | | Position(s) | | Length of |
| and Birth Date | | Held with Fund(s) | | Time Served |
| Independent Trustees (continued) |
| | | | | |
| Thomas F. Madison | | | | |
| 2005 Market Street | | | | |
| Philadelphia, PA 19103 | | | | |
| February 1936 | | | | |
| | | | | |
| Janet L. Yeomans | | Trustee | | Since April 1999 |
| 2005 Market Street | | | | |
| Philadelphia, PA 19103 | | | | |
| July 1948 | | | | |
| | | | | |
| | | | | |
| | | | | |
| | | | | |
| J. Richard Zecher | | Trustee | | Since March 2005 |
| 2005 Market Street | | | | |
| Philadelphia, PA 19103 | | | | |
| July 1940 | | | | |
| | | | | |
| | | | | |
| | | | | |
| | | | | |
| | | | | |
76
| | | Number of Portfolios in | | |
| Principal Occupation(s) | | Fund Complex Overseen | | Other Directorships |
| During Past 5 Years | | by Trustee or Officer | | Held by Trustee or Officer |
| | | | | |
| | | | | |
| | | | | Director |
| | | | | Banner Health |
| | | | | (1996 to 2007) |
| | | | | |
| | | | | |
| Vice President and Treasurer | | 81 | | Director |
| (January 2006–Present) | | | | Okabena Company |
| Vice President — Mergers & Acquisitions | | | | |
| (January 2003–January 2006), and | | | | |
| Vice President | | | | |
| (July 1995–January 2003) | | | | |
| 3M Corporation | | | | |
| | | | | |
| Founder | | 81 | | Director and Audit |
| Investor Analytics | | | | Committee Member |
| (Risk Management) | | | | Investor Analytics |
| (May 1999–Present) | | | | |
| | | | | |
| Founder | | | | Director |
| Sutton Asset Management | | | | Oxigene, Inc. |
| (Hedge Fund) | | | | (2003 to 2008) |
| (September 1996–Present) | | | | |
77
Board of trustees/directors and officers addendum
Delaware Investments® Family of Funds
| Name, Address, | | Position(s) | | Length of |
| and Birth Date | | Held with Fund(s) | | Time Served |
| Officers |
| | | | | |
| David F. Connor | | Vice President, | | Vice President since |
| 2005 Market Street | | Deputy General | | September 2000 |
| Philadelphia, PA 19103 | | Counsel, and Secretary | | and Secretary since |
| December 1963 | | | | October 2005 |
| | | | | |
| | | | | |
| Daniel V. Geatens | | Vice President | | Treasurer |
| 2005 Market Street | | and Treasurer | | since October 25, 2007 |
| Philadelphia, PA 19103 | | | | |
| October 1972 | | | | |
| | | | | |
| David P. O’Connor | | Senior Vice President, | | Senior Vice President, |
| 2005 Market Street | | General Counsel, | | General Counsel, and |
| Philadelphia, PA 19103 | | and Chief Legal Officer | | Chief Legal Officer |
| February 1966 | | | | since October 2005 |
| | | | | |
| Richard Salus | | Senior Vice President | | Chief Financial Officer |
| 2005 Market Street | | and Chief Financial Officer | | since November 2006 |
| Philadelphia, PA 19103 | | | | |
| October 1963 | | | | |
| | | | | |
The Statement of Additional Information for the Fund(s) includes additional information about the Trustees and Officers and is available, without charge, upon request by calling 800 523-1918.
78
| | | Number of Portfolios in | | |
| Principal Occupation(s) | | Fund Complex Overseen | | Other Directorships |
| During Past 5 Years | | by Trustee or Officer | | Held by Trustee or Officer |
| | | | | |
| | | | | |
| David F. Connor has served as | | 81 | | None4 |
| Vice President and Deputy | | | | |
| General Counsel of | | | | |
| Delaware Investments | | | | |
| since 2000. | | | | |
| | | | | |
| Daniel V. Geatens has served | | 81 | | None4 |
| in various capacities at | | | | |
| different times at | | | | |
| Delaware Investments. | | | | |
| | | | | |
| David P. O’Connor has served in | | 81 | | None4 |
| various executive and legal | | | | |
| capacities at different times | | | | |
| at Delaware Investments. | | | | |
| | | | | |
| Richard Salus has served in | | 81 | | None4 |
| various executive capacities | | | | |
| at different times at | | | | |
| Delaware Investments. | | | | |
| | | | | |
4 David F. Connor, Daniel V. Geatens, David P. O’Connor, and Richard Salus serve in similar capacities for the six portfolios of the Optimum Fund Trust, which have the same investment advisor, principal underwriter, and transfer agent as the registrant.
79
About the organization
| Board of trustees | | | |
| | | | |
Patrick P. Coyne
Chairman, President, and
Chief Executive Officer
Delaware Investments®
Family of Funds
Philadelphia, PA Thomas L. Bennett
Private Investor
Rosemont, PA John A. Fry
President
Drexel University
Philadelphia, PA | Anthony D. Knerr
Founder and Managing
Director
Anthony Knerr &
Associates
New York, NY Lucinda S. Landreth
Former Chief Investment
Officer
Assurant, Inc.
Philadelphia, PA | Ann R. Leven
Consultant
ARL Associates
New York, NY Thomas F. Madison
President and
Chief Executive Officer
MLM Partners, Inc.
Minneapolis, MN | Janet L. Yeomans
Vice President and
Treasurer
3M Corporation
St. Paul, MN J. Richard Zecher
Founder
Investor Analytics
Scottsdale, AZ |
| | | | |
| Affiliated officers | | | |
| | | | |
David F. Connor
Vice President, Deputy
General Counsel, and
Secretary
Delaware Investments
Family of Funds
Philadelphia, PA | Daniel V. Geatens
Vice President and
Treasurer
Delaware Investments
Family of Funds
Philadelphia, PA | David P. O’Connor
Senior Vice President,
General Counsel,
and Chief Legal Officer
Delaware Investments
Family of Funds
Philadelphia, PA | Richard Salus
Senior Vice President and
Chief Financial Officer
Delaware Investments
Family of Funds
Philadelphia, PA |
This annual report is for the information of Delaware Core Plus Bond Fund shareholders, but it may be used with prospective investors when preceded or accompanied by a current prospectus for Delaware Core Plus Bond Fund and the Delaware Investments Fund fact sheet for the most recently completed calendar quarter. These documents are available at www.delawareinvestments.com. The prospectus sets forth details about charges, expenses, investment objectives, and operating policies of the investment company. You should read the prospectus carefully before you invest. The figures in this report represent past results that are not a guarantee of future results. The return and principal value of an investment in the investment company will fluctuate so that shares, when redeemed, may be worth more or less than their original cost. |
Delaware Investments is the marketing name of Delaware Management Holdings, Inc. and its subsidiaries. The Fund files its complete schedule of portfolio holdings with the Securities and Exchange Commission (SEC) for the first and third quarters of each fiscal year on Form N-Q. The Fund’s Forms N-Q, as well as a description of the policies and procedures that the Fund uses to determine how to vote proxies (if any) relating to portfolio securities are available without charge (i) upon request, by calling 800 523-1918; and (ii) on the SEC’s Web site at www.sec.gov. In addition, a description of the policies and procedures that the Fund uses to determine how to vote proxies (if any) relating to portfolio securities and the Fund’s Schedule of Investments are available without charge on the Fund’s Web site at www.delawareinvestments.com. The Fund’s Forms N-Q may be reviewed and copied at the SEC’s Public Reference Room in Washington, D.C.; information on the o peration of the Public Reference Room may be obtained by calling 800 SEC-0330. Information (if any) regarding how the Fund voted proxies relating to portfolio securities during the most recently disclosed 12-month period ended June 30 is available without charge (i) through the Fund’s Web site at www.delawareinvestments.com; and (ii) on the SEC’s Web site at www.sec.gov. |
Annual report Delaware Inflation Protected Bond Fund July 31, 2010 Fixed income mutual fund |
This annual report is for the information of Delaware Inflation Protected Bond Fund shareholders, but it may be used with prospective investors when preceded or accompanied by a current prospectus for Delaware Inflation Protected Bond Fund. The figures in the annual report for Delaware Inflation Protected Bond Fund represent past results, which are not a guarantee of future results. The return and principal value of an investment in the Fund will fluctuate so that shares, when redeemed, may be worth more or less than their original cost. Current performance may be higher or lower than the performance data quoted.
You should consider the investment objectives, risks, charges, and expenses of the Fund carefully before investing. The Delaware Inflation Protected Bond Fund prospectus contains this and other important information about the Fund. Prospectuses for all open-end funds in the Delaware Investments® Family of Funds are available from your financial advisor, online at www.delawareinvestments.com, or by phone at 800 523-1918. Please read the prospectus carefully before you invest or send money.
|
You can obtain shareholder reports and prospectuses online instead of in the mail.
Visit www.delawareinvestments.com/edelivery. |
Experience Delaware Investments
Delaware Investments is committed to the pursuit of consistently superior asset management and unparalleled client service. We believe in our investment processes, which seek to deliver consistent results, and in convenient services that help add value for our clients.
If you are interested in learning more about creating an investment plan, contact your financial advisor.
You can learn more about Delaware Investments or obtain a prospectus for Delaware Inflation Protected Bond Fund at www.delawareinvestments.com.
| Manage your investments online |
- 24-hour access to your account information
- Obtain share prices
- Check your account balance and recent transactions
- Request statements or literature
- Make purchases and redemptions
|
Delaware Management Holdings, Inc., and its subsidiaries (collectively known by the marketing name of Delaware Investments) are wholly owned subsidiaries of Macquarie Group Limited, a global provider of banking, financial, advisory, investment and funds management services.
Investments in Delaware Inflation Protected Bond Fund are not and will not be deposits with or liabilities of Macquarie Bank Limited ABN 46 008 583 542 and its holding companies, including their subsidiaries or related companies (Macquarie Group), and are subject to investment risk, including possible delays in repayment and loss of income and capital invested. No Macquarie Group company guarantees or will guarantee the performance of the Fund, the repayment of capital from the Fund, or any particular rate of return.
| Table of contents | |
| Portfolio management review | 1 |
| Performance summary | 4 |
| Disclosure of Fund expenses | 8 |
| Security types | 10 |
| Statement of net assets | 11 |
| Statement of operations | 16 |
| Statements of changes in net assets | 18 |
| Financial highlights | 20 |
| Notes to financial statements | 28 |
| Report of independent registered public accounting firm | 44 |
| Other Fund information | 45 |
| Board of trustees/directors and officers addendum | 48 |
| About the organization | 58 |
Unless otherwise noted, views expressed herein are current as of July 31, 2010, and are subject to change.
Funds are not FDIC insured and are not guaranteed. It is possible to lose the principal amount invested.
Mutual fund advisory services provided by Delaware Management Company, a series of Delaware Management Business Trust, which is a registered investment advisor. Delaware Investments, a member of Macquarie Group, refers to Delaware Management Holdings, Inc. and its subsidiaries, including the Fund’s distributor, Delaware Distributors, L.P. Macquarie Group refers to Macquarie Group Limited and its subsidiaries and affiliates worldwide.
© 2010 Delaware Management Holdings, Inc.
All third-party trademarks cited are the property of their respective owners.
| Portfolio management review | | |
| Delaware Inflation Protected Bond Fund | | Aug. 10, 2010 |
| Performance preview (for the period ended July 31, 2010) | | | | |
| Delaware Inflation Protected Bond Fund (Class A shares) | | 1-year return | | +9.25% |
| Barclays Capital U.S. Treasury Inflation-Protected Securities (TIPS) Index (benchmark) | | 1-year return | | +9.60% |
Past performance does not guarantee future results.
For complete, annualized performance for Delaware Inflation Protected Bond Fund, please see the table on page 4. The performance of Class A shares excludes the applicable sales charge and reflects the reinvestment of all distributions. Index performance returns do not reflect any management fees, transaction costs, or expenses. Indices are unmanaged and one cannot invest directly in an index. |
Shifting expectations for economic growth, a sovereign debt crisis affecting a number of countries across Europe, and what we believe were attractive valuations in competing fixed income asset classes combined to generate uneven performance for Treasury inflation-protected securities (TIPS) during the fiscal year ended July 31, 2010. As the fiscal period began, the U.S. economy was in a recovery following the worst recession since the 1930s; TIPS yields were relatively reasonable in our view, and implied inflation rates were quite low. (The implied inflation rate is a measure of inflation expectations, and is determined by the difference between the nominal yield on a conventional Treasury security and the real yield on a TIPS bond.) TIPS outperformed conventional Treasurys over the first half of the fiscal period, as many investors anticipated a robust economic rebound and rising inflation. By December 2009, however, real yields on TIPS had fallen to 1.0% from 1.8% at the start of the fiscal year while implied inflation had soared to 2.5% from 1.5%. (Source: Bloomberg.)
Beginning in April 2010, however, the euro zone financial crisis and renewed fears of an economic slowdown in the United States caused implied inflation to tumble back below 2%. Real yields on TIPS rebounded only slightly to close the fiscal year at 1.1%. Historically, a real yield of just more than 1% on TIPS is extremely low; in this case, it resulted from a global flight to quality that generated intense demand for Treasury securities. But because conventional government bonds are generally more interest-rate sensitive than TIPS, conventional Treasurys provided investors with safety from the financial storm raging in Europe and capital appreciation if yields tumbled. Meanwhile, fears that “Japanese-style” deflation would take root in the United States — a development we view as unlikely but which gained some credence as leading economic indicators abruptly flashed yellow th is spring — made modest yields on government debt seem palatable. With the economic skies darkening, conventional Treasurys generally outperformed TIPS during the last four months of the fiscal year.
Fund performance
For its fiscal year ended July 31, 2010, Delaware Inflation Protected Bond Fund returned +9.25% for Class A shares at net asset value and +4.38% at maximum offer price. Both figures reflect all distributions reinvested. During the same period, the Barclays Capital U.S. TIPS Index advanced 9.60%. For complete, annualized performance of Delaware Inflation Protected Bond Fund, please the table on page 4.
Fund performance during the period generally benefited from some of our allocation decisions to non-TIPS asset classes (the Fund is allowed to
1
Portfolio management review
Delaware Inflation Protected Bond Fund
invest up to 20% of assets in securities outside of the domestic TIPS market). That flexibility contributed to the Fund’s performance in that it allowed us to pursue what we viewed as exceptionally compelling opportunities within the corporate bond market, among other areas. With markets continuing to price U.S. corporate debt for a serious financial downturn throughout much of the fiscal period, yields over conventional Treasurys and TIPS (yields move inversely to a bond’s price) widened to levels that we believed offered once-in-a-generation type of value. We had allocated approximately 17% of Fund assets to corporate bonds as the reporting period began in August 2009; as of January 2010, we still held about 13% of assets in a mixture of U.S. investment grade and high yield corporate bonds. By late April 2010, when spreads had reverted closer to their historical norms, we shifted this allocation toward areas that we perceived to offer mor e attractive long-term risk-return profiles, including a sizable allocation toward international inflation-protected securities.
Our rationale for this decision was based on our views of the economic growth prospects in the developing countries versus the developed world. While the U.S. and other large industrialized countries, for example, could face significant economic headwinds (and thus lower inflationary pressures and reduced real yields on TIPS) in the coming months and quarters, we believe economic conditions appear significantly more attractive to us in many international markets. We look specifically toward markets that we believe are especially positioned to benefit from rising long-term global demand for commodities as well as those that appear less constrained by structural debt or high fiscal deficits. Examples of these countries include Brazil, South Africa, and Mexico. In our
We think it is only a matter of time before reflation emerges on a worldwide basis, a process that could reward holders of domestic and international TIPS. Secular trends in developing economies — notably China and India — may exert upward pressure on consumer prices in coming years as tens of millions of people join the ranks of the middle class. Viewed from that longer-term perspective, we believe TIPS remain a viable instrument for investors seeking shelter from future inflation.
2
opinion, each of those nations has mature and liquid inflation-protected securities markets. In addition, their growth and inflation rates are higher than those in the U.S., and therefore provide more income than domestic TIPS (source: Bloomberg). While the strong rebound in the U.S. dollar that began a few weeks after we took these positions offset most or all of the relative gains achieved from our international allocations, we view the Fund’s holdings in these markets to be part of a longer-term approach. Over time, we believe that relative inflation and economic growth rates may become more important than currency moves.
Within our domestic TIPS allocation, a combination of factors persuaded us to take a defensive position beginning in early 2010. Real yields were low and Treasury issuance high through most of the fiscal year — a classic prescription for a rise in rates that could cause TIPS prices to decline. To protect against such a possibility, we focused on medium- and shorter-term TIPS, an approach that worked relatively well for three months but also detracted from performance for a brief period when the euro zone crisis overwhelmed all other factors. With risk aversion seemingly affecting nearly all asset classes in April and May, we purchased conventional long-term Treasurys to participate in the flight to quality by bringing the Fund’s duration and interest rate risk back to neutral. While we recognize that nominal yields on conventional Treasury notes and bonds are quite low by historical standards, in our view, the market for those securities is relatively liquid and we are prepared to quickly liquidate our holdings when risk aversion weakens or inflation returns. As always, we view capital preservation as the Fund’s highest investment objective.
Reflation on the horizon
We believe the U.S. economy is likely to remain fragile through the remainder of the calendar year and into 2011, thus muting any inflationary pressures that might develop over the near term. Within this environment, we believe that domestic TIPS are, at best, fairly valued at the close of the fiscal period. Investors were paying full price for inflation insurance, which suggests that TIPS performance should be modest over the next few quarters. However, macroeconomic factors could provide continued support for all government securities, even at low real yields.
Despite TIPS’ full valuations at period end, we continue to believe that inflation-protected securities warrant a meaningful position in a diversified portfolio that seeks to preserve purchasing power. In our view, the trend towards lower inflation rates that began in the early 1980s is near its end. We think it is only a matter of time before reflation emerges on a worldwide basis, a process that could reward holders of domestic and international TIPS. Secular trends in developing economies — notably China and India — may exert upward pressure on consumer prices in coming years as tens of millions of people join the ranks of the middle class. Viewed from that longer-term perspective, we believe TIPS remain a viable instrument for investors seeking shelter from future inflation.
3
| Performance summary | |
| Delaware Inflation Protected Bond Fund | July 31, 2010 |
The performance data quoted represent past performance; past performance does not guarantee future results. Investment return and principal value will fluctuate so your shares, when redeemed, may be worth more or less than their original cost. Please obtain the performance data current for the most recent month end by calling 800 523-1918 or visiting our Web site at www.delawareinvestments.com/performance. Current performance may be lower or higher than the performance data quoted.
You should consider the investment objectives, risks, charges, and expenses of the investment company carefully before investing. The Delaware Inflation Protected Bond Fund prospectus contains this and other important information about the investment company. Please request a prospectus through your financial advisor or by calling 800 523-1918 or visiting our Web site at www.delawareinvestments.com. Read the prospectus carefully before you invest or send money.
| Fund performance | | Average annual total returns through July 31, 2010 |
| | | 1 year | | 5 years | | Lifetime |
| Class A (Est. Dec. 1, 2004) | | | | | | |
| Excluding sales charge | | +9.25% | | +5.59% | | +5.38% |
| Including sales charge | | +4.38% | | +4.62% | | +4.53% |
| Class B (Est. Dec. 1, 2004) | | | | | | |
| Excluding sales charge | | +8.40% | | +4.79% | | +4.65% |
| Including sales charge | | +4.40% | | +4.54% | | +4.50% |
| Class C (Est. Dec. 1, 2004) | | | | | | |
| Excluding sales charge | | +8.40% | | +4.79% | | +4.65% |
| Including sales charge | | +7.40% | | +4.79% | | +4.65% |
| Institutional Class (Est. Dec. 1, 2004) | | | | | | |
| Excluding sales charge | | +9.51% | | +5.85% | | +5.62% |
| Including sales charge | | +9.51% | | +5.85% | | +5.62% |
Returns reflect the reinvestment of all distributions and any applicable sales charges as noted in the following paragraphs.
Performance for Class B and C shares, excluding sales charges, assumes either that contingent deferred sales charges did not apply or that the investment was not redeemed.
Expense limitations were in effect for certain classes during the periods shown in the “Fund performance” chart and in the “Performance of a $10,000 investment” chart. The current expenses for each class are listed on the “Fund expense ratios” chart. (Note that all charts and graphs referred to in the “Performance summary” section of this report are found on pages 4 through 6.) Performance would have been lower had the expense limitations not been in effect.
The Fund offers Class A, B, C, and Institutional Class shares.
Class A shares are sold with a maximum front-end sales charge of up to 4.50%, and have an annual distribution and service fee of up to 0.25% of average daily net assets.
4
Class B shares may only be purchased through dividend reinvestment and certain permitted exchanges as described in the prospectus. Please see the prospectus for additional information on Class B purchase and sales charges. Class B shares have a contingent deferred sales charge that declines from 4.00% to zero depending on the period of time the shares are held.
Class B shares will automatically convert to Class A shares on a quarterly basis approximately eight years after purchase. They are also subject to an annual distribution and service fee of up to 1.00% of average daily net assets.
Class C shares are sold with a contingent deferred sales charge of 1.00% if redeemed during the first 12 months. They are also subject to an annual distribution and service fee of up to 1.00% of average daily net assets.
Institutional Class shares are available without sales or asset-based distribution charges only to certain eligible institutional accounts.
The “Fund performance” table and the “Performance of a $10,000 investment” graph do not reflect the deduction of taxes the shareholder would pay on Fund distributions or redemptions of Fund shares.
Fixed income securities and bond funds can lose value, and investors can lose principal, as interest rates rise. They also may be affected by economic conditions that hinder an issuer’s ability to make interest and principal payments on its debt.
The Fund may also be subject to prepayment risk, the risk that the principal of a fixed income security that is held by the Fund may be prepaid prior to maturity, potentially forcing the Fund to reinvest that money at a lower interest rate.
Interest payments on inflation-indexed debt securities will vary as the principal and/or interest is adjusted for inflation.
The Fund may experience portfolio turnover in excess of 100%, which could result in higher transaction costs and tax liability.
The Fund may invest in derivatives, which may involve additional expenses and are subject to risk, including the risk that an underlying security or securities index moves in the opposite direction from what the portfolio manager anticipated. A derivative transaction depends upon the counterparties’ ability to fulfill their contractual obligations.
The Fund’s expense ratios, as described in the most recent prospectus, are disclosed in the following “Fund expense ratios” chart. Delaware Investments has voluntarily agreed to reimburse certain expenses and/or waive certain fees in order to prevent total fund operating expenses from exceeding 0.55% of the Fund’s average daily net assets. Please see the most recent prospectus and any applicable supplement(s) for additional information on these fee waivers and/or reimbursements.
| Fund expense ratios | Class A | | Class B | | Class C | | Institutional Class |
| Total annual operating expenses | 0.94% | | 1.69% | | 1.69% | | 0.69% |
| (without fee waivers) | | | | | | | |
| Net expenses | 0.80% | | 1.55% | | 1.55% | | 0.55% |
| (including fee waivers, if any) | | | | | | | |
| Type of waiver | Voluntary | | Voluntary | | Voluntary | | Voluntary |
5
Performance summary
Delaware Inflation Protected Bond Fund
Performance of a $10,000 investment
Average annual total returns from Dec. 1, 2004 (Fund’s inception), through July 31, 2010
| For period beginning Dec. 1, 2004, through July 31, 2010 | Starting value | Ending value |
| | Barclays Capital U.S. TIPS Index | $10,000 | $13,372 |
| | Delaware Inflation Protected Bond Fund — Class A Shares | $9,550 | $12,854 |
The chart assumes $10,000 invested in the Fund on Dec. 1, 2004, and includes the effect of a 4.50% front-end sales charge and the reinvestment of all distributions. Please note additional details on these fees in the “Performance summary” section of this report, which includes pages 4 through 6.
The chart also assumes $10,000 invested in the Barclays Capital U.S. TIPS Index as of Dec. 1, 2004.
The Barclays Capital U.S. TIPS Index measures the total return performance of the market for inflation-protected securities issued by the U.S. Treasury.
Index performance returns do not reflect any management fees, transaction costs or expenses. Indices are unmanaged and one cannot invest directly in an index. Past performance is not a guarantee of future results.
Performance of other Fund classes will vary due to different charges and expenses.
The “Fund performance” chart and the “Performance of a $10,000 investment” graph do not reflect the deduction of taxes shareholders would pay on Fund distributions or redemptions of Fund shares.
| | | Nasdaq symbols | | CUSIPs | |
| Class A | | | DIPAX | | | 246094882 | |
| Class B | | | DIPBX | | | 246094874 | |
| Class C | | | DIPCX | | | 246094866 | |
| Institutional Class | | | DIPIX | | | 246094858 | |
6
Disclosure of Fund expenses
For the six-month period February 1, 2010 to July 31, 2010
As a shareholder of the Fund, you incur two types of costs: (1) transaction costs, including sales charges (loads) on purchase payments, reinvested dividends, or other distributions; redemption fees; and exchange fees; and (2) ongoing costs, including management fees; distribution and/or service (12b-1) fees; and other Fund expenses. This example is intended to help you understand your ongoing costs (in dollars) of investing in the Fund and to compare these costs with the ongoing costs of investing in other mutual funds.
The example is based on an investment of $1,000 invested at the beginning of the period and held for the entire six-month period February 1, 2010 to July 31, 2010.
Actual expenses
The first section of the table shown, “Actual Fund return,” provides information about actual account values and actual expenses. You may use the information in this section of the table, together with the amount you invested, to estimate the expenses that you paid over the period. Simply divide your account value by $1,000 (for example, an $8,600 account value divided by $1,000 = 8.6), then multiply the result by the number in the first section under the heading entitled “Expenses Paid During Period” to estimate the expenses you paid on your account during this period.
Hypothetical example for comparison purposes
The second section of the table shown, “Hypothetical 5% return,” provides information about hypothetical account values and hypothetical expenses based on the Fund’s actual expense ratio and an assumed rate of return of 5% per year before expenses, which is not the Fund’s actual return. The hypothetical account values and expenses may not be used to estimate the actual ending account balance or expenses you paid for the period. You may use this information to compare the ongoing costs of investing in the Fund and other funds. To do so, compare this 5% hypothetical example with the 5% hypothetical examples that appear in the shareholder reports of the other funds.
Please note that the expenses shown in the table are meant to highlight your ongoing costs only and do not reflect any transactional costs, such as sales charges (loads), redemption fees, or exchange fees. Therefore, the second section of the table is useful in comparing ongoing costs only, and will not help you determine the relative total costs of owning different funds. In addition, if these transactional costs were included, your costs would have been higher. The Fund’s expenses shown in the table reflect fee waivers in effect. The expenses shown in the table assume reinvestment of all dividends and distributions.
8
Delaware Inflation Protected Bond Fund
Expense analysis of an investment of $1,000
| | | Beginning | | Ending | | | | Expenses |
| | | Account Value | | Account Value | | Annualized | | Paid During Period |
| | | 2/1/10 | | 7/31/10 | | Expense Ratio | | 2/1/10 to 7/31/10* |
| Actual Fund return | | | | | | | | | | | |
| Class A | | $1,000.00 | | | $1,025.70 | | | 0.80% | | $4.02 | |
| Class B | | 1,000.00 | | | 1,021.60 | | | 1.55% | | 7.77 | |
| Class C | | 1,000.00 | | | 1,020.60 | | | 1.55% | | 7.77 | |
| Institutional Class | | 1,000.00 | | | 1,025.80 | | | 0.55% | | 2.76 | |
| Hypothetical 5% return (5% return before expenses) | | | | | | |
| Class A | | $1,000.00 | | | $1,020.83 | | | 0.80% | | $4.01 | |
| Class B | | 1,000.00 | | | 1,017.11 | | | 1.55% | | 7.75 | |
| Class C | | 1,000.00 | | | 1,017.11 | | | 1.55% | | 7.75 | |
| Institutional Class | | 1,000.00 | | | 1,022.07 | | | 0.55% | | 2.76 | |
| * | “Expenses Paid During Period” are equal to the Fund’s annualized expense ratio, multiplied by the average account value over the period, multiplied by 181/365 (to reflect the one-half year period). |
9
| Security types | |
| Delaware Inflation Protected Bond Fund | As of July 31, 2010 |
Sector designations may be different than the sector designations presented in other Fund materials. The sector designations may represent the investment manager’s internal sector classifications, which may result in the sector designations for one fund being different than another fund’s sector designations.
| Security types | Percentage of net assets |
| Convertible Bond | 0.29 | % | |
| Corporate Bonds | 1.60 | % | |
| Sovereign Debt | 8.49 | % | |
| U.S. Treasury Obligations | 88.84 | % | |
| Discount Note | 0.08 | % | |
| Total Value of Securities | 99.30 | % | |
| Receivables and Other Assets Net of Liabilities | 0.70 | % | |
| Total Net Assets | 100.00 | % | |
10
| Statement of net assets | |
| Delaware Inflation Protected Bond Fund | July 31, 2010 |
| | | | Principal amount° | | Value (U.S. $) |
| Convertible Bond – 0.29% | | | | | | | | |
| # | SVB Financial Group 144A 3.875% | | | | | | | | |
| | exercise price $53.04, expiration date 4/15/11 | | USD | | 770,000 | | | $ | 795,988 |
| Total Convertible Bonds (cost $777,580) | | | | | | | | 795,988 |
| | | | | | | | | |
| Corporate Bonds – 1.60% | | | | | | | | |
| Brokerage – 1.09% | | | | | | | | |
| ^=@ | JPMorgan Structured Products 0.644% 5/18/15 | | BRL | | 2,419,000 | | | | 2,651,074 |
• | Morgan Stanley 4.44% 3/5/18 | | USD | | 357,000 | | | | 333,274 |
| | | | | | | | | | 2,984,348 |
| Energy – 0.41% | | | | | | | | |
| | Mariner Energy 8.00% 5/15/17 | | | | 1,000,000 | | | | 1,105,000 |
| | | | | | | | | | 1,105,000 |
| Insurance – 0.10% | | | | | | | | |
• | Prudential Financial 3.92% 6/10/15 | | | | 286,000 | | | | 278,533 |
| | | | | | | | | | 278,533 |
| Total Corporate Bonds (cost $4,217,188) | | | | | | | | 4,367,881 |
| | | | | | | | | |
| Sovereign Debt – 8.49%Δ | | | | | | | | |
| Australia – 2.57% | | | | | | | | |
| @ | Australia Government Inflation Linked Bond | | | | | | | | |
| | 6.12% 8/20/15 | | AUD | | 4,640,000 | | | | 7,014,661 |
| | | | | | | | | | 7,014,661 |
| Brazil – 0.48% | | | | | | | | |
| | Brazil Notas do Tesouro Nacional Series B | | | | | | | | |
| | 6.00% 5/15/15 | | BRL | | 120,000 | | | | 1,315,126 |
| | | | | | | | | | 1,315,126 |
| Mexico – 0.77% | | | | | | | | |
| @ | Mexican Udibonos 4.00% 6/13/19 | | MXN | | 235,375 | | | | 2,093,779 |
| | | | | | | | | | 2,093,779 |
| Poland – 0.68% | | | | | | | | |
| @ | Poland Government Bond 3.00% 8/24/16 | | PLN | | 5,737,312 | | | | 1,840,796 |
| | | | | | | | | | 1,840,796 |
11
Statement of net assets
Delaware Inflation Protected Bond Fund
| | | | Principal amount° | | | Value (U.S. $) |
| Sovereign Debt (continued) | | | | | | | | |
| Republic of Korea – 2.93% | | | | | | | | |
| | Korea Treasury Inflation Linked Bond | | | | | | | | |
| | @2.75% 3/10/17 | | KRW | | 7,439,591,040 | | | $ | 6,540,299 |
| | 2.75% 6/10/20 | | KRW | | 1,606,960,000 | | | | 1,427,949 |
| | | | | | | | | | 7,968,248 |
| South Africa – 1.06% | | | | | | | | |
| @ | South Africa Government Inflation Linked Bond | | | | | | | | |
| | 5.50% 12/7/23 | | ZAR | | 16,528,077 | | | | 2,892,980 |
| | | | | | | | | | 2,892,980 |
| Total Sovereign Debt (cost $22,817,144) | | | | | | | | 23,125,590 |
| | | | | | | | | |
| U.S. Treasury Obligations – 88.84% | | | | | | | | |
| | U.S. Treasury Bonds | | | | | | | | |
| | 4.375% 5/15/40 | | USD | | 5,000,000 | | | | 5,345,335 |
| | 4.625% 2/15/40 | | | | 5,625,000 | | | | 6,256,058 |
| | U.S. Treasury Inflation Index Bonds | | | | | | | | |
| | 2.125% 2/15/40 | | | | 5,731,544 | | | | 6,098,718 |
| | 3.375% 4/15/32 | | | | 2,983,196 | | | | 3,826,414 |
| | U.S. Treasury Inflation Index Notes | | | | | | | | |
| | 0.50% 4/15/15 | | | | 48,077,824 | | | | 48,986,782 |
| | 1.25% 4/15/14 | | | | 23,918,607 | | | | 25,056,606 |
| | 1.375% 1/15/20 | | | | 7,166,430 | | | | 7,366,309 |
| | ∞1.625% 1/15/15 | | | | 26,389,952 | | | | 27,956,855 |
| | 2.00% 1/15/14 | | | | 20,951,760 | | | | 22,374,196 |
| | 2.00% 7/15/14 | | | | 27,769,780 | | | | 29,841,655 |
| | 2.00% 1/15/16 | | | | 29,937,247 | | | | 32,404,734 |
| | 2.375% 1/15/17 | | | | 15,214,619 | | | | 16,832,359 |
| | 3.00% 7/15/12 | | | | 9,091,167 | | | | 9,677,830 |
| Total U.S. Treasury Obligations | | | | | | | | |
| | (cost $231,314,781) | | | | | | | | 242,023,851 |
| | | | | | | | | | |
≠Discount Note – 0.08% | | | | | | | | |
| | Federal Home Loan Bank 0.06% 8/2/10 | | | | 223,001 | | | | 223,001 |
| Total Discount Note (cost $223,001) | | | | | | | | 223,001 |
12
| | | | | |
| Total Value of Securities – 99.30% | | | |
| | (cost $259,349,694) | | $ | 270,536,311 |
| Receivables and Other Assets | | | |
| | Net of Liabilities – 0.70% | | | 1,898,339 |
| Net Assets Applicable to 25,640,470 | | | |
| | Shares Outstanding – 100.00% | | $ | 272,434,650 |
°Principal amount shown is stated in the currency in which each security is denominated.
AUD — Australian Dollar
BRL — Brazilian Real
EUR — European Monetary Unit
KRW — South Korean Won
MXN — Mexican Peso
PLN — Polish Zloty
USD — United States Dollar
ZAR — South African Rand
| Net Asset Value – Delaware Inflation Protected Bond Fund | | | |
| Class A ($156,344,734 / 14,712,742 Shares) | | $10.63 | |
| Net Asset Value – Delaware Inflation Protected Bond Fund | | | |
| Class B ($1,806,400 / 170,140 Shares) | | $10.62 | |
| Net Asset Value – Delaware Inflation Protected Bond Fund | | | |
| Class C ($71,865,910 / 6,766,871 Shares) | | $10.62 | |
| Net Asset Value – Delaware Inflation Protected Bond Fund | | | |
| Institutional Class ($42,417,606 / 3,990,717 Shares) | | $10.63 | |
| | | | |
| Components of Net Assets at July 31, 2010: | | | |
| Shares of beneficial interest (unlimited authorization – no par) | $ | 259,182,627 | |
| Undistributed net investment income | | 452,649 | |
| Accumulated net realized loss on investments | | (537,909 | ) |
| Net unrealized appreciation of investments and foreign currencies | | 13,337,283 | |
| Total net assets | $ | 272,434,650 | |
13
Statement of net assets
Delaware Inflation Protected Bond Fund
| | |
| # | Security exempt from registration under Rule 144A of the Securities Act of 1933, as amended. At July 31, 2010, the aggregate amount of Rule 144A securities was $795,988, which represented 0.29% of the Fund’s net assets. See Note 10 in ”Notes to financial statements.” |
| ^ | Zero coupon security. The rate shown is the yield at the time of purchase. |
| = | Security is being fair valued in accordance with the Fund’s fair valuation policy. At July 31, 2010, the aggregate amount of fair valued securities was $2,651,074, which represented 0.97% of the Fund’s net assets. See Note 1 in “Notes to financial statements.” |
| @ | Illiquid security. At July 31, 2010, the aggregate amount of illiquid securities was $23,033,589, which represented 8.45% of the Fund’s net assets. See Note 10 in “Notes to financial statements.” |
• | Variable rate security. The rate shown is the rate as of July 31, 2010. Interest rates reset periodically. |
| Δ | Securities have been classified by country of origin. |
| ∞ | Fully or partially pledged as collateral for futures contracts. |
| ≠ | The rate shown is the effective yield at time of purchase. |
Summary of abbreviations:
CDS — Credit Default Swap
CPI — Consumer Price Index
HKSB — Hong Kong Shanghai Bank
MSC — Morgan Stanley & Co.
yr — Year
| Net Asset Value and Offering Price Per Share – | | | |
| Delaware Inflation Protected Bond Fund | | | |
| Net asset value Class A (A) | | $ | 10.63 |
| Sales charge (4.50% of offering price) (B) | | | 0.50 |
| Offering price | | $ | 11.13 |
| (A) | Net asset value per share, as illustrated, is the amount which would be paid upon redemption or repurchase of shares. |
| (B) | See the current prospectus for purchases of $100,000 or more. |
1 The following foreign currency exchange contracts, futures contracts and swap contracts were outstanding at July 31, 2010:
Foreign Currency Exchange Contracts
| | | | | | | | | | | | | | | Unrealized |
| | | | | | | | | | | | | | | Appreciation |
| Counterparty | | Currency to be Delivered | | Currency to be Received | | Settlement Date | | (Depreciation) |
| HKSB | | | EUR | 9,744,755 | | | | USD | 12,676,464 | | | 9/15/10 | | | $ | (22,237 | ) |
| MSC | | | EUR | 6,625,377 | | | | USD | 8,599,143 | | | 9/15/10 | | | | (34,597 | ) |
| HKSB | | | USD | 338,798 | | | | AUD | 376,790 | | | 9/15/10 | | | | 86 | |
| | | | | | | | | | | | | | | | $ | (56,748 | ) |
14
| |
| Futures Contracts | | | | | | | | | | | |
| | | | | | | | | | | Unrealized |
| Open Long Contracts | | Cost | | Value | | Expiration Date | | Appreciation |
| 409 U.S. Long Treasury Bond | | $ | 50,331,625 | | $ | 52,645,968 | | 9/21/10 | | $ | 2,314,343 |
Swap Contracts
CDS Contracts
| | | | | Annual | | | | | | |
| Swap Counterparty & | | | | Protection | | Termination | | Unrealized |
| Referenced Obligation | | Notional Value | | Payments | | Date | | Depreciation |
| Protection Purchased: | | | | | | | | | | |
| Barclays | | | | | | | | | | |
| ITRAXX Europe Subordinate | | | | | | | | | | |
| Financials 13.1 5 yr CDS | | $5,635,000 | | 1.00% | | 6/20/15 | | $ | (140,186 | ) |
Inflation Swap Contracts
| | | | | | | Unrealized |
| | | | | | | Appreciation |
| Notional Value | | Expiration Date | | Description | | (Depreciation) |
| $ 2,600,000 | | 4/22/14 | | Agreement with Barclays to receive the notional amount multiplied by the non-revised CPI and to pay the notional amount multiplied by the fixed rate of 1.56%. | | $ (1,595 | ) |
| 1,300,000 | | 1/7/19 | | Agreement with Barclays to receive the notional amount multiplied by the non-revised CPI and to pay the notional amount multiplied by the fixed rate of 1.60%. | | 32,335 | |
| $ 3,900,000 | | | | | | $ 30,740 | |
The use of foreign currency exchange contracts, futures contracts, and swap contracts involves elements of market risk and risks in excess of the amounts recognized in the financial statements. The notional values presented above represent the Fund’s total exposure in such contracts, whereas only the net unrealized appreciation (depreciation) is reflected in the Fund’s net assets.
1See Note 8 in ”Notes to financial statements.”
See accompanying Notes, which are an integral part of the financial statements.
15
| Statement of operations | |
| Delaware Inflation Protected Bond Fund | Year Ended July 31, 2010 |
| Investment Income: | | | | | | |
| Interest | | | | $ | 10,617,484 | |
| | | | | | | |
| Expenses: | | | | | | |
| Management fees | | 1,261,386 | | | | |
| Distribution expenses – Class A | | 301,062 | | | | |
| Distribution expenses – Class B | | 19,234 | | | | |
| Distribution expenses – Class C | | 573,155 | | | | |
| Dividend disbursing and transfer agent fees and expenses | | 298,433 | | | | |
| Accounting and administration expenses | | 111,631 | | | | |
| Registration fees | | 80,805 | | | | |
| Reports and statements to shareholders | | 64,837 | | | | |
| Legal fees | | 42,656 | | | | |
| Audit and tax | | 23,859 | | | | |
| Trustees’ fees | | 15,951 | | | | |
| Custodian fees | | 13,993 | | | | |
| Dues and services | | 12,324 | | | | |
| Insurance fees | | 8,185 | | | | |
| Pricing fees | | 6,284 | | | | |
| Consulting fees | | 4,051 | | | | |
| Trustees’ expenses | | 1,107 | | | 2,838,953 | |
| Less fees waived | | | | | (444,724 | ) |
| Less expense paid indirectly | | | | | (246 | ) |
| Total operating expenses | | | | | 2,393,983 | |
| Net Investment Income | | | | | 8,223,501 | |
| | | | | | | |
| Net Realized and Unrealized Gain (Loss) on Investments | | | | | | |
| and Foreign Currencies: | | | | | | |
| Net realized gain (loss) on: | | | | | | |
| Investments | | | | | 13,182,535 | |
| Futures contracts | | | | | 1,559,283 | |
| Swap contracts | | | | | (41,289 | ) |
| Foreign currencies | | | | | (1,528,403 | ) |
| Net realized gain | | | | | 13,172,126 | |
| Net change in unrealized appreciation/depreciation of | | | | | | |
| investments and foreign currencies | | | | | 2,541,880 | |
| Net Realized and Unrealized Gain on Investments | | | | | | |
| and Foreign Currencies | | | | | 15,714,006 | |
| | | | | | | |
| Net Increase in Net Assets Resulting from Operations | | | | $ | 23,937,507 | |
See accompanying Notes, which are an integral part of the financial statements.
16
Statements of changes in net assets
Delaware Inflation Protected Bond Fund
| | | Year Ended |
| | | 7/31/10 | | 7/31/09 |
| Increase (Decrease) in Net Assets from Operations: | | | | | | | | |
| Net investment income | | $ | 8,223,501 | | | $ | 2,095,345 | |
Net realized gain (loss) on investments and | | | | | | | | |
foreign currencies | | | 13,172,126 | | | | (9,234,306 | ) |
Net change in unrealized appreciation/depreciation | | | | | | | | |
of investments and foreign currencies | | | 2,541,880 | | | | 9,988,753 | |
Net increase in net assets resulting from operations | | | 23,937,507 | | | | 2,849,792 | |
| | | | | | | | | |
| Dividends and Distributions to Shareholders from: | | | | | | | | |
Net investment income: | | | | | | | | |
Class A | | | (4,070,181 | ) | | | (349,273 | ) |
Class B | | | (43,142 | ) | | | (24,174 | ) |
Class C | | | (1,315,439 | ) | | | (125,162 | ) |
Institutional Class | | | (4,035,834 | ) | | | (1,258,122 | ) |
| | | | | | | | | |
Net realized gain on investments: | | | | | | | | |
Class A | | | — | | | | (237,138 | ) |
Class B | | | — | | | | (11,734 | ) |
Class C | | | — | | | | (117,172 | ) |
Institutional Class | | | — | | | | (454,453 | ) |
| | | | (9,464,596 | ) | | | (2,577,228 | ) |
| | | | | | | | | |
| Capital Share Transactions: | | | | | | | | |
Proceeds from shares sold: | | | | | | | | |
Class A | | | 109,791,070 | | | | 93,510,828 | |
Class B | | | 425,095 | | | | 967,035 | |
Class C | | | 39,134,765 | | | | 38,614,188 | |
Institutional Class | | | 63,780,390 | | | | 60,824,235 | |
| | | | | | | | | |
Net asset value of shares issued upon reinvestment | | | | | | | | |
of dividends and distributions: | | | | | | | | |
Class A | | | 3,032,143 | | | | 487,920 | |
Class B | | | 34,764 | | | | 32,934 | |
Class C | | | 838,835 | | | | 218,538 | |
Institutional Class | | | 2,605,277 | | | | 1,712,232 | |
| | | | 219,642,339 | | | | 196,367,910 | |
18
| | | Year Ended |
| | | 7/31/10 | | 7/31/09 |
| Capital Share Transactions (continued): | | | | | | | | |
| Cost of shares repurchased: | | | | | | | | |
| Class A | | $ | (45,997,148 | ) | | $ | (30,679,404 | ) |
| Class B | | | (650,952 | ) | | | (1,108,255 | ) |
| Class C | | | (11,432,820 | ) | | | (8,335,904 | ) |
| Institutional Class | | | (124,740,711 | ) | | | (56,612,572 | ) |
| | | | (182,821,631 | ) | | | (96,736,135 | ) |
| Increase in net assets derived from capital share transactions | | | 36,820,708 | | | | 99,631,775 | |
| Net Increase in Net Assets | | | 51,293,619 | | | | 99,904,339 | |
| | | | | | | | | |
| Net Assets: | | | | | | | | |
| Beginning of year | | | 221,141,031 | | | | 121,236,692 | |
| End of year (including undistributed (distributions in | | | | | | | | |
| excess of) net investment income of $452,649 | | | | | | | | |
| and $(478,368), respectively) | | $ | 272,434,650 | | | $ | 221,141,031 | |
See accompanying Notes, which are an integral part of the financial statements.
19
Financial highlights
Delaware Inflation Protected Bond Fund Class A
Selected data for each share of the Fund outstanding throughout each period were as follows:
| Net asset value, beginning of period |
| |
| Income (loss) from investment operations: |
| Net investment income1 |
| Net realized and unrealized gain (loss) on investments and foreign currencies |
| Total from investment operations |
| |
| Less dividends and distributions from: |
| Net investment income |
| Net realized gain on investments |
| Total dividends and distributions |
| |
| Net asset value, end of period |
| |
| Total return2 |
| |
| Ratios and supplemental data: |
| Net assets, end of period (000 omitted) |
| Ratio of expenses to average net assets |
| Ratio of expenses to average net assets |
| prior to fees waived and expense paid indirectly |
| Ratio of net investment income to average net assets |
| Ratio of net investment income to average net assets |
| prior to fees waived and expense paid indirectly |
| Portfolio turnover |
1 The average shares outstanding method has been applied for per share information. |
2 Total investment return is based on the change in net asset value of a share during the period and assumes reinvestment of dividends and distributions at net asset value and does not reflect the impact of a sales charge. Total investment return during all of the periods shown reflects a waiver by the manager. Performance would have been lower had the waiver not been in effect. |
See accompanying Notes, which are an integral part of the financial statements.
20
| | Year Ended | |
| | 7/31/10 | | 7/31/09 | | 7/31/08 | | 7/31/07 | | 7/31/06 | |
| | $10.080 | | | $10.160 | | | $9.520 | | | $9.540 | | | $9.920 | | |
| | | | | | | | | | | | | | | | |
| | | | | | | | | | | | | | | | |
| | 0.314 | | | 0.124 | | | 0.569 | | | 0.426 | | | 0.576 | | |
| | 0.603 | | | (0.014 | ) | | 0.576 | | | (0.040 | ) | | (0.408 | ) | |
| | 0.917 | | | 0.110 | | | 1.145 | | | 0.386 | | | 0.168 | | |
| | | | | | | | | | | | | | | | |
| | | | | | | | | | | | | | | | |
| | (0.367 | ) | | (0.133 | ) | | (0.505 | ) | | (0.406 | ) | | (0.531 | ) | |
| | — | | | (0.057 | ) | | — | | | — | | | (0.017 | ) | |
| | (0.367 | ) | | (0.190 | ) | | (0.505 | ) | | (0.406 | ) | | (0.548 | ) | |
| | | | | | | | | | | | | | | | |
| | $10.630 | | | $10.080 | | | $10.160 | | | $9.520 | | | $9.540 | | |
| | | | | | | | | | | | | | | | |
| | 9.25% | | | 1.12% | | | 12.13% | | | 4.13% | | | 1.75% | | |
| | | | | | | | | | | | | | | | |
| | | | | | | | | | | | | | | | |
| | $156,345 | | | $83,771 | | | $19,624 | | | $2,329 | | | $4,276 | | |
| | 0.78% | | | 0.75% | | | 0.75% | | | 0.76% | | | 0.75% | | |
| | | | | | | | | | | | | | | | |
| | 0.94% | | | 0.94% | | | 0.94% | | | 1.10% | | | 1.24% | | |
| | 3.00% | | | 1.27% | | | 5.58% | | | 4.46% | | | 5.96% | | |
| | | | | | | | | | | | | | | | |
| | 2.84% | | | 1.08% | | | 5.39% | | | 4.12% | | | 5.47% | | |
| | 118% | | | 188% | | | 178% | | | 553% | | | 294% | | |
21
Financial highlights
Delaware Inflation Protected Bond Fund Class B
Selected data for each share of the Fund outstanding throughout each period were as follows:
| Net asset value, beginning of period |
| |
| Income (loss) from investment operations: |
| Net investment income1 |
| Net realized and unrealized gain (loss) on investments and foreign currencies |
| Total from investment operations |
| |
| Less dividends and distributions from: |
| Net investment income |
| Net realized gain on investments |
| Total dividends and distributions |
| |
| Net asset value, end of period |
| |
| Total return2 |
| |
| Ratios and supplemental data: |
| Net assets, end of period (000 omitted) |
| Ratio of expenses to average net assets |
| Ratio of expenses to average net assets |
| prior to fees waived and expense paid indirectly |
| Ratio of net investment income to average net assets |
| Ratio of net investment income to average net assets |
| prior to fees waived and expense paid indirectly |
| Portfolio turnover |
1 The average shares outstanding method has been applied for per share information. |
2 Total investment return is based on the change in net asset value of a share during the period and assumes reinvestment of dividends and distributions at net asset value and does not reflect the impact of a sales charge. Total investment return during all of the periods shown reflects a waiver by the manager. Performance would have been lower had the waiver not been in effect. |
See accompanying Notes, which are an integral part of the financial statements.
22
| | Year Ended | |
| | 7/31/10 | | 7/31/09 | | 7/31/08 | | 7/31/07 | | 7/31/06 | |
| | $10.020 | | | $10.160 | | | $9.520 | | | $9.540 | | | $9.920 | | |
| | | | | | | | | | | | | | | | |
| | | | | | | | | | | | | | | | |
| | 0.235 | | | 0.051 | | | 0.491 | | | 0.354 | | | 0.503 | | |
| | 0.600 | | | (0.014 | ) | | 0.574 | | | (0.039 | ) | | (0.410 | ) | |
| | 0.835 | | | 0.037 | | | 1.065 | | | 0.315 | | | 0.093 | | |
| | | | | | | | | | | | | | | | |
| | | | | | | | | | | | | | | | |
| | (0.235 | ) | | (0.120 | ) | | (0.425 | ) | | (0.335 | ) | | (0.456 | ) | |
| | — | | | (0.057 | ) | | — | | | — | | | (0.017 | ) | |
| | (0.235 | ) | | (0.177 | ) | | (0.425 | ) | | (0.335 | ) | | (0.473 | ) | |
| | | | | | | | | | | | | | | | |
| | $10.620 | | | $10.020 | | | $10.160 | | | $9.520 | | | $9.540 | | |
| | | | | | | | | | | | | | | | |
| | 8.40% | | | 0.39% | | | 11.25% | | | 3.37% | | | 0.97% | | |
| | | | | | | | | | | | | | | | |
| | | | | | | | | | | | | | | | |
| | $1,806 | | | $1,886 | | | $2,032 | | | $463 | | | $1,381 | | |
| | 1.53% | | | 1.50% | | | 1.50% | | | 1.51% | | | 1.50% | | |
| | | | | | | | | | | | | | | | |
| | 1.69% | | | 1.69% | | | 1.69% | | | 1.85% | | | 1.99% | | |
| | 2.25% | | | 0.52% | | | 4.83% | | | 3.71% | | | 5.21% | | |
| | | | | | | | | | | | | | | | |
| | 2.09% | | | 0.33% | | | 4.64% | | | 3.37% | | | 4.72% | | |
| | 118% | | | 188% | | | 178% | | | 553% | | | 294% | | |
23
Financial highlights
Delaware Inflation Protected Bond Fund Class C
Selected data for each share of the Fund outstanding throughout each period were as follows:
| Net asset value, beginning of period |
| |
| Income (loss) from investment operations: |
| Net investment income1 |
| Net realized and unrealized gain (loss) on investments and foreign currencies |
| Total from investment operations |
| |
| Less dividends and distributions from: |
| Net investment income |
| Net realized gain on investments |
| Total dividends and distributions |
| |
| Net asset value, end of period |
| |
| Total return2 |
| |
| Ratios and supplemental data: |
| Net assets, end of period (000 omitted) |
| Ratio of expenses to average net assets |
| Ratio of expenses to average net assets |
| prior to fees waived and expense paid indirectly |
| Ratio of net investment income to average net assets |
| Ratio of net investment income to average net assets |
| prior to fees waived and expense paid indirectly |
| Portfolio turnover |
1 The average shares outstanding method has been applied for per share information. |
2 Total investment return is based on the change in net asset value of a share during the period and assumes reinvestment of dividends and distributions at net asset value and does not reflect the impact of a sales charge. Total investment return during all of the periods shown reflects a waiver by the manager. Performance would have been lower had the waiver not been in effect. |
See accompanying Notes, which are an integral part of the financial statements.
24
| | Year Ended | |
| | 7/31/10 | | 7/31/09 | | 7/31/08 | | 7/31/07 | | 7/31/06 | |
| | $10.020 | | | $10.160 | | | $9.520 | | | $9.540 | | | $9.920 | | |
| | | | | | | | | | | | | | | | |
| | | | | | | | | | | | | | | | |
| | 0.235 | | | 0.051 | | | 0.492 | | | 0.354 | | | 0.504 | �� | |
| | 0.600 | | | (0.014 | ) | | 0.573 | | | (0.039 | ) | | (0.411 | ) | |
| | 0.835 | | | 0.037 | | | 1.065 | | | 0.315 | | | 0.093 | | |
| | | | | | | | | | | | | | | | |
| | | | | | | | | | | | | | | | |
| | (0.235 | ) | | (0.120 | ) | | (0.425 | ) | | (0.335 | ) | | (0.456 | ) | |
| | — | | | (0.057 | ) | | — | | | — | | | (0.017 | ) | |
| | (0.235 | ) | | (0.177 | ) | | (0.425 | ) | | (0.335 | ) | | (0.473 | ) | |
| | | | | | | | | | | | | | | | |
| | $10.620 | | | $10.020 | | | $10.160 | | | $9.520 | | | $9.540 | | |
| | | | | | | | | | | | | | | | |
| | 8.40% | | | 0.39% | | | 11.25% | | | 3.37% | | | 0.97% | | |
| | | | | | | | | | | | | | | | |
| | | | | | | | | | | | | | | | |
| | $71,866 | | | $40,352 | | | $9,169 | | | $1,095 | | | $1,622 | | |
| | 1.53% | | | 1.50% | | | 1.50% | | | 1.51% | | | 1.50% | | |
| | | | | | | | | | | | | | | | |
| | 1.69% | | | 1.69% | | | 1.69% | | | 1.85% | | | 1.99% | | |
| | 2.25% | | | 0.52% | | | 4.83% | | | 3.71% | | | 5.21% | | |
| | | | | | | | | | | | | | | | |
| | 2.09% | | | 0.33% | | | 4.64% | | | 3.37% | | | 4.72% | | |
| | 118% | | | 188% | | | 178% | | | 553% | | | 294% | | |
25
Financial highlights
Delaware Inflation Protected Bond Fund Institutional Class
Selected data for each share of the Fund outstanding throughout each period were as follows:
| Net asset value, beginning of period |
| |
| Income (loss) from investment operations: |
| Net investment income1 |
| Net realized and unrealized gain (loss) on investments and foreign currencies |
| Total from investment operations |
| |
| Less dividends and distributions from: |
| Net investment income |
| Net realized gain on investments |
| Total dividends and distributions |
| |
| Net asset value, end of period |
| |
| Total return2 |
| |
| Ratios and supplemental data: |
| Net assets, end of period (000 omitted) |
| Ratio of expenses to average net assets |
| Ratio of expenses to average net assets |
| prior to fees waived and expense paid indirectly |
| Ratio of net investment income to average net assets |
| Ratio of net investment income to average net assets |
| prior to fees waived and expense paid indirectly |
| Portfolio turnover |
1 The average shares outstanding method has been applied for per share information. |
2 Total investment return is based on the change in net asset value of a share during the period and assumes reinvestment of dividends and distributions at net asset value. Total investment return during all of the periods shown reflects a waiver by the manager. Performance would have been lower had the waiver not been in effect. |
See accompanying Notes, which are an integral part of the financial statements.
26
| | Year Ended | |
| | 7/31/10 | | 7/31/09 | | 7/31/08 | | 7/31/07 | | 7/31/06 | |
| | $10.100 | | | $10.160 | | | $9.530 | | | $9.540 | | | $9.920 | | |
| | | | | | | | | | | | | | | | |
| | | | | | | | | | | | | | | | |
| | 0.339 | | | 0.148 | | | 0.594 | | | 0.450 | | | 0.600 | | |
| | 0.603 | | | (0.014 | ) | | 0.567 | | | (0.030 | ) | | (0.409 | ) | |
| | 0.942 | | | 0.134 | | | 1.161 | | | 0.420 | | | 0.191 | | |
| | | | | | | | | | | | | | | | |
| | | | | | | | | | | | | | | | |
| | (0.412 | ) | | (0.137 | ) | | (0.531 | ) | | (0.430 | ) | | (0.554 | ) | |
| | — | | | (0.057 | ) | | — | | | — | | | (0.017 | ) | |
| | (0.412 | ) | | (0.194 | ) | | (0.531 | ) | | (0.430 | ) | | (0.571 | ) | |
| | | | | | | | | | | | | | | | |
| | $10.630 | | | $10.100 | | | $10.160 | | | $9.530 | | | $9.540 | | |
| | | | | | | | | | | | | | | | |
| | 9.51% | | | 1.36% | | | 12.30% | | | 4.50% | | | 1.99% | | |
| | | | | | | | | | | | | | | | |
| | | | | | | | | | | | | | | | |
| | $42,418 | | | $95,132 | | | $90,412 | | | $40,544 | | | $29,683 | | |
| | 0.53% | | | 0.50% | | | 0.50% | | | 0.51% | | | 0.50% | | |
| | | | | | | | | | | | | | | | |
| | 0.69% | | | 0.69% | | | 0.69% | | | 0.85% | | | 0.99% | | |
| | 3.25% | | | 1.52% | | | 5.83% | | | 4.71% | | | 6.21% | | |
| | | | | | | | | | | | | | | | |
| | 3.09% | | | 1.33% | | | 5.64% | | | 4.37% | | | 5.72% | | |
| | 118% | | | 188% | | | 178% | | | 553% | | | 294% | | |
27
| Notes to financial statements | |
| Delaware Inflation Protected Bond Fund | July 31, 2010 |
Delaware Group® Government Fund (Trust) is organized as a Delaware statutory trust and offers two series: Delaware Core Plus Bond Fund and Delaware Inflation Protected Bond Fund. These financial statements and the related notes pertain to Delaware Inflation Protected Bond Fund (Fund). The Trust is an open-end investment company. The Fund is considered diversified under the Investment Company Act of 1940, as amended, and offers Class A, Class B, Class C, and Institutional Class shares. Class A shares are sold with a maximum front-end sales charge of up to 4.50%. Class A share purchases of $1,000,000 or more will incur a contingent deferred sales charge (CDSC) of 1% if redeemed during the first year and 0.50% during the second year, provided that Delaware Distributors, L.P. (DDLP) paid a financial advisor a commission on the purchase of those shares. Class B shares may only be purchased through dividend reinvestment and certain permitted exchanges. Prior to June 1, 2007, Class B shares were sold with a CDSC that declined from 4% to zero depending upon the period of time the shares are held. Class B shares will automatically convert to Class A shares on a quarterly basis approximately eight years after purchase. Class C shares are sold with a CDSC of 1%, if redeemed during the first twelve months. Institutional Class shares are not subject to a sales charge and are offered for sale exclusively to certain eligible investors.
The investment objective of the Fund is to seek to provide inflation protection and current income.
1. Significant Accounting Policies
The following accounting policies are in accordance with U.S. generally accepted accounting principles (U.S. GAAP) and are consistently followed by the Fund.
Security Valuation — Securities listed on a foreign exchange are valued at the last quoted sales price on the valuation date. Short-term debt securities are valued at market value. U.S. government and agency securities are valued at the mean between the bid and ask prices. Other debt securities, credit default swap (CDS) contracts and interest rate swap contracts are valued by an independent pricing service or broker. To the extent current market prices are not available, the pricing service may take into account developments related to the specific security, as well as transactions in comparable securities. Foreign currency exchange contracts are valued at the mean between the bid and ask prices. Interpolated values are derived when the settlement date of the contract is an interim date for which quotations are not avai lable. Futures contracts are valued at the daily quoted settlement prices. Generally, other securities and assets for which market quotations are not readily available are valued at fair value as determined in good faith under the direction of the Fund’s Board of Trustees (Board). In determining whether market quotations are readily available or fair valuation will be used, various factors will be taken into consideration, such as market closures or suspension of trading in a security. The Fund may use fair value pricing more frequently for securities traded primarily in non-U.S. markets because, among other things, most foreign markets close well before the Fund values its securities at 4:00 p.m. Eastern time. The earlier close of these foreign markets gives rise to the possibility that significant events, including
28
broad market moves, government actions or pronouncements, aftermarket trading, or news events may have occurred in the interim. To account for this, the Fund may frequently value foreign securities using fair value prices based on third-party vendor modeling tools (international fair value pricing).
Federal Income Taxes — No provision for federal income taxes has been made as the Fund intends to continue to qualify for federal income tax purposes as a regulated investment company under Subchapter M of the Internal Revenue Code of 1986, as amended, and make the requisite distributions to shareholders. The Fund evaluates tax positions taken or expected to be taken in the course of preparing the Fund’s tax returns to determine whether the tax positions are “more-likely-than-not” of being sustained by the applicable tax authority. Tax positions not deemed to meet the more-likely-than-not threshold are recorded as a tax benefit or expense in the current year. Management has analyzed the Fund’s tax positions taken on federal income tax returns for all open tax years (July 31, 2007 – July 31, 2010), and has concluded that no provision for federal income tax is required in the Fund’s financial statements.
Class Accounting — Investment income, common expenses and realized and unrealized gain (loss) on investments are allocated to the various classes of the Fund on the basis of daily net assets of each class. Distribution expenses relating to a specific class are charged directly to that class.
Repurchase Agreements — The Fund may invest in a pooled cash account along with other members of the Delaware Investments® Family of Funds pursuant to an exemptive order issued by the Securities and Exchange Commission. The aggregate daily balance of the pooled cash account is invested in repurchase agreements secured by obligations of the U.S. government. The respective collateral is held by the Fund’s custodian bank until the maturity of the respective repurchase agreements. Each repurchase agreement is at least 102% collateralized. However, in the event of default or bankruptcy by the counterparty to the agreement, realization of the collateral may be subject to legal proceedings. At July 31, 2010, the Fund held no investments in repurchase agree ments.
Inflation-Indexed Bonds — The Fund invests in inflation-indexed bonds. Inflation-indexed bonds are fixed-income securities whose principal value is periodically adjusted to the rate of inflation. The interest rate on these bonds is generally fixed at issuance at a rate lower than typical bonds. Over the life of an inflation-indexed bond, however, interest will be paid based on a principal value, which is adjusted for inflation. Any increase or decrease in the principal amount of an inflation-indexed bond will be included as interest income on the statement of operations, even though investors do not receive their principal until maturity.
Foreign Currency Transactions — Transactions denominated in foreign currencies are recorded at the prevailing exchange rates on the valuation date in accordance with the Fund’s prospectus. The value of all assets and liabilities denominated in foreign currencies is translated into U.S. dollars at the exchange rate of such currencies against the U.S. dollar daily. Transaction gains or losses resulting from changes in exchange rates during the reporting period or upon settlement of the foreign currency transaction are reported in operations for the current period.
29
Notes to financial statements
Delaware Inflation Protected Bond Fund
1. Significant Accounting Policies (continued)
The Fund isolates that portion of realized gains and losses on investments in debt securities, which is due to changes in foreign exchange rates from that which is due to changes in market prices of debt securities. The Fund reports certain foreign currency related transactions as components of realized gains (losses) for financial reporting purposes, whereas such components are treated as ordinary income (loss) for federal income tax purposes.
Use of Estimates — The preparation of financial statements in conformity with U.S. GAAP requires management to make estimates and assumptions that affect the reported amounts of assets and liabilities and disclosure of contingent assets and liabilities at the date of the financial statements and the reported amounts of revenues and expenses during the reporting period. Actual results could differ from those estimates and such differences could be material.
Other — Expenses directly attributable to the Fund are charged directly to the Fund. Other expenses common to various funds within the Delaware Investments® Family of Funds are generally allocated amongst such funds on the basis of average net assets. Management fees and some other expenses are paid monthly. Security transactions are recorded on the date the securities are purchased or sold (trade date) for financial reporting purposes. Costs used in calculating realized gains and losses on the sale of investment securities are those of the specific securities sold. Interest income is recorded on the accrual basis. Discounts and premiums on non-convertible bonds are amortized to interest income over the lives of the respective securities. Realized gains ( losses) on paydowns of mortgage- and asset-backed securities are classified as interest income. The Fund expects to declare and pay dividends from net investment income monthly. Such dividends and distributions, if any, are recorded on the ex-dividend date. The Fund will distribute net realized capital gains, if any, twice a year. The Fund may distribute such income dividends and capital gains more frequently, if necessary, in order to reduce or eliminate federal excise or income taxes on the Fund.
The Fund may receive earnings credits from its custodian when positive cash balances are maintained, which are used to offset custody fees. There were no earnings credits for the year ended July 31, 2010.
The Fund may receive earnings credits from its transfer agent when positive cash balances are maintained, which may be used to offset transfer agent fees. For the year ended July 31, 2010, the Fund earned $246 under this agreement.
| 2. | Investment Management, Administration Agreements and Other Transactions with Affiliates |
In accordance with the terms of its investment management agreement, the Fund pays Delaware Management Company (DMC), a series of Delaware Management Business Trust and the investment manager, an annual fee which is calculated daily at the rate of 0.45% on the first $500 million of average daily net assets of the Fund, 0.40% on the next $500 million, 0.35% on the next $1.5 billion, and 0.30% on average daily net assets in excess of $2.5 billion.
30
Effective December 1, 2009, DMC has voluntarily agreed to waive that portion, if any, of its management fee and/or pay/reimburse the Fund to the extent necessary to ensure that total annual operating expenses (excluding any 12b-1 plan expenses, taxes, interest, inverse floater program expenses, short sale and dividend interest expenses, brokerage fees, certain insurance costs, and nonroutine expenses or costs including, but not limited to, those relating to reorganizations, litigation, conducting shareholder meetings, and liquidations (collectively, nonroutine expenses)), do not exceed 0.55% of average daily net assets of the Fund until such time as the voluntary expenses cap is discontinued. For purposes of this waiver and reimbursement, nonroutine expenses may also include such additional costs and expenses, as may be agreed upon from time to time by the Fund’s Board and DMC. These fee waivers and expense reimbursements apply only to expenses paid directly by the Fund, and may be discontinued at any time because they are voluntary. Prior to December 1, 2009, DMC had contractually agreed to waive that portion, if any, of its management fee and/or pay/reimburse the Fund to the extent necessary to ensure that total annual operating expenses (excluding any 12b-1 plan expenses, taxes, interest, inverse floater program expenses, brokerage fees, certain insurance costs, and nonroutine expenses), did not exceed 0.55% of average daily net assets of the Fund.
Delaware Service Company, Inc. (DSC), an affiliate of DMC, provides fund accounting and financial administration oversight services to the Fund. For these services, the Fund pays DSC fees based on the aggregate daily net assets of the Delaware Investments® Family of Funds at the following annual rate: 0.0050% of the first $30 billion; 0.0045% of the next $10 billion; 0.0040% of the next $10 billion; and 0.0025% of aggregate average daily net assets in excess of $50 billion. The fees payable to DSC under the service agreement described above are allocated among all Funds in the Delaware Investments Family of Funds on a relative net asset value basis. For the year ended July 31, 2010, the Fund was charged $14,015 for these services.
DSC also provides dividend disbursing and transfer agency services. The Fund pays DSC a monthly fee based on the number of shareholder accounts for dividend disbursing and transfer agent services.
Pursuant to a distribution agreement and distribution plan, the Fund pays DDLP, the distributor and an affiliate of DMC, an annual distribution and service fee not to exceed 0.25% of the average daily net assets of the Class A shares and 1.00% of the average daily net assets of the Class B and C shares. Institutional Class shares pay no distribution and service expenses.
At July 31, 2010, the Fund had liabilities payable to affiliates as follows:
| Investment management fee payable to DMC | | $ | 32,080 |
| Dividend disbursing, transfer agent and fund accounting | | | |
| oversight fees and other expenses payable to DSC | | | 13,000 |
| Distribution fees payable to DDLP | | | 94,269 |
| Other expenses payable to DMC and affiliates* | | | 6,087 |
*DMC, as part of its administrative services, pays operating expenses on behalf of the Fund and is reimbursed on a periodic basis. Such expenses include items such as printing of shareholder reports, fees for audit, legal and tax services, registration fees and trustees’ fees.
31
Notes to financial statements
Delaware Inflation Protected Bond Fund
| 2. | Investment Management, Administration Agreements and Other Transactions with Affiliates (continued) |
As provided in the investment management agreement, the Fund bears the cost of certain legal and tax services, including internal legal and tax services provided to the Fund by DMC and/or its affiliates’ employees. For the year ended July 31, 2010, the Fund was charged $13,188 for internal legal and tax services provided by DMC and/or its affiliates’ employees.
For the year ended July 31, 2010, DDLP earned $58,131 for commissions on sales of the Fund’s Class A shares. For the year ended July 31, 2010, DDLP received gross CDSC commissions of $0, $1,499 and $20,591 on redemptions of the Fund’s Class A, Class B and Class C shares, respectively, and these commissions were entirely used to offset up-front commissions previously paid by DDLP to broker-dealers on sales of those shares.
Trustees’ fees include expenses accrued by the Fund for each Trustee’s retainer and meeting fees. Certain officers of DMC, DSC, and DDLP are officers and/or Trustees of the Trust. These officers and Trustees are paid no compensation by the Fund.
3. Investments
For the year ended July 31, 2010, the Fund made purchases of $45,541,659 and sales of $59,832,862 of investment securities other than U.S. government securities and short-term investments. For the year ended July 31, 2010, the Fund made purchases of $307,516,775 and sales of $253,875,727 of long-term U.S. government securities.
At July 31, 2010, the cost of investments for federal income tax purposes was $261,011,022. At July 31, 2010, net unrealized appreciation was $9,525,289, of which $9,753,194 related to unrealized appreciation of investments and $227,905 related to unrealized depreciation of investments.
U.S. GAAP defines fair value as the price that the Fund would receive to sell an asset or pay to transfer a liability in an orderly transaction between market participants at the measurement date under current market conditions. A three level hierarchy for fair value measurements has been established based upon the transparency of inputs to the valuation of an asset or liability. Inputs may be observable or unobservable and refer broadly to the assumptions that market participants would use in pricing the asset or liability. Observable inputs reflect the assumptions market participants would use in pricing the asset or liability based on market data obtained from sources independent of the reporting entity. Unobservable inputs reflect the reporting entity’s own assumptions about the assumptions that market participants would use in pricing the asset or liability developed based on the best information available under the circumstance s. The Fund’s investment in its entirety is assigned a level based upon the observability of the inputs which are significant to the overall valuation. The three level hierarchy of inputs is summarized below.
| Level 1 – | inputs are quoted prices in active markets for identical investments |
| | |
| Level 2 – | other observable inputs (including, but not limited to: quoted prices for similar assets or liabilities in markets that are active, quoted prices for identical or similar assets |
32
| | or liabilities in markets that are not active, inputs other than quoted prices that are observable for the assets or liabilities (such as interest rates, yield curves, volatilities, prepayment speeds, loss severities, credit risks and default rates) or other market-corroborated inputs) |
| | |
| Level 3 – | inputs are significant unobservable inputs (including the fund’s own assumptions used to determine the fair value of investments) |
The following table summarizes the valuation of the Fund’s investments by fair value hierarchy levels as of July 31, 2010:
| | | Level 2 | | Level 3 | | Total |
| Corporate Debt | | $ | 2,512,795 | | | $ | 2,651,074 | | $ | 5,163,869 | |
| Foreign Debt | | | 11,748,437 | | | | 11,377,153 | | | 23,125,590 | |
| U.S. Treasury Obligations | | | 242,023,851 | | | | — | | | 242,023,851 | |
| Short-Term | | | 223,001 | | | | — | | | 223,001 | |
| Total | | $ | 256,508,084 | | | $ | 14,028,227 | | $ | 270,536,311 | |
| | | | | | | | | | | | |
| Foreign Currency Exchange Contracts | | $ | (56,748 | ) | | $ | — | | $ | (56,748 | ) |
| Futures Contracts | | $ | 2,314,343 | | | $ | — | | $ | 2,314,343 | |
| Swap Contracts | | $ | (109,446 | ) | | $ | — | | $ | (109,446 | ) |
The following is a reconciliation of investments in which significant unobservable inputs (Level 3) were used in determining fair value:
| | | Corporate Debt | | Foreign Debt | | Total |
| Balance as of 7/31/09 | | $ | — | | $ | — | | $ | — |
| Purchases | | | 2,501,481 | | | 11,173,259 | | | 13,674,740 |
| Net change in unrealized | | | | | | | | | |
| appreciation/depreciation | | | 149,593 | | | 203,894 | | | 353,487 |
| Balance as of 7/31/10 | | $ | 2,651,074 | | $ | 11,377,153 | | $ | 14,028,227 |
| | | | | | | | | | |
| Net change in unrealized appreciation/depreciation | | | | | | | | | |
| from investments still held as of 7/31/10 | | $ | 149,593 | | $ | 203,894 | | $ | 353,487 |
In January 2010, the Financial Accounting Standards Board issued an Accounting Standards Update, Improving Disclosures about Fair Value Measurements, which introduced new disclosure requirements and clarified certain existing disclosure requirements around fair value measurements currently presented above. The new disclosures and clarifications of existing disclosures are generally effective for the Fund’s fiscal year ending July 31, 2011 and interim periods therein. Management has evaluated the impact of this update on its current disclosures and determined that there were no transfers of securities between Level 1 and Level 2 that had a material impact to the Fund.
33
Notes to financial statements
Delaware Inflation Protected Bond Fund
4. Dividend and Distribution Information
Income and long-term capital gain distributions are determined in accordance with federal income tax regulations, which may differ from U.S. GAAP. Additionally, distributions from net gains on foreign currency transactions and net short-term gains on sales of investment securities are treated as ordinary income for federal income tax purposes. The tax character of dividends and distributions paid during the years ended July 31, 2010 and 2009 was as follows:
| | | Year Ended |
| | | 7/31/10 | | 7/31/09 |
| Ordinary income | | $ | 9,464,596 | | $ | 2,428,904 |
| Long-term capital gain | | | — | | | 148,324 |
| Total | | $ | 9,464,596 | | $ | 2,577,228 |
5. Components of Net Assets on a Tax Basis
As of July 31, 2010, the components of net assets on a tax basis were as follows:
| Shares of beneficial interest | | $ | 259,182,627 | |
| Undistributed ordinary income | | | 2,538,403 | |
| Undistributed long-term capital gains | | | 4,458,120 | |
| Post-October currency losses | | | (1,585,027 | ) |
| Other temporary differences | | | (1,726,148 | ) |
| Unrealized appreciation on investments, | | | | |
| swap contracts and foreign currencies | | | 9,566,675 | |
| Net assets | | $ | 272,434,650 | |
The differences between book basis and tax basis components of net assets are primarily attributable to tax deferral of losses on wash sales, tax deferral of losses on straddles, tax treatment of U.S. Treasury Inflation Index Securities deflationary adjustments, mark-to-market on futures contracts, mark-to-market of foreign currency exchange contracts and tax treatment of market discount and premium on debt instruments and tax treatment of CDS contracts.
Post-October losses represent losses realized on foreign currency transactions from November 1, 2009 through July 31, 2010 that, in accordance with federal income tax regulations, the Fund has elected to defer and treat as having arisen in the following year.
For financial reporting purposes, capital accounts are adjusted to reflect the tax character of permanent book/tax differences. Reclassifications are primarily due to tax treatment of gain (loss) on foreign currency transactions, in-kind distributions of shareholder redemptions, market discount and premium on certain debt instruments, paydowns of mortgage- and asset-backed
34
securities, tax treatment of swap contracts and U.S. Treasury Inflation Index Securities. Results of operations and net assets were not affected by these reclassifications. For the year ended July 31, 2010, the Fund recorded the following reclassifications:
| Undistributed net investment income | | $ | 2,172,112 | |
| Accumulated net realized loss | | | (5,319,600 | ) |
| Paid-in capital | | | 3,147,488 | |
For federal income tax purposes, $1,187,878 of capital loss carryforwards from prior year was utilized in the year ended July 31, 2010.
6. Capital Shares
Transactions in capital shares were as follows:
| | | Year Ended |
| | | 7/31/10 | | 7/31/09 |
| Shares sold: | | | | | | |
| Class A | | 10,505,319 | | | 9,529,971 | |
| Class B | | 40,911 | | | 99,422 | |
| Class C | | 3,752,352 | | | 3,964,894 | |
| Institutional Class | | 6,127,432 | | | 6,241,103 | |
| | | | | | | |
| Shares issued upon reinvestment of dividends and distributions: | | | | | | |
| Class A | | 290,835 | | | 49,441 | |
| Class B | | 3,335 | | | 3,320 | |
| Class C | | 80,262 | | | 22,221 | |
| Institutional Class | | 254,317 | | | 171,878 | |
| | | 21,054,763 | | | 20,082,250 | |
| | | | | | | |
| Shares repurchased: | | | | | | |
| Class A | | (4,395,751 | ) | | (3,199,126 | ) |
| Class B | | (62,408 | ) | | (114,404 | ) |
| Class C | | (1,093,577 | ) | | (861,507 | ) |
| Institutional Class | | (11,810,035 | ) | | (5,893,085 | ) |
| | | (17,361,771 | ) | | (10,068,122 | ) |
| Net increase | | 3,692,992 | | | 10,014,128 | |
For the years ended July 31, 2010 and 2009, 28,148 Class B shares were converted to 28,140 Class A shares valued at $295,485 and 23,875 Class B shares were converted to 23,824 Class A shares valued at $234,437, respectively. The respective amounts are included in Class B redemptions and Class A subscriptions in the table above and the statements of changes in net assets.
35
Notes to financial statements
Delaware Inflation Protected Bond Fund
7. Line of Credit
The Fund, along with certain other funds in the Delaware Investments® Family of Funds (Participants), participates in a $35,000,000 revolving line of credit with The Bank of New York Mellon (BNY Mellon) to be used for temporary or emergency purposes as an additional source of liquidity to fund redemptions of investor shares. Under the agreement, the Participants are charged an annual commitment fee, which is allocated across the Participants on the basis of each Participant’s allocation of the entire facility. The Participants may borrow up to a maximum of one third of their net assets under the agreement. The agreement expires on November 16, 2010. The Fund had no amounts outstanding as of July 31, 2010 or at any time during the year then ended.
8. Derivatives
U.S. GAAP requires enhanced disclosures that enable investors to understand: 1) how and why an entity uses derivatives; 2) how they are accounted for; and 3) how they affect an entity’s results of operations and financial position.
Foreign Currency Exchange Contracts — The Fund may enter into foreign currency exchange contracts as a way of managing foreign exchange rate risk. The Fund may enter into these contracts to fix the U.S. dollar value of a security that it has agreed to buy or sell for the period between the date the trade was entered into and the date the security is delivered and paid for. The Fund may also use these contracts to hedge the U.S. dollar value of securities it already owns that are denominated in foreign currencies. The change in value is recorded as an unrealized gain or loss. When the contract is closed, a realized gain or loss is recorded equal to the difference between the value of the contract at the time it was opened and the value at the time it was closed.
The use of foreign currency exchange contracts does not eliminate fluctuations in the underlying prices of the securities, but does establish a rate of exchange that can be achieved in the future. Although foreign currency exchange contracts limit the risk of loss due to a decline in the value of the hedged currency, they also limit any potential gain that might result should the value of the currency increase. In addition, the Fund could be exposed to risks if the counterparties to the contracts are unable to meet the terms of their contracts. The Fund’s maximum risk of loss from counterparty credit risk is the value of its currency exchanged with the counterparty. The risk is generally mitigated by having a netting arrangement between the Fund and the counterparty and by the posting of collateral by the counterparty to the Fund to cover the Fund’s exposure to the counterparty.
Futures Contracts — A futures contract is an agreement in which the writer (or seller) of the contract agrees to deliver to the buyer an amount of cash or securities equal to a specific dollar amount times the difference between the value of a specific security or index at the close of the last trading day of the contract and the price at which the agreement is made. The Fund may use futures in the normal course of pursuing its investment objective. The Fund may invest in futures contracts to hedge its existing portfolio securities against fluctuations in fair value caused by changes in prevailing market interest rates. Upon entering into a futures contract, the Fund
36
deposits cash or pledges U.S government securities to a broker, equal to the minimum “initial margin” requirements of the exchange on which the contract is traded. Subsequent payments are received from the broker or paid to the broker each day, based on the daily fluctuation in the market value of the contract. These receipts or payments are known as “variation margin” and are recorded daily by the Fund as unrealized gains or losses until the contracts are closed. When the contracts are closed, the Fund records a realized gain or loss equal to the difference between the value of the contract at the time it was opened and the value at the time it was closed. Risks of entering into futures contracts include potential imperfect correlation between the futures contracts and the underlying securities and the possibility of an illiquid secondary market for these instruments. When investing in futures, there is minimal cou nterparty credit risk to the Fund because futures are exchange-traded and the exchange’s clearinghouse, as counterparty to all exchange-traded futures, guarantees against default.
Swap Contracts — The Fund may enter into interest rate swap contracts, index swap contracts, inflation swap contracts and CDS contracts in the normal course of pursuing its investment objective. The Fund may use interest rate swaps to adjust the Fund’s sensitivity to interest rates or to hedge against changes in interest rates. Index swaps may be used to gain exposure to markets that the Fund invests in, such as the corporate bond market. The Fund may also use index swaps as a substitute for futures or options contracts if such contracts are not directly available to the Fund on favorable terms. The Fund may use inflation swaps to hedge the inflation risk in nominal bonds, thereby creating synthetic inflation-indexed bonds. The Fund may enter into CDS contracts in order to hedge against a credit event, to enhance t otal return or to gain exposure to certain securities or markets.
Interest Rate Swaps. An interest rate swap contract is an exchange of interest rates between counterparties. In one instance, an interest rate swap involves payments received by the Fund from another party based on a variable or floating interest rate, in return for making payments based on a fixed interest rate. An interest rate swap can also work in reverse with the Fund receiving payments based on a fixed interest rate and making payments based on a variable or floating interest rate. Interest rate swaps may be used to adjust the Fund’s sensitivity to interest rates or to hedge against changes in interest rates. Periodic payments on such contracts are accrued daily and recorded as unrealized appreciation/depreciation on swap contracts. Upon periodic payment/ receipt or termination of the contract, such amounts are recorded as realized gains or losses on swap contracts. The Fund’s maximum risk of loss from counterparty credit risk is the discounted net value of the cash flows to be received from/paid to the counterparty over the interest rate swap contract’s remaining life, to the extent that the amount is positive. This risk is mitigated by having a netting arrangement between the Fund and the counterparty and by the posting of collateral by the counterparty to the Fund to cover the Fund’s exposure to the counterparty.
Index Swaps. Index swaps involve commitments to pay interest in exchange for a market linked return based on a notional amount. To the extent the total return of the security, instrument or basket of instruments underlying the transaction exceeds the offsetting interest obligation, the Fund will receive a payment from the counterparty. To the extent the total return of the security,
37
Notes to financial statements
Delaware Inflation Protected Bond Fund
8. Derivatives (continued)
instrument or basket of instruments underlying the transaction falls short of the offsetting interest obligation, the Fund will make a payment to the counterparty. The change in value of swap contracts outstanding, if any, is recorded as unrealized appreciation or depreciation daily. A realized gain or loss is recorded on maturity or termination of the swap contract. The Fund’s maximum risk of loss from counterparty credit risk is the discounted net value of the cash flows to be received from/paid to the counterparty over the index swap contract’s remaining life, to the extent that the amount is positive. This risk is mitigated by having a netting arrangement between the Fund and the counterparty and by the posting of collateral by the counterparty to the Fund to cover the Fund’s exposure to the counterparty.
Inflation Swaps. Inflation swaps agreements involve commitments to pay a regular stream of inflation-indexed cash payments in exchange for receiving a stream of nominal interest payments (or vice versa), where both payment streams are based on notional amounts. The nominal interest payments may be based on either a fixed interest rate or variable interest rate such as London Interbank Offered Rate (LIBOR). The change in value of swap contracts outstanding, if any, is recorded as unrealized appreciation or depreciation daily. A realized gain or loss is recorded on maturity or termination of the swap contract. The Fund’s maximum risk of loss from counterparty credit risk is the discounted net value of the cash flows to be received from/paid to the counterparty over the index swap contract’s remaining life, to the extent that the amount is positive. This risk is mitigated by having a netting arrangement between the Fund and the co unterparty and by the posting of collateral by the counterparty to the Fund to cover the Fund’s exposure to the counterparty.
Credit Default Swaps. A CDS contract is a risk-transfer instrument through which one party (purchaser of protection) transfers to another party (seller of protection) the financial risk of a credit event (as defined in the CDS agreement), as it relates to a particular referenced security or basket of securities (such as an index). In exchange for the protection offered by the seller of protection, the purchaser of protection agrees to pay the seller of protection a periodic amount at a stated rate that is applied to the notional amount of the CDS contract. In addition, an upfront payment may be made or received by the Fund in connection with an unwinding or assignment of a CDS contract. Upon the occurrence of a credit event, the seller of protection would pay the par (or other agreed-upon) value of the referenced security (or basket of securities) to the counterparty. Credit events generally include, among others, bankruptcy, failure to pa y, and obligation default.
During the year ended July 31, 2010, the Fund entered into CDS contracts as a purchaser of protection. Periodic payments on such contracts are accrued daily and recorded as unrealized losses (gains) on swap contracts. Upon payment, such amounts are recorded as realized losses (gains) on swap contracts. Upfront payments made or received in connection with CDS contracts are amortized over the expected life of the CDS contracts as unrealized losses (gains) on swap contracts. The change in value of CDS contracts is recorded as unrealized appreciation or depreciation daily. A realized gain or loss is recorded upon a credit event (as defined in the CDS agreement) or the maturity or termination of the agreement. For the year ended July 31, 2010, the
38
Fund did not enter into any CDS contracts as a seller of protection. At July 31, 2010, the aggregate unrealized depreciation of credit default swaps was $140,186. If a credit event had occurred for all swap transactions where collateral posting was required as of July 31, 2010, the swaps’ credit-risk-related contingent features would have been triggered and the Fund would have been received $5,635,000 less the value of the contracts’ related reference obligations.
Credit default swaps may involve greater risks than if the Fund had invested in the referenced obligation directly. Credit default swaps are subject to general market risk, liquidity risk, counterparty risk and credit risk. The Fund’s maximum risk of loss from counterparty credit risk, either as the seller of protection or the buyer of protection, is the fair value of the contract. This risk is mitigated by having a netting arrangement between the Fund and the counterparty and by the posting of collateral by the counterparty to the Fund to cover the Fund’s exposure to the counterparty.
Swaps Generally. Because there is no organized market for swap contracts, the value of open swaps may differ from that which would be realized in the event each Fund terminated its position in the agreement. Risks of entering into these contracts include the potential inability of the counterparty to meet the terms of the contracts. This type of risk is generally limited to the amount of favorable movement in the value of the underlying security, instrument or basket of instruments, if any, at the day of default. Risks also arise from potential losses from adverse market movements and such losses could exceed the unrealized amounts shown on the statement of net assets.
Fair values of derivative instruments as of July 31, 2010 were as follows:
| | | Asset Derivatives | | Liability Derivatives |
| | | Statement of Net | | | | | Statement of Net | | | | |
| | | Assets Location | | Fair value | | Assets Location | | Fair value |
| Foreign exchange contracts | | | | | | | | | | | |
| (Forward Currency Contracts) | | Receivables and other assets net of liabilities | | $ | — | | Liabilities net of receivables and other assets | | $ | (56,748 | ) |
| Interest rate contracts | | | | | | | | | | | |
| (Futures Contracts) | | Receivables and other assets net of liabilities | | | 2,314,343 | | Liabilities net of receivables and other assets | | | — | |
| Credit and inflation contracts | | | | | | | | | | | |
| (Swaps Contracts) | | Receivables and other assets net of liabilities | | | — | | Liabilities net of receivables and other assets | | | (109,446 | ) |
| Total | | | | $ | 2,314,343 | | | | $ | (166,194 | ) |
39
Notes to financial statements
Delaware Inflation Protected Bond Fund
8. Derivatives (continued)
The effect of derivative instruments on the statement of operations for the year ended July 31, 2010 was as follows:
| | | | | | | | | Change in Unrealized |
| | | | | Realized Gain | | Appreciation |
| | | | | or Loss on | | or Depreciation |
| | | Location of Gain or Loss on | | Derivatives | | on Derivatives |
| | | Derivatives Recognized in | | Recognized in | | Recognized in |
| | | Income | | Income | | Income |
| Foreign exchange contracts | | | | | | | | | | | |
| (Forward Currency Contracts) | | Net realized loss on foreign currencies and net change in unrealized appreciation/depreciation of investments and foreign currencies contracts | | $ | (1,513,374 | ) | | | $ | (56,748 | ) |
| Interest rate contracts | | | | | | | | | | | |
| (Futures Contracts) | | Net realized gain on futures contracts and net change in unrealized appreciation/depreciation of investments and futures contracts | | | 1,559,283 | | | | | 1,863,122 | |
| Credit and inflation contracts | | | | | | | | | | | |
| (Swaps Contracts) | | Net realized loss on swap contracts and net change in unrealized appreciation/depreciation of investments and swap contracts | | | (41,289 | ) | | | | (179,557 | ) |
| Total | | | | $ | 1,111,730 | | | | $ | 1,626,817 | |
9. Securities Lending
The Fund, along with other funds in the Delaware Investments® Family of Funds, may lend its securities pursuant to a security lending agreement (Lending Agreement) with BNY Mellon. With respect to each loan, if on any business day the aggregate market value of securities collateral plus cash collateral held is less than the aggregate market value of the securities which are the subject of such loan, the borrower will be notified to provide additional collateral by the end of the following business day which, together with the collateral already held, will be not less than the applicable collateral requirements for such security loan. If the aggregate market value of securities collateral and cash collateral held with respect to a security loan exceeds the applicable collateral
40
requirement, upon the request of the borrower BNY Mellon must return enough collateral to the borrower by the end of the following business day to reduce the value of the remaining collateral to the applicable collateral requirement for such security loan. As a result of the foregoing, the value of the collateral held with respect to a loaned security may be temporarily more or less than the value of the security on loan.
Cash collateral received is generally invested in the BNY Mellon Securities Lending Overnight Fund (the “Collective Trust”) established by BNY Mellon for the purpose of investment on behalf of clients participating in its securities lending programs. The Collective Trust may invest in U.S. government securities and high quality corporate debt, asset-backed and other money market securities and in repurchase agreements collateralized by such securities, provided that the Collective Trust will only hold such assets with a maturity of one business day or less. The Collective Trust seeks to maintain a net asset value per unit of $1.00, but there can be no assurance that it will always be able to do so. The Fund may incur investment losses as a result of investing securities lending collateral in the Collective Trust. This could occur if an investment in the Collective Trust defaulted or if it were necessary to liquidate assets in t he Collective Trust to meet returns on outstanding security loans at a time when the Collective Trust’s net asset value per unit was less than $1.00. Under those circumstances, the Fund may not receive an amount from the Collective Trust that is equal in amount to the collateral the Fund would be required to return to the borrower of the securities and the Fund would be required to make up for this shortfall. The Fund can also accept U.S. government securities and letters of credit (non-cash collateral) in connection with securities loans. In the event of default or bankruptcy by the lending agent, realization and/or retention of the collateral may be subject to legal proceedings. In the event the borrower fails to return loaned securities and the collateral received is insufficient to cover the value of the loaned securities and provided such collateral shortfall is not the result of investment losses, the lending agent has agreed to pay the amount of the shortfall to the Fund, or at the discretion of the lending agent, replace the loaned securities. The Fund continues to record dividends or interest, as applicable, on the securities loaned and is subject to change in value of the securities loaned that may occur during the term of the loan. The Fund has the right under the Lending Agreement to recover the securities from the borrower on demand. With respect to security loans collateralized by non-cash collateral, the Fund receives loan premiums paid by the borrower. With respect to security loans collateralized by cash collateral, the earnings from the collateral investments are shared among the Fund, the security lending agent and the borrower. The Fund records security lending income net of allocations to the security lending agent and the borrower. The Fund had no securities out on loan as of July 31, 2010.
10. Credit and Market Risk
The Fund primarily invests in inflation protected debt securities whose principal and/or interest payments are adjusted for inflation, unlike traditional debt securities that make fixed principal and interest payments. Under normal circumstances, the Fund will invest at least 80% of its net assets in inflation protected debt securities issued by the U.S. government, its agencies or instrumentalities, foreign governments and corporations, which may include synthetic
41
Notes to financial statements
Delaware Inflation Protected Bond Fund
10. Credit and Market Risk (continued)
investments such as options, forwards, futures contracts, or swap agreements that, when combined with non-inflation indexed bonds, have economic characteristics similar to inflation-indexed bonds.
Some countries in which the Fund may invest require governmental approval for the repatriation of investment income, capital or the proceeds of sales of securities by foreign investors. In addition, if there is deterioration in a country’s balance of payments or for other reasons, a country may impose temporary restrictions on foreign capital remittances abroad. The securities exchanges of certain foreign markets are substantially smaller, less liquid and more volatile than the major securities markets in the United States. Consequently, acquisition and disposition of securities by the Fund may be inhibited.
The Fund may invest up to 10% of its net assets in high yield fixed income securities, which carry ratings of BB or lower by Standard and Poor’s Rating Group and/or Ba or lower by Moody’s Investors Service, Inc. Investments in these higher yielding securities are generally accompanied by a greater degree of credit risk than higher rated securities. Additionally, lower rated securities may be more susceptible to adverse economic and competitive industry conditions than investment grade securities.
The Fund invests in fixed income securities whose value is derived from an underlying pool of mortgages or consumer loans. The value of these securities is sensitive to changes in economic conditions, including delinquencies and/or defaults, and may be adversely affected by shifts in the market’s perception of the issuers and changes in interest rates. Investors receive principal and interest payments as the underlying mortgages and consumer loans are paid back. Some of these securities are collateralized mortgage obligations (CMOs). CMOs are debt securities issued by U.S. government agencies or by financial institutions and other mortgage lenders, which are collateralized by a pool of mortgages held under an indenture. Prepayment of mortgages may shorten the stated maturity of the obligation and can result in a loss of premium, if any has been paid. Certain of these securities may be stripped (securities which provide only the princ ipal or interest feature of the underlying security). The yield to maturity on an interest-only CMO is extremely sensitive not only to changes in prevailing interest rates, but also to the rate of principal payments (including prepayments) on the related underlying mortgage assets. A rapid rate of principal payments may have a material adverse effect on the Fund’s yield to maturity. If the underlying mortgage assets experience greater than anticipated prepayments of principal, the Fund may fail to fully recoup its initial investment in these securities even if the securities are rated in the highest rating categories.
The Fund may invest up to 15% of its net assets in illiquid securities, which may include securities with contractual restrictions on resale, securities exempt from registration under Rule 144A of the Securities Act of 1933, as amended, and other securities which may not be readily marketable. The relative illiquidity of these securities may impair the Fund from disposing of them in a timely manner and at a fair price when it is necessary or desirable to do so. While maintaining oversight, the Fund’s Board has delegated to DMC the day-to-day functions of determining whether
42
individual securities are liquid for purposes of the Fund’s limitation on investments in illiquid assets. Securities eligible for resale pursuant to Rule 144A, which are determined to be liquid, are not subject to the Fund’s 15% limit on investments in illiquid securities. Rule 144A and illiquid securities have been identified on the statement of net assets.
11. Contractual Obligations
The Fund enters into contracts in the normal course of business that contain a variety of indemnifications. The Fund’s maximum exposure under these arrangements is unknown. However, the Fund has not had prior claims or losses pursuant to these contracts. Management has reviewed the Fund’s existing contracts and expects the risk of loss to be remote.
12. Subsequent Events
Management has determined no material events or transactions occurred subsequent to July 31, 2010 that would require recognition or disclosure in the Fund’s financial statements.
13. Tax Information (Unaudited)
The information set forth below is for the Fund’s fiscal year as required by federal income tax laws. Shareholders, however, must report distributions on a calendar year basis for income tax purposes, which may include distributions for portions of two fiscal years of a fund. Accordingly, the information needed by shareholders for income tax purposes will be sent to them in January of each year. Please consult your tax advisor for proper treatment of this information.
For the fiscal year ended July 31, 2010, the Fund designates distributions paid during the year as follows:
| (A) Ordinary Income Distributions (Tax Basis) | 100% |
(A) is based on a percentage of the Fund’s total distributions.
43
Report of independent
registered public accounting firm
To the Board of Trustees of Delaware Group® Government Fund and the
Shareholders of Delaware Inflation Protected Bond Fund:
In our opinion, the accompanying statement of net assets and the related statements of operations and of changes in net assets and the financial highlights present fairly, in all material respects, the financial position of Delaware Inflation Protected Bond Fund (one of the series constituting Delaware Group Government Fund, hereafter referred to as the “Fund”) at July 31, 2010, and the results of its operations, the changes in its net assets and the financial highlights for the year then ended, in conformity with accounting principles generally accepted in the United States of America. These financial statements and financial highlights (hereafter referred to as “financial statements”) are the responsibility of the Fund’s management; our responsibility is to express an opinion on these financial statements based on our audit. We conducted our audit of these financial statements in accordance with the standard s of the Public Company Accounting Oversight Board (United States). Those standards require that we plan and perform the audit to obtain reasonable assurance about whether the financial statements are free of material misstatement. An audit includes examining, on a test basis, evidence supporting the amounts and disclosures in the financial statements, assessing the accounting principles used and significant estimates made by management, and evaluating the overall financial statement presentation. We believe that our audit, which included confirmation of securities at July 31, 2010 by correspondence with the custodian and brokers, provides a reasonable basis for our opinion. The statement of changes in net assets for the year ended July 31, 2009 and the financial highlights for each of the four years in the period ended July 31, 2009 were audited by other independent accountants whose report dated September 21, 2009 expressed an unqualified opinion on those statements.
PricewaterhouseCoopers LLP
Philadelphia, Pennsylvania
September 22, 2010
44
Other Fund information
(Unaudited)
Delaware Inflation Protected Bond Fund
Proxy Results
At Joint Special Meetings of Shareholders of Delaware Group® Government Fund (the “Trust”), on behalf of Delaware Inflation Protected Bond Fund (the “Fund”), the shareholders of the Fund voted to (i) elect a Board of Trustees for the Trust at a meeting held on November 12, 2009 and reconvened to March 16, 2010; and to (ii) approve a new investment advisory agreement for the Fund at a meeting held on November 12, 2009 and reconvened to December 4, 2010. At the meeting, the following people were elected to serve as Independent Trustees: Thomas L. Bennett, John A. Fry, Anthony D. Knerr, Lucinda S. Landreth, Ann R. Leven, Thomas F. Madison, Janet L. Yeomans, and J. Richard Zecher. In addition, Patrick P. Coyne was elected to serve as an Interested Trustee.
The following proposals were submitted for a vote of the shareholders:
1. To elect a Board of Trustees for the Trust.
| | | | | % of | | % of | | | | % of | | % of |
| | | | | Outstanding | | Shares | | | | Outstanding | | Shares |
| | | Shares Voted For | | Shares | | Voted | | Shares Withheld | | Shares | | Voted |
| Thomas L. Bennett | | 26,769,523.974 | | 77.228 | | 97.946 | | 561,363.749 | | 1.619 | | 2.054 |
| Patrick P. Coyne | | 26,767,135.736 | | 77.221 | | 97.937 | | 563,751.987 | | 1.626 | | 2.063 |
| John A. Fry | | 26,767,954.014 | | 77.223 | | 97.940 | | 562,933.709 | | 1.624 | | 2.060 |
| Anthony D. Knerr | | 26,656,002.943 | | 76.900 | | 97.531 | | 674,884.780 | | 1.947 | | 2.469 |
| Lucinda S. Landreth | | 26,758,749.280 | | 77.197 | | 97.907 | | 572,138.443 | | 1.650 | | 2.093 |
| Ann R. Leven | | 26,756,297.645 | | 77.190 | | 97.898 | | 574,590.078 | | 1.657 | | 2.102 |
| Thomas F. Madison | | 26,647,346.956 | | 76.875 | | 97.499 | | 683,540.767 | | 1.972 | | 2.501 |
| Janet L. Yeomans | | 26,758,703.037 | | 77.197 | | 97.906 | | 572,184.686 | | 1.650 | | 2.094 |
| J. Richard Zecher | | 26,765,469.038 | | 77.216 | | 97.931 | | 565,418.685 | | 1.631 | | 2.069 |
| 2. | To approve a new investment advisory agreement between the Trust, on behalf of the Fund, and Delaware Management Company. |
Delaware Inflation Protected Bond Fund
| Shares Voted For | 14,426,773.418 |
| Percentage of Outstanding Shares | 59.499% |
| Percentage of Shares Voted | 68.996% |
| Shares Voted Against | 369,845.430 |
| Percentage of Outstanding Shares | 1.526% |
| Percentage of Shares Voted | 1.769% |
| Shares Abstained | 392,232.014 |
| Percentage of Outstanding Shares | 1.617% |
| Percentage of Shares Voted | 1.876% |
| Broker Non-Votes | 5,720,794.334 |
45
Other Fund information
(Unaudited)
Delaware Inflation Protected Bond Fund
Change in Independent Registered Public Accounting Firm
Due to independence matters under the Securities and Exchange Commission’s auditor independence rules relating to the January 4, 2010 acquisition of Delaware Investments (including DMC, DDLP and DSC) by Macquarie Group, Ernst & Young LLP (E&Y) has resigned as the independent registered public accounting firm for Delaware Group® Government Fund (the Trust) effective May 20, 2010. At a meeting held on May 20, 2010, the Board of Trustees of the Trust, upon recommendation of the Audit Committee, selected PricewaterhouseCoopers LLP (PwC) to serve as the independent registered public accounting firm for the Trust for the fiscal year ending July 31, 2010. During the fiscal years ended July 31, 2009 and 2008, E&Y’s audit reports on the financial statements of the Fund did not contain any adverse opinion or disclaimer of opinion, nor were they qualified or mo dified as to uncertainty, audit scope, or accounting principles. In addition, there were no disagreements between the Trust and E&Y on accounting principles, financial statements disclosures or audit scope, which, if not resolved to the satisfaction of E&Y, would have caused them to make reference to the disagreement in their reports. Neither the Trust nor anyone on its behalf has consulted with PwC at any time prior to their selection with respect to the application of accounting principles to a specified transaction, either completed or proposed or the type of audit opinion that might be rendered on the Fund’s financial statements.
46
Board of trustees/directors and officers addendum
Delaware Investments® Family of Funds
A mutual fund is governed by a Board of Trustees/Directors (“Trustees”), which has oversight responsibility for the management of a fund’s business affairs. Trustees establish procedures and oversee and review the performance of the investment manager, the distributor, and others who perform services for the fund. The independent fund trustees, in particular, are advocates
| Name, Address, | | Position(s) | | Length of |
| and Birth Date | | Held with Fund(s) | | Time Served |
| Interested Trustees | | | | |
| | | | | |
| Patrick P. Coyne1 | | Chairman, President, | | Chairman and Trustee |
| 2005 Market Street | | Chief Executive Officer, | | since August 16, 2006 |
| Philadelphia, PA 19103 | | and Trustee | | |
| April 1963 | | | | President and |
| | | | | Chief Executive Officer |
| | | | | since August 1, 2006 |
| | | | | |
| | | | | |
| | | | | |
| | | | | |
| | | | | |
| | | | | |
| | | | | |
| | | | | |
| | | | | |
| | | | | |
| | | | | |
| | | | | |
| | | | | |
| | | | | |
| | | | | |
| | | | | |
| | | | | |
| | | | | |
1 Patrick P. Coyne is considered to be an “Interested Trustee” because he is an executive officer of the Fund’s(s’) investment advisor.
48
for shareholder interests. Each trustee has served in that capacity since he or she was elected to or appointed to the Board of Trustees, and will continue to serve until his or her retirement or the election of a new trustee in his or her place. The following is a list of the Trustees and Officers with certain background and related information.
| | | Number of Portfolios in | | |
| Principal Occupation(s) | | Fund Complex Overseen | | Other Directorships |
| During Past 5 Years | | by Trustee or Officer | | Held by Trustee or Officer |
| |
| |
| Patrick P. Coyne has served in | | 81 | | Director |
| various executive capacities | | | | Kaydon Corp. |
| at different times at | | | | |
| Delaware Investments.2 | | | | Board of Governors Member |
| | | | | Investment Company |
| | | | | Institute (ICI) |
| | | | | |
| | | | | Finance Committee Member |
| | | | | St. John Vianney Roman |
| | | | | Catholic Church |
| |
| | | | | Board of Trustees |
| | | | | Agnes Irwin School |
| |
| | | | | Member of Investment |
| | | | | Committee |
| | | | | Cradle of Liberty Council, |
| | | | | BSA |
| | | | | (2007 – 2010) |
| | | | | |
| |
| | | | | |
| | | | | |
| |
2 Delaware Investments is the marketing name for Delaware Management Holdings, Inc. and its subsidiaries, including the Fund’s(s’) investment advisor, principal underwriter, and its transfer agent.
49
Board of trustees/directors and officers addendum
Delaware Investments® Family of Funds
| Name, Address, | | Position(s) | | Length of |
| and Birth Date | | Held with Fund(s) | | Time Served |
| Independent Trustees | | | | |
| |
| Thomas L. Bennett | | Trustee | | Since March 2005 |
| 2005 Market Street | | | | |
| Philadelphia, PA 19103 | | | | |
| October 1947 | | | | |
| |
| |
| |
| |
| |
| |
| |
| |
| |
| |
| John A. Fry | | Trustee | | Since January 2001 |
| 2005 Market Street | | | | |
| Philadelphia, PA 19103 | | | | |
| May 1960 | | | | |
| |
| |
| |
| |
| |
| |
| |
| |
| Anthony D. Knerr | | Trustee | | Since April 1990 |
| 2005 Market Street | | | | |
| Philadelphia, PA 19103 | | | | |
| December 1938 | | | | |
| |
| |
| Lucinda S. Landreth | | Trustee | | Since March 2005 |
| 2005 Market Street | | | | |
| Philadelphia, PA 19103 | | | | |
| June 1947 | | | | |
| |
50
| | | Number of Portfolios in | | |
| Principal Occupation(s) | | Fund Complex Overseen | | Other Directorships |
| During Past 5 Years | | by Trustee or Officer | | Held by Trustee or Officer |
| | | | | |
| |
| Private Investor | | 81 | | Director |
| (March 2004–Present) | | | | Bryn Mawr Bank Corp. (BMTC) |
| | | | | |
| Investment Manager | | | | Chairman of Investment |
| Morgan Stanley & Co. | | | | Committee |
| (January 1984–March 2004) | | | | Pennsylvania Academy of |
| | | | | Fine Arts |
| | | | | |
| | | | | Investment Committee and |
| | | | | Governance Committee |
| | | | | Member |
| | | | | Pennsylvania Horticultural |
| | | | | Society |
| |
| President | | 81 | | Director |
| Drexel University | | | | Community Health Systems |
| (August 2010–Present) | | | | |
| | | | | Director — Ecore |
| President | | | | International |
| Franklin & Marshall College | | | | (2009-2010) |
| (July 2002–July 2010) | | | | |
| | | | | Director — Allied |
| Executive Vice President | | | | Barton Securities Holdings |
| University of Pennsylvania | | | | (2005 to 2008) |
| (April 1995–June 2002) | | | | |
| |
| Founder and | | 81 | | None |
| Managing Director | | | | |
| Anthony Knerr & Associates | | | | |
| (Strategic Consulting) | | | | |
| (1990–Present) | | | | |
| |
| Chief Investment Officer | | 81 | | None |
| Assurant, Inc. (Insurance) | | | | |
| (2002–2004) | | | | |
| | | | | |
| |
51
Board of trustees/directors and officers addendum
Delaware Investments® Family of Funds
| Name, Address, | | Position(s) | | Length of |
| and Birth Date | | Held with Fund(s) | | Time Served |
| Independent Trustees (continued) | | | | |
| |
| Ann R. Leven | | Trustee | | Since October 1989 |
| 2005 Market Street | | | | |
| Philadelphia, PA 19103 | | | | |
| November 1940 | | | | |
| |
| |
| |
| |
| |
| |
| Thomas F. Madison | | Trustee | | Since May 19973 |
| 2005 Market Street | | | | |
| Philadelphia, PA 19103 | | | | |
| February 1936 | | | | |
| |
| |
| |
| |
| |
| |
| |
| |
| | | | | |
| | | | | |
| | | | | |
| | | | | |
| |
| |
| | | | | |
| | | | | |
| | | | | |
| | | | | |
| | | | | |
| | | | | |
| | | | | |
| | | | | |
| |
3 In 1997, several funds managed by Voyageur Fund Managers, Inc. (the “Voyageur Funds”) were incorporated into the Delaware Investments Family of Funds. Mr. Madison served as a director of the Voyageur Funds from 1993 until 1997.
52
| | | Number of Portfolios in | | |
| Principal Occupation(s) | | Fund Complex Overseen | | Other Directorships |
| During Past 5 Years | | by Trustee or Officer | | Held by Trustee or Officer |
| | | | | |
| |
| Consultant | | 81 | | Director and Audit |
| ARL Associates | | | | Committee Chair – |
| (Financial Planning) | | | | Systemax Inc. |
| (1983–Present) | | | | (2001 – 2009) |
| | | | | |
| | | | | Director and Audit |
| | | | | Committee Chairperson – |
| | | | | Andy Warhol Foundation |
| | | | | (1999 – 2007) |
| |
| President and | | 81 | | Director and Chair of |
| Chief Executive Officer | | | | Compensation Committee, |
| MLM Partners, Inc. | | | | Governance Committee |
| (Small Business Investing | | | | Member |
| and Consulting) | | | | CenterPoint Energy |
| (January 1993–Present) | | | | |
| | | | | Lead Director and Chair of |
| | | | | Audit and Governance |
| | | | | Committees, Member of |
| | | | | Compensation Committee |
| | | | | Digital River, Inc. |
| | | | | |
| | | | | Director and Chair of |
| | | | | Governance Committee, |
| | | | | Audit Committee |
| | | | | Member |
| | | | | Rimage Corporation |
| | | | | |
| | | | | Director and Chair of |
| | | | | Compensation Committee |
| | | | | Spanlink Communications |
| | | | | |
| | | | | Lead Director and Member of |
| | | | | Compensation and |
| | | | | Governance Committees |
| | | | | Valmont Industries, Inc. |
| | | | | (1987 – 2010) |
| |
53
Board of trustees/directors and officers addendum
Delaware Investments® Family of Funds
| Name, Address, | | Position(s) | | Length of |
| and Birth Date | | Held with Fund(s) | | Time Served |
| Independent Trustees (continued) | | | | |
| |
| Thomas F. Madison | | | | |
| 2005 Market Street | | | | |
| Philadelphia, PA 19103 | | | | |
| February 1936 | | | | |
| |
| Janet L. Yeomans | | Trustee | | Since April 1999 |
| 2005 Market Street | | | | |
| Philadelphia, PA 19103 | | | | |
| July 1948 | | | | |
| |
| |
| |
| |
| J. Richard Zecher | | Trustee | | Since March 2005 |
| 2005 Market Street | | | | |
| Philadelphia, PA 19103 | | | | |
| July 1940 | | | | |
| |
| |
| | | | | |
| | | | | |
| | | | | |
| | | | | |
| | | | | |
| | | | | |
| | | | | |
| | | | | |
| | | | | |
| | | | | |
| | | | | |
| | | | | |
| | | | | |
| | | | | |
| |
54
| | | Number of Portfolios in | | |
| Principal Occupation(s) | | Fund Complex Overseen | | Other Directorships |
| During Past 5 Years | | by Trustee or Officer | | Held by Trustee or Officer |
| | | | | |
| |
| | | | | Director |
| | | | | Banner Health |
| | | | | (1996 to 2007) |
| | | | | |
| |
| Vice President and Treasurer | | 81 | | Director |
| (January 2006–Present) | | | | Okabena Company |
| Vice President — Mergers & Acquisitions | | | | |
| (January 2003–January 2006), and | | | | |
| Vice President | | | | |
| (July 1995–January 2003) | | | | |
| 3M Corporation | | | | |
| |
| Founder | | 81 | | Director and Audit |
| Investor Analytics | | | | Committee Member |
| (Risk Management) | | | | Investor Analytics |
| (May 1999–Present) | | | | |
| | | | | |
| Founder | | | | Director |
| Sutton Asset Management | | | | Oxigene, Inc. |
| (Hedge Fund) | | | | (2003 to 2008) |
| (September 1996–Present) | | | | |
| | | | | |
| | | | | |
| | | | | |
| | | | | |
| | | | | |
| | | | | |
| | | | | |
| | | | | |
| | | | | |
| | | | | |
| | | | | |
| |
55
Board of trustees/directors and officers addendum
Delaware Investments® Family of Funds
| Name, Address, | | Position(s) | | Length of |
| and Birth Date | | Held with Fund(s) | | Time Served |
| Officers | | | | |
| | | | | |
| David F. Connor | | Vice President, | | Vice President since |
| 2005 Market Street | | Deputy General | | September 2000 |
| Philadelphia, PA 19103 | | Counsel, and Secretary | | and Secretary since |
| December 1963 | | | | October 2005 |
| |
| |
| Daniel V. Geatens | | Vice President | | Treasurer |
| 2005 Market Street | | and Treasurer | | since October 25, 2007 |
| Philadelphia, PA 19103 | | | | |
| October 1972 | | | | |
| |
| David P. O’Connor | | Senior Vice President, | | Senior Vice President, |
| 2005 Market Street | | General Counsel, | | General Counsel, and |
| Philadelphia, PA 19103 | | and Chief Legal Officer | | Chief Legal Officer |
| February 1966 | | | | since October 2005 |
| |
| Richard Salus | | Senior Vice President | | Chief Financial Officer |
| 2005 Market Street | | and Chief Financial Officer | | since November 2006 |
| Philadelphia, PA 19103 | | | | |
| October 1963 | | | | |
| |
The Statement of Additional Information for the Fund(s) includes additional information about the Trustees and Officers and is available, without charge, upon request by calling 800 523-1918.
56
| | | Number of Portfolios in | | |
| Principal Occupation(s) | | Fund Complex Overseen | | Other Directorships |
| During Past 5 Years | | by Trustee or Officer | | Held by Trustee or Officer |
| |
| |
| David F. Connor has served as | | 81 | | None4 |
| Vice President and Deputy | | | | |
| General Counsel of | | | | |
| Delaware Investments | | | | |
| since 2000. | | | | |
| |
| Daniel V. Geatens has served | | 81 | | None4 |
| in various capacities at | | | | |
| different times at | | | | |
| Delaware Investments. | | | | |
| |
| David P. O’Connor has served in | | 81 | | None4 |
| various executive and legal | | | | |
| capacities at different times | | | | |
| at Delaware Investments. | | | | |
| |
| Richard Salus has served in | | 81 | | None4 |
| various executive capacities | | | | |
| at different times at | | | | |
| Delaware Investments. | | | | |
| |
4 David F. Connor, Daniel V. Geatens, David P. O’Connor, and Richard Salus serve in similar capacities for the six portfolios of the Optimum Fund Trust, which have the same investment advisor, principal underwriter, and transfer agent as the registrant.
57
About the organization
| Board of trustees | | | |
| | | | |
Patrick P. Coyne
Chairman, President, and
Chief Executive Officer
Delaware Investments®
Family of Funds
Philadelphia, PA Thomas L. Bennett
Private Investor
Rosemont, PA John A. Fry
President
Drexel University
Philadelphia, PA | Anthony D. Knerr
Founder and Managing
Director
Anthony Knerr &
Associates
New York, NY Lucinda S. Landreth
Former Chief Investment
Officer
Assurant, Inc.
Philadelphia, PA | Ann R. Leven
Consultant
ARL Associates
New York, NY Thomas F. Madison
President and
Chief Executive Officer
MLM Partners, Inc.
Minneapolis, MN | Janet L. Yeomans
Vice President and
Treasurer
3M Corporation
St. Paul, MN J. Richard Zecher
Founder
Investor Analytics
Scottsdale, AZ |
| | | | |
| Affiliated officers | | | |
| | | | |
David F. Connor
Vice President, Deputy
General Counsel, and
Secretary
Delaware Investments
Family of Funds
Philadelphia, PA | Daniel V. Geatens
Vice President and
Treasurer
Delaware Investments
Family of Funds
Philadelphia, PA | David P. O’Connor
Senior Vice President,
General Counsel,
and Chief Legal Officer
Delaware Investments
Family of Funds
Philadelphia, PA | Richard Salus
Senior Vice President and
Chief Financial Officer
Delaware Investments
Family of Funds
Philadelphia, PA |
This annual report is for the information of Delaware Inflation Protected Bond Fund shareholders, but it may be used with prospective investors when preceded or accompanied by a current prospectus for Delaware Inflation Protected Bond Fund and the Delaware Investments Fund fact sheet for the most recently completed calendar quarter. These documents are available at www.delawareinvestments.com. The prospectus sets forth details about charges, expenses, investment objectives, and operating policies of the investment company. You should read the prospectus carefully before you invest. The figures in this report represent past results that are not a guarantee of future results. The return and principal value of an investment in the investment company will fluctuate so that shares, when redeemed, may be worth more or less than their original cost. |
Delaware Investments is the marketing name of Delaware Management Holdings, Inc. and its subsidiaries. The Fund files its complete schedule of portfolio holdings with the Securities and Exchange Commission (SEC) for the first and third quarters of each fiscal year on Form N-Q. The Fund’s Forms N-Q, as well as a description of the policies and procedures that the Fund uses to determine how to vote proxies (if any) relating to portfolio securities are available without charge (i) upon request, by calling 800 523-1918; and (ii) on the SEC’s Web site at www.sec.gov. In addition, a description of the policies and procedures that the Fund uses to determine how to vote proxies (if any) relating to portfolio securities and the Fund’s Schedule of Investments are available without charge on the Fund’s Web site at www.delawareinvestments.com. The Fund’s Forms N-Q may be reviewed and copied at the SEC’s Public Reference Room in Washington, D.C.; information on the o peration of the Public Reference Room may be obtained by calling 800 SEC-0330. Information (if any) regarding how the Fund voted proxies relating to portfolio securities during the most recently disclosed 12-month period ended June 30 is available without charge (i) through the Fund’s Web site at www.delawareinvestments.com; and (ii) on the SEC’s Web site at www.sec.gov. |
58
Item 2. Code of Ethics
The registrant has adopted a code of ethics that applies to the registrant’s principal executive officer, principal financial officer, principal accounting officer or controller, or persons performing similar functions, regardless of whether these individuals are employed by the registrant or a third party. A copy of the registrant’s Code of Business Ethics has been posted on the Delaware Investments Internet Web site at www.delawareinvestments.com. Any amendments to the Code of Business Ethics, and information on any waiver from its provisions granted by the registrant, will also be posted on this Web site within five business days of such amendment or waiver and will remain on the Web site for at least 12 months.
Item 3. Audit Committee Financial Expert
The registrant’s Board of Trustees/Directors has determined that each member of the registrant’s Audit Committee is an audit committee financial expert, as defined below. For purposes of this item, an “audit committee financial expert” is a person who has the following attributes:
a. An understanding of generally accepted accounting principles and financial statements;
b. The ability to assess the general application of such principles in connection with the accounting for estimates, accruals, and reserves;
c. Experience preparing, auditing, analyzing, or evaluating financial statements that present a breadth and level of complexity of accounting issues that are generally comparable to the breadth and complexity of issues that can reasonably be expected to be raised by the registrant’s financial statements, or experience actively supervising one or more persons engaged in such activities;
d. An understanding of internal controls and procedures for financial reporting; and
e. An understanding of audit committee functions.
An “audit committee financial expert” shall have acquired such attributes through:
a. Education and experience as a principal financial officer, principal accounting officer, controller, public accountant, or auditor or experience in one or more positions that involve the performance of similar functions;
b. Experience actively supervising a principal financial officer, principal accounting officer, controller, public accountant, auditor, or person performing similar functions;
c. Experience overseeing or assessing the performance of companies or public accountants with respect to the preparation, auditing, or evaluation of financial statements; or
d. Other relevant experience.
The registrant’s Board of Trustees/Directors has also determined that each member of the registrant’s Audit Committee is independent. In order to be “independent” for purposes of this item, the Audit Committee member may not: (i) other than in his or her capacity as a member of the Board of Trustees/Directors or any committee thereof, accept directly or indirectly any consulting, advisory or other compensatory fee from the issuer; or (ii) be an “interested person” of the registrant as defined in Section 2(a)(19) of the Investment Company Act of 1940.
The names of the audit committee financial experts on the registrant’s Audit Committee are set forth below:
Thomas L. Bennett 1
John A. Fry
Thomas F. Madison
Janet L. Yeomans
J. Richard Zecher
Item 4. Principal Accountant Fees and Services
(a) Audit fees.
The aggregate fees billed for services provided to the registrant by its independent auditors for the audit of the registrant’s annual financial statements and for services normally provided by the independent auditors in connection with statutory and regulatory filings or engagements were $33,100 for the fiscal year ended July 31, 2010.
____________________
1 The instructions to Form N-CSR require disclosure on the relevant experience of persons who qualify as audit committee financial experts based on “other relevant experience.” The Board of Trustees/Directors has determined that Mr. Bennett qualifies as an audit committee financial expert by virtue of his education, Chartered Financial Analyst designation, and his experience as a credit analyst, portfolio manager and the manager of other credit analysts and portfolio managers.
The aggregate fees billed for services provided to the registrant by its independent auditors for the audit of the registrant’s annual financial statements and for services normally provided by the independent auditors in connection with statutory and regulatory filings or engagements were $32,800 for the fiscal year ended July 31, 2009.
(b) Audit-related fees.
The aggregate fees billed by the registrant’s independent auditors for services relating to the performance of the audit of the registrant’s financial statements and not reported under paragraph (a) of this Item were $0 for the fiscal year ended July 31, 2010.
The aggregate fees billed by the registrant’s independent auditors for services relating to the performance of the audit of the financial statements of the registrant’s investment adviser and other service providers under common control with the adviser and that relate directly to the operations or financial reporting of the registrant were $84,000 for the registrant’s fiscal year ended July 31, 2010. The percentage of these fees relating to services approved by the registrant’s Audit Committee pursuant to the de minimis exception from the pre-approval requirement in Rule 2-01(c)(7)(i)(C) of Regulation S-X was 0%. These audit-related services were as follows: audit procedures performed on Delaware Investments for its consideration into Macquarie’s financial statements as of March 31, 2010.
The aggregate fees billed by the registrant’s independent auditors for services relating to the performance of the audit of the registrant’s financial statements and not reported under paragraph (a) of this Item were $0 for the fiscal year ended July 31, 2009.
The aggregate fees billed by the registrant’s independent auditors for services relating to the performance of the audit of the financial statements of the registrant’s investment adviser and other service providers under common control with the adviser and that relate directly to the operations or financial reporting of the registrant were $19,074 for the registrant’s fiscal year ended July 31, 2009. The percentage of these fees relating to services approved by the registrant’s Audit Committee pursuant to the de minimis exception from the pre-approval requirement in Rule 2-01(c)(7)(i)(C) of Regulation S-X was 0%. These audit-related services were as follows: issuance of report concerning transfer agent's system of internal accounting control pursuant to Rule 17Ad-13 of the Securities Exchange Act.
(c) Tax fees.
The aggregate fees billed by the registrant’s independent auditors for tax-related services provided to the registrant were $6,000 for the fiscal year ended July 31, 2010. The percentage of these fees relating to services approved by the registrant’s Audit Committee pursuant to the de minimis exception from the pre-approval requirement in Rule 2-01(c)(7)(i)(C) of Regulation S-X was 0%.
The aggregate fees billed by the registrant’s independent auditors for tax-related services provided to the registrant’s investment adviser and other service providers under common control with the adviser and that relate directly to the operations or financial reporting of the registrant were $0 for the registrant’s fiscal year ended July 31, 2010.
The aggregate fees billed by the registrant’s independent auditors for tax-related services provided to the registrant were $9,000 for the fiscal year ended July 31, 2009. The percentage of these fees relating to services approved by the registrant’s Audit Committee pursuant to the de minimis exception from the pre-approval requirement in Rule 2-01(c)(7)(i)(C) of Regulation S-X was 0%. These tax-related services were as follows: review of income tax returns and review of annual excise d istribution calculations.
The aggregate fees billed by the registrant’s independent auditors for tax-related services provided to the registrant’s adviser and other service providers under common control with the adviser and that relate directly to the operations or financial reporting of the registrant were $0 for the registrant’s fiscal year ended July 31, 2009.
(d) All other fees.
The aggregate fees billed for all services provided by the independent auditors to the registrant other than those set forth in paragraphs (a), (b) and (c) of this Item were $0 for the fiscal year ended July 31, 2010.
The aggregate fees billed for all services other than those set forth in paragraphs (b) and (c) of this Item provided by the registrant’s independent auditors to the registrant’s adviser and other service providers under common control with the adviser and that relate directly to the operations or financial reporting of the registrant were $0 for the registrant’s fiscal year ended July 31, 2010.
The aggregate fees billed for all services provided by the independent auditors to the registrant other than those set forth in paragraphs (a), (b) and (c) of this Item were $0 for the fiscal year ended July 31, 2009.
The aggregate fees billed for all services other than those set forth in paragraphs (b) and (c) of this Item provided by the registrant’s independent auditors to the registrant’s adviser and other service providers under common control with the adviser and that relate directly to the operations or financial reporting of the registrant were $0 for the registrant’s fiscal year ended July 31, 2009.
(e) The registrant’s Audit Committee has established pre-approval policies and procedures as permitted by Rule 2-01(c)(7)(i)(B) of Regulation S-X (the “Pre-Approval Policy”) with respect to services provided by the registrant’s independent auditors. Pursuant to the Pre-Approval Policy, the Audit Committee has pre-approved the services set forth in the table below with respect to the registrant up to the specified fee limits. Certain fee limits are based on aggregate fees to the registrant and other registrants within the Delaware Investments Family of Funds.
| Service | Range of Fees |
| Audit Services | |
| Statutory audits or financial audits for new Funds | up to $25,000 per Fund |
| Services associated with SEC registration statements (e.g., Form N-1A, Form N-14, etc.), periodic reports and other documents filed with the SEC or other documents issued in connection with securities offerings (e.g., comfort letters for closed-end Fund offerings, consents), and assistance in responding to SEC comment letters | up to $10,000 per Fund |
| Consultations by Fund management as to the accounting or disclosure treatment of transactions or events and/or the actual or potential impact of final or proposed rules, standards or interpretations by the SEC, FASB, or other regulatory or standard-setting bodies (Note: Under SEC rules, some consultations may be considered “audit-related services” rather than “audit services”) | up to $25,000 in the aggregate |
| Audit-Related Services | |
| Consultations by Fund management as to the accounting or disclosure treatment of transactions or events and /or the actual or potential impact of final or proposed rules, standards or interpretations by the SEC, FASB, or other regulatory or standard-setting bodies (Note: Under SEC rules, some consultations may be considered “audit services” rather than “audit-related services”) | up to $25,000 in the aggregate |
| Tax Services | |
| U.S. federal, state and local and international tax planning and advice (e.g., consulting on statutory, regulatory or administrative developments, evaluation of Funds’ tax compliance function, etc.) | up to $25,000 in the aggregate |
| U.S. federal, state and local tax compliance (e.g., excise distribution reviews, etc.) | up to $5,000 per Fund |
| Review of federal, state, local and international income, franchise and other tax returns | up to $5,000 per Fund |
Under the Pre-Approval Policy, the Audit Committee has also pre-approved the services set forth in the table below with respect to the registrant’s investment adviser and other entities controlling, controlled by or under common control with the investment adviser that provide ongoing services to the registrant (the “Control Affiliates”) up to the specified fee limit. This fee limit is based on aggregate fees to the investment adviser and its Control Affiliates.
| Service | Range of Fees |
| Non-Audit Services | |
| Services associated with periodic reports and other documents filed with the SEC and assistance in responding to SEC comment letters | up to $10,000 in the aggregate |
The Pre-Approval Policy requires the registrant’s independent auditors to report to the Audit Committee at each of its regular meetings regarding all services initiated since the last such report was rendered, including those services authorized by the Pre-Approval Policy.
(f) Not applicable.
(g) The aggregate non-audit fees billed by the registrant’s independent auditors for services rendered to the registrant and to its investment adviser and other service providers under common control with the adviser were $0 and $208,714 for the registrant’s fiscal years ended July 31, 2010 and July 31, 2009, respectively.
(h) In connection with its selection of the independent auditors, the registrant’s Audit Committee has considered the independent auditors’ provision of non-audit services to the registrant’s investment adviser and other service providers under common control with the adviser that were not required to be pre-approved pursuant to Rule 2-01(c)(7)(ii) of Regulation S-X. The Audit Committee has determined that the independent auditors’ provision of these services is compatible with maintaining the auditors’ independence.
Item 5. Audit Committee of Listed Registrants
Not applicable.
Item 6. Investments
(a) Included as part of report to shareholders filed under Item 1 of this Form N-CSR.
(b) Divestment of securities in accordance with Section 13(c) of the Investment Company Act of 1940.
Not applicable.
Item 7. Disclosure of Proxy Voting Policies and Procedures for Closed-End Management Investment Companies
Not applicable.
Item 8. Portfolio Managers of Closed-End Management Investment Companies
Not applicable.
Item 9. Purchases of Equity Securities by Closed-End Management Investment Company and Affiliated Purchasers
Not applicable.
Item 10. Submission of Matters to a Vote of Security Holders Not applicable.
Item 11. Controls and Procedures
The registrant’s principal executive officer and principal financial officer have evaluated the registrant’s disclosure controls and procedures within 90 days of the filing of this report and have concluded that they are effective in providing reasonable assurance that the information required to be disclosed by the registrant in its reports or statements filed under the Securities Exchange Act of 1934 is recorded, processed, summarized and reported within the time periods specified in the rules and forms of the Securities and Exchange Commission.
There were no significant changes in the registrant’s internal control over financial reporting that occurred during the second fiscal quarter of the period covered by the report to stockholders included herein (i.e., the registrant’s fourth fiscal quarter) that have materially affected, or are reasonably likely to materially affect, the registrant’s internal control over financial reporting.
Item 12. Exhibits
| (a) | (1) | Code of Ethics |
| | | |
| | | Not applicable. |
| | | |
| | (2) Certifications of Principal Executive Officer and Principal Financial Officer pursuant to Rule 30a-2 under the Investment Company Act of 1940 are attached hereto as Exhibit 99.CERT. |
| | |
| | (3) Written solicitations to purchase securities pursuant to Rule 23c-1 under the Securities Exchange Act of 1934. |
| | | |
| | | Not applicable. |
| | | |
| (b) | Certifications pursuant to Section 906 of the Sarbanes-Oxley Act of 2002 are furnished herewith as Exhibit 99.906CERT. |
SIGNATURES
Pursuant to the requirements of the Securities Exchange Act of 1934 and the Investment Company Act of 1940, the registrant has duly caused this report to be signed on its behalf, by the undersigned, thereunto duly authorized.
Name of Registrant: DELAWARE GROUP® GOVERNMENT FUND
| /s/ PATRICK P. COYNE |
| By: | Patrick P. Coyne |
| Title: | Chief Executive Officer |
| Date: | October 1, 2010 |
Pursuant to the requirements of the Securities Exchange Act of 1934 and the Investment Company Act of 1940, this report has been signed below by the following persons on behalf of the registrant and in the capacities and on the dates indicated.
| /s/ PATRICK P. COYNE |
| By: | Patrick P. Coyne |
| Title: | Chief Executive Officer |
| Date: | October 1, 2010 |
| |
| |
| /s/ RICHARD SALUS |
| By: | Richard Salus |
| Title: | Chief Financial Officer |
| Date: | October 1, 2010 |