UNITED STATES SECURITIES AND EXCHANGE COMMISSION
Washington, D.C. 20549
FORM N-CSR
CERTIFIED SHAREHOLDER REPORT OF REGISTERED MANAGEMENT
INVESTMENT COMPANIES
| Investment Company Act file number: | 811-04304 |
| | |
| Exact name of registrant as specified in charter: | Delaware Group® Government Fund |
| | |
| Address of principal executive offices: | 2005 Market Street |
| | Philadelphia, PA 19103 |
| | |
| Name and address of agent for service: | David F. Connor, Esq. |
| | 2005 Market Street |
| | Philadelphia, PA 19103 |
| | |
| Registrant’s telephone number, including area code: | (800) 523-1918 |
| | |
| Date of fiscal year end: | July 31 |
| | |
| Date of reporting period: | July 31, 2011 |
Item 1. Reports to Stockholders

Annual report Delaware Core Plus Bond Fund July 31, 2011 Fixed income mutual fund |
Carefully consider the Fund’s investment objectives, risk factors, charges, and expenses before investing. This and other information can be found in the Fund’s prospectus and, if available, its summary prospectus, which may be obtained by visiting www.delawareinvestments.com or calling 800 523-1918. Investors should read the prospectus and, if available, the summary prospectus carefully before investing. |
You can obtain shareholder reports and prospectuses online instead of in the mail.
Visit www.delawareinvestments.com/edelivery. |
Experience Delaware Investments
Delaware Investments is committed to the pursuit of consistently superior asset management and unparalleled client service. We believe in our investment processes, which seek to deliver consistent results, and in convenient services that help add value for our clients.
If you are interested in learning more about creating an investment plan, contact your financial advisor.
You can learn more about Delaware Investments or obtain a prospectus for Delaware Core Plus Bond Fund at www.delawareinvestments.com.
Manage your investments online
24-hour access to your account information
Obtain share prices
Check your account balance and recent transactions
Request statements or literature
Make purchases and redemptions
Delaware Management Holdings, Inc. and its subsidiaries (collectively known by the marketing name of Delaware Investments) are wholly owned subsidiaries of Macquarie Group Limited, a global provider of banking, financial, advisory, investment and funds management services.
Investments in Delaware Core Plus Bond Fund are not and will not be deposits with or liabilities of Macquarie Bank Limited ABN 46 008 583 542 and its holding companies, including their subsidiaries or related companies (Macquarie Group), and are subject to investment risk, including possible delays in repayment and loss of income and capital invested. No Macquarie Group company guarantees or will guarantee the performance of the Fund, the repayment of capital from the Fund, or any particular rate of return.
| Table of contents | |
| Portfolio management review | 1 |
| Performance summary | 4 |
| Disclosure of Fund expenses | 8 |
| Security type/sector allocation | 10 |
| Statement of net assets | 12 |
| Statement of assets and liabilities | 39 |
| Statement of operations | 40 |
| Statements of changes in net assets | 42 |
| Financial highlights | 44 |
| Notes to financial statements | 54 |
| Report of independent registered | |
| public accounting firm | 72 |
| Other Fund information | 73 |
| Board of trustees/directors and | |
| officers addendum | 74 |
| About the organization | 84 |
Unless otherwise noted, views expressed herein are current as of July 31, 2011, and subject to change.
Funds are not FDIC insured and are not guaranteed. It is possible to lose the principal amount invested.
Mutual fund advisory services provided by Delaware Management Company, a series of Delaware Management Business Trust, which is a registered investment advisor. Delaware Investments, a member of Macquarie Group, refers to Delaware Management Holdings, Inc. and its subsidiaries, including the Fund’s distributor, Delaware Distributors, L.P. Macquarie Group refers to Macquarie Group Limited and its subsidiaries and affiliates worldwide.
© 2011 Delaware Management Holdings, Inc.
All third-party trademarks cited are the property of their respective owners.
| Portfolio management review | | |
| Delaware Core Plus Bond Fund | | August 9, 2011 |
| Performance preview (for the year ended July 31, 2011) | | | |
| Delaware Core Plus Bond Fund (Class A shares) | 1-year return | | +6.32% |
| Barclays Capital U.S. Aggregate Index (benchmark) | 1-year return | | +4.44% |
Past performance does not guarantee future results.
For complete, annualized performance for Delaware Core Plus Bond Fund, please see the table on page 4.
The performance of Class A shares excludes the applicable sales charge and reflects the reinvestment of all distributions.
Index performance returns do not reflect any management fees, transaction costs, or expenses. Indices are unmanaged and one cannot invest directly in an index.
The Fund’s fiscal year ended July 31, 2011, was characterized by an increasingly challenging economic environment. Bonds with lower credit ratings and higher yields enjoyed solid results for much of the fiscal year. However, in the final months of the fiscal year, many investors began to favor higher-quality securities as debt-related troubles heated up in Europe and the U.S. economy slowed.
Mounting data indicated a faltering global economic recovery and raised new fears of a double-dip recession in the United States. The nation’s gross domestic product, which measures the combined dollar value of goods and services the country produces, grew by an estimated 1.3% in the second quarter of 2011, on the heels of a mere 0.4% increase in the first three months of 2011. Unemployment was an especially big trouble spot, with the U.S. jobless rate finishing July 2011 at 9.1%, up from 8.8% as recently as March 2011. (Sources: U.S. Commerce Department, U.S. Labor Department.)
At the start of the Fund’s fiscal year, in an effort to stimulate the economy, the Federal Reserve announced a second round of quantitative easing, commonly known as QE2. The plan involved the Fed purchasing enormous quantities of government bonds to lower long-term interest rates. In conjunction with a payroll tax cut and a two-year
Interest rate positioning is not typically a part of our overall portfolio management approach, but in late 2010, we identified a tactical need to make the Fund less sensitive to rising rates, given the increase in rates taking place at that time. Within several months, the potential for a further rate increase seemed reduced, and we once again attempted to make the portfolio somewhat more sensitive to interest rate movements by purchasing U.S. Treasury futures. We maintained this positioning throughout the rest of the Fund’s fiscal year.
1
Portfolio management review
Delaware Core Plus Bond Fund
extension of federal income-tax rates following last year’s November elections, it led to a rally in riskier assets such as equities and corporate bonds.
Generally, investors remained tolerant of risk for several months during the Fund’s fiscal year. By spring 2011, however, risk aversion gradually returned to the market. Many bond investors once again began to favor higher-quality debt, while returns on assets such as commercial mortgage-backed securities (CMBS), nonagency residential mortgage-backed securities (MBS), high yield corporate bonds, and equities began to lag Treasurys, which generally benefited from their perceived increased safety.
Within the Fund
For the fiscal year, Delaware Core Plus Bond Fund Class A shares returned +6.32% at net asset value and +1.50% at maximum offer price (both returns include reinvested distributions). In comparison, the Fund’s benchmark, the Barclays Capital U.S. Aggregate Index, returned +4.44%. For complete annualized performance for Delaware Core Plus Bond Fund, please see the table on page 4.
Corporate and international government debt contributed
Relative to its benchmark, the Fund benefited from many of its higher-quality corporate bond positions, and from maintaining a significant overweighting in the corporate bond category. More specifically, increased exposure to high-quality U.S. banks and insurance companies helped, as did the Fund’s allocation to utility, natural resource, healthcare, and communication company bonds, as well as its stake in energy pipeline securities in the form of master limited partnerships.
Periodic investments in the government securities of Australia, Canada, and Brazil — three countries that benefited from conservative fiscal management, low deficits, and low debt ratios — also contributed to the Fund’s performance. The decline in the value of the dollar relative to these countries’ currencies also boosted returns for the Fund.
Mortgage-backed underperformance
For much of its fiscal year, the Fund’s portfolio was conservatively positioned with respect to its residential MBS and CMBS allocations. For example, the Fund had little exposure to riskier, nonagency-backed MBS. Among CMBS, we focused on securities with high credit ratings and whose issue dates occurred when underwriting standards were stricter (for example, many CMBS issued during 2006 and 2007 have lower credit quality). This positioning hampered performance for much of the Fund’s fiscal year, as many bond investors looked to obtain additional yield from riskier securities. However, during the final three months of the fiscal year, our defensive positioning helped the Fund close some of the gap.
A second source of underperformance was the Fund’s short position in the euro currency, given our concern about the region’s mounting debt challenges combined with slow economic growth. At times throughout the fiscal year, this strategy was unsuccessful due to what we viewed as the euro’s surprising strength relative to the dollar. Of final note, the Fund’s more-limited exposure to high yield corporate bonds provided an opportunity cost for the first nine months of its fiscal year — essentially, owning more of these securities could have potentially helped relative performance during that time. That
2
said, this more defensive positioning generally proved helpful in the last several months of the Fund’s fiscal year, when many investors favored bonds with less credit risk.
Relatively few adjustments to the Fund
Changes to the Fund’s broad strategic allocations were generally modest throughout the fiscal year. Many of the tactical adjustments we made were more defensive in nature as we sought to reduce the portfolio’s risk exposure. Entering the fiscal year, for example, we had limited the Fund’s exposure to lower-rated, high yielding bonds. We did more of this in spring 2011 to further reduce the portfolio’s credit risk amid increased market volatility and economic uncertainty. Another way in which we attempted to guard against a potential decline in high yield bond prices was to buy credit default swaps. This approach generally worked well in the final months of the fiscal year, as high yield bonds struggled amid an increasingly risk-averse market backdrop. Similarly, we also purchased credit default swaps to help protect the Fund from falling prices in senior-loan bank debt — another category of security we believed was vulnerable.
Interest rate positioning is not typically a part of our overall portfolio management approach, but in late 2010, we identified a tactical need to make the Fund less sensitive to rising rates, given the increase in rates taking place at that time. Within several months, the potential for a further rate increase seemed reduced, and we once again attempted to make the portfolio somewhat more sensitive to interest rate movements by purchasing U.S. Treasury futures. We maintained this positioning throughout the rest of the Fund’s fiscal year.
Two more modest portfolio adjustments were to reduce the Fund’s allocation to U.S. financial company bonds — which we believed were potentially vulnerable to European debt troubles and a slowing U.S. economy — and to focus on higher-rated credits.
Adhering to our approach
At the end of the fiscal year, we believed the Fund’s relatively defensive positioning was appropriate, given the risks we saw to the global economy. Another risk on the horizon was the potential for investors to perceive deterioration in U.S. credit quality, which could lead to higher bond yields in the future.
Despite the uncertainty, we intend to continue following our overall investment approach, concentrating on fixed income securities that we believe offer good value relative to their risks. We continue to focus on high-quality corporate bonds and on certain international bonds issued by what we view as financially healthy nations, while remaining relatively underweight in U.S. government securities as of the end of the Fund’s fiscal year, whose performance potential we viewed as more limited as of that time.
3
| Performance summary | |
| Delaware Core Plus Bond Fund | July 31, 2011 |
The performance data quoted represent past performance; past performance does not guarantee future results. Investment return and principal value will fluctuate so your shares, when redeemed, may be worth more or less than their original cost. Please obtain the performance data current for the most recent month end by calling 800 523-1918 or visiting our website at www.delawareinvestments.com/performance. Current performance may be lower or higher than the performance data quoted.
| Fund performance1, 2 | Average annual total returns through July 31, 2011 |
| | 1 year | | 5 years | | 10 years | | Lifetime |
| Class A (Est. Aug. 16, 1985) | | | | | | |
| Excluding sales charge | +6.32% | | +7.72% | | +5.81% | | n/a |
| Including sales charge | +1.50% | | +6.72% | | +5.32% | | n/a |
| Class B (Est. May 2, 1994) | | | | | | |
| Excluding sales charge | +5.53% | | +6.93% | | +5.20% | | n/a |
| Including sales charge | +1.53% | | +6.70% | | +5.20% | | n/a |
| Class C (Est. Nov. 29, 1995) | | | | | | |
| Excluding sales charge | +5.53% | | +6.95% | | +5.06% | | n/a |
| Including sales charge | +4.53% | | +6.95% | | +5.06% | | n/a |
| Class R (Est. June 2, 2003) | | | | | | |
| Excluding sales charge | +6.17% | | +7.50% | | n/a | | +4.99% |
| Including sales charge | +6.17% | | +7.50% | | n/a | | +4.99% |
| Institutional Class (Est. June 1, 1992) | | | | | | |
| Excluding sales charge | +6.58% | | +8.02% | | +6.12% | | n/a |
| Including sales charge | +6.58% | | +8.02% | | +6.12% | | n/a |
1 Returns reflect the reinvestment of all distributions and are presented both with and without the applicable sales charges described below. Returns do not reflect the deduction of taxes the shareholder would pay on Fund distributions or redemptions of Fund shares.
Expense limitations were in effect for certain classes during some or all of the periods shown in the “Fund performance” chart. The current expenses for each class are listed on the “Fund expense ratios” table below. Performance would have been lower had expense limitations not been in effect.
Class A shares are sold with a maximum front-end sales charge of up to 4.50%, and have an annual distribution and service fee of up to 0.30% of average daily net assets. This fee has been contractually limited to 0.25% of average daily net assets from Nov. 26, 2010, through Nov. 28, 2011. Additionally, the Fund’s Class A shares are subject to a blended 12b-1 fee of 0.10% of average daily net assets on all shares acquired prior to June 1, 1992, and 0.30% of average daily net assets on all shares acquired on or after June 1, 1992. Performance for Class A shares, excluding sales charges, assumes that no front-end sales charge applied.
4
Class B shares may be purchased only through dividend reinvestment and certain permitted exchanges as described in the prospectus. Please see the prospectus for additional information on Class B shares. Class B shares have a contingent deferred sales charge that declines from 4.00% to zero depending on the period of time the shares are held. They are also subject to an annual distribution and service fee of up to 1.00% of average daily net assets. Class B shares will automatically convert to Class A shares on a quarterly basis approximately eight years after purchase. Ten-year and lifetime performance figures for Class B shares reflect conversion to Class A shares after approximately eight years.
Class C shares are sold with a contingent deferred sales charge of 1.00% if redeemed during the first 12 months. They are also subject to an annual distribution and service fee of up to 1.00% of average daily net assets.
Performance for Class B and C shares, excluding sales charges, assumes either that contingent deferred sales charges did not apply or that the investment was not redeemed.
Class R shares are available only for certain retirement plan products. They are sold without a sales charge and have an annual distribution and service fee of up to 0.60% of average daily net assets, which has been limited contractually to 0.50% from Nov. 26, 2010, through Nov. 28, 2011.
Institutional Class shares are available without sales or asset-based distribution charges only to certain eligible institutional accounts.
The “Fund performance” table and the “Performance of a $10,000 investment” graph do not reflect the deduction of taxes the shareholder would pay on Fund distributions or redemptions of Fund shares.
Fixed income securities and bond funds can lose value, and investors can lose principal, as interest rates rise. They also may be affected by economic conditions that hinder an issuer’s ability to make interest and principal payments on its debt.
The Fund may also be subject to prepayment risk, the risk that the principal of a fixed income security that is held by the Fund may be prepaid prior to maturity, potentially forcing the Fund to reinvest that money at a lower interest rate.
High yielding, noninvestment grade bonds (junk bonds) involve higher risk than investment grade bonds. The high yield secondary market is particularly susceptible to liquidity problems when institutional investors, such as mutual funds and certain other financial institutions, temporarily stop buying bonds for regulatory, financial, or other reasons. In addition, a less liquid secondary market makes it more difficult for the Fund to obtain precise valuations of the high yield securities in its portfolio.
The Fund may invest in derivatives, which may involve additional expenses and are subject to risk, including the risk that an underlying security or securities index moves in the opposite direction from what the portfolio manager anticipated. A derivative transaction depends upon the counterparties’ ability to fulfill their contractual obligations.
5
Performance summary
Delaware Core Plus Bond Fund
International investments entail risks not ordinarily associated with U.S. investments including fluctuation in currency values, differences in accounting principles, or economic or political instability in other nations.
Investing in emerging markets can be riskier than investing in established foreign markets due to increased volatility and lower trading volume.
The Fund may experience portfolio turnover in excess of 100%, which could result in higher transaction costs and tax liability.
If and when the Fund invests in forward foreign currency contracts or uses other investments to hedge against currency risks, the Fund will be subject to special risks, including counterparty risk.
Per Standard & Poor’s credit rating agency, bonds rated below AAA, including A, are more susceptible to the adverse effects of changes in circumstances and economic conditions than those in higher-rated categories, but the obligor’s capacity to meet its financial commitment on the obligation is still strong. Bonds rated BBB exhibit adequate protection parameters, although adverse economic conditions or changing circumstances are more likely to lead to a weakened capacity of the obligor to meet its financial commitments. Bonds rated BB, B, and CCC are regarded as having significant speculative characteristics with BB indicating the least degree of speculation.
2 The Fund’s expense ratios, as described in the most recent prospectus, are disclosed in the following “Fund expense ratios” table. Delaware Investments has agreed to reimburse certain expenses and/or waive certain fees in order to prevent total fund operating expenses (excluding certain fees and expenses) from exceeding 0.65% of the Fund’s average daily net assets from Nov. 26, 2010, through Nov. 28, 2011. Please see the most recent prospectus and any applicable supplement(s) for additional information on these fee waivers and/ or reimbursements.
| Fund expense ratios | Class A | | Class B | | Class C | | Class R | | Institutional Class |
| Total annual operating expenses | 1.34% | | 2.04% | | 2.04% | | 1.64% | | 1.04% |
| (without fee waivers) | | | | | | | | | |
| Net expenses | 0.90% | | 1.65% | | 1.65% | | 1.15% | | 0.65% |
| (including fee waivers, if any) | | | | | | | | | |
| Type of waiver | Contractual | | Contractual | | Contractual | | Contractual | | Contractual |
6
Performance of a $10,000 investment1
Average annual total returns from July 31, 2001, through July 31, 2011
| For period beginning July 31, 2001, through July 31, 2011 | Starting value | Ending value |
| | Barclays Capital U.S. Aggregate Index | $10,000 | $17,369 |
| | Delaware Core Plus Bond Fund — Class A Shares | $9,550 | $16,786 |
1The “Performance of a $10,000 investment” graph assumes $10,000 invested in Class A shares of the Fund on July 31, 2001, and includes the effect of a 4.50% front-end sales charge and the reinvestment of all distributions. The graph does not reflect the deduction of taxes the shareholders would pay on Fund distributions or redemptions of Fund shares. Expense limitations were in effect for some or all of the periods shown. Performance would have been lower had expense limitations not been in effect. Current expenses are listed in the “Fund expense ratios” table on page 6. Please note additional details on pages 4 through 7.
The chart also assumes $10,000 invested in the Barclays Capital U.S. Aggregate Index as of July 31, 2001. The Barclays Capital U.S. Aggregate Index is a broad composite of more than 8,000 securities that tracks the investment grade domestic bond market.
Index performance returns do not reflect any management fees, transaction costs, or expenses. Indices are unmanaged and one cannot invest directly in an index. Past performance is not a guarantee of future results.
Performance of other Fund classes will vary due to different charges and expenses.
| | | Nasdaq symbols | | CUSIPs | |
| Class A | | DEGGX | | 246094205 | |
| Class B | | DEGBX | | 246094601 | |
| Class C | | DUGCX | | 246094700 | |
| Class R | | DUGRX | | 246094809 | |
| Institutional Class | | DUGIX | | 246094502 | |
7
Disclosure of Fund expenses
For the six-month period from February 1, 2011 to July 31, 2011
As a shareholder of the Fund, you incur two types of costs: (1) transaction costs, including sales charges (loads) on purchase payments, reinvested dividends, or other distributions; redemption fees; and exchange fees; and (2) ongoing costs, including management fees; distribution and/or service (12b-1) fees; and other Fund expenses. This example is intended to help you understand your ongoing costs (in dollars) of investing in the Fund and to compare these costs with the ongoing costs of investing in other mutual funds.
The example is based on an investment of $1,000 invested at the beginning of the period and held for the entire six-month period from February 1, 2011 to July 31, 2011.
Actual expenses
The first section of the table shown, “Actual Fund return,” provides information about actual account values and actual expenses. You may use the information in this section of the table, together with the amount you invested, to estimate the expenses that you paid over the period. Simply divide your account value by $1,000 (for example, an $8,600 account value divided by $1,000 = 8.6), then multiply the result by the number in the first section under the heading entitled “Expenses Paid During Period” to estimate the expenses you paid on your account during this period.
Hypothetical example for comparison purposes
The second section of the table shown, “Hypothetical 5% return,” provides information about hypothetical account values and hypothetical expenses based on the Fund’s actual expense ratio and an assumed rate of return of 5% per year before expenses, which is not the Fund’s actual return. The hypothetical account values and expenses may not be used to estimate the actual ending account balance or expenses you paid for the period. You may use this information to compare the ongoing costs of investing in the Fund and other funds. To do so, compare this 5% hypothetical example with the 5% hypothetical examples that appear in the shareholder reports of the other funds.
Please note that the expenses shown in the table are meant to highlight your ongoing costs only and do not reflect any transactional costs, such as sales charges (loads), redemption fees, or exchange fees. Therefore, the second section of the table is useful in comparing ongoing costs only, and will not help you determine the relative total costs of owning different funds. In addition, if these transactional costs were included, your costs would have been higher. The Fund’s expenses shown in the table reflect fee waivers in effect. The expenses shown in the table assume reinvestment of all dividends and distributions.
8
Delaware Core Plus Bond Fund
Expense Analysis of an Investment of $1,000
| | | Beginning | | Ending | | | | | Expenses |
| | | Account Value | | Account Value | | Annualized | | Paid During Period |
| | | 2/1/11 | | 7/31/11 | | Expense Ratio | | 2/1/11 to 7/31/11* |
| Actual Fund return | | | | | | | | | | | | | | | |
| Class A | | $ | 1,000.00 | | | $ | 1,047.50 | | | 0.90 | % | | $ | 4.57 | |
| Class B | | | 1,000.00 | | | | 1,043.70 | | | 1.65 | % | | | 8.36 | |
| Class C | | | 1,000.00 | | | | 1,043.70 | | | 1.65 | % | | | 8.36 | |
| Class R | | | 1,000.00 | | | | 1,047.40 | | | 1.15 | % | | | 5.84 | |
| Institutional Class | | | 1,000.00 | | | | 1,048.80 | | | 0.65 | % | | | 3.30 | |
| Hypothetical 5% return (5% return before expenses) | | | | | | | | | | | | | | | |
| Class A | | $ | 1,000.00 | | | $ | 1,020.33 | | | 0.90 | % | | $ | 4.51 | |
| Class B | | | 1,000.00 | | | | 1,016.61 | | | 1.65 | % | | | 8.25 | |
| Class C | | | 1,000.00 | | | | 1,016.61 | | | 1.65 | % | | | 8.25 | |
| Class R | | | 1,000.00 | | | | 1,019.09 | | | 1.15 | % | | | 5.76 | |
| Institutional Class | | | 1,000.00 | | | | 1,021.57 | | | 0.65 | % | | | 3.26 | |
*“Expenses Paid During Period” are equal to the Fund’s annualized expense ratio, multiplied by the average account value over the period, multiplied by 181/365 (to reflect the one-half year period).
9
Security type/sector allocation
| Delaware Core Plus Bond Fund | As of July 31, 2011 |
Sector designations may be different than the sector designations presented in other Fund materials. The sector designations may represent the investment manager’s internal sector classifications, which may result in the sector designations for one fund being different than another fund’s sector designations.
| Security type/sector | Percentage of net assets |
| Agency Collateralized Mortgage Obligations | 3.13 | % |
| Agency Mortgage-Backed Securities | 15.27 | % |
| Commercial Mortgage-Backed Securities | 6.03 | % |
| Convertible Bonds | 0.44 | % |
| Corporate Bonds | 48.73 | % |
| Banking | 7.91 | % |
| Basic Industries | 5.07 | % |
| Brokerage | 0.52 | % |
| Capital Goods | 1.36 | % |
| Communications | 6.00 | % |
| Consumer Cyclical | 2.92 | % |
| Consumer Non-Cyclical | 6.02 | % |
| Electric | 4.13 | % |
| Energy | 3.95 | % |
| Finance Companies | 2.14 | % |
| Insurance | 1.46 | % |
| Natural Gas | 2.80 | % |
| Real Estate | 1.66 | % |
| Technology | 1.57 | % |
| Transportation | 1.22 | % |
| Non-Agency Asset-Backed Securities | 2.39 | % |
| Non-Agency Collateralized Mortgage Obligations | 0.89 | % |
| Regional Bonds | 0.97 | % |
| Senior Secured Loans | 3.42 | % |
| Sovereign Bonds | 4.54 | % |
| Supranational Banks | 0.35 | % |
| U.S. Treasury Obligations | 9.94 | % |
| Preferred Stock | 0.54 | % |
| Purchased Options | 0.02 | % |
10
| Security type/sector | Percentage of net assets |
| Short-Term Investments | 12.25 | % |
| Securities Lending Collateral | 6.27 | % |
| Total Value of Securities | 115.18 | % |
| Obligation to Return Securities Lending Collateral | (6.29 | %) |
| Other Liabilities Net of Receivables and Other Assets | (8.89 | %) |
| Total Net Assets | 100.00 | % |
11
Statement of net assets
| Delaware Core Plus Bond Fund | July 31, 2011 |
| | | Principal amount° | | Value (U.S. $) |
| Agency Collateralized Mortgage Obligations – 3.13% | | | | | | |
| | Fannie Mae Grantor Trust | | | | | | |
| | Series 2002-T1 A2 7.00% 11/25/31 | USD | | 88,111 | | $ | 104,540 |
| | Fannie Mae Interest Strip | | | | | | |
| | Series 35-2 12.00% 7/1/18 | | | 39,098 | | | 45,309 |
| | Fannie Mae REMICs | | | | | | |
| | Series 1988-15 A 9.00% 6/25/18 | | | 707 | | | 808 |
| | Series 1996-46 ZA 7.50% 11/25/26 | | | 97,399 | | | 109,499 |
| | Series 2002-83 GH 5.00% 12/25/17 | | | 465,000 | | | 507,088 |
| • | Fannie Mae Whole Loan | | | | | | |
| | Series 2002-W1 2A 7.158% 2/25/42 | | | 90,133 | | | 105,451 |
| | Freddie Mac REMICs | | | | | | |
| | Series 2557 WE 5.00% 1/15/18 | | | 300,000 | | | 330,306 |
| | Series 2662 MA 4.50% 10/15/31 | | | 45,765 | | | 47,221 |
| | Series 3131 MC 5.50% 4/15/33 | | | 200,000 | | | 218,579 |
| | Series 3173 PE 6.00% 4/15/35 | | | 325,000 | | | 363,520 |
| | Series 3337 PB 5.50% 7/15/30 | | | 172,608 | | | 174,714 |
| | Series 3656 PM 5.00% 4/15/40 | | | 235,000 | | | 254,315 |
| w | Freddie Mac Structured Pass Through Securities | | | | | | |
| | Series T-42 A5 7.50% 2/25/42 | | | 34,058 | | | 40,736 |
| | GNMA | | | | | | |
| | Series 2010-42 PC 5.00% 7/20/39 | | | 545,000 | | | 595,403 |
| | Series 2010-113 KE 4.50% 9/20/40 | | | 245,000 | | | 254,984 |
| | NCUA Guaranteed Notes | | | | | | |
| | Series 2010-C1 A2 2.90% 10/29/20 | | | 80,000 | | | 81,646 |
| Total Agency Collateralized Mortgage Obligations | | | | | | |
| | (cost $3,038,530) | | | | | | 3,234,119 |
| | | | | | | | |
| Agency Mortgage-Backed Securities – 15.27% | | | | | | |
| | Fannie Mae 10.50% 6/1/30 | | | 11,000 | | | 13,143 |
| • | Fannie Mae ARM | | | | | | |
| | 4.994% 8/1/35 | | | 72,555 | | | 77,636 |
| | 5.139% 11/1/35 | | | 94,446 | | | 100,742 |
| | 6.256% 7/1/36 | | | 189,479 | | | 206,459 |
| | Fannie Mae S.F. 15 yr | | | | | | |
| | 4.00% 7/1/25 to 11/1/25 | | | 1,003,786 | | | 1,054,942 |
| | 5.00% 5/1/21 | | | 152,570 | | | 165,055 |
| | 8.00% 10/1/16 | | | 71,797 | | | 78,445 |
12
| | | Principal amount° | | Value (U.S. $) |
| Agency Mortgage-Backed Securities (continued) | | | | | | |
| | Fannie Mae S.F. 15 yr TBA | | | | | | |
| | 3.50% 9/1/26 | USD | | 500,000 | | $ | 512,422 |
| | 4.50% 9/1/26 | | | 600,000 | | | 636,281 |
| | Fannie Mae S.F. 20 yr 5.50% 8/1/28 | | | 511,767 | | | 556,364 |
| | Fannie Mae S.F. 30 yr | | | | | | |
| | 5.00% 12/1/36 to 7/1/40 | | | 735,689 | | | 787,915 |
| | 6.00% 11/1/37 | | | 339,043 | | | 374,138 |
| | 8.00% 2/1/30 | | | 21,477 | | | 25,312 |
| | 10.00% 7/1/20 to 2/1/25 | | | 159,892 | | | 181,496 |
| | Fannie Mae S.F. 30 yr TBA | | | | | | |
| | 4.00% 9/1/41 | | | 1,500,000 | | | 1,518,281 |
| | 5.50% 9/1/41 | | | 2,340,000 | | | 2,529,760 |
| | 6.00% 9/1/41 | | | 4,990,000 | | | 5,474,772 |
| • | Freddie Mac ARM | | | | | | |
| | 5.181% 7/1/36 | | | 65,072 | | | 68,371 |
| | 5.808% 10/1/36 | | | 169,460 | | | 182,663 |
| | Freddie Mac S.F. 15 yr | | | | | | |
| | 4.50% 7/1/24 | | | 321,803 | | | 342,167 |
| | 5.00% 6/1/18 to 1/1/24 | | | 153,942 | | | 165,156 |
| | 5.50% 8/1/23 | | | 99,116 | | | 107,021 |
| | Freddie Mac S.F. 30 yr | | | | | | |
| | 8.00% 5/1/31 | | | 126,431 | | | 149,957 |
| | 10.00% 1/1/19 | | | 11,805 | | | 13,570 |
| | 11.50% 6/1/15 to 3/1/16 | | | 27,220 | | | 31,416 |
| | GNMA I GPM | | | | | | |
| | 11.00% 3/15/13 | | | 2,520 | | | 2,537 |
| | 12.25% 3/15/14 | | | 5,051 | | | 5,092 |
| | GNMA I S.F. 15 yr 6.50% 7/15/14 | | | 35,393 | | | 38,722 |
| | GNMA I S.F. 30 yr | | | | | | |
| | 7.50% 1/15/32 | | | 14,352 | | | 16,907 |
| | 8.00% 5/15/30 | | | 13,532 | | | 16,124 |
| | 9.50% 10/15/19 to 3/15/23 | | | 38,756 | | | 45,160 |
| | 10.00% 9/15/18 | | | 8,850 | | | 9,925 |
| | 11.00% 8/15/15 to 9/15/15 | | | 11,233 | | | 11,420 |
| | 11.50% 7/15/15 | | | 2,066 | | | 2,081 |
| | 12.00% 2/15/13 to 11/15/15 | | | 69,703 | | | 73,161 |
| | 12.50% 11/15/13 to 1/15/16 | | | 26,953 | | | 27,481 |
| | GNMA II GPM 10.75% 3/20/16 | | | 4,957 | | | 4,992 |
13
Statement of net assets
Delaware Core Plus Bond Fund
| | | Principal amount° | | Value (U.S. $) |
| Agency Mortgage-Backed Securities (continued) | | | | | | |
| | GNMA II S.F. 30 yr | | | | | | |
| | 7.50% 9/20/30 | USD | | 21,522 | | $ | 25,227 |
| | 8.00% 6/20/30 | | | 10,927 | | | 12,988 |
| | 10.00% 11/20/15 to 6/20/21 | | | 30,077 | | | 35,292 |
| | 10.50% 3/20/16 to 2/20/21 | | | 42,752 | | | 48,422 |
| | 11.00% 5/20/15 to 7/20/19 | | | 971 | | | 978 |
| | 12.00% 3/20/14 to 5/20/15 | | | 4,251 | | | 4,498 |
| | 12.50% 10/20/13 to 7/20/15 | | | 16,002 | | | 16,954 |
| Total Agency Mortgage-Backed Securities | | | | | | |
| | (cost $15,516,150) | | | | | | 15,751,445 |
| | | | | | | | |
| Commercial Mortgage-Backed Securities – 6.03% | | | | | | |
| # | American Tower Trust | | | | | | |
| | Series 2007-1A AFX 144A 5.42% 4/15/37 | | | 300,000 | | | 321,905 |
| | Bank of America Merrill Lynch Commercial | | | | | | |
| | Mortgage Securities | | | | | | |
| | •Series 2004-3 A5 5.536% 6/10/39 | | | 148,522 | | | 160,606 |
| | Series 2004-5 A3 4.561% 11/10/41 | | | 317,874 | | | 318,651 |
| | •Series 2005-1 A5 5.163% 11/10/42 | | | 80,000 | | | 87,225 |
| | •Series 2005-6 A4 5.195% 9/10/47 | | | 40,000 | | | 43,964 |
| | •Series 2006-2 A4 5.731% 5/10/45 | | | 115,000 | | | 128,180 |
| | Series 2006-4 A4 5.634% 7/10/46 | | | 200,000 | | | 219,347 |
| | Bear Stearns Commercial Mortgage Securities | | | | | | |
| | •Series 2005-T20 A4A 5.148% 10/12/42 | | | 60,000 | | | 65,951 |
| | •Series 2006-PW12 A4 5.72% 9/11/38 | | | 55,000 | | | 61,070 |
| | Series 2007-PW15 A4 5.331% 2/11/44 | | | 330,000 | | | 347,558 |
| # | CFCRE Commercial Mortgage Trust | | | | | | |
| | Series 2011-C1 A2 144A 3.759% 4/15/44 | | | 100,000 | | | 102,691 |
| w• | Commercial Mortgage Pass Through Certificates | | | | | | |
| | Series 2005-C6 A5A 5.116% 6/10/44 | | | 210,000 | | | 228,340 |
| • | Credit Suisse Mortgage Capital Certificates | | | | | | |
| | Series 2006-C1 AAB 5.422% 2/15/39 | | | 104,094 | | | 109,583 |
| #• | DBUBS Mortgage Trust | | | | | | |
| | Series 2011-LC1A C 144A 5.557% 11/10/46 | | | 100,000 | | | 96,307 |
| | Goldman Sachs Mortgage Securities II | | | | | | |
| | *•Series 2004-GG2 A6 5.396% 8/10/38 | | | 405,000 | | | 436,811 |
| | Series 2005-GG4 A4A 4.751% 7/10/39 | | | 350,000 | | | 373,600 |
14
| | | Principal amount° | | Value (U.S. $) |
| Commercial Mortgage-Backed Securities (continued) | | | | | | |
| | Goldman Sachs Mortgage Securities II (continued) | | | | | | |
| | •Series 2006-GG6 A4 5.553% 4/10/38 | USD | | 435,000 | | $ | 472,952 |
| | #Series 2010-C1 A2 144A 4.592% 8/10/43 | | | 145,000 | | | 148,033 |
| | #•Series 2010-C1 C 144A 5.635% 8/10/43 | | | 300,000 | | | 281,028 |
| • | Greenwich Capital Commercial Funding | | | | | | |
| | Series 2005-GG5 A5 5.224% 4/10/37 | | | 340,000 | | | 366,465 |
| • | JPMorgan Chase Commercial Mortgage Securities | | | | | | |
| | Series 2005-LDP4 A4 4.918% 10/15/42 | | | 125,000 | | | 135,315 |
| | Series 2005-LDP5 A4 5.205% 12/15/44 | | | 100,000 | | | 109,563 |
| | Lehman Brothers-UBS Commercial Mortgage | | | | | | |
| | Trust Series 2004-C1 A4 4.568% 1/15/31 | | | 180,000 | | | 190,257 |
| | Merrill Lynch Mortgage Trust | | | | | | |
| | Series 2005-CIP1 A2 4.96% 7/12/38 | | | 148,688 | | | 151,560 |
| | Morgan Stanley Capital I | | | | | | |
| | Series 2005-HQ6 A4A 4.989% 8/13/42 | | | 492,000 | | | 529,356 |
| | •Series 2007-T27 A4 5.641% 6/11/42 | | | 275,000 | | | 305,313 |
| # | OBP Depositor Trust | | | | | | |
| | Series 2010-OBP A 144A 4.646% 7/15/45 | | | 120,000 | | | 127,367 |
| # | TimberStar Trust | | | | | | |
| | Series 2006-1A A 144A 5.668% 10/15/36 | | | 155,000 | | | 170,364 |
| # | WF-RBS Commercial Mortgage Trust | | | | | | |
| | Series 2011-C3 A4 144A 4.375% 3/15/44 | | | 135,000 | | | 136,009 |
| Total Commercial Mortgage-Backed Securities | | | | | | |
| | (cost $5,414,062) | | | | | | 6,225,371 |
| | | | | | | | |
| Convertible Bonds – 0.44% | | | | | | |
| Φ | Hologic 2.00% exercise price $38.59, | | | | | | |
| | expiration date 12/15/37 | | | 170,000 | | | 164,263 |
| | Linear Technology 3.00% exercise price $44.11, | | | | | | |
| | expiration date 5/1/27 | | | 225,000 | | | 234,562 |
| | Transocean 1.50% exercise price $166.65, | | | | | | |
| | expiration date 12/15/37 | | | 60,000 | | | 60,075 |
| Total Convertible Bonds (cost $412,084) | | | | | | 458,900 |
15
Statement of net assets
Delaware Core Plus Bond Fund
| | | Principal amount° | | Value (U.S. $) |
| Corporate Bonds – 48.73% | | | | | | |
| Banking – 7.91% | | | | | | |
| | Abbey National Treasury Services | | | | | | |
| | 4.00% 4/27/16 | USD | | 120,000 | | $ | 117,646 |
| # | Bank Nederlandse Gemeenten | | | | | | |
| | 144A 4.375% 2/16/21 | | | 340,000 | | | 362,223 |
| # | Bank of Montreal 144A 2.625% 1/25/16 | | | 250,000 | | | 258,036 |
| | BB&T 5.25% 11/1/19 | | | 227,000 | | | 243,810 |
| • | BB&T Capital Trust IV 6.82% 6/12/57 | | | 250,000 | | | 254,063 |
| • | Bear Stearns 5.44% 12/7/12 | AUD | | 200,000 | | | 217,887 |
| • | Branch Banking & Trust 0.57% 9/13/16 | USD | | 280,000 | | | 259,633 |
| *# | Canadian Imperial Bank of Commerce | | | | | | |
| | 144A 2.75% 1/27/16 | | | 200,000 | | | 207,588 |
| | Capital One Financial 4.75% 7/15/21 | | | 100,000 | | | 101,281 |
| | City National 5.25% 9/15/20 | | | 160,000 | | | 167,325 |
| @# | CoBank 144A 7.875% 4/16/18 | | | 250,000 | | | 295,508 |
| # | Export-Import Bank of Korea | | | | | | |
| | 144A 5.25% 2/10/14 | | | 125,000 | | | 135,062 |
| | Fifth Third Bancorp 3.625% 1/25/16 | | | 220,000 | | | 225,785 |
| • | Fifth Third Capital Trust IV 6.50% 4/15/37 | | | 70,000 | | | 68,600 |
| | Goldman Sachs Group | | | | | | |
| | 5.25% 7/27/21 | | | 150,000 | | | 153,415 |
| | 5.375% 3/15/20 | | | 60,000 | | | 62,331 |
| # | HSBC Bank 144A 3.10% 5/24/16 | | | 205,000 | | | 207,716 |
| | JPMorgan Chase 5.60% 7/15/41 | | | 240,000 | | | 243,077 |
| | JPMorgan Chase Bank 6.00% 10/1/17 | | | 250,000 | | | 281,949 |
| | JPMorgan Chase Capital XXV 6.80% 10/1/37 | | | 271,000 | | | 275,570 |
| | KeyBank 5.45% 3/3/16 | | | 250,000 | | | 276,797 |
| | KeyCorp 5.10% 3/24/21 | | | 280,000 | | | 293,500 |
| | Korea Development Bank 8.00% 1/23/14 | | | 195,000 | | | 222,763 |
| | PNC Bank 6.875% 4/1/18 | | | 250,000 | | | 299,966 |
| | PNC Funding | | | | | | |
| | 5.125% 2/8/20 | | | 210,000 | | | 229,470 |
| | 5.25% 11/15/15 | | | 225,000 | | | 248,406 |
| #• | Rabobank 144A 11.00% 12/29/49 | | | 135,000 | | | 172,964 |
| • | SunTrust Capital VIII 6.10% 12/15/36 | | | 240,000 | | | 234,742 |
| | SVB Financial Group 5.375% 9/15/20 | | | 150,000 | | | 154,880 |
| | U.S. Bank North America 4.95% 10/30/14 | | | 250,000 | | | 275,889 |
| • | USB Capital IX 3.50% 4/15/49 | | | 595,000 | | | 487,143 |
16
| | | Principal amount° | | Value (U.S. $) |
| Corporate Bonds (continued) | | | | | | |
| Banking (continued) | | | | | | |
| | Wachovia | | | | | | |
| | •0.619% 10/15/16 | USD | | 95,000 | | $ | 88,889 |
| | 5.25% 8/1/14 | | | 105,000 | | | 113,676 |
| | Wachovia Bank North America 5.60% 3/15/16 | | | 265,000 | | | 292,528 |
| | Wells Fargo 4.60% 4/1/21 | | | 160,000 | | | 166,866 |
| • | Wells Fargo Capital XIII 7.70% 12/29/49 | | | 240,000 | | | 248,700 |
| | Zions Bancorporation | | | | | | |
| | 5.50% 11/16/15 | | | 150,000 | | | 156,115 |
| | *7.75% 9/23/14 | | | 55,000 | | | 60,639 |
| | | | | | | | 8,162,438 |
| Basic Industries – 5.07% | | | | | | |
| * | AK Steel 7.625% 5/15/20 | | | 235,000 | | | 241,463 |
| | Alcoa 6.75% 7/15/18 | | | 325,000 | | | 371,174 |
| | ArcelorMittal 9.85% 6/1/19 | | | 610,000 | | | 795,100 |
| # | Barrick North America Finance 144A | | | | | | |
| | 5.70% 5/30/41 | | | 185,000 | | | 190,875 |
| | CF Industries 7.125% 5/1/20 | | | 100,000 | | | 117,500 |
| # | Codelco 144A 3.75% 11/4/20 | | | 1,161,000 | | | 1,161,990 |
| | Dow Chemical | | | | | | |
| | 4.25% 11/15/20 | | | 229,000 | | | 235,487 |
| | 8.55% 5/15/19 | | | 379,000 | | | 501,448 |
| | duPont (E.I.) deNemours 3.625% 1/15/21 | | | 205,000 | | | 208,234 |
| | Georgia-Pacific | | �� | | | | |
| | 8.00% 1/15/24 | | | 170,000 | | | 210,067 |
| | #144A 5.40% 11/1/20 | | | 195,000 | | | 206,655 |
| * | Hexion Finance 8.875% 2/1/18 | | | 160,000 | | | 170,400 |
| * | International Paper 9.375% 5/15/19 | | | 160,000 | | | 211,863 |
| | Novelis 8.75% 12/15/20 | | | 135,000 | | | 150,863 |
| | Southern Copper 7.50% 7/27/35 | | | 200,000 | | | 227,097 |
| | Teck Resources | | | | | | |
| | 4.75% 1/15/22 | | | 45,000 | | | 47,082 |
| | 6.25% 7/15/41 | | | 105,000 | | | 113,050 |
| | 9.75% 5/15/14 | | | 54,000 | | | 65,857 |
| | | | | | | | 5,226,205 |
| Brokerage – 0.52% | | | | | | |
| | Jefferies Group | | | | | | |
| | 6.25% 1/15/36 | | | 40,000 | | | 38,583 |
| | 6.45% 6/8/27 | | | 275,000 | | | 279,290 |
17
Statement of net assets
Delaware Core Plus Bond Fund
| | | Principal amount° | | | Value (U.S. $) |
| Corporate Bonds (continued) | | | | | | |
| Brokerage (continued) | | | | | | |
| | Lazard Group 6.85% 6/15/17 | USD | | 196,000 | | $ | 220,223 |
| | | | | | | | 538,096 |
| Capital Goods – 1.36% | | | | | | |
| # | ABB Treasury Center USA 144A 4.00% 6/15/21 | | | 70,000 | | | 70,979 |
| * | Ball 5.75% 5/15/21 | | | 495,000 | | | 501,188 |
| #• | Cemex 144A 5.246% 9/30/15 | | | 150,000 | | | 138,750 |
| # | Meccanica Holdings USA 144A 6.25% 7/15/19 | | | 280,000 | | | 293,771 |
| | Republic Services | | | | | | |
| | 4.75% 5/15/23 | | | 80,000 | | | 82,711 |
| | 5.25% 11/15/21 | | | 105,000 | | | 114,600 |
| # | Votorantim Cimentos 144A 7.25% 4/5/41 | | | 200,000 | | | 202,760 |
| | | | | | | | 1,404,759 |
| Communications – 6.00% | | | | | | |
| | America Movil 5.00% 3/30/20 | | | 285,000 | | | 309,847 |
| | AT&T 4.45% 5/15/21 | | | 125,000 | | | 132,438 |
| | CenturyLink 6.45% 6/15/21 | | | 165,000 | | | 170,479 |
| # | Clearwire Communications 144A | | | | | | |
| | 12.00% 12/1/15 | | | 220,000 | | | 225,775 |
| | Cricket Communications 7.75% 10/15/20 | | | 150,000 | | | 149,250 |
| # | Crown Castle Towers 144A 4.883% 8/15/20 | | | 915,000 | | | 945,952 |
| | CSC Holdings 8.50% 6/15/15 | | | 135,000 | | | 146,475 |
| | DIRECTV Holdings 5.00% 3/1/21 | | | 190,000 | | | 203,148 |
| | Discovery Communications 4.375% 6/15/21 | | | 240,000 | | | 247,903 |
| | DISH 7.875% 9/1/19 | | | 115,000 | | | 126,931 |
| | Intelsat Bermuda 11.25% 2/4/17 | | | 525,000 | | | 563,063 |
| # | NBC Universal Media 144A 4.375% 4/1/21 | | | 205,000 | | | 209,977 |
| | Qwest 8.375% 5/1/16 | | | 345,000 | | | 410,550 |
| * | Sprint Nextel | | | | | | |
| | 6.00% 12/1/16 | | | 110,000 | | | 110,550 |
| | 8.375% 8/15/17 | | | 130,000 | | | 142,675 |
| | Telecom Italia Capital 5.25% 10/1/15 | | | 120,000 | | | 120,155 |
| | Telefonica Emisiones | | | | | | |
| | 5.462% 2/16/21 | | | 115,000 | | | 115,540 |
| | 6.421% 6/20/16 | | | 190,000 | | | 208,762 |
| | Time Warner Cable 8.25% 4/1/19 | | | 200,000 | | | 256,694 |
| # | UPCB Finance III 144A 6.625% 7/1/20 | | | 250,000 | | | 251,875 |
| # | VimpelCom Holdings 144A 7.504% 3/1/22 | | | 200,000 | | | 200,500 |
18
| | | | Principal amount° | | Value (U.S. $) |
| Corporate Bonds (continued) | | | | | | | |
| Communications (continued) | | | | | | | |
| | Virgin Media Secured Finance 6.50% 1/15/18 | | USD | | 500,000 | | $ | 552,500 |
| # | Vivendi 144A 6.625% 4/4/18 | | | | 247,000 | | | 284,173 |
| # | Wind Acquisition Finance 144A 11.75% 7/15/17 | | | | 95,000 | | | 105,806 |
| | | | | | | | | 6,191,018 |
| Consumer Cyclical – 2.92% | | | | | | | |
| | CVS Caremark 5.75% 5/15/41 | | | | 225,000 | | | 235,138 |
| # | Delphi 144A 6.125% 5/15/21 | | | | 100,000 | | | 101,500 |
| | Family Dollar Stores 5.00% 2/1/21 | | | | 90,000 | | | 90,148 |
| | Ford Motor Credit | | | | | | | |
| | 5.00% 5/15/18 | | | | 200,000 | | | 201,589 |
| | 12.00% 5/15/15 | | | | 200,000 | | | 251,308 |
| # | FUEL Trust 144A 3.984% 6/15/16 | | | | 200,000 | | | 202,020 |
| * | Goodyear Tire & Rubber 8.25% 8/15/20 | | | | 200,000 | | | 220,500 |
| | Hanesbrands 6.375% 12/15/20 | | | | 145,000 | | | 145,000 |
| | Historic TW 6.875% 6/15/18 | | | | 185,000 | | | 222,083 |
| | Host Hotels & Resorts | | | | | | | |
| | *6.00% 11/1/20 | | | | 95,000 | | | 97,731 |
| | #144A 5.875% 6/15/19 | | | | 75,000 | | | 76,219 |
| # | Hyundai Capital Services 144A 4.375% 7/27/16 | | | | 260,000 | | | 272,002 |
| | Macy’s Retail Holdings 5.90% 12/1/16 | | | | 154,000 | | | 175,726 |
| | MGM Resorts International | | | | | | | |
| | 11.125% 11/15/17 | | | | 215,000 | | | 248,862 |
| | 11.375% 3/1/18 | | | | 125,000 | | | 145,625 |
| | 13.00% 11/15/13 | | | | 55,000 | | | 65,863 |
| * | Time Warner 4.75% 3/29/21 | | | | 60,000 | | | 63,189 |
| | Wyndham Worldwide | | | | | | | |
| | 5.625% 3/1/21 | | | | 90,000 | | | 92,320 |
| | 5.75% 2/1/18 | | | | 105,000 | | | 111,242 |
| | | | | | | | | 3,018,065 |
| Consumer Non-Cyclical – 6.02% | | | | | | | |
| | Amgen | | | | | | | |
| | 3.45% 10/1/20 | | | | 280,000 | | | 276,135 |
| | 4.10% 6/15/21 | | | | 100,000 | | | 102,880 |
| | Anheuser-Busch InBev Worldwide | | | | | | | |
| | 5.375% 11/15/14 | | | | 205,000 | | | 231,585 |
| | Bio-Rad Laboratories 4.875% 12/15/20 | | | | 115,000 | | | 119,057 |
19
Statement of net assets
Delaware Core Plus Bond Fund
| | | | Principal amount° | | Value (U.S. $) |
| Corporate Bonds (continued) | | | | | | | |
| Consumer Non-Cyclical (continued) | | | | | | | |
| # | Bumble Bee Acquisition 144A 9.00% 12/15/17 | | USD | | 90,000 | | $ | 91,238 |
| | CareFusion 6.375% 8/1/19 | | | | 475,000 | | | 551,609 |
| | Celgene | | | | | | | |
| | 2.45% 10/15/15 | | | | 60,000 | | | 60,808 |
| | 3.95% 10/15/20 | | | | 190,000 | | | 191,041 |
| | Coca-Cola Enterprises 3.50% 9/15/20 | | | | 275,000 | | | 273,336 |
| | Covidien International Finance 4.20% 6/15/20 | | | | 520,000 | | | 545,985 |
| # | Del Monte Foods 144A 7.625% 2/15/19 | | | | 90,000 | | | 93,038 |
| | Express Scripts 3.125% 5/15/16 | | | | 195,000 | | | 199,456 |
| | HCA PIK 9.625% 11/15/16 | | | | 91,000 | | | 97,598 |
| | Hospira 6.40% 5/15/15 | | | | 380,000 | | | 436,759 |
| | Kraft Foods 6.125% 8/23/18 | | | | 180,000 | | | 213,038 |
| | McKesson 4.75% 3/1/21 | | | | 235,000 | | | 255,968 |
| | Medco Health Solutions | | | | | | | |
| | 4.125% 9/15/20 | | | | 100,000 | | | 99,373 |
| | 7.125% 3/15/18 | | | | 460,000 | | | 550,855 |
| # | Mylan 144A 6.00% 11/15/18 | | | | 245,000 | | | 251,738 |
| # | Pernod-Ricard 144A 5.75% 4/7/21 | | | | 175,000 | | | 189,976 |
| | Quest Diagnostics | | | | | | | |
| | 4.70% 4/1/21 | | | | 175,000 | | | 185,765 |
| | 4.75% 1/30/20 | | | | 25,000 | | | 26,770 |
| * | Sara Lee 4.10% 9/15/20 | | | | 67,000 | �� | | 65,857 |
| | Whirlpool 4.85% 6/15/21 | | | | 160,000 | | | 163,413 |
| # | Woolworths 144A | | | | | | | |
| | 3.15% 4/12/16 | | | | 155,000 | | | 160,105 |
| | 4.55% 4/12/21 | | | | 160,000 | | | 167,949 |
| | Yale University 2.90% 10/15/14 | | | | 250,000 | | | 264,636 |
| | Zimmer Holdings 4.625% 11/30/19 | | | | 320,000 | | | 344,401 |
| | | | | | | | | 6,210,369 |
| Electric – 4.13% | | | | | | | |
| | Ameren Illinois 9.75% 11/15/18 | | | | 769,000 | | | 1,029,861 |
| # | American Transmission Systems | | | | | | | |
| | 144A 5.25% 1/15/22 | | | | 190,000 | | | 207,100 |
| | CenterPoint Energy 5.95% 2/1/17 | | | | 140,000 | | | 160,297 |
| | CMS Energy | | | | | | | |
| | 4.25% 9/30/15 | | | | 95,000 | | | 99,560 |
| | 6.25% 2/1/20 | | | | 635,000 | | | 696,097 |
20
| | | | Principal amount° | | Value (U.S. $) |
| Corporate Bonds (continued) | | | | | | | |
| Electric (continued) | | | | | | | |
| | Commonwealth Edison | | | | | | | |
| | 4.00% 8/1/20 | | USD | | 45,000 | | $ | 45,997 |
| | 5.80% 3/15/18 | | | | 60,000 | | | 68,933 |
| | Duke Energy Carolinas 3.90% 6/15/21 | | | | 105,000 | | | 109,112 |
| | Florida Power 5.65% 6/15/18 | | | | 55,000 | | | 64,063 |
| | Great Plains Energy 4.85% 6/1/21 | | | | 195,000 | | | 202,271 |
| *# | Ipalco Enterprises 144A 5.00% 5/1/18 | | | | 75,000 | | | 74,623 |
| | Jersey Central Power & Light 5.625% 5/1/16 | | | | 75,000 | | | 85,555 |
| | Pennsylvania Electric 5.20% 4/1/20 | | | | 175,000 | | | 190,529 |
| | Public Service Electric & Gas 3.50% 8/15/20 | | | | 125,000 | | | 126,958 |
| | Public Service of Oklahoma 5.15% 12/1/19 | | | | 215,000 | | | 237,514 |
| # | Puget Energy 144A 6.00% 9/1/21 | | | | 100,000 | | | 101,848 |
| • | Puget Sound Energy 6.974% 6/1/67 | | | | 240,000 | | | 248,087 |
| | Southern California Edison 5.50% 8/15/18 | | | | 250,000 | | | 290,602 |
| • | Wisconsin Energy 6.25% 5/15/67 | | | | 220,000 | | | 222,026 |
| | | | | | | | | 4,261,033 |
| Energy – 3.95% | | | | | | | |
| | Chesapeake Energy | | | | | | | |
| | 6.125% 2/15/21 | | | | 130,000 | | | 136,013 |
| | 6.625% 8/15/20 | | | | 14,000 | | | 15,190 |
| | 6.875% 11/15/20 | | | | 14,000 | | | 15,260 |
| | 9.50% 2/15/15 | | | | 70,000 | | | 82,600 |
| # | CNOOC Finance 2011 144A 4.25% 1/26/21 | | | | 225,000 | | | 228,902 |
| | Ecopetrol 7.625% 7/23/19 | | | | 43,000 | | | 52,460 |
| # | ENI 144A 4.15% 10/1/20 | | | | 140,000 | | | 134,536 |
| | Noble Energy 8.25% 3/1/19 | | | | 385,000 | | | 504,945 |
| | Pemex Project Funding Master Trust | | | | | | | |
| | 6.625% 6/15/35 | | | | 90,000 | | | 98,533 |
| | Petrobras International Finance | | | | | | | |
| | 5.375% 1/27/21 | | | | 160,000 | | | 171,217 |
| | 5.75% 1/20/20 | | | | 40,000 | | | 44,061 |
| | 5.875% 3/1/18 | | | | 45,000 | | | 50,328 |
| | PetroHawk Energy 7.25% 8/15/18 | | | | 235,000 | | | 274,363 |
| | Pride International 6.875% 8/15/20 | | | | 475,000 | | | 572,548 |
| | Range Resources 8.00% 5/15/19 | | | | 220,000 | | | 244,200 |
| | SandRidge Energy 8.75% 1/15/20 | | | | 235,000 | | | 259,088 |
| | Transocean 6.50% 11/15/20 | | | | 350,000 | | | 411,389 |
| | Weatherford International 9.625% 3/1/19 | | | | 150,000 | | | 201,089 |
21
Statement of net assets
Delaware Core Plus Bond Fund
| | | | Principal amount° | | Value (U.S. $) |
| Corporate Bonds (continued) | | | | | | | |
| Energy (continued) | | | | | | | |
| | Williams | | | | | | | |
| | 7.75% 6/15/31 | | USD | | 50,000 | | $ | 60,455 |
| | 8.75% 3/15/32 | | | | 60,000 | | | 79,003 |
| # | Woodside Finance 144A | | | | | | | |
| | 8.125% 3/1/14 | | | | 280,000 | | | 324,215 |
| | 8.75% 3/1/19 | | | | 85,000 | | | 110,080 |
| | | | | | | | | 4,070,475 |
| Finance Companies – 2.14% | | | | | | | |
| # | CDP Financial 144A | | | | | | | |
| | 4.40% 11/25/19 | | | | 280,000 | | | 296,408 |
| | 5.60% 11/25/39 | | | | 250,000 | | | 270,891 |
| | General Electric Capital | | | | | | | |
| | 4.375% 9/16/20 | | | | 80,000 | | | 81,425 |
| | 5.30% 2/11/21 | | | | 145,000 | | | 154,852 |
| | 6.00% 8/7/19 | | | | 765,000 | | | 866,299 |
| #• | ILFC E-Capital Trust II 144A 6.25% 12/21/65 | | | | 210,000 | | | 180,600 |
| | International Lease Finance | | | | | | | |
| | 6.25% 5/15/19 | | | | 88,000 | | | 87,949 |
| | *8.75% 3/15/17 | | | | 100,000 | | | 112,000 |
| | PHH 9.25% 3/1/16 | | | | 145,000 | | | 159,500 |
| | | | | | | | | 2,209,924 |
| Insurance – 1.46% | | | | | | | |
| | American International Group 8.25% 8/15/18 | | | | 250,000 | | | 297,137 |
| • | Chubb 6.375% 3/29/67 | | | | 270,000 | | | 280,125 |
| | Coventry Health Care 5.45% 6/15/21 | | | | 155,000 | | | 164,358 |
| # | Highmark 144A | | | | | | | |
| | 4.75% 5/15/21 | | | | 130,000 | | | 132,870 |
| | 6.125% 5/15/41 | | | | 30,000 | | | 31,406 |
| • | ING Groep 5.775% 12/29/49 | | | | 85,000 | | | 77,350 |
| | MetLife 6.817% 8/15/18 | | | | 220,000 | | | 263,507 |
| | Prudential Financial | | | | | | | |
| | 3.875% 1/14/15 | | | | 65,000 | | | 68,917 |
| | 4.50% 11/15/20 | | | | 50,000 | | | 51,653 |
| | 6.00% 12/1/17 | | | | 120,000 | | | 138,264 |
| w#=‡@ | Twin Reefs Pass Through Trust | | | | | | | |
| | 144A 0.00% 12/31/49 | | | | 200,000 | | | 0 |
| | | | | | | | | 1,505,587 |
22
| | | | Principal amount° | | Value (U.S. $) |
| Corporate Bonds (continued) | | | | | | | |
| Natural Gas – 2.80% | | | | | | | |
| | El Paso Pipeline Partners Operating | | | | | | | |
| | 6.50% 4/1/20 | | USD | | 110,000 | | $ | 127,004 |
| • | Enbridge Energy Partners 8.05% 10/1/37 | | | | 200,000 | | | 220,351 |
| | Energy Transfer Partners | | | | | | | |
| | 4.65% 6/1/21 | | | | 75,000 | | | 75,122 |
| | 9.70% 3/15/19 | | | | 285,000 | | | 370,051 |
| | Enterprise Products Operating | | | | | | | |
| | •7.034% 1/15/68 | | | | 280,000 | | | 295,432 |
| | 9.75% 1/31/14 | | | | 130,000 | | | 156,045 |
| | Kinder Morgan Energy Partners | | | | | | | |
| | 9.00% 2/1/19 | | | | 340,000 | | | 445,332 |
| | NiSource Finance | | | | | | | |
| | 6.40% 3/15/18 | | | | 115,000 | | | 132,866 |
| | 6.80% 1/15/19 | | | | 115,000 | | | 136,641 |
| | Plains All American Pipeline 8.75% 5/1/19 | | | | 195,000 | | | 251,952 |
| | Sempra Energy 6.15% 6/15/18 | | | | 175,000 | | | 203,336 |
| | TC Pipelines 4.65% 6/15/21 | | | | 100,000 | | | 103,371 |
| | TransCanada Pipelines | | | | | | | |
| | *3.80% 10/1/20 | | | | 100,000 | | | 102,346 |
| | •6.35% 5/15/67 | | | | 260,000 | | | 266,639 |
| | | | | | | | | 2,886,488 |
| Real Estate – 1.66% | | | | | | | |
| | Brandywine Operating Partnership | | | | | | | |
| | 4.95% 4/15/18 | | | | 140,000 | | | 145,503 |
| | Developers Diversified Realty | | | | | | | |
| | *4.75% 4/15/18 | | | | 80,000 | | | 81,239 |
| | 7.875% 9/1/20 | | | | 90,000 | | | 106,681 |
| | 9.625% 3/15/16 | | | | 150,000 | | | 183,724 |
| | Digital Realty Trust | | | | | | | |
| | 5.25% 3/15/21 | | | | 195,000 | | | 199,601 |
| | 5.875% 2/1/20 | | | | 95,000 | | | 102,413 |
| | Health Care REIT 5.25% 1/15/22 | | | | 285,000 | | | 295,956 |
| | Regency Centers | | | | | | | |
| | 4.80% 4/15/21 | | | | 55,000 | | | 57,106 |
| | 5.875% 6/15/17 | | | | 95,000 | | | 107,336 |
| | UDR 4.25% 6/1/18 | | | | 75,000 | | | 76,285 |
| | Ventas Realty 4.75% 6/1/21 | | | | 160,000 | | | 162,779 |
| # | WEA Finance 144A 4.625% 5/10/21 | | | | 190,000 | | | 192,179 |
| | | | | | | | | 1,710,802 |
23
Statement of net assets
Delaware Core Plus Bond Fund
| | | | Principal amount° | | Value (U.S. $) |
| Corporate Bonds (continued) | | | | | | | |
| Technology – 1.57% | | | | | | | |
| | GXS Worldwide 9.75% 6/15/15 | | USD | | 240,000 | | $ | 243,600 |
| | Hewlett-Packard 4.30% 6/1/21 | | | | 395,000 | | | 417,432 |
| | National Semiconductor 6.60% 6/15/17 | | | | 255,000 | | | 307,645 |
| # | Seagate Technology International | | | | | | | |
| | 144A 10.00% 5/1/14 | | | | 121,000 | | | 139,755 |
| | Symantec 4.20% 9/15/20 | | | | 125,000 | | | 124,733 |
| | Xerox 4.50% 5/15/21 | | | | 375,000 | | | 387,031 |
| | | | | | | | | 1,620,196 |
| Transportation – 1.22% | | | | | | | |
| # | Brambles USA 144A | | | | | | | |
| | 3.95% 4/1/15 | | | | 125,000 | | | 130,648 |
| | 5.35% 4/1/20 | | | | 205,000 | | | 215,435 |
| | Burlington Northern Santa Fe | | | | | | | |
| | 4.70% 10/1/19 | | | | 115,000 | | | 125,589 |
| | 5.75% 3/15/18 | | | | 15,000 | | | 17,353 |
| | CSX | | | | | | | |
| | 4.25% 6/1/21 | | | | 155,000 | | | 160,693 |
| | 5.50% 4/15/41 | | | | 30,000 | | | 31,156 |
| # | ERAC USA Finance 144A 5.25% 10/1/20 | | | | 370,000 | | | 402,852 |
| | Ryder System 3.50% 6/1/17 | | | | 165,000 | | | 170,241 |
| | | | | | | | | 1,253,967 |
| Total Corporate Bonds (cost $48,013,012) | | | | | | | 50,269,422 |
| | | | | | | | | |
| Non-Agency Asset-Backed Securities – 2.39% | | | | | | | |
| • | Ally Master Owner Trust | | | | | | | |
| | Series 2011-1 A1 1.057% 1/15/16 | | | | 140,000 | | | 141,031 |
| # | Avis Budget Rental Car Funding | | | | | | | |
| | Series 2011-2A A 144A 2.37% 11/20/14 | | | | 135,000 | | | 137,142 |
| • | Bank of America Credit Card Trust | | | | | | | |
| | Series 2007-A9 A9 0.227% 11/17/14 | | | | 90,000 | | | 89,949 |
| | Capital Auto Receivables Asset Trust | | | | | | | |
| | Series 2008-1 A3A 3.86% 8/15/12 | | | | 1,959 | | | 1,962 |
| • | Capital One Multi-Asset Execution Trust | | | | | | | |
| | Series 2007-A4 A4 0.217% 3/16/15 | | | | 400,000 | | | 399,642 |
| # | CIT Equipment Collateral 144A | | | | | | | |
| | Series 2009-VT1 A3 3.07% 8/15/16 | | | | 33,965 | | | 34,115 |
| | Series 2010-VT1A A3 2.41% 5/15/13 | | | | 100,000 | | | 100,056 |
24
| | | | Principal amount° | | Value (U.S. $) |
| Non-Agency Asset-Backed Securities (continued) | | | | | | | |
| | Citibank Credit Card Issuance Trust | | | | | | | |
| | Series 2007-A3 A3 6.15% 6/15/39 | | USD | | 135,000 | | $ | 160,533 |
| | Citicorp Residential Mortgage Securities | | | | | | | |
| | Series 2006-3 A5 5.948% 11/25/36 | | | | 300,000 | | | 241,424 |
| | Discover Card Master Trust | | | | | | | |
| | Series 2007-A1 A1 5.65% 3/16/20 | | | | 190,000 | | | 224,156 |
| # | Ford Auto Securitization Trust | | | | | | | |
| | Series 2011-R1A A3 144A 3.02% 2/15/16 | | CAD | | 100,000 | | | 105,381 |
| • | Ford Credit Floorplan Master Owner Trust | | | | | | | |
| | Series 2009-2 A 1.737% 9/15/14 | | USD | | 100,000 | | | 101,263 |
| # | Great America Leasing Receivables | | | | | | | |
| | Series 2011-1 A3 144A 1.69% 2/15/14 | | | | 160,000 | | | 161,290 |
| | Harley Davidson Motorcycle Trust | | | | | | | |
| | Series 2008-1 A4 4.90% 12/15/13 | | | | 107,386 | | | 109,510 |
| | Series 2009-4 A3 1.87% 2/15/14 | | | | 81,052 | | | 81,357 |
| | John Deere Owner Trust | | | | | | | |
| | Series 2010-A A4 2.13% 10/17/16 | | | | 155,000 | | | 158,733 |
| | Series 2011-A A4 1.96% 4/16/18 | | | | 145,000 | | | 148,334 |
| • | MBNA Credit Card Master Note Trust | | | | | | | |
| | Series 2005-A2 A2 0.267% 10/15/14 | | | | 50,000 | | | 49,992 |
| • | Merrill Auto Trust Securitization | | | | | | | |
| | Series 2007-1 A4 0.247% 12/15/13 | | | | 22,761 | | | 22,757 |
| Total Non-Agency Asset-Backed Securities | | | | | | | |
| | (cost $2,414,892) | | | | | | | 2,468,627 |
| | | | | | | | | |
| Non-Agency Collateralized Mortgage Obligations – 0.89% | | | | | | | |
| | American Home Mortgage Investment Trust | | | | | | | |
| | Series 2005-2 5A1 5.064% 9/25/35 | | | | 20,133 | | | 18,524 |
| •@ | Bank of America Funding | | | | | | | |
| | Series 2006-H 1A2 2.839% 9/20/46 | | | | 6,677 | | | 454 |
| | Citicorp Mortgage Securities | | | | | | | |
| | Series 2006-4 3A1 5.50% 8/25/21 | | | | 30,337 | | | 30,563 |
| | First Horizon Asset Securities | | | | | | | |
| | Series 2006-3 1A11 6.25% 11/25/36 | | | | 37,869 | | | 37,500 |
| •# | GSMPS Mortgage Loan Trust 144A | | | | | | | |
| | Series 1998-2 A 7.75% 5/19/27 | | | | 102,995 | | | 107,660 |
| | Series 1999-3 A 8.00% 8/19/29 | | | | 218,053 | | | 219,755 |
| • | JPMorgan Mortgage Trust | | | | | | | |
| | Series 2007-A1 7A4 5.218% 7/25/35 | | | | 348,035 | | | 156,888 |
25
Statement of net assets
Delaware Core Plus Bond Fund
| | | | Principal amount° | | Value (U.S. $) |
| Non-Agency Collateralized Mortgage Obligations (continued) | | | | | | | |
| | Lehman Mortgage Trust | | | | | | | |
| | Series 2005-2 2A3 5.50% 12/25/35 | | USD | | 35,933 | | $ | 35,013 |
| # | MASTR Reperforming Loan Trust | | | | | | | |
| | Series 2005-1 1A5 144A 8.00% 8/25/34 | | | | 194,278 | | | 197,530 |
| w | Washington Mutual Alternative Mortgage | | | | | | | |
| | Pass Through Certificates | | | | | | | |
| | Series 2005-1 5A2 6.00% 3/25/35 | | | | 149,121 | | | 93,148 |
| • | Wells Fargo Mortgage Backed Securities Trust | | | | | | | |
| | Series 2006-AR5 2A1 2.74% 4/25/36 | | | | 35,078 | | | 27,861 |
| Total Non-Agency Collateralized | | | | | | | |
| | Mortgage Obligations (cost $1,192,811) | | | | | | | 924,896 |
| | | | | | | | | |
| Regional Bonds – 0.97%Δ | | | | | | | |
| Australia – 0.21% | | | | | | | |
| | New South Wales Treasury 6.00% 5/1/20 | | AUD | | 192,000 | | | 219,817 |
| | | | | | | | | 219,817 |
| Canada – 0.76% | | | | | | | |
| | Province of New Brunswick 2.75% 6/15/18 | | USD | | 175,000 | | | 176,902 |
| | Province of Ontario | | | | | | | |
| | 2.30% 5/10/16 | | | | 255,000 | | | 260,999 |
| | 3.00% 7/16/18 | | | | 280,000 | | | 285,183 |
| | Province of Quebec 4.50% | | | | | | | |
| | 4.50% 12/1/19 | | CAD | | 19,000 | | | 21,579 |
| | 4.50% 12/1/20 | | CAD | | 30,000 | | | 33,887 |
| | | | | | | | | 778,550 |
| Total Regional Bonds (cost $936,356) | | | | | | | 998,367 |
| | | | | | | | | |
| «Senior Secured Loans – 3.42% | | | | | | | |
| | Alliance HealthCare Services 5.50% 6/1/16 | | USD | | 99,244 | | | 99,017 |
| | API Technologies Tranche B 3.496% 6/1/16 | | | | 55,000 | | | 54,175 |
| | ATI Holdings 7.50% 3/12/16 | | | | 181,625 | | | 180,792 |
| | BNY ConvergEx Group | | | | | | | |
| | 7.50% 12/16/17 | | | | 70,442 | | | 72,145 |
| | (Eze Castle Software) 8.75% 11/29/17 | | | | 29,558 | | | 30,272 |
| | Brickman Group Holdings Tranche B | | | | | | | |
| | 7.25% 10/14/16 | | | | 99,500 | | | 100,899 |
| | Burlington Coat Factory Warehouse | | | | | | | |
| | Tranche B 6.25% 2/10/17 | | | | 98,997 | | | 99,152 |
26
| | | | Principal amount° | | Value (U.S. $) |
| «Senior Secured Loans (continued) | | | | | | | |
| | Charter Communications Operating Tranche B | | | | | | | |
| | 7.25% 3/6/14 | | USD | | 13,720 | | $ | 13,777 |
| | Chester Downs & Marina 12.375% 12/31/16 | | | | 99,906 | | | 101,904 |
| | Chrysler Group 6.00% 4/28/17 | | | | 200,000 | | | 195,001 |
| | CityCenter Holdings 7.50% 1/10/15 | | | | 140,000 | | | 140,805 |
| | Consolidated Container 5.688% 9/28/14 | | | | 55,000 | | | 50,325 |
| | First Data Tranche B2 2.937% 9/24/14 | | | | 150,175 | | | 140,038 |
| | Frac Tech International Tranche B | | | | | | | |
| | 6.25% 4/19/16 | | | | 178,376 | | | 178,401 |
| | Goodman Global Tranche B 5.75% 10/28/16 | | | | 99,250 | | | 99,888 |
| | Grifols Tranche B 6.00% 6/4/16 | | | | 100,000 | | | 100,500 |
| | HGI Holdings 6.75% 7/27/17 | | | | 87,845 | | | 88,505 |
| | Houghton International Tranche B | | | | | | | |
| | 6.75% 1/11/16 | | | | 99,321 | | | 100,408 |
| | Level 3 Financing Tranche B 11.15% 3/13/14 | | | | 185,000 | | | 195,406 |
| | MGM MIRAGE Tranche E 7.00% 2/21/14 | | | | 125,000 | | | 122,833 |
| | Nortek 5.25% 4/12/17 | | | | 24,938 | | | 24,953 |
| | Nuveen Investment | | | | | | | |
| | 5.757% 5/13/17 | | | | 200,000 | | | 200,107 |
| | 2nd Lien 12.50% 7/9/15 | | | | 85,000 | | | 90,490 |
| | OSI Restaurant Partners | | | | | | | |
| | 2.319% 6/14/13 | | | | 13,254 | | | 12,817 |
| | 2.50% 6/13/14 | | | | 135,881 | | | 131,400 |
| | PQ 6.69% 7/30/15 | | | | 100,000 | | | 98,250 |
| | Reynolds Group Holdings 6.50% 7/7/18 | | | | 255,000 | | | 253,757 |
| | Texas Competitive Electric Holdings | | | | | | | |
| | 3.686% 10/10/14 | | | | 65,000 | | | 51,188 |
| | Toys R Us Tranche B 6.00% 9/1/16 | | | | 99,250 | | | 99,525 |
| | Univision Communications 4.436% 3/29/17 | | | | 132,312 | | | 125,591 |
| | Visant 5.25% 12/31/16 | | | | 273,625 | | | 272,235 |
| Total Senior Secured Loans (cost $3,491,604) | | | | | | | 3,524,556 |
| | | | | | | | | |
| Sovereign Bonds – 4.54%Δ | | | | | | | |
| Australia – 1.53% | | | | | | | |
| | Australian Government | | | | | | | |
| | 4.50% 4/15/20 | | AUD | | 797,000 | | | 859,221 |
| | 5.25% 3/15/19 | | AUD | | 370,000 | | | 421,138 |
| | *6.00% 2/15/17 | | AUD | | 250,000 | | | 294,217 |
| | | | | | | | | 1,574,576 |
27
Statement of net assets
Delaware Core Plus Bond Fund
| | | | Principal amount° | | Value (U.S. $) |
| Sovereign Bonds (continued) | | | | | | | |
| Belgium – 0.06% | | | | | | | |
| | Belgium Government 4.25% 9/28/21 | | EUR | | 42,600 | | $ | 60,596 |
| | | | | | | | | 60,596 |
| Brazil – 0.21% | | | | | | | |
| | Republic of Brazil | | | | | | | |
| | 7.125% 1/20/37 | | USD | | 80,000 | | | 103,000 |
| | 8.875% 10/14/19 | | | | 80,000 | | | 111,200 |
| | | | | | | | | 214,200 |
| Canada – 0.35% | | | | | | | |
| | Canadian Government | | | | | | | |
| | 3.75% 6/1/19 | | CAD | | 172,000 | | | 195,430 |
| | 4.00% 6/1/17 | | CAD | | 51,000 | | | 60,620 |
| | 4.00% 6/1/41 | | CAD | | 91,000 | | | 104,663 |
| | | | | | | | | 360,713 |
| Colombia – 0.02% | | | | | | | |
| | Colombia Government International | | | | | | | |
| | 7.75% 4/14/21 | | COP | | 38,000,000 | | | 24,543 |
| | | | | | | | | 24,543 |
| Indonesia – 0.21% | | | | | | | |
| | Indonesia Treasury Bonds | | | | | | | |
| | 10.50% 8/15/30 | | IDR | | 315,000,000 | | | 44,668 |
| | 11.00% 11/15/20 | | IDR | | 1,147,000,000 | | | 170,923 |
| | | | | | | | | 215,591 |
| Mexico – 0.16% | | | | | | | |
| | Mexican Bonos 8.50% 12/13/18 | | MXN | | 1,699,600 | | | 164,220 |
| | | | | | | | | 164,220 |
| Norway – 1.06% | | | | | | | |
| | Eksportfinans 2.375% 5/25/16 | | USD | | 145,000 | | | 148,265 |
| | Norway Government | | | | | | | |
| | 4.50% 5/22/19 | | NOK | | 2,242,000 | | | 469,574 |
| | 5.00% 5/15/15 | | NOK | | 2,330,000 | | | 472,846 |
| | | | | | | | | 1,090,685 |
| Philippines – 0.25% | | | | | | | |
| | Philippines Government International | | | | | | | |
| | 9.50% 10/21/24 | | USD | | 180,000 | | | 259,884 |
| | | | | | | | | 259,884 |
28
| | | | Principal amount° | | Value (U.S. $) |
| Sovereign Bonds (continued) | | | | | | | |
| Poland – 0.11% | | | | | | | |
| | Poland Government 5.50% 10/25/19 | | PLN | | 164,000 | | $ | 58,255 |
| | Poland Government International | | | | | | | |
| | 5.125% 4/21/21 | | USD | | 49,000 | | | 51,083 |
| | | | | | | | | 109,338 |
| Russia – 0.06% | | | | | | | |
| | Russian-Eurobond 7.50% 3/31/30 | | | | 56,225 | | | 67,329 |
| | | | | | | | | 67,329 |
| South Africa – 0.14% | | | | | | | |
| | South Africa Government 8.00% 12/21/18 | | ZAR | | 990,000 | | | 147,321 |
| | | | | | | | | 147,321 |
| Sweden – 0.29% | | | | | | | |
| | Swedish Government | | | | | | | |
| | 3.00% 7/12/16 | | SEK | | 1,000,000 | | | 164,734 |
| | 5.00% 12/1/20 | | SEK | | 680,000 | | | 130,274 |
| | | | | | | | | 295,008 |
| Turkey – 0.09% | | | | | | | |
| | Republic of Turkey | | | | | | | |
| | 6.875% 3/17/36 | | USD | | 55,000 | | | 60,979 |
| | 7.375% 2/5/25 | | | | 30,000 | | | 35,775 |
| | | | | | | | | 96,754 |
| Total Sovereign Bonds (cost $4,177,659) | | | | | | | 4,680,758 |
| | |
| Supranational Banks – 0.35% | | | | | | | |
| | Inter-American Development Bank | | | | | | | |
| | 5.375% 5/27/14 | | AUD | | 232,000 | | | 258,475 |
| | International Bank for Reconstruction & | | | | | | | |
| | Development 3.375% 4/30/15 | | NOK | | 530,000 | | | 99,049 |
| Total Supranational Banks (cost $286,933) | | | | | | | 357,524 |
| | |
| U.S. Treasury Obligations – 9.94% | | | | | | | |
| | U.S. Treasury Bonds | | | | | | | |
| | 4.25% 11/15/40 | | USD | | 335,000 | | | 341,595 |
| | 4.75% 2/15/41 | | | | 291,000 | | | 322,374 |
29
Statement of net assets
Delaware Core Plus Bond Fund
| | | | Principal amount° | | Value (U.S. $) |
| U.S. Treasury Obligations (continued) | | | | | | | |
| | U.S. Treasury Notes | | | | | | | |
| | *1.50% 6/30/16 | | USD | | 6,205,000 | | $ | 6,253,505 |
| | *3.125% 5/15/21 | | | | 3,250,000 | | | 3,339,362 |
| Total U.S. Treasury Obligations (cost $10,052,272) | | | | | | | 10,256,836 |
| |
| | | | Number of shares | | | |
| Preferred Stock – 0.54% | | | | | | | |
| | Alabama Power 5.625% | | | | 3,715 | | | 92,875 |
| # | Ally Financial 144A 7.00% | | | | 200 | | | 181,713 |
| • | PNC Financial Services Group 8.25% | | | | 260,000 | | | 278,777 |
| Total Preferred Stock (cost $536,469) | | | | | | | 553,365 |
| |
| | | | Number of contracts | | | |
| Purchased Options – 0.02% | | | | | | | |
| Put Options – 0.02% | | | | | | | |
| | U.S. 10 yr futures, strike price $123.00, | | | | | | | |
| | expires 8/26/11 | | | | 44 | | | 13,750 |
| | U.S. 10 yr futures, strike price $121.00, | | | | | | | |
| | expires 9/23/11 | | | | 7 | | | 3,281 |
| Total Purchased Options (cost $34,384) | | | | | | | 17,031 |
| |
| | | | Principal amount° | | | |
| Short-Term Investments – 12.25% | | | | | | | |
| ≠Discount Notes – 5.18% | | | | | | | |
| | Federal Home Loan Bank | | | | | | | |
| | 0.006% 8/3/11 | | USD | | 436,128 | | | 436,127 |
| | 0.01% 8/11/11 | | | | 1,326,759 | | | 1,326,749 |
| | 0.015% 9/1/11 | | | | 92,464 | | | 92,456 |
| | 0.02% 9/20/11 | | | | 184,927 | | | 184,901 |
| | 0.04% 11/2/11 | | | | 184,927 | | | 184,870 |
| | 0.05% 8/6/11 | | | | 2,281,361 | | | 2,281,361 |
| | Freddie Mac | | | | | | | |
| | 0.001% 8/15/11 | | | | 221,721 | | | 221,718 |
| | 0.05% 11/2/11 | | | | 612,645 | | | 612,455 |
| | | | | | | | | 5,340,637 |
30
| | | | Principal amount° | | Value (U.S. $) | |
| Short-Term Investments (continued) | | | | | | | | |
| Repurchase Agreement – 0.76% | | | | | | | | |
| | BNP Paribas 0.14%, dated 7/29/11, to be | | | | | | | | |
| | repurchased on 8/1/11, repurchase | | | | | | | | |
| | price $781,009 (collateralized by | | | | | | | | |
| | U.S. government obligations 3.875% | | | | | | | | |
| | 4/15/29, market value $796,259) | | USD | | 780,646 | | $ | 780,646 | |
| | | | | | | | | 780,646 | |
| ≠U.S. Treasury Bills, Bonds, and Notes – 6.31% | | | | | | | | |
| | U.S. Treasury Bills | | | | | | | | |
| | 0.002% 8/11/11 | | | | 2,418,227 | | | 2,418,056 | |
| | 0.037% 8/4/11 | | | | 4,096,502 | | | 4,096,416 | |
| | | | | | | | | 6,514,472 | |
| Total Short-Term Investments (cost $12,636,797) | | | | | | | 12,635,755 | |
| | |
| Total Value of Securities Before Securities | | | | | | | | |
| | Lending Collateral – 108.91% (cost $108,154,015) | | | | | | | 112,356,972 | |
| | |
| | | | Number of shares | | | | |
| Securities Lending Collateral** – 6.27% | | | | | | | | |
| | Investment Companies | | | | | | | | |
| | BNY Mellon SL DBT II Liquidating Fund | | | | 8,195 | | | 7,909 | |
| | Delaware Investments Collateral Fund No. 1 | | | | 6,465,951 | | | 6,465,951 | |
| | @†Mellon GSL Reinvestment Trust II | | | | 12,695 | | | 0 | |
| Total Securities Lending Collateral (cost $6,486,841) | | | | | | | 6,473,860 | |
| | |
| Total Value of Securities – 115.18% | | | | | | | | |
| | (cost $114,640,856) | | | | | | | 118,830,832 | © |
| Obligation to Return Securities | | | | | | | | |
| | Lending Collateral** – (6.29%) | | | | | | | (6,486,841 | ) |
| Other Liabilities Net of Receivables and | | | | | | | | |
| | Other Assets – (8.89%) | | | | | | | (9,175,427 | ) |
| Net Assets Applicable to 12,244,524 | | | | | | | | |
| | Shares Outstanding – 100.00% | | | | | | $ | 103,168,564 | |
31
Statement of net assets
Delaware Core Plus Bond Fund
| | | | Value (U.S. $) | |
| | | |
| Net Asset Value – Delaware Core Plus Bond Fund | | | | |
| | Class A ($74,106,959 / 8,799,228 Shares) | | | | $8.42 | |
| Net Asset Value – Delaware Core Plus Bond Fund | | | | |
| | Class B ($1,921,062 / 228,099 Shares) | | | | $8.42 | |
| Net Asset Value – Delaware Core Plus Bond Fund | | | | |
| | Class C ($10,146,278 / 1,203,390 Shares) | | | | $8.43 | |
| Net Asset Value – Delaware Core Plus Bond Fund | | | | |
| | Class R ($6,789,232 / 803,544 Shares) | | | | $8.45 | |
| Net Asset Value – Delaware Core Plus Bond Fund | | | | |
| | Institutional Class ($10,205,033 / 1,210,263 Shares) | | | | $8.43 | |
| | |
| Components of Net Assets at July 31, 2011: | | | | |
| Shares of beneficial interest (unlimited authorization – no par) | | | $104,099,022 | |
| Undistributed net investment income | | | 681,367 | |
| Accumulated net realized loss on investments | | | (5,940,028 | ) |
| Net unrealized appreciation of investments and foreign currencies | | | 4,328,203 | |
| Total net assets | | | $103,168,564 | |
°Principal amount is stated in the currency in which each security is denominated.
AUD — Australian Dollar
CAD — Canadian Dollar
CHF — Swiss Franc
CLP — Chilean Peso
COP — Colombian Peso
EUR — European Monetary Unit
GBP — British Pound Sterling
IDR — Indonesian Rupiah
JPY — Japanese Yen
KRW — South Korean Won
MXN — Mexican Peso
NOK — Norwegian Kroner
PLN — Polish Zloty
SEK — Swedish Krona
USD — United States Dollar
ZAR — South African Rand
32
| | |
| • | Variable rate security. The rate shown is the rate as of July 31, 2011. Interest rates reset periodically. |
| w | Pass Through Agreement. Security represents the contractual right to receive a proportionate amount of underlying payments due to the counterparty pursuant to various agreements related to the rescheduling of obligations and the exchange of certain notes. |
| # | Security exempt from registration under Rule 144A of the Securities Act of 1933, as amended. At July 31, 2011, the aggregate amount of Rule 144A securities was $13,537,414, which represented 13.12% of the Fund’s net assets. See Note 10 in “Notes to financial statements.” |
| * | Fully or partially on loan. |
| Φ | Step coupon bond. Coupon increases or decreases periodically based on a predetermined schedule. Stated rate in effect at July 31, 2011. |
| @ | Illiquid security. At July 31, 2011, the aggregate amount of illiquid securities was $295,962, which represented 0.29% of the Fund’s net assets. See Note 10 in “Notes to financial statements.” |
| = | Security is being fair valued in accordance with the Fund’s fair valuation policy. At July 31, 2011, the aggregate amount of fair valued securities was $0, which represented 0.00% of the Fund’s net assets. See Note 1 in “Notes to financial statements.” |
| ‡ | Non income producing security. Security is currently in default. |
| Δ | Securities have been classified by country of origin. |
| « | Senior Secured Loans generally pay interest at rates which are periodically redetermined by reference to a base lending rate plus a premium. These base lending rates are generally: (i) the prime rate offered by one or more United States banks, (ii) the lending rate offered by one or more European banks such as the London Inter-Bank Offered Rate (LIBOR), and (iii) the certificate of deposit rate. Senior Secured Loans may be subject to restrictions on resale. Stated rate in effect at July 31, 2011. |
| † | Non income producing security. |
| ≠ | The rate shown is the effective yield at the time of purchase. |
| ** | See Note 9 in “Notes to financial statements.” |
| © | Includes $9,910,422 of securities loaned. |
33
Statement of net assets
Delaware Core Plus Bond Fund
| |
Summary of abbreviations:
ARM — Adjustable Rate Mortgage
BAML — Bank of America Merrill Lynch
BCLY — Barclays Bank
CDS — Credit Default Swap
CITI — Citigroup Global Markets
GCM — Greenwich Capital Management
GNMA — Government National Mortgage Association
GPM — Graduated Payment Mortgage
GSC — Goldman Sachs Capital
GSMPS — Goldman Sachs Reperforming Mortgage Securities
HSBC — Hong Kong Shanghai Bank
HY — High Yield
JPMC — JPMorgan Chase Bank
MASTR — Mortgage Asset Securitization Transactions, Inc.
MSC — Morgan Stanley Capital
NCUA — National Credit Union Administration
PIK — Pay-in-kind
REIT — Real Estate Investment Trust
REMIC — Real Estate Mortgage Investment Conduit
S.F. — Single Family
TBA — To be announced
yr — Year |
| Net Asset Value and Offering Price Per Share – | | |
| Delaware Core Plus Bond Fund | | |
| Net asset value Class A (A) | | $8.42 |
| Sales charge (4.50% of offering price) (B) | | 0.40 |
| Offering price | | $8.82 |
| (A) | Net asset value per share, as illustrated, is the amount which would be paid upon redemption or repurchase of shares. |
| (B) | See the current prospectus for purchases of $100,000 or more. |
34
| |
| The following foreign currency exchange contracts, futures contracts, options contracts and swap contracts were outstanding at July 31, 20111: |
| |
| Foreign Currency Exchange Contracts |
| | | | | | | | | | | | | | Unrealized |
| | | Contracts to | | | | | | | | | | Appreciation |
| Counterparty | | | Receive (Deliver) | | | In Exchange For | | Settlement Date | | (Depreciation) |
| BAML | | AUD | (328,438 | ) | | USD | 354,429 | | | | 9/2/11 | | | | $ | (4,624 | ) |
| BAML | | COP | 176,150,000 | | | USD | (99,436 | ) | | | 9/2/11 | | | | | (502 | ) |
| BAML | | EUR | 51,823 | | | USD | (74,516 | ) | | | 8/1/11 | | | | | (54 | ) |
| BAML | | EUR | (140,880 | ) | | USD | 202,170 | | | | 9/2/11 | | | | | (103 | ) |
| BAML | | IDR | 1,028,400,000 | | | USD | (120,520 | ) | | | 8/26/11 | | | | | (15 | ) |
| BAML | | NOK | (1,380,850 | ) | | USD | 254,631 | | | | 9/2/11 | | | | | (1,274 | ) |
| BCLY | | AUD | (47,830 | ) | | USD | 51,616 | | | | 9/2/11 | | | | | (673 | ) |
| CITI | | EUR | (98,791 | ) | | USD | 141,886 | | | | 9/2/11 | | | | | 44 | |
| CITI | | SEK | 1,036,680 | | | USD | (163,156 | ) | | | 8/2/11 | | | | | 1,582 | |
| GCM | | AUD | 410,000 | | | USD | (448,200 | ) | | | 8/2/11 | | | | | 1,984 | |
| GCM | | NOK | (449,195 | ) | | USD | 82,992 | | | | 9/2/11 | | | | | (254 | ) |
| GSC | | GBP | (43,893 | ) | | USD | 70,105 | | | | 9/2/11 | | | | | (551 | ) |
| HSBC | | EUR | (10,163 | ) | | USD | 14,598 | | | | 9/2/11 | | | | | 7 | |
| HSBC | | KRW | 84,392,000 | | | USD | (80,000 | ) | | | 9/2/11 | | | | | (163 | ) |
| HSBC | | NOK | (573,214 | ) | | USD | 105,704 | | | | 9/2/11 | | | | | (526 | ) |
| JPMC | | CLP | 39,540,000 | | | USD | (85,170 | ) | | | 9/2/11 | | | | | 1,460 | |
| JPMC | | EUR | (62,448 | ) | | USD | 89,613 | | | | 9/2/11 | | | | | (49 | ) |
| MSC | | CHF | 67,093 | | | USD | (83,459 | ) | | | 9/2/11 | | | | | 1,763 | |
| MSC | | EUR | (124,899 | ) | | USD | 179,468 | | | | 9/2/11 | | | | | 140 | |
| MSC | | JPY | (3,796,460 | ) | | USD | 48,552 | | | | 9/2/11 | | | | | (786 | ) |
| MSC | | KRW | 243,145,500 | | | USD | (229,860 | ) | | | 9/2/11 | | | | | 163 | |
| MSC | | NOK | 1,097,485 | | | USD | (202,264 | ) | | | 8/2/11 | | | | | 1,520 | |
| MSC | | NOK | (885,776 | ) | | USD | 163,699 | | | | 9/2/11 | | | | | (457 | ) |
| | | | | | | | | | | | | | | | $ | (1,368 | ) |
35
Statement of net assets
Delaware Core Plus Bond Fund
| | | | | | | | | |
| Futures Contracts | | | | | | | | |
| | | | | | | | | Unrealized |
| | | | | | | | | Appreciation |
| Contract to Buy | | | Notional Cost | | Notional Value | | Expiration Date | | (Depreciation) |
| 10 U.S. Treasury 10 yr Notes | | $1,246,366 | | $1,256,875 | | 9/21/11 | | $10,509 |
Swap Contracts
CDS Contracts
| | | | | | | | Annual | | | | Unrealized |
| | | | | | | | Protection | | Termination | | Appreciation |
| Counterparty | | Swap & Referenced Obligation | | | Notional Value | | Payments | | Date | | (Depreciation) |
| | | Protection Purchased: | | | | | | | | | | | |
| BAML | | CDX.NA.HY.16 | | $ | 2,105,000 | | 5.00% | | 6/20/16 | | $ | 32,187 | |
| BAML | | Kingdom of Spain 5 yr CDS | | | 288,000 | | 1.00% | | 12/20/15 | | | 1,337 | |
| | | ITRAXX Europe Subordinate | | | | | | | | | | | |
| BCLY | | Financials 15.1 5 yr CDS | | | 1,040,000 | | 1.00% | | 6/20/16 | | | 16,792 | |
| | | Kingdom of Spain | | | | | | | | | | | |
| BCLY | | 5 yr CDS | | | 240,000 | | 1.00% | | 3/20/15 | | | 16,866 | |
| BCLY | | 5 yr CDS | | | 140,000 | | 1.00% | | 3/21/16 | | | 1,127 | |
| | | United States of America | | | | | | | | | | | |
| BCLY | | 5 yr CDS | | | 159,000 | | 0.25% | | 3/20/16 | | | 1,568 | |
| CITI | | Sara Lee 5 yr CDS | | | 90,000 | | 1.00% | | 3/20/16 | | | (5,647 | ) |
| | | ITRAXX Europe Subordinate | | | | | | | | | | | |
| JPMC | | Financials 15.1 5 yr CDS | | | 780,000 | | 1.00% | | 6/20/16 | | | 26,441 | |
| JPMC | | Portuguese Republic 5 yr CDS | | | 156,000 | | 1.00% | | 6/20/15 | | | 40,035 | |
| JPMC | | Viacom 5 yr CDS | | | 250,000 | | 1.00% | | 9/20/15 | | | (4,500 | ) |
| MSC | | Kingdom of Spain 5 yr CDS | | | 200,000 | | 1.00% | | 6/20/16 | | | 5,335 | |
| | | | | $ | 5,448,000 | | | | | | $ | 131,541 | |
36
Swap Contracts (continued)
| | | | | | | | Annual | | | | Unrealized |
| | | | | | | | Protection | | Termination | | Appreciation |
| Counterparty | | Swap & Referenced Obligation | | | Notional Value | | Payments | | Date | | (Depreciation) |
| | | Protection Sold / Moody’s Rating: | | | | | | | | | |
| CITI | | MetLife 5 yr CDS / A | | $ | 80,000 | | 5.00% | | 9/20/14 | | $ | 5,394 | |
| JPMC | | Comcast 5 yr CDS / Baa | | | 250,000 | | 1.00% | | 9/20/15 | | | 6,158 | |
| JPMC | | MetLife 5 yr CDS / A | | | 275,000 | | 1.00% | | 9/20/16 | | | (549 | ) |
| JPMC | | Tyson Foods CDS / Ba | | | 145,000 | | 1.00% | | 3/20/16 | | | 1,024 | |
| | | | | $ | 750,000 | | | | | | $ | 12,027 | |
| Total | | | | | | | | | | | $ | 143,568 | |
The use of foreign currency exchange contracts, futures contracts, options contracts and swap contracts involves elements of market risk and risks in excess of the amounts recognized in the financial statements. The notional values presented above represent the Fund’s total exposure in such contracts, whereas only the net unrealized appreciation (depreciation) is reflected in the Fund’s net assets.
1See Note 8 in “Notes to financial statements.”
See accompanying notes, which are an integral part of the financial statements.
37
| Statement of assets and liabilities |
| Delaware Core Plus Bond Fund | Year Ended July 31, 2011 |
| Assets: | | | |
| Investments, at value1 | | $ | 99,704,186 |
| Short-term investments, at value | | | 12,635,755 |
| Short-term investments held as collateral for loaned securities, at value | | | 6,473,860 |
| Cash | | | 585,781 |
| Foreign currencies, at value | | | 361,757 |
| Receivable for fund shares sold | | | 243,500 |
| Receivable for securities sold | | | 7,699,094 |
| Unrealized gain on foreign currency contracts | | | 7,110 |
| Dividends and interest receivable | | | 970,658 |
| Securities lending income receivable | | | 525 |
| Unrealized gain on credit default swap contracts, | | | |
| (including up front payments received $213,279) | | | 356,847 |
| Purchased options, at value (including costs of $34,384) | | | 17,031 |
| Variation margin receivable on futures contracts | | | 11,875 |
| Total assets | | | 129,067,979 |
| |
| Liabilities: | | | |
| Payable for securities purchased | | | 19,038,837 |
| Payable for fund shares redeemed | | | 124,751 |
| Unrealized loss on foreign currency contracts | | | 8,478 |
| Obligation to return securities lending collateral | | | 6,486,841 |
| Annual protection payments on credit default swaps | | | 15,180 |
| Distributions payable | | | 90,490 |
| Due to manager and affiliates | | | 59,114 |
| Other accrued expenses | | | 70,621 |
| Other liabilities | | | 5,103 |
| Total liabilities | | | 25,899,415 |
| |
| Total Net Assets | | $ | 103,168,564 |
| |
| Investments, at cost | | $ | 95,886,342 |
| Short-term investments, at cost | | | 12,636,797 |
| Short-term investments held as collateral for loaned securities, at cost | | | 6,486,841 |
| Foreign currencies, at cost | | | 358,915 |
| | | | |
| 1including securities on loaned | | | 9,910,422 |
See accompanying notes, which are an integral part of the financial statements.
39
| Statement of operations |
| Delaware Core Plus Bond Fund | Year Ended July 31, 2011 |
| Investment Income: | | | | | | | | |
| Interest | | $ | 4,061,678 | | | | | |
| Dividends | | | 32,835 | | | | | |
| Securities lending income | | | 6,478 | | | | | |
| Foreign tax withheld | | | (6,363 | ) | | $ | 4,094,628 | |
| |
| Expenses: | | | | | | | | |
| Management fees | | | 549,468 | | | | | |
| Distribution expenses – Class A | | | 215,895 | | | | | |
| Distribution expenses – Class B | | | 24,518 | | | | | |
| Distribution expenses – Class C | | | 100,394 | | | | | |
| Distribution expenses – Class R | | | 38,011 | | | | | |
| Dividend disbursing and transfer agent fees and expenses | | | 194,162 | | | | | |
| Registration fees | | | 65,874 | | | | | |
| Reports and statements to shareholders | | | 39,681 | | | | | |
| Accounting and administration expenses | | | 39,328 | | | | | |
| Pricing fees | | | 23,775 | | | | | |
| Dues and services | | | 19,980 | | | | | |
| Legal fees | | | 17,486 | | | | | |
| Audit and tax | | | 15,875 | | | | | |
| Custodian fees | | | 15,316 | | | | | |
| Trustees’ fees | | | 5,437 | | | | | |
| Insurance fees | | | 3,517 | | | | | |
| Consulting fees | | | 1,085 | | | | | |
| Trustees’ expenses | | | 356 | | | | 1,370,158 | |
| Less fees waived | | | | | | | (340,086 | ) |
| Less waived distribution expenses – Class A | | | | | | | (35,982 | ) |
| Less waived distribution expenses – Class R | | | | | | | (6,335 | ) |
| Less expense paid indirectly | | | | | | | (271 | ) |
| Total operating expenses | | | | | | | 987,484 | |
| Net Investment Income | | | | | | | 3,107,144 | |
40
| Net Realized and Unrealized Gain (Loss) on Investments | | | | |
| and Foreign Currencies: | | | | |
| Net realized gain (loss) on: | | | | |
| Investments | | $ | 3,109,829 | |
| Futures contracts | | | 303,909 | |
| Swap contracts | | | (245,955 | ) |
| Foreign currencies | | | 267,482 | |
| Foreign currency exchange contracts | | | (433,059 | ) |
| Net realized gain | | | 3,002,206 | |
| Net change in unrealized appreciation/depreciation of | | | | |
| investments and foreign currencies | | | 125,003 | |
| Net Realized and Unrealized Gain on Investments | | | | |
| and Foreign Currencies | | | 3,127,209 | |
| | | | | |
| Net Increase in Net Assets Resulting from Operations | | $ | 6,234,353 | |
See accompanying notes, which are an integral part of the financial statements.
41
Statements of changes in net assets
Delaware Core Plus Bond Fund
| | | Year Ended |
| | | 7/31/11 | | | 7/31/10 |
| Increase in Net Assets from Operations: | | | | | | | | |
| Net investment income | | $ | 3,107,144 | | | $ | 4,110,652 | |
| Net realized gain on investments | | | 3,002,206 | | | | 4,954,123 | |
| Net change in unrealized appreciation/depreciation of | | | | | | | | |
| investments and foreign currencies | | | 125,003 | | | | 1,839,607 | |
| Net increase in net assets resulting from operations | | | 6,234,353 | | | | 10,904,382 | |
| | | | | | | | | |
| Dividends and Distributions to Shareholders from: | | | | | | | | |
| Net investment income: | | | | | | | | |
| Class A | | | (2,692,377 | ) | | | (3,232,187 | ) |
| Class B | | | (73,235 | ) | | | (149,725 | ) |
| Class C | | | (300,326 | ) | | | (295,498 | ) |
| Class R | | | (221,490 | ) | | | (171,993 | ) |
| Institutional Class | | | (361,456 | ) | | | (293,980 | ) |
| | | | (3,648,884 | ) | | | (4,143,383 | ) |
| | | | | | | | | |
| Capital Share Transactions: | | | | | | | | |
| Proceeds from shares sold: | | | | | | | | |
| Class A | | | 14,524,148 | | | | 15,684,077 | |
| Class B | | | 175,113 | | | | 219,426 | |
| Class C | | | 3,008,528 | | | | 5,398,787 | |
| Class R | | | 1,536,474 | | | | 6,133,846 | |
| Institutional Class | | | 3,867,519 | | | | 12,178,149 | |
| | | | | | | | | |
| Net asset value of shares issued upon reinvestment | | | | | | | | |
| of dividends and distributions: | | | | | | | | |
| Class A | | | 2,029,075 | | | | 2,412,416 | |
| Class B | | | 50,956 | | | | 102,930 | |
| Class C | | | 253,725 | | | | 207,879 | |
| Class R | | | 219,660 | | | | 155,838 | |
| Institutional Class | | | 335,273 | | | | 261,515 | |
| | | | 26,000,471 | | | | 42,754,863 | |
42
| | | Year Ended |
| | | 7/31/11 | | 7/31/10 |
| Capital Share Transactions (continued): | | | | | | | | |
| Cost of shares repurchased: | | | | | | | | |
| Class A | | $ | (16,944,204 | ) | | $ | (15,418,790 | ) |
| Class B | | | (1,553,045 | ) | | | (1,913,917 | ) |
| Class C | | | (3,380,775 | ) | | | (1,970,515 | ) |
| Class R | | | (1,153,381 | ) | | | (736,001 | ) |
| Institutional Class | | | (2,893,560 | ) | | | (7,469,683 | ) |
| | | | (25,924,965 | ) | | | (27,508,906 | ) |
| | | | | | | | | |
| Increase in net assets derived from | | | | | | | | |
| capital share transactions | | | 75,506 | | | | 15,245,957 | |
| Net Increase in Net Assets | | | 2,660,975 | | | | 22,006,956 | |
| | | | | | | | | |
| Net Assets: | | | | | | | | |
| Beginning of year | | | 100,507,589 | | | | 78,500,633 | |
| End of year (including undistributed net investment | | | | | | | | |
| income of $681,367 and $1,179,193, respectively) | | $ | 103,168,564 | | | $ | 100,507,589 | |
See accompanying notes, which are an integral part of the financial statements.
43
Financial highlights
Delaware Core Plus Bond Fund Class A
Selected data for each share of the Fund outstanding throughout each period were as follows:
| Net asset value, beginning of period |
| |
| Income (loss) from investment operations: |
| Net investment income1 |
| Net realized and unrealized gain (loss) on investments and foreign currencies |
| Total from investment operations |
| |
| Less dividends and distributions from: |
| Net investment income |
| Total dividends and distributions |
| |
| Net asset value, end of period |
| |
| Total return2 |
| |
| Ratios and supplemental data: |
| Net assets, end of period (000 omitted) |
| Ratio of expenses to average net assets |
| Ratio of expenses to average net assets |
| prior to fees waived and expense paid indirectly |
| Ratio of net investment income to average net assets |
| Ratio of net investment income to average net assets |
| prior to fees waived and expense paid indirectly |
| Portfolio turnover |
1 The average shares outstanding method has been applied for per share information for the years ended July 31, 2011, 2010, 2009 and 2008. |
2 Total investment return is based on the change in net asset value of a share during the period and assumes reinvestment of dividends and distributions at net asset value and does not reflect the impact of a sales charge. Total investment return during all of the period shown reflects waivers by the manager and distributor. Performance would have been lower had the waivers not been in effect. |
See accompanying notes, which are an integral part of the financial statements.
44
| | | Year Ended | |
| | | 7/31/11 | | 7/31/10 | | 7/31/09 | | 7/31/08 | | 7/31/07 | |
| | | | $8.220 | | | | $7.620 | | | | $7.260 | | | | $7.310 | | | | $7.330 | | |
| | | | | | | | | | | | | | | | | | | | | | |
| | | | | | | | | | | | | | | | | | | | | | |
| | | | 0.264 | | | | 0.366 | | | | 0.367 | | | | 0.332 | | | | 0.305 | | |
| | | | 0.244 | | | | 0.606 | | | | 0.395 | | | | (0.038 | ) | | | 0.015 | | |
| | | | 0.508 | | | | 0.972 | | | | 0.762 | | | | 0.294 | | | | 0.320 | | |
| | | | | | | | | | | | | | | | | | | | | | |
| | | | | | | | | | | | | | | | | | | | | | |
| | | | (0.308 | ) | | | (0.372 | ) | | | (0.402 | ) | | | (0.344 | ) | | | (0.340 | ) | |
| | | | (0.308 | ) | | | (0.372 | ) | | | (0.402 | ) | | | (0.344 | ) | | | (0.340 | ) | |
| | | | | | | | | | | | | | | | | | | | | | |
| | | | $8.420 | | | | $8.220 | | | | $7.620 | | | | $7.260 | | | | $7.310 | | |
| | | | | | | | | | | | | | | | | | | | | | |
| | | | 6.32% | | | | 13.03% | | | | 11.13% | | | | 4.18% | | | | 4.40% | | |
| | | | | | | | | | | | | | | | | | | | | | |
| | | | | | | | | | | | | | | | | | | | | | |
| | | | $74,107 | | | | $72,618 | | | | $64,746 | | | | $58,485 | | | | $64,620 | | |
| | | | 0.90% | | | | 0.91% | | | | 0.98% | | | | 0.95% | | | | 1.02% | | |
| | | | | | | | | | | | | | | | | | | | | | |
| | | | 1.29% | | | | 1.34% | | | | 1.32% | | | | 1.24% | | | | 1.30% | | |
| | | | 3.20% | | | | 4.60% | | | | 5.20% | | | | 4.47% | | | | 4.11% | | |
| | | | | | | | | | | | | | | | | | | | | | |
| | | | 2.81% | | | | 4.17% | | | | 4.86% | | | | 4.18% | | | | 3.83% | | |
| | | | 293% | | | | 264% | | | | 244% | | | | 331% | | | | 338% | | |
45
Financial highlights
Delaware Core Plus Bond Fund Class B
Selected data for each share of the Fund outstanding throughout each period were as follows:
| Net asset value, beginning of period |
| |
| Income (loss) from investment operations: |
| Net investment income1 |
| Net realized and unrealized gain (loss) on investments and foreign currencies |
| Total from investment operations |
| |
| Less dividends and distributions from: |
| Net investment income |
| Total dividends and distributions |
| |
| Net asset value, end of period |
| |
| Total return2 |
| |
| Ratios and supplemental data: |
| Net assets, end of period (000 omitted) |
| Ratio of expenses to average net assets |
| Ratio of expenses to average net assets |
| prior to fees waived and expense paid indirectly |
| Ratio of net investment income to average net assets |
| Ratio of net investment income to average net assets |
| prior to fees waived and expense paid indirectly |
| Portfolio turnover |
1 The average shares outstanding method has been applied for per share information for the years ended July 31, 2011, 2010, 2009 and 2008. |
2 Total investment return is based on the change in net asset value of a share during the period and assumes reinvestment of dividends and distributions at net asset value and does not reflect the impact of a sales charge. Total investment return during all of the periods shown reflects a waiver by the manager. Performance would have been lower had the waiver not been in effect. |
See accompanying notes, which are an integral part of the financial statements.
46
| | | Year Ended | |
| | | 7/31/11 | | 7/31/10 | | 7/31/09 | | 7/31/08 | | 7/31/07 | |
| | | | $8.220 | | | | $7.620 | | | | $7.260 | | | | $7.310 | | | | $7.330 | | |
| | | | | | | | | | | | | | | | | | | | | | |
| | | | | | | | | | | | | | | | | | | | | | |
| | | | 0.202 | | | | 0.305 | | | | 0.314 | | | | 0.276 | | | | 0.251 | | |
| | | | 0.245 | | | | 0.608 | | | | 0.396 | | | | (0.038 | ) | | | 0.015 | | |
| | | | 0.447 | | | | 0.913 | | | | 0.710 | | | | 0.238 | | | | 0.266 | | |
| | | | | | | | | | | | | | | | | | | | | | |
| | | | | | | | | | | | | | | | | | | | | | |
| | | | (0.247 | ) | | | (0.313 | ) | | | (0.350 | ) | | | (0.288 | ) | | | (0.286 | ) | |
| | | | (0.247 | ) | | | (0.313 | ) | | | (0.350 | ) | | | (0.288 | ) | | | (0.286 | ) | |
| | | | | | | | | | | | | | | | | | | | | | |
| | | | $8.420 | | | | $8.220 | | | | $7.620 | | | | $7.260 | | | | $7.310 | | |
| | | | | | | | | | | | | | | | | | | | | | |
| | | | 5.53% | | | | 12.19% | | | | 10.31% | | | | 3.40% | | | | 3.65% | | |
| | | | | | | | | | | | | | | | | | | | | | |
| | | | | | | | | | | | | | | | | | | | | | |
| | | | $1,921 | | | | $3,197 | | | | $4,494 | | | | $7,472 | | | | $10,922 | | |
| | | | 1.65% | | | | 1.66% | | | | 1.73% | | | | 1.70% | | | | 1.74% | | |
| | | | | | | | | | | | | | | | | | | | | | |
| | | | 1.99% | | | | 2.04% | | | | 2.02% | | | | 1.94% | | | | 2.00% | | |
| | | | 2.45% | | | | 3.85% | | | | 4.45% | | | | 3.72% | | | | 3.39% | | |
| | | | | | | | | | | | | | | | | | | | | | |
| | | | 2.11% | | | | 3.47% | | | | 4.16% | | | | 3.48% | | | | 3.13% | | |
| | | | 293% | | | | 264% | | | | 244% | | | | 331% | | | | 338% | | |
47
Financial highlights
Delaware Core Plus Bond Fund Class C
Selected data for each share of the Fund outstanding throughout each period were as follows:
| Net asset value, beginning of period |
| |
| Income (loss) from investment operations: |
| Net investment income1 |
| Net realized and unrealized gain (loss) on investments and foreign currencies |
| Total from investment operations |
| |
| Less dividends and distributions from: |
| Net investment income |
| Total dividends and distributions |
| |
| Net asset value, end of period |
| |
| Total return2 |
| |
| Ratios and supplemental data: |
| Net assets, end of period (000 omitted) |
| Ratio of expenses to average net assets |
| Ratio of expenses to average net assets |
| prior to fees waived and expense paid indirectly |
| Ratio of net investment income to average net assets |
| Ratio of net investment income to average net assets |
| prior to fees waived and expense paid indirectly |
| Portfolio turnover |
1 The average shares outstanding method has been applied for per share information for the years ended July 31, 2011, 2010, 2009 and 2008. |
2 Total investment return is based on the change in net asset value of a share during the period and assumes reinvestment of dividends and distributions at net asset value and does not reflect the impact of a sales charge. Total investment return during all of the periods shown reflects a waiver by the manager. Performance would have been lower had the waiver not been in effect. |
See accompanying notes, which are an integral part of the financial statements.
48
| | | Year Ended | |
| | | 7/31/11 | | 7/31/10 | | 7/31/09 | | 7/31/08 | | 7/31/07 | |
| | | | $8.230 | | | | $7.620 | | | | $7.260 | | | | $7.310 | | | | $7.330 | | |
| | | | | | | | | | | | | | | | | | | | | | |
| | | | | | | | | | | | | | | | | | | | | | |
| | | | 0.203 | | | | 0.307 | | | | 0.314 | | | | 0.276 | | | | 0.251 | | |
| | | | 0.244 | | | | 0.616 | | | | 0.396 | | | | (0.038 | ) | | | 0.015 | | |
| | | | 0.447 | | | | 0.923 | | | | 0.710 | | | | 0.238 | | | | 0.266 | | |
| | | | | | | | | | | | | | | | | | | | | | |
| | | | | | | | | | | | | | | | | | | | | | |
| | | | (0.247 | ) | | | (0.313 | ) | | | (0.350 | ) | | | (0.288 | ) | | | (0.286 | ) | |
| | | | (0.247 | ) | | | (0.313 | ) | | | (0.350 | ) | | | (0.288 | ) | | | (0.286 | ) | |
| | | | | | | | | | | | | | | | | | | | | | |
| | | | $8.430 | | | | $8.230 | | | | $7.620 | | | | $7.260 | | | | $7.310 | | |
| | | | | | | | | | | | | | | | | | | | | | |
| | | | 5.53% | | | | 12.32% | | | | 10.31% | | | | 3.40% | | | | 3.65% | | |
| | | | | | | | | | | | | | | | | | | | | | |
| | | | | | | | | | | | | | | | | | | | | | |
| | | | $10,147 | | | | $10,022 | | | | $5,813 | | | | $5,594 | | | | $5,243 | | |
| | | | 1.65% | | | | 1.66% | | | | 1.73% | | | | 1.70% | | | | 1.74% | | |
| | | | | | | | | | | | | | | | | | | | | | |
| | | | 1.99% | | | | 2.04% | | | | 2.02% | | | | 1.94% | | | | 2.00% | | |
| | | | 2.45% | | | | 3.85% | | | | 4.45% | | | | 3.72% | | | | 3.39% | | |
| | | | | | | | | | | | | | | | | | | | | | |
| | | | 2.11% | | | | 3.47% | | | | 4.16% | | | | 3.48% | | | | 3.13% | | |
| | | | 293% | | | | 264% | | | | 244% | | | | 331% | | | | 338% | | |
49
Financial highlights
Delaware Core Plus Bond Fund Class R
Selected data for each share of the Fund outstanding throughout each period were as follows:
| Net asset value, beginning of period |
| |
| Income (loss) from investment operations: |
| Net investment income1 |
| Net realized and unrealized gain (loss) on investments and foreign currencies |
| Total from investment operations |
| |
| Less dividends and distributions from: |
| Net investment income |
| Total dividends and distributions |
| |
| Net asset value, end of period |
| |
| Total return2 |
| |
| Ratios and supplemental data: |
| Net assets, end of period (000 omitted) |
| Ratio of expenses to average net assets |
| Ratio of expenses to average net assets |
| prior to fees waived and expense paid indirectly |
| Ratio of net investment income to average net assets |
| Ratio of net investment income to average net assets |
| prior to fees waived and expense paid indirectly |
| Portfolio turnover |
1 The average shares outstanding method has been applied for per share information for the years ended July 31, 2011, 2010, 2009 and 2008. |
2 Total investment return is based on the change in net asset value of a share during the period and assumes reinvestment of dividends and distributions at net asset value. Total investment return during all of the periods shown reflects waivers by the manager and distributor. Performance would have been lower had the waivers not been in effect. |
See accompanying notes, which are an integral part of the financial statements.
50
| | | Year Ended | |
| | | 7/31/11 | | 7/31/10 | | 7/31/09 | | 7/31/08 | | 7/31/07 | |
| | | | $8.240 | | | | $7.630 | | | | $7.260 | | | | $7.310 | | | | $7.340 | | |
| | | | | | | | | | | | | | | | | | | | | | |
| | | | | | | | | | | | | | | | | | | | | | |
| | | | 0.244 | | | | 0.350 | | | | 0.349 | | | | 0.313 | | | | 0.289 | | |
| | | | 0.255 | | | | 0.613 | | | | 0.406 | | | | (0.037 | ) | | | 0.005 | | |
| | | | 0.499 | | | | 0.963 | | | | 0.755 | | | | 0.276 | | | | 0.294 | | |
| | | | | | | | | | | | | | | | | | | | | | |
| | | | | | | | | | | | | | | | | | | | | | |
| | | | (0.289 | ) | | | (0.353 | ) | | | (0.385 | ) | | | (0.326 | ) | | | (0.324 | ) | |
| | | | (0.289 | ) | | | (0.353 | ) | | | (0.385 | ) | | | (0.326 | ) | | | (0.324 | ) | |
| | | | | | | | | | | | | | | | | | | | | | |
| | | | $8.450 | | | | $8.240 | | | | $7.630 | | | | $7.260 | | | | $7.310 | | |
| | | | | | | | | | | | | | | | | | | | | | |
| | | | 6.17% | | | | 12.87% | | | | 11.00% | | | | 3.92% | | | | 4.02% | | |
| | | | | | | | | | | | | | | | | | | | | | |
| | | | | | | | | | | | | | | | | | | | | | |
| | | | $6,789 | | | | $6,031 | | | | $235 | | | | $93 | | | | $206 | | |
| | | | 1.15% | | | | 1.16% | | | | 1.23% | | | | 1.20% | | | | 1.24% | | |
| | | | | | | | | | | | | | | | | | | | | | |
| | | | 1.59% | | | | 1.64% | | | | 1.62% | | | | 1.54% | | | | 1.60% | | |
| | | | 2.95% | | | | 4.35% | | | | 4.95% | | | | 4.22% | | | | 3.89% | | |
| | | | | | | | | | | | | | | | | | | | | | |
| | | | 2.51% | | | | 3.87% | | | | 4.56% | | | | 3.88% | | | | 3.53% | | |
| | | | 293% | | | | 264% | | | | 244% | | | | 331% | | | | 338% | | |
51
Financial highlights
Delaware Core Plus Bond Fund Institutional Class
Selected data for each share of the Fund outstanding throughout each period were as follows:
| Net asset value, beginning of period |
| |
| Income (loss) from investment operations: |
| Net investment income1 |
| Net realized and unrealized gain (loss) on investments and foreign currencies |
| Total from investment operations |
| |
| Less dividends and distributions from: |
| Net investment income |
| Total dividends and distributions |
| |
| Net asset value, end of period |
| |
| Total return2 |
| |
| Ratios and supplemental data: |
| Net assets, end of period (000 omitted) |
| Ratio of expenses to average net assets |
| Ratio of expenses to average net assets |
| prior to fees waived and expense paid indirectly |
| Ratio of net investment income to average net assets |
| Ratio of net investment income to average net assets |
| prior to fees waived and expense paid indirectly |
| Portfolio turnover |
1 The average shares outstanding method has been applied for per share information for the years ended July 31, 2011, 2010, 2009 and 2008.
2 Total investment return is based on the change in net asset value of a share during the period and assumes reinvestment of dividends and distributions at net asset value. Total investment return during all of the periods shown reflects a waiver by the manager. Performance would have been lower had the waiver not been in effect.
See accompanying notes, which are an integral part of the financial statements.
52
| | Year Ended |
| | | 7/31/11 | | | 7/31/10 | | 7/31/09 | | 7/31/08 | | 7/31/07 | |
| | | $8.230 | | | $7.630 | | | $7.260 | | | $7.310 | | | $7.330 | | |
| | | | | | | | | | | | | | | | | |
| | | | | | | | | | | | | | | | | |
| | | 0.285 | | | 0.388 | | | 0.384 | | | 0.350 | | | 0.325 | | |
| | | 0.245 | | | 0.605 | | | 0.406 | | | (0.037 | ) | | 0.015 | | |
| | | 0.530 | | | 0.993 | | | 0.790 | | | 0.313 | | | 0.340 | | |
| | | | | | | | | | | | | | | | | |
| | | | | | | | | | | | | | | | | |
| | | (0.330 | ) | | (0.393 | ) | | (0.420 | ) | | (0.363 | ) | | (0.360 | ) | |
| | | (0.330 | ) | | (0.393 | ) | | (0.420 | ) | | (0.363 | ) | | (0.360 | ) | |
| | | | | | | | | | | | | | | | | |
| | | $8.430 | | | $8.230 | | | $7.630 | | | $7.260 | | | $7.310 | | |
| | | | | | | | | | | | | | | | | |
| | | 6.58% | | | 13.30% | | | 11.55% | | | 4.44% | | | 4.69% | | |
| | | | | | | | | | | | | | | | | |
| | | | | | | | | | | | | | | | | |
| | | $10,205 | | | $8,640 | | | $3,213 | | | $44,191 | | | $30,693 | | |
| | | 0.65% | | | 0.66% | | | 0.73% | | | 0.70% | | | 0.74% | | |
| | | | | | | | | | | | | | | | | |
| | | 0.99% | | | 1.04% | | | 1.02% | | | 0.94% | | | 1.00% | | |
| | | 3.45% | | | 4.85% | | | 5.45% | | | 4.72% | | | 4.39% | | |
| | | | | | | | | | | | | | | | | |
| | | 3.11% | | | 4.47% | | | 5.16% | | | 4.48% | | | 4.13% | | |
| | | 293% | | | 264% | | | 244% | | | 331% | | | 338% | | |
53
Notes to financial statements
| Delaware Core Plus Bond Fund | July 31, 2011 |
Delaware Group® Government Fund (Trust) is organized as a Delaware statutory trust and offers two series: Delaware Core Plus Bond Fund and Delaware Inflation Protected Bond Fund. These financial statements and the related notes pertain to Delaware Core Plus Bond Fund (Fund). The Trust is an open-end investment company. The Fund is considered diversified under the Investment Company Act of 1940, as amended, and offers Class A, Class B, Class C, Class R and Institutional Class shares. Class A shares are sold with a maximum front-end sales charge of up to 4.50%. Class A share purchases of $1,000,000 or more will incur a contingent deferred sales charge (CDSC) of 1% if redeemed during the first year and 0.50% during the second year, provided that Delaware Distributors, L.P. (DDLP) paid a financial advisor a commission on the purchase of those shares. Class B shares may be purchased only through dividend reinvestment and certain permitted exchanges. Prior to June 1, 2007, Class B shares were sold with a CDSC that declined from 4% to zero depending upon the period of time the shares were held. Class B shares will automatically convert to Class A shares on a quarterly basis approximately eight years after purchase. Class C shares are sold with a CDSC charge of 1%, if redeemed during the first 12 months. Class R and Institutional Class shares are not subject to a sales charge and are offered for sale exclusively to certain eligible investors.
The investment objective of the Fund is to seek maximum long-term total return, consistent with reasonable risk.
1. Significant Accounting Policies
The following accounting policies are in accordance with U.S. generally accepted accounting principles (U.S. GAAP) and are consistently followed by the Fund.
Security Valuation — Securities listed on a foreign exchange are valued at the last quoted sales price on the valuation date. Short-term debt securities are valued at market value. U.S. government and agency securities are valued based upon valuations provided at the mean between the bid and ask prices. Other debt securities and credit default swap (CDS) contracts are valued by an independent pricing service or broker and reviewed by Management. To the extent current market prices are not available, the pricing service may take into account developments related to the specific security, as well as transactions in comparable securities. Investment companies are valued at net asset value per share. Foreign currency exchange contracts are valued at the mean between the bid and ask prices. Interpolated values are derived when the settlement date of the contract is an interim date for which quotations are not available. Futures contracts and options on futures contracts are valued at the daily quoted settlement prices. Generally, other securities and assets for which market quotations are not readily available are valued at fair value as determined in good faith under the direction of the Fund’s Board of Trustees (Board). In determining whether market quotations are readily available or fair valuation will be used, various factors will be taken into consideration, such as market closures or suspension of trading in a security. The Fund may use fair value pricing more frequently for securities traded primarily in non-U.S. markets because, among other things, most foreign markets close well before the Fund values its securities, generally as of 4:00 p.m. Eastern time. The earlier close of these foreign markets gives rise to the
54
possibility that significant events, including broad market moves, government actions or pronouncements, aftermarket trading, or news events may have occurred in the interim. To account for this, the Fund may frequently value foreign securities using fair value prices based on third-party vendor modeling tools (international fair value pricing).
Federal Income Taxes — No provision for federal income taxes has been made as the Fund intends to continue to qualify for federal income tax purposes as a regulated investment company under Subchapter M of the Internal Revenue Code of 1986, as amended, and make the requisite distributions to shareholders. The Fund evaluates tax positions taken or expected to be taken in the course of preparing the Fund’s tax returns to determine whether the tax positions are “more likely- than-not” of being sustained by the applicable tax authority. Tax positions not deemed to meet the more-likely-than-not threshold are recorded as a tax benefit or expense in the current year. Management has analyzed the Fund’s tax positions taken on federal income tax returns for all open tax years (July 31, 2008 – July 31, 2011), and has concluded that no provision for federal income tax is required in the Fund’s financial statements.
Class Accounting — Investment income and common expenses are allocated to the various classes of the Fund on the basis of “settled shares” of each class in relation to the net assets of the Fund. Realized and unrealized gains (loss) on investments are allocated to the various classes of the Fund on the basis of daily net assets of each class. Distribution expenses relating to a specific class are charged directly to that class.
Repurchase Agreements — The Fund may purchase certain U.S. Government securities subject to the counterparty’s agreement to repurchase them at an agreed upon date and price. The counterparty will be required on a daily basis to maintain the value of the collateral subject to the agreement at not less than the repurchase price (including accrued interest). The agreements are conditioned upon the collateral being deposited under the Federal Reserve book-entry system with the Fund’s custodian or a third party sub-custodian. In the event of default or bankruptcy by the other party to the agreement, retention of the collateral may be subject to legal proceedings. All open repurchase agreements were entered into on July 29, 2011.
To Be Announced Trades — The Fund may contract to purchase securities for a fixed price at a transaction date beyond the customary settlement period (e.g., “when issued,” “delayed delivery,” “forward commitment,” or “TBA transactions”) consistent with the Fund’s ability to manage its investment portfolio and meet redemption requests. These transactions involve a commitment by the Fund to purchase securities for a predetermined price or yield with payment and delivery taking place more than three days in the future, or after a period longer than the customary settlement period for that type of security. No interest will be earned by the Fund on such purchases until the securities are delivered; however the market value may change prior to delivery.
Mortgage Dollar Rolls — The Fund may enter into mortgage “dollar rolls�� in which the Fund sells mortgage-backed securities for delivery in the current month and simultaneously contracts to repurchase substantially similar (same type, coupon, and maturity) securities on a specified
55
Notes to financial statements
Delaware Core Plus Bond Fund
1. Significant Accounting Policies (continued)
future date. Any difference between the sale price and the purchase price is netted against the interest income foregone on the securities to arrive at an implied borrowing (reverse repurchase) rate. Alternatively, the sale and purchase transactions that constitute the dollar roll can be executed at the same price, with the Fund being paid a fee as consideration for entering into the commitment to purchase. Dollar rolls may be renewed prior to cash settlement and initially may involve only a firm commitment by the Fund to buy a security. The Fund accounts for mortgage-dollar-roll transactions as purchases and sales, these transactions will increase the Fund’s portfolio turnover rate.
Foreign Currency Transactions — Transactions denominated in foreign currencies are recorded at the prevailing exchange rates on the valuation date in accordance with the Fund’s prospectus. The value of all assets and liabilities denominated in foreign currencies is translated into U.S. dollars at the exchange rate of such currencies against the U.S. dollar daily. Transaction gains or losses resulting from changes in exchange rates during the reporting period or upon settlement of the foreign currency transaction are reported in operations for the current period. The Fund generally isolates that portion of realized gains and losses on investments in debt securities, which are due to changes in foreign exchange rates from that which are due to changes in market prices of debt securities. The Fund reports certain foreign currency related transactions as components of realized gains (losses) for financial reporting purposes, whereas such components are treated as ordinary income (loss) for federal income tax purposes.
Use of Estimates — The preparation of financial statements in conformity with U.S. GAAP requires management to make estimates and assumptions that affect the reported amounts of assets and liabilities and disclosure of contingent assets and liabilities at the date of the financial statements and the reported amounts of revenues and expenses during the reporting period. Actual results could differ from those estimates and the differences could be material.
Other — Expenses directly attributable to the Fund are charged directly to the Fund. Other expenses common to various funds within the Delaware Investments® Family of Funds are generally allocated amongst such funds on the basis of average net assets. Management fees and some other expenses are paid monthly. Security transactions are recorded on the date the securities are purchased or sold (trade date) for financial reporting purposes. Costs used in calculating realized gains and losses on the sale of investment securities are those of the specific securities sold. Dividend income is recorded on the ex-dividend date and interest income is recorded on the accrual basis. Discounts and premiums on non-convertible debt securities are amortized to interest income over the lives of the respective securities. Realized gains (losses) on paydowns of asset- and mortgage-backed securities are classified as interest income. The Fund declares dividends daily from net investment income and pays such dividends monthly and declares and pays distributions from net realized gain on investments, if any, annually. The Fund may distribute income dividends and capital gains more frequently, if necessary for tax purposes. Dividends and distributions, if any, are recorded on the ex-dividend date.
56
The Fund may receive earnings credits from its custodian when positive cash balances are maintained, which are used to offset custody fees. There were no earnings credits for the year ended July 31, 2011.
The Fund receives earnings credits from its transfer agent when positive cash balances are maintained, which are used to offset transfer agent fees. The expense paid under this arrangement is included in dividend disbursing and transfer agent fees and expenses on the statement of operations with the corresponding expense offset shown as “expense paid indirectly.” For the year ended July 31, 2011, the Fund earned the $271 under this agreement.
2. Investment Management, Administration Agreements and Other Transactions with Affiliates
In accordance with the terms of its investment management agreement, the Fund pays Delaware Management Company (DMC), a series of Delaware Management Business Trust and the investment manager, an annual fee which is calculated daily at the rate of 0.55% on the first $500 million of average daily net assets of the Fund, 0.50% on the next $500 million, 0.45% on the next $1.5 billion, and 0.425% on average daily net assets in excess of $2.5 billion.
Effective November 26, 2010, DMC has contractually agreed to waive that portion, if any, of its management fee and/or pay/reimburse the Fund to the extent necessary to ensure that total annual operating expenses (excluding any 12b-1 plan expenses, taxes, interest, inverse floater program expenses, short sale and dividend interest expenses, brokerage fees, certain insurance costs, and nonroutine expenses or costs including, but not limited to, those relating to reorganizations, litigation, conducting shareholder meetings, and liquidations (collectively, nonroutine expenses)), do not exceed 0.65% of average daily net assets of the Fund through November 28, 2011. Prior to November 26, 2010, the expense limitation was voluntary. For purposes of this waiver and reimbursement, nonroutine expenses may also include such additional costs and expenses, as may be agreed upon from time to time by the Fund’s Board and DMC. This expense waiver and reimbursement applies only to expenses paid directly by the Fund.
Delaware Service Company, Inc. (DSC), an affiliate of DMC, provides fund accounting and financial administration oversight services to the Fund. For these services, the Fund pays DSC fees based on the aggregate daily net assets of the Delaware Investments® Family of Funds at the following annual rate: 0.0050% of the first $30 billion; 0.0045% of the next $10 billion; 0.0040% of the next $10 billion; and 0.0025% of aggregate average daily net assets in excess of $50 billion. The fees payable to DSC under the service agreement described above are allocated among all Funds in the Delaware Investments Family of Funds on a relative net asset value basis. For the year ended July 31, 2011, the Fund was charged $4,953 for these services.
DSC also provides dividend disbursing and transfer agency services. The Fund paid DSC a monthly fee based on the number of shareholder accounts for dividend disbursing and transfer agent services. Effective July 18, 2011, the Fund pays DSC a monthly asset-based fee for these services.
57
Notes to financial statements
Delaware Core Plus Bond Fund
2. Investment Management, Administration Agreements and Other Transactions with Affiliates (continued)
Pursuant to a distribution agreement and distribution plan, the Fund pays DDLP, the distributor and an affiliate of DMC, an annual distribution and service fee not to exceed 0.30% of the average daily net assets of the Class A shares, 1.00% of the average daily net assets of the Class B and Class C shares and 0.60% of the average daily net assets of the Class R shares. Institutional Class shares pay no distribution and service expenses. DDLP has contracted to waive distribution and service fees of Class A and Class R shares from exceeding 0.25% and 0.50%, respectively, of average daily net assets.
The Board has adopted a formula for calculating 12b-1 plan fees for the Fund’s Class A shares that went into effect on June 1, 1992. The total 12b-1 fees to be paid by Class A shareholders of the Fund will be the sum of 0.10% of the average daily net assets representing shares that were acquired prior to June 1, 1992 and 0.30% of the average daily net assets representing shares that were acquired on or after June 1, 1992. All Class A shareholders will bear 12b-1 fees at the same rate, the blended rate based upon the allocation of the 0.10% and 0.30% rates described above. The contractual waiver is applied to the shares of the Fund that were acquired on or after June 1, 1992 in calculating the applicable 12b-1 fee rate.
At July 31, 2011, the Fund had liabilities payable to affiliates as follows:
| Investment management fee payable to DMC | $ | 20,849 |
| Dividend disbursing, transfer agent and fund accounting | | |
| oversight fees and other expenses payable to DSC | | 4,497 |
| Distribution fees payable to DDLP | | 28,550 |
| Other expenses payable to DMC and affiliates* | | 5,218 |
*DMC, as part of its administrative services, pays operating expenses on behalf of the Fund and is reimbursed on a periodic basis. Expenses include items such as printing of shareholder reports, fees for audit, legal and tax services, registration fees and trustees’ fees.
As provided in the investment management agreement, the Fund bears the cost of certain legal and tax services, including internal legal and tax services provided to the Fund by DMC and/or its affiliates’ employees. For the year ended July 31, 2011, the Fund was charged $2,418 for internal legal and tax services provided by DMC and/or its affiliates’ employees.
For the year ended July 31, 2011, DDLP earned $12,419 for commissions on sales of the Fund’s Class A shares. For the year ended July 31, 2011, DDLP received gross CDSC commissions of $2,436, $2,081 and $1,044 on redemption of the Fund’s Class A, Class B and Class C shares, respectively, and these commissions were entirely used to offset up-front commissions previously paid by DDLP to broker/dealers on sales of those shares.
Trustees’ fees include expenses accrued by the Fund for each Trustee’s retainer and meeting fees. Certain officers of DMC, DSC, and DDLP are officers and/or Trustees of the Trust. These officers and Trustees are paid no compensation by the Fund.
58
3. Investments
For the year ended July 31, 2011, the Fund made purchases of $222,935,897 and sales of $222,385,213 of investment securities other than U.S. government securities and short-term investments. For the year ended July 31, 2011, the Fund made purchases of $65,727,279 and sales of $62,360,394 of long-term U.S. government securities.
At July 31, 2011, the cost of investments for federal income tax purposes was $115,155,355. At July 31, 2011, the net unrealized appreciation was $3,675,477, of which $4,547,360 related to unrealized appreciation of investments and $871,883 related to unrealized depreciation of investments.
U.S. GAAP defines fair value as the price that the Fund would receive to sell an asset or pay to transfer a liability in an orderly transaction between market participants at the measurement date under current market conditions. A three level hierarchy for fair value measurements has been established based upon the transparency of inputs to the valuation of an asset or liability. Inputs may be observable or unobservable and refer broadly to the assumptions that market participants would use in pricing the asset or liability. Observable inputs reflect the assumptions market participants would use in pricing the asset or liability based on market data obtained from sources independent of the reporting entity. Unobservable inputs reflect the reporting entity’s own assumptions about the assumptions that market participants would use in pricing the asset or liability developed based on the best information available under the circumstances. The Fund’s investment in its entirety is assigned a level based upon the observability of the inputs which are significant to the overall valuation. The three level hierarchy of inputs is summarized below.
| Level 1 – | inputs are quoted prices in active markets for identical investments (e.g., equity securities, open-end investment companies, futures contracts, options contracts) |
| | |
| Level 2 – | other observable inputs (including, but not limited to: quoted prices for similar assets or liabilities in markets that are active, quoted prices for identical or similar assets or liabilities in markets that are not active, inputs other than quoted prices that are observable for the assets or liabilities (such as interest rates, yield curves, volatilities, prepayment speeds, loss severities, credit risks and default rates) or other market-corroborated inputs) (e.g., debt securities, government securities, swap contracts, foreign currency exchange contracts, foreign securities utilizing international fair value pricing) |
| | |
| Level 3 – | inputs are significant unobservable inputs (including the Fund’s own assumptions used to determine the fair value of investments) (e.g., broker-quoted securities, fair valued securities) |
59
Notes to financial statements
Delaware Core Plus Bond Fund
3. Investments (continued)
The following table summarizes the valuation of the Fund’s investments by fair value hierarchy levels as of July 31, 2011:
| | | Level 1 | | Level 2 | | Level 3 | | Total |
| Agency, Asset-Backed and | | | | | | | | | | | | | | |
| Mortgage-Backed Securities | | $ | — | | $ | 28,499,077 | | | $ | 105,381 | | $ | 28,604,458 | |
| Corporate Debt | | | — | | | 54,252,878 | | | | — | | | 54,252,878 | |
| Foreign Debt | | | — | | | 6,036,649 | | | | — | | | 6,036,649 | |
| U.S. Treasury Obligations | | | — | | | 10,256,836 | | | | — | | | 10,256,836 | |
| Preferred Stock | | | 92,875 | | | 460,490 | | | | — | | | 553,365 | |
| Purchased Options | | | 17,031 | | | — | | | | — | | | 17,031 | |
| Short-Term Investments | | | 780,646 | | | 11,855,109 | | | | — | | | 12,635,755 | |
| Securities Lending Collateral | | | — | | | 6,473,860 | | | | — | | | 6,473,860 | |
| Total | | $ | 890,552 | | $ | 117,834,899 | | | $ | 105,381 | | $ | 118,830,832 | |
| | | | | | | | | | | | | | | |
| Foreign Currency | | | | | | | | | | | | | | |
| Exchange Contracts | | $ | — | | $ | (1,368 | ) | | $ | — | | $ | (1,368 | ) |
| Futures Contracts | | $ | 10,509 | | $ | — | | | $ | — | | $ | 10,509 | |
| Swap Contracts | | $ | — | | $ | 143,568 | | | $ | — | | $ | 143,568 | |
The following is a reconciliation of investments in which significant unobservable inputs (Level 3) were used in determining fair value:
| | | Agency, Asset- | | | | | | | | | | | | | | | | | |
| | | Backed and | | | | | | | | | | | | | | | | | |
| | | Mortgage- | | | | | | | | | | Securities | | | | |
| | | Backed | | Corporate | | Foreign | | Lending | | | | |
| | | Securities | | Debt | | Debt | | Collateral | | Total |
| Balance as of 7/31/10 | | | $ | 275,985 | | | $ | 140,901 | | | $ | 153,491 | | | | $ | 568 | | | $ | 570,945 | |
| Purchases | | | | 101,698 | | | | — | | | | — | | | | | — | | | | 101,698 | |
| Sales | | | | (150,703 | ) | | | (148,185 | ) | | | (154,166 | ) | | | | (677 | ) | | | (453,731 | ) |
| Net realized gain | | | | 703 | | | | 10,232 | | | | 5,027 | | | | | — | | | | 15,962 | |
| Transfers out of Level 3 | | | | (119,999 | ) | | | — | | | | — | | | | | — | | | | (119,999 | ) |
| Net change in unrealized | | | | | | | | | | | | | | | | | | | | | | |
| appreciation/depreciation | | | | (2,303 | ) | | | (2,948 | ) | | | (4,352 | ) | | | | 109 | | | | (9,494 | ) |
| Balance as of 7/31/11 | | | $ | 105,381 | | | $ | — | | | $ | — | | | | $ | — | | | $ | 105,381 | |
| | | | | | | | | | | | | | | | | | | | | | | |
| Net change in unrealized | | | | | | | | | | | | | | | | | | | | | | |
| appreciation/depreciation | | | | | | | | | | | | | | | | | | | | | | |
| from investments still held | | | | | | | | | | | | | | | | | | | | | | |
| as of 7/31/11 | | | $ | 3,683 | | | $ | — | | | $ | — | | | | $ | (539 | ) | | $ | 3,144 | |
60
During the year ended July 31, 2011, the Fund made transfers out of Level 3 investments into Level 2 investments in the amount of $119,999. This was due to the Fund’s pricing vendor being able to supply a matrix price for an investment that had been utilizing a broker quoted price.
The Fund’s policy is to recognize transfers between levels at the end of the reporting period.
During the year ended July 31, 2011, there were no transfers between Level 1 investments and Level 2 investments that had a material impact to the Fund.
4. Dividend and Distribution Information
Income and long-term capital gain distributions are determined in accordance with federal income tax regulations, which may differ from U.S. GAAP. Additionally, distributions from net gains on foreign currency transactions and net short-term gains on sales of investment securities are treated as ordinary income for federal income tax purposes. The tax character of dividends and distributions paid during the years ended July 31, 2011 and 2010 was as follows:
| | | Year Ended |
| | | 7/31/11 | | 7/31/10 |
| Ordinary income | | $ | 3,648,884 | | $ | 4,143,383 |
5. Components of Net Assets on a Tax Basis
As of July 31, 2011, the components of net assets on a tax basis were as follows:
| Shares of beneficial interest | | $ | 104,099,022 | |
| Undistributed ordinary income | | | 1,425,319 | |
| Distributions payable | | | (90,490 | ) |
| Capital loss carryforwards | | | (5,324,390 | ) |
| Other temporary differences | | | (617,702 | ) |
| Unrealized appreciation of investments | | | | |
| and foreign currencies | | | 3,676,805 | |
| Net assets | | $ | 103,168,564 | |
The differences between book basis and tax basis components of net assets are primarily attributable to tax deferral of losses on wash sales, mark-to-market of futures contracts, mark-to-market of foreign currency exchange contracts, tax deferral of losses on straddles, tax treatment of market discount and premium on debt instruments, contingent payment debt instruments and tax treatment of CDS contracts.
61
Notes to financial statements
Delaware Core Plus Bond Fund
5. Components of Net Assets on a Tax Basis (continued)
For financial reporting purposes, capital accounts are adjusted to reflect the tax character of permanent book/tax differences. Reclassifications are primarily due to tax treatment of gain (loss) on foreign currency transactions, market discount and premium on certain debt instruments, paydowns of mortgage- and asset-backed securities and tax treatment of CDS contracts. Results of operations and net assets were not affected by these reclassifications. For the year ended July 31, 2011, the Fund recorded the following reclassifications:
| Undistributed net investment income | | $ | 43,914 | |
| Accumulated net realized loss | | | (43,914 | ) |
For federal income tax purposes, capital loss carryforwards may be carried forward and applied against future capital gains. $3,056,340 was utilized in 2011. Capital loss carryforwards remaining at July 31, 2011 will expire as follows: $775,390 expires in 2015, $2,286,574 expires in 2016 and $2,262,426 expires in 2017.
On December 22, 2010, the Regulated Investment Company Modernization Act of 2010 (the Act) was enacted, which changed various technical rules governing the tax treatment of regulated investment companies. The changes are generally effective for taxable years beginning after the date of enactment. Under the Act, the Fund will be permitted to carry forward capital losses incurred in taxable years beginning after the date of enactment for an unlimited period. However, any losses incurred during those future taxable years will be required to be utilized prior to the losses incurred in pre-enactment taxable years, which carry an expiration date. As a result of this ordering rule, pre-enactment capital loss carryforwards may be more likely to expire unused. Additionally, post-enactment capital loss carryforwards will retain their character as either short-term or long-term capital losses rather than being considered all short-term as permitted under previous regulation.
62
6. Capital Shares
Transactions in capital shares were as follows:
| | | Year Ended |
| | | 7/31/11 | | 7/31/10 |
| Shares sold: | | | | | | |
| Class A | | 1,762,859 | | | 1,967,658 | |
| Class B | | 21,152 | | | 27,391 | |
| Class C | | 362,750 | | | 676,367 | |
| Class R | | 185,006 | | | 773,215 | |
| Institutional Class | | 468,780 | | | 1,526,581 | |
| | | | | | | |
| Shares issued upon reinvestment of dividends and distributions: | | | | | | |
| Class A | | 245,329 | | | 303,563 | |
| Class B | | 6,162 | | | 12,994 | |
| Class C | | 30,645 | | | 26,092 | |
| Class R | | 26,465 | | | 19,345 | |
| Institutional Class | | 40,477 | | | 32,777 | |
| | | 3,149,625 | | | 5,365,983 | |
| | | | | | | |
| Shares repurchased: | | | | | | |
| Class A | | (2,047,086 | ) | | (1,932,409 | ) |
| Class B | | (188,365 | ) | | (241,282 | ) |
| Class C | | (408,278 | ) | | (246,782 | ) |
| Class R | | (139,548 | ) | | (91,736 | ) |
| Institutional Class | | (349,212 | ) | | (930,354 | ) |
| | | (3,132,489 | ) | | (3,442,563 | ) |
| Net increase | | 17,136 | | | 1,923,420 | |
For the years ended July 31, 2011 and 2010, 116,991 Class B shares were converted to 116,932 Class A shares valued at $963,598 and 158,871 Class B shares were converted to 158,871 Class A shares valued at $1,260,404, respectively. The respective amounts are included in Class B redemptions and Class A subscriptions in the table above and the statements of changes in net assets.
7. Line of Credit
The Fund, along with certain other funds in the Delaware Investments® Family of Funds (Participants), was a participant in a $35,000,000 revolving line of credit to be used for temporary or emergency purposes as an additional source of liquidity to fund redemptions of investor shares. Under the agreement, the Participants were charged an annual commitment fee, which was allocated across the Participants on the basis of each Participant’s allocation of the entire facility. The Participants were permitted to borrow up to a maximum of one third of their net assets under the agreement. The line of credit expired on November 16, 2010.
63
Notes to financial statements
Delaware Core Plus Bond Fund
7. Line of Credit (continued)
On November 16, 2010, the Fund, along with the other Participants, entered into an amendment to the agreement for a $50,000,000 revolving line of credit. Effective as of August 1, 2011, the Fund, along with the other Participants, entered into an amendment to the agreement for a $100,000,000 revolving line of credit. The agreement as amended is to be used as described above and operates in substantially the same manner as the original agreement. The new line of credit under the agreement as amended expires on November 15, 2011. The Fund had no amounts outstanding as of July 31, 2011 or at any time during the period then ended.
8. Derivatives
U.S. GAAP requires enhanced disclosures that enable investors to understand: 1) how and why an entity uses derivatives; 2) how they are accounted for; and 3) how they affect an entity’s results of operations and financial position.
Foreign Currency Exchange Contracts — The Fund enters into foreign currency exchange contracts as a way of managing foreign exchange rate risk. The Fund may enter into these contracts to fix the U.S. dollar value of a security that it has agreed to buy or sell for the period between the date the trade was entered into and the date the security is delivered and paid for. The Fund may also use these contracts to hedge the U.S. dollar value of securities it already owns that are denominated in foreign currencies. The change in value is recorded as an unrealized gain or loss. When the contract is closed, a realized gain or loss is recorded equal to the difference between the value of the contract at the time it was opened and the value at the time it was closed.
The use of foreign currency exchange contracts does not eliminate fluctuations in the underlying prices of the securities, but does establish a rate of exchange that can be achieved in the future. Although foreign currency exchange contracts limit the risk of loss due to an unfavorable change in the value of the hedged currency, they also limit any potential gain that might result should the value of the currency change favorably. In addition, the Fund could be exposed to risks if the counterparties to the contracts are unable to meet the terms of their contracts. The Fund’s maximum risk of loss from counterparty credit risk is the value of its currency exchanged with the counterparty. The risk is generally mitigated by having a netting arrangement between the Fund and the counterparty and by the posting of collateral by the counterparty to the Fund to cover the Fund’s exposure to the counterparty.
Futures Contracts — A futures contract is an agreement in which the writer (or seller) of the contract agrees to deliver to the buyer an amount of cash or securities equal to a specific dollar amount times the difference between the value of a specific security or index at the close of the last trading day of the contract and the price at which the agreement is made. The Fund may use futures in the normal course of pursuing its investment objective. The Fund may invest in futures contracts to hedge its existing portfolio securities against fluctuations in fair value caused by changes in prevailing market interest rates. Upon entering into a futures contract, the Fund deposits cash or pledges U.S. government securities to a broker, equal to the minimum “initial margin” requirements of the exchange on which the contract is traded. Subsequent payments
64
are received from the broker or paid to the broker each day, based on the daily fluctuation in the market value of the contract. These receipts or payments are known as “variation margin” and are recorded daily by the Fund as unrealized gains or losses until the contracts are closed. When the contracts are closed, the Fund records a realized gain or loss equal to the difference between the value of the contract at the time it was opened and the value at the time it was closed. Risks of entering into futures contracts include potential imperfect correlation between the futures contracts and the underlying securities and the possibility of an illiquid secondary market for these instruments. When investing in futures, there is minimal counterparty credit risk to the Fund because futures are exchange-traded and the exchange’s clearinghouse, as counterparty to all exchange-traded futures, guarantees against default.
Swap Contracts — The Fund may enter into inflation swaps and CDS contracts in the normal course of pursuing its investment objectives. The Fund may use inflation swaps to hedge the inflation risk in nominal bonds, thereby creating synthetic inflation-indexed bonds. The Fund may enter into CDS contracts in order to hedge against a credit event, to enhance total return or to gain exposure to certain securities or markets.
Inflation Swaps. Inflation swap agreements involve commitments to pay a regular stream of inflation-indexed cash payments in exchange for receiving a stream of nominal interest payments (or vice versa), where both payment streams are based on notional amounts. The nominal interest payments may be based on either a fixed interest rate or variable interest rate such as London Interbank Offered Rate (LIBOR). The change in value of swap contracts outstanding, if any, is recorded as unrealized appreciation or depreciation daily. A realized gain or loss is recorded on maturity or termination of the swap contract. The Fund’s maximum risk of loss from counterparty credit risk is the discounted net value of the cash flows to be received from/paid to the counterparty over the index swap contract’s remaining life, to the extent that the amount is positive. This risk is mitigated by having a netting arrangement between the Fund and the counterparty and by the posting of collateral by the counterparty to the Fund to cover the Fund’s exposure to the counterparty.
Credit Default Swaps. A CDS contract is a risk-transfer instrument through which one party (purchaser of protection) transfers to another party (seller of protection) the financial risk of a credit event (as defined in the CDS agreement), as it relates to a particular reference security or basket of securities (such as an index). In exchange for the protection offered by the seller of protection, the purchaser of protection agrees to pay the seller of protection a periodic amount at a stated rate that is applied to the notional amount of the CDS contract. In addition, an upfront payment may be made or received by the Fund in connection with an unwinding or assignment of a CDS contract. Upon the occurrence of a credit event, the seller of protection would pay the par (or other agreed-upon) value of the reference security (or basket of securities) to the counterparty. Credit events generally include, among others, bankruptcy, failure to pay, and obligation default.
During the year ended July 31, 2011, the Fund entered into CDS contracts as a purchaser and seller of protection. Periodic payments (receipts) on such contracts are accrued daily and recorded as unrealized losses (gains) on swap contracts. Upon payment (receipt), such amounts are recorded
65
Notes to financial statements
Delaware Core Plus Bond Fund
8. Derivatives (continued)
as realized losses (gains) on swap contracts. Upfront payments made or received in connection with CDS contracts are amortized over the expected life of the CDS contracts as unrealized losses (gains) on swap contracts. The change in value of CDS contracts is recorded as unrealized appreciation or depreciation daily. A realized gain or loss is recorded upon a credit event (as defined in the CDS agreement) or the maturity or termination of the agreement. At July 31, 2011, the net unrealized appreciation of credit default swaps was $143,568. If a credit event had occurred for all swap transactions where collateral posting was required as of July 31, 2011, the swaps’ credit-risk-related contingent features would have been triggered and the Fund would have been required to pay $4,698,000 less the value of the contracts’ related reference obligations. The Fund received collateral of $159,000 for certain open derivatives.
As disclosed in the footnotes to the statement of net assets, at July 31, 2011, the notional value of the protection sold was $750,000, which reflects the maximum potential amount the Fund would have been required to make as a seller of credit protection if a credit event had occurred. The quoted market prices and resulting market values for credit default swap agreements on securities and credit indices serve as an indicator of the current status of the payment/performance risk and represent the likelihood of an expected liability (or profit) for the credit derivative if the swap agreement has been closed/sold as of the period end. Increasing market values, in absolute terms when compared to the notional amount of the swap, represent a deterioration of the reference entity’s credit soundness and a greater likelihood of risk of default or other credit event occurring as defined under the terms of the agreement. At July 31, 2011, the net unrealized appreciation of the protection sold was $12,027.
CDS may involve greater risks than if the Fund had invested in the reference obligation directly. Credit default swaps are subject to general market risk, liquidity risk, counterparty risk and credit risk. The Fund’s maximum risk of loss from counterparty credit risk, either as the seller of protection or the buyer of protection, is the fair value of the contract. This risk is mitigated by having a netting arrangement between the Fund and the counterparty and by the posting of collateral by the counterparty to the Fund to cover the Fund’s exposure to the counterparty.
Swaps Generally. Because there is no organized market for swap contracts, the value of open swaps may differ from that which would be realized in the event the Fund terminated its position in the agreement. Risks of entering into these contracts include the potential inability of the counterparty to meet the terms of the contracts. This type of risk is generally limited to the amount of favorable movement in the value of the underlying security, instrument or basket of instruments, if any, at the day of default. Risks also arise from potential losses from adverse market movements and such losses could exceed the unrealized amounts shown on the statement of net assets.
66
Fair values of derivative instruments as of July 31, 2011 were as follows:
| | | Asset Derivatives | | Liabilities Derivatives |
| | | Statement of Assets | | | | | | Statement of Assets | | | | |
| | | and Liabilities Location | | Fair Value | | and Liabilities Location | | Fair Value |
Forward currency exchange contracts
(Foreign currency exchange contracts) | |
Foreign currency exchange contracts, at value | | $ | 7,110 | | | Foreign currency exchange contracts, at value | | $ | (8,478 | ) |
Interest rate contracts
(Futures contracts) | |
Variation margin receivable on futures contracts | | | 10,509 | * | | Variation margin receivable on futures contracts | | | — | |
Credit contracts
(Swap contracts) | |
Credit default swap contracts, at value | | | 143,821 | | | Credit default swap contracts, at value | | | (253 | ) |
| Total | | | | $ | 161,440 | | | | | $ | (8,731 | ) |
*Includes cumulative appreciation of futures contracts from the date the contracts are opened through July 31, 2011. Only current day variation margin is reported on the Fund’s statement of assets and liabilities.
67
Notes to financial statements
Delaware Core Plus Bond Fund
The effect of derivative instruments on the statement of operations for the year ended July 31, 2011 was as follows:
| | | Location of Gain or Loss on
Derivatives Recognized in
Income | | Realized Gain
or Loss on
Derivatives
Recognized in
Income | | Change in
Unrealized
Appreciation
or Depreciation
on Derivatives
Recognized in
Income |
Forward currency exchange contracts
(Foreign currency exchange contracts) | |
Net realized loss on foreign currencies and net change in unrealized appreciation/depreciation of investments and foreign currencies | | | $(433,059 | ) | | $ | 17,305 | |
Interest rate contracts
(Futures contracts) | |
Net realized gain on futures and net change in unrealized appreciation/depreciation of investments and foreign currencies | | | 303,909 | | | | (86,579 | ) |
Credit contracts
(Swap contracts) | |
Net realized loss on swap contracts and net change in unrealized appreciation/depreciation of investments and foreign currencies | | | (245,955 | ) | | | 353,630 | |
| Total | | | | | $(375,105 | ) | | $ | 284,356 | |
The volume of derivative transactions varies throughout the year. Information about derivative transactions reflected is as of the date of this report and generally similar to the volume of derivative activity during the year ended July 31, 2011.
68
9. Securities Lending
The Fund, along with other funds in the Delaware Investments® Family of Funds, may lend its securities pursuant to a security lending agreement (Lending Agreement) with The Bank of New York Mellon (BNY Mellon). At the time a security is loaned, the borrower must post collateral equal to the required percentage of the market value of the loaned security, including any accrued interest. The required percentage is: (i) 102% with respect to U.S. securities and foreign securities that are denominated and payable in U.S. dollars; and (ii) 105% with respect to foreign securities. With respect to each loan, if on any business day the aggregate market value of securities collateral plus cash collateral held is less than the aggregate market value of the securities which are the subject of such loan, the borrower will be notified to provide additional collateral by the end of the following business day which, together with the collateral already held, will be not less than the applicable initial collateral requirements for such security loan. If the aggregate market value of securities collateral and cash collateral held with respect to a security loan exceeds the applicable initial collateral requirement, upon request of the borrower, BNY Mellon must return enough collateral to the borrower by the end of the following business day to reduce the value of the remaining collateral to applicable initial collateral requirement for such security loan. As a result of the foregoing, the value of collateral held with respect to a loaned security may be temporarily more or less than the value of the security on loan.
Cash collateral received is generally invested in the Delaware Investment Collateral Fund No. 1 (Collective Trust) established by BNY Mellon for the purpose of investment on behalf of funds managed by DMC that participates in BNY Mellon’s securities lending program. The Collective Trust may invest in U.S. government securities and high quality corporate debt, asset-backed and other money market securities in repurchase agreements collateralized by such securities, provided that the Collective Trust will generally have a dollar-weighted average portfolio maturity of 60 days or less. The Collective Trust seeks to maintain a net asset value per unit of $1.00, but there can be no assurance that it will always be able to do so. The Fund may incur investment losses as a result of investing securities lending collateral in the Collective Trust or another collateral investment pool. This could occur if an investment in a collateral investment pool defaulted or if it were necessary to liquidate assets in the collateral investment pool to meet returns on outstanding security loans at a time when the collateral investment pool’s net asset value per unit was less than $1.00. Under those circumstances, the Fund may not receive an amount from the collateral investment pool that is equal in amount to the collateral the Fund would be required to return to the borrower of the securities and the Fund would be required to make up for this shortfall. Effective April 20, 2009, BNY Mellon transferred the assets of the Fund’s previous collateral investment pool other than cash and assets with a maturity of one business day or less to the BNY Mellon SL DBT II Liquidating Fund (Liquidating Fund), effectively bifurcating the previous collateral investment pool. The Fund’s exposure to the Liquidating Fund is expected to decrease as the Liquidating Fund’s assets mature or are sold. In October 2008, BNY Mellon transferred certain distressed securities from the previous collateral investment pool into the Mellon GSL Reinvestment Trust II. The Fund can also accept U.S. government securities and letters of credit (non-cash collateral) in connection with securities loans. In the event of default
69
Notes to financial statements
Delaware Core Plus Bond Fund
9. Securities Lending (continued)
or bankruptcy by the lending agent, realization and/or retention of the collateral may be subject to legal proceedings. In the event the borrower fails to return loaned securities and the collateral received is insufficient to cover the value of the loaned securities and provided such collateral shortfall is not the result of investment losses, the lending agent has agreed to pay the amount of the shortfall to the Fund, or at the discretion of the lending agent, replace the loaned securities. The Fund continues to record dividends or interest, as applicable, on the securities loaned and are subject to changes in value of the securities loaned that may occur during the term of the loan. The Fund has the right under the Lending Agreement to recover the securities from the borrower on demand. With respect to security loans collateralized by non-cash collateral, the Fund receives loan premiums paid by the borrower. With respect to security loans collateralized by cash collateral, the earnings from the collateral investments are shared among the Fund, the security lending agent and the borrower. The Fund records security lending income net of allocations to the security lending agent and the borrower.
At July 31, 2011, the value of the securities on loan was $9,910,422 for which the Fund received collateral, comprised of non-cash collateral valued at $3,637,136, and cash collateral of $6,486,841. At July 31, 2011, the value of invested collateral was $6,473,860. Investments purchased with cash collateral are presented on the statement of net assets under the caption “Securities Lending Collateral.”
10. Credit and Market Risk
The Fund may invest a portion of its assets in high yield fixed income securities, which are securities rated lower than BBB- by Standard & Poor’s and Baa3 by Moody’s Investor Services, or similarly rated by another nationally recognized statistical rating organization. Investments in these higher yielding securities are generally accompanied by a greater degree of credit risk than higher rated securities. Additionally, lower rated securities may be more susceptible to adverse economic and competitive industry conditions than investment grade securities.
The Fund invests in fixed income securities whose value is derived from an underlying pool of mortgages or consumer loans. The value of these securities is sensitive to changes in economic conditions, including delinquencies and/or defaults, and may be adversely affected by shifts in the market’s perception of the issuers and changes in interest rates. Investors receive principal and interest payments as the underlying mortgages and consumer loans are paid back. Some of these securities are collateralized mortgage obligations (CMOs). CMOs are debt securities issued by U.S. government agencies or by financial institutions and other mortgage lenders, which are collateralized by a pool of mortgages held under an indenture. Prepayment of mortgages may shorten the stated maturity of the obligations and can result in a loss of premium, if any has been paid. Certain of these securities may be stripped (securities which provide only the principal or interest feature of the underlying security). The yield to maturity on an interest-only CMO is extremely sensitive not only to changes in prevailing interest rates, but also to the rate of principal payments (including prepayments) on the related underlying mortgage assets. A rapid rate of
70
principal payments may have a material adverse effect on the Fund’s yield to maturity. If the underlying mortgage assets experience greater than anticipated prepayments of principal, the Fund may fail to fully recoup its initial investment in these securities even if the securities are rated in the highest rating categories.
The Fund may invest up to 15% of its net assets in illiquid securities, which may include securities with contractual restrictions on resale, securities exempt from registration under Rule 144A of the Securities Act of 1933, as amended, and other securities which may not be readily marketable. The relative illiquidity of these securities may impair the Fund from disposing of them in a timely manner and at a fair price when it is necessary or desirable to do so. While maintaining oversight, the Fund’s Board has delegated to DMC the day-to-day functions of determining whether individual securities are liquid for purposes of the Fund’s limitation on investments in illiquid securities. Securities eligible for resale pursuant to Rule 144A, which are determined to be liquid, are not subject to the Fund’s 15% limit on investments in illiquid securities. Rule 144A and illiquid securities have been identified on the statement of net assets.
11. Contractual Obligations
The Fund enters into contracts in the normal course of business that contain a variety of indemnifications. The Fund’s maximum exposure under these arrangements is unknown. However, the Fund has not had prior claims or losses pursuant to these contracts. Management has reviewed the Fund’s existing contracts and expects the risk of loss to be remote.
12. Subsequent Events
Management has determined that no other material events or transactions occurred subsequent to July 31, 2011 that would require recognition or disclosure in the Fund’s financial statements.
13. Tax Information (Unaudited)
The information set forth below is for the Fund’s fiscal year as required by federal income tax laws. Shareholders, however, must report distributions on a calendar year basis for income tax purposes, which may include distributions for portions of two fiscal years of a fund. Accordingly, the information needed by shareholders for income tax purposes will be sent to them in January of each year. Please consult your tax advisor for proper treatment of this information. All designations are based on financial information available as of the date of this annual report and, accordingly are subject to change. For any and all items requiring designation, it is the intention of the Fund to designate the maximum amount permitted under the Internal Revenue Code and the regulations thereunder.
For the fiscal year ended July 31, 2011, the Fund designates distributions paid during the year as follows:
| (A) Ordinary Income Distributions (Tax Basis) | | 100 | % |
(A) is based on a percentage of each Fund’s total distributions.
71
Report of independent
registered public accounting firm
To the Board of Trustees of Delaware Group Government Fund
and the Shareholders of Delaware Core Plus Bond Fund:
In our opinion, the accompanying statement of net assets, statement of assets and liabilities and the related statements of operations and of changes in net assets and the financial highlights present fairly, in all material respects, the financial position of Delaware Core Plus Bond Fund (one of the series constituting Delaware Group Government Fund, hereafter referred to as the “Fund”) at July 31, 2011, the results of its operations for the year then ended and the changes in its net assets and the financial highlights for each of the two years in the period then ended, in conformity with accounting principles generally accepted in the United States of America. These financial statements and financial highlights (hereafter referred to as “financial statements”) are the responsibility of the Fund’s management; our responsibility is to express an opinion on these financial statements based on our audits. We conducted our audits of these financial statements in accordance with the standards of the Public Company Accounting Oversight Board (United States). Those standards require that we plan and perform the audit to obtain reasonable assurance about whether the financial statements are free of material misstatement. An audit includes examining, on a test basis, evidence supporting the amounts and disclosures in the financial statements, assessing the accounting principles used and significant estimates made by management, and evaluating the overall financial statement presentation. We believe that our audits, which included confirmation of securities at July 31, 2011 by correspondence with the custodian and brokers, provide a reasonable basis for our opinion. The financial highlights for each of the three years in the period ended July 31, 2009 were audited by other independent accountants whose report dated September 21, 2009 expressed an unqualified opinion on those statements.
PricewaterhouseCoopers LLP
Philadelphia, Pennsylvania
September 28, 2011
72
Other Fund information
(Unaudited)
Delaware Core Plus Bond Fund
Change in Independent Registered Public Accounting Firm
Due to independence matters under the Securities and Exchange Commission’s auditor independence rules relating to the January 4, 2010 acquisition of Delaware Investments (including DMC, DDLP and DSC) by Macquarie Group, Ernst & Young LLP (E&Y) has resigned as the independent registered public accounting firm for Delaware Group® Government Fund (the Trust) effective May 20, 2010. At a meeting held on May 20, 2010, the Board of Trustees of the Trust, upon recommendation of the Audit Committee, selected PricewaterhouseCoopers LLP (PwC) to serve as the independent registered public accounting firm for the Trust for the fiscal year ending July 31, 2010. During the fiscal years ended July 31, 2009 and 2008, E&Y’s audit reports on the financial statements of the Trust did not contain any adverse opinion or disclaimer of opinion, nor were they qualified or modified as to uncertainty, audit scope, or accounting principles. In addition, there were no disagreements between the Trust and E&Y on accounting principles, financial statements disclosures or audit scope, which, if not resolved to the satisfaction of E&Y, would have caused them to make reference to the disagreement in their reports. Neither the Trust nor anyone on its behalf has consulted with PwC at any time prior to their selection with respect to the application of accounting principles to a specified transaction, either completed or proposed or the type of audit opinion that might be rendered on the Trust’s financial statements.
73
Board of trustees/directors and officers addendum
Delaware Investments® Family of Funds
A mutual fund is governed by a Board of Trustees/Directors (“Trustees”), which has oversight responsibility for the management of a fund’s business affairs. Trustees establish procedures and oversee and review the performance of the investment manager, the distributor, and others who perform services for the fund. The independent fund trustees, in particular, are advocates
| Name, Address, | | Position(s) | | Length of |
| and Birth Date | | Held with Fund(s) | | Time Served |
| Interested Trustees | | | | |
| | | | | |
| Patrick P. Coyne1 | | Chairman, President, | | Chairman and Trustee |
| 2005 Market Street | | Chief Executive Officer, | | since August 16, 2006 |
| Philadelphia, PA 19103 | | and Trustee | | |
| April 1963 | | | | President and |
| | | | | Chief Executive Officer |
| | | | | since August 1, 2006 |
| | | | | |
| | | | | |
| | | | | |
| | | | | |
| | | | | |
| | | | | |
| | | | | |
| | | | | |
| | | | | |
| | | | | |
| | | | | |
| | | | | |
| | | | | |
| | | | | |
| | | | | |
| | | | | |
| | | | | |
| | | | | |
1 Patrick P. Coyne is considered to be an “Interested Trustee” because he is an executive officer of the Fund’s(s’) investment advisor.
74
for shareholder interests. Each trustee has served in that capacity since he or she was elected to or appointed to the Board of Trustees, and will continue to serve until his or her retirement or the election of a new trustee in his or her place. The following is a list of the Trustees and Officers with certain background and related information.
| | | Number of Portfolios in | | |
| Principal Occupation(s) | | Fund Complex Overseen | | Other Directorships |
| During Past 5 Years | | by Trustee or Officer | | Held by Trustee or Officer |
| |
| |
| Patrick P. Coyne has served in | | 75 | | Director and Audit |
| various executive capacities | | | | Committee Member |
| at different times at | | | | Kaydon Corp. |
| Delaware Investments.2 | | | | |
| | | | | Board of Governors Member |
| | | | | Investment Company |
| | | | | Institute (ICI) |
| | | | | |
| | | | | Finance Committee Member |
| | | | | St. John Vianney Roman |
| | | | | Catholic Church |
| |
| | | | | Board of Trustees |
| | | | | Agnes Irwin School |
| |
| | | | | Member of Investment |
| | | | | Committee |
| | | | | Cradle of Liberty Council, |
| | | | | BSA |
| | | | | (2007–2010) |
| | | | | |
| |
| | | | | |
| | | | | |
| |
2 Delaware Investments is the marketing name for Delaware Management Holdings, Inc. and its subsidiaries, including the Fund’s(s’) investment advisor, principal underwriter, and its transfer agent.
75
Board of trustees/directors and officers addendum
Delaware Investments® Family of Funds
| Name, Address, | | Position(s) | | Length of |
| and Birth Date | | Held with Fund(s) | | Time Served |
| Independent Trustees | | | | |
| |
| Thomas L. Bennett | | Trustee | | Since March 2005 |
| 2005 Market Street | | | | |
| Philadelphia, PA 19103 | | | | |
| October 1947 | | | | |
| |
| |
| |
| |
| |
| |
| |
| |
| |
| |
| |
| John A. Fry | | Trustee | | Since January 2001 |
| 2005 Market Street | | | | |
| Philadelphia, PA 19103 | | | | |
| May 1960 | | | | |
| |
| |
| |
| |
| |
| |
| |
| |
| |
| |
| |
| Anthony D. Knerr | | Trustee | | Since April 1990 |
| 2005 Market Street | | | | |
| Philadelphia, PA 19103 | | | | |
| December 1938 | | | | |
| |
| Lucinda S. Landreth | | Trustee | | Since March 2005 |
| 2005 Market Street | | | | |
| Philadelphia, PA 19103 | | | | |
| June 1947 | | | | |
| |
76
| | | Number of Portfolios in | | |
| Principal Occupation(s) | | Fund Complex Overseen | | Other Directorships |
| During Past 5 Years | | by Trustee or Officer | | Held by Trustee or Officer |
| | | | | |
| |
| Private Investor | | 75 | | Chairman of Investment |
| (March 2004–Present) | | | | Committee |
| | | | | Pennsylvania Academy of |
| Investment Manager | | | | Fine Arts |
| Morgan Stanley & Co. | | | | |
| (January 1984–March 2004) | | | | Investment Committee and |
| | | | | Governance Committee |
| | | | | Member |
| | | | | Pennsylvania Horticultural |
| | | | | Society |
| | | | | |
| | | | | Director |
| | | | | Bryn Mawr Bank Corp. (BMTC) |
| | | | | (2007–2011) |
| |
| President | | 75 | | Board of Governors Member — |
| Drexel University | | | | NASDAQ OMX PHLX LLC |
| (August 2010–Present) | | | | |
| | | | | Director and Audit |
| President | | | | Committee Member |
| Franklin & Marshall College | | | | Community Health Systems |
| (July 2002–July 2010) | | | | |
| | | | | Director — Ecore |
| | | | | International |
| | | | | (2009–2010) |
| | | | | |
| | | | | Director — Allied |
| | | | | Barton Securities Holdings |
| | | | | (2005–2008) |
| |
| Managing Director | | 75 | | None |
| Anthony Knerr & Associates | | | | |
| (Strategic Consulting) | | | | |
| (1990–Present) | | | | |
| |
| Chief Investment Officer | | 75 | | None |
| Assurant, Inc. (Insurance) | | | | |
| (2002–2004) | | | | |
| | | | | |
| |
77
Board of trustees/directors and officers addendum
Delaware Investments® Family of Funds
| Name, Address, | | Position(s) | | Length of |
| and Birth Date | | Held with Fund(s) | | Time Served |
| Independent Trustees (continued) | | | | |
| |
| Ann R. Leven | | Trustee | | Since October 1989 |
| 2005 Market Street | | | | |
| Philadelphia, PA 19103 | | | | |
| November 1940 | | | | |
| |
| |
| |
| |
| |
| |
| Frances A. Sevilla-Sacasa | | Trustee | | Since September 2011 |
| 2005 Market Street | | | | |
| Philadelphia, PA 19103 | | | | |
| January 1956 | | | | |
| |
| |
| |
| |
| |
| |
| |
| |
| | | | | |
| | | | | |
| | | | | |
| | | | | |
| |
| |
| |
| | | | | |
| | | | | |
| | | | | |
| | | | | |
| | | | | |
| | | | | |
| | | | | |
| | | | | |
| | | | | |
| |
78
| | | Number of Portfolios in | | |
| Principal Occupation(s) | | Fund Complex Overseen | | Other Directorships |
| During Past 5 Years | | by Trustee or Officer | | Held by Trustee or Officer |
| | | | | |
| |
| Consultant | | 75 | | Director and Audit |
| ARL Associates | | | | Committee Chair |
| (Financial Planning) | | | | Systemax Inc. |
| (1983–Present) | | | | (2001–2009) |
| | | | | |
| | | | | Director and Audit |
| | | | | Committee Chairperson |
| | | | | Andy Warhol Foundation |
| | | | | (1999–2007) |
| |
| Executive Advisor to Dean | | 75 | | Trust Manager — Camden |
| (since August 2011) and | | | | Property Trust |
| Interim Dean | | | | (since August 2011) |
| (January 2011–July 2011) — | | | | |
| University of Miami School of | | | | Board of Trustees |
| Business Administration | | | | Thunderbird School of |
| | | | | Global Management |
| President — U.S. Trust, | | | | (2007–2011) |
| Bank of America Private | | | | |
| Wealth Management | | | | Board of Trustees |
| (Private Banking) | | | | Carrollton School of the |
| (July 2007–December 2008) | | | | Sacred Heart |
| | | | | (since 2007) |
| President and Director | | | | |
| (November 2005–June 2007) and | | | | Board Member |
| Chief Executive Officer | | | | Foreign Policy Association |
| (April 2007–June 2007) — | | | | (since 2006) |
| U.S. Trust Company | | | | |
| (Private Banking) | | | | Board of Trustees |
| | | | | Georgetown Preparatory School |
| | | | | (2005–2011) |
| | | | | |
| | | | | Board of Trustees |
| | | | | Miami City Ballet |
| | | | | (2000–2011) |
| | | | | |
| | | | | Board of Trustees |
| | | | | St. Thomas University |
| | | | | (2005–2011) |
| |
79
Board of trustees/directors and officers addendum
Delaware Investments® Family of Funds
| Name, Address, | | Position(s) | | Length of |
| and Birth Date | | Held with Fund(s) | | Time Served |
| Independent Trustees (continued) | | | | |
| | | | | |
| Janet L. Yeomans | | Trustee | | Since April 1999 |
| 2005 Market Street | | | | |
| Philadelphia, PA 19103 | | | | |
| July 1948 | | | | |
| |
| |
| |
| |
| J. Richard Zecher | | Trustee | | Since March 2005 |
| 2005 Market Street | | | | |
| Philadelphia, PA 19103 | | | | |
| July 1940 | | | | |
| |
| |
| | | | | |
| | | | | |
| | | | | |
| | | | | |
| | | | | |
| | | | | |
| | | | | |
| | | | | |
| | | | | |
| | | | | |
| | | | | |
| | | | | |
| | | | | |
| | | | | |
| |
80
| | | Number of Portfolios in | | |
| Principal Occupation(s) | | Fund Complex Overseen | | Other Directorships |
| During Past 5 Years | | by Trustee or Officer | | Held by Trustee or Officer |
| | | | | |
| | | | | |
| Vice President and Treasurer | | 75 | | Director and Audit |
| (January 2006–Present) | | | | Committee Member |
| Vice President — Mergers & Acquisitions | | | | Okabena Company |
| (January 2003–January 2006), and | | | | |
| Vice President and Treasurer | | | | Chair — 3M |
| (July 1995–January 2003) | | | | Investment Management |
| 3M Corporation | | | | Company |
| |
| Founder | | 75 | | Director and Audit |
| Investor Analytics | | | | Committee Member |
| (Risk Management) | | | | Investor Analytics |
| (May 1999–Present) | | | | |
| | | | | |
| Founder | | | | Director |
| Sutton Asset Management | | | | Oxigene, Inc. |
| (Hedge Fund) | | | | (2003–2008) |
| (September 1996–Present) | | | | |
| | | | | |
| | | | | |
| | | | | |
| | | | | |
| | | | | |
| | | | | |
| | | | | |
| | | | | |
| | | | | |
| | | | | |
| | | | | |
| |
81
Board of trustees/directors and officers addendum
Delaware Investments® Family of Funds
| Name, Address, | | Position(s) | | Length of |
| and Birth Date | | Held with Fund(s) | | Time Served |
| Officers | | | | |
| | | | | |
| David F. Connor | | Vice President, | | Vice President since |
| 2005 Market Street | | Deputy General | | September 2000 |
| Philadelphia, PA 19103 | | Counsel, and Secretary | | and Secretary since |
| December 1963 | | | | October 2005 |
| |
| |
| Daniel V. Geatens | | Vice President | | Treasurer |
| 2005 Market Street | | and Treasurer | | since October 2007 |
| Philadelphia, PA 19103 | | | | |
| October 1972 | | | | |
| |
| David P. O’Connor | | Senior Vice President, | | Senior Vice President, |
| 2005 Market Street | | General Counsel, | | General Counsel, and |
| Philadelphia, PA 19103 | | and Chief Legal Officer | | Chief Legal Officer |
| February 1966 | | | | since October 2005 |
| |
| Richard Salus | | Senior Vice President | | Chief Financial Officer |
| 2005 Market Street | | and Chief Financial Officer | | since November 2006 |
| Philadelphia, PA 19103 | | | | |
| October 1963 | | | | |
| |
The Statement of Additional Information for the Fund(s) includes additional information about the Trustees and Officers and is available, without charge, upon request by calling 800 523-1918.
82
| | | Number of Portfolios in | | |
| Principal Occupation(s) | | Fund Complex Overseen | | Other Directorships |
| During Past 5 Years | | by Trustee or Officer | | Held by Trustee or Officer |
| |
| |
| David F. Connor has served as | | 75 | | None3 |
| Vice President and Deputy | | | | |
| General Counsel of | | | | |
| Delaware Investments | | | | |
| since 2000. | | | | |
| |
| Daniel V. Geatens has served | | 75 | | None3 |
| in various capacities at | | | | |
| different times at | | | | |
| Delaware Investments. | | | | |
| |
| David P. O’Connor has served in | | 75 | | None3 |
| various executive and legal | | | | |
| capacities at different times | | | | |
| at Delaware Investments. | | | | |
| |
| Richard Salus has served in | | 75 | | None3 |
| various executive capacities | | | | |
| at different times at | | | | |
| Delaware Investments. | | | | |
| |
3 David F. Connor, Daniel V. Geatens, David P. O’Connor, and Richard Salus serve in similar capacities for the six portfolios of the Optimum Fund Trust, which have the same investment advisor, principal underwriter, and transfer agent as the registrant.
83
About the organization
| Board of trustees |
Patrick P. Coyne
Chairman, President, and
Chief Executive Officer
Delaware Investments®
Family of Funds
Philadelphia, PA Thomas L. Bennett
Private Investor
Rosemont, PA John A. Fry
President
Drexel University
Philadelphia, PA | Anthony D. Knerr
Founder and Managing
Director
Anthony Knerr &
Associates
New York, NY Lucinda S. Landreth
Former Chief Investment
Officer
Assurant, Inc.
Philadelphia, PA | Ann R. Leven
Consultant
ARL Associates
New York, NY Frances A.
Sevilla-Sacasa
Executive Advisor
to Dean, University of
Miami School of
Business Administration
Coral Gables, FL | Janet L. Yeomans
Vice President and
Treasurer
3M Corporation
St. Paul, MN J. Richard Zecher
Founder
Investor Analytics
Scottsdale, AZ |
| | | | |
| Affiliated officers |
David F. Connor
Vice President, Deputy
General Counsel, and
Secretary
Delaware Investments
Family of Funds
Philadelphia, PA | Daniel V. Geatens
Vice President and
Treasurer
Delaware Investments
Family of Funds
Philadelphia, PA | David P. O’Connor
Senior Vice President,
General Counsel,
and Chief Legal Officer
Delaware Investments
Family of Funds
Philadelphia, PA | Richard Salus
Senior Vice President and
Chief Financial Officer
Delaware Investments
Family of Funds
Philadelphia, PA |
| This annual report is for the information of Delaware Core Plus Bond Fund shareholders, but it may be used with prospective investors when preceded or accompanied by the Delaware Investments Fund fact sheet for the most recently completed calendar quarter. These documents are available at www.delawareinvestments.com. |
Delaware Investments is the marketing name of Delaware Management Holdings, Inc. and its subsidiaries.
The Fund files its complete schedule of portfolio holdings with the Securities and Exchange Commission (SEC) for the first and third quarters of each fiscal year on Form N-Q. The Fund’s Forms N-Q, as well as a description of the policies and procedures that the Fund uses to determine how to vote proxies (if any) relating to portfolio securities are available without charge (i) upon request, by calling 800 523-1918; and (ii) on the SEC’s website at www.sec.gov. In addition, a description of the policies and procedures that the Fund uses to determine how to vote proxies (if any) relating to portfolio securities and the Fund’s Schedule of Investments are available without charge on the Fund’s website at www.delawareinvestments.com. The Fund’s Forms N-Q may be reviewed and copied at the SEC’s Public Reference Room in Washington, D.C.; information on the operation of the Public Reference Room may be obtained by calling 800 SEC-0330.
Information (if any) regarding how the Fund voted proxies relating to portfolio securities during the most recently disclosed 12-month period ended June 30 is available without charge (i) through the Funds’ website at www.delawareinvestments.com; and (ii) on the SEC’s website at www.sec.gov.
|
Annual report Delaware Inflation Protected Bond Fund
July 31, 2011 Fixed income mutual fund |
| Carefully consider the Fund’s investment objectives, risk factors, charges, and expenses before investing. This and other information can be found in the Fund’s prospectus and, if available, its summary prospectus, which may be obtained by visiting www.delawareinvestments.com or calling 800 523-1918. Investors should read the prospectus and, if available, the summary prospectus carefully before investing. |
You can obtain shareholder reports and prospectuses online instead of in the mail.
Visit www.delawareinvestments.com/edelivery. |
Experience Delaware Investments
Delaware Investments is committed to the pursuit of consistently superior asset management and unparalleled client service. We believe in our investment processes, which seek to deliver consistent results, and in convenient services that help add value for our clients.
If you are interested in learning more about creating an investment plan, contact your financial advisor.
You can learn more about Delaware Investments or obtain a prospectus for Delaware Inflation Protected Bond Fund at www.delawareinvestments.com.
Manage your investments online
- 24-hour access to your account information
- Obtain share prices
- Check your account balance and recent transactions
- Request statements or literature
- Make purchases and redemptions
Delaware Management Holdings, Inc. and its subsidiaries (collectively known by the marketing name of Delaware Investments) are wholly owned subsidiaries of Macquarie Group Limited, a global provider of banking, financial, advisory, investment and funds management services.
Investments in Delaware Inflation Protected Bond Fund are not and will not be deposits with or liabilities of Macquarie Bank Limited ABN 46 008 583 542 and its holding companies, including their subsidiaries or related companies (Macquarie Group), and are subject to investment risk, including possible delays in repayment and loss of income and capital invested. No Macquarie Group company guarantees or will guarantee the performance of the Fund, the repayment of capital from the Fund, or any particular rate of return.
| Table of contents | | |
| Portfolio management review | | 1 |
| Performance summary | | 4 |
| Disclosure of Fund expenses | | 8 |
| Security type/sector allocation | | 10 |
| Statement of net assets | | 11 |
| Statement of operations | | 18 |
| Statements of changes in net assets | | 20 |
| Financial highlights | | 22 |
| Notes to financial statements | | 30 |
| Report of independent registered | | |
| public accounting firm | | 47 |
| Other Fund information | | 48 |
| Board of trustees/directors and | | |
| officers addendum | | 50 |
| About the organization | | 60 |
Unless otherwise noted, views expressed herein are current as of July 31, 2011, and subject to change.
Funds are not FDIC insured and are not guaranteed. It is possible to lose the principal amount invested.
Mutual fund advisory services provided by Delaware Management Company, a series of Delaware Management Business Trust, which is a registered investment advisor. Delaware Investments, a member of Macquarie Group, refers to Delaware Management Holdings, Inc. and its subsidiaries, including the Fund’s distributor, Delaware Distributors, L.P. Macquarie Group refers to Macquarie Group Limited and its subsidiaries and affiliates worldwide.
© 2011 Delaware Management Holdings, Inc.
All third-party trademarks cited are the property of their respective owners.
| Portfolio management review |
| Delaware Inflation Protected Bond Fund | August 9, 2011 |
| Performance preview (for the year ended July 31, 2011) | | | | |
| Delaware Inflation Protected Bond Fund (Class A shares) | | 1-year return | | +10.55% |
| Barclays Capital U.S. Treasury Inflation-Protected | | | | |
| Securities (TIPS) Index (benchmark) | | 1-year return | | +11.79% |
Past performance does not guarantee future results.
For complete, annualized performance for Delaware Inflation Protected Bond Fund, please see the table on page 4. The performance of Class A shares excludes the applicable sales charge and reflects the reinvestment of all distributions.
Index performance returns do not reflect any management fees, transaction costs, or expenses. Indices are unmanaged and one cannot invest directly in an index. |
Performance of Treasury inflation-protected securities (TIPS) during the Fund’s fiscal year ended July 31, 2011, was affected by market reaction to the Federal Reserve’s second round of quantitative easing (QE2). As the fiscal year began, the U.S. economy was decelerating and the euro zone had only recently averted a potentially dangerous default on Greek sovereign debt. Amid growing fears of a double-dip recession — and with interest rates already near zero — Federal Reserve Chairman Ben Bernanke in late August 2010 strongly intimated that the central bank was prepared to provide more monetary stimulus through additional purchases of U.S. Treasury debt using, in effect, newly printed money. The $600 billion program began in November and lasted eight months. (Source: U.S. Federal Reserve Board.)
The consequences of QE2 were widespread throughout global markets and in some cases unintended, in our opinion. Rather than force bond yields lower by supplementing private sector demand for Treasury securities, QE2 had the effect of nudging longer-term rates higher initially as investors’ general expectations for faster economic growth and higher inflation pushed money into riskier assets like equities and commodities. The jump in commodity prices — a response to the dollar devaluation that typically occurs when money is “created,” as in QE2 — was especially significant, since high food prices underwrote political upheaval in the Middle East, which in turn caused energy costs to rise, thus pressuring the U.S. bond market.
Though TIPS prices (which move in the opposite direction of bonds’ yields) held up relatively better than those on conventional Treasury bonds, the sector nonetheless peaked around the time that QE2 began and sustained only a mild correction into February 2011, when U.S. economic growth appeared to wane yet again. In March, the earthquake and tsunami in Japan dealt another blow to the global economy, triggering a strong rally in TIPS and conventional Treasury bonds that continued through the end of the Fund’s fiscal year. The later stages of the surge in TIPS prices were driven primarily by sovereign debt concerns on both sides of the Atlantic and by evidence of broad-based economic weakness in the United States.
Real interest rates on TIPS (rates adjusted for inflation) fluctuated during the fiscal year in response to the shifting expectations for growth and inflation. As the period began, the real rate on a 10-year TIPS bond was 1.1% — a level considered quite low by historical standards — and then
1
Portfolio management review
Delaware Inflation Protected Bond Fund
plunged even lower, to 0.4%, before the start of QE2 in November. However, as investors rotated out of fixed income and into equities and commodities, real yields on TIPS rose, eventually reaching 1.4% in February before falling back to 0.5% by July as the “risk on” trade switched to “risk off.” (Source: Bloomberg.)
Meanwhile, implied inflation rates on TIPS climbed from a low of 1.6% prior to Bernanke’s QE2 speech in August 2010, to 2.6% as oil prices spiked in early spring 2011. (The implied inflation rate is a measure of inflation expectations, and is determined by calculating the difference between the nominal yield on a conventional Treasury security and the real yield on a TIPS bond.) Though the implied inflation rate fell back to about 2.4% by the end of the Fund’s fiscal year, it remained near the highest level since the domestic inflation-protected securities market became mature and liquid more than a decade ago. In our view, if one of the Fed’s motivations for launching QE2 was to push inflation and inflationary expectations up — thereby banishing the threat of “Japanese style” deflation taking hold in the U.S. — policy makers at least succeeded in achieving that goal for the time being. (Source: Bloomberg.)
Fund performance
For its fiscal year ended July 31, 2011, Delaware Inflation Protected Bond Fund returned +10.55% for Class A shares at net asset value and +5.58% at maximum offer price. Both figures reflect all distributions reinvested. During the same period, the benchmark Barclays Capital U.S. TIPS Index returned +11.79%. For complete, annualized performance of the Fund, please see the table on page 4.
As the Fund’s fiscal year began, we anticipated that interest rates would be volatile and believed that TIPS investors at the time were not sufficiently compensated for the risk of higher real and nominal rates. Our strategy was to take what we viewed as only moderate interest rate risk to receive the inflation protection that the TIPS market generally provides. That somewhat defensive position led us to overweight the Fund’s positions in short- and intermediate-term TIPS, an approach that contributed positively to relative performance during the second half of 2010 as interest rates rose. However, this approach detracted from performance when real and nominal rates declined in 2011. Similarly, our decision to replace between 8% and 10% of the Fund’s short-term TIPS with agency mortgage-backed securities detracted from overall relative performance. Though mortgage-backed bonds generated more current income than did equivalent-maturity TIPS, they failed to participate in the price appreciation that occurred in the TIPS market as real interest rates plunged during the last several months of the fiscal year.
Conversely, the Fund’s allocation to TIPS bonds in Australia, Brazil, South Korea, and South Africa contributed to relative performance. The Fund is allowed to hold up to 10% of assets in emerging market and international developed market securities denominated in foreign currencies, and we took full advantage of that flexibility. We found opportunities that we considered to be attractive in relatively healthier economies, particularly where energy and food make up a bigger percentage of inflation statistics than in the U.S.
2
With bond yields at rock-bottom levels, we have maintained a defensive position within the Fund through short- to medium-term domestic TIPS, mortgage-backed U.S. agency bonds, and select international inflation-protected securities. Over the short term, we believe that further appreciation in TIPS bonds will likely be modest at best, with any decline in nominal yields more likely to come from lower implied inflation than from higher real rates. As always, we will continue to manage the Fund as it was intended: to provide our shareholders with potential opportunities for inflation protection and avoiding what we view as risky bets on the short-term direction of interest rates.
3
| Performance summary |
| Delaware Inflation Protected Bond Fund | July 31, 2011 |
The performance data quoted represent past performance; past performance does not guarantee future results. Investment return and principal value will fluctuate so your shares, when redeemed, may be worth more or less than their original cost. Please obtain the performance data current for the most recent month end by calling 800 523-1918 or visiting our website at www.delawareinvestments.com/performance. Current performance may be lower or higher than the performance data quoted.
Fund performance1, 2 | | Average annual total returns through July 31, 2011 |
| | | 1 year | | 3 years | | 5 years | | Lifetime |
| Class A (Est. Dec. 1, 2004) | | | | | | | | | | | |
| Excluding sales charge | | | +10.55 | % | | | +6.89% | | +7.36% | | +6.14% |
| Including sales charge | | | +5.58 | % | | | +5.26% | | +6.37% | | +5.41% |
| Class B (Est. Dec. 1, 2004) | | | | | | | | | | | |
| Excluding sales charge | | | +9.74 | % | | | +6.10% | | +6.55% | | +5.40% |
| Including sales charge | | | +5.74 | % | | | +5.43% | | +6.32% | | +5.40% |
| Class C (Est. Dec. 1, 2004) | | | | | | | | | | | |
| Excluding sales charge | | | +9.74 | % | | | +6.09% | | +6.55% | | +5.40% |
| Including sales charge | | | +8.74 | % | | | +6.09% | | +6.55% | | +5.40% |
| Institutional Class (Est. Dec. 1, 2004) | | | | | | | | | | | |
| Excluding sales charge | | | +10.83 | % | | | +7.15% | | +7.62% | | +6.39% |
| Including sales charge | | | +10.83 | % | | | +7.15% | | +7.62% | | +6.39% |
1 Returns reflect the reinvestment of all distributions and are presented both with and without the applicable sales charges described below. Returns do not reflect the deduction of taxes the shareholder would pay on Fund distributions or redemptions of Fund shares.
Expense limitations were in effect for certain classes during some or all of the periods shown in the “Fund performance” chart. The current expenses for each class are listed on the “Fund expense ratios” table on page 5. Performance would have been lower had expense limitations not been in effect.
Class A shares are sold with a maximum front-end sales charge of up to 4.50%, and have an annual distribution and service fee of up to 0.25% of average daily net assets. Performance for Class A shares, excluding sales charges, assumes that no front-end sales charge applied.
Class B shares may be purchased only through dividend reinvestment and certain permitted exchanges as described in the prospectus. Please see the prospectus for additional information on Class B shares. Class B shares have a contingent deferred sales charge that declines from 4.00% to zero depending on the period of time the shares are held. They are also subject to an annual distribution and service fee of up to 1.00% of average daily net assets. Class B shares will automatically convert to Class A shares on a quarterly basis approximately eight years after purchase.
Class C shares are sold with a contingent deferred sales charge of 1.00% if redeemed during the first 12 months. They are also subject to an annual distribution and service fee of up to 1.00% of average daily net assets.
4
Performance for Class B and C shares, excluding sales charges, assumes either that contingent deferred sales charges did not apply or that the investment was not redeemed.
Institutional Class shares are available without sales or asset-based distribution charges only to certain eligible institutional accounts.
The “Fund performance” table and the “Performance of a $10,000 investment” graph do not reflect the deduction of taxes the shareholder would pay on Fund distributions or redemptions of Fund shares.
Fixed income securities and bond funds can lose value, and investors can lose principal, as interest rates rise. They also may be affected by economic conditions that hinder an issuer’s ability to make interest and principal payments on its debt.
The Fund may also be subject to prepayment risk, the risk that the principal of a fixed income security that is held by the Fund may be prepaid prior to maturity, potentially forcing the Fund to reinvest that money at a lower interest rate.
Interest payments on inflation-indexed debt securities will vary as the principal and/or interest is adjusted for inflation.
The Fund may experience portfolio turnover in excess of 100%, which could result in higher transaction costs and tax liability.
The Fund may invest in derivatives, which may involve additional expenses and are subject to risk, including the risk that an underlying security or securities index moves in the opposite direction from what the portfolio manager anticipated. A derivative transaction depends upon the counterparties’ ability to fulfill their contractual obligations.
International investments entail risks not ordinarily associated with U.S. investments including fluctuation in currency values, differences in accounting principles, or economic or political instability in other nations. Investing in emerging markets can be riskier than investing in established foreign markets due to increased volatility and lower trading volume.
2 The Fund’s expense ratios, as described in the most recent prospectus, are disclosed in the following “Fund expense ratios” table. Delaware Investments has agreed to reimburse certain expenses and/or waive certain fees in order to prevent total fund operating expenses (excluding certain fees and expenses) from exceeding 0.55% of the Fund’s average daily net assets from Nov. 26, 2010, through Nov. 28, 2011. Please see the most recent prospectus and any applicable supplement(s) for additional information on these fee waivers and/or reimbursements.
| Fund expense ratios | | Class A | | Class B | | Class C | | Institutional Class |
| Total annual operating expenses | | 0.94% | | 1.69% | | 1.69% | | 0.69% |
| (without fee waivers) | | | | | | | | |
| Net expenses | | 0.80% | | 1.55% | | 1.55% | | 0.55% |
| (including fee waivers, if any) | | | | | | | | |
| Type of waiver | | Contractual | | Contractual | | Contractual | | Contractual |
5
Performance summary
Delaware Inflation Protected Bond Fund
Performance of a $10,000 investment1
Average annual total returns from Dec. 1, 2004 (Fund’s inception) through July 31, 2011
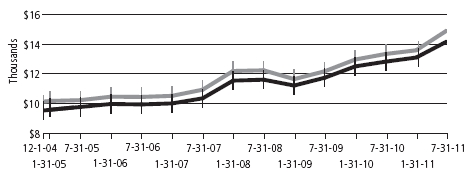
| For period beginning Dec. 1, 2004, through July 31, 2011 | Starting value | Ending value |
| | Barclays Capital U.S. TIPS Index | | $10,000 | | $14,949 |
| | Delaware Inflation Protected Bond Fund —
Class A shares | | $9,550 | | $14,210 |
1 The “Performance of a $10,000 investment” graph assumes $10,000 invested in Class A shares of the Fund on Dec. 1, 2004, and includes the effect of a 4.50% front-end sales charge and the reinvestment of all distributions. The graph does not reflect the deduction of taxes the shareholders would pay on Fund distributions or redemptions of Fund shares. Expense limitations were in effect for some or all of the periods shown. Performance would have been lower had expense limitations not been in effect. Current expenses are listed in the “Fund expense ratios” table on page 5. Please note additional details on pages 4 through 6.
The chart also assumes $10,000 invested in the Barclays Capital U.S. TIPS Index as of Dec. 1, 2004. The Barclays Capital U.S. TIPS Index measures the total return performance of the market for inflation-protected securities issued by the U.S. Treasury.
Index performance returns do not reflect any management fees, transaction costs, or expenses. Indices are unmanaged and one cannot invest directly in an index. Past performance is not a guarantee of future results.
Performance of other Fund classes will vary due to different charges and expenses.
| | | Nasdaq symbols | | CUSIPs | |
| Class A | | | DIPAX | | | 246094882 | |
| Class B | | | DIPBX | | | 246094874 | |
| Class C | | | DIPCX | | | 246094866 | |
| Institutional Class | | | DIPIX | | | 246094858 | |
6
Disclosure of Fund expenses
For the six-month period February 1, 2011 to July 31, 2011
As a shareholder of the Fund, you incur two types of costs: (1) transaction costs, including sales charges (loads) on purchase payments, reinvested dividends, or other distributions; redemption fees; and exchange fees; and (2) ongoing costs, including management fees; distribution and/or service (12b-1) fees; and other Fund expenses. This example is intended to help you understand your ongoing costs (in dollars) of investing in the Fund and to compare these costs with the ongoing costs of investing in other mutual funds.
The example is based on an investment of $1,000 invested at the beginning of the period and held for the entire six-month period February 1, 2011 to July 31, 2011.
Actual expenses
The first section of the table shown, “Actual Fund return,” provides information about actual account values and actual expenses. You may use the information in this section of the table, together with the amount you invested, to estimate the expenses that you paid over the period. Simply divide your account value by $1,000 (for example, an $8,600 account value divided by $1,000 = 8.6), then multiply the result by the number in the first section under the heading entitled “Expenses Paid During Period” to estimate the expenses you paid on your account during this period.
Hypothetical example for comparison purposes
The second section of the table shown, “Hypothetical 5% return,” provides information about hypothetical account values and hypothetical expenses based on the Fund’s actual expense ratio and an assumed rate of return of 5% per year before expenses, which is not the Fund’s actual return. The hypothetical account values and expenses may not be used to estimate the actual ending account balance or expenses you paid for the period. You may use this information to compare the ongoing costs of investing in the Fund and other funds. To do so, compare this 5% hypothetical example with the 5% hypothetical examples that appear in the shareholder reports of the other funds.
Please note that the expenses shown in the table are meant to highlight your ongoing costs only and do not reflect any transactional costs, such as sales charges (loads), redemption fees, or exchange fees. Therefore, the second section of the table is useful in comparing ongoing costs only, and will not help you determine the relative total costs of owning different funds. In addition, if these transactional costs were included, your costs would have been higher. The Fund’s expenses shown in the table reflect fee waivers in effect. The expenses shown in the table assume reinvestment of all dividends and distributions.
8
Delaware Inflation Protected Bond Fund
Expense analysis of an investment of $1,000
| | | Beginning | | Ending | | | | Expenses |
| | | Account Value | | Account Value | | Annualized | | Paid During Period |
| | | 2/1/11 | | 7/31/11 | | Expense Ratio | | 2/1/11 to 7/31/11* |
| Actual Fund return | | | | | | | | | | | | | | | | | |
| Class A | | | $ | 1,000.00 | | | | $ | 1,082.40 | | | 0.80% | | | $ | 4.13 | |
| Class B | | | | 1,000.00 | | | | | 1,078.70 | | | 1.55% | | | | 7.99 | |
| Class C | | | | 1,000.00 | | | | | 1,077.60 | | | 1.55% | | | | 7.98 | |
| Institutional Class | | | | 1,000.00 | | | | | 1,082.80 | | | 0.55% | | | | 2.84 | |
| Hypothetical 5% return (5% return before expenses) | | | | | | | | |
| Class A | | | $ | 1,000.00 | | | | $ | 1,020.83 | | | 0.80% | | | $ | 4.01 | |
| Class B | | | | 1,000.00 | | | | | 1,017.11 | | | 1.55% | | | | 7.75 | |
| Class C | | | | 1,000.00 | | | | | 1,017.11 | | | 1.55% | | | | 7.75 | |
| Institutional Class | | | | 1,000.00 | | | | | 1,022.07 | | | 0.55% | | | | 2.76 | |
*“Expenses Paid During Period” are equal to the Fund’s annualized expense ratio, multiplied by the average account value over the period, multiplied by 181/365 (to reflect the one-half year period).
9
| Security type/sector allocation |
| Delaware Inflation Protected Bond Fund | As of July 31, 2011 |
Sector designations may be different than the sector designations presented in other Fund materials. The sector designations may represent the investment manager’s internal sector classifications, which may result in the sector designations for one fund being different than another fund’s sector designations.
| Security type/sector | Percentage of net assets |
| Agency Collateralized Mortgage Obligations | 1.07% | |
| Agency Mortgage-Backed Securities | 7.60% | |
| Corporate Bonds | 0.91% | |
| Sovereign Bonds | 8.87% | |
| U.S. Treasury Obligations | 76.15% | |
| Purchased Options | 0.03% | |
| Short-Term Investments | 9.35% | |
| Total Value of Securities | 103.98% | |
| Liabilities Net of Receivables and Other Assets | (3.98% | ) |
| Total Net Assets | 100.00% | |
10
| Statement of net assets |
| Delaware Inflation Protected Bond Fund | July 31, 2011 |
| | | Principal amount° | | Value (U.S. $) |
| Agency Collateralized Mortgage Obligations – 1.07% | | | | | | |
| | Fannie Mae REMIC Series 2010-75 NA | | | | | | |
| | 4.00% 9/25/28 | USD | | 2,790,962 | | $ | 2,924,561 |
| • | Freddie Mac REMIC Series 3067 FA | | | | | | |
| | 0.537% 11/15/35 | | | 1,598,277 | | | 1,591,825 |
| Total Agency Collateralized Mortgage | | | | | | |
| | Obligations (cost $4,495,685) | | | | | | 4,516,386 |
| | |
| Agency Mortgage-Backed Securities – 7.60% | | | | | | |
| | Fannie Mae S.F. 15 yr | | | | | | |
| | 4.00% 7/1/25 | | | 2,405,319 | | | 2,524,887 |
| | 4.00% 8/1/25 | | | 3,250,838 | | | 3,412,436 |
| | 4.00% 11/1/25 | | | 3,468,496 | | | 3,652,295 |
| | Fannie Mae S.F. 20 yr 5.50% 4/1/27 | | | 1,275,717 | | | 1,388,083 |
| | Fannie Mae S.F. 30 yr TBA 6.00% 9/1/41 | | | 19,140,000 | | | 20,999,421 |
| Total Agency Mortgage-Backed Securities | | | | | | |
| | (cost $31,819,060) | | | | | | 31,977,122 |
| | |
| Corporate Bonds – 0.91% | | | | | | |
| Banking – 0.08% | | | | | | |
| • | Morgan Stanley 5.36% 3/5/18 | | | 357,000 | | | 363,344 |
| | | | | | | | 363,344 |
| Brokerage – 0.76% | | | | | | |
| =^ | JPMorgan Structured Products | | | | | | |
| | 0.644% 5/18/15 | BRL | | 2,419,000 | | | 3,185,193 |
| | | | | | | | 3,185,193 |
| Insurance – 0.07% | | | | | | |
| • | Prudential Financial 5.47% 6/10/15 | USD | | 286,000 | | | 293,430 |
| | | | | | | | 293,430 |
| Total Corporate Bonds (cost $3,138,761) | | | | | | 3,841,967 |
| | |
| Sovereign Bonds – 8.87%Δ | | | | | | |
| Australia – 2.84% | | | | | | |
| | Australia Government Inflation Linked Bond | | | | | | |
| | 4.00% 8/20/15 | AUD | | 6,214,000 | | | 11,938,462 |
| | | | | | | | 11,938,462 |
11
Statement of net assets
Delaware Inflation Protected Bond Fund
| | | | Principal amount° | | Value (U.S. $) |
| Sovereign Bonds (continued) | | | | | | | |
| Brazil – 1.13% | | | | | | | |
| | Brazil Notas do Tesouro Nacional Series B | | | | | | | |
| | 6.00% 5/15/15 | | BRL | | 360,000 | | $ | 4,740,261 |
| | | | | | | | | 4,740,261 |
| Republic of Korea – 2.29% | | | | | | | |
| | Korea Treasury Inflation Linked Bond | | | | | | | |
| | 2.75% 3/10/17 | | KRW | | 7,741,850,830 | | | 7,887,046 |
| | 2.75% 6/10/20 | | KRW | | 1,672,512,000 | | | 1,775,422 |
| | | | | | | | | 9,662,468 |
| South Africa – 1.84% | | | | | | | |
| | South Africa Government Inflation | | | | | | | |
| | Linked Bond 2.75% 1/31/22 | | ZAR | | 50,831,201 | | | 7,738,143 |
| | | | | | | | | 7,738,143 |
| Sweden – 0.77% | | | | | | | |
| | Sweden Government Inflation | | | | | | | |
| | Linked Bond 0.50% 6/1/17 | | SEK | | 20,082,485 | | | 3,248,402 |
| | | | | | | | | 3,248,402 |
| Total Sovereign Bonds (cost $32,448,712) | | | | | | | 37,327,736 |
| | |
| U.S. Treasury Obligations – 76.15% | | | | | | | |
| | U.S. Treasury Inflation Indexed Bonds | | | | | | | |
| | 0.125% 4/15/16 | | USD | | 11,875,036 | | | 12,406,634 |
| | 2.125% 2/15/41 | | | | 28,845,087 | | | 34,055,231 |
| | U.S. Treasury Inflation Indexed Notes | | | | | | | |
| | 0.50% 4/15/15 | | | | 57,926,643 | | | 61,366,037 |
| | 1.125% 1/15/21 | | | | 93,654,225 | | | 100,978,267 |
| | 1.25% 4/15/14 | | | | 44,204,676 | | | 47,285,211 |
| | 1.625% 1/15/18 | | | | 21,248,617 | | | 24,000,972 |
| | 2.00% 4/15/12 | | | | 16,591,895 | | | 16,897,816 |
| | 2.00% 7/15/14 | | | | 9,940,201 | | | 10,938,108 |
| ∞ | U.S. Treasury Note 1.50% 6/30/16 | | | | 12,320,000 | | | 12,416,305 |
| Total U.S. Treasury Obligations | | | | | | | |
| | (cost $302,263,669) | | | | | | | 320,344,581 |
12
| | | Number of contracts | | Value (U.S. $) | |
| Purchased Options – 0.03% | | | | | | | |
| Put Options – 0.03% | | | | | | | |
| | U.S. 10 yr futures, strike price $121, expires 9/23/11 | | | 235 | | $ | 110,156 | |
| Total Purchased Options (cost $206,173) | | | | | | 110,156 | |
| | |
| | | Principal amount° | | | | |
| Short-Term Investments – 9.35% | | | | | | | |
| ≠Discount Note – 6.97% | | | | | | | |
| | Federal Home Loan Bank 0.05% 8/6/11 | USD | | 29,297,080 | | | 29,297,080 | |
| | | | | | | | 29,297,080 | |
| Repurchase Agreements – 2.38% | | | | | | | |
| | BNP Paribas 0.14%, dated 7/29/11, | | | | | | | |
| | to be repurchased on 8/1/11, repurchase | | | | | | | |
| | price $10,025,117 (collateralized by | | | | | | | |
| | U.S. government obligations 3.875% | | | | | | | |
| | 4/15/29; market value $10,225,515) | | | 10,025,010 | | | 10,025,010 | |
| | | | | | | | 10,025,010 | |
| Total Short-Term Investments | | | | | | | |
| | (cost $39,322,090) | | | | | | 39,322,090 | |
| | |
| Total Value of Securities – 103.98% | | | | | | | |
| | (cost $413,694,150) | | | | | | 437,440,038 | |
| Liabilities Net of Receivables and | | | | | | | |
| | Other Assets – (3.98%) | | | | | | (16,734,218 | ) |
| Net Assets Applicable to 38,113,805 | | | | | | | |
| | Shares Outstanding – 100.00% | | | | | $ | 420,705,820 | |
| | |
| Net Asset Value – Delaware Inflation Protected Bond Fund | | | | | | | |
| | Class A ($189,623,421 / 17,177,963 Shares) | | | | | | $11.04 | |
| Net Asset Value – Delaware Inflation Protected Bond Fund | | | | | | | |
| | Class B ($1,121,414 / 101,700 Shares) | | | | | | $11.03 | |
| Net Asset Value – Delaware Inflation Protected Bond Fund | | | | | | | |
| | Class C ($89,740,078 / 8,134,926 Shares) | | | | | | $11.03 | |
| Net Asset Value – Delaware Inflation Protected Bond Fund | | | | | | | |
| | Institutional Class ($140,220,907 / 12,699,216 Shares) | | | | | | $11.04 | |
13
Statement of net assets
Delaware Inflation Protected Bond Fund
| | | | |
| Components of Net Assets at July 31, 2011: | | | |
| Shares of beneficial interest (unlimited authorization – no par) | | $ | 392,383,129 |
| Undistributed net investment income | | | 143,492 |
| Accumulated net realized gain on investments | | | 3,955,300 |
| Net unrealized appreciation of investments and foreign currencies | | | 24,223,899 |
| Total net assets | | $ | 420,705,820 |
°Principal amount is stated in the currency in which each security is denominated.
AUD — Australian Dollar
BRL — Brazilian Real
CHF — Swiss Franc
EUR — European Monetary Unit
KRW — South Korean Won
SEK — Swedish Krona
USD — United States Dollar
ZAR — South African Rand
| • | Variable rate security. The rate shown is the rate as of July 31, 2011. Interest rates reset periodically. |
| ^ | Zero coupon security. The rate shown is the yield at the time of purchase. |
| = | Security is being fair valued in accordance with the Fund’s fair valuation policy. At July 31, 2011, the aggregate amount of fair valued securities was $3,185,193, which represented 0.76% of the Fund’s net assets. See Note 1 in “Notes to Financial Statements.” |
| Δ | Securities have been classified by country of origin. |
| ∞ | Fully or partially pledged as collateral for futures contracts. |
| ≠ | The rate shown is the effective yield at the time of purchase. |
14
| |
Summary of abbreviations:
BAML — Bank of America Merrill Lynch
BCLY — Barclays Bank
CDS — Credit Default Swap
CITI — Citigroup Global Markets
GSC — Goldman Sachs Capital
HSBC — Hong Kong Shanghai Bank
JPMC — JPMorgan Chase Bank
MSC — Morgan Stanley Capital
REMIC — Real Estate Mortgage Investment Conduit
S.F. — Single Family
TBA — To be announced
yr — Year |
| Net Asset Value and Offering Price Per Share – | | | |
| Delaware Inflation Protected Bond Fund | | | |
| Net asset value Class A (A) | | $ | 11.04 |
| Sales charge (4.50% of offering price) (B) | | | 0.52 |
| Offering price | | $ | 11.56 |
| (A) | Net asset value per share, as illustrated, is the amount which would be paid upon redemption or repurchase of shares. |
| (B) | See the current prospectus for purchases of $100,000 or more. |
The following foreign currency exchange contracts and swap contracts were outstanding at July 31, 20111:
Foreign Currency Exchange Contracts
| | | | | | | | | | | | | | | | | | | | Unrealized |
| | | | | | | | | | | | | | | | | | | | Appreciation |
| Counterparty | | | Contracts to Receive (Deliver) | | In Exchange For | | Settlement Date | | (Depreciation) |
| BAML | | | | CHF | | 3,177,469 | | | | | USD | | (3,944,691 | ) | | | 9/2/11 | | | $ | 91,322 | | |
| BAML | | | | EUR | | (11,756,702 | ) | | | | USD | | 16,871,454 | | | | 9/2/11 | | | | (8,619 | ) | |
| BCLY | | | | CHF | | 1,647,925 | | | | | USD | | (2,055,000 | ) | | | 9/2/11 | | | | 38,191 | | |
| CITI | | | | EUR | | (9,837,267 | ) | | | | USD | | 14,128,528 | | | | 9/2/11 | | | | 4,346 | | |
| GSC | | | | CHF | | 3,400,022 | | | | | USD | | (4,230,093 | ) | | | 9/2/11 | | | | 88,607 | | |
| GSC | | | | EUR | | (2,230,000 | ) | | | | USD | | 3,202,704 | | | | 9/2/11 | | | | 907 | | |
| HSBC | | | | EUR | | (5,342,270 | ) | | | | USD | | 7,673,904 | | | | 9/2/11 | | | | 3,562 | | |
| JPMC | | | | EUR | | (1,043,769 | ) | | | | USD | | 1,497,808 | | | | 9/2/11 | | | | (817 | ) | |
| MSC | | | | CHF | | 2,862,507 | | | | | USD | | (3,560,752 | ) | | | 9/2/11 | | | | 75,197 | | |
| MSC | | | | EUR | | (5,737,052 | ) | | | | USD | | 8,243,599 | | | | 9/2/11 | | | | 6,436 | | |
| | | | | | | | | | | | | | | | | | | | | $ | 299,132 | | |
15
Statement of net assets
Delaware Inflation Protected Bond Fund
| |
Swap Contracts
CDS Contracts |
| | | | | | | | Annual | | | | Unrealized |
| | | | | Notional | | Protection | | Termination | | Appreciation |
| Counterparty | | Swap & Referenced Obligation | | Value | | Payments | | Date | | (Depreciation) |
| | | Protection Purchased: | | | | | | | | | | | | |
| BCLY | | ITRAXX Europe Subordinate | | | | | | | | | | | | |
| | | Financials 15.1 5 yr CDS | | $ | 4,255,000 | | 1.00% | | 6/20/16 | | | $ | 144,238 | |
| JPMC | | ITRAXX Europe Subordinate | | | | | | | | | | | | |
| | | Financials 15.1 5 yr CDS | | | 1,000,000 | | 1.00% | | 6/20/16 | | | | 33,898 | |
| | | | | $ | 5,255,000 | | | | | | | $ | 178,136 | |
The use of foreign currency exchange contracts and swap contracts involves elements of market risk and risks in excess of the amounts recognized in the financial statements. The notional values presented above represent the Fund’s total exposure in such contracts, whereas only the net unrealized appreciation (depreciation) is reflected in the Fund’s net assets.
1See Note 8 in ”Notes to financial statements.”
See accompanying notes, which are an integral part of the financial statements.
16
| Statement of operations |
| Delaware Inflation Protected Bond Fund | July 31, 2011 |
| Investment Income: | | | | | | | |
| | Interest | | | | | $ | 11,581,405 | |
| | |
| Expenses: | | | | | | | |
| | Management fees | | $ | 1,479,761 | | | | |
| | Distribution expenses – Class A | | | 408,740 | | | | |
| | Distribution expenses – Class B | | | 14,772 | | | | |
| | Distribution expenses – Class C | | | 808,129 | | | | |
| | Dividend disbursing and transfer agent fees and expenses | | | 453,834 | | | | |
| | Accounting and administration expenses | | | 129,413 | | | | |
| | Registration fees | | | 88,173 | | | | |
| | Legal fees | | | 53,153 | | | | |
| | Reports and statements to shareholders | | | 52,290 | | | | |
| | Custodian fees | | | 26,204 | | | | |
| | Audit and tax | | | 24,263 | | | | |
| | Trustees’ fees | | | 17,281 | | | | |
| | Dues and services | | | 16,389 | | | | |
| | Insurance fees | | | 11,112 | | | | |
| | Consulting fees | | | 3,799 | | | | |
| | Pricing fees | | | 2,467 | | | | |
| | Trustees’ expenses | | | 1,128 | | | 3,590,908 | |
| | Less fees waived | | | | | | (548,726 | ) |
| | Less expense paid indirectly | | | | | | (210 | ) |
| | Total operating expenses | | | | | | 3,041,972 | |
| Net Investment Income | | | | | | 8,539,433 | |
18
| Net Realized and Unrealized Gain (Loss) on Investments | | | | |
| and Foreign Currencies: | | | | |
| Net realized gain (loss) on: | | | | |
| Investments | | $ | 13,946,607 | |
| Foreign currencies | | | 138,673 | |
| Foreign currency exchange contracts | | | (2,768,730 | ) |
| Futures contracts | | | 4,359,134 | |
| Swap contracts | | | 66,564 | |
| Net realized gain | | | 15,742,248 | |
| Net change in unrealized appreciation/depreciation of investments | | | | |
| and foreign currencies | | | 10,886,616 | |
| Net Realized and Unrealized Gain on Investments and | | | | |
| Foreign Currencies | | | 26,628,864 | |
| |
| Net Increase in Net Assets Resulting from Operations | | $ | 35,168,297 | |
See accompanying notes, which are an integral part of the financial statements.
19
Statements of changes in net assets
Delaware Inflation Protected Bond Fund
| | | | Year Ended |
| | | | 7/31/11 | | 7/31/10 |
| Increase in Net Assets from Operations: | | | | | | | | |
| | Net investment income | | $ | 8,539,433 | | | $ | 8,223,501 | |
| | Net realized gain on investments | | | | | | | | |
| | and foreign currencies | | | 15,742,248 | | | | 13,172,126 | |
| | Net change in unrealized appreciation/depreciation | | | | | | | | |
| | of investments and foreign currencies | | | 10,886,616 | | | | 2,541,880 | |
| | Net increase in net assets resulting from operations | | | 35,168,297 | | | | 23,937,507 | |
| | |
| Dividends and Distributions to Shareholders from: | | | | | | | | |
| | Net investment income: | | | | | | | | |
| | Class A | | | (5,176,216 | ) | | | (4,070,181 | ) |
| | Class B | | | (29,321 | ) | | | (43,142 | ) |
| | Class C | | | (1,932,987 | ) | | | (1,315,439 | ) |
| | Institutional Class | | | (3,178,859 | ) | | | (4,035,834 | ) |
| | |
| | Net realized gain on investments: | | | | | | | | |
| | Class A | | | (5,130,269 | ) | | | — | |
| | Class B | | | (50,583 | ) | | | — | |
| | Class C | | | (2,487,580 | ) | | | — | |
| | Institutional Class | | | (2,111,814 | ) | | | — | |
| | | | | (20,097,629 | ) | | | (9,464,596 | ) |
| | |
| Capital Share Transactions: | | | | | | | | |
| | Proceeds from shares sold: | | | | | | | | |
| | Class A | | | 114,284,845 | | | | 109,791,070 | |
| | Class B | | | 102,825 | | | | 425,095 | |
| | Class C | | | 31,292,600 | | | | 39,134,765 | |
| | Institutional Class | | | 115,561,320 | | | | 63,780,390 | |
| | |
| | Net asset value of shares issued upon reinvestment | | | | | | | | |
| | of dividends and distributions: | | | | | | | | |
| | Class A | | | 7,720,158 | | | | 3,032,143 | |
| | Class B | | | 77,646 | | | | 34,764 | |
| | Class C | | | 3,816,091 | | | | 838,835 | |
| | Institutional Class | | | 3,346,260 | | | | 2,605,277 | |
| | | | | 276,201,745 | | | | 219,642,339 | |
20
| | | Year Ended |
| | | 7/31/11 | | 7/31/10 |
| Capital Share Transactions (continued): | | | | | | | | |
| Cost of shares repurchased: | | | | | | | | |
| Class A | | $ | (95,625,307 | ) | | $ | (45,997,148 | ) |
| Class B | | | (911,700 | ) | | | (650,952 | ) |
| Class C | | | (20,563,927 | ) | | | (11,432,820 | ) |
| Institutional Class | | | (25,900,309 | ) | | | (124,740,711 | ) |
| | | | (143,001,243 | ) | | | (182,821,631 | ) |
| Increase in net assets derived from | | | | | | | | |
| capital share transactions | | | 133,200,502 | | | | 36,820,708 | |
| Net Increase in Net Assets | | | 148,271,170 | | | | 51,293,619 | |
| |
| Net Assets: | | | | | | | | |
| Beginning of year | | | 272,434,650 | | | | 221,141,031 | |
| End of year (including undistributed net investment | | | | | | | | |
| income of $143,492 and $452,649, respectively) | | $ | 420,705,820 | | | $ | 272,434,650 | |
See accompanying notes, which are an integral part of the financial statements.
21
Financial highlights
Delaware Inflation Protected Bond Fund Class A
Selected data for each share of the Fund outstanding throughout each period were as follows:
| |
| Net asset value, beginning of period |
| |
| Income (loss) from investment operations: |
| Net investment income1 |
| Net realized and unrealized gain (loss) on investments and foreign currencies |
| Total from investment operations |
| |
| Less dividends and distributions from: |
| Net investment income |
| Net realized gain on investments |
| Total dividends and distributions |
| |
| Net asset value, end of period |
| |
| Total return2 |
| |
| Ratios and supplemental data: |
| Net assets, end of period (000 omitted) |
| Ratio of expenses to average net assets |
| Ratio of expenses to average net assets |
| prior to fees waived and expense paid indirectly |
| Ratio of net investment income to average net assets |
| Ratio of net investment income to average net assets |
| prior to fees waived and expense paid indirectly |
| Portfolio turnover |
1 The average shares outstanding method has been applied for per share information. |
2 Total investment return is based on the change in net asset value of a share during the period and assumes reinvestment of dividends and distributions at net asset value and does not reflect the impact of a sales charge. Total investment return during all of the periods shown reflects a waiver by the manager. Performance would have been lower had the waiver not been in effect. |
See accompanying notes, which are an integral part of the financial statements.
22
| | | Year Ended | |
| | | 7/31/11 | | | 7/31/10 | | | 7/31/09 | | | 7/31/08 | | | 7/31/07 | | |
| | | $10.630 | | | $10.080 | | | $10.160 | | | $9.520 | | | $9.540 | | |
| | |
| | |
| | | 0.291 | | | 0.314 | | | 0.124 | | | 0.569 | | | 0.426 | | |
| | | 0.787 | | | 0.603 | | | (0.014 | ) | | 0.576 | | | (0.040 | ) | |
| | | 1.078 | | | 0.917 | | | 0.110 | | | 1.145 | | | 0.386 | | |
| | |
| | |
| | | (0.325 | ) | | (0.367 | ) | | (0.133 | ) | | (0.505 | ) | | (0.406 | ) | |
| | | (0.343 | ) | | — | | | (0.057 | ) | | — | | | — | | |
| | | (0.668 | ) | | (0.367 | ) | | (0.190 | ) | | (0.505 | ) | | (0.406 | ) | |
| | |
| | | $11.040 | | | $10.630 | | | $10.080 | | | $10.160 | | | $9.520 | | |
| | |
| | | 10.55% | | | 9.25% | | | 1.12% | | | 12.13% | | | 4.13% | | |
| | |
| | |
| | | $189,624 | | | $156,345 | | | $83,771 | | | $19,624 | | | $2,329 | | |
| | | 0.80% | | | 0.78% | | | 0.75% | | | 0.75% | | | 0.76% | | |
| | |
| | | 0.97% | | | 0.94% | | | 0.94% | | | 0.94% | | | 1.10% | | |
| | | 2.72% | | | 3.00% | | | 1.27% | | | 5.58% | | | 4.46% | | |
| | |
| | | 2.55% | | | 2.84% | | | 1.08% | | | 5.39% | | | 4.12% | | |
| | | 157% | | | 118% | | | 188% | | | 178% | | | 553% | | |
23
Financial highlights
Delaware Inflation Protected Bond Fund Class B
Selected data for each share of the Fund outstanding throughout each period were as follows:
| Net asset value, beginning of period |
| |
| Income (loss) from investment operations: |
| Net investment income1 |
| Net realized and unrealized gain (loss) on investments and foreign currencies |
| Total from investment operations |
| |
| Less dividends and distributions from: |
| Net investment income |
| Net realized gain on investments |
| Total dividends and distributions |
| |
| Net asset value, end of period |
| |
| Total return2 |
| |
| Ratios and supplemental data: |
| Net assets, end of period (000 omitted) |
| Ratio of expenses to average net assets |
| Ratio of expenses to average net assets |
| prior to fees waived and expense paid indirectly |
| Ratio of net investment income to average net assets |
| Ratio of net investment income to average net assets |
| prior to fees waived and expense paid indirectly |
| Portfolio turnover |
1 The average shares outstanding method has been applied for per share information. |
2 Total investment return is based on the change in net asset value of a share during the period and assumes reinvestment of dividends and distributions at net asset value and does not reflect the impact of a sales charge. Total investment return during all of the periods shown reflects a waiver by the manager. Performance would have been lower had the waiver not been in effect. |
See accompanying notes, which are an integral part of the financial statements.
24
| | | Year Ended | |
| | | 7/31/11 | | | 7/31/10 | | | 7/31/09 | | | 7/31/08 | | | 7/31/07 | | |
| | | $10.620 | | | $10.020 | | | $10.160 | | | $9.520 | | | $9.540 | | |
| | |
| | |
| | | 0.210 | | | 0.235 | | | 0.051 | | | 0.491 | | | 0.354 | | |
| | | 0.789 | | | 0.600 | | | (0.014 | ) | | 0.574 | | | (0.039 | ) | |
| | | 0.999 | | | 0.835 | | | 0.037 | | | 1.065 | | | 0.315 | | |
| | |
| | |
| | | (0.246 | ) | | (0.235 | ) | | (0.120 | ) | | (0.425 | ) | | (0.335 | ) | |
| | | (0.343 | ) | | — | | | (0.057 | ) | | — | | | — | | |
| | | (0.589 | ) | | (0.235 | ) | | (0.177 | ) | | (0.425 | ) | | (0.335 | ) | |
| | |
| | | $11.030 | | | $10.620 | | | $10.020 | | | $10.160 | | | $9.520 | | |
| | |
| | | 9.74% | | | 8.40% | | | 0.39% | | | 11.25% | | | 3.37% | | |
| | |
| | |
| | | $1,121 | | | $1,806 | | | $1,886 | | | $2,032 | | | $463 | | |
| | | 1.55% | | | 1.53% | | | 1.50% | | | 1.50% | | | 1.51% | | |
| | |
| | | 1.72% | | | 1.69% | | | 1.69% | | | 1.69% | | | 1.85% | | |
| | | 1.97% | | | 2.25% | | | 0.52% | | | 4.83% | | | 3.71% | | |
| | |
| | | 1.80% | | | 2.09% | | | 0.33% | | | 4.64% | | | 3.37% | | |
| | | 157% | | | 118% | | | 188% | | | 178% | | | 553% | | |
25
Financial highlights
Delaware Inflation Protected Bond Fund Class C
Selected data for each share of the Fund outstanding throughout each period were as follows:
| Net asset value, beginning of period |
| |
| Income (loss) from investment operations: |
| Net investment income1 |
| Net realized and unrealized gain (loss) on investments and foreign currencies |
| Total from investment operations |
| |
| Less dividends and distributions from: |
| Net investment income |
| Net realized gain on investments |
| Total dividends and distributions |
| |
| Net asset value, end of period |
| |
| Total return2 |
| |
| Ratios and supplemental data: |
| Net assets, end of period (000 omitted) |
| Ratio of expenses to average net assets |
| Ratio of expenses to average net assets |
| prior to fees waived and expense paid indirectly |
| Ratio of net investment income to average net assets |
| Ratio of net investment income to average net assets |
| prior to fees waived and expense paid indirectly |
| Portfolio turnover |
1 The average shares outstanding method has been applied for per share information. |
2 Total investment return is based on the change in net asset value of a share during the period and assumes reinvestment of dividends and distributions at net asset value and does not reflect the impact of a sales charge. Total investment return during all of the periods shown reflects a waiver by the manager. Performance would have been lower had the waiver not been in effect. |
See accompanying notes, which are an integral part of the financial statements.
26
| | | Year Ended | |
| | | 7/31/11 | | | 7/31/10 | | | 7/31/09 | | | 7/31/08 | | | 7/31/07 | | |
| | | $10.620 | | | $10.020 | | | $10.160 | | | $9.520 | | | $9.540 | | |
| | | |
| | | |
| | | 0.210 | | | 0.235 | | | 0.051 | | | 0.492 | | | 0.354 | | |
| | | 0.789 | | | 0.600 | | | (0.014 | ) | | 0.573 | | | (0.039 | ) | |
| | | 0.999 | | | 0.835 | | | 0.037 | | | 1.065 | | | 0.315 | | |
| | | |
| | | |
| | | (0.246 | ) | | (0.235 | ) | | (0.120 | ) | | (0.425 | ) | | (0.335 | ) | |
| | | (0.343 | ) | | — | | | (0.057 | ) | | — | | | — | | |
| | | (0.589 | ) | | (0.235 | ) | | (0.177 | ) | | (0.425 | ) | | (0.335 | ) | |
| | | |
| | | $11.030 | | | $10.620 | | | $10.020 | | | $10.160 | | | $9.520 | | |
| | | |
| | | 9.74% | | | 8.40% | | | 0.39% | | | 11.25% | | | 3.37% | | |
| | | |
| | | |
| | | $89,740 | | | $71,866 | | | $40,352 | | | $9,169 | | | $1,095 | | |
| | | 1.55% | | | 1.53% | | | 1.50% | | | 1.50% | | | 1.51% | | |
| | | |
| | | 1.72% | | | 1.69% | | | 1.69% | | | 1.69% | | | 1.85% | | |
| | | 1.97% | | | 2.25% | | | 0.52% | | | 4.83% | | | 3.71% | | |
| | | |
| | | 1.80% | | | 2.09% | | | 0.33% | | | 4.64% | | | 3.37% | | |
| | | 157% | | | 118% | | | 188% | | | 178% | | | 553% | | |
27
Financial highlights
Delaware Inflation Protected Bond Fund Institutional Class
Selected data for each share of the Fund outstanding throughout each period were as follows:
| Net asset value, beginning of period |
| |
| Income (loss) from investment operations: |
| Net investment income1 |
| Net realized and unrealized gain (loss) on investments and foreign currencies |
| Total from investment operations |
| |
| Less dividends and distributions from: |
| Net investment income |
| Net realized gain on investments |
| Total dividends and distributions |
| |
| Net asset value, end of period |
| |
| Total return2 |
| |
| Ratios and supplemental data: |
| Net assets, end of period (000 omitted) |
| Ratio of expenses to average net assets |
| Ratio of expenses to average net assets |
| prior to fees waived and expense paid indirectly |
| Ratio of net investment income to average net assets |
| Ratio of net investment income to average net assets |
| prior to fees waived and expense paid indirectly |
| Portfolio turnover |
1 The average shares outstanding method has been applied for per share information. |
2 Total investment return is based on the change in net asset value of a share during the period and assumes reinvestment of dividends and distributions at net asset value. Total investment return during all of the periods shown reflects a waiver by the manager. Performance would have been lower had the waiver not been in effect. |
See accompanying notes, which are an integral part of the financial statements.
28
| | | Year Ended | |
| | | 7/31/11 | | | 7/31/10 | | | 7/31/09 | | | 7/31/08 | | | 7/31/07 | | |
| | | $10.630 | | | $10.100 | | | $10.160 | | | $9.530 | | | $9.540 | | |
| | | |
| | | |
| | | 0.317 | | | 0.339 | | | 0.148 | | | 0.594 | | | 0.450 | | |
| | | 0.788 | | | 0.603 | | | (0.014 | ) | | 0.567 | | | (0.030 | ) | |
| | | 1.105 | | | 0.942 | | | 0.134 | | | 1.161 | | | 0.420 | | |
| | | |
| | | |
| | | (0.352 | ) | | (0.412 | ) | | (0.137 | ) | | (0.531 | ) | | (0.430 | ) | |
| | | (0.343 | ) | | — | | | (0.057 | ) | | — | | | — | | |
| | | (0.695 | ) | | (0.412 | ) | | (0.194 | ) | | (0.531 | ) | | (0.430 | ) | |
| | | |
| | | $11.040 | | | $10.630 | | | $10.100 | | | $10.160 | | | $9.530 | | |
| | | |
| | | 10.83% | | | 9.51% | | | 1.36% | | | 12.30% | | | 4.50% | | |
| | | |
| | | |
| | | $140,221 | | | $42,418 | | | $95,132 | | | $90,412 | | | $40,544 | | |
| | | 0.55% | | | 0.53% | | | 0.50% | | | 0.50% | | | 0.51% | | |
| | | |
| | | 0.72% | | | 0.69% | | | 0.69% | | | 0.69% | | | 0.85% | | |
| | | 2.97% | | | 3.25% | | | 1.52% | | | 5.83% | | | 4.71% | | |
| | | |
| | | 2.80% | | | 3.09% | | | 1.33% | | | 5.64% | | | 4.37% | | |
| | | 157% | | | 118% | | | 188% | | | 178% | | | 553% | | |
29
| Notes to financial statements | |
| Delaware Inflation Protected Bond Fund | July 31, 2011 |
Delaware Group® Government Fund (Trust) is organized as a Delaware statutory trust and offers two series: Delaware Core Plus Bond Fund and Delaware Inflation Protected Bond Fund. These financial statements and the related notes pertain to Delaware Inflation Protected Bond Fund (Fund). The Trust is an open-end investment company. The Fund is considered diversified under the Investment Company Act of 1940, as amended, and offers Class A, Class B, Class C, and Institutional Class shares. Class A shares are sold with a maximum front-end sales charge of up to 4.50%. Class A share purchases of $1,000,000 or more will incur a contingent deferred sales charge (CDSC) of 1% if redeemed during the first year and 0.50% during the second year, provided that Delaware Distributors, L.P. (DDLP) paid a financial advisor a commission on the purchase of those shares. Class B shares may be purchased only through dividend reinvestment and certain permitted exchanges. Prior to June 1, 2007, Class B shares were sold with a CDSC that declined from 4% to zero depending upon the period of time the shares are held. Class B shares will automatically convert to Class A shares on a quarterly basis approximately eight years after purchase. Class C shares are sold with a CDSC of 1%, if redeemed during the first twelve months. Institutional Class shares are not subject to a sales charge and are offered for sale exclusively to certain eligible investors.
The investment objective of the Fund is to seek to provide inflation protection and current income.
1. Significant Accounting Policies
The following accounting policies are in accordance with U.S. generally accepted accounting principles (U.S. GAAP) and are consistently followed by the Fund.
Security Valuation — Securities listed on a foreign exchange are valued at the last quoted sales price on the valuation date. Short-term debt securities are valued at market value. U.S. government and agency securities are valued at the mean between the bid and ask prices. Other debt securities and credit default swap (CDS) contracts are valued based upon valuations provided by an independent pricing service or broker and reviewed by management. To the extent current market prices are not available, the pricing service may take into account developments related to the specific security, as well as transactions in comparable securities. Foreign currency exchange contracts are valued at the mean between the bid and ask prices. Interpolated values are derived when the settlement date of the contract is an interim date for which quotations are not available. Futures contracts and options on futures contracts are valued at the daily quoted settlement prices. Generally, other securities and assets for which market quotations are not readily available are valued at fair value as determined in good faith under the direction of the Fund’s Board of Trustees (Board). In determining whether market quotations are readily available or fair valuation will be used, various factors will be taken into consideration, such as market closures or suspension of trading in a security. The Fund may use fair value pricing more frequently for securities traded primarily in non-U.S. markets because, among other things, most foreign markets close well before the Fund values its securities, generally as of 4:00 p.m. Eastern time. The earlier close of these foreign markets gives rise to the possibility that significant events, including
30
broad market moves, government actions or pronouncements, aftermarket trading, or news events may have occurred in the interim. To account for this, the Fund may frequently value foreign securities using fair value prices based on third-party vendor modeling tools (international fair value pricing).
Federal Income Taxes — No provision for federal income taxes has been made as the Fund intends to continue to qualify for federal income tax purposes as a regulated investment company under Subchapter M of the Internal Revenue Code of 1986, as amended, and make the requisite distributions to shareholders. The Fund evaluates tax positions taken or expected to be taken in the course of preparing the Fund’s tax returns to determine whether the tax positions are “more-likely-than-not” of being sustained by the applicable tax authority. Tax positions not deemed to meet the more-likely-than-not threshold are recorded as a tax benefit or expense in the current year. Management has analyzed the Fund’s tax positions taken on federal income tax returns for all open tax years (July 31, 2008–July 31, 2011) and has concluded that no provision for federal income tax is required in the Fund’s financial statements.
Class Accounting — Investment income, common expenses and realized and unrealized gain (loss) on investments are allocated to the various classes of the Fund on the basis of daily net assets of each class. Distribution expenses relating to a specific class are charged directly to that class.
Repurchase Agreements — The Fund may purchase certain U.S. Government securities subject to the counterparty’s agreement to repurchase them at an agreed upon date and price. The counterparty will be required on a daily basis to maintain the value of the collateral subject to the agreement at not less than the repurchase price (including accrued interest). The agreements are conditioned upon the collateral being deposited under the Federal Reserve book-entry system with the Fund’s custodian or a third party sub-custodian. In the event of default or bankruptcy by the other party to the agreement, retention of the collateral may be subject to legal proceedings. All open repurchase agreements were entered into on July 29, 2011.
To Be Announced Trades — The Fund may contract to purchase securities for a fixed price at a transaction date beyond the customary settlement period (e.g., “when issued,” “delayed delivery,” “forward commitment,” or “TBA transactions”) consistent with the Fund’s ability to manage its investment portfolio and meet redemption requests. These transactions involve a commitment by the Fund to purchase securities for a predetermined price or yield with payment and delivery taking place more than three days in the future, or after a period longer than the customary settlement period for that type of security. No interest will be earned by the Fund on such purchases until the securities are delivered; however, the market value may change prior to delivery.
Mortgage Dollar Rolls — The Fund may enter into mortgage “dollar rolls” in which the Fund sells mortgage-backed securities for delivery in the current month and simultaneously contracts to repurchase substantially similar (same type, coupon, and maturity) securities on a specified future date. Any difference between the sale price and the purchase price is netted against the interest income foregone on the securities to arrive at an implied borrowing (reverse repurchase) rate.
31
Notes to financial statements
Delaware Inflation Protected Bond Fund
1. Significant Accounting Policies (continued)
Alternatively, the sale and purchase transactions that constitute the dollar roll can be executed at the same price, with the Fund being paid a fee as consideration for entering into the commitment to purchase. Dollar rolls may be renewed prior to cash settlement and initially may involve only a firm commitment by the Fund to buy a security. The Fund accounts for mortgage-dollar-roll transactions as purchases and sales; these transactions will increase the Fund’s portfolio turnover rate.
Inflation-Indexed Bonds — The Fund invests in inflation-indexed bonds. Inflation-indexed bonds are fixed income securities whose principal value is periodically adjusted to the rate of inflation. The interest rate on these bonds is generally fixed at issuance at a rate lower than typical bonds. Over the life of an inflation-indexed bond, however, interest will be paid based on a principal value, which is adjusted for inflation. Any increase or decrease in the principal amount of an inflation-indexed bond will be included as interest income on the statement of operations, even though investors do not receive their principal until maturity.
Foreign Currency Transactions — Transactions denominated in foreign currencies are recorded at the prevailing exchange rates on the valuation date in accordance with the Fund’s prospectus. The value of all assets and liabilities denominated in foreign currencies is translated into U.S. dollars at the exchange rate of such currencies against the U.S. dollar daily. Transaction gains or losses resulting from changes in exchange rates during the reporting period or upon settlement of the foreign currency transaction are reported in operations for the current period. The Fund generally isolates that portion of realized gains and losses on investments in debt securities, which is due to changes in foreign exchange rates from that which is due to changes in market prices of debt securities. The Fund reports certain foreign currency related transactions as components of realized gains (losses) for financial reporting purposes, whereas such components are treated as ordinary income (loss) for federal income tax purposes.
Use of Estimates — The preparation of financial statements in conformity with U.S. GAAP requires management to make estimates and assumptions that affect the reported amounts of assets and liabilities and disclosure of contingent assets and liabilities at the date of the financial statements and the reported amounts of revenues and expenses during the reporting period. Actual results could differ from those estimates and the differences could be material.
Other — Expenses directly attributable to the Fund are charged directly to the Fund. Other expenses common to various funds within the Delaware Investments® Family of Funds are generally allocated amongst such funds on the basis of average net assets. Management fees and some other expenses are paid monthly. Security transactions are recorded on the date the securities are purchased or sold (trade date) for financial reporting purposes. Costs used in calculating realized gains and losses on the sale of investment securities are those of the specific securities sold. Interest income is recorded on the accrual basis. Discounts and premiums on non-convertible debt securities are amortized to interest income over the lives of the respective securities. Realized gains (losses) on paydowns of mortgage- and asset-backed securities are
32
classified as interest income. The Fund expects to declare and pay dividends from net investment income monthly. The Fund will distribute net realized capital gains, if any, at least annually, usually in December. The Fund may distribute income dividends and capital gains more frequently, if necessary, for tax purposes. Dividends and distributions, if any, are recorded on the ex-dividend date.
The Fund may receive earnings credits from its custodian when positive cash balances are maintained, which may be used to offset custody fees. There were no earnings credits for the year ended July 31, 2011.
The Fund may receive earnings credits from its transfer agent when positive cash balances are maintained, which may be used to offset transfer agent fees. For the year ended July 31, 2011, the Fund earned $210 under this agreement.
2. Investment Management, Administration Agreements and Other Transactions with Affiliates
In accordance with the terms of its investment management agreement, the Fund pays Delaware Management Company (DMC), a series of Delaware Management Business Trust and the investment manager, an annual fee, which is calculated daily at the rate of 0.45% on the first $500 million of average daily net assets of the Fund, 0.40% on the next $500 million, 0.35% on the next $1.5 billion, and 0.30% on average daily net assets in excess of $2.5 billion.
Effective November 26, 2010, DMC has contractually agreed to waive that portion, if any, of its management fee and/or pay/reimburse the Fund to the extent necessary to ensure that total annual operating expenses (excluding any 12b-1 plan expenses, taxes, interest, inverse floater program expenses, short sale and dividend interest expenses, brokerage fees, certain insurance costs, and nonroutine expenses or costs including, but not limited to, those relating to reorganizations, litigation, conducting shareholder meetings, and liquidations (collectively, nonroutine expenses)), do not exceed 0.55% of average daily net assets of the Fund through November 28, 2011. Prior to November 26, 2010, the expense limitation was voluntary. For purposes of this waiver and reimbursement, nonroutine expenses may also include such additional costs and expenses as may be agreed upon from time to time by the Fund’s Board and DMC. This expense waiver and reimbursement apply only to expenses paid directly by the Fund.
Delaware Service Company, Inc. (DSC), an affiliate of DMC, provides fund accounting and financial administration oversight services to the Fund. For these services, the Fund pays DSC fees based on the aggregate daily net assets of the Delaware Investments® Family of Funds at the following annual rate: 0.0050% of the first $30 billion; 0.0045% of the next $10 billion; 0.0040% of the next $10 billion; and 0.0025% of aggregate average daily net assets in excess of $50 billion. The fees payable to DSC under the service agreement described above are allocated among all Funds in the Delaware Investments Family of Funds on a relative net asset value basis. For the year ended July 31, 2011, the Fund was charged $16,296 for these services.
DSC also provides dividend disbursing and transfer agency services. The Fund paid DSC a monthly fee based on the number of shareholder accounts for dividend disbursing and transfer agent services. Effective July 18, 2011, the Fund pays DSC a monthly asset-based fee for these services.
33
Notes to financial statements
Delaware Inflation Protected Bond Fund
2. Investment Management, Administration Agreements and Other Transactions with Affiliates (continued)
Pursuant to a distribution agreement and distribution plan, the Fund pays DDLP, the distributor and an affiliate of DMC, an annual distribution and service fee not to exceed 0.25% of the average daily net assets of the Class A shares, 1.00% of the average daily net assets of the Class B and Class C shares. Institutional Class shares pay no distribution and service expenses.
At July 31, 2011, the Fund had liabilities payable to affiliates as follows:
| Investment management fee payable to DMC | | $ | 74,399 |
| Dividend disbursing, transfer agent and fund accounting | | | |
| oversight fees and other expenses payable to DSC | | | 14,243 |
| Distribution fees payable to DDLP | | | 114,744 |
| Other expenses payable to DMC and affiliates* | | | 7,451 |
| *DMC, as part of its administrative services, pays operating expenses on behalf of the Fund and is reimbursed on a periodic basis. Expenses include items such as printing of shareholder reports, fees for audit, legal and tax services, registration fees and trustees’ fees. |
As provided in the investment management agreement, the Fund bears the cost of certain legal and tax services, including internal legal and tax services provided to the Fund by DMC and/or its affiliates’ employees. For the year ended July 31, 2011, the Fund was charged $7,765 for internal legal and tax services provided by DMC and/or its affiliates’ employees.
For the year ended July 31, 2011, DDLP earned $ 40,134 for commissions on sales of the Fund’s Class A shares. For the year ended July 31, 2011, DDLP received gross CDSC commissions of $ 5,547, $ 1,790 and $ 12,732 on redemptions of the Fund’s Class A, Class B and Class C shares, respectively, and these commissions were entirely used to offset up-front commissions previously paid by DDLP to broker-dealers on sales of those shares.
Trustees’ fees include expenses accrued by the Fund for each Trustee’s retainer and meeting fees. Certain officers of DMC, DSC, and DDLP are officers and/or Trustees of the Trust. These officers and Trustees are paid no compensation by the Fund.
3. Investments
For the year ended July 31, 2011, the Fund made purchases of $208,609,272 and sales of $155,253,852 of investment securities other than U.S. government securities and short-term investments. For the year ended July 31, 2011, the Fund made purchases of $396,392,639 and sales of $349,250,095 of long-term U.S. government securities.
At July 31, 2011, the cost of investments for federal income tax purposes was $417,256,263. At July 31, 2011, net unrealized appreciation was $20,183,775, of which $24,274,857 related to unrealized appreciation of investments and $4,091,082 related to unrealized depreciation of investments.
34
U.S. GAAP defines fair value as the price that the Fund would receive to sell an asset or pay to transfer a liability in an orderly transaction between market participants at the measurement date under current market conditions. A three level hierarchy for fair value measurements has been established based upon the transparency of inputs to the valuation of an asset or liability. Inputs may be observable or unobservable and refer broadly to the assumptions that market participants would use in pricing the asset or liability. Observable inputs reflect the assumptions market participants would use in pricing the asset or liability based on market data obtained from sources independent of the reporting entity. Unobservable inputs reflect the reporting entity’s own assumptions about the assumptions that market participants would use in pricing the asset or liability developed based on the best information available under the circumstances. The Fund’s investment in its entirety is assigned a level based upon the observability of the inputs which are significant to the overall valuation. The three level hierarchy of inputs is summarized below.
| Level 1 | – | inputs are quoted prices in active markets for identical investments (e.g., equity securities, open-end investment companies, futures contracts, options contracts) |
| | | |
| Level 2 | – | other observable inputs (including, but not limited to: quoted prices for similar assets or liabilities in markets that are active, quoted prices for identical or similar assets or liabilities in markets that are not active, inputs other than quoted prices that are observable for the assets or liabilities (such as interest rates, yield curves, volatilities, prepayment speeds, loss severities, credit risks and default rates) or other market-corroborated inputs) (e.g., debt securities, government securities, swap contracts, foreign currency exchange contracts, foreign securities utilizing international fair value pricing) |
| | | |
| Level 3 | – | inputs are significant unobservable inputs (including the Fund’s own assumptions used to determine the fair value of investments) (e.g., broker-quoted securities, fair valued securities) |
The following table summarizes the valuation of the Fund’s investments by fair value hierarchy levels as of July 31, 2011:
| | | Level 1 | | Level 2 | | Level 3 | | Total |
| Agency, Asset-Backed & | | | | | | | | | | | | |
| Mortgage-Backed Securities | | $ | — | | $ | 36,493,508 | | $ | — | | $ | 36,493,508 |
| Corporate Debt | | | — | | | 656,774 | | | 3,185,193 | | | 3,841,967 |
| Foreign Debt | | | — | | | 32,587,475 | | | 4,740,261 | | | 37,327,736 |
| U.S. Treasury Obligations | | | — | | | 320,344,581 | | | — | | | 320,344,581 |
| Purchased Options | | | 110,156 | | | — | | | — | | | 110,156 |
| Short-Term Investments | | | 10,025,010 | | | 29,297,080 | | | — | | | 39,322,090 |
| Total | | $ | 10,135,166 | | $ | 419,379,418 | | $ | 7,925,454 | | $ | 437,440,038 |
| |
| Foreign Currency | | | | | | | | | | | | |
| Exchange Contracts | | $ | — | | $ | 299,132 | | $ | — | | $ | 299,132 |
| Swap Contracts | | $ | — | | $ | 178,136 | | $ | — | | $ | 178,136 |
35
Notes to financial statements
Delaware Inflation Protected Bond Fund
3. Investments (continued)
The following is a reconciliation of investments in which significant unobservable inputs (Level 3) were used in determining fair value:
| | | Corporate Debt | | Foreign Debt | | Total |
| Balance as of 7/31/10 | | $ | 2,651,074 | | $ | 11,377,153 | | | $ | 14,028,227 | |
| Purchases | | | — | | | 4,326,964 | | | | 4,326,964 | |
| Sales | | | — | | | (3,592,546 | ) | | | (3,592,546 | ) |
| Net realized gain | | | — | | | 340,902 | | | | 340,902 | |
| Transfer out of Level 3 | | | — | | | (7,921,615 | ) | | | (7,921,615 | ) |
| Net change in unrealized | | | | | | | | | | | |
| appreciation/depreciation | | | 534,119 | | | 209,403 | | | | 743,522 | |
| Balance as of 7/31/11 | | $ | 3,185,193 | | $ | 4,740,261 | | | $ | 7,925,454 | |
| |
| Net change in unrealized | | | | | | | | | | | |
| appreciation/depreciation | | | | | | | | | | | |
| from investments still held | | | | | | | | | | | |
| as of 7/31/11 | | $ | 534,119 | | $ | 381,173 | | | $ | 915,292 | |
During the year ended July 31, 2011, transfers out of Level 3 investments into Level 2 investments were made in the amount of $7,921,615 for the Fund. This was due to the Fund’s pricing vendor being able to supply a matrix price for an investment that had been utilizing a broker quoted price. During the year ended July 31, 2011, there were no transfers between Level 1 investments and Level 2 investments that had a material impact to the Fund.
The Fund’s policy is to recognize transfers between levels at the end of the reporting period.
4. Dividend and Distribution Information
Income and long-term capital gain distributions are determined in accordance with federal income tax regulations, which may differ from U.S. GAAP. Additionally, distributions from net gains on foreign currency transactions and net short-term gains on sales of investment securities are treated as ordinary income for federal income tax purposes. The tax character of dividends and distributions paid during the years ended July 31, 2011 and 2010 was as follows:
| | | Year Ended |
| | | 7/31/11 | | 7/31/10 |
| Ordinary income | | $ | 13,767,558 | | $ | 9,464,596 |
| Long-term capital gain | | | 6,330,071 | | | — |
| Total | | $ | 20,097,629 | | $ | 9,464,596 |
36
5. Components of Net Assets on a Tax Basis
As of July 31, 2011, the components of net assets on a tax basis were as follows:
| Shares of beneficial interest | $ | 392,383,129 | |
| Undistributed ordinary income | | 1,465,180 | |
| Undistributed long-term capital gains | | 8,468,840 | |
| Post-October currency losses | | (84,539 | ) |
| Other temporary differences | | (1,807,325 | ) |
| Unrealized appreciation on investments, | | | |
| swap contracts and foreign currencies | | 20,280,535 | |
| Net assets | $ | 420,705,820 | |
The differences between book basis and tax basis components of net assets are primarily attributable to tax deferral of losses on wash sales, tax deferral of losses on straddles, mark-to-market on future contracts, mark-to-market of foreign currency contracts, tax treatment of CDS contracts, and tax treatment of market discount and premium on debt instruments.
Post-October losses represent losses realized on foreign currency transactions from November 1, 2010 through July, 31, 2011 that, in accordance with federal income tax regulations, the Fund has elected to defer and treat as having arisen in the following fiscal year.
For financial reporting purposes, capital accounts are adjusted to reflect the tax character of permanent book/tax differences. Reclassifications are primarily due to tax treatment of gain (loss) on foreign currency transactions, market discount and premium on certain debt instruments, paydowns of mortgage- and asset-backed securities and tax treatment of CDS contracts. Results of operations and net assets were not affected by these reclassifications. For the year ended July 31, 2011, the Fund recorded the following reclassifications.
| Undistributed net investment income | $ | 1,468,793 | |
| Accumulated net realized gain | | (1,468,793 | ) |
37
Notes to financial statements
Delaware Inflation Protected Bond Fund
6. Capital Shares
Transactions in capital shares were as follows:
| | | Year Ended |
| | | 7/31/11 | | 7/31/10 |
| Shares sold: | | | | | | |
| Class A | | 10,776,523 | | | 10,505,319 | |
| Class B | | 9,720 | | | 40,911 | |
| Class C | | 2,939,402 | | | 3,752,352 | |
| Institutional Class | | 10,832,942 | | | 6,127,432 | |
| |
| Shares issued upon reinvestment of dividends and distributions: | | | | | | |
| Class A | | 729,238 | | | 290,835 | |
| Class B | | 7,352 | | | 3,335 | |
| Class C | | 360,721 | | | 80,262 | |
| Institutional Class | | 315,337 | | | 254,317 | |
| | | 25,971,235 | | | 21,054,763 | |
| |
| Shares repurchased: | | | | | | |
| Class A | | (9,040,540 | ) | | (4,395,751 | ) |
| Class B | | (85,512 | ) | | (62,408 | ) |
| Class C | | (1,932,068 | ) | | (1,093,577 | ) |
| Institutional Class | | (2,439,780 | ) | | (11,810,035 | ) |
| | | (13,497,900 | ) | | (17,361,771 | ) |
| Net increase | | 12,473,335 | | | 3,692,992 | |
For the years ended July 31, 2011 and 2010, 46,716 Class B shares were converted to 46,629 Class A shares valued at $500,969 and 28,148 Class B shares were converted to 28,140 Class A shares valued at $295,485, respectively. The respective amounts are included in Class B redemptions and Class A subscriptions in the table above and the statements of changes in net assets.
7. Line of Credit
The Fund, along with certain other funds in the Delaware Investments® Family of Funds (Participants), was a participant in a $35,000,000 revolving line of credit to be used for temporary or emergency purposes as an additional source of liquidity to fund redemptions of investor shares. Under the agreement, the Participants were charged an annual commitment fee, which was allocated across the Participants on the basis of each Participant’s allocation of the entire facility. The Participants were permitted to borrow up to a maximum of one third of their net assets under the agreement. The line of credit expired on November 16, 2010.
38
On November 16, 2010, the Fund, along with the other Participants, entered into an amendment to the agreement for a $50,000,000 revolving line of credit. Effective as of August 1, 2011, the Fund, along with the other Participants, entered into an amendment to the agreement for a $100,000,000 revolving line of credit. The agreement as amended is to be used as described above and operates in substantially the same manner as the original agreement. The new line of credit under the agreement as amended expires on November 15, 2011. The Fund had no amounts outstanding as of July 31, 2011 or at any time during the year then ended.
8. Derivatives
U.S. GAAP requires enhanced disclosures that enable investors to understand: 1) how and why an entity uses derivatives; 2) how they are accounted for; and 3) how they affect an entity’s results of operations and financial position.
Foreign Currency Exchange Contracts — The Fund may enter into foreign currency exchange contracts as a way of managing foreign exchange rate risk. The Fund may enter into these contracts to fix the U.S. dollar value of a security that it has agreed to buy or sell for the period between the date the trade was entered into and the date the security is delivered and paid for. The Fund may also use these contracts to hedge the U.S. dollar value of securities it already owns that are denominated in foreign currencies. The change in value is recorded as an unrealized gain or loss. When the contract is closed, a realized gain or loss is recorded equal to the difference between the value of the contract at the time it was opened and the value at the time it was closed.
The use of foreign currency exchange contracts does not eliminate fluctuations in the underlying prices of the securities, but does establish a rate of exchange that can be achieved in the future. Although foreign currency exchange contracts limit the risk of loss due to an unfavorable change in the value of the hedged currency, they also limit any potential gain that might result should the value of the currency change favorably. In addition, the Fund could be exposed to risks if the counterparties to the contracts are unable to meet the terms of their contracts. The Fund’s maximum risk of loss from counterparty credit risk is the value of its currency exchanged with the counterparty. The risk is generally mitigated by having a netting arrangement between the Fund and the counterparty and by the posting of collateral by the counterparty to the Fund to cover the Fund’s exposure to the counterparty.
Futures Contracts — A futures contract is an agreement in which the writer (or seller) of the contract agrees to deliver to the buyer an amount of cash or securities equal to a specific dollar amount times the difference between the value of a specific security or index at the close of the last trading day of the contract and the price at which the agreement is made. The Fund may use futures in the normal course of pursuing its investment objective. The Fund may invest in futures contracts to hedge its existing portfolio securities against fluctuations in fair value caused by changes in prevailing market interest rates. Upon entering into a futures contract, the Fund deposits cash or pledges U.S government securities to a broker, equal to the minimum “initial margin” requirements of the exchange on which the contract is traded. Subsequent payments are received from the broker or paid to the broker each day, based on the daily fluctuation in the
39
Notes to financial statements
Delaware Inflation Protected Bond Fund
8. Derivatives (continued)
market value of the contract. These receipts or payments are known as “variation margin” and are recorded daily by the Fund as unrealized gains or losses until the contracts are closed. When the contracts are closed, the Fund records a realized gain or loss equal to the difference between the value of the contract at the time it was opened and the value at the time it was closed. Risks of entering into futures contracts include potential imperfect correlation between the futures contracts and the underlying securities and the possibility of an illiquid secondary market for these instruments. When investing in futures, there is minimal counterparty credit risk to the Fund because futures are exchange-traded and the exchange’s clearinghouse, as counterparty to all exchange-traded futures, guarantees against default.
Swap Contracts — The Fund may enter into inflation swap contracts and CDS contracts in the normal course of pursuing its investment objective. The Fund may use inflation swaps to hedge the inflation risk in nominal bonds, thereby creating synthetic inflation-indexed bonds. The Fund may enter into CDS contracts in order to hedge against a credit event, to enhance total return or to gain exposure to certain securities or markets.
Inflation Swaps. Inflation swaps agreements involve commitments to pay a regular stream of inflation-indexed cash payments in exchange for receiving a stream of nominal interest payments (or vice versa), where both payment streams are based on notional amounts. The nominal interest payments may be based on either a fixed interest rate or variable interest rate such as London Interbank Offered Rate (LIBOR). The change in value of swap contracts outstanding, if any, is recorded as unrealized appreciation or depreciation daily. A realized gain or loss is recorded on maturity or termination of the swap contract. The Fund’s maximum risk of loss from counterparty credit risk is the discounted net value of the cash flows to be received from/paid to the counterparty over the index swap contract’s remaining life, to the extent that the amount is positive. This risk is mitigated by having a netting arrangement between the Fund and the counterparty and by the posting of collateral by the counterparty to the Fund to cover the Fund’s exposure to the counterparty.
Credit Default Swaps. A CDS contract is a risk-transfer instrument through which one party (purchaser of protection) transfers to another party (seller of protection) the financial risk of a credit event (as defined in the CDS agreement), as it relates to a particular reference security or basket of securities (such as an index). In exchange for the protection offered by the seller of protection, the purchaser of protection agrees to pay the seller of protection a periodic amount at a stated rate that is applied to the notional amount of the CDS contract. In addition, an upfront payment may be made or received by the Fund in connection with an unwinding or assignment of a CDS contract. Upon the occurrence of a credit event, the seller of protection would pay the par (or other agreed-upon) value of the referenced security (or basket of securities) to the counterparty. Credit events generally include, among others, bankruptcy, failure to pay and obligation default.
40
During the year ended July 31, 2011, the Fund entered into CDS contracts as a purchaser of protection. Periodic payments on such contracts are accrued daily and recorded as unrealized losses (gains) on swap contracts. Upon payment, such amounts are recorded as realized losses (gains) on swap contracts. Upfront payments made or received in connection with CDS contracts are amortized over the expected life of the CDS contracts as unrealized losses (gains) on swap contracts. The change in value of CDS contracts is recorded as unrealized appreciation or depreciation daily. A realized gain or loss is recorded upon a credit event (as defined in the CDS agreement) or the maturity or termination of the agreement. For the year ended July 31, 2011, the Fund did not enter into any CDS contracts as a seller of protection. At July 31, 2011, the aggregate unrealized appreciation of CDS was $178,136. The Fund had posted $550,000 as collateral for certain open derivatives. If a credit event had occurred for all swap transactions where collateral posting was required as of July 31, 2011, the swaps’ credit-risk-related contingent features would have been triggered and the Fund would have received $5,255,000 less the value of the contracts’ related reference obligations. The Fund received collateral of $ 605,000 for certain open derivatives.
CDS may involve greater risks than if the Fund had invested in the referenced obligation directly. Credit default swaps are subject to general market risk, liquidity risk, counterparty risk and credit risk. The Fund’s maximum risk of loss from counterparty credit risk, either as the seller of protection or the buyer of protection, is the fair value of the contract. This risk is mitigated by having a netting arrangement between the Fund and the counterparty and by the posting of collateral by the counterparty to the Fund to cover the Fund’s exposure to the counterparty.
Swaps Generally. Because there is no organized market for swap contracts, the value of open swaps may differ from that which would be realized in the event the Fund terminated its position in the agreement. Risks of entering into these contracts include the potential inability of the counterparty to meet the terms of the contracts. This type of risk is generally limited to the amount of favorable movement in the value of the underlying security, instrument or basket of instruments, if any, at the day of default. Risks also arise from potential losses from adverse market movements and such losses could exceed the unrealized amounts shown on the statement of net assets.
Fair values of derivative instruments as of July 31, 2011 were as follows:
| | | Asset Derivatives | | Liability Derivatives |
| | | Statement of Net | | | | | Statement of Net | | |
| | | Assets Location | | Fair Value | | Assets Location | | Fair Value |
| Forward currency exchange contracts | | | | | | | | | |
| (Foreign currency exchange contracts) | | Liabilities net of receivables and other assets | | $ | 299,949 | | Liabilities net of receivables and other assets | | $ | (817 | ) |
| Credit contracts | | | | | | | | | |
| (Swap contracts) | | Liabilities net of receivables and other assets | | | 178,136 | | Liabilities net of receivables and other assets | | | — | |
| Total | | | | $ | 478,085 | | | | $ | (817 | ) |
41
Notes to financial statements
Delaware Inflation Protected Bond Fund
8. Derivatives (continued)
The effect of derivative instruments on the statement of operations for the year ended July 31, 2011 was as follows:
| | | | | | | | | Change in |
| | | | | | | | | Unrealized |
| | | | | Realized Gain | | Appreciation |
| | | | | or Loss on | | or Depreciation |
| | | Location of Gain or Loss on | | Derivatives | | on Derivatives |
| | | Derivatives Recognized in | | Recognized in | | Recognized in |
| | | Income | | Income | | Income |
| Forward currency exchange contracts | | | | | | | | | | |
| (Foreign currency exchange contracts) | | Net realized loss on foreign currencies and net change in unrealized appreciation/depreciation of investments and foreign currencies | | $ | (2,768,730 | ) | | $ | 355,880 | |
| Interest rate contracts | | | | | | | | | | |
| (Futures contracts) | | Net realized gain on futures contracts and net change in unrealized appreciation/depreciation of investments and foreign currencies | | | 4,359,134 | | | | (2,314,343 | ) |
| Credit and inflation contracts | | | | | | | | | | |
| (Swap contracts) | | Net realized loss on swap contracts and net change in unrealized appreciation/depreciation of investments and foreign currencies | | | 66,564 | | | | 287,582 | |
| Total | | | | $ | 1,656,968 | | | $ | (1,670,881 | ) |
The volume of derivative transactions varies throughout the year. Information about derivative transactions reflected is as of the date of this report and generally similar to the volume of derivative activity during the year ended July 31, 2011.
42
9. Securities Lending
The Fund, along with other funds in the Delaware Investments® Family of Funds, may lend its securities pursuant to a security lending agreement (Lending Agreement) with The Bank of New York Mellon (BNY Mellon.) At the time a security is loaned, the borrower must post collateral equal to the required percentage of the market value of the loaned security, including any accrued interest. The required percentage is: (i) 102% with respect to U.S. securities and foreign securities that are denominated and payable in U.S. dollars; and (ii) 105% with respect to foreign securities. With respect to each loan, if on any business day the aggregate market value of securities collateral plus cash collateral held is less than the aggregate market value of the securities which are the subject of such loan, the borrower will be notified to provide additional initial collateral by the end of the following business day which, together with the collateral already held, will be not less than the applicable initial collateral requirements for such security loan. If the aggregate market value of securities collateral and cash collateral held with respect to a security loan exceeds the applicable initial collateral requirement, upon request of the borrower BNY Mellon must return enough collateral to the borrower by the end of the following business day to reduce the value of the remaining collateral to the applicable collateral requirement for such security loan. As a result of the foregoing, the value of the collateral held with respect to a loaned security may be temporarily more or less than the value of the security on loan.
Cash collateral received is generally invested in the Delaware Investments Collateral Fund No. 1 (Collective Trust) established by BNY Mellon for the purpose of investment on behalf of funds managed by DMC that participate in BNY Mellon’s securities lending program. The Collective Trust may invest in U.S. government securities and high quality corporate debt, asset-backed and other money market securities and in repurchase agreements collateralized by such securities, provided that the Collective Trust will generally have a dollar-weighted average portfolio maturity of 60 days or less. The Collective Trust seeks to maintain a net asset value per unit of $1.00, but there can be no assurance that it will always be able to do so. The Fund may incur investment losses as a result of investing securities lending collateral in the Collective Trust. This could occur if an investment in the Collective Trust defaulted or if it were necessary to liquidate assets in the Collective Trust to meet returns on outstanding security loans at a time when the Collective Trust’s net asset value per unit was less than $1.00. Under those circumstances, the Fund may not receive an amount from the Collective Trust that is equal in amount to the collateral the Fund would be required to return to the borrower of the securities and the Fund would be required to make up for this shortfall. The Fund can also accept U.S. government securities and letters of credit (non-cash collateral) in connection with securities loans. In the event of default or bankruptcy by the lending agent, realization and/or retention of the collateral may be subject to legal proceedings. In the event the borrower fails to return loaned securities and the collateral received is insufficient to cover the value of the loaned securities and provided such collateral shortfall is not the result of investment losses, the lending agent has agreed to pay the amount of the shortfall to the Fund or, at the discretion of the lending agent, replace the loaned securities. The Fund continues to record dividends or interest, as applicable, on the securities loaned and is subject to change in value of
43
Notes to financial statements
Delaware Inflation Protected Bond Fund
9. Securities Lending (continued)
the securities loaned that may occur during the term of the loan. The Fund has the right under the Lending Agreement to recover the securities from the borrower on demand. With respect to security loans collateralized by non-cash collateral, the Fund receives loan premiums paid by the borrower. With respect to security loans collateralized by cash collateral, the earnings from the collateral investments are shared among the Fund, the security lending agent and the borrower. The Fund records security lending income net of allocations to the security lending agent and the borrower. The Fund had no securities out on loan as of July 31, 2011.
10. Credit and Market Risk
The Fund primarily invests in inflation protected debt securities whose principal and/or interest payments are adjusted for inflation, unlike traditional debt securities that make fixed principal and interest payments. Under normal circumstances, the Fund will invest at least 80% of its net assets in inflation-protected bonds issued by the U.S. government, its agencies or instrumentalities, foreign governments and corporations, which may include synthetic investments such as options, forwards, futures contracts, or swap agreements that, when combined with non-inflation indexed bonds, have economic characteristics similar to inflation-indexed bonds.
Some countries in which the Fund may invest require governmental approval for the repatriation of investment income, capital or the proceeds of sales of securities by foreign investors. In addition, if there is deterioration in a country’s balance of payments or for other reasons, a country may impose temporary restrictions on foreign capital remittances abroad. The securities exchanges of certain foreign markets are substantially smaller, less liquid and more volatile than the major securities markets in the United States. Consequently, acquisition and disposition of securities by the Fund may be inhibited.
The Fund may invest up to 10% of its net assets in high yield fixed income securities, which are securities rated lower than BBB- by Standard & Poor’s and Baa3 by Moody’s Investor Services, or similarly rated by another nationally recognized statistical rating organization. Investments in these higher yielding securities are generally accompanied by a greater degree of credit risk than higher rated securities. Additionally, lower rated securities may be more susceptible to adverse economic and competitive industry conditions than investment grade securities.
The Fund invests in fixed income securities whose value is derived from an underlying pool of mortgages or consumer loans. The value of these securities is sensitive to changes in economic conditions, including delinquencies and/or defaults, and may be adversely affected by shifts in the market’s perception of the issuers and changes in interest rates. Investors receive principal and
44
interest payments as the underlying mortgages and consumer loans are paid back. Prepayment of mortgages may shorten the stated maturity of the obligations and can result in a loss of premium, if any has been paid. Some of these securities are collateralized mortgage obligations (CMOs). CMOs are debt securities issued by U.S. government agencies or by financial institutions and other mortgage lenders, which are collateralized by a pool of mortgages held under an indenture. Prepayment of mortgages may shorten the stated maturity of the obligations and can result in a loss of premium, if any has been paid. Certain of these securities may be stripped (securities which provide only the principal or interest feature of the underlying security). The yield to maturity on an interest-only CMO is extremely sensitive not only to changes in prevailing interest rates, but also to the rate of principal payments (including prepayments) on the related underlying mortgage assets. A rapid rate of principal payments may have a material adverse effect on the Fund’s yield to maturity. If the underlying mortgage assets experience greater than anticipated prepayments of principal, the Fund may fail to fully recoup its initial investment in these securities even if the securities are rated in the highest rating categories.
The Fund may invest up to 15% of its net assets in illiquid securities, which may include securities with contractual restrictions on resale, securities exempt from registration under Rule 144A of the Securities Act of 1933, as amended and other securities which may not be readily marketable. The relative illiquidity of these securities may impair the Fund from disposing of them in a timely manner and at a fair price when it is necessary or desirable to do so. While maintaining oversight, the Fund’s Board has delegated to DMC the day-to-day functions of determining whether individual securities are liquid for purposes of the Fund’s limitation on investments in illiquid securities. Securities eligible for resale pursuant to Rule 144A, which are determined to be liquid, are not subject to the Fund’s 15% limit on investments in illiquid securities. As of July 31, 2011, there were no Rule 144A securities and no securities have been determined to be illiquid under the Fund’s Liquidity Procedures.
11. Contractual Obligations
The Fund enters into contracts in the normal course of business that contain a variety of indemnifications. The Fund’s maximum exposure under these arrangements is unknown. However, the Fund has not had prior claims or losses pursuant to these contracts. Management has reviewed the Fund’s existing contracts and expects the risk of loss to be remote.
12. Subsequent Events
Management has determined that no material events or transactions occurred subsequent to July 31, 2011 that would require recognition or disclosure in the Fund’s financial statements.
45
Notes to financial statements
Delaware Inflation Protected Bond Fund
13. Tax Information (Unaudited)
The information set forth below is for the Fund’s fiscal year as required by federal income tax laws. Shareholders, however, must report distributions on a calendar year basis for income tax purposes, which may include distributions for portions of two fiscal years of a fund. Accordingly, the information needed by shareholders for income tax purposes will be sent to them in January of each year. Please consult your tax advisor for proper treatment of this information.
All designations are based on financial information available as of the date of this annual report and, accordingly are subject to change. For any and all items requiring designation, it is the intention of the Fund to designate the maximum amount permitted under the Internal Revenue Code and the regulations thereunder.
For the fiscal year ended July 31, 2011, the Fund designates distributions paid during the year as follows:
| (A) | Ordinary Income Distribution (Tax Basis) | 68.50% |
| (B) | Long-Term Capital Gains Distributions (Tax Basis) | 31.50% |
| | Total Distributions (Tax Basis) | 100.00% |
(A) and (B) are based on a percentage of the Fund’s total distributions.
46
Report of independent
registered public accounting firm
To the Board of Trustees of Delaware Group® Government Fund
and the Shareholders of Delaware Inflation Protected Bond Fund:
In our opinion, the accompanying statement of net assets and the related statements of operations and of changes in net assets and the financial highlights present fairly, in all material respects, the financial position of Delaware Inflation Protected Bond Fund (one of the series constituting Delaware Group Government Fund, hereafter referred to as the “Fund”) at July 31, 2011, the results of its operations for the year then ended and the changes in its net assets and the financial highlights for each of the two years in the period then ended, in conformity with accounting principles generally accepted in the United States of America. These financial statements and financial highlights (hereafter referred to as “financial statements”) are the responsibility of the Fund’s management; our responsibility is to express an opinion on these financial statements based on our audits. We conducted our audits of these financial statements in accordance with the standards of the Public Company Accounting Oversight Board (United States). Those standards require that we plan and perform the audit to obtain reasonable assurance about whether the financial statements are free of material misstatement. An audit includes examining, on a test basis, evidence supporting the amounts and disclosures in the financial statements, assessing the accounting principles used and significant estimates made by management, and evaluating the overall financial statement presentation. We believe that our audits, which included confirmation of securities at July 31, 2011 by correspondence with the custodian and brokers, provide a reasonable basis for our opinion. The financial highlights for each of the three years in the period ended July 31, 2009 were audited by other independent accountants whose report dated September 21, 2009 expressed an unqualified opinion on those statements.
PricewaterhouseCoopers LLP
Philadelphia, Pennsylvania
September 28, 2011
47
Other Fund information
(Unaudited)
Delaware Inflation Protected Bond Fund
Change in Independent Registered Public Accounting Firm
Due to independence matters under the Securities and Exchange Commission’s auditor independence rules relating to the January 4, 2010 acquisition of Delaware Investments (including DMC, DDLP and DSC) by Macquarie Group, Ernst & Young LLP (E&Y) has resigned as the independent registered public accounting firm for Delaware Group® Government Fund (the Trust) effective May 20, 2010. At a meeting held on May 20, 2010, the Board of Trustees of the Trust, upon recommendation of the Audit Committee, selected PricewaterhouseCoopers LLP (PwC) to serve as the independent registered public accounting firm for the Trust for the fiscal year ending July 31, 2010. During the fiscal years ended July 31, 2009 and 2008, E&Y’s audit reports on the financial statements of the Trust did not contain any adverse opinion or disclaimer of opinion, nor were they qualified or modified as to uncertainty, audit scope, or accounting principles. In addition, there were no disagreements between the Trust and E&Y on accounting principles, financial statements disclosures or audit scope, which, if not resolved to the satisfaction of E&Y, would have caused them to make reference to the disagreements in their reports. Neither the Trust nor anyone on its behalf has consulted with PwC at any time prior to their selection with respect to the application of accounting principles to a specified transaction, either completed or proposed or the type of audit opinion that might be rendered on the Trust’s financial statements.
48
Board of trustees/directors and officers addendum
Delaware Investments® Family of Funds
A mutual fund is governed by a Board of Trustees/Directors (“Trustees”), which has oversight responsibility for the management of a fund’s business affairs. Trustees establish procedures and oversee and review the performance of the investment manager, the distributor, and others who perform services for the fund. The independent fund trustees, in particular, are advocates
| Name, Address, | | Position(s) | | Length of |
| and Birth Date | | Held with Fund(s) | | Time Served |
| Interested Trustees | | | | |
| | | | | |
| Patrick P. Coyne1 | | Chairman, President, | | Chairman and Trustee |
| 2005 Market Street | | Chief Executive Officer, | | since August 16, 2006 |
| Philadelphia, PA 19103 | | and Trustee | | |
| April 1963 | | | | President and |
| | | | | Chief Executive Officer |
| | | | | since August 1, 2006 |
| | | | | |
| | | | | |
| | | | | |
| | | | | |
| | | | | |
| | | | | |
| | | | | |
| | | | | |
| | | | | |
| | | | | |
| | | | | |
| | | | | |
| | | | | |
| | | | | |
| | | | | |
| | | | | |
| | | | | |
| | | | | |
1 Patrick P. Coyne is considered to be an “Interested Trustee” because he is an executive officer of the Fund’s(s’) investment advisor.
50
for shareholder interests. Each trustee has served in that capacity since he or she was elected to or appointed to the Board of Trustees, and will continue to serve until his or her retirement or the election of a new trustee in his or her place. The following is a list of the Trustees and Officers with certain background and related information.
| | | Number of Portfolios in | | |
| Principal Occupation(s) | | Fund Complex Overseen | | Other Directorships |
| During Past 5 Years | | by Trustee or Officer | | Held by Trustee or Officer |
| |
| |
| Patrick P. Coyne has served in | | 75 | | Director and Audit |
| various executive capacities | | | | Committee Member |
| at different times at | | | | Kaydon Corp. |
| Delaware Investments.2 | | | | |
| | | | | Board of Governors Member |
| | | | | Investment Company |
| | | | | Institute (ICI) |
| | | | | |
| | | | | Finance Committee Member |
| | | | | St. John Vianney Roman |
| | | | | Catholic Church |
| |
| | | | | Board of Trustees |
| | | | | Agnes Irwin School |
| |
| | | | | Member of Investment |
| | | | | Committee |
| | | | | Cradle of Liberty Council, |
| | | | | BSA |
| | | | | (2007–2010) |
| | | | | |
| |
| | | | | |
| | | | | |
| |
2 Delaware Investments is the marketing name for Delaware Management Holdings, Inc. and its subsidiaries, including the Fund’s(s’) investment advisor, principal underwriter, and its transfer agent.
51
Board of trustees/directors and officers addendum
Delaware Investments® Family of Funds
| Name, Address, | | Position(s) | | Length of |
| and Birth Date | | Held with Fund(s) | | Time Served |
| Independent Trustees | | | | |
| |
| Thomas L. Bennett | | Trustee | | Since March 2005 |
| 2005 Market Street | | | | |
| Philadelphia, PA 19103 | | | | |
| October 1947 | | | | |
| |
| |
| |
| |
| |
| |
| |
| |
| |
| |
| |
| John A. Fry | | Trustee | | Since January 2001 |
| 2005 Market Street | | | | |
| Philadelphia, PA 19103 | | | | |
| May 1960 | | | | |
| |
| |
| |
| |
| |
| |
| |
| |
| |
| |
| |
| Anthony D. Knerr | | Trustee | | Since April 1990 |
| 2005 Market Street | | | | |
| Philadelphia, PA 19103 | | | | |
| December 1938 | | | | |
| |
| Lucinda S. Landreth | | Trustee | | Since March 2005 |
| 2005 Market Street | | | | |
| Philadelphia, PA 19103 | | | | |
| June 1947 | | | | |
| |
52
| | | Number of Portfolios in | | |
| Principal Occupation(s) | | Fund Complex Overseen | | Other Directorships |
| During Past 5 Years | | by Trustee or Officer | | Held by Trustee or Officer |
| | | | | |
| |
| Private Investor | | 75 | | Chairman of Investment |
| (March 2004–Present) | | | | Committee |
| | | | | Pennsylvania Academy of |
| Investment Manager | | | | Fine Arts |
| Morgan Stanley & Co. | | | | |
| (January 1984–March 2004) | | | | Investment Committee and |
| | | | | Governance Committee |
| | | | | Member |
| | | | | Pennsylvania Horticultural |
| | | | | Society |
| | | | | |
| | | | | Director |
| | | | | Bryn Mawr Bank Corp. (BMTC) |
| | | | | (2007–2011) |
| |
| President | | 75 | | Board of Governors Member — |
| Drexel University | | | | NASDAQ OMX PHLX LLC |
| (August 2010–Present) | | | | |
| | | | | Director and Audit |
| President | | | | Committee Member |
| Franklin & Marshall College | | | | Community Health Systems |
| (July 2002–July 2010) | | | | |
| | | | | Director — Ecore |
| | | | | International |
| | | | | (2009–2010) |
| | | | | |
| | | | | Director — Allied |
| | | | | Barton Securities Holdings |
| | | | | (2005–2008) |
| |
| Managing Director | | 75 | | None |
| Anthony Knerr & Associates | | | | |
| (Strategic Consulting) | | | | |
| (1990–Present) | | | | |
| |
| Chief Investment Officer | | 75 | | None |
| Assurant, Inc. (Insurance) | | | | |
| (2002–2004) | | | | |
| | | | | |
| |
53
Board of trustees/directors and officers addendum
Delaware Investments® Family of Funds
| Name, Address, | | Position(s) | | Length of |
| and Birth Date | | Held with Fund(s) | | Time Served |
| Independent Trustees (continued) | | | | |
| |
| Ann R. Leven | | Trustee | | Since October 1989 |
| 2005 Market Street | | | | |
| Philadelphia, PA 19103 | | | | |
| November 1940 | | | | |
| |
| |
| |
| |
| |
| |
| Frances A. Sevilla-Sacasa | | Trustee | | Since September 2011 |
| 2005 Market Street | | | | |
| Philadelphia, PA 19103 | | | | |
| January 1956 | | | | |
| |
| |
| |
| |
| |
| |
| |
| |
| | | | | |
| | | | | |
| | | | | |
| | | | | |
| |
| |
| |
| | | | | |
| | | | | |
| | | | | |
| | | | | |
| | | | | |
| | | | | |
| | | | | |
| | | | | |
| | | | | |
| |
54
| | | Number of Portfolios in | | |
| Principal Occupation(s) | | Fund Complex Overseen | | Other Directorships |
| During Past 5 Years | | by Trustee or Officer | | Held by Trustee or Officer |
| | | | | |
| |
| Consultant | | 75 | | Director and Audit |
| ARL Associates | | | | Committee Chair |
| (Financial Planning) | | | | Systemax Inc. |
| (1983–Present) | | | | (2001–2009) |
| | | | | |
| | | | | Director and Audit |
| | | | | Committee Chairperson |
| | | | | Andy Warhol Foundation |
| | | | | (1999–2007) |
| |
| Executive Advisor to Dean | | 75 | | Trust Manager — Camden |
| (since August 2011) and | | | | Property Trust |
| Interim Dean | | | | (since August 2011) |
| (January 2011–July 2011) — | | | | |
| University of Miami School of | | | | Board of Trustees |
| Business Administration | | | | Thunderbird School of |
| | | | | Global Management |
| President — U.S. Trust, | | | | (2007–2011) |
| Bank of America Private | | | | |
| Wealth Management | | | | Board of Trustees |
| (Private Banking) | | | | Carrollton School of the |
| (July 2007–December 2008) | | | | Sacred Heart |
| | | | | (since 2007) |
| President and Director | | | | |
| (November 2005–June 2007) and | | | | Board Member |
| Chief Executive Officer | | | | Foreign Policy Association |
| (April 2007–June 2007) — | | | | (since 2006) |
| U.S. Trust Company | | | | |
| (Private Banking) | | | | Board of Trustees |
| | | | | Georgetown Preparatory School |
| | | | | (2005–2011) |
| | | | | |
| | | | | Board of Trustees |
| | | | | Miami City Ballet |
| | | | | (2000–2011) |
| | | | | |
| | | | | Board of Trustees |
| | | | | St. Thomas University |
| | | | | (2005–2011) |
| |
55
Board of trustees/directors and officers addendum
Delaware Investments® Family of Funds
| Name, Address, | | Position(s) | | Length of |
| and Birth Date | | Held with Fund(s) | | Time Served |
| Independent Trustees (continued) | | | | |
| | | | | |
| Janet L. Yeomans | | Trustee | | Since April 1999 |
| 2005 Market Street | | | | |
| Philadelphia, PA 19103 | | | | |
| July 1948 | | | | |
| |
| |
| |
| |
| J. Richard Zecher | | Trustee | | Since March 2005 |
| 2005 Market Street | | | | |
| Philadelphia, PA 19103 | | | | |
| July 1940 | | | | |
| |
| |
| | | | | |
| | | | | |
| | | | | |
| | | | | |
| | | | | |
| | | | | |
| | | | | |
| | | | | |
| | | | | |
| | | | | |
| | | | | |
| | | | | |
| | | | | |
| | | | | |
| |
56
| | | Number of Portfolios in | | |
| Principal Occupation(s) | | Fund Complex Overseen | | Other Directorships |
| During Past 5 Years | | by Trustee or Officer | | Held by Trustee or Officer |
| | | | | |
| | | | | |
| Vice President and Treasurer | | 75 | | Director and Audit |
| (January 2006–Present) | | | | Committee Member |
| Vice President — Mergers & Acquisitions | | | | Okabena Company |
| (January 2003–January 2006), and | | | | |
| Vice President and Treasurer | | | | Chair — 3M |
| (July 1995–January 2003) | | | | Investment Management |
| 3M Corporation | | | | Company |
| |
| Founder | | 75 | | Director and Audit |
| Investor Analytics | | | | Committee Member |
| (Risk Management) | | | | Investor Analytics |
| (May 1999–Present) | | | | |
| | | | | |
| Founder | | | | Director |
| Sutton Asset Management | | | | Oxigene, Inc. |
| (Hedge Fund) | | | | (2003–2008) |
| (September 1996–Present) | | | | |
| | | | | |
| | | | | |
| | | | | |
| | | | | |
| | | | | |
| | | | | |
| | | | | |
| | | | | |
| | | | | |
| | | | | |
| | | | | |
| |
57
Board of trustees/directors and officers addendum
Delaware Investments® Family of Funds
| Name, Address, | | Position(s) | | Length of |
| and Birth Date | | Held with Fund(s) | | Time Served |
| Officers | | | | |
| | | | | |
| David F. Connor | | Vice President, | | Vice President since |
| 2005 Market Street | | Deputy General | | September 2000 |
| Philadelphia, PA 19103 | | Counsel, and Secretary | | and Secretary since |
| December 1963 | | | | October 2005 |
| |
| |
| Daniel V. Geatens | | Vice President | | Treasurer |
| 2005 Market Street | | and Treasurer | | since October 2007 |
| Philadelphia, PA 19103 | | | | |
| October 1972 | | | | |
| |
| David P. O’Connor | | Senior Vice President, | | Senior Vice President, |
| 2005 Market Street | | General Counsel, | | General Counsel, and |
| Philadelphia, PA 19103 | | and Chief Legal Officer | | Chief Legal Officer |
| February 1966 | | | | since October 2005 |
| |
| Richard Salus | | Senior Vice President | | Chief Financial Officer |
| 2005 Market Street | | and Chief Financial Officer | | since November 2006 |
| Philadelphia, PA 19103 | | | | |
| October 1963 | | | | |
| |
The Statement of Additional Information for the Fund(s) includes additional information about the Trustees and Officers and is available, without charge, upon request by calling 800 523-1918.
58
| | | Number of Portfolios in | | |
| Principal Occupation(s) | | Fund Complex Overseen | | Other Directorships |
| During Past 5 Years | | by Trustee or Officer | | Held by Trustee or Officer |
| |
| |
| David F. Connor has served as | | 75 | | None3 |
| Vice President and Deputy | | | | |
| General Counsel of | | | | |
| Delaware Investments | | | | |
| since 2000. | | | | |
| |
| Daniel V. Geatens has served | | 75 | | None3 |
| in various capacities at | | | | |
| different times at | | | | |
| Delaware Investments. | | | | |
| |
| David P. O’Connor has served in | | 75 | | None3 |
| various executive and legal | | | | |
| capacities at different times | | | | |
| at Delaware Investments. | | | | |
| |
| Richard Salus has served in | | 75 | | None3 |
| various executive capacities | | | | |
| at different times at | | | | |
| Delaware Investments. | | | | |
| |
3 David F. Connor, Daniel V. Geatens, David P. O’Connor, and Richard Salus serve in similar capacities for the six portfolios of the Optimum Fund Trust, which have the same investment advisor, principal underwriter, and transfer agent as the registrant.
59
About the organization
| Board of trustees |
Patrick P. Coyne
Chairman, President, and
Chief Executive Officer
Delaware Investments®
Family of Funds
Philadelphia, PA Thomas L. Bennett
Private Investor
Rosemont, PA John A. Fry
President
Drexel University
Philadelphia, PA | Anthony D. Knerr
Founder and Managing
Director
Anthony Knerr &
Associates
New York, NY Lucinda S. Landreth
Former Chief Investment
Officer
Assurant, Inc.
Philadelphia, PA | Ann R. Leven
Consultant
ARL Associates
New York, NY Frances A.
Sevilla-Sacasa
Executive Advisor
to Dean, University of
Miami School of
Business Administration
Coral Gables, FL | Janet L. Yeomans
Vice President and
Treasurer
3M Corporation
St. Paul, MN J. Richard Zecher
Founder
Investor Analytics
Scottsdale, AZ |
| | | | |
| Affiliated officers |
David F. Connor
Vice President, Deputy
General Counsel, and
Secretary
Delaware Investments
Family of Funds
Philadelphia, PA | Daniel V. Geatens
Vice President and
Treasurer
Delaware Investments
Family of Funds
Philadelphia, PA | David P. O’Connor
Senior Vice President,
General Counsel,
and Chief Legal Officer
Delaware Investments
Family of Funds
Philadelphia, PA | Richard Salus
Senior Vice President and
Chief Financial Officer
Delaware Investments
Family of Funds
Philadelphia, PA |
| This annual report is for the information of Delaware Inflation Protected Bond Fund shareholders, but it may be used with prospective investors when preceded or accompanied by the Delaware Investments Fund fact sheet for the most recently completed calendar quarter. These documents are available at www.delawareinvestments.com. |
Delaware Investments is the marketing name of Delaware Management Holdings, Inc. and its subsidiaries. The Fund files its complete schedule of portfolio holdings with the Securities and Exchange Commission (SEC) for the first and third quarters of each fiscal year on Form N-Q. The Fund’s Forms N-Q, as well as a description of the policies and procedures that the Fund uses to determine how to vote proxies (if any) relating to portfolio securities are available without charge (i) upon request, by calling 800 523-1918; and (ii) on the SEC’s website at www.sec.gov. In addition, a description of the policies and procedures that the Fund uses to determine how to vote proxies (if any) relating to portfolio securities and the Fund’s Schedule of Investments are available without charge on the Fund’s website at www.delawareinvestments.com. The Fund’s Forms N-Q may be reviewed and copied at the SEC’s Public Reference Room in Washington, D.C.; information on the operation of the Public Reference Room may be obtained by calling 800 SEC-0330. Information (if any) regarding how the Fund voted proxies relating to portfolio securities during the most recently disclosed 12-month period ended June 30 is available without charge (i) through the Funds’ website at www.delawareinvestments.com; and (ii) on the SEC’s website at www.sec.gov. |
60
Item 2. Code of Ethics
The registrant has adopted a code of ethics that applies to the registrant’s principal executive officer, principal financial officer, principal accounting officer or controller, or persons performing similar functions, regardless of whether these individuals are employed by the registrant or a third party. A copy of the registrant’s Code of Business Ethics has been posted on the Delaware Investments Internet Web site at www.delawareinvestments.com. Any amendments to the Code of Business Ethics, and information on any waiver from its provisions granted by the registrant, will also be posted on this Web site within five business days of such amendment or waiver and will remain on the Web site for at least 12 months.
Item 3. Audit Committee Financial Expert
The registrant’s Board of Trustees/Directors has determined that certain members of the registrant’s Audit Committee are audit committee financial experts, as defined below. For purposes of this item, an “audit committee financial expert” is a person who has the following attributes:
a. An understanding of generally accepted accounting principles and financial statements;
b. The ability to assess the general application of such principles in connection with the accounting for estimates, accruals, and reserves;
c. Experience preparing, auditing, analyzing, or evaluating financial statements that present a breadth and level of complexity of accounting issues that are generally comparable to the breadth and complexity of issues that can reasonably be expected to be raised by the registrant’s financial statements, or experience actively supervising one or more persons engaged in such activities;
d. An understanding of internal controls and procedures for financial reporting; and
e. An understanding of audit committee functions.
An “audit committee financial expert” shall have acquired such attributes through:
a. Education and experience as a principal financial officer, principal accounting officer, controller, public accountant, or auditor or experience in one or more positions that involve the performance of similar functions;
b. Experience actively supervising a principal financial officer, principal accounting officer, controller, public accountant, auditor, or person performing similar functions;
c. Experience overseeing or assessing the performance of companies or public accountants with respect to the preparation, auditing, or evaluation of financial statements; or
d. Other relevant experience.
The registrant’s Board of Trustees/Directors has also determined that each member of the registrant’s Audit Committee is independent. In order to be “independent” for purposes of this item, the Audit Committee member may not: (i) other than in his or her capacity as a member of the Board of Trustees/Directors or any committee thereof, accept directly or indirectly any consulting, advisory or other compensatory fee from the issuer; or (ii) be an “interested person” of the registrant as defined in Section 2(a)(19) of the Investment Company Act of 1940.
The names of the audit committee financial experts on the registrant’s Audit Committee are set forth below:
John A. Fry
Janet L. Yeomans
Item 4. Principal Accountant Fees and Services
(a) Audit fees.
The aggregate fees billed for services provided to the registrant by its independent auditors for the audit of the registrant’s annual financial statements and for services normally provided by the independent auditors in connection with statutory and regulatory filings or engagements were $33,900 for the fiscal year ended July 31, 2011.
The aggregate fees billed for services provided to the registrant by its independent auditors for the audit of the registrant’s annual financial statements and for services normally provided by the independent auditors in connection with statutory and regulatory filings or engagements were $33,100 for the fiscal year ended July 31, 2010.
(b) Audit-related fees.
The aggregate fees billed by the registrant’s independent auditors for services relating to the performance of the audit of the registrant’s financial statements and not reported under paragraph (a) of this Item were $0 for the fiscal year ended July 31, 2011.
The aggregate fees billed by the registrant’s independent auditors for services relating to the performance of the audit of the financial statements of the registrant’s investment adviser and other service providers under common control with the adviser and that relate directly to the operations or financial reporting of the registrant were $593,000 for the registrant’s fiscal year ended July 31, 2011. The percentage of these fees relating to services approved by the registrant’s Audit Committee pursuant to the de minimis exception from the pre-approval requirement in Rule 2-01(c)(7)(i)(C) of Regulation S-X was 0%. These audit-related services were as follows: year end audit procedures; reporting up and subsidiary statutory audits.
The aggregate fees billed by the registrant’s independent auditors for services relating to the performance of the audit of the registrant’s financial statements and not reported under paragraph (a) of this Item were $0 for the fiscal year ended July 31, 2010.
The aggregate fees billed by the registrant’s independent auditors for services relating to the performance of the audit of the financial statements of the registrant’s investment adviser and other service providers under common control with the adviser and that relate directly to the operations or financial reporting of the registrant were $84,000 for the registrant’s fiscal year ended July 31, 2010. The percentage of these fees relating to services approved by the registrant’s Audit Committee pursuant to the de minimis exception from the pre-approval requirement in Rule 2-01(c)(7)(i)(C) of Regulation S-X was 0%. These audit-related services were as follows: audit procedures performed on Delaware Investments for its consideration into Macquarie’s financial statements as of March 31, 2010.
(c) Tax fees.
The aggregate fees billed by the registrant’s independent auditors for tax-related services provided to the registrant were $0 for the fiscal year ended July 31, 2011.
The aggregate fees billed by the registrant’s independent auditors for tax-related services provided to the registrant’s investment adviser and other service providers under common control with the adviser and that relate directly to the operations or financial reporting of the registrant were $10,000 for the registrant’s fiscal year ended July 31, 2011. The percentage of these fees relating to services approved by the registrant’s Audit Committee pursuant to the de minimis exception from the pre-approval requirement in Rule 2-01(c)(7)(i)(C) of Regulation S-X was 0%. These tax-related services were as follows: state and local tax review.
The aggregate fees billed by the registrant’s independent auditors for tax-related services provided to the registrant were $6,000 for the fiscal year ended July 31, 2010. The percentage of these fees relating to services approved by the registrant’s Audit Committee pursuant to the de minimis exception from the pre-approval requirement in Rule 2-01(c)(7)(i)(C) of Regulation S-X was 0%.
The aggregate fees billed by the registrant’s independent auditors for tax-related services provided to the registrant’s investment adviser and other service providers under common control with the adviser and that relate directly to the operations or financial reporting of the registrant were $0 for the registrant’s fiscal year ended July 31, 2010.
(d) All other fees.
The aggregate fees billed for all services provided by the independent auditors to the registrant other than those set forth in paragraphs (a), (b) and (c) of this Item were $0 for the fiscal year ended July 31, 2011.
The aggregate fees billed for all services other than those set forth in paragraphs (b) and (c) of this Item provided by the registrant’s independent auditors to the registrant’s adviser and other service providers under common control with the adviser and that relate directly to the operations or financial reporting of the registrant were $25,000 for the registrant’s fiscal year ended July 31, 2011. The percentage of these fees relating to services approved by the registrant’s Audit Committee pursuant to the de minimis exception from the pre-approval requirement in Rule 2-01(c)(7)(i)(C) of Regulation S-X was 0%. These other services were as follows: attest examination of management’s assertion to the controls in place at the transfer agent to be in compliance with Rule 17ad-13(a)(3) of the Securities Exchange Act of 1934.
The aggregate fees billed for all services provided by the independent auditors to the registrant other than those set forth in paragraphs (a), (b) and (c) of this Item were $0 for the fiscal year ended July 31, 2010.
The aggregate fees billed for all services other than those set forth in paragraphs (b) and (c) of this Item provided by the registrant’s independent auditors to the registrant’s adviser and other service providers under common control with the adviser and that relate directly to the operations or financial reporting of the registrant were $0 for the registrant’s fiscal year ended July 31, 2010.
(e) The registrant’s Audit Committee has established pre-approval policies and procedures as permitted by Rule 2-01(c)(7)(i)(B) of Regulation S-X (the “Pre-Approval Policy”) with respect to services provided by the registrant’s independent auditors. Pursuant to the Pre-Approval Policy, the Audit Committee has pre-approved the services set forth in the table below with respect to the registrant up to the specified fee limits. Certain fee limits are based on aggregate fees to the registrant and other registrants within the Delaware Investments Family of Funds.
| Service | Range of Fees |
| Audit Services | |
| Statutory audits or financial audits for new Funds | up to $25,000 per Fund |
| Services associated with SEC registration statements (e.g., Form N-1A, Form N-14, etc.), periodic reports and other documents filed with the SEC or other documents issued in connection with securities offerings (e.g., comfort letters for closed-end Fund offerings, consents), and assistance in responding to SEC comment letters | up to $10,000 per Fund |
| Consultations by Fund management as to the accounting or disclosure treatment of transactions or events and/or the actual or potential impact of final or proposed rules, standards or interpretations by the SEC, FASB, or other regulatory or standard-setting bodies (Note: Under SEC rules, some consultations may be considered “audit-related services” rather than “audit services”) | up to $25,000 in the aggregate |
| Audit-Related Services | |
| Consultations by Fund management as to the accounting or disclosure treatment of transactions or events and /or the actual or potential impact of final or proposed rules, standards or interpretations by the SEC, FASB, or other regulatory or standard-setting bodies (Note: Under SEC rules, some consultations may be considered “audit services” rather than “audit-related services”) | up to $25,000 in the aggregate |
| Tax Services | |
| U.S. federal, state and local and international tax planning and advice (e.g., consulting on statutory, regulatory or administrative developments, evaluation of Funds’ tax compliance function, etc.) | up to $25,000 in the aggregate |
| U.S. federal, state and local tax compliance (e.g., excise distribution reviews, etc.) | up to $5,000 per Fund |
| Review of federal, state, local and international income, franchise and other tax returns | up to $5,000 per Fund |
Under the Pre-Approval Policy, the Audit Committee has also pre-approved the services set forth in the table below with respect to the registrant’s investment adviser and other entities controlling, controlled by or under common control with the investment adviser that provide ongoing services to the registrant (the “Control Affiliates”) up to the specified fee limit. This fee limit is based on aggregate fees to the investment adviser and its Control Affiliates.
| Service | Range of Fees |
| Non-Audit Services | |
| Services associated with periodic reports and other documents filed with the SEC and assistance in responding to SEC comment letters | up to $10,000 in the aggregate |
The Pre-Approval Policy requires the registrant’s independent auditors to report to the Audit Committee at each of its regular meetings regarding all services initiated since the last such report was rendered, including those services authorized by the Pre-Approval Policy.
(f) Not applicable.
(g) The aggregate non-audit fees billed by the registrant’s independent auditors for services rendered to the registrant and to its investment adviser and other service providers under common control with the adviser were $0 and $0 for the registrant’s fiscal years ended July 31, 2011 and July 31, 2010, respectively.
(h) In connection with its selection of the independent auditors, the registrant’s Audit Committee has considered the independent auditors’ provision of non-audit services to the registrant’s investment adviser and other service providers under common control with the adviser that were not required to be pre-approved pursuant to Rule 2-01(c)(7)(ii) of Regulation S-X. The Audit Committee has determined that the independent auditors’ provision of these services is compatible with maintaining the auditors’ independence.
Item 5. Audit Committee of Listed Registrants
Not applicable.
Item 6. Investments
(a) Included as part of report to shareholders filed under Item 1 of this Form N-CSR.
(b) Divestment of securities in accordance with Section 13(c) of the Investment Company Act of 1940.
Not applicable.
Item 7. Disclosure of Proxy Voting Policies and Procedures for Closed-End Management Investment Companies
Not applicable.
Item 8. Portfolio Managers of Closed-End Management Investment Companies
Not applicable.
Item 9. Purchases of Equity Securities by Closed-End Management Investment Company and Affiliated Purchasers
Not applicable.
Item 10. Submission of Matters to a Vote of Security Holders
Not applicable.
Item 11. Controls and Procedures
The registrant’s principal executive officer and principal financial officer have evaluated the registrant’s disclosure controls and procedures within 90 days of the filing of this report and have concluded that they are effective in providing reasonable assurance that the information required to be disclosed by the registrant in its reports or statements filed under the Securities Exchange Act of 1934 is recorded, processed, summarized and reported within the time periods specified in the rules and forms of the Securities and Exchange Commission.
There were no significant changes in the registrant’s internal control over financial reporting that occurred during the second fiscal quarter of the period covered by the report to stockholders included herein (i.e., the registrant’s fourth fiscal quarter) that have materially affected, or are reasonably likely to materially affect, the registrant’s internal control over financial reporting.
Item 12. Exhibits
| (a) | (1) Code of Ethics |
| | |
| | Not applicable. |
| | |
| | (2) Certifications of Principal Executive Officer and Principal Financial Officer pursuant to Rule 30a-2 under the Investment Company Act of 1940 are attached hereto as Exhibit 99.CERT. |
| | |
| | (3) Written solicitations to purchase securities pursuant to Rule 23c-1 under the Securities Exchange Act of 1934. |
| | |
| | Not applicable. |
(b) Certifications pursuant to Section 906 of the Sarbanes-Oxley Act of 2002 are furnished herewith as Exhibit 99.906CERT.
SIGNATURES
Pursuant to the requirements of the Securities Exchange Act of 1934 and the Investment Company Act of 1940, the registrant has duly caused this report to be signed on its behalf, by the undersigned, thereunto duly authorized.
Name of Registrant: DELAWARE GROUP® GOVERNMENT FUND
| /s/ PATRICK P. COYNE |
| By: | Patrick P. Coyne |
| Title: | Chief Executive Officer |
| Date: | October 3, 2011 |
Pursuant to the requirements of the Securities Exchange Act of 1934 and the Investment Company Act of 1940, this report has been signed below by the following persons on behalf of the registrant and in the capacities and on the dates indicated.
| /s/ PATRICK P. COYNE |
| By: | Patrick P. Coyne |
| Title: | Chief Executive Officer |
| Date: | October 3, 2011 |
| /s/ RICHARD SALUS |
| By: | Richard Salus |
| Title: | Chief Financial Officer |
| Date: | October 3, 2011 |
