UNITED STATES SECURITIES AND EXCHANGE COMMISSION
Washington, D.C. 20549
FORM N-CSR
CERTIFIED SHAREHOLDER REPORT OF REGISTERED MANAGEMENT
INVESTMENT COMPANIES
| Investment Company Act file number: | | 811-04304 |
| | | |
| Exact name of registrant as specified in charter: | | Delaware Group® Government Fund |
| | | |
| Address of principal executive offices: | | 2005 Market Street |
| | Philadelphia, PA 19103 |
| | | |
| Name and address of agent for service: | | David F. Connor, Esq. |
| | 2005 Market Street |
| | Philadelphia, PA 19103 |
| | | |
| Registrant’s telephone number, including area code: | | (800) 523-1918 |
| | | |
| Date of fiscal year end: | | July 31 |
| | | |
| Date of reporting period: | | July 31, 2013 |
Item 1. Reports to Stockholders

Annual report Delaware Core Plus Bond Fund Fixed income mutual fund |
| Carefully consider the Fund’s investment objectives, risk factors, charges, and expenses before investing. This and other information can be found in the Fund’s prospectus and, if available, its summary prospectus, which may be obtained by visiting delawareinvestments.com or calling 800 523-1918. Investors should read the prospectus and, if available, the summary prospectus carefully before investing. |
You can obtain shareholder reports and prospectuses online instead of in the mail.
Visit delawareinvestments.com/edelivery. |
Experience Delaware Investments
Delaware Investments is committed to the pursuit of consistently superior asset management and unparalleled client service. We believe in our investment processes, which seek to deliver consistent results, and in convenient services that help add value for our clients.
If you are interested in learning more about creating an investment plan, contact your financial advisor.
You can learn more about Delaware Investments or obtain a prospectus for Delaware Core Plus Bond Fund at delawareinvestments.com.
Manage your investments online
- 24-hour access to your account information
- Obtain share prices
- Check your account balance and recent transactions
- Request statements or literature
- Make purchases and redemptions
Delaware Management Holdings, Inc. and its subsidiaries (collectively known by the marketing name of Delaware Investments) are wholly owned subsidiaries of Macquarie Group Limited, a global provider of banking, financial, advisory, investment and funds management services.
Investments in Delaware Core Plus Bond Fund are not and will not be deposits with or liabilities of Macquarie Bank Limited ABN 46 008 583 542 and its holding companies, including their subsidiaries or related companies (Macquarie Group), and are subject to investment risk, including possible delays in repayment and loss of income and capital invested. No Macquarie Group company guarantees or will guarantee the performance of the Fund, the repayment of capital from the Fund, or any particular rate of return.
Table of contents
| Portfolio management review | 1 |
| Performance summary | 4 |
| Disclosure of Fund expenses | 8 |
| Security type/sector allocation | 10 |
| Statement of net assets | 12 |
| Statement of assets and liabilities | 45 |
| Statement of operations | 46 |
| Statements of changes in net assets | 48 |
| Financial highlights | 50 |
| Notes to financial statements | 60 |
| Report of independent registered | |
| public accounting firm | 78 |
| Other Fund information | 79 |
| Board of trustees/directors and | |
| officers addendum | 80 |
| About the organization | 88 |
Unless otherwise noted, views expressed herein are current as of July 31, 2013, and subject to change.
Funds are not FDIC insured and are not guaranteed. It is possible to lose the principal amount invested.
Mutual fund advisory services provided by Delaware Management Company, a series of Delaware Management Business Trust, which is a registered investment advisor. Delaware Investments, a member of Macquarie Group, refers to Delaware Management Holdings, Inc. and its subsidiaries, including the Fund’s distributor, Delaware Distributors, L.P. Macquarie Group refers to Macquarie Group Limited and its subsidiaries and affiliates worldwide.
© 2013 Delaware Management Holdings, Inc.
All third-party marks cited are the property of their respective owners.
| Portfolio management review |
| Delaware Core Plus Bond Fund | | August 6, 2013 |
| Performance preview (for the year ended July 31, 2013) |
| Delaware Core Plus Bond Fund (Class A shares) | 1-year return | | -1.51% |
| Barclays U.S. Aggregate Index (benchmark) | 1-year return | | -1.91% |
Past performance does not guarantee future results.
For complete, annualized performance for Delaware Core Plus Bond Fund, please see the table on page 4.
The performance of Class A shares excludes the applicable sales charge and reflects the reinvestment of all distributions. Index performance returns do not reflect any management fees, transaction costs, or expenses. Indices are unmanaged and one cannot invest directly in an index. |
Throughout most of the Fund’s fiscal year ended July 31, 2013, central bank policy was the dominant factor impacting fixed income markets worldwide. Shortly after the period began, European Central Bank (ECB) President Mario Draghi, reacting to severe stress in peripheral European bond markets, promised to do “whatever it takes” to keep the euro currency alive. Shortly thereafter, U.S. Federal Reserve Chairman Ben Bernanke launched a third round of bond buying, known as quantitative easing or QE3. Bernanke’s pledge was particularly notable in that, for the first time, the Fed publicly linked its policies to explicit levels of employment and inflation. The Bank of England and the Bank of Japan subsequently enacted their own quantitative easing measures that mirrored those of the Fed, especially in regard to forward guidance.
Initially, the resulting tidal wave of central bank liquidity — combined with a further deceleration of global economic growth — pushed bond yields sharply lower. With the Fed buying $85 billion in Treasury and mortgage securities each month — and with investors confident that the liquidity spigot would remain wide open indefinitely — credit spreads tightened and nominal yields declined
A flood of central bank liquidity drove fixed income markets worldwide:
- Nominal and real yields declined to historic lows until April
- Anticipation of the looming end to QE3 caused a sharp backup in rates in May and June
- Credit spreads tightened, then widened, amid uncertainty regarding Fed policy
1
Portfolio management review
Delaware Core Plus Bond Fund
to levels last visited in the 1950s. Meanwhile, the Fed also maintained its pledge to keep benchmark interest rates at virtually zero until unemployment falls to 6.5%.
As the year progressed, investors also relearned a difficult lesson: what central banks give, they also can take away. Though monetary policy in the euro zone, United Kingdom, and Japan remained highly expansionary, Chairman Bernanke hinted in mid-May that U.S. policy makers could begin scaling back, or “tapering,” the central bank’s monthly bond purchases by the end of 2013, if not before. Given that the U.S. economy remained mired in slow-growth mode and that the Fed itself forecasted a further deceleration in growth, a large number of shocked investors reacted by exiting the Treasury market. Most Treasury bond yields rose by at least 1% — a particularly dramatic move off of what had been historically low levels — causing double-digit declines among longer-dated securities. Furthermore, in a notable departure from normal cyclical patterns, corporate debt (with the exception of bank loans) did not absorb much of the backup in Treasury rates, causing credit spreads to widen as well. As such, prices of investment grade and high yield corporate bonds also fell sharply during a roughly six-week period amid fears of an imminent withdrawal of Fed liquidity. Those concerns were partially assuaged in July as various Fed officials seemed to clarify their messages about tapering.
Overall, the strongest-performing sectors of the fixed income market during the Fund’s fiscal year were those that offered relatively generous income potential (high yield), indirect exposure to the equity market (convertibles), and minimal duration risk (bank loans). Despite the tepid pace of U.S. and global economic growth, corporate fundamentals generally remained solid, emboldening investors to push corporate yields lower, and credit spreads tighter. The 7.2% average yield on sub-investment-grade bonds, for example, plunged to a low of about 5% in the spring and finished the fiscal period at 6.5%. Notably, the default rate in the high yield sector remained below the historical norm, in part because companies have been able to refinance outstanding debt on favorable terms. The relatively weak and uncertain nature of the economic recovery has also made corporate executives hesitant to begin capital projects or take on additional leverage.
Conversely, interest-rate-sensitive areas such as 10- and 30-year Treasurys and mortgage-backed securities mostly lagged throughout the Fund’s fiscal year. Losses were especially severe at the longer-term end of the Treasury yield curve, with the bulk of the rise in long rates (roughly 1.10%) coming during the turbulent May–June period. On a total return basis, investment grade corporates finished the fiscal year roughly flat throughout the fiscal period, while mortgage-backed bonds fell 1.7% and Treasury inflation-protected securities declined 5.5%.
2
Fund performance
For its fiscal year ended July 31, 2013, Delaware Core Plus Bond Fund (Class A shares) returned -1.51% at net asset value and -5.91% at maximum offer price (both returns reflect all distributions reinvested). In comparison, the Fund’s benchmark, the Barclays U.S. Aggregate Index, returned -1.91% during the same period. For complete annualized performance of Delaware Core Plus Bond Fund, please see table on page 4.
For most of the Fund’s fiscal year, we positioned the Fund to have more interest-rate sensitivity than that of its benchmark. Beginning in May, however, we took a defensive measure to move to a below-average level of duration, or interest rate risk, as it became apparent to us that the Fed indeed seemed serious about reducing the magnitude of its monthly bond purchases.
Our moves to add exposure to high yield bonds, bank loans, and convertibles (the three strongest-performing areas) during the fiscal year also contributed to the Fund’s relative performance, as did the Fund’s allocation toward the domestic banking and finance sectors. From an individual corporate bond perspective, the Fund’s holdings in issues from Taminco Global Chemical, Nara Cable Funding, and JBS USA LLC contributed to Fund performance during the year while issues from the Republic of South Africa, New South Wales Treasury Corp, and Treasury Corp Victoria detracted.
Meanwhile, early in the year hedges against the euro and euro-zone bonds held within the Fund detracted marginally from relative performance. After ECB President Draghi issued his “whatever it takes” proclamation, however, we unwound those positions as investors took a more positive reading on the situation in the euro zone.
Raising the Fund’s exposure to emerging market debt and emerging market currencies also undermined relative performance, especially as those sectors sold off in May and June.
During the Fund’s fiscal year, we invested in single-name (sovereign) credit default swaps, credit default swap baskets, forward foreign currency contracts, interest rate swaps, futures, and options. The credit default swaps and credit default swap baskets were used primarily for potential protection against economic contagion risk stemming from Europe. The forward foreign currency contracts were used to hedge the currency risk of securities denominated in foreign currencies (or to more generally manage foreign currency exposures within the Fund). The interest rate swaps, futures, and options were used primarily to seek to hedge interest rate risks and to seek to capitalize on volatility levels. Though the aggregate derivative positions generally detracted from absolute and relative performance by approximately 0.75%, we were comfortable holding them as risk management tools in an uneven macroeconomic environment.
3
| Performance summary | |
| Delaware Core Plus Bond Fund | July 31, 2013 |
The performance data quoted represent past performance; past performance does not guarantee future results. Investment return and principal value will fluctuate so your shares, when redeemed, may be worth more or less than their original cost. Please obtain the performance data current for the most recent month end by calling 800 523-1918 or visiting our website at delawareinvestments.com/performance. Current performance may be lower or higher than the performance data quoted.
| Fund and benchmark performance1,2 | Average annual total returns through July 31, 2013 |
| 1 year | | 5 years | | 10 years | |
| Class A (Est. Aug. 16, 1985) | | | | | | |
| Excluding sales charge | -1.51% | | +7.07% | | +5.19% | |
| Including sales charge | -5.91% | | +6.10% | | +4.71% | |
| Class B (Est. May 2, 1994) | | | | | | |
| Excluding sales charge | -1.97% | | +6.34% | | +4.57% | |
| Including sales charge | -5.78% | | +6.10% | | +4.57% | |
| Class C (Est. Nov. 29, 1995) | | | | | | |
| Excluding sales charge | -2.24% | | +6.30% | | +4.44% | |
| Including sales charge | -3.19% | | +6.30% | | +4.44% | |
| Class R (Est. June 2, 2003) | | | | | | |
| Excluding sales charge | -1.74% | | +6.88% | | +4.96% | |
| Including sales charge | -1.74% | | +6.88% | | +4.96% | |
| Institutional Class (Est. June 1, 1992) | | | | | | |
| Excluding sales charge | -1.26% | | +7.37% | | +5.48% | |
| Including sales charge | -1.26% | | +7.37% | | +5.48% | |
| Barclays U.S. Aggregate Index | -1.91% | | +5.24% | | +4.89% | |
1 Returns reflect the reinvestment of all distributions and are presented both with and without the applicable sales charges described below. Returns do not reflect the deduction of taxes the shareholder would pay on Fund distributions or redemptions of Fund shares.
Expense limitations were in effect for certain classes during some or all of the periods shown in the “Fund performance” chart. Expenses for each class are listed on the “Fund expense ratios” table on page 6. Performance would have been lower had expense limitations not been in effect.
Class A shares are sold with a maximum front-end sales charge of 4.50%, and have an annual distribution and service fee of 0.30% of average daily net assets. This fee has been contractually limited to 0.25% of average daily net assets from Nov. 28, 2012, through Nov. 28, 2013. Furthermore, the Board has adopted a formula for calculating 12b-1 plan fees for the Fund’s Class A shares that went into effect on June 1, 1992. The Fund’s Class A shares are currently subject to a blended 12b-1 fee equal to the sum of: (i) 0.10% of average daily net assets representing shares acquired prior to June 1, 1992, and (ii) 0.30% of average daily net assets representing shares acquired on or
4
after June 1, 1992. All Class A shares currently bear 12b-1 fees at the same rate, the blended rate, based on the formula described above. This method of calculating Class A 12b-1 fees may be discontinued at the sole discretion of the Board. Performance for Class A shares, excluding sales charges, assumes that no front-end sales charge applied.
Class B shares may be purchased only through dividend reinvestment and certain permitted exchanges as described in the prospectus. Please see the prospectus for additional information on Class B shares. Class B shares have a contingent deferred sales charge that declines from 4.00% to zero depending on the period of time the shares are held. They are also subject to an annual distribution and service fee of 1.00% of average daily net assets. This fee has been contractually limited to 0.25% of average daily net assets from March 1, 2013, through Feb. 28, 2014. Class B shares will automatically convert to Class A shares on a quarterly basis approximately eight years after purchase. Ten-year performance figures for Class B shares reflect conversion to Class A shares after approximately eight years.
Class C shares are sold with a contingent deferred sales charge of 1.00% if redeemed during the first 12 months. They are also subject to an annual distribution and service fee of 1.00% of average daily net assets.
Performance for Class B and C shares, excluding sales charges, assumes either that contingent deferred sales charges did not apply or that the investment was not redeemed.
Class R shares are available only for certain retirement plan products. They are sold without a sales charge and have an annual distribution and service fee of 0.60% of average daily net assets, which has been limited contractually to 0.50% from Nov. 28, 2012, through Nov. 28, 2013.
Institutional Class shares are available without sales or asset-based distribution charges only to certain eligible institutional accounts.
The “Fund performance” table and the “Performance of a $10,000 investment” graph do not reflect the deduction of taxes the shareholder would pay on Fund distributions or redemptions of Fund shares.
Fixed income securities and bond funds can lose value, and investors can lose principal, as interest rates rise. They also may be affected by economic conditions that hinder an issuer’s ability to make interest and principal payments on its debt.
The Fund may also be subject to prepayment risk, the risk that the principal of a fixed income security that is held by the Fund may be prepaid prior to maturity, potentially forcing the Fund to reinvest that money at a lower interest rate.
High yielding, noninvestment grade bonds (junk bonds) involve higher risk than investment grade bonds. The high yield secondary market is particularly susceptible to liquidity problems when institutional investors, such as mutual funds and certain other financial institutions, temporarily stop buying bonds for regulatory, financial, or other reasons. In addition, a less liquid secondary market makes it more difficult for the Fund to obtain precise valuations of the high yield securities in its portfolio.
The Fund may invest in derivatives, which may involve additional expenses and are subject to risk, including the risk that an underlying security or securities index moves in the
5
Performance summary
Delaware Core Plus Bond Fund
opposite direction from what the portfolio manager anticipated. A derivative transaction depends upon the counterparties’ ability to fulfill their contractual obligations.
International investments entail risks not ordinarily associated with U.S. investments including fluctuation in currency values, differences in accounting principles, or economic or political instability in other nations.
Investing in emerging markets can be riskier than investing in established foreign markets due to increased volatility and lower trading volume.
If and when the Fund invests in forward foreign currency contracts or uses other investments to hedge against currency risks, the Fund will be subject to special risks, including counterparty risk.
The Fund may experience portfolio turnover in excess of 100%, which could result in higher transaction costs and tax liability.
Per Standard & Poor’s credit rating agency, bonds rated AA and A are more susceptible to the adverse effects of changes in circumstances and economic conditions than those in the higher-rated AAA category, but the obligor’s capacity to meet its financial commitment on the obligation is still strong. Bonds rated BBB exhibit adequate protection parameters, although adverse economic conditions or changing circumstances are more likely to lead to a weakened capacity of the obligor to meet its financial commitments. Bonds rated BB, B, and CCC are regarded as having significant speculative characteristics, with BB indicating the least degree of speculation of the three.
2 The Fund’s expense ratios, as described in the most recent prospectus, are disclosed in the following “Fund expense ratios” table. Delaware Management Company has agreed to reimburse certain expenses and/or waive certain fees in order to prevent total annual fund operating expenses (excluding certain fees and expenses) from exceeding 0.65% of the Fund’s average daily net assets from Nov. 28, 2012, through Nov. 28, 2013. Please see the most recent prospectus and any applicable supplement(s) for additional information on these fee waivers and/or reimbursements.
| Fund expense ratios | | Class A | | Class B | | Class C | | Class R | | Institutional Class |
| Total annual operating expenses | | 1.18% | | 1.88% | | 1.88% | | 1.48% | | 0.88% |
| (without fee waivers) | | | | | | | | | | |
| Net expenses | | 0.90% | | 1.65% | | 1.65% | | 1.15% | | 0.65% |
| (including fee waivers, if any) | | | | | | | | | | |
| Type of waiver | | Contractual | | Contractual | | Contractual | | Contractual | | Contractual |
6
Performance of a $10,000 investment1
Average annual total returns from July 31, 2003, through July 31, 2013
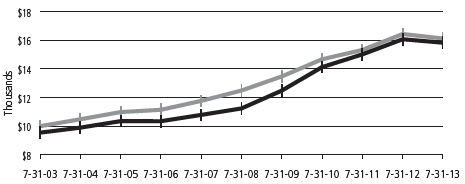
| For period beginning July 31, 2003, through July 31, 2013 | | Starting value | | Ending value | |
| | Barclays U.S. Aggregate Index | | | $ | 10,000 | | | $16,121 | |
| | Delaware Core Plus Bond Fund — Class A shares | | | $ | 9,550 | | | $15,844 | |
1 The “Performance of a $10,000 investment” graph assumes $10,000 invested in Class A shares of the Fund on July 31, 2003, and includes the effect of a 4.50% front-end sales charge and the reinvestment of all distributions. The graph does not reflect the deduction of taxes the shareholders would pay on Fund distributions or redemptions of Fund shares. Expense limitations were in effect for some or all of the periods shown. Performance would have been lower had expense limitations not been in effect. Expenses are listed in the “Fund expense ratios” table on page 6. Please note additional details on pages 4 through 7.
The chart also assumes $10,000 invested in the Barclays U.S. Aggregate Index as of July 31, 2003. The Barclays U.S. Aggregate Index is a broad composite that tracks the investment grade domestic bond market.
Index performance returns do not reflect any management fees, transaction costs, or expenses. Indices are unmanaged and one cannot invest directly in an index. Past performance does not guarantee future results.
Performance of other Fund classes will vary due to different charges and expenses.
| | Nasdaq symbols | | CUSIPs | |
| Class A | | DEGGX | | 246094205 | |
| Class B | | DEGBX | | 246094601 | |
| Class C | | DUGCX | | 246094700 | |
| Class R | | DUGRX | | 246094809 | |
| Institutional Class | | DUGIX | | 246094502 | |
7
Disclosure of Fund expenses
For the six-month period from February 1, 2013 to July 31, 2013 (Unaudited)
As a shareholder of the Fund, you incur two types of costs: (1) transaction costs, including sales charges (loads) on purchase payments, reinvested dividends, or other distributions; redemption fees; and exchange fees; and (2) ongoing costs, including management fees; distribution and/or service (12b-1) fees; and other Fund expenses. This example is intended to help you understand your ongoing costs (in dollars) of investing in the Fund and to compare these costs with the ongoing costs of investing in other mutual funds.
The example is based on an investment of $1,000 invested at the beginning of the period and held for the entire six-month period from Feb. 1, 2013 to July 31, 2013.
Actual expenses
The first section of the table shown, “Actual Fund return,” provides information about actual account values and actual expenses. You may use the information in this section of the table, together with the amount you invested, to estimate the expenses that you paid over the period. Simply divide your account value by $1,000 (for example, an $8,600 account value divided by $1,000 = 8.6), then multiply the result by the number in the first section under the heading entitled “Expenses Paid During Period” to estimate the expenses you paid on your account during this period.
Hypothetical example for comparison purposes
The second section of the table shown, “Hypothetical 5% return,” provides information about hypothetical account values and hypothetical expenses based on the Fund’s actual expense ratio and an assumed rate of return of 5% per year before expenses, which is not the Fund’s actual return. The hypothetical account values and expenses may not be used to estimate the actual ending account balance or expenses you paid for the period. You may use this information to compare the ongoing costs of investing in the Fund and other funds. To do so, compare this 5% hypothetical example with the 5% hypothetical examples that appear in the shareholder reports of the other funds.
Please note that the expenses shown in the table are meant to highlight your ongoing costs only and do not reflect any transactional costs, such as sales charges (loads), redemption fees, or exchange fees. Therefore, the second section of the table is useful in comparing ongoing costs only, and will not help you determine the relative total costs of owning different funds. In addition, if these transactional costs were included, your costs would have been higher. The Fund’s expenses shown in the table reflect fee waivers in effect. The expenses shown in the table assume reinvestment of all dividends and distributions.
8
Delaware Core Plus Bond Fund
Expense analysis of an investment of $1,000
| | Beginning | | Ending | | | | | Expenses |
| | Account Value | | Account Value | | Annualized | | Paid During Period |
| | 2/1/13 | | 7/31/13 | | Expense Ratio | | 2/1/13 to 7/31/13* |
| Actual Fund return† | | | | | | | | | | | | | | | |
| Class A | | $ | 1,000.00 | | | $ | 977.70 | | | 0.90 | % | | $ | 4.41 | |
| Class B | | | 1,000.00 | | | | 976.70 | | | 1.13 | % | | | 5.54 | |
| Class C | | | 1,000.00 | | | | 974.10 | | | 1.65 | % | | | 8.08 | |
| Class R | | | 1,000.00 | | | | 977.70 | | | 1.15 | % | | | 5.64 | |
| Institutional Class | | | 1,000.00 | | | | 978.90 | | | 0.65 | % | | | 3.19 | |
| Hypothetical 5% return (5% return before expenses) | | | | | | | | |
| Class A | | $ | 1,000.00 | | | $ | 1,020.33 | | | 0.90 | % | | $ | 4.51 | |
| Class B | | | 1,000.00 | | | | 1,019.19 | | | 1.13 | % | | | 5.66 | |
| Class C | | | 1,000.00 | | | | 1,016.61 | | | 1.65 | % | | | 8.25 | |
| Class R | | | 1,000.00 | | | | 1,019.09 | | | 1.15 | % | | | 5.76 | |
| Institutional Class | | | 1,000.00 | | | | 1,021.57 | | | 0.65 | % | | | 3.26 | |
*“Expenses Paid During Period” are equal to the Fund’s annualized expense ratio, multiplied by the average account value over the period, multiplied by 181/365 (to reflect the one-half year period).
†Because actual returns reflect only the most recent six-month period, the returns shown may differ significantly from fiscal year returns.
9
| Security type/sector allocation | |
| Delaware Core Plus Bond Fund | As of July 31, 2013 (Unaudited) |
Sector designations may be different than the sector designations presented in other Fund materials. The sector designations may represent the investment manager’s internal sector classifications, which may result in the sector designations for one fund being different than another fund’s sector designations.
| Security type/sector | Percentage of net assets |
| Agency Collateralized Mortgage Obligations | 2.91 | % |
| Agency Mortgage-Backed Securities | 24.44 | % |
| Commercial Mortgage-Backed Securities | 4.95 | % |
| Convertible Bonds | 0.86 | % |
| Corporate Bonds | 48.13 | % |
| Banking | 7.23 | % |
| Basic Industry | 4.13 | % |
| Brokerage | 0.50 | % |
| Capital Goods | 1.51 | % |
| Communications | 5.80 | % |
| Consumer Cyclical | 2.29 | % |
| Consumer Non-Cyclical | 3.58 | % |
| Electric | 5.52 | % |
| Energy | 4.55 | % |
| Finance Companies | 1.72 | % |
| Insurance | 2.91 | % |
| Natural Gas | 3.28 | % |
| Real Estate | 1.83 | % |
| Technology | 2.62 | % |
| Transportation | 0.66 | % |
| Municipal Bonds | 0.17 | % |
| Non-Agency Asset-Backed Securities | 2.31 | % |
| Non-Agency Collateralized Mortgage Obligations | 0.36 | % |
| Regional Bonds | 0.95 | % |
| Senior Secured Loans | 7.84 | % |
| Sovereign Bonds | 1.35 | % |
| Supranational Bank | 0.06 | % |
| U.S. Treasury Obligations | 3.44 | % |
| Convertible Preferred Stock | 0.16 | % |
| Preferred Stock | 0.93 | % |
10
| Security type/sector | Percentage of net assets |
| Short-Term Investments | 19.13 | % |
| Securities Lending Collateral | 0.02 | % |
| Total Value of Securities | 118.01 | % |
| Obligation to Return Securities Lending Collateral | (0.02 | %) |
| Other Liabilities Net of Receivables and Other Assets | (17.99 | %) |
| Total Net Assets | 100.00 | % |
11
| Statement of net assets | |
| Delaware Core Plus Bond Fund | July 31, 2013 |
| | | | Principal amount° | | Value (U.S. $) |
| Agency Collateralized Mortgage Obligations – 2.91% | | | | | | | |
| Fannie Mae Grantor Trust | | | | | | | |
| Series 2002-T1 A2 7.00% 11/25/31 | | USD | | 54,363 | | $ | 63,668 |
| Fannie Mae Interest Strip | | | | | | | |
| Series 35-2 12.00% 7/1/18 | | | | 21,349 | | | 24,021 |
| Fannie Mae REMICs | | | | | | | |
| Series 1988-15 A 9.00% 6/25/18 | | | | 415 | | | 435 |
| Series 1996-46 ZA 7.50% 11/25/26 | | | | 65,540 | | | 75,313 |
| Series 2002-83 GH 5.00% 12/25/17 | | | | 233,496 | | | 247,822 |
| Series 2011-80 CB 4.00% 8/25/26 | | | | 1,953,713 | | | 2,050,759 |
| û•Series 2012-122 SD 5.91% 11/25/42 | | | | 227,627 | | | 58,360 |
| û•Series 2012-124 SD 5.96% 11/25/42 | | | | 320,457 | | | 74,915 |
| ûSeries 2013-26 ID 3.00% 4/25/33 | | | | 309,217 | | | 51,287 |
| ûSeries 2013-38 AI 3.00% 4/25/33 | | | | 311,633 | | | 51,450 |
| ûSeries 2013-44 DI 3.00% 5/25/33 | | | | 918,291 | | | 152,907 |
| • | Fannie Mae Whole Loan | | | | | | | |
| Series 2002-W1 2A 6.756% 2/25/42 | | | | 72,269 | | | 85,889 |
| Freddie Mac REMICs | | | | | | | |
| Series 2557 WE 5.00% 1/15/18 | | | | 197,327 | | | 209,586 |
| Series 3131 MC 5.50% 4/15/33 | | | | 24,816 | | | 24,934 |
| Series 3173 PE 6.00% 4/15/35 | | | | 109,904 | | | 112,970 |
| Series 3656 PM 5.00% 4/15/40 | | | | 235,000 | | | 257,399 |
| û•Series 4148 SA 5.909% 12/15/42 | | | | 376,644 | | | 90,338 |
| ûSeries 4185 LI 3.00% 3/15/33 | | | | 229,630 | | | 38,295 |
| ûSeries 4191 CI 3.00% 4/15/33 | | | | 98,900 | | | 16,539 |
| t | Freddie Mac Structured Pass Through Securities | | | | | | | |
| Series T-42 A5 7.50% 2/25/42 | | | | 28,171 | | | 33,113 |
| GNMA | | | | | | | |
| Series 2010-42 PC 5.00% 7/20/39 | | | | 545,000 | | | 617,858 |
| Series 2010-113 KE 4.50% 9/20/40 | | | | 245,000 | | | 267,287 |
| NCUA Guaranteed Notes | | | | | | | |
| Series 2010-C1 A2 2.90% 10/29/20 | | | | 80,000 | | | 83,078 |
| Total Agency Collateralized Mortgage | | | | | | | |
| Obligations (cost $4,631,117) | | | | | | | 4,688,223 |
| |
| Agency Mortgage-Backed Securities – 24.44% | | | | | | | |
| Fannie Mae | | | | | | | |
| 2.27% 1/1/23 | | | | 213,102 | | | 198,711 |
| 4.50% 5/1/41 | | | | 102,021 | | | 106,917 |
| 10.50% 6/1/30 | | | | 10,672 | | | 10,969 |
12
| | | | | Principal amount° | | Value (U.S. $) |
| Agency Mortgage-Backed Securities (continued) | | | | | | | |
| • | Fannie Mae ARM | | | | | | | |
| | 2.81% 11/1/35 | | USD | | 42,992 | | $ | 45,658 |
| | 4.296% 7/1/36 | | | | 74,954 | | | 81,235 |
| | 5.157% 8/1/35 | | | | 22,488 | | | 24,078 |
| Fannie Mae S.F. 15 yr | | | | | | | |
| | 2.50% 2/1/28 | | | | 367,766 | | | 367,981 |
| | 2.50% 5/1/28 | | | | 49,173 | | | 49,195 |
| | 3.00% 11/1/27 | | | | 106,952 | | | 110,153 |
| | 3.50% 7/1/26 | | | | 120,184 | | | 126,285 |
| | 3.50% 10/1/26 | | | | 109,066 | | | 114,396 |
| | 4.00% 11/1/25 | | | | 239,706 | | | 257,166 |
| | 5.00% 5/1/21 | | | | 73,280 | | | 78,120 |
| | 8.00% 10/1/16 | | | | 27,803 | | | 29,244 |
| Fannie Mae S.F. 15 yr TBA | | | | | | | |
| | 2.50% 9/1/28 | | | | 8,521,000 | | | 8,495,701 |
| | 3.00% 9/1/28 | | | | 5,073,000 | | | 5,204,383 |
| | 3.50% 9/1/28 | | | | 566,000 | | | 591,802 |
| Fannie Mae S.F. 20 yr | | | | | | | |
| | 5.00% 11/1/23 | | | | 9,542 | | | 10,357 |
| | 5.50% 8/1/28 | | | | 187,889 | | | 204,992 |
| | 5.50% 12/1/29 | | | | 16,411 | | | 17,942 |
| Fannie Mae S.F. 30 yr | | | | | | | |
| | 3.50% 7/1/42 | | | | 13,857 | | | 13,984 |
| | 3.50% 6/1/43 | | | | 36,842 | | | 37,192 |
| | 4.00% 11/1/40 | | | | 46,269 | | | 48,097 |
| | 4.00% 1/1/41 | | | | 223,898 | | | 232,743 |
| | 4.00% 2/1/41 | | | | 289,928 | | | 302,385 |
| | 4.00% 9/1/41 | | | | 31,842 | | | 33,096 |
| | 4.00% 10/1/41 | | | | 153,856 | | | 159,934 |
| | 4.00% 12/1/41 | | | | 787,542 | | | 818,654 |
| | 4.00% 3/1/42 | | | | 455,730 | | | 473,893 |
| | 4.00% 1/1/43 | | | | 633,444 | | | 658,401 |
| | 4.00% 4/1/43 | | | | 105,993 | | | 110,181 |
| | 4.50% 7/1/36 | | | | 36,879 | | | 39,068 |
| | 4.50% 4/1/40 | | | | 44,727 | | | 47,445 |
| | 4.50% 8/1/40 | | | | 207,285 | | | 219,611 |
| | 4.50% 11/1/40 | | | | 113,899 | | | 120,820 |
| | 4.50% 2/1/41 | | | | 53,726 | | | 57,010 |
| | 4.50% 3/1/41 | | | | 236,015 | | | 250,444 |
| | 4.50% 5/1/41 | | | | 38,036 | | | 40,418 |
13
Statement of net assets
Delaware Core Plus Bond Fund
| | | | | Principal amount° | | Value (U.S. $) |
| Agency Mortgage-Backed Securities (continued) | | | | | | | |
| Fannie Mae S.F. 30 yr (continued) | | | | | | | |
| | 4.50% 8/1/41 | | USD | | 260,279 | | $ | 276,191 |
| | 4.50% 10/1/41 | | | | 135,017 | | | 143,272 |
| | 4.50% 11/1/41 | | | | 117,072 | | | 124,229 |
| | 8.00% 2/1/30 | | | | 19,908 | | | 20,537 |
| | 10.00% 7/1/20 | | | | 5,015 | | | 5,806 |
| | 10.00% 5/1/22 | | | | 4,832 | | | 5,430 |
| | 10.00% 2/1/25 | | | | 82,211 | | | 92,801 |
| Fannie Mae S.F. 30 yr TBA | | | | | | | |
| | 3.00% 9/1/43 | | | | 11,558,000 | | | 11,169,725 |
| | 3.50% 9/1/43 | | | | 2,746,000 | | | 2,760,588 |
| | 4.50% 9/1/43 | | | | 2,173,000 | | | 2,296,929 |
| • | Freddie Mac ARM | | | | | | | |
| | 2.502% 7/1/36 | | | | 32,783 | | | 34,942 |
| | 5.393% 10/1/36 | | | | 61,639 | | | 65,312 |
| Freddie Mac S.F. 15 yr 5.00% 6/1/18 | | | | 31,397 | | | 33,207 |
| Freddie Mac S.F. 30 yr | | | | | | | |
| | 3.00% 11/1/42 | | | | 113,320 | | | 109,649 |
| | 4.00% 10/1/40 | | | | 125,964 | | | 130,708 |
| | 4.00% 11/1/40 | | | | 79,762 | | | 82,766 |
| | 4.50% 10/1/39 | | | | 158,162 | | | 166,711 |
| | 4.50% 11/1/39 | | | | 265,086 | | | 279,417 |
| | 4.50% 1/1/41 | | | | 207,556 | | | 214,287 |
| | 4.50% 3/1/42 | | | | 484,711 | | | 511,226 |
| | 6.00% 8/1/38 | | | | 272,181 | | | 299,663 |
| | 6.00% 10/1/38 | | | | 399,043 | | | 435,067 |
| | 8.00% 5/1/31 | | | | 84,143 | | | 97,640 |
| | 10.00% 1/1/19 | | | | 7,727 | | | 8,773 |
| | 11.50% 6/1/15 | | | | 743 | | | 755 |
| | 11.50% 8/1/15 | | | | 454 | | | 456 |
| | 11.50% 2/1/16 | | | | 5,489 | | | 5,611 |
| | 11.50% 3/1/16 | | | | 1,143 | | | 1,168 |
| GNMA I GPM 12.25% 3/15/14 | | | | 1,397 | | | 1,405 |
| GNMA I S.F. 15 yr 6.50% 7/15/14 | | | | 12,466 | | | 12,815 |
| GNMA I S.F. 30 yr | | | | | | | |
| | 7.50% 1/15/32 | | | | 10,192 | | | 12,396 |
| | 8.00% 5/15/30 | | | | 12,830 | | | 13,209 |
| | 9.50% 10/15/19 | | | | 2,730 | | | 2,744 |
| | 9.50% 8/15/21 | | | | 9,572 | | | 10,580 |
| | 9.50% 3/15/23 | | | | 12,582 | | | 13,722 |
14
| | | | | Principal amount° | | Value (U.S. $) |
| Agency Mortgage-Backed Securities (continued) | | | �� | | | | |
| GNMA I S.F. 30 yr (continued) | | | | | | | |
| | 10.00% 9/15/18 | | USD | | 6,719 | | $ | 6,756 |
| | 11.00% 8/15/15 | | | | 2,044 | | | 2,066 |
| | 12.00% 4/15/14 | | | | 2,001 | | | 2,010 |
| | 12.00% 5/15/14 | | | | 608 | | | 618 |
| | 12.00% 6/15/14 | | | | 267 | | | 269 |
| | 12.00% 3/15/15 | | | | 827 | | | 831 |
| | 12.00% 5/15/15 | | | | 3,564 | | | 3,583 |
| | 12.00% 6/15/15 | | | | 8,234 | | | 8,378 |
| | 12.50% 12/15/13 | | | | 267 | | | 268 |
| | 12.50% 1/15/16 | | | | 11,080 | | | 11,293 |
| GNMA II S.F. 30 yr | | | | | | | |
| | 7.50% 9/20/30 | | | | 15,251 | | | 18,542 |
| | 8.00% 6/20/30 | | | | 8,631 | | | 10,412 |
| | 10.00% 11/20/15 | | | | 198 | | | 202 |
| | 10.00% 5/20/19 | | | | 980 | | | 1,003 |
| | 10.00% 6/20/20 | | | | 3,247 | | | 3,739 |
| | 10.00% 8/20/20 | | | | 1,715 | | | 1,996 |
| | 10.00% 1/20/21 | | | | 2,525 | | | 2,962 |
| | 10.00% 2/20/21 | | | | 8,151 | | | 9,393 |
| | 10.00% 5/20/21 | | | | 3,329 | | | 3,896 |
| | 10.00% 6/20/21 | | | | 893 | | | 1,043 |
| | 10.50% 3/20/16 | | | | 415 | | | 438 |
| | 10.50% 1/20/18 | | | | 321 | | | 327 |
| | 10.50% 12/20/18 | | | | 325 | | | 372 |
| | 10.50% 2/20/19 | | | | 122 | | | 123 |
| | 10.50% 6/20/19 | | | | 362 | | | 417 |
| | 10.50% 9/20/19 | | | | 338 | | | 393 |
| | 10.50% 1/20/20 | | | | 994 | | | 1,012 |
| | 10.50% 5/20/20 | | | | 5,468 | | | 5,621 |
| | 10.50% 8/20/20 | | | | 472 | | | 475 |
| | 10.50% 10/20/20 | | | | 4,468 | | | 5,225 |
| | 10.50% 2/20/21 | | | | 18,158 | | | 18,261 |
| | 11.00% 5/20/15 | | | | 216 | | | 217 |
| | 11.00% 7/20/19 | | | | 445 | | | 448 |
| | 12.00% 3/20/14 | | | | 39 | | | 39 |
| | 12.00% 4/20/14 | | | | 225 | | | 228 |
| | 12.00% 5/20/15 | | | | 68 | | | 69 |
| | 12.50% 10/20/13 | | | | 124 | | | 124 |
| | 12.50% 12/20/13 | | | | 272 | | | 274 |
15
Statement of net assets
Delaware Core Plus Bond Fund
| | | | Principal amount° | | Value (U.S. $) |
| Agency Mortgage-Backed Securities (continued) | | | | | | | |
| GNMA II S.F. 30 yr (continued) | | | | | | | |
| 12.50% 5/20/14 | | USD | | 135 | | $ | 136 |
| 12.50% 7/20/15 | | | | 294 | | | 296 |
| Total Agency Mortgage-Backed Securities | | | | | | | |
| (cost $39,132,853) | | | | | | | 39,352,153 |
| |
| Commercial Mortgage-Backed Securities – 4.95% | | | | | | | |
| Bank of America Merrill Lynch Commercial | | | | | | | |
| Mortgage Securities | | | | | | | |
| •Series 2006-2 A4 5.73% 5/10/45 | | | | 115,000 | | | 126,468 |
| Series 2006-4 A4 5.634% 7/10/46 | | | | 200,000 | | | 219,609 |
| • | Bear Stearns Commercial Mortgage Securities | | | | | | | |
| Series 2005-T20 A4A 5.143% 10/12/42 | | | | 60,000 | | | 64,561 |
| Series 2006-PW12 A4 5.715% 9/11/38 | | | | 55,000 | | | 60,618 |
| Citigroup Commercial Mortgage Trust | | | | | | | |
| Series 2012-GC8 A4 3.024% 9/10/45 | | | | 180,000 | | | 171,431 |
| • | Commercial Mortgage Pass Through Certificates | | | | | | | |
| Series 2005-C6 A5A 5.116% 6/10/44 | | | | 95,000 | | | 101,460 |
| Series 2013-CR8 A5 3.612% 6/10/46 | | | | 235,000 | | | 231,375 |
| • | Commercial Mortgage Trust | | | | | | | |
| Series 2005-GG5 A5 5.224% 4/10/37 | | | | 340,000 | | | 363,618 |
| • | Credit Suisse Mortgage Capital Certificates | | | | | | | |
| Series 2006-C1 AAB 5.392% 2/15/39 | | | | 51,710 | | | 52,936 |
| # | DBUBS Mortgage Trust | | | | | | | |
| Series 2011-LC1A A3 144A 5.002% 11/10/46 | | | | 850,000 | | | 942,938 |
| #• | FREMF Mortgage Trust | | | | | | | |
| Series 2012-K21 B 144A 3.939% 7/25/45 | | | | 105,000 | | | 96,790 |
| Goldman Sachs Mortgage Securities II | | | | | | | |
| •Series 2004-GG2 A6 5.396% 8/10/38 | | | | 420,000 | | | 430,836 |
| Series 2005-GG4 A4A 4.751% 7/10/39 | | | | 450,000 | | | 471,957 |
| •Series 2006-GG6 A4 5.553% 4/10/38 | | | | 435,000 | | | 473,277 |
| #Series 2010-C1 A2 144A 4.592% 8/10/43 | | | | 245,000 | | | 265,485 |
| #•Series 2010-C1 C 144A 5.635% 8/10/43 | | | | 150,000 | | | 160,452 |
| #Series 2012-ALOHA B 144A 4.049% 4/10/34 | | | | 100,000 | | | 99,692 |
| JPMorgan Chase Commercial | | | | | | | |
| Mortgage Securities | | | | | | | |
| •Series 2005-LDP5 A4 5.20% 12/15/44 | | | | 280,000 | | | 302,288 |
| Series 2011-C5 A3 4.171% 8/15/46 | | | | 165,000 | | | 173,546 |
16
| | | | Principal amount° | | Value (U.S. $) |
| Commercial Mortgage-Backed Securities (continued) | | | | | | | |
| Lehman Brothers-UBS Commercial | | | | | | | |
| Mortgage Trust | | | | | | | |
| Series 2004-C1 A4 4.568% 1/15/31 | | USD | | 103,124 | | $ | 104,640 |
| •Series 2005-C3 B 4.895% 7/15/40 | | | | 60,000 | | | 62,097 |
| Merrill Lynch Mortgage Trust | | | | | | | |
| Series 2005-CIP1 A2 4.96% 7/12/38 | | | | 53,245 | | | 53,721 |
| •Series 2005-CKI1 A6 5.282% 11/12/37 | | | | 286,832 | | | 307,218 |
| Morgan Stanley Capital I | | | | | | | |
| Series 2005-HQ6 A4A 4.989% 8/13/42 | | | | 592,000 | | | 628,067 |
| •Series 2005-HQ7 5.206% 11/14/42 | | | | 480,000 | | | 476,562 |
| •Series 2007-T27 A4 5.647% 6/11/42 | | | | 375,000 | | | 423,900 |
| # | OBP Depositor Trust | | | | | | | |
| Series 2010-OBP A 144A 4.646% 7/15/45 | | | | 115,000 | | | 124,882 |
| # | Timberstar Trust | | | | | | | |
| Series 2006-1A A 144A 5.668% 10/15/36 | | | | 185,000 | | | 207,170 |
| # | VNO Mortgage Trust | | | | | | | |
| Series 2012-6AVE 144A 2.996% 11/15/30 | | | | 350,000 | | | 329,181 |
| WF-RBS Commercial Mortgage Trust | | | | | | | |
| Series 2012-C9 A3 2.87% 11/15/45 | | | | 130,000 | | | 121,936 |
| Series 2013-C11 A5 3.071% 3/15/45 | | | | 115,000 | | | 109,234 |
| Series 2013-C14 A5 3.337% 6/15/46 | | | | 210,000 | | | 202,582 |
| Total Commercial Mortgage-Backed Securities | | | | | | | |
| (cost $7,703,292) | | | | | | | 7,960,527 |
| |
| Convertible Bonds – 0.86% | | | | | | | |
| Advanced Micro Devices 6.00% | | | | | | | |
| exercise price $28.08, | | | | | | | |
| expiration date 4/30/15 | | | | 22,000 | | | 22,784 |
| # | Alaska Communications Systems Group 144A | | | | | | | |
| 6.25% exercise price $10.28, | | | | | | | |
| expiration date 4/27/18 | | | | 24,000 | | | 19,425 |
| Alere 3.00% exercise price $43.98, | | | | | | | |
| expiration date 5/15/16 | | | | 27,000 | | | 28,536 |
| Ares Capital 5.75% exercise price $19.13, | | | | | | | |
| expiration date 2/1/16 | | | | 27,000 | | | 29,531 |
| *Φ | ArvinMeritor 4.00% exercise price $26.73, | | | | | | | |
| expiration date 2/12/27 | | | | 52,000 | | | 48,489 |
| BGC Partners 4.50% exercise price $9.84, | | | | | | | |
| expiration date 7/13/16 | | | | 25,000 | | | 25,641 |
17
Statement of net assets
Delaware Core Plus Bond Fund
| | | | Principal amount° | | Value (U.S. $) |
| Convertible Bonds (continued) | | | | | | | |
| # | Blucora 144A 4.25% exercise price $21.66, | | | |
| expiration date 3/29/19 | | USD | | 17,000 | | $ | 19,752 |
| * | Chesapeake Energy 2.50% exercise price $50.90, | | | |
| expiration date 5/15/37 | | | | 11,000 | | | 10,581 |
| # | Ciena 144A 3.75% exercise price $20.17, | | | |
| expiration date 10/15/18 | | | | 26,000 | | | 35,214 |
| # | Clearwire Communications 144A 8.25% | | | |
| exercise price $7.08, | | | | | | | |
| expiration date 11/30/40 | | | | 22,000 | | | 24,475 |
| Dendreon 2.875% exercise price $51.24, | | | |
| expiration date 1/13/16 | | | | 33,000 | | | 24,131 |
| Equinix 4.75% exercise price $84.32, | | | |
| expiration date 6/13/16 | | | | 5,000 | | | 11,050 |
| Φ | General Cable 4.50% exercise price $36.55, | | | |
| expiration date 11/15/29 | | | | 43,000 | | | 48,401 |
| Gilead Sciences 1.625% exercise price $22.71, | | | |
| expiration date 5/1/16 | | | | 12,000 | | | 32,475 |
| Helix Energy Solutions Group 3.25% | | | |
| exercise price $25.02, | | | | | | | |
| expiration date 3/12/32 | | | | 29,000 | | | 38,679 |
| *Φ | Hologic 2.00% exercise price $31.17, | | | |
| expiration date 2/27/42 | | | | 34,000 | | | 36,338 |
| Iconix Brand Group 2.50% exercise price $30.75, | | | |
| expiration date 5/31/16 | | | | 14,000 | | | 17,054 |
| # | Illumina 144A 0.25% exercise price $83.55, | | | |
| expiration date 3/11/16 | | | | 16,000 | | | 18,110 |
| Intel 3.25% exercise price $21.94, | | | |
| expiration date 8/1/39 | | | | 19,000 | | | 23,619 |
| Jefferies Group 3.875% exercise price $45.72, | | | |
| expiration date 10/31/29 | | | | 32,000 | | | 33,980 |
| Leap Wireless International 4.50% | | | |
| exercise price $93.21, | | | | | | | |
| expiration date 7/10/14 | | | | 46,000 | | | 47,063 |
| # | Lexington Realty Trust 144A 6.00% | | | |
| exercise price $6.84, | | | | | | | |
| expiration date 1/11/30 | | | | 12,000 | | | 22,298 |
| # | Liberty Interactive 144A 0.75% | | | |
| exercise price $1,000.00, | | | | | | | |
| expiration date 3/30/43 | | | | 23,000 | | | 25,933 |
18
| | | | Principal amount° | | Value (U.S. $) |
| Convertible Bonds (continued) | | | | | | | |
| Linear Technology 3.00% exercise price $41.46, | | | |
| expiration date 4/30/27 | | USD | | 225,000 | | $ | 244,405 |
| MGM Resorts International 4.25% | | | | | | | |
| exercise price $18.58, | | | | | | | |
| expiration date 4/10/15 | | | | 32,000 | | | 37,380 |
| Mylan 3.75% exercise price $13.32, | | | | | | | |
| expiration date 9/15/15 | | | | 9,000 | | | 23,012 |
| Nuance Communications 2.75% | | | | | | | |
| exercise price $32.30, | | | | | | | |
| expiration date 11/1/31 | | | | 37,000 | | | 37,879 |
| NuVasive 2.75% exercise price $42.13, | | | |
| expiration date 6/30/17 | | | | 54,000 | | | 52,919 |
| # | Opko Health 144A 3.00% exercise price $7.07, | | | |
| expiration date 1/28/33 | | | | 8,000 | | | 8,600 |
| # | Owens-Brockway Glass Container 144A 3.00% | | | |
| exercise price $47.47, | | | | | | | |
| expiration date 5/28/15 | | | | 37,000 | | | 38,434 |
| * | Peabody Energy 4.75% exercise price $57.95, | | | |
| expiration date 12/15/41 | | | | 19,000 | | | 14,381 |
| PHH 4.00% exercise price $25.80, | | | | | | | |
| expiration date 8/27/14 | | | | 27,000 | | | 29,548 |
| Rovi 2.625% exercise price $47.36, | | | | | | | |
| expiration date 2/10/40 | | | | 14,000 | | | 14,403 |
| # | Ryman Hospitality Properties 144A 3.75% | | | |
| exercise price $21.96, | | | | | | | |
| expiration date 9/29/14 | | | | 15,000 | | | 25,688 |
| SanDisk 1.50% exercise price $52.37, | | | | | | | |
| expiration date 8/11/17 | | | | 35,000 | | | 44,516 |
| SBA Communications 4.00% | | | | | | | |
| exercise price $30.38, | | | | | | | |
| expiration date 9/29/14 | | | | 8,000 | | | 19,685 |
| Steel Dynamics 5.125% exercise price $17.21, | | | |
| expiration date 6/15/14 | | | | 9,000 | | | 9,771 |
| TIBCO Software 2.25% exercise price $50.57, | | | |
| expiration date 4/30/32 | | | | 57,000 | | | 57,783 |
| Titan Machinery 3.75% exercise price $43.17, | | | |
| expiration date 4/30/19 | | | | 26,000 | | | 24,278 |
| • | Vector Group 2.50% exercise price $18.50, | | | |
| expiration date 1/14/19 | | | | 8,000 | | | 9,573 |
19
Statement of net assets
Delaware Core Plus Bond Fund
| | | | | Principal amount° | | Value (U.S. $) |
| Convertible Bonds (continued) | | | | | | | |
| VeriSign 3.25% exercise price $34.37, | | | | | | | |
| | expiration date 8/15/37 | | USD | | 22,000 | | $ | 32,560 |
| # | WellPoint 144A 2.75% exercise price $75.38, | | | | | | | |
| | expiration date 10/15/42 | | | | 16,000 | | | 20,930 |
| Total Convertible Bonds (cost $1,306,596) | | | | | | | 1,389,304 |
| |
| Corporate Bonds – 48.13% | | | | | | | |
| Banking – 7.23% | | | | | | | |
| # | Banco BTG Pactual 144A 4.00% 1/16/20 | | | | 245,000 | | | 210,700 |
| # | Banco do Brasil 144A 3.75% 7/25/18 | | EUR | | 170,000 | | | 224,430 |
| # | Banco Santander Mexico 144A 4.125% 11/9/22 | | USD | | 300,000 | | | 279,375 |
| Bancolombia 5.95% 6/3/21 | | | | 180,000 | | | 188,550 |
| # | Bank Nederlandse Gemeenten 144A | | | | | | | |
| | 1.375% 3/19/18 | | | | 350,000 | | | 344,559 |
| Bank of America | | | | | | | |
| | 3.875% 3/22/17 | | | | 195,000 | | | 206,500 |
| | 4.10% 7/24/23 | | | | 150,000 | | | 150,385 |
| • | 5.20% 12/29/49 | | | | 235,000 | | | 212,675 |
| • | Bank of New York Mellon 4.50% 12/31/49 | | | | 155,000 | | | 144,731 |
| * | Barclays Bank 7.625% 11/21/22 | | | | 400,000 | | | 399,000 |
| BB&T 5.25% 11/1/19 | | | | 627,000 | | | 704,183 |
| # | BBVA Banco Continental 144A 3.25% 4/8/18 | | | | 205,000 | | | 200,388 |
| BBVA U.S. Senior 4.664% 10/9/15 | | | | 200,000 | | | 206,556 |
| • | Branch Banking & Trust 0.592% 9/13/16 | | | | 280,000 | | | 276,125 |
| City National 5.25% 9/15/20 | | | | 160,000 | | | 172,848 |
| • | Deutsche Bank 4.296% 5/24/28 | | | | 200,000 | | | 181,975 |
| • | Fifth Third Bancorp 5.10% 12/31/49 | | | | 200,000 | | | 189,500 |
| • | Fifth Third Capital Trust IV 6.50% 4/15/37 | | | | 510,000 | | | 511,913 |
| Goldman Sachs Group 2.90% 7/19/18 | | | | 420,000 | | | 421,227 |
| #• | HBOS Capital Funding 144A 6.071% 6/29/49 | | | | 790,000 | | | 762,349 |
| JPMorgan Chase | | | | | | | |
| | 2.92% 9/19/17 | | CAD | | 170,000 | | | 165,116 |
| • | 5.15% 12/29/49 | | USD | | 150,000 | | | 139,875 |
| | 6.00% 12/29/49 | | | | 30,000 | | | 29,588 |
| KeyBank 5.45% 3/3/16 | | | | 500,000 | | | 551,616 |
| Morgan Stanley 4.10% 5/22/23 | | | | 535,000 | | | 503,240 |
| Oesterreichische Kontrollbank | | | | | | | |
| | 1.125% 5/29/18 | | | | 175,000 | | | 171,071 |
20
| | | | | Principal amount° | | Value (U.S. $) |
| Corporate Bonds (continued) | | | | | | | |
| Banking (continued) | | | | | | | |
| PNC Bank | | | | | | | |
| | 3.80% 7/25/23 | | USD | | 250,000 | | $ | 247,372 |
| | 6.875% 4/1/18 | | | | 250,000 | | | 300,749 |
| • | PNC Financial Services Group | | | | | | | |
| | 4.494% 5/29/49 | | | | 260,000 | | | 260,325 |
| | 4.85% 5/29/49 | | | | 170,000 | | | 155,125 |
| PNC Funding 5.125% 2/8/20 | | | | 210,000 | | | 235,043 |
| Regions Financial 2.00% 5/15/18 | | | | 215,000 | | | 207,208 |
| Royal Bank of Scotland Group 6.10% 6/10/23 | | | | 45,000 | | | 43,233 |
| # | Russian Agricultural Bank 144A 5.10% 7/25/18 | | | | 200,000 | | | 201,100 |
| # | Sberbank 144A 4.95% 2/7/17 | | | | 200,000 | | | 210,240 |
| # | Standard Chartered 144A 3.95% 1/11/23 | | | | 290,000 | | | 272,764 |
| State Street 3.10% 5/15/23 | | | | 245,000 | | | 229,787 |
| SVB Financial Group 5.375% 9/15/20 | | | | 150,000 | | | 164,171 |
| U.S. Bank North America 4.95% 10/30/14 | | | | 250,000 | | | 263,135 |
| *• | USB Capital IX 3.50% 10/29/49 | | | | 705,000 | | | 627,449 |
| #• | USB Realty 144A 1.415% 12/22/49 | | | | 100,000 | | | 87,000 |
| Wachovia | | | | | | | |
| *• | 0.638% 10/15/16 | | | | 95,000 | | | 93,800 |
| | 5.25% 8/1/14 | | | | 105,000 | | | 109,546 |
| Zions Bancorp | | | | | | | |
| | 4.50% 3/27/17 | | | | 275,000 | | | 284,211 |
| | 7.75% 9/23/14 | | | | 95,000 | | | 101,697 |
| | | | | | | | 11,642,430 |
| Basic Industry – 4.13% | | | | | | | |
| ArcelorMittal 10.35% 6/1/19 | | | | 330,000 | | | 400,125 |
| # | Barrick Gold 144A | | | | | | | |
| | 2.50% 5/1/18 | | | | 70,000 | | | 65,029 |
| | 4.10% 5/1/23 | | | | 190,000 | | | 161,909 |
| CF Industries | | | | | | | |
| | 6.875% 5/1/18 | | | | 210,000 | | | 248,064 |
| | 7.125% 5/1/20 | | | | 275,000 | | | 327,840 |
| Dow Chemical 8.55% 5/15/19 | | | | 479,000 | | | 617,079 |
| # | Freeport-McMoRan Copper & Gold 144A | | | | | | | |
| | 3.875% 3/15/23 | | | | 155,000 | | | 140,506 |
| Georgia-Pacific 8.00% 1/15/24 | | | | 520,000 | | | 675,475 |
| # | Gerdau Trade 144A 4.75% 4/15/23 | | | | 200,000 | | | 183,000 |
| # | Glencore Funding 144A 2.50% 1/15/19 | | | | 285,000 | | | 261,814 |
21
Statement of net assets
Delaware Core Plus Bond Fund
| | | | Principal amount° | | Value (U.S. $) |
| Corporate Bonds (continued) | | | | | | | |
| Basic Industry (continued) | | | | | | | |
| International Paper | | | | | | | |
| 6.00% 11/15/41 | | USD | | 230,000 | | $ | 252,900 |
| 9.375% 5/15/19 | | | | 55,000 | | | 72,828 |
| LYB International Finance 4.00% 7/15/23 | | | | 680,000 | | | 676,221 |
| Nucor 4.00% 8/1/23 | | | | 95,000 | | | 93,704 |
| *# | Phosagro 144A 4.204% 2/13/18 | | | | 200,000 | | | 194,500 |
| Plains Exploration & Production | | | | | | | |
| 6.50% 11/15/20 | | | | 130,000 | | | 140,069 |
| Rio Tinto Finance USA 2.25% 12/14/18 | | | | 135,000 | | | 131,945 |
| Rock Tenn | | | | | | | |
| 3.50% 3/1/20 | | | | 60,000 | | | 59,207 |
| 4.00% 3/1/23 | | | | 55,000 | | | 53,052 |
| Rockwood Specialties Group 4.625% 10/15/20 | | | | 260,000 | | | 265,200 |
| Southern Copper | | | | | | | |
| 3.50% 11/8/22 | | | | 40,000 | | | 36,366 |
| 5.25% 11/8/42 | | | | 160,000 | | | 128,032 |
| # | Taminco Global Chemical 144A 9.75% 3/31/20 | | | | 940,000 | | | 1,064,551 |
| * | Teck Resources 3.75% 2/1/23 | | | | 140,000 | | | 126,922 |
| Vale Overseas 5.625% 9/15/19 | | | | 70,000 | | | 76,297 |
| # | Vedanta Resources 144A 6.00% 1/31/19 | | | | 200,000 | | | 196,000 |
| | | | | | | | 6,648,635 |
| Brokerage – 0.50% | | | | | | | |
| Jefferies Group | | | | | | | |
| 5.125% 1/20/23 | | | | 285,000 | | | 288,976 |
| 6.45% 6/8/27 | | | | 60,000 | | | 62,283 |
| 6.50% 1/20/43 | | | | 50,000 | | | 50,130 |
| Lazard Group 6.85% 6/15/17 | | | | 366,000 | | | 409,674 |
| | | | | | | | 811,063 |
| Capital Goods – 1.51% | | | | | | | |
| # | Ardagh Packaging Finance 144A | | | | | | | |
| 7.00% 11/15/20 | | | | 925,000 | | | 913,437 |
| Ball 5.75% 5/15/21 | | | | 495,000 | | | 527,175 |
| # | Cemex Espana Luxembourg 144A | | | | | | | |
| 9.25% 5/12/20 | | | | 250,000 | | | 274,375 |
| # | Ingersoll-Rand Global Holding 144A | | | | | | | |
| 4.25% 6/15/23 | | | | 380,000 | | | 379,735 |
22
| | | | Principal amount° | | Value (U.S. $) |
| Corporate Bonds (continued) | | | | | | | |
| Capital Goods (continued) | | | | | | | |
| # | URS 144A | | | | | | | |
| 4.35% 4/1/17 | | USD | | 25,000 | | $ | 25,585 |
| 5.50% 4/1/22 | | | | 125,000 | | | 128,171 |
| # | Votorantim Cimentos 144A 7.25% 4/5/41 | | | | 200,000 | | | 190,000 |
| | | | | | | | 2,438,478 |
| Communications – 5.80% | | | | | | | |
| American Tower 5.90% 11/1/21 | | | | 250,000 | | | 275,330 |
| # | American Tower Trust I 144A | | | | | | | |
| 1.551% 3/15/18 | | | | 85,000 | | | 83,003 |
| 3.07% 3/15/23 | | | | 210,000 | | | 200,636 |
| Bell Canada 3.35% 3/22/23 | | CAD | | 50,000 | | | 45,836 |
| CC Holdings GS V 3.849% 4/15/23 | | USD | | 445,000 | | | 420,131 |
| CenturyLink 5.80% 3/15/22 | | | | 265,000 | | | 265,663 |
| # | Clearwire Communications 144A | | | | | | | |
| 12.00% 12/1/15 | | | | 220,000 | | | 233,750 |
| # | Columbus International 144A 11.50% 11/20/14 | | | | 100,000 | | | 108,500 |
| # | Cox Communications 144A 3.25% 12/15/22 | | | | 420,000 | | | 384,517 |
| # | Crown Castle Towers 144A 4.883% 8/15/20 | | | | 800,000 | | | 852,427 |
| # | Digicel Group 144A 10.50% 4/15/18 | | | | 200,000 | | | 218,000 |
| # | Intelsat Jackson Holdings 144A 5.50% 8/1/23 | | | | 345,000 | | | 332,925 |
| # | Millicom International Cellular 144A | | | | | | | |
| 4.75% 5/22/20 | | | | 200,000 | | | 194,500 |
| # | Myriad International Holding 144A | | | | | | | |
| 6.375% 7/28/17 | | | | 200,000 | | | 217,240 |
| # | Nara Cable Funding 144A 8.875% 12/1/18 | | | | 500,000 | | | 527,500 |
| # | Qtel International Finance 144A 3.25% 2/21/23 | | | | 200,000 | | | 184,500 |
| Qwest 6.75% 12/1/21 | | | | 185,000 | | | 207,362 |
| # | SBA Tower Trust 144A 2.24% 4/16/18 | | | | 160,000 | | | 158,030 |
| # | SES 144A 3.60% 4/4/23 | | | | 365,000 | | | 347,157 |
| Sinclair Television Group 6.125% 10/1/22 | | | | 430,000 | | | 436,450 |
| # | Softbank 144A 4.50% 4/15/20 | | | | 240,000 | | | 232,260 |
| Sprint Nextel | | | | | | | |
| 6.00% 12/1/16 | | | | 110,000 | | | 117,150 |
| 8.375% 8/15/17 | | | | 130,000 | | | 147,550 |
| # | TBG Global 144A 4.625% 4/3/18 | | | | 200,000 | | | 197,500 |
| # | Telefonica Chile 144A 3.875% 10/12/22 | | | | 200,000 | | | 184,393 |
| Telefonica Emisiones 3.192% 4/27/18 | | | | 600,000 | | | 593,378 |
| # | Telemar Norte Leste 144A 5.50% 10/23/20 | | | | 265,000 | | | 250,425 |
23
Statement of net assets
Delaware Core Plus Bond Fund
| | | | Principal amount° | | Value (U.S. $) |
| Corporate Bonds (continued) | | | | | | | |
| Communications (continued) | | | | | | | |
| Time Warner Cable 8.25% 4/1/19 | | USD | | 385,000 | | $ | 448,697 |
| # | UPCB Finance III 144A 6.625% 7/1/20 | | | | 250,000 | | | 268,750 |
| Virgin Media Secured Finance 6.50% 1/15/18 | | | | 500,000 | | | 523,750 |
| # | Vivendi 144A | | | | | | | |
| 3.45% 1/12/18 | | | | 455,000 | | | 459,867 |
| 6.625% 4/4/18 | | | | 2,000 | | | 2,288 |
| Vodafone Group 2.95% 2/19/23 | | | | 230,000 | | | 213,283 |
| | | | | | | | 9,332,748 |
| Consumer Cyclical – 2.29% | | | | | | | |
| ADT 4.125% 6/15/23 | | | | 150,000 | | | 129,200 |
| Amazon.com 2.50% 11/29/22 | | | | 370,000 | | | 340,282 |
| # | Daimler Finance North America 144A | | | | | | | |
| 2.25% 7/31/19 | | | | 250,000 | | | 244,957 |
| Ford Motor Credit | | | | | | | |
| 5.875% 8/2/21 | | | | 400,000 | | | 444,274 |
| 12.00% 5/15/15 | | | | 200,000 | | | 236,832 |
| Historic TW 6.875% 6/15/18 | | | | 540,000 | | | 654,478 |
| Host Hotels & Resorts | | | | | | | |
| 3.75% 10/15/23 | | | | 45,000 | | | 41,848 |
| 4.75% 3/1/23 | | | | 175,000 | | | 176,732 |
| 5.25% 3/15/22 | | | | 180,000 | | | 187,813 |
| 5.875% 6/15/19 | | | | 75,000 | | | 80,784 |
| # | Hyundai Capital America 144A 2.125% 10/2/17 | | | | 130,000 | | | 126,995 |
| # | QVC 144A 4.375% 3/15/23 | | | | 435,000 | | | 415,767 |
| # | SACI Falabella 144A 3.75% 4/30/23 | | | | 200,000 | | | 183,655 |
| Western Union | | | | | | | |
| 2.875% 12/10/17 | | | | 130,000 | | | 130,998 |
| 3.65% 8/22/18 | | | | 95,000 | | | 98,475 |
| Wyndham Worldwide | | | | | | | |
| 4.25% 3/1/22 | | | | 100,000 | | | 98,807 |
| 5.625% 3/1/21 | | | | 90,000 | | | 96,922 |
| | | | | | | | 3,688,819 |
| Consumer Non-Cyclical – 3.58% | | | | | | | |
| # | BFF International 144A 7.25% 1/28/20 | | | | 100,000 | | | 111,000 |
| Boston Scientific 6.00% 1/15/20 | | | | 145,000 | | | 165,584 |
| # | BRF - Brasil Foods 144A 5.875% 6/6/22 | | | | 255,000 | | | 259,463 |
24
| | | | | Principal amount° | | Value (U.S. $) |
| Corporate Bonds (continued) | | | | | | | |
| Consumer Non-Cyclical (continued) | | | | | | | |
| CareFusion | | | | | | | |
| # | 144A 3.30% 3/1/23 | | USD | | 185,000 | | $ | 174,523 |
| | 6.375% 8/1/19 | | | | 475,000 | | | 547,756 |
| Celgene 3.95% 10/15/20 | | | | 120,000 | | | 123,571 |
| Constellation Brands | | | | | | | |
| | 3.75% 5/1/21 | | | | 110,000 | | | 103,125 |
| | 4.25% 5/1/23 | | | | 75,000 | | | 70,875 |
| # | Cosan Luxembourg 144A 5.00% 3/14/23 | | | | 200,000 | | | 188,000 |
| Covidien International Finance 2.95% 6/15/23 | | | | 165,000 | | | 157,501 |
| Del Monte 7.625% 2/15/19 | | | | 55,000 | | | 57,750 |
| Energizer Holding 4.70% 5/24/22 | | | | 360,000 | | | 364,163 |
| Fomento Economico Mexicano 4.375% 5/10/43 | | | | 150,000 | | | 129,383 |
| # | Korea Expressway 144A 1.875% 10/22/17 | | | | 200,000 | | | 194,813 |
| Kroger 3.85% 8/1/23 | | | | 150,000 | | | 149,280 |
| Laboratory Corporation of America Holdings | | | | | | | |
| | 2.20% 8/23/17 | | | | 190,000 | | | 188,931 |
| # | Mylan 144A | | | | | | | |
| | 3.125% 1/15/23 | | | | 105,000 | | | 95,901 |
| | 6.00% 11/15/18 | | | | 245,000 | | | 265,063 |
| Newell Rubbermaid 2.05% 12/1/17 | | | | 120,000 | | | 118,497 |
| # | Pernod-Ricard 144A 5.75% 4/7/21 | | | | 660,000 | | | 744,997 |
| Quest Diagnostics 4.70% 4/1/21 | | | | 235,000 | | | 248,631 |
| # | SABMiller Holdings 144A 3.75% 1/15/22 | | | | 400,000 | | | 408,182 |
| # | Want Want China Finance 144A 1.875% 5/14/18 | | | | 200,000 | | | 190,374 |
| Yale University 2.90% 10/15/14 | | | | 125,000 | | | 128,592 |
| Zimmer Holdings 4.625% 11/30/19 | | | | 240,000 | | | 264,231 |
| # | Zoetis 144A 3.25% 2/1/23 | | | | 330,000 | | | 313,922 |
| | | | | | | | 5,764,108 |
| Electric – 5.52% | | | | | | | |
| AES 7.375% 7/1/21 | | | | 535,000 | | | 607,225 |
| Ameren Illinois 9.75% 11/15/18 | | | | 769,000 | | | 1,037,736 |
| # | American Transmission Systems 144A | | | | | | | |
| | 5.25% 1/15/22 | | | | 225,000 | | | 239,697 |
| # | APT Pipelines 144A 3.875% 10/11/22 | | | | 95,000 | | | 88,207 |
| CenterPoint Energy 5.95% 2/1/17 | | | | 165,000 | | | 187,957 |
| CMS Energy 6.25% 2/1/20 | | | | 190,000 | | | 221,073 |
| ComEd Financing III 6.35% 3/15/33 | | | | 190,000 | | | 189,063 |
| #• | Electricite de France 144A 5.25% 12/29/49 | | | | 325,000 | | | 311,351 |
25
Statement of net assets
Delaware Core Plus Bond Fund
| | | | | Principal amount° | | Value (U.S. $) |
| Corporate Bonds (continued) | | | | | | | |
| Electric (continued) | | | | | | | |
| # | Eskom Holdings 144A 6.75% 8/6/23 | | USD | | 200,000 | | $ | 198,380 |
| Exelon Generation 4.25% 6/15/22 | | | | 400,000 | | | 402,678 |
| Great Plains Energy | | | | | | | |
| 4.85% 6/1/21 | | | | 90,000 | | | 97,044 |
| 5.292% 6/15/22 | | | | 305,000 | | | 334,183 |
| • | Integrys Energy Group 6.11% 12/1/66 | | | | 295,000 | | | 309,982 |
| LG&E & KU Energy | | | | | | | |
| 3.75% 11/15/20 | | | | 115,000 | | | 117,733 |
| 4.375% 10/1/21 | | | | 380,000 | | | 393,341 |
| # | Narragansett Electric 144A 4.17% 12/10/42 | | | | 135,000 | | | 122,470 |
| • | National Rural Utilities Cooperative Finance | | | | | | | |
| 4.75% 4/30/43 | | | | 230,000 | | | 222,525 |
| NextEra Energy Capital Holdings | | | | | | | |
| | 3.625% 6/15/23 | | | | 100,000 | | | 97,057 |
| • | 6.35% 10/1/66 | | | | 440,000 | | | 457,926 |
| NV Energy 6.25% 11/15/20 | | | | 240,000 | | | 283,378 |
| Pennsylvania Electric 5.20% 4/1/20 | | | | 175,000 | | | 191,234 |
| • | PPL Capital Funding 6.70% 3/30/67 | | | | 150,000 | | | 156,126 |
| Public Service Company of Oklahoma | | | | | | | |
| 5.15% 12/1/19 | | | | 550,000 | | | 627,601 |
| Puget Energy 6.00% 9/1/21 | | | | 65,000 | | | 71,915 |
| • | Puget Sound Energy 6.974% 6/1/67 | | | | 525,000 | | | 549,342 |
| SCANA 4.125% 2/1/22 | | | | 815,000 | | | 801,625 |
| • | Wisconsin Energy 6.25% 5/15/67 | | | | 535,000 | | | 563,560 |
| | | | | | | | 8,880,409 |
| Energy – 4.55% | | | | | | | |
| Apache 2.625% 1/15/23 | | | | 85,000 | | | 78,942 |
| Continental Resources 4.50% 4/15/23 | | | | 170,000 | | | 165,750 |
| # | Gazprom 144A 4.95% 5/23/16 | | | | 200,000 | | | 210,500 |
| # | Gazprom Neft 144A 4.375% 9/19/22 | | | | 200,000 | | | 186,040 |
| Halliburton 3.50% 8/1/23 | | | | 265,000 | | | 264,817 |
| # | KazMunayGas National 144A 9.125% 7/2/18 | | | | 210,000 | | | 256,463 |
| # | Korea Gas 144A 2.875% 7/29/18 | | | | 200,000 | | | 200,165 |
| Lukoil International Finance 6.125% 11/9/20 | | | | 335,000 | | | 361,030 |
| Newfield Exploration 5.625% 7/1/24 | | | | 175,000 | | | 175,875 |
| Noble Holding International | | | | | | | |
| 3.95% 3/15/22 | | | | 245,000 | | | 240,633 |
| 5.25% 3/15/42 | | | | 35,000 | | | 32,883 |
26
| | | | | Principal amount° | | Value (U.S. $) |
| Corporate Bonds (continued) | | | | | | | |
| Energy (continued) | | | | | | | |
| ONGC Videsh 2.50% 5/7/18 | | USD | | 200,000 | | $ | 189,932 |
| # | Pacific Rubiales Energy 144A 7.25% 12/12/21 | | | | 100,000 | | | 108,000 |
| # | Pertamina Persero 144A 4.875% 5/3/22 | | | | 350,000 | | | 333,375 |
| Petrobras Global Finance 3.00% 1/15/19 | | | | 220,000 | | | 204,836 |
| Petrobras International Finance 5.375% 1/27/21 | | | | 300,000 | | | 300,251 |
| Petrohawk Energy 7.25% 8/15/18 | | | | 340,000 | | | 373,150 |
| Petroleos de Venezuela 9.00% 11/17/21 | | | | 381,000 | | | 318,135 |
| Petroleos Mexicanos | | | | | | | |
| # | 144A 2.286% 7/18/18 | | | | 10,000 | | | 10,275 |
| # | 144A 3.50% 1/30/23 | | | | 225,000 | | | 206,438 |
| | 5.50% 6/27/44 | | | | 110,000 | | | 101,035 |
| Pride International 6.875% 8/15/20 | | | | 475,000 | | | 569,253 |
| Range Resources 8.00% 5/15/19 | | | | 175,000 | | | 189,875 |
| # | Samson Investment 144A 10.00% 2/15/20 | | | | 775,000 | | | 825,374 |
| * | SandRidge Energy 8.75% 1/15/20 | | | | 235,000 | | | 247,925 |
| Statoil 3.95% 5/15/43 | | | | 110,000 | | | 100,293 |
| Talisman Energy 5.50% 5/15/42 | | | | 470,000 | | | 474,731 |
| Weatherford International 9.625% 3/1/19 | | | | 150,000 | | | 192,662 |
| # | Woodside Finance 144A | | | | | | | |
| 8.125% 3/1/14 | | | | 280,000 | | | 290,893 |
| 8.75% 3/1/19 | | | | 85,000 | | | 109,068 |
| | | | | | | | 7,318,599 |
| Finance Companies – 1.72% | | | | | | | |
| # | CDP Financial 144A | | | | | | | |
| 4.40% 11/25/19 | | | | 280,000 | | | 308,850 |
| 5.60% 11/25/39 | | | | 250,000 | | | 287,488 |
| General Electric Capital | | | | | | | |
| | 2.10% 12/11/19 | | | | 65,000 | | | 63,683 |
| | 4.375% 9/16/20 | | | | 230,000 | | | 244,981 |
| | 6.00% 8/7/19 | | | | 470,000 | | | 548,472 |
| • | 6.25% 12/15/49 | | | | 300,000 | | | 313,294 |
| • | 7.125% 12/15/49 | | | | 100,000 | | | 112,688 |
| General Electric Capital Canada Funding | | | | | | | |
| 2.42% 5/31/18 | | CAD | | 9,000 | | | 8,650 |
| #• | ILFC E-Capital Trust II 144A 6.25% 12/21/65 | | USD | | 210,000 | | | 194,775 |
| International Lease Finance | | | | | | | |
| 5.875% 4/1/19 | | | | 85,000 | | | 89,250 |
| 6.25% 5/15/19 | | | | 88,000 | | | 93,280 |
| 8.75% 3/15/17 | | | | 100,000 | | | 115,250 |
27
Statement of net assets
Delaware Core Plus Bond Fund
| | | Principal amount° | | Value (U.S. $) |
| Corporate Bonds (continued) | | | | | | |
| Finance Companies (continued) | | | | | | |
| PHH 9.25% 3/1/16 | USD | | 145,000 | | $ | 164,575 |
| # | Temasek Financial I 144A 2.375% 1/23/23 | | | 250,000 | | | 226,365 |
| | | | | | | 2,771,601 |
| Insurance – 2.91% | | | | | | |
| American International Group 8.25% 8/15/18 | | | 245,000 | | | 307,198 |
| • | Chubb 6.375% 3/29/67 | | | 680,000 | | | 739,499 |
| # | Highmark 144A | | | | | | |
| 4.75% 5/15/21 | | | 200,000 | | | 189,766 |
| 6.125% 5/15/41 | | | 30,000 | | | 26,936 |
| *• | ING Groep 5.775% 12/29/49 | | | 85,000 | | | 85,000 |
| # | ING US 144A | | | | | | |
| 2.90% 2/15/18 | | | 85,000 | | | 84,870 |
| 5.50% 7/15/22 | | | 160,000 | | | 173,038 |
| •5.65% 5/15/53 | | | 220,000 | | | 207,350 |
| # | Liberty Mutual Group 144A | | | | | | |
| 4.25% 6/15/23 | | | 170,000 | | | 167,059 |
| 4.95% 5/1/22 | | | 215,000 | | | 223,199 |
| 6.50% 5/1/42 | | | 190,000 | | | 212,511 |
| MetLife 6.817% 8/15/18 | | | 165,000 | | | 201,632 |
| # | Metropolitan Life Global Funding I 144A | | | | | | |
| 3.00% 1/10/23 | | | 300,000 | | | 286,445 |
| 3.875% 4/11/22 | | | 475,000 | | | 485,776 |
| Prudential Financial | | | | | | |
| 3.875% 1/14/15 | | | 65,000 | | | 67,827 |
| *4.50% 11/15/20 | | | 50,000 | | | 54,059 |
| •5.625% 6/15/43 | | | 95,000 | | | 92,388 |
| •5.875% 9/15/42 | | | 245,000 | | | 248,063 |
| 6.00% 12/1/17 | | | 120,000 | | | 138,505 |
| • | XL Group 6.50% 12/29/49 | | | 160,000 | | | 158,000 |
| #• | ZFS Finance USA Trust II 144A 6.45% 12/15/65 | | | 500,000 | | | 536,249 |
| | | | | | | 4,685,370 |
| Natural Gas – 3.28% | | | | | | |
| AmeriGas Finance 7.00% 5/20/22 | | | 650,000 | | | 695,500 |
| El Paso Pipeline Partners Operating | | | | | | |
| 6.50% 4/1/20 | | | 295,000 | | | 344,919 |
| • | Enbridge Energy Partners 8.05% 10/1/37 | | | 265,000 | | | 300,957 |
| Energy Transfer Partners 9.70% 3/15/19 | | | 127,000 | | | 165,236 |
28
| | | Principal amount° | | Value (U.S. $) |
| Corporate Bonds (continued) | | | | | | |
| Natural Gas (continued) | | | | | | |
| Enterprise Products Operating | | | | | | |
| •7.034% 1/15/68 | USD | | 450,000 | | $ | 505,612 |
| 9.75% 1/31/14 | | | 130,000 | | | 135,657 |
| # | GDF Suez 144A 2.875% 10/10/22 | | | 210,000 | | | 196,212 |
| Kinder Morgan Energy Partners | | | | | | |
| | 4.15% 2/1/24 | | | 65,000 | | | 65,010 |
| 9.00% 2/1/19 | | | 415,000 | | | 534,167 |
| NiSource Finance | | | | | | |
| 3.85% 2/15/23 | | | 100,000 | | | 98,289 |
| 4.80% 2/15/44 | | | 210,000 | | | 195,402 |
| 5.80% 2/1/42 | | | 150,000 | | | 159,968 |
| Plains All American Pipeline 8.75% 5/1/19 | | | 195,000 | | | 254,099 |
| # | Regency Energy Partners 144A 4.50% 11/1/23 | | | 370,000 | | | 348,725 |
| Spectra Energy Capital 3.30% 3/15/23 | | | 55,000 | | | 49,820 |
| Sunoco Logistics Partners Operations | | | | | | |
| 3.45% 1/15/23 | | | 185,000 | | | 174,019 |
| TransCanada Pipelines | | | | | | |
| 3.80% 10/1/20 | | | 100,000 | | | 104,994 |
| •6.35% 5/15/67 | | | 310,000 | | | 325,684 |
| Williams Partners 7.25% 2/1/17 | | | 535,000 | | | 622,978 |
| | | | | | | 5,277,248 |
| Real Estate – 1.83% | | | | | | |
| Alexandria Real Estate Equities 4.60% 4/1/22 | | | 510,000 | | | 523,652 |
| BRE Properties 3.375% 1/15/23 | | | 210,000 | | | 197,100 |
| # | Corporate Office Properties 144A | | | | | | |
| 3.60% 5/15/23 | | | 150,000 | | | 139,201 |
| DDR | | | | | | |
| 4.625% 7/15/22 | | | 80,000 | | | 82,349 |
| 4.75% 4/15/18 | | | 80,000 | | | 86,939 |
| 7.875% 9/1/20 | | | 90,000 | | | 111,180 |
| 9.625% 3/15/16 | | | 150,000 | | | 179,501 |
| Digital Realty Trust | | | | | | |
| 5.25% 3/15/21 | | | 450,000 | | | 472,463 |
| 5.875% 2/1/20 | | | 95,000 | | | 103,628 |
| Duke Realty 3.625% 4/15/23 | | | 150,000 | | | 140,350 |
| National Retail Properties | | | | | | |
| 3.30% 4/15/23 | | | 100,000 | | | 92,751 |
| 3.80% 10/15/22 | | | 90,000 | | | 87,151 |
29
Statement of net assets
Delaware Core Plus Bond Fund
| | | Principal amount° | | Value (U.S. $) |
| Corporate Bonds (continued) | | | | | | |
| Real Estate (continued) | | | | | | |
| Realty Income 4.65% 8/1/23 | USD | | 185,000 | | $ | 189,836 |
| Regency Centers | | | | | | |
| | 4.80% 4/15/21 | | | 55,000 | | | 58,379 |
| 5.875% 6/15/17 | | | 95,000 | | | 106,111 |
| # | WEA Finance 144A 4.625% 5/10/21 | | | 210,000 | | | 222,437 |
| Weingarten Realty Investors 3.50% 4/15/23 | | | 165,000 | | | 154,387 |
| | | | | | | 2,947,415 |
| Technology – 2.62% | | | | | | |
| Agilent Technologies 3.875% 7/15/23 | | | 100,000 | | | 97,546 |
| Apple 2.40% 5/3/23 | | | 380,000 | | | 349,342 |
| Baidu 3.25% 8/6/18 | | | 245,000 | | | 246,136 |
| EMC 2.65% 6/1/20 | | | 50,000 | | | 49,665 |
| Fidelity National Information Services | | | | | | |
| 3.50% 4/15/23 | | | 205,000 | | | 189,358 |
| GXS Worldwide 9.75% 6/15/15 | | | 240,000 | | | 247,050 |
| Microsoft 2.125% 11/15/22 | | | 195,000 | | | 179,049 |
| National Semiconductor 6.60% 6/15/17 | | | 255,000 | | | 300,281 |
| NetApp | | | | | | |
| 2.00% 12/15/17 | | | 125,000 | | | 122,755 |
| 3.25% 12/15/22 | | | 145,000 | | | 134,016 |
| Oracle 2.375% 1/15/19 | | | 325,000 | | | 327,631 |
| # | Samsung Electronics America 144A | | | | | | |
| 1.75% 4/10/17 | | | 200,000 | | | 198,189 |
| Symantec 4.20% 9/15/20 | | | 125,000 | | | 128,728 |
| # | Tencent Holdings 144A 3.375% 3/5/18 | | | 200,000 | | | 202,478 |
| Total System Services | | | | | | |
| 2.375% 6/1/18 | | | 40,000 | | | 38,944 |
| 3.75% 6/1/23 | | | 180,000 | | | 167,489 |
| # | VeriSign 144A 4.625% 5/1/23 | | | 705,000 | | | 680,325 |
| Xerox 6.35% 5/15/18 | | | 490,000 | | | 565,688 |
| | | | | | | 4,224,670 |
| Transportation – 0.66% | | | | | | |
| # | Brambles USA 144A | | | | | | |
| 3.95% 4/1/15 | | | 80,000 | | | 83,441 |
| 5.35% 4/1/20 | | | 205,000 | | | 223,416 |
| # | DP World Sukuk 144A 6.25% 7/2/17 | | | 100,000 | | | 109,750 |
30
| | | Principal amount° | | Value (U.S. $) |
| Corporate Bonds (continued) | | | | | | |
| Transportation (continued) | | | | | | |
| # | ERAC USA Finance 144A 5.25% 10/1/20 | USD | | 370,000 | | $ | 411,936 |
| | United Parcel Service 5.125% 4/1/19 | | | 200,000 | | | 230,298 |
| | | | | | | 1,058,841 |
| Total Corporate Bonds (cost $76,589,749) | | | | | | 77,490,434 |
| |
| Municipal Bonds – 0.17% | | | | | | |
| Golden State Tobacco Securitization, | | | | | | |
| California Settlement Revenue Refunding | | | | | | |
| Asset-Backed Senior Series A-1 | | | | | | |
| 5.125% 6/1/47 | | | 100,000 | | | 71,409 |
| 5.75% 6/1/47 | | | 75,000 | | | 58,568 |
| Grand Parkway Transportation Tax System Toll | | | | | | |
| Revenue Series B 5.00% 4/1/53 | | | 10,000 | | | 9,714 |
| State of Georgia Series D 5.00% 2/1/23 | | | 115,000 | | | 137,599 |
| Total Municipal Bonds (cost $293,796) | | | | | | 277,290 |
| |
| Non-Agency Asset-Backed Securities – 2.31% | | | | | | |
| AEP Texas Central Transition Funding | | | | | | |
| Series 2012-1 A2 1.976% 6/1/21 | | | 395,000 | | | 390,379 |
| • | Ally Master Owner Trust | | | | | | |
| Series 2011-1 A1 1.061% 1/15/16 | | | 140,000 | | | 140,339 |
| Series 2013-2 A 0.641% 4/15/18 | | | 200,000 | | | 199,022 |
| # | Avis Budget Rental Car Funding AESOP | | | | | | |
| Series 2011-2A A 144A 2.37% 11/20/14 | | | 135,000 | | | 137,101 |
| Bank of America Auto Trust | | | | | | |
| Series 2012-1 A3 0.78% 6/15/16 | | | 450,000 | | | 450,411 |
| # | California Republic Auto Receivables Trust | | | | | | |
| Series 2013-1 A2 144A 1.41% 9/17/18 | | | 100,000 | | | 99,665 |
| Capital One Multi-Asset Execution Trust | | | | | | |
| Series 2007-A7 A7 5.75% 7/15/20 | | | 100,000 | | | 116,299 |
| •Series 2013-A2 A2 0.371% 2/15/19 | | | 440,000 | | | 438,320 |
| CenterPoint Energy Transition Bond | | | | | | |
| Series 2012-1 A2 2.161% 10/15/21 | | | 120,000 | | | 119,465 |
| # | Enterprise Fleet Financing | | | | | | |
| Series 2012-1 A2 144A 1.14% 11/20/17 | | | 158,942 | | | 159,399 |
31
Statement of net assets
Delaware Core Plus Bond Fund
| | | Principal amount° | | Value (U.S. $) |
| Non-Agency Asset-Backed Securities (continued) | | | | | | |
| General Electric Capital Credit Card Master | | | | | | |
| Note Trust | | | | | | |
| Series 2012-2 A 2.22% 1/15/22 | USD | | 100,000 | | $ | 99,788 |
| | Series 2012-6 A 1.36% 8/17/20 | | | 170,000 | | | 167,546 |
| John Deere Owner Trust | | | | | | |
| Series 2011-A A4 1.96% 4/16/18 | | | 145,000 | | | 146,527 |
| Mercedes-Benz Auto Lease Trust | | | | | | |
| Series 2013-A A4 0.72% 12/17/18 | | | 180,000 | | | 179,245 |
| # | Navistar Financial Owner Trust | | | | | | |
| Series 2012-A A2 144A 0.85% 3/18/15 | | | 146,458 | | | 146,518 |
| #• | Trafigura Securitisation Finance | | | | | | |
| Series 2012-1A A 144A 2.591% 10/15/15 | | | 160,000 | | | 161,913 |
| # | Volvo Financial Equipment | | | | | | |
| Series 2012-1A A4 144A 1.09% 8/15/17 | | | 330,000 | | | 330,843 |
| World Omni Automobile Lease Securitization Trust | | | | | | |
| Series 2012-A A3 0.93% 11/16/15 | | | 230,000 | | | 230,055 |
| Total Non-Agency Asset-Backed Securities | | | | | | |
| (cost $3,726,515) | | | | | | 3,712,835 |
| |
| Non-Agency Collateralized Mortgage Obligations – 0.36% | | | |
| American Home Mortgage Investment Trust | | | | | | |
| Series 2005-2 5A1 5.064% 9/25/35 | | | 13,127 | | | 13,025 |
| Citicorp Residential Mortgage Securities | | | | | | |
| Series 2006-3 A5 5.948% 11/25/36 | | | 300,000 | | | 285,077 |
| #• | GSMPS Mortgage Loan Trust | | | | | | |
| Series 1998-2 A 144A 7.75% 5/19/27 | | | 73,995 | | | 77,531 |
| • | JPMorgan Mortgage Trust | | | | | | |
| Series 2007-A1 7A4 2.855% 7/25/35 | | | 231,528 | | | 108,473 |
| t | Washington Mutual Alternative Mortgage Pass | | | | | | |
| Through Certificates | | | | | | |
| Series 2005-1 5A2 6.00% 3/25/35 | | | 123,132 | | | 72,447 |
| • | Wells Fargo Mortgage-Backed Securities Trust | | | | | | |
| Series 2006-AR5 2A1 2.639% 4/25/36 | | | 27,487 | | | 24,758 |
| Total Non-Agency Collateralized Mortgage | | | | | | |
| Obligations (cost $721,845) | | | | | | 581,311 |
32
| | | Principal amount° | | Value (U.S. $) |
| ΔRegional Bonds – 0.95% | | | | | | |
| Australia – 0.95% | | | | | | |
| New South Wales Treasury | | | | | | |
| 3.75% 11/20/20 | AUD | | 174,000 | | $ | 196,361 |
| 6.00% 3/1/22 | AUD | | 491,000 | | | 497,254 |
| Queensland Treasury 4.25% 7/21/23 | AUD | | 49,000 | | | 42,472 |
| Victoria Treasury | | | | | | |
| | 5.50% 12/17/24 | AUD | | 264,000 | | | 257,728 |
| 6.00% 10/17/22 | AUD | | 534,000 | | | 542,058 |
| Total Regional Bonds (cost $1,785,832) | | | | | | 1,535,873 |
| |
| «Senior Secured Loans – 7.84% | | | | | | |
| Bausch & Lomb Tranche B 4.00% 5/17/19 | USD | | 202,954 | | | 203,208 |
| Biomet Tranche B 3.75% 7/25/17 | | | 94,288 | | | 95,060 |
| Blackboard Tranche B2 6.25% 10/4/18 | | | 94,289 | | | 95,546 |
| Burlington Coat Factory Warehouse Tranche B2 | | | | | | |
| 4.25% 2/23/17 | | | 696,823 | | | 702,046 |
| Caesars Entertainment Operating Tranche B6 | | | | | | |
| 5.25% 1/28/18 | | | 201,992 | | | 179,629 |
| Calpine Construction Finance Tranche B | | | | | | |
| 3.00% 5/3/20 | | | 550,000 | | | 547,147 |
| Chrysler Group Tranche B 4.25% 5/24/17 | | | 169,567 | | | 172,595 |
| Clear Channel Communications Tranche B | | | | | | |
| 3.65% 1/29/16 | | | 226,352 | | | 212,708 |
| DaVita HealthCare Partners Tranche B | | | | | | |
| 4.50% 10/20/16 | | | 197,468 | | | 197,590 |
| Drillships Financing Holding Tranche B1 | | | | | | |
| 6.00% 2/17/21 | | | 170,000 | | | 172,338 |
| Emdeon 1st Lien 3.75% 11/2/18 | | | 586,108 | | | 590,504 |
| First Data 1st Lien 4.00% 3/24/17 | | | 300,857 | | | 301,368 |
| Getty Images Tranche B 4.75% 9/19/19 | | | 189,050 | | | 189,567 |
| Gray Television 4.75% 10/11/19 | | | 183,153 | | | 185,042 |
| HCA | | | | | | |
| Tranche B4 2.75% 5/1/18 | | | 700,000 | | | 703,282 |
| Tranche B5 1st Lien 2.75% 3/31/17 | | | 455,000 | | | 456,991 |
| Houghton International | | | | | | |
| 1st Lien 5.25% 11/20/19 | | | 746,250 | | | 749,981 |
| 2nd Lien 9.50% 11/20/20 | | | 475,000 | | | 483,016 |
| IASIS Healthcare Tranche B 1st Lien | | | | | | |
| 4.50% 5/3/18 | | | 207,367 | | | 209,285 |
33
Statement of net assets
Delaware Core Plus Bond Fund
| | | Principal amount° | | Value (U.S. $) |
| «Senior Secured Loans (continued) | | | | | | |
| Immucor Tranche B2 5.00% 8/19/18 | USD | | 497,161 | | $ | 502,754 |
| | Infor US Tranche B2 5.25% 4/5/18 | | | 180,147 | | | 182,146 |
| Intelsat Jackson Holdings Tranche B1 | | | | | | |
| 4.50% 4/2/18 | | | 537,293 | | | 542,163 |
| Landry’s Tranche B 4.75% 4/24/18 | | | 183,369 | | | 185,890 |
| Level 3 Financing Tranche B 1st Lien | | | | | | |
| 4.75% 8/1/19 | | | 250,000 | | | 252,213 |
| MultiPlan Tranche B 4.00% 8/18/17 | | | 15,024 | | | 15,148 |
| Novelis Tranche B 3.75% 3/10/17 | | | 183,063 | | | 183,932 |
| Nuveen Investments 2nd Lien 6.50% 2/28/19 | | | 870,000 | | | 872,719 |
| Offshore Group Investment 6.25% 10/17/17 | | | 187,688 | | | 189,189 |
| OSI Restaurant Partners Tranche B 1st Lien | | | | | | |
| 3.50% 10/26/19 | | | 468,000 | | | 470,213 |
| PQ Tranche B 4.50% 8/7/17 | | | 134,325 | | | 135,668 |
| Samson Investment 2nd Lien 6.00% 9/10/18 | | | 345,000 | | | 349,528 |
| Scientific Games International 4.25% 5/22/20 | | | 270,000 | | | 269,663 |
| Smart & Final Tranche B 1st Lien 4.50% 11/15/19 | | | 193,030 | | | 193,573 |
| Truven Health Analytics Tranche B | | | | | | |
| 4.50% 5/23/19 | | | 282,863 | | | 284,984 |
| Univision Communications | | | | | | |
| Tranche C1 1st Lien 4.50% 2/22/20 | | | 193,042 | | | 194,354 |
| Tranche C2 4.50% 2/6/20 | | | 369,075 | | | 371,217 |
| USI Insurance Services Tranche B 5.25% 12/14/19 | | | 189,050 | | | 190,917 |
| Valeant Pharmaceuticals Tranche B | | | | | | |
| 4.50% 5/30/20 | | | 250,000 | | | 253,656 |
| Visant 5.25% 12/22/16 | | | 251,518 | | | 246,676 |
| Warner Chilcott | | | | | | |
| Tranche B1 4.25% 3/15/18 | | | 91,971 | | | 92,212 |
| Tranche B2 4.25% 3/15/18 | | | 3,921 | | | 3,931 |
| Tranche B3 4.25% 3/15/18 | | | 50,494 | | | 50,626 |
| Zayo Group Tranche B 1st Lien 4.50% 7/2/19 | | | 138,947 | | | 140,315 |
| Total Senior Secured Loans (cost $12,502,940) | | | | | | 12,620,590 |
34
| | | Principal amount° | | Value (U.S. $) |
| ΔSovereign Bonds – 1.35% | | | | | | |
| Australia – 0.12% | | | | | | |
| | Australia Government Bond 4.00% 8/20/20 | AUD | | 117,000 | | $ | 193,886 |
| | | | | | | 193,886 |
| Finland – 0.11% | | | | | | |
| Finland Government Bond 4.00% 7/4/25 | EUR | | 113,000 | | | 178,882 |
| | | | | | | 178,882 |
| Japan – 0.26% | | | | | | |
| Japan Bank for International Cooperation | | | | | | |
| 3.375% 7/31/23 | USD | | 420,000 | | | 415,748 |
| | | | | | | 415,748 |
| Mexico – 0.07% | | | | | | |
| Mexican Bonos | | | | | | |
| 6.50% 6/9/22 | MXN | | 371,000 | | | 30,293 |
| 7.75% 5/29/31 | MXN | | 1,063,000 | | | 90,812 |
| | | | | | | 121,105 |
| Nigeria – 0.06% | | | | | | |
| Nigeria Government Bond 15.10% 4/27/17 | NGN | | 14,395,000 | | | 93,451 |
| | | | | | | 93,451 |
| Poland – 0.30% | | | | | | |
| Poland Government Bond | | | | | | |
| 4.00% 10/25/23 | PLN | | 580,000 | | | 180,431 |
| 5.75% 10/25/21 | PLN | | 850,000 | | | 298,802 |
| | | | | | | 479,233 |
| Russia – 0.03% | | | | | | |
| Russian Eurobond 7.50% 3/31/30 | USD | | 45,445 | | | 53,375 |
| | | | | | | 53,375 |
| South Africa – 0.28% | | | | | | |
| South Africa Government Bond | | | | | | |
| 8.00% 12/21/18 | ZAR | | 1,410,000 | | | 148,984 |
| 10.50% 12/21/26 | ZAR | | 2,487,000 | | | 299,634 |
| | | | | | | 448,618 |
| Sri Lanka – 0.12% | | | | | | |
| *# | Sri Lanka Government International Bond 144A | | | | | | |
| 5.875% 7/25/22 | | | 200,000 | | | 194,000 |
| | | | | | | 194,000 |
| Total Sovereign Bonds (cost $2,332,056) | | | | | | 2,178,298 |
35
Statement of net assets
Delaware Core Plus Bond Fund
| | | Principal amount° | | Value (U.S. $) |
| Supranational Bank – 0.06% | | | | | | |
| International Bank for Reconstruction & | | | | | | |
| Development 3.375% 4/30/15 | NOK | | 530,000 | | $ | 92,228 |
| Total Supranational Bank (cost $97,364) | | | | | | 92,228 |
| |
| U.S. Treasury Obligations – 3.44% | | | | | | |
| U.S. Treasury Bonds | | | | | | |
| ∞2.75% 11/15/42 | USD | | 2,420,000 | | | 2,029,586 |
| 2.875% 5/15/43 | | | 270,000 | | | 232,411 |
| U.S. Treasury Notes | | | | | | |
| 1.375% 7/31/18 | | | 1,495,000 | | | 1,493,949 |
| �� 1.75% 5/15/23 | | | 1,924,000 | | | 1,784,660 |
| Total U.S. Treasury Obligations (cost $5,846,580) | | | | | | 5,540,606 |
| |
| | Number of shares | | | |
| Convertible Preferred Stock – 0.16% | | | | | | |
| ArcelorMittal 6.00% exercise price $20.61, | | | | | | |
| expiration date 12/21/15 | | | 475 | | | 10,101 |
| Bank of America 7.25% exercise price $50.00, | | | | | | |
| expiration date 12/31/49 | | | 7 | | | 7,872 |
| # | Chesapeake Energy 144A 5.75% | | | | | | |
| exercise price $27.83, | | | | | | |
| expiration date 12/31/49 | | | 16 | | | 17,160 |
| * | Cliffs Natural Resources 7.00% | | | | | | |
| exercise price $35.53, expiration date 2/1/16 | | | 775 | | | 14,648 |
| Dominion Resources | | | | | | |
| 6.00% exercise price $65.27, | | | | | | |
| expiration date 7/1/16 | | | 90 | | | 4,667 |
| 6.125% exercise price $65.27, | | | | | | |
| expiration date 4/1/16 | | | 90 | | | 4,667 |
| Goodyear Tire & Rubber 5.875% | | | | | | |
| exercise price $18.21, expiration date 3/31/14 | | | 600 | | | 33,394 |
| HealthSouth 6.50% exercise price $30.50, | | | | | | |
| expiration date 12/31/49 | | | 40 | | | 50,210 |
| Intelsat 5.75% exercise price $22.05, | | | | | | |
| expiration date 5/1/16 | | | 405 | | | 23,907 |
| MetlLife 5.00% exercise price $44.28, | | | | | | |
| expiration date 9/4/13 | | | 550 | | | 31,383 |
| SandRidge Energy 8.50% exercise price $8.01, | | | | | | |
| expiration date 12/31/49 | | | 280 | | | 26,883 |
36
| | | Number of shares | | Value (U.S. $) |
| Convertible Preferred Stock (continued) | | | | | | |
| Wells Fargo 7.50% exercise price $156.71, | | | | | | |
| expiration date 12/31/49 | | | 28 | | $ | 32,564 |
| Total Convertible Preferred Stock | | | | | | |
| (cost $254,336) | | | | | | 257,456 |
| |
| Preferred Stock– 0.93% | | | | | | |
| Alabama Power 5.625% | | | 3,715 | | | 91,612 |
| BB&T 5.85% | | | 5,050 | | | 124,483 |
| JPMorgan Chase 5.50% | | | 5,000 | | | 115,150 |
| National Retail Properties 5.70% | | | 4,225 | | | 93,837 |
| * | Public Storage 5.20% | | | 4,400 | | | 95,876 |
| U.S. Bancorp | | | | | | |
| •3.50% | | | 350 | | | 300,125 |
| *5.15% | | | 4,000 | | | 93,320 |
| •6.00% | | | 5,000 | | | 133,250 |
| * | Wells Fargo 5.20% | | | 20,200 | | | 449,045 |
| Total Preferred Stock (cost $1,534,085) | | | | | | 1,496,698 |
| |
| | Principal amount° | | | |
| Short-Term Investments – 19.13% | | | | | | |
| ≠Discount Notes – 11.63% | | | | | | |
| Fannie Mae 0.06% 9/16/13 | USD | | 2,531,880 | | | 2,531,847 |
| Federal Home Loan Bank | | | | | | |
| 0.045% 10/18/13 | | | 2,351,441 | | | 2,351,340 |
| 0.045% 10/23/13 | | | 4,035,077 | | | 4,034,892 |
| 0.055% 8/12/13 | | | 3,382,592 | | | 3,382,582 |
| 0.06% 8/14/13 | | | 2,736,018 | | | 2,736,007 |
| 0.06% 8/16/13 | | | 898,685 | | | 898,681 |
| 0.06% 8/21/13 | | | 1,137,576 | | | 1,137,569 |
| 0.08% 8/30/13 | | | 1,660,331 | | | 1,660,318 |
| | | | | | | 18,733,236 |
| Repurchase Agreements – 4.26% | | | | | | |
| Bank of America 0.03%, dated 7/31/13, to be | | | | | | |
| repurchased on 8/1/13, repurchase | | | | | | |
| price $2,813,343 (collateralized by | | | | | | |
| U.S. Government obligations | | | | | | |
| 0.75%-2.375% 2/28/15-10/31/17; | | | | | | |
| market value $2,869,608) | | | 2,813,341 | | | 2,813,341 |
37
Statement of net assets
Delaware Core Plus Bond Fund
| | | | Principal amount° | | Value (U.S. $) | |
| Short-Term Investments (continued) | | | | | | | | |
| Repurchase Agreements (continued) | | | | | | | | |
| BNP Paribas 0.05%, dated 7/31/13, to be | | | | | | | | |
| repurchased on 8/1/13, repurchase | | | | | | | | |
| price $4,042,665 (collateralized by | | | | | | | | |
| U.S. Government obligations | | | | | | | | |
| 0.25%-4.25% 6/30/14-5/15/23; | | | | | | | | |
| market value $4,129,515) | | USD | | 4,042,659 | | $ | 4,042,659 | |
| | | | | | | | 6,856,000 | |
| U.S. Treasury Obligations – 3.24% | | | | | | | | |
| U.S. Treasury Bills | | | | | | | | |
| 0.028% 10/24/13 | | | | 2,137,623 | | | 2,137,499 | |
| 0.045% 9/26/13 | | | | 3,078,692 | | | 3,078,560 | |
| | | | | | | | 5,216,059 | |
| Total Short-Term Investments (cost $30,804,414) | | | | | | | 30,805,295 | |
| |
| Total Value of Securities Before Securities | | | | | | | | |
| Lending Collateral – 117.99% | | | | | | | | |
| (cost $189,263,370) | | | | | | | 189,979,121 | |
| |
| | | Number of shares | | | | |
| **Securities Lending Collateral – 0.02% | | | | | | | | |
| Investment Company | | | | | | | | |
| Delaware Investments Collateral Fund No.1 | | | | 24,299 | | | 24,299 | |
| Total Securities Lending Collateral | | | | | | | | |
| | (cost $24,299) | | | | | | | 24,299 | |
| |
| ©Total Value of Securities – 118.01% | | | | | | | | |
| (cost $189,287,669) | | | | | | | 190,003,420 | |
| **Obligation to Return Securities | | | | | | | | |
| Lending Collateral – (0.02%) | | | | | | | (24,299 | ) |
| Other Liabilities Net of Receivables and | | | | | | | | |
| Other Assets – (17.99%) | | | | | | | (28,973,144 | ) |
| Net Assets Applicable to 19,294,520 | | | | | | | | |
| Shares Outstanding – 100.00% | | | | | | $ | 161,005,977 | |
38
| | | | | |
| Net Asset Value – Delaware Core Plus Bond Fund | | | | |
| Class A ($81,042,420 / 9,718,642 Shares) | | | | $8.34 | |
| Net Asset Value – Delaware Core Plus Bond Fund | | | | |
| Class B ($687,348 / 82,424 Shares) | | | | $8.34 | |
| Net Asset Value – Delaware Core Plus Bond Fund | | | | |
| Class C ($10,989,529 / 1,316,305 Shares) | | | | $8.35 | |
| Net Asset Value – Delaware Core Plus Bond Fund | | | | |
| Class R ($8,076,917 / 965,358 Shares) | | | | $8.37 | |
| Net Asset Value – Delaware Core Plus Bond Fund | | | | |
| Institutional Class ($60,209,763 / 7,211,791 Shares) | | | | $8.35 | |
| |
| Components of Net Assets at July 31, 2013: | | | | |
| Shares of beneficial interest (unlimited authorization – no par) | | $ | 163,282,837 | |
| Distributions in excess of net investment income | | | (86,491 | ) |
| Accumulated net realized loss on investments | | | (2,733,063 | ) |
| Net unrealized appreciation of investments and derivatives | | | 542,694 | |
| Total net assets | | $ | 161,005,977 | |
| ° | Principal amount shown is stated in the currency in which each security is denominated. |
| û | Interest only security. An interest only security is the interest only portion of a fixed income security which is separated and sold individually from the principal portion of the security. |
| • | Variable rate security. The rate shown is the rate as of July 31, 2013. Interest rates reset periodically. |
| t | Pass Through Agreement. Security represents the contractual right to receive a proportionate amount of underlying payments due to the counterparty pursuant to various agreements related to the rescheduling of obligations and the exchange of certain notes. |
| # | Security exempt from registration under Rule 144A of the Securities Act of 1933, as amended. At July 31, 2013, the aggregate value of Rule 144A securities was $30,460,359, which represented 18.92% of the Fund’s net assets. See Note 10 in “Notes to financial statements.” |
| Φ | Step coupon bond. Coupon increases or decreases periodically based on a predetermined schedule. Stated rate in effect at July 31, 2013. |
| * | Fully or partially on loan. |
| Δ | Securities have been classified by country of origin. |
39
Statement of net assets
Delaware Core Plus Bond Fund
| « | Senior secured loans generally pay interest at rates that are periodically redetermined by reference to a base lending rate plus a premium. These base lending rates are generally: (i) the prime rate offered by one or more United States banks, (ii) the lending rate offered by one or more European banks such as the London Inter-Bank Offered Rate (LIBOR), and (iii) the certificate of deposit rate. Senior secured loans may be subject to restrictions on resale. Stated rate in effect at July 31, 2013. |
| ∞ | Fully or partially pledged as collateral for futures contracts. |
| ≠ | The rate shown is the effective yield at the time of purchase. |
| ** | See Note 9 in “Notes to financial statements” for additional information on securities lending collateral. |
| © | Includes $23,789 of securities loaned. |
| Net Asset Value and Offering Price Per Share – | | | |
| Delaware Core Plus Bond Fund | | | |
| Net asset value Class A (A) | | $ | 8.34 |
| Sales charge (4.50% of offering price) (B) | | | 0.39 |
| Offering price | | $ | 8.73 |
| (A) | Net asset value per share, as illustrated, is the amount which would be paid upon redemption or repurchase of shares. |
| (B) | See the current prospectus for purchases of $100,000 or more. |
40
| |
The following foreign currency exchange contracts, futures contracts and swap contracts were outstanding at July 31, 2013:1 |
Foreign Currency Exchange Contracts
| | | | | | | | | | | | Unrealized |
| | Contracts to | | | | | | | | Appreciation |
| Counterparty | | Receive (Deliver) | | In Exchange For | | Settlement Date | | (Depreciation) |
| BAML | | AUD | (949,147 | ) | | USD | 859,661 | | | 8/23/13 | | | $ | 7,810 | | |
| BAML | | EUR | 169,792 | | | USD | (221,607 | ) | | 8/23/13 | | | | 4,259 | | |
| BAML | | JPY | (15,780,304 | ) | | USD | 157,668 | | | 8/23/13 | | | | (3,449 | ) | |
| BAML | | MXN | 864,481 | | | USD | (67,526 | ) | | 8/23/13 | | | | (11 | ) | |
| CITI | | AUD | (211,292 | ) | | USD | 191,346 | | | 8/23/13 | | | | 1,713 | | |
| CITI | | PLN | (82,974 | ) | | USD | 25,192 | | | 8/23/13 | | | | (719 | ) | |
| DB | | EUR | (60,954 | ) | | USD | 81,000 | | | 8/23/13 | | | | (84 | ) | |
| GSC | | GBP | (140,203 | ) | | USD | 211,649 | | | 8/23/13 | | | | (1,605 | ) | |
| GSC | | PLN | (202,872 | ) | | USD | 61,592 | | | 8/23/13 | | | | (1,763 | ) | |
| HSBC | | EUR | (41,643 | ) | | USD | 54,345 | | | 8/23/13 | | | | (1,052 | ) | |
| HSBC | | JPY | 16,241,000 | | | USD | (162,360 | ) | | 8/23/13 | | | | 3,461 | | |
| JPMC | | BRL | (10,678 | ) | | USD | 4,707 | | | 8/23/13 | | | | 45 | | |
| JPMC | | EUR | (712,860 | ) | | USD | 930,076 | | | 8/23/13 | | | | (18,210 | ) | |
| JPMC | | IDR | 1,357,627,617 | | | USD | (132,749 | ) | | 8/23/13 | | | | (2,090 | ) | |
| MSC | | AUD | (322,704 | ) | | USD | 291,944 | | | 8/23/13 | | | | 2,320 | | |
| TD | | AUD | (228,179 | ) | | USD | 205,201 | | | 8/23/13 | | | | 413 | | |
| TD | | CAD | (25,571 | ) | | USD | 24,841 | | | 8/23/13 | | | | (40 | ) | |
| TD | | GBP | 214,673 | | | USD | (323,867 | ) | | 8/23/13 | | | | 2,659 | | |
| TD | | INR | 1,618,410 | | | USD | (26,392 | ) | | 8/30/13 | | | | (24 | ) | |
| TD | | JPY | (75,148 | ) | | USD | 752 | | | 8/23/13 | | | | (15 | ) | |
| TD | | NOK | (1,034,261 | ) | | USD | 170,026 | | | 8/23/13 | | | | (5,367 | ) | |
| TD | | ZAR | (2,693,905 | ) | | USD | 270,577 | | | 8/23/13 | | | | (1,541 | ) | |
| | | | | | | | | | | | | $ | (13,290 | ) | |
Futures Contracts
| | | | | | | | | | | | | | | Unrealized |
| | | | | | | | | | | | | | | Appreciation |
| Contracts to Buy (Sell) | | | Notional Cost (Proceeds) | | Notional Value | | Expiration Date | | (Depreciation) |
| 1 | Long Gilt | | | $ | 177,099 | | | | $ | 171,420 | | | 10/1/13 | | | $ | (5,679 | ) | |
| (2) | S&P 500 E-mini | | | | (156,495 | ) | | | | (168,050 | ) | | 9/21/13 | | | | (11,555 | ) | |
| (6) | U.S. Treasury 10 yr Note | | | | (757,202 | ) | | | | (758,625 | ) | | 10/1/13 | �� | | | (1,423 | ) | |
| (9) | U.S. Treasury Long Bond | | | | (1,193,153 | ) | | | | (1,206,563 | ) | | 10/1/13 | | | | (13,410 | ) | |
| Total | | | $ | (1,929,751 | ) | | | | | | | | | | $ | (32,067 | ) | |
41
Statement of net assets
Delaware Core Plus Bond Fund
| |
Swap Contracts
CDS Contracts2 |
| | | | | | | Annual | | | | Unrealized |
| | | | | | | Protection | | Termination | | Appreciation |
| Counterparty | | Swap Referenced Obligation | | Notional Value | | Payments | | Date | | (Depreciation) |
| | Protection Purchased: | | | | | | | | | | | | | |
| CITI | | CDX.NA.HY.20 | | USD | 635,000 | | 5.00% | | 6/20/18 | | | $ | (8,007 | ) | |
| DB | | CDX EM.19-V1 | | USD | 920,000 | | 5.00% | | 6/20/18 | | | | (5,277 | ) | |
| JPMC | | ITRAXX Europe | | | | | | | | | | | | | |
| | | Crossover S19 V1 | | EUR | 1,580,000 | | 5.00% | | 6/20/18 | | | | (79,431 | ) | |
| | | | | | | | | | | | $ | (92,715 | ) | |
Interest Rate Swap Contracts3
| | | | Fixed Interest | | Floating Interest | | | | Unrealized |
| Counterparty & Swap | | | | | Rate Received | | Rate Received | | Termination | | Appreciation |
| Referenced Obligation | | | Notional Value | | (Paid) | | (Paid) | | Date | | (Depreciation) |
| CME 10 yr | | $2,435,000 | | 2.833% | | (0.264%) | | 7/29/23 | | $(12,697) |
The use of foreign currency exchange contracts, futures contracts and swap contracts involves elements of market risk and risks in excess of the amounts disclosed in the financial statements. The notional values and foreign currency exchange contracts presented above represent the Fund’s total exposure in such contracts, whereas only the net unrealized appreciation (depreciation) is reflected in the Fund’s net assets.
1See Note 8 in “Notes to financial statements.” |
2A CDS contract is a risk-transfer instrument through which one party (purchaser of protection) transfers to another party (seller of protection) the financial risk of a credit event (as defined in the CDS agreement), as it relates to a particular reference security or basket of securities (such as an index). Periodic payments (receipts) on such contracts are accrued daily and recorded as unrealized losses (gains) on swap contracts. Upon payment (receipt), such amounts are recorded as realized losses (gains) on swap contracts. Upfront payments made or received in connection with CDS contracts are amortized over the expected life of the CDS contracts as unrealized losses (gains) on swap contracts. The change in value of CDS contracts is recorded as unrealized appreciation or depreciation daily. A realized gain or loss is recorded upon a credit event (as defined in the CDS agreement) or the maturity or termination of the agreement. |
3An interest rate swap agreement is an exchange of interest rates between counterparties. Periodic payments on such contracts are accrued daily and recorded as unrealized appreciation/depreciation on swap contracts. Upon periodic payment (receipt) or termination of the contract, such amounts are recorded as realized gains (losses) on swap contracts. |
42
Summary of abbreviations:
ARM — Adjustable Rate Mortgage
AUD — Australian Dollar
BAML — Bank of America Merrill Lynch
BNP — Banque Paribas
BRL — Brazilian Real
CAD — Canadian Dollar
CDS — Credit Default Swap
CDX. EM — Credit Default Swap Index Emerging Markets
CDX. NA — Credit Default Swap Index North America
CITI — Citigroup Global Markets
CME — Chicago Mercantile Exchange Inc.
DB — Deutsche Bank
EUR — European Monetary Unit
GBP — British Pound Sterling
GNMA — Government National Mortgage Association
GPM — Graduated Payment Mortgage
GSC — Goldman Sachs Capital
GSMPS — Goldman Sachs Reperforming Mortgage Securities
HSBC — Hong Kong Shanghai Bank
HY — High Yield
IDR — Indonesian Rupiah
INR — Indian Rupee
JPMC — JPMorgan Chase Bank
JPY — Japanese Yen
MSC — Morgan Stanley Capital
MXN — Mexican Peso
NCUA — National Credit Union Administration
NGN — Nigerian Naira
NOK — Norwegian Krone
PLN — Polish Zloty
REMIC — Real Estate Mortgage Investment Conduit
S.F. — Single Family
TBA — To be announced
TD — Toronto Dominion Bank
UBS — Union Bank of Switzerland
USD — United States Dollar
yr — Year
ZAR — South African RandSee accompanying notes, which are an integral part of the financial statements.
43
| Statement of assets and liabilities | |
| Delaware Core Plus Bond Fund | July 31, 2013 |
| Assets: | | | |
| | Investments, at value (including $23,789 securities on loan) | | $ | 159,173,826 |
| Short-term investments, at value | | | 30,805,295 |
| Short-term investments held as collateral for loaned securities, at value | | | 24,299 |
| Cash | | | 295,851 |
| Cash collateral for derivatives | | | 238,231 |
| Receivable for fund shares sold | | | 43,071 |
| Receivable for securities sold | | | 10,933,651 |
| Dividends and interest receivable | | | 1,266,384 |
| | Unrealized gain on foreign currency exchange contracts | | | 22,680 |
| Foreign currencies, at value | | | 149,475 |
| Other assets | | | 9,594 |
| Total assets | | | 202,962,357 |
| |
| Liabilities: | | | |
| Payable for securities purchased | | | 40,888,016 |
| Payable for fund shares redeemed | | | 447,651 |
| Distributions payable | | | 123,189 |
| Annual protection payments on credit default swap contracts | | | 21,660 |
| Unrealized loss on foreign currency exchange contracts | | | 35,970 |
| Unrealized loss on credit default swap contracts | | | |
| (including upfront payments paid $104,938) | | | 197,653 |
| Unrealized loss on interest rate swap contracts | | | 12,697 |
| Obligation to return securities lending collateral | | | 24,299 |
| Due to manager and affiliates | | | 86,242 |
| Trustees’ fees payable | | | 479 |
| Other accrued expenses | | | 116,845 |
| Variation margin payable | | | 1,679 |
| Total liabilities | | | 41,956,380 |
| |
| Total Net Assets | | $ | 161,005,977 |
| |
| Investments, at cost | | $ | 158,458,956 |
| Short-term investments, at cost | | | 30,804,414 |
| Short-term investments held as collateral for loaned securities, at cost | | | 24,299 |
| Foreign currencies, at cost | | | 150,201 |
See accompanying notes, which are an integral part of the financial statements.
45
| Statement of operations | |
| Delaware Core Plus Bond Fund | Year Ended July 31, 2013 |
| Investment Income: | | | | | | | | |
| | Interest | | $ | 5,828,770 | | | | | |
| Dividends | | | 110,351 | | | | | |
| Securities lending income | | | 180 | | | | | |
| Foreign tax withheld | | | (49 | ) | | $ | 5,939,252 | |
| |
| Expenses: | | | | | | | | |
| Management fees | | | 1,009,201 | | | | | |
| Distribution expenses – Class A | | | 264,968 | | | | | |
| Distribution expenses – Class B | | | 9,708 | | | | | |
| Distribution expenses – Class C | | | 125,440 | | | | | |
| Distribution expenses – Class R | | | 50,397 | | | | | |
| Dividend disbursing and transfer agent fees and expenses | | | 260,580 | | | | | |
| Registration fees | | | 78,611 | | | | | |
| Accounting and administration expenses | | | 71,190 | | | | | |
| Audit and tax | | | 49,197 | | | | | |
| Legal fees | | | 30,828 | | | | | |
| Reports and statements to shareholders | | | 29,604 | | | | | |
| Pricing fees | | | 26,231 | | | | | |
| | Custodian fees | | | 24,316 | | | | | |
| Dues and services | | | 9,595 | | | | | |
| Trustees’ fees | | | 8,452 | | | | | |
| Insurance | | | 2,983 | | | | | |
| Consulting fees | | | 2,186 | | | | | |
| Trustees’ expenses | | | 640 | | | | 2,054,127 | |
| Less fees waived | | | | | | | (409,043 | ) |
| Less waived distribution expenses – Class A | | | | | | | (44,587 | ) |
| Less waived distribution expenses – Class B | | | | | | | (2,555 | ) |
| Less waived distribution expenses – Class R | | | | | | | (8,399 | ) |
| Less expense paid indirectly | | | | | | | (178 | ) |
| Total operating expenses | | | | | | | 1,589,365 | |
| Net Investment Income | | | | | | | 4,349,887 | |
46
| Net Realized and Unrealized Gain (Loss): | | | | |
| Net realized gain (loss) on: | | | | |
| | | Investments | | $ | 709,678 | |
| | Foreign currencies | | | (112,950 | ) |
| | Foreign currency exchange contracts | | | (207,054 | ) |
| | Futures contracts | | | (350,873 | ) |
| | Options written | | | 20,554 | |
| | Swap contracts | | | (650,948 | ) |
| Net realized loss | | | (591,593 | ) |
| Net change in unrealized appreciation (depreciation) of: | | | | |
| | Investments | | | (5,785,866 | ) |
| | Foreign currencies | | | (2,584 | ) |
| | | Foreign currency exchange contracts | | | 84,695 | |
| | Futures contracts | | | (29,675 | ) |
| | Swap contracts | | | (310,426 | ) |
| Net change in unrealized appreciation (depreciation) | | | (6,043,856 | ) |
| Net Realized and Unrealized Loss | | | (6,635,449 | ) |
| | |
| Net Decrease in Net Assets Resulting from Operations | | $ | (2,285,562 | ) |
See accompanying notes, which are an integral part of the financial statements.
47
Statements of changes in net assets
Delaware Core Plus Bond Fund
| | | | | Year Ended |
| | | | 7/31/13 | | 7/31/12 |
| Increase (Decrease) in Net Assets from Operations: | | | | | | | | |
| Net investment income | | $ | 4,349,887 | | | $ | 3,847,460 | |
| Net realized gain (loss) | | | (591,593 | ) | | | 5,518,108 | |
| Net change in unrealized appreciation (depreciation) | | | (6,043,856 | ) | | | 2,258,347 | |
| Net increase (decrease) in net assets | | | | | | | | |
| | resulting from operations | | | (2,285,562 | ) | | | 11,623,915 | |
| | |
| Dividends and Distributions to Shareholders from: | | | | | | | | |
| Net investment income: | | | | | | | | |
| | Class A | | | (2,730,485 | ) | | | (2,640,241 | ) |
| | Class B | | | (25,033 | ) | | | (34,975 | ) |
| | Class C | | | (289,681 | ) | | | (257,850 | ) |
| | Class R | | | (235,625 | ) | | | (212,416 | ) |
| | Institutional Class | | | (2,405,977 | ) | | | (1,436,344 | ) |
| | |
| Net realized gain: | | | | | | | | |
| | Class A | | | (198,651 | ) | | | — | |
| | Class B | | | (2,416 | ) | | | — | |
| | Class C | | | (27,998 | ) | | | — | |
| | Class R | | | (18,246 | ) | | | — | |
| | Institutional Class | | | (168,817 | ) | | | — | |
| | | | | (6,102,929 | ) | | | (4,581,826 | ) |
| | |
| Capital Share Transactions: | | | | | | | | |
| | Proceeds from shares sold: | | | | | | | | |
| | Class A | | | 12,632,942 | | | | 33,688,215 | |
| | Class B | | | 58,051 | | | | 142,597 | |
| | Class C | | | 1,698,682 | | | | 4,255,513 | |
| | Class R | | | 2,441,868 | | | | 3,785,007 | |
| | Institutional Class | | | 17,622,719 | | | | 87,945,849 | |
| | |
| Net asset value of shares issued upon reinvestment of | | | | | | | | |
| | dividends and distributions: | | | | | | | | |
| | Class A | | | 2,618,546 | | | | 2,151,709 | |
| | Class B | | | 20,024 | | | | 25,602 | |
| | Class C | | | 292,656 | | | | 230,447 | |
| | Class R | | | 251,017 | | | | 212,223 | |
| | Institutional Class | | | 2,519,552 | | | | 1,273,479 | |
| | | | | 40,156,057 | | | | 133,710,641 | |
48
| | Year Ended |
| | 7/31/13 | | 7/31/12 |
| Capital Share Transactions (continued): | | | | | | | | |
| Cost of shares redeemed: | | | | | | | | |
| Class A | | $ | (21,141,396 | ) | | $ | (22,329,797 | ) |
| Class B | | | (562,194 | ) | | | (928,579 | ) |
| Class C | | | (3,407,300 | ) | | | (2,113,586 | ) |
| Class R | | | (3,397,339 | ) | | | (1,932,730 | ) |
| Institutional Class | | | (32,201,742 | ) | | | (26,668,220 | ) |
| | | (60,709,971 | ) | | | (53,972,912 | ) |
| Increase (decrease) in net assets derived from capital | | | | | | | | |
| share transactions | | | (20,553,914 | ) | | | 79,737,729 | |
| Net Increase (Decrease) in Net Assets | | | (28,942,405 | ) | | | 86,779,818 | |
| |
| Net Assets: | | | | | | | | |
| Beginning of year | | | 189,948,382 | | | | 103,168,564 | |
| End of year (including undistributed (distributions in | | | | | | | | |
| excess of) net investment income of $(86,491) and | | | | | | | | |
| $248,605, respectively) | | $ | 161,005,977 | | | $ | 189,948,382 | |
See accompanying notes, which are an integral part of the financial statements.
49
Financial highlights
Delaware Core Plus Bond Fund Class A
Selected data for each share of the Fund outstanding throughout each period were as follows:
| Net asset value, beginning of period |
| |
| Income (loss) from investment operations: |
| Net investment income1 |
| Net realized and unrealized gain (loss) |
| Total from investment operations |
| |
| Less dividends and distributions from: |
| Net investment income |
| Net realized gain |
| Total dividends and distributions |
| |
| Net asset value, end of period |
| |
| Total return2 |
| |
| Ratios and supplemental data: |
| Net assets, end of period (000 omitted) |
| Ratio of expenses to average net assets |
| Ratio of expenses to average net assets |
| prior to fees waived |
| Ratio of net investment income to average net assets |
| Ratio of net investment income to average net assets |
| prior to fees waived |
| Portfolio turnover |
| 1 The average shares outstanding method has been applied for per share information. |
2 Total investment return is based on the change in net asset value of a share during the period and assumes reinvestment of dividends and distributions at net asset value and does not reflect the impact of a sales charge. Total investment return during all of the periods shown reflects waivers by the manager and distributor. Performance would have been lower had the waivers not been in effect. |
See accompanying notes, which are an integral part of the financial statements.
50
| | Year Ended | |
| | 7/31/13 | | 7/31/12 | | 7/31/11 | | 7/31/10 | | 7/31/09 | |
| | $8.750 | | | $8.420 | | | $8.220 | | | $7.620 | | | $7.260 | | |
| | | | |
| | | | |
| | 0.202 | | | 0.205 | | | 0.264 | | | 0.366 | | | 0.367 | | |
| | (0.328 | ) | | 0.375 | | | 0.244 | | | 0.606 | | | 0.395 | | |
| | (0.126 | ) | | 0.580 | | | 0.508 | | | 0.972 | | | 0.762 | | |
| | | | |
| | | | |
| | (0.265 | ) | | (0.250 | ) | | (0.308 | ) | | (0.372 | ) | | (0.402 | ) | |
| | (0.019 | ) | | — | | | — | | | — | | | — | | |
| | (0.284 | ) | | (0.250 | ) | | (0.308 | ) | | (0.372 | ) | | (0.402 | ) | |
| | | | |
| | $8.340 | | | $8.750 | | | $8.420 | | | $8.220 | | | $7.620 | | |
| | | | |
| | (1.51% | ) | | 7.01% | | | 6.32% | | | 13.03% | | | 11.13% | | |
| | | | |
| | | | |
| | $81,042 | | | $91,099 | | | $74,107 | | | $72,618 | | | $64,746 | | |
| | 0.90% | | | 0.90% | | | 0.90% | | | 0.91% | | | 0.98% | | |
| | | | |
| | 1.17% | | | 1.18% | | | 1.29% | | | 1.34% | | | 1.32% | | |
| | 2.33% | | | 2.41% | | | 3.20% | | | 4.60% | | | 5.20% | | |
| | | | |
| | 2.06% | | | 2.13% | | | 2.81% | | | 4.17% | | | 4.86% | | |
| | 340% | | | 422% | | | 293% | | | 264% | | | 244% | | |
51
Financial highlights
Delaware Core Plus Bond Fund Class B
Selected data for each share of the Fund outstanding throughout each period were as follows:
| Net asset value, beginning of period |
| |
| Income (loss) from investment operations: |
| Net investment income1 |
| Net realized and unrealized gain (loss) |
| Total from investment operations |
| |
| Less dividends and distributions from: |
| Net investment income |
| Net realized gain |
| Total dividends and distributions |
| |
| Net asset value, end of period |
| |
| Total return2 |
| |
| Ratios and supplemental data: |
| Net assets, end of period (000 omitted) |
| Ratio of expenses to average net assets |
| Ratio of expenses to average net assets |
| prior to fees waived |
| Ratio of net investment income to average net assets |
| Ratio of net investment income to average net assets |
| prior to fees waived |
| Portfolio turnover |
| 1 The average shares outstanding method has been applied for per share information. |
2 Total investment return is based on the change in net asset value of a share during the period and assumes reinvestment of dividends and distributions at net asset value and does not reflect the impact of a sales charge. Total investment return during all of the periods shown reflects waivers by the manager and/or the distributor. Performance would have been lower had the waivers not been in effect. |
See accompanying notes, which are an integral part of the financial statements.
52
| | Year Ended | |
| | 7/31/13 | | 7/31/12 | | 7/31/11 | | 7/31/10 | | 7/31/09 | |
| | $8.750 | | | $8.420 | | | $8.220 | | | $7.620 | | | $7.260 | | |
| | | | |
| | | | |
| | 0.160 | | | 0.141 | | | 0.202 | | | 0.305 | | | 0.314 | | |
| | (0.328 | ) | | 0.375 | | | 0.245 | | | 0.608 | | | 0.396 | | |
| | (0.168 | ) | | 0.516 | | | 0.447 | | | 0.913 | | | 0.710 | | |
| | | | |
| | | | |
| | (0.223 | ) | | (0.186 | ) | | (0.247 | ) | | (0.313 | ) | | (0.350 | ) | |
| | (0.019 | ) | | — | | | — | | | — | | | — | | |
| | (0.242 | ) | | (0.186 | ) | | (0.247 | ) | | (0.313 | ) | | (0.350 | ) | |
| | | | |
| | $8.340 | | | $8.750 | | | $8.420 | | | $8.220 | | | $7.620 | | |
| | | | |
| | (1.97% | ) | | 6.21% | | | 5.53% | | | 12.19% | | | 10.31% | | |
| | | | |
| | | | |
| | $687 | | | $1,211 | | | $1,921 | | | $3,197 | | | $4,494 | | |
| | 1.39% | | | 1.65% | | | 1.65% | | | 1.66% | | | 1.73% | | |
| | | | |
| | 1.87% | | | 1.88% | | | 1.99% | | | 2.04% | | | 2.02% | | |
| | 1.84% | | | 1.66% | | | 2.45% | | | 3.85% | | | 4.45% | | |
| | | | |
| | 1.36% | | | 1.43% | | | 2.11% | | | 3.47% | | | 4.16% | | |
| | 340% | | | 422% | | | 293% | | | 264% | | | 244% | | |
53
Financial highlights
Delaware Core Plus Bond Fund Class C
Selected data for each share of the Fund outstanding throughout each period were as follows:
| Net asset value, beginning of period |
| |
| Income (loss) from investment operations: |
| Net investment income1 |
| Net realized and unrealized gain (loss) |
| Total from investment operations |
| |
| Less dividends and distributions from: |
| Net investment income |
| Net realized gain |
| Total dividends and distributions |
| |
| Net asset value, end of period |
| |
| Total return2 |
| |
| Ratios and supplemental data: |
| Net assets, end of period (000 omitted) |
| Ratio of expenses to average net assets |
| Ratio of expenses to average net assets |
| prior to fees waived |
| Ratio of net investment income to average net assets |
| Ratio of net investment income to average net assets |
| prior to fees waived |
| Portfolio turnover |
| 1 The average shares outstanding method has been applied for per share information. |
2 Total investment return is based on the change in net asset value of a share during the period and assumes reinvestment of dividends and distributions at net asset value and does not reflect the impact of a sales charge. Total investment return during all of the periods shown reflects a waiver by the manager. Performance would have been lower had the waiver not been in effect. |
See accompanying notes, which are an integral part of the financial statements.
54
| | Year Ended | |
| | 7/31/13 | | 7/31/12 | | 7/31/11 | | 7/31/10 | | 7/31/09 | |
| | $8.760 | | | $8.430 | | | $8.230 | | | $7.620 | | | $7.260 | | |
| | | | |
| | | | |
| | 0.137 | | | 0.142 | | | 0.203 | | | 0.307 | | | 0.314 | | |
| | (0.328 | ) | | 0.374 | | | 0.244 | | | 0.616 | | | 0.396 | | |
| | (0.191 | ) | | 0.516 | | | 0.447 | | | 0.923 | | | 0.710 | | |
| | | | |
| | | | |
| | (0.200 | ) | | (0.186 | ) | | (0.247 | ) | | (0.313 | ) | | (0.350 | ) | |
| | (0.019 | ) | | — | | | — | | | — | | | — | | |
| | (0.219 | ) | | (0.186 | ) | | (0.247 | ) | | (0.313 | ) | | (0.350 | ) | |
| | | | |
| | $8.350 | | | $8.760 | | | $8.430 | | | $8.230 | | | $7.620 | | |
| | | | |
| | (2.24% | ) | | 6.20% | | | 5.53% | | | 12.32% | | | 10.31% | | |
| | | | |
| | | | |
| | $10,990 | | | $12,989 | | | $10,147 | | | $10,022 | | | $5,813 | | |
| | 1.65% | | | 1.65% | | | 1.65% | | | 1.66% | | | 1.73% | | |
| | | | |
| | 1.87% | | | 1.88% | | | 1.99% | | | 2.04% | | | 2.02% | | |
| | 1.58% | | | 1.66% | | | 2.45% | | | 3.85% | | | 4.45% | | |
| | | | |
| | 1.36% | | | 1.43% | | | 2.11% | | | 3.47% | | | 4.16% | | |
| | 340% | | | 422% | | | 293% | | | 264% | | | 244% | | |
55
Financial highlights
Delaware Core Plus Bond Fund Class R
Selected data for each share of the Fund outstanding throughout each period were as follows:
| Net asset value, beginning of period |
| |
| Income (loss) from investment operations: |
| Net investment income1 |
| Net realized and unrealized gain (loss) |
| Total from investment operations |
| |
| Less dividends and distributions from: |
| Net investment income |
| Net realized gain |
| Total dividends and distributions |
| |
| Net asset value, end of period |
| |
| Total return2 |
| |
| Ratios and supplemental data: |
| Net assets, end of period (000 omitted) |
| Ratio of expenses to average net assets |
| Ratio of expenses to average net assets |
| prior to fees waived |
| Ratio of net investment income to average net assets |
| Ratio of net investment income to average net assets |
| prior to fees waived |
| Portfolio turnover |
| 1 The average shares outstanding method has been applied for per share information. |
2 Total investment return is based on the change in net asset value of a share during the period and assumes reinvestment of dividends and distributions at net asset value. Total investment return during all of the periods shown reflects waivers by the manager and distributor. Performance would have been lower had the waivers not been in effect. |
See accompanying notes, which are an integral part of the financial statements.
56
| | Year Ended | |
| | 7/31/13 | | 7/31/12 | | 7/31/11 | | 7/31/10 | | 7/31/09 | |
| | $8.780 | | | $8.450 | | | $8.240 | | | $7.630 | | | $7.260 | | |
| | | | |
| | | | |
| | 0.181 | | | 0.185 | | | 0.244 | | | 0.350 | | | 0.349 | | |
| | (0.328 | ) | | 0.374 | | | 0.255 | | | 0.613 | | | 0.406 | | |
| | (0.147 | ) | | 0.559 | | | 0.499 | | | 0.963 | | | 0.755 | | |
| | | | |
| | | | |
| | (0.244 | ) | | (0.229 | ) | | (0.289 | ) | | (0.353 | ) | | (0.385 | ) | |
| | (0.019 | ) | | — | | | — | | | — | | | — | | |
| | (0.263 | ) | | (0.229 | ) | | (0.289 | ) | | (0.353 | ) | | (0.385 | ) | |
| | | | |
| | $8.370 | | | $8.780 | | | $8.450 | | | $8.240 | | | $7.630 | | |
| | | | |
| | (1.74% | ) | | 6.73% | | | 6.17% | | | 12.87% | | | 11.00% | | |
| | | | |
| | | | |
| | $8,077 | | | $9,180 | | | $6,789 | | | $6,031 | | | $235 | | |
| | 1.15% | | | 1.15% | | | 1.15% | | | 1.16% | | | 1.23% | | |
| | | | |
| | 1.47% | | | 1.48% | | | 1.59% | | | 1.64% | | | 1.62% | | |
| | 2.08% | | | 2.16% | | | 2.95% | | | 4.35% | | | 4.95% | | |
| | | | |
| | 1.76% | | | 1.83% | | | 2.51% | | | 3.87% | | | 4.56% | | |
| | 340% | | | 422% | | | 293% | | | 264% | | | 244% | | |
57
Financial highlights
Delaware Core Plus Bond Fund Institutional Class
Selected data for each share of the Fund outstanding throughout each period were as follows:
| Net asset value, beginning of period |
| |
| Income (loss) from investment operations: |
| Net investment income1 |
| Net realized and unrealized gain (loss) |
| Total from investment operations |
| |
| Less dividends and distributions from: |
| Net investment income |
| Net realized gain |
| Total dividends and distributions |
| |
| Net asset value, end of period |
| |
| Total return2 |
| |
| Ratios and supplemental data: |
| Net assets, end of period (000 omitted) |
| Ratio of expenses to average net assets |
| Ratio of expenses to average net assets |
| prior to fees waived |
| Ratio of net investment income to average net assets |
| Ratio of net investment income to average net assets |
| prior to fees waived |
| Portfolio turnover |
| 1 The average shares outstanding method has been applied for per share information. |
2 Total investment return is based on the change in net asset value of a share during the period and assumes reinvestment of dividends and distributions at net asset value. Total investment return during all of the periods shown reflects a waiver by the manager. Performance would have been lower had the waiver not been in effect. |
See accompanying notes, which are an integral part of the financial statements.
58
| | Year Ended | |
| | 7/31/13 | | 7/31/12 | | 7/31/11 | | 7/31/10 | | 7/31/09 | |
| | $8.760 | | | $8.430 | | | $8.230 | | | $7.630 | | | $7.260 | | |
| | | | |
| | | | |
| | 0.224 | | | 0.228 | | | 0.285 | | | 0.388 | | | 0.384 | | |
| | (0.328 | ) | | 0.373 | | | 0.245 | | | 0.605 | | | 0.406 | | |
| | (0.104 | ) | | 0.601 | | | 0.530 | | | 0.993 | | | 0.790 | | |
| | | | |
| | | | |
| | (0.287 | ) | | (0.271 | ) | | (0.330 | ) | | (0.393 | ) | | (0.420 | ) | |
| | (0.019 | ) | | — | | | — | | | — | | | — | | |
| | (0.306 | ) | | (0.271 | ) | | (0.330 | ) | | (0.393 | ) | | (0.420 | ) | |
| | | | |
| | $8.350 | | | $8.760 | | | $8.430 | | | $8.230 | | | $7.630 | | |
| | | | |
| | (1.26% | ) | | 7.27% | | | 6.58% | | | 13.30% | | | 11.55% | | |
| | | | |
| | | | |
| | $60,210 | | | $75,469 | | | $10,205 | | | $8,640 | | | $3,213 | | |
| | 0.65% | | | 0.65% | | | 0.65% | | | 0.66% | | | 0.73% | | |
| | | | |
| | 0.87% | | | 0.88% | | | 0.99% | | | 1.04% | | | 1.02% | | |
| | 2.58% | | | 2.66% | | | 3.45% | | | 4.85% | | | 5.45% | | |
| | | | |
| | 2.36% | | | 2.43% | | | 3.11% | | | 4.47% | | | 5.16% | | |
| | 340% | | | 422% | | | 293% | | | 264% | | | 244% | | |
59
Notes to financial statements |
| Delaware Core Plus Bond Fund | July 31, 2013 |
Delaware Group® Government Fund (Trust) is organized as a Delaware statutory trust and offers two series: Delaware Core Plus Bond Fund and Delaware Inflation Protected Bond Fund. These financial statements and the related notes pertain to Delaware Core Plus Bond Fund (Fund). The Trust is an open-end investment company. The Fund is considered diversified under the Investment Company Act of 1940, as amended, and offers Class A, Class B, Class C, Class R and Institutional Class shares. Class A shares are sold with a maximum front-end sales charge of 4.50%. Class A share purchases of $1,000,000 or more will incur a contingent deferred sales charge (CDSC) of 1.00% if redeemed during the first year and 0.50% during the second year, provided that Delaware Distributors, L.P. (DDLP) paid a financial advisor a commission on the purchase of those shares. Class B shares may be purchased only through dividend reinvestment and certain permitted exchanges. Prior to June 1, 2007, Class B shares were sold with a CDSC that declined from 4.00% to zero depending upon the period of time the shares were held. Class B shares will automatically convert to Class A shares on a quarterly basis approximately eight years after purchase. Class C shares are sold with a CDSC of 1.00%, if redeemed during the first twelve months. Class R and Institutional Class shares are not subject to a sales charge and are offered for sale exclusively to certain eligible investors.
The investment objective of the Fund is to seek maximum long-term total return, consistent with reasonable risk.
1. Significant Accounting Policies
The following accounting policies are in accordance with U.S. generally accepted accounting principles (U.S. GAAP) and are consistently followed by the Fund.
Security Valuation — Equity securities, except those traded on the Nasdaq Stock Market, Inc. (Nasdaq), are valued at the last quoted sales price as of the time of the regular close of the New York Stock Exchange (NYSE) on the valuation date. Securities traded on the Nasdaq are valued in accordance with the Nasdaq Official Closing Price, which may not be the last sales price. If on a particular day an equity security does not trade, then the mean between the bid and ask prices will be used, which approximates fair value. Debt securities, credit default swap (CDS) contracts and interest rate swap contracts are valued based upon valuations provided by an independent pricing service or broker/counterparty and reviewed by management. To the extent current market prices are not available, the pricing service may take into account developments related to the specific security, as well as transactions in comparable securities. U.S. government securities are valued at the mean between the bid and ask prices, which approximates fair value. For asset-backed securities, collateralized mortgage obligations, commercial mortgage securities and U.S. government agency mortgage securities, pricing vendors utilize matrix pricing which considers prepayment speed, attributes of the collateral, yield or price of bonds of comparable quality, coupon, maturity and type as well as broker/dealer-supplied prices. Swap prices are derived using daily swap curves and models that incorporate a number of market data factors, such as discounted cash flows, trades and values of the underlying reference instruments. Investment company securities are valued at net asset value per share, as reported by the
60
underlying investment company. Foreign currency exchange contracts and foreign cross currency exchange contracts are valued at the mean between the bid and ask prices, which approximates fair value. Interpolated values are derived when the settlement date of the contract is an interim date for which quotations are not available. Futures contracts and options on futures contracts are valued at the daily quoted settlement prices. Exchange-traded options are valued at the last reported sale price or, if no sales are reported, at the mean between the last reported bid and ask prices, which approximates fair value. Generally, other securities and assets for which market quotations are not readily available are valued at fair value as determined in good faith under the direction of the Fund’s Board of Trustees (Board). In determining whether market quotations are readily available or fair valuation will be used, various factors will be taken into consideration, such as market closures or suspension of trading in a security.
Federal & Foreign Income Taxes — No provision for federal income taxes has been made as the Fund intends to continue to qualify for federal income tax purposes as a regulated investment company under Subchapter M of the Internal Revenue Code of 1986, as amended, and make the requisite distributions to shareholders. The Fund evaluates tax positions taken or expected to be taken in the course of preparing the Fund’s tax returns to determine whether the tax positions are “more-likely-than-not” of being sustained by the applicable tax authority. Tax positions not deemed to meet the “more-likely-than-not” threshold are recorded as a tax benefit or expense in the current year. Management has analyzed the Fund’s tax positions taken for all open federal income tax years (July 31, 2010–July 31, 2013), and has concluded that no provision for federal income tax is required in the Fund’s financial statements. In regard to foreign taxes only, the Fund has open tax years in certain foreign countries it invests in that may date back to the inception of the Fund.
Class Accounting — Investment income and common expenses are allocated to the various classes of the Fund on the basis of “settled shares” of each class in relation to the net assets of the Fund. Realized and unrealized gain (loss) on investments are allocated to the various classes of the Fund on the basis of daily net assets of each class. Distribution expenses relating to a specific class are charged directly to that class.
Repurchase Agreements — The Fund may purchase certain U.S. government securities subject to the counterparty’s agreement to repurchase them at an agreed upon date and price. The counterparty will be required on a daily basis to maintain the value of the collateral subject to the agreement at not less than the repurchase price (including accrued interest). The agreements are conditioned upon the collateral being deposited under the Federal Reserve book-entry system with the Fund’s custodian or a third party sub-custodian. In the event of default or bankruptcy by the other party to the agreement, retention of the collateral may be subject to legal proceedings. All open repurchase agreements as of the date of this report were entered into on July 31, 2013.
To Be Announced Trades (TBA) — The Fund may contract to purchase securities for a fixed price at a transaction date beyond the customary settlement period (e.g., “when issued,” “delayed delivery,” “forward commitment,” or “TBA transactions”) consistent with the Fund’s ability to
61
Notes to financial statements
Delaware Core Plus Bond Fund
1. Significant Accounting Policies (continued)
manage its investment portfolio and meet redemption requests. These transactions involve a commitment by the Fund to purchase securities for a predetermined price or yield with payment and delivery taking place more than three days in the future, or after a period longer than the customary settlement period for that type of security. No interest will be earned by the Fund on such purchases until the securities are delivered; however, the market value may change prior to delivery.
Foreign Currency Transactions — Transactions denominated in foreign currencies are recorded at the prevailing exchange rates on the valuation date in accordance with the Fund’s prospectus. The value of all assets and liabilities denominated in foreign currencies is translated daily into U.S. dollars at the exchange rate of such currencies against the U.S. dollar. Transaction gains or losses resulting from changes in exchange rates during the reporting period or upon settlement of the foreign currency transaction are reported in operations for the current period. The Fund generally bifurcates that portion of realized gains and losses on investments in debt securities which is due to changes in foreign exchange rates from that which is due to changes in market prices of debt securities. That portion of gains (losses) is included in the statement of operations under the caption net realized gain (loss) on Foreign currencies. The Fund reports certain foreign currency related transactions as components of realized gains (losses) for financial reporting purposes, whereas such components are treated as ordinary income (loss) for federal income tax purposes.
Use of Estimates — The preparation of financial statements in conformity with U.S. GAAP requires management to make estimates and assumptions that affect the fair value of investments, the reported amounts of assets and liabilities and disclosure of contingent assets and liabilities at the date of the financial statements and the reported amounts of revenues and expenses during the reporting period. Actual results could differ from those estimates and the differences could be material.
Other — Expenses directly attributable to the Fund are charged directly to the Fund. Other expenses common to various funds within the Delaware Investments® Family of Funds are generally allocated among such funds on the basis of average net assets. Management fees and some other expenses are paid monthly. Security transactions are recorded on the date the securities are purchased or sold (trade date) for financial reporting purposes. Costs used in calculating realized gains and losses on the sale of investment securities are those of the specific securities sold. Dividend income is recorded on the ex-dividend date and interest income is recorded on the accrual basis. Discounts and premiums on debt securities are amortized to interest income over the lives of the respective securities using the effective interest method. Realized gains (losses) on paydowns of asset- and mortgage-backed securities are classified as interest income. Withholdings taxes and reclaims on foreign interest has been recorded in accordance with the Fund’s understanding of the applicable country’s tax rules and rates. The Fund paid foreign capital gains taxes on certain foreign securities held as components of realized gains (losses) for financial reporting purposes, whereas such components are treated as ordinary
62
loss for federal income tax purposes. The Fund declares dividends daily from net investment income and pays the dividends monthly and declares and pays distributions from net realized gain on investments, if any, annually. The Fund may distribute more frequently, if necessary for tax purposes. Dividends and distributions, if any, are recorded on the ex-dividend date.
The Fund may receive earnings credits from its custodian when positive cash balances are maintained, which are used to offset custody fees. There were no earnings credits for the year ended July 31, 2013.
The Fund receives earnings credits from its transfer agent when positive cash balances are maintained, which are used to offset transfer agent fees. If the amount earned is greater than one dollar, the expense paid under this arrangement is included in dividend disbursing and transfer agent fees and expenses on the statement of operations with the corresponding expense offset shown as “expense paid indirectly.” For the year ended July 31, 2013, the Fund earned $178 under this agreement.
| 2. | Investment Management, Administration Agreements and Other Transactions with Affiliates |
In accordance with the terms of its investment management agreement, the Fund pays Delaware Management Company (DMC), a series of Delaware Management Business Trust and the investment manager, an annual fee which is calculated daily at the rate of 0.55% on the first $500 million of average daily net assets of the Fund, 0.50% on the next $500 million, 0.45% on the next $1.5 billion, and 0.425% on average daily net assets in excess of $2.5 billion.
DMC has contractually agreed to waive that portion, if any, of its management fees and/or pay/reimburse the Fund to the extent necessary to ensure that total annual operating expenses (excluding any 12b-1 plan expenses, taxes, interest, inverse floater program expenses, short sale and dividend interest expense, brokerage fees, certain insurance costs, and nonroutine expenses or costs including, but not limited to, those relating to reorganizations, litigation, conducting shareholder meetings, and liquidations (collectively, nonroutine expenses)), do not exceed 0.65% of average daily net assets of the Fund from Nov. 28, 2012 through Nov. 28, 2013. For purposes of this waiver and reimbursement, nonroutine expenses may also include such additional costs and expenses, as may be agreed upon from time to time by the Fund’s Board and DMC. The expense waiver and reimbursement apply only to expenses paid directly by the Fund and may only be terminated by agreement of DMC and the Fund.
Delaware Service Company, Inc. (DSC), an affiliate of DMC, provides fund accounting and financial administration oversight services to the Fund. For these services, the Fund pays DSC fees based on the aggregate daily net assets of the Delaware Investments® Family of Funds at the following annual rate: 0.0050% of the first $30 billion; 0.0045% of the next $10 billion; 0.0040% of the next $10 billion; and 0.0025% of aggregate average daily net assets in excess of $50 billion. The fees payable to DSC under the service agreement described above are allocated among all Funds in the Delaware Investments Family of Funds on a relative net asset value basis. For the year ended July 31, 2013, the Fund was charged $8,904 for these services.
63
Notes to financial statements
Delaware Core Plus Bond Fund
| 2. | Investment Management, Administration Agreements and Other Transactions with Affiliates (continued) |
DSC is also the transfer agent and dividend disbursing agent of the Fund. The Fund pays DSC a monthly asset-based fee for these services. Pursuant to a sub-transfer agency agreement between DSC and BNY Mellon Investment Servicing (US) Inc. (BNYMIS), BNYMIS provides certain sub-transfer agency services to the Fund. Sub-transfer agency fees are passed on to and paid directly by the Fund.
Pursuant to a distribution agreement and distribution plan, the Fund pays DDLP, the distributor and an affiliate of DMC, an annual distribution and service fee of 0.30% of the average daily net assets of the Class A shares, 1.00% of the average daily net assets of the Class B and C shares and 0.60% of the average daily net assets of the Class R shares. Institutional Class shares pay no distribution and service expenses. DDLP has contracted to limit the Class A and Class R shares’ 12b-1 fees from Nov. 28, 2012 through Nov. 28, 2013 to no more than 0.25% and 0.50%, respectively, of the classes’ average daily net assets. Effective March 1, 2013, DDLP has contracted to limit the Class B shares 12b-1 fees through Feb. 28, 2014 to no more than 0.25% of average daily net assets.
The Board has adopted a formula for calculating 12b-1 plan fees for the Fund’s Class A shares that went into effect on June 1, 1992. The Fund’s Class A shares are currently subject to a blended 12b-1 fee equal to the sum of: (i) 0.10% of the average daily net assets representing shares that were acquired prior to June 1, 1992, and (ii) 0.30% (currently limited to 0.25% through Nov. 28, 2013) of the average daily net assets representing shares acquired on or after June 1, 1992. All Class A shareholders currently bear 12b-1 fees at the same rate, the blended rate based on the formula described above. This method of calculating Class A 12b-1 fees may be discontinued at the sole discretion of the Board.
At July 31, 2013, the Fund had liabilities payable to affiliates as follows:
| Investment management fees payable to DMC | $ | 42,576 |
Dividend disbursing, transfer agent and fund accounting
oversight fees and other expenses payable to DSC | | 3,757 |
| Distribution fees payable to DDLP | | 30,517 |
| Other expenses payable to DMC and affiliates* | | 9,392 |
| * | DMC, as part of its administrative services, pays operating expenses on behalf of the Fund and is reimbursed on a periodic basis. Expenses include items such as printing of shareholder reports, legal and tax services, registration fees and trustees’ fees. |
As provided in the investment management agreement, the Fund bears the cost of certain legal and tax services, including internal legal and tax services provided to the Fund by DMC and/or its affiliates’ employees. For the year ended July 31, 2013, the Fund was charged $5,474 for internal legal and tax services provided by DMC and/or its affiliates’ employees.
64
For the year ended July 31, 2013, DDLP earned $5,132 for commissions on sales of the Fund’s Class A shares. For the year ended July 31, 2013, DDLP received gross CDSC commissions of $2, $12 and $87 on redemptions of the Fund’s Class A, Class B and Class C shares, respectively, and these commissions were entirely used to offset up-front commissions previously paid by DDLP to broker/dealers on sales of those shares.
Trustees’ fees include expenses accrued by the Fund for each Trustee’s retainer and meeting fees. Certain officers of DMC, DSC, and DDLP are officers and/or Trustees of the Trust. These officers and Trustees are paid no compensation by the Fund.
3. Investments
For the year ended July 31, 2013, the Fund made purchases of $493,578,531 and sales of $497,617,928 of investment securities other than U.S. government securities and short-term investments. For the year ended July 31, 2013, the Fund made purchases of $109,786,957 and sales of $124,578,017 of long-term U.S. government securities.
At July 31, 2013, the cost of investments for federal income tax purposes was $190,481,485. At July 31, 2013, net unrealized depreciation was $478,065 of which $3,255,941 related to unrealized appreciation of investments and $3,734,006 related to unrealized depreciation of investments.
U.S. GAAP defines fair value as the price that the Fund would receive to sell an asset or pay to transfer a liability in an orderly transaction between market participants at the measurement date under current market conditions. A three-level hierarchy for fair value measurements has been established based upon the transparency of inputs to the valuation of an asset or liability. Inputs may be observable or unobservable and refer broadly to the assumptions that market participants would use in pricing the asset or liability. Observable inputs reflect the assumptions market participants would use in pricing the asset or liability based on market data obtained from sources independent of the reporting entity. Unobservable inputs reflect the reporting entity’s own assumptions about the assumptions that market participants would use in pricing the asset or liability developed based on the best information available under the circumstances. The Fund’s investment in its entirety is assigned a level based upon the observability of the inputs which are significant to the overall valuation. The three-level hierarchy of inputs is summarized below.
Level 1 – | inputs are quoted prices in active markets for identical investments (e.g., equity securities, open-end investment companies, futures contracts, exchange-traded options contracts) |
| |
Level 2 – | other observable inputs (including, but not limited to: quoted prices for similar assets or liabilities in markets that are active, quoted prices for identical or similar assets or liabilities in markets that are not active, inputs other than quoted prices that are observable for the assets or liabilities (such as interest rates, yield curves, volatilities, prepayment speeds, loss severities, credit risks and default rates) or other market-corroborated inputs) (e.g., debt securities, government securities, swap contracts, foreign currency exchange contracts, foreign securities utilizing international fair value pricing, broker-quoted securities, fair valued securities) |
65
Notes to financial statements
Delaware Core Plus Bond Fund
3. Investments (continued)
Level 3 – | inputs are significant unobservable inputs (including the Fund’s own assumptions used to determine the fair value of investments) (e.g., broker-quoted securities, fair valued securities) |
Level 3 investments are valued using significant unobservable inputs. The Fund may also use an income-based valuation approach in which the anticipated future cash flows of the investment are discounted to calculate fair value. Discounts may also be applied due to the nature or duration of any restrictions on the disposition of the investments. Valuations may also be based upon current market prices of securities that are comparable in coupon, rating, maturity and industry. The derived value of a Level 3 investment may not represent the value which is received upon disposition and this could impact the results of operations.
The following table summarizes the valuation of the Fund’s investments by fair value hierarchy levels as of July 31, 2013:
| | Level 1 | | Level 2 | | Total |
Agency, Asset- &
Mortgage-Backed Securities | | $ | — | | | $ | 56,295,049 | | | $ | 56,295,049 | |
| Corporate Debt | | | — | | | | 78,879,738 | | | | 78,879,738 | |
| Senior Secured Loans | | | — | | | | 12,620,590 | | | | 12,620,590 | |
| Foreign Debt | | | — | | | | 3,806,399 | | | | 3,806,399 | |
| Municipal Bonds | | | — | | | | 277,290 | | | | 277,290 | |
| U.S. Treasury Obligations | | | — | | | | 5,540,606 | | | | 5,540,606 | |
| Convertible Preferred Stock1 | | | 111,836 | | | | 145,620 | | | | 257,456 | |
| Preferred Stock | | | 1,496,698 | | | | — | | | | 1,496,698 | |
| Short-Term Investments | | | — | | | | 30,805,295 | | | | 30,805,295 | |
| Securities Lending Collateral | | | — | | | | 24,299 | | | | 24,299 | |
| Total | | $ | 1,608,534 | | | $ | 188,394,886 | | | $ | 190,003,420 | |
| |
| Foreign Currency Exchange Contracts | | $ | — | | | $ | (13,290 | ) | | $ | (13,290 | ) |
| Futures Contracts | | $ | (32,067 | ) | | $ | — | | | $ | (32,067 | ) |
| Swap Contracts | | $ | — | | | $ | (105,412 | ) | | $ | (105,412 | ) |
| 1 | Security type is valued across multiple levels. The amounts attributed to Level 1 investments and Level 2 investments represent 43.44% and 56.56%, respectively, of the total market value of the security type. Level 1 investments represent exchange traded investments while Level 2 investments represent matrix-priced investments. |
During the year ended July 31, 2013, there were no transfers between Level 1 investments, Level 2 investments or Level 3 investments that had a significant impact to the Fund. The Fund’s policy is to recognize transfers between levels at the beginning of the reporting period.
66
4. Dividend and Distribution Information
Income and long-term capital gain distributions are determined in accordance with federal income tax regulations, which may differ from U.S. GAAP. Additionally, distributions from net gains on foreign currency transactions and net short-term gains on sales of investment securities are treated as ordinary income for federal income tax purposes. The tax character of dividends and distributions paid during the years ended July 31, 2013 and 2012 was as follows:
| | Year
Ended |
| | 7/31/13 | | 7/31/12 |
| Ordinary income | | $ | 5,463,711 | | $ | 4,581,826 |
| Long-term capital gains | | | 639,218 | | | — |
| Total | | $ | 6,102,929 | | $ | 4,581,826 |
5. Components of Net Assets on a Tax Basis
As of July 31, 2013, the components of net assets on a tax basis were as follows:
| Shares of beneficial interest | | $ | 163,282,837 | |
| Qualified late year loss deferred | | | (1,644,170 | ) |
| Distributions payable | | | (123,189 | ) |
| Unrealized depreciation | | | (509,501 | ) |
| Net assets | | $ | 161,005,977 | |
The differences between book basis and tax basis components of net assets are primarily attributable to tax deferral of losses on wash sales, mark-to-market of futures contracts, mark-to market of foreign currency exchange contracts, tax deferral of losses on straddles, tax treatment of market discount and premium on debt instruments, tax treatment of distributions payable, contingent payment debt instruments and tax treatment of CDS contracts.
Qualified late year losses represent losses realized on investment transactions from Nov. 1, 2012 through July 31, 2013 that, in accordance with federal income tax regulations, the Fund has elected to defer and treat as having arisen in the following fiscal year.
For financial reporting purposes, capital accounts are adjusted to reflect the tax character of permanent book/tax differences. Reclassifications are primarily due to tax treatment of gain (loss) on foreign currency transactions, dividends and distributions, market discount and premium on debt instruments, and paydowns of mortgage- and asset-backed securities, contingent payment debt instruments, CDS contracts and foreign capital gains taxes. Results of operations and net assets were not affected by these reclassifications. For the year ended July 31, 2013, the Fund recorded the following reclassifications:
| Distributions in excess of net investment income | | $ | 1,001,818 | |
| Accumulated net realized loss | | | (1,001,818 | ) |
67
Notes to financial statements
Delaware Core Plus Bond Fund
6. Capital Shares
Transactions in capital shares were as follows:
| | Year Ended |
| | 7/31/13 | | 7/31/12 |
| Shares sold: | | | | | | |
| Class A | | 1,456,098 | | | 3,972,365 | |
| Class B | | 6,686 | | | 16,742 | |
| Class C | | 195,769 | | | 500,841 | |
| Class R | | 279,660 | | | 443,388 | |
| Institutional Class | | 2,041,700 | | | 10,367,464 | |
| |
| Shares issued upon reinvestment of dividends and distributions: |
| Class A | | 302,922 | | | 252,817 | |
| Class B | | 2,317 | | | 3,013 | |
| Class C | | 33,814 | | | 27,045 | |
| Class R | | 28,950 | | | 24,847 | |
| Institutional Class | | 290,999 | | | 148,718 | |
| | 4,638,915 | | | 15,757,240 | |
| |
| Shares redeemed: | | | | | | |
| Class A | | (2,454,528 | ) | | (2,610,260 | ) |
| Class B | | (65,057 | ) | | (109,376 | ) |
| Class C | | (396,361 | ) | | (248,193 | ) |
| Class R | | (389,173 | ) | | (225,858 | ) |
| Institutional Class | | (3,737,933 | ) | | (3,109,420 | ) |
| | (7,043,052 | ) | | (6,303,107 | ) |
| Net increase (decrease) | | (2,404,137 | ) | | 9,454,133 | |
For the years ended July 31, 2013 and 2012, 23,025 Class B shares were converted to 23,044 Class A shares valued at $198,965 and 46,811 Class B shares were converted to 46,850 Class A shares valued at $398,042, respectively. The respective amounts are included in Class B redemptions and Class A subscriptions in the table above and the statements of changes in net assets.
7. Line of Credit
The Fund, along with certain other funds in the Delaware Investments® Family of Funds (Participants), was a participant in a $125,000,000 revolving line of credit to be used for temporary or emergency purposes as an additional source of liquidity to fund redemptions of investor shares. Under the agreement, the Participants were charged an annual commitment fee, which was allocated across the Participants on the basis of each Participant’s allocation of the entire facility.
68
The Participants were permitted to borrow up to a maximum of one third of their net assets under the agreement. Each Participant was individually, and not jointly, liable for its particular advances, if any, under the line of credit. The line of credit under the agreement expired on Nov. 13, 2012.
On Nov. 13, 2012, the Fund, along with the other Participants, entered into an amendment to the agreement for a $125,000,000 revolving line of credit. The line of credit is to be used as described above and operates in substantially the same manner as the original agreement. The line of credit available under the agreement expires on Nov. 12, 2013. The Fund had no amounts outstanding as of July 31, 2013 or at any time during the year then ended.
8. Derivatives
U.S. GAAP requires disclosures that enable investors to understand: 1) how and why an entity uses derivatives, 2) how they are accounted for, and 3) how they affect an entity’s results of operations and financial position.
Foreign Currency Exchange Contracts — The Fund may enter into foreign currency exchange contracts and foreign cross currency exchange contracts as a way of managing foreign exchange rate risk. The Fund may enter into these contracts to fix the U.S. dollar value of a security that it has agreed to buy or sell for the period between the date the trade was entered into and the date the security is delivered and paid for. The Fund may also use these contracts to hedge the U.S. dollar value of securities it already owns that are denominated in foreign currencies. The change in value is recorded as an unrealized gain or loss. When the contract is closed, a realized gain or loss is recorded equal to the difference between the value of the contract at the time it was opened and the value at the time it was closed.
The use of foreign currency exchange contracts and foreign cross currency exchange contracts and foreign cross currency exchange contracts does not eliminate fluctuations in the underlying prices of the securities, but does establish a rate of exchange that can be achieved in the future. Although foreign currency exchange contracts limit the risk of loss due to an unfavorable change in the value of the hedged currency, they also limit any potential gain that might result should the value of the currency change favorably. In addition, the Fund could be exposed to risks if the counterparties to the contracts are unable to meet the terms of their contracts. The Fund’s maximum risk of loss from counterparty credit risk is the value of its currency exchanged with the counterparty. The risk is generally mitigated by having a netting arrangement between the Fund and the counterparty and by the posting of collateral by the counterparty to the Fund to cover the Fund’s exposure to the counterparty.
Futures Contracts — A futures contract is an agreement in which the writer (or seller) of the contract agrees to deliver to the buyer an amount of cash or securities equal to a specific dollar amount times the difference between the value of a specific security or index at the close of the last trading day of the contract and the price at which the agreement is made. The Fund may use futures in the normal course of pursuing its investment objective. The Fund may invest in futures contracts to hedge its existing portfolio securities against fluctuations in fair value caused by changes in prevailing market interest rates. Upon entering into a futures contract, the Fund
69
Notes to financial statements
Delaware Core Plus Bond Fund
8. Derivatives (continued)
deposits cash or pledges U.S. government securities to a broker, equal to the minimum “initial margin” requirements of the exchange on which the contract is traded. Subsequent payments are received from the broker or paid to the broker each day, based on the daily fluctuation in the market value of the contract. These receipts or payments are known as “variation margin” and are recorded daily by the Fund as unrealized gains or losses until the contracts are closed. When the contracts are closed, the Fund records a realized gain or loss equal to the difference between the value of the contract at the time it was opened and the value at the time it was closed. Risks of entering into futures contracts include potential imperfect correlation between the futures contracts and the underlying securities and the possibility of an illiquid secondary market for these instruments. When investing in futures, there is reduced counterparty credit risk to the Fund because futures are exchange-traded and the exchange’s clearinghouse, as counterparty to all exchange-traded futures, guarantees against default.
Options Contracts — During the year ended July 31, 2013, the Fund entered into options contracts in the normal course of pursuing its investment objective. The Fund may buy or write options contracts for any number of reasons, including without limitation: to manage the Fund’s exposure to changes in securities prices and foreign currencies; as an efficient means of adjusting the Fund’s overall exposure to certain markets; to protect the value of portfolio securities; and as a cash management tool. The Fund may buy or write call or put options on securities, futures, swaps, “swaptions”, financial indices, and foreign currencies. When the Fund buys an option, a premium is paid and an asset is recorded and adjusted on a daily basis to reflect the current market value of the option purchased. When the Fund writes an option, a premium is received and a liability is recorded and adjusted on a daily basis to reflect the current market value of the option written. Premiums received from writing options that expire unexercised are treated by the Fund on the expiration date as realized gains. The difference between the premium received and the amount paid on effecting a closing purchase transaction, including brokerage commissions, is treated as realized gain or loss. If a call option is exercised, the premium is added to the proceeds from the sale of the underlying security in determining whether the Fund has a realized gain or loss. If a put option is exercised, the premium reduces the cost basis of the securities purchased by the Fund. The Fund, as writer of an option, bears the market risk of an unfavorable change in the price of the security underlying the written option. When writing options, the Fund is subject to minimal counterparty risk because the counterparty is only obligated to pay premiums and does not bear the market risk of an unfavorable market change.
Transactions in options written during the year ended July 31, 2013 for the Fund were as follows:
| Number of | | | | |
| Contracts | | Premiums |
| Options outstanding at July 31, 2012 | | — | | | $ | — | |
| Options written | | 109 | | | | 43,053 | |
| Options terminated in closing purchase transactions | | (109 | ) | | | (43,053 | ) |
| Options outstanding at July 31, 2013 | | — | | | $ | — | |
70
Swap Contracts — The Fund may enter into interest rate swaps and CDS contracts in the normal course of pursuing its investment objective. The Fund may use interest rate swaps to adjust the Fund’s sensitivity to interest rates or to hedge against changes in interest rates. The Fund may enter into CDS contracts in order to hedge against a credit event, to enhance total return or to gain exposure to certain securities or markets. The Fund will not be permitted to enter into any swap transactions unless, at the time of entering into such transactions, the unsecured long-term debt of the actual counterparty, combined with any credit enhancements, is rated at least BBB-by Standard & Poors (S&P) or Baa3 by Moody’s Investors Service (Moody’s) or is determined to be of equivalent credit quality by the Manager.
Interest Rate Swaps. An interest rate swap contract is an exchange of interest rates between counterparties. In one instance, an interest rate swap involves payments received by the Fund from another party based on a variable or floating interest rate, in return for making payments based on a fixed interest rate. An interest rate swap can also work in reverse with the Fund receiving payments based on a fixed interest rate and making payments based on a variable or floating interest rate. Interest rate swaps may be used to adjust the Fund’s sensitivity to interest rates or to hedge against changes in interest rates. Periodic payments on such contracts are accrued daily and recorded as unrealized appreciation/depreciation on swap contracts. Upon periodic payment/receipt or termination of the contract, such amounts are recorded as realized gains or losses on swap contracts. The Fund’s maximum risk of loss from counterparty credit risk is the discounted net value of the cash flows to be received from/paid to the counterparty over the interest rate swap contract’s remaining life, to the extent that the amount is positive. This risk is mitigated by (1) having a netting arrangement between the Fund and the counterparty and by the posting of collateral by the counterparty to the Fund to cover the Fund’s exposure to the counterparty for trades entered prior to June 10, 2013, and (2) trading these instruments through a central counterparty for trades entered on or after June 10, 2013.
Credit Default Swaps. A CDS contract is a risk-transfer instrument through which one party (purchaser of protection) transfers to another party (seller of protection) the financial risk of a credit event (as defined in the CDS agreement), as it relates to a particular reference security or basket of securities (such as an index). In exchange for the protection offered by the seller of protection, the purchaser of protection agrees to pay the seller of protection a periodic amount at a stated rate that is applied to the notional amount of the CDS contract. In addition, an upfront payment may be made or received by the Fund in connection with an unwinding or assignment of a CDS contract. Upon the occurrence of a credit event, the seller of protection would pay the par (or other agreed-upon) value of the reference security (or basket of securities) to the counterparty. Credit events generally include, among others, bankruptcy, failure to pay, and obligation default.
During the year ended July 31, 2013, the Fund entered into CDS contracts as a purchaser and seller of protection. Periodic payments (receipts) on such contracts are accrued daily and recorded as unrealized losses (gains) on swap contracts. Upon payment (receipt), such amounts are recorded as realized losses (gains) on swap contracts. Upfront payments made or received in connection
71
Notes to financial statements
Delaware Core Plus Bond Fund
8. Derivatives (continued)
with CDS contracts are amortized over the expected life of the CDS contracts as unrealized losses (gains) on swap contracts. The change in value of CDS contracts is recorded as unrealized appreciation or depreciation daily. A realized gain or loss is recorded upon a credit event (as defined in the CDS agreement) or the maturity or termination of the agreement. For trades prior to June 10, 2013, the Fund had posted $110,000 in cash collateral for certain open derivatives. This amount is included in cash collateral for derivatives in the statement of assets and liabities. Initial margin and variation margin is posted to central counterparties for CDS basket trades submitted on or after June 10, 2013, as determined by the applicable central counterparty. The Fund had posted $128,231 for these derivatives which is included in cash collateral for derivatives in the statement of assets and liabilities.
CDS contracts may involve greater risks than if the Fund had invested in the reference obligation directly. CDS contracts are subject to general market risk, liquidity risk, counterparty risk and credit risk. The Fund’s maximum risk of loss from counterparty credit risk, either as the seller of protection or the buyer of protection, is the fair value of the contract. This risk is mitigated by (1) having a netting arrangement between the Fund and the counterparty and by the posting of collateral by the counterparty to the Fund to cover the Fund’s exposure to the counterparty for trades entered prior to June 10, 2013, and (2) trading these instruments through a central counterparty for trades entered on or after June 10, 2013.
Swaps Generally. The value of open swaps may differ from that which would be realized in the event the Fund terminated its position in the agreement. Risks of entering into these contracts include the potential inability of the counterparty to meet the terms of the contracts. This type of risk is generally limited to the amount of favorable movement in the value of the underlying security, instrument or basket of instruments, if any, at the day of default. Risks also arise from potential losses from adverse market movements and such losses could exceed the unrealized amounts shown on the statement of net assets.
72
Fair value of derivative instruments as July 31, 2013 was as follows:
| | Asset Derivatives | | Liability Derivatives |
| | Statement of assets and | | | | | | | Statement of assets and | | | | |
| | liabilities location | | Fair Value | | liabilities location | | | Fair Value | |
Forward currency exchange
contracts (Foreign currency
exchange contracts) | |
Unrealized gain on foreign currency exchange contracts | | | $ | 22,680 | | | Unrealized loss on foreign currency exchange contracts | | $ | (35,970 | ) |
Interest rate contracts
(Futures contracts
and interest rate
swap contracts) | |
Variation margin receivable on futures contracts/unrealized gain on interest rate swap contracts | | | | — | | |
Variation margin payable on futures contracts/unrealized loss on interest rate swap contracts | | | (44,764 | )* |
Credit contracts
(CDS contracts) | |
Unrealized gain on credit default swap contracts | | | | — | | | Unrealized loss on credit default swap contracts | | | (92,715 | ) |
| | | | | $ | 22,680 | | | | | $ | (173,449 | ) |
*Includes cumulative depreciation of futures contracts from the date the contracts are opened through July 31, 2013. Only current day variation margin is reported on the Fund’s statement of assets and liabilities.
73
Notes to financial statements
Delaware Core Plus Bond Fund
8. Derivatives (continued)
The effect of derivative instruments on the statement of operations for the year ended July 31, 2013 was as follows:
| | | | | | | | | Change in |
| | | | | | | | | Unrealized |
| | | | | | | | | Appreciation |
| | | | Realized Gain (Loss) | | (Depreciation) |
| | Location of Gain (Loss) on | | on Derivatives | | on Derivatives |
| | Derivatives Recognized in | | Recognized in | | Recognized in |
| | Income | | Income | | Income |
Forward currency
exchange contracts
(Foreign currency
exchange contracts) | |
Net realized gain (loss) on foreign currency exchange contracts and net change in unrealized appreciation (depreciation) of foreign currency exchange contracts | | | $ | (207,054 | ) | | $ | 84,695 | |
Interest rate contracts
(Futures contracts and interest rate
swap contracts) | |
Net realized gain (loss) on futures contracts/net realized gain (loss) on swap contracts and net change in unrealized appreciation (depreciation) of futures contracts/net change in unrealized appreciation (depreciation) of swap contracts | | | | (369,444 | ) | | | (42,372 | ) |
Equity contracts
(Written options) | |
Net realized gain (loss) on written options and net change in unrealized appreciation (depreciation) of written options | | | | 20,554 | | | | — | |
Credit contracts
(CDS contracts) | |
Net realized gain (loss) on swap contracts and net change in unrealized appreciation (depreciation) of swap contracts | | | | (632,377 | ) | | | (297,729 | ) |
| Total | | | | | $ | (1,188,321 | ) | | $ | (255,406 | ) |
74
Derivatives Generally. The table below summarizes the average balance of derivative holdings by the Fund during the year ended July 31, 2013.
| Long | | Short |
| Derivative | | Derivative |
| Volume | | Volume |
| Foreign currency exchange contracts (average cost) | USD | | 3,509,093 | | USD | | 5,059,265 |
| Futures contracts (average notional value) | | | 4,890,336 | | | | 7,285,869 |
| Options contracts (average notional value) | | | 1,304 | | | | 1,385 |
| CDS contracts (average notional value)* | | | 1,366,048 | | | | 9,444 |
| EUR | | 1,334,583 | | | | — |
| Interest rate contracts (average notional value) | COP | | 327,571,429 | | | | — |
| USD | | 38,651 | | | | — |
*Long represents buying protection and short represents selling protection.
9. Securities Lending
The Fund, along with other funds in the Delaware Investments® Family of Funds, may lend its securities pursuant to a security lending agreement (Lending Agreement) with The Bank of New York Mellon (BNY Mellon). At the time a security is loaned, the borrower must post collateral equal to the required percentage of the market value of the loaned security, including any accrued interest. The required percentage is: (i) 102% with respect to U.S. securities and foreign securities that are denominated and payable in U.S. dollars; and (ii) 105% with respect to foreign securities. With respect to each loan, if on any business day the aggregate market value of securities collateral plus cash collateral held is less than the aggregate market value of the securities which are the subject of such loan, the borrower will be notified to provide additional collateral by the end of the following business day which, together with the collateral already held, will be not less than the applicable initial collateral requirements for such security loan. If the aggregate market value of securities collateral and cash collateral held with respect to a security loan exceeds the applicable initial collateral requirement, upon the request of the borrower BNY Mellon must return enough collateral to the borrower by the end of the following business day to reduce the value of the remaining collateral to the applicable initial collateral requirement for such security loan. As a result of the foregoing, the value of the collateral held with respect to a loaned security may be temporarily more or less than the value of the security on loan.
Cash collateral received is generally invested in the Delaware Investments Collateral Fund No. 1 (the “Collective Trust”) established by BNY Mellon for the purpose of investment on behalf of funds managed by DMC that participate in BNY Mellon’s securities lending program. The Collective Trust may invest in U.S. government securities and high-quality corporate debt, asset-backed and other money market securities and in repurchase agreements collateralized by such securities, provided that the Collective Trust will generally have a dollar-weighted average portfolio maturity of 60 days or less. The Fund can also accept U.S. government securities and letters of credit (non-cash collateral) in connection with securities loans. In the event of default or bankruptcy by the lending agent, realization and/or retention of the collateral may be subject
75
Notes to financial statements
Delaware Core Plus Bond Fund
9. Securities Lending (continued)
to legal proceedings. In the event the borrower fails to return loaned securities and the collateral received is insufficient to cover the value of the loaned securities and provided such collateral shortfall is not the result of investment losses, the lending agent has agreed to pay the amount of the shortfall to the Fund or, at the discretion of the lending agent, replace the loaned securities. The Fund continues to record dividends or interest, as applicable, on the securities loaned and is subject to changes in value of the securities loaned that may occur during the term of the loan. The Fund has the right under the Lending Agreement to recover the securities from the borrower on demand. With respect to security loans collateralized by non-cash collateral, the Fund receives loan premiums paid by the borrower. With respect to security loans collateralized by cash collateral, the earnings from the collateral investments are shared among the Fund, the security lending agent and the borrower. The Fund records security lending income net of allocations to the security lending agent and the borrower.
The Collective Trust used for the investment of cash collateral received from borrowers of securities seeks to maintain a net asset value per unit of $1.00, but there can be no assurance that it will always be able to do so. The Fund may incur investment losses as a result of investing securities lending collateral in the Collective Trust or another collateral investment pool. This could occur if an investment in a collateral investment pool defaulted or if it were necessary to liquidate assets in the collateral investment pool to meet returns on outstanding security loans at a time when the collateral investment pool’s net asset value per unit was less than $1.00. Under those circumstances, the Fund may not receive an amount from the collateral investment pool that is equal in amount to the collateral the Fund would be required to return to the borrower of the securities and the Fund would be required to make up for this shortfall.
At July 31, 2013, the value of the securities on loan was $23,789, for which cash collateral was received and invested in accordance with the Lending Agreement. At July 31, 2013, the value of invested collateral was $24,299. These investments are presented on the statement of net assets under the caption “Securities Lending Collateral.”
10. Credit and Market Risk
The Fund invests a portion of its assets in high yield fixed income securities, which are securities rated lower than BBB- by S&P and Baa3 by Moody’s, or similarly rated by another nationally recognized statistical rating organization. Investments in these higher yielding securities are generally accompanied by a greater degree of credit risk than higher rated securities. Additionally, lower rated securities may be more susceptible to adverse economic and competitive industry conditions than investment-grade securities.
The Fund invests in fixed income securities whose value is derived from an underlying pool of mortgages or consumer loans. The value of these securities is sensitive to changes in economic conditions, including delinquencies and/or defaults, and may be adversely affected by shifts in the market’s perception of the issuers and changes in interest rates. Investors receive principal
76
and interest payments as the underlying mortgages and consumer loans are paid back. Some of these securities are collateralized mortgage obligations (CMOs). CMOs are debt securities issued by U.S. government agencies or by financial institutions and other mortgage lenders, which are collateralized by a pool of mortgages held under an indenture. Prepayment of mortgages may shorten the stated maturity of the obligations and can result in a loss of premium, if any has been paid. Certain of these securities may be stripped (securities which provide only the principal or interest feature of the underlying security). The yield to maturity on an interest-only CMO is extremely sensitive not only to changes in prevailing interest rates, but also to the rate of principal payments (including prepayments) on the related underlying mortgage assets. A rapid rate of principal payments may have a material adverse effect on the Fund’s yield to maturity. If the underlying mortgage assets experience greater than anticipated prepayments of principal, the Fund may fail to fully recoup its initial investment in these securities even if the securities are rated in the highest rating categories.
The Fund invests in certain obligations that may have liquidity protection to ensure that the receipt of payments due on the underlying security is timely. Such protection may be provided through guarantees, insurance policies or letters of credit obtained by the issuer or sponsor through third parties, through various means of structuring the transaction or through a combination of such approaches. The Fund will not pay any additional fees for such credit support, although the existence of credit support may increase the price of a security.
The Fund may invest up to 15% of its net assets in illiquid securities, which may include securities with contractual restrictions on resale, securities exempt from registration under Rule 144A of the Securities Act of 1933, as amended, and other securities which may not be readily marketable. The relative illiquidity of these securities may impair the Fund from disposing of them in a timely manner and at a fair price when it is necessary or desirable to do so. While maintaining oversight, the Fund’s Board has delegated to DMC, the day-to-day functions of determining whether individual securities are liquid for purposes of the Fund’s limitation on investments in illiquid securities. Securities eligible for resale pursuant to Rule 144A, which are determined to be liquid, are not subject to the Fund’s 15% limit on investments in illiquid securities. As of July 31, 2013, no securities have been determined to be illiquid under the Fund’s Liquidity Procedures. Rule 144A securities have been identified on the statement of net assets.
11. Contractual Obligations
The Fund enters into contracts in the normal course of business that contain a variety of indemnifications. The Fund’s maximum exposure under these arrangements is unknown. However, the Fund has not had prior claims or losses pursuant to these contracts. Management has reviewed the Fund’s existing contracts and expects the risk of loss to be remote.
12. Subsequent Events
Management has determined that no material events or transactions occurred subsequent to July 31, 2013 that would require recognition or disclosure in the Fund’s financial statements.
77
Report of independent
registered public accounting firm
To the Board of Trustees of Delaware Group® Government Fund
and the Shareholders of Delaware Core Plus Bond Fund:
In our opinion, the accompanying statement of net assets, statement of assets and liabilities and the related statements of operations and of changes in net assets and the financial highlights present fairly, in all material respects, the financial position of Delaware Core Plus Bond Fund (one of the series constituting Delaware Group Government Fund, hereinafter referred to as the “Fund”) at July 31, 2013, the results of its operations for the year then ended, the changes in its net assets for each of the two years in the period then ended and the financial highlights for each of the four years in the period then ended, in conformity with accounting principles generally accepted in the United States of America. These financial statements and financial highlights (hereafter referred to as “financial statements”) are the responsibility of the Fund's management; our responsibility is to express an opinion on these financial statements based on our audits. We conducted our audits of these financial statements in accordance with the standards of the Public Company Accounting Oversight Board (United States). Those standards require that we plan and perform the audit to obtain reasonable assurance about whether the financial statements are free of material misstatement. An audit includes examining, on a test basis, evidence supporting the amounts and disclosures in the financial statements, assessing the accounting principles used and significant estimates made by management, and evaluating the overall financial statement presentation. We believe that our audits, which included confirmation of securities at July 31, 2013 by correspondence with the custodian and brokers, provide a reasonable basis for our opinion. The financial highlights for the year ended July 31, 2009 were audited by other independent accountants whose report dated September 21, 2009 expressed an unqualified opinion on those statements.
PricewaterhouseCoopers LLP
Philadelphia, Pennsylvania
September 20, 2013
78
Other Fund information
(Unaudited)
Delaware Core Plus Bond Fund
Tax Information
The information set forth below is for the Fund’s fiscal year as required by federal laws. Shareholders, however, must report distributions on a calendar year basis for income tax purposes, which may include distributions for portions of two fiscal years of a fund. Accordingly, the information needed by shareholders for income tax purposes will be sent to them in January of each year. Please consult your tax advisor for proper treatment of this information.
All designations are based on financial information available as of the date of this annual report and, accordingly are subject to change. For any and all items requiring designation, it is the intention of the Fund to designate the maximum amount permitted under the Internal Revenue Code and the regulations thereunder.
For the fiscal year ended July 31, 2013, the Fund designates distributions paid during the year as follows:
| (A) Long-Term Capital Gain Distributions (Tax Basis) | 10.47% |
| (B) Ordinary Income Distribution (Tax Basis)* | 89.53% |
| Total Distributions (Tax Basis) | 100% |
| (C) Qualifying Dividends1 | 1.67% |
| (A) | and (B) are based on a percentage of the Fund’s total distributions. |
| (C) | is based on a percentage of the Fund’s ordinary income distributions. |
1 Qualifying dividends represent dividends which qualify for the corporate dividends received deduction.
*For the year ended July 31, 2013, certain dividends paid by the Fund may be subject to a maximum tax rate of 15%, as provided for by the Jobs and Growth Tax Relief Reconciliation Act of 2003 and as extended by the Tax Relief, Unemployment Insurance Reauthorization and Jobs Creation Act of 2010. The Fund intends to designate up to a maximum amount of 1.67% to be taxed at a maximum rate of 15%. Complete information will be computed and reported in conjunction with your 2013 Form 1099-DIV.
79
Board of trustees/directors and officers addendum
Delaware Investments® Family of Funds
A mutual fund is governed by a Board of Trustees/Directors (“Trustees”), which has oversight responsibility for the management of a fund’s business affairs. Trustees establish procedures and oversee and review the performance of the investment manager, the distributor, and others who perform services for the fund. The independent fund trustees, in particular, are advocates
| Name, Address, | Position(s) | Length of |
| and Birth Date | Held with Fund(s) | Time Served |
| Interested Trustees | | |
| | | |
| Patrick P. Coyne1 | Chairman, President, | Chairman and Trustee |
| 2005 Market Street | Chief Executive Officer, | since August 16, 2006 |
| Philadelphia, PA 19103 | and Trustee | |
| April 1963 | | President and |
| | | Chief Executive Officer |
| | | since August 1, 2006 |
| |
| |
| Independent Trustees | | |
| | | |
| Thomas L. Bennett | Trustee | Since March 2005 |
| 2005 Market Street | | |
| Philadelphia, PA 19103 | | |
| October 1947 | | |
| | | |
| Joseph W. Chow | Trustee | Since January 2013 |
| 2005 Market Street | | |
| Philadelphia, PA 19103 | | |
| January 1953 | | |
| |
| |
| John A. Fry | Trustee | Since January 2001 |
| 2005 Market Street | | |
| Philadelphia, PA 19103 | | |
| May 1960 | | |
| |
| |
| |
| |
| Anthony D. Knerr | Trustee | Since April 1990 |
| 2005 Market Street | | |
| Philadelphia, PA 19103 | | |
| December 1938 | | |
| | | |
1 Patrick P. Coyne is considered to be an “Interested Trustee” because he is an executive officer of the Fund’s(s’) investment advisor.
80
for shareholder interests. Each trustee has served in that capacity since he or she was elected to or appointed to the Board of Trustees, and will continue to serve until his or her retirement or the election of a new trustee in his or her place. The following is a list of the Trustees and Officers with certain background and related information.
| Number of Portfolios in | |
| Principal Occupation(s) | Fund Complex Overseen | Other Directorships |
| During Past 5 Years | by Trustee or Officer | Held by Trustee or Officer |
| |
| |
| Patrick P. Coyne has served in | 70 | Director and Audit |
| various executive capacities | | Committee Member |
| at different times at | | Kaydon Corp. |
| Delaware Investments.2 | | |
| | Board of Governors Member |
| | Investment Company |
| | Institute (ICI) |
| |
| |
| | | |
| Private Investor | 70 | Director |
| (March 2004–Present) | | Bryn Mawr Bank Corp. (BMTC) |
| | (2007–2011) |
| |
| |
| Executive Vice President | 70 | Director and Audit Committee |
| (Emerging Economies Strategies, | | Member — Hercules |
| Risk and Corporate Administration) | | Technology Growth |
| State Street Corporation | | Capital, Inc. |
| (July 2004–March 2011) | | |
| | | |
| President | 70 | Director — Hershey Trust |
| Drexel University | | |
| (August 2010–Present) | | Director and Audit |
| | Committee Member |
| President | | Community Health Systems |
| Franklin & Marshall College | | |
| (July 2002–July 2010) | | |
| | | |
| Managing Director | 70 | None |
| AKA Strategy | | |
| (Strategic Consulting) | | |
| (1990–Present) | | |
| | | |
2 Delaware Investments is the marketing name for Delaware Management Holdings, Inc. and its subsidiaries, including the Fund’s(s’) investment advisor, principal underwriter, and its transfer agent.
81
Board of trustees/directors and officers addendum
Delaware Investments® Family of Funds
| Name, Address, | Position(s) | Length of |
| and Birth Date | Held with Fund(s) | Time Served |
| Independent Trustees (continued) | | |
| | | |
| Lucinda S. Landreth | Trustee | Since March 2005 |
| 2005 Market Street | | |
| Philadelphia, PA 19103 | | |
| June 1947 | | |
| | | |
| Frances A. Sevilla-Sacasa | Trustee | Since September 2011 |
| 2005 Market Street | | |
| Philadelphia, PA 19103 | | |
| January 1956 | | |
| |
| |
| |
| |
| |
| |
| |
| |
| |
| |
| |
| |
| |
| |
| Thomas K. Whitford | Trustee | Since January 2013 |
| 2005 Market Street | | |
| Philadelphia, PA 19103 | | |
| March 1956 | | |
| | | |
| | | |
| | | |
| | | |
| | | |
| | | |
| | | |
82
| Number of Portfolios in | |
| Principal Occupation(s) | Fund Complex Overseen | Other Directorships |
| During Past 5 Years | by Trustee or Officer | Held by Trustee or Officer |
| |
| |
| Private Investor | 70 | None |
| (2004–Present) | | |
| |
| |
| |
| Chief Executive Officer — | 70 | Trust Manager and |
| Banco Itaú Europa | | Audit Committee |
| International | | Member — Camden |
| (April 2012–Present) | | Property Trust |
| |
| Executive Advisor to Dean | | |
| (August 2011–March 2012) | | |
| and Interim Dean | | |
| (January 2011–July 2011) — | | |
| University of Miami School of | | |
| Business Administration | | |
| |
| President — U.S. Trust, | | |
| Bank of America Private | | |
| Wealth Management | | |
| (Private Banking) | | |
| (July 2007–December 2008) | | |
| | | |
| Vice Chairman | 70 | None |
| (2010–April 2013) | | |
| Chief Administrative | | |
| Officer (2008–2010) | | |
| and Executive Vice | | |
| President and Chief | | |
| Administrative Officer | | |
| (2007–2009) — | | |
| PNC Financial | | |
| Services Group | | |
| | | |
83
Board of trustees/directors and officers addendum
Delaware Investments® Family of Funds
| Name, Address, | Position(s) | Length of |
| and Birth Date | Held with Fund(s) | Time Served |
| Independent Trustees (continued) | | |
| | | |
| Janet L. Yeomans | Trustee | Since April 1999 |
| 2005 Market Street | | |
| Philadelphia, PA 19103 | | |
| July 1948 | | |
| |
| |
| |
| |
| |
| |
| |
| J. Richard Zecher | Trustee | Since March 2005 |
| 2005 Market Street | | |
| Philadelphia, PA 19103 | | |
| July 1940 | | |
| | | |
| | | |
| | | |
| | | |
| | | |
| | | |
84
| Number of Portfolios in | |
| Principal Occupation(s) | Fund Complex Overseen | Other Directorships |
| During Past 5 Years | by Trustee or Officer | Held by Trustee or Officer |
| |
| |
| Vice President and Treasurer | 70 | Director, Audit |
| (January 2006–July 2012) | | Committee Member and |
| Vice President — Mergers & Acquisitions | | Investment Committee |
| (January 2003–January 2006), and | | Member |
| Vice President and Treasurer | | Okabena Company |
| (July 1995–January 2003) | | |
| 3M Corporation | | Chair — 3M |
| | Investment Management |
| | Company |
| | (2005–2012) |
| | | |
| Founder | 70 | Director and Compensation |
| Investor Analytics | | Committee Member |
| (Risk Management) | | Investor Analytics |
| (May 1999–Present) | | |
| | Director — P/E Investments |
| Founder | | |
| P/E Investments | | |
| (Hedge Fund) | | |
| (September 1996–Present) | | |
| | | |
85
Board of trustees/directors and officers addendum
Delaware Investments® Family of Funds
| Name, Address, | Position(s) | Length of |
| and Birth Date | Held with Fund(s) | Time Served |
| Officers | | |
| | | |
| David F. Connor | Senior Vice President, | Senior Vice President, |
| 2005 Market Street | Deputy General | Deputy General Counsel |
| Philadelphia, PA 19103 | Counsel, and Secretary | since May 2013; |
| December 1963 | | Vice President, Deputy |
| | General Counsel |
| | September 2000– |
| | May 2013; Secretary since |
| | October 2005 |
| | | |
| Daniel V. Geatens | Vice President | Treasurer |
| 2005 Market Street | and Treasurer | since October 2007 |
| Philadelphia, PA 19103 | | |
| October 1972 | | |
| | | |
| David P. O’Connor | Executive Vice President, | Executive Vice President |
| 2005 Market Street | General Counsel | since February 2012; |
| Philadelphia, PA 19103 | and Chief Legal Officer | Senior Vice President |
| February 1966 | | October 2005– |
| | February 2012; |
| | General Counsel and |
| | Chief Legal Officer |
| | since October 2005 |
| | | |
| Richard Salus | Senior Vice President | Chief Financial Officer |
| 2005 Market Street | and Chief Financial Officer | since November 2006 |
| Philadelphia, PA 19103 | | |
| October 1963 | | |
| | | |
The Statement of Additional Information for the Fund(s) includes additional information about the Trustees and Officers and is available, without charge, upon request by calling 800 523-1918.
86
| Number of Portfolios in | |
| Principal Occupation(s) | Fund Complex Overseen | Other Directorships |
| During Past 5 Years | by Trustee or Officer | Held by Trustee or Officer |
| |
| |
| David F. Connor has served as | 70 | None3 |
| Deputy General Counsel of | | |
| Delaware Investments | | |
| since 2000. | | |
| |
| |
| |
| |
| |
| Daniel V. Geatens has served | 70 | None3 |
| in various capacities at | | |
| different times at | | |
| Delaware Investments. | | |
| | | |
| David P. O’Connor has served in | 70 | None3 |
| various executive and legal | | |
| capacities at different times | | |
| at Delaware Investments. | | |
| |
| |
| |
| |
| |
| Richard Salus has served in | 70 | None3 |
| various executive capacities | | |
| at different times at | | |
| Delaware Investments. | | |
| | | |
3 David F. Connor, Daniel V. Geatens, David P. O’Connor, and Richard Salus serve in similar capacities for the six portfolios of the Optimum Fund Trust, which have the same investment advisor, principal underwriter, and transfer agent as the registrant.
87
About the organization
| Board of trustees |
Patrick P. Coyne
Chairman, President, and
Chief Executive Officer
Delaware Investments®
Family of Funds
Philadelphia, PA Thomas L. Bennett
Private Investor
Rosemont, PA | Joseph W. Chow
Former Executive Vice
President
State Street Corporation
Brookline, MA John A. Fry
President
Drexel University
Philadelphia, PA Anthony D. Knerr
Founder and Managing
Director
AKA Strategy
New York, NY | Lucinda S. Landreth
Former Chief Investment
Officer
Assurant, Inc.
Philadelphia, PA Frances A.
Sevilla-Sacasa
Chief Executive Officer
Banco Itaú Europa
International
Miami, FL | Thomas K. Whitford
Former Vice Chairman
PNC Financial Services Group
Pittsburgh, PA Janet L. Yeomans
Former Vice President and
Treasurer
3M Corporation
St. Paul, MN J. Richard Zecher
Founder
Investor Analytics
Scottsdale, AZ |
| | | | |
Affiliated officers |
David F. Connor
Senior Vice President,
Deputy General Counsel,
and Secretary
Delaware Investments
Family of Funds
Philadelphia, PA | Daniel V. Geatens
Vice President and
Treasurer
Delaware Investments
Family of Funds
Philadelphia, PA | David P. O’Connor
Executive Vice President,
General Counsel,
and Chief Legal Officer
Delaware Investments
Family of Funds
Philadelphia, PA | Richard Salus
Senior Vice President and
Chief Financial Officer
Delaware Investments
Family of Funds
Philadelphia, PA |
| | | | |
This annual report is for the information of Delaware Core Plus Bond Fund shareholders, but it may be used with prospective investors when preceded or accompanied by the Delaware Investments Fund fact sheet for the most recently completed calendar quarter. These documents are available at delawareinvestments.com. |
Delaware Investments is the marketing name of Delaware Management Holdings, Inc. and its subsidiaries. The Fund files its complete schedule of portfolio holdings with the Securities and Exchange Commission (SEC) for the first and third quarters of each fiscal year on Form N-Q. The Fund’s Forms N-Q, as well as a description of the policies and procedures that the Fund uses to determine how to vote proxies (if any) relating to portfolio securities are available without charge (i) upon request, by calling 800 523-1918; and (ii) on the SEC’s website at sec.gov. In addition, a description of the policies and procedures that the Fund uses to determine how to vote proxies (if any) relating to portfolio securities and the Fund’s Schedule of Investments are available without charge on the Fund’s website at delawareinvestments.com. The Fund’s Forms N-Q may be reviewed and copied at the SEC’s Public Reference Room in Washington, D.C.; information on the operation of the Public Reference Room may be obtained by calling 800 SEC-0330. Information (if any) regarding how the Fund voted proxies relating to portfolio securities during the most recently disclosed 12-month period ended June 30 is available without charge (i) through the Fund’s website at delawareinvestments.com; and (ii) on the SEC’s website at sec.gov. |
88
Annual report Delaware Inflation Protected Bond Fund July 31, 2013 Fixed income mutual fund |
| Carefully consider the Fund’s investment objectives, risk factors, charges, and expenses before investing. This and other information can be found in the Fund’s prospectus and, if available, its summary prospectus, which may be obtained by visiting delawareinvestments.com or calling 800 523-1918. Investors should read the prospectus and, if available, the summary prospectus carefully before investing. |
You can obtain shareholder reports and prospectuses online instead of in the mail.
Visit delawareinvestments.com/edelivery. |
Experience Delaware Investments
Delaware Investments is committed to the pursuit of consistently superior asset management and unparalleled client service. We believe in our investment processes, which seek to deliver consistent results, and in convenient services that help add value for our clients.
If you are interested in learning more about creating an investment plan, contact your financial advisor.
You can learn more about Delaware Investments or obtain a prospectus for Delaware Inflation Protected Bond Fund at delawareinvestments.com.
Manage your investments online
- 24-hour access to your account information
- Obtain share prices
- Check your account balance and recent transactions
- Request statements or literature
- Make purchases and redemptions
Delaware Management Holdings, Inc. and its subsidiaries (collectively known by the marketing name of Delaware Investments) are wholly owned subsidiaries of Macquarie Group Limited, a global provider of banking, financial, advisory, investment and funds management services.
Investments in Delaware Inflation Protected Bond Fund are not and will not be deposits with or liabilities of Macquarie Bank Limited ABN 46 008 583 542 and its holding companies, including their subsidiaries or related companies (Macquarie Group), and are subject to investment risk, including possible delays in repayment and loss of income and capital invested. No Macquarie Group company guarantees or will guarantee the performance of the Fund, the repayment of capital from the Fund, or any particular rate of return.
| Table of contents | | |
| Portfolio management review | | 1 |
| Performance summary | | 4 |
| Disclosure of Fund expenses | | 8 |
| Security type/sector allocation | | 10 |
| Statement of net assets | | 11 |
| Statement of operations | | 18 |
| Statements of changes in net assets | | 20 |
| Financial highlights | | 22 |
| Notes to financial statements | | 30 |
| Report of independent registered | | |
| public accounting firm | | 49 |
| Other Fund information | | 50 |
| Board of trustees/directors and | | |
| officers addendum | | 52 |
| About the organization | | 60 |
Unless otherwise noted, views expressed herein are current as of July 31, 2013, and subject to change.
Funds are not FDIC insured and are not guaranteed. It is possible to lose the principal amount invested.
Mutual fund advisory services provided by Delaware Management Company, a series of Delaware Management Business Trust, which is a registered investment advisor. Delaware Investments, a member of Macquarie Group, refers to Delaware Management Holdings, Inc. and its subsidiaries, including the Fund’s distributor, Delaware Distributors, L.P. Macquarie Group refers to Macquarie Group Limited and its subsidiaries and affiliates worldwide.
© 2013 Delaware Management Holdings, Inc.
All third-party marks cited are the property of their respective owners.
| Portfolio management review |
| Delaware Inflation Protected Bond Fund | August 6, 2013 |
| Performance preview (for the year ended July 31, 2013) |
| Delaware Inflation Protected Bond Fund (Class A shares) | | 1-year return | | -11.80% |
| Barclays U.S. Treasury Inflation-Protected Securities (TIPS) | | | | |
| Index (benchmark) | | 1-year return | | -5.87% |
Past performance does not guarantee future results.
For complete, annualized performance for Delaware Inflation Protected Bond Fund, please see the table on page 4.
The performance of Class A shares excludes the applicable sales charge and reflects the reinvestment of all distributions.
Index performance returns do not reflect any management fees, transaction costs, or expenses. Indices are unmanaged and one cannot invest directly in an index.
The combination of rising bond yields and falling inflationary expectations pushed prices on Treasury inflation-protected securities (TIPS) significantly lower during the Fund’s fiscal year ended July 31, 2013. While we believe our strategy during the fiscal year was a valid one — overweighting the intermediate portion of the TIPS yield curve in an effort to protect shareholders against rising inflation and interest rates — we nonetheless were caught wrong-footed and subsequently whip-sawed on several occasions.
The bulk of the selloff within the Treasury market occurred in May and June as many investors struggled to understand the implications and timing of a possible “tapering” of the U.S. Federal Reserve’s third round of quantitative easing, or QE3. Amid a swirl of unexpected and seemingly contradictory comments from Fed officials, nominal and real (inflation-adjusted) interest rates shot higher even as inflation expectations plummeted.
Usually, higher bond yields are associated with rising expectations for inflation (thus making TIPS bonds more valuable) since faster economic growth tends to cause consumer inflation to rise as well. Not this time, however. Since the increase in yields
Factors which led to the Fund’s underperformance included:
- An overweight to 5-year TIPS, which underperformed.
- Defensive-minded hedges had a negative overall impact.
- Generally, we incorrectly anticipated movement in inflation expectations.
1
Portfolio management review
Delaware Inflation Protected Bond Fund
was caused by noneconomic factors — investors front-running the perceived looming end to QE3 — it was not tied to a rise in actual or expected inflation. In fact, inflationary expectations declined over the latter months of the fiscal year, putting severe downward pressure on TIPS prices.
In addition to discounting fewer bond purchases by the Fed, investors appeared to interpret a potential tapering of QE3 as a signal that the U.S. economy was healthy enough to be taken off life support. In that scenario, there was, in our opinion, less need to pay a premium to own safe-haven Treasury securities. Finally, less support from the Fed also implied slower growth in such key industries as housing, also suggesting that inflation was less likely to get out of control over the near term. The odd combination of rising nominal yields and falling inflationary expectations caused real (after inflation) Treasury yields to spike, making the TIPS asset class less valuable to investors.
Fund performance
For the fiscal year ended July 31, 2013, Delaware Inflation Protected Bond Fund returned -11.80% at net asset value and -15.74% at maximum offer price (both figures reflect Class A shares with all distributions reinvested). During the same period, the Barclays U.S. TIPS Index, returned -5.87%. For complete, annualized performance of Delaware Inflation Protected Bond Fund, please see the table on page 4.
Our decision to hedge duration risk with interest rate futures and interest rate swaps during the highly negative market conditions in May and June contributed to relative performance. Unfavorable market conditions notwithstanding, the detractors were more numerous. The Fund began the period significantly overweight 5-year TIPS as we sought to defend against interest rate risk and volatility in break-even rates. In yet another major departure from normal market conditions, however, inflation-adjusted yields on TIPS were virtually identical from about the 5-year portion of the curve out to 30 years. Typically, longer maturities tend to have higher breakeven rates. (A breakeven rate refers to a measure of inflation expectations, and is determined by calculating the difference between the nominal yield on a conventional Treasury security and the real yield on a TIPS bond.)
When Fed Chairman Ben Bernanke began hinting of scaling back QE3 in mid-May, the breakeven curve abruptly returned to a more normal configuration, causing breakeven rates on 5-year TIPS to fall farther than longer-duration TIPS. As such, the intermediate-term portion of TIPS curve — where the Fund maintained an overweight position — underperformed the overall market. Similarly, the largest increases in real yields occurred in the 5- and 10-year part of the curve, triggering larger losses per unit of duration (a measure of interest rate risk) than in 20- and 30-year TIPS.
Other factors in the Fund’s underperformance included its exposure to mortgage-backed securities (MBS), which we were using as a higher-yielding surrogate for short-term TIPS. While prices on MBS suffered from the rise in yields, the short-term sector of the TIPS market was the only area to emerge unscathed. Though we subsequently eliminated the Fund’s exposure to MBS — much of which could be classified as defensive in nature — the damage already
2
had been done. Finally, the Fund’s holdings in overseas inflation-linked bond markets — most notably Brazil and Australia — also detracted from relative performance due to currency weakness and assorted credit concerns.
At the end of the fiscal year, the Fund’s allocations reflected our view that global economic growth remains fragile and that the Fed is serious about tapering its bond purchases — despite central bank growth forecasts that are lower now than 18 months earlier. For that reason, we have positioned the portfolio to attempt to protect against further declines in inflation expectations. Specifically, the Fund has significantly less exposure to short- and intermediate-term TIPS, given the tendency of those sectors to experience wide swings in break-even rates.
Elsewhere, we have replaced the Fund’s mortgage holdings with floating-rate AAA-rated asset-backed bonds (as rated by Standard & Poor’s), whose yields tend to rise along with nominal rates. Broadly speaking, we view the floating-rate sector as having potential to be a higher-yielding anchor with less duration risk. During the reporting period, the Fund’s allocation to nominal U.S. Treasury securities was taken to 10%, which was overlaid with a 10% allocation to inflation swaps. As the reporting period came to a close, the Fund’s portfolio held 16% of total assets in floating-rate securities, and 74% in TIPS (including a 9% position in international inflation-linked bonds).
A word on derivatives
In addition to the interest rate futures and interest rate swaps mentioned above, Delaware Inflation Protected Bond Fund held other types of derivatives during the fiscal year, including foreign exchange hedges, credit default swaps, and inflation swaps. Several of these instruments had meaningful effects on the Fund’s absolute return. Foreign currency hedging, for instance, had a negative effect of 0.95 percentage points. Credit default swaps, which were employed as protection against economic contagion risk stemming from Europe, had a total negative effect of 0.96 percentage points. Inflation swaps had a negative effect of 0.11 percentage points, and interest rate risk hedges detracted 0.35 percentage points.
3
| Performance summary | |
| Delaware Inflation Protected Bond Fund | July 31, 2013 |
The performance data quoted represent past performance; past performance does not guarantee future results. Investment return and principal value will fluctuate so your shares, when redeemed, may be worth more or less than their original cost. Please obtain the performance data current for the most recent month end by calling 800 523-1918 or visiting our website at delawareinvestments.com/performance. Current performance may be lower or higher than the performance data quoted.
| Fund and benchmark performance1,2 | | Average annual total returns through July 31, 2013 |
| | 1 year | | 3 years | | 5 years | | Lifetime | |
| Class A (Est. Dec. 1, 2004) | | | | | | | | | |
| Excluding sales charge | | -11.80% | | +1.85% | | +3.14% | | +4.15% | |
| Including sales charge | | -15.74% | | +0.30% | | +2.19% | | +3.60% | |
| Class B (Est. Dec. 1, 2004) | | | | | | | | | |
| Excluding sales charge | | -12.20% | | +1.19% | | +2.43% | | +3.45% | |
| Including sales charge | | -15.44% | | +0.55% | | +2.18% | | +3.45% | |
| Class C (Est. Dec. 1, 2004) | | | | | | | | | |
| Excluding sales charge | | -12.39% | | +1.11% | | +2.38% | | +3.41% | |
| Including sales charge | | -13.20% | | +1.11% | | +2.38% | | +3.41% | |
| Institutional Class (Est. Dec. 1, 2004) | | | | | | | | | |
| Excluding sales charge | | -11.51% | | +2.12% | | +3.40% | | +4.40% | |
| Including sales charge | | -11.51% | | +2.12% | | +3.40% | | +4.40% | |
| Barclays U.S. TIPS Index | | -5.87% | | +4.84% | | +4.66% | | +5.09% | |
1 Returns reflect the reinvestment of all distributions and are presented both with and without the applicable sales charges described below. Returns do not reflect the deduction of taxes the shareholder would pay on Fund distributions or redemptions of Fund shares.
Expense limitations were in effect for certain classes during some or all of the periods shown in the “Fund performance” chart. Expenses for each class are listed on the “Fund expense ratios” table on page 6. Performance would have been lower had expense limitations not been in effect.
Class A shares are sold with a maximum front-end sales charge of 4.50%, and have an annual distribution and service fee of 0.25% of average daily net assets. Performance for Class A shares, excluding sales charges, assumes that no front-end sales charge applied.
Class B shares may be purchased only through dividend reinvestment and certain permitted exchanges as described in the prospectus. Please see the prospectus for additional information on Class B shares. Class B shares have a contingent deferred sales charge that declines from 4.00% to zero depending on
4
the period of time the shares are held. They are also subject to an annual distribution and service fee of 1.00% of average daily net assets. This fee has been contractually limited to 0.25% of average daily net assets from March 1, 2013, through Feb. 28, 2014. Class B shares will automatically convert to Class A shares on a quarterly basis approximately eight years after purchase.
Class C shares are sold with a contingent deferred sales charge of 1.00% if redeemed during the first 12 months. They are also subject to an annual distribution and service fee of 1.00% of average daily net assets.
Performance for Class B and C shares, excluding sales charges, assumes either that contingent deferred sales charges did not apply or that the investment was not redeemed.
Institutional Class shares are available without sales or asset-based distribution charges only to certain eligible institutional accounts.
The “Fund performance” table and the “Performance of a $10,000 investment” graph do not reflect the deduction of taxes the shareholder would pay on Fund distributions or redemptions of Fund shares.
Fixed income securities and bond funds can lose value, and investors can lose principal, as interest rates rise. They also may be affected by economic conditions that hinder an issuer’s ability to make interest and principal payments on its debt.
The Fund may also be subject to prepayment risk, the risk that the principal of a fixed income security that is held by the Fund may be prepaid prior to maturity, potentially forcing the Fund to reinvest that money at a lower interest rate.
Interest payments on inflation-indexed debt securities will vary as the principal and/or interest is adjusted for inflation.
The Fund may experience portfolio turnover in excess of 100%, which could result in higher transaction costs and tax liability.
The Fund may invest in derivatives, which may involve additional expenses and are subject to risk, including the risk that an underlying security or securities index moves in the opposite direction from what the portfolio manager anticipated. A derivative transaction depends upon the counterparties’ ability to fulfill their contractual obligations.
International investments entail risks not ordinarily associated with U.S. investments including fluctuation in currency values, differences in accounting principles, or economic or political instability in other nations.
Investing in emerging markets can be riskier than investing in established foreign markets due to increased volatility and lower trading volume.
5
Performance summary
Delaware Inflation Protected Bond Fund
2 The Fund’s expense ratios, as described in the most recent prospectus, are disclosed in the following “Fund expense ratios” table. Delaware Management Company has agreed to reimburse certain expenses and/or waive certain fees in order to prevent total annual fund operating expenses (excluding certain fees and expenses) from exceeding 0.59% of the Fund’s average daily net assets from Nov. 28, 2012, through Nov. 28, 2013. Please see the most recent prospectus and any applicable supplement(s) for additional information on these fee waivers and/or reimbursements.
| Fund expense ratios | | Class A | | Class B | | Class C | | Institutional Class |
| Total annual operating expenses | | 0.94% | | 1.69% | | 1.69% | | 0.69% |
| (without fee waivers) | | | | | | | | |
| Net expenses | | 0.84% | | 1.59% | | 1.59% | | 0.59% |
| (including fee waivers, if any) | | | | | | | | |
| Type of waiver | | Contractual | | Contractual | | Contractual | | Contractual |
6
Performance of a $10,000 investment1
Average annual total returns from Dec. 1, 2004 (Fund’s inception) through July 31, 2013
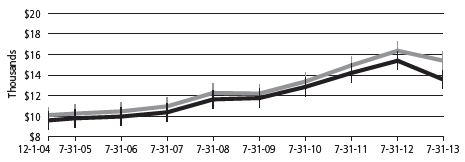
| For period beginning Dec. 1, 2004 through July 31, 2013 | | Starting value | | Ending value |
| | Barclays U.S. TIPS Index | | $10,000 | | $15,409 |
| | Delaware Inflation Protected Bond Fund —
Class A shares | | $9,550 | | $13,580 |
1 The “Performance of a $10,000 investment” graph assumes $10,000 invested in Class A shares of the Fund on Dec. 1, 2004, and includes the effect of a 4.50% front-end sales charge and the reinvestment of all distributions. The graph does not reflect the deduction of taxes the shareholders would pay on Fund distributions or redemptions of Fund shares. Expense limitations were in effect for some or all of the periods shown. Performance would have been lower had expense limitations not been in effect. Expenses are listed in the “Fund expense ratios” table on page 6. Please note additional details on pages 4 through 7.
The chart also assumes $10,000 invested in the Barclays U.S. TIPS Index as of Dec. 1, 2004. The Barclays U.S. TIPS Index measures the total return performance of the market for inflation-protected securities issued by the U.S. Treasury.
Index performance returns do not reflect any management fees, transaction costs, or expenses. Indices are unmanaged and one cannot invest directly in an index. Past performance is not a guarantee of future results.
Performance of other Fund classes will vary due to different charges and expenses.
| | Nasdaq Symbols | | CUSIPs | |
| Class A | | | DIPAX | | | 246094882 | |
| Class B | | | DIPBX | | | 246094874 | |
| Class C | | | DIPCX | | | 246094866 | |
| Institutional Class | | | DIPIX | | | 246094858 | |
7
Disclosure of Fund expenses
For the six-month period from February 1, 2013 to July 31, 2013 (Unaudited)
As a shareholder of the Fund, you incur two types of costs: (1) transaction costs, including sales charges (loads) on purchase payments, reinvested dividends, or other distributions; redemption fees; and exchange fees; and (2) ongoing costs, including management fees; distribution and/or service (12b-1) fees; and other Fund expenses. This example is intended to help you understand your ongoing costs (in dollars) of investing in the Fund and to compare these costs with the ongoing costs of investing in other mutual funds.
The example is based on an investment of $1,000 invested at the beginning of the period and held for the entire six-month period from Feb. 1, 2013 to July 31, 2013.
Actual expenses
The first section of the table shown, “Actual Fund return,” provides information about actual account values and actual expenses. You may use the information in this section of the table, together with the amount you invested, to estimate the expenses that you paid over the period. Simply divide your account value by $1,000 (for example, an $8,600 account value divided by $1,000 = 8.6), then multiply the result by the number in the first section under the heading entitled “Expenses Paid During Period” to estimate the expenses you paid on your account during this period.
Hypothetical example for comparison purposes
The second section of the table shown, “Hypothetical 5% return,” provides information about hypothetical account values and hypothetical expenses based on the Fund’s actual expense ratio and an assumed rate of return of 5% per year before expenses, which is not the Fund’s actual return. The hypothetical account values and expenses may not be used to estimate the actual ending account balance or expenses you paid for the period. You may use this information to compare the ongoing costs of investing in the Fund and other funds. To do so, compare this 5% hypothetical example with the 5% hypothetical examples that appear in the shareholder reports of the other funds.
Please note that the expenses shown in the table are meant to highlight your ongoing costs only and do not reflect any transactional costs, such as sales charges (loads), redemption fees, or exchange fees. Therefore, the second section of the table is useful in comparing ongoing costs only, and will not help you determine the relative total costs of owning different funds. In addition, if these transactional costs were included, your costs would have been higher. The Fund’s expenses shown in the table reflect fee waivers in effect. The expenses shown in the table assume reinvestment of all dividends and distributions.
8
Delaware Inflation Protected Bond Fund
Expense analysis of an investment of $1,000
| | Beginning | | Ending | | | | | | | Expenses |
| | Account Value | | Account Value | | Annualized | | Paid During Period |
| | 2/1/13 | | 7/31/13 | | Expense Ratio | | 2/1/13 to 7/31/13* |
| Actual Fund return† | | | | | | | | | | | | | | | | | | | |
| Class A | | | $ | 1,000.00 | | | | $ | 906.30 | | | | 0.81 | % | | | | $3.83 | |
| Class B | | | | 1,000.00 | | | | | 906.00 | | | | 1.14 | % | | | | 5.39 | |
| Class C | | | | 1,000.00 | | | | | 904.10 | | | | 1.58 | % | | | | 7.46 | |
| Institutional Class | | | | 1,000.00 | | | | | 908.30 | | | | 0.58 | % | | | | 2.74 | |
| Hypothetical 5% return (5% return before expenses) | | | | | | | | | | |
| Class A | | | $ | 1,000.00 | | | | $ | 1,020.78 | | | | 0.81 | % | | | | $4.06 | |
| Class B | | | | 1,000.00 | | | | | 1,019.14 | | | | 1.14 | % | | | | 5.71 | |
| Class C | | | | 1,000.00 | | | | | 1,016.96 | | | | 1.58 | % | | | | 7.90 | |
| Institutional Class | | | | 1,000.00 | | | | | 1,021.92 | | | | 0.58 | % | | | | 2.91 | |
*“Expenses Paid During Period” are equal to the Fund’s annualized expense ratio, multiplied by the average account value over the period, multiplied by 181/365 (to reflect the one-half year period).
†Because actual returns reflect only the most recent six-month period, the returns shown may differ significantly from fiscal year returns.
9
Security type/sector allocation
Delaware Inflation Protected Bond Fund | As of July 31, 2013 (Unaudited) |
Sector designations may be different than the sector designations presented in other Fund materials. The sector designations may represent the investment manager’s internal sector classifications, which may result in the sector designations for one fund being different than another fund’s sector designations.
| Security type/sector | Percentage of net assets |
| Corporate Bonds | | 0.97 | % | |
| Non-Agency Asset-Backed Securities | | 16.55 | % | |
| Sovereign Bonds | | 8.22 | % | |
| U.S. Treasury Obligations | | 74.08 | % | |
| Short-Term Investments | | 0.24 | % | |
| Total Value of Securities | | 100.06 | % | |
| Liabilities Net of Receivables and Other Assets | | (0.06 | %) | |
| Total Net Assets | | 100.00 | % | |
10
Statement of net assets
Delaware Inflation Protected Bond Fund | July 31, 2013 |
| | | | | Principal amount° | | Value (U.S. $) |
| Corporate Bonds – 0.97% | | | | | | |
| JPMorgan Structured Products 6.00% 5/17/15 | BRL | | 2,419,000 | | $ | 2,551,980 |
| Total Corporate Bonds (cost $2,501,481) | | | | | | 2,551,980 |
| |
| Non-Agency Asset-Backed Securities – 16.55% | | | | | | |
| • | Ally Master Owner Trust Series 2011-1 A1 | | | | | | |
| 1.061% 1/15/16 | USD | | 3,000,000 | | | 3,007,269 |
| • | American Express Credit Account Master Trust | | | | | | |
| Series 2013-1 A 0.611% 2/16/21 | | | 1,345,000 | | | 1,345,000 |
| #• | Cabela’s Master Credit Card Trust Series 2012-1A | | | | | | |
| A2 144A 0.721% 2/18/20 | | | 3,000,000 | | | 3,015,183 |
| • | Chase Issuance Trust | | | | | | |
| Series 2012-A2 A2 0.461% 5/15/19 | | | 1,000,000 | | | 996,516 |
| Series 2012-A10 A10 0.451% 12/16/19 | | | 3,000,000 | | | 2,984,040 |
| Series 2013-A3 A3 0.471% 4/15/20 | | | 5,000,000 | | | 4,973,780 |
| #• | Chesapeake Funding Series 2012-2A | | | | | | |
| A 144A 0.636% 5/7/24 | | | 2,450,000 | | | 2,444,686 |
| • | Citibank Credit Card Issuance Trust | | | | | | |
| Series 2008-A6 A6 1.392% 5/22/17 | | | 5,000,000 | | | 5,092,800 |
| Series 2013-A1 A1 0.291% 4/24/17 | | | 3,200,000 | | | 3,195,914 |
| #• | Citibank Omni Master Trust Series 2009-A14A | | | | | | |
| A14 144A 2.941% 8/15/18 | | | 6,500,000 | | | 6,662,084 |
| • | Ford Credit Floorplan Master Owner Trust A Series | | | | | | |
| 2011-1 A2 0.791% 2/15/16 | | | 3,670,000 | | | 3,678,228 |
| • | Nissan Master Owner Trust Receivables Series | | | | | | |
| 2012-A A 0.661% 5/15/17 | | | 3,000,000 | | | 2,995,677 |
| #• | Volkswagen Credit Auto Master Trust Series | | | | | | |
| 2011-1A Note 144A 0.872% 9/20/16 | | | 3,275,000 | | | 3,300,751 |
| Total Non-Agency Asset Backed Securities | | | | | | |
| (cost $43,837,776) | | | | | | 43,691,928 |
| |
| ΔSovereign Bonds – 8.22% | | | | | | |
| Brazil – 3.79% | | | | | | |
| Brazil Notas do Tesouro Nacional Series B | | | | | | |
| 6.00% 5/15/15 | BRL | | 530,000 | | | 5,591,357 |
| 6.00% 8/15/20 | BRL | | 4,029 | | | 4,409,639 |
| | | | | | | 10,000,996 |
| Republic of Korea – 4.43% | | | | | | |
| Korea Treasury Inflation Linked Bond | | | | | | |
| 1.125% 6/10/23 | KRW | | 2,765,195,916 | | | 2,427,230 |
11
Statement of net assets
Delaware Inflation Protected Bond Fund
| | | Principal amount° | | Value (U.S. $) | |
| ΔSovereign Bonds (continued) | | | | | | | |
| Republic of Korea (continued) | | | | | | | |
| 2.75% 3/10/17 | KRW | | 8,065,893,920 | | $ | 7,554,320 | |
| 2.75% 6/10/20 | KRW | | 1,742,512,000 | | | 1,702,019 | |
| | | | | | | 11,683,569 | |
| Total Sovereign Bonds (cost $22,126,445) | | | | | | 21,684,565 | |
| |
| U.S. Treasury Obligations – 74.08% | | | | | | | |
| U.S. Treasury Inflation Indexed Bond | | | | | | | |
| 0.125% 4/15/18 | USD | | 7,809,830 | | | 8,067,312 | |
| ∞0.125% 1/15/23 | | | 55,793,622 | | | 54,440,195 | |
| 0.375% 7/15/23 | | | 28,527,930 | | | 28,464,398 | |
| 0.625% 2/15/43 | | | 3,647,520 | | | 3,035,849 | |
| 0.75% 2/15/42 | | | 26,803,660 | | | 23,345,371 | |
| 2.50% 1/15/29 | | | 40,838,647 | | | 50,348,008 | |
| U.S. Treasury Note 1.75% 5/15/23 | | | 30,000,000 | | | 27,827,340 | |
| Total U.S. Treasury Obligations | | | | | | | |
| (cost $202,958,761) | | | | | | 195,528,473 | |
| |
| Short-Term Investments – 0.24% | | | | | | | |
| Repurchase Agreements – 0.24% | | | | | | | |
| Bank of America 0.03%, dated 7/31/13, to | | | | | | | |
| be repurchased on 8/1/13, repurchase price | | | | | | | |
| $258,519 (collateralized by U.S. government | | | | | | | |
| obligations 0.75%-2.375% 2/28/15–10/31/17; | | | | | | | |
| market value $263,689) | | | 258,519 | | | 258,519 | |
| BNP Paribas 0.05%, dated 7/31/13, to be | | | | | | | |
| repurchased on 8/1/13, repurchase price | | | | | | | |
| $371,482 (collateralized by U.S. government | | | | | | | |
| obligations 0.25%-4.25% 6/30/14–5/15/23; | | | | | | | |
| market value $379,462) | | | 371,481 | | | 371,481 | |
| Total Short-Term Investments (cost $630,000) | | | | | | 630,000 | |
| |
| Total Value of Securities – 100.06% | | | | | | | |
| (cost $272,054,463) | | | | | | 264,086,946 | |
| «Liabilities Net of Receivables and | | | | | | | |
| Other Assets – (0.06%) | | | | | | (163,580 | ) |
| Net Assets Applicable to 28,720,051 | | | | | | | |
| Shares Outstanding – 100.00% | | | | | $ | 263,923,366 | |
12
| | | |
| | | | |
| Net Asset Value – Delaware Inflation Protected Bond Fund | | | |
| Class A ($106,686,074 / 11,606,500 Shares) | | | $9.19 | |
| Net Asset Value – Delaware Inflation Protected Bond Fund | | | |
| Class B ($324,333 / 35,396 Shares) | | | $9.16 | |
| Net Asset Value – Delaware Inflation Protected Bond Fund | | | |
| Class C ($47,628,951 / 5,212,099 Shares) | | | $9.14 | |
| Net Asset Value – Delaware Inflation Protected Bond Fund | | | |
| Institutional Class ($109,284,008 / 11,866,056 Shares) | | | $9.21 | |
| |
| Components of Net Assets at July 31, 2013: | | | |
| Shares of beneficial interest (unlimited authorization – no par) | $ | 303,161,214 | |
| Distributions in excess of net investment income | | (242,442 | ) |
| Accumulated net realized loss | | (31,369,791 | ) |
| Net unrealized depreciation of investments and derivatives | | (7,625,615 | ) |
| Total net assets | $ | 263,923,366 | |
° | Principal amount is stated in the currency in which each security is denominated. |
| • | Variable rate security. The rate shown is the rate as of July 31, 2013. Interest rates reset periodically. |
| # | Security exempt from registration under Rule 144A of the Securities Act of 1933, as amended. At July 31, 2013, the aggregate value of Rule 144A securities was $15,422,704, which represented 5.84% of the Fund’s net assets. See Note 10 in “Notes to financial statements.” |
| Δ | Securities have been classified by country of origin. |
| ∞ | Fully or partially pledged as collateral for futures contracts. |
| « | Includes foreign currency valued at $100 with a cost of $101, $1,499,894 payable for Fund shares redeemed, $821 Trustees’ fees payable, and $1,747,461 cash collateral for derivatives. |
| Net Asset Value and Offering Price Per Share – | | |
| Delaware Inflation Protected Bond Fund | | |
| Net asset value Class A (A) | | $9.19 |
| Sales charge (4.50% of offering price) (B) | | 0.43 |
| Offering price | | $9.62 |
| (A) | | Net asset value per share, as illustrated, is the amount which would be paid upon redemption or repurchase of shares. |
| (B) | | See the current prospectus for purchases of $100,000 or more. |
13
Statement of net assets
Delaware Inflation Protected Bond Fund
The following foreign currency exchange contracts, futures contracts and swap contracts were outstanding at July 31, 2013:1
Foreign Currency Exchange Contracts
| | | | | | | | | | | | | Unrealized |
| | | | | | | | | | | | | Appreciation |
| Counterparty | | | Contracts to Receive (Deliver) | | In Exchange For | | Settlement Date | | (Depreciation) |
| BAML | | | EUR | (11,066,484 | ) | | | USD | 14,443,654 | | 8/23/13 | | | $ | (277,588 | ) | |
| GSC | | | EUR | (4,007,389 | ) | | | USD | 5,230,044 | | 8/23/13 | | | | (100,804 | ) | |
| Total | | | | | | | | | | | | | | $ | (378,392 | ) | |
Futures Contract
| | | | | | | | Unrealized |
| | | | | | | | Appreciation |
| Contract to Buy (Sell) | | | Notional Cost | | Notional Value | | Expiration Date | | (Depreciation) |
| (360) U.S. Treasury 5 yr Note | | $(44,123,201) | | $(43,692,189) | | 10/4/13 | | $431,012 |
Swap Contracts
CDS Contracts2
| | | | | | Annual | | | | Unrealized |
| | | | Notional | | Protection | | Termination | | Appreciation |
| Counterparty | | Swap Referenced Obligation | | Value | | Payments | | Date | | (Depreciation) |
| | Protection Purchased: | | | | | | | | |
| GSC | | CDX.NA.HY.20 | | 3,500,000 | | 5.00% | | 6/20/18 | | | $ | (8,312 | ) | |
| ICE | | CDX.NA.HY.20 | | 2,000,000 | | 5.00% | | 6/20/18 | | | | (80,720 | ) | |
| MSC | | CDX.NA.HY.20 | | 6,250,000 | | 5.00% | | 6/20/18 | | | | (15,122 | ) | |
| Total | | | | | | | | | | | $ | (104,154 | ) | |
14
Inflation Swap Contracts3
| | | | | | | | Unrealized |
| | | | | | | | Appreciation |
| Notional Value | | | Expiration Date | | Description | | (Depreciation) |
| $ | 7,200,000 | | | 4/24/43 | | Agreement with Barclays to receive the notional amount multiplied by the non-revised CPI and to pay the notional amount multiplied by the fixed rate of 2.866%. | | | $ | (133,777 | ) | |
| 7,200,000 | | | 4/25/43 | | Agreement with Barclays to receive the notional amount multiplied by the non-revised CPI and to pay the notional amount multiplied by the fixed rate of 2.875%. | | | | (148,318 | ) | |
| 14,400,000 | | | 6/5/43 | | Agreement with Morgan Stanley to receive the notional amount multiplied by the non-revised CPI and to pay the notional amount multiplied by the fixed rate of 2.835%. | | | (131,174 | ) | |
| $ | 28,800,000 | | | | | | | | $ | (413,269 | ) | |
Interest Rate Swap Contracts4
| | | | | | | | | | | | Unrealized |
| Counterparty & Swap | | | Notional | | Fixed Interest | | Floating Interest | | Termination | | Appreciation |
| Referenced Obligation | | | Value | | Rate Paid | | Rate Received | | Date | | (Depreciation) |
| GSC 5 yr | | | $ | 18,100,000 | | 0.868% | | 0.264% | | 4/25/18 | | | $ | 498,224 | | |
| LCH 5 yr | | | | 18,100,000 | | 1.535% | | 0.273% | | 6/24/18 | | | | (8,121 | ) | |
| MSC 5 yr | | | | 18,100,000 | | 0.873% | | 0.265% | | 4/26/18 | | | | 494,959 | | |
| Total | | | $ | 54,300,000 | | | | | | | | | $ | 985,062 | | |
15
Statement of net assets
Delaware Inflation Protected Bond Fund
The use of foreign currency exchange contracts, futures contracts and swap contracts involves elements of market risk and risks in excess of the amounts disclosed in the financial statements. The notional values and foreign currency exchange contracts presented above represent the Fund’s total exposure in such contracts, whereas only the net unrealized appreciation (depreciation) is reflected in the Fund’s net assets.
1 See Note 8 in “Notes to financial statements.” |
2 A CDS contract is a risk-transfer instrument through which one party (purchaser of protection) transfers to another party (seller of protection) the financial risk of a credit event (as defined in the CDS agreement), as it relates to a particular reference security or basket of securities (such as an index). Periodic payments (receipts) on such contracts are accrued daily and recorded as unrealized losses (gains) on swap contracts. Upon payment (receipt), such amounts are recorded as realized losses (gains) on swap contracts. Upfront payments made or received in connection with CDS contracts are amortized over the expected life of the CDS contracts as unrealized losses (gains) on swap contracts. The change in value of CDS contracts is recorded as unrealized appreciation or depreciation daily. A realized gain or loss is recorded upon a credit event (as defined in the CDS agreement) or the maturity or termination of the agreement. |
3 An inflation swap contract is a commitment to pay a regular stream of inflation-indexed cash payments in exchange for receiving a stream of nominal interest payments, where both payment streams are based on notional amounts, between counterparties. The change in value of inflation swap contracts is recorded as unrealized appreciation or depreciation daily. A realized gain or loss is recorded on maturity or termination of the swap contract. |
4 An interest rate swap agreement is an exchange of interest rates between counterparties. Periodic payments on such contracts are accrued daily and recorded as unrealized appreciation/depreciation on swap contracts. Upon periodic payment/receipt or termination of the contract, such amounts are recorded as realized gains or losses on swap contracts. |
Summary of abbreviations:
BAML — Bank of America Merrill Lynch
BRL — Brazilian Real
CDS — Credit Default Swap
CDX.NA — Credit Default Swap Index North America
CPI — Consumer Price Index
EUR — European Monetary Unit
GSC — Goldman Sachs Capital
HY — High Yield
ICE — IntercontinentalExchange, Inc.
KRW — South Korean Won
LCH — LCH.Clearnet Limited
MSC — Morgan Stanley Capital
USD — United States Dollar
yr — Year
16
Statement of operations
Delaware Inflation Protected Bond Fund | July 31, 2013 |
| Investment Income: | | | | | | |
| Interest | | | | $ | 1,503,559 | |
| |
| Expenses: | | | | | | |
| Management fees | $ | 1,845,444 | | | | |
| Distribution expenses – Class A | | 454,207 | | | | |
| Distribution expenses – Class B | | 5,991 | | | | |
| Distribution expenses – Class C | | 796,926 | | | | |
| Dividend disbursing and transfer agent fees and expenses | | 651,197 | | | | |
| Accounting and administration expenses | | 159,139 | | | | |
| Registration fees | | 92,873 | | | | |
| Reports and statements to shareholders | | 69,267 | | | | |
| Legal fees | | 65,827 | | | | |
| Audit and tax | | 44,399 | | | | |
| Custodian fees | | 31,115 | | | | |
| Trustees’ fees | | 19,298 | | | | |
| Dues and services | | 10,330 | | | | |
| Insurance | | 8,693 | | | | |
| Consulting fees | | 5,240 | | | | |
| Pricing fees | | 3,365 | | | | |
| Trustees’ expenses | | 1,539 | | | 4,264,850 | |
| Less fees waived | | | | | (612,061 | ) |
| Less waived distribution expenses – Class B | | | | | (1,331 | ) |
| Less expense paid indirectly | | | | | (482 | ) |
| Total operating expenses | | | | | 3,650,976 | |
| Net Investment Loss | | | | | (2,147,417 | ) |
18
| Net Realized and Unrealized Gain (Loss): | | | |
| Net realized loss on: | | | |
| Investments | $ | (1,348,856 | ) |
| Foreign currencies | | (281,113 | ) |
| Foreign currency exchange contracts | | (4,484,843 | ) |
| Futures contracts | | (3,297,166 | ) |
| Swap contracts | | (4,102,572 | ) |
| Net realized loss | | (13,514,550 | ) |
| Net change in unrealized appreciation (depreciation) of: | | | |
| Investments | | (28,917,552 | ) |
| Foreign currencies | | (10,949 | ) |
| Foreign currency exchange contracts | | (190,219 | ) |
| Futures contracts | | 314,608 | |
| Swap contracts | | (248,206 | ) |
| Net change in unrealized appreciation (depreciation) | | (29,052,318 | ) |
| Net Realized and Unrealized Loss | | (42,566,868 | ) |
| |
| Net Decrease in Net Assets Resulting from Operations | $ | (44,714,285 | ) |
See accompanying notes, which are an integral part of the financial statements.
19
Statements of changes in net assets
Delaware Inflation Protected Bond Fund
| | Year Ended |
| | 7/31/13 | | 7/31/12 |
| Increase (Decrease) in Net Assets from Operations: | | | | | | | | |
| Net investment income (loss) | | $ | (2,147,417 | ) | | $ | 709,783 | |
| Net realized gain (loss) | | | (13,514,550 | ) | | | 39,798,232 | |
| Net change in unrealized appreciation (depreciation) | | | (29,052,318 | ) | | | (2,797,196 | ) |
| Net increase (decrease) in net assets resulting | | | | | | | | |
| from operations | | | (44,714,285 | ) | | | 37,710,819 | |
| |
| Dividends and Distributions to Shareholders from: | | | | | | | | |
| Net investment income: | | | | | | | | |
| Class A | | | (1,957,864 | ) | | | (4,063,661 | ) |
| Class B | | | (4,340 | ) | | | (9,592 | ) |
| Class C | | | (523,224 | ) | | | (963,926 | ) |
| Institutional Class | | | (1,631,163 | ) | | | (2,860,649 | ) |
| |
| Net realized gain: | | | | | | | | |
| Class A | | | (15,833,227 | ) | | | (8,169,883 | ) |
| Class B | | | (54,606 | ) | | | (37,345 | ) |
| Class C | | | (6,609,350 | ) | | | (3,398,410 | ) |
| Institutional Class | | | (11,814,965 | ) | | | (4,595,078 | ) |
| |
| Return of capital: | | | | | | | | |
| Class A | | | (14,911 | ) | | | — | |
| Class B | | | (50 | ) | | | — | |
| Class C | | | (5,977 | ) | | | — | |
| Institutional Class | | | (11,270 | ) | | | — | |
| | | (38,460,947 | ) | | | (24,098,544 | ) |
| |
| Capital Share Transactions: | | | | | | | | |
| Proceeds from shares sold: | | | | | | | | |
| Class A | | | 67,045,204 | | | | 147,524,149 | |
| Class B | | | — | | | | 115,815 | |
| Class C | | | 10,007,061 | | | | 23,023,991 | |
| Institutional Class | | | 69,941,512 | | | | 98,316,460 | |
| |
| Net asset value of shares issued upon reinvestment of | | | | | | | | |
| dividends and distributions: | | | | | | | | |
| Class A | | | 16,323,964 | | | | 10,372,676 | |
| Class B | | | 58,996 | | | | 46,585 | |
| Class C | | | 6,732,473 | | | | 3,931,858 | |
| Institutional Class | | | 12,118,017 | | | | 5,925,380 | |
| | | 182,227,227 | | | | 289,256,914 | |
20
| | Year Ended |
| | 7/31/13 | | 7/31/12 |
| Capital Share Transactions (continued): | | | | | | | | |
| Cost of shares redeemed: | | | | | | | | |
| Class A | | $ | (198,677,459 | ) | | $ | (94,503,620 | ) |
| Class B | | | (474,467 | ) | | | (442,417 | ) |
| Class C | | | (46,296,114 | ) | | | (25,462,044 | ) |
| Institutional Class | | | (105,805,890 | ) | | | (87,041,627 | ) |
| | | (351,253,930 | ) | | | (207,449,708 | ) |
| Increase (decrease) in net assets derived from | | | | | | | | |
| capital share transactions | | | (169,026,703 | ) | | | 81,807,206 | |
| Net Increase (Decrease) in Net Assets | | | (252,201,935 | ) | | | 95,419,481 | |
| |
| Net Assets: | | | | | | | | |
| Beginning of year | | | 516,125,301 | | | | 420,705,820 | |
| End of year (including undistributed (distributions in | | | | | | | | |
| excess of) net investment income of $(242,442) | | | | | | | | |
| and $2,860,185, respectively) | | $ | 263,923,366 | | | $ | 516,125,301 | |
See accompanying notes, which are an integral part of the financial statements.
21
Financial highlights
Delaware Inflation Protected Bond Fund Class A
Selected data for each share of the Fund outstanding throughout each period were as follows:
| Net asset value, beginning of period |
| |
| Income (loss) from investment operations: |
| Net investment income (loss)1 |
| Net realized and unrealized gain (loss) |
| Total from investment operations |
| |
| Less dividends and distributions from: |
| Net investment income |
| Net realized gain |
| Return of capital |
| Total dividends and distributions |
| |
| Net asset value, end of period |
| |
| Total return2 |
| |
| Ratios and supplemental data: |
| Net assets, end of period (000 omitted) |
| Ratio of expenses to average net assets |
| Ratio of expenses to average net assets |
| prior to fees waived |
| Ratio of net investment income (loss) to average net assets |
| Ratio of net investment income (loss) to average net assets |
| prior to fees waived |
| Portfolio turnover |
1 The average shares outstanding method has been applied for per share information. |
2 Total investment return is based on the change in net asset value of a share during the period and assumes reinvestment of dividends and distributions at net asset value and does not reflect the impact of a sales charge. Total investment return during all of the periods shown reflects a waiver by the manager. Performance would have been lower had the waiver not been in effect. |
See accompanying notes, which are an integral part of the financial statements.
22
| | Year Ended | |
| | 7/31/13 | | 7/31/12 | | 7/31/11 | | 7/31/10 | | 7/31/09 | |
| | $11.330 | | | $11.040 | | | $10.630 | | | $10.080 | | | $10.160 | | |
| | | | |
| | | | |
| | (0.048 | ) | | 0.025 | | | 0.291 | | | 0.314 | | | 0.124 | | |
| | (1.189 | ) | | 0.860 | | | 0.787 | | | 0.603 | | | (0.014 | ) | |
| | (1.237 | ) | | 0.885 | | | 1.078 | | | 0.917 | | | 0.110 | | |
| | | | |
| | | | |
| | (0.099 | ) | | (0.192 | ) | | (0.325 | ) | | (0.367 | ) | | (0.133 | ) | |
| | (0.803 | ) | | (0.403 | ) | | (0.343 | ) | | — | | | (0.057 | ) | |
| | (0.001 | ) | | — | | | — | | | — | | | — | | |
| | (0.903 | ) | | (0.595 | ) | | (0.668 | ) | | (0.367 | ) | | (0.190 | ) | |
| | | | |
| | $9.190 | | | $11.330 | | | $11.040 | | | $10.630 | | | $10.080 | | |
| | | | |
| | (11.80% | ) | | 8.35% | | | 10.55% | | | 9.25% | | | 1.12% | | |
| | | | |
| | | | |
| | $106,686 | | | $259,303 | | | $189,624 | | | $156,345 | | | $83,771 | | |
| | 0.82% | | | 0.81% | | | 0.80% | | | 0.78% | | | 0.75% | | |
| | | | |
| | 0.97% | | | 0.94% | | | 0.97% | | | 0.94% | | | 0.94% | | |
| | (0.46% | ) | | 0.23% | | | 2.72% | | | 3.00% | | | 1.27% | | |
| | | | |
| | (0.61% | ) | | 0.10% | | | 2.55% | | | 2.84% | | | 1.08% | | |
| | 322% | | | 225% | | | 157% | | | 118% | | | 188% | | |
23
Financial highlights
Delaware Inflation Protected Bond Fund Class B
Selected data for each share of the Fund outstanding throughout each period were as follows:
| Net asset value, beginning of period |
| |
| Income (loss) from investment operations: |
| Net investment income (loss)1 |
| Net realized and unrealized gain (loss) |
| Total from investment operations |
| |
| Less dividends and distributions from: |
| Net investment income |
| Net realized gain |
| Return of capital |
| Total dividends and distributions |
| |
| Net asset value, end of period |
| |
| Total return2 |
| |
| Ratios and supplemental data: |
| Net assets, end of period (000 omitted) |
| Ratio of expenses to average net assets |
| Ratio of expenses to average net assets |
| prior to fees waived |
| Ratio of net investment income (loss) to average net assets |
| Ratio of net investment income (loss) to average net assets |
| prior to fees waived |
| Portfolio turnover |
1 The average shares outstanding method has been applied for per share information. |
2 Total investment return is based on the change in net asset value of a share during the period and assumes reinvestment of dividends and distributions at net asset value and does not reflect the impact of a sales charge. Total investment return during all of the periods shown reflects a waiver by the manager and/or the distributor. Performance would have been lower had the waivers not been in effect. |
See accompanying notes, which are an integral part of the financial statements.
24
| | Year Ended | |
| | 7/31/13 | | 7/31/12 | | 7/31/11 | | 7/31/10 | | 7/31/09 | |
| | $11.310 | | | $11.030 | | | $10.620 | | | $10.020 | | | $10.160 | | |
| | | | |
| | | | |
| | (0.104 | ) | | (0.058 | ) | | 0.210 | | | 0.235 | | | 0.051 | | |
| | (1.178 | ) | | 0.857 | | | 0.789 | | | 0.600 | | | (0.014 | ) | |
| | (1.282 | ) | | 0.799 | | | 0.999 | | | 0.835 | | | 0.037 | | |
| | | | |
| | | | |
| | (0.064 | ) | | (0.116 | ) | | (0.246 | ) | | (0.235 | ) | | (0.120 | ) | |
| | (0.803 | ) | | (0.403 | ) | | (0.343 | ) | | — | | | (0.057 | ) | |
| | (0.001 | ) | | — | | | — | | | — | | | — | | |
| | (0.868 | ) | | (0.519 | ) | | (0.589 | ) | | (0.235 | ) | | (0.177 | ) | |
| | | | |
| | $9.160 | | | $11.310 | | | $11.030 | | | $10.620 | | | $10.020 | | |
| | | | |
| | (12.20% | ) | | 7.52% | | | 9.74% | | | 8.40% | | | 0.39% | | |
| | | | |
| | | | |
| | $324 | | | $861 | | | $1,121 | | | $1,806 | | | $1,886 | | |
| | 1.36% | | | 1.56% | | | 1.55% | | | 1.53% | | | 1.50% | | |
| | | | |
| | 1.73% | | | 1.69% | | | 1.72% | | | 1.69% | | | 1.69% | | |
| | (1.00% | ) | | (0.52% | ) | | 1.97% | | | 2.25% | | | 0.52% | | |
| | | | |
| | (1.37% | ) | | (0.65% | ) | | 1.80% | | | 2.09% | | | 0.33% | | |
| | 322% | | | 225% | | | 157% | | | 118% | | | 188% | | |
25
Financial highlights
Delaware Inflation Protected Bond Fund Class C
Selected data for each share of the Fund outstanding throughout each period were as follows:
| Net asset value, beginning of period |
| |
| Income (loss) from investment operations: |
| Net investment income (loss)1 |
| Net realized and unrealized gain (loss) |
| Total from investment operations |
| |
| Less dividends and distributions from: |
| Net investment income |
| Net realized gain |
| Return of capital |
| Total dividends and distributions |
| |
| Net asset value, end of period |
| |
| Total return2 |
| |
| Ratios and supplemental data: |
| Net assets, end of period (000 omitted) |
| Ratio of expenses to average net assets |
| Ratio of expenses to average net assets |
| prior to fees waived |
| Ratio of net investment income (loss) to average net assets |
| Ratio of net investment income (loss) to average net assets |
| prior to fees waived |
| Portfolio turnover |
1 The average shares outstanding method has been applied for per share information. |
2 Total investment return is based on the change in net asset value of a share during the period and assumes reinvestment of dividends and distributions at net asset value and does not reflect the impact of a sales charge. Total investment return during all of the periods shown reflects a waiver by the manager. Performance would have been lower had the waiver not been in effect. |
See accompanying notes, which are an integral part of the financial statements.
26
| | Year Ended | |
| | 7/31/13 | | 7/31/12 | | 7/31/11 | | 7/31/10 | | 7/31/09 | |
| | $11.310 | | | $11.030 | | | $10.620 | | | $10.020 | | | $10.160 | | |
| | | | |
| | | | |
| | (0.127 | ) | | (0.058 | ) | | 0.210 | | | 0.235 | | | 0.051 | | |
| | (1.175 | ) | | 0.857 | | | 0.789 | | | 0.600 | | | (0.014 | ) | |
| | (1.302 | ) | | 0.799 | | | 0.999 | | | 0.835 | | | 0.037 | | |
| | | | |
| | | | |
| | (0.064 | ) | | (0.116 | ) | | (0.246 | ) | | (0.235 | ) | | (0.120 | ) | |
| | (0.803 | ) | | (0.403 | ) | | (0.343 | ) | | — | | | (0.057 | ) | |
| | (0.001 | ) | | — | | | — | | | — | | | — | | |
| | (0.868 | ) | | (0.519 | ) | | (0.589 | ) | | (0.235 | ) | | (0.177 | ) | |
| | | | |
| | $9.140 | | | $11.310 | | | $11.030 | | | $10.620 | | | $10.020 | | |
| | | | |
| | (12.39% | ) | | 7.52% | | | 9.74% | | | 8.40% | | | 0.39% | | |
| | | | |
| | | | |
| | $47,629 | | | $93,561 | | | $89,740 | | | $71,866 | | | $40,352 | | |
| | 1.58% | | | 1.56% | | | 1.55% | | | 1.53% | | | 1.50% | | |
| | | | |
| | 1.73% | | | 1.69% | | | 1.72% | | | 1.69% | | | 1.69% | | |
| | (1.22% | ) | | (0.52% | ) | | 1.97% | | | 2.25% | | | 0.52% | | |
| | | | |
| | (1.37% | ) | | (0.65% | ) | | 1.80% | | | 2.09% | | | 0.33% | | |
| | 322% | | | 225% | | | 157% | | | 118% | | | 188% | | |
27
Financial highlights
Delaware Inflation Protected Bond Fund Institutional Class
Selected data for each share of the Fund outstanding throughout each period were as follows:
| Net asset value, beginning of period |
| |
| Income (loss) from investment operations: |
| Net investment income (loss)1 |
| Net realized and unrealized gain (loss) |
| Total from investment operations |
| |
| Less dividends and distributions from: |
| Net investment income |
| Net realized gain |
| Return of capital |
| Total dividends and distributions |
| |
| Net asset value, end of period |
| |
| Total return2 |
| |
| Ratios and supplemental data: |
| Net assets, end of period (000 omitted) |
| Ratio of expenses to average net assets |
| Ratio of expenses to average net assets |
| prior to fees waived |
| Ratio of net investment income (loss) to average net assets |
| Ratio of net investment income (loss) to average net assets |
| prior to fees waived |
| Portfolio turnover |
1 The average shares outstanding method has been applied for per share information. |
2 Total investment return is based on the change in net asset value of a share during the period and assumes reinvestment of dividends and distributions at net asset value. Total investment return during all of the periods shown reflects a waiver by the manager. Performance would have been lower had the waiver not been in effect. |
See accompanying notes, which are an integral part of the financial statements.
28
| | Year Ended | |
| | 7/31/13 | | 7/31/12 | | 7/31/11 | | 7/31/10 | | 7/31/09 | |
| | $11.340 | | | $11.040 | | | $10.630 | | | $10.100 | | | $10.160 | | |
| | | | |
| | | | |
| | (0.023 | ) | | 0.053 | | | 0.317 | | | 0.339 | | | 0.148 | | |
| | (1.192 | ) | | 0.867 | | | 0.788 | | | 0.603 | | | (0.014 | ) | |
| | (1.215 | ) | | 0.920 | | | 1.105 | | | 0.942 | | | 0.134 | | |
| | | | |
| | | | |
| | (0.111 | ) | | (0.217 | ) | | (0.352 | ) | | (0.412 | ) | | (0.137 | ) | |
| | (0.803 | ) | | (0.403 | ) | | (0.343 | ) | | — | | | (0.057 | ) | |
| | (0.001 | ) | | — | | | — | | | — | | | — | | |
| | (0.915 | ) | | (0.620 | ) | | (0.695 | ) | | (0.412 | ) | | (0.194 | ) | |
| | | | |
| | $9.210 | | | $11.340 | | | $11.040 | | | $10.630 | | | $10.100 | | |
| | | | |
| | (11.51% | ) | | 8.59% | | | 10.83% | | | 9.51% | | | 1.36% | | |
| | | | |
| | | | |
| | $109,284 | | | $162,400 | | | $140,221 | | | $42,418 | | | $95,132 | | |
| | 0.58% | | | 0.56% | | | 0.55% | | | 0.53% | | | 0.50% | | |
| | | | |
| | 0.73% | | | 0.69% | | | 0.72% | | | 0.69% | | | 0.69% | | |
| | (0.22% | ) | | 0.48% | | | 2.97% | | | 3.25% | | | 1.52% | | |
| | | | |
| | (0.37% | ) | | 0.35% | | | 2.80% | | | 3.09% | | | 1.33% | | |
| | 322% | | | 225% | | | 157% | | | 118% | | | 188% | | |
29
| Notes to financial statements | |
| Delaware Inflation Protected Bond Fund | July 31, 2013 |
Delaware Group® Government Fund (Trust) is organized as a Delaware statutory trust and offers two series: Delaware Core Plus Bond Fund and Delaware Inflation Protected Bond Fund. These financial statements and the related notes pertain to Delaware Inflation Protected Bond Fund (Fund). The Trust is an open-end investment company. The Fund is considered diversified under the Investment Company Act of 1940, as amended, and offers Class A, Class B, Class C, and Institutional Class shares. Class A shares are sold with a maximum front-end sales charge of 4.50%. Class A share purchases of $1,000,000 or more will incur a contingent deferred sales charge (CDSC) of 1.00% if redeemed during the first year and 0.50% during the second year, provided that Delaware Distributors, L.P. (DDLP) paid a financial advisor a commission on the purchase of those shares. Class B shares may be purchased only through dividend reinvestment and certain permitted exchanges. Prior to June 1, 2007, Class B shares were sold with a CDSC that declined from 4.00% to zero depending upon the period of time the shares were held. Class B shares will automatically convert to Class A shares on a quarterly basis approximately eight years after purchase. Class C shares are sold with a CDSC of 1.00%, if redeemed during the first twelve months. Institutional Class shares are not subject to a sales charge and are offered for sale exclusively to certain eligible investors.
The investment objective of the Fund is to seek to provide inflation protection and current income.
1. Significant Accounting Policies
The following accounting policies are in accordance with U.S. generally accepted accounting principles (U.S. GAAP) and are consistently followed by the Fund.
Security Valuation — Debt securities, credit default swap (CDS) contracts, inflation swap contracts, and interest rate swap contracts are valued based upon valuations provided by an independent pricing service or broker/counterparty and reviewed by management. To the extent current market prices are not available, the pricing service may take into account developments related to the specific security, as well as transactions in comparable securities. U.S. government securities are valued at the mean between the bid and ask prices, which approximates fair value. For asset-backed securities, collateralized mortgage obligations, commercial mortgage securities and U.S. government agency mortgage securities, pricing vendors utilize matrix pricing, which considers prepayment speed, attributes of the collateral, yield or price of bonds of comparable quality, coupon, maturity and type as well as broker/dealer-supplied prices. Swap prices are derived using daily swap curves and models that incorporate a number of market data factors, such as discounted cash flows, trades and values of the underlying reference instruments. Foreign currency exchange contracts and foreign cross currency exchange contracts are valued at the mean between the bid and ask prices, which approximates fair value. Interpolated values are derived when the settlement date of the contract is an interim date for which quotations are not available. Futures contracts and options on futures contracts are valued at the daily quoted settlement prices. Generally, other securities and assets for which market quotations are not readily available are valued at fair value as determined in good faith under the direction of
30
the Fund’s Board of Trustees (Board). In determining whether market quotations are readily available or fair valuation will be used, various factors will be taken into consideration, such as market closures or suspension of trading in a security.
Federal & Foreign Income Taxes — No provision for federal income taxes has been made as the Fund intends to continue to qualify for federal income tax purposes as a regulated investment company under Subchapter M of the Internal Revenue Code of 1986, as amended, and make the requisite distributions to shareholders. The Fund evaluates tax positions taken or expected to be taken in the course of preparing the Fund’s tax returns to determine whether the tax positions are “more-likely-than-not” of being sustained by the applicable tax authority. Tax positions not deemed to meet the “more-likely-than-not” threshold are recorded as a tax benefit or expense in the current year. Management has analyzed the Fund’s tax positions taken for all open federal income tax years (July 31, 2010–July 31, 2013) and has concluded that no provision for federal income tax is required in the Fund’s financial statements. In regard to foreign taxes only, the Fund has open tax years in certain foreign countries it invests in that may date back to the inception of the Fund.
Class Accounting — Investment income, common expenses and realized and unrealized gain (loss) on investments are allocated to the various classes of the Fund on the basis of daily net assets of each class. Distribution expenses relating to a specific class are charged directly to that class.
Repurchase Agreements — The Fund may purchase certain U.S. government securities subject to the counterparty’s agreement to repurchase them at an agreed upon date and price. The counterparty will be required on a daily basis to maintain the value of the collateral subject to the agreement at not less than the repurchase price (including accrued interest). The agreements are conditioned upon the collateral being deposited under the Federal Reserve book-entry system with the Fund’s custodian or a third-party sub-custodian. In the event of default or bankruptcy by the other party to the agreement, retention of the collateral may be subject to legal proceedings. All open repurchase agreements as of the date of this report were entered into on July 31, 2013.
To Be Announced Trades (TBA) — The Fund may contract to purchase securities for a fixed price at a transaction date beyond the customary settlement period (e.g., “when issued,” “delayed delivery,” “forward commitment,” or “TBA transactions”) consistent with the Fund’s ability to manage its investment portfolio and meet redemption requests. These transactions involve a commitment by the Fund to purchase securities for a predetermined price or yield with payment and delivery taking place more than three days in the future, or after a period longer than the customary settlement period for that type of security. No interest will be earned by the Fund on such purchases until the securities are delivered; however, the market value may change prior to delivery.
Inflation-Indexed Bonds — The Fund invests in inflation-indexed bonds. Inflation-indexed bonds are fixed income securities whose principal value is periodically adjusted to the rate of inflation. The interest rate on these bonds is generally fixed at issuance at a rate lower than
31
Notes to financial statements
Delaware Inflation Protected Bond Fund
1. Significant Accounting Policies (continued)
typical bonds. Over the life of an inflation-indexed bond, however, interest will be paid based on a principal value, which is adjusted for inflation. Any increase or decrease in the principal amount of an inflation-indexed bond will be included as interest income on the statement of operations, even though investors do not receive their principal until maturity.
Foreign Currency Transactions — Transactions denominated in foreign currencies are recorded at the prevailing exchange rates on the valuation date in accordance with the Fund’s prospectus. The value of all assets and liabilities denominated in foreign currencies is translated daily into U.S. dollars at the exchange rate of such currencies against the U.S. dollar. Transaction gains or losses resulting from changes in exchange rates during the reporting period or upon settlement of the foreign currency transaction are reported in operations for the current period. The Fund generally bifurcates that portion of realized gains and losses on investments in debt securities which is due to changes in foreign exchange rates from that which is due to changes in market prices of debt securities. That portion of gains (losses) is included in the statement of operations under the caption net realized loss on foreign currencies. The Fund reports certain foreign currency related transactions as components of realized gains (losses) for financial reporting purposes, whereas such components are treated as ordinary income (loss) for federal income tax purposes.
Use of Estimates — The preparation of financial statements in conformity with U.S. GAAP requires management to make estimates and assumptions that affect the fair value of investments, the reported amounts of assets and liabilities and disclosure of contingent assets and liabilities at the date of the financial statements and the reported amounts of revenues and expenses during the reporting period. Actual results could differ from those estimates and the differences could be material.
Other — Expenses directly attributable to the Fund are charged directly to the Fund. Other expenses common to various funds within the Delaware Investments® Family of Funds are generally allocated among such funds on the basis of average net assets. Management fees and some other expenses are paid monthly. Security transactions are recorded on the date the securities are purchased or sold (trade date) for financial reporting purposes. Costs used in calculating realized gains and losses on the sale of investment securities are those of the specific securities sold. Interest income is recorded on the accrual basis. Discounts and premiums on debt securities are amortized to interest income over the lives of the respective securities using the effective interest method. Realized gains (losses) on paydowns of mortgage- and asset-backed securities are classified as interest income. The Fund expects to declare and pay dividends from net investment income monthly and distributions from net realized gain on investments, if any, at least annually, usually in December. The Fund may distribute more frequently, if necessary for tax purposes. Dividends and distributions, if any, are recorded on the ex-dividend date.
32
The Fund may receive earnings credits from its custodian when positive cash balances are maintained, which are used to offset custody fees. There were no earnings credits for the year ended July 31, 2013.
The Fund receives earnings credits from its transfer agent when positive cash balances are maintained, which are used to offset transfer agent fees. If the amount earned is greater than one dollar, the expense paid under this arrangement is included in dividend disbursing and transfer agent fees and expenses on the statement of operations with the corresponding expense offset shown as “expense paid indirectly.” For the year ended July 31, 2013, the Fund earned $ 482 under this agreement.
2. Investment Management, Administration Agreements and Other Transactions with Affiliates
In accordance with the terms of its investment management agreement, the Fund pays Delaware Management Company (DMC), a series of Delaware Management Business Trust and the investment manager, an annual fee which is calculated daily at the rate of 0.45% on the first $500 million of average daily net assets of the Fund, 0.40% on the next $500 million, 0.35% on the next $1.5 billion, and 0.30% on average daily net assets in excess of $2.5 billion.
Effective Nov. 28, 2012, DMC has contractually agreed to waive that portion, if any, of its management fee and/or pay/reimburse the Fund to the extent necessary to ensure that total annual operating expenses (excluding any 12b-1 plan expenses, taxes, interest, inverse floater program expenses, short sale and dividend interest expenses, brokerage fees, certain insurance costs, and nonroutine expenses or costs including, but not limited to, those relating to reorganizations, litigation, conducting shareholder meetings, and liquidations (collectively, nonroutine expenses)), do not exceed 0.59% of average daily net assets of the Fund from Nov. 28, 2012 through Nov. 28, 2013. Prior to Nov. 28, 2012, DMC had contractually agreed to waive its management fees to the extent necessary to ensure that total annual expenses did not exceed 0.57% of average daily net assets of the Fund. For purposes of this waiver and reimbursement, nonroutine expenses may also include such additional costs and expenses, as may be agreed upon from time to time by the Fund’s Board and DMC. This expense waiver and reimbursement applies only to expenses paid directly by the Fund and may only be terminated by agreement of DMC and the Fund.
Delaware Service Company, Inc. (DSC), an affiliate of DMC, provides fund accounting and financial administration oversight services to the Fund. For these services, the Fund pays DSC fees based on the aggregate daily net assets of the Delaware Investments® Family of Funds at the following annual rate: 0.0050% of the first $30 billion; 0.0045% of the next $10 billion; 0.0040% of the next $10 billion; and 0.0025% of aggregate average daily net assets in excess of $50 billion. The fees payable to DSC under the service agreement described above are allocated among all Funds in the Delaware Investments Family of Funds on a relative net asset value basis. For the year ended July 31, 2013, the Fund was charged $19,908 for these services.
33
Notes to financial statements
Delaware Inflation Protected Bond Fund
2. Investment Management, Administration Agreements and Other Transactions with Affiliates (continued)
DSC is also the transfer agent and dividend disbursing agent of the Fund. The Fund pays DSC a monthly asset-based fee for these services. Pursuant to a sub-transfer agency agreement between DSC and BNY Mellon Investment Servicing (US) Inc. (BNYMIS), BNYMIS provides certain sub-transfer agency services to the Fund. Sub-transfer agency fees are passed on to and paid directly by the Fund.
Pursuant to a distribution agreement and distribution plan, the Fund pays DDLP, the distributor and an affiliate of DMC, an annual distribution and service fee not to exceed 0.25% of the average daily net assets of the Class A shares and 1.00% of the average daily net assets of the Class B and C shares. Institutional Class shares pay no distribution and service expenses. Effective March 1, 2013, DDLP has contracted to waive distribution and service fees through Feb. 28, 2014 in order to prevent distribution and service fees of Class B shares from exceeding 0.25% of average daily net assets.
At July 31, 2013, the Fund had liabilities payable to affiliates as follows:
| Investment management fees payable to DMC | $ | 89,513 |
| Dividend disbursing, transfer agent and fund accounting | | |
| oversight fees and other expenses payable to DSC | | 6,275 |
| Distribution fees payable to DDLP | | 67,159 |
| Other expenses payable to DMC and affiliates* | | 35,981 |
*DMC, as part of its administrative services, pays operating expenses on behalf of the Fund and is reimbursed on a periodic basis. Expenses include items such as printing of shareholder reports, legal and tax services, registration fees and trustees’ fees.
As provided in the investment management agreement, the Fund bears the cost of certain legal and tax services, including internal legal and tax services provided to the Fund by DMC and/or its affiliates’ employees. For the year ended July 31, 2013, the Fund was charged $12,363 for internal legal and tax services provided by DMC and/or its affiliates’ employees.
For the year ended July 31, 2013, DDLP earned $15,670 for commissions on sales of the Fund’s Class A shares. For the year ended July 31, 2013, DDLP received gross CDSC commissions of $1, $123 and $2,087 on redemptions of the Fund’s Class A, Class B and Class C shares, respectively, and these commissions were entirely used to offset up-front commissions previously paid by DDLP to broker-dealers on sales of those shares.
Trustees’ fees include expenses accrued by the Fund for each Trustee’s retainer and meeting fees. Certain officers of DMC, DSC, and DDLP are officers and/or Trustees of the Trust. These officers and Trustees are paid no compensation by the Fund.
34
3. Investments
For the year ended July 31, 2013, the Fund made purchases of $318,898,547 and sales of $ 334,920,307 of investment securities other than U.S. government securities and short-term investments. For the year ended July 31, 2013, the Fund made purchases of $968,769,019 and sales of $1,161,262,985 of long-term U.S. government securities.
At July 31, 2013, the cost of investments for federal income tax purposes was $282,784,596. At July 31, 2013, net unrealized depreciation was $18,697,650, of which $2,217,554 related to unrealized appreciation of investments and $20,915,204 related to unrealized depreciation of investments.
U.S. GAAP defines fair value as the price that the Fund would receive to sell an asset or pay to transfer a liability in an orderly transaction between market participants at the measurement date under current market conditions. A three-level hierarchy for fair value measurements has been established based upon the transparency of inputs to the valuation of an asset or liability. Inputs may be observable or unobservable and refer broadly to the assumptions that market participants would use in pricing the asset or liability. Observable inputs reflect the assumptions market participants would use in pricing the asset or liability based on market data obtained from sources independent of the reporting entity. Unobservable inputs reflect the reporting entity’s own assumptions about the assumptions that market participants would use in pricing the asset or liability developed based on the best information available under the circumstances. The Fund’s investment in its entirety is assigned a level based upon the observability of the inputs which are significant to the overall valuation. The three-level hierarchy of inputs is summarized below.
Level 1 | – | inputs are quoted prices in active markets for identical investments (e.g., equity securities, open-end investment companies, futures contracts, exchange-traded options contracts) |
| | |
Level 2 | – | other observable inputs (including, but not limited to: quoted prices for similar assets or liabilities in markets that are active, quoted prices for identical or similar assets or liabilities in markets that are not active, inputs other than quoted prices that are observable for the assets or liabilities (such as interest rates, yield curves, volatilities, prepayment speeds, loss severities, credit risks and default rates) or other market-corroborated inputs) (e.g., debt securities, government securities, swap contracts, foreign currency exchange contracts, foreign securities utilizing international fair value pricing, broker-quoted securities, fair valued securities) |
| | |
Level 3 | – | inputs are significant unobservable inputs (including the Fund’s own assumptions used to determine the fair value of investments) (e.g., broker-quoted securities, fair valued securities) |
35
Notes to financial statements
Delaware Inflation Protected Bond Fund
3. Investments (continued)
Level 3 investments are valued using significant unobservable inputs. The Fund may also use an income-based valuation approach in which the anticipated future cash flows of the investment are discounted to calculate fair value. Discounts may also be applied due to the nature or duration of any restrictions on the disposition of the investments. Valuations may also be based upon current market prices of securities that are comparable in coupon, rating, maturity and industry. The derived value of a Level 3 investment may not represent the value which is received upon disposition and this could impact the results of operations.
The following table summarizes the valuation of the Fund’s investments by fair value hierarchy levels as of July 31, 2013:
| Level 1 | | Level 2 | | Level 3 | | Total |
| Agency, Asset-Backed & | | | | | | | | | | | | | |
| Mortgage-Backed Securities | $ | — | | $ | 43,691,928 | | | $ | — | | $ | 43,691,928 | |
| Corporate Debt | | — | | | — | | | | 2,551,980 | | | 2,551,980 | |
| Foreign Debt | | — | | | 21,684,565 | | | | — | | | 21,684,565 | |
| U.S. Treasury Obligations | | — | | | 195,528,473 | | | | — | | | 195,528,473 | |
| Short-Term Investments | | — | | | 630,000 | | | | — | | | 630,000 | |
| Total | $ | — | | $ | 261,534,966 | | | $ | 2,551,980 | | $ | 264,086,946 | |
| |
| Foreign Currency | | | | | | | | | | | | | |
| Exchange Contracts | $ | — | | $ | (378,392 | ) | | $ | — | | $ | (378,392 | ) |
| Futures contract | $ | 431,012 | | $ | — | | | $ | — | | $ | 431,012 | |
| Swap Contracts | $ | — | | $ | 467,639 | | | $ | — | | $ | 467,639 | |
During the year ended July 31, 2013, there were no transfers between Level 1 investments, Level 2 investments or Level 3 investments that had a significant impact to the Fund. The Fund’s policy is to recognize transfers between levels at the beginning of the reporting period.
36
4. Dividend and Distribution Information
Income and long-term capital gain distributions are determined in accordance with federal income tax regulations, which may differ from U.S. GAAP. Additionally, distributions from net gains on foreign currency transactions and net short-term gains on sales of investment securities are treated as ordinary income for federal income tax purposes. The tax character of dividends and distributions paid during the years ended July 31, 2013 and 2012 was as follows:
| Year Ended |
| 7/31/13 | | 7/31/12 |
| Ordinary income | $ | 29,645,157 | | $ | 12,480,661 |
| Long-term capital gains | | 8,783,582 | | | 11,617,883 |
| Return of capital | | 32,208 | | | — |
| Total | $ | 38,460,947 | | $ | 24,098,544 |
5. Components of Net Assets on a Tax Basis
As of July 31, 2013, the components of net assets on a tax basis were as follows:
| Shares of beneficial interest | $ | 303,161,214 | |
| Qualified late year loss deferred | | (20,634,865 | ) |
| Unrealized depreciation | | (18,602,983 | ) |
| Net assets | $ | 263,923,366 | |
The differences between book basis and tax basis components of the net assets are primarily attributable to tax deferral of losses on wash sales, tax deferral of losses on straddles, mark-to-market of future contracts, mark-to-market of forward foreign currency contracts, tax treatment of CDS contracts, and tax treatment of market discount and premium on debt instruments.
Qualified late year losses represent losses realized on investment transactions from Nov. 1, 2012 through July 31, 2013 that, in accordance with federal income tax regulations, the Fund has elected to defer and treat as having arisen in the following fiscal year.
For financial reporting purposes, capital accounts are adjusted to reflect the tax character of permanent book/tax differences. Reclassifications are primarily due to tax treatment of net operating losses, tax treatment of gain (loss) on foreign currency transactions, tax treatment of U.S. Treasury Inflation-Indexed Securities deflationary adjustments, market discount and premium on debt instruments, paydowns of mortgage- and asset-backed securities and tax treatment of CDS contracts. Results of operations and net assets were not affected by these reclassifications. For the year ended July 31, 2013, the Fund recorded the following reclassifications.
| Distributions in excess of net investment income | $ | 3,161,381 | |
| Accumulated net realized loss | | (1,191,171 | ) |
| Paid-in capital | | (1,970,210 | ) |
37
Notes to financial statements
Delaware Inflation Protected Bond Fund
6. Capital Shares
Transactions in capital shares were as follows:
| Year Ended |
| 7/31/13 | | | 7/31/12 | |
| Shares sold: | | | | | |
| Class A | 6,308,439 | | | 13,301,451 | |
| Class B | — | | | 10,495 | |
| Class C | 938,451 | | | 2,087,039 | |
| Institutional Class | 6,627,766 | | | 8,935,907 | |
| |
| Shares issued upon reinvestment of dividends and distributions: | | | | | |
| Class A | 1,576,996 | | | 959,928 | |
| Class B | 5,717 | | | 4,328 | |
| Class C | 652,371 | | | 364,852 | |
| Institutional Class | 1,170,367 | | | 547,719 | |
| 17,280,107 | | | 26,211,719 | |
| |
| Shares redeemed | | | | | |
| Class A | (19,166,367 | ) | | (8,551,910 | ) |
| Class B | (46,480 | ) | | (40,364 | ) |
| Class C | (4,647,848 | ) | | (2,317,692 | ) |
| Institutional Class | (10,258,132 | ) | | (7,856,787 | ) |
| (34,118,827 | ) | | (18,766,753 | ) |
| Net increase (decrease) | (16,838,720 | ) | | 7,444,966 | |
For the years ended July 31, 2013 and 2012, 18,091 Class B shares were converted to 18,045 Class A shares valued at $186,379 and 19,473 Class B shares were converted to 19,424 Class A shares valued at $213,416, respectively. The respective amounts are included in Class B redemptions and Class A subscriptions in the table above and the statements of changes in net assets.
7. Line of Credit
The Fund, along with certain other funds in the Delaware Investments® Family of Funds (Participants), was a participant in a $125,000,000 revolving line of credit to be used for temporary or emergency purposes as an additional source of liquidity to fund redemptions of investor shares. Under the agreement, the Participants were charged an annual commitment fee, which was allocated across the Participants on the basis of each Participant’s allocation of the entire facility. The Participants were permitted to borrow up to a maximum of one third of their net assets under the agreement. Each Participant was individually, and not jointly, liable for its particular advances, if any, under the line of credit. The line of credit under the agreement expired on Nov. 13, 2012.
38
On Nov. 13, 2012, the Fund, along with the other Participants, entered into an amendment to the agreement for a $125,000,000 revolving line of credit. The line of credit is to be used as described above and operates in substantially the same manner as the original agreement. The line of credit under the agreement expires on Nov. 12, 2013. The Fund had no amounts outstanding as of July 31, 2013, or at any time during the year then ended.
8. Derivatives
U.S. GAAP requires disclosures that enable investors to understand: 1) how and why an entity uses derivatives; 2) how they are accounted for; and 3) how they affect an entity’s results of operations and financial position.
Foreign Currency Exchange Contracts — The Fund may enter into foreign currency exchange contracts and foreign cross currency exchange contracts as a way of managing foreign exchange rate risk. The Fund may enter into these contracts to fix the U.S. dollar value of a security that it has agreed to buy or sell for the period between the date the trade was entered into and the date the security is delivered and paid for. The Fund may also use these contracts to hedge the U.S. dollar value of securities it already owns that are denominated in foreign currencies. The change in value is recorded as an unrealized gain or loss. When the contract is closed, a realized gain or loss is recorded equal to the difference between the value of the contract at the time it was opened and the value at the time it was closed.
The use of foreign currency exchange contracts and foreign cross currency exchange contracts does not eliminate fluctuations in the underlying prices of the securities, but does establish a rate of exchange that can be achieved in the future. Although foreign currency exchange contracts limit the risk of loss due to an unfavorable change in the value of the hedged currency, they also limit any potential gain that might result should the value of the currency change favorably. In addition, the Fund could be exposed to risks if the counterparties to the contracts are unable to meet the terms of their contracts. The Fund’s maximum risk of loss from counterparty credit risk is the value of its currency exchanged with the counterparty. The risk is generally mitigated by having a netting arrangement between the Fund and the counterparty and by the posting of collateral by the counterparty to the Fund to cover the Fund’s exposure to the counterparty.
Future Contracts — A futures contract is an agreement in which the writer (or seller) of the contract agrees to deliver to the buyer an amount of cash or securities equal to a specific dollar amount times the difference between the value of a specific security or index at the close of the last trading day of the contract and the price at which the agreement is made. The Fund may use futures in the normal course of pursuing its investment objective. The Fund may invest in futures contracts to hedge its existing portfolio securities against fluctuations in fair value caused by changes in prevailing market interest rates. Upon entering into a futures contract, the Fund deposits cash or pledges U.S. government securities to a broker, equal to the minimum “initial margin” requirements of the exchange on which the contract is traded. Subsequent payments are received from the broker or paid to the broker each day, based on the daily fluctuation in the market value of the contract. These receipts or payments are known as “variation margin” and
39
Notes to financial statements
Delaware Inflation Protected Bond Fund
8. Derivatives (continued)
are recorded daily by the Fund as unrealized gains or losses until the contracts are closed. When the contracts are closed, the Fund records a realized gain or loss equal to the difference between the value of the contract at the time it was opened and the value at the time it was closed. Risks of entering into futures contracts include potential imperfect correlation between the futures contracts and the underlying securities and the possibility of an illiquid secondary market for these instruments. When investing in futures, there is reduced counterparty credit risk to the Fund because futures are exchange-traded and the exchange’s clearinghouse, as counterparty to all exchange-traded futures, guarantees against default.
Options Contracts — During the year ended July 31, 2013, the Fund entered into options contracts in the normal course of pursuing its investment objective. The Fund may buy or write options contracts for any number of reasons, including without limitation: to manage the Fund’s exposure to changes in securities prices and foreign currencies; as an efficient means of adjusting the Fund’s overall exposure to certain markets; to protect the value of portfolio securities; and as a cash management tool. The Fund may buy or write call or put options on securities, futures, swaps “swaptions,” financial indices, and foreign currencies. When the Fund buys an option, a premium is paid and an asset is recorded and adjusted on a daily basis to reflect the current market value of the option purchased. When the Fund writes an option, a premium is received and a liability is recorded and adjusted on a daily basis to reflect the current market value of the option written. Premiums received from writing options that expire unexercised are treated by the Fund on the expiration date as realized gains. The difference between the premium received and the amount paid on effecting a closing purchase transaction, including brokerage commissions, is treated as realized gain or loss. If a call option is exercised, the premium is added to the proceeds from the sale of the underlying security in determining whether the Fund has a realized gain or loss. If a put option is exercised, the premium reduces the cost basis of the securities purchased by the Fund. The Fund, as writer of an option, bears the market risk of an unfavorable change in the price of the security underlying the written option. When writing options, the Fund is subject to minimal counterparty risk because the counterparty is only obligated to pay premiums and does not bear the market risk of an unfavorable market change. No options written were outstanding at July 31, 2013.
Swap Contracts — The Fund may enter into interest rate swap contracts, inflation swap contracts and CDS contracts in the normal course of pursuing its investment objectives. The Fund may use interest rate swaps to adjust the Fund’s sensitivity to interest rates or to hedge against changes in interest rates. The Fund may use inflation swaps to hedge the inflation risk in nominal bonds, thereby creating synthetic inflation-indexed bonds. The Fund may enter into CDS contracts in order to hedge against a credit event, to enhance total return or to gain exposure to certain securities or markets. The Fund will not be permitted to enter into any swap transactions
40
unless, at the time of entering into such transactions, the unsecured long-term debt of the actual counterparty, combined with any credit enhancements, is rated at least BBB- by Standard & Poor’s (S&P) or Baa3 by Moody’s Investors Service (Moody’s) or is determined to be of equivalent credit quality by the Manager.
Interest Rate Swaps. An interest rate swap contract is an exchange of interest rates between counterparties. In one instance, an interest rate swap involves payments received by the Fund from another party based on a variable or floating interest rate, in return for making payments based on a fixed interest rate. An interest rate swap can also work in reverse with the Fund receiving payments based on a fixed interest rate and making payments based on a variable or floating interest rate. Interest rate swaps may be used to adjust the Fund’s sensitivity to interest rates or to hedge against changes in interest rates. Periodic payments on such contracts are accrued daily and recorded as unrealized appreciation/depreciation on swap contracts. Upon periodic payment/receipt or termination of the contract, such amounts are recorded as realized gains or losses on swap contracts. The Fund’s maximum risk of loss from counterparty credit risk is the discounted net value of the cash flows to be received from/paid to the counterparty over the interest rate swap contract’s remaining life, to the extent that the amount is positive. This risk is mitigated by (1) having a netting arrangement between the Fund and the counterparty and by the posting of collateral by the counterparty to the Fund to cover the Fund’s exposure to the counterparty for trades entered prior to June 10, 2013, and (2) trading these instruments through a central counterparty for trades entered on or after June 10, 2013.
Inflation Swaps. Inflation swap agreements involve commitments to pay a regular stream of inflation-indexed cash payments in exchange for receiving a stream of nominal interest payments (or vice versa), where both payment streams are based on notional amounts. The nominal interest payments may be based on either a fixed interest rate or variable interest rate such as the London Interbank Offered Rate (LIBOR). The change in value of swap contracts outstanding, if any, is recorded as unrealized appreciation or depreciation daily. A realized gain or loss is recorded on maturity or termination of the swap contract. The Fund’s maximum risk of loss from counterparty credit risk is the discounted net value of the cash flows to be received from/paid to the counterparty over the index swap contract’s remaining life, to the extent that the amount is positive. This risk is mitigated by having a netting arrangement between the Fund and the counterparty and by the posting of collateral by the counterparty to the Fund to cover the Fund’s exposure to the counterparty.
Credit Default Swaps. A CDS contract is a risk-transfer instrument through which one party (purchaser of protection) transfers to another party (seller of protection) the financial risk of a credit event (as defined in the CDS agreement), as it relates to a particular reference security or basket of securities (such as an index). In exchange for the protection offered by the seller of protection, the purchaser of protection agrees to pay the seller of protection a periodic amount at
41
Notes to financial statements
Delaware Inflation Protected Bond Fund
8. Derivatives (continued)
a stated rate that is applied to the notional amount of the CDS contract. In addition, an upfront payment may be made or received by the Fund in connection with an unwinding or assignment of a CDS contract. Upon the occurrence of a credit event, the seller of protection would pay the par (or other agreed-upon) value of the referenced security (or basket of securities) to the counterparty. Credit events generally include, among others, bankruptcy, failure to pay and obligation default.
During the year ended July 31, 2013, the Fund entered into CDS contracts as a purchaser of protection. Periodic payments (receipts) on such contracts are accrued daily and recorded as unrealized losses (gains) on swap contracts. Upon payment (receipt), such amounts are recorded as realized losses (gains) on swap contracts. Upfront payments made or received in connection with CDS contracts are amortized over the expected life of the CDS contracts as unrealized losses (gains) on swap contracts. The change in value of CDS contracts is recorded as unrealized appreciation or depreciation daily. A realized gain or loss is recorded upon a credit event (as defined in the CDS agreement) or the maturity or termination of the agreement. For trades prior to June 10, 2013, the Fund had posted $890,000 as collateral for certain open derivatives. Initial margin and variation margin is posted to central counterparties for CDS basket trades submitted on or after June 10, 2013, as determined by the applicable central counterparty. The Fund had posted $697,461 as collateral for these derivatives. The Fund received collateral of $ 160,000 in return for certain open derivatives.
CDS may involve greater risks than if the Fund had invested in the referenced obligation directly. CDS contracts are subject to general market risk, liquidity risk, counterparty risk and credit risk. The Fund’s maximum risk of loss from counterparty credit risk, either as the seller of protection or the buyer of protection, is the fair value of the contract. This risk is mitigated by (1) having a netting arrangement between the Fund and the counterparty and by the posting of collateral by the counterparty to the Fund to cover the Fund’s exposure to the counterparty for trades entered prior to June 10, 2013, and (2) trading these instruments through a central counterparty for trades entered on or after June 10, 2013.
Swaps Generally. The value of open swaps may differ from that which would be realized in the event the Fund terminated its position in the agreement. Risks of entering into these contracts include the potential inability of the counterparty to meet the terms of the contracts. This type of risk is generally limited to the amount of favorable movement in the value of the underlying security, instrument or basket of instruments, if any, at the day of default. Risks also arise from potential losses from adverse market movements and such losses could exceed the unrealized amounts shown on the statement of net assets.
42
Fair value of derivative instruments as of July 31, 2013 was as follows:
| | Asset Derivatives | | Liability Derivatives |
| | Statement of Net | | | | | Statement of Net | | | | |
| | Assets Location | | Fair Value | | Assets Location | | Fair Value |
| Forward currency exchange | | | | | | | | | | | |
| contracts (Foreign currency | | | | | | | | | | | |
| exchange contracts) | | Liabilities net of receivables and other assets | | $ | — | | Liabilities net of receivables and other assets | | $ | (378,392 | ) |
| Interest rate contracts | | | | | | | | | | | |
| (Futures contracts, inflation and | | | | | | | | | | | |
| interest rate swap contracts) | | Liabilities net of receivables and other assets | | | 1,424,195 | * | Liabilities net of receivables and other assets | | | (421,390 | ) |
| Credit contracts | | | | | | | | | | | |
| (CDS contracts) | | Liabilities net of receivables and other assets | | | — | | Liabilities net of receivables and other assets | | | (104,154 | ) |
| Total | | | | $ | 1,424,195 | | | | $ | (903,936 | ) |
*Includes cumulative appreciation of futures contracts from the date the contracts are opened through July 31, 2013.
43
Notes to financial statements
Delaware Inflation Protected Bond Fund
8. Derivatives (continued)
The effect of derivative instruments on the statement of operations for the year ended July 31, 2013 was as follows:
| | | | Realized | | Change in
Unrealized Appreciation |
| | | | Gain (Loss) | | (Depreciation) |
| | Location of Gain (Loss) on | | on Derivatives | | on Derivatives |
| | Derivatives Recognized in | | Recognized in | | Recognized in |
| | Income | | Income | | Income |
| Forward currency | | | | | | | | | | | |
| exchange contracts | | | | | | | | | | | |
| (Foreign currency | | | | | | | | | | | |
| exchange contracts) | | Net realized loss on foreign currency exchange contracts and net change in unrealized appreciation (depreciation) of foreign currency exchange contracts | | $ | (4,484,843 | ) | | | $ | (190,219 | ) |
| Interest rate contracts | | | | | | | | | | | |
| (Futures contracts, inflation and | | | | | | | | | | | |
| interest rate swap contracts) | | Net realized loss on futures contracts/net realized loss on swap contracts and net change in unrealized appreciation (depreciation) of futures contracts/net change in unrealized appreciation (depreciation) of swap contracts | | | (3,271,947 | ) | | | | 886,401 | |
| Credit contracts | | | | | | | | | | | |
| (CDS contracts) | | Net realized loss on swap contracts and net change in unrealized appreciation (depreciation) of swap contracts | | | (4,127,791 | ) | | | | (819,999 | ) |
| Total | | | | $ | (11,884,581 | ) | | | $ | (123,817 | ) |
44
Derivatives Generally. The table below summarizes the average balance of derivative holdings by the Fund during the year ended July 31, 2013.
| Long | | Short |
| Derivative | | Derivative |
| Volume | | Volume |
| Foreign currency exchange contracts (average cost) | USD | 1,906,612 | | USD | 35,951,862 |
| Futures contracts (average notional value) | | 9,314,008 | | | 23,696,116 |
| Options contracts (average notional value) | | 14,380 | | | — |
| CDS contracts (average notional value)* | | 4,259,603 | | | — |
| EUR | 10,748,294 | | | — |
| Inflation contracts (average notional value) | USD | 6,314,286 | | | — |
| Interest rate contracts (average notional value) | | 11,851,191 | | | — |
*Long represents buying protection and short represents selling protection.
9. Securities Lending
The Fund, along with other funds in the Delaware Investments® Family of Funds, may lend its securities pursuant to a security lending agreement (Lending Agreement) with The Bank of New York Mellon (BNY Mellon). At the time a security is loaned, the borrower must post collateral equal to the required percentage of the market value of the loaned security, including any accrued interest. The required percentage is: (i) 102% with respect to U.S. securities and foreign securities that are denominated and payable in U.S. dollars; and (ii) 105% with respect to foreign securities. With respect to each loan, if on any business day the aggregate market value of securities collateral plus cash collateral held is less than the aggregate market value of the securities which are the subject of such loan, the borrower will be notified to provide additional collateral by the end of the following business day which, together with the collateral already held, will be not less than the applicable initial collateral requirements for such security loan. If the aggregate market value of securities collateral and cash collateral held with respect to a security loan exceeds the applicable initial collateral requirement, upon the request of the borrower BNY Mellon must return enough collateral to the borrower by the end of the following business day to reduce the value of the remaining collateral to the applicable initial collateral requirement for such security loan. As a result of the foregoing, the value of the collateral held with respect to a loaned security may be temporarily more or less than the value of the security on loan.
Cash collateral received is generally invested in the Delaware Investments Collateral Fund No. 1 (the “Collective Trust”) established by BNY Mellon for the purpose of investment on behalf of funds managed by DMC that participate in BNY Mellon’s securities lending program. The Collective Trust may invest in U.S. government securities and high-quality corporate debt, asset-backed and other money market securities and in repurchase agreements collateralized by such securities, provided that the Collective Trust will generally have a dollar-weighted average portfolio maturity of 60 days or less. The Fund can also accept U.S. government securities and letters of credit (non-cash collateral) in connection with securities loans. In the event of default or bankruptcy by the lending agent, realization and/or retention of the collateral may be subject
45
Notes to financial statements
Delaware Inflation Protected Bond Fund
9. Securities Lending (continued)
to legal proceedings. In the event the borrower fails to return loaned securities and the collateral received is insufficient to cover the value of the loaned securities and provided such collateral shortfall is not the result of investment losses, the lending agent has agreed to pay the amount of the shortfall to the Fund or, at the discretion of the lending agent, replace the loaned securities. The Fund continues to record dividends or interest, as applicable, on the securities loaned and is subject to changes in value of the securities loaned that may occur during the term of the loan. The Fund has the right under the Lending Agreement to recover the securities from the borrower on demand. With respect to security loans collateralized by non-cash collateral, the Fund receives loan premiums paid by the borrower. With respect to security loans collateralized by cash collateral, the earnings from the collateral investments are shared among the Fund, the security lending agent and the borrower. The Fund records security lending income net of allocations to the security lending agent and the borrower.
The Collective Trust used for the investment of cash collateral received from borrowers of securities seeks to maintain a net asset value per unit of $1.00, but there can be no assurance that it will always be able to do so. The Fund may incur investment losses as a result of investing securities lending collateral in the Collective Trust. This could occur if an investment in the Collective Trust defaulted or if it were necessary to liquidate assets in the Collective Trust to meet returns on outstanding security loans at a time when the Collective Trust’s net asset value per unit was less than $1.00. Under those circumstances, the Fund may not receive an amount from the Collective Trust that is equal in amount to the collateral the Fund would be required to return to the borrower of the securities and the Fund would be required to make up for this shortfall. The Fund had no securities out on loan as of July 31, 2013.
10. Credit and Market Risk
The Fund primarily invests in inflation-protected debt securities whose principal and/or interest payments are adjusted for inflation, unlike traditional debt securities that make fixed principal and interest payments. Under normal circumstances, the Fund will invest at least 80% of its net assets in inflation-protected bonds issued by the U.S. government, its agencies or instrumentalities, foreign governments and corporations, which may include synthetic investments such as options, forwards, futures contracts, or swap agreements that, when combined with non-inflation-indexed bonds, have economic characteristics similar to inflation-indexed bonds.
Some countries in which the Fund may invest require governmental approval for the repatriation of investment income, capital or the proceeds of sales of securities by foreign investors. In addition, if there is deterioration in a country’s balance of payments or for other reasons, a country may impose temporary restrictions on foreign capital remittances abroad. The securities exchanges of certain foreign markets are substantially smaller, less liquid and more volatile than the major securities markets in the United States. Consequently, acquisition and disposition of securities by the Fund may be inhibited.
46
The Fund may invest up to 10% of its net assets in high yield fixed income securities, which are securities rated lower than BBB- by S&P and Baa3 by Moody’s, or similarly rated by another nationally recognized statistical rating organization. Investments in these higher yielding securities are generally accompanied by a greater degree of credit risk than higher rated securities. Additionally, lower rated securities may be more susceptible to adverse economic and competitive industry conditions than investment grade securities.
The Fund invests in fixed income securities whose value is derived from an underlying pool of mortgages or consumer loans. The value of these securities is sensitive to changes in economic conditions, including delinquencies and/or defaults, and may be adversely affected by shifts in the market’s perception of the issuers and changes in interest rates. Investors receive principal and interest payments as the underlying mortgages and consumer loans are paid back. Some of these securities are collateralized mortgage obligations (CMOs). CMOs are debt securities issued by U.S. government agencies or by financial institutions and other mortgage lenders, which are collateralized by a pool of mortgages held under an indenture. Prepayment of mortgages may shorten the stated maturity of the obligations and can result in a loss of premium, if any has been paid. Certain of these securities may be stripped (securities which provide only the principal or interest feature of the underlying security). The yield to maturity on an interest-only CMO is extremely sensitive not only to changes in prevailing interest rates, but also to the rate of principal payments (including prepayments) on the related underlying mortgage assets. A rapid rate of principal payments may have a material adverse effect on the Fund’s yield to maturity. If the underlying mortgage assets experience greater than anticipated prepayments of principal, the Fund may fail to fully recoup its initial investment in these securities even if the securities are rated in the highest rating categories.
The Fund invests in certain obligations that may have liquidity protection to ensure that the receipt of payments due on the underlying security is timely. Such protection may be provided through guarantees, insurance policies or letters of credit obtained by the issuer or sponsor through third parties, through various means of structuring the transaction or through a combination of such approaches. The Fund will not pay any additional fees for such credit support, although the existence of credit support may increase the price of a security.
The Fund may invest up to 15% of its net assets in illiquid securities, which may include securities with contractual restrictions on resale, securities exempt from registration under Rule 144A of the Securities Act of 1933, as amended and other securities which may not be readily marketable. The relative illiquidity of these securities may impair the Fund from disposing of them in a timely manner and at a fair price when it is necessary or desirable to do so. While maintaining oversight, the Fund’s Board has delegated to DMC the day-to-day functions of determining whether individual securities are liquid for purposes of the Fund’s limitation on investments in illiquid securities. Securities eligible for resale pursuant to Rule 144A, which are determined to be liquid, are not subject to the Fund’s 15% limit on investments in illiquid securities. As of July 31, 2013, no securities have been determined to be illiquid under the Fund’s Liquidity Procedures. Rule 144A securities have been identified on the statement of net assets.
47
Notes to financial statements
Delaware Inflation Protected Bond Fund
11. Contractual Obligations
The Fund enters into contracts in the normal course of business that contain a variety of indemnifications. The Fund’s maximum exposure under these arrangements is unknown. However, the Fund has not had prior claims or losses pursuant to these contracts. Management has reviewed the Fund’s existing contracts and expects the risk of loss to be remote.
12. Subsequent Events
Management has determined that no material events or transactions occurred subsequent to July 31, 2013 that would require recognition or disclosure in the Fund’s financial statements.
48
Report of independent
registered public accounting firm
To the Board of Trustees of Delaware Group® Government Fund
and the Shareholders of Delaware Inflation Protected Bond Fund:
In our opinion, the accompanying statement of net assets and the related statements of operations and of changes in net assets and the financial highlights present fairly, in all material respects, the financial position of Delaware Inflation Protected Bond Fund (one of the series constituting Delaware Group Government Fund, hereinafter referred to as the “Fund”) at July 31, 2013, the results of its operations for the year then ended, the changes in its net assets for each of the two years in the period then ended and the financial highlights for each of the four years in the period then ended, in conformity with accounting principles generally accepted in the United States of America. These financial statements and financial highlights (hereafter referred to as “financial statements”) are the responsibility of the Fund’s management; our responsibility is to express an opinion on these financial statements based on our audits. We conducted our audits of these financial statements in accordance with the standards of the Public Company Accounting Oversight Board (United States). Those standards require that we plan and perform the audit to obtain reasonable assurance about whether the financial statements are free of material misstatement. An audit includes examining, on a test basis, evidence supporting the amounts and disclosures in the financial statements, assessing the accounting principles used and significant estimates made by management, and evaluating the overall financial statement presentation. We believe that our audits, which included confirmation of securities at July 31, 2013 by correspondence with the custodian and brokers, provide a reasonable basis for our opinion. The financial highlights for the year ended July 31, 2009 were audited by other independent accountants whose report dated September 21, 2009 expressed an unqualified opinion on those statements.
PricewaterhouseCoopers LLP
Philadelphia, Pennsylvania
September 20, 2013
49
Other Fund information
(Unaudited)
Delaware Inflation Protected Bond Fund
Tax Information
The information set forth below is for the Fund’s fiscal year as required by federal laws. Shareholders, however, must report distributions on a calendar year basis for income tax purposes, which may include distributions for portions of two fiscal years of a fund. Accordingly, the information needed by shareholders for income tax purposes will be sent to them in January of each year. Please consult your tax advisor for proper treatment of this information.
All designations are based on financial information available as of the date of this annual report and, accordingly are subject to change. For any and all items requiring designation, it is the intention of the Fund to designate the maximum amount permitted under the Internal Revenue Code and the regulations thereunder.
For the fiscal year ended July 31, 2013, the Fund designates distributions paid during the year as follows:
| (A) Ordinary Income Distributions (Tax Basis) | | 77.08 | % |
| (B) Long-Term Capital Gains Distributions (Tax Basis) | | 22.84 | % |
| (C) Return of Capital (Tax Basis) | | 0.08 | % |
| Total Distributions (Tax Basis) | | 100.00 | % |
(A), (B) and (C) are based on a percentage of the Fund’s total distributions.
50
Board of trustees/directors and officers addendum
Delaware Investments® Family of Funds
A mutual fund is governed by a Board of Trustees/Directors (“Trustees”), which has oversight responsibility for the management of a fund’s business affairs. Trustees establish procedures and oversee and review the performance of the investment manager, the distributor, and others who perform services for the fund. The independent fund trustees, in particular, are advocates
| Name, Address, | Position(s) | Length of |
| and Birth Date | Held with Fund(s) | Time Served |
| Interested Trustees | | |
| | | |
| Patrick P. Coyne1 | Chairman, President, | Chairman and Trustee |
| 2005 Market Street | Chief Executive Officer, | since August 16, 2006 |
| Philadelphia, PA 19103 | and Trustee | |
| April 1963 | | President and |
| | | Chief Executive Officer |
| | | since August 1, 2006 |
| |
| Independent Trustees | | |
| | | |
| Thomas L. Bennett | Trustee | Since March 2005 |
| 2005 Market Street | | |
| Philadelphia, PA 19103 | | |
| October 1947 | | |
| | | |
| Joseph W. Chow | Trustee | Since January 2013 |
| 2005 Market Street | | |
| Philadelphia, PA 19103 | | |
| January 1953 | | |
| |
| John A. Fry | Trustee | Since January 2001 |
| 2005 Market Street | | |
| Philadelphia, PA 19103 | | |
| May 1960 | | |
| |
| |
| |
| Anthony D. Knerr | Trustee | Since April 1990 |
| 2005 Market Street | | |
| Philadelphia, PA 19103 | | |
| December 1938 | | |
| | | |
1 Patrick P. Coyne is considered to be an “Interested Trustee” because he is an executive officer of the Fund’s(s’) investment advisor.
52
for shareholder interests. Each trustee has served in that capacity since he or she was elected to or appointed to the Board of Trustees, and will continue to serve until his or her retirement or the election of a new trustee in his or her place. The following is a list of the Trustees and Officers with certain background and related information.
| Number of Portfolios in | |
| Principal Occupation(s) | Fund Complex Overseen | Other Directorships |
| During Past 5 Years | by Trustee or Officer | Held by Trustee or Officer |
| |
| | | |
| Patrick P. Coyne has served in | 70 | Director and Audit |
| various executive capacities | | Committee Member |
| at different times at | | Kaydon Corp. |
| Delaware Investments.2 | | |
| | | Board of Governors Member |
| | | Investment Company |
| | | Institute (ICI) |
| |
| |
| | | |
| Private Investor | 70 | Director |
| (March 2004–Present) | | Bryn Mawr Bank Corp. (BMTC) |
| | | (2007–2011) |
| |
| Executive Vice President | 70 | Director and Audit Committee |
| (Emerging Economies Strategies, | | Member — Hercules |
| Risk and Corporate Administration) | | Technology Growth |
| State Street Corporation | | Capital, Inc. |
| (July 2004–March 2011) | | |
| | | |
| President | 70 | Director — Hershey Trust |
| Drexel University | | |
| (August 2010–Present) | | Director and Audit |
| | | Committee Member |
| President | | Community Health Systems |
| Franklin & Marshall College | | |
| (July 2002–July 2010) | | |
| | | |
| Managing Director | 70 | None |
| AKA Strategy | | |
| (Strategic Consulting) | | |
| (1990–Present) | | |
| | | |
2 Delaware Investments is the marketing name for Delaware Management Holdings, Inc. and its subsidiaries, including the Fund’s(s’) investment advisor, principal underwriter, and its transfer agent.
53
Board of trustees/directors and officers addendum
Delaware Investments® Family of Funds
| Name, Address, | Position(s) | Length of |
| and Birth Date | Held with Fund(s) | Time Served |
| Independent Trustees (continued) | | |
| | | |
| Lucinda S. Landreth | Trustee | Since March 2005 |
| 2005 Market Street | | |
| Philadelphia, PA 19103 | | |
| June 1947 | | |
| | | |
| Frances A. Sevilla-Sacasa | Trustee | Since September 2011 |
| 2005 Market Street | | |
| Philadelphia, PA 19103 | | |
| January 1956 | | |
| |
| |
| |
| |
| |
| |
| |
| |
| |
| |
| |
| |
| |
| Thomas K. Whitford | Trustee | Since January 2013 |
| 2005 Market Street | | |
| Philadelphia, PA 19103 | | |
| March 1956 | | |
| | | |
| | | |
| | | |
| | | |
| | | |
| | | |
54
| Number of Portfolios in | |
| Principal Occupation(s) | Fund Complex Overseen | Other Directorships |
| During Past 5 Years | by Trustee or Officer | Held by Trustee or Officer |
| |
| | | |
| Private Investor | 70 | None |
| (2004–Present) | | |
| |
| |
| Chief Executive Officer — | 70 | Trust Manager and |
| Banco Itaú Europa | | Audit Committee |
| International | | Member — Camden |
| (April 2012–Present) | | Property Trust |
| |
| Executive Advisor to Dean | | |
| (August 2011–March 2012) | | |
| and Interim Dean | | |
| (January 2011–July 2011) — | | |
| University of Miami School of | | |
| Business Administration | | |
| |
| President — U.S. Trust, | | |
| Bank of America Private | | |
| Wealth Management | | |
| (Private Banking) | | |
| (July 2007–December 2008) | | |
| | | |
| Vice Chairman | 70 | None |
| (2010–April 2013) | | |
| Chief Administrative | | |
| Officer (2008–2010) | | |
| and Executive Vice | | |
| President and Chief | | |
| Administrative Officer | | |
| (2007–2009) — | | |
| PNC Financial | | |
| Services Group | | |
| | | |
55
Board of trustees/directors and officers addendum
Delaware Investments® Family of Funds
| Name, Address, | Position(s) | Length of |
| and Birth Date | Held with Fund(s) | Time Served |
| Independent Trustees (continued) | | |
| | | |
| Janet L. Yeomans | Trustee | Since April 1999 |
| 2005 Market Street | | |
| Philadelphia, PA 19103 | | |
| July 1948 | | |
| |
| |
| |
| |
| |
| |
| J. Richard Zecher | Trustee | Since March 2005 |
| 2005 Market Street | | |
| Philadelphia, PA 19103 | | |
| July 1940 | | |
| | | |
| | | |
| | | |
| | | |
| | | |
56
| Number of Portfolios in | |
| Principal Occupation(s) | Fund Complex Overseen | Other Directorships |
| During Past 5 Years | by Trustee or Officer | Held by Trustee or Officer |
| |
| | | |
| Vice President and Treasurer | 70 | Director, Audit |
| (January 2006–July 2012) | | Committee Member and |
| Vice President — Mergers & Acquisitions | | Investment Committee |
| (January 2003–January 2006), and | | Member |
| Vice President and Treasurer | | Okabena Company |
| (July 1995–January 2003) | | |
| 3M Corporation | | Chair — 3M |
| | | Investment Management |
| | | Company |
| | | (2005–2012) |
| | | |
| Founder | 70 | Director and Compensation |
| Investor Analytics | | Committee Member |
| (Risk Management) | | Investor Analytics |
| (May 1999–Present) | | |
| | | Director — P/E Investments |
| Founder | | |
| P/E Investments | | |
| (Hedge Fund) | | |
| (September 1996–Present) | | |
| | | |
57
Board of trustees/directors and officers addendum
Delaware Investments® Family of Funds
| Name, Address, | Position(s) | Length of |
| and Birth Date | Held with Fund(s) | Time Served |
| Officers | | |
| | | |
| David F. Connor | Senior Vice President, | Senior Vice President, |
| 2005 Market Street | Deputy General | Deputy General Counsel |
| Philadelphia, PA 19103 | Counsel, and Secretary | since May 2013; |
| December 1963 | | Vice President, Deputy |
| | General Counsel |
| | September 2000– |
| | May 2013; Secretary since |
| | October 2005 |
| | | |
| Daniel V. Geatens | Vice President | Treasurer |
| 2005 Market Street | and Treasurer | since October 2007 |
| Philadelphia, PA 19103 | | |
| October 1972 | | |
| | | |
| David P. O’Connor | Executive Vice President, | Executive Vice President |
| 2005 Market Street | General Counsel | since February 2012; |
| Philadelphia, PA 19103 | and Chief Legal Officer | Senior Vice President |
| February 1966 | | October 2005– |
| | February 2012; |
| | General Counsel and |
| | Chief Legal Officer |
| | since October 2005 |
| | | |
| Richard Salus | Senior Vice President | Chief Financial Officer |
| 2005 Market Street | and Chief Financial Officer | since November 2006 |
| Philadelphia, PA 19103 | | |
| October 1963 | | |
| | | |
The Statement of Additional Information for the Fund(s) includes additional information about the Trustees and Officers and is available, without charge, upon request by calling 800 523-1918.
58
| Number of Portfolios in | |
| Principal Occupation(s) | Fund Complex Overseen | Other Directorships |
| During Past 5 Years | by Trustee or Officer | Held by Trustee or Officer |
| |
| |
| David F. Connor has served as | 70 | None3 |
| Deputy General Counsel of | | |
| Delaware Investments | | |
| since 2000. | | |
| |
| |
| |
| |
| Daniel V. Geatens has served | 70 | None3 |
| in various capacities at | | |
| different times at | | |
| Delaware Investments. | | |
| | | |
| David P. O’Connor has served in | 70 | None3 |
| various executive and legal | | |
| capacities at different times | | |
| at Delaware Investments. | | |
| |
| |
| |
| |
| Richard Salus has served in | 70 | None3 |
| various executive capacities | | |
| at different times at | | |
| Delaware Investments. | | |
| | | |
3 David F. Connor, Daniel V. Geatens, David P. O’Connor, and Richard Salus serve in similar capacities for the six portfolios of the Optimum Fund Trust, which have the same investment advisor, principal underwriter, and transfer agent as the registrant.
59
About the organization
| Board of trustees | | | |
Patrick P. Coyne
Chairman, President, and
Chief Executive Officer
Delaware Investments®
Family of Funds
Philadelphia, PA
Thomas L. Bennett
Private Investor
Rosemont, PA | Joseph W. Chow
Former Executive Vice
President
State Street Corporation
Brookline, MAJohn A. Fry
President
Drexel University
Philadelphia, PA Anthony D. Knerr
Founder and Managing
Director
AKA Strategy
New York, NY | Lucinda S. Landreth
Former Chief Investment
Officer
Assurant, Inc.
Philadelphia, PAFrances A.
Sevilla-Sacasa
Chief Executive Officer
Banco Itaú Europa
International
Miami, FL | Thomas K. Whitford
Former Vice Chairman
PNC Financial Services Group
Pittsburgh, PAJanet L. Yeomans
Former Vice President and
Treasurer
3M Corporation
St. Paul, MN J. Richard Zecher
Founder
Investor Analytics
Scottsdale, AZ |
| | | | |
| Affiliated officers | | | |
David F. Connor
Senior Vice President,
Deputy General Counsel,
and Secretary
Delaware Investments
Family of Funds
Philadelphia, PA | Daniel V. Geatens
Vice President and
Treasurer
Delaware Investments
Family of Funds
Philadelphia, PA | David P. O’Connor
Executive Vice President,
General Counsel,
and Chief Legal Officer
Delaware Investments
Family of Funds
Philadelphia, PA | Richard Salus
Senior Vice President and
Chief Financial Officer
Delaware Investments
Family of Funds
Philadelphia, PA |
This annual report is for the information of Delaware Inflation Protected Bond Fund shareholders, but it may be used with prospective investors when preceded or accompanied by the Delaware Investments Fund fact sheet for the most recently completed calendar quarter. These documents are available at delawareinvestments.com. |
Delaware Investments is the marketing name of Delaware Management Holdings, Inc. and its subsidiaries. |
The Fund files its complete schedule of portfolio holdings with the Securities and Exchange Commission (SEC) for the first and third quarters of each fiscal year on Form N-Q. The Fund’s Forms N-Q, as well as a description of the policies and procedures that the Fund uses to determine how to vote proxies (if any) relating to portfolio securities are available without charge (i) upon request, by calling 800 523-1918; and (ii) on the SEC’s website at sec.gov. In addition, a description of the policies and procedures that the Fund uses to determine how to vote proxies (if any) relating to portfolio securities and the Fund’s Schedule of Investments are available without charge on the Fund’s website at delawareinvestments.com. The Fund’s Forms N-Q may be reviewed and copied at the SEC’s Public Reference Room in Washington, D.C.; information on the operation of the Public Reference Room may be obtained by calling 800 SEC-0330.
Information (if any) regarding how the Fund voted proxies relating to portfolio securities during the most recently disclosed 12-month period ended June 30 is available without charge (i) through the Fund’s website at delawareinvestments.com; and (ii) on the SEC’s website at sec.gov.
60
Item 2. Code of Ethics
The registrant has adopted a code of ethics that applies to the registrant’s principal executive officer, principal financial officer, principal accounting officer or controller, or persons performing similar functions, regardless of whether these individuals are employed by the registrant or a third party. A copy of the registrant’s Code of Business Ethics has been posted on the Delaware Investments Internet Web site at www.delawareinvestments.com. Any amendments to the Code of Business Ethics, and information on any waiver from its provisions granted by the registrant, will also be posted on this Web site within five business days of such amendment or waiver and will remain on the Web site for at least 12 months.
Item 3. Audit Committee Financial Expert
The registrant’s Board of Trustees/Directors has determined that certain members of the registrant’s Audit Committee are audit committee financial experts, as defined below. For purposes of this item, an “audit committee financial expert” is a person who has the following attributes:
a. An understanding of generally accepted accounting principles and financial statements;
b. The ability to assess the general application of such principles in connection with the accounting for estimates, accruals, and reserves;
c. Experience preparing, auditing, analyzing, or evaluating financial statements that present a breadth and level of complexity of accounting issues that are generally comparable to the breadth and complexity of issues that can reasonably be expected to be raised by the registrant’s financial statements, or experience actively supervising one or more persons engaged in such activities;
d. An understanding of internal controls and procedures for financial reporting; and
e. An understanding of audit committee functions.
An “audit committee financial expert” shall have acquired such attributes through:
a. Education and experience as a principal financial officer, principal accounting officer, controller, public accountant, or auditor or experience in one or more positions that involve the performance of similar functions;
b. Experience actively supervising a principal financial officer, principal accounting officer, controller, public accountant, auditor, or person performing similar functions;
c. Experience overseeing or assessing the performance of companies or public accountants with respect to the preparation, auditing, or evaluation of financial statements; or
d. Other relevant experience.
The registrant’s Board of Trustees/Directors has also determined that each member of the registrant’s Audit Committee is independent. In order to be “independent” for purposes of this item, the Audit Committee member may not: (i) other than in his or her capacity as a member of the Board of Trustees/Directors or any committee thereof, accept directly or indirectly any consulting, advisory or other compensatory fee from the issuer; or (ii) be an “interested person” of the registrant as defined in Section 2(a)(19) of the Investment Company Act of 1940.
The names of the audit committee financial experts on the registrant’s Audit Committee are set forth below:
Thomas L. Bennett1
John A. Fry
Frances A. Sevilla-Sacasa
Janet L. Yeomans
Item 4. Principal Accountant Fees and Services
(a) Audit fees.
The aggregate fees billed for services provided to the registrant by its independent auditors for the audit of the registrant’s annual financial statements and for services normally provided by the independent auditors in connection with statutory and regulatory filings or engagements were $67,970 for the fiscal year ended July 31, 2013.
____________________
|
1 The instructions to Form N-CSR require disclosure on the relevant experience of persons who qualify as audit committee financial experts based on “other relevant experience.” The Board of Trustees/Directors has determined that Mr. Bennett qualifies as an audit committee financial expert by virtue of: his education and Chartered Financial Analyst designation; his experience as a credit analyst, portfolio manager and the manager of other credit analysts and portfolio managers; and his prior service on the audit committees of public companies. |
The aggregate fees billed for services provided to the registrant by its independent auditors for the audit of the registrant’s annual financial statements and for services normally provided by the independent auditors in connection with statutory and regulatory filings or engagements were $37,300 for the fiscal year ended July 31, 2012.
(b) Audit-related fees.
The aggregate fees billed by the registrant’s independent auditors for services relating to the performance of the audit of the registrant’s financial statements and not reported under paragraph (a) of this Item were $0 for the fiscal year ended July 31, 2013.
The aggregate fees billed by the registrant’s independent auditors for services relating to the performance of the audit of the financial statements of the registrant’s investment adviser and other service providers under common control with the adviser and that relate directly to the operations or financial reporting of the registrant were $618,000 for the registrant’s fiscal year ended July 31, 2013. The percentage of these fees relating to services approved by the registrant’s Audit Committee pursuant to the de minimis exception from the pre-approval requirement in Rule 2-01(c)(7)(i)(C) of Regulation S-X was 0%. These audit-related services were as follows: year end audit procedures; group reporting and subsidiary statutory audits.
The aggregate fees billed by the registrant’s independent auditors for services relating to the performance of the audit of the registrant’s financial statements and not reported under paragraph (a) of this Item were $0 for the fiscal year ended July 31, 2012.
The aggregate fees billed by the registrant’s independent auditors for services relating to the performance of the audit of the financial statements of the registrant’s investment adviser and other service providers under common control with the adviser and that relate directly to the operations or financial reporting of the registrant were $565,000 for the registrant’s fiscal year ended July 31, 2012. The percentage of these fees relating to services approved by the registrant’s Audit Committee pursuant to the de minimis exception from the pre-approval requirement in Rule 2-01(c)(7)(i)(C) of Regulation S-X was 0%. These audit-related services were as follows: year end audit procedures; reporting up and subsidiary statutory audits.
(c) Tax fees.
The aggregate fees billed by the registrant’s independent auditors for tax-related services provided to the registrant were $9,700 for the fiscal year ended July 31, 2013. The percentage of these fees relating to services approved by the registrant’s Audit Committee pursuant to the de minimis exception from the pre-approval requirement in Rule 2-01(c)(7)(i)(C) of Regulation S-X was 0%. These tax-related services were as follows: review of income tax returns and review of annual excise distribution calculations.
The aggregate fees billed by the registrant’s independent auditors for tax-related services provided to the registrant’s investment adviser and other service providers under common control with the adviser and that relate directly to the operations or financial reporting of the registrant were $0 for the registrant’s fiscal year ended July 31, 2013.
The aggregate fees billed by the registrant’s independent auditors for tax-related services provided to the registrant were $7,300 for the fiscal year ended July 31, 2012. The percentage of these fees relating to services approved by the registrant’s Audit Committee pursuant to the de minimis exception from the pre-approval requirement in Rule 2-01(c)(7)(i)(C) of Regulation S-X was 0%. These tax-related services were as follows: review of income tax returns and review of annual excise distribution calculations.
The aggregate fees billed by the registrant’s independent auditors for tax-related services provided to the registrant’s investment adviser and other service providers under common control with the adviser and that relate directly to the operations or financial reporting of the registrant were $0 for the registrant’s fiscal year ended July 31, 2012.
(d) All other fees.
The aggregate fees billed for all services provided by the independent auditors to the registrant other than those set forth in paragraphs (a), (b) and (c) of this Item were $0 for the fiscal year ended July 31, 2013.
The aggregate fees billed for all services other than those set forth in paragraphs (b) and (c) of this Item provided by the registrant’s independent auditors to the registrant’s adviser and other service providers under common control with the adviser and that relate directly to the operations or financial reporting of the registrant were $0 for the registrant’s fiscal year ended July 31, 2013. The percentage of these fees relating to services approved by the registrant’s Audit Committee pursuant to the de minimis exception from the pre-approval requirement in Rule 2-01(c)(7)(i)(C) of Regulation S-X was 0%.
The aggregate fees billed for all services provided by the independent auditors to the registrant other than those set forth in paragraphs (a), (b) and (c) of this Item were $0 for the fiscal year ended July 31, 2012.
The aggregate fees billed for all services other than those set forth in paragraphs (b) and (c) of this Item provided by the registrant’s independent auditors to the registrant’s adviser and other service providers under common control with the adviser and that relate directly to the operations or financial reporting of the registrant were $0 for the registrant’s fiscal year ended July 31, 2012. The percentage of these fees relating to services approved by the registrant’s Audit Committee pursuant to the de minimis exception from the pre-approval requirement in Rule 2-01(c)(7)(i)(C) of Regulation S-X was 0%.
(e) The registrant’s Audit Committee has established pre-approval policies and procedures as permitted by Rule 2-01(c)(7)(i)(B) of Regulation S-X (the “Pre-Approval Policy”) with respect to services provided by the registrant’s independent auditors. Pursuant to the Pre-Approval Policy, the Audit Committee has pre-approved the services set forth in the table below with respect to the registrant up to the specified fee limits. Certain fee limits are based on aggregate fees to the registrant and other registrants within the Delaware Investments Family of Funds.
| Service | Range of Fees |
| Audit Services | |
| Statutory audits or financial audits for new Funds | up to $40,000 per Fund |
| Services associated with SEC registration statements (e.g., Form N-1A, Form N-14, etc.), periodic reports and other documents filed with the SEC or other documents issued in connection with securities offerings (e.g., comfort letters for closed-end Fund offerings, consents), and assistance in responding to SEC comment letters |
up to $10,000 per Fund |
| Consultations by Fund management as to the accounting or disclosure treatment of transactions or events and/or the actual or potential impact of final or proposed rules, standards or interpretations by the SEC, FASB, or other regulatory or standard-setting bodies (Note: Under SEC rules, some consultations may be considered “audit-related services” rather than “audit services”) | up to $25,000 in the aggregate |
| Audit-Related Services | |
| Consultations by Fund management as to the accounting or disclosure treatment of transactions or events and /or the actual or potential impact of final or proposed rules, standards or interpretations by the SEC, FASB, or other regulatory or standard-setting bodies (Note: Under SEC rules, some consultations may be considered “audit services” rather than “audit-related services”) | up to $25,000 in the aggregate |
| Tax Services | |
| U.S. federal, state and local and international tax planning and advice (e.g., consulting on statutory, regulatory or administrative developments, evaluation of Funds’ tax compliance function, etc.) | up to $25,000 in the aggregate |
| U.S. federal, state and local tax compliance (e.g., excise distribution reviews, etc.) | up to $5,000 per Fund |
| Review of federal, state, local and international income, franchise and other tax returns | up to $5,000 per Fund |
Under the Pre-Approval Policy, the Audit Committee has also pre-approved the services set forth in the table below with respect to the registrant’s investment adviser and other entities controlling, controlled by or under common control with the investment adviser that provide ongoing services to the registrant (the “Control Affiliates”) up to the specified fee limit. This fee limit is based on aggregate fees to the investment adviser and its Control Affiliates.
| Service | Range of Fees |
| Non-Audit Services | |
| Services associated with periodic reports and other documents filed with the SEC and assistance in responding to SEC comment letters | up to $10,000 in the aggregate |
The Pre-Approval Policy requires the registrant’s independent auditors to report to the Audit Committee at each of its regular meetings regarding all services initiated since the last such report was rendered, including those services authorized by the Pre-Approval Policy.
(f) Not applicable.
(g) The aggregate non-audit fees billed by the registrant’s independent auditors for services rendered to the registrant and to its investment adviser and other service providers under common control with the adviser were $8,891,311 and $10,092,966 for the registrant’s fiscal years ended July 31, 2013 and July 31, 2012, respectively.
(h) In connection with its selection of the independent auditors, the registrant’s Audit Committee has considered the independent auditors’ provision of non-audit services to the registrant’s investment adviser and other service providers under common control with the adviser that were not required to be pre-approved pursuant to Rule 2-01(c)(7)(ii) of Regulation S-X. The Audit Committee has determined that the independent auditors’ provision of these services is compatible with maintaining the auditors’ independence.
Item 5. Audit Committee of Listed Registrants
Not applicable.
Item 6. Investments
(a) Included as part of report to shareholders filed under Item 1 of this Form N-CSR.
(b) Divestment of securities in accordance with Section 13(c) of the Investment Company Act of 1940.
Not applicable.
Item 7. Disclosure of Proxy Voting Policies and Procedures for Closed-End Management Investment Companies
Not applicable.
Item 8. Portfolio Managers of Closed-End Management Investment Companies
Not applicable.
Item 9. Purchases of Equity Securities by Closed-End Management Investment Company and Affiliated Purchasers
Not applicable.
Item 10. Submission of Matters to a Vote of Security Holders
Not applicable.
Item 11. Controls and Procedures
The registrant’s principal executive officer and principal financial officer have evaluated the registrant’s disclosure controls and procedures within 90 days of the filing of this report and have concluded that they are effective in providing reasonable assurance that the information required to be disclosed by the registrant in its reports or statements filed under the Securities Exchange Act of 1934 is recorded, processed, summarized and reported within the time periods specified in the rules and forms of the Securities and Exchange Commission.
There were no significant changes in the registrant’s internal control over financial reporting that occurred during the second fiscal quarter of the period covered by the report to stockholders included herein (i.e., the registrant’s fourth fiscal quarter) that have materially affected, or are reasonably likely to materially affect, the registrant’s internal control over financial reporting.
Item 12. Exhibits
| (a) | (1) Code of Ethics |
| |
| | Not applicable. |
| |
| | (2) Certifications of Principal Executive Officer and Principal Financial Officer pursuant to Rule 30a-2 under the Investment Company Act of 1940 are attached hereto as Exhibit 99.CERT. |
| |
| | (3) Written solicitations to purchase securities pursuant to Rule 23c-1 under the Securities Exchange Act of 1934. |
| |
| | Not applicable. |
| |
| (b) | Certifications pursuant to Section 906 of the Sarbanes-Oxley Act of 2002 are furnished herewith as Exhibit 99.906CERT. |
SIGNATURES
Pursuant to the requirements of the Securities Exchange Act of 1934 and the Investment Company Act of 1940, the registrant has duly caused this report to be signed on its behalf, by the undersigned, thereunto duly authorized.
Name of Registrant: DELAWARE GROUP® GOVERNMENT FUND
| /s/ PATRICK P. COYNE |
| By: | Patrick P. Coyne |
| Title: | Chief Executive Officer |
| Date: | October 2, 2013 |
Pursuant to the requirements of the Securities Exchange Act of 1934 and the Investment Company Act of 1940, this report has been signed below by the following persons on behalf of the registrant and in the capacities and on the dates indicated.
| /s/ PATRICK P. COYNE |
| By: | Patrick P. Coyne |
| Title: | Chief Executive Officer |
| Date: | October 2, 2013 |
| |
| /s/ RICHARD SALUS |
| By: | Richard Salus |
| Title: | Chief Financial Officer |
| Date: | October 2, 2013 |