Item 1. Reports to Stockholders
Annual report
Fixed income mutual fund
Delaware Core Plus Bond Fund
July 31, 2016
Carefully consider the Fund’s investment objectives, risk factors, charges, and expenses before investing. This and other information can be found in the Fund’s prospectus and its summary prospectus, which may be obtained by visiting delawareinvestments.com/literature or calling 800 523-1918. Investors should read the prospectus and the summary prospectus carefully before investing.
You can obtain shareholder reports and prospectuses online instead of in the mail.
Visit delawareinvestments.com/edelivery.
Experience Delaware Investments
Delaware Investments is committed to the pursuit of consistently superior asset management and unparalleled client service. We believe in our investment processes, which seek to deliver consistent results, and in convenient services that help add value for our clients.
If you are interested in learning more about creating an investment plan, contact your financial advisor.
You can learn more about Delaware Investments or obtain a prospectus for Delaware Core Plus Bond Fund at delawareinvestments.com/literature.
Manage your investments online
| • | | 24-hour access to your account information |
| • | | Check your account balance and recent transactions |
| • | | Request statements or literature |
| • | | Make purchases and redemptions |
Delaware Management Holdings, Inc. and its subsidiaries (collectively known by the marketing name of Delaware Investments) are wholly owned subsidiaries of Macquarie Group Limited, a global provider of banking, financial, advisory, investment, and funds management services.
Neither Delaware Investments nor its affiliates referred to in this document are authorized deposit-taking institutions for the purpose of the Banking Act 1959 (Commonwealth of Australia). The obligations of these entities do not represent deposits or other liabilities of Macquarie Bank Limited (MBL), a subsidiary of Macquarie Group Limited and an affiliate of Delaware Investments. MBL does not guarantee or otherwise provide assurance in respect of the obligations of these entities, unless noted otherwise. The Fund is governed by U.S. laws and regulations.
Table of contents
Unless otherwise noted, views expressed herein are current as of July 31, 2016, and subject to change for events occurring after such date.
The Fund is not FDIC insured and is not guaranteed. It is possible to lose the principal amount invested.
Mutual fund advisory services provided by Delaware Management Company, a series of Delaware Management Business Trust, which is a registered investment advisor. Delaware Investments, a member of Macquarie Group, refers to Delaware Management Holdings, Inc. and its subsidiaries, including the Fund’s distributor, Delaware Distributors, L.P. Macquarie Group refers to Macquarie Group Limited and its subsidiaries and affiliates worldwide.
© 2016 Delaware Management Holdings, Inc.
All third-party marks cited are the property of their respective owners.
| | | | |
| Portfolio management review | | | | |
| Delaware Core Plus Bond Fund | | | August 9, 2016 | |
| | | | | | | | |
| Performance preview (for the year ended July 31, 2016) | | | | | | |
| |
Delaware Core Plus Bond Fund (Institutional Class shares) | | | 1-year return | | | | +4.40% | |
| |
Delaware Core Plus Bond Fund (Class A shares) | | | 1-year return | | | | +4.15% | |
| |
Bloomberg Barclays U.S. Aggregate Index* (benchmark) | | | 1-year return | | | | +5.94% | |
| |
Past performance does not guarantee future results.
For complete, annualized performance for Delaware Core Plus Bond Fund, please see the table on page 4.
Institutional Class shares are available without sales or asset-based distribution charges only to certain eligible accounts.
The performance of Class A shares excludes the applicable sales charge and reflects the reinvestment of all distributions. Please see page 7 for a description of the index.
Index performance returns do not reflect any management fees, transaction costs, or expenses. Indices are unmanaged and one cannot invest directly in an index.
*Formerly known as the Barclays U.S. Aggregate Index.
Commodity prices continued to decline during the first half of the Fund’s fiscal year ended July 31, 2016, but began to recover early in 2016, boosting investor confidence and increasing interest in down-in-quality assets (source: Bloomberg). China’s decision to devalue its currency in August 2015, along with signs of its economic deceleration, led Chinese officials to take additional stimulus measures in February 2016. However, questions remained regarding China’s short-term growth trajectory, partly fed by uncertainty over the government’s willingness to take further actions to support its economy.
The U.S. Federal Reserve raised the federal funds rate by 0.25 percentage points in December 2015, the first increase since 2006. However, other central banks, including the European Central Bank (ECB) and the Bank of Japan, flooded markets with liquidity. We believe this divergence in central bank policy caused asset prices to separate from fundamentals, complicating the Fed’s efforts to implement its policy of gradual monetary tightening. The full implementation of Fed policy was also hampered by currency markets, where the dollar rallied whenever anticipation of a Fed rate hike increased, seemingly forcing the U.S. central bank to back off. (A stronger dollar tends to restrain the earnings of American multinationals, and thereby acts as a modest brake on domestic economic growth.)
The following factors affected the fixed income market during the Fund’s fiscal year:
| | ● | | Commodity prices recovered after falling sharply |
| | ● | | Divergent global monetary policy triggered a disconnect between asset prices and fundamentals |
| | ● | | Uncertainty related to China, U.S. monetary policy, and global populism argued for maintaining liquidity. |
1
Portfolio management review
Delaware Core Plus Bond Fund
Late in the Fund’s fiscal year, the ECB introduced its corporate sector purchase program (CSPP), which provided a major non-price-sensitive buyer in the markets. While helping to reduce risk premiums and overall yields, the CSPP also had the effect of encouraging greater risk taking and, as a result, further contributed to a divergence between fundamentals and asset prices.
Within the Fund
For the fiscal year ended July 31, 2016, Delaware Core Plus Bond Fund underperformed its benchmark, the Bloomberg Barclays U.S. Aggregate Index. The Fund’s Institutional Class shares returned +4.40%. The Fund’s Class A shares returned +4.15% at net asset value and -0.57% at maximum offer price. These figures reflect all distributions reinvested. During the same period, the benchmark returned +5.94%. For complete, annualized performance of Delaware Core Plus Bond Fund, please see the table on page 4.
The Fund’s underperformance was largely due to asset allocation. The Fund was generally overweight mortgage-backed securities (MBS) and underweight U.S. Treasurys, which performed well relative to MBS and asset-backed securities (ABS). The Fund’s exposure to out-of-benchmark and below-investment-grade assets also detracted from performance. While the Fund’s bank loan holdings gained in absolute terms, they significantly lagged the overall benchmark. An underweight allocation to the more volatile industrials sector also detracted from performance, particularly in the second half of the Fund’s fiscal year, when energy and metals-and-mining securities rallied strongly.
Weak security selection, notably in the commodity space, was costly to performance as well. The Fund was hurt by its exposure to energy and commodities securities in the first half of the fiscal year, including down-in-quality holdings such as Chesapeake Energy, which we sold in its entirety
before the rebound in commodity prices. Another detractor was Energy Transfer Equity, which owns an equity interest in a limited partnership in the natural gas midstream business. As of the end of the Fund’s fiscal year, the Fund did not hold that security.
BJ’s Wholesale, an operator of membership warehouse clubs in the Eastern United States, generated a negative return and was sold during the fiscal year as we continued to favor higher quality issuers.
Additionally, the junior guaranteed debentures of the wireless telecommunications provider, Sprint, generated a negative return. The Fund sold this debt during the year and purchased the senior guaranteed debt within the company’s capital structure.
While the Fund’s overweight to MBS detracted from performance, results were stronger in the commercial mortgage-backed securities (CMBS) sector, where the Fund’s overweight position performed in line with the benchmark’s CMBS component, which outpaced the overall benchmark. The Fund’s allocation to ABS was a slight detractor, trailing the overall benchmark and its ABS component.
Overall, the fiscal year was a challenging environment for the Fund, which adheres to a bottom-up (bond by bond), fundamentals-focused approach. In the more momentum-driven market that characterized the fiscal period, fundamentals generally deteriorated despite positive market performance.
On the positive side, the Fund’s security selection in U.S. Treasurys was helpful. The Fund used Treasurys to source longer-dated and somewhat higher yielding assets and therefore attempted to counteract exposure to the intermediate part of the yield curve in corporate credit. The benefit was limited, however, because an underweight to the sector detracted from the Fund’s returns.
2
Strong security selection within investment grade credit also aided performance. The Fund’s securities within financials benefited from a supportive regulatory environment that forced a number of banks to increase capital and focus on balance sheet improvement. Some stronger-performing holdings in this group included Wells Fargo, U.S. Bancorp, and JPMorgan Chase.
Throughout the Fund’s fiscal year (and particularly in the first half), we adjusted the portfolio to achieve a higher-quality bias, while attempting to reduce overall risk. For example, the Fund was overweight utilities, which generally have less idiosyncratic risk than healthcare companies, in part due to their reduced exposure to foreign exchange volatility and shareholder-friendly activity. This allocation to a less volatile sector reflected our conservative view and our desire to try to limit those risks.
Although security selection among utilities was a slight detractor for the Fund, it was more than offset by the Fund’s significant sector overweight, as utilities significantly outperformed other high grade credit. Leading performers included MidAmerican Energy and First Mortgage bonds, Duke Energy senior unsecured bonds, and some longer-dated Alabama Power unsecured bonds.
We believe that central bank policy could continue to drive market volatility, while lower yields will likely continue to present challenges for investors. The global wave of populism, that was reflected in
the British vote to leave the European Union (Brexit) and in the U.S. presidential campaign, also continues to be a source of uncertainty. Until those issues are resolved, we think it unlikely that confidence will be strong enough for companies to aggressively invest in their businesses.
From a risk management standpoint, we continue to focus on liquidity given our expectation that volatility will likely persist. We see opportunities, particularly in credits that, in our view, have strong enough balance sheets to weather uncertain times, and we will continue to maintain exposure to sectors such as banking and utilities. Finally, we will maintain a higher-quality bias when seeking incremental yield through high yield bonds and bank loans.
A note about derivatives
The Fund benefited modestly from the use of futures, which added some duration to the Fund. During the fiscal year, the Fund utilized fixed income options to hedge interest rate volatility. Interest rate swaps were utilized as a source of duration and to capture the decline in swap spreads. We also had a small position in credit default swaps in an attempt to protect against emerging market volatility, and we used S&P e-mini futures as a slight hedge. Overall, however, the use of derivatives did not have a material effect on performance (that is, it amounted to less than 0.50 percentage points).
3
| | |
| Performance summary | | |
| Delaware Core Plus Bond Fund | | July 31, 2016 |
The performance data quoted represent past performance; past performance does not guarantee future results. Investment return and principal value will fluctuate so your shares, when redeemed, may be worth more or less than their original cost. Please obtain the performance data current for the most recent month end by calling 800 523-1918 or visiting our website at delawareinvestments.com/performance. Current performance may be lower or higher than the performance data quoted.
| | | | | | | | | | | | |
| Fund and benchmark performance1,2 | | Average annual total returns through July 31, 2016 | |
| | | 1 year | | | 5 years | | | 10 years | |
Class A (Est. Aug. 16, 1985) | | | | | | | | | | | | |
Excluding sales charge | | | +4.15% | | | | +3.33% | | | | +5.50% | |
Including sales charge | | | -0.57% | | | | +2.38% | | | | +5.01% | |
Class C (Est. Nov. 29, 1995) | | | | | | | | | | | | |
Excluding sales charge | | | +3.37% | | | | +2.56% | | | | +4.73% | |
Including sales charge | | | +2.37% | | | | +2.56% | | | | +4.73% | |
Class R (Est. June 2, 2003) | | | | | | | | | | | | |
Excluding sales charge | | | +3.88% | | | | +3.07% | | | | +5.27% | |
Including sales charge | | | +3.88% | | | | +3.07% | | | | +5.27% | |
Institutional Class (Est. June 1, 1992) | | | | | | | | | | | | |
Excluding sales charge | | | +4.40% | | | | +3.59% | | | | +5.78% | |
Including sales charge | | | +4.40% | | | | +3.59% | | | | +5.78% | |
Bloomberg Barclays U.S. Aggregate Index | | | +5.94% | | | | +3.57% | | | | +5.06% | |
1Returns reflect the reinvestment of all distributions and are presented both with and without the applicable sales charges described below. Returns do not reflect the deduction of taxes the shareholder would pay on Fund distributions or redemptions of Fund shares.
Expense limitations were in effect for certain classes during some or all of the periods shown in the “Fund and benchmark performance” table. Expenses for each class are listed on the “Fund expense ratios” table on page 6. Performance would have been lower had expense limitations not been in effect.
Institutional Class shares are available without sales or asset-based distribution charges only to certain eligible accounts.
Class A shares are sold with a maximum front-end sales charge of 4.50%, and have an annual distribution and service fee of 0.25% of average daily net assets. The Board has adopted a formula for calculating 12b-1 plan fees for the Fund’s Class A shares. The Fund’s Class A shares are currently subject to a blended 12b-1 fee equal to the sum of: (i) 0.10% of average daily net assets representing shares acquired prior to June 1, 1992, and (ii) 0.25% of average daily net assets representing shares acquired on or after June 1, 1992. All Class A shares currently bear 12b-1 fees at the same rate, the blended rate, currently 0.25% of average daily net assets, based on the formula described above. This method of calculating Class A 12b-1 fees may be discontinued at the sole discretion of the Board. Performance for Class A shares, excluding sales
4
charges, assumes that no front-end sales charge applied.
Class C shares are sold with a contingent deferred sales charge of 1.00% if redeemed during the first 12 months. They are also subject to an annual distribution and service fee of 1.00% of average daily net assets. Performance for Class C shares, excluding sales charges, assumes either that contingent deferred sales charges did not apply or that the investment was not redeemed.
Class R shares are available only for certain retirement plan products. They are sold without a sales charge and have an annual distribution and service fee of 0.50% of average daily net assets.
Fixed income securities and bond funds can lose value, and investors can lose principal, as interest rates rise. They also may be affected by economic conditions that hinder an issuer’s ability to make interest and principal payments on its debt.
The Fund may also be subject to prepayment risk, the risk that the principal of a fixed income security that is held by the Fund may be prepaid prior to maturity, potentially forcing the Fund to reinvest that money at a lower interest rate.
High yielding, noninvestment grade bonds (junk bonds) involve higher risk than investment grade bonds. The high yield secondary market is particularly susceptible to liquidity problems when institutional investors, such as mutual funds and certain other financial institutions, temporarily stop buying bonds for regulatory, financial, or other reasons. In addition, a less liquid secondary market makes it more difficult for the Fund to obtain precise valuations of the high yield securities in its portfolio.
The Fund may invest in derivatives, which may involve additional expenses and are subject to risk, including the risk that an underlying security or securities index moves in the opposite direction from what the portfolio manager anticipated. A derivative transaction depends
upon the counterparties’ ability to fulfill their contractual obligations.
Investments in mortgage-backed securities (MBS) may involve risks. MBS represent an ownership interest in a pool of mortgage loans. The individual mortgage loans are packaged or “pooled” together for sale to investors. These mortgage loans may have either fixed or adjustable interest rates.
Because the Fund may invest in bank loans and other direct indebtedness, it is subject to the risk that the Fund will not receive payment of principal, interest, and other amounts due in connection with these investments, which primarily depend on the financial condition of the borrower and the lending institution.
International investments entail risks not ordinarily associated with U.S. investments including fluctuation in currency values, differences in accounting principles, or economic or political instability in other nations.
Investing in emerging markets can be riskier than investing in established foreign markets due to increased volatility and lower trading volume.
If and when the Fund invests in forward foreign currency contracts or uses other investments to hedge against currency risks, the Fund will be subject to special risks, including counterparty risk.
The Fund may experience portfolio turnover in excess of 100%, which could result in higher transaction costs and tax liability.
Per Standard & Poor’s credit rating agency, bonds rated AA and A are more susceptible to the adverse effects of changes in circumstances and economic conditions than those in the higher-rated AAA category, but the obligor’s capacity to meet its financial commitment on the obligation is still strong. Bonds rated BBB exhibit adequate protection parameters, although adverse economic conditions or changing circumstances are more likely to lead to a weakened capacity of
5
Performance summary
Delaware Core Plus Bond Fund
the obligor to meet its financial commitments. Bonds rated BB, B, and CCC are regarded as having significant speculative characteristics, with BB indicating the least degree of speculation of the three.
2The Fund’s expense ratios, as described in the most recent prospectus, are disclosed in the following “Fund expense ratios” table. Delaware Management Company has agreed to reimburse certain expenses and/or waive certain fees in order to prevent total annual fund operating expenses (excluding any 12b-1 fees, acquired fund fees and expenses, taxes, interest, short sale and dividend interest expenses, brokerage fees, certain insurance costs, and nonroutine expenses or costs, including, but not limited to, those relating to reorganizations, litigation, conducting shareholder meetings, and liquidations (collectively, nonroutine expenses)) from exceeding 0.65% of the Fund’s average daily net assets during the period from Aug. 1, 2015 through July 31, 2016.* Please see the most recent prospectus and any applicable supplement(s) for additional information on these fee waivers and/or reimbursements.
| | | | | | | | |
| Fund expense ratios | | Class A | | Class C | | Class R | | Institutional Class |
Total annual operating expenses (without fee waivers) | | 1.20% | | 1.95% | | 1.45% | | 0.95% |
Net expenses (including fee waivers, if any) | | 0.90% | | 1.65% | | 1.15% | | 0.65% |
Type of waiver | | Contractual | | Contractual | | Contractual | | Contractual |
*The aggregate contractual waiver period covering this report is from Nov. 28, 2014, through Nov. 28, 2016.
6
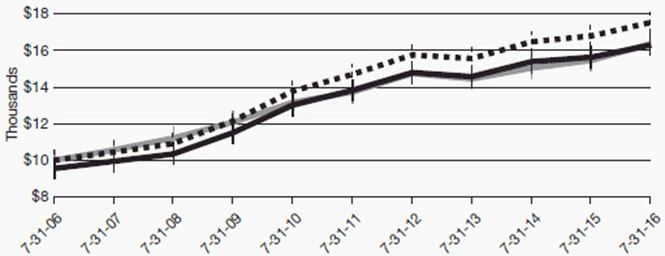
Performance of a $10,000 investment1
Average annual total returns from July 31, 2006, through July 31, 2016
| | | | | | | | | | |
| For period beginning July 31, 2006, through July 31, 2016 | | Starting value | | | | | Ending value |

| | Delaware Core Plus Bond Fund — Institutional Class shares | | | $10,000 | | | | | $17,544 |

| | Bloomberg Barclays U.S. Aggregate Index | | | $10,000 | | | | | $16,379 |

| | Delaware Core Plus Bond Fund — Class A shares | | | $9,550 | | | | | $16,310 |
1The “Performance of a $10,000 investment” graph assumes $10,000 invested in Institutional Class and Class A shares of the Fund on July 31, 2006, and includes the effect of a 4.50% front-end sales charge (for Class A shares) and the reinvestment of all distributions. The graph does not reflect the deduction of taxes the shareholders would pay on Fund distributions or redemptions of Fund shares. Expense limitations were in effect for some or all of the periods shown. Performance would have been lower had expense limitations not been in effect. Expenses are listed in the “Fund expense ratios” table on page 6. Please note additional details on pages 4 through 7.
The graph also assumes $10,000 invested in the Bloomberg Barclays U.S. Aggregate Index as of
July 31, 2006. The Bloomberg Barclays U.S. Aggregate Index (formerly known as the Barclays U.S. Aggregate Index) measures the performance of publicly issued investment grade (Baa3/BBB- or better) corporate, U.S. government, mortgage-and asset-backed securities with at least one year to maturity and at least $250 million par amount outstanding.
Index performance returns do not reflect any management fees, transaction costs, or expenses. Indices are unmanaged and one cannot invest directly in an index. Past performance is not a guarantee of future results.
Performance of other Fund classes will vary due to different charges and expenses.
| | | | | | | | |
| | | Nasdaq symbols | | CUSIPs | | | | |
Class A | | DEGGX | | 246094205 | | | | |
Class C | | DUGCX | | 246094700 | | | | |
Class R | | DUGRX | | 246094809 | | | | |
Institutional Class | | DUGIX | | 246094502 | | | | |
7
Disclosure of Fund expenses
For the six-month period from February 1, 2016 to July 31, 2016 (Unaudited)
As a shareholder of the Fund, you incur two types of costs: (1) transaction costs, including sales charges (loads) on purchase payments, reinvested dividends, or other distributions; redemption fees; and exchange fees; and (2) ongoing costs, including management fees; distribution and/or service (12b-1) fees; and other Fund expenses. This example is intended to help you understand your ongoing costs (in dollars) of investing in the Fund and to compare these costs with the ongoing costs of investing in other mutual funds.
The example is based on an investment of $1,000 invested at the beginning of the period and held for the entire six-month period from Feb. 1, 2016 to July 31, 2016.
Actual expenses
The first section of the table shown, “Actual Fund return,” provides information about actual account values and actual expenses. You may use the information in this section of the table, together with the amount you invested, to estimate the expenses that you paid over the period. Simply divide your account value by $1,000 (for example, an $8,600 account value divided by $1,000 = 8.6), then multiply the result by the number in the first section under the heading entitled “Expenses Paid During Period” to estimate the expenses you paid on your account during this period.
Hypothetical example for comparison purposes
The second section of the table shown, “Hypothetical 5% return,” provides information about hypothetical account values and hypothetical expenses based on the Fund’s actual expense ratio and an assumed rate of return of 5% per year before expenses, which is not the Fund’s actual return. The hypothetical account values and expenses may not be used to estimate the actual ending account balance or expenses you paid for the period. You may use this information to compare the ongoing costs of investing in the Fund and other funds. To do so, compare this 5% hypothetical example with the 5% hypothetical examples that appear in the shareholder reports of the other funds.
Please note that the expenses shown in the table are meant to highlight your ongoing costs only and do not reflect any transactional costs, such as sales charges (loads), redemption fees, or exchange fees. Therefore, the second section of the table is useful in comparing ongoing costs only, and will not help you determine the relative total costs of owning different funds. In addition, if these transactional costs were included, your costs would have been higher. The Fund’s expenses shown in the table reflect fee waivers in effect. The expenses shown in the table assume reinvestment of all dividends and distributions.
8
Delaware Core Plus Bond Fund
Expense analysis of an investment of $1,000
| | | | | | | | | | | | | | | | |
| | | Beginning Account Value 2/1/16 | | | Ending Account Value 7/31/16 | | | Annualized Expense Ratio | | | Expenses Paid During Period 2/1/16 to 7/31/16* | |
Actual Fund return† | | | | | | | | | | | | | | | | |
Class A | | | $1,000.00 | | | | $1,040.70 | | | | 0.90% | | | | $4.57 | |
Class C | | | 1,000.00 | | | | 1,036.80 | | | | 1.65% | | | | 8.36 | |
Class R | | | 1,000.00 | | | | 1,039.30 | | | | 1.15% | | | | 5.83 | |
Institutional Class | | | 1,000.00 | | | | 1,041.90 | | | | 0.65% | | | | 3.30 | |
Hypothetical 5% return (5% return before expenses) | | | | | | | | | |
Class A | | | $1,000.00 | | | | $1,020.39 | | | | 0.90% | | | | $4.52 | |
Class C | | | 1,000.00 | | | | 1,016.66 | | | | 1.65% | | | | 8.27 | |
Class R | | | 1,000.00 | | | | 1,019.14 | | | | 1.15% | | | | 5.77 | |
Institutional Class | | | 1,000.00 | | | | 1,021.63 | | | | 0.65% | | | | 3.27 | |
| * | “Expenses Paid During Period” are equal to the Fund’s annualized expense ratio, multiplied by the average account value over the period, multiplied by 182/366 (to reflect the one-half year period). |
| † | Because actual returns reflect only the most recent six-month period, the returns shown may differ significantly from fiscal year returns. |
9
| | |
| Security type / sector allocation | | |
| Delaware Core Plus Bond Fund | | As of July 31, 2016 (Unaudited) |
Sector designations may be different than the sector designations presented in other Fund materials. The sector designations may represent the investment manager’s internal sector classifications.
| | | | | |
| Security type / sector | | Percentage of net assets |
Agency Collateralized Mortgage Obligations | | | | 4.42 | % |
Agency Commercial Mortgage-Backed Securities | | | | 1.67 | % |
Agency Mortgage-Backed Securities | | | | 28.77 | % |
Collateralized Debt Obligations | | | | 1.62 | % |
Convertible Bonds | | | | 0.19 | % |
Corporate Bonds | | | | 38.12 | % |
Banking | | | | 7.31 | % |
Basic Industry | | | | 1.90 | % |
Brokerage | | | | 0.23 | % |
Capital Goods | | | | 1.16 | % |
Communications | | | | 4.60 | % |
Consumer Cyclical | | | | 2.86 | % |
Consumer Non-Cyclical | | | | 5.41 | % |
Electric | | | | 6.20 | % |
Energy | | | | 1.91 | % |
Finance Companies | | | | 0.86 | % |
Insurance | | | | 1.42 | % |
Natural Gas | | | | 0.07 | % |
REITs | | | | 1.28 | % |
Technology | | | | 1.65 | % |
Transportation | | | | 1.26 | % |
Municipal Bonds | | | | 1.10 | % |
Non-Agency Asset-Backed Securities | | | | 6.65 | % |
Non-Agency Collateralized Mortgage Obligations | | | | 1.38 | % |
Non-Agency Commercial Mortgage-Backed Securities | | | | 4.34 | % |
Regional Bonds | | | | 0.43 | % |
Senior Secured Loans | | | | 2.99 | % |
Sovereign Bonds | | | | 0.45 | % |
U.S. Treasury Obligations | | | | 2.00 | % |
Convertible Preferred Stock | | | | 0.02 | % |
Preferred Stock | | | | 0.95 | % |
Short-Term Investments | | | | 14.69 | % |
Total Value of Securities | | | | 109.79 | % |
Liabilities Net of Receivables and Other Assets | | | | (9.79 | %) |
Total Net Assets | | | | 100.00 | % |
10
| | |
| Schedule of investments | | |
| Delaware Core Plus Bond Fund | | July 31, 2016 |
| | | | | | | | |
| | | Principal amount° | | | Value (U.S. $) | |
| |
Agency Collateralized Mortgage Obligations – 4.42% | | | | | | | | |
| |
Fannie Mae Grantor Trust | | | | | | | | |
Series 2002-T1 A2 7.00% 11/25/31 | | | 38,249 | | | $ | 46,641 | |
Fannie Mae Interest Strip | | | | | | | | |
Series 35 2 12.00% 7/25/18 | | | 4,548 | | | | 4,902 | |
Fannie Mae REMIC Trust | | | | | | | | |
Series 2002-W1 2A 6.221% 2/25/42 • | | | 47,628 | | | | 56,570 | |
Fannie Mae REMICs | | | | | | | | |
Series 1988-15 A 9.00% 6/25/18 | | | 81 | | | | 85 | |
Series 1996-46 ZA 7.50% 11/25/26 | | | 35,661 | | | | 40,366 | |
Series 2002-83 GH 5.00% 12/25/17 | | | 33,292 | | | | 33,948 | |
Series 2005-70 PA 5.50% 8/25/35 | | | 9,505 | | | | 10,818 | |
Series 2008-15 SB 6.112% 8/25/36 •S | | | 25,185 | | | | 5,292 | |
Series 2010-129 SM 5.512% 11/25/40 •S | | | 162,702 | | | | 27,906 | |
Series 2011-80 CB 4.00% 8/25/26 | | | 1,953,713 | | | | 2,182,584 | |
Series 2012-122 SD 5.612% 11/25/42 •S | | | 304,429 | | | | 68,796 | |
Series 2013-26 ID 3.00% 4/25/33 S | | | 225,260 | | | | 28,641 | |
Series 2013-38 AI 3.00% 4/25/33 S | | | 217,415 | | | | 24,692 | |
Series 2013-43 IX 4.00% 5/25/43 S | | | 635,096 | | | | 132,109 | |
Series 2013-44 DI 3.00% 5/25/33 S | | | 673,740 | | | | 89,683 | |
Series 2013-55 AI 3.00% 6/25/33 S | | | 267,543 | | | | 31,729 | |
Series 2014-68 BS 5.662% 11/25/44 •S | | | 226,845 | | | | 48,627 | |
Series 2014-90 SA 5.662% 1/25/45 •S | | | 641,387 | | | | 139,382 | |
Series 2015-27 SA 5.962% 5/25/45 •S | | | 85,420 | | | | 19,340 | |
Series 2015-44 Z 3.00% 9/25/43 | | | 197,301 | | | | 197,791 | |
Series 2016-55 SK 5.517% 8/25/46 •S | | | 165,000 | | | | 43,313 | |
Freddie Mac REMICs | | | | | | | | |
Series 2557 WE 5.00% 1/15/18 | | | 29,286 | | | | 29,901 | |
Series 3656 PM 5.00% 4/15/40 | | | 143,128 | | | | 159,337 | |
Series 4109 AI 3.00% 7/15/31 S | | | 440,449 | | | | 38,160 | |
Series 4120 IK 3.00% 10/15/32 S | | | 343,217 | | | | 38,725 | |
Series 4146 IA 3.50% 12/15/32 S | | | 180,767 | | | | 26,457 | |
Series 4159 KS 5.669% 1/15/43 •S | | | 158,857 | | | | 38,508 | |
Series 4181 DI 2.50% 3/15/33 S | | | 109,648 | | | | 11,291 | |
Series 4184 GS 5.639% 3/15/43 •S | | | 180,703 | | | | 43,139 | |
Series 4185 LI 3.00% 3/15/33 S | | | 166,419 | | | | 19,320 | |
Series 4191 CI 3.00% 4/15/33 S | | | 73,388 | | | | 9,162 | |
Series 4435 DY 3.00% 2/15/35 | | | 162,000 | | | | 170,312 | |
Series 4592 WT 5.50% 6/15/46 | | | 390,207 | | | | 438,441 | |
Series 4594 SG 5.519% 6/15/46 •S | | | 445,399 | | | | 116,694 | |
Freddie Mac Strips | | | | | | | | |
Series 267 S5 5.519% 8/15/42 •S | | | 237,298 | | | | 54,140 | |
Series 299 S1 5.519% 1/15/43 •S | | | 176,841 | | | | 38,907 | |
Series 326 S2 5.469% 3/15/44 •S | | | 118,461 | | | | 27,061 | |
11
Schedule of investments
Delaware Core Plus Bond Fund
| | | | | | | | |
| | | Principal amount° | | | Value (U.S. $) | |
| |
Agency Collateralized Mortgage Obligations (continued) | | | | | | | | |
| |
Freddie Mac Structured Agency Credit Risk Debt Notes | | | | | | | | |
Series 2015-HQA2 M2 3.288% 5/25/28 • | | | 250,000 | | | $ | 257,243 | |
Freddie Mac Structured Pass Through Securities | | | | | | | | |
Series T-42 A5 7.50% 2/25/42 ¿ | | | 19,826 | | | | 23,912 | |
GNMA | | | | | | | | |
Series 2010-42 PC 5.00% 7/20/39 | | | 545,000 | | | | 622,015 | |
Series 2010-113 KE 4.50% 9/20/40 | | | 245,000 | | | | 277,430 | |
Series 2013-113 AZ 3.00% 8/20/43 | | | 202,986 | | | | 203,841 | |
Series 2015-133 AL 3.00% 5/20/45 | | | 214,000 | | | | 221,411 | |
| | | | | | | | |
Total Agency Collateralized Mortgage Obligations (cost $6,068,391) | | | | | | | 6,098,622 | |
| | | | | | | | |
| | | | | | | | |
| |
Agency Commercial Mortgage-Backed Securities – 1.67% | | | | | | | | |
| |
Freddie Mac Multifamily Structured Pass Through Certificates | | | | | | | | |
Series K041 A2 3.171% 10/25/24 ¿ | | | 240,000 | | | | 262,928 | |
Series K055 A2 2.673% 3/25/26 ¿ | | | 245,000 | | | | 258,159 | |
Series K056 A2 2.525% 5/25/26 ¿ | | | 85,000 | | | | 87,546 | |
Series K716 A2 3.13% 6/25/21 ¿ | | | 100,000 | | | | 107,341 | |
Series K722 A1 2.183% 5/25/22 ¿ | | | 89,880 | | | | 92,379 | |
FREMF Mortgage Trust | | | | | | | | |
Series 2011-K10 B 144A 4.631% 11/25/49 #• | | | 110,000 | | | | 120,216 | |
Series 2011-K14 B 144A 5.167% 2/25/47 #• | | | 50,000 | | | | 56,312 | |
Series 2011-K15 B 144A 4.948% 8/25/44 #• | | | 75,000 | | | | 83,380 | |
Series 2012-K18 B 144A 4.255% 1/25/45 #• | | | 55,000 | | | | 60,131 | |
Series 2012-K22 B 144A 3.686% 8/25/45 #• | | | 85,000 | | | | 89,744 | |
Series 2012-K23 C 144A 3.656% 10/25/45 #• | | | 30,000 | | | | 30,036 | |
Series 2012-K708 B 144A 3.751% 2/25/45 #• | | | 110,000 | | | | 113,845 | |
Series 2012-K708 C 144A 3.751% 2/25/45 #• | | | 25,000 | | | | 25,048 | |
Series 2013-K30 C 144A 3.557% 6/25/45 #• | | | 25,000 | | | | 24,097 | |
Series 2013-K33 B 144A 3.503% 8/25/46 #• | | | 65,000 | | | | 67,249 | |
Series 2013-K35 C 144A 3.942% 8/25/23 #• | | | 20,000 | | | | 19,810 | |
Series 2013-K712 B 144A 3.369% 5/25/45 #• | | | 125,000 | | | | 128,395 | |
Series 2013-K712 C 144A 3.369% 5/25/45 #• | | | 300,000 | | | | 305,804 | |
Series 2013-K713 B 144A 3.165% 4/25/46 #• | | | 75,000 | | | | 76,594 | |
Series 2013-K713 C 144A 3.165% 4/25/46 #• | | | 140,000 | | | | 139,961 | |
Series 2014-K716 C 144A 3.953% 8/25/47 #• | | | 150,000 | | | | 149,527 | |
| | | | | | | | |
Total Agency Commercial Mortgage-Backed Securities (cost $2,264,684) | | | | 2,298,502 | |
| | | | | | | | |
| | | | | | | | |
| |
Agency Mortgage-Backed Securities – 28.77% | | | | | | | | |
| |
Fannie Mae | | | | | | | | |
10.50% 6/1/30 | | | 10,009 | | | | 10,205 | |
Fannie Mae ARM | | | | | | | | |
2.413% 5/1/43 • | | | 60,911 | | | | 62,903 | |
12
| | | | | | | | |
| | | Principal amount° | | | Value (U.S. $) | |
| |
Agency Mortgage-Backed Securities (continued) | | | | | | | | |
| |
Fannie Mae ARM | | | | | | | | |
2.553% 6/1/43 • | | | 21,778 | | | $ | 22,494 | |
2.612% 8/1/35 • | | | 17,826 | | | | 18,802 | |
2.731% 7/1/36 • | | | 54,798 | | | | 58,350 | |
2.913% 7/1/45 • | | | 36,012 | | | | 37,481 | |
2.966% 4/1/46 • | | | 20,314 | | | | 21,204 | |
3.21% 4/1/44 • | | | 38,621 | | | | 40,475 | |
3.231% 3/1/44 • | | | 77,509 | | | | 81,686 | |
3.276% 9/1/43 • | | | 52,379 | | | | 54,882 | |
Fannie Mae S.F. 15 yr | | | | | | | | |
2.50% 5/1/31 | | | 170,955 | | | | 177,482 | |
3.00% 11/1/26 | | | 263,700 | | | | 278,314 | |
3.00% 9/1/30 | | | 102,535 | | | | 108,064 | |
3.00% 12/1/30 | | | 283,398 | | | | 298,902 | |
3.00% 2/1/31 | | | 252,472 | | | | 266,107 | |
3.00% 3/1/31 | | | 589,665 | | | | 620,899 | |
3.50% 4/1/26 | | | 232,882 | | | | 248,009 | |
3.50% 7/1/26 | | | 60,940 | | | | 64,722 | |
3.50% 11/1/26 | | | 27,491 | | | | 29,198 | |
3.50% 8/1/29 | | | 120,689 | | | | 127,823 | |
3.50% 4/1/30 | | | 56,992 | | | | 61,042 | |
4.00% 11/1/25 | | | 121,826 | | | | 130,055 | |
4.00% 12/1/26 | | | 38,896 | | | | 41,704 | |
4.00% 1/1/27 | | | 281,603 | | | | 300,204 | |
Fannie Mae S.F. 20 yr | | | | | | | | |
3.00% 8/1/33 | | | 35,234 | | | | 37,106 | |
3.00% 1/1/36 | | | 269,112 | | | | 283,129 | |
3.00% 5/1/36 | | | 178,916 | | | | 188,236 | |
Fannie Mae S.F. 30 yr | | | | | | | | |
3.50% 2/1/45 | | | 313,148 | | | | 333,064 | |
3.50% 2/1/46 | | | 948,369 | | | | 1,001,526 | |
3.50% 3/1/46 | | | 84,045 | | | | 88,780 | |
3.50% 5/1/46 | | | 151,909 | | | | 160,471 | |
4.00% 11/1/42 | | | 334,302 | | | | 364,092 | |
4.00% 4/1/46 | | | 576,478 | | | | 624,685 | |
4.50% 7/1/36 | | | 27,655 | | | | 30,251 | |
4.50% 6/1/38 | | | 72,786 | | | | 79,801 | |
4.50% 4/1/39 | | | 81,620 | | | | 88,909 | |
4.50% 6/1/39 | | | 660,952 | | | | 720,864 | |
4.50% 9/1/39 | | | 21,246 | | | | 23,216 | |
4.50% 11/1/39 | | | 65,350 | | | | 72,675 | |
4.50% 1/1/40 | | | 886,102 | | | | 976,709 | |
4.50% 4/1/40 | | | 32,489 | | | | 35,562 | |
13
Schedule of investments
Delaware Core Plus Bond Fund
| | | | | | | | |
| | | Principal amount° | | | Value (U.S. $) | |
| |
Agency Mortgage-Backed Securities (continued) | | | | | | | | |
| |
Fannie Mae S.F. 30 yr | | | | | | | | |
4.50% 6/1/40 | | | 68,826 | | | $ | 76,307 | |
4.50% 8/1/40 | | | 21,708 | | | | 23,881 | |
4.50% 9/1/40 | | | 104,238 | | | | 114,128 | |
4.50% 11/1/40 | | | 59,123 | | | | 64,743 | |
4.50% 2/1/41 | | | 246,247 | | | | 269,639 | |
4.50% 3/1/41 | | | 77,676 | | | | 85,058 | |
4.50% 4/1/41 | | | 94,431 | | | | 103,166 | |
4.50% 7/1/41 | | | 208,871 | | | | 231,129 | |
4.50% 8/1/41 | | | 39,608 | | | | 44,124 | |
4.50% 10/1/41 | | | 78,348 | | | | 85,640 | |
4.50% 12/1/41 | | | 168,785 | | | | 184,262 | |
4.50% 1/1/42 | | | 590,898 | | | | 646,373 | |
4.50% 4/1/42 | | | 23,183 | | | | 25,376 | |
4.50% 8/1/42 | | | 1,173,486 | | | | 1,289,165 | |
4.50% 9/1/42 | | | 685,150 | | | | 748,726 | |
4.50% 1/1/43 | | | 109,386 | | | | 119,655 | |
4.50% 9/1/43 | | | 90,539 | | | | 99,071 | |
4.50% 10/1/43 | | | 478,983 | | | | 527,548 | |
4.50% 11/1/43 | | | 124,276 | | | | 135,553 | |
4.50% 4/1/44 | | | 219,923 | | | | 239,740 | |
4.50% 5/1/44 | | | 58,412 | | | | 63,657 | |
4.50% 6/1/44 | | | 435,594 | | | | 476,343 | |
4.50% 10/1/44 | | | 417,324 | | | | 456,676 | |
4.50% 12/1/44 | | | 72,981 | | | | 79,759 | |
4.50% 1/1/45 | | | 590,939 | | | | 644,549 | |
4.50% 2/1/45 | | | 323,099 | | | | 353,095 | |
4.50% 4/1/45 | | | 420,169 | | | | 460,071 | |
4.50% 3/1/46 | | | 26,391 | | | | 29,099 | |
5.00% 2/1/35 | | | 7,978 | | | | 8,872 | |
5.00% 10/1/35 | | | 41,319 | | | | 45,811 | |
5.00% 11/1/35 | | | 19,910 | | | | 22,070 | |
5.00% 4/1/37 | | | 11,610 | | | | 12,843 | |
5.00% 8/1/37 | | | 3,018 | | | | 3,349 | |
5.00% 12/1/39 | | | 32,949 | | | | 36,761 | |
5.00% 1/1/40 | | | 7,265 | | | | 8,144 | |
5.00% 11/1/44 | | | 404,540 | | | | 448,863 | |
5.50% 12/1/32 | | | 2,221 | | | | 2,514 | |
5.50% 2/1/33 | | | 29,288 | | | | 33,058 | |
5.50% 6/1/33 | | | 17,710 | | | | 20,028 | |
5.50% 4/1/34 | | | 12,455 | | | | 14,098 | |
5.50% 5/1/34 | | | 122,472 | | | | 138,723 | |
5.50% 7/1/34 | | | 3,963 | | | | 4,492 | |
14
| | | | | | | | |
| | | Principal amount° | | | Value (U.S. $) | |
| |
Agency Mortgage-Backed Securities (continued) | | | | | | | | |
| |
Fannie Mae S.F. 30 yr | | | | | | | | |
5.50% 9/1/34 | | | 48,080 | | | $ | 54,506 | |
5.50% 11/1/34 | | | 12,002 | | | | 13,600 | |
5.50% 12/1/34 | | | 268,345 | | | | 304,109 | |
5.50% 3/1/35 | | | 24,367 | | | | 27,559 | |
5.50% 4/1/35 | | | 70,297 | | | | 79,176 | |
5.50% 5/1/35 | | | 67,084 | | | | 75,971 | |
5.50% 6/1/35 | | | 7,982 | | | | 8,945 | |
5.50% 12/1/35 | | | 11,649 | | | | 13,165 | |
5.50% 1/1/36 | | | 54,494 | | | | 61,790 | |
5.50% 4/1/36 | | | 279,394 | | | | 315,240 | |
5.50% 5/1/36 | | | 5,742 | | | | 6,493 | |
5.50% 7/1/36 | | | 3,407 | | | | 3,863 | |
5.50% 9/1/36 | | | 66,656 | | | | 75,454 | |
5.50% 11/1/36 | | | 9,894 | | | | 11,135 | |
5.50% 1/1/37 | | | 41,444 | | | | 46,604 | |
5.50% 2/1/37 | | | 28,739 | | | | 32,323 | |
5.50% 4/1/37 | | | 83,085 | | | | 93,472 | |
5.50% 8/1/37 | | | 58,816 | | | | 66,581 | |
5.50% 9/1/37 | | | 56,306 | | | | 63,271 | |
5.50% 1/1/38 | | | 613,393 | | | | 694,181 | |
5.50% 2/1/38 | | | 98,966 | | | | 111,928 | |
5.50% 6/1/38 | | | 99,094 | | | | 111,402 | |
5.50% 7/1/38 | | | 19,885 | | | | 22,370 | |
5.50% 9/1/38 | | | 87,910 | | | | 99,506 | |
5.50% 12/1/38 | | | 381,594 | | | | 431,876 | |
5.50% 1/1/39 | | | 64,464 | | | | 73,087 | |
5.50% 2/1/39 | | | 149,154 | | | | 168,659 | |
5.50% 6/1/39 | | | 57,319 | | | | 64,721 | |
5.50% 12/1/39 | | | 113,302 | | | | 128,493 | |
5.50% 3/1/40 | | | 326,168 | | | | 369,684 | |
5.50% 7/1/40 | | | 84,515 | | | | 95,661 | |
5.50% 3/1/41 | | | 250,721 | | | | 283,852 | |
5.50% 6/1/41 | | | 145,131 | | | | 164,283 | |
5.50% 9/1/41 | | | 618,954 | | | | 698,121 | |
6.00% 6/1/36 | | | 4,013 | | | | 4,594 | |
6.00% 9/1/36 | | | 21,873 | | | | 25,477 | |
6.00% 12/1/36 | | | 3,987 | | | | 4,577 | |
6.00% 2/1/37 | | | 13,629 | | | | 15,589 | |
6.00% 6/1/37 | | | 2,277 | | | | 2,625 | |
6.00% 7/1/37 | | | 155,737 | | | | 180,386 | |
6.00% 8/1/37 | | | 43,056 | | | | 49,467 | |
6.00% 9/1/37 | | | 4,443 | | | | 5,079 | |
15
Schedule of investments
Delaware Core Plus Bond Fund
| | | | | | | | |
| | | Principal amount° | | | Value (U.S. $) | |
| |
Agency Mortgage-Backed Securities (continued) | | | | | | | | |
| |
Fannie Mae S.F. 30 yr | | | | | | | | |
6.00% 11/1/37 | | | 682 | | | $ | 778 | |
6.00% 5/1/38 | | | 27,241 | | | | 31,128 | |
6.00% 9/1/38 | | | 167,082 | | | | 191,459 | |
6.00% 10/1/38 | | | 6,251 | | | | 7,153 | |
6.00% 9/1/39 | | | 119,773 | | | | 136,911 | |
6.00% 10/1/39 | | | 192,159 | | | | 222,876 | |
6.00% 3/1/40 | | | 18,088 | | | | 20,681 | |
6.00% 4/1/40 | | | 31,082 | | | | 35,554 | |
6.00% 9/1/40 | | | 16,537 | | | | 18,915 | |
6.00% 11/1/40 | | | 6,434 | | | | 7,458 | |
6.00% 5/1/41 | | | 402,486 | | | | 460,600 | |
6.00% 7/1/41 | | | 344,289 | | | | 394,875 | |
8.00% 2/1/30 | | | 16,607 | | | | 16,891 | |
10.00% 7/1/20 | | | 1,937 | | | | 2,086 | |
10.00% 5/1/22 | | | 1,127 | | | | 1,210 | |
10.00% 2/1/25 | | | 22,005 | | | | 23,808 | |
Fannie Mae S.F. 30 yr TBA | | | | | | | | |
3.00% 8/1/46 | | | 5,105,000 | | | | 5,312,391 | |
3.00% 10/1/46 | | | 5,147,000 | | | | 5,335,187 | |
4.50% 8/1/46 | | | 529,000 | | | | 576,852 | |
Freddie Mac ARM | | | | | | | | |
2.434% 10/1/36 • | | | 39,097 | | | | 41,415 | |
2.831% 9/1/45 • | | | 272,821 | | | | 283,089 | |
2.944% 10/1/45 • | | | 72,566 | | | | 75,883 | |
2.949% 11/1/44 • | | | 24,877 | | | | 25,764 | |
3.107% 3/1/46 • | | | 103,486 | | | | 108,527 | |
Freddie Mac S.F. 20 yr | | | | | | | | |
3.00% 6/1/34 | | | 20,126 | | | | 21,149 | |
3.00% 6/1/36 | | | 32,744 | | | | 34,425 | |
Freddie Mac S.F. 30 yr | | | | | | | | |
3.50% 2/1/45 | | | 69,467 | | | | 73,341 | |
3.50% 8/1/45 | | | 370,534 | | | | 394,496 | |
3.50% 11/1/45 | | | 59,275 | | | | 62,580 | |
3.50% 6/1/46 | | | 300,567 | | | | 317,329 | |
4.50% 10/1/35 | | | 3,806 | | | | 4,161 | |
4.50% 4/1/39 | | | 11,757 | | | | 12,924 | |
4.50% 5/1/40 | | | 439,475 | | | | 489,867 | |
4.50% 8/1/40 | | | 93,671 | | | | 102,511 | |
4.50% 3/1/41 | | | 76,198 | | | | 83,384 | |
4.50% 4/1/41 | | | 52,901 | | | | 57,792 | |
4.50% 3/1/42 | | | 266,744 | | | | 293,070 | |
4.50% 7/1/42 | | | 116,983 | | | | 128,795 | |
16
| | | | | | | | |
| | | Principal amount° | | | Value (U.S. $) | |
| |
Agency Mortgage-Backed Securities (continued) | | | | | | | | |
| |
Freddie Mac S.F. 30 yr | | | | | | | | |
4.50% 8/1/44 | | | 168,094 | | | $ | 185,011 | |
4.50% 7/1/45 | | | 361,000 | | | | 395,149 | |
5.00% 6/1/36 | | | 234,244 | | | | 259,991 | |
5.50% 3/1/34 | | | 4,837 | | | | 5,459 | |
5.50% 12/1/34 | | | 4,560 | | | | 5,159 | |
5.50% 12/1/35 | | | 531,895 | | | | 600,481 | |
5.50% 6/1/36 | | | 2,803 | | | | 3,158 | |
5.50% 11/1/36 | | | 6,097 | | | | 6,824 | |
5.50% 9/1/37 | | | 6,205 | | | | 6,972 | |
5.50% 7/1/38 | | | 22,318 | | | | 25,125 | |
5.50% 6/1/39 | | | 23,211 | | | | 26,072 | |
5.50% 3/1/40 | | | 15,224 | | | | 17,088 | |
5.50% 8/1/40 | | | 54,919 | | | | 61,629 | |
5.50% 1/1/41 | | | 17,601 | | | | 19,796 | |
5.50% 6/1/41 | | | 209,597 | | | | 236,239 | |
6.00% 2/1/36 | | | 9,934 | | | | 11,440 | |
6.00% 1/1/38 | | | 6,033 | | | | 6,907 | |
6.00% 6/1/38 | | | 16,137 | | | | 18,473 | |
6.00% 8/1/38 | | | 101,741 | | | | 118,420 | |
6.00% 5/1/40 | | | 38,272 | | | | 44,137 | |
6.00% 7/1/40 | | | 84,982 | | | | 97,682 | |
10.00% 1/1/19 | | | 1,985 | | | | 2,110 | |
GNMA II S.F. 30 yr | | | | | | | | |
5.50% 5/20/37 | | | 35,440 | | | | 39,548 | |
5.50% 4/20/40 | | | 36,130 | | | | 39,649 | |
6.00% 2/20/39 | | | 54,477 | | | | 62,024 | |
6.00% 4/20/46 | | | 53,417 | | | | 61,414 | |
| | | | | | | | |
Total Agency Mortgage-Backed Securities (cost $39,406,094) | | | | | | | 39,668,389 | |
| | | | | | | | |
| | | | | | | | |
| |
Collateralized Debt Obligations – 1.62% | | | | | | | | |
| |
Avery Point III CLO | | | | | | | | |
Series 2013-3A A 144A 2.079% 1/18/25 #• | | | 250,000 | | | | 247,957 | |
Benefit Street Partners CLO IV | | | | | | | | |
Series 2014-IVA A1A 144A 2.186% 7/20/26 #• | | | 500,000 | | | | 498,418 | |
BlueMountain CLO | | | | | | | | |
Series 2015-2A A1 144A 2.109% 7/18/27 #• | | | 250,000 | | | | 248,267 | |
Cent CLO | | | | | | | | |
Series 2014-21A A1B 144A 2.124% 7/27/26 #• | | | 250,000 | | | | 246,411 | |
Magnetite IX | | | | | | | | |
Series 2014-9A A1 144A 2.135% 7/25/26 #• | | | 495,000 | | | | 495,109 | |
Neuberger Berman CLO XIX | | | | | | | | |
Series 2015-19A A1 144A 2.10% 7/15/27 #• | | | 250,000 | | | | 249,102 | |
17
Schedule of investments
Delaware Core Plus Bond Fund
| | | | | | | | |
| | | Principal amount° | | | Value (U.S. $) | |
| |
Collateralized Debt Obligations (continued) | | | | | | | | |
| |
Shackleton CLO | | | | | | | | |
Series 2014-5A A 144A 2.132% 5/7/26 #• | | | 250,000 | | | $ | 248,371 | |
| | | | | | | | |
Total Collateralized Debt Obligations (cost $2,242,603) | | | | | | | 2,233,635 | |
| | | | | | | | |
| | | | | | | | |
| |
Convertible Bonds – 0.19% | | | | | | | | |
| |
Alaska Communications Systems Group 6.25% exercise price $10.28, maturity date 5/1/18 @ | | | 24,000 | | | | 23,370 | |
Blucora 4.25% exercise price $21.66, maturity date 4/1/19 | | | 5,000 | | | | 4,675 | |
Ciena 144A 3.75% exercise price $20.17, maturity date 10/15/18 # | | | 14,000 | | | | 16,695 | |
General Cable 4.50% exercise price $32.36, maturity date 11/15/29 @f | | | 28,000 | | | | 18,900 | |
Helix Energy Solutions Group 3.25% exercise price $25.02, maturity date 3/15/32 | | | 9,000 | | | | 8,348 | |
Hologic 2.00% exercise price $31.18, maturity date 3/1/42 f | | | 19,000 | | | | 25,864 | |
Intel 3.25% exercise price $21.18, maturity date 8/1/39 | | | 19,000 | | | | 32,490 | |
Jefferies Group 3.875% exercise price $44.19, maturity date 11/1/29 | | | 32,000 | | | | 32,720 | |
Meritor 4.00% exercise price $26.73, maturity date 2/15/27 f | | | 39,000 | | | | 37,952 | |
Nuance Communications 2.75% exercise price $32.30, maturity date 11/1/31 | | | 27,000 | | | | 27,236 | |
Titan Machinery 3.75% exercise price $43.17, maturity date 5/1/19 @ | | | 26,000 | | | | 22,441 | |
Vector Group 2.50% exercise price $15.98, maturity date 1/15/19 • | | | 8,000 | | | | 11,495 | |
| | | | | | | | |
Total Convertible Bonds (cost $249,734) | | | | | | | 262,186 | |
| | | | | | | | |
| | | | | | | | |
| |
Corporate Bonds – 38.12% | | | | | | | | |
| |
Banking – 7.31% | | | | | | | | |
Bank Nederlandse Gemeenten 144A 1.625% 4/19/21 # | | | 182,000 | | | | 184,644 | |
Bank of America 4.45% 3/3/26 | | | 745,000 | | | | 801,667 | |
Bank of New York Mellon | | | | | | | | |
2.15% 2/24/20 | | | 30,000 | | | | 30,676 | |
2.50% 4/15/21 | | | 270,000 | | | | 279,913 | |
2.80% 5/4/26 | | | 65,000 | | | | 67,760 | |
4.625% 12/29/49 • | | | 120,000 | | | | 120,000 | |
BB&T 2.05% 5/10/21 | | | 640,000 | | | | 651,091 | |
Citizens Bank 2.55% 5/13/21 | | | 250,000 | | | | 255,432 | |
Citizens Financial Group 4.30% 12/3/25 | | | 115,000 | | | | 122,301 | |
Compass Bank 3.875% 4/10/25 | | | 250,000 | | | | 241,705 | |
Cooperatieve Rabobank 2.50% 1/19/21 | | | 250,000 | | | | 258,120 | |
Credit Suisse Group 144A 6.25% 12/29/49 #• | | | 200,000 | | | | 194,029 | |
18
| | | | | | | | |
| | | Principal amount° | | | Value (U.S. $) | |
| |
Corporate Bonds (continued) | | | | | | | | |
| |
Banking (continued) | | | | | | | | |
Credit Suisse Group Funding Guernsey 144A | | | | | | | | |
4.55% 4/17/26 # | | | 615,000 | | | $ | 650,368 | |
Fifth Third Bancorp 2.875% 7/27/20 | | | 50,000 | | | | 52,079 | |
Fifth Third Bank | | | | | | | | |
2.25% 6/14/21 | | | 200,000 | | | | 204,136 | |
3.85% 3/15/26 | | | 200,000 | | | | 213,752 | |
JPMorgan Chase | | | | | | | | |
2.95% 10/1/26 | | | 135,000 | | | | 136,485 | |
4.25% 10/1/27 | | | 635,000 | | | | 685,866 | |
KeyBank 3.40% 5/20/26 | | | 545,000 | | | | 561,443 | |
KFW 1.50% 6/15/21 | | | 130,000 | | | | 131,678 | |
Morgan Stanley | | | | | | | | |
2.50% 4/21/21 | | | 45,000 | | | | 45,571 | |
3.125% 7/27/26 | | | 475,000 | | | | 479,404 | |
3.95% 4/23/27 | | | 155,000 | | | | 160,463 | |
PNC Bank | | | | | | | | |
1.85% 7/20/18 | | | 250,000 | | | | 252,966 | |
2.30% 6/1/20 | | | 335,000 | | | | 344,715 | |
2.45% 11/5/20 | | | 250,000 | | | | 258,465 | |
State Street | | | | | | | | |
2.55% 8/18/20 | | | 120,000 | | | | 124,895 | |
3.55% 8/18/25 | | | 150,000 | | | | 165,071 | |
SunTrust Bank 3.30% 5/15/26 | | | 200,000 | | | | 207,820 | |
Swedbank 144A 2.65% 3/10/21 # | | | 200,000 | | | | 208,213 | |
Toronto-Dominion Bank | | | | | | | | |
2.125% 4/7/21 | | | 115,000 | | | | 117,101 | |
2.50% 12/14/20 | | | 150,000 | | | | 155,248 | |
U.S. Bancorp | | | | | | | | |
3.10% 4/27/26 | | | 50,000 | | | | 52,219 | |
3.60% 9/11/24 | | | 125,000 | | | | 136,047 | |
UBS Group Funding Jersey 144A 4.125% 4/15/26 # | | | 350,000 | | | | 370,800 | |
USB Capital IX 3.50% 10/29/49 @• | | | 705,000 | | | | 607,181 | |
Wells Fargo | | | | | | | | |
4.30% 7/22/27 | | | 45,000 | | | | 49,337 | |
4.40% 6/14/46 | | | 375,000 | | | | 398,587 | |
Zions Bancorporation 4.50% 6/13/23 | | | 105,000 | | | | 109,903 | |
| | | | | | | | |
| | | | | | | 10,087,151 | |
| | | | | | | | |
Basic Industry – 1.90% | | | | | | | | |
Bahia Sul Holdings 144A 5.75% 7/14/26 # | | | 300,000 | | | | 295,875 | |
CF Industries 6.875% 5/1/18 | | | 210,000 | | | | 227,644 | |
Dow Chemical 8.55% 5/15/19 | | | 479,000 | | �� | | 570,765 | |
19
Schedule of investments
Delaware Core Plus Bond Fund
| | | | | | | | |
| | | Principal amount° | | | Value (U.S. $) | |
| |
Corporate Bonds (continued) | | | | | | | | |
| |
Basic Industry (continued) | | | | | | | | |
Eastman Chemical | | | | | | | | |
3.80% 3/15/25 | | | 25,000 | | | $ | 26,561 | |
4.65% 10/15/44 | | | 315,000 | | | | 332,005 | |
Georgia-Pacific | | | | | | | | |
144A 2.539% 11/15/19 # | | | 165,000 | | | | 169,217 | |
8.00% 1/15/24 | | | 100,000 | | | | 134,463 | |
International Paper 5.15% 5/15/46 | | | 145,000 | | | | 168,225 | |
INVISTA Finance 144A 4.25% 10/15/19 # | | | 120,000 | | | | 119,690 | |
NOVA Chemicals 144A 5.00% 5/1/25 # | | | 60,000 | | | | 61,050 | |
OCP 144A 4.50% 10/22/25 # | | | 200,000 | | | | 201,562 | |
Rio Tinto Finance USA 3.75% 6/15/25 | | | 185,000 | | | | 199,094 | |
Vale Overseas 5.875% 6/10/21 | | | 50,000 | | | | 51,875 | |
WR Grace & Co-Conn 144A 5.125% 10/1/21 # | | | 60,000 | | | | 63,600 | |
| | | | | | | | |
| | | | | | | 2,621,626 | |
| | | | | | | | |
Brokerage – 0.23% | | | | | | | | |
Jefferies Group | | | | | | | | |
6.45% 6/8/27 | | | 60,000 | | | | 67,162 | |
6.50% 1/20/43 | | | 50,000 | | | | 51,967 | |
Lazard Group | | | | | | | | |
3.75% 2/13/25 | | | 125,000 | | | | 126,466 | |
6.85% 6/15/17 | | | 64,000 | | | | 66,860 | |
| | | | | | | | |
| | | | | | | 312,455 | |
| | | | | | | | |
Capital Goods – 1.16% | | | | | | | | |
Ball 5.00% 3/15/22 | | | 315,000 | | | | 338,625 | |
Cemex 144A 7.75% 4/16/26 # | | | 200,000 | | | | 222,500 | |
Fortive 144A 3.15% 6/15/26 # | | | 150,000 | | | | 159,025 | |
Fortune Brands Home & Security 3.00% 6/15/20 | | | 70,000 | | | | 72,200 | |
General Electric 2.10% 12/11/19 | | | 65,000 | | | | 67,289 | |
Lockheed Martin 3.55% 1/15/26 | | | 105,000 | | | | 115,854 | |
Masco 3.50% 4/1/21 | | | 175,000 | | | | 182,661 | |
Parker-Hannifin 3.30% 11/21/24 | | | 10,000 | | | | 10,819 | |
United Rentals North America 5.875% 9/15/26 | | | 340,000 | | | | 354,875 | |
Waste Management 2.40% 5/15/23 | | | 70,000 | | | | 71,389 | |
| | | | | | | | |
| | | | | | | 1,595,237 | |
| | | | | | | | |
Communications – 4.60% | | | | | | | | |
21st Century Fox America 4.95% 10/15/45 | | | 180,000 | | | | 214,368 | |
American Tower | | | | | | | | |
4.00% 6/1/25 | | | 150,000 | | | | 163,381 | |
4.40% 2/15/26 | | | 95,000 | | | | 105,426 | |
American Tower Trust I 144A 3.07% 3/15/23 # | | | 210,000 | | | | 217,326 | |
AT&T | | | | | | | | |
3.60% 2/17/23 | | | 110,000 | | | | 117,004 | |
20
| | | | | | | | |
| | | Principal amount° | | | Value (U.S. $) | |
| |
Corporate Bonds (continued) | | | | | | | | |
| |
Communications (continued) | | | | | | | | |
AT&T | | | | | | | | |
4.35% 6/15/45 | | | 95,000 | | | $ | 95,513 | |
5.65% 2/15/47 | | | 230,000 | | | | 275,187 | |
CC Holdings GS V 3.849% 4/15/23 | | | 100,000 | | | | 108,219 | |
Charter Communications Operating 144A | | | | | | | | |
4.908% 7/23/25 # | | | 605,000 | | | | 669,212 | |
Columbus International 144A 7.375% 3/30/21 # | | | 200,000 | | | | 214,192 | |
Comcast 2.35% 1/15/27 | | | 580,000 | | | | 581,491 | |
Crown Castle International 5.25% 1/15/23 | | | 150,000 | | | | 172,261 | |
Crown Castle Towers 144A 4.883% 8/15/20 # | | | 505,000 | | | | 551,751 | |
CSC Holdings 5.25% 6/1/24 | | | 525,000 | | | | 501,055 | |
DISH DBS 144A 7.75% 7/1/26 # | | | 255,000 | | | | 265,041 | |
Frontier Communications | | | | | | | | |
10.50% 9/15/22 | | | 80,000 | | | | 86,700 | |
11.00% 9/15/25 | | | 175,000 | | | | 187,469 | |
GTP Acquisition Partners I 144A 2.35% 6/15/20 # | | | 100,000 | | | | 99,653 | |
SBA Tower Trust 144A 2.24% 4/16/18 # | | | 160,000 | | | | 160,320 | |
Sky 144A 3.75% 9/16/24 # | | | 355,000 | | | | 377,549 | |
Sprint Communications 144A 7.00% 3/1/20 # | | | 230,000 | | | | 245,237 | |
Time Warner Cable 7.30% 7/1/38 | | | 145,000 | | | | 189,837 | |
Verizon Communications | | | | | | | | |
1.75% 8/15/21 | | | 270,000 | | | | 270,270 | |
4.125% 8/15/46 | | | 205,000 | | | | 207,965 | |
4.522% 9/15/48 | | | 135,000 | | | | 144,697 | |
4.862% 8/21/46 | | | 60,000 | | | | 67,625 | |
WPP Finance 2010 5.625% 11/15/43 | | | 45,000 | | | | 54,355 | |
| | | | | | | | |
| | | | | | | 6,343,104 | |
| | | | | | | | |
Consumer Cyclical – 2.86% | | | | | | | | |
BMW U.S. Capital | | | | | | | | |
144A 2.00% 4/11/21 # | | | 265,000 | | | | 269,606 | |
144A 2.80% 4/11/26 # | | | 120,000 | | | | 124,871 | |
CVS Health 5.00% 12/1/24 | | | 555,000 | | | | 646,599 | |
Ford Motor Credit 3.096% 5/4/23 | | | 200,000 | | | | 204,385 | |
General Motors Financial | | | | | | | | |
3.45% 4/10/22 | | | 155,000 | | | | 158,318 | |
3.70% 5/9/23 | | | 105,000 | | | | 107,408 | |
5.25% 3/1/26 | | | 65,000 | | | | 72,711 | |
Goodyear Tire & Rubber 5.00% 5/31/26 | | | 325,000 | | | | 343,281 | |
Home Depot 3.00% 4/1/26 | | | 65,000 | | | | 70,065 | |
Hyundai Capital America | | | | | | | | |
144A 2.125% 10/2/17 # | | | 130,000 | | | | 131,178 | |
144A 3.00% 3/18/21 # | | | 70,000 | | | | 72,640 | |
21
Schedule of investments
Delaware Core Plus Bond Fund
| | | | | | | | |
| | | Principal amount° | | | Value (U.S. $) | |
| |
Corporate Bonds (continued) | | | | | | | | |
| |
Consumer Cyclical (continued) | | | | | | | | |
Lowe’s | | | | | | | | |
2.50% 4/15/26 | | | 95,000 | | | $ | 97,525 | |
3.375% 9/15/25 | | | 100,000 | | | | 110,369 | |
3.70% 4/15/46 | | | 150,000 | | | | 158,716 | |
Marriott International 3.125% 6/15/26 | | | 145,000 | | | | 148,277 | |
MGM Resorts International 6.00% 3/15/23 | | | 180,000 | | | | 195,188 | |
O’Reilly Automotive 3.55% 3/15/26 | | | 70,000 | | | | 75,103 | |
Starbucks 2.45% 6/15/26 | | | 80,000 | | | | 82,636 | |
Starwood Hotels & Resorts Worldwide | | | | | | | | |
3.75% 3/15/25 @ | | | 140,000 | | | | 148,538 | |
4.50% 10/1/34 @ | | | 20,000 | | | | 20,972 | |
Target 3.625% 4/15/46 | | | 80,000 | | | | 83,683 | |
Walgreens Boots Alliance | | | | | | | | |
3.10% 6/1/23 | | | 355,000 | | | | 367,246 | |
3.45% 6/1/26 | | | 200,000 | | | | 209,884 | |
4.80% 11/18/44 | | | 40,000 | | | | 45,448 | |
| | | | | | | | |
| | | | | | | 3,944,647 | |
| | | | | | | | |
Consumer Non-Cyclical – 5.41% | | | | | | | | |
AbbVie | | | | | | | | |
3.20% 5/14/26 | | | 215,000 | | | | 220,967 | |
4.45% 5/14/46 | | | 125,000 | | | | 133,515 | |
Anheuser-Busch InBev Finance 3.65% 2/1/26 | | | 740,000 | | | | 796,092 | |
AstraZeneca 3.375% 11/16/25 | | | 180,000 | | | | 193,284 | |
Becton Dickinson 6.375% 8/1/19 | | | 185,000 | | | | 211,305 | |
Biogen | | | | | | | | |
4.05% 9/15/25 | | | 40,000 | | | | 43,870 | |
5.20% 9/15/45 | | | 125,000 | | | | 150,409 | |
Celgene | | | | | | | | |
3.25% 8/15/22 | | | 80,000 | | | | 84,050 | |
3.875% 8/15/25 | | | 145,000 | | | | 157,605 | |
JB y Cia 144A 3.75% 5/13/25 # | | | 150,000 | | | | 155,414 | |
Kraft Heinz Foods 144A 3.00% 6/1/26 # | | | 260,000 | | | | 266,386 | |
LifePoint Health 144A 5.375% 5/1/24 # | | | 402,000 | | | | 412,050 | |
Molson Coors Brewing | | | | | | | | |
2.10% 7/15/21 | | | 35,000 | | | | 35,506 | |
3.00% 7/15/26 | | | 100,000 | | | | 102,340 | |
4.20% 7/15/46 | | | 280,000 | | | | 296,309 | |
Mylan | | | | | | | | |
144A 3.15% 6/15/21 # | | | 50,000 | | | | 51,624 | |
144A 3.95% 6/15/26 # | | | 540,000 | | | | 563,457 | |
New York & Presbyterian Hospital 4.063% 8/1/56 | | | 130,000 | | | | 144,771 | |
22
| | | | | | | | |
| | | Principal amount° | | | Value (U.S. $) | |
| |
Corporate Bonds (continued) | | | | | | | | |
| |
Consumer Non-Cyclical (continued) | | | | | | | | |
Pernod Ricard | | | | | | | | |
144A 3.25% 6/8/26 # | | | 310,000 | | | $ | 321,071 | |
144A 4.45% 1/15/22 # | | | 300,000 | | | | 332,034 | |
Reynolds American | | | | | | | | |
4.00% 6/12/22 | | | 155,000 | | | | 170,223 | |
4.45% 6/12/25 | | | 315,000 | | | | 356,287 | |
St. Jude Medical 2.80% 9/15/20 | | | 75,000 | | | | 77,835 | |
Sysco 3.30% 7/15/26 | | | 400,000 | | | | 423,571 | |
Tempur Sealy International 144A 5.50% 6/15/26 # | | | 330,000 | | | | 334,745 | |
Teva Pharmaceutical Finance Netherlands III | | | | | | | | |
2.20% 7/21/21 | | | 125,000 | | | | 125,777 | |
2.80% 7/21/23 | | | 475,000 | | | | 484,001 | |
3.15% 10/1/26 | | | 80,000 | | | | 81,931 | |
Thermo Fisher Scientific 3.00% 4/15/23 | | | 560,000 | | | | 578,640 | |
Zimmer Biomet Holdings 4.45% 8/15/45 | | | 140,000 | | | | 150,270 | |
| | | | | | | | |
| | | | | | | 7,455,339 | |
| | | | | | | | |
Electric – 6.20% | | | | | | | | |
AES 5.50% 4/15/25 | | | 135,000 | | | | 138,881 | |
AES Gener 144A 5.00% 7/14/25 # | | | 200,000 | | | | 213,889 | |
Alabama Power 4.30% 1/2/46 | | | 105,000 | | | | 122,004 | |
Ameren 3.65% 2/15/26 | | | 110,000 | | | | 119,630 | |
Ameren Illinois 9.75% 11/15/18 | | | 389,000 | | | | 460,303 | |
American Transmission Systems 144A 5.25% 1/15/22 # | | | 100,000 | | | | 114,705 | |
Appalachian Power | | | | | | | | |
3.40% 6/1/25 | | | 270,000 | | | | 290,242 | |
4.45% 6/1/45 | | | 80,000 | | | | 89,002 | |
Black Hills 3.95% 1/15/26 | | | 40,000 | | | | 43,011 | |
Cleveland Electric Illuminating 5.50% 8/15/24 | | | 230,000 | | | | 276,497 | |
CMS Energy 6.25% 2/1/20 | | | 190,000 | | | | 218,018 | |
ComEd Financing III 6.35% 3/15/33 @ | | | 190,000 | | | | 201,739 | |
Commonwealth Edison | | | | | | | | |
3.65% 6/15/46 | | | 5,000 | | | | 5,272 | |
4.35% 11/15/45 | | | 130,000 | | | | 152,859 | |
Consumers Energy 4.10% 11/15/45 | | | 35,000 | | | | 40,405 | |
Dominion Resources 3.90% 10/1/25 | | | 195,000 | | | | 212,417 | |
DTE Energy 3.30% 6/15/22 | | | 115,000 | | | | 121,916 | |
Duke Energy 4.80% 12/15/45 | | | 70,000 | | | | 84,492 | |
Duke Energy Carolinas 3.875% 3/15/46 | | | 95,000 | | | | 105,495 | |
Electricite de France 144A 5.25% 1/29/49 #• | | | 125,000 | | | | 122,344 | |
Emera 6.75% 6/15/76 • | | | 205,000 | | | | 222,018 | |
Emera US Finance 144A 4.75% 6/15/46 # | | | 195,000 | | | | 215,638 | |
Enel 144A 8.75% 9/24/73 #• | | | 200,000 | | | | 232,250 | |
23
Schedule of investments
Delaware Core Plus Bond Fund
| | | | | | | | |
| | | Principal amount° | | | Value (U.S. $) | |
| |
Corporate Bonds (continued) | | | | | | | | |
| |
Electric (continued) | | | | | | | | |
Enel Finance International 144A 6.00% 10/7/39 # | | | 100,000 | | | $ | 121,541 | |
Entergy 4.00% 7/15/22 | | | 285,000 | | | | 309,518 | |
Entergy Arkansas 3.50% 4/1/26 | | | 50,000 | | | | 54,969 | |
Entergy Louisiana 4.95% 1/15/45 | | | 55,000 | | | | 59,076 | |
Entergy Mississippi 2.85% 6/1/28 | | | 105,000 | | | | 108,776 | |
Exelon 3.95% 6/15/25 | | | 90,000 | | | | 98,117 | |
Indiana Michigan Power 4.55% 3/15/46 | | | 65,000 | | | | 75,310 | |
IPALCO Enterprises 3.45% 7/15/20 | | | 125,000 | | | | 129,063 | |
ITC Holdings | | | | | | | | |
3.25% 6/30/26 | | | 75,000 | | | | 76,673 | |
3.65% 6/15/24 | | | 70,000 | | | | 73,588 | |
Kansas City Power & Light 3.65% 8/15/25 | | | 255,000 | | | | 273,518 | |
LG&E & KU Energy 4.375% 10/1/21 | | | 380,000 | | | | 419,892 | |
Louisville Gas & Electric 4.375% 10/1/45 | | | 40,000 | | | | 47,781 | |
Metropolitan Edison 144A 4.00% 4/15/25 # | | | 50,000 | | | | 52,832 | |
MidAmerican Energy 4.25% 5/1/46 | | | 210,000 | | | | 248,234 | |
National Rural Utilities Cooperative Finance | | | | | | | | |
2.30% 11/1/20 | | | 20,000 | | | | 20,734 | |
2.70% 2/15/23 | | | 170,000 | | | | 177,461 | |
4.75% 4/30/43 • | | | 190,000 | | | | 191,055 | |
5.25% 4/20/46 • | | | 60,000 | | | | 63,474 | |
NextEra Energy Capital Holdings | | | | | | | | |
2.40% 9/15/19 | | | 265,000 | | | | 270,459 | |
3.625% 6/15/23 | | | 60,000 | | | | 63,803 | |
NV Energy 6.25% 11/15/20 | | | 100,000 | | | | 118,776 | |
Pennsylvania Electric 5.20% 4/1/20 | | | 175,000 | | | | 190,226 | |
SCANA 4.125% 2/1/22 | | | 85,000 | | | | 89,692 | |
South Carolina Electric & Gas 4.10% 6/15/46 | | | 125,000 | | | | 136,381 | |
Southern | | | | | | | | |
2.75% 6/15/20 | | | 395,000 | | | | 410,355 | |
3.25% 7/1/26 | | | 170,000 | | | | 178,155 | |
4.40% 7/1/46 | | | 160,000 | | | | 178,019 | |
Trans-Allegheny Interstate Line 144A 3.85% 6/1/25 # | | | 115,000 | | | | 123,437 | |
WEC Energy Group 3.55% 6/15/25 | | | 55,000 | | | | 60,151 | |
Wisconsin Electric Power 4.30% 12/15/45 | | | 75,000 | | | | 87,982 | |
Xcel Energy 3.30% 6/1/25 | | | 230,000 | | | | 245,832 | |
| | | | | | | | |
| | | | | | | 8,557,907 | |
| | | | | | | | |
Energy – 1.91% | | | | | | | | |
CNOOC Finance 2015 Australia 2.625% 5/5/20 | | | 200,000 | | | | 204,077 | |
ConocoPhillips 4.95% 3/15/26 | | | 180,000 | | | | 200,559 | |
Dominion Gas Holdings 4.60% 12/15/44 | | | 90,000 | | | | 97,995 | |
24
| | | | | | | | |
| | | Principal amount° | | | Value (U.S. $) | |
| |
Corporate Bonds (continued) | | | | | | | | |
| |
Energy (continued) | | | | | | | | |
Energy Transfer Partners | | | | | | | | |
4.75% 1/15/26 | | | 55,000 | | | $ | 56,310 | |
6.125% 12/15/45 | | | 90,000 | | | | 94,603 | |
9.70% 3/15/19 | | | 127,000 | | | | 146,578 | |
EnLink Midstream Partners | | | | | | | | |
2.70% 4/1/19 | | | 75,000 | | | | 73,520 | |
4.85% 7/15/26 | | | 65,000 | | | | 63,304 | |
Enterprise Products Operating | | | | | | | | |
3.95% 2/15/27 | | | 135,000 | | | | 142,539 | |
7.034% 1/15/68 • | | | 30,000 | | | | 31,655 | |
Noble Energy 5.05% 11/15/44 | | | 90,000 | | | | 89,600 | |
Petrobras Global Finance 8.375% 5/23/21 | | | 50,000 | | | | 52,988 | |
Petroleos Mexicanos | | | | | | | | |
6.625% 6/15/35 | | | 20,000 | | | | 20,779 | |
144A 6.875% 8/4/26 # | | | 55,000 | | | | 61,875 | |
Petronas Global Sukuk 144A 2.707% 3/18/20 # | | | 200,000 | | | | 203,336 | |
Plains All American Pipeline 8.75% 5/1/19 | | | 195,000 | | | | 225,985 | |
Regency Energy Partners 5.875% 3/1/22 | | | 155,000 | | | | 169,246 | |
Shell International Finance | | | | | | | | |
2.875% 5/10/26 | | | 95,000 | | | | 96,995 | |
4.00% 5/10/46 | | | 235,000 | | | | 242,362 | |
Sunoco Logistics Partners Operations 3.90% 7/15/26 | | | 140,000 | | | | 139,427 | |
Woodside Finance | | | | | | | | |
144A 3.65% 3/5/25 # | | | 70,000 | | | | 69,870 | |
144A 8.75% 3/1/19 # | | | 125,000 | | | | 145,361 | |
| | | | | | | | |
| | | | | | | 2,628,964 | |
| | | | | | | | |
Finance Companies – 0.86% | | | | | | | | |
AerCap Ireland Capital 3.95% 2/1/22 | | | 450,000 | | | | 472,356 | |
Affiliated Managers Group 3.50% 8/1/25 | | | 110,000 | | | | 110,829 | |
Aviation Capital Group | | | | | | | | |
144A 2.875% 9/17/18 # | | | 10,000 | | | | 10,162 | |
144A 4.875% 10/1/25 # | | | 80,000 | | | | 83,572 | |
144A 6.75% 4/6/21 # | | | 90,000 | | | | 105,277 | |
Peachtree Corners Funding Trust 144A 3.976% 2/15/25 # | | | 200,000 | | | | 203,487 | |
SMBC Aviation Capital Finance 144A 2.65% 7/15/21 # | | | 200,000 | | | | 201,418 | |
| | | | | | | | |
| | | | | | | 1,187,101 | |
| | | | | | | | |
Insurance – 1.42% | | | | | | | | |
Berkshire Hathaway | | | | | | | | |
2.75% 3/15/23 | | | 85,000 | | | | 88,781 | |
3.125% 3/15/26 | | | 255,000 | | | | 271,740 | |
Highmark 144A 6.125% 5/15/41 #@ | | | 30,000 | | | | 30,169 | |
MetLife 5.25% 12/29/49 • | | | 145,000 | | | | 145,478 | |
25
Schedule of investments
Delaware Core Plus Bond Fund
| | | | | | | | |
| | | Principal amount° | | | Value (U.S. $) | |
| |
Corporate Bonds (continued) | | | | | | | | |
| |
Insurance (continued) | | | | | | | | |
Principal Life Global Funding II 144A 3.00% 4/18/26 # | | | 105,000 | | | $ | 109,045 | |
Prudential Financial | | | | | | | | |
4.50% 11/15/20 | | | 50,000 | | | | 55,125 | |
5.375% 5/15/45 • | | | 95,000 | | | | 98,919 | |
5.625% 6/15/43 • | | | 95,000 | | | | 101,840 | |
5.875% 9/15/42 • | | | 225,000 | | | | 249,637 | |
TIAA Asset Management Finance | | | | | | | | |
144A 2.95% 11/1/19 # | | | 95,000 | | | | 97,557 | |
144A 4.125% 11/1/24 # | | | 425,000 | | | | 449,873 | |
XLIT | | | | | | | | |
4.45% 3/31/25 | | | 85,000 | | | | 86,367 | |
5.50% 3/31/45 | | | 115,000 | | | | 115,621 | |
6.50% 10/29/49 • | | | 80,000 | | | | 55,400 | |
| | | | | | | | |
| | | | | | | 1,955,552 | |
| | | | | | | | |
Natural Gas – 0.07% | | | | | | | | |
Southern Gas Capital 3.25% 6/15/26 | | | 90,000 | | | | 93,647 | |
| | | | | | | | |
| | | | | | | 93,647 | |
| | | | | | | | |
REITs – 1.28% | | | | | | | | |
Alexandria Real Estate Equities 3.95% 1/15/27 | | | 45,000 | | | | 47,135 | |
AvalonBay Communities 2.95% 5/11/26 | | | 195,000 | | | | 198,630 | |
Corporate Office Properties | | | | | | | | |
3.60% 5/15/23 | | | 150,000 | | | | 149,275 | |
5.25% 2/15/24 | | | 85,000 | | | | 92,300 | |
DDR 7.875% 9/1/20 | | | 90,000 | | | | 109,027 | |
Education Realty Operating Partnership 4.60% 12/1/24 | | | 115,000 | | | | 120,854 | |
Hospitality Properties Trust 4.50% 3/15/25 | | | 100,000 | | | | 101,803 | |
Host Hotels & Resorts | | | | | | | | |
3.75% 10/15/23 | | | 135,000 | | | | 137,973 | |
4.50% 2/1/26 | | | 5,000 | | | | 5,345 | |
Kimco Realty 3.40% 11/1/22 | | | 25,000 | | | | 26,349 | |
PLA Administradora Industrial 144A 5.25% 11/10/22 # | | | 200,000 | | | | 207,200 | |
Regency Centers 5.875% 6/15/17 | | | 71,000 | | | | 73,548 | |
Simon Property Group 2.50% 7/15/21 | | | 45,000 | | | | 46,625 | |
Sovran Acquisition 3.50% 7/1/26 | | | 95,000 | | | | 96,361 | |
Trust F/1401 144A 5.25% 1/30/26 # | | | 200,000 | | | | 211,250 | |
UDR 4.00% 10/1/25 | | | 40,000 | | | | 43,745 | |
WP Carey 4.60% 4/1/24 | | | 90,000 | | | | 93,754 | |
| | | | | | | | |
| | | | | | | 1,761,174 | |
| | | | | | | | |
Technology – 1.65% | | | | | | | | |
Apple | | | | | | | | |
2.45% 8/4/26 | | | 80,000 | | | | 80,250 | |
3.85% 8/4/46 | | | 150,000 | | | | 150,950 | |
26
| | | | | | | | |
| | | Principal amount° | | | Value (U.S. $) | |
| |
Corporate Bonds (continued) | | | | | | | | |
| |
Technology (continued) | | | | | | | | |
CDK Global 4.50% 10/15/24 | | | 105,000 | | | $ | 106,507 | |
Diamond 1 Finance 144A 6.02% 6/15/26 # | | | 425,000 | | | | 456,146 | |
Fidelity National Information Services 5.00% 10/15/25 | | | 250,000 | | | | 289,847 | |
NXP 144A 4.625% 6/1/23 # | | | 330,000 | | | | 342,583 | |
Oracle | | | | | | | | |
2.40% 9/15/23 | | | 305,000 | | | | 308,318 | |
4.00% 7/15/46 | | | 130,000 | | | | 134,997 | |
Samsung Electronics America 144A 1.75% 4/10/17 # | | | 200,000 | | | | 200,708 | |
Tencent Holdings 144A 3.375% 5/2/19 # | | | 200,000 | | | | 207,604 | |
| | | | | | | | |
| | | | | | | 2,277,910 | |
| | | | | | | | |
Transportation – 1.26% | | | | | | | | |
Air Canada 2015-1 Class A Pass Through Trust 144A | | | | | | | | |
3.60% 3/15/27 # ¿ | | | 68,906 | | | | 71,317 | |
American Airlines 2014-1 Class A Pass Through Trust | | | | | | | | |
3.70% 10/1/26 ¿ | | | 50,237 | | | | 52,874 | |
American Airlines 2015-1 Class A Pass Through Trust | | | | | | | | |
3.375% 5/1/27 ¿ | | | 85,906 | | | | 89,020 | |
American Airlines 2015-2 Class AA Pass Through Trust | | | | | | | | |
3.60% 9/22/27 ¿ | | | 25,000 | | | | 26,909 | |
American Airlines 2016-1 Class AA Pass Through Trust | | | | | | | | |
3.575% 1/15/28 ¿ | | | 59,853 | | | | 64,417 | |
Burlington Northern Santa Fe 4.70% 9/1/45 | | | 275,000 | | | | 336,448 | |
Canadian National Railway 3.20% 8/2/46 | | | 135,000 | | | | 134,917 | |
ERAC USA Finance 144A 3.30% 12/1/26 # | | | 230,000 | | | | 237,855 | |
Norfolk Southern 2.90% 6/15/26 | | | 170,000 | | | | 176,879 | |
Penske Truck Leasing | | | | | | | | |
144A 3.30% 4/1/21 # | | | 115,000 | | | | 118,993 | |
144A 3.375% 2/1/22 # | | | 215,000 | | | | 219,635 | |
United Airlines 2014-1 Class A Pass Through Trust | | | | | | | | |
4.00% 4/11/26 ¿ | | | 42,423 | | | | 45,684 | |
United Airlines 2014-2 Class A Pass Through Trust | | | | | | | | |
3.75% 9/3/26 ¿ | | | 97,090 | | | | 103,523 | |
United Airlines 2016-1 Class AA Pass Through Trust | | | | | | | | |
3.10% 7/7/28 ¿ | | | 55,000 | | | | 57,269 | |
| | | | | | | | |
| | | | | | | 1,735,740 | |
| | | | | | | | |
| | |
Total Corporate Bonds (cost $50,146,320) | | | | | | | 52,557,554 | |
| | | | | | | | |
27
Schedule of investments
Delaware Core Plus Bond Fund
| | | | | | | | |
| | | Principal amount° | | | Value (U.S. $) | |
| |
Municipal Bonds – 1.10% | | | | | | | | |
| |
Bay Area Toll Authority | | | | | | | | |
(Build America Bond) Series S-3 6.907% 10/1/50 | | | 170,000 | | | $ | 284,225 | |
California State | | | | | | | | |
(Build America Bond) 7.55% 4/1/39 | | | 135,000 | | | | 223,345 | |
(Various Purpose) 5.00% 9/1/26 | | | 90,000 | | | | 118,730 | |
Commonwealth of Massachusetts | | | | | | | | |
Series B 5.00% 7/1/26 | | | 35,000 | | | | 46,047 | |
Series D 5.00% 4/1/26 | | | 35,000 | | | | 45,853 | |
Dallas, Texas Area Rapid Transit | | | | | | | | |
Series A 5.00% 12/1/46 | | | 140,000 | | | | 170,288 | |
New Jersey Turnpike Authority | | | | | | | | |
Series A 7.102% 1/1/41 | | | 90,000 | | | | 140,928 | |
(Build America Bonds) | | | | | | | | |
Series E 5.00% 1/1/45 | | | 140,000 | | | | 166,547 | |
Series F 7.414% 1/1/40 | | | 45,000 | | | | 72,701 | |
New York City, New York | | | | | | | | |
Series C 5.00% 8/1/26 | | | 65,000 | | | | 84,200 | |
Series C 5.00% 8/1/27 | | | 35,000 | | | | 44,969 | |
South Carolina Public Service Authority | | | | | | | | |
Series D 4.77% 12/1/45 | | | 55,000 | | | | 65,393 | |
Texas Water Development Board | | | | | | | | |
Series A 5.00% 10/15/45 | | | 45,000 | | | | 54,990 | |
| | | | | | | | |
Total Municipal Bonds (cost $1,453,160) | | | | | | | 1,518,216 | |
| | | | | | | | |
| | | | | | | | |
| |
Non-Agency Asset-Backed Securities – 6.65% | | | | | | | | |
| |
AEP Texas Central Transition Funding II | | | | | | | | |
Series 2006-A A4 5.17% 1/1/18 | | | 52,899 | | | | 54,743 | |
Ally Master Owner Trust | | | | | | | | |
Series 2012-5 A 1.54% 9/15/19 | | | 365,000 | | | | 366,002 | |
Series 2014-4 A2 1.43% 6/17/19 | | | 180,000 | | | | 180,231 | |
American Express Credit Account Master Trust | | | | | | | | |
Series 2014-1 A 0.851% 12/15/21 • | | | 1,200,000 | | | | 1,200,672 | |
Series 2014-3 A 1.49% 4/15/20 | | | 100,000 | | | | 100,554 | |
ARI Fleet Lease Trust | | | | | | | | |
Series 2015-A A2 144A 1.11% 11/15/18 # | | | 69,203 | | | | 69,082 | |
Avis Budget Rental Car Funding AESOP | | | | | | | | |
Series 2013-1A A 144A 1.92% 9/20/19 # | | | 120,000 | | | | 120,049 | |
Series 2014-1A A 144A 2.46% 7/20/20 # | | | 200,000 | | | | 202,096 | |
Bank of America Credit Card Trust | | | | | | | | |
Series 2014-A3 A 0.771% 1/15/20 • | | | 265,000 | | | | 265,280 | |
Series 2015-A1 A 0.811% 6/15/20 • | | | 360,000 | | | | 360,480 | |
Series 2016-A1 A 0.871% 10/15/21 • | | | 125,000 | | | | 125,145 | |
28
| | | | | | | | |
| | | Principal amount° | | | Value (U.S. $) | |
| |
Non-Agency Asset-Backed Securities (continued) | | | | | | | | |
| |
California Republic Auto Receivables Trust | | | | | | | | |
Series 2013-1 A2 144A 1.41% 9/17/18 # | | | 11,474 | | | $ | 11,482 | |
Capital One Multi-Asset Execution Trust | | | | | | | | |
Series 2007-A2 A2 0.561% 12/16/19 • | | | 110,000 | | | | 109,947 | |
Series 2007-A5 A5 0.521% 7/15/20 • | | | 155,000 | | | | 154,721 | |
Series 2014-A4 A4 0.841% 6/15/22 • | | | 120,000 | | | | 119,566 | |
Series 2016-A1 A1 0.931% 2/15/22 • | | | 205,000 | | | | 205,497 | |
Chase Issuance Trust | | | | | | | | |
Series 2013-A6 A6 0.901% 7/15/20 • | | | 150,000 | | �� | | 150,472 | |
Series 2014-A5 A5 0.851% 4/15/21 • | | | 125,000 | | | | 124,969 | |
Series 2016-A1 A 0.891% 5/17/21 • | | | 115,000 | | | | 115,165 | |
Chesapeake Funding | | | | | | | | |
Series 2014-1A A 144A 0.89% 3/7/26 #• | | | 116,640 | | | | 116,285 | |
Citibank Credit Card Issuance Trust | | | | | | | | |
Series 2013-A4 A4 0.908% 7/24/20 • | | | 335,000 | | | | 336,102 | |
Series 2014-A6 A6 2.15% 7/15/21 | | | 200,000 | | | | 204,836 | |
Series 2014-A9 A9 0.738% 11/23/18 • | | | 100,000 | | | | 100,042 | |
Citicorp Residential Mortgage Trust | | | | | | | | |
Series 2006-3 A5 5.91% 11/25/36 f | | | 300,000 | | | | 297,168 | |
CNH Equipment Trust | | | | | | | | |
Series 2016-B A2B 0.881% 10/15/19 • | | | 100,000 | | | | 99,984 | |
Discover Card Execution Note Trust | | | | | | | | |
Series 2013-A1 A1 0.781% 8/17/20 • | | | 200,000 | | | | 200,138 | |
Series 2014-A1 A1 0.911% 7/15/21 • | | | 200,000 | | | | 200,401 | |
Series 2015-A3 A 1.45% 3/15/21 | | | 120,000 | | | | 120,738 | |
Series 2016-A2 A2 1.021% 9/15/21 • | | | 100,000 | | | | 100,469 | |
FirstKey Lending Trust | | | | | | | | |
Series 2015-SFR1 A 144A 2.553% 3/9/47 # | | | 97,134 | | | | 97,240 | |
Ford Credit Auto Lease Trust | | | | | | | | |
Series 2015-A A3 1.13% 6/15/18 | | | 90,000 | | | | 90,042 | |
Ford Credit Auto Owner Trust | | | | | | | | |
Series 2016-2 A 144A 2.03% 12/15/27 # | | | 130,000 | | | | 131,124 | |
Series 2016-B A2B 0.791% 3/15/19 • | | | 110,000 | | | | 110,129 | |
GE Dealer Floorplan Master Note Trust | | | | | | | | |
Series 2014-2 A 0.937% 10/20/19 • | | | 30,000 | | | | 29,917 | |
Golden Credit Card Trust | | | | | | | | |
Series 2014-2A A 144A 0.931% 3/15/21 #• | | | 500,000 | | | | 497,351 | |
GreatAmerica Leasing Receivables | | | | | | | | |
Series 2014-1 A3 144A 0.89% 7/15/17 # | | | 34,033 | | | | 34,015 | |
HOA Funding | | | | | | | | |
Series 2014-1A A2 144A 4.846% 8/20/44 # | | | 48,250 | | | | 43,825 | |
Honda Auto Receivables Owner Trust | | | | | | | | |
Series 2015-3 A3 1.27% 4/18/19 | | | 100,000 | | | | 100,286 | |
29
Schedule of investments
Delaware Core Plus Bond Fund
| | | | | | | | |
| | | Principal amount° | | | Value (U.S. $) | |
| |
Non-Agency Asset-Backed Securities (continued) | | | | | | | | |
| |
Hyundai Auto Lease Securitization Trust | | | | | | | | |
Series 2014-A A4 144A 1.01% 9/15/17 # | | | 100,981 | | | $ | 100,983 | |
Hyundai Auto Receivables Trust | | | | | | | | |
Series 2015-C A2B 0.851% 11/15/18 • | | | 108,127 | | | | 108,012 | |
Mercedes-Benz Auto Lease Trust | | | | | | | | |
Series 2016-A A2B 1.041% 7/16/18 • | | | 80,000 | | | | 80,027 | |
Mercedes-Benz Master Owner Trust | | | | | | | | |
Series 2016-AA A 144A 1.061% 5/15/20 #• | | | 100,000 | | | | 100,165 | |
Nissan Auto Lease Trust | | | | | | | | |
Series 2015-B A2B 1.011% 12/15/17 • | | | 83,694 | | | | 83,846 | |
Series 2016-A A2B 0.861% 8/15/18 • | | | 80,000 | | | | 80,122 | |
Nissan Auto Receivables Owner Trust | | | | | | | | |
Series 2015-C A2B 0.831% 11/15/18 • | | | 84,406 | | | | 84,452 | |
Penarth Master Issuer | | | | | | | | |
Series 2015-1A A1 144A 0.882% 3/18/19 #• | | | 150,000 | | | | 149,491 | |
PFS Financing | | | | | | | | |
Series 2015-AA A 144A 1.101% 4/15/20 #• | | | 100,000 | | | | 99,124 | |
Porsche Innovative Lease Owner Trust | | | | | | | | |
Series 2015-1 A3 144A 1.19% 7/23/18 # | | | 100,000 | | | | 99,977 | |
Synchrony Credit Card Master Note Trust | | | | | | | | |
Series 2012-6 A 1.36% 8/17/20 | | | 100,000 | | | | 100,240 | |
Toyota Auto Receivables Owner Trust | | | | | | | | |
Series 2016-B A2B 0.731% 10/15/18 • | | | 95,000 | | | | 95,046 | |
Trade MAPS 1 | | | | | | | | |
Series 2013-1A A 144A 1.174% 12/10/18 #• | | | 250,000 | | | | 249,231 | |
Verizon Owner Trust | | | | | | | | |
Series 2016-1A A 144A 1.42% 1/20/21 # | | | 310,000 | | | | 310,078 | |
Volkswagen Auto Lease Trust | | | | | | | | |
Series 2015-A A3 1.25% 12/20/17 | | | 95,000 | | | | 94,981 | |
Volkswagen Credit Auto Master Trust | | | | | | | | |
Series 2014-1A A2 144A 1.40% 7/22/19 # | | | 265,000 | | | | 263,574 | |
Volvo Financial Equipment | | | | | | | | |
Series 2014-1A A3 144A 0.82% 4/16/18 # | | | 42,562 | | | | 42,518 | |
World Financial Network Credit Card Master Trust | | | | | | | | |
Series 2015-A A 0.961% 2/15/22 • | | | 85,000 | | | | 85,079 | |
| | | | | | | | |
Total Non-Agency Asset-Backed Securities
(cost $9,142,695) | | | | | | | 9,173,191 | |
| | | | | | | | |
| | | | | | | | |
| |
Non-Agency Collateralized Mortgage Obligations – 1.38% | | | | | | | | |
| |
American Home Mortgage Investment Trust | | | | | | | | |
Series 2005-2 5A1 5.064% 9/25/35 f | | | 4,281 | | | | 4,262 | |
Credit Suisse First Boston Mortgage Securities | | | | | | | | |
Series 2005-5 6A3 5.00% 7/25/35 | | | 78,741 | | | | 78,373 | |
GSMPS Mortgage Loan Trust | | | | | | | | |
Series 1998-2 A 144A 7.75% 5/19/27 #• | | | 39,368 | | | | 40,889 | |
30
| | | | | | | | |
| | | Principal amount° | | | Value (U.S. $) | |
| |
Non-Agency Collateralized Mortgage Obligations (continued) | | | | | | | | |
| |
JPMorgan Mortgage Trust | | | | | | | | |
Series 2006-S1 1A1 6.00% 4/25/36 | | | 55,529 | | | $ | 56,805 | |
Series 2007-A1 7A4 2.997% 7/25/35 • | | | 109,424 | | | | 96,724 | |
Series 2014-2 B1 144A 3.429% 6/25/29 #• | | | 84,563 | | | | 84,646 | |
Series 2014-2 B2 144A 3.429% 6/25/29 #• | | | 84,563 | | | | 82,415 | |
Series 2014-IVR6 2A4 144A 2.50% 7/25/44 #• | | | 100,000 | | | | 101,071 | |
Series 2015-1 B1 144A 2.662% 12/25/44 #• | | | 197,720 | | | | 195,435 | |
Series 2015-4 B1 144A 3.634% 6/25/45 #• | | | 97,816 | | | | 95,230 | |
Series 2015-4 B2 144A 3.634% 6/25/45 #• | | | 97,816 | | | | 93,304 | |
Series 2015-5 B2 144A 2.897% 5/25/45 #• | | | 98,669 | | | | 92,455 | |
Series 2015-6 B1 144A 3.642% 10/25/45 #• | | | 98,067 | | | | 100,018 | |
Series 2015-6 B2 144A 3.642% 10/25/45 #• | | | 98,067 | | | | 98,152 | |
New Residential Mortgage Loan Trust | | | | | | | | |
Series 2015-2A A1 144A 3.75% 8/25/55 #• | | | 98,340 | | | | 102,591 | |
Sequoia Mortgage Trust | | | | | | | | |
Series 2013-11 B1 144A 3.668% 9/25/43 #• | | | 93,654 | | | | 95,777 | |
Series 2014-2 A4 144A 3.50% 7/25/44 #• | | | 62,819 | | | | 64,650 | |
Series 2015-1 B2 144A 3.884% 1/25/45 #• | | | 48,314 | | | | 48,580 | |
Structured Asset Securities Mortgage Pass Through Certificates | | | | | | | | |
Series 2004-20 2A1 5.50% 11/25/34 ¿ | | | 30,267 | | | | 30,773 | |
Towd Point Mortgage Trust | | | | | | | | |
Series 2015-5 A1B 144A 2.75% 5/25/55 #• | | | 91,867 | | | | 92,862 | |
Series 2015-6 A1B 144A 2.75% 4/25/55 #• | | | 94,051 | | | | 95,152 | |
Washington Mutual Mortgage Pass Through Certificates Trust | | | | | | | | |
Series 2005-1 5A2 6.00% 3/25/35 ¿ | | | 68,456 | | | | 32,630 | |
Wells Fargo Mortgage-Backed Securities Trust | | | | | | | | |
Series 2006-AR5 2A1 3.158% 4/25/36 • | | | 15,221 | | | | 14,258 | |
WinWater Mortgage Loan Trust | | | | | | | | |
Series 2015-3 B1 144A 3.914% 3/20/45 #• | | | 97,366 | | | | 101,375 | |
| | | | | | | | |
Total Non-Agency Collateralized Mortgage Obligations (cost $1,922,074) | | | | 1,898,427 | |
| | | | | | | | |
| | | | | | | | |
| |
Non-Agency Commercial Mortgage-Backed Securities – 4.34% | | | | | | | | |
| |
Banc of America Commercial Mortgage Trust | | | | | | | | |
Series 2007-4 AM 5.808% 2/10/51 • | | | 80,000 | | | | 82,997 | |
Bear Stearns Commercial Mortgage Securities Trust | | | | | | | | |
Series 2007-PW18 A4 5.70% 6/11/50 | | | 60,654 | | | | 62,532 | |
Citigroup Commercial Mortgage Trust | | | | | | | | |
Series 2007-C6 AM 5.712% 12/10/49 • | | | 65,000 | | | | 66,191 | |
Series 2014-GC25 A4 3.635% 10/10/47 | | | 120,000 | | | | 132,168 | |
Series 2015-GC27 A5 3.137% 2/10/48 | | | 150,000 | | | | 159,333 | |
Series 2016-P3 A4 3.329% 4/15/49 | | | 110,000 | | | | 119,137 | |
31
Schedule of investments
Delaware Core Plus Bond Fund
| | | | | | | | |
| | | Principal amount° | | | Value (U.S. $) | |
| |
Non-Agency Commercial Mortgage-Backed Securities (continued) | | | | | | | | |
| |
COMM Mortgage Trust | | | | | | | | |
Series 2013-CR6 AM 144A 3.147% 3/10/46 # | | | 110,000 | | | $ | 115,857 | |
Series 2014-CR19 A5 3.796% 8/10/47 | | | 155,000 | | | | 172,163 | |
Series 2014-CR20 A4 3.59% 11/10/47 | | | 55,000 | | | | 60,440 | |
Series 2014-CR20 AM 3.938% 11/10/47 | | | 410,000 | | | | 452,740 | |
Series 2015-3BP A 144A 3.178% 2/10/35 # | | | 190,000 | | | | 202,512 | |
Series 2015-CR23 A4 3.497% 5/10/48 | | | 55,000 | | | | 60,012 | |
Commercial Mortgage Trust | | | | | | | | |
Series 2007-GG9 AM 5.475% 3/10/39 | | | 80,000 | | | | 81,101 | |
DB-JPM | | | | | | | | |
Series 2016-C1 A4 3.276% 5/10/49 | | | 130,000 | | | | 140,390 | |
Series 2016-C3 A5 2.89% 9/10/49 | | | 80,000 | | | | 83,140 | |
DB-UBS Mortgage Trust | | | | | | | | |
Series 2011-LC1A A3 144A 5.002% 11/10/46 # | | | 100,000 | | | | 112,352 | |
Series 2011-LC1A C 144A 5.697% 11/10/46 #• | | | 145,000 | | | | 167,373 | |
GRACE Mortgage Trust | | | | | | | | |
Series 2014-GRCE A 144A 3.369% 6/10/28 # | | | 300,000 | | | | 321,318 | |
GS Mortgage Securities Trust | | | | | | | | |
Series 2010-C1 C 144A 5.635% 8/10/43 #• | | | 150,000 | | | | 165,196 | |
Series 2014-GC24 A5 3.931% 9/10/47 | | | 245,000 | | | | 274,620 | |
Series 2015-GC32 A4 3.764% 7/10/48 | | | 75,000 | | | | 83,470 | |
Hilton USA Trust | | | | | | | | |
Series 2013-HLT AFX 144A 2.662% 11/5/30 # | | | 100,000 | | | | 100,605 | |
Series 2013-HLT BFX 144A 3.367% 11/5/30 # | | | 225,000 | | | | 226,590 | |
JPM-BB Commercial Mortgage Securities Trust | | | | | | | | |
Series 2015-C33 A4 3.77% 12/15/48 | | | 255,000 | | | | 284,402 | |
Series 2016-C2 A4 3.144% 6/15/49 | | | 200,000 | | | | 213,865 | |
JPMorgan Chase Commercial Mortgage Securities Trust | | | | | | | | |
Series 2005-CB11 E 5.495% 8/12/37 • | | | 35,000 | | | | 37,803 | |
Series 2005-LDP5 D 5.55% 12/15/44 • | | | 60,000 | | | | 59,811 | |
Series 2006-LDP8 AM 5.44% 5/15/45 | | | 48,333 | | | | 48,311 | |
Series 2013-LC11 B 3.499% 4/15/46 | | | 95,000 | | | | 101,176 | |
Series 2015-JP1 A5 3.914% 1/15/49 | | | 165,000 | | | | 186,633 | |
Series 2016-C2 A4 2.822% 8/15/49 | | | 130,000 | | | | 135,196 | |
LB-UBS Commercial Mortgage Trust | | | | | | | | |
Series 2004-C1 A4 4.568% 1/15/31 | | | 6,585 | | | | 6,593 | |
Series 2006-C6 AJ 5.452% 9/15/39 • | | | 115,000 | | | | 107,169 | |
Series 2006-C6 AM 5.413% 9/15/39 | | | 350,000 | | | | 350,041 | |
Morgan Stanley Bank of America Merrill Lynch Trust | | | | | | | | |
Series 2014-C17 A5 3.741% 8/15/47 | | | 100,000 | | | | 110,733 | |
Series 2015-C23 A4 3.719% 7/15/50 | | | 215,000 | | | | 237,894 | |
Series 2015-C26 A5 3.531% 10/15/48 | | | 140,000 | | | | 153,615 | |
Series 2016-C29 A4 3.325% 5/15/49 | | | 95,000 | | | | 102,365 | |
32
| | | | | | | | |
| | | Principal amount° | | | Value (U.S. $) | |
| |
Non-Agency Commercial Mortgage-Backed Securities (continued) | | | | | | | | |
| |
Morgan Stanley Capital I Trust | | | | | | | | |
Series 2005-HQ7 C 5.198% 11/14/42 • | | | 5,579 | | | $ | 5,572 | |
Series 2006-HQ10 B 5.448% 11/12/41 • | | | 100,000 | | | | 95,605 | |
Wells Fargo Commercial Mortgage Trust | | | | | | | | |
Series 2012-LC5 A3 2.918% 10/15/45 | | | 75,000 | | | | 79,513 | |
Series 2014-LC18 A5 3.405% 12/15/47 | | | 35,000 | | | | 37,903 | |
Series 2015-NXS3 A4 3.617% 9/15/57 | | | 90,000 | | | | 99,070 | |
WF-RBS Commercial Mortgage Trust | | | | | | | | |
Series 2012-C10 A3 2.875% 12/15/45 | | | 85,000 | | | | 89,938 | |
| | | | | | | | |
Total Non-Agency Commercial Mortgage-Backed Securities (cost $5,848,021) | | | | 5,985,445 | |
| | | | | | | | |
| | | | | | | | |
| |
Regional Bonds – 0.43%D | | | | | | | | |
| |
Canada – 0.28% | | | | | | | | |
Province of British Columbia Canada 2.25% 6/2/26 | | | 245,000 | | | | 253,300 | |
Province of Manitoba Canada 2.125% 6/22/26 | | | 110,000 | | | | 110,910 | |
Province of Quebec Canada 2.50% 4/20/26 | | | 15,000 | | | | 15,547 | |
| | | | | | | | |
| | | | | | | 379,757 | |
| | | | | | | | |
Japan – 0.15% | | | | | | | | |
Japan Finance Organization For Municipalities 144A | | | | | | | | |
2.125% 4/13/21 # | | | 206,000 | | | | 210,167 | |
| | | | | | | | |
| | | | | | | 210,167 | |
| | | | | | | | |
Total Regional Bonds (cost $574,204) | | | | | | | 589,924 | |
| | | | | | | | |
| | | | | | | | |
| |
Senior Secured Loans – 2.99%« | | | | | | | | |
| |
Activision Blizzard Tranche B 1st Lien 3.25% 10/11/20 | | | 43,988 | | | | 44,232 | |
Air Medical Group Holdings Tranche B 1st Lien 4.25% 4/28/22 | | | 349,118 | | | | 343,518 | |
Aramark Services Tranche E 1st Lien 3.25% 9/7/19 | | | 114,977 | | | | 115,444 | |
Avago Technologies Cayman Finance Tranche B 1st Lien 4.25% 2/1/23 | | | 121,542 | | | | 121,972 | |
Community Health Systems Tranche H 1st Lien 4.00% 1/27/21 | | | 349,118 | | | | 345,270 | |
DaVita HealthCare Partners Tranche B 1st Lien 3.50% 6/24/21 | | | 558,600 | | | | 561,742 | |
FCA U.S. (Chrysler) Tranche B 3.50% 5/24/17 | | | 96,804 | | | | 97,089 | |
First Data Tranche B 1st Lien 4.488% 3/24/21 | | | 300,857 | | | | 302,601 | |
Hilton Worldwide Finance Tranche B2 1st Lien 3.50% 10/26/20 | | | 211,017 | | | | 211,808 | |
IASIS Healthcare Tranche B 1st Lien 4.50% 5/3/18 | | | 201,115 | | | | 201,157 | |
Keurig Green Mountain Tranche B 1st Lien 5.25% 3/3/23 | | | 350,000 | | | | 353,132 | |
Level 3 Financing Tranche B 1st Lien 4.00% 1/15/20 | | | 250,000 | | | | 251,406 | |
MGM Growth Properties Operating Partnership Tranche B 1st Lien
4.00% 4/25/23 | | | 349,125 | | | | 352,071 | |
33
Schedule of investments
Delaware Core Plus Bond Fund
| | | | | | | | |
| | | Principal amount° | | | Value (U.S. $) | |
| |
Senior Secured Loans« (continued) | | | | | | | | |
| |
SFR Group Tranche B 1st Lien 5.002% 1/15/24 | | | 349,125 | | | $ | 349,998 | |
Solera Tranche B 1st Lien 5.75% 3/3/23 | | | 139,650 | | | | 140,972 | |
T-Mobile USA Tranche B 1st Lien 3.50% 11/9/22 | | | 334,662 | | | | 337,119 | |
| | | | | | | | |
Total Senior Secured Loans (cost $4,099,450) | | | | | | | 4,129,531 | |
| | | | | | | | |
| | | | | | | | |
| |
Sovereign Bonds – 0.45%D | | | | | | | | |
| |
Germany – 0.15% | | | | | | | | |
FMS Wertmanagement AoeR 1.375% 6/8/21 | | | 200,000 | | | | 201,424 | |
| | | | | | | | |
| | | | | | | 201,424 | |
| | | | | | | | |
Guatemala – 0.15% | | | | | | | | |
Guatemala Government Bond 144A 4.50% 5/3/26 # | | | 200,000 | | | | 211,250 | |
| | | | | | | | |
| | | | | | | 211,250 | |
| | | | | | | | |
Qatar – 0.15% | | | | | | | | |
Qatar Government International Bond 144A | | | | | | | | |
3.25% 6/2/26 # | | | 200,000 | | | | 205,518 | |
| | | | | | | | |
| | | | | | | 205,518 | |
| | | | | | | | |
Total Sovereign Bonds (cost $596,192) | | | | | | | 618,192 | |
| | | | | | | | |
| | | | | | | | |
| |
U.S. Treasury Obligations – 2.00% | | | | | | | | |
| |
U.S. Treasury Notes | | | | | | | | |
1.125% 7/31/21 | | | 755,000 | | | | 758,274 | |
1.625% 5/15/26 | | | 1,975,000 | | | | 2,004,625 | |
| | | | | | | | |
Total U.S. Treasury Obligations (cost $2,756,367) | | | | | | | 2,762,899 | |
| | | | | | | | |
| | |
| | | Number of Shares | | | | |
| |
Convertible Preferred Stock – 0.02% | | | | | | | | |
| |
Bank of America 7.25% exercise price $50.00, expiration date 12/31/49 | | | 7 | | | | 8,442 | |
Wells Fargo 7.50% exercise price $156.71, expiration date 12/31/49 | | | 14 | | | | 18,638 | |
| | | | | | | | |
Total Convertible Preferred Stock (cost $26,268) | | | | | | | 27,080 | |
| | | | | | | | |
| | | | | | | | |
| |
Preferred Stock – 0.95% | | | | | | | | |
| |
General Electric 5.00% • | | | 481,000 | | | | 518,879 | |
Integrys Energy Group 6.00% @• | | | 4,400 | | | | 118,943 | |
PNC Preferred Funding Trust II 144A 1.875% #• | | | 300,000 | | | | 274,920 | |
U.S. Bancorp 3.50% • | | | 350 | | | | 308,700 | |
USB Realty 1.827% #@• | | | 100,000 | | | | 85,750 | |
| | | | | | | | |
Total Preferred Stock (cost $1,210,276) | | | | | | | 1,307,192 | |
| | | | | | | | |
34
| | | | | | | | |
| | | Principal amount° | | | Value (U.S. $) | |
| |
Short-Term Investments – 14.69% | | | | | | | | |
| |
Discount Notes – 8.79%≠ | | | | | | | | |
Federal Home Loan Bank | | | | | | | | |
0.163% 8/3/16 | | | 998,947 | | | $ | 998,937 | |
0.176% 8/5/16 | | | 2,411,610 | | | | 2,411,547 | |
0.241% 8/10/16 | | | 1,846,769 | | | | 1,846,687 | |
0.271% 8/29/16 | | | 837,172 | | | | 837,057 | |
0.281% 8/26/16 | | | 2,687,755 | | | | 2,687,424 | |
0.318% 9/7/16 | | | 600,640 | | | | 600,491 | |
0.322% 9/19/16 | | | 1,009,362 | | | | 1,009,031 | |
0.375% 9/21/16 | | | 161,833 | | | | 161,766 | |
0.376% 9/23/16 | | | 197,405 | | | | 197,335 | |
0.464% 8/15/16 | | | 1,374,021 | | | | 1,373,926 | |
| | | | | | | | |
| | | | | | | 12,124,201 | |
| | | | | | | | |
Repurchase Agreements – 5.90% | | | | | | | | |
Bank of America Merrill Lynch | | | | | | | | |
0.29%, dated 7/29/16, to be repurchased on 8/1/16, repurchase price $2,308,678 (collateralized by U.S. government obligations 3.375% 5/15/44; market value $2,354,796) | | | 2,308,622 | | | | 2,308,622 | |
Bank of Montreal | | | | | | | | |
0.26%, dated 7/29/16, to be repurchased on 8/1/16, repurchase price $3,847,787 (collateralized by U.S. government obligations 0.125%–3.125% | | | | | | | | |
2/15/19–11/15/45; market value $3,924,658) | | | 3,847,703 | | | | 3,847,703 | |
BNP Paribas | | | | | | | | |
0.33%, dated 7/29/16, to be repurchased on 8/1/16, repurchase price $1,981,729 (collateralized by U.S. government obligations 0.00%–4.25% | | | | | | | | |
8/31/19–11/15/40; market value $2,021,308) | | | 1,981,675 | | | | 1,981,675 | |
| | | | | | | | |
| | | | | | | 8,138,000 | |
| | | | | | | | |
Total Short-Term Investments (cost $20,261,380) | | | | | | | 20,262,201 | |
| | | | | | | | |
| | |
Total Value of Securities – 109.79% | | | | | | | | |
(cost $148,267,913) | | | | | | $ | 151,391,186 | |
| | | | | | | | |
| # | Security exempt from registration under Rule 144A of the Securities Act of 1933, as amended. At July 31, 2016, the aggregate value of Rule 144A securities was $24,439,038, which represents 17.72% of the Fund’s net assets. See Note 11 in “Notes to financial statements.” |
| @ | Illiquid security. At July 31, 2016, the aggregate value of illiquid securities was $1,278,003, which represents 0.93% of the Fund’s net assets. See Note 11 in “Notes to financial statements.” |
| ¿ | Pass Through Agreement. Security represents the contractual right to receive a proportionate amount of underlying payments due to the counterparty pursuant to various agreements related to the rescheduling of obligations and the exchange of certain notes. |
35
Schedule of investments
Delaware Core Plus Bond Fund
| ≠ | The rate shown is the effective yield at the time of purchase. |
| ° | Principal amount shown is stated in U.S. dollars unless noted that the security is denominated in another currency. |
| • | Variable rate security. The rate shown is the rate as of July 31, 2016. Interest rates reset periodically. |
| D | Securities have been classified by country of origin. |
| S | Interest only security. An interest only security is the interest only portion of a fixed income security, which is separated and sold individually from the principal portion of the security. |
| « | Senior secured loans generally pay interest at rates which are periodically redetermined by reference to a base lending rate plus a premium. These base lending rates are generally: (i) the prime rate offered by one or more U.S. banks, (ii) the lending rate offered by one or more European banks such as the London Interbank Offered Rate (LIBOR), and (iii) the certificate of deposit rate. Senior secured loans may be subject to restrictions on resale. Stated rate in effect at July 31, 2016. |
| f | Step coupon bond. Coupon increases or decreases periodically based on a predetermined schedule. Stated rate in effect at July 31, 2016. |
The following futures contracts and swap contract were outstanding at July 31, 2016:1
Futures Contracts
| | | | | | | | | | | | | | | | | | | | |
| Contracts to Buy (Sell) | | Notional
Cost
(Proceeds) | | | Notional
Value | | | Expiration
Date | | | Unrealized
Appreciation
(Depreciation) | |
| | (7 | ) | | E-mini S&P 500 Index | | $ | (712,555 | ) | | $ | (758,870 | ) | | | 9/19/16 | | | $ | (46,315 | ) |
| | (36 | ) | | U.S. Treasury 10 yr Notes | | | (4,746,836 | ) | | | (4,789,688 | ) | | | 9/22/16 | | | | (42,852 | ) |
| | 84 | | | U.S. Treasury Long Bonds | | | 14,308,436 | | | | 14,652,750 | | | | 9/21/16 | | | | 344,314 | |
| | | | | | | | | | | | | | | | | | | | |
| | | | | | $ | 8,849,045 | | | | | | | | | | | $ | 255,147 | |
| | | | | | | | | | | | | | | | | | | | |
Swap Contract
CDS Contract2
| | | | | | | | | | | | | | | | | | | | | | |
Counterparty | | Swap Referenced Obligation | | Notional Value3 | | | Annual Protection Payments | | | Termination Date | | | Upfront
Payments
Paid
(Received) | | | Unrealized Appreciation (Depreciation)4 | |
| | Protection Purchased: | | | | | | | | | | | | | | | | | |
MSC | | CDX.EM.255 | | | 355,000 | | | | 1.00% | | | | 6/20/21 | | | $ | 27,292 | | | $ | (1,321 | ) |
The use of futures contracts and swap contract involves elements of market risk and risks in excess of the amounts disclosed in these financial statements. The notional values presented above represent the Fund’s total exposure in such contracts, whereas only the net unrealized appreciation (depreciation) is reflected in the Fund’s net assets.
1See Note 8 in “Notes to financial statements.”
36
2A CDS contract is a risk-transfer instrument through which one party (purchaser of protection) transfers to another party (seller of protection) the financial risk of a credit event (as defined in the CDS agreement), as it relates to a particular reference security or basket of securities (such as an index). Periodic payments (receipts) on such contracts are accrued daily and recorded as unrealized losses (gains) on swap contracts. Upon payment (receipt), such amounts are recorded as realized losses (gains) on swap contracts. Upfront payments made or received in connection with CDS contracts are amortized over the expected life of the CDS contracts as unrealized losses (gains) on swap contracts. The change in value of CDS contracts is recorded daily as unrealized appreciation or depreciation. A realized gain or loss is recorded upon a credit event (as defined in the CDS agreement) or the maturity or termination of the agreement.
3Notional value shown is stated in U.S. dollars unless noted that the swap is denominated in another currency.
4Unrealized appreciation (depreciation) does not include periodic interest payments (receipt) on swap contracts accrued daily in the amount of $(4,025).
5Markit’s CDX.EM Index is composed of fourteen sovereign issuers from the following regions: Latin America, Middle East, Eastern Europe, Africa and Asia.
Summary of abbreviations:
ARM – Adjustable Rate Mortgage
BB – Barclays Bank
CDS – Credit Default Swap
CDX.EM – Credit Default Swap Index Emerging Markets
CLO – Collateralized Loan Obligation
DB – Deutsche Bank
GE – General Electric
GNMA – Government National Mortgage Association
GS – Goldman Sachs
GSMPS – Goldman Sachs Reperforming Mortgage Securities
JPM – JPMorgan
LB – Lehman Brothers
MSC – Morgan Stanley Capital
RBS – Royal Bank of Scotland
REIT – Real Estate Investment Trust
REMIC – Real Estate Mortgage Investment Conduit
S.F. – Single Family
TBA – To be announced
UBS – Union Bank of Switzerland
WF – Wells Fargo
yr – Year
See accompanying notes, which are an integral part of the financial statements.
37
| | |
| Statement of assets and liabilities |
| Delaware Core Plus Bond Fund | | July 31, 2016 |
| | | | |
Assets: | | | | |
Investments, at value1 | | $ | 131,128,985 | |
Short-term investments, at value2 | | | 20,262,201 | |
Cash collateral due from brokers for futures contracts | | | 303,000 | |
Cash | | | 156,355 | |
Receivable for securities sold | | | 9,031,697 | |
Dividends and interest receivable | | | 721,538 | |
Receivable for fund shares sold | | | 220,487 | |
Variation margin due from broker on futures contracts | | | 71,065 | |
Upfront payments paid on credit default swap contracts | | | 27,292 | |
Other assets3 | | | 97,871 | |
| | | | |
Total assets | | | 162,020,491 | |
| | | | |
Liabilities: | | | | |
Payable for securities purchased | | | 23,556,738 | |
Other accrued expenses | | | 80,266 | |
Income distribution payable | | | 78,530 | |
Payable for fund shares redeemed | | | 34,114 | |
Distribution fees payable to affiliates | | | 24,731 | |
Investment management fees payable to affiliates | | | 22,849 | |
Audit and tax fees payable | | | 3,783 | |
Dividend disbursing and transfer agent fees and expenses payable to affiliates | | | 2,318 | |
Unrealized depreciation on credit default swap contracts | | | 1,321 | |
Accounting and administration expenses payable to affiliates | | | 536 | |
Swap payments payable | | | 432 | |
Trustees’ fees and expenses payable | | | 317 | |
Legal fees payable to affiliates | | | 192 | |
Reports and statements to shareholders payable to affiliates | | | 58 | |
Bond proceeds payable3 | | | 326,237 | |
| | | | |
Total liabilities | | | 24,132,422 | |
| | | | |
Total Net Assets | | $ | 137,888,069 | |
| | | | |
38
| | | | |
Net Assets Consist of: | | | | |
Paid-in capital | | $ | 136,826,985 | |
Distributions in excess of net investment income | | | (106,250 | ) |
Accumulated net realized loss on investments | | | (2,205,562 | ) |
Net unrealized appreciation of investments | | | 3,123,273 | |
Net unrealized depreciation of foreign currencies | | | (178 | ) |
Net unrealized appreciation of futures contracts | | | 255,147 | |
Net unrealized depreciation of swap contracts | | | (5,346 | ) |
| | | | |
Total Net Assets | | $ | 137,888,069 | |
| | | | |
| |
Net Asset Value | | | | |
Class A: | | | | |
Net assets | | $ | 69,523,828 | |
Shares of beneficial interest outstanding, unlimited authorization, no par | | | 8,110,958 | |
Net asset value per share | | $ | 8.57 | |
Sales charge | | | 4.50 | % |
Offering price per share, equal to net asset value per share / (1 – sales charge) | | $ | 8.97 | |
| |
Class C: | | | | |
Net assets | | $ | 9,489,866 | |
Shares of beneficial interest outstanding, unlimited authorization, no par | | | 1,105,847 | |
Net asset value per share | | $ | 8.58 | |
| |
Class R: | | | | |
Net assets | | $ | 6,793,178 | |
Shares of beneficial interest outstanding, unlimited authorization, no par | | | 789,902 | |
Net asset value per share | | $ | 8.60 | |
| |
Institutional Class: | | | | |
Net assets | | $ | 52,081,197 | |
Shares of beneficial interest outstanding, unlimited authorization, no par | | | 6,069,262 | |
Net asset value per share | | $ | 8.58 | |
| |
| | | | |
1 Investments, at cost | | $ | 128,006,533 | |
2 Short-term investments, at cost | | | 20,261,380 | |
3 See Note 13 in “Notes to financial statements.” | | | | |
See accompanying notes, which are an integral part of the financial statements.
39
Statement of operations
| | | | |
Delaware Core Plus Bond Fund | | | Year ended July 31, 2016 | |
| | | | |
Investment Income: | | | | |
Interest | | $ | 3,488,226 | |
Dividends | | | 25,925 | |
| | | | |
| | | 3,514,151 | |
| | | | |
Expenses: | | | | |
Management fees | | | 716,643 | |
Distribution expenses – Class A | | | 171,517 | |
Distribution expenses – Class C | | | 92,663 | |
Distribution expenses – Class R | | | 33,033 | |
Dividend disbursing and transfer agent fees and expenses | | | 162,224 | |
Registration fees | | | 75,624 | |
Legal fees | | | 70,176 | |
Audit and tax fees | | | 54,739 | |
Reports and statements to shareholders | | | 45,730 | |
Accounting and administration expenses | | | 42,277 | |
Custodian fees | | | 22,646 | |
Trustees’ fees and expenses | | | 6,238 | |
Other | | | 53,722 | |
| | | | |
| | | 1,547,232 | |
Less expenses waived | | | (405,591 | ) |
Less expense paid indirectly | | | (187 | ) |
| | | | |
Total operating expenses | | | 1,141,454 | |
| | | | |
Net Investment Income | | | 2,372,697 | |
| | | | |
40
| | | | |
Net Realized and Unrealized Gain (Loss): | | | | |
Net realized gain (loss) on: | | | | |
Investments | | $ | 159,837 | |
Foreign currencies | | | (92,584 | ) |
Foreign currency exchange contracts | | | 13,470 | |
Futures contracts | | | 259,399 | |
Options purchased | | | 33,391 | |
Options written | | | (38,240 | ) |
Swap contracts | | | 132,857 | |
| | | | |
Net realized gain | | | 468,130 | |
| | | | |
Net change in unrealized appreciation (depreciation) of: | | | | |
Investments | | | 2,458,078 | |
Foreign currencies | | | 3,231 | |
Foreign currency exchange contracts | | | (574 | ) |
Futures contracts | | | 95,170 | |
Swap contracts | | | 2,309 | |
| | | | |
Net change in unrealized appreciation (depreciation) | | | 2,558,214 | |
| | | | |
Net Realized and Unrealized Gain | | | 3,026,344 | |
| | | | |
Net Increase in Net Assets Resulting from Operations | | $ | 5,399,041 | |
| | | | |
See accompanying notes, which are an integral part of the financial statements.
41
Statements of changes in net assets
Delaware Core Plus Bond Fund
| | | | | | | | |
| | | Year ended | |
| | | 7/31/16 | | | 7/31/15 | |
Increase (Decrease) in Net Assets from Operations: | | | | | | | | |
Net investment income | | $ | 2,372,697 | | | $ | 2,800,072 | |
Net realized gain | | | 468,130 | | | | 666,012 | |
Net change in unrealized appreciation (depreciation) | | | 2,558,214 | | | | (1,559,793 | ) |
| | | | | | | | |
Net increase in net assets resulting from operations | | | 5,399,041 | | | | 1,906,291 | |
| | | | | | | | |
| | |
Dividends and Distributions to Shareholders from: | | | | | | | | |
Net investment income: | | | | | | | | |
Class A | | | (1,595,501 | ) | | | (1,801,805 | ) |
Class B | | | — | | | | (1,451 | ) |
Class C | | | (145,027 | ) | | | (174,573 | ) |
Class R | | | (136,982 | ) | | | (186,474 | ) |
Institutional Class | | | (1,167,961 | ) | | | (1,183,298 | ) |
| | |
Return of capital: | | | | | | | | |
Class A | | | (64,610 | ) | | | (46,183 | ) |
Class C | | | (8,809 | ) | | | (6,030 | ) |
Class R | | | (6,292 | ) | | | (4,930 | ) |
Institutional Class | | | (48,347 | ) | | | (33,232 | ) |
| | | | | | | | |
| | | (3,173,529 | ) | | | (3,437,976 | ) |
| | | | | | | | |
| | |
Capital Share Transactions: | | | | | | | | |
Proceeds from shares sold: | | | | | | | | |
Class A | | | 26,720,996 | | | | 11,057,627 | |
Class B | | | — | | | | 89 | |
Class C | | | 3,897,214 | | | | 2,288,758 | |
Class R | | | 1,324,152 | | | | 1,277,507 | |
Institutional Class | | | 20,253,016 | | | | 21,004,192 | |
42
| | | | | | | | |
| | | Year ended | |
| | | 7/31/16 | | | 7/31/15 | |
Capital Share Transactions (continued): | | | | | | | | |
Net asset value of shares issued upon reinvestment of dividends and distributions: | | | | | | | | |
Class A | | $ | 1,520,870 | | | $ | 1,670,136 | |
Class B | | | — | | | | 1,131 | |
Class C | | | 142,343 | | | | 169,730 | |
Class R | | | 143,695 | | | | 192,500 | |
Institutional Class | | | 1,206,863 | | | | 1,192,045 | |
| | | | | | | | |
| | | 55,209,149 | | | | 38,853,715 | |
| | | | | | | | |
Cost of shares redeemed: | | | | | | | | |
Class A | | | (23,861,526 | ) | | | (13,368,386 | ) |
Class B | | | — | | | | (289,338 | ) |
Class C | | | (3,104,476 | ) | | | (2,562,532 | ) |
Class R | | | (1,640,481 | ) | | | (2,320,453 | ) |
Institutional Class | | | (16,401,880 | ) | | | (5,680,717 | ) |
| | | | | | | | |
| | | (45,008,363 | ) | | | (24,221,426 | ) |
| | | | | | | | |
Increase in net assets derived from capital share transactions | | | 10,200,786 | | | | 14,632,289 | |
| | | | | | | | |
Net Increase in Net Assets | | | 12,426,298 | | | | 13,100,604 | |
| | |
Net Assets: | | | | | | | | |
Beginning of year | | | 125,461,771 | | | | 112,361,167 | |
| | | | | | | | |
End of year | | $ | 137,888,069 | | | $ | 125,461,771 | |
| | | | | | | | |
| | |
Distributions in excess of net investment income | | $ | (106,250 | ) | | $ | (104,321 | ) |
| | | | | | | | |
See accompanying notes, which are an integral part of the financial statements.
43
Financial highlights
Delaware Core Plus Bond Fund Class A
Selected data for each share of the Fund outstanding throughout each period were as follows:
|
Net asset value, beginning of period |
|
Income (loss) from investment operations: |
Net investment income1 |
Net realized and unrealized gain (loss) |
Total from investment operations |
|
Less dividends and distributions from: |
Net investment income |
Return of capital |
Net realized gain |
Total dividends and distributions |
|
Net asset value, end of period |
|
Total return2 |
|
Ratios and supplemental data: |
Net assets, end of period (000 omitted) |
Ratio of expenses to average net assets |
Ratio of expenses to average net assets prior to fees waived |
Ratio of net investment income to average net assets |
Ratio of net investment income to average net assets prior to fees waived |
Portfolio turnover |
| 1 | The average shares outstanding method has been applied for per share information. |
| 2 | Total investment return is based on the change in net asset value of a share during the period and assumes reinvestment of dividends and distributions at net asset value and does not reflect the impact of a sales charge. Total investment return during all of the periods shown reflects waivers by the manager and/or distributor. Performance would have been lower had the waivers not been in effect. |
See accompanying notes, which are an integral part of the financial statements.
44
| | | | | | | | | | | | | | | | | | | | |
| | | Year ended | |
| |
| | | 7/31/16 | | | 7/31/15 | | | 7/31/14 | | | 7/31/13 | | | 7/31/12 | |
| |
| | $ | 8.430 | | | $ | 8.530 | | | $ | 8.340 | | | $ | 8.750 | | | $ | 8.420 | |
| | | | | |
| | | | | | | | | | | | | | | | | | | | | |
| | | 0.151 | | | | 0.196 | | | | 0.226 | | | | 0.202 | | | | 0.205 | |
| | | 0.192 | | | | (0.056 | ) | | | 0.233 | | | | (0.328 | ) | | | 0.375 | |
| | | | | | | | | | | | | | | | | | | | |
| | | 0.343 | | | | 0.140 | | | | 0.459 | | | | (0.126 | ) | | | 0.580 | |
| | | | | | | | | | | | | | | | | | | | |
| | | | | |
| | | | | | | | | | | | | | | | | | | | | |
| | | (0.195 | ) | | | (0.234 | ) | | | (0.234 | ) | | | (0.265 | ) | | | (0.250 | ) |
| | | (0.008 | ) | | | (0.006 | ) | | | (0.035 | ) | | | — | | | | — | |
| | | — | | | | — | | | | — | | | | (0.019 | ) | | | — | |
| | | | | | | | | | | | | | | | | | | | |
| | | (0.203 | ) | | | (0.240 | ) | | | (0.269 | ) | | | (0.284 | ) | | | (0.250 | ) |
| | | | | | | | | | | | | | | | | | | | |
| | | | | |
| | $ | 8.570 | | | $ | 8.430 | | | $ | 8.530 | | | $ | 8.340 | | | $ | 8.750 | |
| | | | | | | | | | | | | | | | | | | | |
| | | | | |
| | | 4.15% | | | | 1.65% | | | | 5.60% | | | | (1.51% | ) | | | 7.01% | |
| | | | | |
| | | | | | | | | | | | | | | | | | | | | |
| | $ | 69,524 | | | $ | 64,069 | | | $ | 65,466 | | | $ | 81,042 | | | $ | 91,099 | |
| | | 0.90% | | | | 0.91% | | | | 0.90% | | | | 0.90% | | | | 0.90% | |
| | | 1.21% | | | | 1.21% | | | | 1.19% | | | | 1.17% | | | | 1.18% | |
| | | 1.80% | | | | 2.30% | | | | 2.70% | | | | 2.33% | | | | 2.41% | |
| | | 1.49% | | | | 2.00% | | | | 2.41% | | | | 2.06% | | | | 2.13% | |
| | | 316% | | | | 313% | | | | 273% | | | | 340% | | | | 422% | |
45
Financial highlights
Delaware Core Plus Bond Fund Class C
Selected data for each share of the Fund outstanding throughout each period were as follows:
|
Net asset value, beginning of period |
|
Income (loss) from investment operations: |
Net investment income1 |
Net realized and unrealized gain (loss) |
Total from investment operations |
|
Less dividends and distributions from: |
Net investment income |
Return of capital |
Net realized gain |
Total dividends and distributions |
|
Net asset value, end of period |
|
Total return2 |
|
Ratios and supplemental data: |
Net assets, end of period (000 omitted) |
Ratio of expenses to average net assets |
Ratio of expenses to average net assets prior to fees waived |
Ratio of net investment income to average net assets |
Ratio of net investment income to average net assets prior to fees waived |
Portfolio turnover |
| 1 | The average shares outstanding method has been applied for per share information. |
| 2 | Total investment return is based on the change in net asset value of a share during the period and assumes reinvestment of dividends and distributions at net asset value and does not reflect the impact of a sales charge. Total investment return during all of the periods shown reflects a waiver by the manager. Performance would have been lower had the waiver not been in effect. |
See accompanying notes, which are an integral part of the financial statements.
46
| | | | | | | | | | | | | | | | | | | | |
| Year ended | |
| |
| | | 7/31/16 | | | 7/31/15 | | | 7/31/14 | | | 7/31/13 | | | 7/31/12 | |
| |
| | $ | 8.440 | | | $ | 8.540 | | | $ | 8.350 | | | $ | 8.760 | | | $ | 8.430 | |
| | | | | |
| | | | | | | | | | | | | | | | | | | | | |
| | | 0.088 | | | | 0.132 | | | | 0.164 | | | | 0.137 | | | | 0.142 | |
| | | 0.192 | | | | (0.056 | ) | | | 0.232 | | | | (0.328 | ) | | | 0.374 | |
| | | | | | | | | | | | | | | | | | | | |
| | | 0.280 | | | | 0.076 | | | | 0.396 | | | | (0.191 | ) | | | 0.516 | |
| | | | | | | | | | | | | | | | | | | | |
| | | | | |
| | | | | | | | | | | | | | | | | | | | | |
| | | (0.132 | ) | | | (0.170 | ) | | | (0.171 | ) | | | (0.200 | ) | | | (0.186 | ) |
| | | (0.008 | ) | | | (0.006 | ) | | | (0.035 | ) | | | — | | | | — | |
| | | — | | | | — | | | | — | | | | (0.019 | ) | | | — | |
| | | | | | | | | | | | | | | | | | | | |
| | | (0.140 | ) | | | (0.176 | ) | | | (0.206 | ) | | | (0.219 | ) | | | (0.186 | ) |
| | | | | | | | | | | | | | | | | | | | |
| | | | | |
| | $ | 8.580 | | | $ | 8.440 | | | $ | 8.540 | | | $ | 8.350 | | | $ | 8.760 | |
| | | | | | | | | | | | | | | | | | | | |
| | | | | |
| | | 3.37% | | | | 0.89% | | | | 4.81% | | | | (2.24% | ) | | | 6.20% | |
| | | | | |
| | | | | | | | | | | | | | | | | | | | | |
| | $ | 9,490 | | | $ | 8,375 | | | $ | 8,572 | | | $ | 10,990 | | | $ | 12,989 | |
| | | 1.65% | | | | 1.66% | | | | 1.65% | | | | 1.65% | | | | 1.65% | |
| | | 1.96% | | | | 1.96% | | | | 1.93% | | | | 1.87% | | | | 1.88% | |
| | | 1.05% | | | | 1.55% | | | | 1.95% | | | | 1.58% | | | | 1.66% | |
| | | 0.74% | | | | 1.25% | | | | 1.67% | | | | 1.36% | | | | 1.43% | |
| | | 316% | | | | 313% | | | | 273% | | | | 340% | | | | 422% | |
47
Financial highlights
Delaware Core Plus Bond Fund Class R
Selected data for each share of the Fund outstanding throughout each period were as follows:
|
Net asset value, beginning of period |
|
Income (loss) from investment operations: |
Net investment income1 |
Net realized and unrealized gain (loss) |
Total from investment operations |
|
Less dividends and distributions from: |
Net investment income |
Return of capital |
Net realized gain |
Total dividends and distributions |
|
Net asset value, end of period |
|
Total return2 |
|
Ratios and supplemental data: |
Net assets, end of period (000 omitted) |
Ratio of expenses to average net assets |
Ratio of expenses to average net assets prior to fees waived |
Ratio of net investment income to average net assets |
Ratio of net investment income to average net assets prior to fees waived |
Portfolio turnover |
| 1 | The average shares outstanding method has been applied for per share information. |
| 2 | Total investment return is based on the change in net asset value of a share during the period and assumes reinvestment of dividends and distributions at net asset value. Total investment return during all of the periods shown reflects waivers by the manager and/or distributor. Performance would have been lower had the waivers not been in effect. |
See accompanying notes, which are an integral part of the financial statements.
48
| | | | | | | | | | | | | | | | | | | | |
| | | Year ended | |
| |
| | | 7/31/16 | | | 7/31/15 | | | 7/31/14 | | | 7/31/13 | | | 7/31/12 | |
| |
| | $ | 8.460 | | | $ | 8.560 | | | $ | 8.370 | | | $ | 8.780 | | | $ | 8.450 | |
| | | | | |
| | | | | | | | | | | | | | | | | | | | | |
| | | 0.130 | | | | 0.176 | | | | 0.206 | | | | 0.181 | | | | 0.185 | |
| | | 0.192 | | | | (0.056 | ) | | | 0.233 | | | | (0.328 | ) | | | 0.374 | |
| | | | | | | | | | | | | | | | | | | | |
| | | 0.322 | | | | 0.120 | | | | 0.439 | | | | (0.147 | ) | | | 0.559 | |
| | | | | | | | | | | | | | | | | | | | |
| | | | | |
| | | | | | | | | | | | | | | | | | | | | |
| | | (0.174 | ) | | | (0.214 | ) | | | (0.214 | ) | | | (0.244 | ) | | | (0.229 | ) |
| | | (0.008 | ) | | | (0.006 | ) | | | (0.035 | ) | | | — | | | | — | |
| | | — | | | | — | | | | — | | | | (0.019 | ) | | | — | |
| | | | | | | | | | | | | | | | | | | | |
| | | (0.182 | ) | | | (0.220 | ) | | | (0.249 | ) | | | (0.263 | ) | | | (0.229 | ) |
| | | | | | | | | | | | | | | | | | | | |
| | | | | |
| | $ | 8.600 | | | $ | 8.460 | | | $ | 8.560 | | | $ | 8.370 | | | $ | 8.780 | |
| | | | | | | | | | | | | | | | | | | | |
| | | | | |
| | | 3.88% | | | | 1.40% | | | | 5.32% | | | | (1.74% | ) | | | 6.73% | |
| | | | | |
| | | | | | | | | | | | | | | | | | | | | |
| | $ | 6,793 | | | $ | 6,863 | | | $ | 7,793 | | | $ | 8,077 | | | $ | 9,180 | |
| | | 1.15% | | | | 1.16% | | | | 1.15% | | | | 1.15% | | | | 1.15% | |
| | | 1.46% | | | | 1.46% | | | | 1.45% | | | | 1.47% | | | | 1.48% | |
| | | 1.55% | | | | 2.05% | | | | 2.45% | | | | 2.08% | | | | 2.16% | |
| | | 1.24% | | | | 1.75% | | | | 2.15% | | | | 1.76% | | | | 1.83% | |
| | | 316% | | | | 313% | | | | 273% | | | | 340% | | | | 422% | |
49
Financial highlights
Delaware Core Plus Bond Fund Institutional Class
Selected data for each share of the Fund outstanding throughout each period were as follows:
|
Net asset value, beginning of period |
|
Income (loss) from investment operations: |
Net investment income1 |
Net realized and unrealized gain (loss) |
Total from investment operations |
|
Less dividends and distributions from: |
Net investment income |
Return of capital |
Net realized gain |
Total dividends and distributions |
|
Net asset value, end of period |
|
Total return2 |
|
Ratios and supplemental data: |
Net assets, end of period (000 omitted) |
Ratio of expenses to average net assets |
Ratio of expenses to average net assets prior to fees waived |
Ratio of net investment income to average net assets |
Ratio of net investment income to average net assets prior to fees waived |
Portfolio turnover |
|
| 1 | The average shares outstanding method has been applied for per share information. |
| 2 | Total investment return is based on the change in net asset value of a share during the period and assumes reinvestment of dividends and distributions at net asset value. Total investment return during all of the periods shown reflects a waiver by the manager. Performance would have been lower had the waiver not been in effect. |
See accompanying notes, which are an integral part of the financial statements.
50
| | | | | | | | | | | | | | | | | | | | |
| | | Year ended | |
| |
| | | 7/31/16 | | | 7/31/15 | | | 7/31/14 | | | 7/31/13 | | | 7/31/12 | |
| |
| | $ | 8.440 | | | $ | 8.540 | | | $ | 8.350 | | | $ | 8.760 | | | $ | 8.430 | |
| | | | | |
| | | | | | | | | | | | | | | | | | | | | |
| | | 0.172 | | | | 0.215 | | | | 0.248 | | | | 0.224 | | | | 0.228 | |
| | | 0.192 | | | | (0.053 | ) | | | 0.233 | | | | (0.328 | ) | | | 0.373 | |
| | | | | | | | | | | | | | | | | | | | |
| | | 0.364 | | | | 0.162 | | | | 0.481 | | | | (0.104 | ) | | | 0.601 | |
| | | | | | | | | | | | | | | | | | | | |
| | | | | |
| | | | | | | | | | | | | | | | | | | | | |
| | | (0.216 | ) | | | (0.256 | ) | | | (0.256 | ) | | | (0.287 | ) | | | (0.271 | ) |
| | | (0.008 | ) | | | (0.006 | ) | | | (0.035 | ) | | | — | | | | — | |
| | | — | | | | — | | | | — | | | | (0.019 | ) | | | — | |
| | | | | | | | | | | | | | | | | | | | |
| | | (0.224 | ) | | | (0.262 | ) | | | (0.291 | ) | | | (0.306 | ) | | | (0.271 | ) |
| | | | | | | | | | | | | | | | | | | | |
| | | | | |
| | $ | 8.580 | | | $ | 8.440 | | | $ | 8.540 | | | $ | 8.350 | | | $ | 8.760 | |
| | | | | | | | | | | | | | | | | | | | |
| | | | | |
| | | 4.40% | | | | 1.90% | | | | 5.86% | | | | (1.26% | ) | | | 7.27% | |
| | | | | |
| | | | | | | | | | | | | | | | | | | | | |
| | $ | 52,081 | | | $ | 46,155 | | | $ | 30,241 | | | $ | 60,210 | | | $ | 75,469 | |
| | | 0.65% | | | | 0.66% | | | | 0.65% | | | | 0.65% | | | | 0.65% | |
| | | 0.96% | | | | 0.96% | | | | 0.93% | | | | 0.87% | | | | 0.88% | |
| | | 2.05% | | | | 2.55% | | | | 2.95% | | | | 2.58% | | | | 2.66% | |
| | | 1.74% | | | | 2.25% | | | | 2.67% | | | | 2.36% | | | | 2.43% | |
| | | | 316% | | | | 313% | | | | 273% | | | | 340% | | | | 422% | |
51
| | |
| Notes to financial statements |
| Delaware Core Plus Bond Fund | | July 31, 2016 |
Delaware Group® Government Fund (Trust) is organized as a Delaware statutory trust and offers two series: Delaware Core Plus Bond Fund and Delaware Emerging Markets Debt Fund. These financial statements and the related notes pertain to Delaware Core Plus Bond Fund (Fund). The Trust is an open-end investment company. The Fund is considered diversified under the Investment Company Act of 1940 (1940 Act), as amended, and offers Class A, Class C, Class R, and Institutional Class shares. Class A shares are sold with a maximum front-end sales charge of 4.50%. Class A share purchases of $1,000,000 or more will incur a contingent deferred sales charge (CDSC) of 1.00% if redeemed during the first year, and 0.50% during the second year, provided that Delaware Distributors, L.P. (DDLP) paid a financial advisor a commission on the purchase of those shares. Effective Sept. 25, 2014, all remaining shares of Class B were converted to Class A shares. Class C shares are sold with a CDSC of 1.00%, if redeemed during the first 12 months. Class R and Institutional Class shares are not subject to a sales charge and are offered for sale exclusively to certain eligible investors.
The investment objective of the Fund is to seek maximum long-term total return, consistent with reasonable risk.
1. Significant Accounting Policies
The following accounting policies are in accordance with U.S. generally accepted accounting principles (U.S. GAAP) and are consistently followed by the Fund.
Security Valuation — Equity securities, except those traded on the Nasdaq Stock Market LLC (Nasdaq), are valued at the last quoted sales price as of the time of the regular close of the New York Stock Exchange on the valuation date. Equity securities traded on the Nasdaq are valued in accordance with the Nasdaq Official Closing Price, which may not be the last sales price. If, on a particular day, an equity security does not trade, the mean between the bid and ask prices will be used, which approximates fair value. U.S. government and agency securities are valued at the mean between the bid and ask prices, which approximates fair value. Other debt securities, credit default swap (CDS) contracts and interest rate swap contracts are valued based upon valuations provided by an independent pricing service or broker/counterparty and reviewed by management. To the extent current market prices are not available, the pricing service may take into account developments related to the specific security, as well as transactions in comparable securities. For asset-backed securities, collateralized mortgage obligations, commercial mortgage securities, and U.S. government agency mortgage securities, pricing vendors utilize matrix pricing which considers prepayment speed, attributes of the collateral, yield or price of bonds of comparable quality, coupon, maturity, and type as well as broker/dealer-supplied prices. Valuations for fixed income securities utilize matrix systems, which reflect such factors as security prices, yields, maturities, and ratings, and are supplemented by dealer and exchange quotations. Swap prices are derived using daily swap curves and models that incorporate a number of market data factors, such as discounted cash flows, trades, and values of the underlying reference instruments. Foreign currency exchange contracts and foreign cross currency exchange contracts are valued at the mean between the bid and ask prices, which approximates fair value. Interpolated values are derived when the settlement date of the contract is an interim date for which quotations are not available. Futures contracts and options on futures contracts are valued at the daily quoted settlement prices. Generally, other securities and assets for which market quotations are not readily available are valued at fair value as determined in good faith under the direction of the Trust’s Board of Trustees (Board). In determining
52
whether market quotations are readily available or fair valuation will be used, various factors will be taken into consideration, such as market closures or suspension of trading in a security.
Federal and Foreign Income Taxes — No provision for federal income taxes has been made as the Fund intends to continue to qualify for federal income tax purposes as a regulated investment company under Subchapter M of the Internal Revenue Code of 1986, as amended, and make the requisite distributions to shareholders. The Fund evaluates tax positions taken or expected to be taken in the course of preparing the Fund’s tax returns to determine whether the tax positions are “more-likely-than-not” of being sustained by the applicable tax authority. Tax positions not deemed to meet the “more-likely-than-not” threshold are recorded as a tax benefit or expense in the current year. Management has analyzed the Fund’s tax positions taken for all open federal income tax years (July 31, 2013–July 31, 2016), and has concluded that no provision for federal income tax is required in the Fund’s financial statements. In regard to foreign taxes only, the Fund has open tax years in certain foreign countries in which it invests that may date back to the inception of the Fund.
Class Accounting — Investment income and common expenses are allocated to the various classes of the Fund on the basis of “settled shares” of each class in relation to the net assets of the Fund. Realized and unrealized gain (loss) on investments are allocated to the various classes of the Fund on the basis of daily net assets of each class. Distribution expenses relating to a specific class are charged directly to that class.
Repurchase Agreements — The Fund may purchase certain U.S. government securities subject to the counterparty’s agreement to repurchase them at an agreed upon date and price. The counterparty will be required on a daily basis to maintain the value of the collateral subject to the agreement at not less than the repurchase price (including accrued interest). The agreements are conditioned upon the collateral being deposited under the Federal Reserve book-entry system with the Fund’s custodian or a third party sub-custodian. In the event of default or bankruptcy by the other party to the agreement, retention of the collateral may be subject to legal proceedings. All open repurchase agreements as of the date of this report were entered into on July 29, 2016 and matured on the next business day.
To Be Announced Trades (TBA) — The Fund may contract to purchase or sell securities for a fixed price at a transaction date beyond the customary settlement period (examples: when issued, delayed delivery, forward commitment, or TBA transactions) consistent with the Fund’s ability to manage its investment portfolio and meet redemption requests. These transactions involve a commitment by the Fund to purchase or sell securities for a predetermined price or yield with payment and delivery taking place more than three days in the future, or after a period longer than the customary settlement period for that type of security. No interest will be earned by the Fund on such purchases until the securities are delivered or transaction is completed; however, the market value may change prior to delivery.
Foreign Currency Transactions — Transactions denominated in foreign currencies are recorded at the prevailing exchange rates on the valuation date in accordance with the Fund’s prospectus. The value of all assets and liabilities denominated in foreign currencies is translated daily into U.S. dollars at the exchange rate of such currencies against the U.S. dollar. Transaction gains or losses resulting from changes in exchange rates during the reporting period or upon settlement of the foreign currency transaction are reported in operations for the current period. The Fund generally bifurcates that portion of realized gains and losses on investments in debt securities which is due to changes in foreign exchange
53
Notes to financial statements
Delaware Core Plus Bond Fund
1. Significant Accounting Policies (continued)
rates from that which is due to changes in market prices of debt securities. That portion of gains (losses), which is due to changes in foreign exchange rates, is included on the “Statement of operations” under “Net realized gain (loss) on foreign currencies.” The Fund reports certain foreign currency related transactions as components of realized gains (losses) for financial reporting purposes, whereas such components are treated as ordinary income (loss) for federal income tax purposes.
Use of Estimates — The Fund is an investment company, whose financial statements are prepared in conformity with U.S. GAAP. Therefore, the Fund follows the accounting and reporting guidelines for investment companies. The preparation of financial statements in conformity with U.S. GAAP requires management to make estimates and assumptions that affect the fair value of investments, the reported amounts of assets and liabilities and disclosure of contingent assets and liabilities at the date of the financial statements, and the reported amounts of revenues and expenses during the reporting period. Actual results could differ from those estimates and the differences could be material.
Other — Expenses directly attributable to the Fund are charged directly to the Fund. Other expenses common to various funds within the Delaware Investments® Family of Funds are generally allocated among such funds on the basis of average net assets. Management fees and some other expenses are paid monthly. Security transactions are recorded on the date the securities are purchased or sold (trade date) for financial reporting purposes. Costs used in calculating realized gains and losses on the sale of investment securities are those of the specific securities sold. Dividend income is recorded on the ex-dividend date and interest income is recorded on the accrual basis. Discounts and premiums on debt securities are accreted or amortized to interest income, respectively, over the lives of the respective securities using the effective interest method. Realized gains (losses) on paydowns of asset- and mortgage-backed securities are classified as interest income. The Fund declares dividends daily from net investment income and pays the dividends monthly and declares and pays distributions from net realized gain on investments, if any, annually. The Fund may distribute more frequently, if necessary for tax purposes. Dividends and distributions, if any, are recorded on the ex-dividend date.
The Fund may receive earnings credits from its custodian when positive cash balances are maintained, which may be used to offset custody fees. There were no such earnings credits for the year ended July 31, 2016.
The Fund receives earnings credits from its transfer agent when positive cash balances are maintained, which may be used to offset transfer agent fees. If the amount earned is greater than $1.00, the expense paid under this arrangement is included on the “Statement of operations” under “Dividend disbursing and transfer agent fees and expenses” with the corresponding expense offset shown under “Less expense paid indirectly.” For the year ended July 31, 2016, the Fund earned $187 under this agreement.
54
2. Investment Management, Administration Agreements, and Other Transactions with Affiliates
In accordance with the terms of its investment management agreement, the Fund pays Delaware Management Company (DMC), a series of Delaware Management Business Trust and the investment manager, an annual fee which is calculated daily at the rate of 0.55% on the first $500 million of average daily net assets of the Fund, 0.50% on the next $500 million, 0.45% on the next $1.5 billion, and 0.425% on average daily net assets in excess of $2.5 billion.
DMC has contractually agreed to waive all or a portion, if any, of its investment advisory fees and/or pay/reimburse the Fund to the extent necessary to ensure total annual operating expenses (excluding any distribution and service (12b-1) fees, acquired fund fees and expenses, taxes, interest, short sale and dividend interest expenses, brokerage fees, certain insurance costs, and nonroutine expenses or costs, including, but not limited to, those relating to reorganizations, litigation, conducting shareholder meetings, and liquidations (collectively, nonroutine expenses)), from exceeding 0.65% of the Fund’s average daily net assets from Aug. 1, 2015 through July 31, 2016.* These waivers and reimbursements may only be terminated by agreement of DMC and the Fund.
Delaware Investments Fund Services Company (DIFSC), an affiliate of DMC, provides fund accounting and financial administration oversight services to the Fund. For these services, DIFSC’s fees are calculated based on the aggregate daily net assets of the Delaware Investments® Family of Funds at the following annual rate: 0.0050% of the first $30 billion; 0.0045% of the next $10 billion; 0.0040% of the next $10 billion; and 0.0025% of aggregate average daily net assets in excess of $50 billion. The fees payable to DIFSC under the service agreement described above are allocated among all funds in the Delaware Investments Family of Funds on a relative net asset value (NAV) basis. For the year ended July 31, 2016, the Fund was charged $6,193 for these services. This amount is included on the “Statement of operations” under “Accounting and administration expenses.”
DIFSC is also the transfer agent and dividend disbursing agent of the Fund. For these services, DIFSC’s fees are calculated based on the aggregate daily net assets of the retail funds within the Delaware Investments Family of Funds at the following annual rate: 0.025% of the first $20 billion; 0.020% of the next $5 billion; 0.015% of the next $5 billion; and 0.013% on average daily net assets in excess of $30 billion. The fees payable to DIFSC under the service agreement described above are allocated among all retail funds in the Delaware Investments Family of Funds on a relative NAV basis. This amount is included on the “Statement of operations” under “Dividend disbursing and transfer agent fees and expenses.” For the year ended July 31, 2016, the Fund was charged $27,127 for these services. Pursuant to a sub-transfer agency agreement between DIFSC and BNY Mellon Investment Servicing (US) Inc. (BNYMIS), BNYMIS provides certain sub-transfer agency services to the Fund. Sub-transfer agency fees are paid by the Fund and are also included on the “Statement of operations” under “Dividend disbursing and transfer agent fees and expenses.”
Pursuant to a distribution agreement and distribution plan, the Fund pays DDLP, the distributor and an affiliate of DMC, annual 12b-1 fees of 0.25% of the average daily net assets of the Class A shares, 1.00% of the average daily net assets of the Class C shares, and 0.50% of the average daily net assets of the Class R shares. The Board has adopted a formula for calculating 12b-1 fees for the Fund’s Class A shares that went into effect on June 1, 1992. The Fund’s Class A shares are currently subject to a blended 12b-1 fees equal to the sum of: (i) 0.10% of the average daily net assets representing shares
55
Notes to financial statements
Delaware Core Plus Bond Fund
2. Investment Management, Administration Agreements, and Other Transactions with Affiliates (continued)
that were acquired prior to June 1, 1992, and (ii) 0.25% of the average daily net assets representing shares that were acquired on or after June 1, 1992. All Class A shareholders currently bear 12b-1 fees at the same rate, the blended rate based on the formula described above. This method of calculating Class A 12b-1 fees may be discontinued at the sole discretion of the Board. Institutional Class shares pay no 12b-1 fees.
As provided in the investment management agreement, the Fund bears a portion of the cost of certain resources shared with DMC, including the cost of internal personnel of DMC and/or its affiliates that provide legal, tax, and regulatory reporting services to the Fund. For the year ended July 31, 2016, the Fund was charged $2,752 for internal legal, tax, and regulatory reporting provided by DMC and/or its affiliates’ employees. This amount is included on the “Statement of operations” under “Legal fees.”
For the year ended July 31, 2016, DDLP earned $2,491 for commissions on sales of the Fund’s Class A shares. For the year ended July 31, 2016, DDLP received gross CDSC commissions of $30 and 1,321 on redemptions of the Fund’s Class A and Class C shares, respectively, and these commissions were entirely used to offset upfront commissions previously paid by DDLP to broker/dealers on sales of those shares.
Trustees’ fees include expenses accrued by the Fund for each Trustee’s retainer and meeting fees. Certain officers of DMC, DIFSC, and DDLP are officers and/or Trustees of the Trust. These officers and Trustees are paid no compensation by the Fund.
*The aggregate contractual waiver period covering this report is from Nov. 28, 2014 through Nov. 28, 2016.
3. Investments
For the year ended July 31, 2016, the Fund made purchases and sales of investment securities other than short-term investments as follows:
| | | | |
Purchases other than U.S. government securities | | $ | 268,450,675 | |
Purchases of U.S. government securities | | | 140,018,195 | |
Sales other than U.S. government securities | | | 258,160,331 | |
Sales of U.S. government securities | | | 143,189,194 | |
56
At July 31, 2016, the cost and unrealized appreciation (depreciation) of investments for federal income tax purposes were as follows:
| | | | |
Cost of investments | | $ | 148,909,761 | |
Aggregate unrealized appreciation of investments | | $ | 3,786,090 | |
Aggregate unrealized depreciation of investments | | | (1,304,665 | ) |
Net unrealized appreciation of investments | | $ | 2,481,425 | |
U.S. GAAP defines fair value as the price that the Fund would receive to sell an asset or pay to transfer a liability in an orderly transaction between market participants at the measurement date under current market conditions. A three-level hierarchy for fair value measurements has been established based upon the transparency of inputs to the valuation of an asset or liability. Inputs may be observable or unobservable and refer broadly to the assumptions that market participants would use in pricing the asset or liability. Observable inputs reflect the assumptions market participants would use in pricing the asset or liability based on market data obtained from sources independent of the reporting entity. Unobservable inputs reflect the reporting entity’s own assumptions about the assumptions that market participants would use in pricing the asset or liability based on the best information available under the circumstances. The Fund’s investment in its entirety is assigned a level based upon the observability of the inputs which are significant to the overall valuation. The three-level hierarchy of inputs is summarized below.
| | |
| Level 1 – | | Inputs are quoted prices in active markets for identical investments. (Examples: equity securities, open-end investment companies, futures contracts, exchange-traded options contracts) |
| |
| Level 2 – | | Other observable inputs, including, but not limited to: quoted prices for similar assets or liabilities in markets that are active, quoted prices for identical or similar assets or liabilities in markets that are not active, inputs other than quoted prices that are observable for the assets or liabilities (such as interest rates, yield curves, volatilities, prepayment speeds, loss severities, credit risks, and default rates), or other market-corroborated inputs. (Examples: debt securities, government securities, swap contracts, foreign currency exchange contracts, foreign securities utilizing international fair value pricing, broker-quoted securities, fair valued securities) |
| |
| Level 3 – | | Significant unobservable inputs, including the Fund’s own assumptions used to determine the fair value of investments. (Examples: broker-quoted securities, fair valued securities) |
Level 3 investments are valued using significant unobservable inputs. The Fund may also use an income-based valuation approach in which the anticipated future cash flows of the investment are discounted to calculate fair value. Discounts may also be applied due to the nature or duration of any restrictions on the disposition of the investments. Valuations may also be based upon current market prices of securities that are comparable in coupon, rating, maturity, and industry. The derived value of a Level 3 investment may not represent the value which is received upon disposition and this could impact the results of operations.
57
Notes to financial statements
Delaware Core Plus Bond Fund
3. Investments (continued)
The following table summarizes the valuation of the Fund’s investments by fair value hierarchy levels as of July 31, 2016:
| | | | | | | | | | | | |
Securities | | Level 1 | | | Level 2 | | | Total | |
Agency, Asset-
& Mortgage-Backed Securities | | $ | — | | | $ | 67,356,211 | | | $ | 67,356,211 | |
Corporate Debt | | | — | | | | 52,819,740 | | | | 52,819,740 | |
Municipal Bonds | | | — | | | | 1,518,216 | | | | 1,518,216 | |
Foreign Bonds | | | — | | | | 1,208,116 | | | | 1,208,116 | |
Senior Secured Loans | | | — | | | | 4,129,531 | | | | 4,129,531 | |
U.S. Treasury Obligations | | | — | | | | 2,762,899 | | | | 2,762,899 | |
Convertible Preferred Stock | | | 27,080 | | | | — | | | | 27,080 | |
Preferred Stock1 | | | 308,700 | | | | 998,492 | | | | 1,307,192 | |
Short-Term Investments | | | — | | | | 20,262,201 | | | | 20,262,201 | |
| | | | | | | | | | | | |
Total Value of Securities | | $ | 335,780 | | | $ | 151,055,406 | | | $ | 151,391,186 | |
| | | | | | | | | | | | |
Futures Contracts | | $ | 255,147 | | | $ | — | | | $ | 255,147 | |
Swap Contracts | | | — | | | | (1,321 | ) | | | (1,321 | ) |
1Security type is valued across multiple levels. Level 1 investments represent exchange-traded investments and Level 2 investments represent investments with observable inputs or matrix-priced investments. The amounts attributed to Level 1 investments and Level 2 investments represent the following percentages of the total market value of this security type:
| | | | | | | | | | | | |
| | | Level 1 | | | Level 2 | | | Total | |
Preferred Stock | | | 23.62 | % | | | 76.38 | % | | | 100.00 | % |
During the year ended July 31, 2016, there were no transfers between Level 1 investments, Level 2 investments or Level 3 investments that had a significant impact to the Fund. The Fund’s policy is to recognize transfers between levels at the beginning of the reporting period.
A reconciliation of Level 3 investments is presented when the Fund has a significant amount of Level 3 investments at the beginning, interim, or end of period in relation to net assets. Management has determined not to provide additional disclosure on Level 3 inputs since the Level 3 investments are not considered significant to the Fund’s net assets at the end of the year.
4. Dividend and Distribution Information
Income and long-term capital gain distributions are determined in accordance with federal income tax regulations, which may differ from U.S. GAAP. Additionally, distributions from net gains on foreign currency transactions and net short-term gains on sales of investment securities are treated as ordinary
58
income for federal income tax purposes. The tax character of dividends and distributions paid during the years ended July 31, 2016 and 2015 was as follows:
| | | | | | | | | | | | |
| | | Year ended | |
| | | 7/31/16 | | | | | | 7/31/15 | |
Ordinary | | $ | 3,045,471 | | | | | | | $ | 3,347,601 | |
Return of capital | | | 128,058 | | | | | | | | 90,375 | |
| | | | | | | | | | | | |
Total | | $ | 3,173,529 | | | | | | | $ | 3,437,976 | |
| | | | | | | | | | | | |
5. Components of Net Assets on a Tax Basis
As of July 31, 2016, the components of net assets on a tax basis were as follows:
| | | | |
Shares of beneficial interest | | $ | 136,826,985 | |
Distributions payable | | | (78,530 | ) |
Troubled debt litigation | | | (228,366 | ) |
Other temporary differences | | | (6,532 | ) |
Capital loss carryforwards | | | (1,106,735 | ) |
Unrealized appreciation of investments, foreign currencies and derivatives | | | 2,481,247 | |
| | | | |
Net assets | | $ | 137,888,069 | |
| | | | |
The differences between book basis and tax basis components of net assets are primarily attributable to tax deferral of losses on wash sales, tax deferral of straddle losses, mark-to-market of futures contracts, tax treatment of market discount and premium on debt instruments, contingent payment debt instruments, and CDS contracts.
For financial reporting purposes, capital accounts are adjusted to reflect the tax character of permanent book/tax differences. Reclassifications are primarily due to tax treatment of gain (loss) on foreign currency transactions, market discount and premium on debt instruments, paydowns of asset- and mortgage-backed securities, and CDS contracts. Results of operations and net assets were not affected by these reclassifications. For the year ended July 31, 2016, the Fund recorded the following reclassifications:
| | | | |
Distributions in excess of net investment income | | $ | 670,845 | |
Accumulated net realized loss | | | (670,845 | ) |
On Dec. 22, 2010, the Regulated Investment Company Modernization Act of 2010 (Act) was enacted, which changed various technical rules governing the tax treatment of regulated investment companies. The changes were generally effective for taxable years beginning after the date of enactment. Under the Act, the Fund is permitted to carry forward capital losses incurred in taxable years beginning after the date of enactment for an unlimited period. Additionally, post-enactment capital loss carryforwards will retain their character as either short-term or long-term capital losses rather than being considered all short-term as permitted under previous regulation.
59
Notes to financial statements
Delaware Core Plus Bond Fund
5. Components of Net Assets on a Tax Basis (continued)
Losses incurred that will be carried forward under the Act are as follows:
| | | | | | |
| | | Loss carryforward character |
| | | Short-term | | | | Long-term |
| | $— | | | | $1,106,735 |
6. Capital Shares
Transactions in capital shares were as follows:
| | | | | | | | | | | | |
| | | Year ended | |
| | | 7/31/16 | | | | | | 7/31/15 | |
Shares sold: | | | | | | | | | | | | |
Class A | | | 3,171,785 | | | | | | | | 1,291,198 | |
Class B | | | — | | | | | | | | 11 | |
Class C | | | 466,751 | | | | | | | | 268,164 | |
Class R | | | 156,819 | | | | | | | | 148,788 | |
Institutional Class | | | 2,416,690 | | | | | | | | 2,452,865 | |
| | | |
Shares issued upon reinvestment of dividends and distributions: | | | | | | | | | | | | |
Class A | | | 181,533 | | | | | | | | 195,628 | |
Class B | | | — | | | | | | | | 132 | |
Class C | | | 16,964 | | | | | | | | 19,856 | |
Class R | | | 17,085 | | | | | | | | 22,471 | |
Institutional Class | | | 143,761 | | | | | | | | 139,520 | |
| | | | | | | | | | | | |
| | | 6,571,388 | | | | | | | | 4,538,633 | |
| | | | | | | | | | | | |
| | | |
Shares redeemed: | | | | | | | | | | | | |
Class A | | | (2,841,943 | ) | | | | | | | (1,564,208 | ) |
Class B | | | — | | | | | | | | (34,032 | ) |
Class C | | | (370,047 | ) | | | | | | | (299,834 | ) |
Class R | | | (195,284 | ) | | | | | | | (270,838 | ) |
Institutional Class | | | (1,959,593 | ) | | | | | | | (666,346 | ) |
| | | | | | | | | | | | |
| | | (5,366,867 | ) | | | | | | | (2,835,258 | ) |
| | | | | | | | | | | | |
Net increase | | | 1,204,521 | | | | | | | | 1,703,375 | |
| | | | | | | | | | | | |
For the year ended July 31, 2015, 10,479 Class B shares were converted to 10,481 Class A shares valued at $89,090. The amounts are included in Class B redemptions and Class A subscriptions in the table above and the “Statements of changes in net assets.”
Certain shareholders of Class A shares may exchange their shares for Institutional Class shares. For the year ended July 31, 2016, 444,706 Class A shares were exchanged to 444,814 Institutional Class shares valued at $3,772,744. The exchange transactions are included as subscriptions and redemptions in the table above and the “Statements of changes in net assets.”
60
7. Line of Credit
The Fund, along with certain other funds in the Delaware Investments® Family of Funds (Participants), was a participant in a $275,000,000 revolving line of credit intended to be used for temporary or emergency purposes as an additional source of liquidity to fund redemptions of investor shares. Under the agreement, the Participants were charged an annual commitment fee of 0.08%, which was allocated across the Participants on the basis of each Participant’s allocation of the entire facility. The Participants were permitted to borrow up to a maximum of one third of their net assets under the agreement. Each Participant was individually, and not jointly, liable for its particular advances, if any, under the line of credit. The line of credit available under the agreement expired on Nov. 9, 2015.
On Nov. 9, 2015, the Fund, along with the other Participants, entered into an amendment to the agreement for a $155,000,000 revolving line of credit. The line of credit is to be used as described above and operates in substantially the same manner as the original agreement, with the exception of the annual commitment fee. Under the amendment to the agreement, the Participants are charged an annual commitment fee of 0.10%, which is allocated across the Participants on the basis of each Participant’s allocation of the entire facility. The line of credit available under the agreement expires on Nov. 7, 2016.
The Fund had no amounts outstanding as of July 31, 2016, or at any time during the year then ended.
8. Derivatives
U.S. GAAP requires disclosures that enable investors to understand: 1) how and why an entity uses derivatives; 2) how they are accounted for; and 3) how they affect an entity’s results of operations and financial position.
Foreign Currency Exchange Contracts — The Fund may enter into foreign currency exchange contracts and foreign cross currency exchange contracts as a way of managing foreign exchange rate risk. The Fund may enter into these contracts to fix the U.S. dollar value of securities that it has agreed to buy or sell for the period between the date the trade was entered into and the date the security is delivered and paid for. The Fund may also use these contracts to hedge the U.S. dollar value of securities it already owns that are denominated in foreign currencies. In addition, the Fund may enter into these contracts to facilitate or expedite the settlement of portfolio transactions. The change in value is recorded as an unrealized gain or loss. When the contract is closed, a realized gain or loss is recorded equal to the difference between the value of the contract at the time it was opened and the value at the time it was closed.
The use of foreign currency exchange contracts and foreign cross currency exchange contracts does not eliminate fluctuations in the underlying prices of the securities, but does establish a rate of exchange that can be achieved in the future. Although foreign currency exchange contracts and foreign cross currency exchange contracts limit the risk of loss due to an unfavorable change in the value of the hedged currency, they also limit any potential gain that might result should the value of the currency change favorably. In addition, the Fund could be exposed to risks if the counterparties to the contracts are unable to meet the terms of their contracts. The Fund’s maximum risk of loss from counterparty credit risk is the value of its currency exchanged with the counterparty. The risk is generally mitigated by having a netting arrangement between the Fund and the counterparty and by the posting of collateral by the
61
Notes to financial statements
Delaware Core Plus Bond Fund
8. Derivatives (continued)
counterparty to the Fund to cover the Fund’s exposure to the counterparty. No foreign currency exchange contracts were outstanding at July 31, 2016.
During the year ended July 31, 2016, the Fund used foreign currency exchange contracts to hedge the U.S. dollar value of securities it already owned that were denominated in foreign currencies.
Futures Contracts — A futures contract is an agreement in which the writer (or seller) of the contract agrees to deliver to the buyer an amount of cash or securities equal to a specific dollar amount times the difference between the value of a specific security or index at the close of the last trading day of the contract and the price at which the agreement is made. The Fund may use futures in the normal course of pursuing its investment objective. The Fund may invest in futures contracts to hedge its existing portfolio securities against fluctuations in fair value caused by changes in interest rates or market conditions. Upon entering into a futures contract, the Fund deposits cash or pledges U.S. government securities to a broker, equal to the minimum “initial margin” requirements of the exchange on which the contract is traded. Subsequent payments are received from the broker or paid to the broker each day, based on the daily fluctuation in the market value of the contract. These receipts or payments are known as “variation margin” and are recorded daily by the Fund as unrealized gains or losses until the contracts are closed. When the contracts are closed, the Fund records a realized gain or loss equal to the difference between the value of the contract at the time it was opened and the value at the time it was closed. Risks of entering into futures contracts include potential imperfect correlation between the futures contracts and the underlying securities and the possibility of an illiquid secondary market for these instruments. When investing in futures, there is reduced counterparty credit risk to the Fund because futures are exchange-traded and the exchange’s clearinghouse, as counterparty to all exchange-traded futures, guarantees against default.
During the year ended July 31, 2016, the Fund used futures contracts to hedge the Fund’s existing portfolio securities against fluctuations in value caused by changes in interest rates or market conditions.
Options Contracts — During the year ended July 31, 2016, the Fund entered into options contracts in the normal course of pursuing its investment objective. The Fund may buy or write options contracts for any number of reasons, including without limitation: to manage the Fund’s exposure to changes in securities prices caused by interest rates or market conditions and foreign currencies; as an efficient means of adjusting the Fund’s overall exposure to certain markets; to protect the value of portfolio securities; and as a cash management tool. The Fund may buy or write call or put options on securities, futures, swaps, swaptions, financial indices, and foreign currencies. When the Fund buys an option, a premium is paid and an asset is recorded and adjusted on a daily basis to reflect the current market value of the option purchased. When the Fund writes an option, a premium is received and a liability is recorded and adjusted on a daily basis to reflect the current market value of the option written. Premiums received from writing options that expire unexercised are treated by the Fund on the expiration date as realized gains. The difference between the premium received and the amount paid on effecting a closing purchase transaction, including brokerage commissions, is treated as realized gain or loss. If a call option is exercised, the premium is added to the proceeds from the sale of the underlying security in determining whether the Fund has a realized gain or loss. If a put option is exercised, the premium reduces the cost basis of the securities purchased by the Fund. The Fund, as writer of an
62
option, bears the market risk of an unfavorable change in the price of the security underlying the written option. When writing options, the Fund is subject to minimal counterparty risk because the counterparty is only obligated to pay premiums and does not bear the market risk of an unfavorable market change.
Transactions in options written during the year ended July 31, 2016 for the Fund were as follows:
| | | | | | | | |
| | | Number of | | | | |
| Call Options | | Contracts | | | Premiums | |
Options outstanding July 31, 2015 | | | — | | | $ | — | |
Options written | | | 49 | | | | 7,656 | |
Options exercised | | | (49) | | | | (7,656 | ) |
| | | | | | | | |
Options outstanding July 31, 2016 | | | — | | | $ | — | |
| | | | | | | | |
During the year ended July 31, 2016, the Fund used options contracts to manage the Fund’s exposure to changes in securities prices caused by interest rates or market conditions.
Swap Contracts — The Fund may enter into interest rate swap contracts and CDS contracts in the normal course of pursuing its investment objective. The Fund may use interest rate swaps to manage the Fund’s sensitivity to interest rates or the hedge against changes in interest rates. The Fund may enter into CDS contracts in order to hedge against a credit event, to enhance total return or to gain exposure to certain securities or markets. The Fund will not be permitted to enter into any swap transactions unless, at the time of entering into such transactions, the unsecured long-term debt of the actual counterparty, combined with any credit enhancements, is rated at least BBB- by Standard & Poor’s Financial Services LLC (S&P) or Baa3 by Moody’s Investors Service, Inc. (Moody’s) or is determined to be of equivalent credit quality by DMC.
Interest Rate Swaps. An interest rate swap contract is an exchange of interest rates between counterparties. In one instance, an interest rate swap involves payments received by the Fund from another party based on a variable or floating interest rate, in return for making payments based on a fixed interest rate. An interest rate swap can also work in reverse with the Fund receiving payments based on a fixed interest rate and making payments based on a variable or floating interest rate. Interest rate swaps may be used to adjust the Fund’s sensitivity to interest rates or to hedge against changes in interest rates. Periodic payments on such contracts are accrued daily and recorded as unrealized appreciation (depreciation) on swap contracts. Upon periodic payments (receipt) or termination of the contract, such amounts are recorded as realized gains or losses on swap contracts. The Fund’s maximum risk of loss from counterparty credit risk is the discounted net value of the cash flows to be received from/paid to the counterparty over the interest rate swap contract’s remaining life, to the extent that the amount is positive. This risk is mitigated by (1) for bilateral swap contacts, having a netting arrangement between the Fund and the counterparty and by the posting of collateral by the counterparty to the Fund to cover the Fund’s exposure to the counterparty, and (2) for cleared swaps, trading these instruments through a central counterparty. No interest rate swap contracts were outstanding at July 31, 2016.
During the year ended July 31, 2016, the Fund used interest rate swap contracts to manage the Fund’s sensitivity to interest rates or to hedge against changes in interest rates.
63
Notes to financial statements
Delaware Core Plus Bond Fund
8. Derivatives (continued)
Credit Default Swaps. A CDS contract is a risk-transfer instrument through which one party (purchaser of protection) transfers to another party (seller of protection) the financial risk of a credit event (as defined in the CDS agreement), as it relates to a particular reference security or basket of securities (such as an index). In exchange for the protection offered by the seller of protection, the purchaser of protection agrees to pay the seller of protection a periodic amount at a stated rate that is applied to the notional amount of the CDS contract. In addition, an upfront payment may be made or received by the Fund in connection with an unwinding or assignment of a CDS contract. Upon the occurrence of a credit event, the seller of protection would pay the par (or other agreed-upon) value of the reference security (or basket of securities) to the counterparty. Credit events generally include, among others, bankruptcy, failure to pay, and obligation default.
During the year ended July 31, 2016, the Fund entered into CDS contracts as a purchaser and seller of protection, as a hedge against credit events. Periodic payments (receipts) on such contracts are accrued daily and recorded as unrealized losses (gains) on swap contracts. Upon payment (receipt), such amounts are recorded as realized losses (gains) on swap contracts. Upfront payments made or received in connection with CDS contracts are amortized over the expected life of the CDS contracts as unrealized losses (gains) on swap contracts. The change in value of CDS contracts is recorded daily as unrealized appreciation or depreciation. A realized gain or loss is recorded upon a credit event (as defined in the CDS agreement) or the maturity or termination of the agreement. Initial margin and variation margin are posted to central counterparties for centrally cleared CDS basket trades, as determined by the applicable central counterparty.
CDS contracts may involve greater risks than if the Fund had invested in the reference obligation directly. CDS contracts are subject to general market risk, liquidity risk, counterparty risk, and credit risk. The Fund’s maximum risk of loss from counterparty credit risk, either as the seller of protection or the buyer of protection, is the fair value of the contract. This risk is mitigated by (1) for bilateral swap contracts, having a netting arrangement between the Fund and the counterparty and by the posting of collateral by the counterparty to the Fund to cover the Fund’s exposure to the counterparty, or (2) for cleared swaps, trading these instruments through a central counterparty.
During the year ended July 31, 2016, the Fund used CDS contracts to hedge against credit events.
Swaps Generally. The value of open swaps may differ from that which would be realized in the event the Fund terminated its position in the contract on a given day. Risks of entering into these contracts include the potential inability of the counterparty to meet the terms of the contracts. This type of risk is generally limited to the amount of favorable movement in the value of the underlying security, instrument, or basket of instruments, if any, at the day of default. Risks also arise from potential losses from adverse market movements and such losses could exceed the unrealized amounts shown on the “Schedule of investments.”
64
Fair values of derivative instruments as of July 31, 2016 was as follows:
| | | | | | | | | | | | | | | | | | | | |
| | | | | Asset Derivatives Fair Value |
Statements of Assets and Liabilities Location | | Equity
Contracts | | Interest
Rate
Contracts | | Credit
Contracts | | Total |
| Variation margin due from broker on futures contracts* | | $— | | | $ | 344,314 | | | $— | | | $ | 344,314 | |
| | | | | | | | | | | | | | | | | | | | |
| | | |
| | | | | Liability Derivatives Fair Value | | |
Statements of Assets and Liabilities Location | | Equity
Contracts | | Interest
Rate
Contracts | | Credit
Contracts | | Total |
| Variation margin due from broker on futures contracts* | | | $ | 46,315 | | | | $ | 42,852 | | | | $ | — | | | | $ | 89,167 | |
| Unrealized depreciation on credit default swap contracts | | | | — | | | | | — | | | | | 1,321 | | | | | 1,321 | |
| | | | | | | | | | | | | | | | | | | | |
| Total | | | $ | 46,315 | | | | $ | 42,852 | | | | $ | 1,321 | | | | $ | 90,488 | |
| | | | | | | | | | | | | | | | | | | | |
*Includes cumulative appreciation (depreciation) of futures contracts from the date the contracts were opened through July 31, 2016. Only current day variation margin is reported on the Fund’s “Statement of assets and liabilities.”
The effect of derivative instruments on the “Statement of operations” for the year ended July 31, 2016 was as follows:
| | | | | | | | | | | | | | | | | | | | | | | | |
| | | Net Realized Gain (Loss) on: | |
| | | Foreign Currency Exchange Contracts | | | Futures Contracts | | | Options Purchased | | | Options
Written | | | Swap
Contracts | | | Total | |
Currency contracts | | $ | 13,470 | | | $ | — | | | $ | — | | | $ | — | | | $ | — | | | $ | 13,470 | |
Interest rate contracts | | | — | | | | 261,007 | | | | 33,391 | | | | (38,240 | ) | | | 209,956 | | | | 466,114 | |
Equity contracts | | | — | | | | (1,608 | ) | | | — | | | | — | | | | — | | | | (1,608 | ) |
Credit contracts | | | — | | | | — | | | | — | | | | — | | | | (77,099 | ) | | | (77,099 | ) |
| | | | | | | | | | | | | | | | | | | | | | | | |
Total | | $ | 13,470 | | | $ | 259,399 | | | $ | 33,391 | | | $ | (38,240 | ) | | $ | 132,857 | | | $ | 400,877 | |
| | | | | | | | | | | | | | | | | | | | | | | | |
| | | | | | | | | | | | | | | | |
| | | Net Change in Unrealized Appreciation (Depreciation) of: | |
| | | Foreign
Currency
Exchange
Contracts | | | Futures
Contracts | | | Swap
Contracts | | | Total | |
Currency contracts | | $ | (574 | ) | | $ | — | | | $ | — | | | $ | (574 | ) |
Interest rate contracts | | | — | | | | 137,496 | | | | — | | | | 137,496 | |
Equity contracts | | | — | | | | (42,326 | ) | | | — | | | | (42,326 | ) |
Credit contracts | | | — | | | | — | | | | 2,309 | | | | 2,309 | |
| | | | | | | | | | | | | | | | |
Total | | $ | (574 | ) | | $ | 95,170 | | | $ | 2,309 | | | $ | 96,905 | |
| | | | | | | | | | | | | | | | |
65
Notes to financial statements
Delaware Core Plus Bond Fund
8. Derivatives (continued)
Derivatives Generally. The table below summarizes the average balance of derivative holdings by the Fund during the year ended July 31, 2016:
| | | | | | | | | | | | | | | | |
| | | | | | Long Derivative Volume | | | | | | Short Derivative Volume | |
Foreign currency exchange contracts (average cost) | | | USD | | | | 72,747 | | | | USD | | | | 20,009 | |
Futures contracts (average notional value) | | | | | | | 8,772,158 | | | | | | | | 2,240,298 | |
Options contracts (average notional value) | | | | | | | 3,621 | | | | | | | | 73 | |
CDS contracts (average notional value)* | | | EUR | | | | 355,020 | | | | | | | | — | |
CDS contracts (average notional value)* | | | USD | | | | 1,510,676 | | | | | | | | 222,869 | |
Interest rate swap contracts (average notional value)** | | | | | | | 1,015,777 | | | | | | | | — | |
*Long represents buying protection and short represents selling protection.
**Long represents receiving fixed interest payments and short represents paying fixed interest payments.
9. Offsetting
In December 2011, the Financial Accounting Standards Board (FASB) issued guidance that expanded disclosure requirements on the offsetting of certain assets and liabilities. The disclosures are required for investments and derivative financial instruments subject to master netting or similar agreements which are eligible for offset on the “Statement of assets and liabilities” and require an entity to disclose both gross and net information about such investments and transactions in the financial statements. In January 2013, the FASB issued guidance that clarified which investments and transactions are subject to the offsetting disclosure requirements. The scope of the disclosure requirements for offsetting is limited to derivative instruments, repurchase agreements and reverse repurchase agreements, and securities borrowing.
In order to better define its contractual rights and to secure rights that will help the Fund mitigate its counterparty risk, the Fund entered into an International Swaps and Derivatives Association, Inc. Master Agreement (ISDA Master Agreement) or a similar agreement with certain of its derivative contract counterparties. An ISDA Master Agreement is a bilateral agreement between the Fund and a counterparty that governs over-the-counter (OTC) derivatives and foreign exchange contracts and typically contains, among other things, collateral posting items and netting provisions in the event of a default and/or termination event. Under an ISDA Master Agreement, the Fund may, under certain circumstances, offset with the counterparty certain derivative financial instruments’ payables and/or receivables with collateral held and/or posted and create one single net payment. The provisions of the ISDA Master Agreement typically permit a single net payment in the event of default (close-out), including the bankruptcy or insolvency of the counterparty. However, bankruptcy or insolvency laws of a particular jurisdiction may impose restrictions on or prohibitions against the right of offset in bankruptcy, insolvency or other events.
For financial reporting purposes, the Fund does not offset derivative assets and derivative liabilities that are subject to netting arrangements on the “Statement of assets and liabilities.”
66
At July 31, 2016, the Fund had the following assets and liabilities subject to offsetting provisions:
Offsetting of Financial Assets and Liabilities and Derivative Assets and Liabilities
| | | | | | | | | | |
| Counterparty | | | | | | Gross Value of
Derivative Asset | | Gross Value of
Derivative Liability | | Net Position |
Morgan Stanley Capital | | | | | | $— | | $(1,321) | | $(1,321) |
| | | | | | | | | | | | |
| | | | | Gross Amounts Not Offset in the Statement of Assets and Liabilities | | |
Counterparty | | Net Position | | Fair Value of Non-Cash Collateral Received | | Cash Collateral
Received | | Fair Value of Non-Cash Collateral Pledged | | Cash Collateral Pledged | | Net Exposure(a) |
Morgan Stanley Capital | | $(1,321) | | $— | | $— | | $— | | $— | | $(1,321) |
Master Repurchase Agreements
| | | | | | | | | | | | | | | | | | | | | | | | | | | |
| Counterparty | | | | Repurchase
Agreements | | Fair Value of Non-Cash Collateral Received | | Cash Collateral Received | | Net Collateral Received | | Net
Exposure(a) |
Bank of America Merrill Lynch | | | $ | 2,308,622 | | | | $ | (2,308,622 | ) | | | $ | — | | | | $ | (2,308,622 | ) | | | $ | — | |
Bank of Montreal | | | | 3,847,703 | | | | | (3,847,703 | ) | | | | — | | | | | (3,847,703 | ) | | | | — | |
BNP Paribas | | | | 1,981,675 | | | | | (1,981,675 | ) | | | | — | | | | | (1,981,675 | ) | | | | — | |
| | | | | | | | | | | | | | | | | | | | | | | | | |
Total | | | $ | 8,138,000 | | | | $ | (8,138,000 | ) | | | $ | — | | | | $ | (8,138,000 | ) | | | $ | — | |
| | | | | | | | | | | | | | | | | | | | | | | | | | | |
(a)Net exposure represents the receivable (payable) that would be due from (to) the counterparty in the event of default.
10. Securities Lending
The Fund, along with other funds in the Delaware Investments® Family of Funds, may lend its securities pursuant to a security lending agreement (Lending Agreement) with The Bank of New York Mellon (BNY Mellon). At the time a security is loaned, the borrower must post collateral equal to the required percentage of the market value of the loaned security, including any accrued interest. The required percentage is: (1) 102% with respect to U.S. securities and foreign securities that are denominated and payable in U.S. dollars; and (2) 105% with respect to foreign securities. With respect to each loan, if on any business day the aggregate market value of securities collateral plus cash collateral held is less than the aggregate market value of the securities that are the subject of such loan, the borrower will be notified to provide additional collateral by the end of the following business day, which, together with the collateral already held, will be not less than the applicable initial collateral requirements for such security loan. If the aggregate market value of securities collateral and cash collateral held with respect to a security loan exceeds the applicable initial collateral requirement, upon the request of the borrower, BNY Mellon must return enough collateral to the borrower by the end of the following business day to reduce the value of the remaining collateral to the applicable initial collateral requirement for such security loan. As a result of the foregoing, the value of the collateral held with respect to a loaned security on any particular day may be more or less than the value of the security on loan.
Prior to Dec. 29, 2015, cash collateral received was generally invested in the Delaware Investments Collateral Fund No. 1 (Collective Trust), a pooled account established by BNY Mellon for the use of funds
67
Notes to financial statements
Delaware Core Plus Bond Fund
10. Securities Lending (continued)
managed by DMC that participate in BNY Mellon’s securities lending program. The Collective Trust sought to maintain a NAV per unit of $1.00.
On Dec. 29, 2015, the assets in the Collective Trust were transferred to a series of individual separate accounts, each corresponding to a Fund. The investment guidelines permit each separate account to hold certain securities that would be considered eligible securities for a money market fund. Cash collateral received is generally invested in government securities; certain obligations issued by government sponsored enterprises; repurchase agreements collateralized by U.S. Treasury securities; obligations issued by the central government of any Organization for Economic Cooperation and Development (OECD) country or its agencies, instrumentalities, or establishments; obligations of supranational organizations; commercial paper, notes, bonds, and other debt obligations; certificates of deposit, time deposits, and other bank obligations; and asset-backed securities.
In the event of default or bankruptcy by the lending agent, realization and/or retention of the collateral may be subject to legal proceedings. In the event the borrower fails to return loaned securities and the collateral received is insufficient to cover the value of the loaned securities and provided such collateral shortfall is not the result of investment losses, the lending agent has agreed to pay the amount of the shortfall to the Fund or, at the discretion of the lending agent, replace the loaned securities. The Fund continues to record dividends or interest, as applicable, on the securities loaned and is subject to changes in value of the securities loaned that may occur during the term of the loan. The Fund has the right under the Lending Agreement to recover the securities from the borrower on demand. With respect to security loans collateralized by non-cash collateral, the Fund receives loan premiums paid by the borrower. With respect to security loans collateralized by cash collateral, the earnings from the collateral investments are shared among the Fund, the security lending agent, and the borrower. The Fund records security lending income net of allocations to the security lending agent and the borrower.
The Fund may incur investment losses as a result of investing securities lending collateral. This could occur if an investment in the collateral investment account defaulted or became impaired. Under those circumstances, the value of a Fund’s cash collateral account may be less than the amount the Fund would be required to return to the borrowers of the securities and the Fund would be required to make up for this shortfall.
During the year ended July 31, 2016, the Fund had no securities out on loan.
11. Credit and Market Risk
The Fund invests a portion of its assets in high yield fixed income securities, which are securities rated lower than BBB- by S&P and lower than Baa3 by Moody’s, or similarly rated by another nationally recognized statistical rating organization. Investments in these higher yielding securities are generally accompanied by a greater degree of credit risk than higher rated securities. Additionally, lower rated securities may be more susceptible to adverse economic and competitive industry conditions than investment grade securities.
The Fund invests in fixed income securities whose value is derived from an underlying pool of mortgages or consumer loans. The value of these securities is sensitive to changes in economic conditions,
68
including delinquencies and/or defaults, and may be adversely affected by shifts in the market’s perception of the issuers and changes in interest rates. Investors receive principal and interest payments as the underlying mortgages and consumer loans are paid back. Some of these securities are collateralized mortgage obligations (CMOs). CMOs are debt securities issued by U.S. government agencies or by financial institutions and other mortgage lenders, which are collateralized by a pool of mortgages held under an indenture. Prepayment of mortgages may shorten the stated maturity of the obligations and can result in a loss of premium, if any has been paid. Certain of these securities may be stripped (securities which provide only the principal or interest feature of the underlying security). The yield to maturity on an interest-only CMO is extremely sensitive not only to changes in prevailing interest rates, but also to the rate of principal payments (including prepayments) on the related underlying mortgage assets. A rapid rate of principal payments may have a material adverse effect on the Fund’s yield to maturity. If the underlying mortgage assets experience greater-than-anticipated prepayments of principal, the Fund may fail to fully recoup its initial investment in these securities even if the securities are rated in the highest rating categories.
The Fund invests in bank loans and other securities that may subject it to direct indebtedness risk, the risk that the Fund will not receive payment of principal, interest, and other amounts due in connection with these investments and will depend primarily on the financial condition of the borrower. Loans that are fully secured offer the Fund more protection than unsecured loans in the event of nonpayment of scheduled interest or principal, although there is no assurance that the liquidation of collateral from a secured loan would satisfy the corporate borrower’s obligation, or that the collateral can be liquidated. Some loans or claims may be in default at the time of purchase. Certain of the loans and the other direct indebtedness acquired by the Fund may involve revolving credit facilities or other standby financing commitments that obligate the Fund to pay additional cash on a certain date or on demand. These commitments may require the Fund to increase its investment in a company at a time when the Fund might not otherwise decide to do so (including at a time when the company’s financial condition makes it unlikely that such amounts will be repaid). To the extent that the Fund is committed to advance additional funds, it will at all times hold and maintain cash or other high grade debt obligations in an amount sufficient to meet such commitments.
As the Fund may be required to rely upon another lending institution to collect and pass on to the Fund amounts payable with respect to the loan and to enforce the Fund’s rights under the loan and other direct indebtedness, an insolvency, bankruptcy, or reorganization of the lending institution may delay or prevent the Fund from receiving such amounts. The highly leveraged nature of many loans may make them especially vulnerable to adverse changes in economic or market conditions. Investments in such loans and other direct indebtedness may involve additional risk to the Fund.
The Fund invests in certain obligations that may have liquidity protection designed to ensure that the receipt of payments due on the underlying security is timely. Such protection may be provided through guarantees, insurance policies, or letters of credit obtained by the issuer or sponsor through third parties, through various means of structuring the transaction or through a combination of such approaches. The Fund will not pay any additional fees for such credit support, although the existence of credit support may increase the price of the security.
69
Notes to financial statements
Delaware Core Plus Bond Fund
11. Credit and Market Risk (continued)
The Fund may invest up to 15% of its net assets in illiquid securities, which may include securities with contractual restrictions on resale, securities exempt from registration under Rule 144A promulgated under the Securities Act of 1933, as amended, and other securities which may not be readily marketable. The relative illiquidity of these securities may impair the Fund from disposing of them in a timely manner and at a fair price when it is necessary or desirable to do so. While maintaining oversight, the Board has delegated to DMC, the day-to-day functions of determining whether individual securities are liquid for purposes of the Fund’s limitation on investments in illiquid securities. Securities eligible for resale pursuant to Rule 144A, which are determined to be liquid, are not subject to the Fund’s 15% limit on investments in illiquid securities. Rule 144A and illiquid securities have been identified on the “Schedule of investments.” When monitoring compliance with the Fund’s illiquid limit, certain holdings that are common to multiple clients of the investment manager may be aggregated and considered illiquid in the aggregate solely for monitoring purposes. For purposes of determining illiquidity for financial reporting purposes, only the holdings of this Fund will be considered.
12. Contractual Obligations
The Fund enters into contracts in the normal course of business that contain a variety of indemnifications. The Fund’s maximum exposure under these arrangements is unknown. However, the Fund has not had prior claims or losses pursuant to these contracts. Management has reviewed the Fund’s existing contracts and expects the risk of loss to be remote.
13. General Motors Term Loan Litigation
The Fund received notice of a litigation proceeding related to a General Motors Corporation (G.M.) term loan participation previously held by the Fund in 2009. We believe the matter subject to the litigation notice will likely lead to a recovery from the Fund of certain amounts received by the Fund because a U.S. Court of Appeals has ruled that the Fund and similarly situated investors were unsecured creditors rather than secured lenders of G.M. as a result of an erroneous Uniform Commercial Code filing made by a third party. The Fund received the full principal on the loans in 2009 after the G.M. bankruptcy. However, based upon the court ruling the estate is seeking to recover such amounts arguing that, as unsecured creditors, the Fund should not have received payment in full. Based upon currently available information related to the litigation and the Fund’s potential exposure, the Fund recorded a liability of $326,237 and an asset of $97,871 based on the expected recoveries to unsecured creditors as of July 31, 2016 that resulted in a net decrease in the Fund’s NAV to reflect this likely recovery.
14. Subsequent Events
Management has determined that no material events or transactions occurred subsequent to July 31, 2016 that would require recognition or disclosure in the Fund’s financial statements.
70
Report of independent
registered public accounting firm
To the Board of Trustees of Delaware Group® Government Fund
and the Shareholders of Delaware Core Plus Bond Fund:
In our opinion, the accompanying statement of assets and liabilities, including the schedule of investments, and the related statements of operations and of changes in net assets and the financial highlights present fairly, in all material respects, the financial position of Delaware Core Plus Bond Fund (one of the series constituting Delaware Group® Government Fund, hereinafter referred to as the “Fund”) at July 31, 2016, the results of its operations for the year then ended, the changes in its net assets for each of the two years in the period then ended and the financial highlights for each of the five years in the period then ended, in conformity with accounting principles generally accepted in the United States of America. These financial statements and financial highlights (hereafter referred to as “financial statements”) are the responsibility of the Fund’s management. Our responsibility is to express an opinion on these financial statements based on our audits. We conducted our audits of these financial statements in accordance with the standards of the Public Company Accounting Oversight Board (United States). Those standards require that we plan and perform the audit to obtain reasonable assurance about whether the financial statements are free of material misstatement. An audit includes examining, on a test basis, evidence supporting the amounts and disclosures in the financial statements, assessing the accounting principles used and significant estimates made by management, and evaluating the overall financial statement presentation. We believe that our audits, which included confirmation of securities at July 31, 2016 by correspondence with the custodian and brokers and the application of alternative auditing procedures where confirmations of securities purchased had not been received, provide a reasonable basis for our opinion.
PricewaterhouseCoopers LLP
Philadelphia, Pennsylvania
September 19, 2016
71
Other Fund information (Unaudited)
Delaware Core Plus Bond Fund
Tax Information
The information set forth below is for the Fund’s fiscal year as required by federal income tax laws. Shareholders, however, must report distributions on a calendar year basis for income tax purposes, which may include distributions for portions of two fiscal years of the Fund. Accordingly, the information needed by shareholders for income tax purposes will be sent to them in January of each year. Please consult your tax advisor for proper treatment of this information.
All disclosures are based on financial information available as of the date of this annual report and, accordingly are subject to change. For any and all items requiring reporting, it is the intention of the Fund to report the maximum amount permitted under the Internal Revenue Code and the regulations thereunder.
For the fiscal year ended July 31, 2016, the Fund reports distributions paid during the year as follows:
| | | | |
(A) Ordinary Income Distributions (Tax Basis)* | | | 95.96 | % |
(B) Return of Capital (Tax Basis) | | | 4.04 | % |
Total Distributions (Tax Basis) | | | 100.00 | % |
(C) Qualifying Dividends1 | | | 0.64 | % |
(A) and (B) are based on a percentage of the Fund’s total distributions.
(C) is based on a percentage of the Fund’s ordinary income distributions.
1Qualifying dividends represent dividends which qualify for the corporate dividends received deduction.
*For the fiscal year ended July 31, 2016, certain dividends paid by the Fund may be subject to a maximum tax rate of 20%. The percentage of dividends paid by the Fund from ordinary income reported as qualified income is 0.85%. Complete information will be computed and reported in conjunction with your 2016 Form 1099-DIV.
72
This page intentionally left blank.
Board of trustees / directors and officers addendum
Delaware Investments® Family of Funds
A mutual fund is governed by a Board of Trustees/Directors (“Trustees”), which has oversight responsibility for the management of a fund’s business affairs. Trustees establish procedures and oversee and review the performance of the investment manager, the distributor, and others who perform services for the fund. The independent fund trustees, in particular, are advocates
| | | | |
Name, Address, and Birth Date | | Position(s) Held with Fund(s) | | Length of Time Served |
Interested Trustee | | |
Shawn K. Lytle1, 3 | | President, | | Trustee since |
2005 Market Street | | Chief Executive Officer, | | September 2015 |
Philadelphia, PA 19103 | | and Trustee | | |
February 1970 | | | | President and |
| | | | Chief Executive Officer |
| | | | since August 2015 |
| | | | |
| | | | |
Independent Trustees | | |
Thomas L. Bennett | | Chairman and Trustee | | Trustee since |
2005 Market Street | | | | March 2005 |
Philadelphia, PA 19103 | | | | |
October 1947 | | | | Chairman since |
| | | | March 2015 |
| | | | | |
Ann D. Borowiec | | Trustee | | Since March 2015 |
2005 Market Street | | | | |
Philadelphia, PA 19103 | | | | |
November 1958 | | | | |
| | | | |
| | | | |
| | | | |
| | | | | |
Joseph W. Chow | | Trustee | | Since January 2013 |
2005 Market Street | | | | |
Philadelphia, PA 19103 | | | | |
January 1953 | | | | |
| | | | |
| | | | |
| | | | | |
| 1 | Shawn K. Lytle is considered to be an “Interested Trustee” because he is an executive officer of the Fund’s(s’) investment advisor. |
74
for shareholder interests. Each trustee has served in that capacity since he or she was elected to or appointed to the Board of Trustees, and will continue to serve until his or her retirement or the election of a new trustee in his or her place. The following is a list of the Trustees and Officers with certain background and related information.
| | | | |
Principal Occupation(s) During the Past Five Years | | Number of Portfolios in Fund Complex Overseen by Trustee or Officer | | Other Directorships Held by Trustee or Officer |
| | | | |
Shawn K. Lytle has served as | | 62 | | Trustee — UBS |
President of | | | | Relationship Funds, |
Delaware Investments2 | | | | SMA Relationship |
since June 2015 and was the | | | | Trust, and UBS Funds |
Regional Head of Americas for | | | | (May 2010–April 2015) |
UBS Global Asset | | | | |
Management from | | | | |
2010 through 2015. | | | | |
| | | | |
Private Investor | | 62 | | Director — |
(March 2004–Present) | | | | Bryn Mawr Bank Corp. (BMTC) |
| | | | (2007–2011) |
| | | | |
| | | | | |
Chief Executive Officer | | 62 | | None |
Private Wealth Management | | | | |
(2011–2013) and | | | | |
Market Manager, | | | | |
New Jersey Private | | | | |
Bank (2005–2011) — | | | | |
J.P. Morgan Chase & Co. | | | | |
| | | | | |
Executive Vice President | | 62 | | Director and Audit Committee |
(Emerging Economies | | | | Member — Hercules |
Strategies, Risks, and | | | | Technology Growth |
Corporate Administration) | | | | Capital, Inc. |
State Street Corporation | | | | (2004–2014) |
(July 2004–March 2011) | | | | |
| | | | | |
| 2 | Delaware Investments is the marketing name for Delaware Management Holdings, Inc. and its subsidiaries, including the Fund’s(s’) investment advisor, principal underwriter, and its transfer agent. |
75
Board of trustees / directors and officers addendum
Delaware Investments® Family of Funds
| | | | |
Name, Address, and Birth Date | | Position(s) Held with Fund(s) | | Length of Time Served |
Independent Trustees (continued) | | |
John A. Fry | | Trustee | | Since January 2001 |
2005 Market Street | | | | |
Philadelphia, PA 19103 | | | | |
May 1960 | | | | |
| | | | |
| | | | |
| | | | | |
Lucinda S. Landreth | | Trustee | | Since March 2005 |
2005 Market Street | | | | |
Philadelphia, PA 19103 | | | | |
June 1947 | | | | |
| | | | | |
Frances A. Sevilla-Sacasa | | Trustee | | Since September 2011 |
2005 Market Street | | | | |
Philadelphia, PA 19103 | | | | |
January 1956 | | | | |
| | | | |
| | | | |
| | | | |
| | | | |
| | | | |
| | | | |
| | |
| | | | | |
76
| | | | |
Principal Occupation(s) During the Past Five Years | | Number of Portfolios in Fund Complex Overseen by Trustee or Officer | | Other Directorships Held by Trustee or Officer |
| | |
| | | | |
President — | | 62 | | Director, Audit Committee, |
Drexel University | | | | and Governance Committee |
(August 2010–Present) | | | | Member — Community |
| | | | Health Systems |
President — | | | | |
Franklin & Marshall College | | | | Director — Drexel |
(July 2002–July 2010) | | | | Morgan & Co. |
| | | | | |
Private Investor | | 62 | | None |
(2004–Present) | | | | |
| | | | |
| | | | | |
Chief Executive Officer — | | 62 | | Trust Manager and |
Banco Itaú | | | | Audit Committee |
International | | | | Member — Camden |
(April 2012–Present) | | | | Property Trust |
| | |
Executive Advisor to Dean | | | | |
(August 2011–March 2012) and Interim Dean | | | | |
(January 2011–July 2011) — | | | | |
University of Miami School of | | | | |
Business Administration | | | | |
| | |
President — U.S. Trust, | | | | |
Bank of America Private | | | | |
Wealth Management | | | | |
(Private Banking) | | | | |
(July 2007–December 2008) | | | | |
| | | | | |
77
Board of trustees / directors and officers addendum
Delaware Investments® Family of Funds
| | | | |
Name, Address, and Birth Date | | Position(s) Held with Fund(s) | | Length of Time Served |
Independent Trustees (continued) |
Thomas K. Whitford | | Trustee | | Since January 2013 |
2005 Market Street | | | | |
Philadelphia, PA 19103 | | | | |
March 1956 | | | | |
| | |
| | | | |
| | |
| | | | |
| | | | | |
Janet L. Yeomans | | Trustee | | Since April 1999 |
2005 Market Street | | | | |
Philadelphia, PA 19103 | | | | |
July 1948 | | | | |
| | | | |
| | |
| | | | |
| | | | | |
78
| | | | |
Principal Occupation(s) During the Past Five Years | | Number of Portfolios in Fund Complex Overseen by Trustee or Officer | | Other Directorships Held by Trustee or Officer |
| | | | |
Vice Chairman | | 62 | | Director — HSBC Finance |
(2010–April 2013), | | | | Corporation and HSBC |
Chief Administrative | | | | North America Holdings Inc. |
Officer (2008–2010), and Executive Vice | | | | Director — |
President and Chief | | | | HSBC Bank |
Administrative Officer | | | | |
(2007–2009) — | | | | |
PNC Financial | | | | |
Services Group | | | | |
| | | | | |
Vice President and Treasurer | | 62 | | Director, Audit and |
(January 2006–July 2012) | | | | Compliance Committee Chair, |
Vice President — | | | | Investment Committee |
Mergers & Acquisitions | | | | Member, and Governance |
(January 2003–January 2006), | | | | Committee Member — |
and Vice President | | | | Okabena Company |
and Treasurer | | | | |
(July 1995–January 2003) | | | | |
3M Company | | | | |
| | | | | |
79
Board of trustees / directors and officers addendum
Delaware Investments® Family of Funds
| | | | |
Name, Address, and Birth Date | | Position(s) Held with Fund(s) | | Length of Time Served |
Officers | | | | |
David F. Connor | | Senior Vice President, | | Senior Vice President |
2005 Market Street | | General Counsel, | | since May 2013; |
Philadelphia, PA 19103 | | and Secretary | | General Counsel |
December 1963 | | | | since May 2015; |
| | | | Secretary since |
| | | | October 2005 |
| | |
| | | | |
| | | | | |
Daniel V. Geatens | | Vice President | | Treasurer since October 2007 |
2005 Market Street | | and Treasurer | | |
Philadelphia, PA 19103 | | | | |
October 1972 | | | | |
| | | | |
| | |
| | | | |
| | | | | |
Richard Salus | | Senior Vice President | | Chief Financial Officer |
2005 Market Street | | and Chief Financial Officer | | since November 2006 |
Philadelphia, PA 19103 | | | | |
October 1963 | | | | |
| | | | | |
The Statement of Additional Information for the Fund(s) includes additional information about the Trustees and Officers and is available, without charge, upon request by calling 800 523-1918.
80
| | | | |
Principal Occupation(s) During the Past Five Years | | Number of Portfolios in Fund Complex Overseen by Trustee or Officer | | Other Directorships Held by Trustee or Officer |
| | | | |
David F. Connor has served as | | 62 | | None3 |
Senior Vice President of the Fund(s) and the investment advisor since 2013, General Counsel of the Fund(s) and the investment advisor since 2015, and Secretary of the Fund(s) and the investment advisor since 2005. | | | | |
| | | | | |
Daniel V. Geatens has served | | 62 | | None3 |
as Vice President and | | | | |
Treasurer of the Fund(s) since 2007 and Vice President and Director of Financial | | | | |
Administration of the investment advisor since 2010. | | | | |
| | | | | |
Richard Salus has served as | | 62 | | None3 |
Senior Vice President and Chief Financial Officer of the Fund(s) and the investment advisor since 2006. | | | | |
| | | | | |
| 3 | Shawn K. Lytle, David F. Connor, Daniel V. Geatens, and Richard Salus serve in similar capacities for the six portfolios of the Optimum Fund Trust, which have the same investment advisor, principal underwriter, and transfer agent as the registrant. |
81
About the organization
Board of trustees
Shawn K. Lytle
President and
Chief Executive Officer
Delaware Investments®
Family of Funds
Philadelphia, PA
Thomas L. Bennett
Chairman of the Board
Delaware Investments
Family of Funds
Private Investor
Rosemont, PA
Ann D. Borowiec
Former Chief Executive
Officer
Private Wealth Management
J.P. Morgan Chase & Co.
New York, NY
Joseph W. Chow
Former Executive Vice
President
State Street Corporation
Boston, MA
John A. Fry
President
Drexel University
Philadelphia, PA
Lucinda S. Landreth
Former Chief Investment
Officer
Assurant, Inc.
New York, NY
Frances A.
Sevilla-Sacasa
Chief Executive Officer
Banco Itaú
International
Miami, FL
Thomas K. Whitford
Former Vice Chairman
PNC Financial Services Group
Pittsburgh, PA
Janet L. Yeomans
Former Vice President and
Treasurer
3M Company
St. Paul, MN
Affiliated officers
David F. Connor
Senior Vice President,
General Counsel,
and Secretary
Delaware Investments
Family of Funds
Philadelphia, PA
Daniel V. Geatens
Vice President and
Treasurer
Delaware Investments
Family of Funds
Philadelphia, PA
Richard Salus
Senior Vice President and
Chief Financial Officer
Delaware Investments
Family of Funds
Philadelphia, PA
This annual report is for the information of Delaware Core Plus Bond Fund shareholders, but it may be used with prospective investors when preceded or accompanied by the Delaware Investments Fund fact sheet for the most recently completed calendar quarter. These documents are available at delawareinvestments.com/literature.
Delaware Investments is the marketing name of Delaware Management Holdings, Inc. and its subsidiaries.
The Fund files its complete schedule of portfolio holdings with the Securities and Exchange Commission (SEC) for the first and third quarters of each fiscal year on Form N-Q. The Fund’s Forms N-Q, as well as a description of the policies and procedures that the Fund uses to determine how to vote proxies (if any) relating to portfolio securities are available without charge (i) upon request, by calling 800 523-1918; and (ii) on the SEC’s website at sec.gov. In addition, a description of the policies and procedures that the Fund uses to determine how to vote proxies (if any) relating to portfolio securities and the Schedule of Investments included in the Fund’s most recent Form N-Q are available without charge on the Fund’s website at delawareinvestments.com/literature. The Fund’s Forms N-Q may be reviewed and copied at the SEC’s Public Reference Room in Washington, D.C.; information on the operation of the Public Reference Room may be obtained by calling 800 SEC-0330.
Information (if any) regarding how the Fund voted proxies relating to portfolio securities during the most recently disclosed 12-month period ended June 30 is available without charge (i) through the Fund’s website at delawareinvestments.com/proxy; and (ii) on the SEC’s website at sec.gov.
82
Annual report
Fixed income mutual fund
Delaware Emerging Markets Debt Fund
July 31, 2016
Carefully consider the Fund’s investment objectives, risk factors, charges, and expenses before investing. This and other information can be found in the Fund’s prospectus and, if available, its summary prospectus, which may be obtained by visiting delawareinvestments.com/literature or calling 800 523-1918. Investors should read the prospectus and, if available, the summary prospectus carefully before investing.
You can obtain shareholder reports and prospectuses online instead of in the mail.
Visit delawareinvestments.com/edelivery.
Experience Delaware Investments
Delaware Investments is committed to the pursuit of consistently superior asset management and unparalleled client service. We believe in our investment processes, which seek to deliver consistent results, and in convenient services that help add value for our clients.
If you are interested in learning more about creating an investment plan, contact your financial advisor.
You can learn more about Delaware Investments or obtain a prospectus for Delaware Emerging Markets Debt Fund at delawareinvestments.com/literature.
Manage your investments online
| ● | | 24-hour access to your account information |
| ● | | Check your account balance and recent transactions |
| ● | | Request statements or literature |
| ● | | Make purchases and redemptions |
Delaware Management Holdings, Inc. and its subsidiaries (collectively known by the marketing name of Delaware Investments) are wholly owned subsidiaries of Macquarie Group Limited, a global provider of banking, financial, advisory, investment and funds management services.
Neither Delaware Investments nor its affiliates referred to in this document are authorized deposit-taking institutions for the purpose of the Banking Act 1959 (Commonwealth of Australia). The obligations of these entities do not represent deposits or other liabilities of Macquarie Bank Limited (MBL), a subsidiary of Macquarie Group Limited and an affiliate of Delaware Investments. MBL does not guarantee or otherwise provide assurance in respect of the obligations of these entities, unless noted otherwise. The Fund is governed by U.S. laws and regulations.
Table of contents
Unless otherwise noted, views expressed herein are current as of July 31, 2016, and subject to change for events occurring after such date.
The Fund is not FDIC insured and is not guaranteed. It is possible to lose the principal amount invested.
Mutual fund advisory services provided by Delaware Management Company, a series of Delaware Management Business Trust, which is a registered investment advisor. Delaware Investments, a member of Macquarie Group, refers to Delaware Management Holdings, Inc. and its subsidiaries, including the Fund’s distributor, Delaware Distributors, L.P. Macquarie Group refers to Macquarie Group Limited and its subsidiaries and affiliates worldwide.
© 2016 Delaware Management Holdings, Inc.
All third-party marks cited are the property of their respective owners.
| | | | |
| Portfolio management review | | | | |
| Delaware Emerging Markets Debt Fund | | | August 9, 2016 | |
| | | | | | | | |
| Performance preview (for the 1-year period ended July 31, 2016) | | | | | | |
| |
Delaware Emerging Markets Debt Fund (Institutional Class shares) | | | 1-year return | | | | +7.49% | |
| |
Delaware Emerging Markets Debt Fund (Class A shares) | | | 1-year return | | | | +7.62% | |
| |
J.P. Morgan Corporate Emerging Markets Bond Index (CEMBI) Broad Diversified (benchmark) | | | 1-year return | | | | +7.01% | |
| |
Past performance does not guarantee future results.
For complete, annualized performance for Delaware Emerging Markets Debt Fund, please see the table on page 4. Institutional Class shares are available without sales or asset-based distribution charges only to certain eligible accounts. The performance of Class A shares excludes the applicable sales charge and reflects the reinvestment of all distributions. Please see page 7 for a description of the index.
Index performance returns do not reflect any management fees, transaction costs, or expenses. Indices are unmanaged and one cannot invest directly in an index.
The overarching theme for the fiscal year ended July 31, 2016, was shifting global monetary policies. The period began with China’s 1.9% devaluation of its currency, the renminbi, which seemed to surprise many. In theory, the shift was explained as a policy liberalization necessary for the Chinese currency’s inclusion with the euro, Japanese yen, British pound, and U.S. dollar in the International Monetary Fund’s basket of supplementary international reserve currencies. In practice, China’s export sector sorely needed the devaluation, and the move subsequently increased global deflationary pressures.
The U.S. dollar displayed significant strength relative to global and emerging market currencies in the first half of the fiscal year. The U.S. Federal Reserve began to tighten its monetary policy in December 2015, raising fears that higher global interest rates would emerge. However, headed into 2016, concerns around the financial health of China, European debt, and Britain’s vote to exit the European Union (Brexit) prompted Fed Chairwoman Janet Yellen to downshift and take a more gradual approach toward increasing U.S. interest rates.
Amid weakening demand and relative U.S. dollar strength, oil and commodity prices — which had stabilized in early 2015 — resumed their slide, particularly during the first half of the Fund’s fiscal
year. As the price per barrel of West Texas Intermediate (WTI) crude oil fell 44%, emerging market securities suffered a steep selloff. (WTI is a grade of crude oil used as a benchmark in oil pricing.)
As the year progressed, the European Central Bank, Bank of Japan, and Bank of England all expanded quantitative easing within their regions. The central banks’ introduction of broad asset-purchase programs, coupled with an unprecedented move toward negative interest rate policies, seemed to help calm international asset markets. Weakened developed market currencies and suppressed volatility improved the backdrop for commodities in the second half of the Fund’s fiscal year, which drove strong demand for emerging market yields.
In Latin America, many countries struggled with commodity weakness in the first half of the fiscal year. Economic stagnation increased political dissatisfaction, ultimately prompting a rejection of rampant corruption and ineffective populism in several bellwether countries. For example, the Brazilian economy suffered on the heels of a widespread corruption scandal involving semipublic multinational energy corporation Petrobras, the nation’s largest nonsovereign debt issuer. The scandal ultimately led to the impeachment proceedings of President Dilma
1
Portfolio management review
Delaware Emerging Markets Debt Fund
Rousseff, who was replaced with the ostensibly market-friendly Michel Temer. In Argentina, a 2015 general election led to the rejection of former president Cristina Fernandez de Kirchner’s brand of populism. She was replaced with Mauricio Macri, who was viewed as a business-friendly alternative.
In Asia, China dominated the news, yet the Chinese government managed to muddle through the country’s slowing growth with a combination of fiscal stimulus and better general global financing conditions. These moves led to relative optimism regarding the nation’s regional trading partners. Indonesia and India proved resilient as their domestic reform agendas slowly progressed and their diversified economies seemed to successfully weather commodity volatility.
The Central and Eastern Europe, Middle East, and Africa (CEEMEA) region was generally resilient. Eastern Europe shrugged off concerns surrounding the Brexit vote, and Russia benefited from strong local dollar liquidity. In contrast, Middle Eastern economies were forced to confront growing budget deficits with increased borrowing.
Fund performance
For the fiscal year ended July 31, 2016, Delaware Emerging Markets Debt Fund outperformed its benchmark, the J.P. Morgan Corporate Emerging Markets Bond Index (CEMBI) Broad Diversified. The Fund’s Institutional Class shares returned +7.49%. The Fund’s Class A shares returned +7.62% at net asset value and +2.78% at maximum offer price. These figures reflect all distributions reinvested. For the same period, the Fund’s benchmark returned +7.01%. For complete, annualized performance for Delaware Emerging Markets Debt Fund, please see the table on page 4.
The Fund’s strong overall performance can be attributed, in part, to our dynamic approach to regional allocation throughout the fiscal year. As commodity prices dipped amid market volatility
early in the period, we reduced high-volatility holdings in commodity-exporting areas such as the Middle East and Latin America, while increasing exposure to lower-volatility regions, primarily in Central and Eastern Europe (CEE). We felt market conditions approached a bottom in late winter 2016, and actively rebuilt the Fund’s allocation to higher yielding issues in Latin America and the Middle East at what we believed to be attractive valuations.
From a sector perspective, commodity-based industrial holdings — including industrials, metals and mining, and pulp and paper — were the largest contributors to performance, due primarily to credit selection. Industrial holdings contributed 0.38 percentage points to overall return while metals and mining added an additional 0.13 percentage points and pulp and paper brought in 0.12 percentage points.
The Fund avoided some of the weakest-performing sectors within the benchmark index. Performance was further enhanced by an increased allocation to off-index sovereign and quasi-sovereign issues, which largely benefit from significantly higher trading liquidity than corporate issues. Out-of-index allocations added more than 3 percentage points to the Fund’s performance.
The Fund’s underweight positions within the financial and utilities sectors were the largest sector detractors, reducing performance by 1.33 percentage points and 0.42 percentage points, respectively. Within financials, we remained on the sidelines in an attempt to avoid risks related to negative economic trends on levered bank balance sheets. Within utilities, we saw few relative value opportunities during the fiscal year.
Individual contributors to performance included Indonesian state-owned oil and natural gas company Pertamina and Indonesian sovereign debt. The resilience of its diversified economy, relatively orthodox monetary policy, and the
2
government’s modest progress on economic reform, have driven Indonesia’s outperformance.
YPF, an Argentine energy exploration and production company, benefited from the uptick in oil prices and improved political sentiment that followed the election of President Mauricio Macri.
Among individual holdings, sovereign debt of the Republic of Cameroon in central Africa was the largest drag on the Fund’s performance. We originally viewed yields on the nation’s debt as attractive compared to more oil-centric regional peers. Global turmoil in early 2016 led us to reconsider the position, which we ultimately sold as a risk management measure.
Digicel, a Jamaica-based Caribbean and Central America mobile phone network provider, underperformed after a long-discussed initial public offering was shelved in the fall of 2015, due to volatile market conditions. While the market was disappointed, we believed the core company’s business remained relatively stable. For this reason, we continue to hold the issue in the Fund.
With regard to credit quality, the Fund’s allocation to crossover BBB-rated and BB-rated issues
added a meaningful boost to relative performance. As the fiscal year progressed, we increased the Fund’s allocation to BB-rated and B-rated credit, as Brazil’s credit rating was downgraded from investment grade to junk and Argentina’s credit rating was upgraded from CCC to B.
Regionally, we increased the Fund’s allocation within Latin America, attracted by higher yields, while reducing exposure to Asia and the CEE region.
A word on foreign currency hedges
During the fiscal year, Delaware Emerging Markets Debt Fund invested in currency hedges in forward foreign exchange contracts. These positions detracted 0.024 percentage points from performance for the fiscal year. The total outstanding exposure at fiscal year end was 0.39 percentage points notional (notional value is the face amount of a security that is used to calculate the payout on a derivative contract of that underlying security at settlement).
3
| | |
| Performance summary | | |
| Delaware Emerging Markets Debt Fund | | July 31, 2016 |
The performance data quoted represent past performance; past performance does not guarantee future results. Investment return and principal value will fluctuate so your shares, when redeemed, may be worth more or less than their original cost. Please obtain the performance data current for the most recent month end by calling 800 523-1918 or visiting our website at delawareinvestments.com/performance. Current performance may be lower or higher than the performance data quoted.
| | | | | | | | | | | | | | | | |
| Fund and benchmark performance1, 2, 3 | | Average annual total returns through July 31, 2016 | |
| | | 1 year | | | 3 years | | | 5 years | | | Lifetime | |
Class A (Est. Sept. 30, 2013) | | | | | | | | | | | | | | | | |
Excluding sales charge | | | +7.62% | | | | +4.00% | | | | +5.88% | | | | +6.38% | |
Including sales charge | | | +2.78% | | | | +2.41% | | | | +4.91% | | | | +5.53% | |
Class C (Est. Sept. 30, 2013) | | | | | | | | | | | | | | | | |
Excluding sales charge | | | +7.49% | | | | +3.74% | | | | +5.41% | | | | +5.87% | |
Including sales charge | | | +6.49% | | | | +3.74% | | | | +5.41% | | | | +5.87% | |
Class R (Est. Sept. 30, 2013) | | | | | | | | | | | | | | | | |
Excluding sales charge | | | +7.49% | | | | +3.91% | | | | +5.72% | | | | +6.21% | |
Including sales charge | | | +7.49% | | | | +3.91% | | | | +5.72% | | | | +6.21% | |
Institutional Class (Est. Sept. 30, 2013) | | | | | | | | | | | | | | | | |
Excluding sales charge | | | +7.49% | | | | +4.08% | | | | +6.03% | | | | +6.55% | |
Including sales charge | | | +7.49% | | | | +4.08% | | | | +6.03% | | | | +6.55% | |
J.P. Morgan Corporate Emerging Markets Bond Index (CEMBI) Broad Diversified | | | +7.01% | | | | +5.97% | | | | +5.36% | | | | +5.37% | |
1 A privately offered fund managed by the Fund’s portfolio manager was reorganized into the Fund and the Fund commenced operations on Sept. 30, 2013. This privately offered fund commenced operations on Nov. 3, 2010 and had an investment objective and strategies that were, in all material respects, the same as those of the Fund, and was managed in a manner that, in all material respects, complied with the investment guidelines and restrictions of the Fund. However, the privately offered fund was not registered as an investment under the Investment Company Act of 1940 (1940 Act). As a result, the privately offered fund was not subject to certain investment limitations, diversification requirements, liquidity requirements, and other restrictions imposed by
the 1940 Act and the Internal Revenue Code of 1986, as amended, which, if applicable, may have adversely affected its performance.
The Fund’s performance for the periods prior to its commencement of operations on Sept. 30, 2013 is that of the privately offered fund. Because the privately offered fund was a master fund that did not charge any management or other asset-based fees, the privately offered fund’s performance shown above has been restated, on a one-time basis, to reflect the fees, expenses, and waivers and reimbursements for each class of the Fund at the commencement of the Fund’s operations. If the performance of the privately offered fund had not been restated, the performance for such classes may have been higher than the performance shown in the average annual total returns table above.
4
2 Returns reflect the reinvestment of all distributions and are presented both with and without the applicable sales charges described below. Returns do not reflect the deduction of taxes the shareholder would pay on Fund distributions or redemptions of Fund shares.
Expense limitations were in effect for certain classes during some or all of the periods shown in the “Fund and benchmark performance” table. Expenses for each class are listed on the “Fund expense ratios” table on page 6. Performance would have been lower had expense limitations not been in effect.
Institutional Class shares are available without sales or asset-based distribution charges only to certain eligible accounts.
Class A shares are sold with a maximum front-end sales charge of 4.50%, and have an annual distribution and service fee of 0.25% of average daily net assets. Performance for Class A shares, excluding sales charges, assumes that no front-end sales charge applied.
Class C shares are sold with a contingent deferred sales charge of 1.00% if redeemed during the first 12 months. They are also subject to an annual distribution and service fee of 1.00% of average daily net assets. Performance for Class C shares, excluding sales charges, assumes either that contingent deferred sales charges did not apply or that the investment was not redeemed.
Class R shares are available only for certain retirement plan products. They are sold without a sales charge and have an annual distribution and service fee of 0.50% of average daily net assets.
The distributor has voluntarily suspended the distribution and service fees for Class A, Class C, and Class R shares. The suspension of the distribution and service fees will remain in effect while the Fund is not broadly distributed.
Fixed income securities and bond funds can lose value, and investors can lose principal, as interest rates rise. They also may be affected by economic
conditions that hinder an issuer’s ability to make interest and principal payments on its debt.
The Fund may also be subject to prepayment risk, the risk that the principal of a fixed income security that is held by the Fund may be prepaid prior to maturity, potentially forcing the Fund to reinvest that money at a lower interest rate.
High yielding, non-investment-grade bonds (junk bonds) involve higher risk than investment grade bonds.
The high yield secondary market is particularly susceptible to liquidity problems when institutional investors, such as mutual funds and certain other financial institutions, temporarily stop buying bonds for regulatory, financial, or other reasons. In addition, a less liquid secondary market makes it more difficult for the Fund to obtain precise valuations of the high yield securities in its portfolio.
The Fund may invest in derivatives, which may involve additional expenses and are subject to risk, including the risk that an underlying security or securities index moves in the opposite direction from what the portfolio manager anticipated. A derivative transaction depends upon the counterparties’ ability to fulfill their contractual obligations.
If and when the Fund invests in forward foreign currency contracts or uses other investments to hedge against currency risks, the Fund will be subject to special risks, including counterparty risk.
Diversification may not protect against market risk.
International investments entail risks not ordinarily associated with U.S. investments including fluctuation in currency values, differences in accounting principles, or economic or political instability in other nations.
Investing in emerging markets can be riskier than investing in established foreign markets due to increased volatility and lower trading volume.
5
Performance summary
Delaware Emerging Markets Debt Fund
The Fund may experience portfolio turnover in excess of 100%, which could result in higher transaction costs and tax liability.
Short sales risk is the risk that a fund may lose more money than the actual cost of its investment and that the third party to the short sale may fail to honor its contract terms, causing a loss to the fund.
Leveraging risk is the risk that certain fund transactions, such as reverse repurchase agreements, short sales, loans of portfolio securities, and the use of when-issued, delayed delivery or forward commitment transactions, or derivative instruments, may give rise to leverage, causing a fund to be more volatile than if it had not been leveraged.
3 The Fund’s expense ratios, as described in the most recent prospectus, are disclosed in the following “Fund expense ratios” table. Delaware Management Company has agreed to reimburse certain expenses and/or waive certain fees in order to prevent total annual fund operating expenses (excluding any 12b-1 fees, acquired fund fees and expenses, taxes, interest, short sale dividend and interest expenses, brokerage fees, certain insurance costs, and nonroutine expenses or costs, including, but not limited to, those relating to reorganizations, litigation, conducting shareholder meetings, and liquidations (collectively, nonroutine expenses)) from exceeding 1.00% of the Fund’s average daily net assets during the period from Aug. 1, 2015 through July 31, 2016.* Please see the most recent prospectus and any applicable supplement(s) for additional information on these fee waivers and/or reimbursements.
| | | | | | | | |
| Fund expense ratios | | Class A | | Class C | | Class R | | Institutional Class |
Total annual operating expenses (without fee waivers) | | 2.02% | | 2.77% | | 2.27% | | 1.77% |
Net expenses (including fee waivers, if any) | | 1.13% | | 1.13% | | 1.13% | | 1.13% |
Type of waiver | | Contractual
(Investment
manager
waiver);
Voluntary
(12b-1 fee
waiver) | | Contractual
(Investment
manager
waiver);
Voluntary
(12b-1 fee
waiver) | | Contractual
(Investment
manager
waiver);
Voluntary
(12b-1 fee
waiver) | | Contractual |
*The aggregate contractual waiver period covering this report is from Nov. 28, 2014, through Nov. 28, 2016.
6
Performance of a $10,000 investment1
Average annual total returns from Sept. 30, 2013 (Fund’s inception) through July 31, 2016
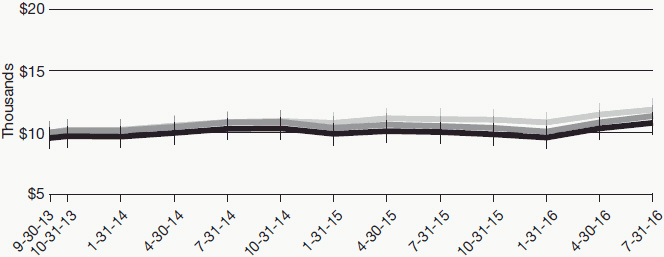
| | | | | | |
|
| For period beginning Sept. 30, 2013, through July 31, 2016 | | Starting value | | | Ending value |
|
 J.P. Morgan Corporate Emerging Markets Bond Index (CEMBI) Broad Diversified J.P. Morgan Corporate Emerging Markets Bond Index (CEMBI) Broad Diversified
| | | $10,000 | | | $11,871 |
 Delaware Emerging Markets Debt Fund — Institutional Class shares Delaware Emerging Markets Debt Fund — Institutional Class shares
| | | $10,000 | | | $11,323 |
 Delaware Emerging Markets Debt Fund — Class A shares Delaware Emerging Markets Debt Fund — Class A shares
| | | $9,550 | | | $10,793 |
|
1 The “Performance of a $10,000 investment” graph assumes $10,000 invested in Institutional Class and Class A shares of the Fund on Sept. 30, 2013, and includes the effect of a 4.50% front-end sales charge (for Class A shares) and the reinvestment of all distributions. The graph does not reflect the deduction of taxes the shareholders would pay on Fund distributions or redemptions of Fund shares. Expense limitations were in effect for some or all of the periods shown. Performance would have been lower had expense limitations not been in effect. Expenses are listed in the “Fund expense ratios” table on page 6. Please note additional details on pages 4 through 7.
The graph also assumes $10,000 invested in the J.P. Morgan Corporate Emerging Markets Bond Index (CEMBI) Broad Diversified as of
Sept. 30, 2013. The J.P. Morgan Corporate Emerging Markets Bond Index (CEMBI) Broad Diversified tracks U.S. dollar–denominated emerging market corporate bonds, limiting the weights of countries with larger corporate debt stocks by including only a specified portion of those countries’ eligible current face amounts of debt outstanding.
Index performance returns do not reflect any management fees, transaction costs, or expenses. Indices are unmanaged and one cannot invest directly in an index. Past performance is not a guarantee of future results.
Performance of other Fund classes will vary due to different charges and expenses.
| | | | | | | | |
| | | Nasdaq symbols | | CUSIPs | | | | |
Class A | | DEDAX | | 246094841 | | | | |
Class C | | DEDCX | | 246094833 | | | | |
Class R | | DEDRX | | 246094825 | | | | |
Institutional Class | | DEDIX | | 246094817 | | | | |
7
Disclosure of Fund expenses
For the six-month period February 1, 2016 to July 31, 2016 (Unaudited)
As a shareholder of the Fund, you incur two types of costs: (1) transaction costs, including sales charges (loads) on purchase payments, reinvested dividends, or other distributions; redemption fees; and exchange fees; and (2) ongoing costs, including management fees; distribution and/or service (12b-1) fees; and other Fund expenses. This example is intended to help you understand your ongoing costs (in dollars) of investing in the Fund and to compare these costs with the ongoing costs of investing in other mutual funds.
The example is based on an investment of $1,000 invested at the beginning of the period and held for the entire six-month period from Feb. 1, 2016 to July 31, 2016.
Actual expenses
The first section of the table shown, “Actual Fund return,” provides information about actual account values and actual expenses. You may use the information in this section of the table, together with the amount you invested, to estimate the expenses that you paid over the period. Simply divide your account value by $1,000 (for example, an $8,600 account value divided by $1,000 = 8.6), then multiply the result by the number in the first section under the heading entitled “Expenses Paid During Period” to estimate the expenses you paid on your account during this period.
Hypothetical example for comparison purposes
The second section of the table shown, “Hypothetical 5% return,” provides information about hypothetical account values and hypothetical expenses based on the Fund’s actual expense ratio and an assumed rate of return of 5% per year before expenses, which is not the Fund’s actual return. The hypothetical account values and expenses may not be used to estimate the actual ending account balance or expenses you paid for the period. You may use this information to compare the ongoing costs of investing in the Fund and other funds. To do so, compare this 5% hypothetical example with the 5% hypothetical examples that appear in the shareholder reports of the other funds.
Please note that the expenses shown in the table are meant to highlight your ongoing costs only and do not reflect any transactional costs, such as sales charges (loads), redemption fees, or exchange fees. Therefore, the second section of the table is useful in comparing ongoing costs only, and will not help you determine the relative total costs of owning different funds. In addition, if these transactional costs were included, your costs would have been higher. The Fund’s expenses shown in the table reflect fee waivers in effect. The expenses shown in the table assume reinvestment of all dividends and distributions.
8
Delaware Emerging Markets Debt Fund
Expense analysis of an investment of $1,000
| | | | | | | | | | | | | | | | | | | | |
| | | Beginning Account Value 2/1/16 | | Ending Account Value 7/31/16 | | Annualized Expense Ratio | | Expenses Paid During Period 2/1/16 to 7/31/16* |
Actual Fund return† | | | | | | | | | | | | | | | | | | | | |
Class A | | | | $1,000.00 | | | | | $1,125.50 | | | | | 1.02% | | | | | $5.39 | |
Class C | | | | 1,000.00 | | | | | 1,125.50 | | | | | 1.02% | | | | | 5.39 | |
Class R | | | | 1,000.00 | | | | | 1,125.50 | | | | | 1.02% | | | | | 5.39 | |
Institutional Class | | | | 1,000.00 | | | | | 1,125.50 | | | | | 1.02% | | | | | 5.39 | |
Hypothetical 5% return (5% return before expenses) | | | | | | | | | | | |
Class A | | | | $1,000.00 | | | | | $1,019.79 | | | | | 1.02% | | | | | $5.12 | |
Class C | | | | 1,000.00 | | | | | 1,019.79 | | | | | 1.02% | | | | | 5.12 | |
Class R | | | | 1,000.00 | | | | | 1,019.79 | | | | | 1.02% | | | | | 5.12 | |
Institutional Class | | | | 1,000.00 | | | | | 1,019.79 | | | | | 1.02% | | | | | 5.12 | |
| * | “Expenses Paid During Period” are equal to the Fund’s annualized expense ratio, multiplied by the average account value over the period, multiplied by 182/366 (to reflect the one-half year period). |
| † | Because actual returns reflect only the most recent six-month period, the returns shown may differ significantly from fiscal year returns. |
9
| | |
| Security type / sector allocation | | |
| Delaware Emerging Markets Debt Fund | | As of July 31, 2016 (Unaudited) |
Sector designations may be different than the sector designations presented in other fund materials. The sector designations may represent the investment manager’s internal sector classifications.
| | | | | |
| Security type / sector | | Percentage of net assets |
Corporate Bonds | | | | 65.13 | % |
Banking | | | | 12.25 | % |
Basic Industry | | | | 10.48 | % |
Capital Goods | | | | 2.18 | % |
Communications | | | | 13.96 | % |
Consumer Cyclical | | | | 1.90 | % |
Consumer Non-Cyclical | | | | 6.86 | % |
Electric | | | | 3.25 | % |
Energy | | | | 12.61 | % |
Real Estate | | | | 1.06 | % |
Transportation | | | | 0.58 | % |
Regional Bond | | | | 1.31 | % |
Senior Secured Loan | | | | 2.10 | % |
Sovereign Bonds | | | | 21.11 | % |
Supranational Banks | | | | 2.42 | % |
Exchange-Traded Fund | | | | 0.95 | % |
Short-Term Investments | | | | 3.58 | % |
Total Value of Securities | | | | 96.60 | % |
Receivables and Other Assets Net of Liabilities | | | | 3.40 | % |
Total Net Assets | | | | 100.00 | % |
10
| | |
| Schedule of investments | | |
| Delaware Emerging Markets Debt Fund | | July 31, 2016 |
| | | | | | | | |
| | | Principal amount° | | | Value (U.S. $) | |
| |
Corporate Bonds – 65.13% | | | | | | | | |
| |
Banking – 12.25% | | | | | | | | |
Banco Nacional de Costa Rica 144A 5.875% 4/25/21 # | | | 235,000 | | | $ | 245,575 | |
BBVA Bancomer 6.50% 3/10/21 | | | 250,000 | | | | 278,125 | |
Export Credit Bank of Turkey 144A 5.375% 2/8/21 # | | | 275,000 | | | | 279,511 | |
Export-Import Bank of India 144A 3.375% 8/5/26 # | | | 200,000 | | | | 200,869 | |
Export-Import Bank of Korea 2.125% 2/11/21 | | | 225,000 | | | | 228,026 | |
ICICI Bank 144A 4.00% 3/18/26 # | | | 200,000 | | | | 206,501 | |
Industrial & Commercial Bank of China 2.635% 5/26/21 | | | 250,000 | | | | 252,829 | |
SUAM Finance 144A 4.875% 4/17/24 # | | | 220,000 | | | | 230,450 | |
Turkiye Is Bankasi 144A 5.375% 10/6/21 # | | | 210,000 | | | | 208,163 | |
Woori Bank 144A 4.75% 4/30/24 # | | | 295,000 | | | | 312,577 | |
| | | | | | | | |
| | | | | | | 2,442,626 | |
| | | | | | | | |
Basic Industry – 10.48% | | | | | | | | |
Bahia Sul Holdings 144A 5.75% 7/14/26 # | | | 240,000 | | | | 236,700 | |
Cia Brasileira de Aluminio 144A 6.75% 4/5/21 # | | | 200,000 | | | | 212,250 | |
MMC Norilsk Nickel | | | | | | | | |
144A 5.55% 10/28/20 # | | | 250,000 | | | | 264,119 | |
144A 6.625% 10/14/22 # | | | 200,000 | | | | 222,851 | |
OCP 144A 4.50% 10/22/25 # | | | 500,000 | | | | 503,905 | |
Southern Copper 5.875% 4/23/45 | | | 195,000 | | | | 194,868 | |
Suzano Trading 144A 5.875% 1/23/21 # | | | 190,000 | | | | 200,279 | |
Vale Overseas 5.875% 6/10/21 | | | 245,000 | | | | 254,188 | |
| | | | | | | | |
| | | | | | | 2,089,160 | |
| | | | | | | | |
Capital Goods – 2.18% | | | | | | | | |
Cemex 144A 7.75% 4/16/26 # | | | 250,000 | | | | 278,125 | |
Union Andina de Cementos 144A 5.875% 10/30/21 # | | | 150,000 | | | | 156,750 | |
| | | | | | | | |
| | | | | | | 434,875 | |
| | | | | | | | |
Communications – 13.96% | | | | | | | | |
Cablevision 144A 6.50% 6/15/21 # | | | 180,000 | | | | 185,850 | |
Colombia Telecomunicaciones 144A 5.375% 9/27/22 # | | | 200,000 | | | | 195,500 | |
Columbus International 144A 7.375% 3/30/21 # | | | 250,000 | | | | 267,740 | |
Digicel Group 144A 8.25% 9/30/20 # | | | 300,000 | | | | 275,250 | |
GTH Finance 144A 7.25% 4/26/23 # | | | 200,000 | | | | 210,750 | |
JD.com 3.125% 4/29/21 | | | 400,000 | | | | 397,924 | |
Millicom International Cellular | | | | | | | | |
144A 6.00% 3/15/25 # | | | 200,000 | | | | 207,065 | |
144A 6.625% 10/15/21 # | | | 200,000 | | | | 209,490 | |
MTS International Funding 144A 5.00% 5/30/23 # | | | 200,000 | | | | 207,000 | |
Myriad International Holdings 144A 5.50% 7/21/25 # | | | 200,000 | | | | 214,150 | |
Ooredoo International Finance 144A 3.75% 6/22/26 # | | | 200,000 | | | | 207,000 | |
VTR Finance 144A 6.875% 1/15/24 # | | | 200,000 | | | | 206,500 | |
| | | | | | | | |
| | | | | | | 2,784,219 | |
| | | | | | | | |
11
Schedule of investments
Delaware Emerging Markets Debt Fund
| | | | | | | | |
| | | Principal amount° | | | Value (U.S. $) | |
| |
Corporate Bonds (continued) | | | | | | | | |
| |
Consumer Cyclical – 1.90% | | | | | | | | |
Cencosud 144A 6.625% 2/12/45 # | | | 355,000 | | | $ | 378,995 | |
| | | | | | | | |
| | | | | | | 378,995 | |
| | | | | | | | |
Consumer Non-Cyclical – 6.86% | | | | | | | | |
Arcor SAIC 144A 6.00% 7/6/23 # | | | 155,000 | | | | 162,328 | |
Cosan Luxembourg 144A 7.00% 1/20/27 # | | | 200,000 | | | | 203,750 | |
JB y Cia 144A 3.75% 5/13/25 # | | | 200,000 | | | | 207,218 | |
JBS Investments 144A 7.75% 10/28/20 # | | | 200,000 | | | | 213,000 | |
JBS USA 144A 5.75% 6/15/25 # | | | 150,000 | | | | 147,000 | |
Marfrig Holdings Europe 144A 8.00% 6/8/23 # | | | 200,000 | | | | 206,000 | |
Sigma Alimentos 144A 4.125% 5/2/26 # | | | 220,000 | | | | 228,800 | |
| | | | | | | | |
| | | | | | | 1,368,096 | |
| | | | | | | | |
Electric – 3.25% | | | | | | | | |
AES Andres 144A 7.95% 5/11/26 # | | | 200,000 | | | | 210,750 | |
AES Gener 144A 8.375% 12/18/73 #@• | | | 200,000 | | | | 215,500 | |
Perusahaan Listrik Negara 144A 5.50% 11/22/21 # | | | 200,000 | | | | 221,188 | |
| | | | | | | | |
| | | | | | | 647,438 | |
| | | | | | | | |
Energy – 12.61% | | | | | | | | |
CNOOC Finance 2015 Australia 2.625% 5/5/20 | | | 400,000 | | | | 408,154 | |
Ecopetrol | | | | | | | | |
5.875% 9/18/23 | | | 55,000 | | | | 57,613 | |
7.375% 9/18/43 | | | 160,000 | | | | 161,120 | |
Pertamina Persero | | | | | | | | |
144A 5.25% 5/23/21 # | | | 200,000 | | | | 217,324 | |
144A 5.625% 5/20/43 # | | | 200,000 | | | | 207,291 | |
Petrobras Global Finance | | | | | | | | |
4.875% 3/17/20 | | | 65,000 | | | | 63,480 | |
6.25% 3/17/24 | | | 50,000 | | | | 47,000 | |
7.875% 3/15/19 | | | 205,000 | | | | 217,915 | |
8.375% 5/23/21 | | | 105,000 | | | | 111,274 | |
8.75% 5/23/26 | | | 35,000 | | | | 36,477 | |
Petroleos Mexicanos | | | | | | | | |
144A 6.375% 2/4/21 # | | | 125,000 | | | | 137,466 | |
144A 6.875% 8/4/26 # | | | 175,000 | | | | 196,875 | |
Petronas Global Sukuk 144A 2.707% 3/18/20 # | | | 205,000 | | | | 208,420 | |
Tengizchevroil Finance International 144A 4.00% 8/15/26 # | | | 200,000 | | | | 199,704 | |
YPF | | | | | | | | |
144A 8.50% 3/23/21 # | | | 125,000 | | | | 134,375 | |
144A 31.354% 7/7/20 #• | | | 100,000 | | | | 109,250 | |
| | | | | | | | |
| | | | | | | 2,513,738 | |
| | | | | | | | |
Real Estate – 1.06% | | | | | | | | |
Trust F 144A 5.25% 1/30/26 # | | | 200,000 | | | | 211,250 | |
| | | | | | | | |
| | | | | | | 211,250 | |
| | | | | | | | |
12
| | | | | | | | |
| | | Principal amount° | | | Value (U.S. $) | |
| |
Corporate Bonds (continued) | | | | | | | | |
| |
Transportation – 0.58% | | | | | | | | |
DP World 144A 6.85% 7/2/37 # | | | 100,000 | | | $ | 115,500 | |
| | | | | | | | |
| | | | | | | 115,500 | |
| | | | | | | | |
Total Corporate Bonds (cost $12,461,627) | | | | | | | 12,985,897 | |
| | | | | | | | |
| | | | | | | | |
| |
Regional Bond – 1.31%D | | | | | | | | |
| |
Argentina – 1.31% | | | | | | | | |
City of Buenos Aires Argentina 144A 7.50% 6/1/27 # | | | 250,000 | | | | 260,625 | |
| | | | | | | | |
Total Regional Bond (cost $247,845) | | | | | | | 260,625 | |
| | | | | | | | |
| | | | | | | | |
| |
Senior Secured Loan – 2.10%« | | | | | | | | |
| |
Republic of Angola (Unsecured) 7.045% 12/16/23 @ | | | 478,125 | | | | 418,359 | |
| | | | | | | | |
Total Senior Secured Loan (cost $478,125) | | | | | | | 418,359 | |
| | | | | | | | |
| | | | | | | | |
| |
Sovereign Bonds – 21.11%D | | | | | | | | |
| |
Argentina – 1.12% | | | | | | | | |
Argentine Republic Government International Bond 144A | | | | | | | | |
7.125% 7/6/36 # | | | 220,000 | | | | 224,070 | |
| | | | | | | | |
| | | | | | | 224,070 | |
| | | | | | | | |
Brazil – 0.44% | | | | | | | | |
Brazil Notas do Tesouro Nacional Series F 10.00% 1/1/23 | | | BRL 306,000 | | | | 86,899 | |
| | | | | | | | |
| | | | | | | 86,899 | |
| | | | | | | | |
Croatia – 1.19% | | | | | | | | |
Croatia Government International Bond 144A | | | | | | | | |
6.375% 3/24/21 # | | | 215,000 | | | | 237,446 | |
| | | | | | | | |
| | | | | | | 237,446 | |
| | | | | | | | |
Dominican Republic – 1.13% | | | | | | | | |
Dominican Republic International Bond 144A | | | | | | | | |
6.875% 1/29/26 # | | | 200,000 | | | | 225,000 | |
| | | | | | | | |
| | | | | | | 225,000 | |
| | | | | | | | |
Ecuador – 1.00% | | | | | | | | |
Ecuador Government International Bond 144A | | | | | | | | |
10.75% 3/28/22 # | | | 200,000 | | | | 200,107 | |
| | | | | | | | |
| | | | | | | 200,107 | |
| | | | | | | | |
Guatemala – 1.06% | | | | | | | | |
Guatemala Government Bond 144A 4.50% 5/3/26 # | | | 200,000 | | | | 211,250 | |
| | | | | | | | |
| | | | | | | 211,250 | |
| | | | | | | | |
Hungary – 0.58% | | | | | | | | |
Hungary Government International Bond 5.75% 11/22/23 | | | 100,000 | | | | 115,240 | |
| | | | | | | | |
| | | | | | | 115,240 | |
| | | | | | | | |
13
Schedule of investments
Delaware Emerging Markets Debt Fund
| | | | | | | | |
| | | Principal amount° | | | Value (U.S. $) | |
| |
Sovereign BondsD (continued) | | | | | | | | |
| |
Indonesia – 1.62% | | | | | | | | |
Indonesia Government International Bond 144A | | | | | | | | |
5.95% 1/8/46 # | | | 200,000 | | | $ | 250,195 | |
Indonesia Treasury Bond 8.375% 9/15/26 | | IDR | 850,000,000 | | | | 71,934 | |
| | | | | | | | |
| | | | | | | 322,129 | |
| | | | | | | | |
Jamaica – 1.10% | | | | | | | | |
Jamaica Government International Bond 6.75% 4/28/28 | | | 200,000 | | | | 219,000 | |
| | | | | | | | |
| | | | | | | 219,000 | |
| | | | | | | | |
Mexico – 0.14% | | | | | | | | |
Mexican Bonos 5.75% 3/5/26 | | MXN | 528,600 | | | | 27,848 | |
| | | | | | | | |
| | | | | | | 27,848 | |
| | | | | | | | |
Mongolia – 0.91% | | | | | | | | |
Mongolia Government International Bond 144A | | | | | | | | |
5.125% 12/5/22 # | | | 200,000 | | | | 181,587 | |
| | | | | | | | |
| | | | | | | 181,587 | |
| | | | | | | | |
Paraguay – 1.08% | | | | | | | | |
Paraguay Government International Bond 144A | | | | | | | | |
5.00% 4/15/26 # | | | 200,000 | | | | 214,500 | |
| | | | | | | | |
| | | | | | | 214,500 | |
| | | | | | | | |
Qatar – 1.26% | | | | | | | | |
Qatar Government International Bond 144A | | | | | | | | |
3.25% 6/2/26 # | | | 245,000 | | | | 251,760 | |
| | | | | | | | |
| | | | | | | 251,760 | |
| | | | | | | | |
Russia – 1.12% | | | | | | | | |
Russian Foreign Bond - Eurobond 7.85% 3/10/18 | | RUB | 15,000,000 | | | | 223,432 | |
| | | | | | | | |
| | | | | | | 223,432 | |
| | | | | | | | |
Senegal – 0.99% | | | | | | | | |
Senegal Government International Bond 144A | | | | | | | | |
6.25% 7/30/24 # | | | 200,000 | | | | 196,825 | |
| | | | | | | | |
| | | | | | | 196,825 | |
| | | | | | | | |
Serbia – 1.04% | | | | | | | | |
Republic of Serbia 144A 4.875% 2/25/20 # | | | 200,000 | | | | 208,114 | |
| | | | | | | | |
| | | | | | | 208,114 | |
| | | | | | | | |
South Africa – 0.46% | | | | | | | | |
South Africa Government Bond 8.00% 1/31/30 | | ZAR | 1,390,000 | | | | 92,266 | |
| | | | | | | | |
| | | | | | | 92,266 | |
| | | | | | | | |
Sri Lanka – 2.06% | | | | | | | | |
Sri Lanka Government International Bond | | | | | | | | |
144A 6.125% 6/3/25 # | | | 200,000 | | | | 202,857 | |
144A 6.825% 7/18/26 # | | | 200,000 | | | | 208,711 | |
| | | | | | | | |
| | | | | | | 411,568 | |
| | | | | | | | |
14
| | | | | | | | |
| | | Principal amount° | | | Value (U.S. $) | |
| |
Sovereign BondsD (continued) | | | | | | | | |
| |
Ukraine – 1.00% | | | | | | | | |
Ukraine Government International Bond 144A | | | | | | | | |
7.75% 9/1/19 # | | | 200,000 | | | $ | 199,500 | |
| | | | | | | | |
| | | | | �� | | 199,500 | |
| | | | | | | | |
Uruguay – 1.81% | | | | | | | | |
Uruguay Government International Bond 5.10% 6/18/50 | | | 355,000 | | | | 360,325 | |
| | | | | | | | |
| | | | | | | 360,325 | |
| | | | | | | | |
Total Sovereign Bonds (cost $4,013,365) | | | | | | | 4,208,866 | |
| | | | | | | | |
| | | | | | | | |
| |
Supranational Banks – 2.42% | | | | | | | | |
| |
Banque Ouest Africaine de Developpement 144A | | | | | | | | |
5.50% 5/6/21 # | | | 200,000 | | | | 210,500 | |
European Bank for Reconstruction & Development | | | | | | | | |
7.375% 4/15/19 | | IDR | 250,000,000 | | | | 19,224 | |
Inter-American Development Bank 6.00% 9/5/17 | | INR | 17,000,000 | | | | 251,864 | |
| | | | | | | | |
Total Supranational Banks (cost $469,358) | | | | | | | 481,588 | |
| | | | | | | | |
| | |
| | | Number of shares | | | | |
| |
Exchange-Traded Fund – 0.95% | | | | | | | | |
| |
VanEck VectorsTM J.P. Morgan EM Local Currency Bond ETF | | | | | | | | |
| | | 10,000 | | | | 189,300 | |
| | | | | | | | |
Total Exchange-Traded Fund (cost $188,651) | | | | | | | 189,300 | |
| | | | | | | | |
| | |
| | | Principal amount° | | | | |
| |
Short-Term Investments – 3.58% | | | | | | | | |
| |
Discount Notes – 2.48%≠ | | | | | | | | |
Federal Home Loan Bank | | | | | | | | |
0.162% 8/3/16 | | | 137,859 | | | | 137,857 | |
0.241% 8/10/16 | | | 111,985 | | | | 111,980 | |
0.271% 8/29/16 | | | 32,498 | | | | 32,493 | |
0.281% 8/26/16 | | | 148,360 | | | | 148,342 | |
0.318% 9/7/16 | | | 36,422 | | | | 36,413 | |
0.322% 9/19/16 | | | 27,743 | | | | 27,734 | |
| | | | | | | | |
| | | | | | | 494,819 | |
| | | | | | | | |
Repurchase Agreements – 1.10% | | | | | | | | |
Bank of America Merrill Lynch | | | | | | | | |
0.29%, dated 7/29/16, to be repurchased on 8/1/16,repurchase price $62,128 (collateralized by U.S. government obligations 3.375% 5/15/44; market value $63,369) | | | 62,127 | | | | 62,127 | |
15
Schedule of investments
Delaware Emerging Markets Debt Fund
| | | | | | | | |
| | | Principal amount° | | | Value (U.S. $) | |
| |
Short-Term Investments (continued) | | | | | | | | |
| |
Repurchase Agreements (continued) | | | | | | | | |
Bank of Montreal | | | | | | | | |
0.26%, dated 7/29/16, to be repurchased on 8/1/16,repurchase price $103,547 (collateralized by U.S. government obligations 0.125%–3.125% 2/15/19–11/15/45; market value $105,616) | | | 103,545 | | | $ | 103,545 | |
BNP Paribas | | | | | | | | |
0.33%, dated 7/29/16, to be repurchased on 8/1/16,repurchase price $53,330 (collateralized by U.S. government obligations 0.00%–4.250% 8/31/19–11/15/40; market value $54,395) | | | 53,328 | | | | 53,328 | |
| | | | | | | | |
| | | | | | | 219,000 | |
| | | | | | | | |
Total Short-Term Investments (cost $713,792) | | | | | | | 713,819 | |
| | | | | | | | |
| | |
Total Value of Securities – 96.60%
(cost $18,572,763) | | | | | | $ | 19,258,454 | |
| | | | | | | | |
| # | Security exempt from registration under Rule 144A of the Securities Act of 1933, as amended. At July 31, 2016, the aggregate value of Rule 144A securities was $13,759,951, which represents 69.02% of the Fund’s net assets. See Note 11 in “Notes to financial statements.” |
| @ | Illiquid security. At July 31, 2016, the aggregate value of illiquid securities was $633,859, which represents 3.18% of the Fund’s net assets. See Note 11 in “Notes to financial statements.” |
| ≠ | The rate shown is the effective yield at the time of purchase. |
| ° | Principal amount shown is stated in U.S. dollars unless noted that the security is denominated in another currency. |
| ● | Variable rate security. The rate shown is the rate as of July 31, 2016. Interest rates reset periodically. |
| D | Securities have been classified by country of origin. |
| « | Senior secured loans generally pay interest at rates which are periodically redetermined by reference to a base lending rate plus a premium. These base lending rates are generally: (i) the prime rate offered by one or more U.S. banks, (ii) the lending rate offered by one or more European banks such as the London Interbank Offered Rate (LIBOR), and (iii) the certificate of deposit rate. Senior secured loans may be subject to restrictions on resale. Stated rate in effect at July 31, 2016. |
16
The following foreign currency exchange contracts were outstanding at July 31, 2016:1
Foreign Currency Exchange Contracts
| | | | | | | | | | | | | | | | | | |
Counterparty | | Contracts to
Receive (Deliver) | | | In Exchange For | | | Settlement Date | | Unrealized
Appreciation
(Depreciation) | |
BCLY | | EUR | | | (29,454 | ) | | USD | | | 32,403 | | | 9/2/16 | | $ | (574 | ) |
BNP | | INR | | | 13,364,000 | | | USD | | | (197,546 | ) | | 9/2/16 | | | 1,708 | |
BNYM | | ZAR | | | (55,600 | ) | | USD | | | 4,003 | | | 8/1/16 | | | 1 | |
CSFB | | ZAR | | | 299,374 | | | USD | | | (21,561 | ) | | 8/2/16 | | | (14 | ) |
TD | | ZAR | | | (1,231,033 | ) | | USD | | | 85,392 | | | 9/2/16 | | | (2,660 | ) |
| | | | | | | | | | | | | | | | | | |
| | | | | | | | | | | | | | | | $ | (1,539 | ) |
| | | | | | | | | | | | | | | | | | |
The use of foreign currency exchange contracts involves elements of market risk and risks in excess of the amounts recognized in the financial statements. The foreign currency exchange contract presented above represents the Fund’s total exposure in such contracts, whereas only the net unrealized appreciation (depreciation) is reflected in the Fund’s net assets.
1See Note 8 in “Notes to financial statements.”
Summary of abbreviations:
BCLY – Barclays
BNP – BNP Paribas
BNYM – BNY Mellon
BRL – Brazilian Real
CSFB – Credit Suisse First Boston
EM – Emerging Markets
ETF – Exchange Traded Fund
EUR – Euro
IDR – Indonesian Rupiah
INR – Indian Rupee
MXN – Mexican Peso
RUB – Russian Ruble
TD – Toronto Dominion Bank
USD – U.S. Dollar
ZAR – South African Rand
See accompanying notes, which are an integral part of the financial statements.
17
| | |
| Statement of assets and liabilities |
| Delaware Emerging Markets Debt Fund | | July 31, 2016 |
| | | | |
Assets: | | | | |
Investments, at value1 | | $ | 18,544,635 | |
Short-term investments, at value2 | | | 713,819 | |
Foreign currencies, at value3 | | | 12,997 | |
Receivable for securities sold | | | 1,112,424 | |
Interest receivable | | | 267,600 | |
Unrealized appreciation on foreign currency exchange contracts | | | 1,709 | |
| | | | |
Total assets | | | 20,653,184 | |
| | | | |
Liabilities: | | | | |
Cash overdraft | | | 63,261 | |
Payable for securities purchased | | | 618,666 | |
Other accrued expenses | | | 17,323 | |
Investment management fees payable to affiliate | | | 10,684 | |
Unrealized depreciation on foreign currency exchange contracts | | | 3,248 | |
Audit and tax fees payable | | | 1,690 | |
Dividend disbursing and transfer agent fees and expenses payable to affiliates | | | 342 | |
Accounting and administration expenses payable to affiliates | | | 79 | |
Trustees’ fees and expenses payable | | | 48 | |
Legal fees payable to affiliates | | | 28 | |
Reports and statements to shareholders expenses payable to affiliates | | | 8 | |
Capital gain tax payable | | | 831 | |
| | | | |
Total liabilities | | | 716,208 | |
| | | | |
Total Net Assets | | $ | 19,936,976 | |
| | | | |
| |
Net Assets Consist of: | | | | |
Paid-in capital | | $ | 19,929,444 | |
Distributions in excess of net investment income | | | (2,321 | ) |
Accumulated net realized loss on investments | | | (674,485 | ) |
Net unrealized appreciation of investments | | | 685,691 | |
Net unrealized appreciation of foreign currencies | | | 186 | |
Net unrealized depreciation of foreign currency exchange contracts | | | (1,539 | ) |
| | | | |
Total Net Assets | | $ | 19,936,976 | |
| | | | |
18
| | | | |
Class A: | | | | |
Net assets | | $ | 2,289 | |
Shares of beneficial interest outstanding, unlimited authorization, no par | | | 270 | |
Net asset value per share | | $ | 8.48 | |
Sales charge | | | 4.50 | % |
Offering price per share, equal to net asset value per share / (1 – sales charge) | | $ | 8.88 | |
| |
Class C: | | | | |
Net assets | | $ | 2,273 | |
Shares of beneficial interest outstanding, unlimited authorization, no par | | | 268 | |
Net asset value per share | | $ | 8.48 | |
| |
Class R: | | | | |
Net assets | | $ | 2,282 | |
Shares of beneficial interest outstanding, unlimited authorization, no par | | | 269 | |
Net asset value per share | | $ | 8.48 | |
| |
Institutional Class: | | | | |
Net assets | | $ | 19,930,132 | |
Shares of beneficial interest outstanding, unlimited authorization, no par | | | 2,349,271 | |
Net asset value per share | | $ | 8.48 | |
| |
| | | | |
1 Investments, at cost | | $ | 17,858,971 | |
2 Short-term investments, at cost | | | 713,792 | |
3 Foreign currencies, at cost | | | 13,015 | |
See accompanying notes, which are an integral part of the financial statements.
19
Statement of operations
| | | | |
| Delaware Emerging Markets Debt Fund | | | Year ended July 31, 2016 | |
| | | | |
Investment Income: | | | | |
Interest | | $ | 996,636 | |
Dividends | | | 8,937 | |
| | | | |
| | | 1,005,573 | |
| | | | |
Expenses: | | | | |
Management fees | | | 138,444 | |
Distribution expenses — Class A | | | 5 | |
Distribution expenses — Class C | | | 21 | |
Distribution expenses — Class R | | | 11 | |
Registration fees | | | 76,493 | |
Audit and tax fees | | | 46,922 | |
Reports and statements to shareholders expenses | | | 17,737 | |
Legal fees | | | 11,489 | |
Dividend disbursing and transfer agent fees and expenses | | | 6,138 | |
Accounting and administration expenses | | | 5,987 | |
Custodian fees | | | 5,561 | |
Trustees’ fees and expenses | | | 882 | |
Other | | | 14,457 | |
| | | | |
Expenses before dividends on short sales and interest expense | | | 324,147 | |
Dividends on short sales | | | 3,153 | |
Interest expense | | | 3,462 | |
| | | | |
| | | 330,762 | |
Less expenses waived | | | (141,044 | ) |
Less waived distribution expenses — Class A | | | (5 | ) |
Less waived distribution expenses — Class C | | | (21 | ) |
Less waived distribution expenses — Class R | | | (11 | ) |
| | | | |
Total operating expenses | | | 189,681 | |
| | | | |
| Net Investment Income | | | 815,892 | |
| | | | |
20
| | | | |
Net Realized and Unrealized Gain (Loss): | | | | |
Net realized gain (loss) on: | | | | |
Investments1 | | $ | (27,189 | ) |
Foreign currencies | | | (37,341 | ) |
Foreign currency exchange contracts | | | (22,328 | ) |
Securities sold short | | | 1,830 | |
| | | | |
Net realized loss | | | (85,028 | ) |
| | | | |
Net change in unrealized appreciation (depreciation) of: | | | | |
Investments2 | | | 668,922 | |
Foreign currencies | | | 1,369 | |
Foreign currency exchange contracts | | | (1,699 | ) |
| | | | |
Net change in unrealized appreciation (depreciation) | | | 668,592 | |
| | | | |
Net Realized and Unrealized Gain | | | 583,564 | |
| | | | |
Net Increase in Net Assets Resulting from Operations | | $ | 1,399,456 | |
| | | | |
| 1 | Includes $ 37 capital gains taxes paid. |
| 2 | Includes $ 831 capital gains taxes accrued. |
See accompanying notes, which are an integral part of the financial statements.
21
Statements of changes in net assets
Delaware Emerging Markets Debt Fund
| | | | | | | | |
| | | Year ended | |
| | | 7/31/16 | | | 7/31/15 | |
Increase (Decrease) in Net Assets from Operations: | | | | | | | | |
Net investment income | | $ | 815,892 | | | $ | 820,222 | |
Net realized loss | | | (85,028 | ) | | | (723,295 | ) |
Net change in unrealized appreciation (depreciation) | | | 668,592 | | | | (584,975 | ) |
| | | | | | | | |
Net increase (decrease) in net assets resulting from operations | | | 1,399,456 | | | | (488,048 | ) |
| | | | | | | | |
| | |
Dividends and Distributions to Shareholders from: | | | | | | | | |
Net investment income: | | | | | | | | |
Class A | | | (87 | ) | | | (76 | ) |
Class C | | | (86 | ) | | | (76 | ) |
Class R | | | (86 | ) | | | (76 | ) |
Institutional Class | | | (755,933 | ) | | | (665,411 | ) |
| | |
Net realized gain: | | | | | | | | |
Class A | | | — | | | | (24 | ) |
Class C | | | — | | | | (23 | ) |
Class R | | | — | | | | (24 | ) |
Institutional Class | | | — | | | | (205,499 | ) |
| | | | | | | | |
| | | (756,192 | ) | | | (871,209 | ) |
| | | | | | | | |
| | |
Capital Share Transactions: | | | | | | | | |
Net asset value of shares issued upon reinvestment of dividends and distributions: | | | | | | | | |
Class A | | | 87 | | | | 100 | |
Class C | | | 86 | | | | 99 | |
Class R | | | 86 | | | | 100 | |
Institutional Class | | | 755,933 | | | | 870,910 | |
| | | | | | | | |
| | | 756,192 | | | | 871,209 | |
| | | | | | | | |
Increase in net assets derived from capital share transactions | | | 756,192 | | | | 871,209 | |
| | | | | | | | |
Net Increase (Decrease) in Net Assets | | | 1,399,456 | | | | (488,048 | ) |
| | |
Net Assets: | | | | | | | | |
Beginning of year | | | 18,537,520 | | | | 19,025,568 | |
| | | | | | | | |
End of year | | $ | 19,936,976 | | | $ | 18,537,520 | |
| | | | | | | | |
| | |
Distributions in excess of net investment income | | $ | (2,321 | ) | | $ | (5,467 | ) |
| | | | | | | | |
See accompanying notes, which are an integral part of the financial statements.
22
This page intentionally left blank.
Financial highlights
Delaware Emerging Markets Debt Fund Class A
Selected data for each share of the Fund outstanding throughout each period were as follows:
|
Net asset value, beginning of period |
|
Income (loss) from investment operations: |
Net investment income2 |
Net realized and unrealized gain (loss) |
Total from investment operations |
|
Less dividends and distributions from: |
Net investment income |
Net realized gain |
Total dividends and distributions |
|
Net asset value, end of period |
|
Total return3 |
|
Ratios and supplemental data: |
Net assets, end of period (000 omitted) |
Ratio of expenses to average net assets excluding interest expense |
Ratio of expenses to average net assets |
Ratio of expenses to average net assets prior to fees waived |
Ratio of net investment income to average net assets excluding interest expense |
Ratio of net investment income to average net assets |
Ratio of net investment income to average net assets prior to fees waived |
Portfolio turnover |
| 1 | Date of commencement of operations; ratios have been annualized and total return and portfolio turnover have not been annualized. |
| 2 | The average shares outstanding method has been applied for per share information. |
| 3 | Total investment return is based on the change in net asset value of a share during the period and assumes reinvestment of dividends and distributions at net asset value and does not reflect the impact of a sales charge. Total investment return during all of the periods shown reflects waivers by the manager and/or distributor. Performance would have been lower had the waivers not been in effect. |
See accompanying notes, which are an integral part of the financial statements.
24
| | | | | | | | | | | | | | | | |
| | | | | | | | | 9/30/131 | | | | |
| | | Year ended | | | to | | | | |
| | | | | | | | | | | | |
| | | 7/31/16 | | | 7/31/15 | | | 7/31/14 | | | | |
| |
| | | | |
| | $ | 8.210 | | | $ | 8.840 | | | $ | 8.500 | | | | | |
| | | | |
| | | | | | | | | | | | | | | | | |
| | | 0.358 | | | | 0.371 | | | | 0.323 | | | | | |
| | | 0.241 | | | | (0.604 | ) | | | 0.333 | | | | | |
| | | | | | | | | | | | | | | | |
| | | 0.599 | | | | (0.233 | ) | | | 0.656 | | | | | |
| | | | | | | | | | | | | | | | |
| | | | |
| | | | | | | | | | | | | | | | | |
| | | (0.329 | ) | | | (0.303 | ) | | | (0.316 | ) | | | | |
| | | — | | | | (0.094 | ) | | | — | | | | | |
| | | | | | | | | | | | | | | | |
| | | (0.329 | ) | | | (0.397 | ) | | | (0.316 | ) | | | | |
| | | | | | | | | | | | | | | | |
| | | | |
| | $ | 8.480 | | | $ | 8.210 | | | $ | 8.840 | | | | | |
| | | | | | | | | | | | | | | | |
| | | | |
| | | 7.62% | | | | (2.65% | ) | | | 7.86% | | | | | |
| | | | |
| | | | | | | | | | | | | | | | | |
| | $ | 3 | | | $ | 2 | | | $ | 2 | | | | | |
| | | 1.01% | | | | 1.08% | | | | 1.31% | | | | | |
| | | 1.03% | | | | 1.14% | | | | 1.50% | | | | | |
| | | 2.04% | | | | 2.03% | | | | 2.48% | | | | | |
| | | 4.44% | | | | 4.46% | | | | 4.66% | | | | | |
| | | 4.42% | | | | 4.40% | | | | 4.47% | | | | | |
| | | 3.41% | | | | 3.51% | | | | 3.49% | | | | | |
| | | 232% | | | | 288% | | | | 152% | | | | | |
25
Financial highlights
Delaware Emerging Markets Debt Fund Class C
Selected data for each share of the Fund outstanding throughout each period were as follows:
|
Net asset value, beginning of period |
|
Income (loss) from investment operations: |
Net investment income2 |
Net realized and unrealized gain (loss) |
Total from investment operations |
|
Less dividends and distributions from: |
Net investment income |
Net realized gain |
Total dividends and distributions |
|
Net asset value, end of period |
|
Total return3 |
|
Ratios and supplemental data: |
Net assets, end of period (000 omitted) |
Ratio of expenses to average net assets excluding interest expense |
Ratio of expenses to average net assets |
Ratio of expenses to average net assets prior to fees waived |
Ratio of net investment income to average net assets excluding interest expense |
Ratio of net investment income to average net assets |
Ratio of net investment income to average net assets prior to fees waived |
Portfolio turnover |
| 1 | Date of commencement of operations; ratios have been annualized and total return and portfolio turnover have not been annualized. |
| 2 | The average shares outstanding method has been applied for per share information. |
| 3 | Total investment return is based on the change in net asset value of a share during the period and assumes reinvestment of dividends and distributions at net asset value and does not reflect the impact of a sales charge. Total investment return during all of the periods shown reflects waivers by the manager and/or distributor. Performance would have been lower had the waivers not been in effect. |
See accompanying notes, which are an integral part of the financial statements.
26
| | | | | | | | | | | | | | | | |
| | | | | | | | | 9/30/131 | | | | |
| | | Year ended | | | to | | | | |
| | | | | | | | | | | | |
| | | 7/31/16 | | | 7/31/15 | | | 7/31/14 | | | | |
| |
| | | | |
| | $ | 8.220 | | | $ | 8.840 | | | $ | 8.500 | | | | | |
| | | | |
| | | | | | | | | | | | | | | | | |
| | | 0.359 | | | | 0.371 | | | | 0.271 | | | | | |
| | | 0.230 | | | | (0.594 | ) | | | 0.333 | | | | | |
| | | | | | | | | | | | | | | | |
| | | 0.589 | | | | (0.223 | ) | | | 0.604 | | | | | |
| | | | | | | | | | | | | | | | |
| | | | |
| | | | | | | | | | | | | | | | | |
| | | (0.329 | ) | | | (0.303 | ) | | | (0.264 | ) | | | | |
| | | — | | | | (0.094 | ) | | | — | | | | | |
| | | | | | | | | | | | | | | | |
| | | (0.329 | ) | | | (0.397 | ) | | | (0.264 | ) | | | | |
| | | | | | | | | | | | | | | | |
| | | | |
| | $ | 8.480 | | | $ | 8.220 | | | $ | 8.840 | | | | | |
| | | | | | | | | | | | | | | | |
| | | | |
| | | 7.49% | | | | (2.53% | ) | | | 7.22% | | | | | |
| | | | |
| | | | | | | | | | | | | | | | | |
| | $ | 2 | | | $ | 2 | | | $ | 2 | | | | | |
| | | 1.01% | | | | 1.08% | | | | 2.03% | | | | | |
| | | 1.03% | | | | 1.14% | | | | 2.22% | | | | | |
| | | 2.79% | | | | 2.78% | | | | 3.20% | | | | | |
| | | 4.44% | | | | 4.46% | | | | 3.94% | | | | | |
| | | 4.42% | | | | 4.40% | | | | 3.75% | | | | | |
| | | 2.66% | | | | 2.76% | | | | 2.77% | | | | | |
| | | 232% | | | | 288% | | | | 152% | | | | | |
27
Financial highlights
Delaware Emerging Markets Debt Fund Class R
Selected data for each share of the Fund outstanding throughout each period were as follows:
|
Net asset value, beginning of period |
|
Income (loss) from investment operations: |
Net investment income2 |
Net realized and unrealized gain (loss) |
Total from investment operations |
|
Less dividends and distributions from: |
Net investment income |
Net realized gain |
Total dividends and distributions |
|
Net asset value, end of period |
|
Total return3 |
|
Ratios and supplemental data: |
Net assets, end of period (000 omitted) |
Ratio of expenses to average net assets excluding interest expense |
Ratio of expenses to average net assets |
Ratio of expenses to average net assets prior to fees waived |
Ratio of net investment income to average net assets excluding interest expense |
Ratio of net investment income to average net assets |
Ratio of net investment income to average net assets prior to fees waived |
Portfolio turnover |
| 1 | Date of commencement of operations; ratios have been annualized and total return and portfolio turnover have not been annualized. |
| 2 | The average shares outstanding method has been applied for per share information. |
| 3 | Total investment return is based on the change in net asset value of a share during the period and assumes reinvestment of dividends and distributions at net asset value. Total investment return during all of the periods shown reflects waivers by the manager and/or distributor. Performance would have been lower had the waivers not been in effect. |
See accompanying notes, which are an integral part of the financial statements.
28
| | | | | | | | | | | | | | | | |
| | | | | | | | | 9/30/131 | | | | |
| | | Year ended | | | to | | | | |
| | | | | | | | | | | | |
| | | 7/31/16 | | | 7/31/15 | | | 7/31/14 | | | | |
| |
| | | | |
| | $ | 8.220 | | | $ | 8.840 | | | $ | 8.500 | | | | | |
| | | | |
| | | | | | | | | | | | | | | | | |
| | | 0.359 | | | | 0.371 | | | | 0.306 | | | | | |
| | | 0.230 | | | | (0.594 | ) | | | 0.332 | | | | | |
| | | | | | | | | | | | | | | | |
| | | 0.589 | | | | (0.223 | ) | | | 0.638 | | | | | |
| | | | | | | | | | | | | | | | |
| | | | |
| | | | | | | | | | | | | | | | | |
| | | (0.329 | ) | | | (0.303 | ) | | | (0.298 | ) | | | | |
| | | — | | | | (0.094 | ) | | | — | | | | | |
| | | | | | | | | | | | | | | | |
| | | (0.329 | ) | | | (0.397 | ) | | | (0.298 | ) | | | | |
| | | | | | | | | | | | | | | | |
| | | | |
| | $ | 8.480 | | | $ | 8.220 | | | $ | 8.840 | | | | | |
| | | | | | | | | | | | | | | | |
| | | | |
| | | 7.49% | | | | (2.53% | ) | | | 7.64% | | | | | |
| | | | |
| | | | | | | | | | | | | | | | | |
| | $ | 2 | | | $ | 2 | | | $ | 2 | | | | | |
| | | 1.01% | | | | 1.08% | | | | 1.55% | | | | | |
| | | 1.03% | | | | 1.14% | | | | 1.74% | | | | | |
| | | 2.29% | | | | 2.28% | | | | 2.72% | | | | | |
| | | 4.44% | | | | 4.46% | | | | 4.42% | | | | | |
| | | 4.42% | | | | 4.40% | | | | 4.23% | | | | | |
| | | 3.16% | | | | 3.26% | | | | 3.25% | | | | | |
| | | 232% | | | | 288% | | | | 152% | | | | | |
29
Financial highlights
Delaware Emerging Markets Debt Fund Institutional Class
Selected data for each share of the Fund outstanding throughout each period were as follows:
|
Net asset value, beginning of period |
|
Income (loss) from investment operations: |
Net investment income2 |
Net realized and unrealized gain (loss) |
Total from investment operations |
|
Less dividends and distributions from: |
Net investment income |
Net realized gain |
Total dividends and distributions |
|
Net asset value, end of period |
|
Total return3 |
|
Ratios and supplemental data: |
Net assets, end of period (000 omitted) |
Ratio of expenses to average net assets excluding interest expense |
Ratio of expenses to average net assets |
Ratio of expenses to average net assets prior to fees waived |
Ratio of net investment income to average net assets excluding interest expense |
Ratio of net investment income to average net assets |
Ratio of net investment income to average net assets prior to fees waived |
Portfolio turnover |
| 1 | Date of commencement of operations; ratios have been annualized and total return and portfolio turnover have not been annualized. |
| 2 | The average shares outstanding method has been applied for per share information. |
| 3 | Total investment return is based on the change in net asset value of a share during the period and assumes reinvestment of dividends and distributions at net asset value. Total investment return during all of the periods shown reflects a waiver by the manager. Performance would have been lower had the waiver not been in effect. |
See accompanying notes, which are an integral part of the financial statements.
30
| | | | | | | | | | | | | | | | |
| | | | | | | | | 9/30/131 | | | | |
| | | Year ended | | | to | | | | |
| | | | | | | | | | | | |
| | | 7/31/16 | | | 7/31/15 | | | 7/31/14 | | | | |
| |
| | | | |
| | $ | 8.220 | | | $ | 8.840 | | | $ | 8.500 | | | | | |
| | | | |
| | | | | | | | | | | | | | | | | |
| | | 0.359 | | | | 0.371 | | | | 0.340 | | | | | |
| | | 0.230 | | | | (0.594 | ) | | | 0.333 | | | | | |
| | | | | | | | | | | | | | | | |
| | | 0.589 | | | | (0.223 | ) | | | 0.673 | | | | | |
| | | | | | | | | | | | | | | | |
| | | | |
| | | | | | | | | | | | | | | | | |
| | | (0.329 | ) | | | (0.303 | ) | | | (0.333 | ) | | | | |
| | | — | | | | (0.094 | ) | | | — | | | | | |
| | | | | | | | | | | | | | | | |
| | | (0.329 | ) | | | (0.397 | ) | | | (0.333 | ) | | | | |
| | | | | | | | | | | | | | | | |
| | | | |
| | $ | 8.480 | | | $ | 8.220 | | | $ | 8.840 | | | | | |
| | | | | | | | | | | | | | | | |
| | | | |
| | | 7.49% | | | | (2.53% | ) | | | 8.08% | | | | | |
| | | | |
| | | | | | | | | | | | | | | | | |
| | $ | 19,930 | | | $ | 18,532 | | | $ | 19,020 | | | | | |
| | | 1.01% | | | | 1.08% | | | | 1.07% | | | | | |
| | | 1.03% | | | | 1.14% | | | | 1.26% | | | | | |
| | | 1.79% | | | | 1.78% | | | | 2.24% | | | | | |
| | | 4.44% | | | | 4.46% | | | | 4.90% | | | | | |
| | | 4.42% | | | | 4.40% | | | | 4.71% | | | | | |
| | | 3.66% | | | | 3.76% | | | | 3.73% | | | | | |
| | | 232% | | | | 288% | | | | 152% | | | | | |
31
| | |
| Notes to financial statements |
| Delaware Emerging Markets Debt Fund | | July 31, 2016 |
Delaware Group® Government Fund (Trust) is organized as a Delaware statutory trust and offers two series: Delaware Core Plus Bond Fund and Delaware Emerging Markets Debt Fund. These financial statements and the related notes pertains to Delaware Emerging Markets Debt Fund (Fund). The Trust is an open-end investment company. The Fund is considered diversified under the Investment Company Act of 1940, as amended, and offers Class A, Class C, Class R, and Institutional Class shares. Class A shares are sold with a maximum front-end sales charge of 4.50%. Class A share purchases of $1,000,000 or more will incur a contingent deferred sales charge (CDSC) of 1.00% if redeemed during the first year and 0.50% during the second year, provided that Delaware Distributors, L.P. (DDLP) paid a financial advisor a commission on the purchase of those shares. Class C shares are sold with a CDSC charge of 1.00%, if redeemed during the first 12 months. Class R and Institutional Class shares are not subject to a sales charge and are offered for sale exclusively to certain eligible investors.
The investment objective of the Fund is to primarily seek current income and secondarily capital appreciation.
1. Significant Accounting Policies
The following accounting policies are in accordance with U.S. generally accepted accounting principles (U.S. GAAP) and are consistently followed by the Fund.
Security Valuation — Equity securities and exchange-traded funds (ETFs), except those traded on the Nasdaq Stock Market LLC (Nasdaq), are valued at the last quoted sales price as of the time of the regular close of the New York Stock Exchange on the valuation date. Equity securities and ETFs traded on the Nasdaq are valued in accordance with the Nasdaq Official Closing Price, which may not be the last sales price. If, on a particular day, an equity security or ETF does not trade, the mean between the bid and ask prices will be used, which approximates fair value. Securities listed on a foreign exchange are normally valued at the last quoted sales price on the valuation date. Debt securities are valued based upon valuations provided by an independent pricing service or broker/counterparty and reviewed by management. To the extent current market prices are not available, the pricing service may take into account developments related to the specific security, as well as transactions in comparable securities. U.S. government and agency securities are valued at the mean between the bid and ask prices, which approximates fair value. Valuations for fixed income securities utilize matrix systems, which reflect such factors as security prices, yields, maturities, and ratings, and are supplemented by dealer and exchange quotations. Foreign currency exchange contracts and foreign cross currency exchange contracts are valued at the mean between the bid and ask prices, which approximates fair value. Interpolated values are derived when the settlement date of the contract is an interim date for which quotations are not available. Generally, other securities and assets for which market quotations are not readily available are valued at fair value as determined in good faith under the direction of the Trust’s Board of Trustees (Board). In determining whether market quotations are readily available or fair valuation will be used, various factors will be taken into consideration, such as market closures or suspension of trading in a security.
Federal and Foreign Income Taxes — No provision for federal income taxes has been made as the Fund intends to continue to qualify for federal income tax purposes as a regulated investment company under Subchapter M of the Internal Revenue Code of 1986, as amended, and make the requisite distributions to shareholders. The Fund evaluates tax positions taken or expected to be taken
32
in the course of preparing the Fund’s tax returns to determine whether the tax positions are “more-likely-than-not” of being sustained by the applicable tax authority. Tax positions not deemed to meet the “more-likely-than-not” threshold are recorded as a tax benefit or expense in the current year. Management has analyzed the Fund’s tax positions taken for all open federal income tax years (July 31, 2014–July 31, 2016), and has concluded that no provision for federal income tax is required in the Fund’s financial statements. In regard to foreign taxes only, the Fund has open tax years in certain foreign countries in which it invests that may date back to the inception of the Fund.
Class Accounting — Investment income, common expenses and realized and unrealized gain (loss) on investments are allocated to the various classes of the Fund on the basis of daily net assets of each class. Distribution expenses relating to a specific class are charged directly to that class.
Repurchase Agreements — The Fund may purchase certain U.S. government securities subject to the counterparty’s agreement to repurchase them at an agreed upon date and price. The counterparty will be required on a daily basis to maintain the value of the collateral subject to the agreement at not less than the repurchase price (including accrued interest). The agreements are conditioned upon the collateral being deposited under the Federal Reserve book-entry system with the Fund’s custodian or a third party sub-custodian. In the event of default or bankruptcy by the other party to the agreement, retention of the collateral may be subject to legal proceedings. All open repurchase agreements as of the date of this report were entered into on July 29, 2016 and matured on the next business day.
Short Sales — The Fund may make short sales in an attempt to protect against declines in an individual security or the overall market, to manage duration, or for such other purposes consistent with the Fund’s investment objectives and strategies. Typically, short sales are transactions in which the Fund sells a security it does not own and, at the time a short sale is effected, the Fund incurs an obligation to replace the security borrowed at whatever its price may be at the time the Fund purchases it for delivery to the lender. The price at such time may be more or less than the price at which the security was sold by the Fund. When a short sale transaction is closed out by delivery of the security, any gain or loss on the transaction generally is taxable as short-term capital gain or loss. Until the security is replaced, the Fund is required to pay to the lender amounts equal to any dividends or interest that accrue during the period of the loan. To borrow the security, the Fund also may be required to pay a premium, which would increase the cost of the security sold. The proceeds of the short sale, and potentially additional margin, will be retained by the broker from whom the security is borrowed, to the extent necessary to meet margin requirements, until the short position is closed out.
Leverage — The Fund may employ leverage to attempt to take advantage of or increase the total return of investment opportunities the investment manager believes are attractive. The Fund may initiate leverage to the extent that the sum of aggregate borrowed funds and the notional value plus any gain or minus any loss of derivatives positions may not exceed an amount equal to 33 1/3% of the Fund’s total assets, measured at the time the leverage is employed. When the Fund initiates leverage, the leverage may include borrowing through a margin account maintained with a broker. For the year ended July 31, 2016, the Fund maintained an average margin account balance of $66,785 for which it paid interest at an average rate of 5.18%.
Foreign Currency Transactions — Transactions denominated in foreign currencies are recorded at the prevailing exchange rates on the valuation date in accordance with the Fund’s prospectus. The value of
33
Notes to financial statements
Delaware Emerging Markets Debt Fund
1. Significant Accounting Policies (continued)
all assets and liabilities denominated in foreign currencies is translated daily into U.S. dollars at the exchange rate of such currencies against the U.S. dollar. Transaction gains or losses resulting from changes in exchange rates during the reporting period or upon settlement of the foreign currency transaction are reported in operations for the current period. The Fund generally bifurcates that portion of realized gains and losses on investments in debt securities which is due to changes in foreign exchange rates from that which is due to changes in market prices of debt securities. That portion of gains (losses) attributable to changes in foreign exchange rates is included on the “Statement of operations” under “Net realized gain (loss) on foreign currencies.” The Fund reports certain foreign currency related transactions as components of realized gains (losses) for financial reporting purposes, whereas such components are treated as ordinary income (loss) for federal income tax purposes.
Use of Estimates — The Fund is an investment company, whose financial statements are prepared in conformity with U.S. GAAP. Therefore, the Fund follows the accounting and reporting guidelines for investment companies. The preparation of financial statements in conformity with U.S. GAAP requires management to make estimates and assumptions that affect the fair value of investments, the reported amounts of assets and liabilities and disclosure of contingent assets and liabilities at the date of the financial statements, and the reported amounts of revenues and expenses during the reporting period. Actual results could differ from those estimates and the differences could be material.
Other — Expenses directly attributable to the Fund are charged directly to the Fund. Other expenses common to various funds within the Delaware Investments® Family of Funds are generally allocated among such funds on the basis of average net assets. Management fees and some other expenses are paid monthly. Security transactions are recorded on the date the securities are purchased or sold (trade date) for financial reporting purposes. Costs used in calculating realized gains and losses on the sale of investment securities are those of the specific securities sold. Dividend income is recorded on the ex-dividend date and interest income is recorded on the accrual basis. Discounts and premiums on debt securities are accreted or amortized to interest income, respectively, over the lives of the respective securities using the effective interest method. The Fund declares and pays dividends from net investment income monthly and pays distributions from net realized gain on investments, if any, annually. The Fund may distribute more frequently, if necessary for tax purposes. Dividends and distributions, if any, are recorded on the ex-dividend date.
The Fund may receive earnings credits from its custodian when positive cash balances are maintained, which may be used to offset custody fees. There were no such earnings credits for the year ended July 31, 2016.
The Fund may receive earnings credits from its transfer agent when positive cash balances are maintained, which may be used to offset transfer agent fees. If the amount earned is greater than $1.00, the expense paid under this arrangement is included on the “Statement of operations” under “Dividend disbursing and transfer agent fees and expenses” with the corresponding expense offset shown under “Less expense paid indirectly.” For the year ended July 31, 2016, the Fund earned less than $1.00 under this agreement.
34
2. Investment Management, Administration Agreements, and Other Transactions with Affiliates
In accordance with the terms of its investment management agreement, the Fund pays Delaware Management Company (DMC), a series of Delaware Management Business Trust and the investment manager, an annual fee which is calculated daily at the rate of 0.75% on the first $500 million of average daily net assets of the Fund, 0.70% on the next $500 million, 0.65% on the next $1.5 billion, and 0.60% on average daily net assets in excess of $2.5 billion.
DMC has contractually agreed to waive all or a portion, if any, of its management fee and/or pay/reimburse the Fund to the extent necessary to limit annual operating expenses (excluding any 12b-1 fees, taxes, interest, short sale dividend and interest expenses, brokerage fees, certain insurance costs, acquired fund fees and expenses, and nonroutine expenses or costs including, but not limited to, those relating to reorganizations, litigation, conducting shareholder meetings, and liquidations), to 1.00% of average daily net assets of the Fund from Aug. 1, 2015 through July 31, 2016.* For purposes of this waiver and reimbursement, nonroutine expenses may also include such additional costs and expenses, as may be agreed upon from time to time by the Fund’s Board and DMC. This expense waiver and reimbursement may be terminated only by agreement of the Fund’s Board and DMC and apply only to expenses paid directly by the Fund.
Delaware Investments Fund Services Company (DIFSC), an affiliate of DMC, provides fund accounting and financial administration oversight services to the Fund. For these services, DIFSC’s fees are calculated based on the aggregate daily net assets of the Delaware Investments® Family of Funds at the following annual rate: 0.0050% of the first $30 billion; 0.0045% of the next $10 billion; 0.0040% of the next $10 billion; and 0.0025% of aggregate average daily net assets in excess of $50 billion. The fees payable to DIFSC under the service agreement described above are allocated among all funds in the Delaware Investments Family of Funds on a relative NAV basis. For the year ended July 31, 2016, the Fund was charged $877 for these services. This amount is included on the “Statement of operations” under “Accounting and administration expenses.”
DIFSC is also the transfer agent and dividend disbursing agent of the Fund. For these services, DIFSC’s fees are calculated based on the aggregate daily net assets of the retail funds within the Delaware Investments Family of Funds at the following annual rate: 0.025% of the first $20 billion; 0.020% of the next $5 billion; 0.015% of the next $5 billion; and 0.013% of average daily net assets in excess of $30 billion. The fees payable to DIFSC under the service agreement described above are allocated among all retail funds in the Delaware Investments Family of Funds on a relative NAV basis. This amount is included on the “Statement of operations” under “Dividend disbursing and transfer agent fees and expenses.” For the year ended July 31, 2016, the Fund was charged $3,842 for these services. Pursuant to a sub-transfer agency agreement between DIFSC and BNY Mellon Investment Servicing (US) Inc. (BNYMIS), BNYMIS provides certain sub-transfer agency services to the Fund. Sub-transfer agency fees are paid by the Fund and are also included on the “Statement of operations” under “Dividend disbursing and transfer agent fees and expenses.”
Pursuant to a distribution agreement and distribution plan, the Fund pays DDLP, the distributor and an affiliate of DMC, an annual distribution and service fee of 0.25%, 1.00%, and 0.50% of the average daily net assets of the Class A, Class C, and Class R shares, respectively. Institutional Class shares pay no distribution and service expenses. Effective July 22, 2014, DDLP agreed to voluntarily suspend the
35
Notes to financial statements
Delaware Emerging Markets Debt Fund
2. Investment Management, Administration Agreements, and Other Transactions with Affiliates (continued)
distribution and service fees for Class A, Class C, and Class R shares. The suspension of the distribution and service fees will remain in effect while the Fund is not broadly distributed.
As provided in the investment management agreement, the Fund bears a portion of the cost of resources shared with DMC, including the cost of internal personnel of DMC and/or its affiliates that provide legal, tax, and regulatory reporting services to the Fund. For the year ended July 31, 2016, the Fund was charged $393 for internal legal, tax, and regulatory reporting services provided by DMC and/or its affiliates’ employees. This amount is included on the “Statement of operations” under “Legal fees.”
For the year ended July 31, 2016, DDLP earned no commissions on sales of the Fund’s Class A shares. For the year ended July 31, 2016, DDLP received no gross CDSC commissions on redemption of the Fund’s Class A and Class C shares.
Trustees’ fees include expenses accrued by the Fund for each Trustee’s retainer and meeting fees. Certain officers of DMC, DIFSC, and DDLP are officers and/or Trustees of the Trust. These officers and Trustees are paid no compensation by the Fund.
* The aggregate contractual waiver period covering this report is from Nov. 28, 2014, through Nov. 28, 2016.
3. Investments
For the year ended July 31, 2016, the Fund made purchases and sales of investment securities other than short-term investments as follows:
| | | | |
Purchases | | $ | 40,811,337 | |
Sales | | | 40,506,138 | |
At July 31, 2016, the cost and unrealized appreciation (depreciation) of investments for federal income tax purposes for the Fund were as follows:
| | | | |
Cost of investments | | $ | 18,575,207 | |
| | | | |
Aggregate unrealized appreciation of investments | | $ | 809,255 | |
Aggregate unrealized depreciation of investments | | | (126,008 | ) |
| | | | |
Net unrealized appreciation of investments | | $ | 683,247 | |
| | | | |
U.S. GAAP defines fair value as the price that the Fund would receive to sell an asset or pay to transfer a liability in an orderly transaction between market participants at the measurement date under current market conditions. A three-level hierarchy for fair value measurements has been established based upon the transparency of inputs to the valuation of an asset or liability. Inputs may be observable or unobservable and refer broadly to the assumptions that market participants would use in pricing the asset or liability. Observable inputs reflect the assumptions market participants would use in pricing the asset or liability based on market data obtained from sources independent of the reporting entity. Unobservable inputs reflect the reporting entity’s own assumptions about the assumptions that market participants would use in pricing the asset or liability based on the best information available under the circumstances. The Fund’s investment in its entirety is assigned a level based upon the
36
observability of the inputs which are significant to the overall valuation. The three-level hierarchy of inputs is summarized below.
| | |
| Level 1 – | | Inputs are quoted prices in active markets for identical investments. (Examples: equity securities, open-end investment companies, futures contracts, exchange-traded options contracts) |
| |
| Level 2 – | | Other observable inputs, including, but not limited to: quoted prices for similar assets or liabilities in markets that are active, quoted prices for identical or similar assets or liabilities in markets that are not active, inputs other than quoted prices that are observable for the assets or liabilities (such as interest rates, yield curves, volatilities, prepayment speeds, loss severities, credit risks and default rates) or other market-corroborated inputs. (Examples: debt securities, government securities, swap contracts, foreign currency exchange contracts, foreign securities utilizing international fair value pricing, broker-quoted securities, fair valued securities) |
| |
| Level 3 – | | Significant unobservable inputs, including the Fund’s own assumptions used to determine the fair value of investments. (Examples: broker-quoted securities, fair valued securities) |
Level 3 investments are valued using significant unobservable inputs. The Fund may also use an income-based valuation approach in which the anticipated future cash flows of the investment are discounted to calculate fair value. Discounts may also be applied due to the nature or duration of any restrictions on the disposition of the investments. Valuations may also be based upon current market prices of securities that are comparable in coupon, rating, maturity, and industry. The derived value of a Level 3 investment may not represent the value which is received upon disposition and this could impact the results of operations.
The following table summarizes the valuation of the Fund’s investments by fair value hierarchy levels as of July 31, 2016:
| | | | | | | | | | | | | | | | |
Securities | | Level 1 | | | Level 2 | | | Level 3 | | | Total | |
Corporate Debt | | $ | — | | | $ | 12,985,897 | | | $ | — | | | $ | 12,985,897 | |
Foreign Debt | | | — | | | | 4,951,079 | | | | — | | | | 4,951,079 | |
Senior Secured Loan | | | — | | | | — | | | | 418,359 | | | | 418,359 | |
Exchange-Traded Fund | | | 189,300 | | | | — | | | | — | | | | 189,300 | |
Short-Term Investments | | | — | | | | 713,819 | | | | — | | | | 713,819 | |
| | | | | | | | | | | | | | | | |
Total Value of Securities | | $ | 189,300 | | | $ | 18,650,795 | | | $ | 418,359 | | | $ | 19,258,454 | |
| | | | | | | | | | | | | | | | |
Foreign Currency Exchange Contracts | | $ | — | | | $ | (1,539 | ) | | $ | — | | | $ | (1,539 | ) |
37
Notes to financial statements
Delaware Emerging Markets Debt Fund
3. Investments (continued)
During the year ended July 31, 2016, there were no transfers between Level 1 investments, Level 2 investments or Level 3 investments that had a significant impact to the Fund. The Fund’s policy is to recognize transfers between levels at the beginning of the reporting period.
The Fund’s investments that are categorized as Level 3 were valued utilizing third party pricing information without adjustment. Such valuations are based on unobservable inputs. A significant change in third party information inputs could result in significantly lower or higher value of such Level 3 investments. The following is a reconciliation of investments in which significant unobservable inputs (Level 3) were used in determining fair value:
| | | | |
| | | Senior Secured Loan | |
Balance as of 7/31/15 | | | $495,975 | |
Net change in unrealized appreciation (depreciation) | | | (45,741) | |
Sales | | | (31,875) | |
Balance as of 7/31/16 | | | $418,359 | |
Net change in unrealized appreciation (depreciation) from investments still held at the end of the period | | | $ (45,741) �� | |
4. Dividend and Distribution Information
Income and long-term capital gain distributions are determined in accordance with federal income tax regulations, which may differ from U.S. GAAP. Additionally, distributions from net gains on foreign currency transactions and net short-term gains on sales of investment securities are treated as ordinary income for federal income tax purposes. The tax character of dividends and distributions paid during the years ended July 31, 2016 and 2015 was as follows:
| | | | | | | | | | | | |
| | | Year ended | |
| | | 7/31/16 | | | | | | 7/31/15 | |
Ordinary income | | $ | 756,192 | | | | | | | $ | 851,429 | |
Long term capital gains | | | — | | | | | | | | 19,780 | |
| | | | | | | | | | | | |
Total | | $ | 756,192 | | | | | | | $ | 871,209 | |
| | | | | | | | | | | | |
5. Components of Net Assets on a Tax Basis
As of July 31, 2016, the components of net assets on a tax basis were as follows:
| | | | |
Shares of beneficial interest | | $ | 19,929,444 | |
Undistributed ordinary income | | | 1,193 | |
Straddle losses deferred | | | (5,039 | ) |
Capital loss carryforwards | | | (672,041 | ) |
Unrealized appreciation of investments and foreign currencies | | | 683,419 | |
| | | | |
Net assets | | $ | 19,936,976 | |
| | | | |
The differences between book basis and tax basis components of the net assets are primarily attributable to tax deferral of losses on wash sales and mark-to-market of forward foreign currency contracts.
38
For financial reporting purposes, capital accounts are adjusted to reflect the tax character of permanent book/tax differences. Reclassifications are primarily due to tax treatment of gain (loss) on foreign currency transactions, foreign capital gains tax, and non-deductible short sale dividend expense. Results of operations and net assets were not affected by these reclassifications. For the year ended July 31, 2016, the Fund recorded the following reclassifications:
| | | | |
Distributions in excess of net investment income | | $ | (56,554 | ) |
Accumulated net realized loss on investments | | | 56,554 | |
On Dec. 22, 2010, the Regulated Investment Company Modernization Act of 2010 (Act) was enacted, which changed various technical rules governing the tax treatment of regulated investment companies. The changes were generally effective for taxable years beginning after the date of enactment. Under the Act, the Fund is permitted to carry forward capital losses incurred in taxable years beginning after the date of enactment for an unlimited period. Additionally, post-enactment capital loss carryforwards will retain their character as either short-term or long-term capital losses rather than being considered all short-term as permitted under previous regulation.
Losses incurred that will be carried forward under the Act are as follows:
| | | | | | | | | | | | |
| | | Loss carryforward character | |
| | | Short-term | | | | | | Long-term | |
| | $ | 173,777 | | | | | | | $ | 498,264 | |
6. Capital Shares
Transactions in capital shares were as follows:
| | | | | | | | | | | | |
| | | Year ended | |
| | | 7/31/16 | | | | | | 7/31/15 | |
Shares issued upon reinvestment of dividends and distributions: | | | | | | | | | | | | |
Class A | | | 11 | | | | | | | | 12 | |
Class C | | | 11 | | | | | | | | 12 | |
Class R | | | 11 | | | | | | | | 12 | |
Institutional Class | | | 94,559 | | | | | | | | 103,729 | |
| | | | | | | | | | | | |
Net increase | | | 94,592 | | | | | | | | 103,765 | |
| | | | | | | | | | | | |
7. Line of Credit
The Fund, along with certain other funds in the Delaware Investments® Family of Funds (Participants), was a participant in a $275,000,000 revolving line of credit intended to be used for temporary or emergency purposes as an additional source of liquidity to fund redemptions of investor shares. Under the agreement, the Participants were charged an annual commitment fee of 0.08%, which was allocated across the Participants on the basis of each Participant’s allocation of the entire facility. The Participants were permitted to borrow up to a maximum of one third of their net assets under the agreement. Each Participant was individually, and not jointly, liable for its particular advances, if any, under the line of credit. The line of credit under the agreement expired on Nov. 9, 2015.
39
Notes to financial statements
Delaware Emerging Markets Debt Fund
7. Line of Credit (continued)
On Nov. 9, 2015, the Fund, along with the other Participants, entered into an amendment to the agreement for a $155,000,000 revolving line of credit. The line of credit is to be used as described above and operates in substantially the same manner as the original agreement, with the exception of the annual commitment fee. Under the amendment to the agreement, the Participants are charged an annual commitment fee of 0.10%, which is allocated across the Participants on the basis of each Participant’s allocation of the entire facility. The line of credit available under the agreement expires on Nov. 7, 2016.
The Fund had no amounts outstanding as of July 31, 2016 or at any time during the year then ended.
8. Derivatives
U.S. GAAP requires disclosures that enable investors to understand: (1) how and why an entity uses derivatives; (2) how they are accounted for; and (3) how they affect an entity’s results of operations and financial position.
Foreign Currency Exchange Contracts — The Fund may enter into foreign currency exchange contracts and foreign cross currency exchange contracts as a way of managing foreign exchange rate risk. The Fund may enter into these contracts to fix the U.S. dollar value of a security that it has agreed to buy or sell for the period between the date the trade was entered into and the date the security is delivered and paid for. The Fund may also use these contracts to hedge the U.S. dollar value of securities it already owns that are denominated in foreign currencies. In addition, the Fund may enter into these contracts to facilitate or expedite the settlement of portfolio transactions. The change in value is recorded as an unrealized gain or loss. When the contract is closed, a realized gain or loss is recorded equal to the difference between the value of the contract at the time it was opened and the value at the time it was closed.
The use of foreign currency exchange contracts and foreign cross currency exchange contracts does not eliminate fluctuations in the underlying prices of the securities, but does establish a rate of exchange that can be achieved in the future. Although foreign currency exchange contracts and foreign cross currency exchange contracts limit the risk of loss due to an unfavorable change in the value of the hedged currency, they also limit any potential gain that might result should the value of the currency change favorably. In addition, the Fund could be exposed to risks if the counterparties to the contracts are unable to meet the terms of their contracts. The Fund’s maximum risk of loss from counterparty credit risk is the value of its currency exchanged with the counterparty. The risk is generally mitigated by having a netting arrangement between the Fund and the counterparty and by the posting of collateral by the counterparty to the Fund to cover the Fund’s exposure to the counterparty.
During the year ended July 31, 2016, the Fund entered into foreign currency exchange contracts and cross currency exchange contracts to fix the U.S. dollar value of a security between trade date and settlement date, to hedge the U.S. dollar value of securities it already owned that were denominated in foreign currencies, and to facilitate or expedite the settlement of portfolio transactions.
At July 31, 2016, the Fund experienced net realized and unrealized gains or losses attributable to foreign currency holdings, which are disclosed as “Unrealized appreciation or depreciation on foreign currency
40
exchange contracts” on the “Statement of assets and liabilities” and as “Net realized loss on foreign currency exchange contracts” on the “Statement of operations.”
Derivatives Generally. The table below summarizes the average balance of derivative holdings by the Fund during the year ended July 31, 2016.
| | | | | | | | |
| | | Long Derivative
Volume | | | Short Derivative
Volume | |
Foreign currency exchange contracts (average cost) | | | $232,450 | | | | $86,183 | |
9. Offsetting
In December 2011, the Financial Accounting Standards Board (FASB) issued guidance that expanded disclosure requirements on the offsetting of certain assets and liabilities. The disclosures are required for investments and derivative financial instruments subject to master netting or similar agreements which are eligible for offset in the “Statement of assets and liabilities” and require an entity to disclose both gross and net information about such investments and transactions in the financial statements. In January 2013, the FASB issued guidance that clarified which investments and transactions are subject to the offsetting disclosure requirements. The scope of the disclosure requirements for offsetting is limited to derivative instruments, repurchase agreements and reverse repurchase agreements, and securities borrowing.
In order to better define its contractual rights and to secure rights that will help the Fund mitigate its counterparty risk, the Fund entered into an International Swaps and Derivatives Association, Inc. Master Agreement (ISDA Master Agreement) or a similar agreement with certain of its derivative contract counterparties. An ISDA Master Agreement is a bilateral agreement between the Fund and a counterparty that governs over-the-counter (OTC) derivatives and foreign exchange contracts and typically contains, among other things, collateral posting items and provisions in the event of a default and/or termination event. Under an ISDA Master Agreement, the Fund may, under certain circumstances, offset with the counterparty certain derivative financial instruments’ payables and/or receivables with collateral held and/or posted and create one single net payment. The provisions of the ISDA Master Agreement typically permit a single net payment in the event of default (close-out), including the bankruptcy or insolvency of the counterparty. However, bankruptcy or insolvency laws of a particular jurisdiction may impose restrictions on or prohibitions against the right of offset in bankruptcy, insolvency, or other events.
For financial reporting purposes, the Fund does not offset derivative assets and derivative liabilities that are subject to netting arrangements in the “Statement of assets and liabilities.”
41
Notes to financial statements
Delaware Emerging Markets Debt Fund
9. Offsetting (continued)
At July 31, 2016, the Fund had the following assets and liabilities subject to offsetting provisions:
Offsetting of Financial Assets and Liabilities and Derivatives Assets and Liabilities
| | | | | | | | | | | | | | | |
Counterparty | | Gross Value of
Derivative Asset | | Gross Value of
Derivative Liability | | Net Position |
Barclays | | | $ | — | | | | $ | (574 | ) | | | $ | (574 | ) |
BNP Paribas | | | | 1,708 | | | | | — | | | | | 1,708 | |
BNY Mellon | | | | 1 | | | | | — | | | | | 1 | |
Credit Suisse First Boston | | | | — | | | | | (14 | ) | | | | (14 | ) |
Toronto Dominion Bank | | | | — | | | | | (2,660 | ) | | | | (2,660 | ) |
| | | | | | | | | | | | | | | |
Total | | | $ | 1,709 | | | | $ | (3,248 | ) | | | $ | (1,539 | ) |
| | | | | | | | | | | | | | | |
| | | | | | | | | | | | | | | | | | | | | | | | | | | | | | |
Counterparty | | Net Position | | Fair Value of
Non-Cash
Collateral Received | | Cash Collateral Received | | Fair Value of
Non-Cash
Collateral Pledged | | Cash Collateral Pledged | | Net Exposure(a) |
Barclays | | | $ | (574 | ) | | | $ | — | | | | $ | — | | | | $ | — | | | | $ | — | | | | $ | (574 | ) |
BNP Paribas | | | | 1,708 | | | | | — | | | | | — | | | | | — | | | | | — | | | | | 1,708 | |
BNY Mellon | | | | 1 | | | | | — | | | | | — | | | | | — | | | | | — | | | | | 1 | |
Credit Suisse First Boston | | | | (14 | ) | | | | — | | | | | — | | | | | — | | | | | — | | | | | (14 | ) |
Toronto Dominion Bank | | | | (2,660 | ) | | | | — | | | | | — | | | | | — | | | | | — | | | | | (2,660 | ) |
| | | | | | | | | | | | | | | | | | | | | | | | | | | | | | |
Total | | | $ | (1,539 | ) | | | $ | — | | | | $ | — | | | | $ | — | | | | $ | — | | | | $ | (1,539 | ) |
| | | | | | | | | | | | | | | | | | | | | | | | | | | | | | |
(a)Net exposure represents the receivable (payable) that would be due from (to) the counterparty in the event of default.
Master Repurchase Agreements
| | | | | | | | | | | | | | | | | | | | | | | | | |
Counterparty | | Repurchase Agreements | | Fair Value of
Non-Cash Collateral Received | | Cash Collateral Received | | Net Collateral Received | | Net Exposure(a) |
Bank of America Merrill Lynch | | | $ | 62,127 | | | | $ | (62,127 | ) | | | $ | — | | | | $ | (62,127 | ) | | | $ | — | |
Bank of Montreal | | | | 103,545 | | | | | (103,545 | ) | | | | — | | | | | (103,545 | ) | | | | — | |
BNP Paribas | | | | 53,328 | | | | | (53,328 | ) | | | | — | | | | | (53,328 | ) | | | | — | |
| | | | | | | | | | | | | | | | | | | | | | | | | |
Total | | | $ | 219,000 | | | | $ | (219,000 | ) | | | $ | — | | | | $ | (219,000 | ) | | | $ | — | |
| | | | | | | | | | | | | | | | | | | | | | | | | |
(a)Net exposure represents the receivable (payable) that would be due from (to) the counterparty in the event of default.
10. Securities Lending
Each Fund, along with other funds in the Delaware Investments® Family of Funds, may lend its securities pursuant to a security lending agreement (Lending Agreement) with The Bank of New York Mellon (BNY Mellon). At the time a security is loaned, the borrower must post collateral equal to the required percentage of the market value of the loaned security, including any accrued interest. The required percentage is: (1) 102% with respect to U.S. securities and foreign securities that are denominated and
42
payable in U.S. dollars; and (2) 105% with respect to foreign securities. With respect to each loan, if on any business day the aggregate market value of securities collateral plus cash collateral held is less than the aggregate market value of the securities which are the subject of such loan, the borrower will be notified to provide additional collateral by the end of the following business day which, together with the collateral already held, will be not less than the applicable initial collateral requirements for such security loan. If the aggregate market value of securities collateral and cash collateral held with respect to a security loan exceeds the applicable initial collateral requirement, upon request of the borrower, BNY Mellon must return enough collateral to the borrower by the end of the following business day to reduce the value of the remaining collateral to the applicable initial collateral requirement for such security loan. As a result of the foregoing, the value of the collateral held with respect to a loaned security on any particular day may be more or less than the value of the security on loan.
Prior to Dec. 29, 2015, cash collateral received was generally invested in the Delaware Investments Collateral Fund No. 1 (Collective Trust), a pooled account established by BNY Mellon for the use of funds managed by DMC that participate in BNY Mellon’s securities lending program. The Collective Trust sought to maintain a NAV per unit of $1.00.
On Dec. 29, 2015, the assets of the Collective Trust were transferred to a series of individual separate accounts, each corresponding to a Fund. The investment guidelines permit each separate account to hold certain securities that would be considered eligible securities for a money market fund. Cash collateral received is generally invested in government securities; certain obligations issued by government sponsored enterprises; repurchase agreements collateralized by U.S. Treasury securities; obligations issued by the central government of any Organization for Economic Cooperation and Development (OECD) country or its agencies, instrumentalities or establishments; obligations of supranational organizations, commercial paper, notes, bonds and other debt obligations; certificates of deposits and other bank obligations; and asset-backed securities.
In the event of default or bankruptcy by the lending agent, realization and/or retention of the collateral may be subject to legal proceedings. In the event the borrower fails to return loaned securities and the collateral received is insufficient to cover the value of the loaned securities and provided such collateral shortfall is not the result of investment losses, the lending agent has agreed to pay the amount of the shortfall to the Fund or, at the discretion of the lending agent, replace the loaned securities. The Fund continues to record dividends or interest, as applicable, on the securities loaned and is subject to changes in value of the securities loaned that may occur during the term of the loan. The Fund has the right under the Lending Agreement to recover the securities from the borrower on demand. With respect to security loans collateralized by non-cash collateral, the Fund receives loan premiums paid by the borrower. With respect to security loans collateralized by cash collateral, the earnings from the collateral investments are shared among the Fund, the security lending agent, and the borrower. The Fund records security lending income net of allocations to the security lending agent and the borrower.
The Fund may incur investment losses as a result of investing securities lending collateral. This could occur if an investment in the collateral investment account defaulted or became impaired. Under those circumstances, the value of a Fund’s cash collateral account may be less than the amount the Fund would be required to return to the borrowers of the securities and the Fund would be required to make up for this shortfall.
43
Notes to financial statements
Delaware Emerging Markets Debt Fund
10. Securities Lending (continued)
During the year ended July 31, 2016, the Fund had no securities on loan.
11. Credit and Market Risk
Some countries in which the Fund may invest require governmental approval for the repatriation of investment income, capital or the proceeds of sales of securities by foreign investors. In addition, if there is deterioration in a country’s balance of payments or for other reasons, a country may impose temporary restrictions on foreign capital remittances abroad.
The securities exchanges of certain foreign markets are substantially smaller, less liquid, and more volatile than the major securities markets in the United States. Consequently, acquisition and disposition of securities by the Fund may be inhibited. In addition, a significant portion of the aggregate market value of equity securities listed on the major securities exchanges in emerging markets is held by a smaller number of investors. This may limit the number of shares available for acquisition or disposition by the Fund.
The Fund invests a portion of its assets in high yield, fixed income securities, which are securities rated lower than BBB- by Standard & Poor’s Financial Services LLC and Baa3 by Moody’s Investors Service, Inc., or similarly rated by another nationally recognized statistical rating organization. Investments in these higher yielding securities are generally accompanied by a greater degree of credit risk than higher rated securities. Additionally, lower rated securities may be more susceptible to adverse economic and competitive industry conditions than investment grade securities.
The Fund invests in certain obligations that may have liquidity protection designed to ensure that the receipt of payments due on the underlying security is timely. Such protection may be provided through guarantees, insurance policies, or letters of credit obtained by the issuer or sponsor through third parties, through various means of structuring the transaction, or through a combination of such approaches. The Fund will not pay any additional fees for such credit support, although the existence of credit support may increase the price of the security.
The Fund invests in bank loans and other securities that may subject it to direct indebtedness risk, the risk that the Fund will not receive payment of principal, interest, and other amounts due in connection with these investments and will depend primarily on the financial condition of the borrower. Loans that are fully secured offer the Fund more protection than unsecured loans in the event of nonpayment of scheduled interest or principal, although there is no assurance that the liquidation of collateral from a secured loan would satisfy the corporate borrower’s obligation, or that the collateral can be liquidated. Some loans or claims may be in default at the time of purchase. Certain of the loans and the other direct indebtedness acquired by the Fund may involve revolving credit facilities or other standby financing commitments that obligate the Fund to pay additional cash on a certain date or on demand. These commitments may require the Fund to increase its investment in a company at a time when the Fund might not otherwise decide to do so (including at a time when the company’s financial condition makes it unlikely that such amounts will be repaid). To the extent that the Fund is committed to advance additional funds, it will at all times hold and maintain cash or other high grade debt obligations in an amount sufficient to meet such commitments. As the Fund may be required to rely upon another lending institution to collect and pass on to the Fund amounts payable with respect to the loan and to enforce
44
the Fund’s rights under the loan and other direct indebtedness, an insolvency, bankruptcy, or reorganization of the lending institution may delay or prevent the Fund from receiving such amounts. The highly leveraged nature of many loans may make them especially vulnerable to adverse changes in economic or market conditions. Investments in such loans and other direct indebtedness may involve additional risk to the Fund.
The Fund may invest up to 15% of its net assets in illiquid securities, which may include securities with contractual restrictions on resale, securities exempt from registration under Rule 144A promulgated under the Securities Act of 1933, as amended, and other securities which may not be readily marketable. The relative illiquidity of these securities may impair the Fund from disposing of them in a timely manner and at a fair price when it is necessary or desirable to do so. While maintaining oversight, the Fund’s Board has delegated to DMC, the day-to-day functions of determining whether individual securities are liquid for purposes of the Fund’s limitation on investments in illiquid securities. Securities eligible for resale pursuant to Rule 144A, which are determined to be liquid, are not subject to the Fund’s 15% limit on investments in illiquid securities. Rule 144A and illiquid securities have been identified on the “Schedule of investments.” When monitoring compliance with the Fund’s illiquid limit, certain holdings that are common to multiple clients of the investment manager may be aggregated and considered illiquid in the aggregate solely for monitoring purposes. For purposes of determining illiquidity for financial reporting purposes, only the holdings of this Fund will be considered.
12. Contractual Obligations
The Fund enters into contracts in the normal course of business that contain a variety of indemnifications. The Fund’s maximum exposure under these arrangements is unknown. However, the Fund has not had prior claims or losses pursuant to these contracts. Management has reviewed the Fund’s existing contracts and expects the risk of loss to be remote.
13. Subsequent Events
Management has determined that no material events or transactions occurred subsequent to July 31, 2016 that would require recognition or disclosure in the Fund’s financial statements.
45
Report of independent
registered public accounting firm
To the Board of Trustees of Delaware Group® Government Fund
and the Shareholders of Delaware Emerging Markets Debt Fund:
In our opinion, the accompanying statement of assets and liabilities, including the schedule of investments, and the related statements of operations, of changes in net assets and the financial highlights present fairly, in all material respects, the financial position of Delaware Emerging Markets Debt Fund (one of the series constituting Delaware Group® Government Fund, hereinafter referred to as the “Fund”) at July 31, 2016, the results of its operations for the year then ended and the changes in its net assets for each of the two years in period then ended and the financial highlights for the periods presented, in conformity with accounting principles generally accepted in the United States of America. These financial statements and financial highlights (hereafter referred to as “financial statements”) are the responsibility of the Fund’s management. Our responsibility is to express an opinion on these financial statements based on our audits. We conducted our audits of these financial statements in accordance with the standards of the Public Company Accounting Oversight Board (United States). Those standards require that we plan and perform the audit to obtain reasonable assurance about whether the financial statements are free of material misstatement. An audit includes examining, on a test basis, evidence supporting the amounts and disclosures in the financial statements, assessing the accounting principles used and significant estimates made by management, and evaluating the overall financial statement presentation. We believe that our audits, which included confirmation of securities at July 31, 2016 by correspondence with the custodian and brokers and the application of alternative auditing procedures where confirmations of securities purchased had not been received, provide a reasonable basis for our opinion.
PricewaterhouseCoopers LLP
Philadelphia, Pennsylvania
September 19, 2016
46
Other Fund information (Unaudited)
Delaware Emerging Markets Debt Fund
Tax Information
The information set forth below is for the Fund’s fiscal year as required by federal laws. Shareholders, however, must report distributions on a calendar year basis for income tax purposes, which may include distributions for portions of two fiscal years of a fund. Accordingly, the information needed by shareholders for income tax purposes will be sent to them in January of each year. Please consult your tax advisor for proper treatment of this information.
All disclosures are based on financial information available as of the date of this annual report and, accordingly are subject to change. For any and all items requiring reporting, it is the intention of the Fund to report the maximum amount permitted under the Internal Revenue Code and the regulations thereunder.
For the fiscal year ended July 31, 2016, the Fund reports distributions paid during the year as follows:
| | | | |
(A) Ordinary Income Distribution (Tax Basis) | | | 100.00 | % |
(A) is based on a percentage of the Fund’s total distributions.
47
Board of trustees / directors and officers addendum
Delaware Investments® Family of Funds
A mutual fund is governed by a Board of Trustees/Directors (“Trustees”), which has oversight responsibility for the management of a fund’s business affairs. Trustees establish procedures and oversee and review the performance of the investment manager, the distributor, and others who perform services for the fund. The independent fund trustees, in particular, are advocates
| | | | |
Name, Address, and Birth Date | | Position(s) Held with Fund(s) | | Length of Time Served |
Interested Trustee | | |
Shawn K. Lytle1, 3 | | President, | | Trustee since |
2005 Market Street | | Chief Executive Officer, | | September 2015 |
Philadelphia, PA 19103 | | and Trustee | | |
February 1970 | | | | President and |
| | | | Chief Executive Officer |
| | | | since August 2015 |
| | |
| | | | |
Independent Trustees | | |
Thomas L. Bennett | | Chairman and Trustee | | Trustee since |
2005 Market Street | | | | March 2005 |
Philadelphia, PA 19103 | | | | |
October 1947 | | | | Chairman since |
| | | | March 2015 |
| | | | | |
Ann D. Borowiec | | Trustee | | Since March 2015 |
2005 Market Street | | | | |
Philadelphia, PA 19103 | | | | |
November 1958 | | | | |
| | |
| | | | |
| | | | | |
Joseph W. Chow | | Trustee | | Since January 2013 |
2005 Market Street | | | | |
Philadelphia, PA 19103 | | | | |
January 1953 | | | | |
| | |
| | | | |
| | | | | |
| 1 | Shawn K. Lytle is considered to be an “Interested Trustee” because he is an executive officer of the Fund’s(s’) investment advisor. |
48
for shareholder interests. Each trustee has served in that capacity since he or she was elected to or appointed to the Board of Trustees, and will continue to serve until his or her retirement or the election of a new trustee in his or her place. The following is a list of the Trustees and Officers with certain background and related information.
| | | | |
Principal Occupation(s) During the Past Five Years | | Number of Portfolios in Fund Complex Overseen by Trustee or Officer | | Other Directorships Held by Trustee or Officer |
| | | | |
Shawn K. Lytle has served as | | 62 | | Trustee — UBS |
President of | | | | Relationship Funds, |
Delaware Investments2 | | | | SMA Relationship |
since June 2015 and was the | | | | Trust, and UBS Funds |
Regional Head of Americas for | | | | (May 2010–April 2015) |
UBS Global Asset | | | | |
Management from | | | | |
2010 through 2015. | | | | |
| | | | |
Private Investor | | 62 | | Director — |
(March 2004–Present) | | | | Bryn Mawr Bank Corp. (BMTC) |
| | | | (2007–2011) |
| | |
| | | | |
| | | | | |
Chief Executive Officer | | 62 | | None |
Private Wealth Management | | | | |
(2011–2013) and | | | | |
Market Manager, | | | | |
New Jersey Private | | | | |
Bank (2005–2011) — | | | | |
J.P. Morgan Chase & Co. | | | | |
| | | | | |
Executive Vice President | | 62 | | Director and Audit Committee |
(Emerging Economies | | | | Member — Hercules |
Strategies, Risks, and | | | | Technology Growth |
Corporate Administration) | | | | Capital, Inc. |
State Street Corporation | | | | (2004–2014) |
(July 2004–March 2011) | | | | |
| | | | | |
| 2 | Delaware Investments is the marketing name for Delaware Management Holdings, Inc. and its subsidiaries, including the Fund’s(s’) investment advisor, principal underwriter, and its transfer agent. |
49
Board of trustees / directors and officers addendum
Delaware Investments® Family of Funds
| | | | |
Name, Address, and Birth Date | | Position(s) Held with Fund(s) | | Length of Time Served |
Independent Trustees (continued) | | |
John A. Fry | | Trustee | | Since January 2001 |
2005 Market Street | | | | |
Philadelphia, PA 19103 | | | | |
May 1960 | | | | |
| | |
| | | | |
| | | | | |
Lucinda S. Landreth | | Trustee | | Since March 2005 |
2005 Market Street | | | | |
Philadelphia, PA 19103 | | | | |
June 1947 | | | | |
Frances A. Sevilla-Sacasa | | Trustee | | Since September 2011 |
2005 Market Street | | | | |
Philadelphia, PA 19103 | | | | |
January 1956 | | | | |
| | |
| | | | |
| | |
| | | | |
| | |
| | | | |
| | | | | |
50
| | | | |
Principal Occupation(s) During the Past Five Years | | Number of Portfolios in Fund Complex Overseen by Trustee or Officer | | Other Directorships Held by Trustee or Officer |
| | | | |
President — | | 62 | | Director, Audit Committee, |
Drexel University | | | | and Governance Committee |
(August 2010–Present) | | | | Member — Community |
| | | | Health Systems |
President — | | | | |
Franklin & Marshall College | | | | Director — Drexel |
(July 2002–July 2010) | | | | Morgan & Co. |
| | | | | |
Private Investor | | 62 | | None |
(2004–Present) | | | | |
| | |
| | | | |
| | | | | |
Chief Executive Officer — | | 62 | | Trust Manager and |
Banco Itaú | | | | Audit Committee |
International | | | | Member — Camden |
(April 2012–Present) | | | | Property Trust |
| | |
Executive Advisor to Dean | | | | |
(August 2011–March 2012) and Interim Dean | | | | |
(January 2011–July 2011) — | | | | |
University of Miami School of | | | | |
Business Administration | | | | |
| | |
President — U.S. Trust, | | | | |
Bank of America Private | | | | |
Wealth Management | | | | |
(Private Banking) | | | | |
(July 2007–December 2008) | | | | |
| | | | | |
51
Board of trustees / directors and officers addendum
Delaware Investments® Family of Funds
| | | | |
Name, Address, and Birth Date | | Position(s) Held with Fund(s) | | Length of Time Served |
Independent Trustees (continued) | | |
Thomas K. Whitford | | Trustee | | Since January 2013 |
2005 Market Street | | | | |
Philadelphia, PA 19103 | | | | |
March 1956 | | | | |
| | |
| | | | |
| | |
| | | | |
| | | | | |
Janet L. Yeomans | | Trustee | | Since April 1999 |
2005 Market Street | | | | |
Philadelphia, PA 19103 | | | | |
July 1948 | | | | |
| | |
| | | | |
| | |
| | | | |
| | | | | |
52
| | | | |
Principal Occupation(s) During the Past Five Years | | Number of Portfolios in Fund Complex Overseen by Trustee or Officer | | Other Directorships Held by Trustee or Officer |
| | | | |
Vice Chairman | | 62 | | Director — HSBC Finance |
(2010–April 2013), | | | | Corporation and HSBC |
Chief Administrative | | | | North America Holdings Inc. |
Officer (2008–2010), and Executive Vice President and Chief | | | | Director — HSBC Bank |
Administrative Officer | | | | |
(2007–2009) — | | | | |
PNC Financial | | | | |
Services Group | | | | |
| | | | | |
Vice President and Treasurer | | 62 | | Director, Audit and |
(January 2006–July 2012) | | | | Compliance Committee Chair, |
Vice President — | | | | Investment Committee |
Mergers & Acquisitions | | | | Member, and Governance |
(January 2003–January 2006), | | | | Committee Member — |
and Vice President | | | | Okabena Company |
and Treasurer | | | | |
(July 1995–January 2003) | | | | |
3M Company | | | | |
| | | | | |
53
Board of trustees / directors and officers addendum
Delaware Investments® Family of Funds
| | | | |
Name, Address, and Birth Date | | Position(s) Held with Fund(s) | | Length of Time Served |
Officers | | | | |
David F. Connor | | Senior Vice President, | | Senior Vice President |
2005 Market Street | | General Counsel, | | since May 2013; |
Philadelphia, PA 19103 | | and Secretary | | General Counsel |
December 1963 | | | | since May 2015; |
| | | | Secretary since |
| | | | October 2005 |
| | |
| | | | |
| | |
| | | | |
| | | | | |
Daniel V. Geatens | | Vice President | | Treasurer since October 2007 |
2005 Market Street | | and Treasurer | | |
Philadelphia, PA 19103 | | | | |
October 1972 | | | | |
| | |
| | | | |
| | |
| | | | |
| | | | | |
Richard Salus | | Senior Vice President | | Chief Financial Officer |
2005 Market Street | | and Chief Financial Officer | | since November 2006 |
Philadelphia, PA 19103 | | | | |
October 1963 | | | | |
| | | | |
| | | | | |
The Statement of Additional Information for the Fund(s) includes additional information about the Trustees and Officers and is available, without charge, upon request by calling 800 523-1918.
54
| | | | |
Principal Occupation(s) During the Past Five Years | | Number of Portfolios in Fund Complex Overseen by Trustee or Officer | | Other Directorships Held by Trustee or Officer |
| | | | |
David F. Connor has served as | | 62 | | None3 |
Senior Vice President of the Fund(s) and the investment advisor since 2013, General Counsel of the Fund(s) and the investment advisor since 2015, and Secretary of the Fund(s) and the investment advisor since 2005. | | | | |
| | | | | |
Daniel V. Geatens has served | | 62 | | None3 |
as Vice President and | | | | |
Treasurer of the Fund(s) since 2007 and Vice President and Director of Financial | | | | |
Administration of the investment advisor since 2010. | | | | |
| | | | | |
Richard Salus has served as | | 62 | | None3 |
Senior Vice President and Chief Financial Officer of the Fund(s) and the investment advisor since 2006. | | | | |
| | | | | |
| 3 | Shawn K. Lytle, David F. Connor, Daniel V. Geatens, and Richard Salus serve in similar capacities for the six portfolios of the Optimum Fund Trust, which have the same investment advisor, principal underwriter, and transfer agent as the registrant. |
55
About the organization
| | | | | | |
| Board of trustees | | | | | | |
| | | |
Shawn K. Lytle President and Chief Executive Officer Delaware Investments® Family of Funds Philadelphia, PA Thomas L. Bennett Chairman of the Board Delaware Investments Family of Funds Private Investor Rosemont, PA | | Ann D. Borowiec Former Chief Executive Officer Private Wealth Management J.P. Morgan Chase & Co. New York, NY Joseph W. Chow Former Executive Vice President State Street Corporation Boston, MA | | John A. Fry President Drexel University Philadelphia, PA Lucinda S. Landreth Former Chief Investment Officer Assurant, Inc. New York, NY | | Frances A. Sevilla-Sacasa Chief Executive Officer Banco Itaú International Miami, FL Thomas K. Whitford Former Vice Chairman PNC Financial Services Group Pittsburgh, PA Janet L. Yeomans Former Vice President and Treasurer 3M Company St. Paul, MN |
| | | |
| Affiliated officers | | | | | | |
| | | |
David F. Connor Senior Vice President, General Counsel, and Secretary Delaware Investments Family of Funds Philadelphia, PA | | Daniel V. Geatens Vice President and Treasurer Delaware Investments Family of Funds Philadelphia, PA | | Richard Salus Senior Vice President and Chief Financial Officer Delaware Investments Family of Funds Philadelphia, PA | | |
This annual report is for the information of Delaware Emerging Markets Debt Fund shareholders, but it may be used with prospective investors when preceded or accompanied by the Delaware Investments Fund fact sheet for the most recently completed calendar quarter. These documents are available at delawareinvestments.com/literature.
Delaware Investments is the marketing name of Delaware Management Holdings, Inc. and its subsidiaries.
The Fund files its complete schedule of portfolio holdings with the Securities and Exchange Commission (SEC) for the first and third quarters of each fiscal year on Form N-Q. The Fund’s Forms N-Q, as well as a description of the policies and procedures that the Fund uses to determine how to vote proxies (if any) relating to portfolio securities are available without charge (i) upon request, by calling 800 523-1918; and (ii) on the SEC’s website at sec.gov. In addition, a description of the policies and procedures that the Fund uses to determine how to vote proxies (if any) relating to portfolio securities and the Schedule of Investments included in the Fund’s most recent Form N-Q are available without charge on the Fund’s website at delawareinvestments.com/literature. The Fund’s Forms N-Q may be reviewed and copied at the SEC’s Public Reference Room in Washington, D.C.; information on the operation of the Public Reference Room may be obtained by calling 800 SEC-0330.
Information (if any) regarding how the Fund voted proxies relating to portfolio securities during the most recently disclosed 12-month period ended June 30 is available without charge (i) through the Fund’s website at delawareinvestments.com/proxy; and (ii) on the SEC’s website at sec.gov.
56
Item 2. Code of Ethics
The registrant has adopted a code of ethics that applies to the registrant’s principal executive officer, principal financial officer, principal accounting officer or controller, or persons performing similar functions, regardless of whether these individuals are employed by the registrant or a third party. A copy of the registrant’s Code of Business Ethics has been posted on the Delaware Investments Internet Web site at www.delawareinvestments.com. Any amendments to the Code of Business Ethics, and information on any waiver from its provisions granted by the registrant, will also be posted on this Web site within five business days of such amendment or waiver and will remain on the Web site for at least 12 months.
Item 3. Audit Committee Financial Expert
The registrant’s Board of Trustees/Directors has determined that certain members of the registrant’s Audit Committee are audit committee financial experts, as defined below. For purposes of this item, an “audit committee financial expert” is a person who has the following attributes:
a. An understanding of generally accepted accounting principles and financial statements;
b. The ability to assess the general application of such principles in connection with the accounting for estimates, accruals, and reserves;
c. Experience preparing, auditing, analyzing, or evaluating financial statements that present a breadth and level of complexity of accounting issues that are generally comparable to the breadth and complexity of issues that can reasonably be expected to be raised by the registrant’s financial statements, or experience actively supervising one or more persons engaged in such activities;
d. An understanding of internal controls and procedures for financial reporting; and
e. An understanding of audit committee functions.
An “audit committee financial expert” shall have acquired such attributes through:
a. Education and experience as a principal financial officer, principal accounting officer, controller, public accountant, or auditor or experience in one or more positions that involve the performance of similar functions;
b. Experience actively supervising a principal financial officer, principal accounting officer, controller, public accountant, auditor, or person performing similar functions;
c. Experience overseeing or assessing the performance of companies or public accountants with respect to the preparation, auditing, or evaluation of financial statements; or
d. Other relevant experience.
The registrant’s Board of Trustees/Directors has also determined that each member of the registrant’s Audit Committee is independent. In order to be “independent” for purposes of this item, the Audit Committee member may not: (i) other than in his or her capacity as a member of the Board of Trustees/Directors or any committee thereof, accept directly or indirectly any consulting, advisory or other compensatory fee from the issuer; or (ii) be an “interested person” of the registrant as defined in Section 2(a)(19) of the Investment Company Act of 1940.
The names of the audit committee financial experts on the registrant’s Audit Committee are set forth below:
Item 4. Principal Accountant Fees and Services
PricewaterhouseCoopers LLP (“PwC”), the Independent Accountant to the series portfolios of Delaware Group Government Fund (“Funds”), has advised the Audit Committee of the Board of Trustees of the Funds (“Audit Committee”) that, as of the date of the filing of this Annual Report on Form N-CSR, it is in discussions with the staff of the Securities and Exchange Commission (“SEC Staff”), or the SEC, regarding the interpretation and application of Rule 2-01(c)(1)(ii)(A) of Regulation S-X, or the Loan Rule.
The Loan Rule prohibits accounting firms, such as PwC, from having certain financial relationships with their audit clients and affiliated entities. Specifically, the Loan Rule provides, in relevant part, that an accounting firm generally would not be independent if it receives a loan from a lender that is a “record or beneficial owner of more than ten percent of the audit client’s equity securities.” Under the SEC Staff’s interpretation of the Loan Rule, based on information provided to us by PwC, some of PwC’s relationships with its lenders who also own shares of one or more funds within the Delaware Investments Family of Funds investment company complex implicate the Loan Rule, calling into question PwC’s independence with respect to the Funds. PwC believes that, in light of the facts of these lending relationships, its ability to exercise objective judgment with respect to the audit of the Funds has not been impaired.
The Audit Committee has considered the lending relationships described by PwC and has concluded that (1) the lending relationships did not affect PwC’s application of objective judgment in conducting its audits and issuing reports on the Funds’ financial statements; and (2) a reasonable investor with knowledge of the lending relationships described by PwC would reach the same conclusion. In making this determination, the Audit Committee considered, among other things, PwC’s description of the relevant lending relationships and PwC’s representation that its objectivity was not impaired in conducting its audit of the Funds’ financial statements. In connection with this determination, PwC advised the Audit Committee that it believes PwC is independent and it continues to have discussions with the SEC Staff.
If the SEC were ultimately to determine that PwC was not independent with respect to the Funds for certain time periods, the Funds’ filings with the SEC that contain the Funds’ financial statements for such periods would be non-compliant with the applicable securities laws. If the SEC determines that PwC was not independent, among other things, the Funds could be required to have independent audits conducted on the Funds’ previously audited financial statements by another registered public accounting firm for the affected periods. The time involved to conduct such independent audits may impair the Funds’ ability to issue shares. Any of the foregoing possible outcomes potentially could have a material adverse effect on the Funds.
The aggregate fees billed for services provided to the registrant by its independent auditors for the audit of the registrant’s annual financial statements and for services normally provided by the independent auditors in connection with statutory and regulatory filings or engagements were $88,050 for the fiscal year ended July 31, 2016.
The aggregate fees billed for services provided to the registrant by its independent auditors for the audit of the registrant’s annual financial statements and for services normally provided by the independent auditors in connection with statutory and regulatory filings or engagements were $84,705 for the fiscal year ended July 31, 2015.
The aggregate fees billed by the registrant’s independent auditors for services relating to the performance of the audit of the registrant’s financial statements and not reported under paragraph (a) of this Item were $0 for the fiscal year ended July 31, 2016.
The aggregate fees billed by the registrant’s independent auditors for services relating to the performance of the audit of the registrant’s financial statements and not reported under paragraph (a) of this Item were $0 for the fiscal year ended July 31, 2015.
The aggregate fees billed by the registrant’s independent auditors for tax-related services provided to the registrant’s investment adviser and other service providers under common control with the adviser and that relate directly to the operations or financial reporting of the registrant were $0 for the registrant’s fiscal year ended July 31, 2016.
The aggregate fees billed by the registrant’s independent auditors for tax-related services provided to the registrant’s investment adviser and other service providers under common control with the adviser and that relate directly to the operations or financial reporting of the registrant were $0 for the registrant’s fiscal year ended July 31, 2015.
The aggregate fees billed for all services provided by the independent auditors to the registrant other than those set forth in paragraphs (a), (b) and (c) of this Item were $0 for the fiscal year ended July 31, 2016.
The aggregate fees billed for all services provided by the independent auditors to the registrant other than those set forth in paragraphs (a), (b) and (c) of this Item were $0 for the fiscal year ended July 31, 2015.
(e) The registrant’s Audit Committee has established pre-approval policies and procedures as permitted by Rule 2-01(c)(7)(i)(B) of Regulation S-X (the “Pre-Approval Policy”) with respect to services provided by the registrant’s independent auditors. Pursuant to the Pre-Approval Policy, the Audit Committee has pre-approved the services set forth in the table below with respect to the registrant up to the specified fee limits. Certain fee limits are based on aggregate fees to the registrant and other registrants within the Delaware Investments Family of Funds.
Under the Pre-Approval Policy, the Audit Committee has also pre-approved the services set forth in the table below with respect to the registrant’s investment adviser and other entities controlling, controlled by or under common control with the investment adviser that provide ongoing services to the registrant (the “Control Affiliates”) up to the specified fee limit. This fee limit is based on aggregate fees to the investment adviser and its Control Affiliates.
The Pre-Approval Policy requires the registrant’s independent auditors to report to the Audit Committee at each of its regular meetings regarding all services initiated since the last such report was rendered, including those services authorized by the Pre-Approval Policy.
(f) Not applicable.
(g) The aggregate non-audit fees billed by the registrant’s independent auditors for services rendered to the registrant and to its investment adviser and other service providers under common control with the adviser were $10,036,000 and $7,530,526 for the registrant’s fiscal years ended July 31, 2016 and July 31, 2015, respectively.
(h) In connection with its selection of the independent auditors, the registrant’s Audit Committee has considered the independent auditors’ provision of non-audit services to the registrant’s investment adviser and other service providers under common control with the adviser that were not required to be pre-approved pursuant to Rule 2-01(c)(7)(ii) of Regulation S-X. The Audit Committee has determined that the independent auditors’ provision of these services is compatible with maintaining the auditors’ independence.
Item 5. Audit Committee of Listed Registrants
Not applicable.
Item 6. Investments
(a) Included as part of report to shareholders filed under Item 1 of this Form N-CSR.
(b) Divestment of securities in accordance with Section 13(c) of the Investment Company Act of 1940.
Not applicable.
Item 7. Disclosure of Proxy Voting Policies and Procedures for Closed-End Management Investment Companies
Not applicable.
Item 8. Portfolio Managers of Closed-End Management Investment Companies
Not applicable.
Item 9. Purchases of Equity Securities by Closed-End Management Investment Company and Affiliated Purchasers
Not applicable.
Item 10. Submission of Matters to a Vote of Security Holders
Not applicable.
Item 11. Controls and Procedures
The registrant’s principal executive officer and principal financial officer have evaluated the registrant’s disclosure controls and procedures within 90 days of the filing of this report and have concluded that they are effective in providing reasonable assurance that the information required to be disclosed by the registrant in its reports or statements filed under the Securities Exchange Act of 1934 is recorded, processed, summarized and reported within the time periods specified in the rules and forms of the Securities and Exchange Commission.
There were no significant changes in the registrant’s internal control over financial reporting that occurred during the second fiscal quarter of the period covered by the report to stockholders included herein (i.e., the registrant’s fourth fiscal quarter) that have materially affected, or are reasonably likely to materially affect, the registrant’s internal control over financial reporting.
Item 12. Exhibits
Not applicable.
(2) Certifications of Principal Executive Officer and Principal Financial Officer pursuant to Rule 30a-2 under the Investment Company Act of 1940 are attached hereto as Exhibit 99.CERT.
(3) Written solicitations to purchase securities pursuant to Rule 23c-1 under the Securities Exchange Act of 1934.
Not applicable.
(b) Certifications pursuant to Section 906 of the Sarbanes-Oxley Act of 2002 are furnished herewith as Exhibit 99.906CERT.
Pursuant to the requirements of the Securities Exchange Act of 1934 and the Investment Company Act of 1940, the registrant has duly caused this report to be signed on its behalf, by the undersigned, thereunto duly authorized.
Pursuant to the requirements of the Securities Exchange Act of 1934 and the Investment Company Act of 1940, this report has been signed below by the following persons on behalf of the registrant and in the capacities and on the dates indicated.