Item 1. Reports to Stockholders
Fixed income mutual fund
Delaware Emerging Markets Debt Fund
July 31, 2018
Carefully consider the Fund’s investment objectives, risk factors, charges, and expenses before investing. This and other information can be found in the Fund’s prospectus and its summary prospectus, which may be obtained by visiting delawarefunds.com/literature or calling 800 523-1918. Investors should read the prospectus and the summary prospectus carefully before investing.
You can obtain shareholder reports and prospectuses online instead of in the mail. Visit delawarefunds.com/edelivery.
Experience Delaware Funds® by Macquarie
Macquarie Investment Management (MIM) is a global asset manager with offices throughout the United States, Europe, Asia, and Australia. We are active managers who prioritize autonomy and accountability at the investment team level in pursuit of opportunities that matter for our clients. Delaware Funds is one of the longest-standing mutual fund families, with more than 75 years in existence.
If you are interested in learning more about creating an investment plan, contact your financial advisor.
You can learn more about Delaware Funds or obtain a prospectus for Delaware Emerging Markets Debt Fund at delawarefunds.com/literature.
Manage your account online
| ● | | Check your account balance and transactions |
| ● | | View statements and tax forms |
| ● | | Make purchases and redemptions |
Visit delawarefunds.com/account-access.
Macquarie Asset Management (MAM) offers a diverse range of products including securities investment management, infrastructure and real asset management, and fund and equity-based structured products. Macquarie Investment Management (MIM) is the marketing name for certain companies comprising the asset management division of Macquarie Group. This includes the following registered investment advisers: Macquarie Investment Management Business Trust (MIMBT), Macquarie Funds Management Hong Kong Limited, Macquarie Investment Management Austria Kapitalanlage AG, Macquarie Investment Management Global Limited, Macquarie Investment Management Europe Limited, and Macquarie Capital Investment Management LLC.
The Fund is distributed by Delaware Distributors, L.P. (DDLP), an affiliate of MIMBT and Macquarie Group Limited.
Other than Macquarie Bank Limited (MBL), none of the entities noted are authorized deposit-taking institutions for the purposes of the Banking Act 1959 (Commonwealth of Australia). The obligations of these entities do not represent deposits or other liabilities of MBL. MBL does not guarantee or otherwise provide assurance in respect of the obligations of these entities, unless noted otherwise. The Fund is governed by US laws and regulations.
Unless otherwise noted, views expressed herein are current as of July 31, 2018, and subject to change for events occurring after such date.
The Fund is not FDIC insured and is not guaranteed. It is possible to lose the principal amount invested.
Advisory services provided by Delaware Management Company, a series of MIMBT, a US registered investment advisor.
All third-party marks cited are the property of their respective owners.
© 2018 Macquarie Management Holdings, Inc.
| | |
| Portfolio management review | | |
| Delaware Emerging Markets Debt Fund | | August 7, 2018 |
| | | | | | | | |
Performance preview (for the year ended July 31, 2018) | | | | | | | | |
Delaware Emerging Markets Debt Fund (Institutional Class shares) | | | 1-year return | | | | +0.16 | % |
Delaware Emerging Markets Debt Fund (Class A shares) | | | 1-year return | | | | -0.10 | % |
J.P. Morgan Corporate Emerging Markets Bond Index (CEMBI) Broad Diversified (benchmark) | | | 1-year return | | | | +0.51 | % |
Past performance does not guarantee future results.
For complete, annualized performance for Delaware Emerging Markets Debt Fund, please see the table on page 5. Institutional Class shares are not subject to a sales charge and are offered for sale exclusively to certain eligible investors. In addition, Institutional Class shares pay no distribution and service fee.
The performance of Class A shares excludes the applicable sales charge. Both Institutional Class shares and Class A shares reflect the reinvestment of all distributions.
Please see page 8 for a description of the index. Index performance returns do not reflect any management fees, transaction costs, or expenses. Indices are unmanaged and one cannot invest directly in an index.
For the first six months of the fiscal year ended July 31, 2018, emerging market economies continued to benefit from the favorable macro conditions that had characterized the previous 12 months. Fiscal expansion in the United States, a slow but steady rebound in the euro zone, and continued growth in China’s economy were all contributing factors to a generally favorable period that investors characterized as globally coordinated growth.
Beginning in January 2018 and continuing through the end of the fiscal period, however, many of these macro fundamentals slowed down and then reversed. First, and foremost, beginning with the US Federal Reserve and subsequently echoed somewhat by the Bank of Japan and the European Central Bank, there was a shift in developed-market central banks from a fairly easy monetary stance to a tighter one. As interest rates on an absolute, risk-free basis began to rise, the US dollar gained strength, casting a pall on emerging market economies.
Secondarily, China’s economy, upon which many emerging markets depend, began to slow during this period. As the largest consumer of many of the commodities exported by emerging market countries, China’s economic health is a crucial factor in emerging market performance (source: Bloomberg). When the fiscal year began in August 2017, we believe the Chinese growth
While there may be some truth to the
saying that a rising tide lifts all boats, it
seems that when the tide goes out, a lot
depends on the precise location of each
boat. In the case of emerging markets,
virtually all countries benefited from the
benign macro environment that
persisted through the end of 2017, and
we believe investors tended to look no
further for an explanation of their
positive performance. However, the
broadly tightening conditions that took
hold early in 2018 heightened
sensitivities to idiosyncratic factors
within emerging markets, driving greater
country performance dispersion.
| | |
| Portfolio management review | | |
| Delaware Emerging Markets Debt Fund | | |
was pumped up somewhat artificially in support of President Xi Jinping’s political agenda, which included the elimination of term limits. However, starting in January 2018, we began to see a return to economic reality in China.
Equally, if not more important, was the relative strength of the US dollar. Throughout the last six months of 2017, the dollar had been relatively weak, which, in our view, is advantageous for emerging market countries that issue bonds denominated in dollars. A weak dollar effectively lowers the cost of servicing the interest on the bonds that they have issued. When the dollar rises, the cost of servicing those bonds increases commensurately. It also supports benign inflation dynamics and strong commodity pricing. From the beginning of the fiscal year through mid-February 2018, the US Dollar Index declined 4.6%, creating a favorable backdrop for emerging market debt. From that point on, however, and continuing through the end of the fiscal year, the US Dollar Index gained 6.7%, which created significant pressure on that debt.
The looming threat and, ultimately, the imposition of US tariffs on trade were another factor that adversely affected emerging market economies during the fiscal year. As the fiscal period began and for much of the period, investors generally considered the Trump administration’s rhetoric as little more than posturing for a better deal. When the threats came closer to fruition, however, markets repriced accordingly. In the past, investors found what was good for the US was also good for emerging markets. If the US economy grew at a certain rate, investors could expect an even higher factor of growth for its emerging market trading partners. With the imposition of tariffs, however, that factor appears to be decreasing. In essence, advancing a protectionist trade agenda weakened global growth forecasts during the latter half of the fiscal year.
While there may be some truth to the saying that a rising tide lifts all boats, it seems that when the tide goes out, a lot depends on the precise location of each boat. In the case of emerging markets, virtually all countries benefited from the benign macro environment that persisted through the end of 2017, and we believe investors tended to look no further for an explanation of their positive performance. However, the broadly tightening conditions that took hold early in 2018 heightened sensitivities to idiosyncratic factors within emerging markets, driving greater country performance dispersion.
Two countries represented in the Fund’s portfolio — Argentina and Turkey — experienced dramatic declines in their currencies. Over the course of the fiscal year, the Argentine peso declined nearly 36% versus the dollar while the Turkish lira depreciated more than 28%. In both cases, political uncertainty played a significant role. Although Mexico’s currency also depreciated during the fiscal period, it stood in stark contrast as the Mexican peso gained strength in the latter half of the fiscal year as political uncertainty concerning its presidential election stabilized following the victory of Andres Manuel Lopez Obrador in early July 2018.
Within the Fund
For the fiscal year ended July 31, 2018, Delaware Emerging Markets Debt Fund underperformed its benchmark, the J.P. Morgan Corporate Emerging Markets Bond Index (CEMBI) Broad Diversified. The Fund’s Institutional Class shares returned +0.16%. The Fund’s Class A shares declined -0.10% at net asset value and -4.59% at maximum offer price. These figures reflect all distributions reinvested. For the same period, the Fund’s benchmark returned +0.51%. For complete annualized performance for Delaware Emerging Markets Debt Fund, please see the table on page 5.
The Fund’s underperformance relative to the benchmark was partially the result of the sharp change in the economic environment that occurred early in 2018. As the Fund’s fiscal year progressed, attempting to take advantage of the then favorable financing conditions balanced by interest rate concerns, the Fund decreased duration (a measure of a bond’s price sensitivity to changes in interest rates) and increased its exposure to high yield relative to high grade securities, raising high yield exposure from 55% to 58% of the portfolio, with a corresponding decrease in high grade exposure from 45% to 42%. Since January 2018, however, given ongoing concern about higher interest rates and tightening financing conditions, the Fund shortened duration further and reduced its high yield exposure to 52% while increasing its high grade position to 48%. These dynamic changes in portfolio positioning acted to reduce underperformance relative to the benchmark, but were insufficient in overcoming the sharp downturns that took place in several countries.
Argentina was the most significant detractor from the Fund’s performance during the fiscal year, affected by both country and credit selection. We carried an overweight position in Argentina into the beginning of the fiscal year, based on our belief that Mauricio Macri — elected president in 2015 and a former J.P. Morgan banker who spoke the language of the markets — could execute a financial turnaround and get Argentina re-engaged with the markets. However, in our opinion, Macri and the government acted too slowly and failed to enact a credible fiscal program. Even though Argentina has now secured a $50 billion program from the International Monetary Fund (IMF), investors remain skeptical. We owned bonds linked to the peso that were issued by YPF S.A., the Argentine national oil company. Even though the company has decent leverage metrics versus its peers and a fairly compelling growth opportunity, it declined sharply given investors’
broad Argentinian risk-off sentiment and currency depreciation. We maintained the Fund’s position in the bonds based on solid fundamentals and a belief that IMF support could ultimately stabilize Argentine assets.
Turkey was another significant detractor during fiscal period. We transitioned the Fund from an underweight position relative to the benchmark to an overweight just prior to the election held on June 24, 2018. Typically, markets settle down after an election, as the pre-election rhetoric cools off. Unfortunately, this was not one of those times. Once viewed as a market savior, Turkish president Recep Tayyip Erdogan increasingly seems driven purely by politics, in our view. Shedding his prior hands-off approach, he now openly criticizes central bank policy and independence, creating a two-pronged problem as the market struggles with both currency depreciation and inflation. Further, his policy shift on Syria, in defiance of Turkey’s North Atlantic Treaty Organization (NATO) allies, seems to have further alienated investors. Among the Fund’s Turkish holdings, we were heavily skewed toward banks, given that corporates were trading tight relative to sovereign bonds. We held subordinated bonds of two banks, Akbank Turk AS and Turkiye Is Bankasi AS. Despite the strength of these Turkish banks, they were punished inordinately as investors fled the country. We maintained the Fund’s positions in both banks as they have solid capital buffers to absorb some of the volatility; however, we are constantly assessing relative value and may dispose of these positions going forward.
Mexico also detracted from performance, as we took the Fund from a neutral position relative to the benchmark to an underweight and then back to neutral following the presidential election in early July 2018. In our view, the Fund underperformed moderately based on credit selection. Although the election is over, uncertainty continues to hang over the market. President-elect Lopez Obrador will not take office
| | |
| Portfolio management review | | |
| Delaware Emerging Markets Debt Fund | | |
until Dec. 1, though he has already made some policy pronouncements. Additionally, Mexico and the US continued to trade barbs over the renegotiation of the North American Free Trade Agreement (NAFTA).
Angola was the leading contributor to the Fund’s performance during the fiscal year, as its sovereign bonds performed well. A new government proved more market friendly, engaging the IMF for policy supervision. That seemed to help improve investors’ view as it regained access to capital markets. Higher oil prices also contributed.
The Fund’s investments in Israel also performed well, benefiting from both its sector and credit selection. Absent a position in Teva Pharmaceutical Finance, both a poor performer and a large position in the benchmark, the Fund was significantly underweight for much of the fiscal period. We renewed the Fund’s position in Teva Pharmaceutical after new management and a turnaround plan were put in place.
Elsewhere, Chile performed well, benefiting from strong credit selection. Egypt, an overweight position in the Fund, benefited from strong fiscal performance under an IMF program. Additionally, Kazakhstan benefited from higher commodity prices and a low level of political malaise.
A note about derivatives
During the fiscal year, Delaware Emerging Markets Debt Fund invested in currency hedges in forward foreign exchange contracts, options, and credit default swaps. These positions did not have a material effect on the Fund’s performance, contributing 0.15 percentage points for the fiscal year. The total outstanding notional exposure at the end of the fiscal year was -10.35% (notional value is the face amount of a security that is used to calculate the payout on a derivative contract of that underlying security at settlement).
| | |
| Performance summary | | |
| Delaware Emerging Markets Debt Fund | | July 31, 2018 |
The performance quoted represents past performance and does not guarantee future results. Investment return and principal value of an investment will fluctuate so that shares, when redeemed, may be worth more or less than their original cost. Current performance may be lower or higher than the performance quoted. Performance data current to the most recent month end may be obtained by calling 800 523-1918 or visiting delawarefunds.com/performance.
| | | | | | | | |
| Fund and benchmark performance1, 2, 3 | | Average annual total returns through July 31, 2018 |
| | | | |
| | | 1 year | | 3 years | | 5 years | | Lifetime |
Class A (Est. Sept. 30, 2013) | | | | | | | | |
Excluding sales charge | | -0.10% | | +5.12% | | +3.95% | | +5.73% |
Including sales charge | | -4.59% | | +3.52% | | +3.00% | | +5.11% |
Class C (Est. Sept. 30, 2013) | | | | | | | | |
Excluding sales charge | | -0.84% | | +4.72% | | +3.59% | | +5.22% |
Including sales charge | | -1.78% | | +4.72% | | +3.59% | | +5.22% |
Class R (Est. Sept. 30, 2013) | | | | | | | | |
Excluding sales charge | | +0.16% | | +5.20% | | +3.97% | | +5.65% |
Including sales charge | | +0.16% | | +5.20% | | +3.97% | | +5.65% |
Institutional Class (Est. Sept. 30, 2013) | | | | | | | | |
Excluding sales charge | | +0.16% | | +5.24% | | +4.10% | | +5.92% |
Including sales charge | | +0.16% | | +5.24% | | +4.10% | | +5.92% |
J.P. Morgan Corporate Emerging Markets Bond Index (CEMBI) Broad Diversified | | +0.51% | | +4.46% | | +4.86% | | +4.97%* |
*The benchmark lifetime return is for Class A share comparison only and is calculated using the last business day in the month of the Fund’s Class A inception date.
1 A privately offered fund managed by the Fund’s portfolio manager was reorganized into the Fund and the Fund commenced operations on Sept. 30, 2013. This privately offered fund commenced operations on Nov. 3, 2010 and had an investment objective and strategies that were, in all material respects, the same as those of the Fund, and was managed in a manner that, in all material respects, complied with the investment guidelines and restrictions of the Fund. However, the privately offered fund was not registered as an investment under the Investment Company Act of 1940 (1940 Act). As a result, the privately offered fund was not subject to certain investment limitations, diversification requirements, liquidity requirements, and other restrictions imposed by the 1940 Act and the Internal Revenue Code of
1986, as amended, which, if applicable, may have adversely affected its performance.
The Fund’s performance for the periods prior to its commencement of operations on Sept. 30, 2013 is that of the privately offered fund. Because the privately offered fund was a master fund that did not charge any management or other asset-based fees, the privately offered fund’s performance shown above has been restated, on a one-time basis, to reflect the fees, expenses, and waivers and reimbursements for each class of the Fund at the commencement of the Fund’s operations. If the performance of the privately offered fund had not been restated, the performance for such classes may have been higher than the performance shown in the average annual total returns table above.
| | |
| Performance summary | | |
| Delaware Emerging Markets Debt Fund | | |
2 Returns reflect the reinvestment of all distributions and are presented both with and without the applicable sales charges described below. Returns do not reflect the deduction of taxes the shareholder would pay on Fund distributions or redemptions of Fund shares.
Expense limitations were in effect for certain classes during some or all of the periods shown in the “Fund and benchmark performance” table. Expenses for each class are listed on the “Fund expense ratios” table on page 7. Performance would have been lower had expense limitations not been in effect.
Institutional Class shares are not subject to a sales charge and are offered for sale exclusively to certain eligible investors. In addition, Institutional Class shares pay no distribution and service fee.
Class A shares are sold with a maximum front-end sales charge of 4.50%, and have an annual distribution and service fee of 0.25% of average daily net assets. Performance for Class A shares, excluding sales charges, assumes that no front-end sales charge applied.
Class C shares are sold with a contingent deferred sales charge of 1.00% if redeemed during the first 12 months. They are also subject to an annual distribution and service fee of 1.00% of average daily net assets. Performance for Class C shares, excluding sales charges, assumes either that contingent deferred sales charges did not apply or that the investment was not redeemed.
Class R shares are available only for certain retirement plan products. They are sold without a sales charge and have an annual distribution and service fee of 0.50% of average daily net assets.
Fixed income securities and bond funds can lose value, and investors can lose principal, as interest rates rise. They also may be affected by economic conditions that hinder an issuer’s ability to make interest and principal payments on its debt.
The Fund may also be subject to prepayment risk, the risk that the principal of a bond that is held by a portfolio will be prepaid prior to maturity, at the time when interest rates are lower than what the bond was paying. A portfolio may then have to reinvest that money at a lower interest rate.
High yielding, non-investment-grade bonds (junk bonds) involve higher risk than investment grade bonds. The high yield secondary market is particularly susceptible to liquidity problems when institutional investors, such as mutual funds and certain other financial institutions, temporarily stop buying bonds for regulatory, financial, or other reasons. In addition, a less liquid secondary market makes it more difficult for the Fund to obtain precise valuations of the high yield securities in its portfolio.
The Fund may invest in derivatives, which may involve additional expenses and are subject to risk, including the risk that an underlying security or securities index moves in the opposite direction from what the portfolio manager anticipated. A derivatives transaction depends upon the counterparties’ ability to fulfill their contractual obligations.
If and when the Fund invests in forward foreign currency contracts or uses other investments to hedge against currency risks, the Fund will be subject to special risks, including counterparty risk.
Diversification may not protect against market risk.
International investments entail risks not ordinarily associated with US investments including fluctuation in currency values, differences in accounting principles, or economic or political instability in other nations. Investing in emerging markets can be riskier than investing in established foreign markets due to increased volatility and lower trading volume.
The Fund may experience portfolio turnover in excess of 100%, which could result in higher transaction costs and tax liability.
Leverage risk is the risk associated with securities or practices (for example, borrowing and the use of certain derivatives) and investment in certain types of derivatives that multiply small index or market movements into larger changes in value. Use of derivative instruments may involve leverage. Leverage magnifies the potential for gain and the risk of loss. As a result, a relatively small
decline in the value of the underlying investments could result in a relatively large loss. Although the Fund will seek to manage the Fund’s risk from the leverage associated with derivative investments by closely monitoring the volatility of such investments, the Fund may not be successful in this respect.
3 The Fund’s expense ratios, as described in the most recent prospectus, are disclosed in the following “Fund expense ratios” table. Delaware Management Company has agreed to reimburse certain expenses and/or waive certain fees in order to prevent total annual fund operating expenses (excluding any 12b-1 fees, acquired fund fees and expenses, taxes, interest, short sale and dividend and interest expenses, brokerage fees, certain insurance costs, and nonroutine expenses or costs, including, but not limited to, those relating to reorganizations, litigation, conducting shareholder meetings, and liquidations (collectively, nonroutine expenses)) from exceeding 0.79% of the Fund’s average daily net assets during the period from April 1, 2018 to July 31, 2018.* Please see the most recent prospectus and any applicable supplement(s) for additional information on these fee waivers and/or reimbursements. Please see the “Financial highlights” section in this report for the most recent expense ratios.
| | | | | | | | |
| | | | |
| Fund expense ratios | | Class A | | Class C | | Class R | | Institutional Class |
Total annual operating expenses (without fee waivers) | | 1.91% | | 2.66% | | 2.16% | | 1.66% |
Net expenses (including fee waivers, if any) | | 1.04% | | 1.79% | | 1.29% | | 0.79% |
| Type of waiver | | Contractual | | Contractual | | Contractual
(Investment
manager
waiver);
Voluntary
(12b-1 fee
waiver) | | Contractual |
*For the period Aug. 1, 2017 to Nov. 27, 2017, the waiver was set at 1.00% of the Fund’s average daily net assets and for the period Nov. 28, 2017 to March 31, 2018, the waiver was set at 0.95% of the Fund’s average daily net assets. The aggregate contractual waiver period covering this report is from Nov. 28, 2016 through April 1, 2019.
| | |
| Performance summary | | |
| Delaware Emerging Markets Debt Fund | | |
Performance of a $10,000 investment1
Average annual total returns from Sept. 30, 2013 (Fund’s inception) through July 31, 2018
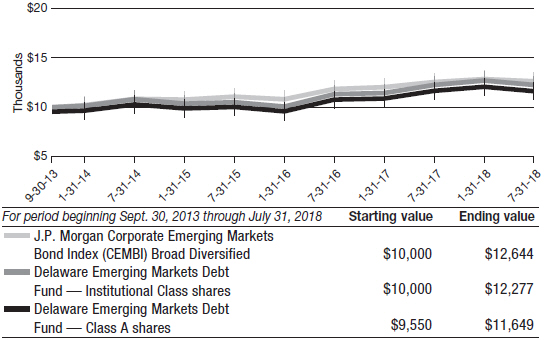
1 The “Performance of a $10,000 investment” graph assumes $10,000 invested in Institutional Class and Class A shares of the Fund on Sept. 30, 2013, and includes the effect of a 4.50% front-end sales charge (for Class A shares) and the reinvestment of all distributions. The graph does not reflect the deduction of taxes the shareholders would pay on Fund distributions or redemptions of Fund shares. Expense limitations were in effect for some or all of the periods shown. Performance would have been lower had expense limitations not been in effect. Expenses are listed in the “Fund expense ratios” table on page 7. Please note additional details on pages 5 through 9.
The graph also assumes $10,000 invested in the J.P. Morgan Corporate Emerging Markets Bond Index (CEMBI) Broad Diversified as of Sept. 30, 2013. The J.P. Morgan Corporate Emerging Markets Bond Index (CEMBI) Broad Diversified tracks US dollar–denominated
emerging market corporate bonds, limiting the weights of countries with larger corporate debt stocks by including only a specified portion of those countries’ eligible current face amounts of debt outstanding.
The US Dollar Index, mentioned on page 2, measures the weighted mean value of the US dollar relative to a basket of six foreign currencies: the euro, Japanese yen, British pound sterling, Canadian dollar, Swedish krona, and Swiss franc. The index goes up when the US dollar gains strength, or value, compared to other currencies.
Index performance returns do not reflect any management fees, transaction costs, or expenses. Indices are unmanaged and one cannot invest directly in an index. Past performance is not a guarantee of future results.
Performance of other Fund classes will vary due to different charges and expenses.
| | | | | | |
| | | | |
| | | Nasdaq symbols | | CUSIPs | | |
Class A | | DEDAX | | 246094841 | | |
Class C | | DEDCX | | 246094833 | | |
Class R | | DEDRX | | 246094825 | | |
Institutional Class | | DEDIX | | 246094817 | | |
| | |
| Disclosure of Fund expenses | | |
| For the six-month period February 1, 2018 to July 31, 2018 (Unaudited) | | |
As a shareholder of the Fund, you incur two types of costs: (1) transaction costs, including sales charges (loads) on purchase payments, reinvested dividends, or other distributions; redemption fees; and exchange fees; and (2) ongoing costs, including management fees; distribution and service (12b-1) fees; and other Fund expenses. This example is intended to help you understand your ongoing costs (in dollars) of investing in the Fund and to compare these costs with the ongoing costs of investing in other mutual funds.
The example is based on an investment of $1,000 invested at the beginning of the period and held for the entire six-month period from Feb. 1, 2018 to July 31, 2018.
Actual expenses
The first section of the table shown, “Actual Fund return,” provides information about actual account values and actual expenses. You may use the information in this section of the table, together with the amount you invested, to estimate the expenses that you paid over the period. Simply divide your account value by $1,000 (for example, an $8,600 account value divided by $1,000 = 8.6), then multiply the result by the number in the first section under the heading entitled “Expenses Paid During Period” to estimate the expenses you paid on your account during this period.
Hypothetical example for comparison purposes
The second section of the table shown, “Hypothetical 5% return,” provides information about hypothetical account values and hypothetical expenses based on the Fund’s actual expense ratio and an assumed rate of return of 5% per year before expenses, which is not the Fund’s actual return. The hypothetical account values and expenses may not be used to estimate the actual ending account balance or expenses you paid for the period. You may use this information to compare the ongoing costs of investing in the Fund and other funds. To do so, compare this 5% hypothetical example with the 5% hypothetical examples that appear in the shareholder reports of the other funds.
Please note that the expenses shown in the table are meant to highlight your ongoing costs only and do not reflect any transactional costs, such as sales charges (loads), redemption fees, or exchange fees. Therefore, the second section of the table is useful in comparing ongoing costs only, and will not help you determine the relative total costs of owning different funds. In addition, if these transactional costs were included, your costs would have been higher. The Fund’s expenses shown in the table reflect fee waivers in effect. The expenses shown in the table assume reinvestment of all dividends and distributions.
Delaware Emerging Markets Debt Fund
Expense analysis of an investment of $1,000
| | | | | | | | | | | | | | | | |
| | | Beginning | | | Ending | | | | | | Expenses | |
| | | Account Value | | | Account Value | | | Annualized | | | Paid During Period | |
| | | 2/1/18 | | | 7/31/18 | | | Expense Ratio | | | 2/1/18 to 7/31/18* | |
| | | | |
Actual Fund return† | | | | | | | | | | | | | | | | |
Class A | | | $1,000.00 | | | | $964.00 | | | | 1.09% | | | | $5.31 | |
Class C | | | 1,000.00 | | | | 960.40 | | | | 1.84% | | | | 8.94 | |
Class R | | | 1,000.00 | | | | 965.10 | | | | 0.84% | | | | 4.09 | |
Institutional Class | | | 1,000.00 | | | | 965.20 | | | | 0.84% | | | | 4.09 | |
| | | | |
Hypothetical 5% return (5% return before expenses) | | | | | | | | | | | | | | | | |
Class A | | | $1,000.00 | | | | $1,019.39 | | | | 1.09% | | | | $5.46 | |
Class C | | | 1,000.00 | | | | 1,015.67 | | | | 1.84% | | | | 9.20 | |
Class R | | | 1,000.00 | | | | 1,020.63 | | | | 0.84% | | | | 4.21 | |
Institutional Class | | | 1,000.00 | | | | 1,020.63 | | | | 0.84% | | | | 4.21 | |
| * | “Expenses Paid During Period” are equal to the Fund’s annualized expense ratio, multiplied by the average account value over the period, multiplied by 181/365 (to reflect the one-half year period). |
| † | Because actual returns reflect only the most recent six-month period, the returns shown may differ significantly from fiscal year returns. |
11
Security type / country and sector allocation
| | |
| Delaware Emerging Markets Debt Fund | | As of July 31, 2018 (Unaudited) |
Sector designations may be different than the sector designations presented in other fund materials. The sector designations may represent the investment manager’s internal sector classifications.
| | | | |
Security type / country | | | Percentage of net assets | |
Corporate Bonds by Country | | | 70.53% | |
Argentina | | | 4.02% | |
Australia | | | 1.42% | |
Brazil | | | 11.75% | |
Chile | | | 4.62% | |
China | | | 3.72% | |
Colombia | | | 1.78% | |
Dominican Republic | | | 0.96% | |
Georgia | | | 0.92% | |
Ghana | | | 1.09% | |
Guatemala | | | 0.95% | |
Hong Kong | | | 1.20% | |
India | | | 1.72% | |
Indonesia | | | 1.82% | |
Israel | | | 3.02% | |
Jamaica | | | 0.59% | |
Kazakhstan | | | 1.84% | |
Kuwait | | | 1.13% | |
Mexico | | | 5.28% | |
Morocco | | | 1.35% | |
Netherlands | | | 1.00% | |
Peru | | | 0.87% | |
Republic of Korea | | | 0.91% | |
Russia | | | 3.98% | |
Singapore | | | 1.13% | |
South Africa | | | 2.75% | |
Spain | | | 0.82% | |
Turkey | | | 3.41% | |
Ukraine | | | 2.86% | |
United Arab Emirates | | | 1.77% | |
Zambia | | | 1.85% | |
Loan Agreement | | | 1.50% | |
Regional Bonds | | | 1.20% | |
Sovereign Bonds by Country | | | 18.94% | |
Angola | | | 0.97% | |
Argentina | | | 1.87% | |
Azerbaijan | | | 0.63% | |
Bermuda | | | 0.87% | |
Brazil | | | 0.34% | |
12
| | | | |
Security type / country | | | Percentage of net assets | |
Dominican Republic | | | 1.51% | |
Egypt | | | 1.82% | |
Ivory Coast | | | 0.85% | |
Jordan | | | 1.12% | |
Mexico | | | 0.07% | |
Mongolia | | | 0.90% | |
Nigeria | | | 0.95% | |
Qatar | | | 0.95% | |
Senegal | | | 1.04% | |
South Africa | | | 2.44% | |
Turkey | | | 0.89% | |
Ukraine | | | 1.72% | |
Supranational Banks | | | 2.37% | |
Options Purchased | | | 0.25% | |
Short-Term Investments | | | 2.12% | |
Total Value of Securities | | | 96.91% | |
Receivables and Other Assets Net of Liabilities | | | 3.09% | |
Total Net Assets | | | 100.00% | |
| |
Corporate bonds by sector | | | Percentage of net assets | |
Banking | | | 12.75% | |
Basic Industry | | | 16.39% | |
Capital Goods | | | 0.90% | |
Communications | | | 4.29% | |
Consumer Cyclical | | | 1.87% | |
Consumer Non-Cyclical | | | 9.28% | |
Electric | | | 6.82% | |
Energy | | | 16.46% | |
Transportation | | | 0.88% | |
Utilities | | | 0.89% | |
Total | | | 70.53% | |
13
| | |
| Schedule of investments | | |
| Delaware Emerging Markets Debt Fund | | July 31, 2018 |
| | | | | | | | | | | | |
| | | | | | Principal amount° | | | Value (US $) | |
Corporate Bonds – 70.53%D | | | | | | | | | | | | |
| | |
Argentina – 4.02% | | | | | | | | | | | | |
Rio Energy 144A 6.875% 2/1/25 # | | | | | | | 225,000 | | | $ | 187,650 | |
Tecpetrol 144A 4.875% 12/12/22 # | | | | | | | 335,000 | | | | 316,156 | |
Transportadora de Gas del Sur 144A 6.75% 5/2/25 # | | | | | | | 170,000 | | | | 160,599 | |
YPF | | | | | | | | | | | | |
144A 7.00% 12/15/47 # | | | | | | | 150,000 | | | | 121,031 | |
144A 36.75% (BADLARPP + 4.00%) 7/7/20 #• | | | | | | | 170,000 | | | | 92,521 | |
| | | | | | | | | | | | |
| | | | | | | | | | | 877,957 | |
| | | | | | | | | | | | |
Australia – 1.42% | | | | | | | | | | | | |
Adani Abbot Point Terminal 144A 4.45% 12/15/22 # | | | | | | | 340,000 | | | | 310,301 | |
| | | | | | | | | | | | |
| | | | | | | | | | | 310,301 | |
| | | | | | | | | | | | |
Brazil – 11.75% | | | | | | | | | | | | |
Aegea Finance 144A 5.75% 10/10/24 # | | | | | | | 200,000 | | | | 193,300 | |
Banco do Brasil 144A 4.875% 4/19/23 # | | | | | | | 315,000 | | | | 310,181 | |
Braskem Netherlands Finance 144A 4.50% 1/10/28 # | | | | | | | 315,000 | | | | 303,077 | |
Cemig Geracao e Transmissao 144A 9.25% 12/5/24 # | | | | | | | 270,000 | | | | 282,461 | |
CSN Resources 144A 7.625% 2/13/23 # | | | | | | | 205,000 | | | | 194,240 | |
ESAL 144A 6.25% 2/5/23 # | | | | | | | 200,000 | | | | 195,060 | |
JBS USA LUX 144A 6.75% 2/15/28 # | | | | | | | 120,000 | | | | 113,550 | |
Marfrig Holdings Europe 144A 8.00% 6/8/23 # | | | | | | | 200,000 | | | | 205,250 | |
Petrobras Global Finance | | | | | | | | | | | | |
7.25% 3/17/44 | | | | | | | 105,000 | | | | 103,556 | |
7.375% 1/17/27 | | | | | | | 130,000 | | | | 135,330 | |
Rede D’or Finance 144A 4.95% 1/17/28 # | | | | | | | 200,000 | | | | 183,375 | |
Suzano Austria 144A 7.00% 3/16/47 # | | | | | | | 200,000 | | | | 214,500 | |
Swiss Insured Brazil Power Finance 144A 9.85% 7/16/32 # | | | BRL | | | | 500,000 | | | | 129,553 | |
| | | | | | | | | | | | |
| | | | | | | | | | | 2,563,433 | |
| | | | | | | | | | | | |
Chile – 4.62% | | | | | | | | | | | | |
AES Gener 144A 8.375% 12/18/73 #µ | | | | | | | 200,000 | | | | 208,000 | |
Banco de Credito e Inversiones 144A 3.50% 10/12/27 # | | | | | | | 200,000 | | | | 185,125 | |
Enel Chile 4.875% 6/12/28 | | | | | | | 205,000 | | | | 210,029 | |
Geopark 144A 6.50% 9/21/24 # | | | | | | | 200,000 | | | | 198,084 | |
VTR Finance 144A 6.875% 1/15/24 # | | | | | | | 200,000 | | | | 207,480 | |
| | | | | | | | | | | | |
| | | | | | | | | | | 1,008,718 | |
| | | | | | | | | | | | |
China – 3.72% | | | | | | | | | | | | |
Baidu 4.375% 3/29/28 | | | | | | | 215,000 | | | | 213,410 | |
Bank of China 144A 5.00% 11/13/24 # | | | | | | | 205,000 | | | | 211,106 | |
BOC Aviation 144A 2.375% 9/15/21 # | | | | | | | 200,000 | | | | 191,193 | |
JD.com 3.125% 4/29/21 | | | | | | | 200,000 | | | | 195,116 | |
| | | | | | | | | | | | |
| | | | | | | | | | | 810,825 | |
| | | | | | | | | | | | |
| | | | | | | | |
| | | Principal amount° | | | Value (US $) | |
Corporate BondsD (continued) | | | | | | | | |
| |
Colombia – 1.78% | | | | | | | | |
Ecopetrol | | | | | | | | |
5.875% 9/18/23 | | | 50,000 | | | $ | 53,700 | |
7.375% 9/18/43 | | | 110,000 | | | | 126,087 | |
Frontera Energy 144A 9.70% 6/25/23 # | | | 200,000 | | | | 209,250 | |
| | | | | | | | |
| | | | | | | 389,037 | |
| | | | | | | | |
Dominican Republic – 0.96% | | | | | | | | |
AES Andres 144A 7.95% 5/11/26 # | | | 200,000 | | | | 209,000 | |
| | | | | | | | |
| | | | | | | 209,000 | |
| | | | | | | | |
Georgia – 0.92% | | | | | | | | |
Bank of Georgia 144A 6.00% 7/26/23 # | | | 200,000 | | | | 200,013 | |
| | | | | | | | |
| | | | | | | 200,013 | |
| | | | | | | | |
Ghana – 1.09% | | | | | | | | |
Tullow Oil 144A 7.00% 3/1/25 # | | | 245,000 | | | | 238,875 | |
| | | | | | | | |
| | | | | | | 238,875 | |
| | | | | | | | |
Guatemala – 0.95% | | | | | | | | |
Comunicaciones Celulares via Comcel Trust 144A 6.875% 2/6/24 # | | | 200,000 | | | | 208,097 | |
| | | | | | | | |
| | | | | | | 208,097 | |
| | | | | | | | |
Hong Kong – 1.20% | | | | | | | | |
CK Hutchison International 17 144A 2.875% 4/5/22 # | | | 270,000 | | | | 262,045 | |
| | | | | | | | |
| | | | | | | 262,045 | |
| | | | | | | | |
India – 1.72% | | | | | | | | |
ICICI Bank 144A 4.00% 3/18/26 # | | | 200,000 | | | | 188,440 | |
Vedanta Resources 144A 6.125% 8/9/24 # | | | 200,000 | | | | 186,748 | |
| | | | | | | | |
| | | | | | | 375,188 | |
| | | | | | | | |
Indonesia – 1.82% | | | | | | | | |
Perusahaan Gas Negara Persero 144A 5.125% 5/16/24 # | | | 200,000 | | | | 201,852 | |
Perusahaan Listrik Negara 144A 5.25% 5/15/47 # | | | 200,000 | | | | 194,495 | |
| | | | | | | | |
| | | | | | | 396,347 | |
| | | | | | | | |
Israel – 3.02% | | | | | | | | |
Israel Chemicals 144A 6.375% 5/31/38 # | | | 250,000 | | | | 250,156 | |
Israel Electric 144A 4.25% 8/14/28 # | | | 200,000 | | | | 195,957 | |
Teva Pharmaceutical Finance Netherlands III 6.75% 3/1/28 | | | 200,000 | | | | 213,816 | |
| | | | | | | | |
| | | | | | | 659,929 | |
| | | | | | | | |
Jamaica – 0.59% | | | | | | | | |
Digicel Group 144A 7.125% 4/1/22 # | | | 200,000 | | | | 128,250 | |
| | | | | | | | |
| | | | | | | 128,250 | |
| | | | | | | | |
15
Schedule of investments
Delaware Emerging Markets Debt Fund
| | | | | | | | |
| | | Principal amount° | | | Value (US $) | |
Corporate BondsD (continued) | | | | | | | | |
| |
Kazakhstan – 1.84% | | | | | | | | |
KazMunayGas National JSC 144A 6.375% 10/24/48 # | | | 200,000 | | | $ | 209,690 | |
KazTransGas JSC 144A 4.375% 9/26/27 # | | | 200,000 | | | | 192,772 | |
| | | | | | | | |
| | | | | | | 402,462 | |
| | | | | | | | |
Kuwait – 1.13% | | | | | | | | |
Equate Petrochemical 144A 3.00% 3/3/22 # | | | 255,000 | | | | 246,019 | |
| | | | | | | | |
| | | | | | | 246,019 | |
| | | | | | | | |
Mexico – 5.28% | | | | | | | | |
Banco Santander Mexico 144A 4.125% 11/9/22 # | | | 150,000 | | | | 150,660 | |
Cydsa 144A 6.25% 10/4/27 # | | | 200,000 | | | | 193,500 | |
Grupo Cementos de Chihuahua 144A 5.25% 6/23/24 # | | | 200,000 | | | | 197,000 | |
Infraestructura Energetica Nova 144A 4.875% 1/14/48 # | | | 240,000 | | | | 210,000 | |
Mexichem 144A 5.50% 1/15/48 # | | | 220,000 | | | | 206,778 | |
Petroleos Mexicanos 6.75% 9/21/47 | | | 210,000 | | | | 194,250 | |
| | | | | | | | |
| | | | | | | 1,152,188 | |
| | | | | | | | |
Morocco – 1.35% | | | | | | | | |
OCP 144A 4.50% 10/22/25 # | | | 300,000 | | | | 294,599 | |
| | | | | | | | |
| | | | | | | 294,599 | |
| | | | | | | | |
Netherlands – 1.00% | | | | | | | | |
Syngenta Finance 144A 5.182% 4/24/28 # | | | 225,000 | | | | 218,749 | |
| | | | | | | | |
| | | | | | | 218,749 | |
| | | | | | | | |
Peru – 0.87% | | | | | | | | |
Kallpa Generacion 144A 4.125% 8/16/27 # | | | 200,000 | | | | 188,750 | |
| | | | | | | | |
| | | | | | | 188,750 | |
| | | | | | | | |
Republic of Korea – 0.91% | | | | | | | | |
Woori Bank 144A 4.75% 4/30/24 # | | | 200,000 | | | | 198,658 | |
| | | | | | | | |
| | | | | | | 198,658 | |
| | | | | | | | |
Russia – 3.98% | | | | | | | | |
Gazprom OAO via Gaz Capital 144A 4.95% 3/23/27 # | | | 260,000 | | | | 253,330 | |
Novolipetsk Steel via Steel Funding DAC 144A 4.00% 9/21/24 # | | | 200,000 | | | | 188,825 | |
Phosagro OAO via Phosagro Bond Funding DAC 144A 3.95% 11/3/21 # | | | 240,000 | | | | 234,908 | |
VEON Holdings 144A 4.95% 6/16/24 # | | | 200,000 | | | | 191,924 | |
| | | | | | | | |
| | | | | | | 868,987 | |
| | | | | | | | |
Singapore – 1.13% | | | | | | | | |
DBS Group Holdings 144A 4.52% 12/11/28 #µ | | | 245,000 | | | | 247,249 | |
| | | | | | | | |
| | | | | | | 247,249 | |
| | | | | | | | |
South Africa – 2.75% | | | | | | | | |
Growthpoint Properties International 144A 5.872% 5/2/23 # | | | 200,000 | | | | 207,064 | |
Myriad International Holdings 144A 4.85% 7/6/27 # | | | 200,000 | | | | 199,873 | |
16
| | | | | | | | |
| | | Principal amount° | | | Value (US $) | |
Corporate BondsD (continued) | | | | | | | | |
| |
South Africa (continued) | | | | | | | | |
Transnet SOC 144A 4.00% 7/26/22 # | | | 200,000 | | | $ | 192,839 | |
| | | | | | | | |
| | | | | | | 599,776 | |
| | | | | | | | |
Spain – 0.82% | | | | | | | | |
Atento Luxco 1 144A 6.125% 8/10/22 # | | | 180,000 | | | | 177,885 | |
| | | | | | | | |
| | | | | | | 177,885 | |
| | | | | | | | |
Turkey – 3.41% | | | | | | | | |
Akbank Turk 144A 7.20% 3/16/27 #µ | | | 205,000 | | | | 170,298 | |
Petkim Petrokimya Holding 144A 5.875% 1/26/23 # | | | 200,000 | | | | 179,910 | |
Turkiye Garanti Bankasi 144A 6.25% 4/20/21 # | | | 210,000 | | | | 207,442 | |
Turkiye Is Bankasi 144A 7.00% 6/29/28 #µ | | | 240,000 | | | | 185,872 | |
| | | | | | | | |
| | | | | | | 743,522 | |
| | | | | | | | |
Ukraine – 2.86% | | | | | | | | |
Kernel Holding 144A 8.75% 1/31/22 # | | | 220,000 | | | | 226,184 | |
MHP | | | | | | | | |
144A 6.95% 4/3/26 # | | | 200,000 | | | | 193,243 | |
144A 7.75% 5/10/24 # | | | 200,000 | | | | 205,790 | |
| | | | | | | | |
| | | | | | | 625,217 | |
| | | | | | | | |
United Arab Emirates – 1.77% | | | | | | | | |
Abu Dhabi Crude Oil Pipeline | | | | | | | | |
144A 3.65% 11/2/29 # | | | 200,000 | | | | 191,965 | |
144A 4.60% 11/2/47 # | | | 200,000 | | | | 194,380 | |
| | | | | | | | |
| | | | | | | 386,345 | |
| | | | | | | | |
Zambia – 1.85% | | | | | | | | |
First Quantum Minerals | | | | | | | | |
144A 7.25% 4/1/23 # | | | 200,000 | | | | 201,750 | |
144A 7.50% 4/1/25 # | | | 200,000 | | | | 202,000 | |
| | | | | | | | |
| | | | | | | 403,750 | |
| | | | | | | | |
Total Corporate Bonds (cost $15,868,171) | | | | | | | 15,392,171 | |
| | | | | | | | |
|
| |
Loan Agreement – 1.50% | | | | | | | | |
| |
Republic of Angola 8.747% (LIBOR06M + 6.25%) 12/16/23 =• | | | 350,625 | | | | 328,571 | |
| | | | | | | | |
Total Loan Agreement (cost $350,625) | | | | | | | 328,571 | |
| | | | | | | | |
|
| |
Regional Bonds – 1.20%D | | | | | | | | |
| |
Argentina – 1.20% | | | | | | | | |
Provincia de Cordoba | | | | | | | | |
144A 7.125% 8/1/27 # | | | 155,000 | | | | 127,295 | |
144A 7.45% 9/1/24 # | | | 150,000 | | | | 134,064 | |
| | | | | | | | |
Total Regional Bonds (cost $315,807) | | | | | | | 261,359 | |
| | | | | | | | |
17
Schedule of investments
Delaware Emerging Markets Debt Fund
| | | | | | | | | | | | |
| | | | | | Principal amount° | | | Value (US $) | |
Sovereign Bonds – 18.94%D | | | | | | | | | | | | |
| |
Angola – 0.97% | | | | | | | | | | | | |
Angolan Government International Bond 144A 9.375% 5/8/48 # | | | | | | | 200,000 | | | $ | 212,461 | |
| | | | | | | | | | | | |
| | | | | | | | | | | 212,461 | |
| | | | | | | | | | | | |
Argentina – 1.87% | | | | | | | | | | | | |
Argentine Bonos del Tesoro | | | | | | | | | | | | |
16.00% 10/17/23 | | | ARS | | | | 467,000 | | | | 15,863 | |
21.20% 9/19/18 | | | ARS | | | | 315,000 | | | | 12,145 | |
Argentine Republic Government International Bond | | | | | | | | | | | | |
5.625% 1/26/22 | | | | | | | 125,000 | | | | 119,000 | |
6.875% 1/11/48 | | | | | | | 330,000 | | | | 260,043 | |
| | | | | | | | | | | | |
| | | | | | | | | | | 407,051 | |
| | | | | | | | | | | | |
Azerbaijan – 0.63% | | | | | | | | | | | | |
Republic of Azerbaijan International Bond 144A 3.50% 9/1/32 # | | | | | | | 160,000 | | | | 136,868 | |
| | | | | | | | | | | | |
| | | | | | | | | | | 136,868 | |
| | | | | | | | | | | | |
Bermuda – 0.87% | | | | | | | | | | | | |
Bermuda Government International Bond 144A 3.717% 1/25/27 # | | | | | | | 200,000 | | | | 190,228 | |
| | | | | | | | | | | | |
| | | | | | | | | | | 190,228 | |
| | | | | | | | | | | | |
Brazil – 0.34% | | | | | | | | | | | | |
Brazil Notas do Tesouro Nacional Series F 10.00% 1/1/23 | | | BRL | | | | 280,000 | | | | 74,282 | |
| | | | | | | | | | | | |
| | | | | | | | | | | 74,282 | |
| | | | | | | | | | | | |
Dominican Republic – 1.51% | | | | | | | | | | | | |
Dominican Republic International Bond 144A 6.00% 7/19/28 # | | | | | | | 325,000 | | | | 329,063 | |
| | | | | | | | | | | | |
| | | | | | | | | | | 329,063 | |
| | | | | | | | | | | | |
Egypt – 1.82% | | | | | | | | | | | | |
Egypt Government International Bond | | | | | | | | | | | | |
144A 5.577% 2/21/23 # | | | | | | | 200,000 | | | | 198,837 | |
144A 7.903% 2/21/48 # | | | | | | | 200,000 | | | | 199,202 | |
| | | | | | | | | | | | |
| | | | | | | | | | | 398,039 | |
| | | | | | | | | | | | |
Ivory Coast – 0.85% | | | | | | | | | | | | |
Ivory Coast Government International Bond 144A 6.125% 6/15/33 # | | | | | | | 200,000 | | | | 184,237 | |
| | | | | | | | | | | | |
| | | | | | | | | | | 184,237 | |
| | | | | | | | | | | | |
Jordan – 1.12% | | | | | | | | | | | | |
Jordan Government International Bond 144A 5.75% 1/31/27 # | | | | | | | 255,000 | | | | 244,637 | |
| | | | | | | | | | | | |
| | | | | | | | | | | 244,637 | |
| | | | | | | | | | | | |
18
| | | | | | | | | | | | |
| | | | | | Principal amount° | | | Value (US $) | |
Sovereign BondsD (continued) | | | | | | | | | | | | |
| |
Mexico – 0.07% | | | | | | | | | | | | |
Mexican Bonos 6.50% 6/9/22 | | | MXN | | | | 297,000 | | | $ | 15,258 | |
| | | | | | | | | | | | |
| | | | | | | | | | | 15,258 | |
| | | | | | | | | | | | |
Mongolia – 0.90% | | | | | | | | | | | | |
Mongolia Government International Bond 144A 5.625% 5/1/23 # | | | | | | | 200,000 | | | | 195,921 | |
| | | | | | | | | | | | |
| | | | | | | | | | | 195,921 | |
| | | | | | | | | | | | |
Nigeria – 0.95% | | | | | | | | | | | | |
Nigeria Government International Bond 144A 7.875% 2/16/32 # | | | | | | | 200,000 | | | | 207,161 | |
| | | | | | | | | | | | |
| | | | | | | | | | | 207,161 | |
| | | | | | | | | | | | |
Qatar – 0.95% | | | | | | | | | | | | |
Qatar Government International Bond 144A 3.875% 4/23/23 # | | | | | | | 206,000 | | | | 207,078 | |
| | | | | | | | | | | | |
| | | | | | | | | | | 207,078 | |
| | | | | | | | | | | | |
Senegal – 1.04% | | | | | | | | | | | | |
Senegal Government International Bond 144A 6.75% 3/13/48 # | | | | | | | 250,000 | | | | 227,475 | |
| | | | | | | | | | | | |
| | | | | | | | | | | 227,475 | |
| | | | | | | | | | | | |
South Africa – 2.44% | | | | | | | | | | | | |
Republic of South Africa Government Bond 8.75% 1/31/44 | | | ZAR | | | | 4,659,000 | | | | 329,557 | |
Republic of South Africa Government International Bond 5.875% 6/22/30 | | | | | | | 200,000 | | | | 202,614 | |
| | | | | | | | | | | | |
| | | | | | | | | | | 532,171 | |
| | | | | | | | | | | | |
Turkey – 0.89% | | | | | | | | | | | | |
Turkey Government Bond 8.00% 3/12/25 | | | TRY | | | | 1,542,000 | | | | 194,726 | |
| | | | | | | | | | | | |
| | | | | | | | | | | 194,726 | |
| | | | | | | | | | | | |
Ukraine – 1.72% | | | | | | | | | | | | |
Ukraine Government International Bond | | | | | | | | | | | | |
144A 7.375% 9/25/32 # | | | | | | | 200,000 | | | | 182,059 | |
144A 7.75% 9/1/26 # | | | | | | | 200,000 | | | | 193,972 | |
| | | | | | | | | | | | |
| | | | | | | | | | | 376,031 | |
| | | | | | | | | | | | |
Total Sovereign Bonds (cost $4,328,880) | | | | | | | | | | | 4,132,687 | |
| | | | | | | | | | | | |
|
| |
Supranational Banks – 2.37% | | | | | | | | | | | | |
| |
Banque Ouest Africaine de Developpement 144A 5.00% 7/27/27 # | | | | | | | 240,000 | | | | 233,183 | |
Inter-American Development Bank | | | | | | | | | | | | |
6.25% 6/15/21 | | | IDR | | | | 300,000,000 | | | | 19,891 | |
7.875% 3/14/23 | | | IDR | | | | 1,870,000,000 | | | | 130,966 | |
| | |
| Schedule of investments | | |
| Delaware Emerging Markets Debt Fund | | |
| | | | | | | | | | | | |
| | | | | | Principal amount° | | | Value (US $) | |
Supranational Banks (continued) | | | | | | | | | | | | |
International Finance 7.00% 7/20/27 | | | MXN | | | | 2,650,000 | | | $ | 133,810 | |
| | | | | | | | | | | | |
Total Supranational Banks (cost $535,561) | | | | | | | | | | | 517,850 | |
| | | | | | | | | | | | |
| | | |
| | | | | | Number of contracts | | | | |
Options Purchased – 0.25% | | | | | | | | | | | | |
| |
Currency Put Options – 0.25% | | | | | | | | | | | | |
USD vs CLP strike price CLP 630, expiration date 9/25/18, notional amount CLP 1,348,830,000 (CITI) | | | | | | | 2,141,000 | | | | 22,904 | |
USD vs INR strike price INR 67, expiration date 1/24/19, notional amount INR 501,294,000 (HSBC) | | | | | | | 7,482,000 | | | | 20,454 | |
USD vs JPY strike price JPY 108, expiration date 9/20/18, notional amount JPY 378,000,000 (BOA) | | | | | | | 3,500,000 | | | | 10,979 | |
USD vs TRY strike price TRY 4, expiration date 8/31/18, notional amount TRY 9,058,880 (BNP) | | | | | | | 2,264,720 | | | | 1 | |
| | | | | | | | | | | | |
Total Options Purchased (cost $55,113) | | | | | | | | | | | 54,338 | |
| | | | | | | | | | | | |
| | | |
| | | | | | Principal amount° | | | | |
Short-Term Investments – 2.12% | | | | | | | | | | | | |
| |
Repurchase Agreements – 2.12% | | | | | | | | | | | | |
Bank of America Merrill Lynch | | | | | | | | | | | | |
1.84%, dated 7/31/18, to be repurchased on 8/1/18, repurchase price $73,431 (collateralized by US government obligations 2.25% 11/15/27; market value $74,896) | | | | | | | 73,428 | | | | 73,428 | |
Bank of Montreal | | | | | | | | | | | | |
1.83%, dated 7/31/18, to be repurchased on 8/1/18, repurchase price $146,863 (collateralized by US government obligations 0.125%–2.875% 7/15/22–11/15/46; market value $149,792) | | | | | | | 146,855 | | | | 146,855 | |
BNP Paribas | | | | | | | | | | | | |
1.87%, dated 7/31/18, to be repurchased on 8/1/18, repurchase price $241,730 (collateralized by US government obligations 0.00%–4.75% 12/31/22–8/15/46; market value $246,552) | | | | | | | 241,717 | | | | 241,717 | |
| | | | | | | | | | | | |
Total Short-Term Investments (cost $462,000) | | | | | | | | | | | 462,000 | |
| | | | | | | | | | | | |
| | | |
Total Value of Securities – 96.91%
(cost $21,916,157) | | | | | | | | | | $ | 21,148,976 | |
| | | | | | | | | | | | |
| # | Security exempt from registration under Rule 144A of the Securities Act of 1933, as amended. At July 31, 2018, the aggregate value of Rule 144A securities was $17,350,618, which represents 79.50% of the Fund’s net assets. See Note 11 in “Notes to financial statements.” |
| = | The value of this security was determined using significant unobservable inputs and is reported as a Level 3 security in the disclosure table located in Note 3 in “Notes to financial statements.” |
° Principal amount shown is stated in US Dollars unless noted that the security is denominated in another currency.
| D | Securities have been classified by country of origin. Aggregate classification by business sector has been presented on page 13 in “Security type / country and sector allocations.” |
| µ | Fixed to variable rate investment. The rate shown reflects the fixed rate in effect at July 31, 2018. Rate will reset at a future date. |
| • | Variable rate investment. Rates reset periodically. Rate shown reflects the rate in effect at July 31, 2018. For securities based on a published reference rate and spread, the reference rate and spread are indicated in their description above. The reference rate descriptions (i.e. LIBOR03M, LIBOR06M, etc.) used in this report are identical for different securities, but the underlying reference rates may differ due to the timing of the reset period. Certain variable rate securities are not based on a published reference rate and spread but are determined by the issuer or agent and are based on current market conditions, or for mortgage-backed securities, are impacted by the individual mortgages which are paying off over time. These securities do not indicate a reference rate and spread in their description above. |
The following foreign currency exchange contracts and futures contracts were outstanding at July 31, 2018:1
Foreign Currency Exchange Contracts
| | | | | | | | | | | | | | | | |
Counterparty | | Contracts to Receive (Deliver) | | In Exchange For | | Settlement Date | | | Unrealized
Appreciation | | | Unrealized
Depreciation | |
BNP | | JPY (10,489,887) | | USD 96,090 | | | 8/10/18 | | | $ | 2,213 | | | $ | — | |
GS | | BRL 1,202,952 | | USD (322,637) | | | 8/10/18 | | | | — | | | | (2,510 | ) |
| | | | | | | | | | | | | | | | |
Total Foreign Currency Exchange Contracts | | | | | | | | $ | 2,213 | | | $ | (2,510 | ) |
| | | | | | | | | | | | | | | | |
Futures Contract
| | | | | | | | | | | | | | | | | | | | |
Contracts to Buy (Sell) | | Notional
Amount | | | Notional
Cost
(Proceeds) | | | Expiration
Date | | | Value/
Unrealized
Depreciation | | | Variation
Margin
Due from
(Due to)
Brokers | |
US Treasury | | | | | | | | | | | | | | | | | | | | |
(6) Long Bonds | | $ | (857,813 | ) | | $ | (855,732 | ) | | | 9/20/18 | | | $ | (2,081 | ) | | $ | (2,063 | ) |
The use of foreign currency exchange contracts and futures contracts involve elements of market risk and risks in excess of the amounts disclosed in these financial statements. The foreign currency exchange contracts and notional amounts presented above represent the Fund’s total exposure in such contracts, whereas only the net unrealized appreciation (depreciation) is reflected in the Fund’s net assets.
| 1See | Note 8 in “Notes to financial statements.” |
| | |
| Schedule of investments | | |
| Delaware Emerging Markets Debt Fund | | |
Summary of abbreviations:
ARS – Argentine Peso
BADLARPP – Argentina Term Deposit Rate
BNP – BNP Paribas
BOA – Bank of America
BRL – Brazilian Real
CITI – Citigroup Global Markets
CLP – Chilean Peso
DAC – Designated Activity Company
GS – Goldman Sachs
ICE – Intercontinental Exchange
IDR – Indonesian Rupiah
INR – Indian Rupee
JPY – Japanese Yen
JSC – Joint Stock Company
LIBOR – London Interbank Offered Rate
LIBOR06M – ICE LIBOR USD 6 Month
MXN – Mexican Peso
TRY – Turkish Lira
USD – US Dollar
ZAR – South African Rand
See accompanying notes, which are an integral part of the financial statements.
This page intentionally left blank.
| | |
| Statement of assets and liabilities | | |
| Delaware Emerging Markets Debt Fund | | July 31, 2018 |
| | | | |
Assets: | | | | |
Investments, at value1 | | $ | 21,094,638 | |
Options purchased, at value2 | | | 54,338 | |
Foreign currencies, at value3 | | | 399,375 | |
Interest receivable | | | 306,505 | |
Cash | | | 26,002 | |
Cash collateral due from broker | | | 16,000 | |
Receivable for securities sold | | | 4,248 | |
Unrealized appreciation on foreign currency exchange contracts | | | 2,213 | |
| | | | |
Total assets | | | 21,903,319 | |
| | | | |
Liabilities: | | | | |
Audit and tax fees payable | | | 48,112 | |
Other accrued expenses | | | 21,528 | |
Investment management fees payable to affiliates | | | 4,519 | |
Unrealized depreciation on foreign currency exchange contracts | | | 2,510 | |
Variation margin due to broker on futures contracts | | | 2,063 | |
Accounting and administration expenses payable to affiliates | | | 409 | |
Dividend disbursing and transfer agent fees and expenses payable to affiliates | | | 352 | |
Distribution fees payable to affiliates | | | 80 | |
Trustees’ fees and expenses payable | | | 62 | |
Legal fees payable to affiliates | | | 24 | |
Reports and statements to shareholders expenses payable to affiliates | | | 18 | |
| | | | |
Total liabilities | | | 79,677 | |
| | | | |
Total Net Assets | | $ | 21,823,642 | |
| | | | |
| |
Net Assets Consist of: | | | | |
Paid-in capital | | $ | 22,419,152 | |
Undistributed net investment income | | | 36,706 | |
Accumulated net realized gain | | | 140,295 | |
Net unrealized depreciation of investments | | | (766,406 | ) |
Net unrealized depreciation of foreign currencies | | | (2,952 | ) |
Net unrealized depreciation of foreign currency exchange contracts | | | (297 | ) |
Net unrealized depreciation of futures contracts | | | (2,081 | ) |
Net unrealized depreciation of options purchased | | | (775 | ) |
| | | | |
Total Net Assets | | $ | 21,823,642 | |
| | | | |
| | | | |
Class A: | | | | |
Net assets | | $ | 56,466 | |
Shares of beneficial interest outstanding, unlimited authorization, no par | | | 6,838 | |
Net asset value per share | | $ | 8.26 | |
Sales charge | | | 4.50 | % |
Offering price per share, equal to net asset value per share / (1 – sales charge) | | $ | 8.65 | |
| |
Class C: | | | | |
Net assets | | $ | 81,942 | |
Shares of beneficial interest outstanding, unlimited authorization, no par | | | 9,923 | |
Net asset value per share | | $ | 8.26 | |
| |
Class R: | | | | |
Net assets | | $ | 2,471 | |
Shares of beneficial interest outstanding, unlimited authorization, no par | | | 299 | |
Net asset value per share | | $ | 8.26 | |
| |
Institutional Class: | | | | |
Net assets | | $ | 21,682,763 | |
Shares of beneficial interest outstanding, unlimited authorization, no par | | | 2,622,764 | |
Net asset value per share | | $ | 8.27 | |
| |
1 Investments, at cost | | $ | 21,861,044 | |
2 Options purchased, at cost | | | 55,113 | |
3 Foreign currencies, at cost | | | 401,605 | |
See accompanying notes, which are an integral part of the financial statements.
| | |
| Statement of operations | | |
| Delaware Emerging Markets Debt Fund | | Year ended July 31, 2018 |
| | | | |
Investment Income: | | | | |
Interest | | $ | 1,262,247 | |
Foreign tax withheld | | | (81 | ) |
| | | | |
| | | 1,262,166 | |
| | | | |
Expenses: | | | | |
Management fees | | | 165,174 | |
Distribution expenses – Class A | | | 110 | |
Distribution expenses – Class C | | | 790 | |
Distribution expenses – Class R | | | 12 | |
Registration fees | | | 52,916 | |
Audit and tax fees | | | 50,719 | |
Accounting and administration expenses | | | 32,627 | |
Reports and statements to shareholders expenses | | | 21,603 | |
Legal fees | | | 13,477 | |
Dividend disbursing and transfer agent fees and expenses | | | 6,692 | |
Custodian fees | | | 5,601 | |
Trustees’ fees and expenses | | | 972 | |
Other | | | 14,627 | |
| | | | |
| | | 365,320 | |
Less expenses waived | | | (161,941 | ) |
Less waived distribution expenses – Class R | | | (12 | ) |
Less expense paid indirectly | | | (1,184 | ) |
| | | | |
Total operating expenses | | | 202,183 | |
| | | | |
Net Investment Income | | | 1,059,983 | |
| | | | |
| | | | |
Net Realized and Unrealized Gain (Loss): | | | | |
Net realized gain (loss) on: | | | | |
Investments | | $ | 356,842 | |
Foreign currencies | | | (25,028 | ) |
Foreign currency exchange contracts | | | 5,099 | |
Futures contracts | | | 34,765 | |
Options purchased | | | (11,806 | ) |
Swap contracts | | | (14,854 | ) |
| | | | |
Net realized gain | | | 345,018 | |
| | | | |
Net change in unrealized appreciation (depreciation) of: | | | | |
Investments1 | | | (1,406,107 | ) |
Foreign currencies | | | (3,082 | ) |
Foreign currency exchange contracts | | | (654 | ) |
Futures contracts | | | (2,081 | ) |
Options purchased | | | 28,255 | |
Swap contracts | | | 7,307 | |
| | | | |
Net change in unrealized appreciation (depreciation) | | | (1,376,362 | ) |
| | | | |
Net Realized and Unrealized Loss | | | (1,031,344 | ) |
| | | | |
Net Increase in Net Assets Resulting from Operations | | $ | 28,639 | |
| | | | |
| 1 | Includes decrease of $11 capital gains taxes accrued. |
See accompanying notes, which are an integral part of the financial statements.
| | |
| Statements of changes in net assets | | |
| Delaware Emerging Markets Debt Fund | | |
| | | | | | | | |
| | | Year ended | |
| | | 7/31/18 | | | 7/31/17 | |
Increase (Decrease) in Net Assets from Operations: | | | | | | | | |
Net investment income | | $ | 1,059,983 | | | $ | 925,769 | |
Net realized gain | | | 345,018 | | | | 786,912 | |
Net change in unrealized appreciation (depreciation) | | | (1,376,362 | ) | | | (80,487 | ) |
| | | | | | | | |
Net increase in net assets resulting from operations | | | 28,639 | | | | 1,632,194 | |
| | | | | | | | |
| | |
Dividends and Distributions to Shareholders from: | | | | | | | | |
Net investment income: | | | | | | | | |
Class A | | | (1,956 | ) | | | (503 | ) |
Class C | | | (2,926 | ) | | | (338 | ) |
Class R | | | (118 | ) | | | (104 | ) |
Institutional Class | | | (1,027,398 | ) | | | (911,292 | ) |
| | |
Net realized gain: | | | | | | | | |
Class A | | | (455 | ) | | | — | |
Class C | | | (1,207 | ) | | | — | |
Class R | | | (36 | ) | | | — | |
Institutional Class | | | (317,542 | ) | | | — | |
| | | | | | | | |
| | | (1,351,638 | ) | | | (912,237 | ) |
| | | | | | | | |
Capital Share Transactions: | | | | | | | | |
Proceeds from shares sold: | | | | | | | | |
Class A | | | 92,140 | | | | 48,538 | |
Class C | | | 58,822 | | | | 59,542 | |
Institutional Class | | | 126,314 | | | | — | |
| | |
Net asset value of shares issued upon reinvestment of dividends and distributions: | | | | | | | | |
Class A | | | 2,411 | | | | 502 | |
Class C | | | 4,133 | | | | 338 | |
Class R | | | 154 | | | | 104 | |
Institutional Class | | | 1,341,785 | | | | 911,292 | |
| | | | | | | | |
| | | 1,625,759 | | | | 1,020,316 | |
| | | | | | | | |
| | | | | | | | |
| | | Year ended | |
| | | 7/31/18 | | | 7/31/17 | |
Capital Share Transactions (continued): | | | | | | | | |
Cost of shares redeemed: | | | | | | | | |
Class A | | $ | (61,604 | ) | | $ | (25,345 | ) |
Class C | | | (38,549 | ) | | | — | |
Institutional Class | | | (30,869 | ) | | | — | |
| | | | | | | | |
| | | (131,022 | ) | | | (25,345 | ) |
| | | | | | | | |
Increase in net assets derived from capital share transactions | | | 1,494,737 | | | | 994,971 | |
| | | | | | | | |
Net Increase in Net Assets | | | 171,738 | | | | 1,714,928 | |
Net Assets: | | | | | | | | |
Beginning of year | | | 21,651,904 | | | | 19,936,976 | |
| | | | | | | | |
End of year | | $ | 21,823,642 | | | $ | 21,651,904 | |
| | | | | | | | |
Undistributed net investment income | | $ | 36,706 | | | $ | 56,892 | |
| | | | | | | | |
See accompanying notes, which are an integral part of the financial statements.
Financial highlights
Delaware Emerging Markets Debt Fund Class A
Selected data for each share of the Fund outstanding throughout each period were as follows:
|
Net asset value, beginning of period |
|
Income (loss) from investment operations: |
Net investment income2 |
Net realized and unrealized gain (loss) |
| |
Total from investment operations |
| |
|
Less dividends and distributions from: |
Net investment income |
Net realized gain |
| |
Total dividends and distributions |
| |
|
Net asset value, end of period |
|
Total return3 |
|
Ratios and supplemental data: |
Net assets, end of period (000 omitted) |
Ratio of expenses to average net assets excluding interest expense |
Ratio of expenses to average net assets |
Ratio of expenses to average net assets prior to fees waived4 |
Ratio of net investment income to average net assets excluding interest expense |
Ratio of net investment income to average net assets |
Ratio of net investment income to average net assets prior to fees waived4 |
Portfolio turnover |
| 1 | Date of commencement of operations; ratios have been annualized and total return and portfolio turnover have not been annualized. |
| 2 | The average shares outstanding method has been applied for per share information. |
| 3 | Total investment return is based on the change in net asset value of a share during the period and assumes reinvestment of dividends and distributions at net asset value and does not reflect the impact of a sales charge. Total investment return during all of the periods shown reflects waivers by the manager and/or distributor. Performance would have been lower had the waivers not been in effect. |
| 4 | Expenses paid indirectly were not material and had no impact on the ratios disclosed. Expenses paid indirectly for the year ended July 31, 2018 are reflected on the “Statement of operations.” |
See accompanying notes, which are an integral part of the financial statements.
| | | | | | | | | | | | | | | | | | | | | | | | | | | | |
| | | | | | | | | | | Year ended | | | | | | | | | | | | 9/30/131
to | |
| | | 7/31/18 | | | | | 7/31/17 | | | | | 7/31/16 | | | | | 7/31/15 | | | | | 7/31/14 | |
| | $ | 8.77 | | | | | $ | 8.48 | | | | | $ | 8.21 | | | | | $ | 8.84 | | | | | $ | 8.50 | |
| | | | | | | | | |
| | | | | | | | | | | | | | | | | | | | | | | | | | | | |
| | | 0.39 | | | | | | 0.37 | | | | | | 0.36 | | | | | | 0.37 | | | | | | 0.32 | |
| | | (0.39 | ) | | | | | 0.29 | | | | | | 0.24 | | | | | | (0.61 | ) | | | | | 0.34 | |
| | | | | | | | | | | | | | | | | | | | | | | | | | | | |
| | | — | | | | | | 0.66 | | | | | | 0.60 | | | | | | (0.24 | ) | | | | | 0.66 | |
| | | | | | | | | | | | | | | | | | | | | | | | | | | | |
| | | | | | | | | |
| | | (0.38 | ) | | | | | (0.37 | ) | | | | | (0.33 | ) | | | | | (0.30 | ) | | | | | (0.32 | ) |
| | | (0.13 | ) | | | | | — | | | | | | — | | | | | | (0.09 | ) | | | | | — | |
| | | | | | | | | | | | | | | | | | | | | | | | | | | | |
| | | (0.51 | ) | | | | | (0.37 | ) | | | | | (0.33 | ) | | | | | (0.39 | ) | | | | | (0.32 | ) |
| | | | | | | | | | | | | | | | | | | | | | | | | | | | |
| | | | | | | | | |
| | $ | 8.26 | | | | | $ | 8.77 | | | | | $ | 8.48 | | | | | $ | 8.21 | | | | | $ | 8.84 | |
| | | | | | | | | | | | | | | | | | | | | | | | | | | | |
| | | | | | | | | |
| | | (0.10% | ) | | | | | 8.03% | | | | | | 7.62% | | | | | | (2.65% | ) | | | | | 7.86% | |
| | | | | | | | | |
| | | | | | | | | | | | | | | | | | | | | | | | | | | | |
| | $ | 57 | | | | | $ | 27 | | | | | $ | 3 | | | | | $ | 2 | | | | | $ | 2 | |
| | | 1.16% | | | | | | 1.22% | | | | | | 1.01% | | | | | | 1.08% | | | | | | 1.31% | |
| | | 1.16% | | | | | | 1.22% | | | | | | 1.03% | | | | | | 1.14% | | | | | | 1.50% | |
| | | 1.90% | | | | | | 1.91% | | | | | | 2.04% | | | | | | 2.03% | | | | | | 2.48% | |
| | | 4.57% | | | | | | 4.30% | | | | | | 4.44% | | | | | | 4.46% | | | | | | 4.66% | |
| | | 4.57% | | | | | | 4.30% | | | | | | 4.42% | | | | | | 4.40% | | | | | | 4.47% | |
| | | 3.83% | | | | | | 3.61% | | | | | | 3.41% | | | | | | 3.51% | | | | | | 3.49% | |
| | | 108% | | | | | | 154% | | | | | | 232% | | | | | | 288% | | | | | | 152% | |
Financial highlights
Delaware Emerging Markets Debt Fund Class C
Selected data for each share of the Fund outstanding throughout each period were as follows:
|
Net asset value, beginning of period |
|
Income (loss) from investment operations: |
Net investment income2 |
Net realized and unrealized gain (loss) |
| |
Total from investment operations |
| |
|
Less dividends and distributions from: |
Net investment income |
Net realized gain |
Total dividends and distributions |
|
Net asset value, end of period |
|
Total return3 |
|
Ratios and supplemental data: |
Net assets, end of period (000 omitted) |
Ratio of expenses to average net assets excluding interest expense |
Ratio of expenses to average net assets |
Ratio of expenses to average net assets prior to fees waived4 |
Ratio of net investment income to average net assets excluding interest expense |
Ratio of net investment income to average net assets |
Ratio of net investment income to average net assets prior to fees waived4 |
Portfolio turnover |
| 1 | Date of commencement of operations; ratios have been annualized and total return and portfolio turnover have not been annualized. |
| 2 | The average shares outstanding method has been applied for per share information. |
| 3 | Total investment return is based on the change in net asset value of a share during the period and assumes reinvestment of dividends and distributions at net asset value and does not reflect the impact of a sales charge. Total investment return during all of the periods shown reflects waivers by the manager and/or distributor. Performance would have been lower had the waivers not been in effect. |
| 4 | Expenses paid indirectly were not material and had no impact on the ratios disclosed. Expenses paid indirectly for the year ended July 31, 2018 are reflected on the “Statement of operations.” |
See accompanying notes, which are an integral part of the financial statements.
| | | | | | | | | | | | | | | | | | | | | | | | | | | | |
| | | Year ended | | | | | 9/30/131 to | |
| | | 7/31/18 | | | | | 7/31/17 | | | | | 7/31/16 | | | | | 7/31/15 | | | | | 7/31/14 | |
| | $ | 8.77 | | | | | $ | 8.48 | | | | | $ | 8.22 | | | | | $ | 8.84 | | | | | $ | 8.50 | |
| | | | | | | | | |
| | | | | | | | | | | | | | | | | | | | | | | | | | | | |
| | | 0.33 | | | | | | 0.32 | | | | | | 0.36 | | | | | | 0.37 | | | | | | 0.27 | |
| | | (0.39 | ) | | | | | 0.32 | | | | | | 0.23 | | | | | | (0.60 | ) | | | | | 0.33 | |
| | | | | | | | | | | | | | | | | | | | | | | | | | | | |
| | | (0.06 | ) | | | | | 0.64 | | | | | | 0.59 | | | | | | (0.23 | ) | | | | | 0.60 | |
| | | | | | | | | | | | | | | | | | | | | | | | | | | | |
| | | | | | | | | |
| | | | | | | | | | | | | | | | | | | | | | | | | | | | |
| | | (0.32 | ) | | | | | (0.35 | ) | | | | | (0.33 | ) | | | | | (0.30 | ) | | | | | (0.26 | ) |
| | | (0.13 | ) | | | | | — | | | | | | — | | | | | | (0.09 | ) | | | | | — | |
| | | | | | | | | | | | | | | | | | | | | | | | | | | | |
| | | (0.45 | ) | | | | | (0.35 | ) | | | | | (0.33 | ) | | | | | (0.39 | ) | | | | | (0.26 | ) |
| | | | | | | | | | | | | | | | | | | | | | | | | | | | |
| | | | | | | | | |
| | $ | 8.26 | | | | | $ | 8.77 | | | | | $ | 8.48 | | | | | $ | 8.22 | | | | | $ | 8.84 | |
| | | | | | | | | | | | | | | | | | | | | | | | | | | | |
| | | | | | | | | |
| | | (0.84% | ) | | | | | 7.74% | | | | | | 7.49% | | | | | | (2.53% | ) | | | | | 7.22% | |
| | | | | | | | | |
| | | | | | | | | | | | | | | | | | | | | | | | | | | | |
| | $ | 82 | | | | | $ | 63 | | | | | $ | 2 | | | | | $ | 2 | | | | | $ | 2 | |
| | | 1.91% | | | | | | 1.81% | | | | | | 1.01% | | | | | | 1.08% | | | | | | 2.03% | |
| | | 1.91% | | | | | | 1.81% | | | | | | 1.03% | | | | | | 1.14% | | | | | | 2.22% | |
| | | 2.65% | | | | | | 2.66% | | | | | | 2.79% | | | | | | 2.78% | | | | | | 3.20% | |
| | | 3.82% | | | | | | 3.71% | | | | | | 4.44% | | | | | | 4.46% | | | | | | 3.94% | |
| | | 3.82% | | | | | | 3.71% | | | | | | 4.42% | | | | | | 4.40% | | | | | | 3.75% | |
| | | 3.08% | | | | | | 2.86% | | | | | | 2.66% | | | | | | 2.76% | | | | | | 2.77% | |
| | | 108% | | | | | | 154% | | | | | | 232% | | | | | | 288% | | | | | | 152% | |
Financial highlights
Delaware Emerging Markets Debt Fund Class R
Selected data for each share of the Fund outstanding throughout each period were as follows:
|
Net asset value, beginning of period |
|
Income (loss) from investment operations: |
Net investment income2 |
Net realized and unrealized gain (loss) |
Total from investment operations |
|
Less dividends and distributions from: |
Net investment income |
Net realized gain |
Total dividends and distributions |
|
Net asset value, end of period |
|
Total return3 |
|
Ratios and supplemental data: |
Net assets, end of period (000 omitted) |
Ratio of expenses to average net assets excluding interest expense |
Ratio of expenses to average net assets |
Ratio of expenses to average net assets prior to fees waived4 |
Ratio of net investment income to average net assets excluding interest expense |
Ratio of net investment income to average net assets |
Ratio of net investment income to average net assets prior to fees waived4 |
Portfolio turnover |
| 1 | Date of commencement of operations; ratios have been annualized and total return and portfolio turnover have not been annualized. |
| 2 | The average shares outstanding method has been applied for per share information. |
| 3 | Total investment return is based on the change in net asset value of a share during the period and assumes reinvestment of dividends and distributions at net asset value. Total investment return during all of the periods shown reflects waivers by the manager and/or distributor. Performance would have been lower had the waivers not been in effect. |
| 4 | Expenses paid indirectly were not material and had no impact on the ratios disclosed. Expenses paid indirectly for the year ended July 31, 2018 are reflected on the “Statement of operations.” |
See accompanying notes, which are an integral part of the financial statements.
| | | | | | | | | | | | | | | | | | | | | | | | | | | | |
| | | Year ended | | | | | 9/30/131 to | |
| | | 7/31/18 | | | | | 7/31/17 | | | | | 7/31/16 | | | | | 7/31/15 | | | | | 7/31/14 | |
| | $ | 8.77 | | | | | $ | 8.48 | | | | | $ | 8.22 | | | | | $ | 8.84 | | | | | $ | 8.50 | |
| | | | | | | | | |
| | | | | | | | | | | | | | | | | | | | | | | | | | | | |
| | | 0.42 | | | | | | 0.39 | | | | | | 0.36 | | | | | | 0.37 | | | | | | 0.31 | |
| | | (0.39 | ) | | | | | 0.28 | | | | | | 0.23 | | | | | | (0.60 | ) | | | | | 0.33 | |
| | | | | | | | | | | | | | | | | | | | | | | | | | | | |
| | | 0.03 | | | | | | 0.67 | | | | | | 0.59 | | | | | | (0.23 | ) | | | | | 0.64 | |
| | | | | | | | | | | | | | | | | | | | | | | | | | | | |
| | | | | | | | | |
| | | | | | | | | | | | | | | | | | | | | | | | | | | | |
| | | (0.41 | ) | | | | | (0.38 | ) | | | | | (0.33 | ) | | | | | (0.30 | ) | | | | | (0.30 | ) |
| | | (0.13 | ) | | | | | — | | | | | | — | | | | | | (0.09 | ) | | | | | — | |
| | | | | | | | | | | | | | | | | | | | | | | | | | | | |
| | | (0.54 | ) | | | | | (0.38 | ) | | | | | (0.33 | ) | | | | | (0.39 | ) | | | | | (0.30 | ) |
| | | | | | | | | | | | | | | | | | | | | | | | | | | | |
| | | | | | | | | |
| | $ | 8.26 | | | | | $ | 8.77 | | | | | $ | 8.48 | | | | | $ | 8.22 | | | | | $ | 8.84 | |
| | | | | | | | | | | | | | | | | | | | | | | | | | | | |
| | | | | | | | | | | | | | | | | | | | | | | | | | | | |
| | | | | | | | | | | | | | | | | | | | | | | | | | | | |
| | | | | | | | | |
| | | 0.16% | | | | | | 8.13% | | | | | | 7.49% | | | | | | (2.53% | ) | | | | | 7.64% | |
| | | | | | | | | | | | | | | | | | | | | | | | | | | | |
| | | | | | | | | | | | | | | | | | | | | | | | | | | | |
| | $ | 2 | | | | | $ | 2 | | | | | $ | 2 | | | | | $ | 2 | | | | | $ | 2 | |
| | | 0.91% | | | | | | 1.00% | | | | | | 1.01% | | | | | | 1.08% | | | | | | 1.55% | |
| | | 0.91% | | | | | | 1.00% | | | | | | 1.03% | | | | | | 1.14% | | | | | | 1.74% | |
| | | 2.13% | | | | | | 2.16% | | | | | | 2.29% | | | | | | 2.28% | | | | | | 2.72% | |
| | | 4.82% | | | | | | 4.52% | | | | | | 4.44% | | | | | | 4.46% | | | | | | 4.42% | |
| | | 4.82% | | | | | | 4.52% | | | | | | 4.42% | | | | | | 4.40% | | | | | | 4.23% | |
| | | 3.60% | | | | | | 3.36% | | | | | | 3.16% | | | | | | 3.26% | | | | | | 3.25% | |
| | | 108% | | | | | | 154% | | | | | | 232% | | | | | | 288% | | | | | | 152% | |
Financial highlights
Delaware Emerging Markets Debt Fund Institutional Class
Selected data for each share of the Fund outstanding throughout each period were as follows:
|
Net asset value, beginning of period |
|
Income (loss) from investment operations: |
Net investment income2 |
Net realized and unrealized gain (loss) |
| |
Total from investment operations |
| |
|
Less dividends and distributions from: |
Net investment income |
Net realized gain |
Total dividends and distributions |
|
|
Net asset value, end of period |
|
Total return3 |
|
Ratios and supplemental data: |
Net assets, end of period (000 omitted) |
Ratio of expenses to average net assets excluding interest expense |
Ratio of expenses to average net assets |
Ratio of expenses to average net assets prior to fees waived4 |
Ratio of net investment income to average net assets excluding interest expense |
Ratio of net investment income to average net assets |
Ratio of net investment income to average net assets prior to fees waived4 |
Portfolio turnover |
| 1 | Date of commencement of operations; ratios have been annualized and total return and portfolio turnover have not been annualized. |
| 2 | The average shares outstanding method has been applied for per share information. |
| 3 | Total investment return is based on the change in net asset value of a share during the period and assumes reinvestment of dividends and distributions at net asset value. Total investment return during all of the periods shown reflects a waiver by the manager. Performance would have been lower had the waiver not been in effect. |
| 4 | Expenses paid indirectly were not material and had no impact on the ratios disclosed. Expenses paid indirectly for the year ended July 31, 2018 are reflected on the “Statement of operations.” |
See accompanying notes, which are an integral part of the financial statements.
| | | | | | | | | | | | | | | | | | | | | | | | | | | | |
| | | Year ended | | | | | 9/30/131 to | |
| | | 7/31/18 | | | | | 7/31/17 | | | | | 7/31/16 | | | | | 7/31/15 | | | | | 7/31/14 | |
| | $ | 8.78 | | | | | $ | 8.48 | | | | | $ | 8.22 | | | | | $ | 8.84 | | | | | $ | 8.50 | |
| | | | | | | | | |
| | | | | | | | | | | | | | | | | | | | | | | | | | | | |
| | | 0.42 | | | | | | 0.39 | | | | | | 0.36 | | | | | | 0.37 | | | | | | 0.34 | |
| | | (0.39 | ) | | | | | 0.29 | | | | | | 0.23 | | | | | | (0.60 | ) | | | | | 0.33 | |
| | | | | | | | | | | | | | | | | | | | | | | | | | | | |
| | | 0.03 | | | | | | 0.68 | | | | | | 0.59 | | | | | | (0.23 | ) | | | | | 0.67 | |
| | | | | | | | | | | | | | | | | | | | | | | | | | | | |
| | | | | | | | | |
| | | | | | | | | | | | | | | | | | | | | | | | | | | | |
| | | (0.41 | ) | | | | | (0.38 | ) | | | | | (0.33 | ) | | | | | (0.30 | ) | | | | | (0.33 | ) |
| | | (0.13 | ) | | | | | — | | | | | | — | | | | | | (0.09 | ) | | | | | — | |
| | | (0.54 | ) | | | | | (0.38 | ) | | | | | (0.33 | ) | | | | | (0.39 | ) | | | | | (0.33 | ) |
| | | | | | | | | | | | | | | | | | | | | | | | | | | | |
| | | | | | | | | |
| | $ | 8.27 | | | | | $ | 8.78 | | | | | $ | 8.48 | | | | | $ | 8.22 | | | | | $ | 8.84 | |
| | | | | | | | | | | | | | | | | | | | | | | | | | | | |
| | | | | | | | | |
| | | | | | | | | | | | | | | | | | | | | | | | | | | | |
| | | | | | | | | |
| | | 0.16% | | | | | | 8.25% | | | | | | 7.49% | | | | | | (2.53% | ) | | | | | 8.08% | |
| | | | | | | | | |
| | | | | | | | | | | | | | | | | | | | | | | | | | | | |
| | $ | 21,683 | | | | | $ | 21,560 | | | | | $ | 19,930 | | | | | $ | 18,532 | | | | | $ | 19,020 | |
| | | 0.91% | | | | | | 1.00% | | | | | | 1.01% | | | | | | 1.08% | | | | | | 1.07% | |
| | | 0.91% | | | | | | 1.00% | | | | | | 1.03% | | | | | | 1.14% | | | | | | 1.26% | |
| | | 1.65% | | | | | | 1.66% | | | | | | 1.79% | | | | | | 1.78% | | | | | | 2.24% | |
| | | 4.82% | | | | | | 4.52% | | | | | | 4.44% | | | | | | 4.46% | | | | | | 4.90% | |
| | | 4.82% | | | | | | 4.52% | | | | | | 4.42% | | | | | | 4.40% | | | | | | 4.71% | |
| | | 4.08% | | | | | | 3.86% | | | | | | 3.66% | | | | | | 3.76% | | | | | | 3.73% | |
| | | 108% | | | | | | 154% | | | | | | 232% | | | | | | 288% | | | | | | 152% | |
| | |
| Notes to financial statements | | |
| Delaware Emerging Markets Debt Fund | | July 31, 2018 |
Delaware Group® Government Fund (Trust) is organized as a Delaware statutory trust and offers two series: Delaware Strategic Income Fund and Delaware Emerging Markets Debt Fund. These financial statements and the related notes pertain to Delaware Emerging Markets Debt Fund (Fund). The Trust is an open-end investment company. The Fund is considered diversified under the Investment Company Act of 1940, as amended (1940 Act), and offers Class A, Class C, Class R, and Institutional Class shares. Class A shares are sold with a maximum front-end sales charge of 4.50%. Class A share purchases of $1,000,000 or more will incur a contingent deferred sales charge (CDSC) instead of a front-end sales charge of 1.00% if redeemed during the first year and 0.50% during the second year, provided that Delaware Distributors, L.P. (DDLP) paid a financial advisor a commission on the purchase of those shares. Class C shares are sold with a CDSC of 1.00%, which will be incurred if redeemed during the first 12 months. Class R and Institutional Class shares are not subject to a sales charge and are offered for sale exclusively to certain eligible investors.
The investment objective of the Fund is to primarily seek current income and secondarily capital appreciation.
1. Significant Accounting Policies
The following accounting policies are in accordance with US generally accepted accounting principles (US GAAP) and are consistently followed by the Fund. The Fund is an investment company and follows accounting and reporting guidance under Financial Accounting Standards Board (FASB) Accounting Standards Codification (ASC) Topic 946, “Financial Services – Investment Companies.”
Security Valuation – Equity securities, except those traded on the Nasdaq Stock Market LLC (Nasdaq), are valued at the last quoted sales price as of the time of the regular close of the New York Stock Exchange on the valuation date. Equity securities traded on the Nasdaq are valued in accordance with the Nasdaq Official Closing Price, which may not be the last sales price. If, on a particular day, an equity security does not trade, the mean between the bid and ask prices will be used, which approximates fair value. Equity securities listed on a foreign exchange are normally valued at the last quoted sales price on the valuation date. US government and agency securities are valued at the mean between the bid and ask prices, which approximates fair value. Other debt securities and credit default swap (CDS) contracts are valued based upon valuations provided by an independent pricing service or broker/counterparty and reviewed by management. To the extent current market prices are not available, the pricing service may take into account developments related to the specific security, as well as transactions in comparable securities. Valuations for fixed income securities utilize matrix systems, which reflect such factors as security prices, yields, maturities, and ratings, and are supplemented by dealer and exchange quotations. Swap prices are derived using daily swap curves and models that incorporate a number of market data factors, such as discounted cash flows, trades, and values of the underlying reference instruments. Foreign currency exchange contracts and foreign cross currency exchange contracts are valued at the mean between the bid and ask prices, which approximates fair value. Interpolated values are derived when the settlement date of the contract is an interim date for which quotations are not available. Futures contracts and options on futures contracts are valued at the daily quoted settlement prices. Exchange-traded options are valued at the last reported sale price or, if no sales are reported, at the mean between the last reported bid and ask prices, which approximates fair value. Generally, other securities and assets for which market quotations are not readily available are
valued at fair value as determined in good faith under the direction of the Trust’s Board of Trustees (Board). In determining whether market quotations are readily available or fair valuation will be used, various factors will be taken into consideration, such as market closures or suspension of trading in a security. Restricted securities are valued at fair value using methods approved by the Board.
Federal and Foreign Income Taxes – No provision for federal income taxes has been made as the Fund intends to continue to qualify for federal income tax purposes as a regulated investment company under Subchapter M of the Internal Revenue Code of 1986, as amended, and make the requisite distributions to shareholders. The Fund evaluates tax positions taken or expected to be taken in the course of preparing the Fund’s tax returns to determine whether the tax positions are “more-likely-than-not” of being sustained by the applicable tax authority. Tax positions not deemed to meet the “more-likely-than-not” threshold are recorded as a tax benefit or expense in the current year. Management has analyzed the Fund’s tax positions taken or expected to be taken on the Fund’s federal income tax returns through the year ended July 31, 2018 and for all open tax years (years ended July 31, 2015–July 31, 2017), and has concluded that no provision for federal income tax is required in the Fund’s financial statements. In regard to foreign taxes only, the Fund has open tax years in certain foreign countries in which it invests that may date back to the inception of the Fund. If applicable, the Fund recognizes interest accrued on unrecognized tax benefits in interest expense and penalties in other expenses on the “Statement of operations.” During the year ended July 31, 2018, the Fund did not incur any interest or tax penalties.
Class Accounting – Investment income, common expenses and realized and unrealized gain (loss) on investments are allocated to the various classes of the Fund on the basis of daily net assets of each class. Distribution expenses relating to a specific class are charged directly to that class.
Repurchase Agreements – The Fund may purchase certain US government securities subject to the counterparty’s agreement to repurchase them at an agreed upon date and price. The counterparty will be required on a daily basis to maintain the value of the collateral subject to the agreement at not less than the repurchase price (including accrued interest). The agreements are conditioned upon the collateral being deposited under the Federal Reserve book-entry system with the Fund’s custodian or a third party sub-custodian. In the event of default or bankruptcy by the other party to the agreement, retention of the collateral may be subject to legal proceedings. All open repurchase agreements as of the date of this report were entered into on July 31, 2018 and matured on the next business day.
Foreign Currency Transactions – Transactions denominated in foreign currencies are recorded at the prevailing exchange rates on the valuation date in accordance with the Fund’s prospectus. The value of all assets and liabilities denominated in foreign currencies is translated daily into US dollars at the exchange rate of such currencies against the US dollar. Transaction gains or losses resulting from changes in exchange rates during the reporting period or upon settlement of the foreign currency transaction are reported in operations for the current period. The Fund generally bifurcates that portion of realized gains and losses on investments in debt securities which is due to changes in foreign exchange rates from that which is due to changes in market prices of debt securities. That portion of gains (losses) attributable to changes in foreign exchange rates is included on the “Statement of operations” under “Net realized gain (loss) on foreign currencies.” The Fund reports certain foreign currency related
| | |
| Notes to financial statements | | |
| Delaware Emerging Markets Debt Fund | | |
1. Significant Accounting Policies (continued)
transactions as components of realized gains (losses) for financial reporting purposes, whereas such components are treated as ordinary income (loss) for federal income tax purposes.
Use of Estimates – The Fund is an investment company, whose financial statements are prepared in conformity with US GAAP. Therefore, the Fund follows the accounting and reporting guidelines for investment companies. The preparation of financial statements in conformity with US GAAP requires management to make estimates and assumptions that affect the fair value of investments, the reported amounts of assets and liabilities and disclosure of contingent assets and liabilities at the date of the financial statements, and the reported amounts of revenues and expenses during the reporting period. Actual results could differ from those estimates and the differences could be material.
Other – Expenses directly attributable to the Fund are charged directly to the Fund. Other expenses common to various funds within the Delaware Funds® by Macquarie (Delaware Funds) are generally allocated among such funds on the basis of average net assets. Management fees and certain other expenses are paid monthly. Security transactions are recorded on the date the securities are purchased or sold (trade date) for financial reporting purposes. Costs used in calculating realized gains and losses on the sale of investment securities are those of the specific securities sold. Dividend income is recorded on the ex-dividend date and interest income is recorded on the accrual basis. Discounts and premiums on debt securities are accreted or amortized to interest income, respectively, over the lives of the respective securities using the effective interest method. The Fund declares and pays dividends from net investment income monthly and pays distributions from net realized gain on investments, if any, annually. The Fund may distribute more frequently, if necessary for tax purposes. Dividends and distributions, if any, are recorded on the ex-dividend date.
The Fund receives earnings credits from its custodian when positive cash balances are maintained, which may be used to offset custody fees. The expense paid under this arrangement is included on the “Statement of operations” under “Custodian fees” with the corresponding expense offset included under “Less expenses paid indirectly.” For the year ended July 31, 2018, the Fund earned $1,181 under this arrangement.
The Fund receives earnings credits from its transfer agent when positive cash balances are maintained, which may be used to offset transfer agent fees. If the amount earned is greater than $1, the expense paid under this arrangement is included on the “Statement of operations” under “Dividend disbursing and transfer agent fees and expenses” with the corresponding expense offset included under “Less expenses paid indirectly.” For the year ended July 31, 2018, the Fund earned $3 under this arrangement.
2. Investment Management, Administration Agreements, and Other Transactions with Affiliates
In accordance with the terms of its investment management agreement, the Fund pays Delaware Management Company (DMC), a series of Macquarie Investment Management Business Trust and the investment manager, an annual fee which is calculated daily and paid monthly at the rate of 0.75% on the first $500 million of average daily net assets of the Fund, 0.70% on the next $500 million, 0.65% on the next $1.5 billion, and 0.60% on average daily net assets in excess of $2.5 billion.
Effective April 1, 2018, DMC has contractually agreed to waive all or a portion, if any, of its management fee and/or pay/reimburse the Fund to the extent necessary to limit annual operating expenses (excluding any distribution and service (12b-1) fees, acquired fund fees and expenses, taxes, interest, short sale dividend and interest expenses, brokerage fees, certain insurance costs, and nonroutine expenses or costs including, but not limited to, those relating to reorganizations, litigation, conducting shareholder meetings, and liquidations), to 0.79% of average daily net assets of the Fund. From Aug. 1, 2017 through Nov. 27, 2017, the expenses were limited to 1.00% of average daily net assets of the Fund and from Nov. 28, 2017 through March 31, 2018, the expenses were limited to 0.95% of average daily net assets of the Fund. The expense waivers were in effect from Aug. 1, 2017 through July 31, 2018.* For purposes of these waivers and reimbursements, nonroutine expenses may also include such additional costs and expenses, as may be agreed upon from time to time by the Fund’s Board and DMC. These expense waivers and reimbursements apply only to expenses paid directly by the Fund and may be terminated by agreement of DMC and the Fund. The waivers and reimbursements are accrued daily and received monthly.
Delaware Investments Fund Services Company (DIFSC), an affiliate of DMC, provides fund accounting and financial administration oversight services to the Fund. For these services, DIFSC’s fees were calculated daily and paid monthly based on the aggregate daily net assets of the Delaware Funds from Aug. 1, 2017 through Aug. 31, 2017 at the following annual rate: 0.0050% of the first $30 billion; 0.0045% of the next $10 billion; 0.0040% of the next $10 billion; and 0.0025% of aggregate average daily net assets in excess of $50 billion. The fees payable to DIFSC under the service agreement described above were allocated among all funds in the Delaware Funds on a relative net asset value (NAV) basis. Effective Sept. 1, 2017, the Fund as well as the other Delaware Funds entered into an amendment to the DIFSC agreement. Under the amendment to the DIFSC agreement, DIFSC’s fees are calculated daily and paid monthly based on the aggregate daily net assets of all funds within the Delaware Funds at the following annual rate: 0.00475% of the first $35 billion; 0.0040% of the next $10 billion; and 0.0025% of aggregate average daily net assets in excess of $45 billion (Total Fee). Each Fund in the Delaware Funds pays a minimum of $4,000, which, in aggregate, is subtracted from the Total Fee. Each Fund then pays its portion of the remainder of the Total Fee on a relative net asset value (NAV) basis. For the year ended July 31, 2018, the Fund was charged $4,509 for these services. This amount is included on the “Statement of operations” under “Accounting and administration expenses.”
DIFSC is also the transfer agent and dividend disbursing agent of the Fund. For these services, DIFSC’s fees were calculated daily and paid monthly based on the aggregate daily net assets of the retail funds within the Delaware Funds from Aug. 1, 2017 through June 30, 2018 at the following annual rate: 0.025% of the first $20 billion; 0.020% of the next $5 billion; 0.015% of the next $5 billion; and 0.013% of average daily net assets in excess of $30 billion. Effective July 1, 2018, the Fund as well as the other Delaware Funds entered into an amendment to the DIFSC agreement. Under the amendment to the DIFSC agreement, DIFSC’s fees are calculated daily and paid monthly based on the aggregate daily net assets of the retail funds within the Delaware Funds at the following annual rate: 0.014% of the first $20 billion; 0.011% of the next $5 billion; 0.007% of the next $5 billion; 0.005% of the next $20 billion; and 0.0025% of average daily net assets in excess of $50 billion. The fees payable to DIFSC under the transfer agent agreement described above are allocated among all retail funds in the Delaware Funds on a relative NAV basis. This amount is included on the “Statement of operations” under “Dividend disbursing and transfer agent fees and expenses.” For the year ended July 31, 2018, the Fund was
| | |
| Notes to financial statements | | |
| Delaware Emerging Markets Debt Fund | | |
2. Investment Management, Administration Agreements, and Other Transactions with Affiliates (continued)
charged $4,300 for these services. Pursuant to a sub-transfer agency agreement between DIFSC and BNY Mellon Investment Servicing (US) Inc. (BNYMIS), BNYMIS provides certain sub-transfer agency services to the Fund. Sub-transfer agency fees are paid by the Fund and are also included on the “Statement of operations” under “Dividend disbursing and transfer agent fees and expenses.”
Pursuant to a distribution agreement and distribution plan, the Fund pays DDLP, the distributor and an affiliate of DMC, annual 12b-1 fees of 0.25%, 1.00%, and 0.50% of the average daily net assets of the Class A, Class C, and Class R shares, respectively. The fees are calculated daily and paid monthly. DDLP has agreed to voluntarily suspend the 12b-1 fee for the Class R shares and the suspension of the 12b-1 fee will continue while the Fund is not broadly distributed. Institutional Class shares pay no 12b-1 fee.
As provided in the investment management agreement, the Fund bears a portion of the cost of certain resources shared with DMC, including the cost of internal personnel of DMC and/or its affiliates that provide legal, tax, and regulatory reporting services to the Fund. For the year ended July 31, 2018, the Fund was charged $417 for internal legal, tax, and regulatory reporting services provided by DMC and/or its affiliates’ employees. This amount is included on the “Statement of operations” under “Legal fees.”
For the year ended July 31, 2018, DDLP earned $162 in commissions on sales of the Fund’s Class A shares. For the year ended July 31, 2018, DDLP received gross CDSC commission of $35 on redemption of the Fund Class C shares, and these commissions were entirely used to offset upfront commissions previously paid by DDLP to broker/dealers on sales of those shares.
Trustees’ fees include expenses accrued by the Fund for each Trustee’s retainer and meeting fees. Certain officers of DMC, DIFSC, and DDLP are officers and/or Trustees of the Trust. These officers and Trustees are paid no compensation by the Fund.
| * | The aggregate contractual waiver period covering this report is from Nov. 28, 2017 through April 1, 2019. |
3. Investments
For the year ended July 31, 2018, the Fund made purchases and sales of investment securities other than short-term investments as follows:
| | | | |
Purchases | | $ | 23,457,938 | |
Sales | | | 22,647,239 | |
The tax cost of investments includes adjustments to net unrealized appreciation (depreciation) which may not necessarily be final tax cost basis adjustments, but approximate the tax basis unrealized gains and losses that may be realized and distributed to shareholders. At July 31, 2018, the cost and unrealized appreciation (depreciation) of investments and derivatives for federal income tax purposes for the Fund were as follows:
| | | | |
Cost of investments and derivatives | | $ | 21,917,501 | |
| | | | |
Aggregate unrealized appreciation of investments and derivatives | | $ | 209,810 | |
Aggregate unrealized depreciation of investments and derivatives | | | (980,713 | ) |
| | | | |
Net unrealized depreciation of investments and derivatives | | $ | (770,903 | ) |
| | | | |
US GAAP defines fair value as the price that the Fund would receive to sell an asset or pay to transfer a liability in an orderly transaction between market participants at the measurement date under current market conditions. A three-level hierarchy for fair value measurements has been established based upon the transparency of inputs to the valuation of an asset or liability. Inputs may be observable or unobservable and refer broadly to the assumptions that market participants would use in pricing the asset or liability. Observable inputs reflect the assumptions market participants would use in pricing the asset or liability based on market data obtained from sources independent of the reporting entity. Unobservable inputs reflect the reporting entity’s own assumptions about the assumptions that market participants would use in pricing the asset or liability based on the best information available under the circumstances. The Fund’s investment in its entirety is assigned a level based upon the observability of the inputs which are significant to the overall valuation. The three-level hierarchy of inputs is summarized below.
| | |
| Level 1 – | | Inputs are quoted prices in active markets for identical investments. (Examples: equity securities, open-end investment companies, futures contracts, exchange-traded options contracts) |
| |
| Level 2 – | | Other observable inputs, including, but not limited to: quoted prices for similar assets or liabilities in markets that are active, quoted prices for identical or similar assets or liabilities in markets that are not active, inputs other than quoted prices that are observable for the assets or liabilities (such as interest rates, yield curves, volatilities, prepayment speeds, loss severities, credit risks and default rates) or other market-corroborated inputs. (Examples: debt securities, government securities, swap contracts, foreign currency exchange contracts, foreign securities utilizing international fair value pricing, broker-quoted securities, fair valued securities) |
| |
| Level 3 – | | Significant unobservable inputs, including the Fund’s own assumptions used to determine the fair value of investments. (Examples: broker-quoted securities, fair valued securities) |
Level 3 investments are valued using significant unobservable inputs. The Fund may also use an income-based valuation approach in which the anticipated future cash flows of the investment are discounted to calculate fair value. Discounts may also be applied due to the nature or duration of any restrictions on the disposition of the investments. Valuations may also be based upon current market prices of securities that are comparable in coupon, rating, maturity, and industry. The derived value of a Level 3 investment may not represent the value which is received upon disposition and this could impact the results of operations.
| | |
| Notes to financial statements | | |
| Delaware Emerging Markets Debt Fund | | |
3. Investments (continued)
The following table summarizes the valuation of the Fund’s investments by fair value hierarchy levels as of July 31, 2018:
| | | | | | | | | | | | | | | | |
Securities | | Level 1 | | | Level 2 | | | Level 3 | | | Total | |
Assets: | | | | | | | | | | | | |
Corporate Debt | | $ | — | | | $ | 15,392,171 | | | $ | — | | | $ | 15,392,171 | |
Foreign Debt | | | — | | | | 4,911,896 | | | | — | | | | 4,911,896 | |
Loan Agreement | | | — | | | | — | | | | 328,571 | | | | 328,571 | |
Options Purchased | | | — | | | | 54,338 | | | | — | | | | 54,338 | |
Short-Term Investments | | | — | | | | 462,000 | | | | — | | | | 462,000 | |
| | | | | | | | | | | | | | | | |
Total Value of Securities | | $ | — | | | $ | 20,820,405 | | | $ | 328,571 | | | $ | 21,148,976 | |
| | | | | | | | | | | | | | | | |
Derivatives1 | | | | | | | | | | | | | | | | |
Assets: | | | | | | | | | | | | | | | | |
Foreign Currency Exchange Contracts | | $ | — | | | $ | 2,213 | | | $ | — | | | $ | 2,213 | |
Liabilities: | | | | | | | | | | | | | | | | |
Foreign Currency Exchange Contracts | | | — | | | | (2,510 | ) | | | — | | | | (2,510 | ) |
Futures Contracts | | | (2,081 | ) | | | — | | | | — | | | | (2,081 | ) |
1Foreign currency exchange contracts and futures contracts are valued at the unrealized appreciation (depreciation) on the instrument at the period end.
During the year ended July 31, 2018, there were no transfers between Level 1 investments, Level 2 investments, or Level 3 investments that had a significant impact to the Fund. The Fund’s policy is to recognize transfers between levels based on fair value at the beginning of the reporting period.
The Fund’s investments that are categorized as Level 3 were valued utilizing third party pricing information without adjustment. Such valuations are based on unobservable inputs. A significant change in third party information inputs could result in significantly lower or higher value of such Level 3 investments.
The following is a reconciliation of investments in which significant unobservable inputs (Level 3) were used in determining fair value:
| | | | |
| | | Loan Agreement | |
Balance as of 7/31/17 | | | $379,153 | |
Sales | | | (63,750 | ) |
Net change in unrealized appreciation (depreciation) | | | 13,168 | |
Balance as of 7/31/18 | | | $328,571 | |
Net change in unrealized appreciation (depreciation) from investments still held at the end of the period | | | $ 13,168 | |
4. Dividend and Distribution Information
Income and long-term capital gain distributions are determined in accordance with federal income tax regulations, which may differ from US GAAP. Additionally, distributions from net gains on foreign currency transactions and net short-term gains on sales of investment securities are treated as ordinary income for federal income tax purposes. The tax character of dividends and distributions paid during the years ended July 31, 2018 and 2017 was as follows:
| | | | | | | | |
| | | Year ended | |
| | | 7/31/18 | | | 7/31/17 | |
Ordinary income | | $ | 1,218,412 | | | $ | 912,237 | |
Long term capital gains | | | 133,226 | | | | — | |
| | | | | | | | |
Total | | $ | 1,351,638 | | | $ | 912,237 | |
| | | | | | | | |
5. Components of Net Assets on a Tax Basis
As of July 31, 2018, the components of net assets on a tax basis were as follows:
| | | | |
Shares of beneficial interest | | $ | 22,419,152 | |
Undistributed ordinary income | | | 54,538 | |
Undistributed long-term capital gains | | | 120,855 | |
Unrealized depreciation of investments, foreign currencies, and derivatives | | | (770,903 | ) |
| | | | |
Net assets | | $ | 21,823,642 | |
| | | | |
The differences between book basis and tax basis components of the net assets are primarily attributable to tax deferral of straddle losses, mark-to-market of forward foreign currency contracts, and mark to market of futures contracts.
For financial reporting purposes, capital accounts are adjusted to reflect the tax character of permanent book/tax differences. Reclassifications are primarily due to tax treatment of gain (loss) on foreign currency transactions, and CDS swaps. Results of operations and net assets were not affected by these reclassifications. For the year ended July 31, 2018, the Fund recorded the following reclassifications:
| | | | |
Undistributed net investment income | | $ | (47,771 | ) |
Accumulated net realized gain | | | 47,771 | |
Under the Regulated Investment Company Modernization Act of 2010 (Act), net capital losses recognized for the tax years beginning after Dec. 22, 2010 may be carried forward indefinitely, and their character is retained as short-term and/or long-term losses. At July 31, 2018, the Fund had no capital loss carryforwards.
| | |
| Notes to financial statements | | |
| Delaware Emerging Markets Debt Fund | | |
6. Capital Shares
Transactions in capital shares were as follows:
| | | | | | | | |
| | | Year ended | | | Year ended | |
| | | 7/31/18 | | | 7/31/17 | |
Shares sold: | | | | | | | | |
Class A | | | 10,576 | | | | 5,621 | |
Class C | | | 6,628 | | | | 6,846 | |
Institutional Class | | | 14,515 | | | | — | |
| | |
Shares issued upon reinvestment of dividends and distributions: | | | | | | | | |
Class A | | | 287 | | | | 58 | |
Class C | | | 480 | | | | 39 | |
Class R | | | 18 | | | | 12 | |
Institutional Class | | | 155,689 | | | | 106,879 | |
| | | | | | | | |
| | | 188,193 | | | | 119,455 | |
| | | | | | | | |
| | |
Shares redeemed: | | | | | | | | |
Class A | | | (7,045 | ) | | | (2,929 | ) |
Class C | | | (4,338 | ) | | | — | |
Institutional Class | | | (3,590 | ) | | | — | |
| | | | | | | | |
| | | (14,973 | ) | | | (2,929 | ) |
| | | | | | | | |
Net increase | | | 173,220 | | | | 116,526 | |
| | | | | | | | |
7. Line of Credit
The Fund, along with certain other funds in the Delaware Funds (Participants), was a participant in a $155,000,000 revolving line of credit intended to be used for temporary or emergency purposes as an additional source of liquidity to fund redemptions of investor shares. Under the agreement, the Participants were charged an annual commitment fee of 0.15%, which was generally allocated across the Participants based on a weighted average of the respective net assets of each Participant. The Participants were permitted to borrow up to a maximum of one-third of their net assets under the agreement. Each Participant was individually, and not jointly, liable for its particular advances, if any, under the line of credit. The line of credit available under the agreement expired on Nov. 6, 2017.
On Nov. 6, 2017, the Fund, along with the other Participants, entered into an amendment to the agreement for a $155,000,000 revolving line of credit. The line of credit is to be used as described above and operates in substantially the same manner as the original agreement. The line of credit available under the agreement expires on Nov. 5, 2018.
The Fund had no amounts outstanding as of July 31, 2018 or at any time during the year then ended.
8. Derivatives
US GAAP requires disclosures that enable investors to understand: (1) how and why an entity uses derivatives; (2) how they are accounted for; and (3) how they affect an entity’s results of operations and financial position.
Foreign Currency Exchange Contracts — The Fund may enter into foreign currency exchange contracts and foreign cross currency exchange contracts as a way of managing foreign exchange rate risk. The Fund may enter into these contracts to fix the US dollar value of a security that it has agreed to buy or sell for the period between the date the trade was entered into and the date the security is delivered and paid for. The Fund may also enter into these contracts to hedge the US dollar value of securities it already owns that are denominated in foreign currencies. In addition, the Fund may enter into these contracts to facilitate or expedite the settlement of portfolio transactions. The change in value is recorded as an unrealized gain or loss. When the contract is closed, a realized gain or loss is recorded equal to the difference between the value of the contract at the time it was opened and the value at the time it was closed.
The use of foreign currency exchange contracts and foreign cross currency exchange contracts does not eliminate fluctuations in the underlying prices of the securities, but does establish a rate of exchange that can be achieved in the future. Although foreign currency exchange contracts and foreign cross currency exchange contracts limit the risk of loss due to an unfavorable change in the value of the hedged currency, they also limit any potential gain that might result should the value of the currency change favorably. In addition, the Fund could be exposed to risks if the counterparties to the contracts are unable to meet the terms of their contracts. The Fund’s maximum risk of loss from counterparty credit risk is the value of its currency exchanged with the counterparty. The risk is generally mitigated by having a netting arrangement between the Fund and the counterparty and by the posting of collateral by the counterparty to the Fund to cover the Fund’s exposure to the counterparty.
During the year ended July 31, 2018, the Fund used foreign currency exchange contracts and cross currency exchange contracts to hedge the US dollar value of securities it already owned that were denominated in foreign currencies and to facilitate or expedite the settlement of portfolio transactions.
Futures Contracts – A futures contract is an agreement in which the writer (or seller) of the contract agrees to deliver to the buyer an amount of cash or securities equal to a specific dollar amount times the difference between the value of a specific security or index at the close of the last trading day of the contract and the price at which the agreement is made. The Fund may use futures contracts in the normal course of pursuing its investment objective. The Fund may invest in futures contracts to hedge its existing portfolio securities against fluctuations in fair value caused by changes in interest rates or market conditions. Upon entering into a futures contract, the Fund deposits cash or pledges US government securities to a broker, equal to the minimum “initial margin” requirements of the exchange on which the contract is traded. Subsequent payments are received from the broker or paid to the broker each day, based on the daily fluctuation in the market value of the contract. These receipts or payments are known as “variation margin” and are recorded daily by the Fund as unrealized gains or losses until the contracts are closed. When the contracts are closed, the Fund records a realized gain or loss equal to the difference between the value of the contract at the time it was opened and the value at the time it was closed. Risks of entering into futures contracts include potential imperfect correlation between the
| | |
| Notes to financial statements | | |
| Delaware Emerging Markets Debt Fund | | |
8. Derivatives (continued)
futures contracts and the underlying securities and the possibility of an illiquid secondary market for these instruments. When investing in futures, there is reduced counterparty credit risk to the Fund because futures are exchange-traded and the exchange’s clearinghouse, as counterparty to all exchange-traded futures, guarantees against default. At July 31, 2018, the Fund posted $16,000 cash collateral for open Futures contracts, which is shown as “Cash collateral due from broker” on the “Statement of assets and liabilities.”
During the year ended July 31, 2018, the Fund used futures contracts to hedge the Fund’s existing portfolio securities against fluctuations in value caused by changes in interest rates or market conditions.
Options Contracts – The Fund may enter into options contracts in the normal course of pursuing its investment objective. The Fund may buy or write options contracts for any number of reasons, including without limitation: to manage the Fund’s exposure to changes in securities prices caused by interest rates or market conditions and foreign currencies; as an efficient means of adjusting the Fund’s overall exposure to certain markets; to protect the value of portfolio securities; and as a cash management tool. The Fund may buy or write call or put options on securities, futures, swaps, swaptions, financial indices, and foreign currencies. When the Fund buys an option, a premium is paid and an asset is recorded and adjusted on a daily basis to reflect the current market value of the option purchased. When the Fund writes an option, a premium is received and a liability is recorded and adjusted on a daily basis to reflect the current market value of the option written. Premiums received from writing options that expire unexercised are treated by the Fund on the expiration date as realized gains. The difference between the premium received and the amount paid on effecting a closing purchase transaction, including brokerage commissions, is treated as realized gain or loss. If a call option is exercised, the premium is added to the proceeds from the sale of the underlying security in determining whether the Fund has a realized gain or loss. If a put option is exercised, the premium reduces the cost basis of the securities purchased by the Fund. The Fund, as writer of an option, bears the market risk of an unfavorable change in the price of the security underlying the written option. When writing options, the Fund is subject to minimal counterparty risk because the counterparty is only obligated to pay premiums and does not bear the market risk of an unfavorable market change. No options written were outstanding at July 31, 2018.
There were no transactions in options written during the year ended July 31, 2018.
During the year ended July 31, 2018, the Fund used options purchased contracts to manage the Fund’s exposure to changes in securities prices caused by interest rates or market conditions, to manage the Fund’s exposure to changes in foreign currencies, and to adjust the Fund’s overall exposure to certain markets.
Swap Contracts – The Fund may enter into CDS contracts in the normal course of pursuing its investment objective. The Fund may enter into CDS contracts in order to hedge against credit events, to enhance total return, or to gain exposure to certain securities or markets. The Fund will not be permitted to enter into any swap transactions unless, at the time of entering into such transactions, the unsecured long-term debt of the actual counterparty, combined with any credit enhancements, is rated at least BBB- by Standard & Poor’s Financial Services LLC (S&P) or Baa3 by Moody’s Investors Service, Inc. (Moody’s) or is determined to be of equivalent credit quality by DMC.
Credit Default Swaps. A CDS contract is a risk-transfer instrument through which one party (purchaser of protection) transfers to another party (seller of protection) the financial risk of a credit event (as defined in the CDS agreement), as it relates to a particular reference security or basket of securities (such as an index). In exchange for the protection offered by the seller of protection, the purchaser of protection agrees to pay the seller of protection a periodic amount at a stated rate that is applied to the notional amount of the CDS contract. In addition, an upfront payment may be made or received by the Fund in connection with an unwinding or assignment of a CDS contract. Upon the occurrence of a credit event, the seller of protection would pay the par (or other agreed-upon) value of the reference security (or basket of securities) to the counterparty. Credit events generally include, among others, bankruptcy, failure to pay, and obligation default.
During the year ended July 31, 2018, the Fund entered into CDS contracts as a purchaser of protection. Periodic payments (receipts) on such contracts are accrued daily and recorded as unrealized losses (gains) on swap contracts. Upon payment (receipt), such amounts are recorded as realized losses (gains) on swap contracts. Upfront payments made or received in connection with CDS contracts are amortized over the expected life of the CDS contracts as unrealized losses (gains) on swap contracts. The change in value of CDS contracts is recorded daily as unrealized appreciation or depreciation. A realized gain or loss is recorded upon a credit event (as defined in the CDS agreement) or the maturity or termination of the agreement. For the year ended July 31, 2018, the Fund did not enter into any CDS contracts as a seller of protection. Initial margin and variation margin are posted to central counterparties for centrally cleared CDS basket trades, as determined by the applicable central counterparty.
CDS contracts may involve greater risks than if the Fund had invested in the reference obligation directly. CDS contracts are subject to general market risk, liquidity risk, counterparty risk, and credit risk. The Fund’s maximum risk of loss from counterparty credit risk, either as the seller of protection or the buyer of protection, is the fair value of the contract. This risk is mitigated by (1) for bilateral swap contracts, having a netting arrangement between the Fund and the counterparty and by the posting of collateral by the counterparty to the Fund to cover the Fund’s exposure to the counterparty and (2) for cleared swaps, trading these instruments through a central counterparty.
During the year ended July 31, 2018, the Fund used CDS contracts to hedge against credit events.
Swaps Generally. For centrally cleared swaps, payments are received from the broker or paid to the broker each day, based on the daily fluctuation in the market value of the contract. These receipts or payments are known as “variation margin” and are recorded by the Fund as unrealized gains or losses until the contracts are closed. When the contracts are closed, the Fund records a realized gain or loss equal to the difference between the value of the contract at the time it was opened and the value at the time it was closed. The value of open swaps may differ from that which would be realized in the event the Fund terminated its position in the contract on a given day. Risks of entering into these contracts include the potential inability of the counterparty to meet the terms of the contracts. This type of risk is generally limited to the amount of favorable movement in the value of the underlying security, instrument, or basket of instruments, if any, at the day of default. Risks also arise from potential losses from adverse market movements and such losses could exceed the unrealized amounts that would be shown on the “Schedule of investments.”
| | |
| Notes to financial statements | | |
| Delaware Emerging Markets Debt Fund | | |
8. Derivatives (continued)
Fair value of derivative instruments as of July 31, 2018 was as follows:
| | | | | | | | | | | | |
| | | Asset Derivatives Fair Value | | | | |
| Statement of Assets and | | Currency | | | | | | | |
| Liabilities Location | | Contracts | | | | | | Total | |
Unrealized appreciation on foreign currency exchange contracts | | | $ 2,213 | | | | | | | | $ 2,213 | |
Options purchased, at value | | | 54,338 | | | | | | | | 54,338 | |
Total | | | $56,551 | | | | | | | | $56,551 | |
| | | | | | | | |
| | | Liability Derivatives Fair Value | |
| Statement of Assets and | | Currency | | | | |
| Liabilities Location | | Contracts | | | Total | |
Variation margin due to broker on futures contracts* | | | $(2,063) | | | | $(2,063) | |
Unrealized depreciation on foreign currency exchange contracts | | | (2,510) | | | | (2,510) | |
Total | | | $(4,573) | | | | $(4,573) | |
*Includes cumulative appreciation (depreciation) of futures contracts from the date the contracts are opened through July 31, 2018. Only current day variation margin is reported on the “Statement of assets and liabilities.”
The effect of derivative instruments on the “Statement of operations” for the year ended July 31, 2018 was as follows:
| | | | | | | | | | | | | | | | | | | | |
| | | | | | Net Realized Gain (Loss) on: | | | | |
| | | Foreign | | | | | | | | | | | | | |
| | | Currency | | | | | | | | | | | | | |
| | | Exchange | | | Futures | | | Options | | | Swap | | | | |
| | | Contracts | | | Contracts | | | Purchased | | | Contracts | | | Total | |
Currency contracts | | | $5,099 | | | | $ — | | | | $(11,806) | | | | $ — | | | | $ (6,707) | |
Interest rate contracts | | | — | | | | 34,765 | | | | — | | | | — | | | | 34,765 | |
Credit contracts | | | — | | | | — | | | | — | | | | (14,854) | | | | (14,854) | |
Total | | | $5,099 | | | | $34,765 | | | | $(11,806) | | | | $(14,854) | | | | $ 13,204 | |
| | | | | | | | | | | | | | | | | | | | |
| | | Net Change in Unrealized Appreciation (Depreciation) of: | | | | |
| | | Foreign | | | | | | | | | | | | | |
| | | Currency | | | | | | | | | | | | | |
| | | Exchange | | | Futures | | | Options | | | Swap | | | | |
| | | Contracts | | | Contracts | | | Purchased | | | Contracts | | | Total | |
Currency contracts | | $ | (654 | ) | | $ | — | | | $ | — | | | $ | — | | | $ | (654 | ) |
Interest rate contracts | | | — | | | | (2,081 | ) | | | 28,255 | | | | — | | | | 26,174 | |
Credit contracts | | | — | | | | — | | | | — | | | | 7,307 | | | | 7,307 | |
| | | | | | | | | | | | | | | | | | | | |
Total | | $ | (654 | ) | | $ | (2,081 | ) | | $ | 28,255 | | | $ | 7,307 | | | $ | 32,827 | |
| | | | | | | | | | | | | | | | | | | | |
Derivatives Generally. The table below summarizes the average balance of derivative holdings by the Fund during the year ended July 31, 2018.
| | | | | | | | |
| | | Long Derivative
Volume | | | Short Derivative
Volume | |
Foreign currency exchange contracts (average cost) | | $ | 147,379 | | | $ | 171,559 | |
Futures contracts (average notional value) | | | — | | | | 242,947 | |
Options contracts (average value) | | | 18,147 | | | | — | |
CDS contracts (average notional value)* | | | 450,692 | | | | — | |
| * | Long represents buying protection and short represents selling protection. |
9. Offsetting
The Fund entered into an International Swaps and Derivatives Association, Inc. Master Agreement (ISDA Master Agreement) or a similar agreement with certain of its derivative contract counterparties in order to better define its contractual rights and to secure rights that will help the Fund mitigate its counterparty risk. An ISDA Master Agreement is a bilateral agreement between the Fund and a counterparty that governs over-the-counter (OTC) derivatives and foreign exchange contracts and typically contains, among other things, collateral posting items and provisions in the event of a default and/or termination event. Under an ISDA Master Agreement, the Fund may, under certain circumstances, offset with the counterparty certain derivative financial instruments’ payables and/or receivables with collateral held and/or posted and create one single net payment. The provisions of the ISDA Master Agreement typically permit a single net payment in the event of default (close-out), including the bankruptcy or insolvency of the counterparty. However, bankruptcy or insolvency laws of a particular jurisdiction may impose restrictions on or prohibitions against the right of offset in bankruptcy, insolvency, or other events.
For financial reporting purposes, the Fund does not offset derivative assets and derivative liabilities that are subject to netting arrangements in the “Statement of assets and liabilities.”
| | |
| Notes to financial statements | | |
| Delaware Emerging Markets Debt Fund | | |
9. Offsetting (continued)
At July 31, 2018, the Fund had the following assets and liabilities subject to offsetting provisions:
Offsetting of Financial Assets and Liabilities and Derivatives Assets and Liabilities
| | | | | | | | | | | | |
| | | Gross Value of | | | Gross Value of | | | | |
Counterparty | | Derivative Asset | | | Derivative Liability | | | Net Position | |
Bank of America Merrill Lynch | | | $ — | | | | $ (984 | ) | | | $ (984 | ) |
BNP Paribas | | | 2,213 | | | | (10,190 | ) | | | (7,977 | ) |
Citigroup Global Markets | | | 9,772 | | | | — | | | | 9,772 | |
Goldman Sachs | | | — | | | | (2,510 | ) | | | (2,510 | ) |
Hong Kong Shanghai Bank | | | 627 | | | | — | | | | 627 | |
Total | | | $12,612 | | | | $(13,684 | ) | | | $(1,072 | ) |
| | | | | | | | | | | | | | | | | | | | | | | | |
| | | | | | Fair Value of | | | | | | Fair Value of | | | Cash | | | | |
Counterparty | | Net Position | | | Non-Cash
Collateral Received | | | Cash Collateral
Received | | | Non-Cash
Collateral Pledged | | | Collateral
Pledged | | | Net Exposure(a) | |
Bank of America Merrill Lynch | | | $ (984) | | | | $— | | | | $— | | | | $— | | | | $— | | | | $ (984) | |
BNP Paribas | | | (7,977 | ) | | | — | | | | — | | | | — | | | | — | | | | (7,977) | |
Citigroup Global Markets | | | 9,772 | | | | — | | | | — | | | | — | | | | — | | | | 9,772 | |
Goldman Sachs | | | (2,510 | ) | | | — | | | | — | | | | — | | | | — | | | | (2,510) | |
Hong Kong Shanghai Bank | | | 627 | | | | — | | | | — | | | | — | | | | — | | | | 627 | |
Total | | | $(1,072) | | | | $— | | | | $— | | | | $— | | | | $— | | | | $(1,072) | |
| (a) | Net exposure represents the receivable (payable) that would be due from (to) the counterparty in the event of default. |
Master Repurchase Agreements
Repurchase agreements are entered into by the Fund under Master Repurchase Agreements (each, an MRA). The MRA permits the Fund, under certain circumstances including an event of default (such as bankruptcy or insolvency), to offset payables and/or receivables with collateral held by and/or posted to the counterparty. As a result, one single net payment is created. Bankruptcy or insolvency laws of a particular jurisdiction may impose restrictions on or prohibitions against such a right of offset in the event of the MRA counterparty’s bankruptcy or insolvency. Based on the terms of the MRA, the Fund receives securities as collateral with a market value in excess of the repurchase price at maturity. Upon a bankruptcy or insolvency of the MRA counterparty, the Fund would recognize a liability with respect to such excess collateral. The liability reflects the Fund’s obligation under bankruptcy law to return the excess to the counterparty. As of July 31, 2018, the following table is a summary of the Fund’s repurchase agreements by counterparty which are subject to offset under an MRA:
| | | | | | | | | | | | | | | | | | | | |
| | | | | | Fair Value of | | | | | | | | | | |
| | | | | | Non-Cash | | | Cash Collateral | | | Net Collateral | | | | |
Counterparty | | Repurchase Agreements | | | Collateral Received(a) | | | Received | | | Received | | | Net Exposure(b) | |
Bank of America Merrill Lynch | | $ | 73,428 | | | $ | (73,428 | ) | | $ | — | | | $ | (73,428 | ) | | $ | — | |
Bank of Montreal | | | 146,855 | | | | (146,855 | ) | | | — | | | | (146,855 | ) | | | — | |
BNP Paribas | | | 241,717 | | | | (241,717 | ) | | | — | | | | (241,717 | ) | | | — | |
| | | | | | | | | | | | | | | | | | | | |
Total | | $ | 462,000 | | | $ | (462,000 | ) | | $ | — | | | $ | (462,000 | ) | | $ | — | |
| | | | | | | | | | | | | | | | | | | | |
(a)The value of the related collateral received exceeded the value of the repurchase agreements as of July 31, 2018.
(b)Net exposure represents the receivable (payable) that would be due from (to) the counterparty in the event of default.
10. Securities Lending
The Fund, along with other funds in the Delaware Funds, may lend its securities pursuant to a security lending agreement (Lending Agreement) with The Bank of New York Mellon (BNY Mellon). At the time a security is loaned, the borrower must post collateral equal to the required percentage of the market value of the loaned security, including any accrued interest. The required percentage is: (1) 102% with respect to US securities and foreign securities that are denominated and payable in US dollars; and (2) 105% with respect to foreign securities. With respect to each loan, if on any business day the aggregate market value of securities collateral plus cash collateral held is less than the aggregate market value of the securities which are the subject of such loan, the borrower will be notified to provide additional collateral by the end of the following business day which, together with the collateral already held, will be not less than the applicable initial collateral requirements for such security loan. If the aggregate market value of securities collateral and cash collateral held with respect to a security loan exceeds the applicable initial collateral requirement, upon request of the borrower, BNY Mellon must return enough collateral to the borrower by the end of the following business day to reduce the value of the remaining collateral to the applicable initial collateral requirement for such security loan. As a result of the foregoing, the value of the collateral held with respect to a loaned security on any particular day may be more or less than the value of the security on loan. The collateral percentage with respect to the market value of the loaned security is determined by the security lending agent.
| | |
| Notes to financial statements | | |
| Delaware Emerging Markets Debt Fund | | |
10. Securities Lending (continued)
Cash collateral received by each fund of the Trust is generally invested in a series of individual separate accounts, each corresponding to a fund. The investment guidelines permit each separate account to hold certain securities that would be considered eligible securities for a money market fund. Cash collateral received is generally invested in government securities; certain obligations issued by government sponsored enterprises; repurchase agreements collateralized by US Treasury securities; obligations issued by the central government of any Organization for Economic Cooperation and Development (OECD) country or its agencies, instrumentalities or establishments; obligations of supranational organizations, commercial paper, notes, bonds, and other debt obligations; certificates of deposit, time deposits, and other bank obligations; and asset-backed securities. A fund can also accept US government securities and letters of credit (non-cash collateral) in connection with securities loans.
In the event of default or bankruptcy by the lending agent, realization and/or retention of the collateral may be subject to legal proceedings. In the event the borrower fails to return loaned securities and the collateral received is insufficient to cover the value of the loaned securities and provided such collateral shortfall is not the result of investment losses, the lending agent has agreed to pay the amount of the shortfall to the Fund or, at the discretion of the lending agent, replace the loaned securities. The Fund continues to record dividends or interest, as applicable, on the securities loaned and is subject to changes in value of the securities loaned that may occur during the term of the loan. The Fund has the right under the Lending Agreement to recover the securities from the borrower on demand. With respect to security loans collateralized by non-cash collateral, the Fund receives loan premiums paid by the borrower. With respect to security loans collateralized by cash collateral, the earnings from the collateral investments are shared among the Fund, the security lending agent, and the borrower. The Fund records security lending income net of allocations to the security lending agent and the borrower.
The Fund may incur investment losses as a result of investing securities lending collateral. This could occur if an investment in the collateral investment account defaulted or became impaired. Under those circumstances, the value of a Fund’s cash collateral account may be less than the amount the Fund would be required to return to the borrowers of the securities and the Fund would be required to make up for this shortfall.
During the year ended July 31, 2018, the Fund had no securities out on loan.
11. Credit and Market Risk
Some countries in which the Fund may invest require governmental approval for the repatriation of investment income, capital, or the proceeds of sales of securities by foreign investors. In addition, if there is deterioration in a country’s balance of payments or for other reasons, a country may impose temporary restrictions on foreign capital remittances abroad.
The securities exchanges of certain foreign markets are substantially smaller, less liquid, and more volatile than the major securities markets in the US. Consequently, acquisition and disposition of securities by the Fund may be inhibited. In addition, a significant portion of the aggregate market value of equity securities listed on the major securities exchanges in emerging markets is held by a smaller number of investors. This may limit the number of shares available for acquisition or disposition by the Fund.
The Fund invests a portion of its assets in high yield, fixed income securities, which are securities rated lower than BBB- by S&P and Baa3 by Moody’s, or similarly rated by another nationally recognized statistical rating organization. Investments in these higher yielding securities are generally accompanied by a greater degree of credit risk than higher rated securities. Additionally, lower rated securities may be more susceptible to adverse economic and competitive industry conditions than investment grade securities.
The Fund invests in certain obligations that may have liquidity protection designed to ensure that the receipt of payments due on the underlying security is timely. Such protection may be provided through guarantees, insurance policies, or letters of credit obtained by the issuer or sponsor through third parties, through various means of structuring the transaction, or through a combination of such approaches. The Fund will not pay any additional fees for such credit support, although the existence of credit support may increase the price of the security.
The Fund invests in bank loans and other securities that may subject it to direct indebtedness risk, the risk that the Fund will not receive payment of principal, interest, and other amounts due in connection with these investments and will depend primarily on the financial condition of the borrower. Loans that are fully secured offer the Fund more protection than unsecured loans in the event of nonpayment of scheduled interest or principal, although there is no assurance that the liquidation of collateral from a secured loan would satisfy the corporate borrower’s obligation, or that the collateral can be liquidated. Some loans or claims may be in default at the time of purchase. Certain of the loans and the other direct indebtedness acquired by the Fund may involve revolving credit facilities or other standby financing commitments that obligate the Fund to pay additional cash on a certain date or on demand. These commitments may require the Fund to increase its investment in a company at a time when the Fund might not otherwise decide to do so (including at a time when the company’s financial condition makes it unlikely that such amounts will be repaid). To the extent that the Fund is committed to advance additional funds, it will at all times hold and maintain cash or other high-grade debt obligations in an amount sufficient to meet such commitments. When a loan agreement is purchased the Fund may pay an assignment fee. On an ongoing basis, the Fund may receive a commitment fee based on the undrawn portion of the underlying line of credit portion of a loan agreement. Prepayment penalty fees are received upon the prepayment of a loan agreement by the borrower. Prepayment penalty, facility, commitment, consent, and amendment fees are recorded to income as earned or paid.
When interest rates rise, fixed income securities (i.e., debt obligations) generally will decline in value. These declines in value are greater for fixed income securities with longer maturities or durations.
As the Fund may be required to rely upon another lending institution to collect and pass on to the Fund amounts payable with respect to the loan and to enforce the Fund’s rights under the loan and other direct indebtedness, an insolvency, bankruptcy, or reorganization of the lending institution may delay or prevent the Fund from receiving such amounts. The highly leveraged nature of many loans may make them especially vulnerable to adverse changes in economic or market conditions. Investments in such loans and other direct indebtedness may involve additional risk to the Fund.
The Fund may invest up to 15% of its net assets in illiquid securities, which may include securities with contractual restrictions on resale, securities exempt from registration under Rule 144A promulgated under the Securities Act of 1933, as amended, and other securities which may not be readily marketable.
| | |
| Notes to financial statements | | |
| Delaware Emerging Markets Debt Fund | | |
11. Credit and Market Risk (continued)
The relative illiquidity of these securities may impair the Fund from disposing of them in a timely manner and at a fair price when it is necessary or desirable to do so. While maintaining oversight, the Board has delegated to DMC, the day-to-day functions of determining whether individual securities are liquid for purposes of the Fund’s limitation on investments in illiquid securities. Securities eligible for resale pursuant to Rule 144A, which are determined to be liquid, are not subject to the Fund’s 15% limit on investments in illiquid securities. Rule 144A securities have been identified on the “Schedule of investments.” Restricted securities are valued pursuant to the security valuation procedures described in Note 1.
12. Contractual Obligations
The Fund enters into contracts in the normal course of business that contain a variety of indemnifications. The Fund’s maximum exposure under these arrangements is unknown. However, the Fund has not had prior claims or losses pursuant to these contracts. Management has reviewed the Fund’s existing contracts and expects the risk of loss to be remote.
13. Recent Accounting Pronouncements
In March 2017, the Financial Accounting Standards Board issued an Accounting Standards Update, ASU 2017-08, Receivables – Nonrefundable Fees and Other Costs (Subtopic 310-20), Premium Amortization on Purchased Callable Debt Securities (ASU) which amends the amortization period for certain purchased callable debt securities held at a premium, shortening such period to the earliest call date. The ASU does not require any accounting change for debt securities held at a discount; the discount continues to be amortized to maturity. The ASU is effective for fiscal years, and interim periods within those fiscal years, beginning after Dec. 15, 2018. At this time, management is evaluating the implications of these changes on the financial statements.
14. Subsequent Events
Management has determined that no material events or transactions occurred subsequent to July 31, 2018, that would require recognition or disclosure in the Fund’s financial statements.
Report of independent
registered public accounting firm
To the Board of Trustees of Delaware Group® Government Fund
and Shareholders of Delaware Emerging Markets Debt Fund
Opinion on the Financial Statements
We have audited the accompanying statement of assets and liabilities, including the schedule of investments, of Delaware Emerging Markets Debt Fund (one of the funds constituting Delaware Group® Government Fund, referred to hereafter as the “Fund”) as of July 31, 2018, the related statement of operations for the year ended July 31, 2018, the statements of changes in net assets for each of the two years in the period ended July 31, 2018, including the related notes, and the financial highlights for each of the periods indicated therein (collectively referred to as the “financial statements”). In our opinion, the financial statements present fairly, in all material respects, the financial position of the Fund as of July 31, 2018, the results of its operations for the year then ended, the changes in its net assets for each of the two years in the period ended July 31, 2018 and the financial highlights for each of the periods indicated therein in conformity with accounting principles generally accepted in the United States of America.
Basis for Opinion
These financial statements are the responsibility of the Fund’s management. Our responsibility is to express an opinion on the Fund’s financial statements based on our audits. We are a public accounting firm registered with the Public Company Accounting Oversight Board (United States) (“PCAOB”) and are required to be independent with respect to the Fund in accordance with the U.S. federal securities laws and the applicable rules and regulations of the Securities and Exchange Commission and the PCAOB.
We conducted our audits of these financial statements in accordance with the standards of the PCAOB. Those standards require that we plan and perform the audit to obtain reasonable assurance about whether the financial statements are free of material misstatement, whether due to error or fraud.
Our audits included performing procedures to assess the risks of material misstatement of the financial statements, whether due to error or fraud, and performing procedures that respond to those risks. Such procedures included examining, on a test basis, evidence regarding the amounts and disclosures in the financial statements. Our audits also included evaluating the accounting principles used and significant estimates made by management, as well as evaluating the overall presentation of the financial statements. Our procedures included confirmation of securities owned as of July 31, 2018 by correspondence with the custodian and brokers. We believe that our audits provide a reasonable basis for our opinion.
PricewaterhouseCoopers LLP
Philadelphia, Pennsylvania
September 18, 2018
We have served as the auditor of one or more investment companies in Delaware Funds® by Macquarie since 2010.
Other Fund information (Unaudited)
Delaware Emerging Markets Debt Fund
Tax Information
The information set forth below is for the Fund’s fiscal year as required by federal income tax laws. Shareholders, however, must report distributions on a calendar year basis for income tax purposes, which may include distributions for portions of two fiscal years of the Fund. Accordingly, the information needed by shareholders for income tax purposes will be sent to them in January of each year. Please consult your tax advisor for proper treatment of this information.
All disclosures are based on financial information available as of the date of this annual report and, accordingly are subject to change. For any and all items requiring reporting, it is the intention of the Fund to report the maximum amount permitted under the Internal Revenue Code and the regulations thereunder.
For the fiscal year ended July 31, 2018, the Fund reports distributions paid during the year as follows:
| | | | |
(A) Ordinary Income Distribution (Tax Basis) | | | 90.14 | % |
(B) Long-Term Capital Gains Distribution (Tax Basis) | | | 9.86 | %�� |
Total Distributions (Tax Basis) | | | 100.00 | % |
(A) and (B) are based on a percentage of the Fund’s total distributions.
For the fiscal year ended July 31, 2018, certain interest income paid by the Fund determined to be Short-Term Capital Gains may be subject to relief from US withholding for foreign shareholders, as provided by the American Jobs Creation Act of 2004, and by the Tax Relief Unemployment Insurance Reauthorization and Jobs Creation Act of 2010, and as extended by the American Taxpayer Relief Act of 2012. For the fiscal year ended July 31, 2018, the Fund reported maximum distributions of Short-Term Capital Gains of $134,183.
Board consideration of sub-advisory agreements for Delaware Emerging Markets Debt Fund at a meeting held November 15-16, 2017
At a meeting held on Nov. 15-16, 2017, the Board of Trustees (“Board”) of Delaware Group® Government Fund, including a majority of non-interested or independent Trustees (the “Independent Trustees”), approved a new Sub-Advisory Agreement between Delaware Management Company (“DMC” or “Management”) and each of Macquarie Investment Management Europe Limited (“MIMEL”) and Macquarie Investment Management Global Limited (“MIMGL”) for Delaware Emerging Markets Debt Fund (the “Fund”). MIMEL and MIMGL may also be referenced as “sub-advisor(s)” below.
In reaching the decision to approve the Sub-Advisory Agreements, the Board considered and reviewed information about each of MIMEL and MIMGL, including its personnel, operations, and financial condition, which had been provided by MIMEL and MIMGL, respectively. The Board also reviewed material furnished by DMC, including: a memorandum from DMC reviewing the Sub-Advisory Agreements and the various services proposed to be rendered by MIMEL and MIMGL; information concerning MIMEL’s and MIMGL’s organizational structure and the experience of their key investment management personnel; copies of MIMEL’s and MIMGL’s Form ADV, financial statements, compliance policies and procedures, and Codes of Ethics; relevant performance information provided with respect to MIMEL and MIMGL; and a copy of the Sub-Advisory Agreements.
In considering such information and materials, the Independent Trustees received assistance and advice from and met separately with independent counsel. The materials prepared by Management in connection with the approval of the Sub-Advisory Agreements were sent to the Independent Trustees in advance of the meeting. While attention was given to all information furnished, the following discusses some primary factors relevant to the Board’s decision. This discussion of the information and factors considered by the Board (as well as the discussion above) is not intended to be exhaustive, but rather summarizes certain factors considered by the Board. In view of the wide variety of factors considered, the Board did not, unless otherwise noted, find it practicable to quantify or otherwise assign relative weights to the following factors. In addition, individual Trustees may have assigned different weights to various factors.
Nature, quality, and extent of services. The Board considered the nature, quality, and extent of services that MIMEL and MIMGL each would provide as a sub-advisor to the Fund. The Trustees considered the investment process to be employed by MIMEL and MIMGL in connection with DMC’s collaboration with MIMEL and MIMGL in managing the Fund, and the qualifications and experience of MIMEL and MIMGL’s fixed income teams with regard to implementing the Fund’s investment mandates. The Board considered MIMEL and MIMGL’s organization, personnel, and operations. The Trustees also considered Management’s review and recommendation process with respect to MIMEL and MIMGL, and Management’s favorable assessment as to the nature, quality, and extent of the sub-advisory services expected to be provided by MIMEL and MIMGL to the Fund. Based on their consideration and review of the foregoing factors, the Board concluded that the nature, quality, and extent of the sub-advisory services to be provided by MIMEL and MIMGL, as well as MIMEL and MIMGL’s ability to render such services based on its experience, organization and resources, were appropriate for the Fund, in light of the Fund’s investment objective, strategies, and policies.
In discussing the nature of the services proposed to be provided by the sub-advisors, several Board members observed that, unlike traditional sub-advisors, who make the investment-related decisions with respect to the sub-advised portfolio, the relationship contemplated in this case is more like a collaborative effort between the advisor and sub-advisors and a cross-pollination of investment ideas. Moreover, the Board noted the advisor’s and sub-advisors’ stated intention that the former retain the decision-making authority with respect to purchases and sales of securities in the sub-advised Fund.
Sub-advisory fees. The Board considered that DMC would not pay MIMEL and MIMGL fees in conjunction with the services that would be rendered to the sub-advised Fund. The Board concluded that, in light of the quality and extent of the services to be provided and the business relationships between the advisor and sub-advisors, the proposed fee arrangement was understandable and reasonable.
Investment performance. In evaluating performance, the Board considered that MIMEL and MIMGL would provide investment advice and recommendations, including with respect to specific securities, for consideration and evaluation by DMC’s portfolio managers, but that DMC’s portfolio managers for the Fund would retain final portfolio management discretion over the Fund.
Economies of scale and fall-out benefits. The Board considered whether the proposed fee arrangement would reflect economies of scale for the benefit of Fund investors as assets in the Fund increased, as applicable. The Board noting that DMC would not pay MIMEL or MIMGL fees in conjunction with their services, concluded that analysis of economies of scale would be moot.
| | |
| Board of trustees / directors and officers addendum | | |
| Delaware Funds® by Macquarie | | |
A mutual fund is governed by a Board of Trustees/Directors (“Trustees”), which has oversight responsibility for the management of a fund’s business affairs. Trustees establish procedures and oversee and review the performance of the investment manager, the distributor, and others who perform services for the fund. The independent fund trustees, in particular, are advocates
| | | | |
| Name, Address, | | Position(s) | | Length of |
| and Birth Date | | Held with Fund(s) | | Time Served |
Interested Trustee | | |
Shawn K. Lytle1, 2 | | President, | | Trustee since |
2005 Market Street | | Chief Executive Officer, | | September 2015 |
Philadelphia, PA 19103 | | and Trustee | | |
February 1970 | | | | President and |
| | | | Chief Executive Officer |
| | | | since August 2015 |
| | | | |
Independent Trustees | | |
Thomas L. Bennett | | Chair and Trustee | | Trustee since |
2005 Market Street | | | | March 2005 |
Philadelphia, PA 19103 | | | | |
October 1947 | | | | Chair since |
| | | | | March 2015 |
Ann D. Borowiec | | Trustee | | Since March 2015 |
| 2005 Market Street | | | | |
| Philadelphia, PA 19103 | | | | |
| November 1958 | | | | |
| | | | |
| | | | |
| | | | |
| | | | | |
Joseph W. Chow | | Trustee | | Since January 2013 |
2005 Market Street | | | | |
Philadelphia, PA 19103 | | | | |
January 1953 | | | | |
| | | | |
| | | | | |
| 1 | Shawn K. Lytle is considered to be an “Interested Trustee” because he is an executive officer of the Fund’s(s’) investment advisor. |
2 Shawn K. Lytle, David F. Connor, Daniel V. Geatens, and Richard Salus serve in similar capacities for the six portfolios of the Optimum Fund Trust, which have the same investment advisor, principal underwriter, and transfer agent as the registrant. Mr. Geatens also serves as the Chief Financial Officer and Treasurer for Macquarie Global Infrastructure Total Return Fund Inc., which has an affiliated investment manager.
for shareholder interests. Each trustee has served in that capacity since he or she was elected to or appointed to the Board of Trustees, and will continue to serve until his or her retirement or the election of a new trustee in his or her place. The following is a list of the Trustees and Officers with certain background and related information.
| | | | |
Principal Occupation(s)
During the Past Five Years | | Number of Portfolios in Fund Complex Overseen by Trustee or Officer | | Other Directorships Held by Trustee or Officer |
| | | | |
| | |
President — Macquarie | | 59 | | Trustee — UBS |
Investment Management3 | | | | Relationship Funds, |
(June 2015–Present) | | | | SMA Relationship |
| | | | Trust, and UBS Funds |
Regional Head of | | | | (May 2010–April 2015) |
Americas — UBS Global | | | | |
Asset Management | | | | |
(April 2010–May 2015) | | | | |
| | | | |
Private Investor | | 59 | | None |
(March 2004–Present) | | | | |
| | | | |
| | | | |
| | | | |
| | | | | |
Chief Executive Officer, | | 59 | | Director — |
Private Wealth Management | | | | Banco Santander International |
(2011–2013) and | | | | (October 2016–Present) |
Market Manager, | | | | |
New Jersey Private | | | | Director — |
Bank (2005–2011) — | | | | Santander Bank, N.A. |
J.P. Morgan Chase & Co. | | | | (December 2016–Present) |
Private Investor | | 59 | | Director and Audit Committee |
(April 2011–Present) | | | | Member — Hercules |
| | | | Technology Growth |
| | | | Capital, Inc. |
| | | | | (July 2004–July 2014) |
| 3 | Macquarie Investment Management is the marketing name for Macquarie Management Holdings, Inc. and its subsidiaries, including the Fund’s(s’) investment advisor, principal underwriter, and its transfer agent. |
| | |
| Board of trustees / directors and officers addendum | | |
| Delaware Funds® by Macquarie | | |
| | | | |
Name, Address, and Birth Date | | Position(s) Held with Fund(s) | | Length of Time Served |
Independent Trustees (continued) | | |
John A. Fry | | Trustee | | Since January 2001 |
| 2005 Market Street | | | | |
| Philadelphia, PA 19103 | | | | |
| May 1960 | | | | |
| | | | |
| | | | |
| | | | |
| | | | |
| | | | |
| | | | |
| | | | |
| | | | | |
| | |
Lucinda S. Landreth | | Trustee | | Since March 2005 |
2005 Market Street | | | | |
Philadelphia, PA 19103 | | | | |
June 1947 | | | | |
Frances A. Sevilla-Sacasa | | Trustee | | Since September 2011 |
2005 Market Street | | | | |
Philadelphia, PA 19103 | | | | |
January 1956 | | | | |
| | | | |
| | | | |
| | | | |
| | | | |
| | | | |
| | | | |
| | | | |
| | | | |
| | | | |
| | | | |
| | | | | |
| | | | |
Principal Occupation(s)
During the Past Five Years | | Number of Portfolios in Fund Complex Overseen by Trustee or Officer | | Other Directorships Held by Trustee or Officer |
| | |
President — | | 59 | | Director; Compensation |
Drexel University | | | | Committee and |
(August 2010–Present) | | | | Governance Committee |
| | | | Member — Community |
President — | | | | Health Systems |
Franklin & Marshall College | | | | |
(July 2002–July 2010) | | | | Director — Drexel |
| | | | Morgan & Co. |
| | |
| | | | Director; Audit Committee |
| | | | Member — vTv |
| | | | Therapeutics LLC |
| | |
| | | | Director; Audit Committee |
| | | | Member — FS Credit Real |
| | | | | Estate Income Trust, Inc. |
Private Investor | | 59 | | None |
(2004–Present) | | | | |
| | | | |
| | | | | |
Private Investor | | 59 | | Trust Manager and |
(January 2017–Present) | | | | Audit Committee |
| | | | Chair — Camden |
Chief Executive Officer — | | | | Property Trust |
Banco Itaú | | | | (August 2011–Present) |
International | | | | |
(April 2012–December 2016) | | | | Director — |
| | | | Carrizo Oil & Gas, Inc. |
Executive Advisor to Dean | | | | (March 2018–Present) |
(August 2011–March 2012) | | | | |
and Interim Dean | | | | |
(January 2011–July 2011) — | | | | |
University of Miami School of | | | | |
Business Administration | | | | |
| | |
President — U.S. Trust, | | | | |
Bank of America Private | | | | |
Wealth Management | | | | |
(Private Banking) | | | | |
(July 2007–December 2008) | | | | |
| | |
| Board of trustees / directors and officers addendum | | |
| Delaware Funds® by Macquarie | | |
| | | | |
Name, Address, and Birth Date | | Position(s) Held with Fund(s) | | Length of Time Served |
Independent Trustees (continued) | | |
| Thomas K. Whitford | | Trustee | | Since January 2013 |
2005 Market Street | | | | |
Philadelphia, PA 19103 | | | | |
March 1956 | | | | |
| | |
| | | | | |
Janet L. Yeomans | | Trustee | | Since April 1999 |
2005 Market Street | | | | |
Philadelphia, PA 19103 | | | | |
July 1948 | | | | |
| | |
| | | | |
Officers | | |
| David F. Connor | | Senior Vice President, | | Senior Vice President |
2005 Market Street | | General Counsel, | | since May 2013; |
Philadelphia, PA 19103 | | and Secretary | | General Counsel |
December 1963 | | | | since May 2015; |
| | | | Secretary since |
| | | | October 2005 |
Daniel V. Geatens | | Vice President | | Vice President and |
2005 Market Street | | and Treasurer | | Treasurer since October 2007 |
Philadelphia, PA 19103 | | | | |
October 1972 | | | | |
| | |
| | | | | |
Richard Salus | | Senior Vice President | | Senior Vice President and |
2005 Market Street | | and Chief Financial Officer | | Chief Financial Officer |
Philadelphia, PA 19103 | | | | since November 2006 |
October 1963 | | | | |
| | |
| | | | | |
The Statement of Additional Information for the Fund(s) includes additional information about the Trustees and Officers and is available, without charge, upon request by calling 800 523-1918.
| | | | |
Principal Occupation(s) During the Past Five Years | | Number of Portfolios in Fund Complex Overseen by Trustee or Officer | | Other Directorships Held by Trustee or Officer |
| | | | |
Vice Chairman | | 59 | | Director — HSBC Finance |
(2010–April 2013) — | | | | Corporation and HSBC |
PNC Financial | | | | North America Holdings Inc. |
Services Group | | | | (December 2013–Present) |
| | |
| | | | Director — |
| | | | HSBC USA Inc. |
| | | | | (July 2014–March 2017) |
Vice President and Treasurer | | 59 | | Director (2009–2017); |
(January 2006–July 2012), | | | | Personnel and Compensation |
Vice President — | | | | Committee Chair; Member of |
Mergers & Acquisitions | | | | Nominating, Investments, and |
(January 2003–January 2006), | | | | Audit Committees for various |
and Vice President | | | | periods throughout |
and Treasurer | | | | directorship — |
(July 1995–January 2003) — | | | | Okabena Company |
3M Company | | | | |
| | | | |
David F. Connor has served | | 59 | | None2 |
in various capacities at | | | | |
different times at | | | | |
Macquarie Investment | | | | |
Management. | | | | |
| | | | | |
Daniel V. Geatens has served | | 59 | | None2 |
in various capacities at | | | | |
different times at | | | | |
Macquarie Investment | | | | |
Management. | | | | |
| | | | | |
Richard Salus has served | | 59 | | None2 |
in various executive capacities | | | | |
at different times at | | | | |
Macquarie Investment | | | | |
Management. | | | | |
| | | | | |
About the organization
| | | | | | |
| Board of trustees | | | | | | |
| | | |
| Shawn K. Lytle | | Ann D. Borowiec | | John A. Fry | | Frances A. |
| President and | | Former Chief Executive | | President | | Sevilla-Sacasa |
| Chief Executive Officer | | Officer | | Drexel University | | Former Chief Executive |
| Delaware Funds® | | Private Wealth Management | | Philadelphia, PA | | Officer |
| by Macquarie | | J.P. Morgan Chase & Co. | | | | Banco Itaú International |
| Philadelphia, PA | | New York, NY | | Lucinda S. Landreth | | Miami, FL |
| Thomas L. Bennett | | Joseph W. Chow | | Former Chief Investment Officer | | Thomas K. Whitford |
| Chairman of the Board | | Former Executive Vice | | Assurant, Inc. | | Former Vice Chairman |
| Delaware Funds | | President | | New York, NY | | PNC Financial Services Group |
| by Macquarie | | State Street Corporation | | | | Pittsburgh, PA |
| Private Investor | | Boston, MA | | | | |
| Rosemont, PA | | | | | | Janet L. Yeomans |
| | | | | | Former Vice President and |
| | | | | | Treasurer |
| | | | | | 3M Company |
| | | | | | St. Paul, MN |
| | | |
| Affiliated officers | | | | | | |
| | | |
| David F. Connor | | Daniel V. Geatens | | Richard Salus | | |
| Senior Vice President, | | Vice President and | | Senior Vice President and | | |
| General Counsel, | | Treasurer | | Chief Financial Officer | | |
| and Secretary | | Delaware Funds | | Delaware Funds | | |
| Delaware Funds | | by Macquarie | | by Macquarie | | |
| by Macquarie | | Philadelphia, PA | | Philadelphia, PA | | |
| Philadelphia, PA | | | | | | |
This annual report is for the information of Delaware Emerging Markets Debt Fund shareholders, but it may be used with prospective investors when preceded or accompanied by the Delaware Fund fact sheet for the most recently completed calendar quarter. These documents are available at delawarefunds.com/literature.
The Fund files its complete schedule of portfolio holdings with the Securities and Exchange Commission (SEC) for the first and third quarters of each fiscal year on Form N-Q. The Fund’s Forms N-Q, as well as a description of the policies and procedures that the Fund uses to determine how to vote proxies (if any) relating to portfolio securities are available without charge (i) upon request, by calling 800 523-1918; and (ii) on the SEC’s website at sec.gov. In addition, a description of the policies and procedures that the Fund uses to determine how to vote proxies (if any) relating to portfolio securities and the Schedule of Investments included in the Fund’s most recent Form N-Q are available without charge on the Fund’s website at delawarefunds.com/literature. The Fund’s Forms N-Q may be reviewed and copied at the SEC’s Public Reference Room in Washington, D.C.; information on the operation of the Public Reference Room may be obtained by calling 800 SEC-0330.
Information (if any) regarding how the Fund voted proxies relating to portfolio securities during the most recently disclosed 12-month period ended June 30 is available without charge (i) through the Fund’s website at delawarefunds.com/proxy; and (ii) on the SEC’s website at sec.gov.
66

Fixed income mutual fund
Delaware Strategic Income Fund
July 31, 2018
Carefully consider the Fund’s investment objectives, risk factors, charges, and expenses before investing. This and other information can be found in the Fund’s prospectus and its summary prospectus, which may be obtained by visiting delawarefunds.com/literature or calling 800 523-1918. Investors should read the prospectus and the summary prospectus carefully before investing.
You can obtain shareholder reports and prospectuses online instead of in the mail. Visit delawarefunds.com/edelivery.
Experience Delaware Funds® by Macquarie
Macquarie Investment Management (MIM) is a global asset manager with offices throughout the United States, Europe, Asia, and Australia. We are active managers who prioritize autonomy and accountability at the investment team level in pursuit of opportunities that matter for our clients. Delaware Funds is one of the longest-standing mutual fund families, with more than 75 years in existence.
If you are interested in learning more about creating an investment plan, contact your financial advisor.
You can learn more about Delaware Funds or obtain a prospectus for Delaware Strategic Income Fund at delawarefunds.com/literature.
Manage your account online
| · | | Check your account balance and transactions |
| · | | View statements and tax forms |
| · | | Make purchases and redemptions |
Visit delawarefunds.com/account-access.
Macquarie Asset Management (MAM) offers a diverse range of products including securities investment management, infrastructure and real asset management, and fund and equity-based structured products. Macquarie Investment Management (MIM) is the marketing name for certain companies comprising the asset management division of Macquarie Group. This includes the following registered investment advisers: Macquarie Investment Management Business Trust (MIMBT), Macquarie Funds Management Hong Kong Limited, Macquarie Investment Management Austria Kapitalanlage AG, Macquarie Investment Management Global Limited, Macquarie Investment Management Europe Limited, and Macquarie Capital Investment Management LLC.
The Fund is distributed by Delaware Distributors, L.P. (DDLP), an affiliate of MIMBT and Macquarie Group Limited.
Other than Macquarie Bank Limited (MBL), none of the entities noted are authorized deposit-taking institutions for the purposes of the Banking Act 1959 (Commonwealth of Australia). The obligations of these entities do not represent deposits or other liabilities of MBL. MBL does not guarantee or otherwise provide assurance in respect of the obligations of these entities, unless noted otherwise. The Fund is governed by US laws and regulations.
Table of contents
Unless otherwise noted, views expressed herein are current as of July 31, 2018, and subject to change for events occurring after such date.
The Fund is not FDIC insured and is not guaranteed. It is possible to lose the principal amount invested.
Advisory services provided by Delaware Management Company, a series of MIMBT, a US registered investment advisor.
All third-party marks cited are the property of their respective owners.
© 2018 Macquarie Management Holdings, Inc.
| | |
| Portfolio management review | | |
| |
| Delaware Strategic Income Fund | | August 7, 2018 |
| | | | | | | | |
| Performance preview (for the year ended July 31, 2018) | | | | | | |
Delaware Strategic Income Fund (Institutional Class shares) | | | 1-year return | | | | -0.36 | % |
Delaware Strategic Income Fund (Class A shares) | | | 1-year return | | | | -0.62 | % |
Bloomberg Barclays US Aggregate Index (benchmark) | | | 1-year return | | | | -0.80 | % |
Past performance does not guarantee future results.
For complete, annualized performance for Delaware Strategic Income Fund, please see the table on page 4.
Institutional Class shares are not subject to a sales charge and are offered for sale exclusively to certain eligible investors. In addition, Institutional Class shares pay no distribution and service fee.
The performance of Class A shares excludes the applicable sales charge. Both Institutional Class shares and Class A shares reflect the reinvestment of all distributions.
Please see page 7 for a description of the index. Index performance returns do not reflect any management fees, transaction costs, or expenses. Indices are unmanaged and one cannot invest directly in an index.
Volatility took hold in financial markets over the course of the fiscal year ended July 31, 2018. Passage of US tax-reform legislation in December 2017 drove market performance early in the fiscal period. That boosted our confidence in corporate credit, given that we believed companies would likely have more cash available to improve balance sheets or invest in capital projects. As a result, entering 2018 we maintained the Fund’s overweight position in both investment grade and down-in-quality credit.
Over the past few years, central banks have generally pursued easy monetary policies, underpinning a period of synchronized global economic growth. However, during the Fund’s fiscal year, a decoupling of global economic growth led to divergent central bank policies. In the United States, confidence grew in the Federal Reserve’s ability to raise interest rates, which translated into US dollar strength in 2018. That, in turn, led to a selloff in emerging markets.
During the fiscal year, concerns mounted over international trade and tariffs, focusing particularly on China and potential renegotiation of the North American Free Trade Agreement (NAFTA). It is not clear how China might respond. The ongoing devaluation of China’s currency suggests to us that the stakes are increasing along with the potential risks that could arise from the imposition of further tariffs on Chinese imports. We believe
During the fiscal
year, the Fund
benefited, in our
view, from:
| | · | | Growing investor confidence in the Fed |
| | · | | Increased credit available to corporations, a result of tax reform |
| | · | | Reduced exposure to higher volatility holdings |
| | · | | Strong security selection, particularly in industrials. |
1
Portfolio management review
Delaware Strategic Income Fund
the fallout could have a meaningful impact on global growth.
Within the Fund
For the fiscal year ended July 31, 2018, Delaware Strategic Income Fund Institutional Class shares returned -0.36%. The Fund’s Class A shares returned -0.62% at net asset value and -5.13% at maximum offer price. These figures reflect reinvestment of all distributions. During the same period, the Fund’s benchmark, the Bloomberg Barclays US Aggregate Index, returned -0.80%. For complete annualized performance of Delaware Strategic Income Fund, please see the table on page 4.
The Fund outperformed its benchmark but trailed its Morningstar peer group, the Morningstar Multisector Bond Category, of similarly managed strategic income type products during the fiscal year. At period end, the Fund was overweight credit relative to its peer group and had more interest rate sensitivity, which detracted in a period of rising interest rates. However, we reduced the Fund’s duration to 4.25 to 4.5 years compared with 6.0 years for the Bloomberg Barclays US Aggregate Index, giving a boost to benchmark-relative returns. In contrast, however, the peer group’s average duration was about 3.5 years.
In response to the changing environment, we sought to reduce risk during the fiscal year by moving up both in quality and capital structure, and by reducing exposure to higher volatility holdings. As noted above, we reduced duration and applied some credit hedges to manage volatility.
The key contributors to the Fund’s performance included high-grade credit (rated AAA to low BBB), led by strong security selection, particularly in industrials. Energy sector holdings also contributed as energy companies performed reasonably well, bolstered by rising crude oil prices.
Among individual holdings, Myriad International Holdings BV, a media company, performed well and remains a core holding in the Fund. Developed-market high yield holdings contributed broadly, led by commodity-sensitive sectors, including chemicals, metals & mining, and energy.
Platform Specialty Products Corporation, a specialty chemical manufacturer of metal and plastic plating, added to returns. The specialty chemical space performed well, in line with commodity-sensitive sectors.
The Fund had a modest amount of exposure to bank loans, which performed well. Down-in-quality assets were the strongest contributors, including second-lien bank loans, like those issued by Kronos Inc., a workforce management solutions provider. Another second-lien holding, insurance software solutions provider Applied Systems Inc., also performed well. Overall, second-lien loans had double-digit gains during the fiscal year. The Fund still holds Kronos and Applied Systems.
The Fund also had small positions in some long-dated tobacco-settlement financing authority bonds. Buckeye Tobacco Settlement Financing Authority did notably well, with a double-digit gain.
Collateralized debt obligations (CDOs) performed well, outpacing the benchmark. These primarily AAA-rated floating-rate instruments provided positive coupon resets as the London interbank offered rate (LIBOR) steadily rose along with the federal funds rate. A modest allocation to emerging markets currency added to the Fund’s performance overall. The Fund’s significant underweight to US Treasurys contributed as rates rose. During the fiscal period, the Fund’s weighting to Treasurys rose from about 1.5% to almost 5% by fiscal year end.
An overweight to high yield energy securities contributed to performance, particularly the Fund’s exposure to the oilfield services sub-sector, which, led by Diamond Offshore Drilling Inc., was the strongest-performing energy
2
sub-sector. The midstream sub-sector, the Fund’s largest weighting within energy, outperformed the broader market. High yield issues within exploration and production also did well, including Alta Mesa Holdings LP and Southwestern Energy Co. We sold a portion of our position in Alta Mesa for a profit and continue to own Southwestern Energy.
Emerging market bonds detracted from performance, averaging an 11% weighting within the Fund’s portfolio. Digicel Group Ltd., a wireless telecommunications company with a footprint in the Caribbean, was one of the Fund’s weakest-performing securities. Although we have reduced the Fund’s position in a risk managed manner, we still own Digicel.
In Argentina, significant volatility in the first half of 2018 affected the Fund. Exposure to Argentine utility company Rio Energy S.A., a secured position, detracted from performance partly because of the significant selloff in the Argentine peso; however, we continue to own the credit based on the need, in our opinion, for continued power generating assets in Argentina and relative value. Emerging market sovereign bond exposure had mixed results. We sold Mexican federal government development bonds (bonos) on our concerns over the NAFTA renegotiation.
Lastly, banking made up 10% of the Fund’s portfolio. Strong results from lower-capital-structure securities issued by US Bancorp, Royal Bank of Scotland Group PLC, and Barclays PLC were partially offset by longer-dated subordinated securities issued by Goldman Sachs Group Inc. and New Zealand’s Westpac Banking Corp. Rising rates held back their performance. We believe banks’ fundamentals remain sound and continue to be an important part of the Fund’s portfolio.
The Fund focuses primarily on generating income, so the portfolio tends to maintain more lower-quality assets, high yield bonds, bank loans, and emerging market bonds in search of sources of additional income. However, with valuations above their long-term historical averages in many asset classes, we’re seeking a more conservative positioning, maintaining the Fund’s credit exposure but moving up in capital structure and shortening maturities where appropriate in an attempt to reduce potential volatility in some longer-dated securities. We continue to leverage the bottom-up (bond by bond) research process to source what we believe is the most attractive risk-adjusted return.
The Fund’s exposure to credit is supported by a relatively strong economic backdrop. However, we are closely monitoring the geopolitical landscape, including trade-related issues, due to the potential affects they may have on growth expectations.
A note about derivatives
The Fund used four types of derivatives during the fiscal year: futures, foreign currency exchange contracts, options, and swaps. The Fund used interest rate futures to lower the portfolio’s overall duration. The Fund also used foreign currency exchange contracts to hedge the US dollar value of certain foreign currency securities. In some cases, the Fund used foreign currency exchange contracts to gain market exposure to take advantage of a total return opportunity. The Fund also used options, including calls on emerging market exposure, and credit default swaps as credit hedges. None of these derivatives had a material effect on the Fund’s performance (that is, it amounted to less than 0.50 percentage points) during the fiscal year.
3
| | |
| Performance summary | | |
| Delaware Strategic Income Fund | | July 31, 2018 |
The performance quoted represents past performance and does not guarantee future results. Investment return and principal value of an investment will fluctuate so that shares, when redeemed, may be worth more or less than their original cost. Current performance may be lower or higher than the performance quoted. Performance data current to the most recent month end may be obtained by calling 800 523-1918 or visiting delawarefunds.com/performance.
| | | | | | | | | | | | | | | | |
| Fund and benchmark performance1,2 | | Average annual total returns through July 31, 2018 | |
| | | 1 year | | | 5 years | | | 10 years | | | Lifetime | |
Class A (Est. Aug. 16, 1985) | | | | | | | | | | | | | | | | |
Excluding sales charge | | | -0.62 | % | | | +2.48 | % | | | +4.75 | % | | | +5.71 | % |
Including sales charge | | | -5.13 | % | | | +1.55 | % | | | +4.27 | % | | | +5.56 | % |
Class C (Est. Nov. 29, 1995) | | | | | | | | | | | | | | | | |
Excluding sales charge | | | -1.35 | % | | | +1.71 | % | | | +3.98 | % | | | +4.07 | % |
Including sales charge | | | -2.30 | % | | | +1.71 | % | | | +3.98 | % | | | +4.07 | % |
Class R (Est. June 2, 2003) | | | | | | | | | | | | | | | | |
Excluding sales charge | | | -0.97 | % | | | +2.20 | % | | | +4.52 | % | | | +3.72 | % |
Including sales charge | | | -0.97 | % | | | +2.20 | % | | | +4.52 | % | | | +3.72 | % |
Institutional Class (Est. June 1, 1992) | | | | | | | | | | | | | | | | |
Excluding sales charge | | | -0.36 | % | | | +2.73 | % | | | +5.03 | % | | | +5.19 | % |
Including sales charge | | | -0.36 | % | | | +2.73 | % | | | +5.03 | % | | | +5.19 | % |
Bloomberg Barclays US Aggregate Index | | | -0.80 | % | | | +2.25 | % | | | +3.73 | % | | | +5.36 | %* |
* The benchmark lifetime return is for Institutional Class share comparison only and is calculated using the last business day in the month of the Fund’s Institutional Class inception date.
1Returns reflect the reinvestment of all distributions and are presented both with and without the applicable sales charges described below. Returns do not reflect the deduction of taxes the shareholder would pay on Fund distributions or redemptions of Fund shares.
Expense limitations were in effect for certain classes during some or all of the periods shown in the “Fund and benchmark performance” table. Expenses for each class are listed on the “Fund expense ratios” table on page 6. Performance would have been lower had expense limitations not been in effect.
Institutional Class shares are not subject to a sales charge and are offered for sale exclusively to certain eligible investors. In addition, Institutional Class shares pay no distribution and service fee.
Class A shares are sold with a maximum front-end sales charge of 4.50%, and have an annual distribution and service fee of 0.25% of average daily net assets. The Board has adopted a formula for calculating 12b-1 plan fees for the Fund’s Class A shares. The Fund’s Class A shares are currently subject to a blended 12b-1 fee equal to the sum of: (i) 0.10% of average daily net assets representing shares acquired prior to June 1, 1992, and (ii) 0.25% of average daily net assets representing shares acquired on or after June 1, 1992. All Class A shares currently bear 12b-1 fees at the same rate, the blended rate, currently 0.25% of average daily net assets, based on the formula described above. This method of calculating Class A 12b-1 fees may be discontinued at the sole discretion of the Board. Performance for Class A shares, excluding sales
4
charges, assumes that no front-end sales charge applied.
Class C shares are sold with a contingent deferred sales charge of 1.00% if redeemed during the first 12 months. They are also subject to an annual distribution and service fee of 1.00% of average daily net assets. Performance for Class C shares, excluding sales charges, assumes either that contingent deferred sales charges did not apply or that the investment was not redeemed.
Class R shares are available only for certain retirement plan products. They are sold without a sales charge and have an annual distribution and service fee of 0.50% of average daily net assets.
Fixed income securities and bond funds can lose value, and investors can lose principal, as interest rates rise. They also may be affected by economic conditions that hinder an issuer’s ability to make interest and principal payments on its debt.
The Fund may also be subject to prepayment risk, the risk that the principal of a bond that is held by a portfolio will be prepaid prior to maturity, at the time when interest rates are lower than what the bond was paying. A portfolio may then have to reinvest that money at a lower interest rate.
High yielding, non-investment-grade bonds (junk bonds) involve higher risk than investment grade bonds. The high yield secondary market is particularly susceptible to liquidity problems when institutional investors, such as mutual funds and certain other financial institutions, temporarily stop buying bonds for regulatory, financial, or other reasons. In addition, a less liquid secondary market makes it more difficult for the Fund to obtain precise valuations of the high yield securities in its portfolio.
The Fund may invest in derivatives, which may involve additional expenses and are subject to risk, including the risk that an underlying security or securities index moves in the opposite direction from what the portfolio manager anticipated. A derivatives transaction depends upon the
counterparties’ ability to fulfill their contractual obligations.
Because the Fund may invest in bank loans and other direct indebtedness, it is subject to the risk that the Fund will not receive payment of principal, interest, and other amounts due in connection with these investments, which primarily depend on the financial condition of the borrower and the lending institution.
International investments entail risks not ordinarily associated with US investments including fluctuation in currency values, differences in accounting principles, or economic or political instability in other nations. Investing in emerging markets can be riskier than investing in established foreign markets due to increased volatility and lower trading volume.
If and when the Fund invests in forward foreign currency contracts or uses other investments to hedge against currency risks, the Fund will be subject to special risks, including counterparty risk.
The Fund may experience portfolio turnover in excess of 100%, which could result in higher transaction costs and tax liability.
This document may mention bond ratings published by nationally recognized statistical rating organizations (NRSROs) Standard & Poor’s, Moody’s Investors Service, and Fitch, Inc. For securities rated by an NRSRO other than S&P, the rating is converted to the equivalent S&P credit rating. Bonds rated AAA are rated as having the highest quality and are generally considered to have the lowest degree of investment risk. Bonds rated AA are considered to be of high quality, but with a slightly higher degree of risk than bonds rated AAA. Bonds rated A are considered to have many favorable investment qualities, though they are somewhat more susceptible to adverse economic conditions. Bonds rated BBB are believed to be of medium-grade quality and generally riskier over the long term. Bonds rated
5
| | |
| Performance summary | | |
| Delaware Strategic Income Fund | | |
BB, B, and CCC are regarded as having significant speculative characteristics, with BB indicating the least degree of speculation of the three.
A collateralized debt obligation (CDO) is a security that pools together individual debt obligations and
repackages the asset sold to investors on the secondary market. These packages consist of auto loans, credit card debt, mortgages, or corporate debt.
2The Fund’s expense ratios, as described in the most recent prospectus, are disclosed in the following “Fund expense ratios” table. Delaware Management Company has agreed to reimburse certain expenses and/or waive certain fees in order to prevent total annual fund operating expenses (excluding any 12b-1 fees, acquired fund fees and expenses, taxes, interest, short sale and dividend interest expenses, brokerage fees, certain insurance costs, and nonroutine expenses or costs, including, but not limited to, those relating to reorganizations, litigation, conducting shareholder meetings, and liquidations (collectively, nonroutine expenses)) from exceeding 0.59% of the Fund’s average daily net assets during the period from April 1, 2018 through July 31, 2018.* Please see the most recent prospectus and any applicable supplement(s) for additional information on these fee waivers and/or reimbursements. Please see the “Financial highlights” section in this report for the most recent expense ratios.
| | | | | | | | |
Fund expense ratios | | Class A | | Class C | | Class R | | Institutional Class |
Total annual operating expenses (without fee waivers) | | 1.29% | | 2.04% | | 1.54% | | 1.04% |
Net expenses (including fee waivers, if any) | | 0.84% | | 1.59% | | 1.09% | | 0.59% |
Type of waiver | | Contractual | | Contractual | | Contractual | | Contractual |
*For the period Aug. 1, 2017 to March 31, 2018, the waiver was set at 0.65% of the Fund’s average daily net assets. The aggregate contractual waiver period covering this report is from Nov. 28, 2016, through April 1, 2019.
6
Performance of a $10,000 investment1
Average annual total returns from July 31, 2008 through July 31, 2018
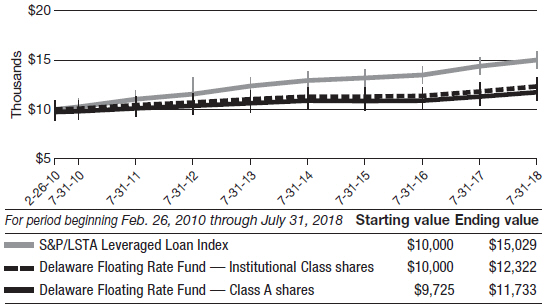
1The “Performance of a $10,000 investment” graph assumes $10,000 invested in Institutional Class and Class A shares of the Fund on July 31, 2008, and includes the effect of a 4.50% front-end sales charge (for Class A shares) and the reinvestment of all distributions. The graph does not reflect the deduction of taxes the shareholders would pay on Fund distributions or redemptions of Fund shares. Expense limitations were in effect for some or all of the periods shown. Performance would have been lower had expense limitations not been in effect. Expenses are listed in the “Fund expense ratios” table on page 6. Please note additional details on pages 4 through 8.
The graph also assumes $10,000 invested in the Bloomberg Barclays US Aggregate Index as of July 31, 2008. The Bloomberg Barclays US Aggregate Index measures the performance of publicly issued investment grade (Baa3/BBB- or better) corporate, US government, mortgage- and asset-backed securities with at least one year to
maturity and at least $250 million par amount outstanding.
The Morningstar Multisector Bond Category, mentioned on page 2, compares funds that seek income by diversifying their assets among several fixed income sectors, usually US government obligations, US corporate bonds, foreign bonds, and high yield US debt securities. These funds typically hold 35% to 65% of bond assets in securities that are not rated or are rated by a major agency such as Standard & Poor’s or Moody’s at the level of BB (considered speculative for taxable bonds) and below.
Index performance returns do not reflect any management fees, transaction costs, or expenses. Indices are unmanaged and one cannot invest directly in an index. Past performance is not a guarantee of future results.
Performance of other Fund classes will vary due to different charges and expenses.
7
| | |
| Performance summary | | |
| Delaware Strategic Income Fund | | |
| | | | | | | | |
| | | | |
| | | Nasdaq symbols | | CUSIPs | | | |
Class A | | DEGGX | | | 246094205 | | | |
Class C | | DUGCX | | | 246094700 | | | |
Class R | | DUGRX | | | 246094809 | | | |
Institutional Class | | DUGIX | | | 246094502 | | | |
8
Disclosure of Fund expenses
For the six-month period from February 1, 2018 to July 31, 2018 (Unaudited)
As a shareholder of the Fund, you incur two types of costs: (1) transaction costs, including sales charges (loads) on purchase payments, reinvested dividends, or other distributions; redemption fees; and exchange fees; and (2) ongoing costs, including management fees; distribution and service (12b-1) fees; and other Fund expenses. This example is intended to help you understand your ongoing costs (in dollars) of investing in the Fund and to compare these costs with the ongoing costs of investing in other mutual funds.
The example is based on an investment of $1,000 invested at the beginning of the period and held for the entire six-month period from Feb. 1, 2018 to July 31, 2018.
Actual expenses
The first section of the table shown, “Actual Fund return,” provides information about actual account values and actual expenses. You may use the information in this section of the table, together with the amount you invested, to estimate the expenses that you paid over the period. Simply divide your account value by $1,000 (for example, an $8,600 account value divided by $1,000 = 8.6), then multiply the result by the number in the first section under the heading entitled “Expenses Paid During Period” to estimate the expenses you paid on your account during this period.
Hypothetical example for comparison purposes
The second section of the table shown, “Hypothetical 5% return,” provides information about hypothetical account values and hypothetical expenses based on the Fund’s actual expense ratio and an assumed rate of return of 5% per year before expenses, which is not the Fund’s actual return. The hypothetical account values and expenses may not be used to estimate the actual ending account balance or expenses you paid for the period. You may use this information to compare the ongoing costs of investing in the Fund and other funds. To do so, compare this 5% hypothetical example with the 5% hypothetical examples that appear in the shareholder reports of the other funds.
Please note that the expenses shown in the table are meant to highlight your ongoing costs only and do not reflect any transactional costs, such as sales charges (loads), redemption fees, or exchange fees. Therefore, the second section of the table is useful in comparing ongoing costs only, and will not help you determine the relative total costs of owning different funds. In addition, if these transactional costs were included, your costs would have been higher. The Fund’s expenses shown in the table reflect fee waivers in effect. The expenses shown in the table assume reinvestment of all dividends and distributions.
9
Disclosure of Fund expenses
For the six-month period from February 1, 2018 to July 31, 2018 (Unaudited)
Delaware Strategic Income Fund
Expense analysis of an investment of $1,000
| | | | | | | | | | | | | | | | | | | | |
| | | Beginning
Account Value
2/1/18 | | Ending
Account Value
7/31/18 | | Annualized
Expense Ratio | | Expenses
Paid During Period
2/1/18 to 7/31/18* |
| | | | |
Actual Fund return† | | | | | | | | |
Class A | | $1,000.00 | | $982.80 | | 0.86% | | $4.23 |
Class C | | 1,000.00 | | 979.20 | | 1.61% | | 7.90 |
Class R | | 1,000.00 | | 981.70 | | 1.11% | | 5.45 |
Institutional Class | | 1,000.00 | | 985.30 | | 0.61% | | 3.00 |
Hypothetical 5% return (5% return before expenses) | | | | |
Class A | | $1,000.00 | | $1,020.53 | | 0.86% | | $4.31 |
Class C | | 1,000.00 | | 1,016.81 | | 1.61% | | 8.05 |
Class R | | 1,000.00 | | 1,019.29 | | 1.11% | | 5.56 |
Institutional Class | | 1,000.00 | | 1,021.77 | | 0.61% | | 3.06 |
| * | “Expenses Paid During Period” are equal to the Fund’s annualized expense ratio, multiplied by the average account value over the period, multiplied by 181/365 (to reflect the one-half year period). |
| † | Because actual returns reflect only the most recent six-month period, the returns shown may differ significantly from fiscal year returns. |
10
| | |
| Security type / sector allocation |
| Delaware Strategic Income Fund | | As of July 31, 2018 (Unaudited) |
Sector designations may be different than the sector designations presented in other Fund materials. The sector designations may represent the investment manager’s internal sector classifications.
| | | | | |
| Security type / sector | | Percentage of net assets |
Agency Collateralized Mortgage Obligations | | | | 10.49 | % |
Agency Commercial Mortgage-Backed Securities | | | | 0.96 | % |
Agency Mortgage-Backed Securities | | | | 1.94 | % |
Collateralized Debt Obligations | | | | 1.50 | % |
Corporate Bonds | | | | 55.92 | % |
Banking | | | | 9.56 | % |
Basic Industry | | | | 6.01 | % |
Brokerage | | | | 1.74 | % |
Capital Goods | | | | 3.95 | % |
Communications | | | | 5.77 | % |
Consumer Cyclical | | | | 2.18 | % |
Consumer Non-Cyclical | | | | 5.02 | % |
Electric | | | | 4.12 | % |
Energy | | | | 9.89 | % |
Finance Companies | | | | 1.20 | % |
Insurance | | | | 2.09 | % |
Real Estate | | | | 0.35 | % |
REITs | | | | 0.54 | % |
Technology | | | | 2.06 | % |
Transportation | | | | 1.16 | % |
Utilities | | | | 0.28 | % |
Municipal Bonds | | | | 3.27 | % |
Non-Agency Asset-Backed Securities | | | | 5.30 | % |
Non-Agency Collateralized Mortgage Obligations | | | | 3.10 | % |
Non-Agency Commercial Mortgage-Backed Securities | | | | 3.31 | % |
Loan Agreements | | | | 3.22 | % |
Regional Bond | | | | 0.19 | % |
Sovereign Bonds | | | | 2.25 | % |
Supranational Banks | | | | 1.01 | % |
US Treasury Obligations | | | | 4.64 | % |
Convertible Preferred Stock | | | | 0.03 | % |
Preferred Stock | | | | 1.23 | % |
Options Purchased | | | | 0.11 | % |
Short-Term Investments | | | | 1.37 | % |
Total Value of Securities | | | | 99.84 | % |
Receivables and Other Assets Net of Liabilities | | | | 0.16 | % |
Total Net Assets | | | | 100.00 | % |
11
| | |
| Schedule of investments |
| Delaware Strategic Income Fund | | July 31, 2018 |
| | | | | | | | |
| | | Principal amount° | | | Value (US $) | |
Agency Collateralized Mortgage Obligations – 10.49% | | | | | | | | |
Fannie Mae Connecticut Avenue Securities | | | | | | | | |
Series 2017-C04 2M2 4.914% (LIBOR01M + 2.85%) 11/25/29 ● | | | 65,000 | | | $ | 68,286 | |
Series 2018-C01 1M2 4.314% (LIBOR01M + 2.25%) 7/25/30 ● | | | 50,000 | | | | 50,710 | |
Series 2018-C02 2M2 4.264% (LIBOR01M + 2.20%) 8/25/30 ● | | | 45,000 | | | | 45,223 | |
Series 2018-C03 1M2 4.214% (LIBOR01M + 2.15%) 10/25/30 ● | | | 40,000 | | | | 40,061 | |
Series 2018-C05 1M2 4.432% (LIBOR01M + 2.35%) 1/25/31 ● | | | 35,000 | | | | 35,212 | |
Fannie Mae Grantor Trust | | | | | | | | |
Series 2002-T1 A2 7.00% 11/25/31 | | | 26,920 | | | | 30,502 | |
Fannie Mae Interest Strip | | | | | | | | |
Series 418 C12 3.00% 8/25/33 ∑ | | | 164,197 | | | | 21,457 | |
Series 419 C3 3.00% 11/25/43 ∑ | | | 63,039 | | | | 12,408 | |
Fannie Mae REMIC Trust | | | | | | | | |
Series 2002-W1 2A 7.50% 2/25/42 ● | | | 36,241 | | | | 39,132 | |
Fannie Mae REMICs | | | | | | | | |
Series 2008-15 SB 4.536% (6.60% minus LIBOR01M, Cap 6.60%) 8/25/36 ∑● | | | 17,039 | | | | 2,804 | |
Series 2012-44 IK 3.50% 12/25/31 ∑ | | | 36,480 | | | | 3,867 | |
Series 2012-115 MI 3.50% 3/25/42 ∑ | | | 45,850 | | | | 5,673 | |
Series 2012-118 AI 3.50% 11/25/37 ∑ | | | 97,617 | | | | 10,711 | |
Series 2012-122 SD 4.036% (6.10% minus LIBOR01M, Cap 6.10%) 11/25/42 ∑● | | | 213,844 | | | | 35,466 | |
Series 2012-128 IC 3.00% 11/25/32 ∑ | | | 144,128 | | | | 18,754 | |
Series 2012-132 AI 3.00% 12/25/27 ∑ | | | 127,211 | | | | 11,522 | |
Series 2012-137 AI 3.00% 12/25/27 ∑ | | | 44,960 | | | | 4,045 | |
Series 2012-137 WI 3.50% 12/25/32 ∑ | | | 3,485,059 | | | | 578,002 | |
Series 2012-144 PI 3.50% 6/25/42 ∑ | | | 50,549 | | | | 6,760 | |
Series 2012-146 IO 3.50% 1/25/43 ∑ | | | 124,833 | | | | 25,290 | |
Series 2012-149 IC 3.50% 1/25/28 ∑ | | | 90,658 | | | | 9,571 | |
Series 2013-1 YI 3.00% 2/25/33 ∑ | | | 113,434 | | | | 15,103 | |
Series 2013-7 EI 3.00% 10/25/40 ∑ | | | 90,090 | | | | 12,175 | |
Series 2013-26 ID 3.00% 4/25/33 ∑ | | | 163,553 | | | | 23,186 | |
Series 2013-35 IB 3.00% 4/25/33 ∑ | | | 152,621 | | | | 20,024 | |
Series 2013-35 IG 3.00% 4/25/28 ∑ | | | 59,951 | | | | 5,433 | |
Series 2013-38 AI 3.00% 4/25/33 ∑ | | | 159,768 | | | | 21,726 | |
Series 2013-41 HI 3.00% 2/25/33 ∑ | | | 132,111 | | | | 14,538 | |
Series 2013-43 IX 4.00% 5/25/43 ∑ | | | 475,947 | | | | 116,909 | |
Series 2013-44 DI 3.00% 5/25/33 ∑ | | | 490,097 | | | | 69,923 | |
Series 2013-45 PI 3.00% 5/25/33 ∑ | | | 52,478 | | | | 7,440 | |
Series 2013-55 AI 3.00% 6/25/33 ∑ | | | 198,703 | | | | 28,535 | |
12
| | | | | | | | |
| | | Principal amount° | | | Value (US $) | |
Agency Collateralized Mortgage Obligations (continued) | | | | | | | | |
Fannie Mae REMICs | | | | | | | | |
Series 2013-73 KE 3.00% 7/25/43 | | | 4,000 | | | $ | 3,731 | |
Series 2013-92 SA 3.886% (5.95% minus LIBOR01M, Cap 5.95%) 9/25/43 ∑● | | | 186,305 | | | | 33,472 | |
Series 2013-101 HS 4.436% (6.50% minus LIBOR01M, Cap 6.50%) 10/25/43 ∑● | | | 63,965 | | | | 13,839 | |
Series 2013-103 SK 3.856% (5.92% minus LIBOR01M, Cap 5.92%) 10/25/43 ∑● | | | 362,737 | | | | 66,639 | |
Series 2014-64 IT 3.50% 6/25/41 ∑ | | | 37,311 | | | | 3,941 | |
Series 2014-68 BS 4.086% (6.15% minus LIBOR01M, Cap 6.15%) 11/25/44 ∑● | | | 152,766 | | | | 28,609 | |
Series 2014-90 SA 4.086% (6.15% minus LIBOR01M, Cap 6.15%) 1/25/45 ∑● | | | 1,290,526 | | | | 232,314 | |
Series 2015-27 SA 4.386% (6.45% minus LIBOR01M, Cap 6.45%) 5/25/45 ∑● | | | 58,370 | | | | 11,490 | |
Series 2015-44 Z 3.00% 9/25/43 | | | 204,051 | | | | 191,170 | |
Series 2015-59 CI 3.50% 8/25/30 ∑ | | | 47,311 | | | | 4,573 | |
Series 2015-66 ID 3.50% 5/25/42 ∑ | | | 213,735 | | | | 32,707 | |
Series 2015-89 AZ 3.50% 12/25/45 | | | 20,856 | | | | 19,982 | |
Series 2015-95 SH 3.936% (6.00% minus LIBOR01M, Cap 6.00%) 1/25/46 ∑● | | | 157,444 | | | | 28,279 | |
Series 2016-6 AI 3.50% 4/25/34 ∑ | | | 100,251 | | | | 12,696 | |
Series 2016-33 DI 3.50% 6/25/36 ∑ | | | 235,295 | | | | 35,324 | |
Series 2016-33 EL 3.00% 6/25/46 | | | 6,000 | | | | 5,365 | |
Series 2016-36 SB 3.936% (6.00% minus LIBOR01M, Cap 6.00%) 3/25/43 ∑● | | | 77,536 | | | | 10,137 | |
Series 2016-40 IO 3.50% 7/25/36 ∑ | | | 66,023 | | | | 11,001 | |
Series 2016-40 ZC 3.00% 7/25/46 | | | 42,576 | | | | 38,162 | |
Series 2016-50 IB 3.00% 2/25/46 ∑ | | | 86,172 | | | | 13,425 | |
Series 2016-51 LI 3.00% 8/25/46 ∑ | | | 238,240 | | | | 37,974 | |
Series 2016-55 SK 3.936% (6.00% minus LIBOR01M, Cap 6.00%) 8/25/46 ∑● | | | 131,063 | | | | 25,119 | |
Series 2016-62 SA 3.936% (6.00% minus LIBOR01M, Cap 6.00%) 9/25/46 ∑● | | | 263,249 | | | | 52,352 | |
Series 2016-64 CI 3.50% 7/25/43 ∑ | | | 98,179 | | | | 13,567 | |
Series 2016-74 GS 3.936% (6.00% minus LIBOR01M, Cap 6.00%) 10/25/46 ∑● | | | 84,448 | | | | 18,159 | |
Series 2016-79 JS 3.986% (6.05% minus LIBOR01M, Cap 6.05%) 11/25/46 ∑● | | | 350,767 | | | | 71,231 | |
Series 2016-83 PI 3.50% 7/25/45 ∑ | | | 81,553 | | | | 14,030 | |
Series 2016-99 DI 3.50% 1/25/46 ∑ | | | 88,425 | | | | 16,781 | |
Series 2017-4 AI 3.50% 5/25/41 ∑ | | | 102,787 | | | | 12,719 | |
Series 2017-4 BI 3.50% 5/25/41 ∑ | | | 77,775 | | | | 12,316 | |
Series 2017-8 BZ 3.00% 2/25/47 | | | 130,746 | | | | 113,729 | |
13
Schedule of investments
Delaware Strategic Income Fund
| | | | | | | | |
| | | Principal amount° | | | Value (US $) | |
Agency Collateralized Mortgage Obligations (continued) | | | | | | | | |
Fannie Mae REMICs | | | | | | | | |
Series 2017-8 SG 3.936% (6.00% minus LIBOR01M, | | | | | | | | |
Cap 6.00%) 2/25/47 ∑● | | | 196,181 | | | $ | 37,144 | |
Series 2017-12 JI 3.50% 5/25/40 ∑ | | | 76,610 | | | | 11,288 | |
Series 2017-15 NZ 3.50% 3/25/47 | | | 33,624 | | | | 32,440 | |
Series 2017-16 SM 3.986% (6.05% minus LIBOR01M, Cap 6.05%) 3/25/47 ∑● | | | 228,606 | | | | 43,606 | |
Series 2017-16 YW 3.00% 3/25/47 | | | 30,000 | | | | 27,604 | |
Series 2017-17 LI 3.00% 4/25/37 ∑ | | | 118,287 | | | | 11,533 | |
Series 2017-21 ZD 3.50% 4/25/47 | | | 47,147 | | | | 44,832 | |
Series 2017-25 BL 3.00% 4/25/47 | | | 16,000 | | | | 14,855 | |
Series 2017-26 VZ 3.00% 4/25/47 | | | 85,342 | | | | 74,684 | |
Series 2017-28 Z 3.50% 4/25/47 | | | 5,239 | | | | 4,848 | |
Series 2017-39 CY 3.50% 5/25/47 | | | 5,000 | | | | 4,895 | |
Series 2017-45 JZ 3.00% 6/25/47 | | | 12,427 | | | | 10,643 | |
Series 2017-45 ZK 3.50% 6/25/47 | | | 26,040 | | | | 24,629 | |
Series 2017-46 JI 3.50% 1/25/43 ∑ | | | 111,496 | | | | 15,321 | |
Series 2017-46 VG 3.50% 4/25/38 | | | 21,000 | | | | 20,593 | |
Series 2017-61 TB 3.00% 8/25/44 | | | 26,000 | | | | 24,130 | |
Series 2017-69 SG 4.086% (6.15% minus LIBOR01M, Cap 6.15%) 9/25/47 ∑● | | | 136,204 | | | | 26,352 | |
Series 2017-77 HZ 3.50% 10/25/47 | | | 45,300 | | | | 43,683 | |
Series 2017-88 IE 3.00% 11/25/47 ∑ | | | 96,069 | | | | 18,640 | |
Series 2017-96 EZ 3.50% 12/25/47 | | | 40,824 | | | | 39,249 | |
Series 2018-8 MU 3.00% 2/25/48 | | | 65,000 | | | | 59,144 | |
Series 2018-21 IO 3.00% 4/25/48 ∑ | | | 161,213 | | | | 32,097 | |
Freddie Mac REMICs | | | | | | | | |
Series 3939 EI 3.00% 3/15/26 ∑ | | | 85,834 | | | | 4,691 | |
Series 4050 EI 4.00% 2/15/39 ∑ | | | 115,416 | | | | 12,307 | |
Series 4101 WI 3.50% 8/15/32 ∑ | | | 53,488 | | | | 9,395 | |
Series 4109 AI 3.00% 7/15/31 ∑ | | | 294,856 | | | | 36,411 | |
Series 4120 IK 3.00% 10/15/32 ∑ | | | 245,730 | | | | 35,188 | |
Series 4135 AI 3.50% 11/15/42 ∑ | | | 99,637 | | | | 21,125 | |
Series 4139 IP 3.50% 4/15/42 ∑ | | | 50,281 | | | | 6,557 | |
Series 4146 IA 3.50% 12/15/32 ∑ | | | 124,851 | | | | 19,613 | |
Series 4150 IO 3.50% 1/15/43 ∑ | | | 103,777 | | | | 21,463 | |
Series 4150 UI 3.50% 8/15/32 ∑ | | | 157,536 | | | | 17,425 | |
Series 4159 KS 4.078% (6.15% minus LIBOR01M, Cap 6.15%) 1/15/43 ∑● | | | 113,971 | | | | 22,169 | |
Series 4181 DI 2.50% 3/15/33 ∑ | | | 82,118 | | | | 10,106 | |
Series 4184 GS 4.048% (6.12% minus LIBOR01M, Cap 6.12%) 3/15/43 ∑● | | | 133,028 | | | | 25,259 | |
Series 4185 LI 3.00% 3/15/33 ∑ | | | 125,940 | | | | 18,273 | |
Series 4186 IB 3.00% 3/15/33 ∑ | | | 68,571 | | | | 8,967 | |
14
| | | | | | | | |
| | | Principal amount° | | | Value (US $) | |
Agency Collateralized Mortgage Obligations (continued) | | | | | | | | |
Freddie Mac REMICs | | | | | | | | |
Series 4191 CI 3.00% 4/15/33 ∑ | | | 54,336 | | | $ | 7,736 | |
Series 4216 KI 3.50% 6/15/28 ∑ | | | 91,315 | | | | 9,135 | |
Series 4435 DY 3.00% 2/15/35 | | | 162,000 | | | | 153,362 | |
Series 4456 MZ 3.50% 3/15/45 | | | 5,618 | | | | 5,319 | |
Series 4464 DA 2.50% 1/15/43 | | | 19,024 | | | | 17,144 | |
Series 4494 SA 4.108% (6.18% minus LIBOR01M, Cap 6.18%) 7/15/45 ∑● | | | 63,757 | | | | 11,928 | |
Series 4504 IO 3.50% 5/15/42 ∑ | | | 51,195 | | | | 6,018 | |
Series 4527 CI 3.50% 2/15/44 ∑ | | | 134,629 | | | | 24,018 | |
Series 4531 PZ 3.50% 11/15/45 | | | 3,293 | | | | 3,095 | |
Series 4543 HI 3.00% 4/15/44 ∑ | | | 72,107 | | | | 11,525 | |
Series 4581 LI 3.00% 5/15/36 ∑ | | | 70,836 | | | | 9,846 | |
Series 4594 SG 3.928% (6.00% minus LIBOR01M, Cap 6.00%) 6/15/46 ∑● | | | 365,393 | | | | 76,824 | |
Series 4601 IN 3.50% 7/15/46 ∑ | | | 476,851 | | | | 107,188 | |
Series 4610 IB 3.00% 6/15/41 ∑ | | | 368,271 | | | | 45,883 | |
Series 4614 HB 2.50% 9/15/46 | | | 77,000 | | | | 67,686 | |
Series 4623 LZ 2.50% 10/15/46 | | | 67,904 | | | | 55,681 | |
Series 4623 MS 3.928% (6.00% minus LIBOR01M, Cap 6.00%) 10/15/46 ∑● | | | 87,989 | | | | 18,236 | |
Series 4623 MW 2.50% 10/15/46 | | | 75,000 | | | | 66,495 | |
Series 4625 BI 3.50% 6/15/46 ∑ | | | 232,981 | | | | 49,850 | |
Series 4625 PZ 3.00% 6/15/46 | | | 34,777 | | | | 31,019 | |
Series 4627 PI 3.50% 5/15/44 ∑ | | | 128,684 | | | | 18,866 | |
Series 4631 GS 3.928% (6.00% minus LIBOR01M, Cap 6.00%) 11/15/46 ∑● | | | 283,097 | | | | 50,565 | |
Series 4631 LJ 3.00% 3/15/41 | | | 17,000 | | | | 16,184 | |
Series 4636 NZ 3.00% 12/15/46 | | | 88,081 | | | | 78,572 | |
Series 4644 GI 3.50% 5/15/40 ∑ | | | 80,631 | | | | 11,583 | |
Series 4648 MZ 3.00% 6/15/46 | | | 18,827 | | | | 16,980 | |
Series 4648 ND 3.00% 9/15/46 | | | 10,000 | | | | 9,136 | |
Series 4650 JE 3.00% 7/15/46 | | | 12,000 | | | | 10,905 | |
Series 4655 WI 3.50% 8/15/43 ∑ | | | 82,898 | | | | 14,357 | |
Series 4657 JZ 3.50% 2/15/47 | | | 3,152 | | | | 2,867 | |
Series 4657 NW 3.00% 4/15/45 | | | 16,000 | | | | 15,248 | |
Series 4657 PS 3.928% (6.00% minus LIBOR01M, Cap 6.00%) 2/15/47 ∑● | | | 169,057 | | | | 32,352 | |
Series 4663 HZ 3.50% 3/15/47 | | | 16,763 | | | | 16,107 | |
Series 4665 NI 3.50% 7/15/41 ∑ | | | 311,943 | | | | 41,422 | |
Series 4669 QW 3.00% 9/15/44 | | | 3,000 | | | | 2,798 | |
Series 4673 WI 3.50% 9/15/43 ∑ | | | 84,785 | | | | 13,550 | |
Series 4690 WI 3.50% 12/15/43 ∑ | | | 91,763 | | | | 14,927 | |
Series 4700 WI 3.50% 1/15/44 ∑ | | | 90,745 | | | | 15,310 | |
15
Schedule of investments
Delaware Strategic Income Fund
| | | | | | | | |
| | | Principal amount° | | | Value (US $) | |
Agency Collateralized Mortgage Obligations (continued) | | | | | | | | |
Freddie Mac REMICs | | | | | | | | |
Series 4703 CI 3.50% 7/15/42 ∑ | | | 147,862 | | | $ | 20,190 | |
Freddie Mac Strips | | | | | | | | |
Series 267 S5 3.928% (6.00% minus LIBOR01M, Cap 6.00%) 8/15/42 ∑● | | | 169,432 | | | | 29,214 | |
Series 299 S1 3.928% (6.00% minus LIBOR01M, Cap 6.00%) 1/15/43 ∑● | | | 131,070 | | | | 21,215 | |
Series 319 S2 3.928% (6.00% minus LIBOR01M, Cap 6.00%) 11/15/43 ∑● | | | 59,051 | | | | 10,841 | |
Freddie Mac Structured Agency Credit Risk Debt Notes | | | | | | | | |
Series 2017-DNA1 M2 5.314% (LIBOR01M + 3.25%) 7/25/29 ● | | | 250,000 | | | | 271,880 | |
Series 2018-DNA1 M2 3.864% (LIBOR01M + 1.80%) 7/25/30 ● | | | 75,000 | | | | 74,368 | |
Series 2018-HQA1 M2 4.364% (LIBOR01M + 2.30%) 9/25/30 ● | | | 75,000 | | | | 75,226 | |
Freddie Mac Structured Pass Through Certificates | | | | | | | | |
Series T-42 A5 7.50% 2/25/42 ¨ | | | 15,529 | | | | 17,675 | |
GNMA | | | | | | | | |
Series 2011-157 SG 4.514% (6.60% minus LIBOR01M, | | | | | | | | |
Cap 6.60%) 12/20/41 ∑● | | | 68,056 | | | | 13,402 | |
Series 2012-108 KI 4.00% 8/16/42 ∑ | | | 128,429 | | | | 24,412 | |
Series 2012-136 MX 2.00% 11/20/42 | | | 30,000 | | | | 25,667 | |
Series 2013-22 IO 3.00% 2/20/43 ∑ | | | 376,077 | | | | 71,842 | |
Series 2013-113 LY 3.00% 5/20/43 | | | 22,000 | | | | 21,271 | |
Series 2013-182 CZ 2.50% 12/20/43 | | | 33,638 | | | | 29,787 | |
Series 2015-64 GZ 2.00% 5/20/45 | | | 83,095 | | | | 63,354 | |
Series 2015-74 CI 3.00% 10/16/39 ∑ | | | 126,889 | | | | 15,272 | |
Series 2015-76 MZ 3.00% 5/20/45 | | | 32,986 | | | | 31,195 | |
Series 2015-127 LM 3.00% 9/20/45 | | | 9,000 | | | | 8,236 | |
Series 2015-133 AL 3.00% 5/20/45 | | | 214,000 | | | | 201,155 | |
Series 2015-142 AI 4.00% 2/20/44 ∑ | | | 45,559 | | | | 6,257 | |
Series 2016-103 DY 2.50% 8/20/46 | | | 2,000 | | | | 1,708 | |
Series 2016-108 SK 3.964% (6.05% minus LIBOR01M, Cap 6.05%) 8/20/46 ∑● | | | 194,571 | | | | 37,834 | |
Series 2016-111 PB 2.50% 8/20/46 | | | 74,000 | | | | 64,450 | |
Series 2016-115 SA 4.014% (6.10% minus LIBOR01M, Cap 6.10%) 8/20/46 ∑● | | | 274,835 | | | | 51,474 | |
Series 2016-116 GI 3.50% 11/20/44 ∑ | | | 234,486 | | | | 41,418 | |
Series 2016-118 DI 3.50% 3/20/43 ∑ | | | 520,985 | | | | 73,579 | |
Series 2016-118 ES 4.014% (6.10% minus LIBOR01M, Cap 6.10%) 9/20/46 ∑● | | | 101,413 | | | | 20,580 | |
Series 2016-120 NS 4.014% (6.10% minus LIBOR01M, Cap 6.10%) 9/20/46 ∑● | | | 274,404 | | | | 54,137 | |
16
| | | | | | | | |
| | | Principal amount° | | | Value (US $) | |
Agency Collateralized Mortgage Obligations (continued) | | | | | | | | |
GNMA | | | | | | | | |
Series 2016-121 JS 4.014% (6.10% minus LIBOR01M, Cap 6.10%) 9/20/46 ∑● | | | 367,241 | | | $ | 70,557 | |
Series 2016-126 NS 4.014% (6.10% minus LIBOR01M, Cap 6.10%) 9/20/46 ∑● | | | 116,011 | | | | 22,885 | |
Series 2016-134 MW 3.00% 10/20/46 | | | 12,000 | | | | 11,595 | |
Series 2016-147 ST 3.964% (6.05% minus LIBOR01M, Cap 6.05%) 10/20/46 ∑● | | | 117,623 | | | | 23,173 | |
Series 2016-149 GI 4.00% 11/20/46 ∑ | | | 88,686 | | | | 20,310 | |
Series 2016-156 PB 2.00% 11/20/46 | | | 46,000 | | | | 36,053 | |
Series 2016-160 GI 3.50% 11/20/46 ∑ | | | 162,204 | | | | 38,372 | |
Series 2016-163 XI 3.00% 10/20/46 ∑ | | | 181,022 | | | | 25,759 | |
Series 2016-171 IP 3.00% 3/20/46 ∑ | | | 231,982 | | | | 37,325 | |
Series 2017-4 BW 3.00% 1/20/47 | | | 12,000 | | | | 11,345 | |
Series 2017-10 IB 4.00% 1/20/47 ∑ | | | 137,799 | | | | 30,741 | |
Series 2017-10 KZ 3.00% 1/20/47 | | | 18,827 | | | | 16,996 | |
Series 2017-11 IM 3.00% 5/20/42 ∑ | | | 219,159 | | | | 26,930 | |
Series 2017-18 GM 2.50% 2/20/47 | | | 6,000 | | | | 5,353 | |
Series 2017-18 IQ 4.00% 12/16/43 ∑ | | | 87,391 | | | | 18,986 | |
Series 2017-18 QS 4.028% (6.10% minus LIBOR01M, Cap 6.10%) 2/16/47 ∑● | | | 133,850 | | | | 23,789 | |
Series 2017-25 WZ 3.00% 2/20/47 | | | 18,780 | | | | 17,433 | |
Series 2017-34 DY 3.50% 3/20/47 | | | 20,000 | | | | 19,896 | |
Series 2017-56 JZ 3.00% 4/20/47 | | | 32,183 | | | | 28,625 | |
Series 2017-56 QS 4.064% (6.15% minus LIBOR01M, Cap 6.15%) 4/20/47 ∑● | | | 287,830 | | | | 52,481 | |
Series 2017-68 SB 4.064% (6.15% minus LIBOR01M, Cap 6.15%) 5/20/47 ∑● | | | 222,846 | | | | 37,588 | |
Series 2017-80 AS 4.114% (6.20% minus LIBOR01M, Cap 6.20%) 5/20/47 ∑● | | | 180,652 | | | | 33,707 | |
Series 2017-91 SM 4.114% (6.20% minus LIBOR01M, Cap 6.20%) 6/20/47 ∑● | | | 109,802 | | | | 20,944 | |
Series 2017-101 AI 4.00% 7/20/47 ∑ | | | 93,682 | | | | 18,553 | |
Series 2017-101 KS 4.114% (6.20% minus LIBOR01M, Cap 6.20%) 7/20/47 ∑● | | | 129,650 | | | | 23,925 | |
Series 2017-101 SK 4.114% (6.20% minus LIBOR01M, Cap 6.20%) 7/20/47 ∑● | | | 325,610 | | | | 60,060 | |
Series 2017-101 TI 4.00% 3/20/44 ∑ | | | 117,844 | | | | 19,380 | |
Series 2017-107 QZ 3.00% 8/20/45 | | | 21,639 | | | | 18,761 | |
Series 2017-113 LB 3.00% 7/20/47 | | | 55,000 | | | | 50,870 | |
Series 2017-114 IK 4.00% 10/20/44 ∑ | | | 183,070 | | | | 39,888 | |
Series 2017-116 ZL 3.00% 6/20/47 | | | 42,247 | | | | 36,925 | |
Series 2017-117 SD 4.114% (6.20% minus LIBOR01M, Cap 6.20%) 8/20/47 ∑● | | | 108,068 | | | | 20,674 | |
17
Schedule of investments
Delaware Strategic Income Fund
| | | | | | | | |
| | | Principal amount° | | | Value (US $) | |
Agency Collateralized Mortgage Obligations (continued) | | | | | | | | |
GNMA | | | | | | | | |
Series 2017-120 QS 4.114% (6.20% minus LIBOR01M, Cap 6.20%) 8/20/47 ∑● | | | 187,838 | | | $ | 36,955 | |
Series 2017-121 CW 3.00% 8/20/47 | | | 47,000 | | | | 42,857 | |
Series 2017-130 YJ 2.50% 8/20/47 | | | 25,000 | | | | 22,182 | |
Series 2017-134 ES 4.114% (6.20% minus LIBOR01M, Cap 6.20%) 9/20/47 ∑● | | | 218,413 | | | | 39,461 | |
Series 2017-134 KI 4.00% 5/20/44 ∑ | | | 94,241 | | | | 16,551 | |
Series 2017-141 JS 4.114% (6.20% minus LIBOR01M, Cap 6.20%) 9/20/47 ∑● | | | 114,493 | | | | 22,573 | |
Series 2017-156 LP 2.50% 10/20/47 | | | 12,000 | | | | 10,277 | |
Series 2017-163 HS 4.114% (6.20% minus LIBOR01M, Cap 6.20%) 11/20/47 ∑● | | | 214,135 | | | | 38,107 | |
Series 2017-170 SQ 4.114% (6.20% minus LIBOR01M, Cap 6.20%) 11/20/47 ∑● | | | 318,701 | | | | 48,761 | |
Series 2017-184 AL 3.00% 6/20/47 | | | 24,000 | | | | 23,527 | |
Series 2018-1 ST 4.114% (6.20% minus LIBOR01M, Cap 6.20%) 1/20/48 ∑● | | | 190,510 | | | | 37,917 | |
Series 2018-18 CZ 3.00% 2/20/48 | | | 6,075 | | | | 5,240 | |
Series 2018-46 AS 4.114% (6.20% minus LIBOR01M, Cap 6.20%) 3/20/48 ∑● | | | 227,140 | | | | 46,069 | |
Series 2018-63 BZ 3.00% 4/20/48 | | | 34,256 | | | | 30,218 | |
Total Agency Collateralized Mortgage Obligations (cost $7,405,480) | | | | | | | 7,344,370 | |
| | | | | | | |
Agency Commercial Mortgage-Backed Securities – 0.96% | | | | | | | | |
Freddie Mac Multifamily Structured Pass Through Certificates | | | | | | | | |
Series K058 A2 2.653% 8/25/26 ¨ | | | 80,000 | | | | 75,847 | |
FREMF Mortgage Trust | | | | | | | | |
Series 2011-K14 B 144A 5.18% 2/25/47 #● | | | 50,000 | | | | 52,303 | |
Series 2011-K704 B 144A 4.418% 10/25/30 #● | | | 30,000 | | | | 29,954 | |
Series 2013-K25 C 144A 3.619% 11/25/45 #● | | | 45,000 | | | | 44,284 | |
Series 2013-K33 C 144A 3.50% 8/25/46 #● | | | 15,000 | | | | 14,686 | |
Series 2013-K712 B 144A 3.36% 5/25/45 #● | | | 60,000 | | | | 60,056 | |
Series 2013-K713 B 144A 3.154% 4/25/46 #● | | | 35,000 | | | | 34,923 | |
Series 2013-K713 C 144A 3.154% 4/25/46 #● | | | 105,000 | | | | 104,329 | |
Series 2014-K717 B 144A 3.628% 11/25/47 #● | | | 35,000 | | | | 35,078 | |
Series 2014-K717 C 144A 3.628% 11/25/47 #● | | | 20,000 | | | | 19,825 | |
Series 2016-K53 B 144A 4.019% 3/25/49 #● | | | 50,000 | | | | 49,465 | |
Series 2016-K722 B 144A 3.835% 7/25/49 #● | | | 75,000 | | | | 74,072 | |
Series 2016-K723 B 144A 3.58% 11/25/23 #● | | | 45,000 | | | | 43,387 | |
Series 2017-K71 B 144A 3.753% 11/25/50 #● | | | 35,000 | | | | 33,137 | |
Total Agency Commercial Mortgage-Backed Securities (cost $681,540) | | | | | | | 671,346 | |
18
| | | | | | | | |
| | | Principal amount° | | | Value (US $) | |
Agency Mortgage-Backed Securities – 1.94% | | | | | | | | |
Fannie Mae S.F. 30 yr 4.50% 10/1/43 | | | 226,650 | | | $ | 237,538 | |
5.00% 8/1/35 | | | 21,304 | | | | 22,754 | |
5.00% 7/1/36 | | | 96,938 | | | | 103,535 | |
5.00% 6/1/39 | | | 98,764 | | | | 105,441 | |
5.00% 6/1/44 | | | 77,440 | | | | 83,138 | |
5.50% 7/1/40 | | | 29,671 | | | | 32,128 | |
5.50% 9/1/41 | | | 32,045 | | | | 35,366 | |
5.50% 5/1/44 | | | 129,784 | | | | 140,700 | |
6.00% 9/1/36 | | | 15,890 | | | | 17,688 | |
6.00% 6/1/37 | | | 1,386 | | | | 1,525 | |
6.00% 7/1/37 | | | 1,099 | | | | 1,200 | |
6.00% 10/1/38 | | | 9,818 | | | | 10,759 | |
6.00% 10/1/39 | | | 117,643 | | | | 129,114 | |
6.00% 11/1/40 | | | 3,917 | | | | 4,303 | |
6.00% 7/1/41 | | | 125,069 | | | | 137,244 | |
Freddie Mac S.F. 30 yr | | | | | | | | |
5.00% 12/1/44 | | | 39,738 | | | | 42,470 | |
5.50% 6/1/41 | | | 124,553 | | | | 135,203 | |
5.50% 9/1/41 | | | 49,356 | | | | 53,761 | |
6.00% 8/1/38 | | | 58,768 | | | | 64,529 | |
Total Agency Mortgage-Backed Securities (cost $1,387,196) | | | | | | | 1,358,396 | |
| | | | | | | |
Collateralized Debt Obligations – 1.50% | | | | | | | | |
Benefit Street Partners CLO IV | | | | | | | | |
Series 2014-IVA A1R 144A 3.838% (LIBOR03M + 1.49%) 1/20/29 #● | | | 500,000 | | | | 501,161 | |
Cedar Funding VI CLO | | | | | | | | |
Series 2016-6A A1 144A 3.818% (LIBOR03M + 1.47%) 10/20/28 #● | | | 250,000 | | | | 250,270 | |
Venture CDO | | | | | | | | |
Series 2016-25A A1 144A 3.838% (LIBOR03M + 1.49%) 4/20/29 #● | | | 100,000 | | | | 100,300 | |
Venture XXIV CLO | | | | | | | | |
Series 2016-24A A1D 144A 3.768% (LIBOR03M + 1.42%) 10/20/28 #● | | | 195,000 | | | | 195,081 | |
Total Collateralized Debt Obligations (cost $1,043,830) | | | | | | | 1,046,812 | |
| | | | | | | |
Corporate Bonds – 55.92% | | | | | | | | |
Banking – 9.56% | | | | | | | | |
Akbank Turk 144A 7.20% 3/16/27 #µ | | | 200,000 | | | | 166,144 | |
Banco de Credito e Inversiones 144A 3.50% 10/12/27 # | | | 200,000 | | | | 185,125 | |
19
Schedule of investments
Delaware Strategic Income Fund
| | | | | | | | | | | | |
| | | | | | Principal amount° | | | Value (US $) | |
Corporate Bonds (continued) | | | | | | | | | | | | |
Banking (continued) | | | | | | | | | | | | |
Bank of America | | | | | | | | | | | | |
3.864% 7/23/24 µ | | | | | | | 55,000 | | | $ | 55,024 | |
4.271% 7/23/29 µ | | | | | | | 45,000 | | | | 45,218 | |
5.625% 7/1/20 | | | | | | | 25,000 | | | | 26,124 | |
Bank of Montreal 3.803% 12/15/32 µ | | | | | | | 130,000 | | | | 121,606 | |
Bank of New York Mellon 4.625% µy | | | | | | | 570,000 | | | | 545,895 | |
Barclays 8.25% µy | | | | | | | 325,000 | | | | 331,552 | |
Citizens Bank 3.70% 3/29/23 | | | | | | | 250,000 | | | | 249,477 | |
Credit Suisse Group 144A 6.25% #µy | | | | | | | 300,000 | | | | 301,883 | |
Fifth Third Bancorp 3.95% 3/14/28 | | | | | | | 115,000 | | | | 113,355 | |
Fifth Third Bank 3.35% 7/26/21 | | | | | | | 200,000 | | | | 199,768 | |
Goldman Sachs Group | | | | | | | | | | | | |
4.223% 5/1/29 µ | | | | | | | 145,000 | | | | 143,707 | |
5.15% 5/22/45 | | | | | | | 25,000 | | | | 25,987 | |
6.00% 6/15/20 | | | | | | | 185,000 | | | | 193,974 | |
HSBC Holdings 3.95% 5/18/24 µ | | | | | | | 200,000 | | | | 199,782 | |
JPMorgan Chase & Co. | | | | | | | | | | | | |
3.797% 7/23/24 µ | | | | | | | 50,000 | | | | 49,994 | |
4.203% 7/23/29 µ | | | | | | | 125,000 | | | | 125,371 | |
6.75% µy | | | | | | | 440,000 | | | | 481,250 | |
Morgan Stanley 3.737% 4/24/24 µ | | | | | | | 75,000 | | | | 74,588 | |
3.772% 1/24/29 µ | | | | | | | 195,000 | | | | 187,727 | |
5.00% 11/24/25 | | | | | | | 35,000 | | | | 36,435 | |
5.50% 1/26/20 | | | | | | | 200,000 | | | | 206,695 | |
Nationwide Building Society 144A 4.363% 8/1/24 #µ | | | | | | | 200,000 | | | | 200,712 | |
PNC Financial Services Group 5.00% µy | | | | | | | 315,000 | | | | 313,425 | |
Royal Bank of Scotland Group 8.625% µy | | | | | | | 600,000 | | | | 648,960 | |
Santander UK 144A 5.00% 11/7/23 # | | | | | | | 215,000 | | | | 218,609 | |
SunTrust Banks | | | | | | | | | | | | |
3.00% 2/2/23 | | | | | | | 95,000 | | | | 92,894 | |
4.00% 5/1/25 | | | | | | | 60,000 | | | | 60,129 | |
Swiss Insured Brazil Power Finance 144A 9.85% 7/16/32 # | | | BRL | | | | 500,000 | | | | 129,553 | |
Turkiye Garanti Bankasi 144A 6.25% 4/20/21 # | | | | | | | 200,000 | | | | 197,564 | |
US Bancorp 2.375% 7/22/26 | | | | | | | 40,000 | | | | 36,369 | |
USB Capital IX 3.50% (LIBOR03M + 1.02%) y● | | | | | | | 510,696 | | | | 631,997 | |
Westpac Banking 5.00% µy | | | | | | | 20,000 | | | | 18,011 | |
Zions Bancorporation 4.50% 6/13/23 | | | | | | | 75,000 | | | | 75,584 | |
| | | | | | | | | | | | |
| | | | | | | | | | | 6,690,488 | |
Basic Industry – 6.01% | | | | | | | | | | | | |
Anglo American Capital 144A 4.75% 4/10/27 # | | | | | | | 400,000 | | | | 389,925 | |
20
| | | | | | | | |
| | | Principal amount° | | | Value (US $) | |
Corporate Bonds (continued) | | | | | | | | |
Basic Industry (continued) | | | | | | | | |
Barrick North America Finance 5.75% 5/1/43 | | | 105,000 | | | $ | 116,973 | |
BHP Billiton Finance USA 144A 6.25% 10/19/75 #µ | | | 400,000 | | | | 422,000 | |
Braskem Netherlands Finance 144A 4.50% 1/10/28 # | | | 200,000 | | | | 192,430 | |
Cleveland-Cliffs 5.75% 3/1/25 | | | 195,000 | | | | 189,881 | |
CSN Resources 144A 7.625% 2/13/23 # | | | 200,000 | | | | 189,502 | |
Equate Petrochemical 144A 3.00% 3/3/22 # | | | 200,000 | | | | 192,956 | |
Georgia-Pacific 8.00% 1/15/24 | | | 195,000 | | | | 234,888 | |
Hudbay Minerals 144A 7.625% 1/15/25 # | | | 235,000 | | | | 244,106 | |
Mexichem 144A 5.50% 1/15/48 # | | | 200,000 | | | | 187,980 | |
NOVA Chemicals | | | | | | | | |
144A 5.00% 5/1/25 # | | | 60,000 | | | | 57,300 | |
144A 5.25% 6/1/27 # | | | 400,000 | | | | 375,396 | |
Novolipetsk Steel Via Steel Funding DAC 144A 4.00% 9/21/24 # | | | 200,000 | | | | 188,825 | |
Nucor 3.95% 5/1/28 | | | 50,000 | | | | 50,141 | |
OCP 144A 4.50% 10/22/25 # | | | 200,000 | | | | 196,399 | |
Petkim Petrokimya Holding 144A 5.875% 1/26/23 # | | | 200,000 | | | | 179,910 | |
Phosagro OAO Via Phosagro Bond Funding DAC 144A 3.95% 11/3/21 # | | | 200,000 | | | | 195,757 | |
Platform Specialty Products 144A 5.875% 12/1/25 # | | | 180,000 | | | | 181,071 | |
Syngenta Finance 144A 3.933% 4/23/21 # | | | 225,000 | | | | 224,845 | |
Vedanta Resources 144A 7.125% 5/31/23 # | | | 200,000 | | | | 197,750 | |
| | | | | | | 4,208,035 | |
| | | | | | | |
Brokerage – 1.74% | | | | | | | | |
Charles Schwab | | | | | | | | |
3.25% 5/21/21 | | | 50,000 | | | | 50,091 | |
3.85% 5/21/25 | | | 50,000 | | | | 50,565 | |
E*TRADE Financial | | | | | | | | |
3.80% 8/24/27 | | | 65,000 | | | | 62,286 | |
5.30% µy | | | 20,000 | | | | 19,725 | |
Jefferies Group | | | | | | | | |
4.15% 1/23/30 | | | 30,000 | | | | 27,143 | |
6.45% 6/8/27 | | | 60,000 | | | | 64,668 | |
6.50% 1/20/43 | | | 565,000 | | | | 582,323 | |
NFP 144A 6.875% 7/15/25 # | | | 370,000 | | | | 361,675 | |
| | | | | | | | |
| | | | | | | 1,218,476 | |
| | | | | | | |
Capital Goods – 3.95% | | | | | | | | |
Advanced Disposal Services 144A 5.625% 11/15/24 # | | | 275,000 | | | | 272,250 | |
Ardagh Packaging Finance 144A 6.00% 2/15/25 # | | | 295,000 | | | | 288,731 | |
BWAY Holding 144A 7.25% 4/15/25 # | | | 103,000 | | | | 100,618 | |
Crane 4.20% 3/15/48 | | | 45,000 | | | | 42,759 | |
21
Schedule of investments
Delaware Strategic Income Fund
| | | | | | | | |
| | | Principal amount° | | | Value (US $) | |
Corporate Bonds (continued) | | | | | | | | |
Capital Goods (continued) | | | | | | | | |
General Dynamics | | | | | | | | |
3.00% 5/11/21 | | | 30,000 | | | $ | 29,886 | |
3.375% 5/15/23 | | | 50,000 | | | | 50,107 | |
Grupo Cementos de Chihuahua 144A 5.25% 6/23/24 # | | | 200,000 | | | | 197,000 | |
Harris 4.40% 6/15/28 | | | 40,000 | | | | 40,597 | |
Herc Rentals 144A 7.75% 6/1/24 # | | | 174,000 | | | | 187,325 | |
L3 Technologies | | | | | | | | |
3.85% 6/15/23 | | | 30,000 | | | | 30,002 | |
4.40% 6/15/28 | | | 145,000 | | | | 146,150 | |
New Enterprise Stone & Lime 144A 10.125% 4/1/22 # | | | 240,000 | | | | 256,200 | |
Nvent Finance 144A 4.55% 4/15/28 # | | | 175,000 | | | | 171,874 | |
Standard Industries 144A 6.00% 10/15/25 # | | | 355,000 | | | | 361,213 | |
TransDigm 6.375% 6/15/26 | | | 240,000 | | | | 241,800 | |
United Rentals North America 5.875% 9/15/26 | | | 344,000 | | | | 350,450 | |
| | | | | | | 2,766,962 | |
Communications – 5.77% | | | | | | | | |
Altice Luxembourg 144A 7.75% 5/15/22 # | | | 200,000 | | | | 199,750 | |
AT&T | | | | | | | | |
4.50% 3/9/48 | | | 5,000 | | | | 4,416 | |
5.25% 3/1/37 | | | 140,000 | | | | 140,612 | |
CCO Holdings 144A 5.875% 5/1/27 # | | | 235,000 | | | | 233,825 | |
Cequel Communications Holdings I 144A 7.75% 7/15/25 # | | | 250,000 | | | | 264,687 | |
Charter Communications Operating 5.375% 4/1/38 | | | 35,000 | | | | 34,701 | |
Crown Castle International 3.80% 2/15/28 | | | 150,000 | | | | 142,381 | |
Deutsche Telekom International Finance 144A 4.375% 6/21/28 # | | | 220,000 | | | | 221,713 | |
Digicel Group 144A 7.125% 4/1/22 # | | | 200,000 | | | | 128,250 | |
Discovery Communications 5.20% 9/20/47 | | | 110,000 | | | | 108,782 | |
GTP Acquisition Partners I 144A 2.35% 6/15/20 # | | | 100,000 | | | | 98,107 | |
Level 3 Financing 5.375% 5/1/25 | | | 150,000 | | | | 146,625 | |
Myriad International Holdings 144A 4.85% 7/6/27 # | | | 200,000 | | | | 199,873 | |
Nexstar Broadcasting 144A 5.625% 8/1/24 # | | | 100,000 | | | | 98,750 | |
Radiate Holdco 144A 6.625% 2/15/25 # | | | 200,000 | | | | 187,500 | |
Sirius XM Radio 144A 5.375% 4/15/25 # | | | 145,000 | | | | 144,275 | |
Sprint 7.875% 9/15/23 | | | 280,000 | | | | 299,250 | |
Telefonica Emisiones 4.895% 3/6/48 | | | 300,000 | | | | 293,574 | |
TELUS 4.60% 11/16/48 | | | 105,000 | | | | 104,910 | |
Time Warner Cable 7.30% 7/1/38 | | | 170,000 | | | | 197,551 | |
Time Warner Entertainment 8.375% 3/15/23 | | | 80,000 | | | | 93,082 | |
Verizon Communications 4.125% 8/15/46 | | | 95,000 | | | | 85,796 | |
22
| | | | | | | | |
| | | Principal amount° | | | Value (US $) | |
Corporate Bonds (continued) | | | | | | | | |
Communications (continued) | | | | | | | | |
Verizon Communications 4.50% 8/10/33 | | | 180,000 | | | $ | 178,367 | |
Viacom 4.375% 3/15/43 | | | 105,000 | | | | 92,402 | |
Vodafone Group 3.75% 1/16/24 | | | 135,000 | | | | 133,580 | |
Zayo Group 6.375% 5/15/25 | | | 200,000 | | | | 207,750 | |
| | | | | | | 4,040,509 | |
| | | | | | | |
Consumer Cyclical – 2.18% | | | | | | | | |
AMC Entertainment Holdings 6.125% 5/15/27 | | | 265,000 | | | | 258,375 | |
Atento Luxco 1 144A 6.125% 8/10/22 # | | | 95,000 | | | | 93,884 | |
Dollar Tree | | | | | | | | |
3.70% 5/15/23 | | | 85,000 | | | | 84,297 | |
4.00% 5/15/25 | | | 50,000 | | | | 49,574 | |
General Motors Financial | | | | | | | | |
4.35% 4/9/25 | | | 95,000 | | | | 93,937 | |
5.25% 3/1/26 | | | 20,000 | | | | 20,743 | |
Golden Nugget 144A 8.75% 10/1/25 # | | | 117,000 | | | | 121,680 | |
M/I Homes 5.625% 8/1/25 | | | 200,000 | | | | 188,560 | |
Murphy Oil USA 5.625% 5/1/27 | | | 155,000 | | | | 154,613 | |
Prime Security Services Borrower 144A 9.25% 5/15/23 # | | | 138,000 | | | | 148,005 | |
Scientific Games International 10.00% 12/1/22 | | | 235,000 | | | | 251,744 | |
Staples 144A 8.50% 9/15/25 # | | | 60,000 | | | | 56,550 | |
| | | | | | | 1,521,962 | |
| | | | | | | |
Consumer Non-Cyclical – 5.02% | | | | | | | | |
Air Medical Group Holdings 144A 6.375% 5/15/23 # | | | 264,000 | | | | 242,783 | |
BAT Capital | | | | | | | | |
144A 3.222% 8/15/24 # | | | 80,000 | | | | 76,519 | |
144A 4.54% 8/15/47 # | | | 60,000 | | | | 57,122 | |
Bayer US Finance II 144A 4.375% 12/15/28 # | | | 200,000 | | | | 203,000 | |
Becton Dickinson and Co. 3.363% 6/6/24 | | | 250,000 | | | | 241,554 | |
Campbell Soup 3.65% 3/15/23 | | | 100,000 | | | | 98,184 | |
Charles River Laboratories International 144A 5.50% 4/1/26 # | | | 180,000 | | | | 182,700 | |
CVS Health | | | | | | | | |
3.70% 3/9/23 | | | 70,000 | | | | 69,635 | |
4.30% 3/25/28 | | | 185,000 | | | | 184,660 | |
ESAL 144A 6.25% 2/5/23 # | | | 200,000 | | | | 195,060 | |
General Mills 3.70% 10/17/23 | | | 90,000 | | | | 89,846 | |
HCA 5.375% 2/1/25 | | | 285,000 | | | | 289,275 | |
IHS Markit 4.75% 8/1/28 | | | 30,000 | | | | 29,913 | |
Marfrig Holdings Europe 144A 8.00% 6/8/23 # | | | 200,000 | | | | 205,250 | |
MHP 144A 6.95% 4/3/26 # | | | 200,000 | | | | 193,243 | |
MPH Acquisition Holdings 144A 7.125% 6/1/24 # | | | 238,000 | | | | 246,925 | |
23
Schedule of investments
Delaware Strategic Income Fund
| | | | | | | | |
| | | Principal amount° | | | Value (US $) | |
Corporate Bonds (continued) | | | | | | | | |
Consumer Non-Cyclical (continued) | | | | | | | | |
Mylan 144A 4.55% 4/15/28 # | | | 55,000 | | | $ | 54,338 | |
New York & Presbyterian Hospital 4.063% 8/1/56 | | | 130,000 | | | | 126,782 | |
Pilgrim’s Pride 144A 5.75% 3/15/25 # | | | 120,000 | | | | 115,050 | |
Surgery Center Holdings | | | | | | | | |
144A 6.75% 7/1/25 # | | | 150,000 | | | | 142,313 | |
144A 8.875% 4/15/21 # | | | 250,000 | | | | 258,125 | |
Teva Pharmaceutical Finance Netherlands III 6.00% 4/15/24 | | | 200,000 | | | | 207,183 | |
| | | | | | | 3,509,460 | |
| | | | | | | |
Electric – 4.12% | | | | | | | | |
Ausgrid Finance | | | | | | | | |
144A 3.85% 5/1/23 # | | | 75,000 | | | | 74,619 | |
144A 4.35% 8/1/28 # | | | 45,000 | | | | 44,879 | |
Avangrid 3.15% 12/1/24 | | | 105,000 | | | | 100,424 | |
Berkshire Hathaway Energy 144A 4.45% 1/15/49 # | | | 135,000 | | | | 137,366 | |
Calpine | | | | | | | | |
144A 5.25% 6/1/26 # | | | 125,000 | | | | 118,594 | |
5.75% 1/15/25 | | | 300,000 | | | | 276,750 | |
144A 5.875% 1/15/24 # | | | 175,000 | | | | 176,313 | |
Cleveland Electric Illuminating 5.50% 8/15/24 | | | 170,000 | | | | 185,368 | |
ComEd Financing III 6.35% 3/15/33 | | | 175,000 | | | | 185,938 | |
Duke Energy Florida 3.80% 7/15/28 | | | 115,000 | | | | 116,118 | |
Enel 144A 8.75% 9/24/73 #µ | | | 400,000 | | | | 443,500 | |
Enel Chile 4.875% 6/12/28 | | | 65,000 | | | | 66,594 | |
Entergy Louisiana 4.00% 3/15/33 | | | 155,000 | | | | 155,415 | |
IPALCO Enterprises 3.70% 9/1/24 | | | 90,000 | | | | 86,950 | |
Israel Electric 144A 4.25% 8/14/28 # | | | 200,000 | | | | 195,957 | |
Mississippi Power 3.95% 3/30/28 | | | 65,000 | | | | 64,637 | |
Narragansett Electric 144A 3.919% 8/1/28 # | | | 55,000 | | | | 55,382 | |
National Rural Utilities Cooperative Finance | | | | | | | | |
4.75% 4/30/43 µ | | | 140,000 | | | | 142,098 | |
5.25% 4/20/46 µ | | | 110,000 | | | | 112,550 | |
Nevada Power 2.75% 4/15/20 | | | 70,000 | | | | 69,614 | |
PSEG Power 3.85% 6/1/23 | | | 75,000 | | | | 74,782 | |
| | | | | | | 2,883,848 | |
| | | | | | | |
Energy – 9.89% | | | | | | | | |
Abu Dhabi Crude Oil Pipeline 144A 4.60% 11/2/47 # | | | 200,000 | | | | 194,380 | |
Alta Mesa Holdings 7.875% 12/15/24 | | | 150,000 | | | | 156,750 | |
AmeriGas Partners | | | | | | | | |
5.625% 5/20/24 | | | 75,000 | | | | 74,250 | |
5.875% 8/20/26 | | | 105,000 | | | | 102,637 | |
Anadarko Petroleum 6.60% 3/15/46 | | | 60,000 | | | | 74,220 | |
24
| | | | | | | | |
| | | Principal amount° | | | Value (US $) | |
Corporate Bonds (continued) | | | | | | | | |
Energy (continued) | | | | | | | | |
Andeavor Logistics 4.25% 12/1/27 | | | 145,000 | | | $ | 143,087 | |
Cheniere Corpus Christi Holdings 7.00% 6/30/24 | | | 185,000 | | | | 203,153 | |
Cheniere Energy Partners 5.25% 10/1/25 | | | 185,000 | | | | 185,000 | |
Chesapeake Energy 8.00% 1/15/25 | | | 115,000 | | | | 118,163 | |
Crestwood Midstream Partners 5.75% 4/1/25 | | | 245,000 | | | | 248,369 | |
Diamond Offshore Drilling 7.875% 8/15/25 | | | 235,000 | | | | 245,575 | |
Enbridge | | | | | | | | |
4.00% 10/1/23 | | | 25,000 | | | | 25,268 | |
6.25% 3/1/78 µ | | | 35,000 | | | | 34,311 | |
Enbridge Energy Partners | | | | | | | | |
4.375% 10/15/20 | | | 15,000 | | | | 15,237 | |
5.20% 3/15/20 | | | 5,000 | | | | 5,135 | |
5.50% 9/15/40 | | | 20,000 | | | | 21,211 | |
Energy Transfer Partners | | | | | | | | |
4.20% 9/15/23 | | | 15,000 | | | | 15,039 | |
4.95% 6/15/28 | | | 25,000 | | | | 25,542 | |
6.00% 6/15/48 | | | 60,000 | | | | 62,961 | |
6.125% 12/15/45 | | | 85,000 | | | | 88,588 | |
6.625% µy | | | 100,000 | | | | 95,188 | |
Ensco 7.75% 2/1/26 | | | 285,000 | | | | 277,519 | |
Gazprom OAO Via Gaz Capital 144A 4.95% 3/23/27 # | | | 200,000 | | | | 194,869 | |
Genesis Energy 6.50% 10/1/25 | | | 183,000 | | | | 177,968 | |
Gulfport Energy 6.00% 10/15/24 | | | 285,000 | | | | 276,450 | |
KazMunayGas National 144A 6.375% 10/24/48 # | | | 200,000 | | | | 209,690 | |
KazTransGas JSC 144A 4.375% 9/26/27 # | | | 200,000 | | | | 192,772 | |
Laredo Petroleum 6.25% 3/15/23 | | | 375,000 | | | | 378,750 | |
Marathon Oil 5.20% 6/1/45 | | | 120,000 | | | | 127,133 | |
MPLX 4.875% 12/1/24 | | | 160,000 | | | | 165,964 | |
Murphy Oil 6.875% 8/15/24 | | | 430,000 | | | | 452,575 | |
NiSource 144A 5.65% #µy | | | 60,000 | | | | 59,775 | |
Noble Energy | | | | | | | | |
3.85% 1/15/28 | | | 95,000 | | | | 91,904 | |
4.95% 8/15/47 | | | 10,000 | | | | 10,178 | |
5.05% 11/15/44 | | | 20,000 | | | | 20,290 | |
Occidental Petroleum 4.20% 3/15/48 | | | 90,000 | | | | 90,391 | |
ONEOK | | | | | | | | |
4.55% 7/15/28 | | | 70,000 | | | | 71,592 | |
7.50% 9/1/23 | | | 90,000 | | | | 103,434 | |
Petrobras Global Finance 7.375% 1/17/27 | | | 75,000 | | | | 78,075 | |
Petroleos Mexicanos 6.75% 9/21/47 | | | 35,000 | | | | 32,375 | |
Precision Drilling 144A 7.125% 1/15/26 # | | | 120,000 | | | | 123,450 | |
25
Schedule of investments
Delaware Strategic Income Fund
| | | | | | | | |
| | | Principal amount° | | | Value (US $) | |
Corporate Bonds (continued) | | | | | | | | |
Energy (continued) | | | | | | | | |
Precision Drilling 7.75% 12/15/23 | | | 220,000 | | | $ | 233,750 | |
Rio Energy 144A 6.875% 2/1/25 # | | | 150,000 | | | | 125,100 | |
Sabine Pass Liquefaction | | | | | | | | |
5.625% 3/1/25 | | | 110,000 | | | | 117,426 | |
5.875% 6/30/26 | | | 170,000 | | | | 185,232 | |
Southwestern Energy | | | | | | | | |
6.20% 1/23/25 | | | 245,000 | | | | 242,244 | |
7.75% 10/1/27 | | | 300,000 | | | | 315,188 | |
Transcanada Trust 5.875% 8/15/76 µ | | | 175,000 | | | | 176,313 | |
Transcontinental Gas Pipe Line | | | | | | | | |
144A 4.00% 3/15/28 # | | | 35,000 | | | | 34,545 | |
144A 4.60% 3/15/48 # | | | 35,000 | | | | 34,526 | |
Williams 4.55% 6/24/24 | | | 40,000 | | | | 40,400 | |
Williams Partners | | | | | | | | |
3.75% 6/15/27 | | | 30,000 | | | | 28,982 | |
4.85% 3/1/48 | | | 65,000 | | | | 64,146 | |
YPF 144A 36.75% (BADLARPP + 4.00%) 7/7/20 #● | | | 105,000 | | | | 57,145 | |
| | | | | | | 6,924,215 | |
Finance Companies – 1.20% | | | | | | | | |
AerCap Global Aviation Trust 144A 6.50% 6/15/45 #µ | | | 400,000 | | | | 414,500 | |
GE Capital International Funding Co. Unlimited 4.418% 11/15/35 | | | 200,000 | | | | 194,935 | |
International Lease Finance 8.625% 1/15/22 | | | 200,000 | | | | 228,389 | |
| | | | | | | 837,824 | |
Insurance – 2.09% | | | | | | | | |
AssuredPartners 144A 7.00% 8/15/25 # | | | 225,000 | | | | 217,687 | |
AXA Equitable Holdings | | | | | | | | |
144A 4.35% 4/20/28 # | | | 30,000 | | | | 29,363 | |
144A 5.00% 4/20/48 # | | | 45,000 | | | | 43,234 | |
HUB International 144A 7.00% 5/1/26 # | | | 425,000 | | | | 427,656 | |
MetLife 5.25% µy | | | 145,000 | | | | 148,263 | |
USIS Merger Sub 144A 6.875% 5/1/25 # | | | 400,000 | | | | 396,000 | |
Voya Financial 144A 4.70% 1/23/48 #µ | | | 65,000 | | | | 57,444 | |
XLIT | | | | | | | | |
4.797% (LIBOR03M + 2.458%) y● | | | 65,000 | | | | 64,188 | |
5.50% 3/31/45 | | | 75,000 | | | | 78,385 | |
| | | | | | | 1,462,220 | |
Real Estate – 0.35% | | | | | | | | |
WeWork 144A 7.875% 5/1/25 # | | | 250,000 | | | | 244,375 | |
| | | | | | | 244,375 | |
26
| | | | | | | | |
| | | Principal amount° | | | Value (US $) | |
Corporate Bonds (continued) | | | | | | | | |
REITs – 0.54% | | | | | | | | |
Alexandria Real Estate Equities 4.70% 7/1/30 | | | 20,000 | | | $ | 20,246 | |
Corporate Office Properties 5.25% 2/15/24 | | | 85,000 | | | | 87,983 | |
Education Realty Operating Partnership 4.60% 12/1/24 | | | 115,000 | | | | 114,386 | |
Hospitality Properties Trust 4.50% 3/15/25 | | | 100,000 | | | | 97,689 | |
Kilroy Realty 3.45% 12/15/24 | | | 60,000 | | | | 57,530 | |
| | | | | | | 377,834 | |
| | | | | | | |
Technology – 2.06% | | | | | | | | |
Analog Devices 2.95% 1/12/21 | | | 20,000 | | | | 19,779 | |
CommScope Technologies
144A 5.00% 3/15/27 # | | | 275,000 | | | | 265,031 | |
144A 6.00% 6/15/25 # | | | 95,000 | | | | 98,325 | |
Corning 4.375% 11/15/57 | | | 30,000 | | | | 26,532 | |
Dell International 144A 6.02% 6/15/26 # | | | 130,000 | | | | 137,477 | |
Genesys Telecommunications Laboratories 144A 10.00% 11/30/24 # | | | 205,000 | | | | 228,063 | |
Marvell Technology Group 4.875% 6/22/28 | | | 100,000 | | | | 101,304 | |
Microchip Technology
144A 3.922% 6/1/21 # | | | 55,000 | | | | 55,140 | |
144A 4.333% 6/1/23 # | | | 60,000 | | | | 60,225 | |
Oracle 2.40% 9/15/23 | | | 95,000 | | | | 90,786 | |
salesforce.com 3.70% 4/11/28 | | | 110,000 | | | | 110,502 | |
Solera 144A 10.50% 3/1/24 # | | | 225,000 | | | | 249,920 | |
| | | | | | | 1,443,084 | |
| | | | | | | |
Transportation – 1.16% | | | | | | | | |
Adani Abbot Point Terminal 144A 4.45% 12/15/22 # | | | 200,000 | | | | 182,530 | |
Avis Budget Car Rental 144A 6.375% 4/1/24 # | | | 260,000 | | | | 258,700 | |
Burlington Northern Santa Fe 4.15% 12/15/48 | | | 45,000 | | | | 45,599 | |
FedEx 4.05% 2/15/48 | | | 20,000 | | | | 18,555 | |
Norfolk Southern 3.80% 8/1/28 | | | 65,000 | | | | 65,123 | |
Transnet SOC 144A 4.00% 7/26/22 # | | | 200,000 | | | | 192,839 | |
Union Pacific 3.50% 6/8/23 | | | 50,000 | | | | 50,055 | |
| | | | | | | 813,401 | |
| | | | | | | |
Utilities – 0.28% | | | | | | | | |
Aegea Finance 144A 5.75% 10/10/24 # | | | 200,000 | | | | 193,300 | |
| | | | | | | 193,300 | |
| | |
Total Corporate Bonds (cost $39,908,350) | | | | | | | 39,135,993 | |
| | | | | | | |
Municipal Bonds – 3.27% | | | | | | | | |
Bay Area, California Toll Authority | | | | | | | | |
(Build America Bond) Series S-3 6.907% 10/1/50 | | | 170,000 | | | | 245,706 | |
27
Schedule of investments
Delaware Strategic Income Fund
| | | | | | | | |
| | | Principal amount° | | | Value (US $) | |
Municipal Bonds (continued) | | | | | | | | |
Buckeye, Ohio Tobacco Settlement Financing Authority | | | | | | | | |
(Asset-Backed Senior Turbo) | | | | | | | | |
Series A-2 5.875% 6/1/47 | | | 1,000,000 | | | $ | 1,008,610 | |
Series A-2 6.50% 6/1/47 | | | 200,000 | | | | 205,998 | |
New Jersey Turnpike Authority | | | | | | | | |
(Build America Bonds) Series A 7.102% 1/1/41 | | | 90,000 | | | | 126,349 | |
South Carolina Public Service Authority | | | | | | | | |
Series D 4.77% 12/1/45 | | | 55,000 | | | | 57,543 | |
State of California Various Purposes | | | | | | | | |
(Build America Bond) 7.55% 4/1/39 | | | 135,000 | | | | 199,755 | |
Tarrant County Cultural Education Facilities Finance Corporation Retirement Facility Revenue | | | | | | | | |
(Buckner Senior Living - Ventana Project) 6.625% 11/15/37 | | | 400,000 | | | | 443,920 | |
Total Municipal Bonds (cost $2,222,079) | | | | | | | 2,287,881 | |
| | | | | | | |
Non-Agency Asset-Backed Securities – 5.30% | | | | | | | | |
American Express Credit Account Master Trust | | | | | | | | |
Series 2018-3 A 2.392% (LIBOR01M + 0.32%) 10/15/25 ● | | | 100,000 | | | | 100,000 | |
Series 2018-5 A 2.412% (LIBOR01M + 0.34%) 12/15/25 ● | | | 500,000 | | | | 499,844 | |
Citibank Credit Card Issuance Trust | | | | | | | | |
Series 2017-A7 A7 2.467% (LIBOR01M + 0.37%) 8/8/24 ● | | | 500,000 | | | | 501,350 | |
Series 2018-A2 A2 2.416% (LIBOR01M + 0.33%) 1/21/25 ● | | | 500,000 | | | | 499,551 | |
Citicorp Residential Mortgage Trust | | | | | | | | |
Series 2006-3 A5 5.344% 11/25/36 ● | | | 300,000 | | | | 308,587 | |
Discover Card Execution Note Trust | | | | | | | | |
Series 2017-A5 A5 2.672% (LIBOR01M + 0.60%) 12/15/26 ● | | | 605,000 | | | | 609,350 | |
Ford Credit Auto Owner Trust | | | | | | | | |
Series 2018-1 A 144A 3.19% 7/15/31 # | | | 100,000 | | | | 97,872 | |
Hardee’s Funding | | | | | | | | |
Series 2018-1A A2I 144A 4.25% 6/20/48 # | | | 50,000 | | | | 50,001 | |
HOA Funding | | | | | | | | |
Series 2014-1A A2 144A 4.846% 8/20/44 # | | | 46,250 | | | | 45,308 | |
Mercedes-Benz Master Owner Trust | | | | | | | | |
Series 2017-BA A 144A 2.492% (LIBOR01M + 0.42%) 5/16/22 #● | | | 365,000 | | | | 366,169 | |
New Residential Mortgage Loan Trust | | | | | | | | |
Series 2018-RPL1 A1 144A 3.50% 12/25/57 #● | | | 98,442 | | | | 97,779 | |
28
| | | | | | | | |
| | | Principal amount° | | | Value (US $) | |
Non-Agency Asset-Backed Securities (continued) | | | | | | | | |
PFS Financing | | | | | | | | |
Series 2018-A A 144A 2.474% (LIBOR01M + 0.40%) 2/15/22 #● | | | 100,000 | | | $ | 99,993 | |
Tesla Auto Lease Trust | | | | | | | | |
Series 2018-A B 144A 2.75% 2/20/20 # | | | 215,000 | | | | 213,877 | |
Volkswagen Auto Loan Enhanced Trust | | | | | | | | |
Series 2018-1 A2B 2.285% (LIBOR01M + 0.18%) 7/20/21 ● | | | 100,000 | | | | 100,001 | |
Volvo Financial Equipment Master Owner Trust | | | | | | | | |
Series 2017-A A 144A 2.572% (LIBOR01M + 0.50%) 11/15/22 #● | | | 75,000 | | | | 75,105 | |
Wendy’s Funding | | | | | | | | |
Series 2018-1A A2I 144A 3.573% 3/15/48 # | | | 49,750 | | | | 47,999 | |
Total Non-Agency Asset-Backed Securities
(cost $3,674,767) | | | | | | | 3,712,786 | |
| | | | | | | |
Non-Agency Collateralized Mortgage Obligations – 3.10% | | | | | | | | |
Credit Suisse First Boston Mortgage Securities | | | | | | | | |
Series 2005-5 6A3 5.00% 7/25/35 | | | 46,075 | | | | 46,010 | |
Flagstar Mortgage Trust | | | | | | | | |
Series 2018-1 A5 144A 3.50% 3/25/48 #● | | | 94,065 | | | | 92,536 | |
Galton Funding Mortgage Trust | | | | | | | | |
Series 2018-1 A43 144A 3.50% 11/25/57 #● | | | 79,234 | | | | 78,682 | |
GSMPS Mortgage Loan Trust | | | | | | | | |
Series 1998-2 A 144A 7.75% 5/19/27 #● | | | 23,094 | | | | 23,337 | |
JPMorgan Mortgage Trust | | | | | | | | |
Series 2006-S1 1A1 6.00% 4/25/36 | | | 36,042 | | | | 38,057 | |
Series 2007-A1 7A4 4.065% 7/25/35 ● | | | 66,231 | | | | 59,954 | |
Series 2014-2 B1 144A 3.419% 6/25/29 #● | | | 68,369 | | | | 67,088 | |
Series 2014-2 B2 144A 3.419% 6/25/29 #● | | | 68,369 | | | | 66,670 | |
Series 2014-IVR6 2A4 144A 2.50% 7/25/44 #● | | | 100,000 | | | | 100,115 | |
Series 2015-4 B1 144A 3.625% 6/25/45 #● | | | 93,061 | | | | 90,330 | |
Series 2015-4 B2 144A 3.625% 6/25/45 #● | | | 93,061 | | | | 88,574 | |
Series 2015-5 B2 144A 3.006% 5/25/45 #● | | | 95,724 | | | | 94,261 | |
Series 2015-6 B1 144A 3.614% 10/25/45 #● | | | 92,510 | | | | 90,474 | |
Series 2015-6 B2 144A 3.614% 10/25/45 #● | | | 92,510 | | | | 89,800 | |
Series 2016-4 B1 144A 3.902% 10/25/46 #● | | | 95,703 | | | | 94,197 | |
Series 2016-4 B2 144A 3.902% 10/25/46 #● | | | 95,703 | | | | 93,654 | |
Series 2017-1 B2 144A 3.551% 1/25/47 #● | | | 82,408 | | | | 78,594 | |
Series 2017-2 A3 144A 3.50% 5/25/47 #● | | | 35,036 | | | | 34,176 | |
Series 2018-3 A5 144A 3.50% 9/25/48 #● | | | 96,599 | | | | 95,339 | |
Series 2018-4 A15 144A 3.50% 10/25/48 #● | | | 53,328 | | | | 52,944 | |
Series 2018-6 1A4 144A 3.50% 12/25/48 #● | | | 34,789 | | | | 34,463 | |
Series 2018-7FRB A2 144A 2.841% 4/25/46 #● | | | 42,721 | | | | 42,792 | |
29
Schedule of investments
Delaware Strategic Income Fund
| | | | | | | | |
| | | Principal amount° | | | Value (US $) | |
Non-Agency Collateralized Mortgage Obligations (continued) | | | | | | | | |
Sequoia Mortgage Trust | | | | | | | | |
Series 2014-2 A4 144A 3.50% 7/25/44 #● | | | 35,417 | | | $ | 34,967 | |
Series 2015-1 B2 144A 3.877% 1/25/45 #● | | | 45,826 | | | | 45,594 | |
Series 2017-4 A1 144A 3.50% 7/25/47 #● | | | 86,460 | | | | 84,444 | |
Series 2018-5 A4 144A 3.50% 5/25/48 #● | | | 98,200 | | | | 96,949 | |
Towd Point Mortgage Trust | | | | | | | | |
Series 2015-5 A1B 144A 2.75% 5/25/55 #● | | | 51,821 | | | | 51,029 | |
Series 2015-6 A1B 144A 2.75% 4/25/55 #● | | | 58,631 | | | | 57,464 | |
Series 2017-1 A1 144A 2.75% 10/25/56 #● | | | 71,778 | | | | 70,314 | |
Series 2017-2 A1 144A 2.75% 4/25/57 #● | | | 73,506 | | | | 72,043 | |
Series 2018-1 A1 144A 3.00% 1/25/58 #● | | | 92,427 | | | | 90,686 | |
Washington Mutual Mortgage Pass Through Certificates Trust | | | | | | | | |
Series 2005-1 5A2 6.00% 3/25/35 ¨ | | | 22,288 | | | | 3,406 | |
Wells Fargo Mortgage-Backed Securities Trust | | | | | | | | |
Series 2006-AR5 2A1 4.181% 4/25/36 ● | | | 9,055 | | | | 8,599 | |
Total Non-Agency Collateralized Mortgage Obligations (cost $2,209,169) | | | | | | | 2,167,542 | |
| | | | | | | |
Non-Agency Commercial Mortgage-Backed Securities – 3.31% | | | | | | | | |
Banc of America Commercial Mortgage Trust | | | | | | | | |
Series 2017-BNK3 C 4.352% 2/15/50 ● | | | 35,000 | | | | 34,138 | |
BANK | | | | | | | | |
Series 2017-BNK4 XA 1.448% 5/15/50 ∑● | | | 450,498 | | | | 40,075 | |
Series 2017-BNK5 B 3.896% 6/15/60 ● | | | 60,000 | | | | 58,495 | |
Series 2017-BNK7 A5 3.435% 9/15/60 | | | 65,000 | | | | 63,273 | |
Caesars Palace Las Vegas Trust | | | | | | | | |
Series 2017-VICI B 144A 3.835% 10/15/34 # | | | 60,000 | | | | 60,038 | |
CD Mortgage Trust | | | | | | | | |
Series 2016-CD2 A3 3.248% 11/10/49 | | | 85,000 | | | | 82,478 | |
Series 2016-CD2 A4 3.526% 11/10/49 ● | | | 80,000 | | | | 78,915 | |
Citigroup Commercial Mortgage Trust | | | | | | | | |
Series 2014-GC25 A4 3.635% 10/10/47 | | | 75,000 | | | | 75,171 | |
Series 2017-C4 A4 3.471% 10/12/50 | | | 45,000 | | | | 43,734 | |
COMM Mortgage Trust | | | | | | | | |
Series 2013-CR6 AM 144A 3.147% 3/10/46 # | | | 110,000 | | | | 107,457 | |
Series 2014-CR19 A5 3.796% 8/10/47 | | | 80,000 | | | | 80,957 | |
Series 2015-CR23 A4 3.497% 5/10/48 | | | 85,000 | | | | 84,358 | |
Commercial Mortgage Pass Through Certificates | | | | | | | | |
Series 2016-CR28 A4 3.762% 2/10/49 ¨ | | | 70,000 | | | | 70,281 | |
GRACE Mortgage Trust | | | | | | | | |
Series 2014-GRCE B 144A 3.52% 6/10/28 # | | | 100,000 | | | | 99,520 | |
GS Mortgage Securities Trust | | | | | | | | |
Series 2010-C1 C 144A 5.635% 8/10/43 #● | | | 150,000 | | | | 153,058 | |
30
| | | | | | | | |
| | | Principal amount° | | | Value (US $) | |
Non-Agency Commercial Mortgage-Backed Securities (continued) | | | | | | | | |
GS Mortgage Securities Trust | | | | | | | | |
Series 2015-GC32 A4 3.764% 7/10/48 | | | 75,000 | | | $ | 75,536 | |
Series 2017-GS6 A3 3.433% 5/10/50 | | | 75,000 | | | | 73,021 | |
Series 2018-GS9 A4 3.992% 3/10/51 ● | | | 40,000 | | | | 40,478 | |
JPM-BB Commercial Mortgage Securities Trust | | | | | | | | |
Series 2015-C27 XA 1.33% 2/15/48 ∑● | | | 1,124,217 | | | | 60,020 | |
Series 2015-C31 A3 3.801% 8/15/48 | | | 65,000 | | | | 65,503 | |
JPMorgan Chase Commercial Mortgage Securities Trust | | | | | | | | |
Series 2005-CB11 E 5.539% 8/12/37 ● | | | 35,000 | | | | 36,141 | |
Series 2013-LC11 B 3.499% 4/15/46 | | | 130,000 | | | | 126,492 | |
Series 2016-WIKI A 144A 2.798% 10/5/31 # | | | 90,000 | | | | 88,132 | |
Series 2016-WIKI B 144A 3.201% 10/5/31 # | | | 85,000 | | | | 83,365 | |
LB-UBS Commercial Mortgage Trust | | | | | | | | |
Series 2006-C6 AJ 5.452% 9/15/39 ● | | | 76,502 | | | | 53,647 | |
Morgan Stanley Capital I Trust | | | | | | | | |
Series 2006-HQ10 B 5.448% 11/12/41 ● | | | 100,000 | | | | 94,677 | |
UBS Commercial Mortgage Trust | | | | | | | | |
Series 2018-C9 A4 4.117% 3/15/51 ● | | | 70,000 | | | | 71,274 | |
Wells Fargo Commercial Mortgage Trust | | | | | | | | |
Series 2015-C30 XA 0.94% 9/15/58 ∑● | | | 1,896,758 | | | | 98,527 | |
Series 2015-NXS3 A4 3.617% 9/15/57 | | | 45,000 | | | | 44,754 | |
Series 2017-C38 A5 3.453% 7/15/50 | | | 90,000 | | | | 87,653 | |
Series 2017-RB1 XA 1.282% 3/15/50 ∑● | | | 995,469 | | | | 85,976 | |
Total Non-Agency Commercial Mortgage-Backed Securities (cost $2,445,430) | | | | | | | 2,317,144 | |
| | | | | | | |
Loan Agreements – 3.22% | | | | | | | | |
Applied Systems 2nd Lien 9.334% (LIBOR03M + 7.00%) 9/19/25 ● | | | 270,000 | | | | 279,281 | |
Ball Metalpack Finco Tranche B 1st Lien 6.837% (LIBOR03M + 4.50%) 7/26/25 ● | | | 140,000 | | | | 141,051 | |
Blue Ribbon 1st Lien 6.334% (LIBOR03M + 4.00%) 11/13/21 ● | | | 102,808 | | | | 101,395 | |
Chesapeake Energy 1st Lien 9.577% (LIBOR03M + 7.50%) 8/23/21 ● | | | 175,000 | | | | 183,477 | |
Dakota Holding Tranche B 1st Lien 5.584% (LIBOR03M + 3.25%) 2/13/25 ● | | | 174,563 | | | | 174,796 | |
Deck Chassis Acquisition 2nd Lien 8.077% (LIBOR03M + 6.00%) 6/15/23 =● | | | 200,000 | | | | 201,750 | |
GIP III Stetson I Tranche B 1st Lien 6.583% (LIBOR03M + 4.25%) 7/18/25 ● | | | 105,000 | | | | 105,624 | |
Hyperion Insurance Group Tranche B 1st Lien 5.625% (LIBOR03M + 3.50%) 12/20/24 ● | | | 174,561 | | | | 175,671 | |
Kronos 2nd Lien 10.593% (LIBOR03M + 8.25%) 11/1/24 ● | | | 150,000 | | | | 154,988 | |
31
Schedule of investments
Delaware Strategic Income Fund
| | | | | | | | | | | | |
| | | | | | Principal amount° | | | Value (US $) | |
Loan Agreements (continued) | | | | | | | | | | | | |
Pisces Midco Tranche B 1st Lien 6.087% (LIBOR03M + 3.75%) 4/12/25 ● | | | | | | | 175,000 | | | $ | 175,520 | |
Sigma US Tranche B2 1st Lien 5.375% (LIBOR03M + 3.00%) 7/2/25 ● | | | | | | | 175,000 | | | | 175,109 | |
Summit Midstream Partners Holdings Tranche B 1st Lien 8.077% (LIBOR03M + 6.00%) 5/21/22 ● | | | | | | | 209,375 | | | | 212,581 | |
Weight Watchers International Tranche B 1st Lien 6.85% (LIBOR03M + 4.75%) 11/29/24 ● | | | | | | | 172,785 | | | | 174,405 | |
| | | | | | | | | | | | |
Total Loan Agreements (cost $2,260,127) | | | | | | | | | | | 2,255,648 | |
| | | | | | | | | | |
Regional Bond – 0.19%D | | | | | | | | | | | | |
Argentina – 0.19% | | | | | | | | | | | | |
Provincia de Cordoba 144A 7.45% 9/1/24 # | | | | | | | 150,000 | | | | 134,064 | |
Total Regional Bond (cost $156,938) | | | | | | | | | | | 134,064 | |
| | | | | | | | | | |
Sovereign Bonds – 2.25%D | | | | | | | | | | | | |
Argentina – 0.41% | | | | | | | | | | | | |
Argentine Bonos del Tesoro 21.20% 9/19/18 | | | ARS | | | | 3,060,000 | | | | 117,980 | |
Argentine Republic Government International Bond 5.625% 1/26/22 | | | | | | | 175,000 | | | | 166,600 | |
| | | | | | | | | | | 284,580 | |
Bermuda – 0.27% | | | | | | | | | | | | |
Bermuda Government International Bond 144A 3.717% 1/25/27 # | | | | | | | 200,000 | | | | 190,228 | |
| | | | | | | | | | | 190,228 | |
Egypt – 0.29% | | | | | | | | | | | | |
Egypt Government International Bond 144A 5.577% 2/21/23 # | | | | | | | 200,000 | | | | 198,837 | |
| | | | | | | | | | | 198,837 | |
Ivory Coast – 0.26% | | | | | | | | | | | | |
Ivory Coast Government International Bond 144A 6.125% 6/15/33 # | | | | | | | 200,000 | | | | 184,237 | |
| | | | | | | | | | | 184,237 | |
Senegal – 0.26% | | | | | | | | | | | | |
Senegal Government International Bond 144A 6.75% 3/13/48 # | | | | | | | 200,000 | | | | 181,980 | |
| | | | | | | | | | | 181,980 | |
South Africa – 0.15% | | | | | | | | | | | | |
Republic of South Africa Government Bond 8.75% 1/31/44 | | | ZAR | | | | 1,500,000 | | | | 106,104 | |
| | | | | | | | | | | 106,104 | |
32
| | | | | | | | | | | | |
| | | | | | Principal amount° | | | Value (US $) | |
Sovereign BondsD (continued) | | | | | | | | | | | | |
Sri Lanka – 0.35% | | | | | | | | | | | | |
Sri Lanka Government International Bond 144A 5.75% 1/18/22 # | | | | | | | 250,000 | | | $ | 247,826 | |
| | | | | | | | | | | 247,826 | |
Ukraine – 0.26% | | | | | | | | | | | | |
Ukraine Government International Bond 144A 7.375% 9/25/32 # | | | | | | | 200,000 | | | | 182,059 | |
| | | | | | | | | | | 182,059 | |
Total Sovereign Bonds (cost $1,719,954) | | | | | | | | | | | 1,575,851 | |
| | | | | | | | | | |
Supranational Banks – 1.01% | | | | | | | | | | | | |
Banque Ouest Africaine de Developpement 144A 5.00% 7/27/27 # | | | | | | | 200,000 | | | | 194,319 | |
European Bank for Reconstruction & Development 6.00% 5/4/20 | | | INR | | | | 7,100,000 | | | | 101,204 | |
Inter-American Development Bank
6.25% 6/15/21 | | | IDR | | | | 2,900,000,000 | | | | 192,281 | |
7.875% 3/14/23 | | | IDR | | | | 2,500,000,000 | | | | 175,089 | |
International Finance 7.00% 7/20/27 | | | MXN | | | | 910,000 | | | | 45,950 | |
Total Supranational Banks (cost $773,811) | | | | | | | | | | | 708,843 | |
| | | | | | | | | | |
US Treasury Obligations – 4.64% | | | | | | | | | | | | |
US Treasury Bond 3.125% 5/15/48 | | | | | | | 970,000 | | | | 978,658 | |
US Treasury Floating Rate Note 2.043% (USBMMY3M + 0.033%) 4/30/20 ● | | | | | | | 700,000 | | | | 700,112 | |
US Treasury Notes 2.625% 6/30/23 | | | | | | | 815,000 | | | | 806,850 | |
2.75% 7/31/23 | | | | | | | 450,000 | | | | 448,005 | |
2.875% 5/15/28 | | | | | | | 315,000 | | | | 312,791 | |
Total US Treasury Obligations (cost $3,268,064) | | | | | | | | | | | 3,246,416 | |
| | | | | | | | | | |
| | | | | | Number of shares | | | | |
Convertible Preferred Stock – 0.03% | | | | | | | | | | | | |
Wells Fargo & Co. 7.50% exercise price $156.71 y | | | | | | | 14 | | | | 17,766 | |
Total Convertible Preferred Stock (cost $17,973) | | | | | | | | | | | 17,766 | |
33
Schedule of investments
Delaware Strategic Income Fund
| | | | | | | | |
| | | Number of shares | | | Value (US $) | |
Preferred Stock – 1.23% | | | | | | | | |
Bank of America 6.50% µy | | | 400,000 | | | $ | 429,500 | |
Morgan Stanley 5.55% µy | | | 20,000 | | | | 20,525 | |
US Bancorp 3.50% (LIBOR03M + 1.02%) y● | | | 350 | | | | 320,845 | |
USB Realty 144A 3.486% (LIBOR03M + 1.147%) #y● | | | 100,000 | | | | 89,520 | |
Total Preferred Stock (cost $780,210) | | | | | | | 860,390 | |
| | | | | | | |
| | | Number of
contracts | | | | |
Options Purchased – 0.11% | | | | | | | | |
Currency Put Options – 0.11% | | | | | | | | |
USD vs CLP strike price CLP 630.00, expiration date 9/25/18, notional amount CLP 1,345,657 (CITI) | | | 3,455,000 | | | | 36,960 | |
USD vs INR strike price INR 67.00, expiration date 1/24/19, notional amount INR 1,087,049 (HSBC) | | | 7,244,000 | | | | 19,803 | |
USD vs JPY strike price JPY 108.00, expiration date 9/20/18, notional amount JPY 817,289 (BAML) | | | 5,500,000 | | | | 17,253 | |
Total Options Purchased (cost $59,187) | | | | | | | 74,016 | |
| | | | | | | |
| | | Principal amount° | | | | |
Short-Term Investments – 1.37% | | | | | | | | |
Repurchase Agreements – 1.37% | | | | | | | | |
Bank of America Merrill Lynch
1.84%, dated 7/31/18, to be repurchased on 8/1/18, repurchase price $152,426 (collateralized by US government obligations 2.25% 11/15/27; market value $155,466) | | | 152,418 | | | | 152,418 | |
Bank of Montreal
1.83%, dated 7/31/18, to be repurchased on 8/1/18, repurchase price $304,851 (collateralized by US government obligations 0.125%–2.875% 7/15/22–11/15/46; market value $310,933) | | | 304,836 | | | | 304,836 | |
BNP Paribas
1.87%, dated 7/31/18, to be repurchased on 8/1/18, repurchase price $501,772 (collateralized by US government obligations 0.00%–4.75% 12/31/22–8/15/46; market value $511,781) | | | 501,746 | | | | 501,746 | |
Total Short-Term Investments (cost $959,000) | | | | | | | 959,000 | |
| | | | | | | |
Total Value of Securities – 99.84%
(cost $70,973,105) | | | | | | $ | 69,874,264 | |
| # | Security exempt from registration under Rule 144A of the Securities Act of 1933, as amended. At July 31, 2018, the aggregate value of Rule 144A securities was $24,749,146, which represents 35.36% of the Fund’s net assets. See Note 11 in “Notes to financial statements.” |
34
| ¨ | Pass Through Agreement. Security represents the contractual right to receive a proportionate amount of underlying payments due to the counterparty pursuant to various agreements related to the rescheduling of obligations and the exchange of certain notes. |
| = | The value of this security was determined using significant unobservable inputs and is reported as a Level 3 security in the disclosure table located in Note 3 in “Notes to financial statements.” |
| ° | Principal amount shown is stated in US Dollars unless noted that the security is denominated in another currency. |
| D | Securities have been classified by country of origin. |
| µ | Fixed to variable rate investment. The rate shown reflects the fixed rate in effect at July 31, 2018. Rate will reset at a future date. |
| ∑ | Interest only security. An interest only security is the interest only portion of a fixed income security, which is separated and sold individually from the principal portion of the security. |
| y | No contractual maturity date. |
| ● | Variable rate investment. Rates reset periodically. Rate shown reflects the rate in effect at July 31, 2018. For securities based on a published reference rate and spread, the reference rate and spread are indicated in their description above. The reference rate descriptions (i.e. LIBOR03M, LIBOR06M, etc.) used in this report are identical for different securities, but the underlying reference rates may differ due to the timing of the reset period. Certain variable rate securities are not based on a published reference rate and spread but are determined by the issuer or agent and are based on current market conditions, or for mortgage-backed securities, are impacted by the individual mortgages which are paying off over time. These securities do not indicate a reference rate and spread in their description above. |
The following foreign currency exchange contracts, futures contracts, and swap contracts were outstanding at July 31, 2018:1
Foreign Currency Exchange Contracts
| | | | | | | | | | | | | | | | | | | | | | | | | | |
Counterparty | | Contracts to
Receive (Deliver) | | | In Exchange For | | | Settlement
Date | | | Unrealized
Appreciation | | | Unrealized
Depreciation | |
| | | | | | | |
BAML | | AUD | | | 113,236 | | | | USD | | | | (83,831 | ) | | | 8/10/18 | | | $ | 304 | | | $ | — | |
BAML | | CAD | | | 92,889 | | | | USD | | | | (69,797 | ) | | | 8/10/18 | | | | 1,622 | | | | — | |
BAML | | EUR | | | 60,759 | | | | USD | | | | (71,324 | ) | | | 8/10/18 | | | | — | | | | (222 | ) |
BAML | | NZD | | | 105,769 | | | | USD | | | | (72,870 | ) | | | 8/10/18 | | | | — | | | | (777 | ) |
BNP | | AUD | | | 94,460 | | | | USD | | | | (69,903 | ) | | | 8/10/18 | | | | 280 | | | | — | |
HSBC | | EUR | | | (60,004 | ) | | | USD | | | | 70,431 | | | | 8/10/18 | | | | 213 | | | | — | |
| | | | | | | | | | | | | | | | | | | | | | | | | | |
Total Foreign Currency Exchange Contracts | | | | | | | | | | | | | | | $ | 2,419 | | | $ | (999 | ) |
| | | | | | | | | | | | | | | | | | | | | | | | | | |
35
Schedule of investments
Delaware Strategic Income Fund
Futures Contracts
| | | | | | | | | | | | | | | | | | | | |
Contracts to Buy (Sell) | | Notional Amount | | | Notional
Cost
(Proceeds) | | | Expiration
Date | | | Value/
Unrealized
Appreciation | | | Variation
Margin
Due from
(Due to)
Brokers | |
(19) US Treasury 5 yr Notes | | $ | (2,149,375 | ) | | $ | (2,172,478 | ) | | | 9/28/18 | | | $ | 23,103 | | | $ | (148 | ) |
(59) US Treasury 10 yr Notes | | | (7,045,891 | ) | | | (7,134,684 | ) | | | 9/20/18 | | | | 88,793 | | | | (2,766 | ) |
| | | | | | | | | | | | | | | | | | | | |
Total Futures Contracts | | | | | | $ | (9,307,162 | ) | | | | | | $ | 111,896 | | | $ | (2,914 | ) |
| | | | | | | | | | | | | | | | | | | | |
| | | | | |
Swap Contracts | | | | | | | | | | | | | | | | | | | | |
| | | | | |
CDS Contracts2 | | | | | | | | | | | | | | | | | | | | |
| | | | | | | | | | | | | | | | | | | | | | | | | | | | |
Reference Obligation/ Termination Date/ Payment Frequency | | Notional Amount3 | | | Annual
Protection
Payments | | | Value | | | Upfront
Payments
Paid
(Received) | | | Unrealized Appreciation4 | | | Unrealized Depreciation4 | | | Variation
Margin
Due from
(Due to)
Brokers | |
Centrally Cleared/ Protection Purchased: | | | | | | | | | | | | | | | | | | | | | | | | | | | | |
CDX.NA.HY.305 6/20/23- Quarterly | | | 1,460,000 | | | | 5.00 | % | | $ | (102,386 | ) | | $ | (90,021 | ) | | $ | — | | | $ | (12,365 | ) | | $ | (2,009 | ) |
Over-The- Counter/ Protection Sold/ Moody’s Ratings: | | | | | | | | | | | | | | | | | | | | | | | | | | | | |
MSC-CMBX.NA.BBB.66 5/11/63- Monthly | | | 460,000 | | | | 3.00 | % | | | (50,683 | ) | | | (51,427 | ) | | | 744 | | | | — | | | | — | |
| | | | | | | | | | | | | | | | | | | | | | | | | | | | |
Total CDS Contracts | | | | | | | | | | $ | (153,069 | ) | | $ | (141,448 | ) | | $ | 744 | | | $ | (12,365 | ) | | $ | (2,009 | ) |
| | | | | | | | | | | | | | | | | | | | | | | | | | | | |
The use of foreign currency exchange contracts, futures contracts, and swap contracts involves elements of market risk and risks in excess of the amounts disclosed in the financial statements. The notional amounts and foreign currency exchange contracts presented above represent the Fund’s total exposure in such contracts, whereas only the net unrealized appreciation (depreciation) is reflected in the Fund’s net assets.
1See Note 8 in “Notes to financial statements.”
36
2A CDS contract is a risk-transfer instrument through which one party (purchaser of protection) transfers to another party (seller of protection) the financial risk of a credit event (as defined in the CDS agreement), as it relates to a particular reference security or basket of securities (such as an index). Periodic payments (receipts) on such contracts are accrued daily and recorded as unrealized losses (gains) on swap contracts. Upon payment (receipt), such amounts are recorded as realized losses (gains) on swap contracts. Upfront payments made or received in connection with CDS contracts are amortized over the expected life of the CDS contracts as unrealized losses (gains) on swap contracts. The change in value of CDS contracts is recorded daily as unrealized appreciation or depreciation. A realized gain or loss is recorded upon a credit event (as defined in the CDS agreement) or the maturity or termination of the agreement.
3Notional amount shown is stated in US dollars unless noted that the swap is denominated in another currency.
4Unrealized appreciation (depreciation) does not include periodic interest payments (receipt) on swap contracts accrued daily in the amount of $(5,582).
5Markit’s CDX.NA.HY Index is composed of 100 liquid North American entities with high yield credit ratings that trade in the CDS market.
6Markit’s CMBX.NA Index is a synthetic tradable index referencing a basket of 25 commercial mortgage-backed securities in North America. Credit-quality ratings are measured on a scale that ranges from AAA (highest) to BB (lowest). US Agency and US Agency mortgage-backed securities appear under US Government.
Summary of abbreviations:
ARS – Argentine Peso
AUD – Australian Dollar
BADLARPP – Argentina Term Deposit Rate
BAML – Bank of America Merrill Lynch
BB – Barclays Bank
BNP – BNP Paribas
BRL – Brazilian Real
CAD – Canadian Dollar
CDO – Collateralized Debt Obligation
CDS – Credit Default Swap
CDX.NA.HY – Credit Default Swap Index North American High-Yield
CITI – Citigroup Global Markets Inc.
CLO – Collateralized Loan Obligation
CLP – Chilean Peso
CMBX.NA – Commercial Mortgage-Backed Securities Index North America
EUR – European Monetary Unit
FREMF – Freddie Mac Multifamily
GNMA – Government National Mortgage Association
GS – Goldman Sachs
GSMPS – Goldman Sachs Reperforming Mortgage Securities
HSBC – Hong Kong Shanghai Bank
ICE – Intercontinental Exchange
IDR – Indonesian Rupiah
INR – Indian Rupee
37
Schedule of investments
Delaware Strategic Income Fund
Summary of abbreviations (continued)
JPM – JPMorgan
JPY – Japanese Yen
LB – Lehman Brothers
LIBOR – London Interbank Offered Rate
LIBOR01M – ICE LIBOR USD 1 Month
LIBOR03M – ICE LIBOR USD 3 Month
MSC – Morgan Stanley Capital
MXN – Mexican Peso
NZD – New Zealand Dollar
REIT – Real Estate Investment Trust
REMIC – Real Estate Mortgage Investment Conduit
S.F. – Single Family
USBMMY3M – US Treasury 3 Month Bill Money Market Yield
USD – US Dollar
yr – Year
ZAR – South African Rand
See accompanying notes, which are an integral part of the financial statements.
38
This page intentionally left blank.
| | |
| Statement of assets and liabilities |
| Delaware Strategic Income Fund | | July 31, 2018 |
| | | | |
Assets: | | | | |
Investments, at value1 | | $ | 69,800,248 | |
Foreign currencies, at value2 | | | 61,239 | |
Options purchased, at value3 | | | 74,016 | |
Cash | | | 126,470 | |
Cash collateral due from brokers | | | 134,770 | |
Receivable for securities sold | | | 1,254,924 | |
Interest receivable | | | 754,038 | |
Receivable for fund shares sold | | | 74,114 | |
Unrealized appreciation on foreign currency exchange contracts | | | 2,419 | |
Unrealized appreciation on credit default swap contracts | | | 744 | |
Receivable from investment manager | | | 967 | |
Other assets4 | | | 97,871 | |
| | | | |
Total assets | | | 72,381,820 | |
| | | | |
Liabilities: | | | | |
Payable for securities purchased | | | 1,684,139 | |
Upfront payments received on credit default swap contracts | | | 141,448 | |
Distribution payable | | | 71,106 | |
Other accrued expenses | | | 61,972 | |
Audit and tax fees payable | | | 52,582 | |
Payable for fund shares redeemed | | | 29,724 | |
Distribution fees payable to affiliates | | | 11,956 | |
Swap payments payable | | | 8,146 | |
Variation margin due to broker on futures contracts | | | 2,914 | |
Dividend disbursing and transfer agent fees and expenses payable to affiliates | | | 1,146 | |
Unrealized depreciation on foreign currency exchange contracts | | | 999 | |
Accounting and administration expenses payable to affiliates | | | 563 | |
Trustees’ fees and expenses payable to affiliates | | | 206 | |
Legal fees payable to affiliates | | | 77 | |
Reports and statements to shareholders expenses payable to affiliates | | | 57 | |
Variation margin due to broker on centrally cleared credit default swap contracts | | | 2,009 | |
Contingent liabilities4 | | | 326,237 | |
| | | | |
Total liabilities | | | 2,395,281 | |
| | | | |
Total Net Assets | | $ | 69,986,539 | |
| | | | |
40
| | | | |
Net Assets Consist of: | | | | |
Paid-in capital | | $ | 75,523,385 | |
Distributions in excess of net investment income | | | (176,875 | ) |
Accumulated net realized loss | | | (4,356,613 | ) |
Net unrealized depreciation of investments | | | (1,113,670 | ) |
Net unrealized depreciation of foreign currencies | | | (630 | ) |
Net unrealized appreciation of foreign currency exchange contracts | | | 1,420 | |
Net unrealized appreciation of futures contracts | | | 111,896 | |
Net unrealized appreciation of options purchased | | | 14,829 | |
Net unrealized depreciation of swap contracts | | | (17,203 | ) |
| | | | |
Total Net Assets | | $ | 69,986,539 | |
| | | | |
| |
Net Asset Value | | | | |
Class A: | | | | |
Net assets | | $ | 33,911,557 | |
Shares of beneficial interest outstanding, unlimited authorization, no par | | | 4,234,400 | |
Net asset value per share | | $ | 8.01 | |
Sales charge | | | 4.50 | % |
Offering price per share, equal to net asset value per share / (1 – sales charge) | | $ | 8.39 | |
| |
Class C: | | | | |
Net assets | | $ | 3,449,441 | |
Shares of beneficial interest outstanding, unlimited authorization, no par | | | 430,248 | |
Net asset value per share | | $ | 8.02 | |
| |
Class R: | | | | |
Net assets | | $ | 4,259,269 | |
Shares of beneficial interest outstanding, unlimited authorization, no par | | | 530,104 | |
Net asset value per share | | $ | 8.03 | |
| |
Institutional Class: | | | | |
Net assets | | $ | 28,366,272 | |
Shares of beneficial interest outstanding, unlimited authorization, no par | | | 3,538,559 | |
Net asset value per share | | $ | 8.02 | |
1 Investments, at cost | | $ | 70,913,918 | |
2 Foreign currencies, at cost | | | 61,429 | |
3 Options purchased, at cost | | | 59,187 | |
4 See Note 13 in “Notes to financial statements.” | | | | |
See accompanying notes, which are an integral part of the financial statements.
41
| | |
| Statement of operations |
| Delaware Strategic Income Fund | | Year ended July 31, 2018 |
| | | | |
Investment Income: | | | | |
Interest | | $ | 3,672,548 | |
Dividends | | | 22,762 | |
Foreign tax withheld | | | (1,586 | ) |
| | | | |
| | | 3,693,724 | |
| | | | |
Expenses: | | | | |
Management fees | | | 430,923 | |
Distribution expenses – Class A | | | 98,202 | |
Distribution expenses – Class C | | | 47,355 | |
Distribution expenses – Class R | | | 23,970 | |
Dividend disbursing and transfer agent fees and expenses | | | 96,186 | |
Registration fees | | | 71,306 | |
Legal fees | | | 53,672 | |
Audit and tax fees | | | 52,846 | |
Accounting and administration expenses | | | 42,797 | |
Reports and statements to shareholders expenses | | | 37,781 | |
Custodian fees | | | 24,106 | |
Trustees’ fees and expenses | | | 3,746 | |
Other | | | 52,093 | |
| | | 1,034,983 | |
| | | | |
Less expenses waived | | | (368,549 | ) |
Less expenses paid indirectly | | | (945 | ) |
| | | | |
Total operating expenses | | | 665,489 | |
| | | | |
Net Investment Income | | | 3,028,235 | |
| | | | |
42
| | | | |
Net Realized and Unrealized Gain (Loss): | | | | |
Net realized gain (loss) on: | | | | |
Investments* | | $ | (483,954 | ) |
Foreign currencies | | | (179,753 | ) |
Foreign currency exchange contracts | | | (42,018 | ) |
Futures contracts | | | 81,745 | |
Options purchased | | | (7,988 | ) |
Options written | | | 6,406 | |
Swap contracts | | | (192,642 | ) |
| | | | |
Net realized loss | | | (818,204 | ) |
| | | | |
Net change in unrealized appreciation (depreciation) of: | | | | |
Investments** | | | (2,567,298 | ) |
Foreign currencies | | | 34 | |
Foreign currency exchange contracts | | | (4,952 | ) |
Futures contracts | | | 64,097 | |
Options purchased | | | 18,271 | |
Swap contracts | | | (17,234 | ) |
| | | | |
Net change in unrealized appreciation (depreciation) | | | (2,507,082 | ) |
| | | | |
Net Realized and Unrealized Loss | | | (3,325,286 | ) |
| | | | |
Net Decrease in Net Assets Resulting from Operations | | $ | (297,051 | ) |
| | | | |
* Includes $(3,137) capital gain taxes paid.
** Includes $364 increase of capital gain taxes accrued.
See accompanying notes, which are an integral part of the financial statements.
43
Statements of changes in net assets
Delaware Strategic Income Fund
| | | | | | | | |
| | | Year ended | |
| | | 7/31/18 | | | 7/31/17 | |
Increase (Decrease) in Net Assets from Operations: | | | | | | | | |
Net investment income | | $ | 3,028,235 | | | $ | 3,343,670 | |
Net realized loss | | | (818,204 | ) | | | (514,675 | ) |
Net change in unrealized appreciation (depreciation) | | | (2,507,082 | ) | | | (1,869,172 | ) |
| | | | | | | | |
Net increase (decrease) in net assets resulting from operations | | | (297,051 | ) | | | 959,823 | |
| | | | | | | | |
| | |
Dividends and Distributions to Shareholders from: | | | | | | | | |
Net investment income: | | | | | | | | |
Class A | | | (1,552,628 | ) | | | (2,072,447 | ) |
Class C | | | (153,928 | ) | | | (205,608 | ) |
Class R | | | (177,132 | ) | | | (209,798 | ) |
Institutional Class | | | (1,242,954 | ) | | | (1,646,207 | ) |
| | |
Return of capital: | | | | | | | | |
Class A | | | (111,353 | ) | | | — | |
Class C | | | (11,314 | ) | | | — | |
Class R | | | (13,940 | ) | | | — | |
Institutional Class | | | (93,054 | ) | | | — | |
| | | | | | | | |
| | | (3,356,303 | ) | | | (4,134,060 | ) |
| | | | | | | | |
| | |
Capital Share Transactions: | | | | | | | | |
Proceeds from shares sold: | | | | | | | | |
Class A | | | 2,687,402 | | | | 6,369,718 | |
Class C | | | 676,646 | | | | 1,282,218 | |
Class R | | | 449,591 | | | | 689,331 | |
Institutional Class | | | 17,003,462 | | | | 22,005,985 | |
| | |
Net asset value of shares issued upon reinvestment of dividends and distributions: | | | | | | | | |
Class A | | | 1,524,955 | | | | 1,879,296 | |
Class C | | | 160,123 | | | | 189,278 | |
Class R | | | 191,072 | | | | 206,676 | |
Institutional Class | | | 1,321,849 | | | | 1,580,499 | |
| | | | | | | | |
| | | 24,015,100 | | | | 34,203,001 | |
| | | | | | | | |
44
| | | | | | | | |
| | | Year ended | |
| | | 7/31/18 | | | 7/31/17 | |
Capital Share Transactions (continued): | | | | | | | | |
Cost of shares redeemed: | | | | | | | | |
Class A | | $ | (19,738,537 | ) | | $ | (24,891,676 | ) |
Class C | | | (2,149,123 | ) | | | (5,731,991 | ) |
Class R | | | (1,877,771 | ) | | | (1,826,644 | ) |
Institutional Class | | | (22,370,603 | ) | | | (40,705,695 | ) |
| | | | | | | | |
| | | (46,136,034 | ) | | | (73,156,006 | ) |
| | | | | | | | |
Decrease in net assets derived from capital share transactions | | | (22,120,934 | ) | | | (38,953,005 | ) |
| | | | | | | | |
Net Decrease in Net Assets | | | (25,774,288 | ) | | | (42,127,242 | ) |
| | |
Net Assets: | | | | | | | | |
Beginning of year | | | 95,760,827 | | | | 137,888,069 | |
| | | | | | | | |
End of year | | $ | 69,986,539 | | | $ | 95,760,827 | |
| | | | | | | | |
| | |
Distributions in excess of net investment income | | $ | (176,875 | ) | | $ | (104,228 | ) |
| | | | | | | | |
See accompanying notes, which are an integral part of the financial statements.
45
Financial highlights
Delaware Strategic Income Fund Class A
Selected data for each share of the Fund outstanding throughout each period were as follows:
|
Net asset value, beginning of period |
|
Income (loss) from investment operations: |
Net investment income1 |
Net realized and unrealized gain (loss) |
| |
Total from investment operations |
| |
|
Less dividends and distributions from: |
Net investment income |
Return of capital |
| |
Total dividends and distributions |
| |
|
Net asset value, end of period |
| |
|
Total return2 |
|
Ratios and supplemental data: |
Net assets, end of period (000 omitted) |
Ratio of expenses to average net assets |
Ratio of expenses to average net assets prior to fees waived3 |
Ratio of net investment income to average net assets |
Ratio of net investment income to average net assets prior to fees waived3 |
Portfolio turnover |
| 1 | The average shares outstanding method has been applied for per share information. |
| 2 | Total investment return is based on the change in net asset value of a share during the period and assumes reinvestment of dividends and distributions at net asset value and does not reflect the impact of a sales charge. Total investment return during all of the periods shown reflects waivers by the manager and/or distributor. Performance would have been lower had the waivers not been in effect. |
| 3 | Expenses paid indirectly were not material and had no impact on the ratios disclosed. Expenses paid indirectly for the year ended July 31, 2018 are reflected on the “Statement of operations.” |
See accompanying notes, which are an integral part of the financial statements.
46
| | | | | | | | | | | | | | | | | | | | | | | | | | | | |
| | | Year ended |
| | | 7/31/18 | | 7/31/17 | | 7/31/16 | | 7/31/15 | | 7/31/14 |
| | | | | | | $ | 8.41 | | | | $ | 8.57 | | | | $ | 8.43 | | | | $ | 8.53 | | | | $ | 8.34 | |
| | | | | |
| | | | | | | | 0.32 | | | | | 0.24 | | | | | 0.15 | | | | | 0.20 | | | | | 0.23 | |
| | | | | | | | (0.37 | ) | | | | (0.10 | ) | | | | 0.20 | | | | | (0.06 | ) | | | | 0.23 | |
| | | | | | | | | | | | | | | | | | | | | | | | | | | | | |
| | | | | | | | (0.05 | ) | | | | 0.14 | | | | | 0.35 | | | | | 0.14 | | | | | 0.46 | |
| | | | | | | | | | | | | | | | | | | | | | | | | | | | | |
| | | | | |
| | | | | | | | (0.32 | ) | | | | (0.30 | ) | | | | (0.20 | ) | | | | (0.23 | ) | | | | (0.23 | ) |
| | | | | | | | (0.03 | ) | | | | — | | | | | (0.01 | ) | | | | (0.01 | ) | | | | (0.04 | ) |
| | | | | | | | | | | | | | | | | | | | | | | | | | | | | |
| | | | | | | | (0.35 | ) | | | | (0.30 | ) | | | | (0.21 | ) | | | | (0.24 | ) | | | | (0.27 | ) |
| | | | | | | | | | | | | | | | | | | | | | | | | | | | | |
| | | | | |
| | | | | | | $ | 8.01 | | | | $ | 8.41 | | | | $ | 8.57 | | | | $ | 8.43 | | | | $ | 8.53 | |
| | | | | | | | | | | | | | | | | | | | | | | | | | | | | |
| | | | | |
| | | | | | | | (0.62% | ) | | | | 1.73% | | | | | 4.15% | | | | | 1.65% | | | | | 5.60% | |
| | | | | |
| | | | | | | $ | 33,912 | | | | $ | 51,220 | | | | $ | 69,524 | | | | $ | 64,069 | | | | $ | 65,466 | |
| | | | | | | | 0.88% | | | | | 0.90% | | | | | 0.90% | | | | | 0.91% | | | | | 0.90% | |
| | | | | | | | 1.35% | | | | | 1.29% | | | | | 1.21% | | | | | 1.21% | | | | | 1.19% | |
| | | | | | | | 3.83% | | | | | 2.84% | | | | | 1.80% | | | | | 2.30% | | | | | 2.70% | |
| | | | | | | | 3.36% | | | | | 2.45% | | | | | 1.49% | | | | | 2.00% | | | | | 2.41% | |
| | | | | | | | 125% | | | | | 210% | | | | | 316% | | | | | 313% | | | | | 273% | |
47
Financial highlights
Delaware Strategic Income Fund Class C
Selected data for each share of the Fund outstanding throughout each period were as follows:
|
Net asset value, beginning of period |
|
Income (loss) from investment operations: |
Net investment income1 |
Net realized and unrealized gain (loss) |
| |
Total from investment operations |
| |
|
Less dividends and distributions from: |
Net investment income |
Return of capital |
| |
Total dividends and distributions |
| |
|
Net asset value, end of period |
| |
|
Total return2 |
|
Ratios and supplemental data: |
Net assets, end of period (000 omitted) |
Ratio of expenses to average net assets |
Ratio of expenses to average net assets prior to fees waived3 |
Ratio of net investment income to average net assets |
Ratio of net investment income to average net assets prior to fees waived3 |
Portfolio turnover |
| 1 | The average shares outstanding method has been applied for per share information. |
| 2 | Total investment return is based on the change in net asset value of a share during the period and assumes reinvestment of dividends and distributions at net asset value and does not reflect the impact of a sales charge. Total investment return during all of the periods shown reflects a waiver by the manager. Performance would have been lower had the waiver not been in effect. |
| 3 | Expenses paid indirectly were not material and had no impact on the ratios disclosed. Expenses paid indirectly for the year ended July 31, 2018 are reflected on the “Statement of operations.” |
See accompanying notes, which are an integral part of the financial statements.
48
| | | | | | | | | | | | | | | | | | | | | | | | | | | | |
| | | Year ended | |
| | | 7/31/18 | | | | | 7/31/17 | | | | | 7/31/16 | | | | | 7/31/15 | | | | | 7/31/14 | |
| | $ | 8.42 | | | | | $ | 8.58 | | | | | $ | 8.44 | | | | | $ | 8.54 | | | | | $ | 8.35 | |
| | | | | | | | | |
| | | 0.25 | | | | | | 0.18 | | | | | | 0.09 | | | | | | 0.13 | | | | | | 0.16 | |
| | | (0.36 | ) | | | | | (0.10 | ) | | | | | 0.19 | | | | | | (0.05 | ) | | | | | 0.24 | |
| | | | | | | | | | | | | | | | | | | | | | | | | | | | |
| | | (0.11 | ) | | | | | 0.08 | | | | | | 0.28 | | | | | | 0.08 | | | | | | 0.40 | |
| | | | | | | | | | | | | | | | | | | | | | | | | | | | |
| | | | | | | | | |
| | | (0.26 | ) | | | | | (0.24 | ) | | | | | (0.13 | ) | | | | | (0.17 | ) | | | | | (0.17 | ) |
| | | (0.03 | ) | | | | | — | | | | | | (0.01 | ) | | | | | (0.01 | ) | | | | | (0.04 | ) |
| | | | | | | | | | | | | | | | | | | | | | | | | | | | |
| | | (0.29 | ) | | | | | (0.24 | ) | | | | | (0.14 | ) | | | | | (0.18 | ) | | | | | (0.21 | ) |
| | | | | | | | | | | | | | | | | | | | | | | | | | | | |
| | | | | | | | | |
| | $ | 8.02 | | | | | $ | 8.42 | | | | | $ | 8.58 | | | | | $ | 8.44 | | | | | $ | 8.54 | |
| | | | | | | | | | | | | | | | | | | | | | | | | | | | |
| | | | | | | | | |
| | | (1.35% | ) | | | | | 0.97% | | | | | | 3.37% | | | | | | 0.89% | | | | | | 4.81% | |
| | | | | | | | | |
| | $ | 3,450 | | | | | $ | 4,996 | | | | | $ | 9,490 | | | | | $ | 8,375 | | | | | $ | 8,572 | |
| | | 1.63% | | | | | | 1.65% | | | | | | 1.65% | | | | | | 1.66% | | | | | | 1.65% | |
| | | 2.10% | | | | | | 2.04% | | | | | | 1.96% | | | | | | 1.96% | | | | | | 1.93% | |
| | | 3.08% | | | | | | 2.09% | | | | | | 1.05% | | | | | | 1.55% | | | | | | 1.95% | |
| | | 2.61% | | | | | | 1.70% | | | | | | 0.74% | | | | | | 1.25% | | | | | | 1.67% | |
| | | 125% | | | | | | 210% | | | | | | 316% | | | | | | 313% | | | | | | 273% | |
49
Financial highlights
Delaware Strategic Income Fund Class R
Selected data for each share of the Fund outstanding throughout each period were as follows:
|
Net asset value, beginning of period |
|
Income (loss) from investment operations: |
Net investment income1 |
Net realized and unrealized gain (loss) |
| |
Total from investment operations |
| |
|
Less dividends and distributions from: |
Net investment income |
Return of capital |
| |
Total dividends and distributions |
| |
|
Net asset value, end of period. |
|
|
Total return2 |
|
Ratios and supplemental data: |
Net assets, end of period (000 omitted) |
Ratio of expenses to average net assets |
Ratio of expenses to average net assets prior to fees waived3 |
Ratio of net investment income to average net assets |
Ratio of net investment income to average net assets prior to fees waived3 |
Portfolio turnover |
| 1 | The average shares outstanding method has been applied for per share information. |
| 2 | Total investment return is based on the change in net asset value of a share during the period and assumes reinvestment of dividends and distributions at net asset value. Total investment return during all of the periods shown reflects waivers by the manager and/or distributor. Performance would have been lower had the waivers not been in effect. |
| 3 | Expenses paid indirectly were not material and had no impact on the ratios disclosed. Expenses paid indirectly for the year ended July 31, 2018 are reflected on the “Statement of operations.” |
See accompanying notes, which are an integral part of the financial statements.
50
| | | | | | | | | | | | | | | | | | | | | | | | | | | | |
| Year ended | |
| |
| | | 7/31/18 | | | | | 7/31/17 | | | | | 7/31/16 | | | | | 7/31/15 | | | | | 7/31/14 | |
| |
| | | | | | | | | |
| | $ | 8.44 | | | | | $ | 8.60 | | | | | $ | 8.46 | | | | | $ | 8.56 | | | | | $ | 8.37 | |
| | | | | | | | | |
| | | 0.30 | | | | | | 0.22 | | | | | | 0.13 | | | | | | 0.18 | | | | | | 0.21 | |
| | | (0.38 | ) | | | | | (0.10 | ) | | | | | 0.19 | | | | | | (0.06 | ) | | | | | 0.23 | |
| | | | | | | | | | | | | | | | | | | | | | | | | | | | |
| | | (0.08 | ) | | | | | 0.12 | | | | | | 0.32 | | | | | | 0.12 | | | | | | 0.44 | |
| | | | | | | | | | | | | | | | | | | | | | | | | | | | |
| | | | | | | | | |
| | | (0.30 | ) | | | | | (0.28 | ) | | | | | (0.17 | ) | | | | | (0.21 | ) | | | | | (0.21 | ) |
| | | (0.03 | ) | | | | | — | | | | | | (0.01 | ) | | | | | (0.01 | ) | | | | | (0.04 | ) |
| | | | | | | | | | | | | | | | | | | | | | | | | | | | |
| | | (0.33 | ) | | | | | (0.28 | ) | | | | | (0.18 | ) | | | | | (0.22 | ) | | | | | (0.25 | ) |
| | | | | | | | | | | | | | | | | | | | | | | | | | | | |
| | | | | | | | | |
| | $ | 8.03 | | | | | $ | 8.44 | | | | | $ | 8.60 | | | | | $ | 8.46 | | | | | $ | 8.56 | |
| | | | | | | | | | | | | | | | | | | | | | | | | | | | |
| | | | | | | | | |
| | | (0.97% | ) | | | | | 1.48% | | | | | | 3.88% | | | | | | 1.40% | | | | | | 5.32% | |
| | | | | | | | | |
| | $ | 4,259 | | | | | $ | 5,725 | | | | | $ | 6,793 | | | | | $ | 6,863 | | | | | $ | 7,793 | |
| | | 1.13% | | | | | | 1.15% | | | | | | 1.15% | | | | | | 1.16% | | | | | | 1.15% | |
| | | 1.60% | | | | | | 1.54% | | | | | | 1.46% | | | | | | 1.46% | | | | | | 1.45% | |
| | | 3.58% | | | | | | 2.59% | | | | | | 1.55% | | | | | | 2.05% | | | | | | 2.45% | |
| | | 3.11% | | | | | | 2.20% | | | | | | 1.24% | | | | | | 1.75% | | | | | | 2.15% | |
| | | 125% | | | | | | 210% | | | | | | 316% | | | | | | 313% | | | | | | 273% | |
51
Financial highlights
Delaware Strategic Income Fund Institutional Class
Selected data for each share of the Fund outstanding throughout each period were as follows:
|
Net asset value, beginning of period |
|
Income (loss) from investment operations: |
Net investment income1 |
Net realized and unrealized gain (loss) |
| |
Total from investment operations |
| |
|
Less dividends and distributions from: |
Net investment income |
Return of capital |
| |
Total dividends and distributions |
| |
|
Net asset value, end of period |
| |
|
Total return2 |
|
Ratios and supplemental data: |
Net assets, end of period (000 omitted) |
Ratio of expenses to average net assets |
Ratio of expenses to average net assets prior to fees waived3 |
Ratio of net investment income to average net assets |
Ratio of net investment income to average net assets prior to fees waived3 |
Portfolio turnover |
| 1 | The average shares outstanding method has been applied for per share information. |
| 2 | Total investment return is based on the change in net asset value of a share during the period and assumes reinvestment of dividends and distributions at net asset value. Total investment return during all of the periods shown reflects a waiver by the manager. Performance would have been lower had the waiver not been in effect. |
| 3 | Expenses paid indirectly were not material and had no impact on the ratios disclosed. Expenses paid indirectly for the year ended July 31, 2018 are reflected on the “Statement of operations.” |
See accompanying notes, which are an integral part of the financial statements.
52
| | | | | | | | | | | | | | | | | | | | | | | | | | | | |
| | | Year ended | |
| |
| | | 7/31/18 | | | | | | 7/31/17 | | | | | | 7/31/16 | | | | | | 7/31/15 | | | | | | 7/31/14 | |
| |
| | | | | | | | | |
| | $ | 8.42 | | | | | $ | 8.58 | | | | | $ | 8.44 | | | | | $ | 8.54 | | | | | $ | 8.35 | |
| | | | | | | | | |
| | | 0.34 | | | | | | 0.26 | | | | | | 0.17 | | | | | | 0.22 | | | | | | 0.25 | |
| | | (0.37 | ) | | | | | (0.10 | ) | | | | | 0.20 | | | | | | (0.05 | ) | | | | | 0.24 | |
| | | | | | | | | | | | | | | | | | | | | | | | | | | | |
| | | (0.03 | ) | | | | | 0.16 | | | | | | 0.37 | | | | | | 0.17 | | | | | | 0.49 | |
| | | | | | | | | | | | | | | | | | | | | | | | | | | | |
| | | | | | | | | |
| | | (0.34 | ) | | | | | (0.32 | ) | | | | | (0.22 | ) | | | | | (0.26 | ) | | | | | (0.26 | ) |
| | | (0.03 | ) | | | | | — | | | | | | (0.01 | ) | | | | | (0.01 | ) | | | | | (0.04 | ) |
| | | | | | | | | | | | | | | | | | | | | | | | | | | | |
| | | (0.37 | ) | | | | | (0.32 | ) | | | | | (0.23 | ) | | | | | (0.27 | ) | | | | | (0.30 | ) |
| | | | | | | | | | | | | | | | | | | | | | | | | | | | |
| | | | | | | | | |
| | $ | 8.02 | | | | | $ | 8.42 | | | | | $ | 8.58 | | | | | $ | 8.44 | | | | | $ | 8.54 | |
| | | | | | | | | | | | | | | | | | | | | | | | | | | | |
| | | | | | | | | |
| | | (0.36% | ) | | | | | 1.99% | | | | | | 4.40% | | | | | | 1.90% | | | | | | 5.86% | |
| | | | | | | | | |
| | $ | 28,366 | | | | | $ | 33,820 | | | | | $ | 52,081 | | | | | $ | 46,155 | | | | | $ | 30,241 | |
| | | 0.63% | | | | | | 0.65% | | | | | | 0.65% | | | | | | 0.66% | | | | | | 0.65% | |
| | | 1.10% | | | | | | 1.04% | | | | | | 0.96% | | | | | | 0.96% | | | | | | 0.93% | |
| | | 4.08% | | | | | | 3.09% | | | | | | 2.05% | | | | | | 2.55% | | | | | | 2.95% | |
| | | 3.61% | | | | | | 2.70% | | | | | | 1.74% | | | | | | 2.25% | | | | | | 2.67% | |
| | | 125% | | | | | | 210% | | | | | | 316% | | | | | | 313% | | | | | | 273% | |
53
| | |
| Notes to financial statements | | |
| Delaware Strategic Income Fund | | July 31, 2018 |
Delaware Group® Government Fund (Trust) is organized as a Delaware statutory trust and offers two series: Delaware Emerging Markets Debt Fund and Delaware Strategic Income Fund. These financial statements and the related notes pertain to Delaware Strategic Income Fund (Fund). The Trust is an open-end investment company. The Fund is considered diversified under the Investment Company Act of 1940, as amended (1940 Act), and offers Class A, Class C, Class R, and Institutional Class shares. Class A shares are sold with a maximum front-end sales charge of 4.50%. Class A share purchases of $1,000,000 or more will incur a contingent deferred sales charge (CDSC) instead of a front-end sales charge of 1.00% if redeemed during the first year, and 0.50% during the second year, provided that Delaware Distributors, L.P. (DDLP) paid a financial advisor a commission on the purchase of those shares. Class C shares are sold with a CDSC of 1.00%, which will be incurred if redeemed during the first 12 months. Class R and Institutional Class shares are not subject to a sales charge and are offered for sale exclusively to certain eligible investors.
The investment objective of the Fund is to seek high current income and, secondarily, long-term total return.
1. Significant Accounting Policies
The following accounting policies are in accordance with US generally accepted accounting principles (US GAAP) and are consistently followed by the Fund. The Fund is an investment company and follows accounting and reporting guidance under Financial Accounting Standards Board (FASB) Accounting Standards Codification (ASC) Topic 946, Financial Services - Investment Companies.
Security Valuation – Equity securities, except those traded on the Nasdaq Stock Market LLC (Nasdaq), are valued at the last quoted sales price as of the time of the regular close of the New York Stock Exchange on the valuation date. Equity securities traded on the Nasdaq are valued in accordance with the Nasdaq Official Closing Price, which may not be the last sales price. If, on a particular day, an equity security does not trade, the mean between the bid and ask prices will be used, which approximates fair value. US government and agency securities are valued at the mean between the bid and ask prices, which approximates fair value. Equity securities listed on a foreign exchange are normally valued at the last quoted sales price on the valuation date. Other debt securities and credit default swap (CDS) contracts are valued based upon valuations provided by an independent pricing service or broker/counterparty and reviewed by management. To the extent current market prices are not available, the pricing service may take into account developments related to the specific security, as well as transactions in comparable securities. Valuations for fixed income securities utilize matrix systems, which reflect such factors as security prices, yields, maturities, and ratings, and are supplemented by dealer and exchange quotations. For asset-backed securities, collateralized mortgage obligations, commercial mortgage securities, and US government agency mortgage securities, pricing vendors utilize matrix pricing which considers prepayment speed, attributes of the collateral, yield or price of bonds of comparable quality, coupon, maturity, and type as well as broker/dealer-supplied prices. Swap prices are derived using daily swap curves and models that incorporate a number of market data factors, such as discounted cash flows, trades, and values of the underlying reference instruments. Foreign currency exchange contracts and foreign cross currency exchange contracts are valued at the mean between the bid and ask prices, which approximates fair value. Interpolated values are derived when the settlement date of the contract is an interim date for which quotations are not
54
available. Futures contracts and options on futures contracts are valued at the daily quoted settlement prices. Exchange-traded options are valued at the last reported sale price or, if no sales are reported, at the mean between the last reported bid and ask prices, which approximates fair value. Generally, other securities and assets for which market quotations are not readily available are valued at fair value as determined in good faith under the direction of the Trust’s Board of Trustees (Board). In determining whether market quotations are readily available or fair valuation will be used, various factors will be taken into consideration, such as market closures or suspension of trading in a security. Restricted securities are valued at fair value using methods approved by the Board.
Federal and Foreign Income Taxes – No provision for federal income taxes has been made as the Fund intends to continue to qualify for federal income tax purposes as a regulated investment company under Subchapter M of the Internal Revenue Code of 1986, as amended, and make the requisite distributions to shareholders. The Fund evaluates tax positions taken or expected to be taken in the course of preparing the Fund’s tax returns to determine whether the tax positions are “more-likely-than-not” of being sustained by the applicable tax authority. Tax positions not deemed to meet the “more-likely-than-not” threshold are recorded as a tax benefit or expense in the current year. Management has analyzed the Fund’s tax positions taken or expected to be taken on the Fund’s federal income tax returns through the year ended July 31, 2018 and for all open tax years (years ended July 31, 2015–July 31, 2017), and has concluded that no provision for federal income tax is required in the Fund’s financial statements. In regard to foreign taxes only, the Fund has open tax years in certain foreign countries in which it invests that may date back to the inception of the Fund. If applicable, the Fund recognizes interest accrued on unrecognized tax benefits in interest expense and penalties in other expenses on the “Statement of operations.” During the year ended July 31, 2018, the Fund did not incur any interest or tax penalties.
Class Accounting – Investment income and common expenses are allocated to the various classes of the Fund on the basis of “settled shares” of each class in relation to the net assets of the Fund. Realized and unrealized gain (loss) on investments are allocated to the various classes of the Fund on the basis of daily net assets of each class. Distribution expenses relating to a specific class are charged directly to that class.
Repurchase Agreements – The Fund may purchase certain US government securities subject to the counterparty’s agreement to repurchase them at an agreed upon date and price. The counterparty will be required on a daily basis to maintain the value of the collateral subject to the agreement at not less than the repurchase price (including accrued interest). The agreements are conditioned upon the collateral being deposited under the Federal Reserve book-entry system with the Fund’s custodian or a third party sub-custodian. In the event of default or bankruptcy by the other party to the agreement, retention of the collateral may be subject to legal proceedings. All open repurchase agreements as of the date of this report were entered into on July 31, 2018, and matured on the next business day.
To Be Announced Trades (TBA) – The Fund may contract to purchase or sell securities for a fixed price at a transaction date beyond the customary settlement period (examples: when issued, delayed delivery, forward commitment, or TBA transactions) consistent with the Fund’s ability to manage its investment portfolio and meet redemption requests. These transactions involve a commitment by the Fund to purchase or deliver securities for a predetermined price or yield with payment and delivery taking
55
Notes to financial statements
Delaware Strategic Income Fund
1. Significant Accounting Policies (continued)
place more than three days in the future, or after a period longer than the customary settlement period for that type of security. No interest will be earned by the Fund on such purchases until the securities are delivered or transaction is completed; however, the market value may change prior to delivery.
Foreign Currency Transactions – Transactions denominated in foreign currencies are recorded at the prevailing exchange rates on the valuation date in accordance with the Fund’s prospectus. The value of all assets and liabilities denominated in foreign currencies is translated daily into US dollars at the exchange rate of such currencies against the US dollar. Transaction gains or losses resulting from changes in exchange rates during the reporting period or upon settlement of the foreign currency transaction are reported in operations for the current period. The Fund generally bifurcates that portion of realized gains and losses on investments in debt securities which is due to changes in foreign exchange rates from that which is due to changes in market prices of debt securities. That portion of gains (losses), which is due to changes in foreign exchange rates, is included on the “Statement of operations” under “Net realized gain (loss) on foreign currencies.” The Fund reports certain foreign currency related transactions as components of realized gains (losses) for financial reporting purposes, whereas such components are treated as ordinary income (loss) for federal income tax purposes.
Use of Estimates – The Fund is an investment company, whose financial statements are prepared in conformity with US GAAP. Therefore, the Fund follows the accounting and reporting guidelines for investment companies. The preparation of financial statements in conformity with US GAAP requires management to make estimates and assumptions that affect the fair value of investments, the reported amounts of assets and liabilities and disclosure of contingent assets and liabilities at the date of the financial statements, and the reported amounts of revenues and expenses during the reporting period. Actual results could differ from those estimates and the differences could be material.
Other – Expenses directly attributable to the Fund are charged directly to the Fund. Other expenses common to various funds within the Delaware Funds® by Macquarie (Delaware Funds) are generally allocated among such funds on the basis of average net assets. Management fees and certain other expenses are paid monthly. Security transactions are recorded on the date the securities are purchased or sold (trade date) for financial reporting purposes. Costs used in calculating realized gains and losses on the sale of investment securities are those of the specific securities sold. Dividend income is recorded on the ex-dividend date and interest income is recorded on the accrual basis. Discounts and premiums on debt securities are accreted or amortized to interest income, respectively, over the lives of the respective securities using the effective interest method. Realized gains (losses) on paydowns of asset- and mortgage-backed securities are classified as interest income. Withholding taxes and reclaims on foreign dividends and interest have been recorded in accordance with the Fund’s understanding of the applicable country’s tax rules and rates. The Fund may pay foreign capital gains taxes on certain foreign securities held, which are reported as components of realized losses for financial reporting purposes, whereas such components are treated as ordinary loss for federal income tax purposes. The Fund declares dividends daily from net investment income and pays the dividends monthly and declares and pays distributions from net realized gain on investments, if any, annually. The Fund may distribute more frequently, if necessary for tax purposes. Dividends and distributions, if any, are recorded on the ex-dividend date.
56
The Fund receives earnings credits from its custodian when positive cash balances are maintained, which may be used to offset custody fees. The expense paid under this arrangement is included on the “Statement of operations” under “Custodian fees” with the corresponding expense offset included under “Less expenses paid indirectly.” For the year ended July 31, 2018, the Fund earned $717 under this agreement.
The Fund receives earnings credits from its transfer agent when positive cash balances are maintained, which may be used to offset transfer agent fees. If the amount earned is greater than $1, the expense paid under this arrangement is included on the “Statement of operations” under “Dividend disbursing and transfer agent fees and expenses” with the corresponding expense offset included under “Less expense paid indirectly.” For the year ended July 31, 2018, the Fund earned $228 under this arrangement.
2. Investment Management, Administration Agreements, and Other Transactions with Affiliates
In accordance with the terms of its investment management agreement, the Fund pays Delaware Management Company (DMC), a series of Macquarie Investment Management Business Trust, and the investment manager, an annual fee which is calculated daily and paid monthly at the rate of 0.55% on the first $500 million of average daily net assets of the Fund, 0.50% on the next $500 million, 0.45% on the next $1.5 billion, and 0.425% on average daily net assets in excess of $2.5 billion.
Effective April 1, 2018, DMC has contractually agreed to waive all or a portion of its investment advisory fees and/or pay/reimburse expenses (excluding any distribution and service (12b-1) fees, acquired fund fees and expenses, taxes, interest, short sale dividend and interest expenses, brokerage fees, certain insurance costs, and nonroutine expenses or costs, including, but not limited to, those relating to reorganizations, litigation, conducting shareholder meetings, and liquidations (collectively, nonroutine expenses)), in order to prevent total annual operating expenses from exceeding 0.59% of the Fund’s average daily net assets. Prior to April 1, 2018, DMC had contractually agreed to waive its investment advisory fees to ensure total annual operating expenses did not exceed 0.65% of the Fund’s average daily net assets. The expense waivers were in effect from Aug. 1, 2017 through July 31, 2018.* These waivers and reimbursements may only be terminated by agreement of DMC and the Fund. The waivers and reimbursements are accrued daily and received monthly.
Delaware Investments Fund Services Company (DIFSC), an affiliate of DMC, provides fund accounting and financial administration oversight services to the Fund. For these services, DIFSC’s fees were calculated daily and paid monthly based on the aggregate daily net assets of all funds within the Delaware Funds from Aug. 1, 2017 through Aug. 31, 2017 at the following annual rate: 0.0050% of the first $30 billion; 0.0045% of the next $10 billion; 0.0040% of the next $10 billion; and 0.0025% of aggregate average daily net assets in excess of $50 billion. The fees payable to DIFSC under the service agreement described above were allocated among all funds in the Delaware Funds on a relative net asset value (NAV) basis. Effective Sept. 1, 2017, the Fund as well as the other Delaware Funds entered into an amendment to the DIFSC agreement. DIFSC’s fees are calculated daily and paid monthly based on the aggregate daily net assets of all funds within the Delaware Funds at the following annual rate: 0.00475% of the first $35 billion; 0.0040% of the next $10 billion; and 0.0025% of aggregate average daily net assets in excess of $45 billion (Total Fee). Each Fund in the Delaware Funds pays a minimum of $4,000, which, in aggregate, is subtracted from the Total Fee. Each Fund then pays its portion of the
57
Notes to financial statements
Delaware Strategic Income Fund
2. Investment Management, Administration Agreements, and Other Transactions with Affiliates (continued)
remainder of the Total Fee on a relative NAV basis. For the year ended July 31, 2018, the Fund was charged $6,691 for these services. This amount is included on the “Statement of operations” under “Accounting and administration expenses.”
DIFSC is also the transfer agent and dividend disbursing agent of the Fund. For these services, DIFSC’s fees were calculated daily and paid monthly based on the aggregate daily net assets of the retail funds within the Delaware Funds from Aug. 1, 2017 through June 30, 2018 at the following annual rate: 0.025% of the first $20 billion; 0.020% of the next $5 billion; 0.015% of the next $5 billion; and 0.013% of average daily net assets in excess of $30 billion. Effective July 1, 2018, the Fund as well as the other Delaware Funds entered into an amendment to the DIFSC agreement. Under the amendment to the DIFSC agreement, DIFSC’s fees are calculated daily and paid monthly based on the aggregate daily net assets of the retail funds within the Delaware Funds at the following annual rate: 0.014% of the first $20 billion; 0.011% of the next $5 billion; 0.007% of the next $5 billion; 0.005% of the next $20 billion; and 0.0025% of average daily nets assets in excess of $50 billion. The fees payable to DIFSC under the transfer agent agreement described above are allocated among all retail funds in the Delaware Funds on a relative NAV basis. This amount is included on the “Statement of operations” under “Dividend disbursing and transfer agent fees and expenses.” For the year ended July 31, 2018, the Fund was charged $15,307 for these services. Pursuant to a sub-transfer agency agreement between DIFSC and BNY Mellon Investment Servicing (US) Inc. (BNYMIS), BNYMIS provides certain sub-transfer agency services to the Fund. Sub-transfer agency fees are paid by the Fund and are also included on the “Statement of operations” under “Dividend disbursing and transfer agent fees and expenses.”
Pursuant to a distribution agreement and distribution plan, the Fund pays DDLP, the distributor and an affiliate of DMC, annual 12b-1 fees of 0.25% of the average daily net assets of the Class A shares, 1.00% of the average daily net assets of the Class C shares, and 0.50% of the average daily net assets of the Class R shares. The Board has adopted a formula for calculating 12b-1 fees for the Fund’s Class A shares that went into effect on June 1, 1992. The Fund’s Class A shares are currently subject to a blended 12b-1 fees equal to the sum of: (i) 0.10% of the average daily net assets representing shares acquired prior to June 1, 1992, and (ii) 0.25% of the average daily net assets representing shares acquired on or after June 1, 1992. All Class A shareholders currently bear 12b-1 fees at the same, blended rate currently 0.25% of the average daily net assets based on the formula described above. This method of calculating Class A 12b-1 fees may be discontinued at the sole discretion of the Board. Institutional Class shares pay no 12b-1 fees.
As provided in the investment management agreement, the Fund bears a portion of the cost of certain resources shared with DMC, including the cost of internal personnel of DMC and/or its affiliates that provide legal, tax, and regulatory reporting services to the Fund. For the year ended July 31, 2018, the Fund was charged $2,247 for internal legal, tax, and regulatory reporting services provided by DMC and/or its affiliates’ employees. This amount is included on the “Statement of operations” under “Legal fees.”
For the year ended July 31, 2018, DDLP earned $1,344 for commissions on sales of the Fund’s Class A shares. For the year ended July 31, 2018, DDLP received gross CDSC commissions of $97 on
58
redemptions of the Fund’s Class C shares and these commissions were entirely used to offset upfront commissions previously paid by DDLP to broker/dealers on sales of those shares.
Trustees’ fees include expenses accrued by the Fund for each Trustee’s retainer and meeting fees. Certain officers of DMC, DIFSC, and DDLP are officers and/or Trustees of the Trust. These officers and Trustees are paid no compensation by the Fund.
Cross trades for the year ended July 31, 2018 were executed by the Fund pursuant to procedures adopted by the Board designed to ensure compliance with Rule 17a-7 under the 1940 Act. Cross trading is the buying or selling of portfolio securities between funds of investment companies, or between a fund of an investment company and another entity, that are or could be considered affiliates by virtue of having a common investment advisor (or affiliated investment advisors), common directors/trustees and/or common officers. At its regularly scheduled meetings, the Board reviews such transactions for compliance with the procedures adopted by the Board. Pursuant to these procedures, for the year ended July 31, 2018, the Fund engaged in Rule 17a-7 securities purchases of $154,925 and Rule 17a-7 securities sales of $1,959,993, which resulted in net realized gains of $43,030.
*The aggregate contractual waiver period covering this report is from Nov. 28, 2016, through April 1, 2019.
3. Investments
For the year ended July 31, 2018, the Fund made purchases and sales of investment securities other than short-term investments as follows:
| | | | |
Purchases other than US government securities | | $ | 71,058,881 | |
Purchases of US government securities | | | 24,740,801 | |
Sales other than US government securities | | | 92,484,127 | |
Sales of US government securities | | | 24,991,849 | |
The tax cost of investments includes adjustments to net unrealized appreciation (depreciation) which may not necessarily be final tax cost basis adjustments, but approximate the tax basis unrealized gains and losses that may be realized and distributed to shareholders. At July 31, 2018, the cost and unrealized appreciation (depreciation) of investments and derivatives for federal income tax purposes for the Fund were as follows:
| | | | |
Cost of investments and derivatives | | $ | 71,289,508 | |
| | | | |
Aggregate unrealized appreciation of investments and derivatives | | $ | 1,002,648 | |
Aggregate unrealized depreciation of investments and derivatives | | | (2,316,197 | ) |
| | | | |
Net unrealized depreciation of investments and derivatives | | $ | (1,313,549 | ) |
| | | | |
US GAAP defines fair value as the price that the Fund would receive to sell an asset or pay to transfer a liability in an orderly transaction between market participants at the measurement date under current market conditions. A three-level hierarchy for fair value measurements has been established based upon the transparency of inputs to the valuation of an asset or liability. Inputs may be observable or unobservable and refer broadly to the assumptions that market participants would use in pricing the asset or liability. Observable inputs reflect the assumptions market participants would use in pricing the asset or liability based on market data obtained from sources independent of the reporting entity.
59
Notes to financial statements
Delaware Strategic Income Fund
3. Investments (continued)
Unobservable inputs reflect the reporting entity’s own assumptions about the assumptions that market participants would use in pricing the asset or liability based on the best information available under the circumstances. The Fund’s investment in its entirety is assigned a level based upon the observability of the inputs which are significant to the overall valuation. The three-level hierarchy of inputs is summarized below, and on the next page.
|
Level 1 – Inputs are quoted prices in active markets for identical investments. (Examples: equity securities, open-end investment companies, futures contracts, exchange-traded options contracts) |
|
Level 2 – Other observable inputs, including, but not limited to: quoted prices for similar assets or liabilities in markets that are active, quoted prices for identical or similar assets or liabilities in markets that are not active, inputs other than quoted prices that are observable for the assets or liabilities (such as interest rates, yield curves, volatilities, prepayment speeds, loss severities, credit risks, and default rates), or other market-corroborated inputs. (Examples: debt securities, government securities, swap contracts, foreign currency exchange contracts, foreign securities utilizing international fair value pricing, broker-quoted securities, fair valued securities) |
|
Level 3 – Significant unobservable inputs, including the Fund’s own assumptions used to determine the fair value of investments. (Examples: broker-quoted securities, fair valued securities) |
Level 3 investments are valued using significant unobservable inputs. The Fund may also use an income-based valuation approach in which the anticipated future cash flows of the investment are discounted to calculate fair value. Discounts may also be applied due to the nature or duration of any restrictions on the disposition of the investments. Valuations may also be based upon current market prices of securities that are comparable in coupon, rating, maturity, and industry. The derived value of a Level 3 investment may not represent the value which is received upon disposition and this could impact the results of operations.
60
The following table summarizes the valuation of the Fund’s investments by fair value hierarchy levels as of July 31, 2018:
| | | | | | | | | | | | | | | | |
| | | Level 1 | | | Level 2 | | | Level 3 | | | Total | |
Securities | | | | | | | | | | | | | | | | |
Assets: | | | | | | | | | | | | | | | | |
Agency, Asset- & Mortgage-Backed Securities | | $ | — | | | $ | 18,618,396 | | | $ | — | | | $ | 18,618,396 | |
Corporate Debt | | | — | | | | 39,135,993 | | | | — | | | | 39,135,993 | |
Municipal Bonds | | | — | | | | 2,287,881 | | | | — | | | | 2,287,881 | |
Foreign Bonds | | | — | | | | 2,418,758 | | | | — | | | | 2,418,758 | |
Loan Agreements1 | | | — | | | | 2,053,898 | | | | 201,750 | | | | 2,255,648 | |
US Treasury Obligation | | | — | | | | 3,246,416 | | | | — | | | | 3,246,416 | |
Convertible Preferred Stock | | | 17,766 | | | | — | | | | — | | | | 17,766 | |
Preferred Stock1 | | | 320,845 | | | | 539,545 | | | | — | | | | 860,390 | |
Short-Term Investments | | | — | | | | 959,000 | | | | — | | | | 959,000 | |
Options Purchased | | | — | | | | 74,016 | | | | — | | | | 74,016 | |
| | | | | | | | | | | | | | | | |
Total Value of Securities | | $ | 338,611 | | | $ | 69,333,903 | | | $ | 201,750 | | | $ | 69,874,264 | |
| | | | | | | | | | | | | | | | |
Derivatives2 | | | | | | | | | | | | | | | | |
Assets: | | | | | | | | | | | | | | | | |
Foreign Currency Exchange Contracts | | $ | — | | | $ | 2,419 | | | $ | — | | | $ | 2,419 | |
Futures Contracts | | | 111,896 | | | | — | | | | — | | | | 111,896 | |
Swap Contracts | | | — | | | | 744 | | | | — | | | | 744 | |
Liabilities: | | | | | | | | | | | | | | | | |
Foreign Currency Exchange Contracts | | | — | | | | (999 | ) | | | — | | | | (999 | ) |
Swap Contracts | | | — | | | | (12,365 | ) | | | — | | | | (12,365 | ) |
1Security type is valued across multiple levels. Level 1 investments represent exchange-traded investments, Level 2 investments represent investments with observable inputs or matrix-priced investments and Level 3 investments represent investments without observable inputs. The amounts attributed to Level 1 investments, Level 2 investments, and Level 3 investments represent the following percentages of the total market value of these security types:
| | | | | | | | | | | | | | | | |
| | | Level 1 | | | Level 2 | | | Level 3 | | | Total | |
Loan Agreements | | | — | | | | 91.06 | % | | | 8.94 | % | | | 100.00 | % |
Preferred Stock | | | 37.29 | % | | | 62.71 | % | | | — | | | | 100.00 | % |
2Foreign currency exchange contracts, futures contracts and swap contracts are valued at the unrealized appreciation (depreciation) on the instrument at the year end.
During the year ended July 31, 2018, there were no transfers between Level 1 investments, Level 2 investments, or Level 3 investments that had a significant impact to the Fund. The Fund’s policy is to recognize transfers between levels based on fair value at the beginning of the reporting period.
61
Notes to financial statements
Delaware Strategic Income Fund
3. Investments (continued)
A reconciliation of Level 3 investments is presented when the Fund has a significant amount of Level 3 investments at the beginning, interim, or end of the year in relation to the Fund’s net assets. Management has determined not to provide a reconciliation of Level 3 investments as they were not considered significant to the Fund’s net assets at the beginning, interim, or end of the year. Management has determined not to provide additional disclosure on Level 3 inputs since the Level 3 investments were not considered significant to the Fund’s net assets at the end of the year.
4. Dividend and Distribution Information
Income and long-term capital gain distributions are determined in accordance with federal income tax regulations, which may differ from US GAAP. Additionally, distributions from net gains on foreign currency transactions and net short-term gains on sales of investment securities are treated as ordinary income for federal income tax purposes. The tax character of dividends and distributions paid during the years ended July 31, 2018 and 2017 was as follows:
| | | | | | | | |
| | | Year ended | |
| | | 7/31/18 | | | 7/31/17 | |
Ordinary income | | $ | 3,126,642 | | | $ | 4,134,060 | |
Return of capital | | | 229,661 | | | | — | |
| | | | | | | | |
Total | | $ | 3,356,303 | | | $ | 4,134,060 | |
| | | | | | | | |
5. Components of Net Assets on a Tax Basis
As of July 31, 2018, the components of net assets on a tax basis were as follows:
| | | | |
Shares of beneficial interest | | $ | 75,523,385 | |
Distributions payable | | | (71,106 | ) |
Troubled debt litigation | | | (228,366 | ) |
Capital loss carryforwards | | | (3,802,273 | ) |
Qualified late year loss deferrals | | | (121,552 | ) |
Unrealized depreciation of investments, foreign currencies and derivatives | | | (1,313,549 | ) |
| | | | |
Net assets | | $ | 69,986,539 | |
| | | | |
The differences between book basis and tax basis components of net assets are primarily attributable to tax deferral of losses on wash sales, mark-to-market of futures contracts, mark-to-market on foreign currency exchange contracts, tax treatment of market discount and premium on debt instruments, and mark-to-market of CDS contracts.
For financial reporting purposes, capital accounts are adjusted to reflect the tax character of permanent book/tax differences. Reclassifications are primarily due to foreign capital gains tax, tax treatment of gain (loss) on foreign currency transactions, market discount and premium on debt instruments, paydowns of asset- and mortgage-backed securities, contingent payment debt instruments, and CDS contracts. Results of operations and net assets were not affected by these reclassifications. For the year ended July 31, 2018, the Fund recorded the following reclassifications:
| | | | |
Distributions in excess of net investment income | | $ | 25,760 | |
Accumulated net realized loss | | | (25,760 | ) |
62
Under the Regulated Investment Company Modernization Act of 2010 (Act), net capital losses recognized for tax years beginning after Dec. 22, 2010 may be carried forward indefinitely, and their character is retained as short-term and/or long-term losses. At July 31, 2018, capital loss carryforwards available to offset future realized capital gains as follows:
| | | | | | | | |
| | | No Expiration | |
| | | Loss carryforward character | |
| | |
| | | Short-term | | | Long-term | |
| | $ | 2,426,355 | | | $ | 1,375,918 | |
6. Capital Shares
Transactions in capital shares were as follows:
| | | | | | | | |
| | | Year ended | |
| | | 7/31/18 | | | 7/31/17 | |
Shares sold: | | | | | | | | |
Class A | | | 328,331 | | | | 763,586 | |
Class C | | | 81,220 | | | | 153,560 | |
Class R | | | 54,141 | | | | 82,402 | |
Institutional Class | | | 2,037,509 | | | | 2,624,716 | |
| | |
Shares issued upon reinvestment of dividends and distributions: | | | | | | | | |
Class A | | | 185,008 | | | | 225,335 | |
Class C | | | 19,434 | | | | 22,672 | |
Class R | | | 23,367 | | | | 24,712 | |
Institutional Class | | | 160,626 | | | | 189,351 | |
| | | | | | | | |
| | | 2,889,636 | | | | 4,086,334 | |
| | | | | | | | |
| | |
Shares redeemed: | | | | | | | | |
Class A | | | (2,369,305 | ) | | | (3,009,513 | ) |
Class C | | | (263,863 | ) | | | (688,622 | ) |
Class R | | | (225,963 | ) | | | (218,457 | ) |
Institutional Class | | | (2,676,815 | ) | | | (4,866,090 | ) |
| | | | | | | | |
| | | (5,535,946 | ) | | | (8,782,682 | ) |
| | | | | | | | |
Net decrease | | | (2,646,310 | ) | | | (4,696,348 | ) |
| | | | | | | | |
63
Notes to financial statements
Delaware Strategic Income Fund
6. Capital Shares (continued)
Certain shareholders may exchange shares of one class for shares of another class in the same Fund. These exchange transactions are included as subscriptions and redemptions in the tables on the previous page and on the “Statements of changes in net assets.” For the years ended July 31, 2018 and 2017, the Fund had the following exchange transactions.
| | | | | | | | | | | | | | | | | | | | |
| | | Exchange Redemptions | | | Exchange Subscriptions | | | | |
| | | Class A
Shares | | | Class C
Shares | | | Class A
Shares | | | Institutional
Class
Shares | | | Value | |
Year ended 7/31/18 | | | 3,757 | | | | 24,406 | | | | 24,485 | | | | 3,756 | | | $ | 226,490 | |
Year ended 7/31/17 | | | 71,413 | | | | — | | | | — | | | | 71,479 | | | | 591,575 | |
7. Line of Credit
The Fund, along with certain other funds in the Delaware Funds (Participants), was a participant in a $155,000,000 revolving line of credit intended to be used for temporary or emergency purposes as an additional source of liquidity to fund redemptions of investor shares. Under the agreement, the Participants were charged an annual commitment fee of 0.15%, which was generally allocated across the Participants based on a weighted average of the respective net assets of each Participant. The Participants were permitted to borrow up to a maximum of one-third of their net assets under the agreement. Each Participant was individually, and not jointly, liable for its particular advances, if any, under the line of credit. The line of credit available under the agreement expired on Nov. 6, 2017.
On Nov. 6, 2017, the Fund, along with the other Participants, entered into an amendment to the agreement for a $155,000,000 revolving line of credit. The line of credit is to be used as described above and operates in substantially the same manner as the original agreement. The line of credit available under the agreement expires on Nov. 5, 2018.
The Fund had no amounts outstanding as of July 31, 2018, or at any time during the year then ended.
8. Derivatives
US GAAP requires disclosures that enable investors to understand: 1) how and why an entity uses derivatives; 2) how they are accounted for; and 3) how they affect an entity’s results of operations and financial position.
Foreign Currency Exchange Contracts – The Fund may enter into foreign currency exchange contracts and foreign cross currency exchange contracts as a way of managing foreign exchange rate risk. The Fund may enter into these contracts to fix the US dollar value of securities that it has agreed to buy or sell for the period between the date the trade was entered into and the date the security is delivered and paid for. The Fund may also use these contracts to hedge the US dollar value of securities it already owns that are denominated in foreign currencies. In addition, the Fund may enter into these contracts to facilitate or expedite the settlement of portfolio transactions. The change in value is recorded as an unrealized gain or loss. When the contract is closed, a realized gain or loss is recorded
64
equal to the difference between the value of the contract at the time it was opened and the value at the time it was closed.
The use of foreign currency exchange contracts and foreign cross currency exchange contracts does not eliminate fluctuations in the underlying prices of the securities, but does establish a rate of exchange that can be achieved in the future. Although foreign currency exchange contracts and foreign cross currency exchange contracts limit the risk of loss due to an unfavorable change in the value of the hedged currency, they also limit any potential gain that might result should the value of the currency change favorably. In addition, the Fund could be exposed to risks if the counterparties to the contracts are unable to meet the terms of their contracts. The Fund’s maximum risk of loss from counterparty credit risk is the value of its currency exchanged with the counterparty. The risk is generally mitigated by having a netting arrangement between the Fund and the counterparty and by the posting of collateral by the counterparty to the Fund to cover the Fund’s exposure to the counterparty.
During the year ended July 31, 2018, the Fund used foreign currency exchange contracts to hedge the US dollar value of securities it already owned that were denominated in foreign currencies.
Futures Contracts – A futures contract is an agreement in which the writer (or seller) of the contract agrees to deliver to the buyer an amount of cash or securities equal to a specific dollar amount times the difference between the value of a specific security or index at the close of the last trading day of the contract and the price at which the agreement is made. The Fund may use futures contracts in the normal course of pursuing its investment objective. The Fund may invest in futures contracts to hedge its existing portfolio securities against fluctuations in value caused by changes in interest rates or market conditions. Upon entering into a futures contract, the Fund deposits cash or pledges US government securities to a broker, equal to the minimum “initial margin” requirements of the exchange on which the contract is traded. Subsequent payments are received from the broker or paid to the broker each day, based on the daily fluctuation in the market value of the contract. These receipts or payments are known as “variation margin” and are recorded daily by the Fund as unrealized gains or losses until the contracts are closed. When the contracts are closed, the Fund records a realized gain or loss equal to the difference between the value of the contract at the time it was opened and the value at the time it was closed. Risks of entering into futures contracts include potential imperfect correlation between the futures contracts and the underlying securities and the possibility of an illiquid secondary market for these instruments. When investing in futures, there is reduced counterparty credit risk to the Fund because futures are exchange-traded and the exchange’s clearinghouse, as counterparty to all exchange-traded futures, guarantees against default. At July 31, 2018, the Fund posted $90,000 in cash as collateral for open futures contracts, which is presented as “Cash collateral due from brokers” on the “Statement of assets and liabilities.”
During the year ended July 31, 2018, the Fund used futures contracts to hedge the Fund’s existing portfolio securities against fluctuations in value caused by changes in interest rates or market conditions and to facilitate investments in portfolio securities.
Options Contracts – The Fund may enter into options contracts in the normal course of pursuing its investment objective. The Fund may buy or write options contracts for any number of reasons, including without limitation: to manage the Fund’s exposure to changes in securities prices caused by interest rates or market conditions and foreign currencies; as an efficient means of adjusting the Fund’s overall
65
Notes to financial statements
Delaware Strategic Income Fund
8. Derivatives (continued)
exposure to certain markets; to protect the value of portfolio securities; and as a cash management tool. The Fund may buy or write call or put options on securities, futures, swaps, swaptions, financial indices, and foreign currencies. When the Fund buys an option, a premium is paid and an asset is recorded and adjusted on a daily basis to reflect the current market value of the option purchased. When the Fund writes an option, a premium is received and a liability is recorded and adjusted on a daily basis to reflect the current market value of the option written. Premiums received from writing options that expire unexercised are treated by the Fund on the expiration date as realized gains. The difference between the premium received and the amount paid on effecting a closing purchase transaction, including brokerage commissions, is treated as realized gain or loss. If a call option is exercised, the premium is added to the proceeds from the sale of the underlying security in determining whether the Fund has a realized gain or loss. If a put option is exercised, the premium reduces the cost basis of the securities purchased by the Fund. The Fund, as writer of an option, bears the market risk of an unfavorable change in the price of the security underlying the written option. When writing options, the Fund is subject to minimal counterparty risk because the counterparty is only obligated to pay premiums and does not bear the market risk of an unfavorable market change.
During the year ended July 31, 2018, the Fund used options contracts to manage the Fund’s exposure to changes in securities prices caused by interest rates or market conditions, to manage the Fund’s exposure to changes in foreign currencies, to adjust the Fund’s overall exposure to certain markets, and to protect the value of portfolio securities.
Swap Contracts – The Fund may enter into CDS contracts in the normal course of pursuing its investment objective. The Fund may enter into CDS contracts in order to hedge against a credit event, to enhance total return or to gain exposure to certain securities or markets. The Fund will not be permitted to enter into any swap transactions unless, at the time of entering into such transactions, the unsecured long-term debt of the actual counterparty, combined with any credit enhancements, is rated at least BBB- by Standard & Poor’s Financial Services LLC (S&P) or Baa3 by Moody’s Investors Service, Inc. (Moody’s) or is determined to be of equivalent quality by DMC.
Credit Default Swaps. A CDS contract is a risk-transfer instrument through which one party (purchaser of protection) transfers to another party (seller of protection) the financial risk of a credit event (as defined in the CDS agreement), as it relates to a particular reference security or basket of securities (such as an index). In exchange for the protection offered by the seller of protection, the purchaser of protection agrees to pay the seller of protection a periodic amount at a stated rate that is applied to the notional amount of the CDS contract. In addition, an upfront payment may be made or received by the Fund in connection with an unwinding or assignment of a CDS contract. Upon the occurrence of a credit event, the seller of protection would pay the par (or other agreed-upon) value of the reference security (or basket of securities) to the counterparty. Credit events generally include, among others, bankruptcy, failure to pay, and obligation default.
During the year ended July 31, 2018, the Fund entered into CDS contracts as a purchaser and seller of protection, as a hedge against credit events. Periodic payments (receipts) on such contracts are accrued daily and recorded as unrealized losses (gains) on swap contracts. Upon payment (receipt), such amounts are recorded as realized losses (gains) on swap contracts. Upfront payments made or received
66
in connection with CDS contracts are amortized over the expected life of the CDS contracts as unrealized losses (gains) on swap contracts. The change in value of CDS contracts is recorded daily as unrealized appreciation or depreciation. A realized gain or loss is recorded upon a credit event (as defined in the CDS agreement) or the maturity or termination of the agreement. Initial margin and variation margin are posted to central counterparties for centrally cleared CDS basket trades, as determined by the applicable central counterparty.
As disclosed in the footnotes to the “Schedule of investments” at July 31, 2018, the notional amount of the protection sold was $460,000, which reflects the maximum potential amount the Fund would have been required to make as a seller of credit protection if a credit event had occurred. In addition to serving as the source of the current value of the securities, the quoted market prices and resulting market values for credit default swap agreements on securities and credit indices serve as an indicator of the current status of the payment/performance risk and represent the likelihood of an expected liability (or profit) for the credit derivative if the swap agreement has been closed/sold as of the period end. Increasing market values, in absolute terms when compared to the notional amount of the swap, represent a deterioration of the reference entity’s credit soundness and a greater likelihood of risk of default or other credit event occurring as defined under the terms of the agreement. At July 31, 2018, there were no recourse provisions with third parties to recover any amounts paid under the credit derivative agreement (including any purchased credit protection) nor was any collateral held by the Fund and other third parties which the Fund can obtain in the occurrence of a credit event. At July 31, 2018, net unrealized appreciation of the protection sold was $744.
CDS contracts may involve greater risks than if the Fund had invested in the reference obligation directly. CDS contracts are subject to general market risk, liquidity risk, counterparty risk, and credit risk. The Fund’s maximum risk of loss from counterparty credit risk, either as the seller of protection or the buyer of protection, is the fair value of the contract. This risk is mitigated by (1) for bilateral swap contracts, having a netting arrangement between the Fund and the counterparty and by the posting of collateral by the counterparty to the Fund to cover the Fund’s exposure to the counterparty, and (2) for cleared swaps, trading these instruments through a central counterparty.
During the year ended July 31, 2018, the Fund used CDS contracts to hedge against credit events, and to gain exposure to certain securities or markets.
Swaps Generally. The value of open swaps may differ from that which would be realized in the event the Fund terminated its position in the contract on a given day. Risks of entering into these contracts include the potential inability of the counterparty to meet the terms of the contracts. This type of risk is generally limited to the amount of favorable movement in the value of the underlying security, instrument, or basket of instruments, if any, at the day of default. Risks also arise from potential losses from adverse market movements and such losses could exceed the unrealized amounts shown on the “Schedule of investments.” For centrally cleared swaps, payments are received from the broker or paid to the broker each day, based on the daily fluctuation in the market value of the contract. These receipts or payments are known as “variation margin” and are recorded by the Fund as unrealized gains or losses until the contracts are closed. When the contracts are closed, the Fund records a realized gain or loss equal to the difference between the value of the contract at the time it was opened and the value at the time it was closed.
67
Notes to financial statements
Delaware Strategic Income Fund
8. Derivatives (continued)
At July 31, 2018, the Fund posted $44,770 in cash as collateral for open centrally cleared swap contracts which is included in “Cash collateral due from brokers” on the “Statement of assets and liabilities.”
Fair values of derivative instruments as of July 31, 2018 was as follows:
| | | | | | | | | | | | | | | | |
| | | | | | Asset Derivatives Fair Value | | | | |
Statement of Assets and Liabilities Location | | Currency
Contracts | | | Interest Rate
Contracts | | | Credit
Contracts | | | Total | |
Unrealized appreciation on foreign currency exchange contracts | | $ | 2,419 | | | $ | — | | | $ | — | | | $ | 2,419 | |
Variation margin due to broker on futures contracts* | | | — | | | | 111,896 | | | | — | | | | 111,896 | |
Unrealized appreciation on credit default swap contracts | | | — | | | | — | | | | 744 | | | | 744 | |
Options purchased, at value | | | — | | | | 74,016 | | | | — | | | | 74,016 | |
| | | | | | | | | | | | | | | | |
Total | | $ | 2,419 | | | $ | 185,912 | | | $ | 744 | | | $ | 189,075 | |
| | | | | | | | | | | | | | | | |
Fair values of derivative instruments as of July 31, 2018 was as follows:
| | | | | | | | | | | | |
| | | Liability Derivatives Fair Value | |
Statement of Assets and Liabilities Location | | Currency
Contracts | | | Credit
Contracts | | | Total | |
Unrealized depreciation on foreign currency exchange contracts | | $ | 999 | | | $ | — | | | $ | 999 | |
Variation margin due to broker on centrally cleared credit default swap contracts** | | | — | | | | 12,365 | | | | 12,365 | |
| | | | | | | | | | | | |
Total | | $ | 999 | | | $ | 12,365 | | | $ | 13,364 | |
| | | | | | | | | | | | |
*Includes cumulative appreciation (depreciation) of futures contracts from the date the contracts were opened through July 31, 2018. Only current day variation margin is reported on the Fund’s “Statement of assets and liabilities.”
**Includes cumulative appreciation (depreciation) of centrally cleared credit default swap contracts from the date the contracts were opened through July 31, 2018. Only current day variation margin is reported on the “Statement of assets and liabilities.”
68
The effect of derivative instruments on the “Statement of operations” for the year ended July 31, 2018 was as follows:
| | | | | | | | | | | | | | | | | | | | | | | | |
| | | Net Realized Gain (Loss) on: | |
| | | Foreign
Currency
Exchange
Contracts | | | Futures
Contracts | | | Options
Written | | | Options
Purchased | | | Swap
Contracts | | | Total | |
Currency contracts | | $ | (42,018 | ) | | $ | — | | | $ | — | | | $ | (13,740 | ) | | $ | — | | | $ | (55,758 | ) |
Interest rate contracts | | | — | | | | 81,745 | | | | 6,406 | | | | 5,752 | | | | | | | | 93,903 | |
Credit contracts | | | — | | | | — | | | | — | | | | — | | | | (192,642 | ) | | | (192,642 | ) |
| | | | | | | | | | | | | | | | | | | | | | | | |
Total | | $ | (42,018 | ) | | $ | 81,745 | | | $ | 6,406 | | | $ | (7,988 | ) | | $ | (192,642 | ) | | $ | (154,497 | ) |
| | | | | | | | | | | | | | | | | | | | | | | | |
| | | | | | | | | | | | | | | | | | | | |
| |
| | | Net Change in Unrealized Appreciation (Depreciation) of: | |
| | | Foreign
Currency
Exchange
Contracts | | | Futures
Contracts | | | Options
Purchased | | | Swap
Contracts | | | Total | |
Currency contracts | | $ | (4,952 | ) | | $ | — | | | $ | 18,271 | | | $ | — | | | $ | 13,319 | |
Interest rate contracts | | | — | | | | 64,097 | | | | — | | | | — | | | | 64,097 | |
Credit contracts | | | — | | | | — | | | | — | | | | (17,234 | ) | | | (17,234 | ) |
| | | | | | | | | | | | | | | | | | | | |
Total | | $ | (4,952 | ) | | $ | 64,097 | | | $ | 18,271 | | | $ | (17,234 | ) | | $ | 60,182 | |
| | | | | | | | | | | | | | | | | | | | |
Derivatives Generally. The table below summarizes the average balance of derivative holdings by the Fund during the year ended July 31, 2018:
| | | | | | | | | | | | | | | | |
| | | | | | Long
Derivative
Volume | | | | | | Short
Derivative
Volume | |
Foreign currency exchange contracts (average cost) | | | USD | | | | 592,580 | | | | USD | | | | 286,966 | |
Futures contracts (average notional value) | | | | | | | 743,074 | | | | | | | | 8,199,152 | |
Options contracts (average value) | | | | | | | 4,811 | | | | | | | | 40 | |
CDS contracts (average notional value)* | | | | | | | 2,340,288 | | | | | | | | 458,095 | |
*Long represents buying protection and short represents selling protection.
9. Offsetting
The Fund entered into an International Swaps and Derivatives Association, Inc. Master Agreement (ISDA Master Agreement) or a similar agreement with certain of its derivative contract counterparties in order to better define its contractual rights and to secure rights that will help the Fund mitigate its counterparty risk. An ISDA Master Agreement is a bilateral agreement between the Fund and a counterparty that governs over-the-counter (OTC) derivatives and foreign exchange contracts and typically contains, among other things, collateral posting items and netting provisions in the event of a default and/or termination event. Under an ISDA Master Agreement, the Fund may, under certain circumstances, offset with the counterparty certain derivative financial instruments’ payables and/or receivables with collateral held and/or posted and create one single net payment. The provisions of the ISDA Master Agreement typically permit a single net payment in the event of default (close-out), including the bankruptcy or
69
Notes to financial statements
Delaware Strategic Income Fund
9. Offsetting (continued)
insolvency of the counterparty. However, bankruptcy or insolvency laws of a particular jurisdiction may impose restrictions on or prohibitions against the right of offset in bankruptcy, insolvency, or other events.
For financial reporting purposes, the Fund does not offset derivative assets and derivative liabilities that are subject to netting arrangements on the “Statement of assets and liabilities.”
At July 31, 2018, the Fund had the following assets and liabilities subject to offsetting provisions:
Offsetting of Financial Assets and Liabilities and Derivative Assets and Liabilities
| | | | | | | | | | | | | | | |
Counterparty | | Gross Value of
Derivative Asset | | Gross Value of
Derivative Liability | | Net Position |
Bank of America Merrill Lynch | | | $ | 1,926 | | | | $ | (2,545 | ) | | | $ | (619 | ) |
BNP Paribas | | | | 280 | | | | | — | | | | | 280 | |
Citigroup Global Markets | | | | 15,769 | | | | | — | | | | | 15,769 | |
Hong Kong Shanghai Bank | | | | 819 | | | | | — | | | | | 819 | |
Morgan Stanley Capital | | | | 744 | | | | | — | | | | | 744 | |
| | | | | | | | | | | | | | | |
Total | | | $ | 19,538 | | | | $ | (2,545 | ) | | | $ | 16,993 | |
| | | | | | | | | | | | | | | |
Offsetting of Financial Assets and Liabilities and Derivative Assets and Liabilities (continued)
| | | | | | | | | | | | | | | | | | | | | | | | | | | | | | |
Counterparty | | Net
Position | | Fair Value of
Non-Cash
Collateral
Received | | Cash
Collateral
Received | | Fair Value of
Non-Cash
Collateral
Pledged | | Cash Collateral
Pledged | | Net
Exposure(a) |
Bank of America Merrill Lynch | | | $ | (619 | ) | | | $ | — | | | | $ | — | | | | $ | — | | | | $ | — | | | | $ | (619 | ) |
BNP Paribas | | | | 280 | | | | | — | | | | | — | | | | | — | | | | | — | | | | | 280 | |
Citigroup Global Markets | | | | 15,769 | | | | | — | | | | | — | | | | | — | | | | | — | | | | | 15,769 | |
Hong Kong Shanghai Bank | | | | 819 | | | | | — | | | | | — | | | | | — | | | | | — | | | | | 819 | |
Morgan Stanley Capital | | | | 744 | | | | | — | | | | | — | | | | | — | | | | | — | | | | | 744 | |
| | | | | | | | | | | | | | | | | | | | | | | | | | | | | | |
Total | | | $ | 16,993 | | | | $ | — | | | | $ | — | | | | $ | — | | | | $ | — | | | | $ | 16,993 | |
| | | | | | | | | | | | | | | | | | | | | | | | | | | | | | |
Master Repurchase Agreements
Repurchase agreements are entered into by the Fund under Master Repurchase Agreements (each, an MRA). The MRA permits the Fund, under certain circumstances including an event of default (such as bankruptcy or insolvency), to offset payables and/or receivables with collateral held by and/or posted to the counterparty. As a result, one single net payment is created. Bankruptcy or insolvency laws of a particular jurisdiction may impose restrictions on or prohibitions against such a right of offset in the event of the MRA counterparty’s bankruptcy or insolvency. Based on the terms of the MRA, the Fund receives securities as collateral with a market value in excess of the repurchase price at maturity. Upon a bankruptcy or insolvency of the MRA counterparty, the Fund would recognize a liability with respect to such excess collateral. The liability reflects the Fund’s obligation under bankruptcy law to return
70
the excess to the counterparty. As of July 31, 2018, the following table is a summary of the Fund’s repurchase agreements by counterparty which are subject to offset under an MRA:
| | | | | | | | | | | | | | | | | | | | | | | | | |
Counterparty | | Repurchase
Agreements | | Fair Value of
Non-Cash
Collateral Received(b) | | Cash Collateral
Received | | Net Collateral
Received | | Net
Exposure(a) |
Bank of America Merrill Lynch | | | $ | 152,418 | | | | $ | (152,418 | ) | | | $ | — | | | | $ | (152,418 | ) | | | $ | — | |
Bank of Montreal | | | | 304,836 | | | | | (304,836 | ) | | | | — | | | | | (304,836 | ) | | | | — | |
BNP Paribas | | | | 501,746 | | | | | (501,746 | ) | | | | — | | | | | (501,746 | ) | | | | — | |
| | | | | | | | | | | | | | | | | | | | | | | | | |
Total | | | $ | 959,000 | | | | $ | (959,000 | ) | | | $ | — | | | | $ | (959,000 | ) | | | $ | — | |
| | | | | | | | | | | | | | | | | | | | | | | | | |
(a)Net exposure represents the receivable (payable) that would be due from (to) the counterparty in the event of default.
(b)The value of the related collateral received exceeded the value of the repurchase agreements as of July 31, 2018.
10. Securities Lending
The Fund, along with other funds in the Delaware Funds, may lend its securities pursuant to a security lending agreement (Lending Agreement) with The Bank of New York Mellon (BNY Mellon). At the time a security is loaned, the borrower must post collateral equal to the required percentage of the market value of the loaned security, including any accrued interest. The required percentage is: (1) 102% with respect to US securities and foreign securities that are denominated and payable in US dollars; and (2) 105% with respect to foreign securities. With respect to each loan, if on any business day, the aggregate market value of securities collateral plus cash collateral held is less than the aggregate market value of the securities which are the subject of such loan, the borrower will be notified to provide additional collateral by the end of the following business day, which, together with the collateral already held, will be not less than the applicable initial collateral requirements for such security loan. If the aggregate market value of securities collateral and cash collateral held with respect to a security loan exceeds the applicable initial collateral requirement, upon request of the borrower, BNY Mellon must return enough collateral to the borrower by the end of the following business day to reduce the value of the remaining collateral to the applicable initial collateral requirement for such security loan. As a result of the foregoing, the value of the collateral held with respect to a loaned security on any particular day may be more or less than the value of the security on loan. The collateral percentage with respect to the market value of the loaned security is determined by the security lending agent.
Cash collateral received by each fund of the Trust is generally invested in a series of individual separate accounts, each corresponding to a fund. The investment guidelines permit each separate account to hold certain securities that would be considered eligible securities for a money market fund. Cash collateral received is generally invested in government securities; certain obligations issued by government sponsored enterprises; repurchase agreements collateralized by US Treasury securities; obligations issued by the central government of any Organization for Economic Cooperation and Development (OECD) country or its agencies, instrumentalities, or establishments; obligations of supranational organizations; commercial paper, notes, bonds, and other debt obligations; certificates of deposit, time deposits, and other bank obligations; and asset-backed securities. A fund can also accept US government securities and letters of credit (non-cash collateral) in connection with securities loans.
71
Notes to financial statements
Delaware Strategic Income Fund
10. Securities Lending (continued)
In the event of default or bankruptcy by the lending agent, realization and/or retention of the collateral may be subject to legal proceedings. In the event the borrower fails to return loaned securities and the collateral received is insufficient to cover the value of the loaned securities and provided such collateral shortfall is not the result of investment losses, the lending agent has agreed to pay the amount of the shortfall to the Fund or, at the discretion of the lending agent, replace the loaned securities. The Fund continues to record dividends or interest, as applicable, on the securities loaned and is subject to changes in value of the securities loaned that may occur during the term of the loan. The Fund has the right under the Lending Agreement to recover the securities from the borrower on demand. With respect to security loans collateralized by non-cash collateral, the Fund receives loan premiums paid by the borrower. With respect to security loans collateralized by cash collateral, the earnings from the collateral investments are shared among the Fund, the security lending agent, and the borrower. The Fund records security lending income net of allocations to the security lending agent, and the borrower.
The Fund may incur investment losses as a result of investing securities lending collateral. This could occur if an investment in the collateral investment account defaulted or became impaired. Under those circumstances, the value of a Fund’s cash collateral account may be less than the amount the Fund would be required to return to the borrowers of the securities and the Fund would be required to make up for this shortfall.
During the year ended July 31, 2018, the Fund had no securities out on loan.
11. Credit and Market Risk
Some countries in which the Fund may invest require governmental approval for the repatriation of investment income, capital, or the proceeds of sales of securities by foreign investors. In addition, if there is deterioration in a country’s balance of payments or for other reasons, a country may impose temporary restrictions on foreign capital remittances abroad.
The securities exchanges of certain foreign markets are substantially smaller, less liquid, and more volatile than the major securities markets in the US. Consequently, acquisition and disposition of securities by the Fund may be inhibited. In addition, a significant portion of the aggregate market value of securities listed on the major securities exchanges in emerging markets is held by a smaller number of investors. This may limit the number of shares available for acquisition or disposition by the Fund.
The Fund invests a portion of its assets in high yield fixed income securities, which are securities rated lower than BBB- by S&P and lower than Baa3 by Moody’s, or similarly rated by another nationally recognized statistical rating organization. Investments in these higher yielding securities are generally accompanied by a greater degree of credit risk than higher rated securities. Additionally, lower rated securities may be more susceptible to adverse economic and competitive industry conditions than investment grade securities.
The Fund invests in fixed income securities whose value is derived from an underlying pool of mortgages or consumer loans. The value of these securities is sensitive to changes in economic conditions, including delinquencies and/or defaults, and may be adversely affected by shifts in the market’s perception of the issuers and changes in interest rates. Investors receive principal and interest payments
72
as the underlying mortgages and consumer loans are paid back. Some of these securities are collateralized mortgage obligations (CMOs). CMOs are debt securities issued by US government agencies or by financial institutions and other mortgage lenders, which are collateralized by a pool of mortgages held under an indenture. Prepayment of mortgages may shorten the stated maturity of the obligations and can result in a loss of premium, if any has been paid. Certain of these securities may be stripped (securities which provide only the principal or interest feature of the underlying security). The yield to maturity on an interest-only CMO is extremely sensitive not only to changes in prevailing interest rates, but also to the rate of principal payments (including prepayments) on the related underlying mortgage assets. A rapid rate of principal payments may have a material adverse effect on the Fund’s yield to maturity. If the underlying mortgage assets experience greater than anticipated prepayments of principal, the Fund may fail to fully recoup its initial investment in these securities even if the securities are rated in the highest rating categories.
The Fund invests in bank loans and other securities that may subject it to direct indebtedness risk, the risk that the Fund will not receive payment of principal, interest, and other amounts due in connection with these investments and will depend primarily on the financial condition of the borrower. Loans that are fully secured offer the Fund more protection than unsecured loans in the event of nonpayment of scheduled interest or principal, although there is no assurance that the liquidation of collateral from a secured loan would satisfy the corporate borrower’s obligation, or that the collateral can be liquidated. Some loans or claims may be in default at the time of purchase. Certain of the loans and the other direct indebtedness acquired by the Fund may involve revolving credit facilities or other standby financing commitments that obligate the Fund to pay additional cash on a certain date or on demand. These commitments may require the Fund to increase its investment in a company at a time when the Fund might not otherwise decide to do so (including at a time when the company’s financial condition makes it unlikely that such amounts will be repaid). To the extent that the Fund is committed to advance additional funds, it will at all times hold and maintain cash or other high grade debt obligations in an amount sufficient to meet such commitments. When a loan agreement is purchased, the Fund may pay an assignment fee. On an ongoing basis, the Fund may receive a commitment fee based on the undrawn portion of the underlying line of credit portion of a loan agreement. Prepayment penalty fees are received upon the prepayment of a loan agreement by the borrower. Prepayment penalty, facility, commitment, consent, and amendment fees are recorded to income as earned or paid.
When interest rates rise, fixed income securities (i.e, debt obligations) generally will decline in value. These declines in value are greater for fixed income securities with longer maturities or durations.
As the Fund may be required to rely upon another lending institution to collect and pass on to the Fund amounts payable with respect to the loan and to enforce the Fund’s rights under the loan and other direct indebtedness, an insolvency, bankruptcy, or reorganization of the lending institution may delay or prevent the Fund from receiving such amounts. The highly leveraged nature of many loans may make them especially vulnerable to adverse changes in economic or market conditions. Investments in such loans and other direct indebtedness may involve additional risk to the Fund.
The Fund invests in certain obligations that may have liquidity protection designed to ensure that the receipt of payments due on the underlying security is timely. Such protection may be provided through guarantees, insurance policies, or letters of credit obtained by the issuer or sponsor through third parties,
73
Notes to financial statements
Delaware Strategic Income Fund
11. Credit and Market Risk (continued)
through various means of structuring the transaction or through a combination of such approaches. The Fund will not pay any additional fees for such credit support, although the existence of credit support may increase the price of the security.
The Fund may invest up to 15% of its net assets in illiquid securities, which may include securities with contractual restrictions on resale, securities exempt from registration under Rule 144A promulgated under the Securities Act of 1933, as amended, and other securities which may not be readily marketable. The relative illiquidity of these securities may impair the Fund from disposing of them in a timely manner and at a fair price when it is necessary or desirable to do so. While maintaining oversight, the Board has delegated to DMC, the day-to-day functions of determining whether individual securities are liquid for purposes of the Fund’s limitation on investments in illiquid securities. Securities eligible for resale pursuant to Rule 144A, which are determined to be liquid, are not subject to the Fund’s 15% limit on investments in illiquid securities. Rule 144A securities have been identified on the “Schedule of investments.” Restricted securities are valued pursuant to security valuation procedures described in Note 1.
12. Contractual Obligations
The Fund enters into contracts in the normal course of business that contain a variety of indemnifications. The Fund’s maximum exposure under these arrangements is unknown. However, the Fund has not had prior claims or losses pursuant to these contracts. Management has reviewed the Fund’s existing contracts and expects the risk of loss to be remote.
13. General Motors Term Loan Litigation
The Fund received notice of a litigation proceeding related to a General Motors Corporation (G.M.) term loan participation previously held by the Fund in 2009. Management believes the matter subject to the litigation notice will likely lead to a recovery from the Fund of certain amounts received by the Fund because a US Court of Appeals has ruled that the Fund and similarly situated investors were unsecured creditors rather than secured lenders of G.M. as a result of an erroneous Uniform Commercial Code filing made by a third party. The Fund received the full principal on the loans in 2009 after the G.M. bankruptcy. However, based upon the court ruling the estate is seeking to recover such amounts arguing that, as unsecured creditors, the Fund should not have received payment in full. Based upon currently available information related to the litigation and the Fund’s potential exposure, the Fund recorded a contingent liability of $326,237 and an asset of $97,871 based on the expected recoveries to unsecured creditors as of July 31, 2018 that resulted in a net decrease in the Fund’s NAV to reflect this potential recovery.
14. Recent Accounting Pronouncements
In March 2017, the Financial Accounting Standards Board issued an Accounting Standards Update, ASU 2017-08, Receivables – Nonrefundable Fees and Other Costs (Subtopic 310-20), Premium Amortization on Purchased Callable Debt Securities (ASU) which amends the amortization period for certain purchased callable debt securities held at a premium, shortening such period to the earliest call date. The ASU does not require any accounting change for debt securities held at a discount; the
74
discount continues to be amortized to maturity. The ASU is effective for fiscal years, and interim periods within those fiscal years, beginning after Dec. 15, 2018. At this time, management is evaluating the implications of these changes on the financial statements.
15. Subsequent Events
Management has determined that no material events or transactions occurred subsequent to July 31, 2018, that would require recognition or disclosure in the Fund’s financial statements.
75
Report of independent
registered public accounting firm
To the Board of Trustees of Delaware Group® Government Fund and Shareholders of Delaware Strategic Income Fund
Opinion on the Financial Statements
We have audited the accompanying statement of assets and liabilities, including the schedule of investments, of Delaware Strategic Income Fund (one of the funds constituting Delaware Group® Government Fund, referred to hereafter as the “Fund”) as of July 31, 2018, the related statement of operations for the year ended July 31, 2018, the statements of changes in net assets for each of the two years in the period ended July 31, 2018, including the related notes, and the financial highlights for each of the five years in the period ended July 31, 2018 (collectively referred to as the “financial statements”). In our opinion, the financial statements present fairly, in all material respects, the financial position of the Fund as of July 31, 2018, the results of its operations for the year then ended, the changes in its net assets for each of the two years in the period ended July 31, 2018 and the financial highlights for each of the five years in the period ended July 31, 2018 in conformity with accounting principles generally accepted in the United States of America.
Basis for Opinion
These financial statements are the responsibility of the Fund’s management. Our responsibility is to express an opinion on the Fund’s financial statements based on our audits. We are a public accounting firm registered with the Public Company Accounting Oversight Board (United States) (“PCAOB”) and are required to be independent with respect to the Fund in accordance with the U.S. federal securities laws and the applicable rules and regulations of the Securities and Exchange Commission and the PCAOB.
We conducted our audits of these financial statements in accordance with the standards of the PCAOB. Those standards require that we plan and perform the audit to obtain reasonable assurance about whether the financial statements are free of material misstatement, whether due to error or fraud.
Our audits included performing procedures to assess the risks of material misstatement of the financial statements, whether due to error or fraud, and performing procedures that respond to those risks. Such procedures included examining, on a test basis, evidence regarding the amounts and disclosures in the financial statements. Our audits also included evaluating the accounting principles used and significant estimates made by management, as well as evaluating the overall presentation of the financial statements. Our procedures included confirmation of securities owned as of July 31, 2018 by correspondence with the custodian and brokers; when replies were not received from brokers, we performed other auditing procedures. We believe that our audits provide a reasonable basis for our opinion.
PricewaterhouseCoopers LLP
Philadelphia, Pennsylvania
September 18, 2018
We have served as the auditor of one or more investment companies in Delaware Funds® by Macquarie since 2010.
76
This page intentionally left blank.
Other Fund information (Unaudited)
Delaware Strategic Income Fund
Tax Information
The information set forth below is for the Fund’s fiscal year as required by federal income tax laws. Shareholders, however, must report distributions on a calendar year basis for income tax purposes, which may include distributions for portions of two fiscal years of the Fund. Accordingly, the information needed by shareholders for income tax purposes will be sent to them in January of each year. Please consult your tax advisor for proper treatment of this information.
All disclosures are based on financial information available as of the date of this annual report and, accordingly are subject to change. For any and all items requiring reporting, it is the intention of the Fund to report the maximum amount permitted under the Internal Revenue Code and the regulations thereunder.
For the fiscal year ended July 31, 2018, the Fund reports distributions paid during the year as follows:
| | | | |
(A) Ordinary Income Distributions (Tax Basis)* | | | 93.16 | % |
(B) Return of Capital (Tax Basis) | | | 6.84 | % |
Total Distributions | | | 100.00 | % |
(A) and (B) are based on a percentage of the Fund’s total distributions.
Board consideration of sub-advisory agreements for Delaware Strategic Income Fund at a meeting held November 15-16, 2017
At a meeting held on Nov. 15-16, 2017, the Board of Trustees (“Board”) of Delaware Group® Government Fund, including a majority of non-interested or independent Trustees (the “Independent Trustees”), approved a new Sub-Advisory Agreement between Delaware Management Company (“DMC” or “Management”) and each of Macquarie Investment Management Europe Limited (“MIMEL”) and Macquarie Investment Management Global Limited (“MIMGL”) for Delaware Strategic Income Fund (the “Fund”). MIMEL and MIMGL may also be referenced as “sub-advisor(s)” below.
In reaching the decision to approve the Sub-Advisory Agreements, the Board considered and reviewed information about each of MIMEL and MIMGL, including its personnel, operations, and financial condition, which had been provided by MIMEL and MIMGL, respectively. The Board also reviewed material furnished by DMC, including: a memorandum from DMC reviewing the Sub-Advisory Agreements and the various services proposed to be rendered by MIMEL and MIMGL; information concerning MIMEL’s and MIMGL’s organizational structure and the experience of their key investment management personnel; copies of MIMEL’s and MIMGL’s Form ADV, financial statements, compliance policies and procedures, and Codes of Ethics; relevant performance information provided with respect to MIMEL and MIMGL; and a copy of the Sub-Advisory Agreements.
In considering such information and materials, the Independent Trustees received assistance and advice from and met separately with independent counsel. The materials prepared by Management in connection with the approval of the Sub-Advisory Agreements were sent to the Independent Trustees in advance of the meeting. While attention was given to all information furnished, the following discusses some primary factors relevant to the Board’s decision. This discussion of the information and factors
78
considered by the Board (as well as the discussion above) is not intended to be exhaustive, but rather summarizes certain factors considered by the Board. In view of the wide variety of factors considered, the Board did not, unless otherwise noted, find it practicable to quantify or otherwise assign relative weights to the following factors. In addition, individual Trustees may have assigned different weights to various factors.
Nature, quality, and extent of services. The Board considered the nature, quality, and extent of services that MIMEL and MIMGL each would provide as a sub-advisor to the Fund. The Trustees considered the investment process to be employed by MIMEL and MIMGL in connection with DMC’s collaboration with MIMEL and MIMGL in managing the Fund, and the qualifications and experience of MIMEL and MIMGL’s fixed income teams with regard to implementing the Fund’s investment mandates. The Board considered MIMEL and MIMGL’s organization, personnel, and operations. The Trustees also considered Management’s review and recommendation process with respect to MIMEL and MIMGL, and Management’s favorable assessment as to the nature, quality, and extent of the sub-advisory services expected to be provided by MIMEL and MIMGL to the Fund. Based on their consideration and review of the foregoing factors, the Board concluded that the nature, quality, and extent of the sub-advisory services to be provided by MIMEL and MIMGL, as well as MIMEL and MIMGL’s ability to render such services based on its experience, organization and resources, were appropriate for the Fund, in light of the Fund’s investment objective, strategies, and policies.
In discussing the nature of the services proposed to be provided by the sub-advisors, several Board members observed that, unlike traditional sub-advisors, who make the investment-related decisions with respect to the sub-advised portfolio, the relationship contemplated in this case is more like a collaborative effort between the advisor and sub-advisors and a cross-pollination of investment ideas. Moreover, the Board noted the advisor’s and sub-advisors’ stated intention that the former retain the decision-making authority with respect to purchases and sales of securities in the sub-advised Fund.
Sub-advisory fees. The Board considered that DMC would not pay MIMEL and MIMGL fees in conjunction with the services that would be rendered to the sub-advised Fund. The Board concluded that, in light of the quality and extent of the services to be provided and the business relationships between the advisor and sub-advisors, the proposed fee arrangement was understandable and reasonable.
Investment performance. In evaluating performance, the Board considered that MIMEL and MIMGL would provide investment advice and recommendations, including with respect to specific securities, for consideration and evaluation by DMC’s portfolio managers, but that DMC’s portfolio managers for the Fund would retain final portfolio management discretion over the Fund.
Economies of scale and fall-out benefits. The Board considered whether the proposed fee arrangement would reflect economies of scale for the benefit of Fund investors as assets in the Fund increased, as applicable. The Board noting that DMC would not pay MIMEL or MIMGL fees in conjunction with their services, concluded that analysis of economies of scale would be moot.
79
Board of trustees / directors and officers addendum
Delaware Funds® by Macquarie
A mutual fund is governed by a Board of Trustees/Directors (“Trustees”), which has oversight responsibility for the management of a fund’s business affairs. Trustees establish procedures and oversee and review the performance of the investment manager, the distributor, and others who perform services for the fund. The independent fund trustees, in particular, are advocates
| | | | |
Name, Address, and Birth Date | | Position(s) Held with Fund(s) | | Length of Time Served |
Interested Trustee | | |
Shawn K. Lytle1, 2 | | President, | | Trustee since |
2005 Market Street | | Chief Executive Officer, | | September 2015 |
Philadelphia, PA 19103 | | and Trustee | | |
February 1970 | | | | President and |
| | | | Chief Executive Officer |
| | | | since August 2015 |
| | | | |
Independent Trustees | | |
Thomas L. Bennett | | Chair and Trustee | | Trustee since |
2005 Market Street | | | | March 2005 |
Philadelphia, PA 19103 | | | | |
October 1947 | | | | Chair since |
| | | | | March 2015 |
Ann D. Borowiec | | Trustee | | Since March 2015 |
2005 Market Street | | | | |
Philadelphia, PA 19103 | | | | |
November 1958 | | | | |
| | | | |
Joseph W. Chow | | Trustee | | Since January 2013 |
2005 Market Street | | | | |
Philadelphia, PA 19103 | | | | |
January 1953 | | | | |
| | | | |
| | | | | |
| 1 | Shawn K. Lytle is considered to be an “Interested Trustee” because he is an executive officer of the Fund’s(s’) investment advisor. |
| 2 | Shawn K. Lytle, David F. Connor, Daniel V. Geatens, and Richard Salus serve in similar capacities for the six portfolios of the Optimum Fund Trust, which have the same investment advisor, principal underwriter, and transfer agent as the registrant. Mr. Geatens also serves as the Chief Financial Officer and Treasurer for Macquarie Global Infrastructure Total Return Fund Inc., which has an affiliated investment manager. |
80
for shareholder interests. Each trustee has served in that capacity since he or she was elected to or appointed to the Board of Trustees, and will continue to serve until his or her retirement or the election of a new trustee in his or her place. The following is a list of the Trustees and Officers with certain background and related information.
| | | | |
| | Number of Portfolios in | | |
| Principal Occupation(s) | | Fund Complex Overseen | | Other Directorships |
| During the Past Five Years | | by Trustee or Officer | | Held by Trustee or Officer |
| | | | |
President — Macquarie | | 59 | | Trustee — UBS |
Investment Management3 | | | | Relationship Funds, |
(June 2015–Present) | | | | SMA Relationship |
| | | | Trust, and UBS Funds |
Regional Head of | | | | (May 2010–April 2015) |
Americas — UBS Global | | | | |
Asset Management | | | | |
(April 2010–May 2015) | | | | |
| | | | |
Private Investor | | 59 | | None |
(March 2004–Present) | | | | |
| | | | |
Chief Executive Officer, | | 59 | | Director — |
Private Wealth Management | | | | Banco Santander International |
(2011–2013) and | | | | (October 2016–Present) |
Market Manager, | | | | |
New Jersey Private | | | | Director — |
Bank (2005–2011) — | | | | Santander Bank, N.A. |
J.P. Morgan Chase & Co. | | | | (December 2016–Present) |
Private Investor | | 59 | | Director and Audit Committee |
(April 2011–Present) | | | | Member — Hercules |
| | | | Technology Growth |
| | | | Capital, Inc. |
| | | | | (July 2004–July 2014) |
| 3 | Macquarie Investment Management is the marketing name for Macquarie Management Holdings, Inc. and its subsidiaries, including the Fund’s(s’) investment advisor, principal underwriter, and its transfer agent. |
81
| | |
| Board of trustees / directors and officers addendum | | |
| Delaware Funds® by Macquarie | | |
| | | | |
| Name, Address, | | Position(s) | | Length of |
| and Birth Date | | Held with Fund(s) | | Time Served |
Independent Trustees (continued) | | | | |
| John A. Fry | | Trustee | | Since January 2001 |
| 2005 Market Street | | | | |
| Philadelphia, PA 19103 | | | | |
| May 1960 | | | | |
| | | | | |
Lucinda S. Landreth | | Trustee | | Since March 2005 |
| 2005 Market Street | | | | |
| Philadelphia, PA 19103 | | | | |
June 1947 | | | | |
Frances A. Sevilla-Sacasa | | Trustee | | Since September 2011 |
| 2005 Market Street | | | | |
| Philadelphia, PA 19103 | | | | |
| January 1956 | | | | |
| | | | | |
82
| | | | |
| | Number of Portfolios in | | |
| Principal Occupation(s) | | Fund Complex Overseen | | Other Directorships |
| During the Past Five Years | | by Trustee or Officer | | Held by Trustee or Officer |
| | | | |
| President — | | 59 | | Director; Compensation |
| Drexel University | | | | Committee and |
| (August 2010–Present) | | | | Governance Committee |
| | | | Member — Community |
| President — | | | | Health Systems |
| Franklin & Marshall College | | | | |
| (July 2002–July 2010) | | | | Director — Drexel |
| | | | Morgan & Co. |
| | |
| | | | Director; Audit Committee |
| | | | Member — vTv |
| | | | Therapeutics LLC |
| | |
| | | | Director; Audit Committee |
| | | | Member — FS Credit Real |
| | | | | Estate Income Trust, Inc. |
Private Investor | | 59 | | None |
| (2004–Present) | | | | |
| | | | | |
Private Investor | | 59 | | Trust Manager and |
| (January 2017–Present) | | | | Audit Committee |
| | | | Chair — Camden |
| Chief Executive Officer — | | | | Property Trust |
| Banco Itaú | | | | (August 2011–Present) |
| International | | | | |
| (April 2012–December 2016) | | | | Director — |
| | | | Carrizo Oil & Gas, Inc. |
| Executive Advisor to Dean | | | | (March 2018–Present) |
| (August 2011–March 2012) | | | | |
| and Interim Dean | | | | |
| (January 2011–July 2011) — | | | | |
| University of Miami School of | | | | |
| Business Administration | | | | |
| | |
| President — U.S. Trust, | | | | |
| Bank of America Private | | | | |
| Wealth Management | | | | |
| (Private Banking) | | | | |
(July 2007–December 2008) | | | | |
83
| | |
| Board of trustees / directors and officers addendum | | |
| Delaware Funds® by Macquarie | | |
| | | | |
| Name, Address, | | Position(s) | | Length of |
| and Birth Date | | Held with Fund(s) | | Time Served |
Independent Trustees (continued) | | |
| Thomas K. Whitford | | Trustee | | Since January 2013 |
| 2005 Market Street | | | | |
| Philadelphia, PA 19103 | �� | | | |
| March 1956 | | | | |
| | | | | |
| Janet L. Yeomans | | Trustee | | Since April 1999 |
| 2005 Market Street | | | | |
| Philadelphia, PA 19103 | | | | |
| July 1948 | | | | |
| | | | | |
Officers | | |
| David F. Connor | | Senior Vice President, | | Senior Vice President |
| 2005 Market Street | | General Counsel, | | since May 2013; |
| Philadelphia, PA 19103 | | and Secretary | | General Counsel |
| December 1963 | | | | since May 2015; |
| | | | Secretary since |
| | | | October 2005 |
Daniel V. Geatens | | Vice President | | Vice President and |
| 2005 Market Street | | and Treasurer | | Treasurer since October 2007 |
| Philadelphia, PA 19103 | | | | |
| October 1972 | | | | |
| | | | | |
| Richard Salus | | Senior Vice President | | Senior Vice President and |
| 2005 Market Street | | and Chief Financial Officer | | Chief Financial Officer |
| Philadelphia, PA 19103 | | | | since November 2006 |
| October 1963 | | | | |
| | | | |
| | | | |
| | | | | |
The Statement of Additional Information for the Fund(s) includes additional information about the Trustees and Officers and is available, without charge, upon request by calling 800 523-1918.
84
| | | | |
| | Number of Portfolios in | | |
| Principal Occupation(s) | | Fund Complex Overseen | | Other Directorships |
| During the Past Five Years | | by Trustee or Officer | | Held by Trustee or Officer |
| | | | |
| Vice Chairman | | 59 | | Director — HSBC Finance |
| (2010–April 2013) — | | | | Corporation and HSBC |
| PNC Financial | | | | North America Holdings Inc. |
| Services Group | | | | (December 2013–Present) |
| | | | | |
| | | | Director — |
| | | | HSBC USA Inc. |
| | | | (July 2014–March 2017) |
| Vice President and Treasurer | | 59 | | Director (2009–2017); |
| (January 2006–July 2012), | | | | Personnel and Compensation |
| Vice President — | | | | Committee Chair; Member of |
| Mergers & Acquisitions | | | | Nominating, Investments, and |
| (January 2003–January 2006), | | | | Audit Committees for various |
| and Vice President | | | | periods throughout |
| and Treasurer | | | | directorship — |
| (July 1995–January 2003) — | | | | Okabena Company |
3M Company | | | | |
| | | | |
| David F. Connor has served | | 59 | | None2 |
| in various capacities at | | | | |
| different times at | | | | |
| Macquarie Investment | | | | |
Management. | | | | |
| Daniel V. Geatens has served | | 59 | | None2 |
| in various capacities at | | | | |
| different times at | | | | |
| Macquarie Investment | | | | |
Management. | | | | |
| Richard Salus has served | | 59 | | None2 |
| in various executive capacities | | | | |
| at different times at | | | | |
| Macquarie Investment | | | | |
Management. | | | | |
| | | | | |
85
About the organization
| | | | | | |
| Board of trustees | | | | | | |
| | | |
| Shawn K. Lytle | | Ann D. Borowiec | | John A. Fry | | Frances A. |
President and Chief Executive Officer Delaware Funds® by Macquarie Philadelphia, PA Thomas L. Bennett Chairman of the Board Delaware Funds by Macquarie Private Investor Rosemont, PA | | Former Chief Executive Officer Private Wealth Management J.P. Morgan Chase & Co. New York, NY Joseph W. Chow Former Executive Vice President State Street Corporation Boston, MA | | President Drexel University Philadelphia, PA Lucinda S. Landreth Former Chief Investment Officer Assurant, Inc. New York, NY | | Sevilla-Sacasa Former Chief Executive Officer Banco Itaú International Miami, FL Thomas K. Whitford Former Vice Chairman PNC Financial Services Group Pittsburgh, PA Janet L. Yeomans Former Vice President and Treasurer 3M Company St. Paul, MN |
| | | |
| Affiliated officers | | | | | | |
| | | |
| David F. Connor | | Daniel V. Geatens | | Richard Salus | | |
| Senior Vice President, | | Vice President and | | Senior Vice President and | | |
| General Counsel, | | Treasurer | | Chief Financial Officer | | |
| and Secretary | | Delaware Funds | | Delaware Funds | �� | |
| Delaware Funds | | by Macquarie | | by Macquarie | | |
| by Macquarie | | Philadelphia, PA | | Philadelphia, PA | | |
| Philadelphia, PA | | | | | | |
This annual report is for the information of Delaware Strategic Income Fund shareholders, but it may be used with prospective investors when preceded or accompanied by the Delaware Fund fact sheet for the most recently completed calendar quarter. These documents are available at delawarefunds.com/literature.
The Fund files its complete schedule of portfolio holdings with the Securities and Exchange Commission (SEC) for the first and third quarters of each fiscal year on Form N-Q. The Fund’s Forms N-Q, as well as a description of the policies and procedures that the Fund uses to determine how to vote proxies (if any) relating to portfolio securities are available without charge (i) upon request, by calling 800 523-1918; and (ii) on the SEC’s website at sec.gov. In addition, a description of the policies and procedures that the Fund uses to determine how to vote proxies (if any) relating to portfolio securities and the Schedule of Investments included in the Fund’s most recent Form N-Q are available without charge on the Fund’s website at delawarefunds.com/literature. The Fund’s Forms N-Q may be reviewed and copied at the SEC’s Public Reference Room in Washington, D.C.; information on the operation of the Public Reference Room may be obtained by calling 800 SEC-0330.
Information (if any) regarding how the Fund voted proxies relating to portfolio securities during the most recently disclosed 12-month period ended June 30 is available without charge (i) through the Fund’s website at delawarefunds.com/proxy; and (ii) on the SEC’s website at sec.gov.
86
Item 2. Code of Ethics
Item 3. Audit Committee Financial Expert
The registrant’s Board of Trustees has determined that certain members of the registrant’s Audit Committee are audit committee financial experts, as defined below. For purposes of this item, an “audit committee financial expert” is a person who has the following attributes:
a. An understanding of generally accepted accounting principles and financial statements;
b. The ability to assess the general application of such principles in connection with the accounting for estimates, accruals, and reserves;
c. Experience preparing, auditing, analyzing, or evaluating financial statements that present a breadth and level of complexity of accounting issues that are generally comparable to the breadth and complexity of issues that can reasonably be expected to be raised by the registrant’s financial statements, or experience actively supervising one or more persons engaged in such activities;
d. An understanding of internal controls and procedures for financial reporting; and
e. An understanding of audit committee functions.
An “audit committee financial expert” shall have acquired such attributes through:
a. Education and experience as a principal financial officer, principal accounting officer, controller, public accountant, or auditor or experience in one or more positions that involve the performance of similar functions;
b. Experience actively supervising a principal financial officer, principal accounting officer, controller, public accountant, auditor, or person performing similar functions;
c. Experience overseeing or assessing the performance of companies or public accountants with respect to the preparation, auditing, or evaluation of financial statements; or
d. Other relevant experience.
The registrant’s Board of Trustees has also determined that each member of the registrant’s Audit Committee is independent. In order to be “independent” for purposes of this item, the Audit Committee member may not: (i) other than in his or her capacity as a member of the Board of Trustees or any committee thereof, accept directly or indirectly any consulting, advisory or other compensatory fee from the issuer; or (ii) be an “interested person” of the registrant as defined in Section 2(a)(19) of the Investment Company Act of 1940.
The names of the audit committee financial experts on the registrant’s Audit Committee are set forth below:
Joseph W. Chow
John A. Fry
Lucinda S. Landreth
Thomas K. Whitford
Janet L. Yeomans
Item 4. Principal Accountant Fees and Services
The aggregate fees billed for services provided to the registrant by its independent auditors for the audit of the registrant’s annual financial statements and for services normally provided by the independent auditors in connection with statutory and regulatory filings or engagements were $90,580 for the fiscal year ended July 31, 2018.
The aggregate fees billed for services provided to the registrant by its independent auditors for the audit of the registrant’s annual financial statements and for services normally provided by the independent auditors in connection with statutory and regulatory filings or engagements were $88,050 for the fiscal year ended July 31, 2017.
The aggregate fees billed by the registrant’s independent auditors for services relating to the performance of the audit of the registrant’s financial statements and not reported under paragraph (a) of this Item were $0 for the fiscal year ended July 31, 2018.
The aggregate fees billed by the registrant’s independent auditors for services relating to the performance of the audit of the registrant’s financial statements and not reported under paragraph (a) of this Item were $0 for the fiscal year ended July 31, 2017.
The aggregate fees billed by the registrant’s independent auditors for tax-related services provided to the registrant’s investment adviser and other service providers under common control with the adviser and that relate directly to the operations or financial reporting of the registrant were $0 for the registrant’s fiscal year ended July 31, 2018.
The aggregate fees billed by the registrant’s independent auditors for tax-related services provided to the registrant’s investment adviser and other service providers under common control with the adviser and that relate directly to the operations or financial reporting of the registrant were $0 for the registrant’s fiscal year ended July 31, 2017.
The aggregate fees billed for all services provided by the independent auditors to the registrant other than those set forth in paragraphs (a), (b) and (c) of this Item were $0 for the fiscal year ended July 31, 2018.
The aggregate fees billed for all services provided by the independent auditors to the registrant other than those set forth in paragraphs (a), (b) and (c) of this Item were $0 for the fiscal year ended July 31, 2017.
Under the Pre-Approval Policy, the Audit Committee has also pre-approved the services set forth in the table below with respect to the registrant’s investment adviser and other entities controlling, controlled by or under common control with the investment adviser that provide ongoing services to the registrant (the “Control Affiliates”) up to the specified fee limit. This fee limit is based on aggregate fees to the investment adviser and its Control Affiliates.
The Pre-Approval Policy requires the registrant’s independent auditors to report to the Audit Committee at each of its regular meetings regarding all services initiated since the last such report was rendered, including those services authorized by the Pre-Approval Policy.
(f) Not applicable.
(g) The aggregate non-audit fees billed by the registrant’s independent auditors for services rendered to the registrant and to its investment adviser and other service providers under common control with the adviser were $11,748,000 and $11,180,000 for the registrant’s fiscal years ended July 31, 2018 and July 31, 2017, respectively.
(h) In connection with its selection of the independent auditors, the registrant’s Audit Committee has considered the independent auditors’ provision of non-audit services to the registrant’s investment adviser and other service providers under common control with the adviser that were not required to be pre-approved pursuant to Rule 2-01(c)(7)(ii) of Regulation S-X. The Audit Committee has determined that the independent auditors’ provision of these services is compatible with maintaining the auditors’ independence.
Item 5. Audit Committee of Listed Registrants
Not applicable.
Item 6. Investments
(a) Included as part of report to shareholders filed under Item 1 of this Form N-CSR.
(b) Divestment of securities in accordance with Section 13(c) of the Investment Company Act of 1940.
Not applicable.
Item 7. Disclosure of Proxy Voting Policies and Procedures for Closed-End Management Investment Companies
Not applicable.
Item 8. Portfolio Managers of Closed-End Management Investment Companies
Not applicable.
Item 9. Purchases of Equity Securities by Closed-End Management Investment Company and Affiliated Purchasers
Not applicable.
Item 10. Submission of Matters to a Vote of Security Holders
Not applicable.
Item 11. Controls and Procedures
The registrant’s principal executive officer and principal financial officer have evaluated the registrant’s disclosure controls and procedures within 90 days of the filing of this report and have concluded that they are effective in providing reasonable assurance that the information required to be disclosed by the registrant in its reports or statements filed under the Securities Exchange Act of 1934 is recorded, processed, summarized and reported within the time periods specified in the rules and forms of the Securities and Exchange Commission.
There were no significant changes in the registrant’s internal control over financial reporting that occurred during the second fiscal quarter of the period covered by the report to stockholders included herein (i.e., the registrant’s fourth fiscal quarter) that have materially affected, or are reasonably likely to materially affect, the registrant’s internal control over financial reporting.
Item 12. Disclosure of Securities Lending Activities for Closed-End Management Investment Companies
Not applicable.
Item 13. Exhibits
Not applicable.
(2) Certifications of Principal Executive Officer and Principal Financial Officer pursuant to Rule 30a-2 under the Investment Company Act of 1940 are attached hereto as Exhibit 99.CERT.
(3) Written solicitations to purchase securities pursuant to Rule 23c-1 under the Securities Exchange Act of 1934.
Not applicable.
(b) Certifications pursuant to Section 906 of the Sarbanes-Oxley Act of 2002 are furnished herewith as Exhibit 99.906CERT.
Pursuant to the requirements of the Securities Exchange Act of 1934 and the Investment Company Act of 1940, the registrant has duly caused this report to be signed on its behalf, by the undersigned, thereunto duly authorized.
Pursuant to the requirements of the Securities Exchange Act of 1934 and the Investment Company Act of 1940, this report has been signed below by the following persons on behalf of the registrant and in the capacities and on the dates indicated.