UNITED STATES SECURITIES AND EXCHANGE COMMISSION
Washington, D.C. 20549
FORM N-CSR
CERTIFIED SHAREHOLDER REPORT OF REGISTERED MANAGEMENT
INVESTMENT COMPANIES
| Investment Company Act file number: | | 811-04304 |
| | | |
| Exact name of registrant as specified in charter: | | Delaware Group® Government Fund |
| | | |
| Address of principal executive offices: | | 610 Market Street |
| | Philadelphia, PA 19106 |
| | | |
| Name and address of agent for service: | | David F. Connor, Esq. |
| | 610 Market Street |
| | Philadelphia, PA 19106 |
| | | |
| Registrant’s telephone number, including area code: | | (800) 523-1918 |
| | | |
| Date of fiscal year end: | | July 31 |
| | | |
| Date of reporting period: | | July 31, 2020 |
Item 1. Reports to Stockholders
Annual report
Fixed income mutual fund
Delaware Emerging Markets Debt Corporate Fund
(formerly, Delaware Emerging Markets Debt Fund)
July 31, 2020
Beginning on or about June 1, 2021, as permitted by regulations adopted by the Securities and Exchange Commission, paper copies of your Fund’s shareholder reports will no longer be sent to you by mail, unless you specifically request them from the Fund or from your financial intermediary, such as a broker/dealer, bank, or insurance company. Instead, you will be notified by mail each time a report is posted on the website and provided with a link to access the report.
If you already elected to receive shareholder reports electronically, you will not be affected by this change and you do not need to take any action. You may elect to receive shareholder reports and other communications from the Fund electronically by signing up at delawarefunds.com/edelivery. If you own these shares through a financial intermediary, you may contact your financial intermediary.
You may elect to receive paper copies of all future shareholder reports free of charge. You can inform the Fund that you wish to continue receiving paper copies of your shareholder reports by contacting us at 800 523-1918. If you own these shares through a financial intermediary, you may contact your financial intermediary to elect to continue to receive paper copies of your shareholder reports. Your election to receive reports in paper will apply to all funds held with the Delaware Funds® by Macquarie or your financial intermediary.
Carefully consider the Fund’s investment objectives, risk factors, charges, and expenses before investing. This and other information can be found in the Fund’s prospectus and its summary prospectus, which may be obtained by visiting delawarefunds.com/literature or calling 800 523-1918. Investors should read the prospectus and the summary prospectus carefully before investing.
You can obtain shareholder reports and prospectuses online instead of in the mail.
Visit delawarefunds.com/edelivery.
Experience Delaware Funds® by Macquarie
Macquarie Investment Management (MIM) is a global asset manager with offices in the United States, Europe, Asia, and Australia. As active managers, we prioritize autonomy and accountability at the investment team level in pursuit of opportunities that matter for clients. Delaware Funds is one of the longest-standing mutual fund families, with more than 80 years in existence.
If you are interested in learning more about creating an investment plan, contact your financial advisor.
You can learn more about Delaware Funds or obtain a prospectus for Delaware Emerging Markets Debt Corporate Fund at delawarefunds.com/literature.
Manage your account online
| · | | Check your account balance and transactions |
| · | | View statements and tax forms |
| · | | Make purchases and redemptions |
Visit delawarefunds.com/account-access.
Macquarie Asset Management (MAM) offers a diverse range of products including securities investment management, infrastructure and real asset management, and fund and equity-based structured products. MIM is the marketing name for certain companies comprising the asset management division of Macquarie Group. This includes the following investment advisers: Macquarie Investment Management Business Trust (MIMBT), Macquarie Funds Management Hong Kong Limited, Macquarie Investment Management Austria Kapitalanlage AG, Macquarie Investment Management Global Limited, Macquarie Investment Management Europe Limited, and Macquarie Investment Management Europe S.A.
The Fund is distributed by Delaware Distributors, L.P. (DDLP), an affiliate of MIMBT and Macquarie Group Limited.
Other than Macquarie Bank Limited (MBL), none of the entities noted are authorized deposit-taking institutions for the purposes of the Banking Act 1959 (Commonwealth of Australia). The obligations of these entities do not represent deposits or other liabilities of MBL. MBL does not guarantee or otherwise provide assurance in respect of the obligations of these entities, unless noted otherwise.
The Fund is governed by US laws and regulations.
Table of contents
Unless otherwise noted, views expressed herein are current as of July 31, 2020, and subject to change for events occurring after such date.
The Fund is not FDIC insured and is not guaranteed. It is possible to lose the principal amount invested.
Advisory services provided by Delaware Management Company, a series of MIMBT, a US registered investment advisor.
All third-party marks cited are the property of their respective owners.
© 2020 Macquarie Management Holdings, Inc.
Portfolio management review
| | |
| Delaware Emerging Markets Debt Corporate Fund | | August 11, 2020 (Unaudited) |
| | | | | | |
Performance preview (for the year ended July 31, 2020) | |
Delaware Emerging Markets Debt Corporate Fund
(Institutional Class shares) | | 1-year return | | | +1.88% | |
Delaware Emerging Markets Debt Corporate Fund
(Class A shares) | | 1-year return | | | +1.73% | |
J.P. Morgan Corporate Emerging Markets Bond Index (CEMBI) Broad
Diversified (benchmark) | | 1-year return | | | +5.21% | |
Past performance does not guarantee future results.
For complete, annualized performance for Delaware Emerging Markets Debt Corporate Fund, please see the table on page 6.
Institutional Class shares are not subject to a sales charge and are offered for sale exclusively to certain eligible investors. In addition, Institutional Class shares pay no distribution and service fee.
The performance of Class A shares excludes the applicable sales charge. Both Institutional Class shares and Class A shares reflect the reinvestment of all distributions.
Please see page 9 for a description of the index. Index performance returns do not reflect any management fees, transaction costs, or expenses. Indices are unmanaged and one cannot invest directly in an index.
Investment objective
The Fund seeks current income and, secondarily, capital appreciation.
| | | | |
Market review Tepid global growth coupled with the US Federal Reserve’s looser, more accommodating monetary policy would have been the major story line for the Fund’s fiscal year ended July 31, 2020 had it not been for the coronavirus pandemic, which injected a jolt of extreme volatility that began in late February and persisted into early April. The fiscal period began much as the prior fiscal year left off, with emerging markets debt posting mixed returns that largely reflected external factors, most notably the sharp drop in US Treasury yields and expectations for continued monetary easing on the part of the European Central Bank (ECB) and the Fed. In the final quarter of 2019, emerging markets debt posted stronger returns. Compared with corporate credits in developed markets, emerging markets corporate debt with similar credit quality provided a relatively stable yield pickup of approximately 100 basis points for BB-rated debt and 50 basis | | | | • Emerging markets debt sold off sharply on coronavirus concerns. • Central bank and government stimulus led to a strong rebound. • Travel restrictions placed severe pressure on airlines. • In this crisis, emerging markets demonstrated notable maturity. |
1
Portfolio managment review
Delaware Emerging Markets Debt Corporate Fund
points for BBB-rated debt. (One basis point equals one hundredth of a percentage point.)
Emerging market currencies were also performing well at the end of 2019. A drag on performance for much of the year, emerging market currencies responded positively when a Phase 1 trade agreement between the United States and China appeared imminent. An apparent bottoming out of global economic activity also propelled emerging market currencies.
Overall, from August 2019 through January 2020, the combined backdrop of a stable rate and a stable dollar was broadly supportive of emerging markets risk assets. Given that hard currency assets in emerging markets were no exception, emerging markets debt enjoyed relatively strong performance during this time.
As the new year began, however, concern about the coronavirus, first identified in December 2019, began to swell. Little more than background chatter, particularly in the US, in January and early February, coronavirus fears suddenly became widespread and global markets sold off precipitously later in February.
As was the case with risk assets worldwide, by the end of the Fund’s fiscal year, many emerging markets debt markets had largely bounced back. The J.P. Morgan Government Bond Index–Emerging Markets (GBI-EM) Global Diversified dropped 15.21% in dollar terms in the first quarter of 2020 but gained 9.82% in the second quarter. Similarly, the J.P. Morgan Emerging Markets Bond Index (EMBI) Global Diversified (sovereigns), declined 13.38% in the first quarter but gained 12.26% in the second quarter. Finally, the J.P. Morgan Corporate Emerging Markets Bond Index (CEMBI) Broad Diversified (corporates), fell 10.17% in the first quarter but gained 11.15% in the second quarter.
Although emerging markets debt, like virtually all asset classes, succumbed to the coronavirus-induced selloff, it is important to note that emerging markets debt weathered this crisis much better than it did previous disruptions. In the past, emerging
markets have suffered disproportionately because of a mismatch of asset liabilities in the underlying economy. A country would borrow dollars and spend locally. If the local currency subsequently softened, debt balances were destroyed, wreaking havoc on the economy. Though this still happens, it has happened far less frequently, following several notable crises including the Mexican peso crisis or Tequila Crisis of 1994, the Russian debt crisis of 1998, and the so-called taper tantrum of 2013. In the aftermath of these and other notable economic disruptions, central bankers have improved policy making by rebalancing asset liabilities and reducing fundamental mismatches with emerging market economies.
In the crises mentioned above, emerging markets suffered more significantly than their developed counterparts. During the selloff in February and March, three countries – Argentina, Ecuador, and Lebanon – struggled due to poor fiscal and monetary policies. And all three are paying the price via defaults or restructuring. However, overall, the emerging markets asset class demonstrated maturity throughout the crisis. The problems in Argentina, Ecuador, and Lebanon were limited to those countries and did not spread. In our view, this is a sign of relative maturity in the emerging markets debt market.
Better management, at both the corporate and sovereign levels, is another sign of maturity that enabled emerging markets to come through the coronavirus selloff. We saw many companies maintain adequate liquidity and access to external financing. Despite battling the macroeconomic environment and headwinds, most companies, with a few exceptions noted further on, came through the crisis in reasonable shape.
The role of central bank and government intervention in enabling emerging markets, indeed
2
global markets, to recover quickly cannot be overstated. Most notable were the Fed’s injection of trillions of dollars of liquidity into financial markets and the US government’s fiscal programs, including enhanced unemployment benefits and a payroll protection program. In conjunction with other global stimulative actions, governments acted quickly to curtail volatility, enabling asset prices to rebound sharply in the final months of the Fund’s fiscal year.
Source: Bloomberg.
Within the Fund
For the fiscal year ended July 31, 2020,
Delaware Emerging Markets Debt Corporate Fund underperformed its benchmark, the J.P. Morgan CEMBI Broad Diversified. The Fund’s Institutional Class shares gained 1.88%. The Fund’s Class A shares advanced 1.73% at net asset value and declined 2.85% at maximum offer price. These figures reflect all distributions reinvested. For the same period, the Fund’s benchmark gained 5.21%. For complete, annualized performance for Delaware Emerging Markets Debt Corporate Fund, please see the table on page 6.
The Fund was broadly diversified across regions, with fairly stable country allocations. Over the course of the fiscal year, the Fund was overweight Latin America, underweight Asia, and neutral to slightly underweight Central and Eastern Europe, the Middle East, and Africa (CEEMEA). We have a bias toward what we deem more attractive relative value and higher yielding regions. Consequently, we have positioned the Fund to be overweight high yield securities and underweight low-beta (low volatility) investment grade securities consistently throughout the fiscal year.
Within Latin America, Brazil and Panama made notable contributions to the Fund’s performance while Mexico, Chile, and Ecuador detracted from performance. Brazil represented the
Fund’s largest country overweight throughout the 12-month period. Brazil offers a large, liquid credit market that, in our opinion, provides a significant opportunity for credit selection. And despite being fairly acrimonious in its politics, its fiscal framework has been relatively conservative under the direction of Economy Minister Paulo Guedes and the Bolsonaro administration more broadly. The Fund also held a relative overweight in Panama, which offered the mid-quality investment grade credits that benefited from global demand for decently yielding investment grade assets.
In Brazil, the Fund’s two largest outperforming holdings were Cia Siderurgica Nacional S.A. (CSN) and JBS Investments II GmbH CSN is an iron-ore producer and is integrated into steel production. The company benefited from a benign demand environment prior to the February 2020 selloff and high iron ore prices, along with the successful completion of several liability-management transactions post the selloff. JBS S.A. (domiciled in Brazil) is the world’s largest meat-processing company; it profited from strong operating performance and continued improvement of its credit profile.
In addition to a favorable overweight in Panama, the Fund gained from positions in Banco General S.A. and C&W Senior Financing DAC.C&W Senior Financing (domiciled in Ireland) is a high yield credit that benefited from relatively stable operating trends as well as developed-market crossover investor sponsorship.
Latin America was also responsible for several of the Fund’s leading detractors from performance. As was the case in other regions, the coronavirus pandemic created significant distress for several of the Fund’s positions. Travel restrictions that were imposed to curb the spread of the virus were particularly detrimental, driving several airlines into default. Among them was Mexican flagship carrier Aerovias de Mexico S.A. de CV The imposition of travel restrictions combined with a leveraged balance sheet pushed the airline’s bonds into
3
Portfolio management review
Delaware Emerging Markets Debt Corporate Fund
default in mid-July. The month before, the airline had initiated Chapter 11 bankruptcy proceedings. The Fund continued to hold the position at the end of the fiscal year because we believed that the potential participation in the debtor-in-possession (DIP) financing process and subsequent restructuring could offer a better recovery value than what the bond prices reflected at that time.
The Fund’s second-largest underperformer, LATAM Finance Ltd., was from another airline that defaulted. In Chile, LATAM Airlines Group S.A. filed for bankruptcy in late May, seeking a coronavirus-related emergency reorganization. At the time of its filing, LATAM was the world’s largest airline to seek protection due to the coronavirus. Unlike some other carriers that had been experiencing management turmoil and losses for some time, LATAM had a solid financial footing prior to the pandemic, even approving a dividend payment earlier in the fiscal year. We exited the LATAM position before the end of the fiscal year and entered into a position in Azul, a Brazilian airline whose bonds performed well as of the time of this report and, in our opinion, has better prospects than LATAM due to its focus on domestic travel.
Ecuador was another problematic region for the Fund. Prior to the pandemic, we had sold an infrastructure company to invest in the sovereign bonds, which subsequently underwent significant distress, largely due to the pandemic. Ecuador sovereign, an off-benchmark position, is currently restructuring its debt.
YPF Luz, a generation company in Argentina, also detracted from the Fund’s performance. The negative election outcome in Argentina in August 2019 drove a significant selloff in Argentina corporate credit, and we decided to exit the electricity generation sector as the change in political landscape had negative consequences for all corporates, but even more for that sector in particular.
Within CEEMEA, the Fund benefited from its positions in Ukraine and Kazakhstan but was hurt by a position in Lithuania. In Ukraine, the election of Volodymyr Zelensky as president in May 2019 was a positive outcome, normalizing monetary policy that underpinned strength and credit. The Fund held several positive-performing credits, with security selection and sizing the most significant drivers. We complemented the Fund’s corporate holdings with Ukrainian sovereign bonds, an off-benchmark position that was the Fund’s overall strongest performer during the 12-month period. Within the benchmark, the Fund’s strongest performer was MHP S.A., a major grain and poultry producer in which the Fund was overweight. As was the case with JBS, MHP’s operating performance was relatively stable.
Like Panama, Kazakhstan benefited from global demand for investment grade assets with an attractive yield. Kaztransgas AO, the state-owned gas transportation company, was the leading contributor, and the Fund benefited from an overweight position.
The pandemic also took a toll on the Fund’s ASG Finance DAC holding from Avia Solutions Group PLC, a Lithuanian-based global aerospace company. Among Avia Solutions Group’s lines of business, Avia Support Services – which provides maintenance, repair, overhaul, and ground handling for airlines – suffered a significant downturn in business due to the effects of the virus on commercial aviation. We continued to hold Avia Solutions Group at the end of the fiscal year because we believe that even though operational performance will likely deteriorate, the company has a comfortable liquidity position to support the business until operations recover.
Our position in Tullow Oil, a Ghana-based exploration and production (E&P) company, also
4
detracted from performance. The bonds underperformed initially in late 2019 after a significant downward revision of production guidance. The pandemic accelerated the poor performance due to the sharp drop in oil prices, which coupled with low production levels, drove the company to burn cash and remain highly levered. The company presented an asset disposal program in late 2019 that is being executed.
In Asia, the Fund benefited from favorable security selection in Indonesia, although it suffered a significant coronavirus-related loss in India. While the Fund had an underweight position in Indonesia compared to the benchmark, Indonesian corporate credit is skewed down in quality. The Fund’s holdings, however, were generally up in quality, helping it to withstand a selloff. The Fund’s strongest performer was Listrindo Capital BV, a private electric utility (domiciled in Netherlands) that held up well in a highly volatile market.
In India, a coronavirus-related downturn in retailing led to severe distress for Future Retail Ltd., a diversified retailer owned by Future Group. In addition to a sharp drop in business for Future Retail itself, the sudden drop of Future Retail stock
drove to insufficient collateralization of debt at Future Group holding, which triggered a liquidity problem for the group. We continued to hold the position as of the end of fiscal year. Despite short-term liquidity problems, we believe the business is attractive. Additionally, Future Group is in conversations to sell a part of its business, injecting the cash that the company needs to keep performing on the bonds.
Throughout the Fund’s fiscal year, the portfolio composition remained consistent, with no dramatic changes to the Fund’s regional or quality biases. On a quality basis, at the end of the fiscal year, the Fund was overweight BB-rated and A-rated credits, much as it was throughout the
12-month period.
A note about derivatives
During the fiscal year, Delaware Emerging Markets Debt Corporate Fund invested in forward foreign currency exchange contracts, options, credit default swaps, and futures. These positions detracted 0.16 percentage points from performance for the fiscal year. The Fund had exposure to derivatives at the end of the fiscal year.
5
Performance summary
| | |
| Delaware Emerging Markets Debt Corporate Fund | | July 31, 2020 (Unaudited) |
The performance quoted represents past performance and does not guarantee future results. Investment return and principal value of an investment will fluctuate so that shares, when redeemed, may be worth more or less than their original cost. Current performance may be lower or higher than the performance quoted. Performance data current to the most recent month end may be obtained by calling 800 523-1918 or visiting delawarefunds.com/performance.
| | | | | | | | | | | | | | | | |
| Fund and benchmark performance1,2,3 | | Average annual total returns through July 31, 2020 | |
| | | | 1 year | | | | 3 year | | | | 5 year | | | | Lifetime | |
| | | | |
Class A (Est. September 30, 2013) | | | | | | | | | | | | | | | | |
Excluding sales charge | | | +1.73% | | | | +3.85% | | | | +5.42% | | | | +5.76% | |
Including sales charge | | | -2.85% | | | | +2.27% | | | | +4.46% | | | | +5.27% | |
Class C (Est. September 30, 2013) | | | | | | | | | | | | | | | | |
Excluding sales charge | | | +0.99% | | | | +3.05% | | | | +4.85% | | | | +5.18% | |
Including sales charge | | | +0.01% | | | | +3.05% | | | | +4.85% | | | | +5.18% | |
Class R (Est. September 30, 2013) | | | | | | | | | | | | | | | | |
Excluding sales charge | | | +2.00% | | | | +4.10% | | | | +5.57% | | | | +5.75% | |
Including sales charge | | | +2.00% | | | | +4.10% | | | | +5.57% | | | | +5.75% | |
Institutional Class (Est. September 30, 2013) | | | | | | | | | | | | | | | | |
Excluding sales charge | | | +1.88% | | | | +4.05% | | | | +5.56% | | | | +5.95% | |
Including sales charge | | | +1.88% | | | | +4.05% | | | | +5.56% | | | | +5.95% | |
J.P. Morgan Corporate Emerging Markets | | | | | | | | | | | | | | | | |
Bond Index (CEMBI) Broad Diversified | | | +5.21% | | | | +5.04% | | | | +5.62% | | | | +5.33%* | |
*The benchmark lifetime return is for Class A share comparison only and is calculated using the month end prior to the Fund’s Class A inception date (November 3, 2010).
1 A privately offered fund managed by the Fund’s portfolio manager was reorganized into the Fund and the Fund commenced operations on September 30, 2013. This privately offered fund commenced operations on November 3, 2010 and had an investment objective and strategies that were, in all material respects, the same as those of the Fund, and was managed in a manner that, in all material respects, complied with the investment guidelines and restrictions of the Fund. However, the privately offered fund was not registered as an investment under the Investment Company Act of 1940 (1940 Act). As a result, the privately offered fund was not subject to certain investment limitations, diversification requirements, liquidity requirements, and other restrictions imposed by
the 1940 Act and the Internal Revenue Code of 1986, as amended, which, if applicable, may have adversely affected its performance.
The Fund’s performance for the periods prior to its commencement of operations on September 30, 2013 is that of the privately offered fund. Because the privately offered fund was a master fund that did not charge any management or other asset-based fees, the privately offered fund’s performance shown above has been restated, on a one-time basis, to reflect the fees, expenses, and waivers and reimbursements for each class of the Fund at the commencement of the Fund’s operations. If the performance of the privately offered fund had not been restated, the performance for such classes may have been
6
higher than the performance shown in the average annual total returns table on page 6.
2 Returns reflect the reinvestment of all distributions and are presented both with and without the applicable sales charges described below. Returns do not reflect the deduction of taxes the shareholder would pay on Fund distributions or redemptions of Fund shares.
Expense limitations were in effect for certain classes during some or all of the periods shown in the “Fund and benchmark performance” table. Expenses for each class are listed on the “Fund expense ratios” table on page 8. Performance would have been lower had expense limitations not been in effect.
Institutional Class shares are not subject to a sales charge and are offered for sale exclusively to certain eligible investors. In addition, Institutional Class shares pay no distribution and service (12b-1) fee.
Class A shares are sold with a maximum front-end sales charge of 4.50%, and have an annual 12b-1 fee of 0.25% of average daily net assets. Performance for Class A shares, excluding sales charges, assumes that no front-end sales charge applied.
Class C shares are sold with a contingent deferred sales charge of 1.00% if redeemed during the first 12 months. They are also subject to an annual 12b-1 fee of 1.00% of average daily net assets. Performance for Class C shares, excluding sales charges, assumes either that contingent deferred sales charges did not apply or that the investment was not redeemed.
Class R shares are available only for certain retirement plan products. They are sold without a sales charge and have an annual 12b-1 fee of 0.50% of average daily net assets.
Fixed income securities and bond funds can lose value, and investors can lose principal, as interest rates rise. They also may be affected by economic conditions that hinder an issuer’s ability
to make interest and principal payments on its debt. The Fund may also be subject to prepayment risk, the risk that the principal of a bond that is held by a portfolio will be prepaid prior to maturity, at the time when interest rates are lower than what the bond was paying. A portfolio may then have to reinvest that money at a lower interest rate.
High yielding, non-investment-grade bonds (junk bonds) involve higher risk than investment grade bonds. The high yield secondary market is particularly susceptible to liquidity problems when institutional investors, such as mutual funds and certain other financial institutions, temporarily stop buying bonds for regulatory, financial, or other reasons. In addition, a less liquid secondary market makes it more difficult for the Fund to obtain precise valuations of the high yield securities in its portfolio.
The Fund may invest in derivatives, which may involve additional expenses and are subject to risk, including the risk that an underlying security or securities index moves in the opposite direction from what the portfolio manager anticipated. A derivatives transaction depends upon the counterparties’ ability to fulfill their contractual obligations.
If and when the Fund invests in forward foreign currency contracts or uses other investments to hedge against currency risks, the Fund will be subject to special risks, including counterparty risk.
Diversification may not protect against market risk.
International investments entail risks including fluctuation in currency values, differences in accounting principles, or economic or political instability. Investing in emerging markets can be riskier than investing in established foreign markets due to increased volatility, lower trading volume, and higher risk of market closures. In many emerging markets, there is substantially less publicly available information and the available
7
Performance summary
Delaware Emerging Markets Debt Corporate Fund
information may be incomplete or misleading. Legal claims are generally more difficult to pursue.
The Fund may experience portfolio turnover in excess of 100%, which could result in higher transaction costs and tax liability.
Leverage risk is the risk associated with securities or practices (for example, borrowing and the use of certain derivatives) and investment in certain types of derivatives that multiply small index or market movements into larger changes in value. Use of derivative instruments may involve leverage. Leverage magnifies the potential for gain and the risk of loss. As a result, a relatively small decline in the value of the underlying investments could result in a relatively large loss. Although the Fund will seek to manage the Fund’s risk from the leverage associated with derivative investments by closely monitoring the volatility of such investments, the Fund may not be successful in this respect.
IBOR risk is the risk that changes related to the use of the London interbank offered rate (LIBOR) or similar rates (such as EONIA) could have adverse impacts on financial instruments that reference these rates. The potential abandonment of these rates and transition to alternative rates could affect the value and liquidity of instruments that reference them and could affect investment strategy performance.
The disruptions caused by natural disasters, pandemics, or similar events could prevent the Fund from executing advantageous investment decisions in a timely manner and could negatively impact the Fund’s ability to achieve its investment objective and the value of the Fund’s investments.
3 The Fund’s expense ratios, as described in the most recent prospectus, are disclosed in the following “Fund expense ratios” table. Delaware Management Company has agreed to reimburse certain expenses and/or waive certain fees in order to prevent total annual fund operating expenses (excluding any 12b-1 fees, acquired fund fees and expenses, taxes, interest, short sale dividend and interest expenses, brokerage fees, certain insurance costs, and nonroutine expenses or costs, including, but not limited to, those relating to reorganizations, litigation, conducting shareholder meetings, and liquidations (collectively, nonroutine expenses)) from exceeding 0.79% of the Fund’s average daily net assets from August 1, 2019 to July 31, 2020.* Please see the most recent prospectus and any applicable supplement(s) for additional information on these fee waivers and/or reimbursements. Please see the “Financial highlights” section in this report for the most recent expense ratios.
| | | | | | | | |
| Fund expense ratios | | Class A | | Class C | | Class R | | Institutional Class |
Total annual operating expenses | | | | | | | | |
(without fee waivers) | | 1.90% | | 2.65% | | 2.15% | | 1.65% |
Net expenses | | | | | | | | |
(including fee waivers, if any) | | 1.04% | | 1.79% | | 1.29% | | 0.79% |
Type of waiver | | Contractual | | Contractual | | Contractual | | Contractual |
*The aggregate contractual waiver period covering this report is from November 28, 2018 through November 29, 2020.
8
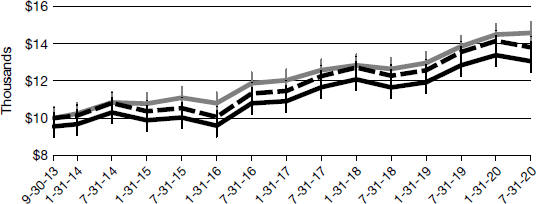
Performance of a $10,000 investment1
Average annual total returns from September 30, 2013 (Fund’s inception) through July 31, 2020
| | | | | | |
| | | |
| For period beginning September 30, 2013 through July 31, 2020 | | Starting value | | Ending value |
| | | |
 | | J.P. Morgan Corporate Emerging Markets Bond Index (CEMBI) Broad Diversified | | $10,000 | | $14,581 |
 | | Delaware Emerging Markets Debt Corporate Fund – Institutional Class shares | | $10,000 | | $13,808 |
 | | Delaware Emerging Markets Debt Corporate Fund – Class A shares | | $9,550 | | $13,060 |
1 The “Performance of a $10,000 investment” graph assumes $10,000 invested in Institutional Class and Class A shares of the Fund on September 30, 2013, and includes the effect of a 4.50% front-end sales charge (for Class A shares) and the reinvestment of all distributions. The graph does not reflect the deduction of taxes the shareholders would pay on Fund distributions or redemptions of Fund shares. Expense limitations were in effect for some or all of the periods shown. Performance would have been lower had expense limitations not been in effect. Expenses are listed in the “Fund expense ratios” table on page 8. Please note additional details on pages 6 through 10.
The graph also assumes $10,000 invested in the J.P. Morgan Corporate Emerging Markets Bond Index (CEMBI) Broad Diversified as of September 30, 2013. The J.P. Morgan Corporate Emerging Markets Bond Index (CEMBI) Broad Diversified tracks
US dollar–denominated emerging market corporate bonds, limiting the weights of countries with larger corporate debt stocks by including only a specified portion of those countries’ eligible current face amounts of debt outstanding.
The J.P. Morgan Government Bond Index–Emerging Markets (GBI-EM) Global Diversified, mentioned on page 2, tracks local currency government bonds issued by emerging markets, limiting the weights of the index countries by only including a specified portion of those countries’ eligible current face amounts of debt outstanding.
The J.P. Morgan Emerging Markets Bond Index (EMBI) Global Diversified, mentioned on page 2, tracks total returns for US dollar-denominated
9
Performance summary
Delaware Emerging Markets Debt Corporate Fund
debt instruments issued by emerging market sovereign and quasi-sovereign entities, including Brady bonds, loans, and Eurobonds, and limits the weights of the index countries by only including a specified portion of those countries’ eligible current face amounts of debt outstanding.
Index performance returns do not reflect any management fees, transaction costs, or expenses.
Indices are unmanaged and one cannot invest directly in an index. Past performance is not a guarantee of future results.
Performance of other Fund classes will vary due to different charges and expenses.
| | | | |
| | | Nasdaq symbols | | CUSIPs |
| Class A | | DEDAX | | 246094841 |
| Class C | | DEDCX | | 246094833 |
| Class R | | DEDRX | | 246094825 |
| Institutional Class | | DEDIX | | 246094817 |
10
Disclosure of Fund expenses
For the six-month period from February 1, 2020 to July 31, 2020 (Unaudited)
As a shareholder of the Fund, you incur two types of costs: (1) transaction costs, including sales charges (loads) on purchase payments, reinvested dividends, or other distributions; redemption fees; and exchange fees; and (2) ongoing costs, including management fees; distribution and service (12b-1) fees; and other Fund expenses. This example is intended to help you understand your ongoing costs (in dollars) of investing in the Fund and to compare these costs with the ongoing costs of investing in other mutual funds.
The example is based on an investment of $1,000 invested at the beginning of the period and held for the entire six-month period from February 1, 2020 to July 31, 2020.
Actual expenses
The first section of the table shown, “Actual Fund return,” provides information about actual account values and actual expenses. You may use the information in this section of the table, together with the amount you invested, to estimate the expenses that you paid over the period. Simply divide your account value by $1,000 (for example, an $8,600 account value divided by $1,000 = 8.6), then multiply the result by the number in the first section under the heading entitled “Expenses Paid During Period” to estimate the expenses you paid on your account during this period.
Hypothetical example for comparison purposes
The second section of the table shown, “Hypothetical 5% return,” provides information about hypothetical account values and hypothetical expenses based on the Fund’s actual expense ratio and an assumed rate of return of 5% per year before expenses, which is not the Fund’s actual return. The hypothetical account values and expenses may not be used to estimate the actual ending account balance or expenses you paid for the period. You may use this information to compare the ongoing costs of investing in the Fund and other funds. To do so, compare this 5% hypothetical example with the 5% hypothetical examples that appear in the shareholder reports of the other funds.
Please note that the expenses shown in the table are meant to highlight your ongoing costs only and do not reflect any transactional costs, such as sales charges (loads), redemption fees, or exchange fees. Therefore, the second section of the table is useful in comparing ongoing costs only, and will not help you determine the relative total costs of owning different funds. In addition, if these transactional costs were included, your costs would have been higher. The Fund’s expenses shown in the table reflect fee waivers in effect and assume reinvestment of all dividends and distributions.
11
Disclosure of Fund expenses
For the six-month period from February 1, 2020 to July 31, 2020 (Unaudited)
Delaware Emerging Markets Debt Corporate Fund
Expense analysis of an investment of $1,000
| | | | | | | | | | | | | | |
| | | Beginning Account Value | | | Ending Account Value | | | Annualized | | | Expenses Paid During Period |
| | | 2/1/20 | | | 7/31/20 | | | Expense Ratio | | | 2/1/20 to 7/31/20* |
Actual Fund return† | | | | | | | | | | | | | | |
Class A | | | $1,000.00 | | | | $975.70 | | | | 1.04% | | | $5.11 |
Class C | | | 1,000.00 | | | | 972.00 | | | | 1.79% | | | 8.78 |
Class R | | | 1,000.00 | | | | 976.90 | | | | 0.79% | | | 3.88 |
Institutional Class | | | 1,000.00 | | | | 975.80 | | | | 0.79% | | | 3.88 |
|
Hypothetical 5% return (5% return before expenses) |
Class A | | | $1,000.00 | | | | $1,019.69 | | | | 1.04% | | | $5.22 |
Class C | | | 1,000.00 | | | | 1,015.96 | | | | 1.79% | | | 8.97 |
Class R | | | 1,000.00 | | | | 1,020.93 | | | | 0.79% | | | 3.97 |
Institutional Class | | | 1,000.00 | | | | 1,020.93 | | | | 0.79% | | | 3.97 |
*“Expenses Paid During Period” are equal to the Fund’s annualized expense ratio, multiplied by the average account value over the period, multiplied by 182/366 (to reflect the one-half year period).
†Because actual returns reflect only the most recent six-month period, the returns shown may differ significantly from fiscal year returns.
In addition to the Fund’s expenses reflected above, the Fund also indirectly bears its portion of the fees and expenses of the investment companies (Underlying Funds) in which it invests. The table above does not reflect the expenses of the Underlying Funds.
12
Security type / country and sector allocation
| | |
| Delaware Emerging Markets Debt Corporate Fund | | As of July 31, 2020 (Unaudited) |
Sector designations may be different than the sector designations presented in other Fund materials. The sector designations may represent the investment manager’s internal sector classifications.
| | |
| Security type / country | | Percentage of net assets |
| |
Corporate Bonds | | 94.67% |
Argentina | | 2.54% |
Brazil | | 11.08% |
Chile | | 3.77% |
China | | 5.52% |
Colombia | | 6.84% |
Congo (Democratic Republic) | | 0.97% |
Dominican Republic | | 0.65% |
Georgia | | 1.00% |
Ghana | | 0.51% |
Hong Kong | | 2.76% |
India | | 4.39% |
Indonesia | | 2.23% |
Israel | | 4.50% |
Jamaica | | 0.47% |
Kazakhstan | | 1.86% |
Kuwait | | 0.97% |
Lithuania | | 0.72% |
Macao | | 2.00% |
Mexico | | 7.58% |
Morocco | | 1.19% |
Nigeria | | 1.00% |
Panama | | 3.11% |
Paraguay | | 2.19% |
Peru | | 2.30% |
Qatar | | 2.20% |
Republic of Korea | | 2.81% |
Russia | | 3.80% |
Saudi Arabia | | 2.76% |
Singapore | | 1.01% |
South Africa | | 1.40% |
Thailand | | 1.59% |
Turkey | | 2.97% |
Ukraine | | 2.22% |
United Arab Emirates | | 1.39% |
United Kingdom | | 0.30% |
United States | | 0.42% |
Vietnam | | 1.04% |
Zambia | | 0.61% |
13
Security type / country and sector allocation
Delaware Emerging Markets Debt Corporate Fund
| | |
| Security type / country | | Percentage of net assets |
Sovereign Bonds | | 1.63% |
Argentina | | 0.60% |
Mongolia | | 1.03% |
Supranational Bank | | 0.80% |
Short-Term Investments | | 2.74% |
Total Value of Securities | | 99.84% |
Receivables and Other Assets Net of Liabilities | | 0.16% |
Total Net Assets | | 100.00% |
| |
| Corporate bonds by sector | | Percentage of net assets |
| |
Banking | | 17.25% |
Basic Industry | | 12.61% |
Capital Goods | | 0.73% |
Communications | | 11.62% |
Consumer Cyclical | | 6.07% |
Consumer Non-Cyclical | | 6.12% |
Electric | | 9.40% |
Energy | | 16.11% |
Industrials | | 9.68% |
Insurance | | 1.71% |
Real Estate | | 2.73% |
Utilities | | 0.64% |
Total | | 94.67% |
14
Schedule of investments
| | |
| Delaware Emerging Markets Debt Corporate Fund | | July 31, 2020 |
| | | | | | | | |
| | | Principal Amount° | | | Value (US $) | |
Corporate Bonds – 94.67%Ä | | | | | | | | |
Argentina – 2.54% | | | | | | | | |
Aeropuertos Argentina 2000 144A PIK 9.375% 2/1/27 #, * | | | 791,296 | | | $ | 583,581 | |
Tecpetrol 144A 4.875% 12/12/22 # | | | 235,000 | | | | 229,497 | |
Transportadora de Gas del Sur 144A 6.75% 5/2/25 # | | | 515,000 | | | | 451,431 | |
YPF 144A 8.50% 6/27/29 # | | | 637,000 | | | | 510,129 | |
| | | | | | | | |
| | | | | | | 1,774,638 | |
| | | | | | | | |
Brazil – 11.08% | | | | | | | | |
Aegea Finance 144A 5.75% 10/10/24 # | | | 435,000 | | | | 449,640 | |
Azul Investments 144A 5.875% 10/26/24 # | | | 650,000 | | | | 340,369 | |
Banco BTG Pactual 144A 4.50% 1/10/25 # | | | 470,000 | | | | 470,940 | |
Braskem Netherlands Finance 144A 8.50% 1/23/81 #, µ | | | 465,000 | | | | 470,840 | |
BRF 144A 4.875% 1/24/30 # | | | 380,000 | | | | 380,361 | |
Centrais Eletricas Brasileiras 144A 4.625% 2/4/30 # | | | 595,000 | | | | 602,066 | |
CSN Islands XI 144A 6.75% 1/28/28 # | | | 255,000 | | | | 237,150 | |
CSN Resources | | | 200,000 | | | | 202,750 | |
144A 7.625% 2/13/23 # | | | | | | | | |
144A 7.625% 4/17/26 # | | | 200,000 | | | | 198,140 | |
JBS Investments II | | | 490,000 | | | | 521,066 | |
144A 5.75% 1/15/28 # | | | | | | | | |
144A 7.00% 1/15/26 # | | | 295,000 | | | | 317,796 | |
Klabin Austria 144A 7.00% 4/3/49 # | | | 600,000 | | | | 660,750 | |
Petrobras Global Finance | | | 210,000 | | | | 220,684 | |
5.60% 1/3/31 | | | | | | | | |
6.75% 6/3/50 | | | 350,000 | | | | 381,407 | |
Rede D’or Finance 144A 4.50% 1/22/30 # | | | 520,000 | | | | 466,830 | |
Rumo Luxembourg 144A 5.25% 1/10/28 # | | | 650,000 | | | | 676,195 | |
Ultrapar International 144A 5.25% 6/6/29 # | | | 620,000 | | | | 625,447 | |
Vale Overseas 3.75% 7/8/30 | | | 495,000 | | | | 531,863 | |
| | | | | | | | |
| | | | | | | 7,754,294 | |
| | | | | | | | |
Chile – 3.77% | | | | | | | | |
AES Gener 144A 7.125% 3/26/79 #, µ | | | 605,000 | | | | 616,634 | |
Engie Energia Chile 144A 4.50% 1/29/25 # | | | 435,000 | | | | 478,907 | |
Inversiones CMPC 144A 3.85% 1/13/30 # | | | 410,000 | | | | 430,014 | |
Sable International Finance 144A 5.75% 9/7/27 # | | | 350,000 | | | | 367,728 | |
Sociedad Quimica y Minera de Chile 144A 3.625% 4/3/23 # | | | 500,000 | | | | 522,073 | |
VTR Finance 144A 6.375% 7/15/28 # | | | 205,000 | | | | 219,200 | |
| | | | | | | | |
| | | | | | | 2,634,556 | |
| | | | | | | | |
15
Schedule of investments
Delaware Emerging Markets Debt Corporate Fund
| | | | | | | | |
| | | Principal Amount° | | | Value (US $) | |
Corporate BondsÄ (continued) | | | | | | | | |
China – 5.52% | | | | | | | | |
Baidu 3.875% 9/29/23 | | | 400,000 | | | $ | 430,062 | |
Bank of China 144A 5.00% 11/13/24 # | | | 420,000 | | | | 472,324 | |
China Overseas Finance Cayman V 3.95% 11/15/22 | | | 392,000 | | | | 413,773 | |
Kaisa Group Holdings 9.375% 6/30/24 | | | 545,000 | | | | 502,003 | |
Shimao Group Holdings 5.60% 7/15/26 | | | 615,000 | | | | 657,607 | |
Tencent Holdings 144A 3.28% 4/11/24 # | | | 640,000 | | | | 683,745 | |
Weibo 3.375% 7/8/30 | | | 670,000 | | | | 704,753 | |
| | | | | | | | |
| | | | | | | 3,864,267 | |
| | | | | | | | |
Colombia – 6.84% | | | | | | | | |
Bancolombia 3.00% 1/29/25 | | | 765,000 | | | | 761,894 | |
Colombia Telecomunicaciones 144A 4.95% 7/17/30 # | | | 460,000 | | | | 473,662 | |
Ecopetrol | | | 311,000 | | | | 344,627 | |
5.375% 6/26/26 | | | | | | | | |
6.875% 4/29/30 | | | 285,000 | | | | 343,885 | |
Geopark | | | 565,000 | | | | 495,788 | |
144A 5.50% 1/17/27 # | | | | | | | | |
144A 6.50% 9/21/24 # | | | 210,000 | | | | 198,450 | |
Gran Tierra Energy 144A 7.75% 5/23/27 # | | | 400,000 | | | | 192,250 | |
Grupo Energia Bogota 144A 4.875% 5/15/30 # | | | 610,000 | | | | 666,425 | |
Millicom International Cellular 144A 6.25% 3/25/29 # | | | 670,000 | | | | 739,054 | |
Oleoducto Central 144A 4.00% 7/14/27 # | | | 550,000 | | | | 569,387 | |
| | | | | | | | |
| | | | | | | 4,785,422 | |
| | | | | | | | |
Congo (Democratic Republic) – 0.97% | | | | | | | | |
HTA Group 144A 7.00% 12/18/25 # | | | 655,000 | | | | 679,058 | |
| | | | | | | | |
| | | | | | | 679,058 | |
| | | | | | | | |
Dominican Republic – 0.65% | | | | | | | | |
AES Andres 144A 7.95% 5/11/26 # | | | 440,000 | | | | 454,850 | |
| | | | | | | | |
| | | | | | | 454,850 | |
| | | | | | | | |
Georgia – 1.00% | | | | | | | | |
Bank of Georgia 144A 6.00% 7/26/23 # | | | 680,000 | | | | 697,136 | |
| | | | | | | | |
| | | | | | | 697,136 | |
| | | | | | | | |
Ghana – 0.51% | | | | | | | | |
Tullow Oil 144A 7.00% 3/1/25 # | | | 595,000 | | | | 355,878 | |
| | | | | | | | |
| | | | | | | 355,878 | |
| | | | | | | | |
Hong Kong – 2.76% | | | | | | | | |
AIA Group | | | | | | | | |
3.125% 3/13/23 | | | 715,000 | | | | 747,581 | |
144A 3.375% 4/7/30 # | | | 400,000 | | | | 448,820 | |
16
| | | | | | | | |
| | | Principal Amount° | | | Value (US $) | |
Corporate BondsÄ (continued) | | | | | | | | |
Hong Kong (continued) | | | | | | | | |
CLP Power Hong Kong Financing 2.875% 4/26/23 | | | 200,000 | | | $ | 208,075 | |
Goodman HK Finance 4.375% 6/19/24 | | | 485,000 | | | | 526,011 | |
| | | | | | | | |
| | | | | | | 1,930,487 | |
| | | | | | | | |
India – 4.39% | | | | | | | | |
Adani Electricity Mumbai 144A 3.949% 2/12/30 # | | | 610,000 | | | | 603,995 | |
Future Retail 144A 5.60% 1/22/25 # | | | 780,000 | | | | 509,124 | |
Greenko Solar Mauritius 144A 5.95% 7/29/26 # | | | 560,000 | | | | 570,507 | |
ICICI Bank 144A 4.00% 3/18/26 # | | | 450,000 | | | | 473,355 | |
ReNew Power 144A 5.875% 3/5/27 # | | | 590,000 | | | | 591,995 | |
Vedanta Resources Finance II 144A 9.25% 4/23/26 # | | | 455,000 | | | | 321,912 | |
| | | | | | | | |
| | | | | | | 3,070,888 | |
| | | | | | | | |
Indonesia – 2.23% | | | | | | | | |
Bayan Resources 144A 6.125% 1/24/23 # | | | 360,000 | | | | 346,412 | |
Hutama Karya Persero 144A 3.75% 5/11/30 # | | | 543,000 | | | | 591,940 | |
Listrindo Capital 144A 4.95% 9/14/26 # | | | 602,000 | | | | 624,575 | |
| | | | | | | | |
| | | | | | | 1,562,927 | |
| | | | | | | | |
Israel – 4.50% | | | | | | | | |
Altice Financing 144A 5.00% 1/15/28 # | | | 600,000 | | | | 616,719 | |
Bank Leumi Le-Israel 144A 3.275% 1/29/31 #, µ | | | 655,000 | | | | 649,662 | |
Israel Chemicals 6.375% 5/31/38 | | | 475,000 | | | | 582,238 | |
Israel Electric 144A 5.00% 11/12/24 # | | | 400,000 | | | | 451,258 | |
Teva Pharmaceutical Finance Netherlands III 6.75% 3/1/28 | | | 490,000 | | | | 544,794 | |
144A 7.125% 1/31/25 # | | | 275,000 | | | | 302,357 | |
| | | | | | | | |
| | | | | | | 3,147,028 | |
| | | | | | | | |
Jamaica – 0.47% | | | | | | | | |
Digicel Group 0.5 PIK 10.00% 4/1/24 * | | | 428,155 | | | | 325,398 | |
| | | | | | | | |
| | | | | | | 325,398 | |
| | | | | | | | |
Kazakhstan – 1.86% | | | | | | | | |
KazTransGas JSC 144A 4.375% 9/26/27 # | | | 575,000 | | | | 627,561 | |
Tengizchevroil Finance Co. International 144A 2.625% 8/15/25 # | | | 670,000 | | | | 676,765 | |
| | | | | | | | |
| | | | | | | 1,304,326 | |
| | | | | | | | |
Kuwait – 0.97% | | | | | | | | |
Equate Petrochemical 144A 3.00% 3/3/22 # | | | 275,000 | | | | 279,969 | |
MEGlobal Canada 144A 5.875% 5/18/30 # | | | 335,000 | | | | 397,099 | |
| | | | | | | | |
| | | | | | | 677,068 | |
| | | | | | | | |
17
Schedule of investments
Delaware Emerging Markets Debt Corporate Fund
| | | | | | | | |
| | | Principal Amount° | | | Value (US $) | |
Corporate BondsD (continued) | | | | | | | | |
Lithuania – 0.72% | | | | | | | | |
ASG Finance Designated Activity 144A 7.875%
12/3/24 # | | | 734,000 | | | $ | 506,460 | |
| | | | | | | | |
| | | | | | | 506,460 | |
| | | | | | | | |
Macao – 2.00% | | | | | | | | |
MGM China Holdings 144A 5.25% 6/18/25 # | | | 495,000 | | | | 511,087 | |
Sands China
144A 3.80% 1/8/26 # | | | 380,000 | | | | 397,290 | |
144A 4.375% 6/18/30 # | | | 465,000 | | | | 490,180 | |
| | | | | | | | |
| | | | | | | 1,398,557 | |
Mexico – 7.58% | | | | | | | | |
Aerovias de Mexico 144A 7.00% 2/5/25 #, ‡ | | | 505,000 | | | | 114,888 | |
Banco Mercantil del Norte
144A 6.75% #, µ, y | | | 240,000 | | | | 228,983 | |
144A 8.375% #, µ, y | | | 410,000 | | | | 414,838 | |
Banco Santander Mexico Institucion de Banca | | | | | | | | |
Multiple Grupo Financiero | | | | | | | | |
144A 5.375% 4/17/25 # | | | 250,000 | | | | 277,606 | |
144A 5.95% 10/1/28 #, µ | | | 335,000 | | | | 347,499 | |
BBVA Bancomer 144A 5.125% 1/18/33 #, µ | | | 260,000 | | | | 245,053 | |
Cemex 144A 7.375% 6/5/27 # | | | 795,000 | | | | 849,545 | |
Grupo Cementos de Chihuahua 144A 5.25%
6/23/24 # | | | 500,000 | | | | 506,822 | |
Industrias Penoles 144A 4.75% 8/6/50 # | | | 670,000 | | | | 695,437 | |
Infraestructura Energetica Nova
144A 3.75% 1/14/28 # | | | 420,000 | | | | 423,070 | |
144A 4.875% 1/14/48 # | | | 300,000 | | | | 296,039 | |
Minera Mexico 144A 4.50% 1/26/50 # | | | 525,000 | | | | 573,604 | |
Petroleos Mexicanos 144A 5.95% 1/28/31 # | | | 385,000 | | | | 331,602 | |
| | | | | | | | |
| | | | | | | 5,304,986 | |
| | | | | | | | |
Morocco – 1.19% | | | | | | | | |
OCP | | | | | | | | |
144A 4.50% 10/22/25 # | | | 515,000 | | | | 539,483 | |
144A 6.875% 4/25/44 # | | | 235,000 | | | | 293,061 | |
| | | | | | | | |
| | | | | | | 832,544 | |
| | | | | | | | |
Nigeria – 1.00% | | | | | | | | |
IHS Netherlands Holdco 144A 7.125% 3/18/25 # | | | 685,000 | | | | 700,413 | |
| | | | | | | | |
| | | | | | | 700,413 | |
| | | | | | | | |
Panama – 3.11% | | | | | | | | |
Autoridad del Canal de Panama 144A 4.95%
7/29/35 # | | | 530,000 | | | | 619,064 | |
18
| | | | | | | | |
| | | Principal Amount° | | | Value (US $) | |
Corporate BondsD (continued) | | �� | | | | | | |
Panama (continued) | | | | | | | | |
Banco General 144A 4.125% 8/7/27 # | | | 400,000 | | | $ | 435,424 | |
Banistmo 144A 4.25% 7/31/27 # | | | 700,000 | | | | 696,150 | |
C&W Senior Financing 144A 7.50% 10/15/26 # | | | 400,000 | | | | 427,162 | |
| | | | | | | | |
| | | | | | | 2,177,800 | |
| | | | | | | | |
Paraguay – 2.19% | | | | | | | | |
Bioceanico Sovereign Certificate 144A 2.971%
6/5/34 #, ^ | | | 725,363 | | | | 524,982 | |
Rutas 2 and 7 Finance 144A 3.413% 9/30/36 #, ^ | | | 615,000 | | | | 426,656 | |
Telefonica Celular del Paraguay 144A 5.875%
4/15/27 # | | | 550,000 | | | | 584,078 | |
| | | | | | | | |
| | | | | | | 1,535,716 | |
| | | | | | | | |
Peru – 2.30% | | | | | | | | |
Banco de Credito del Peru 144A 2.70% 1/11/25 # | | | 505,000 | | | | 517,531 | |
Kallpa Generacion 144A 4.125% 8/16/27 # | | | 600,000 | | | | 617,700 | |
Lima Metro Line 2 Finance 144A 4.35% 4/5/36 # | | | 425,000 | | | | 470,760 | |
| | | | | | | | |
| | | | | | | 1,605,991 | |
| | | | | | | | |
Qatar – 2.20% | | | | | | | | |
Ooredoo International Finance 144A 5.00%
10/19/25 # | | | 510,000 | | | | 597,656 | |
QNB Finance 2.625%
5/12/25 | | | 355,000 | | | | 373,229 | |
3.50% 3/28/24 | | | 525,000 | | | | 565,364 | |
| | | | | | | | |
| | | | | | | 1,536,249 | |
| | | | | | | | |
Republic of Korea – 2.81% | | | | | | | | |
Kia Motors 144A 3.00% 4/25/23 # | | | 695,000 | | | | 721,999 | |
Shinhan Financial Group 144A 3.34% 2/5/30 #, µ | | | 555,000 | | | | 582,051 | |
Woori Bank 144A 4.75% 4/30/24 # | | | 600,000 | | | | 661,166 | |
| | | | | | | | |
| | | | | | | 1,965,216 | |
Russia – 3.80% | | | | | | | | |
Gazprom PJSC via Gaz Finance 144A 3.25%
2/25/30 # | | | 455,000 | | | | 459,265 | |
Lukoil Securities 144A 3.875% 5/6/30 # | | | 575,000 | | | | 610,382 | |
Novolipetsk Steel Via Steel Funding DAC 144A
4.00% 9/21/24 # | | | 600,000 | | | | 639,775 | |
Phosagro OAO Via Phosagro Bond Funding 144A
3.949% 4/24/23 # | | | 200,000 | | | | 208,674 | |
VEON Holdings 144A 4.00% 4/9/25 # | | | 708,000 | | | | 739,672 | |
| | | | | | | | |
| | | | | | | 2,657,768 | |
| | | | | | | | |
Saudi Arabia – 2.76% | | | | | | | | |
Arabian Centres Sukuk 144A 5.375% 11/26/24 # | | | 525,000 | | | | 472,762 | |
19
Schedule of investments
Delaware Emerging Markets Debt Corporate Fund
| | | | | | | | |
| | | Principal Amount° | | | Value (US $) | |
Corporate BondsD (continued) | | | | | | | | |
Saudi Arabia (continued) | | | | | | | | |
Saudi Arabian Oil 144A 2.875%
4/16/24 # | | | 485,000 | | | $ | 511,048 | |
144A 4.25% 4/16/39 # | | | 400,000 | | | | 482,112 | |
Saudi Electricity Global Sukuk 4 4.222% 1/27/24 | | | 430,000 | | | | 467,034 | |
| | | | | | | | |
| | | | | | | 1,932,956 | |
| | | | | | | | |
Singapore – 1.01% | | | | | | | | |
DBS Group Holdings 144A 4.52% 12/11/28 #, µ | | | 645,000 | | | | 703,112 | |
| | | | | | | | |
| | | | | | | 703,112 | |
| | | | | | | | |
South Africa – 1.40% | | | | | | | | |
Gold Fields Orogen Holdings BVI 144A 6.125% 5/15/29 # | | | 540,000 | | | | 634,500 | |
Sasol Financing USA 5.875% 3/27/24 | | | 370,000 | | | | 347,800 | |
| | | | | | | | |
| | | | | | | 982,300 | |
| | | | | | | | |
Thailand – 1.59% | | | | | | | | |
Bangkok Bank 144A 3.733% 9/25/34 #, µ | | | 625,000 | | | | 628,341 | |
PTTEP Treasury Center 144A 2.587% 6/10/27 # | | | 465,000 | | | | 483,543 | |
| | | | | | | | |
| | | | | | | 1,111,884 | |
| | | | | | | | |
Turkey – 2.97% | | | | | | | | |
Akbank T.A.S. 144A 6.80% 2/6/26 # | | | 530,000 | | | | 520,229 | |
Turk Telekomunikasyon 144A 6.875% 2/28/25 # | | | 600,000 | | | | 626,400 | |
Turkcell Iletisim Hizmetleri 144A 5.80% 4/11/28 # | | | 590,000 | | | | 579,079 | |
Turkiye Garanti Bankasi 144A 5.25% 9/13/22 # | | | 355,000 | | | | 351,177 | |
| | | | | | | | |
| | | | | | | 2,076,885 | |
| | | | | | | | |
Ukraine – 2.22% | | | | | | | | |
Kernel Holding 144A 6.50% 10/17/24 # | | | 645,000 | | | | 641,775 | |
Metinvest 144A 8.50% 4/23/26 # | | | 300,000 | | | | 295,677 | |
MHP
144A 6.95% 4/3/26 # | | | 400,000 | | | | 406,396 | |
144A 7.75% 5/10/24 # | | | 200,000 | | | | 210,868 | |
| | | | | | | | |
| | | | | | | 1,554,716 | |
| | | | | | | | |
United Arab Emirates – 1.39% | | | | | | | | |
DP World Crescent 144A 3.908% 5/31/23 # | | | 465,000 | | | | 487,692 | |
Emirates NBD Bank PJSC 2.625% 2/18/25 | | | 470,000 | | | | 482,721 | |
| | | | | | | | |
| | | | | | | 970,413 | |
| | | | | | | | |
United Kingdom – 0.30% | | | | | | | | |
CK Hutchison International 20 144A 2.50% 5/8/30 # | | | 200,000 | | | | 210,489 | |
| | | | | | | | |
| | | | | | | 210,489 | |
| | | | | | | | |
20
| | | | | | | | |
| | Principal Amount° | | | Value (US $) | |
Corporate BondsD (continued) | | | | | | | | |
United States – 0.42% | | | | | | | | |
Resorts World Las Vegas 144A 4.625% 4/16/29 # | | | 300,000 | | | $ | 296,738 | |
| | | | | | | | |
| | | | | | | 296,738 | |
| | | | | | | | |
Vietnam – 1.04% | | | | | | | | |
Mong Duong Finance Holdings 144A 5.125%
5/7/29 # | | | 720,000 | | | | 727,589 | |
| | | | | | | | |
| | | | | | | 727,589 | |
| | | | | | | | |
Zambia – 0.61% | | | | | | | | |
First Quantum Minerals 144A 7.50% 4/1/25 # | | | 425,000 | | | | 429,781 | |
| | | | | | | | |
| | | | | | | 429,781 | |
| | | | | | | | |
Total Corporate Bonds (cost $65,623,205) | | | | | | | 66,236,784 | |
| | | | | | | | |
| | | | | | | | |
Sovereign Bonds – 1.63%D | | | | | | | | |
Argentina – 0.60% | | | | | | | | |
Argentine Republic Government International Bond
5.625% 1/26/22 | | | 938,000 | | | | 417,424 | |
Mongolia – 1.03% | | | | | | | | |
Development Bank of Mongolia 144A 7.25%
10/23/23 # | | | 710,000 | | | | 720,673 | |
| | | | | | | | |
Total Sovereign Bonds (cost $1,257,013) | | | | | | | 1,138,097 | |
| | | | | | | | |
| | | | | | | | |
Supranational Bank – 0.80% | | | | | | | | |
Banque Ouest Africaine de Developpement
144A 4.70% 10/22/31 # | | | 548,000 | | | | 561,656 | |
| | | | | | | | |
Total Supranational Bank (cost $548,000) | | | | | | | 561,656 | |
| | | | | | | | |
| | |
| | | Number of shares | | | | |
Short-Term Investments – 2.74% | | | | | | | | |
Money Market Mutual Funds – 2.74% | | | | | | | | |
BlackRock FedFund – Institutional Shares | | | | | | | | |
(seven-day effective yield 0.060%) | | | 383,944 | | | | 383,944 | |
Fidelity Investments Money Market Government | | | | | | | | |
Portfolio – Class I (seven-day effective yield 0.050%) | | | 383,943 | | | | 383,943 | |
GS Financial Square Government Fund – | | | | | | | | |
Institutional Shares (seven-day effective yield 0.130%) | | | 383,943 | | | | 383,943 | |
21
Schedule of investments
Delaware Emerging Markets Debt Corporate Fund
| | | | | | | | |
| | | Number of shares | | | Value (US $) | |
Short-Term Investments (continued) | | | | | | | | |
Money Market Mutual Funds (continued) | | | | | | | | |
Morgan Stanley Government Portfolio – Institutional | | | | | | | | |
Share Class (seven-day effective yield 0.010%) | | | 383,944 | | | $ | 383,944 | |
State Street Institutional US Government Money | | | | | | | | |
Market Fund – Investor Class (seven-day effective yield 0.010%) | | | 383,943 | | | | 383,943 | |
| | | | | | | | |
Total Short-Term Investments (cost $1,919,717) | | | | | | | 1,919,717 | |
| | | | | | | | |
Total Value of Securities–99.84% | | | | | | | | |
(cost $69,347,935) | | | | | | $ | 69,856,254 | |
| | | | | | | | |
| D | Securities have been classified by country of origin. Aggregate classification by business sector has been presented on page 14 in “Security type / sector and country allocations.” |
| ○ | Principal amount shown is stated in USD unless noted that the security is denominated in another currency. |
| # | Security exempt from registration under Rule 144A of the Securities Act of 1933, as amended. At July 31, 2020, the aggregate value of Rule 144A securities was $57,056,310, which represents 81.38% of the Fund’s net assets. See Note 11 in “Notes to financial statements.” |
| * | PIK. 78% of the income received was in cash and 22% was in principal. |
| µ | Fixed to variable rate investment. The rate shown reflects the fixed rate in effect at July 31, 2020. Rate will reset at a future date. |
| ‡ | Non-income producing security. Security is currently in default. |
| y | No contractual maturity date. |
| ^ | Zero-coupon security. The rate shown is the effective yield at the time of purchase. |
The following futures and swap contracts were outstanding at July. 31, 2020:1
Futures Contracts
| | | | | | | | | | | | | | | | | | | | |
| | | Notional | | | Notional Cost | | | Expiration | | | Value/
Unrealized | | | Variation
Margin
Due from
(Due to) | |
Contracts to Buy (Sell) | | Amount | | | (Proceeds) | | | Date | | | Depreciation | | | Brokers | |
11 US Treasury 10 yr Ultra Notes | | $ | (1,751,750 | ) | | | $ (1,727,461) | | | | 9/21/20 | | | | $ (24,289) | | | $ | (859 | ) |
22
Swap Contracts
CDS Contracts2
| | | | | | | | | | | | | | | | | | | | | | | | |
Counterparty/ Reference Obligation/ Termination Date/ Payment Frequency | | Notional
Amount3 | | | Annual
Protection
Payments | | | Value | | | Upfront
Payments
Paid
(Received) | | | Unrealized
Depreciation4 | | | Variation
Margin
Due from
(Due to)
Brokers | |
Over-The-Counter: | | | | | | | | | | | | | | | | | | | | | | | | |
Protection Purchased | | | | | | | | | | | | | | | | | | | | | | | | |
Moody’s Ratings: | | | | | | | | | | | | | | | | | | | | | | | | |
JPMCB-Mexico
3.60% | | | | | | | | | | | | | | | | | | | | | | | | |
12/31/21 WR | | | | | | | | | | | | | | | | | | | | | | | | |
6/20/25-Quarterly | | | 3,709,000 | | | | 1.000 | % | | $ | 75,203 | | | $ | 259,306 | | | | $ (184,103) | | | $ | — | |
The use of futures and swap contracts involve elements of market risk and risks in excess of the amounts disclosed in these financial statements. The notional amounts presented above represent the Fund’s total exposure in such contracts, whereas only the variation margin is reflected in the Fund’s net assets.
| 1 | See Note 8 in “Notes to Financial statements”: |
| 2 | A CDS contract is a risk-transfer instrument through which one party (purchaser of protection) transfers to another party (seller of protection) the financial risk of a credit event (as defined in the CDS agreement), as it relates to a particular reference security or basket of securities (such as an index). Periodic payments (receipts) on such contracts are accrued daily and recorded as unrealized losses (gains) on swap contracts. Upon payment (receipt), such amounts are recorded as realized losses (gains) on swap contracts. Upfront payments made or received in connection with CDS contracts are amortized over the expected life of the CDS contracts as unrealized losses (gains) on swap contracts. The change in value of CDS contracts is recorded daily as unrealized appreciation or depreciation. A realized gain or loss is recorded upon a credit event (as defined in the CDS agreement) or the maturity or termination of the CDS agreement. |
| 3 | Notional amount shown is stated in USD unless noted that the swap is denominated in another currency. |
| 4 | Unrealized appreciation (depreciation) does not include periodic interest payments (receipt) on swap contracts accrued daily in the amount of $(4,121). |
Summary of abbreviations:
CDS – Credit Default Swap
DAC – Designated Activity Company
GS – Goldman Sachs
JPMCB – JPMorgan Chase Bank
JSC – Joint Stock Company
PIK – Payment-in-Kind
23
Schedule of investments
Delaware Emerging Markets Debt Corporate Fund
Summary of abbreviations: (continued)
PJSC – Private Joint Stock Company
yr – Year
See accompanying notes, which are an integral part of the financial statements.
24
Statement of assets and liabilities
| | |
Delaware Emerging Markets Debt Corporate Fund | | July 31, 2020 |
| | | | |
Assets: | | | | |
Investments, at value* | | $ | 69,856,254 | |
Cash | | | 92,499 | |
Cash collateral due from brokers | | | 27,500 | |
Foreign currencies, at valueD | | | 6 | |
Receivable for securities sold | | | 971,992 | |
Dividends and interest receivable | | | 701,151 | |
Receivable for fund shares sold | | | 103,060 | |
Upfront payments paid on over the counter credit default swap contracts | | | 259,306 | |
| | | | |
Total Assets | | | 72,011,768 | |
| | | | |
Liabilities: | | | | |
Payable for securities purchased | | | 1,603,525 | |
Unrealized depreciation on over the counter credit default swap contracts | | | 184,103 | |
Payable for fund shares redeemed | | | 105,112 | |
Cash collateral due to brokers | | | 80,000 | |
Other accrued expenses | | | 40,302 | |
Investment management fees payable to affiliates | | | 17,609 | |
Audit and tax fees payable | | | 6,500 | |
Swap payment payable | | | 4,121 | |
Variation margin due to broker on futures contracts | | | 859 | |
Dividend disbursing and transfer agent fees and expenses payable to affiliates | | | 544 | |
Accounting and administration expenses payable to affiliates | | | 537 | |
Trustees’ fees and expenses payable to affiliates | | | 235 | |
Legal fees payable to affiliates | | | 102 | |
Distribution fees payable to affiliates | | | 99 | |
Reports and statements to shareholders expenses payable to affiliates | | | 88 | |
| | | | |
Total Liabilities | | | 2,043,736 | |
| | | | |
Total Net Assets | | $ | 69,968,032 | |
| | | | |
| |
Net Assets Consist of: | | | | |
Paid-in capital | | $ | 71,089,042 | |
Total distributable earnings (loss) | | | (1,121,010 | ) |
| | | | |
Total Net Assets | | $ | 69,968,032 | |
| | | | |
25
Statement of assets and liabilities
Delaware Emerging Markets Debt Corporate Fund
| | | | |
Net Asset Value | | | | |
Class A: | | | | |
Net assets | | $ | 280,983 | |
Shares of beneficial interest outstanding, unlimited authorization, no par | | | 33,154 | |
Net asset value per share | | $ | 8.48 | |
Sales charge | | | 4.50 | % |
Offering price per share, equal to net asset value per share / (1 - sales charge) | | $ | 8.88 | |
Class C: | | | | |
Net assets | | $ | 83,901 | |
Shares of beneficial interest outstanding, unlimited authorization, no par | | | 9,909 | |
Net asset value per share | | $ | 8.47 | |
Class R: | | | | |
Net assets | | $ | 2,779 | |
Shares of beneficial interest outstanding, unlimited authorization, no par | | | 328 | |
Net asset value per share | | $ | 8.47 | |
Institutional Class: | | | | |
Net assets | | $ | 69,600,369 | |
Shares of beneficial interest outstanding, unlimited authorization, no par | | | 8,213,573 | |
Net asset value per share | | $ | 8.47 | |
| | | | |
*Investments, at cost | | $ | 69,347,935 | |
DForeign currencies, at cost | | | 6 | |
See accompanying notes, which are an integral part of the financial statements.
26
Statement of operations
| | |
| Delaware Emerging Markets Debt Corporate Fund | | Year ended July 31, 2020 |
| | | | |
Investment Income: | | | | |
Interest | | $ | 3,256,046 | |
Dividends | | | 89,841 | |
| | | | |
| | | 3,345,887 | |
| | | | |
| |
Expenses: | | | | |
Management fees | | | 521,289 | |
Distribution expenses - Class A | | | 214 | |
Distribution expenses - Class C | | | 745 | |
Distribution expenses - Class R | | | 13 | |
Registration fees | | | 60,643 | |
Accounting and administration expenses | | | 54,906 | |
Dividend disbursing and transfer agent fees and expenses | | | 53,500 | |
Audit and tax fees | | | 49,716 | |
Reports and statements to shareholders expenses | | | 43,813 | |
Legal fees | | | 43,620 | |
Custodian fees | | | 4,843 | |
Trustees’ fees and expenses | | | 3,857 | |
Other | | | 23,248 | |
| | | | |
| | | 860,407 | |
Less expenses waived | | | (307,848 | ) |
Less waived distribution
expenses - Class R | | | (13 | ) |
Less expenses paid indirectly | | | (3,046 | ) |
| | | | |
Total operating expenses | | | 549,500 | |
| | | | |
Net Investment Income | | | 2,796,387 | |
| | | | |
27
Statement of operations
Delaware Emerging Markets Debt Corporate Fund
| | | | |
Net Realized and Unrealized Gain (Loss): | | | | |
Net realized gain (loss) on: | | | | |
Investments | | $ | (1,315,183 | ) |
Foreign currencies | | | (1,267 | ) |
Foreign currency exchange contracts | | | (21 | ) |
Futures contracts | | | 832 | |
Options purchased | | | (35,336 | ) |
Swap contracts | | | 157,078 | |
| | | | |
Net realized loss | | | (1,193,897 | ) |
| | | | |
| |
Net change in unrealized appreciation (depreciation) of: | | | | |
Investments | | | (284,482 | ) |
Foreign currencies | | | 635 | |
Futures contracts | | | (24,289 | ) |
Swap contracts | | | (188,224 | ) |
| | | | |
Net change in unrealized appreciation (depreciation) | | | (496,360 | ) |
| | | | |
Net Realized and Unrealized Loss | | | (1,690,257 | ) |
| | | | |
Net Increase in Net Assets Resulting from Operations | | $ | 1,106,130 | |
| | | | |
See accompanying notes, which are an integral part of the financial statements.
28
Statements of changes in net assets
Delaware Emerging Markets Debt Corporate Fund
| | | | | | | | |
| | | Year ended | |
| | |
| | | 7/31/20 | | | 7/31/19 | |
| | |
Increase (Decrease) in Net Assets from Operations: | | | | | | | | |
Net investment income | | $ | 2,796,387 | | | $ | 1,187,721 | |
Net realized loss | | | (1,193,897 | ) | | | (357,340 | ) |
Net change in unrealized appreciation (depreciation) | | | (496,360 | ) | | | 1,558,433 | |
| | | | | | | | |
Net increase in net assets resulting from operations | | | 1,106,130 | | | | 2,388,814 | |
| | | | | | | | |
| | |
Dividends and Distributions to Shareholders from: | | | | | | | | |
Distributable earnings: | | | | | | | | |
Class A | | | (3,482 | ) | | | (5,436 | ) |
Class C | | | (2,353 | ) | | | (2,388 | ) |
Class R | | | (110 | ) | | | (130 | ) |
Institutional Class | | | (2,848,204 | ) | | | (1,158,341 | ) |
| | |
Return of capital: | | | | | | | | |
Class A | | | (184 | ) | | | — | |
Class C | | | (55 | ) | | | — | |
Class R | | | (2 | ) | | | — | |
Institutional Class | | | (45,634 | ) | | | — | |
| | | | | | | | |
| | | (2,900,024 | ) | | | (1,166,295 | ) |
| | | | | | | | |
| | |
Capital Share Transactions: | | | | | | | | |
Proceeds from shares sold: | | | | | | | | |
Class A | | | 216,071 | | | | 111,456 | |
Class C | | | 24,880 | | | | 14,307 | |
Institutional Class | | | 43,794,371 | | | | 28,002,416 | |
| | |
Net asset value of shares issued upon reinvestment of
dividends and distributions: | | | | | | | | |
Class A | | | 3,136 | | | | 5,108 | |
Class C | | | 2,408 | | | | 2,387 | |
Class R | | | 112 | | | | 129 | |
Institutional Class | | | 2,887,015 | | | | 1,155,876 | |
| | | | | | | | |
| | | 46,927,993 | | | | 29,291,679 | |
| | | | | | | | |
29
Statements of changes in net assets
Delaware Emerging Markets Debt Corporate Fund
| | | | | | | | |
| | | Year ended | |
| | |
| | | 7/31/20 | | | 7/31/19 | |
| | |
Capital Share Transactions (continued): | | | | | | | | |
Cost of shares redeemed: | | | | | | | | |
Class A | | $ | (30,714 | ) | | $ | (86,125 | ) |
Class C | | | (2,119 | ) | | | (38,686 | ) |
Institutional Class | | | (27,074,534 | ) | | | (271,729 | ) |
| | | | | | | | |
| | | (27,107,367 | ) | | | (396,540 | ) |
| | | | | | | | |
Increase in net assets derived from capital share transactions | | | 19,820,626 | | | | 28,895,139 | |
| | | | | | | | |
Net Increase in Net Assets | | | 18,026,732 | | | | 30,117,658 | |
| | |
Net Assets: | | | | | | | | |
Beginning of year | | | 51,941,300 | | | | 21,823,642 | |
| | | | | | | | |
End of year | | $ | 69,968,032 | | | $ | 51,941,300 | |
| | | | | | | | |
See accompanying notes, which are an integral part of the financial statements.
30
This page intentionally left blank.
Financial highlights
Delaware Emerging Markets Debt Corporate Fund Class A
Selected data for each share of the Fund outstanding throughout each period were as follows:
| | | | | | | | | | | | | | | | | | | | |
| | | Year ended | |
| | | | |
| | | 7/31/20 | | | 7/31/19 | | | 7/31/18 | | | 7/31/17 | | | 7/31/16 | |
| |
Net asset value, beginning of period | | $ | 8.67 | | | $ | 8.26 | | | $ | 8.77 | | | $ | 8.48 | | | $ | 8.21 | |
| | | | | |
Income (loss) from investment operations: | | | | | | | | | | | | | | | | | | | | |
Net investment income1 | | | 0.32 | | | | 0.40 | | | | 0.39 | | | | 0.37 | | | | 0.36 | |
Net realized and unrealized gain (loss) | | | (0.18 | ) | | | 0.41 | | | | (0.39 | ) | | | 0.29 | | | | 0.24 | |
| | | | | | | | | | | | | | | | | | | | |
Total from investment operations | | | 0.14 | | | | 0.81 | | | | — | | | | 0.66 | | | | 0.60 | |
| | | | | | | | | | | | | | | | | | | | |
| | | | | |
Less dividends and distributions from: | | | | | | | | | | | | | | | | | | | | |
Net investment income | | | (0.32 | ) | | | (0.35 | ) | | | (0.38 | ) | | | (0.37 | ) | | | (0.33 | ) |
Net realized gain | | | — | | | | (0.05 | ) | | | (0.13 | ) | | | — | | | | — | |
Return of capital | | | (0.01 | ) | | | — | | | | — | | | | — | | | | — | |
| | | | | | | | | | | | | | | | | | | | |
Total dividends and distributions | | | (0.33 | ) | | | (0.40 | ) | | | (0.51 | ) | | | (0.37 | ) | | | (0.33 | ) |
| | | | | | | | | | | | | | | | | | | | |
| | | | | |
Net asset value, end of period | | $ | 8.48 | | | $ | 8.67 | | | $ | 8.26 | | | $ | 8.77 | | | $ | 8.48 | |
| | | | | | | | | | | | | | | | | | | | |
| | | | | |
Total return2 | | | 1.73% | | | | 10.21% | | | | (0.10%) | | | | 8.03% | | | | 7.62% | |
| | | | | |
Ratios and supplemental data: | | | | | | | | | | | | | | | | | | | | |
Net assets, end of period (000 omitted) | | $ | 281 | | | $ | 93 | | | $ | 57 | | | $ | 27 | | | $ | 3 | |
Ratio of expenses to average net assets3 | | | 1.04% | | | | 1.04% | | | | 1.16% | | | | 1.22% | | | | 1.03% | |
Ratio of expenses to average net assets prior to interest expenses reimbursed3 | | | 1.04% | | | | 1.04% | | | | 1.16% | | | | 1.22% | | | | 1.01% | |
Ratio of expenses to average net assets
prior to fees waived3 | | | 1.48% | | | | 1.90% | | | | 1.90% | | | | 1.91% | | | | 2.04% | |
Ratio of net investment income to average net assets | | | 3.77% | | | | 4.88% | | | | 4.57% | | | | 4.30% | | | | 4.42% | |
Ratio of net investment income to average net assets prior to interest expenses reimbursed | | | 3.77% | | | | 4.88% | | | | 4.57% | | | | 4.30% | | | | 4.44% | |
Ratio of net investment income to average net assets
prior to fees waived | | | 3.33% | | | | 4.02% | | | | 3.83% | | | | 3.61% | | | | 3.41% | |
Portfolio turnover | | | 93% | | | | 74% | | | | 108% | | | | 154% | | | | 232% | |
| |
| 1 | The average shares outstanding method has been applied for per share information. |
| 2 | Total return is based on the change in net asset value of a share during the period and assumes reinvestment of dividends and distributions at net asset value and does not reflect the impact of a sales charge. Total return during all of the periods shown reflects waivers by the manager and/or distributor. Performance would have been lower had the waivers not been in effect. |
| 3 | Expense ratios do not include expenses of the Underlying Funds in which the Fund invests. |
See accompanying notes, which are an integral part of the financial statements.
32
Financial highlights
Delaware Emerging Markets Debt Corporate Fund Class C
Selected data for each share of the Fund outstanding throughout each period were as follows:
| | | | | | | | | | | | | | | | | | | | |
| | | Year ended | |
| | | | |
| | | 7/31/20 | | | 7/31/19 | | | 7/31/18 | | | 7/31/17 | | | 7/31/16 | |
| |
Net asset value, beginning of period | | $ | 8.66 | | | $ | 8.26 | | | $ | 8.77 | | | $ | 8.48 | | | $ | 8.22 | |
| | | | | |
Income (loss) from investment operations: | | | | | | | | | | | | | | | | | | | | |
Net investment income1 | | | 0.25 | | | | 0.34 | | | | 0.33 | | | | 0.32 | | | | 0.36 | |
Net realized and unrealized gain (loss) | | | (0.17 | ) | | | 0.40 | | | | (0.39 | ) | | | 0.32 | | | | 0.23 | |
| | | | | | | | | | | | | | | | | | | | |
Total from investment operations | | | 0.08 | | | | 0.74 | | | | (0.06 | ) | | | 0.64 | | | | 0.59 | |
| | | | | | | | | | | | | | | | | | | | |
| | | | | |
Less dividends and distributions from: | | | | | | | | | | | | | | | | | | | | |
Net investment income | | | (0.26 | ) | | | (0.29 | ) | | | (0.32 | ) | | | (0.35 | ) | | | (0.33 | ) |
Net realized gain | | | — | | | | (0.05 | ) | | | (0.13 | ) | | | — | | | | — | |
Return of capital | | | (0.01 | ) | | | — | | | | — | | | | — | | | | — | |
| | | | | | | | | | | | | | | | | | | | |
Total dividends and distributions | | | (0.27 | ) | | | (0.34 | ) | | | (0.45 | ) | | | (0.35 | ) | | | (0.33 | ) |
| | | | | | | | | | | | | | | | | | | | |
| | | | | |
Net asset value, end of period | | $ | 8.47 | | | $ | 8.66 | | | $ | 8.26 | | | $ | 8.77 | | | $ | 8.48 | |
| | | | | | | | | | | | | | | | | | | | |
| | | | | |
Total return2 | | | 0.99% | | | | 9.27% | | | | (0.84%) | | | | 7.74% | | | | 7.49% | |
| | | | | |
Ratios and supplemental data: | | | | | | | | | | | | | | | | | | | | |
Net assets, end of period (000 omitted) | | $ | 84 | | | $ | 61 | | | $ | 82 | | | $ | 63 | | | $ | 2 | |
Ratio of expenses to average net assets3 | | | 1.79% | | | | 1.79% | | | | 1.91% | | | | 1.81% | | | | 1.03% | |
Ratio of expenses to average net assets prior to interest expenses reimbursed3 | | | 1.79% | | | | 1.79% | | | | 1.91% | | | | 1.81% | | | | 1.01% | |
Ratio of expenses to average net assets
prior to fees waived3 | | | 2.23% | | | | 2.65% | | | | 2.65% | | | | 2.66% | | | | 2.79% | |
Ratio of net investment income to average net assets | | | 3.02% | | | | 4.13% | | | | 3.82% | | | | 3.71% | | | | 4.42% | |
Ratio of net investment income to average net assets prior to interest expenses reimbursed | | | 3.02% | | | | 4.13% | | | | 3.82% | | | | 3.71% | | | | 4.44% | |
Ratio of net investment income to average net assets
prior to fees waived | | | 2.58% | | | | 3.27% | | | | 3.08% | | | | 2.86% | | | | 2.66% | |
Portfolio turnover | | | 93% | | | | 74% | | | | 108% | | | | 154% | | | | 232% | |
| |
| 1 | The average shares outstanding method has been applied for per share information. |
| 2 | Total return is based on the change in net asset value of a share during the period and assumes reinvestment of dividends and distributions at net asset value and does not reflect the impact of a sales charge. Total return during all of the periods shown reflects waivers by the manager and/or distributor. Performance would have been lower had the waivers not been in effect. |
| 3 | Expense ratios do not include expenses of the Underlying Funds in which the Fund invests. |
See accompanying notes, which are an integral part of the financial statements.
33
Financial highlights
Delaware Emerging Markets Debt Corporate Fund Class R
Selected data for each share of the Fund outstanding throughout each period were as follows:
| | | | | | | | | | | | | | | | | | | | |
| | | Year ended | |
| | | 7/31/20 | | | 7/31/19 | | | 7/31/18 | | | 7/31/17 | | | 7/31/16 | |
Net asset value, beginning of period | | $ | 8.66 | | | $ | 8.26 | | | $ | 8.77 | | | $ | 8.48 | | | $ | 8.22 | |
| | | | | |
Income (loss) from investment operations: | | | | | | | | | | | | | | | | | | | | |
Net investment income1 | | | 0.34 | | | | 0.42 | | | | 0.42 | | | | 0.39 | | | | 0.36 | |
Net realized and unrealized gain (loss) | | | (0.18 | ) | | | 0.40 | | | | (0.39 | ) | | | 0.28 | | | | 0.23 | |
| | | | | | | | | | | | | | | | | | | | |
Total from investment operations | | | 0.16 | | | | 0.82 | | | | 0.03 | | | | 0.67 | | | | 0.59 | |
| | | | | | | | | | | | | | | | | | | | |
| | | | | |
Less dividends and distributions from: | | | | | | | | | | | | | | | | | | | | |
Net investment income | | | (0.34 | ) | | | (0.37 | ) | | | (0.41 | ) | | | (0.38 | ) | | | (0.33 | ) |
Net realized gain | | | — | | | | (0.05 | ) | | | (0.13 | ) | | | — | | | | — | |
Return of capital | | | (0.01 | ) | | | — | | | | — | | | | — | | | | — | |
| | | | | | | | | | | | | | | | | | | | |
Total dividends and distributions | | | (0.35 | ) | | | (0.42 | ) | | | (0.54 | ) | | | (0.38 | ) | | | (0.33 | ) |
| | | | | | | | | | | | | | | | | | | | |
| | | | | |
Net asset value, end of period | | $ | 8.47 | | | $ | 8.66 | | | $ | 8.26 | | | $ | 8.77 | | | $ | 8.48 | |
| | | | | | | | | | | | | | | | | | | | |
| | | | | |
Total return2 | | | 2.00% | | | | 10.42% | | | | 0.16% | | | | 8.13% | | | | 7.49% | |
| | | | | |
Ratios and supplemental data: | | | | | | | | | | | | | | | | | | | | |
Net assets, end of period (000 omitted) | | $ | 3 | | | $ | 3 | | | $ | 2 | | | $ | 2 | | | $ | 2 | |
Ratio of expenses to average net assets3 | | | 0.79% | | | | 0.79% | | | | 0.91% | | | | 1.00% | | | | 1.03% | |
Ratio of expenses to average net assets prior to interest expenses reimbursed3 | | | 0.79% | | | | 0.79% | | | | 0.91% | | | | 1.00% | | | | 1.01% | |
Ratio of expenses to average net assets prior to fees waived3 | | | 1.73% | | | | 2.15% | | | | 2.13% | | | | 2.16% | | | | 2.29% | |
Ratio of net investment income to average net assets | | | 4.02% | | | | 5.13% | | | | 4.82% | | | | 4.52% | | | | 4.42% | |
Ratio of net investment income to average net assets prior to interest expenses reimbursed | | | 4.02% | | | | 5.13% | | | | 4.82% | | | | 4.52% | | | | 4.44% | |
Ratio of net investment income to average net assets prior to fees waived | | | 3.08% | | | | 3.77% | | | | 3.60% | | | | 3.36% | | | | 3.16% | |
Portfolio turnover | | | 93% | | | | 74% | | | | 108% | | | | 154% | | | | 232% | |
| 1 | The average shares outstanding method has been applied for per share information. |
| 2 | Total return is based on the change in net asset value of a share during the period and assumes reinvestment of dividends and distributions at net asset value and does not reflect the impact of a sales charge. Total return during all of the periods shown reflects waivers by the manager and/or distributor. Performance would have been lower had the waivers not been in effect. |
| 3 | Expense ratios do not include expenses of the Underlying Funds in which the Fund invests. |
See accompanying notes, which are an integral part of the financial statements.
34
Financial highlights
Delaware Emerging Markets Debt Corporate Fund Institutional Class
Selected data for each share of the Fund outstanding throughout each period were as follows:
| | | | | | | | | | | | | | | | | | | | |
| | | Year ended | |
| | | 7/31/20 | | | 7/31/19 | | | 7/31/18 | | | 7/31/17 | | | 7/31/16 | |
Net asset value, beginning of period | | $ | 8.67 | | | $ | 8.27 | | | $ | 8.78 | | | $ | 8.48 | | | $ | 8.22 | |
| | | | | |
Income (loss) from investment operations: | | | | | | | | | | | | | | | | | | | | |
Net investment income1 | | | 0.34 | | | | 0.42 | | | | 0.42 | | | | 0.39 | | | | 0.36 | |
Net realized and unrealized gain (loss) | | | (0.19 | ) | | | 0.40 | | | | (0.39 | ) | | | 0.29 | | | | 0.23 | |
| | | | | | | | | | | | | | | | | | | | |
Total from investment operations | | | 0.15 | | | | 0.82 | | | | 0.03 | | | | 0.68 | | | | 0.59 | |
| | | | | | | | | | | | | | | | | | | | |
| | | | | |
Less dividends and distributions from: | | | | | | | | | | | | | | | | | | | | |
Net investment income | | | (0.34 | ) | | | (0.37 | ) | | | (0.41 | ) | | | (0.38 | ) | | | (0.33 | ) |
Net realized gain | | | — | | | | (0.05 | ) | | | (0.13 | ) | | | — | | | | — | |
Return of capital | | | (0.01 | ) | | | — | | | | — | | | | — | | | | — | |
| | | | | | | | | | | | | | | | | | | | |
Total dividends and distributions | | | (0.35 | ) | | | (0.42 | ) | | | (0.54 | ) | | | (0.38 | ) | | | (0.33 | ) |
| | | | | | | | | | | | | | | | | | | | |
| | | | | |
Net asset value, end of period | | $ | 8.47 | | | $ | 8.67 | | | $ | 8.27 | | | $ | 8.78 | | | $ | 8.48 | |
| | | | | | | | | | | | | | | | | | | | |
| | | | | |
Total return2 | | | 1.88% | | | | 10.41% | | | | 0.16% | | | | 8.25% | | | | 7.49% | |
| | | | | |
Ratios and supplemental data: | | | | | | | | | | | | | | | | | | | | |
Net assets, end of period (000 omitted) | | $ | 69,600 | | | $ | 51,784 | | | $ | 21,683 | | | $ | 21,560 | | | $ | 19,930 | |
Ratio of expenses to average net assets3 | | | 0.79% | | | | 0.79% | | | | 0.91% | | | | 1.00% | | | | 1.03% | |
Ratio of expenses to average net assets prior to interest expenses reimbursed3 | | | 0.79% | | | | 0.79% | | | | 0.91% | | | | 1.00% | | | | 1.01% | |
Ratio of expenses to average net assets prior to fees waived3 | | | 1.23% | | | | 1.65% | | | | 1.65% | | | | 1.66% | | | | 1.79% | |
Ratio of net investment income to average net assets | | | 4.02% | | | | 5.13% | | | | 4.82% | | | | 4.52% | | | | 4.42% | |
Ratio of net investment income to average net assets prior to interest expenses reimbursed | | | 4.02% | | | | 5.13% | | | | 4.82% | | | | 4.52% | | | | 4.44% | |
Ratio of net investment income to average net assets prior to fees waived | | | 3.58% | | | | 4.27% | | | | 4.08% | | | | 3.86% | | | | 3.66% | |
Portfolio turnover | | | 93% | | | | 74% | | | | 108% | | | | 154% | | | | 232% | |
| 1 | The average shares outstanding method has been applied for per share information. |
| 2 | Total return is based on the change in net asset value of a share during the period and assumes reinvestment of dividends and distributions at net asset value. Total return during all of the periods shown reflects a waiver by the manager. Performance would have been lower had the waiver not been in effect. |
| 3 | Expense ratios do not include expenses of the Underlying Funds in which the Fund invests. |
See accompanying notes, which are an integral part of the financial statements.
35
Notes to financial statements
| | |
| Delaware Emerging Markets Debt Corporate Fund | | July 31, 2020 |
Delaware Group® Government Fund (Trust) is organized as a Delaware statutory trust and offers two series: Delaware Strategic Income Fund and Delaware Emerging Markets Debt Corporate Fund (formerly, Delaware Emerging Markets Debt Fund). These financial statements and the related notes pertain to Delaware Emerging Markets Debt Corporate Fund (Fund). The Fund is an open-end investment company. The Fund is considered diversified under the Investment Company Act of 1940, as amended, and offers Class A, Class C, Class R, and Institutional Class shares. Class A shares are sold with a maximum front-end sales charge of 4.50%. Class A share purchases of $1,000,000 or more will incur a contingent deferred sales charge (CDSC) instead of a front-end sales charge of 1.00%, if redeemed during the first year and 0.50% during the second year, provided that Delaware Distributors, L.P. (DDLP) paid a financial advisor a commission on the purchase of those shares. Class C shares are sold with a CDSC of 1.00%, which will be incurred if redeemed during the first 12 months. Class R and Institutional Class shares are not subject to a sales charge and are offered for sale exclusively to certain eligible investors.
1. Significant Accounting Policies
The Fund follows accounting and reporting guidance under Financial Accounting Standards Board (FASB) Accounting Standards Codification Topic 946, Financial Services – Investment Companies. The following accounting policies are in accordance with US generally accepted accounting principles (US GAAP) and are consistently followed by the Fund.
Security Valuation — Equity securities, except those traded on the Nasdaq Stock Market LLC (Nasdaq), are valued at the last quoted sales price as of the time of the regular close of the New York Stock Exchange on the valuation date. Equity securities traded on the Nasdaq are valued in accordance with the Nasdaq Official Closing Price, which may not be the last sales price. If, on a particular day, an equity security does not trade, the mean between the bid and ask prices will be used, which approximates fair value. Equity securities listed on a foreign exchange are normally valued at the last quoted sales price on the valuation date. US government and agency securities are valued at the mean between the bid and ask prices, which approximates fair value. Other debt securities and credit default swap (CDS) contracts are valued based upon valuations provided by an independent pricing service or broker/counterparty and reviewed by management. To the extent current market prices are not available, the pricing service may take into account developments related to the specific security, as well as transactions in comparable securities. Valuations for fixed income securities utilize matrix systems, which reflect such factors as security prices, yields, maturities, and ratings, and are supplemented by dealer and exchange quotations. Foreign currency exchange contracts and foreign cross currency exchange contracts are valued at the mean between the bid and ask prices, which approximates fair value. Interpolated values are derived when the settlement date of the contract is an interim date for which quotations are not available. Futures contracts and options on futures contracts are valued at the daily quoted settlement prices. Exchange-traded options are valued at the last reported sale price or, if no sales are reported, at the mean between the last reported bid and ask prices, which approximates fair value. Open-end investment companies are valued at their published net asset value (NAV). Generally, other securities and assets for which market quotations are not readily available are valued at fair value as determined in good faith under the direction of the Trust’s Board of Trustees (Board). In determining whether market
36
quotations are readily available or fair valuation will be used, various factors will be taken into consideration, such as market closures or suspension of trading in a security. Restricted securities are valued at fair value using methods approved by the Board.
Federal and Foreign Income Taxes — No provision for federal income taxes has been made as the Fund intends to continue to qualify for federal income tax purposes as a regulated investment company under Subchapter M of the Internal Revenue Code of 1986, as amended, and make the requisite distributions to shareholders. The Fund evaluates tax positions taken or expected to be taken in the course of preparing the Fund’s tax returns to determine whether the tax positions are “more-likely-than-not” of being sustained by the applicable tax authority. Tax positions not deemed to meet the “more-likely-than-not” threshold are recorded as a tax benefit or expense in the current year. Management has analyzed the Fund’s tax positions taken or expected to be taken on the Fund’s federal income tax returns through the year ended July 31, 2020 and for all open tax years (years ended July 31, 2017—July 31, 2019), and has concluded that no provision for federal income tax is required in the Fund’s financial statements. In regard to foreign taxes only, the Fund has open tax years in certain foreign countries in which it invests that may date back to the inception of the Fund. If applicable, the Fund recognizes interest accrued on unrecognized tax benefits in interest expense and penalties in “Other” on the “Statement of operations.” During the year ended July 31, 2020, the Fund did not incur any interest or tax penalties.
Class Accounting — Investment income, common expenses, and realized and unrealized gain (loss) on investments are allocated to the classes of the Fund on the basis of daily net assets of each class. Distribution expenses relating to a specific class are charged directly to that class.
Foreign Currency Transactions — Transactions denominated in foreign currencies are recorded at the prevailing exchange rates on the valuation date in accordance with the Fund’s prospectus. The value of all assets and liabilities denominated in foreign currencies is translated daily into US dollars at the exchange rate of such currencies against the US dollar. Transaction gains or losses resulting from changes in exchange rates during the reporting period or upon settlement of the foreign currency transaction are reported in operations for the current period. The Fund generally bifurcates that portion of realized gains and losses on investments in debt securities which is due to changes in foreign exchange rates from that which is due to changes in market prices of debt securities. That portion of gains (losses), which is due to changes in foreign exchange rates, is included on the “Statement of operations” under “Net realized gain (loss) on foreign currencies.” The Fund reports certain foreign currency related transactions as components of realized gains (losses) for financial reporting purposes, whereas such components are treated as ordinary income (loss) for federal income tax purposes.
Use of Estimates — The preparation of financial statements in conformity with US GAAP requires management to make estimates and assumptions that affect the fair value of investments, the reported amounts of assets and liabilities and disclosure of contingent assets and liabilities at the date of the financial statements, and the reported amounts of revenues and expenses during the reporting period. Actual results could differ from those estimates and the differences could be material.
37
Notes to financial statements
Delaware Emerging Markets Debt Corporate Fund
1. Significant Accounting Policies (continued)
Other — Expenses directly attributable to the Fund are charged directly to that Fund. Other expenses common to various funds within the Delaware Funds® by Macquarie (Delaware Funds) are generally allocated among such funds on the basis of average net assets. Management fees and certain other expenses are paid monthly. Security transactions are recorded on the date the securities are purchased or sold (trade date) for financial reporting purposes. Costs used in calculating realized gains and losses on the sale of investment securities are those of the specific securities sold. Dividend income is recorded on the ex-dividend date and interest income is recorded on the accrual basis. Discounts and premiums on debt securities are accreted or amortized to interest income, respectively, over the lives of the respective securities using the effective interest method. The Fund declares and pays dividends from net investment income monthly and pays distributions from net realized gain on investments, if any, annually. The Fund may distribute more frequently, if necessary for tax purposes. Dividends and distributions, if any, are recorded on the ex-dividend date.
The Fund receives earnings credits from its custodian when positive cash balances are maintained, which may be used to offset custody fees. The expenses paid under this arrangement are included on the “Statement of operations” under “Custodian fees” with the corresponding expenses offset included under “Less expenses paid indirectly.” For the year ended July 31, 2020, the Fund earned $2,235 under this arrangement.
The Fund receives earnings credits from its transfer agent when positive cash balances are maintained, which may be used to offset transfer agent fees. If the amount earned is greater than $1, the expenses paid under this arrangement are included on the “Statement of operations” under “Dividend disbursing and transfer agent fees and expenses” with the corresponding expenses offset included under “Less expenses paid indirectly.” For the year ended July 31, 2020, the Fund earned $811 under this arrangement.
2. Investment Management, Administration Agreements, and Other Transactions with Affiliates
In accordance with the terms of its investment management agreement, the Fund pays Delaware Management Company (DMC), a series of Macquarie Investment Management Business Trust and the investment manager, an annual fee which is calculated daily and paid monthly at the rate of 0.75% on the first $500 million of the average daily net assets of the Fund, 0.70% on the next $500 million, 0.65% on the next $1.5 billion, and 0.60% on average daily net assets in excess of $2.5 billion.
DMC has contractually agreed to waive all or a portion, if any, of its management fee and/or pay/reimburse the Fund to the extent necessary to ensure total annual operating expenses (excluding any distribution and service (12b-1) fees, acquired fund fees and expenses, taxes, interest, short sale dividend and interest expenses, brokerage fees, certain insurance costs, and nonroutine expenses or costs, including, but not limited to, those relating to reorganizations, litigation, conducting shareholder meetings, and liquidations), do not exceed 0.79% of the Fund’s average daily net assets from August 1, 2019 through July 31, 2020.* These waivers and reimbursements may only be terminated by agreement of DMC and the Fund. The waivers and reimbursements are accrued daily and received monthly.
38
DMC may seek investment advice and recommendations from its affiliates: Macquarie Investment Management Europe Limited, Macquarie Investment Management Austria Kapitalanlage AG, and Macquarie Investment Management Global Limited (together, the “Affiliated Sub-Advisors”). The Manager may also permit these Affiliated Sub-Advisors to execute Fund security trades on behalf of the Manager and exercise investment discretion for securities in certain markets where DMC believes it will be beneficial to utilize an Affiliated Sub-Advisor’s specialized market knowledge. Although the Affiliated Sub-Advisors serve as sub-advisors, DMC has ultimate responsibility for all investment advisory services. For these services, DMC, not the Fund, pays each Affiliated Sub-Advisor a portion of its investment management fee.
Delaware Investments Fund Services Company (DIFSC), an affiliate of DMC, provides fund accounting and financial administration oversight services to the Fund. For these services, DIFSC’s fees are calculated daily and paid monthly based on the aggregate daily net assets of all funds within the Delaware Funds at the following annual rates: 0.00475% of the first $35 billion; 0.0040% of the next $10 billion; and 0.0025% of aggregate average daily net assets in excess of $45 billion (Total Fee). Each fund in the Delaware Funds pays a minimum of $4,000, which, in aggregate, is subtracted from the Total Fee. Each fund then pays its portion of the remainder of the Total Fee on a relative NAV basis. This amount is included on the “Statement of operations” under “Accounting and administration expenses.” For the year ended July 31, 2020, the Fund was charged $6,410 for these services.
DIFSC is also the transfer agent and dividend disbursing agent of the Fund. For these services, DIFSC’s fees are calculated daily and paid monthly based on the aggregate daily net assets of the retail funds within the Delaware Funds at the following annual rates: 0.014% of the first $20 billion; 0.011% of the next $5 billion; 0.007% of the next $5 billion; 0.005% of the next $20 billion; and 0.0025% of average daily net assets in excess of $50 billion. The fees payable to DIFSC under the shareholder services agreement described above are allocated among all retail funds in the Delaware Funds on a relative NAV basis. This amount is included on the “Statement of operations” under “Dividend disbursing and transfer agent fees and expenses.” For the year ended July 31, 2020, the Fund was charged $6,438 for these services. Pursuant to a sub-transfer agency agreement between DIFSC and BNY Mellon Investment Servicing (US) Inc. (BNYMIS), BNYMIS provides certain sub-transfer agency services to the Fund. Sub-transfer agency fees are paid by the Fund and are also included on the “Statement of operations” under “Dividend disbursing and transfer agent fees and expenses.” The fees that are calculated daily and paid as invoices are received on a monthly or quarterly basis.
Pursuant to a distribution agreement and distribution plan, the Fund pays DDLP, the distributor and an affiliate of DMC, an annual 12b-1 fee of 0.25%, 1.00%, and 0.50% of the average daily net assets of the Class A, Class C, and Class R shares, respectively. These fees are calculated daily and paid monthly. DDLP has agreed to voluntarily suspend the 12b-1 fee for the Class R shares and the suspension of the 12b-1 fee will continue while the Fund is not broadly distributed. Institutional Class shares do not pay 12b-1 fee.
As provided in the investment management agreement, the Fund bears a portion of the cost of certain resources shared with DMC, including the cost of internal personnel of DMC and/or its affiliates that provide legal, tax, and regulatory reporting services to the Fund. For the year ended July 31, 2020, the
39
Notes to financial statements
Delaware Emerging Markets Debt Corporate Fund
2. Investment Management, Administration Agreements, and Other Transactions with Affiliates (continued)
Fund was charged $12,134 for internal legal, tax, and regulatory reporting services provided by DMC and/or its affiliates’ employees. This amount is included on the “Statement of operations” under “Legal fees.”
For the year ended July 31, 2020, DDLP earned $13 in commissions on sales of the Fund’s Class A shares. For the year ended July 31, 2020, DDLP did not receive gross CDSC commission on redemption of the Fund Class A and Class C shares.
Trustees’ fees include expenses accrued by the Fund for each Trustee’s retainer and meeting fees. Certain officers of DMC, DIFSC, and DDLP are officers and/or Trustees of the Trust. These officers and Trustees are paid no compensation by the Fund.
In addition to the management fees and other expenses of the Fund, the Fund indirectly bears the investment management fees and other expenses of the investment companies (Underlying Funds) in which it invests. The amount of these fees and expenses incurred indirectly by the Fund will vary based upon the expense and fee levels of the Underlying Funds and the number of shares that are owned of the Underlying Funds at different times.
*The aggregate contractual waiver period covering this report is from November 28, 2018 through November 29, 2020.
3. Investments
For the year ended July 31, 2020, the Fund made purchases and sales of investment securities other than short-term investments as follows:
| | |
Purchases | | Sales |
| $88,577,404 | | $59,484,710 |
The tax cost of investments includes adjustments to net unrealized appreciation (depreciation) which may not necessarily be the final tax cost basis adjustments, but approximates the tax basis unrealized gains and losses that may be realized and distributed to shareholders. At July 31, 2020, the cost and unrealized appreciation (depreciation) of investments for federal income tax purposes were as follows:
| | | | | | |
Cost of
investments
and derivatives | | Aggregate
unrealized
appreciation
of investments
and derivatives | | Aggregate
unrealized
depreciation
of investments
and derivatives | | Net unrealized
appreciation
of investments
and derivatives |
| $69,171,015 | | $2,683,231 | | $(2,206,384) | | $476,847 |
US GAAP defines fair value as the price that the Fund would receive to sell an asset or pay to transfer a liability in an orderly transaction between market participants at the measurement date under current market conditions. A three-level hierarchy for fair value measurements has been established based upon the transparency of inputs to the valuation of an asset or liability. Inputs may be observable or
40
unobservable and refer broadly to the assumptions that market participants would use in pricing the asset or liability. Observable inputs reflect the assumptions market participants would use in pricing the asset or liability based on market data obtained from sources independent of the reporting entity. Unobservable inputs reflect the reporting entity’s own assumptions about the assumptions that market participants would use in pricing the asset or liability based on the best information available under the circumstances. The Fund’s investment in its entirety is assigned a level based upon the observability of the inputs which are significant to the overall valuation. The three-level hierarchy of inputs is summarized as follows:
| | | | |
| Level 1 | | – | | Inputs are quoted prices in active markets for identical investments. (Examples: equity securities, open-end investment companies, futures contracts, and exchange-traded options contracts) |
| | |
| Level 2 | | – | | Other observable inputs, including, but not limited to: quoted prices for similar assets or liabilities in markets that are active, quoted prices for identical or similar assets or liabilities in markets that are not active, inputs other than quoted prices that are observable for the assets or liabilities (such as interest rates, yield curves, volatilities, prepayment speeds, loss severities, credit risks, and default rates) or other market-corroborated inputs. (Examples: debt securities, government securities, swap contracts, foreign currency exchange contracts, foreign securities utilizing international fair value pricing, broker-quoted securities, and fair valued securities) |
| | |
| Level 3 | | – | | Significant unobservable inputs, including the Fund’s own assumptions used to determine the fair value of investments. (Examples: broker-quoted securities and fair valued securities) |
Level 3 investments are valued using significant unobservable inputs. The Fund may also use an income-based valuation approach in which the anticipated future cash flows of the investment are discounted to calculate fair value. Discounts may also be applied due to the nature or duration of any restrictions on the disposition of the investments. Valuations may also be based upon current market prices of securities that are comparable in coupon, rating, maturity, and industry. The derived value of a Level 3 investment may not represent the value which is received upon disposition and this could impact the results of operations.
41
Notes to financial statements
Delaware Emerging Markets Debt Corporate Fund
3. Investments (continued)
The following table summarizes the valuation of the Fund’s investments by fair value hierarchy levels as of July 31, 2020:
| | | | | | | | | | | | |
| | | Level 1 | | | Level 2 | | | Total | |
Securities | | | | | | | | | | | | |
| | | |
Assets: | | | | | | | | | | | | |
Corporate Bonds | | $ | — | | | $ | 66,236,784 | | | $ | 66,236,784 | |
Sovereign Bonds | | | — | | | | 1,138,097 | | | | 1,138,097 | |
Supranational Bank | | | — | | | | 561,656 | | | | 561,656 | |
Short-Term Investments | | | 1,919,717 | | | | — | | | | 1,919,717 | |
| | | | | | | | | | | | |
Total Value of Securities | | $ | 1,919,717 | | | $ | 67,936,537 | | | $ | 69,856,254 | |
| | | | | | | | | | | | |
| | | |
Derivatives1 | | | | | | | | | | | | |
| | | |
Assets: | | | | | | | | | | | | |
Swap Contracts | | $ | — | | | $ | 75,203 | | | $ | 75,203 | |
Liabilities: | | | | | | | | | | | | |
Futures Contracts | | | (24,289 | ) | | | — | | | | (24,289 | ) |
1Swap contracts are valued at fair value and futures contracts are valued at the unrealized appreciation (depreciation) on the instrument at the year end.
During the year ended July 31, 2020, there were no transfers into or out of Level 3 investments. The Fund’s policy is to recognize transfers into or out of Level 3 investments based on fair value at the beginning of the reporting period.
A reconciliation of Level 3 investments is presented when the Fund has a significant amount of Level 3 investments at the beginning, interim, or end of the period in relation to net assets. During the year ended July 31, 2020, there were no Level 3 investments.
4. Dividend and Distribution Information
Income and long-term capital gain distributions are determined in accordance with federal income tax regulations, which may differ from US GAAP. Additionally, distributions from net gains on foreign currency transactions and net short-term gains on sales of investment securities are treated as ordinary income for federal income tax purposes. The tax character of dividends and distributions paid during the years ended July 31, 2020 and 2019 were as follows:
| | | | | | | | |
| | | Year ended | |
| | | 7/31/20 | | | 7/31/19 | |
Ordinary income | | $ | 2,854,149 | | | $ | 1,045,440 | |
Long-term capital gains | | | — | | | | 120,855 | |
Return of capital | | | 45,875 | | | | — | |
| | | | | | | | |
Total | | $ | 2,900,024 | | | $ | 1,166,295 | |
| | | | | | | | |
42
5. Components of Net Assets on a Tax Basis
As of July 31, 2020, the components of net assets on a tax basis were as follows:
| | | | |
Shares of beneficial interest | | $ | 71,089,042 | |
Qualified late year loss deferrals | | | (223,839 | ) |
Capital loss carryforwards | | | (1,374,018 | ) |
Unrealized appreciation of investments | | | 476,847 | |
| | | | |
Net assets | | $ | 69,968,032 | |
| | | | |
The differences between book basis and tax basis components of net assets are primarily attributable to tax deferral of losses on wash sales, mark-to-market of futures contracts, tax treatment of swap contracts, defaulted interest, amortization of premium on callable bonds.
Qualified late year ordinary and capital losses (including currency and specified gain/loss items) represent losses realized from January 1, 2020 through July 31, 2020 and November 1, 2019 through July 31, 2020, respectively, that, in accordance with federal income tax regulations, the Funds have elected to defer and treat as having arisen in the following fiscal year.
At July 31, 2020, capital loss carryforwards available to offset future realized capital gains were as follows:
| | | | |
Loss carryforward character | | |
Short-term | | Long-term | | Total |
| $1,198,211 | | $175,807 | | $1,374,018 |
43
Notes to financial statements
Delaware Emerging Markets Debt Corporate Fund
6. Capital Shares
Transactions in capital shares were as follows:
| | | | | | | | |
| | | Year ended | |
| | | 7/31/20 | | | 7/31/19 | |
Shares sold: | | | | | | | | |
Class A | | | 25,678 | | | | 13,620 | |
Class C | | | 2,841 | | | | 1,666 | |
Institutional Class | | | 5,100,206 | | | | 3,240,572 | |
| | |
Shares issued upon reinvestment of dividends and distributions: | | | | | | | | |
Class A | | | 376 | | | | 631 | |
Class C | | | 290 | | | | 294 | |
Class R | | | 13 | | | | 16 | |
Institutional Class | | | 345,726 | | | | 141,593 | |
| | | | | | | | |
| | | 5,475,130 | | | | 3,398,392 | |
| | | | | | | | |
| | |
Shares redeemed: | | | | | | | | |
Class A | | | (3,693 | ) | | | (10,296 | ) |
Class C | | | (256 | ) | | | (4,849 | ) |
Institutional Class | | | (3,205,216 | ) | | | (32,072 | ) |
| | | | | | | | |
| | | (3,209,165 | ) | | | (47,217 | ) |
| | | | | | | | |
Net increase | | | 2,265,965 | | | | 3,351,175 | |
| | | | | | | | |
7. Line of Credit
The Fund, along with certain other funds in the Delaware Funds (Participants), was a participant in a $220,000,000 revolving line of credit intended to be used for temporary or emergency purposes as an additional source of liquidity to fund redemptions of investor shares. Under the agreement, the Participants were charged an annual commitment fee of 0.15%, which was allocated across the Participants based on a weighted average of the respective net assets of each Participant. The Participants were permitted to borrow up to a maximum of one-third of their net assets under the agreement. Each Participant was individually, and not jointly, liable for its particular advances, if any, under the line of credit. The line of credit available under the agreement expired on November 4, 2019.
On November 4, 2019, the Participants entered into an amendment to the agreement for a $250,000,000 revolving line of credit. The revolving line of credit available was increased to $275,000,000 on May 6, 2020. The revolving line of credit is to be used as described above and operates in substantially the same manner as the original agreement. The line of credit available under the agreement expires on November 2, 2020.
The Fund had no amounts outstanding as of July 31, 2020, or at any time during the year then ended.
44
8. Derivatives
US GAAP requires disclosures that enable investors to understand: (1) how and why an entity uses derivatives; (2) how they are accounted for; and (3) how they affect an entity’s results of operations and financial position.
Foreign Currency Exchange Contracts — The Fund may enter into foreign currency exchange contracts and foreign cross currency exchange contracts as a way of managing foreign exchange rate risk. The Fund may enter into these contracts to fix the US dollar value of a security that it has agreed to buy or sell for the period between the date the trade was entered into and the date the security is delivered and paid for. The Fund may also enter into these contracts to hedge the US dollar value of securities it already owns that are denominated in foreign currencies. In addition, the Fund may enter into these contracts to facilitate or expedite the settlement of portfolio transactions. The change in value is recorded as an unrealized gain or loss. When the contract is closed, a realized gain or loss is recorded equal to the difference between the value of the contract at the time it was opened and the value at the time it was closed.
The use of foreign currency exchange contracts and foreign cross currency exchange contracts does not eliminate fluctuations in the underlying prices of the securities, but does establish a rate of exchange that can be achieved in the future. Although foreign currency exchange contracts and foreign cross currency exchange contracts limit the risk of loss due to an unfavorable change in the value of the hedged currency, they also limit any potential gain that might result should the value of the currency change favorably. In addition, the Fund could be exposed to risks if the counterparties to the contracts are unable to meet the terms of their contracts. The Fund’s maximum risk of loss from counterparty credit risk is the value of its currency exchanged with the counterparty. The risk is generally mitigated by having a netting arrangement between the Fund and the counterparty and by the posting of collateral by the counterparty to the Fund to cover the Fund’s exposure to the counterparty. No foreign currency exchange contracts and foreign cross currency exchange contracts were outstanding at July 31, 2020.
Futures Contracts — A futures contract is an agreement in which the writer (or seller) of the contract agrees to deliver to the buyer an amount of cash or securities equal to a specific dollar amount times the difference between the value of a specific security or index at the close of the last trading day of the contract and the price at which the agreement is made. The Fund may use futures contracts in the normal course of pursuing its investment objective. The Fund may invest in futures contracts to hedge its existing portfolio securities against fluctuations in value caused by changes in interest rates or market conditions. Upon entering into a futures contract, the Fund deposits cash or pledges US government securities to a broker, equal to the minimum “initial margin” requirements of the exchange on which the contract is traded. Subsequent payments are received from the broker or paid to the broker each day, based on the daily fluctuation in the market value of the contract. These receipts or payments are known as “variation margin” and are recorded daily by the Fund as unrealized gains or losses until the contracts are closed. When the contracts are closed, the Fund records a realized gain or loss equal to the difference between the value of the contract at the time it was opened and the value at the time it was closed. Risks of entering into futures contracts include potential imperfect correlation between the futures contracts and the underlying securities and the possibility of an illiquid secondary market for
45
Notes to financial statements
Delaware Emerging Markets Debt Corporate Fund
8. Derivatives (continued)
these instruments. When investing in futures, there is reduced counterparty credit risk to the Fund because futures are exchange-traded and the exchange’s clearinghouse, as counterparty to all exchange-traded futures, guarantees against default. At July 31, 2020, the Fund posted $27,500 in cash as collateral for open futures contracts, which is presented as “Cash collateral due from brokers” on the “Statement of assets and liabilities.”
During the year ended July 31, 2020, the Fund used futures contracts to hedge the Fund’s existing portfolio securities against fluctuations in value caused by changes in interest rates or market conditions.
Options Contracts — The Fund may enter into options contracts in the normal course of pursuing its investment objective. The Fund may buy or write options contracts for any number of reasons, including without limitation: to manage the Fund’s exposure to changes in securities prices caused by interest rates or market conditions and foreign currencies; as an efficient means of adjusting the Fund’s overall exposure to certain markets; to protect the value of portfolio securities; and as a cash management tool. The Fund may buy or write call or put options on securities, futures, swaps, swaptions, financial indices, and foreign currencies. When the Fund buys an option, a premium is paid and an asset is recorded and adjusted on a daily basis to reflect the current market value of the option purchased. When the Fund writes an option, a premium is received and a liability is recorded and adjusted on a daily basis to reflect the current market value of the option written. Premiums received from writing options that expire unexercised are treated by the Fund on the expiration date as realized gains. The difference between the premium received and the amount paid on effecting a closing purchase transaction, including brokerage commissions, is treated as realized gain or loss. If a call option is exercised, the premium is added to the proceeds from the sale of the underlying security in determining whether the Fund has a realized gain or loss. If a put option is exercised, the premium reduces the cost basis of the securities purchased by the Fund. The Fund, as writer of an option, bears the market risk of an unfavorable change in the price of the security underlying the written option. When writing options, the Fund is subject to minimal counterparty risk because the counterparty is only obligated to pay premiums and does not bear the market risk of an unfavorable market change. No options written contracts were outstanding at July 31, 2020.
There were no transactions in options written during the year ended July 31, 2020.
During the year ended July 31, 2020, the Fund used options purchased contracts to manage the Fund’s exposure to changes in securities prices caused by interest rates or market conditions.
Swap Contracts — The Fund may enter into CDS contracts in the normal course of pursuing its investment objective. The Fund may enter into CDS contracts in order to hedge against credit events, to enhance total return, or to gain exposure to certain securities or markets. The Fund will not be permitted to enter into any swap transactions unless, at the time of entering into such transactions, the unsecured long-term debt of the actual counterparty, combined with any credit enhancements, is rated at least BBB- by Standard & Poor’s Financial Services LLC (S&P) or Baa3 by Moody’s Investors Service, Inc. (Moody’s) or is determined to be of equivalent credit quality by DMC.
Credit Default Swaps. A CDS contract is a risk-transfer instrument through which one party (purchaser of protection) transfers to another party (seller of protection) the financial risk of a credit event (as defined in
46
the CDS agreement), as it relates to a particular reference security or basket of securities (such as an index). In exchange for the protection offered by the seller of protection, the purchaser of protection agrees to pay the seller of protection a periodic amount at a stated rate that is applied to the notional amount of the CDS contract. In addition, an upfront payment may be made or received by the Fund in connection with an unwinding or assignment of a CDS contract. Upon the occurrence of a credit event, the seller of protection would pay the par (or other agreed-upon) value of the reference security (or basket of securities) to the counterparty. Credit events generally include, among others, bankruptcy, failure to pay, and obligation default.
During the year ended July 31, 2020, the Fund entered into CDS contracts as a purchaser of protection. Periodic payments (receipts) on such contracts are accrued daily and recorded as unrealized losses (gains) on swap contracts. Upon payment (receipt), such amounts are recorded as realized losses (gains) on swap contracts. Upfront payments made or received in connection with CDS contracts are amortized over the expected life of the CDS contracts as unrealized losses (gains) on swap contracts. The change in value of CDS contracts is recorded daily as unrealized appreciation or depreciation. A realized gain or loss is recorded upon a credit event (as defined in the CDS agreement) or the maturity or termination of the agreement. Initial margin and variation margin are posted to central counterparties for CDS basket trades, as determined by the applicable central counterparty. During the year ended July 31, 2020, the Fund did not enter into any CDS contracts as a seller of protection.
CDS contracts may involve greater risks than if the Fund had invested in the reference obligation directly. CDS contracts are subject to general market risk, liquidity risk, counterparty risk, and credit risk. The Fund’s maximum risk of loss from counterparty credit risk, either as the seller of protection or the buyer of protection, is the fair value of the contract. This risk is mitigated by (1) for bilateral swap contracts, having a netting arrangement between the Fund and the counterparty and by the posting of collateral by the counterparty to the Fund to cover the Fund’s exposure to the counterparty or (2) for cleared swaps, trading these instruments through a central counterparty.
During the year ended July 31, 2020, the Fund used CDS contracts to hedge against credit events.
Swaps Generally. The value of open swaps may differ from that which would be realized in the event the Fund terminated its position in the contract on a given day. Risks of entering into these contracts include the potential inability of the counterparty to meet the terms of the contracts. This type of risk is generally limited to the amount of favorable movement in the value of the underlying security, instrument, or basket of instruments, if any, at the day of default. Risks also arise from potential losses from adverse market movements and such losses could exceed the unrealized amounts that would be shown on the “Schedule of investments.” For centrally cleared swaps, payments are received from the broker or paid to the broker each day, based on the daily fluctuation in the market value of the contract. These receipts or payments are known as “variation margin” and are recorded by the Fund as unrealized gains or losses until the contracts are closed. When the contracts are closed, the Fund records a realized gain or loss equal to the difference between the value of the contract at the time it was opened and the value at the time it was closed.
47
Notes to financial statements
Delaware Emerging Markets Debt Corporate Fund
8. Derivatives (continued)
At July 31, 2020, the Fund received $80,000 in cash collateral for open over-the-counter credit default swap contracts, which is included in “Cash collateral due to brokers” on the “Statement of assets and liabilities.”
Fair values of derivative instruments as of July 31, 2020 was as follows:
| | | | | | | | | | | | |
| | | Liability Derivatives Fair Value | |
| | | |
Statement of Assets and Liabilities Location | | Interest
Rate
Contracts | | | Credit Contracts | | | Total | |
Variation margin due from broker on futures contracts | | $ | 24,289 | | | $ | — | | | $ | 24,289 | |
Unrealized depreciation of over the counter credit default swap contracts* | | | — | | | | 184,103 | | | | 184,103 | |
| | | | | | | | | | | | |
Total Liability Derivatives Fair Value | | $ | 24,289 | | | $ | 184,103 | | | $ | 208,392 | |
| | | | | | | | | | | | |
*Includes cumulative appreciation (depreciation) of futures contracts from the date the contracts were opened through July 31, 2020. Only current day variation margin is reported on the “Statement of assets and liabilities.”
48
The effect of derivative instruments on the “Statement of operations” for the year ended July 31, 2020 was as follows:
| | | | | | | | | | | | | | | | | | | | |
| | | Net Realized Gain (Loss) on: | | | | |
| | | Foreign
Currency
Exchange
Contracts | | | Futures
Contracts | | | Options
Purchased | | | Swap
Contracts | | | Total | |
Currency contracts | | $ | (21 | ) | | $ | — | | | $ | — | | | $ | — | | | $ | (21 | ) |
Interest rate contracts | | | — | | | | 832 | | | | (35,336 | ) | | | — | | | | (34,504 | ) |
Credit contracts | | | — | | | | — | | | | — | | | | 157,077 | | | | 157,077 | |
| | | | | | | | | | | | | | | | | | | | |
Total | | $ | (21 | ) | | $ | 832 | | | $ | (35,336 | ) | | $ | 157,077 | | | $ | 122,552 | |
| | | | | | | | | | | | | | | | | | | | |
| | | | | | | | | | | | | | | | |
| | | Net Change in Unrealized Appreciation (Depreciation) of: | | | | |
| | | Foreign
Currency
Exchange
Contracts | | | Futures
Contracts | | | Swap
Contracts | | | Total | |
Interest rate contracts | | $ | — | | | $ | (24,289 | ) | | $ | — | | | $ | (24,289 | ) |
Credit contracts | | | — | | | | — | | | | (188,224 | ) | | | (188,224 | ) |
| | | | | | | | | | | | | | | | |
Total | | $ | — | | | $ | (24,289 | ) | | $ | (188,224 | ) | | $ | (212,513 | ) |
| | | | | | | | | | | | | | | | |
The table below summarizes the average balance of derivative holdings by the Fund during the year ended July 31, 2020:
| | | | |
| | | Long Derivative Volume | | Short Derivative Volume |
Futures contracts (average notional value) | | $ — | | $409,800 |
Options contracts (average notional value) | | 394 | | — |
CDS contracts (average notional value)* | | 1,509,988 | | — |
*Long represents buying protection and short represents selling protection.
9. Offsetting
The Fund entered into an International Swaps and Derivatives Association, Inc. Master Agreement (ISDA Master Agreement) or a similar agreement with certain of its derivative contract counterparties in order to better define its contractual rights and to secure rights that will help the Fund mitigate its counterparty risk. An ISDA Master Agreement is a bilateral agreement between the Fund and a counterparty that governs over-the-counter (OTC) derivatives and foreign exchange contracts and typically contains, among other things, collateral posting items and netting provisions in the event of a default and/or termination event. Under an ISDA Master Agreement, the Fund may, under certain circumstances, offset with the counterparty certain derivative financial instruments’ payables and/or receivables with collateral held and/or posted and create one single net payment. The provisions of the ISDA Master Agreement typically permit a single net payment in the event of default (close-out), including the bankruptcy or
49
Notes to financial statements
Delaware Emerging Markets Debt Corporate Fund
9. Offsetting (continued)
insolvency of the counterparty. However, bankruptcy or insolvency laws of a particular jurisdiction may impose restrictions on or prohibitions against the right of offset in bankruptcy, insolvency, or other events.
For financial reporting purposes, the Fund does not offset derivative assets and derivative liabilities that are subject to netting arrangements on the “Statement of assets and liabilities.”
At July 31, 2020, the Fund had the following assets and liabilities subject to offsetting provisions:
Offsetting of Financial Assets and Liabilities and Derivative Assets and Liabilities
| | | | | | | | | | | | |
Counterparty | | Gross Value of
Derivative Asset | | | Gross Value of
Derivative Liability | | | Net Position | |
| JPMorgan Chase Bank | | $ | 75,203 | | | $ | — | | | $ | 75,203 | |
| | | | | | | | | | | | | | | | | | | | | | | | |
Counterparty | | Net Position | | | Fair Value of
Non-Cash
Collateral Received | | | Cash Collateral
Received(a) | | | Fair Value of
Non-Cash
Collateral Pledged | | | Cash Collateral
Pledged | | | Net Exposure(b) | |
JPMorgan Chase Bank | | $ | 75,203 | | | $ | — | | | $ | (75,203 | ) | | $ | — | | | $ | — | | | $ | — | |
(a)The value of the related collateral exceeded the value of the derivatives as of July 31, 2020, as applicable.
(b)Net exposure represents the receivable (payable) that would be due from (to) the counterparty in the event of default.
10. Securities Lending
The Fund, along with other funds in the Delaware Funds, may lend its securities pursuant to a security lending agreement (Lending Agreement) with The Bank of New York Mellon (BNY Mellon). At the time a security is loaned, the borrower must post collateral equal to the required percentage of the market value of the loaned security, including any accrued interest. The required percentage is: (1) 102% with respect to US securities and foreign securities that are denominated and payable in US dollars; and (2) 105% with respect to foreign securities. With respect to each loan, if on any business day the aggregate market value of securities collateral plus cash collateral held is less than the aggregate market value of the securities which are the subject of such loan, the borrower will be notified to provide additional collateral by the end of the following business day, which, together with the collateral already held, will be not less than the applicable initial collateral requirements for such security loan. If the aggregate market value of securities collateral and cash collateral held with respect to a security loan exceeds the applicable initial collateral requirement, upon the request of the borrower, BNY Mellon must return enough collateral to the borrower by the end of the following business day to reduce the value of the remaining collateral to the applicable initial collateral requirement for such security loan. As a result of the foregoing, the value of the collateral held with respect to a loaned security on any particular day, may be more or less than the value of the security on loan. The collateral percentage with respect to the market value of the loaned security is determined by the security lending agent.
Cash collateral received by each fund of the Trust is generally invested in a series of individual separate accounts, each corresponding to a fund. The investment guidelines permit each separate account to
50
hold certain securities that would be considered eligible securities for a money market fund. Cash collateral received is generally invested in government securities; certain obligations issued by government sponsored enterprises; repurchase agreements collateralized by US Treasury securities; obligations issued by the central government of any Organization for Economic Cooperation and Development (OECD) country or its agencies, instrumentalities, or establishments; obligations of supranational organizations; commercial paper, notes, bonds, and other debt obligations; certificates of deposit, time deposits, and other bank obligations; and asset-backed securities. A fund can also accept US government securities and letters of credit (non-cash collateral) in connection with securities loans.
In the event of default or bankruptcy by the lending agent, realization and/or retention of the collateral may be subject to legal proceedings. In the event the borrower fails to return loaned securities and the collateral received is insufficient to cover the value of the loaned securities and provided such collateral shortfall is not the result of investment losses, the lending agent has agreed to pay the amount of the shortfall to the Fund or, at the discretion of the lending agent, replace the loaned securities. The Fund continues to record dividends or interest, as applicable, on the securities loaned and is subject to changes in value of the securities loaned that may occur during the term of the loan. The Fund has the right under the Lending Agreement to recover the securities from the borrower on demand. With respect to security loans collateralized by non-cash collateral, the Fund receives loan premiums paid by the borrower. With respect to security loans collateralized by cash collateral, the earnings from the collateral investments are shared among the Fund, the security lending agent, and the borrower. The Fund records security lending income net of allocations to the security lending agent and the borrower.
The Fund may incur investment losses as a result of investing securities lending collateral. This could occur if an investment in the collateral investment account defaulted or became impaired. Under those circumstances, the value of the Fund’s cash collateral account may be less than the amount the Fund would be required to return to the borrowers of the securities and the Fund would be required to make up for this shortfall.
During the year ended July 31, 2020, the Fund had no securities out on loan.
11. Credit and Market Risk
Beginning in January 2020, global financial markets have experienced and may continue to experience significant volatility resulting from the spread of a novel coronavirus known as COVID-19. The outbreak of COVID-19 has resulted in travel and border restrictions, quarantines, supply chain disruptions, lower consumer demand and general market uncertainty. The effects of COVID-19 have and may continue to adversely affect the global economy, the economies of certain nations and individual issuers, all of which may negatively impact the Funds’ performance.
When interest rates rise, fixed income securities (i.e. debt obligations) generally will decline in value. These declines in value are greater for fixed income securities with longer maturities or durations.
IBOR risk is the risk that potential changes related to the use of the London interbank offered rate (LIBOR) could have adverse impacts on financial instruments that reference LIBOR. The potential abandonment of LIBOR could affect the value and liquidity of instruments that reference LIBOR. The use of alternative reference rate products may impact investment strategy performance. These risks may also
51
Notes to financial statements
Delaware Emerging Markets Debt Corporate Fund
11. Credit and Market Risk (continued)
apply with respect to changes in connection with other interbank offered rates (“IBORs”), such as the euro overnight index average (EONIA), which are also the subject of recent reform.
Some countries in which the Fund may invest require governmental approval for the repatriation of investment income, capital, or the proceeds of sales of securities by foreign investors. In addition, if there is deterioration in a country’s balance of payments or for other reasons, a country may impose temporary restrictions on foreign capital remittances abroad.
The securities exchanges of certain foreign markets are substantially smaller, less liquid, and more volatile than the major securities markets in the US. Consequently, acquisition and disposition of securities by the Fund may be inhibited. In addition, a significant portion of the aggregate market value of equity securities listed on the major securities exchanges in emerging markets is held by a smaller number of investors. This may limit the number of shares available for acquisition or disposition by the Fund.
The Fund invests a portion of its assets in high yield fixed income securities, which are securities rated lower than BBB- by Standard & Poor’s Financial Services LLC and Baa3 by Moody’s Investors Service, Inc., or similarly rated by another nationally recognized statistical rating organization. Investments in these higher yielding securities are generally accompanied by a greater degree of credit risk than higher rated securities. Additionally, lower rated securities may be more susceptible to adverse economic and competitive industry conditions than investment grade securities.
The Fund invests in certain obligations that may have liquidity protection designed to ensure that the receipt of payments due on the underlying security is timely. Such protection may be provided through guarantees, insurance policies, or letters of credit obtained by the issuer or sponsor through third parties, through various means of structuring the transaction, or through a combination of such approaches. The Fund will not pay any additional fees for such credit support, although the existence of credit support may increase the price of the security.
The Fund invests in bank loans and other securities that may subject it to direct indebtedness risk, the risk that the Fund will not receive payment of principal, interest, and other amounts due in connection with these investments and will depend primarily on the financial condition of the borrower. Loans that are fully secured offer the Fund more protection than unsecured loans in the event of nonpayment of scheduled interest or principal, although there is no assurance that the liquidation of collateral from a secured loan would satisfy the corporate borrower’s obligation, or that the collateral can be liquidated. Some loans or claims may be in default at the time of purchase. Certain of the loans and the other direct indebtedness acquired by the Fund may involve revolving credit facilities or other standby financing commitments that obligate the Fund to pay additional cash on a certain date or on demand. These commitments may require the Fund to increase its investment in a company at a time when the Fund might not otherwise decide to do so (including at a time when the company’s financial condition makes it unlikely that such amounts will be repaid). To the extent that the Fund is committed to advance additional funds, it will at all times hold and maintain cash or other high grade debt obligations in an amount sufficient to meet such commitments. When a loan agreement is purchased the Fund may pay an assignment fee. On an ongoing basis, the Fund may receive a commitment fee based on the undrawn
52
portion of the underlying line of credit portion of a loan agreement. Prepayment penalty fees are received upon the prepayment of a loan agreement by the borrower. Prepayment penalty, facility, commitment, consent, and amendment fees are recorded to income as earned or paid.
As the Fund may be required to rely upon another lending institution to collect and pass on to the Fund amounts payable with respect to the loan and to enforce the Fund’s rights under the loan and other direct indebtedness, an insolvency, bankruptcy, or reorganization of the lending institution may delay or prevent the Fund from receiving such amounts. The highly leveraged nature of many loans may make them especially vulnerable to adverse changes in economic or market conditions. Investments in such loans and other direct indebtedness may involve additional risk to the Fund.
The Fund may invest up to 15% of its net assets in illiquid securities, which may include securities with contractual restrictions on resale, securities exempt from registration under Rule 144A promulgated under the Securities Act of 1933, as amended, and other securities which may not be readily marketable. The relative illiquidity of these securities may impair the Fund from disposing of them in a timely manner and at a fair price when it is necessary or desirable to do so. While maintaining oversight, the Board has delegated to DMC, the day-to-day functions of determining whether individual securities are liquid for purposes of the Fund’s limitation on investments in illiquid securities. Securities eligible for resale pursuant to Rule 144A, which are determined to be liquid, are not subject to the Fund’s 15% limit on investments in illiquid securities. Rule 144A securities have been identified on the “Schedule of investments.”
12. Contractual Obligations
The Fund enters into contracts in the normal course of business that contain a variety of indemnifications. The Fund’s maximum exposure under these arrangements is unknown. However, the Fund has not had prior claims or losses pursuant to these contracts. Management has reviewed the Fund’s existing contracts and expects the risk of loss to be remote.
13. Recent Accounting Pronouncements
In March 2017, FASB issued an Accounting Standards Update (ASU), ASU 2017-08, Receivables— Nonrefundable Fees and Other Costs (Subtopic 310-20), Premium Amortization on Purchased Callable Debt Securities which amends the amortization period for certain callable debt securities purchased at a premium, shortening such period to the earliest call date. ASU 2017-08 does not require any accounting change for debt securities held at a discount; the discount continues to be amortized to maturity. ASU 2017-08 is effective for fiscal years, and interim periods within those fiscal years, beginning after December 15, 2018. Management has implemented ASU 2017-08 and determined that the impact of this guidance to the Fund’s net assets at the end of the year is not material.
In August 2018, FASB issued ASU 2018-13, which changes certain fair value measurement disclosure requirements. ASU 2018-13, in addition to other modifications and additions, removes the requirement to disclose the amount and reasons for transfers between Level 1 and Level 2 of the fair value hierarchy, the policy for the timing of transfers between levels and the valuation process for Level 3 fair value
53
Notes to financial statements
Delaware Emerging Markets Debt Corporate Fund
13. Recent Accounting Pronouncements (continued)
measurements. ASU 2018-13 is effective for fiscal years, and interim periods within those fiscal years, beginning after December 15, 2019. Management has implemented ASU 2018-13 on the financial statements.
In March 2020, FASB issued ASU 2020-04, Reference Rate Reform (Topic 848) – Facilitation of the Effects of Reference Rate Reform on Financial Reporting. The amendments in ASU 2020-04 provides optional temporary financial reporting relief from the effect of certain types of contract modifications due to the planned discontinuation of LIBOR and other interbank-offered based reference rates as of the end of 2021. ASU 2020-04 is effective for certain reference rate-related contract modifications that occur during the period March 12, 2020 through December 31, 2022. Management is currently evaluating the impact, of applying this ASU.
14. Subsequent Events
Management has determined that no material events or transactions occurred subsequent to July 31, 2020, that would require recognition or disclosure in the Fund’s financial statements.
54
Report of independent
registered public accounting firm
To the Board of Trustees of Delaware Group® Government Fund and Shareholders of Delaware Emerging Markets Debt Corporate Fund
Opinion on the Financial Statements
We have audited the accompanying statement of assets and liabilities, including the schedule of investments, of Delaware Emerging Markets Debt Corporate Fund (one of the funds constituting Delaware Group® Government Fund, referred to hereafter as the “Fund”) as of July 31, 2020, the related statement of operations for the year ended July 31, 2020, the statements of changes in net assets for each of the two years in the period ended July 31, 2020, including the related notes, and the financial highlights for each of the five years in the period ended July 31, 2020 (collectively referred to as the “financial statements”). In our opinion, the financial statements present fairly, in all material respects, the financial position of the Fund as of July 31, 2020, the results of its operations for the year then ended, the changes in its net assets for each of the two years in the period ended July 31, 2020 and the financial highlights for each of the five years in the period ended July 31, 2020 in conformity with accounting principles generally accepted in the United States of America.
Basis for Opinion
These financial statements are the responsibility of the Fund’s management. Our responsibility is to express an opinion on the Fund’s financial statements based on our audits. We are a public accounting firm registered with the Public Company Accounting Oversight Board (United States) (PCAOB) and are required to be independent with respect to the Fund in accordance with the U.S. federal securities laws and the applicable rules and regulations of the Securities and Exchange Commission and the PCAOB.
We conducted our audits of these financial statements in accordance with the standards of the PCAOB. Those standards require that we plan and perform the audit to obtain reasonable assurance about whether the financial statements are free of material misstatement, whether due to error or fraud.
Our audits included performing procedures to assess the risks of material misstatement of the financial statements, whether due to error or fraud, and performing procedures that respond to those risks. Such procedures included examining, on a test basis, evidence regarding the amounts and disclosures in the financial statements. Our audits also included evaluating the accounting principles used and significant estimates made by management, as well as evaluating the overall presentation of the financial statements. Our procedures included confirmation of securities owned as of July 31, 2020 by correspondence with the custodian, transfer agents and brokers; when replies were not received from brokers, we performed other auditing procedures. We believe that our audits provide a reasonable basis for our opinion.
/s/PricewaterhouseCoopers LLP
Philadelphia, Pennsylvania
September 23, 2020
We have served as the auditor of one or more investment companies in Delaware Funds® by Macquarie since 2010.
55
Other Fund information (Unaudited)
Delaware Emerging Markets Debt Corporate Fund
Liquidity Risk Management Program
The Securities and Exchange Commission (the “SEC”) has adopted Rule 22e-4 under the Investment Company Act of 1940 (the “Liquidity Rule”), which requires all open-end funds (other than money market funds) to adopt and implement a program reasonably designed to assess and manage the fund’s “liquidity risk,” defined as the risk that the fund could not meet requests to redeem shares issued by the fund without significant dilution of remaining investors’ interests in the fund.
The Fund has adopted and implemented a liquidity risk management program in accordance with the Liquidity Rule (the “Program”). The Board has designated the Division Director of the US Operational Risk Group of Macquarie Asset Management as the Program Administrator for each Fund in the Trust.
As required by the Liquidity Rule, the Program includes policies and procedures that provide for: (1) assessment, management, and review (no less frequently than annually) of the Fund’s liquidity risk; (2) classification of each of the Fund’s portfolio holdings into one of four liquidity categories (Highly Liquid, Moderately Liquid, Less Liquid, and Illiquid); (3) for funds that do not primarily hold assets that are Highly Liquid, establishing and maintaining a minimum percentage of the Fund’s net assets in Highly Liquid investments (called a “Highly Liquid Investment Minimum” or “HLIM”); and (4) prohibiting the Fund’s acquisition of Illiquid investments if, immediately after the acquisition, the Fund would hold more than 15% of its net assets in Illiquid assets. The Program also requires reporting to the SEC (on a non-public basis) and to the Board if the Fund’s holdings of Illiquid assets exceed 15% of the Fund’s net assets. Funds with HLIMs must have procedures for addressing HLIM shortfalls, including reporting to the Board and, with respect to HLIM shortfalls lasting more than seven consecutive calendar days, reporting to the SEC (on a non-public basis).
In assessing and managing the Fund’s liquidity risk, the Program Administrator considers, as relevant, a variety of factors, including: (1) the Fund’s investment strategy and liquidity of portfolio investments during both normal and reasonably foreseeable stressed conditions; (2) short-term and long-term cash flow projections for the Fund during both normal and reasonably foreseeable stressed conditions; and (3) the Fund’s holdings of cash and cash equivalents and any borrowing arrangements. Classification of the Fund’s portfolio holdings in the four liquidity categories is based on the number of days it is reasonably expected to take to convert the investment to cash (for Highly Liquid and Moderately Liquid holdings) or to sell or dispose of the investment (for Less Liquid and Illiquid investments), in current market conditions without significantly changing the investment’s market value. The Fund primarily holds assets that are classified as Highly Liquid, and therefore is not required to establish an HLIM.
At a meeting of the Board held on May 19-21, 2020, the Program Administrator provided a written report to the Board addressing the Program’s operation and assessing the adequacy and effectiveness of its implementation for the period from December 1, 2018 through March 31, 2020. The report concluded that the Program is appropriately designed and effectively implemented and that it meets the requirements of Rule 22e-4 and the Fund’s liquidity needs. The Fund’s HLIM is set at an appropriate level and the Fund complied with its HLIM at all times during the reporting period.
56
Tax Information
The information set forth below is for the Fund’s fiscal year as required by federal income tax laws. Shareholders, however, must report distributions on a calendar year basis for income tax purposes, which may include distributions for portions of two fiscal years of the Fund. Accordingly, the information needed by shareholders for income tax purposes will be sent to them in January of each year. Please consult your tax advisor for proper treatment of this information.
All disclosures are based on financial information available as of the date of this annual report and, accordingly, are subject to change. For any and all items requiring reporting, it is the intention of the Fund to report the maximum amount permitted under the Internal Revenue Code and the regulations thereunder.
For the fiscal year ended July 31, 2020, the Fund reports distributions paid during the year as follows:
| | | | |
(A) Ordinary Income Distributions (Tax Basis) | | | 98.42% | |
(B) Return of Capital (Tax Basis) | | | 1.58% | |
Total Distributions (Tax Basis) | | | 100.00% | |
(A) and (B) are based on a percentage of the Fund’s total distributions.
57
Board of trustees / directors and officers addendum
Delaware Funds® by Macquarie
A mutual fund is governed by a Board of Trustees/Directors (“Trustees”), which has oversight responsibility for the management of a fund’s business affairs. Trustees establish procedures and oversee and review the performance of the investment manager, the distributor, and others who perform services for the fund. The independent fund trustees, in particular, are advocates for shareholder interests. Each trustee has served in that capacity since he or she was elected to or appointed to the Board of Trustees, and will continue to serve until his or her retirement or the election of a new trustee in his or her place. The following is a list of the Trustees and Officers with certain background and related information.
| | | | | | | | | | | | |
Name, Address, and Birth Date | | Position(s) Held with
Fund(s) | | Length of Time Served | | Principal Occupation(s) During the Past Five Years | | Number of Portfolios in Fund Complex Overseen by Trustee or Officer | | | Other Directorships Held by Trustee or Officer |
| | | | | |
Interested Trustee | | | | | | | | | | | | |
| | | | | |
Shawn K. Lytle1 2005 Market Street Philadelphia, PA 19103 February 1970 | | President, Chief Executive Officer, and Trustee | | President and Chief Executive Officer since August 2015 Trustee since September 2015 | | President — Macquarie Investment Management2 (June 2015–Present) Regional Head of Americas — UBS Global Asset Management (April 2010–May 2015) | | | 93 | | | Trustee — UBS Relationship Funds, SMA Relationship Trust, and UBS Funds (May 2010–April 2015) |
| | | | | |
Independent Trustees | | | | | | | | | | | | |
| | | | | |
Jerome D. Abernathy 2005 Market Street Philadelphia, PA 19103 July 1959 | | Trustee | | Since January 2019 | | Managing Member, Stonebrook Capital Management, LLC (financial technology: macro factors and databases) (January 1993-Present) | | | 93 | | | None |
58
| | | | | | | | | | |
Name, Address, and Birth Date | | Position(s) Held with Fund(s) | | Length of Time Served | | Principal Occupation(s) During the Past Five Years | | Number of
Portfolios in Fund
Complex Overseen
by Trustee or Officer | | Other Directorships Held by Trustee or Officer |
| | | | | |
Thomas L. Bennett 2005 Market Street Philadelphia, PA 19103 October 1947 | | Chair and Trustee | | Trustee since March
2005Chair since March 2015 | | Private Investor
(March 2004–Present) | | 93 | | None |
| | | | | |
Ann D. Borowiec 2005 Market Street
Philadelphia, PA 19103 November 1958 | | Trustee | | Since March 2015 | | Chief Executive Officer, Private
Wealth Management(2011–2013) and Market
Manager, New Jersey Private
Bank (2005–2011) — J.P.
Morgan Chase & Co. | | 93 | | Director — Banco Santander
International (October
2016–December 2019)
Director — Santander Bank,
N.A. (December 2016–
December 2019) |
| | | | | |
Joseph W. Chow 2005 Market Street Philadelphia, PA 19103 January 1953 | | Trustee | | Since January 2013 | | Private Investor
(April 2011–Present) | | 93 | | Director and Audit
Committee Member —
Hercules Technology
Growth Capital, Inc.
(July 2004–July 2014) |
59
| | | | | | | | | | |
Board of trustees / directors and officers addendum Delaware Funds® by Macquarie |
| | | | | |
Name, Address, and Birth Date | | Position(s) Held with Fund(s) | | Length of Time Served | | Principal
Occupation(s) During the Past Five Years | | Number of
Portfolios in Fund Complex Overseen by Trustee or Officer | | Other Directorships Held by Trustee or Officer |
| | | | | |
John A. Fry 2005 Market Street Philadelphia, PA 19103 May 1960 | | Trustee | | Since January 2001 | | President — Drexel University (August 2010–Present) President — Franklin & Marshall College (July 2002–June 2010) | | 93 | | Director; Compensation Committee and Governance Committee Member — Community Health Systems (May 2004–Present) Director — Drexel Morgan & Co. (2015–2019) Director and Audit Committee Member — vTv Therapeutics Inc. (2017–Present) Director and Audit Committee Member — FS Credit Real Estate Income Trust, Inc. (2018–Present) Director — Federal Reserve Bank of Philadelphia (January 2020–Present) |
| | | | | |
Lucinda S. Landreth 2005 Market Street Philadelphia, PA 19103 June 1947 | | Trustee | | Since March 2005 | | Private Investor (2004–Present) | | 93 | | None |
60
| | | | | | | | | | |
Name, Address, and Birth Date | | Position(s) Held with Fund(s) | | Length of Time Served | | Principal Occupation(s) During the Past Five Years | | Number of Portfolios in Fund Complex Overseen
by Trustee or Officer | | Other Directorships Held by Trustee or Officer |
| | | | | |
Frances A. Sevilla-Sacasa 2005 Market Street Philadelphia, PA 19103 January 1956 | | Trustee | | Since September 2011 | | Private Investor (January 2017–Present) Chief Executive Officer — Banco Itaú International (April 2012–December 2016) Executive Advisor to Dean (August 2011–March 2012) and Interim Dean (January 2011–July 2011) — University of Miami School of Business Administration President — U.S. Trust, Bank of America Private Wealth Management (Private Banking) (July 2007-December 2008) | | 93 | | Trust Manager and Audit Committee Chair — Camden Property Trust (August 2011–Present) Director; Strategic Planning and Reserves Committee and Nominating and Governance Committee Member — Callon Petroleum Company (December 2019–Present) Director; Audit Committee Member — Carrizo Oil & Gas, Inc. (March 2018–December 2019) |
61
Board of trustees / directors and officers addendum
Delaware Funds® by Macquarie
| | | | | | | | | | |
Name, Address, and Birth Date | | Position(s)
Held with
Fund(s) | | Length of Time
Served | | Principal Occupation(s) During the Past Five Years | | Number of
Portfolios in Fund
Complex Overseen
by Trustee
or Officer | | Other Directorships Held by Trustee or Officer |
| | | | | |
Thomas K. Whitford 2005 Market Street Philadelphia, PA 19103 March 1956 | | Trustee | | Since January 2013 | | Vice Chairman (2010–April 2013) — PNC Financial Services Group | | 93 | | Director — HSBC North America Holdings Inc. (December 2013–Present) Director — HSBC USA Inc. (July 2014–Present) Director — HSBC Bank USA, National Association (July 2014–March 2017) Director — HSBC Finance Corporation (December 2013–April 2018) |
62
| | | | | | | | | | |
Name, Address, and Birth Date | | Position(s)
Held with
Fund(s) | | Length of Time
Served | | Principal Occupation(s) During the Past Five Years | | Number of
Portfolios in Fund
Complex Overseen
by Trustee
or Officer | | Other Directorships Held by Trustee or Officer |
| | | | | |
Christianna Wood 2005 Market Street Philadelphia, PA 19103 August 1959 | | Trustee | | Since January 2019 | | Chief Executive Officer and President — Gore Creek Capital, Ltd. (August 2009–Present) | | 93 | | Director; Finance Committee and Audit Committee Member — H&R Block Corporation (July 2008–Present) Director; Investments Committee, Capital and Finance Committee, and Audit Committee Member — Grange Insurance (2013–Present) Trustee; Chair of Nominating and Governance Committee and Audit Committee Member — The Merger Fund (2013–Present), The Merger Fund VL (2013–Present); WCM Alternatives: Event-Driven Fund (2013–Present), and WCM Alternatives: Credit Event Fund (December 2017–Present) Director; Chair of Governance Committee and Audit Committee Member — International Securities Exchange (2010–2016) |
63
Board of trustees / directors and officers addendum
Delaware Funds® by Macquarie
| | | | | | | | | | |
Name, Address, and Birth Date | | Position(s) Held with Fund(s) | | Length of Time Served | | Principal Occupation(s) During the Past Five Years | | Number of
Portfolios in Fund
Complex Overseen by Trustee or Officer | | Other Directorships Held by Trustee or Officer |
| | | | | |
Janet L. Yeomans 2005 Market Street Philadelphia, PA 19103 July 1948 | | Trustee | | Since April 1999 | | Vice President and Treasurer (January 2006–July 2012), Vice President – Mergers & Acquisitions (January 2003–January 2006), and Vice President and Treasurer (July 1995–January 2003) – 3M Company | | 93 | | Director; Personnel and Compensation Committee Chair; Member of Nominating, Investments, and Audit Committees for various periods throughout directorship – Okabena Company (2009–2017) |
| | | | | |
Officers | | | | | | | | | | |
| | | | | |
David F. Connor 2005 Market Street Philadelphia, PA 19103 December 1963 | | Senior Vice President, General Counsel, and Secretary | | Senior Vice President, since May 2013; General Counsel since May 2015; Secretary since October 2005 | | David F. Connor has served in various capacities at different times at Macquarie Investment Management. | | 93 | | None3 |
| | | | | |
Daniel V. Geatens 2005 Market Street Philadelphia, PA 19103 October 1972 | | Vice President and Treasurer | | Vice President and Treasurer since October 2007 | | Daniel V. Geatens has served in various capacities at different times at Macquarie Investment Management. | | 93 | | None3 |
64
| | | | | | | | | | |
Name, Address, and Birth Date | | Position(s) Held with Fund(s) | | Length of Time Served | | Principal Occupation(s) During the Past Five Years | | Number of
Portfolios in Fund
Complex Overseen by Trustee or Officer | | Other Directorships Held by Trustee or Officer |
| | | | | |
Richard Salus 2005 Market Street Philadelphia, PA 19103 October 1963 | | Senior Vice President and Chief Financial Officer | | Senior Vice President and Chief Financial Officer since November 2006 | | Richard Salus has served in various capacities at different times at Macquarie Investment Management. | | 93 | | None |
1 Shawn K. Lytle is considered to be an “Interested Trustee” because he is an executive officer of the Fund’s(s’) investment advisor.
2 Macquarie Investment Management is the marketing name for Macquarie Management Holdings, Inc. and its subsidiaries, including the Fund’s(s’) investment manager, principal underwriter, and its transfer agent.
3 David F. Connor and Daniel V. Geatens serve in similar capacities for the six portfolios of the Optimum Fund Trust, which have the same investment advisor, principal underwriter, and transfer agent as the registrant. Mr. Geatens also serves as the Chief Financial Officer of the Optimum Fund Trust, and he is the Chief Financial Officer and Treasurer for Macquarie Global Infrastructure Total Return Fund Inc.
The Statement of Additional Information for the Fund(s) includes additional information about the Trustees and Officers and is available, without charge, upon request by calling 800 523-1918.
65
About the organization
Board of trustees
Shawn K. Lytle
President and
Chief Executive Officer
Delaware Funds®
by Macquarie
Philadelphia, PA
Jerome D. Abernathy
Managing Member
Stonebrook Capital
Management, LLC
Jersey City, NJ
Thomas L. Bennett
Chairman of the Board
Delaware Funds
by Macquarie
Private Investor
Rosemont, PA
Ann D. Borowiec
Former Chief Executive
Officer
Private Wealth Management
J.P. Morgan Chase & Co.
New York, NY
Joseph W. Chow
Former Executive Vice
President
State Street Corporation
Boston, MA
John A. Fry
President
Drexel University
Philadelphia, PA
Lucinda S. Landreth
Former Chief Investment
Officer
Assurant, Inc.
New York, NY
Frances A.
Sevilla-Sacasa
Former Chief Executive
Officer
Banco Itaú International
Miami, FL
Thomas K. Whitford
Former Vice Chairman
PNC Financial Services Group
Pittsburgh, PA
Christianna Wood
Chief Executive Officer
and President
Gore Creek Capital, Ltd.
Golden, CO
Janet L. Yeomans
Former Vice President and
Treasurer
3M Company
St. Paul, MN
Affiliated officers
David F. Connor
Senior Vice President,
General Counsel,
and Secretary
Delaware Funds
by Macquarie
Philadelphia, PA
Daniel V. Geatens
Vice President and
Treasurer
Delaware Funds
by Macquarie
Philadelphia, PA
Richard Salus
Senior Vice President and
Chief Financial Officer
Delaware Funds
by Macquarie
Philadelphia, PA
This annual report is for the information of Delaware Emerging Markets Debt Corporate Fund shareholders, but it may be used with prospective investors when preceded or accompanied by the Delaware Fund fact sheet for the most recently completed calendar quarter. These documents are available at delawarefunds.com/literature.
The Fund files its complete schedule of portfolio holdings with the Securities and Exchange Commission (SEC) for the first and third quarters of each fiscal year on Form N-PORT. The Fund’s Forms N-PORT, as well as a description of the policies and procedures that the Fund uses to determine how to vote proxies (if any) relating to portfolio securities, are available without charge (i) upon request, by calling 800 523-1918; and (ii) on the SEC’s website at sec.gov. In addition, a description of the policies and procedures that the Fund uses to determine how to vote proxies (if any) relating to portfolio securities and the Schedule of Investments included in the Fund’s most recent Form N-PORT are available without charge on the Fund’s website at delawarefunds.com/literature. The Fund’s Forms N-PORT may be reviewed and copied at the SEC’s Public Reference Room in Washington, D.C.; information on the operation of the Public Reference Room may be obtained by calling 800 SEC-0330.
Information (if any) regarding how the Fund voted proxies relating to portfolio securities during the most recently disclosed 12-month period ended June 30 is available without charge (i) through the Fund’s website at delawarefunds.com/proxy; and (ii) on the SEC’s website at sec.gov.
66
Annual report
Fixed income mutual fund
Delaware Strategic Income Fund
July 31, 2020
Beginning on or about June 1, 2021, as permitted by regulations adopted by the Securities and Exchange Commission, paper copies of your Fund’s shareholder reports will no longer be sent to you by mail, unless you specifically request them from the Fund or from your financial intermediary, such as a broker/dealer, bank, or insurance company. Instead, you will be notified by mail each time a report is posted on the website and provided with a link to access the report.
If you already elected to receive shareholder reports electronically, you will not be affected by this change and you do not need to take any action. You may elect to receive shareholder reports and other communications from the Fund electronically by signing up at delawarefunds.com/edelivery. If you own these shares through a financial intermediary, you may contact your financial intermediary.
You may elect to receive paper copies of all future shareholder reports free of charge. You can inform the Fund that you wish to continue receiving paper copies of your shareholder reports by contacting us at 800 523-1918. If you own these shares through a financial intermediary, you may contact your financial intermediary to elect to continue to receive paper copies of your shareholder reports. Your election to receive reports in paper will apply to all funds held with the Delaware Funds® by Macquarie or your financial intermediary.
Carefully consider the Fund’s investment objectives, risk factors, charges, and expenses before investing. This and other information can be found in the Fund’s prospectus and its summary prospectus, which may be obtained by visiting delawarefunds.com/literature or calling 800 523-1918. Investors should read the prospectus and the summary prospectus carefully before investing.
You can obtain shareholder reports and prospectuses online instead of in the mail. Visit delawarefunds.com/edelivery.
Experience Delaware Funds® by Macquarie
Macquarie Investment Management (MIM) is a global asset manager with offices in the United States, Europe, Asia, and Australia. As active managers, we prioritize autonomy and accountability at the investment team level in pursuit of opportunities that matter for clients. Delaware Funds is one of the longest-standing mutual fund families, with more than 80 years in existence.
If you are interested in learning more about creating an investment plan, contact your financial advisor.
You can learn more about Delaware Funds or obtain a prospectus for Delaware Strategic Income Fund at delawarefunds.com/literature.
Manage your account online
| ● | | Check your account balance and transactions |
| ● | | View statements and tax forms |
| ● | | Make purchases and redemptions |
Visit delawarefunds.com/account-access.
Macquarie Asset Management (MAM) offers a diverse range of products including securities investment management, infrastructure and real asset management, and fund and equity-based structured products. MIM is the marketing name for certain companies comprising the asset management division of Macquarie Group. This includes the following investment advisers: Macquarie Investment Management Business Trust (MIMBT), Macquarie Funds Management Hong Kong Limited, Macquarie Investment Management Austria Kapitalanlage AG, Macquarie Investment Management Global Limited, Macquarie Investment Management Europe Limited, and Macquarie Investment Management Europe S.A.
The Fund is distributed by Delaware Distributors, L.P.
(DDLP), an affiliate of MIMBT and Macquarie Group Limited.
Other than Macquarie Bank Limited (MBL), none of the entities noted are authorized deposit-taking institutions for the purposes of the Banking Act 1959 (Commonwealth of Australia). The obligations of these entities do not represent deposits or other liabilities of MBL. MBL does not guarantee or otherwise provide assurance in respect of the obligations of these entities, unless noted otherwise.
The Fund is governed by US laws and regulations.
Unless otherwise noted, views expressed herein are current as of July 31, 2020, and subject to change for events occurring after such date.
The Fund is not FDIC insured and is not guaranteed. It is possible to lose the principal amount invested.
Advisory services provided by Delaware Management Company, a series of MIMBT, a US registered investment advisor.
All third-party marks cited are the property of their respective owners.
© 2020 Macquarie Management Holdings, Inc.
Portfolio management review
| | | | |
| Delaware Strategic Income Fund | | August 11, 2020 (Unaudited) |
| | | | |
Performance preview (for the year ended July 31, 2020) | | |
| | |
| Delaware Strategic Income Fund (Institutional Class shares) | | 1-year return | | +6.53% |
| Delaware Strategic Income Fund (Class A shares) | | 1-year return | | +6.27% |
| Bloomberg Barclays US Aggregate Index (benchmark) | | 1-year return | | +10.12% |
Past performance does not guarantee future results.
For complete, annualized performance for Delaware Strategic Income Fund, please see the table on page 5.
Institutional Class shares are not subject to a sales charge and are offered for sale exclusively to certain eligible investors. In addition, Institutional Class shares pay no distribution and service fee.
The performance of Class A shares excludes the applicable sales charge. Both Institutional Class shares and Class A shares reflect the reinvestment of all distributions.
Please see page 8 for a description of the index. Index performance returns do not reflect any management fees, transaction costs, or expenses. Indices are unmanaged and one cannot invest directly in an index.
Investment objective
The Fund seeks high current income and, secondarily, long-term total return.
Market review
The Fund’s fiscal year opened the day after the US Federal Reserve cut interest rates for the first time since the 2008-2009 recession. After a series of federal-funds-rate hikes that began in 2015, the Fed responded to slowing global growth and an inversion of the Treasury yield curve with a reduction of 0.25 percentage points in July 2019, followed by two more 0.25-percentage-point cuts in September and October. Taken together, those reductions gave confidence to investors in capital markets that the central bank would act to stabilize the economy. In December, the announcement of a Phase 1 trade deal with China also buoyed investor enthusiasm. Risk assets reacted as expected and generally performed well into 2020.
The economic backdrop shifted sharply in February and March when it became clear that COVID-19, cases of which first emerged in China, had become a full-fledged pandemic necessitating strong lockdown measures to control the spread of the virus. The ensuing precipitous global market selloff was short-lived, however, as the Fed and other central banks stepped in to provide
|
In our opinion, the following key factors influenced the Fund’s performance: ● Interest rate cuts provided investors with confidence early in the period. ● The coronavirus-induced selloff was short lived. ● Central banks stepped in quickly to provide liquidity. ● Out-of-benchmark holdings hurt performance. |
1
Portfolio management review
Delaware Strategic Income Fund
liquidity. Investors responded by igniting a rally that continued through the end of the Fund’s fiscal period.
Within the Fund
For the fiscal year ended July 31, 2020, Delaware Strategic Income Fund underperformed its benchmark, the Bloomberg Barclays US Aggregate Index. The Fund’s Institutional Class shares gained 6.53%. The Fund’s Class A shares advanced 6.27% at net asset value and 1.48% at maximum offer price (both figures reflect all distributions reinvested). For the same period, the benchmark gained 10.12%. For complete, annualized performance of Delaware Strategic Income Fund, please see the table on page 5.
Given the Fed’s interest rate cuts in mid-2019, the team decided to maintain the Fund’s risk profile, which included significant exposure to out-of-benchmark “plus sectors.” Credit spreads (the difference in yield compared to US Treasurys of the same maturity) compressed in the fourth quarter of 2019, indicating an overall assessment of lower market risk as investors responded favorably to the Fed’s monetary stimulus. However, as the Fund’s exposure to higher-beta (higher-risk) asset classes – including high yield bonds and emerging market bonds – benefited, we decided to raise the Fund’s capital cushion to reduce risk. Entering 2020, we added exposure to Treasurys and other highly liquid assets, as we believed more favorable opportunities would be forthcoming.
As markets sold off in reaction to the effects of the coronavirus, and the economy dramatically slowed down, the Fund significantly underperformed the benchmark, hurt by the allocation of roughly 33% of assets to corporate credit – both high yield and investment grade – and nearly 20% of assets to emerging market bonds. However, when the monetary and fiscal tide turned positive in late March, higher-beta sectors rallied and
the Fund’s relative performance improved significantly, compared to both its peers and the benchmark. As market pricing dislocations expanded in the early spring, we drew down the Fund’s capital cushion, redeploying proceeds into higher yielding assets.
Overall, the Fund underperformed its benchmark largely because the 12-month period was unfavorable for focusing on the out-of-benchmark sectors that strategic funds typically hold. The major detractors from the Fund’s relative performance at the sector level were high yield bonds, including bank loans, and emerging market bonds. In this environment of heightened volatility, any higher-risk, out-of-benchmark assets weighed on performance relative to the benchmark.
A small exposure to a senior unsecured convertible bond in Cheniere Energy Inc. detracted from the Fund’s performance. Despite the negative performance, the Fund still has exposure to that credit, as we believe the company is striking an attractive mix of debt reduction and shareholder return with a healthy liquidity profile.
Exposure to the energy sector overall hurt the Fund’s performance as the entire sector underperformed meaningfully during what was a particularly challenging period. Our goal, therefore, was to make sure that we had strong selection within energy sector credits. Accordingly, we sought out what we viewed as the most robust companies – ones we thought had the potential to survive volatile markets.
High yield holdings within the energy sector also detracted during the fiscal period because of the collapse in energy prices. Significant price pressures hurt Precision Drilling Corp. However, we believe the firm is undervalued and like that it is reducing its debt, which we see as a positive catalyst in a challenging environment.
Movie theater chain AMC Entertainment Holdings Inc. also detracted. We exited this
2
position, as we see further challenges ahead for the issuer. Offsetting this performance somewhat was an investment in Calpine Corp., the largest US generator of electricity from natural gas and geothermal resources.
Emerging market bonds also reduced the Fund’s performance. Mexican airline company Aerovias de Mexico S.A. de CV filed for Chapter 11 restructuring during the second quarter of 2020 because it had been hurt by coronavirus-related travel restrictions. However, we have maintained the Fund’s exposure to Aerovias de Mexico as we seek greater clarity around management’s plans as the company explores options for its future.
Another detractor we continued to hold is Companhia Siderúrgica Nacional SA, Brazil’s largest steel company. Despite its poor performance, we see commodity prices, including iron ore prices, firming up, and we believe a weaker dollar could also be favorable.
An underweight to investment grade corporate credit aided the Fund’s relative performance. In addition to the Fund’s underweight, the market volatility presented investment opportunities in companies that were aggressively seeking liquidity, such as Delta Air Lines Inc. first lien bonds, issued in April of this year.
Our allocation to non-agency residential mortgage-backed securities, an out-of-benchmark sector, experienced high volatility and detracted from the Fund’s relative performance. Yield-curve management and duration management also lessened performance. We maintain a material duration that is short relative to the benchmark. The Fund does, however, carry more duration than its peer group, and this contributed to performance relative to its competitors.
We believe it is worth noting that the Fund had strong performance relative to its peer group in a particularly
challenging environment, placing in Morningstar’s top quartile for the 12-month period. The Fund benefited by putting the capital cushion it built at the end of 2019 to work in the spring when opportunities arose. Leveraging that cushion provided liquidity during a volatile period.
Given the uncertain economic backdrop, we believe that risks remain elevated. Strong central bank policy responses in the United States and globally have helped boost investor confidence. At the end of the Fund’s fiscal year, we continue to be concerned about the risks of policy mistakes, particularly on the fiscal side. In addition to the national election coming up in November, geopolitical tensions are on the rise. Along with US-China political and trade tension, which is a new cold war, in our opinion, the overall rise in populism around the world has created greater uncertainty about the direction of various countries’ governments. With that said, we continue to identify investment opportunities in issuers that benefit from today’s environment, such as those in technology and healthcare.
Looking at the COVID-19 crisis, we believe that even if a vaccine came to the market tomorrow, and business returned to some semblance of normalcy, central banks around the world would have to successfully navigate a policy reversal without experiencing a policy misstep. As a result, we continue to take a prudent investment approach by evaluating investment opportunities with the goal of identifying companies that have demonstrated financial flexibility and management teams that have exhibited the discipline to execute through the uncertainties of today’s macroeconomic environment.
A note about derivatives
The Fund used three types of derivatives during the fiscal year: futures, foreign currency exchange contracts, and swaps. The Fund used interest rate futures to manage the portfolio’s overall duration. The Fund also used foreign currency exchange contracts to hedge the US dollar value of certain
3
Portfolio management review
Delaware Strategic Income Fund
foreign currency securities. In some cases, the Fund used foreign currency exchange contracts to gain market exposure to take advantage of a total return opportunity. The Fund also used credit default swaps as a way to gain exposure to certain segments of
the commercial mortgage-backed securities market. None of these derivatives had a material effect on the Fund’s performance (that is, it amounted to less than 0.50 percentage points) during the fiscal year.
4
Performance summary
| | |
| Delaware Strategic Income Fund | | July 31, 2020 (Unaudited) |
The performance quoted represents past performance and does not guarantee future results. Investment return and principal value of an investment will fluctuate so that shares, when redeemed, may be worth more or less than their original cost. Current performance may be lower or higher than the performance quoted. Performance data current to the most recent month end may be obtained by calling 800 523-1918 or visiting delawarefunds.com/performance.
| | | | | | | | | | | | | | | | |
| Fund and benchmark performance1,2 | | Average annual total returns through July 31, 2020 | |
| | | | |
| | | 1 year | | | 5 year | | | 10 year | | | Lifetime | |
| | | | |
Class A (Est. August 16, 1985) | | | | | | | | | | | | | | | | |
Excluding sales charge | | | +6.27% | | | | +3.32% | | | | +3.54% | | | | +5.71% | |
Including sales charge | | | +1.48% | | | | +2.36% | | | | +3.06% | | | | +5.57% | |
| | | | |
Class C (Est. November 29, 1995) | | | | | | | | | | | | | | | | |
Excluding sales charge | | | +5.47% | | | | +2.55% | | | | +2.77% | | | | +4.14% | |
Including sales charge | | | +4.47% | | | | +2.55% | | | | +2.77% | | | | +4.14% | |
| | | | |
Class R (Est. June 2, 2003) | | | | | | | | | | | | | | | | |
Excluding sales charge | | | +5.99% | | | | +3.06% | | | | +3.29% | | | | +3.93% | |
Including sales charge | | | +5.99% | | | | +3.06% | | | | +3.29% | | | | +3.93% | |
| | | | |
Institutional Class (Est. June 1, 1992) | | | | | | | | | | | | | | | | |
Excluding sales charge | | | +6.53% | | | | +3.57% | | | | +3.80% | | | | +5.25% | |
Including sales charge | | | +6.53% | | | | +3.57% | | | | +3.80% | | | | +5.25% | |
| | | | |
Bloomberg Barclays US Aggregate Index | | | +10.12% | | | | +4.47% | | | | +3.87% | | | | +5.62%* | |
*The benchmark lifetime return is for Institutional Class share comparison only and is calculated using the last business day in the month of the Fund’s Institutional Class inception date.
1Returns reflect the reinvestment of all distributions and are presented both with and without the applicable sales charges described below. Returns do not reflect the deduction of taxes the shareholder would pay on Fund distributions or redemptions of Fund shares.
Expense limitations were in effect for certain classes during some or all of the periods shown in the “Fund and benchmark performance” table. Expenses for each class are listed on the “Fund expense ratios” table on page 7. Performance would have been lower had expense limitations not been in effect.
Institutional Class shares are not subject to a sales charge and are offered for sale exclusively to certain eligible investors. In
addition, Institutional Class shares pay no distribution and service (12b-1) fee.
Class A shares are sold with a maximum front-end sales charge of 4.50%, and have an annual 12b-1 fee of 0.25% of average daily net assets. The Board has adopted a formula for calculating 12b-1 plan fees for the Fund’s Class A shares. The Fund’s Class A shares are currently subject to a blended 12b-1 fee equal to the sum of: (i) 0.10% of average daily net assets representing shares acquired prior to June 1, 1992, and (ii) 0.25% of average daily net assets representing shares acquired on or after June 1, 1992. All Class A shares currently bear 12b-1 fees at the same rate,
5
Performance summary
Delaware Strategic Income Fund
the blended rate, currently 0.25% of average daily net assets, based on the formula described above. This method of calculating Class A 12b-1 fees may be discontinued at the sole discretion of the Board. Performance for Class A shares, excluding sales charges, assumes that no front-end sales charge applied.
Class C shares are sold with a contingent deferred sales charge of 1.00% if redeemed during the first 12 months. They are also subject to an annual 12b-1 fee of 1.00% of average daily net assets. Performance for Class C shares, excluding sales charges, assumes either that contingent deferred sales charges did not apply or that the investment was not redeemed.
Class R shares are available only for certain retirement plan products. They are sold without a sales charge and have an annual 12b-1 fee of 0.50% of average daily net assets.
Fixed income securities and bond funds can lose value, and investors can lose principal, as interest rates rise. They also may be affected by economic conditions that hinder an issuer’s ability to make interest and principal payments on its debt. The Fund may also be subject to prepayment risk, the risk that the principal of a bond that is held by a portfolio will be prepaid prior to maturity, at the time when interest rates are lower than what the bond was paying. A portfolio may then have to reinvest that money at a lower interest rate.
High yielding, non-investment-grade bonds (junk bonds) involve higher risk than investment grade bonds. The high yield secondary market is particularly susceptible to liquidity problems when institutional investors, such as mutual funds and certain other financial institutions, temporarily stop buying bonds for regulatory, financial, or other reasons. In addition, a less liquid secondary market makes it more difficult for the Fund to obtain precise valuations of the high yield securities in its portfolio.
The Fund may invest in derivatives, which may involve additional expenses and are subject to risk, including the risk that an underlying security or securities index moves in the opposite direction from what the portfolio manager anticipated. A derivatives transaction depends upon the counterparties’ ability to fulfill their contractual obligations.
If and when the Fund invests in forward foreign currency contracts or uses other investments to hedge against currency risks, the Fund will be subject to special risks, including counterparty risk.
The Fund may experience portfolio turnover in excess of 100%, which could result in higher transaction costs and tax liability.
International investments entail risks including fluctuation in currency values, differences in accounting principles, or economic or political instability. Investing in emerging markets can be riskier than investing in established foreign markets due to increased volatility, lower trading volume, and higher risk of market closures. In many emerging markets, there is substantially less publicly available information and the available information may be incomplete or misleading. Legal claims are generally more difficult to pursue.
IBOR risk is the risk that changes related to the use of the London interbank offered rate (LIBOR) or similar rates (such as EONIA) could have adverse impacts on financial instruments that reference these rates. The potential abandonment of these rates and transition to alternative rates could affect the value and liquidity of instruments that reference them and could affect investment strategy performance.
This document may mention bond ratings published by nationally recognized statistical rating organizations (NRSROs) Standard & Poor’s, Moody’s Investors Service, and Fitch, Inc. For securities rated by an NRSRO other than S&P, the rating is converted to the equivalent S&P credit
6
rating. Bonds rated AAA are rated as having the highest quality and are generally considered to have the lowest degree of investment risk. Bonds rated AA are considered to be of high quality, but with a slightly higher degree of risk than bonds rated AAA. Bonds rated A are considered to have many favorable investment qualities, though they are somewhat more susceptible to adverse economic conditions. Bonds rated BBB are believed to be of medium-grade quality and generally riskier
over the long term. Bonds rated BB, B, and CCC are regarded as having significant speculative characteristics, with BB indicating the least degree of speculation of the three.
The disruptions caused by natural disasters, pandemics, or similar events could prevent the Fund from executing advantageous investment decisions in a timely manner and could negatively impact the Fund’s ability to achieve its investment objective and the value of the Fund’s investments.
2The Fund’s expense ratios, as described in the most recent prospectus, are disclosed in the following “Fund expense ratios” table. Delaware Management Company has agreed to reimburse certain expenses and/or waive certain fees in order to prevent total annual fund operating expenses (excluding any 12b-1 fees, acquired fund fees and expenses, taxes, interest, short sale dividend and interest expenses, brokerage fees, certain insurance costs, and nonroutine expenses or costs, including, but not limited to, those relating to reorganizations, litigation, conducting shareholder meetings, and liquidations (collectively, nonroutine expenses)) from exceeding 0.59% of the Fund’s average daily net assets from August 1, 2019 to July 31, 2020.* Please see the most recent prospectus and any applicable supplement(s) for additional information on these fee waivers and/or reimbursements. Please see the “Financial highlights” section in this report for the most recent expense ratios.
| | | | | | | | |
| Fund expense ratios | | Class A | | Class C | | Class R | | Institutional Class |
| | | | |
Total annual operating expenses (without fee waivers) | | 1.50% | | 2.25% | | 1.75% | | 1.25% |
| | | | |
Net expenses (including fee waivers, if any) | | 0.84% | | 1.59% | | 1.09% | | 0.59% |
| | | | |
Type of waiver | | Contractual | | Contractual | | Contractual | | Contractual |
*The aggregate contractual waiver period covering this report is from November 28, 2018 through November 29, 2020.
7
Performance summary
Delaware Strategic Income Fund
Performance of a $10,000 investment1
Average annual total returns from July 31, 2010 through July 31, 2020 $16
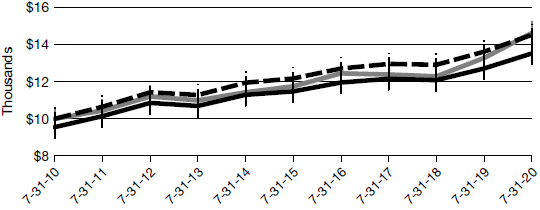
| | | | | | |
| For period beginning July 31, 2010 through July 31, 2020 | | Starting value | | Ending value |
| | | |

| | Bloomberg Barclays US Aggregate Index | | $10,000 | | $14,616 |
| | | |

| | Delaware Strategic Income Fund — Institutional Class shares | | $10,000 | | $14,516 |
| | | |

| | Delaware Strategic Income Fund — Class A shares | | $9,550 | | $13,517 |
1The “Performance of a $10,000 investment” graph assumes $10,000 invested in Institutional Class and Class A shares of the Fund on July 31, 2010, and includes the effect of a 4.50% front-end sales charge (for Class A shares) and the reinvestment of all distributions. The graph does not reflect the deduction of taxes the shareholders would pay on Fund distributions or redemptions of Fund shares. Expense limitations were in effect for some or all of the periods shown. Performance would have been lower had expense limitations not been in effect. Expenses are listed in the “Fund expense ratios” table on page 7. Please note additional details on pages 5 through 9.
The graph also assumes $10,000 invested in the Bloomberg Barclays US Aggregate Index as of July 31, 2010. The Bloomberg
Barclays US Aggregate Index measures the performance of publicly issued investment grade (Baa3/BBB- or better) corporate, US government, mortgage- and asset-backed securities with at least one year to maturity and at least $300 million par amount outstanding.
Index performance returns do not reflect any management fees, transaction costs, or expenses. Indices are unmanaged and one cannot invest directly in an index. Past performance is not a guarantee of future results.
Performance of other Fund classes will vary due to different charges and expenses.
8
| | | | |
| | | Nasdaq symbols | | CUSIPs |
| Class A | | DEGGX | | 246094205 |
| Class C | | DUGCX | | 246094700 |
| Class R | | DUGRX | | 246094809 |
| Institutional Class | | DUGIX | | 246094502 |
9
Disclosure of Fund expenses
For the six-month period from February 1, 2020 to July 31, 2020 (Unaudited)
As a shareholder of the Fund, you incur two types of costs: (1) transaction costs, including sales charges (loads) on purchase payments, reinvested dividends, or other distributions; redemption fees; and exchange fees; and (2) ongoing costs, including management fees; distribution and service (12b-1) fees; and other Fund expenses. This example is intended to help you understand your ongoing costs (in dollars) of investing in the Fund and to compare these costs with the ongoing costs of investing in other mutual funds.
The example is based on an investment of $1,000 invested at the beginning of the period and held for the entire six-month period from February 1, 2020 to July 31, 2020.
Actual expenses
The first section of the table shown, “Actual Fund return,” provides information about actual account values and actual expenses. You may use the information in this section of the table, together with the amount you invested, to estimate the expenses that you paid over the period. Simply divide your account value by $1,000 (for example, an $8,600 account value divided by $1,000 = 8.6), then multiply the result by the number in the first section under the heading entitled “Expenses Paid During Period” to estimate the expenses you paid on your account during this period.
Hypothetical example for comparison purposes
The second section of the table shown, “Hypothetical 5% return,” provides information about hypothetical account values and hypothetical expenses based on the Fund’s actual expense ratio and an assumed rate of return of 5% per year before expenses, which is not the Fund’s actual return. The hypothetical account values and expenses may not be used to estimate the actual ending account balance or expenses you paid for the period. You may use this information to compare the ongoing costs of investing in the Fund and other funds. To do so, compare this 5% hypothetical example with the 5% hypothetical examples that appear in the shareholder reports of the other funds.
Please note that the expenses shown in the table are meant to highlight your ongoing costs only and do not reflect any transactional costs, such as sales charges (loads), redemption fees, or exchange fees. Therefore, the second section of the table is useful in comparing ongoing costs only, and will not help you determine the relative total costs of owning different funds. In addition, if these transactional costs were included, your costs would have been higher. The Fund’s expenses shown in the table reflect fee waivers in effect and assume reinvestment of all dividends and distributions.
10
Delaware Strategic Income Fund
Expense analysis of an investment of $1,000
| | | | | | | | | | | | | | | | |
| | | Beginning Account Value 2/1/20 | | | Ending Account Value 7/31/20 | | | Annualized Expense Ratio | | | Expenses Paid During Period 2/1/20 to 7/31/20* | |
| |
| | | | |
Actual Fund return† | | | | | | | | | | | | | | | | |
Class A | | | $1,000.00 | | | | $1,017.10 | | | | 0.84% | | | | $4.21 | |
Class C | | | 1,000.00 | | | | 1,013.30 | | | | 1.59% | | | | 7.96 | |
Class R | | | 1,000.00 | | | | 1,015.80 | | | | 1.09% | | | | 5.46 | |
Institutional Class | | | 1,000.00 | | | | 1,018.40 | | | | 0.59% | | | | 2.96 | |
| |
| | | |
Hypothetical 5% return (5% return before expenses) | | | | | | | | | | | | | |
Class A | | | $1,000.00 | | | | $1,020.69 | | | | 0.84% | | | | $4.22 | |
Class C | | | 1,000.00 | | | | 1,016.96 | | | | 1.59% | | | | 7.97 | |
Class R | | | 1,000.00 | | | | 1,019.44 | | | | 1.09% | | | | 5.47 | |
Institutional Class | | | 1,000.00 | | | | 1,021.93 | | | | 0.59% | | | | 2.97 | |
| |
*“Expenses Paid During Period” are equal to the Fund’s annualized expense ratio, multiplied by the average account value over the period, multiplied by 182/366 (to reflect the one-half year period).
†Because actual returns reflect only the most recent six-month period, the returns shown may differ significantly from fiscal year returns.
In addition to the Fund’s expenses reflected above, the Fund also indirectly bears its portion of the fees and expenses of the investment companies (Underlying Funds) in which it invests. The table above does not reflect the expenses of the Underlying Funds.
11
Security type / sector allocation
| | |
Delaware Strategic Income Fund | | As of July 31, 2020 (Unaudited) |
Sector designations may be different than the sector designations presented in other Fund materials. The sector designations may represent the investment manager’s internal sector classifications.
| | |
| Security type / sector | | Percentage of net assets |
Agency Collateralized Mortgage Obligations | | 6.30% |
Agency Commercial Mortgage-Backed Securities | | 1.24% |
Convertible Bonds | | 1.45% |
Corporate Bonds | | 54.22% |
Banking | | 7.73% |
Basic Industry | | 8.40% |
Brokerage | | 1.20% |
Capital Goods | | 1.21% |
Communications | | 5.22% |
Consumer Cyclical | | 4.11% |
Consumer Non-Cyclical | | 2.80% |
Electric | | 5.05% |
Energy | | 8.43% |
Finance Companies | | 0.54% |
Insurance | | 2.69% |
Natural Gas | | 0.09% |
Real Estate | | 0.59% |
Technology | | 2.57% |
Transportation | | 2.58% |
Utilities | | 1.01% |
Municipal Bonds | | 1.90% |
Non-Agency Asset-Backed Securities | | 2.17% |
Non-Agency Collateralized Mortgage Obligations | | 10.57% |
Non-Agency Commercial Mortgage-Backed Securities | | 5.63% |
Loan Agreements | | 4.19% |
Sovereign Bonds | | 5.33% |
Supranational Bank | | 0.49% |
US Treasury Obligations | | 2.36% |
Preferred Stock | | 0.97% |
Short-Term Investments | | 3.64% |
Total Value of Securities | | 100.46% |
Liabilities Net of Receivables and Other Assets | | (0.46%) |
Total Net Assets | | 100.00% |
12
Schedule of investments
| | | | |
| Delaware Strategic Income Fund | | | | July 31, 2020 |
| | | | | | | | | | |
| | | | | Principal amount° | | | Value (US $) | |
| | | |
Agency Collateralized Mortgage Obligations — 6.30% | | | | | | | | | | |
| |
| | | |
Fannie Mae Connecticut Avenue Securities | | | | | | | | | | |
Series 2017-C04 2M2 3.022% (LIBOR01M + 2.85%) 11/25/29 • | | | | | 22,994 | | | $ | 22,395 | |
Series 2018-C02 2M2 2.372% (LIBOR01M + 2.20%, Floor 2.20%) 8/25/30 • | | | | | 393,595 | | | | 376,830 | |
Series 2018-C03 1M2 2.322% (LIBOR01M + 2.15%, Floor 2.15%) 10/25/30 • | | | | | 519,976 | | | | 505,688 | |
Series 2018-C05 1M2 2.522% (LIBOR01M + 2.35%, Floor 2.35%) 1/25/31 • | | | | | 502,747 | | | | 485,431 | |
Fannie Mae REMICs | | | | | | | | | | |
Series 2017-77 HZ 3.50% 10/25/47 | | | | | 48,580 | | | | 53,116 | |
Freddie Mac Structured Agency Credit Risk Debt Notes | | | | | | | | | | |
Series 2017-DNA1 M2 3.422% (LIBOR01M + 3.25%, Floor 3.25%) 7/25/29 • | | | | | 244,244 | | | | 244,704 | |
Series 2018-HQA1 M2 2.472% (LIBOR01M + 2.30%) 9/25/30 • | | | | | 443,720 | | | | 422,265 | |
Freddie Mac Structured Agency Credit Risk REMIC Trust | | | | | | | | | | |
Series 2020-HQA2 M2 144A 3.272% (LIBOR01M + 3.10%) 3/25/50 #, • | | | | | 500,000 | | | | 479,036 | |
GNMA | | | | | | | | | | |
Series 2017-34 DY 3.50% 3/20/47 | | | | | 20,000 | | | | 22,747 | |
Series 2017-130 YJ 2.50% 8/20/47 | | | | | 25,000 | | | | 27,453 | |
| | | | | | | | | | |
Total Agency Collateralized Mortgage Obligations (cost $2,730,286) | | | | | | | | | 2,639,665 | |
| | | | | | | | | | |
| | | | | | | | | | |
| |
| | | |
Agency Commercial Mortgage-Backed Securities — 1.24% | | | | | | | | | | |
| |
FREMF Mortgage Trust | | | | | | | | | | |
Series 2013-K25 C 144A 3.619% 11/25/45 #, • | | | | | 45,000 | | | | 46,299 | |
Series 2014-K717 B 144A 3.63% 11/25/47 #, • | | | | | 35,000 | | | | 35,697 | |
Series 2014-K717 C 144A 3.63% 11/25/47 #, • | | | | | 20,000 | | | | 20,123 | |
Series 2015-K721 B 144A 3.565% 11/25/47 #, • | | | | | 235,000 | | | | 243,374 | |
Series 2016-K53 B 144A 4.021% 3/25/49 #, • | | | | | 50,000 | | | | 55,015 | |
Series 2016-K722 B 144A 3.843% 7/25/49 #, • | | | | | 75,000 | | | | 78,867 | |
Series 2017-K71 B 144A 3.753% 11/25/50 #, • | | | | | 35,000 | | | | 38,744 | |
| | | | | | | | | | |
| | | |
Total Agency Commercial Mortgage-Backed Securities (cost $498,507) | | | | | | | | | 518,119 | |
| | | | | | | | | | |
13
Schedule of investments
Delaware Strategic Income Fund
| | | | | | | | | | |
| | | | | Principal amount° | | | Value (US $) | |
| | | |
Convertible Bonds — 1.45% | | | | | | | | | | |
| |
Boingo Wireless 1.00% exercise price $42.32, maturity date 10/1/23 | | | | | 385,000 | | | $ | 346,526 | |
Cheniere Energy 4.25% exercise price $138.38, maturity date 3/15/45 | | | | | 400,000 | | | | 261,922 | |
| | | | | | | | | | |
Total Convertible Bonds (cost $633,763) | | | | | | | | | 608,448 | |
| | | | | | | | | | |
| | | | | | | | | | |
| |
| | | |
Corporate Bonds — 54.22% | | | | | | | | | | |
| |
Banking — 7.73% | | | | | | | | | | |
Ally Financial 5.75% 11/20/25 | | | | | 75,000 | | | | 84,766 | |
Banistmo 144A 4.25% 7/31/27 # | | | | | 320,000 | | | | 318,240 | |
Bank of America 5.125% µ, y | | | | | 180,000 | | | | 186,662 | |
Bank of New York Mellon 4.70% µ, y | | | | | 30,000 | | | | 32,558 | |
BBVA Bancomer 144A 6.75% 9/30/22 # | | | | | 236,000 | | | | 255,214 | |
Citizens Financial Group 5.65% µ, y | | | | | 35,000 | | | | 37,187 | |
Credit Suisse Group 144A 6.25% #, µ, y | | | | | 500,000 | | | | 534,475 | |
JPMorgan Chase & Co. | | | | | 35,000 | | | | 37,833 | |
2.522% 4/22/31 µ | | | | | | | | | | |
3.109% 4/22/41 µ | | | | | 20,000 | | | | 22,756 | |
3.109% 4/22/51 µ | | | | | 30,000 | | | | 34,171 | |
5.00% µ, y | | | | | 90,000 | | | | 90,644 | |
Natwest Group 8.625% µ, y | | | | | 535,000 | | | | 560,150 | |
Popular 6.125% 9/14/23 | | | | | 449,000 | | | | 477,577 | |
Truist Financial 4.95% µ, y | | | | | 35,000 | | | | 37,450 | |
Turkiye Garanti Bankasi 144A 5.875% 3/16/23 # | | | | | 220,000 | | | | 217,800 | |
UBS Group 6.875% µ, y | | | | | 200,000 | | | | 203,514 | |
USB Capital IX 3.50% (LIBOR03M + 1.02%) y, • | | | | | 125,000 | | | | 109,157 | |
| | | | | | | | | | |
| | | | | | | | | 3,240,154 | |
| | | | | | | | | | |
Basic Industry — 8.40% | | | | | | | | | | |
Avient 144A 5.75% 5/15/25 # | | | | | 32,000 | | | | 34,776 | |
BHP Billiton Finance USA 144A 6.25% 10/19/75 #, µ | | | | | 400,000 | | | | 403,166 | |
Chemours 7.00% 5/15/25 | | | | | 179,000 | | | | 182,311 | |
Corp Nacional del Cobre de Chile 144A 3.15% 1/14/30 # | | | | | 218,000 | | | | 234,691 | |
CSN Islands XI 144A 6.75% 1/28/28 # | | | | | 235,000 | | | | 218,550 | |
First Quantum Minerals 144A 7.50% 4/1/25 # | | | | | 200,000 | | | | 202,250 | |
Freeport-McMoRan 5.45% 3/15/43 | | | | | 578,000 | | | | 644,158 | |
Gold Fields Orogen Holdings BVI 144A 6.125% 5/15/29 # | | | | | 200,000 | | | | 235,000 | |
GUSAP III 144A 4.25% 1/21/30 # | | | | | 430,000 | | | | 437,920 | |
Hudbay Minerals 144A 7.625% 1/15/25 # | | | | | 145,000 | | | | 147,094 | |
LYB International Finance III 2.875% 5/1/25 | | | | | 70,000 | | | | 75,733 | |
14
| | | | | | | | | | |
| | | | | Principal amount° | | | Value (US $) | |
| | | |
Corporate Bonds (continued) | | | | | | | | | | |
| |
Basic Industry (continued) | | | | | | | | | | |
Methanex 5.25% 12/15/29 | | | | | 235,000 | | | $ | 227,850 | |
Novolipetsk Steel Via Steel Funding DAC 144A 4.00% 9/21/24 # | | | | | 200,000 | | | | 213,258 | |
Nutrien 2.95% 5/13/30 | | | | | 35,000 | | | | 38,557 | |
Syngenta Finance 144A 3.933% 4/23/21 # | | | | | 225,000 | | | | 227,291 | |
| | | | | | | | | | |
| | | | | | | | | 3,522,605 | |
| | | | | | | | | | |
Brokerage — 1.20% | | | | | | | | | | |
Charles Schwab 5.375% µ, y | | | | | 35,000 | | | | 38,412 | |
Jefferies Group 6.50% 1/20/43 | | | | | 365,000 | | | | 464,631 | |
| | | | | | | | | | |
| | | | | | | | | 503,043 | |
| | | | | | | | | | |
Capital Goods — 1.21% | | | | | | | | | | |
Boise Cascade 144A 4.875% 7/1/30 # | | | | | 59,000 | | | | 62,835 | |
Grupo Cementos de Chihuahua 144A 5.25% 6/23/24 # | | | | | 200,000 | | | | 202,729 | |
Mauser Packaging Solutions Holding 144A 5.50% 4/15/24 # | | | | | 60,000 | | | | 61,262 | |
Standard Industries 144A 5.00% 2/15/27 # | | | | | 23,000 | | | | 24,629 | |
TransDigm 144A 6.25% 3/15/26 # | | | | | 62,000 | | | | 65,488 | |
United Rentals North America | | | | | | | | | | |
3.875% 2/15/31 | | | | | 26,000 | | | | 26,000 | |
4.00% 7/15/30 | | | | | 13,000 | | | | 13,471 | |
WESCO Distribution 144A 7.25% 6/15/28 # | | | | | 45,000 | | | | 49,226 | |
| | | | | | | | | | |
| | | | | | | | | 505,640 | |
| | | | | | | | | | |
Communications — 5.22% | | | | | | | | | | |
Altice Financing 144A 5.00% 1/15/28 # | | | | | 230,000 | | | | 236,409 | |
AMC Networks 4.75% 8/1/25 | | | | | 208,000 | | | | 213,534 | |
Charter Communications Operating | | | | | | | | | | |
2.80% 4/1/31 | | | | | 20,000 | | | | 21,038 | |
4.80% 3/1/50 | | | | | 30,000 | | | | 36,250 | |
Clear Channel Worldwide Holdings 9.25% 2/15/24 | | | | | 20,000 | | | | 18,204 | |
CSC Holdings 5.875% 9/15/22 | | | | | 18,000 | | | | 19,345 | |
HTA Group 144A 7.00% 12/18/25 # | | | | | 210,000 | | | | 217,713 | |
LCPR Senior Secured Financing 144A 6.75% 10/15/27 # | | | | | 235,000 | | | | 254,211 | |
Netflix 144A 3.625% 6/15/25 # | | | | | 60,000 | | | | 63,750 | |
Radiate Holdco 144A 6.625% 2/15/25 # | | | | | 217,000 | | | | 223,240 | |
Sirius XM Radio 144A 4.625% 7/15/24 # | | | | | 54,000 | | | | 56,929 | |
Sprint 7.875% 9/15/23 | | | | | 205,000 | | | | 238,312 | |
Terrier Media Buyer 144A 8.875% 12/15/27 # | | | | | 40,000 | | | | 41,075 | |
Time Warner Cable 7.30% 7/1/38 | | | | | 170,000 | | | | 247,610 | |
15
Schedule of investments
Delaware Strategic Income Fund
| | | | | | | | | | |
| | | | | Principal amount° | | | Value (US $) | |
| | | |
Corporate Bonds (continued) | | | | | | | | | | |
| |
Communications (continued) | | | | | | | | | | |
Time Warner Entertainment 8.375% 3/15/23 | | | | | 80,000 | | | $ | 94,845 | |
Turkcell Iletisim Hizmetleri 144A 5.80% 4/11/28 # | | | | | 210,000 | | | | 206,113 | |
| | | | | | | | | | |
| | | | | | | | | 2,188,578 | |
| | | | | | | | | | |
Consumer Cyclical — 4.11% | | | | | | | | | | |
Allison Transmission 144A 5.875% 6/1/29 # | | | | | 195,000 | | | | 215,696 | |
Colt Merger Sub 144A 6.25% 7/1/25 # | | | | | 50,000 | | | | 52,418 | |
Ford Motor Credit 4.542% 8/1/26 | | | | | 200,000 | | | | 206,250 | |
Future Retail 144A 5.60% 1/22/25 # | | | | | 225,000 | | | | 146,863 | |
General Motors 6.125% 10/1/25 | | | | | 20,000 | | | | 23,342 | |
General Motors Financial 2.20% 4/1/24 | | EUR | | | 150,000 | | | | 177,952 | |
Hutama Karya Persero 144A 3.75% 5/11/30 # | | | | | 200,000 | | | | 218,026 | |
L Brands 144A 9.375% 7/1/25 # | | | | | 60,000 | | | | 66,975 | |
MGM Resorts International 5.75% 6/15/25 | | | | | 50,000 | | | | 51,781 | |
Prime Security Services Borrower 144A 5.75% 4/15/26 # | | | | | 350,000 | | | | 389,310 | |
Scientific Games International 144A 8.25% 3/15/26 # | | | | | 172,000 | | | | 172,567 | |
| | | | | | | | | | |
| | | | | | | | | 1,721,180 | |
| | | | | | | | | | |
Consumer Non-Cyclical — 2.80% | | | | | | | | | | |
Aramark Services 144A 5.00% 2/1/28 # | | | | | 40,000 | | | | 40,316 | |
Bausch Health | | | | | | | | | | |
144A 5.50% 11/1/25 # | | | | | 47,000 | | | | 48,819 | |
144A 6.25% 2/15/29 # | | | | | 53,000 | | | | 56,384 | |
Encompass Health | | | | | | | | | | |
4.50% 2/1/28 | | | | | 25,000 | | | | 26,167 | |
4.75% 2/1/30 | | | | | 19,000 | | | | 20,108 | |
MHP 144A 6.95% 4/3/26 # | | | | | 200,000 | | | | 203,198 | |
Pilgrim’s Pride 144A 5.875% 9/30/27 # | | | | | 46,000 | | | | 48,702 | |
Post Holdings 144A 4.625% 4/15/30 # | | | | | 17,000 | | | | 17,914 | |
Rede D’or Finance 144A 4.50% 1/22/30 # | | | | | 270,000 | | | | 242,392 | |
Tenet Healthcare | | | | | | | | | | |
5.125% 5/1/25 | | | | | 70,000 | | | | 72,098 | |
6.875% 11/15/31 | | | | | 100,000 | | | | 95,856 | |
Teva Pharmaceutical Finance Netherlands III 6.75% 3/1/28 | | | | | 200,000 | | | | 222,365 | |
US Foods 144A 6.25% 4/15/25 # | | | | | 75,000 | | | | 80,538 | |
| | | | | | | | | | |
| | | | | | | | | 1,174,857 | |
| | | | | | | | | | |
16
| | | | | | | | | | |
| | | | | Principal amount° | | | Value (US $) | |
| | | |
Corporate Bonds (continued) | | | | | | | | | | |
| |
Electric — 5.05% | | | | | | | | | | |
Calpine | | | | | | | | | | |
144A 5.00% 2/1/31 # | | | | | 40,000 | | | $ | 41,095 | |
144A 5.125% 3/15/28 # | | | | | 78,000 | | | | 81,133 | |
144A 5.25% 6/1/26 # | | | | | 455,000 | | | | 474,522 | |
Comision Federal de Electricidad 144A 4.875% 1/15/24 # | | | | | 200,000 | | | | 212,729 | |
Duke Energy 4.875% µ, y | | | | | 80,000 | | | | 82,707 | |
Israel Electric 144A 5.00% 11/12/24 # | | | | | 200,000 | | | | 225,629 | |
NRG Energy 144A 4.45% 6/15/29 # | | | | | 335,000 | | | | 365,806 | |
PG&E 5.25% 7/1/30 | | | | | 80,000 | | | | 83,300 | |
Vistra Operations | | | | | | | | | | |
144A 3.55% 7/15/24 # | | | | | 460,000 | | | | 484,154 | |
144A 5.50% 9/1/26 # | | | | | 61,000 | | | | 64,355 | |
| | | | | | | | | | |
| | | | | | | | | 2,115,430 | |
| | | | | | | | | | |
Energy — 8.43% | | | | | | | | | | |
Cheniere Corpus Christi Holdings 7.00% 6/30/24 | | | | | 300,000 | | | | 346,648 | |
Energy Transfer Operating 7.125% µ, y | | | | | 195,000 | | | | 162,338 | |
KazMunayGas National JSC 144A 6.375% 10/24/48 # | | | | | 400,000 | | | | 535,800 | |
KazTransGas JSC 144A 4.375% 9/26/27 # | | | | | 200,000 | | | | 218,282 | |
Lukoil Securities 144A 3.875% 5/6/30 # | | | | | 220,000 | | | | 233,537 | |
Marathon Oil 4.40% 7/15/27 | | | | | 160,000 | | | | 162,672 | |
MPLX 5.50% 2/15/49 | | | | | 105,000 | | | | 125,964 | |
Noble Energy 4.20% 10/15/49 | | | | | 265,000 | | | | 335,752 | |
Oleoducto Central 144A 4.00% 7/14/27 # | | | | | 205,000 | | | | 212,226 | |
Petrobras Global Finance 5.60% 1/3/31 | | | | | 145,000 | | | | 152,377 | |
Petroleos Mexicanos 6.50% 1/23/29 | | | | | 200,000 | | | | 185,018 | |
Precision Drilling 7.75% 12/15/23 | | | | | 220,000 | | | | 165,802 | |
Saudi Arabian Oil 144A 4.25% 4/16/39 # | | | | | 200,000 | | | | 241,056 | |
Southwestern Energy 7.75% 10/1/27 | | | | | 485,000 | | | | 457,258 | |
| | | | | | | | | | |
| | | | | | | | | 3,534,730 | |
| | | | | | | | | | |
Finance Companies — 0.54% | | | | | | | | | | |
Aviation Capital Group 144A 5.50% 12/15/24 # | | | | | 205,000 | | | | 210,166 | |
Avolon Holdings Funding 144A 3.95% 7/1/24 # | | | | | 20,000 | | | | 18,215 | |
| | | | | | | | | | |
| | | | | | | | | 228,381 | |
| | | | | | | | | | |
Insurance — 2.69% | | | | | | | | | | |
American International Group 3.40% 6/30/30 | | | | | 45,000 | | | | 50,329 | |
Aon 2.80% 5/15/30 | | | | | 25,000 | | | | 27,607 | |
AssuredPartners 144A 7.00% 8/15/25 # | | | | | 238,000 | | | | 242,311 | |
17
Schedule of investments
Delaware Strategic Income Fund
| | | | | | | | | | |
| | | | | Principal amount° | | | Value (US $) | |
| | | |
Corporate Bonds (continued) | | | | | | | | | | |
| |
Insurance (continued) | | | | | | | | | | |
Brighthouse Financial | | | | | | | | | | |
3.70% 6/22/27 | | | | | 170,000 | | | $ | 177,317 | |
4.70% 6/22/47 | | | | | 155,000 | | | | 154,019 | |
5.625% 5/15/30 | | | | | 25,000 | | | | 28,640 | |
HUB International 144A 7.00% 5/1/26 # | | | | | 195,000 | | | | 204,458 | |
USI 144A 6.875% 5/1/25 # | | | | | 235,000 | | | | 241,607 | |
| | | | | | | | | | |
| | | | | | | | | 1,126,288 | |
| | | | | | | | | | |
Natural Gas — 0.09% | | | | | | | | | | |
Sempra Energy 4.875% µ, y | | | | | 35,000 | | | | 36,323 | |
| | | | | | | | | | |
| | | | | | | | | 36,323 | |
| | | | | | | | | | |
Real Estate — 0.59% | | | | | | | | | | |
Aroundtown 2.00% 11/2/26 | | EUR | | | 200,000 | | | | 248,828 | |
| | | | | | | | | | |
| | | | | | | | | 248,828 | |
| | | | | | | | | | |
Technology — 2.57% | | | | | | | | | | |
Broadcom | | | | | | | | | | |
144A 3.15% 11/15/25 # | | | | | 25,000 | | | | 26,988 | |
144A 4.15% 11/15/30 # | | | | | 15,000 | | | | 16,880 | |
CDK Global 5.875% 6/15/26 | | | | | 23,000 | | | | 24,633 | |
CommScope Technologies 144A 5.00% 3/15/27 # | | | | | 448,000 | | | | 433,908 | |
Fiserv 2.65% 6/1/30 | | | | | 35,000 | | | | 38,373 | |
Global Payments 2.90% 5/15/30 | | | | | 45,000 | | | | 49,393 | |
Iron Mountain 144A 5.25% 7/15/30 # | | | | | 205,000 | | | | 215,378 | |
NXP | | | | | | | | | | |
144A 3.40% 5/1/30 # | | | | | 10,000 | | | | 11,065 | |
144A 4.30% 6/18/29 # | | | | | 13,000 | | | | 15,180 | |
Verscend Escrow 144A 9.75% 8/15/26 # | | | | | 220,000 | | | | 244,225 | |
| | | | | | | | | | |
| | | | | | | | | 1,076,023 | |
| | | | | | | | | | |
Transportation — 2.58% | | | | | | | | | | |
Aerovias de Mexico 144A 7.00% 2/5/25 #, ‡ | | | | | 225,000 | | | | 51,188 | |
ASG Finance Designated Activity 144A 7.875% 12/3/24 # | | | | | 230,000 | | | | 158,700 | |
Delta Air Lines 144A 7.00% 5/1/25 # | | | | | 390,000 | | | | 417,233 | |
Mileage Plus Holdings 144A 6.50% 6/20/27 # | | | | | 175,000 | | | | 181,563 | |
Rutas 2 and 7 Finance 144A 3.413% 9/30/36 #, ^ | | | | | 255,000 | | | | 176,906 | |
Southwest Airlines | | | | | | | | | | |
5.125% 6/15/27 | | | | | 60,000 | | | | 63,042 | |
5.25% 5/4/25 | | | | | 30,000 | | | | 32,163 | |
| | | | | | | | | | |
| | | | | | | | | 1,080,795 | |
| | | | | | | | | | |
18
| | | | | | | | | | |
| | | | | Principal amount° | | | Value (US $) | |
| | | |
Corporate Bonds (continued) | | | | | | | | | | |
| |
Utilities — 1.01% | | | | | | | | | | |
Aegea Finance 144A 5.75% 10/10/24 # | | | | | 200,000 | | | $ | 206,731 | |
Grupo Energia Bogota 144A 4.875% 5/15/30 # | | | | | 200,000 | | | | 218,500 | |
| | | | | | | | | | |
| | | | | | | | | 425,231 | |
| | | | | | | | | | |
Total Corporate Bonds (cost $21,761,980) | | | | | | | | | 22,728,086 | |
| | | | | | | | | | |
| | | | | | | | | | |
| |
| | | |
Municipal Bonds — 1.90% | | | | | | | | | | |
| |
Bay Area, California Toll Authority | | | | | | | | | | |
(Build America Bonds) Series S-3 6.907% 10/1/50 | | | | | 170,000 | | | | 322,204 | |
New Jersey Turnpike Authority | | | | | | | | | | |
(Build America Bonds) Series A 7.102% 1/1/41 | | | | | 90,000 | | | | 154,967 | |
South Carolina Public Service Authority | | | | | | | | | | |
Series D 4.77% 12/1/45 | | | | | 55,000 | | | | 72,173 | |
State of California Various Purpose | | | | | | | | | | |
(Build America Bonds) 7.55% 4/1/39 | | | | | 135,000 | | | | 245,723 | |
| | | | | | | | | | |
Total Municipal Bonds (cost $650,941) | | | | | | | | | 795,067 | |
| | | | | | | | | | |
| | | | | | | | | | |
| |
| | | |
Non-Agency Asset-Backed Securities — 2.17% | | | | | | | | | | |
| |
Citicorp Residential Mortgage Trust | | | | | | | | | | |
Series 2006-3 A5 5.141% 11/25/36 • | | | | | 327,086 | | | | 337,952 | |
Hardee’s Funding | | | | | | | | | | |
Series 2018-1A A2I 144A 4.25% 6/20/48 # | | | | | 49,125 | | | | 49,380 | |
HOA Funding | | | | | | | | | | |
Series 2014-1A A2 144A 4.846% 8/20/44 # | | | | | 491,175 | | | | 450,294 | |
Towd Point Mortgage Trust | | | | | | | | | | |
Series 2015-5 A1B 144A 2.75% 5/25/55 #, • | | | | | 20,071 | | | | 20,206 | |
Wendy’s Funding | | | | | | | | | | |
Series 2018-1A A2I 144A 3.573% 3/15/48 # | | | | | 48,750 | | | | 50,613 | |
| | | | | | | | | | |
Total Non-Agency Asset-Backed Securities (cost $907,140) | | | | | | | | | 908,445 | |
| | | | | | | | | | |
| | | | | | | | | | |
| |
| | | |
Non-Agency Collateralized Mortgage Obligations — 10.57% | | | | | | | | | | |
| |
Chase Home Lending Mortgage Trust | | | | | | | | | | |
Series 2019-ATR2 A3 144A 3.50% 7/25/49 #, • | | | | | 57,210 | | | | 58,781 | |
Connecticut Avenue Securities Trust | | | | | | | | | | |
Series 2019-R01 2M2 144A 2.622% (LIBOR01M + 2.45%) 7/25/31 #, • | | | | | 408,690 | | | | 401,780 | |
Series 2019-R07 1M2 144A 2.272% (LIBOR01M + 2.10%) 10/25/39 #, • | | | | | 500,000 | | | | 488,410 | |
Credit Suisse First Boston Mortgage Securities | | | | | | | | | | |
Series 2005-5 6A3 5.00% 7/25/35 | | | | | 24,729 | | | | 24,889 | |
Flagstar Mortgage Trust | | | | | | | | | | |
Series 2018-5 A7 144A 4.00% 9/25/48 #, • | | | | | 16,900 | | | | 17,021 | |
19
Schedule of investments
Delaware Strategic Income Fund
| | | | | | | | | | |
| | | | | Principal amount° | | | Value (US $) | |
| | | |
Non-Agency Collateralized Mortgage Obligations (continued) | | | | | | | | | | |
| |
Galton Funding Mortgage Trust | | | | | | | | | | |
Series 2018-1 A43 144A 3.50% 11/25/57 #, • | | | | | 26,727 | | | $ | 26,985 | |
GSMPS Mortgage Loan Trust | | | | | | | | | | |
Series 1998-2 A 144A 7.75% 5/19/27 #, • | | | | | 13,536 | | | | 13,531 | |
JPMorgan Mortgage Trust | | | | | | | | | | |
Series 2006-S1 1A1 6.00% 4/25/36 | | | | | 25,891 | | | | 28,003 | |
Series 2007-A1 7A4 3.78% 7/25/35 • | | | | | 39,186 | | | | 34,221 | |
Series 2014-2 B1 144A 3.399% 6/25/29 #, • | | | | | 47,506 | | | | 47,511 | |
Series 2014-2 B2 144A 3.399% 6/25/29 #, • | | | | | 47,506 | | | | 47,486 | |
Series 2014-IVR6 2A4 144A 2.50% 7/25/44 #, • | | | | | 90,670 | | | | 91,822 | |
Series 2015-4 B1 144A 3.616% 6/25/45 #, • | | | | | 87,758 | | | | 89,202 | |
Series 2015-4 B2 144A 3.616% 6/25/45 #, • | | | | | 87,758 | | | | 88,872 | |
Series 2015-5 B2 144A 2.681% 5/25/45 #, • | | | | | 92,483 | | | | 93,920 | |
Series 2015-6 B1 144A 3.587% 10/25/45 #, • | | | | | 86,315 | | | | 87,822 | |
Series 2015-6 B2 144A 3.587% 10/25/45 #, • | | | | | 86,316 | | | | 87,345 | |
Series 2016-4 B1 144A 3.876% 10/25/46 #, • | | | | | 90,549 | | | | 94,508 | |
Series 2016-4 B2 144A 3.876% 10/25/46 #, • | | | | | 90,549 | | | | 92,920 | |
Series 2017-2 A3 144A 3.50% 5/25/47 #, • | | | | | 22,223 | | | | 22,794 | |
Series 2018-4 A15 144A 3.50% 10/25/48 #, • | | | | | 16,029 | | | | 16,127 | |
Series 2020-1 A4 144A 3.50% 6/25/50 #, • | | | | | 416,672 | | | | 425,617 | |
New Residential Mortgage Loan Trust | | | | | | | | | | |
Series 2018-RPL1 A1 144A 3.50% 12/25/57 #, • | | | | | 71,382 | | | | 76,254 | |
Sequoia Mortgage Trust | | | | | | | | | | |
Series 2014-1 B3 144A 3.918% 4/25/44 #, • | | | | | 425,897 | | | | 434,315 | |
Series 2014-2 A4 144A 3.50% 7/25/44 #, • | | | | | 17,386 | | | | 17,935 | |
Series 2015-1 B2 144A 3.871% 1/25/45 #, • | | | | | 38,777 | | | | 39,276 | |
Series 2017-4 A1 144A 3.50% 7/25/47 #, • | | | | | 46,248 | | | | 47,601 | |
Series 2017-5 B2 144A 3.832% 8/25/47 #, • | | | | | 464,103 | | | | 474,838 | |
Series 2017-6 B2 144A 3.738% 9/25/47 #, • | | | | | 464,466 | | | | 473,183 | |
Series 2017-7 B2 144A 3.744% 10/25/47 #, • | | | | | 466,389 | | | | 447,319 | |
Series 2018-5 A4 144A 3.50% 5/25/48 #, • | | | | | 34,393 | | | | 34,692 | |
Washington Mutual Mortgage Pass Through | | | | | | | | | | |
Certificates Trust | | | | | | | | | | |
Series 2005-1 5A2 6.00% 3/25/35 _ | | | | | 2,651 | | | | 129 | |
Wells Fargo Mortgage-Backed Securities Trust | | | | | | | | | | |
Series 2006-AR5 2A1 3.995% 4/25/36 • | | | | | 4,559 | | | | 4,272 | |
| | | | | | | | | | |
Total Non-Agency Collateralized Mortgage Obligations (cost $4,482,055) | | | | | | | | | 4,429,381 | |
| | | | | | | | | | |
| | | | | | | | | | |
| |
| | | |
Non-Agency Commercial Mortgage-Backed Securities — 5.63% | | | | | | | | | | |
| |
BANK | | | | | | | | | | |
Series 2017-BNK5 B 3.896% 6/15/60 • | | | | | 60,000 | | | | 62,478 | |
CD Mortgage Trust | | | | | | | | | | |
Series 2016-CD2 A3 3.248% 11/10/49 | | | | | 85,000 | | | | 92,364 | |
20
| | | | | | | | | | |
| | | | | Principal amount° | | | Value (US $) | |
| | | |
Non-Agency Commercial Mortgage-Backed Securities (continued) | | | | | | | | | | |
| |
Citigroup Commercial Mortgage Trust | | | | | | | | | | |
Series 2014-GC25 A4 3.635% 10/10/47 | | | | | 75,000 | | | $ | 81,636 | |
COMM Mortgage Trust | | | | | | | | | | |
Series 2013-CR6 AM 144A 3.147% 3/10/46 # | | | | | 110,000 | | | | 113,080 | |
GS Mortgage Securities Trust | | | | | | | | | | |
Series 2010-C1 C 144A 5.635% 8/10/43 #, • | | | | | 150,000 | | | | 131,194 | |
Series 2015-GC32 A4 3.764% 7/10/48 | | | | | 75,000 | | | | 83,583 | |
Series 2017-GS6 A3 3.433% 5/10/50 | | | | | 75,000 | | | | 83,943 | |
Series 2017-GS6 B 3.869% 5/10/50 | | | | | 500,000 | | | | 545,260 | |
Series 2018-GS9 A4 3.992% 3/10/51 • | | | | | 40,000 | | | | 45,874 | |
Series 2020-GC47 A5 2.377% 5/12/53 | | | | | 80,000 | | | | 85,265 | |
Series 2020-GC47 B 3.571% 5/12/53 | | | | | 500,000 | | | | 529,523 | |
JPM-BB Commercial Mortgage Securities Trust | | | | | | | | | | |
Series 2015-C31 A3 3.801% 8/15/48 | | | | | 105,000 | | | | 117,317 | |
JPMorgan Chase Commercial Mortgage Securities Trust | | | | | | | | | | |
Series 2013-LC11 B 3.499% 4/15/46 | | | | | 130,000 | | | | 126,334 | |
Series 2016-WIKI A 144A 2.798% 10/5/31 # | | | | | 90,000 | | | | 89,122 | |
Series 2016-WIKI B 144A 3.201% 10/5/31 # | | | | | 85,000 | | | | 83,529 | |
LB-UBS Commercial Mortgage Trust | | | | | | | | | | |
Series 2006-C6 AJ 5.452% 9/15/39 • | | | | | 53,296 | | | | 30,721 | |
Morgan Stanley Capital I Trust | | | | | | | | | | |
Series 2006-HQ10 B 5.448% 11/12/41 • | | | | | 62,003 | | | | 61,118 | |
| | | | | | | | | | |
Total Non-Agency Commercial Mortgage-Backed Securities (cost $2,392,499) | | | | | | | | | 2,362,341 | |
| | | | | | | | | | |
| | | | | | | | | | |
| |
| | | |
Loan Agreements — 4.19% | | | | | | | | | | |
| |
Acrisure Tranche B 3.661% (LIBOR01M + 3.50%) 2/15/27 • | | | | | 124,058 | | | | 119,902 | |
Applied Systems 2nd Lien 8.00% (LIBOR03M + 7.00%) 9/19/25 • | | | | | 225,822 | | | | 228,306 | |
AssuredPartners 3.661% (LIBOR01M + 3.50%) 2/12/27 • | | | | | 123,675 | | | | 120,377 | |
AthenaHealth Tranche B 1st Lien 4.818% (LIBOR03M + 4.50%) 2/11/26 • | | | | | 123,747 | | | | 122,277 | |
Blue Ribbon 1st Lien 5.00% (LIBOR03M + 4.00%) 11/15/21 • | | | | | 53,647 | | | | 48,909 | |
Buckeye Partners 2.921% (LIBOR01M + 2.75%) 11/1/26 • | | | | | 82,871 | | | | 81,248 | |
BWay Holding 3.523% (LIBOR03M + 3.25%) 4/3/24 • | | | | | 65,370 | | | | 61,209 | |
Calpine 2.42% (LIBOR01M + 2.25%) 1/15/24 • | | | | | 10,875 | | | | 10,674 | |
Connect US Finco 5.50% (LIBOR01M + 4.50%) 12/12/26 • | | | | | 74,812 | | | | 73,036 | |
21
Schedule of investments
Delaware Strategic Income Fund
| | | | | | | | | | |
| | | | | Principal amount° | | | Value (US $) | |
| | | |
Loan Agreements (continued) | | | | | | | | | | |
| |
Frontier Communications Tranche B-1 5.352% (LIBOR03M + 2.75%) 6/17/24 • | | | | | 296,600 | | | $ | 293,263 | |
Gentiva Health Services Tranche B 3.438% (LIBOR01M + 3.25%) 7/2/25 • | | | | | 99,403 | | | | 98,222 | |
Hamilton Projects Acquiror 5.75% (LIBOR03M + 4.75%) 6/17/27 • | | | | | 220,000 | | | | 219,505 | |
Informatica 2nd Lien 7.125% (LIBOR03M + 0.00%) 2/14/25 • | | | | | 31,000 | | | | 30,351 | |
Stars Group Holdings 3.808% (LIBOR03M + 3.50%) 7/10/25 • | | | | | 36,574 | | | | 36,616 | |
Terrier Media Buyer 4.411% (LIBOR01M + 4.25%) 12/17/26 • | | | | | 13,930 | | | | 13,590 | |
Ultimate Software Group 1st Lien 3.911% (LIBOR01M + 3.75%) 5/4/26 • | | | | | 118,468 | | | | 117,632 | |
Verscend Holding Tranche B 4.661% (LIBOR01M + 4.50%) 8/27/25 • | | | | | 83,241 | | | | 83,084 | |
| | | | | | | | | | |
Total Loan Agreements (cost $1,765,508) | | | | | | | | | 1,758,201 | |
| | | | | | | | | | |
| | | | | | | | | | |
| |
| | | |
Sovereign BondsD — 5.33% | | | | | | | | | | |
| |
Brazil — 0.49% | | | | | | | | | | |
Brazilian Government International Bond 4.75% 1/14/50 | | | | | 200,000 | | | | 207,375 | |
| | | | | | | | | | |
| | | | | | | | | 207,375 | |
| | | | | | | | | | |
Egypt — 0.98% | | | | | | | | | | |
Egypt Government International Bond | | | | | | | | | | |
144A 5.75% 5/29/24 # | | | | | 206,000 | | | | 208,093 | |
144A 7.60% 3/1/29 # | | | | | 200,000 | | | | 204,474 | |
| | | | | | | | | | |
| | | | | | | | | 412,567 | |
| | | | | | | | | | |
El Salvador — 0.47% | | | | | | | | | | |
El Salvador Government International Bond 144A 7.65% 6/15/35 # | | | | | 217,000 | | | | 195,300 | |
| | | | | | | | | | |
| | | | | | | | | 195,300 | |
| | | | | | | | | | |
Honduras — 0.76% | | | | | | | | | | |
Honduras Government International Bond 144A 5.625% 6/24/30 # | | | | | 303,000 | | | | 320,423 | |
| | | | | | | | | | |
| | | | | | | | | 320,423 | |
| | | | | | | | | | |
Ivory Coast — 0.47% | | | | | | | | | | |
Ivory Coast Government International Bond 144A 6.125% 6/15/33 # | | | | | 200,000 | | | | 195,906 | |
| | | | | | | | | | |
| | | | | | | | | 195,906 | |
| | | | | | | | | | |
22
| | | | | | | | | | |
| | | | | Principal amount° | | | Value (US $) | |
| | | |
Sovereign Bonds (continued) | | | | | | | | | | |
| |
Mongolia — 0.56% | | | | | | | | | | |
Mongolia Government International Bond 144A 5.625% 5/1/23 # | | | | | 230,000 | | | $ | 234,603 | |
| | | | | | | | | | |
| | | | | | | | | 234,603 | |
| | | | | | | | | | |
Paraguay — 0.56% | | | | | | | | | | |
Paraguay Government International Bond 144A 4.95% 4/28/31 # | | | | | 200,000 | | | | 234,500 | |
| | | | | | | | | | |
| | | | | | | | | 234,500 | |
| | | | | | | | | | |
Senegal — 0.46% | | | | | | | | | | |
Senegal Government International Bond 144A 6.75% 3/13/48 # | | | | | 200,000 | | | | 190,734 | |
| | | | | | | | | | |
| | | | | | | | | 190,734 | |
| | | | | | | | | | |
Uzbekistan — 0.58% | | | | | | | | | | |
Republic of Uzbekistan Bond 144A 4.75% 2/20/24 # | | | | | 226,000 | | | | 241,091 | |
| | | | | | | | | | |
| | | | | | | | | 241,091 | |
| | | | | | | | | | |
Total Sovereign Bonds (cost $2,160,104) | | | | | | | | | 2,232,499 | |
| | | | | | | | | | |
| | | | | | | | | | |
| |
| | | |
Supranational Bank — 0.49% | | | | | | | | | | |
| |
Banque Ouest Africaine de Developpement 144A 4.70% 10/22/31 # | | | | | 200,000 | | | | 204,984 | |
| | | | | | | | | | |
Total Supranational Bank (cost $200,000) | | | | | | | | | 204,984 | |
| | | | | | | | | | |
| | | | | | | | | | |
| |
| | | |
US Treasury Obligations — 2.36% | | | | | | | | | | |
| |
US Treasury Inflation Indexed Note 0.125% 10/15/24 | | | | | 99,933 | | | | 106,085 | |
US Treasury Notes 0.375% 4/30/25 | | | | | 780,000 | | | | 786,322 | |
0.625% 5/15/30 | | | | | 95,000 | | | | 95,785 | |
| | | | | | | | | | |
Total US Treasury Obligations (cost $977,806) | | | | | | | | | 988,192 | |
| | | | | | | | | | |
| | | | | | | | | | |
| | | Number of shares | | | | |
| | | |
Preferred Stock — 0.97% | | | | | | | | | | |
| |
Morgan Stanley 4.085% (LIBOR03M + 3.81%) • | | | | | 115,000 | | | | 112,642 | |
US Bancorp 3.50% (LIBOR03M + 1.02%) • | | | | | 350 | | | | 293,265 | |
| | | | | | | | | | |
Total Preferred Stock (cost $363,428) | | | | | | | | | 405,907 | |
| | | | | | | | | | |
23
Schedule of investments
Delaware Strategic Income Fund
| | | | | | | | | | |
| | | Number of shares | | | Value (US $) | |
| | | |
Short-Term Investments — 3.64% | | | | | | | | | | |
| |
Money Market Mutual Funds — 3.64% | | | | | | | | | | |
BlackRock FedFund – Institutional Shares (seven-day effective yield 0.06%) | | | | | 305,427 | | | $ | 305,427 | |
Fidelity Investments Money Market Government | | | | | | | | | | |
Portfolio – Class I (seven-day effective yield 0.05%) | | | | | 305,427 | | | | 305,427 | |
GS Financial Square Government Fund – | | | | | | | | | | |
Institutional Shares (seven-day effective yield 0.13%) | | | | | 305,426 | | | | 305,426 | |
Morgan Stanley Government Portfolio – Institutional | | | | | | | | | | |
Share Class (seven-day effective yield 0.01%) | | | | | 305,426 | | | | 305,426 | |
State Street Institutional US Government Money | | | | | | | | | | |
Market Fund – Investor Class (seven-day effective yield 0.01%) | | | | | 305,427 | | | �� | 305,427 | |
| | | | | | | | | | |
Total Short-Term Investments (cost $1,527,133) | | | | | | | | | 1,527,133 | |
| | | | | | | | | | |
Total Value of Securities—100.46% (cost $41,051,150) | | | | | | | | $ | 42,106,468 | |
| | | | | | | | | | |
| ° | Principal amount shown is stated in USD unless noted that the security is denominated in another currency. |
| ● | Variable rate investment. Rates reset periodically. Rate shown reflects the rate in effect at July 31, 2020. For securities based on a published reference rate and spread, the reference rate and spread are indicated in their description above. The reference rate descriptions (i.e. LIBOR03M, LIBOR06M, etc.) used in this report are identical for different securities, but the underlying reference rates may differ due to the timing of the reset period. Certain variable rate securities are not based on a published reference rate and spread but are determined by the issuer or agent and are based on current market conditions, or for mortgage-backed securities, are impacted by the individual mortgages which are paying off over time. These securities do not indicate a reference rate and spread in their description above. |
| # | Security exempt from registration under Rule 144A of the Securities Act of 1933, as amended. At July 31, 2020, the aggregate value of Rule 144A securities was $22,679,526, which represents 54.11% of the Fund’s net assets. See Note 11 in “Notes to financial statements.” |
| µ | Fixed to variable rate investment. The rate shown reflects the fixed rate in effect at July 31, 2020. Rate will reset at a future date. |
| y | No contractual maturity date. |
| ‡ | Non-income producing security. Security is currently in default. |
| ^ | Zero-coupon security. The rate shown is the effective yield at the time of purchase. |
| ¨ | Pass Through Agreement. Security represents the contractual right to receive a proportionate amount of underlying payments due to the counterparty pursuant to various agreements related to the rescheduling of obligations and the exchange of certain notes. |
24
| D | Securities have been classified by country of origin. |
The following foreign currency exchange contracts and futures contracts were outstanding at July 31, 2020:1
Foreign Currency Exchange Contracts
| | | | | | | | | | | | | | | | | | | | | | | | | | | | |
| Counterparty | | Currency to Receive (Deliver) | | | In Exchange For | | | Settlement Date | | | Unrealized Appreciation | | | Unrealized Depreciation | |
Toronto-Dominion Bank | | | EUR | | | | 360,000 | | | | USD | | | | (418,938 | ) | | | 9/18/20 | | | $ | 5,580 | | | $ | — | |
Futures Contracts
| | | | | | | | | | | | | | | | | | | | | | | | | | |
Contracts to Buy (Sell) | | Notional
Amount | | | Notional
Cost
(Proceeds) | | | Expiration
Date | | | Value/
Unrealized
Appreciation
Depreciation | | | Value/
Unrealized | | | Variation
Margin
Due
from
(Due to)
Brokers | |
| | US Treasury 5 yr | | | | | | | | | | | | | | | | | | | | | | | | |
15 | | Notes | | $ | 1,891,875 | | | $ | 1,882,067 | | | | 9/30/20 | | | $ | 9,808 | | | $ | — | | | $ | 1,172 | |
| | US Treasury | | | | | | | | | | | | | | | | | | | | | | | | |
(5) | | 10 yr Notes | | | (700,391 | ) | | | (694,402 | ) | | | 9/21/20 | | | | — | | | | (5,989 | ) | | | (313 | ) |
| | US Treasury | | | | | | | | | | | | | | | | | | | | | | | | |
| | 10 yr Ultra | | | | | | | | | | | | | | | | | | | | | | | | |
6 | | Notes | | | 955,500 | | | | 942,343 | | | | 9/21/20 | | | | 13,157 | | | | — | | | | 469 | |
| | | | | | | | | | | | | | | | | | | | | | | | | | |
Total Futures Contracts | | | | | | $ | 2,130,008 | | | | | | | $ | 22,965 | | | $ | (5,989 | ) | | $ | 1,328 | |
| | | | | | | | | | | | | | | | | | | | | | | | | | |
The use of foreign currency exchange contracts and futures contracts involves elements of market risk and risks in excess of the amounts disclosed in these financial statements. The foreign currency exchange contracts and notional amounts presented above represent the Fund’s total exposure in such contracts, whereas only the net unrealized appreciation (depreciation) and variation margin is reflected in the Fund’s net assets.
1See Note 8 in “Notes to financial statements.”
Summary of abbreviations:
BB – Barclays Bank
CD – Certificate of Deposit
DAC – Designated Activity Company
EUR – European Monetary Unit
FREMF – Freddie Mac Multifamily
GNMA – Government National Mortgage Association
GS – Goldman Sachs
GSMPS – Goldman Sachs Reperforming Mortgage Securities
25
Schedule of investments
Delaware Strategic Income Fund
Summary of abbreviations: (continued)
ICE – Intercontinental Exchange
JPM – JPMorgan
JSC – Joint Stock Company
LB – Lehman Brothers
LIBOR – London interbank offered rate
LIBOR01M – ICE LIBOR USD 1 Month
LIBOR03M – ICE LIBOR USD 3 Month
LIBOR06M – ICE LIBOR USD 6 Month
REMIC – Real Estate Mortgage Investment Conduit
USD – US Dollar yr–Year
See accompanying notes, which are an integral part of the financial statements.
26
Statement of assets and liabilities
| | |
| Delaware Strategic Income Fund | | July 31, 2020 |
| | | | |
Assets: | | | | |
Investments, at value* | | $ | 42,106,468 | |
Cash | | | 14,188 | |
Cash collateral due from brokers | | | 21,428 | |
Foreign currencies, at valueÄ | | | 4,557 | |
Receivable for securities sold | | | 524,577 | |
Dividends and interest receivable | | | 370,807 | |
Receivable for fund shares sold | | | 11,263 | |
Variation margin due from broker on future contracts | | | 1,328 | |
Unrealized appreciation on foreign currency exchange contracts | | | 5,580 | |
| | | | |
Total Assets | | | 43,060,196 | |
| | | | |
| |
Liabilities: | | | | |
Payable for securities purchased | | | 1,027,472 | |
Other accrued expenses | | | 53,431 | |
Distribution payable | | | 35,296 | |
Payable for fund shares redeemed | | | 11,097 | |
Investment management fees payable to affiliates | | | 8,522 | |
Distribution fees payable to affiliates | | | 8,069 | |
Legal fees payable to affiliates | | | 471 | |
Accounting and administration expenses payable to affiliates | | | 459 | |
Dividend disbursing and transfer agent fees and expenses payable to affiliates | | | 330 | |
Trustees’ fees and expenses payable to affiliates | | | 145 | |
Reports and statements to shareholders expenses payable to affiliates | | | 52 | |
| | | | |
Total Liabilities | | | 1,145,344 | |
| | | | |
Total Net Assets | | $ | 41,914,852 | |
| | | | |
| |
Net Assets Consist of: | | | | |
Paid-in capital | | $ | 46,122,534 | |
Total distributable earnings (loss) | | | (4,207,682 | ) |
| | | | |
Total Net Assets | | $ | 41,914,852 | |
| | | | |
27
Statement of assets and liabilities
Delaware Strategic Income Fund
| | | | |
Net Asset Value | | | | |
Class A: | | | | |
Net assets | | $ | 29,792,949 | |
Shares of beneficial interest outstanding, unlimited authorization, no par | | | 3,614,797 | |
Net asset value per share | | $ | 8.24 | |
Sales charge | | | 4.50 | % |
Offering price per share, equal to net asset value per share / (1—sales charge) | | $ | 8.63 | |
Class C: | | | | |
Net assets | | $ | 1,845,534 | |
Shares of beneficial interest outstanding, unlimited authorization, no par | | | 223,725 | |
Net asset value per share | | $ | 8.25 | |
Class R: | | | | |
Net assets | | $ | 431,100 | |
Shares of beneficial interest outstanding, unlimited authorization, no par | | | 52,135 | |
Net asset value per share | | $ | 8.27 | |
Institutional Class: | | | | |
Net assets | | $ | 9,845,269 | |
Shares of beneficial interest outstanding, unlimited authorization, no par | | | 1,193,377 | |
Net asset value per share | | $ | 8.25 | |
*Investments, at cost | | $ | 41,051,150 | |
D Foreign currencies, at cost | | | 4,549 | |
See accompanying notes, which are an integral part of the financial statements.
28
Statement of operations
| | | | | | |
| Delaware Strategic Income Fund | | Year ended July 31, 2020 |
| | | | |
Investment Income: | | | | |
Interest | | $ | 1,964,061 | |
Dividends | | | 24,226 | |
| | | | |
| | | 1,988,287 | |
| | | | |
| |
Expenses: | | | | |
Management fees | | | 243,026 | |
Distribution expenses—Class A | | | 73,016 | |
Distribution expenses—Class C | | | 24,077 | |
Distribution expenses—Class R | | | 3,027 | |
Registration fees | | | 62,427 | |
Audit and tax fees | | | 55,051 | |
Accounting and administration expenses | | | 48,393 | |
Dividend disbursing and transfer agent fees and expenses | | | 48,060 | |
Reports and statements to shareholders expenses | | | 35,530 | |
Legal fees | | | 23,944 | |
Custodian fees | | | 5,555 | |
Trustees’ fees and expenses | | | 2,589 | |
Other | | | 39,531 | |
| | | | |
| | | 664,226 | |
Less expenses waived | | | (301,125 | ) |
Less expenses paid indirectly | | | (1,981 | ) |
| | | | |
Total operating expenses | | | 361,120 | |
| | | | |
Net Investment Income | | | 1,627,167 | |
| | | | |
29
Statement of operations
Delaware Strategic Income Fund
| | | | |
Net Realized and Unrealized Gain (Loss): | | | | |
Net realized gain (loss) on: | | | | |
Investments | | $ | 590,712 | |
Foreign currencies | | | (26,634 | ) |
Foreign currency exchange contracts | | | 4,229 | |
Futures contracts | | | 130,310 | |
Swap contracts | | | 12,170 | |
| | | | |
Net realized gain | | | 710,787 | |
| | | | |
| |
Net change in unrealized appreciation (depreciation) of: | | | | |
Investments | | | 169,283 | |
Foreign currencies | | | (383 | ) |
Foreign currency exchange contracts | | | 5,580 | |
Futures contracts | | | 93,675 | |
Swap contracts | | | (7,299 | ) |
| | | | |
Net change in unrealized appreciation (depreciation) | | | 260,856 | |
| | | | |
Net Realized and Unrealized Gain | | | 971,643 | |
| | | | |
Net Increase in Net Assets Resulting from Operations | | $ | 2,598,810 | |
| | | | |
See accompanying notes, which are an integral part of the financial statements.
30
Statements of changes in net assets
Delaware Strategic Income Fund
| | | | | | | | |
| | | Year ended | |
| | | 7/31/20 | | | 7/31/19 | |
Increase (Decrease) in Net Assets from Operations: | | | | | | | | |
Net investment income | | $ | 1,627,167 | | | $ | 2,359,166 | |
Net realized gain (loss) | | | 710,787 | | | | (1,578,275 | ) |
Net change in unrealized appreciation (depreciation) | | | 260,856 | | | | 1,767,287 | |
| | | | | | | | |
Net increase in net assets resulting from operations | | | 2,598,810 | | | | 2,548,178 | |
| | | | | | | | |
| | |
Dividends and Distributions to Shareholders from: | | | | | | | | |
Distributable earnings: | | | | | | | | |
Class A | | | (1,150,976 | ) | | | (1,094,155 | ) |
Class C | | | (77,116 | ) | | | (82,589 | ) |
Class R | | | (22,494 | ) | | | (147,003 | ) |
Institutional Class | | | (506,825 | ) | | | (736,666 | ) |
| | |
Return of capital: | | | | | | | | |
Class A | | | (14,898 | ) | | | (273,423 | ) |
Class C | | | (922 | ) | | | (24,582 | ) |
Class R | | | (215 | ) | | | (6,480 | ) |
Institutional Class | | | (4,918 | ) | | | (144,868 | ) |
| | | | | | | | |
| | | (1,778,364 | ) | | | (2,509,766 | ) |
| | | | | | | | |
| | |
Capital Share Transactions: | | | | | | | | |
Proceeds from shares sold: | | | | | | | | |
Class A | | | 2,325,216 | | | | 1,381,511 | |
Class C | | | 546,156 | | | | 413,394 | |
Class R | | | 150,741 | | | | 372,716 | |
Institutional Class | | | 2,218,451 | | | | 3,688,096 | |
| | |
Net asset value of shares issued upon reinvestment of dividends and distributions: | | | | | | | | |
Class A | | | 1,062,593 | | | | 1,235,675 | |
Class C | | | 74,732 | | | | 100,614 | |
Class R | | | 21,539 | | | | 145,343 | |
Institutional Class | | | 516,863 | | | | 890,867 | |
| | | | | | | | |
| | | 6,916,291 | | | | 8,228,216 | |
| | | | | | | | |
31
Statements of changes in net assets
Delaware Strategic Income Fund
| | | | | | | | |
| | | Year ended | |
| | | 7/31/20 | | | 7/31/19 | |
Capital Share Transactions (continued): | | | | | | | | |
Cost of shares redeemed: | | | | | | | | |
Class A | | $ | (5,249,182 | ) | | $ | (5,672,122 | ) |
Class C | | | (1,575,998 | ) | | | (1,182,749 | ) |
Class R | | | (477,132 | ) | | | (4,054,866 | ) |
Institutional Class | | | (9,539,619 | ) | | | (16,323,384 | ) |
| | | | | | | | |
| | | (16,841,931 | ) | | | (27,233,121 | ) |
| | | | | | | | |
Decrease in net assets derived from capital share transactions | | | (9,925,640 | ) | | | (19,004,905 | ) |
| | | | | | | | |
Net Decrease in Net Assets | | | (9,105,194 | ) | | | (18,966,493 | ) |
| | |
Net Assets: | | | | | | | | |
Beginning of year | | | 51,020,046 | | | | 69,986,539 | |
| | | | | | | | |
End of year | | $ | 41,914,852 | | | $ | 51,020,046 | |
| | | | | | | | |
See accompanying notes, which are an integral part of the financial statements.
32
This page intentionally left blank.
Financial highlights
Delaware Strategic Income Fund Class A
Selected data for each share of the Fund outstanding throughout each period were as follows:
| | | | | | | | | | | | | | | | | | | | | | | | | | | | | | | | | | | | | | | | |
| | | | | | Year ended | |
| | | | | | | | |
| | | | | | | 7/31/20 | | | | | | | | 7/31/19 | | | | | | | | 7/31/18 | | | | | | | | 7/31/17 | | | | | | | | 7/31/16 | |
| |
Net asset value, beginning of period | | | | | | $ | 8.07 | | | | | | | $ | 8.01 | | | | | | | $ | 8.41 | | | | | | | $ | 8.57 | | | | | | | $ | 8.43 | |
| | | | | | | | | | |
Income (loss) from investment operations: | | | | | | | | | | | | | | | | | | | | | | | | | | | | | | | | | | | | | | | | |
Net investment income1 | | | | | | | 0.29 | | | | | | | | 0.32 | | | | | | | | 0.32 | | | | | | | | 0.24 | | | | | | | | 0.15 | |
Net realized and unrealized gain (loss) | | | | | | | 0.20 | | | | | | | | 0.08 | | | | | | | | (0.37 | ) | | | | | | | (0.10 | ) | | | | | | | 0.20 | |
| | | | | | | | | | | | | | | | | | | | | | | | | | | | | | | | | | | | | | | | |
Total from investment operations | | | | | | | 0.49 | | | | | | | | 0.40 | | | | | | | | (0.05 | ) | | | | | | | 0.14 | | | | | | | | 0.35 | |
| | | | | | | | | | | | | | | | | | | | | | | | | | | | | | | | | | | | | | | | |
| | | | | | | | | | |
Less dividends and distributions from: | | | | | | | | | | | | | | | | | | | | | | | | | | | | | | | | | | | | | | | | |
Net investment income | | | | | | | (0.32 | ) | | | | | | | (0.27 | ) | | | | | | | (0.32 | ) | | | | | | | (0.30 | ) | | | | | | | (0.20 | ) |
Return of capital | | | | | | | — | 2 | | | | | | | (0.07 | ) | | | | | | | (0.03 | ) | | | | | | | — | | | | | | | | (0.01 | ) |
| | | | | | | | | | | | | | | | | | | | | | | | | | | | | | | | | | | | | | | | |
Total dividends and distributions | | | | | | | (0.32 | ) | | | | | | | (0.34 | ) | | | | | | | (0.35 | ) | | | | | | | (0.30 | ) | | | | | | | (0.21 | ) |
| | | | | | | | | | | | | | | | | | | | | | | | | | | | | | | | | | | | | | | | |
| | | | | | | | | | |
Net asset value, end of period | | | | | | $ | 8.24 | | | | | | | $ | 8.07 | | | | | | | $ | 8.01 | | | | | | | $ | 8.41 | | | | | | | $ | 8.57 | |
| | | | | | | | | | | | | | | | | | | | | | | | | | | | | | | | | | | | | | | | |
| | | | | | | | | | |
Total return3 | | | | | | | 6.27% | | | | | | | | 5.20% | | | | | | | | (0.62%) | | | | | | | | 1.73% | | | | | | | | 4.15% | |
| | | | | | | | | | |
Ratios and supplemental data: | | | | | | | | | | | | | | | | | | | | | | | | | | | | | | | | | | | | | | | | |
Net assets, end of period (000 omitted) | | | | | | $ | 29,793 | | | | | | | $ | 31,032 | | | | | | | $ | 33,912 | | | | | | | $ | 51,220 | | | | | | | $ | 69,524 | |
Ratio of expenses to average net assets4 | | | | | | | 0.84% | | | | | | | | 0.84% | | | | | | | | 0.88% | | | | | | | | 0.90% | | | | | | | | 0.90% | |
Ratio of expenses to average net assets prior to fees waived4 | | | | | | | 1.52% | | | | | | | | 1.50% | | | | | | | | 1.35% | | | | | | | | 1.29% | | | | | | | | 1.21% | |
Ratio of net investment income to average net assets | | | | | | | 3.66% | | | | | | | | 4.09% | | | | | | | | 3.83% | | | | | | | | 2.84% | | | | | | | | 1.80% | |
Ratio of net investment income to average net assets prior to fees waived | | | | | | | 2.98% | | | | | | | | 3.43% | | | | | | | | 3.36% | | | | | | | | 2.45% | | | | | | | | 1.49% | |
Portfolio turnover | | | | | | | 130% | | | | | | | | 106% | | | | | | | | 125% | | | | | | | | 210% | | | | | | | | 316% | |
| 1 | The average shares outstanding method has been applied for per share information. |
| 2 | Amount is less than $0.005 per share. |
| 3 | Total return is based on the change in net asset value of a share during the period and assumes reinvestment of dividends and distributions at net asset value and does not reflect the impact of a sales charge. Total return during all of the periods shown reflects a waiver by the manager. Performance would have been lower had the waiver not been in effect. |
| 4 | Expense ratios do not include expenses of the Underlying Funds in which the Fund invests. |
See accompanying notes, which are an integral part of the financial statements.
34
Financial highlights
Delaware Strategic Income Fund Class C
Selected data for each share of the Fund outstanding throughout each period were as follows:
| | | | | | | | | | | | | | | | | | | | | | | | | | | | | | | | | | | | | | |
| | | | | Year ended | |
| | | | | | |
| | | | | 7/31/20 | | | | | | | | 7/31/19 | | | | | | | | 7/31/18 | | | | | | | | 7/31/17 | | | | | | | | 7/31/16 | |
| |
Net asset value, beginning of period | | | | $ | 8.08 | | | | | | | $ | 8.02 | | | | | | | $ | 8.42 | | | | | | | $ | 8.58 | | | | | | | $ | 8.44 | |
| | | | | | | | | | |
Income (loss) from investment operations: | | | | | | | | | | | | | | | | | | | | | | | | | | | | | | | | | | | | | | |
Net investment income1 | | | | | 0.23 | | | | | | | | 0.26 | | | | | | | | 0.25 | | | | | | | | 0.18 | | | | | | | | 0.09 | |
Net realized and unrealized gain (loss) | | | | | 0.20 | | | | | | | | 0.08 | | | | | | | | (0.36 | ) | | | | | | | (0.10 | ) | | | | | | | 0.19 | |
| | | | | | | | | | | | | | | | | | | | | | | | | | | | | | | | | | | | | | |
Total from investment operations | | | | | 0.43 | | | | | | | | 0.34 | | | | | | | | (0.11 | ) | | | | | | | 0.08 | | | | | | | | 0.28 | |
| | | | | | | | | | | | | | | | | | | | | | | | | | | | | | | | | | | | | | |
| | | | | | | | | | |
Less dividends and distributions from: | | | | | | | | | | | | | | | | | | | | | | | | | | | | | | | | | | | | | | |
Net investment income | | | | | (0.26 | ) | | | | | | | (0.21 | ) | | | | | | | (0.26 | ) | | | | | | | (0.24 | ) | | | | | | | (0.13 | ) |
Return of capital | | | | | — | 2 | | | | | | | (0.07 | ) | | | | | | | (0.03 | ) | | | | | | | — | | | | | | | | (0.01 | ) |
| | | | | | | | | | | | | | | | | | | | | | | | | | | | | | | | | | | | | | |
Total dividends and distributions | | | | | (0.26 | ) | | | | | | | (0.28 | ) | | | | | | | (0.29 | ) | | | | | | | (0.24 | ) | | | | | | | (0.14 | ) |
| | | | | | | | | | | | | | | | | | | | | | | | | | | | | | | | | | | | | | |
| | | | | | | | | | |
Net asset value, end of period | | | | $ | 8.25 | | | | | | | $ | 8.08 | | | | | | | $ | 8.02 | | | | | | | $ | 8.42 | | | | | | | $ | 8.58 | |
| | | | | | | | | | | | | | | | | | | | | | | | | | | | | | | | | | | | | | |
| | | | | | | | | | |
Total return3 | | | | | 5.47% | | | | | | | | 4.42% | | | | | | | | (1.35%) | | | | | | | | 0.97% | | | | | | | | 3.37% | |
| | | | | | | | | | |
Ratios and supplemental data: | | | | | | | | | | | | | | | | | | | | | | | | | | | | | | | | | | | | | | |
Net assets, end of period (000 omitted) | | | | $ | 1,846 | | | | | | | $ | 2,793 | | | | | | | $ | 3,450 | | | | | | | $ | 4,996 | | | | | | | $ | 9,490 | |
Ratio of expenses to average net assets4 | | | | | 1.59% | | | | | | | | 1.59% | | | | | | | | 1.63% | | | | | | | | 1.65% | | | | | | | | 1.65% | |
Ratio of expenses to average net assets prior to fees waived4 | | | | | 2.27% | | | | | | | | 2.25% | | | | | | | | 2.10% | | | | | | | | 2.04% | | | | | | | | 1.96% | |
Ratio of net investment income to average net assets | | | | | 2.91% | | | | | | | | 3.34% | | | | | | | | 3.08% | | | | | | | | 2.09% | | | | | | | | 1.05% | |
Ratio of net investment income to average net assets prior to fees waived | | | | | 2.23% | | | | | | | | 2.68% | | | | | | | | 2.61% | | | | | | | | 1.70% | | | | | | | | 0.74% | |
Portfolio turnover | | | | | 130% | | | | | | | | 106% | | | | | | | | 125% | | | | | | | | 210% | | | | | | | | 316% | |
| 1 | The average shares outstanding method has been applied for per share information. |
| 2 | Amount is less than $0.005 per share. |
| 3 | Total return is based on the change in net asset value of a share during the period and assumes reinvestment of dividends and distributions at net asset value and does not reflect the impact of a sales charge. Total return during all of the periods shown reflects a waiver by the manager. Performance would have been lower had the waiver not been in effect. |
| 4 | Expense ratios do not include expenses of the Underlying Funds in which the Fund invests. |
See accompanying notes, which are an integral part of the financial statements.
35
Financial highlights
Delaware Strategic Income Fund Class R
Selected data for each share of the Fund outstanding throughout each period were as follows:
| | | | | | | | | | | | | | | | | | | | | | | | | | | | | | | | | | | | | | |
| | | | | Year ended | |
| | | | | | |
| | | | | 7/31/20 | | | | | | | | 7/31/19 | | | | | | | | 7/31/18 | | | | | | | | 7/31/17 | | | | | | | | 7/31/16 | |
| |
Net asset value, beginning of period | | | | $ | 8.10 | | | | | | | $ | 8.03 | | | | | | | $ | 8.44 | | | | | | | $ | 8.60 | | | | | | | $ | 8.46 | |
| | | | | | | | | | |
Income (loss) from investment operations: | | | | | | | | | | | | | | | | | | | | | | | | | | | | | | | | | | | | | | |
Net investment income1 | | | | | 0.27 | | | | | | | | 0.30 | | | | | | | | 0.30 | | | | | | | | 0.22 | | | | | | | | 0.13 | |
Net realized and unrealized gain (loss) | | | | | 0.20 | | | | | | | | 0.09 | | | | | | | | (0.38 | ) | | | | | | | (0.10 | ) | | | | | | | 0.19 | |
| | | | | | | | | | | | | | | | | | | | | | | | | | | | | | | | | | | | | | |
Total from investment operations | | | | | 0.47 | | | | | | | | 0.39 | | | | | | | | (0.08 | ) | | | | | | | 0.12 | | | | | | | | 0.32 | |
| | | | | | | | | | | | | | | | | | | | | | | | | | | | | | | | | | | | | | |
| | | | | | | | | | |
Less dividends and distributions from: | | | | | | | | | | | | | | | | | | | | | | | | | | | | | | | | | | | | | | |
Net investment income | | | | | (0.30 | ) | | | | | | | (0.25 | ) | | | | | | | (0.30 | ) | | | | | | | (0.28 | ) | | | | | | | (0.17 | ) |
Return of capital | | | | | — | 2 | | | | | | | (0.07 | ) | | | | | | | (0.03 | ) | | | | | | | — | | | | | | | | (0.01 | ) |
| | | | | | | | | | | | | | | | | | | | | | | | | | | | | | | | | | | | | | |
Total dividends and distributions | | | | | (0.30 | ) | | | | | | | (0.32 | ) | | | | | | | (0.33 | ) | | | | | | | (0.28 | ) | | | | | | | (0.18 | ) |
| | | | | | | | | | | | | | | | | | | | | | | | | | | | | | | | | | | | | | |
| | | | | | | | | | |
Net asset value, end of period | | | | $ | 8.27 | | | | | | | $ | 8.10 | | | | | | | $ | 8.03 | | | | | | | $ | 8.44 | | | | | | | $ | 8.60 | |
| | | | | | | | | | | | | | | | | | | | | | | | | | | | | | | | | | | | | | |
| | | | | | | | | | |
Total return3 | | | | | 5.99 | % | | | | | | | 5.07 | % | | | | | | | (0.97 | %) | | | | | | | 1.48 | % | | | | | | | 3.88 | % |
| | | | | | | | | | |
Ratios and supplemental data: | | | | | | | | | | | | | | | | | | | | | | | | | | | | | | | | | | | | | | |
Net assets, end of period (000 omitted) | | | | $ | 431 | | | | | | | $ | 738 | | | | | | | $ | 4,259 | | | | | | | $ | 5,725 | | | | | | | $ | 6,793 | |
Ratio of expenses to average net assets4 | | | | | 1.09 | % | | | | | | | 1.09 | % | | | | | | | 1.13 | % | | | | | | | 1.15 | % | | | | | | | 1.15 | % |
Ratio of expenses to average net assets prior to fees waived4 | | | | | 1.77 | % | | | | | | | 1.75 | % | | | | | | | 1.60 | % | | | | | | | 1.54 | % | | | | | | | 1.46 | % |
Ratio of net investment income to average net assets | | | | | 3.41 | % | | | | | | | 3.84 | % | | | | | | | 3.58 | % | | | | | | | 2.59 | % | | | | | | | 1.55 | % |
Ratio of net investment income to average net assets prior to fees waived | | | | | 2.73 | % | | | | | | | 3.18 | % | | | | | | | 3.11 | % | | | | | | | 2.20 | % | | | | | | | 1.24 | % |
Portfolio turnover | | | | | 130 | % | | | | | | | 106 | % | | | | | | | 125 | % | | | | | | | 210 | % | | | | | | | 316 | % |
| 1 | The average shares outstanding method has been applied for per share information. |
| 2 | Amount is less than $0.005 per share. |
| 3 | Total return is based on the change in net asset value of a share during the period and assumes reinvestment of dividends and distributions at net asset value. Total return during all of the periods shown reflects a waiver by the manager. Performance would have been lower had the waiver not been in effect. |
| 4 | Expense ratios do not include expenses of the Underlying Funds in which the Fund invests. |
See accompanying notes, which are an integral part of the financial statements.
36
Financial highlights
Delaware Strategic Income Fund Institutional Class
Selected data for each share of the Fund outstanding throughout each period were as follows:
| | | | | | | | | | | | | | | | | | | | | | | | | | | | | | | | | | | | | | |
| | | | | Year ended | |
| | | | | | |
| | | | | 7/31/20 | | | | | | | | 7/31/19 | | | | | | | | 7/31/18 | | | | | | | | 7/31/17 | | | | | | | | 7/31/16 | |
| |
Net asset value, beginning of period | | | | $ | 8.08 | | | | | | | $ | 8.02 | | | | | | | $ | 8.42 | | | | | | | $ | 8.58 | | | | | | | $ | 8.44 | |
| | | | | | | | | | |
Income (loss) from investment operations: | | | | | | | | | | | | | | | | | | | | | | | | | | | | | | | | | | | | | | |
Net investment income1 | | | | | 0.31 | | | | | | | | 0.34 | | | | | | | | 0.34 | | | | | | | | 0.26 | | | | | | | | 0.17 | |
Net realized and unrealized gain (loss) | | | | | 0.20 | | | | | | | | 0.08 | | | | | | | | (0.37 | ) | | | | | | | (0.10 | ) | | | | | | | 0.20 | |
| | | | | | | | | | | | | | | | | | | | | | | | | | | | | | | | | | | | | | |
Total from investment operations | | | | | 0.51 | | | | | | | | 0.42 | | | | | | | | (0.03 | ) | | | | | | | 0.16 | | | | | | | | 0.37 | |
| | | | | | | | | | | | | | | | | | | | | | | | | | | | | | | | | | | | | | |
| | | | | | | | | | |
Less dividends and distributions from: | | | | | | | | | | | | | | | | | | | | | | | | | | | | | | | | | | | | | | |
Net investment income | | | | | (0.34 | ) | | | | | | | (0.29 | ) | | | | | | | (0.34 | ) | | | | | | | (0.32 | ) | | | | | | | (0.22 | ) |
Return of capital | | | | | — | 2 | | | | | | | (0.07 | ) | | | | | | | (0.03 | ) | | | | | | | — | | | | | | | | (0.01 | ) |
| | | | | | | | | | | | | | | | | | | | | | | | | | | | | | | | | | | | | | |
Total dividends and distributions | | | | | (0.34 | ) | | | | | | | (0.36 | ) | | | | | | | (0.37 | ) | | | | | | | (0.32 | ) | | | | | | | (0.23 | ) |
| | | | | | | | | | | | | | | | | | | | | | | | | | | | | | | | | | | | | | |
| | | | | | | | | | |
Net asset value, end of period | | | | $ | 8.25 | | | | | | | $ | 8.08 | | | | | | | $ | 8.02 | | | | | | | $ | 8.42 | | | | | | | $ | 8.58 | |
| | | | | | | | | | | | | | | | | | | | | | | | | | | | | | | | | | | | | | |
| | | | | | | | | | |
Total return3 | | | | | 6.53 | % | | | | | | | 5.47 | % | | | | | | | (0.36 | %) | | | | | | | 1.99 | % | | | | | | | 4.40 | % |
| | | | | | | | | | |
Ratios and supplemental data: | | | | | | | | | | | | | | | | | | | | | | | | | | | | | | | | | | | | | | |
Net assets, end of period (000 omitted) | | | | $ | 9,845 | | | | | | | $ | 16,457 | | | | | | | $ | 28,366 | | | | | | | $ | 33,820 | | | | | | | $ | 52,081 | |
Ratio of expenses to average net assets4 | | | | | 0.59 | % | | | | | | | 0.59 | % | | | | | | | 0.63 | % | | | | | | | 0.65 | % | | | | | | | 0.65 | % |
Ratio of expenses to average net assets prior to fees waived4 | | | | | 1.27 | % | | | | | | | 1.25 | % | | | | | | | 1.10 | % | | | | | | | 1.04 | % | | | | | | | 0.96 | % |
Ratio of net investment income to average net assets | | | | | 3.91 | % | | | | | | | 4.34 | % | | | | | | | 4.08 | % | | | | | | | 3.09 | % | | | | | | | 2.05 | % |
Ratio of net investment income to average net assets prior to fees waived | | | | | 3.23 | % | | | | | | | 3.68 | % | | | | | | | 3.61 | % | | | | | | | 2.70 | % | | | | | | | 1.74 | % |
Portfolio turnover | | | | | 130 | % | | | | | | | 106 | % | | | | | | | 125 | % | | | | | | | 210 | % | | | | | | | 316 | % |
| 1 | The average shares outstanding method has been applied for per share information. |
| 2 | Amount is less than $0.005 per share. |
| 3 | Total return is based on the change in net asset value of a share during the period and assumes reinvestment of dividends and distributions at net asset value. Total return during all of the periods shown reflects a waiver by the manager. Performance would have been lower had the waiver not been in effect. |
| 4 | Expense ratios do not include expenses of the Underlying Funds in which the Fund invests. |
See accompanying notes, which are an integral part of the financial statements.
37
Notes to financial statements
| | |
| Delaware Strategic Income Fund | | July 31, 2020 |
Delaware Group® Government Fund (Trust) is organized as a Delaware statutory trust and offers two series: Delaware Emerging Markets Debt Corporate Fund (formerly, Delaware Emerging Markets Debt Fund) and Delaware Strategic Income Fund. These financial statements and the related notes pertain to Delaware Strategic Income Fund (Fund). The Fund is an open-end investment company. The Fund is considered diversified under the Investment Company Act of 1940, as amended, and offers Class A, Class C, Class R, and Institutional Class shares. Class A shares are sold with a maximum front-end sales charge of 4.50%. Class A share purchases of $1,000,000 or more will incur a contingent deferred sales charge (CDSC) instead of a front-end sales charge of 1.00% if redeemed during the first year, and 0.50% during the second year, provided that Delaware Distributors, L.P. (DDLP) paid a financial advisor a commission on the purchase of those shares. Class C shares are sold with a CDSC of 1.00%, which will be incurred if redeemed during the first 12 months. Class R and Institutional Class shares are not subject to a sales charge and are offered for sale exclusively to certain eligible investors.
1. Significant Accounting Policies
The Fund follows accounting and reporting guidance under Financial Accounting Standards Board (FASB) Accounting Standards Codification Topic 946, Financial Services—Investment Companies. The following accounting policies are in accordance with US generally accepted accounting principles (US GAAP) and are consistently followed by the Fund.
Security Valuation — Equity securities, except those traded on the Nasdaq Stock Market LLC (Nasdaq), are valued at the last quoted sales price as of the time of the regular close of the New York Stock Exchange on the valuation date. Equity securities traded on the Nasdaq are valued in accordance with the Nasdaq Official Closing Price, which may not be the last sales price. If, on a particular day, an equity security does not trade, the mean between the bid and ask prices will be used, which approximates fair value. Equity securities listed on a foreign exchange are normally valued at the last quoted sales price on the valuation date. US government and agency securities are valued at the mean between the bid and ask prices, which approximates fair value. Open-end investment companies are valued at their published net asset value (NAV). Other debt securities and credit default swap (CDS) contracts are valued based upon valuations provided by an independent pricing service or broker/counterparty and reviewed by management. To the extent current market prices are not available, the pricing service may take into account developments related to the specific security, as well as transactions in comparable securities. Valuations for fixed income securities utilize matrix systems, which reflect such factors as security prices, yields, maturities, and ratings, and are supplemented by dealer and exchange quotations. For asset-backed securities, collateralized mortgage obligations, commercial mortgage securities, and US government agency mortgage securities, pricing vendors utilize matrix pricing which considers prepayment speed, attributes of the collateral, yield or price of bonds of comparable quality, coupon, maturity, and type as well as broker/dealer-supplied prices. Swap prices are derived using daily swap curves and models that incorporate a number of market data factors, such as discounted cash flows, trades, and values of the underlying reference instruments. Foreign currency exchange contracts and foreign cross currency exchange contracts are valued at the mean between the bid and ask prices, which approximates fair value. Interpolated values are derived when the settlement date of the contract is an interim date for which quotations are not available. Futures contracts and
38
options on futures contracts are valued at the daily quoted settlement prices. Exchange-traded options are valued at the last reported sale price or, if no sales are reported, at the mean between the last reported bid and ask prices, which approximates fair value. Generally, other securities and assets for which market quotations are not readily available are valued at fair value as determined in good faith under the direction of the Trust’s Board of Trustees (Board). In determining whether market quotations are readily available or fair valuation will be used, various factors will be taken into consideration, such as market closures or suspension of trading in a security. Restricted securities are valued at fair value using methods approved by the Board.
Federal Income Taxes — No provision for federal income taxes has been made as the Fund intends to continue to qualify for federal income tax purposes as a regulated investment company under Subchapter M of the Internal Revenue Code of 1986, as amended, and make the requisite distributions to shareholders. The Fund evaluates tax positions taken or expected to be taken in the course of preparing the Fund’s tax returns to determine whether the tax positions are “more-likely-than-not” of being sustained by the applicable tax authority. Tax positions not deemed to meet the “more-likely-than-not” threshold are recorded as a tax benefit or expense in the current year. Management has analyzed the Fund’s tax positions taken or expected to be taken on the Fund’s federal income tax returns through the year ended July 31, 2020 and for all open tax years (years ended July 31, 2017–July 31, 2019), and has concluded that no provision for federal income tax is required in the Fund’s financial statements. If applicable, the Fund recognizes interest accrued on unrecognized tax benefits in interest expense and penalties in “Other” on the “Statements of operations.” During the year ended July 31, 2020, the Fund did not incur any interest or tax penalties.
Class Accounting — Investment income and common expenses are allocated to the various classes of the Fund on the basis of “settled shares” of each class in relation to the net assets of the Fund. Realized and unrealized gain (loss) on investments are allocated to the various classes of the Fund on the basis of daily net assets of each class. Distribution expenses relating to a specific class are charged directly to that class.
To Be Announced Trades (TBA) — The Fund may contract to purchase or sell securities for a fixed price at a transaction date beyond the customary settlement period (examples: when issued, delayed delivery, forward commitment, deliver or TBA transactions) consistent with the Fund’s ability to manage its investment portfolio and meet redemption requests. These transactions involve a commitment by the Fund to purchase or sell securities for a predetermined price or yield with payment and delivery taking place more than three days in the future, or after a period longer than the customary settlement period for that type of security. No interest will be earned by the Fund on such purchases until the securities are delivered or the transaction is completed; however, the market value may change prior to delivery.
Foreign Currency Transactions — Transactions denominated in foreign currencies are recorded at the prevailing exchange rates on the valuation date in accordance with the Fund’s prospectus. The value of all assets and liabilities denominated in foreign currencies is translated daily into US dollars at the exchange rate of such currencies against the US dollar. Transaction gains or losses resulting from changes in exchange rates during the reporting period or upon settlement of the foreign currency transaction are reported in operations for the current period. The Fund generally does not bifurcate that
39
Notes to financial statements
Delaware Strategic Income Fund
1. Significant Accounting Policies (continued)
portion of realized gains and losses on investments which is due to changes in foreign exchange rates from that which is due to changes in market prices. These gains and losses are included on the “Statement of operations” under “Net realized gain (loss) on foreign currencies.” The Fund reports certain foreign currency related transactions as components of realized gains (losses) for financial reporting purposes, whereas such components are treated as ordinary income (loss) for federal income tax purposes.
Use of Estimates — The preparation of financial statements in conformity with US GAAP requires management to make estimates and assumptions that affect the fair value of investments, the reported amounts of assets and liabilities and disclosure of contingent assets and liabilities at the date of the financial statements, and the reported amounts of revenues and expenses during the reporting period. Actual results could differ from those estimates and the differences could be material.
Other — Expenses directly attributable to the Fund are charged directly to the Fund. Other expenses common to various funds within the Delaware Funds® by Macquarie (Delaware Funds) are generally allocated among such funds on the basis of average net assets. Management fees and certain other expenses are paid monthly. Security transactions are recorded on the date the securities are purchased or sold (trade date) for financial reporting purposes. Costs used in calculating realized gains and losses on the sale of investment securities are those of the specific securities sold. Dividend income is recorded on the ex-dividend date and interest income is recorded on the accrual basis. Discounts and premiums on debt securities are accreted or amortized to interest income, respectively, over the lives of the respective securities using the effective interest method. Realized gains (losses) on paydowns of asset-and mortgage-backed securities are classified as interest income. Withholding taxes and reclaims on foreign dividends and interest have been recorded in accordance with the Fund’s understanding of the applicable country’s tax rules and rates. The Fund may pay foreign capital gains taxes on certain foreign securities held, which are reported as components of realized losses for financial reporting purposes, whereas such components are treated as ordinary loss for federal income tax purposes. The Fund declares dividends daily from net investment income and pays the dividends monthly and declares and pays distributions from net realized gain on investments, if any, annually. The Fund may distribute more frequently, if necessary for tax purposes. Dividends and distributions, if any, are recorded on the ex-dividend date.
The Fund receives earnings credits from its custodian when positive cash balances are maintained, which may be used to offset custody fees. The expenses paid under this arrangement are included on the “Statement of operations” under “Custodian fees” with the corresponding expenses offset included under “Less expenses paid indirectly.” For the year ended July 31, 2020, the Fund earned $1,776 under this arrangement.
The Fund receives earnings credits from its transfer agent when positive cash balances are maintained, which may be used to offset transfer agent fees. If the amount earned is greater than $1, the expenses paid under this arrangement are included on the “Statement of operations” under “Dividend disbursing
40
and transfer agent fees and expenses” with the corresponding expenses offset included under “Less expenses paid indirectly.” For the year ended July 31, 2020, the Fund earned $205 under this arrangement.
2. Investment Management, Administration Agreements, and Other Transactions with Affiliates
In accordance with the terms of its investment management agreement, the Fund pays Delaware Management Company (DMC), a series of Macquarie Investment Management Business Trust, and the investment manager, an annual fee which is calculated daily and paid monthly at the rates of 0.55% on the first $500 million of average daily net assets of the Fund, 0.50% on the next $500 million, 0.45% on the next $1.5 billion, and 0.425% on average daily net assets in excess of $2.5 billion.
DMC has contractually agreed to waive that portion, if any, of its management fee and/or pay/ reimburse the Fund to the extent necessary to ensure total annual operating expenses (excluding any distribution and service (12b-1) fees, acquired fund fees and expenses, taxes, interest, short sale dividend and interest expenses, brokerage fees, certain insurance costs, and nonroutine expenses or costs, including, but not limited to, those relating to reorganizations, litigation, conducting shareholder meetings, and liquidations), in order to prevent total annual operating expenses from exceeding 0.59% of the Fund’s average daily net assets. This waiver was in effect from August 1, 2019 through July 31, 2020.* This waiver and reimbursement may be terminated only by agreement of DMC and the Fund. The waiver and reimbursement are accrued daily and received monthly.
DMC may seek investment advice and recommendations from its affiliates: Macquarie Investment Management Europe Limited, Macquarie Investment Management Austria Kapitalanlage AG, and Macquarie Investment Management Global Limited (together, the “Affiliated Sub-Advisors”). The Manager may also permit these Affiliated Sub-Advisors to execute Fund security trades on behalf of the Manager and exercise investment discretion for securities in certain markets where DMC believes it will be beneficial to utilize an Affiliated Sub-Advisor’s specialized market knowledge. Although the Affiliated Sub-Advisors serve as sub-advisors, DMC has ultimate responsibility for all investment advisory services. For these services, DMC, not the Fund, pays each Affiliated Sub-Advisor a portion of its investment management fee.
Delaware Investments Fund Services Company (DIFSC), an affiliate of DMC, provides fund accounting and financial administrative oversight services to the Fund. For these services, DIFSC’s fees are calculated daily and paid monthly based on the aggregate daily net assets of all funds within the Delaware Funds at the following annual rates: 0.00475% of the first $35 billion; 0.0040% of the next $10 billion; and 0.0025% of aggregate average daily net assets in excess of $45 billion (Total Fee). Each fund in the Delaware Funds pays a minimum of $4,000, which, in aggregate, is subtracted from the Total Fee. Each fund then pays its portion of the remainder of the Total Fee on a relative NAV basis. This amount is included on the “Statement of operations” under “Accounting and administration expenses.” For the year ended July 31, 2020, the Fund was charged $5,540 for these services.
41
Notes to financial statements
Delaware Strategic Income Fund
2. Investment Management, Administration Agreements, and Other Transactions with Affiliates (continued)
DIFSC is also the transfer agent and dividend disbursing agent of the Fund. For these services, DIFSC’s fees are calculated daily and paid monthly based on the aggregate daily net assets of the retail funds within the Delaware Funds at the following annual rates: 0.014% of the first $20 billion; 0.011% of the next $5 billion; 0.007% of the next $5 billion; 0.005% of the next $20 billion; and 0.0025% of average daily net assets in excess of $50 billion. The fees payable to DIFSC under the shareholder services agreement described on previous page are allocated among all retail funds in the Delaware Funds on a relative NAV basis. This amount is included on the “Statement of operations” under “Dividend disbursing and transfer agent fees and expenses.” For the year ended July 31, 2020, the Fund was charged $4,106 for these services. Pursuant to a sub-transfer agency agreement between DIFSC and BNY Mellon Investment Servicing (US) Inc. (BNYMIS), BNYMIS provides certain sub-transfer agency services to the Fund. Sub-transfer agency fees are paid by the Fund and are also included on the “Statement of operations” under “Dividend disbursing and transfer agent fees and expenses.” The fees that are calculated daily and paid as invoices are received on a monthly or quarterly basis.
Pursuant to a distribution agreement and distribution plan, the Fund pays DDLP, the distributor and an affiliate of DMC, annual 12b-1 fees of 0.25% of the average daily net assets of the Class A shares, 1.00% of the average daily net assets of the Class C shares, and 0.50% of the average daily net assets of the Class R shares. The Board has adopted a formula for calculating 12b-1 fees for the Fund’s Class A shares that went into effect on June 1, 1992. The Fund’s Class A shares are currently subject to a blended 12b-1 fee equal to the sum of: (i) 0.10% of the average daily net assets representing shares acquired prior to June 1, 1992, and (ii) 0.25% of the average daily net assets representing shares acquired on or after June 1, 1992. All Class A shareholders currently bear 12b-1 fees at the same, blended rate currently 0.25% of the average daily net assets based on the formula described above. This method of calculating Class A 12b-1 fees may be discontinued at the sole discretion of the Board. Institutional Class shares do not pay 12b-1 fees.
As provided in the investment management agreement, the Fund bears a portion of the cost of certain resources shared with DMC, including the cost of internal personnel of DMC and/or its affiliates that provide legal, tax, and regulatory reporting services to the Fund. For the year ended July 31, 2020, the Fund was charged $5,938 for internal legal, tax, and regulatory reporting services provided by DMC and/or its affiliates’ employees. This amount is included on the “Statement of operations” under “Legal fees.”
For the year ended July 31, 2020, DDLP earned $2,161 for commissions on sales of the Fund’s Class A shares. For the year ended July 31, 2020, DDLP received gross CDSC commissions of $11 on redemptions of the Fund’s Class C shares and these commissions were entirely used to offset upfront commissions previously paid by DDLP to broker/dealers on sales of those shares.
Trustees’ fees include expenses accrued by the Fund for each Trustee’s retainer and meeting fees. Certain officers of DMC, DIFSC, and DDLP are officers and/or Trustees of the Trust. These officers and Trustees are paid no compensation by the Fund.
42
In addition to the management fees and other expenses of the Fund, the Fund indirectly bears the investment management fees and other expenses of the investment companies (Underlying Funds) in which it invests. The amount of these fees and expenses incurred indirectly by the Fund will vary based upon the expense and fee levels of the Underlying Funds and the number of shares that are owned of the Underlying Funds at different times.
* The aggregate contractual waiver period covering this report is from November 28,2018, through November 29, 2020.
3. Investments
For the year ended July 31, 2020, the Fund made purchases and sales of investment securities other than short-term investments as follows:
| | | | |
Purchases other than US government securities | | $ | 40,000,734 | |
Purchases of US government securities | | | 16,076,023 | |
Sales other than US government securities | | | 48,096,277 | |
Sales of US government securities | | | 18,373,072 | |
The tax cost of investments includes adjustments to net unrealized appreciation (depreciation) which may not necessarily be the final tax cost basis adjustments, but approximates the tax basis unrealized gains and losses that may be realized and distributed to shareholders. At July 31, 2020, the cost and unrealized appreciation (depreciation) of investments for federal income tax purposes were as follows:
| | | | |
Cost of investments | | $ | 41,198,689 | |
| | | | |
Aggregate unrealized appreciation of investments | | $ | 2,036,064 | |
Aggregate unrealized depreciation of investments | | | (1,105,729 | ) |
| | | | |
Net unrealized appreciation of investments | | $ | 930,335 | |
| | | | |
US GAAP defines fair value as the price that the Fund would receive to sell an asset or pay to transfer a liability in an orderly transaction between market participants at the measurement date under current market conditions. A three-level hierarchy for fair value measurements has been established based upon the transparency of inputs to the valuation of an asset or liability. Inputs may be observable or unobservable and refer broadly to the assumptions that market participants would use in pricing the asset or liability. Observable inputs reflect the assumptions market participants would use in pricing the asset or liability based on market data obtained from sources independent of the reporting entity. Unobservable inputs reflect the reporting entity’s own assumptions about the assumptions that market participants would use in pricing the asset or liability based on the best information available under the
43
Notes to financial statements
Delaware Strategic Income Fund
3. Investments (continued)
circumstances. The Fund’s investment in its entirety is assigned a level based upon the observability of the inputs which are significant to the overall valuation. The three-level hierarchy of inputs is summarized as follows:
| | | | |
| | |
| Level 1 | | – | | Inputs are quoted prices in active markets for identical investments. (Examples: equity securities, open-end investment companies, futures contracts, and exchange-traded options contracts) |
| | |
| Level 2 | | – | | Other observable inputs, including, but not limited to: quoted prices for similar assets or liabilities in markets that are active, quoted prices for identical or similar assets or liabilities in markets that are not active, inputs other than quoted prices that are observable for the assets or liabilities (such as interest rates, yield curves, volatilities, prepayment speeds, loss severities, credit risks, and default rates) or other market-corroborated inputs. (Examples: debt securities, government securities, swap contracts, foreign currency exchange contracts, foreign securities utilizing international fair value pricing, broker-quoted securities, and fair valued securities) |
| | |
| Level 3 | | – | | Significant unobservable inputs, including the Fund’s own assumptions used to determine the fair value of investments. (Examples: broker-quoted securities and fair valued securities) |
Level 3 investments are valued using significant unobservable inputs. The Fund may also use an income-based valuation approach in which the anticipated future cash flows of the investment are discounted to calculate fair value. Discounts may also be applied due to the nature or duration of any restrictions on the disposition of the investments. Valuations may also be based upon current market prices of securities that are comparable in coupon, rating, maturity, and industry. The derived value of a Level 3 investment may not represent the value which is received upon disposition and this could impact the results of operations.
44
The following table summarizes the valuation of the Fund’s investments by fair value hierarchy levels as of July 31, 2020:
| | | | | | | | | | | | |
| | | Level 1 | | | Level 2 | | | Total | |
| | | | | | | | | | | | |
Securities | | | | | | | | | | | | |
| | | |
Assets: | | | | | | | | | | | | |
| | | |
Agency Collateralized Mortgage Obligations | | $ | — | | | $ | 2,639,665 | | | $ | 2,639,665 | |
Agency Commercial Mortgage-Backed Securities | | | — | | | | 518,119 | | | | 518,119 | |
Convertible Bonds | | | — | | | | 608,448 | | | | 608,448 | |
Corporate Bonds | | | — | | | | 22,728,086 | | | | 22,728,086 | |
Loan Agreements | | | — | | | | 1,758,201 | | | | 1,758,201 | |
Municipal Bonds | | | — | | | | 795,067 | | | | 795,067 | |
Non-Agency Asset-Backed Securities | | | — | | | | 908,445 | | | | 908,445 | |
Non-Agency Collateralized Mortgage Obligations | | | — | | | | 4,429,381 | | | | 4,429,381 | |
Non-Agency Commercial Mortgage-Backed Securities | | | — | | | | 2,362,341 | | | | 2,362,341 | |
Preferred Stock1 | | | 293,265 | | | | 112,642 | | | | 405,907 | |
| | | |
Sovereign Bonds | | | — | | | | 2,232,499 | | | | 2,232,499 | |
| | | |
Supranational Bank | | | — | | | | 204,984 | | | | 204,984 | |
US Treasury Obligations | | | — | | | | 988,192 | | | | 988,192 | |
Short-Term Investments | | | 1,527,133 | | | | — | | | | 1,527,133 | |
| | | | | | | | | | | | |
Total Value of Securities | | $ | 1,820,398 | | | $ | 40,286,070 | | | $ | 42,106,468 | |
| | | | | | | | | | | | |
| | | |
Derivatives2 | | | | | | | | | | | | |
| | | |
Assets: | | | | | | | | | | | | |
| | | |
Foreign Currency Exchange Contracts | | $ | — | | | | 5,580 | | | | 5,580 | |
Futures Contracts | | $ | 22,965 | | | $ | — | | | $ | 22,965 | |
Liabilities: | | | | | | | | | | | | |
Futures Contracts | | | (5,989 | ) | | | — | | | | (5,989 | ) |
1Security type is valued across multiple levels. Level 1 investments represent exchange-traded investments, Level 2 investments represent investments with observable inputs or matrix-priced investments, and Level 3 investments represent investments without observable inputs. The amounts attributed to Level 1 investments, Level 2 investments, and Level 3 investments represent the following percentages of the total market value of these security types:
| | | | | | | | | | | | |
| | | Level 1 | | | Level 2 | | | Total | |
| | | | | | | | | | | | |
Preferred Stock | | | 72.25% | | | | 27.75% | | | | 100.00% | |
2Foreign currency exchange contracts and futures contracts are valued at the unrealized appreciation (depreciation) on the instrument at the year end.
During the year ended July 31, 2020, there were no transfers into or out of Level 3 investments. The Fund’s policy is to recognize transfers into or out of Level 3 investments based on fair value at the beginning of the reporting period.
45
Notes to financial statements
Delaware Strategic Income Fund
3. Investments (continued)
A reconciliation of Level 3 investments is presented when the Fund has a significant amount of Level 3 investments at the beginning, interim, or end of the period in relation to net assets. During the year ended July 31, 2020, there were no Level 3 investments.
4. Dividend and Distribution Information
Income and long-term capital gain distributions are determined in accordance with federal income tax regulations, which may differ from US GAAP. Additionally, distributions from net gains on foreign currency transactions and net short-term gains on sales of investment securities are treated as ordinary income for federal income tax purposes. The tax character of dividends and distributions paid during the years ended July 31, 2020 and 2019 were as follows:
| | | | | | | | |
| | | Year ended | |
| | | 7/31/20 | | | 7/31/19 | |
Ordinary income | | $ | 1,757,411 | | | $ | 2,060,413 | |
Return of capital | | | 20,953 | | | | 449,353 | |
| | | | | | | | |
Total | | $ | 1,778,364 | | | $ | 2,509,766 | |
| | | | | | | | |
5. Components of Net Assets on a Tax Basis
As of July 31, 2020, the components of net assets on a tax basis were as follows:
| | | | |
Shares of beneficial interest | | $ | 46,122,534 | |
Qualified late year loss deferrals | | | (8,503 | ) |
Distributions payable | | | (35,296 | ) |
Capital loss carryforwards | | | (5,094,218 | ) |
Unrealized appreciation of investments, foreign currencies, and derivatives | | | 930,335 | |
| | | | |
Net assets | | $ | 41,914,852 | |
| | | | |
The differences between book basis and tax basis components of net assets are primarily attributable to tax deferral of losses on wash sales, tax deferral of losses on straddles, mark-to-market of futures contracts, mark-to-market on foreign currency contracts, tax treatment of swap contracts, tax treatment of market discount and premium on debt instruments, amortization of premium on callable bonds and tax adjustment on US Treasury inflation bonds.
Qualified late year ordinary and capital losses (including currency and specified gain/loss items) represent losses realized from January 1, 2020 through July 31, 2020 and November 1, 2019 through July 31, 2020, respectively, that, in accordance with federal income tax regulations, the Funds have elected to defer and treat as having arisen in the following fiscal year.
At July 31, 2020, capital loss carryforwards available to offset future realized capital gains, are as follows:
| | | | |
| Loss carryforward character | | |
| | |
| Short-term | | Long-term | | Total |
| | | | |
| $2,066,549 | | $3,027,669 | | $5,094,218 |
46
At July 31, 2020, the Fund utilized $553,933 of capital loss carryforwards.
6. Capital Shares
Transactions in capital shares were as follows:
| | | | | | | | |
| | | Year ended | |
| | | 7/31/20 | | | 7/31/19 | |
Shares sold: | | | | | | | | |
Class A | | | 289,779 | | | | 175,185 | |
Class C | | | 67,052 | | | | 53,356 | |
Class R | | | 19,037 | | | | 47,249 | |
Institutional Class | | | 283,581 | | | | 466,438 | |
| | |
Shares issued upon reinvestment of dividends and distributions: | | | | | | | | |
Class A | | | 132,990 | | | | 157,085 | |
Class C | | | 9,354 | | | | 12,787 | |
Class R | | | 2,686 | | | | 18,474 | |
Institutional Class | | | 64,481 | | | | 113,096 | |
| | | | | | | | |
| | | 868,960 | | | | 1,043,670 | |
| | | | | | | | |
| | |
Shares redeemed: | | | | | | | | |
Class A | | | (653,497 | ) | | | (721,145 | ) |
Class C | | | (198,420 | ) | | | (150,652 | ) |
Class R | | | (60,725 | ) | | | (504,690 | ) |
Institutional Class | | | (1,192,161 | ) | | | (2,080,617 | ) |
| | | | | | | | |
| | | (2,104,803 | ) | | | (3,457,104 | ) |
| | | | | | | | |
Net decrease | | | (1,235,843 | ) | | | (2,413,434 | ) |
| | | | | | | | |
47
Notes to financial statements
Delaware Strategic Income Fund
6. Capital Shares (continued)
Certain shareholders may exchange shares of one class for shares of another class in the same Fund. These exchange transactions are included as subscriptions and redemptions in the table on the previous page and on the “Statements of changes in net assets.” For the years ended July 31, 2020 and 2019, the Fund had the following exchange transactions:
| | | | | | | | | | | | | | | | | | | | |
| | | Exchange Redemptions | | | Exchange Subscriptions | | | | |
| | | | | | | | | | | | |
| | | Class A
Shares | | | Class C
Shares | | | Class A
Shares | | | Institutional
Class Shares | | | Value | |
| | | | | | | | | | | | | | | | | | | | |
Year ended | | | | | | | | | | | | | | | | | | | | |
7/31/20 | | | — | | | | 2,018 | | | | 2,022 | | | | — | | | $ | 16,286 | |
7/31/19 | | | 1,162 | | | | 1,583 | | | | 1,584 | | | | 1,160 | | | | 21,687 | |
7. Line of Credit
The Fund, along with certain other funds in the Delaware Funds (Participants), was a participant in a $220,000,000 revolving line of credit intended to be used for temporary or emergency purposes as an additional source of liquidity to fund redemptions of investor shares. Under the agreement, the Participants were charged an annual commitment fee of 0.15%, which was allocated across the Participants based on a weighted average of the respective net assets of each Participant. The Participants were permitted to borrow up to a maximum of one-third of their net assets under the agreement. Each Participant was individually, and not jointly, liable for its particular advances, if any, under the line of credit. The line of credit available under the agreement expired on November 4, 2019.
On November 4, 2019, the Participants entered into an amendment to the agreement for a $250,000,000 revolving line of credit. The revolving line of credit available was increased to $275,000,000 on May 6, 2020. The revolving line of credit is to be used as described above and operates in substantially the same manner as the original agreement. The line of credit available under the agreement expires on November 2, 2020.
The Fund had no amounts outstanding as of July 31, 2020, or at any time during the year then ended.
8. Derivatives
US GAAP requires disclosures that enable investors to understand: (1) how and why an entity uses derivatives; (2) how they are accounted for; and (3) how they affect an entity’s results of operations and financial position.
Foreign Currency Exchange Contracts — The Fund may enter into foreign currency exchange contracts and foreign cross currency exchange contracts as a way of managing foreign exchange rate risk. The Fund may enter into these contracts to fix the US dollar value of a security that it has agreed to buy or sell for the period between the date the trade was entered into and the date the security is delivered and paid for. The Fund may also enter these contracts to hedge the US dollar value of securities it already owns that are denominated in foreign currencies. In addition, the Fund may enter into these contracts to facilitate or expedite the settlement of portfolio transactions. The change in value is
48
recorded as an unrealized gain or loss. When the contract is closed, a realized gain or loss is recorded equal to the difference between the value of the contract at the time it was opened and the value at the time it was closed.
The use of foreign currency exchange contracts and foreign cross currency exchange contracts does not eliminate fluctuations in the underlying prices of the securities, but does establish a rate of exchange that can be achieved in the future. Although foreign currency exchange contracts and foreign cross currency exchange contracts limit the risk of loss due to an unfavorable change in the value of the hedged currency, they also limit any potential gain that might result should the value of the currency change favorably. In addition, the Fund could be exposed to risks if the counterparties to the contracts are unable to meet the terms of their contracts. The Fund’s maximum risk of loss from counterparty credit risk is the value of its currency exchanged with the counterparty. The risk is generally mitigated by having a netting arrangement between the Fund and the counterparty and by the posting of collateral by the counterparty to the Fund to cover the Fund’s exposure to the counterparty.
During the year ended July 31, 2020, the Fund used foreign currency exchange contracts to hedge the US dollar value of securities it already owned that were denominated in foreign currencies.
Futures Contracts — A futures contract is an agreement in which the writer (or seller) of the contract agrees to deliver to the buyer an amount of cash or securities equal to a specific dollar amount times the difference between the value of a specific security or index at the close of the last trading day of the contract and the price at which the agreement is made. The Fund may use futures contracts in the normal course of pursuing its investment objective. The Fund may invest in futures contracts to hedge its existing portfolio securities against fluctuations in value caused by changes in interest rates or market conditions. Upon entering into a futures contract, the Fund deposits cash or pledges US government securities to a broker, equal to the minimum “initial margin” requirements of the exchange on which the contract is traded. Subsequent payments are received from the broker or paid to the broker each day, based on the daily fluctuation in the market value of the contract. These receipts or payments are known as “variation margin” and are recorded daily by the Fund as unrealized gains or losses until the contracts are closed. When the contracts are closed, the Fund records a realized gain or loss equal to the difference between the value of the contract at the time it was opened and the value at the time it was closed. Risks of entering into futures contracts include potential imperfect correlation between the futures contracts and the underlying securities and the possibility of an illiquid secondary market for these instruments. When investing in futures, there is reduced counterparty credit risk to the Fund because futures are exchange-traded and the exchange’s clearinghouse, as counterparty to all exchange-traded futures, guarantees against default. At July 31, 2020, the Fund posted $21,428 in cash as collateral for open futures contracts, which is presented as “Cash collateral due from brokers” on the “Statement of assets and liabilities.”
During the year ended July 31, 2020, the Fund used futures contracts to hedge the Fund’s existing portfolio securities against fluctuations in value caused by changes in interest rates or market conditions.
Swap Contracts — The Fund may enter into CDS contracts in the normal course of pursuing its investment objective. The Fund may enter into CDS contracts in order to hedge against a credit event, to enhance total return, or to gain exposure to certain securities or markets. The Fund will not be permitted
49
Notes to financial statements
Delaware Strategic Income Fund
8. Derivatives (continued)
to enter into any swap transactions unless, at the time of entering into such transactions, the unsecured long-term debt of the actual counterparty, combined with any credit enhancements, is rated at least BBB- by Standard & Poor’s Financial Services LLC (S&P) or Baa3 by Moody’s Investors Service, Inc. (Moody’s) or is determined to be of equivalent credit quality by DMC.
Credit Default Swaps. A CDS contract is a risk-transfer instrument through which one party (purchaser of protection) transfers to another party (seller of protection) the financial risk of a credit event (as defined in the CDS agreement), as it relates to a particular reference security or basket of securities (such as an index). In exchange for the protection offered by the seller of protection, the purchaser of protection agrees to pay the seller of protection a periodic amount at a stated rate that is applied to the notional amount of the CDS contract. In addition, an upfront payment may be made or received by the Fund in connection with an unwinding or assignment of a CDS contract. Upon the occurrence of a credit event, the seller of protection would pay the par (or other agreed-upon) value of the reference security (or basket of securities) to the counterparty. Credit events generally include, among others, bankruptcy, failure to pay, and obligation default.
During the year ended July 31, 2020, the Fund entered into CDS contracts as a purchaser and seller of protection, as a hedge against credit events. Periodic payments (receipts) on such contracts are accrued daily and recorded as unrealized losses (gains) on swap contracts. Upon payment (receipt), such amounts are recorded as realized losses (gains) on swap contracts. Upfront payments made or received in connection with CDS contracts are amortized over the expected life of the CDS contracts as unrealized losses (gains) on swap contracts. The change in value of CDS contracts is recorded daily as unrealized appreciation or depreciation. A realized gain or loss is recorded upon a credit event (as defined in the CDS agreement) or the maturity or termination of the agreement. Initial margin and variation margin are posted to central counterparties for centrally cleared CDS basket trades, as determined by the applicable central counterparty. At July 31, 2020, the Fund had no open CDS contracts.
CDS contracts may involve greater risks than if the Fund had invested in the reference obligation directly. CDS contracts are subject to general market risk, liquidity risk, counterparty risk, and credit risk. The Fund’s maximum risk of loss from counterparty credit risk, either as the seller of protection or the buyer of protection, is the fair value of the contract. This risk is mitigated by (1) for bilateral swap contracts, having a netting arrangement between the Fund and the counterparty and by the posting of collateral by the counterparty to the Fund to cover the Fund’s exposure to the counterparty, and (2) for cleared swaps, trading these instruments through a central counterparty.
During the year ended July 31, 2020, the Fund used CDS contracts to gain exposure to certain securities or markets.
Swaps Generally. The value of open swaps may differ from that which would be realized in the event the Fund terminated its position in the contract on a given day. Risks of entering into these contracts include the potential inability of the counterparty to meet the terms of the contracts. This type of risk is generally limited to the amount of favorable movement in the value of the underlying security, instrument, or basket of instruments, if any, at the day of default. Risks also arise from potential losses from adverse
50
market movements and such losses could exceed the unrealized amounts shown on the “Schedule of investments.” For centrally cleared swaps, payments are received from the broker or paid to the broker each day, based on the daily fluctuation in the market value of the contract. These receipts or payments are known as “variation margin” and are recorded by the Fund as unrealized gains or losses until the contracts are closed. When the contracts are closed, the Fund records a realized gain or loss equal to the difference between the value of the contract at the time it was opened and the value at the time it was closed.
Fair values of derivative instruments as of July 31, 2020 were as follows:
| | | | | | | | | | | | | | | | | | | | |
| | | | | | Asset Derivatives Fair Value | | | | |
| | | | | | | | | Interest | | | | | | | |
| Statement of Assets and | | Currency | | | Equity | | | Rate | | | Credit | | | | |
Liabilities Location | | Contracts | | | Contracts | | | Contracts | | | Contracts | | | Total | |
Variation margin due from broker on futures contracts* | | $ | — | | | $ | — | | | $ | 22,965 | | | $ | — | | | $ | 22,965 | |
Unrealized appreciation on foreign currency exchange contracts | | | 5,580 | | | | — | | | | — | | | | — | | | | 5,580 | |
| | | | | | | | | | | | | | | | | | | | |
Total | | | 5,580 | | | | — | | | | 22,965 | | | | — | | | | 28,545 | |
| | | | | | | | | | | | | | | | | | | | |
| | | | | | | | | | | | | | | | | | | | |
| | | | | | Liability Derivatives Fair Value | | | | |
| | | | | | | | | Interest | | | | | | | |
| Statement of Assets and | | Currency | | | Equity | | | Rate | | | Credit | | | | |
Liabilities Location | | Contracts | | | Contracts | | | Contracts | | | Contracts | | | Total | |
Variation margin due from broker on futures contracts* | | $ | — | | | $ | — | | | $ | (5,989 | ) | | $ | — | | | $ | (5,989 | ) |
*Includes cumulative appreciation (depreciation) of futures contracts from the date the contracts are opened through July 31, 2020. Only current day variation margin is reported on the “Statement of assets and liabilities.”
51
Notes to financial statements
Delaware Strategic Income Fund
8. Derivatives (continued)
The effect of derivative instruments on the “Statement of operations” for the year ended July 31, 2020 was as follows:
| | | | | | | | | | | | | | | | |
| | | Net Realized Gain (Loss) on: | | | | |
| | | | |
| | | Foreign | | | | | | | | | | |
| | | Currency | | | | | | | | | | |
| | | Exchange | | | Futures | | | Swap | | | | |
| | | Contracts | | | Contracts | | | Contracts | | | Total | |
| | | | |
Currency contracts | | $ | 4,229 | | | $ | — | | | $ | — | | | $ | 4,229 | |
Interest rate contracts | | | — | | | | 130,310 | | | | — | | | | 130,310 | |
Credit contracts | | | — | | | | — | | | | 12,170 | | | | 12,170 | |
| | | | | | | | | | | | | | | | |
| | | | |
Total | | $ | 4,229 | | | $ | 130,310 | | | $ | 12,170 | | | $ | 146,709 | |
| | | | | | | | | | | | | | | | |
| | | | | | | | | | | | | | | | |
| | | Net Change in Unrealized Appreciation (Depreciation) of: | | | | |
| | | | |
| | | Foreign | | | | | | | | | | |
| | | Currency | | | | | | | | | | |
| | | Exchange | | | Futures | | | Swap | | | | |
| | | Contracts | | | Contracts | | | Contracts | | | Total | |
| | | | |
Currency contracts | | | $5,580 | | | $ | — | | | $ | — | | | | $ 5,580 | |
Interest rate contracts | | | — | | | | 93,675 | | | | — | | | | 93,675 | |
Credit contracts | | | — | | | | — | | | | (7,299) | | | | (7,299) | |
| | | | | | | | | | | | | | | | |
| | | | |
Total | | | $5,580 | | | $ | 93,675 | | | $ | (7,299) | | | | $91,956 | |
| | | | | | | | | | | | | | | | |
The table below summarizes the average balance of derivative holdings by the Fund during the year ended July 31, 2020:
| | | | |
| | | Long Derivative | | Short Derivative |
| | | Volume | | Volume |
Foreign currency exchange contracts (average notional value) | | $ 13,292 | | $ — |
Futures contracts (average notional value) | | 3,968,235 | | 1,378,517 |
CDS contracts (average notional value)* | | — | | 101,818 |
*Long represents buying protection and short represents selling protection.
9. Offsetting
The Fund entered into an International Swaps and Derivatives Association, Inc. Master Agreement (ISDA Master Agreement) or a similar agreement with certain of its derivative contract counterparties in order to better define its contractual rights and to secure rights that will help the Fund mitigate its counterparty risk. An ISDA Master Agreement is a bilateral agreement between the Fund and a counterparty that governs over-the-counter (OTC) derivatives and foreign exchange contracts and typically contains, among other things, collateral posting items and netting provisions in the event of a default and/or termination event. Under an ISDA Master Agreement, the Fund may, under certain circumstances, offset
52
with the counterparty certain derivative financial instruments’ payables and/or receivables with collateral held and/or posted and create one single net payment. The provisions of the ISDA Master Agreement typically permit a single net payment in the event of default (close-out), including the bankruptcy or insolvency of the counterparty. However, bankruptcy or insolvency laws of a particular jurisdiction may impose restrictions on or prohibitions against the right of offset in bankruptcy, insolvency, or other events.
For financial reporting purposes, the Fund does not offset derivative assets and derivative liabilities that are subject to netting arrangements on the “Statement of assets and liabilities.”
At July 31, 2020, the Fund had the following assets and liabilities subject to offsetting provisions:
Offsetting of Financial Assets and Liabilities and Derivative Assets and Liabilities
| | | | | | |
| | | Gross Value of | | Gross Value of | | |
Counterparty | | Derivative Asset | | Derivative Liability | | Net Position |
| | | |
Toronto-Dominion Bank | | $5,580 | | $— | | $5,580 |
| | | | | | | | | | | | |
| | | | | Fair Value of | | | | | | | | |
| | | | | Non-Cash | | | | Fair Value of | | Cash | | |
| | | | | Collateral | | Cash Collateral | | Non-Cash | | Collateral | | |
Counterparty | | Net Position | | Received | | Received(a) | | Collateral Pledged | | Pledged | | Net Exposure(b) |
Toronto-Dominion Bank | | $5,580 | | $— | | $— | | $— | | $— | | $5,580 |
(a)The value of the related collateral exceeded the value of the derivatives as of July 31, 2020, as applicable.
(b)Net exposure represents the receivable (payable) that would be due from (to) the counterparty in the event of default.
10. Securities Lending
The Fund, along with other funds in the Delaware Funds, may lend its securities pursuant to a security lending agreement (Lending Agreement) with The Bank of New York Mellon (BNY Mellon). At the time a security is loaned, the borrower must post collateral equal to the required percentage of the market value of the loaned security, including any accrued interest. The required percentage is: (1) 102% with respect to US securities and foreign securities that are denominated and payable in US dollars; and (2) 105% with respect to foreign securities. With respect to each loan, if on any business day the aggregate market value of securities collateral plus cash collateral held is less than the aggregate market value of the securities which are the subject of such loan, the borrower will be notified to provide additional collateral by the end of the following business day, which, together with the collateral already held, will be not less than the applicable initial collateral requirements for such security loan. If the aggregate market value of securities collateral and cash collateral held with respect to a security loan exceeds the applicable initial collateral requirement, upon the request of the borrower, BNY Mellon must return enough collateral to the borrower by the end of the following business day to reduce the value of the remaining collateral to the applicable initial collateral requirement for such security loan. As a result of the foregoing, the value of the collateral held with respect to a loaned security on any particular day, may be more or less than the value of the security on loan. The collateral percentage with respect to the market value of the loaned securities is determined by the security lending agent.
53
Notes to financial statements
Delaware Strategic Income Fund
10. Securities Lending (continued)
Cash collateral received by each fund of the Trust is generally invested in a series of individual separate accounts, each corresponding to a fund. The investment guidelines permit each separate account to hold certain securities that would be considered eligible securities for a money market fund. Cash collateral received is generally invested in government securities; certain obligations issued by government sponsored enterprises; repurchase agreements collateralized by US Treasury securities; obligations issued by the central government of any Organization for Economic Cooperation and Development (OECD) country or its agencies, instrumentalities, or establishments; obligations of supranational organizations; commercial paper, notes, bonds, and other debt obligations; certificates of deposit, time deposits, and other bank obligations; and asset-backed securities. A fund can also accept US government securities and letters of credit (non-cash collateral) in connection with securities loans.
In the event of default or bankruptcy by the lending agent, realization and/or retention of the collateral may be subject to legal proceedings. In the event the borrower fails to return loaned securities and the collateral received is insufficient to cover the value of the loaned securities and provided such collateral shortfall is not the result of investment losses, the lending agent has agreed to pay the amount of the shortfall to the Fund or, at the discretion of the lending agent, replace the loaned securities. The Fund continues to record dividends or interest, as applicable, on the securities loaned and is subject to changes in value of the securities loaned that may occur during the term of the loan. The Fund has the right under the Lending Agreement to recover the securities from the borrower on demand. With respect to security loans collateralized by non-cash collateral, the Fund receives loan premiums paid by the borrower. With respect to security loans collateralized by cash collateral, the earnings from the collateral investments are shared among the Fund, the security lending agent, and the borrower. The Fund records security lending income net of allocations to the security lending agent and the borrower.
The Fund may incur investment losses as a result of investing securities lending collateral. This could occur if an investment in the collateral investment account defaulted or became impaired. Under those circumstances, the value of the Fund’s cash collateral account may be less than the amount the Fund would be required to return to the borrowers of the securities and the Fund would be required to make up for this shortfall.
During the year ended July 31, 2020, the Fund had no securities out on loan.
11. Credit and Market Risk
Beginning in January 2020, global financial markets have experienced and may continue to experience significant volatility resulting from the spread of a novel coronavirus known as COVID-19. The outbreak of COVID-19 has resulted in travel and border restrictions, quarantines, supply chain disruptions, lower consumer demand and general market uncertainty. The effects of COVID-19 have and may continue to adversely affect the global economy, the economies of certain nations and individual issuers, all of which may negatively impact the Fund’s performance.
Some countries in which the Fund may invest require governmental approval for the repatriation of investment income, capital, or the proceeds of sales of securities by foreign investors. In addition, if there
54
is deterioration in a country’s balance of payments or for other reasons, a country may impose temporary restrictions on foreign capital remittances abroad.
The securities exchanges of certain foreign markets are substantially smaller, less liquid, and more volatile than the major securities markets in the US. Consequently, acquisition and disposition of securities by the Fund may be inhibited. In addition, a significant portion of the aggregate market value of securities listed on the major securities exchanges in emerging markets is held by a smaller number of investors. This may limit the number of shares available for acquisition or disposition by the Fund.
The Fund invests a portion of its assets in high-yield fixed income securities, which are securities rated lower than BBB- by S&P and lower than Baa3 by Moody’s, or similarly rated by another nationally recognized statistical rating organization. Investments in these higher yielding securities are generally accompanied by a greater degree of credit risk than higher rated securities. Additionally, lower rated securities may be more susceptible to adverse economic and competitive industry conditions than investment grade securities.
The Fund invests in fixed income securities whose value is derived from an underlying pool of mortgages or consumer loans. The value of these securities is sensitive to changes in economic conditions, including delinquencies and/or defaults, and may be adversely affected by shifts in the market’s perception of the issuers and changes in interest rates. Investors receive principal and interest payments as the underlying mortgages and consumer loans are paid back. Some of these securities are collateralized mortgage obligations (CMOs). CMOs are debt securities issued by US government agencies or by financial institutions and other mortgage lenders, which are collateralized by a pool of mortgages held under an indenture. Prepayment of mortgages may shorten the stated maturity of the obligations and can result in a loss of premium, if any has been paid. Certain of these securities may be stripped (securities which provide only the principal or interest feature of the underlying security). The yield to maturity on an interest-only CMO is extremely sensitive not only to changes in prevailing interest rates, but also to the rate of principal payments (including prepayments) on the related underlying mortgage assets. A rapid rate of principal payments may have a material adverse effect on the Fund’s yield to maturity. If the underlying mortgage assets experience greater than anticipated prepayments of principal, the Fund may fail to fully recoup its initial investment in these securities even if the securities are rated in the highest rating categories.
The Fund invests in certain obligations that may have liquidity protection designed to ensure that the receipt of payments due on the underlying security is timely. Such protection may be provided through guarantees, insurance policies, or letters of credit obtained by the issuer or sponsor through third parties, through various means of structuring the transaction, or through a combination of such approaches. The Fund will not pay any additional fees for such credit support, although the existence of credit support may increase the price of the security.
The Fund invests in bank loans and other securities that may subject it to direct indebtedness risk, the risk that the Fund will not receive payment of principal, interest, and other amounts due in connection with these investments and will depend primarily on the financial condition of the borrower. Loans that are fully secured offer the Fund more protection than unsecured loans in the event of nonpayment of
55
Notes to financial statements
Delaware Strategic Income Fund
11. Credit and Market Risk (continued)
scheduled interest or principal, although there is no assurance that the liquidation of collateral from a secured loan would satisfy the corporate borrower’s obligation, or that the collateral can be liquidated.
Some loans or claims may be in default at the time of purchase. Certain of the loans and the other direct indebtedness acquired by the Fund may involve revolving credit facilities or other standby financing commitments that obligate the Fund to pay additional cash on a certain date or on demand. These commitments may require the Fund to increase its investment in a company at a time when the Fund might not otherwise decide to do so (including at a time when the company’s financial condition makes it unlikely that such amounts will be repaid). To the extent that the Fund is committed to advance additional funds, it will at all times hold and maintain cash or other high-grade debt obligations in an amount sufficient to meet such commitments. When a loan agreement is purchased, the Fund may pay an assignment fee. On an ongoing basis, the Fund may receive a commitment fee based on the undrawn portion of the underlying line of credit portion of a loan agreement. Prepayment penalty fees are received upon the prepayment of a loan agreement by the borrower. Prepayment penalty, facility, commitment, consent, and amendment fees are recorded to income as earned or paid.
As the Fund may be required to rely upon another lending institution to collect and pass on to the Fund amounts payable with respect to the loan and to enforce the Fund’s rights under the loan and other direct indebtedness, an insolvency, bankruptcy, or reorganization of the lending institution may delay or prevent the Fund from receiving such amounts. The highly leveraged nature of many loans may make them especially vulnerable to adverse changes in economic or market conditions. Investments in such loans and other direct indebtedness may involve additional risk to the Fund.
When interest rates rise, fixed income securities (i.e. debt obligations) generally will decline in value. These declines in value are greater for fixed income securities with longer maturities or durations.
IBOR risk is the risk that potential changes related to the use of the London interbank offered rate (LIBOR) could have adverse impacts on financial instruments that reference LIBOR. The potential abandonment of LIBOR could affect the value and liquidity of instruments that reference LIBOR. The use of alternative reference rate products may impact investment strategy performance. These risks may also apply with respect to changes in connection with other interbank offered rates (“IBORs”), such as the euro overnight index average (EONIA), which are also the subject of recent reform.
The Fund may invest up to 15% of its net assets in illiquid securities, which may include securities with contractual restrictions on resale, securities exempt from registration under Rule 144A promulgated under the Securities Act of 1933, as amended, and other securities which may not be readily marketable. The relative illiquidity of these securities may impair the Fund from disposing of them in a timely manner and at a fair price when it is necessary or desirable to do so. While maintaining oversight, the Board has delegated to DMC, the day-to-day functions of determining whether individual securities are liquid for purposes of the Fund’s limitation on investments in illiquid securities. Securities eligible for resale pursuant to Rule 144A, which are determined to be liquid, are not subject to the Fund’s 15% limit on investments in illiquid securities. Rule 144A securities have been identified on the “Schedule of investments.”
66
12. Contractual Obligations
The Fund enters into contracts in the normal course of business that contain a variety of indemnifications. The Fund’s maximum exposure under these arrangements is unknown. However, the Fund has not had prior claims or losses pursuant to these contracts. Management has reviewed the Fund’s existing contracts and expects the risk of loss to be remote.
13. Recent Accounting Pronouncements
In March 2017, FASB issued an Accounting Standards Update (ASU), ASU 2017-08, Receivables — Nonrefundable Fees and Other Costs (Subtopic 310-20), Premium Amortization on Purchased Callable Debt Securities which amends the amortization period for certain callable debt securities purchased at a premium, shortening such period to the earliest call date. ASU 2017-08 does not require any accounting change for debt securities held at a discount; the discount continues to be amortized to maturity. ASU 2017-08 is effective for fiscal years, and interim periods within those fiscal years, beginning after December 15, 2018. Management has implemented ASU 2017-08 and determined that the impact of this guidance to the Fund’s net assets at the end of the period is not material.
In August 2018, FASB issued ASU 2018-13, which changes certain fair value measurement disclosure requirements. ASU 2018-13, in addition to other modifications and additions, removes the requirement to disclose the amount and reasons for transfers between Level 1 and Level 2 of the fair value hierarchy, the policy for the timing of transfers between levels and the valuation process for Level 3 fair value measurements. ASU 2018-13 is effective for fiscal years, and interim periods within those fiscal years, beginning after December 15, 2019. At this time, Management is evaluating the implications of these changes on the financial statements.
In March 2020, FASB issued ASU 2020-04, Reference Rate Reform (Topic 848) – Facilitation of the Effects of Reference Rate Reform on Financial Reporting. The amendments in ASU 2020-04 provide optional temporary financial reporting relief from the effect of certain types of contract modifications due to the planned discontinuation of LIBOR and other interbank-offered based reference rates as of the end of 2021. ASU 2020-04 is effective for certain reference rate-related contract modifications that occur during the period March 12, 2020 through December 31, 2022. As of the financial reporting period, Management is evaluating the impact of applying this ASU.
14. Subsequent Events
Management has determined that no material events or transactions occurred subsequent to July 31, 2020, that would require recognition or disclosure in the Fund’s financial statements.
57
Report of independent
registered public accounting firm
To the Board of Trustees of Delaware Group® Government Fund and Shareholders of Delaware Strategic Income Fund
Opinion on the Financial Statements
We have audited the accompanying statement of assets and liabilities, including the schedule of investments, of Delaware Strategic Income Fund (one of the funds constituting the Delaware Group® Government Fund, referred to hereafter as the “Fund”) as of July 31, 2020, the related statement of operations for the year ended July 31, 2020, the statements of changes in net assets for each of the two years in the period ended July 31, 2020, including the related notes, and the financial highlights for each of the five years in the period ended July 31, 2020 (collectively referred to as the “financial statements”). In our opinion, the financial statements present fairly, in all material respects, the financial position of the Fund as of July 31, 2020, the results of its operations for the year then ended, the changes in its net assets for each of the two years in the period ended July 31, 2020 and the financial highlights for each of the five years in the period ended July 31, 2020 in conformity with accounting principles generally accepted in the United States of America.
Basis for Opinion
These financial statements are the responsibility of the Fund’s management. Our responsibility is to express an opinion on the Fund’s financial statements based on our audits. We are a public accounting firm registered with the Public Company Accounting Oversight Board (United States) (PCAOB) and are required to be independent with respect to the Fund in accordance with the U.S. federal securities laws and the applicable rules and regulations of the Securities and Exchange Commission and the PCAOB.
We conducted our audits of these financial statements in accordance with the standards of the PCAOB. Those standards require that we plan and perform the audit to obtain reasonable assurance about whether the financial statements are free of material misstatement, whether due to error or fraud.
Our audits included performing procedures to assess the risks of material misstatement of the financial statements, whether due to error or fraud, and performing procedures that respond to those risks. Such procedures included examining, on a test basis, evidence regarding the amounts and disclosures in the financial statements. Our audits also included evaluating the accounting principles used and significant estimates made by management, as well as evaluating the overall presentation of the financial statements. Our procedures included confirmation of securities owned as of July 31, 2020 by correspondence with the custodian, transfer agents and brokers; when replies were not received from brokers, we performed other auditing procedures. We believe that our audits provide a reasonable basis for our opinion.
/s/PricewaterhouseCoopers LLP
Philadelphia, Pennsylvania
September 23, 2020
We have served as the auditor of one or more investment companies in Delaware Funds® by Macquarie since 2010.
58
Other Fund information (Unaudited)
Delaware Strategic Income Fund
Liquidity Risk Management Program
The Securities and Exchange Commission (the “SEC”) has adopted Rule 22e-4 under the Investment Company Act of 1940 (the “Liquidity Rule”), which requires all open-end funds (other than money market funds) to adopt and implement a program reasonably designed to assess and manage the fund’s “liquidity risk,” defined as the risk that the fund could not meet requests to redeem shares issued by the fund without significant dilution of remaining investors’ interests in the fund.
The Fund has adopted and implemented a liquidity risk management program in accordance with the Liquidity Rule (the “Program”). The Board has designated the Division Director of the US Operational Risk Group of Macquarie Asset Management as the Program Administrator for each Fund in the Trust.
As required by the Liquidity Rule, the Program includes policies and procedures that provide for:
(1) assessment, management, and review (no less frequently than annually) of the Fund’s liquidity risk;
(2) classification of each of the Fund’s portfolio holdings into one of four liquidity categories
(Highly Liquid, Moderately Liquid, Less Liquid, and Illiquid); (3) for funds that do not primarily hold assets that are Highly Liquid, establishing and maintaining a minimum percentage of the Fund’s net assets in Highly Liquid investments (called a “Highly Liquid Investment Minimum” or “HLIM”); and (4) prohibiting the Fund’s acquisition of Illiquid investments if, immediately after the acquisition, the Fund would hold more than 15% of its net assets in Illiquid assets. The Program also requires reporting to the SEC (on a non-public basis) and to the Board if the Fund’s holdings of Illiquid assets exceed 15% of the Fund’s net assets. Funds with HLIMs must have procedures for addressing HLIM shortfalls, including reporting to the Board and, with respect to HLIM shortfalls lasting more than seven consecutive calendar days, reporting to the SEC (on a non-public basis).
In assessing and managing the Fund’s liquidity risk, the Program Administrator considers, as relevant, a variety of factors, including: (1) the Fund’s investment strategy and liquidity of portfolio investments during both normal and reasonably foreseeable stressed conditions; (2) short-term and long-term cash flow projections for the Fund during both normal and reasonably foreseeable stressed conditions; and (3) the Fund’s holdings of cash and cash equivalents and any borrowing arrangements. Classification of the Fund’s portfolio holdings in the four liquidity categories is based on the number of days it is reasonably expected to take to convert the investment to cash (for Highly Liquid and Moderately Liquid holdings) or to sell or dispose of the investment (for Less Liquid and Illiquid investments), in current market conditions without significantly changing the investment’s market value. The Fund primarily holds assets that are classified as Highly Liquid, and therefore is not required to establish an HLIM.
At a meeting of the Board held on May 19-21, 2020, the Program Administrator provided a written report to the Board addressing the Program’s operation and assessing the adequacy and effectiveness of its implementation for the period from December 1, 2018 through March 31, 2020. The report concluded that the Program is appropriately designed and effectively implemented and that it meets the requirements of Rule 22e-4 and the Fund’s liquidity needs. The Fund’s HLIM is set at an appropriate level and the Fund complied with its HLIM at all times during the reporting period.
59
Other Fund information (Unaudited)
Delaware Strategic Income Fund
Tax Information
The information set forth below is for the Fund’s fiscal year as required by federal income tax laws. Shareholders, however, must report distributions on a calendar year basis for income tax purposes, which may include distributions for portions of two fiscal years of the Fund. Accordingly, the information needed by shareholders for income tax purposes will be sent to them in January of each year. Please consult your tax advisor for proper treatment of this information.
All disclosures are based on financial information available as of the date of this annual report and, accordingly, are subject to change. For any and all items requiring reporting, it is the intention of the Fund to report the maximum amount permitted under the Internal Revenue Code and the regulations thereunder.
For the fiscal year ended July 31, 2020, the Fund reports distributions paid during the year as follows:
| | | | |
(A) Ordinary Income Distributions (Tax Basis) | | | 98.82 | % |
(B) Return of Capital (Tax Basis) | | | 1.18 | % |
Total Distributions (Tax Basis) | | | 100.00 | % |
(A) and (B) are based on a percentage of the Fund’s total distributions.
60
Board of trustees / directors and officers addendum
Delaware Funds® by Macquarie
A mutual fund is governed by a Board of Trustees/Directors (“Trustees”), which has oversight responsibility for the management of a fund’s business affairs. Trustees establish procedures and oversee and review the performance of the investment manager, the distributor, and others who perform services for the fund. The independent fund trustees, in particular, are advocates for shareholder interests. Each trustee has served in that capacity since he or she was elected to or appointed to the Board of Trustees, and will continue to serve until his or her retirement or the election of a new trustee in his or her place. The following is a list of the Trustees and Officers with certain background and related information.
| | | | | | | | | | |
Name,
Address,
and Birth Date | | Position(s) Held with
Fund(s) | | Length of Time Served | | Principal Occupation(s) During the Past Five Years | | Number of Portfolios in Fund Complex Overseen by Trusted or Officer | | Other Directorships Held by Trustee or Officer |
|
Interested Trustee | | | | | | | | | | |
|
| | | | | |
Shawn K. Lytle1 | | President, | | President and | | President — Macquarie | | 93 | | Trustee — UBS Relationship |
2005 Market Street | | Chief Executive | | Chief Executive | | Investment Management2 | | | | Funds, SMA Relationship Trust, |
Philadelphia, PA | | Officer, | | Officer | | (June 2015–Present) | | | | and UBS Funds |
19103 | | and Trustee | | since August 2015 | | Regional Head of Americas — | | | | (May 2010–April 2015) |
February 1970 | | | | Trustee since | | UBS Global Asset Management | | | | |
| | | | September 2015 | | (April 2010–May 2015) | | | | |
|
| Independent Trustees | | | | | | | | | | |
|
| | | | | |
Jerome D. | | Trustee | | Since January 2019 | | Managing Member, Stonebrook | | 93 | | None |
Abernathy | | | | | | Capital Management, LLC | | | | |
2005 Market Street | | | | | | (financial technology: macro | | | | |
Philadelphia, PA | | | | | | factors and databases) | | | | |
19103 | | | | | | (January 1993-Present) | | | | |
61
Board of trustees / directors and officers addendum
Delaware Funds® by Macquarie
| | | | | | | | | | |
Name,
Address,
and Birth Date | | Position(s) Held with
Fund(s) | | Length of Time Served | | Principal Occupation(s) During the Past Five Years | | Number of Portfolios in Fund Complex Overseen by Trusted or Officer | | Other Directorships Held by Trustee or Officer |
|
| | | | | |
July 19590 | | | | | | | | | | |
| | | | | |
| Thomas L. Bennett | | Chair and Trustee | | Trustee since March | | Private Investor | | 93 | | None |
| 2005 Market Street | | | | 2005 | | (March 2004–Present) | | | | |
| Philadelphia, PA | | | | Chair since March | | | | | | |
| 19103 | | | | 2015 | | | | | | |
| October 1947 | | | | | | | | | | |
| | | | | |
| Ann D. Borowiec | | Trustee | | Since March 2015 | | Chief Executive Officer, Private | | 93 | | Director —Banco Santander |
| 2005 Market Street | | | | | | Wealth Management | | | | International |
| Philadelphia, PA | | | | | | (2011–2013) and Market | | | | (October 2016–December 2019) |
| 19103 | | | | | | Manager, New Jersey Private | | | | Director —Santander Bank, N.A. |
| November 1958 | | | | | | Bank (2005–2011) — J.P. | | | | (December 2016–December |
| | | | | | Morgan Chase & Co. | | | | 2019) |
| | | | | |
| Joseph W. Chow | | Trustee | | Since January 2013 | | Private Investor | | 93 | | Director and Audit Committee |
| 2005 Market Street | | | | | | (April 2011–Present) | | | | Member —Hercules Technology |
| Philadelphia, PA | | | | | | | | | | Growth Capital, Inc. |
| 19103 | | | | | | | | | | (July 2004–July 2014) |
| January 1953 | | | | | | | | | | |
62
| | | | | | | | | | |
Name,
Address,
and Birth Date | | Position(s) Held with
Fund(s) | | Length of Time Served | | Principal Occupation(s) During the Past Five Years | | Number of Portfolios in Fund Complex Overseen by Trusted or Officer | | Other Directorships Held by Trustee or Officer |
|
| | | | | |
John A. Fry | | Trustee | | Since January 2001 | | President —Drexel University | | 93 | | Director; Compensation |
2005 Market Street | | | | | | (August 2010–Present) | | | | Committee and Governance |
Philadelphia, PA | | | | | | President — Franklin & Marshall | | | | Committee Member — |
19103 | | | | | | College (July 2002–June 2010) | | | | Community Health Systems |
May 1960 | | | | | | | | | | (May 2004–Present) |
| | | | | | | | | | Director —Drexel Morgan & Co. |
| | | | | | | | | | (2015–2019) |
| | | | | | | | | | Director and Audit Committee |
| | | | | | | | | | Member —vTv Therapeutics Inc. |
| | | | | | | | | | (2017–Present) |
| | | | | | | | | | Director and Audit Committee |
| | | | | | | | | | Member —FS Credit Real Estate |
| | | | | | | | | | Income Trust, Inc. |
| | | | | | | | | | (2018–Present) |
| | | | | | | | | | Director — Federal Reserve |
| | | | | | | | | | Bank of Philadelphia |
| | | | | | | | | | (January 2020–Present) |
| Lucinda S. Landreth | | Trustee | | Since March 2005 | | Private Investor (2004–Present) | | 93 | | None |
| 2005 Market Street | | | | | | | | | | |
| Philadelphia, PA | | | | | | | | | | |
| 19103 | | | | | | | | | | |
| June 1947 | | | | | | | | | | |
63
Board of trustees / directors and officers addendum
Delaware Funds® by Macquarie
| | | | | | | | | | |
Name,
Address,
and Birth Date | | Position(s) Held with
Fund(s) | | Length of Time Served | | Principal Occupation(s) During the Past Five Years | | Number of Portfolios in Fund Complex Overseen by Trusted or Officer | | Other Directorships Held by Trustee or Officer |
|
| | | | | |
| Frances A. | | Trustee | | Since September | | Private Investor | | 93 | | Trust Manager and Audit |
| Sevilla-Sacasa | | | | 2011 | | (January 2017–Present) | | | | Committee Chair —Camden |
| 2005 Market Street | | | | | | Chief Executive Officer —Banco | | | | Property Trust |
| Philadelphia, PA | | | | | | Itaú International | | | | (August 2011–Present) |
| 19103 | | | | | | (April 2012–December 2016) | | | | Director; Strategic |
| January 1956 | | | | | | Executive Advisor to Dean | | | | Planning and Reserves |
| | | | | | (August 2011–March 2012) and | | | | Committee and Nominating |
| | | | | | Interim Dean | | | | and Governance |
| | | | | | (January 2011–July 2011) — | | | | Committee Member — |
| | | | | | University of Miami School of | | | | Callon Petroleum Company |
| | | | | | Business Administration | | | | (December 2019–Present) |
| | | | | | President —U.S. Trust, Bank of | | | | Director; Audit Committee |
| | | | | | America Private Wealth | | | | Member —Carrizo Oil & Gas, |
| | | | | | Management (Private Banking) | | | | Inc. (March 2018–December |
| | | | | | (July 2007-December 2008) | | | | 2019) |
64
| | | | | | | | | | |
Name,
Address,
and Birth Date | | Position(s) Held with
Fund(s) | | Length of Time Served | | Principal Occupation(s) During the Past Five Years | | Number of Portfolios in Fund Complex Overseen by Trusted or Officer | | Other Directorships Held by Trustee or Officer |
|
| | | | | |
Thomas K. Whitford | | Trustee | | Since January 2013 | | Vice Chairman (2010–April 2013) | | 93 | | Director —HSBC North America |
2005 Market Street | | | | | | — PNC Financial Services Group | | | | Holdings Inc. |
Philadelphia, PA | | | | | | | | | | (December 2013–Present) |
19103 | | | | | | | | | | Director — HSBC USA Inc. |
March 1956 | | | | | | | | | | (July 2014–Present) |
| | | | | | | | | | Director — HSBC Bank USA, |
| | | | | | | | | | National Association |
| | | | | | | | | | (July 2014–March 2017) |
| | | | | | | | | | Director — HSBC Finance |
| | | | | | | | | | Corporation |
| | | | | | | | | | (December 2013–April 2018) |
65
Board of trustees / directors and officers addendum
Delaware Funds® by Macquarie
| | | | | | | | | | |
Name,
Address,
and Birth Date | | Position(s) Held with
Fund(s) | | Length of Time Served | | Principal Occupation(s) During the Past Five Years | | Number of Portfolios in Fund Complex Overseen by Trusted or Officer | | Other Directorships Held by Trustee or Officer |
|
| | | | | |
Christianna Wood | | Trustee | | Since January 2019 | | Chief Executive Officer and | | 93 | | Director; Finance Committee and |
2005 Market Street | | | | | | President —Gore Creek Capital, | | | | Audit Committee Member — |
Philadelphia, PA | | | | | | Ltd. (August 2009–Present) | | | | H&R Block Corporation |
19103 | | | | | | | | | | (July 2008–Present) |
August 1959 | | | | | | | | | | Director; Investments |
| | | | | | | | | | Committee, Capital and Finance |
| | | | | | | | | | Committee, and Audit |
| | | | | | | | | | Committee Member — Grange |
| | | | | | | | | | Insurance (2013–Present) |
| | | | | | | | | | Trustee; Chair of Nominating and |
| | | | | | | | | | Governance Committee and |
| | | | | | | | | | Audit Committee Member —The |
| | | | | | | | | | Merger Fund (2013–Present), The |
| | | | | | | | | | Merger Fund VL (2013–Present); |
| | | | | | | | | | WCM Alternatives: Event-Driven |
| | | | | | | | | | Fund (2013–Present), and WCM |
| | | | | | | | | | Alternatives: Credit Event Fund |
| | | | | | | | | | (December 2017–Present) |
| | | | | | | | | | Director; Chair of Governance |
| | | | | | | | | | Committee and Audit Committee |
| | | | | | | | | | Member — International |
| | | | | | | | | | Securities Exchange (2010–2016) |
66
| | | | | | | | | | |
Name,
Address,
and Birth Date | | Position(s) Held with Fund(s) | | Length of Time Served | | Principal Occupation(s) During the Past Five Years | | Number of Portfolios in Fund Complex Overseen by Trusted or Officer | | Other Directorships Held by Trustee or Officer |
|
| | | | | |
Janet L. Yeomans | | Trustee | | Since April 1999 | | Vice President and Treasurer | | 93 | | Director; Personnel and |
2005 Market Street | | | | | | (January 2006–July 2012), Vice | | | | Compensation Committee Chair; |
Philadelphia, PA | | | | | | President —Mergers & | | | | Member of Nominating, |
19103 | | | | | | Acquisitions | | | | Investments, and Audit |
July 1948 | | | | | | (January 2003–January 2006), | | | | Committees for various periods |
| | | | | | and Vice President and Treasurer | | | | throughout directorship — |
| | | | | | (July 1995–January 2003) — 3M | | | | Okabena Company (2009–2017) |
| | | | | | Company | | | | |
|
| | | | | |
Officers | | | | | | | | | | |
|
| | | | | |
David F. Connor | | Senior Vice President, | | Senior Vice President, | | David F. Connor has served in | | 93 | | None3 |
2005 Market Street | | General Counsel, and | | since May 2013; | | various capacities at different | | | | |
Philadelphia, PA | | Secretary | | General Counsel | | times at Macquarie Investment | | | | |
19103 | | | | since May 2015; | | Management. | | | | |
December 1963 | | | | Secretary since | | | | | | |
| | | | October 2005 | | | | | | |
| | | | | |
Daniel V. Geatens | | Vice President and | | Vice President and | | Daniel V. Geatens has served in | | 93 | | None3 |
2005 Market Street | | Treasurer | | Treasurer since | | various capacities at different | | | | |
Philadelphia, PA | | | | October 2007 | | times at Macquarie Investment | | | | |
19103 | | | | | | Management. | | | | |
October 1972 | | | | | | | | | | |
67
Board of trustees / directors and officers addendum
Delaware Funds® by Macquarie
| | | | | | | | | | |
Name,
Address,
and Birth Date | | Position(s) Held with Fund(s) | | Length of Time Served | | Principal Occupation(s) During the Past Five Years | | Number of Portfolios in Fund Complex Overseen by Trusted or Officer | | Other Directorships Held by Trustee or Officer |
|
Richard Salus | | Senior Vice President | | Senior Vice President | | Richard Salus has served in | | 93 | | None |
2005 Market Street | | and Chief Financial | | and Chief Financial | | various capacities at different | | | | |
Philadelphia, PA | | Officer | | Officer since | | times at Macquarie Investment | | | | |
19103 | | | | November 2006 | | Management. | | | | |
October 1963 | | | | | | | | | | |
1 Shawn K. Lytle is considered to be an “Interested Trustee” because he is an executive officer of the Fund’s(s’) investment advisor.
2 Macquarie Investment Management is the marketing name for Macquarie Management Holdings, Inc. and its subsidiaries, including the Fund’s(s’) investment manager, principal underwriter, and its transfer agent.
3 David F. Connor and Daniel V. Geatens serve in similar capacities for the six portfolios of the Optimum Fund Trust, which have the same investment advisor, principal underwriter, and transfer agent as the registrant. Mr. Geatens also serves as the Chief Financial Officer of the Optimum Fund Trust, and he is the Chief Financial Officer and Treasurer for Macquarie Global Infrastructure Total Return Fund Inc.
The Statement of Additional Information for the Fund(s) includes additional information about the Trustees and Officers and is available, without charge, upon request by calling 800 523-1918.
68
About the organization
Board of trustees
Shawn K. Lytle
President and
Chief Executive Officer
Delaware Funds®
by Macquarie
Philadelphia, PA
Jerome D. Abernathy
Managing Member
Stonebrook Capital
Management, LLC
Jersey City, NJ
Thomas L. Bennett
Chairman of the Board
Delaware Funds
by Macquarie
Private Investor
Rosemont, PA
Ann D. Borowiec
Former Chief Executive
Officer
Private Wealth Management
J.P. Morgan Chase & Co.
New York, NY
Joseph W. Chow
Former Executive Vice
President
State Street Corporation
Boston, MA
John A. Fry
President
Drexel University
Philadelphia, PA
Lucinda S. Landreth
Former Chief Investment
Officer
Assurant, Inc.
New York, NY
Frances A.
Sevilla-Sacasa
Former Chief Executive
Officer
Banco Itaú International
Miami, FL
Thomas K. Whitford
Former Vice Chairman
PNC Financial Services Group
Pittsburgh, PA
Christianna Wood
Chief Executive Officer
and President
Gore Creek Capital, Ltd.
Golden, CO
Janet L. Yeomans
Former Vice President and
Treasurer
3M Company
St. Paul, MN
Affiliated officers
| | | | | | |
| David F. Connor | | Daniel V. Geatens | | Richard Salus | | |
| Senior Vice President, | | Vice President and | | Senior Vice President and | | |
| General Counsel, | | Treasurer | | Chief Financial Officer | | |
| and Secretary | | Delaware Funds | | Delaware Funds | | |
| Delaware Funds | | by Macquarie | | by Macquarie | | |
| by Macquarie | | Philadelphia, PA | | Philadelphia, PA | | |
| Philadelphia, PA | | | | | | |
This annual report is for the information of Delaware Strategic Income Fund shareholders, but it may be used with prospective investors when preceded or accompanied by the Delaware Fund fact sheet for the most recently completed calendar quarter. These documents are available at delawarefunds.com/literature.
The Fund files its complete schedule of portfolio holdings with the Securities and Exchange Commission (SEC) for the first and third quarters of each fiscal year on Form N-PORT. The Fund’s Forms N-PORT, as well as a description of the policies and procedures that the Fund uses to determine how to vote proxies (if any) relating to portfolio securities, are available without charge (i) upon request, by calling 800 523-1918; and (ii) on the SEC’s website at sec.gov. In addition, a description of the policies and procedures that the Fund uses to determine how to vote proxies (if any) relating to portfolio securities and the Schedule of Investments included in the Fund’s most recent Form N-PORT are available without charge on the Fund’s website at delawarefunds.com/literature. The Fund’s Forms N-PORT may be reviewed and copied at the SEC’s Public Reference Room in Washington, D.C.; information on the operation of the Public Reference Room may be obtained by calling 800 SEC-0330.
Information (if any) regarding how the Fund voted proxies relating to portfolio securities during the most recently disclosed 12-month period ended June 30 is available without charge (i) through the Fund’s website at delawarefunds.com/proxy; and (ii) on the SEC’s website at sec.gov.
69
Item 2. Code of Ethics
The registrant has adopted a code of ethics that applies to the registrant’s principal executive officer, principal financial officer, principal accounting officer or controller, or persons performing similar functions, regardless of whether these individuals are employed by the registrant or a third party. A copy of the registrant’s Code of Business Ethics has been posted on the Delaware Funds® by Macquarie Internet Web site at www.delawarefunds.com. Any amendments to the Code of Business Ethics, and information on any waiver from its provisions granted by the registrant, will also be posted on this Web site within five business days of such amendment or waiver and will remain on the Web site for at least 12 months.
Item 3. Audit Committee Financial Expert
The registrant’s Board of Trustees has determined that certain members of the registrant’s Audit Committee are audit committee financial experts, as defined below. For purposes of this item, an “audit committee financial expert” is a person who has the following attributes:
a. An understanding of generally accepted accounting principles and financial statements;
b. The ability to assess the general application of such principles in connection with the accounting for estimates, accruals, and reserves;
c. Experience preparing, auditing, analyzing, or evaluating financial statements that present a breadth and level of complexity of accounting issues that are generally comparable to the breadth and complexity of issues that can reasonably be expected to be raised by the registrant’s financial statements, or experience actively supervising one or more persons engaged in such activities;
d. An understanding of internal controls and procedures for financial reporting; and
e. An understanding of audit committee functions.
An “audit committee financial expert” shall have acquired such attributes through:
a. Education and experience as a principal financial officer, principal accounting officer, controller, public accountant, or auditor or experience in one or more positions that involve the performance of similar functions;
b. Experience actively supervising a principal financial officer, principal accounting officer, controller, public accountant, auditor, or person performing similar functions;
c. Experience overseeing or assessing the performance of companies or public accountants with respect to the preparation, auditing, or evaluation of financial statements; or
d. Other relevant experience.
The registrant’s Board of Trustees has also determined that each member of the registrant’s Audit Committee is independent. In order to be “independent” for purposes of this item, the Audit Committee member may not: (i) other than in his or her capacity as a member of the Board of Trustees or any committee thereof, accept directly or indirectly any consulting, advisory or other compensatory fee from the issuer; or (ii) be an “interested person” of the registrant as defined in Section 2(a)(19) of the Investment Company Act of 1940.
The names of the audit committee financial experts on the registrant’s Audit Committee are set forth below:
Jerome D. Abernathy
John A. Fry
Thomas K. Whitford, Chair
Christianna Wood
Item 4. Principal Accountant Fees and Services
(a) Audit fees.
The aggregate fees billed for services provided to the registrant by its independent auditors for the audit of the registrant’s annual financial statements and for services normally provided by the independent auditors in connection with statutory and regulatory filings or engagements were $90,870 for the fiscal year ended July 31, 2020.
The aggregate fees billed for services provided to the registrant by its independent auditors for the audit of the registrant’s annual financial statements and for services normally provided by the independent auditors in connection with statutory and regulatory filings or engagements were $92,390 for the fiscal year ended July 31, 2019.
(b) Audit-related fees.
The aggregate fees billed by the registrant’s independent auditors for services relating to the performance of the audit of the registrant’s financial statements and not reported under paragraph (a) of this Item were $0 for the fiscal year ended July 31, 2020.
The aggregate fees billed by the registrant’s independent auditors for services relating to the performance of the audit of the financial statements of the registrant’s investment adviser and other service providers under common control with the adviser and that relate directly to the operations or financial reporting of the registrant were $903,282 for the registrant’s fiscal year ended July 31, 2020. The percentage of these fees relating to services approved by the registrant’s Audit Committee pursuant to the de minimis exception from the pre-approval requirement in Rule 2-01(c)(7)(i)(C) of Regulation S-X was 0%. These audit-related services were as follows: year end audit procedures; group reporting and subsidiary statutory audits.
The aggregate fees billed by the registrant’s independent auditors for services relating to the performance of the audit of the registrant’s financial statements and not reported under paragraph (a) of this Item were $0 for the fiscal year ended July 31, 2019.
The aggregate fees billed by the registrant’s independent auditors for services relating to the performance of the audit of the financial statements of the registrant’s investment adviser and other service providers under common control with the adviser and that relate directly to the operations or financial reporting of the registrant were $909,000 for the registrant’s fiscal year ended July 31, 2019. The percentage of these fees relating to services approved by the registrant’s Audit Committee pursuant to the de minimis exception from the pre-approval requirement in Rule 2-01(c)(7)(i)(C) of Regulation S-X was 0%. These audit-related services were as follows: year end audit procedures; group reporting and subsidiary statutory audits.
(c) Tax fees.
The aggregate fees billed by the registrant’s independent auditors for tax-related services provided to the registrant were $13,000 for the fiscal year ended July 31, 2020. The percentage of these fees relating to services approved by the registrant’s Audit Committee pursuant to the de minimis exception from the pre-approval requirement in Rule 2-01(c)(7)(i)(C) of Regulation S-X was 0%. These tax-related services were as follows: review of income tax returns and review of annual excise distribution calculations.
The aggregate fees billed by the registrant’s independent auditors for tax-related services provided to the registrant’s investment adviser and other service providers under common control with the adviser and that relate directly to the operations or financial reporting of the registrant were $0 for the registrant’s fiscal year ended July 31, 2020.
The aggregate fees billed by the registrant’s independent auditors for tax-related services provided to the registrant were $13,000 for the fiscal year ended July 31, 2019. The percentage of these fees relating to services approved by the registrant’s Audit Committee pursuant to the de minimis exception from the pre-approval requirement in Rule 2-01(c)(7)(i)(C) of Regulation S-X was 0%. These tax-related services were as follows: review of income tax returns and review of annual excise distribution calculations.
The aggregate fees billed by the registrant’s independent auditors for tax-related services provided to the registrant’s investment adviser and other service providers under common control with the adviser and that relate directly to the operations or financial reporting of the registrant were $0 for the registrant’s fiscal year ended July 31, 2019.
(d) All other fees.
The aggregate fees billed for all services provided by the independent auditors to the registrant other than those set forth in paragraphs (a), (b) and (c) of this Item were $0 for the fiscal year ended July 31, 2020.
The aggregate fees billed for all services other than those set forth in paragraphs (b) and (c) of this Item provided by the registrant’s independent auditors to the registrant’s adviser and other service providers under common control with the adviser and that relate directly to the operations or financial reporting of the registrant were $0 for the registrant’s fiscal year ended July 31, 2020. The percentage of these fees relating to services approved by the registrant’s Audit Committee pursuant to the de minimis exception from the pre-approval requirement in Rule 2-01(c)(7)(i)(C) of Regulation S-X was 0%.
The aggregate fees billed for all services provided by the independent auditors to the registrant other than those set forth in paragraphs (a), (b) and (c) of this Item were $0 for the fiscal year ended July 31, 2019.
The aggregate fees billed for all services other than those set forth in paragraphs (b) and (c) of this Item provided by the registrant’s independent auditors to the registrant’s adviser and other service providers under common control with the adviser and that relate directly to the operations or financial reporting of the registrant were $0 for the registrant’s fiscal year ended July 31, 2019. The percentage of these fees relating to services approved by the registrant’s Audit Committee pursuant to the de minimis exception from the pre-approval requirement in Rule 2-01(c)(7)(i)(C) of Regulation S-X was 0%.
(e) The registrant’s Audit Committee has established pre-approval policies and procedures as permitted by Rule 2-01(c)(7)(i)(B) of Regulation S-X (the “Pre-Approval Policy”) with respect to services provided by the registrant’s independent auditors. Pursuant to the Pre-Approval Policy, the Audit Committee has pre-approved the services set forth in the table below with respect to the registrant up to the specified fee limits. Certain fee limits are based on aggregate fees to the registrant and other registrants within the Delaware Funds® by Macquarie.
| Service | Range of Fees |
| Audit Services | |
| Statutory audits or financial audits for new Funds | up to $40,000 per Fund |
| Services associated with SEC registration statements (e.g., Form N-1A, Form N-14, etc.), periodic reports and other documents filed with the SEC or other documents issued in connection with securities offerings (e.g., comfort letters for closed-end Fund offerings, consents), and assistance in responding to SEC comment letters | up to $10,000 per Fund |
| Consultations by Fund management as to the accounting or disclosure treatment of transactions or events and/or the actual or potential impact of final or proposed rules, standards or interpretations by the SEC, FASB, or other regulatory or standard-setting bodies (Note: Under SEC rules, some consultations may be considered “audit-related services” rather than “audit services”) | up to $25,000 in the aggregate |
| Audit-Related Services | |
| Consultations by Fund management as to the accounting or disclosure treatment of transactions or events and /or the actual or potential impact of final or proposed rules, standards or interpretations by the SEC, FASB, or other regulatory or standard-setting bodies (Note: Under SEC rules, some consultations may be considered “audit services” rather than “audit-related services”) | up to $25,000 in the aggregate |
| Tax Services | |
| U.S. federal, state and local and international tax planning and advice (e.g., consulting on statutory, regulatory or administrative developments, evaluation of Funds’ tax compliance function, etc.) | up to $25,000 in the aggregate |
| U.S. federal, state and local tax compliance (e.g., excise distribution reviews, etc.) | up to $5,000 per Fund |
| Review of federal, state, local and international income, franchise and other tax returns | up to $5,000 per Fund |
Under the Pre-Approval Policy, the Audit Committee has also pre-approved the services set forth in the table below with respect to the registrant’s investment adviser and other entities controlling, controlled by or under common control with the investment adviser that provide ongoing services to the registrant (the “Control Affiliates”) up to the specified fee limit. This fee limit is based on aggregate fees to the investment adviser and its Control Affiliates.
| Service | Range of Fees |
| Non-Audit Services | |
| Services associated with periodic reports and other documents filed with the SEC and assistance in responding to SEC comment letters | up to $10,000 in the aggregate |
The Pre-Approval Policy requires the registrant’s independent auditors to report to the Audit Committee at each of its regular meetings regarding all services initiated since the last such report was rendered, including those services authorized by the Pre-Approval Policy.
(f) Not applicable.
(g) The aggregate non-audit fees billed by the registrant’s independent auditors for services rendered to the registrant and to its investment adviser and other service providers under common control with the adviser were $5,607,000 and $9,955,000 for the registrant’s fiscal years ended July 31, 2020 and July 31, 2029, respectively.
(h) In connection with its selection of the independent auditors, the registrant’s Audit Committee has considered the independent auditors’ provision of non-audit services to the registrant’s investment adviser and other service providers under common control with the adviser that were not required to be pre-approved pursuant to Rule 2-01(c)(7)(ii) of Regulation S-X. The Audit Committee has determined that the independent auditors’ provision of these services is compatible with maintaining the auditors’ independence.
Item 5. Audit Committee of Listed Registrants
Not applicable.
Item 6. Investments
(a) Included as part of report to shareholders filed under Item 1 of this Form N-CSR.
(b) Divestment of securities in accordance with Section 13(c) of the Investment Company Act of 1940.
Not applicable.
Item 7. Disclosure of Proxy Voting Policies and Procedures for Closed-End Management Investment Companies
Not applicable.
Item 8. Portfolio Managers of Closed-End Management Investment Companies
Not applicable.
Item 9. Purchases of Equity Securities by Closed-End Management Investment Companies and Affiliated Purchasers
Not applicable.
Item 10. Submission of Matters to a Vote of Security Holders
Not applicable.
Item 11. Controls and Procedures
The registrant’s principal executive officer and principal financial officer have evaluated the registrant’s disclosure controls and procedures within 90 days of the filing of this report and have concluded that they are effective in providing reasonable assurance that the information required to be disclosed by the registrant in its reports or statements filed under the Securities Exchange Act of 1934 is recorded, processed, summarized and reported within the time periods specified in the rules and forms of the Securities and Exchange Commission.
There were no significant changes in the registrant’s internal control over financial reporting that occurred during the period covered by the report to stockholders included herein that have materially affected, or are reasonably likely to materially affect, the registrant’s internal control over financial reporting.
Item 12. Disclosure of Securities Lending Activities for Closed-End Management Investment Companies
Not applicable.
Item 13. Exhibits
(a) (1) Code of Ethics
Not applicable.
(2) Certifications of Principal Executive Officer and Principal Financial Officer pursuant to Rule 30a-2 under the Investment Company Act of 1940 are attached hereto as Exhibit 99.CERT.
(3) Written solicitations to purchase securities pursuant to Rule 23c-1 under the Securities Exchange Act of 1934.
Not applicable.
(b) Certifications pursuant to Section 906 of the Sarbanes-Oxley Act of 2002 are furnished herewith as Exhibit 99.906CERT.
SIGNATURES
Pursuant to the requirements of the Securities Exchange Act of 1934 and the Investment Company Act of 1940, the registrant has duly caused this report to be signed on its behalf, by the undersigned, thereunto duly authorized.
DELAWARE GROUP® GOVERNMENT FUND
| /s/ SHAWN K. LYTLE |
| By: | Shawn K. Lytle |
| Title: | President and Chief Executive Officer |
| Date: | October 6, 2020 |
Pursuant to the requirements of the Securities Exchange Act of 1934 and the Investment Company Act of 1940, this report has been signed below by the following persons on behalf of the registrant and in the capacities and on the dates indicated.
| /s/ SHAWN K. LYTLE |
| By: | Shawn K. Lytle |
| Title: | President and Chief Executive Officer |
| Date: | October 6, 2020 |
| |
| /s/ RICHARD SALUS |
| By: | Richard Salus |
| Title: | Chief Financial Officer |
| Date: | October 6, 2020 |