UNITED STATES SECURITIES AND EXCHANGE COMMISSION
Washington, D.C. 20549
FORM N-CSR
CERTIFIED SHAREHOLDER REPORT OF REGISTERED MANAGEMENT
INVESTMENT COMPANIES
| Investment Company Act file number: | 811-04304 |
| | |
| Exact name of registrant as specified in charter: | Delaware Group® Government Fund |
| | |
| Address of principal executive offices: | 610 Market Street Philadelphia, PA 19106 |
| | |
| Name and address of agent for service: | David F. Connor, Esq. 610 Market Street Philadelphia, PA 19106 |
| | |
| Registrant’s telephone number, including area code: | (800) 523-1918 |
| | |
| Date of fiscal year end: | July 31 |
| | |
| Date of reporting period: | July 31, 2023 |
Item 1. Reports to Stockholders
Annual report
Fixed income mutual fund
Delaware Strategic Income Fund
July 31, 2023
Carefully consider the Fund's investment objectives, risk factors, charges, and expenses before investing. This and other information can be found in the Fund's prospectus and its summary prospectus, which may be obtained by visiting delawarefunds.com/literature or calling 800 523-1918. Investors should read the prospectus and the summary prospectus carefully before investing.
You can obtain shareholder reports and prospectuses online instead of in the mail.
Visit delawarefunds.com/edelivery.
Experience Delaware Funds by Macquarie®
Macquarie Asset Management (MAM) is a global asset manager that aims to deliver positive impact for everyone. MAM Public Investments traces its roots to 1929 and partners with institutional and individual clients to deliver specialist active investment capabilities across global equities, fixed income, and multi-asset solutions using a conviction-based, long-term approach to investing. In the US, retail investors recognize our Delaware Funds by Macquarie family of funds as one of the oldest mutual fund families.
If you are interested in learning more about creating an investment plan, contact your financial advisor.
You can learn more about Delaware Funds or obtain a prospectus for Delaware Strategic Income Fund at delawarefunds.com/literature.
Manage your account online
| • | Check your account balance and transactions |
| • | View statements and tax forms |
| • | Make purchases and redemptions |
Visit delawarefunds.com/account-access.
Macquarie Asset Management (MAM) is the asset management division of Macquarie Group. MAM is a full-service asset manager offering a diverse range of products across public and private markets including fixed income, equities, multi-asset solutions, private credit, infrastructure, renewables, natural assets, real estate, and asset finance. The Public Investments business is a part of MAM and includes the following investment advisers: Macquarie Investment Management Business Trust (MIMBT), Macquarie Investment Management Austria Kapitalanlage AG, Macquarie Investment Management Global Limited, Macquarie Investment Management Europe Limited, and Macquarie Investment Management Europe S.A.
The Fund is distributed by Delaware Distributors, L.P. (DDLP), an affiliate of MIMBT and Macquarie Group Limited.
Other than Macquarie Bank Limited ABN 46 008 583 542 ("Macquarie Bank"), any Macquarie Group entity noted in this document is not an authorized deposit-taking institution for the purposes of the Banking Act 1959 (Commonwealth of Australia). The obligations of these other Macquarie Group entities do not represent deposits or other liabilities of Macquarie Bank. Macquarie Bank does not guarantee or otherwise provide assurance in respect of the obligations of these other Macquarie Group entities. In addition, if this document relates to an investment, (a) the investor is subject to investment risk including possible delays in repayment and loss of income and principal invested and (b) none of Macquarie Bank or any other Macquarie Group entity guarantees any particular rate of return on or the performance of the investment, nor do they guarantee repayment of capital in respect of the investment.
The Fund is governed by US laws and regulations.
This annual report is for the information of Delaware Strategic Income Fund shareholders, but it may be used with prospective investors when preceded or accompanied by the Delaware Fund fact sheet for the most recently completed calendar quarter. These documents are available at delawarefunds.com/literature.
Unless otherwise noted, views expressed herein are current as of July 31,2023, and subject to change for events occurring after such date.
The Fund is not FDIC insured and is not guaranteed. It is possible to lose the principal amount invested.
Advisory services provided by Delaware Management Company, a series of MIMBT, a US registered investment advisor.
All third-party marks cited are the property of their respective owners.
© 2023 Macquarie Management Holdings, Inc.
Portfolio management review
| Delaware Strategic Income Fund | July 31, 2023 (Unaudited) |
| Performance preview (for the year ended July 31, 2023) | | |
| Delaware Strategic Income Fund (Institutional Class shares) | 1-year return | +4.26% |
| Delaware Strategic Income Fund (Class A shares) | 1-year return | +4.00% |
| Bloomberg US Aggregate Index (benchmark) | 1-year return | -3.37% |
Past performance does not guarantee future results.
For complete, annualized performance for Delaware Strategic Income Fund, please see the table on page 5. Institutional Class shares are not subject to a sales charge and are offered for sale exclusively to certain eligible investors. In addition, Institutional Class shares pay no distribution and service fee.
The performance of Class A shares excludes the applicable sales charge. The performance of both Institutional Class shares and Class A shares reflects the reinvestment of all distributions.
Please see page 8 for a description of the index. Index performance returns do not reflect any management fees, transaction costs, or expenses. Indices are unmanaged and one cannot invest directly in an index.
Investment objective
The Fund seeks high current income and, secondarily, long-term total return.
Market review
The fiscal year ended July 31, 2023, experienced several critical geopolitical, monetary policy, financial, and economic events. The year started with US inflation well above the Federal Reserve's target, as residual stimulus from the pandemic continued to support consumer spending despite corporations' pricing power.
The idea that inflation would be transitory was tested during the year, as the Fed continued to raise short-term rates, reaching the highest level in 22 years. The debate shifted from inflation to recession as the months passed and concerns mounted that the Fed would tighten monetary policy too much. Early in the fiscal year, economists predicted that the steep climb in short-term rates would lead to economic contraction. This appeared to be supported by the yield curve inversion, in which the US Treasury 10-year to 3-month yield spread slipped into negative territory in fall 2022.
| Allocations to high yield, emerging markets debt, non-agency mortgage-backed securities (MBS), and bank loans, as well as favorable yield-curve management, drove performance for the fiscal year. An underweight to investment grade corporates and an overweight to commercial mortgage-backed securities (CMBS) detracted from performance. |
Portfolio management review
Delaware Strategic Income Fund
However, at fiscal year end, inflation as measured by the US Consumer Price Index (CPI) had dropped to 3.2% from a high of 9.1% a year earlier. Investors noted the improvement and began to use terms like “immaculate disinflation” or “no landing,” implying that the Fed had successfully transitioned inflation from near-double-digit annual increases to a level that would indicate the tightening cycle was nearing completion without tipping the economy into a recession.
In March, Silicon Valley Bank, a little-known regional bank with an idiosyncratic depositor base and long history of high-quality lending, succumbed to depositor panic and was taken into receivership by the Federal Deposit Insurance Corporation (FDIC). The event spooked depositors and markets, opening the door to the possibility of a run on banks. At record speed, the Fed put into place a lending facility for US banks to borrow against Treasury and agency mortgage-backed securities (MBS) at par, effectively insuring deposits. Additionally, in Europe, the Swiss regulator engineered an arrangement between UBS and Credit Suisse to prevent a confidence crisis at Credit Suisse from becoming a systemic issue.
Despite the temporary market disruption, central banks remained focused on fighting inflation. Markets seemed willing to accept that the worst had been averted, as interest rate volatility retreated from the highs observed during March and credit markets again began to outperform high-quality assets such as Treasurys. Higher yields were viewed as an opportunity for many fixed income investors and may have provided important technical support at a time when most central banks in the developed world were raising short-term rates. Indeed, despite the Silicon Valley Bank default and broader banking sector concerns, credit premiums have yet to match the highs seen during other stress periods. Looking forward, we think the silver lining for fixed income investors may be in the higher yields that can potentially offer an income buffer to further price volatility.
Within the Fund
For the fiscal year ended July 31, 2023, Delaware Strategic Income Fund posted a positive return and outperformed its benchmark, the Bloomberg US Aggregate Index. The Fund's Institutional Class shares gained 4.26%. The Fund's Class A shares advanced 4.00% at net asset value and declined 0.71% at maximum offer price. These figures reflect all distributions reinvested. For the same period, the Fund's benchmark fell 3.37%. For complete, annualized performance of Delaware Strategic Income Fund, please see the table on page 5.
Allocations to high yield corporates, emerging markets debt, non-agency MBS, and bank loans, as well as favorable yield-curve management, drove outperformance for the fiscal year. An underweight to investment grade corporates and an overweight to commercial mortgage-backed securities (CMBS) detracted from performance.
The Fund's position in cruise ship operator Carnival Corp. senior unsecured bonds performed well, aided by favorable booking activity following the COVID-19 slowdown and the return to free-cash-flow generation. Additional exposure to the cruise line industry, including Royal Caribbean Cruises Ltd., was also beneficial. Exposure to subordinated levels of the capital structure of SVB Financial Group, which filed for bankruptcy in March, offset some of this performance. The Fund's exposure to pharmaceutical company Bausch Health Companies Inc. and wireless provider
Altice France SA weighed on performance. These securities remain in the portfolio.
A meaningful allocation to Brazilian and Mexican emerging market corporates proved beneficial. Alsea SAB de CV, an operator of various restaurant segments in Latin America, as well as bank operator Banco Mercantil del Norte SA contributed to performance and remain in the Fund's portfolio. Exposure to CIFI Holdings Group Co. Ltd., a real estate development company in China, somewhat offset this as the bond performed poorly. We sold the position during the fiscal year.
Structured credit plays an important role in the Fund throughout the market cycle, and this fiscal year was no exception. The Fund carried an overweight to non-agency MBS, asset-backed securities (ABS), and CMBS. Exposure to credit risk transfer (CRT) notes, which structure mortgage credit risk into securities, thereby shifting risk from government sponsored entities to private capital, contributed to performance. The allocation to CMBS and security selection within ABS slightly detracted from performance. A meaningful underweight to agency mortgage-backed securities aided performance as the sector underperformed.
The Fund had lower interest rate sensitivity than the benchmark for the entire fiscal year. This benefited overall performance when rates moved meaningfully higher. As overall rates advanced, we increased the Fund's duration but remained shorter than the benchmark, in adherence with the Fund's investment style.
During the fiscal year, we reduced the Fund's exposure to credit markets on concerns about rising market volatility and relatively low risk premiums, given the uncertain economic backdrop. We decreased the Fund's exposure to high yield corporates and bank loans by about 3 percentage points each and lowered the emerging markets allocation by approximately 10 percentage points over the 12-month period. We used the proceeds from the sales primarily to increase the higher-quality, more liquid portion of the Fund by investing in US Treasurys.
Key risks and opportunities
We think investors face complex considerations going forward, from the remaining stress on smaller regional banks to pressure in commercial real estate markets, the possibility of lingering inflation, and the risk of recession. However, we suggest the landscape may be simplified to something more straightforward: Although many believe the Fed has successfully brought down inflation without pushing real growth into negative territory, our base case remains that the economy may experience a shallow recession. As we transition away from near-double-digit inflation to slowing growth, we believe there are relatively simple implications to be considered.
First, with yields returning to where they were before quantitative easing (QE) monetary policy took hold, bonds seem to be acting like bonds again, featuring historically compelling yields and a return to their inverse correlation with equities.
Second, history suggests it may be better to be early than late at turning points in tightening cycles, as yield curve inversions and rising recession risks mean the outlook for longer-term interest rates is quite bright, in our view.
Lastly, transitions don't usually go smoothly. In our opinion, volatility is likely to remain high; credit spreads, while more attractive than before the tightening cycle, may need to increase further as recession risks take center
Portfolio management review
Delaware Strategic Income Fund
stage; and market movements may happen rapidly.
We think this is a compelling time for agile active management and bottom-up (bond by bond) security selection as dispersion (the gap between the best- and worst-performing assets) increases. We believe value has emerged in certain areas of the market, such as agency MBS. Meanwhile the high-income feature of credit and emerging markets debt, coupled with volatility, may create opportunities down the road. Bonds are bonds again, in our view, and we believe exposure to the asset class is as attractive as we've seen in decades. We believe agility and security selection will remain key to navigating the uncertainty.
During the fiscal year, the Fund used a variety of derivatives, including futures to manage interest rate risk, swaps and swaptions to adjust the Fund's overall exposure to certain markets, and currency forwards to increase or decrease exposure to foreign currencies. The use of derivatives detracted modestly from the Fund's performance for the fiscal year.
Performance summary
| Delaware Strategic Income Fund | July 31, 2023 (Unaudited) |
The performance quoted represents past performance and does not guarantee future results. Investment return and principal value of an investment will fluctuate so that shares, when redeemed, may be worth more or less than their original cost. Current performance may be lower or higher than the performance quoted. Performance data current to the most recent month end may be obtained by calling 800 523-1918 or visiting delawarefunds.com/performance.
| Fund and benchmark performance1,2 | Average annual total returns through July 31, 2023 |
| | 1 year | 5 year | 10 year |
| Class A (Est. August 16, 1985) | | | |
| Excluding sales charge | +4.00% | +2.38% | +2.43% |
| Including sales charge | -0.71% | +1.43% | +1.96% |
| Class C (Est. November 29, 1995) | | | |
| Excluding sales charge | +3.08% | +1.56% | +1.64% |
| Including sales charge | +2.09% | +1.56% | +1.64% |
| Class R (Est. June 2, 2003) | | | |
| Excluding sales charge | +3.74% | +2.10% | +2.15% |
| Including sales charge | +3.74% | +2.10% | +2.15% |
| Institutional Class (Est. June 1, 1992) | | | |
| Excluding sales charge | +4.26% | +2.61% | +2.67% |
| Including sales charge | +4.26% | +2.61% | +2.67% |
| Bloomberg US Aggregate Index | -3.37% | +0.75% | +1.50% |
1Returns reflect the reinvestment of all distributions and are presented both with and without the applicable sales charges described below. Returns do not reflect the deduction of taxes the shareholder would pay on Fund distributions or redemptions of Fund shares.
Expense limitations were in effect for certain classes during some or all of the periods shown in the “Fund and benchmark performance” table. Expenses for each class are listed in the “Fund expense ratios” table on page 7. Performance would have been lower had expense limitations not been in effect.
Class A shares are sold with a maximum front-end sales charge of 4.50%, and have an annual distribution and service (12b-1) fee of 0.25% of average daily net assets. The Board has adopted a formula for calculating 12b-1 plan fees for the Fund's Class A shares. The Fund's Class A shares are currently subject to a blended 12b-1 fee equal to the sum of: (i) 0.10% of average daily net assets representing shares acquired prior to June 1, 1992, and (ii) 0.25% of average daily net assets representing shares acquired on or after June 1, 1992. All Class A shares currently bear 12b-1 fees at the blended rate, which is currently 0.25% of average daily net assets, based on the formula described previously. This method of calculating Class A 12b-1 fees may be discontinued at the sole discretion of the Board. Performance for Class A shares, excluding sales charges, assumes that no front-end sales charge applied.
Class C shares are sold with a contingent deferred sales charge (CDSC) of 1.00% if
Performance summary
Delaware Strategic Income Fund
redeemed during the first 12 months. They are also subject to an annual 12b-1 fee of 1.00% of average daily net assets. Performance for Class C shares, excluding sales charges, assumes either that CDSCs did not apply or that the investment was not redeemed.
Class R shares are available only for certain retirement plan products. They are sold without a sales charge and have an annual 12b-1 fee of 0.50% of average daily net assets.
Institutional Class shares are not subject to a sales charge and are offered for sale exclusively to certain eligible investors. In addition, Institutional Class shares pay no 12b-1 fee.
Fixed income securities and bond funds can lose value, and investors can lose principal, as interest rates rise. They also may be affected by economic conditions that hinder an issuer's ability to make interest and principal payments on its debt. This includes prepayment risk, the risk that the principal of a bond that is held by a portfolio will be prepaid prior to maturity, at the time when interest rates are lower than what the bond was paying. A portfolio may then have to reinvest that money at a lower interest rate.
High yielding, non-investment-grade bonds (junk bonds) involve higher risk than investment grade bonds. The high yield secondary market is particularly susceptible to liquidity problems when institutional investors, such as mutual funds and certain other financial institutions, temporarily stop buying bonds for regulatory, financial, or other reasons. In addition, a less liquid secondary market makes it more difficult to obtain precise valuations of the high yield securities.
The Fund may invest in derivatives, which may involve additional expenses and are subject to risk, including the risk that an underlying security or securities index moves in the opposite direction from what the portfolio manager anticipated. A derivatives transaction depends upon the counterparties' ability to fulfill their contractual obligations.
If and when the Fund invests in forward foreign currency contracts or uses other investments to hedge against currency risks, the Fund will be subject to special risks, including counterparty risk.
The Fund may experience portfolio turnover in excess of 100%, which could result in higher transaction costs and tax liability.
International investments entail risks including fluctuation in currency values, differences in accounting principles, or economic or political instability. Investing in emerging markets can be riskier than investing in established foreign markets due to increased volatility, lower trading volume, and higher risk of market closures. In many emerging markets, there is substantially less publicly available information and the available information may be incomplete or misleading. Legal claims are generally more difficult to pursue.
IBOR risk is the risk that changes related to the use of the London interbank offered rate (LIBOR) or similar rates (such as EONIA) could have adverse impacts on financial instruments that reference these rates. The potential abandonment of these rates and transition to alternative rates could affect the value and liquidity of instruments that reference them and could affect investment strategy performance.
This document may mention bond ratings published by nationally recognized statistical rating organizations (NRSROs) Standard & Poor's, Moody's Investors Service, and Fitch, Inc. For securities rated by an NRSRO other than S&P, the rating is converted to the equivalent S&P credit rating. Bonds rated AAA
are rated as having the highest quality and are generally considered to have the lowest degree of investment risk. Bonds rated AA are considered to be of high quality, but with a slightly higher degree of risk than bonds rated AAA. Bonds rated A are considered to have many favorable investment qualities, though they are somewhat more susceptible to adverse economic conditions. Bonds rated BBB are believed to be of medium-grade quality and generally riskier over the long term. Bonds rated BB, B, and CCC are regarded as having significant speculative characteristics, with BB indicating the least degree of speculation of the three.
The disruptions caused by natural disasters, pandemics, or similar events could prevent the Fund from executing advantageous investment decisions in a timely manner and could negatively impact the Fund's ability to achieve its investment objective and the value of the Fund's investments.
2The Fund's expense ratios, as described in the most recent prospectus, are disclosed in the following “Fund expense ratios” table. The expense ratios below may differ from the expense ratios in the “Financial highlights” since they are based on different time periods and the expense ratios in the prospectus include acquired fund fees and expenses, if any. See Note 2 in “Notes to financial statements” for additional details. Please see the “Financial highlights” section in this report for the most recent expense ratios.
| Fund expense ratios | Class A | Class C | Class R | Institutional Class |
| Total annual operating expenses (without fee waivers) | 1.24% | 1.99% | 1.49% | 0.99% |
| Net expenses (including fee waivers, if any) | 0.84% | 1.59% | 1.09% | 0.59% |
| Type of waiver | Contractual | Contractual | Contractual | Contractual |
Performance summary
Delaware Strategic Income Fund
Performance of a $10,000 investment1
For the period July 31, 2013 through July 31, 2023
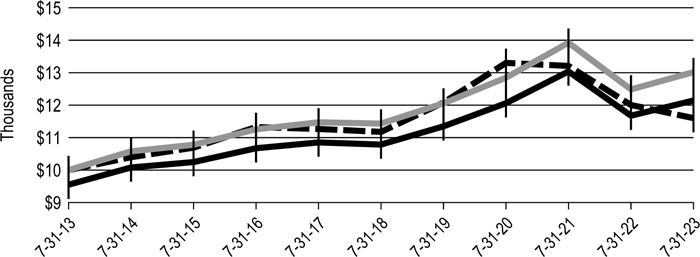
| | | Starting value | Ending value |
 | Delaware Strategic Income Fund – Institutional Class shares | $10,000 | $13,017 |
 | Delaware Strategic Income Fund – Class A shares | $9,550 | $12,143 |
 | Bloomberg US Aggregate Index | $10,000 | $11,601 |
1The “Performance of a $10,000 investment” graph assumes $10,000 invested in Institutional Class and Class A shares of the Fund on July 31, 2013, and includes the effect of a 4.50% front-end sales charge (for Class A shares) and the reinvestment of all distributions. The graph does not reflect the deduction of taxes the shareholders would pay on Fund distributions or redemptions of Fund shares. Expense limitations were in effect for some or all of the periods shown. Performance would have been lower had expense limitations not been in effect. Expenses are listed in the “Fund expense ratios” table on page 7. Please note additional details on pages 5 through 9.
The graph also assumes $10,000 invested in the Bloomberg US Aggregate Index as of July 31, 2013. The Bloomberg US Aggregate Index is a broad-based benchmark that measures the investment grade, US dollar-denominated, fixed-rate taxable bond market.
The US Consumer Price Index (CPI), mentioned on pages 1-2, is a measure of inflation that is calculated by the US Department of Labor, representing changes in prices of all goods and services purchased for consumption by urban households.
Index performance returns do not reflect any management fees, transaction costs, or expenses. Indices are unmanaged and one cannot invest directly in an index. Past performance does not guarantee future results.
Performance of other Fund classes will vary due to different charges and expenses.
| | Nasdaq symbols | CUSIPs |
| Class A | DEGGX | 246094205 |
| Class C | DUGCX | 246094700 |
| Class R | DUGRX | 246094809 |
| Institutional Class | DUGIX | 246094502 |
Disclosure of Fund expenses
For the six-month period from February 1, 2023 to July 31, 2023 (Unaudited)
As a shareholder of the Fund, you incur two types of costs: (1) transaction costs, including sales charges (loads) on purchase payments, reinvested dividends, or other distributions; redemption fees; and exchange fees; and (2) ongoing costs, including management fees; distribution and service (12b-1) fees; and other Fund expenses. This example is intended to help you understand your ongoing costs (in dollars) of investing in the Fund and to compare these costs with the ongoing costs of investing in other mutual funds.
The example is based on an investment of $1,000 invested at the beginning of the period and held for the entire six-month period from February 1, 2023 to July 31, 2023.
Actual expenses
The first section of the table shown, “Actual Fund return,” provides information about actual account values and actual expenses. You may use the information in this section of the table, together with the amount you invested, to estimate the expenses that you paid over the period. Simply divide your account value by $1,000 (for example, an $8,600 account value divided by $1,000 = 8.6), then multiply the result by the number in the first section under the heading entitled “Expenses Paid During Period” to estimate the expenses you paid on your account during this period.
Hypothetical example for comparison purposes
The second section of the table shown, “Hypothetical 5% return,” provides information about hypothetical account values and hypothetical expenses based on the Fund's actual expense ratio and an assumed rate of return of 5% per year before expenses, which is not the Fund's actual return. The hypothetical account values and expenses may not be used to estimate the actual ending account balance or expenses you paid for the period. You may use this information to compare the ongoing costs of investing in the Fund and other funds. To do so, compare this 5% hypothetical example with the 5% hypothetical examples that appear in the shareholder reports of the other funds.
Please note that the expenses shown in the table are meant to highlight your ongoing costs only and do not reflect any transactional costs, such as sales charges (loads), redemption fees, or exchange fees. Therefore, the second section of the table is useful in comparing ongoing costs only, and will not help you determine the relative total costs of owning different funds. In addition, if these transactional costs were included, your costs would have been higher. The Fund's expenses shown in the table reflect fee waivers in effect and assume reinvestment of all dividends and distributions.
Delaware Strategic Income Fund
Expense analysis of an investment of $1,000
| | | Beginning
Account Value
2/1/23 | | Ending
Account Value
7/31/23 | | Annualized
Expense Ratio | | Expenses
Paid During Period
2/1/23 to 7/31/23* |
| Actual Fund return† | | | | | | | | | | | | | | |
| Class A | | $ | 1,000.00 | | | $ | 1,012.40 | | | 0.84% | | $ | 4.19 | |
| Class C | | | 1,000.00 | | | | 1,007.30 | | | 1.59% | | | 7.91 | |
| Class R | | | 1,000.00 | | | | 1,009.90 | | | 1.09% | | | 5.43 | |
| Institutional Class | | | 1,000.00 | | | | 1,013.70 | | | 0.59% | | | 2.95 | |
| Hypothetical 5% return (5% return before expenses) | | | | | | |
| Class A | | $ | 1,000.00 | | | $ | 1,020.63 | | | 0.84% | | $ | 4.21 | |
| Class C | | | 1,000.00 | | | | 1,016.91 | | | 1.59% | | | 7.95 | |
| Class R | | | 1,000.00 | | | | 1,019.39 | | | 1.09% | | | 5.46 | |
| Institutional Class | | | 1,000.00 | | | | 1,021.87 | | | 0.59% | | | 2.96 | |
*“Expenses Paid During Period” are equal to the Fund's annualized expense ratio, multiplied by the average account value over the period, multiplied by 181/365 (to reflect the one-half year period).
†Because actual returns reflect only the most recent six-month period, the returns shown may differ significantly from fiscal year returns.
In addition to the Fund's expenses reflected above, the Fund also indirectly bears its portion of the fees and expenses of any investment companies (Underlying Funds), in which it invests. The table above does not reflect the expenses of any Underlying Funds.
Security type / sector allocations
| Delaware Strategic Income Fund | As of July 31, 2023 (Unaudited) |
Sector designations may be different from the sector designations presented in other Fund materials. The sector designations may represent the investment manager's internal sector classifications, which may result in the sector designations for one fund being different from another fund's sector designations.
| Security type / sector | Percentage of net assets |
| Agency Collateralized Mortgage Obligations | 7.52% | |
| Agency Commercial Mortgage-Backed Securities | 1.82% | |
| Agency Mortgage-Backed Securities | 4.84% | |
| Convertible Bonds | 1.92% | |
| Corporate Bonds | 38.96% | |
| Banking | 3.59% | |
| Basic Industry | 2.72% | |
| Brokerage | 0.72% | |
| Capital Goods | 3.59% | |
| Communications | 6.47% | |
| Consumer Cyclical | 3.49% | |
| Consumer Non-Cyclical | 3.37% | |
| Electric | 1.44% | |
| Energy | 5.05% | |
| Finance Companies | 1.09% | |
| Government Agency | 2.22% | |
| Insurance | 0.26% | |
| Natural Gas | 0.51% | |
| Technology | 1.47% | |
| Transportation | 2.41% | |
| Utilities | 0.56% | |
| Municipal Bonds | 0.93% | |
| Non-Agency Asset-Backed Securities | 5.60% | |
| Non-Agency Collateralized Mortgage Obligations | 5.59% | |
| Non-Agency Commercial Mortgage-Backed Securities | 3.17% | |
| Loan Agreements | 2.93% | |
| Sovereign Bonds | 3.77% | |
| US Treasury Obligations | 19.50% | |
| Common Stock | 0.76% | |
| Short-Term Investments | 1.71% | |
| Total Value of Securities | 99.02% | |
| Receivables and Other Assets Net of Liabilities | 0.98% | |
| Total Net Assets | 100.00% | |
Schedule of investments
| Delaware Strategic Income Fund | July 31, 2023 |
| | | Principal
amount° | | | Value (US $) | |
| Agency Collateralized Mortgage Obligations — 7.52% | | | | | | |
| Freddie Mac Structured Agency Credit Risk REMIC Trust | | | | | | | | |
| Series 2020-HQA2 M2 144A 8.283% (SOFR + 3.21%) 3/25/50 #, • | | | 1,097,554 | | | $ | 1,124,871 | |
| Series 2021-DNA1 M2 144A 6.869% (SOFR + 1.80%) 1/25/51 #, • | | | 1,103,840 | | | | 1,105,712 | |
| Series 2021-DNA3 M2 144A 7.169% (SOFR+ 2.10%) 10/25/33 #, • | | | 1,350,000 | | | | 1,339,457 | |
| Series 2021-HQA1 M2 144A 7.319% (SOFR + 2.25%) 8/25/33 #, • | | | 1,891,441 | | | | 1,884,799 | |
| Series 2021-HQA2 M2 144A 7.119% (SOFR + 2.05%) 12/25/33 #, • | | | 2,000,000 | | | | 1,967,540 | |
| Total Agency Collateralized Mortgage Obligations (cost $7,436,770) | | | | | | | 7,422,379 | |
| | | | | | | | | |
| Agency Commercial Mortgage-Backed Securities — 1.82% | | | | | | | | |
| FREMF Mortgage Trust | | | | | | | | |
| Series 2017-K66 B 144A 4.038% 7/25/27 #, • | | | 325,000 | | | | 303,869 | |
| Series 2017-K71 B 144A 3.752% 11/25/50 #, • | | | 325,000 | | | | 298,774 | |
| Series 2018-K72 B 144A 3.994% 12/25/50 #, • | | | 325,000 | | | | 302,610 | |
| Series 2018-K86 C 144A 4.294% 11/25/51 #, • | | | 970,000 | | | | 893,647 | |
| Total Agency Commercial Mortgage-Backed Securities (cost $2,140,546) | | | | | | | 1,798,900 | |
| | | | | | | | | |
| Agency Mortgage-Backed Securities — 4.84% | | | | | | | | |
| Fannie Mae S.F. 30 yr | | | | | | | | |
| 4.50% 2/1/53 | | | 787,948 | | | | 754,333 | |
| 5.00% 9/1/52 | | | 879,657 | | | | 859,246 | |
| 5.50% 10/1/52 | | | 835,590 | | | | 832,578 | |
| 5.50% 7/1/53 | | | 755,916 | | | | 750,695 | |
| 6.00% 12/1/52 | | | 407,114 | | | | 410,327 | |
| Freddie Mac S.F. 15 yr | | | | | | | | |
| 5.00% 6/1/38 | | | 430,198 | | | | 427,152 | |
| Freddie Mac S.F. 20 yr | | | | | | | | |
| 5.50% 6/1/43 | | | 442,304 | | | | 441,977 | |
| Freddie Mac S.F. 30 yr | | | | | | | | |
| 5.00% 6/1/53 | | | 304,637 | | | | 298,391 | |
| Total Agency Mortgage-Backed Securities (cost $4,797,718) | | | | | | | 4,774,699 | |
Schedule of investments
Delaware Strategic Income Fund
| | | Principal
amount° | | | Value (US $) | |
| Convertible Bonds — 1.92% | | | | | | | | |
| Helix Energy Solutions Group 6.75% exercise price $6.97, maturity date 2/15/26 | | | 290,000 | | | $ | 446,310 | |
| Kaman 3.25% exercise price $65.26, maturity date 5/1/24 | | | 1,124,000 | | | | 1,085,784 | |
| Spirit Airlines 1.00% exercise price $42.10, maturity date 5/15/26 | | | 404,000 | | | | 357,615 | |
| Total Convertible Bonds (cost $1,728,092) | | | | | | | 1,889,709 | |
| | | | | | | | | |
| Corporate Bonds — 38.96% | | | | | | | | |
| Banking — 3.59% | | | | | | | | |
| Access Bank 144A 6.125% 9/21/26 # | | | 600,000 | | | | 525,030 | |
| Banco Mercantil del Norte 144A 8.375% | | | | | | | | |
| 10/14/30 #, m, ψ | | | 500,000 | | | | 490,530 | |
| Bank of New York Mellon 4.70% 9/20/25 m, ψ | | | 47,000 | | | | 46,003 | |
| Deutsche Bank | | | | | | | | |
| 5.625% 5/19/31 m | EUR | | 200,000 | | | | 214,998 | |
| 6.72% 1/18/29 m | | | 150,000 | | | | 152,861 | |
| 7.146% 7/13/27 m | | | 150,000 | | | | 153,061 | |
| Huntington National Bank 4.552% 5/17/28 m | | | 775,000 | | | | 736,599 | |
| KeyBank 4.15% 8/8/25 | | | 770,000 | | | | 737,184 | |
| Popular 7.25% 3/13/28 | | | 255,000 | | | | 257,808 | |
| SVB Financial Group | | | | | | | | |
| 4.00% 5/15/26 m, ‡, ψ | | | 385,000 | | | | 26,089 | |
| 4.57% 4/29/33 m, ‡ | | | 71,000 | | | | 47,690 | |
| Truist Financial 4.95% 9/1/25 m, ψ | | | 165,000 | | | | 156,040 | |
| | | | | | | | 3,543,893 | |
| Basic Industry — 2.72% | | | | | | | | |
| CSN Resources 144A 5.875% 4/8/32 # | | | 535,000 | | | | 446,496 | |
| Domtar 144A 6.75% 10/1/28 # | | | 509,000 | | | | 445,070 | |
| First Quantum Minerals 144A 6.875% 10/15/27 # | | | 1,000,000 | | | | 984,510 | |
| Sasol Financing USA | | | | | | | | |
| 6.50% 9/27/28 | | | 440,000 | | | | 407,624 | |
| 144A 8.75% 5/3/29 # | | | 400,000 | | | | 400,449 | |
| | | | | | | | 2,684,149 | |
| Brokerage — 0.72% | | | | | | | | |
| Jefferies Financial Group 6.50% 1/20/43 NFP | | | 245,000 | | | | 244,057 | |
| 144A 6.875% 8/15/28 # | | | 270,000 | | | | 239,296 | |
| 144A 7.50% 10/1/30 # | | | 235,000 | | | | 228,796 | |
| | | | | | | | 712,149 | |
| | | Principal
amount° | | | Value (US $) | |
| Corporate Bonds (continued) | | | | | | | | |
| Capital Goods — 3.59% | | | | | | | | |
| Ardagh Metal Packaging Finance USA 2.00% 9/1/28 | EUR | | 300,000 | | | $ | 278,007 | |
| Cemex 144A 9.125% 3/14/28 #, m, ψ | | | 370,000 | | | | 385,279 | |
| Embraer Netherlands Finance | | | | | | | | |
| 5.40% 2/1/27 | | | 490,000 | | | | 480,852 | |
| 144A 7.00% 7/28/30 # | | | 495,000 | | | | 500,742 | |
| Mauser Packaging Solutions Holding 144A 7.875% 8/15/26 # | | | 460,000 | | | | 459,205 | |
| SAN Miguel Industrias 144A 3.50% 8/2/28 # | | | 640,000 | | | | 547,420 | |
| Standard Industries | | | | | | | | |
| 144A 3.375% 1/15/31 # | | | 159,000 | | | | 128,544 | |
| 144A 4.375% 7/15/30 # | | | 313,000 | | | | 272,053 | |
| Turkiye Sise ve Cam Fabrikalari 144A 6.95% 3/14/26 # | | | 500,000 | | | | 490,880 | |
| | | | | | | | 3,542,982 | |
| Communications — 6.47% | | | | | | | | |
| Altice France 144A 5.50% 10/15/29 # | | | 865,000 | | | | 614,982 | |
| Cellnex Finance 144A 3.875% 7/7/41 # | | | 200,000 | | | | 144,806 | |
| CMG Media 144A 8.875% 12/15/27 # | | | 415,000 | | | | 324,405 | |
| Consolidated Communications | | | | | | | | |
| 144A 5.00% 10/1/28 # | | | 340,000 | | | | 251,865 | |
| 144A 6.50% 10/1/28 # | | | 540,000 | | | | 425,250 | |
| CSC Holdings 144A 5.375% 2/1/28 # | | | 835,000 | | | | 698,255 | |
| Cumulus Media New Holdings 144A 6.75% 7/1/26 # | | | 500,000 | | | | 375,687 | |
| Directv Financing 144A 5.875% 8/15/27 # | | | 530,000 | | | | 478,921 | |
| Discovery Communications 4.00% 9/15/55 | | | 10,000 | | | | 6,635 | |
| DISH DBS 144A 5.75% 12/1/28 # | | | 315,000 | | | | 242,989 | |
| Frontier Communications Holdings 144A 5.875% 10/15/27 # | | | 500,000 | | | | 458,439 | |
| Gray Escrow II 144A 5.375% 11/15/31 # | | | 350,000 | | | | 244,584 | |
| IHS Holding 144A 5.625% 11/29/26 # | | | 400,000 | | | | 350,708 | |
| Prosus 144A 4.193% 1/19/32 # | | | 580,000 | | | | 491,170 | |
| Time Warner Cable 7.30% 7/1/38 | | | 350,000 | | | | 357,110 | |
| Turkcell Iletisim Hizmetleri 144A 5.80% 4/11/28 # | | | 555,000 | | | | 505,534 | |
| Vmed O2 UK Financing I 144A 4.25% 1/31/31 # | | | 400,000 | | | | 331,587 | |
| Warnermedia Holdings 5.141% 3/15/52 | | | 95,000 | | | | 77,271 | |
| | | | | | | | 6,380,198 | |
| Consumer Cyclical — 3.49% | | | | | | | | |
| Alsea 144A 7.75% 12/14/26 # | | | 600,000 | | | | 604,316 | |
| Arcos Dorados 144A 6.125% 5/27/29 # | | | 370,000 | | | | 358,391 | |
| Bath & Body Works 6.875% 11/1/35 | | | 460,000 | | | | 427,332 | |
Schedule of investments
Delaware Strategic Income Fund
| | | Principal
amount° | | | Value (US $) | |
| Corporate Bonds (continued) | | | | | | |
| Consumer Cyclical (continued) | | | | | | | | |
| Carnival | | | | | | | | |
| 144A 5.75% 3/1/27 # | | | 355,000 | | | $ | 328,698 | |
| 144A 7.625% 3/1/26 # | | | 653,000 | | | | 644,782 | |
| Ford Motor Credit 6.95% 6/10/26 | | | 215,000 | | | | 216,913 | |
| PetSmart 144A 7.75% 2/15/29 # | | | 250,000 | | | | 244,090 | |
| Royal Caribbean Cruises 144A 5.50% 4/1/28 # | | | 135,000 | | | | 127,361 | |
| Staples 144A 7.50% 4/15/26 # | | | 510,000 | | | | 421,979 | |
| VICI Properties 4.95% 2/15/30 | | | 75,000 | | | | 71,029 | |
| | | | | | | | 3,444,891 | |
| Consumer Non-Cyclical — 3.37% | | | | | | | | |
| Bausch Health | | | | | | | | |
| 144A 5.50% 11/1/25 # | | | 120,000 | | | | 108,162 | |
| 144A 11.00% 9/30/28 # | | | 173,000 | | | | 127,977 | |
| Central American Bottling 144A 5.25% 4/27/29 # | | | 585,000 | | | | 540,201 | |
| DaVita | | | | | | | | |
| 144A 3.75% 2/15/31 # | | | 250,000 | | | | 200,182 | |
| 144A 4.625% 6/1/30 # | | | 335,000 | | | | 286,158 | |
| InRetail Consumer 144A 3.25% 3/22/28 # | | | 625,000 | | | | 542,197 | |
| JBS USA LUX 144A 3.00% 2/2/29 # | | | 25,000 | | | | 21,455 | |
| MHP Lux 144A 6.25% 9/19/29 # | | | 505,000 | | | | 267,650 | |
| Organon & Co. 144A 5.125% 4/30/31 # | | | 500,000 | | | | 424,309 | |
| Pilgrim's Pride 144A 5.875% 9/30/27 # | | | 121,000 | | | | 119,790 | |
| Tenet Healthcare | | | | | | | | |
| 6.125% 10/1/28 | | | 145,000 | | | | 138,256 | |
| 6.875% 11/15/31 | | | 370,000 | | | | 370,890 | |
| Teva Pharmaceutical Finance Netherlands III 5.125% 5/9/29 | | | 200,000 | | | | 183,434 | |
| | | | | | | | 3,330,661 | |
| Electric — 1.44% | | | | | | | | |
| Calpine | | | | | | | | |
| 144A 5.00% 2/1/31 # | | | 145,000 | | | | 122,182 | |
| 144A 5.125% 3/15/28 # | | | 279,000 | | | | 253,317 | |
| Duke Energy 4.875% 9/16/24 m, ψ | | | 80,000 | | | | 77,968 | |
| NRG Energy 144A 4.45% 6/15/29 # | | | 285,000 | | | | 253,704 | |
| Pacific Gas and Electric 3.30% 8/1/40 | | | 367,000 | | | | 252,764 | |
| Vistra 144A 7.00% 12/15/26 #, m, ψ | | | 520,000 | | | | 463,268 | |
| | | | | | | | 1,423,203 | |
| | | Principal
amount° | | | Value (US $) | |
| Corporate Bonds (continued) | | | | | | | | |
| Energy — 5.05% | | | | | | | | |
| CNX Midstream Partners 144A 4.75% 4/15/30 # | | | 500,000 | | | $ | 433,830 | |
| CNX Resources 144A 6.00% 1/15/29 # | | | 700,000 | | | | 655,356 | |
| Crestwood Midstream Partners 144A 6.00% 2/1/29 # | | | 442,000 | | | | 416,992 | |
| Energean Israel Finance 144A 8.50% 9/30/33 # | | | 550,000 | | | | 551,375 | |
| Energy Transfer 6.50% 11/15/26 m, ψ | | | 485,000 | | | | 440,529 | |
| Genesis Energy 7.75% 2/1/28 | | | 505,000 | | | | 491,587 | |
| Geopark 144A 5.50% 1/17/27 # | | | 620,000 | | | | 533,362 | |
| Guara Norte 144A 5.198% 6/15/34 # | | | 548,241 | | | | 489,716 | |
| PDC Energy 5.75% 5/15/26 | | | 445,000 | | | | 447,937 | |
| Tullow Oil 144A 10.25% 5/15/26 # | | | 640,000 | | | | 521,088 | |
| | | | | | | | 4,981,772 | |
| Finance Companies — 1.09% | | | | | | | | |
| AerCap Ireland Capital DAC | | | | | | | | |
| 2.45% 10/29/26 | | | 150,000 | | | | 135,003 | |
| 3.30% 1/30/32 | | | 150,000 | | | | 123,136 | |
| 3.40% 10/29/33 | | | 150,000 | | | | 120,066 | |
| Castlelake Aviation Finance DAC 144A 5.00% 4/15/27 # | | | 620,000 | | | | 572,583 | |
| RKPF Overseas 2020 5.125% 7/26/26 | | | 300,000 | | | | 122,242 | |
| | | | | | | | 1,073,030 | |
| Government Agency — 2.22% | | | | | | | | |
| Ecopetrol 6.875% 4/29/30 | | | 595,000 | | | | 561,113 | |
| Georgian Railway JSC 4.00% 6/17/28 | | | 355,000 | | | | 309,524 | |
| Oryx Funding 144A 5.80% 2/3/31 # | | | 485,000 | | | | 476,480 | |
| Petroleos Mexicanos 5.95% 1/28/31 | | | 1,135,000 | | | | 843,707 | |
| | | | | | | | 2,190,824 | |
| Insurance — 0.26% | | | | | | | | |
| Brighthouse Financial 4.70% 6/22/47 | | | 112,000 | | | | 86,382 | |
| MetLife 3.85% 9/15/25 m, ψ | | | 185,000 | | | | 173,329 | |
| | | | | | | | 259,711 | |
| Natural Gas — 0.51% | | | | | | | | |
| Medco Laurel Tree 144A 6.95% 11/12/28 # | | | 545,000 | | | | 500,706 | |
| | | | | | | | 500,706 | |
| Technology — 1.47% | | | | | | | | |
| Broadcom 144A 3.469% 4/15/34 # | | | 320,000 | | | | 262,670 | |
| CommScope Technologies 144A 6.00% 6/15/25 # | | | 100,000 | | | | 90,811 | |
| Entegris Escrow 144A 4.75% 4/15/29 # | | | 90,000 | | | | 84,042 | |
Schedule of investments
Delaware Strategic Income Fund
| | | Principal
amount° | | | Value (US $) | |
| Corporate Bonds (continued) | | | | | | | | |
| Technology (continued) | | | | | | | | |
| Iron Mountain | | | | | | | | |
| 144A 5.25% 7/15/30 # | | | 71,000 | | | $ | 64,248 | |
| 144A 5.625% 7/15/32 # | | | 600,000 | | | | 541,097 | |
| Iron Mountain Information Management Services 144A 5.00% 7/15/32 # | | | 230,000 | | | | 199,250 | |
| NCR | | | | | | | | |
| 144A 5.00% 10/1/28 # | | | 105,000 | | | | 95,076 | |
| 144A 5.125% 4/15/29 # | | | 127,000 | | | | 113,684 | |
| | | | | | | | 1,450,878 | |
| Transportation — 2.41% | | | | | | | | |
| Abertis Infraestructuras Finance 3.248% 11/24/25 m, ψ | | EUR | 100,000 | | | | 100,871 | |
| Acu Petroleo Luxembourg 144A 7.50% 7/13/35 # | | | 505,534 | | | | 452,669 | |
| Azul Secured Finance 144A 11.93% 8/28/28 # | | | 435,000 | | | | 438,263 | |
| Grupo Aeromexico 144A 8.50% 3/17/27 # | | | 500,000 | | | | 453,347 | |
| International Consolidated Airlines Group 3.75% 3/25/29 | | EUR | 200,000 | | | | 195,158 | |
| Mileage Plus Holdings 144A 6.50% 6/20/27 # | | | 320,000 | | | | 320,270 | |
| United Airlines 144A 4.625% 4/15/29 # | | | 457,000 | | | | 413,933 | |
| | | | | | | | 2,374,511 | |
| Utilities — 0.56% | | | | | | | | |
| Clean Renewable Power Mauritius 144A 4.25% 3/25/27 # | | | 623,100 | | | | 554,762 | |
| | | | | | | | 554,762 | |
| Total Corporate Bonds (cost $42,133,472) | | | | | | | 38,448,320 | |
| | | | | | | | | |
| Municipal Bonds — 0.93% | | | | | | | | |
| Commonwealth of Puerto Rico (Restructured) | | | | | | | | |
| Series A 2.993% 7/1/24^ | | | 6,064 | | | | 5,825 | |
| Series A-1 4.00% 7/1/35 | | | 27,144 | | | | 25,143 | |
| GDB Debt Recovery Authority of Puerto Rico (Taxable) | | | | | | | | |
| 7.50% 8/20/40 | | | 1,077,403 | | | | 886,164 | |
| Total Municipal Bonds (cost $992,454) | | | | | | | 917,132 | |
| | | | | | | | | |
| Non-Agency Asset-Backed Securities — 5.60% | | | | | | | | |
| Citicorp Residential Mortgage Trust Series 2006-3 A5 4.704% 11/25/36 f | | | 69,294 | | | | 67,841 | |
| DataBank Issuer Series 2021-1A A2 144A 2.06% 2/27/51 # | | | 1,000,000 | | | | 875,610 | |
| | | Principal
amount° | | | Value (US $) | |
| Non-Agency Asset-Backed Securities (continued) | | | | | | | | |
| Diamond Infrastructure Funding Series 2021-1A A 144A 1.76% 4/15/49 # | | | 750,000 | | | $ | 645,838 | |
| Domino's Pizza Master Issuer Series 2021-1A A2I 144A 2.662% 4/25/51 # | | | 439,875 | | | | 371,797 | |
| Hardee's Funding Series 2020-1A A2 144A 3.981% 12/20/50 # | | | 2,145,000 | | | | 1,812,585 | |
| Taco Bell Funding Series 2018-1A A2II 144A 4.94% 11/25/48 # | | | 955,000 | | | | 896,980 | |
| Wendy's Funding Series 2018-1A A2II 144A 3.884% 3/15/48 # | | | 945,000 | | | | 856,340 | |
| Total Non-Agency Asset-Backed Securities (cost $6,049,425) | | | | | | | 5,526,991 | |
| | | | | | | | | |
| Non-Agency Collateralized Mortgage Obligations — 5.59% | | | | | | | | |
| JPMorgan Mortgage Trust Series 2021-13 B1 144A 3.142% 4/25/52 #, • | | | 577,693 | | | | 452,658 | |
| Sequoia Mortgage Trust | | | | | | | | |
| Series 2014-1 B3 144A 3.981% 4/25/44 #, • | | | 675,449 | | | | 611,353 | |
| Series 2017-5 B2 144A 3.779% 8/25/47 #, • | | | 1,651,944 | | | | 1,499,510 | |
| Series 2017-6 B2 144A 3.726% 9/25/47 #, • | | | 1,670,539 | | | | 1,492,674 | |
| Series 2017-7 B2 144A 3.726% 10/25/47 #, • | | | 1,663,174 | | | | 1,459,263 | |
| Total Non-Agency Collateralized Mortgage Obligations (cost $6,469,519) | | | | | | | 5,515,458 | |
| | | | | | | | | |
| Non-Agency Commercial Mortgage-Backed Securities — 3.17% | | | | | | | | |
| BANK Series 2022-BNK39 B 3.239% 2/15/55 • | | | 600,000 | | | | 444,989 | |
| Benchmark Mortgage Trust | | | | | | | | |
| Series 2020-B21 C 3.345% 12/17/53 • | | | 500,000 | | | | 345,024 | |
| Series 2020-B22 A5 1.973% 1/15/54 | | | 1,500,000 | | | | 1,183,777 | |
| DBJPM Mortgage Trust Series 2020-C9 B 2.567% 8/15/53 | | | 500,000 | | | | 366,080 | |
| Goldman Sachs Mortgage Securities Trust | | | | | | | | |
| Series 2017-GS6 B 3.869% 5/10/50 | | | 500,000 | | | | 425,969 | |
| GS Mortgage Securities Trust Series 2018-GS9 B 4.321% 3/10/51 • | | | 280,000 | | | | 245,117 | |
| JPMorgan Chase Commercial Mortgage Securities | | | | | | | | |
| Trust Series 2013-LC11 B 3.499% 4/15/46 | | | 130,000 | | | | 113,750 | |
| Total Non-Agency Commercial Mortgage-Backed Securities (cost $3,760,822) | | | | | | | 3,124,706 | |
Schedule of investments
Delaware Strategic Income Fund
| | | Principal
amount° | | | Value (US $) | |
| Loan Agreements — 2.93% | | | | | | | | |
| Applied Systems 2nd Lien 11.992% (SOFR03M + 6.75%) 9/17/27 • | | | 451,630 | | | $ | 454,264 | |
| AssuredPartners 8.933% (SOFR01M + 3.61%) 2/12/27 • | | | 447,144 | | | | 445,002 | |
| Connect US Finco 8.819% (SOFR01M + 3.50%) 12/11/26 • | | | 275,738 | | | | 275,508 | |
| Frontier Communications Tranche B 9.183% (SOFR01M + 3.86%) 5/1/28 • | | | 684,250 | | | | 650,037 | |
| Hamilton Projects Acquiror 9.933% (SOFR01M + 4.61%) 6/17/27 • | | | 657,731 | | | | 652,716 | |
| Ultimate Software Group 1st Lien 9.219% (SOFR03M + 3.75%) 5/4/26 • | | | 418,865 | | | | 418,484 | |
| Total Loan Agreements (cost $2,892,909) | | | | | | | 2,896,011 | |
| | | | | | | | | |
| Sovereign Bonds — 3.77%∆ | | | | | | | | |
| Brazil — 0.43% | | | | | | | | |
| Brazilian Government International Bond 4.75% 1/14/50 | | | 550,000 | | | | 423,017 | |
| | | | | | | | 423,017 | |
| Dominican Republic — 0.37% | | | | | | | | |
| Dominican Republic International Bond 144A 4.50% 1/30/30 # | | | 414,000 | | | | 367,983 | |
| | | | | | | | 367,983 | |
| Honduras — 0.80% | | | | | | | | |
| Honduras Government International Bond 144A 5.625% 6/24/30 # | | | 959,000 | | | | 791,175 | |
| | | | | | | | 791,175 | |
| Ivory Coast — 0.72% | | | | | | | | |
| Ivory Coast Government International Bond 144A 6.125% 6/15/33 # | | | 784,000 | | | | 707,061 | |
| | | | | | | | 707,061 | |
| Senegal — 0.58% | | | | | | | | |
| Senegal Government International Bond 144A 6.75% 3/13/48 # | | | 764,000 | | | | 575,037 | |
| | | | | | | | 575,037 | |
| | | Principal
amount° | | | Value (US $) | |
| Sovereign Bonds∆ (continued) | | | | | | | | |
| Uzbekistan — 0.87% | | | | | | | | |
| Republic of Uzbekistan International Bond 144A 4.75% 2/20/24 # | | | 862,000 | | | $ | 855,606 | |
| | | | | | | | 855,606 | |
| Total Sovereign Bonds (cost $4,392,426) | | | | | | | 3,719,879 | |
| | | | | | | | | |
| US Treasury Obligations — 19.50% | | | | | | | | |
| US Treasury Bonds | | | | | | | | |
| 3.625% 2/15/53 | | | 1,595,000 | | | | 1,488,085 | |
| 3.875% 2/15/43 | | | 1,770,000 | | | | 1,691,456 | |
| US Treasury Floating Rate Notes 5.418% (USBMMY3M + 0.17%) 4/30/25 • | | | 1,390,000 | | | | 1,391,602 | |
| US Treasury Notes | | | | | | | | |
| 3.375% 5/15/33 | | | 6,245,000 | | | | 5,957,633 | |
| 3.50% 1/31/30 | | | 3,100,000 | | | | 2,992,893 | |
| 3.75% 6/30/30 | | | 675,000 | | | | 661,816 | |
| 4.00% 6/30/28 | | | 615,000 | | | | 610,099 | |
| 4.125% 11/15/32 | | | 480,000 | | | | 485,625 | |
| 4.50% 11/30/24 | | | 1,370,000 | | | | 1,356,407 | |
| 4.75% 6/30/25 | | | 2,620,000 | | | | 2,605,672 | |
| Total US Treasury Obligations (cost $19,522,739) | | | | | | | 19,241,288 | |
| | | | | | | | | |
| | | | Number of | | | | | |
| | | | shares | | | | | |
| Common Stock — 0.76% | | | | | | | | |
| Transportation — 0.76% | | | | | | | | |
| Grupo Aeromexico =, † | | | 49,917 | | | | 745,252 | |
| Total Common Stock (cost $815,893) | | | | | | | 745,252 | |
| | | | | | | | | |
| Short-Term Investments — 1.71% | | | | | | | | |
| Money Market Mutual Funds — 1.71% | | | | | | | | |
| BlackRock Liquidity FedFund – Institutional Shares (seven-day effective yield 5.15%) | | | 422,454 | | | | 422,454 | |
| Fidelity Investments Money Market Government Portfolio – Class I (seven-day effective yield 5.16%) | | | 422,454 | | | | 422,454 | |
| Goldman Sachs Financial Square Government Fund – Institutional Shares (seven-day effective yield 5.29%) | | | 422,454 | | | | 422,454 | |
Schedule of investments
Delaware Strategic Income Fund
| | | Number of | | | | |
| | | shares | | | Value (US $) | |
| Short-Term Investments (continued) | | | | | | | | |
| Money Market Mutual Funds (continued) | | | | | | | | |
| Morgan Stanley Institutional Liquidity Funds Government Portfolio – Institutional Class (seven-day effective yield 5.19%) | | | 422,453 | | | $ | 422,453 | |
| Total Short-Term Investments (cost $1,689,815) | | | | | | | 1,689,815 | |
Total Value of Securities—99.02% (cost $104,822,600) | | | | | | $ | 97,710,539 | |
| ° | Principal amount shown is stated in USD unless noted that the security is denominated in another currency. |
| # | Security exempt from registration under Rule 144A of the Securities Act of 1933, as amended. At July 31, 2023, the aggregate value of Rule 144A securities was $51,672,010, which represents 52.36% of the Fund's net assets. See Note 12 in “Notes to financial statements.” |
| • | Variable rate investment. Rates reset periodically. Rate shown reflects the rate in effect at July 31, 2023. For securities based on a published reference rate and spread, the reference rate and spread are indicated in their descriptions. The reference rate descriptions (i.e. SOFR01M, SOFR03M, etc.) used in this report are identical for different securities, but the underlying reference rates may differ due to the timing of the reset period. Certain variable rate securities are not based on a published reference rate and spread but are determined by the issuer or agent and are based on current market conditions, or for mortgage-backed securities, are impacted by the individual mortgages which are paying off over time. These securities do not indicate a reference rate and spread in their descriptions. |
| m | Fixed to variable rate investment. The rate shown reflects the fixed rate in effect at July 31, 2023. Rate will reset at a future date. |
| Y | Perpetual security. Maturity date represents next call date. |
| ‡ | Non-income producing security. Security is currently in default. |
| ^ | Zero-coupon security. The rate shown is the effective yield at the time of purchase. |
| f | Step coupon bond. Stated rate in effect at July 31, 2023 through maturity date. |
| ∆ | Securities have been classified by country of risk. |
| = | The value of this security was determined using significant unobservable inputs and is reported as a Level 3 security in the disclosure table located in Note 3 in “Notes to financial statements.” |
| † | Non-income producing security. |
The following foreign currency exchange contracts and futures contracts were outstanding at July 31, 2023:1
Foreign Currency Exchange Contracts
| Counterparty | | Currency to
Receive (Deliver) | | | In Exchange For | | | Settlement
Date | | Unrealized
Appreciation | | | Unrealized
Depreciation | |
| CITI | | EUR | 86,999 | | | USD | (95,791 | ) | | 8/25/23 | | $ | — | | | $ | (6 | ) |
| JPMCB | | EUR | (817,247 | ) | | USD | 899,026 | | | 8/25/23 | | | — | | | | (747 | ) |
| Total Foreign Currency Exchange Contracts | | $ | — | | | $ | (753 | ) |
Futures Contracts
Exchange-Traded
| Contracts to Buy (Sell) | | Notional
Amount | | | Notional
Cost
(Proceeds) | | | Expiration
Date | | Value/
Unrealized
Appreciation | | | Value/
Unrealized
Depreciation | | | Variation
Margin
Due from
(Due to)
Brokers | |
| (2) | | Euro-BOBL | | $ | (231,780 | ) | | $ | (234,656 | ) | | 9/7/23 | | $ | 2,876 | | | $ | — | | | $ | (140 | ) |
| 109 | | US Treasury 5 yr Notes | | | 11,643,414 | | | | 11,794,624 | | | 9/29/23 | | | — | | | | (151,210 | ) | | | 6,062 | |
| 25 | | US Treasury 10 yr Notes | | | 2,785,156 | | | | 2,827,250 | | | 9/20/23 | | | — | | | | (42,094 | ) | | | 1,562 | |
| 10 | | US Treasury 10 yr Ultra Notes | | | 1,169,844 | | | | 1,185,010 | | | 9/20/23 | | | — | | | | (15,166 | ) | | | 938 | |
| Total Futures Contracts | | | | | | $ | 15,572,228 | | | | | $ | 2,876 | | | $ | (208,470 | ) | | $ | 8,422 | |
The use of foreign currency exchange contracts and futures contracts involves elements of market risk and risks in excess of the amounts disclosed in the financial statements. The foreign currency exchange contracts and notional amounts presented above represent the Fund's total exposure in such contracts, whereas only the net unrealized appreciation (depreciation) and variation margin are reflected in the Fund's net assets.
| 1 | See Note 9 in “Notes to financial statements.” |
Schedule of investments
Delaware Strategic Income Fund
Summary of abbreviations:
BOBL – Bundesobligationen
CITI – Citigroup
DAC – Designated Activity Company
FREMF – Freddie Mac Multifamily
GS – Goldman Sachs
JPMCB – JPMorgan Chase Bank
JSC – Joint Stock Company
REMIC – Real Estate Mortgage Investment Conduit
S.F. – Single Family
SOFR – Secured Overnight Financing Rate
SOFR01M – Secured Overnight Financing Rate 1 Month
SOFR03M – Secured Overnight Financing Rate 3 Month
USBMMY3M – US Treasury 3 Month Bill Money Market Yield
yr – Year
Summary of currencies:
EUR – European Monetary Unit
USD – US Dollar
See accompanying notes, which are an integral part of the financial statements.
Statement of assets and liabilities
| Delaware Strategic Income Fund | July 31, 2023 |
| Assets: | | | |
| Investments, at value* | | $ | 97,710,539 | |
| Cash | | | 37,072 | |
| Cash collateral due from broker | | | 248,911 | |
| Dividends and interest receivable | | | 978,115 | |
| Receivable for securities sold | | | 503,333 | |
| Receivable for fund shares sold | | | 42,052 | |
| Prepaid expenses | | | 19,294 | |
| Variation margin due from broker on futures contracts | | | 8,422 | |
| Other assets | | | 806 | |
| Total Assets | | | 99,548,544 | |
| Liabilities: | | | | |
| Due to custodian | | | 132 | |
| Payable for securities purchased | | | 492,312 | |
| Other accrued expenses | | | 152,047 | |
| Payable for fund shares redeemed | | | 147,881 | |
| Investment management fees payable to affiliates | | | 34,014 | |
| Administration expenses payable to affiliates | | | 16,868 | |
| Distribution fees payable to affiliates | | | 15,816 | |
| Distribution payable | | | 10,482 | |
| Unrealized depreciation on foreign currency exchange contracts | | | 753 | |
| Total Liabilities | | | 870,305 | |
| Total Net Assets | | $ | 98,678,239 | |
| | | | | |
| Net Assets Consist of: | | | | |
| Paid-in capital | | $ | 122,650,820 | |
| Total distributable earnings (loss) | | | (23,972,581 | ) |
| Total Net Assets | | $ | 98,678,239 | |
Statement of assets and liabilities
Delaware Strategic Income Fund
| Net Asset Value | | | | |
| | | | | |
| Class A: | | | | |
| Net assets | | $ | 71,421,813 | |
| Shares of beneficial interest outstanding, unlimited authorization, no par | | | 9,776,751 | |
| Net asset value per share | | $ | 7.31 | |
| Sales charge | | | 4.50 | % |
| Offering price per share, equal to net asset value per share / (1 - sales charge) | | $ | 7.65 | |
| | | | | |
| Class C: | | | | |
| Net assets | | $ | 819,184 | |
| Shares of beneficial interest outstanding, unlimited authorization, no par | | | 112,149 | |
| Net asset value per share | | $ | 7.30 | |
| | | | | |
| Class R: | | | | |
| Net assets | | $ | 174,493 | |
| Shares of beneficial interest outstanding, unlimited authorization, no par | | | 23,832 | |
| Net asset value per share | | $ | 7.32 | |
| | | | | |
| Institutional Class: | | | | |
| Net assets | | $ | 26,262,749 | |
| Shares of beneficial interest outstanding, unlimited authorization, no par | | | 3,593,449 | |
| Net asset value per share | | $ | 7.31 | |
| | | | | |
| *Investments, at cost | | $ | 104,822,600 | |
See accompanying notes, which are an integral part of the financial statements.
Statement of operations
| Delaware Strategic Income Fund | Year ended July 31, 2023 |
| Investment Income: | | | |
| Interest | | $ | 5,356,607 | |
| Dividends | | | 80,999 | |
| Foreign tax withheld | | | (1,059 | ) |
| | | | 5,436,547 | |
| Expenses: | | | | |
| Management fees | | | 525,805 | |
| Distribution expenses — Class A | | | 183,223 | |
| Distribution expenses — Class C | | | 9,473 | |
| Distribution expenses — Class R | | | 787 | |
| Dividend disbursing and transfer agent fees and expenses | | | 87,917 | |
| Registration fees | | | 66,134 | |
| Accounting and administration expenses | | | 55,410 | |
| Audit and tax fees | | | 49,410 | |
| Reports and statements to shareholders expenses | | | 34,766 | |
| Legal fees | | | 29,554 | |
| Custodian fees | | | 14,510 | |
| Trustees' fees and expenses | | | 4,402 | |
| Other | | | 40,707 | |
| | | | 1,102,098 | |
| Less expenses waived | | | (344,460 | ) |
| Less expenses paid indirectly | | | (111 | ) |
| Total operating expenses | | | 757,527 | |
| Net Investment Income (Loss) | | | 4,679,020 | |
Statement of operations
Delaware Strategic Income Fund
| Net Realized and Unrealized Gain (Loss): | | | |
| Net realized gain (loss) on: | | | |
| Investments | | $ | (4,682,858 | ) |
| Foreign currencies | | | (394,368 | ) |
| Foreign currency exchange contracts | | | 1,082 | |
| Futures contracts | | | 304,444 | |
| Options purchased | | | (103,571 | ) |
| Options written | | | 66,345 | |
| Swap contracts | | | 21,603 | |
| Net realized gain (loss) | | | (4,787,323 | ) |
| | | | | |
| Net change in unrealized appreciation (depreciation) on: | | | | |
| Investments | | | 4,347,356 | |
| Foreign currencies | | | 8,219 | |
| Foreign currency exchange contracts | | | (104,926 | ) |
| Futures contracts | | | (139,748 | ) |
| Options purchased | | | 61,380 | |
| Options written | | | (22,862 | ) |
| Net change in unrealized appreciation (depreciation) | | | 4,149,419 | |
| Net Realized and Unrealized Gain (Loss) | | | (637,904 | ) |
| Net Increase (Decrease) in Net Assets Resulting from Operations | | $ | 4,041,116 | |
See accompanying notes, which are an integral part of the financial statements.
Statements of changes in net assets
Delaware Strategic Income Fund
| | | Year ended | |
| | | 7/31/23 | | | 7/31/22 | |
| Increase (Decrease) in Net Assets from Operations: | | | | | | | | |
| Net investment income (loss) | | $ | 4,679,020 | | | $ | 3,727,159 | |
| Net realized gain (loss) | | | (4,787,323 | ) | | | (1,274,500 | ) |
| Net change in unrealized appreciation (depreciation) | | | 4,149,419 | | | | (14,864,832 | ) |
| Net increase (decrease) in net assets resulting from operations | | | 4,041,116 | | | | (12,412,173 | ) |
| | | | | | | | | |
| Dividends and Distributions to Shareholders from: | | | | | | | | |
| Distributable earnings: | | | | | | | | |
| Class A | | | (3,565,873 | ) | | | (3,262,736 | ) |
| Class C | | | (38,935 | ) | | | (39,080 | ) |
| Class R | | | (7,287 | ) | | | (5,847 | ) |
| Institutional Class | | | (1,089,875 | ) | | | (703,462 | ) |
| | | | (4,701,970 | ) | | | (4,011,125 | ) |
| Capital Share Transactions: | | | | | | | | |
| Proceeds from shares sold: | | | | | | | | |
| Class A | | | 5,531,741 | | | | 3,940,143 | |
| Class C | | | 201,893 | | | | 370,161 | |
| Class R | | | 40,545 | | | | 13,966 | |
| Institutional Class | | | 42,692,222 | | | | 11,002,091 | |
| | | | | | | | | |
| Net assets from merger:1 | | | | | | | | |
| Class A | | | — | | | | 73,890,835 | |
| Institutional Class | | | — | | | | 294,650 | |
| | | | | | | | | |
| Net asset value of shares issued upon reinvestment of dividends and distributions: | | | | | | | | |
| Class A | | | 3,464,773 | | | | 3,270,373 | |
| Class C | | | 38,911 | | | | 38,749 | |
| Class R | | | 7,284 | | | | 5,839 | �� |
| Institutional Class | | | 1,089,171 | | | | 703,742 | |
| | | | 53,066,540 | | | | 93,530,549 | |
Statements of changes in net assets
Delaware Strategic Income Fund
| | | Year ended | |
| | | 7/31/23 | | | 7/31/22 | |
| Capital Share Transactions (continued): | | | | | | | | |
| Cost of shares redeemed: | | | | | | | | |
| Class A | | $ | (16,051,864 | ) | | $ | (19,911,369 | ) |
| Class C | | | (520,915 | ) | | | (567,428 | ) |
| Class R | | | (20,141 | ) | | | (19,219 | ) |
| Institutional Class | | | (32,791,372 | ) | | | (10,522,231 | ) |
| | | | (49,384,292 | ) | | | (31,020,247 | ) |
| Increase in net assets derived from capital share transactions | | | 3,682,248 | | | | 62,510,302 | |
| Net Increase in Net Assets | | | 3,021,394 | | | | 46,087,004 | |
| Net Assets: | | | | | | | | |
| Beginning of year | | | 95,656,845 | | | | 49,569,841 | |
| End of year | | $ | 98,678,239 | | | $ | 95,656,845 | |
| 1 | See Note 7 in “Notes to financial statements.” |
See accompanying notes, which are an integral part of the financial statements.
Financial highlights
Delaware Strategic Income Fund Class A
Selected data for each share of the Fund outstanding throughout each period were as follows:
| Net asset value, beginning of period |
| |
| Income (loss) from investment operations: |
| Net investment income1 |
| Net realized and unrealized gain (loss) |
| Total from investment operations |
| |
| Less dividends and distributions from: |
| Net investment income |
| Return of capital |
| Total dividends and distributions |
| |
| Net asset value, end of period |
| |
| Total return3 |
| |
| Ratios and supplemental data: |
| Net assets, end of period (000 omitted) |
| Ratio of expenses to average net assets4 |
| Ratio of expenses to average net assets prior to fees waived4 |
| Ratio of net investment income to average net assets |
| Ratio of net investment income to average net assets prior to fees waived |
| Portfolio turnover |
| 1 | Calculated using average shares outstanding. |
| 2 | Amount is less than $0.005 per share. |
| 3 | Total return is based on the change in net asset value of a share during the period and assumes reinvestment of dividends and distributions at net asset value and does not reflect the impact of a sales charge. Total return during the period reflects waivers by the manager and/or distributor. Performance would have been lower had the waivers not been in effect. |
| 4 | Expense ratios do not include expenses of any investment companies in which the Fund invests. |
| 5 | Net expense ratio includes extraordinary expenses. |
See accompanying notes, which are an integral part of the financial statements.
| Year ended | |
| 7/31/23 | | | 7/31/22 | | | 7/31/21 | | | 7/31/20 | | | 7/31/19 | |
| $ | 7.38 | | | $ | 8.57 | | | $ | 8.24 | | | $ | 8.07 | | | $ | 8.01 | |
| | | | | | | | | | | | | | | | | | | |
| | | | | | | | | | | | | | | | | | | |
| | 0.35 | | | | 0.29 | | | | 0.30 | | | | 0.29 | | | | 0.32 | |
| | (0.07 | ) | | | (1.17 | ) | | | 0.35 | | | | 0.20 | | | | 0.08 | |
| | 0.28 | | | | (0.88 | ) | | | 0.65 | | | | 0.49 | | | | 0.40 | |
| | | | | | | | | | | | | | | | | | | |
| | | | | | | | | | | | | | | | | | | |
| | (0.35 | ) | | | (0.31 | ) | | | (0.32 | ) | | | (0.32 | ) | | | (0.27 | ) |
| | — | | | | — | | | | — | 2 | | | — | 2 | | | (0.07 | ) |
| | (0.35 | ) | | | (0.31 | ) | | | (0.32 | ) | | | (0.32 | ) | | | (0.34 | ) |
| | | | | | | | | | | | | | | | | | | |
| $ | 7.31 | | | $ | 7.38 | | | $ | 8.57 | | | $ | 8.24 | | | $ | 8.07 | |
| | | | | | | | | | | | | | | | | | | |
| | 4.00 | % | | | (10.45 | )% | | | 8.02 | % | | | 6.27 | % | | | 5.20 | % |
| | | | | | | | | | | | | | | | | | | |
| | | | | | | | | | | | | | | | | | | |
| $ | 71,422 | | | $ | 79,273 | | | $ | 31,690 | | | $ | 29,793 | | | $ | 31,032 | |
| | 0.84 | % | | | 0.90 | %5 | | | 0.84 | % | | | 0.84 | % | | | 0.84 | % |
| | 1.20 | % | | | 1.24 | % | | | 1.53 | % | | | 1.52 | % | | | 1.50 | % |
| | 4.85 | % | | | 3.62 | % | | | 3.54 | % | | | 3.66 | % | | | 4.09 | % |
| | 4.49 | % | | | 3.28 | % | | | 2.85 | % | | | 2.98 | % | | | 3.43 | % |
| | 99 | % | | | 65 | % | | | 89 | % | | | 130 | % | | | 106 | % |
Financial highlights
Delaware Strategic Income Fund Class C
Selected data for each share of the Fund outstanding throughout each period were as follows:
| Net asset value, beginning of period |
| |
| Income (loss) from investment operations: |
| Net investment income1 |
| Net realized and unrealized gain (loss) |
| Total from investment operations |
| |
| Less dividends and distributions from: |
| Net investment income |
| Return of capital |
| Total dividends and distributions |
| |
| Net asset value, end of period |
| |
| Total return3 |
| |
| Ratios and supplemental data: |
| Net assets, end of period (000 omitted) |
| Ratio of expenses to average net assets4 |
| Ratio of expenses to average net assets prior to fees waived4 |
| Ratio of net investment income to average net assets |
| Ratio of net investment income to average net assets prior to fees waived |
| Portfolio turnover |
| 1 | Calculated using average shares outstanding. |
| 2 | Amount is less than $0.005 per share. |
| 3 | Total return is based on the change in net asset value of a share during the period and assumes reinvestment of dividends and distributions at net asset value and does not reflect the impact of a sales charge. Total return during the period reflects waivers by the manager and/or distributor. Performance would have been lower had the waivers not been in effect. |
| 4 | Expense ratios do not include expenses of any investment companies in which the Fund invests. |
| 5 | Net expense ratio includes extraordinary expenses. |
See accompanying notes, which are an integral part of the financial statements.
| Year ended | |
| 7/31/23 | | | 7/31/22 | | | 7/31/21 | | | 7/31/20 | | | 7/31/19 | |
| $ | 7.38 | | | $ | 8.58 | | | $ | 8.25 | | | $ | 8.08 | | | $ | 8.02 | |
| | | | | | | | | | | | | | | | | | | |
| | | | | | | | | | | | | | | | | | | |
| | 0.30 | | | | 0.23 | | | | 0.24 | | | | 0.23 | | | | 0.26 | |
| | (0.08 | ) | | | (1.18 | ) | | | 0.35 | | | | 0.20 | | | | 0.08 | |
| | 0.22 | | | | (0.95 | ) | | | 0.59 | | | | 0.43 | | | | 0.34 | |
| | | | | | | | | | | | | | | | | | | |
| | | | | | | | | | | | | | | | | | | |
| | (0.30 | ) | | | (0.25 | ) | | | (0.26 | ) | | | (0.26 | ) | | | (0.21 | ) |
| | — | | | | — | | | | — | 2 | | | — | 2 | | | (0.07 | ) |
| | (0.30 | ) | | | (0.25 | ) | | | (0.26 | ) | | | (0.26 | ) | | | (0.28 | ) |
| | | | | | | | | | | | | | | | | | | |
| $ | 7.30 | | | $ | 7.38 | | | $ | 8.58 | | | $ | 8.25 | | | $ | 8.08 | |
| | | | | | | | | | | | | | | | | | | |
| | 3.08 | % | | | (11.22 | )% | | | 7.21 | % | | | 5.47 | % | | | 4.42 | % |
| | | | | | | | | | | | | | | | | | | |
| | | | | | | | | | | | | | | | | | | |
| $ | 819 | | | $ | 1,110 | | | $ | 1,451 | | | $ | 1,846 | | | $ | 2,793 | |
| | 1.59 | % | | | 1.65 | %5 | | | 1.59 | % | | | 1.59 | % | | | 1.59 | % |
| | 1.95 | % | | | 1.99 | % | | | 2.28 | % | | | 2.27 | % | | | 2.25 | % |
| | 4.10 | % | | | 2.87 | % | | | 2.79 | % | | | 2.91 | % | | | 3.34 | % |
| | 3.74 | % | | | 2.53 | % | | | 2.10 | % | | | 2.23 | % | | | 2.68 | % |
| | 99 | % | | | 65 | % | | | 89 | % | | | 130 | % | | | 106 | % |
Financial highlights
Delaware Strategic Income Fund Class R
Selected data for each share of the Fund outstanding throughout each period were as follows:
| Net asset value, beginning of period |
| |
| Income (loss) from investment operations: |
| Net investment income1 |
| Net realized and unrealized gain (loss) |
| Total from investment operations |
| |
| Less dividends and distributions from: |
| Net investment income |
| Return of capital |
| Total dividends and distributions |
| |
| Net asset value, end of period |
| |
| Total return3 |
| |
| Ratios and supplemental data: |
| Net assets, end of period (000 omitted) |
| Ratio of expenses to average net assets4 |
| Ratio of expenses to average net assets prior to fees waived4 |
| Ratio of net investment income to average net assets |
| Ratio of net investment income to average net assets prior to fees waived |
| Portfolio turnover |
| 1 | Calculated using average shares outstanding. |
| 2 | Amount is less than $0.005 per share. |
| 3 | Total return is based on the change in net asset value of a share during the period and assumes reinvestment of dividends and distributions at net asset value. Total return during the period reflects waivers by the manager and/or distributor. Performance would have been lower had the waivers not been in effect. |
| 4 | Expense ratios do not include expenses of any investment companies in which the Fund invests. |
| 5 | Net expense ratio includes extraordinary expenses. |
See accompanying notes, which are an integral part of the financial statements.
| Year ended | |
| 7/31/23 | | | 7/31/22 | | | 7/31/21 | | | 7/31/20 | | | 7/31/19 | |
| $ | 7.39 | | | $ | 8.60 | | | $ | 8.27 | | | $ | 8.10 | | | $ | 8.03 | |
| | | | | | | | | | | | | | | | | | | |
| | | | | | | | | | | | | | | | | | | |
| | 0.33 | | | | 0.27 | | | | 0.28 | | | | 0.27 | | | | 0.30 | |
| | (0.06 | ) | | | (1.19 | ) | | | 0.35 | | | | 0.20 | | | | 0.09 | |
| | 0.27 | | | | (0.92 | ) | | | 0.63 | | | | 0.47 | | | | 0.39 | |
| | | | | | | | | | | | | | | | | | | |
| | | | | | | | | | | | | | | | | | | |
| | (0.34 | ) | | | (0.29 | ) | | | (0.30 | ) | | | (0.30 | ) | | | (0.25 | ) |
| | — | | | | — | | | | — | 2 | | | — | 2 | | | (0.07 | ) |
| | (0.34 | ) | | | (0.29 | ) | | | (0.30 | ) | | | (0.30 | ) | | | (0.32 | ) |
| | | | | | | | | | | | | | | | | | | |
| $ | 7.32 | | | $ | 7.39 | | | $ | 8.60 | | | $ | 8.27 | | | $ | 8.10 | |
| | | | | | | | | | | | | | | | | | | |
| | 3.74 | % | | | (10.86 | )% | | | 7.74 | % | | | 5.99 | % | | | 5.07 | % |
| | | | | | | | | | | | | | | | | | | |
| | | | | | | | | | | | | | | | | | | |
| $ | 174 | | | $ | 148 | | | $ | 171 | | | $ | 431 | | | $ | 738 | |
| | 1.09 | % | | | 1.15 | %5 | | | 1.09 | % | | | 1.09 | % | | | 1.09 | % |
| | 1.45 | % | | | 1.49 | % | | | 1.78 | % | | | 1.77 | % | | | 1.75 | % |
| | 4.60 | % | | | 3.37 | % | | | 3.29 | % | | | 3.41 | % | | | 3.84 | % |
| | 4.24 | % | | | 3.03 | % | | | 2.60 | % | | | 2.73 | % | | | 3.18 | % |
| | 99 | % | | | 65 | % | | | 89 | % | | | 130 | % | | | 106 | % |
Financial highlights
Delaware Strategic Income Fund Institutional Class
Selected data for each share of the Fund outstanding throughout each period were as follows:
| Net asset value, beginning of period |
| |
| Income (loss) from investment operations: |
| Net investment income1 |
| Net realized and unrealized gain (loss) |
| Total from investment operations |
| |
| Less dividends and distributions from: |
| Net investment income |
| Return of capital |
| Total dividends and distributions |
| |
| Net asset value, end of period |
| |
| Total return3 |
| |
| Ratios and supplemental data: |
| Net assets, end of period (000 omitted) |
| Ratio of expenses to average net assets4 |
| Ratio of expenses to average net assets prior to fees waived4 |
| Ratio of net investment income to average net assets |
| Ratio of net investment income to average net assets prior to fees waived |
| Portfolio turnover |
| 1 | Calculated using average shares outstanding. |
| 2 | Amount is less than $0.005 per share. |
| 3 | Total return is based on the change in net asset value of a share during the period and assumes reinvestment of dividends and distributions at net asset value. Total return during the period reflects waivers by the manager. Performance would have been lower had the waivers not been in effect. |
| 4 | Expense ratios do not include expenses of any investment companies in which the Fund invests. |
| 5 | Net expense ratio includes extraordinary expenses. |
See accompanying notes, which are an integral part of the financial statements.
| Year ended | |
| 7/31/23 | | | 7/31/22 | | | 7/31/21 | | | 7/31/20 | | | 7/31/19 | |
| $ | 7.38 | | | $ | 8.58 | | | $ | 8.25 | | | $ | 8.08 | | | $ | 8.02 | |
| | | | | | | | | | | | | | | | | | | |
| | | | | | | | | | | | | | | | | | | |
| | 0.37 | | | | 0.31 | | | | 0.32 | | | | 0.31 | | | | 0.34 | |
| | (0.07 | ) | | | (1.18 | ) | | | 0.35 | | | | 0.20 | | | | 0.08 | |
| | 0.30 | | | | (0.87 | ) | | | 0.67 | | | | 0.51 | | | | 0.42 | |
| | | | | | | | | | | | | | | | | | | |
| | | | | | | | | | | | | | | | | | | |
| | (0.37 | ) | | | (0.33 | ) | | | (0.34 | ) | | | (0.34 | ) | | | (0.29 | ) |
| | — | | | | — | | | | — | 2 | | | — | 2 | | | (0.07 | ) |
| | (0.37 | ) | | | (0.33 | ) | | | (0.34 | ) | | | (0.34 | ) | | | (0.36 | ) |
| | | | | | | | | | | | | | | | | | | |
| $ | 7.31 | | | $ | 7.38 | | | $ | 8.58 | | | $ | 8.25 | | | $ | 8.08 | |
| | | | | | | | | | | | | | | | | | | |
| | 4.26 | % | | | (10.33 | )% | | | 8.29 | % | | | 6.53 | % | | | 5.47 | % |
| | | | | | | | | | | | | | | | | | | |
| | | | | | | | | | | | | | | | | | | |
| $ | 26,263 | | | $ | 15,126 | | | $ | 16,258 | | | $ | 9,845 | | | $ | 16,457 | |
| | 0.59 | % | | | 0.65 | %5 | | | 0.59 | % | | | 0.59 | % | | | 0.59 | % |
| | 0.95 | % | | | 0.99 | % | | | 1.28 | % | | | 1.27 | % | | | 1.25 | % |
| | 5.10 | % | | | 3.87 | % | | | 3.79 | % | | | 3.91 | % | | | 4.34 | % |
| | 4.74 | % | | | 3.53 | % | | | 3.10 | % | | | 3.23 | % | | | 3.68 | % |
| | 99 | % | | | 65 | % | | | 89 | % | | | 130 | % | | | 106 | % |
Notes to financial statements
| Delaware Strategic Income Fund | July 31, 2023 |
Delaware Group® Government Fund (Trust) is organized as a Delaware statutory trust and offers two series: Delaware Emerging Markets Debt Corporate Fund and Delaware Strategic Income Fund. These financial statements and the related notes pertain to Delaware Strategic Income Fund (Fund). The Trust is an open-end investment company. The Fund is considered diversified under the Investment Company Act of 1940, as amended (1940 Act), and offers Class A, Class C, Class R, and Institutional Class shares. Class A shares are sold with a maximum front-end sales charge of 4.50%. There is no front-end sales charge when you purchase $1 million or more of Class A shares. However, if Delaware Distributors, L.P. (DDLP) paid your financial intermediary a commission on your purchase of $1 million or more of Class A shares, you will have to pay a limited contingent deferred sales charge (Limited CDSC) of 1.00% if you redeem these shares within the first 18 months after your purchase, unless a specific waiver of the Limited CDSC applies. Class C shares have no upfront sales charge, but are sold with a contingent deferred sales charge (CDSC) of 1.00%, which will be incurred if redeemed during the first 12 months. Class R and Institutional Class shares are not subject to a sales charge and are offered for sale exclusively to certain eligible investors.
1. Significant Accounting Policies
The Fund follows accounting and reporting guidance under Financial Accounting Standards Board (FASB) Accounting Standards Codification Topic 946, Financial Services — Investment Companies. The following accounting policies are in accordance with US generally accepted accounting principles (US GAAP) and are consistently followed by the Fund.
Security Valuation — Equity securities and exchange-traded funds (ETFs), except those traded on the Nasdaq Stock Market LLC (Nasdaq), are valued at the last quoted sales price as of the time of the regular close of the New York Stock Exchange on the valuation date. Equity securities and ETFs traded on the Nasdaq are valued in accordance with the Nasdaq Official Closing Price, which may not be the last sales price. If, on a particular day, an equity security or ETF does not trade, the mean between the bid and the ask prices will be used, which approximates fair value. Equity securities listed on a foreign exchange are normally valued at the last quoted sales price on the valuation date. US government and agency securities are valued at the mean between the bid and the ask prices, which approximates fair value. Open-end investment companies, other than ETFs, are valued at their published net asset value (NAV). Fixed income securities and credit default swap (CDS) contracts are generally priced based upon valuations provided by an independent pricing service or broker/counterparty in accordance with methodologies included within Delaware Management Company (DMC)'s Pricing Policy (the Policy). Fixed income security valuations are then reviewed by DMC as part of its duties as the Fund's valuation designee and, to the extent required by the Policy and applicable regulation, fair valued consistent with the Policy. To the extent current market prices are not available, the pricing service may take into account developments related to the specific security, as well as transactions in comparable securities. Valuations for fixed income securities utilize matrix systems, which reflect such factors as security prices, yields, maturities, and ratings, and are supplemented by dealer and exchange quotations. For asset-backed securities, collateralized
mortgage obligations (CMOs), commercial mortgage securities, and US government agency mortgage securities, pricing vendors utilize matrix pricing which considers prepayment speed, attributes of the collateral, yield or price of bonds of comparable quality, coupon, maturity, and type as well as broker/dealer-supplied prices. Swap prices are derived using daily swap curves and models that incorporate a number of market data factors, such as discounted cash flows, trades, and values of the underlying reference instruments. Foreign currency exchange contracts are valued at the mean between the bid and the ask prices, which approximates fair value. Interpolated values are derived when the settlement date of the contract is an interim date for which quotations are not available. Futures contracts and options on futures contracts are valued at the daily quoted settlement prices. Exchange-traded options are valued at the last reported sale price or, if no sales are reported, at the mean between the last reported bid and the ask prices, which approximates fair value. Generally, other securities and assets for which market quotations are not readily available are valued at fair value as determined in good faith by DMC. Subject to the oversight of the Trust's Board of Trustees (Board), DMC, as valuation designee, has adopted policies and procedures to fair value securities for which market quotations are not readily available consistent with the requirements of Rule 2a-5 under the 1940 Act. In determining whether market quotations are readily available or fair valuation will be used, various factors will be taken into consideration, such as market closures or suspension of trading in a security. Restricted securities and private placements are valued at fair value.
Federal and Foreign Income Taxes — No provision for federal income taxes has been made as the Fund intends to continue to qualify for federal income tax purposes as a regulated investment company under Subchapter M of the Internal Revenue Code of 1986, as amended, and make the requisite distributions to shareholders. The Fund evaluates tax positions taken or expected to be taken in the course of preparing the Fund's tax returns to determine whether the tax positions are “more-likely-than-not” of being sustained by the applicable tax authority. Tax positions not deemed to meet the “more-likely-than-not” threshold are recorded as a tax benefit or expense in the current year. Management has analyzed the Fund's tax positions taken or expected to be taken on the Fund's federal income tax returns through the year ended July 31, 2023, and for all open tax years (years ended July 31, 2020–July 31, 2022), and has concluded that no provision for federal income tax is required in the Fund's financial statements. In regard to foreign taxes only, the Fund has open tax years in certain foreign countries in which it invests that may date back to the inception of the Fund. If applicable, the Fund recognizes interest accrued on unrecognized tax benefits in interest expense and penalties in “Other” on the “Statement of operations.” During the year ended July 31, 2023, the Fund did not incur any interest or tax penalties.
Class Accounting — Investment income and common expenses are allocated to the various classes of the Fund on the basis of “settled shares” of each class in relation to the net assets of the Fund. Realized and unrealized gain (loss) on investments are allocated to the various classes of the Fund on the basis of daily net assets of each class. Distribution expenses relating to a specific class are charged directly to that class.
Notes to financial statements
Delaware Strategic Income Fund
1. Significant Accounting Policies (continued)
To Be Announced Trades (TBA) — The Fund may contract to purchase or sell securities for a fixed price at a transaction date beyond the customary settlement period (examples: when issued, delayed delivery, forward commitment, or TBA transactions) consistent with the Fund's ability to manage its investment portfolio and meet redemption requests. These transactions involve a commitment by the Fund to purchase or sell securities for a predetermined price or yield with payment and delivery taking place more than three days in the future, or after a period longer than the customary settlement period for that type of security. No interest will be earned by the Fund on such purchases until the securities are delivered or the transaction is completed; however, the market value may change prior to delivery.
Foreign Currency Transactions — Transactions denominated in foreign currencies are recorded at the prevailing exchange rates on the valuation date. The value of all assets and liabilities denominated in foreign currencies is translated daily into US dollars at the exchange rate of such currencies against the US dollar. Transaction gains or losses resulting from changes in exchange rates during the reporting period or upon settlement of the foreign currency transaction are reported in operations for the current period. The Fund generally bifurcates that portion of realized gains and losses on investments in debt securities which is due to changes in foreign exchange rates from that which is due to changes in market prices of debt securities. That portion of gains (losses), attributable to changes in foreign exchange rates, is included on the “Statement of operations” under “Net realized gain (loss) on foreign currencies.” The Fund reports certain foreign currency related transactions as components of realized gains (losses) for financial reporting purposes, whereas such components are treated as ordinary income (loss) for federal income tax purposes.
Derivative Financial Instruments — The Fund may invest in various derivative financial instruments. These instruments are used to obtain exposure to a security, commodity, index, market, and/or other assets without owning or taking physical custody of securities, commodities and/or other referenced assets or to manage market, equity, credit, interest rate, foreign currency exchange rate, commodity and/or other risks. Derivative financial instruments may give rise to a form of economic leverage and involve risks, including the imperfect correlation between the value of a derivative financial instrument and the underlying asset, possible default of the counterparty to the transaction or illiquidity of the instrument. Pursuant to Rule 18f-4 under the 1940 Act, among other things, the Fund intends to use either derivative financial instruments with embedded leverage in a limited manner or comply with an outer limit on fund leverage risk based on value-at-risk.
Segregation and Collateralization — In certain cases, based on requirements and agreements with certain exchanges and third-party broker-dealers, the Fund may deliver or receive collateral in connection with certain investments (e.g., futures contracts, foreign currency exchange contracts, options written, securities with extended settlement periods, and swaps). Certain countries require that cash reserves be held while investing in companies incorporated in that country. Cash collateral that has been pledged/received to cover obligations of the Fund
under derivative contracts, if any, will be reported separately on the “Statement of assets and liabilities” as cash collateral due to/from broker. Securities collateral pledged for the same purpose, if any, is noted on the “Schedule of investments.”
Use of Estimates — The preparation of financial statements in conformity with US GAAP requires management to make estimates and assumptions that affect the fair value of investments, the reported amounts of assets and liabilities and disclosure of contingent assets and liabilities at the date of the financial statements, and the reported amounts of revenues and expenses during the reporting period. Actual results could differ from those estimates and the differences could be material.
Other — Expenses directly attributable to the Fund are charged directly to the Fund. Other expenses common to various funds within the Delaware Funds by Macquarie® (Delaware Funds) are generally allocated among such funds on the basis of average net assets. Management fees and certain other expenses are paid monthly. Security transactions are recorded on the date the securities are purchased or sold (trade date) for financial reporting purposes. Costs used in calculating realized gains and losses on the sale of investment securities are those of the specific securities sold. Dividend income is recorded on the ex-dividend date and interest income is recorded on an accrual basis. Income and capital gain distributions from any investment companies (Underlying Funds) in which the Fund invests are recorded on the exdividend date. Discounts and premiums on debt securities are accreted or amortized to interest income, respectively, over the lives of the respective securities using the effective interest method. Premiums on callable debt securities are amortized to interest income to the earliest call date using the effective interest method. Realized gains (losses) on paydowns of asset- and mortgage-backed securities are classified as interest income. Withholding taxes and reclaims on foreign dividends and interest have been recorded in accordance with the Fund's understanding of the applicable country's tax rules and rates. The Fund may pay foreign capital gains taxes on certain foreign securities held, which are reported as components of realized losses for financial reporting purposes, whereas such components are treated as ordinary loss for federal income tax purposes. The Fund declares dividends daily from net investment income and pays the dividends monthly and declares and pays distributions from net realized gain on investments, if any, at least annually. The Fund may distribute more frequently, if necessary for tax purposes. Dividends and distributions, if any, are recorded on the ex-dividend date.
The Fund receives earnings credits from its transfer agent when positive cash balances are maintained, which may be used to offset transfer agent fees. If the amount earned is greater than $1, the expenses paid under this arrangement are included on the “Statement of operations” under “Dividend disbursing and transfer agent fees and expenses” with the corresponding expenses offset included under “Less expenses paid indirectly.”
Notes to financial statements
Delaware Strategic Income Fund
2. Investment Management, Administration Agreements, and Other Transactions with Affiliates
In accordance with the terms of its investment management agreement, the Fund pays DMC, a series of Macquarie Investment Management Business Trust, and the investment manager, an annual fee which is calculated daily and paid monthly at the rates of 0.55% on the first $500 million of average daily net assets of the Fund, 0.50% on the next $500 million, 0.45% on the next $1.5 billion, and 0.425% on average daily net assets in excess of $2.5 billion.
DMC has contractually agreed to waive all or a portion of its management fee and/or pay/reimburse expenses (excluding any acquired fund fees and expenses, taxes, interest, short sale dividend and interest expenses, brokerage fees, certain insurance costs, and nonroutine expenses or costs, including, but not limited to, those relating to reorganizations, litigation, conducting shareholder meetings, and liquidations), in order to prevent total annual operating fund expenses from exceeding the following percentage of the Fund's average daily net assets from August 1, 2022 through November 28, 2023. These waivers and reimbursements may only be terminated by agreement of DMC and the Fund. The waivers and reimbursements are accrued daily and received monthly.
| | | Operating expense limitation as a percentage of average daily net assets | |
| | | Class A | | | Class C | | | Class R | | | Institutional Class | |
| | | | 0.84 | % | | | 1.59 | % | | | 1.09 | % | | | 0.59 | % |
DMC may seek investment advice and recommendations from its affiliates: Macquarie Investment Management Europe Limited, Macquarie Investment Management Austria Kapitalanlage AG, and Macquarie Investment Management Global Limited (together, the “Affiliated Sub-Advisors”). DMC may also permit these Affiliated Sub-Advisors to execute Fund security trades on its behalf and exercise investment discretion for securities in certain markets where DMC believes it will be beneficial to utilize an Affiliated Sub-Advisor's specialized market knowledge. Although the Affiliated Sub-Advisors serve as sub-advisors, DMC has ultimate responsibility for all investment advisory services. For these services, DMC, not the Fund, may pay each Affiliated Sub-Advisor a portion of its investment management fee.
Delaware Investments Fund Services Company (DIFSC), an affiliate of DMC, provides fund accounting and financial administrative oversight services to the Fund. For these services, DIFSC's fees are calculated daily and paid monthly based on the aggregate daily net assets of all funds within the Delaware Funds at the following annual rates: 0.00475% of the first $35 billion; 0.0040% of the next $10 billion; 0.0025% of the next $45 billion; and 0.0015% of aggregate average daily net assets in excess of $90 billion (Total Fee). Each fund in the Delaware Funds pays a minimum of $4,000, which, in aggregate, is subtracted from the Total Fee. Each fund then pays its portion of the remainder of the Total Fee on a relative NAV basis. This amount is included on the “Statement of operations” under “Accounting and administration expenses.” For the year ended July 31, 2023, the Fund paid $6,812 for these services.
DIFSC is also the transfer agent and dividend disbursing agent of the Fund. For these services, DIFSC's fees are calculated daily and paid monthly, based on the aggregate daily net assets of the retail funds within the Delaware Funds at the following annual rates: 0.014% of the first $20 billion; 0.011% of the next $5 billion; 0.007% of the next $5 billion; 0.004% of the next $20 billion; 0.002% of the next $25 billion; and 0.0015% of average daily net assets in excess of $75 billion. The fees payable to DIFSC under the shareholder services agreement described above are allocated among all retail funds in the Delaware Funds on a relative NAV basis. This amount is included on the “Statement of operations” under “Dividend disbursing and transfer agent fees and expenses.” For the year ended July 31, 2023, the Fund paid $5,986 for these services. Pursuant to a sub-transfer agency agreement between DIFSC and BNY Mellon Investment Servicing (US) Inc. (BNYMIS), BNYMIS provides certain sub-transfer agency services to the Fund. Sub-transfer agency fees are paid by the Fund and are also included on the “Statement of operations” under “Dividend disbursing and transfer agent fees and expenses.” The fees that are calculated daily and paid as invoices are received on a monthly or quarterly basis.
Pursuant to a distribution agreement and distribution plan, the Fund pays DDLP, the distributor and an affiliate of DMC, an annual distribution and service (12b-1) fees of 0.25%, 1.00%, and 0.50% of the average daily net assets of the Class A, Class C, and Class R shares, respectively. The fees are calculated daily and paid monthly. The Board has adopted a formula for calculating 12b-1 fees for the Fund's Class A shares that went into effect on June 1,1992. The Fund's Class A shares are currently subject to a blended 12b-1 fee equal to the sum of: (i) 0.10% of the average daily net assets representing shares acquired prior to June 1, 1992, and (ii) 0.25% of the average daily net assets representing shares acquired on or after June 1,1992. All Class A shareholders currently bear 12b-1 fees at the same, blended rate currently 0.25% of the average daily net assets based on the formula described above. This method of calculating Class A 12b-1 fees may be discontinued at the sole discretion of the Board. Institutional Class shares do not pay a 12b-1 fee.
As provided in the investment management agreement, the Fund bears a portion of the cost of certain resources shared with DMC, including the cost of internal personnel of DMC and/or its affiliates that provide legal and regulatory reporting services to the Fund. For the year ended July 31, 2023, the Fund paid $4,193 for internal legal and regulatory reporting services provided by DMC and/or its affiliates' employees. This amount is included on the “Statement of operations” under “Legal fees.”
For the year ended July 31, 2023, DDLP earned $2,977 for commissions on sales of the Fund's Class A shares. For the year ended July 31, 2023, DDLP received gross CDSC commissions of $1,282 and $43 on redemptions of the Fund's Class A and Class C shares, respectively, and these commissions were entirely used to offset upfront commissions previously paid by DDLP to broker/dealers on sales of those shares.
Notes to financial statements
Delaware Strategic Income Fund
2. Investment Management, Administration Agreements, and Other Transactions with Affiliates (continued)
Trustees' fees include expenses accrued by the Fund for each Trustee's retainer and meeting fees. Certain officers of DMC, DIFSC, and DDLP are officers and/or Trustees of the Trust. These officers and Trustees are paid no compensation by the Fund.
In addition to the management fees and other expenses of the Fund, the Fund indirectly bears the investment management fees and other expenses of any Underlying Funds, including ETFs in which it invests. The amount of these fees and expenses incurred indirectly by the Fund will vary based upon the expense and fee levels of any Underlying Funds and the number of shares that are owned of any Underlying Funds at different times.
3. Investments
For the year ended July 31, 2023, the Fund made purchases and sales of investment securities other than short-term investments as follows:
| Purchases other than US government securities | | $ | 23,599,786 | |
| Purchases of US government securities | | | 70,970,324 | |
| Sales other than US government securities | | | 37,681,869 | |
| Sales of US government securities | | | 53,826,343 | |
The tax cost of investments and derivatives includes adjustments to net unrealized appreciation (depreciation) which may not necessarily be the final tax cost basis adjustments but which approximate the tax basis unrealized gains and losses that may be realized and distributed to shareholders. At July 31, 2023, the cost and unrealized appreciation (depreciation) of investments and derivatives for federal income tax purposes for the Fund were as follows:
| Cost of investments and derivatives | | $ | 104,812,983 | |
| Aggregate unrealized appreciation of investments and derivatives | | $ | 999,391 | |
| Aggregate unrealized depreciation of investments and derivatives | | | (8,429,254 | ) |
| Net unrealized depreciation of investments and derivatives | | $ | (7,429,863 | ) |
US GAAP defines fair value as the price that the Fund would receive to sell an asset or pay to transfer a liability in an orderly transaction between market participants at the measurement date under current market conditions. A three-level hierarchy for fair value measurements has been established based upon the transparency of inputs to the valuation of an asset or liability. Inputs may be observable or unobservable and refer broadly to the assumptions that market participants would use in pricing the asset or liability. Observable inputs reflect the assumptions market participants would use in pricing the asset or liability based on market data obtained from sources independent of the reporting entity. Unobservable inputs reflect the reporting entity's own assumptions about the assumptions that market participants would use in pricing the asset or liability based on the best information available under the circumstances. The Fund's
investment in its entirety is assigned a level based upon the observability of the inputs which are significant to the overall valuation. The three-level hierarchy of inputs is summarized as follows:
| Level 1 – | Inputs are quoted prices in active markets for identical investments. (Examples: equity securities, open-end investment companies, futures contracts, and exchange-traded options contracts) |
| | |
| Level 2 – | Other observable inputs, including, but not limited to: quoted prices for similar assets or liabilities in markets that are active, quoted prices for identical or similar assets or liabilities in markets that are not active, inputs other than quoted prices that are observable for the assets or liabilities (such as interest rates, yield curves, volatilities, prepayment speeds, loss severities, credit risks, and default rates) or other market-corroborated inputs. (Examples: debt securities, government securities, swap contracts, foreign currency exchange contracts, foreign securities utilizing international fair value pricing, broker-quoted securities, and fair valued securities) |
| | |
| Level 3 – | Significant unobservable inputs, including the Fund's own assumptions used to determine the fair value of investments. (Examples: broker-quoted securities and fair valued securities) |
Level 3 investments are valued using significant unobservable inputs. The Fund may also use an income-based valuation approach in which the anticipated future cash flows of the investment are discounted to calculate fair value. Discounts may also be applied due to the nature or duration of any restrictions on the disposition of the investments. Valuations may also be based upon current market prices of securities that are comparable in coupon, rating, maturity, and industry. The derived value of a Level 3 investment may not represent the value which is received upon disposition and this could impact the results of operations.
The following table summarizes the valuation of the Fund's investments by fair value hierarchy levels as of July 31, 2023:
| | | Level 1 | | | Level 2 | | | Level 3 | | | Total | |
| Securities | | | | | | | | | | | | |
| Assets: | | | | | | | | | | | | |
| Agency Collateralized Mortgage Obligations | | $ | — | | | $ | 7,422,379 | | | $ | — | | | $ | 7,422,379 | |
| Agency Commercial Mortgage-Backed Securities | | | — | | | | 1,798,900 | | | | — | | | | 1,798,900 | |
| Agency Mortgage-Backed Securities | | | — | | | | 4,774,699 | | | | — | | | | 4,774,699 | |
| Common Stock | | | — | | | | — | | | | 745,252 | | | | 745,252 | |
| Convertible Bonds | | | — | | | | 1,889,709 | | | | — | | | | 1,889,709 | |
| Corporate Bonds | | | — | | | | 38,448,320 | | | | — | | | | 38,448,320 | |
| Loan Agreements | | | — | | | | 2,896,011 | | | | — | | | | 2,896,011 | |
| Municipal Bonds | | | — | | | | 917,132 | | | | — | | | | 917,132 | |
| Non-Agency Asset-Backed Securities | | | — | | | | 5,526,991 | | | | — | | | | 5,526,991 | |
Notes to financial statements
Delaware Strategic Income Fund
3. Investments (continued)
| | | Level 1 | | | Level 2 | | | Level 3 | | | Total | |
| Non-Agency Collateralized Mortgage Obligations | | $ | — | | | $ | 5,515,458 | | | $ | — | | | $ | 5,515,458 | |
| Non-Agency Commercial Mortgage-Backed Securities | | | — | | | | 3,124,706 | | | | — | | | | 3,124,706 | |
| Sovereign Bonds | | | — | | | | 3,719,879 | | | | — | | | | 3,719,879 | |
| US Treasury Obligations | | | — | | | | 19,241,288 | | | | — | | | | 19,241,288 | |
| Short-Term Investments | | | 1,689,815 | | | | — | | | | — | | | | 1,689,815 | |
| Total Value of Securities | | $ | 1,689,815 | | | $ | 95,275,472 | | | $ | 745,252 | | | $ | 97,710,539 | |
| | | | | | | | | | | | | | | | | |
| Derivatives1 | | | | | | | | | | | | | | | | |
| Assets: | | | | | | | | | | | | | | | | |
| Futures Contracts | | $ | 2,876 | | | $ | — | | | $ | — | | | $ | 2,876 | |
| Liabilities: | | | | | | | | | | | | | | | | |
| Foreign Currency Exchange Contracts | | $ | — | | | $ | (753 | ) | | $ | — | | | $ | (753 | ) |
| Futures Contracts | | | (208,470 | ) | | | — | | | | — | | | | (208,470 | ) |
1Foreign currency exchange contracts and futures contracts are valued at the unrealized appreciation (depreciation) on the instrument at the year end.
During the year ended July 31, 2023, there were no transfers into or out of Level 3 investments. The Fund's policy is to recognize transfers into or out of Level 3 investments based on fair value at the beginning of the reporting year.
A reconciliation of Level 3 investments is presented when the Fund has a significant amount of Level 3 investments at the beginning or end of the year in relation to the Fund's net assets. Management has determined not to provide a reconciliation of Level 3 investments as the Level 3 investments were not considered significant to the Fund's net assets at the beginning or end of the year. Management has determined not to provide additional disclosure on Level 3 inputs since the Level 3 investments are not considered significant to the Fund's net assets at the end of the year.
4. Dividend and Distribution Information
Income and long-term capital gain distributions are determined in accordance with federal income tax regulations, which may differ from US GAAP. Additionally, distributions from net gains on foreign currency transactions and net short-term gains on sales of investment securities are treated as ordinary income for federal income tax purposes. The tax character of dividends and distributions paid during the years ended July 31, 2023 and 2022 were as follows:
| | | Year ended | |
| | | 7/31/23 | | | 7/31/22 | |
| Ordinary income | | $ | 4,701,970 | | | $ | 4,011,125 | |
5. Components of Net Assets on a Tax Basis
As of July 31, 2023, the components of net assets on a tax basis were as follows:
| Shares of beneficial interest | | $ | 122,650,820 | |
| Qualified late year loss deferrals | | | (9,469 | ) |
| Distributions payable | | | (10,482 | ) |
| Capital loss carryforwards* | | | (16,522,767 | ) |
| Unrealized appreciation (depreciation) of investments and derivatives | | | (7,429,863 | ) |
| Net assets | | $ | 98,678,239 | |
* A portion of the Fund's capital loss carryforward is subject to limitations under the Internal Revenue Code and related regulations.
The differences between book basis and tax basis components of net assets are primarily attributable to tax deferral of losses on wash sales, mark-to-market of futures contracts, mark-to-market on foreign currency contracts, tax treatment of market discount and premium on debt instruments, and amortization of premium on callable bonds, and tax treatment of swap contracts.
Qualified late year ordinary and capital losses (including currency and specified gain/loss items) represent losses realized from January 1, 2023 through July 31, 2023 and November 1, 2022 through July 31, 2023, respectively, that, in accordance with federal income tax regulations, the Funds have elected to defer and treat as having arisen in the following fiscal year.
For financial reporting purposes, capital accounts are adjusted to reflect the tax character of permanent book/tax differences. Results of operations and net assets were not affected by these reclassifications. For the year ended July 31, 2023, the Fund had no reclassifications.
For federal income tax purposes, capital loss carryforwards may be carried forward and applied against future capital gains. At July 31, 2023, the Fund has capital loss carryforwards available to offset future realized capital gains as follows:
| | Loss carryforward character | | | | |
| | Short-term | | | Long-term | | | Total | |
| | $ | 4,056,404 | | | $ | 12,466,363 | | | $ | 16,522,767 | |
6. Capital Shares
Transactions in capital shares were as follows:
| | | Year ended | |
| | | 7/31/23 | | | 7/31/22 | |
| Shares sold: | �� | | | | | |
| Class A | | | 763,231 | | | | 483,856 | |
| Class C | | | 28,368 | | | | 45,450 | |
| Class R | | | 5,587 | | | | 1,750 | |
| Institutional Class | | | 5,879,329 | | | | 1,333,031 | |
Notes to financial statements
Delaware Strategic Income Fund
6. Capital Shares (continued)
| | | Year ended | |
| | | 7/31/23 | | | 7/31/22 | |
| Shares from merger:1 | | | | | | |
| Class A | | | — | | | | 8,632,107 | |
| Institutional Class | | | — | | | | 34,381 | |
| | | | | | | | | |
| Shares issued upon reinvestment of dividends and distributions: | | | | | | | | |
| Class A | | | 479,254 | | | | 409,690 | |
| Class C | | | 5,386 | | | | 4,844 | |
| Class R | | | 1,005 | | | | 728 | |
| Institutional Class | | | 150,235 | | | | 88,088 | |
| | | | 7,312,395 | | | | 11,033,925 | |
| Shares redeemed: | | | | | | | | |
| Class A | | | (2,210,820 | ) | | | (2,477,987 | ) |
| Class C | | | (72,126 | ) | | | (68,900 | ) |
| Class R | | | (2,776 | ) | | | (2,379 | ) |
| Institutional Class | | | (4,486,193 | ) | | | (1,300,456 | ) |
| | | | (6,771,915 | ) | | | (3,849,722 | ) |
| Net increase | | | 540,480 | | | | 7,184,203 | |
Certain shareholders may exchange shares of one class for shares of another class in the same Fund. These exchange transactions are included as subscriptions and redemptions in the table above and on the “Statements of changes in net assets.” For the years ended July 31, 2023 and 2022, the Fund had the following exchange transactions:
| | | Exchange Redemptions | | | Exchange Subscriptions | | | | |
| | | Class A
Shares | | | Class C
Shares | | | Class A
Shares | | | Institutional
Class
Shares | | | Value | |
| Year ended | | | | | | | | | | | | | | | |
| 7/31/23 | | | 12,413 | | | | 114 | | | | 114 | | | | 12,427 | | | $ | 92,952 | |
| 7/31/22 | | | — | | | | 1,876 | | | | 1,879 | | | | — | | | | 14,169 | |
7. Reorganization
On May 26-27, 2021, the Board approved a proposal to reorganize (the "Reorganization") Delaware Strategic Income II Fund (the "Acquired Fund"), a series of Delaware Group® Equity Funds IV, with and into Delaware Strategic Income Fund (the “Acquiring Fund”), a series of the Trust. Pursuant to an Agreement and Plan of Reorganization (the “Plan”): (i) all of the property, assets, and goodwill of the Acquired Fund were acquired by the Acquiring Fund, and (ii) the
Trust, on behalf of the Acquiring Fund, assumed the liabilities of the Acquired Fund, in exchange for shares of the Acquiring Fund. In accordance with the Plan, the Acquired Fund liquidated and dissolved following the Reorganization. The purpose of the transaction was to allow shareholders of the Acquired Fund to own shares of the Acquiring Fund, a Fund with a similar investment objective and style as, and potentially lower net expenses than the Acquired Fund. The Reorganization was accomplished by a tax-free exchange of shares on September 17, 2021. For financial reporting purposes, assets received and shares issued by the Acquiring Fund were recorded at fair value; however, the cost basis of the investments received from the Acquired Fund was carried forward to align ongoing reporting of the Acquiring Fund's realized and unrealized gains and losses with amounts distributable to shareholders for tax purposes.
The share transactions associated with the Reorganization are as follows:
| | | Acquired
Fund
Net Assets | | | Acquired
Fund Shares
Outstanding | | | Shares
Converted
to Acquiring
Fund | | | Acquiring
Fund
Net Assets | | | Conversion
Ratio | |
| | | Delaware Strategic Income II
Fund | | | Delaware Strategic
Income Fund | | | | |
| Class A | | $ | 73,890,835 | | | | 7,537,916 | | | | 8,632,107 | | | $ | 31,542,679 | | | | 1.1452 | |
| Class C | | | — | | | | — | | | | — | | | | 1,515,878 | | | | — | |
| Class R | | | — | | | | — | | | | — | | | | 169,702 | | | | — | |
| Institutional Class | | | 294,650 | | | | 30,083 | | | | 34,381 | | | | 12,887,521 | | | | 1.1429 | |
The net assets of the Acquiring Fund before the Reorganization were $46,115,780. The net assets of the Acquiring Fund immediately following the Reorganization were $120,301,265.
Assuming the Reorganization had been completed on August 1,2021, the Acquiring Fund's pro forma results of operations for the year ended July 31, 2022, would have been as follows:
| Net investment income | | $ | 6,711,383 | |
| Net realized gain on investments | | | 1,329,005 | |
| Net change in unrealized appreciation (depreciation) | | | (14,176,954 | ) |
| Net decrease in net assets resulting from operations | | $ | (6,136,566 | ) |
8. Line of Credit
The Fund, along with certain other funds in the Delaware Funds (Participants), was a participant in a $355,000,000 revolving line of credit (Agreement) intended to be used for temporary or emergency purposes as an additional source of liquidity to fund redemptions of investor shares. Under the Agreement, the Participants were charged an annual commitment fee of 0.15%, which was allocated across the Participants based on a weighted average of the respective net assets of each Participant. The Participants were permitted to borrow up to a maximum of one-third of their net assets under the Agreement. Each Participant was individually, and not jointly, liable for
Notes to financial statements
Delaware Strategic Income Fund
8. Line of Credit (continued)
its particular advances, if any, under the line of credit. The line of credit available under the Agreement expired on October 31, 2022.
On October 31, 2022, the Fund, along with the other Participants, entered into an amendment to the Agreement for a $355,000,000 revolving line of credit to be used as described above. It operates in substantially the same manner as the original Agreement. Under the amendment to the Agreement, the Participants are charged an annual commitment fee of 0.15%, which is allocated across the Participants based on a weighted average of the respective net assets of each Participant. The line of credit available under the Agreement expires on October 30, 2023.
The Fund had no amounts outstanding as of July 31, 2023, or at any time during the year then ended.
9. Derivatives
US GAAP requires disclosures that enable investors to understand: (1) how and why an entity uses derivatives; (2) how they are accounted for; and (3) how they affect an entity's results of operations and financial position.
Foreign Currency Exchange Contracts — The Fund may enter into foreign currency exchange contracts and foreign cross currency exchange contracts as a way of managing foreign exchange rate risk. The Fund may enter into these contracts to fix the US dollar value of a security that it has agreed to buy or sell for the period between the date the trade was entered into and the date the security is delivered and paid for. The Fund may also enter into these contracts to hedge the US dollar value of securities it already owns that are denominated in foreign currencies. In addition, the Fund may enter into these contracts to facilitate or expedite the settlement of portfolio transactions. The change in value is recorded as an unrealized gain or loss. When the contract is closed, a realized gain or loss is recorded equal to the difference between the value of the contract at the time it was opened and the value at the time it was closed.
The use of foreign currency exchange contracts and foreign cross currency exchange contracts does not eliminate fluctuations in the underlying prices of the securities, but does establish a rate of exchange that can be achieved in the future. Although foreign currency exchange contracts and foreign cross currency exchange contracts limit the risk of loss due to an unfavorable change in the value of the hedged currency, they also limit any potential gain that might result should the value of the currency change favorably. In addition, the Fund could be exposed to risks if the counterparties to the contracts are unable to meet the terms of their contracts. The Fund's maximum risk of loss from counterparty credit risk is the value of its currency exchanged with the counterparty. The risk is generally mitigated by having a netting arrangement between the Fund and the counterparty and by the posting of collateral by the counterparty to the Fund to cover the Fund's exposure to the counterparty.
During the year ended July 31, 2023, the Fund entered into foreign currency exchange contracts to hedge the US dollar value of securities it already owns that are denominated in foreign currencies to increase/decrease exposure to foreign currencies.
Futures Contracts — A futures contract is an agreement in which the writer (or seller) of the contract agrees to deliver to the buyer an amount of cash or securities equal to a specific dollar amount times the difference between the value of a specific security or index at the close of the last trading day of the contract and the price at which the agreement is made. The Fund may use futures contracts in the normal course of pursuing its investment objective. The Fund may invest in futures contracts to hedge its existing portfolio securities against fluctuations in value caused by changes in interest rates or market conditions. Upon entering into a futures contract, the Fund deposits cash or pledges US government securities to a broker, equal to the minimum “initial margin” requirements of the exchange on which the contract is traded. Subsequent payments are received from the broker or paid to the broker each day, based on the daily fluctuation in the market value of the contract. These receipts or payments are known as “variation margin” and are recorded daily by the Fund as unrealized gains or losses until the contracts are closed. When the contracts are closed, the Fund records a realized gain or loss equal to the difference between the value of the contract at the time it was opened and the value at the time it was closed. Risks of entering into futures contracts include potential imperfect correlation between the futures contracts and the underlying securities and the possibility of an illiquid secondary market for these instruments. When investing in futures, there is reduced counterparty credit risk to the Fund because futures are exchange-traded and the exchange's clearinghouse, as counterparty to all exchange-traded futures, guarantees against default. At July 31, 2023, the Fund posted $248,911 in cash as collateral for open futures contracts, which is presented as “Cash collateral due from broker” on the “Statement of assets and liabilities.”
During the year ended July 31, 2023, the Fund entered into futures contracts to hedge the Fund's existing portfolio securities against fluctuations in value caused by changes in interest rates or market conditions.
Options Contracts — The Fund may enter into options contracts in the normal course of pursuing its investment objective. The Fund may buy or write options contracts for any number of reasons, including without limitation: to manage the Fund's exposure to changes in securities prices caused by interest rates or market conditions and foreign currencies; as an efficient means of adjusting the Fund's overall exposure to certain markets; to protect the value of portfolio securities; and as a cash management tool. The Fund may buy or write call or put options on securities, futures, swaps, swaptions, financial indices, and foreign currencies. When the Fund buys an option, a premium is paid and an asset is recorded and adjusted on a daily basis to reflect the current market value of the option purchased. When the Fund writes an option, a premium is received and a liability is recorded and adjusted on a daily basis to reflect the current market value of the option written. Premiums received from writing options that expire unexercised are treated by the Fund on the expiration date as realized gains. The difference between the premium received and the amount paid on effecting a closing purchase transaction, including brokerage commissions, is treated as realized gain or loss. If a call option is exercised,
Notes to financial statements
Delaware Strategic Income Fund
9. Derivatives (continued)
the premium is added to the proceeds from the sale of the underlying security in determining whether the Fund has a realized gain or loss. If a put option is exercised, the premium reduces the cost basis of the securities purchased by the Fund. The Fund, as writer of an option, bears the market risk of an unfavorable change in the price of the security underlying the written option. When writing options, the Fund is subject to minimal counterparty risk because the counterparty is only obligated to pay premiums and does not bear the market risk of an unfavorable market change.
During the year ended July 31, 2023, the Fund used options contracts to manage the Fund's exposure to changes in securities prices caused by interest rates or market conditions and to adjust the Fund's overall exposure to certain markets.
Swap Contracts —The Fund may enter into CDS contracts in the normal course of pursuing its investment objective. The Fund may enter into CDS contracts in order to hedge against credit events, to enhance total return, or to gain exposure to certain securities or markets. The Fund will not be permitted to enter into any swap transactions unless, at the time of entering into such transactions, the unsecured long-term debt of the actual counterparty, combined with any credit enhancements, is rated at least BBB- by Standard & Poor's Financial Services LLC (S&P) or Baa3 by Moody's Investors Service, Inc. (Moody's) or is determined to be of equivalent credit quality by DMC.
Credit Default Swaps. A CDS contract is a risk-transfer instrument through which one party (purchaser of protection) transfers to another party (seller of protection) the financial risk of a credit event (as defined in the CDS agreement), as it relates to a particular reference security or basket of securities (such as an index). In exchange for the protection offered by the seller of protection, the purchaser of protection agrees to pay the seller of protection a periodic amount at a stated rate that is applied to the notional amount of the CDS contract. In addition, an upfront payment may be made or received by the Fund in connection with an unwinding or assignment of a CDS contract. Upon the occurrence of a credit event, the seller of protection would pay the par (or other agreed-upon) value of the reference security (or basket of securities) to the counterparty. Credit events generally include, among others, bankruptcy, failure to pay, and obligation default.
During the year ended July 31, 2023, the Fund entered into CDS contracts as a purchaser of protection. Periodic payments (receipts) on such contracts are accrued daily and recorded as unrealized losses (gains) on swap contracts. Upon payment (receipt), such amounts are recorded as realized losses (gains) on swap contracts. Upfront payments made or received in connection with CDS contracts are amortized over the expected life of the CDS contracts as unrealized losses (gains) on swap contracts. The change in value of CDS contracts is recorded daily as unrealized appreciation or depreciation. A realized gain or loss is recorded upon a credit event (as defined in the CDS agreement) or the maturity or termination of the agreement. Initial margin and variation margin are posted to central counterparties for CDS basket trades, as
determined by the applicable central counterparty. During the year ended July 31, 2023, the Fund did not enter into any CDS contracts as a seller of protection.
CDS contracts may involve greater risks than if the Fund had invested in the reference obligation directly. CDS contracts are subject to general market risk, liquidity risk, counterparty risk, and credit risk. The Fund's maximum risk of loss from counterparty credit risk, either as the seller of protection or the buyer of protection, is the fair value of the contract. This risk is mitigated by (1) for bilateral swap contracts, having a netting arrangement between the Fund and the counterparty and by the posting of collateral by the counterparty to the Fund to cover the Fund's exposure to the counterparty or (2) for cleared swaps, trading these instruments through a central counterparty.
During the year ended July 31, 2023, the Fund used CDS contracts to hedge against credit events.
Swaps Generally. For centrally cleared swaps, payments are received from the broker or paid to the broker each day, based on the daily fluctuation in the market value of the contract. These receipts or payments are known as “variation margin” and are recorded by the Fund as unrealized gains or losses until the contracts are closed. When the contracts are closed, the Fund records a realized gain or loss equal to the difference between the value of the contract at the time it was opened and the value at the time it was closed. The value of open swaps may differ from that which would be realized in the event the Fund terminated its position in the contract on a given day. Risks of entering into these contracts include the potential inability of the counterparty to meet the terms of the contracts. This type of risk is generally limited to the amount of favorable movement in the value of the underlying security, instrument, or basket of instruments, if any, at the day of default. Risks also arise from potential losses from adverse market movements and such losses could exceed the unrealized amounts shown on the “Schedule of investments.”
Fair values of derivative instruments as of July 31, 2023 were as follows:
| | | Asset Derivatives Fair Value | |
| | | Interest | |
| Statement of Assets and | | Rate | |
| Liabilities Location | | Contracts | |
| Variation margin due from broker on futures contracts* | | $ | 2,876 | |
| | | Liability Derivatives Fair Value | |
| | | | | | Interest | | | | |
| Statement of Assets and | | Currency | | | Rate | | | | |
| Liabilities Location | | Contracts | | | Contracts | | | Total | |
| Unrealized depreciation on foreign currency exchange contracts | | $ | (753 | ) | | $ | — | | | $ | (753 | ) |
| Variation margin due from broker on futures contracts* | | | — | | | | (208,470 | ) | | | (208,470 | ) |
| Total | | $ | (753 | ) | | $ | (208,470 | ) | | $ | (209,223 | ) |
Notes to financial statements
Delaware Strategic Income Fund
9. Derivatives (continued)
*Includes cumulative appreciation (depreciation) of futures contracts from the date the contracts were opened through July 31, 2023. Only current day variation margin is reported on the “Statement of assets and liabilities.”
The effect of derivative instruments on the “Statement of operations” for the year ended July 31, 2023 was as follows:
| | | Net Realized Gain (Loss) on: | |
| | | Foreign
Currency
Exchange
Contracts | | | Futures
Contracts | | | Options
Purchased | | | Options
Written | | | Swap
Contracts | | | Total | |
| Currency contracts | | $ | 1,082 | | | $ | — | | | $ | (63,237 | ) | | $ | 23,310 | | | $ | — | | | $ | (38,845 | ) |
| Interest rate contracts | | | — | | | | 304,444 | | | | (27,944 | ) | | | — | | | | — | | | | 276,500 | |
| Credit contracts | | | — | | | | — | | | | (12,390 | ) | | | 43,035 | | | | 21,603 | | | | 52,248 | |
| Total | | $ | 1,082 | | | $ | 304,444 | | | $ | (103,571 | ) | | $ | 66,345 | | | $ | 21,603 | | | $ | 289,903 | |
| | | Net Change in Unrealized Appreciation (Depreciation) on: | |
| | | Foreign
Currency
Exchange
Contracts | | | Futures
Contracts | | | Options
Purchased | | | Options
Written | | | Total | |
| Currency contracts | | $ | (104,926 | ) | | $ | — | | | $ | 61,380 | | | $ | (22,862 | ) | | $ | (66,408 | ) |
| Interest rate contracts | | | — | | | | (139,748 | ) | | | — | | | | — | | | | (139,748 | ) |
| Total | | $ | (104,926 | ) | | $ | (139,748 | ) | | $ | 61,380 | | | $ | (22,862 | ) | | $ | (206,156 | ) |
The table below summarizes the average daily balance of derivative holdings by the Fund during the year ended July 31, 2023:
| | | Long Derivative
Volume | | | Short Derivative
Volume | |
| Foreign currency exchange contracts (average notional value) | | $ | 161,658 | | | $ | 2,079,359 | |
| Futures contracts (average notional value) | | | 3,148,926 | | | | 1,129,338 | |
| Options contracts (average notional value)* | | | 21,271 | | | | 13,178 | |
| CDS contracts (average notional value)** | | | 46,614 | | | | — | |
*Long represents purchased options and short represents written options.
**Long represents buying protection and short represents selling protection.
10. Offsetting
The Fund entered into an International Swaps and Derivatives Association, Inc. Master Agreement (ISDA Master Agreement) or a similar agreement with certain of its derivative contract counterparties in order to better define its contractual rights and to secure rights that will help the Fund mitigate its counterparty risk. An ISDA Master Agreement is a bilateral agreement between the Fund and a counterparty that governs certain over-the-counter derivatives and foreign exchange contracts and typically contains, among other things, collateral posting items and netting provisions in the event of a default and/or termination event. Under an ISDA Master Agreement, the Fund may, under certain circumstances, offset with the counterparty certain derivative financial instruments' payables and/or receivables with collateral held and/or posted and create one single net payment. The provisions of the ISDA Master Agreement typically permit a single net payment in the event of default (close-out), including the bankruptcy or insolvency of the counterparty. However, bankruptcy or insolvency laws of a particular jurisdiction may impose restrictions on or prohibitions against the right of offset in bankruptcy, insolvency, or other events.
For financial reporting purposes, the Fund does not offset derivative assets and derivative liabilities that are subject to netting arrangements on the “Statement of assets and liabilities.”
At July 31, 2023, the Fund had the following assets and liabilities subject to offsetting provisions:
Offsetting of Financial Assets and Liabilities and Derivative Assets and Liabilities
| Counterparty | | Gross Value of
Derivative Asset | | | Gross Value of
Derivative Liability | | | Net Position | |
| Citigroup | | $ | — | | | $ | (6 | ) | | $ | (6 | ) |
| JPMorgan Chase Bank | | | — | | | | (747 | ) | | | (747 | ) |
| Total | | $ | — | | | $ | (753 | ) | | $ | (753 | ) |
| Counterparty | | Net Position | | | Fair Value of
Non-Cash
Collateral
Received | | | Cash Collateral
Received | | | Fair Value of
Non-Cash
Collateral
Pledged | | | Cash Collateral
Pledged | | | Net Exposure(a) | |
| Citigroup | | $ | (6 | ) | | $ | — | | | $ | — | | | $ | — | | | $ | — | | | $ | (6 | ) |
JPMorgan
Chase
Bank | | | (747 | ) | | | — | | | | — | | | | — | | | | — | | | | (747 | ) |
| Total | | $ | (753 | ) | | $ | — | | | $ | — | | | $ | — | | | $ | — | | | $ | (753 | ) |
(a)Net exposure represents the receivable (payable) that would be due from (to) the counterparty in the event of default.
11. Securities Lending
The Fund, along with other funds in the Delaware Funds, may lend its securities pursuant to a security lending agreement (Lending Agreement) with The Bank of New York Mellon
Notes to financial statements
Delaware Strategic Income Fund
11. Securities Lending (continued)
(BNY Mellon). At the time a security is loaned, the borrower must post collateral equal to the required percentage of the market value of the loaned security, including any accrued interest. The required percentage is: (1) 102% with respect to US securities and foreign securities that are denominated and payable in US dollars; and (2) 105% with respect to foreign securities. With respect to each loan, if on any business day the aggregate market value of securities collateral plus cash collateral held is less than the aggregate market value of the securities which are the subject of such loan, the borrower will be notified to provide additional collateral by the end of the following business day, which, together with the collateral already held, will be not less than the applicable initial collateral requirements for such security loan. If the aggregate market value of securities collateral and cash collateral held with respect to a security loan exceeds the applicable initial collateral requirement, upon the request of the borrower, BNY Mellon must return enough collateral to the borrower by the end of the following business day to reduce the value of the remaining collateral to the applicable initial collateral requirement for such security loan. As a result of the foregoing, the value of the collateral held with respect to a loaned security on any particular day, may be more or less than the value of the security on loan. The collateral percentage with respect to the market value of the loaned security is determined by the security lending agent.
Cash collateral received by the Fund is generally invested in an individual separate account. The investment guidelines permit each separate account to hold certain securities that would be considered eligible securities for a money market fund. Cash collateral received is generally invested in government securities; certain obligations issued by government sponsored enterprises; repurchase agreements collateralized by US Treasury securities; obligations issued by the central government of any Organization for Economic Cooperation and Development (OECD) country or its agencies, instrumentalities, or establishments; obligations of supranational organizations; commercial paper, notes, bonds, and other debt obligations; certificates of deposit, time deposits, and other bank obligations; certain money market funds; and asset-backed securities. The Fund can also accept US government securities and letters of credit (non-cash collateral) in connection with securities loans.
In the event of default or bankruptcy by the lending agent, realization and/or retention of the collateral may be subject to legal proceedings. In the event the borrower fails to return loaned securities and the collateral received is insufficient to cover the value of the loaned securities and provided such collateral shortfall is not the result of investment losses, the lending agent has agreed to pay the amount of the shortfall to the Fund or, at the discretion of the lending agent, replace the loaned securities. The Fund continues to record dividends or interest, as applicable, on the securities loaned and is subject to changes in value of the securities loaned that may occur during the term of the loan. The Fund has the right under the Lending Agreement to recover the securities from the borrower on demand. With respect to security loans collateralized by non-cash collateral, the Fund receives loan premiums paid by the borrower. With respect to security loans collateralized by cash collateral, the earnings from the collateral investments are
shared among the Fund, the security lending agent, and the borrower. The Fund records security lending income net of allocations to the security lending agent and the borrower.
The Fund may incur investment losses as a result of investing securities lending collateral. This could occur if an investment in the collateral investment account defaulted or became impaired. Under those circumstances, the value of the Fund's cash collateral account may be less than the amount the Fund would be required to return to the borrowers of the securities and the Fund would be required to make up for this shortfall.
At July 31, 2023, the Fund had no securities out on loan.
12. Credit and Market Risk
The global outbreak of COVID-19 resulted in travel restrictions, closed international borders, enhanced health screenings at ports of entry and elsewhere, disruption of and delays in healthcare service preparation and delivery, prolonged quarantines, cancellations, supply chain disruptions, and lower consumer demand, as well as general concern and uncertainty. The impact of COVID-19, and other infectious illness outbreaks that may arise in the future, could adversely affect the economies of many nations or the entire global economy, individual issuers and capital markets in ways that cannot necessarily be foreseen. In addition, the impact of infectious illnesses in emerging market countries may be greater due to generally less established healthcare systems. Public health crises caused by the COVID-19 outbreak may exacerbate other pre-existing political, social and economic risks in certain countries or globally. The duration of the outbreak, its full economic impact and ongoing effects at the macro-level and on individual businesses are unpredictable and may result in significant and prolonged effects on a Fund's performance.
Beginning in late February 2022, global financial markets have experienced and may continue to experience significant volatility related to military action by Russia in Ukraine. As a result of this military action, the US and many other countries have imposed sanctions on Russia and certain Russian individuals, banks and corporations. The ongoing hostilities and resulting sanctions are expected to have a severe adverse effect on the region's economies and more globally, including significant negative impact on markets for certain securities and commodities, such as oil and natural gas. Any cessation of trading on the Russian securities markets will impact the value and liquidity of certain portfolio holdings. The extent and duration of military action, sanctions, and resulting market disruptions are impossible to predict, but could be substantial and prolonged and impact the Fund's performance.
Some countries in which the Fund may invest require governmental approval for the repatriation of investment income, capital, or the proceeds of sales of securities by foreign investors. In addition, if there is deterioration in a country's balance of payments or for other reasons, a country may impose temporary restrictions on foreign capital remittances abroad.
The securities exchanges of certain foreign markets are substantially smaller, less liquid, and more volatile than the major securities markets in the US. Consequently, acquisition and disposition of securities by the Fund may be inhibited. In addition, a significant portion of the
Notes to financial statements
Delaware Strategic Income Fund
12. Credit and Market Risk (continued)
aggregate market value of equity securities listed on the major securities exchanges in emerging markets is held by a smaller number of investors. This may limit the number of shares available for acquisition or disposition by the Fund.
The Fund invests a portion of its assets in high yield fixed income securities, which are securities rated lower than BBB- by S&P and lower than Baa3 by Moody's, or similarly rated by another nationally recognized statistical rating organization. Investments in these higher yielding securities are generally accompanied by a greater degree of credit risk than higher rated securities. Additionally, lower rated securities may be more susceptible to adverse economic and competitive industry conditions than investment grade securities.
The Fund invests in fixed income securities whose value is derived from an underlying pool of mortgages or consumer loans. The value of these securities is sensitive to changes in economic conditions, including delinquencies and/or defaults, and may be adversely affected by shifts in the market's perception of the issuers and changes in interest rates. Investors receive principal and interest payments as the underlying mortgages and consumer loans are paid back. Some of these securities are CMOs. CMOs are debt securities issued by US government agencies or by financial institutions and other mortgage lenders, which are collateralized by a pool of mortgages held under an indenture. Prepayment of mortgages may shorten the stated maturity of the obligations and can result in a loss of premium, if any has been paid. Certain of these securities may be stripped (securities which provide only the principal or interest feature of the underlying security). The yield to maturity on an interest-only CMO is extremely sensitive not only to changes in prevailing interest rates, but also to the rate of principal payments (including prepayments) on the related underlying mortgage assets. A rapid rate of principal payments may have a material adverse effect on the Fund's yield to maturity. If the underlying mortgage assets experience greater than anticipated prepayments of principal, the Fund may fail to fully recoup its initial investment in these securities even if the securities are rated in the highest rating categories.
The Fund invests in certain obligations that may have liquidity protection designed to ensure that the receipt of payments due on the underlying security is timely. Such protection may be provided through guarantees, insurance policies, or letters of credit obtained by the issuer or sponsor through third parties, through various means of structuring the transaction, or through a combination of such approaches. The Fund will usually not pay any additional fees for such credit support, although the existence of credit support may increase the price of a security.
The Fund invests in bank loans and other securities that may subject it to direct indebtedness risk, the risk that the Fund will not receive payment of principal, interest, and other amounts due in connection with these investments and will depend primarily on the financial condition of the borrower. Loans that are fully secured offer the Fund more protection than unsecured loans in the event of nonpayment of scheduled interest or principal, although there is no assurance that the liquidation of collateral from a secured loan would satisfy the corporate borrower's obligation, or that the collateral can be liquidated. Some loans or claims may be in default at the time of
purchase. Certain of the loans and the other direct indebtedness acquired by the Fund may involve revolving credit facilities or other standby financing commitments that obligate the Fund to pay additional cash on a certain date or on demand. These commitments may require the Fund to increase its investment in a company at a time when the Fund might not otherwise decide to do so (including at a time when the company's financial condition makes it unlikely that such amounts will be repaid). To the extent that the Fund is committed to advance additional funds, it will at all times hold and maintain cash or other high-grade debt obligations in an amount sufficient to meet such commitments. When a loan agreement is purchased, the Fund may pay an assignment fee. On an ongoing basis, the Fund may receive a commitment fee based on the undrawn portion of the underlying line of credit portion of a loan agreement. Prepayment penalty fees are received upon the prepayment of a loan agreement by the borrower. Prepayment penalty, facility, commitment, consent, and amendment fees are recorded to income as earned or paid.
As the Fund may be required to rely upon another lending institution to collect and pass on to the Fund amounts payable with respect to the loan and to enforce the Fund's rights under the loan and other direct indebtedness, an insolvency, bankruptcy, or reorganization of the lending institution may delay or prevent the Fund from receiving such amounts. The highly leveraged nature of many loans may make them especially vulnerable to adverse changes in economic or market conditions. Investments in such loans and other direct indebtedness may involve additional risk to the Fund.
When interest rates rise, fixed income securities (i.e. debt obligations) generally will decline in value. These declines in value are greater for fixed income securities with longer maturities or durations. Interest rate changes are influenced by a number of factors, such as government policy, monetary policy, inflation expectations, and the supply and demand of bonds. A fund may be subject to a greater risk of rising interest rates when interest rates are low or inflation rates are high or rising.
IBOR is the risk that changes related to the use of the London interbank offered rate (LIBOR) and other interbank offered rate (collectively, IBORs) could have adverse impacts on financial instruments that reference LIBOR (or the corresponding IBOR). The abandonment of LIBOR could affect the value and liquidity of instruments that reference LIBOR. The use of alternative reference rate products may impact investment strategy performance. These risks may also apply with respect to changes in connection with other IBORs, such as the euro overnight index average, which are also the subject of recent reform.
The Fund may invest up to 15% of its net assets in illiquid securities, which may include securities with contractual restrictions on resale, securities exempt from registration under Rule 144A promulgated under the Securities Act of 1933, as amended, and other securities which may not be readily marketable. The relative illiquidity of these securities may impair the Fund from disposing of them in a timely manner and at a fair price when it is necessary or desirable to do so. While maintaining oversight, the Board has delegated to DMC the day-to-day functions of determining whether individual securities are liquid for purposes of the Fund's
Notes to financial statements
Delaware Strategic Income Fund
12. Credit and Market Risk (continued)
limitation on investments in illiquid securities. Securities eligible for resale pursuant to Rule 144A, which are determined to be liquid, are not subject to the Fund's 15% limit on investments in illiquid securities. Rule 144A securities have been identified on the “Schedule of investments.”
13. Contractual Obligations
The Fund enters into contracts in the normal course of business that contain a variety of indemnifications. The Fund's maximum exposure under these arrangements is unknown. However, the Fund has not had prior claims or losses pursuant to these contracts. Management has reviewed the Fund's existing contracts and expects the risk of loss to be remote.
14. Recent Accounting Pronouncements
In March 2020, FASB issued an Accounting Standards Update (ASU), ASU 2020-04, Reference Rate Reform (Topic 848) — Facilitation of the Effects of Reference Rate Reform on Financial Reporting. The amendments in ASU 2020-04 provide optional temporary financial reporting relief from the effect of certain types of contract modifications due to the planned discontinuation of LIBOR and other interbank-offered based reference rates as of the end of 2021. In March 2021, the administrator for LIBOR announced the extension of the publication of a majority of the USD LIBOR settings to June 30, 2023. On December 21, 2022, FASB issued ASU 2022-06 to defer the sunset date of Accounting Standards Codification Topic 848 until December 31, 2024. ASU 2020-04 is effective for certain reference rate-related contract modifications that occur during the period March 12, 2020 through December 31, 2024. Management is currently evaluating ASU 2020-04 and ASU 2022-06, but does not believe there will be a material impact.
15. Subsequent Events
Management has determined that no material events or transactions occurred subsequent to July 31, 2023, that would require recognition or disclosure in the Fund's financial statements.
Report of independent
registered public accounting firm
To the Board of Trustees of Delaware Group® Government Fund and Shareholders of Delaware Strategic Income Fund
Opinion on the Financial Statements
We have audited the accompanying statement of assets and liabilities, including the schedule of investments, of Delaware Strategic Income Fund (one of the funds constituting Delaware Group® Government Fund, referred to hereafter as the “Fund”) as of July 31, 2023, the related statement of operations for the year ended July 31, 2023, the statement of changes in net assets for each of the two years in the period ended July 31, 2023, including the related notes, and the financial highlights for each of the five years in the period ended July 31, 2023 (collectively referred to as the “financial statements”). In our opinion, the financial statements present fairly, in all material respects, the financial position of the Fund as of July 31, 2023, the results of its operations for the year then ended, the changes in its net assets for each of the two years in the period ended July 31, 2023 and the financial highlights for each of the five years in the period ended July 31, 2023 in conformity with accounting principles generally accepted in the United States of America.
Basis for Opinion
These financial statements are the responsibility of the Fund's management. Our responsibility is to express an opinion on the Fund's financial statements based on our audits. We are a public accounting firm registered with the Public Company Accounting Oversight Board (United States) (PCAOB) and are required to be independent with respect to the Fund in accordance with the U.S. federal securities laws and the applicable rules and regulations of the Securities and Exchange Commission and the PCAOB.
We conducted our audits of these financial statements in accordance with the standards of the PCAOB. Those standards require that we plan and perform the audit to obtain reasonable assurance about whether the financial statements are free of material misstatement, whether due to error or fraud.
Our audits included performing procedures to assess the risks of material misstatement of the financial statements, whether due to error or fraud, and performing procedures that respond to those risks. Such procedures included examining, on a test basis, evidence regarding the amounts and disclosures in the financial statements. Our audits also included evaluating the accounting principles used and significant estimates made by management, as well as evaluating the overall presentation of the financial statements. Our procedures included confirmation of securities owned as of July 31, 2023 by correspondence with the custodian, transfer agents, agent banks and brokers; when replies were not received from brokers, we performed other auditing procedures. We believe that our audits provide a reasonable basis for our opinion.
/s/ PricewaterhouseCoopers LLP
Philadelphia, Pennsylvania
September 21, 2023
We have served as the auditor of one or more investment companies in Delaware Funds by Macquarie® since 2010.
Other Fund information (Unaudited)
Delaware Strategic Income Fund
Liquidity Risk Management Program
The Securities and Exchange Commission (the “SEC”) has adopted Rule 22e-4 under the Investment Company Act of 1940 (the “Liquidity Rule”), which requires all open-end funds (other than money market funds) to adopt and implement a program reasonably designed to assess and manage the fund's “liquidity risk,” defined as the risk that the fund could not meet requests to redeem shares issued by the fund without significant dilution of remaining investors' interests in the fund.
The Fund has adopted and implemented a liquidity risk management program in accordance with the Liquidity Rule (the “Program”). The Board has designated a member of the US Operational Risk Group of Macquarie Asset Management as the Program Administrator for each Fund in the Trust.
As required by the Liquidity Rule, the Program includes policies and procedures that provide for: (1) assessment, management, and review (no less frequently than annually) of the Fund's liquidity risk; (2) classification of each of the Fund's portfolio holdings into one of four liquidity categories (Highly Liquid, Moderately Liquid, Less Liquid, and Illiquid); (3) for funds that do not primarily hold assets that are Highly Liquid, establishing and maintaining a minimum percentage of the Fund's net assets in Highly Liquid investments (called a “Highly Liquid Investment Minimum” or “HLIM”); and (4) prohibiting the Fund's acquisition of Illiquid investments if, immediately after the acquisition, the Fund would hold more than 15% of its net assets in Illiquid assets. The Program also requires reporting to the SEC (on a non-public basis) and to the Board if the Fund's holdings of Illiquid assets exceed 15% of the Fund's net assets. Funds with HLIMs must have procedures for addressing HLIM shortfalls, including reporting to the Board and, with respect to HLIM shortfalls lasting more than seven consecutive calendar days, reporting to the SEC (on a non-public basis).
In assessing and managing the Fund's liquidity risk, the Program Administrator considers, as relevant, a variety of factors, including: (1) the Fund's investment strategy and liquidity of portfolio investments during both normal and reasonably foreseeable stressed conditions; (2) short-term and long-term cash flow projections for the Fund during both normal and reasonably foreseeable stressed conditions; and (3) the Fund's holdings of cash and cash equivalents and any borrowing arrangements. Classification of the Fund's portfolio holdings in the four liquidity categories is based on the number of days it is reasonably expected to take to convert the investment to cash (for Highly Liquid and Moderately Liquid holdings) or to sell or dispose of the investment (for Less Liquid and Illiquid investments), in current market conditions without significantly changing the investment's market value. The Fund primarily holds assets that are classified as Highly Liquid, and therefore is not required to establish an HLIM.
At a meeting of the Board held on May 23-25, 2023, the Program Administrator provided a written report to the Board addressing the Program's operation and assessing the adequacy and effectiveness of its implementation for the period from April 1, 2022 through March 31, 2023. The report concluded that the Program is appropriately designed and effectively implemented and that it meets the requirements of Rule 22e-4 and the Fund's liquidity needs. The Fund's HLIM is set at an appropriate level and the Fund complied with its HLIM at all times during the reporting period.
Tax Information
The information set forth below is for the Fund's fiscal year as required by federal income tax laws. Shareholders, however, must report distributions on a calendar year basis for income tax purposes, which may include distributions for portions of two fiscal years of the Fund. Accordingly, the information needed by shareholders for income tax purposes will be sent to them in January of each year. Please consult your tax advisor for proper treatment of this information.
All disclosures are based on financial information available as of the date of this annual report and, accordingly are subject to change. For any and all items requiring reporting, it is the intention of the Fund to report the maximum amount permitted under the Internal Revenue Code and the regulations thereunder.
For the year ended July 31, 2023, the Fund reports distributions paid during the year as follows:
| (A) Ordinary Income Distributions (Tax Basis) | | | 100.00 | % |
(A) is based on a percentage of the Fund's total distributions.
The percentage of the ordinary dividends reported by the Fund that is treated as a Section 163(j) interest dividend and thus is eligible to be treated as interest income for purposes of Section 163(j) and the regulations thereunder is 98.80%.
Form N-PORT and proxy voting information
The Fund files its complete schedule of portfolio holdings with the Securities and Exchange Commission (SEC) for the first and third quarters of each fiscal year on Form N-PORT. The Fund's Form N-PORT, as well as a description of the policies and procedures that the Fund uses to determine how to vote proxies (if any) relating to portfolio securities, is available without charge (i) upon request, by calling 800 523-1918; and (ii) on the SEC's website at sec.gov. In addition, a description of the policies and procedures that the Fund uses to determine how to vote proxies (if any) relating to portfolio securities and the Schedule of Investments included in the Fund's most recent Form N-PORT are available without charge on the Fund's website at delawarefunds.com/literature.
Information (if any) regarding how the Fund voted proxies relating to portfolio securities during the most recently disclosed 12-month period ended June 30 is available without charge (i) through the Fund's website at delawarefunds.com/proxy; and (ii) on the SEC's website at sec.gov.
Board of trustees and officers addendum
Delaware Funds by Macquarie®
A mutual fund is governed by a Board of Trustees (“Trustees”), which has oversight responsibility for the management of a fund’s business affairs. Trustees establish procedures and oversee and review the performance of the investment manager, the distributor, and others who perform services for the fund. The independent fund trustees, in particular, are advocates for shareholder interests. Each trustee has served in that capacity since he or she was elected to or appointed to the Board of Trustees, and will continue to serve until his or her retirement or the election of a new trustee in his or her place. The following is a list of the Trustees and Officers with certain background and related information.
Name,
Address,
and Birth Year | Position(s)
Held with
the Trust | Length of Time
Served1 | Number of
Funds in Fund
Complex Overseen
by Trustee | Principal
Occupation(s)
During the
Past Five Years | Other
Directorships
Held by Trustee
During the
Past Five Years |
| Interested Trustee |
| |
Shawn K. Lytle2
100 Independence
610 Market Street
Philadelphia, PA
19106-2354
1970 | President,
Chief Executive
Officer,
and Trustee | President and
Chief Executive
Officer
since August 2015
Trustee since
September 2015 | 106 | Macquarie Asset
Management3
(2015–Present)
-Global Head of
Macquarie Asset
Management Public
Investments
(2019–Present)
-Head of Americas of
Macquarie Group
(2017–Present) | None |
| | | | | | |
Name,
Address,
and Birth Year | Position(s)
Held with
the Trust | Length of Time
Served1 | Number of
Funds in Fund
Complex Overseen
by Trustee | Principal
Occupation(s)
During the
Past Five Years | Other
Directorships
Held by Trustee
During the
Past Five Years |
| Independent Trustees |
| |
Jerome D. Abernathy
100 Independence
610 Market Street
Philadelphia, PA
19106-2354
1959 | Trustee | Since January 2019 | 106 | Stonebrook Capital
Management, LLC (financial
technology: macro
factors and databases)
-Managing Member
(1993-Present) | None |
| | | | | | |
Ann D. Borowiec
100 Independence
610 Market Street
Philadelphia, PA
19106-2354
1958 | Trustee | Since March 2015 | 106 | J.P. Morgan Chase & Co.
(1987–2013)
-Chief Executive Officer,
Private Wealth
Management (2011–2013) | Banco Santander International
(2016-2019)
Santander Bank, N.A.
(2016-2019) |
Board of trustees and officers addendum
Delaware Funds by Macquarie®
Name,
Address,
and Birth Year | Position(s)
Held with
the Trust | Length of Time
Served1 | Number of
Funds in Fund
Complex Overseen
by Trustee | Principal
Occupation(s)
During the
Past Five Years | Other
Directorships
Held by Trustee
During the
Past Five Years |
| | | | | | |
Joseph W. Chow
100 Independence
610 Market Street
Philadelphia, PA
19106-2354
1953 | Trustee | Since January 2013 | 106 | Private Investor
(2011–Present)
State Street Bank and
Trust Company
(1996-2011)
-Executive Vice President
of Enterprise Risk
Management and Emerging Economies
Strategy; and Chief Risk
and Corporate Administration Officer | None |
| | | | | | |
H. Jeffrey Dobbs
100 Independence
610 Market Street
Philadelphia, PA
19106-2354
1955 | Trustee | Since April 20194 | 106 | KPMG LLP
(2002-2015)
-Global Sector Chairman,
Industrial Manufacturing
(2010-2015) | TechAccel LLC
(2015–Present)
PatientsVoices, Inc.
(2018–Present)
Valparaiso University Board
(2012-Present)
Ivy Funds Complex (2019-2021) |
Name,
Address,
and Birth Year | Position(s)
Held with
the Trust | Length of Time
Served1 | Number of
Funds in Fund
Complex Overseen
by Trustee | Principal
Occupation(s)
During the
Past Five Years | Other
Directorships
Held by Trustee
During the
Past Five Years |
| | | | | | |
John A. Fry
100 Independence
610 Market Street
Philadelphia, PA
19106-2354
1960 | Trustee | Since January 2001 | 106 | Drexel University
-President
(2010–Present) | Federal Reserve
Bank of Philadelphia
(2020–Present)
Kresge Foundation (2018–Present)
FS Credit Real Estate Income
Trust, Inc. (2018-Present)
vTv Therapeutics Inc.
(2017–Present)
Community Health Systems
(2004–Present)
Drexel Morgan & Co. (2015–2019) |
Board of trustees and officers addendum
Delaware Funds by Macquarie®
Name,
Address,
and Birth Year | Position(s)
Held with
the Trust | Length of Time
Served1 | Number of
Funds in Fund
Complex Overseen
by Trustee | Principal
Occupation(s)
During the
Past Five Years | Other
Directorships
Held by Trustee
During the
Past Five Years |
| | | | | | |
Joseph Harroz, Jr.
100 Independence
610 Market Street
Philadelphia, PA
19106-2354
1967 | Trustee | Since November 19984 | 106 | University of Oklahoma
-President
(2020–Present)
-Interim President
(2019–2020)
-Vice President and
Dean, College of Law
(2010–2019)
Brookhaven Investments
LLC (commercial
enterprises)
-Managing Member
(2019–Present)
St. Clair, LLC
(commercial enterprises)
-Managing Member
(2019–Present) | OU Medicine, Inc.
(2020–Present)
Big 12 Athletic Conference
(2019–Present)
Valliance Bank
(2007–Present)
Ivy Funds Complex
(1998-2021) |
Name,
Address,
and Birth Year | Position(s)
Held with
the Trust | Length of Time
Served1 | Number of
Funds in Fund
Complex Overseen
by Trustee | Principal
Occupation(s)
During the
Past Five Years | Other
Directorships
Held by Trustee
During the
Past Five Years |
| | | | | | |
Sandra A.J. Lawrence
100 Independence
610 Market Street
Philadelphia, PA
19106-2354
1957 | Trustee | Since April 20194 | 106 | Children’s Mercy
Hospitals and Clinics
(2005–2019)
-Chief Administrative
Officer
(2016–2019) | Brixmor Property Group Inc.
(2021-Present)
Sera Prognostics Inc.
(biotechnology) (2021-Present)
Recology (resource recovery)
(2021-Present)
Evergy, Inc., Kansas City Power
& Light Company, KCP&L
Greater Missouri Operations
Company, Westar Energy, Inc.
and Kansas Gas and Electric
Company (related utility
companies) (2018-Present)
National Association of Corporate
Directors (2017-Present)
American Shared Hospital
Services (medical device)
(2017-2021)
Ivy Funds Complex (2019-2021) |
Board of trustees and officers addendum
Delaware Funds by Macquarie®
Name,
Address,
and Birth Year | Position(s)
Held with
the Trust | Length of Time
Served1 | Number of
Funds in Fund
Complex Overseen
by Trustee | Principal
Occupation(s)
During the
Past Five Years | Other
Directorships
Held by Trustee
During the
Past Five Years |
| | | | | | |
Frances A.
Sevilla-Sacasa
100 Independence
610 Market Street
Philadelphia, PA
19106-2354
1956 | Trustee | Since September
2011 | 106 | Banco Itaú International
-Chief Executive Officer
(2012–2016)
Bank of America,
U.S. Trust Private Wealth
-President (2007-2008)
U.S. Trust Corp.
-President & CEO
(2005-2007) | Invitation Homes Inc.
(2023-Present)
Florida Chapter of National
Association of Corporate
Directors (2021-Present)
Callon Petroleum Company
(2019-Present)
Camden Property Trust
(2011-Present)
New Senior Investment
Group Inc. (REIT) (2021)
Carrizo Oil & Gas, Inc.
(2018-2019) |
| | | | | | |
Thomas K. Whitford
100 Independence
610 Market Street
Philadelphia, PA
19106-2354
1956 | Chair and Trustee | Trustee since January
2013 Chair since January
2023 | 106 | PNC Financial Services
Group (1983–2013)
-Vice Chairman
(2009-2013) | HSBC USA Inc.
(2014–2022)
HSBC North America
Holdings Inc.
(2013–2022) |
Name,
Address,
and Birth Year | Position(s)
Held with
the Trust | Length of Time
Served1 | Number of
Funds in Fund
Complex Overseen
by Trustee | Principal
Occupation(s)
During the
Past Five Years | Other
Directorships
Held by Trustee
During the
Past Five Years |
| | | | | | |
Christianna Wood
100 Independence
610 Market Street
Philadelphia, PA
19106-2354
1959 | Trustee | Since January 2019 | 106 | Gore Creek
Capital, Ltd.
-Chief Executive Officer
and President
(2009–Present)
Capital Z Asset
Management
-Chief Executive Officer
(2008-2009)
California Public
Employees' Retirement
System (CalPERS)
-Senior Investment
Officer of Global Equity
(2002-2008) | The Merger Fund
(2013–2021),
The Merger Fund VL
(2013–2021),
WCM Alternatives: Event-Driven
Fund (2013–2021),
and WCM Alternatives: Credit
Event Fund (2017–2021)
Grange Insurance
(2013–Present)
H&R Block Corporation
(2008–2022)
International Securities
Exchange (2010-2018)
Vassar College Trustee
(2006-2018) |
Board of trustees and officers addendum
Delaware Funds by Macquarie®
Name,
Address,
and Birth Year | Position(s)
Held with
the Trust | Length of Time
Served1 | Number of
Funds in Fund
Complex Overseen
by Trustee | Principal
Occupation(s)
During the
Past Five Years | Other
Directorships
Held by Trustee
During the
Past Five Years |
| | | | | | |
Janet L. Yeomans
100 Independence
610 Market Street
Philadelphia, PA 19106-2354 1948 | Trustee | Since April 1999 | 106 | 3M Company
(1995-2012)
-Vice President and
Treasurer (2006–2012) | Temple University Hospital
(2017-Present)
Pennsylvania State System of
Higher Education (2018-Present) |
| | | | | | |
| Officers |
| | | | | | |
David F. Connor
100 Independence
610 Market Street
Philadelphia, PA
19106-2354
1963 | Senior Vice President,
General Counsel, and
Secretary | Senior Vice President,
since May 2013;
General Counsel
since May 2015;
Secretary since
October 2005 | 106 | David F. Connor has
served in various
capacities at different
times at Macquarie Asset
Management. | None5 |
| | | | | | |
Daniel V. Geatens
100 Independence
610 Market Street
Philadelphia, PA
19106-2354
1972 | Senior Vice President
and Treasurer | Senior Vice President
and Treasurer since
October 2007 | 106 | Daniel V. Geatens has
served in various
capacities at different
times at Macquarie Asset
Management. | None5 |
Name,
Address,
and Birth Year | Position(s)
Held with
the Trust | Length of Time
Served1 | Number of
Funds in Fund
Complex Overseen
by Trustee | Principal
Occupation(s)
During the
Past Five Years | Other
Directorships
Held by Trustee
During the
Past Five Years |
| | | | | | |
Richard Salus
100 Independence
610 Market Street
Philadelphia, PA
19106-2354 1963 | Senior Vice President
and Chief Financial
Officer | Senior Vice President
and Chief Financial
Officer since
November 2006 | 106 | Richard Salus has
served in various
capacities at different
times at Macquarie Asset
Management. | None |
1 “Length of Time Served” refers to the time since the Trustee or officer began serving one or more of the Trusts in the Delaware Funds complex.
2 Shawn K. Lytle is considered to be an “Interested Trustee” because he is an executive officer of the Funds' investment advisor.
3 Macquarie Asset Management is the marketing name for certain companies comprising the asset management division of Macquarie Group, including the Funds' investment advisor, principal underwriter, and transfer agent.
4 Includes time served on the Board of the Ivy Funds complex prior to the date when the Ivy Funds joined the Delaware Funds complex.
5 David F. Connor and Daniel V. Geatens serve in similar capacities for the six portfolios of the Optimum Fund Trust, which have the same investment manager, principal underwriter, and transfer agent as the Funds. Mr. Geatens also serves as the Chief Financial Officer of the Optimum Fund Trust.
The Statement of Additional Information for the Fund(s) includes additional information about the Trustees and Officers and is available, without charge, upon request by calling 800 523-1918.
Annual report
Fixed income mutual fund
Delaware Emerging Markets Debt Corporate Fund
July 31, 2023
Carefully consider the Fund’s investment objectives, risk factors, charges, and expenses before investing. This and other information can be found in the Fund’s prospectus and its summary prospectus, which may be obtained by visiting delawarefunds.com/literature or calling 800 523-1918. Investors should read the prospectus and the summary prospectus carefully before investing.
You can obtain shareholder reports and prospectuses online instead of in the mail.
Visit delawarefunds.com/edelivery.
Experience Delaware Funds by Macquarie®
Macquarie Asset Management (MAM) is a global asset manager that aims to deliver positive impact for everyone. MAM Public Investments traces its roots to 1929 and partners with institutional and individual clients to deliver specialist active investment capabilities across global equities, fixed income, and multi-asset solutions using a conviction-based, long-term approach to investing. In the US, retail investors recognize our Delaware Funds by Macquarie family of funds as one of the oldest mutual fund families.
If you are interested in learning more about creating an investment plan, contact your financial advisor.
You can learn more about Delaware Funds or obtain a prospectus for Delaware Emerging Markets Debt Corporate Fund at delawarefunds.com/literature.
Manage your account online
| ● | Check your account balance and transactions |
| ● | View statements and tax forms |
| ● | Make purchases and redemptions |
Visit delawarefunds.com/account-access.
Macquarie Asset Management (MAM) is the asset management division of Macquarie Group. MAM is a full-service asset manager offering a diverse range of products across public and private markets including fixed income, equities, multi-asset solutions, private credit, infrastructure, renewables, natural assets, real estate, and asset finance. The Public Investments business is a part of MAM and includes the following investment advisers: Macquarie Investment Management Business Trust (MIMBT), Macquarie Investment Management Austria Kapitalanlage AG, Macquarie Investment Management Global Limited, Macquarie Investment Management Europe Limited, and Macquarie Investment Management Europe S.A.
The Fund is distributed by Delaware Distributors, L.P. (DDLP), an affiliate of MIMBT and Macquarie Group Limited.
Other than Macquarie Bank Limited ABN 46 008 583 542 (“Macquarie Bank”), any Macquarie Group entity noted in this document is not an authorized deposit-taking institution for the purposes of the Banking Act 1959 (Commonwealth of Australia). The obligations of these other Macquarie Group entities do not represent deposits or other liabilities of Macquarie Bank. Macquarie Bank does not guarantee or otherwise provide assurance in respect of the obligations of these other Macquarie Group entities. In addition, if this document relates to an investment, (a) the investor is subject to investment risk including possible delays in repayment and loss of income and principal invested and (b) none of Macquarie Bank or any other Macquarie Group entity guarantees any particular rate of return on or the performance of the investment, nor do they guarantee repayment of capital in respect of the investment.
The Fund is governed by US laws and regulations.
Table of contents
This annual report is for the information of Delaware Emerging Markets Debt Corporate Fund shareholders, but it may be used with prospective investors when preceded or accompanied by the Delaware Fund fact sheet for the most recently completed calendar quarter. These documents are available at delawarefunds.com/literature.
Unless otherwise noted, views expressed herein are current as of July 31, 2023, and subject to change for events occurring after such date.
The Fund is not FDIC insured and is not guaranteed. It is possible to lose the principal amount invested.
Advisory services provided by Delaware Management Company, a series of MIMBT, a US registered investment advisor.
All third-party marks cited are the property of their respective owners.
© 2023 Macquarie Management Holdings, Inc.
| Portfolio management review | |
| Delaware Emerging Markets Debt Corporate Fund | July 31, 2023 (Unaudited) |
Performance preview (for the year ended July 31, 2023)
| Delaware Emerging Markets Debt Corporate Fund (Institutional Class shares) | 1-year return | +7.01% |
| Delaware Emerging Markets Debt Corporate Fund (Class A shares) | 1-year return | +6.74% |
| J.P. Morgan Corporate Emerging Markets Bond Index (CEMBI) Broad Diversified (benchmark) | 1-year return | +5.59% |
Past performance does not guarantee future results.
For complete, annualized performance for Delaware Emerging Markets Debt Corporate Fund, please see the table on page 5.
Institutional Class shares are not subject to a sales charge and are offered for sale exclusively to certain eligible investors. In addition, Institutional Class shares pay no distribution and service fee.
The performance of Class A shares excludes the applicable sales charge. The performance of both Institutional Class shares and Class A shares reflects the reinvestment of all distributions.
Please see page 8 for a description of the index. Index performance returns do not reflect any management fees, transaction costs, or expenses. Indices are unmanaged and one cannot invest directly in an index.
Investment objective
The Fund seeks current income and, secondarily, capital appreciation.
Market review
Emerging market countries continued to respond aggressively to inflation, in many cases taking the lead relative to their developed market counterparts during the fiscal year ended July 31, 2023. Taken as a whole, the rate-tightening activity of central banks in both emerging and developed markets was the principal driver of risk sentiment across the globe.
During the fiscal year, the US Federal Reserve raised interest rates 300 basis points to 5.25%. (One basis point equals one-hundredth of a percentage point.) The European Central Bank, moving in near lockstep, raised rates to 4.25%. Given that credit issued within those developed markets is considered risk free, this created a considerable challenge for emerging markets. With few exceptions, developing countries responded to inflationary pressures by hiking
In emerging markets, with generally tighter monetary policy and higher real rates, inflation trended lower more convincingly than in developed markets.
Portfolio management review
Delaware Emerging Markets Debt Corporate Fund
rates early and often, maintaining credibility. Emerging markets then acted preemptively to protect their assets and economies from outflows.
Their efforts here were largely successful. As the fiscal year closed, inflation in developed countries slowed, albeit grudgingly. Developed-nation central banks were still engaged and data dependent, watching vigilantly for any sign of an inflationary outbreak. In emerging markets, however, with their generally tighter monetary policy and higher real rates, inflation trended lower more convincingly. In fact, toward the end of the fiscal period, it appeared that several emerging market countries were poised to begin cutting rates, a development that still seems far off in developed countries.
For example, Brazil, which doesn’t have a reputation for acting in an orthodox manner, nonetheless began hiking rates from 2% in March 2021 to a high of 13.75%. Brazil acted convincingly and, as a result, it was positioned to begin cutting rates as the fiscal period ended. In fact, throughout the developing regions, we saw mature decision making that helped them weather market volatility better than expected.
China, and the impact of its COVID-19 response on global trade, also had a significant effect on emerging market investing during the fiscal period. With its zero-COVID policy, China implemented a much stricter regime to tamp down the pandemic’s spread than anywhere else in the world. A significant slowdown in China’s economy and severe supply chain disruptions everywhere else resulted. When China lifted the restrictions late in 2022, we expected a rapid and sustained increase in economic activity, similar to what took place in the West. Instead, in the latter half of the fiscal period, China failed to live up to those expectations. We saw a struggle to achieve growth targets, even from the very soft comparisons with the year-ago period.
The problems in China reverberated throughout emerging markets. The China-US trade rivalry, one of the few significant issues that has garnered bipartisan support in the US, also came into play. As the dispute continues, there is a growing call in the US to reinvigorate near shoring – moving production from China to closer locales, such as Mexico, which has become a relative beneficiary.
The Russia-Ukraine war also affected emerging markets, including distortions in markets such as oil and other commodities, caused by restrictions on trade with Russia. Diplomatic efforts to end the war have so far met with no success. Given that Ukraine is a breadbasket country, disruptions in food production and exports will likely continue to exert inflationary pressure on the country’s trading peers.
Within the Fund
For the fiscal year ended July 31, 2023, Delaware Emerging Markets Debt Corporate Fund outperformed its benchmark, the J.P. Morgan Corporate Emerging Markets Bond Index (CEMBI) Broad Diversified. The Fund’s Institutional Class shares gained 7.01%. The Fund’s Class A shares returned 6.74% at net asset value and 1.93% at maximum offer price. These figures reflect all distributions reinvested. For the same period, the Fund’s benchmark advanced 5.59%. For complete annualized performance for Delaware Emerging Markets Debt Corporate Fund, please see the table on page 5.
The Fund held consistent positioning on a regional basis throughout the fiscal period. It carried a significant overweight allocation relative to the benchmark in Latin America,
which was funded by its underweighting to Asia. The Fund’s allocation to Central Europe, Middle East, and Africa (CEMEA) was in line with the benchmark.
On a regional basis, Brazil, Mexico, and Russia outperformed the benchmark during the fiscal year. Brazil and Mexico are the core of the Fund’s holdings in Latin America. They are also the Fund’s largest overweight positions relative to the benchmark. Both benefited from strong security selection and high yield compression (rising bond prices as credit spreads narrowed).
The Fund’s Russian credits outperformed compared with the benchmark, largely due to a technicality arising from the war in Ukraine. Shortly after the war broke out, in March 2022, Russia was removed from major market indices. On paper, at least, the value of Russian securities went to zero. We focused on exiting our positions during the fiscal period but did so at sensible levels. We sold in the high 60s and high 70s, substantially more than the bonds’ lows in the 20s. We attribute the gain to both index dynamics and making the right investment calls.
China was the most significant regional underperformer by far. While we had substantially underweighted the country, we had a high yield bias and were hurt by poor security selection, most of which was due to stress in the property sector. The Fund was underweight at the country level, but what it owned was high beta (more volatile), resulting from our belief that these positions would significantly outperform in the fourth quarter of 2022. Then the bottom fell out, and the Fund experienced severe distress, particularly in the property sector but also in high yield, generally. Although investment grade credits performed well, that did not help offset the Fund’s high yield exposure.
Macao, Panama, and Qatar also lagged the benchmark but to a far lesser extent. With an underweight in Macao, the Fund underperformed as the gaming industry staged a sharp recovery. The Fund remained underweight at the end of the fiscal period. In Panama, the Fund had less-liquid positioning than the benchmark and consequently lagged a market rally. We have since reduced some of that less-liquid exposure. In Qatar, the Fund was also underweight given what we viewed as tight valuations. However, we are positioned to reduce the underweight if and when we see issuance of new Qatari corporates.
Studio City Finance Ltd., a Macao-based casino, was a significant contributor to outperformance relative to the benchmark in the fiscal period. We reversed our positioning from an underweight to the benchmark to an overweight just as travel to Macao resumed following the COVID-19 pandemic. Studio City also benefited as authorities in Macao reinstituted concessions to major casino operators.
Aeropuertos Argentina 2000 SA operates airports globally. Based in Argentina, which has experienced considerable volatility, the company proved its ability to manage its balance sheet through turbulent times. During the fiscal period, the company secured access to refinancing funds and added to Fund performance.
VEON Holdings BV (VEON Ltd.) also contributed significantly to performance. Initially founded in Russia as VimpelCom Ltd., telecommunications company VEON divested its Russian assets and is now domiciled in the Netherlands, where it does business globally. Although the company avoided Ukraine-war-imposed sanctions, we took advantage of its relative strength to exit.
Portfolio management review
Delaware Emerging Markets Debt Corporate Fund
Grupo Aeroméxico SAB de CV, a formerly distressed Mexican airline, benefited from strong fundamental performance as the travel industry recovered from the pandemic. We profited from both restructured bonds that we owned as well as a piece of restructured equity that we acquired due to an earlier bankruptcy.
Bonds of Sino-Ocean Land Treasure IV Ltd., from Chinese property developer Sino-Ocean Group Holding Ltd., were a significant detractor during the fiscal period. Sino-Ocean Group Holding was formerly owned and occasionally supported by China Life Insurance Co. Ltd., a large financial company in China. Despite verbal commitments, China Life did little to support Sino-Ocean, allowing it to flirt with default. We reduced our position somewhat but still own some exposure.
RKPF Overseas 2020 A Ltd. (Road King Infrastructure Ltd.), also in the Chinese property sector, likewise detracted from performance. Although it is a higher-quality high yield credit, it was nonetheless swept up in the same challenges confronting the entire sector. We maintained exposure and continue to keep a vigilant eye on the Chinese government’s next policy steps.
Wynn Macau Ltd. benefited from the same macro supports as Studio City but was a relative detractor from the Fund’s performance given our lack of ownership. We saw better value elsewhere.
Among industrial sectors, the strongest contributors to performance during the Fund’s fiscal period were industrials, transports, and technology, media, and telecommunications (TMT). The weakest sectors were real estate, pulp and paper, and sovereigns, which mainly consisted of credit default swap (CDS) hedges.
At the end of the fiscal period, the Fund looked much like it had at the outset: regionally overweight Latin America and underweight Asia, with an eye to neutralizing those positions as market conditions permit. From a duration perspective, the Fund was neutral to slightly overweight duration, which we expect it to maintain.
Relative to the benchmark, the Fund was overweight high yield and underweight investment grade credits when the fiscal period began. As the year progressed, and as high yield spreads compressed, we narrowed the relative over- and underweights. All things being equal, we expect to continue increasing the Fund’s exposure to investment grade securities and thus keep raising the Fund’s overall quality level.
A note about derivatives
During the fiscal year, Delaware Emerging Markets Debt Corporate Fund invested in credit default swaps and US dollar futures. These positions added 0.31 percentage points to performance for the fiscal year. The Fund had exposure to derivatives at the end of the fiscal year.
| Performance summary | |
| Delaware Emerging Markets Debt Corporate Fund | July 31, 2023 (Unaudited) |
The performance quoted represents past performance and does not guarantee future results. Investment return and principal value of an investment will fluctuate so that shares, when redeemed, may be worth more or less than their original cost. Current performance may be lower or higher than the performance quoted. Performance data current to the most recent month end may be obtained by calling 800 523-1918 or visiting delawarefunds.com/performance.
| Fund and benchmark performance1,2,3 | Average annual total returns through July 31, 2023 |
| | 1 year | 5 year | 10 year |
| Class A (Est. September 30, 2013) | | | |
| Excluding sales charge | +6.74% | +2.36% | +3.15% |
| Including sales charge | +1.93% | +1.42% | +2.68% |
| Class C (Est. September 30, 2013) | | | |
| Excluding sales charge | +5.98% | +1.59% | +2.59% |
| Including sales charge | +4.98% | +1.59% | +2.59% |
| Class R (Est. September 30, 2013) | | | |
| Excluding sales charge | +7.15% | +2.65% | +3.31% |
| Including sales charge | +7.15% | +2.65% | +3.31% |
| Institutional Class (Est. September 30, 2013) | | |
| Excluding sales charge | +7.01% | +2.59% | +3.34% |
| Including sales charge | +7.01% | +2.59% | +3.34% |
| J.P. Morgan Corporate Emerging Markets Bond Index (CEMBI) Broad Diversified | +5.59% | +2.30% | +3.57% |
1 A privately offered fund managed by the Fund’s portfolio manager was reorganized into the Fund and the Fund commenced operations on September 30, 2013. This privately offered fund commenced operations on November 3, 2010 and had an investment objective and strategies that were, in all material respects, the same as those of the Fund, and was managed in a manner that, in all material respects, complied with the investment guidelines and restrictions of the Fund. However, the privately offered fund was not registered as an investment under the Investment Company Act of 1940 (1940 Act). As a result, the privately offered fund was not subject to certain investment limitations, diversification requirements, liquidity requirements, and other restrictions imposed by the 1940 Act and the Internal Revenue Code of 1986, as amended, which, if applicable, may have adversely affected its performance.
The Fund’s performance for the periods prior to its commencement of operations on September 30, 2013 is that of the privately offered fund. Because the privately offered fund was a master fund that did not charge any management or other asset-based fees, the privately offered fund’s performance shown above has been restated, on a one-time basis, to reflect the fees, expenses, and waivers and reimbursements for each class of the Fund at the commencement of the Fund’s operations. If the performance of the privately offered fund had not been restated, the
Performance summary
Delaware Emerging Markets Debt Corporate Fund
performance for such classes may have been higher than the performance shown in the average annual total returns table on page 5.
2 Returns reflect the reinvestment of all distributions and are presented both with and without the applicable sales charges described below. Returns do not reflect the deduction of taxes the shareholder would pay on Fund distributions or redemptions of Fund shares.
Expense limitations were in effect for certain classes during some or all of the periods shown in the “Fund and benchmark performance” table. Expenses for each class are listed in the “Fund expense ratios” table on page 7. Performance would have been lower had expense limitations not been in effect.
Class A shares are sold with a maximum front-end sales charge of 4.50%, and have an annual distribution and service (12b-1) fee of 0.25% of average daily net assets. Performance for Class A shares, excluding sales charges, assumes that no front-end sales charge applied.
Class C shares are sold with a contingent deferred sales charge (CDSC) of 1.00% if redeemed during the first 12 months. They are also subject to an annual 12b-1 fee of 1.00% of average daily net assets. Performance for Class C shares, excluding sales charges, assumes either that CDSCs did not apply or that the investment was not redeemed.
Class R shares are available only for certain retirement plan products. They are sold without a sales charge and have an annual 12b-1 fee of 0.50% of average daily net assets. Delaware Distributors, L.P. has agreed to voluntarily suspend the 12b-1 for Class R shares and the suspension of the 12b-1 fee will continue while the Class is not broadly distributed.
Institutional Class shares are not subject to a sales charge and are offered for sale exclusively to certain eligible investors. In addition, Institutional Class shares pay no 12b-1 fee.
Fixed income securities and bond funds can lose value, and investors can lose principal, as interest rates rise. They also may be affected by economic conditions that hinder an issuer’s ability to make interest and principal payments on its debt. This includes prepayment risk, the risk that the principal of a bond that is held by a portfolio will be prepaid prior to maturity, at the time when interest rates are lower than what the bond was paying. A portfolio may then have to reinvest that money at a lower interest rate.
High yielding, non-investment-grade bonds (junk bonds) involve higher risk than investment grade bonds. The high yield secondary market is particularly susceptible to liquidity problems when institutional investors, such as mutual funds and certain other financial institutions, temporarily stop buying bonds for regulatory, financial, or other reasons. In addition, a less liquid secondary market makes it more difficult to obtain precise valuations of the high yield securities.
The Fund may invest in derivatives, which may involve additional expenses and are subject to risk, including the risk that an underlying security or securities index moves in the opposite direction from what the portfolio manager anticipated. A derivatives transaction depends upon the counterparties’ ability to fulfill their contractual obligations.
International investments entail risks including fluctuation in currency values, differences in accounting principles, or economic or political instability. Investing in emerging markets can be riskier than investing in established foreign markets due to increased volatility, lower
trading volume, and higher risk of market closures. In many emerging markets, there is substantially less publicly available information and the available information may be incomplete or misleading. Legal claims are generally more difficult to pursue.
If and when the Fund invests in forward foreign currency contracts or uses other investments to hedge against currency risks, the Fund will be subject to special risks, including counterparty risk.
Diversification may not protect against market risk.
The Fund may experience portfolio turnover in excess of 100%, which could result in higher transaction costs and tax liability.
If and when the Fund invests in forward foreign currency contracts or uses other investments to hedge against currency risks, the Fund will be subject to special risks, including counterparty risk.
IBOR risk is the risk that changes related to the use of the London interbank offered rate (LIBOR) or similar rates (such as EONIA) could have adverse impacts on financial instruments that reference these rates. The abandonment of these rates and transition to alternative rates could affect the value and liquidity of instruments that reference them and could affect investment strategy performance.
The disruptions caused by natural disasters, pandemics, or similar events could prevent the Fund from executing advantageous investment decisions in a timely manner and could negatively impact the Fund’s ability to achieve its investment objective and the value of the Fund’s investments.
3The Fund’s expense ratios, as described in the most recent prospectus, are disclosed in the following “Fund expense ratios” table. The expense ratios below may differ from the expense ratios in the “Financial highlights” since they are based on different time periods and the expense ratios in the prospectus include acquired fund fees and expenses, if any. See Note 2 in “Notes to financial statements” for additional details. Please see the “Financial highlights” section in this report for the most recent expense ratios.
| Fund expense ratios | Class A | Class C | Class R | Institutional
Class |
| Total annual operating expenses (without fee waivers) | 1.43% | 2.18% | 1.68% | 1.18% |
| Net expenses (including fee waivers, if any) | 1.04% | 1.79% | 1.29% | 0.79% |
| Type of waiver | Contractual | Contractual | Contractual | Contractual |
Performance summary
Delaware Emerging Markets Debt Corporate Fund
Performance of a $10,000 investment1
For the period September 30, 2013 (Fund’s inception) through July 31, 2023
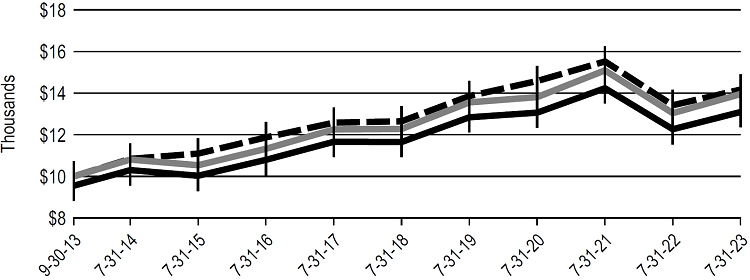
| | | | | | |
| | | | Starting value | | Ending value |
 | J.P. Morgan Corporate Emerging Markets Bond Index (CEMBI) Broad Diversified | | $ | 10,000 | | | $ | 14,168 | |
 | Delaware Emerging Markets Debt Corporate Fund – Institutional Class shares | | $ | 10,000 | | | $ | 13,953 | |
 | Delaware Emerging Markets Debt Corporate Fund – Class A shares | | $ | 9,550 | | | $ | 13,091 | |
1The “Performance of a $10,000 investment” graph assumes $10,000 invested in Institutional Class and Class A shares of the Fund on September 30, 2013, and includes the effect of a 4.50% front-end sales charge (for Class A shares) and the reinvestment of all distributions. The graph does not reflect the deduction of taxes the shareholders would pay on Fund distributions or redemptions of Fund shares. Expense limitations were in effect for some or all of the periods shown. Performance would have been lower had expense limitations not been in effect. Expenses are listed in the “Fund expense ratios” table on page 7. Please note additional details on pages 5 through 9.
The graph also assumes $10,000 invested in the J.P. Morgan Corporate Emerging Markets Bond Index (CEMBI) Broad Diversified as of September 30, 2013. The J.P. Morgan Corporate Emerging Markets Bond Index (CEMBI) Broad Diversified tracks US dollar-denominated emerging market corporate bonds, limiting the weights of countries with larger corporate debt stocks by including only a specified portion of those countries’ eligible current face amounts of debt outstanding.
Index performance returns do not reflect any management fees, transaction costs, or expenses. Indices are unmanaged and one cannot invest directly in an index. Past performance does not guarantee future results.
Performance of other Fund classes will vary due to different charges and expenses.
| | Nasdaq symbols | | CUSIPs | |
| Class A | DEDAX | | 246094841 | |
| Class C | DEDCX | | 246094833 | |
| Class R | DEDRX | | 246094825 | |
| Institutional Class | DEDIX | | 246094817 | |
Disclosure of Fund expenses
For the six-month period from February 1, 2023 to July 31, 2023 (Unaudited)
As a shareholder of the Fund, you incur two types of costs: (1) transaction costs, including sales charges (loads) on purchase payments, reinvested dividends, or other distributions; redemption fees; and exchange fees; and (2) ongoing costs, including management fees; distribution and service (12b-1) fees; and other Fund expenses. This example is intended to help you understand your ongoing costs (in dollars) of investing in the Fund and to compare these costs with the ongoing costs of investing in other mutual funds.
The example is based on an investment of $1,000 invested at the beginning of the period and held for the entire six-month period from February 1, 2023 to July 31, 2023.
Actual expenses
The first section of the table shown, “Actual Fund return,” provides information about actual account values and actual expenses. You may use the information in this section of the table, together with the amount you invested, to estimate the expenses that you paid over the period. Simply divide your account value by $1,000 (for example, an $8,600 account value divided by $1,000 = 8.6), then multiply the result by the number in the first section under the heading entitled “Expenses Paid During Period” to estimate the expenses you paid on your account during this period.
Hypothetical example for comparison purposes
The second section of the table shown, “Hypothetical 5% return,” provides information about hypothetical account values and hypothetical expenses based on the Fund’s actual expense ratio and an assumed rate of return of 5% per year before expenses, which is not the Fund’s actual return. The hypothetical account values and expenses may not be used to estimate the actual ending account balance or expenses you paid for the period. You may use this information to compare the ongoing costs of investing in the Fund and other funds. To do so, compare this 5% hypothetical example with the 5% hypothetical examples that appear in the shareholder reports of the other funds.
Please note that the expenses shown in the table are meant to highlight your ongoing costs only and do not reflect any transactional costs, such as sales charges (loads), redemption fees, or exchange fees. Therefore, the second section of the table is useful in comparing ongoing costs only, and will not help you determine the relative total costs of owning different funds. In addition, if these transactional costs were included, your costs would have been higher. The Fund’s expenses shown in the table reflect fee waivers in effect and assume reinvestment of all dividends and distributions.
Delaware Emerging Markets Debt Corporate Fund
Expense analysis of an investment of $1,000
| | | Beginning
Account Value
2/1/23 | | Ending
Account Value
7/31/23 | | Annualized
Expense Ratio | | Expenses
Paid During Period
2/1/23 to 7/31/23* |
| Actual Fund return† | | | | | | | | |
| Class A | | $ | 1,000.00 | | | $ | 1,007.90 | | | 1.04% | | $ | 5.18 | |
| Class C | | | 1,000.00 | | | | 1,004.40 | | | 1.79% | | | 8.90 | |
| Class R | | | 1,000.00 | | | | 1,007.90 | | | 0.79% | | | 3.93 | |
| Institutional Class | | | 1,000.00 | | | | 1,007.80 | | | 0.79% | | | 3.93 | |
| Hypothetical 5% return (5% return before expenses) |
| Class A | | $ | 1,000.00 | | | $ | 1,019.64 | | | 1.04% | | $ | 5.21 | |
| Class C | | | 1,000.00 | | | | 1,015.92 | | | 1.79% | | | 8.95 | |
| Class R | | | 1,000.00 | | | | 1,020.88 | | | 0.79% | | | 3.96 | |
| Institutional Class | | | 1,000.00 | | | | 1,020.88 | | | 0.79% | | | 3.96 | |
*“Expenses Paid During Period” are equal to the Fund’s annualized expense ratio, multiplied by the average account value over the period, multiplied by 181/365 (to reflect the one-half year period).
†Because actual returns reflect only the most recent six-month period, the returns shown may differ significantly from fiscal year returns.
In addition to the Fund’s expenses reflected above, the Fund also indirectly bears its portion of the fees and expenses of any investment companies (Underlying Funds), in which it invests. The table above does not reflect the expenses of any Underlying Funds.
| Security type / country and sector allocations |
| Delaware Emerging Markets Debt Corporate Fund | As of July 31, 2023 (Unaudited) |
Sector designations may be different from the sector designations presented in other Fund materials. The sector designations may represent the investment manager’s internal sector classifications, which may result in the sector designations for one fund being different from another fund’s sector designations.
| Security type / country | Percentage of net assets |
| Corporate Bonds | 91.09 | % |
| Argentina | 1.88 | % |
| Australia | 0.46 | % |
| Brazil | 9.76 | % |
| Chile | 2.73 | % |
| China | 4.81 | % |
| Colombia | 3.57 | % |
| Costa Rica | 0.94 | % |
| Georgia | 0.79 | % |
| Ghana | 1.42 | % |
| Guatemala | 1.90 | % |
| Hong Kong | 2.69 | % |
| India | 3.32 | % |
| Indonesia | 4.49 | % |
| Israel | 5.52 | % |
| Jamaica | 0.76 | % |
| Kazakhstan | 0.89 | % |
| Kuwait | 0.85 | % |
| Macao | 3.20 | % |
| Madagascar | 0.60 | % |
| Malaysia | 1.60 | % |
| Mexico | 7.73 | % |
| Morocco | 0.68 | % |
| Nigeria | 1.42 | % |
| Oman | 0.87 | % |
| Paraguay | 0.88 | % |
| Peru | 2.59 | % |
| Philippines | 1.81 | % |
| Qatar | 0.85 | % |
| Republic of Korea | 2.95 | % |
| Republic of Vietnam | 0.62 | % |
| Saudi Arabia | 2.59 | % |
| Singapore | 0.35 | % |
| South Africa | 2.42 | % |
| Taiwan | 0.79 | % |
| Thailand | 1.70 | % |
| Security type / country | Percentage of net assets |
| Turkey | 3.44 | % |
| Ukraine | 0.99 | % |
| United Arab Emirates | 3.95 | % |
| United States | 0.89 | % |
| Zambia | 1.39 | % |
| Sovereign Bonds | 2.24 | % |
| Common Stock by Country | 0.50 | % |
| Short-Term Investments | 5.04 | % |
| Total Value of Securities | 98.87 | % |
| Receivables and Other Assets Net of Liabilities | 1.13 | % |
| Total Net Assets | 100.00 | % |
| | | |
| Corporate bonds by sector | Percentage of net assets |
| Banking | 10.72 | % |
| Basic Industry | 7.87 | % |
| Basic Materials | 0.97 | % |
| Capital Goods | 2.36 | % |
| Communications | 7.14 | % |
| Consumer Cyclical | 8.20 | % |
| Consumer Non-Cyclical | 6.10 | % |
| Electric | 5.24 | % |
| Energy | 14.00 | % |
| Finance Companies | 0.51 | % |
| Financials | 7.41 | % |
| Government Agency | 2.91 | % |
| Industrials | 7.41 | % |
| Insurance | 1.38 | % |
| Natural Gas | 0.77 | % |
| Real Estate | 1.56 | % |
| Technology | 1.78 | % |
| Transportation | 2.40 | % |
| Utilities | 2.36 | % |
| Total | 91.09 | % |
| Schedule of investments | |
| Delaware Emerging Markets Debt Corporate Fund | July 31, 2023 |
| | |
| | | Principal
amount° | | | Value (US $) | |
| Corporate Bonds – 91.09%Δ | | | | | | |
| Argentina – 1.88% | | | | | | | | |
| Aeropuertos Argentina 2000 144A 8.50% 8/1/31 # | | | 544,629 | | | $ | 517,117 | |
| Transportadora de Gas del Sur 144A 6.75% 5/2/25 # | | | 715,000 | | | | 679,967 | |
| YPF 144A 6.95% 7/21/27 # | | | 535,000 | | | | 455,390 | |
| | | | | | | | 1,652,474 | |
| Australia – 0.46% | | | | | | | | |
| AngloGold Ashanti Holdings 3.375% 11/1/28 | | | 460,000 | | | | 407,760 | |
| | | | | | | | 407,760 | |
| Brazil – 9.76% | | | | | | | | |
| Acu Petroleo Luxembourg 144A 7.50% 7/13/35 # | | | 765,663 | | | | 685,596 | |
| Arcos Dorados 144A 6.125% 5/27/29 # | | | 410,000 | | | | 397,136 | |
| Azul Secured Finance | | | | | | | | |
| 144A 11.50% 5/28/29 # | | | 420,000 | | | | 378,995 | |
| 144A 11.93% 8/28/28 # | | | 1,095,000 | | | | 1,103,212 | |
| Banco do Brasil 144A 6.25% 4/18/30 # | | | 665,000 | | | | 664,834 | |
| Braskem Netherlands Finance 144A 7.25% 2/13/33 # | | | 650,000 | | | | 640,891 | |
| CSN Resources | | | | | | | | |
| 144A 5.875% 4/8/32 # | | | 630,000 | | | | 525,780 | |
| 144A 7.625% 4/17/26 # | | | 400,000 | | | | 399,413 | |
| Embraer Netherlands Finance | | | | | | | | |
| 5.40% 2/1/27 | | | 665,000 | | | | 652,584 | |
| 144A 7.00% 7/28/30 # | | | 625,000 | | | | 632,250 | |
| Guara Norte 144A 5.198% 6/15/34 # | | | 756,042 | | | | 675,335 | |
| Natura Cosmeticos 144A 4.125% 5/3/28 # | | | 620,000 | | | | 546,625 | |
| Rumo Luxembourg 144A 5.25% 1/10/28 # | | | 660,000 | | | | 628,980 | |
| Vale Overseas 6.125% 6/12/33 | | | 645,000 | | | | 649,061 | |
| | | | | | | | 8,580,692 | |
| Chile – 2.73% | | | | | | | | |
| AES Andes 144A 7.125% 3/26/79 #, µ | | | 605,000 | | | | 579,257 | |
| Alfa Desarrollo 144A 4.55% 9/27/51 # | | | 815,957 | | | | 621,163 | |
| Banco de Credito e Inversiones 144A 3.50% 10/12/27 # | | | 765,000 | | | | 706,269 | |
| Colbun 144A 3.95% 10/11/27 # | | | 520,000 | | | | 492,158 | |
| | | | | | | | 2,398,847 | |
| China – 4.81% | | | | | | | | |
| Alibaba Group Holding 2.70% 2/9/41 | | | 645,000 | | | | 434,311 | |
| BOC Aviation USA 144A 4.875% 5/3/33 # | | | 740,000 | | | | 720,632 | |
| Country Garden Holdings | | | | | | | | |
| 3.875% 10/22/30 | | | 900,000 | | | | 128,691 | |
| 4.20% 2/6/26 | | | 274,000 | | | | 50,701 | |
| 7.25% 4/8/26 | | | 405,000 | | | | 74,173 | |
| | | Principal
amount° | | | Value (US $) | |
| Corporate BondsΔ (continued) | | | | | | |
| China (continued) | | | | | | | | |
| ENN Energy Holdings 144A 2.625% 9/17/30 # | | | 750,000 | | | $ | 623,511 | |
| Huarong Finance 2019 3.875% 11/13/29 | | | 570,000 | | | | 450,016 | |
| Prosus 144A 4.193% 1/19/32 # | | | 780,000 | | | | 660,539 | |
| RKPF Overseas 2020 5.125% 7/26/26 | | | 380,000 | | | | 154,840 | |
| Sino-Ocean Land Treasure IV 4.75% 8/5/29 | | | 420,000 | | | | 36,503 | |
| Tencent Holdings | | | | | | | | |
| 144A 2.88% 4/22/31 # | | | 495,000 | | | | 419,361 | |
| 144A 3.68% 4/22/41 # | | | 350,000 | | | | 266,969 | |
| West China Cement 4.95% 7/8/26 | | | 275,000 | | | | 208,766 | |
| | | | | | | | 4,229,013 | |
| Colombia – 3.57% | | | | | | | | |
| Banco GNB Sudameris 144A 7.50% 4/16/31 #, µ | | | 800,000 | | | | 670,000 | |
| Bancolombia 6.909% 10/18/27 µ | | | 570,000 | | | | 560,139 | |
| Canacol Energy 144A 5.75% 11/24/28 # | | | 450,000 | | | | 394,714 | |
| Ecopetrol | | | | | | | | |
| 5.875% 11/2/51 | | | 410,000 | | | | 284,958 | |
| 6.875% 4/29/30 | | | 640,000 | | | | 603,549 | |
| Geopark 144A 5.50% 1/17/27 # | | | 725,000 | | | | 623,690 | |
| | | | | | | | 3,137,050 | |
| Costa Rica – 0.94% | | | | | | | | |
| Liberty Costa Rica Senior Secured Finance 144A 10.875% 1/15/31 # | | | 820,000 | | | | 823,183 | |
| | | | | | | | 823,183 | |
| Georgia – 0.79% | | | | | | | | |
| Georgian Railway JSC 4.00% 6/17/28 | | | 797,000 | | | | 694,904 | |
| | | | | | | | 694,904 | |
| Ghana – 1.42% | | | | | | | | |
| Kosmos Energy 144A 7.75% 5/1/27 # | | | 815,000 | | | | 749,570 | |
| Tullow Oil 144A 10.25% 5/15/26 # | | | 610,000 | | | | 496,662 | |
| | | | | | | | 1,246,232 | |
| Guatemala – 1.90% | | | | | | | | |
| Banco Industrial 144A 4.875% 1/29/31 #, µ | | | 455,000 | | | | 424,629 | |
| Central American Bottling 144A 5.25% 4/27/29 # | | | 670,000 | | | | 618,692 | |
| CT Trust 144A 5.125% 2/3/32 # | | | 750,000 | | | | 624,332 | |
| | | | | | | | 1,667,653 | |
| Hong Kong – 2.69% | | | | | | | | |
| AIA Group 144A 3.375% 4/7/30 # | | | 600,000 | | | | 545,457 | |
Schedule of investments
Delaware Emerging Markets Debt Corporate Fund
| | | Principal
amount° | | | Value (US $) | |
| Corporate BondsΔ (continued) | | | | | | |
| Hong Kong (continued) | | | | | | | | |
| CK Hutchison International 23 | | | | | | | | |
| 144A 4.75% 4/21/28 # | | | 460,000 | | | $ | 453,981 | |
| 144A 4.875% 4/21/33 # | | | 825,000 | | | | 813,089 | |
| Standard Chartered 144A 6.301% 1/9/29 #, µ | | | 540,000 | | | | 549,124 | |
| | | | | | | | 2,361,651 | |
| India – 3.32% | | | | | | | | |
| Future Retail 144A 5.60% 1/22/25 #, ‡ | | | 425,000 | | | | 12,240 | |
| Greenko Power II 144A 4.30% 12/13/28 # | | | 440,563 | | | | 388,770 | |
| ICICI Bank 144A 4.00% 3/18/26 # | | | 450,000 | | | | 433,275 | |
| JSW Hydro Energy 144A 4.125% 5/18/31 # | | | 676,200 | | | | 570,580 | |
| Summit Digitel Infrastructure 144A 2.875% 8/12/31 # | | | 990,000 | | | | 787,345 | |
| UltraTech Cement 144A 2.80% 2/16/31 # | | | 895,000 | | | | 731,771 | |
| | | | | | | | 2,923,981 | |
| Indonesia – 4.49% | | | | | | | | |
| Cikarang Listrindo 144A 4.95% 9/14/26 # | | | 792,000 | | | | 753,695 | |
| Freeport Indonesia | | | | | | | | |
| 144A 5.315% 4/14/32 # | | | 630,000 | | | | 599,968 | |
| 144A 6.20% 4/14/52 # | | | 270,000 | | | | 252,661 | |
| Indika Energy Capital IV 144A 8.25% 10/22/25 # | | | 595,000 | | | | 593,833 | |
| Indofood CBP Sukses Makmur | | | | | | | | |
| 3.541% 4/27/32 | | | 605,000 | | | | 510,457 | |
| 4.805% 4/27/52 | | | 280,000 | | | | 214,517 | |
| Medco Laurel Tree 144A 6.95% 11/12/28 # | | | 754,000 | | | | 692,720 | |
| Minejesa Capital 144A 5.625% 8/10/37 # | | | 395,000 | | | | 328,057 | |
| | | | | | | | 3,945,908 | |
| Israel – 5.52% | | | | | | | | |
| Altice Financing 144A 5.00% 1/15/28 # | | | 600,000 | | | | 466,273 | |
| Bank Hapoalim BM 144A 3.255% 1/21/32 #, µ | | | 605,000 | | | | 520,427 | |
| Bank Leumi Le-Israel | | | | | | | | |
| 144A 5.125% 7/27/27 # | | | 515,000 | | | | 510,236 | |
| 144A 7.129% 7/18/33 #, µ | | | 650,000 | | | | 642,362 | |
| Energean Israel Finance | | | | | | | | |
| 144A 4.875% 3/30/26 # | | | 535,000 | | | | 500,693 | |
| 144A 8.50% 9/30/33 # | | | 400,000 | | | | 401,000 | |
| ICL Group 144A 6.375% 5/31/38 # | | | 380,000 | | | | 385,463 | |
| Israel Electric 144A 3.75% 2/22/32 # | | | 635,000 | | | | 540,290 | |
| Teva Pharmaceutical Finance Netherlands III | | | | | | | | |
| 5.125% 5/9/29 | | | 560,000 | | | | 513,615 | |
| 6.75% 3/1/28 | | | 375,000 | | | | 372,437 | |
| | | | | | | | 4,852,796 | |
| | | Principal
amount° | | | Value (US $) | |
| Corporate BondsΔ (continued) | | | | | | |
| Jamaica – 0.76% | | | | | | | | |
| Sagicor Financial 144A 5.30% 5/13/28 # | | | 700,000 | | | $ | 665,165 | |
| | | | | | | | 665,165 | |
| Kazakhstan – 0.89% | | | | | | | | |
| KazMunayGas National | | | | | | | | |
| 144A 4.75% 4/19/27 # | | | 200,000 | | | | 191,438 | |
| 144A 5.375% 4/24/30 # | | | 630,000 | | | | 594,080 | |
| | | | | | | | 785,518 | |
| Kuwait – 0.85% | | | | | | | | |
| NBK SPC 144A 1.625% 9/15/27 #, µ | | | 835,000 | | | | 747,330 | |
| | | | | | | | 747,330 | |
| Macao – 3.20% | | | | | | | | |
| MGM China Holdings | | | | | | | | |
| 144A 4.75% 2/1/27 # | | | 960,000 | | | | 882,336 | |
| 144A 5.25% 6/18/25 # | | | 205,000 | | | | 197,142 | |
| Sands China | | | | | | | | |
| 3.75% 8/8/31 | | | 465,000 | | | | 390,419 | |
| 4.30% 1/8/26 | | | 580,000 | | | | 553,060 | |
| Studio City Finance 144A 5.00% 1/15/29 # | | | 1,030,000 | | | | 794,588 | |
| | | | | | | | 2,817,545 | |
| Madagascar – 0.60% | | | | | | | | |
| Axian Telecom 144A 7.375% 2/16/27 # | | | 575,000 | | | | 530,668 | |
| | | | | | | | 530,668 | |
| Malaysia – 1.60% | | | | | | | | |
| CIMB Bank 144A 2.125% 7/20/27 # | | | 725,000 | | | | 650,729 | |
| MISC Capital Two Labuan 144A 3.75% 4/6/27 # | | | 810,000 | | | | 759,791 | |
| | | | | | | | 1,410,520 | |
| Mexico – 7.73% | | | | | | | | |
| Alsea 144A 7.75% 12/14/26 # | | | 590,000 | | | | 594,244 | |
| America Movil 4.70% 7/21/32 | | | 740,000 | | | | 713,390 | |
| Banco Mercantil del Norte 144A 8.375% 10/14/30 #, µ, Ψ | | | 410,000 | | | | 402,235 | |
| BBVA Bancomer 144A 5.875% 9/13/34 #, µ | | | 620,000 | | | | 555,418 | |
| Cemex 144A 9.125% 3/14/28 #, µ, Ψ | | | 620,000 | | | | 645,602 | |
| CIBANCO Institucion de Banca Multiple Trust 144A 4.375% 7/22/31 # | | | 890,000 | | | | 668,659 | |
| GCC 144A 3.614% 4/20/32 # | | | 790,000 | | | | 672,088 | |
| Grupo Aeromexico 144A 8.50% 3/17/27 # | | | 1,010,000 | | | | 915,762 | |
| Infraestructura Energetica Nova 144A 4.75% 1/15/51 # | | | 880,000 | | | | 680,460 | |
| Nemak 144A 3.625% 6/28/31 # | | | 575,000 | | | | 456,149 | |
Schedule of investments
Delaware Emerging Markets Debt Corporate Fund
| | | Principal
amount° | | | Value (US $) | |
| Corporate BondsΔ (continued) | | | | | | |
| Mexico (continued) | | | | | | | | |
| Petroleos Mexicanos 144A 10.00% 2/7/33 # | | | 535,000 | | | $ | 498,710 | |
| | | | | | | | 6,802,717 | |
| Morocco – 0.68% | | | | | | | | |
| OCP | | | | | | | | |
| 144A 5.125% 6/23/51 # | | | 270,000 | | | | 205,096 | |
| 144A 6.875% 4/25/44 # | | | 415,000 | | | | 391,540 | |
| | | | | | | | 596,636 | |
| Nigeria – 1.42% | | | | | | | | |
| Access Bank 144A 6.125% 9/21/26 # | | | 765,000 | | | | 669,413 | |
| IHS Holding 144A 5.625% 11/29/26 # | | | 665,000 | | | | 583,052 | |
| | | | | | | | 1,252,465 | |
| Oman – 0.87% | | | | | | | | |
| Oryx Funding 144A 5.80% 2/3/31 # | | | 780,000 | | | | 766,297 | |
| | | | | | | | 766,297 | |
| Paraguay – 0.88% | | | | | | | | |
| Banco Continental 144A 2.75% 12/10/25 # | | | 850,000 | | | | 774,130 | |
| | | | | | | | 774,130 | |
| Peru – 2.59% | | | | | | | | |
| Consorcio Transmantaro 144A 5.20% 4/11/38 # | | | 605,000 | | | | 572,304 | |
| InRetail Consumer 144A 3.25% 3/22/28 # | | | 715,000 | | | | 620,273 | |
| Lima Metro Line 2 Finance 144A 4.35% 4/5/36 # | | | 555,054 | | | | 505,957 | |
| SAN Miguel Industrias 144A 3.50% 8/2/28 # | | | 680,000 | | | | 581,634 | |
| | | | | | | | 2,280,168 | |
| Philippines – 1.81% | | | | | | | | |
| International Container Terminal Services 4.75% 6/17/30 | | | 645,000 | | | | 622,490 | |
| Jollibee Worldwide Pte 3.90% 1/23/25 µ, Ψ | | | 392,000 | | | | 375,340 | |
| Rizal Commercial Banking 6.50% 8/27/25 µ, Ψ | | | 675,000 | | | | 597,419 | |
| | | | | | | | 1,595,249 | |
| Qatar – 0.85% | | | | | | | | |
| QNB Finance 2.625% 5/12/25 | | | 790,000 | | | | 749,019 | |
| | | | | | | | 749,019 | |
| Republic of Korea – 2.95% | | | | | | | | |
| Hana Bank 144A 1.25% 12/16/26 # | | | 335,000 | | | | 289,425 | |
| Kia 144A 2.375% 2/14/25 # | | | 645,000 | | | | 613,175 | |
| Shinhan Bank 3.875% 3/24/26 | | | 490,000 | | | | 462,323 | |
| Shinhan Financial Group 144A 5.00% 7/24/28 # | | | 365,000 | | | | 361,330 | |
| | | Principal
amount° | | | Value (US $) | |
| Corporate BondsΔ (continued) | | | | | | |
| Republic of Korea (continued) | | | | | | | | |
| SK Hynix | | | | | | | | |
| 144A 1.50% 1/19/26 # | | | 390,000 | | | $ | 349,120 | |
| 144A 6.50% 1/17/33 # | | | 510,000 | | | | 521,309 | |
| | | | | | | | 2,596,682 | |
| Republic of Vietnam – 0.62% | | | | | | | | |
| Mong Duong Finance Holdings 144A 5.125% 5/7/29 # | | | 600,000 | | | | 542,984 | |
| | | | | | | | 542,984 | |
| Saudi Arabia – 2.59% | | | | | | | | |
| EIG Pearl Holdings 144A 4.387% 11/30/46 # | | | 515,000 | | | | 402,882 | |
| Greensaif Pipelines Bidco 144A 6.51% 2/23/42 # | | | 580,000 | | | | 600,968 | |
| Saudi Arabian Oil | | | | | | | | |
| 144A 3.50% 11/24/70 # | | | 410,000 | | | | 272,677 | |
| 144A 4.25% 4/16/39 # | | | 600,000 | | | | 528,132 | |
| TMS Issuer 144A 5.78% 8/23/32 # | | | 465,000 | | | | 476,625 | |
| | | | | | | | 2,281,284 | |
| Singapore – 0.35% | | | | | | | | |
| GLP 3.875% 6/4/25 | | | 445,000 | | | | 310,388 | |
| | | | | | | | 310,388 | |
| South Africa – 2.42% | | | | | | | | |
| Anglo American Capital 144A 5.50% 5/2/33 # | | | 735,000 | | | | 722,004 | |
| Bidvest Group UK 144A 3.625% 9/23/26 # | | | 585,000 | | | | 529,422 | |
| Sasol Financing USA | | | | | | | | |
| 6.50% 9/27/28 | | | 400,000 | | | | 370,567 | |
| 144A 8.75% 5/3/29 # | | | 505,000 | | | | 505,568 | |
| | | | | | | | 2,127,561 | |
| Taiwan – 0.79% | | | | | | | | |
| TSMC Global 144A 4.625% 7/22/32 # | | | 695,000 | | | | 691,592 | |
| | | | | | | | 691,592 | |
| Thailand – 1.70% | | | | | | | | |
| Bangkok Bank 144A 5.00% 9/23/25 #, µ, Ψ | | | 580,000 | | | | 554,581 | |
| PTTEP Treasury Center 144A 2.587% 6/10/27 # | | | 465,000 | | | | 423,744 | |
| Thaioil Treasury Center 144A 2.50% 6/18/30 # | | | 640,000 | | | | 521,005 | |
| | | | | | | | 1,499,330 | |
| Turkey – 3.44% | | | | | | | | |
| Akbank TAS | | | | | | | | |
| 144A 6.80% 2/6/26 # | | | 730,000 | | | | 713,568 | |
| 6.80% 6/22/31 µ | | | 270,000 | | | | 252,280 | |
| Coca-Cola Icecek 144A 4.50% 1/20/29 # | | | 475,000 | | | | 429,314 | |
Schedule of investments
Delaware Emerging Markets Debt Corporate Fund
| | | Principal
amount° | | | Value (US $) | |
| Corporate BondsΔ (continued) | | | | | | |
| Turkey (continued) | | | | | | | | |
| Turkcell Iletisim Hizmetleri 144A 5.80% 4/11/28 # | | | 605,000 | | | $ | 551,078 | |
| Turkiye Garanti Bankasi 144A 7.177% 5/24/27 #, µ | | | 695,000 | | | | 653,157 | |
| Turkiye Sise ve Cam Fabrikalari 144A 6.95% 3/14/26 # | | | 435,000 | | | | 427,066 | |
| | | | | | | | 3,026,463 | |
| Ukraine – 0.99% | | | | | | | | |
| Metinvest 144A 7.75% 10/17/29 # | | | 810,000 | | | | 490,050 | |
| MHP Lux 144A 6.25% 9/19/29 # | | | 430,000 | | | | 227,900 | |
| State Agency of Roads of Ukraine 144A 6.25% 6/24/30 # | | | 560,000 | | | | 154,000 | |
| | | | | | | | 871,950 | |
| United Arab Emirates – 3.95% | | | | | | | | |
| Abu Dhabi National Energy PJSC 144A 2.00% 4/29/28 # | | | 585,000 | | | | 518,172 | |
| Emirates NBD Bank PJSC | | | | | | | | |
| 2.625% 2/18/25 | | | 410,000 | | | | 391,242 | |
| 6.125% 4/9/26 µ, Ψ | | | 400,000 | | | | 398,130 | |
| First Abu Dhabi Bank 4.50% 4/5/26 µ, Ψ | | | 415,000 | | | | 393,059 | |
| Galaxy Pipeline Assets Bidco 144A 2.94% 9/30/40 # | | | 812,122 | | | | 657,453 | |
| MAF Global Securities 7.875% 6/30/27 µ, Ψ | | | 635,000 | | | | 648,964 | |
| Sweihan PV Power PJSC 144A 3.625% 1/31/49 # | | | 581,706 | | | | 468,159 | |
| | | | | | | | 3,475,179 | |
| United States – 0.89% | | | | | | | | |
| JBS USA LUX | | | | | | | | |
| 144A 3.75% 12/1/31 # | | | 310,000 | | | | 263,890 | |
| 144A 5.50% 1/15/30 # | | | 540,000 | | | | 522,785 | |
| | | | | | | | 786,675 | |
| Zambia – 1.39% | | | | | | | | |
| First Quantum Minerals | | | | | | | | |
| 144A 6.875% 10/15/27 # | | | 515,000 | | | | 507,023 | |
| 144A 8.625% 6/1/31 # | | | 700,000 | | | | 717,500 | |
| | | | | | | | 1,224,523 | |
| Total Corporate Bonds (cost $84,709,927) | | | | | | | 80,130,182 | |
| |
| Sovereign Bonds – 2.24%Δ | | | | | | | | |
| Hong Kong – 0.59% | | | | | | | | |
| Airport Authority 144A 2.50% 1/12/32 # | | | 610,000 | | | | 514,443 | |
| | | | | | | | 514,443 | |
| Poland – 0.86% | | | | | | | | |
| Bank Gospodarstwa Krajowego 144A 5.375% 5/22/33 # | | | 760,000 | | | | 760,262 | |
| | | | | | | | 760,262 | |
| | | Principal
amount° | | | Value (US $) | |
| Sovereign BondsΔ (continued) | | | | | | | | |
| Republic of Korea – 0.79% | | | | | | | | |
| Korea Hydro & Nuclear Power 144A 5.00% 7/18/28 # | | | 695,000 | | | $ | 692,743 | |
| | | | | | | | 692,743 | |
| Total Sovereign Bonds (cost $2,026,215) | | | | | | | 1,967,448 | |
| | | | | | | | | |
| | | | Number of
shares | | | | | |
| Common Stock – 0.50%Δ | | | | | | | | |
| Mexico – 0.50% | | | | | | | | |
| Grupo Aeromexico =, † | | | 29,657 | | | | 442,774 | |
| Total Common Stock (cost $484,744) | | | | | | | 442,774 | |
| |
| Short-Term Investments – 5.04% | | | | | | | | |
| Money Market Mutual Funds – 5.04% | | | | | | | | |
BlackRock Liquidity FedFund – Institutional Shares
(seven-day effective yield 5.15%) | | | 1,108,291 | | | | 1,108,291 | |
Fidelity Investments Money Market Government Portfolio –
Class I (seven-day effective yield 5.16%) | | | 1,108,291 | | | | 1,108,291 | |
Goldman Sachs Financial Square Government Fund –
Institutional Shares (seven-day effective yield 5.29%) | | | 1,108,291 | | | | 1,108,291 | |
Morgan Stanley Institutional Liquidity Funds Government
Portfolio – Institutional Class (seven-day effective yield 5.19%) | | | 1,108,291 | | | | 1,108,291 | |
| Total Short-Term Investments (cost $4,433,164) | | | | | | | 4,433,164 | |
Total Value of Securities–98.87%
(cost $91,654,050) | | | | | | $ | 86,973,568 | |
| | |
| ° | Principal amount shown is stated in USD unless noted that the security is denominated in another currency. |
| Δ | Securities have been classified by country of risk. Aggregate classification by business sector has been presented on page 12 in “Security type / country and sector allocations.” |
| # | Security exempt from registration under Rule 144A of the Securities Act of 1933, as amended. At July 31, 2023, the aggregate value of Rule 144A securities was $67,867,558, which represents 77.15% of the Fund’s net assets. See Note 11 in “Notes to financial statements.” |
| µ | Fixed to variable rate investment. The rate shown reflects the fixed rate in effect at July 31, 2023. Rate will reset at a future date. |
| ‡ | Non-income producing security. Security is currently in default. |
| Ψ | Perpetual security. Maturity date represents next call date. |
Schedule of investments
Delaware Emerging Markets Debt Corporate Fund
| = | The value of this security was determined using significant unobservable inputs and is reported as a Level 3 security in the disclosure table located in Note 3 in “Notes to financial statements.” |
| † | Non-income producing security. |
The following futures contracts and swap contracts were outstanding at July 31, 2023:1
Futures Contracts
Exchange-Traded
| Contracts to Buy (Sell) | | Notional
Amount | | | Notional
Cost
(Proceeds) | | | Expiration
Date | | Value/
Unrealized
Appreciation | | | Variation
Margin
Due from
(Due to)
Brokers | |
| (17) | | US Treasury 10 yr Ultra Notes | | $ | (1,988,734 | ) | | $ | (2,037,699 | ) | | 9/20/23 | | $ | 48,965 | | | $ | (1,594 | ) |
| (2) | | US Treasury Long Bonds | | | (248,875 | ) | | | (253,667 | ) | | 9/20/23 | | | 4,792 | | | | (375 | ) |
| Total Futures Contracts | | | | | | $ | (2,291,366 | ) | | | | $ | 53,757 | | | $ | (1,969 | ) |
Swap Contracts
CDS Contracts2
Counterparty/
Reference Obligation/
Termination Date/
Payment Frequency | | Notional
Amount3 | | | Annual
Protection
Payments | | | Value | | | Upfront
Payments
Paid
(Received) | | | Unrealized
Depreciation4 | |
| Over-The-Counter: | | | | | | | | | | | | | | | | | | | | |
| Protection Purchased/Moody’s Ratings: | | | | | | | | | | | | | | | | | | | | |
| JPMCB Mexico 10.375% 1/28/33 Baa2 6/22/26-Quarterly | | | 1,748,000 | | | | 1.000 | % | | $ | (23,894 | ) | | $ | 7,560 | | | $ | (31,454 | ) |
| JPMCB Republic of Brazil 4.25% 1/7/25 Ba2 6/20/26-Quarterly | | | 2,527,000 | | | | 1.000 | % | | | (14,457 | ) | | | 46,153 | | | | (60,610 | ) |
| Total CDS Contracts | | | | | | | | | | $ | (38,351 | ) | | $ | 53,713 | | | $ | (92,064 | ) |
The use of futures contracts and swap contracts involve elements of market risk and risks in excess of the amounts disclosed in the financial statements. The notional amounts presented above represent the Fund’s total exposure in such contracts, whereas only the variation margin and unrealized appreciation (depreciation) are reflected in the Fund’s net assets.
| 1 | See Note 8 in “Notes to financial statements.” |
| 2 | A CDS contract is a risk-transfer instrument through which one party (purchaser of protection) transfers to another party (seller of protection) the financial risk of a credit event (as defined in the CDS agreement), as it relates to a particular reference security or basket of securities (such as an index). Periodic payments (receipts) on such contracts are accrued daily and recorded as unrealized losses (gains) on swap contracts. Upon payment (receipt), such amounts are recorded as realized losses (gains) on swap contracts. Upfront payments made or received in connection with CDS contracts are amortized over the expected life of the CDS contracts as unrealized losses (gains) on swap contracts. The change in value of CDS contracts is recorded daily as unrealized appreciation or depreciation. A realized gain or loss is recorded upon a credit event (as defined in the CDS agreement) or the maturity or termination of the CDS agreement. |
| 3 | Notional amount shown is stated in USD unless noted that the swap is denominated in another currency. |
| 4 | Unrealized appreciation (depreciation) does not include periodic interest payments (receipt) on swap contracts accrued daily in the amount of $(4,988). |
Summary of abbreviations:
CDS – Credit Default Swap
JPMCB – JPMorgan Chase Bank
JSC – Joint Stock Company
PJSC – Private Joint Stock Company
yr – Year
USD – US Dollar
See accompanying notes, which are an integral part of the financial statements.
| Statement of assets and liabilities | |
| Delaware Emerging Markets Debt Corporate Fund | July 31, 2023 |
| Assets: | | | |
| Investments, at value* | | $ | 86,973,568 | |
| Cash | | | 417,205 | |
| Cash collateral due from broker | | | 55,400 | |
| Foreign currencies, at valueΔ | | | 5 | |
| Dividends and interest receivable | | | 1,143,402 | |
| Receivable for securities sold | | | 474,088 | |
| Receivable for fund shares sold | | | 231,761 | |
| Upfront payments paid on credit default swap contracts | | | 53,713 | |
| Prepaid expenses | | | 8,019 | |
| Other assets | | | 559 | |
| Total Assets | | | 89,357,720 | |
| Liabilities: | | | | |
| Payable for securities purchased | | | 1,061,090 | |
| Other accrued expenses | | | 163,070 | |
| Unrealized depreciation on credit default swap contracts | | | 92,064 | |
| Investment management fees payable to affiliates | | | 37,217 | |
| Payable for fund shares redeemed | | | 15,835 | |
| Administration expenses payable to affiliates | | | 14,645 | |
| Swap payments payable | | | 4,988 | |
| Variation margin due to broker on futures contracts | | | 1,969 | |
| Distribution fees payable to affiliates | | | 364 | |
| Total Liabilities | | | 1,391,242 | |
| Total Net Assets | | $ | 87,966,478 | |
| | | | | |
| Net Assets Consist of: | | | | |
| Paid-in capital | | $ | 101,069,174 | |
| Total distributable earnings (loss) | | | (13,102,696 | ) |
| Total Net Assets | | $ | 87,966,478 | |
| Net Asset Value | | | |
| | | | |
| Class A: | | | | |
| Net assets | | $ | 753,452 | |
| Shares of beneficial interest outstanding, unlimited authorization, no par | | | 101,150 | |
| Net asset value per share | | $ | 7.45 | |
| Sales charge | | | 4.50 | % |
| Offering price per share, equal to net asset value per share / (1 - sales charge) | | $ | 7.80 | |
| | | | | |
| Class C: | | | | |
| Net assets | | $ | 244,130 | |
| Shares of beneficial interest outstanding, unlimited authorization, no par | | | 32,835 | |
| Net asset value per share | | $ | 7.44 | |
| | | | | |
| Class R: | | | | |
| Net assets | | $ | 2,816 | |
| Shares of beneficial interest outstanding, unlimited authorization, no par | | | 378 | |
| Net asset value per share | | $ | 7.45 | |
| | | | | |
| Institutional Class: | | | | |
| Net assets | | $ | 86,966,080 | |
| Shares of beneficial interest outstanding, unlimited authorization, no par | | | 11,685,803 | |
| Net asset value per share | | $ | 7.44 | |
| | | | |
| *Investments, at cost | | $ | 91,654,050 | |
| ΔForeign currencies, at cost | | | 6 | |
See accompanying notes, which are an integral part of the financial statements.
| Statement of operations | |
| Delaware Emerging Markets Debt Corporate Fund | Year ended July 31, 2023 |
| Investment Income: | | | |
| Interest | | $ | 5,171,316 | |
| Dividends | | | 140,521 | |
| Foreign tax withheld | | | (11,826 | ) |
| | | | 5,300,011 | |
| | | | | |
| Expenses: | | | | |
| Management fees | | | 610,262 | |
| Distribution expenses — Class A | | | 1,860 | |
| Distribution expenses — Class C | | | 2,154 | |
| Distribution expenses — Class R | | | 13 | |
| Dividend disbursing and transfer agent fees and expenses | | | 93,609 | |
| Registration fees | | | 73,135 | |
| Accounting and administration expenses | | | 52,768 | |
| Audit and tax fees | | | 44,771 | |
| Legal fees | | | 35,314 | |
| Reports and statements to shareholders expenses | | | 29,244 | |
| Trustees’ fees and expenses | | | 3,314 | |
| Other | | | 25,837 | |
| | | | 972,281 | |
| Less expenses waived | | | (325,299 | ) |
| Less waived distribution expenses — Class R | | | (13 | ) |
| Less expenses paid indirectly | | | (59 | ) |
| Total operating expenses | | | 646,910 | |
| Net Investment Income (Loss) | | | 4,653,101 | |
| Net Realized and Unrealized Gain (Loss): | | | |
| Net realized gain (loss) on: | | | |
| Investments | | $ | (7,077,918 | ) |
| Futures contracts | | | 173,955 | |
| Swap contracts | | | (61,821 | ) |
| Net realized gain (loss) | | | (6,965,784 | ) |
| | | | | |
| Net change in unrealized appreciation (depreciation) on: | | | | |
| Investments | | | 7,910,600 | |
| Foreign currencies | | | (1 | ) |
| Futures contracts | | | 113,687 | |
| Swap contracts | | | (156,055 | ) |
| Net change in unrealized appreciation (depreciation) | | | 7,868,231 | |
| Net Realized and Unrealized Gain (Loss) | | | 902,447 | |
| Net Increase (Decrease) in Net Assets Resulting from Operations | | $ | 5,555,548 | |
See accompanying notes, which are an integral part of the financial statements.
Statements of changes in net assets
Delaware Emerging Markets Debt Corporate Fund
| | | Year ended |
| | | 7/31/23 | | | 7/31/22 | |
| Increase (Decrease) in Net Assets from Operations: | | | | | | | | |
| Net investment income (loss) | | $ | 4,653,101 | | | $ | 3,540,281 | |
| Net realized gain (loss) | | | (6,965,784 | ) | | | (1,393,604 | ) |
| Net change in unrealized appreciation (depreciation) | | | 7,868,231 | | | | (14,710,837 | ) |
| Net increase (decrease) in net assets resulting from operations | | | 5,555,548 | | | | (12,564,160 | ) |
| | | | | | | | | |
| Dividends and Distributions to Shareholders from: | | | | | | | | |
| Distributable earnings: | | | | | | | | |
| Class A | | | (38,098 | ) | | | (39,568 | ) |
| Class C | | | (9,809 | ) | | | (5,017 | ) |
| Class R | | | (146 | ) | | | (133 | ) |
| Institutional Class | | | (4,336,974 | ) | | | (3,932,638 | ) |
| | | | (4,385,027 | ) | | | (3,977,356 | ) |
| | | | | | | | | |
| Capital Share Transactions: | | | | | | | | |
| Proceeds from shares sold: | | | | | | | | |
| Class A | | | 91,277 | | | | 366,899 | |
| Class C | | | 68,839 | | | | 151,347 | |
| Institutional Class | | | 36,422,812 | | | | 54,184,674 | |
| | | | | | | | | |
| Net asset value of shares issued upon reinvestment of dividends and distributions: | | | | | | | | |
| Class A | | | 38,098 | | | | 39,568 | |
| Class C | | | 9,708 | | | | 5,017 | |
| Class R | | | 146 | | | | 133 | |
| Institutional Class | | | 4,137,470 | | | | 3,843,722 | |
| | | | 40,768,350 | | | | 58,591,360 | |
| | | Year ended |
| | | 7/31/23 | | | 7/31/22 | |
| Capital Share Transactions (continued): | | | | | | | | |
| Cost of shares redeemed: | | | | | | | | |
| Class A | | $ | (152,861 | ) | | $ | (283,336 | ) |
| Class C | | | (47,773 | ) | | | (18,387 | ) |
| Institutional Class | | | (50,778,932 | ) | | | (32,170,599 | ) |
| | | | (50,979,566 | ) | | | (32,472,322 | ) |
| Increase (decrease) in net assets derived from capital share transactions | | | (10,211,216 | ) | | | 26,119,038 | |
| Net Increase (Decrease) in Net Assets | | | (9,040,695 | ) | | | 9,577,522 | |
| | | | | | | | | |
| Net Assets: | | | | | | | | |
| Beginning of year | | | 97,007,173 | | | | 87,429,651 | |
| End of year | | $ | 87,966,478 | | | $ | 97,007,173 | |
See accompanying notes, which are an integral part of the financial statements.
Financial highlights
Delaware Emerging Markets Debt Corporate Fund Class A
Selected data for each share of the Fund outstanding throughout each period were as follows:
| Net asset value, beginning of period |
| |
| Income (loss) from investment operations: |
| Net investment income1 |
| Net realized and unrealized gain (loss) |
| Total from investment operations |
| |
| Less dividends and distributions from: |
| Net investment income |
| Net realized gain |
| Return of capital |
| Total dividends and distributions |
| |
| Net asset value, end of period |
| |
| Total return2 |
| |
| Ratios and supplemental data: |
| Net assets, end of period (000 omitted) |
| Ratio of expenses to average net assets3 |
| Ratio of expenses to average net assets prior to fees waived3 |
| Ratio of net investment income to average net assets |
| Ratio of net investment income to average net assets prior to fees waived |
| Portfolio turnover |
| | |
| 1 | Calculated using average shares outstanding. |
| 2 | Total return is based on the change in net asset value of a share during the period and assumes reinvestment of dividends and distributions at net asset value and does not reflect the impact of a sales charge. Total return during the period reflects waivers by the manager and/or distributor. Performance would have been lower had the waivers not been in effect. |
| 3 | Expense ratios do not include expenses of any investment companies in which the Fund invests. |
See accompanying notes, which are an integral part of the financial statements.
| Year ended |
| 7/31/23 | | | 7/31/22 | | | 7/31/21 | | | 7/31/20 | | | 7/31/19 | |
| $ | 7.35 | | | $ | 8.91 | | | $ | 8.48 | | | $ | 8.67 | | | $ | 8.26 | |
| | | | | | | | | | | | | | | | | | | |
| | | | | | | | | | | | | | | | | | | |
| | 0.40 | | | | 0.32 | | | | 0.33 | | | | 0.32 | | | | 0.40 | |
| | 0.08 | | | | (1.52 | ) | | | 0.42 | | | | (0.18 | ) | | | 0.41 | |
| | 0.48 | | | | (1.20 | ) | | | 0.75 | | | | 0.14 | | | | 0.81 | |
| | | | | | | | | | | | | | | | | | | |
| | | | | | | | | | | | | | | | | | | |
| | (0.38 | ) | | | (0.31 | ) | | | (0.32 | ) | | | (0.32 | ) | | | (0.35 | ) |
| | — | | | | (0.05 | ) | | | — | | | | — | | | | (0.05 | ) |
| | — | | | | — | | | | — | | | | (0.01 | ) | | | — | |
| | (0.38 | ) | | | (0.36 | ) | | | (0.32 | ) | | | (0.33 | ) | | | (0.40 | ) |
| | | | | | | | | | | | | | | | | | | |
| $ | 7.45 | | | $ | 7.35 | | | $ | 8.91 | | | $ | 8.48 | | | $ | 8.67 | |
| | | | | | | | | | | | | | | | | | | |
| | 6.74 | % | | | (13.83 | )% | | | 8.99 | % | | | 1.73 | % | | | 10.21 | % |
| | | | | | | | | | | | | | | | | | | |
| | | | | | | | | | | | | | | | | | | |
| $ | 753 | | | $ | 767 | | | $ | 817 | | | $ | 281 | | | $ | 93 | |
| | 1.04 | % | | | 1.04 | % | | | 1.04 | % | | | 1.04 | % | | | 1.04 | % |
| | 1.44 | % | | | 1.43 | % | | | 1.42 | % | | | 1.48 | % | | | 1.90 | % |
| | 5.47 | % | | | 3.87 | % | | | 3.69 | % | | | 3.77 | % | | | 4.88 | % |
| | 5.07 | % | | | 3.48 | % | | | 3.31 | % | | | 3.33 | % | | | 4.02 | % |
| | 67 | % | | | 55 | % | | | 99 | % | | | 93 | % | | | 74 | % |
Financial highlights
Delaware Emerging Markets Debt Corporate Fund Class C
Selected data for each share of the Fund outstanding throughout each period were as follows:
| Net asset value, beginning of period |
| |
| Income (loss) from investment operations: |
| Net investment income1 |
| Net realized and unrealized gain (loss) |
| Total from investment operations |
| |
| Less dividends and distributions from: |
| Net investment income |
| Net realized gain |
| Return of capital |
| Total dividends and distributions |
| |
| Net asset value, end of period |
| |
| Total return2 |
| |
| Ratios and supplemental data: |
| Net assets, end of period (000 omitted) |
| Ratio of expenses to average net assets3 |
| Ratio of expenses to average net assets prior to fees waived3 |
| Ratio of net investment income to average net assets |
| Ratio of net investment income to average net assets prior to fees waived |
| Portfolio turnover |
| | |
| 1 | Calculated using average shares outstanding. |
| 2 | Total return is based on the change in net asset value of a share during the period and assumes reinvestment of dividends and distributions at net asset value and does not reflect the impact of a sales charge. Total return during the period reflects waivers by the manager and/or distributor. Performance would have been lower had the waivers not been in effect. |
| 3 | Expense ratios do not include expenses of any investment companies in which the Fund invests. |
See accompanying notes, which are an integral part of the financial statements.
| Year ended |
| 7/31/23 | | | 7/31/22 | | | 7/31/21 | | | 7/31/20 | | | 7/31/19 | |
| $ | 7.34 | | | $ | 8.90 | | | $ | 8.47 | | | $ | 8.66 | | | $ | 8.26 | |
| | | | | | | | | | | | | | | | | | | |
| | | | | | | | | | | | | | | | | | | |
| | 0.34 | | | | 0.25 | | | | 0.26 | | | | 0.25 | | | | 0.34 | |
| | 0.09 | | | | (1.51 | ) | | | 0.43 | | | | (0.17 | ) | | | 0.40 | |
| | 0.43 | | | | (1.26 | ) | | | 0.69 | | | | 0.08 | | | | 0.74 | |
| | | | | | | | | | | | | | | | | | | |
| | | | | | | | | | | | | | | | | | | |
| | (0.33 | ) | | | (0.25 | ) | | | (0.26 | ) | | | (0.26 | ) | | | (0.29 | ) |
| | — | | | | (0.05 | ) | | | — | | | | — | | | | (0.05 | ) |
| | — | | | | — | | | | — | | | | (0.01 | ) | | | — | |
| | (0.33 | ) | | | (0.30 | ) | | | (0.26 | ) | | | (0.27 | ) | | | (0.34 | ) |
| | | | | | | | | | | | | | | | | | | |
| $ | 7.44 | | | $ | 7.34 | | | $ | 8.90 | | | $ | 8.47 | | | $ | 8.66 | |
| | | | | | | | | | | | | | | | | | | |
| | 5.98 | % | | | (14.46 | )% | | | 8.19 | % | | | 0.99 | % | | | 9.27 | % |
| | | | | | | | | | | | | | | | | | | |
| | | | | | | | | | | | | | | | | | | |
| $ | 244 | | | $ | 210 | | | $ | 99 | | | $ | 84 | | | $ | 61 | |
| | 1.79 | % | | | 1.79 | % | | | 1.79 | % | | | 1.79 | % | | | 1.79 | % |
| | 2.19 | % | | | 2.18 | % | | | 2.17 | % | | | 2.23 | % | | | 2.65 | % |
| | 4.72 | % | | | 3.12 | % | | | 2.94 | % | | | 3.02 | % | | | 4.13 | % |
| | 4.32 | % | | | 2.73 | % | | | 2.56 | % | | | 2.58 | % | | | 3.27 | % |
| | 67 | % | | | 55 | % | | | 99 | % | | | 93 | % | | | 74 | % |
Financial highlights
Delaware Emerging Markets Debt Corporate Fund Class R
Selected data for each share of the Fund outstanding throughout each period were as follows:
| Net asset value, beginning of period |
| |
| Income (loss) from investment operations: |
| Net investment income1 |
| Net realized and unrealized gain (loss) |
| Total from investment operations |
| |
| Less dividends and distributions from: |
| Net investment income |
| Net realized gain |
| Return of capital |
| Total dividends and distributions |
| |
| Net asset value, end of period |
| |
| Total return2 |
| |
| Ratios and supplemental data: |
| Net assets, end of period (000 omitted) |
| Ratio of expenses to average net assets3 |
| Ratio of expenses to average net assets prior to fees waived3 |
| Ratio of net investment income to average net assets |
| Ratio of net investment income to average net assets prior to fees waived |
| Portfolio turnover |
| | |
| 1 | Calculated using average shares outstanding. |
| 2 | Total return is based on the change in net asset value of a share during the period and assumes reinvestment of dividends and distributions at net asset value. Total return during the period reflects waivers by the manager and/or distributor. Performance would have been lower had the waivers not been in effect. |
| 3 | Expense ratios do not include expenses of any investment companies in which the Fund invests. |
See accompanying notes, which are an integral part of the financial statements.
| Year ended |
| 7/31/23 | | | 7/31/22 | | | 7/31/21 | | | 7/31/20 | | | 7/31/19 | |
| $ | 7.34 | | | $ | 8.90 | | | $ | 8.47 | | | $ | 8.66 | | | $ | 8.26 | |
| | | | | | | | | | | | | | | | | | | |
| | | | | | | | | | | | | | | | | | | |
| | 0.42 | | | | 0.34 | | | | 0.35 | | | | 0.34 | | | | 0.42 | |
| | 0.09 | | | | (1.51 | ) | | | 0.43 | | | | (0.18 | ) | | | 0.40 | |
| | 0.51 | | | | (1.17 | ) | | | 0.78 | | | | 0.16 | | | | 0.82 | |
| | | | | | | | | | | | | | | | | | | |
| | | | | | | | | | | | | | | | | | | |
| | (0.40 | ) | | | (0.34 | ) | | | (0.35 | ) | | | (0.34 | ) | | | (0.37 | ) |
| | — | | | | (0.05 | ) | | | — | | | | — | | | | (0.05 | ) |
| | — | | | | — | | | | — | | | | (0.01 | ) | | | — | |
| | (0.40 | ) | | | (0.39 | ) | | | (0.35 | ) | | | (0.35 | ) | | | (0.42 | ) |
| | | | | | | | | | | | | | | | | | | |
| $ | 7.45 | | | $ | 7.34 | | | $ | 8.90 | | | $ | 8.47 | | | $ | 8.66 | |
| | | | | | | | | | | | | | | | | | | |
| | 7.15 | % | | | (13.60 | )% | | | 9.30 | % | | | 2.00 | % | | | 10.42 | % |
| | | | | | | | | | | | | | | | | | | |
| | | | | | | | | | | | | | | | | | | |
| $ | 3 | | | $ | 3 | | | $ | 3 | | | $ | 3 | | | $ | 3 | |
| | 0.79 | % | | | 0.79 | % | | | 0.79 | % | | | 0.79 | % | | | 0.79 | % |
| | 1.69 | % | | | 1.68 | % | | | 1.68 | % | | | 1.73 | % | | | 2.15 | % |
| | 5.72 | % | | | 4.12 | % | | | 3.94 | % | | | 4.02 | % | | | 5.13 | % |
| | 4.82 | % | | | 3.23 | % | | | 3.05 | % | | | 3.08 | % | | | 3.77 | % |
| | 67 | % | | | 55 | % | | | 99 | % | | | 93 | % | | | 74 | % |
Financial highlights
Delaware Emerging Markets Debt Corporate Fund Institutional Class
Selected data for each share of the Fund outstanding throughout each period were as follows:
| Net asset value, beginning of period |
| |
| Income (loss) from investment operations: |
| Net investment income1 |
| Net realized and unrealized gain (loss) |
| Total from investment operations |
| |
| Less dividends and distributions from: |
| Net investment income |
| Net realized gain |
| Return of capital |
| Total dividends and distributions |
| |
| Net asset value, end of period |
| |
| Total return2 |
| |
| Ratios and supplemental data: |
| Net assets, end of period (000 omitted) |
| Ratio of expenses to average net assets3 |
| Ratio of expenses to average net assets prior to fees waived3 |
| Ratio of net investment income to average net assets |
| Ratio of net investment income to average net assets prior to fees waived . |
| Portfolio turnover |
| | |
| 1 | Calculated using average shares outstanding. |
| 2 | Total return is based on the change in net asset value of a share during the period and assumes reinvestment of dividends and distributions at net asset value. Total return during the period reflects waivers by the manager. Performance would have been lower had the waivers not been in effect. |
| 3 | Expense ratios do not include expenses of any investment companies in which the Fund invests. |
See accompanying notes, which are an integral part of the financial statements.
| Year ended | |
| | 7/31/23 | | | | 7/31/22 | | | | 7/31/21 | | | | 7/31/20 | | | | 7/31/19 | |
| $ | 7.34 | | | $ | 8.90 | | | $ | 8.47 | | | $ | 8.67 | | | $ | 8.27 | |
| | | | | | | | | | | | | | | | | | | |
| | | | | | | | | | | | | | | | | | | |
| | 0.42 | | | | 0.34 | | | | 0.35 | | | | 0.34 | | | | 0.42 | |
| | 0.08 | | | | (1.51 | ) | | | 0.43 | | | | (0.19 | ) | | | 0.40 | |
| | 0.50 | | | | (1.17 | ) | | | 0.78 | | | | 0.15 | | | | 0.82 | |
| | | | | | | | | | | | | | | | | | | |
| | | | | | | | | | | | | | | | | | | |
| | (0.40 | ) | | | (0.34 | ) | | | (0.35 | ) | | | (0.34 | ) | | | (0.37 | ) |
| | — | | | | (0.05 | ) | | | — | | | | — | | | | (0.05 | ) |
| | — | | | | — | | | | — | | | | (0.01 | ) | | | — | |
| | (0.40 | ) | | | (0.39 | ) | | | (0.35 | ) | | | (0.35 | ) | | | (0.42 | ) |
| | | | | | | | | | | | | | | | | | | |
| $ | 7.44 | | | $ | 7.34 | | | $ | 8.90 | | | $ | 8.47 | | | $ | 8.67 | |
| | | | | | | | | | | | | | | | | | | |
| | 7.01 | % | | | (13.60 | )% | | | 9.30 | % | | | 1.88 | % | | | 10.41 | % |
| | | | | | | | | | | | | | | | | | | |
| | | | | | | | | | | | | | | | | | | |
| $ | 86,966 | | | $ | 96,027 | | | $ | 86,511 | | | $ | 69,600 | | | $ | 51,784 | |
| | 0.79 | % | | | 0.79 | % | | | 0.79 | % | | | 0.79 | % | | | 0.79 | % |
| | 1.19 | % | | | 1.18 | % | | | 1.17 | % | | | 1.23 | % | | | 1.65 | % |
| | 5.72 | % | | | 4.12 | % | | | 3.94 | % | | | 4.02 | % | | | 5.13 | % |
| | 5.32 | % | | | 3.73 | % | | | 3.56 | % | | | 3.58 | % | | | 4.27 | % |
| | 67 | % | | | 55 | % | | | 99 | % | | | 93 | % | | | 74 | % |
| Notes to financial statements | |
| Delaware Emerging Markets Debt Corporate Fund | July 31, 2023 |
Delaware Group® Government Fund (Trust) is organized as a Delaware statutory trust and offers two series: Delaware Emerging Markets Debt Corporate Fund and Delaware Strategic Income Fund. These financial statements and the related notes pertain to Delaware Emerging Markets Debt Corporate Fund (Fund). The Trust is an open-end investment company. The Fund is considered diversified under the Investment Company Act of 1940, as amended (1940 Act), and offers Class A, Class C, Class R, and Institutional Class shares. Class A shares are sold with a maximum front-end sales charge of 4.50%. There is no front-end sales charge when you purchase $1 million or more of Class A shares. However, if Delaware Distributors, L.P. (DDLP) paid your financial intermediary a commission on your purchase of $1 million or more of Class A shares, you will have to pay a limited contingent deferred sales charge (Limited CDSC) of 1.00% if you redeem these shares within the first 18 months after your purchase, unless a specific waiver of the Limited CDSC applies. Class C shares have no upfront sales charge, but are sold with a contingent deferred sales charge (CDSC) of 1.00%, which will be incurred if redeemed during the first 12 months. Class R and Institutional Class shares are not subject to a sales charge and are offered for sale exclusively to certain eligible investors.
1. Significant Accounting Policies
The Fund follows accounting and reporting guidance under Financial Accounting Standards Board (FASB) Accounting Standards Codification Topic 946, Financial Services — Investment Companies. The following accounting policies are in accordance with US generally accepted accounting principles (US GAAP) and are consistently followed by the Fund.
Security Valuation — Equity securities and exchange-traded funds (ETFs), except those traded on the Nasdaq Stock Market LLC (Nasdaq), are valued at the last quoted sales price as of the time of the regular close of the New York Stock Exchange on the valuation date. Equity securities and ETFs traded on the Nasdaq are valued in accordance with the Nasdaq Official Closing Price, which may not be the last sales price. If, on a particular day, an equity security or ETF does not trade, the mean between the bid and the ask prices will be used, which approximates fair value. Equity securities listed on a foreign exchange are normally valued at the last quoted sales price on the valuation date. Fixed income securities and credit default swap (CDS) contracts are generally priced based upon valuations provided by an independent pricing service or broker/counterparty in accordance with methodologies included within Delaware Management Company (DMC)’s Pricing Policy (the Policy). Fixed income security valuations are then reviewed by DMC as part of its duties as the Fund’s valuation designee and, to the extent required by the Policy and applicable regulation, fair valued consistent with the Policy. To the extent current market prices are not available, the pricing service may take into account developments related to the specific security, as well as transactions in comparable securities. Valuations for fixed income securities utilize matrix systems, which reflect such factors as security prices, yields, maturities, and ratings, and are supplemented by dealer and exchange quotations. Futures contracts are valued at the daily quoted settlement prices. Open-end investment companies, other than ETFs, are valued at their published net asset value (NAV). Generally, other securities and assets for which market quotations are not readily available are
valued at fair value as determined in good faith by DMC. Subject to the oversight of the Trust’s Board of Trustees (Board), DMC, as valuation designee, has adopted policies and procedures to fair value securities for which market quotations are not readily available consistent with the requirements of Rule 2a-5 under the 1940 Act. In determining whether market quotations are readily available or fair valuation will be used, various factors will be taken into consideration, such as market closures or suspension of trading in a security. Restricted securities and private placements are valued at fair value.
Federal and Foreign Income Taxes — No provision for federal income taxes has been made as the Fund intends to continue to qualify for federal income tax purposes as a regulated investment company under Subchapter M of the Internal Revenue Code of 1986, as amended, and make the requisite distributions to shareholders. The Fund evaluates tax positions taken or expected to be taken in the course of preparing the Fund’s tax returns to determine whether the tax positions are “more-likely-than-not” of being sustained by the applicable tax authority. Tax positions not deemed to meet the “more-likely-than-not” threshold are recorded as a tax benefit or expense in the current year. Management has analyzed the Fund’s tax positions taken or expected to be taken on the Fund’s federal income tax returns through the year ended July 31, 2023, and for all open tax years (years ended July 31, 2020–July 31, 2022), and has concluded that no provision for federal income tax is required in the Fund’s financial statements. In regard to foreign taxes only, the Fund has open tax years in certain foreign countries in which it invests that may date back to the inception of the Fund. If applicable, the Fund recognizes interest accrued on unrecognized tax benefits in interest expense and penalties in “Other” on the “Statement of operations.” During the year ended July 31, 2023, the Fund did not incur any interest or tax penalties.
Class Accounting — Investment income, common expenses, and realized and unrealized gain (loss) on investments are allocated to the various classes of the Fund on the basis of daily net assets of each class. Distribution expenses relating to a specific class are charged directly to that class.
Foreign Currency Transactions — Transactions denominated in foreign currencies are recorded at the prevailing exchange rates on the valuation date. The value of all assets and liabilities denominated in foreign currencies is translated daily into US dollars at the exchange rate of such currencies against the US dollar. Transaction gains or losses resulting from changes in exchange rates during the reporting period or upon settlement of the foreign currency transaction are reported in operations for the current period. The Fund generally bifurcates that portion of realized gains and losses on investments in debt securities which is due to changes in foreign exchange rates from that which is due to changes in market prices of debt securities. That portion of gains (losses), attributable to changes in foreign exchange rates, is included on the “Statement of operations” under “Net realized gain (loss) on foreign currencies.” The Fund reports certain foreign currency related transactions as components of realized gains (losses) for financial reporting purposes, whereas such components are treated as ordinary income (loss) for federal income tax purposes.
Notes to financial statements
Delaware Emerging Markets Debt Corporate Fund
1. Significant Accounting Policies (continued)
Derivative Financial Instruments — The Fund may invest in various derivative financial instruments. These instruments are used to obtain exposure to a security, commodity, index, market, and/or other assets without owning or taking physical custody of securities, commodities and/or other referenced assets or to manage market, equity, credit, interest rate, foreign currency exchange rate, commodity and/or other risks. Derivative financial instruments may give rise to a form of economic leverage and involve risks, including the imperfect correlation between the value of a derivative financial instrument and the underlying asset, possible default of the counterparty to the transaction or illiquidity of the instrument. Pursuant to Rule 18f-4 under the 1940 Act, among other things, the Fund intends to use either derivative financial instruments with embedded leverage in a limited manner or comply with an outer limit on fund leverage risk based on value-at-risk.
Segregation and Collateralization — In certain cases, based on requirements and agreements with certain exchanges and third-party broker-dealers, the Fund may deliver or receive collateral in connection with certain investments (e.g., futures contracts, foreign currency exchange contracts, options written, securities with extended settlement periods, and swaps). Certain countries require that cash reserves be held while investing in companies incorporated in that country. Cash collateral that has been pledged/received to cover obligations of the Fund under derivative contracts, if any, will be reported separately on the “Statement of assets and liabilities” as cash collateral due to/from broker. Securities collateral pledged for the same purpose, if any, is noted on the “Schedule of investments.”
Use of Estimates — The preparation of financial statements in conformity with US GAAP requires management to make estimates and assumptions that affect the fair value of investments, the reported amounts of assets and liabilities and disclosure of contingent assets and liabilities at the date of the financial statements, and the reported amounts of revenues and expenses during the reporting period. Actual results could differ from those estimates and the differences could be material.
Other — Expenses directly attributable to the Fund are charged directly to the Fund. Other expenses common to various funds within the Delaware Funds by Macquarie® (Delaware Funds) are generally allocated among such funds on the basis of average net assets. Management fees and certain other expenses are paid monthly. Security transactions are recorded on the date the securities are purchased or sold (trade date) for financial reporting purposes. Costs used in calculating realized gains and losses on the sale of investment securities are those of the specific securities sold. Dividend income is recorded on the ex-dividend date and interest income is recorded on an accrual basis. Income and capital gain distributions from any investment companies (Underlying Funds) in which the Fund invests are recorded on the ex-dividend date. Discounts and premiums on debt securities are accreted or amortized to interest income, respectively, over the lives of the respective securities using the effective interest method. Premiums on callable debt securities are amortized to interest income to the earliest call date using the effective interest method. Withholding taxes and reclaims on
foreign interest have been recorded in accordance with the Fund’s understanding of the applicable country’s tax rules and rates. The Fund declares and pays dividends from net investment income monthly and declares and pays distributions from net realized gain on investments, if any, at least annually. The Fund may distribute more frequently, if necessary for tax purposes. Dividends and distributions, if any, are recorded on the ex-dividend date.
The Fund receives earnings credits from its transfer agent when positive cash balances are maintained, which may be used to offset transfer agent fees. If the amount earned is greater than $1, the expenses paid under this arrangement are included on the “Statement of operations” under “Dividend disbursing and transfer agent fees and expenses” with the corresponding expenses offset included under “Less expenses paid indirectly.”
2. Investment Management, Administration Agreements, and Other Transactions with Affiliates
In accordance with the terms of its investment management agreement, the Fund pays DMC, a series of Macquarie Investment Management Business Trust and the investment manager, an annual fee which is calculated daily and paid monthly at the rate of 0.75% on the first $500 million of average daily net assets of the Fund, 0.70% on the next $500 million, 0.65% on the next $1.5 billion, and 0.60% on average daily net assets in excess of $2.5 billion.
DMC has contractually agreed to waive all or a portion of its management fee and/or pay/reimburse expenses (excluding any acquired fund fees and expenses, taxes, interest, short sale dividend and interest expenses, brokerage fees, certain insurance costs, and nonroutine expenses or costs, including, but not limited to, those relating to reorganizations, litigation, conducting shareholder meetings, and liquidations), in order to prevent total annual fund operating expenses from exceeding the following percentage of the Fund’s average daily net assets from August 1, 2022 through November 28, 2023. These waivers and reimbursements may only be terminated by agreement of DMC and the Fund. The waivers and reimbursements are accrued daily and received monthly.
| | | Operating expense limitation as a percentage of average daily net assets | |
| | | Class A | | | Class C | | | Class R | | | Institutional Class | |
| | | | 1.04 | % | | | 1.79 | % | | | 1.29 | % | | | 0.79 | % |
DMC may seek investment advice and recommendations from its affiliates: Macquarie Investment Management Europe Limited, Macquarie Investment Management Austria Kapitalanlage AG, and Macquarie Investment Management Global Limited (together, the “Affiliated Sub-Advisors”). DMC may also permit these Affiliated Sub-Advisors to execute Fund security trades on its behalf and exercise investment discretion for securities in certain markets where DMC believes it will be beneficial to utilize an Affiliated Sub-Advisor’s specialized market knowledge. Although the Affiliated Sub-Advisors serve as sub-advisors, DMC has ultimate responsibility for all investment advisory services. For these services, DMC, not the Fund, may pay each Affiliated Sub-Advisor a portion of its investment management fee.
Notes to financial statements
Delaware Emerging Markets Debt Corporate Fund
2. Investment Management, Administration Agreements, and Other Transactions with Affiliates (continued)
Delaware Investments Fund Services Company (DIFSC), an affiliate of DMC, provides fund accounting and financial administrative oversight services to the Fund. For these services, DIFSC’s fees are calculated daily and paid monthly, based on the aggregate daily net assets of all funds within the Delaware Funds at the following annual rates: 0.00475% of the first $35 billion; 0.0040% of the next $10 billion; 0.0025% of the next $45 billion; and 0.0015% of aggregate average daily net assets in excess of $90 billion (Total Fee). Each fund in the Delaware Funds pays a minimum of $4,000, which, in aggregate, is subtracted from the Total Fee. Each fund then pays its portion of the remainder of the Total Fee on a relative NAV basis. This amount is included on the “Statement of operations” under “Accounting and administration expenses.” For the year ended July 31, 2023, the Fund paid $6,391 for these services.
DIFSC is also the transfer agent and dividend disbursing agent of the Fund. For these services, DIFSC’s fees are calculated daily and paid monthly, based on the aggregate daily net assets of the retail funds within the Delaware Funds at the following annual rates: 0.014% of the first $20 billion; 0.011% of the next $5 billion; 0.007% of the next $5 billion; 0.004% of the next $20 billion; 0.002% of the next $25 billion; and 0.0015% of average daily net assets in excess of $75 billion. The fees payable to DIFSC under the shareholder services agreement described above are allocated among all retail funds in the Delaware Funds on a relative NAV basis. This amount is included on the “Statement of operations” under “Dividend disbursing and transfer agent fees and expenses.” For the year ended July 31, 2023, the Fund paid $5,089 for these services. Pursuant to a sub-transfer agency agreement between DIFSC and BNY Mellon Investment Servicing (US) Inc. (BNYMIS), BNYMIS provides certain sub-transfer agency services to the Fund. Sub-transfer agency fees are paid by the Fund and are also included on the “Statement of operations” under “Dividend disbursing and transfer agent fees and expenses.” The fees that are calculated daily and paid as invoices are received on a monthly or quarterly basis.
Pursuant to a distribution agreement and distribution plan, the Fund pays DDLP, the distributor and an affiliate of DMC, an annual distribution and service (12b-1) fee of 0.25%, 1.00%, and 0.50% of the average daily net assets of the Class A, Class C, and Class R shares, respectively. The fees are calculated daily and paid monthly. DDLP has agreed to voluntarily suspend the 12b-1 fee for the Class R shares and the suspension of the 12b-1 fee will continue while the Class is not broadly distributed. Institutional Class shares do not pay a 12b-1 fee.
As provided in the investment management agreement, the Fund bears a portion of the cost of certain resources shared with DMC, including the cost of internal personnel of DMC and/or its affiliates that provide legal and regulatory reporting services to the Fund. For the year ended July 31, 2023, the Fund paid $3,664 for internal legal and regulatory reporting services provided by DMC and/or its affiliates’ employees. This amount is included on the “Statement of operations” under “Legal fees.”
For the year ended July 31, 2023, DDLP earned $73 for commissions on sales of the Fund’s Class A shares. For the year ended July 31, 2023, DDLP received gross CDSC commissions of $97 on redemptions of the Fund’s Class C shares, and these commissions were entirely used to offset upfront commissions previously paid by DDLP to broker/dealers on sales of those shares.
Trustees’ fees include expenses accrued by the Fund for each Trustee’s retainer and meeting fees. Certain officers of DMC, DIFSC, and DDLP are officers and/or Trustees of the Trust. These officers and Trustees are paid no compensation by the Fund.
In addition to the management fees and other expenses of the Fund, the Fund indirectly bears the investment management fees and other expenses of any Underlying Funds, including ETFs, in which it invests. The amount of these fees and expenses incurred indirectly by the Fund will vary based upon the expense and fee levels of any Underlying Funds and the number of shares that are owned of any Underlying Funds at different times.
3. Investments
For the year ended July 31, 2023, the Fund made purchases and sales of investment securities other than short-term investments as follows:
| Purchases | | $ | 51,881,785 | |
| Sales | | | 60,226,579 | |
The tax cost of investments and derivatives includes adjustments to net unrealized appreciation (depreciation) which may not necessarily be the final tax cost basis adjustments but which approximate the tax basis unrealized gains and losses that may be realized and distributed to shareholders. At July 31, 2023, the cost and unrealized appreciation (depreciation) of investments and derivatives for federal income tax purposes for the Fund were as follows:
| Cost of investments and derivatives | | $ | 91,833,001 | |
| Aggregate unrealized appreciation of investments and derivatives | | $ | 999,606 | |
| Aggregate unrealized depreciation of investments and derivatives | | | (5,908,945 | ) |
| Net unrealized depreciation of investments and derivatives | | $ | (4,909,339 | ) |
US GAAP defines fair value as the price that the Fund would receive to sell an asset or pay to transfer a liability in an orderly transaction between market participants at the measurement date under current market conditions. A three-level hierarchy for fair value measurements has been established based upon the transparency of inputs to the valuation of an asset or liability. Inputs may be observable or unobservable and refer broadly to the assumptions that market participants would use in pricing the asset or liability. Observable inputs reflect the assumptions market participants would use in pricing the asset or liability based on market data obtained from sources independent of the reporting entity. Unobservable inputs reflect the reporting entity’s own assumptions about the assumptions that market participants would use in pricing the asset or liability based on the best information available under the circumstances. The Fund’s
Notes to financial statements
Delaware Emerging Markets Debt Corporate Fund
3. Investments (continued)
investment in its entirety is assigned a level based upon the observability of the inputs which are significant to the overall valuation. The three-level hierarchy of inputs is summarized as follows:
| Level 1 – | Inputs are quoted prices in active markets for identical investments. (Examples: equity securities, open-end investment companies, futures contracts, and exchange-traded options contracts) |
| Level 2 – | Other observable inputs, including, but not limited to: quoted prices for similar assets or liabilities in markets that are active, quoted prices for identical or similar assets or liabilities in markets that are not active, inputs other than quoted prices that are observable for the assets or liabilities (such as interest rates, yield curves, volatilities, prepayment speeds, loss severities, credit risks, and default rates) or other market-corroborated inputs. (Examples: debt securities, government securities, swap contracts, foreign currency exchange contracts, foreign securities utilizing international fair value pricing, broker-quoted securities, and fair valued securities) |
| Level 3 – | Significant unobservable inputs, including the Fund’s own assumptions used to determine the fair value of investments. (Examples: broker-quoted securities and fair valued securities) |
Level 3 investments are valued using significant unobservable inputs. The Fund may also use an income-based valuation approach in which the anticipated future cash flows of the investment are discounted to calculate fair value. Discounts may also be applied due to the nature or duration of any restrictions on the disposition of the investments. Valuations may also be based upon current market prices of securities that are comparable in coupon, rating, maturity, and industry. The derived value of a Level 3 investment may not represent the value which is received upon disposition and this could impact the results of operations.
The following table summarizes the valuation of the Fund’s investments by fair value hierarchy levels as of July 31, 2023:
| | | Level 1 | | | Level 2 | | | Level 3 | | | Total | |
| Securities | | | | | | | | | | | | | | | | |
| Assets: | | | | | | | | | | | | | | | | |
| Common Stock | | $ | — | | | $ | — | | | $ | 442,774 | | | $ | 442,774 | |
| Corporate Bonds | | | — | | | | 80,130,182 | | | | — | | | | 80,130,182 | |
| Sovereign Bonds | | | — | | | | 1,967,448 | | | | — | | | | 1,967,448 | |
| Short-Term Investments | | | 4,433,164 | | | | — | | | | — | | | | 4,433,164 | |
| Total Value of Securities | | $ | 4,433,164 | | | $ | 82,097,630 | | | $ | 442,774 | | | $ | 86,973,568 | |
| | | | | | | | | | | | | | | | | |
| Derivatives1 | | | | | | | | | | | | | | | | |
| Assets: | | | | | | | | | | | | | | | | |
| Futures Contracts | | $ | 53,757 | | | $ | — | | | $ | — | | | $ | 53,757 | |
| | | Level 1 | | | Level 2 | | | Level 3 | | | Total | |
| Liabilities: | | | | | | | | | | | | | | | | |
| Over-The-Counter Credit Default Swaps | | $ | — | | | $ | (92,064 | ) | | $ | — | | | $ | (92,064 | ) |
1Futures contracts and swap contracts are valued at the unrealized appreciation (depreciation) on the instrument at the year end.
During the year ended July 31, 2023, there were no transfers into or out of Level 3 investments. The Fund’s policy is to recognize transfers into or out of Level 3 investments based on fair value at the beginning of the reporting year.
A reconciliation of Level 3 investments is presented when the Fund has a significant amount of Level 3 investments at the beginning or end of the year in relation to the Fund’s net assets. Management has determined not to provide a reconciliation of Level 3 investments as the Level 3 investments were not considered significant to the Fund’s net assets at the beginning or end of the year. Management has determined not to provide additional disclosure on Level 3 inputs since the Level 3 investments are not considered significant to the Fund’s net assets at the end of the year.
4. Dividend and Distribution Information
Income and long-term capital gain distributions are determined in accordance with federal income tax regulations, which may differ from US GAAP. Additionally, distributions from net gains on foreign currency transactions and net short-term gains on sales of investment securities are treated as ordinary income for federal income tax purposes. The tax character of dividends and distributions paid during the years ended July 31, 2023 and 2022 were as follows:
| | | Year ended | |
| | | 7/31/23 | | | 7/31/22 | |
| Ordinary income | | $ | 4,385,027 | | | $ | 3,622,843 | |
| Long-term capital gains | | | — | | | | 354,513 | |
| Total | | $ | 4,385,027 | | | $ | 3,977,356 | |
5. Components of Net Assets on a Tax Basis
As of July 31, 2023, the components of net assets on a tax basis were as follows:
| Shares of beneficial interest | | $ | 101,069,174 | |
| Undistributed ordinary income | | | 61,293 | |
| Capital loss carryforwards | | | (8,254,650 | ) |
| Unrealized depreciation of investments and derivatives | | | (4,909,339 | ) |
| Net assets | | $ | 87,966,478 | |
The differences between book basis and tax basis components of net assets are primarily attributable to tax deferral of losses on wash sales, the mark-to-market on future contracts, tax treatment of swap contracts and amortization of premium on callable bonds.
Notes to financial statements
Delaware Emerging Markets Debt Corporate Fund
5. Components of Net Assets on a Tax Basis (continued)
For financial reporting purposes, capital accounts are adjusted to reflect the tax character of permanent book/tax differences. Results of operations and net assets were not affected by these reclassifications. For the year ended July 31, 2023, the Fund had no reclassifications.
For federal income tax purposes, capital loss carryforwards may be carried forward and applied against future capital gains. At July 31, 2023, the Fund has capital loss carryforwards available to offset future realized capital gains as follows:
| | Loss carryforward character | | | | | |
| | Short-term | | | | Long-term | | | | Total | |
| | $2,594,732 | | | | $5,659,918 | | | | $8,254,650 | |
6. Capital Shares
Transactions in capital shares were as follows:
| | | Year ended | |
| | | 7/31/23 | | | 7/31/22 | |
| Shares sold: | | | | | | | | |
| Class A | | | 12,333 | | | | 42,191 | |
| Class C | | | 9,361 | | | | 19,267 | |
| Institutional Class | | | 5,050,629 | | | | 6,765,116 | |
| | | | | | | | | |
| Shares issued upon reinvestment of dividends and distributions: | | | | | | | | |
| Class A | | | 5,223 | | | | 4,815 | |
| Class C | | | 1,332 | | | | 616 | |
| Class R | | | 20 | | | | 16 | |
| Institutional Class | | | 567,661 | | | | 473,783 | |
| | | | 5,646,559 | | | | 7,305,804 | |
| | | | | | | | | |
| Shares redeemed: | | | | | | | | |
| Class A | | | (20,812 | ) | | | (34,303 | ) |
| Class C | | | (6,533 | ) | | | (2,302 | ) |
| Institutional Class | | | (7,017,388 | ) | | | (3,869,943 | ) |
| | | | (7,044,733 | ) | | | (3,906,548 | ) |
| Net increase (decrease) | | | (1,398,174 | ) | | | 3,399,256 | |
Certain shareholders may exchange shares of one class for shares of another class in the same Fund. These exchange transactions are included as subscriptions and redemptions in the table above and on the “Statements of changes in net assets.” For the years ended July 31, 2023 and 2022, the Fund had the following exchange transactions:
| | | Exchange Redemptions | | | Exchange Subscriptions | | | | |
| | | Class A
Shares | | | Class C
Shares | | | Class A
Shares | | | Institutional
Class
Shares | | | Value | |
| Year ended | | | | | | | | | | | | | | | | | | | | |
| 7/31/23 | | | 268 | | | | 229 | | | | 228 | | | | 268 | | | $ | 3,718 | |
| 7/31/22 | | | — | | | | 205 | | | | 205 | | | | — | | | | 1,677 | |
7. Line of Credit
The Fund, along with certain other funds in the Delaware Funds (Participants), was a participant in a $355,000,000 revolving line of credit (Agreement) intended to be used for temporary or emergency purposes as an additional source of liquidity to fund redemptions of investor shares. Under the Agreement, the Participants were charged an annual commitment fee of 0.15%, which was allocated across the Participants based on a weighted average of the respective net assets of each Participant. The Participants were permitted to borrow up to a maximum of one-third of their net assets under the Agreement. Each Participant was individually, and not jointly, liable for its particular advances, if any, under the line of credit. The line of credit available under the Agreement expired on October 31, 2022.
On October 31, 2022, the Fund, along with the other Participants, entered into an amendment to the Agreement for a $355,000,000 revolving line of credit to be used as described above. It operates in substantially the same manner as the original Agreement. Under the amendment to the Agreement, the Participants are charged an annual commitment fee of 0.15%, which is allocated across the Participants based on a weighted average of the respective net assets of each Participant. The line of credit available under the Agreement expires on October 30, 2023.
The Fund had no amounts outstanding as of July 31, 2023, or at any time during the year then ended.
8. Derivatives
US GAAP requires disclosures that enable investors to understand: (1) how and why an entity uses derivatives; (2) how they are accounted for; and (3) how they affect an entity’s results of operations and financial position.
Futures Contracts — A futures contract is an agreement in which the writer (or seller) of the contract agrees to deliver to the buyer an amount of cash or securities equal to a specific dollar amount times the difference between the value of a specific security or index at the close of the last trading day of the contract and the price at which the agreement is made. The Fund may use futures contracts in the normal course of pursuing its investment objective. The Fund may invest in futures contracts to hedge its existing portfolio securities against fluctuations in value caused
Notes to financial statements
Delaware Emerging Markets Debt Corporate Fund
8. Derivatives (continued)
by changes in interest rates or market conditions. Upon entering into a futures contract, the Fund deposits cash or pledges US government securities to a broker, equal to the minimum “initial margin” requirements of the exchange on which the contract is traded. Subsequent payments are received from the broker or paid to the broker each day, based on the daily fluctuation in the market value of the contract. These receipts or payments are known as “variation margin” and are recorded daily by the Fund as unrealized gains or losses until the contracts are closed. When the contracts are closed, the Fund records a realized gain or loss equal to the difference between the value of the contract at the time it was opened and the value at the time it was closed. Risks of entering into futures contracts include potential imperfect correlation between the futures contracts and the underlying securities and the possibility of an illiquid secondary market for these instruments. When investing in futures, there is reduced counterparty credit risk to the Fund because futures are exchange-traded and the exchange’s clearinghouse, as counterparty to all exchange-traded futures, guarantees against default. At July 31, 2023, the Fund posted $55,400 in cash as collateral for open futures contracts, which is presented as “Cash collateral due from broker” on the “Statement of assets and liabilities.”
During the year ended July 31, 2023, the Fund entered into futures contracts to hedge the Fund’s existing portfolio securities against fluctuations in value caused by changes in interest rates or market conditions.
Swap Contracts —The Fund may enter into CDS contracts in the normal course of pursuing its investment objective. The Fund may enter into CDS contracts in order to hedge against credit events, to enhance total return, or to gain exposure to certain securities or markets. The Fund will not be permitted to enter into any swap transactions unless, at the time of entering into such transactions, the unsecured long-term debt of the actual counterparty, combined with any credit enhancements, is rated at least BBB- by Standard & Poor’s Financial Services LLC (S&P) or Baa3 by Moody’s Investors Service, Inc. (Moody’s) or is determined to be of equivalent credit quality by DMC.
Credit Default Swaps. A CDS contract is a risk-transfer instrument through which one party (purchaser of protection) transfers to another party (seller of protection) the financial risk of a credit event (as defined in the CDS agreement), as it relates to a particular reference security or basket of securities (such as an index). In exchange for the protection offered by the seller of protection, the purchaser of protection agrees to pay the seller of protection a periodic amount at a stated rate that is applied to the notional amount of the CDS contract. In addition, an upfront payment may be made or received by the Fund in connection with an unwinding or assignment of a CDS contract. Upon the occurrence of a credit event, the seller of protection would pay the par (or other agreed-upon) value of the reference security (or basket of securities) to the counterparty. Credit events generally include, among others, bankruptcy, failure to pay, and obligation default.
During the year ended July 31, 2023, the Fund entered into CDS contracts as a purchaser of protection. Periodic payments (receipts) on such contracts are accrued daily and recorded as
unrealized losses (gains) on swap contracts. Upon payment (receipt), such amounts are recorded as realized losses (gains) on swap contracts. Upfront payments made or received in connection with CDS contracts are amortized over the expected life of the CDS contracts as unrealized losses (gains) on swap contracts. The change in value of CDS contracts is recorded daily as unrealized appreciation or depreciation. A realized gain or loss is recorded upon a credit event (as defined in the CDS agreement) or the maturity or termination of the agreement. Initial margin and variation margin are posted to central counterparties for CDS basket trades, as determined by the applicable central counterparty. During the year ended July 31, 2023, the Fund did not enter into any CDS contracts as a seller of protection.
CDS contracts may involve greater risks than if the Fund had invested in the reference obligation directly. CDS contracts are subject to general market risk, liquidity risk, counterparty risk, and credit risk. The Fund’s maximum risk of loss from counterparty credit risk, either as the seller of protection or the buyer of protection, is the fair value of the contract. This risk is mitigated by (1) for bilateral swap contracts, having a netting arrangement between the Fund and the counterparty and by the posting of collateral by the counterparty to the Fund to cover the Fund’s exposure to the counterparty or (2) for cleared swaps, trading these instruments through a central counterparty.
During the year ended July 31, 2023, the Fund used CDS contracts to hedge against credit events.
Swaps Generally. For centrally cleared swaps, payments are received from the broker or paid to the broker each day, based on the daily fluctuation in the market value of the contract. These receipts or payments are known as “variation margin” and are recorded by the Fund as unrealized gains or losses until the contracts are closed. When the contracts are closed, the Fund records a realized gain or loss equal to the difference between the value of the contract at the time it was opened and the value at the time it was closed. The value of open swaps may differ from that which would be realized in the event the Fund terminated its position in the contract on a given day. Risks of entering into these contracts include the potential inability of the counterparty to meet the terms of the contracts. This type of risk is generally limited to the amount of favorable movement in the value of the underlying security, instrument, or basket of instruments, if any, at the day of default. Risks also arise from potential losses from adverse market movements and such losses could exceed the unrealized amounts shown on the “Schedule of investments.”
Fair values of derivative instruments as of July 31, 2023 were as follows:
| | | Asset Derivatives Fair Value | |
Statement of Assets and
Liabilities Location | | Interest
Rate
Contracts | |
| Variation margin due to broker on futures contracts* | | $ | 53,757 | |
Notes to financial statements
Delaware Emerging Markets Debt Corporate Fund
8. Derivatives (continued)
| | | Liability Derivatives Fair Value | |
| Statement of Assets and | | Credit | |
| Liabilities Location | | Contracts | |
| Unrealized depreciation on credit default swap contracts | | $ | (92,064) | |
*Includes cumulative appreciation (depreciation) of futures contracts from the date the contracts were opened through July 31, 2023. Only current day variation margin is reported on the “Statement of assets and liabilities.”
The effect of derivative instruments on the “Statement of operations” for the year ended July 31, 2023 was as follows:
| | | Net Realized Gain (Loss) on: | |
| | | Futures
Contracts | | | Swap
Contracts | | | Total | |
| Interest rate contracts | | $ | 173,955 | | | $ | — | | | $ | 173,955 | |
| Credit contracts | | | — | | | | (61,821 | ) | | | (61,821 | ) |
| Total | | $ | 173,955 | | | $ | (61,821) | | | $ | 112,134 | |
| | | | |
| | | Net Change in Unrealized Appreciation (Depreciation) on: | |
| | | Futures
Contracts | | | Swap
Contracts | | | Total | |
| Interest rate contracts | | $ | 113,687 | | | $ | — | | | $ | 113,687 | |
| Credit contracts | | | — | | | | (156,055 | ) | | | (156,055 | ) |
| Total | | $ | 113,687 | | | $ | (156,055 | ) | | $ | (42,368 | ) |
The table below summarizes the average daily balance of derivative holdings by the Fund during the year ended July 31, 2023:
| | | Long Derivative
Volume | | | Short Derivative
Volume | |
| Futures contracts (average notional value) | | | — | | | | 2,276,628 | |
| CDS contracts (average notional value)* | | | 4,275,000 | | | | — | |
| | |
| * | Long represents buying protection and short represents selling protection. |
9. Offsetting
The Fund entered into an International Swaps and Derivatives Association, Inc. Master Agreement (ISDA Master Agreement) or a similar agreement with certain of its derivative contract counterparties in order to better define its contractual rights and to secure rights that will help the Fund mitigate its counterparty risk. An ISDA Master Agreement is a bilateral agreement between the Fund and a counterparty that governs certain over-the-counter derivatives and foreign exchange contracts and typically contains, among other things, collateral posting items and netting provisions in the event of a default and/or termination event. Under an ISDA Master Agreement, the Fund may, under certain circumstances, offset with the counterparty certain
derivative financial instruments’ payables and/or receivables with collateral held and/or posted and create one single net payment. The provisions of the ISDA Master Agreement typically permit a single net payment in the event of default (close-out), including the bankruptcy or insolvency of the counterparty. However, bankruptcy or insolvency laws of a particular jurisdiction may impose restrictions on or prohibitions against the right of offset in bankruptcy, insolvency, or other events.
For financial reporting purposes, the Fund does not offset derivative assets and derivative liabilities that are subject to netting arrangements on the “Statement of assets and liabilities.”
At July 31, 2023, the Fund had the following assets and liabilities subject to offsetting provisions:
Offsetting of Financial Assets and Liabilities and Derivative Assets and Liabilities
| Counterparty | | Gross Value of
Derivative Asset | | | Gross Value of
Derivative Liability | | Net Position | |
| JP Morgan Chase Bank | | $ | — | | | $ | (92,064 | ) | $ | (92,064 | ) |
| Counterparty | | Net Position | | | Fair Value of
Non-Cash
Collateral Received | | | Cash Collateral
Received | | | Fair Value of
Non-Cash
Collateral Pledged | | | Cash Collateral
Pledged | | | Net
Exposure(a) | |
| JPMorgan Chase Bank | | $ | (92,064 | ) | | $ | — | | | $ | — | | | $ | — | | | $ | — | | | $ | (92,064 | ) |
| | |
| (a) | Net exposure represents the receivable (payable) that would be due from (to) the counterparty in the event of default. |
10. Securities Lending
The Fund, along with other funds in the Delaware Funds, may lend its securities pursuant to a security lending agreement (Lending Agreement) with The Bank of New York Mellon (BNY Mellon). At the time a security is loaned, the borrower must post collateral equal to the required percentage of the market value of the loaned security, including any accrued interest. The required percentage is: (1) 102% with respect to US securities and foreign securities that are denominated and payable in US dollars; and (2) 105% with respect to foreign securities. With respect to each loan, if on any business day the aggregate market value of securities collateral plus cash collateral held is less than the aggregate market value of the securities which are the subject of such loan, the borrower will be notified to provide additional collateral by the end of the following business day, which, together with the collateral already held, will be not less than the applicable initial collateral requirements for such security loan. If the aggregate market value of securities collateral and cash collateral held with respect to a security loan exceeds the applicable initial collateral requirement, upon the request of the borrower, BNY Mellon must return enough collateral to the borrower by the end of the following business day to reduce the value of the remaining collateral to the applicable initial collateral requirement for such security loan. As a result of the foregoing, the value of the collateral held with respect to a loaned security
Notes to financial statements
Delaware Emerging Markets Debt Corporate Fund
10. Securities Lending (continued)
on any particular day, may be more or less than the value of the security on loan. The collateral percentage with respect to the market value of the loaned security is determined by the security lending agent.
Cash collateral received by the Fund is generally invested in an individual separate account. The investment guidelines permit each separate account to hold certain securities that would be considered eligible securities for a money market fund. Cash collateral received is generally invested in government securities; certain obligations issued by government sponsored enterprises; repurchase agreements collateralized by US Treasury securities; obligations issued by the central government of any Organization for Economic Cooperation and Development (OECD) country or its agencies, instrumentalities, or establishments; obligations of supranational organizations; commercial paper, notes, bonds, and other debt obligations; certificates of deposit, time deposits, and other bank obligations; certain money market funds; and asset-backed securities. The Fund can also accept US government securities and letters of credit (non-cash collateral) in connection with securities loans.
In the event of default or bankruptcy by the lending agent, realization and/or retention of the collateral may be subject to legal proceedings. In the event the borrower fails to return loaned securities and the collateral received is insufficient to cover the value of the loaned securities and provided such collateral shortfall is not the result of investment losses, the lending agent has agreed to pay the amount of the shortfall to the Fund or, at the discretion of the lending agent, replace the loaned securities. The Fund continues to record dividends or interest, as applicable, on the securities loaned and is subject to changes in value of the securities loaned that may occur during the term of the loan. The Fund has the right under the Lending Agreement to recover the securities from the borrower on demand. With respect to security loans collateralized by non-cash collateral, the Fund receives loan premiums paid by the borrower. With respect to security loans collateralized by cash collateral, the earnings from the collateral investments are shared among the Fund, the security lending agent, and the borrower. The Fund records security lending income net of allocations to the security lending agent and the borrower.
The Fund may incur investment losses as a result of investing securities lending collateral. This could occur if an investment in the collateral investment account defaulted or became impaired. Under those circumstances, the value of the Fund’s cash collateral account may be less than the amount the Fund would be required to return to the borrowers of the securities and the Fund would be required to make up for this shortfall.
At July 31, 2023, the Fund had no securities out on loan.
11. Credit and Market Risk
The global outbreak of COVID-19 resulted in travel restrictions, closed international borders, enhanced health screenings at ports of entry and elsewhere, disruption of and delays in healthcare service preparation and delivery, prolonged quarantines, cancellations, supply chain disruptions, and lower consumer demand, as well as general concern and uncertainty. The
impact of COVID-19, and other infectious illness outbreaks that may arise in the future, could adversely affect the economies of many nations or the entire global economy, individual issuers and capital markets in ways that cannot necessarily be foreseen. In addition, the impact of infectious illnesses in emerging market countries may be greater due to generally less established healthcare systems. Public health crises caused by the COVID-19 outbreak may exacerbate other pre-existing political, social and economic risks in certain countries or globally. The duration of the outbreak, its full economic impact and ongoing effects at the macro-level and on individual businesses are unpredictable and may result in significant and prolonged effects on a Fund’s performance.
IBOR is the risk that changes related to the use of the London interbank offered rate (LIBOR) and other interbank offered rate (collectively, IBORs) could have adverse impacts on financial instruments that reference LIBOR (or the corresponding IBOR). The abandonment of LIBOR could affect the value and liquidity of instruments that reference LIBOR. The use of alternative reference rate products may impact investment strategy performance. These risks may also apply with respect to changes in connection with other IBORs, such as the euro overnight index average, which are also the subject of recent reform.
Some countries in which the Fund may invest require governmental approval for the repatriation of investment income, capital, or the proceeds of sales of securities by foreign investors. In addition, if there is deterioration in a country’s balance of payments or for other reasons, a country may impose temporary restrictions on foreign capital remittances abroad.
The securities exchanges of certain foreign markets are substantially smaller, less liquid, and more volatile than the major securities markets in the US. Consequently, acquisition and disposition of securities by the Fund may be inhibited. In addition, a significant portion of the aggregate market value of securities listed on the major securities exchanges in emerging markets is held by a smaller number of investors. This may limit the number of shares available for acquisition or disposition by the Fund.
The Fund invests a portion of its assets in high yield fixed income securities, which are securities rated lower than BBB- by S&P and Baa3 by Moody’s, or similarly rated by another nationally recognized statistical rating organization. Investments in these higher yielding securities are generally accompanied by a greater degree of credit risk than higher rated securities. Additionally, lower rated securities may be more susceptible to adverse economic and competitive industry conditions than investment grade securities.
The Fund invests in certain obligations that may have liquidity protection designed to ensure that the receipt of payments due on the underlying security is timely. Such protection may be provided through guarantees, insurance policies, or letters of credit obtained by the issuer or sponsor through third parties, through various means of structuring the transaction, or through a combination of such approaches. The Fund will usually not pay any additional fees for such credit support, although the existence of credit support may increase the price of a security.
Notes to financial statements
Delaware Emerging Markets Debt Corporate Fund
11. Credit and Market Risk (continued)
The Fund invests in bank loans and other securities that may subject it to direct indebtedness risk, the risk that the Fund will not receive payment of principal, interest, and other amounts due in connection with these investments and will depend primarily on the financial condition of the borrower. Loans that are fully secured offer the Fund more protection than unsecured loans in the event of nonpayment of scheduled interest or principal, although there is no assurance that the liquidation of collateral from a secured loan would satisfy the corporate borrower’s obligation, or that the collateral can be liquidated. Some loans or claims may be in default at the time of purchase. Certain of the loans and the other direct indebtedness acquired by the Fund may involve revolving credit facilities or other standby financing commitments that obligate the Fund to pay additional cash on a certain date or on demand. These commitments may require the Fund to increase its investment in a company at a time when the Fund might not otherwise decide to do so (including at a time when the company’s financial condition makes it unlikely that such amounts will be repaid). To the extent that the Fund is committed to advance additional funds, it will at all times hold and maintain cash or other high-grade debt obligations in an amount sufficient to meet such commitments. When a loan agreement is purchased, the Fund may pay an assignment fee. On an ongoing basis, the Fund may receive a commitment fee based on the undrawn portion of the underlying line of credit portion of a loan agreement. Prepayment penalty fees are received upon the prepayment of a loan agreement by the borrower. Prepayment penalty, facility, commitment, consent, and amendment fees are recorded to income as earned or paid.
When interest rates rise, fixed income securities (i.e. debt obligations) generally will decline in value. These declines in value are greater for fixed income securities with longer maturities or durations. Interest rate changes are influenced by a number of factors, such as government policy, monetary policy, inflation expectations, and the supply and demand of bonds. A fund may be subject to a greater risk of rising interest rates when interest rates are low or inflation rates are high or rising.
The Fund may invest up to 15% of its net assets in illiquid securities, which may include securities with contractual restrictions on resale, securities exempt from registration under Rule 144A promulgated under the Securities Act of 1933, as amended, and other securities which may not be readily marketable. The relative illiquidity of these securities may impair the Fund from disposing of them in a timely manner and at a fair price when it is necessary or desirable to do so. While maintaining oversight, the Board has delegated to DMC the day-to-day functions of determining whether individual securities are liquid for purposes of the Fund’s limitation on investments in illiquid securities. Securities eligible for resale pursuant to Rule 144A, which are determined to be liquid, are not subject to the Fund’s 15% limit on investments in illiquid securities. Rule 144A securities have been identified on the “Schedule of investments.”
12. Contractual Obligations
The Fund enters into contracts in the normal course of business that contain a variety of indemnifications. The Fund’s maximum exposure under these arrangements is unknown.
However, the Fund has not had prior claims or losses pursuant to these contracts. Management has reviewed the Fund’s existing contracts and expects the risk of loss to be remote.
13. Recent Accounting Pronouncements
In March 2020, FASB issued an Accounting Standards Update (ASU), ASU 2020-04, Reference Rate Reform (Topic 848) – Facilitation of the Effects of Reference Rate Reform on Financial Reporting. The amendments in ASU 2020-04 provide optional temporary financial reporting relief from the effect of certain types of contract modifications due to the planned discontinuation of LIBOR and other interbank-offered based reference rates as of the end of 2021. In March 2021, the administrator for LIBOR announced the extension of the publication of a majority of the USD LIBOR settings to June 30, 2023. On December 21, 2022, FASB issued ASU 2022-06 to defer the sunset date of Accounting Standards Codification Topic 848 until December 31, 2024. ASU 2020-04 is effective for certain reference rate-related contract modifications that occur during the period March 12, 2020 through December 31, 2024. Management is currently evaluating ASU 2020-04 and ASU 2022-06, but does not believe there will be a material impact.
14. Subsequent Events
Management has determined that no material events or transactions occurred subsequent to July 31, 2023, that would require recognition or disclosure in the Fund’s financial statements.
Report of independent
registered public accounting firm
To the Board of Trustees of Delaware Group® Government Fund and Shareholders of Delaware Emerging Markets Debt Corporate Fund
Opinion on the Financial Statements
We have audited the accompanying statement of assets and liabilities, including the schedule of investments, of Delaware Emerging Markets Debt Corporate Fund (one of the funds constituting Delaware Group® Government Fund, referred to hereafter as the “Fund”) as of July 31, 2023, the related statement of operations for the year ended July 31, 2023, the statement of changes in net assets for each of the two years in the period ended July 31, 2023, including the related notes, and the financial highlights for each of the five years in the period ended July 31, 2023 (collectively referred to as the “financial statements”). In our opinion, the financial statements present fairly, in all material respects, the financial position of the Fund as of July 31, 2023, the results of its operations for the year then ended, the changes in its net assets for each of the two years in the period ended July 31, 2023 and the financial highlights for each of the five years in the period ended July 31, 2023 in conformity with accounting principles generally accepted in the United States of America.
Basis for Opinion
These financial statements are the responsibility of the Fund’s management. Our responsibility is to express an opinion on the Fund’s financial statements based on our audits. We are a public accounting firm registered with the Public Company Accounting Oversight Board (United States) (PCAOB) and are required to be independent with respect to the Fund in accordance with the U.S. federal securities laws and the applicable rules and regulations of the Securities and Exchange Commission and the PCAOB.
We conducted our audits of these financial statements in accordance with the standards of the PCAOB. Those standards require that we plan and perform the audit to obtain reasonable assurance about whether the financial statements are free of material misstatement, whether due to error or fraud.
Our audits included performing procedures to assess the risks of material misstatement of the financial statements, whether due to error or fraud, and performing procedures that respond to those risks. Such procedures included examining, on a test basis, evidence regarding the amounts and disclosures in the financial statements. Our audits also included evaluating the accounting principles used and significant estimates made by management, as well as evaluating the overall presentation of the financial statements. Our procedures included confirmation of securities owned as of July 31, 2023 by correspondence with the custodian, transfer agents and brokers; when replies were not received from brokers, we performed other auditing procedures. We believe that our audits provide a reasonable basis for our opinion.
/s/ PricewaterhouseCoopers LLP
Philadelphia, Pennsylvania
September 21, 2023
We have served as the auditor of one or more investment companies in Delaware Funds by Macquarie® since 2010.
Other Fund information (Unaudited)
Delaware Emerging Markets Debt Corporate Fund
Liquidity Risk Management Program
The Securities and Exchange Commission (the “SEC”) has adopted Rule 22e-4 under the Investment Company Act of 1940 (the “Liquidity Rule”), which requires all open-end funds (other than money market funds) to adopt and implement a program reasonably designed to assess and manage the fund’s “liquidity risk,” defined as the risk that the fund could not meet requests to redeem shares issued by the fund without significant dilution of remaining investors’ interests in the fund.
The Fund has adopted and implemented a liquidity risk management program in accordance with the Liquidity Rule (the “Program”). The Board has designated a member of the US Operational Risk Group of Macquarie Asset Management as the Program Administrator for each Fund in the Trust.
As required by the Liquidity Rule, the Program includes policies and procedures that provide for: (1) assessment, management, and review (no less frequently than annually) of the Fund’s liquidity risk; (2) classification of each of the Fund’s portfolio holdings into one of four liquidity categories (Highly Liquid, Moderately Liquid, Less Liquid, and Illiquid); (3) for funds that do not primarily hold assets that are Highly Liquid, establishing and maintaining a minimum percentage of the Fund’s net assets in Highly Liquid investments (called a “Highly Liquid Investment Minimum” or “HLIM”); and (4) prohibiting the Fund’s acquisition of Illiquid investments if, immediately after the acquisition, the Fund would hold more than 15% of its net assets in Illiquid assets. The Program also requires reporting to the SEC (on a non-public basis) and to the Board if the Fund’s holdings of Illiquid assets exceed 15% of the Fund’s net assets. Funds with HLIMs must have procedures for addressing HLIM shortfalls, including reporting to the Board and, with respect to HLIM shortfalls lasting more than seven consecutive calendar days, reporting to the SEC (on a non-public basis).
In assessing and managing the Fund’s liquidity risk, the Program Administrator considers, as relevant, a variety of factors, including: (1) the Fund’s investment strategy and liquidity of portfolio investments during both normal and reasonably foreseeable stressed conditions; (2) short-term and long-term cash flow projections for the Fund during both normal and reasonably foreseeable stressed conditions; and (3) the Fund’s holdings of cash and cash equivalents and any borrowing arrangements. Classification of the Fund’s portfolio holdings in the four liquidity categories is based on the number of days it is reasonably expected to take to convert the investment to cash (for Highly Liquid and Moderately Liquid holdings) or to sell or dispose of the investment (for Less Liquid and Illiquid investments), in current market conditions without significantly changing the investment’s market value. The Fund primarily holds assets that are classified as Highly Liquid, and therefore is not required to establish an HLIM.
At a meeting of the Board held on May 23-25, 2023, the Program Administrator provided a written report to the Board addressing the Program’s operation and assessing the adequacy and effectiveness of its implementation for the period from April 1, 2022 through March 31, 2023. The report concluded that the Program is appropriately designed and effectively implemented and that it meets the requirements of Rule 22e-4 and the Fund’s liquidity needs. The Fund’s HLIM is set at an appropriate level and the Fund complied with its HLIM at all times during the reporting period.
Other Fund information (Unaudited)
Delaware Emerging Markets Debt Corporate Fund
Tax Information
The information set forth below is for the Fund’s fiscal year as required by federal income tax laws. Shareholders, however, must report distributions on a calendar year basis for income tax purposes, which may include distributions for portions of two fiscal years of the Fund. Accordingly, the information needed by shareholders for income tax purposes will be sent to them in January of each year. Please consult your tax advisor for proper treatment of this information.
All disclosures are based on financial information available as of the date of this annual report and, accordingly are subject to change. For any and all items requiring reporting, it is the intention of the Fund to report the maximum amount permitted under the Internal Revenue Code and the regulations thereunder.
For the year ended July 31, 2023, the Fund reports distributions paid during the year as follows:
| (A) Ordinary Income Distributions (Tax Basis) | 100.00% |
(A) is based on a percentage of the Fund’s total distributions.
For the fiscal year ended July 31, 2023, certain interest income paid by the Fund, determined to be Qualified Interest Income and Short-term Capital Gains may be subject to relief from US withholding for foreign shareholders, as provided by the American Jobs Creation Act of 2004; the Tax Relief Unemployment Insurance Reauthorization, and Job Creation Act of 2010; and as extended by the American Taxpayer Relief Act of 2012. For the year ended July 31, 2023, the Fund has reported maximum distributions of Qualified Interest Income of $369,960.
The percentage of the ordinary dividends reported by the Fund that is treated as a Section 163(j) interest dividend and thus is eligible to be treated as interest income for purposes of Section 163(j) and the regulations thereunder is 100%.
Form N-PORT and proxy voting information
The Fund files its complete schedule of portfolio holdings with the Securities and Exchange Commission (SEC) for the first and third quarters of each fiscal year on Form N-PORT. The Fund’s Form N-PORT, as well as a description of the policies and procedures that the Fund uses to determine how to vote proxies (if any) relating to portfolio securities, is available without charge (i) upon request, by calling 800 523-1918; and (ii) on the SEC’s website at sec.gov. In addition, a description of the policies and procedures that the Fund uses to determine how to vote proxies (if any) relating to portfolio securities and the Schedule of Investments included in the Fund’s most recent Form N-PORT are available without charge on the Fund’s website at delawarefunds.com/literature.
Information (if any) regarding how the Fund voted proxies relating to portfolio securities during the most recently disclosed 12-month period ended June 30 is available without charge (i) through the Fund’s website at delawarefunds.com/proxy; and (ii) on the SEC’s website at sec.gov.
Board of trustees and officers addendum
Delaware Funds by Macquarie®
A mutual fund is governed by a Board of Trustees (“Trustees”), which has oversight responsibility for the management of a fund’s business affairs. Trustees establish procedures and oversee and review the performance of the investment manager, the distributor, and others who perform services for the fund. The independent fund trustees, in particular, are advocates for shareholder interests. Each trustee has served in that capacity since he or she was elected to or appointed to the Board of Trustees, and will continue to serve until his or her retirement or the election of a new trustee in his or her place. The following is a list of the Trustees and Officers with certain background and related information.
Name,
Address,
and Birth Year | | Position(s)
Held with
the Trust | | Length of Time
Served1 | | Number of
Funds in Fund
Complex Overseen
by Trustee | | Principal
Occupation(s)
During the
Past Five Years | | Other
Directorships
Held by Trustee
During the
Past Five Years |
| Interested Trustee | | | | | | | | | | |
| | | | | | | | | | | |
Shawn K. Lytle2
100 Independence 610 Market Street Philadelphia, PA
19106-2354 1970 | | President, Chief Executive Officer, and Trustee | | President and Chief Executive Officer since August 2015 Trustee since September 2015 | | 106 | | Macquarie Asset Management3
(2015–Present) -Global Head of Macquarie Asset Management Public Investments
(2019–Present)
-Head of Americas of Macquarie Group
(2017–Present) | | None |
Board of trustees and officers addendum
Delaware Funds by Macquarie®
Name,
Address,
and Birth Year | | Position(s)
Held with
the Trust | | Length of Time
Served1 | | Number of
Funds in Fund
Complex Overseen
by Trustee | | Principal
Occupation(s)
During the
Past Five Years | | Other
Directorships
Held by Trustee
During the
Past Five Years |
| Independent Trustees | | | | | | | | | | |
| | | | | | | | | | | |
Jerome D. Abernathy
100 Independence
610 Market Street
Philadelphia, PA
19106-2354
1959 | | Trustee | | Since January 2019 | | 106 | | Stonebrook Capital
Management, LLC
(financial
technology: macro
factors and databases)
-Managing Member
(1993-Present) | | None |
| | | | | | | | | | | |
Ann D. Borowiec
100 Independence
610 Market Street
Philadelphia, PA
19106-2354
1958 | | Trustee | | Since March 2015 | | 106 | | J.P. Morgan Chase & Co.
(1987-2013)
-Chief Executive Officer,
Private Wealth
Management
(2011–2013) | | Banco Santander International
(2016–2019)
Santander Bank, N.A.
(2016-2019) |
Name,
Address,
and Birth Year | | Position(s)
Held with
the Trust | | Length of Time
Served1 | | Number of
Funds in Fund
Complex Overseen
by Trustee | | Principal
Occupation(s)
During the
Past Five Years | | Other
Directorships
Held by Trustee
During the
Past Five Years |
| | | | | | | | | | | |
Joseph W. Chow
100 Independence
610 Market Street
Philadelphia, PA
19106-2354
1953 | | Trustee | | Since January 2013 | | 106 | | Private Investor
(2011–Present)
State Street Bank and
Trust Company
(1996-2011)
-Executive Vice President
of Enterprise Risk
Management and
Emerging Economies
Strategy; and Chief Risk
and Corporate
Administration Officer | | None |
| | | | | | | | | | | |
H. Jeffrey Dobbs
100 Independence
610 Market Street
Philadelphia, PA
19106-2354
1955 | | Trustee | | Since April 20194 | | 106 | | KPMG LLP
(2002-2015)
-Global Sector Chairman,
Industrial Manufacturing
(2010-2015) | | TechAccel LLC
(2015–Present)
PatientsVoices, Inc.
(2018–Present)
Valparaiso University Board
(2012-Present)
Ivy Funds Complex
(2019-2021) |
Board of trustees and officers addendum
Delaware Funds by Macquarie®
Name,
Address,
and Birth Year | | Position(s)
Held with
the Trust | | Length of Time
Served1 | | Number of
Funds in Fund
Complex Overseen
by Trustee | | Principal
Occupation(s)
During the
Past Five Years | | Other
Directorships
Held by Trustee
During the
Past Five Years |
| | | | | | | | | | | |
John A. Fry
100 Independence
610 Market Street
Philadelphia, PA
19106-2354
1960 | | Trustee | | Since January 2001 | | 106 | | Drexel University
-President
(2010–Present) | | Federal Reserve
Bank of
Philadelphia
(2020–Present)
Kresge Foundation (2018-Present)
FS Credit Real Estate Income
Trust, Inc. (2018–Present)
vTv Therapeutics Inc.
(2017–Present)
Community Health Systems
(2004–Present)
Drexel Morgan & Co.
(2015–2019) |
Name,
Address,
and Birth Year | | Position(s)
Held with
the Trust | | Length of Time
Served1 | | Number of
Funds in Fund
Complex Overseen
by Trustee | | Principal
Occupation(s)
During the
Past Five Years | | Other
Directorships
Held by Trustee
During the
Past Five Years |
| | | | | | | | | | | |
Joseph Harroz, Jr.
100 Independence
610 Market Street
Philadelphia, PA
19106-2354
1967 | | Trustee | | Since November 19984 | | 106 | | University of Oklahoma
-President
(2020–Present)
-Interim President
(2019–2020)
-Vice President and
Dean, College of Law
(2010–2019)
Brookhaven Investments
LLC (commercial
enterprises)
-Managing Member (2019–Present)
St. Clair, LLC
(commercial enterprises)
-Managing Member
(2019–Present) | | OU Medicine, Inc.
(2020–Present)
Big 12 Athletic Conference
(2019-Present)
Valliance Bank
(2007–Present)
Ivy Funds Complex
(1998-2021) |
Board of trustees and officers addendum
Delaware Funds by Macquarie®
Name,
Address,
and Birth Year | | Position(s)
Held with
the Trust | | Length of Time
Served1 | | Number of
Funds in Fund
Complex Overseen
by Trustee | | Principal
Occupation(s)
During the
Past Five Years | | Other
Directorships
Held by Trustee
During the
Past Five Years |
| | | | | | | | | | | |
Sandra A.J.
Lawrence
100 Independence
610 Market Street
Philadelphia, PA
19106-2354
1957 | | Trustee | | Since April 20194 | | 106 | | Children’s Mercy
Hospitals and Clinics
(2005–2019)
-Chief Administrative
Officer
(2016–2019) | | Brixmor Property Group Inc.
(2021-Present)
Sera Prognostics Inc.
(biotechnology)
(2021-Present)
Recology (resource recovery)
(2021-Present) Evergy, Inc., Kansas City Power & Light Company, KCP&L
Greater Missouri Operations
Company, Westar Energy, Inc.
and Kansas Gas and Electric Company (related utility companies)
(2018-Present)
National Association of Corporate
Directors (2017-Present)
American Shared Hospital
Services (medical device)
(2017-2021)
Ivy Funds Complex
(2019-2021) |
Name,
Address,
and Birth Year | | Position(s)
Held with
the Trust | | Length of Time
Served1 | | Number of
Funds in Fund
Complex Overseen
by Trustee | | Principal
Occupation(s)
During the
Past Five Years | | Other
Directorships
Held by Trustee
During the
Past Five Years |
| | | | | | | | | | | |
Frances A. Sevilla-Sacasa
100 Independence
610 Market Street
Philadelphia, PA
19106-2354
1956 | | Trustee | | Since September 2011 | | 106 | | Banco Itaú International
-Chief Executive Officer
(2012–2016) Bank of America, U.S. Trust Private Wealth
-President (2007-2008) U.S. Trust Corp.
-President & CEO
(2005-2007) | | Invitation Homes Inc.
(2023-Present) Florida Chapter of National Association of Corporate Directors
(2021-Present) Callon Petroleum Company
(2019-Present) Camden Property Trust
(2011-Present) New Senior Investment Group Inc. (REIT) (2021) Carrizo Oil & Gas, Inc.
(2018-2019) |
| | | | | | | | | | | |
Thomas K. Whitford
100 Independence
610 Market Street
Philadelphia, PA
19106-2354
1956 | | Chair and Trustee | | Trustee since January 2013
Chair since January 2023 | | 106 | | PNC Financial Services Group (1983–2013)
-Vice Chairman
(2009-2013) | | HSBC USA Inc. (2014–2022) HSBC North America Holdings Inc.
(2013–2022) |
Board of trustees and officers addendum
Delaware Funds by Macquarie®
Name,
Address,
and Birth Year | | Position(s)
Held with
the Trust | | Length of Time
Served1 | | Number of
Funds in Fund
Complex Overseen
by Trustee | | Principal
Occupation(s)
During the
Past Five Years | | Other
Directorships
Held by Trustee
During the
Past Five Years |
| | | | | | | | | | | |
Christianna Wood
100 Independence
610 Market Street
Philadelphia, PA
19106-2354
1959 | | Trustee | | Since January 2019 | | 106 | | Gore Creek Capital, Ltd.
-Chief Executive Officer and President
(2009–Present)
Capital Z Asset Management
-Chief Executive Officer
(2008-2009)
California Public Employees’ Retirement System (CalPERS)
-Senior Investment Officer of Global Equity
(2002-2008) | | The Merger Fund
(2013–2021),
The Merger Fund VL
(2013–2021),
WCM Alternatives: Event-Driven Fund (2013–2021),
and WCM Alternatives: Credit Event Fund
(2017–2021) Grange Insurance
(2013–Present) H&R Block Corporation
(2008–2022) International Securities Exchange (2010-2018) Vassar College Trustee (2006-2018) |
Name,
Address,
and Birth Year | | Position(s)
Held with
the Trust | | Length of Time
Served1 | | Number of
Funds in Fund
Complex Overseen
by Trustee | | Principal
Occupation(s)
During the
Past Five Years | | Other
Directorships
Held by Trustee
During the
Past Five Years |
| | | | | | | | | | | |
Janet L. Yeomans
100 Independence
610 Market Street Philadelphia, PA
19106-2354
1948 | | Trustee | | Since April 1999 | | 106 | | 3M Company
(1995-2012)
-Vice President and
Treasurer
(2006–2012) | | Temple University Hospital
(2017-Present)
Pennsylvania State System of
Higher Education
(2018-Present) |
| | | | | | | | | | | |
| Officers | | | | | | | | | | |
| | | | | | | | | | | |
David F. Connor
100 Independence
610 Market Street
Philadelphia, PA
19106-2354
1963 | | Senior Vice President, General Counsel, and Secretary | | Senior Vice President, since May 2013; General Counsel since May 2015; Secretary since October 2005 | | 106 | | David F. Connor has served in various capacities at different times at Macquarie Asset Management. | | None5 |
| | | | | | | | | | | |
Daniel V. Geatens
100 Independence
610 Market Street
Philadelphia, PA
19106-2354
1972 | | Senior Vice President and Treasurer | | Senior Vice President and Treasurer since October 2007 | | 106 | | Daniel V. Geatens has served in various capacities at different times at Macquarie Asset Management. | | None5 |
Board of trustees and officers addendum
Delaware Funds by Macquarie®
Name,
Address,
and Birth Year | | Position(s)
Held with
the Trust | | Length of Time
Served1 | | Number of
Funds in Fund
Complex Overseen
by Trustee | | Principal
Occupation(s)
During the
Past Five Years | | Other
Directorships
Held by Trustee
During the
Past Five Years |
| | | | | | | | | | | |
Richard Salus
100 Independence
610 Market Street
Philadelphia, PA
19106-2354
1963 | | Senior Vice President
and Chief Financial Officer | | Senior Vice President
and Chief Financial
Officer since
November 2006 | | 106 | | Richard Salus has served in various capacities at different times at Macquarie Asset Management. | | None |
1 “Length of Time Served” refers to the time since the Trustee or officer began serving one or more of the Trusts in the Delaware Funds complex.
2 Shawn K. Lytle is considered to be an “Interested Trustee” because he is an executive officer of the Funds’ investment advisor.
3 Macquarie Asset Management is the marketing name for certain companies comprising the asset management division of Macquarie Group, including the Funds’ investment advisor, principal underwriter, and transfer agent.
4 Includes time served on the Board of the Ivy Funds complex prior to the date when the Ivy Funds joined the Delaware Funds complex.
5 David F. Connor and Daniel V. Geatens serve in similar capacities for the six portfolios of the Optimum Fund Trust, which have the same investment manager, principal underwriter, and transfer agent as the Funds. Mr. Geatens also serves as the Chief Financial Officer of the Optimum Fund Trust.
The Statement of Additional Information for the Fund(s) includes additional information about the Trustees and Officers and is available, without charge, upon request by calling 800 523-1918.
Item 2. Code of Ethics
The registrant has adopted a code of ethics that applies to the registrant’s principal executive officer, principal financial officer, principal accounting officer or controller, or persons performing similar functions, regardless of whether these individuals are employed by the registrant or a third party. A copy of the registrant’s Code of Business Ethics has been posted on the Delaware Funds by Macquarie® Internet Web site at www.delawarefunds.com. Any amendments to the Code of Business Ethics, and information on any waiver from its provisions granted by the registrant, will also be posted on this Web site within five business days of such amendment or waiver and will remain on the Web site for at least 12 months.
Item 3. Audit Committee Financial Expert
The registrant’s Board of Trustees has determined that certain members of the registrant’s Audit Committee are audit committee financial experts, as defined below. For purposes of this item, an “audit committee financial expert” is a person who has the following attributes:
a. An understanding of generally accepted accounting principles and financial statements;
b. The ability to assess the general application of such principles in connection with the accounting for estimates, accruals, and reserves;
c. Experience preparing, auditing, analyzing, or evaluating financial statements that present a breadth and level of complexity of accounting issues that are generally comparable to the breadth and complexity of issues that can reasonably be expected to be raised by the registrant’s financial statements, or experience actively supervising one or more persons engaged in such activities;
d. An understanding of internal controls and procedures for financial reporting; and
e. An understanding of audit committee functions.
An “audit committee financial expert” shall have acquired such attributes through:
a. Education and experience as a principal financial officer, principal accounting officer, controller, public accountant, or auditor or experience in one or more positions that involve the performance of similar functions;
b. Experience actively supervising a principal financial officer, principal accounting officer, controller, public accountant, auditor, or person performing similar functions;
c. Experience overseeing or assessing the performance of companies or public accountants with respect to the preparation, auditing, or evaluation of financial statements; or
d. Other relevant experience.
The registrant’s Board of Trustees has also determined that each member of the registrant’s Audit Committee is independent. In order to be “independent” for purposes of this item, the Audit Committee member may not: (i) other than in his or her capacity as a member of the Board of Trustees or any committee thereof, accept directly or indirectly any consulting,
advisory or other compensatory fee from the issuer; or (ii) be an “interested person” of the registrant as defined in Section 2(a)(19) of the Investment Company Act of 1940.
The names of the audit committee financial experts on the registrant’s Audit Committee are set forth below:
H. Jeffrey Dobbs
Sandra A.J. Lawrence
Frances Sevilla-Sacasa, Chair
Item 4. Principal Accountant Fees and Services
(a) Audit fees.
The aggregate fees billed for services provided to the registrant by its independent auditors for the audit of the registrant’s annual financial statements and for services normally provided by the independent auditors in connection with statutory and regulatory filings or engagements were $89,143 for the fiscal year ended July 31, 2023.
The aggregate fees billed for services provided to the registrant by its independent auditors for the audit of the registrant’s annual financial statements and for services normally provided by the independent auditors in connection with statutory and regulatory filings or engagements were $90,643 for the fiscal year ended July 31, 2022.
(b) Audit-related fees.
The aggregate fees billed by the registrant’s independent auditors for services relating to the performance of the audit of the registrant’s financial statements and not reported under paragraph (a) of this Item were $0 for the fiscal year ended July 31, 2023.
The aggregate fees billed by the registrant’s independent auditors for services relating to the performance of the audit of the financial statements of the registrant’s investment adviser and other service providers under common control with the adviser and that relate directly to the operations or financial reporting of the registrant were $1,362,878 for the registrant’s fiscal year ended July 31, 2023. The percentage of these fees relating to services approved by the registrant’s Audit Committee pursuant to the de minimis exception from the pre-approval requirement in Rule 2-01(c)(7)(i)(C) of Regulation S-X was 0%. These audit-related services were as follows: year end audit procedures; group reporting and subsidiary statutory audits.
The aggregate fees billed by the registrant’s independent auditors for services relating to the performance of the audit of the registrant’s financial statements and not reported under paragraph (a) of this Item were $0 for the fiscal year ended July 31, 2022.
The aggregate fees billed by the registrant’s independent auditors for services relating to the performance of the audit of the financial statements of the registrant’s investment adviser and other service providers under common control with the adviser and that relate directly to the operations or financial reporting of the registrant were $2,050,189 for the registrant’s fiscal year ended July 31, 2022. The percentage of these fees relating to services approved by the registrant’s Audit Committee pursuant to the de minimis exception from the pre-approval requirement in Rule 2-01(c)(7)(i)(C) of Regulation S-X was 0%. These audit-related services were as follows: year end audit procedures; group reporting and subsidiary statutory audits.
(c) Tax fees.
The aggregate fees billed by the registrant’s independent auditors for tax-related services provided to the registrant were $12,520 for the fiscal year ended July 31, 2023. The percentage of these fees relating to services approved by the registrant’s Audit Committee pursuant to the de minimis exception from the pre-approval requirement in Rule 2-01(c)(7)(i)(C) of Regulation S-X was 0%. These tax-related services were as follows: review of income tax returns and review of annual excise distribution calculations.
The aggregate fees billed by the registrant’s independent auditors for tax-related services provided to the registrant’s investment adviser and other service providers under common control with the adviser and that relate directly to the operations or financial reporting of the registrant were $0 for the registrant’s fiscal year ended July 31, 2023.
The aggregate fees billed by the registrant’s independent auditors for tax-related services provided to the registrant were $12,520 for the fiscal year ended July 31, 2022. The percentage of these fees relating to services approved by the registrant’s Audit Committee pursuant to the de minimis exception from the pre-approval requirement in Rule 2-01(c)(7)(i)(C) of Regulation S-X was 0%. These tax-related services were as follows: review of income tax returns and review of annual excise distribution calculations.
The aggregate fees billed by the registrant’s independent auditors for tax-related services provided to the registrant’s investment adviser and other service providers under common control with the adviser and that relate directly to the operations or financial reporting of the registrant were $0 for the registrant’s fiscal year ended July 31, 2022.
(d) All other fees.
The aggregate fees billed for all services provided by the independent auditors to the registrant other than those set forth in paragraphs (a), (b) and (c) of this Item were $0 for the fiscal year ended July 31, 2023.
The aggregate fees billed for all services other than those set forth in paragraphs (b) and (c) of this Item provided by the registrant’s independent auditors to the registrant’s adviser and other service providers under common control with the adviser and that relate directly to the operations or financial reporting of the registrant were $0 for the registrant’s fiscal year ended July 31, 2023. The percentage of these fees relating to services approved by the registrant’s Audit Committee pursuant to the de minimis exception from the pre-approval requirement in Rule 2-01(c)(7)(i)(C) of Regulation S-X was 0%.
The aggregate fees billed for all services provided by the independent auditors to the registrant other than those set forth in paragraphs (a), (b) and (c) of this Item were $0 for the fiscal year ended July 31, 2022.
The aggregate fees billed for all services other than those set forth in paragraphs (b) and (c) of this Item provided by the registrant’s independent auditors to the registrant’s adviser and other service providers under common control with the adviser and that relate directly to the operations or financial reporting of the registrant were $0 for the registrant’s fiscal year ended July 31, 2022. The percentage of these fees relating to services approved by the registrant’s Audit
Committee pursuant to the de minimis exception from the pre-approval requirement in Rule 2-01(c)(7)(i)(C) of Regulation S-X was 0%.
(e) The registrant’s Audit Committee has established pre-approval policies and procedures as permitted by Rule 2-01(c)(7)(i)(B) of Regulation S-X (the “Pre-Approval Policy”) with respect to services provided by the registrant’s independent auditors. Pursuant to the Pre-Approval Policy, the Audit Committee has pre-approved the services set forth in the table below with respect to the registrant up to the specified fee limits. Certain fee limits are based on aggregate fees to the registrant and other registrants within the Delaware Funds by Macquarie®.
| Service | Range of Fees |
| Audit Services | |
| Statutory audits or financial audits for new Funds | up to $50,000 per Fund |
| Services associated with SEC registration statements (e.g., Form N-1A, Form N-14, etc.), periodic reports and other documents filed with the SEC or other documents issued in connection with securities offerings (e.g., comfort letters for closed-end Fund offerings, consents), and assistance in responding to SEC comment letters | up to $10,000 per Fund |
| Consultations by Fund management as to the accounting or disclosure treatment of transactions or events and/or the actual or potential impact of final or proposed rules, standards or interpretations by the SEC, FASB, or other regulatory or standard-setting bodies (Note: Under SEC rules, some consultations may be considered “audit-related services” rather than “audit services”) | up to $25,000 in the aggregate |
| Audit-Related Services | |
| Consultations by Fund management as to the accounting or disclosure treatment of transactions or events and /or the actual or potential impact of final or proposed rules, standards or interpretations by the SEC, FASB, or other regulatory or standard-setting bodies (Note: Under SEC rules, some consultations may be considered “audit services” rather than “audit-related services”) | up to $25,000 in the aggregate |
| Tax Services | |
| U.S. federal, state and local and international tax planning and advice (e.g., consulting on statutory, regulatory or administrative developments, evaluation of Funds’ tax compliance function, etc.) | up to $25,000 in the aggregate |
| U.S. federal, state and local tax compliance (e.g., excise distribution reviews, etc.) | up to $5,000 per Fund |
| Review of federal, state, local and international income, franchise and other tax returns | up to $5,000 per Fund |
Under the Pre-Approval Policy, the Audit Committee has also pre-approved the services set forth in the table below with respect to the registrant’s investment adviser and other entities controlling, controlled by or under common control with the investment adviser that provide ongoing services to the registrant (the “Control Affiliates”) up to the specified fee limit. This fee limit is based on aggregate fees to the investment adviser and its Control Affiliates.
| Service | Range of Fees |
| Non-Audit Services | |
| Services associated with periodic reports and other documents filed with the SEC and assistance in responding to SEC comment letters | up to $10,000 in the aggregate |
The Pre-Approval Policy requires the registrant’s independent auditors to report to the Audit Committee at each of its regular meetings regarding all services initiated since the last such report was rendered, including those services authorized by the Pre-Approval Policy.
(f) Not applicable.
(g) The aggregate non-audit fees billed by the registrant’s independent auditors for services rendered to the registrant and to its investment adviser and other service providers under common control with the adviser were $24,428,000 and $10,812,067 for the registrant’s fiscal years ended July 31, 2023 and July 31, 2022, respectively.
(h) In connection with its selection of the independent auditors, the registrant’s Audit Committee has considered the independent auditors’ provision of non-audit services to the registrant’s investment adviser and other service providers under common control with the adviser that were not required to be pre-approved pursuant to Rule 2-01(c)(7)(ii) of Regulation S-X. The Audit Committee has determined that the independent auditors’ provision of these services is compatible with maintaining the auditors’ independence.
Item 5. Audit Committee of Listed Registrants
Not applicable.
Item 6. Investments
(a) Included as part of report to shareholders filed under Item 1 of this Form N-CSR.
(b) Divestment of securities in accordance with Section 13(c) of the Investment Company Act of 1940.
Not applicable.
Item 7. Disclosure of Proxy Voting Policies and Procedures for Closed-End Management Investment Companies
Not applicable.
Item 8. Portfolio Managers of Closed-End Management Investment Companies
Not applicable.
Item 9. Purchases of Equity Securities by Closed-End Management Investment Companies and Affiliated Purchasers
Not applicable.
Item 10. Submission of Matters to a Vote of Security Holders
Not applicable.
Item 11. Controls and Procedures
The registrant’s principal executive officer and principal financial officers, or persons performing similar functions, have concluded that the registrant’s disclosure controls and procedures (as defined in Rule 30a-3(c) under the Investment Company Act of 1940, as amended (17 CFR 270.30a-3(c))) are effective, as of a date within 90 days of the filing of this report, based on their evaluation of these controls and procedures required by Rule 30a-3(b) under the Investment Company Act of 1940 (17 CFR 270.30a-3(b)) and Rules 13a-15(b) or 15d-15(b) under the Securities Exchange Act of 1934, as amended (17 CFR 240.13a-15(b) or 240.15d-15(b)) and provide reasonable assurance that the information required to be disclosed by the registrant in its reports or statements filed under the Securities Exchange Act of 1934 is recorded, processed, summarized and reported within the time periods specified in the rules and forms of the Securities and Exchange Commission.
There were no significant changes in the registrant’s internal control over financial reporting (as defined in Rule 30a-3(d) under the Investment Company Act of 1940 (17 CFR 270.30a-3(d)) that occurred during the period covered by the report to stockholders included herein that have materially affected, or are reasonably likely to materially affect, the registrant’s internal control over financial reporting.
Item 12. Disclosure of Securities Lending Activities for Closed-End Management Investment Companies
Not applicable.
Item 13. Exhibits
Not applicable.
(2) Certifications of Principal Executive Officer and Principal Financial Officer pursuant to Rule 30a-2 under the Investment Company Act of 1940 are attached hereto as Exhibit 99.CERT.
(3) Written solicitations to purchase securities pursuant to Rule 23c-1 under the Securities Exchange Act of 1934.
Not applicable.
SIGNATURES
Pursuant to the requirements of the Securities Exchange Act of 1934 and the Investment Company Act of 1940, the registrant has duly caused this report to be signed on its behalf, by the undersigned, thereunto duly authorized.
DELAWARE GROUP® GOVERNMENT FUND
| /s/ SHAWN K. LYTLE | |
| By: | Shawn K. Lytle | |
| Title: | President and Chief Executive Officer |
| Date: | September 27, 2023 | |
Pursuant to the requirements of the Securities Exchange Act of 1934 and the Investment Company Act of 1940, this report has been signed below by the following persons on behalf of the registrant and in the capacities and on the dates indicated.
| /s/ SHAWN K. LYTLE | |
| By: | Shawn K. Lytle | |
| Title: | President and Chief Executive Officer |
| Date: | September 27, 2023 | |
| /s/ RICHARD SALUS | |
| By: | Richard Salus | |
| Title: | Chief Financial Officer |
| Date: | September 27, 2023 | |