UNITED STATES SECURITIES AND EXCHANGE COMMISSION
Washington, D.C. 20549
FORM N-CSR
CERTIFIED SHAREHOLDER REPORT OF REGISTERED MANAGEMENT
INVESTMENT COMPANIES
| Investment Company Act file number: | | 811-04304 |
| | |
| Exact name of registrant as specified in charter: | | Delaware Group® Government Fund |
| | |
| Address of principal executive offices: | | 610 Market Street |
| | Philadelphia, PA 19106 |
| | |
| Name and address of agent for service: | | David F. Connor, Esq. |
| | 610 Market Street |
| | Philadelphia, PA 19106 |
| | |
| Registrant’s telephone number, including area code: | | (800) 523-1918 |
| | |
| Date of fiscal year end: | | July 31 |
| | |
| Date of reporting period: | | July 31, 2022 |
Item 1. Reports to Stockholders
Table of Contents
Annual report
Fixed income mutual fund
Delaware Emerging Markets Debt Corporate Fund
July 31, 2022
Carefully consider the Fund's investment objectives, risk factors, charges, and expenses before investing. This and other information can be found in the Fund's prospectus and its summary prospectus, which may be obtained by visiting delawarefunds.com/literature or calling 800 523-1918. Investors should read the prospectus and the summary prospectus carefully before investing.
You can obtain shareholder reports and prospectuses online instead of in the mail.
Visit delawarefunds.com/edelivery.
Table of Contents
Experience Delaware Funds by Macquarie®
Macquarie Asset Management (MAM) is a global asset manager that aims to deliver positive impact for everyone. MAM Public Investments traces its roots to 1929 and partners with institutional and individual clients to deliver specialist active investment capabilities across global equities, fixed income, and multi-asset solutions using a conviction-based, long-term approach to investing. In the US, retail investors recognize our Delaware Funds by Macquarie family of funds as one of the oldest mutual fund families.
If you are interested in learning more about creating an investment plan, contact your financial advisor.
You can learn more about Delaware Funds or obtain a prospectus for Delaware Emerging Markets Debt Corporate Fund at delawarefunds.com/literature.
Manage your account online
| ● | Check your account balance and transactions |
| ● | View statements and tax forms |
| ● | Make purchases and redemptions |
Visit delawarefunds.com/account-access.
Macquarie Asset Management (MAM) is the asset management division of Macquarie Group. MAM is a full-service asset manager offering a diverse range of products across public and private markets including fixed income, equities, multi-asset solutions, private credit, infrastructure, renewables, natural assets, real estate, and asset finance. The Public Investments business is a part of MAM and includes the following investment advisers: Macquarie Investment Management Business Trust (MIMBT), Macquarie Funds Management Hong Kong Limited, Macquarie Investment Management Austria Kapitalanlage AG, Macquarie Investment Management Global Limited, Macquarie Investment Management Europe Limited, and Macquarie Investment Management Europe S.A.
The Fund is distributed by Delaware Distributors, L.P. (DDLP), an affiliate of MIMBT and Macquarie Group Limited.
Other than Macquarie Bank Limited ABN 46 008 583 542 ("Macquarie Bank"), any Macquarie Group entity noted in this document is not an authorized deposit-taking institution for the purposes of the Banking Act 1959 (Commonwealth of Australia). The obligations of these other Macquarie Group entities do not represent deposits or other liabilities of Macquarie Bank. Macquarie Bank does not guarantee or otherwise provide assurance in respect of the obligations of these other Macquarie Group entities. In addition, if this document relates to an investment, (a) the investor is subject to investment risk including possible delays in repayment and loss of income and principal invested and (b) none of Macquarie Bank or any other Macquarie Group entity guarantees any particular rate of return on or the performance of the investment, nor do they guarantee repayment of capital in respect of the investment.
The Fund is governed by US laws and regulations.
Unless otherwise noted, views expressed herein are current as of July 31, 2022, and subject to change for events occurring after such date.
The Fund is not FDIC insured and is not guaranteed. It is possible to lose the principal amount invested.
Advisory services provided by Delaware Management Company, a series of MIMBT, a US registered investment advisor.
All third-party marks cited are the property of their respective owners.
© 2022 Macquarie Management Holdings, Inc.
Table of Contents
| Portfolio management review | |
| Delaware Emerging Markets Debt Corporate Fund | July 31, 2022 (Unaudited) |
| Performance preview (for the year ended July 31, 2022) | | | | |
| Delaware Emerging Markets Debt Corporate Fund | | | | |
| (Institutional Class shares) | | 1-year return | | -13.60% |
| Delaware Emerging Markets Debt Corporate Fund | | | | |
| (Class A shares) | | 1-year return | | -13.83% |
| J.P. Morgan Corporate Emerging Markets Bond Index (CEMBI) Broad | | | | |
| Diversified (benchmark) | | 1-year return | | -13.54% |
Past performance does not guarantee future results.
For complete, annualized performance for Delaware Emerging Markets Debt Corporate Fund, please see the table on page 5.
Institutional Class shares are not subject to a sales charge and are offered for sale exclusively to certain eligible investors. In addition, Institutional Class shares pay no distribution and service fee.
The performance of Class A shares excludes the applicable sales charge. The performance of both Institutional Class shares and Class A shares reflects the reinvestment of all distributions.
Please see page 8 for a description of the index. Index performance returns do not reflect any management fees, transaction costs, or expenses. Indices are unmanaged and one cannot invest directly in an index.
Investment objective
The Fund seeks current income and, secondarily, capital appreciation.
Market review
Although it was not apparent at the time, as the fiscal year began in August 2021, global economies and markets were nearing the end of the post-pandemic euphoria that had taken hold in the previous fiscal year. The initial pandemic-induced market selloff in March 2020 and economic lockdowns had given rise to extraordinary counter measures, including extremely loose fiscal and monetary policy that was very much warranted. But as the initial shocks abated, central banks began taking stock of overheated asset prices, tight labor markets, supply-chain disruptions, and inflation.
Initially dismissed as transitory, it wasn’t long before central banks, investors, and consumers saw inflation as entrenched, quite possibly for a prolonged period. That prompted a dramatic shift in central bank policy to a much tighter framework. Bucking the commonly held view that governance and
During the Fund’s fiscal year:
| ● | The economic backdrop was supportive for emerging markets.
|
| ● | Transportation and infrastructure led the recovery.
|
| ● | High yield outperformed investment grade. |
1
Table of Contents
Portfolio management review
Delaware Emerging Markets Debt Corporate Fund
policy standards are generally higher in developed markets, we saw emerging market central banks tighten monetary policy preventatively based on their own views of inflation. With only some exceptions, notably Turkey, emerging market countries were quicker to initiate rate hikes than developed market countries.
The US Federal Reserve began to raise interest rates in mid-March 2022 with a 0.25 percentage point increase. That was followed in early May with a 0.50 percentage point increase and then 0.75 percentage point increases in mid-June and late July. The Fed’s aggressive response took the wind out of the sails of all risk assets. In the emerging market universe, that had a particularly negative effect on longer-duration and higher-beta (more volatile) assets.
In addition to the tragic loss of life and property, the outbreak of the Russia-Ukraine war in late February had a significant negative effect on global markets. The conflict led to immediate shortages and higher prices of commodities, adding to inflation and supply-chain problems. In particular, the war led to severe food shortages and higher prices in food-importing countries throughout the Middle East, Asia, and Africa. Energy supplies were also curtailed, leading to higher prices and shortages, most notably in Europe.
The US dollar strengthened significantly throughout the fiscal period. Usually, a negative factor for emerging market debt, its effect over the past few months was mixed. Bonds that are not US-dollar-denominated tend to experience difficulty as the dollar rises, and a stronger dollar typically stokes inflation in emerging market countries. However, the balance sheets for both emerging market corporate and sovereign bonds are considerably more manageable and resilient today than they have been in the past.
Within the Fund
For the fiscal year ended July 31, 2022, Delaware Emerging Markets Debt Corporate Fund’s Institutional Class shares posted negative performance and slightly underperformed its benchmark, the J.P. Morgan Corporate Emerging Markets Bond Index (CEMBI) Broad Diversified. The Fund’s Class A shares also underperformed the benchmark. The Fund’s Institutional Class shares declined 13.60%. The Fund’s Class A shares declined 13.83% at net asset value and 17.71% at maximum offer price. These figures reflect all distributions reinvested. For the same period, the Fund’s benchmark declined 13.54%. For complete annualized performance for Delaware Emerging Markets Debt Corporate Fund, please see the table on page 5.
The effects of the pandemic were far reaching, suppressing significant volumes of global trade. Similarly, the effects of inflation, supply-chain disruptions, and the Russia-Ukraine conflict were widespread. However, not all emerging markets were affected to the same degree, and we have seen both regional winners and losers. On the positive side, Latin America, as a net commodity exporter, was more resilient overall to geopolitical shocks, due in no small part to being untouched by sanctions that affected other commodities producers. On the opposite end of the transaction, resource importers, particularly those that are dollar denominated, suffered greatly. This caused severe price pressures in Turkey and India.
Latin America was not free of concern, however. Particularly in 2021 and 2022, the markets were sensitive to the lurch towards
2
Table of Contents
populism as elections took place in Chile, Colombia, and Peru. Traditionally center right countries, all three took steps towards a more populist government. It’s a trend we will continue to monitor as Brazil heads into an election later this year. While the populist shift raises concerns about fiscal and monetary policy, what we’ve seen so far is limited sharp rhetoric that panders to polarized and unhappy voter bases as the election nears. But the actual mechanics of passing populist policies has gotten stuck in still fragmented legislative bodies.
Brazil was a significant detractor from Fund performance during the period. Our holdings were subject to all elements of the slowdown that occurred this year. Our significant overweight to Brazil relative to the benchmark was disadvantageous as was some negative security selection. Nonetheless, we anticipate maintaining our overweight, a nod to the underlying strength of the corporate credits – mainly large, blue-chip companies with a long track record of conservative management – that we continue to hold.
The most notable underperforming security we held in Brazil was Azul Linhas Aéreas Brasileiras SA. The airline mainly suffered from the inflation-induced selloff and the cost pressures resulting from higher jet-fuel prices. As the recovery from the pandemic continues, however, we believe Azul will recover. Stone Co., a payments processor, also detracted as the company experienced several strategic missteps. We exited that position.
Mexican airline Grupo Aeromexico SAB de CV was a notable contributor in the region. This was a distressed security in which we took an active approach to restructuring, obtaining a favorable outcome for secured bond holders.
We held an overweight position in Ukraine based on the strong fundamentals of our corporate bond holdings. When the war broke out, we were punished dramatically as the conflict resulted in sudden and severe economic disruptions. What we do next in Ukraine will depend on our evaluation of each individual credit and to what extent normal business operations resume. There are some hopeful signs; at the end of the period, arrangements were underway with Russia to resume limited grain exports.
The most significant underperforming credit in Ukraine was Ukravtodor, the state agency of roads, a quasi-sovereign that currently trades as a distressed bond. Kernel Holding SA and MHP SA, both blue-chip agricultural producers, also plunged into distress. Both still maintain good balance sheets and we think could potentially recover if conditions normalize.
Perhaps counterintuitively, the Fund benefited from its holdings in Russia for two reasons. Prior to the outbreak of war, we had maintained an underweight position that was beneficial. Then, after the conflict broke out, Russian credits were dropped from the Fund’s benchmark, essentially zeroing out their value. In reality, however, the credits we owned retained residual value that was actually quite high in some cases. So, we outperformed the index for that reason as well. Our leading outperformer was an underweight position in energy producer Gazprom PJSC. We have since exited the position. The Fund also benefited on a relative basis by not owning several credits, including MMC Norilsk Nickel PJSC, VTBBank PJSC, and Sberbank of Russia PJSC.
Our investments in China underperformed for several reasons. The Common Prosperity policy introduced last year is a series of social
3
Table of Contents
Portfolio management review
Delaware Emerging Markets Debt Corporate Fund
constructs that are often at odds with general market practices. The Three Red Lines policy, also implemented last year, was a response in large part to the China Evergrande debacle that roiled China’s equity markets. For investors, both policies have been at odds with the typical goals of western capital markets. Many times, the policies have conflicted with the goals of the companies they are intended to help. The continuation of zero-COVID policies has also undercut China’s economic performance, wreaking havoc on supply chains and economic growth.
The property sector, which accounts for 15% to 25% of China’s gross domestic product, was especially weak. Although the Three Red Lines policy was intended to force the property-development sector to manage balance sheets more conservatively, an extreme credit crunch has taken hold instead. In the early stages, we saw some credit differentiation, but over time a broad generalized panic has brought not just high-yield bond issuers, but also investment grade issuers, to distressed levels. We intend to focus on credits we believe have a better chance of survival through this tumultuous period. Among our holdings during the period, only CIFI Holdings Group Co. Ltd. remains in the Fund. Although we think this property developer and manager is more likely to survive, that hasn’t exempted it from near-term distress.
We also underperformed significantly in India, where some adverse security selection combined with an overweight just prior to the selloff earlier this year contributed to the decline. The leading detractor was Future Retail Ltd., a distressed credit that was undergoing protracted litigation in an attempt to close a sale to Reliance Industries Ltd. Despite going to the Indian supreme court and arbitrators in Singapore, the suit was not resolved, and little was left to recover by unsecured bond holders.
We did outperform in several other parts of Asia. The Fund benefitted from an underweight in Macao, which was hard hit by the zero-COVID policy that severely restricts travel to the island’s gaming venues. We may reduce the underweighting in the expectation that China may relax its zero-COVID policy soon. We were also underweight Hong Kong and Singapore relative to the benchmark. These are both investment-grade-centric countries, where we saw limited value versus developed markets. Both countries underperformed relative to the broader emerging market realm as credits succumbed to the duration selloff earlier in the year. As valuations adjust and yields improve, we may consider reducing our underweight.
The Fund also benefited from US Treasury futures that we purchased to hedge duration. As interest rates rose throughout the latter half of the fiscal year, the futures performed well. Throughout the year, as volatility increased, we also sought to improve credit quality at the margin. Functionally, we mainly held excess cash as a hedge against volatility. As valuations became more attractive, we began to redeploy the cash. We also reduced duration during the course of the fiscal year and are prepared to restore some of that duration when the macroeconomic environment improves.
During the fiscal year, Delaware Emerging Markets Debt Corporate Fund invested in credit default swaps and US dollar futures. These positions added 0.31 percentage points to performance for the fiscal year. The Fund had exposure to derivatives at the end of the fiscal year.
4
Table of Contents
| Performance summary | |
| Delaware Emerging Markets Debt Corporate Fund | July 31, 2022 (Unaudited) |
The performance quoted represents past performance and does not guarantee future results. Investment return and principal value of an investment will fluctuate so that shares, when redeemed, may be worth more or less than their original cost. Current performance may be lower or higher than the performance quoted. Performance data current to the most recent month end may be obtained by calling 800 523-1918 or visiting delawarefunds.com/performance.
| Fund and benchmark performance1,2,3 | | Average annual total returns through July 31, 2022 |
| | 1 year | | 5 year | | 10 year | | Lifetime |
| Class A (Est. September 30, 2013) | | | | | | | | | | | | | | | | | | | | |
| Excluding sales charge | | | -13.83 | % | | | | +1.02 | % | | | | +3.29 | % | | | | +4.20 | % | |
| Including sales charge | | | -17.71 | % | | | | +0.09 | % | | | | +2.82 | % | | | | +3.79 | % | |
| Class C (Est. September 30, 2013) | | | | | | | | | | | | | | | | | | | | |
| Excluding sales charge | | | -14.46 | % | | | | +0.25 | % | | | | +2.72 | % | | | | +3.60 | % | |
| Including sales charge | | | -15.28 | % | | | | +0.25 | % | | | | +2.72 | % | | | | +3.60 | % | |
| Class R (Est. September 30, 2013) | | | | | | | | | | | | | | | | | | | | |
| Excluding sales charge | | | -13.60 | % | | | | +1.27 | % | | | | +3.38 | % | | | | +4.24 | % | |
| Including sales charge | | | -13.60 | % | | | | +1.27 | % | | | | +3.38 | % | | | | +4.24 | % | |
| Institutional Class (Est. September 30, 2013) | | | | | | | | | | | | | | | | | | | | |
| Excluding sales charge | | | -13.60 | % | | | | +1.25 | % | | | | +3.48 | % | | | | +4.40 | % | |
| Including sales charge | | | -13.60 | % | | | | +1.25 | % | | | | +3.48 | % | | | | +4.40 | % | |
| J.P. Morgan Corporate Emerging Markets | | | | | | | | | | | | | | | | | | | | |
| Bond Index (CEMBI) Broad Diversified | | | -13.54 | % | | | | +1.30 | % | | | | +3.25 | % | | | | +3.67 | %* | |
| * | The benchmark lifetime return is for Class A share comparison only and is calculated using the month end prior to the Fund’s Class A inception date (November 3, 2010). |
| 1 | A privately offered fund managed by the Fund’s portfolio manager was reorganized into the Fund and the Fund commenced operations on September 30, 2013. This privately offered fund commenced operations on November 3, 2010 and had an investment objective and strategies that were, in all material respects, the same as those of the Fund, and was managed in a manner that, in all material respects, complied with the investment guidelines and restrictions of the Fund. However, the privately offered fund was not registered as an investment under the Investment Company Act of 1940 (1940 Act). As a result, the privately offered fund was not subject to certain investment limitations, diversification requirements, liquidity requirements, and other restrictions imposed by the 1940 Act and the Internal Revenue Code of 1986, as amended, which, if applicable, may have adversely affected its performance. |
The Fund’s performance for the periods prior to its commencement of operations on September 30, 2013 is that of the privately offered fund. Because the privately offered fund was a master fund that did not charge any management or other asset-based fees, the privately offered fund’s performance shown above has been restated, on a one-
5
Table of Contents
Performance summary
Delaware Emerging Markets Debt Corporate Fund
time basis, to reflect the fees, expenses, and waivers and reimbursements for each class of the Fund at the commencement of the Fund’s operations. If the performance of the privately offered fund had not been restated, the performance for such classes may have been higher than the performance shown in the average annual total returns table on page 5.
| 2 | Returns reflect the reinvestment of all distributions and are presented both with and without the applicable sales charges described below. Returns do not reflect the deduction of taxes the shareholder would pay on Fund distributions or redemptions of Fund shares. |
Expense limitations were in effect for certain classes during some or all of the periods shown in the “Fund and benchmark performance” table. Expenses for each class are listed in the “Fund expense ratios” table on page 7. Performance would have been lower had expense limitations not been in effect.
Institutional Class shares are not subject to a sales charge and are offered for sale exclusively to certain eligible investors. In addition, Institutional Class shares pay no distribution and service (12b-1) fee.
Class A shares are sold with a maximum front-end sales charge of 4.50%, and have an annual 12b-1 fee of 0.25% of average daily net assets. Performance for Class A shares, excluding sales charges, assumes that no front-end sales charge applied.
Class C shares are sold with a contingent deferred sales charge (CDSC) of 1.00% if redeemed during the first 12 months. They are also subject to an annual 12b-1 fee of 1.00% of average daily net assets. Performance for Class C shares, excluding sales charges, assumes either that CDSCs did not apply or that the investment was not redeemed.
Class R shares are available only for certain retirement plan products. They are sold without a sales charge and have an annual 12b-1 fee of 0.50% of average daily net assets. Delaware Distributors, L.P. has agreed to voluntarily suspend the 12b-1 for the Class R Shares and the suspension of the 12b-1 fee will continue while the Class is not broadly distributed.
Fixed income securities and bond funds can lose value, and investors can lose principal, as interest rates rise. They also may be affected by economic conditions that hinder an issuer’s ability to make interest and principal payments on its debt. This includes prepayment risk, the risk that the principal of a bond that is held by a portfolio will be prepaid prior to maturity, at the time when interest rates are lower than what the bond was paying. A portfolio may then have to reinvest that money at a lower interest rate.
High yielding, non-investment-grade bonds (junk bonds) involve higher risk than investment grade bonds. The high yield secondary market is particularly susceptible to liquidity problems when institutional investors, such as mutual funds and certain other financial institutions, temporarily stop buying bonds for regulatory, financial, or other reasons. In addition, a less liquid secondary market makes it more difficult to obtain precise valuations of the high yield securities.
The Fund may invest in derivatives, which may involve additional expenses and are subject to risk, including the risk that an underlying security or securities index moves in the opposite direction from what the portfolio manager anticipated. A derivatives transaction depends upon the counterparties’ ability to fulfill their contractual obligations.
International investments entail risks including fluctuation in currency values, differences in
6
Table of Contents
accounting principles, or economic or political instability. Investing in emerging markets can be riskier than investing in established foreign markets due to increased volatility, lower trading volume, and higher risk of market closures. In many emerging markets, there is substantially less publicly available information and the available information may be incomplete or misleading. Legal claims are generally more difficult to pursue.
If and when the Fund invests in forward foreign currency contracts or uses other investments to hedge against currency risks, the Fund will be subject to special risks, including counterparty risk.
Diversification may not protect against market risk.
The Fund may experience portfolio turnover in excess of 100%, which could result in higher transaction costs and tax liability.
If and when the Fund invests in forward foreign currency contracts or uses other investments to hedge against currency risks, the Fund will be subject to special risks, including counterparty risk.
IBOR risk is the risk that changes related to the use of the London interbank offered rate (LIBOR) or similar rates (such as EONIA) could have adverse impacts on financial instruments that reference these rates. The abandonment of these rates and transition to alternative rates could affect the value and liquidity of instruments that reference them and could affect investment strategy performance.
The disruptions caused by natural disasters, pandemics, or similar events could prevent the Fund from executing advantageous investment decisions in a timely manner and could negatively impact the Fund’s ability to achieve its investment objective and the value of the Fund’s investments.
| 3 | The Fund’s expense ratios, as described in the most recent prospectus, are disclosed in the following “Fund expense ratios” table. The expense ratios below may differ from the expense ratios in the "Financial highlights" since they are based on different time periods and the expense ratios in the prospectus include acquired fund fees and expenses, if any. See Note 2 in "Notes to financial statements" for additional details. Please see the most recent prospectus and any applicable supplement(s) for additional information on these fee waivers and/or reimbursements. Please see the “Financial highlights” section in this report for the most recent expense ratios. |
| | | | | | | | Institutional |
| Fund expense ratios | | Class A | | Class C | | Class R | | Class |
| Total annual operating expenses | | | | | | | | |
| (without fee waivers) | | 1.42% | | 2.17% | | 1.67% | | 1.17% |
| Net expenses (including fee | | | | | | | | |
| waivers, if any) | | 1.04% | | 1.79% | | 1.29% | | 0.79% |
| Type of waiver | | Contractual | | Contractual | | Contractual | | Contractual |
7
Table of Contents
Performance summary
Delaware Emerging Markets Debt Corporate Fund
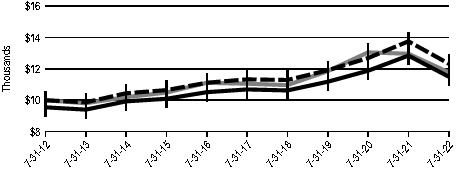
Performance of a $10,000 investment1
For the period September 30, 2013 (Fund's inception) through July 31, 2022

| | | | Starting value | | Ending value |
 | J.P. Morgan Corporate Emerging Markets Bond Index | | | | | | | | | | |
| (CEMBI) Broad Diversified | | | $ | 10,000 | | | | $ | 13,279 | |
 | Delaware Emerging Markets Debt Corporate Fund — | | | | | | | | | | |
| Institutional Class shares | | | $ | 10,000 | | | | $ | 13,039 | |
 | Delaware Emerging Markets Debt Corporate Fund — | | | | | | | | | | |
| Class A shares | | | | $9,550 | | | | $ | 12,265 | |
| 1 | The “Performance of a $10,000 investment” graph assumes $10,000 invested in Institutional Class and Class A shares of the Fund on September 30, 2013, and includes the effect of a 4.50% front-end sales charge (for Class A shares) and the reinvestment of all distributions. The graph does not reflect the deduction of taxes the shareholders would pay on Fund distributions or redemptions of Fund shares. Expense limitations were in effect for some or all of the periods shown. Performance would have been lower had expense limitations not been in effect. Expenses are listed in the “Fund expense ratios” table on page 7. Please note additional details on pages 5 through 9. |
The graph also assumes $10,000 invested in the J.P. Morgan Corporate Emerging Markets Bond Index (CEMBI) Broad Diversified as of September 30, 2013. The J.P. Morgan Corporate Emerging Markets Bond Index (CEMBI) Broad Diversified tracks US dollar-denominated emerging market corporate bonds, limiting the weights of countries with larger corporate debt stocks by including only a specified portion of those countries’ eligible current face amounts of debt outstanding.
Index performance returns do not reflect any management fees, transaction costs, or expenses. Indices are unmanaged and one cannot invest directly in an index. Past performance does not guarantee future results.
8
Table of Contents
| | Nasdaq symbols | | CUSIPs |
| Class A | | DEDAX | | 246094841 |
| Class C | | DEDCX | | 246094833 |
| Class R | | DEDRX | | 246094825 |
| Institutional Class | | DEDIX | | 246094817 |
9
Table of Contents
Disclosure of Fund expenses
For the six-month period from February 1, 2022 to July 31, 2022 (Unaudited)
As a shareholder of the Fund, you incur two types of costs: (1) transaction costs, including sales charges (loads) on purchase payments, reinvested dividends, or other distributions; redemption fees; and exchange fees; and (2) ongoing costs, including management fees; distribution and service (12b-1) fees; and other Fund expenses. This example is intended to help you understand your ongoing costs (in dollars) of investing in the Fund and to compare these costs with the ongoing costs of investing in other mutual funds.
The example is based on an investment of $1,000 invested at the beginning of the period and held for the entire six-month period from February 1, 2022 to July 31, 2022.
Actual expenses
The first section of the table shown, “Actual Fund return,” provides information about actual account values and actual expenses. You may use the information in this section of the table, together with the amount you invested, to estimate the expenses that you paid over the period. Simply divide your account value by $1,000 (for example, an $8,600 account value divided by $1,000 = 8.6), then multiply the result by the number in the first section under the heading entitled “Expenses Paid During Period” to estimate the expenses you paid on your account during this period.
Hypothetical example for comparison purposes
The second section of the table shown, “Hypothetical 5% return,” provides information about hypothetical account values and hypothetical expenses based on the Fund’s actual expense ratio and an assumed rate of return of 5% per year before expenses, which is not the Fund’s actual return. The hypothetical account values and expenses may not be used to estimate the actual ending account balance or expenses you paid for the period. You may use this information to compare the ongoing costs of investing in the Fund and other funds. To do so, compare this 5% hypothetical example with the 5% hypothetical examples that appear in the shareholder reports of the other funds.
Please note that the expenses shown in the table are meant to highlight your ongoing costs only and do not reflect any transactional costs, such as sales charges (loads), redemption fees, or exchange fees. Therefore, the second section of the table is useful in comparing ongoing costs only, and will not help you determine the relative total costs of owning different funds. In addition, if these transactional costs were included, your costs would have been higher. The Fund's expenses shown in the table reflect fee waivers in effect and assume reinvestment of all dividends and distributions.
10
Table of Contents
Delaware Emerging Markets Debt Corporate Fund
Expense analysis of an investment of $1,000
| | Beginning
Account Value
2/1/22 | | Ending
Account Value
7/31/22 | | Annualized
Expense Ratio | | Expenses
Paid During Period
2/1/22 to 7/31/22* |
| Actual Fund return† | | | | | | | | | | | | | | | | | | | | |
| Class A | | | $ | 1,000.00 | | | | | $889.10 | | | | 1.04 | % | | | | $ | 4.87 | |
| Class C | | | | 1,000.00 | | | | | 886.00 | | | | 1.79 | % | | | | | 8.37 | |
| Class R | | | | 1,000.00 | | | | | 889.30 | | | | 0.79 | % | | | | | 3.70 | |
| Institutional Class | | | | 1,000.00 | | | | | 889.30 | | | | 0.79 | % | | | | | 3.70 | |
| Hypothetical 5% return (5% return before expenses) |
| Class A | | | $ | 1,000.00 | | | | $ | 1,019.64 | | | | 1.04 | % | | | | $ | 5.21 | |
| Class C | | | | 1,000.00 | | | | | 1,015.92 | | | | 1.79 | % | | | | | 8.95 | |
| Class R | | | | 1,000.00 | | | | | 1,020.88 | | | | 0.79 | % | | | | | 3.96 | |
| Institutional Class | | | | 1,000.00 | | | | | 1,020.88 | | | | 0.79 | % | | | | | 3.96 | |
| * | “Expenses Paid During Period” are equal to the Fund's annualized ratio, multiplied by the average account value over the period, multiplied by 181/365 (to reflect the one-half year period). |
| † | Because actual returns reflect only the most recent six-month period, the returns shown may differ significantly from fiscal year returns. |
In addition to the Fund's expenses reflected above, the Fund also indirectly bears its portion of the fees and expenses of any investment companies (Underlying Funds) in which it invests. The table above does not reflect the expenses of any Underlying Funds.
11
Table of Contents
| Security type / country and sector allocations |
| Delaware Emerging Markets Debt Corporate Fund | As of July 31, 2022 (Unaudited) |
Sector designations may be different from the sector designations presented in other Fund materials. The sector designations may represent the investment manager’s internal sector classifications.
| Security type / country | | Percentage of net assets |
| Corporate Bonds | | | 89.56 | % | |
| Argentina | | | 1.77 | % | |
| Barbados | | | 0.68 | % | |
| Brazil | | | 9.38 | % | |
| Chile | | | 4.62 | % | |
| China | | | 5.47 | % | |
| Colombia | | | 4.03 | % | |
| Czech Republic | | | 0.79 | % | |
| Georgia | | | 1.07 | % | |
| Ghana | | | 0.95 | % | |
| Guatemala | | | 2.10 | % | |
| Hong Kong | | | 1.33 | % | |
| India | | | 5.89 | % | |
| Indonesia | | | 4.13 | % | |
| Israel | | | 4.63 | % | |
| Kazakhstan | | | 0.60 | % | |
| Kuwait | | | 1.20 | % | |
| Macao | | | 1.60 | % | |
| Malaysia | | | 1.76 | % | |
| Mauritius | | | 0.36 | % | |
| Mexico | | | 6.30 | % | |
| Morocco | | | 0.92 | % | |
| Netherlands | | | 0.33 | % | |
| Nigeria | | | 1.09 | % | |
| Oman | | | 0.76 | % | |
| Panama | | | 0.41 | % | |
| Paraguay | | | 1.36 | % | |
| Peru | | | 2.82 | % | |
| Philippines | | | 0.81 | % | |
| Qatar | | | 2.23 | % | |
| Republic of Korea | | | 2.97 | % | |
| Republic of Vietnam | | | 0.30 | % | |
| Russia | | | 0.57 | % | |
| Saudi Arabia | | | 2.58 | % | |
| Singapore | | | 0.80 | % | |
| South Africa | | | 3.02 | % | |
| Taiwan | | | 0.96 | % | |
| Tanzania | | | 0.38 | % | |
12
Table of Contents
| Security type / country | | Percentage of net assets |
| Thailand | | | 1.42 | % | |
| Turkey | | | 2.56 | % | |
| Ukraine | | | 0.65 | % | |
| United Arab Emirates | | | 3.02 | % | |
| Zambia | | | 0.94 | % | |
| Sovereign Bonds | | | 1.62 | % | |
| Common Stock by Country | | | 0.30 | % | |
| Short-Term Investments | | | 8.90 | % | |
| Total Value of Securities | | | 100.38 | % | |
| Liabilities Net of Receivables and Other Assets | | | (0.38 | %) | |
| Total Net Assets | | | 100.00 | % | |
| | |
| Corporate bonds by sector | | Percentage of net assets |
| Banking | | | 13.00 | % | |
| Basic Industry | | | 7.78 | % | |
| Basic Materials | | | 3.39 | % | |
| Capital Goods | | | 0.10 | % | |
| Communications | | | 8.43 | % | |
| Consumer Cyclical | | | 8.19 | % | |
| Consumer Non-Cyclical | | | 7.12 | % | |
| Electric | | | 6.58 | % | |
| Energy | | | 15.37 | % | |
| Finance Companies | | | 0.61 | % | |
| Financials | | | 1.61 | % | |
| Industrials | | | 7.54 | % | |
| Insurance | | | 1.08 | % | |
| Real Estate | | | 1.91 | % | |
| Technology | | | 3.65 | % | |
| Utilities | | | 3.20 | % | |
| Total | | | 89.56 | % | |
13
Table of Contents
| Schedule of investments | |
| Delaware Emerging Markets Debt Corporate Fund | July 31, 2022 |
| | | Principal | | | |
| | | | amount° | | Value (US $) |
| Corporate Bonds – 89.56%Δ | | | | | |
| Argentina – 1.77% | | | | | |
| Aeropuertos Argentina 2000 144A 8.50% 8/1/31 # | | 854,629 | | $ | 621,281 |
| Transportadora de Gas del Sur 144A 6.75% 5/2/25 # | | 515,000 | | | 418,474 |
| YPF 144A 6.95% 7/21/27 # | | 1,210,000 | | | 676,708 |
| | | | | | 1,716,463 |
| Barbados – 0.68% | | | | | |
| Sagicor Financial 144A 5.30% 5/13/28 # | | 700,000 | | | 655,525 |
| | | | | | 655,525 |
| Brazil – 9.38% | | | | | |
| Acu Petroleo Luxembourg 144A 7.50% 7/13/35 # | | 435,000 | | | 364,371 |
| Arcos Dorados 144A 6.125% 5/27/29 # | | 610,000 | | | 580,427 |
| Azul Investments | | | | | |
| 144A 5.875% 10/26/24 # | | 420,000 | | | 294,545 |
| 144A 7.25% 6/15/26 # | | 600,000 | | | 406,461 |
| B2W Digital 144A 4.375% 12/20/30 # | | 545,000 | | | 416,634 |
| Braskem Netherlands Finance 144A 4.50% 1/31/30 # | | 755,000 | | | 690,927 |
| CSN Resources 144A 5.875% 4/8/32 # | | 840,000 | | | 671,587 |
| Gol Finance 144A 8.00% 6/30/26 # | | 360,000 | | | 238,797 |
| Guara Norte 144A 5.198% 6/15/34 # | | 1,109,338 | | | 912,108 |
| Klabin Austria 144A 3.20% 1/12/31 # | | 415,000 | | | 339,600 |
| MARB BondCo 144A 3.95% 1/29/31 # | | 990,000 | | | 808,721 |
| MercadoLibre 3.125% 1/14/31 | | 645,000 | | | 498,812 |
| Natura & Co. Luxembourg Holdings 144A 6.00% 4/19/29 # | | 790,000 | | | 733,290 |
| Petrobras Global Finance 6.75% 6/3/50 | | 350,000 | | | 327,075 |
| Suzano Austria 3.125% 1/15/32 | | 725,000 | | | 590,161 |
| Vale Overseas 3.75% 7/8/30 | | 800,000 | | | 732,776 |
| XP 144A 3.25% 7/1/26 # | | 545,000 | | | 489,780 |
| | | | | | 9,096,072 |
| Chile – 4.62% | | | | | |
| AES Andes 144A 7.125% 3/26/79 #, µ | | 605,000 | | | 552,589 |
| Alfa Desarrollo 144A 4.55% 9/27/51 # | | 817,789 | | | 590,599 |
| Antofagasta 144A 5.625% 5/13/32 # | | 750,000 | | | 743,438 |
| Cia Cervecerias Unidas 144A 3.35% 1/19/32 # | | 775,000 | | | 675,207 |
| Falabella 144A 3.375% 1/15/32 # | | 605,000 | | | 504,712 |
| Inversiones La Construccion 144A 4.75% 2/7/32 # | | 635,000 | | | 481,711 |
| Sociedad de Transmision Austral 144A 4.00% 1/27/32 # | | 510,000 | | | 428,555 |
| Telefonica Moviles Chile 144A 3.537% 11/18/31 # | | 585,000 | | | 506,739 |
| | | | | | 4,483,550 |
| China – 5.47% | | | | | |
| Agile Group Holdings 5.50% 5/17/26 | | 465,000 | | | 121,704 |
14
Table of Contents
| | | Principal | | | |
| | | | amount° | | Value (US $) |
| Corporate BondsΔ (continued) | | | | | |
| China (continued) | | | | | |
| Alibaba Group Holding 2.70% 2/9/41 | | 445,000 | | $ | 310,841 |
| Bank of China 144A 5.00% 11/13/24 # | | 420,000 | | | 430,733 |
| China Evergrande Group 10.00% 4/11/23 | | 520,000 | | | 45,607 |
| CIFI Holdings Group | | | | | |
| 5.25% 5/13/26 | | 200,000 | | | 71,767 |
| 5.95% 10/20/25 | | 280,000 | | | 104,440 |
| 6.00% 7/16/25 | | 230,000 | | | 88,235 |
| 6.45% 11/7/24 | | 605,000 | | | 237,462 |
| ENN Energy Holdings | | | | | |
| 144A 2.625% 9/17/30 # | | 735,000 | | | 637,501 |
| 144A 4.625% 5/17/27 # | | 750,000 | | | 768,105 |
| Huarong Finance 2019 3.875% 11/13/29 | | 770,000 | | | 591,937 |
| JD.com 3.875% 4/29/26 | | 665,000 | | | 657,859 |
| Lenovo Group 144A 6.536% 7/27/32 # | | 680,000 | | | 677,439 |
| Tencent Holdings | | | | | |
| 144A 2.88% 4/22/31 # | | 325,000 | | | 285,854 |
| 144A 3.68% 4/22/41 # | | 350,000 | | | 276,972 |
| | | | | | 5,306,456 |
| Colombia – 4.03% | | | | | |
| Banco de Bogota 144A 6.25% 5/12/26 # | | 565,000 | | | 539,174 |
| Banco GNB Sudameris 144A 7.50% 4/16/31 #, µ | | 405,000 | | | 332,325 |
| Bancolombia 4.875% 10/18/27 µ | | 570,000 | | | 524,699 |
| Canacol Energy 144A 5.75% 11/24/28 # | | 860,000 | | | 711,217 |
| Ecopetrol | | | | | |
| 4.625% 11/2/31 | | 840,000 | | | 692,924 |
| 5.375% 6/26/26 | | 491,000 | | | 475,880 |
| Geopark 144A 5.50% 1/17/27 # | | 735,000 | | | 633,400 |
| | | | | | 3,909,619 |
| Czech Republic – 0.79% | | | | | |
| Energo-Pro 144A 8.50% 2/4/27 # | | 795,000 | | | 761,988 |
| | | | | | 761,988 |
| Georgia – 1.07% | | | | | |
| Bank of Georgia 144A 6.00% 7/26/23 # | | 680,000 | | | 683,558 |
| Silknet JSC 144A 8.375% 1/31/27 # | | 365,000 | | | 353,138 |
| | | | | | 1,036,696 |
| Ghana – 0.95% | | | | | |
| Kosmos Energy 144A 7.75% 5/1/27 # | | 410,000 | | | 348,566 |
| Tullow Oil 144A 10.25% 5/15/26 # | | 610,000 | | | 572,689 |
| | | | | | 921,255 |
15
Table of Contents
Schedule of investments
Delaware Emerging Markets Debt Corporate Fund
| | | Principal | | | |
| | | | amount° | | Value (US $) |
| Corporate BondsΔ (continued) | | | | | |
| Guatemala – 2.10% | | | | | |
| Banco Industrial 144A 4.875% 1/29/31 #, µ | | 455,000 | | $ | 423,043 |
| Central American Bottling 144A 5.25% 4/27/29 # | | 795,000 | | | 753,660 |
| CT Trust 144A 5.125% 2/3/32 # | | 960,000 | | | 860,170 |
| | | | | | 2,036,873 |
| Hong Kong – 1.33% | | | | | |
| AIA Group 144A 3.375% 4/7/30 # | | 400,000 | | | 384,003 |
| CLP Power Hong Kong Financing 2.875% 4/26/23 | | 419,000 | | | 418,087 |
| Goodman HK Finance 4.375% 6/19/24 | | 485,000 | | | 486,989 |
| | | | | | 1,289,079 |
| India – 5.89% | | | | | |
| Azure Power Energy 144A 3.575% 8/19/26 # | | 375,843 | | | 329,802 |
| CA Magnum Holdings 144A 5.375% 10/31/26 # | | 1,040,000 | | | 920,369 |
| Clean Renewable Power Mauritius 144A 4.25% 3/25/27 # | | 416,500 | | | 335,542 |
| Future Retail 144A 5.60% 1/22/25 # | | 425,000 | | | 49,555 |
| Greenko Power II 144A 4.30% 12/13/28 # | | 865,087 | | | 743,320 |
| ICICI Bank 144A 4.00% 3/18/26 # | | 650,000 | | | 646,753 |
| JSW Hydro Energy 144A 4.125% 5/18/31 # | | 289,800 | | | 250,371 |
| JSW Steel 144A 5.05% 4/5/32 # | | 295,000 | | | 231,466 |
| Summit Digitel Infrastructure 144A 2.875% 8/12/31 # | | 1,000,000 | | | 779,814 |
| UltraTech Cement 144A 2.80% 2/16/31 # | | 835,000 | | | 677,211 |
| Vedanta Resources Finance II 144A 8.95% 3/11/25 # | | 1,020,000 | | | 749,644 |
| | | | | | 5,713,847 |
| Indonesia – 4.13% | | | | | |
| Cikarang Listrindo 144A 4.95% 9/14/26 # | | 802,000 | | | 740,920 |
| Freeport Indonesia 144A 5.315% 4/14/32 # | | 630,000 | | | 592,200 |
| Indika Energy Capital IV 144A 8.25% 10/22/25 # | | 845,000 | | | 823,241 |
| Indofood CBP Sukses Makmur Tbk Pt 3.541% 4/27/32 | | 605,000 | | | 498,472 |
| Medco Laurel Tree 144A 6.95% 11/12/28 # | | 630,000 | | | 542,839 |
| Minejesa Capital 144A 5.625% 8/10/37 # | | 395,000 | | | 321,819 |
| Perusahaan Perseroan Persero 144A 3.875% 7/17/29 # | | 525,000 | | | 483,664 |
| | | | | | 4,003,155 |
| Israel – 4.63% | | | | | |
| Altice Financing 144A 5.00% 1/15/28 # | | 600,000 | | | 529,848 |
| Bank Hapoalim 144A 3.255% 1/21/32 #, µ | | 605,000 | | | 523,082 |
| Bank Leumi Le-Israel 144A 3.275% 1/29/31 #, µ | | 650,000 | | | 583,050 |
| Bank Leumi Le-Israel BM 144A 5.125% 7/27/27 # | | 720,000 | | | 736,448 |
| ICL Group 144A 6.375% 5/31/38 # | | 450,000 | | | 451,550 |
| Israel Electric 144A 3.75% 2/22/32 # | | 845,000 | | | 779,747 |
16
Table of Contents
| | | Principal | | | |
| | | | amount° | | Value (US $) |
| Corporate BondsΔ (continued) | | | | | |
| Israel (continued) | | | | | |
| Teva Pharmaceutical Finance Netherlands III | | | | | |
| 5.125% 5/9/29 | | 560,000 | | $ | 515,178 |
| 6.75% 3/1/28 | | 375,000 | | | 376,664 |
| | | | | | 4,495,567 |
| Kazakhstan – 0.60% | | | | | |
| KazTransGas JSC 144A 4.375% 9/26/27 # | | 269,000 | | | 236,922 |
| Tengizchevroil Finance Co International 144A 2.625% | | | | | |
| 8/15/25 # | | 420,000 | | | 350,167 |
| | | | | | 587,089 |
| Kuwait – 1.20% | | | | | |
| MEGlobal Canada 144A 5.00% 5/18/25 # | | 405,000 | | | 411,183 |
| NBK SPC 144A 1.625% 9/15/27 #, µ | | 835,000 | | | 752,627 |
| | | | | | 1,163,810 |
| Macao – 1.60% | | | | | |
| MGM China Holdings 144A 4.75% 2/1/27 # | | 475,000 | | | 376,780 |
| Sands China | | | | | |
| 144A 3.25% 8/8/31 # | | 465,000 | | | 360,977 |
| 4.30% 1/8/26 | | 580,000 | | | 523,125 |
| Wynn Macau 144A 5.625% 8/26/28 # | | 375,000 | | | 293,434 |
| | | | | | 1,554,316 |
| Malaysia – 1.76% | | | | | |
| CIMB Bank 144A 2.125% 7/20/27 # | | 525,000 | | | 483,616 |
| Misc Capital Two Labuan 144A 3.75% 4/6/27 # | | 1,280,000 | | | 1,224,684 |
| | | | | | 1,708,300 |
| Mauritius – 0.36% | | | | | |
| Axian Telecom 144A 7.375% 2/16/27 # | | 375,000 | | | 346,429 |
| | | | | | 346,429 |
| Mexico – 6.30% | | | | | |
| Alsea 144A 7.75% 12/14/26 # | | 800,000 | | | 763,644 |
| America Movil 4.70% 7/21/32 | | 950,000 | | | 986,461 |
| Banco Mercantil del Norte 144A 8.375% 10/14/30 #, µ, ψ | | 410,000 | | | 390,174 |
| BBVA Bancomer 144A 5.125% 1/18/33 #, µ | | 460,000 | | | 398,990 |
| Cemex 144A 5.20% 9/17/30 # | | 450,000 | | | 405,985 |
| CIBANCO Institucion de Banca Multiple Trust 144A 4.375% | | | | | |
| 7/22/31 # | | 640,000 | | | 441,722 |
| GCC 144A 3.614% 4/20/32 # | | 800,000 | | | 669,465 |
| Grupo Aeromexico 144A 8.50% 3/17/27 # | | 800,000 | | | 766,704 |
| Nemak 144A 3.625% 6/28/31 # | | 785,000 | | | 613,395 |
17
Table of Contents
Schedule of investments
Delaware Emerging Markets Debt Corporate Fund
| | | Principal | | | |
| | | | amount° | | Value (US $) |
| Corporate BondsΔ (continued) | | | | | |
| Mexico (continued) | | | | | |
| Petroleos Mexicanos 6.95% 1/28/60 | | 1,004,000 | | $ | 678,286 |
| | | | | | 6,114,826 |
| Morocco – 0.92% | | | | | |
| OCP | | | | | |
| 144A 3.75% 6/23/31 # | | 380,000 | | | 309,779 |
| 144A 4.50% 10/22/25 # | | 400,000 | | | 394,326 |
| 144A 5.125% 6/23/51 # | | 270,000 | | | 191,315 |
| | | | | | 895,420 |
| Netherlands – 0.33% | | | | | |
| VEON Holdings 144A 3.375% 11/25/27 # | | 665,000 | | | 319,865 |
| | | | | | 319,865 |
| Nigeria – 1.09% | | | | | |
| Access Bank | | | | | |
| 144A 6.125% 9/21/26 # | | 415,000 | | | 308,698 |
| 144A 9.125% 10/7/26 #, µ, ψ | | 540,000 | | | 385,719 |
| IHS Holding 144A 5.625% 11/29/26 # | | 430,000 | | | 358,973 |
| | | | | | 1,053,390 |
| Oman – 0.76% | | | | | |
| Oryx Funding 144A 5.80% 2/3/31 # | | 790,000 | | | 740,372 |
| | | | | | 740,372 |
| Panama – 0.41% | | | | | |
| UEP Penonome II 144A 6.50% 10/1/38 # | | 441,109 | | | 401,149 |
| | | | | | 401,149 |
| Paraguay – 1.36% | | | | | |
| Banco Continental 144A 2.75% 12/10/25 # | | 900,000 | | | 780,768 |
| Rutas 2 and 7 Finance 144A 10.255% 9/30/36 #, ^ | | 899,000 | | | 536,182 |
| | | | | | 1,316,950 |
| Peru – 2.82% | | | | | |
| Consorcio Transmantaro 144A 5.20% 4/11/38 # | | 605,000 | | | 557,344 |
| InRetail Consumer 144A 3.25% 3/22/28 # | | 720,000 | | | 598,759 |
| Lima Metro Line 2 Finance 144A 4.35% 4/5/36 # | | 399,149 | | | 361,393 |
| SAN Miguel Industrias Pet 144A 3.50% 8/2/28 # | | 1,090,000 | | | 906,542 |
| Volcan Cia Minera 144A 4.375% 2/11/26 # | | 359,000 | | | 314,558 |
| | | | | | 2,738,596 |
| Philippines – 0.81% | | | | | |
| International Container Terminal Services 4.75% 6/17/30 | | 855,000 | | | 786,856 |
| | | | | | 786,856 |
18
Table of Contents
| | | | | Principal | | | |
| | | | amount° | | Value (US $) |
| Corporate BondsΔ (continued) | | | | | |
| Qatar – 2.23% | | | | | |
| Ooredoo International Finance 144A 5.00% 10/19/25 # | | 425,000 | | $ | 440,340 |
| Qatar Energy | | | | | |
| | 144A 1.375% 9/12/26 # | | 275,000 | | | 254,425 |
| | 144A 2.25% 7/12/31 # | | 325,000 | | | 289,447 |
| QNB Finance 2.625% 5/12/25 | | 1,215,000 | | | 1,175,027 |
| | | | | | | 2,159,239 |
| Republic of Korea – 2.97% | | | | | |
| Hana Bank 144A 1.25% 12/16/26 # | | 335,000 | | | 304,701 |
| Kia 144A 2.375% 2/14/25 # | | 855,000 | | | 819,766 |
| NongHyup Bank 144A 0.875% 7/28/24 # | | 430,000 | | | 408,137 |
| Shinhan Financial Group 144A 3.34% 2/5/30 #, µ | | 355,000 | | | 343,347 |
| SK Hynix | | | | | |
| | 144A 1.50% 1/19/26 # | | 590,000 | | | 531,696 |
| | 144A 2.375% 1/19/31 # | | 595,000 | | | 472,439 |
| | | | | | | 2,880,086 |
| Republic of Vietnam – 0.30% | | | | | |
| Mong Duong Finance Holdings 144A 5.125% 5/7/29 # | | 350,000 | | | 287,875 |
| | | | | | | 287,875 |
| Russia – 0.57% | | | | | |
| Lukoil Capital DAC | | | | | |
| | 144A 2.80% 4/26/27 # | | 405,000 | | | 258,879 |
| | 144A 3.60% 10/26/31 # | | 405,000 | | | 224,028 |
| Phosagro OAO Via Phosagro Bond Funding DAC 144A | | | | | |
| | 3.949% 4/24/23 # | | 200,000 | | | 67,750 |
| | | | | | | 550,657 |
| Saudi Arabia – 2.58% | | | | | |
| EIG Pearl Holdings 144A 3.545% 8/31/36 # | | 895,000 | | | 783,916 |
| SA Global Sukuk 144A 2.694% 6/17/31 # | | 415,000 | | | 379,266 |
| Saudi Arabian Oil | | | | | |
| | 144A 3.50% 11/24/70 # | | 410,000 | | | 316,678 |
| | 144A 4.25% 4/16/39 # | | 400,000 | | | 387,506 |
| Saudi Electricity Global Sukuk Co. 4 4.222% 1/27/24 | | 630,000 | | | 635,470 |
| | | | | | | 2,502,836 |
| Singapore – 0.80% | | | | | |
| Oversea-Chinese Banking 144A 4.25% 6/19/24 # | | 775,000 | | | 780,225 |
| | | | | | | 780,225 |
| South Africa – 3.02% | | | | | |
| AngloGold Ashanti Holdings 3.375% 11/1/28 | | 830,000 | | | 722,473 |
| Bidvest Group UK 144A 3.625% 9/23/26 # | | 995,000 | | | 891,918 |
19
Table of Contents
Schedule of investments
Delaware Emerging Markets Debt Corporate Fund
| | | | Principal | | | |
| | | amount° | | Value (US $) |
| Corporate BondsΔ (continued) | | | | | |
| South Africa (continued) | | | | | |
| Sasol Financing USA 4.375% 9/18/26 | | 725,000 | | $ | 658,438 |
| Stillwater Mining 144A 4.00% 11/16/26 # | | 760,000 | | | 654,626 |
| | | | | | 2,927,455 |
| Taiwan – 0.96% | | | | | |
| TSMC Global 144A 4.625% 7/22/32 # | | 905,000 | | | 933,497 |
| | | | | | 933,497 |
| Tanzania – 0.38% | | | | | |
| HTA Group 144A 7.00% 12/18/25 # | | 415,000 | | | 368,445 |
| | | | | | 368,445 |
| Thailand – 1.42% | | | | | |
| Bangkok Bank 144A 5.00% 9/23/25 #, µ, Ψ | | 380,000 | | | 355,790 |
| GC Treasury Center 144A 5.20% 3/30/52 # | | 670,000 | | | 594,414 |
| PTTEP Treasury Center 144A 2.587% 6/10/27 # | | 465,000 | | | 431,878 |
| | | | | | 1,382,082 |
| Turkey – 2.56% | | | | | |
| Akbank TAS 144A 6.80% 2/6/26 # | | 730,000 | | | 638,243 |
| Coca-Cola Icecek 144A 4.50% 1/20/29 # | | 610,000 | | | 490,092 |
| Turkcell Iletisim Hizmetleri 144A 5.80% 4/11/28 # | | 790,000 | | | 604,153 |
| Turkiye Sise ve Cam Fabrikalari 144A 6.95% 3/14/26 # | | 845,000 | | | 748,603 |
| | | | | | 2,481,091 |
| Ukraine – 0.65% | | | | | |
| Kernel Holding 144A 6.50% 10/17/24 # | | 445,000 | | | 181,774 |
| Metinvest 144A 7.75% 10/17/29 # | | 425,000 | | | 169,150 |
| MHP 144A 6.25% 9/19/29 # | | 430,000 | | | 180,385 |
| State Agency of Roads of Ukraine 144A 6.25% 6/24/28 # | | 560,000 | | | 101,348 |
| | | | | | 632,657 |
| United Arab Emirates – 3.02% | | | | | |
| Abu Dhabi National Energy PJSC 144A 2.00% 4/29/28 # | | 585,000 | | | 530,231 |
| Emirates NBD Bank PJSC 2.625% 2/18/25 | | 470,000 | | | 456,433 |
| Galaxy Pipeline Assets Bidco 144A 2.94% 9/30/40 # | | 1,036,654 | | | 873,734 |
| MAF Global Securities 6.375% 3/20/26 µ, Ψ | | 590,000 | | | 562,978 |
| Sweihan PV Power PJSC 144A 3.625% 1/31/49 # | | 600,000 | | | 507,080 |
| | | | | | 2,930,456 |
20
Table of Contents
| | | | | Principal | | | |
| | | | amount° | | Value (US $) |
| Corporate BondsΔ (continued) | | | | | |
| Zambia – 0.94% | | | | | |
| First Quantum Minerals | | | | | |
| | 144A 6.875% 10/15/27 # | | 515,000 | | $ | 491,699 |
| | 144A 7.50% 4/1/25 # | | 425,000 | | | 423,655 |
| | | | | | | 915,354 |
| Total Corporate Bonds (cost $99,184,578) | | | | | 86,885,468 |
| | | | | | | |
| Sovereign Bonds – 1.62%Δ | | | | | |
| Bermuda – 0.35% | | | | | |
| Bermuda Government International Bond 144A 5.00% | | | | | |
| | 7/15/32 # | | 325,000 | | | 337,289 |
| Hong Kong – 0.72% | | | | | |
| Airport Authority | | | | | |
| | 144A 2.50% 1/12/32 # | | 410,000 | | | 368,258 |
| | 144A 3.25% 1/12/52 # | | 405,000 | | | 332,056 |
| | | | | | | 700,314 |
| Philippines – 0.55% | | | | | |
| Philippine Government International Bond 3.229% 3/29/27 | | 535,000 | | | 532,321 |
| Total Sovereign Bonds (cost $1,669,592) | | | | | 1,569,924 |
| | | | | | | |
| | | | Number of | | | |
| | | | shares | | | |
| Common Stock – 0.30% | | | | | |
| Mexico – 0.30% | | | | | |
| Grupo Aeromexico † | | 29,657 | | | 288,052 |
| Total Common Stock (cost $484,743) | | | | | 288,052 |
| | | | | | | |
| Short-Term Investments – 8.90% | | | | | |
| Money Market Mutual Funds – 8.90% | | | | | |
| BlackRock Liquidity FedFund – Institutional Shares | | | | | |
| | (seven-day effective yield 1.73%) | | 2,159,214 | | | 2,159,214 |
| Fidelity Investments Money Market Government Portfolio – | | | | | |
| | Class I (seven-day effective yield 1.49%) | | 2,159,212 | | | 2,159,212 |
| GS Financial Square Government Fund – Institutional | | | | | |
| | Shares (seven-day effective yield 1.73%) | | 2,159,212 | | | 2,159,212 |
21
Table of Contents
Schedule of investments
Delaware Emerging Markets Debt Corporate Fund
| | Number of | | | |
| | shares | | Value (US $) |
| Short-Term Investments (continued) | | | | | |
| Money Market Mutual Funds (continued) | | | | | |
| Morgan Stanley Institutional Liquidity Funds Government | | | | | |
| Portfolio – Institutional Class (seven-day effective yield | | | | | |
| 1.60%) | | 2,159,212 | | $ | 2,159,212 |
| Total Short-Term Investments (cost $8,632,568) | | | | | 8,636,850 |
| Total Value of Securities–100.38% | | | | | |
| (cost $109,971,481) | | | | $ | 97,380,294 |
| ° | Principal amount shown is stated in USD unless noted that the security is denominated in another currency. |
| Δ | Securities have been classified by country of risk. Aggregate classification by business sector has been presented on page 13 in “Security type / country and sector allocations.” |
| # | Security exempt from registration under Rule 144A of the Securities Act of 1933, as amended. At July 31, 2022, the aggregate value of Rule 144A securities was $72,369,955, which represents 74.60% of the Fund's net assets. See Note 11 in “Notes to financial statements." |
| µ | Fixed to variable rate investment. The rate shown reflects the fixed rate in effect at July 31, 2022. Rate will reset at a future date. |
| Ψ | Perpetual security. Maturity date represents next call date. |
| ^ | Zero-coupon security. The rate shown is the effective yield at the time of purchase. |
| † | Non-income producing security. |
The following futures and swap contracts were outstanding at July 31, 2022:1
Futures Contracts
Exchange-Traded
| | | | | | | | | | | | | | | | | | Variation |
| | | | | | | | | | | | | | | | | | Margin |
| | | | | | | | Notional | | | | Value/ | | Due from |
| | | | Notional | | Cost | | Expiration | | Unrealized | | (Due to) |
| Contracts to Buy (Sell) | | Amount | | (Proceeds) | | Date | | Depreciation | | Brokers |
| | US Treasury | | | | | | | | | | | | | | | | | | |
| | 10 yr Ultra | | | | | | | | | | | | | | | | | | |
| (17) | | Notes | | $ | (2,231,250 | ) | | $ | (2,180,606 | ) | | 9/21/22 | | $ | (50,644 | ) | | $ | (7,703 | ) |
| | US Treasury | | | | | | | | | | | | | | | | | | |
| | Long | | | | | | | | | | | | | | | | | | |
| (2) | | Bonds | | | (288,000 | ) | | | (278,714 | ) | | 9/21/22 | | | (9,286 | ) | | | (1,688 | ) |
| Total Futures Contracts | | | | | | $ | (2,459,320 | ) | | | | $ | (59,930 | ) | | $ | (9,391 | ) |
22
Table of Contents
Swap Contracts
CDS Contracts2
| Counterparty/ | | | | | | | | | | | | | | | | Variation |
| Reference | | | | | | | | | | Upfront | | | | | Margin |
| Obligation/ | | | | Annual | | | | | Payments | | | | | Due from |
| Termination Date/ | | Notional | | Protection | | | | | Paid | | Unrealized | | (Due to) |
| Payment Frequency | | Amount3 | | Payments | | Value | | (Received) | | Appreciation4 | | Brokers |
| Over-The-Counter: | | | | | | | | | | | | | | | | | |
| Protection Purchased/ | | | | | | | | | | | | | | | | | |
| Moody’s | | | | | | | | | | | | | | | | | |
| Ratings: | | | | | | | | | | | | | | | | | |
| JPMCB-Federated | | | | | | | | | | | | | | | | | |
| Republic of | | | | | | | | | | | | | | | | | |
| Brazil | | | | | | | | | | | | | | | | | |
| 4.25% | | | | | | | | | | | | | | | | | |
| 6/6/25 B2 | | | | | | | | | | | | | | | | | |
| 6/20/26- | | | | | | | | | | | | | | | | | |
| Quarterly | | 2,527,000 | | 1.000 | % | | $ | 115,453 | | $ | 62,136 | | $ | 53,317 | | $ | — |
| JPMCB-United | | | | | | | | | | | | | | | | | |
| Mexican States | | | | | | | | | | | | | | | | | |
| 10.375% | | | | | | | | | | | | | | | | | |
| 9/20/22 Baa2 | | | | | | | | | | | | | | | | | |
| 6/22/26- | | | | | | | | | | | | | | | | | |
| Quarterly | | 1,748,000 | | 1.000 | % | | | 20,729 | | | 10,174 | | | 10,555 | | | — |
| Total CDS Contracts | | | | | | | $ | 136,182 | | $ | 72,310 | | $ | 63,872 | | $ | — |
The use of futures and swap contracts involve elements of market risk and risks in excess of the amounts disclosed in these financial statements. The notional amounts presented above represent the Fund’s total exposure in such contracts, whereas only the variation margin and unrealized appreciation (depreciation) are reflected in the Fund’s net assets.
| 1 | See Note 8 in “Notes to financial statements.” |
| 2 | A CDS contract is a risk-transfer instrument through which one party (purchaser of protection) transfers to another party (seller of protection) the financial risk of a credit event (as defined in the CDS agreement), as it relates to a particular reference security or basket of securities (such as an index). Periodic payments (receipts) on such contracts are accrued daily and recorded as unrealized losses (gains) on swap contracts. Upon payment (receipt), such amounts are recorded as realized losses (gains) on swap contracts. Upfront payments made or received in connection with CDS contracts are amortized over the expected life of the CDS contracts as unrealized losses (gains) on swap contracts. The change in value of CDS contracts is recorded daily as unrealized appreciation or depreciation. A realized gain or loss is recorded upon a credit event (as defined in the CDS agreement) or the maturity or termination of the CDS agreement. |
23
Table of Contents
Schedule of investments
Delaware Emerging Markets Debt Corporate Fund
| 3 | Notional amount shown is stated in USD unless noted that the swap is denominated in another currency. |
| 4 | Unrealized appreciation (depreciation) does not include periodic interest payments (receipt) on swap contracts accrued daily in the amount of $4,869. |
Summary of abbreviations:
CDS – Credit Default Swap
DAC – Designated Activity Company
GS – Goldman Sachs
JSC – Joint Stock Company
PJSC – Private Joint Stock Company
yr – Year
USD – US Dollar
See accompanying notes, which are an integral part of the financial statements.
24
Table of Contents
| Statement of assets and liabilities | |
| Delaware Emerging Markets Debt Corporate Fund | July 31, 2022 |
| Assets: | | | |
| | Investments, at value* | $ | 97,380,294 | |
| Cash | | 180,556 | |
| Cash collateral due from broker | | 54,350 | |
| Foreign currencies, at valueΔ | | 6 | |
| Dividends and interest receivable | | 1,184,418 | |
| Receivable for fund shares sold | | 114,041 | |
| Upfront payments paid on credit default swap contracts | | 72,310 | |
| Unrealized appreciation on credit default swap contracts | | 63,872 | |
| Prepaid expenses | | 1,244 | |
| Other assets | | 558 | |
| Total Assets | | 99,051,649 | |
| Liabilities: | | | |
| Payable for fund shares redeemed | | 1,505,740 | |
| Payable for securities purchased | | 199,465 | |
| Cash collateral due to broker | | 150,000 | |
| Other accrued expenses | | 136,457 | |
| Investment management fees payable to affiliates | | 31,257 | |
| Variation margin due to broker on futures contracts | | 9,391 | |
| Administration expenses payable to affiliates | | 7,232 | |
| Swap payments payable | | 4,869 | |
| Distribution fees payable to affiliates | | 65 | |
| Total Liabilities | | 2,044,476 | |
| Total Net Assets | $ | 97,007,173 | |
| | |
| Net Assets Consist of: | | | |
| Paid-in capital | $ | 111,280,390 | |
| Total distributable earnings (loss) | | (14,273,217 | ) |
| Total Net Assets | $ | 97,007,173 | |
25
Table of Contents
Statement of assets and liabilities
Delaware Emerging Markets Debt Corporate Fund
| Net Asset Value | | | |
| | | | |
| Class A: | | | |
| Net assets | $ | 767,025 | |
| Shares of beneficial interest outstanding, unlimited authorization, no par | | 104,406 | |
| Net asset value per share | $ | 7.35 | |
| Sales charge | | 4.50 | % |
| Offering price per share, equal to net asset value per share / (1 - sales | | | |
| charge) | $ | 7.70 | |
| | | | |
| Class C: | | | |
| Net assets | $ | 210,343 | |
| Shares of beneficial interest outstanding, unlimited authorization, no par | | 28,675 | |
| Net asset value per share | $ | 7.34 | |
| | | | |
| Class R: | | | |
| Net assets | $ | 2,629 | |
| Shares of beneficial interest outstanding, unlimited authorization, no par | | 358 | |
| Net asset value per share | $ | 7.34 | |
| | | | |
| Institutional Class: | | | |
| Net assets | $ | 96,027,176 | |
| Shares of beneficial interest outstanding, unlimited authorization, no par | | 13,084,901 | |
| Net asset value per share | $ | 7.34 | |
| ___________________ |
| *Investments, at cost | $ | 109,971,481 | |
| ΔForeign currencies, at cost | | 6 | |
See accompanying notes, which are an integral part of the financial statements.
26
Table of Contents
| Statement of operations | |
| Delaware Emerging Markets Debt Corporate Fund | Year ended July 31, 2022 |
| Investment Income: | | | |
| | Interest | $ | 4,195,079 | |
| Dividends | | 28,044 | |
| | | 4,223,123 | |
| | |
| Expenses: | | | |
| Management fees | | 644,613 | |
| Distribution expenses — Class A | | 2,227 | |
| Distribution expenses — Class C | | 1,352 | |
| Distribution expenses — Class R | | 14 | |
| Dividend disbursing and transfer agent fees and expenses | | 160,012 | |
| Accounting and administration expenses | | 54,371 | |
| Audit and tax fees | | 44,863 | |
| Legal fees | | 33,812 | |
| Reports and statements to shareholders expenses | | 26,045 | |
| Registration fees | | 9,618 | |
| Custodian fees | | 6,679 | |
| Trustees’ fees and expenses | | 2,836 | |
| Other | | 33,306 | |
| | | 1,019,748 | |
| Less expenses waived | | (336,389 | ) |
| Less waived distribution | | | |
| expenses — Class R | | (14 | ) |
| Less expenses paid indirectly | | (503 | ) |
| Total operating expenses | | 682,842 | |
| Net Investment Income (Loss) | | 3,540,281 | |
27
Table of Contents
Statement of operations
Delaware Emerging Markets Debt Corporate Fund
| Net Realized and Unrealized Gain (Loss): | | | |
| Net realized gain (loss) on: | | | |
| | | Investments | $ | (1,582,331 | ) |
| | Foreign currencies | | (3,212 | ) |
| | Foreign currency exchange contracts | | 3,208 | |
| | Futures contracts | | 249,969 | |
| | Swap contracts | | (61,238 | ) |
| Net realized gain (loss) | | (1,393,604 | ) |
| | | |
| Net change in unrealized appreciation (depreciation) on: | | | |
| | Investments | | (14,782,205 | ) |
| | Foreign currencies | | (1 | ) |
| | Futures contracts | | 1,972 | |
| | Swap contracts | | 69,397 | |
| Net change in unrealized appreciation (depreciation) | | (14,710,837 | ) |
| Net Realized and Unrealized Gain (Loss) | | (16,104,441 | ) |
| Net Increase (Decrease) in Net Assets Resulting from Operations | $ | (12,564,160 | ) |
See accompanying notes, which are an integral part of the financial statements.
28
Table of Contents
Statements of changes in net assets
Delaware Emerging Markets Debt Corporate Fund
| | | | Year ended |
| | | 7/31/22 | | 7/31/21 |
| Increase (Decrease) in Net Assets from Operations: | | | | | | | | |
| Net investment income (loss) | | $ | 3,540,281 | | | $ | 2,907,302 | |
| Net realized gain (loss) | | | (1,393,604 | ) | | | 1,560,903 | |
| Net change in unrealized appreciation (depreciation) | | | (14,710,837 | ) | | | 1,822,656 | |
| Net increase (decrease) in net assets resulting from | | | | | | | | |
| operations | | | (12,564,160 | ) | | | 6,290,861 | |
| | | | | | | | | |
| Dividends and Distributions to Shareholders from: | | | | | | | | |
| Distributable earnings: | | | | | | | | |
| Class A | | | (39,568 | ) | | | (17,592 | ) |
| Class C | | | (5,017 | ) | | | (2,699 | ) |
| Class R | | | (133 | ) | | | (116 | ) |
| Institutional Class | | | (3,932,638 | ) | | | (2,881,145 | ) |
| | | | (3,977,356 | ) | | | (2,901,552 | ) |
| | | | | | | | | |
| Capital Share Transactions: | | | | | | | | |
| Proceeds from shares sold: | | | | | | | | |
| Class A | | | 366,899 | | | | 557,501 | |
| Class C | | | 151,347 | | | | 168,737 | |
| Institutional Class | | | 54,184,674 | | | | 29,640,532 | |
| | | | | | | | | | |
| Net asset value of shares issued upon reinvestment of | | | | | | | | |
| dividends and distributions: | | | | | | | | |
| Class A | | | 39,568 | | | | 17,571 | |
| Class C | | | 5,017 | | | | 2,699 | |
| Class R | | | 133 | | | | 116 | |
| Institutional Class | | | 3,843,722 | | | | 2,818,437 | |
| | | | 58,591,360 | | | | 33,205,593 | |
29
Table of Contents
Statements of changes in net assets
Delaware Emerging Markets Debt Corporate Fund
| | | | | Year ended |
| | | | 7/31/22 | | 7/31/21 |
| Capital Share Transactions (continued): | | | | | | | | |
| Cost of shares redeemed: | | | | | | | | |
| | Class A | | $ | (283,336 | ) | | $ | (60,262 | ) |
| | Class C | | | (18,387 | ) | | | (161,435 | ) |
| | Institutional Class | | | (32,170,599 | ) | | | (18,911,586 | ) |
| | | | | (32,472,322 | ) | | | (19,133,283 | ) |
| Increase in net assets derived from capital share | | | | | | | | |
| | transactions | | | 26,119,038 | | | | 14,072,310 | |
| Net Increase in Net Assets | | | 9,577,522 | | | | 17,461,619 | |
| | | | | | | | | |
| Net Assets: | | | | | | | | |
| Beginning of year | | | 87,429,651 | | | | 69,968,032 | |
| End of year | | $ | 97,007,173 | | | $ | 87,429,651 | |
See accompanying notes, which are an integral part of the financial statements.
30
Table of Contents
Financial highlights
Delaware Emerging Markets Debt Corporate Fund Class A
Selected data for each share of the Fund outstanding throughout each period were as follows:
| Net asset value, beginning of period |
| |
| Income (loss) from investment operations: |
| Net investment income1 |
| Net realized and unrealized gain (loss) |
| Total from investment operations |
| |
| Less dividends and distributions from: |
| Net investment income |
| Net realized gain |
| Return of capital |
| Total dividends and distributions |
| |
| Net asset value, end of period |
| |
| Total return2 |
| |
| Ratios and supplemental data: |
| Net assets, end of period (000 omitted) |
| Ratio of expenses to average net assets3 |
| Ratio of expenses to average net assets prior to fees waived3 |
| Ratio of net investment income to average net assets |
| Ratio of net investment income to average net assets prior to fees waived |
| Portfolio turnover |
| 1 | Calculated using average shares outstanding. |
| 2 | Total return is based on the change in net asset value of a share during the period and assumes reinvestment of dividends and distributions at net asset value and does not reflect the impact of a sales charge. Total return during all of the periods shown reflects waivers by the manager and/or distributor. Performance would have been lower had the waivers not been in effect. |
| 3 | Expense ratios do not include expenses of any Underlying Funds in which the Fund invests. |
See accompanying notes, which are an integral part of the financial statements.
32
Table of Contents
| | Year ended | |
| 7/31/22 | | 7/31/21 | | 7/31/20 | | 7/31/19 | | 7/31/18 | |
| $ | 8.91 | | | $ | 8.48 | | | $ | 8.67 | | | $ | 8.26 | | | $ | 8.77 | | |
| | | |
| | | |
| | 0.32 | | | | 0.33 | | | | 0.32 | | | | 0.40 | | | | 0.39 | | |
| | (1.52 | ) | | | 0.42 | | | | (0.18 | ) | | | 0.41 | | | | (0.39 | ) | |
| | (1.20 | ) | | | 0.75 | | | | 0.14 | | | | 0.81 | | | | — | | |
| | | |
| | | |
| | (0.31 | ) | | | (0.32 | ) | | | (0.32 | ) | | | (0.35 | ) | | | (0.38 | ) | |
| | (0.05 | ) | | | — | | | | — | | | | (0.05 | ) | | | (0.13 | ) | |
| | — | | | | — | | | | (0.01 | ) | | | — | | | | — | | |
| | (0.36 | ) | | | (0.32 | ) | | | (0.33 | ) | | | (0.40 | ) | | | (0.51 | ) | |
| | | |
| $ | 7.35 | | | $ | 8.91 | | | $ | 8.48 | | | $ | 8.67 | | | $ | 8.26 | | |
| | | |
| | (13.83% | ) | | | 8.99% | | | | 1.73% | | | | 10.21% | | | | (0.10% | ) | |
| | | |
| | | |
| $ | 767 | | | $ | 817 | | | $ | 281 | | | $ | 93 | | | $ | 57 | | |
| | 1.04% | | | | 1.04% | | | | 1.04% | | | | 1.04% | | | | 1.16% | | |
| | 1.43% | | | | 1.42% | | | | 1.48% | | | | 1.90% | | | | 1.90% | | |
| | 3.87% | | | | 3.69% | | | | 3.77% | | | | 4.88% | | | | 4.57% | | |
| | 3.48% | | | | 3.31% | | | | 3.33% | | | | 4.02% | | | | 3.83% | | |
| | 55% | | | | 99% | | | | 93% | | | | 74% | | | | 108% | | |
33
Table of Contents
Financial highlights
Delaware Emerging Markets Debt Corporate Fund Class C
Selected data for each share of the Fund outstanding throughout each period were as follows:
| Net asset value, beginning of period |
| |
| Income (loss) from investment operations: |
| Net investment income1 |
| Net realized and unrealized gain (loss) |
| Total from investment operations |
| |
| Less dividends and distributions from: |
| Net investment income |
| Net realized gain |
| Return of capital |
| Total dividends and distributions |
| |
| Net asset value, end of period |
| |
| Total return2 |
| |
| Ratios and supplemental data: |
| Net assets, end of period (000 omitted) |
| Ratio of expenses to average net assets3 |
| Ratio of expenses to average net assets prior to fees waived3 |
| Ratio of net investment income to average net assets |
| Ratio of net investment income to average net assets prior to fees waived |
| Portfolio turnover |
| 1 | Calculated using average shares outstanding. |
| 2 | Total return is based on the change in net asset value of a share during the period and assumes reinvestment of dividends and distributions at net asset value and does not reflect the impact of a sales charge. Total return during all of the periods shown reflects waivers by the manager and/or distributor. Performance would have been lower had the waivers not been in effect. |
| 3 | Expense ratios do not include expenses of any Underlying Funds in which the Fund invests. |
See accompanying notes, which are an integral part of the financial statements.
34
Table of Contents
| | Year ended | |
| 7/31/22 | | | 7/31/21 | | | 7/31/20 | | | 7/31/19 | | | 7/31/18 | | |
| $ | 8.90 | | | $ | 8.47 | | | $ | 8.66 | | | $ | 8.26 | | | $ | 8.77 | | |
| | | |
| | | |
| | 0.25 | | | | 0.26 | | | | 0.25 | | | | 0.34 | | | | 0.33 | | |
| | (1.51 | ) | | | 0.43 | | | | (0.17 | ) | | | 0.40 | | | | (0.39 | ) | |
| | (1.26 | ) | | | 0.69 | | | | 0.08 | | | | 0.74 | | | | (0.06 | ) | |
| | | |
| | | |
| | (0.25 | ) | | | (0.26 | ) | | | (0.26 | ) | | | (0.29 | ) | | | (0.32 | ) | |
| | (0.05 | ) | | | — | | | | — | | | | (0.05 | ) | | | (0.13 | ) | |
| | — | | | | — | | | | (0.01 | ) | | | — | | | | — | | |
| | (0.30 | ) | | | (0.26 | ) | | | (0.27 | ) | | | (0.34 | ) | | | (0.45 | ) | |
| | | |
| $ | 7.34 | | | $ | 8.90 | | | $ | 8.47 | | | $ | 8.66 | | | $ | 8.26 | | |
| | | |
| | (14.46% | ) | | | 8.19% | | | | 0.99% | | | | 9.27% | | | | (0.84% | ) | |
| | | |
| | | |
| $ | 210 | | | $ | 99 | | | $ | 84 | | | $ | 61 | | | $ | 82 | | |
| | 1.79% | | | | 1.79% | | | | 1.79% | | | | 1.79% | | | | 1.91% | | |
| | 2.18% | | | | 2.17% | | | | 2.23% | | | | 2.65% | | | | 2.65% | | |
| | 3.12% | | | | 2.94% | | | | 3.02% | | | | 4.13% | | | | 3.82% | | |
| | 2.73% | | | | 2.56% | | | | 2.58% | | | | 3.27% | | | | 3.08% | | |
| | 55% | | | | 99% | | | | 93% | | | | 74% | | | | 108% | | |
35
Table of Contents
Financial highlights
Delaware Emerging Markets Debt Corporate Fund Class R
Selected data for each share of the Fund outstanding throughout each period were as follows:
| Net asset value, beginning of period |
| |
| Income (loss) from investment operations: |
| Net investment income1 |
| Net realized and unrealized gain (loss) |
| Total from investment operations |
| |
| Less dividends and distributions from: |
| Net investment income |
| Net realized gain |
| Return of capital |
| Total dividends and distributions |
| |
| Net asset value, end of period |
| |
| Total return2 |
| |
| Ratios and supplemental data: |
| Net assets, end of period (000 omitted) |
| Ratio of expenses to average net assets3 |
| Ratio of expenses to average net assets prior to fees waived3 |
| Ratio of net investment income to average net assets |
| Ratio of net investment income to average net assets prior to fees waived |
| Portfolio turnover |
| 1 | Calculated using average shares outstanding. |
| 2 | Total return is based on the change in net asset value of a share during the period and assumes reinvestment of dividends and distributions at net asset value. Total return during all of the periods shown reflects waivers by the manager and/or distributor. Performance would have been lower had the waivers not been in effect. |
| 3 | Expense ratios do not include expenses of any Underlying Funds in which the Fund invests. |
See accompanying notes, which are an integral part of the financial statements.
36
Table of Contents
| | Year ended | |
| 7/31/22 | | | 7/31/21 | | | 7/31/20 | | | 7/31/19 | | | 7/31/18 | | |
| $ | 8.90 | | | $ | 8.47 | | | $ | 8.66 | | | $ | 8.26 | | | $ | 8.77 | | |
| | |
| | |
| | 0.34 | | | | 0.35 | | | | 0.34 | | | | 0.42 | | | | 0.42 | | |
| | (1.51 | ) | | | 0.43 | | | | (0.18 | ) | | | 0.40 | | | | (0.39 | ) | |
| | (1.17 | ) | | | 0.78 | | | | 0.16 | | | | 0.82 | | | | 0.03 | | |
| | |
| | |
| | (0.34 | ) | | | (0.35 | ) | | | (0.34 | ) | | | (0.37 | ) | | | (0.41 | ) | |
| | (0.05 | ) | | | — | | | | — | | | | (0.05 | ) | | | (0.13 | ) | |
| | — | | | | — | | | | (0.01 | ) | | | — | | | | — | | |
| | (0.39 | ) | | | (0.35 | ) | | | (0.35 | ) | | | (0.42 | ) | | | (0.54 | ) | |
| | |
| $ | 7.34 | | | $ | 8.90 | | | $ | 8.47 | | | $ | 8.66 | | | $ | 8.26 | | |
| | |
| | (13.60% | ) | | | 9.30% | | | | 2.00% | | | | 10.42% | | | | 0.16% | | |
| | |
| | |
| $ | 3 | | | $ | 3 | | | $ | 3 | | | $ | 3 | | | $ | 2 | | |
| | 0.79% | | | | 0.79% | | | | 0.79% | | | | 0.79% | | | | 0.91% | | |
| | 1.68% | | | | 1.68% | | | | 1.73% | | | | 2.15% | | | | 2.13% | | |
| | 4.12% | | | | 3.94% | | | | 4.02% | | | | 5.13% | | | | 4.82% | | |
| | 3.23% | | | | 3.05% | | | | 3.08% | | | | 3.77% | | | | 3.60% | | |
| | 55% | | | | 99% | | | | 93% | | | | 74% | | | | 108% | | |
37
Table of Contents
Financial highlights
Delaware Emerging Markets Debt Corporate Fund Institutional Class
Selected data for each share of the Fund outstanding throughout each period were as follows:
| Net asset value, beginning of period |
| |
| Income (loss) from investment operations: |
| Net investment income1 |
| Net realized and unrealized gain (loss) |
| Total from investment operations |
| |
| Less dividends and distributions from: |
| Net investment income |
| Net realized gain |
| Return of capital |
| Total dividends and distributions |
| |
| Net asset value, end of period |
| |
| Total return2 |
| |
| Ratios and supplemental data: |
| Net assets, end of period (000 omitted) |
| Ratio of expenses to average net assets3 |
| Ratio of expenses to average net assets prior to fees waived3 |
| Ratio of net investment income to average net assets |
| Ratio of net investment income to average net assets prior to fees waived |
| Portfolio turnover |
| 1 | Calculated using average shares outstanding. |
| 2 | Total return is based on the change in net asset value of a share during the period and assumes reinvestment of dividends and distributions at net asset value. Total return during all of the periods shown reflects a waiver by the manager. Performance would have been lower had the waiver not been in effect. |
| 3 | Expense ratios do not include expenses of any Underlying Funds in which the Fund invests. |
See accompanying notes, which are an integral part of the financial statements.
38
Table of Contents
| | Year ended | |
| 7/31/22 | | 7/31/21 | | 7/31/20 | | 7/31/19 | | 7/31/18 | |
| $ | 8.90 | | | $ | 8.47 | | | $ | 8.67 | | | $ | 8.27 | | | $ | 8.78 | | |
| | |
| | |
| | 0.34 | | | | 0.35 | | | | 0.34 | | | | 0.42 | | | | 0.42 | | |
| | (1.51 | ) | | | 0.43 | | | | (0.19 | ) | | | 0.40 | | | | (0.39 | ) | |
| | (1.17 | ) | | | 0.78 | | | | 0.15 | | | | 0.82 | | | | 0.03 | | |
| | |
| | |
| | (0.34 | ) | | | (0.35 | ) | | | (0.34 | ) | | | (0.37 | ) | | | (0.41 | ) | |
| | (0.05 | ) | | | — | | | | — | | | | (0.05 | ) | | | (0.13 | ) | |
| | — | | | | — | | | | (0.01 | ) | | | — | | | | — | | |
| | (0.39 | ) | | | (0.35 | ) | | | (0.35 | ) | | | (0.42 | ) | | | (0.54 | ) | |
| | |
| $ | 7.34 | | | $ | 8.90 | | | $ | 8.47 | | | $ | 8.67 | | | $ | 8.27 | | |
| | |
| | (13.60% | ) | | | 9.30% | | | | 1.88% | | | | 10.41% | | | | 0.16% | | |
| | |
| | |
| $ | 96,027 | | | $ | 86,511 | | | $ | 69,600 | | | $ | 51,784 | | | $ | 21,683 | | |
| | 0.79% | | | | 0.79% | | | | 0.79% | | | | 0.79% | | | | 0.91% | | |
| | 1.18% | | | | 1.17% | | | | 1.23% | | | | 1.65% | | | | 1.65% | | |
| | 4.12% | | | | 3.94% | | | | 4.02% | | | | 5.13% | | | | 4.82% | | |
| | 3.73% | | | | 3.56% | | | | 3.58% | | | | 4.27% | | | | 4.08% | | |
| | 55% | | | | 99% | | | | 93% | | | | 74% | | | | 108% | | |
39
Table of Contents
| Notes to financial statements | |
| Delaware Emerging Markets Debt Corporate Fund | July 31, 2022 |
Delaware Group® Government Fund (Trust) is organized as a Delaware statutory trust and offers two series: Delaware Strategic Income Fund and Delaware Emerging Markets Debt Corporate Fund. These financial statements and the related notes pertain to Delaware Emerging Markets Debt Corporate Fund (Fund). The Trust is an open-end investment company. The Fund is considered diversified under the Investment Company Act of 1940, as amended, and offers Class A, Class C, Class R, and Institutional Class shares. Class A shares are sold with a maximum front-end sales charge of 4.50%. There is no front-end sales charge when you purchase $1,000,000 or more of Class A shares. However, if Delaware Distributors, L.P. (DDLP) paid your financial intermediary a commission on your purchase of $1,000,000 or more of Class A shares, for shares purchased prior to July 1, 2020, you will have to pay a limited contingent deferred sales charge (Limited CDSC) of 1.00% if you redeem these shares within the first year after your purchase and 0.50% if you redeem these shares within the second year, or for shares purchased on or after July 1, 2020, you will have to pay a Limited CDSC of 1.00% if you redeem these shares within the first 18 months after your purchase; unless a specific waiver of the Limited CDSC applies. Class C shares have no upfront sales charge, but are sold with a CDSC of 1.00%, which will be incurred if redeemed during the first 12 months. Class R and Institutional Class shares are not subject to a sales charge and are offered for sale exclusively to certain eligible investors.
1. Significant Accounting Policies
The Fund follows accounting and reporting guidance under Financial Accounting Standards Board (FASB) Accounting Standards Codification Topic 946, Financial Services — Investment Companies. The following accounting policies are in accordance with US generally accepted accounting principles (US GAAP) and are consistently followed by the Fund.
Security Valuation — Equity securities, except those traded on the Nasdaq Stock Market LLC (Nasdaq), are valued at the last quoted sales price as of the time of the regular close of the New York Stock Exchange on the valuation date. Equity securities traded on the Nasdaq are valued in accordance with the Nasdaq Official Closing Price, which may not be the last sales price. If, on a particular day, an equity security does not trade, the mean between the bid and ask prices will be used, which approximates fair value. Equity Securities listed on a foreign exchange are normally valued at the last quoted sales price on the valuation date. Debt securities and credit default swap (CDS) contracts are valued based upon valuations provided by an independent pricing service or broker/counterparty and reviewed by management. To the extent current market prices are not available, the pricing service may take into account developments related to the specific security, as well as transactions in comparable securities. Valuations for fixed income securities utilize matrix systems, which reflect such factors as security prices, yields, maturities, and ratings, and are supplemented by dealer and exchange quotations. Foreign currency exchange contracts are valued at the mean between the bid and ask prices, which approximates fair value. Interpolated values are derived when the settlement date of the contract is an interim date for which quotations are not available. Futures contracts and options on futures contracts are valued at the daily quoted settlement prices. Open-end investment companies are valued at their
40
Table of Contents
published net asset value (NAV). Generally, other securities and assets for which market quotations are not readily available are valued at fair value as determined in good faith under the direction of the Trust’s Board of Trustees (Board). In determining whether market quotations are readily available or fair valuation will be used, various factors will be taken into consideration, such as market closures or suspension of trading in a security. Restricted securities are valued at fair value using methods approved by the Board.
Federal and Foreign Income Taxes — No provision for federal income taxes has been made as the Fund intends to continue to qualify for federal income tax purposes as a regulated investment company under Subchapter M of the Internal Revenue Code of 1986, as amended, and make the requisite distributions to shareholders. The Fund evaluates tax positions taken or expected to be taken in the course of preparing the Fund’s tax returns to determine whether the tax positions are “more-likely-than-not” of being sustained by the applicable tax authority. Tax positions not deemed to meet the “more-likely-than-not” threshold are recorded as a tax benefit or expense in the current year. Management has analyzed the Fund’s tax positions taken or expected to be taken on the Fund’s federal income tax returns through the year ended July 31, 2022, and for all open tax years (years ended July 31, 2019–July 31, 2021), and has concluded that no provision for federal income tax is required in the Fund’s financial statements. In regard to foreign taxes only, the Fund has open tax years in certain foreign countries in which it invests that may date back to the inception of the Fund. If applicable, the Fund recognizes interest accrued on unrecognized tax benefits in interest expense and penalties in “Other” on the “Statement of operations.” During the year ended July 31, 2022, the Fund did not incur any interest or tax penalties.
Class Accounting — Investment income, common expenses, and realized and unrealized gain (loss) on investments are allocated to the various classes of the Fund on the basis of daily net assets of each class. Distribution expenses relating to a specific class are charged directly to that class.
Foreign Currency Transactions — Transactions denominated in foreign currencies are recorded at the prevailing exchange rates on the valuation date in accordance with the Fund’s prospectus. The value of all assets and liabilities denominated in foreign currencies is translated daily into US dollars at the exchange rate of such currencies against the US dollar. Transaction gains or losses resulting from changes in exchange rates during the reporting period or upon settlement of the foreign currency transaction are reported in operations for the current period. The Fund generally bifurcates that portion of realized gains and losses on investments in debt securities which is due to changes in foreign exchange rates from that which is due to changes in market prices of debt securities. That portion of gains (losses), attributable to changes in foreign exchange rates, is included on the “Statement of operations” under “Net realized gain (loss) on foreign currencies.” The Fund reports certain foreign currency related transactions as components of realized gains (losses) for financial reporting purposes, whereas such components are treated as ordinary income (loss) for federal income tax purposes.
41
Table of Contents
Notes to financial statements
Delaware Emerging Markets Debt Corporate Fund
1. Significant Accounting Policies (continued)
Use of Estimates — The preparation of financial statements in conformity with US GAAP requires management to make estimates and assumptions that affect the fair value of investments, the reported amounts of assets and liabilities and disclosure of contingent assets and liabilities at the date of the financial statements, and the reported amounts of revenues and expenses during the reporting period. Actual results could differ from those estimates and the differences could be material.
Other — Expenses directly attributable to the Fund are charged directly to the Fund. Other expenses common to various funds within the Delaware Funds by Macquarie® (Delaware Funds) are generally allocated among such fund on the basis of average net assets. Management fees and certain other expenses are paid monthly. Security transactions are recorded on the date the securities are purchased or sold (trade date) for financial reporting purposes. Costs used in calculating realized gains and losses on the sale of investment securities are those of the specific securities sold. Dividend income is recorded on the ex-dividend date and interest income is recorded on the accrual basis. Income and capital gain distributions from any investment companies (Underlying Funds) in which the Fund invests are recorded on the ex-dividend date. Discounts and premiums on debt securities are accreted or amortized to interest income, respectively, over the lives of the respective securities using the effective interest method. Premiums on callable debt securities are amortized to interest income to the earliest call date using the effective interest method. The Fund declares and pays dividends from net investment income monthly and pays distributions from net realized gain on investments, if any, annually. The Fund may distribute more frequently, if necessary for tax purposes. Dividends and distributions, if any, are recorded on the ex-dividend date.
The Fund receives earnings credits from its custodian when positive cash balances are maintained, which may be used to offset custody fees. There were no such earnings credits for the year ended July 31, 2022.
The Fund receives earnings credits from its transfer agent when positive cash balances are maintained, which may be used to offset transfer agent fees. If the amount earned is greater than $1, the expenses paid under this arrangement are included on the “Statement of operations” under “Dividend disbursing and transfer agent fees and expenses” with the corresponding expenses offset included under “Less expenses paid indirectly.” For the year ended July 31, 2022, the Fund earned $503 under this arrangement.
2. Investment Management, Administration Agreements, and Other Transactions with Affiliates
In accordance with the terms of its investment management agreement, the Fund pays Delaware Management Company (DMC), a series of Macquarie Investment Management Business Trust and the investment manager, an annual fee which is calculated daily and paid monthly at the rate
42
Table of Contents
of 0.75% on the first $500 million of average daily net assets of the Fund, 0.70% on the next $500 million, 0.65% on the next $1.5 billion, and 0.60% on average daily net assets in excess of $2.5 billion.
DMC has contractually agreed to waive all or a portion, of its management fee and/or pay/reimburse expenses (excluding any distribution and service (12b-1) fees, acquired fund fees and expenses, taxes, interest, short sale dividend and interest expenses, brokerage fees, certain insurance costs, and nonroutine expenses or costs, including, but not limited to, those relating to reorganizations, litigation, conducting shareholder meetings, and liquidations), in order to prevent total fund annual operating expenses from exceeding 0.79% of the Fund’s average daily net assets from August 1, 2021 through July 31, 2022.* These waivers and reimbursements may only be terminated by agreement of DMC and the Fund. The waivers and reimbursements are accrued daily and received monthly.
DMC may seek investment advice and recommendations from its affiliates: Macquarie Investment Management Europe Limited, Macquarie Investment Management Austria Kapitalanlage AG, and Macquarie Investment Management Global Limited (together, the “Affiliated Sub-Advisors”). The DMC may also permit these Affiliated Sub-Advisors to execute Fund security trades on its behalf and exercise investment discretion for securities in certain markets where DMC believes it will be beneficial to utilize an Affiliated Sub-Advisor’s specialized market knowledge. Although the Affiliated Sub-Advisors serve as sub-advisors, DMC has ultimate responsibility for all investment advisory services. For these services, DMC, not the Fund, pays each Affiliated Sub-Advisor a portion of its investment management fee.
Delaware Investments Fund Services Company (DIFSC), an affiliate of DMC, provides fund accounting and financial administrative oversight services to the Fund. For these services, DIFSC’s fees are calculated daily and paid monthly, based on the aggregate daily net assets of all funds within the Delaware Funds at the following annual rates: 0.00475% of the first $35 billion; 0.0040% of the next $10 billion; 0.0025% of the next $45 billion; and 0.0015% of aggregate average daily net assets in excess of $90 billion (Total Fee). The fund in the Delaware Funds pays a minimum of $4,000, which, in aggregate, is subtracted from the Total Fee. The fund then pays its portion of the remainder of the Total Fee on a relative NAV basis. This amount is included on the “Statement of operations” under “Accounting and administration expenses.” For the year ended July 31, 2022, the Fund paid $6,769 for these services.
DIFSC is also the transfer agent and dividend disbursing agent of the Fund. For these services, DIFSC’s fees are calculated daily and paid monthly, based on the aggregate daily net assets of the retail funds within the Delaware Funds at the following annual rates: 0.014% of the first $20 billion; 0.011% of the next $5 billion; 0.007% of the next $5 billion; 0.005% of the next $20 billion; and 0.0025% of average daily net assets in excess of $50 billion. The fees payable to DIFSC under the shareholder services agreement described above are allocated among all retail funds in the Delaware Funds on a relative NAV basis. This amount is included on the “Statement of operations” under “Dividend disbursing and transfer agent fees and expenses.” For the year ended July 31, 2022, the Fund paid $3,865 for these services. Pursuant to a sub-transfer agency
43
Table of Contents
Notes to financial statements
Delaware Emerging Markets Debt Corporate Fund
2. Investment Management, Administration Agreements, and Other Transactions with Affiliates (continued)
agreement between DIFSC and BNY Mellon Investment Servicing (US) Inc. (BNYMIS), BNYMIS provides certain sub-transfer agency services to the Fund. Sub-transfer agency fees are paid by the Fund and are also included on the “Statement of operations” under “Dividend disbursing and transfer agent fees and expenses.” The fees are calculated daily and paid as invoices are received on a monthly or quarterly basis.
Pursuant to a distribution agreement and distribution plan, the Fund pays DDLP, the distributor and affiliate of DMC, annual 12b-1 fees of 0.25%, 1.00%, and 0.50% of the average daily net assets of the Class A, Class C, and Class R shares, respectively. The fees are calculated daily and paid monthly. DDLP has agreed to voluntarily suspend the 12b-1 fee for the Class R shares and the suspension of the 12b-1 fee will continue while the Class is not broadly distributed. Institutional Class shares do not pay 12b-1 fee.
As provided in the investment management agreement, the Fund bears a portion of the cost of certain resources shared with DMC, including the cost of internal personnel of DMC and/or its affiliates that provide legal and regulatory reporting services to the Fund. For the year ended July 31, 2022, the Fund paid $1,475 for internal legal and regulatory reporting services provided by DMC and/or its affiliates’ employees. This amount is included on the “Statement of operations” under “Legal fees.”
For the year ended July 31, 2022, DDLP earned $193 for commissions on sales of the Fund’s Class A shares. For the year ended July 31, 2022, DDLP received gross CDSC commissions of $9 on redemptions of the Fund’s Class C shares, and these commissions were entirely used to offset upfront commissions previously paid by DDLP to broker/dealers on sales of those shares.
Trustees’ fees include expenses accrued by the Fund for each Trustee’s retainer and meeting fees. Certain officers of DMC, DIFSC, and DDLP are officers and/or Trustees of the Trust. These officers and Trustees are paid no compensation by the Fund.
In addition to the management fees and other expenses of the Fund, the Fund indirectly bears the investment management fees and other expenses of any Underlying Funds in which it invests. The amount of these fees and expenses incurred indirectly by the Fund will vary based upon the expense and fee level of any Underlying Funds and the number of shares that are owned of any Underlying Funds at different times.
| * | The aggregate contractual waiver period covering this report is from November 29, 2020 through November 26, 2022. |
44
Table of Contents
3. Investments
For the year ended July 31, 2022, the Fund made purchases and sales of investment securities other than short-term investments as follows:
| Purchases | | $ | 67,345,834 |
| Sales | | | 43,903,225 |
The tax cost of investments and derivatives includes adjustments to net unrealized appreciation (depreciation) which may not necessarily be the final tax cost basis adjustments but which approximate the tax basis unrealized gains and losses that may be realized and distributed to shareholders. At July 31, 2022, the cost and unrealized appreciation (depreciation) of investments and derivatives for federal income tax purposes for the Fund were as follows:
| Cost of investments and derivatives | | $ | 109,984,808 | |
| Aggregate unrealized appreciation of investments and derivatives | | $ | 310,141 | |
| Aggregate unrealized depreciation of investments and derivatives | | | (12,910,713 | ) |
| Net unrealized depreciation of investments and derivatives | | $ | (12,600,572 | ) |
US GAAP defines fair value as the price that the Fund would receive to sell an asset or pay to transfer a liability in an orderly transaction between market participants at the measurement date under current market conditions. A three-level hierarchy for fair value measurements has been established based upon the transparency of inputs to the valuation of an asset or liability. Inputs may be observable or unobservable and refer broadly to the assumptions that market participants would use in pricing the asset or liability. Observable inputs reflect the assumptions market participants would use in pricing the asset or liability based on market data obtained from sources independent of the reporting entity. Unobservable inputs reflect the reporting entity’s own assumptions about the assumptions that market participants would use in pricing the asset or liability based on the best information available under the circumstances. The Fund's investment in its entirety is assigned a level based upon the observability of the inputs which are significant to the overall valuation. The three-level hierarchy of inputs is summarized as follows:
| Level 1 – | Inputs are quoted prices in active markets for identical investments. (Examples: equity securities, open-end investment companies, futures contracts, and exchange-traded options contracts) |
| | |
| Level 2 – | Other observable inputs, including, but not limited to: quoted prices for similar assets or liabilities in markets that are active, quoted prices for identical or similar assets or liabilities in markets that are not active, inputs other than quoted prices that are observable for the assets or liabilities (such as interest rates, yield curves, volatilities, prepayment speeds, loss severities, credit risks, and default rates) or other market-corroborated inputs. (Examples: debt securities, government securities, swap contracts, foreign currency exchange contracts, foreign securities utilizing international fair value pricing, broker-quoted securities, and fair valued securities) |
45
Table of Contents
Notes to financial statements
Delaware Emerging Markets Debt Corporate Fund
3. Investments (continued)
| Level 3 – | Significant unobservable inputs, including the Fund's own assumptions used to determine the fair value of investments. (Examples: broker-quoted securities and fair valued securities) |
Level 3 investments are valued using significant unobservable inputs. The Fund may also use an income-based valuation approach in which the anticipated future cash flows of the investment are discounted to calculate fair value. Discounts may also be applied due to the nature or duration of any restrictions on the disposition of the investments. Valuations may also be based upon current market prices of securities that are comparable in coupon, rating, maturity, and industry. The derived value of a Level 3 investment may not represent the value which is received upon disposition and this could impact the results of operations.
The following table summarizes the valuation of the Fund’s investments by fair value hierarchy levels as of July 31, 2022:
| | Level 1 | | Level 2 | | Total |
| Securities | | | | | | | | | | | |
| Assets: | | | | | | | | | | | |
| Common Stock | | $ | 288,052 | | | $ | — | | $ | 288,052 | |
| Corporate Bonds | | | — | | | | 86,885,468 | | | 86,885,468 | |
| Sovereign Bonds | | | — | | | | 1,569,924 | | | 1,569,924 | |
| Short-Term Investments | | | 8,636,850 | | | | — | | | 8,636,850 | |
| Total Value of Securities | | $ | 8,924,902 | | | $ | 88,455,392 | | $ | 97,380,294 | |
| | | | | | | | | | | | |
| Derivatives1 | | | | | | | | | | | |
| Assets: | | | | | | | | | | | |
| OTC Credit Default Swaps | | $ | — | | | $ | 63,872 | | $ | 63,872 | |
| Liabilities: | | | | | | | | | | | |
| Futures Contracts | | $ | (59,930 | ) | | $ | — | | $ | (59,930 | ) |
| 1 | Futures contracts and swap contracts are valued at the unrealized appreciation (depreciation) on the instrument at the year end. |
During the year ended July 31, 2022, there were no transfers into or out of Level 3 investments. The Fund’s policy is to recognize transfers into or out of Level 3 investments based on fair value at the beginning of the reporting period.
A reconciliation of Level 3 investments is presented when the Fund has a significant amount of Level 3 investments at the beginning or end of the year in relation to the Fund’s net assets. During the year ended July 31, 2022, there were no Level 3 investments.
46
Table of Contents
4. Dividend and Distribution Information
Income and long-term capital gain distributions are determined in accordance with federal income tax regulations, which may differ from US GAAP. Additionally, distributions from net gains on foreign currency transactions and net short-term gains on sales of investment securities are treated as ordinary income for federal income tax purposes. The tax character of dividends and distributions paid during the years ended July 31, 2022 and 2021 were as follows:
| | Year ended |
| | 7/31/22 | | 7/31/21 |
| Ordinary income | | $ | 3,622,843 | | $ | 2,851,665 |
| Long-term capital gains | | | 354,513 | | | 49,887 |
| Total | | $ | 3,977,356 | | $ | 2,901,552 |
5. Components of Net Assets on a Tax Basis
As of July 31, 2022, the components of net assets on a tax basis were as follows:
| Shares of beneficial interest | | $ | 111,280,390 | |
| Undistributed ordinary income | | | 3,102 | |
| Qualified late year loss deferrals | | | (1,675,747 | ) |
| Unrealized depreciation of investments and derivatives | | | (12,600,572 | ) |
| Net assets | | $ | 97,007,173 | |
The differences between book basis and tax basis components of net assets are primarily attributable to tax deferral of losses on wash sales, mark-to-market of futures contracts, tax treatment of swap contracts, and amortization of premium on callable bonds.
Qualified late year ordinary and capital losses (including currency and specified gain/loss items) represent losses from January 1, 2022 through July 31, 2022 and November 1, 2021 through July 31, 2022, respectively, that, in accordance with federal income tax regulations, the Fund has elected to defer and treat as having arisen in the following fiscal year.
For financial reporting purposes, capital accounts are adjusted to reflect the tax character of permanent book/tax differences. Results of operations and net assets were not affected by these reclassifications. For the year ended July 31, 2022, the Fund had no reclassifications.
6. Capital Shares
Transactions in capital shares were as follows:
| | Year ended |
| | 7/31/22 | | 7/31/21 |
| Shares sold: | | | | |
| Class A | | 42,191 | | 63,325 |
| Class C | | 19,267 | | 19,719 |
| Institutional Class | | 6,765,116 | | 3,345,906 |
47
Table of Contents
Notes to financial statements
Delaware Emerging Markets Debt Corporate Fund
6. Capital Shares (continued)
| | | | Year ended |
| | | 7/31/22 | | 7/31/21 |
| Shares issued upon reinvestment of dividends and distributions: | | | | | | |
| Class A | | 4,815 | | | 1,994 | |
| Class C | | 616 | | | 308 | |
| Class R | | 16 | | | 14 | |
| Institutional Class | | 473,783 | | | 321,115 | |
| | | 7,305,804 | | | 3,752,381 | |
| | | | | | | |
| Shares redeemed: | | | | | | |
| Class A | | (34,303 | ) | | (6,770 | ) |
| Class C | | (2,302 | ) | | (18,842 | ) |
| Institutional Class | | (3,869,943 | ) | | (2,164,649 | ) |
| | | (3,906,548 | ) | | (2,190,261 | ) |
| Net increase | | 3,399,256 | | | 1,562,120 | |
Certain shareholders may exchange shares of one class for shares of another class in the same Fund. These exchange transactions are included as subscriptions and redemptions in the table above and on the “Statements of changes in net assets.” For the years ended July 31, 2022 and 2021, the Fund had the following exchange transactions:
| | Exchange Redemptions | | Exchange Subscriptions | | | |
| | Class C | | Class A | | | |
| | Shares | | Shares | | Value |
| Year ended | | | | | | | | | | | |
| 7/31/22 | | | 205 | | | | 205 | | | $ | 1,677 |
| 7/31/21 | | | 76 | | | | 76 | | | | 675 |
7. Line of Credit
The Fund, along with certain other funds in the Delaware Funds (Participants), was a participant in a $225,000,000 revolving line of credit (Agreement) intended to be used for temporary or emergency purposes as an additional source of liquidity to fund redemptions of investor shares. Under the Agreement, the Participants were charged an annual commitment fee of 0.15% with the addition of an upfront fee of 0.05%, which was allocated across the Participants based on a weighted average of the respective net assets of each Participant. The Participants were permitted to borrow up to a maximum of one-third of their net assets under the Agreement. Each Participant was individually, and not jointly, liable for its particular advances, if any, under the line of credit. The line of credit available under the Agreement expired on November 1, 2021.
On November 1, 2021, the Fund, along with the other Participants, entered into an amendment to the Agreement for a $355,000,000 revolving line of credit to be used as described above and operates in substantially the same manner as the original Agreement. Under the amendment to
48
Table of Contents
the agreement, the Participants are charged an annual commitment fee of 0.15%, with the addition of an upfront fee of 0.05%, which is allocated across the Participants based on a weighted average of the respective net assets of each Participant. The line of credit available under the Agreement expires on October 31, 2022.
The Fund had no amounts outstanding as of July 31, 2022, or at any time during the year then ended.
8. Derivatives
US GAAP requires disclosures that enable investors to understand: (1) how and why an entity uses derivatives; (2) how they are accounted for; and (3) how they affect an entity’s results of operations and financial position.
Foreign Currency Exchange Contracts — The Fund may enter into foreign currency exchange contracts and foreign cross currency exchange contracts as a way of managing foreign exchange rate risk. The Fund may enter into these contracts to fix the US dollar value of a security that it has agreed to buy or sell for the period between the date the trade was entered into and the date the security is delivered and paid for. The Fund may also enter into these contracts to hedge the US dollar value of securities it already owns that are denominated in foreign currencies. In addition, the Fund may enter into these contracts to facilitate or expedite the settlement of portfolio transactions. The change in value is recorded as an unrealized gain or loss. When the contract is closed, a realized gain or loss is recorded equal to the difference between the value of the contract at the time it was opened and the value at the time it was closed.
The use of foreign currency exchange contracts and foreign cross currency exchange contracts does not eliminate fluctuations in the underlying prices of the securities, but does establish a rate of exchange that can be achieved in the future. Although foreign currency exchange contracts and foreign cross currency exchange contracts limit the risk of loss due to an unfavorable change in the value of the hedged currency, they also limit any potential gain that might result should the value of the currency change favorably. In addition, the Fund could be exposed to risks if the counterparties to the contracts are unable to meet the terms of their contracts. The Fund’s maximum risk of loss from counterparty credit risk is the value of its currency exchanged with the counterparty. The risk is generally mitigated by having a netting arrangement between the Fund and the counterparty and by the posting of collateral by the counterparty to the Fund to cover the Fund's exposure to the counterparty. No foreign currency exchange contracts and foreign cross currency exchange contracts were outstanding at July 31, 2022.
Futures Contracts — A futures contract is an agreement in which the writer (or seller) of the contract agrees to deliver to the buyer an amount of cash or securities equal to a specific dollar amount times the difference between the value of a specific security or index at the close of the last trading day of the contract and the price at which the agreement is made. The Fund may use futures contracts in the normal course of pursuing its investment objective. The Fund may invest in futures contracts to hedge its existing portfolio securities against fluctuations in value caused
49
Table of Contents
Notes to financial statements
Delaware Emerging Markets Debt Corporate Fund
8. Derivatives (continued)
by changes in interest rates or market conditions. Upon entering into a futures contract, the Fund deposits cash or pledges US government securities to a broker, equal to the minimum “initial margin” requirements of the exchange on which the contract is traded. Subsequent payments are received from the broker or paid to the broker each day, based on the daily fluctuation in the market value of the contract. These receipts or payments are known as “variation margin” and are recorded daily by the Fund as unrealized gains or losses until the contracts are closed. When the contracts are closed, the Fund records a realized gain or loss equal to the difference between the value of the contract at the time it was opened and the value at the time it was closed. Risks of entering into futures contracts include potential imperfect correlation between the futures contracts and the underlying securities and the possibility of an illiquid secondary market for these instruments. When investing in futures, there is reduced counterparty credit risk to the Fund because futures are exchange-traded and the exchange’s clearinghouse, as counterparty to all exchange-traded futures, guarantees against default. At July 31, 2022, the Fund posted $54,350 in cash as collateral for open futures contracts, which is presented as “Cash collateral due from broker” on the “Statement of assets and liabilities.”
During the year ended July 31, 2022, the Fund used futures contracts to hedge the Fund’s existing portfolio securities against fluctuations in value caused by changes in interest rates or market conditions.
Swap Contracts — The Fund may enter into CDS contracts in the normal course of pursuing its investment objective. The Fund may enter into CDS contracts in order to hedge against credit events, to enhance total return, or to gain exposure to certain securities or markets. The Fund will not be permitted to enter into any swap transactions unless, at the time of entering into such transactions, the unsecured long-term debt of the actual counterparty, combined with any credit enhancements, is rated at least BBB- by Standard & Poor’s Financial Services LLC (S&P) or Baa3 by Moody’s Investors Service, Inc. (Moody’s) or is determined to be of equivalent credit quality by DMC.
Credit Default Swaps. A CDS contract is a risk-transfer instrument through which one party (purchaser of protection) transfers to another party (seller of protection) the financial risk of a credit event (as defined in the CDS agreement), as it relates to a particular reference security or basket of securities (such as an index). In exchange for the protection offered by the seller of protection, the purchaser of protection agrees to pay the seller of protection a periodic amount at a stated rate that is applied to the notional amount of the CDS contract. In addition, an upfront payment may be made or received by the Fund in connection with an unwinding or assignment of a CDS contract. Upon the occurrence of a credit event, the seller of protection would pay the par (or other agreed-upon) value of the reference security (or basket of securities) to the counterparty. Credit events generally include, among others, bankruptcy, failure to pay, and obligation default.
During the year ended July 31, 2022, the Fund entered into CDS contracts as a purchaser of protection. Periodic payments (receipts) on such contracts are accrued daily and recorded as
50
Table of Contents
unrealized losses (gains) on swap contracts. Upon payment (receipt), such amounts are recorded as realized losses (gains) on swap contracts. Upfront payments made or received in connection with CDS contracts are amortized over the expected life of the CDS contracts as unrealized losses (gains) on swap contracts. The change in value of CDS contracts is recorded daily as unrealized appreciation or depreciation. A realized gain or loss is recorded upon a credit event (as defined in the CDS agreement) or the maturity or termination of the agreement. Initial margin and variation margin are posted to central counterparties for CDS basket trades, as determined by the applicable central counterparty. During the year ended July 31, 2022, the Fund did not enter into any CDS contracts as a seller of protection.
CDS contracts may involve greater risks than if the Fund had invested in the reference obligation directly. CDS contracts are subject to general market risk, liquidity risk, counterparty risk, and credit risk. The Fund’s maximum risk of loss from counterparty credit risk, either as the seller of protection or the buyer of protection, is the fair value of the contract. This risk is mitigated by (1) for bilateral swap contracts, having a netting arrangement between the Fund and the counterparty and by the posting of collateral by the counterparty to the Fund to cover the Fund’s exposure to the counterparty or (2) for cleared swaps, trading these instruments through a central counterparty.
During the year ended July 31, 2022, the Fund used CDS contracts to hedge against credit events.
Swaps Generally. For centrally cleared swaps, payments are received from the broker or paid to the broker each day, based on the daily fluctuation in the market value of the contract. These receipts or payments are known as “variation margin” and are recorded by the Fund as unrealized gains or losses until the contracts are closed. When the contracts are closed, the Fund records a realized gain or loss equal to the difference between the value of the contract at the time it was opened and the value at the time it was closed. The value of open swaps may differ from that which would be realized in the event the Fund terminated its position in the contract on a given day. Risks of entering into these contracts include the potential inability of the counterparty to meet the terms of the contracts. This type of risk is generally limited to the amount of favorable movement in the value of the underlying security, instrument, or basket of instruments, if any, at the day of default. Risks also arise from potential losses from adverse market movements and such losses could exceed the unrealized amounts shown on the “Schedule of investments.”
At July 31, 2022, the Fund received $150,000 in cash collateral for open over-the-counter credit default swap contracts, which is included in “Cash collateral due from broker” on the “Statement of assets and liabilities.”
51
Table of Contents
Notes to financial statements
Delaware Emerging Markets Debt Corporate Fund
8. Derivatives (continued)
Fair values of derivative instruments as of July 31, 2022 were as follows:
| Asset Derivatives Fair Value |
| Statement of Assets and | | Credit | | |
| Liabilities Location | | Contracts | | |
| Unrealized appreciation on credit default swap contracts | | $ | 63,872 | | |
| Liability Derivatives Fair Value |
| | Interest | | |
| Statement of Assets and | | Rate | | |
| Liabilities Location | | Contracts | | |
| Variation margin due to broker on futures contracts* | | $ | (59,930 | ) | |
| * | Includes cumulative appreciation (depreciation) of futures contracts from the date the contracts were opened through July 31, 2022. Only current day variation margin is reported on the “Statement of assets and liabilities.” |
The effect of derivative instruments on the “Statement of operations” for the year ended July 31, 2022 was as follows:
| Net Realized Gain (Loss) on: | |
| Foreign | | | | | | | | | | | |
| Currency | | | | | | | | | | | |
| Exchange | | Futures | | Swap | | | | | |
| Contracts | | Contracts | | Contracts | | | Total | |
| Currency contracts | | $ | 3,208 | | | $ | — | | $ | — | | | $ | 3,208 | |
| Interest rate contracts | | | — | | | | 249,969 | | | — | | | | 249,969 | |
| Credit contracts | | | — | | | | — | | | (61,238 | ) | | | (61,238 | ) |
| Total | | $ | 3,208 | | | $ | 249,969 | | $ | (61,238 | ) | | $ | 191,939 | |
| | |
| Net Change in Unrealized Appreciation (Depreciation) on: |
| Futures | | Swap | | | | | |
| Contracts | | Contracts | | Total |
| Interest rate contracts | | $ | 1,972 | | | | $ | — | | | | $ | 1,972 | |
| Credit contracts | | | — | | | | | 69,397 | | | | | 69,397 | |
| Total | | $ | 1,972 | | | | $ | 69,397 | | | | $ | 71,369 | |
The table below summarizes the average daily balance of derivative holdings by the Fund during the year ended July 31, 2022:
| Long Derivative | | Short Derivative |
| Volume | | Volume |
| Futures contracts (average notional value) | $ | — | | $ | 2,106,200 |
| CDS contracts (average notional value)** | | 4,258,036 | | | — |
| ** | Long represents buying protection and short represents selling protection. |
52
Table of Contents
9. Offsetting
The Fund entered into an International Swaps and Derivatives Association, Inc. Master Agreement (ISDA Master Agreement) or a similar agreement with certain of its derivative contract counterparties in order to better define its contractual rights and to secure rights that will help the Fund mitigate its counterparty risk. An ISDA Master Agreement is a bilateral agreement between the Fund and a counterparty that governs over-the-counter (OTC) derivatives and foreign exchange contracts and typically contains, among other things, collateral posting items and netting provisions in the event of a default and/or termination event. Under an ISDA Master Agreement, the Fund may, under certain circumstances, offset with the counterparty certain derivative financial instruments’ payables and/or receivables with collateral held and/or posted and create one single net payment. The provisions of the ISDA Master Agreement typically permit a single net payment in the event of default (close-out), including the bankruptcy or insolvency of the counterparty. However, bankruptcy or insolvency laws of a particular jurisdiction may impose restrictions on or prohibitions against the right of offset in bankruptcy, insolvency, or other events.
For financial reporting purposes, the Fund does not offset derivative assets and derivative liabilities that are subject to netting arrangements on the “Statement of assets and liabilities.”
At July 31, 2022, the Fund had the following assets and liabilities subject to offsetting provisions:
Offsetting of Financial Assets and Liabilities and Derivative Assets and Liabilities
| Gross Value of | | Gross Value of | | | |
| Counterparty | Derivative Asset | | Derivative Liability | | Net Position |
| JPMorgan Chase Bank | | $63,872 | | $— | | | $63,872 |
| | | | | Fair Value of | | | | | | Fair Value of | | | | |
| | | | | Non-Cash | | | | | | Non-Cash | | | | |
| | | | | Collateral | | Cash Collateral | | | Collateral | | Cash Collateral | | |
| Counterparty | | Net Position | | Received | | Received(a) | | | Pledged | | Pledged | | Net Exposure(b) |
| JPMorgan | | | | | | | | | | | | | | | |
| Chase | | | | | | | | | | | | | | | |
| Bank | | | $63,872 | | $— | | | $(63,872) | | | $— | | $— | | $— |
| (a) | The value of the related collateral exceeded the value of the derivatives as of July 31, 2022, as applicable. |
| (b) | Net exposure represents the receivable (payable) that would be due from (to) the counterparty in the event of default. |
10. Securities Lending
The Fund, along with other funds in Delaware Funds, may lend its securities pursuant to a security lending agreement (Lending Agreement) with The Bank of New York Mellon (BNY Mellon). At the time a security is loaned, the borrower must post collateral equal to the required percentage of the market value of the loaned security, including any accrued interest. The required percentage is: (1) 102% with respect to US securities and foreign securities that are
53
Table of Contents
Notes to financial statements
Delaware Emerging Markets Debt Corporate Fund
10. Securities Lending (continued)
denominated and payable in US dollars; and (2) 105% with respect to foreign securities. With respect to each loan, if on any business day the aggregate market value of securities collateral plus cash collateral held is less than the aggregate market value of the securities which are the subject of such loan, the borrower will be notified to provide additional collateral by the end of the following business day, which, together with the collateral already held, will be not less than the applicable initial collateral requirements for such security loan. If the aggregate market value of securities collateral and cash collateral held with respect to a security loan exceeds the applicable initial collateral requirement, upon the request of the borrower, BNY Mellon must return enough collateral to the borrower by the end of the following business day to reduce the value of the remaining collateral to the applicable initial collateral requirement for such security loan. As a result of the foregoing, the value of the collateral held with respect to a loaned security on any particular day, may be more or less than the value of the security on loan. The collateral percentage with respect to the market value of the loaned security is determined by the security lending agent.
Cash collateral received by the fund of the Trust is generally invested in a series of individual separate accounts, each corresponding to a fund. The investment guidelines permit each separate account to hold certain securities that would be considered eligible securities for a money market fund. Cash collateral received is generally invested in government securities; certain obligations issued by government sponsored enterprises; repurchase agreements collateralized by US Treasury securities; obligations issued by the central government of any Organization for Economic Cooperation and Development (OECD) country or its agencies, instrumentalities, or establishments; obligations of supranational organizations; commercial paper, notes, bonds, and other debt obligations; certificates of deposit, time deposits, and other bank obligations; certain money market funds; and asset-backed securities. The Fund can also accept US government securities and letters of credit (non-cash collateral) in connection with securities loans.
In the event of default or bankruptcy by the lending agent, realization and/or retention of the collateral may be subject to legal proceedings. In the event the borrower fails to return loaned securities and the collateral received is insufficient to cover the value of the loaned securities and provided such collateral shortfall is not the result of investment losses, the lending agent has agreed to pay the amount of the shortfall to the Fund or, at the discretion of the lending agent, replace the loaned securities. The Fund continues to record dividends or interest, as applicable, on the securities loaned and is subject to changes in value of the securities loaned that may occur during the term of the loan. The Fund has the right under the Lending Agreement to recover the securities from the borrower on demand. With respect to security loans collateralized by non-cash collateral, the Fund receives loan premiums paid by the borrower. With respect to security loans collateralized by cash collateral, the earnings from the collateral investments are shared among the Fund, the security lending agent, and the borrower. The Fund records security lending income net of allocations to the security lending agent and the borrower.
54
Table of Contents
The Fund may incur investment losses as a result of investing securities lending collateral. This could occur if an investment in the collateral investment account defaulted or became impaired. Under those circumstances, the value of the Fund's cash collateral account may be less than the amount the Fund would be required to return to the borrowers of the securities and the Fund would be required to make up for this shortfall.
During the year ended July 31, 2022, the Fund had no securities out on loan.
11. Credit and Market Risk
Beginning in January 2020, global financial markets have experienced and may continue to experience significant volatility resulting from the spread of a novel coronavirus known as COVID-19. The outbreak of COVID-19 has resulted in travel and border restrictions, quarantines, supply chain disruptions, lower consumer demand, and general market uncertainty. The effects of COVID-19 have and may continue to adversely affect the global economy, the economies of certain nations, and individual issuers, all of which may negatively impact the Fund’s performance.
Beginning in late February 2022, global financial markets have experienced and may continue to experience significant volatility related to military action by Russia in Ukraine. As a result of this military action, the US and many other countries have imposed sanctions on Russia and certain Russian individuals, banks and corporations. The ongoing hostilities and resulting sanctions are expected to have a severe adverse effect on the region’s economies and more globally, including significant negative impact on markets for certain securities and commodities, such as oil and natural gas. Any cessation of trading on the Russian securities markets will impact the value and liquidity of certain portfolio holdings. The extent and duration of military action, sanctions, and resulting market disruptions are impossible to predict, but could be substantial and prolonged and impact your Fund’s performance.
When interest rates rise, fixed income securities (i.e. debt obligations) generally will decline in value. These declines in value are greater for fixed income securities with longer maturities or durations.
IBOR is the risk that changes related to the use of the London interbank offered rate (LIBOR) and other interbank offered rate (collectively, “IBORs”) could have adverse impacts on financial instruments that reference LIBOR (or the corresponding IBOR). The abandonment of LIBOR could affect the value and liquidity of instruments that reference LIBOR. The use of alternative reference rate products may impact investment strategy performance. These risks may also apply with respect to changes in connection with other IBORs, such as the euro overnight index average (EONIA), which are also the subject of recent reform.
Some countries in which the Fund may invest require governmental approval for the repatriation of investment income, capital, or the proceeds of sales of securities by foreign investors. In addition, if there is deterioration in a country’s balance of payments or for other reasons, a country may impose temporary restrictions on foreign capital remittances abroad.
55
Table of Contents
Notes to financial statements
Delaware Emerging Markets Debt Corporate Fund
11. Credit and Market Risk (continued)
The securities exchanges of certain foreign markets are substantially smaller, less liquid, and more volatile than the major securities markets in the US. Consequently, acquisition and disposition of securities by the Fund may be inhibited. In addition, a significant portion of the aggregate market value of securities listed on the major securities exchanges in emerging markets is held by a smaller number of investors. This may limit the number of shares available for acquisition or disposition by the Fund.
The Fund invests a portion of its assets in high yield fixed income securities, which are securities rated lower than BBB- by Standard & Poor’s Financial Services LLC and Baa3 by Moody’s Investors Service, Inc., or similarly rated by another nationally recognized statistical rating organization. Investments in these higher yielding securities are generally accompanied by a greater degree of credit risk than higher rated securities. Additionally, lower rated securities may be more susceptible to adverse economic and competitive industry conditions than investment grade securities.
The Fund invests in certain obligations that may have liquidity protection designed to ensure that the receipt of payments due on the underlying security is timely. Such protection may be provided through guarantees, insurance policies, or letters of credit obtained by the issuer or sponsor through third parties, through various means of structuring the transaction, or through a combination of such approaches. The Fund will not pay any additional fees for such credit support, although the existence of credit support may increase the price of the security.
The Fund invests in bank loans and other securities that may subject it to direct indebtedness risk, the risk that the Fund will not receive payment of principal, interest, and other amounts due in connection with these investments and will depend primarily on the financial condition of the borrower. Loans that are fully secured offer the Fund more protection than unsecured loans in the event of nonpayment of scheduled interest or principal, although there is no assurance that the liquidation of collateral from a secured loan would satisfy the corporate borrower’s obligation, or that the collateral can be liquidated. Some loans or claims may be in default at the time of purchase. Certain of the loans and the other direct indebtedness acquired by the Fund may involve revolving credit facilities or other standby financing commitments that obligate the Fund to pay additional cash on a certain date or on demand. These commitments may require the Fund to increase its investment in a company at a time when the Fund might not otherwise decide to do so (including at a time when the company’s financial condition makes it unlikely that such amounts will be repaid). To the extent that the Fund is committed to advance additional funds, it will at all times hold and maintain cash or other high grade debt obligations in an amount sufficient to meet such commitments. When a loan agreement is purchased, the Fund may pay an assignment fee. On an ongoing basis, the Fund may receive a commitment fee based on the undrawn portion of the underlying line of credit portion of a loan agreement. Prepayment penalty fees are received upon the prepayment of a loan agreement by the borrower. Prepayment penalty, facility, commitment, consent, and amendment fees are recorded to income as earned or paid.
56
Table of Contents
As the Fund may be required to rely upon another lending institution to collect and pass on to the Fund amounts payable with respect to the loan and to enforce the Fund’s rights under the loan and other direct indebtedness, an insolvency, bankruptcy, or reorganization of the lending institution may delay or prevent the Fund from receiving such amounts. The highly leveraged nature of many loans may make them especially vulnerable to adverse changes in economic or market conditions. Investments in such loans and other direct indebtedness may involve additional risk to the Fund.
The Fund may invest up to 15% of its net assets in illiquid securities, which may include securities with contractual restrictions on resale, securities exempt from registration under Rule 144A promulgated under the Securities Act of 1933, as amended, and other securities which may not be readily marketable. The relative illiquidity of these securities may impair the Fund from disposing of them in a timely manner and at a fair price when it is necessary or desirable to do so. While maintaining oversight, the Board has delegated to DMC, the day-to-day functions of determining whether individual securities are liquid for purposes of the Fund’s limitation on investments in illiquid securities. Securities eligible for resale pursuant to Rule 144A, which are determined to be liquid, are not subject to the Fund’s 15% limit on investments in illiquid securities. Rule 144A securities have been identified on the “Schedule of investments.”
12. Contractual Obligations
The Fund enters into contracts in the normal course of business that contain a variety of indemnifications. The Fund's maximum exposure under these arrangements is unknown. However, the Fund has not had prior claims or losses pursuant to these contracts. Management has reviewed the Fund's existing contracts and expects the risk of loss to be remote.
13. Recent Accounting Pronouncements
In March 2020, FASB issued an Accounting Standards Update (ASU), ASU 2020-04, Reference Rate Reform (Topic 848) – Facilitation of the Effects of Reference Rate Reform on Financial Reporting. The amendments in ASU 2020-04 provide optional temporary financial reporting relief from the effect of certain types of contract modifications due to the planned discontinuation of LIBOR and other interbank-offered based reference rates as of the end of 2021. In March 2021, the administrator for LIBOR announced the extension of the publication of a majority of the USD LIBOR settings to June 30, 2023. ASU 2020-04 is effective for certain reference rate-related contract modifications that occur during the period March 12, 2020 through December 31, 2022. As of the financial reporting period, Management is evaluating the impact of applying this ASU.
14. Subsequent Events
Management has determined that no material events or transactions occurred subsequent to July 31, 2022, that would require recognition or disclosure in the Fund's financial statements.
57
Table of Contents
Report of independent
registered public accounting firm
To the Board of Trustees of Delaware Group® Government Fund and Shareholders of Delaware Emerging Markets Debt Corporate Fund
Opinion on the Financial Statements
We have audited the accompanying statement of assets and liabilities, including the schedule of investments, of Delaware Emerging Markets Debt Corporate Fund (one of the funds constituting Delaware Group® Government Fund, referred to hereafter as the “Fund”) as of July 31, 2022, the related statement of operations for the year ended July 31, 2022, the statements of changes in net assets for each of the two years in the period ended July 31, 2022, including the related notes, and the financial highlights for each of the five years in the period ended July 31, 2022 (collectively referred to as the “financial statements”). In our opinion, the financial statements present fairly, in all material respects, the financial position of the Fund as of July 31, 2022, the results of its operations for the year then ended, the changes in its net assets for each of the two years in the period ended July 31, 2022 and the financial highlights for each of the five years in the period ended July 31, 2022 in conformity with accounting principles generally accepted in the United States of America.
Basis for Opinion
These financial statements are the responsibility of the Fund’s management. Our responsibility is to express an opinion on the Fund’s financial statements based on our audits. We are a public accounting firm registered with the Public Company Accounting Oversight Board (United States) (PCAOB) and are required to be independent with respect to the Fund in accordance with the U.S. federal securities laws and the applicable rules and regulations of the Securities and Exchange Commission and the PCAOB.
We conducted our audits of these financial statements in accordance with the standards of the PCAOB. Those standards require that we plan and perform the audit to obtain reasonable assurance about whether the financial statements are free of material misstatement, whether due to error or fraud.
Our audits included performing procedures to assess the risks of material misstatement of the financial statements, whether due to error or fraud, and performing procedures that respond to those risks. Such procedures included examining, on a test basis, evidence regarding the amounts and disclosures in the financial statements. Our audits also included evaluating the accounting principles used and significant estimates made by management, as well as evaluating the overall presentation of the financial statements. Our procedures included confirmation of securities owned as of July 31, 2022 by correspondence with the custodian, transfer agents, and brokers; when replies were not received from brokers, we performed other auditing procedures. We believe that our audits provide a reasonable basis for our opinion.
/s/PricewaterhouseCoopers LLP
Philadelphia, Pennsylvania
September 16, 2022
We have served as the auditor of one or more investment companies in Delaware Funds by Macquarie® since 2010.
58
Table of Contents
Other Fund information (Unaudited)
Delaware Emerging Markets Debt Corporate Fund
Liquidity Risk Management Program
The Securities and Exchange Commission (the “SEC”) has adopted Rule 22e-4 under the Investment Company Act of 1940 (the “Liquidity Rule”), which requires all open-end funds (other than money market funds) to adopt and implement a program reasonably designed to assess and manage the fund’s “liquidity risk,” defined as the risk that the fund could not meet requests to redeem shares issued by the fund without significant dilution of remaining investors’ interests in the fund.
The Fund has adopted and implemented a liquidity risk management program in accordance with the Liquidity Rule (the “Program”). The Board has designated a member of the US Operational Risk Group of Macquarie Asset Management as the Program Administrator for each Fund in the Trust.
As required by the Liquidity Rule, the Program includes policies and procedures that provide for: (1) assessment, management, and review (no less frequently than annually) of the Fund’s liquidity risk; (2) classification of each of the Fund’s portfolio holdings into one of four liquidity categories (Highly Liquid, Moderately Liquid, Less Liquid, and Illiquid); (3) for funds that do not primarily hold assets that are Highly Liquid, establishing and maintaining a minimum percentage of the Fund’s net assets in Highly Liquid investments (called a “Highly Liquid Investment Minimum” or “HLIM”); and (4) prohibiting the Fund’s acquisition of Illiquid investments if, immediately after the acquisition, the Fund would hold more than 15% of its net assets in Illiquid assets. The Program also requires reporting to the SEC (on a non-public basis) and to the Board if the Fund’s holdings of Illiquid assets exceed 15% of the Fund’s net assets. Funds with HLIMs must have procedures for addressing HLIM shortfalls, including reporting to the Board and, with respect to HLIM shortfalls lasting more than seven consecutive calendar days, reporting to the SEC (on a non-public basis).
In assessing and managing the Fund’s liquidity risk, the Program Administrator considers, as relevant, a variety of factors, including: (1) the Fund’s investment strategy and liquidity of portfolio investments during both normal and reasonably foreseeable stressed conditions; (2) short-term and long-term cash flow projections for the Fund during both normal and reasonably foreseeable stressed conditions; and (3) the Fund’s holdings of cash and cash equivalents and any borrowing arrangements. Classification of the Fund’s portfolio holdings in the four liquidity categories is based on the number of days it is reasonably expected to take to convert the investment to cash (for Highly Liquid and Moderately Liquid holdings) or to sell or dispose of the investment (for Less Liquid and Illiquid investments), in current market conditions without significantly changing the investment’s market value. The Fund primarily holds assets that are classified as Highly Liquid, and therefore is not required to establish an HLIM.
At a meeting of the Board held on May 17-19, 2022, the Program Administrator provided the required written annual report to the Board addressing the Program’s operation and assessing the adequacy and effectiveness of its implementation for the period from April 1, 2021 through March 31, 2022. The report concluded that the Program is appropriately designed and effectively implemented and that it meets the requirements of Rule 22e-4 and the Fund’s liquidity needs. The Fund’s HLIM is set at an appropriate level and the Fund complied with its HLIM at all times during the reporting period.
59
Table of Contents
Other Fund information (Unaudited)
Delaware Emerging Markets Debt Corporate Fund
Tax Information
The information set forth below is for the Fund’s fiscal year as required by federal income tax laws. Shareholders, however, must report distributions on a calendar year basis for income tax purposes, which may include distributions for portions of two fiscal years of the Fund.
Accordingly, the information needed by shareholders for income tax purposes will be sent to them in January of each year. Please consult your tax advisor for proper treatment of this information. All disclosures are based on financial information available as of the date of this annual report and, accordingly are subject to change. For any and all items requiring reporting, it is the intention of the Fund to report the maximum amount permitted under the Internal Revenue Code and the regulations thereunder.
For the year ended July 31, 2022, the Fund reports distributions paid during the year as follows:
| (A) Long-Term Capital Gains Distribution (Tax Basis) | 8.91% |
| (B) Ordinary Income Distributions (Tax Basis) | 91.09% |
| Total Distributions (Tax Basis) | 100.00% |
For the fiscal year ended July 31, 2022, certain interest income paid by the Fund, determined to be Qualified Interest Income and Short-term Capital Gains may be subject to relief from US withholding for foreign shareholders, as provided by the American Jobs Creation Act of 2004; the Tax Relief Unemployment Insurance Reauthorization, and Job Creations Act of 2010; and as extended by the American Taxpayer Relief Act of 2012. For the year ended July 31, 2022, the Fund has reported maximum distributions of Qualified Interest Income of $1,562,366 and Qualified Short-term Capital Gains of $77,419.
The percentage of the ordinary dividends reported by Delaware Emerging Markets Debt Corporate Fund that is treated as a Section 163(j) interest dividend and thus is eligible to be treated as interest income for purposes of Section 163(j) and the regulations thereunder is 99.50%.
60
Table of Contents
Board of trustees / directors and officers addendum
Delaware Funds by Macquarie®
A mutual fund is governed by a Board of Trustees/Directors (“Trustees”), which has oversight responsibility for the management of a fund’s business affairs. Trustees establish procedures and oversee and review the performance of the investment manager, the distributor, and others who perform services for the fund. The independent fund trustees, in particular, are advocates for shareholder interests. Each trustee has served in that capacity since he or she was elected to or appointed to the Board of Trustees, and will continue to serve until his or her retirement or the election of a new trustee in his or her place. The following is a list of the Trustees and Officers with certain background and related information.
| | | | | | | | | | Other |
| | | | | | Number of | | Principal | | Directorships |
| Name, | | Position(s) | | | | Funds in Fund | | Occupation(s) | | Held by Trustee |
| Address, | | Held with | | Length of Time | | Complex Overseen | | During the | | During the |
| and Birth Date | | the Trust | | Served | | by Trustee | | Past Five Years | | Past Five Years |
| Interested Trustee | | | | | | | | | | |
| | | | | | | | | | | |
| Shawn K. Lytle1 | | President, | | President and | | 128 | | Macquarie Asset | | None |
| 100 Independence | | Chief Executive | | Chief Executive | | | | Management2 | | |
| 610 Market Street | | Officer, | | Officer | | | | (2015–Present) | | |
| Philadelphia, PA | | and Trustee | | since August 2015 | | | | -Global Head of | | |
| 19106-2354 | | | | | | | | Macquarie Asset | | |
| February 1970 | | | | Trustee since | | | | Management | | |
| | | | September 2015 | | | | (2019–Present) | | |
| | | | | | | | -Head of Americas of | | |
| | | | | | | | Macquarie Group | | |
| | | | | | | | (2017–Present) | | |
| | | | | | | | -Deputy Global Head of | | |
| | | | | | | | Macquarie Asset | | |
| | | | | | | | Management | | |
| | | | | | | | (2017–2019) | | |
| | | | | | | | -Head of Macquarie | | |
| | | | | | | | Asset Management | | |
| | | | | | | | Americas (2015–2017) | | |
61
Table of Contents
Board of trustees / directors and officers addendum
Delaware Funds by Macquarie®
| | | | | | | | | | | Other |
| | | | | | Number of | | Principal | | Directorships |
| Name, | | Position(s) | | | | Funds in Fund | | Occupation(s) | | Held by Trustee |
| Address, | | Held with | | Length of Time | | Complex Overseen | | During the | | During the |
| and Birth Date | | the Trust | | Served | | by Trustee | | Past Five Years | | Past Five Years |
| Independent Trustees | | | | | | | | | | |
| |
| Jerome D. | | Trustee | | Since January 2019 | | 128 | | Stonebrook Capital | | None |
| Abernathy | | | | | | | | Management, LLC | | |
| 100 Independence | | | | | | | | (financial | | |
| 610 Market Street | | | | | | | | technology: macro | | |
| Philadelphia, PA | | | | | | | | factors and databases) | | |
| 19106-2354 | | | | | | | | -Managing Member | | |
| July 1959 | | | | | | | | (1993-Present) | | |
| |
| Thomas L. Bennett | | Chair and Trustee | | Trustee since March | | 128 | | Private Investor | | None |
| 100 Independence | | | | 2005 | | | | (2004–Present) | | |
| 610 Market Street | | | | | | | | | | |
| Philadelphia, PA | | | | Chair since March | | | | | | |
| 19106-2354 | | | | 2015 | | | | | | |
| October 1947 | | | | | | | | | | |
| |
| Ann D. Borowiec | | Trustee | | Since March 2015 | | 128 | | J.P. Morgan Chase & Co. | | Banco Santander International |
| 100 Independence | | | | | | | | (1987-2013) | | (2016–2019) |
| 610 Market Street | | | | | | | | -Chief Executive Officer, | | Santander Bank, N.A. |
| Philadelphia, PA | | | | | | | | Private Wealth | | (2016-2019) |
| 19106-2354 | | | | | | | | Management | | |
| November 1958 | | | | | | | | (2011–2013) | | |
62
Table of Contents
| | | | | | | | | | Other |
| | | | | | Number of | | Principal | | Directorships |
| Name, | | Position(s) | | | | Funds in Fund | | Occupation(s) | | Held by Trustee |
| Address, | | Held with | | Length of Time | | Complex Overseen | | During the | | During the |
| and Birth Date | | the Trust | | Served | | by Trustee | | Past Five Years | | Past Five Years |
| | | | | | | | | | | |
| Joseph W. Chow | | Trustee | | Since January 2013 | | 128 | | Private Investor | | None |
| 100 Independence | | | | | | | | (2011–Present) | | |
| 610 Market Street | | | | | | | | | | |
| Philadelphia, PA | | | | | | | | | | |
| 19106-2354 | | | | | | | | | | |
| January 1953 | | | | | | | | | | |
| |
| H. Jeffrey Dobbs3 | | Trustee | | Since December 2021 | | 128 | | KPMG LLP | | TechAccel LLC |
| 100 Independence | | | | | | | | (2010-2015) | | (2015–Present) |
| 610 Market Street | | | | | | | | -Global Sector Chairman, | | PatientsVoices, Inc. |
| Philadelphia, PA | | | | | | | | Industrial Manufacturing | | (2018–Present) |
| 19106-2354 | | | | | | | | (2010-2015) | | Valparaiso University Board |
| May 1955 | | | | | | | | | | (2012-Present) |
| | | | | | | | | | Ivy Funds Complex (2019-2021) |
63
Table of Contents
Board of trustees / directors and officers addendum
Delaware Funds by Macquarie®
| | | | | | | | | | Other |
| | | | |
| Number of | | Principal | | Directorships |
| Name, | | Position(s) | | | | Funds in Fund | | Occupation(s) | | Held by Trustee |
| Address, | | Held with | | Length of Time | | Complex Overseen | | During the | | During the |
| and Birth Date | | the Trust | | Served | | by Trustee | | Past Five Years | | Past Five Years |
| | | | | | | | | | | |
| John A. Fry | | Trustee | | Since January 2001 | | 128 | | Drexel University | | Federal Reserve |
| 100 Independence | | | | | | | | -President | | Bank of Philadelphia |
| 610 Market Street | | | | | | | | (August 2010–Present) | | (2020–Present) |
| Philadelphia, PA | | | | | | | | | | FS Credit Real Estate Income |
| 19106-2354 | | | | | | | | | | Trust, Inc. (2018–Present) |
| May 1960 | | | | | | | | | | vTv Therapeutics Inc. |
| | | | | | | | | | (2017–Present) |
| | | | | | | | | | Community Health Systems |
| | | | | | | | | | (2004–Present) |
| | | | | | | | | | Drexel Morgan & Co. |
| | | | | | | | | | (2015–2019) |
64
Table of Contents
| | | | | | | | | | Other |
| | | | | | Number of | | Principal | | Directorships |
| Name, | | Position(s) | | | | Funds in Fund | | Occupation(s) | | Held by Trustee |
| Address, | | Held with | | Length of Time | | Complex Overseen | | During the | | During the |
| and Birth Date | | the Trust | | Served | | by Trustee | | Past Five Years | | Past Five Years |
| | | | | | | | | | | |
| Joseph Harroz, Jr.3 | | Trustee | | Since December 2021 | | 128 | | University of Oklahoma | | OU Medicine, Inc. |
| 100 Independence | | | | | | | | -President | | (2020–Present) |
| 610 Market Street | | | | | | | | (2020–Present) | | Big 12 Athletic Conference |
| Philadelphia, PA | | | | | | | | -Interim President | | (2019-Present) |
| 19106-2354 | | | | | | | | (2019–2020) | | Valliance Bank |
| January 1967 | | | | | | | | -Vice President and | | (2007–Present) |
| | | | | | | | Dean, College of Law | | Ivy Funds |
| | | | | | | | (2010–2019) | | (1998-2021) |
| | | | | | | | Brookhaven Investments | | |
| | | | | | | | LLC (commercial | | |
| | | | | | | | enterprises) | | |
| | | | | | | | -Managing Member | | |
| | | | | | | | (2019–Present) | | |
| | | | | | | | St. Clair, LLC | | |
| | | | | | | | (commercial enterprises) | | |
| | | | | | | | -Managing Member | | |
| | | | | | | | (2019–Present) | | |
65
Table of Contents
Board of trustees / directors and officers addendum
Delaware Funds by Macquarie®
| | | | | | | | | | Other |
| | | | | | Number of | | Principal | | Directorships |
| Name, | | Position(s) | | | | Funds in Fund | | Occupation(s) | | Held by Trustee |
| Address, | | Held with | | Length of Time | | Complex Overseen | | During the | | During the |
| and Birth Date | | the Trust | | Served | | by Trustee | | Past Five Years | | Past Five Years |
| | | | | | | | | | |
| Sandra A.J. | | Trustee | | Since December 2021 | | 128 | | Children’s Mercy | | Brixmor Property Group Inc. |
| Lawrence3 | | | | | | | | Hospitals and Clinics | | (2021-Present) |
| 100 Independence | | | | | | | | (2005–2019) | | Sera Prognostics Inc. |
| 610 Market Street | | | | | | | | -Chief Of Administrative | | (biotechnology) (2021-Present) |
| Philadelphia, PA | | | | | | | | Officer | | Recology (resource recovery) |
| 19106-2354 | | | | | | | | (2016–2019) | | (2021-Present) |
| September 1957 | | | | | | | | | | Evergy, Inc., Kansas City Power |
| | | | | | | | | | & Light Company, KCP&L |
| | | | | | | | | | Greater Missouri Operations |
| | | | | | | | | | Company, Westar Energy, Inc. |
| | | | | | | | | | and Kansas Gas and Electric |
| | | | | | | | | | Company (related utility |
| | | | | | | | | | companies) (2018-Present) |
| | | | | | | | | | National Association of Corporate |
| | | | | | | | | | Directors (2017-Present) |
| | | | | | | | | | Ivy Funds Complex (2019-2021) |
| | | | | | | | | | American Shared Hospital |
| | | | | | | | | | Services (medical device) |
| | | | | | | | | | (2017-2021) |
| | | | | | | | | | Ivy NextShares (2019) |
| | | | | | | | | | Westar Energy (utility) |
| | | | | | | | | | (2004-2018) |
66
Table of Contents
| | | | | | | | | | Other |
| | | | | | Number of | | Principal | | Directorships |
| Name, | | Position(s) | | | | Funds in Fund | | Occupation(s) | | Held by Trustee |
| Address, | | Held with | | Length of Time | | Complex Overseen | | During the | | During the |
| and Birth Date | | the Trust | | Served | | by Trustee | | Past Five Years | | Past Five Years |
| | | | | | | | | | | |
| Frances A. | | Trustee | | Since September | | 128 | | Banco Itaú International | | Florida Chapter of National |
| Sevilla-Sacasa | | | | 2011 | | | | -Chief Executive Officer | | Association of Corporate |
| 100 Independence | | | | | | | | (2012–2016) | | Directors (2021-Present) |
| 610 Market Street | | | | | | | | | | Callon Petroleum Company |
| Philadelphia, PA | | | | | | | | | | (2019-Present) |
| 19106-2354 | | | | | | | | | | Camden Property Trust |
| January 1956 | | | | | | | | | | (2011-Present) |
| | | | | | | | | | New Senior Investment |
| | | | | | | | | | Group Inc. (2021) |
| | | | | | | | | | Carrizo Oil & Gas, Inc. |
| | | | | | | | | | (2018-2019) |
| | | | | | | | | | | |
| Thomas K. Whitford | | Trustee | | Since January 2013 | | 128 | | PNC Financial Services | | HSBC USA Inc. |
| 100 Independence | | | | | | | | Group (1983–2013) | | (2014–Present) |
| 610 Market Street | | | | | | | | -Vice Chairman | | HSBC North America |
| Philadelphia, PA | | | | | | | | (2009-2013) | | Holdings Inc. |
| 19106-2354 | | | | | | | | | | (2013–Present) |
| March 1956 | | | | | | | | | | HSBC Finance Corporation |
| | | | | | | | | | (2013–2018) |
67
Table of Contents
Board of trustees / directors and officers addendum
Delaware Funds by Macquarie®
| | | | | | | | | | Other |
| | | | | | Number of | | Principal | | Directorships |
| Name, | | Position(s) | | | | Funds in Fund | | Occupation(s) | | Held by Trustee |
| Address, | | Held with | | Length of Time | | Complex Overseen | | During the | | During the |
| and Birth Date | | the Trust | | Served | | by Trustee | | Past Five Years | | Past Five Years |
| | | | | | | | | | | |
| Christianna Wood | | Trustee | | Since January 2019 | | 128 | | Gore Creek | | The Merger Fund |
| 100 Independence | | | | | | | | Capital, Ltd. | | (2013–2021), |
| 610 Market Street | | | | | | | | -Chief Executive Officer | | The Merger Fund VL |
| Philadelphia, PA | | | | | | | | and President | | (2013–2021), |
| 19106-2354 | | | | | | | | (2009–Present) | | WCM Alternatives: Event-Driven |
| August 1959 | | | | | | | | | | Fund (2013–2021), |
| | | | | | | | | | and WCM Alternatives: Credit |
| | | | | | | | | | Event Fund (2017–2021) |
| | | | | | | | | | Grange Insurance |
| | | | | | | | | | (2013–Present) |
| | | | | | | | | | H&R Block Corporation |
| | | | | | | | | | (2008–Present) |
68
Table of Contents
| | | | | | | | | | Other |
| | | | | | Number of | | Principal | | Directorships |
| Name, | | Position(s) | | | | Funds in Fund | | Occupation(s) | | Held by Trustee |
| Address, | | Held with | | Length of Time | | Complex Overseen | | During the | | During the |
| and Birth Date | | the Trust | | Served | | by Trustee | | Past Five Years | | Past Five Years |
| | | | | | | | | | | |
| Janet L. Yeomans | | Trustee | | Since April 1999 | | 128 | | 3M Company | | Okabena Company (2009–2017) |
| 100 Independence | | | | | | | | (1995-2012) | | |
| 610 Market Street | | | | | | | | -Vice President and | | |
| Philadelphia, PA | | | | | | | | Treasurer (2006–2012) | | |
| 19106-2354 | | | | | | | | | | |
| July 1948 | | | | | | | | | | |
| | | | | | | | | | | |
| Officers | | | | | | | | | | |
| | | | | | | | | | | |
| David F. Connor | | Senior Vice President, | | Senior Vice President, | | 128 | | David F. Connor has | | None4 |
| 100 Independence | | General Counsel, and | | since May 2013; | | | | served in various | | |
| 610 Market Street | | Secretary | | General Counsel | | | | capacities at different | | |
| Philadelphia, PA | | | | since May 2015; | | | | times at Macquarie Asset | | |
| 19106-2354 | | | | Secretary since | | | | Management. | | |
| December 1963 | | | | October 2005 | | | | | | |
| | | | | | | | | | | |
| Daniel V. Geatens | | Senior Vice President | | Senior Vice President | | 128 | | Daniel V. Geatens has | | None4 |
| 100 Independence | | and Treasurer | | and Treasurer since | | | | served in various | | |
| 610 Market Street | | | | October 2007 | | | | capacities at different | | |
| Philadelphia, PA | | | | | | | | times at Macquarie Asset | | |
| 19106-2354 | | | | | | | | Management. | | |
| October 1972 | | | | | | | | | | |
69
Table of Contents
Board of trustees / directors and officers addendum
Delaware Funds by Macquarie®
| | | | | | | | | | Other |
| | | | | | Number of | | Principal | | Directorships |
| Name, | | Position(s) | | | | Funds in Fund | | Occupation(s) | | Held by Trustee |
| Address, | | Held with | | Length of Time | | Complex Overseen | | During the | | During the |
| and Birth Date | | the Trust | | Served | | by Trustee | | Past Five Years | | Past Five Years |
| | | | | | | | | | |
| Richard Salus | | Senior Vice President | | Senior Vice President | | 128 | | Richard Salus has | | None |
| 100 Independence | | and Chief Financial | | and Chief Financial | | | | served in various | | |
| 610 Market Street | | Officer | | Officer since | | | | capacities at different | | |
| Philadelphia, PA | | | | November 2006 | | | | times at Macquarie Asset | | |
| 19106-2354 | | | | | | | | Management. | | |
| October 1963 | | | | | | | | | | |
| 1 | Shawn K. Lytle is considered to be an “Interested Trustee” because he is an executive officer of the Fund’s(s’) investment advisor. |
| 2 | Macquarie Asset Management is the marketing name for Macquarie Management Holdings, Inc. and its subsidiaries, including the Fund’s(s’) investment advisor, principal underwriter, and its transfer agent. |
| 3 | Messrs. Dobbs and Harroz and Ms. Lawrence were elected as Trustees of the Trust effective December 17, 2021. |
| 4 | David F. Connor and Daniel V. Geatens serve in similar capacities for the six portfolios of the Optimum Fund Trust, which have the same investment advisor, principal underwriter, and transfer agent as the registrant. Mr. Geatens also serves as the Chief Financial Officer of the Optimum Fund Trust and he is the Chief Financial Officer and Treasurer for Macquarie Global Infrastructure Total Return Fund Inc. |
The Statement of Additional Information for the Fund(s) includes additional information about the Trustees and Officers and is available, without charge, upon request by calling 800 523-1918.
70
Table of Contents
About the organization
| Board of trustees | | | |
| | | | |
Shawn K. Lytle
President and
Chief Executive Officer
Delaware Funds
by Macquarie®
Jerome D. Abernathy
Managing Member
Stonebrook Capital
Management, LLC
Thomas L. Bennett
Chairman of the Board
Delaware Funds
by Macquarie
Private Investor | Ann D. Borowiec
Former Chief Executive
Officer
Private Wealth Management
J.P. Morgan Chase & Co.
Joseph W. Chow
Private Investor
H. Jeffrey Dobbs
Former Global Sector
Chairman
Industrial Manufacturing,
KPMG, LLP | John A. Fry
President
Drexel University
Joseph Harroz, Jr.
President
University of Oklahoma
Sandra A.J. Lawrence
Former Chief Administrative
Officer
Children's Mercy Hospitals
and Clinics | Frances A.
Sevilla-Sacasa
Former Chief Executive
Officer
Banco Itaú International
Thomas K. Whitford
Former Vice Chairman
PNC Financial Services
Group
Christianna Wood
Chief Executive Officer
and President
Gore Creek Capital, Ltd.
Janet L. Yeomans
Former Vice President and
Treasurer
3M Company |
| |
| Affiliated officers | | | |
| | | | |
David F. Connor
Senior Vice President,
General Counsel,
and Secretary
Delaware Funds
by Macquarie | Daniel V. Geatens
Senior Vice President and
Treasurer
Delaware Funds
by Macquarie | Richard Salus
Senior Vice President and
Chief Financial Officer
Delaware Funds
by Macquarie | |
| | | | |
| This annual report is for the information of Delaware Emerging Markets Debt Corporate Fund shareholders, but it may be used with prospective investors when preceded or accompanied by the Delaware Fund fact sheet for the most recently completed calendar quarter. These documents are available at delawarefunds.com/literature. |
The Fund files its complete schedule of portfolio holdings with the Securities and Exchange Commission (SEC) for the first and third quarters of each fiscal year on Form N-PORT. The Fund’s Forms N-PORT, as well as a description of the policies and procedures that the Fund uses to determine how to vote proxies (if any) relating to portfolio securities, are available without charge (i) upon request, by calling 800 523-1918; and (ii) on the SEC’s website at sec.gov. In addition, a description of the policies and procedures that the Fund uses to determine how to vote proxies (if any) relating to portfolio securities and the Schedule of Investments included in the Fund’s most recent Form N-PORT are available without charge on the Fund’s website at delawarefunds.com/literature. The Fund’s Forms N-PORT may be reviewed and copied at the SEC’s Public Reference Room in Washington, D.C.; information on the operation of the Public Reference Room may be obtained by calling 800 SEC-0330.
Information (if any) regarding how the Fund voted proxies relating to portfolio securities during the most recently disclosed 12-month period ended June 30 is available without charge (i) through the Fund’s website at delawarefunds.com/proxy; and (ii) on the SEC’s website at sec.gov.
71
Table of Contents
Annual report
Fixed income mutual fund
Delaware Strategic Income Fund
July 31, 2022
Carefully consider the Fund's investment objectives, risk factors, charges, and expenses before investing. This and other information can be found in the Fund's prospectus and its summary prospectus, which may be obtained by visiting delawarefunds.com/literature or calling 800 523-1918. Investors should read the prospectus and the summary prospectus carefully before investing.
You can obtain shareholder reports and prospectuses online instead of in the mail.
Visit delawarefunds.com/edelivery.
Table of Contents
Experience Delaware Funds by Macquarie®
Macquarie Asset Management (MAM) is a global asset manager that aims to deliver positive impact for everyone. MAM Public Investments traces its roots to 1929 and partners with institutional and individual clients to deliver specialist active investment capabilities across global equities, fixed income, and multi-asset solutions using a conviction-based, long-term approach to investing. In the US, retail investors recognize our Delaware Funds by Macquarie family of funds as one of the oldest mutual fund families.
If you are interested in learning more about creating an investment plan, contact your financial advisor.
You can learn more about Delaware Funds or obtain a prospectus for Delaware Strategic Income Fund at delawarefunds.com/literature.
Manage your account online
| ● | Check your account balance and transactions |
| ● | View statements and tax forms |
| ● | Make purchases and redemptions |
Visit delawarefunds.com/account-access.
Macquarie Asset Management (MAM) is the asset management division of Macquarie Group. MAM is a full-service asset manager offering a diverse range of products across public and private markets including fixed income, equities, multi-asset solutions, private credit, infrastructure, renewables, natural assets, real estate, and asset finance. The Public Investments business is a part of MAM and includes the following investment advisers: Macquarie Investment Management Business Trust (MIMBT), Macquarie Funds Management Hong Kong Limited, Macquarie Investment Management Austria Kapitalanlage AG, Macquarie Investment Management Global Limited, Macquarie Investment Management Europe Limited, and Macquarie Investment Management Europe S.A.
The Fund is distributed by Delaware Distributors, L.P. (DDLP), an affiliate of MIMBT and Macquarie Group Limited.
Other than Macquarie Bank Limited ABN 46 008 583 542 ("Macquarie Bank"), any Macquarie Group entity noted in this document is not an authorized deposit-taking institution for the purposes of the Banking Act 1959 (Commonwealth of Australia). The obligations of these other Macquarie Group entities do not represent deposits or other liabilities of Macquarie Bank. Macquarie Bank does not guarantee or otherwise provide assurance in respect of the obligations of these other Macquarie Group entities. In addition, if this document relates to an investment, (a) the investor is subject to investment risk including possible delays in repayment and loss of income and principal invested and (b) none of Macquarie Bank or any other Macquarie Group entity guarantees any particular rate of return on or the performance of the investment, nor do they guarantee repayment of capital in respect of the investment.
The Fund is governed by US laws and regulations.
Unless otherwise noted, views expressed herein are current as of July 31, 2022, and subject to change for events occurring after such date.
The Fund is not FDIC insured and is not guaranteed. It is possible to lose the principal amount invested.
Advisory services provided by Delaware Management Company, a series of MIMBT, a US registered investment advisor.
All third-party marks cited are the property of their respective owners.
© 2022 Macquarie Management Holdings, Inc.
Table of Contents
| Portfolio management review | |
| Delaware Strategic Income Fund | July 31, 2022 (Unaudited) |
Performance preview (for the year ended July 31, 2022)
| Delaware Strategic Income Fund (Institutional Class shares) | | 1-year return | | -10.33% |
| Delaware Strategic Income Fund (Class A shares) | | 1-year return | | -10.45% |
| Bloomberg US Aggregate Index (benchmark) | | 1-year return | | -9.12% |
Past performance does not guarantee future results.
For complete, annualized performance for Delaware Strategic Income Fund, please see the table on page 4. Institutional Class shares are not subject to a sales charge and are offered for sale exclusively to certain eligible investors. In addition, Institutional Class shares pay no distribution and service fee.
The performance of Class A shares excludes the applicable sales charge. The performance of both Institutional Class shares and Class A shares reflects the reinvestment of all distributions.
Please see page 7 for a description of the index. Index performance returns do not reflect any management fees, transaction costs, or expenses. Indices are unmanaged and one cannot invest directly in an index.
Investment objective
The Fund seeks high current income and, secondarily, long-term total return.
Market review
Rising inflationary concerns and expectations of tighter monetary policy dominated the Fund’s fiscal year ended July 31, 2022. As inflation persisted, central banks abruptly shifted from low interest rates and quantitative easing to a tighter regime to slow consumer price increases.
Roughly halfway through the Fund’s fiscal year, inflationary concerns were compounded by Russia’s invasion of Ukraine and China’s zero-COVID policy, which curtailed economic production, adding to supply-chain issues and higher prices.
The strength of the US consumer and labor market, while generally supportive of economic growth and overall resilience, could further add to persistent inflationary pressures, resulting in the need for the US Federal Reserve to raise interest rates above the level currently priced into markets.
Source: Bloomberg.
Within the Fund
For the fiscal year ended July 31, 2022, Delaware Strategic Income Fund underperformed its benchmark, the Bloomberg US Aggregate Index. The Fund’s Institutional Class shares declined 10.33%. The Fund’s Class A shares declined 10.45% at net asset value and fell 14.44% at maximum offer price (both figures reflect all distributions reinvested). For the same period, the benchmark declined 9.12%. For complete, annualized performance of Delaware Strategic Income Fund, please see the table on page 4.
The Fund’s core component of the portfolio is generally allocated about one-third to corporate bonds, one-third to emerging markets debt, and one-third to securitized credit. In addition, the Fund has a smaller allocation to tactical assets, including convertible bonds, bank loans, agency mortgage-backed securities, and non-US dollar assets.
During the Fund’s fiscal year, its duration (a measure of a portfolio’s sensitivity to higher interest rates) was shorter than that of the
1
Table of Contents
Portfolio management review
Delaware Strategic Income Fund
broad US bond market benchmark. That lowered exposure to more interest-rate-sensitive assets and proved highly favorable during the year. Relative to the broad benchmark, the Fund is exposed to much greater credit risk and generally carries less interest rate sensitivity.
The Fund’s duration risk was tempered by heavy exposure to high yield and emerging markets bonds, both of which typically have lower duration and, as a result, less sensitivity to interest rate movements than the benchmark. However, in a period when riskier assets generally underperformed, the Fund’s overall allocation and structure were unfavorable relative to the benchmark.
At fiscal year end, the Fund had a roughly 22% allocation to securitized credit, and 30% each to emerging markets debt and corporate credit. Because the portfolio is dedicated to generating income, it tends to have a bias for down-in-quality assets. The Fund also had a small allocation to bank loans, convertible securities, and cash.
We adjusted risk in various sectors throughout the fiscal year. Exposure to CCC-rated bonds migrated lower and closed the year around 5%. Having some liquid assets readily available in US Treasury bonds and cash allowed the Fund to remain agile and well positioned for this period of heightened volatility, in our view.
During the final six months of the fiscal year, the Fund shifted some assets away from emerging markets and high yield into investment grade credit and US Treasurys.
The Fund’s overweight to credit sectors relative to the benchmark weighed on relative performance. Emerging markets bonds, high yield bonds, and securitized debt all underperformed the benchmark.
Within emerging markets, Lukoil PJSC, the Russian oil and gas exploration and production company, was a major detractor from performance. The Fund held debt in Lukoil when Russia invaded Ukraine and subsequently exited the position in response to uncertainty surrounding the company’s credit profile and exposure to economic sanctions. The Fund also had some Ukrainian corporate bond exposure, which weighed on performance.
While high yield detractors included exposure to Carnival Corp. and Royal Caribbean Cruises Ltd. in the leisure sector, we recently added to the Fund's exposure to Carnival based on its position as a market leader by geography and end market. In our view, its large fixed-asset base provides decent collateral coverage. Additionally, Carnival remains committed to returning to investment grade ratings over time after being downgraded to high yield early in the pandemic, and continues to take proactive steps to shore up liquidity.
Within high yield, Artera Services LLC also detracted from performance. Artera provides insulation, maintenance, and repair for gas and electric distribution lines. We exited the position based on concerns about the company’s fundamentals.
Yield curve management was a primary contributor to the Fund’s performance relative to the benchmark since the Fund was less exposed to the detrimental impact of rising interest rates during the fiscal year. Secondly, the Fund benefited from its underweight to non-corporate bonds, which weighed on the benchmark’s overall return.
As outlined earlier, the market environment during the fiscal year made for difficult comparisons with the Fund’s benchmark because of the Fund's meaningful allocation to
2
Table of Contents
high yield and emerging markets. Considering the Fund’s performance relative to its peer group, it closed out the fiscal year in the fourth quartile. A key detractor was security selection within emerging markets debt, including exposure to debt the Fund held in Russia and Ukraine prior to the war. Since the Russian invasion of Ukraine, we have reduced that exposure.
Most of the Fund’s risk management involved addressing the shifting landscape that resulted from inflationary pressure and the Russia-Ukraine war. Our major objective was to minimize further downside risk associated with the conflict. From a monetary-policy perspective, regarding interest rate sensitivity, we continue to maintain a meaningfully shorter duration than the benchmark.
We have seen a significant increase in absolute yields in 2022. Interest rates and credit spreads have both moved higher. As a result, we believe income should once again be a significant source of return within fixed income. As we move deeper into the rate hiking cycle, we will continue to explore for opportunities to add higher yielding assets on price weakness. The Fund’s higher-beta nature (exposure to market volatility) should typically perform well if credit spreads tighten, and we believe its income component could help cushion some of the downside associated with risk premiums increasing due to macroeconomic, geopolitical concerns, or central bank policy mistakes.
The Fund used interest rate futures to hedge interest rate risk and fixed income options to a small degree. The Fund also used currency forwards to hedge the portfolio’s currency risk. Overall, the Fund’s use of derivatives during the fiscal year modestly benefited the portfolio.
3
Table of Contents
| Performance summary | |
| Delaware Strategic Income Fund | July 31, 2022 (Unaudited) |
The performance quoted represents past performance and does not guarantee future results. Investment return and principal value of an investment will fluctuate so that shares, when redeemed, may be worth more or less than their original cost. Current performance may be lower or higher than the performance quoted. Performance data current to the most recent month end may be obtained by calling 800 523-1918 or visiting delawarefunds.com/performance.
| Fund and benchmark performance1,2 | | Average annual total returns through July 31, 2022 |
| | 1 year | | 5 year | | 10 year | | Lifetime |
| Class A (Est. August 16, 1985) | | | | | | | | |
| Excluding sales charge | | -10.45% | | +1.45% | | +1.87% | | +5.30% |
| Including sales charge | | -14.44% | | +0.51% | | +1.41% | | +5.16% |
| Class C (Est. November 29, 1995) | | | | | | | | |
| Excluding sales charge | | -11.22% | | +0.67% | | +1.10% | | +3.63% |
| Including sales charge | | -12.08% | | +0.67% | | +1.10% | | +3.63% |
| Class R (Est. June 2, 2003) | | | | | | | | |
| Excluding sales charge | | -10.86% | | +1.16% | | +1.60% | | +3.29% |
| Including sales charge | | -10.86% | | +1.16% | | +1.60% | | +3.29% |
| Institutional Class (Est. June 1, 1992) | | | | | | | | |
| Excluding sales charge | | -10.33% | | +1.68% | | +2.12% | | +4.79% |
| Including sales charge | | -10.33% | | +1.68% | | +2.12% | | +4.79% |
| Bloomberg US Aggregate Index | | -9.12% | | +1.28% | | +1.65% | | +4.91%* |
| * | The benchmark lifetime return is for Institutional Class share comparison only and is calculated using the month end prior to the Fund's Institutional Class inception date. |
| 1 | Returns reflect the reinvestment of all distributions and are presented both with and without the applicable sales charges described below. Returns do not reflect the deduction of taxes the shareholder would pay on Fund distributions or redemptions of Fund shares. |
Expense limitations were in effect for certain classes during some or all of the periods shown in the “Fund and benchmark performance” table. Expenses for each class are listed in the “Fund expense ratios” table on page 6. Performance would have been lower had expense limitations not been in effect.
Institutional Class shares are not subject to a sales charge and are offered for sale exclusively to certain eligible investors. In addition, Institutional Class shares pay no distribution and service (12b-1) fee.
Class A shares are sold with a maximum front-end sales charge of 4.50%, and have an annual 12b-1 fee of 0.25% of average daily net assets. The Board has adopted a formula for calculating 12b-1 plan fees for the Fund’s Class A shares. The Fund’s Class A shares are currently subject to a blended 12b-1 fee equal to the sum of: (i) 0.10% of average daily net assets representing shares acquired prior to June 1, 1992, and (ii) 0.25% of average daily net assets representing shares acquired on or after June 1, 1992. All Class A shares currently bear 12b-1 fees at the blended
4
Table of Contents
rate, which is currently 0.25% of average daily net assets, based on the formula described previously. This method of calculating Class A 12b-1 fees may be discontinued at the sole discretion of the Board. Performance for Class A shares, excluding sales charges, assumes that no front-end sale charge applied.
Class C shares are sold with a contingent deferred sales charge (CDSC) of 1.00% if redeemed during the first 12 months. They are also subject to an annual 12b-1 fee of 1.00% of average daily net assets. Performance for Class C shares, excluding sales charges, assumes either that CDSCs did not apply or that the investment was not redeemed.
Class R shares are available only for certain retirement plan products. They are sold without a sales charge and have an annual 12b-1 fee of 0.50% of average daily net assets.
Fixed income securities and bond funds can lose value, and investors can lose principal, as interest rates rise. They also may be affected by economic conditions that hinder an issuer’s ability to make interest and principal payments on its debt. This includes prepayment risk, the risk that the principal of a bond that is held by a portfolio will be prepaid prior to maturity, at the time when interest rates are lower than what the bond was paying. A portfolio may then have to reinvest that money at a lower interest rate.
High yielding, non-investment-grade bonds (junk bonds) involve higher risk than investment grade bonds. The high yield secondary market is particularly susceptible to liquidity problems when institutional investors, such as mutual funds and certain other financial institutions, temporarily stop buying bonds for regulatory, financial, or other reasons. In addition, a less liquid secondary market makes it more difficult to obtain precise valuations of the high yield securities.
The Fund may invest in derivatives, which may involve additional expenses and are subject to risk, including the risk that an underlying security or securities index moves in the opposite direction from what the portfolio manager anticipated. A derivatives transaction depends upon the counterparties’ ability to fulfill their contractual obligations.
If and when the Fund invests in forward foreign currency contracts or uses other investments to hedge against currency risks, the Fund will be subject to special risks, including counterparty risk.
The Fund may experience portfolio turnover in excess of 100%, which could result in higher transaction costs and tax liability.
International investments entail risks, including fluctuation in currency values, differences in accounting principles, or economic or political instability. Investing in emerging markets can be riskier than investing in established foreign markets, due to increased volatility, lower trading volume, and higher risk of market closures. In many emerging markets, there is substantially less publicly available information and the available information may be incomplete or misleading. Legal claims are generally more difficult to pursue.
IBOR risk is the risk that changes related to the use of the London interbank offered rate (LIBOR) or similar rates (such as EONIA) could have adverse impacts on financial instruments that reference these rates. The potential abandonment of these rates and transition to alternative rates could affect the value and liquidity of instruments that reference them and could affect investment strategy performance.
5
Table of Contents
Performance summary
Delaware Strategic Income Fund
This document may mention bond ratings published by nationally recognized statistical rating organizations (NRSROs) Standard & Poor’s, Moody’s Investors Service, and Fitch, Inc. For securities rated by an NRSRO other than S&P, the rating is converted to the equivalent S&P credit rating. Bonds rated AAA are rated as having the highest quality and are generally considered to have the lowest degree of investment risk. Bonds rated AA are considered to be of high quality, but with a slightly higher degree of risk than bonds rated AAA. Bonds rated A are considered to have many favorable investment qualities, though they are somewhat more susceptible to adverse economic conditions. Bonds rated BBB are believed to be of medium-grade quality and generally riskier over the long term. Bonds rated BB, B, and CCC are regarded as having significant speculative characteristics, with BB indicating the least degree of speculation of the three.
The disruptions caused by natural disasters, pandemics, or similar events could prevent the Fund from executing advantageous investment decisions in a timely manner and could negatively impact the Fund’s ability to achieve its investment objective and the value of the Fund’s investments.
| 2 | The Fund’s expense ratios, as described in the most recent prospectus, are disclosed in the following “Fund expense ratios” table. The expense ratios below may differ from the expense ratios in the “Financial highlights” since they are based on different time periods and the expense ratios in the prospectus include acquired fund fees and expenses, if any. See Note 2 in “Notes to financial statements” for additional details. Please see the “Financial highlights” section in this report for the most recent expense ratios. |
| | | | | | | | Institutional |
| Fund expense ratios | | Class A | | Class C | | Class R | | Class |
| Total annual operating expenses | | | | | | | | |
| (without fee waivers) | | 1.53% | | 2.28% | | 1.78% | | 1.28% |
| Net expenses (including fee | | | | | | | | |
| waivers, if any) | | 0.84% | | 1.59% | | 1.09% | | 0.59% |
| Type of waiver | | Contractual | | Contractual | | Contractual | | Contractual |
6
Table of Contents
Performance of a $10,000 investment1
For the period July 31, 2012 through July 31, 2022
| | | Starting value | | Ending value |
 | Delaware Strategic Income Fund — Institutional Class | | | | | | |
| shares | | | $10,000 | | | $12,329 |
 | Bloomberg US Aggregate Index | | | $10,000 | | | $11,776 |
 | Delaware Strategic Income Fund — Class A shares | | | $9,550 | | | $11,500 |
| 1 | The “Performance of a $10,000 investment” graph assumes $10,000 invested in Institutional Class and Class A shares of the Fund on July 31, 2012, and includes the effect of a 4.50% front-end sales charge (for Class A shares) and the reinvestment of all distributions. The graph does not reflect the deduction of taxes the shareholders would pay on Fund distributions or redemptions of Fund shares. Expense limitations were in effect for some or all of the periods shown. Performance would have been lower had expense limitations not been in effect. Expenses are listed in the “Fund expense ratios” table on page 6. Please note additional details on pages 4 through 8. |
The graph also assumes $10,000 invested in the Bloomberg US Aggregate Index as of July 31, 2012. The Bloomberg US Aggregate Index is a broad-based benchmark that measures the investment grade, US dollar-denominated, fixed-rate taxable bond market.
Index performance returns do not reflect any management fees, transaction costs, or expenses. Indices are unmanaged and one cannot invest directly in an index. Past performance does not guarantee future results.
Performance of other Fund classes will vary due to different charges and expenses.
7
Table of Contents
Performance summary
Delaware Strategic Income Fund
| | Nasdaq symbols | | CUSIPs |
| Class A | | DEGGX | | 246094205 |
| Class C | | DUGCX | | 246094700 |
| Class R | | DUGRX | | 246094809 |
| Institutional Class | | DUGIX | | 246094502 |
8
Table of Contents
Disclosure of Fund expenses
For the six-month period from February 1, 2022 to July 31, 2022 (Unaudited)
As a shareholder of the Fund, you incur two types of costs: (1) transaction costs, including sales charges (loads) on purchase payments, reinvested dividends, or other distributions; redemption fees; and exchange fees; and (2) ongoing costs, including management fees; distribution and service (12b-1) fees; and other Fund expenses. This example is intended to help you understand your ongoing costs (in dollars) of investing in the Fund and to compare these costs with the ongoing costs of investing in other mutual funds.
The example is based on an investment of $1,000 invested at the beginning of the period and held for the entire six-month period from February 1, 2022 to July 31, 2022.
Actual expenses
The first section of the table shown, “Actual Fund return,” provides information about actual account values and actual expenses. You may use the information in this section of the table, together with the amount you invested, to estimate the expenses that you paid over the period. Simply divide your account value by $1,000 (for example, an $8,600 account value divided by $1,000 = 8.6), then multiply the result by the number in the first section under the heading entitled “Expenses Paid During Period” to estimate the expenses you paid on your account during this period.
Hypothetical example for comparison purposes
The second section of the table shown, “Hypothetical 5% return,” provides information about hypothetical account values and hypothetical expenses based on the Fund’s actual expense ratio and an assumed rate of return of 5% per year before expenses, which is not the Fund’s actual return. The hypothetical account values and expenses may not be used to estimate the actual ending account balance or expenses you paid for the period. You may use this information to compare the ongoing costs of investing in the Fund and other funds. To do so, compare this 5% hypothetical example with the 5% hypothetical examples that appear in the shareholder reports of the other funds.
Please note that the expenses shown in the table are meant to highlight your ongoing costs only and do not reflect any transactional costs, such as sales charges (loads), redemption fees, or exchange fees. Therefore, the second section of the table is useful in comparing ongoing costs only, and will not help you determine the relative total costs of owning different funds. In addition, if these transactional costs were included, your costs would have been higher. The Fund's expenses shown in the table reflect fee waivers in effect and assume reinvestment of all dividends and distributions.
9
Table of Contents
Disclosure of Fund expenses
For the six-month period from February 1, 2022 to July 31, 2022 (Unaudited)
Delaware Strategic Income Fund
Expense analysis of an investment of $1,000
| | Beginning | | Ending | | | | Expenses |
| | Account Value | | Account Value | | Annualized | | Paid During Period |
| | 2/1/22 | | 7/31/22 | | Expense Ratio | | 2/1/22 to 7/31/22* |
| Actual Fund return† | | | | | | | | | | | | | | | | | |
| Class A | | | $ | 1,000.00 | | | | $ | 913.50 | | | 0.87% | | | $ | 4.13 | |
| Class C | | | | 1,000.00 | | | | | 910.10 | | | 1.62% | | | | 7.67 | |
| Class R | | | | 1,000.00 | | | | | 911.40 | | | 1.12% | | | | 5.31 | |
| Institutional Class | | | | 1,000.00 | | | | | 914.60 | | | 0.62% | | | | 2.94 | |
| Hypothetical 5% return (5% return before expenses) | | | | | | | | |
| Class A | | | $ | 1,000.00 | | | | $ | 1,020.48 | | | 0.87% | | | $ | 4.36 | |
| Class C | | | | 1,000.00 | | | | | 1,016.76 | | | 1.62% | | | | 8.10 | |
| Class R | | | | 1,000.00 | | | | | 1,019.24 | | | 1.12% | | | | 5.61 | |
| Institutional Class | | | | 1,000.00 | | | | | 1,021.72 | | | 0.62% | | | | 3.11 | |
| * | “Expenses Paid During Period” are equal to the Fund's annualized expense ratio, multiplied by the average account value over the period, multiplied by 181/365 (to reflect the one-half year period). |
| † | Because actual returns reflect only the most recent six-month period, the returns shown may differ significantly from fiscal year returns. |
In addition to the Fund's expenses reflected above, the Fund also indirectly bears its portion of the fees and expenses of any investment companies (Underlying Funds) in which it invests. The table above does not reflect the expenses of any Underlying Funds.
10
Table of Contents
| Security type / sector allocation | |
| Delaware Strategic Income Fund | As of July 31, 2022 (Unaudited) |
Sector designations may be different from the sector designations presented in other Fund materials. The sector designations may represent the investment manager’s internal sector classifications.
| Security type / sector | Percentage of net assets |
| Agency Collateralized Mortgage Obligations | | 8.09 | % | |
| Agency Commercial Mortgage-Backed Securities | | 1.99 | % | |
| Convertible Bonds | | 2.32 | % | |
| Corporate Bonds | | 51.06 | % | |
| Banking | | 3.82 | % | |
| Basic Industry | | 5.94 | % | |
| Brokerage | | 1.71 | % | |
| Capital Goods | | 1.86 | % | |
| Communications | | 6.32 | % | |
| Consumer Cyclical | | 4.29 | % | |
| Consumer Non-Cyclical | | 3.76 | % | |
| Electric | | 2.20 | % | |
| Energy | | 8.18 | % | |
| Finance Companies | | 1.78 | % | |
| Insurance | | 1.88 | % | |
| Natural Gas | | 0.49 | % | |
| Real Estate Investment Trusts | | 0.05 | % | |
| Technology | | 2.24 | % | |
| Transportation | | 5.08 | % | |
| Utilities | | 1.46 | % | |
| Municipal Bonds | | 0.76 | % | |
| Non-Agency Asset-Backed Securities | | 3.33 | % | |
| Non-Agency Collateralized Mortgage Obligations | | 6.35 | % | |
| Non-Agency Commercial Mortgage-Backed Securities | | 1.90 | % | |
| Loan Agreements | | 5.94 | % | |
| Sovereign Bonds | | 7.07 | % | |
| Supranational Bank | | 0.69 | % | |
| US Treasury Obligations | | 7.90 | % | |
| Common Stock | | 0.51 | % | |
| Options Purchased | | 0.00 | % | |
| Short-Term Investments | | 0.99 | % | |
| Total Value of Securities Before Options Written | | 98.90 | % | |
| Options Written | | 0.00 | % | |
| Receivables and Other Assets Net of Liabilities | | 1.10 | % | |
| Total Net Assets | | 100.00 | % | |
11
Table of Contents
| Schedule of investments | |
| Delaware Strategic Income Fund | July 31, 2022 |
| | | | Principal | | | |
| | | amount° | | Value (US $) |
| Agency Collateralized Mortgage Obligations – 8.09% | | | | | |
| Freddie Mac Structured Agency Credit Risk REMIC | | | | | |
| Trust | | | | | |
| Series 2020-HQA2 M2 144A 5.359% | | | | | |
| (LIBOR01M + 3.10%) 3/25/50 #, ● | | 1,394,191 | | $ | 1,396,292 |
| Series 2021-DNA1 M2 144A 3.314% (SOFR + | | | | | |
| 1.80%) 1/25/51 #, ● | | 1,393,007 | | | 1,361,664 |
| Series 2021-DNA3 M2 144A 3.614% (SOFR+ | | | | | |
| 2.10%) 10/25/33 #, ● | | 1,350,000 | | | 1,285,439 |
| Series 2021-HQA1 M2 144A 3.764% (SOFR + | | | | | |
| 2.25%) 8/25/33 #, ● | | 2,000,000 | | | 1,868,501 |
| Series 2021-HQA2 M2 144A 3.564% (SOFR + | | | | | |
| 2.05%) 12/25/33 #, ● | | 2,000,000 | | | 1,827,675 |
| Total Agency Collateralized Mortgage Obligations (cost $8,129,716) | | | 7,739,571 |
| |
| Agency Commercial Mortgage-Backed Securities – 1.99% | | | | | |
| FREMF Mortgage Trust | | | | | |
| Series 2017-K66 B 144A 4.037% 7/25/27 #, ● | | 325,000 | | | 321,542 |
| Series 2017-K71 B 144A 3.753% 11/25/50 #, ● | | 325,000 | | | 316,177 |
| Series 2018-K72 B 144A 3.993% 12/25/50 #, ● | | 325,000 | | | 320,807 |
| Series 2018-K86 C 144A 4.294% 11/25/51 #, ● | | 970,000 | | | 941,113 |
| Total Agency Commercial Mortgage-Backed Securities (cost $2,140,546) | | | 1,899,639 |
| |
| Convertible Bonds – 2.32% | | | | | |
| Blackstone Mortgage Trust 4.75% exercise price | | | | | |
| $36.23, maturity date 3/15/23 | | 245,000 | | | 245,863 |
| Helix Energy Solutions Group 6.75% exercise price | | | | | |
| $6.97, maturity date 2/15/26 | | 290,000 | | | 301,649 |
| Kaman 3.25% exercise price $65.26, maturity date | | | | | |
| 5/1/24 | | 1,124,000 | | | 1,071,313 |
| Paratek Pharmaceuticals 4.75% exercise price | | | | | |
| $15.90, maturity date 5/1/24 | | 265,000 | | | 231,080 |
| Spirit Airlines 1.00% exercise price $49.07, maturity | | | | | |
| date 5/15/26 | | 404,000 | | | 365,418 |
| Total Convertible Bonds (cost $2,187,804) | | | | | 2,215,323 |
| |
| Corporate Bonds – 51.06% | | | | | |
| Banking – 3.82% | | | | | |
| Access Bank | | | | | |
| 144A 6.125% 9/21/26 # | | 400,000 | | | 297,540 |
| 144A 9.125% 10/7/26 #, µ, ψ | | 400,000 | | | 285,718 |
12
Table of Contents
| | | | | | Principal | | | |
| | | | | amount° | | Value (US $) |
| Corporate Bonds (continued) | | | | | | | |
| Banking (continued) | | | | | | | |
| Ally Financial 5.75% 11/20/25 | | | | 330,000 | | $ | 334,606 |
| Banco de Bogota 144A 6.25% 5/12/26 # | | | | 410,000 | | | 391,259 |
| Banco Mercantil del Norte 144A 8.375% | | | | | | | |
| 10/14/30 #, µ, ψ | | | | 500,000 | | | 475,822 |
| Bank of America | | | | | | | |
| 4.948% 7/22/28 µ | | | | 70,000 | | | 72,062 |
| 5.015% 7/22/33 µ | | | | 115,000 | | | 120,029 |
| 6.125% 4/27/27 µ, ψ | | | | 65,000 | | | 65,488 |
| Bank of New York Mellon 4.70% 9/20/25 µ, ψ | | | | 47,000 | | | 46,930 |
| Barclays 4.375% 3/15/28 µ, ψ | | | | 470,000 | | | 383,191 |
| Deutsche Bank 5.625% 5/19/31 µ | | EUR | | 300,000 | | | 319,309 |
| Fifth Third Bancorp 4.337% 4/25/33 µ | | | | 65,000 | | | 64,004 |
| JPMorgan Chase & Co. 4.912% 7/25/33 µ | | | | 45,000 | | | 46,963 |
| PNC Financial Services Group 6.00% 5/15/27 µ, ψ | | | | 50,000 | | | 50,438 |
| SVB Financial Group | | | | | | | |
| 4.00% 5/15/26 µ, ψ | | | | 385,000 | | | 312,582 |
| 4.57% 4/29/33 µ | | | | 95,000 | | | 92,153 |
| Truist Financial 4.95% 9/1/25 µ, ψ | | | | 165,000 | | | 167,145 |
| Wells Fargo & Co. | | | | | | | |
| 4.611% 4/25/53 µ | | | | 85,000 | | | 83,369 |
| 4.808% 7/25/28 µ | | | | 45,000 | | | 46,074 |
| | | | | | | | 3,654,682 |
| Basic Industry – 5.94% | | | | | | | |
| AngloGold Ashanti Holdings | | | | | | | |
| 3.375% 11/1/28 | | | | 200,000 | | | 174,090 |
| 3.75% 10/1/30 | | | | 440,000 | | | 377,566 |
| Bidvest Group UK 144A 3.625% 9/23/26 # | | | | 600,000 | | | 537,840 |
| Celanese US Holdings 6.05% 3/15/25 | | | | 30,000 | | | 30,265 |
| CSN Resources 144A 5.875% 4/8/32 # | | | | 535,000 | | | 427,737 |
| Domtar 144A 6.75% 10/1/28 # | | | | 509,000 | | | 470,020 |
| First Quantum Minerals 144A 6.875% 10/15/27 # | | | | 1,000,000 | | | 954,755 |
| JSW Steel 144A 5.05% 4/5/32 # | | | | 405,000 | | | 317,775 |
| Methanex 5.25% 12/15/29 | | | | 900,000 | | | 795,668 |
| Sasol Financing USA 4.375% 9/18/26 | | | | 675,000 | | | 613,028 |
| Stillwater Mining 144A 4.00% 11/16/26 # | | | | 620,000 | | | 534,037 |
| Westlake 1.625% 7/17/29 | | EUR | | 500,000 | | | 450,567 |
| | | | | | | | 5,683,348 |
| Brokerage – 1.71% | | | | | | | |
| Charles Schwab 5.375% 6/1/25 µ, ψ | | | | 35,000 | | | 35,714 |
| Jefferies Group 6.50% 1/20/43 | | | | 1,400,000 | | | 1,419,463 |
13
Table of Contents
Schedule of investments
Delaware Strategic Income Fund
| | | | Principal | | | |
| | | amount° | | Value (US $) |
| Corporate Bonds (continued) | | | | | |
| Brokerage (continued) | | | | | |
| XP 144A 3.25% 7/1/26 # | | 200,000 | | $ | 179,736 |
| | | | | | 1,634,913 |
| Capital Goods – 1.86% | | | | | |
| Roller Bearing Co. of America 144A 4.375% | | | | | |
| 10/15/29 # | | 250,000 | | | 226,949 |
| SAN Miguel Industrias Pet 144A 3.50% 8/2/28 # | | 640,000 | | | 532,281 |
| Standard Industries | | | | | |
| 144A 3.375% 1/15/31 # | | 159,000 | | | 129,637 |
| 144A 4.375% 7/15/30 # | | 313,000 | | | 273,856 |
| Turkiye Sise ve Cam Fabrikalari 144A 6.95% | | | | | |
| 3/14/26 # | | 700,000 | | | 620,144 |
| | | | | | 1,782,867 |
| Communications – 6.32% | | | | | |
| Altice France 144A 5.50% 10/15/29 # | | 865,000 | | | 744,981 |
| Cellnex Finance 144A 3.875% 7/7/41 # | | 200,000 | | | 142,809 |
| CMG Media 144A 8.875% 12/15/27 # | | 415,000 | | | 333,139 |
| Cumulus Media New Holdings 144A 6.75% | | | | | |
| 7/1/26 # | | 500,000 | | | 447,359 |
| Discovery Communications 4.00% 9/15/55 | | 10,000 | | | 7,281 |
| HTA Group 144A 7.00% 12/18/25 # | | 750,000 | | | 665,865 |
| LCPR Senior Secured Financing DAC 144A | | | | | |
| 5.125% 7/15/29 # | | 610,000 | | | 536,570 |
| Magallanes | | | | | |
| 144A 3.755% 3/15/27 # | | 150,000 | | | 144,265 |
| 144A 4.279% 3/15/32 # | | 25,000 | | | 23,350 |
| 144A 5.141% 3/15/52 # | | 95,000 | | | 83,782 |
| Rogers Communications | | | | | |
| 144A 3.80% 3/15/32 # | | 20,000 | | | 19,380 |
| 144A 4.55% 3/15/52 # | | 30,000 | | | 28,160 |
| Sprint Capital 8.75% 3/15/32 | | 525,000 | | | 680,807 |
| Time Warner Cable 7.30% 7/1/38 | | 650,000 | | | 704,477 |
| Turkcell Iletisim Hizmetleri 144A 5.80% 4/11/28 # | | 755,000 | | | 577,386 |
| Vmed O2 UK Financing I 144A 4.25% 1/31/31 # | | 400,000 | | | 351,238 |
| VTR Comunicaciones 144A 4.375% 4/15/29 # | | 850,000 | | | 558,462 |
| | | | | | 6,049,311 |
| Consumer Cyclical – 4.29% | | | | | |
| Alsea 144A 7.75% 12/14/26 # | | 600,000 | | | 572,733 |
| Arcos Dorados 144A 6.125% 5/27/29 # | | 370,000 | | | 352,062 |
| B2W Digital 144A 4.375% 12/20/30 # | | 630,000 | | | 481,613 |
14
Table of Contents
| | | | | | Principal | | | |
| | | | | amount° | | Value (US $) |
| Corporate Bonds (continued) | | | | | | | |
| Consumer Cyclical (continued) | | | | | | | |
| Bath & Body Works 6.875% 11/1/35 | | | | 460,000 | | $ | 422,758 |
| BorgWarner 1.00% 5/19/31 | | EUR | | 500,000 | | | 407,354 |
| Carnival | | | | | | | |
| 144A 5.75% 3/1/27 # | | | | 355,000 | | | 285,553 |
| 144A 7.625% 3/1/26 # | | | | 653,000 | | | 563,500 |
| General Motors Financial 5.70% 9/30/30 µ, ψ | | | | 80,000 | | | 76,100 |
| MGM Resorts International 4.75% 10/15/28 | | | | 425,000 | | | 385,702 |
| PetSmart 144A 7.75% 2/15/29 # | | | | 250,000 | | | 241,278 |
| Royal Caribbean Cruises 144A 5.50% 4/1/28 # | | | | 135,000 | | | 101,540 |
| Six Flags Entertainment 144A 4.875% 7/31/24 # | | | | 140,000 | | | 138,214 |
| VICI Properties 4.95% 2/15/30 | | | | 75,000 | | | 73,555 |
| | | | | | | | 4,101,962 |
| Consumer Non-Cyclical – 3.76% | | | | | | | |
| Bausch Health | | | | | | | |
| 144A 5.50% 11/1/25 # | | | | 120,000 | | | 107,245 |
| 144A 6.25% 2/15/29 # | | | | 637,000 | | | 341,951 |
| Central American Bottling 144A 5.25% 4/27/29 # | | | | 585,000 | | | 554,580 |
| CSL Finance | | | | | | | |
| 144A 4.05% 4/27/29 # | | | | 30,000 | | | 30,235 |
| 144A 4.75% 4/27/52 # | | | | 50,000 | | | 50,392 |
| InRetail Consumer 144A 3.25% 3/22/28 # | | | | 625,000 | | | 519,756 |
| JBS USA LUX 144A 3.00% 2/2/29 # | | | | 25,000 | | | 21,552 |
| MARB BondCo 144A 3.95% 1/29/31 # | | | | 305,000 | | | 249,151 |
| MHP 144A 6.25% 9/19/29 # | | | | 505,000 | | | 211,848 |
| Organon & Co. 144A 5.125% 4/30/31 # | | | | 500,000 | | | 468,740 |
| Pilgrim's Pride 144A 5.875% 9/30/27 # | | | | 121,000 | | | 121,174 |
| Tenet Healthcare | | | | | | | |
| 144A 4.25% 6/1/29 # | | | | 255,000 | | | 237,685 |
| 144A 6.125% 10/1/28 # | | | | 145,000 | | | 141,544 |
| 6.875% 11/15/31 | | | | 370,000 | | | 357,507 |
| Teva Pharmaceutical Finance Netherlands III | | | | | | | |
| 5.125% 5/9/29 | | | | 200,000 | | | 183,992 |
| | | | | | | | 3,597,352 |
| Electric – 2.20% | | | | | | | |
| Calpine | | | | | | | |
| 144A 5.00% 2/1/31 # | | | | 145,000 | | | 128,891 |
| 144A 5.125% 3/15/28 # | | | | 279,000 | | | 263,124 |
| Duke Energy 4.875% 9/16/24 µ, ψ | | | | 80,000 | | | 75,797 |
| Fells Point Funding Trust 144A 3.046% 1/31/27 # | | | | 100,000 | | | 94,247 |
| NRG Energy 144A 4.45% 6/15/29 # | | | | 335,000 | | | 308,302 |
15
Table of Contents
Schedule of investments
Delaware Strategic Income Fund
| | | | Principal | | | |
| | | amount° | | Value (US $) |
| Corporate Bonds (continued) | | | | | |
| Electric (continued) | | | | | |
| Pacific Gas and Electric 3.30% 8/1/40 | | 517,000 | | $ | 378,256 |
| PG&E 5.25% 7/1/30 | | 315,000 | | | 283,483 |
| UEP Penonome II 144A 6.50% 10/1/38 # | | 626,091 | | | 569,373 |
| | | | | | 2,101,473 |
| Energy – 8.18% | | | | | |
| Canacol Energy 144A 5.75% 11/24/28 # | | 610,000 | | | 504,468 |
| CNX Midstream Partners 144A 4.75% 4/15/30 # | | 500,000 | | | 431,840 |
| CNX Resources 144A 6.00% 1/15/29 # | | 700,000 | | | 681,860 |
| Crestwood Midstream Partners 144A 6.00% | | | | | |
| 2/1/29 # | | 442,000 | | | 403,409 |
| Ecopetrol 4.625% 11/2/31 | | 615,000 | | | 507,320 |
| Energy Transfer 6.50% 11/15/26 µ, ψ | | 485,000 | | | 441,350 |
| Genesis Energy 7.75% 2/1/28 | | 505,000 | | | 488,524 |
| Geopark 144A 5.50% 1/17/27 # | | 620,000 | | | 534,297 |
| Guara Norte 144A 5.198% 6/15/34 # | | 580,413 | | | 477,221 |
| Murphy Oil | | | | | |
| 5.875% 12/1/27 | | 365,000 | | | 361,604 |
| 6.375% 7/15/28 | | 270,000 | | | 269,949 |
| NuStar Logistics 6.375% 10/1/30 | | 125,000 | | | 115,412 |
| PDC Energy 5.75% 5/15/26 | | 445,000 | | | 435,544 |
| Petroleos Mexicanos 5.95% 1/28/31 | | 1,135,000 | | | 884,505 |
| Southwestern Energy 7.75% 10/1/27 | | 655,000 | | | 683,908 |
| Tullow Oil 144A 10.25% 5/15/26 # | | 640,000 | | | 600,854 |
| | | | | | 7,822,065 |
| Finance Companies – 1.78% | | | | | |
| AerCap Ireland Capital DAC | | | | | |
| 2.45% 10/29/26 | | 150,000 | | | 133,499 |
| 3.30% 1/30/32 | | 150,000 | | | 126,089 |
| 3.40% 10/29/33 | | 150,000 | | | 123,938 |
| Agile Group Holdings 5.50% 5/17/26 | | 300,000 | | | 78,519 |
| Castlelake Aviation Finance DAC 144A 5.00% | | | | | |
| 4/15/27 # | | 620,000 | | | 522,420 |
| CIFI Holdings Group 6.45% 11/7/24 | | 200,000 | | | 78,500 |
| Oryx Funding 144A 5.80% 2/3/31 # | | 685,000 | | | 641,968 |
| | | | | | 1,704,933 |
| Insurance – 1.88% | | | | | |
| Brighthouse Financial | | | | | |
| 4.70% 6/22/47 | | 244,000 | | | 199,202 |
| 5.625% 5/15/30 | | 25,000 | | | 25,200 |
| Brown & Brown 4.95% 3/17/52 | | 136,000 | | | 124,661 |
16
Table of Contents
| | | | | | Principal | | | |
| | | | | amount° | | Value (US $) |
| Corporate Bonds (continued) | | | | | | | |
| Insurance (continued) | | | | | | | |
| HUB International 144A 5.625% 12/1/29 # | | | | 545,000 | | $ | 483,545 |
| MetLife 3.85% 9/15/25 µ, ψ | | | | 185,000 | | | 175,148 |
| Sagicor Financial 144A 5.30% 5/13/28 # | | | | 400,000 | | | 374,586 |
| USI 144A 6.875% 5/1/25 # | | | | 425,000 | | | 415,177 |
| | | | | | | | 1,797,519 |
| Natural Gas – 0.49% | | | | | | | |
| Medco Laurel Tree 144A 6.95% 11/12/28 # | | | | 545,000 | | | 469,599 |
| | | | | | | | 469,599 |
| Real Estate Investment Trusts – 0.05% | | | | | | | |
| American Homes 4 Rent 3.625% 4/15/32 | | | | 50,000 | | | 45,411 |
| | | | | | | | 45,411 |
| Technology – 2.24% | | | | | | | |
| Broadcom 144A 3.469% 4/15/34 # | | | | 1,185,000 | | | 1,015,535 |
| Entegris Escrow 144A 4.75% 4/15/29 # | | | | 90,000 | | | 86,850 |
| ION Trading Technologies 144A 5.75% 5/15/28 # | | | | 250,000 | | | 206,101 |
| Iron Mountain | | | | | | | |
| 144A 5.25% 7/15/30 # | | | | 71,000 | | | 66,541 |
| 144A 5.625% 7/15/32 # | | | | 600,000 | | | 563,640 |
| Iron Mountain Information Management Services | | | | | | | |
| 144A 5.00% 7/15/32 # | | | | 230,000 | | | 207,674 |
| | | | | | | | 2,146,341 |
| Transportation – 5.08% | | | | | | | |
| Abertis Infraestructuras Finance 3.248% | | | | | | | |
| 11/24/25 µ, ψ | | EUR | | 400,000 | | | 366,996 |
| Azul Investments 144A 7.25% 6/15/26 # | | | | 640,000 | | | 433,558 |
| Babcock International Group 1.375% 9/13/27 | | EUR | | 500,000 | | | 464,754 |
| DAE Funding 144A 3.375% 3/20/28 # | | | | 695,000 | | | 613,988 |
| Delta Air Lines 7.375% 1/15/26 | | | | 661,000 | | | 694,942 |
| Grupo Aeromexico 144A 8.50% 3/17/27 # | | | | 500,000 | | | 479,190 |
| International Consolidated Airlines Group 3.75% | | | | | | | |
| 3/25/29 | | EUR | | 300,000 | | | 236,636 |
| Mileage Plus Holdings 144A 6.50% 6/20/27 # | | | | 625,000 | | | 632,216 |
| Rutas 2 and 7 Finance 144A 3.018% 9/30/36 #, ^ | | | | 705,667 | | | 420,874 |
| United Airlines | | | | | | | |
| 144A 4.375% 4/15/26 # | | | | 100,000 | | | 96,146 |
| 144A 4.625% 4/15/29 # | | | | 457,000 | | | 421,626 |
| | | | | | | | 4,860,926 |
17
Table of Contents
Schedule of investments
Delaware Strategic Income Fund
| | | | | | Principal | | | |
| | | | | amount° | | Value (US $) |
| Corporate Bonds (continued) | | | | | | | |
| Utilities – 1.46% | | | | | | | |
| Clean Renewable Power Mauritius 144A 4.25% | | | | | |
| 3/25/27 # | | | | 656,600 | | $ | 528,973 |
| Electricite de France | | | | | | | |
| 2.875% 12/15/26 µ, ψ | | EUR | | 600,000 | | | 521,494 |
| 3.00% 9/3/27 µ, ψ | | EUR | | 400,000 | | | 340,759 |
| | | | | | | | 1,391,226 |
| Total Corporate Bonds (cost $56,375,137) | | | | | | | 48,843,928 |
| | |
| Municipal Bonds – 0.76% | | | | | | | |
| Commonwealth of Puerto Rico | | | | | | | |
| (Restructured - Capital Appreciation) | | | | | | | |
| Series A 2.993% 7/1/24^ | | | | 12,435 | | | 11,571 |
| Series A 4.364% 7/1/33^ | | | | 48,098 | | | 28,665 |
| Series A-1 4.00% 7/1/33 | | | | 37,375 | | | 35,870 |
| Series A-1 4.00% 7/1/35 | | | | 27,144 | | | 25,697 |
| Series A-1 4.00% 7/1/37 | | | | 28,832 | | | 27,008 |
| Series A-1 5.625% 7/1/29 | | | | 31,431 | | | 34,788 |
| GDB Debt Recovery Authority of Puerto Rico | | | | | | | |
| (Taxable) | | | | | | | |
| 7.50% 8/20/40 | | | | 638,655 | | | 566,807 |
| Total Municipal Bonds (cost $779,231) | | | | | | | 730,406 |
| | |
| Non-Agency Asset-Backed Securities – 3.33% | | | | | |
| CRMSI 2006-3 A5 | | | | | | | |
| Series 2006-3 A5 4.726% 11/25/36 ● | | | | 130,365 | | | 125,549 |
| Diamond Infrastructure Funding | | | | | | | |
| Series 2021-1A A 144A 1.76% 4/15/49 # | | | | 750,000 | | | 660,209 |
| Domino's Pizza Master Issuer | | | | | | | |
| Series 2021-1A A2I 144A 2.662% 4/25/51 # | | 444,375 | | | 391,288 |
| Hardee's Funding | | | | | | | |
| Series 2020-1A A2 144A 3.981% 12/20/50 # | | 2,167,000 | | | 2,003,160 |
| Total Non-Agency Asset-Backed Securities (cost $3,479,049) | | | | 3,180,206 |
| | |
| Non-Agency Collateralized Mortgage Obligations – 6.35% | | | | |
| JPMorgan Mortgage Trust | | | | | | | |
| Series 2021-13 B1 144A 3.144% 4/25/52 #, ● | | 590,634 | | | 498,961 |
| Sequoia Mortgage Trust | | | | | | | |
| Series 2014-1 B3 144A 3.916% 4/25/44 #, ● | | 707,302 | | | 700,477 |
| Series 2017-5 B2 144A 3.804% 8/25/47 #, ● | | 1,750,998 | | | 1,635,134 |
18
Table of Contents
| | | | Principal | | | |
| | | amount° | | Value (US $) |
| Non-Agency Collateralized Mortgage Obligations (continued) | | | | | |
| Sequoia Mortgage Trust | | | | | |
| Series 2017-6 B2 144A 3.723% 9/25/47 #, ● | | 1,750,563 | | $ | 1,622,141 |
| Series 2017-7 B2 144A 3.724% 10/25/47 #, ● | | 1,757,856 | | | 1,621,829 |
| Total Non-Agency Collateralized Mortgage Obligations (cost $6,800,019) | | | 6,078,542 |
| |
| Non-Agency Commercial Mortgage-Backed Securities – 1.90% | | | | | |
| Benchmark Mortgage Trust | | | | | |
| Series 2020-B22 A5 1.973% 1/15/54 | | 500,000 | | | 430,957 |
| COMM Mortgage Trust | | | | | |
| Series 2013-CR6 AM 144A 3.147% 3/10/46 # | | 110,000 | | | 109,011 |
| DB-JPM Mortgage Trust | | | | | |
| Series 2020-C9 B 2.567% 8/15/53 | | 500,000 | | | 412,179 |
| GS Mortgage Securities Trust | | | | | |
| Series 2017-GS6 B 3.869% 5/10/50 | | 500,000 | | | 472,337 |
| Series 2018-GS9 B 4.321% 3/10/51 ● | | 280,000 | | | 269,811 |
| JPMorgan Chase Commercial Mortgage Securities | | | | | |
| Trust | | | | | |
| Series 2013-LC11 B 3.499% 4/15/46 | | 130,000 | | | 126,417 |
| Total Non-Agency Commercial Mortgage-Backed Securities (cost | | | |
| $2,119,458) | | | | | 1,820,712 |
| |
| Loan Agreements – 5.94% | | | | | |
| Acrisure 1st Lien 6.623% (LIBOR01M + 4.25%) | | | | | |
| 2/15/27 ● | | 199,000 | | | 192,533 |
| Acrisure Tranche B 5.872% (LIBOR01M + 3.50%) | | | | | |
| 2/15/27 ● | | 300,043 | | | 286,691 |
| Applied Systems 2nd Lien 7.75% (LIBOR03M + | | | | | |
| 5.50%) 9/19/25 ● | | 1,346,453 | | | 1,320,197 |
| AssuredPartners 5.519% (LIBOR01M + 3.50%) | | | | | |
| 2/12/27 ● | | 451,778 | | | 431,730 |
| BWay Holding 5.037% (LIBOR01M + 3.25%) | | | | | |
| 4/3/24 ● | | 167,178 | | | 160,679 |
| Connect US Finco 5.88% (LIBOR01M + 3.50%) | | | | | |
| 12/11/26 ● | | 278,588 | | | 269,011 |
| Frontier Communications Tranche B 6.063% | | | | | |
| (LIBOR03M + 3.75%) 5/1/28 ● | | 691,250 | | | 662,477 |
| Global Medical Response 5.963% (LIBOR01M + | | | | | |
| 4.75%) 10/2/25 ● | | 211,775 | | | 203,348 |
| Hamilton Projects Acquiror 6.75% (LIBOR03M + | | | | | |
| 4.50%) 6/17/27 ● | | 753,480 | | | 730,561 |
| Spirit Aerosystems Tranche B 6.122% (LIBOR01M | | | | | |
| + 3.75%) 1/15/25 ● | | 679,863 | | | 669,240 |
19
Table of Contents
Schedule of investments
Delaware Strategic Income Fund
| | | | | | Principal | | | |
| | | | | amount° | | Value (US $) |
| Loan Agreements (continued) | | | | | | | |
| Ultimate Software Group 1st Lien 6.122% | | | | | | | |
| (LIBOR01M + 3.75%) 5/4/26 ● | | | | 423,216 | | $ | 412,636 |
| Verscend Holding Tranche B 6.372% (LIBOR01M + | | | | | | | |
| 4.00%) 8/27/25 ● | | | | 349,875 | | | 341,857 |
| Total Loan Agreements (cost $5,799,925) | | | | | | | 5,680,960 |
| |
| Sovereign Bonds – 7.07%Δ | | | | | | | |
| Brazil – 0.50% | | | | | | | |
| Brazil Notas do Tesouro Nacional 10.00% 1/1/27 | | BRL | | 356,000 | | | 62,789 |
| Brazilian Government International Bond 4.75% | | | | | | | |
| 1/14/50 | | | | 550,000 | | | 414,957 |
| | | | | | | | 477,746 |
| Chile – 0.36% | | | | | | | |
| Bonos de la Tesoreria de la Republica en pesos | | | | | | | |
| 144A 2.30% 10/1/28 # | | CLP | | 290,000,000 | | | 248,401 |
| 144A 2.80% 10/1/33 # | | CLP | | 130,000,000 | | | 100,854 |
| | | | | | | | 349,255 |
| Czech Republic – 0.04% | | | | | | | |
| Czech Republic Government Bond 2.40% 9/17/25 | | CZK | | 1,010,000 | | | 38,353 |
| | | | | | | | 38,353 |
| Dominican Republic – 0.37% | | | | | | | |
| Dominican Republic International Bond 144A | | | | | | | |
| 4.50% 1/30/30 # | | | | 414,000 | | | 359,510 |
| | | | | | | | 359,510 |
| Egypt – 1.06% | | | | | | | |
| Egypt Government International Bonds | | | | | | | |
| 144A 5.75% 5/29/24 # | | | | 723,000 | | | 618,931 |
| 144A 7.60% 3/1/29 # | | | | 564,000 | | | 393,257 |
| | | | | | | | 1,012,188 |
| Honduras – 0.75% | | | | | | | |
| Honduras Government International Bond 144A | | | | | | | |
| 5.625% 6/24/30 # | | | | 959,000 | | | 717,565 |
| | | | | | | | 717,565 |
| Hungary – 0.03% | | | | | | | |
| Hungary Government Bond 5.50% 6/24/25 | | HUF | | 13,530,000 | | | 30,127 |
| | | | | | | | 30,127 |
20
Table of Contents
| | | | | | Principal | | | |
| | | | | amount° | | Value (US $) |
| Sovereign BondsΔ (continued) | | | | | | | |
| Indonesia – 0.51% | | | | | | | |
| Indonesia Treasury Bonds | | | | | | | |
| 6.125% 5/15/28 | | IDR | | 4,207,000,000 | | $ | 275,267 |
| 6.50% 2/15/31 | | IDR | | 3,249,000,000 | | | 211,927 |
| | | | | | | | 487,194 |
| Ivory Coast – 0.99% | | | | | | | |
| Ivory Coast Government International Bond 144A | | | | | | | |
| 6.125% 6/15/33 # | | | | 1,164,000 | | | 948,311 |
| | | | | | | | 948,311 |
| Mexico – 0.12% | | | | | | | |
| Mexican Bonos 8.50% 5/31/29 | | MXN | | 2,300,000 | | | 111,777 |
| | | | | | | | 111,777 |
| Mongolia – 0.51% | | | | | | | |
| Mongolia Government International Bond 144A | | | | | | | |
| 3.50% 7/7/27 # | | | | 602,000 | | | 486,221 |
| | | | | | | | 486,221 |
| Peru – 0.35% | | | | | | | |
| Peruvian Government International Bond 144A | | | | | | | |
| 5.35% 8/12/40 # | | PEN | | 1,794,000 | | | 331,041 |
| | | | | | | | 331,041 |
| Poland – 0.04% | | | | | | | |
| Republic of Poland Government Bond 2.50% | | | | | | | |
| 4/25/24 | | PLN | | 186,000 | | | 37,482 |
| | | | | | | | 37,482 |
| Senegal – 0.57% | | | | | | | |
| Senegal Government International Bond 144A | | | | | | | |
| 6.75% 3/13/48 # | | | | 764,000 | | | 542,723 |
| | | | | | | | 542,723 |
| Uzbekistan – 0.87% | | | | | | | |
| Republic of Uzbekistan International Bond 144A | | | | | | | |
| 4.75% 2/20/24 # | | | | 862,000 | | | 836,312 |
| | | | | | | | 836,312 |
| Total Sovereign Bonds (cost $8,409,977) | | | | | | | 6,765,805 |
| |
| Supranational Bank – 0.69% | | | | | | | |
| Banque Ouest Africaine de Developpement | | | | | | | |
| 144A 4.70% 10/22/31 # | | | | 804,000 | | | 663,300 |
21
Table of Contents
Schedule of investments
Delaware Strategic Income Fund
| | | | Principal | | | |
| | | amount° | | Value (US $) |
| Supranational Bank (continued) | | | | | |
| Total Supranational Bank (cost $835,408) | | | | | 663,300 |
| |
| US Treasury Obligations – 7.90% | | | | | |
| US Treasury Bonds | | | | | |
| 2.375% 2/15/42 | | 135,000 | | $ | 117,619 |
| 2.875% 5/15/52 | | 2,175,000 | | | 2,104,313 |
| US Treasury Floating Rate Note | | | | | |
| 2.461% (0.08% minus USBMMY3M) 4/30/24 ● | | 2,335,000 | | | 2,337,671 |
| US Treasury Notes | | | | | |
| 2.50% 5/31/24 | | 2,900,000 | | | 2,878,193 |
| 3.25% 6/30/27 | | 115,000 | | | 117,889 |
| Total US Treasury Obligations (cost $7,280,001) | | | | | 7,555,685 |
| |
| | | Number of | | | |
| | | shares | | | |
| Common Stock – 0.51% | | | | | |
| Transportation – 0.51% | | | | | |
| Grupo Aeromexico † | | 49,917 | | | 484,833 |
| Total Common Stock (cost $815,893) | | | | | 484,833 |
| |
| | | Number of | | | |
| | | contracts | | | |
| Options Purchased – 0.00% | | | | | |
| Foreign Currency Put Options – 0.00% | | | | | |
| AUD vs JPY, strike price 78 AUD, expiration date | | | | | |
| 8/23/22, notional amount 251,160,000 (JPMCB) | | 3,220,000 | | | 367 |
| GBP vs JPY, strike price 148 GBP, expiration date | | | | | |
| 8/23/22, notional amount 286,380,000 (JPMCB) | | 1,935,000 | | | 1,491 |
| Total Options Purchased (cost $63,238) | | | | | 1,858 |
| |
| | | Number of | | | |
| | | shares | | | |
| Short-Term Investments – 0.99% | | | | | |
| Money Market Mutual Funds – 0.99% | | | | | |
| BlackRock Liquidity FedFund – Institutional Shares | | | | | |
| (seven-day effective yield 1.73%) | | 237,136 | | | 237,136 |
| Fidelity Investments Money Market Government | | | | | |
| Portfolio – Class I (seven-day effective yield | | | | | |
| 1.49%) | | 237,136 | | | 237,136 |
22
Table of Contents
| | | | Number of | | | | |
| | | shares | | Value (US $) |
| Short-Term Investments (continued) | | | | | | | |
| Money Market Mutual Funds (continued) | | | | | | | |
| GS Financial Square Government Fund – | | | | | | | |
| Institutional Shares (seven-day effective yield | | | | | | | |
| 1.73%) | | 237,136 | | | $ | 237,136 | |
| Morgan Stanley Institutional Liquidity Funds | | | | | | | |
| Government Portfolio – Institutional Class | | | | | | | |
| (seven-day effective yield 1.60%) | | 237,137 | | | | 237,137 | |
| Total Short-Term Investments (cost $948,545) | | | | | | 948,545 | |
| Total Value of Securities Before | | | | | | | |
| Options Written–98.90% | | | | | | | |
| (cost $106,163,947) | | | | | | 94,609,313 | |
| |
| | | Number of | | | | | |
| | | contracts | | | | | |
| Options Written – (0.00%) | | | | | | | |
| Foreign Currency Put Options – (0.00%) | | | | | | | |
| AUD vs JPY, strike price 72 AUD, expiration date | | | | | | | |
| 8/23/22, notional amount (231,840,000) | | | | | | | |
| (JPMCB) | | (3,220,000 | ) | | | (92 | ) |
| GBP vs JPY, strike price 140 GBP, expiration date | | | | | | | |
| 8/23/22, notional amount (270,900,000) | | | | | | | |
| (JPMCB) | | (1,935,000 | ) | | | (356 | ) |
| Total Options Written (premium received $23,310) | | | | | $ | (448 | ) |
| ° | Principal amount shown is stated in USD unless noted that the security is denominated in another currency. |
| # | Security exempt from registration under Rule 144A of the Securities Act of 1933, as amended. At July 31, 2022, the aggregate value of Rule 144A securities was $55,910,137, which represents 58.45% of the Fund's net assets. See Note 12 in “Notes to financial statements." |
| ● | Variable rate investment. Rates reset periodically. Rate shown reflects the rate in effect at July 31, 2022. For securities based on a published reference rate and spread, the reference rate and spread are indicated in their descriptions. The reference rate descriptions (i.e. LIBOR03M, LIBOR06M, etc.) used in this report are identical for different securities, but the underlying reference rates may differ due to the timing of the reset period. Certain variable rate securities are not based on a published reference rate and spread but are determined by the issuer or agent and are based on current market conditions, or for mortgage-backed securities, are impacted by the individual mortgages which are paying off over time. These securities do not indicate a reference rate and spread in their descriptions. |
| µ | Fixed to variable rate investment. The rate shown reflects the fixed rate in effect at July 31, 2022. Rate will reset at a future date. |
23
Table of Contents
Schedule of investments
Delaware Strategic Income Fund
| ψ | Perpetual security. Maturity date represents next call date. |
| ^ | Zero-coupon security. The rate shown is the effective yield at the time of purchase. |
| Δ | Securities have been classified by country of risk. |
| † | Non-income producing security. |
The following foreign currency exchange contracts and futures contracts were outstanding at July 31, 2022:1
Foreign Currency Exchange Contracts
| | Currency to | | | | Settlement | | Unrealized |
| Counterparty | | Receive (Deliver) | | In Exchange For | | Date | | Appreciation |
| TD | | EUR (3,157,247) | | USD 3,328,246 | | 8/19/22 | | $ | 104,173 |
Futures Contracts
Exchange-Traded
| | | | | | | | | | | | | | | | | | | | | Variation |
| | | | | | | | | | | | | | | | | | | | | Margin |
| | | | | | | | Notional | | | | Value/ | | Value/ | | Due from |
| | | | Notional | | Cost | | Expiration | | Unrealized | | Unrealized | | (Due to) |
| Contracts to Buy (Sell) | | Amount | | (Proceeds) | | Date | | Appreciation | | Depreciation | | Brokers |
| | US | | | | | | | | | | | | | | | | | | | | | |
| | Treasury | | | | | | | | | | | | | | | | | | | | | |
| | 10 yr | | | | | | | | | | | | | | | | | | | | | |
| (37) | | Notes | | $ | (4,482,203 | ) | | $ | (4,410,424 | ) | | 9/21/22 | | $ | — | | $ | (71,779 | ) | | $ | (5,781 | ) |
| | US | | | | | | | | | | | | | | | | | | | | | |
| | Treasury | | | | | | | | | | | | | | | | | | | | | |
| | 10 yr | | | | | | | | | | | | | | | | | | | | | |
| | Ultra | | | | | | | | | | | | | | | | | | | | | |
| 2 | | Notes | | | 262,500 | | | | 256,567 | | | 9/21/22 | | | 5,933 | | | — | | | | 906 | |
| Total Futures Contracts | | | $ | (4,153,857 | ) | | | | $ | 5,933 | | $ | (71,779 | ) | | $ | (4,875 | ) |
The use of foreign currency exchange contracts and futures contracts involves elements of market risk and risks in excess of the amounts disclosed in these financial statements. The foreign currency exchange contracts and notional amounts presented above represent the Fund’s total exposure in such contracts, whereas only the net unrealized appreciation (depreciation) and variation margin are reflected in the Fund’s net assets.
| 1 | See Note 8 in “Notes to financial statements.” |
Summary of abbreviations:
DAC – Designated Activity Company
FREMF – Freddie Mac Multifamily
GS – Goldman Sachs
24
Table of Contents
Summary of abbreviations: (continued)
ICE – Intercontinental Exchange, Inc.
JPM – JPMorgan
JPMCB – JPMorgan Chase Bank
LIBOR – London Interbank Offered Rate
LIBOR01M – ICE LIBOR USD 1 Month
LIBOR03M – ICE LIBOR USD 3 Month
LIBOR06M – ICE LIBOR USD 6 Month
REMIC – Real Estate Mortgage Investment Conduit
SOFR – Secured Overnight Financing Rate
TD – TD Bank
USBMMY3M – US Treasury 3 Month Bill Money Market Yield
yr – Year
Summary of currencies:
AUD – Australian Dollar
BRL – Brazilian Real
CLP – Chilean Peso
CZK – Czech Koruna
EUR – European Monetary Unit
GBP – British Pound Sterling
HUF – Hungarian Forint
IDR – Indonesian Rupiah
JPY – Japanese Yen
MXN – Mexican Peso
PEN – Peruvian Sol
PLN – Polish Zloty
USD – US Dollar
See accompanying notes, which are an integral part of the financial statements.
25
Table of Contents
| Statement of assets and liabilities | |
| Delaware Strategic Income Fund | July 31, 2022 |
| Assets: | | | | |
| | Investments, at value* | | $ | 94,609,313 | |
| Cash | | | 163,074 | |
| Cash collateral due from broker | | | 69,328 | |
| Foreign currencies, at valueΔ | | | 166,859 | |
| Dividends and interest receivable | | | 995,394 | |
| Receivable for fund shares sold | | | 299,378 | |
| Unrealized appreciation on foreign currency exchange contracts | | | 104,173 | |
| Receivable from investment manager | | | 39,959 | |
| Receivable for securities sold | | | 7,026 | |
| Prepaid expenses | | | 3,686 | |
| Other assets | | | 806 | |
| Total Assets | | | 96,458,996 | |
| Liabilities: | | | | |
| Options written, at valueΣ | | | 448 | |
| Payable for fund shares redeemed | | | 410,681 | |
| Other accrued expenses | | | 235,826 | |
| Cash collateral due to brokers | | | 130,000 | |
| Distribution payable | | | 8,635 | |
| Accounting and administration expenses payable to affiliates | | | 8,273 | |
| Variation margin due to broker on futures contracts | | | 4,875 | |
| Distribution fees payable to affiliates | | | 3,413 | |
| Total Liabilities | | | 802,151 | |
| Total Net Assets | | $ | 95,656,845 | |
| |
| Net Assets Consist of: | | | | |
| Paid-in capital | | $ | 118,968,572 | |
| Total distributable earnings (loss) | | | (23,311,727 | ) |
| Total Net Assets | | $ | 95,656,845 | |
26
Table of Contents
| Net Asset Value | | | | |
| | | | | |
| Class A: | | | | |
| Net assets | | $ | 79,272,836 | |
| Shares of beneficial interest outstanding, unlimited authorization, no par | | | 10,745,086 | |
| Net asset value per share | | $ | 7.38 | |
| Sales charge | | | 4.50 | % |
| Offering price per share, equal to net asset value per share / (1 - sales | | | | |
| charge) | | $ | 7.73 | |
| | | | | |
| Class C: | | | | |
| Net assets | | $ | 1,110,314 | |
| Shares of beneficial interest outstanding, unlimited authorization, no par | | | 150,521 | |
| Net asset value per share | | $ | 7.38 | |
| | | | | |
| Class R: | | | | |
| Net assets | | $ | 148,015 | |
| Shares of beneficial interest outstanding, unlimited authorization, no par | | | 20,016 | |
| Net asset value per share | | $ | 7.39 | |
| | | | | |
| Institutional Class: | | | | |
| Net assets | | $ | 15,125,680 | |
| Shares of beneficial interest outstanding, unlimited authorization, no par | | | 2,050,078 | |
| Net asset value per share | | $ | 7.38 | |
| ____________________ |
| * Investments, at cost | | $ | 106,163,947 | |
| Δ Foreign currencies, at cost | | | 167,993 | |
| Σ Options written, premium received | | | (23,310 | ) |
See accompanying notes, which are an integral part of the financial statements.
27
Table of Contents
| Statement of operations | |
| Delaware Strategic Income Fund | Year ended July 31, 2022 |
| Investment Income: | | | | |
| | Interest | | $ | 4,606,402 | |
| Dividends | | | 7,561 | |
| Foreign tax withheld | | | (4,155 | ) |
| | | | 4,609,808 | |
| |
| Expenses: | | | | |
| Management fees | | | 562,541 | |
| Distribution expenses — Class A | | | 209,657 | |
| Distribution expenses — Class C | | | 12,478 | |
| Distribution expenses — Class R | | | 805 | |
| Dividend disbursing and transfer agent fees and expenses | | | 157,429 | |
| Legal fees | | | 63,535 | |
| Accounting and administration expenses | | | 57,585 | |
| Audit and tax fees | | | 55,466 | |
| Reports and statements to shareholders expenses | | | 38,567 | |
| Custodian fees | | | 10,208 | |
| Registration fees | | | 8,737 | |
| Trustees’ fees and expenses | | | 3,541 | |
| Other | | | 52,193 | |
| | | | 1,232,742 | |
| Less expenses waived | | | (349,800 | ) |
| Less expenses paid indirectly | | | (293 | ) |
| Total operating expenses | | | 882,649 | |
| Net Investment Income (Loss) | | | 3,727,159 | |
28
Table of Contents
| Net Realized and Unrealized Gain (Loss): | | | | |
| | Net realized gain (loss) on: | | | | |
| | Investments | | $ | (1,974,255 | ) |
| | Foreign currencies | | | (372,918 | ) |
| | Foreign currency exchange contracts | | | 635,037 | |
| | Futures contracts | | | 367,834 | |
| | Options written | | | 9,553 | |
| | Swap contracts | | | 60,249 | |
| Net realized gain (loss) | | | (1,274,500 | ) |
| | | | | | |
| Net change in unrealized appreciation (depreciation) on: | | | | |
| | Investments | | | (14,853,579 | ) |
| | Foreign currencies | | | (5,646 | ) |
| | Foreign currency exchange contracts | | | 77,254 | |
| | Futures contracts | | | (44,343 | ) |
| | Options purchased | | | (61,380 | ) |
| | Options written | | | 22,862 | |
| Net change in unrealized appreciation (depreciation) | | | (14,864,832 | ) |
| Net Realized and Unrealized Gain (Loss) | | | (16,139,332 | ) |
| Net Increase (Decrease) in Net Assets Resulting from Operations | | $ | (12,412,173 | ) |
See accompanying notes, which are an integral part of the financial statements.
29
Table of Contents
Statements of changes in net assets
Delaware Strategic Income Fund
| | | | | Year ended |
| | | | 7/31/22 | | 7/31/21 |
| Increase (Decrease) in Net Assets from Operations: | | | | | | | | |
| Net investment income (loss) | | $ | 3,727,159 | | | $ | 1,636,365 | |
| Net realized gain (loss) | | | (1,274,500 | ) | | | 1,371,462 | |
| Net change in unrealized appreciation (depreciation) | | | (14,864,832 | ) | | | 432,077 | |
| Net increase (decrease) in net assets resulting from
operations | | | (12,412,173 | ) | | | 3,439,904 | |
| | | | | | | | | | |
| Dividends and Distributions to Shareholders from: | | | | | | | | |
| Distributable earnings: | | | | | | | | |
| | Class A | | | (3,262,736 | ) | | | (1,178,685 | ) |
| | Class C | | | (39,080 | ) | | | (48,136 | ) |
| | Class R | | | (5,847 | ) | | | (8,823 | ) |
| | Institutional Class | | | (703,462 | ) | | | (505,146 | ) |
| | | | | | | | | | | |
| Return of capital: | | | | | | | | |
| | Class A | | | — | | | | (7,452 | ) |
| | Class C | | | — | | | | (341 | ) |
| | Class R | | | — | | | | (40 | ) |
| | Institutional Class | | | — | | | | (3,820 | ) |
| | | | | (4,011,125 | ) | | | (1,752,443 | ) |
| | | | | | | | | | | |
| Capital Share Transactions: | | | | | | | | |
| Proceeds from shares sold: | | | | | | | | |
| | Class A | | | 3,940,143 | | | | 3,593,624 | |
| | Class C | | | 370,161 | | | | 283,386 | |
| | Class R | | | 13,966 | | | | 32,235 | |
| | Institutional Class | | | 11,002,091 | | | | 15,491,085 | |
| | | | | | | | | | | |
| Net assets from merger:1 | | | | | | | | |
| | Class A | | | 73,890,835 | | | | — | |
| | Institutional Class | | | 294,650 | | | | — | |
| | | | | | | | | |
| Net asset value of shares issued upon reinvestment of
dividends and distributions: | | | | | | | | |
| | Class A | | | 3,270,373 | | | | 1,090,088 | |
| | Class C | | | 38,749 | | | | 49,450 | |
| | Class R | | | 5,839 | | | | 8,440 | |
| | Institutional Class | | | 703,742 | | | | 514,967 | |
| | | | | 93,530,549 | | | | 21,063,275 | |
30
Table of Contents
| | | | | Year ended |
| | | | 7/31/22 | | 7/31/21 |
| Capital Share Transactions (continued): | | | | | | | | |
| Cost of shares redeemed: | | | | | | | | |
| | Class A | | $ | (19,911,369 | ) | | $ | (3,991,917 | ) |
| | Class C | | | (567,428 | ) | | | (796,473 | ) |
| | Class R | | | (19,219 | ) | | | (314,841 | ) |
| | Institutional Class | | | (10,522,231 | ) | | | (9,992,516 | ) |
| | | | | (31,020,247 | ) | | | (15,095,747 | ) |
| Increase in net assets derived from capital share
transactions | | | 62,510,302 | | | | 5,967,528 | |
| Net Increase in Net Assets | | | 46,087,004 | | | | 7,654,989 | |
| | | | | | | | | |
| Net Assets: | | | | | | | | |
| Beginning of year | | | 49,569,841 | | | | 41,914,852 | |
| End of year | | $ | 95,656,845 | | | $ | 49,569,841 | |
| 1 | See Note 7 in “Notes to financial statements.” |
See accompanying notes, which are an integral part of the financial statements.
31
Table of Contents
Financial highlights
Delaware Strategic Income Fund Class A
Selected data for each share of the Fund outstanding throughout each period were as follows:
| Net asset value, beginning of period |
| |
| Income (loss) from investment operations: |
| Net investment income1 |
| Net realized and unrealized gain (loss) |
| Total from investment operations |
| |
| Less dividends and distributions from: |
| Net investment income |
| Net realized gain |
| Return of capital |
| Total dividends and distributions |
| |
| Net asset value, end of period |
| |
| Total return3 |
| |
| Ratios and supplemental data: |
| Net assets, end of period (000 omitted) |
| Ratio of expenses to average net assets4 |
| Ratio of expenses to average net assets prior to fees waived4 |
| Ratio of net investment income to average net assets |
| Ratio of net investment income to average net assets prior to fees waived |
| Portfolio turnover |
| 1 | Calculated using average shares outstanding. |
| 2 | Amount is less than $0.005 per share. |
| 3 | Total return is based on the change in net asset value of a share during the period and assumes reinvestment of dividends and distributions at net asset value and does not reflect the impact of a sales charge. Total return during all of the periods shown reflects a waiver by the manager. Performance would have been lower had the waiver not been in effect. |
| 4 | Expense ratios do not include expenses of any Underlying Funds in which the Fund invests. |
| 5 | Net expense ratio includes extraordinary expenses. |
See accompanying notes, which are an integral part of the financial statements.
32
Table of Contents
| Year ended | |
| | 7/31/22 | | 7/31/21 | | 7/31/20 | | 7/31/19 | | 7/31/18 | |
| $ | 8.57 | | | $ | 8.24 | | | $ | 8.07 | | | $ | 8.01 | | | $ | 8.41 | | |
| | | | | | | | | | | | | | | | | | | | |
| | | | | | | | | | | | | | | | | | | | |
| | 0.29 | | | | 0.30 | | | | 0.29 | | | | 0.32 | | | | 0.32 | | |
| | (1.17 | ) | | | 0.35 | | | | 0.20 | | | | 0.08 | | | | (0.37 | ) | |
| | (0.88 | ) | | | 0.65 | | | | 0.49 | | | | 0.40 | | | | (0.05 | ) | |
| | | | | | | | | | | | | | | | | | | | |
| | | | | | | | | | | | | | | | | | | | |
| | (0.31 | ) | | | (0.32 | ) | | | (0.32 | ) | | | (0.27 | ) | | | (0.32 | ) | |
| | — | | | | — | | | | — | | | | — | | | | — | | |
| | — | | | | — | 2 | | | — | 2 | | | (0.07 | ) | | | (0.03 | ) | |
| | (0.31 | ) | | | (0.32 | ) | | | (0.32 | ) | | | (0.34 | ) | | | (0.35 | ) | |
| | | | | | | | | | | | | | | | | | | | |
| $ | 7.38 | | | $ | 8.57 | | | $ | 8.24 | | | $ | 8.07 | | | $ | 8.01 | | |
| | | | | | | | | | | | | | | | | | | | |
| | (10.45% | ) | | | 8.02% | | | | 6.27% | | | | 5.20% | | | | (0.62% | ) | |
| | | | | | | | | | | | | | | | | | | | |
| | | | | | | | | | | | | | | | | | | | |
| $ | 79,273 | | | $ | 31,690 | | | $ | 29,793 | | | $ | 31,032 | | | $ | 33,912 | | |
| | 0.90% | 5 | | | 0.84% | | | | 0.84% | | | | 0.84% | | | | 0.88% | | |
| | 1.24% | | | | 1.53% | | | | 1.52% | | | | 1.50% | | | | 1.35% | | |
| | 3.62% | | | | 3.54% | | | | 3.66% | | | | 4.09% | | | | 3.83% | | |
| | 3.28% | | | | 2.85% | | | | 2.98% | | | | 3.43% | | | | 3.36% | | |
| | 65% | | | | 89% | | | | 130% | | | | 106% | | | | 125% | | |
33
Table of Contents
Financial highlights
Delaware Strategic Income Fund Class C
Selected data for each share of the Fund outstanding throughout each period were as follows:
| Net asset value, beginning of period |
| |
| Income (loss) from investment operations: |
| Net investment income1 |
| Net realized and unrealized gain (loss) |
| Total from investment operations |
| |
| Less dividends and distributions from: |
| Net investment income |
| Net realized gain |
| Return of capital |
| Total dividends and distributions |
| |
| Net asset value, end of period |
| |
| Total return3 |
| |
| Ratios and supplemental data: |
| Net assets, end of period (000 omitted) |
| Ratio of expenses to average net assets4 |
| Ratio of expenses to average net assets prior to fees waived4 |
| Ratio of net investment income to average net assets |
| Ratio of net investment income to average net assets prior to fees waived |
| Portfolio turnover |
| 1 | Calculated using average shares outstanding. |
| 2 | Amount is less than $0.005 per share. |
| 3 | Total return is based on the change in net asset value of a share during the period and assumes reinvestment of dividends and distributions at net asset value and does not reflect the impact of a sales charge. Total return during all of the periods shown reflects a waiver by the manager. Performance would have been lower had the waiver not been in effect. |
| 4 | Expense ratios do not include expenses of any Underlying Funds in which the Fund invests. |
| 5 | Net expense ratio includes extraordinary expenses. |
See accompanying notes, which are an integral part of the financial statements.
34
Table of Contents
| Year ended |
| 7/31/22 | | 7/31/21 | | 7/31/20 | | 7/31/19 | | 7/31/18 | |
| $ | 8.58 | | | $ | 8.25 | | | $ | 8.08 | | | $ | 8.02 | | | $ | 8.42 | | |
| | | | | | | | | | | | | | | | | | | | |
| | | | | | | | | | | | | | | | | | | | |
| | 0.23 | | | | 0.24 | | | | 0.23 | | | | 0.26 | | | | 0.25 | | |
| | (1.18 | ) | | | 0.35 | | | | 0.20 | | | | 0.08 | | | | (0.36 | ) | |
| | (0.95 | ) | | | 0.59 | | | | 0.43 | | | | 0.34 | | | | (0.11 | ) | |
| | | | | | | | | | | | | | | | | | | | |
| | | | | | | | | | | | | | | | | | | | |
| | (0.25 | ) | | | (0.26 | ) | | | (0.26 | ) | | | (0.21 | ) | | | (0.26 | ) | |
| | — | | | | — | | | | — | | | | — | | | | — | | |
| | — | | | | — | 2 | | | — | 2 | | | (0.07 | ) | | | (0.03 | ) | |
| | (0.25 | ) | | | (0.26 | ) | | | (0.26 | ) | | | (0.28 | ) | | | (0.29 | ) | |
| | | | | | | | | | | | | | | | | | | | |
| $ | 7.38 | | | $ | 8.58 | | | $ | 8.25 | | | $ | 8.08 | | | $ | 8.02 | | |
| | | | | | | | | | | | | | | | | | | | |
| | (11.22% | ) | | | 7.21% | | | | 5.47% | | | | 4.42% | | | | (1.35% | ) | |
| | | | | | | | | | | | | | | | | | | | |
| | | | | | | | | | | | | | | | | | | | |
| $ | 1,110 | | | $ | 1,451 | | | $ | 1,846 | | | $ | 2,793 | | | $ | 3,450 | | |
| | 1.65% | 5 | | | 1.59% | | | | 1.59% | | | | 1.59% | | | | 1.63% | | |
| | 1.99% | | | | 2.28% | | | | 2.27% | | | | 2.25% | | | | 2.10% | | |
| | 2.87% | | | | 2.79% | | | | 2.91% | | | | 3.34% | | | | 3.08% | | |
| | 2.53% | | | | 2.10% | | | | 2.23% | | | | 2.68% | | | | 2.61% | | |
| | 65% | | | | 89% | | | | 130% | | | | 106% | | | | 125% | | |
35
Table of Contents
Financial highlights
Delaware Strategic Income Fund Class R
Selected data for each share of the Fund outstanding throughout each period were as follows:
| Net asset value, beginning of period |
| |
| Income (loss) from investment operations: |
| Net investment income1 |
| Net realized and unrealized gain (loss) |
| Total from investment operations |
| |
| Less dividends and distributions from: |
| Net investment income |
| Net realized gain |
| Return of capital. |
| Total dividends and distributions |
| |
| Net asset value, end of period |
| |
| Total return3 |
| |
| Ratios and supplemental data: |
| Net assets, end of period (000 omitted) |
| Ratio of expenses to average net assets4 |
| Ratio of expenses to average net assets prior to fees waived4 |
| Ratio of net investment income to average net assets |
| Ratio of net investment income to average net assets prior to fees waived |
| Portfolio turnover |
| 1 | Calculated using average shares outstanding. |
| 2 | Amount is less than $0.005 per share. |
| 3 | Total return is based on the change in net asset value of a share during the period and assumes reinvestment of dividends and distributions at net asset value. Total return during all of the periods shown reflects a waiver by the manager. Performance would have been lower had the waiver not been in effect. |
| 4 | Expense ratios do not include expenses of any Underlying Funds in which the Fund invests. |
| 5 | Net expense ratio includes extraordinary expenses. |
See accompanying notes, which are an integral part of the financial statements.
36
Table of Contents
| Year ended |
| 7/31/22 | | 7/31/21 | | 7/31/20 | | 7/31/19 | | 7/31/18 | |
| $ | 8.60 | | | $ | 8.27 | | | $ | 8.10 | | | $ | 8.03 | | | $ | 8.44 | | |
| | | | | | | | | | | | | | | | | | | | |
| | | | | | | | | | | | | | | | | | | | |
| | 0.27 | | | | 0.28 | | | | 0.27 | | | | 0.30 | | | | 0.30 | | |
| | (1.19 | ) | | | 0.35 | | | | 0.20 | | | | 0.09 | | | | (0.38 | ) | |
| | (0.92 | ) | | | 0.63 | | | | 0.47 | | | | 0.39 | | | | (0.08 | ) | |
| | | | | | | | | | | | | | | | | | | | |
| | | | | | | | | | | | | | | | | | | | |
| | (0.29 | ) | | | (0.30 | ) | | | (0.30 | ) | | | (0.25 | ) | | | (0.30 | ) | |
| | — | | | | — | | | | — | | | | — | | | | — | | |
| | — | | | | — | 2 | | | — | 2 | | | (0.07 | ) | | | (0.03 | ) | |
| | (0.29 | ) | | | (0.30 | ) | | | (0.30 | ) | | | (0.32 | ) | | | (0.33 | ) | |
| | | | | | | | | | | | | | | | | | | | |
| $ | 7.39 | | | $ | 8.60 | | | $ | 8.27 | | | $ | 8.10 | | | $ | 8.03 | | |
| | | | | | | | | | | | | | | | | | | | |
| | (10.86% | ) | | | 7.74% | | | | 5.99% | | | | 5.07% | | | | (0.97% | ) | |
| | | | | | | | | | | | | | | | | | | | |
| | | | | | | | | | | | | | | | | | | | |
| $ | 148 | | | $ | 171 | | | $ | 431 | | | $ | 738 | | | $ | 4,259 | | |
| | 1.15% | 5 | | | 1.09% | | | | 1.09% | | | | 1.09% | | | | 1.13% | | |
| | 1.49% | | | | 1.78% | | | | 1.77% | | | | 1.75% | | | | 1.60% | | |
| | 3.37% | | | | 3.29% | | | | 3.41% | | | | 3.84% | | | | 3.58% | | |
| | 3.03% | | | | 2.60% | | | | 2.73% | | | | 3.18% | | | | 3.11% | | |
| | 65% | | | | 89% | | | | 130% | | | | 106% | | | | 125% | | |
37
Table of Contents
Financial highlights
Delaware Strategic Income Fund Institutional Class
Selected data for each share of the Fund outstanding throughout each period were as follows:
| Net asset value, beginning of period |
| |
| Income (loss) from investment operations: |
| Net investment income1 |
| Net realized and unrealized gain (loss) |
| Total from investment operations |
| |
| Less dividends and distributions from: |
| Net investment income |
| Net realized gain |
| Return of capital. |
| Total dividends and distributions |
| |
| Net asset value, end of period |
| |
| Total return3 |
| |
| Ratios and supplemental data: |
| Net assets, end of period (000 omitted) |
| Ratio of expenses to average net assets4 |
| Ratio of expenses to average net assets prior to fees waived4 |
| Ratio of net investment income to average net assets |
| Ratio of net investment income to average net assets prior to fees waived |
| Portfolio turnover |
| 1 | Calculated using average shares outstanding. |
| 2 | Amount is less than $0.005 per share. |
| 3 | Total return is based on the change in net asset value of a share during the period and assumes reinvestment of dividends and distributions at net asset value. Total return during all of the periods shown reflects a waiver by the manager. Performance would have been lower had the waiver not been in effect. |
| 4 | Expense ratios do not include expenses of any Underlying Funds in which the Fund invests. |
| 5 | Net expense ratio includes extraordinary expenses. |
See accompanying notes, which are an integral part of the financial statements.
38
Table of Contents
| Year ended |
| 7/31/22 | | 7/31/21 | | 7/31/20 | | 7/31/19 | | 7/31/18 | |
| $ | 8.58 | | | $ | 8.25 | | | $ | 8.08 | | | $ | 8.02 | | | $ | 8.42 | | |
| | | | | | | | | | | | | | | | | | | | |
| | | | | | | | | | | | | | | | | | | | |
| | 0.31 | | | | 0.32 | | | | 0.31 | | | | 0.34 | | | | 0.34 | | |
| | (1.18 | ) | | | 0.35 | | | | 0.20 | | | | 0.08 | | | | (0.37 | ) | |
| | (0.87 | ) | | | 0.67 | | | | 0.51 | | | | 0.42 | | | | (0.03 | ) | |
| | | | | | | | | | | | | | | | | | | | |
| | | | | | | | | | | | | | | | | | | | |
| | (0.33 | ) | | | (0.34 | ) | | | (0.34 | ) | | | (0.29 | ) | | | (0.34 | ) | |
| | — | | | | — | | | | — | | | | — | | | | — | | |
| | — | | | | — | 2 | | | — | 2 | | | (0.07 | ) | | | (0.03 | ) | |
| | (0.33 | ) | | | (0.34 | ) | | | (0.34 | ) | | | (0.36 | ) | | | (0.37 | ) | |
| | | | | | | | | | | | | | | | | | | | |
| $ | 7.38 | | | $ | 8.58 | | | $ | 8.25 | | | $ | 8.08 | | | $ | 8.02 | | |
| | | | | | | | | | | | | | | | | | | | |
| | (10.33% | ) | | | 8.29% | | | | 6.53% | | | | 5.47% | | | | (0.36% | ) | |
| | | | | | | | | | | | | | | | | | | | |
| | | | | | | | | | | | | | | | | | | | |
| $ | 15,126 | | | $ | 16,258 | | | $ | 9,845 | | | $ | 16,457 | | | $ | 28,366 | | |
| | 0.65% | 5 | | | 0.59% | | | | 0.59% | | | | 0.59% | | | | 0.63% | | |
| | 0.99% | | | | 1.28% | | | | 1.27% | | | | 1.25% | | | | 1.10% | | |
| | 3.87% | | | | 3.79% | | | | 3.91% | | | | 4.34% | | | | 4.08% | | |
| | 3.53% | | | | 3.10% | | | | 3.23% | | | | 3.68% | | | | 3.61% | | |
| | 65% | | | | 89% | | | | 130% | | | | 106% | | | | 125% | | |
39
Table of Contents
| Notes to financial statements | | |
| Delaware Strategic Income Fund | | July 31, 2022 |
Delaware Group® Government Fund (Trust) is organized as a Delaware statutory trust and offers two series: Delaware Emerging Markets Debt Corporate Fund and Delaware Strategic Income Fund. These financial statements and the related notes pertain to Delaware Strategic Income Fund (Fund). The Trust is an open-end investment company. The Fund is considered diversified under the Investment Company Act of 1940, as amended, and offers Class A, Class C, Class R, and Institutional Class shares. Class A shares are sold with a maximum front-end sales charge of 4.50%. There is no front-end sales charge when you purchase $1,000,000 or more of Class A shares. However, if Delaware Distributors, L.P. (DDLP) paid your financial intermediary a commission on your purchase of $1,000,000 or more of Class A shares, for shares purchased prior to July 1, 2020, you will have to pay a limited contingent deferred sales charge (Limited CDSC) of 1.00% if you redeem these shares within the first year after your purchase and 0.50% if you redeem these shares within the second year, or for shares purchased on or after July 1, 2020, you will have to pay a Limited CDSC of 1.00% if you redeem these shares within the first 18 months after your purchase, unless a specific waiver of the Limited CDSC applies. Class C shares have no upfront sales charge, but are sold with a CDSC of 1.00%, which will be incurred if redeemed during the first 12 months. Class R and Institutional Class shares are not subject to a sales charge and are offered for sale exclusively to certain eligible investors.
1. Significant Accounting Policies
The Fund follows accounting and reporting guidance under Financial Accounting Standards Board (FASB) Accounting Standards Codification Topic 946, Financial Services — Investment Companies. The following accounting policies are in accordance with US generally accepted accounting principles (US GAAP) and are consistently followed by the Fund.
Security Valuation — Equity securities, except those traded on the Nasdaq Stock Market LLC (Nasdaq), are valued at the last quoted sales price as of the time of the regular close of the New York Stock Exchange on the valuation date. Equity securities traded on the Nasdaq are valued in accordance with the Nasdaq Official Closing Price, which may not be the last sales price. If, on a particular day, an equity security does not trade, the mean between the bid and ask prices will be used, which approximates fair value. Equity securities listed on a foreign exchange are normally valued at the last quoted sales price on the valuation date. US government and agency securities are valued at the mean between the bid and the ask prices, which approximates fair value. Open-end investment companies are valued at their published net asset value (NAV). Other debt securities and credit default swap (CDS) contracts are valued based upon valuations provided by an independent pricing service or broker/counterparty and reviewed by management. To the extent current market prices are not available, the pricing service may take into account developments related to the specific security, as well as transactions in comparable securities. Valuations for fixed income securities utilize matrix systems, which reflect such factors as security prices, yields, maturities, and ratings, and are supplemented by dealer and exchange quotations. For asset-backed securities, collateralized mortgage obligations (CMOs), commercial mortgage securities, and US government agency mortgage securities, pricing vendors utilize matrix pricing which considers prepayment speed, attributes of the collateral, yield or price of
40
Table of Contents
bonds of comparable quality, coupon, maturity, and type as well as broker/dealer-supplied prices. Swap prices are derived using daily swap curves and models that incorporate a number of market data factors, such as discounted cash flows, trades, and values of the underlying reference instruments. Foreign currency exchange contracts are valued at the mean between the bid and ask prices, which approximates fair value. Interpolated values are derived when the settlement date of the contract is an interim date for which quotations are not available. Futures contracts and options on futures contracts are valued at the daily quoted settlement prices. Generally, other securities and assets for which market quotations are not readily available are valued at fair value as determined in good faith under the direction of the Trust’s Board of Trustees (Board). In determining whether market quotations are readily available or fair valuation will be used, various factors will be taken into consideration, such as market closures or suspension of trading in a security. Restricted securities are valued at fair value using methods approved by the Board.
Federal and Foreign Income Taxes — No provision for federal income taxes has been made as the Fund intends to continue to qualify for federal income tax purposes as a regulated investment company under Subchapter M of the Internal Revenue Code of 1986, as amended, and make the requisite distributions to shareholders. The Fund evaluates tax positions taken or expected to be taken in the course of preparing the Fund’s tax returns to determine whether the tax positions are “more-likely-than-not” of being sustained by the applicable tax authority. Tax positions not deemed to meet the “more-likely-than-not” threshold are recorded as a tax benefit or expense in the current year. Management has analyzed the Fund’s tax positions taken or expected to be taken on the Fund’s federal income tax returns through the year ended July 31, 2022, and for all open tax years (years ended July 31, 2019–July 31, 2021), and has concluded that no provision for federal income tax is required in the Fund’s financial statements. In regard to foreign taxes only, the Fund has open tax years in certain foreign countries in which it invests that may date back to the inception of the Fund. If applicable, the Fund recognizes interest accrued on unrecognized tax benefits in interest expense and penalties in “Other” on the “Statement of operations.” During the year ended July 31, 2022, the Fund did not incur any interest or tax penalties.
Class Accounting — Investment income and common expenses are allocated to the various classes of the Fund on the basis of “settled shares” of each class in relation to the net assets of the Fund. Realized and unrealized gain (loss) on investments are allocated to the various classes of the Fund on the basis of daily net assets of each class. Distribution expenses relating to a specific class are charged directly to that class.
To Be Announced Trades (TBA) — The Fund may contract to purchase or sell securities for a fixed price at a transaction date beyond the customary settlement period (examples: when issued, delayed delivery, forward commitment, or TBA transactions) consistent with the Fund’s ability to manage its investment portfolio and meet redemption requests. These transactions involve a commitment by the Fund to purchase or sell securities for a predetermined price or yield with payment and delivery taking place more than three days in the future, or after a period longer than the customary settlement period for that type of security. No interest will be earned
41
Table of Contents
Notes to financial statements
Delaware Strategic Income Fund
1. Significant Accounting Policies (continued)
by the Fund on such purchases until the securities are delivered or the transaction is completed; however, the market value may change prior to delivery.
Foreign Currency Transactions — Transactions denominated in foreign currencies are recorded at the prevailing exchange rates on the valuation date in accordance with the Fund’s prospectus. The value of all assets and liabilities denominated in foreign currencies is translated daily into US dollars at the exchange rate of such currencies against the US dollar. Transaction gains or losses resulting from changes in exchange rates during the reporting period or upon settlement of the foreign currency transaction are reported in operations for the current period. The Fund generally "bifurcates" that portion of realized gains and losses on investments in debt securities which is due to changes in foreign exchange rates from that which is due to changes in market prices of debt securities. That portion of gains (losses), attributable to changes in foreign exchange rates, is included on the “Statement of operations” under “Net realized gain (loss) on foreign currencies.” The Fund reports certain foreign currency related transactions as components of realized gains (losses) for financial reporting purposes, whereas such components are treated as ordinary income (loss) for federal income tax purposes.
Use of Estimates — The preparation of financial statements in conformity with US GAAP requires management to make estimates and assumptions that affect the fair value of investments, the reported amounts of assets and liabilities and disclosure of contingent assets and liabilities at the date of the financial statements, and the reported amounts of revenues and expenses during the reporting period. Actual results could differ from those estimates and the differences could be material.
Other — Expenses directly attributable to the Fund are charged directly to the Fund. Other expenses common to various funds within the Delaware Funds by Macquarie® (Delaware Funds) are generally allocated among such fund on the basis of average net assets. Management fees and certain other expenses are paid monthly. Security transactions are recorded on the date the securities are purchased or sold (trade date) for financial reporting purposes. Costs used in calculating realized gains and losses on the sale of investment securities are those of the specific securities sold. Dividend income is recorded on the ex-dividend date and interest income is recorded on the accrual basis. Income and capital gain distributions from any investment companies (Underlying Funds) in which the Fund invests are recorded on the ex-dividend date. Discounts and premiums on debt securities are accreted or amortized to interest income, respectively, over the lives of the respective securities using the effective interest method. Premiums on callable debt securities are amortized to interest income to the earliest call date using the effective interest method. Realized gains (losses) on paydowns of asset- and mortgage-backed securities are classified as interest income. Withholding taxes and reclaims on foreign dividends and interest have been recorded in accordance with the Fund’s understanding of the applicable country’s tax rules and rates. The Fund may pay foreign capital gains taxes on certain foreign securities held, which are reported as components of realized losses for financial reporting purposes, whereas such components are treated as ordinary loss for federal income
42
Table of Contents
tax purposes. The Fund declares dividends daily from net investment income and pays the dividends monthly and declares and pays distributions from net realized gain on investments, if any, annually. The Fund may distribute more frequently, if necessary for tax purposes. Dividends and distributions, if any, are recorded on the ex-dividend date.
The Fund receives earnings credits from its custodian when positive cash balances are maintained, which may be used to offset custody fees. There were no such earnings credits for the year ended July 31, 2022.
The Fund receives earnings credits from its transfer agent when positive cash balances are maintained, which may be used to offset transfer agent fees. If the amount earned is greater than $1, the expenses paid under this arrangement are included on the “Statement of operations” under “Dividend disbursing and transfer agent fees and expenses” with the corresponding expenses offset included under “Less expenses paid indirectly.” For the year ended July 31, 2022, the Fund earned $293 under this arrangement.
2. Investment Management, Administration Agreements, and Other Transactions with Affiliates
In accordance with the terms of its investment management agreement, the Fund pays Delaware Management Company (DMC), a series of Macquarie Investment Management Business Trust, and the investment manager, an annual fee which is calculated daily and paid monthly at the rates of 0.55% on the first $500 million of average daily net assets of the Fund, 0.50% on the next $500 million, 0.45% on the next $1.5 billion, and 0.425% on average daily net assets in excess of $2.5 billion.
DMC has contractually agreed to waive all or a portion, if any, of its management fee and/or pay/reimburse the Fund to the extent necessary to ensure total annual operating expenses (excluding any distribution and service (12b-1) fees, acquired fund fees and expenses, taxes, interest, short sale dividend and interest expenses, brokerage fees, certain insurance costs, and nonroutine expenses or costs, including, but not limited to, those relating to reorganizations, litigation, conducting shareholder meetings, and liquidations), in order to prevent total fund annual operating expenses from exceeding 0.59% of the Fund���s average daily net assets. This waiver was in effect from August 1, 2021 through July 31, 2022.* These waivers and reimbursements may only be terminated by agreement of DMC and the Fund. The waivers and reimbursement are accrued daily and received monthly.
DMC may seek investment advice and recommendations from its affiliates: Macquarie Investment Management Europe Limited, Macquarie Investment Management Austria Kapitalanlage AG, and Macquarie Investment Management Global Limited (together, the “Affiliated Sub-Advisors”). The Manager may also permit these Affiliated Sub-Advisors to execute Fund security trades on its behalf DMC and exercise investment discretion for securities in certain markets where DMC believes it will be beneficial to utilize an Affiliated Sub-Advisor’s specialized market knowledge. Although the Affiliated Sub-Advisors serve as sub-advisors, DMC
43
Table of Contents
Notes to financial statements
Delaware Strategic Income Fund
2. Investment Management, Administration Agreements, and Other Transactions with Affiliates (continued)
has ultimate responsibility for all investment advisory services. For these services, DMC, not the Fund, pays each Affiliated Sub-Advisor a portion of its investment management fee.
Delaware Investments Fund Services Company (DIFSC), an affiliate of DMC, provides fund accounting and financial administrative oversight services to the Fund. For these services, DIFSC’s fees are calculated daily and paid monthly based on the aggregate daily net assets of all funds within the Delaware Funds at the following annual rates: 0.00475% of the first $35 billion; 0.0040% of the next $10 billion; 0.0025% of the next $45 billion; and 0.0015% of aggregate average daily net assets in excess of $90 billion (Total Fee). The fund in the Delaware Funds pays a minimum of $4,000, which, in aggregate, is subtracted from the Total Fee. the fund then pays its portion of the remainder of the Total Fee on a relative NAV basis. This amount is included on the “Statement of operations” under “Accounting and administration expenses.” For the year ended July 31, 2022, the Fund paid $7,309 for these services.
DIFSC is also the transfer agent and dividend disbursing agent of the Fund. For these services, DIFSC’s fees are calculated daily and paid monthly, based on the aggregate daily net assets of the retail funds within the Delaware Funds at the following annual rates: 0.014% of the first $20 billion; 0.011% of the next $5 billion; 0.007% of the next $5 billion; 0.005% of the next $20 billion; and 0.0025% of average daily net assets in excess of $50 billion. The fees payable to DIFSC under the shareholder services agreement described above are allocated among all retail funds in the Delaware Funds on a relative NAV basis. This amount is included on the “Statement of operations” under “Dividend disbursing and transfer agent fees and expenses.” For the year ended July 31, 2022, the Fund paid $3,547 for these services. Pursuant to a sub-transfer agency agreement between DIFSC and BNY Mellon Investment Servicing (US) Inc. (BNYMIS), BNYMIS provides certain sub-transfer agency services to the Fund. Sub-transfer agency fees are paid by the Fund and are also included on the “Statement of operations” under “Dividend disbursing and transfer agent fees and expenses.” The fees that are calculated daily and paid as invoices are received on a monthly or quarterly basis.
Pursuant to a distribution agreement and distribution plan, the Fund pays DDLP, the distributor and an affiliate of DMC, annual 12b-1 fees of 0.25%, 1.00%, and 0.50% of the average daily net assets of the Class A, Class C, and Class R shares, respectively. The fees are calculated daily and paid monthly. The Board has adopted a formula for calculating 12b-1 fees for the Fund’s Class A shares that went into effect on June 1, 1992. The Fund’s Class A shares are currently subject to a blended 12b-1 fee equal to the sum of: (i) 0.10% of the average daily net assets representing shares acquired prior to June 1, 1992, and (ii) 0.25% of the average daily net assets representing shares acquired on or after June 1, 1992. All Class A shareholders currently bear 12b-1 fees at the same, blended rate currently 0.25% of the average daily net assets based on the formula described above. This method of calculating Class A 12b-1 fees may be discontinued at the sole discretion of the Board. Institutional Class shares do not pay 12b-1 fees.
44
Table of Contents
As provided in the investment management agreement, the Fund bears a portion of the cost of certain resources shared with DMC, including the cost of internal personnel of DMC and/or its affiliates that provide legal and regulatory reporting services to the Fund. For the year ended July 31, 2022, the Fund paid $4,167 for internal legal and regulatory reporting services provided by DMC and/or its affiliates’ employees. This amount is included on the “Statement of operations” under “Legal fees.”
For the year ended July 31, 2022, DDLP earned $3,306 for commissions on sales of the Fund’s Class A shares. For the year ended July 31, 2022, DDLP received gross CDSC commissions of $123 on redemptions of the Fund’s Class A shares, and these commissions were entirely used to offset upfront commissions previously paid by DDLP to broker/dealers on sales of those shares.
Trustees’ fees include expenses accrued by the Fund for each Trustee’s retainer and meeting fees. Certain officers of DMC, DIFSC, and DDLP are officers and/or Trustees of the Trust. These officers and Trustees are paid no compensation by the Fund.
In addition to the management fees and other expenses of the Fund, the Fund indirectly bears the investment management fees and other expenses of any Underlying Funds in which it invests. The amount of these fees and expenses incurred indirectly by the Fund will vary based upon the expense and fee levels of any Underlying Funds and the number of shares that are owned of any Underlying Funds at different times.
____________________
|
| * | The aggregate contractual waiver period covering this report is from November 27, 2020 through November 30, 2022. |
3. Investments
For the year ended July 31, 2022, the Fund made purchases and sales of investment securities other than short-term investments as follows:
| Purchases other than US government securities | | $ | 41,265,558 |
| Purchases of US government securities | | | 21,997,152 |
| Sales other than US government securities | | | 53,827,339 |
| Sales of US government securities | | | 19,049,983 |
The tax cost of investments and derivatives includes adjustments to net unrealized appreciation (depreciation) which may not necessarily be the final tax cost basis adjustments but which approximate the tax basis unrealized gains and losses that may be realized and distributed to shareholders. At July 31, 2022, the cost and unrealized appreciation (depreciation) of investments and derivatives for federal income tax purposes for the Fund were as follows:
| Cost of investments and derivatives | | $ | 106,466,353 | |
| Aggregate unrealized appreciation of investments and derivatives | | $ | 475,880 | |
| Aggregate unrealized depreciation of investments and derivatives | | | (12,295,041 | ) |
| Net unrealized depreciation of investments and derivatives | | $ | (11,819,161 | ) |
45
Table of Contents
Notes to financial statements
Delaware Strategic Income Fund
3. Investments (continued)
US GAAP defines fair value as the price that the Fund would receive to sell an asset or pay to transfer a liability in an orderly transaction between market participants at the measurement date under current market conditions. A three-level hierarchy for fair value measurements has been established based upon the transparency of inputs to the valuation of an asset or liability. Inputs may be observable or unobservable and refer broadly to the assumptions that market participants would use in pricing the asset or liability. Observable inputs reflect the assumptions market participants would use in pricing the asset or liability based on market data obtained from sources independent of the reporting entity. Unobservable inputs reflect the reporting entity’s own assumptions about the assumptions that market participants would use in pricing the asset or liability based on the best information available under the circumstances. The Fund's investment in its entirety is assigned a level based upon the observability of the inputs which are significant to the overall valuation. The three-level hierarchy of inputs is summarized as follows:
| Level 1 – | Inputs are quoted prices in active markets for identical investments. (Examples: equity securities, open-end investment companies, futures contracts, and exchange-traded options contracts) |
| | |
| Level 2 – | Other observable inputs, including, but not limited to: quoted prices for similar assets or liabilities in markets that are active, quoted prices for identical or similar assets or liabilities in markets that are not active, inputs other than quoted prices that are observable for the assets or liabilities (such as interest rates, yield curves, volatilities, prepayment speeds, loss severities, credit risks, and default rates) or other market-corroborated inputs. (Examples: debt securities, government securities, swap contracts, foreign currency exchange contracts, foreign securities utilizing international fair value pricing, broker-quoted securities, and fair valued securities) |
| | |
| Level 3 – | Significant unobservable inputs, including the Fund's own assumptions used to determine the fair value of investments. (Examples: broker-quoted securities and fair valued securities) |
The following table summarizes the valuation of the Fund’s investments by fair value hierarchy levels as of July 31, 2022:
| | Level 1 | | Level 2 | | Total |
| Securities | | | | | | | | | |
| Assets: | | | | | | | | | |
| Agency Collateralized Mortgage Obligations | | $ | — | | $ | 7,739,571 | | $ | 7,739,571 |
| Agency Commercial Mortgage-Backed Securities | | | — | | | 1,899,639 | | | 1,899,639 |
| Common Stock | | | 484,833 | | | — | | | 484,833 |
| Convertible Bonds | | | — | | | 2,215,323 | | | 2,215,323 |
| Corporate Bonds | | | — | | | 48,843,928 | | | 48,843,928 |
| Loan Agreements | | | — | | | 5,680,960 | | | 5,680,960 |
| Municipal Bonds | | | — | | | 730,406 | | | 730,406 |
| Non-Agency Asset-Backed Securities | | | — | | | 3,180,206 | | | 3,180,206 |
46
Table of Contents
| | Level 1 | | | Level 2 | | | Total | |
| Non-Agency Collateralized Mortgage Obligations | | $ | — | | | $ | 6,078,542 | | | $ | 6,078,542 | |
| Non-Agency Commercial Mortgage-Backed Securities | | | — | | | | 1,820,712 | | | | 1,820,712 | |
| Sovereign Bonds | | | — | | | | 6,765,805 | | | | 6,765,805 | |
| Supranational Bank | | | — | | | | 663,300 | | | | 663,300 | |
| US Treasury Obligations | | | — | | | | 7,555,685 | | | | 7,555,685 | |
| Options Purchased | | | — | | | | 1,858 | | | | 1,858 | |
| Short-Term Investments | | | 948,545 | | | | — | | | | 948,545 | |
| Total Value of Securities Before Options Written | | $ | 1,433,378 | | | $ | 93,175,935 | | | $ | 94,609,313 | |
| Liabilities: | | | | | | | | | | | | |
| Options Written | | $ | — | | | $ | (448 | ) | | $ | (448 | ) |
| Derivatives1 | | | | | | | | | | | | |
| Assets: | | | | | | | | | | | | |
| Foreign Currency Exchange Contracts | | $ | — | | | $ | 104,173 | | | $ | 104,173 | |
| Futures Contracts | | | 5,933 | | | | — | | | | 5,933 | |
| Liabilities: | | | | | | | | | | | | |
| Futures Contracts | | $ | (71,779 | ) | | $ | — | | | $ | (71,779 | ) |
| 1 | Foreign currency exchange contracts and futures contracts are valued at the unrealized appreciation (depreciation) on the instrument at the year end. |
During the year ended July 31, 2022, there were no transfers into or out of Level 3 investments. The Fund’s policy is to recognize transfers into or out of Level 3 investments based on fair value at the beginning of the reporting period.
4. Dividend and Distribution Information
Income and long-term capital gain distributions are determined in accordance with federal income tax regulations, which may differ from US GAAP. Additionally, distributions from net gains on foreign currency transactions and net short-term gains on sales of investment securities are treated as ordinary income for federal income tax purposes. The tax character of dividends and distributions paid during the years ended July 31, 2022 and 2021 were as follows:
| | Year ended |
| | 7/31/22 | | 7/31/21 |
| Ordinary income | | $ | 4,011,125 | | $ | 1,740,790 |
| Return of capital | | | — | | | 11,653 |
| Total | | $ | 4,011,125 | | $ | 1,752,443 |
47
Table of Contents
Notes to financial statements
Delaware Strategic Income Fund
5. Components of Net Assets on a Tax Basis
As of July 31, 2022, the components of net assets on a tax basis were as follows:
| Shares of beneficial interest | | $ | 118,968,572 | |
| Undistributed ordinary income | | | 358,012 | |
| Distributions payable | | | (8,635 | ) |
| Capital loss carryforwards* | | | (11,841,943 | ) |
| Unrealized depreciation of investments and foreign currencies | | | (11,819,161 | ) |
| Net assets | | $ | 95,656,845 | |
| * | A portion of the Fund's capital loss carryforward is subject to limitation under the Internal Revenue Code and related regulations. |
The differences between book basis and tax basis components of net assets are primarily attributable to tax deferral of losses on wash sales, tax deferral of losses on straddles, mark-to-market of futures contracts, mark-to-market on foreign currency contracts, tax treatment of market discount and premium on debt instruments, and amortization of premium on callable bonds, and tax treatment of swap contracts.
Qualified late year ordinary and capital losses (including currency and specified gain/loss items) represent losses realized from January 1, 2022 through July 31, 2022 and November 1, 2021 through July 31, 2022, respectively, that, in accordance with federal income tax regulations, the Funds have elected to defer and treat as having arisen in the following fiscal year.
For financial reporting purposes, capital accounts are adjusted to reflect the tax character of permanent book/tax differences. Results of operations and net assets were not affected by these reclassifications. For the year ended July 31, 2022, the Fund recorded the following reclassifications from wash sales and capital loss carryover from merger:
| Paid-in capital | | $ | 6,198,932 | |
| Total distributable earnings (loss) | | | (6,198,932 | ) |
At July 31, 2022, capital loss carryforwards available to offset future realized capital gains, are as follows:
| | Loss carryforward character | | |
| | Short-term | | Long-term | | Total |
| | $3,572,883 | | $8,269,060 | | $11,841,943 |
48
Table of Contents
6. Capital Shares
Transactions in capital shares were as follows:
| | | | Year ended | |
| | | 7/31/22 | | | 7/31/21 | |
| Shares sold: | | | | | | |
| Class A | | 483,856 | | | 424,044 | |
| Class C | | 45,450 | | | 33,262 | |
| Class R | | 1,750 | | | 3,810 | |
| Institutional Class | | 1,333,031 | | | 1,814,888 | |
| Shares from merger:1 | | | | | | |
| Class A | | 8,632,107 | | | — | |
| Institutional Class | | 34,381 | | | — | |
| Shares issued upon reinvestment of dividends and distributions: | | | | | | |
| Class A | | 409,690 | | | 128,338 | |
| Class C | | 4,844 | | | 5,824 | |
| Class R | | 728 | | | 995 | |
| Institutional Class | | 88,088 | | | 60,519 | |
| | | 11,033,925 | | | 2,471,680 | |
| | | | | | | |
| Shares redeemed: | | | | | | |
| Class A | | (2,477,987 | ) | | (469,759 | ) |
| Class C | | (68,900 | ) | | (93,684 | ) |
| Class R | | (2,379 | ) | | (37,023 | ) |
| Institutional Class | | (1,300,456 | ) | | (1,173,750 | ) |
| | | (3,849,722 | ) | | (1,774,216 | ) |
| Net increase | | 7,184,203 | | | 697,464 | |
Certain shareholders may exchange shares of one class for shares of another class in the same Fund. These exchange transactions are included as subscriptions and redemptions in the table above and on the “Statements of changes in net assets.” For the years ended July 31, 2022 and 2021, the Fund had the following exchange transactions:
| | Exchange Redemptions | | Exchange Subscriptions | | | |
| | | | | | | | | | Institutional | | | |
| | Class A | | Class C | | Class A | | Class | | | |
| Year ended | | Shares | | Shares | | Shares | | Shares | | Value |
| 7/31/22 | | | — | | | 1,876 | | 1,879 | | | — | | | $ | 14,169 |
| 7/31/21 | | | 1,630 | | | 11,037 | | 11,065 | | | 1,628 | | | | 108,391 |
49
Table of Contents
Notes to financial statements
Delaware Strategic Income Fund
7. Reorganization
On May 26-27, 2021, the Board approved a proposal to reorganize (the "Reorganization") Delaware Strategic Income II Fund (the "Acquired Fund"), a series of Delaware Group® Equity Funds IV, with and into Delaware Strategic Income Fund (the “Acquiring Fund”), a series of the Trust. Pursuant to an Agreement and Plan of Reorganization (the “Plan”): (i) all of the property, assets, and goodwill of the Acquired Fund were acquired by the Acquiring Fund, and (ii) the Trust, on behalf of the Acquiring Fund, assumed the liabilities of the Acquired Fund, in exchange for shares of the Acquiring Fund. In accordance with the Plan, the Acquired Fund liquidated and dissolved following the Reorganization. The purpose of the transaction was to allow shareholders of the Acquired Fund to own shares of the Acquiring Fund, a Fund with a similar investment objective and style as, and potentially lower net expenses than, the Acquired Fund. The Reorganization was accomplished by a tax-free exchange of shares on September 17, 2021. For financial reporting purposes, assets received and shares issued by the Acquiring Fund were recorded at fair value; however, the cost basis of the investments received from the Acquired Fund was carried forward to align ongoing reporting of the Acquiring Fund's realized and unrealized gains and losses with amounts distributable to shareholders for tax purposes.
The share transactions associated with the Reorganization are as follows:
| | | | | | | Shares | | | | | | | |
| | Acquired | | Acquired | | Converted | | Acquiring | | | | |
| | Fund | | Fund Shares | | to Acquiring | | Fund | | Conversion |
| | Net Assets | | Outstanding | | Fund | | Net Assets | | Ratio |
| | Delaware Strategic Income II | | | | | | | | | |
| | Fund | | Delaware Strategic Income Fund | | | | |
| Class A | | $ | 73,890,835 | | 7,537,916 | | 8,632,107 | | $ | 31,542,679 | | | 1.1452 | |
| Class C | | | — | | — | | — | | | 1,515,878 | | | — | |
| Class R | | | — | | — | | — | | | 169,702 | | | — | |
Institutional
Class | | | 294,650 | | 30,083 | | 34,381 | | | 12,887,521 | | | 1.1429 | |
The net assets of the Acquired Fund before the Reorganization were $46,115,780. The net assets of the Acquiring Fund immediately following the Reorganization were $120,301,265.
Assuming the Reorganization had been completed on August 1, 2021, the Acquiring Fund's pro forma results of operations for the year ended July 31, 2022, would have been as follows:
| Net investment income | | $ | 6,711,383 | |
| Net realized gain on investments | | | 1,329,005 | |
| Net change in unrealized appreciation (depreciation) | | | (14,176,954 | ) |
| Net decrease in net assets resulting from operations | | $ | (6,136,566 | ) |
Because the combined investment portfolios have been managed as a single integrated portfolio since the acquisition was completed, it is not practical to separate the amounts of revenue and
50
Table of Contents
earnings of the Acquired Fund that have been included in the Acquiring Fund’s Statement of Operations since the Reorganization was consummated on September 17, 2021.
8. Line of Credit
The Fund, along with certain other funds in the Delaware Funds (Participants), was a participant in a $225,000,000 revolving line of credit (Agreement) intended to be used for temporary or emergency purposes as an additional source of liquidity to fund redemptions of investor shares. Under the Agreement, the Participants were charged an annual commitment fee of 0.15% with the addition of an upfront fee of 0.05%, which was allocated across the Participants based on a weighted average of the respective net assets of each Participant. The Participants were permitted to borrow up to a maximum of one-third of their net assets under the Agreement. Each Participant was individually, and not jointly, liable for its particular advances, if any, under the line of credit. The line of credit available under the Agreement expired on November 1, 2021.
On November 1, 2021, the Fund, along with the other Participants, entered into an amendment to the agreement for a $355,000,000 revolving line of credit to be used as described above and operates in substantially the same manner as the original Agreement. Under the amendment to the agreement, the Participants are charged an annual commitment fee of 0.15%, with the addition of an upfront fee of 0.05%, which is allocated across the Participants based on a weighted average of the respective net assets of each Participant. The line of credit available under the agreement expires on October 31, 2022.
The Fund had no amounts outstanding as of July 31, 2022, or at any time during the year then ended.
9. Derivatives
US GAAP requires disclosures that enable investors to understand: (1) how and why an entity uses derivatives; (2) how they are accounted for; and (3) how they affect an entity’s results of operations and financial position.
Foreign Currency Exchange Contracts — The Fund may enter into foreign currency exchange contracts and foreign cross currency exchange contracts as a way of managing foreign exchange rate risk. The Fund may enter into these contracts to fix the US dollar value of a security that it has agreed to buy or sell for the period between the date the trade was entered into and the date the security is delivered and paid for. The Fund may also enter into these contracts to hedge the US dollar value of securities it already owns that are denominated in foreign currencies. In addition, the Fund may enter into these contracts to facilitate or expedite the settlement of portfolio transactions. The change in value is recorded as an unrealized gain or loss. When the contract is closed, a realized gain or loss is recorded equal to the difference between the value of the contract at the time it was opened and the value at the time it was closed.
The use of foreign currency exchange contracts and foreign cross currency exchange contracts does not eliminate fluctuations in the underlying prices of the securities, but does establish a rate
51
Table of Contents
Notes to financial statements
Delaware Strategic Income Fund
9. Derivatives (continued)
of exchange that can be achieved in the future. Although foreign currency exchange contracts and foreign cross currency exchange contracts limit the risk of loss due to an unfavorable change in the value of the hedged currency, they also limit any potential gain that might result should the value of the currency change favorably. In addition, the Fund could be exposed to risks if the counterparties to the contracts are unable to meet the terms of their contracts. The Fund's maximum risk of loss from counterparty credit risk is the value of its currency exchanged with the counterparty. The risk is generally mitigated by having a netting arrangement between the Fund and the counterparty and by the posting of collateral by the counterparty to the Fund to cover the Fund's exposure to the counterparty.
At July 31, 2022, the Fund received $100,000 in cash as collateral for open foreign currency exchange contracts, which is presented as “Cash collateral due to brokers” on the “Statement of assets and liabilities.”
During the year ended July 31, 2022, the Fund entered into foreign currency exchange contracts to hedge the US dollar value of securities it already owns that are denominated in foreign currencies to increase/decrease exposure to foreign currencies.
Futures Contracts — A futures contract is an agreement in which the writer (or seller) of the contract agrees to deliver to the buyer an amount of cash or securities equal to a specific dollar amount times the difference between the value of a specific security or index at the close of the last trading day of the contract and the price at which the agreement is made. The Fund may use futures contracts in the normal course of pursuing its investment objective. The Fund may invest in futures contracts to hedge its existing portfolio securities against fluctuations in value caused by changes in interest rates or market conditions. Upon entering into a futures contract, the Fund deposits cash or pledges US government securities to a broker, equal to the minimum “initial margin” requirements of the exchange on which the contract is traded. Subsequent payments are received from the broker or paid to the broker each day, based on the daily fluctuation in the market value of the contract. These receipts or payments are known as “variation margin” and are recorded daily by the Fund as unrealized gains or losses until the contracts are closed. When the contracts are closed, the Fund records a realized gain or loss equal to the difference between the value of the contract at the time it was opened and the value at the time it was closed. Risks of entering into futures contracts include potential imperfect correlation between the futures contracts and the underlying securities and the possibility of an illiquid secondary market for these instruments. When investing in futures, there is reduced counterparty credit risk to the Fund because futures are exchange-traded and the exchange’s clearinghouse, as counterparty to all exchange-traded futures, guarantees against default. At July 31, 2022, the Fund posted $69,328 in cash as collateral for open futures contracts, which is presented as “Cash collateral due from broker” on the “Statement of assets and liabilities.”
During the year ended July 31, 2022, the Fund used futures contracts to hedge the Fund’s existing portfolio securities against fluctuations in value caused by changes in interest rates or market conditions.
52
Table of Contents
Options Contracts — The Fund may enter into options contracts in the normal course of pursuing its investment objective. The Fund may buy or write options contracts for any number of reasons, including without limitation: to manage the Fund's exposure to changes in securities prices caused by interest rates or market conditions and foreign currencies; as an efficient means of adjusting the Fund's overall exposure to certain markets; to protect the value of portfolio securities; and as a cash management tool. The Fund may buy or write call or put options on securities, futures, swaps, swaptions, financial indices, and foreign currencies. When the Fund buys an option, a premium is paid and an asset is recorded and adjusted on a daily basis to reflect the current market value of the option purchased. When the Fund writes an option, a premium is received and a liability is recorded and adjusted on a daily basis to reflect the current market value of the option written. Premiums received from writing options that expire unexercised are treated by the Fund on the expiration date as realized gains. The difference between the premium received and the amount paid on effecting a closing purchase transaction, including brokerage commissions, is treated as realized gain or loss. If a call option is exercised, the premium is added to the proceeds from the sale of the underlying security in determining whether the Fund has a realized gain or loss. If a put option is exercised, the premium reduces the cost basis of the securities purchased by the Fund. The Fund, as writer of an option, bears the market risk of an unfavorable change in the price of the security underlying the written option. When writing options, the Fund is subject to minimal counterparty risk because the counterparty is only obligated to pay premiums and does not bear the market risk of an unfavorable market change.
During the year ended July 31, 2022, the Fund used options contracts to manage the Fund’s exposure to changes in foreign currencies and to adjust the Fund’s overall exposure to certain markets.
At July 31, 2022, the Fund received $30,000 in cash as collateral for options contracts, which is presented as “Cash collateral due to brokers” on the “Statement of assets and liabilities.” Fair values of derivative instruments as of July 31, 2022 were as follows:
| Asset Derivatives Fair Value | |
| | | | | | | Interest | | | | | |
| Statement of Assets and | Currency | | Equity | | Rate | | | | | |
| Liabilities Location | Contracts | | Contracts | | Contracts | | | Total | |
Unrealized appreciation on foreign currency exchange
contracts | $ | 104,173 | | $ | — | | $ | — | | | $ | 104,173 | |
| Variation margin due to broker on futures contracts* | | — | | | — | | | 5,933 | | | | 5,933 | |
| Options purchased** | | — | | | 1,858 | | | — | | | | 1,858 | |
| Total | $ | 104,173 | | $ | 1,858 | | $ | 5,933 | | | $ | 111,964 | |
| | | | | |
| | | | Liability Derivatives Fair Value | |
| | | | | | | Interest | | | | | |
| Statement of Assets and | | | | Equity | | Rate | | | | | |
| Liabilities Location | | | | Contracts | | Contracts | | | Total | |
| Variation margin due to broker on futures contracts* | | | | $ | — | | $ | (71,779 | ) | | $ | (71,779 | ) |
53
Table of Contents
Notes to financial statements
Delaware Strategic Income Fund
9. Derivatives (continued)
| | Liability Derivatives Fair Value | |
| | | | | | Interest | | | | |
| Statement of Assets and | | Equity | | Rate | | | | |
| Liabilities Location | | Contracts | | Contracts | | Total |
| Options written, at value | | $ | (448 | ) | | $ | — | | | $ | (448 | ) |
| Total | | $ | (448 | ) | | $ | (71,779 | ) | | $ | (72,227 | ) |
| * | Includes cumulative appreciation (depreciation) of futures contracts from the date the contracts were opened through July 31, 2022. Only current day variation margin is reported on the “Statement of assets and liabilities.” |
| ** | Included with "Investments, at value." |
The effect of derivative instruments on the “Statement of operations” for the year ended July 31, 2022 was as follows:
| | Net Realized Gain (Loss) on: |
| | Foreign | | | | | | | | | | | | | | |
| | Currency | | | | | | | | | | | | | | |
| | Exchange | | Futures | | Options | | Swap | | | | |
| | Contracts | | Contracts | | Written | | Contracts | | Total |
| Currency | | | | | | | | | | | | | | | | | | |
| contracts | | $ | 635,037 | | $ | — | | | $ | 9,553 | | | $ | — | | $ | 644,590 | |
| Interest rate | | | | | | | | | | | | | | | | | | |
| contracts | | | — | | | 367,834 | | | | — | | | | 60,249 | | | 428,083 | |
| Total | | $ | 635,037 | | $ | 367,834 | | | $ | 9,553 | | | $ | 60,249 | | $ | 1,072,673 | |
| | Net Change in Unrealized Appreciation (Depreciation) on: |
| | Foreign | | | | | | | | | | | | | | | |
| | Currency | | | | | | | | | | | | | | | |
| | Exchange | | Futures | | Options | | Options | | | | |
| | Contracts | | Contracts | | Purchased | | Written | | Total |
| Currency | | | | | | | | | | | | | | | | | | |
| contracts | | $ | 77,254 | | $ | — | | | $ | (61,380 | ) | | $ | 22,862 | | $ | 38,736 | |
| Interest rate | | | | | | | | | | | | | | | | | | |
| contracts | | | — | | | (44,343 | ) | | | — | | | | — | | | (44,343 | ) |
| Total | | $ | 77,254 | | $ | (44,343 | ) | | $ | (61,380 | ) | | $ | 22,862 | | $ | (5,607 | ) |
The table below summarizes the average daily balance of derivative holdings by the Fund during the year ended July 31, 2022:
| | Long Derivative | | Short Derivative |
| | Volume | | Volume |
| Foreign currency exchange contracts (average notional value) | | | $ | 37,037 | | | $ | 4,212,083 |
| Futures contracts (average notional value) | | | | 277,027 | | | | 4,006,533 |
54
Table of Contents
| | Long Derivative | | Short Derivative |
| | Volume | | Volume |
| Options contracts (average notional value)* | | EUR | | | 187,540 | | | | — |
| Options contracts (average notional value)* | | USD | | $ | 10,804 | | | $ | 4,690 |
| * | Long represents purchased options and short represents written options. |
10. Offsetting
The Fund entered into an International Swaps and Derivatives Association, Inc. Master Agreement (ISDA Master Agreement) or a similar agreement with certain of its derivative contract counterparties in order to better define its contractual rights and to secure rights that will help the Fund mitigate its counterparty risk. An ISDA Master Agreement is a bilateral agreement between the Fund and a counterparty that governs over-the-counter (OTC) derivatives and foreign exchange contracts and typically contains, among other things, collateral posting items and netting provisions in the event of a default and/or termination event. Under an ISDA Master Agreement, the Fund may, under certain circumstances, offset with the counterparty certain derivative financial instruments’ payables and/or receivables with collateral held and/or posted and create one single net payment. The provisions of the ISDA Master Agreement typically permit a single net payment in the event of default (close-out), including the bankruptcy or insolvency of the counterparty. However, bankruptcy or insolvency laws of a particular jurisdiction may impose restrictions on or prohibitions against the right of offset in bankruptcy, insolvency, or other events.
For financial reporting purposes, the Fund does not offset derivative assets and derivative liabilities that are subject to netting arrangements on the “Statement of assets and liabilities.”
At July 31, 2022, the Fund had the following assets and liabilities subject to offsetting provisions:
Offsetting of Financial Assets and Liabilities and Derivative Assets and Liabilities
| Delaware Strategic Income Fund | | | | | | | | | | | | | | | | |
| | Gross Value of | | Gross Value of | | | | | |
| Counterparty | | Derivative Asset | | Derivative Liability | | Net Position |
| TD Bank | | | $ | 104,173 | | | | $ | — | | | | | $ | 104,173 | |
| JPMorgan | | | | 22,862 | | | | | (61,380 | ) | | | | | (38,518 | ) |
| | | | | | Fair Value of | | | | | | Fair Value of | | | | | | | | | | | |
| | | | | | Non-Cash | | | | | | Non-Cash | | | | | | | | | | | |
| | | | | | Collateral | | Cash Collateral | | Collateral | | Cash Collateral | | | | | | |
| Counterparty | | Net Position | | Received | | Received | | Pledged | | Pledged | | Net Exposure(a) |
| TD Bank | | $ | 104,173 | | | | $ | — | | | $ | (100,000 | ) | | | $ | — | | | | $ | — | | | | $ | 4,173 | | |
| JPMorgan | | | (38,518 | ) | | | | — | | | | — | | | | | — | | | | | — | | | | | (38,518 | ) | |
| (a) | Net exposure represents the receivable (payable) that would be due from (to) the counterparty in the event of default. |
55
Table of Contents
Notes to financial statements
Delaware Strategic Income Fund
11. Securities Lending
The Fund, along with other funds in Delaware Funds, may lend its securities pursuant to a security lending agreement (Lending Agreement) with The Bank of New York Mellon (BNY Mellon). At the time a security is loaned, the borrower must post collateral equal to the required percentage of the market value of the loaned security, including any accrued interest. The required percentage is: (1) 102% with respect to US securities and foreign securities that are denominated and payable in US dollars; and (2) 105% with respect to foreign securities. With respect to each loan, if on any business day the aggregate market value of securities collateral plus cash collateral held is less than the aggregate market value of the securities which are the subject of such loan, the borrower will be notified to provide additional collateral by the end of the following business day, which, together with the collateral already held, will be not less than the applicable initial collateral requirements for such security loan. If the aggregate market value of securities collateral and cash collateral held with respect to a security loan exceeds the applicable initial collateral requirement, upon the request of the borrower, BNY Mellon must return enough collateral to the borrower by the end of the following business day to reduce the value of the remaining collateral to the applicable initial collateral requirement for such security loan. As a result of the foregoing, the value of the collateral held with respect to a loaned security on any particular day, may be more or less than the value of the security on loan. The collateral percentage with respect to the market value of the loaned security is determined by the security lending agent.
Cash collateral received by each fund of the Trust is generally invested in a series of individual separate accounts, each corresponding to a fund. The investment guidelines permit each separate account to hold certain securities that would be considered eligible securities for a money market fund. Cash collateral received is generally invested in government securities; certain obligations issued by government sponsored enterprises; repurchase agreements collateralized by US Treasury securities; obligations issued by the central government of any Organization for Economic Cooperation and Development (OECD) country or its agencies, instrumentalities, or establishments; obligations of supranational organizations; commercial paper, notes, bonds, and other debt obligations; certificates of deposit, time deposits, and other bank obligations; certain money market funds; and asset-backed securities. The Fund can also accept US government securities and letters of credit (non-cash collateral) in connection with securities loans.
In the event of default or bankruptcy by the lending agent, realization and/or retention of the collateral may be subject to legal proceedings. In the event the borrower fails to return loaned securities and the collateral received is insufficient to cover the value of the loaned securities and provided such collateral shortfall is not the result of investment losses, the lending agent has agreed to pay the amount of the shortfall to the Fund or, at the discretion of the lending agent, replace the loaned securities. The Fund continues to record dividends or interest, as applicable, on the securities loaned and is subject to changes in value of the securities loaned that may occur during the term of the loan. The Fund has the right under the Lending Agreement to recover the securities from the borrower on demand. With respect to security loans collateralized
56
Table of Contents
by non-cash collateral, the Fund receives loan premiums paid by the borrower. With respect to security loans collateralized by cash collateral, the earnings from the collateral investments are shared among the Fund, the security lending agent, and the borrower. The Fund records security lending income net of allocations to the security lending agent and the borrower.
The Fund may incur investment losses as a result of investing securities lending collateral. This could occur if an investment in the collateral investment account defaulted or became impaired. Under those circumstances, the value of the Fund's cash collateral account may be less than the amount the Fund would be required to return to the borrowers of the securities and the Fund would be required to make up for this shortfall.
During the year ended July 31, 2022, the Fund had no securities out on loan.
12. Credit and Market Risk
Beginning in January 2020, global financial markets have experienced and may continue to experience significant volatility resulting from the spread of a novel coronavirus known as COVID-19. The outbreak of COVID-19 has resulted in travel and border restrictions, quarantines, supply chain disruptions, lower consumer demand, and general market uncertainty. The effects of COVID-19 have and may continue to adversely affect the global economy, the economies of certain nations and individual issuers, all of which may negatively impact the Fund's performance.
Beginning in late February 2022, global financial markets have experienced and may continue to experience significant volatility related to military action by Russia in Ukraine. As a result of this military action, the US and many other countries have imposed sanctions on Russia and certain Russian individuals, banks and corporations. The ongoing hostilities and resulting sanctions are expected to have a severe adverse effect on the region’s economies and more globally, including significant negative impact on markets for certain securities and commodities, such as oil and natural gas. Any cessation of trading on the Russian securities markets will impact the value and liquidity of certain portfolio holdings. The extent and duration of military action, sanctions, and resulting market disruptions are impossible to predict, but could be substantial and prolonged and impact the Fund’s performance.
Some countries in which the Fund may invest require governmental approval for the repatriation of investment income, capital, or the proceeds of sales of securities by foreign investors. In addition, if there is deterioration in a country’s balance of payments or for other reasons, a country may impose temporary restrictions on foreign capital remittances abroad.
The securities exchanges of certain foreign markets are substantially smaller, less liquid, and more volatile than the major securities markets in the US. Consequently, acquisition and disposition of securities by the Fund may be inhibited. In addition, a significant portion of the aggregate market value of equity securities listed on the major securities exchanges in emerging markets is held by a smaller number of investors. This may limit the number of shares available for acquisition or disposition by the Fund.
57
Table of Contents
Notes to financial statements
Delaware Strategic Income Fund
12. Credit and Market Risk (continued)
The Fund invests a portion of its assets in high yield fixed income securities, which are securities rated lower than BBB- by Standard & Poor’s Financial Services LLC and lower than Baa3 by Moody’s Investors Service, Inc., or similarly rated by another nationally recognized statistical rating organization. Investments in these higher yielding securities are generally accompanied by a greater degree of credit risk than higher rated securities. Additionally, lower rated securities may be more susceptible to adverse economic and competitive industry conditions than investment grade securities.
The Fund invests in fixed income securities whose value is derived from an underlying pool of mortgages or consumer loans. The value of these securities is sensitive to changes in economic conditions, including delinquencies and/or defaults, and may be adversely affected by shifts in the market’s perception of the issuers and changes in interest rates. Investors receive principal and interest payments as the underlying mortgages and consumer loans are paid back. Some of these securities are CMOs. CMOs are debt securities issued by US government agencies or by financial institutions and other mortgage lenders, which are collateralized by a pool of mortgages held under an indenture. Prepayment of mortgages may shorten the stated maturity of the obligations and can result in a loss of premium, if any has been paid. Certain of these securities may be stripped (securities which provide only the principal or interest feature of the underlying security). The yield to maturity on an interest-only CMO is extremely sensitive not only to changes in prevailing interest rates, but also to the rate of principal payments (including prepayments) on the related underlying mortgage assets. A rapid rate of principal payments may have a material adverse effect on the Fund’s yield to maturity. If the underlying mortgage assets experience greater than anticipated prepayments of principal, the Fund may fail to fully recoup its initial investment in these securities even if the securities are rated in the highest rating categories.
The Fund invests in certain obligations that may have liquidity protection designed to ensure that the receipt of payments due on the underlying security is timely. Such protection may be provided through guarantees, insurance policies, or letters of credit obtained by the issuer or sponsor through third parties, through various means of structuring the transaction, or through a combination of such approaches. The Fund will not pay any additional fees for such credit support, although the existence of credit support may increase the price of a security.
The Fund invests in bank loans and other securities that may subject it to direct indebtedness risk, the risk that the Fund will not receive payment of principal, interest, and other amounts due in connection with these investments and will depend primarily on the financial condition of the borrower. Loans that are fully secured offer the Fund more protection than unsecured loans in the event of nonpayment of scheduled interest or principal, although there is no assurance that the liquidation of collateral from a secured loan would satisfy the corporate borrower’s obligation, or that the collateral can be liquidated. Some loans or claims may be in default at the time of purchase. Certain of the loans and the other direct indebtedness acquired by the Fund may involve revolving credit facilities or other standby financing commitments that obligate the Fund
58
Table of Contents
to pay additional cash on a certain date or on demand. These commitments may require the Fund to increase its investment in a company at a time when the Fund might not otherwise decide to do so (including at a time when the company’s financial condition makes it unlikely that such amounts will be repaid). To the extent that the Fund is committed to advance additional funds, it will at all times hold and maintain cash or other high grade debt obligations in an amount sufficient to meet such commitments. When a loan agreement is purchased, the Fund may pay an assignment fee. On an ongoing basis, the Fund may receive a commitment fee based on the undrawn portion of the underlying line of credit portion of a loan agreement. Prepayment penalty fees are received upon the prepayment of a loan agreement by a borrower. Prepayment penalty, facility, commitment, consent and amendment fees are recorded to income as earned or paid.
As the Fund may be required to rely upon another lending institution to collect and pass on to the Fund amounts payable with respect to the loan and to enforce the Fund’s rights under the loan and other direct indebtedness, an insolvency, bankruptcy, or reorganization of the lending institution may delay or prevent the Fund from receiving such amounts. The highly leveraged nature of many loans may make them especially vulnerable to adverse changes in economic or market conditions. Investments in such loans and other direct indebtedness may involve additional risk to the Fund.
When interest rates rise, fixed income securities (i.e. debt obligations) generally will decline in value. These declines in value are greater for fixed income securities with longer maturities or durations.
IBOR risk is the risk that changes related to the use of the London interbank offered rate (LIBOR) and other interbank offered rate (collectively, "IBORs") could have adverse impacts on financial instruments that reference LIBOR (or the corresponding IBOR). The abandonment of LIBOR could affect the value and liquidity of instruments that reference LIBOR. The use of alternative reference rate products may impact investment strategy performance. These risks may also apply with respect to changes in connection with other IBORs, such as the euro overnight index average (EONIA), which are also the subject of recent reform.
The Fund may invest up to 15% of its net assets in illiquid securities, which may include securities with contractual restrictions on resale, securities exempt from registration under Rule 144A promulgated under the Securities Act of 1933, as amended, and other securities which may not be readily marketable. The relative illiquidity of these securities may impair the Fund from disposing of them in a timely manner and at a fair price when it is necessary or desirable to do so. While maintaining oversight, the Board has delegated to DMC the day-to-day functions of determining whether individual securities are liquid for purposes of the Fund’s limitation on investments in illiquid securities. Securities eligible for resale pursuant to Rule 144A, which are determined to be liquid, are not subject to the Fund’s 15% limit on investments in illiquid securities. Rule 144A securities have been identified on the “Schedule of investments.”
59
Table of Contents
Notes to financial statements
Delaware Strategic Income Fund
13. Contractual Obligations
The Fund enters into contracts in the normal course of business that contain a variety of indemnifications. The Fund's maximum exposure under these arrangements is unknown. However, the Fund has not had prior claims or losses pursuant to these contracts. Management has reviewed the Fund's existing contracts and expects the risk of loss to be remote.
14. Recent Accounting Pronouncements
In March 2020, FASB issued an Accounting Standards Update (ASU), ASU 2020-04, Reference Rate Reform (Topic 848) – Facilitation of the Effects of Reference Rate Reform on Financial Reporting. The amendments in ASU 2020-04 provide optional temporary financial reporting relief from the effect of certain types of contract modifications due to the planned discontinuation of LIBOR and other interbank-offered based reference rates as of the end of 2021. In March 2021, the administrator for LIBOR announced the extension of the publication of a majority of the USD LIBOR settings to June 30, 2023. ASU 2020-04 is effective for certain reference rate-related contract modifications that occur during the period March 12, 2020 through December 31, 2022. As of the financial reporting period, Management is evaluating the impact of applying this ASU.
15. Subsequent Events
Management has determined that no material events or transactions occurred subsequent to July 31, 2022, that would require recognition or disclosure in the Fund's financial statements.
60
Table of Contents
Report of independent
registered public accounting firm
To the Board of Trustees of Delaware Group® Government Fund and Shareholders of Delaware Strategic Income Fund
Opinion on the Financial Statements
We have audited the accompanying statement of assets and liabilities, including the schedule of investments, of Delaware Strategic Income Fund (one of the funds constituting Delaware Group® Government Fund, referred to hereafter as the “Fund”) as of July 31, 2022, the related statement of operations for the year ended July 31, 2022, the statements of changes in net assets for each of the two years in the period ended July 31, 2022, including the related notes, and the financial highlights for each of the five years in the period ended July 31, 2022 (collectively referred to as the “financial statements”). In our opinion, the financial statements present fairly, in all material respects, the financial position of the Fund as of July 31, 2022, the results of its operations for the year then ended, the changes in its net assets for each of the two years in the period ended July 31, 2022 and the financial highlights for each of the five years in the period ended July 31, 2022 in conformity with accounting principles generally accepted in the United States of America.
Basis for Opinion
These financial statements are the responsibility of the Fund’s management. Our responsibility is to express an opinion on the Fund’s financial statements based on our audits. We are a public accounting firm registered with the Public Company Accounting Oversight Board (United States) (PCAOB) and are required to be independent with respect to the Fund in accordance with the U.S. federal securities laws and the applicable rules and regulations of the Securities and Exchange Commission and the PCAOB.
We conducted our audits of these financial statements in accordance with the standards of the PCAOB. Those standards require that we plan and perform the audit to obtain reasonable assurance about whether the financial statements are free of material misstatement, whether due to error or fraud.
Our audits included performing procedures to assess the risks of material misstatement of the financial statements, whether due to error or fraud, and performing procedures that respond to those risks. Such procedures included examining, on a test basis, evidence regarding the amounts and disclosures in the financial statements. Our audits also included evaluating the accounting principles used and significant estimates made by management, as well as evaluating the overall presentation of the financial statements. Our procedures included confirmation of securities owned as of July 31, 2022 by correspondence with the custodian, transfer agents, agent banks and brokers; when replies were not received from agent banks, we performed other auditing procedure. We believe that our audits provide a reasonable basis for our opinion.
/s/PricewaterhouseCoopers LLP
Philadelphia, Pennsylvania
September 16, 2022
We have served as the auditor of one or more investment companies in Delaware Funds by Macquarie® since 2010.
61
Table of Contents
Other Fund information (Unaudited)
Delaware Strategic Income Fund
Liquidity Risk Management Program
The Securities and Exchange Commission (the “SEC”) has adopted Rule 22e-4 under the Investment Company Act of 1940 (the “Liquidity Rule”), which requires all open-end funds (other than money market funds) to adopt and implement a program reasonably designed to assess and manage the fund’s “liquidity risk,” defined as the risk that the fund could not meet requests to redeem shares issued by the fund without significant dilution of remaining investors’ interests in the fund.
The Fund has adopted and implemented a liquidity risk management program in accordance with the Liquidity Rule (the “Program”). The Board has designated a member of the US Operational Risk Group of Macquarie Asset Management as the Program Administrator for each Fund in the Trust.
As required by the Liquidity Rule, the Program includes policies and procedures that provide for: (1) assessment, management, and review (no less frequently than annually) of the Fund’s liquidity risk; (2) classification of each of the Fund’s portfolio holdings into one of four liquidity categories (Highly Liquid, Moderately Liquid, Less Liquid, and Illiquid); (3) for funds that do not primarily hold assets that are Highly Liquid, establishing and maintaining a minimum percentage of the Fund’s net assets in Highly Liquid investments (called a “Highly Liquid Investment Minimum” or “HLIM”); and (4) prohibiting the Fund’s acquisition of Illiquid investments if, immediately after the acquisition, the Fund would hold more than 15% of its net assets in Illiquid assets. The Program also requires reporting to the SEC (on a non-public basis) and to the Board if the Fund’s holdings of Illiquid assets exceed 15% of the Fund’s net assets. Funds with HLIMs must have procedures for addressing HLIM shortfalls, including reporting to the Board and, with respect to HLIM shortfalls lasting more than seven consecutive calendar days, reporting to the SEC (on a non-public basis).
In assessing and managing the Fund’s liquidity risk, the Program Administrator considers, as relevant, a variety of factors, including: (1) the Fund’s investment strategy and liquidity of portfolio investments during both normal and reasonably foreseeable stressed conditions; (2) short-term and long-term cash flow projections for the Fund during both normal and reasonably foreseeable stressed conditions; and (3) the Fund’s holdings of cash and cash equivalents and any borrowing arrangements. Classification of the Fund’s portfolio holdings in the four liquidity categories is based on the number of days it is reasonably expected to take to convert the investment to cash (for Highly Liquid and Moderately Liquid holdings) or to sell or dispose of the investment (for Less Liquid and Illiquid investments), in current market conditions without significantly changing the investment’s market value. The Fund primarily holds assets that are classified as Highly Liquid, and therefore is not required to establish an HLIM.
At a meeting of the Board held on May 17-19, 2022, the Program Administrator provided the required written annual report to the Board addressing the Program’s operation and assessing the adequacy and effectiveness of its implementation for the period from April 1, 2021 through March 31, 2022. The report concluded that the Program is appropriately designed and effectively implemented and that it meets the requirements of Rule 22e-4 and the Fund’s liquidity needs. The Fund’s HLIM is set at an appropriate level and the Fund complied with its HLIM at all times during the reporting period.
62
Table of Contents
Tax Information
The information set forth below is for the Fund’s fiscal year as required by federal income tax laws. Shareholders, however, must report distributions on a calendar year basis for income tax purposes, which may include distributions for portions of two fiscal years of the Fund.
Accordingly, the information needed by shareholders for income tax purposes will be sent to them in January of each year. Please consult your tax advisor for proper treatment of this information. All disclosures are based on financial information available as of the date of this annual report and, accordingly are subject to change. For any and all items requiring reporting, it is the intention of the Fund to report the maximum amount permitted under the Internal Revenue Code and the regulations thereunder.
For the fiscal year ended July 31, 2022, the Fund reports distributions paid during the year as follows:
| (A) Ordinary Income Distributions (Tax Basis) | | 100.00% |
| Total Distributions (Tax Basis) | | 100.00% |
____________________
|
| (A) | is based on a percentage of the Fund's total distributions. |
The percentage of the ordinary dividends reported by the fund that is treated as a Section 163(j) interest dividend and thus is eligible to be treated as interest income for purposes of Section 163(j) and the regulations thereunder is 100.00%.
63
Table of Contents
Board of trustees / directors and officers addendum
Delaware Funds by Macquarie®
A mutual fund is governed by a Board of Trustees/Directors (“Trustees”), which has oversight responsibility for the management of a fund’s business affairs. Trustees establish procedures and oversee and review the performance of the investment manager, the distributor, and others who perform services for the fund. The independent fund trustees, in particular, are advocates for shareholder interests. Each trustee has served in that capacity since he or she was elected to or appointed to the Board of Trustees, and will continue to serve until his or her retirement or the election of a new trustee in his or her place. The following is a list of the Trustees and Officers with certain background and related information.
| | | | | | | | | | Other |
| | | | | | Number of | | Principal | | Directorships |
| Name, | | Position(s) | | | | Funds in Fund | | Occupation(s) | | Held by Trustee |
| Address, | | Held with | | Length of Time | | Complex Overseen | | During the | | During the |
| and Birth Date | | the Trust | | Served | | by Trustee | | Past Five Years | | Past Five Years |
| Interested Trustee | | | | | | | | | | |
| | | | | | | | | | | |
| Shawn K. Lytle1 | | President, | | President and | | 128 | | Macquarie Asset | | None |
| 100 Independence | | Chief Executive | | Chief Executive | | | | Management2 | | |
| 610 Market Street | | Officer, | | Officer | | | | (2015–Present) | | |
| Philadelphia, PA | | and Trustee | | since August 2015 | | | | -Global Head of | | |
| 19106-2354 | | | | | | | | Macquarie Asset | | |
| February 1970 | | | | Trustee since | | | | Management | | |
| | | | September 2015 | | | | (2019–Present) | | |
| | | | | | | | -Head of Americas of | | |
| | | | | | | | Macquarie Group | | |
| | | | | | | | (2017–Present) | | |
| | | | | | | | -Deputy Global Head of | | |
| | | | | | | | Macquarie Asset | | |
| | | | | | | | Management | | |
| | | | | | | | (2017–2019) | | |
| | | | | | | | -Head of Macquarie | | |
| | | | | | | | Asset Management | | |
| | | | | | | | Americas (2015–2017) | | |
64
Table of Contents
| | | | | | | | | | Other |
| | | | | | Number of | | Principal | | Directorships |
| Name, | | Position(s) | | | | Funds in Fund | | Occupation(s) | | Held by Trustee |
| Address, | | Held with | | Length of Time | | Complex Overseen | | During the | | During the |
| and Birth Date | | the Trust | | Served | | by Trustee | | Past Five Years | | Past Five Years |
| Independent Trustees | | | | | | | | | | |
| | | | | | | | | | | |
| Jerome D. | | Trustee | | Since January 2019 | | 128 | | Stonebrook Capital | | None |
| Abernathy | | | | | | | | Management, LLC | | |
| 100 Independence | | | | | | | | (financial | | |
| 610 Market Street | | | | | | | | technology: macro | | |
| Philadelphia, PA | | | | | | | | factors and databases) | | |
| 19106-2354 | | | | | | | | -Managing Member | | |
| July 1959 | | | | | | | | (1993-Present) | | |
| | | | | | | | | | | |
| Thomas L. Bennett | | Chair and Trustee | | Trustee since March | | 128 | | Private Investor | | None |
| 100 Independence | | | | 2005 | | | | (2004–Present) | | |
| 610 Market Street | | | | | | | | | | |
| Philadelphia, PA | | | | Chair since March | | | | | | |
| 19106-2354 | | | | 2015 | | | | | | |
| October 1947 | | | | | | | | | | |
| | | | | | | | | | | |
| Ann D. Borowiec | | Trustee | | Since March 2015 | | 128 | | J.P. Morgan Chase & Co. | | Banco Santander International |
| 100 Independence | | | | | | | | (1987-2013) | | (2016–2019) |
| 610 Market Street | | | | | | | | -Chief Executive Officer, | | Santander Bank, N.A. |
| Philadelphia, PA | | | | | | | | Private Wealth | | (2016-2019) |
| 19106-2354 | | | | | | | | Management | | |
| November 1958 | | | | | | | | (2011–2013) | | |
65
Table of Contents
Board of trustees / directors and officers addendum
Delaware Funds by Macquarie®
| | | | | | | | | | Other |
| | | | | | Number of | | Principal | | Directorships |
| Name, | | Position(s) | | | | Funds in Fund | | Occupation(s) | | Held by Trustee |
| Address, | | Held with | | Length of Time | | Complex Overseen | | During the | | During the |
| and Birth Date | | the Trust | | Served | | by Trustee | | Past Five Years | | Past Five Years |
| | | | | | | | | | | |
| Joseph W. Chow | | Trustee | | Since January 2013 | | 128 | | Private Investor | | None |
| 100 Independence | | | | | | | | (2011–Present) | | |
| 610 Market Street | | | | | | | | | | |
| Philadelphia, PA | | | | | | | | | | |
| 19106-2354 | | | | | | | | | | |
| January 1953 | | | | | | | | | | |
| | | | | | | | | | | |
| H. Jeffrey Dobbs3 | | Trustee | | Since December 2021 | | 128 | | KPMG LLP | | TechAccel LLC |
| 100 Independence | | | | | | | | (2010-2015) | | (2015–Present) |
| 610 Market Street | | | | | | | | -Global Sector Chairman, | | PatientsVoices, Inc. |
| Philadelphia, PA | | | | | | | | Industrial Manufacturing | | (2018–Present) |
| 19106-2354 | | | | | | | | (2010-2015) | | Valparaiso University Board |
| May 1955 | | | | | | | | | | (2012-Present) |
| | | | | | | | | | Ivy Funds Complex (2019-2021) |
66
Table of Contents
| | | | | | | | | | Other |
| | | | | | Number of | | Principal | | Directorships |
| Name, | | Position(s) | | | | Funds in Fund | | Occupation(s) | | Held by Trustee |
| Address, | | Held with | | Length of Time | | Complex Overseen | | During the | | During the |
| and Birth Date | | the Trust | | Served | | by Trustee | | Past Five Years | | Past Five Years |
| | | | | | | | | | | |
| John A. Fry | | Trustee | | Since January 2001 | | 128 | | Drexel University | | Federal Reserve |
| 100 Independence | | | | | | | | -President | | Bank of Philadelphia |
| 610 Market Street | | | | | | | | (August 2010–Present) | | (2020–Present) |
| Philadelphia, PA | | | | | | | | | | FS Credit Real Estate Income |
| 19106-2354 | | | | | | | | | | Trust, Inc. (2018–Present) |
| May 1960 | | | | | | | | | | vTv Therapeutics Inc. |
| | | | | | | | | | (2017–Present) |
| | | | | | | | | | Community Health Systems |
| | | | | | | | | | (2004–Present) |
| | | | | | | | | | Drexel Morgan & Co. |
| | | | | | | | | | (2015–2019) |
67
Table of Contents
Board of trustees / directors and officers addendum
Delaware Funds by Macquarie®
| | | | | | | | | | Other |
| | | | | | Number of | | Principal | | Directorships |
| Name, | | Position(s) | | | | Funds in Fund | | Occupation(s) | | Held by Trustee |
| Address, | | Held with | | Length of Time | | Complex Overseen | | During the | | During the |
| and Birth Date | | the Trust | | Served | | by Trustee | | Past Five Years | | Past Five Years |
| | | | | | | | | | | |
| Joseph Harroz, Jr.3 | | Trustee | | Since December 2021 | | 128 | | University of Oklahoma | | OU Medicine, Inc. |
| 100 Independence | | | | | | | | -President | | (2020–Present) |
| 610 Market Street | | | | | | | | (2020–Present) | | Big 12 Athletic Conference |
| Philadelphia, PA | | | | | | | | -Interim President | | (2019-Present) |
| 19106-2354 | | | | | | | | (2019–2020) | | Valliance Bank |
| January 1967 | | | | | | | | -Vice President and | | (2007–Present) |
| | | | | | | | Dean, College of Law | | Ivy Funds |
| | | | | | | | (2010–2019) | | (1998-2021) |
| | | | | | | | Brookhaven Investments | | |
| | | | | | | | LLC (commercial | | |
| | | | | | | | enterprises) | | |
| | | | | | | | -Managing Member | | |
| | | | | | | | (2019–Present) | | |
| | | | | | | | St. Clair, LLC | | |
| | | | | | | | (commercial enterprises) | | |
| | | | | | | | -Managing Member | | |
| | | | | | | | (2019–Present) | | |
68
Table of Contents
| | | | | | | | | | Other |
| | | | | | Number of | | Principal | | Directorships |
| Name, | | Position(s) | | | | Funds in Fund | | Occupation(s) | | Held by Trustee |
| Address, | | Held with | | Length of Time | | Complex Overseen | | During the | | During the |
| and Birth Date | | the Trust | | Served | | by Trustee | | Past Five Years | | Past Five Years |
| | | | | | | | | | | |
| Sandra A.J. | | Trustee | | Since December 2021 | | 128 | | Children’s Mercy | | Brixmor Property Group Inc. |
| Lawrence3 | | | | | | | | Hospitals and Clinics | | (2021-Present) |
| 100 Independence | | | | | | | | (2005–2019) | | Sera Prognostics Inc. |
| 610 Market Street | | | | | | | | -Chief Administrative | | (biotechnology) (2021-Present) |
| Philadelphia, PA | | | | | | | | Officer | | Recology (resource recovery) |
| 19106-2354 | | | | | | | | (2016–2019) | | (2021-Present) |
| September 1957 | | | | | | | | | | Evergy, Inc., Kansas City Power |
| | | | | | | | | | & Light Company, KCP&L |
| | | | | | | | | | Greater Missouri Operations |
| | | | | | | | | | Company, Westar Energy, Inc. |
| | | | | | | | | | and Kansas Gas and Electric |
| | | | | | | | | | Company (related utility |
| | | | | | | | | | companies) (2018-Present) |
| | | | | | | | | | National Association of Corporate |
| | | | | | | | | | Directors (2017-Present) |
| | | | | | | | | | Ivy Funds Complex (2019-2021) |
| | | | | | | | | | American Shared Hospital |
| | | | | | | | | | Services (medical device) |
| | | | | | | | | | (2017-2021) |
| | | | | | | | | | Ivy NextShares (2019) |
| | | | | | | | | | Westar Energy (utility) |
| | | | | | | | | | (2004-2018) |
69
Table of Contents
Board of trustees / directors and officers addendum
Delaware Funds by Macquarie®
| | | | | | | | | | Other |
| | | | | | Number of | | Principal | | Directorships |
| Name, | | Position(s) | | | | Funds in Fund | | Occupation(s) | | Held by Trustee |
| Address, | | Held with | | Length of Time | | Complex Overseen | | During the | | During the |
| and Birth Date | | the Trust | | Served | | by Trustee | | Past Five Years | | Past Five Years |
| | | | | | | | | | | |
| Frances A. | | Trustee | | Since September | | 128 | | Banco Itaú International | | Florida Chapter of National |
| Sevilla-Sacasa | | | | 2011 | | | | -Chief Executive Officer | | Association of Corporate |
| 100 Independence | | | | | | | | (2012–2016) | | Directors (2021-Present) |
| 610 Market Street | | | | | | | | | | Callon Petroleum Company |
| Philadelphia, PA | | | | | | | | | | (2019-Present) |
| 19106-2354 | | | | | | | | | | Camden Property Trust |
| January 1956 | | | | | | | | | | (2011-Present) |
| | | | | | | | | | New Senior Investment |
| | | | | | | | | | Group Inc. (2021) |
| | | | | | | | | | Carrizo Oil & Gas, Inc. |
| | | | | | | | | | (2018-2019) |
| | | | | | | | | | | |
| Thomas K. Whitford | | Trustee | | Since January 2013 | | 128 | | PNC Financial Services | | HSBC USA Inc. |
| 100 Independence | | | | | | | | Group (1983–2013) | | (2014–Present) |
| 610 Market Street | | | | | | | | -Vice Chairman | | HSBC North America |
| Philadelphia, PA | | | | | | | | (2009-2013) | | Holdings Inc. |
| 19106-2354 | | | | | | | | | | (2013–Present) |
| March 1956 | | | | | | | | | | HSBC Finance Corporation |
| | | | | | | | | | (2013–2018) |
70
Table of Contents
| | | | | | | | | | Other |
| | | | | | Number of | | Principal | | Directorships |
| Name, | | Position(s) | | | | Funds in Fund | | Occupation(s) | | Held by Trustee |
| Address, | | Held with | | Length of Time | | Complex Overseen | | During the | | During the |
| and Birth Date | | the Trust | | Served | | by Trustee | | Past Five Years | | Past Five Years |
| | | | | | | | | | | |
| Christianna Wood | | Trustee | | Since January 2019 | | 128 | | Gore Creek | | The Merger Fund |
| 100 Independence | | | | | | | | Capital, Ltd. | | (2013–2021), |
| 610 Market Street | | | | | | | | -Chief Executive Officer | | The Merger Fund VL |
| Philadelphia, PA | | | | | | | | and President | | (2013–2021), |
| 19106-2354 | | | | | | | | (2009–Present) | | WCM Alternatives: Event-Driven |
| August 1959 | | | | | | | | | | Fund (2013–2021), |
| | | | | | | | | | and WCM Alternatives: Credit |
| | | | | | | | | | Event Fund (2017–2021) |
| | | | | | | | | | Grange Insurance |
| | | | | | | | | | (2013–Present) |
| | | | | | | | | | H&R Block Corporation |
| | | | | | | | | | (2008–Present) |
71
Table of Contents
Board of trustees / directors and officers addendum
Delaware Funds by Macquarie®
| | | | | | | | | | Other |
| | | | | | Number of | | Principal | | Directorships |
| Name, | | Position(s) | | | | Funds in Fund | | Occupation(s) | | Held by Trustee |
| Address, | | Held with | | Length of Time | | Complex Overseen | | During the | | During the |
| and Birth Date | | the Trust | | Served | | by Trustee | | Past Five Years | | Past Five Years |
| | | | | | | | | | | |
| Janet L. Yeomans | | Trustee | | Since April 1999 | | 128 | | 3M Company | | Okabena Company (2009–2017) |
| 100 Independence | | | | | | | | (1995-2012) | | |
| 610 Market Street | | | | | | | | -Vice President and | | |
| Philadelphia, PA | | | | | | | | Treasurer (2006–2012) | | |
| 19106-2354 | | | | | | | | | | |
| July 1948 | | | | | | | | | | |
| | | | | | | | | | | |
| Officers | | | | | | | | | | |
| | | | | | | | | | | |
| David F. Connor | | Senior Vice President, | | Senior Vice President, | | 128 | | David F. Connor has | | None4 |
| 100 Independence | | General Counsel, and | | since May 2013; | | | | served in various | | |
| 610 Market Street | | Secretary | | General Counsel | | | | capacities at different | | |
| Philadelphia, PA | | | | since May 2015; | | | | times at Macquarie Asset | | |
| 19106-2354 | | | | Secretary since | | | | Management. | | |
| December 1963 | | | | October 2005 | | | | | | |
| | | | | | | | | | | |
| Daniel V. Geatens | | Senior Vice President | | Senior Vice President | | 128 | | Daniel V. Geatens has | | None4 |
| 100 Independence | | and Treasurer | | and Treasurer since | | | | served in various | | |
| 610 Market Street | | | | October 2007 | | | | capacities at different | | |
| Philadelphia, PA | | | | | | | | times at Macquarie Asset | | |
| 19106-2354 | | | | | | | | Management. | | |
| October 1972 | | | | | | | | | | |
72
Table of Contents
| | | | | | | | | | Other |
| | | | | | Number of | | Principal | | Directorships |
| Name, | | Position(s) | | | | Funds in Fund | | Occupation(s) | | Held by Trustee |
| Address, | | Held with | | Length of Time | | Complex Overseen | | During the | | During the |
| and Birth Date | | the Trust | | Served | | by Trustee | | Past Five Years | | Past Five Years |
| | | | | | | | | | | |
| Richard Salus | | Senior Vice President | | Senior Vice President | | 128 | | Richard Salus has | | None |
| 100 Independence | | and Chief Financial | | and Chief Financial | | | | served in various | | |
| 610 Market Street | | Officer | | Officer since | | | | capacities at different | | |
| Philadelphia, PA | | | | November 2006 | | | | times at Macquarie Asset | | |
| 19106-2354 | | | | | | | | Management. | | |
| October 1963 | | | | | | | | | | |
| 1 | Shawn K. Lytle is considered to be an “Interested Trustee” because he is an executive officer of the Fund’s(s’) investment advisor. |
| 2 | Macquarie Asset Management is the marketing name for Macquarie Management Holdings, Inc. and its subsidiaries, including the Fund’s(s’) investment advisor, principal underwriter, and its transfer agent. |
| 3 | Messrs. Dobbs and Harroz and Ms. Lawrence were elected as Trustees of the Trust effective December 17, 2021. |
| 4 | David F. Connor and Daniel V. Geatens serve in similar capacities for the six portfolios of the Optimum Fund Trust, which have the same investment advisor, principal underwriter, and transfer agent as the registrant. Mr. Geatens also serves as the Chief Financial Officer of the Optimum Fund Trust and he is the Chief Financial Officer and Treasurer for Macquarie Global Infrastructure Total Return Fund Inc. |
The Statement of Additional Information for the Fund(s) includes additional information about the Trustees and Officers and is available, without charge, upon request by calling 800 523-1918.
73
Table of Contents
About the organization
| Board of trustees | | | | | | |
Shawn K. Lytle
President and
Chief Executive Officer
Delaware Funds
by Macquarie® Jerome D. Abernathy
Managing Member
Stonebrook Capital
Management, LLC Thomas L. Bennett
Chairman of the Board
Delaware Funds
by Macquarie
Private Investor | | Ann D. Borowiec
Former Chief Executive
Officer
Private Wealth Management
J.P. Morgan Chase & Co. Joseph W. Chow
Private Investor H. Jeffrey Dobbs
Former Global Sector
Chairman
Industrial Manufacturing,
KPMG, LLP | | John A. Fry
President
Drexel University Joseph Harroz, Jr.
President
University of Oklahoma Sandra A.J. Lawrence
Former Chief Administrative
Officer
Children's Mercy Hospitals
and Clinics | | Frances A.
Sevilla-Sacasa
Former Chief Executive
Officer
Banco Itaú International Thomas K. Whitford
Former Vice Chairman
PNC Financial Services
Group Christianna Wood
Chief Executive Officer
and President
Gore Creek Capital, Ltd. Janet L. Yeomans
Former Vice President and
Treasurer
3M Company |
| | | | | | | |
| Affiliated officers | | | | | | |
David F. Connor
Senior Vice President,
General Counsel,
and Secretary
Delaware Funds
by Macquarie | | Daniel V. Geatens
Senior Vice President and
Treasurer
Delaware Funds
by Macquarie | | Richard Salus
Senior Vice President and
Chief Financial Officer
Delaware Funds
by Macquarie | | |
This annual report is for the information of Delaware Strategic Income Fund shareholders, but it may be used with prospective investors when preceded or accompanied by the Delaware Fund fact sheet for the most recently completed calendar quarter. These documents are available at delawarefunds.com/literature. |
The Fund files its complete schedule of portfolio holdings with the Securities and Exchange Commission (SEC) for the first and third quarters of each fiscal year on Form N-PORT. The Fund’s Forms N-PORT, as well as a description of the policies and procedures that the Fund uses to determine how to vote proxies (if any) relating to portfolio securities, are available without charge (i) upon request, by calling 800 523-1918; and (ii) on the SEC’s website at sec.gov. In addition, a description of the policies and procedures that the Fund uses to determine how to vote proxies (if any) relating to portfolio securities and the Schedule of Investments included in the Fund’s most recent Form N-PORT are available without charge on the Fund’s website at delawarefunds.com/literature. The Fund’s Forms N-PORT may be reviewed and copied at the SEC’s Public Reference Room in Washington, D.C.; information on the operation of the Public Reference Room may be obtained by calling 800 SEC-0330.
Information (if any) regarding how the Fund voted proxies relating to portfolio securities during the most recently disclosed 12-month period ended June 30 is available without charge (i) through the Fund’s website at delawarefunds.com/proxy; and (ii) on the SEC’s website at sec.gov.
74
Item 2. Code of Ethics
The registrant has adopted a code of ethics that applies to the registrant’s principal executive officer, principal financial officer, principal accounting officer or controller, or persons performing similar functions, regardless of whether these individuals are employed by the registrant or a third party. A copy of the registrant’s Code of Business Ethics has been posted on the Delaware Funds by Macquarie® Internet Web site at www.delawarefunds.com. Any amendments to the Code of Business Ethics, and information on any waiver from its provisions granted by the registrant, will also be posted on this Web site within five business days of such amendment or waiver and will remain on the Web site for at least 12 months.
Item 3. Audit Committee Financial Expert
The registrant’s Board of Trustees has determined that certain members of the registrant’s Audit Committee are audit committee financial experts, as defined below. For purposes of this item, an “audit committee financial expert” is a person who has the following attributes:
a. An understanding of generally accepted accounting principles and financial statements;
b. The ability to assess the general application of such principles in connection with the accounting for estimates, accruals, and reserves;
c. Experience preparing, auditing, analyzing, or evaluating financial statements that present a breadth and level of complexity of accounting issues that are generally comparable to the breadth and complexity of issues that can reasonably be expected to be raised by the registrant’s financial statements, or experience actively supervising one or more persons engaged in such activities;
d. An understanding of internal controls and procedures for financial reporting; and
e. An understanding of audit committee functions.
An “audit committee financial expert” shall have acquired such attributes through:
a. Education and experience as a principal financial officer, principal accounting officer, controller, public accountant, or auditor or experience in one or more positions that involve the performance of similar functions;
b. Experience actively supervising a principal financial officer, principal accounting officer, controller, public accountant, auditor, or person performing similar functions;
c. Experience overseeing or assessing the performance of companies or public accountants with respect to the preparation, auditing, or evaluation of financial statements; or
d. Other relevant experience.
The registrant’s Board of Trustees has also determined that each member of the registrant’s Audit Committee is independent. In order to be “independent” for purposes of this item, the Audit Committee member may not: (i) other than in his or her capacity as a member of the Board of Trustees or any committee thereof, accept directly or indirectly any consulting, advisory or other compensatory fee from the issuer; or (ii) be an “interested person” of the registrant as defined in Section 2(a)(19) of the Investment Company Act of 1940.
The names of the audit committee financial experts on the registrant’s Audit Committee are set forth below:
H. Jeffrey Dobbs
John A. Fry
Sandra A.J. Lawrence
Frances Sevilla-Sacasa, Chair
Item 4. Principal Accountant Fees and Services
(a) Audit fees.
The aggregate fees billed for services provided to the registrant by its independent auditors for the audit of the registrant’s annual financial statements and for services normally provided by the independent auditors in connection with statutory and regulatory filings or engagements were $90,643 for the fiscal year ended July 31, 2022.
The aggregate fees billed for services provided to the registrant by its independent auditors for the audit of the registrant’s annual financial statements and for services normally provided by the independent auditors in connection with statutory and regulatory filings or engagements were $81,783 for the fiscal year ended July 31, 2021.
(b) Audit-related fees.
The aggregate fees billed by the registrant’s independent auditors for services relating to the performance of the audit of the registrant’s financial statements and not reported under paragraph (a) of this Item were $0 for the fiscal year ended July 31, 2022.
The aggregate fees billed by the registrant’s independent auditors for services relating to the performance of the audit of the financial statements of the registrant’s investment adviser and other service providers under common control with the adviser and that relate directly to the operations or financial reporting of the registrant were $2,050,189 for the registrant’s fiscal year ended July 31, 2022. The percentage of these fees relating to services approved by the registrant’s Audit Committee pursuant to the de minimis exception from the pre-approval requirement in Rule 2-01(c)(7)(i)(C) of Regulation S-X was 0%. These audit-related services were as follows: year end audit procedures; group reporting and subsidiary statutory audits.
The aggregate fees billed by the registrant’s independent auditors for services relating to the performance of the audit of the registrant’s financial statements and not reported under paragraph (a) of this Item were $0 for the fiscal year ended July 31, 2021.
The aggregate fees billed by the registrant’s independent auditors for services relating to the performance of the audit of the financial statements of the registrant’s investment adviser and other service providers under common control with the adviser and that relate directly to the operations or financial reporting of the registrant were $958,376 for the registrant’s fiscal year ended July 31, 2021. The percentage of these fees relating to services approved by the registrant’s Audit Committee pursuant to the de minimis exception from the pre-approval requirement in Rule 2-01(c)(7)(i)(C) of Regulation S-X was 0%. These audit-related services were as follows: year end audit procedures; group reporting and subsidiary statutory audits.
(c) Tax fees.
The aggregate fees billed by the registrant’s independent auditors for tax-related services provided to the registrant were $12,520 for the fiscal year ended July 31, 2022. The percentage of these fees relating to services approved by the registrant’s Audit Committee pursuant to the de minimis exception from the pre-approval requirement in Rule 2-01(c)(7)(i)(C) of Regulation S-X was 0%. These tax-related services were as follows: review of income tax returns and review of annual excise distribution calculations.
The aggregate fees billed by the registrant’s independent auditors for tax-related services provided to the registrant’s investment adviser and other service providers under common control with the adviser and that relate directly to the operations or financial reporting of the registrant were $0 for the registrant’s fiscal year ended July 31, 2022.
The aggregate fees billed by the registrant’s independent auditors for tax-related services provided to the registrant were $13,000 for the fiscal year ended July 31, 2021. The percentage of these fees relating to services approved by the registrant’s Audit Committee pursuant to the de minimis exception from the pre-approval requirement in Rule 2-01(c)(7)(i)(C) of Regulation S-X was 0%. These tax-related services were as follows: review of income tax returns and review of annual excise distribution calculations.
The aggregate fees billed by the registrant’s independent auditors for tax-related services provided to the registrant’s investment adviser and other service providers under common control with the adviser and that relate directly to the operations or financial reporting of the registrant were $0 for the registrant’s fiscal year ended July 31, 2021.
(d) All other fees.
The aggregate fees billed for all services provided by the independent auditors to the registrant other than those set forth in paragraphs (a), (b) and (c) of this Item were $0 for the fiscal year ended July 31, 2022.
The aggregate fees billed for all services other than those set forth in paragraphs (b) and (c) of this Item provided by the registrant’s independent auditors to the registrant’s adviser and other service providers under common control with the adviser and that relate directly to the operations or financial reporting of the registrant were $0 for the registrant’s fiscal year ended July 31, 2022. The percentage of these fees relating to services approved by the registrant’s Audit Committee pursuant to the de minimis exception from the pre-approval requirement in Rule 2-01(c)(7)(i)(C) of Regulation S-X was 0%.
The aggregate fees billed for all services provided by the independent auditors to the registrant other than those set forth in paragraphs (a), (b) and (c) of this Item were $0 for the fiscal year ended July 31, 2021.
The aggregate fees billed for all services other than those set forth in paragraphs (b) and (c) of this Item provided by the registrant’s independent auditors to the registrant’s adviser and other service providers under common control with the adviser and that relate directly to the operations or financial reporting of the registrant were $0 for the registrant’s fiscal year ended July 31, 2021. The percentage of these fees relating to services approved by the registrant’s Audit Committee pursuant to the de minimis exception from the pre-approval requirement in Rule 2-01(c)(7)(i)(C) of Regulation S-X was 0%.
(e) The registrant’s Audit Committee has established pre-approval policies and procedures as permitted by Rule 2-01(c)(7)(i)(B) of Regulation S-X (the “Pre-Approval Policy”) with respect to services provided by the registrant’s independent auditors. Pursuant to the Pre-Approval Policy, the Audit Committee has pre-approved the services set forth in the table below with respect to the registrant up to the specified fee limits. Certain fee limits are based on aggregate fees to the registrant and other registrants within the Delaware Funds by Macquarie®.
| Service | Range of Fees |
| Audit Services | |
| Statutory audits or financial audits for new Funds | up to $50,000 per Fund |
| Services associated with SEC registration statements (e.g., Form N-1A, Form N-14, etc.), periodic reports and other documents filed with the SEC or other documents issued in connection with securities offerings (e.g., comfort letters for closed-end Fund offerings, consents), and assistance in responding to SEC comment letters | up to $10,000 per Fund |
| Consultations by Fund management as to the accounting or disclosure treatment of transactions or events and/or the actual or potential impact of final or proposed rules, standards or interpretations by the SEC, FASB, or other regulatory or standard-setting bodies (Note: Under SEC rules, some consultations may be considered “audit-related services” rather than “audit services”) | up to $25,000 in the aggregate |
| Audit-Related Services | |
| Consultations by Fund management as to the accounting or disclosure treatment of transactions or events and /or the actual or potential impact of final or proposed rules, standards or interpretations by the SEC, FASB, or other regulatory or standard-setting bodies (Note: Under SEC rules, some consultations may be considered “audit services” rather than “audit-related services”) | up to $25,000 in the aggregate |
| Tax Services | |
| U.S. federal, state and local and international tax planning and advice (e.g., consulting on statutory, regulatory or administrative developments, evaluation of Funds’ tax compliance function, etc.) | up to $25,000 in the aggregate |
| U.S. federal, state and local tax compliance (e.g., excise distribution reviews, etc.) | up to $5,000 per Fund |
| Review of federal, state, local and international income, franchise and other tax returns | up to $5,000 per Fund |
Under the Pre-Approval Policy, the Audit Committee has also pre-approved the services set forth in the table below with respect to the registrant’s investment adviser and other entities controlling, controlled by or under common control with the investment adviser that provide ongoing services to the registrant (the “Control Affiliates”) up to the specified fee limit. This fee limit is based on aggregate fees to the investment adviser and its Control Affiliates.
| Service | Range of Fees |
| Non-Audit Services | |
| Services associated with periodic reports and other documents filed with the SEC and assistance in responding to SEC comment letters | up to $10,000 in the aggregate |
The Pre-Approval Policy requires the registrant’s independent auditors to report to the Audit Committee at each of its regular meetings regarding all services initiated since the last such report was rendered, including those services authorized by the Pre-Approval Policy.
(f) Not applicable.
(g) The aggregate non-audit fees billed by the registrant’s independent auditors for services rendered to the registrant and to its investment adviser and other service providers under common control with the adviser were $10,812,067 and $9,044,000 for the registrant’s fiscal years ended July 31, 2022 and July 31, 2021, respectively.
(h) In connection with its selection of the independent auditors, the registrant’s Audit Committee has considered the independent auditors’ provision of non-audit services to the registrant’s investment adviser and other service providers under common control with the adviser that were not required to be pre-approved pursuant to Rule 2-01(c)(7)(ii) of Regulation S-X. The Audit Committee has determined that the independent auditors’ provision of these services is compatible with maintaining the auditors’ independence.
Item 5. Audit Committee of Listed Registrants
Not applicable.
Item 6. Investments
(a) Included as part of report to shareholders filed under Item 1 of this Form N-CSR.
(b) Divestment of securities in accordance with Section 13(c) of the Investment Company Act of 1940.
Not applicable.
Item 7. Disclosure of Proxy Voting Policies and Procedures for Closed-End Management Investment Companies
Not applicable.
Item 8. Portfolio Managers of Closed-End Management Investment Companies
Not applicable.
Item 9. Purchases of Equity Securities by Closed-End Management Investment Companies and Affiliated Purchasers
Not applicable.
Item 10. Submission of Matters to a Vote of Security Holders
Not applicable.
Item 11. Controls and Procedures
The registrant’s principal executive officer and principal financial officers, or persons performing similar functions, have concluded that the registrant’s disclosure controls and procedures (as defined in Rule 30a-3(c) under the Investment Company Act of 1940, as amended (17 CFR 270.30a-3(c))) are effective, as of a date within 90 days of the filing of this report, based on their evaluation of these controls and procedures required by Rule 30a-3(b) under the Investment Company Act of 1940 (17 CFR 270.30a-3(b)) and Rules 13a-15(b) or 15d-15(b) under the Securities Exchange Act of 1934, as amended (17 CFR 240.13a-15(b) or 240.15d-15(b)) and provide reasonable assurance that the information required to be disclosed by the registrant in its reports or statements filed under the Securities Exchange Act of 1934 is recorded, processed, summarized and reported within the time periods specified in the rules and forms of the Securities and Exchange Commission.
There were no significant changes in the registrant’s internal control over financial reporting (as defined in Rule 30a-3(d) under the Investment Company Act of 1940 (17 CFR 270.30a-3(d)) that occurred during the period covered by the report to stockholders included herein that have materially affected, or are reasonably likely to materially affect, the registrant’s internal control over financial reporting.
Item 12. Disclosure of Securities Lending Activities for Closed-End Management Investment Companies
Not applicable.
Item 13. Exhibits
(a) (1) Code of Ethics
Not applicable.
(2) Certifications of Principal Executive Officer and Principal Financial Officer pursuant to Rule 30a-2 under the Investment Company Act of 1940 are attached hereto as Exhibit 99.CERT.
(3) Written solicitations to purchase securities pursuant to Rule 23c-1 under the Securities Exchange Act of 1934.
Not applicable.
(b) Certifications pursuant to Section 906 of the Sarbanes-Oxley Act of 2002 are furnished herewith as Exhibit 99.906CERT.
SIGNATURES
Pursuant to the requirements of the Securities Exchange Act of 1934 and the Investment Company Act of 1940, the registrant has duly caused this report to be signed on its behalf, by the undersigned, thereunto duly authorized.
DELAWARE GROUP® GOVERNMENT FUND
| /s/ SHAWN K. LYTLE |
| By: | Shawn K. Lytle |
| Title: | President and Chief Executive Officer |
| Date: | October 3, 2022 |
Pursuant to the requirements of the Securities Exchange Act of 1934 and the Investment Company Act of 1940, this report has been signed below by the following persons on behalf of the registrant and in the capacities and on the dates indicated.
| /s/ SHAWN K. LYTLE |
| By: | Shawn K. Lytle |
| Title: | President and Chief Executive Officer |
| Date: | October 3, 2022 |
| /s/ RICHARD SALUS |
| By: | Richard Salus |
| Title: | Chief Financial Officer |
| Date: | October 3, 2022 |