Item 1. Reports to Stockholders
Annual report
Fixed income mutual fund
Delaware Emerging Markets Debt Fund
July 31, 2019
Beginning on or about June 1, 2021, as permitted by regulations adopted by the Securities and Exchange Commission, paper copies of your Fund’s shareholder reports will no longer be sent to you by mail, unless you specifically request them from the Fund or from your financial intermediary, such as a broker/dealer, bank, or insurance company. Instead, you will be notified by mail each time a report is posted on the website and provided with a link to access the report.
If you already elected to receive shareholder reports electronically, you will not be affected by this change and you do not need to take any action. You may elect to receive shareholder reports and other communications from the Fund electronically by signing up at delawarefunds.com/edelivery. If you own these shares through a financial intermediary, you may contact your financial intermediary.
You may elect to receive paper copies of all future shareholder reports free of charge. You can inform the Fund that you wish to continue receiving paper copies of your shareholder reports by contacting us at 800523-1918. If you own these shares through a financial intermediary, you may contact your financial intermediary to elect to continue to receive paper copies of your shareholder reports. Your election to receive reports in paper will apply to all funds held with the Delaware Funds® by Macquarie or your financial intermediary.
Carefully consider the Fund’s investment objectives, risk factors, charges, and expenses before investing. This and other information can be found in the Fund’s prospectus and its summary prospectus, which may be obtained by visiting delawarefunds.com/literature or calling 800523-1918. Investors should read the prospectus and the summary prospectus carefully before investing.
You can obtain shareholder reports and prospectuses online instead of in the mail. Visit delawarefunds.com/edelivery.
Experience Delaware Funds®by Macquarie
Macquarie Investment Management (MIM) is a global asset manager with offices throughout the United States, Europe, Asia, and Australia. As active managers we prioritize autonomy and accountability at the investment team level in pursuit of opportunities that matter for clients. Delaware Funds is one of the longest-standing mutual fund families, with more than 80 years in existence.
If you are interested in learning more about creating an investment plan, contact your financial advisor.
You can learn more about Delaware Funds or obtain a prospectus for Delaware Emerging Markets Debt Fund at delawarefunds.com/literature.
Manage your account online
| ● | | Check your account balance and transactions |
| ● | | View statements and tax forms |
| ● | | Make purchases and redemptions |
Visit delawarefunds.com/account-access.
Macquarie Asset Management (MAM) offers a diverse range of products including securities investment management, infrastructure and real asset management, and fund and equity-based structured products. MIM is the marketing name for certain companies comprising the asset management division of Macquarie Group. This includes the following investment advisers: Macquarie Investment Management Business Trust (MIMBT), Delaware Capital Management Advisers, Inc., Macquarie Funds Management Hong Kong Limited, Macquarie Investment Management Austria Kapitalanlage AG, Macquarie Investment Management Global Limited, Macquarie Investment Management Europe Limited, Macquarie Capital Investment Management LLC, and Macquarie Investment Management Europe S.A.
The Fund is distributed byDelaware Distributors, L.P. (DDLP), an affiliate of MIMBT and Macquarie Group Limited.
Other than Macquarie Bank Limited (MBL), none of the entities noted are authorized deposit-taking institutions for the purposes of the Banking Act 1959 (Commonwealth of Australia). The obligations of these entities do not represent deposits or other liabilities of MBL. MBL does not guarantee or otherwise provide assurance in respect of the obligations of these entities, unless noted otherwise. The Fund is governed by US laws and regulations.
Table of contents
Unless otherwise noted, views expressed herein are current as of July 31, 2019, and subject to change for events occurring after such date.
The Fund is not FDIC insured and is not guaranteed. It is possible to lose the principal amount invested.
Advisory services provided by Delaware Management Company, a series of MIMBT, a US registered investment advisor.
All third-party marks cited are the property of their respective owners.
© 2019 Macquarie Management Holdings, Inc.
Portfolio management review
| | |
| Delaware Emerging Markets Debt Fund | | August 13, 2019 |
| | | | | | |
Performance preview (for the year ended July 31, 2019) | |
Delaware Emerging Markets Debt Fund (Institutional Class shares) | | 1-year return | | | +10.41 | % |
Delaware Emerging Markets Debt Fund (Class A shares) | | 1-year return | | | +10.21 | % |
J.P. Morgan Corporate Emerging Markets Bond Index (CEMBI) Broad Diversified (benchmark) | | 1-year return | | | +9.61 | % |
Past performance does not guarantee future results.
For complete, annualized performance for Delaware Emerging Markets Debt Fund, please see the table on page 6. Institutional Class shares are not subject to a sales charge and are offered for sale exclusively to certain eligible investors. In addition, Institutional Class shares pay no distribution and service fee.
The performance of Class A shares excludes the applicable sales charge. Both Institutional Class shares and Class A shares reflect the reinvestment of all distributions.
Please see page 9 for a description of the index. Index performance returns do not reflect any management fees, transaction costs, or expenses. Indices are unmanaged and one cannot invest directly in an index.
Market review
During the Fund’s fiscal year ended July 31, 2019, the most significant factor driving performance in emerging markets largely came from outside those markets. Divergent central banking policies in developed countries dominated through the end of 2018 while the first seven months of 2019 were characterized by those same central banks’ convergent views.
Most of the developed world was easing interest rates (a response to a worldwide slowdown in economic growth). The United States, however, was a notable holdout in 2018, with the US Federal Reserve even implementing a rate hike during what was a highly volatile December – its ninth since it began normalizing rates in December 2015. In January 2019, however, the Fed did an abrupt about-face, taking further rate hikes off the table for 2019 and hinting at possible rate cuts. The Fed then reduced rates 0.25 percentage points to a target range of2.00%-2.25% on July 31, the final day of the Fund’s fiscal year.
In our opinion, the effect of central bank policy on emerging markets was similar to that on developed countries. In the latter half of 2018, a sharp tightening of financial conditions bore particular pain for the weaker credits within emerging markets, especially high yield bonds, which significantly underperformed their developed market counterparts. The sovereign
|
● Emerging markets debt benefited from the Fed’s policy course reversal halfway through the Fund’s fiscal year. |
● Global central bank monetary policy easing stimulated emerging market economic activity. |
● However, the strong US dollar raised the cost of servicing emerging markets debt. |
● Throughout the12-month period, uncertainty regardingUS-China trade relations weighed on global financial markets. |
1
Portfolio management review
Delaware Emerging Markets Debt Fund
bonds issued by frontier countries (where stock exchanges and currency markets are too small or underdeveloped to be classified as emerging markets) in the Central and Eastern Europe, Middle East, and Africa (CEEMEA) region were notably weak. Cash began to flow out of the markets. Furthermore, the tighter central bank policy added fuel to the fire in Argentina and Turkey, two large developing countries that are dealing with financial and economic problems distinct from emerging markets as a whole.
With the Fed’s course reversal in January 2019, core rates stabilized, driving record cash flows into the global credit markets. In turn, that unlocked financing opportunities for the weaker credits within emerging markets. The Fed’s newfound dovish posture seemed to ease financial conditions across the board. Global easing within developed markets also enabled central banks in emerging markets to ease policy and cut rates without creating a large drag on their foreign exchange. This played out visibly in Turkey, which had struggled in 2018’s tight environment. Aided by global easing, Turkey’s currency strengthened in the first half of 2019, easing its inflation crunch and enabling an aggressive reduction in policy rates.
One outlier to the easing story was the US dollar, which remained strong. While that didn’t prevent emerging market credit from rebounding sharply, it put a damper on emerging market foreign exchange rates and pressured dollar-denominated commodities such as oil and gas. The strong dollar also raised the cost of servicing the debt for dollar-denominated emerging market credits.
If interest rates were the single most significant factor affecting emerging market returns during the12-month period, the ongoingUS-China trade dispute wasn’t far behind. Unquestionably, the imposition of tariffs contributed to China’s economic slowdown, and in turn, broader emerging market performance. The effects of the dispute have been particularly difficult to manage
given the uncertainty arising from the seemingly volatileUS-China trade negotiations.
China’s response to this challenge has been markedly different from its response to previous slowdowns. In 2015, when China confronted severe weakness in the yuan that pressured emerging markets initially and developed markets later, it responded with an aggressive action on monetary policy. This time, it appears that China has taken a more cautious approach to managing its currency, hoping to reach a trade deal. We have seen a step up in stimulus, but China tends to favor fiscal rather than monetary policy, putting more money in consumers’ pockets via tax cuts and other incentives. This has had a noticeably different effect on emerging markets. Where China’s aggressive monetary policy in 2015 tended to lift the ceiling for growth in emerging markets, the recent fiscal stimulus is more likely, in our view, to provide a floor for economic growth without raising overall growth expectations.
While the performance of emerging market currencies (foreign exchange) is not a large component of Fund performance, we think it noteworthy that the performance of emerging market currencies lagged that of the credit market rally in 2019. This was partly the result of the developed market central banks all adopting a dovish view, which was a potent catalyst for emerging market credit spreads, especially after the weakness at the end of 2018. Emerging market foreign exchange also rallied in 2019, but in a much more benign fashion, mainly because the overall emerging market growth profile was weak.
Source: Bloomberg.
2
Within the Fund
For the fiscal year ended July 31, 2019, Delaware Emerging Markets Debt Fund outperformed its benchmark, the J.P. Morgan Corporate Emerging Markets Bond Index (CEMBI) Broad Diversified. The Fund’s Institutional Class shares gained 10.41%. The Fund’s Class A shares advanced 10.21% at net asset value and 5.25% at maximum offer price. These figures reflect all distributions reinvested. For the same period, the Fund’s benchmark gained 9.61%. For complete annualized performance for Delaware Emerging Markets Debt Fund, please see the table on page 6.
The Fund is broadly diversified across regions and benefited from overweight positions in Latin America and frontier CEEMEA. Those overweights relative to the benchmark were funded by underweights tolow-beta(low-risk) Asian credits. That positioning was particularly helpful for the Fund in the early stages of the 2019 risk rally. In the second quarter of 2019 and in July, that effect tapered off somewhat when investment grade bonds led in generating returns as US rates rallied.
Within Latin America, Brazil and Mexico made notable contributions to the Fund’s performance during the fiscal year. Brazil benefited from attractive opportunities in corporates and a sharp shift in its central bank monetary policy. The election of President Jair Bolsonaro in January 2019 also benefited the Fund. Although his social agenda could be considered arguable, on the fiscal side he installed as finance minister a respected individual who has sought to tackle Brazil’s largest structural problems. As of this writing, significant progress has been made in advancing a major pension reform bill.
During the fiscal year, the Fund maintained a significant overweight in Brazil, which contributed to performance. Individual contributors to performance includedPetrobras Global Finance BV,JBS S.A., andSuzano
Austria GmbH. Petrobras benefited from cohesive and independent decision making that included a focus on improving its balance sheet and deleveraging. JBS, the world’s largest meat-processing company, benefited from strong underlying fundamentals, partly driven by higher pricing that resulted from an outbreak of Asian swine flu. Suzano, the largest pulp and paper manufacturer in Latin America, benefited from an aggressive deleveraging program.
In Mexico, we carefully navigated the increased volatility following the election of President Andrés Manuel López Obrador in July 2018. During the fiscal year, Mexico was a fairly dynamic credit that contributed to the Fund’s performance, despite mixed reactions to López Obrador’s agenda. Although he campaigned on boosting spending to provide economic stimulus, since taking office López Obrador has kept an eye on maintaining a balanced budget. At the same time, credit markets faced significant challenges. Petróleos Mexicanos, the state-owned petroleum company and an important oil and gas sovereign bond, was facing major financing challenges. López Obrador’s cancellation of a major airport expansion project in Mexico City led to a crisis of confidence among investors. We believe potential changes to the banking system and a pending revision to its trade agreement with the US also weighed on the market. Growth expectations have fallen, with Mexico’s gross domestic product (GDP) growth rate flirting with recessionary levels.
In the frontier CEEMEA region, we augmented our core corporate strategy with some sovereign positions that contributed to performance. These included both sovereigns and corporates in Ukraine and Ghana. In Kazakhstan, anoil-exporting country with solid credit metrics, we sourced higher-duration quasi-sovereign bonds that added to performance.
The Fund also benefited from its positions in Turkey. The Fund had a roughly neutral weighting with a moderatelyup-in-quality bias that
3
Portfolio management review
Delaware Emerging Markets Debt Fund
augmented corporates with a sovereign position. Fighting off issues on all fronts, including the establishment of an executive presidency and the threat of international sanctions, Turkey’s central bank raised rates. That helped to stabilize its markets and economy, enabling a rebound in exports, a reduction in imports, an improvement in tourism, and a narrowing of the current account deficit. Turkey recovered sharply from what had been a painful position in late 2018.
An underweight in Asia detracted from the Fund’s performance relative to the benchmark. For the most part, securities in the region traded relatively tight and did not suffer much in the broad selloff at the end of 2018. As a result, we didn’t see strong relative value and decided to carry underweight positions in China, Hong Kong, India, South Korea, and Thailand.
As spreads tightened aggressively and yields dropped precipitously during the fiscal year, we took a more active stance, implementing severalup-in-quality trades from high yield to investment grade. Additionally, as cash flows increased, we began raising and holding cash as we thought that tight spreads didn’t compensate for potential market volatility. We also sold some of the Fund’s higher-beta positions at a profit and reinvested the proceeds in investment grade, neutralizing some of the Fund’s underweight positions, particularly in China and India.
In India, uncertainty about Prime Minister Narendra Modi’sre-election bid led us to a somewhat defensive position in late 2018. Following his convincing win, based in part on apro-business agenda, we increased the Fund’s exposure from an underweight to a relative overweight. The Fund was broadly underweight in South Korea as well. Although we increased the Fund’s exposure somewhat during the fiscal year to a near-neutral position with severalup-in-quality grades, we believe South Korea is sensitive to global trade and export data that have been broadly weak. Similarly, Thailand is sensitive to
global trade conditions, and we maintained the Fund’s underweight there. While we also maintained an underweight in Hong Kong, we largely neutralized the Fund’s position in China, given the country’s stimulus measures.
The most significant individual detractor from the Fund’s performance wasDigicel Group Ltd., a Caribbean telecommunications operator. Mixed operating results and excessive leverage led the company to initiate a distressed-debt exchange. As of this writing, the result has not been encouraging.
Argentine local currency bonds also detracted from the Fund’s performance. Initially, we had a relatively constructive view on the Argentine economy. Inclusion of the bonds in J.P. Morgan’s local bond index appeared to be a positive as well. When Argentina’s fiscal position grew more tenuous, however, we liquidated the Fund’s position.
Teva Pharmaceutical Finance Netherlands IIIbonds were also a detractor, as Israeli multinational Teva Pharmaceutical Industries faced increasing competition in the commoditized generics business and issues resulting from the opioid epidemic.
Near the end of the Fund’s fiscal year, we anticipated that US dollar-denominated emerging markets debt would likely perform in line with similarly rated corporate bonds in developed markets. This was the case, and we expect the close relationship to continue. While we view emerging market fundamentals as mixed at best, we are cognizant of the dovish turn by the most important central banks. Reflecting what was the strong performance of the emerging markets asset class, we have continued to reduce the Fund’s beta, a measure of its volatility relative to the market, to bring it closer to neutral. As of this review, we believe there are more opportunities in corporate debt due to the larger number of issuers and believe that security selection (both at the
4
sovereign and corporate level) should remain an important driver of performance for the Fund.
A note about derivatives
During the fiscal year, Delaware Emerging Markets Debt Fund engaged in currency hedges through forward foreign currency exchange contracts and options. These positions detracted 0.36 percentage points from performance for the fiscal year. The Fund had no exposure to derivatives at the end of the fiscal year.
5
| | |
| Performance summary | | |
| Delaware Emerging Markets Debt Fund | | July 31, 2019 |
The performance quoted represents past performance and does not guarantee future results. Investment return and principal value of an investment will fluctuate so that shares, when redeemed, may be worth more or less than their original cost. Current performance may be lower or higher than the performance quoted. Performance data current to the most recent month end may be obtained by calling 800523-1918 or visiting delawarefunds.com/performance.
| | | | | | | | | | | | | | | | |
| Fund and benchmark performance1, 2, 3 | | | Average annual total returns through July 31, 2019 | |
| | | | |
| | | 1 year | | | 3 years | | | 5 years | | | Lifetime | |
Class A (Est. Sept. 30, 2013) | | | | | | | | | | | | | | | | |
Excluding sales charge | | | +10.21% | | | | +5.95% | | | | +4.50% | | | | +6.24% | |
Including sales charge | | | +5.25% | | | | +4.34% | | | | +3.54% | | | | +5.68% | |
Class C (Est. Sept. 30, 2013) | | | | | | | | | | | | | | | | |
Excluding sales charge | | | +9.27% | | | | +5.30% | | | | +4.11% | | | | +5.67% | |
Including sales charge | | | +8.27% | | | | +5.30% | | | | +4.11% | | | | +5.67% | |
Class R (Est. Sept. 30, 2013) | | | | | | | | | | | | | | | | |
Excluding sales charge | | | +10.42% | | | | +6.14% | | | | +4.61% | | | | +6.19% | |
Including sales charge | | | +10.42% | | | | +6.14% | | | | +4.61% | | | | +6.19% | |
Institutional Class (Est. Sept. 30, 2013) | | | | | | | | | | | | | | | | |
Excluding sales charge | | | +10.41% | | | | +6.18% | | | | +4.63% | | | | +6.43% | |
Including sales charge | | | +10.41% | | | | +6.18% | | | | +4.63% | | | | +6.43% | |
J.P. Morgan Corporate Emerging Markets Bond Index (CEMBI) Broad Diversified | | | +9.61% | | | | +5.30% | | | | +5.04% | | | | +5.75%* | |
*The benchmark lifetime return is for Class A share comparison only and is calculated using the last business day in the month of the Fund’s Class A inception date.
1 A privately offered fund managed by the Fund’s portfolio manager was reorganized into the Fund and the Fund commenced operations on Sept. 30, 2013. This privately offered fund commenced operations on Nov. 3, 2010 and had an investment objective and strategies that were, in all material respects, the same as those of the Fund, and was managed in a manner that, in all material respects, complied with the investment guidelines and restrictions of the Fund. However, the privately offered fund was not registered as an investment under the Investment Company Act of 1940 (1940 Act). As a result, the privately offered fund was not subject to certain investment limitations, diversification requirements, liquidity requirements, and other restrictions imposed by the 1940 Act and the Internal Revenue Code of
1986, as amended, which, if applicable, may have adversely affected its performance.
The Fund’s performance for the periods prior to its commencement of operations on Sept. 30, 2013 is that of the privately offered fund. Because the privately offered fund was a master fund that did not charge any management or other asset-based fees, the privately offered fund’s performance shown above has been restated, on aone-time basis, to reflect the fees, expenses, and waivers and reimbursements for each class of the Fund at the commencement of the Fund’s operations. If the performance of the privately offered fund had not been restated, the performance for such classes may have been higher than the performance shown in the average annual total returns table above.
6
2 Returns reflect the reinvestment of all distributions and are presented both with and without the applicable sales charges described below. Returns do not reflect the deduction of taxes the shareholder would pay on Fund distributions or redemptions of Fund shares.
Expense limitations were in effect for certain classes during some or all of the periods shown in the “Fund and benchmark performance” table. Expenses for each class are listed on the “Fund expense ratios” table on page 8. Performance would have been lower had expense limitations not been in effect.
Institutional Class shares are not subject to a sales charge and are offered for sale exclusively to certain eligible investors. In addition, Institutional Class shares pay no distribution and service(12b-1) fee.
Class A shares are sold with a maximumfront-end sales charge of 4.50%, and have an annual12b-1 fee of 0.25% of average daily net assets. Performance for Class A shares, excluding sales charges, assumes that nofront-end sales charge applied.
Class C shares are sold with a contingent deferred sales charge of 1.00% if redeemed during the first 12 months. They are also subject to an annual12b-1 fee of 1.00% of average daily net assets. Performance for Class C shares, excluding sales charges, assumes either that contingent deferred sales charges did not apply or that the investment was not redeemed.
Class R shares are available only for certain retirement plan products. They are sold without a sales charge and have an annual12b-1 fee of 0.50% of average daily net assets.
Fixed income securities and bond funds can lose value, and investors can lose principal, as interest rates rise. They also may be affected by economic conditions that hinder an issuer’s ability to make interest and principal payments on its debt.
The Fund may also be subject to prepayment risk, the risk that the principal of a bond that is held by a portfolio will be prepaid prior to maturity, at the time when interest rates are lower than what the bond was paying. A portfolio may then have to reinvest that money at a lower interest rate.
High yielding,non-investment-grade bonds (junk bonds) involve higher risk than investment grade bonds. The high yield secondary market is particularly susceptible to liquidity problems when institutional investors, such as mutual funds and certain other financial institutions, temporarily stop buying bonds for regulatory, financial, or other reasons. In addition, a less liquid secondary market makes it more difficult for the Fund to obtain precise valuations of the high yield securities in its portfolio.
The Fund may invest in derivatives, which may involve additional expenses and are subject to risk, including the risk that an underlying security or securities index moves in the opposite direction from what the portfolio manager anticipated. A derivatives transaction depends upon the counterparties’ ability to fulfill their contractual obligations.
If and when the Fund invests in forward foreign currency contracts or uses other investments to hedge against currency risks, the Fund will be subject to special risks, including counterparty risk.
Diversification may not protect against market risk.
International investments entail risks not ordinarily associated with US investments including fluctuation in currency values, differences in accounting principles, or economic or political instability in other nations. Investing in emerging markets can be riskier than investing in established foreign markets due to increased volatility and lower trading volume.
7
Performance summary
Delaware Emerging Markets Debt Fund
Portfolio turnover is a measure of how frequently the managers buy and sell assets within a fund over a particular period. It is usually reported for a12-month time period.
Leverage risk is the risk associated with securities or practices (for example, borrowing and the use of certain derivatives) and investment in certain types of derivatives that multiply small index or market movements into larger changes in value. Use of derivative instruments may involve leverage. Leverage magnifies the potential for gain
and the risk of loss. As a result, a relatively small decline in the value of the underlying investments could result in a relatively large loss. Although the Fund will seek to manage the Fund’s risk from the leverage associated with derivative investments by closely monitoring the volatility of such investments, the Fund may not be successful in this respect.
Gross domestic product, mentioned on page 3, is a measure of all goods and services produced by a nation in a year.
3 The Fund’s expense ratios, as described in the most recent prospectus, are disclosed in the following “Fund expense ratios” table. Delaware Management Company has agreed to reimburse certain expenses and/or waive certain fees in order to prevent total annual fund operating expenses (excluding any12b-1 fees, acquired fund fees and expenses, taxes, interest, short sale and dividend and interest expenses, brokerage fees, certain insurance costs, and nonroutine expenses or costs, including, but not limited to, those relating to reorganizations, litigation, conducting shareholder meetings, and liquidations) from exceeding 0.79% of the Fund’s average daily net assets during the period from Aug. 1, 2018 to July 31, 2019.* Please see the most recent prospectus and any applicable supplement(s) for additional information on these fee waivers and/or reimbursements. Please see the “Financial highlights” section in this report for the most recent expense ratios.
| | | | | | | | |
| Fund expense ratios | | Class A | | Class C | | Class R | | Institutional Class |
Total annual operating expenses (without fee waivers) | | 1.90% | | 2.65% | | 2.15% | | 1.65% |
Net expenses | | 1.04% | | 1.79% | | 1.29% | | 0.79% |
(including fee waivers, if any) Type of waiver | | Contractual | | Contractual | | Contractual
(Investment
manager
waiver);
Voluntary
(12b-1 fee
waiver) | | Contractual |
*The aggregate contractual waiver period covering this report is from April 1, 2018 through Nov. 28, 2019.
8
Performance of a $10,000 investment1
Average annual total returns from Sept. 30, 2013 (Fund’s inception) through July 31, 2019
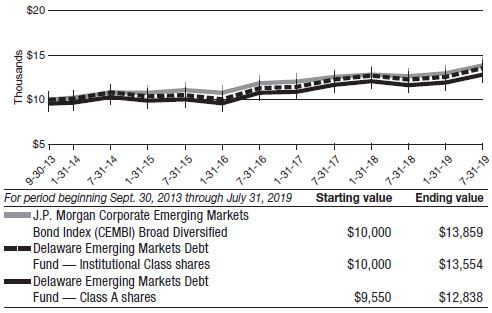
1 The “Performance of a $10,000 investment” graph assumes $10,000 invested in Institutional Class and Class A shares of the Fund on Sept. 30, 2013, and includes the effect of a 4.50%front-end sales charge (for Class A shares) and the reinvestment of all distributions. The graph does not reflect the deduction of taxes the shareholders would pay on Fund distributions or redemptions of Fund shares. Expense limitations were in effect for some or all of the periods shown. Performance would have been lower had expense limitations not been in effect. Expenses are listed in the “Fund expense ratios” table on page 8. Please note additional details on pages 6 through 10.
The graph also assumes $10,000 invested in the J.P. Morgan Corporate Emerging Markets Bond Index (CEMBI) Broad Diversified as of Sept. 30, 2013. The J.P. Morgan Corporate Emerging Markets Bond Index (CEMBI) Broad Diversified tracks US dollar–denominated
emerging market corporate bonds, limiting the weights of countries with larger corporate debt stocks by including only a specified portion of those countries’ eligible current face amounts of debt outstanding.
Index performance returns do not reflect any management fees, transaction costs, or expenses. Indices are unmanaged and one cannot invest directly in an index.Past performance is not a guarantee of future results.
Performance of other Fund classes will vary due to different charges and expenses.
9
Performance summary
Delaware Emerging Markets Debt Fund
| | | | | | |
| | | Nasdaq symbols | | CUSIPs | | |
Class A | | DEDAX | | 246094841 | | |
Class C | | DEDCX | | 246094833 | | |
Class R | | DEDRX | | 246094825 | | |
Institutional Class | | DEDIX | | 246094817 | | |
10
Disclosure of Fund expenses
For thesix-month period February 1, 2019 to July 31, 2019 (Unaudited)
As a shareholder of the Fund, you incur two types of costs: (1) transaction costs, including sales charges (loads) on purchase payments, reinvested dividends, or other distributions; redemption fees; and exchange fees; and (2) ongoing costs, including management fees; distribution and service(12b-1) fees; and other Fund expenses. This example is intended to help you understand your ongoing costs (in dollars) of investing in the Fund and to compare these costs with the ongoing costs of investing in other mutual funds.
The example is based on an investment of $1,000 invested at the beginning of the period and held for the entiresix-month period from Feb. 1, 2019 to July 31, 2019.
Actual expenses
The first section of the table shown, “Actual Fund return,” provides information about actual account values and actual expenses. You may use the information in this section of the table, together with the amount you invested, to estimate the expenses that you paid over the period. Simply divide your account value by $1,000 (for example, an $8,600 account value divided by $1,000 = 8.6), then multiply the result by the number in the first section under the heading entitled “Expenses Paid During Period” to estimate the expenses you paid on your account during this period.
Hypothetical example for comparison purposes
The second section of the table shown, “Hypothetical 5% return,” provides information about hypothetical account values and hypothetical expenses based on the Fund’s actual expense ratio and an assumed rate of return of 5% per year before expenses, which is not the Fund’s actual return. The hypothetical account values and expenses may not be used to estimate the actual ending account balance or expenses you paid for the period. You may use this information to compare the ongoing costs of investing in the Fund and other funds. To do so, compare this 5% hypothetical example with the 5% hypothetical examples that appear in the shareholder reports of the other funds.
Please note that the expenses shown in the table are meant to highlight your ongoing costs only and do not reflect any transactional costs, such as sales charges (loads), redemption fees, or exchange fees. Therefore, the second section of the table is useful in comparing ongoing costs only, and will not help you determine the relative total costs of owning different funds. In addition, if these transactional costs were included, your costs would have been higher. The Fund’s expenses shown in the table reflect fee waivers in effect and assume reinvestment of all dividends and distributions.
11
Disclosure of Fund expenses
For thesix-month period February 1, 2019 to July 31, 2019 (Unaudited)
Delaware Emerging Markets Debt Fund
Expense analysis of an investment of $1,000
| | | | | | | | | | | | | | | | |
| | | Beginning Account Value 2/1/19 | | Ending Account Value 7/31/19 | | Annualized Expense Ratio | | | Expenses Paid During Period 2/1/19 to 7/31/19* |
| | | | |
Actual Fund return† | | | | | | | | | | | | | | | | |
Class A | | | $1,000.00 | | | | $1,076.50 | | | | 1.04% | | | | $5.35 | |
Class C | | | 1,000.00 | | | | 1,071.70 | | | | 1.79% | | | | 9.19 | |
Class R | | | 1,000.00 | | | | 1,076.90 | | | | 0.79% | | | | 4.07 | |
Institutional Class | | | 1,000.00 | | | | 1,078.20 | | | | 0.79% | | | | 4.07 | |
|
Hypothetical 5% return(5% return before expenses) | |
Class A | | | $1,000.00 | | | | $1,019.64 | | | | 1.04% | | | | $5.21 | |
Class C | | | 1,000.00 | | | | 1,015.92 | | | | 1.79% | | | | 8.95 | |
Class R | | | 1,000.00 | | | | 1,020.88 | | | | 0.79% | | | | 3.96 | |
Institutional Class | | | 1,000.00 | | | | 1,020.88 | | | | 0.79% | | | | 3.96 | |
*“Expenses Paid During Period” are equal to the Fund’s annualized expense ratio, multiplied by the average account value over the period, multiplied by 181/365 (to reflect theone-half year period).
†Because actual returns reflect only the most recentsix-month period, the returns shown may differ significantly from fiscal year returns.
In addition to the Fund’s expenses reflected above, the Fund also indirectly bears its portion of the fees and expenses of the investment companies (Underlying Funds) in which it invests. The table above does not reflect the expenses of the Underlying Funds.
12
Security type / country and sector allocation
| | |
| Delaware Emerging Markets Debt Fund | | As of July 31, 2019 (Unaudited) |
Sector designations may be different than the sector designations presented in other Fund materials. The sector designations may represent the investment manager’s internal sector classifications.
| | |
| Security type / country | | Percentage of net assets |
| |
Corporate Bonds by Country | | 70.20% |
Argentina | | 4.36% |
Australia | | 0.38% |
Bahrain | | 0.50% |
Brazil | | 9.88% |
Canada | | 0.77% |
Cayman Islands | | 0.77% |
Chile | | 2.88% |
China | | 3.66% |
Colombia | | 2.43% |
Dominican Republic | | 0.92% |
Georgia | | 0.79% |
Ghana | | 0.48% |
Guatemala | | 0.40% |
Hong Kong | | 0.92% |
India | | 3.29% |
Indonesia | | 1.48% |
Ireland | | 0.82% |
Israel | | 2.67% |
Jamaica | | 0.07% |
Kazakhstan | | 0.87% |
Kuwait | | 0.92% |
Mexico | | 4.41% |
Morocco | | 0.95% |
Panama | | 0.79% |
Peru | | 1.64% |
Qatar | | 1.03% |
Republic of Korea | | 3.49% |
Republic of Vietnam | | 1.40% |
Russia | | 2.58% |
Saudi Arabia | | 1.20% |
Singapore | | 1.67% |
South Africa | | 2.15% |
Spain | | 1.08% |
Switzerland | | 0.86% |
Turkey | | 2.74% |
Ukraine | | 2.07% |
United Arab Emirates | | 1.87% |
United States | | 1.01% |
13
Security type / country and sector allocation
Delaware Emerging Markets Debt Fund
| | | | |
| Security type / country | | Percentage of net assets |
| |
Sovereign Bonds by Country | | | 6.70 | % |
Argentina | | | 0.21 | % |
Dominican Republic | | | 0.69 | % |
Egypt | | | 0.83 | % |
El Salvador | | | 0.74 | % |
Ghana | | | 0.64 | % |
Ivory Coast | | | 0.36 | % |
Kenya | | | 0.42 | % |
Mongolia | | | 0.40 | % |
Nigeria | | | 0.41 | % |
Russia | | | 0.40 | % |
Sri Lanka | | | 0.78 | % |
Turkey | | | 0.41 | % |
Ukraine | | | 0.41 | % |
Supranational Bank | | | 0.49 | % |
Short-Term Investments | | | 24.27 | % |
Total Value of Securities | | | 101.66 | % |
Liabilities Net of Receivables and Other Assets | | | (1.66 | %) |
Total Net Assets | | | 100.00 | % |
| |
| Corporate bonds by sector | | Percentage of net assets |
Banking | | | 15.54 | % |
Basic Industry | | | 13.45 | % |
Capital Goods | | | 0.40 | % |
Communications | | | 3.78 | % |
Consumer Cyclical | | | 4.91 | % |
ConsumerNon-Cyclical | | | 7.58 | % |
Electric | | | 8.29 | % |
Energy | | | 11.74 | % |
Industrial | | | 3.63 | % |
Utilities | | | 0.88 | % |
Total | | | 70.20 | % |
14
| | |
| Schedule of investments |
| Delaware Emerging Markets Debt Fund | | July 31, 2019 |
| | | | | | | | |
| | | Principal amount° | | | Value (US $) | |
Corporate Bonds – 70.20%D | | | | | | | | |
Argentina – 4.36% | | | | | | | | |
Aeropuertos Argentina 2000 144A 6.875% 2/1/27 # | | | 382,656 | | | $ | 371,180 | |
Pampa Energia 144A 9.125% 4/15/29 # | | | 235,000 | | | | 234,871 | |
Tecpetrol 144A 4.875% 12/12/22 # | | | 235,000 | | | | 228,537 | |
Telecom Argentina 144A 8.00% 7/18/26 # | | | 420,000 | | | | 426,563 | |
Transportadora de Gas del Sur 144A 6.75% 5/2/25 # | | | 170,000 | | | | 160,650 | |
YPF | | | | | | | | |
144A 8.50% 6/27/29 # | | | 240,000 | | | | 232,200 | |
144A 51.625% (BADLARPP + 4.00%) 7/7/20 #● | | | 170,000 | | | | 62,900 | |
YPF Energia Electrica 144A 10.00% 7/25/26 # | | | 550,000 | | | | 550,083 | |
| | | | | | | | |
| | | | | | | 2,266,984 | |
| | | | | | | | |
Australia – 0.38% | | | | | | | | |
Adani Abbot Point Terminal 144A 4.45% 12/15/22 # | | | 200,000 | | | | 198,444 | |
| | | | | | | | |
| | | | | | | 198,444 | |
| | | | | | | | |
Bahrain – 0.50% | | | | | | | | |
Oil and Gas Holding 144A 7.625% 11/7/24 # | | | 230,000 | | | | 257,966 | |
| | | | | | | | |
| | | | | | | 257,966 | |
| | | | | | | | |
Brazil – 9.88% | | | | | | | | |
Aegea Finance 144A 5.75% 10/10/24 # | | | 435,000 | | | | 454,036 | |
Braskem Finance 6.45% 2/3/24 | | | 265,000 | | | | 294,998 | |
CSN Resources 144A 7.625% 2/13/23 # | | | 435,000 | | | | 462,166 | |
Itau Unibanco Holding 144A 5.50% 8/6/22 # | | | 400,000 | | | | 422,520 | |
JBS Investments II | | | | | | | | |
144A 5.75% 1/15/28 # | | | 490,000 | | | | 496,003 | |
144A 7.00% 1/15/26 # | | | 245,000 | | | | 262,885 | |
Klabin Austria 144A 7.00% 4/3/49 # | | | 400,000 | | | | 430,104 | |
Marfrig Holdings Europe 144A 8.00% 6/8/23 # | | | 200,000 | | | | 208,252 | |
Petrobras Global Finance | | | | | | | | |
6.90% 3/19/49 | | | 300,000 | | | | 337,755 | |
7.25% 3/17/44 | | | 105,000 | | | | 123,270 | |
7.375% 1/17/27 | | | 130,000 | | | | 154,136 | |
Rede D’or Finance 144A 4.95% 1/17/28 # | | | 460,000 | | | | 462,392 | |
Suzano Austria 144A 5.00% 1/15/30 # | | | 435,000 | | | | 445,549 | |
Usiminas International 144A 5.875% 7/18/26 # | | | 570,000 | | | | 579,662 | |
| | | | | | | | |
| | | | | | | 5,133,728 | |
| | | | | | | | |
Canada – 0.77% | | | | | | | | |
Gran Tierra Energy 144A 7.75% 5/23/27 # | | | 400,000 | | | | 398,500 | |
| | | | | | | | |
| | | | | | | 398,500 | |
| | | | | | | | |
Cayman Islands – 0.77% | | | | | | | | |
Bioceanico Sovereign Certificate 144A 2.668% 6/5/34 # | | | 585,000 | | | | 402,187 | |
| | | | | | | | |
| | | | | | | 402,187 | |
| | | | | | | | |
15
Schedule of investments
Delaware Emerging Markets Debt Fund
| | | | | | | | |
| | | Principal amount° | | | Value (US $) | |
Corporate BondsD(continued) | | | | | | | | |
Chile – 2.88% | | | | | | | | |
AES Gener 144A 7.125% 3/26/79 #µ | | | 405,000 | | | $ | 437,906 | |
Banco de Credito e Inversiones 144A 3.50% 10/12/27 # | | | 200,000 | | | | 205,377 | |
Engie Energia Chile 144A 4.50% 1/29/25 # | | | 200,000 | | | | 212,683 | |
Latam Finance 144A 7.00% 3/1/26 # | | | 405,000 | | | | 429,806 | |
Sociedad Quimica y Minera de Chile 144A 4.25% 5/7/29 # | | | 200,000 | | | | 211,500 | |
| | | | | | | | |
| | | | | | | 1,497,272 | |
| | | | | | | | |
China – 3.66% | | | | | | | | |
Baidu 3.875% 9/29/23 | | | 400,000 | | | | 414,691 | |
Bank of China 144A 5.00% 11/13/24 # | | | 405,000 | | | | 437,834 | |
JD.com 3.125% 4/29/21 | | | 400,000 | | | | 399,987 | |
State Grid Overseas Investment 2016 144A 2.25% 5/4/20 # | | | 210,000 | | | | 209,509 | |
Tencent Holdings 144A 3.975% 4/11/29 # | | | 415,000 | | | | 437,715 | |
| | | | | | | | |
| | | | | | | 1,899,736 | |
| | | | | | | | |
Colombia – 2.43% | | | | | | | | |
Empresas Publicas de Medellin 144A 4.25% 7/18/29 # | | | 380,000 | | | | 391,590 | |
Geopark 144A 6.50% 9/21/24 # | | | 400,000 | | | | 417,500 | |
Millicom International Cellular 144A 6.25% 3/25/29 # | | | 420,000 | | | | 454,335 | |
| | | | | | | | |
| | | | | | | 1,263,425 | |
| | | | | | | | |
Dominican Republic – 0.92% | | | | | | | | |
AES Andres 144A 7.95% 5/11/26 # | | | 440,000 | | | | 476,854 | |
| | | | | | | | |
| | | | | | | 476,854 | |
| | | | | | | | |
Georgia – 0.79% | | | | | | | | |
Bank of Georgia 144A 6.00% 7/26/23 # | | | 400,000 | | | | 408,092 | |
| | | | | | | | |
| | | | | | | 408,092 | |
| | | | | | | | |
Ghana – 0.48% | | | | | | | | |
Tullow Oil 144A 7.00% 3/1/25 # | | | 245,000 | | | | 247,144 | |
| | | | | | | | |
| | | | | | | 247,144 | |
| | | | | | | | |
Guatemala – 0.40% | | | | | | | | |
Comunicaciones Celulares via Comcel Trust 144A 6.875% 2/6/24 # | | | 200,000 | | | | 207,500 | |
| | | | | | | | |
| | | | | | | 207,500 | |
| | | | | | | | |
Hong Kong – 0.92% | | | | | | | | |
CK Hutchison International 17 144A 2.875% 4/5/22 # | | | 475,000 | | | | 476,958 | |
| | | | | | | | |
| | | | | | | 476,958 | |
| | | | | | | | |
India – 3.29% | | | | | | | | |
Adani Ports & Special Economic Zone | | | | | | | | |
144A 3.375% 7/24/24 # | | | 265,000 | | | | 265,004 | |
144A 4.375% 7/3/29 # | | | 205,000 | | | | 210,291 | |
16
| | | | | | | | |
| | | Principal amount° | | | Value (US $) | |
Corporate BondsD(continued) | | | | | | | | |
India(continued) | | | | | | | | |
Greenko Solar Mauritius 144A 5.95% 7/29/26 # | | | 760,000 | | | $ | 759,024 | |
ICICI Bank 144A 4.00% 3/18/26 # | | | 460,000 | | | | 473,354 | |
| | | | | | | | |
| | | | | | | 1,707,673 | |
| | | | | | | | |
Indonesia – 1.48% | | | | | | | | |
Listrindo Capital 144A 4.95% 9/14/26 # | | | 550,000 | | | | 552,337 | |
Perusahaan Listrik Negara 144A 5.25% 5/15/47 # | | | 200,000 | | | | 215,994 | |
| | | | | | | | |
| | | | | | | 768,331 | |
| | | | | | | | |
Ireland – 0.82% | | | | | | | | |
C&W Senior Financing DAC 144A 7.50% 10/15/26 # | | | 400,000 | | | | 428,000 | |
| | | | | | | | |
| | | | | | | 428,000 | |
| | | | | | | | |
Israel – 2.67% | | | | | | | | |
Israel Chemicals 144A 6.375% 5/31/38 # | | | 450,000 | | | | 511,119 | |
Israel Electric 144A 5.00% 11/12/24 # | | | 400,000 | | | | 435,600 | |
Teva Pharmaceutical Finance Netherlands III 6.75% 3/1/28 | | | 490,000 | | | | 440,387 | |
| | | | | | | | |
| | | | | | | 1,387,106 | |
| | | | | | | | |
Jamaica – 0.07% | | | | | | | | |
Digicel Group Two 144A PIK 9.125% 4/1/24 # | | | 200,855 | | | | 37,660 | |
| | | | | | | | |
| | | | | | | 37,660 | |
| | | | | | | | |
Kazakhstan – 0.87% | | | | | | | | |
KazMunayGas National JSC 144A 6.375% 10/24/48 # | | | 200,000 | | | | 242,305 | |
KazTransGas JSC 144A 4.375% 9/26/27 # | | | 200,000 | | | | 208,124 | |
| | | | | | | | |
| | | | | | | 450,429 | |
| | | | | | | | |
Kuwait – 0.92% | | | | | | | | |
Equate Petrochemical 144A 3.00% 3/3/22 # | | | 475,000 | | | | 477,171 | |
| | | | | | | | |
| | | | | | | 477,171 | |
| | | | | | | | |
Mexico – 4.41% | | | | | | | | |
Banco Mercantil del Norte 144A 6.75%#µy | | | 440,000 | | | | 440,000 | |
Banco Santander Mexico | | | | | | | | |
144A 4.125% 11/9/22 # | | | 150,000 | | | | 155,250 | |
144A 5.95% 10/1/28 #µ | | | 205,000 | | | | 218,325 | |
BBVA Bancomer 144A 5.125% 1/18/33 #µ | | | 460,000 | | | | 443,900 | |
Cydsa 144A 6.25% 10/4/27 # | | | 430,000 | | | | 433,767 | |
Grupo Cementos de Chihuahua 144A 5.25% 6/23/24 # | | | 200,000 | | | | 205,502 | |
Infraestructura Energetica Nova 144A 4.875% 1/14/48 # | | | 200,000 | | | | 173,000 | |
Mexichem 144A 5.50% 1/15/48 # | | | 220,000 | | | | 221,650 | |
| | | | | | | | |
| | | | | | | 2,291,394 | |
| | | | | | | | |
17
Schedule of investments
Delaware Emerging Markets Debt Fund
| | | | | | | | |
| | | Principal amount° | | | Value (US $) | |
Corporate BondsD(continued) | | | | | | | | |
Morocco – 0.95% | | | | | | | | |
OCP | | | | | | | | |
144A 4.50% 10/22/25 # | | | 200,000 | | | $ | 208,475 | |
144A 6.875% 4/25/44 # | | | 235,000 | | | | 283,147 | |
| | | | | | | | |
| | | | | | | 491,622 | |
| | | | | | | | |
Panama – 0.79% | | | | | | | | |
Banco General 144A 4.125% 8/7/27 # | | | 400,000 | | | | 411,800 | |
| | | | | | | | |
| | | | | | | 411,800 | |
| | | | | | | | |
Peru – 1.64% | | | | | | | | |
Kallpa Generacion 144A 4.125% 8/16/27 # | | | 400,000 | | | | 411,000 | |
Lima Metro Line 2 Finance 144A 4.35% 4/5/36 # | | | 425,000 | | | | 439,344 | |
| | | | | | | | |
| | | | | | | 850,344 | |
| | | | | | | | |
Qatar – 1.03% | | | | | | | | |
QNB Finance 3.50% 3/28/24 | | | 525,000 | | | | 537,193 | |
| | | | | | | | |
| | | | | | | 537,193 | |
| | | | | | | | |
Republic of Korea – 3.49% | | | | | | | | |
Kia Motors 144A 3.00% 4/25/23 # | | | 345,000 | | | | 346,207 | |
Kookmin Bank 144A 2.875% 3/25/23 # | | | 475,000 | | | | 478,605 | |
Shinhan Financial Group 144A 3.34% 2/5/30 #µ | | | 555,000 | | | | 558,802 | |
Woori Bank 144A 4.75% 4/30/24 # | | | 400,000 | | | | 426,656 | |
| | | | | | | | |
| | | | | | | 1,810,270 | |
| | | | | | | | |
Republic of Vietnam – 1.40% | | | | | | | | |
Mong Duong Finance Holdings 144A 5.125% 5/7/29 # | | | 720,000 | | | | 728,753 | |
| | | | | | | | |
| | | | | | | 728,753 | |
| | | | | | | | |
Russia – 2.58% | | | | | | | | |
Gazprom OAO via Gaz Capital 144A 4.95% 3/23/27 # | | | 460,000 | | | | 488,906 | |
Novolipetsk Steel via Steel Funding DAC 144A 4.00% 9/21/24 # | | | 400,000 | | | | 406,270 | |
Phosagro OAO via Phosagro Bond Funding DAC | | | | | | | | |
144A 3.949% 4/24/23 # | | | 200,000 | | | | 202,821 | |
144A 3.95% 11/3/21 # | | | 240,000 | | | | 244,462 | |
| | | | | | | | |
| | | | | | | 1,342,459 | |
| | | | | | | | |
Saudi Arabia – 1.20% | | | | | | | | |
Saudi Arabian Oil | | | | | | | | |
144A 4.25% 4/16/39 # | | | 400,000 | | | | 416,906 | |
144A 4.375% 4/16/49 # | | | 200,000 | | | | 208,033 | |
| | | | | | | | |
| | | | | | | 624,939 | |
| | | | | | | | |
Singapore – 1.67% | | | | | | | | |
BOC Aviation 144A 2.375% 9/15/21 # | | | 400,000 | | | | 395,761 | |
DBS Group Holdings 144A 4.52% 12/11/28 #µ | | | 445,000 | | | | 470,207 | |
| | | | | | | | |
| | | | | | | 865,968 | |
| | | | | | | | |
18
| | | | | | | | |
| | | Principal amount° | | | Value (US $) | |
Corporate BondsD(continued) | | | | | | | | |
South Africa – 2.15% | | | | | | | | |
Gold Fields Orogen Holdings BVI 144A 6.125% 5/15/29 # | | | 230,000 | | | $ | 251,850 | |
Growthpoint Properties International 144A 5.872% 5/2/23 # | | | 400,000 | | | | 424,083 | |
SASOL Financing USA | | | | | | | | |
5.875% 3/27/24 | | | 200,000 | | | | 214,552 | |
6.50% 9/27/28 | | | 200,000 | | | | 225,376 | |
| | | | | | | | |
| | | | | | | 1,115,861 | |
| | | | | | | | |
Spain – 1.08% | | | | | | | | |
Atento Luxco 1 144A 6.125% 8/10/22 # | | | 315,000 | | | | 321,141 | |
International Airport Finance 144A 12.00% 3/15/33 # | | | 215,000 | | | | 242,000 | |
| | | | | | | | |
| | | | | | | 563,141 | |
| | | | | | | | |
Switzerland – 0.86% | | | | | | | | |
Syngenta Finance 144A 5.182% 4/24/28 # | | | 425,000 | | | | 446,532 | |
| | | | | | | | |
| | | | | | | 446,532 | |
| | | | | | | | |
Turkey – 2.74% | | | | | | | | |
Akbank T.A.S. 144A 7.20% 3/16/27 #µ | | | 205,000 | | | | 184,660 | |
Petkim Petrokimya Holding 144A 5.875% 1/26/23 # | | | 400,000 | | | | 389,325 | |
Turk Telekomunikasyon 144A 6.875% 2/28/25 # | | | 400,000 | | | | 410,642 | |
Turkiye Garanti Bankasi 144A 6.25% 4/20/21 # | | | 430,000 | | | | 438,914 | |
| | | | | | | | |
| | | | | | | 1,423,541 | |
| | | | | | | | |
Ukraine – 2.07% | | | | | | | | |
Kernel Holding 144A 8.75% 1/31/22 # | | | 420,000 | | | | 447,812 | |
MHP 144A 7.75% 5/10/24 # | | | 200,000 | | | | 214,091 | |
MHP LUX 144A 6.95% 4/3/26 # | | | 400,000 | | | | 411,722 | |
| | | | | | | | |
| | | | | | | 1,073,625 | |
| | | | | | | | |
United Arab Emirates – 1.87% | | | | | | | | |
ADES International Holding 144A 8.625% 4/24/24 # | | | 430,000 | | | | 431,075 | |
Emirates NBD 3.25% 11/14/22 | | | 530,000 | | | | 539,701 | |
| | | | | | | | |
| | | | | | | 970,776 | |
| | | | | | | | |
United States – 1.01% | | | | | | | | |
Resorts World Las Vegas 144A 4.625% 4/16/29 # | | | 500,000 | | | | 523,852 | |
| | | | | | | | |
| | | | | | | 523,852 | |
| | | | | | | | |
Total Corporate Bonds(cost $35,819,095) | | | | | | | 36,463,230 | |
| | | | | | | | |
| | | | | | | | |
Sovereign Bonds – 6.70%D | | | | | | | | |
Argentina – 0.21% | | | | | | | | |
Argentine Republic Government International Bond 5.625% 1/26/22 | | | 125,000 | | | | 108,250 | |
| | | | | | | | |
| | | | | | | 108,250 | |
| | | | | | | | |
19
Schedule of investments
Delaware Emerging Markets Debt Fund
| | | | | | | | |
| | | Principal amount° | | | Value (US $) | |
Sovereign BondsD(continued) | | | | | | | | |
Dominican Republic – 0.69% | | | | | | | | |
Dominican Republic International Bond 144A 6.00% 7/19/28 # | | | 325,000 | | | $ | 357,097 | |
| | | | | | | | |
| | | | | | | 357,097 | |
| | | | | | | | |
Egypt – 0.83% | | | | | | | | |
Egypt Government International Bond 144A 7.60% 3/1/29 # | | | 400,000 | | | | 429,314 | |
| | | | | | | | |
| | | | | | | 429,314 | |
| | | | | | | | |
El Salvador – 0.74% | | | | | | | | |
El Salvador Government International Bond 144A 7.125% 1/20/50 # | | | 380,000 | | | | 386,650 | |
| | | | | | | | |
| | | | | | | 386,650 | |
| | | | | | | | |
Ghana – 0.64% | | | | | | | | |
Ghana Government International Bond 144A 7.875% 3/26/27 # | | | 315,000 | | | | 333,297 | |
| | | | | | | | |
| | | | | | | 333,297 | |
| | | | | | | | |
Ivory Coast – 0.36% | | | | | | | | |
Ivory Coast Government International Bond 144A 6.125% 6/15/33 # | | | 200,000 | | | | 189,051 | |
| | | | | | | | |
| | | | | | | 189,051 | |
| | | | | | | | |
Kenya – 0.42% | | | | | | | | |
Kenya Government International Bond 144A 8.00% 5/22/32 # | �� | | 205,000 | | | | 217,890 | |
| | | | | | | | |
| | | | | | | 217,890 | |
| | | | | | | | |
Mongolia – 0.40% | | | | | | | | |
Development Bank of Mongolia 144A 7.25% 10/23/23 # | | | 200,000 | | | | 209,500 | |
| | | | | | | | |
| | | | | | | 209,500 | |
| | | | | | | | |
Nigeria – 0.41% | | | | | | | | |
Nigeria Government International Bond 144A 7.875% 2/16/32 # | | | 200,000 | | | | 212,998 | |
| | | | | | | | |
| | | | | | | 212,998 | |
| | | | | | | | |
Russia – 0.40% | | | | | | | | |
Russian Foreign Bond - Eurobond 144A 4.25% 6/23/27 # | | | 200,000 | | | | 209,078 | |
| | | | | | | | |
| | | | | | | 209,078 | |
| | | | | | | | |
Sri Lanka – 0.78% | | | | | | | | |
Sri Lanka Government International Bond 144A 7.55% 3/28/30 # | | | 400,000 | | | | 407,178 | |
| | | | | | | | |
| | | | | | | 407,178 | |
| | | | | | | | |
Turkey – 0.41% | | | | | | | | |
Turkey Government International Bond 7.625% 4/26/29 | | | 200,000 | | | | 210,427 | |
| | | | | | | | |
| | | | | | | 210,427 | |
| | | | | | | | |
20
| | | | | | | | |
| | | Principal amount° | | | Value (US $) | |
Sovereign BondsD(continued) | | | | | | | | |
Ukraine – 0.41% | | | | | | | | |
Ukraine Government International Bond 144A 7.75% 9/1/26 # | | | 200,000 | | | $ | 211,732 | |
| | | | | | | | |
| | | | | | | 211,732 | |
| | | | | | | | |
Total Sovereign Bonds(cost $3,357,552) | | | | | | | 3,482,462 | |
| | | | | | | | |
| | | | | | | |
Supranational Bank – 0.49% | | | | | | | | |
Banque Ouest Africaine de Developpement 144A 5.00% 7/27/27 # | | | 240,000 | | | | 252,905 | |
| | | | | | | | |
Total Supranational Bank(cost $235,378) | | | | | | | 252,905 | |
| | | | | | | | |
| | |
| | | Number of shares | | | | |
Short-Term Investments – 24.27% | | | | | | | | |
Money Market Mutual Funds – 24.27% | | | | | | | | |
BlackRock FedFund - Institutional Shares(seven-day effective yield 2.23%) | | | 2,521,918 | | | | 2,521,502 | |
Fidelity Investments Money Market Government Portfolio - Class I(seven-day effective yield 2.19%) | | | 2,521,918 | | | | 2,521,492 | |
GS Financial Square Government Fund - Institutional Shares(seven-day effective yield 2.23%) | | | 2,521,918 | | | | 2,521,501 | |
Morgan Stanley Government Portfolio - Institutional Class(seven-day effective yield 2.21%) | | | 2,521,918 | | | | 2,521,497 | |
State Street Institutional US Government Money Market Fund - Investor Class
(seven-day effective yield 2.18%) | | | 2,521,918 | | | | 2,521,487 | |
| | | | | | | | |
Total Short-Term Investments(cost $12,607,479) | | | | | | | 12,607,479 | |
| | | | | | | | |
Total Value of Securities – 101.66%
(cost $52,019,504) | | | | | | $ | 52,806,076 | |
| | | | | | | | |
| # | Security exempt from registration under Rule 144A of the Securities Act of 1933, as amended. At July 31, 2019, the aggregate value of Rule 144A securities was $36,197,874, which represents 69.69% of the Fund’s net assets. See Note 10 in “Notes to financial statements.” |
| PIK. 78% of the income received was in cash and 22% was in principal. |
| ° | Principal amount shown is stated in USD unless noted that the security is denominated in another currency. |
| D | Securities have been classified by country of origin. Aggregate classification by business sector has been presented on page 13 in “Security type / country and sector allocations.” |
| µ | Fixed to variable rate investment. The rate shown reflects the fixed rate in effect at July 31, 2019. Rate will reset at a future date. |
| y | No contractual maturity date. |
| ● | | Variable rate investment. Rates reset periodically. Rate shown reflects the rate in effect at July 31, 2019. For securities based on a published reference rate and spread, the reference rate and |
21
Schedule of investments
Delaware Emerging Markets Debt Fund
| | spread are indicated in their description above. The reference rate descriptions (i.e. LIBOR03M, LIBOR06M, etc.) used in this report are identical for different securities, but the underlying reference rates may differ due to the timing of the reset period. Certain variable rate securities are not based on a published reference rate and spread but are determined by the issuer or agent and are based on current market conditions, or for mortgage-backed securities, are impacted by the individual mortgages which are paying off over time. These securities do not indicate a reference rate and spread in their description above. |
Summary of abbreviations:
BADLARPP – Argentina Term Deposit Rate
DAC – Designated Activity Company
GS – Goldman Sachs
ICE – Intercontinental Exchange
JSC – Joint Stock Company
LIBOR – London Interbank Offered Rate
LIBOR03M – ICE LIBOR USD 3 Month
LIBOR06M – ICE LIBOR USD 6 Month
PIK –Payment-in-kind
USD – US Dollar
See accompanying notes, which are an integral part of the financial statements.
22
This page intentionally left blank.
| | |
| Statement of assets and liabilities | | |
| Delaware Emerging Markets Debt Fund | | July 31, 2019 |
| | | | |
Assets: | | | | |
Investments, at value1 | | $ | 52,806,076 | |
Cash | | | 1,323,004 | |
Foreign currencies, at value2 | | | 16,945 | |
Receivable for fund shares sold | | | 3,785,805 | |
Receivable for securities sold | | | 437,061 | |
Interest receivable | | | 529,707 | |
| | | | |
Total assets | | | 58,898,598 | |
| | | | |
Liabilities: | | | | |
Payable for securities purchased | | | 6,908,043 | |
Other accrued expenses | | | 30,447 | |
Investment management fees payable to affiliates | | | 11,437 | |
Audit and tax fees payable | | | 6,450 | |
Accounting and administration expenses payable to affiliates | | | 449 | |
Dividend disbursing and transfer agent fees and expenses payable to affiliates | | | 283 | |
Trustees’ fees and expenses payable to affiliates | | | 77 | |
Distribution fees payable to affiliates | | | 59 | |
Legal fees payable to affiliates | | | 27 | |
Reports and statements to shareholders expenses payable to affiliates | | | 26 | |
| | | | |
Total liabilities | | | 6,957,298 | |
| | | | |
Total Net Assets | | $ | 51,941,300 | |
| | | | |
| |
Net Assets Consist of: | | | | |
Paid-in capital | | $ | 51,314,291 | |
Total distributable earnings (loss) | | | 627,009 | |
| | | | |
Total Net Assets | | $ | 51,941,300 | |
| | | | |
24
| | | | |
| |
Class A: | | | | |
Net assets | | $ | 93,552 | |
Shares of beneficial interest outstanding, unlimited authorization, no par | | | 10,793 | |
Net asset value per share | | $ | 8.67 | |
Sales charge | | | 4.50 | % |
Offering price per share, equal to net asset value per share / (1 – sales charge) | | $ | 9.08 | |
| |
Class C: | | | | |
Net assets | | $ | 60,939 | |
Shares of beneficial interest outstanding, unlimited authorization, no par | | | 7,034 | |
Net asset value per share | | $ | 8.66 | |
| |
Class R: | | | | |
Net assets | | $ | 2,729 | |
Shares of beneficial interest outstanding, unlimited authorization, no par | | | 315 | |
Net asset value per share | | $ | 8.66 | |
| |
Institutional Class: | | | | |
Net assets | | $ | 51,784,080 | |
Shares of beneficial interest outstanding, unlimited authorization, no par | | | 5,972,857 | |
Net asset value per share | | $ | 8.67 | |
| |
| | | | |
1Investments, at cost | | $ | 52,019,504 | |
| 2Foreign currencies, at cost | | | 17,580 | |
See accompanying notes, which are an integral part of the financial statements.
25
| | |
| Statement of operations | | |
| Delaware Emerging Markets Debt Fund | | Year ended July 31, 2019 |
| | | | |
Investment Income: | | | | |
Interest | | $ | 1,350,276 | |
Dividends | | | 20,665 | |
| | | | |
| | | 1,370,941 | |
| | | | |
| |
Expenses: | | | | |
Management fees | | | 173,847 | |
Distribution expenses – Class A | | | 277 | |
Distribution expenses – Class C | | | 590 | |
Distribution expenses – Class R | | | 13 | |
Audit and tax fees | | | 51,087 | |
Registration fees | | | 47,832 | |
Accounting and administration expenses | | | 44,797 | |
Reports and statements to shareholders expenses | | | 25,939 | |
Legal fees | | | 15,929 | |
Dividend disbursing and transfer agent fees and expenses | | | 4,085 | |
Custodian fees | | | 2,422 | |
Trustees’ fees and expenses | | | 1,247 | |
Other | | | 14,659 | |
| | | | |
| | | 382,724 | |
Less expenses waived | | | (198,223 | ) |
Less waived distribution expenses – Class R | | | (13 | ) |
Less expense paid indirectly | | | (1,268 | ) |
| | | | |
Total operating expenses | | | 183,220 | |
| | | | |
Net Investment Income | | | 1,187,721 | |
| | | | |
26
| | | | |
Net Realized and Unrealized Gain (Loss): | | | | |
Net realized gain (loss) on: | | | | |
Investments | | $ | (184,069 | ) |
Foreign currencies | | | (81,951 | ) |
Foreign currency exchange contracts | | | (14,651 | ) |
Futures contracts | | | 2,983 | |
Options purchased | | | (79,652 | ) |
| | | | |
Net realized loss | | | (357,340 | ) |
| | | | |
Net change in unrealized appreciation (depreciation) of: | | | | |
Investments | | | 1,552,978 | |
Foreign currencies | | | 2,302 | |
Foreign currency exchange contracts | | | 297 | |
Futures contracts | | | 2,081 | |
Options purchased | | | 775 | |
| | | | |
Net change in unrealized appreciation (depreciation) | | | 1,558,433 | |
| | | | |
Net Realized and Unrealized Gain | | | 1,201,093 | |
| | | | |
Net Increase in Net Assets Resulting from Operations | | $ | 2,388,814 | |
| | | | |
See accompanying notes, which are an integral part of the financial statements.
27
Statements of changes in net assets
Delaware Emerging Markets Debt Fund
| | | | | | | | |
| | | Year ended | |
| | | 7/31/19 | | | 7/31/18 | |
Increase (Decrease) in Net Assets from Operations: | | | | | | | | |
Net investment income | | $ | 1,187,721 | | | $ | 1,059,983 | |
Net realized gain (loss) | | | (357,340 | ) | | | 345,018 | |
Net change in unrealized appreciation (depreciation) | | | 1,558,433 | | | | (1,376,362 | ) |
| | | | | | | | |
Net increase in net assets resulting from operations | | | 2,388,814 | | | | 28,639 | |
| | | | | | | | |
| | |
Dividends and Distributions to Shareholders from: | | | | | | | | |
Distributable earnings*: | | | | | | | | |
Class A | | | (5,436 | ) | | | (2,411 | ) |
Class C | | | (2,388 | ) | | | (4,133 | ) |
Class R | | | (130 | ) | | | (154 | ) |
Institutional Class | | | (1,158,341 | ) | | | (1,344,940 | ) |
| | | | | | | | |
| | | (1,166,295 | ) | | | (1,351,638 | ) |
| | | | | | | | |
Capital Share Transactions: | | | | | | | | |
Proceeds from shares sold: | | | | | | | | |
Class A | | | 111,456 | | | | 92,140 | |
Class C | | | 14,307 | | | | 58,822 | |
Institutional Class | | | 28,002,416 | | | | 126,314 | |
| | |
Net asset value of shares issued upon reinvestment of dividends and distributions: | | | | | | | | |
Class A | | | 5,108 | | | | 2,411 | |
Class C | | | 2,387 | | | | 4,133 | |
Class R | | | 129 | | | | 154 | |
Institutional Class | | | 1,155,876 | | | | 1,341,785 | |
| | | | | | | | |
| | | 29,291,679 | | | | 1,625,759 | |
| | | | | | | | |
28
| | | | | | | | |
| | | Year ended | |
| | | 7/31/19 | | | 7/31/18 | |
Capital Share Transactions (continued): | | | | | | | | |
Cost of shares redeemed: | | | | | | | | |
Class A | | $ | (86,125 | ) | | $ | (61,604 | ) |
Class C | | | (38,686 | ) | | | (38,549 | ) |
Institutional Class | | | (271,729 | ) | | | (30,869 | ) |
| | | | | | | | |
| | | (396,540 | ) | | | (131,022 | ) |
| | | | | | | | |
Increase in net assets derived from capital share transactions | | | 28,895,139 | | | | 1,494,737 | |
| | | | | | | | |
Net Increase in Net Assets | | | 30,117,658 | | | | 171,738 | |
| | |
Net Assets: | | | | | | | | |
Beginning of year | | | 21,823,642 | | | | 21,651,904 | |
| | | | | | | | |
End of year1 | | $ | 51,941,300 | | | $ | 21,823,642 | |
| | | | | | | | |
| 1 | Net Assets – End of year includes undistributed net investment income of $36,706 in 2018. The Securities and Exchange Commission eliminated the requirement to disclose undistributed (distributions in excess of) net investment income in 2018. |
| * | For the year ended July 31, 2019, the Fund has adopted amendments to RegulationS-X (see Note 12 in “Notes to financial statements”). For the year ended July 31, 2018, the dividends and distributions to shareholders were as follows: |
| | | | | | | | | | | | | | | | |
| | | Class A | | | Class C | | | Class R | | | Institutional Class | |
Dividends from net investment income | | $ | (1,956 | ) | | $ | (2,926 | ) | | $ | (118 | ) | | $ | (1,027,398 | ) |
Distributions from net realized gain | | | (455 | ) | | | (1,207 | ) | | | (36 | ) | | | (317,542 | ) |
See accompanying notes, which are an integral part of the financial statements.
29
Financial highlights
Delaware Emerging Markets Debt Fund Class A
Selected data for each share of the Fund outstanding throughout each period were as follows:
|
Net asset value, beginning of period |
|
Income (loss) from investment operations: |
Net investment income1 |
Net realized and unrealized gain (loss) |
Total from investment operations |
|
Less dividends and distributions from: |
Net investment income |
Net realized gain |
Total dividends and distributions |
|
Net asset value, end of period |
|
Total return2 |
|
Ratios and supplemental data: |
Net assets, end of period (000 omitted) |
Ratio of expenses to average net assets excluding interest expense |
Ratio of expenses to average net assets |
Ratio of expenses to average net assets prior to fees waived |
Ratio of net investment income to average net assets excluding interest expense |
Ratio of net investment income to average net assets |
Ratio of net investment income to average net assets prior to fees waived |
Portfolio turnover |
| 1 | The average shares outstanding method has been applied for per share information. |
| 2 | Total return is based on the change in net asset value of a share during the period and assumes reinvestment of dividends and distributions at net asset value and does not reflect the impact of a sales charge. Total return during all of the periods shown reflects waivers by the manager and/or distributor. Performance would have been lower had the waivers not been in effect. |
See accompanying notes, which are an integral part of the financial statements.
30
| | | | | | | | | | | | | | | | | | | | | | | | | | | | |
| | | Year ended | |
| | | 7/31/19 | | | | | 7/31/18 | | | | | 7/31/17 | | | | | 7/31/16 | | | | | 7/31/15 | |
| |
| | $ | 8.26 | | | | | $ | 8.77 | | | | | $ | 8.48 | | | | | $ | 8.21 | | | | | $ | 8.84 | |
| | | | | | | | | |
| | | 0.40 | | | | | | 0.39 | | | | | | 0.37 | | | | | | 0.36 | | | | | | 0.37 | |
| | | 0.41 | | | | | | (0.39 | ) | | | | | 0.29 | | | | | | 0.24 | | | | | | (0.61 | ) |
| | | | | | | | | | | | | | | | | | | | | | | | | | | | |
| | | 0.81 | | | | | | — | | | | | | 0.66 | | | | | | 0.60 | | | | | | (0.24 | ) |
| | | | | | | | | | | | | | | | | | | | | | | | | | | | |
| | | | | | | | | |
| | | (0.35 | ) | | | | | (0.38 | ) | | | | | (0.37 | ) | | | | | (0.33 | ) | | | | | (0.30 | ) |
| | | (0.05 | ) | | | | | (0.13 | ) | | | | | — | | | | | | — | | | | | | (0.09 | ) |
| | | | | | | | | | | | | | | | | | | | | | | | | | | | |
| | | (0.40 | ) | | | | | (0.51 | ) | | | | | (0.37 | ) | | | | | (0.33 | ) | | | | | (0.39 | ) |
| | | | | | | | | | | | | | | | | | | | | | | | | | | | |
| | | | | | | | | |
| | $ | 8.67 | | | | | $ | 8.26 | | | | | $ | 8.77 | | | | | $ | 8.48 | | | | | $ | 8.21 | |
| | | | | | | | | | | | | | | | | | | | | | | | | | | | |
| | | | | | | | | |
| | | 10.21% | | | | | | (0.10% | ) | | | | | 8.03% | | | | | | 7.62% | | | | | | (2.65% | ) |
| | | | | | | | | |
| | $ | 93 | | | | | $ | 57 | | | | | $ | 27 | | | | | $ | 3 | | | | | $ | 2 | |
| | | 1.04% | | | | | | 1.16% | | | | | | 1.22% | | | | | | 1.01% | | | | | | 1.08% | |
| | | 1.04% | | | | | | 1.16% | | | | | | 1.22% | | | | | | 1.03% | | | | | | 1.14% | |
| | | 1.90% | | | | | | 1.90% | | | | | | 1.91% | | | | | | 2.04% | | | | | | 2.03% | |
| | | 4.88% | | | | | | 4.57% | | | | | | 4.30% | | | | | | 4.44% | | | | | | 4.46% | |
| | | 4.88% | | | | | | 4.57% | | | | | | 4.30% | | | | | | 4.42% | | | | | | 4.40% | |
| | | 4.02% | | | | | | 3.83% | | | | | | 3.61% | | | | | | 3.41% | | | | | | 3.51% | |
| | | 74% | | | | | | 108% | | | | | | 154% | | | | | | 232% | | | | | | 288% | |
| | | | | | | | | | | | | | | | | | | | | | | | | | | | |
| |
31
Financial highlights
Delaware Emerging Markets Debt Fund Class C
Selected data for each share of the Fund outstanding throughout each period were as follows:
|
Net asset value, beginning of period |
|
Income (loss) from investment operations: |
Net investment income1 |
Net realized and unrealized gain (loss) |
Total from investment operations |
|
Less dividends and distributions from: |
Net investment income |
Net realized gain |
Total dividends and distributions |
|
Net asset value, end of period |
|
Total return2 |
|
Ratios and supplemental data: |
Net assets, end of period (000 omitted) |
Ratio of expenses to average net assets excluding interest expense |
Ratio of expenses to average net assets |
Ratio of expenses to average net assets prior to fees waived |
Ratio of net investment income to average net assets excluding interest expense |
Ratio of net investment income to average net assets |
Ratio of net investment income to average net assets prior to fees waived |
Portfolio turnover |
| 1 | The average shares outstanding method has been applied for per share information. |
| 2 | Total return is based on the change in net asset value of a share during the period and assumes reinvestment of dividends and distributions at net asset value and does not reflect the impact of a sales charge. Total return during all of the periods shown reflects waivers by the manager and/or distributor. Performance would have been lower had the waivers not been in effect. |
See accompanying notes, which are an integral part of the financial statements.
32
| | | | | | | | | | | | | | | | | | | | | | | | | | | | |
| | | Year ended | |
| | | 7/31/19 | | | | | 7/31/18 | | | | | 7/31/17 | | | | | 7/31/16 | | | | | 7/31/15 | |
| |
| | $ | 8.26 | | | | | $ | 8.77 | | | | | $ | 8.48 | | | | | $ | 8.22 | | | | | $ | 8.84 | |
| | | | | | | | | |
| | | 0.34 | | | | | | 0.33 | | | | | | 0.32 | | | | | | 0.36 | | | | | | 0.37 | |
| | | 0.40 | | | | | | (0.39 | ) | | | | | 0.32 | | | | | | 0.23 | | | | | | (0.60 | ) |
| | | | | | | | | | | | | | | | | | | | | | | | | | | | |
| | | 0.74 | | | | | | (0.06 | ) | | | | | 0.64 | | | | | | 0.59 | | | | | | (0.23 | ) |
| | | | | | | | | | | | | | | | | | | | | | | | | | | | |
| | | | | | | | | |
| | | (0.29 | ) | | | | | (0.32 | ) | | | | | (0.35 | ) | | | | | (0.33 | ) | | | | | (0.30 | ) |
| | | (0.05 | ) | | | | | (0.13 | ) | | | | | — | | | | | | — | | | | | | (0.09 | ) |
| | | | | | | | | | | | | | | | | | | | | | | | | | | | |
| | | (0.34 | ) | | | | | (0.45 | ) | | | | | (0.35 | ) | | | | | (0.33 | ) | | | | | (0.39 | ) |
| | | | | | | | | | | | | | | | | | | | | | | | | | | | |
| | | | | | | | | |
| | $ | 8.66 | | | | | $ | 8.26 | | | | | $ | 8.77 | | | | | $ | 8.48 | | | | | $ | 8.22 | |
| | | | | | | | | | | | | | | | | | | | | | | | | | | | |
| | | | | | | | | |
| | | 9.27% | | | | | | (0.84% | ) | | | | | 7.74% | | | | | | 7.49% | | | | | | (2.53% | ) |
| | | | | | | | | |
| | $ | 61 | | | | | $ | 82 | | | | | $ | 63 | | | | | $ | 2 | | | | | $ | 2 | |
| | | 1.79% | | | | | | 1.91% | | | | | | 1.81% | | | | | | 1.01% | | | | | | 1.08% | |
| | | 1.79% | | | | | | 1.91% | | | | | | 1.81% | | | | | | 1.03% | | | | | | 1.14% | |
| | | 2.65% | | | | | | 2.65% | | | | | | 2.66% | | | | | | 2.79% | | | | | | 2.78% | |
| | | 4.13% | | | | | | 3.82% | | | | | | 3.71% | | | | | | 4.44% | | | | | | 4.46% | |
| | | 4.13% | | | | | | 3.82% | | | | | | 3.71% | | | | | | 4.42% | | | | | | 4.40% | |
| | | 3.27% | | | | | | 3.08% | | | | | | 2.86% | | | | | | 2.66% | | | | | | 2.76% | |
| | | 74% | | | | | | 108% | | | | | | 154% | | | | | | 232% | | | | | | 288% | |
| | | | | | | | | | | | | | | | | | | | | | | | | | | | |
| |
33
Financial highlights
Delaware Emerging Markets Debt Fund Class R
Selected data for each share of the Fund outstanding throughout each period were as follows:
|
Net asset value, beginning of period |
|
Income (loss) from investment operations: |
Net investment income1 |
Net realized and unrealized gain (loss) |
Total from investment operations |
|
Less dividends and distributions from: |
Net investment income |
Net realized gain |
Total dividends and distributions |
|
Net asset value, end of period |
|
Total return2 |
|
Ratios and supplemental data: |
Net assets, end of period (000 omitted) |
Ratio of expenses to average net assets excluding interest expense |
Ratio of expenses to average net assets |
Ratio of expenses to average net assets prior to fees waived |
Ratio of net investment income to average net assets excluding interest expense |
Ratio of net investment income to average net assets |
Ratio of net investment income to average net assets prior to fees waived |
Portfolio turnover |
| 1 | The average shares outstanding method has been applied for per share information. |
| 2 | Total return is based on the change in net asset value of a share during the period and assumes reinvestment of dividends and distributions at net asset value. Total return during all of the periods shown reflects waivers by the manager and/or distributor. Performance would have been lower had the waivers not been in effect. |
See accompanying notes, which are an integral part of the financial statements.
34
��
| | | | | | | | | | | | | | | | | | | | | | | | | | | | |
| | | Year ended | |
| | | 7/31/19 | | | | | 7/31/18 | | | | | 7/31/17 | | | | | 7/31/16 | | | | | 7/31/15 | |
| |
| | $ | 8.26 | | | | | $ | 8.77 | | | | | $ | 8.48 | | | | | $ | 8.22 | | | | | $ | 8.84 | |
| | | | | | | | | |
| | | 0.42 | | | | | | 0.42 | | | | | | 0.39 | | | | | | 0.36 | | | | | | 0.37 | |
| | | 0.40 | | | | | | (0.39 | ) | | | | | 0.28 | | | | | | 0.23 | | | | | | (0.60 | ) |
| | | | | | | | | | | | | | | | | | | | | | | | | | | | |
| | | 0.82 | | | | | | 0.03 | | | | | | 0.67 | | | | | | 0.59 | | | | | | (0.23 | ) |
| | | | | | | | | | | | | | | | | | | | | | | | | | | | |
| | | | | | | | | |
| | | (0.37 | ) | | | | | (0.41 | ) | | | | | (0.38 | ) | | | | | (0.33 | ) | | | | | (0.30 | ) |
| | | (0.05 | ) | | | | | (0.13 | ) | | | | | — | | | | | | — | | | | | | (0.09 | ) |
| | | | | | | | | | | | | | | | | | | | | | | | | | | | |
| | | (0.42 | ) | | | | | (0.54 | ) | | | | | (0.38 | ) | | | | | (0.33 | ) | | | | | (0.39 | ) |
| | | | | | | | | | | | | | | | | | | | | | | | | | | | |
| | | | | | | | | |
| | $ | 8.66 | | | | | $ | 8.26 | | | | | $ | 8.77 | | | | | $ | 8.48 | | | | | $ | 8.22 | |
| | | | | | | | | | | | | | | | | | | | | | | | | | | | |
| | | | | | | | | |
| | | 10.42% | | | | | | 0.16% | | | | | | 8.13% | | | | | | 7.49% | | | | | | (2.53% | ) |
| | | | | | | | | |
| | $ | 3 | | | | | $ | 2 | | | | | $ | 2 | | | | | $ | 2 | | | | | $ | 2 | |
| | | 0.79% | | | | | | 0.91% | | | | | | 1.00% | | | | | | 1.01% | | | | | | 1.08% | |
| | | 0.79% | | | | | | 0.91% | | | | | | 1.00% | | | | | | 1.03% | | | | | | 1.14% | |
| | | 2.15% | | | | | | 2.13% | | | | | | 2.16% | | | | | | 2.29% | | | | | | 2.28% | |
| | | 5.13% | | | | | | 4.82% | | | | | | 4.52% | | | | | | 4.44% | | | | | | 4.46% | |
| | | 5.13% | | | | | | 4.82% | | | | | | 4.52% | | | | | | 4.42% | | | | | | 4.40% | |
| | | 3.77% | | | | | | 3.60% | | | | | | 3.36% | | | | | | 3.16% | | | | | | 3.26% | |
| | | 74% | | | | | | 108% | | | | | | 154% | | | | | | 232% | | | | | | 288% | |
| | | | | | | | | | | | | | | | | | | | | | | | | | | | |
| |
35
Financial highlights
Delaware Emerging Markets Debt Fund Institutional Class
Selected data for each share of the Fund outstanding throughout each period were as follows:
|
Net asset value, beginning of period |
|
Income (loss) from investment operations: |
Net investment income1 |
Net realized and unrealized gain (loss) |
Total from investment operations |
|
Less dividends and distributions from: |
Net investment income |
Net realized gain |
Total dividends and distributions |
|
Net asset value, end of period |
|
Total return2 |
|
Ratios and supplemental data: |
Net assets, end of period (000 omitted) |
Ratio of expenses to average net assets excluding interest expense |
Ratio of expenses to average net assets |
Ratio of expenses to average net assets prior to fees waived |
Ratio of net investment income to average net assets excluding interest expense |
Ratio of net investment income to average net assets |
Ratio of net investment income to average net assets prior to fees waived |
Portfolio turnover |
| 1 | The average shares outstanding method has been applied for per share information. |
| 2 | Total return is based on the change in net asset value of a share during the period and assumes reinvestment of dividends and distributions at net asset value. Total return during all of the periods shown reflects a waiver by the manager. Performance would have been lower had the waiver not been in effect. |
See accompanying notes, which are an integral part of the financial statements.
36
| | | | | | | | | | | | | | | | | | | | | | | | | | | | |
| | | Year ended | |
| | | 7/31/19 | | | | | 7/31/18 | | | | | 7/31/17 | | | | | 7/31/16 | | | | | 7/31/15 | |
| | $ | 8.27 | | | | | $ | 8.78 | | | | | $ | 8.48 | | | | | $ | 8.22 | | | | | $ | 8.84 | |
| | | | | | | | | |
| | | 0.42 | | | | | | 0.42 | | | | | | 0.39 | | | | | | 0.36 | | | | | | 0.37 | |
| | | 0.40 | | | | | | (0.39 | ) | | | | | 0.29 | | | | | | 0.23 | | | | | | (0.60 | ) |
| | | | | | | | | | | | | | | | | | | | | | | | | | | | |
| | | 0.82 | | | | | | 0.03 | | | | | | 0.68 | | | | | | 0.59 | | | | | | (0.23 | ) |
| | | | | | | | | | | | | | | | | | | | | | | | | | | | |
| | | | | | | | | |
| | | (0.37 | ) | | | | | (0.41 | ) | | | | | (0.38 | ) | | | | | (0.33 | ) | | | | | (0.30 | ) |
| | | (0.05 | ) | | | | | (0.13 | ) | | | | | — | | | | | | — | | | | | | (0.09 | ) |
| | | | | | | | | | | | | | | | | | | | | | | | | | | | |
| | | (0.42 | ) | | | | | (0.54 | ) | | | | | (0.38 | ) | | | | | (0.33 | ) | | | | | (0.39 | ) |
| | | | | | | | | | | | | | | | | | | | | | | | | | | | |
| | | | | | | | | |
| | $ | 8.67 | | | | | $ | 8.27 | | | | | $ | 8.78 | | | | | $ | 8.48 | | | | | $ | 8.22 | |
| | | | | | | | | | | | | | | | | | | | | | | | | | | | |
| | | | | | | | | |
| | | 10.41% | | | | | | 0.16% | | | | | | 8.25% | | | | | | 7.49% | | | | | | (2.53% | ) |
| | | | | | | | | |
| | $ | 51,784 | | | | | $ | 21,683 | | | | | $ | 21,560 | | | | | $ | 19,930 | | | | | $ | 18,532 | |
| | | 0.79% | | | | | | 0.91% | | | | | | 1.00% | | | | | | 1.01% | | | | | | 1.08% | |
| | | 0.79% | | | | | | 0.91% | | | | | | 1.00% | | | | | | 1.03% | | | | | | 1.14% | |
| | | 1.65% | | | | | | 1.65% | | | | | | 1.66% | | | | | | 1.79% | | | | | | 1.78% | |
| | | 5.13% | | | | | | 4.82% | | | | | | 4.52% | | | | | | 4.44% | | | | | | 4.46% | |
| | | 5.13% | | | | | | 4.82% | | | | | | 4.52% | | | | | | 4.42% | | | | | | 4.40% | |
| | | 4.27% | | | | | | 4.08% | | | | | | 3.86% | | | | | | 3.66% | | | | | | 3.76% | |
| | | 74% | | | | | | 108% | | | | | | 154% | | | | | | 232% | | | | | | 288% | |
| | | | | | | | | | | | | | | | | | | | | | | | | | | | |
| |
37
| | |
| Notes to financial statements | | |
| Delaware Emerging Markets Debt Fund | | July 31, 2019 |
Delaware Group® Government Fund (Trust) is organized as a Delaware statutory trust and offers two series: Delaware Strategic Income Fund and Delaware Emerging Markets Debt Fund. These financial statements and the related notes pertain to Delaware Emerging Markets Debt Fund (Fund). The Fund is anopen-end investment company. The Fund is considered diversified under the Investment Company Act of 1940, as amended, and offers Class A, Class C, Class R, and Institutional Class shares. Class A shares are sold with a maximumfront-end sales charge of 4.50%. Class A share purchases of $1,000,000 or more will incur a contingent deferred sales charge (CDSC) instead of afront-end sales charge of 1.00%, if redeemed during the first year and 0.50% during the second year, provided that Delaware Distributors, L.P. (DDLP) paid a financial advisor a commission on the purchase of those shares. Class C shares are sold with a CDSC of 1.00%, which will be incurred if redeemed during the first 12 months. Class R and Institutional Class shares are not subject to a sales charge and are offered for sale exclusively to certain eligible investors.
The investment objective of the Fund is to primarily seek current income and secondarily capital appreciation.
1. Significant Accounting Policies
The Fund follows accounting and reporting guidance under Financial Accounting Standards Board (FASB) Accounting Standards Codification Topic 946, Financial Services – Investment Companies. The following accounting policies are in accordance with US generally accepted accounting principles (US GAAP) and are consistently followed by the Fund.
Security Valuation— Equity securities, except those traded on the Nasdaq Stock Market LLC (Nasdaq), are valued at the last quoted sales price as of the time of the regular close of the New York Stock Exchange on the valuation date. Equity securities traded on the Nasdaq are valued in accordance with the Nasdaq Official Closing Price, which may not be the last sales price. If, on a particular day, an equity security does not trade, the mean between the bid and ask prices will be used, which approximates fair value. Equity securities listed on a foreign exchange are normally valued at the last quoted sales price on the valuation date. US government and agency securities are valued at the mean between the bid and ask prices, which approximates fair value. Other debt securities and credit default swap (CDS) contracts are valued based upon valuations provided by an independent pricing service or broker/counterparty and reviewed by management. To the extent current market prices are not available, the pricing service may take into account developments related to the specific security, as well as transactions in comparable securities. Valuations for fixed income securities utilize matrix systems, which reflect such factors as security prices, yields, maturities, and ratings, and are supplemented by dealer and exchange quotations. Foreign currency exchange contracts and foreign cross currency exchange contracts are valued at the mean between the bid and ask prices, which approximates fair value. Interpolated values are derived when the settlement date of the contract is an interim date for which quotations are not available. Futures contracts and options on futures contracts are valued at the daily quoted settlement prices. Exchange-traded options are valued at the last reported sale price or, if no sales are reported, at the mean between the last reported bid and ask prices, which approximates fair value.Open-end investment companies are valued at their published net asset value. Investments in repurchase agreements are generally valued at par, which approximates fair value, each business day. Generally, other securities and assets for which market quotations are not readily available are valued at
38
fair value as determined in good faith under the direction of the Trust’s Board of Trustees (Board). In determining whether market quotations are readily available or fair valuation will be used, various factors will be taken into consideration, such as market closures or suspension of trading in a security. Restricted securities are valued at fair value using methods approved by the Board.
Federal and Foreign Income Taxes— No provision for federal income taxes has been made as the Fund intends to continue to qualify for federal income tax purposes as a regulated investment company under Subchapter M of the Internal Revenue Code of 1986, as amended, and make the requisite distributions to shareholders. The Fund evaluates tax positions taken or expected to be taken in the course of preparing the Fund’s tax returns to determine whether the tax positions are“more-likely-than-not” of being sustained by the applicable tax authority. Tax positions not deemed to meet the“more-likely-than-not” threshold are recorded as a tax benefit or expense in the current year. Management has analyzed the Fund’s tax positions taken or expected to be taken on the Fund’s federal income tax returns through year ended July 31, 2019 and for all open tax years (years ended July 31, 2016–July 31, 2018), and has concluded that no provision for federal income tax is required in the Fund’s financial statements. In regard to foreign taxes only, the Fund has open tax years in certain foreign countries in which it invests that may date back to the inception of the Fund. If applicable, the Fund recognizes interest accrued on unrecognized tax benefits in interest expense and penalties in “Other expenses” on the “Statement of operations.” During the year ended July 31, 2019, the Fund did not incur any interest or tax penalties.
Class Accounting— Investment income, common expenses, and realized and unrealized gain (loss) on investments are allocated to the various classes of the Fund on the basis of daily net assets of each class. Distribution expenses relating to a specific class are charged directly to that class.
Repurchase Agreements— The Fund may purchase certain US government securities subject to the counterparty’s agreement to repurchase them at an agreed upon date and price. The counterparty will be required on a daily basis to maintain the value of the collateral subject to the agreement at not less than the repurchase price (including accrued interest). The agreements are conditioned upon the collateral being deposited under the Federal Reserve book-entry system with the Fund’s custodian or a third-partysub-custodian. In the event of default or bankruptcy by the other party to the agreement, retention of the collateral may be subject to legal proceedings. At July 31, 2019, the Fund held no investments in repurchase agreements.
Foreign Currency Transactions— Transactions denominated in foreign currencies are recorded at the prevailing exchange rates on the valuation date in accordance with the Fund’s prospectus. The value of all assets and liabilities denominated in foreign currencies is translated daily into US dollars at the exchange rate of such currencies against the US dollar. Transaction gains or losses resulting from changes in exchange rates during the reporting period or upon settlement of the foreign currency transaction are reported in operations for the current period. The Fund generally bifurcates that portion of realized gains and losses on investments in debt securities which is due to changes in foreign exchange rates from that which is due to changes in market prices of debt securities. That portion of gains (losses) attributable to changes in foreign exchange rates is included on the “Statement of operations” under “Net realized gain (loss) on foreign currencies.” The Fund reports certain foreign currency related
39
Notes to financial statements
Delaware Emerging Markets Debt Fund
1. Significant Accounting Policies (continued)
transactions as components of realized gains (losses) for financial reporting purposes, whereas such components are treated as ordinary income (loss) for federal income tax purposes.
Use of Estimates— The preparation of financial statements in conformity with US GAAP requires management to make estimates and assumptions that affect the fair value of investments, the reported amounts of assets and liabilities and disclosure of contingent assets and liabilities at the date of the financial statements, and the reported amounts of revenues and expenses during the reporting period. Actual results could differ from those estimates and the differences could be material.
Other— Expenses directly attributable to the Fund are charged directly to the Fund. Other expenses common to various funds within the Delaware Funds® by Macquarie (Delaware Funds) are generally allocated among such funds on the basis of average net assets. Management fees and certain other expenses are paid monthly. Security transactions are recorded on the date the securities are purchased or sold (trade date) for financial reporting purposes. Costs used in calculating realized gains and losses on the sale of investment securities are those of the specific securities sold. Dividend income is recorded on theex-dividend date and interest income is recorded on the accrual basis. Discounts and premiums on debt securities are accreted or amortized to interest income, respectively, over the lives of the respective securities using the effective interest method. The Fund declares and pays dividends from net investment income monthly and pays distributions from net realized gain on investments, if any, annually. The Fund may distribute more frequently, if necessary for tax purposes. Dividends and distributions, if any, are recorded on theex-dividend date.
The Fund receives earnings credits from its custodian when positive cash balances are maintained, which may be used to offset custody fees. The expenses paid under this arrangement are included on the “Statement of operations” under “Custodian fees” with the corresponding expenses offset included under “Less expenses paid indirectly.” For the year ended July 31, 2019, the Fund earned $1,228 under this arrangement.
The Fund receives earnings credits from its transfer agent when positive cash balances are maintained, which may be used to offset transfer agent fees. If the amount earned is greater than $1, the expenses paid under this arrangement are included on the “Statement of operations” under “Dividend disbursing and transfer agent fees and expenses” with the corresponding expenses offset included under “Less expenses paid indirectly.” For the year ended July 31, 2019, the Fund earned $40 under this arrangement.
2. Investment Management, Administration Agreements, and Other Transactions with Affiliates
In accordance with the terms of its investment management agreement, the Fund pays Delaware Management Company (DMC), a series of Macquarie Investment Management Business Trust and the investment manager, an annual fee which is calculated daily and paid monthly at the rate of 0.75% on the first $500 million of average daily net assets of the Fund, 0.70% on the next $500 million, 0.65% on the next $1.5 billion, and 0.60% on average daily net assets in excess of $2.5 billion.
DMC has contractually agreed to waive all or a portion, if any, of its management fee and/or pay/reimburse the Fund to the extent necessary to ensure total annual operating expenses (excluding
40
any distribution and service(12b-1) fees, acquired fund fees and expenses, taxes, interest, short sale dividend and interest expenses, brokerage fees, certain insurance costs, and nonroutine expenses or costs, including, but not limited to, those relating to reorganizations, litigation, conducting shareholder meetings, and liquidations), do not exceed 0.79% of the Fund’s average daily net assets from Aug. 1, 2018 through July 31, 2019.* This waiver and reimbursement may only be terminated by agreement of DMC and the Fund. The waiver and reimbursement are accrued daily and received monthly.
Effective May 30, 2019, DMC may seek investment advice and recommendations from its affiliates: Macquarie Investment Management Europe Limited, Macquarie Investment Management Austria Kapitalanlage AG, and Macquarie Investment Management Global Limited (together, the “AffiliatedSub-Advisors”). The Manager may also permit these AffiliatedSub-Advisors to execute Fund security trades on behalf of the Manager and exercise investment discretion for securities in certain markets where DMC believes it will be beneficial to utilize an AffiliatedSub-Advisor’s specialized market knowledge. Although the AffiliatedSub-Advisors serve assub-advisors, DMC has ultimate responsibility for all investment advisory services. For these services, DMC, not the Fund, pays each AffiliatedSub-Advisor a portion of its investment management fee.
Delaware Investments Fund Services Company (DIFSC), an affiliate of DMC, provides fund accounting and financial administrative oversight services to the Fund. For these services, DIFSC’s fees are calculated daily and paid monthly based on the aggregate daily net assets of all funds within the Delaware Funds at the following annual rate: 0.00475% of the first $35 billion; 0.0040% of the next $10 billion; and 0.0025% of aggregate average daily net assets in excess of $45 billion (Total Fee). Each fund in the Delaware Funds pays a minimum of $4,000, which, in aggregate, is subtracted from the Total Fee. Each fund then pays its portion of the remainder of the Total Fee on a relative net asset value (NAV) basis. This amount is included on the “Statement of operations” under “Accounting and administration expenses.” For the year ended July 31, 2019, the Fund was charged $4,876 for these services.
DIFSC is also the transfer agent and dividend disbursing agent of the Fund. For these services, DIFSC’s fees are calculated daily and paid monthly based on the aggregate daily net assets of the retail funds within the Delaware Funds at the following annual rate: 0.014% of the first $20 billion; 0.011% of the next $5 billion; 0.007% of the next $5 billion; 0.005% of the next $20 billion; and 0.0025% of average daily net assets in excess of $50 billion. The fees payable to DIFSC under the shareholder services agreement described on the previous page are allocated among all retail funds in the Delaware Funds on a relative NAV basis. This amount is included on the “Statement of operations” under “Dividend disbursing and transfer agent fees and expenses.” For the year ended July 31, 2019, the Fund was charged $2,120 for these services.
Pursuant to asub-transfer agency agreement between DIFSC and BNY Mellon Investment Servicing (US) Inc. (BNYMIS), BNYMIS provides certainsub-transfer agency services to the Fund.Sub-transfer agency fees are paid by the Fund and are also included on the “Statement of operations” under “Dividend disbursing and transfer agent fees and expenses.” The fees that are calculated daily and paid as invoices are received on a monthly or quarterly basis.
Pursuant to a distribution agreement and distribution plan, the Fund pays DDLP, the distributor and an affiliate of DMC, an annual12b-1 fee of 0.25%, 1.00%, and 0.50% of the average daily net assets of the
41
Notes to financial statements
Delaware Emerging Markets Debt Fund
2. Investment Management, Administration Agreements, and Other Transactions with Affiliates (continued)
Class A, Class C, and Class R shares, respectively. These fees are calculated daily and paid monthly. DDLP has agreed to voluntarily suspend the12b-1 fee for the Class R shares and the suspension of the12b-1 fee will continue while the Fund is not broadly distributed. Institutional Class shares do not pay12b-1 fee.
As provided in the investment management agreement, the Fund bears a portion of the cost of certain resources shared with DMC, including the cost of internal personnel of DMC and/or its affiliates that provide legal, tax, and regulatory reporting services to the Fund. For the year ended July 31, 2019, the Fund was charged $629 for internal legal, tax, and regulatory reporting services provided by DMC and/or its affiliates’ employees. This amount is included on the “Statement of operations” under “Legal fees.”
For the year ended July 31, 2019, DDLP earned $47 in commissions on sales of the Fund’s Class A shares. For the year ended July 31, 2019, DDLP did not receive gross CDSC commission on redemption of the Fund Class A and Class C shares.
Trustees’ fees include expenses accrued by the Fund for each Trustee’s retainer and meeting fees. Certain officers of DMC, DIFSC, and DDLP are officers and/or Trustees of the Trust. These officers and Trustees are paid no compensation by the Fund.
In addition to the management fees and other expenses of the Fund, the Fund indirectly bears the investment management fees and other expenses of the investment companies (Underlying Funds) in which it invests. The amount of these fees and expenses incurred indirectly by the Fund will vary based upon the expense and fee levels of the Underlying Funds and the number of shares that are owned of the Underlying Funds at different times.
*The aggregate contractual waiver period covering this report is from April 1, 2018 through Nov. 28, 2019.
3. Investments
For the year ended July 31, 2019, the Fund made purchases and sales of investment securities other than short-term investments as follows:
| | | | |
Purchases | | | $34,890,163 | |
Sales | | | 16,612,523 | |
42
The tax cost of investments includes adjustments to net unrealized appreciation (depreciation) which may not necessarily be final tax cost basis adjustments, but approximate the tax basis unrealized gains and losses that may be realized and distributed to shareholders. At July 31, 2019, the cost and unrealized appreciation (depreciation) of investments for federal income tax purposes for the Fund were as follows:
| | | | |
Cost of investments | | $ | 52,023,791 | |
| | | | |
Aggregate unrealized appreciation of investments | | $ | 1,048,749 | |
Aggregate unrealized depreciation of investments | | | (266,464 | ) |
| | | | |
Net unrealized appreciation of investments | | $ | 782,285 | |
| | | | |
US GAAP defines fair value as the price that the Fund would receive to sell an asset or pay to transfer a liability in an orderly transaction between market participants at the measurement date under current market conditions. A three-level hierarchy for fair value measurements has been established based upon the transparency of inputs to the valuation of an asset or liability. Inputs may be observable or unobservable and refer broadly to the assumptions that market participants would use in pricing the asset or liability. Observable inputs reflect the assumptions market participants would use in pricing the asset or liability based on market data obtained from sources independent of the reporting entity. Unobservable inputs reflect the reporting entity’s own assumptions about the assumptions that market participants would use in pricing the asset or liability based on the best information available under the circumstances. The Fund’s investment in its entirety is assigned a level based upon the observability of the inputs which are significant to the overall valuation. The three-level hierarchy of inputs is summarized below.
| | | | |
| Level 1 | | – | | Inputs are quoted prices in active markets for identical investments. (Examples: equity securities, open-end investment companies, futures contracts, and exchange-traded options contracts) |
| | |
| Level 2 | | – | | Other observable inputs, including, but not limited to: quoted prices for similar assets or liabilities in markets that are active, quoted prices for identical or similar assets or liabilities in markets that are not active, inputs other than quoted prices that are observable for the assets or liabilities (such as interest rates, yield curves, volatilities, prepayment speeds, loss severities, credit risks, and default rates) or other market-corroborated inputs. (Examples: debt securities, government securities, swap contracts, foreign currency exchange contracts, foreign securities utilizing international fair value pricing, broker-quoted securities, and fair valued securities) |
| | |
| Level 3 | | – | | Significant unobservable inputs, including the Fund’s own assumptions used to determine the fair value of investments. (Examples: broker-quoted securities and fair valued securities) |
Level 3 investments are valued using significant unobservable inputs. The Fund may also use an income-based valuation approach in which the anticipated future cash flows of the investment are discounted to calculate fair value. Discounts may also be applied due to the nature or duration of any restrictions on the disposition of the investments. Valuations may also be based upon current market prices of securities that are comparable in coupon, rating, maturity, and industry. The derived value of a Level 3 investment may not represent the value which is received upon disposition and this could impact the results of operations.
43
Notes to financial statements
Delaware Emerging Markets Debt Fund
3. Investments (continued)
The following table summarizes the valuation of the Fund’s investments by fair value hierarchy levels as of July 31, 2019:
| | | | | | | | | | | | |
| | | Level 1 | | | Level 2 | | | Total | |
Securities | | | | | | | | | | | | |
| | | |
Assets: | | | | | | | | | | | | |
Corporate Debt | | $ | — | | | $ | 36,463,230 | | | $ | 36,463,230 | |
Foreign Debt | | | — | | | | 3,735,367 | | | | 3,735,367 | |
Short-Term Investments | | | 12,607,479 | | | | — | | | | 12,607,479 | |
| | | | | | | | | | | | |
Total Value of Securities | | $ | 12,607,479 | | | $ | 40,198,597 | | | $ | 52,806,076 | |
| | | | | | | | | | | | |
During the year ended July 31, 2019, there were no transfers between Level 1 investments, Level 2 investments, or Level 3 investments that had a significant impact to the Fund. The Fund’s policy is to recognize transfers between levels based on fair value at the beginning of the reporting period.
The Fund’s investments that are categorized as Level 3 were valued utilizing third party pricing information without adjustment. Such valuations are based on unobservable inputs. A significant change in third party information inputs could result in significantly lower or higher value of such Level 3 investments.
The following is a reconciliation of investments in which significant unobservable inputs (Level 3) were used in determining fair value:
| | | | | |
| | | Loan Agreement |
Balance as of 7/31/18 | | | $ | 328,571 | |
Sales | | | | (341,063) | |
Net realized gain (loss) | | | | (9,562) | |
Net change in unrealized appreciation (depreciation) | | | | 22,054 | |
| | | | | |
Balance as of 7/31/19 | | | $ | — | |
| | | | | |
Net change in unrealized appreciation (depreciation) from investments still held at the end of the period | | | $ | — | |
| | | | | |
44
4. Dividend and Distribution Information
Income and long-term capital gain distributions are determined in accordance with federal income tax regulations, which may differ from US GAAP. Additionally, distributions from net gains on foreign currency transactions and net short-term gains on sales of investment securities are treated as ordinary income for federal income tax purposes. The tax character of dividends and distributions paid during the years ended July 31, 2019 and 2018 was as follows:
| | | | | | | | |
| | | Year ended | |
| | | 7/31/19 | | | 7/31/18 | |
Ordinary income | | $ | 1,045,440 | | | $ | 1,218,412 | |
Long term capital gains | | | 120,855 | | | | 133,226 | |
| | | | | | | | |
Total | | $ | 1,166,295 | | | $ | 1,351,638 | |
| | | | | | | | |
5. Components of Net Assets on a Tax Basis
As of July 31, 2019, the components of net assets on a tax basis were as follows:
| | | | |
Shares of beneficial interest | | $ | 51,314,291 | |
Undistributed ordinary income | | | 23,729 | |
Capital loss carryforwards | | | (179,005 | ) |
Unrealized appreciation of investments and foreign currencies | | | 782,285 | |
| | | | |
Net assets | | $ | 51,941,300 | |
| | | | |
The differences between book basis and tax basis components of the net assets are primarily attributable to tax deferral of straddle losses.
At July 31, 2019, capital loss carryforwards available to offset future realized capital gains were as follows:
| | | | | | | | |
| | | | | Loss carryforward character | | | |
| | | |
| | | Short-term | | Long-term | | Total | |
| | $ — | | $179,005 | | $ | 179,005 | |
45
Notes to financial statements
Delaware Emerging Markets Debt Fund
6. Capital Shares
Transactions in capital shares were as follows:
| | | | | | | | |
| | | Year ended | |
| | | 7/31/19 | | | 7/31/18 | |
Shares sold: | | | | | | | | |
Class A | | | 13,620 | | | | 10,576 | |
Class C | | | 1,666 | | | | 6,628 | |
Institutional Class | | | 3,240,572 | | | | 14,515 | |
| | |
Shares issued upon reinvestment of dividends and distributions: | | | | | | | | |
Class A | | | 631 | | | | 287 | |
Class C | | | 294 | | | | 480 | |
Class R | | | 16 | | | | 18 | |
Institutional Class | | | 141,593 | | | | 155,689 | |
| | | | | | | | |
| | | 3,398,392 | | | | 188,193 | |
| | | | | | | | |
Shares redeemed: | | | | | | | | |
Class A | | | (10,296 | ) | | | (7,045 | ) |
Class C | | | (4,849 | ) | | | (4,338 | ) |
Institutional Class | | | (32,072 | ) | | | (3,590 | ) |
| | | | | | | | |
| | | (47,217 | ) | | | (14,973 | ) |
| | | | | | | | |
Net increase | | | 3,351,175 | | | | 173,220 | |
| | | | | | | | |
7. Line of Credit
The Fund, along with certain other funds in the Delaware Funds (Participants), was a participant in a revolving line of credit intended to be used for temporary or emergency purposes as an additional source of liquidity to fund redemptions of investor shares. The revolving line of credit available was reduced from $155,000,000 to $130,000,000 on Sept. 6, 2018. Under the agreement, the Participants were charged an annual commitment fee of 0.15%, which was allocated across the Participants based on a weighted average of the respective net assets of each Participant. The Participants were permitted to borrow up to a maximum ofone-third of their net assets under the agreement. Each Participant was individually, and not jointly, liable for its particular advances, if any, under the line of credit. The line of credit available under the agreement expired on Nov. 5, 2018.
On Nov. 5, 2018, the Participants entered into an amendment to the agreement for a $190,000,000 revolving line of credit. The revolving line of credit available was increased to $220,000,000 on Nov. 29, 2018. The revolving line of credit is to be used as described above and operates in substantially the same manner as the original agreement. The line of credit available under the agreement expires on Nov. 4, 2019.
The Fund had no amounts outstanding as of July 31, 2019, or at any time during the year then ended.
46
8. Derivatives
US GAAP requires disclosures that enable investors to understand: (1) how and why an entity uses derivatives; (2) how they are accounted for; and (3) how they affect an entity’s results of operations and financial position.
Foreign Currency Exchange Contracts— The Fund may enter into foreign currency exchange contracts and foreign cross currency exchange contracts as a way of managing foreign exchange rate risk. The Fund may enter into these contracts to fix the US dollar value of a security that it has agreed to buy or sell for the period between the date the trade was entered into and the date the security is delivered and paid for. The Fund may also enter into these contracts to hedge the US dollar value of securities it already owns that are denominated in foreign currencies. In addition, the Fund may enter into these contracts to facilitate or expedite the settlement of portfolio transactions. The change in value is recorded as an unrealized gain or loss. When the contract is closed, a realized gain or loss is recorded equal to the difference between the value of the contract at the time it was opened and the value at the time it was closed.
The use of foreign currency exchange contracts and foreign cross currency exchange contracts does not eliminate fluctuations in the underlying prices of the securities, but does establish a rate of exchange that can be achieved in the future. Although foreign currency exchange contracts and foreign cross currency exchange contracts limit the risk of loss due to an unfavorable change in the value of the hedged currency, they also limit any potential gain that might result should the value of the currency change favorably. In addition, the Fund could be exposed to risks if the counterparties to the contracts are unable to meet the terms of their contracts. The Fund’s maximum risk of loss from counterparty credit risk is the value of its currency exchanged with the counterparty. The risk is generally mitigated by having a netting arrangement between the Fund and the counterparty and by the posting of collateral by the counterparty to the Fund to cover the Fund’s exposure to the counterparty. No foreign currency exchange contracts and foreign cross currency exchange contracts were outstanding at July 31, 2019.
During the year ended July 31, 2019, the Fund used foreign currency exchange contracts and cross currency exchange contracts to fix the US dollar value of a security between trade date and settlement date, to hedge the US dollar value of securities it already owns that are denominated in foreign currencies and to facilitate or expedite the settlement of portfolio transactions.
Futures Contracts— A futures contract is an agreement in which the writer (or seller) of the contract agrees to deliver to the buyer an amount of cash or securities equal to a specific dollar amount times the difference between the value of a specific security or index at the close of the last trading day of the contract and the price at which the agreement is made. The Fund may use futures contracts in the normal course of pursuing its investment objective. The Fund may invest in futures contracts to hedge its existing portfolio securities against fluctuations in value caused by changes in interest rates or market conditions. Upon entering into a futures contract, the Fund deposits cash or pledges US government securities to a broker, equal to the minimum “initial margin” requirements of the exchange on which the contract is traded. Subsequent payments are received from the broker or paid to the broker each day, based on the daily fluctuation in the market value of the contract. These receipts or payments are known as “variation margin” and are recorded daily by the Fund as unrealized gains or losses until the contracts are closed. When the contracts are closed, the Fund records a realized gain or loss equal to the
47
Notes to financial statements
Delaware Emerging Markets Debt Fund
8. Derivatives (continued)
difference between the value of the contract at the time it was opened and the value at the time it was closed. Risks of entering into futures contracts include potential imperfect correlation between the futures contracts and the underlying securities and the possibility of an illiquid secondary market for these instruments. When investing in futures, there is reduced counterparty credit risk to the Fund because futures are exchange-traded and the exchange’s clearinghouse, as counterparty to all exchange-traded futures, guarantees against default. No futures contracts were outstanding at July 31, 2019.
During the year ended July 31, 2019, the Fund used futures contracts to hedge the Fund’s existing portfolio securities against fluctuations in value caused by changes in interest rates or market conditions.
Options Contracts— The Fund may enter into options contracts in the normal course of pursuing its investment objective. The Fund may buy or write options contracts for any number of reasons, including without limitation: to manage the Fund’s exposure to changes in securities prices caused by interest rates or market conditions and foreign currencies; as an efficient means of adjusting the Fund’s overall exposure to certain markets; to protect the value of portfolio securities; and as a cash management tool. The Fund may buy or write call or put options on securities, futures, swaps, swaptions, financial indices, and foreign currencies. When the Fund buys an option, a premium is paid and an asset is recorded and adjusted on a daily basis to reflect the current market value of the option purchased. When the Fund writes an option, a premium is received and a liability is recorded and adjusted on a daily basis to reflect the current market value of the option written. Premiums received from writing options that expire unexercised are treated by the Fund on the expiration date as realized gains. The difference between the premium received and the amount paid on effecting a closing purchase transaction, including brokerage commissions, is treated as realized gain or loss. If a call option is exercised, the premium is added to the proceeds from the sale of the underlying security in determining whether the Fund has a realized gain or loss. If a put option is exercised, the premium reduces the cost basis of the securities purchased by the Fund. The Fund, as writer of an option, bears the market risk of an unfavorable change in the price of the security underlying the written option. When writing options, the Fund is subject to minimal counterparty risk because the counterparty is only obligated to pay premiums and does not bear the market risk of an unfavorable market change. No options written contracts were outstanding at July 31, 2019.
There were no transactions in options written during the year ended July 31, 2019.
During the year ended July 31, 2019, the Fund used options purchased contracts to manage the Fund’s exposure to changes in securities prices caused by interest rates or market conditions.
48
The effect of derivative instruments on the “Statement of operations” for the year ended July 31, 2019 was as follows:
| | | | | | | | | | | | | | | | | | | | | | |
| | | | | | | Net Realized Gain (Loss) on: | | |
| | | | | Foreign Currency
Exchange
Contracts | | Futures Contracts | | Options Purchased | | Total |
| | Currency contracts | | | $ | (14,651 | ) | | | $ | — | | | | $ | (79,652 | ) | | | $ | (94,303 | ) |
| | Interest rate contracts | | | | — | | | | | 2,983 | | | | | — | | | | | 2,983 | |
| | | | | | | | | | | | | | | | | | | | | | |
| | Total | | | $ | (14,651 | ) | | | $ | 2,983 | | | | $ | (79,652 | ) | | | $ | (91,320 | ) |
| | | | | | | | | | | | | | | | | | | | | | |
| | |
| | | | | Net Change in Unrealized Appreciation (Depreciation) of: |
| | | | | Foreign
Currency
Exchange
Contracts | | Futures
Contracts | | Options
Purchased | | Total |
| | Currency contracts | | | $ | 297 | | | | $ | — | | | | $ | 775 | | | | $ | 1,072 | |
| | Interest rate contracts | | | | — | | | | | 2,081 | | | | | — | | | | | 2,081 | |
| | | | | | | | | | | | | | | | | | | | | | |
| | Total | | | $ | 297 | | | | $ | 2,081 | | | | $ | 775 | | | | $ | 3,153 | |
| | | | | | | | | | | | | | | | | | | | | | |
Derivatives Generally.The table below summarizes the average balance of derivative holdings by the Fund during the year ended July 31, 2019.
| | | | | | | | |
| | | Long Derivative
Volume | | | Short Derivative
Volume | |
Foreign currency exchange contracts (average cost) | | | $279,172 | | | | $ 19,037 | |
Futures contracts (average notional value) | | | — | | | | 349,476 | |
Options contracts (average value) | | | 6,167 | | | | — | |
9. Securities Lending
The Fund, along with other funds in the Delaware Funds, may lend its securities pursuant to a security lending agreement (Lending Agreement) with The Bank of New York Mellon (BNY Mellon). At the time a security is loaned, the borrower must post collateral equal to the required percentage of the market value of the loaned security, including any accrued interest. The required percentage is: (1) 102% with respect to US securities and foreign securities that are denominated and payable in US dollars; and (2) 105% with respect to foreign securities. With respect to each loan, if on any business day, the aggregate market value of securities collateral plus cash collateral held is less than the aggregate market value of the securities which are the subject of such loan, the borrower will be notified to provide additional collateral by the end of the following business day, which, together with the collateral already held, will be not less than the applicable initial collateral requirements for such security loan. If the aggregate market value of securities collateral and cash collateral held with respect to a security loan exceeds the applicable initial collateral requirement, upon request of the borrower, BNY Mellon must return enough collateral to the borrower by the end of the following business day to reduce the value of the remaining collateral to the applicable initial collateral requirement for such security loan. As a result of the foregoing, the value of the collateral held with respect to a loaned security on any particular day, may be
49
Notes to financial statements
Delaware Emerging Markets Debt Fund
9. Securities Lending (continued)
more or less than the value of the security on loan. The collateral percentage with respect to the market value of the loaned security is determined by the security lending agent.
Cash collateral received by each fund of the Trust is generally invested in a series of individual separate accounts, each corresponding to a fund. The investment guidelines permit each separate account to hold certain securities that would be considered eligible securities for a money market fund. Cash collateral received is generally invested in government securities; certain obligations issued by government sponsored enterprises; repurchase agreements collateralized by US Treasury securities; obligations issued by the central government of any Organization for Economic Cooperation and Development (OECD) country or its agencies, instrumentalities or establishments; obligations of supranational organizations; commercial paper, notes, bonds, and other debt obligations; certificates of deposit, time deposits, and other bank obligations; and asset-backed securities. The Fund can also accept US government securities and letters of credit(non-cash collateral) in connection with securities loans.
In the event of default or bankruptcy by the lending agent, realization and/or retention of the collateral may be subject to legal proceedings. In the event the borrower fails to return loaned securities and the collateral received is insufficient to cover the value of the loaned securities and provided such collateral shortfall is not the result of investment losses, the lending agent has agreed to pay the amount of the shortfall to the Fund or, at the discretion of the lending agent, replace the loaned securities. The Fund continues to record dividends or interest, as applicable, on the securities loaned and is subject to changes in value of the securities loaned that may occur during the term of the loan. The Fund has the right under the Lending Agreement to recover the securities from the borrower on demand. With respect to security loans collateralized bynon-cash collateral, the Fund receives loan premiums paid by the borrower. With respect to security loans collateralized by cash collateral, the earnings from the collateral investments are shared among the Fund, the security lending agent, and the borrower. The Fund records security lending income net of allocations to the security lending agent and the borrower.
The Fund may incur investment losses as a result of investing securities lending collateral. This could occur if an investment in the collateral investment account defaulted or became impaired. Under those circumstances, the value of the Fund’s cash collateral account may be less than the amount the Fund would be required to return to the borrowers of the securities and the Fund would be required to make up for this shortfall.
During the year ended July 31, 2019, the Fund had no securities out on loan.
10. Credit and Market Risk
When interest rates rise, fixed income securities (i.e. debt obligations) generally will decline in value. These declines in value are greater for fixed income securities with longer maturities or durations.
Some countries in which the Fund may invest require governmental approval for the repatriation of investment income, capital, or the proceeds of sales of securities by foreign investors. In addition, if there is deterioration in a country’s balance of payments or for other reasons, a country may impose temporary restrictions on foreign capital remittances abroad.
50
The securities exchanges of certain foreign markets are substantially smaller, less liquid, and more volatile than the major securities markets in the US. Consequently, acquisition and disposition of securities by the Fund may be inhibited. In addition, a significant portion of the aggregate market value of equity securities listed on the major securities exchanges in emerging markets is held by a smaller number of investors. This may limit the number of shares available for acquisition or disposition by the Fund.
The Fund invests a portion of its assets in high yield fixed income securities, which are securities rated lower thanBBB- by Standard & Poor’s Financial Services LLC and Baa3 by Moody’s Investors Service, Inc., or similarly rated by another nationally recognized statistical rating organization. Investments in these higher yielding securities are generally accompanied by a greater degree of credit risk than higher rated securities. Additionally, lower rated securities may be more susceptible to adverse economic and competitive industry conditions than investment grade securities.
The Fund invests in certain obligations that may have liquidity protection designed to ensure that the receipt of payments due on the underlying security is timely. Such protection may be provided through guarantees, insurance policies, or letters of credit obtained by the issuer or sponsor through third parties, through various means of structuring the transaction, or through a combination of such approaches. The Fund will not pay any additional fees for such credit support, although the existence of credit support may increase the price of the security.
The Fund invests in bank loans and other securities that may subject it to direct indebtedness risk, the risk that the Fund will not receive payment of principal, interest, and other amounts due in connection with these investments and will depend primarily on the financial condition of the borrower. Loans that are fully secured offer the Fund more protection than unsecured loans in the event of nonpayment of scheduled interest or principal, although there is no assurance that the liquidation of collateral from a secured loan would satisfy the corporate borrower’s obligation, or that the collateral can be liquidated. Some loans or claims may be in default at the time of purchase. Certain of the loans and the other direct indebtedness acquired by the Fund may involve revolving credit facilities or other standby financing commitments that obligate the Fund to pay additional cash on a certain date or on demand. These commitments may require the Fund to increase its investment in a company at a time when the Fund might not otherwise decide to do so (including at a time when the company’s financial condition makes it unlikely that such amounts will be repaid). To the extent that the Fund is committed to advance additional funds, it will at all times hold and maintain cash or other high grade debt obligations in an amount sufficient to meet such commitments. When a loan agreement is purchased the Fund may pay an assignment fee. On an ongoing basis, the Fund may receive a commitment fee based on the undrawn portion of the underlying line of credit portion of a loan agreement. Prepayment penalty fees are received upon the prepayment of a loan agreement by the borrower. Prepayment penalty, facility, commitment, consent, and amendment fees are recorded to income as earned or paid.
As the Fund may be required to rely upon another lending institution to collect and pass on to the Fund amounts payable with respect to the loan and to enforce the Fund’s rights under the loan and other direct indebtedness, an insolvency, bankruptcy, or reorganization of the lending institution may delay or prevent the Fund from receiving such amounts. The highly leveraged nature of many loans may make
51
Notes to financial statements
Delaware Emerging Markets Debt Fund
10. Credit and Market Risk (continued)
them especially vulnerable to adverse changes in economic or market conditions. Investments in such loans and other direct indebtedness may involve additional risk to the Fund.
The Fund may invest up to 15% of its net assets in illiquid securities, which may include securities with contractual restrictions on resale, securities exempt from registration under Rule 144A promulgated under the Securities Act of 1933, as amended, and other securities which may not be readily marketable. The relative illiquidity of these securities may impair the Fund from disposing of them in a timely manner and at a fair price when it is necessary or desirable to do so. While maintaining oversight, the Board has delegated to DMC, theday-to-day functions of determining whether individual securities are liquid for purposes of the Fund’s limitation on investments in illiquid securities. Securities eligible for resale pursuant to Rule 144A, which are determined to be liquid, are not subject to the Fund’s 15% limit on investments in illiquid securities. Rule 144A securities have been identified on the “Schedule of investments.” Restricted securities are valued pursuant to the security valuation procedures described in Note 1.
11. Contractual Obligations
The Fund enters into contracts in the normal course of business that contain a variety of indemnifications. The Fund’s maximum exposure under these arrangements is unknown. However, the Fund has not had prior claims or losses pursuant to these contracts. Management has reviewed the Fund’s existing contracts and expects the risk of loss to be remote.
12. Recent Accounting Pronouncements
In March 2017, the FASB issued an Accounting Standards Update (ASU), ASU2017-08, Receivables — Nonrefundable Fees and Other Costs (Subtopic310-20), Premium Amortization on Purchased Callable Debt Securities which amends the amortization period for certain callable debt securities purchased at a premium, shortening such period to the earliest call date. The ASU2017-08 does not require any accounting change for debt securities held at a discount; the discount continues to be amortized to maturity. The ASU2017-08 is effective for fiscal years, and interim periods within those fiscal years, beginning after Dec. 15, 2018. At this time, management is evaluating the implications of these changes on the financial statements.
In August 2018, the FASB issued an ASU2018-13, which changes certain fair value measurement disclosure requirements. The ASU2018-13, in addition to other modifications and additions, removes the requirement to disclose the amount and reasons for transfers between Level 1 and Level 2 of the fair value hierarchy, the policy for the timing of transfers between levels and the valuation process for Level 3 fair value measurements. The ASU2018-13 is effective for fiscal years, and interim periods within those fiscal years, beginning after Dec. 15, 2019. At this time, management is evaluating the implications of these changes on the financial statements.
In August 2018, the Securities and Exchange Commission (SEC) adopted amendments to RegulationS-X to update and simplify the disclosure requirements for registered investment companies by eliminating requirements that are redundant or duplicative of US GAAP requirements or other SEC disclosure requirements. The new amendments require the presentation of the total, rather than the
52
components, of distributable earnings on the “Statement of assets and liabilities” and the total, rather than the components, of dividends from net investment income and distributions from net realized gains on the “Statements of changes in net assets.” The amendments also removed the requirement for the parenthetical disclosure of undistributed net investment income on the “Statements of changes in net assets” and certain tax adjustments that were reflected in the “Notes to financial statements.” All of these have been reflected in the Fund’s financial statements.
13. Subsequent Events
Management has determined that no material events or transactions occurred subsequent to July 31, 2019, that would require recognition or disclosure in the Fund’s financial statements.
53
Report of independent
registered public accounting firm
To the Board of Trustees of Delaware Group® Government Fund and Shareholders of Delaware Emerging Markets Debt Fund
Opinion on the Financial Statements
We have audited the accompanying statement of assets and liabilities, including the schedule of investments, of Delaware Emerging Markets Debt Fund (one of the funds constituting Delaware Group® Government Fund, referred to hereafter as the “Fund”) as of July 31, 2019, the related statement of operations for the year ended July 31, 2019, the statements of changes in net assets for each of the two years in the period ended July 31, 2019, including the related notes, and the financial highlights for each of the five years in the period ended July 31, 2019 (collectively referred to as the “financial statements”). In our opinion, the financial statements present fairly, in all material respects, the financial position of the Fund as of July 31, 2019, the results of its operations for the year then ended, the changes in its net assets for each of the two years in the period ended July 31, 2019 and the financial highlights for each of the five years in the period ended July 31, 2019 in conformity with accounting principles generally accepted in the United States of America.
Basis for Opinion
These financial statements are the responsibility of the Fund’s management. Our responsibility is to express an opinion on the Fund’s financial statements based on our audits. We are a public accounting firm registered with the Public Company Accounting Oversight Board (United States) (PCAOB) and are required to be independent with respect to the Fund in accordance with the U.S. federal securities laws and the applicable rules and regulations of the Securities and Exchange Commission and the PCAOB.
We conducted our audits of these financial statements in accordance with the standards of the PCAOB. Those standards require that we plan and perform the audit to obtain reasonable assurance about whether the financial statements are free of material misstatement, whether due to error or fraud.
Our audits included performing procedures to assess the risks of material misstatement of the financial statements, whether due to error or fraud, and performing procedures that respond to those risks. Such procedures included examining, on a test basis, evidence regarding the amounts and disclosures in the financial statements. Our audits also included evaluating the accounting principles used and significant estimates made by management, as well as evaluating the overall presentation of the financial statements. Our procedures included confirmation of securities owned as of July 31, 2019 by correspondence with the custodian, transfer agents and brokers; when replies were not received from brokers, we performed other auditing procedures. We believe that our audits provide a reasonable basis for our opinion.
/s/ PricewaterhouseCoopers LLP
Philadelphia, Pennsylvania
September 17, 2019
We have served as the auditor of one or more investment companies in Delaware Funds® by Macquarie since 2010.
54
Other Fund information (Unaudited)
Delaware Emerging Markets Debt Fund
Tax Information
The information set forth below is for the Fund’s fiscal year as required by federal income tax laws. Shareholders, however, must report distributions on a calendar year basis for income tax purposes, which may include distributions for portions of two fiscal years of the Fund. Accordingly, the information needed by shareholders for income tax purposes will be sent to them in January of each year. Please consult your tax advisor for proper treatment of this information.
All disclosures are based on financial information available as of the date of this annual report and, accordingly are subject to change. For any and all items requiring reporting, it is the intention of the Fund to report the maximum amount permitted under the Internal Revenue Code and the regulations thereunder.
For the fiscal year ended July 31, 2019, the Fund reports distributions paid during the year as follows:
| | | | |
(A) Ordinary Income Distribution (Tax Basis) | | | 89.64 | % |
(B) Long-Term Capital Gains Distribution (Tax Basis) | | | 10.36 | % |
Total Distributions (Tax Basis) | | | 100.00 | % |
(A) and (B) are based on a percentage of the Fund’s total distributions.
Board consideration ofSub-Advisory agreements for Delaware Emerging Markets Debt Fund at a meeting held February27-28, 2019
At a meeting held on Feb.27-28, 2019, the Board of Trustees (the “Board”) of Delaware Emerging Markets Debt Fund (the “Fund”), including a majority ofnon-interested or independent Trustees (the “Independent Trustees”), approved newSub-Advisory Agreements between Delaware Management Company (“DMC” or “Management”) and Macquarie Investment Management Europe Limited (“MIMEL”), Macquarie Investment Management Austria Kapitalanlage (“MIMAK”), and Macquarie Investment Management Global Limited (“MIMGL”), respectively. MIMEL, MIMAK, and MIMGL may also be referenced as“Sub-Advisors” below.
In reaching the decision to approve theSub-Advisory Agreements, the Board considered and reviewed information about each of MIMEL, MIMAK, and MIMGL, including its personnel, operations, and financial condition, which had been provided by MIMEL, MIMAK, and MIMGL, respectively. The Board also reviewed material furnished by DMC in advance of the meeting, including: a memorandum from DMC reviewing theSub-Advisory Agreements and the various services proposed to be rendered by MIMEL, MIMAK, and MIMGL; information concerning MIMEL’s, MIMAK’s, and MIMGL’s organizational structure and the experience of their key investment management personnel; copies of MIMEL’s, MIMAK’s, and MIMGL’s Form ADV, financial statements, compliance policies and procedures, and Codes of Ethics; relevant performance information provided with respect to MIMEL, MIMAK, and MIMGL; and a copy of theSub-Advisory Agreements.
In considering such information and materials, the Independent Trustees received assistance and advice from and met separately with their independent counsel. While attention was given to all information furnished, the following discusses some primary factors relevant to the Board’s decision to approve theSub-Advisory Agreements. This discussion of the information and factors considered by the Board (as
55
Other Fund information (Unaudited)
Delaware Emerging Markets Debt Fund
Board consideration ofSub-Advisory agreements for Delaware Emerging Markets Debt Fund at a meeting held February27-28, 2019 (continued)
well as the discussion above) is not intended to be exhaustive, but rather summarizes certain factors considered by the Board. In view of the wide variety of factors considered, the Board did not, unless otherwise noted, find it practicable to quantify or otherwise assign relative weights to the following factors. In addition, individual Trustees may have assigned different weights to various factors.
Nature, extent, and quality of services.In considering the nature, extent, and quality of the services to be provided by theSub-Advisors, the Board reviewed the services to be provided by eachSub-Advisor pursuant to eachSub-Advisory Agreement and as described at the meeting. The Board reviewed materials provided by theSub-Advisors regarding the experience and qualifications of the personnel who will be responsible for providing services to the Fund. The Board also considered relevant performance information provided with respect to eachSub-Advisor. In discussing the nature of the services proposed to be provided by theSub-Advisors, it was observed that, unlike traditionalsub-advisors who make all of the investment related decisions with respect to asub-advised portfolio, the relationship between DMC (the Fund’s investment manager) and theSub-Advisors as currently contemplated is primarily more of a collaborative effort between DMC and theSub-Advisors and a cross pollination of investment ideas. The Board further noted the stated intention under the newSub-Advisory Agreements that DMC would have the sole discretion to delegate portions of the implementation of the Fund’s strategy to theSub-Advisors who would be permitted to execute Fund trades and exercise investment discretion pursuant to that delegation and subject to DMC oversight. However, DMC and the Fund’s named portfolio managers will continue to retain principal responsibility for the Fund’s strategy and investment process and be primarily responsible for theday-to-day management of the Fund’s portfolio. Based upon these considerations, the Board was satisfied with the nature and quality of the overall services to be provided by theSub-Advisors to the Fund and its shareholders and was confident in the abilities of theSub-Advisors to provide quality services to the Fund and its shareholders.
Investment performance.In regards to the appointment of theSub-Advisors for the Fund, the Board reviewed information on prior performance for theSub-Advisors. In evaluating performance, the Board considered that theSub-Advisors would provide investment advice and recommendations, including with respect to specific securities, but that DMC’s portfolio managers for the Fund would retain principal responsibility for the Fund’s strategy as described above. In addition, the Board considered that theSub-Advisors would also execute Fund security trades on behalf of DMC and be permitted by DMC to exercise investment discretion for securities in certain markets where DMC wanted to utilize aSub-Advisor’s specialized market knowledge.
Sub-Advisory fees.The Board considered that DMC would pay theSub-Advisors asub-advisory fee based on the extent to which aSub-Advisor provides services to the Fund as described in theSub-Advisory Agreements. In considering the appropriateness of thesub-advisory fees, the Board also reviewed and considered the fees in light of the nature, extent, and quality of thesub-advisory services to be provided by eachSub-Advisor, as more fully discussed above. The Board noted that thesub-advisory fees are paid by DMC to each Sub-Advisor and are not additional fees borne by the Fund, and that the management fee paid by the Fund to DMC would stay the same at current asset levels. The Board was provided with information showing an estimate of thesub-advisory fees to be paid to eachSub-Advisor based on a projection ofSub-Advisor allocations given certain historical investment trends,
56
as well as information regarding the expected impact thesub-advisory arrangements would have on the profitability of DMC. The Board also noted that, given the collaborative nature of the services to be provided by theSub-Advisors to the Fund, there were no comparable accounts and corresponding fees to which theSub-Advisors were able to compare this arrangement. The Board concluded that, in light of the quality and extent of the services to be provided and the business relationships between DMC and theSub-Advisors, the proposed fee arrangement was understandable and reasonable.
Profitability, economies of scale, andfall-out benefits.Information about eachSub-Advisor’s profitability from its relationship with the Fund was not available because it had not begun to provide services to the Fund. With regard to potentialfall-out benefits derived or to be derived by theSub-Advisors and their affiliates in connection with their relationship to the Fund, the Board considered the potential benefit to DMC and theSub-Advisors of marketing a global approach on the portfolio management of their fixed income investment strategies. The Trustees also noted that economies of scale are shared with the Fund and its shareholders through investment management fee breakpoints in DMC’s fee schedule for the Fund so that as the Fund grows in size, its effective investment management fee rate declines.
57
Board of trustees / directors and officers addendum
Delaware Funds®by Macquarie
A mutual fund is governed by a Board of Trustees/Directors (“Trustees”), which has oversight responsibility for the management of a fund’s business affairs. Trustees establish procedures and oversee and review the performance of the investment manager, the distributor, and others who perform services for the fund. The independent fund trustees, in particular, are advocates
| | | | |
Name, Address, and Birth Date | | Position(s) Held with Fund(s) | | Length of Time Served |
Interested Trustee | | | | |
Shawn K. Lytle1 | | President, | | President and |
2005 Market Street | | Chief Executive Officer, | | Chief Executive Officer |
Philadelphia, PA 19103 | | and Trustee | | since August 2015 |
February 1970 | | | | |
| | |
| | | | Trustee since |
| | | | September 2015 |
Independent Trustees | | | | |
Thomas L. Bennett | | Chair and Trustee | | Trustee since |
2005 Market Street | | | | March 2005 |
Philadelphia, PA 19103 | | | | |
October 1947 | | | | Chair since |
| | | | March 2015 |
Jerome D. Abernathy | | Trustee | | Since January 2019 |
2005 Market Street | | | | |
Philadelphia, PA 19103 | | | | |
July 1959 | | | | |
Ann D. Borowiec | | Trustee | | Since March 2015 |
2005 Market Street | | | | |
Philadelphia, PA 19103 | | | | |
November 1958 | | | | |
| | | | | |
1 Shawn K. Lytle is considered to be an “Interested Trustee” because he is an executive officer of the Fund’s(s’) investment advisor.
58
for shareholder interests. Each trustee has served in that capacity since he or she was elected to or appointed to the Board of Trustees, and will continue to serve until his or her retirement or the election of a new trustee in his or her place. The following is a list of the Trustees and Officers with certain background and related information.
| | | | |
| | | Number of Portfolios in | | |
| Principal Occupation(s) | | Fund Complex Overseen | | Other Directorships |
| During the Past Five Years | | by Trustee or Officer | | Held by Trustee or Officer |
| | | | |
President — Macquarie | | 59 | | Trustee — UBS |
Investment Management2 | | | | Relationship Funds, |
(June 2015–Present) | | | | SMA Relationship |
| | | | Trust, and UBS Funds |
Regional Head of | | | | (May 2010–April 2015) |
Americas — UBS Global | | | | |
Asset Management | | | | |
(April 2010–May 2015) | | | | |
| | | | |
Private Investor | | 59 | | None |
(March 2004–Present) | | | | |
Managing Member, | | 59 | | None |
Stonebrook Capital | | | | |
Management, LLC (financial | | | | |
technology: macro factors | | | | |
and databases) | | | | |
(January 1993–Present) | | | | |
Chief Executive Officer, | | 59 | | Director — |
Private Wealth Management | | | | Banco Santander International |
(2011–2013) and | | | | (October 2016–Present) |
Market Manager, | | | | |
New Jersey Private | | | | Director — |
Bank (2005–2011) — | | | | Santander Bank, N.A. |
J.P. Morgan Chase & Co. | | | | (December 2016–Present) |
| | | | | |
| | 2 | Macquarie Investment Management is the marketing name for Macquarie Management Holdings, Inc. and its subsidiaries, including the Fund’s(s’) investment advisor, principal underwriter, and its transfer agent. |
59
Board of trustees / directors and officers addendum
Delaware Funds®by Macquarie
| | | | |
| Name, Address, | | Position(s) | | Length of |
| and Birth Date | | Held with Fund(s) | | Time Served |
Independent Trustees (continued) | | | | |
| | |
Joseph W. Chow | | Trustee | | Since January 2013 |
2005 Market Street | | | | |
Philadelphia, PA 19103 | | | | |
January 1953 | | | | |
| | | | | |
John A. Fry | | Trustee | | Since January 2001 |
2005 Market Street | | | | |
Philadelphia, PA 19103 | | | | |
May 1960 | | | | |
| | | | |
| | | | |
| | | | |
| | | | |
| | | | |
| | | | |
| | | | |
| | | | |
| | | | |
| | | | |
| | | | |
Lucinda S. Landreth | | Trustee | | Since March 2005 |
2005 Market Street | | | | |
Philadelphia, PA 19103 | | | | |
June 1947 | | | | |
60
| | | | |
| | | Number of Portfolios in | | |
| Principal Occupation(s) | | Fund Complex Overseen | | Other Directorships |
| During the Past Five Years | | by Trustee or Officer | | Held by Trustee or Officer |
| | | | |
Private Investor | | 59 | | Director and Audit Committee |
(April 2011–Present) | | | | Member — Hercules |
| | | | Technology Growth |
| | | | Capital, Inc. |
| | | | (July 2004–July 2014) |
President — | | 59 | | Director; Compensation |
| Drexel University | | | | Committee and |
| (August 2010–Present) | | | | Governance Committee |
| | | | Member — Community |
| President — | | | | Health Systems |
| Franklin & Marshall College | | | | (May 2004–present) |
| (July 2002–June 2010) | | | | |
| | | | Director — Drexel |
| | | | Morgan & Co. |
| | | | (2015–present) |
| | |
| | | | Director and Audit Committee |
| | | | Member — vTv |
| | | | Therapeutics Inc. |
| | | | (2017–present) |
| | |
| | | | Director and Audit Committee |
| | | | Member — FS Credit Real |
| | | | Estate Income Trust, Inc. |
| | | | | (2018–present) |
Private Investor | | 59 | | None |
(2004–Present) | | | | |
| | | | |
| | | | |
| | | | | |
61
Board of trustees / directors and officers addendum
Delaware Funds®by Macquarie
| | | | |
| Name, Address, | | Position(s) | | Length of |
| and Birth Date | | Held with Fund(s) | | Time Served |
Independent Trustees (continued) | | | | |
Frances A. Sevilla-Sacasa | | Trustee | | Since September 2011 |
2005 Market Street | | | | |
Philadelphia, PA 19103 | | | | |
January 1956 | | | | |
| | | | |
| | | | |
| | | | |
| | | | |
| | | | |
| | | | |
| | | | |
| | | | |
| | | | |
| | | | |
| | | | |
| | | | |
| | | | |
| | | | |
Thomas K. Whitford | | Trustee | | Since January 2013 |
2005 Market Street | | | | |
Philadelphia, PA 19103 | | | | |
March 1956 | | | | |
| | | | |
| | | | |
| | | | |
| | | | |
| | | | |
| | | | |
| | | | |
| | | | |
| | | | |
| | | | | |
62
| | | | |
| | | Number of Portfolios in | | |
| Principal Occupation(s) | | Fund Complex Overseen | | Other Directorships |
| During the Past Five Years | | by Trustee or Officer | | Held by Trustee or Officer |
| | | | |
Private Investor | | 59 | | Trust Manager and |
(January 2017–Present) | | | | Audit Committee |
| | | | Chair — Camden |
Chief Executive Officer — | | | | Property Trust |
Banco Itaú | | | | (August 2011–Present) |
International | | | | |
(April 2012–December 2016) | | | | Director; Audit |
| | | | Committee Member — |
Executive Advisor to Dean | | | | Carrizo Oil & Gas, Inc. |
(August 2011–March 2012) | | | | (March 2018–Present) |
and Interim Dean | | | | |
(January 2011–July 2011) — | | | | |
University of Miami School of | | | | |
Business Administration | | | | |
| | |
President — U.S. Trust, | | | | |
Bank of America Private | | | | |
Wealth Management | | | | |
(Private Banking) | | | | |
(July 2007–December 2008) | | | | |
Vice Chairman | | 59 | | Director — HSBC North |
(2010–April 2013) — | | | | America Holdings Inc. |
PNC Financial | | | | (December 2013–Present) |
Services Group | | | | |
| | | | Director — HSBC USA Inc. |
| | | | (July 2014–Present) |
| | |
| | | | Director — |
| | | | HSBC Bank USA, |
| | | | National Association |
| | | | (July 2014–March 2017) |
| | |
| | | | Director — HSBC |
| | | | Finance Corporation |
| | | | (December 2013–April 2018) |
| | | | | |
63
Board of trustees / directors and officers addendum
Delaware Funds®by Macquarie
| | | | |
| Name, Address, | | Position(s) | | Length of |
| and Birth Date | | Held with Fund(s) | | Time Served |
Independent Trustees (continued) | | | | |
Christianna Wood | | Trustee | | Since January 2019 |
2005 Market Street | | | | |
Philadelphia, PA 19103 | | | | |
August 1959 | | | | |
| | | | |
| | | | |
| | | | |
| | | | |
| | | | |
| | | | |
| | | | |
| | | | |
| | | | |
| | | | |
| | | | |
| | | | |
| | | | |
| | | | |
| | | | |
| | | | |
| | | | |
| | | | |
| | | | |
| | | | |
| | | | |
| | | | | |
64
| | | | |
| | | Number of Portfolios in | | |
| Principal Occupation(s) | | Fund Complex Overseen | | Other Directorships |
| During the Past Five Years | | by Trustee or Officer | | Held by Trustee or Officer |
| | | | |
Chief Executive Officer | | 59 | | Director; Finance Committee |
and President — | | | | and Audit Committee |
Gore Creek | | | | Member — H&R |
Capital, Ltd. | | | | Block Corporation |
(August 2009–Present) | | | | (July 2008–Present) |
| | |
| | | | Director; Chair of Investments |
| | | | Committee and Audit |
| | | | Committee Member — |
| | | | Grange Insurance |
| | | | (2013–Present) |
| | |
| | | | Trustee; Chair of |
| | | | Nominating and Governance |
| | | | Committee and Audit |
| | | | Committee Member — |
| | | | The Merger Fund |
| | | | (2013–Present), |
| | | | The Merger Fund VL |
| | | | (2013-Present), |
| | | | WCM Alternatives: |
| | | | Event-Driven Fund |
| | | | (2013–Present), |
| | | | and WCM Alternatives: |
| | | | Credit Event Fund |
| | | | (December 2017–Present) |
| | |
| | | | Director; Chair of |
| | | | Governance Committee |
| | | | and Audit Committee |
| | | | Member — International |
| | | | Securities Exchange |
| | | | | (2010–2016) |
65
Board of trustees / directors and officers addendum
Delaware Funds®by Macquarie
| | | | |
| Name, Address, | | Position(s) | | Length of |
| and Birth Date | | Held with Fund(s) | | Time Served |
Independent Trustees (continued) | | |
Janet L. Yeomans | | Trustee | | Since April 1999 |
2005 Market Street | | | | |
Philadelphia, PA 19103 | | | | |
July 1948 | | | | |
| | |
| | | | |
Officers | | | | |
David F. Connor | | Senior Vice President, | | Senior Vice President since |
2005 Market Street | | General Counsel, | | May 2013; General |
Philadelphia, PA 19103 | | and Secretary | | Counsel since May 2015; |
December 1963 | | | | Secretary since |
| | | | October 2005 |
| | | | |
Daniel V. Geatens | | Vice President | | Vice President and |
2005 Market Street | | and Treasurer | | Treasurer since October 2007 |
Philadelphia, PA 19103 | | | | |
October 1972 | | | | |
| | |
| | | | |
Richard Salus | | Senior Vice President | | Senior Vice President and |
2005 Market Street | | and Chief Financial Officer | | Chief Financial Officer |
Philadelphia, PA 19103 | | | | since November 2006 |
October 1963 | | | | |
| | | | | |
The Statement of Additional Information for the Fund(s) includes additional information about the Trustees and Officers and is available, without charge, upon request by calling 800523-1918.
66
| | | | |
| | | Number of Portfolios in | | |
| Principal Occupation(s) | | Fund Complex Overseen | | Other Directorships |
| During the Past Five Years | | by Trustee or Officer | | Held by Trustee or Officer |
| | | | |
Vice President and Treasurer | | 59 | | Director; Personnel and |
(January 2006–July 2012), | | | | Compensation Committee |
Vice President — | | | | Chair; Member of Nominating, |
Mergers & Acquisitions | | | | Investments, and Audit |
(January 2003–January 2006), | | | | Committees for various |
and Vice President | | | | periods throughout |
and Treasurer | | | | directorship — |
(July 1995–January 2003) — | | | | Okabena Company |
3M Company | | | | (2009–2017) |
| | | | |
David F. Connor has served | | 59 | | None3 |
in various capacities at | | | | |
different times at | | | | |
Macquarie Investment | | | | |
Management. | | | | |
Daniel V. Geatens has served | | 59 | | None3 |
in various capacities at | | | | |
different times at | | | | |
Macquarie Investment | | | | |
Management. | | | | |
Richard Salus has served | | 59 | | None3 |
in various capacities | | | | |
at different times at | | | | |
Macquarie Investment | | | | |
Management. | | | | |
| 3 | David F. Connor, Daniel V. Geatens, and Richard Salus serve in similar capacities for the six portfolios of the Optimum Fund Trust, which have the same investment advisor, principal underwriter, and transfer agent as the registrant. Mr. Geatens also serves as the Chief Financial Officer and Treasurer for Macquarie Global Infrastructure Total Return Fund Inc., which has an affiliated investment manager. |
67
About the organization
| | | | | | |
| Board of trustees | | | | | | |
| | | |
Shawn K. Lytle President and Chief Executive Officer Delaware Funds® by Macquarie Philadelphia, PA Thomas L. Bennett Chairman of the Board Delaware Funds by Macquarie Private Investor Rosemont, PA Jerome D. Abernathy Managing Member Stonebrook Capital Management, LLC Jersey City, NJ Affiliated officers David F. Connor Senior Vice President, General Counsel, and Secretary Delaware Funds by Macquarie Philadelphia, PA | | Ann D. Borowiec Former Chief Executive Officer Private Wealth Management J.P. Morgan Chase & Co. New York, NY Joseph W. Chow Former Executive Vice President State Street Corporation Boston, MA John A. Fry President Drexel University Philadelphia, PA Daniel V. Geatens Vice President and Treasurer Delaware Funds by Macquarie Philadelphia, PA | | Lucinda S. Landreth Former Chief Investment Officer Assurant, Inc. New York, NY Frances A. Sevilla-Sacasa Former Chief Executive Officer Banco Itaú International Miami, FL Richard Salus Senior Vice President and Chief Financial Officer Delaware Funds by Macquarie Philadelphia, PA | | Thomas K. Whitford Former Vice Chairman PNC Financial Services Group Pittsburgh, PA Christianna Wood Chief Executive Officer and President Gore Creek Capital, Ltd. Golden, CO Janet L. Yeomans Former Vice President and Treasurer 3M Company St. Paul, MN |
This annual report is for the information of Delaware Emerging Markets Debt Fund shareholders, but it may be used with prospective investors when preceded or accompanied by the Delaware Fund fact sheet for the most recently completed calendar quarter. These documents are available at delawarefunds.com/literature.
The Fund files its complete schedule of portfolio holdings with the Securities and Exchange Commission (SEC) for the first and third quarters of each fiscal year on FormN-Q or FormN-PORT (available for filings after March 31, 2019). The Fund’s FormsN-Q or FormsN-PORT, as well as a description of the policies and procedures that the Fund uses to determine how to vote proxies (if any) relating to portfolio securities, are available without charge (i) upon request, by calling 800523-1918; and (ii) on the SEC’s website at sec.gov. In addition, a description of the policies and procedures that the Fund uses to determine how to vote proxies (if any) relating to portfolio securities and the Schedule of Investments included in the Fund’s most recent FormN-Q or FormN-PORT are available without charge on the Fund’s website at delawarefunds.com/literature. The Fund’s FormsN-Q and FormsN-PORT may be reviewed and copied at the SEC’s Public Reference Room in Washington, D.C.; information on the operation of the Public Reference Room may be obtained by calling 800SEC-0330.
Information (if any) regarding how the Fund voted proxies relating to portfolio securities during the most recently disclosed12-month period ended June 30 is available without charge (i) through the Fund’s website at delawarefunds.com/proxy; and (ii) on the SEC’s website at sec.gov.
68
Annual report
Fixed income mutual fund
Delaware Strategic Income Fund
July 31, 2019
|
Beginning on or about June 1, 2021, as permitted by regulations adopted by the Securities and Exchange Commission, paper copies of your Fund’s shareholder reports will no longer be sent to you by mail, unless you specifically request them from the Fund or from your financial intermediary, such as a broker/dealer, bank, or insurance company. Instead, you will be notified by mail each time a report is posted on the website and provided with a link to access the report. If you already elected to receive shareholder reports electronically, you will not be affected by this change and you do not need to take any action. You may elect to receive shareholder reports and other communications from the Fund electronically by signing up at delawarefunds.com/edelivery. If you own these shares through a financial intermediary, you may contact your financial intermediary. You may elect to receive paper copies of all future shareholder reports free of charge. You can inform the Fund that you wish to continue receiving paper copies of your shareholder reports by contacting us at 800523-1918. If you own these shares through a financial intermediary, you may contact your financial intermediary to elect to continue to receive paper copies of your shareholder reports. Your election to receive reports in paper will apply to all funds held with the Delaware Funds® by Macquarie or your financial intermediary. |
Carefully consider the Fund’s investment objectives, risk factors, charges, and expenses before investing. This and other information can be found in the Fund’s prospectus and its summary prospectus, which may be obtained by visiting delawarefunds.com/literature or calling800 523-1918. Investors should read the prospectus and the summary prospectus carefully before investing.
You can obtain shareholder reports and prospectuses online instead of in the mail.
Visit delawarefunds.com/edelivery.
Experience Delaware Funds®by Macquarie
Macquarie Investment Management (MIM) is a global asset manager with offices throughout the United States, Europe, Asia, and Australia. As active managers we prioritize autonomy and accountability at the investment team level in pursuit of opportunities that matter for our clients. Delaware Funds is one of the longest-standing mutual fund families, with more than 80 years in existence.
If you are interested in learning more about creating an investment plan, contact your financial advisor.
You can learn more about Delaware Funds or obtain a prospectus for Delaware Strategic Income Fund at delawarefunds.com/literature.
Manage your account online
| • | | Check your account balance and transactions |
| • | | View statements and tax forms |
| • | | Make purchases and redemptions |
Visit delawarefunds.com/account-access.
Macquarie Asset Management (MAM) offers a diverse range of products including securities investment management, infrastructure and real asset management, and fund and equity-based structured products. MIM is the marketing name for certain companies comprising the asset management division of Macquarie Group. This includes the following investment advisers: Macquarie Investment Management Business Trust (MIMBT), Delaware Capital Management Advisers, Inc., Macquarie Funds Management Hong Kong Limited, Macquarie Investment Management Austria Kapitalanlage AG, Macquarie Investment Management Global Limited, Macquarie Investment Management Europe Limited, Macquarie Capital Investment Management LLC, and Macquarie Investment Management Europe S.A.
The Fund is distributed byDelaware Distributors, L.P. (DDLP), an affiliate of MIMBT and Macquarie Group Limited.
Other than Macquarie Bank Limited (MBL), none of the entities noted are authorized deposit-taking institutions for the purposes of the Banking Act 1959 (Commonwealth of Australia). The obligations of these entities do not represent deposits or other liabilities of MBL. MBL does not guarantee or otherwise provide assurance in respect of the obligations of these entities, unless noted otherwise. The Fund is governed by US laws and regulations.
Unless otherwise noted, views expressed herein are current as of July 31, 2019, and subject to change for events occurring after such date.
The Fund is not FDIC insured and is not guaranteed. It is possible to lose the principal amount invested.
Advisory services provided by Delaware Management Company, a series of MIMBT, a US registered investment advisor.
All third-party marks cited are the property of their respective owners.
© 2019 Macquarie Management Holdings, Inc.
| | |
| Portfolio management review | | |
Delaware Strategic Income Fund | | August 7, 2018 |
| | | | |
| | |
| Performance preview (for the year ended July 31, 2019) | | | | |
Delaware Strategic Income Fund (Institutional Class shares) | | 1-year return | | +5.47% |
Delaware Strategic Income Fund (Class A shares) | | 1-year return | | +5.20% |
Bloomberg Barclays US Aggregate Index (benchmark) | | 1-year return | | +8.08% |
Past performance does not guarantee future results.
For complete, annualized performance for Delaware Strategic Income Fund, please see the table on page 5.
Institutional Class shares are not subject to a sales charge and are offered for sale exclusively to certain eligible investors. In addition, Institutional Class shares pay no distribution and service fee.
The performance of Class A shares excludes the applicable sales charge. Both Institutional Class shares and Class A shares reflect the reinvestment of all distributions.
Please see page 8 for a description of the index. Index performance returns do not reflect any management fees, transaction costs, or expenses. Indices are unmanaged and one cannot invest directly in an index.
Market review
The market comprised two distinct regimes, or economic scenarios, during the Fund’s fiscal year ended July 31, 2019. In the opening months of the period, rising interest rates posed the greatest risk as investors focused on global monetary policy tightening and the ongoing effects of the Trump administration’s fiscal stimulus. The Federal Open Market Committee (FOMC) felt confident enough in the economic recovery to raise the federal funds rate in September and late December 2018 by a cumulative 0.50 percentage points.Ten-year inflationary expectations had held above 2% for most of 2018 and the US economy flirted with a 3% plus annual growth rate. (Source: Bloomberg.) By October 2018, the10-year US Treasury yield had risen above 3%, which ultimately proved far too restrictive for US economic growth. As a result, investors questioned whether the Federal Reserve’s rate hikes were excessive. Would economic growth be weaker structurally than initially expected? By the end of the fourth quarter of 2018, those concerns about financial conditions escalated and the lack of liquidity prompted a significant widespread selloff in risk assets. High yield bond spreads widened by 210 basis points. (One basis point is a hundredth of a percentage point.)
The economic picture changed dramatically during the second half of the fiscal year against the
|
As 2018 drew to a close, a spike in market volatility and deterioration in financial conditions led to a significant pivot in monetary policy, not just in the US, but globally. |
1
Portfolio management review
Delaware Strategic Income Fund
destabilizing backdrop of theUS-China trade war headlines, hard Brexit concerns, and the broadening influence of populism. As 2018 drew to a close, a spike in market volatility and deterioration in financial conditions led to a significant pivot in monetary policy, not just in the United States but globally, with the European Central Bank (ECB) and most other central banks shifting to a renewed easing cycle.
By early 2019, the liquidity-induced overreactions among spread sectors had corrected and investors returned to fixed income markets, causing credit spreads to compress, in many cases to long-term averages or below. Reflecting the monetary policy pivot andlower-for-longer paradigm,10-year Treasury yields declined significantly, from more than 3% in the fall of 2018 to less than 2% by the end of the period.
Within the Fund
For the fiscal year ended July 31, 2019, Delaware Strategic Income Fund underperformed its benchmark, the Bloomberg Barclays US Aggregate Index. The Fund’s Institutional Class shares returned +5.47%. The Fund’s Class A shares returned +5.20% at net asset value and +0.44% at maximum offer price. These figures reflect all distributions reinvested. During the same period, the benchmark returned +8.08%. For complete, annualized performance of Delaware Strategic Income Fund, please see the table on page 5.
The investment thesis that has informed the Fund’s decisions for several years is the idea that structural forces, which we refer to as the “4 Ds” – demographics, digitalization, debt, and deglobalization – are, in our opinion, defining this decade’s macroeconomic backdrop. With this in mind, we believed it prudent to invest with the tide of monetary policy stimulus, recognizing the asset market’s dependency on it, as evidenced by the deterioration in global financial condition indices when central banks withdrew stimulus in 2018.
Accordingly, as quantitative tightening accelerated initially, we reduced the Fund’s exposure to corporate spread sectors. In late 2018, spreads widened acrossnon-government sectors, reaching the widest levels sincemid-2016. Believing that was overdone, we modestly increased exposure to risk assets such as emerging markets, anticipating a likely pivot in monetary policy.
During the second half of the Fund’s fiscal period, that is precisely what happened. Spread sectors compressed substantially: investment grade from a wide of 1.57% to 1.08%, high yield from a peak of 5.37% to 3.71%, and emerging markets from a peak of 3.5% to 2.78%. As a result, our theme this year has been to monetize performance in certain risk assets while acknowledging the technical support of monetary policy containment and global investor demand and diversifying return sources. Accordingly, we reduced exposure to corporate credit, particularly high yield bonds, and added to securitized assets (+6%, as of July 31, 2019, to commercial mortgage-backed securities (CMBS) and residential mortgage-backed securities (RMBS)) that, in our view, have less sensitivity to the business cycle and economic growth. We shifted some allocation to emerging markets, as the latter were poised to benefit more from easy policy, in our view.
The Fund underperformed the general bond market as represented by the Bloomberg Barclays US Aggregate Index. As a strategic income fund, the Fund’s fundamental objective is to provide investors with a higher-yielding diversified set of income sources as an alternative to a broad market, investment grade benchmark. The Fund has a structurally different profile than the benchmark, including a shorter duration. (Duration measures a bond’s sensitivity to interest rates, by indicating the approximate percentage of change in a bond or bond fund’s price given a 1% change in interest rates.)
2
While we did not engage in meaningful active duration management, the Fund’s structural short duration of just under two years during the period detracted from performance relative to the benchmark with the10-year Treasury declining from 2.96% to 2.02%.
The second largest detractor was the Fund’s allocation to certain agency collateralized mortgage obligations (CMOs). Purchased in 2017 to benefit from a rising interest rate environment, they did so untilmid-2018. However, as interest rates declined and liquidity deteriorated, their prepayment sensitivity and lower liquidity relative to other asset classes resulted in underperformance.
The Fund’s allocation to certain higher-beta energy securities includingAlta Mesa Resources Inc., an exploration and production company (E&P) andEnsco Inc., a provider of oil and gas services and equipment, detracted. Security selection within emerging markets was another detractor reflected in the underperformance of Caribbean mobile phone providerDigicel Group Ltd.as fundamentals deteriorated. We retained exposure to the latter as we believe our research indicates that current valuations compensate investors for the increased fundamental risk.
The largest contributors to relative performance were the Fund’s overweights to high yield (0.9% excess returns), investment grade (+1.7% excess returns), emerging market debt (+2.4% excess returns), and securitized credit (CMBS excess returns +1.3%). This was advantageous asnon-Treasury securities earned more income than Treasurys and agency mortgage-backed securities (MBS), which make up the bulk of the benchmark.
Securitized assets benefited from US consumer strength and the residential housing market, which we believe is more robust and less sensitive to the global business cycle than corporate debt. The fundamental stability of those sectors was beneficial.
Individual contributors to performance included financial issuersJefferies Group LLC, Royal Bank of Scotland Group Plc,andCredit Suisse Group AG,whose fundamental underpinnings remained robust during the fiscal year. Allocations to emerging market integrated oils issuersKazMunayGas NationalandPetrobraswere additive as the issuers benefited from strong investor demand.
Looking at the market’s current risks and opportunities at the end of the Fund’s fiscal year, we see a complicated backdrop with three different developments converging. The first has been gradual – persistent pressure on potential global growth and interest rates by the trends of the 4 Ds previously discussed. Second is the cyclical maturity of the record-length US economic expansion and classic late-cycle behavior, such as increased borrowing by riskier issuers, of many businesses. The third development is geopolitical risk.
Despite the monetary-policy-induced liquidity tide, market technicals have not, in our opinion, signaled over-exuberant behavior as investors sought fixed in come securities. They resisted grabbing the highest yielding, riskiest securities even as credit spreads compressed this year and the lowest-quality securities generally underperformed. Further, in the context of global rates, with more than $11 trillion of negative debt by the end of July 2019, US interest rates are compelling, in our view. As such, we believe US dollar high-quality securities should benefit from both safe-haven buyers and global investors (in Japan and Europe) starved for positive yields.
Against this backdrop and given unprecedented monetary policy, economic, and market conditions globally as negative yields become normalized, we think a balanced approach is most appropriate for the Fund. While we experience more bouts of volatility, as active investors, we see potential opportunities, particularly in security selection. We are committed to using all alpha levers to navigate
3
Portfolio management review
Delaware Strategic Income Fund
this environment, including yield curve management, sector allocation, quality allocation, and security selection as well as global opportunities to seek less correlated risk.
A note about derivatives
The Fund used four types of derivatives during the fiscal year: futures, foreign currency exchange contracts, options, and swaps. The Fund used interest rate futures to manage the portfolio’s overall duration. The Fund also used foreign
currency exchange contracts to hedge the US dollar value of certain foreign currency securities. In some cases, the Fund used foreign currency exchange contracts to gain market exposure to take advantage of a total return opportunity. The Fund also used options, including calls on emerging market exposure, and credit default swaps as credit hedges. None of these derivatives had a material effect on the Fund’s performance (that is, it amounted to less than 0.50 percentage points) during the fiscal year.
4
| | |
| Performance summary | | |
| Delaware Strategic Income Fund | | July 31, 2019 |
The performance quoted represents past performance and does not guarantee future results. Investment return and principal value of an investment will fluctuate so that shares, when redeemed, may be worth more or less than their original cost. Current performance may be lower or higher than the performance quoted. Performance data current to the most recent month end may be obtained by calling 800523-1918 or visiting delawarefunds.com/performance.
| | | | | | | | | | | | | | | | | | | | |
| Fund and benchmark performance1,2 | | Average annual total returns through July 31, 2019 |
| | | | |
| | | 1 year | | 5 years | | 10 years | | Lifetime |
Class A (Est. Aug. 16, 1985) | | | | | | | | | | | | | | | | | | | | |
Excluding sales charge | | | | +5.20 | % | | | | +2.40 | % | | | | +4.18 | % | | | | +5.69 | % |
Including sales charge | | | | +0.44 | % | | | | +1.47 | % | | | | +3.70 | % | | | | +5.55 | % |
Class C (Est. Nov. 29, 1995) | | | | | | | | | | | | | | | | | | | | |
Excluding sales charge | | | | +4.42 | % | | | | +1.64 | % | | | | +3.42 | % | | | | +4.08 | % |
Including sales charge | | | | +3.42 | % | | | | +1.64 | % | | | | +3.42 | % | | | | +4.08 | % |
Class R (Est. June 2, 2003) | | | | | | | | | | | | | | | | | | | | |
Excluding sales charge | | | | +5.07 | % | | | | +2.15 | % | | | | +3.94 | % | | | | +3.80 | % |
Including sales charge | | | | +5.07 | % | | | | +2.15 | % | | | | +3.94 | % | | | | +3.80 | % |
Institutional Class (Est. June 1, 1992) | | | | | | | | | | | | | | | | | | | | |
Excluding sales charge | | | | +5.47 | % | | | | +2.66 | % | | | | +4.44 | % | | | | +5.20 | % |
Including sales charge | | | | +5.47 | % | | | | +2.66 | % | | | | +4.44 | % | | | | +5.20 | % |
Bloomberg Barclays US Aggregate Index | | | | +8.08 | % | | | | +3.05 | % | | | | +3.75 | % | | | | +5.46 | %* |
* The benchmark lifetime return is for Institutional Class share comparison only and is calculated using the last business day in the month of the Fund’s Institutional Class inception date.
1Returns reflect the reinvestment of all distributions and are presented both with and without the applicable sales charges described below. Returns do not reflect the deduction of taxes the shareholder would pay on Fund distributions or redemptions of Fund shares.
Expense limitations were in effect for certain classes during some or all of the periods shown in the “Fund and benchmark performance” table. Expenses for each class are listed on the “Fund expense ratios” table on page 7. Performance would have been lower had expense limitations not been in effect.
Institutional Class shares are not subject to a sales charge and are offered for sale exclusively to certain eligible investors. In addition, Institutional Class shares pay no distribution and service(12b-1) fee.
Class A shares are sold with a maximumfront-end sales charge of 4.50%, and have an annual12b-1 fee of 0.25% of average daily net assets. The Board has adopted a formula for calculating12b-1 plan fees for the Fund’s Class A shares. The Fund’s Class A shares are currently subject to a blended12b-1 fee equal to the sum of: (i) 0.10% of average daily net assets representing shares acquired prior to June 1, 1992, and (ii) 0.25% of average daily net assets representing shares acquired on or after June 1, 1992. All Class A shares currently bear12b-1 fees at the same rate, the blended rate, currently 0.25% of average daily net assets, based on the formula described above. This method of calculating Class A12b-1 fees may be discontinued at the sole discretion of the Board. Performance for Class A shares, excluding sales charges, assumes that nofront-end sales charge applied.
5
Performance summary
Delaware Strategic Income Fund
Class C shares are sold with a contingent deferred sales charge of 1.00% if redeemed during the first 12 months. They are also subject to an annual12b-1 fee of 1.00% of average daily net assets. Performance for Class C shares, excluding sales charges, assumes either that contingent deferred sales charges did not apply or that the investment was not redeemed.
Class R shares are available only for certain retirement plan products. They are sold without a sales charge and have an annual12b-1 fee of 0.50% of average daily net assets.
Fixed income securities and bond funds can lose value, and investors can lose principal, as interest rates rise. They also may be affected by economic conditions that hinder an issuer’s ability to make interest and principal payments on its debt.
The Fund may also be subject to prepayment risk, the risk that the principal of a bond that is held by a portfolio will be prepaid prior to maturity, at the time when interest rates are lower than what the bond was paying. A portfolio may then have to reinvest that money at a lower interest rate.
High yielding,non-investment-grade bonds (junk bonds) involve higher risk than investment grade bonds. The high yield secondary market is particularly susceptible to liquidity problems when institutional investors, such as mutual funds and certain other financial institutions, temporarily stop buying bonds for regulatory, financial, or other reasons. In addition, a less liquid secondary market makes it more difficult for the Fund to obtain precise valuations of the high yield securities in its portfolio.
The Fund may invest in derivatives, which may involve additional expenses and are subject to risk, including the risk that an underlying security or securities index moves in the opposite direction from what the portfolio manager anticipated. A derivatives transaction depends upon the counterparties’ ability to fulfill their contractual obligations.
Because the Fund may invest in bank loans and other direct indebtedness, it is subject to the risk that the Fund will not receive payment of principal, interest, and other amounts due in connection with these investments, which primarily depend on the financial condition of the borrower and the lending institution.
International investments entail risks not ordinarily associated with US investments including fluctuation in currency values, differences in accounting principles, or economic or political instability in other nations. Investing in emerging markets can be riskier than investing in established foreign markets due to increased volatility and lower trading volume.
If and when the Fund invests in forward foreign currency contracts or uses other investments to hedge against currency risks, the Fund will be subject to special risks, including counterparty risk.
The Fund may experience portfolio turnover in excess of 100%, which could result in higher transaction costs and tax liability.
This document may mention bond ratings published by nationally recognized statistical rating organizations (NRSROs) Standard & Poor’s, Moody’s Investors Service, and Fitch, Inc. For securities rated by an NRSRO other than S&P, the rating is converted to the equivalent S&P credit rating. Bonds rated AAA are rated as having the highest quality and are generally considered to have the lowest degree of investment risk. Bonds rated AA are considered to be of high quality, but with a slightly higher degree of risk than bonds rated AAA. Bonds rated A are considered to have many favorable investment qualities, though they are somewhat more susceptible to adverse economic conditions. Bonds rated BBB are believed to be of medium-grade quality and generally riskier over the long term.
6
Bonds rated BB, B, and CCC are regarded as having significant speculative characteristics, with BB indicating the least degree of speculation of the three.
2The Fund’s expense ratios, as described in the most recent prospectus, are disclosed in the following “Fund expense ratios” table. Delaware Management Company has agreed to reimburse certain expenses and/or waive certain fees in order to prevent total annual fund operating expenses (excluding any12b-1 fees, acquired fund fees and expenses, taxes, interest, short sale and dividend and interest expenses, brokerage fees, certain insurance costs, and nonroutine expenses or costs, including, but not limited to, those relating to reorganizations, litigation, conducting shareholder meetings, and liquidations) from exceeding 0.59% of the Fund’s average daily net assets during the period from Aug. 1, 2018 to July 31, 2019.* Please see the most recent prospectus and any applicable supplement(s) for additional information on these fee waivers and/or reimbursements. Please see the “Financial highlights” section in this report for the most recent expense ratios.
| | | | | | | | | | | | | | | | | | | | |
Fund expense ratios | | Class A | | Class C | | Class R | | Institutional Class |
Total annual operating expenses | | 1.35% | | 2.10% | | 1.60% | | 1.10% |
(without fee waivers) Net expenses | | 0.84% | | 1.59% | | 1.09% | | 0.59% |
(including fee waivers, if any) Type of waiver | | Contractual | | Contractual | | Contractual | | Contractual |
*The aggregate contractual waiver period covering this report is from April 1, 2018, through Nov. 28, 2019.
7
Performance summary
Delaware Strategic Income Fund
Performance of a $10,000 investment1
Average annual total returns from July 31, 2009 through July 31, 2019
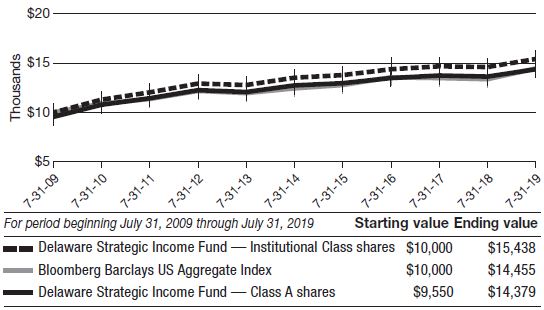
1The “Performance of a $10,000 investment” graph assumes $10,000 invested in Institutional Class and Class A shares of the Fund on July 31, 2009, and includes the effect of a 4.50%front-end sales charge (for Class A shares) and the reinvestment of all distributions. The graph does not reflect the deduction of taxes the shareholders would pay on Fund distributions or redemptions of Fund shares. Expense limitations were in effect for some or all of the periods shown. Performance would have been lower had expense limitations not been in effect. Expenses are listed in the “Fund expense ratios” table on page 7. Please note additional details on pages 5 through 8.
The graph also assumes $10,000 invested in the Bloomberg Barclays US Aggregate Index as of
July 31, 2009. The Bloomberg Barclays US Aggregate Index measures the performance of publicly issued investment grade(Baa3/BBB- or better) corporate, US government, mortgage- and asset-backed securities with at least one year to maturity and at least $300 million par amount outstanding.
Index performance returns do not reflect any management fees, transaction costs, or expenses. Indices are unmanaged and one cannot invest directly in an index.Past performance is not a guarantee of future results.
Performance of other Fund classes will vary due to different charges and expenses.
| | | | | | |
| | | Nasdaq symbols | | CUSIPs | | |
Class A | | DEGGX | | 246094205 | | |
Class C | | DUGCX | | 246094700 | | |
Class R | | DUGRX | | 246094809 | | |
Institutional Class | | DUGIX | | 246094502 | | |
8
Disclosure of Fund expenses
For thesix-month period from February 1, 2019 to July 31, 2019 (Unaudited)
As a shareholder of the Fund, you incur two types of costs: (1) transaction costs, including sales charges (loads) on purchase payments, reinvested dividends, or other distributions; redemption fees; and exchange fees; and (2) ongoing costs, including management fees; distribution and service(12b-1) fees; and other Fund expenses. This example is intended to help you understand your ongoing costs (in dollars) of investing in the Fund and to compare these costs with the ongoing costs of investing in other mutual funds.
The example is based on an investment of $1,000 invested at the beginning of the period and held for the entiresix-month period from Feb. 1, 2019 to July 31, 2019.
Actual expenses
The first section of the table shown, “Actual Fund return,” provides information about actual account values and actual expenses. You may use the information in this section of the table, together with the amount you invested, to estimate the expenses that you paid over the period. Simply divide your account value by $1,000 (for example, an $8,600 account value divided by $1,000 = 8.6), then multiply the result by the number in the first section under the heading entitled “Expenses Paid During Period” to estimate the expenses you paid on your account during this period.
Hypothetical example for comparison purposes
The second section of the table shown, “Hypothetical 5% return,” provides information about hypothetical account values and hypothetical expenses based on the Fund’s actual expense ratio and an assumed rate of return of 5% per year before expenses, which is not the Fund’s actual return. The hypothetical account values and expenses may not be used to estimate the actual ending account balance or expenses you paid for the period. You may use this information to compare the ongoing costs of investing in the Fund and other funds. To do so, compare this 5% hypothetical example with the 5% hypothetical examples that appear in the shareholder reports of the other funds.
Please note that the expenses shown in the table are meant to highlight your ongoing costs only and do not reflect any transactional costs, such as sales charges (loads), redemption fees, or exchange fees. Therefore, the second section of the table is useful in comparing ongoing costs only, and will not help you determine the relative total costs of owning different funds. In addition, if these transactional costs were included, your costs would have been higher. The Fund’s expenses shown in the table reflect fee waivers in effect and assume reinvestment of all dividends and distributions.
9
Disclosure of Fund expenses
For thesix-month period from February 1, 2019 to July 31, 2019 (Unaudited)
Delaware Strategic Income Fund
Expense analysis of an investment of $1,000
| | | | | | | | | | | | | | | | |
| | | Beginning Account Value 2/1/19 | | Ending Account Value 7/31/19 | | Annualized Expense Ratio | | Expenses Paid During Period 2/1/19 to 7/31/19* |
Actual Fund return† | | | | | | | | | | | | | | | | |
Class A | | | $1,000.00 | | | | $1,054.70 | | | | 0.84 | % | | | $4.28 | |
Class C | | | 1,000.00 | | | | 1,050.70 | | | | 1.59 | % | | | 8.08 | |
Class R | | | 1,000.00 | | | | 1,053.20 | | | | 1.09 | % | | | 5.55 | |
Institutional Class | | | 1,000.00 | | | | 1,055.90 | | | | 0.59 | % | | | 3.01 | |
Hypothetical 5% return(5% return before expenses) | | | | | | | | | |
Class A | | | $1,000.00 | | | | $1,020.63 | | | | 0.84 | % | | | $4.21 | |
Class C | | | 1,000.00 | | | | 1,016.91 | | | | 1.59 | % | | | 7.95 | |
Class R | | | 1,000.00 | | | | 1,019.39 | | | | 1.09 | % | | | 5.46 | |
Institutional Class | | | 1,000.00 | | | | 1,021.87 | | | | 0.59 | % | | | 2.96 | |
| * | “Expenses Paid During Period” are equal to the Fund’s annualized expense ratio, multiplied by the average account value over the period, multiplied by 181/365 (to reflect theone-half year period). |
| † | Because actual returns reflect only the most recentsix-month period, the returns shown may differ significantly from fiscal year returns. |
In addition to the Fund’s expenses reflected above, the Fund also indirectly bears its portion of the fees and expenses of the investment companies (Underlying Funds) in which it invests. The table above does not reflect the expenses of the Underlying Funds.
10
| | |
| Security type / sector allocation |
| Delaware Strategic Income Fund | | As of July 31, 2019 (Unaudited) |
Sector designations may be different than the sector designations presented in other Fund materials. The sector designations may represent the investment manager’s internal sector classifications.
| | | | |
| Security type / sector | | Percentage of net assets |
Agency Collateralized Mortgage Obligations | | | 6.83 | % |
Agency Commercial Mortgage-Backed Securities | | | 2.65 | % |
Agency Mortgage-Backed Securities | | | 2.65 | % |
Corporate Bonds | | | 57.35 | % |
Banking | | | 8.25 | % |
Basic Industry | | | 8.29 | % |
Brokerage | | | 1.26 | % |
Capital Goods | | | 4.50 | % |
Communications | | | 6.80 | % |
Consumer Cyclical | | | 2.99 | % |
ConsumerNon-Cyclical | | | 4.48 | % |
Electric | | | 3.52 | % |
Energy | | | 10.15 | % |
Finance Companies | | | 1.44 | % |
Insurance | | | 1.99 | % |
Natural Gas | | | 0.15 | % |
REITs | | | 0.18 | % |
Technology | | | 2.11 | % |
Transportation | | | 0.83 | % |
Utilities | | | 0.41 | % |
Municipal Bonds | | | 1.37 | % |
Non-Agency Asset-Backed Securities | | | 6.12 | % |
Non-Agency Collateralized Mortgage Obligations | | | 6.40 | % |
Non-Agency Commercial Mortgage-Backed Securities | | | 5.22 | % |
Loan Agreements | | | 5.54 | % |
Sovereign Bonds | | | 2.91 | % |
Supranational Bank | | | 0.41 | % |
US Treasury Obligations | | | 0.14 | % |
Preferred Stock | | | 0.76 | % |
Short-Term Investments | | | 2.37 | % |
Total Value of Securities | | | 100.72 | % |
Liabilities Net of Receivables and Other Assets | | | (0.72 | %) |
Total Net Assets | | | 100.00 | % |
11
| | |
| Schedule of investments |
| Delaware Strategic Income Fund | | July 31, 2019 |
| | | | | | | | |
| | | Principal amount° | | | Value (US $) | |
| |
Agency Collateralized Mortgage Obligations – 6.83% | | | | | | | | |
| |
Fannie Mae Connecticut Avenue Securities | | | | | | | | |
Series2017-C04 2M2 5.116% (LIBOR01M + 2.85%) 11/25/29● | | | 25,000 | | | $ | 25,809 | |
Series2018-C02 2M2 4.466% (LIBOR01M + 2.20%, Floor 2.20%) 8/25/30● | | | 545,000 | | | | 549,111 | |
Series2018-C03 1M2 4.416% (LIBOR01M + 2.15%, Floor 2.15%) 10/25/30● | | | 590,000 | | | | 594,415 | |
Series2018-C05 1M2 4.616% (LIBOR01M + 2.35%, Floor 2.35%) 1/25/31● | | | 585,000 | | | | 590,891 | |
Fannie Mae Interest Strip
Series 419 C3 3.00% 11/25/43S | | | 56,757 | | | | 7,818 | |
Fannie Mae REMICs | | | | | | | | |
Series2008-15 SB 4.334% (6.60% minus LIBOR01M, Cap 6.60%) 8/25/36S● | | | 14,776 | | | | 2,613 | |
Series2012-44 IK 3.50% 12/25/31S | | | 29,865 | | | | 2,518 | |
Series2012-115 MI 3.50% 3/25/42S | | | 37,209 | | | | 3,467 | |
Series2012-118 AI 3.50% 11/25/37S | | | 79,136 | | | | 5,332 | |
Series2012-128 IC 3.00% 11/25/32S | | | 125,617 | | | | 15,372 | |
Series2012-146 IO 3.50% 1/25/43S | | | 108,289 | | | | 18,865 | |
Series2013-7 EI 3.00% 10/25/40S | | | 74,831 | | | | 7,550 | |
Series2013-26 ID 3.00% 4/25/33S | | | 142,614 | | | | 16,877 | |
Series2013-35 IB 3.00% 4/25/33S | | | 130,747 | | | | 16,288 | |
Series2013-35 IG 3.00% 4/25/28S | | | 47,448 | | | | 3,816 | |
Series2013-38 AI 3.00% 4/25/33S | | | 140,435 | | | | 16,090 | |
Series2013-41 HI 3.00% 2/25/33S | | | 108,421 | | | | 10,522 | |
Series2013-45 PI 3.00% 5/25/33S | | | 45,764 | | | | 5,383 | |
Series2013-103 SK 3.654% (5.92% minus LIBOR01M, Cap 5.92%) 10/25/43S● | | | 318,080 | | | | 66,776 | |
Series2014-64 IT 3.50% 6/25/41S | | | 30,126 | | | | 1,771 | |
Series2015-89 AZ 3.50% 12/25/45 | | | 21,598 | | | | 22,246 | |
Series2016-6 AI 3.50% 4/25/34S | | | 81,216 | | | | 8,431 | |
Series2016-33 DI 3.50% 6/25/36S | | | 202,459 | | | | 24,539 | |
Series2016-36 SB 3.734% (6.00% minus LIBOR01M, Cap 6.00%) 3/25/43S● | | | 65,921 | | | | 7,787 | |
Series2016-40 IO 3.50% 7/25/36S | | | 54,258 | | | | 6,220 | |
Series2016-50 IB 3.00% 2/25/46S | | | 78,747 | | | | 10,171 | |
Series2016-62 SA 3.734% (6.00% minus LIBOR01M, Cap 6.00%) 9/25/46S● | | | 233,805 | | | | 52,314 | |
Series2016-64 CI 3.50% 7/25/43S | | | 81,630 | | | | 7,024 | |
Series2016-83 PI 3.50% 7/25/45S | | | 70,794 | | | | 8,423 | |
Series2016-99 DI 3.50% 1/25/46S | | | 77,439 | | | | 9,564 | |
Series2017-4 AI 3.50% 5/25/41S | | | 83,576 | | | | 4,725 | |
Series2017-4 BI 3.50% 5/25/41S | | | 65,650 | | | | 4,942 | |
Series2017-12 JI 3.50% 5/25/40S | | | 62,151 | | | | 5,626 | |
12
| | | | | | | | |
| | | Principal amount° | | | Value (US $) | |
| |
Agency Collateralized Mortgage Obligations(continued) | | | | | | | | |
| |
Fannie Mae REMICs | | | | | | | | |
Series2017-25 BL 3.00% 4/25/47 | | | 16,000 | | | $ | 15,346 | |
Series2017-77 HZ 3.50% 10/25/47 | | | 46,912 | | | | 47,585 | |
Freddie Mac REMICs | | | | | | | | |
Series 4135 AI 3.50% 11/15/42S | | | 86,705 | | | | 14,635 | |
Series 4146 IA 3.50% 12/15/32S | | | 105,877 | | | | 15,326 | |
Series 4181 DI 2.50% 3/15/33S | | | 70,461 | | | | 6,649 | |
Series 4185 LI 3.00% 3/15/33S | | | 111,616 | | | | 13,263 | |
Series 4186 IB 3.00% 3/15/33S | | | 58,659 | | | | 7,122 | |
Series 4191 CI 3.00% 4/15/33S | | | 47,490 | | | | 5,592 | |
Series 4504 IO 3.50% 5/15/42S | | | 41,450 | | | | 2,607 | |
Series 4543 HI 3.00% 4/15/44S | | | 63,788 | | | | 7,673 | |
Series 4644 GI 3.50% 5/15/40S | | | 65,597 | | | | 4,556 | |
Series 4665 NI 3.50% 7/15/41S | | | 251,254 | | | | 14,573 | |
Series 4673 WI 3.50% 9/15/43S | | | 73,741 | | | | 4,743 | |
Series 4690 WI 3.50% 12/15/43S | | | 80,064 | | | | 6,850 | |
Series 4703 CI 3.50% 7/15/42S | | | 128,849 | | | | 7,545 | |
Freddie Mac Strips | | | | | | | | |
Series 319 S2 3.675% (6.00% minus LIBOR01M, Cap 6.00%) 11/15/43S● | | | 50,093 | | | | 8,674 | |
Freddie Mac Structured Agency Credit Risk Debt Notes | | | | | | | | |
Series 2017-DNA1 M2 5.516% (LIBOR01M + 3.25%, Floor 3.25%) 7/25/29● | | | 250,000 | | | | 264,262 | |
Series 2018-HQA1 M2 4.566% (LIBOR01M + 2.30%) 9/25/30● | | | 555,000 | | | | 558,440 | |
GNMA | | | | | | | | |
Series2011-157 SG 4.329% (6.60% minus LIBOR01M, Cap 6.60%) 12/20/41S● | | | 59,325 | | | | 12,826 | |
Series2013-113 LY 3.00% 5/20/43 | | | 22,000 | | | | 22,249 | |
Series2015-74 CI 3.00% 10/16/39S | | | 103,963 | | | | 8,593 | |
Series2015-142 AI 4.00% 2/20/44S | | | 35,405 | | | | 2,586 | |
Series2016-108 SK 3.779% (6.05% minus LIBOR01M, Cap 6.05%) 8/20/46S● | | | 174,810 | | | | 39,192 | |
Series2016-118 ES 3.829% (6.10% minus LIBOR01M, Cap 6.10%) 9/20/46S● | | | 88,777 | | | | 18,198 | |
Series2016-126 NS 3.829% (6.10% minus LIBOR01M, Cap 6.10%) 9/20/46S● | | | 103,961 | | | | 21,347 | |
Series2016-156 PB 2.00% 11/20/46 | | | 46,000 | | | | 40,550 | |
Series2016-163 XI 3.00% 10/20/46S | | | 150,039 | | | | 12,366 | |
Series2017-18 IQ 4.00% 12/16/43S | | | 76,731 | | | | 9,404 | |
Series2017-18 QS 3.768% (6.10% minus LIBOR01M, Cap 6.10%) 2/16/47S● | | | 119,291 | | | | 21,621 | |
Series2017-34 DY 3.50% 3/20/47 | | | 20,000 | | | | 21,316 | |
Series2017-56 JZ 3.00% 4/20/47 | | | 33,162 | | | | 32,799 | |
13
Schedule of investments
Delaware Strategic Income Fund
| | | | | | | | |
| | | Principal amount° | | | Value (US $) | |
| |
Agency Collateralized Mortgage Obligations(continued) | | | | | | | | |
| |
GNMA | | | | | | | | |
Series2017-101 AI 4.00% 7/20/47S | | | 82,416 | | | $ | 11,024 | |
Series2017-101 TI 4.00% 3/20/44S | | | 98,289 | | | | 8,512 | |
Series2017-107 QZ 3.00% 8/20/45 | | | 22,297 | | | | 21,927 | |
Series2017-130 YJ 2.50% 8/20/47 | | | 25,000 | | | | 24,643 | |
Series2017-141 JS 3.929% (6.20% minus LIBOR01M, Cap 6.20%) 9/20/47S● | | | 105,516 | | | | 18,131 | |
| | | | | | | | |
Total Agency Collateralized Mortgage Obligations(cost $3,581,853) | | | | | | | 3,486,021 | |
| | | | | | | | |
| | | | | | | | |
| |
Agency Commercial Mortgage-Backed Securities – 2.65% | | | | | | | | |
| |
Freddie Mac Multifamily Structured Pass Through Certificates
Series K058 A2 2.653% 8/25/26¨ | | | 80,000 | | | | 81,800 | |
FREMF Mortgage Trust | | | | | | | | |
Series2011-K14 B 144A 5.18% 2/25/47 #● | | | 50,000 | | | | 52,126 | |
Series2013-K25 C 144A 3.619% 11/25/45 #● | | | 45,000 | | | | 45,850 | |
Series 2013-K712 B 144A 3.314% 5/25/45 #● | | | 60,000 | | | | 59,975 | |
Series 2013-K713 B 144A 3.155% 4/25/46 #● | | | 35,000 | | | | 35,072 | |
Series 2013-K713 C 144A 3.155% 4/25/46 #● | | | 105,000 | | | | 105,023 | |
Series 2014-K717 B 144A 3.629% 11/25/47 #● | | | 35,000 | | | | 35,762 | |
Series 2014-K717 C 144A 3.629% 11/25/47 #● | | | 20,000 | | | | 20,280 | |
Series2015-K48 B 144A 3.637% 8/25/48 #● | | | 500,000 | | | | 510,418 | |
Series 2015-K721 B 144A 3.565% 11/25/47 #● | | | 235,000 | | | | 240,281 | |
Series2016-K53 B 144A 4.019% 3/25/49 #● | | | 50,000 | | | | 52,391 | |
Series 2016-K722 B 144A 3.84% 7/25/49 #● | | | 75,000 | | | | 77,429 | |
Series2017-K71 B 144A 3.753% 11/25/50 #● | | | 35,000 | | | | 35,931 | |
| | | | | | | | |
Total Agency Commercial Mortgage-Backed Securities(cost $1,327,822) | | | | | | | 1,352,338 | |
| | | | | | | | |
| | | | | | | | |
| |
Agency Mortgage-Backed Securities – 2.65% | | | | | | | | |
| |
Fannie Mae S.F. 30 yr | | | | | | | | |
3.00% 7/1/49 | | | 60,798 | | | | 61,354 | |
3.50% 6/1/49 | | | 575,937 | | | | 590,163 | |
4.00% 4/1/49 | | | 547,778 | | | | 566,827 | |
4.50% 9/1/48 | | | 39,757 | | | | 42,334 | |
5.00% 7/1/47 | | | 7,437 | | | | 8,091 | |
5.50% 8/1/48 | | | 53,551 | | | | 58,668 | |
6.00% 7/1/41 | | | 21,447 | | | | 24,575 | |
| | | | | | | | |
Total Agency Mortgage-Backed Securities(cost $1,349,297) | | | | | | | 1,352,012 | |
| | | | | | | | |
| | | | | | | | |
| |
Corporate Bonds – 57.35% | | | | | | | | |
| |
Banking – 8.25% | | | | | | | | |
Akbank T.A.S. 144A 7.20% 3/16/27 #µ | | | 200,000 | | | | 180,156 | |
Banco de Credito e Inversiones 144A 3.50% 10/12/27 # | | | 200,000 | | | | 205,377 | |
14
| | | | | | | | |
| | | Principal amount° | | | Value (US $) | |
| |
Corporate Bonds(continued) | | | | | | | | |
| |
Banking(continued) | | | | | | | | |
Banco Santander 2.706% 6/27/24 | | | 200,000 | | | $ | 199,504 | |
Bank of America | | | | | | | | |
3.194% 7/23/30 µ | | | 55,000 | | | | 55,521 | |
3.458% 3/15/25 µ | | | 85,000 | | | | 87,997 | |
BB&T 2.50% 8/1/24 | | | 35,000 | | | | 34,949 | |
Credit Suisse Group 144A 6.25% #µy | | | 300,000 | | | | 316,788 | |
Fifth Third Bancorp | | | | | | | | |
3.65% 1/25/24 | | | 125,000 | | | | 130,934 | |
3.95% 3/14/28 | | | 115,000 | | | | 124,572 | |
JPMorgan Chase & Co. | | | | | | | | |
4.023% 12/5/24 µ | | | 210,000 | | | | 222,443 | |
5.00% µy | | | 60,000 | | | | 60,765 | |
Morgan Stanley | | | | | | | | |
3.78% (LIBOR03M + 1.22%) 5/8/24● | | | 80,000 | | | | 81,162 | |
5.00% 11/24/25 | | | 50,000 | | | | 55,335 | |
PNC Financial Services Group 2.60% 7/23/26 | | | 150,000 | | | | 149,787 | |
Popular 6.125% 9/14/23 | | | 250,000 | | | | 269,375 | |
Royal Bank of Scotland Group 8.625% µy | | | 600,000 | | | | 639,750 | |
Santander UK 144A 5.00% 11/7/23 # | | | 215,000 | | | | 226,825 | |
SunTrust Banks | | | | | | | | |
3.00% 2/2/23 | | | 95,000 | | | | 96,701 | |
4.00% 5/1/25 | | | 60,000 | | | | 64,055 | |
Turkiye Garanti Bankasi 144A 6.25% 4/20/21 # | | | 200,000 | | | | 204,146 | |
UBS Group Funding Switzerland 6.875% µy | | | 200,000 | | | | 207,270 | |
USB Capital IX 3.50% (LIBOR03M + 1.02%)y● | | | 705,000 | | | | 595,951 | |
| | | | | | | | |
| | | | | | | 4,209,363 | |
| | | | | | | | |
Basic Industry – 8.29% | | | | | | | | |
BHP Billiton Finance USA 144A 6.25% 10/19/75 #µ | | | 400,000 | | | | 416,808 | |
Braskem Finance 6.45% 2/3/24 | | | 200,000 | | | | 222,640 | |
CSN Resources 144A 7.625% 2/13/23 # | | | 275,000 | | | | 292,174 | |
Equate Petrochemical 144A 3.00% 3/3/22 # | | | 200,000 | | | | 200,914 | |
Georgia-Pacific 8.00% 1/15/24 | | | 170,000 | | | | 208,768 | |
Gold Fields Orogen Holdings BVI 144A 6.125% 5/15/29 # | | | 200,000 | | | | 219,000 | |
Hudbay Minerals 144A 7.625% 1/15/25 # | | | 235,000 | | | | 244,698 | |
Mexichem 144A 5.50% 1/15/48 # | | | 200,000 | | | | 201,500 | |
NOVA Chemicals 144A 5.00% 5/1/25 # | | | 60,000 | | | | 62,025 | |
Novolipetsk Steel Via Steel Funding DAC 144A 4.00% 9/21/24 # | | | 200,000 | | | | 203,135 | |
OCP 144A 4.50% 10/22/25 # | | | 400,000 | | | | 416,950 | |
Petkim Petrokimya Holding 144A 5.875% 1/26/23 # | | | 200,000 | | | | 194,663 | |
Phosagro OAO Via Phosagro Bond Funding DAC 144A 3.95% 11/3/21 # | | | 200,000 | | | | 203,718 | |
15
Schedule of investments
Delaware Strategic Income Fund
| | | | | | | | |
| | | Principal amount° | | | Value (US $) | |
| |
Corporate Bonds(continued) | | | | | | | | |
| |
Basic Industry(continued) | | | | | | | | |
RPM International 4.55% 3/1/29 | | | 60,000 | | | $ | 63,770 | |
SASOL Financing USA 5.875% 3/27/24 | | | 400,000 | | | | 429,104 | |
Suzano Austria 144A 6.00% 1/15/29 # | | | 200,000 | | | | 221,500 | |
Syngenta Finance 144A 3.933% 4/23/21 # | | | 225,000 | | | | 228,674 | |
Vedanta Resources 144A 7.125% 5/31/23 # | | | 200,000 | | | | 200,850 | |
| | | | | | | | |
| | | | | | | 4,230,891 | |
| | | | | | | | |
Brokerage – 1.26% | | | | | | | | |
Jefferies Group | | | | | | | | |
4.15% 1/23/30 | | | 30,000 | | | | 29,760 | |
6.45% 6/8/27 | | | 60,000 | | | | 68,925 | |
6.50% 1/20/43 | | | 365,000 | | | | 410,609 | |
Lazard Group | | | | | | | | |
4.375% 3/11/29 | | | 25,000 | | | | 26,702 | |
4.50% 9/19/28 | | | 100,000 | | | | 107,035 | |
| | | | | | | | |
| | | | | | | 643,031 | |
| | | | | | | | |
Capital Goods – 4.50% | | | | | | | | |
Ardagh Packaging Finance 144A 6.00% 2/15/25 # | | | 295,000 | | | | 305,325 | |
EnPro Industries 5.75% 10/15/26 | | | 40,000 | | | | 41,400 | |
Grupo Cementos de Chihuahua 144A 5.25% 6/23/24 # | | | 200,000 | | | | 205,502 | |
Mauser Packaging Solutions Holding 144A 7.25% 4/15/25 # | | | 103,000 | | | | 97,979 | |
New Enterprise Stone & Lime 144A 10.125% 4/1/22 # | | | 190,000 | | | | 195,463 | |
Northrop Grumman 3.25% 8/1/23 | | | 180,000 | | | | 186,462 | |
nVent Finance 4.55% 4/15/28 | | | 18,000 | | | | 18,465 | |
Standard Industries 144A 6.00% 10/15/25 # | | | 255,000 | | | | 268,069 | |
TransDigm 144A 6.25% 3/15/26 # | | | 200,000 | | | | 210,250 | |
United Rentals North America 5.875% 9/15/26 | | | 344,000 | | | | 367,220 | |
United Technologies 3.65% 8/16/23 | | | 200,000 | | | | 209,534 | |
Waste Management | | | | | | | | |
2.95% 6/15/24 | | | 55,000 | | | | 56,400 | |
4.00% 7/15/39 | | | 20,000 | | | | 21,845 | |
4.15% 7/15/49 | | | 100,000 | | | | 110,607 | |
| | | | | | | | |
| | | | | | | 2,294,521 | |
| | | | | | | | |
Communications – 6.80% | | | | | | | | |
AT&T | | | | | | | | |
4.35% 3/1/29 | | | 75,000 | | | | 81,089 | |
4.85% 7/15/45 | | | 105,000 | | | | 112,926 | |
CCO Holdings 144A 5.875% 5/1/27 # | | | 235,000 | | | | 247,044 | |
Charter Communications Operating | | | | | | | | |
4.464% 7/23/22 | | | 50,000 | | | | 52,370 | |
5.05% 3/30/29 | | | 30,000 | | | | 32,964 | |
5.125% 7/1/49 | | | 45,000 | | | | 46,013 | |
16
| | | | | | | | |
| | | Principal amount° | | | Value (US $) | |
| |
Corporate Bonds(continued) | | | | | | | | |
| |
Communications(continued) | | | | | | | | |
Crown Castle International | | | | | | | | |
3.80% 2/15/28 | | | 150,000 | | | $ | 156,897 | |
4.30% 2/15/29 | | | 35,000 | | | | 37,994 | |
CSC Holdings 144A 7.75% 7/15/25 # | | | 250,000 | | | | 269,375 | |
Digicel Group Two 144A PIK 9.125% 4/1/24 # | | | 200,855 | | | | 37,660 | |
Discovery Communications | | | | | | | | |
4.125% 5/15/29 | | | 70,000 | | | | 73,185 | |
5.20% 9/20/47 | | | 135,000 | | | | 143,441 | |
Fox | | | | | | | | |
144A 4.709% 1/25/29 # | | | 35,000 | | | | 39,203 | |
144A 5.576% 1/25/49 # | | | 35,000 | | | | 42,778 | |
Level 3 Financing 5.375% 5/1/25 | | | 150,000 | | | | 154,875 | |
Radiate Holdco 144A 6.625% 2/15/25 # | | | 200,000 | | | | 198,500 | |
Sprint 7.875% 9/15/23 | | | 280,000 | | | | 311,850 | |
Telecom Argentina 144A 8.00% 7/18/26 # | | | 260,000 | | | | 264,063 | |
Telefonica Emisiones 5.52% 3/1/49 | | | 150,000 | | | | 177,682 | |
Time Warner Cable 7.30% 7/1/38 | | | 170,000 | | | | 210,923 | |
Time Warner Entertainment 8.375% 3/15/23 | | | 80,000 | | | | 94,399 | |
Verizon Communications | | | | | | | | |
4.50% 8/10/33 | | | 280,000 | | | | 316,809 | |
4.522% 9/15/48 | | | 60,000 | | | | 66,321 | |
Viacom 4.375% 3/15/43 | | | 130,000 | | | | 128,710 | |
Zayo Group 6.375% 5/15/25 | | | 170,000 | | | | 174,913 | |
| | | | | | | | |
| | | | | | | 3,471,984 | |
| | | | | | | | |
Consumer Cyclical – 2.99% | | | | | | | | |
AMC Entertainment Holdings 6.125% 5/15/27 | | | 265,000 | | | | 238,665 | |
Atento Luxco 1 144A 6.125% 8/10/22 # | | | 65,000 | | | | 66,267 | |
General Motors Financial | | | | | | | | |
4.35% 4/9/25 | | | 95,000 | | | | 98,458 | |
5.25% 3/1/26 | | | 55,000 | | | | 59,307 | |
Golden Nugget 144A 8.75% 10/1/25 # | | | 86,000 | | | | 90,300 | |
Lowe’s | | | | | | | | |
4.05% 5/3/47 | | | 20,000 | | | | 20,100 | |
4.55% 4/5/49 | | | 130,000 | | | | 141,317 | |
M/I Homes 5.625% 8/1/25 | | | 200,000 | | | | 204,000 | |
Prime Security Services Borrower | | | | | | | | |
144A 5.75% 4/15/26 # | | | 65,000 | | | | 68,009 | |
144A 9.25% 5/15/23 # | | | 50,000 | | | | 52,625 | |
Resorts World Las Vegas 144A 4.625% 4/16/29 # | | | 200,000 | | | | 209,541 | |
Scientific Games International | | | | | | | | |
10.00% 12/1/22 | | | 127,000 | | | | 132,876 | |
17
Schedule of investments
Delaware Strategic Income Fund
| | | | | | | | |
| | | Principal amount° | | | Value (US $) | |
| |
Corporate Bonds(continued) | | | | | | | | |
| |
Consumer Cyclical(continued) | | | | | | | | |
Scientific Games International | | | | | | | | |
144A 8.25% 3/15/26 # | | | 135,000 | | | $ | 144,825 | |
| | | | | | | | |
| | | | | | | 1,526,290 | |
| | | | | | | | |
ConsumerNon-Cyclical – 4.48% | | | | | | | | |
Anheuser-Busch InBev Worldwide 3.65% 2/1/26 | | | 130,000 | | | | 137,250 | |
Bristol-Myers Squibb | | | | | | | | |
144A 2.90% 7/26/24 # | | | 70,000 | | | | 71,686 | |
144A 4.125% 6/15/39 # | | | 60,000 | | | | 65,550 | |
144A 4.25% 10/26/49 # | | | 120,000 | | | | 131,518 | |
Charles River Laboratories International 144A 5.50% 4/1/26 # | | | 180,000 | | | | 190,800 | |
Cigna | | | | | | | | |
144A 3.193% (LIBOR03M + 0.89%) 7/15/23 #● | | | 155,000 | | | | 155,438 | |
144A 4.125% 11/15/25 # | | | 192,000 | | | | 204,081 | |
CVS Health 4.10% 3/25/25 | | | 180,000 | | | | 189,593 | |
JBS Investments II | | | | | | | | |
144A 5.75% 1/15/28 # | | | 200,000 | | | | 202,450 | |
144A 7.00% 1/15/26 # | | | 200,000 | | | | 214,600 | |
Marfrig Holdings Europe 144A 8.00% 6/8/23 # | | | 200,000 | | | | 208,252 | |
Mars | | | | | | | | |
144A 3.875% 4/1/39 # | | | 10,000 | | | | 10,956 | |
144A 3.95% 4/1/49 # | | | 95,000 | | | | 103,436 | |
MHP 144A 6.95% 4/3/26 # | | | 200,000 | | | | 205,861 | |
New York & Presbyterian Hospital 4.063% 8/1/56 | | | 130,000 | | | | 141,844 | |
Surgery Center Holdings 144A 6.75% 7/1/25 # | | | 60,000 | | | | 53,550 | |
| | | | | | | | |
| | | | | | | 2,286,865 | |
| | | | | | | | |
Electric – 3.52% | | | | | | | | |
Avangrid 3.15% 12/1/24 | | | 105,000 | | | | 107,645 | |
Calpine | | | | | | | | |
144A 5.25% 6/1/26 # | | | 125,000 | | | | 126,721 | |
5.75% 1/15/25 | | | 85,000 | | | | 85,319 | |
Cleveland Electric Illuminating 5.50% 8/15/24 | | | 170,000 | | | | 192,412 | |
ComEd Financing III 6.35% 3/15/33 | | | 75,000 | | | | 77,806 | |
Entergy Louisiana 4.00% 3/15/33 | | | 155,000 | | | | 172,322 | |
IPALCO Enterprises 3.70% 9/1/24 | | | 90,000 | | | | 92,653 | |
Israel Electric 144A 5.00% 11/12/24 # | | | 200,000 | | | | 217,800 | |
NextEra Energy Capital Holdings | | | | | | | | |
2.90% 4/1/22 | | | 115,000 | | | | 116,750 | |
3.15% 4/1/24 | | | 75,000 | | | | 77,205 | |
5.65% 5/1/79 µ | | | 15,000 | | | | 15,803 | |
PacifiCorp 3.50% 6/15/29 | | | 160,000 | | | | 172,331 | |
18
| | | | | | | | |
| | | Principal amount° | | | Value (US $) | |
| |
Corporate Bonds(continued) | | | | | | | | |
| |
Electric(continued) | | | | | | | | |
Southern California Edison | | | | | | | | |
4.20% 3/1/29 | | | 15,000 | | | $ | 16,381 | |
4.875% 3/1/49 | | | 100,000 | | | | 115,883 | |
Southwestern Electric Power 4.10% 9/15/28 | | | 190,000 | | | | 207,908 | |
| | | | | | | | |
| | | | | | | 1,794,939 | |
| | | | | | | | |
Energy – 10.15% | | | | | | | | |
ADES International Holding 144A 8.625% 4/24/24 # | | | 200,000 | | | | 200,500 | |
AmeriGas Partners 5.875% 8/20/26 | | | 105,000 | | | | 111,825 | |
Chesapeake Energy 8.00% 1/15/25 | | | 115,000 | | | | 98,900 | |
Diamond Offshore Drilling 7.875% 8/15/25 | | | 235,000 | | | | 225,013 | |
Energy Transfer Operating | | | | | | | | |
5.25% 4/15/29 | | | 40,000 | | | | 44,689 | |
6.25% 4/15/49 | | | 20,000 | | | | 23,800 | |
6.625% µy | | | 100,000 | | | | 95,152 | |
Energy Transfer Partners 5.00% 10/1/22 | | | 100,000 | | | | 106,079 | |
Enterprise Products Operating | | | | | | | | |
3.125% 7/31/29 | | | 35,000 | | | | 35,285 | |
4.20% 1/31/50 | | | 35,000 | | | | 35,733 | |
Gazprom OAO Via Gaz Capital 144A 4.95% 3/23/27 # | | | 200,000 | | | | 212,568 | |
Genesis Energy 6.50% 10/1/25 | | | 183,000 | | | | 182,314 | |
KazMunayGas National 144A 6.375% 10/24/48 # | | | 400,000 | | | | 484,610 | |
KazTransGas JSC 144A 4.375% 9/26/27 # | | | 200,000 | | | | 208,124 | |
Marathon Oil | | | | | | | | |
2.80% 11/1/22 | | | 100,000 | | | | 100,319 | |
4.40% 7/15/27 | | | 110,000 | | | | 115,965 | |
MPLX 4.80% 2/15/29 | | | 175,000 | | | | 191,418 | |
Murphy Oil 6.875% 8/15/24 | | | 290,000 | | | | 304,471 | |
Noble Energy 3.90% 11/15/24 | | | 205,000 | | | | 213,766 | |
ONEOK 7.50% 9/1/23 | | | 90,000 | | | | 105,168 | |
Petrobras Global Finance 7.375% 1/17/27 | | | 330,000 | | | | 391,268 | |
Petroleos Mexicanos 4.625% 9/21/23 | | | 195,000 | | | | 192,660 | |
Precision Drilling | | | | | | | | |
144A 7.125% 1/15/26 # | | | 120,000 | | | | 114,600 | |
7.75% 12/15/23 | | | 220,000 | | | | 222,200 | |
Sabine Pass Liquefaction 5.75% 5/15/24 | | | 280,000 | | | | 310,966 | |
Saudi Arabian Oil 144A 4.25% 4/16/39 # | | | 200,000 | | | | 208,453 | |
Schlumberger Holdings 144A 4.30% 5/1/29 # | | | 110,000 | | | | 118,922 | |
Southwestern Energy 7.75% 10/1/27 | | | 465,000 | | | | 405,861 | |
Whiting Petroleum 6.625% 1/15/26 | | | 123,000 | | | | 116,543 | |
| | | | | | | | |
| | | | | | | 5,177,172 | |
| | | | | | | | |
Finance Companies – 1.44% | | | | | | | | |
AerCap Ireland Capital 3.65% 7/21/27 | | | 350,000 | | | | 351,130 | |
19
Schedule of investments
Delaware Strategic Income Fund
| | | | | | | | |
| | | Principal amount° | | | Value (US $) | |
| |
Corporate Bonds(continued) | | | | | | | | |
| |
Finance Companies(continued) | | | | | | | | |
Avolon Holdings Funding | | | | | | | | |
144A 3.95% 7/1/24 # | | | 100,000 | | | $ | 102,446 | |
144A 4.375% 5/1/26 # | | | 50,000 | | | | 51,773 | |
International Lease Finance 8.625% 1/15/22 | | | 200,000 | | | | 227,379 | |
| | | | | | | | |
| | | | | | | 732,728 | |
| | | | | | | | |
Insurance – 1.99% | | | | | | | | |
AssuredPartners 144A 7.00% 8/15/25 # | | | 50,000 | | | | 50,375 | |
HUB International 144A 7.00% 5/1/26 # | | | 225,000 | | | | 229,358 | |
MetLife 5.25% µy | | | 145,000 | | | | 146,722 | |
Prudential Financial 4.35% 2/25/50 | | | 155,000 | | | | 176,515 | |
USI 144A 6.875% 5/1/25 # | | | 200,000 | | | | 199,040 | |
Voya Financial 4.70% 1/23/48 µ | | | 65,000 | | | | 59,997 | |
XLIT | | | | | | | | |
4.761% (LIBOR03M + 2.458%)y● | | | 65,000 | | | | 65,131 | |
5.50% 3/31/45 | | | 75,000 | | | | 90,515 | |
| | | | | | | | |
| | | | | | | 1,017,653 | |
| | | | | | | | |
Natural Gas – 0.15% | | | | | | | | |
Boston Gas 144A 3.001% 8/1/29 # | | | 15,000 | | | | 15,159 | |
NiSource 5.65% µy | | | 60,000 | | | | 59,732 | |
| | | | | | | | |
| | | | | | | 74,891 | |
| | | | | | | | |
REITs – 0.18% | | | | | | | | |
Corporate Office Properties 5.25% 2/15/24 | | | 85,000 | | | | 90,946 | |
| | | | | | | | |
| | | | | | | 90,946 | |
| | | | | | | | |
Technology – 2.11% | | | | | | | | |
Broadcom | | | | | | | | |
144A 3.125% 4/15/21 # | | | 180,000 | | | | 181,083 | |
144A 4.25% 4/15/26 # | | | 45,000 | | | | 45,384 | |
CommScope Technologies 144A 5.00% 3/15/27 # | | | 65,000 | | | | 54,844 | |
Microchip Technology | | | | | | | | |
3.922% 6/1/21 | | | 280,000 | | | | 285,002 | |
4.333% 6/1/23 | | | 85,000 | | | | 88,419 | |
NXP | | | | | | | | |
144A 4.125% 6/1/21 # | | | 200,000 | | | | 204,673 | |
144A 4.30% 6/18/29 # | | | 30,000 | | | | 31,096 | |
144A 4.875% 3/1/24 # | | | 175,000 | | | | 187,859 | |
| | | | | | | | |
| | | | | | | 1,078,360 | |
| | | | | | | | |
Transportation – 0.83% | | | | | | | | |
Adani Abbot Point Terminal 144A 4.45% 12/15/22 # | | | 200,000 | | | | 198,444 | |
Avis Budget Car Rental 144A 6.375% 4/1/24 # | | | 55,000 | | | | 57,750 | |
DAE Funding 144A 5.75% 11/15/23 # | | | 160,000 | | | | 168,600 | |
| | | | | | | | |
| | | | | | | 424,794 | |
| | | | | | | | |
20
| | | | | | | | |
| | | Principal amount° | | | Value (US $) | |
| |
Corporate Bonds(continued) | | | | | | | | |
| |
Utilities – 0.41% | | | | | | | | |
Aegea Finance 144A 5.75% 10/10/24 # | | | 200,000 | | | $ | 208,752 | |
| | | | | | | | |
| | | | | | | 208,752 | |
| | | | | | | | |
| | |
Total Corporate Bonds(cost $28,520,080) | | | | | | | 29,263,180 | |
| | | | | | | | |
| | | | | | | | |
| |
Municipal Bonds – 1.37% | | | | | | | | |
| |
Bay Area, California Toll Authority (Build America Bonds) SeriesS-3 6.907% 10/1/50 | | | 170,000 | | | | 276,343 | |
New Jersey Turnpike Authority (Build America Bonds) Series A 7.102% 1/1/41 | | | 90,000 | | | | 138,036 | |
South Carolina Public Service Authority
Series D 4.77% 12/1/45 | | | 55,000 | | | | 65,920 | |
State of California Various Purposes
7.55% 4/1/39 | | | 135,000 | | | | 216,769 | |
| | | | | | | | |
Total Municipal Bonds(cost $656,215) | | | | | | | 697,068 | |
| | | | | | | | |
| | | | | | | | |
| |
Non-Agency Asset-Backed Securities – 6.12% | | | | | | | | |
| |
American Express Credit Account Master Trust
Series2018-3 A 2.645% (LIBOR01M + 0.32%) 10/15/25● | | | 100,000 | | | | 99,996 | |
Chase Issuance Trust
Series2018-A1 A1 2.525% (LIBOR01M + 0.20%) 4/17/23● | | | 500,000 | | | | 500,586 | |
Citibank Credit Card Issuance Trust | | | | | | | | |
Series2017-A7 A7 2.734% (LIBOR01M + 0.37%) 8/8/24● | | | 500,000 | | | | 501,300 | |
Series2018-A2 A2 2.602% (LIBOR01M + 0.33%) 1/20/25● | | | 500,000 | | | | 500,299 | |
Citicorp Residential Mortgage Trust
Series2006-3 A5 5.178% 11/25/36● | | | 400,000 | | | | 411,473 | |
Ford Credit Auto Lease Trust
Series2019-B A2A 2.28% 2/15/22 | | | 200,000 | | | | 199,854 | |
Ford Credit Auto Owner Trust
Series2018-1 A 144A 3.19% 7/15/31 # | | | 100,000 | | | | 102,949 | |
Hardee’s Funding
Series2018-1A A2I 144A 4.25% 6/20/48 # | | | 49,625 | | | | 50,499 | |
HOA Funding
Series2014-1A A2 144A 4.846% 8/20/44 # | | | 45,250 | | | | 45,241 | |
PFS Financing
Series2018-A A 144A 2.725% (LIBOR01M + 0.40%) 2/17/22 #● | | | 100,000 | | | | 100,050 | |
21
Schedule of investments
Delaware Strategic Income Fund
| | | | | | | | |
| | | Principal amount° | | | Value (US $) | |
| |
Non-Agency Asset-Backed Securities(continued) | | | | | | | | |
| |
PFS Financing
Series2018-E A 144A 2.775% (LIBOR01M + 0.45%) 10/17/22 #● | | | 145,000 | | | $ | 145,013 | |
Towd Point Mortgage Trust | | | | | | | | |
Series2015-5 A1B 144A 2.75% 5/25/55 #● | | | 37,787 | | | | 37,708 | |
Series2015-6 A1B 144A 2.75% 4/25/55 #● | | | 44,658 | | | | 44,644 | |
Series2017-1 A1 144A 2.75% 10/25/56 #● | | | 57,772 | | | | 58,003 | |
Series2017-2 A1 144A 2.75% 4/25/57 #● | | | 59,158 | | | | 59,299 | |
Series2018-1 A1 144A 3.00% 1/25/58 #● | | | 76,064 | | | | 76,420 | |
Volkswagen Auto Loan Enhanced Trust
Series2018-1 A2B 2.452% (LIBOR01M + 0.18%) 7/20/21● | | | 63,984 | | | | 63,995 | |
Volvo Financial Equipment Master Owner Trust
Series2017-A A 144A 2.825% (LIBOR01M + 0.50%) 11/15/22 #● | | | 75,000 | | | | 75,209 | |
Wendy’s Funding
Series2018-1A A2I 144A 3.573% 3/15/48 # | | | 49,250 | | | | 49,624 | |
| | | | | | | | |
TotalNon-Agency Asset-Backed Securities
(cost $3,067,019) | | | | | | | 3,122,162 | |
| | | | | | | | |
| | | | | | | | |
| |
Non-Agency Collateralized Mortgage Obligations – 6.40% | | | | | | | | |
| |
| |
Chase Home Lending Mortgage Trust | | | | | | | | |
Series 2019-ATR1 A4 144A 4.00% 4/25/49 #● | | | 480,509 | | | | 487,042 | |
Series 2019-ATR2 A3 144A 3.50% 7/25/49 #● | | | 100,000 | | | | 101,125 | |
Connecticut Avenue Securities Trust
Series2019-R01 2M2 144A 4.716% (LIBOR01M + 2.45%) 7/25/31 #● | | | 575,000 | | | | 583,349 | |
Credit Suisse First Boston Mortgage Securities
Series2005-5 6A3 5.00% 7/25/35 | | | 32,791 | | | | 33,000 | |
Flagstar Mortgage Trust | | | | | | | | |
Series2018-1 A5 144A 3.50% 3/25/48 #● | | | 79,324 | | | | 80,456 | |
Series2018-5 A7 144A 4.00% 9/25/48 #● | | | 72,487 | | | | 73,520 | |
Galton Funding Mortgage Trust
Series2018-1 A43 144A 3.50% 11/25/57 #● | | | 57,668 | | | | 58,003 | |
GSMPS Mortgage Loan Trust
Series1998-2 A 144A 7.75% 5/19/27 #● | | | 16,246 | | | | 16,334 | |
JPMorgan Mortgage Trust | | | | | | | | |
Series2006-S1 1A1 6.00% 4/25/36 | | | 31,337 | | | | 33,558 | |
Series2007-A1 7A4 4.685% 7/25/35● | | | 50,013 | | | | 45,563 | |
Series2014-2 B1 144A 3.407% 6/25/29 #● | | | 59,698 | | | | 60,490 | |
Series2014-2 B2 144A 3.407% 6/25/29 #● | | | 59,698 | | | | 60,162 | |
Series 2014-IVR6 2A4 144A 2.50% 7/25/44 #● | | | 100,000 | | | | 99,118 | |
Series2015-4 B1 144A 3.624% 6/25/45 #● | | | 90,473 | | | | 92,588 | |
Series2015-4 B2 144A 3.624% 6/25/45 #● | | | 90,473 | | | | 91,511 | |
22
| | | | | | | | |
| | | Principal amount° | | | Value (US $) | |
| |
Non-Agency Collateralized Mortgage Obligations(continued) | | | | | | | | |
| |
JPMorgan Mortgage Trust | | | | | | | | |
Series2015-5 B2 144A 3.389% 5/25/45 #● | | | 94,094 | | | $ | 93,210 | |
Series2015-6 B1 144A 3.611% 10/25/45 #● | | | 89,497 | | | | 91,388 | |
Series2015-6 B2 144A 3.611% 10/25/45 #● | | | 89,497 | | | | 90,755 | |
Series2016-4 B1 144A 3.897% 10/25/46 #● | | | 92,939 | | | | 96,157 | |
Series2016-4 B2 144A 3.897% 10/25/46 #● | | | 92,939 | | | | 95,648 | |
Series2017-1 B2 144A 3.546% 1/25/47 #● | | | 80,466 | | | | 80,431 | |
Series2017-2 A3 144A 3.50% 5/25/47 #● | | | 31,919 | | | | 32,363 | |
Series2018-4 A15 144A 3.50% 10/25/48 #● | | | 44,344 | | | | 44,747 | |
Series2018-6 1A4 144A 3.50% 12/25/48 #● | | | 354,571 | | | | 357,847 | |
Series 2018-7FRB A2 144A 3.154% (LIBOR01M + 0.75%) 4/25/46 #● | | | 30,457 | | | | 30,357 | |
New Residential Mortgage Loan Trust
Series 2018-RPL1 A1 144A 3.50% 12/25/57 #● | | | 87,431 | | | | 89,075 | |
Sequoia Mortgage Trust | | | | | | | | |
Series2014-2 A4 144A 3.50% 7/25/44 #● | | | 28,789 | | | | 29,254 | |
Series2015-1 B2 144A 3.878% 1/25/45 #● | | | 44,489 | | | | 45,527 | |
Series2017-4 A1 144A 3.50% 7/25/47 #● | | | 77,263 | | | | 78,285 | |
Series2018-5 A4 144A 3.50% 5/25/48 #● | | | 84,815 | | | | 86,262 | |
Washington Mutual Mortgage Pass Through Certificates Trust
Series2005-1 5A2 6.00% 3/25/35¨ | | | 9,598 | | | | 994 | |
Wells Fargo Mortgage-Backed Securities Trust
Series2006-AR5 2A1 5.187% 4/25/36● | | | 5,809 | | | | 5,825 | |
| | | | | | | | |
TotalNon-Agency Collateralized Mortgage Obligations(cost $3,232,869) | | | | | | | 3,263,944 | |
| | | | | | | | |
| | | | | | | | |
| |
Non-Agency Commercial Mortgage-Backed Securities – 5.22% | | | | | | | | |
| |
BANK | | | | | | | | |
Series 2017-BNK4 XA 1.433% 5/15/50S● | | | 446,218 | | | | 35,373 | |
Series 2017-BNK5 B 3.896% 6/15/60● | | | 60,000 | | | | 62,833 | |
Series 2017-BNK7 A5 3.435% 9/15/60 | | | 65,000 | | | | 68,623 | |
BENCHMARK Mortgage Trust
Series2018-B6 A4 4.261% 10/10/51 | | | 80,000 | | | | 89,767 | |
Caesars Palace Las Vegas Trust
Series 2017-VICI B 144A 3.835% 10/15/34 # | | | 60,000 | | | | 62,148 | |
Cantor Commercial Real Estate Lending
Series2019-CF1 A5 3.786% 5/15/52 | | | 300,000 | | | | 324,871 | |
CD Mortgage Trust
Series2016-CD2 A3 3.248% 11/10/49 | | | 85,000 | | | | 88,553 | |
Citigroup Commercial Mortgage Trust | | | | | | | | |
Series 2014-GC25 A4 3.635% 10/10/47 | | | 75,000 | | | | 79,250 | |
Series2017-C4 A4 3.471% 10/12/50 | | | 45,000 | | | | 47,612 | |
COMM Mortgage Trust
Series2013-CR6 AM 144A 3.147% 3/10/46 # | | | 110,000 | | | | 112,197 | |
23
Schedule of investments
Delaware Strategic Income Fund
| | | | | | | | |
| | | Principal amount° | | | Value (US $) | |
| |
Non-Agency Commercial Mortgage-Backed Securities(continued) | | | | | | | | |
| |
COMM Mortgage Trust | | | | | | | | |
Series 2014-CR19 A5 3.796% 8/10/47 | | | 80,000 | | | $ | 84,965 | |
Series 2015-CR23 A4 3.497% 5/10/48 | | | 85,000 | | | | 89,510 | |
Series 2016-CR28 A4 3.762% 2/10/49 | | | 70,000 | | | | 74,838 | |
GRACE Mortgage Trust
Series 2014-GRCE B 144A 3.52% 6/10/28 # | | | 100,000 | | | | 101,248 | |
GS Mortgage Securities Trust | | | | | | | | |
Series2010-C1 C 144A 5.635% 8/10/43 #● | | | 150,000 | | | | 152,911 | |
Series 2015-GC32 A4 3.764% 7/10/48 | | | 75,000 | | | | 80,137 | |
Series2017-GS6 A3 3.433% 5/10/50 | | | 75,000 | | | | 79,135 | |
Series2018-GS9 A4 3.992% 3/10/51● | | | 40,000 | | | | 43,802 | |
JPM-BB Commercial Mortgage Securities Trust | | | | | | | | |
Series2015-C27 XA 1.303% 2/15/48S● | | | 1,105,119 | | | | 47,723 | |
Series2015-C31 A3 3.801% 8/15/48 | | | 105,000 | | | | 112,375 | |
JPMorgan Chase Commercial Mortgage Securities Trust | | | | | | | | |
Series 2005-CB11 E 5.568% 8/12/37● | | | 35,000 | | | | 35,381 | |
Series 2013-LC11 B 3.499% 4/15/46 | | | 130,000 | | | | 132,096 | |
Series 2016-WIKI A 144A 2.798% 10/5/31 # | | | 90,000 | | | | 90,626 | |
Series 2016-WIKI B 144A 3.201% 10/5/31 # | | | 85,000 | | | | 85,776 | |
LB-UBS Commercial Mortgage Trust
Series2006-C6 AJ 5.452% 9/15/39● | | | 56,085 | | | | 32,529 | |
Morgan Stanley Capital I Trust
Series 2006-HQ10 B 5.448% 11/12/41● | | | 74,366 | | | | 67,749 | |
UBS Commercial Mortgage Trust
Series2018-C9 A4 4.117% 3/15/51● | | | 70,000 | | | | 77,403 | |
Wells Fargo Commercial Mortgage Trust | | | | | | | | |
Series2015-C30 XA 0.904% 9/15/58S● | | | 1,861,450 | | | | 81,864 | |
Series 2015-NXS3 A4 3.617% 9/15/57 | | | 45,000 | | | | 47,737 | |
Series2017-C38 A5 3.453% 7/15/50 | | | 90,000 | | | | 94,932 | |
Series2017-RB1 XA 1.275% 3/15/50S● | | | 991,285 | | | | 77,640 | |
| | | | | | | | |
TotalNon-Agency Commercial Mortgage-Backed Securities(cost $2,668,826) | | | | | | | 2,661,604 | |
| | | | | | | | |
| | | | | | | | |
| |
Loan Agreements – 5.54% | | | | | | | | |
| |
Acrisure Tranche B 1st Lien 0.00% 11/22/23● X | | | 125,000 | | | | 123,594 | |
Applied Systems 2nd Lien 9.33% (LIBOR03M + 7.00%) 9/19/25● | | | 270,000 | | | | 273,645 | |
AssuredPartners Tranche B 1st Lien 0.00% 10/22/24● X | | | 125,000 | | | | 124,672 | |
Blackstone CQP Holdco Tranche B 1st Lien 5.887% (LIBOR03M + 3.50%) 6/20/24● | | | 125,000 | | | | 125,664 | |
Blue Ribbon 1st Lien 6.388% (LIBOR01M + 4.00%) 11/13/21● | | | 73,530 | | | | 66,066 | |
Cornerstone Building Brands Tranche B 1st Lien 6.119% (LIBOR01M + 3.75%) 4/12/25● | | | 173,250 | | | | 169,460 | |
24
| | | | | | | | |
| | | Principal amount° | | | Value (US $) | |
| |
Loan Agreements(continued) | | | | | | | | |
| |
Deerfield Dakota Holding Tranche B 1st Lien 5.484% (LIBOR01M + 3.25%) 2/13/25● | | | 172,813 | | | $ | 168,762 | |
DTZ US Borrower Tranche B 1st Lien 5.484% (LIBOR01M + 3.25%) 8/21/25● | | | 99,250 | | | | 99,788 | |
Frontier Communications Tranche B1 1st Lien 5.99% (LIBOR01M + 3.75%) 6/15/24● | | | 125,000 | | | | 123,765 | |
Gentiva Health Services Tranche B 1st Lien 0.00% 7/2/25● X | | | 125,000 | | | | 125,663 | |
GIP III Stetson I Tranche B 1st Lien 6.55% (LIBOR01M + 4.25%) 7/18/25● | | | 84,310 | | | | 84,801 | |
Grizzly Finco Tranche B 1st Lien 5.57% (LIBOR03M + 3.25%) 10/1/25● | | | 125,000 | | | | 125,359 | |
Hoya Midco Tranche B 1st Lien 5.734% (LIBOR01M + 3.50%) 6/30/24● | | | 125,000 | | | | 124,115 | |
Kronos Tranche B 1st Lien 5.579% (LIBOR03M + 3.00%) 11/1/23● | | | 125,000 | | | | 125,274 | |
Mauser Packaging Solutions Holding Tranche B 1st Lien 0.00% 4/3/24● X | | | 125,000 | | | | 123,229 | |
Penn National Gaming Tranche B1 1st Lien 4.484% (LIBOR01M + 2.25%) 10/15/25● | | | 99,500 | | | | 99,783 | |
Stars Group Holdings Tranche B 1st Lien 5.83% (LIBOR03M + 3.50%) 7/10/25● | | | 112,306 | | | | 113,008 | |
Summit Midstream Partners Holdings Tranche B 1st Lien 8.234% (LIBOR01M + 6.00%) 5/21/22● | | | 168,537 | | | | 166,430 | |
Ultimate Software Group 1st Lien 0.00% 5/3/26● X | | | 125,000 | | | | 126,113 | |
Verscend Holding Tranche B 1st Lien 6.734% (LIBOR01M + 4.50%) 8/27/25● | | | 84,088 | | | | 84,613 | |
VVC Holding Tranche B 1st Lien 7.045% (LIBOR03M + 4.50%) 2/11/26● | | | 125,000 | | | | 125,664 | |
Wand NewCo 3 Tranche B 1st Lien 0.00% 2/5/26● X | | | 125,000 | | | | 126,016 | |
| | | | | | | | |
Total Loan Agreements(cost $2,846,307) | | | | | | | 2,825,484 | |
| | | | | | | | |
| | | | | | | | |
| |
Sovereign Bonds – 2.91%D | | | | | | | | |
| |
Argentina – 0.30% | | | | | | | | |
Argentine Republic Government International Bond 5.625% 1/26/22 | | | 175,000 | | | | 151,550 | |
| | | | | | | | |
| | | | | | | 151,550 | |
| | | | | | | | |
Egypt – 0.83% | | | | | | | | |
Egypt Government International Bond | | | | | | | | |
144A 6.125% 1/31/22 # | | | 200,000 | | | | 209,450 | |
144A 7.60% 3/1/29 # | | | 200,000 | | | | 214,657 | |
| | | | | | | | |
| | | | | | | 424,107 | |
| | | | | | | | |
25
Schedule of investments
Delaware Strategic Income Fund
| | | | | | | | | | | | |
| | | | | | Principal amount° | | | Value (US $) | |
| |
Sovereign BondsD(continued) | | | | | | | | | | | | |
| |
Ghana – 0.42% | | | | | | | | | | | | |
Ghana Government International Bond 144A 7.875% 3/26/27 # | | | | | | | 200,000 | | | $ | 211,617 | |
| | | | | | | | | | | | |
| | | | | | | | | | | 211,617 | |
| | | | | | | | | | | | |
Ivory Coast – 0.37% | | | | | | | | | | | | |
Ivory Coast Government International Bond 144A 6.125% 6/15/33 # | | | | | | | 200,000 | | | | 189,051 | |
| | | | | | | | | | | | |
| | | | | | | | | | | 189,051 | |
| | | | | | | | | | | | |
Mexico – 0.12% | | | | | | | | | | | | |
Mexican Bonos 7.75% 5/29/31 | | | MXN | | | | 1,200,000 | | | | 63,359 | |
| | | | | | | | | | | | |
| | | | | | | | | | | 63,359 | |
| | | | | | | | | | | | |
Senegal – 0.38% | | | | | | | | | | | | |
Senegal Government International Bond 144A 6.75% 3/13/48 # | | | | | | | 200,000 | | | | 192,572 | |
| | | | | | | | | | | | |
| | | | | | | | | | | 192,572 | |
| | | | | | | | | | | | |
Sri Lanka – 0.49% | | | | | | | | | | | | |
Sri Lanka Government International Bond 144A 5.75% 4/18/23 # | | | | | | | 250,000 | | | | 250,685 | |
| | | | | | | | | | | | |
| | | | | | | | | | | 250,685 | |
| | | | | | | | | | | | |
Total Sovereign Bonds(cost $1,481,219) | | | | | | | | | | | 1,482,941 | |
| | | | | | | | | | | | |
| | | | | | | | | | | | |
| |
Supranational Bank – 0.41% | | | | | | | | | | | | |
| |
Banque Ouest Africaine de Developpement 144A 5.00% 7/27/27 # | | | | | | | 200,000 | | | | 210,754 | |
| | | | | | | | | | | | |
Total Supranational Bank(cost $196,148) | | | | | | | | | | | 210,754 | |
| | | | | | | | | | | | |
| | | | | | | | | | | | |
| |
US Treasury Obligations – 0.14% | | | | | | | | | | | | |
| |
US Treasury Bonds
2.875% 5/15/49 | | | | | | | 10,000 | | | | 10,713 | |
US Treasury Notes | | | | | | | | | | | | |
1.75% 6/30/24 | | | | | | | 25,000 | | | | 24,904 | |
2.375% 5/15/29 | | | | | | | 35,000 | | | | 36,110 | |
| | | | | | | | | | | | |
Total US Treasury Obligations(cost $71,428) | | | | | | | | | | | 71,727 | |
| | | | | | | | | | | | |
26
| | | | | | | | |
| | | Number of shares | | | Value (US $) | |
| |
Preferred Stock – 0.76% | | | | | | | | |
| |
Bank of America 6.50%µ | | | 85,000 | | | $ | 94,645 | |
US Bancorp 3.50% (LIBOR03M + 1.02%)● | | | 350 | | | | 291,193 | |
| | | | | | | | |
Total Preferred Stock(cost $340,666) | | | | | | | 385,838 | |
| | | | | | | | |
| | | | | | | | |
| |
Short-Term Investments – 2.37% | | | | | | | | |
| |
Money Market Mutual Funds – 2.37% | | | | | | | | |
BlackRock FedFund – Institutional Shares(seven-day effective yield 2.23%) | | | 242,269 | | | | 242,221 | |
Fidelity Investments Money Market Government Portfolio - Class I(seven-day effective yield 2.19%) | | | 242,269 | | | | 242,220 | |
GS Financial Square Government Fund – Institutional Shares(seven-day effective yield 2.23%) | | | 242,269 | | | | 242,221 | |
Morgan Stanley Government Portfolio – Institutional Class(seven-day effective yield 2.21%) | | | 242,269 | | | | 242,221 | |
State Street Institutional US Government Money Market Fund – Investor Class(seven-day effective yield 2.18%) | | | 242,269 | | | | 242,220 | |
| | | | | | | | |
Total Short-Term Investments(cost $1,211,103) | | | | | | | 1,211,103 | |
| | | | | | | | |
| | |
Total Value of Securities – 100.72%
(cost $50,550,852) | | | | | | $ | 51,386,176 | |
| | | | | | | | |
| # | Security exempt from registration under Rule 144A of the Securities Act of 1933, as amended. At July 31, 2019, the aggregate value of Rule 144A securities was $20,493,684, which represents 40.17% of the Fund’s net assets. See Note 11 in “Notes to financial statements.” |
| ¨ | Pass Through Agreement. Security represents the contractual right to receive a proportionate amount of underlying payments due to the counterparty pursuant to various agreements related to the rescheduling of obligations and the exchange of certain notes. |
| PIK. 78% of the income received was in cash and 22% was in principal. |
| ° | Principal amount shown is stated in USD unless noted that the security is denominated in another currency. |
| D | Securities have been classified by country of origin. |
| µ | Fixed to variable rate investment. The rate shown reflects the fixed rate in effect at July 31, 2019. Rate will reset at a future date. |
| S | Interest only security. An interest only security is the interest only portion of a fixed income security, which is separated and sold individually from the principal portion of the security. |
| y | No contractual maturity date. |
| ● | Variable rate investment. Rates reset periodically. Rate shown reflects the rate in effect at July 31, 2019. For securities based on a published reference rate and spread, the reference rate and spread are indicated in their description above. The reference rate descriptions (i.e. LIBOR03M, LIBOR06M, etc.) used in this report are identical for different securities, but the underlying reference rates may differ due to the timing of the reset period. Certain variable rate securities are not based on |
27
Schedule of investments
Delaware Strategic Income Fund
a published reference rate and spread but are determined by the issuer or agent and are based on current market conditions, or for mortgage-backed securities, are impacted by the individual mortgages which are paying off over time. These securities do not indicate a reference rate and spread in their description above.
| | X | This loan will settle after July 31, 2019, at which time the interest rate, based on the LIBOR and the agreed upon spread on trade date, will be reflected. |
The following futures contracts and swap contracts were outstanding at July 31, 2019:1
Futures Contracts
| | | | | | | | | | | | | | | | | | | | | | |
| Contracts to Buy (Sell) | | Notional Amount | | | Notional Cost (Proceeds) | | | Expiration Date | | | Value/ Unrealized Depreciation | | | Variation Margin Due from (Due to) Brokers | |
55 | | US Treasury 5 yr Notes | | $ | 6,465,508 | | | $ | 6,473,592 | | | | 9/30/19 | | | $ | (8,084 | ) | | $ | (3,438 | ) |
(31) | | US Treasury 10 yr Notes | | | (3,950,078 | ) | | | (3,881,463 | ) | | | 9/19/19 | | | | (68,615 | ) | | | (2,422 | ) |
| | | | | | | | | | | | | | | | | | | | | | |
Total Futures Contracts | | | | | | $ | 2,592,129 | | | | | | | $ | (76,699 | ) | | $ | (5,860 | ) |
| | | | | | | | | | | | | | | | | | | | | | |
Swap Contracts
CDS Contracts2
| | | | | | | | | | | | | | | | | | | | |
Reference Obligation/ Termination Date/ Payment Frequency | | Notional Amount3 | | | Annual Protection Payments | | | Value | | | Upfront Payments Paid (Received) | | | Unrealized Appreciation4 | |
Over-The-Counter/ Protection Sold/ Moody’s Ratings: | | | | | | | | | | | | | | | | | | | | |
MSC-CMBX.NA.BBB.65 5/11/63- Monthly | | | 460,000 | | | | 3.00% | | | $ | (43,249 | ) | | $ | (50,279 | ) | | $ | 7,030 | |
The use of futures contracts and swap contracts involves elements of market risk and risks in excess of the amounts disclosed in the financial statements. The notional amounts presented above represent the Fund’s total exposure in such contracts, whereas only the net unrealized appreciation (depreciation) is reflected in the Fund’s net assets.
1See Note 8 in “Notes to financial statements.”
2A CDS contract is a risk-transfer instrument through which one party (purchaser of protection) transfers to another party (seller of protection) the financial risk of a credit event (as defined in the CDS agreement), as it relates to a particular reference security or basket of securities (such as an index). Periodic payments (receipts) on such contracts are accrued daily and recorded as unrealized losses (gains) on swap contracts. Upon payment (receipt), such amounts are recorded as realized losses (gains) on swap contracts. Upfront payments made or received in connection with CDS contracts are amortized
28
over the expected life of the CDS contracts as unrealized losses (gains) on swap contracts. The change in value of CDS contracts is recorded daily as unrealized appreciation or depreciation. A realized gain or loss is recorded upon a credit event (as defined in the CDS agreement) or the maturity or termination of the CDS agreement.
3Notional amount shown is stated in USD unless noted that the swap is denominated in another currency.
4Unrealized appreciation (depreciation) does not include periodic interest payments (receipt) on swap contracts accrued daily in the amount of $(1,975).
5Markit’s CMBX.NA Index is a synthetic tradable index referencing a basket of 25 commercial mortgage-backed securities in North America. Credit-quality ratings are measured on a scale that ranges from AAA (highest) to BB (lowest). US Agency and US Agency mortgage-backed securities appear under US Government.
Summary of abbreviations:
BB – Barclays Bank
CDS – Credit Default Swap
CMBX.NA – Commercial Mortgage-Backed Securities Index North America
FREMF – Freddie Mac Multifamily
GNMA – Government National Mortgage Association
GS – Goldman Sachs
GSMPS – Goldman Sachs Reperforming Mortgage Securities
ICE – Intercontinental Exchange
JPM – JPMorgan
LB – Lehman Brothers
LIBOR – London Interbank Offered Rate
LIBOR01M – ICE LIBOR USD 1 Month
LIBOR03M – ICE LIBOR USD 3 Month
LIBOR06M – ICE LIBOR USD 6 Month
MSC – Morgan Stanley Capital
MXN – Mexican Peso
PIK – Paymentin-kind
REIT – Real Estate Investment Trust
REMIC – Real Estate Mortgage Investment Conduit
S.F. – Single Family
USD – US Dollar
yr – Year
See accompanying notes, which are an integral part of the financial statements.
29
This page intentionally left blank.
| | |
| Statement of assets and liabilities |
| Delaware Strategic Income Fund | | July 31, 2019 |
| | | | |
Assets: | | | | |
Investments, at value1 | | $ | 51,386,176 | |
Foreign currencies, at value2 | | | 60,082 | |
Cash collateral due from brokers | | | 13,673 | |
Cash | | | 15,088 | |
Receivable for securities sold | | | 689,732 | |
Interest receivable | | | 492,220 | |
Unrealized appreciation on credit default swap contracts | | | 7,030 | |
Receivable for fund shares sold | | | 32,352 | |
Swap payments receivable | | | 371 | |
| | | | |
Total assets | | | 52,696,724 | |
| | | | |
Liabilities: | | | | |
Payable for securities purchased | | | 1,446,069 | |
Other accrued expenses | | | 71,072 | |
Upfront payments received on credit default swap contracts | | | 50,279 | |
Distribution payable | | | 47,965 | |
Payable for fund shares redeemed | | | 21,153 | |
Dividend disbursing and transfer agent fees and expenses payable to nonaffiliates | | | 11,320 | |
Distribution fees payable to affiliates | | | 9,284 | |
Audit and tax fees payable | | | 6,450 | |
Investment management fees payable to affiliates | | | 6,048 | |
Variation margin due to broker on futures contracts | | | 5,860 | |
Accounting and administration expenses payable to affiliates | | | 503 | |
Dividend disbursing and transfer agent fees and expenses payable to affiliates | | | 424 | |
Trustees’ fees and expenses payable to affiliates | | | 166 | |
Legal fees payable to affiliates | | | 58 | |
Reports and statements to shareholders expenses payable to affiliates | | | 27 | |
| | | | |
Total liabilities | | | 1,676,678 | |
| | | | |
Total Net Assets | | $ | 51,020,046 | |
| | | | |
| |
Net Assets Consist of: | | | | |
Paid-in capital | | $ | 56,069,127 | |
Total distributable earnings (loss) | | | (5,049,081 | ) |
| | | | |
Total Net Assets | | $ | 51,020,046 | |
| | | | |
31
Statement of assets and liabilities
Delaware Strategic Income Fund
| | | | |
Net Asset Value | | | | |
Class A: | | | | |
Net assets | | $ | 31,032,424 | |
Shares of beneficial interest outstanding, unlimited authorization, no par | | | 3,845,525 | |
Net asset value per share | | $ | 8.07 | |
Sales charge | | | 4.50 | % |
Offering price per share, equal to net asset value per share / (1 – sales charge) | | $ | 8.45 | |
| |
Class C: | | | | |
Net assets | | $ | 2,792,711 | |
Shares of beneficial interest outstanding, unlimited authorization, no par | | | 345,739 | |
Net asset value per share | | $ | 8.08 | |
| |
Class R: | | | | |
Net assets | | $ | 737,857 | |
Shares of beneficial interest outstanding, unlimited authorization, no par | | | 91,137 | |
Net asset value per share | | $ | 8.10 | |
| |
Institutional Class: | | | | |
Net assets | | $ | 16,457,054 | |
Shares of beneficial interest outstanding, unlimited authorization, no par | | | 2,037,476 | |
Net asset value per share | | $ | 8.08 | |
1Investments, at cost | | $ | 50,550,852 | |
2Foreign currencies, at cost | | | 59,632 | |
See accompanying notes, which are an integral part of the financial statements.
32
This page intentionally left blank.
| | |
| Statement of operations |
| Delaware Strategic Income Fund | | Year ended July 31, 2019 |
| | | | |
Investment Income: | | | | |
Interest | | $ | 2,799,436 | |
Dividends | | | 26,347 | |
| | | | |
| | | 2,825,783 | |
| | | | |
Expenses: | | | | |
Management fees | | | 315,567 | |
Distribution expenses — Class A | | | 78,873 | |
Distribution expenses — Class C | | | 29,821 | |
Distribution expenses — Class R | | | 18,761 | |
Dividend disbursing and transfer agent fees and expenses | | | 66,838 | |
Registration fees | | | 62,657 | |
Audit and tax fees | | | 57,772 | |
Accounting and administration expenses | | | 53,224 | |
Legal fees | | | 47,403 | |
Reports and statements to shareholders expenses | | | 39,940 | |
Custodian fees | | | 12,888 | |
Trustees’ fees and expenses | | | 3,264 | |
Other | | | 56,715 | |
| | | | |
| | | 843,723 | |
Less expenses waived | | | (376,841 | ) |
Less expenses paid indirectly | | | (265 | ) |
| | | | |
Total operating expenses | | | 466,617 | |
| | | | |
Net Investment Income | | | 2,359,166 | |
| | | | |
34
| | | | |
Net Realized and Unrealized Gain (Loss): | | | | |
Net realized gain (loss) on: | | | | |
Investments* | | $ | (1,357,790 | ) |
Foreign currencies | | | (164,261 | ) |
Foreign currency exchange contracts | | | (36,493 | ) |
Futures contracts | | | 85,756 | |
Options purchased | | | (77,242 | ) |
Swap contracts | | | (28,245 | ) |
| | | | |
Net realized loss | | | (1,578,275 | ) |
| | | | |
Net change in unrealized appreciation (depreciation) of: | | | | |
Investments | | | 1,948,994 | |
Foreign currencies | | | 879 | |
Foreign currency exchange contracts | | | (1,420 | ) |
Futures contracts | | | (188,595 | ) |
Options purchased | | | (14,829 | ) |
Swap contracts | | | 22,258 | |
| | | | |
Net change in unrealized appreciation (depreciation) | | | 1,767,287 | |
| | | | |
Net Realized and Unrealized Gain | | | 189,012 | |
| | | | |
Net Increase in Net Assets Resulting from Operations | | $ | 2,548,178 | |
| | | | |
*Includes $228,366 related to the General Motors term loan litigation. See Note 13 in
“Notes to financial statements.”
See accompanying notes, which are an integral part of the financial statements.
35
Statements of changes in net assets
Delaware Strategic Income Fund
| | | | | | | | |
| | | Year ended | |
| | | 7/31/19 | | | 7/31/18 | |
Increase (Decrease) in Net Assets from Operations: | | | | | | | | |
Net investment income | | $ | 2,359,166 | | | $ | 3,028,235 | |
Net realized loss | | | (1,578,275 | ) | | | (818,204 | ) |
Net change in unrealized appreciation (depreciation) | | | 1,767,287 | | | | (2,507,082 | ) |
| | | | | | | | |
Net increase (decrease) in net assets resulting from operations | | | 2,548,178 | | | | (297,051 | ) |
| | | | | | | | |
| | |
Dividends and Distributions to Shareholders from: | | | | | | | | |
Distributable earnings*: | | | | | | | | |
Class A | | | (1,094,155 | ) | | | (1,552,628 | ) |
Class C | | | (82,589 | ) | | | (153,928 | ) |
Class R | | | (147,003 | ) | | | (177,132 | ) |
Institutional Class | | | (736,666 | ) | | | (1,242,954 | ) |
| | |
Return of capital: | | | | | | | | |
Class A | | | (273,423 | ) | | | (111,353 | ) |
Class C | | | (24,582 | ) | | | (11,314 | ) |
Class R | | | (6,480 | ) | | | (13,940 | ) |
Institutional Class | | | (144,868 | ) | | | (93,054 | ) |
| | | | | | | | |
| | | (2,509,766 | ) | | | (3,356,303 | ) |
| | | | | | | | |
| | |
Capital Share Transactions: | | | | | | | | |
Proceeds from shares sold: | | | | | | | | |
Class A | | | 1,381,511 | | | | 2,687,402 | |
Class C | | | 413,394 | | | | 676,646 | |
Class R | | | 372,716 | | | | 449,591 | |
Institutional Class | | | 3,688,096 | | | | 17,003,462 | |
| | |
Net asset value of shares issued upon reinvestment of dividends and distributions: | | | | | | | | |
Class A | | | 1,235,675 | | | | 1,524,955 | |
Class C | | | 100,614 | | | | 160,123 | |
Class R | | | 145,343 | | | | 191,072 | |
Institutional Class | | | 890,867 | | | | 1,321,849 | |
| | | | | | | | |
| | | 8,228,216 | | | | 24,015,100 | |
| | | | | | | | |
36
| | | | | | | | |
| | | Year ended | |
| | | 7/31/19 | | | 7/31/18 | |
Capital Share Transactions (continued): | | | | | | | | |
Cost of shares redeemed: | | | | | | | | |
Class A | | $ | (5,672,122 | ) | | $ | (19,738,537 | ) |
Class C | | | (1,182,749 | ) | | | (2,149,123 | ) |
Class R | | | (4,054,866 | ) | | | (1,877,771 | ) |
Institutional Class | | | (16,323,384 | ) | | | (22,370,603 | ) |
| | | | | | | | |
| | | (27,233,121 | ) | | | (46,136,034 | ) |
| | | | | | | | |
Decrease in net assets derived from capital share transactions | | | (19,004,905 | ) | | | (22,120,934 | ) |
| | | | | | | | |
Net Decrease in Net Assets | | | (18,966,493 | ) | | | (25,774,288 | ) |
| | |
Net Assets: | | | | | | | | |
Beginning of year | | | 69,986,539 | | | | 95,760,827 | |
| | | | | | | | |
End of year1 | | $ | 51,020,046 | | | $ | 69,986,539 | |
| | | | | | | | |
| 1 | Net Assets – End of year includes distributions in excess of net investment income of $176,875 in 2018. The Securities and Exchange Commission eliminated the requirement to disclose undistributed (distributions in excess of) net investment income in 2018. |
| * | For the year ended July 31, 2019, the Fund has adopted amendments to RegulationS-X (see Note 14 in “Notes to financial statements”). For the year ended July 31, 2018, the dividends and distributions to shareholders were as follows: |
| | | | | | | | |
| | | Class A | | Class C | | Class R | | Institutional
Class |
Dividends from net investment income | | $(1,552,628) | | $(153,928) | | $(177,132) | | $(1,242,954) |
See accompanying notes, which are an integral part of the financial statements.
37
Financial highlights
Delaware Strategic Income Fund Class A
Selected data for each share of the Fund outstanding throughout each period were as follows:
|
Net asset value, beginning of period |
|
Income (loss) from investment operations: |
Net investment income1 |
Net realized and unrealized gain (loss) |
Total from investment operations |
|
Less dividends and distributions from: |
Net investment income |
Return of capital |
Total dividends and distributions |
|
Net asset value, end of period. |
|
Total return2 |
|
Ratios and supplemental data: |
Net assets, end of period (000 omitted) |
Ratio of expenses to average net assets |
Ratio of expenses to average net assets prior to fees waived |
Ratio of net investment income to average net assets |
Ratio of net investment income to average net assets prior to fees waived |
Portfolio turnover |
| 1 | The average shares outstanding have been applied for per share information. |
| 2 | Total return is based on the change in net asset value of a share during the period and assumes reinvestment of dividends and distributions at net asset value and does not reflect the impact of a sales charge. Total return during all of the periods shown reflects a waiver by the manager. Performance would have been lower had the waiver not been in effect. |
See accompanying notes, which are an integral part of the financial statements.
38
| | | | | | | | | | | | | | | | | | | | | | | | | | | | |
| | | Year ended |
| | | 7/31/19 | | 7/31/18 | | 7/31/17 | | 7/31/16 | | 7/31/15 |
| | | | | | | | $ 8.01 | | | | $ | 8.41 | | | | $ | 8.57 | | | | $ | 8.43 | | | | $ | 8.53 | |
| | | | | |
| | | | | | | | 0.32 | | | | | 0.32 | | | | | 0.24 | | | | | 0.15 | | | | | 0.20 | |
| | | | | | | | 0.08 | | | | | (0.37 | ) | | | | (0.10 | ) | | | | 0.20 | | | | | (0.06 | ) |
| | | | | | | | | | | | | | | | | | | | | | | | | | | | | |
| | | | | | | | 0.40 | | | | | (0.05 | ) | | | | 0.14 | | | | | 0.35 | | | | | 0.14 | |
| | | | | | | | | | | | | | | | | | | | | | | | | | | | | |
| | | | | |
| | | | | | | | (0.27) | | | | | (0.32 | ) | | | | (0.30 | ) | | | | (0.20 | ) | | | | (0.23 | ) |
| | | | | | | | (0.07) | | | | | (0.03 | ) | | | | — | | | | | (0.01 | ) | | | | (0.01 | ) |
| | | | | | | | | | | | | | | | | | | | | | | | | | | | | |
| | | | | | | | (0.34) | | | | | (0.35 | ) | | | | (0.30 | ) | | | | (0.21 | ) | | | | (0.24 | ) |
| | | | | | | | | | | | | | | | | | | | | | | | | | | | | |
| | | | | |
| | | | | | | | $ 8.07 | | | | $ | 8.01 | | | | $ | 8.41 | | | | $ | 8.57 | | | | $ | 8.43 | |
| | | | | | | | | | | | | | | | | | | | | | | | | | | | | |
| | | | | |
| | | | | | | | 5.20% | | | | | (0.62% | ) | | | | 1.73% | | | | | 4.15% | | | | | 1.65% | |
| | | | | |
| | | | | | | | $31,032 | | | | $ | 33,912 | | | | $ | 51,220 | | | | $ | 69,524 | | | | $ | 64,069 | |
| | | | | | | | 0.84% | | | | | 0.88% | | | | | 0.90% | | | | | 0.90% | | | | | 0.91% | |
| | | | | |
| | | | | | | | 1.50% | | | | | 1.35% | | | | | 1.29% | | | | | 1.21% | | | | | 1.21% | |
| | | | | | | | 4.09% | | | | | 3.83% | | | | | 2.84% | | | | | 1.80% | | | | | 2.30% | |
| | | | | |
| | | | | | | | 3.43% | | | | | 3.36% | | | | | 2.45% | | | | | 1.49% | | | | | 2.00% | |
| | | | | | | | 106% | | | | | 125% | | | | | 210% | | | | | 316% | | | | | 313% | |
39
Financial highlights
Delaware Strategic Income Fund Class C
Selected data for each share of the Fund outstanding throughout each period were as follows:
|
Net asset value, beginning of period |
|
Income (loss) from investment operations: |
Net investment income1 |
Net realized and unrealized gain (loss) |
Total from investment operations |
|
Less dividends and distributions from: |
Net investment income |
Return of capital |
Total dividends and distributions |
|
Net asset value, end of period. |
|
Total return2 |
|
Ratios and supplemental data: |
Net assets, end of period (000 omitted) |
Ratio of expenses to average net assets |
Ratio of expenses to average net assets prior to fees waived |
Ratio of net investment income to average net assets |
Ratio of net investment income to average net assets prior to fees waived |
Portfolio turnover |
| 1 | The average shares outstanding have been applied for per share information. |
| 2 | Total return is based on the change in net asset value of a share during the period and assumes reinvestment of dividends and distributions at net asset value and does not reflect the impact of a sales charge. Total return during all of the periods shown reflects a waiver by the manager. Performance would have been lower had the waiver not been in effect. |
See accompanying notes, which are an integral part of the financial statements.
40
| | | | | | | | | | | | | | | | | | | | | | |
| | | | Year ended | |
| | |
| | | | 7/31/19 | | | 7/31/18 | | | 7/31/17 | | | 7/31/16 | | | 7/31/15 | |
| | |
| | | | | $ 8.02 | | | $ | 8.42 | | | $ | 8.58 | | | $ | 8.44 | | | $ | 8.54 | |
| | | | | |
| | | | | 0.26 | | | | 0.25 | | | | 0.18 | | | | 0.09 | | | | 0.13 | |
| | | | | 0.08 | | | | (0.36 | ) | | | (0.10 | ) | | | 0.19 | | | | (0.05 | ) |
| | | | | | | | | | | | | | | | | | | | | | |
| | | | | 0.34 | | | | (0.11 | ) | | | 0.08 | | | | 0.28 | | | | 0.08 | |
| | | | | | | | | | | | | | | | | | | | | | |
| | | | | |
| | | | | (0.21) | | | | (0.26 | ) | | | (0.24 | ) | | | (0.13 | ) | | | (0.17 | ) |
| | | | | (0.07) | | | | (0.03 | ) | | | — | | | | (0.01 | ) | | | (0.01 | ) |
| | | | | | | | | | | | | | | | | | | | | | |
| | | | | (0.28) | | | | (0.29 | ) | | | (0.24 | ) | | | (0.14 | ) | | | (0.18 | ) |
| | | | | | | | | | | | | | | | | | | | | | |
| | | | | |
| | | | | $ 8.08 | | | $ | 8.02 | | | $ | 8.42 | | | $ | 8.58 | | | $ | 8.44 | |
| | | | | | | | | | | | | | | | | | | | | | |
| | | | | |
| | | | | 4.42% | | | | (1.35% | ) | | | 0.97% | | | | 3.37% | | | | 0.89% | |
| | | | | |
| | | | | $ 2,793 | | | $ | 3,450 | | | $ | 4,996 | | | $ | 9,490 | | | $ | 8,375 | |
| | | | | 1.59% | | | | 1.63% | | | | 1.65% | | | | 1.65% | | | | 1.66% | |
| | | | | |
| | | | | 2.25% | | | | 2.10% | | | | 2.04% | | | | 1.96% | | | | 1.96% | |
| | | | | 3.34% | | | | 3.08% | | | | 2.09% | | | | 1.05% | | | | 1.55% | |
| | | | | |
| | | | | 2.68% | | | | 2.61% | | | | 1.70% | | | | 0.74% | | | | 1.25% | |
| | | | | 106% | | | | 125% | | | | 210% | | | | 316% | | | | 313% | |
| | |
41
Financial highlights
Delaware Strategic Income Fund Class R
Selected data for each share of the Fund outstanding throughout each period were as follows:
|
Net asset value, beginning of period |
|
Income (loss) from investment operations: |
Net investment income1 |
Net realized and unrealized gain (loss) |
Total from investment operations |
|
Less dividends and distributions from: |
Net investment income |
Return of capital |
Total dividends and distributions |
|
Net asset value, end of period. |
|
Total return2 |
|
Ratios and supplemental data: |
Net assets, end of period (000 omitted) |
Ratio of expenses to average net assets |
Ratio of expenses to average net assets prior to fees waived |
Ratio of net investment income to average net assets |
Ratio of net investment income to average net assets prior to fees waived |
Portfolio turnover |
| 1 | The average shares outstanding have been applied for per share information. |
| 2 | Total return is based on the change in net asset value of a share during the period and assumes reinvestment of dividends and distributions at net asset value. Total return during all of the periods shown reflects a waiver by the manager. Performance would have been lower had the waiver not been in effect. |
See accompanying notes, which are an integral part of the financial statements.
42
| | | | | | | | | | | | | | | | | | | | |
| Year ended | |
| |
| | | 7/31/19 | | | 7/31/18 | | | 7/31/17 | | | 7/31/16 | | | 7/31/15 | |
| |
| | $ | 8.03 | | | $ | 8.44 | | | $ | 8.60 | | | $ | 8.46 | | | $ | 8.56 | |
| | | | | |
| | | 0.30 | | | | 0.30 | | | | 0.22 | | | | 0.13 | | | | 0.18 | |
| | | 0.09 | | | | (0.38 | ) | | | (0.10 | ) | | | 0.19 | | | | (0.06 | ) |
| | | | | | | | | | | | | | | | | | | | |
| | | 0.39 | | | | (0.08 | ) | | | 0.12 | | | | 0.32 | | | | 0.12 | |
| | | | | | | | | | | | | | | | | | | | |
| | | | | |
| | | (0.25 | ) | | | (0.30 | ) | | | (0.28 | ) | | | (0.17 | ) | | | (0.21 | ) |
| | | (0.07 | ) | | | (0.03 | ) | | | — | | | | (0.01 | ) | | | (0.01 | ) |
| | | | | | | | | | | | | | | | | | | | |
| | | (0.32 | ) | | | (0.33 | ) | | | (0.28 | ) | | | (0.18 | ) | | | (0.22 | ) |
| | | | | | | | | | | | | | | | | | | | |
| | | | | |
| | $ | 8.10 | | | $ | 8.03 | | | $ | 8.44 | | | $ | 8.60 | | | $ | 8.46 | |
| | | | | | | | | | | | | | | | | | | | |
| | | | | |
| | | 5.07% | | | | (0.97% | ) | | | 1.48% | | | | 3.88% | | | | 1.40% | |
| | | | | |
| | $ | 738 | | | $ | 4,259 | | | $ | 5,725 | | | $ | 6,793 | | | $ | 6,863 | |
| | | 1.09% | | | | 1.13% | | | | 1.15% | | | | 1.15% | | | | 1.16% | |
| | | | | |
| | | 1.75% | | | | 1.60% | | | | 1.54% | | | | 1.46% | | | | 1.46% | |
| | | 3.84% | | | | 3.58% | | | | 2.59% | | | | 1.55% | | | | 2.05% | |
| | | | | |
| | | 3.18% | | | | 3.11% | | | | 2.20% | | | | 1.24% | | | | 1.75% | |
| | | 106% | | | | 125% | | | | 210% | | | | 316% | | | | 313% | |
| |
43
Financial highlights
Delaware Strategic Income Fund Institutional Class
Selected data for each share of the Fund outstanding throughout each period were as follows:
|
Net asset value, beginning of period |
|
Income (loss) from investment operations: |
Net investment income1 |
Net realized and unrealized gain (loss) |
Total from investment operations |
|
Less dividends and distributions from: |
Net investment income |
Return of capital |
Total dividends and distributions |
|
Net asset value, end of period |
|
Total return2 |
|
Ratios and supplemental data: |
Net assets, end of period (000 omitted) |
Ratio of expenses to average net assets |
Ratio of expenses to average net assets prior to fees waived |
Ratio of net investment income to average net assets |
Ratio of net investment income to average net assets prior to fees waived |
Portfolio turnover |
1 The average shares outstanding have been applied for per share information.
2 Total return is based on the change in net asset value of a share during the period and assumes reinvestment of dividends and distributions at net asset value. Total return during all of the periods shown reflects a waiver by the manager. Performance would have been lower had the waiver not been in effect.
See accompanying notes, which are an integral part of the financial statements.
44
| | | | | | | | | | | | | | | | | | | | |
| Year ended | |
| |
| | | 7/31/19 | | | 7/31/18 | | | 7/31/17 | | | 7/31/16 | | | 7/31/15 | |
| |
| | $ | 8.02 | | | $ | 8.42 | | | $ | 8.58 | | | $ | 8.44 | | | $ | 8.54 | |
| | | | | |
| | | 0.34 | | | | 0.34 | | | | 0.26 | | | | 0.17 | | | | 0.22 | |
| | | 0.08 | | | | (0.37 | ) | | | (0.10 | ) | | | 0.20 | | | | (0.05 | ) |
| | | | | | | | | | | | | | | | | | | | |
| | | 0.42 | | | | (0.03 | ) | | | 0.16 | | | | 0.37 | | | | 0.17 | |
| | | | | | | | | | | | | | | | | | | | |
| | | | | |
| | | (0.29 | ) | | | (0.34 | ) | | | (0.32 | ) | | | (0.22 | ) | | | (0.26 | ) |
| | | (0.07 | ) | | | (0.03 | ) | | | — | | | | (0.01 | ) | | | (0.01 | ) |
| | | | | | | | | | | | | | | | | | | | |
| | | (0.36 | ) | | | (0.37 | ) | | | (0.32 | ) | | | (0.23 | ) | | | (0.27 | ) |
| | | | | | | | | | | | | | | | | | | | |
| | | | | |
| | $ | 8.08 | | | $ | 8.02 | | | $ | 8.42 | | | $ | 8.58 | | | $ | 8.44 | |
| | | | | | | | | | | | | | | | | | | | |
| | | | | |
| | | 5.47% | | | | (0.36% | ) | | | 1.99% | | | | 4.40% | | | | 1.90% | |
| | | | | |
| | $ | 16,457 | | | $ | 28,366 | | | $ | 33,820 | | | $ | 52,081 | | | $ | 46,155 | |
| | | 0.59% | | | | 0.63% | | | | 0.65% | | | | 0.65% | | | | 0.66% | |
| | | | | |
| | | 1.25% | | | | 1.10% | | | | 1.04% | | | | 0.96% | | | | 0.96% | |
| | | 4.34% | | | | 4.08% | | | | 3.09% | | | | 2.05% | | | | 2.55% | |
| | | | | |
| | | 3.68% | | | | 3.61% | | | | 2.70% | | | | 1.74% | | | | 2.25% | |
| | | 106% | | | | 125% | | | | 210% | | | | 316% | | | | 313% | |
| |
45
| | |
| Notes to financial statements | | |
| Delaware Strategic Income Fund | | July 31, 2019 |
Delaware Group® Government Fund (Trust) is organized as a Delaware statutory trust and offers two series: Delaware Emerging Markets Debt Fund and Delaware Strategic Income Fund. These financial statements and the related notes pertain to Delaware Strategic Income Fund (Fund). The Fund is anopen-end investment company. The Fund is considered diversified under the Investment Company Act of 1940, as amended (1940 Act), and offers Class A, Class C, Class R, and Institutional Class shares. Class A shares are sold with a maximumfront-end sales charge of 4.50%. Class A share purchases of $1,000,000 or more will incur a contingent deferred sales charge (CDSC) instead of afront-end sales charge of 1.00% if redeemed during the first year, and 0.50% during the second year, provided that Delaware Distributors, L.P. (DDLP) paid a financial advisor a commission on the purchase of those shares. Class C shares are sold with a CDSC of 1.00%, which will be incurred if redeemed during the first 12 months. Class R and Institutional Class shares are not subject to a sales charge and are offered for sale exclusively to certain eligible investors.
The investment objective of the Fund is to seek high current income and, secondarily, long-term total return.
1. Significant Accounting Policies
The Fund follows accounting and reporting guidance under Financial Accounting Standards Board (FASB) Accounting Standards Codification Topic 946, Financial Services — Investment Companies. The following accounting policies are in accordance with US generally accepted accounting principles (US GAAP) and are consistently followed by the Fund.
Security Valuation— Equity securities, except those traded on the Nasdaq Stock Market LLC (Nasdaq), are valued at the last quoted sales price as of the time of the regular close of the New York Stock Exchange on the valuation date. Equity securities traded on the Nasdaq are valued in accordance with the Nasdaq Official Closing Price, which may not be the last sales price. If, on a particular day, an equity security does not trade, the mean between the bid and ask prices will be used, which approximates fair value. Equity securities listed on a foreign exchange are normally valued at the last quoted sales price on the valuation date. US government and agency securities are valued at the mean between the bid and ask prices, which approximates fair value.Open-end investment companies are valued at their published net asset value (NAV). Investments in repurchase agreements are generally valued at par, which approximates fair value, each business day. Other debt securities and credit default swap (CDS) contracts are valued based upon valuations provided by an independent pricing service or broker/counterparty and reviewed by management. To the extent current market prices are not available, the pricing service may take into account developments related to the specific security, as well as transactions in comparable securities. Valuations for fixed income securities utilize matrix systems, which reflect such factors as security prices, yields, maturities, and ratings, and are supplemented by dealer and exchange quotations. For asset-backed securities, collateralized mortgage obligations, commercial mortgage securities, and US government agency mortgage securities, pricing vendors utilize matrix pricing which considers prepayment speed, attributes of the collateral, yield or price of bonds of comparable quality, coupon, maturity, and type as well as broker/dealer-supplied prices. Swap prices are derived using daily swap curves and models that incorporate a number of market data factors, such as discounted cash flows, trades, and values of the underlying reference instruments. Foreign currency exchange contracts and foreign cross currency exchange contracts are valued at the mean between the
46
bid and ask prices, which approximates fair value. Interpolated values are derived when the settlement date of the contract is an interim date for which quotations are not available. Futures contracts and options on futures contracts are valued at the daily quoted settlement prices. Exchange-traded options are valued at the last reported sale price or, if no sales are reported, at the mean between the last reported bid and ask prices, which approximates fair value. Generally, other securities and assets for which market quotations are not readily available are valued at fair value as determined in good faith under the direction of the Trust’s Board of Trustees (Board). In determining whether market quotations are readily available or fair valuation will be used, various factors will be taken into consideration, such as market closures or suspension of trading in a security. Restricted securities are valued at fair value using methods approved by the Board.
Federal and Foreign Income Taxes— No provision for federal income taxes has been made as the Fund intends to continue to qualify for federal income tax purposes as a regulated investment company under Subchapter M of the Internal Revenue Code of 1986, as amended, and make the requisite distributions to shareholders. The Fund evaluates tax positions taken or expected to be taken in the course of preparing the Fund’s tax returns to determine whether the tax positions are“more-likely-than-not” of being sustained by the applicable tax authority. Tax positions not deemed to meet the“more-likely-than-not” threshold are recorded as a tax benefit or expense in the current year. Management has analyzed the Fund’s tax positions taken or expected to be taken on the Fund’s federal income tax returns through the year ended July 31, 2019 and for all open tax years (years ended July 31, 2016–July 31, 2018), and has concluded that no provision for federal income tax is required in the Fund’s financial statements. In regard to foreign taxes only, the Fund has open tax years in certain foreign countries in which it invests that may date back to the inception of the Fund. If applicable, the Fund recognizes interest accrued on unrecognized tax benefits in interest expense and penalties in “Other expenses” on the “Statement of operations.” During the year ended July 31, 2019, the Fund did not incur any interest or tax penalties.
Class Accounting— Investment income and common expenses are allocated to the various classes of the Fund on the basis of “settled shares” of each class in relation to the net assets of the Fund. Realized and unrealized gain (loss) on investments are allocated to the various classes of the Fund on the basis of daily net assets of each class. Distribution expenses relating to a specific class are charged directly to that class.
Repurchase Agreements— The Fund may purchase certain US government securities subject to the counterparty’s agreement to repurchase them at an agreed upon date and price. The counterparty will be required on a daily basis to maintain the value of the collateral subject to the agreement at not less than the repurchase price (including accrued interest). The agreements are conditioned upon the collateral being deposited under the Federal Reserve book-entry system with the Fund’s custodian or a third partysub-custodian. In the event of default or bankruptcy by the other party to the agreement, retention of the collateral may be subject to legal proceedings. At July 31, 2019, the Fund held no investments in repurchase agreements.
To Be Announced Trades (TBA)— The Fund may contract to purchase or sell securities for a fixed price at a transaction date beyond the customary settlement period (examples: when issued, delayed delivery, forward commitment, or TBA transactions) consistent with the Fund’s ability to manage its
47
Notes to financial statements
Delaware Strategic Income Fund
1. Significant Accounting Policies (continued)
investment portfolio and meet redemption requests. These transactions involve a commitment by the Fund to purchase or deliver securities for a predetermined price or yield with payment and delivery taking place more than three days in the future, or after a period longer than the customary settlement period for that type of security. No interest will be earned by the Fund on such purchases until the securities are delivered or transaction is completed; however, the market value may change prior to delivery.
Foreign Currency Transactions— Transactions denominated in foreign currencies are recorded at the prevailing exchange rates on the valuation date in accordance with the Fund’s prospectus. The value of all assets and liabilities denominated in foreign currencies is translated daily into US dollars at the exchange rate of such currencies against the US dollar. Transaction gains or losses resulting from changes in exchange rates during the reporting period or upon settlement of the foreign currency transaction are reported in operations for the current period. The Fund generally bifurcates that portion of realized gains and losses on investments in debt securities which is due to changes in foreign exchange rates from that which is due to changes in market prices of debt securities. That portion of gains (losses), attributable to changes in foreign exchange rates, is included on the “Statement of operations” under “Net realized gain (loss) on foreign currencies.” The Fund reports certain foreign currency related transactions as components of realized gains (losses) for financial reporting purposes, whereas such components are treated as ordinary income (loss) for federal income tax purposes.
Use of Estimates— The preparation of financial statements in conformity with US GAAP requires management to make estimates and assumptions that affect the fair value of investments, the reported amounts of assets and liabilities and disclosure of contingent assets and liabilities at the date of the financial statements, and the reported amounts of revenues and expenses during the reporting period. Actual results could differ from those estimates and the differences could be material.
Other— Expenses directly attributable to the Fund are charged directly to the Fund. Other expenses common to various funds within the Delaware Funds® by Macquarie (Delaware Funds) are generally allocated among such funds on the basis of average net assets. Management fees and certain other expenses are paid monthly. Security transactions are recorded on the date the securities are purchased or sold (trade date) for financial reporting purposes. Costs used in calculating realized gains and losses on the sale of investment securities are those of the specific securities sold. Dividend income is recorded on theex-dividend date and interest income is recorded on the accrual basis. Discounts and premiums on debt securities are accreted or amortized to interest income, respectively, over the lives of the respective securities using the effective interest method. Realized gains (losses) on paydowns of asset- and mortgage-backed securities are classified as interest income. Withholding taxes and reclaims on foreign dividends and interest have been recorded in accordance with the Fund’s understanding of the applicable country’s tax rules and rates. The Fund may pay foreign capital gains taxes on certain foreign securities held, which are reported as components of realized losses for financial reporting purposes, whereas such components are treated as ordinary loss for federal income tax purposes. The Fund declares dividends daily from net investment income and pays the dividends monthly and declares and pays distributions from net realized gain on investments, if any, annually. The Fund may distribute more frequently, if necessary for tax purposes. Dividends and distributions, if any, are recorded on theex-dividend date.
48
The Fund receives earnings credits from its custodian when positive cash balances are maintained, which may be used to offset custody fees. The expenses paid under this arrangement are included on the “Statement of operations” under “Custodian fees” with the corresponding expenses offset included under “Less expenses paid indirectly.” For the year ended July 31, 2019, the Fund earned $83 under this arrangement.
The Fund receives earnings credits from its transfer agent when positive cash balances are maintained, which may be used to offset transfer agent fees. If the amount earned is greater than $1, the expenses paid under this arrangement are included on the “Statement of operations” under “Dividend disbursing and transfer agent fees and expenses” with the corresponding expenses offset included under “Less expenses paid indirectly.” For the year ended July 31, 2019, the Fund earned $182 under this arrangement.
2. Investment Management, Administration Agreements, and Other Transactions with Affiliates
In accordance with the terms of its investment management agreement, the Fund pays Delaware Management Company (DMC), a series of Macquarie Investment Management Business Trust, and the investment manager, an annual fee which is calculated daily and paid monthly at the rates of 0.55% on the first $500 million of average daily net assets of the Fund, 0.50% on the next $500 million, 0.45% on the next $1.5 billion, and 0.425% on average daily net assets in excess of $2.5 billion.
DMC has contractually agreed to waive all or a portion, if any, of its management fee and/or pay/ reimburse the Fund to the extent necessary to ensure total annual operating expenses (excluding any distribution and service(12b-1) fees, acquired fund fees and expenses, taxes, interest, short sale dividend and interest expenses, brokerage fees, certain insurance costs, and nonroutine expenses or costs, including, but not limited to, those relating to reorganizations, litigation, conducting shareholder meetings, and liquidations), in order to prevent total annual operating expenses from exceeding 0.59% of the Fund’s average daily net assets. This waiver was in effect from Aug. 1, 2018 through July 31, 2019.* This waiver and reimbursement may only be terminated by agreement of DMC and the Fund. The waiver and reimbursement are accrued daily and received monthly.
Delaware Investments Fund Services Company (DIFSC), an affiliate of DMC, provides fund accounting and financial administrative oversight services to the Fund. For these services, DIFSC’s fees are calculated daily and paid monthly based on the aggregate daily net assets of all funds within the Delaware Funds at the following annual rates: 0.00475% of the first $35 billion; 0.0040% of the next $10 billion; and 0.0025% of aggregate average daily net assets in excess of $45 billion (Total Fee). Each fund in the Delaware Funds pays a minimum of $4,000, which, in aggregate, is subtracted from the Total Fee. Each fund then pays its portion of the remainder of the Total Fee on a relative NAV basis. This amount is included on the “Statement of operations” under “Accounting and administration expenses.” For the year ended July 31, 2019, the Fund was charged $6,169 for these services.
Effective May 30, 2019, DMC may seek investment advice and recommendations from its affiliates: Macquarie Investment Management Europe Limited, Macquarie Investment Management Austria Kapitalanlage AG, and Macquarie Investment Management Global Limited (together, the “AffiliatedSub-Advisors”). The Manager may also permit these AffiliatedSub-Advisors to execute Fund security trades on behalf of the Manager and exercise investment discretion for securities in certain markets where DMC
49
Notes to financial statements
Delaware Strategic Income Fund
2. Investment Management, Administration Agreements, and Other Transactions with Affiliates (continued)
believes it will be beneficial to utilize an AffiliatedSub-Advisor’s specialized market knowledge. Although the AffiliatedSub-Advisors serve assub-advisors, DMC has ultimate responsibility for all investment advisory services. For these services, DMC, not the Fund, pays each AffiliatedSub-Advisor a portion of its investment management fee.
DIFSC is also the transfer agent and dividend disbursing agent of the Fund. For these services, DIFSC’s fees are calculated daily and paid monthly based on the aggregate daily net assets of the retail funds within the Delaware Funds at the following annual rates: 0.014% of the first $20 billion; 0.011% of the next $5 billion; 0.007% of the next $5 billion; 0.005% of the next $20 billion; and 0.0025% of average daily net assets in excess of $50 billion. The fees payable to DIFSC under the shareholder services agreement described on previous page are allocated among all retail funds in the Delaware Funds on a relative NAV basis. This amount is included on the “Statement of operations” under “Dividend disbursing and transfer agent fees and expenses.” For the year ended July 31, 2019, the Fund was charged $5,116 for these services. Pursuant to asub-transfer agency agreement between DIFSC and BNY Mellon Investment Servicing (US) Inc. (BNYMIS), BNYMIS provides certainsub-transfer agency services to the Fund.Sub-transfer agency fees are paid by the Fund and are also included on the “Statement of operations” under “Dividend disbursing and transfer agent fees and expenses.” The fees that are calculated daily and paid as invoices are received on a monthly or quarterly basis.
Pursuant to a distribution agreement and distribution plan, the Fund pays DDLP, the distributor and an affiliate of DMC, annual12b-1 fees of 0.25% of the average daily net assets of the Class A shares, 1.00% of the average daily net assets of the Class C shares, and 0.50% of the average daily net assets of the Class R shares. The Board has adopted a formula for calculating12b-1 fees for the Fund’s Class A shares that went into effect on June 1, 1992. The Fund’s Class A shares are currently subject to a blended12b-1 fee equal to the sum of: (i) 0.10% of the average daily net assets representing shares acquired prior to June 1, 1992, and (ii) 0.25% of the average daily net assets representing shares acquired on or after June 1, 1992. All Class A shareholders currently bear12b-1 fees at the same, blended rate currently 0.25% of the average daily net assets based on the formula described above. This method of calculating Class A12b-1 fees may be discontinued at the sole discretion of the Board. Institutional Class shares do not pay12b-1 fees.
As provided in the investment management agreement, the Fund bears a portion of the cost of certain resources shared with DMC, including the cost of internal personnel of DMC and/or its affiliates that provide legal, tax, and regulatory reporting services to the Fund. For the year ended July 31, 2019, the Fund was charged $5,144 for internal legal, tax, and regulatory reporting services provided by DMC and/or its affiliates’ employees. This amount is included on the “Statement of operations” under “Legal fees.”
For the year ended July 31, 2019, DDLP earned $1,074 for commissions on sales of the Fund’s Class A shares. For the year ended July 31, 2019, DDLP received gross CDSC commissions of $81 and $180 on redemptions of the Fund’s Class A and Class C shares, respectively, and these commissions were entirely used to offset upfront commissions previously paid by DDLP to broker/dealers on sales of those shares.
50
Trustees’ fees include expenses accrued by the Fund for each Trustee’s retainer and meeting fees. Certain officers of DMC, DIFSC, and DDLP are officers and/or Trustees of the Trust. These officers and Trustees are paid no compensation by the Fund.
In addition to the management fees and other expenses of the Fund, the Fund indirectly bears the investment management fees and other expenses of the investment companies (Underlying Funds) in which it invests. The amount of these fees and expenses incurred indirectly by the Fund will vary based upon the expense and fee levels of the Underlying Funds and the number of shares that are owned of the Underlying Funds at different times.
Cross trades for the year ended July 31, 2019 were executed by the Fund pursuant to procedures adopted by the Board designed to ensure compliance with Rule17a-7 under the 1940 Act. Cross trading is the buying or selling of portfolio securities between funds of investment companies, or between a fund of an investment company and another entity, that are or could be considered affiliates by virtue of having a common investment advisor (or affiliated investment advisors), common directors/ trustees and/or common officers. At its regularly scheduled meetings, the Board reviews such transactions for compliance with the procedures adopted by the Board. Pursuant to these procedures, for the year ended July 31, 2019, the Fund engaged in Rule17a-7 securities sales of $461,148, which resulted in a net realized gain of $59,086.
*The aggregate contractual waiver period covering this report is from April 1, 2018, through Nov. 28, 2019.
3. Investments
For the year ended July 31, 2019, the Fund made purchases and sales of investment securities other than short-term investments as follows:
| | | | |
Purchases other than US government securities | | $ | 41,519,192 | |
Purchases of US government securities | | | 18,302,368 | |
Sales other than US government securities | | | 52,548,302 | |
Sales of US government securities | | | 25,508,554 | |
The tax cost of investments includes adjustments to net unrealized appreciation (depreciation) which may not necessarily be final tax cost basis adjustments, but approximate the tax basis unrealized gains and losses that may be realized and distributed to shareholders. At July 31, 2019, the cost and unrealized appreciation (depreciation) of investments and derivatives for federal income tax purposes for the Fund were as follows:
| | | | |
Cost of investments and derivatives | | $ | 50,655,096 | |
| | | | |
Aggregate unrealized appreciation of investments and derivatives | | $ | 1,600,828 | |
Aggregate unrealized depreciation of investments and derivatives | | | (939,417 | ) |
| | | | |
Net unrealized appreciation of investments and derivatives | | $ | 661,411 | |
| | | | |
US GAAP defines fair value as the price that the Fund would receive to sell an asset or pay to transfer a liability in an orderly transaction between market participants at the measurement date under current market conditions. A three-level hierarchy for fair value measurements has been established based upon the transparency of inputs to the valuation of an asset or liability. Inputs may be observable or
51
Notes to financial statements
Delaware Strategic Income Fund
3. Investments (continued)
unobservable and refer broadly to the assumptions that market participants would use in pricing the asset or liability. Observable inputs reflect the assumptions market participants would use in pricing the asset or liability based on market data obtained from sources independent of the reporting entity. Unobservable inputs reflect the reporting entity’s own assumptions about the assumptions that market participants would use in pricing the asset or liability based on the best information available under the circumstances. The Fund’s investment in its entirety is assigned a level based upon the observability of the inputs which are significant to the overall valuation. The three-level hierarchy of inputs is summarized below.
| | |
| Level 1 – | | Inputs are quoted prices in active markets for identical investments. (Examples: equity securities,open-end investment companies, futures contracts, and exchange-traded options contracts) |
| |
| Level 2 – | | Other observable inputs, including, but not limited to: quoted prices for similar assets or liabilities in markets that are active, quoted prices for identical or similar assets or liabilities in markets that are not active, inputs other than quoted prices that are observable for the assets or liabilities (such as interest rates, yield curves, volatilities, prepayment speeds, loss severities, credit risks, and default rates) or other market-corroborated inputs. (Examples: debt securities, government securities, swap contracts, foreign currency exchange contracts, foreign securities utilizing international fair value pricing, broker-quoted securities, and fair valued securities) |
| |
| Level 3 – | | Significant unobservable inputs, including the Fund’s own assumptions used to determine the fair value of investments. (Examples: broker-quoted securities and fair valued securities) |
Level 3 investments are valued using significant unobservable inputs. The Fund may also use an income-based valuation approach in which the anticipated future cash flows of the investment are discounted to calculate fair value. Discounts may also be applied due to the nature or duration of any restrictions on the disposition of the investments. Valuations may also be based upon current market prices of securities that are comparable in coupon, rating, maturity, and industry. The derived value of a Level 3 investment may not represent the value which is received upon disposition and this could impact the results of operations.
52
The following table summarizes the valuation of the Fund’s investments by fair value hierarchy levels as of July 31, 2019:
| | | | | | | | | | | | |
| | | Level 1 | | | Level 2 | | | Total | |
Securities | | | | | | | | | | | | |
Assets: | | | | | | | | | | | | |
Agency, Asset-& Mortgage-Backed Securities | | $ | — | | | $ | 15,238,081 | | | $ | 15,238,081 | |
Corporate Debt | | | — | | | | 29,263,180 | | | | 29,263,180 | |
Municipal Bonds | | | — | | | | 697,068 | | | | 697,068 | |
Foreign Bonds | | | — | | | | 1,693,695 | | | | 1,693,695 | |
Loan Agreements | | | — | | | | 2,825,484 | | | | 2,825,484 | |
US Treasury Obligation | | | — | | | | 71,727 | | | | 71,727 | |
Preferred Stock1 | | | 291,193 | | | | 94,645 | | | | 385,838 | |
Short-Term Investments | | | 1,211,103 | | | | — | | | | 1,211,103 | |
| | | | | | | | | | | | |
Total Value of Securities | | $ | 1,502,296 | | | $ | 49,883,880 | | | $ | 51,386,176 | |
| | | | | | | | | | | | |
Derivatives2 | | | | | | | | | | | | |
Assets: | | | | | | | | | | | | |
Swap Contracts | | | — | | | | 7,030 | | | | 7,030 | |
Liabilities: | | | | | | | | | | | | |
Futures Contracts | | | (76,699 | ) | | | — | | | | (76,699 | ) |
1Security type is valued across multiple levels. Level 1 investments represent exchange-traded investments and Level 2 investments represent investments with observable inputs or matrix-priced investments. The amounts attributed to Level 1 investments and Level 2 investments represent the following percentages of the total value of these security types:
| | | | | | | | | | | | |
| | | Level 1 | | | Level 2 | | | Total | |
| | | |
Preferred Stock | | | 75.47 | % | | | 24.53 | % | | | 100.00 | % |
2Futures contracts and swap contracts are valued at the unrealized appreciation (depreciation) on the instrument at the year end.
During the year ended July 31, 2019, there were no transfers between Level 1 investments, Level 2 investments, or Level 3 investments that had a significant impact to the Fund. The Fund’s policy is to recognize transfers between levels based on fair value at the beginning of the reporting period.
A reconciliation of Level 3 investments is presented when the Fund has a significant amount of Level 3 investments at the beginning, interim, or end of the year in relation to the Fund’s net assets. Management has determined not to provide a reconciliation of Level 3 investments as they were not considered significant to the Fund’s net assets at the beginning, interim, or end of the year. Management has determined not to provide additional disclosure on Level 3 inputs since the Level 3 investments were not considered significant to the Fund’s net assets at the end of the year.
53
Notes to financial statements
Delaware Strategic Income Fund
4. Dividend and Distribution Information
Income and long-term capital gain distributions are determined in accordance with federal income tax regulations, which may differ from US GAAP. Additionally, distributions from net gains on foreign currency transactions and net short-term gains on sales of investment securities are treated as ordinary income for federal income tax purposes. The tax character of dividends and distributions paid during the years ended July 31, 2019 and 2018 were as follows:
| | | | | | | | | | | | |
| | | Year ended | |
| | | 7/31/19 | | | | | | 7/31/18 | |
Ordinary income | | $ | 2,060,413 | | | | | | | $ | 3,126,642 | |
Return of capital | | | 449,353 | | | | | | | | 229,661 | |
| | | | | | | | | | | | |
Total | | $ | 2,509,766 | | | | | | | $ | 3,356,303 | |
| | | | | | | | | | | | |
5. Components of Net Assets on a Tax Basis
As of July 31, 2019, the components of net assets on a tax basis were as follows:
| | | | |
Shares of beneficial interest | | $ | 56,069,127 | |
Distributions payable | | | (47,965 | ) |
Capital loss carryforwards | | | (5,648,151 | ) |
Qualified late year loss deferrals | | | (14,376 | ) |
Unrealized appreciation of investments, foreign currencies and derivatives | | | 661,411 | |
| | | | |
Net assets | | $ | 51,020,046 | |
| | | | |
The differences between book basis and tax basis components of net assets are primarily attributable to tax deferral of losses on wash sales,mark-to-market of futures contracts, swap accrual basis adjustment, tax treatment of market discount and premium on debt instruments, andmark-to-market of CDS contracts.
Qualified late year currency and specified losses represent losses realized from Nov. 1, 2018 through July 31, 2019, that, in accordance with federal income tax regulations, the Fund has elected to defer and treat as having arisen in the following fiscal year.
Under the Regulated Investment Company Modernization Act of 2010 (Act), net capital losses recognized for tax years beginning after Dec. 22, 2010 may be carried forward indefinitely, and their character is retained as short-term and/or long-term losses. At July 31, 2019, capital loss carryforwards available to offset future realized capital gains as follows:
| | | | | | | | | | |
| Loss carryforward character | |
| Short-term | | | Long-term | | | Total | |
| | |
| $ | 2,710,786 | | | $ | 2,937,365 | | | $ | 5,648,151 | |
54
6. Capital Shares
Transactions in capital shares were as follows:
| | | | | | | | | | | | |
| | | Year ended | |
| | | 7/31/19 | | | | | | 7/31/18 | |
Shares sold: | | | | | | | | | | | | |
Class A | | | 175,185 | | | | | | | | 328,331 | |
Class C | | | 53,356 | | | | | | | | 81,220 | |
Class R | | | 47,249 | | | | | | | | 54,141 | |
Institutional Class | | | 466,438 | | | | | | | | 2,037,509 | |
| | | |
Shares issued upon reinvestment of dividends and distributions: | | | | | | | | | | | | |
Class A | | | 157,085 | | | | | | | | 185,008 | |
Class C | | | 12,787 | | | | | | | | 19,434 | |
Class R | | | 18,474 | | | | | | | | 23,367 | |
Institutional Class | | | 113,096 | | | | | | | | 160,626 | |
| | | | | | | | | | | | |
| | | 1,043,670 | | | | | | | | 2,889,636 | |
| | | | | | | | | | | | |
| | | |
Shares redeemed: | | | | | | | | | | | | |
Class A | | | (721,145 | ) | | | | | | | (2,369,305 | ) |
Class C | | | (150,652 | ) | | | | | | | (263,863 | ) |
Class R | | | (504,690 | ) | | | | | | | (225,963 | ) |
Institutional Class | | | (2,080,617 | ) | | | | | | | (2,676,815 | ) |
| | | | | | | | | | | | |
| | | (3,457,104 | ) | | | | | | | (5,535,946 | ) |
| | | | | | | | | | | | |
Net decrease | | | (2,413,434 | ) | | | | | | | (2,646,310 | ) |
| | | | | | | | | | | | |
Certain shareholders may exchange shares of one class for shares of another class in the same Fund. These exchange transactions are included as subscriptions and redemptions in the tables on the previous page and on the “Statements of changes in net assets.” For the year ended July 31, 2019 and 2018, the Fund had the following exchange transactions.
| | | | | | | | | | | | | | | | | | | | |
| | | Exchange Redemptions | | | Exchange Subscriptions | | | | |
| | | Class A
Shares | | | Class C
Shares | | | Class A Shares | | | Institutional
Class Shares | | | Value | |
Year ended 7/31/19 | | | 1,162 | | | | 1,583 | | | | 1,584 | | | | 1,160 | | | $ | 21,687 | |
Year ended 7/31/18 | | | 3,757 | | | | 24,406 | | | | 24,485 | | | | 3,756 | | | | 226,490 | |
7. Line of Credit
The Fund, along with certain other funds in the Delaware Funds (Participants), was a participant in a revolving line of credit intended to be used for temporary or emergency purposes as an additional source of liquidity to fund redemptions of investor shares. The revolving line of credit available was reduced
55
Notes to financial statements
Delaware Strategic Income Fund
7. Line of Credit (continued)
from $155,000,000 to $130,000,0000 on Sept. 6, 2018. Under the agreement, the Participants were charged an annual commitment fee of 0.15%, which was allocated across the Participants based on a weighted average of the respective net assets of each Participant. The Participants were permitted to borrow up to a maximum ofone-third of their net assets under the agreement. Each Participant was individually, and not jointly, liable for its particular advances, if any, under the line of credit. The line of credit available under the agreement expired on Nov. 5, 2018.
On Nov. 5, 2018, the Participants entered into an amendment to the agreement for a $190,000,000 revolving line of credit. The revolving line of credit available was increased to $220,000,000 on Nov. 29, 2018. The revolving line of credit is to be used as described above and operates in substantially the same manner as the original agreement. The line of credit available under the agreement expires on Nov. 4, 2019.
The Fund had no amounts outstanding as of July 31, 2019, or at any time during the year then ended.
8. Derivatives
US GAAP requires disclosures that enable investors to understand: 1) how and why an entity uses derivatives; 2) how they are accounted for; and 3) how they affect an entity’s results of operations and financial position.
Foreign Currency Exchange Contracts— The Fund may enter into foreign currency exchange contracts and foreign cross currency exchange contracts as a way of managing foreign exchange rate risk. The Fund may enter into these contracts to fix the US dollar value of a security that it has agreed to buy or sell for the period between the date the trade was entered into and the date the security is delivered and paid for. The Fund may also use these contracts to hedge the US dollar value of securities it already owns that are denominated in foreign currencies. In addition, the Fund may enter into these contracts to facilitate or expedite the settlement of portfolio transactions. The change in value is recorded as an unrealized gain or loss. When the contract is closed, a realized gain or loss is recorded equal to the difference between the value of the contract at the time it was opened and the value at the time it was closed.
The use of foreign currency exchange contracts and foreign cross currency exchange contracts does not eliminate fluctuations in the underlying prices of the securities, but does establish a rate of exchange that can be achieved in the future. Although foreign currency exchange contracts and foreign cross currency exchange contracts limit the risk of loss due to an unfavorable change in the value of the hedged currency, they also limit any potential gain that might result should the value of the currency change favorably. In addition, the Fund could be exposed to risks if the counterparties to the contracts are unable to meet the terms of their contracts. The Fund’s maximum risk of loss from counterparty credit risk is the value of its currency exchanged with the counterparty. The risk is generally mitigated by having a netting arrangement between the Fund and the counterparty and by the posting of collateral by the counterparty to the Fund to cover the Fund’s exposure to the counterparty. No foreign currency exchange contracts or foreign cross currency exchange contracts were outstanding at July 31, 2019.
56
During the year ended July 31, 2019, the Fund used foreign currency exchange contracts to hedge the US dollar value of securities it already owned that were denominated in foreign currencies.
Futures Contracts— A futures contract is an agreement in which the writer (or seller) of the contract agrees to deliver to the buyer an amount of cash or securities equal to a specific dollar amount times the difference between the value of a specific security or index at the close of the last trading day of the contract and the price at which the agreement is made. The Fund may use futures contracts in the normal course of pursuing its investment objective. The Fund may invest in futures contracts to hedge its existing portfolio securities against fluctuations in value caused by changes in interest rates or market conditions. Upon entering into a futures contract, the Fund deposits cash or pledges US government securities to a broker, equal to the minimum “initial margin” requirements of the exchange on which the contract is traded. Subsequent payments are received from the broker or paid to the broker each day, based on the daily fluctuation in the market value of the contract. These receipts or payments are known as “variation margin” and are recorded daily by the Fund as unrealized gains or losses until the contracts are closed. When the contracts are closed, the Fund records a realized gain or loss equal to the difference between the value of the contract at the time it was opened and the value at the time it was closed. Risks of entering into futures contracts include potential imperfect correlation between the futures contracts and the underlying securities and the possibility of an illiquid secondary market for these instruments. When investing in futures, there is reduced counterparty credit risk to the Fund because futures are exchange-traded and the exchange’s clearinghouse, as counterparty to all exchange-traded futures, guarantees against default. At July 31, 2019, the Fund posted $13,673 in cash as collateral for open futures contracts, which is presented as “Cash collateral due from brokers” on the “Statement of assets and liabilities.”
During the year ended July 31, 2019, the Fund used futures contracts to hedge the Fund’s existing portfolio securities against fluctuations in value caused by changes in interest rates or market conditions, and to facilitate to facilitate investments in portfolio securities.
Options Contracts— The Fund may enter into options contracts in the normal course of pursuing its investment objective. The Fund may buy or write options contracts for any number of reasons, including without limitation: to manage the Fund’s exposure to changes in securities prices caused by interest rates or market conditions and foreign currencies; as an efficient means of adjusting the Fund’s overall exposure to certain markets; to protect the value of portfolio securities; and as a cash management tool. The Fund may buy or write call or put options on securities, futures, swaps, swaptions, financial indices, and foreign currencies. When the Fund buys an option, a premium is paid and an asset is recorded and adjusted on a daily basis to reflect the current market value of the option purchased. When the Fund writes an option, a premium is received and a liability is recorded and adjusted on a daily basis to reflect the current market value of the option written. Premiums received from writing options that expire unexercised are treated by the Fund on the expiration date as realized gains. The difference between the premium received and the amount paid on effecting a closing purchase transaction, including brokerage commissions, is treated as realized gain or loss. If a call option is exercised, the premium is added to the proceeds from the sale of the underlying security in determining whether the Fund has a realized gain or loss. If a put option is exercised, the premium reduces the cost basis of the securities purchased by the Fund. The Fund, as writer of an option, bears the market risk of an unfavorable change in the price of the security underlying the written option. When writing options, the Fund is subject to minimal counterparty
57
Notes to financial statements
Delaware Strategic Income Fund
8. Derivatives (continued)
risk because the counterparty is only obligated to pay premiums and does not bear the market risk of an unfavorable market change. No options contracts were outstanding at July 31, 2019.
During the year ended July 31, 2019, the Fund used options contracts to manage the Fund’s exposure to changes in securities prices caused by interest rates or market conditions, to manage the Fund’s exposure to changes in foreign currencies, to adjust the Fund’s overall exposure to certain markets, and to protect the value of portfolio securities.
Swap Contracts— The Fund may enter into CDS contracts in the normal course of pursuing its investment objective. The Fund may enter into CDS contracts in order to hedge against a credit event, to enhance total return or to gain exposure to certain securities or markets. The Fund will not be permitted to enter into any swap transactions unless, at the time of entering into such transactions, the unsecured long-term debt of the actual counterparty, combined with any credit enhancements, is rated at leastBBB- by Standard & Poor’s Financial Services LLC (S&P) or Baa3 by Moody’s Investors Service, Inc. (Moody’s) or is determined to be of equivalent quality by DMC.
Credit Default Swaps. A CDS contract is a risk-transfer instrument through which one party (purchaser of protection) transfers to another party (seller of protection) the financial risk of a credit event (as defined in the CDS agreement), as it relates to a particular reference security or basket of securities (such as an index). In exchange for the protection offered by the seller of protection, the purchaser of protection agrees to pay the seller of protection a periodic amount at a stated rate that is applied to the notional amount of the CDS contract. In addition, an upfront payment may be made or received by the Fund in connection with an unwinding or assignment of a CDS contract. Upon the occurrence of a credit event, the seller of protection would pay the par (or other agreed-upon) value of the reference security (or basket of securities) to the counterparty. Credit events generally include, among others, bankruptcy, failure to pay, and obligation default.
During the year ended July 31, 2019, the Fund entered into CDS contracts as a purchaser and seller of protection, as a hedge against credit events. Periodic payments (receipts) on such contracts are accrued daily and recorded as unrealized losses (gains) on swap contracts. Upon payment (receipt), such amounts are recorded as realized losses (gains) on swap contracts. Upfront payments made or received in connection with CDS contracts are amortized over the expected life of the CDS contracts as unrealized losses (gains) on swap contracts. The change in value of CDS contracts is recorded daily as unrealized appreciation or depreciation. A realized gain or loss is recorded upon a credit event (as defined in the CDS agreement) or the maturity or termination of the agreement. Initial margin and variation margin are posted to central counterparties for centrally cleared CDS basket trades, as determined by the applicable central counterparty.
As disclosed in the footnotes to the “Schedule of investments” at July 31, 2019, the notional amount of the protection sold was $460,000, which reflects the maximum potential amount the Fund would have been required to make as a seller of credit protection if a credit event had occurred. In addition to serving as the source of the current value of the securities, the quoted market prices and resulting market values for credit default swap agreements on securities and credit indices serve as an indicator of the current status of the payment/performance risk and represent the likelihood of an expected liability (or profit) for the credit derivative if the swap agreement has been closed/sold as of the period end.
58
Increasing market values, in absolute terms when compared to the notional amount of the swap, represent a deterioration of the reference entity’s credit soundness and a greater likelihood of risk of default or other credit event occurring as defined under the terms of the agreement. At July 31, 2019, there were no recourse provisions with third parties to recover any amounts paid under the credit derivative agreement (including any purchased credit protection) nor was any collateral held by the Fund and other third parties which the Fund can obtain in the occurrence of a credit event. At July 31, 2019, net unrealized appreciation of the protection sold was $7,030.
CDS contracts may involve greater risks than if the Fund had invested in the reference obligation directly. CDS contracts are subject to general market risk, liquidity risk, counterparty risk, and credit risk. The Fund’s maximum risk of loss from counterparty credit risk, either as the seller of protection or the buyer of protection, is the fair value of the contract. This risk is mitigated by (1) for bilateral swap contracts, having a netting arrangement between the Fund and the counterparty and by the posting of collateral by the counterparty to the Fund to cover the Fund’s exposure to the counterparty, and (2) for cleared swaps, trading these instruments through a central counterparty.
During the year ended July 31, 2019, the Fund used CDS contracts to hedge against credit events.
Swaps Generally. The value of open swaps may differ from that which would be realized in the event the Fund terminated its position in the contract on a given day. Risks of entering into these contracts include the potential inability of the counterparty to meet the terms of the contracts. This type of risk is generally limited to the amount of favorable movement in the value of the underlying security, instrument, or basket of instruments, if any, at the day of default. Risks also arise from potential losses from adverse market movements and such losses could exceed the unrealized amounts shown on the “Schedule of investments.” For centrally cleared swaps, payments are received from the broker or paid to the broker each day, based on the daily fluctuation in the market value of the contract. These receipts or payments are known as “variation margin” and are recorded by the Fund as unrealized gains or losses until the contracts are closed. When the contracts are closed, the Fund records a realized gain or loss equal to the difference between the value of the contract at the time it was opened and the value at the time it was closed.
Fair values of derivative instruments as of July 31, 2019 was as follows:
| | | | | | | | |
| | | Asset Derivatives Fair Value |
| | | | |
Statement of Assets and Liabilities Location | | Currency
Contracts | | Interest Rate
Contracts | | Credit Contracts | | Total |
Unrealized appreciation on credit default swap contracts | | $— | | $— | | $7,030 | | $7,030 |
59
Notes to financial statements
Delaware Strategic Income Fund
8. Derivatives (continued)
Fair values of derivative instruments as of July 31, 2019 was as follows:
| | | | | | | | |
| | | Liability Derivatives Fair Value | | |
| | | | |
Statement of Assets and Liabilities Location | | Currency Contracts | | Interest Rate Contracts | | Credit Contracts | | Total |
Variation margin due to broker on futures contracts* | | $— | | $76,699 | | $— | | $76,699 |
*Includes cumulative appreciation (depreciation) of futures contracts from the date the contracts were opened through July 31, 2019. Only current day variation margin is reported on the Fund’s “Statement of assets and liabilities.”
The effect of derivative instruments on the “Statement of operations” for the year ended July 31, 2019 was as follows:
| | | | | | | | | | | | | | | | | | | | |
| | | Net Realized Gain (Loss) on: | |
| | | Foreign Currency Exchange Contracts | | | Futures Contracts | | | Options Purchased | | | Swap Contracts | | | Total | |
Currency contracts | | $ | (36,493 | ) | | $ | — | | | $ | (71,456 | ) | | $ | — | | | $ | (107,949 | ) |
Interest rate contracts | | | — | | | | 85,756 | | | | (4,210 | ) | | | | | | | 81,546 | |
Equity contracts | | | — | | | | | | | | (1,576 | ) | | | — | | | | (1,576 | ) |
Credit contracts | | | — | | | | — | | | | — | | | | (28,245 | ) | | | (28,245 | ) |
| | | | | | | | | | | | | | | | | | | | |
Total | | $ | (36,493 | ) | | $ | 85,756 | | | $ | (77,242 | ) | | $ | (28,245 | ) | | $ | (56,224 | ) |
| | | | | | | | | | | | | | | | | | | | |
| |
| | | Net Change in Unrealized Appreciation (Depreciation) of: | |
| | | Foreign Currency Exchange Contracts | | | Futures Contracts | | | Options Purchased | | | Swap Contracts | | | Total | |
Currency contracts | | $ | (1,420 | ) | | $ | — | | | $ | (14,829 | ) | | $ | — | | | $ | (16,249 | ) |
Interest rate contracts | | | — | | | | (188,595 | ) | | | — | | | | — | | | | (188,595 | ) |
Credit contracts | | | — | | | | — | | | | — | | | | 22,258 | | | | 22,258 | |
| | | | | | | | | | | | | | | | | | | | |
Total | | $ | (1,420 | ) | | $ | (188,595 | ) | | $ | (14,829 | ) | | $ | 22,258 | | | $ | (182,586 | ) |
| | | | | | | | | | | | | | | | | | | | |
Derivatives Generally.The table below summarizes the average balance of derivative holdings by the Fund during the year ended July 31, 2019:
| | | | | | | | | | | | | | | | |
| | | | | | Long Derivative Volume | | | | | | Short Derivative Volume | |
Foreign currency exchange contracts (average cost) | | | USD | | | | 403,269 | | | | USD | | | | 12,994 | |
Futures contracts (average notional value) | | | | | | | 1,427,481 | | | | | | | | 5,149,467 | |
Options contracts (average value) | | | | | | | 6,768 | | | | | | | | — | |
CDS contracts (average notional value)* | | | | | | | 1,733,984 | | | | | | | | 458,175 | |
*Long represents buying protection and short represents selling protection.
60
9. Offsetting
The Fund entered into an International Swaps and Derivatives Association, Inc. Master Agreement (ISDA Master Agreement) or a similar agreement with certain of its derivative contract counterparties in order to better define its contractual rights and to secure rights that will help the Fund mitigate its counterparty risk. An ISDA Master Agreement is a bilateral agreement between the Fund and a counterparty that governsover-the-counter (OTC) derivatives and foreign exchange contracts and typically contains, among other things, collateral posting items and netting provisions in the event of a default and/or termination event. Under an ISDA Master Agreement, the Fund may, under certain circumstances, offset with the counterparty certain derivative financial instruments’ payables and/or receivables with collateral held and/or posted and create one single net payment. The provisions of the ISDA Master Agreement typically permit a single net payment in the event of default(close-out), including the bankruptcy or insolvency of the counterparty. However, bankruptcy or insolvency laws of a particular jurisdiction may impose restrictions on or prohibitions against the right of offset in bankruptcy, insolvency, or other events.
For financial reporting purposes, the Fund does not offset derivative assets and derivative liabilities that are subject to netting arrangements on the “Statement of assets and liabilities.”
At July 31, 2019, the Fund had the following assets and liabilities subject to offsetting provisions:
Offsetting of Financial Assets and Liabilities and Derivative Assets and Liabilities
| | | | | | |
| Counterparty | | Gross Value of Derivative Asset | | Gross Value of Derivative Liability | | Net Position |
Morgan Stanley Capital Services LLC | | $7,030 | | $— | | $7,030 |
Offsetting of Financial Assets and Liabilities and Derivative Assets and Liabilities (continued)
| | | | | | | | | | | | |
| Counterparty | | Net Position | | Fair Value of Non-Cash Collateral Received | | Cash Collateral Received | | Fair Value of Non-Cash Collateral Pledged | | Cash Collateral Pledged | | Net Exposure(a) |
Morgan Stanley Capital Services LLC | | $7,030 | | $— | | $— | | $— | | $— | | $7,030 |
10. Securities Lending
The Fund, along with other funds in the Delaware Funds, may lend its securities pursuant to a security lending agreement (Lending Agreement) with The Bank of New York Mellon (BNY Mellon). At the time a security is loaned, the borrower must post collateral equal to the required percentage of the market value of the loaned security, including any accrued interest. The required percentage is: (1) 102% with respect to US securities and foreign securities that are denominated and payable in US dollars; and (2) 105% with respect to foreign securities. With respect to each loan, if on any business day, the aggregate market value of securities collateral plus cash collateral held is less than the aggregate market value of the securities which are the subject of such loan, the borrower will be notified to provide additional collateral by the end of the following business day, which, together with the collateral already held, will be not less than the applicable initial collateral requirements for such security loan. If the aggregate
61
Notes to financial statements
Delaware Strategic Income Fund
10. Securities Lending (continued)
market value of securities collateral and cash collateral held with respect to a security loan exceeds the applicable initial collateral requirement, upon request of the borrower, BNY Mellon must return enough collateral to the borrower by the end of the following business day to reduce the value of the remaining collateral to the applicable initial collateral requirement for such security loan. As a result of the foregoing, the value of the collateral held with respect to a loaned security on any particular day may be more or less than the value of the security on loan. The collateral percentage with respect to the market value of the loaned security is determined by the security lending agent.
Cash collateral received by each fund of the Trust is generally invested in a series of individual separate accounts, each corresponding to a fund. The investment guidelines permit each separate account to hold certain securities that would be considered eligible securities for a money market fund. Cash collateral received is generally invested in government securities; certain obligations issued by government sponsored enterprises; repurchase agreements collateralized by US Treasury securities; obligations issued by the central government of any Organization for Economic Cooperation and Development (OECD) country or its agencies, instrumentalities, or establishments; obligations of supranational organizations; commercial paper, notes, bonds, and other debt obligations; certificates of deposit, time deposits, and other bank obligations; and asset-backed securities. A fund can also accept US government securities and letters of credit(non-cash collateral) in connection with securities loans.
In the event of default or bankruptcy by the lending agent, realization and/or retention of the collateral may be subject to legal proceedings. In the event the borrower fails to return loaned securities and the collateral received is insufficient to cover the value of the loaned securities and provided such collateral shortfall is not the result of investment losses, the lending agent has agreed to pay the amount of the shortfall to the Fund or, at the discretion of the lending agent, replace the loaned securities. The Fund continues to record dividends or interest, as applicable, on the securities loaned and is subject to changes in value of the securities loaned that may occur during the term of the loan. The Fund has the right under the Lending Agreement to recover the securities from the borrower on demand. With respect to security loans collateralized bynon-cash collateral, the Fund receives loan premiums paid by the borrower. With respect to security loans collateralized by cash collateral, the earnings from the collateral investments are shared among the Fund, the security lending agent, and the borrower. The Fund records security lending income net of allocations to the security lending agent and the borrower.
The Fund may incur investment losses as a result of investing securities lending collateral. This could occur if an investment in the collateral investment account defaulted or became impaired. Under those circumstances, the value of the Fund’s cash collateral account may be less than the amount the Fund would be required to return to the borrowers of the securities and the Fund would be required to make up for this shortfall.
During the year ended July 31, 2019, the Fund had no securities out on loan.
11. Credit and Market Risk
Some countries in which the Fund may invest require governmental approval for the repatriation of investment income, capital, or the proceeds of sales of securities by foreign investors. In addition, if there
62
is deterioration in a country’s balance of payments or for other reasons, a country may impose temporary restrictions on foreign capital remittances abroad.
The securities exchanges of certain foreign markets are substantially smaller, less liquid, and more volatile than the major securities markets in the US. Consequently, acquisition and disposition of securities by the Fund may be inhibited. In addition, a significant portion of the aggregate market value of securities listed on the major securities exchanges in emerging markets is held by a smaller number of investors. This may limit the number of shares available for acquisition or disposition by the Fund.
The Fund invests a portion of its assets in high yield fixed income securities, which are securities rated lower thanBBB- by S&P and lower than Baa3 by Moody’s, or similarly rated by another nationally recognized statistical rating organization. Investments in these higher yielding securities are generally accompanied by a greater degree of credit risk than higher rated securities. Additionally, lower rated securities may be more susceptible to adverse economic and competitive industry conditions than investment grade securities.
The Fund invests in fixed income securities whose value is derived from an underlying pool of mortgages or consumer loans. The value of these securities is sensitive to changes in economic conditions, including delinquencies and/or defaults, and may be adversely affected by shifts in the market’s perception of the issuers and changes in interest rates. Investors receive principal and interest payments as the underlying mortgages and consumer loans are paid back. Some of these securities are collateralized mortgage obligations (CMOs). CMOs are debt securities issued by US government agencies or by financial institutions and other mortgage lenders, which are collateralized by a pool of mortgages held under an indenture. Prepayment of mortgages may shorten the stated maturity of the obligations and can result in a loss of premium, if any has been paid. Certain of these securities may be stripped (securities which provide only the principal or interest feature of the underlying security). The yield to maturity on an interest-only CMO is extremely sensitive not only to changes in prevailing interest rates, but also to the rate of principal payments (including prepayments) on the related underlying mortgage assets. A rapid rate of principal payments may have a material adverse effect on the Fund’s yield to maturity. If the underlying mortgage assets experience greater than anticipated prepayments of principal, the Fund may fail to fully recoup its initial investment in these securities even if the securities are rated in the highest rating categories.
The Fund invests in certain obligations that may have liquidity protection designed to ensure that the receipt of payments due on the underlying security is timely. Such protection may be provided through guarantees, insurance policies, or letters of credit obtained by the issuer or sponsor through third parties, through various means of structuring the transaction or through a combination of such approaches. The Fund will not pay any additional fees for such credit support, although the existence of credit support may increase the price of the security.
The Fund invests in bank loans and other securities that may subject it to direct indebtedness risk, the risk that the Fund will not receive payment of principal, interest, and other amounts due in connection with these investments and will depend primarily on the financial condition of the borrower. Loans that are fully secured offer the Fund more protection than unsecured loans in the event of nonpayment of scheduled interest or principal, although there is no assurance that the liquidation of collateral from a secured loan would satisfy the corporate borrower’s obligation, or that the collateral can be liquidated.
63
Notes to financial statements
Delaware Strategic Income Fund
11. Credit and Market Risk (continued)
Some loans or claims may be in default at the time of purchase. Certain of the loans and the other direct indebtedness acquired by the Fund may involve revolving credit facilities or other standby financing commitments that obligate the Fund to pay additional cash on a certain date or on demand. These commitments may require the Fund to increase its investment in a company at a time when the Fund might not otherwise decide to do so (including at a time when the company’s financial condition makes it unlikely that such amounts will be repaid). To the extent that the Fund is committed to advance additional funds, it will at all times hold and maintain cash or other high grade debt obligations in an amount sufficient to meet such commitments. When a loan agreement is purchased, the Fund may pay an assignment fee. On an ongoing basis, the Fund may receive a commitment fee based on the undrawn portion of the underlying line of credit portion of a loan agreement. Prepayment penalty fees are received upon the prepayment of a loan agreement by the borrower. Prepayment penalty, facility, commitment, consent, and amendment fees are recorded to income as earned or paid.
As the Fund may be required to rely upon another lending institution to collect and pass on to the Fund amounts payable with respect to the loan and to enforce the Fund’s rights under the loan and other direct indebtedness, an insolvency, bankruptcy, or reorganization of the lending institution may delay or prevent the Fund from receiving such amounts. The highly leveraged nature of many loans may make them especially vulnerable to adverse changes in economic or market conditions. Investments in such loans and other direct indebtedness may involve additional risk to the Fund.
When interest rates rise, fixed income securities (i.e. debt obligations) generally will decline in value. These declines in value are greater for fixed income securities with longer maturities or durations.
The Fund may invest up to 15% of its net assets in illiquid securities, which may include securities with contractual restrictions on resale, securities exempt from registration under Rule 144A promulgated under the Securities Act of 1933, as amended, and other securities which may not be readily marketable. The relative illiquidity of these securities may impair the Fund from disposing of them in a timely manner and at a fair price when it is necessary or desirable to do so. While maintaining oversight, the Board has delegated to DMC, theday-to-day functions of determining whether individual securities are liquid for purposes of the Fund’s limitation on investments in illiquid securities. Securities eligible for resale pursuant to Rule 144A, which are determined to be liquid, are not subject to the Fund’s 15% limit on investments in illiquid securities. Rule 144A securities have been identified on the “Schedule of investments.” Restricted securities are valued pursuant to security valuation procedures described in Note 1.
12. Contractual Obligations
The Fund enters into contracts in the normal course of business that contain a variety of indemnifications. The Fund’s maximum exposure under these arrangements is unknown. However, the Fund has not had prior claims or losses pursuant to these contracts. Management has reviewed the Fund’s existing contracts and expects the risk of loss to be remote.
64
13. General Motors Term Loan Litigation
The Fund received notice of a litigation proceeding related to a General Motors Corporation (G.M.) term loan participation previously held by the Fund in 2009. Because it was believed that the Fund was a secured creditor, the Fund received the full principal on the loans in 2009 after the G.M. bankruptcy. However, based upon a US Court of Appeals ruling, the Motors Liquidation Company Avoidance Action Trust sought to recover such amounts arguing that the Fund was an unsecured creditor and, as an unsecured creditor, the Fund should not have received payment in full. Based on available information related to the litigation and the Fund’s potential exposure, the Fund previously recorded a contingent liability of $326,237 and an asset of $97,871 based on the potential recoveries by the estate that resulted in a net decrease in the Fund’s NAV to reflect this potential recovery.
During the period, the plaintiff and the term loan lenders, which included the Fund, reached an agreement in principle that resolved the disputes. The parties agreed to terms of a settlement agreement and presented the settlement agreement to the court for approval at a hearing on June 12, 2019. The court approved the settlement documentation and dismissed the case on July 2, 2019. The court’s approval of the settlement and dismissal of the case with prejudice became final on July 16, 2019.
The contingent liability and other asset were removed in connection with the case being settled, which resulted in the Fund recognizing a gain in the amount of the liability reversed.
14. Recent Accounting Pronouncements
In March 2017, the FASB issued an Accounting Standards Update (ASU), ASU2017-08, Receivables —Nonrefundable Fees and Other Costs (Subtopic310-20), Premium Amortization on Purchased Callable Debt Securities which amends the amortization period for certain callable debt securities purchased at a premium, shortening such period to the earliest call date. The ASU2017-08 does not require any accounting change for debt securities held at a discount; the discount continues to be amortized to maturity. The ASU2017-08 is effective for fiscal years, and interim periods within those fiscal years, beginning after Dec. 15, 2018. At this time, management is evaluating the implications of these changes on the financial statements.
In August 2018, the FASB issued an ASU2018-13, which changes certain fair value measurement disclosure requirements. The ASU2018-13, in addition to other modifications and additions, removes the requirement to disclose the amount and reasons for transfers between Level 1 and Level 2 of the fair value hierarchy, the policy for the timing of transfers between levels and the valuation process for Level 3 fair value measurements. The ASU2018-13 is effective for fiscal years, and interim periods within those fiscal years, beginning after Dec. 15, 2019. At this time, management is evaluating the implications of these changes on the financial statements.
In August 2018, the Securities and Exchange Commission (SEC) adopted amendments to RegulationS-X to update and simplify the disclosure requirements for registered investment companies by eliminating requirements that are redundant or duplicative of US GAAP requirements or other SEC disclosure requirements. The new amendments require the presentation of the total, rather than the components, of distributable earnings on the “Statement of assets and liabilities” and the total, rather than the components, of dividends from net investment income and distributions from net realized gains on the “Statements of changes in net assets.” The amendments also removed the requirement for the
65
Notes to financial statements
Delaware Strategic Income Fund
14. Recent Accounting Pronouncements (continued)
parenthetical disclosure of undistributed net investment income on the “Statements of changes in net assets” and certain tax adjustments that were reflected in the “Notes to financial statements.” All of these have been reflected in the Fund’s financial statements.
15. Subsequent Events
Management has determined that no material events or transactions occurred subsequent to July 31, 2019, that would require recognition or disclosure in the Fund’s financial statements.
66
Report of independent
registered public accounting firm
To the Board of Trustees of Delaware Group® Government Fund and Shareholders of Delaware Strategic Income Fund
Opinion on the Financial Statements
We have audited the accompanying statement of assets and liabilities, including the schedule of investments, of Delaware Strategic Income Fund (one of the funds constituting Delaware Group® Government Fund, referred to hereafter as the “Fund”) as of July 31, 2019, the related statement of operations for the year ended July 31, 2019, the statements of changes in net assets for each of the two years in the period ended July 31, 2019, including the related notes, and the financial highlights for each of the five years in the period ended July 31, 2019 (collectively referred to as the “financial statements”). In our opinion, the financial statements present fairly, in all material respects, the financial position of the Fund as of July 31, 2019, the results of its operations for the year then ended, the changes in its net assets for each of the two years in the period ended July 31, 2019 and the financial highlights for each of the five years in the period ended July 31, 2019 in conformity with accounting principles generally accepted in the United States of America.
Basis for Opinion
These financial statements are the responsibility of the Fund’s management. Our responsibility is to express an opinion on the Fund’s financial statements based on our audits. We are a public accounting firm registered with the Public Company Accounting Oversight Board (United States) (PCAOB) and are required to be independent with respect to the Fund in accordance with the U.S. federal securities laws and the applicable rules and regulations of the Securities and Exchange Commission and the PCAOB.
We conducted our audits of these financial statements in accordance with the standards of the PCAOB. Those standards require that we plan and perform the audit to obtain reasonable assurance about whether the financial statements are free of material misstatement, whether due to error or fraud.
Our audits included performing procedures to assess the risks of material misstatement of the financial statements, whether due to error or fraud, and performing procedures that respond to those risks. Such procedures included examining, on a test basis, evidence regarding the amounts and disclosures in the financial statements. Our audits also included evaluating the accounting principles used and significant estimates made by management, as well as evaluating the overall presentation of the financial statements. Our procedures included confirmation of securities owned as of July 31, 2019 by correspondence with the custodian, transfer agents and brokers; when replies were not received from brokers, we performed other auditing procedures. We believe that our audits provide a reasonable basis for our opinion.
/s/ PricewaterhouseCoopers LLP
Philadelphia, Pennsylvania
September 17, 2019
We have served as the auditor of one or more investment companies in Delaware Funds® by Macquarie since 2010.
67
This page intentionally left blank.
Other Fund information (Unaudited)
Delaware Strategic Income Fund
Tax Information
The information set forth below is for the Fund’s fiscal year as required by federal income tax laws. Shareholders, however, must report distributions on a calendar year basis for income tax purposes, which may include distributions for portions of two fiscal years of the Fund. Accordingly, the information needed by shareholders for income tax purposes will be sent to them in January of each year. Please consult your tax advisor for proper treatment of this information.
All disclosures are based on financial information available as of the date of this annual report and, accordingly are subject to change. For any and all items requiring reporting, it is the intention of the Fund to report the maximum amount permitted under the Internal Revenue Code and the regulations thereunder.
For the fiscal year ended July 31, 2019, the Fund reports distributions paid during the year as follows:
| | | | |
(A) Ordinary Income Distributions (Tax Basis) | | | 82.10 | % |
(B) Return of Capital (Tax Basis) | | | 17.90 | % |
Total Distributions. | | | 100.00 | % |
(A) and (B) are based on a percentage of the Fund’s total distributions.
Board consideration ofSub-Advisory agreements for Delaware Strategic Income Fund at a meeting held February27-28, 2019
At a meeting held on Feb.27-28, 2019, the Board of Trustees (the “Board”) of Delaware Strategic Income Fund (the “Fund”), including a majority ofnon-interested or independent Trustees (the “Independent Trustees”), approved newSub-Advisory Agreements between Delaware Management Company (“DMC” or “Management”) and Macquarie Investment Management Europe Limited (“MIMEL”), Macquarie Investment Management Austria Kapitalanlage (“MIMAK”), and Macquarie Investment Management Global Limited (“MIMGL”), respectively. MIMEL, MIMAK, and MIMGL may also be referenced as“Sub-Advisors” below.
In reaching the decision to approve theSub-Advisory Agreements, the Board considered and reviewed information about each of MIMEL, MIMAK, and MIMGL, including its personnel, operations, and financial condition, which had been provided by MIMEL, MIMAK, and MIMGL, respectively. The Board also reviewed material furnished by DMC in advance of the meeting, including: a memorandum from DMC reviewing theSub-Advisory Agreements and the various services proposed to be rendered by MIMEL, MIMAK and MIMGL; information concerning MIMEL’s, MIMAK’s, and MIMGL’s organizational structure and the experience of their key investment management personnel; copies of MIMEL’s, MIMAK’s, and MIMGL’s Form ADV, financial statements, compliance policies and procedures, and Codes of Ethics; relevant performance information provided with respect to MIMEL, MIMAK, and MIMGL; and a copy of theSub-Advisory Agreements.
In considering such information and materials, the Independent Trustees received assistance and advice from and met separately with their independent counsel. While attention was given to all information
69
Other Fund information (Unaudited)
Delaware Strategic Income Fund
Board consideration ofSub-Advisory agreements for Delaware Strategic Income Fund at a meeting held February27-28, 2019 (continued)
furnished, the following discusses some primary factors relevant to the Board’s decision to approve theSub-Advisory Agreements. This discussion of the information and factors considered by the Board
(as well as the discussion above) is not intended to be exhaustive, but rather summarizes certain factors considered by the Board. In view of the wide variety of factors considered, the Board did not, unless otherwise noted, find it practicable to quantify or otherwise assign relative weights to the following factors. In addition, individual Trustees may have assigned different weights to various factors.
Nature, extent, and quality of services.In considering the nature, extent, and quality of the services to be provided by theSub-Advisors, the Board reviewed the services to be provided by eachSub-Advisor pursuant to eachSub-Advisory Agreement and as described at the meeting. The Board reviewed materials provided by theSub-Advisors regarding the experience and qualifications of the personnel who will be responsible for providing services to the Fund. The Board also considered relevant performance information provided with respect to eachSub-Advisor. In discussing the nature of the services proposed to be provided by theSub-Advisors, it was observed that, unlike traditionalsub-advisors who make all of the investment related decisions with respect to asub-advised portfolio, the relationship between DMC (the Fund’s investment manager) and theSub-Advisors as currently contemplated is primarily more of a collaborative effort between DMC and theSub-Advisors and a cross pollination of investment ideas. The Board further noted the stated intention under the newSub-Advisory Agreements that DMC would have the sole discretion to delegate portions of the implementation of the Fund’s strategy to theSub-Advisors who would be permitted to execute Fund trades and exercise investment discretion pursuant to that delegation and subject to DMC oversight. However, DMC and the Fund’s named portfolio managers will continue to retain principal responsibility for the Fund’s strategy and investment process and be primarily responsible for theday-to-day management of the Fund’s portfolio. Based upon these considerations, the Board was satisfied with the nature and quality of the overall services to be provided by theSub-Advisors to the Fund and its shareholders and was confident in the abilities of theSub-Advisors to provide quality services to the Fund and its shareholders.
Investment performance.In regards to the appointment of theSub-Advisors for the Fund, the Board reviewed information on prior performance for theSub-Advisors. In evaluating performance, the Board considered that theSub-Advisors would provide investment advice and recommendations, including with respect to specific securities, but that DMC’s portfolio managers for the Fund would retain principal responsibility for the Fund’s strategy as described above. In addition, the Board considered that theSub-Advisors would also execute Fund security trades on behalf of DMC and be permitted by DMC to exercise investment discretion for securities in certain markets where DMC wanted to utilize aSub-Advisor’s specialized market knowledge.
Sub-Advisory fees.The Board considered that DMC would pay theSub-Advisors asub-advisory fee based on the extent to which aSub-Advisor provides services to the Fund as described in theSub-Advisory Agreements. In considering the appropriateness of thesub-advisory fees, the Board also reviewed and considered the fees in light of the nature, extent, and quality of thesub-advisory services to be provided by eachSub-Advisor, as more fully discussed above. The Board noted that thesub-advisory fees are paid by DMC to eachSub-Advisor and are not additional fees borne by the Fund,
70
and that the management fee paid by the Fund to DMC would stay the same at current asset levels. The Board was provided with information showing an estimate of thesub-advisory fees to be paid to eachSub-Advisor based on a projection ofSub-Advisor allocations given certain historical investment trends, as well as information regarding the expected impact thesub-advisory arrangements would have on the profitability of DMC. The Board also noted that, given the collaborative nature of the services to be provided by theSub-Advisors to the Fund, there were no comparable accounts and corresponding fees to which theSub-Advisors were able to compare this arrangement. The Board concluded that, in light of the quality and extent of the services to be provided and the business relationships between DMC and theSub-Advisors, the proposed fee arrangement was understandable and reasonable.
Profitability, economies of scale, andfall-out benefits.Information about eachSub-Advisor’s profitability from its relationship with the Fund was not available because it had not begun to provide services to the Fund. With regard to potentialfall-out benefits derived or to be derived by theSub-Advisors and their affiliates in connection with their relationship to the Fund, the Board considered the potential benefit to DMC and theSub-Advisors of marketing a global approach on the portfolio management of their fixed income investment strategies. The Trustees also noted that economies of scale are shared with the Fund and its shareholders through investment management fee breakpoints in DMC’s fee schedule for the Fund so that as the Fund grows in size, its effective investment management fee rate declines.
71
Board of trustees / directors and officers addendum
Delaware Funds®by Macquarie
A mutual fund is governed by a Board of Trustees/Directors (“Trustees”), which has oversight responsibility for the management of a fund’s business affairs. Trustees establish procedures and oversee and review the performance of the investment manager, the distributor, and others who perform services for the fund. The independent fund trustees, in particular, are advocates
| | | | |
Name, Address, and Birth Date | | Position(s) Held with Fund(s) | | Length of Time Served |
| | |
| Interested Trustee | | | | |
| Shawn K. Lytle1 | | President, | | President and |
| 2005 Market Street | | Chief Executive Officer, | | Chief Executive Officer |
| Philadelphia, PA 19103 | | and Trustee | | since August 2015 |
| February 1970 | | | | |
| | |
| | | | Trustee since |
| | | | September 2015 |
| | |
| Independent Trustees | | | | |
| Thomas L. Bennett | | Chair and Trustee | | Trustee since |
| 2005 Market Street | | | | March 2005 |
| Philadelphia, PA 19103 | | | | |
| October 1947 | | | | Chair since |
| | | | | March 2015 |
| Jerome D. Abernathy | | Trustee | | Since January 2019 |
| 2005 Market Street | | | | |
| Philadelphia, PA 19103 | | | | |
July 1959 | | | | |
| Ann D. Borowiec | | Trustee | | Since March 2015 |
| 2005 Market Street | | | | |
| Philadelphia, PA 19103 | | | | |
November 1958 | | | | |
| | | | | |
1 Shawn K. Lytle is considered to be an “Interested Trustee” because he is an executive officer of the Fund’s(s’) investment advisor.
72
for shareholder interests. Each trustee has served in that capacity since he or she was elected to or appointed to the Board of Trustees, and will continue to serve until his or her retirement or the election of a new trustee in his or her place. The following is a list of the Trustees and Officers with certain background and related information.
| | | | |
Principal Occupation(s) During the Past Five Years | | Number of Portfolios in Fund Complex Overseen by Trustee or Officer | | Other Directorships Held by Trustee or Officer |
| | |
| | | | |
| | |
| President — Macquarie | | 59 | | Trustee — UBS |
| Investment Management2 | | | | Relationship Funds, |
| (June 2015–Present) | | | | SMA Relationship |
| | | | Trust, and UBS Funds |
| Regional Head of | | | | (May 2010–April 2015) |
| Americas — UBS Global | | | | |
| Asset Management | | | | |
(April 2010–May 2015) | | | | |
| | |
| | | | |
| Private Investor | | 59 | | None |
(March 2004–Present) | | | | |
| Managing Member, | | 59 | | None |
| Stonebrook Capital | | | | |
| Management, LLC (financial | | | | |
| technology: macro factors | | | | |
| and databases) | | | | |
| (January 1993–Present) | | | | |
| Chief Executive Officer, | | 59 | | Director — |
| Private Wealth Management | | | | Banco Santander International |
| (2011–2013) and | | | | (October 2016–Present) |
| Market Manager, | | | | |
| New Jersey Private | | | | Director — |
| Bank (2005–2011) — | | | | Santander Bank, N.A. |
| J.P. Morgan Chase & Co. | | | | (December 2016–Present) |
| | 2 | Macquarie Investment Management is the marketing name for Macquarie Management Holdings, Inc. and its subsidiaries, including the Fund’s(s’) investment advisor, principal underwriter, and its transfer agent. |
73
Board of trustees / directors and officers addendum
Delaware Funds®by Macquarie
| | | | |
Name, Address, and Birth Date | | Position(s) Held with Fund(s) | | Length of Time Served |
| | |
| Independent Trustees (continued) | | | | |
| | |
| Joseph W. Chow | | Trustee | | Since January 2013 |
| 2005 Market Street | | | | |
| Philadelphia, PA 19103 | | | | |
January 1953 | | | | |
| | |
| John A. Fry | | Trustee | | Since January 2001 |
| 2005 Market Street | | | | |
| Philadelphia, PA 19103 | | | | |
May 1960 | | | | |
| Lucinda S. Landreth | | Trustee | | Since March 2005 |
| 2005 Market Street | | | | |
| Philadelphia, PA 19103 | | | | |
| June 1947 | | | | |
74
| | | | |
Principal Occupation(s) During the Past Five Years | | Number of Portfolios in Fund Complex Overseen by Trustee or Officer | | Other Directorships Held by Trustee or Officer |
| | |
| | | | |
| Private Investor | | 59 | | Director and Audit Committee |
| (April 2011–Present) | | | | Member — Hercules |
| | | | Technology Growth |
| | | | Capital, Inc. |
| | | | | (July 2004–July 2014) |
| President — | | 59 | | Director; Compensation |
| Drexel University | | | | Committee and |
| (August 2010–Present) | | | | Governance Committee |
| | | | Member — Community |
| President — | | | | Health Systems |
| Franklin & Marshall College | | | | (May 2004–present) |
| (July 2002–June 2010) | | | | |
| | | | Director — Drexel |
| | | | Morgan & Co. |
| | | | (2015–present) |
| | |
| | | | Director and Audit Committee |
| | | | Member — vTv |
| | | | Therapeutics Inc. |
| | | | (2017–present) |
| | |
| | | | Director and Audit Committee |
| | | | Member — FS Credit Real |
| | | | Estate Income Trust, Inc. |
| | | | | (2018–present) |
Private Investor (2004–Present) | | 59 | | None |
75
Board of trustees / directors and officers addendum
Delaware Funds®by Macquarie
| | | | |
Name, Address, and Birth Date | | Position(s) Held with Fund(s) | | Length of Time Served |
| | |
Independent Trustees (continued) | | | | |
Frances A. Sevilla-Sacasa 2005 Market Street Philadelphia, PA 19103 January 1956 | | Trustee | | Since September 2011 |
Thomas K. Whitford 2005 Market Street Philadelphia, PA 19103 March 1956 | | Trustee | | Since January 2013 |
76
| | | | |
Principal Occupation(s) During the Past Five Years | | Number of Portfolios in Fund Complex Overseen by Trustee or Officer | | Other Directorships Held by Trustee or Officer |
| | |
| | | | |
| Private Investor | | 59 | | Trust Manager and |
| (January 2017–Present) | | | | Audit Committee |
| | | | Chair — Camden |
| Chief Executive Officer — | | | | Property Trust |
| Banco Itaú | | | | (August 2011–Present) |
| International | | | | |
| (April 2012–December 2016) | | | | Director; Audit |
| | | | Committee Member — |
| Executive Advisor to Dean | | | | Carrizo Oil & Gas, Inc. |
| (August 2011–March 2012) | | | | (March 2018–Present) |
| and Interim Dean | | | | |
| (January 2011–July 2011) — | | | | |
| University of Miami School of | | | | |
| Business Administration | | | | |
| | |
| President — U.S. Trust, | | | | |
| Bank of America Private | | | | |
| Wealth Management | | | | |
| (Private Banking) | | | | |
| (July 2007–December 2008) | | | | |
| Vice Chairman | | 59 | | Director — HSBC North |
| (2010–April 2013) — | | | | America Holdings Inc. |
| PNC Financial | | | | (December 2013–Present) |
| Services Group | | | | |
| | | | Director — HSBC USA Inc. (July 2014–Present) |
| | |
| | | | Director — HSBC Bank USA, National Association (July 2014–March 2017) |
| | |
| | | | | Director — HSBC Finance Corporation (December 2013–April 2018) |
77
Board of trustees / directors and officers addendum
Delaware Funds®by Macquarie
| | | | |
Name, Address, and Birth Date | | Position(s) Held with Fund(s) | | Length of Time Served |
Independent Trustees (continued) | | |
Christianna Wood 2005 Market Street Philadelphia, PA 19103 August 1959 | | Trustee | | Since January 2019 |
78
| | | | |
| | | Number of Portfolios in | | |
| Principal Occupation(s) | | Fund Complex Overseen | | Other Directorships |
| During the Past Five Years | | by Trustee or Officer | | Held by Trustee or Officer |
| | | | |
Chief Executive Officer and President — Gore Creek Capital, Ltd. (August 2009–Present) | | 59 | | Director; Finance Committee and Audit Committee Member — H&R Block Corporation (July 2008–Present) |
| | |
| | | | Director; Chair of Investments Committee and Audit Committee Member — Grange Insurance (2013–Present) |
| | |
| | | | Trustee; Chair of Nominating and Governance Committee and Audit Committee Member — The Merger Fund (2013–Present), The Merger Fund VL (2013-Present), WCM Alternatives: Event-Driven Fund (2013–Present), and WCM Alternatives: Credit Event Fund (December 2017–Present) |
| | |
| | | | | Director; Chair of Governance Committee and Audit Committee Member — International Securities Exchange (2010–2016) |
79
Board of trustees / directors and officers addendum
Delaware Funds®by Macquarie
| | | | |
Name, Address, and Birth Date | | Position(s) Held with Fund(s) | | Length of Time Served |
Independent Trustees (continued) | | |
Janet L. Yeomans 2005 Market Street Philadelphia, PA 19103 July 1948 | | Trustee | | Since April 1999 |
| | |
| | | | |
Officers | | | | |
David F. Connor 2005 Market Street Philadelphia, PA 19103 December 1963 | | Senior Vice President, General Counsel, and Secretary | | Senior Vice President since May 2013; General Counsel since May 2015; Secretary since October 2005 |
Daniel V. Geatens 2005 Market Street Philadelphia, PA 19103 October 1972 | | Vice President and Treasurer | | Vice President and Treasurer since October 2007 |
Richard Salus 2005 Market Street Philadelphia, PA 19103 October 1963 | | Senior Vice President and Chief Financial Officer | | Senior Vice President and Chief Financial Officer since November 2006 |
The Statement of Additional Information for the Fund(s) includes additional information about the Trustees and Officers and is available, without charge, upon request bycalling 800 523-1918.
80
| | | | |
Principal Occupation(s) During the Past Five Years | | Number of Portfolios in Fund Complex Overseen by Trustee or Officer | | Other Directorships Held by Trustee or Officer |
| | |
| | | | |
Vice President and Treasurer (January 2006–July 2012), Vice President — Mergers & Acquisitions (January 2003–January 2006), and Vice President and Treasurer (July 1995–January 2003) — 3M Company | | 59 | | Director; Personnel and Compensation Committee Chair; Member of Nominating, Investments, and Audit Committees for various periods throughout directorship — Okabena Company (2009–2017) |
| | |
| | | | |
David F. Connor has served in various capacities at different times at Macquarie Investment Management. | | 59 | | None3 |
Daniel V. Geatens has served in various capacities at different times at Macquarie Investment Management. | | 59 | | None3 |
Richard Salus has served in various capacities at different times at Macquarie Investment Management. | | 59 | | None3 |
| 3 | David F. Connor, Daniel V. Geatens, and Richard Salus serve in similar capacities for the six portfolios of the Optimum Fund Trust, which have the same investment advisor, principal underwriter, and transfer agent as the registrant. Mr. Geatens also serves as the Chief Financial Officer and Treasurer for Macquarie Global Infrastructure Total Return Fund Inc., which has an affiliated investment manager. |
81
About the organization
| | | | | | |
Board of trustees | | | | | | |
| | | |
Shawn K. Lytle President and Chief Executive Officer Delaware Funds® by Macquarie Philadelphia, PA Thomas L. Bennett Chairman of the Board Delaware Funds by Macquarie Private Investor Rosemont, PA Jerome D. Abernathy Managing Member Stonebrook Capital Management, LLC Jersey City, NJ | | Ann D. Borowiec Former Chief Executive Officer Private Wealth Management J.P. Morgan Chase & Co. New York, NY Joseph W. Chow Former Executive Vice President State Street Corporation Boston, MA John A. Fry President Drexel University Philadelphia, PA | | Lucinda S. Landreth Former Chief Investment Officer Assurant, Inc. New York, NY Frances A. Sevilla-Sacasa Former Chief Executive Officer Banco Itaú International Miami, FL | | Thomas K. Whitford Former Vice Chairman PNC Financial Services Group Pittsburgh, PA Christianna Wood Chief Executive Officer and President Gore Creek Capital, Ltd. Golden, CO Janet L. Yeomans Former Vice President and Treasurer 3M Company St. Paul, MN |
| | | |
Affiliated officers | | | | | | |
| | | |
David F. Connor | | Daniel V. Geatens | | Richard Salus | | |
Senior Vice President, | | Vice President and | | Senior Vice President and | | |
General Counsel, | | Treasurer | | Chief Financial Officer | | |
and Secretary | | Delaware Funds | | Delaware Funds | | |
Delaware Funds | | by Macquarie | | by Macquarie | | |
by Macquarie | | Philadelphia, PA | | Philadelphia, PA | | |
Philadelphia, PA | | | | | | |
This annual report is for the information of Delaware Strategic Income Fund shareholders, but it may be used with prospective investors when preceded or accompanied by the Delaware Fund fact sheet for the most recently completed calendar quarter. These documents are available at delawarefunds.com/literature.
The Fund files its complete schedule of portfolio holdings with the Securities and Exchange Commission (SEC) for the first and third quarters of each fiscal year on FormN-Q or FormN-PORT (available for filings after March 31, 2019). The Fund’s FormsN-Q or FormsN-PORT, as well as a description of the policies and procedures that the Fund uses to determine how to vote proxies (if any) relating to portfolio securities, are available without charge (i) upon request, by calling 800523-1918; and (ii) on the SEC’s website at sec.gov. In addition, a description of the policies and procedures that the Fund uses to determine how to vote proxies (if any) relating to portfolio securities and the Schedule of Investments included in the Fund’s most recent FormN-Q or FormN-PORT are available without charge on the Fund’s website at delawarefunds.com/literature. The Fund’s FormsN-Q and FormsN-PORT may be reviewed and copied at the SEC’s Public Reference Room in Washington, D.C.; information on the operation of the Public Reference Room may be obtained by calling 800SEC-0330.
Information (if any) regarding how the Fund voted proxies relating to portfolio securities during the most recently disclosed12-month period ended June 30 is available without charge (i) through the Fund’s website at delawarefunds.com/proxy; and (ii) on the SEC’s website at sec.gov.
82
Item 2. Code of Ethics
Item 3. Audit Committee Financial Expert
The registrant’s Board of Trustees has determined that certain members of the registrant’s Audit Committee are audit committee financial experts, as defined below. For purposes of this item, an “audit committee financial expert” is a person who has the following attributes:
a. An understanding of generally accepted accounting principles and financial statements;
b. The ability to assess the general application of such principles in connection with the accounting for estimates, accruals, and reserves;
c. Experience preparing, auditing, analyzing, or evaluating financial statements that present a breadth and level of complexity of accounting issues that are generally comparable to the breadth and complexity of issues that can reasonably be expected to be raised by the registrant’s financial statements, or experience actively supervising one or more persons engaged in such activities;
d. An understanding of internal controls and procedures for financial reporting; and
e. An understanding of audit committee functions.
An “audit committee financial expert” shall have acquired such attributes through:
a. Education and experience as a principal financial officer, principal accounting officer, controller, public accountant, or auditor or experience in one or more positions that involve the performance of similar functions;
b. Experience actively supervising a principal financial officer, principal accounting officer, controller, public accountant, auditor, or person performing similar functions;
c. Experience overseeing or assessing the performance of companies or public accountants with respect to the preparation, auditing, or evaluation of financial statements; or
d. Other relevant experience.
The registrant’s Board of Trustees has also determined that each member of the registrant’s Audit Committee is independent. In order to be “independent” for purposes of this item, the Audit Committee member may not: (i) other than in his or her capacity as a member of the Board of Trustees or any committee thereof, accept directly or indirectly any consulting, advisory or other compensatory fee from the issuer; or (ii) be an “interested person” of the registrant as defined in Section 2(a)(19) of the Investment Company Act of 1940.
The names of the audit committee financial experts on the registrant’s Audit Committee are set forth below:
John A. Fry
Lucinda S. Landreth
Thomas K. Whitford
Christianna Wood
Item 4. Principal Accountant Fees and Services
The aggregate fees billed for services provided to the registrant by its independent auditors for the audit of the registrant’s annual financial statements and for services normally provided by the independent auditors in connection with statutory and regulatory filings or engagements were $92,390 for the fiscal year ended July 31, 2019.
The aggregate fees billed for services provided to the registrant by its independent auditors for the audit of the registrant’s annual financial statements and for services normally provided by the independent auditors in connection with statutory and regulatory filings or engagements were $90,580 for the fiscal year ended July 31, 2018.
The aggregate fees billed by the registrant’s independent auditors for services relating to the performance of the audit of the registrant’s financial statements and not reported under paragraph (a) of this Item were $0 for the fiscal year ended July 31, 2019.
The aggregate fees billed by the registrant’s independent auditors for services relating to the performance of the audit of the registrant’s financial statements and not reported under paragraph (a) of this Item were $0 for the fiscal year ended July 31, 2018.
The aggregate fees billed by the registrant’s independent auditors for tax-related services provided to the registrant’s investment adviser and other service providers under common control with the adviser and that relate directly to the operations or financial reporting of the registrant were $0 for the registrant’s fiscal year ended July 31, 2019.
The aggregate fees billed by the registrant’s independent auditors for tax-related services provided to the registrant’s investment adviser and other service providers under common control with the adviser and that relate directly to the operations or financial reporting of the registrant were $0 for the registrant’s fiscal year ended July 31, 2018.
The aggregate fees billed for all services provided by the independent auditors to the registrant other than those set forth in paragraphs (a), (b) and (c) of this Item were $0 for the fiscal year ended July 31, 2019.
The aggregate fees billed for all services provided by the independent auditors to the registrant other than those set forth in paragraphs (a), (b) and (c) of this Item were $0 for the fiscal year ended July 31, 2018.
Under the Pre-Approval Policy, the Audit Committee has also pre-approved the services set forth in the table below with respect to the registrant’s investment adviser and other entities controlling, controlled by or under common control with the investment adviser that provide ongoing services to the registrant (the “Control Affiliates”) up to the specified fee limit. This fee limit is based on aggregate fees to the investment adviser and its Control Affiliates.
The Pre-Approval Policy requires the registrant’s independent auditors to report to the Audit Committee at each of its regular meetings regarding all services initiated since the last such report was rendered, including those services authorized by the Pre-Approval Policy.
(f) Not applicable.
(g) The aggregate non-audit fees billed by the registrant’s independent auditors for services rendered to the registrant and to its investment adviser and other service providers under common control with the adviser were $9,955,000 and $11,748,000 for the registrant’s fiscal years ended July 31, 2019 and July 31, 2018, respectively.
(h) In connection with its selection of the independent auditors, the registrant’s Audit Committee has considered the independent auditors’ provision of non-audit services to the registrant’s investment adviser and other service providers under common control with the adviser that were not required to be pre-approved pursuant to Rule 2-01(c)(7)(ii) of Regulation S-X. The Audit Committee has determined that the independent auditors’ provision of these services is compatible with maintaining the auditors’ independence.
Item 5. Audit Committee of Listed Registrants
Not applicable.
Item 6. Investments
(a) Included as part of report to shareholders filed under Item 1 of this Form N-CSR.
(b) Divestment of securities in accordance with Section 13(c) of the Investment Company Act of 1940.
Not applicable.
Item 7. Disclosure of Proxy Voting Policies and Procedures for Closed-End Management Investment Companies
Not applicable.
Item 8. Portfolio Managers of Closed-End Management Investment Companies
Not applicable.
Item 9. Purchases of Equity Securities by Closed-End Management Investment Companies and Affiliated Purchasers
Not applicable.
Item 10. Submission of Matters to a Vote of Security Holders
Not applicable.
Item 11. Controls and Procedures
The registrant’s principal executive officer and principal financial officer have evaluated the registrant’s disclosure controls and procedures within 90 days of the filing of this report and have concluded that they are effective in providing reasonable assurance that the information required to be disclosed by the registrant in its reports or statements filed under the Securities Exchange Act of 1934 is recorded, processed, summarized and reported within the time periods specified in the rules and forms of the Securities and Exchange Commission.
There were no significant changes in the registrant’s internal control over financial reporting that occurred during the period covered by the report to stockholders included herein that have materially affected, or are reasonably likely to materially affect, the registrant’s internal control over financial reporting.
Item 12. Disclosure of Securities Lending Activities for Closed-End Management Investment Companies
Not applicable.
Item 13. Exhibits
Not applicable.
(2) Certifications of Principal Executive Officer and Principal Financial Officer pursuant to Rule 30a-2 under the Investment Company Act of 1940 are attached hereto as Exhibit 99.CERT.
(3) Written solicitations to purchase securities pursuant to Rule 23c-1 under the Securities Exchange Act of 1934.
Not applicable.
(b) Certifications pursuant to Section 906 of the Sarbanes-Oxley Act of 2002 are furnished herewith as Exhibit 99.906CERT.
Pursuant to the requirements of the Securities Exchange Act of 1934 and the Investment Company Act of 1940, the registrant has duly caused this report to be signed on its behalf, by the undersigned, thereunto duly authorized.
Pursuant to the requirements of the Securities Exchange Act of 1934 and the Investment Company Act of 1940, this report has been signed below by the following persons on behalf of the registrant and in the capacities and on the dates indicated.