UNITED STATES SECURITIES AND EXCHANGE COMMISSION
Washington, D.C. 20549
FORM N-CSR
CERTIFIED SHAREHOLDER REPORT OF REGISTERED MANAGEMENT
INVESTMENT COMPANIES
| Investment Company Act file number: | | 811-04304 |
| | |
| Exact name of registrant as specified in charter: | | Delaware Group® Government Fund |
| | |
| Address of principal executive offices: | | 2005 Market Street |
| | | Philadelphia, PA 19103 |
| | |
| Name and address of agent for service: | | David F. Connor, Esq. |
| | 2005 Market Street |
| | Philadelphia, PA 19103 |
| | |
| Registrant’s telephone number, including area code: | | (800) 523-1918 |
| | |
| Date of fiscal year end: | | July 31 |
| | |
| Date of reporting period: | | July 31, 2017 |
Item 1. Reports to Stockholders
| | |

| | 
Annual report |
Fixed income mutual fund
Delaware Emerging Markets Debt Fund
July 31, 2017
Carefully consider the Fund’s investment objectives, risk factors, charges, and expenses before investing. This and other information can be found in the Fund’s prospectus and its summary prospectus, which may be obtained by visiting delawarefunds.com/literature or calling 800 523-1918. Investors should read the prospectus and the summary prospectus carefully before investing.
You can obtain shareholder reports and prospectuses online instead of in the mail.
Visit delawarefunds.com/edelivery.
Experience Delaware FundsSM by Macquarie
Macquarie Investment Management (MIM) is a global asset manager with offices throughout the United States, Europe, Asia, and Australia. We are active managers who prioritize autonomy and accountability at the investment team level in pursuit of opportunities that matter for our clients. Delaware Funds by Macquarie is one of the longest-standing mutual fund families, with more than 75 years in existence.
If you are interested in learning more about creating an investment plan, contact your financial advisor.
You can learn more about Delaware Funds by Macquarie or obtain a prospectus for Delaware Emerging Markets Debt Fund at delawarefunds.com/literature.
Manage your account online
• Check your account balance and transactions
• View statements and tax forms
• Make purchases and redemptions
Visit delawarefunds.com/account-access.
Macquarie Investment Management (MIM) is the marketing name for the registered investment advisers including Macquarie Investment Management Business Trust (MIMBT) (formerly, Delaware Management Business Trust), Macquarie Funds Management Hong Kong Limited, Macquarie Investment Management Austria Kapitalanlage AG, Macquarie Investment Management Global Limited, Macquarie Bank International Limited, Macquarie Investment Management Europe Limited, Macquarie Investment Management Limited, and Macquarie Capital Investment Management, Inc.
The Funds are distributed by Delaware Distributors, L.P., an affiliate of Macquarie Investment Management Business Trust and Macquarie Group Limited. Macquarie Investment Management (MIM), a member of Macquarie Group, refers to the companies comprising the asset management division of Macquarie Group Limited and its subsidiaries and affiliates worldwide.
Other than Macquarie Bank Limited (MBL), none of the entities noted are authorized deposit-taking institutions for the purposes of the Banking Act 1959 (Commonwealth of Australia). The obligations of these entities do not represent deposits or other liabilities of MBL. MBL does not guarantee or otherwise provide assurance in respect of the obligations of these entities, unless noted otherwise. The Fund is governed by US laws and regulations.
Table of contents
Unless otherwise noted, views expressed herein are current as of July 31, 2017, and subject to change for events occurring after such date.
The Fund is not FDIC insured and is not guaranteed. It is possible to lose the principal amount invested. Advisory services provided by Delaware Management Company, a series of MIMBT, a US registered investment advisor.
All third-party marks cited are the property of their respective owners.
© 2017 Macquarie Management Holdings, Inc. (formerly, Delaware Management Holdings, Inc.)
| | |
| Portfolio management review | | |
| Delaware Emerging Markets Debt Fund | | August 8, 2017 |
| | | | | | | | |
Performance preview (for the year ended July 31, 2017) | | | | | | | | |
Delaware Emerging Markets Debt Fund (Institutional Class shares) | | | 1-year return | | | | +8.25% | |
Delaware Emerging Markets Debt Fund (Class A shares) | | | 1-year return | | | | +8.03% | |
J.P. Morgan Corporate Emerging Markets Bond Index (CEMBI) Broad Diversified (benchmark) | | | 1-year return | | | | +5.97% | |
Past performance does not guarantee future results.
For complete, annualized performance for Delaware Emerging Markets Debt Fund, please see the table on page 4. Institutional Class shares are available without sales or asset-based distribution charges only to certain eligible accounts. The performance of Class A shares excludes the applicable sales charge. Both Institutional Class shares and Class A shares reflect the reinvestment of all distributions.
Please see page 7 for a description of the index. Index performance returns do not reflect any management fees, transaction costs, or expenses. Indices are unmanaged and one cannot invest directly in an index.
Throughout the Fund’s fiscal year ended July 31, 2017, emerging market economies generally benefited from a globally synchronized recovery led by China and aided by continued accommodative monetary policies in developed markets. Moderate gross domestic product (GDP) growth in emerging markets was observed throughout the fiscal year. Consistent with developed markets, inflation trended sharply lower in emerging markets, notably in Brazil, Russia, and India. The resulting high real interest rates enabled emerging market central banks in many instances to aggressively cut interest rates and support domestic growth. In Brazil, for example, inflation plunged from 8.7% at the beginning of the period to 2.7% at the end (source: Bloomberg).
Although weakness in foreign exchange rates would typically accompany such an extended rate-cutting regime across emerging markets, this was not the case. Instead it was also a period of volatility for the US dollar, which peaked in value shortly after the November 2016 US presidential election. By the end of the Fund’s fiscal year, however, the dollar had dropped to its lowest point in the preceding 12 months (source: Bloomberg). Overall, the dollar’s relative weakness moderated the effect of rate cuts on foreign exchange rates. In our opinion, this helped keep inflation in check.
China was both a surprising and stabilizing influence on emerging markets, as it posted solid economic results during the fiscal year. In an effort to cement his leadership position, President Xi Jinping attempted to create stability on both the economic and geopolitical fronts. Additionally, we believe MSCI’s decision to include Chinese equities in its emerging markets index provided a significant boost to equities, and further stabilized the yuan, which depreciated only slightly during the fiscal year.
In our opinion, the single most significant event that influenced emerging markets during the fiscal year was the US presidential election and its aftermath. The Trump campaign’s pre-election populist rhetoric targeted large trade deficits with several emerging market trading partners – notably China and Mexico. Consequently, the election result seemed to raise concern that the incoming administration would act swiftly to implement tariffs, enact a border-adjustment tax, and renegotiate trade agreements, especially the North American Free Trade Agreement (NAFTA) with Mexico.
Increased volatility in the most frequently cited countries was immediate, feeding through to both asset prices and currency exchange rates. Mexico’s peso, for example, began the fiscal year at 18.75 to the dollar. Following the election, the
| | |
| Portfolio management review | | |
| Delaware Emerging Markets Debt Fund | | |
peso dropped sharply in January 2017 to 21.955, an all-time low (source: Reuters). As it became apparent, however, that significant change to US trade policy would come slowly, if at all, the peso more than recovered, finishing the fiscal period at 17.80, a net gain on the dollar for the fiscal year.
Unlike in the Fund’s previous fiscal year, energy prices were largely range-bound during the fiscal year ended July 31, 2017, therefore minimizing their effect on emerging markets. Early in the fiscal period, the Organization of the Petroleum Exporting Countries (OPEC) acted to stabilize oil markets with its first production cuts in years. Although not a member, Russia joined with OPEC in the cuts, which were renewed roughly six months later. Though compliance among some weaker member states was spotty, the effort seemed effective overall.
In Latin America, the ongoing “operation car wash” scandal in Brazil, though still rancorous politically, appeared to lose its grip on the markets and the economy. President Michel Temer had largely fended off accusations against him, which we viewed as encouraging, given his market-friendly positions. The central bank adopted a more accommodative tone and, as previously noted, inflation tapered off.
In Argentina, the government under President Mauricio Macri slowly introduced its reform agenda. Relative to its emerging market peers, inflation proved difficult to curb there but growth appeared to recover during the fiscal period.
Despite the ceaseless procession of headlines concerning Russia and its meddling in the US election, there has been little impact. Because the new round of US-imposed sanctions mainly targeted individuals rather than corporations, we believe its effect on investable securities should be slight.
Other political concerns of note included the rift in the Gulf Cooperation Council that opened between Qatar and other member nations. Saudi
Arabia and its cohorts sought to compel Qatar to abandon its support for Iran and the Muslim Brotherhood, among other issues. In South Africa, President Jacob Zuma continued to battle factions within his own party, the African National Congress. Discussions about nationalizing the country’s central bank, the South African Reserve Bank (SARB), have raised concerns about its independence.
Fund performance
For the fiscal year ended July 31, 2017, Delaware Emerging Markets Debt Fund outperformed its benchmark, the J.P. Morgan Corporate Emerging Markets Bond Index (CEMBI) Broad Diversified. The Fund’s Institutional Class shares returned +8.25%. The Fund’s Class A shares returned +8.03% at net asset value and +3.17% at maximum offer price. These figures reflect all distributions reinvested. For the same period, the J.P. Morgan Corporate Emerging Markets Bond Index (CEMBI) Broad Diversified returned +5.97%. For complete annualized performance for Delaware Emerging Markets Debt Fund, please see the table on page 4.
The Fund’s outperformance relative to the benchmark was due in large part to its allocation to sovereign and quasi-sovereign securities, which are not included in the benchmark. These debt securities ended the fiscal year at 41.7% of the Fund’s portfolio. Relative to corporate securities, the allocation provided a duration and yield advantage with a stronger liquidity profile in a risk-on environment.
A large overweight position relative to the benchmark in Latin America, which moderated only slightly throughout the fiscal year, was a significant driver of the Fund’s positive performance. Brazil and Argentina – which contributed 0.62 and 0.61 percentage points, respectively, in excess returns versus the benchmark – were the strongest performers, due mainly to the Fund’s overweight allocation
within those countries. Jamaica contributed 0.30 percentage points to the Fund’s performance. The improved credit position of Digicel Group, the Caribbean, Central America, and Asia Pacific mobile phone network provider, drove this performance from Jamaica. The Fund did not have an allocation to Venezuela, given our concern with its dire political and economic situation. We remain cautious there.
Some of the Fund’s most significant detractors were in Asia. Tight credit spreads led us to slowly increase the Fund’s underweight position within much of the region, which in turn funded overweight allocations elsewhere. China, Singapore, and the Philippines detracted 0.12, 0.10, and 0.09 percentage points, respectively, from relative performance, all due to the Fund’s underweight positions. An underweight position in Israel, also due to tight credit spreads, detracted 0.18 percentage points from the Fund’s relative performance. The lack of a position in Zambian metals and mining company First Quantum Minerals likewise hurt the Fund’s relative performance.
From a sector perspective, consumer companies, industrials, and pulp and paper were the largest contributors to the Fund’s performance, while financials, oil and gas, and metals and mining were the most significant detractors. Financials were penalized by an underweight position, which was used as a source of funding for the Fund’s allocation to sovereigns and quasi-sovereigns. Similarly, an underweight position relative to the benchmark in oil and gas companies was used to fund positions in off-benchmark sovereigns that are actually national oil and gas companies. Our up-in-quality bias negatively affected the Fund’s position in metals and mining as lesser-quality companies outperformed in this sector.
Individual contributors to performance included Brazilian petrochemical company Petrobras,the Fund’s strongest performer. As it recovered from both a commodity selloff and fallout from the car
wash scandal, Petrobras initiated a liability management program that sharply improved both its balance sheet and cash flow position.
Similarly, Digicel Group launched a liability management program, led by bank-loan refinancing, that improved its balance sheet and extended the runway for execution of its growth plan.
Among individual holdings, Mexican local bonds were the most significant drag on performance as we sought to reduce risk after the US presidential election by selling the Fund’s position. Similarly, we sold the Fund’s position in Sigma Alimentos, a Mexican food processing and distribution company, given the concern that trade with Mexico could be adversely affected if NAFTA is renegotiated.
With regard to credit quality, we started the year with a mix that was 54% high grade versus 46% high yield. Looking to take advantage of the market’s orientation and investors’ chase for yield, we began reducing the quality of the mix and, by the end of April 2017, the Fund was positioned at 42% high grade and 58% high yield. In the last three months of the fiscal year, we modestly improved the Fund’s credit quality and ended the fiscal year with 45% high grade and 55% high yield.
A word on foreign currency hedges
During the fiscal year, Delaware Emerging Markets Debt Fund invested in currency hedges in forward foreign exchange contracts, options, and credit default swaps. These positions did not have a material effect on the Fund’s performance, contributing 0.08 percentage points for the fiscal year. The total outstanding notional exposure at the end of the fiscal year was -2.30% (notional value is the face amount of a security that is used to calculate the payout on a derivative contract of that underlying security at settlement).
| | |
| Performance summary | | |
| Delaware Emerging Markets Debt Fund | | July 31, 2017 |
The performance quoted represents past performance and does not guarantee future results. Investment return and principal value of an investment will fluctuate so that shares, when redeemed, may be worth more or less than their original cost. Current performance may be lower or higher than the performance quoted. Performance data current to the most recent month end may be obtained by calling 800 523-1918 or visiting delawarefunds.com/performance.
| | | | | | | | | | | | |
| Fund and benchmark performance1, 2, 3 | | Average annual total returns through July 31, 2017 |
| | | | |
| | | 1 year | | 3 years | | | 5 years | | | Lifetime |
Class A (Est. Sept. 30, 2013) | | | | | | | | | | | | |
Excluding sales charge | | +8.03% | | | +4.21% | | | | +5.62% | | | +6.63% |
Including sales charge | | +3.17% | | | +2.63% | | | | +4.65% | | | +5.90% |
Class C (Est. Sept. 30, 2013) | | | | | | | | | | | | |
Excluding sales charge | | +7.74% | | | +4.12% | | | | +5.25% | | | +6.15% |
Including sales charge | | +6.74% | | | +4.12% | | | | +5.25% | | | +6.15% |
Class R (Est. Sept. 30, 2013) | | | | | | | | | | | | |
Excluding sales charge | | +8.13% | | | +4.25% | | | | +5.53% | | | +6.49% |
Including sales charge | | +8.13% | | | +4.25% | | | | +5.53% | | | +6.49% |
Institutional Class (Est. Sept. 30, 2013) | | | | | | | | | | | | |
Excluding sales charge | | +8.25% | | | +4.28% | | | | +5.76% | | | +6.80% |
Including sales charge | | +8.25% | | | +4.28% | | | | +5.76% | | | +6.80% |
J.P. Morgan Corporate Emerging Markets | | | | | | | | | | | | |
Bond Index (CEMBI) Broad Diversified | | +5.97% | | | +5.09 | % | | | +5.23 | % | | +6.17%* |
* The benchmark lifetime return is for Class A share comparison only and is calculated using the last business day in the month of the Fund’s Class A inception date.
1 A privately offered fund managed by the Fund’s portfolio manager was reorganized into the Fund and the Fund commenced operations on Sept. 30, 2013. This privately offered fund commenced operations on Nov. 3, 2010 and had an investment objective and strategies that were, in all material respects, the same as those of the Fund, and was managed in a manner that, in all material respects, complied with the investment guidelines and restrictions of the Fund. However, the privately offered fund was not registered as an investment under the Investment Company Act of 1940 (1940 Act). As a result, the privately offered fund was not subject to certain investment limitations, diversification requirements, liquidity requirements, and other restrictions imposed by
the 1940 Act and the Internal Revenue Code of 1986, as amended, which, if applicable, may have adversely affected its performance.
The Fund’s performance for the periods prior to its commencement of operations on Sept. 30, 2013 is that of the privately offered fund. Because the privately offered fund was a master fund that did not charge any management or other asset-based fees, the privately offered fund’s performance shown above has been restated, on a one-time basis, to reflect the fees, expenses, and waivers and reimbursements for each class of the Fund at the commencement of the Fund’s operations. If the performance of the privately offered fund had not been restated, the performance for such classes may have been higher than the performance shown in the average annual total returns table above.
2 Returns reflect the reinvestment of all distributions and are presented both with and without the applicable sales charges described below. Returns do not reflect the deduction of taxes the shareholder would pay on Fund distributions or redemptions of Fund shares.
Expense limitations were in effect for certain classes during some or all of the periods shown in the “Fund and benchmark performance” table. Expenses for each class are listed on the “Fund expense ratios” table on page 6. Performance would have been lower had expense limitations not been in effect.
Institutional Class shares are available without sales or asset-based distribution charges only to certain eligible accounts.
Class A shares are sold with a maximum front-end sales charge of 4.50%, and have an annual distribution and service fee of 0.25% of average daily net assets. Performance for Class A shares, excluding sales charges, assumes that no front-end sales charge applied.
Class C shares are sold with a contingent deferred sales charge of 1.00% if redeemed during the first 12 months. They are also subject to an annual distribution and service fee of 1.00% of average daily net assets. Performance for Class C shares, excluding sales charges, assumes either that contingent deferred sales charges did not apply or that the investment was not redeemed.
Class R shares are available only for certain retirement plan products. They are sold without a sales charge and have an annual distribution and service fee of 0.50% of average daily net assets.
Fixed income securities and bond funds can lose value, and investors can lose principal, as interest rates rise. They also may be affected by economic conditions that hinder an issuer’s ability to make interest and principal payments on its debt.
The Fund may also be subject to prepayment risk, the risk that the principal of a bond that is held by a portfolio will be prepaid prior to maturity, at the
time when interest rates are lower than what the bond was paying. A portfolio may then have to reinvest that money at a lower interest rate.
High yielding, non-investment-grade bonds (junk bonds) involve higher risk than investment grade bonds. The high yield secondary market is particularly susceptible to liquidity problems when institutional investors, such as mutual funds and certain other financial institutions, temporarily stop buying bonds for regulatory, financial, or other reasons. In addition, a less liquid secondary market makes it more difficult for the Fund to obtain precise valuations of the high yield securities in its portfolio.
The Fund may invest in derivatives, which may involve additional expenses and are subject to risk, including the risk that an underlying security or securities index moves in the opposite direction from what the portfolio manager anticipated. A derivative transaction depends upon the counterparties’ ability to fulfill their contractual obligations.
If and when the Fund invests in forward foreign currency contracts or uses other investments to hedge against currency risks, the Fund will be subject to special risks, including counterparty risk.
Diversification may not protect against market risk.
International investments entail risks not ordinarily associated with US investments including fluctuation in currency values, differences in accounting principles, or economic or political instability in other nations. Investing in emerging markets can be riskier than investing in established foreign markets due to increased volatility and lower trading volume.
The Fund may experience portfolio turnover in excess of 100%, which could result in higher trading costs and tax liability.
Leverage risk is the risk associated with securities or practices (for example, borrowing and the use of certain derivatives) and investment in certain
| | |
| Performance summary | | |
| Delaware Emerging Markets Debt Fund | | |
types of derivatives that multiply small index or market movements into larger changes in value. Use of derivative instruments may involve leverage. Leverage magnifies the potential for gain and the risk of loss. As a result, a relatively small decline in the value of the underlying investments
could result in a relatively large loss. Although the Fund will seek to manage the Fund’s risk from the leverage associated with derivative investments by closely monitoring the volatility of such investments, the Fund may not be successful in this respect.
3 The Fund’s expense ratios, as described in the most recent prospectus, are disclosed in the following “Fund expense ratios” table. Delaware Management Company has agreed to reimburse certain expenses and/or waive certain fees in order to prevent total annual fund operating expenses (excluding any 12b-1 fees, acquired fund fees and expenses, taxes, interest, short sale and dividend interest expenses, brokerage fees, certain insurance costs, and nonroutine expenses or costs, including, but not limited to, those relating to reorganizations, litigation, conducting shareholder meetings, and liquidations (collectively, nonroutine expenses)) from exceeding 1.00% of the Fund’s average daily net assets during the period from Aug. 1, 2016 through July 31, 2017.* Please see the most recent prospectus and any applicable supplement(s) for additional information on these fee waivers and/or reimbursements.
| | | | | | | | |
| | | | |
| Fund expense ratios | | Class A | | Class C | | Class R | | Institutional Class |
| Total annual operating expenses (without fee waivers) | | 2.05% | | 2.80% | | 2.30% | | 1.80% |
| Net expenses (including fee waivers, if any) | | 1.29% | | 2.04% | | 1.04% | | 1.04% |
| Type of waiver | | Contractual | | Contractual | | Contractual
(Investment manager waiver); Voluntary (12b-1 fee waiver) | | Contractual |
*The aggregate contractual waiver period covering this report is from Nov. 27, 2015 through Nov. 28, 2017.
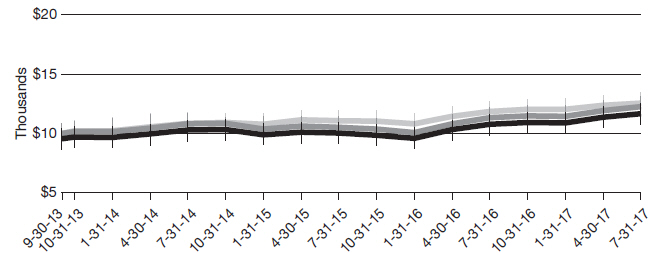
Performance of a $10,000 investment1
Average annual total returns from Sept. 30, 2013 (Fund’s inception) through July 31, 2017
| | | | | | |
| For period beginning Sept. 30, 2013, through July 31, 2017 | | Starting value | | Ending value |
 | | J.P. Morgan Corporate Emerging Markets Bond Index (CEMBI) Broad Diversified | | $10,000 | | $12,581 |

| | Delaware Emerging Markets Debt Fund – Institutional Class shares | | $10,000 | | $12,257 |

| | Delaware Emerging Markets Debt Fund – Class A shares | | $9,550 | | $11,660 |
1 The “Performance of a $10,000 investment” graph assumes $10,000 invested in Institutional Class and Class A shares of the Fund on Sept. 30, 2013, and includes the effect of a 4.50% front-end sales charge (for Class A shares) and the reinvestment of all distributions. The graph does not reflect the deduction of taxes the shareholders would pay on Fund distributions or redemptions of Fund shares. Expense limitations were in effect for some or all of the periods shown. Performance would have been lower had expense limitations not been in effect. Expenses are listed in the “Fund expense ratios” table on page 6. Please note additional details on pages 4 through 7.
The graph also assumes $10,000 invested in the J.P. Morgan Corporate Emerging Markets Bond Index (CEMBI) Broad Diversified as of
Sept. 30, 2013. The J.P. Morgan Corporate Emerging Markets Bond Index (CEMBI) Broad Diversified tracks US dollar–denominated emerging market corporate bonds, limiting the weights of countries with larger corporate debt stocks by including only a specified portion of those countries’ eligible current face amounts of debt outstanding.
Index performance returns do not reflect any management fees, transaction costs, or expenses. Indices are unmanaged and one cannot invest directly in an index. Past performance is not a guarantee of future results.
Performance of other Fund classes will vary due to different charges and expenses.
| | | | | | |
| | | Nasdaq symbols | | CUSIPs | | |
Class A | | DEDAX | | 246094841 | | |
Class C | | DEDCX | | 246094833 | | |
Class R | | DEDRX | | 246094825 | | |
Institutional Class | | DEDIX | | 246094817 | | |
| | |
| Disclosure of Fund expenses | | |
| For the six-month period from February 1, 2017 to July 31, 2017 (Unaudited) | | |
As a shareholder of the Fund, you incur two types of costs: (1) transaction costs, including sales charges (loads) on purchase payments, reinvested dividends, or other distributions; redemption fees; and exchange fees; and (2) ongoing costs, including management fees; distribution and/or service (12b-1) fees; and other Fund expenses. This example is intended to help you understand your ongoing costs (in dollars) of investing in the Fund and to compare these costs with the ongoing costs of investing in other mutual funds.
The example is based on an investment of $1,000 invested at the beginning of the period and held for the entire six-month period from Feb. 1, 2017 to July 31, 2017.
Actual expenses
The first section of the table shown, “Actual Fund return,” provides information about actual account values and actual expenses. You may use the information in this section of the table, together with the amount you invested, to estimate the expenses that you paid over the period. Simply divide your account value by $1,000 (for example, an $8,600 account value divided by $1,000 = 8.6), then multiply the result by the number in the first section under the heading entitled “Expenses Paid During Period” to estimate the expenses you paid on your account during this period.
Hypothetical example for comparison purposes
The second section of the table shown, “Hypothetical 5% return,” provides information about hypothetical account values and hypothetical expenses based on the Fund’s actual expense ratio and an assumed rate of return of 5% per year before expenses, which is not the Fund’s actual return. The hypothetical account values and expenses may not be used to estimate the actual ending account balance or expenses you paid for the period. You may use this information to compare the ongoing costs of investing in the Fund and other funds. To do so, compare this 5% hypothetical example with the 5% hypothetical examples that appear in the shareholder reports of the other funds.
Please note that the expenses shown in the table are meant to highlight your ongoing costs only and do not reflect any transactional costs, such as sales charges (loads), redemption fees, or exchange fees. Therefore, the second section of the table is useful in comparing ongoing costs only, and will not help you determine the relative total costs of owning different funds. In addition, if these transactional costs were included, your costs would have been higher. The Fund’s expenses shown in the table reflect fee waivers in effect. The expenses shown in the table assume reinvestment of all dividends and distributions.
Delaware Emerging Markets Debt Fund
Expense analysis of an investment of $1,000
| | | | | | | | | | | | |
| | | Beginning | | | Ending | | | | | Expenses |
| | | | |
| | | Account Value | | | Account Value | | | Annualized | | Paid During Period |
| | | | |
| | | 2/1/17 | | | 7/31/17 | | | Expense Ratio | | 2/1/17 to 7/31/17* |
|
Actual Fund return† |
Class A | | | $1,000.00 | | | | $1,068.80 | | | 1.24% | | $6.36 |
Class C | | | 1,000.00 | | | | 1,066.00 | | | 1.96% | | 10.04 |
Class R | | | 1,000.00 | | | | 1,068.50 | | | 1.00% | | 5.13 |
Institutional Class | | | 1,000.00 | | | | 1,069.70 | | | 1.00% | | 5.13 |
|
Hypothetical 5% return (5% return before expenses) |
Class A | | | $1,000.00 | | | | $1,018.65 | | | 1.24% | | $6.21 |
Class C | | | 1,000.00 | | | | 1,015.08 | | | 1.96% | | 9.79 |
Class R | | | 1,000.00 | | | | 1,019.84 | | | 1.00% | | 5.01 |
Institutional Class | | | 1,000.00 | | | | 1,019.84 | | | 1.00% | | 5.01 |
* “Expenses Paid During Period” are equal to the Fund’s annualized expense ratio, multiplied by the average account value over the period, multiplied by 181/365 (to reflect the one-half year period).
† Because actual returns reflect only the most recent six-month period, the returns shown may differ significantly from fiscal year returns.
| | |
| Security type / country and sector allocation |
| Delaware Emerging Markets Debt Fund | | As of July 31, 2017 (Unaudited) |
Sector designations may be different than the sector designations presented in other fund materials. The sector designations may represent the investment manager’s internal sector classifications.
| | | | |
Security type / country | | | Percentage of net assets | |
Corporate Bonds by Country | | | 68.13% | |
Argentina | | | 2.65% | |
Austria | | | 1.86% | |
Azerbaijan | | | 1.02% | |
Bermuda | | | 0.91% | |
Brazil | | | 0.91% | |
Canada | | | 1.90% | |
Cayman Islands | | | 4.18% | |
Chile | | | 4.38% | |
Colombia | | | 1.73% | |
Costa Rica. | | | 1.13% | |
Curacao | | | 1.08% | |
Georgia. | | | 0.95% | |
India | | | 3.27% | |
Indonesia | | | 3.86% | |
Ireland | | | 2.99% | |
Jamaica | | | 1.65% | |
Kazakhstan | | | 1.84% | |
Luxembourg | | | 7.89% | |
Mexico | | | 4.48% | |
Morocco | | | 2.34% | |
Netherlands | | | 9.15% | |
Republic of Korea | | | 1.43% | |
Singapore | | | 0.91% | |
South Africa | | | 0.90% | |
Turkey | | | 4.16% | |
United States | | | 0.56% | |
Loan Agreement | | | 1.75% | |
Regional Bonds | | | 2.14% | |
Sovereign Bonds by Country | | | 22.96% | |
Argentina | | | 2.32% | |
Bahrain | | | 0.95% | |
Bermuda | | | 0.94% | |
Bolivia | | | 0.90% | |
Brazil | | | 1.02% | |
Chile | | | 1.39% | |
Colombia | | | 1.18% | |
Croatia | | | 1.10% | |
Ecuador | | | 0.93% | |
10
| | | | |
| |
| Security type / country | | | Percentage of net assets | |
Egypt | | | 1.96% | |
Hungary | | | 0.53% | |
Ivory Coast | | | 0.91% | |
Jordan | | | 1.17% | |
Mexico | | | 0.08% | |
Nigeria | | | 1.53% | |
Russia | | | 0.97% | |
South Africa | | | 0.43% | |
Sri Lanka | | | 1.31% | |
Turkey | | | 1.37% | |
Ukraine | | | 0.95% | |
Uruguay | | | 1.02% | |
Supranational Banks | | | 1.57% | |
Options Purchased | | | 0.09% | |
Short-Term Investments | | | 2.63% | |
Total Value of Securities | | | 99.27% | |
Receivables and Other Assets Net of Liabilities | | | 0.73% | |
Total Net Assets | | | 100.00% | |
| |
| Corporate bonds by sector | | | Percentage of net assets | |
Banking | | | 13.54% | |
Basic Industry | | | 12.43% | |
Brokerage | | | 1.08% | |
Capital Goods | | | 0.95% | |
Communications | | | 9.33% | |
Consumer Cyclical | | | 4.49% | |
Consumer Non-Cyclical | | | 4.84% | |
Electric | | | 5.40% | |
Energy | | | 13.27% | |
Real Estate | | | 0.97% | |
Transportation | | | 1.83% | |
Total | | | 68.13% | |
11
| | |
| Schedule of investments | | |
| Delaware Emerging Markets Debt Fund | | July 31, 2017 |
| | | | | | | | |
| | | Principal amount° | | | Value (US $) | |
| |
Corporate Bonds – 68.13%D | | | | | | | | |
| |
Argentina – 2.65% | | | | | | | | |
Cablevision 144A 6.50% 6/15/21 # | | | 180,000 | | | $ | 191,250 | |
Pampa Energia 144A 7.50% 1/24/27 # | | | 200,000 | | | | 208,000 | |
YPF 144A 24.104% 7/7/20 #● | | | 170,000 | | | | 175,100 | |
| | | | | | | | |
| | | | | | | 574,350 | |
| | | | | | | | |
Austria – 1.86% | | | | | | | | |
ESAL 144A 6.25% 2/5/23 # | | | 200,000 | | | | 189,500 | |
Suzano Austria 144A 7.00% 3/16/47 # | | | 200,000 | | | | 212,500 | |
| | | | | | | | |
| | | | | | | 402,000 | |
| | | | | | | | |
Azerbaijan – 1.02% | | | | | | | | |
Southern Gas Corridor 144A 6.875% 3/24/26 # | | | 200,000 | | | | 220,450 | |
| | | | | | | | |
| | | | | | | 220,450 | |
| | | | | | | | |
Bermuda – 0.91% | | | | | | | | |
Tengizchevroil Finance Co. International 144A 4.00% 8/15/26 # | | | 200,000 | | | | 196,620 | |
| | | | | | | | |
| | | | | | | 196,620 | |
| | | | | | | | |
Brazil – 0.91% | | | | | | | | |
Banco Nacional de Desenvolvimento Economico e Social 144A 4.75% 5/9/24 # | | | 200,000 | | | | 198,400 | |
| | | | | | | | |
| | | | | | | 198,400 | |
| | | | | | | | |
Canada – 1.90% | | | | | | | | |
First Quantum Minerals 144A 7.25% 4/1/23 # | | | 200,000 | | | | 206,750 | |
St. Marys Cement 144A 5.75% 1/28/27 # | | | 200,000 | | | | 204,850 | |
| | | | | | | | |
| | | | | | | 411,600 | |
| | | | | | | | |
Cayman Islands – 4.18% | | | | | | | | |
Comcel Trust via Communicaciones Celulares 144A 6.875% 2/6/24 # | | | 200,000 | | | | 211,700 | |
JD.com 3.125% 4/29/21 | | | 400,000 | | | | 401,264 | |
Petrobras Global Finance 6.75% 1/27/41 | | | 80,000 | | | | 77,100 | |
Vale Overseas | | | | | | | | |
5.875% 6/10/21 | | | 100,000 | | | | 109,375 | |
6.25% 8/10/26 | | | 95,000 | | | | 105,830 | |
| | | | | | | | |
| | | | | | | 905,269 | |
| | | | | | | | |
Chile – 4.38% | | | | | | | | |
AES Gener 144A 8.375% 12/18/73 #● | | | 200,000 | | | | 215,250 | |
Cencosud 144A 6.625% 2/12/45 # | | | 355,000 | | | | 388,121 | |
Corp Nacional del Cobre de Chile 144A 4.50% 8/1/47 # | | | 220,000 | | | | 218,097 | |
Enel Americas 4.00% 10/25/26 | | | 125,000 | | | | 126,094 | |
| | | | | | | | |
| | | | | | | 947,562 | |
| | | | | | | | |
Colombia – 1.73% | | | | | | | | |
Banco de Bogota 144A 4.375% 8/3/27 # | | | 200,000 | | | | 198,750 | |
Ecopetrol | | | | | | | | |
5.875% 9/18/23 | | | 50,000 | | | | 55,189 | |
| | | | | | | | |
| | | Principal amount° | | | Value (US $) | |
| |
Corporate BondsD (continued) | | | | | | | | |
| |
Colombia (continued) | | | | | | | | |
Ecopetrol | | | | | | | | |
7.375% 9/18/43 | | | 110,000 | | | $ | 121,413 | |
| | | | | | | | |
| | | | | | | 375,352 | |
| | | | | | | | |
Costa Rica – 1.13% | | | | | | | | |
Banco Nacional de Costa Rica 144A 5.875% 4/25/21 # | | | 235,000 | | | | 244,400 | |
| | | | | | | | |
| | | | | | | 244,400 | |
| | | | | | | | |
Curacao – 1.08% | | | | | | | | |
SUAM Finance 144A 4.875% 4/17/24 # | | | 220,000 | | | | 233,750 | |
| | | | | | | | |
| | | | | | | 233,750 | |
| | | | | | | | |
Georgia – 0.95% | | | | | | | | |
BGEO Group 144A 6.00% 7/26/23 # | | | 200,000 | | | | 205,104 | |
| | | | | | | | |
| | | | | | | 205,104 | |
| | | | | | | | |
India – 3.27% | | | | | | | | |
Export-Import Bank of India 144A 3.375% 8/5/26 # | | | 200,000 | | | | 196,078 | |
ICICI Bank 144A 4.00% 3/18/26 # | | | 200,000 | | | | 204,025 | |
Vedanta Resources 144A 8.25% 6/7/21 # | | | 275,000 | | | | 308,000 | |
| | | | | | | | |
| | | | | | | 708,103 | |
| | | | | | | | |
Indonesia – 3.86% | | | | | | | | |
Pertamina Persero 144A 5.25% 5/23/21 # | | | 200,000 | | | | 216,686 | |
Perusahaan Gas Negara Persero 144A 5.125% 5/16/24 # | | | 200,000 | | | | 216,820 | |
Perusahaan Listrik Negara | | | | | | | | |
144A 4.125% 5/15/27 # | | | 200,000 | | | | 198,329 | |
144A 5.25% 5/15/47 # | | | 200,000 | | | | 203,850 | |
| | | | | | | | |
| | | | | | | 835,685 | |
| | | | | | | | |
Ireland – 2.99% | | | | | | | | |
MMC Norilsk Nickel OJSC via MMC Finance 144A 4.10% 4/11/23 # | | | 200,000 | | | | 199,327 | |
Mobile Telesystems OJSC via MTS International Funding 144A 5.00% 5/30/23 # | | | 200,000 | | | | 205,088 | |
Phosagro OAO via Phosagro Bond Funding 144A 3.95% 11/3/21 # | | | 240,000 | | | | 242,227 | |
| | | | | | | | |
| | | | | | | 646,642 | |
| | | | | | | | |
Jamaica – 1.65% | | | | | | | | |
Digicel Group 144A 7.125% 4/1/22 # | | | 400,000 | | | | 357,000 | |
| | | | | | | | |
| | | | | | | 357,000 | |
| | | | | | | | |
Kazakhstan – 1.84% | | | | | | | | |
KazMunayGas National | | | | | | | | |
144A 3.875% 4/19/22 # | | | 200,000 | | | | 199,284 | |
144A 4.75% 4/19/27 # | | | 200,000 | | | | 199,211 | |
| | | | | | | | |
| | | | | | | 398,495 | |
| | | | | | | | |
Luxembourg – 7.89% | | | | | | | | |
Atento Luxco 1 144A 6.125% 8/10/22 # | | | 180,000 | | | | 182,629 | |
13
Schedule of investments
Delaware Emerging Markets Debt Fund
| | | | | | | | |
| | | Principal amount° | | | Value (US $) | |
| |
Corporate BondsD (continued) | | | | | | | | |
| |
Luxembourg (continued) | | | | | | | | |
Gazprom OAO Via Gaz Capital 144A 4.95% 3/23/27 # | | | 260,000 | | | $ | 262,996 | |
Kernel Holding 144A 8.75% 1/31/22 # | | | 220,000 | | | | 240,222 | |
MHP 144A 7.75% 5/10/24 # | | | 200,000 | | | | 207,500 | |
Petrobras Global Finance 5.375% 1/27/21 | | | 170,000 | | | | 175,100 | |
Raizen Fuels Finance 144A 5.30% 1/20/27 # | | | 225,000 | | | | 231,750 | |
Topaz Marine 144A 9.125% 7/26/22 # | | | 200,000 | | | | 199,375 | |
VM Holding 144A 5.375% 5/4/27 # | | | 200,000 | | | | 208,000 | |
| | | | | | | | |
| | | | | | | 1,707,572 | |
| | | | | | | | |
Mexico – 4.48% | | | | | | | | |
BBVA Bancomer 6.50% 3/10/21 | | | 250,000 | | | | 276,875 | |
Becle 144A 3.75% 5/13/25 # | | | 200,000 | | | | 202,829 | |
Petroleos Mexicanos | | | | | | | | |
6.75% 9/21/47 | | | 140,000 | | | | 147,728 | |
144A 6.75% 9/21/47 # | | | 125,000 | | | | 131,900 | |
Trust F/1401 144A 5.25% 1/30/26 # | | | 200,000 | | | | 210,250 | |
| | | | | | | | |
| | | | | | | 969,582 | |
| | | | | | | | |
Morocco – 2.34% | | | | | | | | |
OCP 144A 4.50% 10/22/25 # | | | 500,000 | | | | 505,930 | |
| | | | | | | | |
| | | | | | | 505,930 | |
| | | | | | | | |
Netherlands – 9.15% | | | | | | | | |
AES Andres 144A 7.95% 5/11/26 # | | | 200,000 | | | | 217,222 | |
Equate Petrochemical 144A 3.00% 3/3/22 # | | | 255,000 | | | | 254,655 | |
Marfrig Holdings Europe 144A 8.00% 6/8/23 # | | | 200,000 | | | | 208,900 | |
Myriad International Holdings | | | | | | | | |
144A 4.85% 7/6/27 # | | | 200,000 | | | | 206,800 | |
144A 5.50% 7/21/25 # | | | 200,000 | | | | 217,135 | |
Petrobras Global Finance | | | | | | | | |
7.25% 3/17/44 | | | 105,000 | | | | 105,919 | |
7.375% 1/17/27 | | | 130,000 | | | | 141,115 | |
VimpelCom Holdings | | | | | | | | |
144A 4.95% 6/16/24 # | | | 200,000 | | | | 201,750 | |
144A 5.95% 2/13/23 # | | | 200,000 | | | | 215,202 | |
VTR Finance 144A 6.875% 1/15/24 # | | | 200,000 | | | | 213,750 | |
| | | | | | | | |
| | | | | | | 1,982,448 | |
| | | | | | | | |
Republic of Korea – 1.43% | | | | | | | | |
Woori Bank 144A 4.75% 4/30/24 # | | | 295,000 | | | | 310,024 | |
| | | | | | | | |
| | | | | | | 310,024 | |
| | | | | | | | |
Singapore – 0.91% | | | | | | | | |
BOC Aviation 144A 2.375% 9/15/21 # | | | 200,000 | | | | 196,728 | |
| | | | | | | | |
| | | | | | | 196,728 | |
| | | | | | | | |
14
| | | | | | | | | | | | |
| | | | | | Principal amount° | | | Value (US $) | |
| |
Corporate BondsD (continued) | | | | | | | | | | | | |
| |
South Africa – 0.90% | | | | | | | | | | | | |
Transnet SOC 144A 4.00% 7/26/22 # | | | | | | | 200,000 | | | $ | 196,006 | |
| | | | | | | | | | | | |
| | | | | | | | | | | 196,006 | |
| | | | | | | | | | | | |
Turkey – 4.16% | | | | | | | | | | | | |
Akbank 144A 7.20% 3/16/27 #● | | | | | | | 205,000 | | | | 214,230 | |
Export Credit Bank of Turkey 144A 5.375% 10/24/23 # | | | | | | | 215,000 | | | | 220,229 | |
Turkiye Garanti Bankasi 144A 6.25% 4/20/21 # | | | | | | | 210,000 | | | | 224,300 | |
Turkiye Is Bankasi 144A 7.00% 6/29/28 #● | | | | | | | 240,000 | | | | 242,531 | |
| | | | | | | | | | | | |
| | | | | | | | | | | 901,290 | |
| | | | | | | | | | | | |
United States – 0.56% | | | | | | | | | | | | |
Southern Copper 5.875% 4/23/45 | | | | | | | 110,000 | | | | 121,868 | |
| | | | | | | | | | | | |
| | | | | | | | | | | 121,868 | |
| | | | | | | | | | | | |
Total Corporate Bonds (cost $14,239,606) | | | | | | | | | | | 14,752,230 | |
| | | | | | | | | | | | |
|
| |
Loan Agreement – 1.75%« | | | | | | | | | | | | |
Republic of Angola (Unsecured) 7.57% 12/16/23 | | | | | | | 414,375 | | | | 379,153 | |
| | | | | | | | | | | | |
Total Loan Agreement (cost $414,375) | | | | | | | | | | | 379,153 | |
| | | | | | | | | | | | |
|
| |
Regional Bonds – 2.14%D | | | | | | | | | | | | |
| |
Argentina – 2.14% | | | | | | | | | | | | |
Provincia de Buenos Aires 144A 7.875% 6/15/27 # | | | | | | | 150,000 | | | | 153,476 | |
Provincia de Cordoba | | | | | | | | | | | | |
144A 7.125% 6/10/21 # | | | | | | | 150,000 | | | | 157,275 | |
144A 7.125% 8/1/27 # | | | | | | | 155,000 | | | | 152,040 | |
| | | | | | | | | | | | |
Total Regional Bonds (cost $464,086) | | | | | | | | | | | 462,791 | |
| | | | | | | | | | | | |
|
| |
Sovereign Bonds – 22.96%D | | | | | | | | | | | | |
| |
Argentina – 2.32% | | | | | | | | | | | | |
Argentine Bonos del Tesoro | | | | | | | | | | | | |
16.00% 10/17/23 | | | ARS | | | | 694,000 | | | | 42,284 | |
22.75% 3/5/18 | | | ARS | | | | 800,000 | | | | 49,445 | |
Argentine Republic Government International Bond | | | | | | | | | | | | |
5.625% 1/26/22 | | | | | | | 125,000 | | | | 128,437 | |
144A 7.125% 6/28/17 # | | | | | | | 310,000 | | | | 281,945 | |
| | | | | | | | | | | | |
| | | | | | | | | | | 502,111 | |
| | | | | | | | | | | | |
Bahrain – 0.95% | | | | | | | | | | | | |
Bahrain Government International Bond 144A 7.00% 10/12/28 # | | | | | | | 200,000 | | | | 206,025 | |
| | | | | | | | | | | | |
| | | | | | | | | | | 206,025 | |
| | | | | | | | | | | | |
15
| | |
Schedule of investments Delaware Emerging Markets Debt Fund | | |
| | | | | | | | | | | | |
| | | | | | Principal amount° | | | Value (US $) | |
| |
Sovereign BondsD (continued) | | | | | | | | | | | | |
| |
Bermuda – 0.94% | | | | | | | | | | | | |
Bermuda Government International Bond 144A 3.717% 1/25/27 # | | | | | | | 200,000 | | | $ | 202,734 | |
| | | | | | | | | | | | |
| | | | | | | | | | | 202,734 | |
| | | | | | | | | | | | |
Bolivia – 0.90% | | | | | | | | | | | | |
Bolivian Government International Bond 144A 4.50% 3/20/28 # | | | | | | | 200,000 | | | | 195,250 | |
| | | | | | | | | | | | |
| | | | | | | | | | | 195,250 | |
| | | | | | | | | | | | |
Brazil – 1.02% | | | | | | | | | | | | |
Brazil Notas do Tesouro Nacional Series F 10.00% 1/1/25 | | | BRL | | | | 682,000 | | | | 220,648 | |
| | | | | | | | | | | | |
| | | | | | | | | | | 220,648 | |
| | | | | | | | | | | | |
Chile – 1.39% | | | | | | | | | | | | |
Bonos de la Tesoreria de la Republica en pesos 4.50% 3/1/21 | | | CLP | | | | 185,000,000 | | | | 300,437 | |
| | | | | | | | | | | | |
| | | | | | | | | | | 300,437 | |
| | | | | | | | | | | | |
Colombia – 1.18% | | | | | | | | | | | | |
Colombia Government International Bond 5.00% 6/15/45 | | | | | | | 250,000 | | | | 254,875 | |
| | | | | | | | | | | | |
| | | | | | | | | | | 254,875 | |
| | | | | | | | | | | | |
Croatia – 1.10% | | | | | | | | | | | | |
Croatia Government International Bond 144A 5.50% 4/4/23 # | | | | | | | 215,000 | | | | 239,176 | |
| | | | | | | | | | | | |
| | | | | | | | | | | 239,176 | |
| | | | | | | | | | | | |
Ecuador – 0.93% | | | | | | | | | | | | |
Ecuador Government International Bond 144A 8.75% 6/2/23 # | | | | | | | 200,000 | | | | 200,500 | |
| | | | | | | | | | | | |
| | | | | | | | | | | 200,500 | |
| | | | | | | | | | | | |
Egypt – 1.96% | | | | | | | | | | | | |
Egypt Government International Bond | | | | | | | | | | | | |
144A 6.125% 1/31/22 # | | | | | | | 200,000 | | | | 206,720 | |
144A 8.50% 1/31/47 # | | | | | | | 200,000 | | | | 217,911 | |
| | | | | | | | | | | | |
| | | | | | | | | | | 424,631 | |
| | | | | | | | | | | | |
Hungary – 0.53% | | | | | | | | | | | | |
Hungary Government International Bond 5.75% 11/22/23 | | | | | | | 100,000 | | | | 115,440 | |
| | | | | | | | | | | | |
| | | | | | | | | | | 115,440 | |
| | | | | | | | | | | | |
Ivory Coast – 0.91% | | | | | | | | | | | | |
Ivory Coast Government International Bond 144A 6.125% 6/15/33 # | | | | | | | 200,000 | | | | 196,459 | |
| | | | | | | | | | | | |
| | | | | | | | | | | 196,459 | |
| | | | | | | | | | | | |
Jordan – 1.17% | | | | | | | | | | | | |
Jordan Government International Bond 144A 5.75% 1/31/27 # | | | | | | | 255,000 | | | | 254,022 | |
| | | | | | | | | | | | |
| | | | | | | | | | | 254,022 | |
| | | | | | | | | | | | |
| | | | | | | | | | | | |
| | | | | | Principal amount° | | | Value (US $) | |
| |
Sovereign BondsD (continued) | | | | | | | | | | | | |
| |
Mexico – 0.08% | | | | | | | | | | | | |
Mexican Bonos 6.50% 6/9/22 | | | MXN | | | | 297,000 | | | $ | 16,527 | |
| | | | | | | | | | | | |
| | | | | | | | | | | 16,527 | |
| | | | | | | | | | | | |
Nigeria – 1.53% | | | | | | | | | | | | |
Nigeria Government International Bond 144A 7.875% 2/16/32 # | | | | | | | 300,000 | | | | 332,153 | |
| | | | | | | | | | | | |
| | | | | | | | | | | 332,153 | |
| | | | | | | | | | | | |
Russia – 0.97% | | | | | | | | | | | | |
Russian Foreign Bond – Eurobond 144A 4.75% 5/27/26 # | | | | | | | 200,000 | | | | 209,770 | |
| | | | | | | | | | | | |
| | | | | | | | | | | 209,770 | |
| | | | | | | | | | | | |
South Africa – 0.43% | | | | | | | | | | | | |
Republic of South Africa Government Bond 8.00% 1/31/30 | | | ZAR | | | | 1,350,000 | | | | 93,796 | |
| | | | | | | | | | | | |
| | | | | | | | | | | 93,796 | |
| | | | | | | | | | | | |
Sri Lanka – 1.31% | | | | | | | | | | | | |
Sri Lanka Government International Bond 144A 6.20% 5/11/27 # | | | | | | | 275,000 | | | | 283,938 | |
| | | | | | | | | | | | |
| | | | | | | | | | | 283,938 | |
| | | | | | | | | | | | |
Turkey – 1.37% | | | | | | | | | | | | |
Turkey Government Bond 8.00% 3/12/25 | | | TRY | | | | 422,000 | | | | 105,579 | |
Turkey Government International Bond 3.25% 3/23/23 | | | | | | | 200,000 | | | | 189,968 | |
| | | | | | | | | | | | |
| | | | | | | | | | | 295,547 | |
| | | | | | | | | | | | |
Ukraine – 0.95% | | | | | | | | | | | | |
Ukraine Government International Bond 144A 7.75% 9/1/22 # | | | | | | | 200,000 | | | | 205,500 | |
| | | | | | | | | | | | |
| | | | | | | | | | | 205,500 | |
| | | | | | | | | | | | |
Uruguay – 1.02% | | | | | | | | | | | | |
Uruguay Government International Bond 144A 9.875% 6/20/22 # | | | UYU | | | | 5,856,000 | | | | 220,825 | |
| | | | | | | | | | | | |
| | | | | | | | | | | 220,825 | |
| | | | | | | | | | | | |
Total Sovereign Bonds (cost $4,813,259) | | | | | | | | | | | 4,970,364 | |
| | | | | | | | | | | | |
|
| |
Supranational Banks – 1.57% | | | | | | | | | | | | |
| |
Banque Ouest Africaine de Developpement 144A | | | | | | | | | | | | |
5.00% 7/27/27 # | | | | | | | 240,000 | | | | 240,552 | |
Inter-American Development Bank 6.25% 6/15/21 | | | IDR | | | | 300,000,000 | | | | 22,502 | |
International Finance 6.30% 11/25/24 | | | INR | | | | 4,910,000 | | | | 77,777 | |
| | | | | | | | | | | | |
Total Supranational Banks (cost $334,330) | | | | | | | | | | | 340,831 | |
| | | | | | | | | | | | |
17
Schedule of investments
Delaware Emerging Markets Debt Fund
| | | | | | | | |
| | | Number of contracts | | | Value (US $) | |
| |
Options Purchased – 0.09% | | | | | | | | |
| |
Currency Call Option – 0.04% | | | | | | | | |
USD vs JPY strike price JPY 109.00, expiration date 9/27/17 (BAML) | | | 820,000 | | | $ | 8,776 | |
| | | | | | | | |
| | | | | | | 8,776 | |
| | | | | | | | |
Currency Put Options – 0.05% | | | | | | | | |
USD vs BRL strike price BRL 3.50, expiration date 9/27/17 (BAML) | | | 410,000 | | | | 793 | |
USD vs KRW strike price KRW 1,160.00, expiration date 9/27/17 (BAML) | | | 410,000 | | | | 1,748 | |
USD vs MXN strike price MXN 18.50, expiration date 9/27/17 (BAML) | | | 410,000 | | | | 3,243 | |
USD vs MXN strike price MXN 19.00, expiration date 8/11/17 (BAML) | | | 500,000 | | | | 34 | |
USD vs TRY strike price TRY 3.75, expiration date 9/27/17 (BAML) | | | 410,000 | | | | 1,970 | |
USD vs TWD strike price TWD 30.50, expiration date 9/27/17 (BAML) | | | 410,000 | | | | 1,758 | |
| | | | | | | | |
| | | | | | | 9,546 | |
| | | | | | | | |
Total Options Purchased (cost $47,352) | | | | | | | 18,322 | |
| | | | | | | | |
| | |
| | | Principal amount° | | | | |
Short-Term Investments – 2.63% | | | | | | | | |
Repurchase Agreements – 1.93% | | | | | | | | |
Bank of America Merrill Lynch | | | | | | | | |
0.97%, dated 7/31/17, to be repurchased on 8/1/17, repurchase price $76,670 (collateralized by US government obligations 0.125% 4/15/18; market value $78,201) | | | 76,668 | | | | 76,668 | |
Bank of Montreal | | | | | | | | |
0.90%, dated 7/31/17, to be repurchased on 8/1/17, repurchase price $191,675 (collateralized by US government obligations 0.00%–4.375% 1/11/18–8/15/40; market value $195,503) | | | 191,670 | | | | 191,670 | |
BNP Paribas | | | | | | | | |
1.04%, dated 7/31/17, to be repurchased on 8/1/17, repurchase price $150,666 (collateralized by US government obligations 0.00%–2.50% 10/12/17–8/15/46; market value $153,675) | | | 150,662 | | | | 150,662 | |
| | | | | | | | |
| | | | | | | 419,000 | |
| | | | | | | | |
| | | | | | | | |
| | | Principal amount° | | | Value (US $) | |
| |
Short-Term Investments (continued) | | | | | | | | |
| |
US Treasury Obligation – 0.70% ≠ | | | | | | | | |
US Treasury Bill 0.92% 8/3/17 | | | 150,597 | | | $ | 150,589 | |
| | | | | | | | |
| | | | | | | 150,589 | |
| | | | | | | | |
Total Short-Term Investments (cost $569,590) | | | | | | | 569,589 | |
| | | | | | | | |
| | |
Total Value of Securities – 99.27% (cost $20,882,598) | | | | | | $ | 21,493,280 | |
| | | | | | | | |
| # | Security exempt from registration under Rule 144A of the Securities Act of 1933, as amended. At July 31, 2017, the aggregate value of Rule 144A securities was $16,943,631, which represents 78.25% of the Fund’s net assets. See Note 11 in “Notes to financial statements.” |
| ≠ | The rate shown is the effective yield at the time of purchase. |
| « | Loan agreements generally pay interest at rates which are periodically reset by reference to a base lending rate plus a premium. These base lending rates are generally: (i) the prime rate offered by one or more US banks, (ii) the lending rate offered by one or more European banks such as the London Interbank Offered Rate (LIBOR), and (iii) the certificate of deposit rate. Loan agreements may be subject to restrictions on resale. Stated rate in effect at July 31, 2017. |
| ° | Principal amount shown is stated in US dollars unless noted that the security is denominated in another currency. |
| D | Securities have been classified by country of origin. Aggregate classification by business sector has been presented on page 11 in “ Security type / country and sector allocations.” |
| ● | Variable rate security. Each rate shown is as of July 31, 2017. Interest rates reset periodically. |
The following foreign currency exchange contracts and swap contract were outstanding at July 31, 20171:
Foreign Currency Exchange Contracts
| | | | | | | | | | | | | | | | | | | | | | | | | | | | | | | | | | | | |
| | | | | | | | | | | | | | | | | | | | | | | | | | | Unrealized | |
| | | Contracts to | | | | | | | | | | | | | | | | | | | | | Appreciation | |
Counterparty | | Receive (Deliver) | | | | | | In Exchange For | | | | | | Settlement Date | | | | | | (Depreciation) | |
HSBC | | | INR | | | | 4,827,402 | | | | | | | | USD | | | | (74,710 | ) | | | | | | | 9/1/17 | | | | | | | $ | 299 | |
TD | | | ZAR | | | | (46,202 | ) | | | | | | | USD | | | | 3,543 | | | | | | | | 9/1/17 | | | | | | | | 58 | |
| | | | | | | | | | | | | | | | | | | | | | | | | | | | | | | | | | | | |
| | | | | | | | | | | | | | | | | | | | | | | | | | | | | | | | | | $ | 357 | |
| | | | | | | | | | | | | | | | | | | | | | | | | | | | | | | | | | | | |
19
Schedule of investments
Delaware Emerging Markets Debt Fund
Swap Contract
CDS Contract2
| | | | | | | | | | | | | | | | | | | | | | |
Counterparty | | Swap Referenced Obligation | | Notional Value3 | | | Annual
Protection
Payments | | | Termination
Date | | | Upfront
Payment
Paid
(Received) | | | Unrealized
Appreciation
(Depreciation)4 | |
| | Protection Purchased: | | | | | | | | | | | | | | | | | | | | |
HSBC | | CDX.EM.275 | | | 570,000 | | | | 1.00% | | | | 6/20/22 | | | $ | 29,736 | | | | $ (6,642) | |
The use of foreign currency exchange contracts and swap contracts involve elements of market risk and risks in excess of the amounts disclosed in these financial statements. The foreign currency exchange contracts and notional values presented above represent the Fund’s total exposure in such contracts, whereas only the net unrealized appreciation (depreciation) is reflected in the Fund’s net assets.
1See Note 8 in “Notes to financial statements.”
2A Credit Default Swap (CDS) contract is a risk-transfer instrument through which one party (purchaser of protection) transfers to another party (seller of protection) the financial risk of a credit event (as defined in the CDS agreement), as it relates to a particular reference security or basket of securities (such as an index). Periodic payments (receipts) on such contracts are accrued daily and recorded as unrealized losses (gains) on swap contracts. Upon payment (receipt), such amounts are recorded as realized losses (gains) on swap contracts. Upfront payments made or received in connection with CDS contracts are amortized over the expected life of the CDS contracts as unrealized losses (gains) on swap contracts. The change in value of CDS contracts is recorded daily as unrealized appreciation or depreciation. A realized gain or loss is recorded upon a credit event (as defined in the CDS agreement) or the maturity or termination of the agreement.
3Notional value shown is stated in US dollars unless noted that the swap is denominated in another currency. 4Unrealized appreciation (depreciation) does not include periodic interest payments (receipts) on swap contracts accrued daily in the amount of $(665).
5Markit’s Emerging markets CDX Index, or the CDX.EM Index is composed of 15 sovereign issuers from the following countries: Argentina, Brazil, Chile, China, Colombia, Indonesia, Malaysia, Mexico, Panama, Peru, Philippines, Russia, South Africa, Turkey, and Venezuela, which have a S&P credit quality ratings CCC and above.
Summary of abbreviations:
ARS – Argentine Peso
BAML – Bank of America Merrill Lynch
BRL – Brazilian Real
CDX.EM – Credit Default Swap Index Emerging Markets
CLP – Chilean Peso
HSBC – Hong Kong Shanghai Bank
IDR – Indonesian Rupiah
INR – Indian Rupee
JPY – Japanese Yen
(continued)
Summary of abbreviations (continued):
KRW – South Korean Won
MXN – Mexican Peso
OJSC – Open Joint Stock Company
S&P – Standard & Poor’s Financial Services LLC
TD – Toronto Dominion Bank
TRY – Turkish Lira
TWD – Taiwan New Dollar
USD – US Dollar
UYU – Uruguayan Peso
ZAR – South African Rand
See accompanying notes, which are an integral part of the financial statements.
21
| | |
| Statement of assets and liabilities |
| Delaware Emerging Markets Debt Fund | | July 31, 2017 |
| | | | |
Assets: | | | | |
Investments, at value1 | | | $20,905,369 | |
Short-term investments, at value2 | | | 569,589 | |
Options purchased, at value3 | | | 18,322 | |
Receivable for securities sold | | | 657,610 | |
Interest receivable | | | 253,464 | |
Cash | | | 42,183 | |
Receivable for fund shares sold | | | 40,000 | |
Upfront payments paid on credit default swap contracts | | | 29,736 | |
Foreign currencies, at value4 | | | 7,004 | |
Unrealized appreciation on foreign currency exchange contracts | | | 357 | |
| | | | |
Total assets | | | 22,523,634 | |
| | | | |
Liabilities: | | | | |
Payable for securities purchased | | | 789,116 | |
Audit and tax fees payable | | | 45,188 | |
Other accrued expenses | | | 23,779 | |
Unrealized depreciation on credit default swap contracts | | | 6,642 | |
Investment management fees payable to affiliates | | | 5,764 | |
Swaps payment payable | | | 665 | |
Dividend disbursing and transfer agent fees and expenses payable to affiliates | | | 360 | |
Accounting and administration expenses payable to affiliates | | | 84 | |
Trustees’ fees and expenses payable | | | 52 | |
Distribution fees payable to affiliates | | | 27 | |
Legal fees payable to affiliates | | | 23 | |
Reports and statements to shareholders expenses payable to affiliates | | | 19 | |
Deferred capital gains tax payable | | | 11 | |
| | | | |
Total liabilities | | | 871,730 | |
| | | | |
Total Net Assets | | | $21,651,904 | |
| | | | |
| |
Net Assets Consist of: | | | | |
Paid-in capital | | | $20,924,415 | |
Undistributed net investment income | | | 56,892 | |
Accumulated net realized gain | | | 66,746 | |
Net unrealized appreciation of investments | | | 639,701 | |
Net unrealized appreciation of foreign currencies | | | 130 | |
Net unrealized appreciation of foreign currency exchange contracts | | | 357 | |
Net unrealized depreciation of options purchased | | | (29,030 | ) |
Net unrealized depreciation of swap contracts | | | (7,307 | ) |
| | | | |
Total Net Assets | | | $21,651,904 | |
| | | | |
| | | | |
Class A: | | | | |
Net assets | | $ | 26,475 | |
Shares of beneficial interest outstanding, unlimited authorization, no par | | | 3,020 | |
Net asset value per share | | $ | 8.77 | |
Sales charge | | | 4.50 | % |
Offering price per share, equal to net asset value per share / (1 – sales charge) | | $ | 9.18 | |
| |
Class C: | | | | |
Net assets | | $ | 62,722 | |
Shares of beneficial interest outstanding, unlimited authorization, no par | | | 7,153 | |
Net asset value per share | | $ | 8.77 | |
| |
Class R: | | | | |
Net assets | | $ | 2,465 | |
Shares of beneficial interest outstanding, unlimited authorization, no par | | | 281 | |
Net asset value per share | | $ | 8.77 | |
| |
Institutional Class: | | | | |
Net assets | | $ | 21,560,242 | |
Shares of beneficial interest outstanding, unlimited authorization, no par | | | 2,456,150 | |
Net asset value per share | | $ | 8.78 | |
| |
| | | | |
1 Investments, at cost | | $ | 20,265,656 | |
2 Short-term investments, at cost | | | 569,590 | |
3 Options purchased, at cost | | | 47,352 | |
4 Foreign currencies, at cost | | | 6,762 | |
See accompanying notes, which are an integral part of the financial statements.
| | |
| Statement of operations |
| Delaware Emerging Markets Debt Fund | | Year ended July 31, 2017 |
| | | | |
Investment Income: | | | | |
Interest | | | $1,125,699 | |
Dividends | | | 5,011 | |
| | | | |
| | | 1,130,710 | |
| | | | |
Expenses: | | | | |
Management fees | | | 153,633 | |
Distribution expenses – Class A | | | 32 | |
Distribution expenses – Class C | | | 84 | |
Distribution expenses – Class R | | | 12 | |
Registration fees | | | 58,813 | |
Audit and tax fees | | | 49,285 | |
Reports and statements to shareholders expenses | | | 22,047 | |
Legal fees | | | 21,088 | |
Accounting and administration expenses | | | 8,257 | |
Dividend disbursing and transfer agent fees and expenses | | | 6,338 | |
Custodian fees | | | 4,787 | |
Trustees’ fees and expenses | | | 984 | |
Other | | | 14,446 | |
| | | | |
| | | 339,806 | |
Less expenses waived | | | (134,832 | ) |
Less waived distribution expenses – Class A | | | (4 | ) |
Less waived distribution expenses – Class C | | | (16 | ) |
Less waived distribution expenses – Class R | | | (12 | ) |
Less expense paid indirectly | | | (1 | ) |
| | | | |
Total operating expenses | | | 204,941 | |
| | | | |
Net Investment Income | | | 925,769 | |
| | | | |
| | | | |
Net Realized and Unrealized Gain (Loss): | | | | |
Net realized gain (loss) on: | | | | |
Investments1 | | | $ 728,576 | |
Foreign currencies | | | (10,556 | ) |
Foreign currency exchange contracts | | | 69,741 | |
Futures contracts | | | 20,075 | |
Options purchased | | | (4,240 | ) |
Swap contracts | | | (16,684 | ) |
| | | | |
Net realized gain | | | 786,912 | |
| | | | |
Net change in unrealized appreciation (depreciation) of: | | | | |
Investments2 | | | (45,159 | ) |
Foreign currencies | | | (887 | ) |
Foreign currency exchange contracts | | | 1,896 | |
Options purchased | | | (29,030 | ) |
Swap contracts | | | (7,307 | ) |
| | | | |
Net change in unrealized appreciation (depreciation) | | | (80,487 | ) |
| | | | |
Net Realized and Unrealized Gain | | | 706,425 | |
| | | | |
Net Increase in Net Assets Resulting from Operations | | $ | 1,632,194 | |
| | | | |
| 1 | Includes $2,117 capital gains taxes paid. |
| 2 | Includes ($820) capital gains taxes accrued. |
See accompanying notes, which are an integral part of the financial statements.
Statements of changes in net assets
Delaware Emerging Markets Debt Fund
| | | | | | | | |
| | | Year ended | |
| | | 7/31/17 | | | 7/31/16 | |
Increase (Decrease) in Net Assets from Operations: | | | | | | | | |
Net investment income | | $ | 925,769 | | | $ | 815,892 | |
Net realized gain (loss) | | | 786,912 | | | | (85,028 | ) |
Net change in unrealized appreciation (depreciation) | | | (80,487 | ) | | | 668,592 | |
| | | | | | | | |
Net increase in net assets resulting from operations | | | 1,632,194 | | | | 1,399,456 | |
| | | | | | | | |
| | |
Dividends and Distributions to Shareholders from: | | | | | | | | |
Net investment income: | | | | | | | | |
Class A | | | (503 | ) | | | (87 | ) |
Class C | | | (338 | ) | | | (86 | ) |
Class R | | | (104 | ) | | | (86 | ) |
Institutional Class | | | (911,292 | ) | | | (755,933 | ) |
| | | | | | | | |
| | | (912,237 | ) | | | (756,192 | ) |
| | | | | | | | |
| | |
Capital Share Transactions: | | | | | | | | |
Proceeds from shares sold: | | | | | | | | |
Class A | | | 48,538 | | | | — | |
Class C | | | 59,542 | | | | — | |
| | |
Net asset value of shares issued upon reinvestment of dividends and distributions: | | | | | | | | |
Class A | | | 502 | | | | 87 | |
Class C | | | 338 | | | | 86 | |
Class R | | | 104 | | | | 86 | |
Institutional Class | | | 911,292 | | | | 755,933 | |
| | | | | | | | |
| | | 1,020,316 | | | | 756,192 | |
| | | | | | | | |
Cost of shares redeemed: | | | | | | | | |
Class A | | | (25,345 | ) | | | — | |
| | | | | | | | |
Increase in net assets derived from capital share transactions | | | 994,971 | | | | 756,192 | |
| | | | | | | | |
Net Increase in Net Assets | | | 1,714,928 | | | | 1,399,456 | |
| | |
Net Assets: | | | | | | | | |
Beginning of year | | | 19,936,976 | | | | 18,537,520 | |
| | | | | | | | |
End of year | | $ | 21,651,904 | | | $ | 19,936,976 | |
| | | | | | | | |
| | |
Undistributed (distributions in excess of) net investment income | | $ | 56,892 | | | $ | (2,321 | ) |
| | | | | | | | |
See accompanying notes, which are an integral part of the financial statements.
This page intentionally left blank.
Financial highlights
Delaware Emerging Markets Debt Fund Class A
Selected data for each share of the Fund outstanding throughout each period were as follows:
|
| |
| |
|
| |
|
Net asset value, beginning of period |
|
Income (loss) from investment operations: |
Net investment income2 |
Net realized and unrealized gain (loss) |
|
Total from investment operations. |
|
|
Less dividends and distributions from: |
Net investment income |
Net realized gain |
|
Total dividends and distributions |
|
|
Net asset value, end of period |
|
|
Total return3 |
|
Ratios and supplemental data: |
Net assets, end of period (000 omitted) |
Ratio of expenses to average net assets excluding interest expense. |
Ratio of expenses to average net assets |
Ratio of expenses to average net assets prior to fees waived |
Ratio of net investment income to average net assets excluding interest expense . |
Ratio of net investment income to average net assets |
Ratio of net investment income to average net assets prior to fees waived |
Portfolio turnover |
|
|
| 1 | Date of commencement of operations; ratios have been annualized and total return and portfolio turnover have not been annualized. |
| 2 | The average shares outstanding method has been applied for per share information. |
| 3 | Total investment return is based on the change in net asset value of a share during the period and assumes reinvestment of dividends and distributions at net asset value and does not reflect the impact of a sales charge. Total investment return during all of the periods shown reflects waivers by the manager and/or distributor. Performance would have been lower had the waivers not been in effect. |
See accompanying notes, which are an integral part of the financial statements.
| | | | | | | | | | | | | | | | | | | | | | |
| | | | | | | | | | | | | | | | | | 9/30/131 | |
| | | Year ended | | | | | to | |
| | | 7/31/17 | | | | | 7/31/16 | | | | | 7/31/15 | | | | | 7/31/14 | |
| |
| | $ | 8.48 | | | | | $ | 8.21 | | | | | $ | 8.84 | | | | | $ | 8.50 | |
| | | | | | | |
| | | | | | | | | | | | | | | | | | | | | | |
| | | 0.37 | | | | | | 0.36 | | | | | | 0.37 | | | | | | 0.32 | |
| | | 0.29 | | | | | | 0.24 | | | | | | (0.61 | ) | | | | | 0.34 | |
| | | | | | | | | | | | | | | | | | | | | | |
| | | 0.66 | | | | | | 0.60 | | | | | | (0.24 | ) | | | | | 0.66 | |
| | | | | | | | | | | | | | | | | | | | | | |
| | | | | | | |
| | | | | | | | | | | | | | | | | | | | | | |
| | | (0.37 | ) | | | | | (0.33 | ) | | | | | (0.30 | ) | | | | | (0.32 | ) |
| | | — | | | | | | — | | | | | | (0.09 | ) | | | | | — | |
| | | | | | | | | | | | | | | | | | | | | | |
| | | (0.37 | ) | | | | | (0.33 | ) | | | | | (0.39 | ) | | | | | (0.32 | ) |
| | | | | | | | | | | | | | | | | | | | | | |
| | | | | | | |
| | $ | 8.77 | | | | | $ | 8.48 | | | | | $ | 8.21 | | | | | $ | 8.84 | |
| | | | | | | | | | | | | | | | | | | | | | |
| | | | | | | |
| | | 8.03% | | | | | | 7.62% | | | | | | (2.65% | ) | | | | | 7.86% | |
| | | | | | | |
| | | | | | | | | | | | | | | | | | | | | | |
| | $ | 27 | | | | | $ | 3 | | | | | $ | 2 | | | | | $ | 2 | |
| | | 1.22% | | | | | | 1.01% | | | | | | 1.08% | | | | | | 1.31% | |
| | | 1.22% | | | | | | 1.03% | | | | | | 1.14% | | | | | | 1.50% | |
| | | 1.91% | | | | | | 2.04% | | | | | | 2.03% | | | | | | 2.48% | |
| | | 4.30% | | | | | | 4.44% | | | | | | 4.46% | | | | | | 4.66% | |
| | | 4.30% | | | | | | 4.42% | | | | | | 4.40% | | | | | | 4.47% | |
| | | 3.61% | | | | | | 3.41% | | | | | | 3.51% | | | | | | 3.49% | |
| | | 154% | | | | | | 232% | | | | | | 288% | | | | | | 152% | |
| | | | | | | | | | | | | | | | | | | | | | |
| |
Financial highlights
Delaware Emerging Markets Debt Fund Class C
Selected data for each share of the Fund outstanding throughout each period were as follows:
|
| |
| |
| |
Net asset value, beginning of period |
|
Income (loss) from investment operations: |
Net investment income2 |
Net realized and unrealized gain (loss) |
|
Total from investment operations. |
|
|
Less dividends and distributions from: |
Net investment income |
Net realized gain |
|
Total dividends and distributions |
|
|
Net asset value, end of period |
|
|
Total return3 |
|
Ratios and supplemental data: |
Net assets, end of period (000 omitted) |
Ratio of expenses to average net assets excluding interest expense. |
Ratio of expenses to average net assets |
Ratio of expenses to average net assets prior to fees waived |
Ratio of net investment income to average net assets excluding interest expense . |
Ratio of net investment income to average net assets |
Ratio of net investment income to average net assets prior to fees waived |
Portfolio turnover |
|
|
| 1 | Date of commencement of operations; ratios have been annualized and total return and portfolio turnover have not been annualized. |
| 2 | The average shares outstanding method has been applied for per share information. |
| 3 | Total investment return is based on the change in net asset value of a share during the period and assumes reinvestment of dividends and distributions at net asset value and does not reflect the impact of a sales charge. Total investment return during all of the periods shown reflects waivers by the manager and/or distributor. Performance would have been lower had the waivers not been in effect. |
See accompanying notes, which are an integral part of the financial statements.
| | | | | | | | | | | | | | | | | | | | | | |
| | | Year ended | | | | | 9/30/131
to | |
| | | 7/31/17 | | | | | 7/31/16 | | | | | 7/31/15 | | | | | 7/31/14 | |
| | | $ | 8.48 | | | | | $ | 8.22 | | | | | $ | 8.84 | | | | | $ | 8.50 | |
| | | | | | | |
| |
|
|
| | | | | | | | | | | | | | | | | | |
| | | 0.32 | | | | | | 0.36 | | | | | | 0.37 | | | | | | 0.27 | |
| | | 0.32 | | | | | | 0.23 | | | | | | (0.60 | ) | | | | | 0.33 | |
| | | | | | | | | | | | | | | | | | | | | | |
| | | 0.64 | | | | | | 0.59 | | | | | | (0.23 | ) | | | | | 0.60 | |
| | | | | | | | | | | | | | | | | | | | | | |
| | | | | | | |
| |
|
|
| | | | | | | | | | | | | | | | | | |
| | | (0.35 | ) | | | | | (0.33 | ) | | | | | (0.30 | ) | | | | | (0.26 | ) |
| | | — | | | | | | — | | | | | | (0.09 | ) | | | | | — | |
| | | | | | | | | | | | | | | | | | | | | | |
| | | (0.35 | ) | | | | | (0.33 | ) | | | | | (0.39 | ) | | | | | (0.26 | ) |
| | | | | | | | | | | | | | | | | | | | | | |
| | | | | | | |
| | $ | 8.77 | | | | | $ | 8.48 | | | | | $ | 8.22 | | | | | $ | 8.84 | |
| | | | | | | | | | | | | | | | | | | | | | |
| | | | | | | |
| | | 7.74% | | | | | | 7.49% | | | | | | (2.53% | ) | | | | | 7.22% | |
| | | | | | | |
| |
|
|
| | | | | | | | | | | | | | | | | | |
| | $ | 63 | | | | | $ | 2 | | | | | $ | 2 | | | | | $ | 2 | |
| | | 1.81% | | | | | | 1.01% | | | | | | 1.08% | | | | | | 2.03% | |
| | | 1.81% | | | | | | 1.03% | | | | | | 1.14% | | | | | | 2.22% | |
| | | 2.66% | | | | | | 2.79% | | | | | | 2.78% | | | | | | 3.20% | |
| | | 3.71% | | | | | | 4.44% | | | | | | 4.46% | | | | | | 3.94% | |
| | | 3.71% | | | | | | 4.42% | | | | | | 4.40% | | | | | | 3.75% | |
| | | 2.86% | | | | | | 2.66% | | | | | | 2.76% | | | | | | 2.77% | |
| | | 154% | | | | | | 232% | | | | | | 288% | | | | | | 152% | |
| | | | | | | | | | | | | | | | | | | | | | |
| |
Financial highlights
Delaware Emerging Markets Debt Fund Class R
Selected data for each share of the Fund outstanding throughout each period were as follows:
|
| |
| |
|
| |
|
Net asset value, beginning of period |
|
Income (loss) from investment operations: |
Net investment income2 |
Net realized and unrealized gain (loss) |
|
Total from investment operations |
|
|
Less dividends and distributions from: |
Net investment income |
Net realized gain |
|
Total dividends and distributions |
|
|
Net asset value, end of period |
|
|
Total return3 |
|
Ratios and supplemental data: |
Net assets, end of period (000 omitted) |
Ratio of expenses to average net assets excluding interest expense |
Ratio of expenses to average net assets |
Ratio of expenses to average net assets prior to fees waived |
Ratio of net investment income to average net assets excluding interest expense |
Ratio of net investment income to average net assets |
Ratio of net investment income to average net assets prior to fees waived |
Portfolio turnover |
|
|
| 1 | Date of commencement of operations; ratios have been annualized and total return and portfolio turnover have not been annualized. |
| 2 | The average shares outstanding method has been applied for per share information. |
| 3 | Total investment return is based on the change in net asset value of a share during the period and assumes reinvestment of dividends and distributions at net asset value. Total investment return during all of the periods shown reflects waivers by the manager and/or distributor. Performance would have been lower had the waivers not been in effect. |
See accompanying notes, which are an integral part of the financial statements.
| | | | | | | | | | | | | | | | | | | | | | |
| | | | | | | | | | | | | | | | | | 9/30/131 | |
| | | Year ended | | | | | | | | | | to | |
| | | | | | | |
| | | 7/31/17 | | | | | 7/31/16 | | | | | 7/31/15 | | | | | 7/31/14 | |
| |
| | $ | 8.48 | | | | | $ | 8.22 | | | | | $ | 8.84 | | | | | $ | 8.50 | |
| | | | | | | |
| | | | | | | | | | | | | | | | | | | | | | |
| | | 0.39 | | | | | | 0.36 | | | | | | 0.37 | | | | | | 0.31 | |
| | | 0.28 | | | | | | 0.23 | | | | | | (0.60 | ) | | | | | 0.33 | |
| | | | | | | | | | | | | | | | | | | | | | |
| | | 0.67 | | | | | | 0.59 | | | | | | (0.23 | ) | | | | | 0.64 | |
| | | | | | | | | | | | | | | | | | | | | | |
| | | | | | | |
| | | | | | | | | | | | | | | | | | | | | | |
| | | (0.38 | ) | | | | | (0.33 | ) | | | | | (0.30 | ) | | | | | (0.30 | ) |
| | | — | | | | | | — | | | | | | (0.09 | ) | | | | | — | |
| | | | | | | | | | | | | | | | | | | | | | |
| | | (0.38 | ) | | | | | (0.33 | ) | | | | | (0.39 | ) | | | | | (0.30 | ) |
| | | | | | | | | | | | | | | | | | | | | | |
| | | | | | | |
| | $ | 8.77 | | | | | $ | 8.48 | | | | | $ | 8.22 | | | | | $ | 8.84 | |
| | | | | | | | | | | | | | | | | | | | | | |
| | | | | | | |
| | | 8.13% | | | | | | 7.49% | | | | | | (2.53% | ) | | | | | 7.64% | |
| | | | | | | |
| | | | | | | | | | | | | | | | | | | | | | |
| | $ | 2 | | | | | $ | 2 | | | | | $ | 2 | | | | | $ | 2 | |
| | | 1.00% | | | | | | 1.01% | | | | | | 1.08% | | | | | | 1.55% | |
| | | 1.00% | | | | | | 1.03% | | | | | | 1.14% | | | | | | 1.74% | |
| | | 2.16% | | | | | | 2.29% | | | | | | 2.28% | | | | | | 2.72% | |
| | | 4.52% | | | | | | 4.44% | | | | | | 4.46% | | | | | | 4.42% | |
| | | 4.52% | | | | | | 4.42% | | | | | | 4.40% | | | | | | 4.23% | |
| | | 3.36% | | | | | | 3.16% | | | | | | 3.26% | | | | | | 3.25% | |
| | | 154% | | | | | | 232% | | | | | | 288% | | | | | | 152% | |
| | | | | | | | | | | | | | | | | | | | | | |
| |
Financial highlights
Delaware Emerging Markets Debt Fund Institutional Class
Selected data for each share of the Fund outstanding throughout each period were as follows:
|
| |
|
| |
|
Net asset value, beginning of period |
|
Income (loss) from investment operations: |
Net investment income2 |
Net realized and unrealized gain (loss) |
|
Total from investment operations |
|
|
Less dividends and distributions from: |
Net investment income |
Net realized gain |
|
Total dividends and distributions |
|
|
Net asset value, end of period |
|
|
Total return3 |
|
Ratios and supplemental data: |
Net assets, end of period (000 omitted) |
Ratio of expenses to average net assets excluding interest expense |
Ratio of expenses to average net assets |
Ratio of expenses to average net assets prior to fees waived |
Ratio of net investment income to average net assets excluding interest expense |
Ratio of net investment income to average net assets |
Ratio of net investment income to average net assets prior to fees waived |
Portfolio turnover |
|
|
| 1 | Date of commencement of operations; ratios have been annualized and total return and portfolio turnover have not been annualized. |
| 2 | The average shares outstanding method has been applied for per share information. |
| 3 | Total investment return is based on the change in net asset value of a share during the period and assumes reinvestment of dividends and distributions at net asset value. Total investment return during all of the periods shown reflects a waiver by the manager. Performance would have been lower had the waiver not been in effect. |
See accompanying notes, which are an integral part of the financial statements.
| | | | | | | | | | | | | | | | | | | | | | |
| | | | | | | | | | | | | | | | | | 9/30/131 | |
| | | Year ended | | | | | | | | | | to | |
| | | | | | | |
| | | 7/31/17 | | | | | 7/31/16 | | | | | 7/31/15 | | | | | 7/31/14 | |
| |
| | $ | 8.48 | | | | | $ | 8.22 | | | | | $ | 8.84 | | | | | $ | 8.50 | |
| | | | | | | |
| | | | | | | | | | | | | | | | | | | | | | |
| | | 0.39 | | | | | | 0.36 | | | | | | 0.37 | | | | | | 0.34 | |
| | | 0.29 | | | | | | 0.23 | | | | | | (0.60 | ) | | | | | 0.33 | |
| | | | | | | | | | | | | | | | | | | | | | |
| | | 0.68 | | | | | | 0.59 | | | | | | (0.23 | ) | | | | | 0.67 | |
| | | | | | | | | | | | | | | | | | | | | | |
| | | | | | | |
| | | | | | | | | | | | | | | | | | |
| | | (0.38 | ) | | | | | (0.33 | ) | | | | | (0.30 | ) | | | | | (0.33 | ) |
| | | — | | | | | | — | | | | | | (0.09 | ) | | | | | — | |
| | | | | | | | | | | | | | | | | | | | | | |
| | | (0.38 | ) | | | | | (0.33 | ) | | | | | (0.39 | ) | | | | | (0.33 | ) |
| | | | | | | | | | | | | | | | | | | | | | |
| | | | | | | |
| | $ | 8.78 | | | | | $ | 8.48 | | | | | $ | 8.22 | | | | | $ | 8.84 | |
| | | | | | | | | | | | | | | | | | | | | | |
| | | | | | | |
| | | 8.25% | | | | | | 7.49% | | | | | | (2.53% | ) | | | | | 8.08% | |
| | | | | | | |
| | | | | | | | | | | | | | | | | | |
| | $ | 21,560 | | | | | $ | 19,930 | | | | | $ | 18,532 | | | | | $ | 19,020 | |
| | | 1.00% | | | | | | 1.01% | | | | | | 1.08% | | | | | | 1.07% | |
| | | 1.00% | | | | | | 1.03% | | | | | | 1.14% | | | | | | 1.26% | |
| | | 1.66% | | | | | | 1.79% | | | | | | 1.78% | | | | | | 2.24% | |
| | | 4.52% | | | | | | 4.44% | | | | | | 4.46% | | | | | | 4.90% | |
| | | 4.52% | | | | | | 4.42% | | | | | | 4.40% | | | | | | 4.71% | |
| | | 3.86% | | | | | | 3.66% | | | | | | 3.76% | | | | | | 3.73% | |
| | | 154% | | | | | | 232% | | | | | | 288% | | | | | | 152% | |
| | | | | | | | | | | | | | | | | | | | | | |
| |
| | |
| Notes to financial statements | | |
| Delaware Emerging Markets Debt Fund | | July 31, 2017 |
Delaware Group® Government Fund (Trust) is organized as a Delaware statutory trust and offers two series: Delaware Strategic Income Fund (formerly, Delaware Core Plus Bond Fund) and Delaware Emerging Markets Debt Fund. These financial statements and the related notes pertain to Delaware Emerging Markets Debt Fund (Fund). The Trust is an open-end investment company. The Fund is considered diversified under the Investment Company Act of 1940, as amended (1940 Act), and offers Class A, Class C, Class R, and Institutional Class shares. Class A shares are sold with a maximum front-end sales charge of 4.50%. Class A share purchases of $1,000,000 or more will incur a contingent deferred sales charge (CDSC) of 1.00% if redeemed during the first year and 0.50% during the second year, provided that Delaware Distributors, L.P. (DDLP) paid a financial advisor a commission on the purchase of those shares. Class C shares are sold with a CDSC of 1.00%, if redeemed during the first 12 months. Class R and Institutional Class shares are not subject to a sales charge and are offered for sale exclusively to certain eligible investors.
The investment objective of the Fund is to primarily seek current income and secondarily capital appreciation.
1. Significant Accounting Policies
The following accounting policies are in accordance with US generally accepted accounting principles (US GAAP) and are consistently followed by the Fund.
Security Valuation – Equity securities and exchange-traded funds (ETFs), except those traded on the Nasdaq Stock Market LLC (Nasdaq), are valued at the last quoted sales price as of the time of the regular close of the New York Stock Exchange on the valuation date. Equity securities and ETFs traded on the Nasdaq are valued in accordance with the Nasdaq Official Closing Price, which may not be the last sales price. If, on a particular day, an equity security or ETF does not trade, the mean between the bid and ask prices will be used, which approximates fair value. Securities listed on a foreign exchange are normally valued at the last quoted sales price on the valuation date. Debt securities and credit default swap (CDS) contracts are valued based upon valuations provided by an independent pricing service or broker/counterparty and reviewed by management. To the extent current market prices are not available, the pricing service may take into account developments related to the specific security, as well as transactions in comparable securities. US government and agency securities are valued at the mean between the bid and ask prices, which approximates fair value. Valuations for fixed income securities utilize matrix systems, which reflect such factors as security prices, yields, maturities, and ratings, and are supplemented by dealer and exchange quotations. Swap prices are derived using daily swap curves and models that incorporate a number of market data factors, such as discounted cash flows, trades, and values of the underlying reference instruments. Foreign currency exchange contracts and foreign cross currency exchange contracts are valued at the mean between the bid and ask prices, which approximates fair value. Interpolated values are derived when the settlement date of the contract is an interim date for which quotations are not available. Exchange-traded options are valued at the last reported sale price or, if no sales are reported, at the mean between the last reported bid and ask prices, which approximates fair value. Generally, other securities and assets for which market quotations are not readily available are valued at fair value as determined in good faith under the direction of the Trust’s Board of Trustees (Board). In determining whether market quotations are readily available or fair
valuation will be used, various factors will be taken into consideration, such as market closures or suspension of trading in a security.
Federal and Foreign Income Taxes – No provision for federal income taxes has been made as the Fund intends to continue to qualify for federal income tax purposes as a regulated investment company under Subchapter M of the Internal Revenue Code of 1986, as amended, and make the requisite distributions to shareholders. The Fund evaluates tax positions taken or expected to be taken in the course of preparing the Fund’s tax returns to determine whether the tax positions are “more-likely-than-not” of being sustained by the applicable tax authority. Tax positions not deemed to meet the “more-likely-than-not” threshold are recorded as a tax benefit or expense in the current year. Management has analyzed the Fund’s tax positions taken or to be taken on the Fund’s federal income tax returns through the year ended July 31, 2017 and for all open tax years (years ended July 31, 2014–July 31, 2016), and has concluded that no provision for federal income tax is required in the Fund’s financial statements. In regard to foreign taxes only, the Fund has open tax years in certain foreign countries in which it invests that may date back to the inception of the Fund. If applicable, the Fund recognizes interest accrued on unrecognized tax benefits in interest expense and penalties in other expenses on the “Statement of operations.” During the year ended July 31, 2017, the Fund did not incur any interest or tax penalties.
Class Accounting – Investment income, common expenses and realized and unrealized gain (loss) on investments are allocated to the various classes of the Fund on the basis of daily net assets of each class. Distribution expenses relating to a specific class are charged directly to that class.
Repurchase Agreements – The Fund may purchase certain US government securities subject to the counterparty’s agreement to repurchase them at an agreed upon date and price. The counterparty will be required on a daily basis to maintain the value of the collateral subject to the agreement at not less than the repurchase price (including accrued interest). The agreements are conditioned upon the collateral being deposited under the Federal Reserve book-entry system with the Fund’s custodian or a third party sub-custodian. In the event of default or bankruptcy by the other party to the agreement, retention of the collateral may be subject to legal proceedings. All open repurchase agreements as of the date of this report were entered into on July 31, 2017 and matured on the next business day.
Foreign Currency Transactions – Transactions denominated in foreign currencies are recorded at the prevailing exchange rates on the valuation date in accordance with the Fund’s prospectus. The value of all assets and liabilities denominated in foreign currencies is translated daily into US dollars at the exchange rate of such currencies against the US dollar. Transaction gains or losses resulting from changes in exchange rates during the reporting period or upon settlement of the foreign currency transaction are reported in operations for the current period. The Fund generally bifurcates that portion of realized gains and losses on investments in debt securities which is due to changes in foreign exchange rates from that which is due to changes in market prices of debt securities. That portion of gains (losses) attributable to changes in foreign exchange rates is included on the “Statement of operations” under “Net realized gain (loss) on foreign currencies.” The Fund reports certain foreign currency related transactions as components of realized gains (losses) for financial reporting purposes, whereas such components are treated as ordinary income (loss) for federal income tax purposes.
Use of Estimates – The Fund is an investment company, whose financial statements are prepared in conformity with US GAAP. Therefore, the Fund follows the accounting and reporting guidelines for
| | |
| Notes to financial statements | | |
| Delaware Emerging Markets Debt Fund | | |
1. Significant Accounting Policies (continued)
investment companies. The preparation of financial statements in conformity with US GAAP requires management to make estimates and assumptions that affect the fair value of investments, the reported amounts of assets and liabilities and disclosure of contingent assets and liabilities at the date of the financial statements, and the reported amounts of revenues and expenses during the reporting period. Actual results could differ from those estimates and the differences could be material.
Other – Expenses directly attributable to the Fund are charged directly to the Fund. Other expenses common to various funds within the Delaware FundsSM by Macquarie (Delaware Funds) are generally allocated among such funds on the basis of average net assets. Management fees and certain other expenses are paid monthly. Security transactions are recorded on the date the securities are purchased or sold (trade date) for financial reporting purposes. Costs used in calculating realized gains and losses on the sale of investment securities are those of the specific securities sold. Dividend income is recorded on the ex-dividend date and interest income is recorded on the accrual basis. Discounts and premiums on debt securities are accreted or amortized to interest income, respectively, over the lives of the respective securities using the effective interest method. The Fund declares and pays dividends from net investment income monthly and pays distributions from net realized gain on investments, if any, annually. The Fund may distribute more frequently, if necessary for tax purposes. Dividends and distributions, if any, are recorded on the ex-dividend date.
The Fund may receive earnings credits from its custodian when positive cash balances are maintained, which may be used to offset custody fees. There were no such earnings credits for the year ended July 31, 2017.
The Fund receives earnings credits from its transfer agent when positive cash balances are maintained, which may be used to offset transfer agent fees. If the amount earned is greater than $1, the expense paid under this arrangement is included on the “Statement of operations” under “Dividend disbursing and transfer agent fees and expenses” with the corresponding expense offset shown under “Less expense paid indirectly.” For the year ended July 31, 2017, the Fund earned $1 under this agreement.
2. Investment Management, Administration Agreements, and Other Transactions with Affiliates
In accordance with the terms of its investment management agreement, the Fund pays Delaware Management Company (DMC), a series of Macquarie Investment Management Business Trust (formerly, Delaware Management Business Trust) and the investment manager, an annual fee which is calculated daily and paid monthly at the rate of 0.75% on the first $500 million of average daily net assets of the Fund, 0.70% on the next $500 million, 0.65% on the next $1.5 billion, and 0.60% on average daily net assets in excess of $2.5 billion.
DMC has contractually agreed to waive all or a portion, if any, of its management fee and/or pay/reimburse the Fund to the extent necessary to limit annual operating expenses (excluding any 12b-1 fees, acquired fund fees and expenses, taxes, interest, short sale and dividend interest expenses, brokerage fees, certain insurance costs, and nonroutine expenses or costs including, but not limited to, those relating to reorganizations, litigation, conducting shareholder meetings, and liquidations), to 1.00% of average daily net assets of the Fund from Aug. 1, 2016 through July 31, 2017.* For purposes of these waivers and reimbursements, nonroutine expenses may also include such additional costs and
expenses, as may be agreed upon from time to time by the Fund’s Board and DMC. These expense waivers and reimbursements apply only to expenses paid directly by the Fund and may be terminated by agreement of DMC and the Fund.
Delaware Investments Fund Services Company (DIFSC), an affiliate of DMC, provides fund accounting and financial administration oversight services to the Fund. For these services, DIFSC’s fees are calculated daily and paid monthly based on the aggregate daily net assets of the Delaware Funds at the following annual rate: 0.0050% of the first $30 billion; 0.0045% of the next $10 billion; 0.0040% of the next $10 billion; and 0.0025% of aggregate average daily net assets in excess of $50 billion. The fees payable to DIFSC under the service agreement described above are allocated among all funds in the Delaware Funds on a relative net asset value (NAV) basis. For the year ended July 31, 2017, the Fund was charged $955 for these services. This amount is included on the “Statement of operations” under “Accounting and administration expenses.”
DIFSC is also the transfer agent and dividend disbursing agent of the Fund. For these services, DIFSC’s fees are calculated daily and paid monthly based on the aggregate daily net assets of the retail funds within the Delaware Funds at the following annual rate: 0.025% of the first $20 billion; 0.020% of the next $5 billion; 0.015% of the next $5 billion; and 0.013% of average daily net assets in excess of $30 billion. The fees payable to DIFSC under the service agreement described above are allocated among all retail funds in the Delaware Funds on a relative NAV basis. This amount is included on the “Statement of operations” under “Dividend disbursing and transfer agent fees and expenses.” For the year ended July 31, 2017, the Fund was charged $4,100 for these services. Pursuant to a sub-transfer agency agreement between DIFSC and BNY Mellon Investment Servicing (US) Inc. (BNYMIS), BNYMIS provides certain sub-transfer agency services to the Fund. Sub-transfer agency fees are paid by the Fund and are also included on the “Statement of operations” under “Dividend disbursing and transfer agent fees and expenses.”
Pursuant to a distribution agreement and distribution plan, the Fund pays DDLP, the distributor and an affiliate of DMC, annual distribution and service (12b-1) fees of 0.25%, 1.00%, and 0.50% of the average daily net assets of the Class A, Class C, and Class R shares, respectively. The fees are calculated daily and paid monthly. Prior to March 22, 2017, DDLP agreed to voluntarily suspend the 12b-1 fee for Class A, Class C, and Class R shares. Effective March 22, 2017, the voluntary suspension was discontinued for Class A and Class C shares. The suspension of the 12b-1 fee remains in effect for the Class R shares and will continue while the Fund is not broadly distributed. Institutional Class shares pay no 12b-1 fee.
As provided in the investment management agreement, the Fund bears a portion of the cost of certain resources shared with DMC, including the cost of internal personnel of DMC and/or its affiliates that provide legal, tax, and regulatory reporting services to the Fund. For the year ended July 31, 2017, the Fund was charged $410 for internal legal, tax, and regulatory reporting services provided by DMC and/or its affiliates’ employees. This amount is included on the “Statement of operations” under “Legal fees.”
For the year ended July 31, 2017, DDLP earned less than $1 in commissions on sales of the Fund’s Class A shares. For the year ended July 31, 2017, DDLP received no gross CDSC commissions on redemption of the Fund’s Class A and Class C shares.
| | |
| Notes to financial statements | | |
| Delaware Emerging Markets Debt Fund | | |
2. Investment Management, Administration Agreements, and Other Transactions with Affiliates (continued)
Trustees’ fees include expenses accrued by the Fund for each Trustee’s retainer and meeting fees. Certain officers of DMC, DIFSC, and DDLP are officers and/or Trustees of the Trust. These officers and Trustees are paid no compensation by the Fund.
Cross trades for the year ended July 31, 2017, were executed by the Fund pursuant to procedures adopted by the Board designed to ensure compliance with Rule 17a-7 under the 1940 Act. Cross trading is the buying or selling of portfolio securities between funds of investment companies, or between a fund of an investment company and another entity, that are or could be considered affiliates by virtue of having a common investment advisor (or affiliated investment advisors), common directors/trustees and/or common officers. At its regularly scheduled meetings, the Board reviews such transactions for compliance with the procedures adopted by the Board. Pursuant to these procedures, for the year ended July 31, 2017, the Fund engaged in securities sales of $185,446, which resulted in net realized gains of $18.
* The aggregate contractual waiver period covering this report is from Nov. 27, 2015 through Nov. 28, 2017.
3. Investments
For the year ended July 31, 2017, the Fund made purchases and sales of investment securities other than short-term investments as follows:
| | | | |
Purchases | | $ | 31,630,181 | |
Sales | | | 29,988,355 | |
At July 31, 2017, the cost and unrealized appreciation (depreciation) of investments for federal income tax purposes for the Fund were as follows:
| | | | |
Cost of investments | | $ | 20,886,945 | |
| | | | |
Aggregate unrealized appreciation of investments | | $ | 715,436 | |
Aggregate unrealized depreciation of investments | | | (109,101 | ) |
| | | | |
Net unrealized appreciation of investments | | $ | 606,335 | |
| | | | |
US GAAP defines fair value as the price that the Fund would receive to sell an asset or pay to transfer a liability in an orderly transaction between market participants at the measurement date under current market conditions. A three-level hierarchy for fair value measurements has been established based upon the transparency of inputs to the valuation of an asset or liability. Inputs may be observable or unobservable and refer broadly to the assumptions that market participants would use in pricing the asset or liability. Observable inputs reflect the assumptions market participants would use in pricing the asset or liability based on market data obtained from sources independent of the reporting entity. Unobservable inputs reflect the reporting entity’s own assumptions about the assumptions that market participants would use in pricing the asset or liability based on the best information available under the circumstances. The Fund’s investment in its entirety is assigned a level based upon the observability of the inputs which are significant to the overall valuation. The three-level hierarchy of inputs is summarized on the next page.
| | |
| Level 1 – | | Inputs are quoted prices in active markets for identical investments. (Examples: equity securities, open-end investment companies, futures contracts, exchange-traded options contracts) |
| |
| Level 2 – | | Other observable inputs, including, but not limited to: quoted prices for similar assets or liabilities in markets that are active, quoted prices for identical or similar assets or liabilities in markets that are not active, inputs other than quoted prices that are observable for the assets or liabilities (such as interest rates, yield curves, volatilities, prepayment speeds, loss severities, credit risks and default rates) or other market-corroborated inputs. (Examples: debt securities, government securities, swap contracts, foreign currency exchange contracts, foreign securities utilizing international fair value pricing, broker-quoted securities, fair valued securities) |
| |
| Level 3 – | | Significant unobservable inputs, including the Fund’s own assumptions used to determine the fair value of investments. (Examples: broker-quoted securities, fair valued securities) |
Level 3 investments are valued using significant unobservable inputs. The Fund may also use an income-based valuation approach in which the anticipated future cash flows of the investment are discounted to calculate fair value. Discounts may also be applied due to the nature or duration of any restrictions on the disposition of the investments. Valuations may also be based upon current market prices of securities that are comparable in coupon, rating, maturity, and industry. The derived value of a Level 3 investment may not represent the value which is received upon disposition and this could impact the results of operations.
The following table summarizes the valuation of the Fund’s investments by fair value hierarchy levels as of July 31, 2017:
| | | | | | | | | | | | |
Securities | | Level 2 | | | Level 3 | | | Total | |
Assets: | | | | | | | | | | | | |
Corporate Debt | | $ | 14,752,230 | | | $ | — | | | $ | 14,752,230 | |
Foreign Debt | | | 5,773,986 | | | | — | | | | 5,773,986 | |
Loan Agreement | | | — | | | | 379,153 | | | | 379,153 | |
Options Purchased | | | 18,322 | | | | — | | | | 18,322 | |
Short-Term Investments | | | 569,589 | | | | — | | | | 569,589 | |
| | | | | | | | | | | | |
Total Value of Securities | | $ | 21,114,127 | | | $ | 379,153 | | | $ | 21,493,280 | |
| | | | | | | | | | | | |
Derivatives: | | | | | | | | | | | | |
Foreign Currency Exchange Contracts | | $ | 357 | | | $ | — | | | $ | 357 | |
Swap Contract | | | (6,642 | ) | | | — | | | | (6,642 | ) |
During the year ended July 31, 2017, there were no transfers between Level 1 investments, Level 2 investments or Level 3 investments that had a significant impact to the Fund. The Fund’s policy is to recognize transfers between levels based on fair value at the beginning of the reporting period.
The Fund’s investments that are categorized as Level 3 were valued utilizing third party pricing information without adjustment. Such valuations are based on unobservable inputs. A significant change in third party information inputs could result in significantly lower or higher value of such Level 3
| | |
| Notes to financial statements | | |
| Delaware Emerging Markets Debt Fund | | |
3. Investments (continued)
investments. The following is a reconciliation of investments in which significant unobservable inputs (Level 3) were used in determining fair value:
| | |
| | | Loan Agreement |
Balance as of 7/31/16 | | $418,359 |
Net change in unrealized appreciation (depreciation) | | 24,544 |
Sales | | (63,750) |
Balance as of 7/31/17 | | $379,153 |
Net change in unrealized appreciation (depreciation) from investments still held at the end of the period | | $ 24,544 |
4. Dividend and Distribution Information
Income and long-term capital gain distributions are determined in accordance with federal income tax regulations, which may differ from US GAAP. Additionally, distributions from net gains on foreign currency transactions and net short-term gains on sales of investment securities are treated as ordinary income for federal income tax purposes. The tax character of dividends and distributions paid during the years ended July 31, 2017 and 2016 was as follows:
| | | | |
| | | Year ended |
| | | 7/31/17 | | 7/31/16 |
Ordinary income | | $912,237 | | $756,192 |
5. Components of Net Assets on a Tax Basis
As of July 31, 2017, the components of net assets on a tax basis were as follows:
| | | | |
Shares of beneficial interest | | $ | 20,924,415 | |
Undistributed ordinary income | | | 121,035 | |
Unrealized appreciation of investments and foreign currencies | | | 606,454 | |
| | | | |
Net assets | | $ | 21,651,904 | |
| | | | |
The differences between book basis and tax basis components of the net assets are primarily attributable to tax deferral of losses on wash sales, tax deferral of straddle losses, mark-to-market of forward foreign currency contracts, and CDS contracts.
For financial reporting purposes, capital accounts are adjusted to reflect the tax character of permanent book/tax differences. Reclassifications are primarily due to tax treatment of gain (loss) on foreign currency transactions, foreign capital gains tax, and CDS swaps. Results of operations and net assets were not affected by these reclassifications. For the year ended July 31, 2017, the Fund recorded the following reclassifications:
| | | | |
Undistributed net investment income | | $ | 45,681 | |
Accumulated net realized gain | | | (45,681 | ) |
For federal income tax purposes, capital loss carryforwards may be carried forward and applied against future capital gains. At July 31, 2017, the Fund utilized $672,041 of capital loss carryforwards.
Under the Regulated Investment Company Modernization Act of 2010 (Act), net capital losses recognized for the tax years beginning after Dec. 22, 2010 may be carried forward indefinitely, and their character is retained as short-term and/or long-term losses. At July 31, 2017, the Fund had no capital loss carryforwards.
6. Capital Shares
Transactions in capital shares were as follows:
| | | | | | | | | | | | | | | |
| | | Year ended |
| | | 7/31/17 | | | | 7/31/16 |
Shares sold: | | | | | | | | | | | | | | | |
Class A | | | | 5,621 | | | | | | | | | | — | |
Class C | | | | 6,846 | | | | | | | | | | — | |
| | | |
Shares issued upon reinvestment of dividends and distributions: | | | | | | | | | | | | | | | |
Class A | | | | 58 | | | | | | | | | | 11 | |
Class C | | | | 39 | | | | | | | | | | 11 | |
Class R | | | | 12 | | | | | | | | | | 11 | |
Institutional Class | | | | 106,879 | | | | | | | | | | 94,559 | |
| | | | | | | | | | | | | | | |
| | | | 119,455 | | | | | | | | | | 94,592 | |
| | | | | | | | | | | | | | | |
| | | |
Shares redeemed: | | | | | | | | | | | | | | | |
Class A | | | | (2,929 | ) | | | | | | | | | — | |
| | | | | | | | | | | | | | | |
Net increase | | | | 116,526 | | | | | | | | | | 94,592 | |
| | | | | | | | | | | | | | | |
7. Line of Credit
The Fund, along with certain other funds in the Delaware Funds (Participants), was a participant in a $155,000,000 revolving line of credit to be used for temporary or emergency purposes as an additional source of liquidity to fund redemptions of investor shares. Under the agreement, the Participants were charged an annual commitment fee of 0.10%, which was allocated across the Participants on the basis of relative net assets of each Participant’s allocation of the entire facility. The Participants were permitted to borrow up to a maximum of one-third of their net assets under the agreement. Each Participant was individually, and not jointly, liable for its particular advances, if any, under the line of credit. The line of credit available under the agreement expired on Nov. 7, 2016.
On Nov. 7, 2016, the Fund, along with the other Participants, entered into an amendment to the agreement for a $155,000,000 revolving line of credit. The line of credit is to be used as described above and operates in substantially the same manner as the original agreement, with the exception of the annual commitment fee. Under the amendment to the agreement, the Participants are charged an annual commitment fee of 0.15%, which is allocated across the Participants on the basis of relative net assets of each Participant’s allocation of the entire facility. The line of credit available under the agreement expires on Nov. 6, 2017.
The Fund had no amounts outstanding as of July 31, 2017 or at any time during the year then ended.
| | |
| Notes to financial statements | | |
| Delaware Emerging Markets Debt Fund | | |
8. Derivatives
US GAAP requires disclosures that enable investors to understand: (1) how and why an entity uses derivatives; (2) how they are accounted for; and (3) how they affect an entity’s results of operations and financial position.
Foreign Currency Exchange Contracts – The Fund may enter into foreign currency exchange contracts and foreign cross currency exchange contracts as a way of managing foreign exchange rate risk. The Fund may enter into these contracts to fix the US dollar value of a security that it has agreed to buy or sell for the period between the date the trade was entered into and the date the security is delivered and paid for. The Fund may also use these contracts to hedge the US dollar value of securities it already owns that are denominated in foreign currencies. In addition, the Fund may enter into these contracts to facilitate or expedite the settlement of portfolio transactions. The change in value is recorded as an unrealized gain or loss. When the contract is closed, a realized gain or loss is recorded equal to the difference between the value of the contract at the time it was opened and the value at the time it was closed.
The use of foreign currency exchange contracts and foreign cross currency exchange contracts does not eliminate fluctuations in the underlying prices of the securities, but does establish a rate of exchange that can be achieved in the future. Although foreign currency exchange contracts and foreign cross currency exchange contracts limit the risk of loss due to an unfavorable change in the value of the hedged currency, they also limit any potential gain that might result should the value of the currency change favorably. In addition, the Fund could be exposed to risks if the counterparties to the contracts are unable to meet the terms of their contracts. The Fund’s maximum risk of loss from counterparty credit risk is the value of its currency exchanged with the counterparty. The risk is generally mitigated by having a netting arrangement between the Fund and the counterparty and by the posting of collateral by the counterparty to the Fund to cover the Fund’s exposure to the counterparty.
During the year ended July 31, 2017, the Fund used foreign currency exchange contracts and cross currency exchange contracts to hedge the US dollar value of securities it already owned that were denominated in foreign currencies and to facilitate or expedite the settlement of portfolio transactions.
Futures Contracts – A futures contract is an agreement in which the writer (or seller) of the contract agrees to deliver to the buyer an amount of cash or securities equal to a specific dollar amount times the difference between the value of a specific security or index at the close of the last trading day of the contract and the price at which the agreement is made. The Fund may use futures contracts in the normal course of pursuing its investment objective. The Fund may invest in futures contracts to hedge its existing portfolio securities against fluctuations in fair value caused by changes in interest rates or market conditions. Upon entering into a futures contract, the Fund deposits cash or pledges US government securities to a broker, equal to the minimum “initial margin” requirements of the exchange on which the contract is traded. Subsequent payments are received from the broker or paid to the broker each day, based on the daily fluctuation in the market value of the contract. These receipts or payments are known as “variation margin” and are recorded daily by the Fund as unrealized gains or losses until the contracts are closed. When the contracts are closed, the Fund records a realized gain or loss equal to the difference between the value of the contract at the time it was opened and the value at the time it was closed. Risks of entering into futures contracts include potential imperfect correlation between the
futures contracts and the underlying securities and the possibility of an illiquid secondary market for these instruments. When investing in futures, there is reduced counterparty credit risk to the Fund because futures are exchange-traded and the exchange’s clearinghouse, as counterparty to all exchange-traded futures, guarantees against default. No futures contracts were outstanding at July 31, 2017.
During the year ended July 31, 2017, the Fund used futures contracts to hedge the Fund’s existing portfolio securities against fluctuations in value caused by changes in interest rates or market conditions.
Options Contracts – The Fund may enter into options contracts in the normal course of pursuing its investment objective. The Fund may buy or write options contracts for any number of reasons, including without limitation: to manage the Fund’s exposure to changes in securities prices caused by interest rates or market conditions and foreign currencies; as an efficient means of adjusting the Fund’s overall exposure to certain markets; to protect the value of portfolio securities; and as a cash management tool. The Fund may buy or write call or put options on securities, futures, swaps, swaptions, financial indices, and foreign currencies. When the Fund buys an option, a premium is paid and an asset is recorded and adjusted on a daily basis to reflect the current market value of the option purchased. When the Fund writes an option, a premium is received and a liability is recorded and adjusted on a daily basis to reflect the current market value of the option written. Premiums received from writing options that expire unexercised are treated by the Fund on the expiration date as realized gains. The difference between the premium received and the amount paid on effecting a closing purchase transaction, including brokerage commissions, is treated as realized gain or loss. If a call option is exercised, the premium is added to the proceeds from the sale of the underlying security in determining whether the Fund has a realized gain or loss. If a put option is exercised, the premium reduces the cost basis of the securities purchased by the Fund. The Fund, as writer of an option, bears the market risk of an unfavorable change in the price of the security underlying the written option. When writing options, the Fund is subject to minimal counterparty risk because the counterparty is only obligated to pay premiums and does not bear the market risk of an unfavorable market change. No options written were outstanding at July 31, 2017.
There were no transactions in options written during the year ended July 31, 2017.
During the year ended July 31, 2017, the Fund used options purchased contracts to manage the Fund’s exposure to changes in securities prices caused by interest rates or market conditions and to manage the Fund’s exposure to changes in foreign currencies.
Swap Contracts – The Fund may enter into CDS contracts in the normal course of pursuing its investment objective. The Fund may enter into CDS contracts in order to hedge against credit events, to enhance total return, or to gain exposure to certain securities or markets. The Fund will not be permitted to enter into any swap transactions unless, at the time of entering into such transactions, the unsecured long-term debt of the actual counterparty, combined with any credit enhancements, is rated at least BBB- by Standard & Poor’s Financial Services LLC (S&P) or at least Baa3 by Moody’s Investors Service, Inc. (Moody’s) or is determined to be of equivalent credit quality by DMC.
Credit Default Swaps. A CDS contract is a risk-transfer instrument through which one party (purchaser of protection) transfers to another party (seller of protection) the financial risk of a credit event (as defined in the CDS agreement), as it relates to a particular reference security or basket of securities (such as an
| | |
| Notes to financial statements | | |
| Delaware Emerging Markets Debt Fund | | |
8. Derivatives (continued)
index). In exchange for the protection offered by the seller of protection, the purchaser of protection agrees to pay the seller of protection a periodic amount at a stated rate that is applied to the notional amount of the CDS contract. In addition, an upfront payment may be made or received by the Fund in connection with an unwinding or assignment of a CDS contract. Upon the occurrence of a credit event, the seller of protection would pay the par (or other agreed-upon) value of the reference security (or basket of securities) to the counterparty. Credit events generally include, among others, bankruptcy, failure to pay, and obligation default.
During the year ended July 31, 2017, the Fund entered into CDS contracts as a purchaser of protection. Periodic payments (receipts) on such contracts are accrued daily and recorded as unrealized losses (gains) on swap contracts. Upon payment (receipt), such amounts are recorded as realized losses (gains) on swap contracts. Upfront payments made or received in connection with CDS contracts are amortized over the expected life of the CDS contracts as unrealized losses (gains) on swap contracts. The change in value of CDS contracts is recorded daily as unrealized appreciation or depreciation. A realized gain or loss is recorded upon a credit event (as defined in the CDS agreement) or the maturity or termination of the agreement. For the year ended July 31, 2017, the Fund did not enter into any CDS contracts as a seller of protection. Initial margin and variation margin are posted to central counterparties for central cleared CDS basket trades, as determined by the applicable central counterparty.
CDS contracts may involve greater risks than if the Fund had invested in the reference obligation directly. CDS contracts are subject to general market risk, liquidity risk, counterparty risk, and credit risk. The Fund’s maximum risk of loss from counterparty credit risk, either as the seller of protection or the buyer of protection, is the fair value of the contract. This risk is mitigated by (1) for bilateral swap contracts, having a netting arrangement between the Fund and the counterparty and by the posting of collateral by the counterparty to the Fund to cover the Fund’s exposure to the counterparty or (2) for cleared swaps, trading these instruments through a central counterparty.
During the year ended July 31, 2017, the Fund used CDS contracts to hedge against credit events.
Swaps Generally. The value of open swaps may differ from that which would be realized in the event the Fund terminated its position in the contract on a given day. Risks of entering into these contracts include the potential inability of the counterparty to meet the terms of the contracts. This type of risk is generally limited to the amount of favorable movement in the value of the underlying security, instrument, or basket of instruments, if any, at the day of default. Risks also arise from potential losses from adverse market movements and such losses could exceed the unrealized amounts shown on the “Schedule of investments.”
Fair value of derivative instruments as of July 31, 2017 was as follows:
| | | | | | | | | | | | |
| | | Asset Derivatives Fair Value | | | | |
Statement of Assets and Liabilities Location | | Currency
Contracts | | | Credit
Contracts | | | Total | |
Unrealized appreciation on foreign currency exchange contracts | | | $ 357 | | | | $ — | | | | $ 357 | |
Upfront payments paid on credit default swap contracts | | | — | | | | 29,736 | | | | 29,736 | |
Options purchased, at value | | | 18,322 | | | | — | | | | 18,322 | |
| | | | | | | | | | | | |
Total | | | $18,679 | | | | $29,736 | | | | $48,415 | |
| | | | | | | | | | | | |
| | |
| | | Liability Derivatives Fair Value | | | | |
Statement of Assets and Liabilities Location | | Credit
Contracts | | | Total | | | | |
Unrealized depreciation on credit default swap contracts | | | $(6,642 | ) | | | $(6,642 | ) | | | | |
| | | | | | | | | | | | |
The effect of derivative instruments on the “Statement of operations” for the year ended July 31, 2017 was as follows:
| | | | | | | | | | | | | | | | | | | | | | | | | | | | | | | | | | | | |
| | | | | | | | | Net Realized Gain (Loss) on: | | | | |
| | | Foreign Currency Exchange Contracts | | | | | | Futures Contracts | | | | | | Options Purchased | | | | | | Swap Contracts | | | | | | Total | |
Currency contracts | | $ | 69,741 | | | | | | | $ | — | | | | | | | $ | (4,240 | ) | | | | | | $ | — | | | | | | | $ | 65,501 | |
Interest rate contracts | | | — | | | | | | | | 20,075 | | | | | | | | — | | | | | | | | — | | | | | | | | 20,075 | |
Credit contracts | | | — | | | | | | | | — | | | | | | | | — | | | | | | | | (16,684 | ) | | | | | | | (16,684 | ) |
| | | | | | | | | | | | | | | | | | | | | | | | | | | | | | | | | | | | |
Total | | $ | 69,741 | | | | | | | $ | 20,075 | | | | | | | $ | (4,240 | ) | | | | | | $ | (16,684 | ) | | | | | | $ | 68,892 | |
| | | | | | | | | | | | | | | | | | | | | | | | | | | | | | | | | | | | |
| | | | | |
| | | | | | | | | | | | Net Change in Unrealized Appreciation (Depreciation) of: | | | | |
| | | | | | Foreign
Currency
Exchange
Contracts | | | | | | Options
Purchased | | | | | | Swap
Contracts | | | | | | Total | | | | |
Currency contracts | | | | | | | $1,896 | | | | | | | | $(29,030 | ) | | | | | | | $ — | | | | | | | | $(27,134) | | |
Credit contracts | | | | | | | — | | | | | | | | — | | | | | | | | (7,307 | ) | | | | | | | (7,307 | ) | |
| | | | | | | | | | | | | | | | | | | | | | | | | | | | | | | | | |
Total | | | | | | | $1,896 | | | | | | | | $(29,030 | ) | | | | | | | $(7,307 | ) | | | | | | | $(34,441 | ) | |
| | | | | | | | | | | | | | | | | | | | | | | | | | | | | | | | | | | | |
47
| | |
| Notes to financial statements | | |
| Delaware Emerging Markets Debt Fund | | |
8. Derivatives (continued)
Derivatives Generally. The table below summarizes the average balance of derivative holdings by the Fund during the year ended July 31, 2017.
| | | | | | | | |
| | | Long Derivative
Volume | | | Short Derivative
Volume | |
Foreign currency exchange contracts (average cost) | | $ | 231,849 | | | $ | 153,729 | |
Futures contracts (average notional value) | | | — | | | | 245,371 | |
Options contracts (average notional value) | | | 3,589 | | | | — | |
CDS contracts (average notional value)* | | | 350,595 | | | | — | |
*Long represents buying protection and short represents selling protection.
9. Offsetting
The Fund entered into an International Swaps and Derivatives Association, Inc. Master Agreement (ISDA Master Agreement) or a similar agreement with certain of its derivative contract counterparties in order to better define its contractual rights and to secure rights that will help the Fund mitigate its counterparty risk. An ISDA Master Agreement is a bilateral agreement between the Fund and a counterparty that governs over-the-counter (OTC) derivatives and foreign exchange contracts and typically contains, among other things, collateral posting items and provisions in the event of a default and/or termination event. Under an ISDA Master Agreement, the Fund may, under certain circumstances, offset with the counterparty certain derivative financial instruments’ payables and/or receivables with collateral held and/or posted and create one single net payment. The provisions of the ISDA Master Agreement typically permit a single net payment in the event of default (close-out), including the bankruptcy or insolvency of the counterparty. However, bankruptcy or insolvency laws of a particular jurisdiction may impose restrictions on or prohibitions against the right of offset in bankruptcy, insolvency, or other events.
For financial reporting purposes, the Fund does not offset derivative assets and derivative liabilities that are subject to netting arrangements in the “Statement of assets and liabilities.”
At July 31, 2017, the Fund had the following assets and liabilities subject to offsetting provisions:
Offsetting of Financial Assets and Liabilities and Derivatives Assets and Liabilities
| | | | | | | | | | | | | | | | |
Counterparty | | Gross Value of Derivative Asset | | | | | Gross Value of
Derivative Liability | | | | | Net Position | |
Bank of America Merrill Lynch | | $2,155 | | | | | | $(31,185) | | | | | | | $(29,030) | |
HSBC | | 299 | | | | | | (6,642) | | | | | | | (6,343) | |
Toronto Dominion Bank | | 58 | | | | | | — | | | | | | | 58 | |
Total | | $2,512 | | | | | | $(37,827) | | | | | | | $(35,315) | |
| | | | | | | | | | | | | | |
Counterparty | | Net Position | | Fair Value of
Non-Cash Collateral Received | | Cash Collateral Received | | Fair Value of
Non-Cash
Collateral Pledged | | Cash
Collateral Pledged | | Net Exposure(a) | |
Bank of America Merrill Lynch | | $(29,030) | | $— | | $— | | $— | | $— | | | $(29,030) | |
HSBC | | (6,343) | | — | | — | | — | | — | | | (6,343) | |
Toronto Dominion Bank | | 58 | | — | | — | | — | | — | | | 58 | |
Total | | $(35,315) | | $— | | $— | | $— | | $— | | | $(35,315) | |
(a) Net exposure represents the receivable (payable) that would be due from (to) the counterparty in the event of default.
Master Repurchase Agreements
| | | | | | | | | | | | | | | | |
Counterparty | | Repurchase Agreements | | | Fair Value of
Non-Cash Collateral Received(a) | | | Cash Collateral Received | | Net Collateral Received | | | Net Exposure(b) |
Bank of America Merrill Lynch | | | $ 76,668 | | | | $ (76,668) | | | $— | | | $ (76,668) | | | $— |
Bank of Montreal | | | 191,670 | | | | (191,670) | | | — | | | (191,670) | | | — |
BNP Paribas | | | 150,662 | | | | (150,662) | | | — | | | (150,662) | | | — |
Total | | | $419,000 | | | | $(419,000) | | | $— | | | $(419,000) | | | $— |
(a) The value of the related collateral received exceeded the value of the repurchase agreements as of July 31, 2017.
(b) Net exposure represents the receivable (payable) that would be due from (to) the counterparty in the event of default.
10. Securities Lending
The Fund, along with other funds in the Delaware Funds, may lend its securities pursuant to a security lending agreement (Lending Agreement) with The Bank of New York Mellon (BNY Mellon). At the time a security is loaned, the borrower must post collateral equal to the required percentage of the market value of the loaned security, including any accrued interest. The required percentage is: (1) 102% with respect to US securities and foreign securities that are denominated and payable in US dollars; and (2) 105% with respect to foreign securities. With respect to each loan, if on any business day the aggregate market value of securities collateral plus cash collateral held is less than the aggregate market value of the securities which are the subject of such loan, the borrower will be notified to provide additional collateral by the end of the following business day which, together with the collateral already held, will be not less than the applicable initial collateral requirements for such security loan. If the aggregate market value of securities collateral and cash collateral held with respect to a security loan exceeds the applicable initial
49
| | |
| Notes to financial statements | | |
| Delaware Emerging Markets Debt Fund | | |
10. Securities Lending (continued)
collateral requirement, upon request of the borrower, BNY Mellon must return enough collateral to the borrower by the end of the following business day to reduce the value of the remaining collateral to the applicable initial collateral requirement for such security loan. As a result of the foregoing, the value of the collateral held with respect to a loaned security on any particular day may be more or less than the value of the security on loan.
Cash collateral received by each fund of the Trust is generally invested in a series of individual separate accounts, each corresponding to a fund. The investment guidelines permit each separate account to hold certain securities that would be considered eligible securities for a money market fund. Cash collateral received is generally invested in government securities; certain obligations issued by government sponsored enterprises; repurchase agreements collateralized by US Treasury securities; obligations issued by the central government of any Organization for Economic Cooperation and Development (OECD) country or its agencies, instrumentalities or establishments; obligations of supranational organizations, commercial paper, notes, bonds, and other debt obligations; certificates of deposit, time deposits, and other bank obligations; and asset-backed securities. A Fund can also accept US government securities and letters of credit (non-cash collateral) in connection with securities loans.
In the event of default or bankruptcy by the lending agent, realization and/or retention of the collateral may be subject to legal proceedings. In the event the borrower fails to return loaned securities and the collateral received is insufficient to cover the value of the loaned securities and provided such collateral shortfall is not the result of investment losses, the lending agent has agreed to pay the amount of the shortfall to the Fund or, at the discretion of the lending agent, replace the loaned securities. The Fund continues to record dividends or interest, as applicable, on the securities loaned and is subject to changes in value of the securities loaned that may occur during the term of the loan. The Fund has the right under the Lending Agreement to recover the securities from the borrower on demand. With respect to security loans collateralized by non-cash collateral, the Fund receives loan premiums paid by the borrower. With respect to security loans collateralized by cash collateral, the earnings from the collateral investments are shared among the Fund, the security lending agent, and the borrower. The Fund records security lending income net of allocations to the security lending agent and the borrower.
The Fund may incur investment losses as a result of investing securities lending collateral. This could occur if an investment in the collateral investment account defaulted or became impaired. Under those circumstances, the value of a Fund’s cash collateral account may be less than the amount the Fund would be required to return to the borrowers of the securities and the Fund would be required to make up for this shortfall.
During the year ended July 31, 2017, the Fund had no securities out on loan.
11. Credit and Market Risk
Some countries in which the Fund may invest require governmental approval for the repatriation of investment income, capital, or the proceeds of sales of securities by foreign investors. In addition, if there is deterioration in a country’s balance of payments or for other reasons, a country may impose temporary restrictions on foreign capital remittances abroad.
The securities exchanges of certain foreign markets are substantially smaller, less liquid, and more volatile than the major securities markets in the US. Consequently, acquisition and disposition of securities by the Fund may be inhibited. In addition, a significant portion of the aggregate market value of equity securities listed on the major securities exchanges in emerging markets is held by a smaller number of investors. This may limit the number of shares available for acquisition or disposition by the Fund.
The Fund invests a portion of its assets in high yield, fixed income securities, which are securities rated lower than BBB- by S&P and Baa3 by Moody’s, or similarly rated by another nationally recognized statistical rating organization. Investments in these higher yielding securities are generally accompanied by a greater degree of credit risk than higher rated securities. Additionally, lower rated securities may be more susceptible to adverse economic and competitive industry conditions than investment grade securities.
The Fund invests in certain obligations that may have liquidity protection designed to ensure that the receipt of payments due on the underlying security is timely. Such protection may be provided through guarantees, insurance policies, or letters of credit obtained by the issuer or sponsor through third parties, through various means of structuring the transaction, or through a combination of such approaches. The Fund will not pay any additional fees for such credit support, although the existence of credit support may increase the price of the security.
The Fund invests in bank loans and other securities that may subject it to direct indebtedness risk, the risk that the Fund will not receive payment of principal, interest, and other amounts due in connection with these investments and will depend primarily on the financial condition of the borrower. Loans that are fully secured offer the Fund more protection than unsecured loans in the event of nonpayment of scheduled interest or principal, although there is no assurance that the liquidation of collateral from a secured loan would satisfy the corporate borrower’s obligation, or that the collateral can be liquidated. Some loans or claims may be in default at the time of purchase. Certain of the loans and the other direct indebtedness acquired by the Fund may involve revolving credit facilities or other standby financing commitments that obligate the Fund to pay additional cash on a certain date or on demand. These commitments may require the Fund to increase its investment in a company at a time when the Fund might not otherwise decide to do so (including at a time when the company’s financial condition makes it unlikely that such amounts will be repaid). To the extent that the Fund is committed to advance additional funds, it will at all times hold and maintain cash or other high-grade debt obligations in an amount sufficient to meet such commitments. When a loan agreement is purchased the Fund may pay an assignment fee. On an ongoing basis, the Fund may receive a commitment fee based on the undrawn portion of the underlying line of credit portion of a loan agreement. Prepayment penalty fees are received upon the prepayment of a loan agreement by the borrower. Prepayment penalty, facility, commitment, consent, and amendment fees are recorded to income as earned or paid.
As the Fund may be required to rely upon another lending institution to collect and pass on to the Fund amounts payable with respect to the loan and to enforce the Fund’s rights under the loan and other direct indebtedness, an insolvency, bankruptcy, or reorganization of the lending institution may delay or prevent the Fund from receiving such amounts. The highly leveraged nature of many loans may make
51
| | |
| Notes to financial statements | | |
| Delaware Emerging Markets Debt Fund | | |
11. Credit and Market Risk (continued)
them especially vulnerable to adverse changes in economic or market conditions. Investments in such loans and other direct indebtedness may involve additional risk to the Fund.
The Fund may invest up to 15% of its net assets in illiquid securities, which may include securities with contractual restrictions on resale, securities exempt from registration under Rule 144A promulgated under the Securities Act of 1933, as amended, and other securities which may not be readily marketable. The relative illiquidity of these securities may impair the Fund from disposing of them in a timely manner and at a fair price when it is necessary or desirable to do so. While maintaining oversight, the Fund’s Board has delegated to DMC, the day-to-day functions of determining whether individual securities are liquid for purposes of the Fund’s limitation on investments in illiquid securities. Securities eligible for resale pursuant to Rule 144A, which are determined to be liquid, are not subject to the Fund’s 15% limit on investments in illiquid securities. Rule 144A securities have been identified on the “Schedule of investments.”
12. Contractual Obligations
The Fund enters into contracts in the normal course of business that contain a variety of indemnifications. The Fund’s maximum exposure under these arrangements is unknown. However, the Fund has not had prior claims or losses pursuant to these contracts. Management has reviewed the Fund’s existing contracts and expects the risk of loss to be remote.
13. Recent Accounting Pronouncements
In October 2016, the Securities and Exchange Commission released its Final Rule on Investment Company Reporting Modernization (the “Rule”). The Rule contains amendments to Regulation S-X which impact financial statement presentation, particularly the presentation of derivative investments. Although it is still evaluating the impact of the Rule, management believes that many of the Regulation S-X amendments are materially consistent with the Fund’s current financial statement presentation and expects that the Fund will comply with the Rule’s Regulation S-X amendments by the Aug. 1, 2017 compliance date.
14. Subsequent Events
From Sept. 1, 2017, DIFSC’s fees are calculated daily and paid monthly based on the aggregate daily net assets of the Delaware Funds at the following annual rate: 0.00475% of the first $35 billion; 0.0040% of the next $10 billion; and 0.0025% of aggregate average daily net assets in excess of $45 billion (the “Total Fee”). Each Fund in the Delaware Funds pays a minimum of $4,000, which, in aggregate, is subtracted from the Total Fee. Each Fund in the Delaware Funds then pays its relative portion of the remainder of the Total Fee on a relative NAV basis.
Management has determined that no other material events or transactions occurred subsequent to July 31, 2017 that would require recognition or disclosure in the Fund’s financial statements.
Report of independent
registered public accounting firm
To the Board of Trustees of Delaware Group® Government Fund
and the Shareholders of Delaware Emerging Markets Debt Fund:
In our opinion, the accompanying statement of assets and liabilities, including the schedule of investments, and the related statements of operations and of changes in net assets and the financial highlights present fairly, in all material respects, the financial position of the Delaware Emerging Markets Debt Fund (one of the series constituting Delaware Group® Government Fund, hereafter referred to as the “Fund”) as of July 31, 2017, the results of its operations for the year then ended, the changes in its net assets for each of the two years in the period then ended and the financial highlights for each of the periods indicated, in conformity with accounting principles generally accepted in the United States of America. These financial statements and financial highlights (hereafter referred to as “financial statements”) are the responsibility of the Fund’s management. Our responsibility is to express an opinion on these financial statements based on our audits. We conducted our audits of these financial statements in accordance with the standards of the Public Company Accounting Oversight Board (United States). Those standards require that we plan and perform the audit to obtain reasonable assurance about whether the financial statements are free of material misstatement. An audit includes examining, on a test basis, evidence supporting the amounts and disclosures in the financial statements, assessing the accounting principles used and significant estimates made by management, and evaluating the overall financial statement presentation. We believe that our audits, which included confirmation of securities as of July 31, 2017 by correspondence with the custodian and brokers, provide a reasonable basis for our opinion.
PricewaterhouseCoopers LLP
Philadelphia, Pennsylvania
September 18, 2017
53
Other Fund information (Unaudited)
Delaware Emerging Markets Debt Fund
Tax Information
The information set forth below is for the Fund’s fiscal year as required by federal income tax laws. Shareholders, however, must report distributions on a calendar year basis for income tax purposes, which may include distributions for portions of two fiscal years of the Fund. Accordingly, the information needed by shareholders for income tax purposes will be sent to them in January of each year. Please consult your tax advisor for proper treatment of this information.
All disclosures are based on financial information available as of the date of this annual report and, accordingly are subject to change. For any and all items requiring reporting, it is the intention of the Fund to report the maximum amount permitted under the Internal Revenue Code and the regulations thereunder.
For the fiscal year ended July 31, 2017, the Fund reports distributions paid during the year as follows:
| | | | |
(A) Ordinary Income Distribution (Tax Basis) | | | 100.00 | % |
(A) is based on a percentage of the Fund’s total distributions.
For the fiscal year ended July 31, 2017, certain interest income paid by the Fund determined to be Short-Term Capital Gains may be subject to relief from US withholding for foreign shareholders, as provided by the American Jobs Creation Act of 2004, and by the Tax Relief Unemployment Insurance Reauthorization and Jobs Creation Act of 2010, and as extended by the American Taxpayer Relief Act of 2012. For the fiscal year ended July 31, 2017, the Fund reported maximum distributions of Short-Term Capital Gains of $69,190.
54
This page intentionally left blank.
Board of trustees / directors and officers addendum
Delaware FundsSM by Macquarie
A mutual fund is governed by a Board of Trustees/Directors (“Trustees”), which has oversight responsibility for the management of a fund’s business affairs. Trustees establish procedures and oversee and review the performance of the investment manager, the distributor, and others who perform services for the fund. The independent fund trustees, in particular, are advocates
| | | | |
Name, Address, and Birth Date | | Position(s) Held with Fund(s) | | Length of Time Served |
Interested Trustee | | |
Shawn K. Lytle1, 2 | | President, | | Trustee since |
2005 Market Street | | Chief Executive Officer, | | September 2015 |
Philadelphia, PA 19103 | | and Trustee | | |
February 1970 | | | | President and |
| | | | Chief Executive Officer |
| | | | since August 2015 |
| | | | |
Independent Trustees | | |
Thomas L. Bennett | | Chairman and Trustee | | Trustee since |
2005 Market Street | | | | March 2005 |
Philadelphia, PA 19103 | | | | |
October 1947 | | | | Chairman since |
| | | | | March 2015 |
Ann D. Borowiec | | Trustee | | Since March 2015 |
2005 Market Street | | | | |
Philadelphia, PA 19103 | | | | |
November 1958 | | | | |
| | | | |
| | | | |
| | | | | |
Joseph W. Chow | | Trustee | | Since January 2013 |
2005 Market Street | | | | |
Philadelphia, PA 19103 | | | | |
January 1953 | | | | |
| | | | |
| | | | | |
| 1 | Shawn K. Lytle is considered to be an “Interested Trustee” because he is an executive officer of the Fund’s(s’) investment advisor. |
| 2 | Shawn K. Lytle, David F. Connor, Daniel V. Geatens, and Richard Salus serve in similar capacities for the six portfolios of the Optimum Fund Trust, which have the same investment advisor, principal underwriter, and transfer agent as the registrant. |
for shareholder interests. Each trustee has served in that capacity since he or she was elected to or appointed to the Board of Trustees, and will continue to serve until his or her retirement or the election of a new trustee in his or her place. The following is a list of the Trustees and Officers with certain background and related information.
| | | | |
Principal Occupation(s) During the Past Five Years | | Number of Portfolios in Fund Complex Overseen by Trustee or Officer | | Other Directorships Held by Trustee or Officer |
| | | | |
Shawn K. Lytle has served as | | 62 | | Trustee — UBS |
President of | | | | Relationship Funds, |
Macquarie Investment | | | | SMA Relationship |
Management3 | | | | Trust, and UBS Funds |
since June 2015 and was the | | | | (May 2010–April 2015) |
Regional Head of Americas for | | | | |
UBS Global Asset | | | | |
Management from
2010 through 2015. | | | | |
| | | | |
Private Investor | | 62 | | None |
(March 2004–Present) | | | | |
| | | | |
| | | | |
| | | | | |
Chief Executive Officer, | | 62 | | Director — |
Private Wealth Management | | | | Banco Santander International |
(2011–2013) and | | | | |
Market Manager, | | | | Director — |
New Jersey Private | | | | Santander Bank, N.A. |
Bank (2005–2011) — | | | | |
J.P. Morgan Chase & Co. | | | | |
Executive Vice President | | 62 | | Director and Audit Committee |
| (Emerging Economies | | | | Member — Hercules |
| Strategies, Risks, and | | | | Technology Growth |
Corporate Administration) | | | | Capital, Inc. |
State Street Corporation | | | | (2004–2014) |
(July 2004–March 2011) | | | | |
| 3 | Macquarie Investment Management (formerly known as Delaware Investments) is the marketing name for Macquarie Management Holdings, Inc. (formerly known as Delaware Management Holdings, Inc.) and its subsidiaries, including the Fund’s(s’) investment advisor, principal underwriter, and its transfer agent. |
Board of trustees / directors and officers addendum
Delaware FundsSM by Macquarie
| | | | |
Name, Address, and Birth Date | | Position(s) Held with Fund(s) | | Length of Time Served |
Independent Trustees (continued) | | |
John A. Fry | | Trustee | | Since January 2001 |
2005 Market Street | | | | |
Philadelphia, PA 19103 | | | | |
May 1960 | | | | |
| | | | |
| | | | |
| | | | |
| | | | |
| | | | |
| | | | |
| | | | |
| | | | |
| | | | | |
| | |
Lucinda S. Landreth | | Trustee | | Since March 2005 |
2005 Market Street | | | | |
Philadelphia, PA 19103 | | | | |
June 1947 | | | | |
Frances A. Sevilla-Sacasa | | Trustee | | Since September 2011 |
2005 Market Street | | | | |
Philadelphia, PA 19103 | | | | |
January 1956 | | | | |
| | | | |
| | | | |
| | | | |
| | | | |
| | | | |
| | | | |
| | | | |
| | | | |
| | | | |
| | | | |
| | | | |
| | | | |
| | | | | |
| | | | |
Principal Occupation(s) During the Past Five Years | | Number of Portfolios in Fund Complex Overseen by Trustee or Officer | | Other Directorships Held by Trustee or Officer |
| | |
President — | | 62 | | Director, Audit Committee, |
Drexel University | | | | and Governance Committee |
(August 2010–Present) | | | | Member — Community |
| | | | Health Systems |
President — | | | | |
Franklin & Marshall College | | | | Director — Drexel |
(July 2002–July 2010) | | | | Morgan & Co. |
| | |
| | | | Director, Audit Committee |
| | | | Member — vTv |
| | | | Therapeutics LLC |
| | |
| | | | Director — FS Credit Real |
| | | | | Estate Income Trust, Inc. |
Private Investor | | 62 | | None |
(2004–Present) | | | | |
| | | | |
| | | | | |
Chief Executive Officer — | | 62 | | Trust Manager and |
Banco Itaú | | | | Audit Committee |
International | | | | Member — Camden |
(April 2012–December 2016) | | | | Property Trust |
| | |
Executive Advisor to Dean | | | | |
(August 2011–March 2012) and Interim Dean | | | | |
(January 2011–July 2011) — | | | | |
University of Miami School of | | | | |
Business Administration | | | | |
| | |
President — U.S. Trust, | | | | |
Bank of America Private | | | | |
Wealth Management | | | | |
(Private Banking) | | | | |
(July 2007–December 2008) | | | | |
Board of trustees / directors and officers addendum
Delaware FundsSM by Macquarie
| | | | |
| Name, Address, | | Position(s) | | Length of |
| and Birth Date | | Held with Fund(s) | | Time Served |
Independent Trustees (continued) | | |
| Thomas K. Whitford | | Trustee | | Since January 2013 |
| 2005 Market Street | | | | |
| Philadelphia, PA 19103 | | | | |
| March 1956 | | | | |
| | | | |
| | | | |
| | | | | |
| Janet L. Yeomans | | Trustee | | Since April 1999 |
| 2005 Market Street | | | | |
| Philadelphia, PA 19103 | | | | |
| July 1948 | | | | |
| | | | |
| | | | |
| | | | |
| | | | |
| | | | |
| | | | |
Officers | | |
| David F. Connor | | Senior Vice President, | | Senior Vice President |
| 2005 Market Street | | General Counsel, | | since May 2013; |
| Philadelphia, PA 19103 | | and Secretary | | General Counsel |
| December 1963 | | | | since May 2015; |
| | | | Secretary since |
| | | | | October 2005 |
| Daniel V. Geatens | | Vice President | | Treasurer since October 2007 |
| 2005 Market Street | | and Treasurer | | |
| Philadelphia, PA 19103 | | | | |
| October 1972 | | | | |
| | | | |
| | | | | |
| Richard Salus | | Senior Vice President | | Chief Financial Officer |
| 2005 Market Street | | and Chief Financial Officer | | since November 2006 |
| Philadelphia, PA 19103 | | | | |
| October 1963 | | | | |
| | | | |
| | | | |
| | | | | |
The Statement of Additional Information for the Fund(s) includes additional information about the Trustees and Officers and is available, without charge, upon request by calling 800 523-1918.
| | | | |
Principal Occupation(s) During the Past Five Years | | Number of Portfolios in Fund Complex Overseen by Trustee or Officer | | Other Directorships Held by Trustee or Officer |
| | |
Vice Chairman | | 62 | | Director —HSBC Finance |
(2010–April 2013) — | | | | Corporation and HSBC |
PNC Financial | | | | North America Holdings Inc. |
Services Group | | | | |
| | | | Director — |
| | | | | HSBC USA Inc. |
Vice President and Treasurer | | 62 | | Director, Personnel and |
(January 2006–July 2012), | | | | Compensation Committee |
Vice President — | | | | Chair, and Member of |
Mergers & Acquisitions | | | | Nominating, Investments, and |
(January 2003–January 2006), | | | | Audit Committees — |
and Vice President | | | | Okabena Company |
and Treasurer | | | | (2009–2014) |
(July 1995–January 2003) —
3M Company | | | | |
| | | | |
| | |
David F. Connor has served | | 62 | | None2 |
in various capacities at different times at | | | | |
Macquarie Investment | | | | |
Management. | | | | |
| | | | |
| | | | | |
Daniel V. Geatens has served | | 62 | | None2 |
in various capacities at different times at | | | | |
Macquarie Investment | | | | |
Management. | | | | |
| | | | | |
Richard Salus has served | | 62 | | None2 |
in various executive capacities at different times at | | | | |
Macquarie Investment | | | | |
Management. | | | | |
| | | | | |
About the organization
| | | | | | |
Board of trustees Shawn K. Lytle President and Chief Executive Officer Delaware FundsSM by Macquarie Philadelphia, PA Thomas L. Bennett Chairman of the Board Delaware Funds by Macquarie Private Investor Rosemont, PA | | Ann D. Borowiec Former Chief Executive Officer Private Wealth Management J.P. Morgan Chase & Co. New York, NY Joseph W. Chow Former Executive Vice President State Street Corporation Boston, MA | | John A. Fry President Drexel University Philadelphia, PA Lucinda S. Landreth Former Chief Investment Officer Assurant, Inc. New York, NY | | Frances A. Sevilla-Sacasa Former Chief Executive Officer Banco Itaú International Miami, FL Thomas K. Whitford Former Vice Chairman PNC Financial Services Group Pittsburgh, PA Janet L. Yeomans Former Vice President and Treasurer 3M Company St. Paul, MN |
| |
| Affiliated officers | | |
| | | |
David F. Connor Senior Vice President, General Counsel, and Secretary Delaware Funds by Macquarie Philadelphia, PA | | Daniel V. Geatens Vice President and Treasurer Delaware Funds by Macquarie Philadelphia, PA | | Richard Salus Senior Vice President and Chief Financial Officer Delaware Funds by Macquarie Philadelphia, PA | | |
This annual report is for the information of Delaware Emerging Markets Debt Fund shareholders, but it may be used with prospective investors when preceded or accompanied by the Delaware Fund fact sheet for the most recently completed calendar quarter. These documents are available at delawarefunds.com/literature.
The Fund files its complete schedule of portfolio holdings with the Securities and Exchange Commission (SEC) for the first and third quarters of each fiscal year on Form N-Q. The Fund’s Forms N-Q, as well as a description of the policies and procedures that the Fund uses to determine how to vote proxies (if any) relating to portfolio securities are available without charge (i) upon request, by calling 800 523-1918; and (ii) on the SEC’s website at sec.gov. In addition, a description of the policies and procedures that the Fund uses to determine how to vote proxies (if any) relating to portfolio securities and the Schedules of Investments included in the Fund’s most recent Form N-Q are available without charge on the Fund’s website at delawarefunds.com/literature. The Fund’s Forms N-Q may be reviewed and copied at the SEC’s Public Reference Room in Washington, D.C.; information on the operation of the Public Reference Room may be obtained by calling 800 SEC-0330.
Information (if any) regarding how the Fund voted proxies relating to portfolio securities during the most recently disclosed 12-month period ended June 30 is available without charge (i) through the Fund’s website at delawarefunds.com/proxy; and (ii) on the SEC’s website at sec.gov.
| | |

| | 
Annual report |
Fixed income mutual fund
Delaware Strategic Income Fund
(formerly, Delaware Core Plus Bond Fund)
July 31, 2017
Carefully consider the Fund’s investment objectives, risk factors, charges, and expenses before investing. This and other information can be found in the Fund’s prospectus and its summary prospectus, which may be obtained by visiting delawarefunds.com/literature or calling 800 523-1918. Investors should read the prospectus and the summary prospectus carefully before investing.
You can obtain shareholder reports and prospectuses online instead of in the mail.
Visit delawarefunds.com/edelivery.
Experience Delaware FundsSM by Macquarie
Macquarie Investment Management (MIM) is a global asset manager with offices throughout the United States, Europe, Asia, and Australia. We are active managers who prioritize autonomy and accountability at the investment team level in pursuit of opportunities that matter for our clients. Delaware Funds by Macquarie is one of the longest-standing mutual fund families, with more than 75 years in existence.
If you are interested in learning more about creating an investment plan, contact your financial advisor.
You can learn more about Delaware Funds by Macquarie or obtain a prospectus for Delaware Strategic Income Fund at delawarefunds.com/literature.
Manage your investments online
| ● | | Check your account balance and recent transactions |
| ● | | View statements and tax forms |
| ● | | Make purchases and redemptions |
Visit delawarefunds.com/account-access.
Macquarie Investment Management (MIM) is the marketing name for the registered investment advisers including Macquarie Investment Management Business Trust (MIMBT) (formerly, Delaware Management Business Trust), Macquarie Funds Management Hong Kong Limited, Macquarie Investment Management Austria Kapitalanlage AG, Macquarie Investment Management Global Limited, Macquarie Bank International Limited, Macquarie Investment Management Europe Limited, Macquarie Investment Management Limited, and Macquarie Capital Investment Management, Inc.
The Funds are distributed by Delaware Distributors, L.P., an affiliate of Macquarie Investment Management Business Trust and Macquarie Group Limited. Macquarie Investment Management (MIM), a member of Macquarie Group, refers to the companies comprising the asset management division of Macquarie Group Limited and its subsidiaries and affiliates worldwide.
Other than Macquarie Bank Limited (MBL), none of the entities noted are authorized deposit-taking institutions for the purposes of the Banking Act 1959 (Commonwealth of Australia). The obligations of these entities do not represent deposits or other liabilities of MBL. MBL does not guarantee or otherwise provide assurance in respect of the obligations of these entities, unless noted otherwise. The Fund is governed by US laws and regulations.
Table of contents
Unless otherwise noted, views expressed herein are current as of July 31, 2017, and subject to change for events occurring after such date.
The Fund is not FDIC insured and is not guaranteed. It is possible to lose the principal amount invested.
Advisory services provided by Delaware Management Company, a series of MIMBT, a US registered investment advisor.
All third-party marks cited are the property of their respective owners.
© 2017 Macquarie Management Holdings, Inc. (formerly, Delaware Management Holdings, Inc.)
| | |
| Portfolio management review | | |
| Delaware Strategic Income Fund | | August 8, 2017 |
| | | | | | | | |
Performance preview (for the year ended July 31, 2017) | | | | | | | | |
Delaware Strategic Income Fund (Institutional Class shares) | | | 1-year return | | | | +1.99% | |
Delaware Strategic Income Fund (Class A shares) | | | 1-year return | | | | +1.73% | |
Bloomberg Barclays US Aggregate Index (benchmark) | | | 1-year return | | | | -0.51% | |
Past performance does not guarantee future results.
For complete, annualized performance for Delaware Strategic Income Fund, please see the table on page 4.
Institutional Class shares are available without sales or asset-based distribution charges only to certain eligible accounts. The performance of Class A shares excludes the applicable sales charge. Both Institutional Class shares and Class A shares reflect the reinvestment of all distributions.
Please see page 7 for a description of the index. Index performance returns do not reflect any management fees, transaction costs, or expenses. Indices are unmanaged and one cannot invest directly in an index.
Effective Jan. 31, 2017, the investment strategies for Delaware Core Plus Bond Fund changed and the Fund was repositioned as a strategic income fund. In connection with the repositioning, the Fund’s name changed to Delaware Strategic Income Fund. These changes may have resulted in higher portfolio turnover during the repositioning. Please see the Fund’s prospectus for more information.
Central banks continued to play a pivotal role in financial markets during the Fund’s fiscal year ended July 31, 2017, with the US Federal Reserve’s monetary policy diverging from those of the European Central Bank (ECB) and the Bank of Japan. In 2016, the ECB expanded its quantitative easing program into purchasing corporate bonds, creating a global hunt for yield that resulted in additional demand for US bonds, which offered higher returns. Similarly, 0% rates in Japan, where quantitative easing continued unabated, also drove currency from Asia into US markets. The political environment was positive for market performance during the fiscal year, despite some surprises. After a brief spell of Brexit-related volatility in the summer of 2016, the stock market and riskier assets rebounded with strength, supported largely by confidence that, if needed, central banks would help maintain market stability. The rally continued up to the November 2016 US presidential election and its unexpected outcome.
Halfway through the fiscal
year, we changed the
Fund’s overall strategy and
focus from core plus to
strategic income. The new
strategy is more
differentiated and income-
focused, with a secondary
quest for capital
appreciation. The change
was part of an effort to
offer investors more
opportunity to address risk.
| | |
| Portfolio management review | | |
| Delaware Strategic Income Fund | | |
After an overnight post-election selloff, markets rebounded as investors seemed more optimistic that President Trump’s pro-growth agenda would include tax cuts, infrastructure spending, tax repatriation, and healthcare reform. However, as the fiscal year progressed, the Trump administration’s legislative agenda faltered, leading investors, in our opinion, to lower their expectations for rapid, substantive results.
Within the Fund
For the fiscal year ended July 31, 2017, Delaware Strategic Income Fund outperformed its benchmark, the Bloomberg Barclays US Aggregate Index. The Fund’s Institutional Class shares returned +1.99%. The Fund’s Class A shares returned +1.73% at net asset value and -2.81% at maximum offer price. These figures reflect all distributions reinvested. During the same period, the Bloomberg Barclays US Aggregate Index returned -0.51%. For complete, annualized performance of Delaware Strategic Income Fund, please see the table on page 4.
Halfway through the fiscal year, we changed the Fund’s overall strategy and focus from core plus to strategic income. The new strategy’s primary investment objective is income, with a secondary quest for capital appreciation. The change was part of an effort to offer investors additional investment opportunities that may provide more income in what continues to be a low yield environment.
A significant contributor to the Fund’s relative outperformance was a major underweight to US Treasurys, which returned -2.55%. The Fund had an average allocation of just 1% to Treasurys versus 36% in the benchmark. Much of those assets were redeployed in what we viewed as the stronger-performing credit and “plus” (out of benchmark) sectors, where the Fund benefited from solid security selection and an overweight to the investment grade credit sector, with an average allocation of 36% versus 31% in the
benchmark. Within investment grade bonds, the Fund focused down in capital structures, particularly financials, where risks were still modest, in our opinion.
Overall, the Fund’s high-grade credit holdings returned 2.28%, nearly doubling the benchmark’s 1.26% gain. High-grade financial securities, returning about 4.40%, boosted the Fund’s results significantly, due to an overweight and security selection. The Fund received a bonus when PNC non-cumulated preferred securities were called, resulting in double-digit returns. The Fund also gained from solid security selection in high-grade utilities, which generated a 1.6% return compared with a negative return in the benchmark. Emera, an energy and services’ company, and ComEd Financing, a Commonwealth Edison special holding company, also contributed to the Fund’s returns.
The Fund’s out-of-benchmark components performed relatively well. High yield credit gained 8.68% versus the benchmark’s negative return. This generated close to half of the portfolio’s overall excess return relative to the benchmark. Strong-performing issuers included equipment rentals company United Rentals and oil and gas company Halcón Resources. Emerging markets, to which the portfolio allocated an average of 8% during the fiscal year, also generally performed well. Contributors included Brazilian pulp and paper manufacturer Suzano, which had double-digit returns; wireless provider Digicel; and Brazilian petroleum multinational Petrobras.An allocation to bank loans, another plus component, also added to the Fund’s performance with lower-rated loans outperforming higher quality. Down-in-quality bank loan securities significantly contributed to performance for the Fund. The portfolio’s average allocations to these higher yielding sectors rose as the Fund transitioned into a strategic income fund, bringing the portfolio’s average quality down as we sourced additional
income. The fiscal year ended with significantly higher allocations to these areas.
Although in our view, structured products were less important to the Fund than credit holdings, the Fund benefited from solid security selection and an underweight in mortgage-backed securities (MBS). Contributions came from out-of-benchmark collateralized mortgage obligation (CMO) holdings, both agency and whole loan CMOs, that produced higher returns than fixed-rate agency CMOs and the overall benchmark.
Certain financial sector securities detracted modestly from the Fund’s performance during the fiscal year due to changes in interest rates. Within banking, rising interest rates led to negative returns for both the The Bank of New York Mellon and State Street, which was sold during the year. Additionally, medical-device manufacturer, Zimmer Biomet, was sold on concerns about its relative value and rising volatility related to uncertainty about healthcare reform and the potential effect on the industry. Bonds of the lower-rated beauty and personal care products company, Revlon Consumer Products, were sold at a loss as the company experienced weak results in its mass retail market. The Fund’s industrials holdings underperformed their benchmark peers.
We believe central bank policy shifts in the coming months should continue to be a key focus. In our view, the ECB could phase out bond purchases, while the Fed is likely to begin to reduce the size of its balance sheet by slowing the reinvestment
program of both MBS and US Treasury products. We see mixed signals regarding credit, with improving corporate fundamentals inspiring greater confidence while valuations become more stretched. Inflationary pressures will likely remain elusive but we must continue to monitor the labor market for signs of wage pressures.
With these policies in mind, we see both areas of opportunity and idiosyncratic risks in a low-volatility market where risk premiums are priced through their long-term historical averages. The heightened risk, in our opinion, is that disappointing news could have a larger-than-normal effect on price performance, underscoring the importance of research-based, bottom-up (bond by bond) security selection.
A note about derivatives
The Fund used four types of derivatives during the fiscal year: futures, currency exchange contracts, options, and swaps. The Fund used futures and interest rate swaps to manage interest rate risk and to gain exposure to certain markets. The Fund also used currency exchange contracts to hedge the US dollar value of foreign currency securities. The Fund had very limited use of options, primarily to manage foreign-currency or interest rate-driven volatility. We used credit default swaps to manage the Fund’s credit exposure. None of these derivatives had a material effect on the Fund’s performance (that is, it amounted to less than 0.50 percentage points) although the Fund’s use of futures detracted modestly.
| | |
| Performance summary | | |
| Delaware Strategic Income Fund | | July 31, 2017 |
The performance quoted represents past performance and does not guarantee future results. Investment return and principal value of an investment will fluctuate so that shares, when redeemed, may be worth more or less than their original cost. Current performance may be lower or higher than the performance quoted. Performance data current for the most recent month end may be obtained by calling 800 523-1918 or visiting delawarefunds.com/performance.
| | | | | | | | |
| Fund and benchmark performance1,2 | | Average annual total returns through July 31, 2017 |
| | | | |
| | | 1 year | | 5 years | | 10 years | | Lifetime |
Class A (Est. Aug. 16, 1985) | | | | | | | | |
Excluding sales charge | | +1.73% | | +2.29% | | +5.25% | | +5.91% |
Including sales charge | | -2.81% | | +1.36% | | +4.77% | | +5.76% |
Class C (Est. Nov. 29, 1995) | | | | | | | | |
Excluding sales charge | | +0.97% | | +1.53% | | +4.47% | | +4.32% |
Including sales charge | | -0.01% | | +1.53% | | +4.47% | | +4.32% |
Class R (Est. June 2, 2003) | | | | | | | | |
Excluding sales charge | | +1.48% | | +2.04% | | +5.02% | | +4.06% |
Including sales charge | | +1.48% | | +2.04% | | +5.02% | | +4.06% |
Institutional Class (Est. June 1, 1992) | | | | | | | | |
Excluding sales charge | | +1.99% | | +2.55% | | +5.52% | | +5.42% |
Including sales charge | | +1.99% | | +2.55% | | +5.52% | | +5.42% |
Bloomberg Barclays US Aggregate Index | | -0.51% | | +2.02% | | +4.44% | | +5.61%* |
* The benchmark lifetime return is for Institutional Class share comparison only and is calculated using the last business day in the month of the Fund’s Institutional Class inception date.
1Returns reflect the reinvestment of all distributions and are presented both with and without the applicable sales charges described below. Returns do not reflect the deduction of taxes the shareholder would pay on Fund distributions or redemptions of Fund shares.
Expense limitations were in effect for certain classes during some or all of the periods shown in the “Fund and benchmark performance” table. Expenses for each class are listed on the “Fund expense ratios” table on page 6. Performance would have been lower had expense limitations not been in effect.
Institutional Class shares are available without sales or asset-based distribution charges only to certain eligible accounts.
Class A shares are sold with a maximum front-end sales charge of 4.50%, and have an annual
distribution and service fee of 0.25% of average daily net assets. The Board has adopted a formula for calculating 12b-1 plan fees for the Fund’s Class A shares. The Fund’s Class A shares are currently subject to a blended 12b-1 fee equal to the sum of: (i) 0.10% of average daily net assets representing shares acquired prior to June 1, 1992, and (ii) 0.25% of average daily net assets representing shares acquired on or after June 1, 1992. All Class A shares currently bear 12b-1 fees at the same rate, the blended rate, currently 0.25% of average daily net assets, based on the formula described above. This method of calculating Class A 12b-1 fees may be discontinued at the sole discretion of the Board. Performance for Class A shares, excluding sales charges, assumes that no front-end sales charge applied.
Class C shares are sold with a contingent deferred sales charge of 1.00% if redeemed during the first 12 months. They are also subject to an annual distribution and service fee of 1.00% of average daily net assets. Performance for Class C shares, excluding sales charges, assumes either that contingent deferred sales charges did not apply or that the investment was not redeemed.
Class R shares are available only for certain retirement plan products. They are sold without a sales charge and have an annual distribution and service fee of 0.50% of average daily net assets.
Fixed income securities and bond funds can lose value, and investors can lose principal, as interest rates rise. They also may be affected by economic conditions that hinder an issuer’s ability to make interest and principal payments on its debt.
The Fund may also be subject to prepayment risk, the risk that the principal of a bond that is held by a portfolio will be prepaid prior to maturity, at the time when interest rates are lower than what the bond was paying. A portfolio may then have to reinvest that money at a lower interest rate.
High yielding, non-investment-grade bonds (junk bonds) involve higher risk than investment grade bonds. The high yield secondary market is particularly susceptible to liquidity problems when institutional investors, such as mutual funds and certain other financial institutions, temporarily stop buying bonds for regulatory, financial, or other reasons. In addition, a less liquid secondary market makes it more difficult for the Fund to obtain precise valuations of the high yield securities in its portfolio.
The Fund may invest in derivatives, which may involve additional expenses and are subject to risk, including the risk that an underlying security or securities index moves in the opposite direction from what the portfolio manager anticipated. A derivatives transaction depends upon the counterparties’ ability to fulfill their contractual obligations.
Investments in mortgage-backed securities (MBS) may involve risks. MBS represent an ownership interest in a pool of mortgage loans. The individual mortgage loans are packaged or “pooled” together for sale to investors. These mortgage loans may have either fixed or adjustable interest rates.
Because the Fund may invest in bank loans and other direct indebtedness, it is subject to the risk that the Fund will not receive payment of principal, interest, and other amounts due in connection with these investments, which primarily depend on the financial condition of the borrower and the lending institution.
International investments entail risks not ordinarily associated with US investments including fluctuation in currency values, differences in accounting principles, or economic or political instability in other nations. Investing in emerging markets can be riskier than investing in established foreign markets due to increased volatility and lower trading volume.
If and when the Fund invests in forward foreign currency contracts or uses other investments to hedge against currency risks, the Fund will be subject to special risks, including counterparty risk.
The Fund may experience portfolio turnover in excess of 100%, which could result in higher trading costs and tax liability.
This document may mention bond ratings published by nationally recognized statistical rating organizations (NRSROs) Standard & Poor’s, Moody’s Investors Service, and Fitch, Inc. For securities rated by an NRSRO other than S&P, the rating is converted to the equivalent S&P credit rating. Bonds rated AAA are rated as having the highest quality and are generally considered to have the lowest degree of investment risk. Bonds rated AA are considered to be of high quality, but with a slightly higher degree of risk than bonds rated AAA. Bonds rated A are considered to have
| | |
| Performance summary | | |
| Delaware Strategic Income Fund | | |
many favorable investment qualities, though they are somewhat more susceptible to adverse economic conditions. Bonds rated BBB are believed to be of medium-grade quality and
generally riskier over the long term. Bonds rated BB, B, and CCC are regarded as having significant speculative characteristics, with BB indicating the least degree of speculation of the three.
2The Fund’s expense ratios, as described in the most recent prospectus, are disclosed in the following “Fund expense ratios” table. Delaware Management Company has agreed to reimburse certain expenses and/or waive certain fees in order to prevent total annual fund operating expenses (excluding any 12b-1 fees, acquired fund fees and expenses, taxes, interest, short sale and dividend interest expenses, brokerage fees, certain insurance costs, and nonroutine expenses or costs, including, but not limited to, those relating to reorganizations, litigation, conducting shareholder meetings, and liquidations (collectively, nonroutine expenses)) from exceeding 0.65% of the Fund’s average daily net assets during the period from Aug. 1, 2016 through July 31, 2017.* Please see the most recent prospectus and any applicable supplement(s) for additional information on these fee waivers and/or reimbursements.
| | | | | | | | |
| | | | |
| Fund expense ratios | | Class A | | Class C | | Class R | | Institutional Class |
Total annual operating expenses (without fee waivers) | | 1.21% | | 1.96% | | 1.46% | | 0.96% |
Net expenses (including fee waivers, if any) | | 0.90% | | 1.65% | | 1.15% | | 0.65% |
| Type of waiver | | Contractual | | Contractual | | Contractual | | Contractual |
*The aggregate contractual waiver period covering this report is from Nov. 27, 2015, through Jan. 31, 2018.
Performance of a $10,000 investment1
Average annual total returns from July 31, 2007, through July 31, 2017
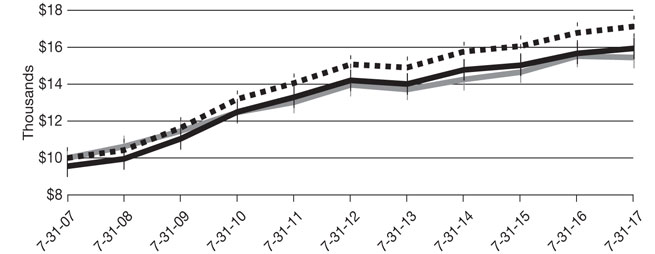
| | | | | | | | | | | | | | |
| For period beginning July 31, 2007, through July 31, 2017 | | Starting value | | | Ending value | |

| | Delaware Strategic Income Fund — Institutional Class shares | | | $10,000 | | | | $17,115 | |

| | Delaware Strategic Income Fund — Class A shares | | | $9,550 | | | | $15,933 | |

| | Bloomberg Barclays US Aggregate Index | | | $10,000 | | | | $15,435 | |
1The “Performance of a $10,000 investment” graph assumes $10,000 invested in Institutional Class and Class A shares of the Fund on July 31, 2007, and includes the effect of a 4.50% front-end sales charge (for Class A shares) and the reinvestment of all distributions. The graph does not reflect the deduction of taxes the shareholders would pay on Fund distributions or redemptions of Fund shares. Expense limitations were in effect for some or all of the periods shown. Performance would have been lower had expense limitations not been in effect. Expenses are listed in the “Fund expense ratios” table on page 6. Please note additional details on pages 4 through 7.
The graph also assumes $10,000 invested in the Bloomberg Barclays US Aggregate Index as of July 31, 2007. The Bloomberg Barclays US Aggregate Index measures the performance of publicly issued investment grade (Baa3/BBB- or better) corporate, US government, mortgage- and asset-backed securities with at least one year to maturity and at least $250 million par amount outstanding.
Index performance returns do not reflect any management fees, transaction costs, or expenses. Indices are unmanaged and one cannot invest directly in an index. Past performance is not a guarantee of future results.
Performance of other Fund classes will vary due to different charges and expenses.
| | | | | | |
| | | | |
| | | Nasdaq symbols | | CUSIPs | | |
Class A | | DEGGX | | 246094205 | | |
Class C | | DUGCX | | 246094700 | | |
Class R | | DUGRX | | 246094809 | | |
Institutional Class | | DUGIX | | 246094502 | | |
| | |
| Disclosure of Fund expenses | | |
| For the six-month period from February 1, 2017 to July 31, 2017 (Unaudited) | | |
As a shareholder of the Fund, you incur two types of costs: (1) transaction costs, including sales charges (loads) on purchase payments, reinvested dividends, or other distributions; redemption fees; and exchange fees; and (2) ongoing costs, including management fees; distribution and/or service (12b-1) fees; and other Fund expenses. This example is intended to help you understand your ongoing costs (in dollars) of investing in the Fund and to compare these costs with the ongoing costs of investing in other mutual funds.
The example is based on an investment of $1,000 invested at the beginning of the period and held for the entire six-month period from Feb. 1, 2017 to July 31, 2017.
Actual expenses
The first section of the table shown, “Actual Fund return,” provides information about actual account values and actual expenses. You may use the information in this section of the table, together with the amount you invested, to estimate the expenses that you paid over the period. Simply divide your account value by $1,000 (for example, an $8,600 account value divided by $1,000 = 8.6), then multiply the result by the number in the first section under the heading entitled “Expenses Paid During Period” to estimate the expenses you paid on your account during this period.
Hypothetical example for comparison purposes
The second section of the table shown, “Hypothetical 5% return,” provides information about hypothetical account values and hypothetical expenses based on the Fund’s actual expense ratio and an assumed rate of return of 5% per year before expenses, which is not the Fund’s actual return. The hypothetical account values and expenses may not be used to estimate the actual ending account balance or expenses you paid for the period. You may use this information to compare the ongoing costs of investing in the Fund and other funds. To do so, compare this 5% hypothetical example with the 5% hypothetical examples that appear in the shareholder reports of the other funds.
Please note that the expenses shown in the table are meant to highlight your ongoing costs only and do not reflect any transactional costs, such as sales charges (loads), redemption fees, or exchange fees. Therefore, the second section of the table is useful in comparing ongoing costs only, and will not help you determine the relative total costs of owning different funds. In addition, if these transactional costs were included, your costs would have been higher. The Fund’s expenses shown in the table reflect fee waivers in effect. The expenses shown in the table assume reinvestment of all dividends and distributions.
Delaware Strategic Income Fund
Expense analysis of an investment of $1,000
| | | | | | | | | | | | | | | | |
| | | Beginning
Account Value
2/1/17 | | | Ending
Account Value
7/31/17 | | | Annualized
Expense Ratio | | | Expenses
Paid During Period
2/1/17 to 7/31/17* | |
| | | | |
Actual Fund return† | | | | | | | | | | | | | | | | |
Class A | | | $1,000.00 | | | | $1,042.90 | | | | 0.90% | | | | $4.56 | |
Class C | | | 1,000.00 | | | | 1,039.10 | | | | 1.65% | | | | 8.34 | |
Class R | | | 1,000.00 | | | | 1,041.60 | | | | 1.15% | | | | 5.82 | |
Institutional Class | | | 1,000.00 | | | | 1,044.20 | | | | 0.65% | | | | 3.29 | |
| | | | |
Hypothetical 5% return (5% return before expenses) | | | | | | | | | | | | | | | | |
Class A | | | $1,000.00 | | | | $1,020.33 | | | | 0.90% | | | | $4.51 | |
Class C | | | 1,000.00 | | | | 1,016.61 | | | | 1.65% | | | | 8.25 | |
Class R | | | 1,000.00 | | | | 1,019.09 | | | | 1.15% | | | | 5.76 | |
Institutional Class | | | 1,000.00 | | | | 1,021.57 | | | | 0.65% | | | | 3.26 | |
| * | “Expenses Paid During Period” are equal to the Fund’s annualized expense ratio, multiplied by the average account value over the period, multiplied by 181/365 (to reflect the one-half year period). |
| † | Because actual returns reflect only the most recent six-month period, the returns shown may differ significantly from fiscal year returns. |
Security type / sector allocation
| | |
| Delaware Strategic Income Fund | | As of July 31, 2017 (Unaudited) |
Sector designations may be different than the sector designations presented in other Fund materials. The sector designations may represent the investment manager’s internal sector classifications.
| | | | |
Security type / sector | | | Percentage of net assets | |
Agency Collateralized Mortgage Obligations | | | 8.14% | |
Agency Commercial Mortgage-Backed Securities | | | 1.61% | |
Agency Mortgage-Backed Securities | | | 5.05% | |
Collateralized Debt Obligations | | | 1.36% | |
Convertible Bond | | | 0.03% | |
Corporate Bonds | | | 61.93% | |
Banking | | | 10.00% | |
Basic Industry | | | 6.26% | |
Brokerage | | | 1.38% | |
Capital Goods | | | 5.71% | |
Communications | | | 9.08% | |
Consumer Cyclical | | | 4.13% | |
Consumer Non-Cyclical | | | 6.51% | |
Electric | | | 3.02% | |
Energy | | | 10.09% | |
Finance Companies | | | 1.22% | |
Insurance | | | 0.94% | |
Natural Gas | | | 0.29% | |
REITs | | | 1.32% | |
Technology | | | 1.53% | |
Transportation | | | 0.45% | |
Municipal Bonds | | | 2.19% | |
Non-Agency Asset-Backed Securities | | | 0.69% | |
Non-Agency Collateralized Mortgage Obligations | | | 2.42% | |
Non-Agency Commercial Mortgage-Backed Securities | | | 5.90% | |
Regional Bond | | | 0.16% | |
Loan Agreements | | | 1.72% | |
Sovereign Bonds | | | 5.10% | |
Supranational Banks | | | 0.83% | |
US Treasury Obligation | | | 0.05% | |
Convertible Preferred Stock | | | 0.03% | |
Preferred Stock | | | 2.02% | |
Options Purchased | | | 0.00% | |
Short-Term Investments | | | 0.68% | |
Total Value of Securities | | | 99.91% | |
Receivables and Other Assets Net of Liabilities | | | 0.09% | |
Total Net Assets | | | 100.00% | |
10
| | |
| Schedule of investments | | |
| Delaware Strategic Income Fund | | July 31, 2017 |
| | | | | | | | |
| | | Principal amount° | | | Value (US $) | |
| |
Agency Collateralized Mortgage Obligations – 8.14% | | | | | | | | |
| |
Fannie Mae Connecticut Avenue Securities | | | | | | | | |
Series 2017-C04 2M2 4.082% 11/25/29● | | | 65,000 | | | $ | 67,212 | |
Series 2017-C05 1M2 3.424% 1/25/30 ● | | | 70,000 | | | | 69,936 | |
Fannie Mae Grantor Trust | | | | | | | | |
Series 2002-T1 A2 7.00% 11/25/31 | | | 31,531 | | | | 37,343 | |
Fannie Mae Interest Strip | | | | | | | | |
Series 35 2 12.00% 7/25/18 | | | 1,656 | | | | 1,708 | |
Series 419 C3 3.00% 11/25/43 S | | | 71,949 | | | | 13,985 | |
Fannie Mae REMIC Trust | | | | | | | | |
Series 2002-W1 2A 7.50% 2/25/42● | | | 41,024 | | | | 46,529 | |
Fannie Mae REMICs | | | | | | | | |
Series 1988-15 A 9.00% 6/25/18 | | | 17 | | | | 17 | |
Series 1996-46 ZA 7.50% 11/25/26 | | | 28,655 | | | | 33,104 | |
Series 2002-83 GH 5.00% 12/25/17 | | | 5,110 | | | | 5,122 | |
Series 2005-70 PA 5.50% 8/25/35 | | | 7,509 | | | | 8,485 | |
Series 2008-15 SB 5.368% 8/25/36 S● | | | 20,764 | | | | 3,924 | |
Series 2010-129 SM 4.768% 11/25/40 S● | | | 131,673 | | | | 21,176 | |
Series 2012-115 MI 3.50% 3/25/42 S | | | 55,117 | | | | 6,902 | |
Series 2012-118 AI 3.50% 11/25/37 S | | | 126,536 | | | | 16,580 | |
Series 2012-122 SD 4.868% 11/25/42 S● | | | 254,136 | | | | 50,590 | |
Series 2012-137 WI 3.50% 12/25/32 S | | | 4,047,710 | | | | 659,073 | |
Series 2012-139 NS 5.468% 12/25/42 S ● | | | 2,476,001 | | | | 607,759 | |
Series 2013-7 EI 3.00% 10/25/40 S | | | 106,398 | | | | 13,971 | |
Series 2013-26 ID 3.00% 4/25/33 S | | | 189,560 | | | | 27,082 | |
Series 2013-38 AI 3.00% 4/25/33 S | | | 180,255 | | | | 25,576 | |
Series 2013-41 HI 3.00% 2/25/33 S | | | 157,623 | | | | 16,902 | |
Series 2013-43 IX 4.00% 5/25/43 S | | | 550,646 | | | | 131,064 | |
Series 2013-44 DI 3.00% 5/25/33 S | | | 569,390 | | | | 81,696 | |
Series 2013-45 PI 3.00% 5/25/33 S | | | 60,940 | | | | 8,668 | |
Series 2013-55 AI 3.00% 6/25/33 S | | | 229,601 | | | | 33,229 | |
Series 2013-103 SK 4.688% 10/25/43 S● | | | 208,485 | | | | 48,255 | |
Series 2014-64 IT 3.50% 6/25/41 S | | | 48,805 | | | | 5,368 | |
Series 2014-68 BS 4.918% 11/25/44 S● | | | 186,933 | | | | 39,411 | |
Series 2014-90 SA 4.918% 1/25/45 S● | | | 3,484,994 | | | | 678,970 | |
Series 2015-27 SA 5.218% 5/25/45 S● | | | 70,691 | | | | 13,893 | |
Series 2015-44 Z 3.00% 9/25/43 | | | 203,303 | | | | 198,663 | |
Series 2015-66 ID 3.50% 5/25/42 S | | | 255,117 | | | | 41,134 | |
Series 2015-89 AZ 3.50% 12/25/45 | | | 20,140 | | | | 19,611 | |
Series 2015-95 SH 4.768% 1/25/46 S● | | | 183,141 | | | | 42,351 | |
Series 2016-6 AI 3.50% 4/25/34 S | | | 122,321 | | | | 15,496 | |
Series 2016-33 DI 3.50% 6/25/36 S | | | 279,431 | | | | 41,645 | |
Series 2016-36 SB 4.768% 3/25/43 S● | | | 89,436 | | | | 15,269 | |
Series 2016-40 IO 3.50% 7/25/36 S | | | 78,746 | | | | 12,112 | |
Schedule of investments
Delaware Strategic Income Fund
| | | | | | | | |
| | | Principal amount° | | | Value (US $) | |
| |
Agency Collateralized Mortgage Obligations (continued) | | | | | | | | |
| |
Fannie Mae REMICs | | | | | | | | |
Series 2016-40 ZC 3.00% 7/25/46 | | | 38,221 | | | $ | 35,413 | |
Series 2016-50 IB 3.00% 2/25/46 S | | | 94,586 | | | | 13,750 | |
Series 2016-55 SK 4.768% 8/25/46 S● | | | 149,184 | | | | 34,629 | |
Series 2016-62 SA 4.768% 9/25/46 S● | | | 295,383 | | | | 71,490 | |
Series 2016-64 CI 3.50% 7/25/43 S | | | 120,111 | | | | 17,356 | |
Series 2016-74 GS 4.768% 10/25/46 S● | | | 94,389 | | | | 23,581 | |
Series 2016-79 JS 4.818% 11/25/46 S● | | | 187,829 | | | | 41,776 | |
Series 2016-83 PI 3.50% 7/25/45 S | | | 93,297 | | | | 15,923 | |
Series 2016-99 DI 3.50% 1/25/46 S | | | 96,939 | | | | 16,467 | |
Series 2017-4 AI 3.50% 5/25/41 S | | | 127,486 | | | | 15,719 | |
Series 2017-4 BI 3.50% 5/25/41 S | | | 93,364 | | | | 12,159 | |
Series 2017-8 BZ 3.00% 2/25/47 | | | 126,887 | | | | 117,096 | |
Series 2017-8 SG 4.768% 2/25/47 S● | | | 220,054 | | | | 50,133 | |
Series 2017-12 JI 3.50% 5/25/40 S | | | 93,328 | | | | 12,369 | |
Series 2017-15 NZ 3.50% 3/25/47 | | | 22,323 | | | | 22,081 | |
Series 2017-16 SM 4.818% 3/25/47 S● | | | 261,746 | | | | 57,888 | |
Series 2017-21 ZD 3.50% 4/25/47 | | | 39,457 | | | | 38,817 | |
Series 2017-25 BL 3.00% 4/25/47 | | | 16,000 | | | | 14,642 | |
Series 2017-25 GS 5.468% 4/25/47 S● | | | 275,691 | | | | 43,268 | |
Series 2017-45 JZ 3.00% 6/25/47 | | | 12,060 | | | | 10,444 | |
Series 2017-45 ZK 3.50% 6/25/47 | | | 25,146 | | | | 24,846 | |
Series 2017-46 JI 3.50% 1/25/43 S | | | 136,096 | | | | 16,598 | |
Series 2017-46 VG 3.50% 4/25/38 | | | 21,000 | | | | 21,744 | |
Freddie Mac REMICs | | | | | | | | |
Series 3656 PM 5.00% 4/15/40 | | | 548,247 | | | | 603,729 | |
Series 3939 EI 3.00% 3/15/26 S | | | 117,973 | | | | 7,756 | |
Series 4050 EI 4.00% 2/15/39 S | | | 158,546 | | | | 17,707 | |
Series 4100 EI 3.00% 8/15/27 S | | | 1,220,332 | | | | 120,113 | |
Series 4101 WI 3.50% 8/15/32 S | | | 71,403 | | | | 10,309 | |
Series 4109 AI 3.00% 7/15/31 S | | | 355,850 | | | | 40,820 | |
Series 4120 IK 3.00% 10/15/32 S | | | 284,927 | | | | 40,173 | |
Series 4135 AI 3.50% 11/15/42 S | | | 119,270 | | | | 24,380 | |
Series 4146 IA 3.50% 12/15/32 S | | | 150,015 | | | | 23,584 | |
Series 4150 UI 3.50% 8/15/32 S | | | 126,966 | | | | 13,807 | |
Series 4159 KS 4.924% 1/15/43 S● | | | 133,660 | | | | 30,425 | |
Series 4181 DI 2.50% 3/15/33 S | | | 95,406 | | | | 11,907 | |
Series 4184 GS 4.894% 3/15/43 S● | | | 154,097 | | | | 34,416 | |
Series 4185 LI 3.00% 3/15/33 S | | | 141,662 | | | | 20,285 | |
Series 4191 CI 3.00% 4/15/33 S | | | 63,073 | | | | 9,050 | |
Series 4435 DY 3.00% 2/15/35 | | | 162,000 | | | | 163,159 | |
Series 4494 SA 4.954% 7/15/45 S● | | | 74,992 | | | | 16,784 | |
Series 4504 IO 3.50% 5/15/42 S | | | 63,701 | | | | 6,752 | |
12
| | | | | | | | |
| | | Principal amount° | | | Value (US $) | |
| |
Agency Collateralized Mortgage Obligations (continued) | | | | | | | | |
| |
Freddie Mac REMICs | | | | | | | | |
Series 4527 CI 3.50% 2/15/44 S | | | 155,752 | | | $ | 26,452 | |
Series 4543 HI 3.00% 4/15/44 S | | | 82,137 | | | | 13,035 | |
Series 4581 LI 3.00% 5/15/36 S | | | 82,922 | | | | 11,586 | |
Series 4594 SG 4.774% 6/15/46 S● | | | 413,902 | | | | 97,152 | |
Series 4614 HB 2.50% 9/15/46 | | | 77,000 | | | | 70,077 | |
Series 4623 LZ 2.50% 10/15/46 | | | 66,229 | | | | 57,752 | |
Series 4623 MW 2.50% 10/15/46 | | | 75,000 | | | | 68,982 | |
Series 4625 BI 3.50% 6/15/46 S | | | 266,300 | | | | 55,370 | |
Series 4625 PZ 3.00% 6/15/46 | | | 30,682 | | | | 29,054 | |
Series 4631 GS 4.774% 11/15/46 S● | | | 332,029 | | | | 69,984 | |
Series 4631 LJ 3.00% 3/15/41 | | | 17,000 | | | | 16,891 | |
Series 4636 NZ 3.00% 12/15/46 | | | 85,481 | | | | 81,663 | |
Series 4644 GI 3.50% 5/15/40 S | | | 95,535 | | | | 14,946 | |
Series 4648 MZ 3.00% 6/15/46 | | | 15,226 | | | | 14,506 | |
Series 4648 ND 3.00% 9/15/46 | | | 10,000 | | | | 9,671 | |
Series 4650 JE 3.00% 7/15/46 | | | 12,000 | | | | 11,593 | |
Series 4655 WI 3.50% 8/15/43 S | | | 96,554 | | | | 15,949 | |
Series 4657 NW 3.00% 4/15/45 | | | 16,000 | | | | 15,906 | |
Series 4657 PS 4.774% 2/15/47 S● | | | 192,743 | | | | 42,560 | |
Series 4663 HZ 3.50% 3/15/47 | | | 16,187 | | | | 15,732 | |
Series 4665 NI 3.50% 7/15/41 S | | | 375,420 | | | | 48,992 | |
Series 4675 KS 4.774% 4/15/47 S● | | | 136,585 | | | | 32,434 | |
Freddie Mac Strips | | | | | | | | |
Series 267 S5 4.774% 8/15/42 S● | | | 197,804 | | | | 41,457 | |
Series 299 S1 4.774% 1/15/43 S● | | | 150,410 | | | | 29,845 | |
Series 319 S2 4.774% 11/15/43 S● | | | 70,469 | | | | 15,745 | |
Series 326 S2 4.724% 3/15/44 S● | | | 101,750 | | | | 19,423 | |
Series 337 S1 4.824% 9/15/44 S● | | | 103,399 | | | | 23,858 | |
Freddie Mac Structured Agency Credit Risk Debt Notes | | | | | | | | |
Series 2017-DNA1 M2 4.482% 7/25/29● | | | 250,000 | | | | 265,592 | |
Freddie Mac Structured Pass Through Certificates | | | | | | | | |
Series T-42 A5 7.50% 2/25/42 ◆ | | | 17,356 | | | | 20,256 | |
GNMA | | | | | | | | |
Series 2012-136 MX 2.00% 11/20/42 | | | 30,000 | | | | 27,554 | |
Series 2013-113 AZ 3.00% 8/20/43 | | | 209,160 | | | | 202,654 | |
Series 2013-113 LY 3.00% 5/20/43 | | | 22,000 | | | | 22,021 | |
Series 2015-64 GZ 2.00% 5/20/45 | | | 81,451 | | | | 68,698 | |
Series 2015-74 CI 3.00% 10/16/39 S | | | 148,017 | | | | 20,881 | |
Series 2015-133 AL 3.00% 5/20/45 | | | 214,000 | | | | 209,443 | |
Series 2015-142 AI 4.00% 2/20/44 S | | | 61,694 | | | | 7,988 | |
Series 2016-108 SK 4.822% 8/20/46 S● | | | 210,255 | | | | 49,384 | |
Series 2016-111 PB 2.50% 8/20/46 | | | 74,000 | | | | 67,835 | |
Schedule of investments
Delaware Strategic Income Fund
| | | | | | | | |
| | | Principal amount° | | | Value (US $) | |
| |
Agency Collateralized Mortgage Obligations (continued) | | | | | | | | |
| |
GNMA | | | | | | | | |
Series 2016-116 GI 3.50% 11/20/44 S | | | 261,247 | | | $ | 41,655 | |
Series 2016-118 DI 3.50% 3/20/43 S | | | 589,289 | | | | 92,829 | |
Series 2016-118 ES 4.872% 9/20/46 S● | | | 113,232 | | | | 26,647 | |
Series 2016-120 AS 4.872% 9/20/46 S● | | | 225,857 | | | | 55,108 | |
Series 2016-120 NS 4.872% 9/20/46 S● | | | 300,499 | | | | 74,630 | |
Series 2016-121 JS 4.872% 9/20/46 S● | | | 212,267 | | | | 50,824 | |
Series 2016-126 NS 4.872% 9/20/46 S● | | | 130,948 | | | | 30,649 | |
Series 2016-134 MW 3.00% 10/20/46 | | | 12,000 | | | | 12,205 | |
Series 2016-147 ST 4.822% 10/20/46 S● | | | 130,720 | | | | 30,657 | |
Series 2016-149 GI 4.00% 11/20/46 S | | | 96,985 | | | | 21,606 | |
Series 2016-156 PB 2.00% 11/20/46 | | | 46,000 | | | | 37,948 | |
Series 2016-160 GI 3.50% 11/20/46 S | | | 179,340 | | | | 42,342 | |
Series 2016-163 XI 3.00% 10/20/46 S | | | 207,601 | | | | 28,849 | |
Series 2016-171 IP 3.00% 3/20/46 S | | | 159,290 | | | | 25,382 | |
Series 2017-4 BW 3.00% 1/20/47 | | | 12,000 | | | | 11,482 | |
Series 2017-10 IB 4.00% 1/20/47 S | | | 162,490 | | | | 39,589 | |
Series 2017-10 KZ 3.00% 1/20/47 | | | 15,226 | | | | 14,105 | |
Series 2017-18 IQ 4.00% 12/16/43 S | | | 97,431 | | | | 18,650 | |
Series 2017-18 QS 4.874% 2/16/47 S● | | | 147,552 | | | | 33,683 | |
Series 2017-34 DY 3.50% 3/20/47 | | | 20,000 | | | | 20,039 | |
Series 2017-56 JZ 3.00% 4/20/47 | | | 30,226 | | | | 28,354 | |
Series 2017-107 QZ 3.00% 8/20/45 | | | 21,000 | | | | 20,018 | |
Series 2017-114 IK 4.00% 10/20/44 S | | | 205,000 | | | | 44,870 | |
| | | | | | | | |
Total Agency Collateralized Mortgage Obligations (cost $7,994,710) | | | | 7,798,198 | |
| | | | | | | | |
|
| |
Agency Commercial Mortgage-Backed Securities – 1.61% | | | | | | | | |
| |
Freddie Mac Multifamily Structured Pass Through | | | | | | | | |
Certificates | | | | | | | | |
Series K719 A1 2.53% 12/25/21 ◆ | | | 56,676 | | | | 57,662 | |
Series KS03 A4 3.161% 5/25/25 ◆● | | | 110,000 | | | | 113,990 | |
FREMF Mortgage Trust | | | | | | | | |
Series 2010-K7 B 144A 5.50% 4/25/20 #● | | | 95,000 | | | | 102,416 | |
Series 2011-K12 B 144A 4.344% 1/25/46 #● | | | 80,000 | | | | 84,766 | |
Series 2011-K14 B 144A 5.167% 2/25/47 #● | | | 50,000 | | | | 54,592 | |
Series 2011-K15 B 144A 4.948% 8/25/44 #● | | | 135,000 | | | | 146,878 | |
Series 2011-K704 B 144A 4.536% 10/25/30 #● | | | 80,000 | | | | 81,729 | |
Series 2012-K18 B 144A 4.255% 1/25/45 #● | | | 55,000 | | | | 58,366 | |
Series 2012-K22 B 144A 3.686% 8/25/45 #● | | | 190,000 | | | | 197,538 | |
Series 2012-K23 B 144A 3.655% 10/25/45 #● | | | 100,000 | | | | 104,349 | |
Series 2012-K708 B 144A 3.751% 2/25/45 #● | | | 110,000 | | | | 112,343 | |
Series 2013-K32 B 144A 3.537% 10/25/46 #● | | | 100,000 | | | | 103,602 | |
Series 2013-K33 B 144A 3.502% 8/25/46 #● | | | 120,000 | | | | 123,941 | |
14
| | | | | | | | |
| | | Principal amount° | | | Value (US $) | |
| |
Agency Commercial Mortgage-Backed Securities (continued) | | | | | | | | |
| |
FREMF Mortgage Trust | | | | | | | | |
Series 2013-K712 B 144A 3.365% 5/25/45 #● | | | 60,000 | | | $ | 61,303 | |
Series 2013-K713 B 144A 3.165% 4/25/46 #● | | | 35,000 | | | | 35,665 | |
Series 2013-K713 C 144A 3.165% 4/25/46 #● | | | 105,000 | | | | 105,738 | |
| | | | | | | | |
Total Agency Commercial Mortgage-Backed Securities (cost $1,543,434) | | | | 1,544,878 | |
| | | | | | | | |
|
| |
Agency Mortgage-Backed Securities – 5.05% | | | | | | | | |
| |
Fannie Mae | | | | | | | | |
10.50% 6/1/30 | | | 9,725 | | | | 9,879 | |
Fannie Mae S.F. 30 yr | | | | | | | | |
4.50% 9/1/39 | | | 16,206 | | | | 17,597 | |
4.50% 1/1/40 | | | 427,654 | | | | 464,493 | |
4.50% 8/1/40 | | | 16,783 | | | | 18,155 | |
4.50% 8/1/42 | | | 781,803 | | | | 848,846 | |
4.50% 10/1/44 | | | 12,080 | | | | 13,150 | |
4.50% 3/1/46 | | | 20,424 | | | | 22,155 | |
5.50% 11/1/34 | | | 3,221 | | | | 3,600 | |
5.50% 8/1/37 | | | 15,515 | | | | 17,367 | |
5.50% 6/1/39 | | | 44,930 | | | | 50,193 | |
5.50% 7/1/40 | | | 38,779 | | | | 43,325 | |
5.50% 9/1/41 | | | 58,109 | | | | 65,754 | |
6.00% 6/1/36 | | | 3,035 | | | | 3,460 | |
6.00% 9/1/36 | | | 18,911 | | | | 21,818 | |
6.00% 12/1/36 | | | 3,021 | | | | 3,422 | |
6.00% 6/1/37 | | | 1,731 | | | | 1,969 | |
6.00% 7/1/37 | | | 121,077 | | | | 138,106 | |
6.00% 8/1/37 | | | 88,705 | | | | 101,341 | |
6.00% 5/1/38 | | | 17,140 | | | | 19,479 | |
6.00% 9/1/38 | | | 125,265 | | | | 142,371 | |
6.00% 10/1/38 | | | 12,536 | | | | 14,238 | |
6.00% 9/1/39 | | | 88,392 | | | | 100,365 | |
6.00% 10/1/39 | | | 149,448 | | | | 170,837 | |
6.00% 3/1/40 | | | 14,357 | | | | 16,334 | |
6.00% 4/1/40 | | | 23,324 | | | | 26,366 | |
6.00% 11/1/40 | | | 4,904 | | | | 5,595 | |
6.00% 5/1/41 | | | 33,521 | | | | 37,955 | |
6.00% 7/1/41 | | | 51,294 | | | | 58,590 | |
6.50% 5/1/40 | | | 30,299 | | | | 33,983 | |
10.00% 2/1/25 | | | 11,991 | | | | 12,334 | |
Freddie Mac S.F. 30 yr | | | | | | | | |
4.50% 4/1/39 | | | 9,156 | | | | 9,893 | |
5.00% 12/1/41 | | | 1,336,071 | | | | 1,472,592 | |
5.00% 4/1/44 | | | 53,980 | | | | 59,858 | |
15
Schedule of investments
Delaware Strategic Income Fund
| | | | | | | | |
| | | Principal amount° | | | Value (US $) | |
| |
Agency Mortgage-Backed Securities (continued) | | | | | |
| |
Freddie Mac S.F. 30 yr | | | | | | | | |
5.50% 3/1/34 | | | 3,893 | | | $ | 4,350 | |
5.50% 12/1/34 | | | 3,563 | | | | 3,993 | |
5.50% 11/1/36 | | | 4,756 | | | | 5,319 | |
5.50% 9/1/37 | | | 4,680 | | | | 5,217 | |
5.50% 8/1/40 | | | 40,164 | | | | 44,723 | |
5.50% 1/1/41 | | | 13,278 | | | | 14,806 | |
5.50% 6/1/41 | | | 78,204 | | | | 87,333 | |
6.00% 2/1/36 | | | 7,524 | | | | 8,524 | |
6.00% 9/1/37 | | | 11,349 | | | | 12,791 | |
6.00% 1/1/38 | | | 4,368 | | | | 4,919 | |
6.00% 6/1/38 | | | 12,005 | | | | 13,594 | |
6.00% 8/1/38 | | | 73,734 | | | | 83,895 | |
6.00% 5/1/40 | | | 29,660 | | | | 33,628 | |
6.00% 7/1/40 | | | 64,128 | | | | 72,619 | |
GNMA I S.F. 30 yr | | | | | | | | |
5.50% 2/15/41 | | | 33,903 | | | | 37,825 | |
GNMA II S.F. 30 yr | | | | | | | | |
5.50% 5/20/37 | | | 29,066 | | | | 32,267 | |
5.50% 4/20/40 | | | 24,142 | | | | 26,333 | |
6.00% 2/20/39 | | | 29,184 | | | | 32,433 | |
6.00% 10/20/39 | | | 57,467 | | | | 63,911 | |
6.00% 2/20/40 | | | 116,355 | | | | 129,914 | |
6.00% 4/20/46 | | | 34,807 | | | | 38,870 | |
6.50% 10/20/39 | | | 44,194 | | | | 49,407 | |
| | | | | | | | |
Total Agency Mortgage-Backed Securities (cost $4,830,395) | | | | 4,832,091 | |
| | | | | | | | |
|
| |
Collateralized Debt Obligations – 1.36% | | | | | | | | |
| |
Benefit Street Partners CLO IV | | | | | | | | |
Series 2014-IVA A1R 144A 2.797% 1/20/29 #● | | | 500,000 | | | | 505,000 | |
BlueMountain CLO | | | | | | | | |
Series 2015-2A A1 144A 2.734% 7/18/27 #● | | | 250,000 | | | | 250,470 | |
Cedar Funding VI CLO | | | | | | | | |
Series 2016-6A A1 144A 2.777% 10/20/28 #● | | | 250,000 | | | | 251,821 | |
Venture CDO | | | | | | | | |
Series 2016-25A A1 144A 2.797% 4/20/29 #● | | | 100,000 | | | | 100,271 | |
Venture XXIV CLO | | | | | | | | |
Series 2016-24A A1D 144A 2.727% 10/20/28 #● | | | 195,000 | | | | 196,635 | |
| | | | | | | | |
Total Collateralized Debt Obligations (cost $1,293,830) | | | | 1,304,197 | |
| | | | | | | | |
16
| | | | | | | | |
| | | Principal amount° | | | Value (US $) | |
| |
Convertible Bond – 0.03% | | | | | |
| |
General Cable 4.50% exercise price $31.01, maturity date 11/15/29 f | | | 28,000 | | | $ | 24,780 | |
| | | | | | | | |
Total Convertible Bond (cost $32,847) | | | | 24,780 | |
| | | | | | | | |
|
| |
Corporate Bonds – 61.93% | | | | | |
| |
Banking - 10.00% | | | | | | | | |
Akbank 144A 7.20% 3/16/27 #● | | | 200,000 | | | | 209,005 | |
Ally Financial 5.75% 11/20/25 | | | 440,000 | | | | 472,450 | |
Banco Nacional de Costa Rica 144A 5.875% 4/25/21 # | | | 200,000 | | | | 208,000 | |
Banco Santander 4.25% 4/11/27 | | | 200,000 | | | | 209,824 | |
Bank of America | | | | | | | | |
3.593% 7/21/28 ● | | | 55,000 | | | | 55,272 | |
4.183% 11/25/27 | | | 155,000 | | | | 160,421 | |
4.443% 1/20/48 ● | | | 40,000 | | | | 42,702 | |
Bank of New York Mellon 4.625%y• | | | 770,000 | | | | 784,630 | |
Barclays 8.25%y● | | | 525,000 | | | | 559,177 | |
BBVA Bancomer 144A 6.50% 3/10/21 # | | | 150,000 | | | | 166,125 | |
Credit Suisse Group 144A 6.25%#y● | | | 300,000 | | | | 322,612 | |
Credit Suisse Group Funding Guernsey 4.55% 4/17/26 | | | 315,000 | | | | 338,876 | |
Goldman Sachs Group 5.15% 5/22/45 | | | 135,000 | | | | 153,122 | |
JPMorgan Chase & Co. | | | | | | | | |
3.882% 7/24/38 ● | | | 135,000 | | | | 135,281 | |
4.032% 7/24/48 ● | | | 95,000 | | | | 95,776 | |
6.75%y● | | | 640,000 | | | | 733,920 | |
Landwirtschaftliche Rentenbank 5.375% 4/23/24 | | | NZD 38,000 | | | | 31,692 | |
Morgan Stanley | | | | | | | | |
3.591% 7/22/28 ● | | | 150,000 | | | | 150,620 | |
3.95% 4/23/27 | | | 95,000 | | | | 96,539 | |
4.375% 1/22/47 | | | 210,000 | | | | 220,777 | |
5.00% 11/24/25 | | | 195,000 | | | | 213,935 | |
PNC Financial Services Group 5.00%y● | | | 315,000 | | | | 326,813 | |
Popular 7.00% 7/1/19 | | | 295,000 | | | | 312,700 | |
Royal Bank of Scotland Group 8.625%y● | | | 600,000 | | | | 664,128 | |
Santander UK 144A 5.00% 11/7/23 # | | | 200,000 | | | | 216,923 | |
SunTrust Banks 5.05%y● | | | 200,000 | | | | 202,750 | |
Turkiye Garanti Bankasi 144A 6.25% 4/20/21 # | | | 200,000 | | | | 213,619 | |
UBS Group 6.875%y● | | | 1,060,000 | | | | 1,164,458 | |
USB Capital IX 3.50%y● | | | 705,000 | | | | 630,975 | |
Wells Fargo & Co. 4.75% 12/7/46 | | | 55,000 | | | | 59,717 | |
Wells Fargo Capital X 5.95% 12/15/36 | | | 50,000 | | | | 56,825 | |
Westpac Banking 4.322% 11/23/31 ● | | | 70,000 | | | | 72,317 | |
Woori Bank 144A 4.75% 4/30/24 # | | | 200,000 | | | | 210,186 | |
| | |
| Schedule of investments | | |
| Delaware Strategic Income Fund | | |
| | | | | | | | |
| | | Principal amount° | | | Value (US $) | |
Corporate Bonds (continued) | | | | | | | | |
| |
Banking (continued) | | | | | | | | |
Zions Bancorporation 4.50% 6/13/23 | | | 75,000 | | | $ | 80,374 | |
| | | | | | | | |
| | | | | | | 9,572,541 | |
| | | | | | | | |
Basic Industry – 6.26% | | | | | | | | |
Allegheny Technologies 7.875% 8/15/23 | | | 230,000 | | | | 242,650 | |
Barrick North America Finance 5.75% 5/1/43 | | | 85,000 | | | | 104,365 | |
BHP Billiton Finance USA 144A 6.25% 10/19/75 #● | | | 600,000 | | | | 656,400 | |
Chemours 7.00% 5/15/25 | | | 160,000 | | | | 179,200 | |
CK Hutchison International 144A 3.50% 4/5/27 # | | | 200,000 | | | | 204,746 | |
Cliffs Natural Resources 144A 5.75% 3/1/25 # | | | 175,000 | | | | 171,500 | |
Coeur Mining 144A 5.875% 6/1/24 # | | | 340,000 | | | | 337,025 | |
Corp Nacional del Cobre de Chile 144A 4.50% 8/1/47 # | | | 200,000 | | | | 198,270 | |
Equate Petrochemical 144A 3.00% 3/3/22 # | | | 200,000 | | | | 199,730 | |
FMG Resources 144A 5.125% 5/15/24 # | | | 280,000 | | | | 292,250 | |
Freeport-McMoRan 4.55% 11/14/24 | | | 325,000 | | | | 319,313 | |
Georgia-Pacific 8.00% 1/15/24 | | | 195,000 | | | | 252,899 | |
Hudbay Minerals 144A 7.625% 1/15/25 # | | | 235,000 | | | | 259,088 | |
International Paper 4.35% 8/15/48 | | | 90,000 | | | | 89,908 | |
Joseph T Ryerson & Son 144A 11.00% 5/15/22 # | | | 205,000 | | | | 234,725 | |
Koppers 144A 6.00% 2/15/25 # | | | 250,000 | | | | 266,875 | |
Kraton Polymers 144A 7.00% 4/15/25 # | | | 200,000 | | | | 216,000 | |
NOVA Chemicals | | | | | | | | |
144A 5.00% 5/1/25 # | | | 60,000 | | | | 60,450 | |
144A 5.25% 6/1/27 # | | | 200,000 | | | | 201,000 | |
OCP 144A 4.50% 10/22/25 # | | | 200,000 | | | | 202,372 | |
Phosagro OAO via Phosagro Bond Funding 144A | | | | | | | | |
3.95% 11/3/21 # | | | 200,000 | | | | 201,856 | |
Steel Dynamics 5.00% 12/15/26 | | | 200,000 | | | | 211,500 | |
Suzano Austria 144A 5.75% 7/14/26 # | | | 300,000 | | | | 318,750 | |
Vale Overseas | | | | | | | | |
5.875% 6/10/21 | | | 40,000 | | | | 43,750 | |
6.25% 8/10/26 | | | 100,000 | | | | 111,400 | |
Vedanta Resources 144A 6.375% 7/30/22 # | | | 200,000 | | | | 208,000 | |
VM Holding 144A 5.375% 5/4/27 # | | | 200,000 | | | | 208,000 | |
| | | | | | | | |
| | | | | | | 5,992,022 | |
| | | | | | | | |
Brokerage – 1.38% | | | | | | | | |
E*TRADE Financial 5.875%y● | | | 160,000 | | | | 172,096 | |
Jefferies Group | | | | | | | | |
6.45% 6/8/27 | | | 60,000 | | | | 69,405 | |
6.50% 1/20/43 | | | 765,000 | | | | 872,790 | |
NFP 144A 6.875% 7/15/25 # | | | 200,000 | | | | 203,975 | |
| | | | | | | | |
| | | | | | | 1,318,266 | |
| | | | | | | | |
| | | | | | | | |
| | | Principal amount° | | | Value (US $) | |
Corporate Bonds (continued) | | | | | | | | |
| |
Capital Goods – 5.71% | | | | | | | | |
Advanced Disposal Services 144A 5.625% 11/15/24 # | | | 275,000 | | | $ | 286,000 | |
Ardagh Packaging Finance 144A 6.00% 2/15/25 # | | | 295,000 | | | | 315,833 | |
BMC East 144A 5.50% 10/1/24 # | | | 150,000 | | | | 158,250 | |
Boise Cascade 144A 5.625% 9/1/24 # | | | 350,000 | | | | 365,750 | |
Builders FirstSource 144A 5.625% 9/1/24 # | | | 475,000 | | | | 500,531 | |
BWAY Holding 144A 7.25% 4/15/25 # | | | 485,000 | | | | 506,825 | |
Flex Acquisition 144A 6.875% 1/15/25 # | | | 640,000 | | | | 673,200 | |
General Cable 5.75% 10/1/22 | | | 180,000 | | | | 185,400 | |
Herc Rentals 144A 7.75% 6/1/24 # | | | 228,000 | | | | 248,520 | |
Siemens Financieringsmaatschappij 144A | | | | | | | | |
4.20% 3/16/47 # | | | 285,000 | | | | 304,710 | |
St. Marys Cement Canada 144A 5.75% 1/28/27 # | | | 200,000 | | | | 204,850 | |
Standard Industries 144A 5.00% 2/15/27 # | | | 350,000 | | | | 361,813 | |
StandardAero Aviation Holdings 144A 10.00% 7/15/23 # | | | 220,000 | | | | 244,750 | |
Summit Materials 144A 5.125% 6/1/25 # | | | 125,000 | | | | 128,750 | |
TransDigm 6.375% 6/15/26 | | | 240,000 | | | | 251,400 | |
Tyco Electronics Group 3.125% 8/15/27 | | | 40,000 | | | | 39,680 | |
United Rentals North America 5.875% 9/15/26 | | | 340,000 | | | | 367,200 | |
US Concrete 6.375% 6/1/24 | | | 225,000 | | | | 241,313 | |
Zekelman Industries 144A 9.875% 6/15/23 # | | | 75,000 | | | | 85,125 | |
| | | | | | | | |
| | | | | | | 5,469,900 | |
| | | | | | | | |
Communications – 9.08% | | | | | | | | |
American Tower 4.40% 2/15/26 | | | 75,000 | | | | 79,736 | |
AT&T | | | | | | | | |
3.90% 8/14/27 | | | 175,000 | | | | 175,228 | |
4.25% 3/1/27 | | | 140,000 | | | | 144,275 | |
4.90% 8/14/37 | | | 180,000 | | | | 179,749 | |
5.15% 2/14/50 | | | 240,000 | | | | 240,079 | |
Cablevision 144A 6.50% 6/15/21 # | | | 150,000 | | | | 159,375 | |
CC Holdings GS V 3.849% 4/15/23 | | | 100,000 | | | | 105,583 | |
CCO Holdings 144A 5.875% 5/1/27 # | | | 235,000 | | | | 253,358 | |
CenturyLink 6.75% 12/1/23 | | | 280,000 | | | | 298,200 | |
Cequel Communications Holdings I 144A 7.75% 7/15/25 # | | | 250,000 | | | | 280,313 | |
Cincinnati Bell 144A 7.00% 7/15/24 # | | | 540,000 | | | | 548,100 | |
Crown Castle International | | | | | | | | |
3.65% 9/1/27 | | | 225,000 | | | | 225,194 | |
5.25% 1/15/23 | | | 150,000 | | | | 167,749 | |
CSC Holdings | | | | | | | | |
144A 5.50% 4/15/27 # | | | 200,000 | | | | 213,500 | |
144A 10.875% 10/15/25 # | | | 200,000 | | | | 250,000 | |
Digicel 144A 6.75% 3/1/23 # | | | 200,000 | | | | 192,000 | |
DISH DBS 7.75% 7/1/26 | | | 255,000 | | | | 306,000 | |
| | |
| Schedule of investments | | |
| Delaware Strategic Income Fund | | |
| | | | | | | | |
| | | Principal amount° | | | Value (US $) | |
Corporate Bonds (continued) | | | | | | | | |
| |
Communications (continued) | | | | | | | | |
Gray Television 144A 5.875% 7/15/26 # | | | 300,000 | | | $ | 311,250 | |
GTP Acquisition Partners I 144A 2.35% 6/15/20 # | | | 100,000 | | | | 99,072 | |
Millicom International Cellular 144A 6.00% 3/15/25 # | | | 200,000 | | | | 211,590 | |
Myriad International Holdings | | | | | | | | |
144A 4.85% 7/6/27 # | | | 200,000 | | | | 206,800 | |
144A 5.50% 7/21/25 # | | | 200,000 | | | | 217,135 | |
Nexstar Broadcasting 144A 5.625% 8/1/24 # | | | 100,000 | | | | 103,625 | |
Nielsen Luxembourg 144A 5.00% 2/1/25 # | | | 295,000 | | | | 305,325 | |
Radiate Holdco 144A 6.625% 2/15/25 # | | | 200,000 | | | | 200,750 | |
SFR Group 144A 7.375% 5/1/26 # | | | 200,000 | | | | 217,250 | |
Sirius XM Radio 144A 5.375% 4/15/25 # | | | 290,000 | | | | 305,225 | |
Sprint 7.875% 9/15/23 | | | 370,000 | | | | 420,875 | |
Telecom Italia 144A 5.303% 5/30/24 # | | | 200,000 | | | | 220,250 | |
Time Warner Cable 7.30% 7/1/38 | | | 350,000 | | | | 447,973 | |
Time Warner Entertainment 8.375% 3/15/23 | | | 80,000 | | | | 100,334 | |
Uniti Group 144A 7.125% 12/15/24 # | | | 500,000 | | | | 490,000 | |
Verizon Communications 5.25% 3/16/37 | | | 70,000 | | | | 74,882 | |
VimpelCom Holdings 144A 4.95% 6/16/24 # | | | 200,000 | | | | 201,750 | |
Virgin Media Secured Finance 144A 5.50% 8/15/26 # | | | 200,000 | | | | 212,500 | |
VTR Finance 144A 6.875% 1/15/24 # | | | 200,000 | | | | 213,750 | |
Zayo Group 144A 5.75% 1/15/27 # | | | 295,000 | | | | 313,438 | |
| | | | | | | | |
| | | | | | | 8,692,213 | |
| | | | | | | | |
Consumer Cyclical – 4.13% | | | | | | | | |
AMC Entertainment Holdings 6.125% 5/15/27 | | | 265,000 | | | | 273,255 | |
Atento Luxco 1 144A 6.125% 8/10/22 # | | | 95,000 | | | | 96,387 | |
Boyd Gaming 6.375% 4/1/26 | | | 275,000 | | | | 300,437 | |
Coach 4.125% 7/15/27 | | | 75,000 | | | | 75,675 | |
General Motors Financial 5.25% 3/1/26 | | | 120,000 | | | | 130,405 | |
GEO Group 6.00% 4/15/26 | | | 225,000 | | | | 235,381 | |
JD.com 3.125% 4/29/21 | | | 200,000 | | | | 200,632 | |
M/I Homes 144A 5.625% 8/1/25 # | | | 200,000 | | | | 200,000 | |
Mohegan Gaming & Entertainment 144A | | | | | | | | |
7.875% 10/15/24 # | | | 250,000 | | | | 265,000 | |
Murphy Oil USA 5.625% 5/1/27 | | | 305,000 | | | | 322,156 | |
Penn National Gaming 144A 5.625% 1/15/27 # | | | 200,000 | | | | 206,500 | |
Penske Automotive Group 5.50% 5/15/26 | | | 290,000 | | | | 291,450 | |
PetSmart 144A 5.875% 6/1/25 # | | | 200,000 | | | | 193,125 | |
Prime Security Services Borrower 144A 9.25% 5/15/23 # | | | 455,000 | | | | 509,031 | |
Rite Aid 144A 6.125% 4/1/23 # | | | 150,000 | | | | 149,250 | |
Scientific Games International 10.00% 12/1/22 | | | 385,000 | | | | 430,719 | |
Wyndham Worldwide 4.15% 4/1/24 | | | 70,000 | | | | 72,789 | |
| | | | | | | | |
| | | | | | | 3,952,192 | |
| | | | | | | | |
| | | | | | | | |
| | | Principal amount° | | | Value (US $) | |
Corporate Bonds (continued) | | | | | | | | |
| |
Consumer Non-Cyclical – 6.51% | | | | | | | | |
Air Medical Group Holdings 144A 6.375% 5/15/23 # | | | 270,000 | | | $ | 260,550 | |
Albertsons | | | | | | | | |
144A 5.75% 3/15/25 # | | | 230,000 | | | | 209,300 | |
144A 6.625% 6/15/24 # | | | 500,000 | | | | 471,250 | |
Becle 144A 3.75% 5/13/25 # | | | 150,000 | | | | 152,122 | |
Becton Dickinson & Co. 3.70% 6/6/27 | | | 190,000 | | | | 192,282 | |
Biogen 5.20% 9/15/45 | | | 145,000 | | | | 167,346 | |
Change Healthcare Holdings 144A 5.75% 3/1/25 # | | | 230,000 | | | | 238,625 | |
CHS 6.25% 3/31/23 | | | 250,000 | | | | 256,875 | |
Cott Holdings 144A 5.50% 4/1/25 # | | | 595,000 | | | | 626,981 | |
DaVita 5.00% 5/1/25 | | | 150,000 | | | | 152,595 | |
ESAL 144A 6.25% 2/5/23 # | | | 200,000 | | | | 189,500 | |
HCA | | | | | | | | |
5.375% 2/1/25 | | | 285,000 | | | | 303,986 | |
5.875% 2/15/26 | | | 105,000 | | | | 114,713 | |
HealthSouth 5.75% 9/15/25 | | | 135,000 | | | | 139,725 | |
Hill-Rom Holdings 144A 5.00% 2/15/25 # | | | 250,000 | | | | 258,125 | |
KAR Auction Services 144A 5.125% 6/1/25 # | | | 200,000 | | | | 209,000 | |
Kroger 2.65% 10/15/26 | | | 65,000 | | | | 60,418 | |
Kronos Acquisition Holdings 144A 9.00% 8/15/23 # | | | 275,000 | | | | 277,063 | |
Marfrig Holdings Europe 144A 8.00% 6/8/23 # | | | 200,000 | | | | 208,900 | |
MPH Acquisition Holdings 144A 7.125% 6/1/24 # | | | 230,000 | | | | 249,550 | |
Mylan 3.95% 6/15/26 | | | 115,000 | | | | 117,809 | |
New York & Presbyterian Hospital 4.063% 8/1/56 | | | 130,000 | | | | 128,870 | |
Surgery Center Holdings | | | | | | | | |
144A 6.75% 7/1/25 # | | | 250,000 | | | | 257,500 | |
144A 8.875% 4/15/21 # | | | 250,000 | | | | 271,875 | |
Tempur Sealy International 5.50% 6/15/26 | | | 330,000 | | | | 340,725 | |
Tenet Healthcare 144A 7.00% 8/1/25 # | | | 385,000 | | | | 380,791 | |
| | | | | | | | |
| | | | | | | 6,236,476 | |
| | | | | | | | |
Electric – 3.02% | | | | | | | | |
AES 5.50% 4/15/25 | | | 135,000 | | | | 142,087 | |
AES Gener 144A 8.375% 12/18/73 #● | | | 200,000 | | | | 215,250 | |
Calpine | | | | | | | | |
144A 5.25% 6/1/26 # | | | 125,000 | | | | 123,125 | |
5.50% 2/1/24 | | | 65,000 | | | | 61,181 | |
5.75% 1/15/25 | | | 160,000 | | | | 149,600 | |
ComEd Financing III 6.35% 3/15/33 | | | 190,000 | | | | 209,852 | |
DTE Electric 3.75% 8/15/47 | | | 220,000 | | | | 219,881 | |
Dynegy | | | | | | | | |
7.625% 11/1/24 | | | 170,000 | | | | 169,150 | |
144A 8.00% 1/15/25 # | | | 125,000 | | | | 124,375 | |
| | |
| Schedule of investments | | |
| Delaware Strategic Income Fund | | |
| | | | | | | | |
| | | Principal amount° | | | Value (US $) | |
Corporate Bonds (continued) | | | | | | | | |
| |
Electric (continued) | | | | | | | | |
Emera 6.75% 6/15/76 ● | | | 155,000 | | | $ | 177,475 | |
Emera US Finance 4.75% 6/15/46 | | | 105,000 | | | | 113,092 | |
Enel 144A 8.75% 9/24/73 #● | | | 400,000 | | | | 483,000 | |
Enel Americas 4.00% 10/25/26 | | | 100,000 | | | | 100,875 | |
Metropolitan Edison 144A 4.00% 4/15/25 # | | | 50,000 | | | | 51,454 | |
National Rural Utilities Cooperative Finance | | | | | | | | |
4.75% 4/30/43 ● | | | 140,000 | | | | 145,260 | |
5.25% 4/20/46 ● | | | 110,000 | | | | 118,040 | |
Perusahaan Listrik Negara 144A 5.25% 5/15/47 # | | | 200,000 | | | | 203,850 | |
SCANA 4.125% 2/1/22 | | | 85,000 | | | | 88,475 | |
| | | | | | | | |
| | | | | | | 2,896,022 | |
| | | | | | | | |
Energy – 10.09% | | | | | | | | |
Alta Mesa Holdings 144A 7.875% 12/15/24 # | | | 150,000 | | | | 158,250 | |
AmeriGas Partners 5.50% 5/20/25 | | | 315,000 | | | | 319,725 | |
Anadarko Petroleum 6.60% 3/15/46 | | | 195,000 | | | | 241,544 | |
Andeavor 144A 4.75% 12/15/23 # | | | 95,000 | | | | 103,044 | |
Antero Resources 5.00% 3/1/25 | | | 290,000 | | | | 287,100 | |
Cheniere Corpus Christi Holdings 5.875% 3/31/25 | | | 155,000 | | | | 168,563 | |
Chesapeake Energy 144A 8.00% 12/15/22 # | | | 152,000 | | | | 161,690 | |
Crestwood Midstream Partners 5.75% 4/1/25 | | | 245,000 | | | | 246,837 | |
Ecopetrol 7.375% 9/18/43 | | | 150,000 | | | | 165,563 | |
Energy Transfer 6.125% 12/15/45 | | | 410,000 | | | | 450,755 | |
Enterprise Products Operating 7.034% 1/15/68 ● | | | 30,000 | | | | 30,750 | |
Gazprom OAO Via Gaz Capital 144A 4.95% 3/23/27 # | | | 200,000 | | | | 202,304 | |
Genesis Energy 5.625% 6/15/24 | | | 285,000 | | | | 276,450 | |
Gulfport Energy 144A 6.00% 10/15/24 # | | | 285,000 | | | | 283,404 | |
Halcon Resources 144A 6.75% 2/15/25 # | | | 225,000 | | | | 231,188 | |
Hilcorp Energy I 144A 5.75% 10/1/25 # | | | 285,000 | | | | 279,300 | |
KazMunayGas National 144A 4.75% 4/19/27 # | | | 200,000 | | | | 199,211 | |
Laredo Petroleum 6.25% 3/15/23 | | | 250,000 | | | | 259,063 | |
Marathon Oil 4.40% 7/15/27 | | | 170,000 | | | | 173,196 | |
MPLX 4.875% 12/1/24 | | | 210,000 | | | | 225,995 | |
Murphy Oil 6.875% 8/15/24 | | | 430,000 | | | | 457,950 | |
Nabors Industries 5.50% 1/15/23 | | | 276,000 | | | | 263,138 | |
Newfield Exploration 5.375% 1/1/26 | | | 250,000 | | | | 261,875 | |
Noble Energy 5.05% 11/15/44 | | | 230,000 | | | | 239,600 | |
NuStar Logistics 5.625% 4/28/27 | | | 100,000 | | | | 106,250 | |
Oasis Petroleum 6.875% 3/15/22 | | | 250,000 | | | | 248,750 | |
ONEOK | | | | | | | | |
4.95% 7/13/47 | | | 75,000 | | | | 75,159 | |
7.50% 9/1/23 | | | 140,000 | | | | 169,862 | |
Pertamina Persero 144A 4.875% 5/3/22 # | | | 200,000 | | | | 214,644 | |
| | | | | | | | |
| | | Principal amount° | | | Value (US $) | |
| |
Corporate Bonds (continued) | | | | | | | | |
| |
Energy (continued) | | | | | | | | |
Petrobras Global Finance | | | | | | | | |
5.375% 1/27/21 | | | 25,000 | | | $ | 25,750 | |
6.75% 1/27/41 | | | 230,000 | | | | 221,663 | |
7.375% 1/17/27 | | | 75,000 | | | | 81,413 | |
Petroleos Mexicanos 6.75% 9/21/47 | | | 35,000 | | | | 36,932 | |
Precision Drilling | | | | | | | | |
6.625% 11/15/20 | | | 119,582 | | | | 118,984 | |
7.75% 12/15/23 | | | 100,000 | | | | 101,000 | |
QEP Resources 6.875% 3/1/21 | | | 170,000 | | | | 178,925 | |
Raizen Fuels Finance 144A 5.30% 1/20/27 # | | | 200,000 | | | | 206,000 | |
Sabine Pass Liquefaction | | | | | | | | |
5.625% 3/1/25 | | | 95,000 | | | | 105,844 | |
5.75% 5/15/24 | | | 395,000 | | | | 444,701 | |
Southern Gas Corridor 144A 6.875% 3/24/26 # | | | 200,000 | | | | 220,450 | |
Southwestern Energy 6.70% 1/23/25 | | | 245,000 | | | | 242,474 | |
Tengizchevroil Finance International 144A 4.00% 8/15/26 # | | | 200,000 | | | | 196,620 | |
Transcanada Trust | | | | | | | | |
5.30% 3/15/77 ● | | | 165,000 | | | | 171,084 | |
5.875% 8/15/76 ● | | | 275,000 | | | | 301,593 | |
Transocean Proteus 144A 6.25% 12/1/24 # | | | 237,500 | | | | 249,969 | |
WildHorse Resource Development 144A 6.875% 2/1/25 # | | | 150,000 | | | | 147,375 | |
YPF 144A 24.104% 7/7/20 #● | | | 105,000 | | | | 108,150 | |
| | | | | | | | |
| | | | | | | 9,660,087 | |
| | | | | | | | |
Finance Companies – 1.22% | | | | | | | | |
AerCap Global Aviation Trust 144A 6.50% 6/15/45 #● | | | 400,000 | | | | 432,000 | |
International Lease Finance 8.625% 1/15/22 | | | 600,000 | | | | 741,032 | |
| | | | | | | | |
| | | | | | | 1,173,032 | |
| | | | | | | | |
Insurance – 0.94% | | | | | | | | |
AssuredPartners 144A 7.00% 8/15/25 # | | | 195,000 | | | | 196,950 | |
MetLife 5.25%y● | | | 145,000 | | | | 151,951 | |
Prudential Financial 5.375% 5/15/45 ● | | | 95,000 | | | | 103,200 | |
USIS Merger Sub 144A 6.875% 5/1/25 # | | | 250,000 | | | | 259,375 | |
XLIT
3.761%y● | | | 65,000 | | | | 61,100 | |
5.50% 3/31/45 | | | 115,000 | | | | 125,612 | |
| | | | | | | | |
| | | | | | | 898,188 | |
| | | | | | | | |
Natural Gas – 0.29% | | | | | | | | |
Boston Gas 144A 3.15% 8/1/27 # | | | 65,000 | | | | 64,939 | |
Perusahaan Gas Negara Persero 144A 5.125% 5/16/24 # | | | 200,000 | | | | 216,820 | |
| | | | | | | | |
| | | | | | | 281,759 | |
| | | | | | | | |
| | |
| Schedule of investments | | |
| Delaware Strategic Income Fund | | |
| | | | | | | | |
| | | Principal amount° | | | Value (US $) | |
| |
Corporate Bonds (continued) | | | | | | | | |
| |
REITs – 1.32% | | | | | | | | |
Corporate Office Properties | | | | | | | | |
3.60% 5/15/23 | | | 150,000 | | | $ | 150,260 | |
5.25% 2/15/24 | | | 85,000 | | | | 91,416 | |
DDR 7.875% 9/1/20 | | | 90,000 | | | | 103,056 | |
Education Realty Operating Partnership 4.60% 12/1/24 | | | 115,000 | | | | 117,904 | |
ESH Hospitality 144A 5.25% 5/1/25 # | | | 160,000 | | | | 167,600 | |
Hospitality Properties Trust 4.50% 3/15/25 | | | 100,000 | | | | 103,471 | |
Host Hotels & Resorts 3.75% 10/15/23 | | | 135,000 | | | | 138,804 | |
LifeStorage 3.50% 7/1/26 | | | 95,000 | | | | 91,023 | |
Regency Centers 3.60% 2/1/27 | | | 90,000 | | | | 89,951 | |
Trust F/1401 144A 5.25% 1/30/26 # | | | 200,000 | | | | 210,250 | |
| | | | | | | | |
| | | | | | | 1,263,735 | |
| | | | | | | | |
Technology – 1.53% | | | | | | | | |
CDK Global 5.00% 10/15/24 | | | 110,000 | | | | 116,875 | |
CommScope Technologies 144A 5.00% 3/15/27 # | | | 250,000 | | | | 251,250 | |
Dell International
144A 6.02% 6/15/26 # | | | 75,000 | | | | 83,891 | |
144A 8.10% 7/15/36 # | | | 5,000 | | | | 6,327 | |
Iron Mountain US Holdings 144A 5.375% 6/1/26 # | | | 200,000 | | | | 213,500 | |
NXP 144A 4.625% 6/1/23 # | | | 330,000 | | | | 357,284 | |
Solera 144A 10.50% 3/1/24 # | | | 225,000 | | | | 259,875 | |
Symantec 144A 5.00% 4/15/25 # | | | 170,000 | | | | 178,500 | |
| | | | | | | | |
| | | | | | | 1,467,502 | |
| | | | | | | | |
Transportation – 0.45% | | | | | | | | |
American Airlines 2015-1 Class A Pass Through Trust | | | | | | | | |
3.375% 5/1/27 ¨ | | | 81,353 | | | | 82,167 | |
American Airlines 2015-2 Class AA Pass Through Trust | | | | | | | | |
3.60% 9/22/27 ¨ | | | 23,817 | | | | 24,541 | |
Avis Budget Car Rental 144A 6.375% 4/1/24 # | | | 120,000 | | | | 123,825 | |
Transnet SOC 144A 4.00% 7/26/22 # | | | 200,000 | | | | 196,006 | |
| | | | | | | | |
| | | | | | | 426,539 | |
| | | | | | | | |
| | |
Total Corporate Bonds (cost $57,829,209) | | | | | | | 59,300,474 | |
| | | | | | | | |
|
| |
Municipal Bonds – 2.19% | | | | | | | | |
| |
Bay Area, California Toll Authority
(Build America Bond) Series S-3 6.907% 10/1/50 | | | 170,000 | | | | 260,256 | |
Buckeye, Ohio Tobacco Settlement Financing Authority
(Asset-Backed Senior Turbo) Series A-2 5.875% 6/1/47 | | | 1,000,000 | | | | 947,150 | |
| | | | | | | | |
| | | Principal amount° | | | Value (US $) | |
| |
Municipal Bonds (continued) | | | | | | | | |
| |
New Jersey Turnpike Authority | | | | | | | | |
(Build America Bonds) | | | | | | | | |
Series A 7.102% 1/1/41 | | | 90,000 | | | $ | 131,812 | |
Series F 7.414% 1/1/40 | | | 45,000 | | | | 68,157 | |
South Carolina Public Service Authority | | | | | | | | |
Series D 4.77% 12/1/45 | | | 55,000 | | | | 55,800 | |
State of California Various Purposes | | | | | | | | |
(Build America Bond) 7.55% 4/1/39 | | | 135,000 | | | | 209,547 | |
Tarrant County Cultural Education Facilities Finance | | | | | | | | |
Corporation Retirement Facility Revenue | | | | | | | | |
(Buckner Senior Living – Ventana Project) 6.625% 11/15/37 | | | 400,000 | | | | 429,284 | |
| | | | | | | | |
Total Municipal Bonds (cost $2,098,954) | | | | | | | 2,102,006 | |
| | | | | | | | |
|
| |
Non-Agency Asset-Backed Securities – 0.69% | | | | | | | | |
| |
American Express Credit Account Master Trust | | | | | | | | |
Series 2017-5 A 1.632% 2/18/25 ● | | | 100,000 | | | | 100,000 | |
Citicorp Residential Mortgage Trust | | | | | | | | |
Series 2006-3 A5 5.536% 11/25/36 f | | | 300,000 | | | | 315,302 | |
Discover Card Execution Note Trust | | | | | | | | |
Series 2017-A3 A3 1.456% 10/17/22 ● | | | 100,000 | | | | 100,190 | |
Series 2017-A5 A5 1.829% 12/15/26 ● | | | 105,000 | | | | 105,557 | |
HOA Funding | | | | | | | | |
Series 2014-1A A2 144A 4.846% 8/20/44 # | | | 47,250 | | | | 44,793 | |
| | | | | | | | |
Total Non-Agency Asset-Backed Securities
(cost $613,525) | | | | | | | 665,842 | |
| | | | | | | | |
|
| |
Non-Agency Collateralized Mortgage Obligations – 2.42% | | | | | | | | |
| |
American Home Mortgage Investment Trust | | | | | | | | |
Series 2005-2 5A1 5.064% 9/25/35 f | | | 2,732 | | | | 2,695 | |
Credit Suisse First Boston Mortgage Securities | | | | | | | | |
Series 2005-5 6A3 5.00% 7/25/35 | | | 57,304 | | | | 57,031 | |
GSMPS Mortgage Loan Trust | | | | | | | | |
Series 1998-2 A 144A 7.75% 5/19/27 #● | | | 28,557 | | | | 29,219 | |
JPMorgan Mortgage Trust | | | | | | | | |
Series 2006-S1 1A1 6.00% 4/25/36 | | | 45,707 | | | | 47,288 | |
Series 2007-A1 7A4 3.545% 7/25/35 ● | | | 88,597 | | | | 79,255 | |
Series 2014-2 B1 144A 3.424% 6/25/29 #● | | | 76,579 | | | | 76,963 | |
Series 2014-2 B2 144A 3.424% 6/25/29 #● | | | 76,579 | | | | 75,424 | |
Series 2014-IVR6 2A4 144A 2.50% 7/25/44 #● | | | 100,000 | | | | 99,854 | |
Series 2015-1 B1 144A 2.618% 12/25/44 #● | | | 196,080 | | | | 194,792 | |
Series 2015-4 B1 144A 3.628% 6/25/45 #● | | | 95,511 | | | | 94,330 | |
Series 2015-4 B2 144A 3.628% 6/25/45 #● | | | 95,511 | | | | 93,242 | |
| | |
| Schedule of investments | | |
| Delaware Strategic Income Fund | | |
| | | | | | | | |
| | | Principal amount° | | | Value (US $) | |
| |
Non-Agency Collateralized Mortgage Obligations (continued) | | | | | | | | |
| |
JPMorgan Mortgage Trust | | | | | | | | |
Series 2015-5 B2 144A 2.858% 5/25/45 #● | | | 97,267 | | | $ | 95,328 | |
Series 2015-6 B1 144A 3.624% 10/25/45 #● | | | 95,359 | | | | 94,869 | |
Series 2015-6 B2 144A 3.624% 10/25/45 #● | | | 95,359 | | | | 93,861 | |
Series 2016-4 B1 144A 3.904% 10/25/46 #● | | | 98,325 | | | | 99,256 | |
Series 2016-4 B2 144A 3.904% 10/25/46 #● | | | 98,325 | | | | 100,290 | |
Series 2017-1 B2 144A 3.569% 1/25/47 #● | | | 84,259 | | | | 83,807 | |
Series 2017-2 A3 144A 3.50% 5/25/47 #● | | | 39,437 | | | | 40,208 | |
New Residential Mortgage Loan Trust | | | | | | | | |
Series 2016-4A A1 144A 3.75% 11/25/56 #● | | | 85,609 | | | | 88,648 | |
Series 2017-1A A1 144A 4.00% 2/25/57 #● | | | 89,697 | | | | 93,720 | |
Series 2017-2A A3 144A 4.00% 3/25/57 #● | | | 91,806 | | | | 95,988 | |
Sequoia Mortgage Trust | | | | | | | | |
Series 2014-2 A4 144A 3.50% 7/25/44 #● | | | 47,145 | | | | 47,977 | |
Series 2015-1 B2 144A 3.877% 1/25/45 #● | | | 47,105 | | | | 47,728 | |
Series 2017-4 A1 144A 3.50% 7/25/47 #● | | | 98,620 | | | | 100,384 | |
Structured Asset Securities Mortgage Pass Through | | | | | | | | |
Certificates | | | | | | | | |
Series 2004-20 2A1 5.50% 11/25/34 ¨ | | | 22,319 | | | | 22,800 | |
Towd Point Mortgage Trust | | | | | | | | |
Series 2015-5 A1B 144A 2.75% 5/25/55 #● | | | 69,762 | | | | 70,365 | |
Series 2015-6 A1B 144A 2.75% 4/25/55 #● | | | 73,808 | | | | 74,476 | |
Series 2017-1 A1 144A 2.75% 10/25/56 #● | | | 90,366 | | | | 91,188 | |
Series 2017-2 A1 144A 2.75% 4/25/57 #● | | | 96,180 | | | | 97,105 | |
Washington Mutual Mortgage Pass Through Certificates
Trust | | | | | | | | |
Series 2005-1 5A2 6.00% 3/25/35 ¨ | | | 54,245 | | | | 15,776 | |
Wells Fargo Mortgage-Backed Securities Trust | | | | | | | | |
Series 2006-AR5 2A1 3.328% 4/25/36 ● | | | 12,249 | | | | 11,558 | |
| | | | | | | | |
Total Non-Agency Collateralized Mortgage Obligations (cost $2,336,552) | | | | | | | 2,315,425 | |
| | | | | | | | |
|
| |
Non-Agency Commercial Mortgage-Backed Securities – 5.90% | | | | | | | | |
| |
Banc of America Commercial Mortgage Trust | | | | | | | | |
Series 2017-BNK3 C 4.352% 2/15/50 ● | | | 35,000 | | | | 35,986 | |
BANK | | | | | | | | |
Series 2017-BNK4 XA 1.461% 5/15/50 ● | | | 454,118 | | | | 46,123 | |
Series 2017-BNK5 A5 3.39% 6/15/60 | | | 145,000 | | | | 149,928 | |
Series 2017-BNK5 B 3.896% 6/15/60 | | | 60,000 | | | | 61,385 | |
Bear Stearns Commercial Mortgage Securities Trust | | | | | | | | |
Series 2007-PW18 A4 5.70% 6/11/50 | | | 33,198 | | | | 33,324 | |
CD Mortgage Trust | | | | | | | | |
Series 2016-CD2 A3 3.248% 11/10/49 | | | 85,000 | | | | 86,706 | |
Series 2016-CD2 A4 3.526% 11/10/49 ● | | | 80,000 | | | | 83,155 | |
| | | | | | | | |
| | | Principal amount° | | | Value (US $) | |
| |
Non-Agency Commercial Mortgage-Backed Securities (continued) | | | | | | | | |
| |
CFCRE Commercial Mortgage Trust | | | | | | | | |
Series 2016-C7 A3 3.839% 12/10/54 | | | 125,000 | | | $ | 131,231 | |
Series 2017-C8 A4 3.572% 6/15/50 | | | 45,000 | | | | 46,196 | |
Citigroup Commercial Mortgage Trust | | | | | | | | |
Series 2014-GC25 A4 3.635% 10/10/47 | | | 75,000 | | | | 78,430 | |
Series 2015-GC27 A5 3.137% 2/10/48 | | | 150,000 | | | | 151,413 | |
Series 2016-P3 A4 3.329% 4/15/49 | | | 110,000 | | | | 112,700 | |
COMM Mortgage Trust | | | | | | | | |
Series 2013-CR6 AM 144A 3.147% 3/10/46 # | | | 110,000 | | | | 111,342 | |
Series 2013-WWP A2 144A 3.424% 3/10/31 # | | | 100,000 | | | | 104,781 | |
Series 2014-CR19 A5 3.796% 8/10/47 | | | 80,000 | | | | 84,351 | |
Series 2015-3BP A 144A 3.178% 2/10/35 # | | | 190,000 | | | | 193,477 | |
Series 2015-CR23 A4 3.497% 5/10/48 | | | 85,000 | | | | 87,972 | |
DB-JPM | | | | | | | | |
Series 2016-C1 A4 3.276% 5/10/49 | | | 255,000 | | | | 260,749 | |
Series 2016-C3 A5 2.89% 9/10/49 | | | 105,000 | | | | 103,938 | |
DB-UBS Mortgage Trust | | | | | | | | |
Series 2011-LC1A C 144A 5.685% 11/10/46 #● | | | 245,000 | | | | 267,444 | |
GRACE Mortgage Trust | | | | | | | | |
Series 2014-GRCE B 144A 3.52% 6/10/28 # | | | 200,000 | | | | 206,077 | |
GS Mortgage Securities Trust | | | | | | | | |
Series 2010-C1 C 144A 5.635% 8/10/43 #● | | | 150,000 | | | | 158,959 | |
Series 2015-GC32 A4 3.764% 7/10/48 | | | 75,000 | | | | 79,232 | |
Series 2017-GS5 A4 3.674% 3/10/50 | | | 435,000 | | | | 456,658 | |
Series 2017-GS6 A3 3.433% 5/10/50 | | | 75,000 | | | | 77,171 | |
JPM-BB Commercial Mortgage Securities Trust | | | | | | | | |
Series 2015-C31 A3 3.801% 8/15/48 | | | 65,000 | | | | 68,625 | |
JPMorgan Chase Commercial Mortgage Securities Trust | | | | | | | | |
Series 2005-CB11 E 5.525% 8/12/37 ● | | | 35,000 | | | | 36,311 | |
Series 2013-LC11 B 3.499% 4/15/46 | | | 95,000 | | | | 95,741 | |
Series 2015-JP1 A5 3.914% 1/15/49 | | | 165,000 | | | | 176,656 | |
Series 2016-JP2 A4 2.822% 8/15/49 | | | 220,000 | | | | 216,583 | |
Series 2016-JP2 AS 3.056% 8/15/49 | | | 150,000 | | | | 147,017 | |
Series 2016-WIKI A 144A 2.798% 10/5/31 # | | | 90,000 | | | | 91,505 | |
Series 2016-WIKI B 144A 3.201% 10/5/31 # | | | 85,000 | | | | 86,765 | |
LB-UBS Commercial Mortgage Trust | | | | | | | | |
Series 2006-C6 AJ 5.452% 9/15/39 ● | | | 88,566 | | | | 70,853 | |
Morgan Stanley BAML Trust | | | | | | | | |
Series 2014-C17 A5 3.741% 8/15/47 | | | 100,000 | | | | 105,141 | |
Series 2015-C26 A5 3.531% 10/15/48 | | | 100,000 | | | | 103,669 | |
Series 2016-C29 A4 3.325% 5/15/49 | | | 95,000 | | | | 96,943 | |
Morgan Stanley Capital I Trust | | | | | | | | |
Series 2006-HQ10 B 5.448% 11/12/41 ● | | | 100,000 | | | | 94,135 | |
| | |
| Schedule of investments | | |
| Delaware Strategic Income Fund | | |
| | | | | | | | |
| | | Principal amount° | | | Value (US $) | |
Non-Agency Commercial Mortgage-Backed Securities (continued) | | | | | | | | |
| |
UBS Commercial Mortgage Trust | | | | | | | | |
Series 2012-C1 A3 3.40% 5/10/45 | | | 211,020 | | | $ | 219,970 | |
Wells Fargo Commercial Mortgage Trust | | | | | | | | |
Series 2014-LC18 A5 3.405% 12/15/47 | | | 135,000 | | | | 138,934 | |
Series 2015-C30 XA 1.001% 9/15/58 ● | | | 1,962,419 | | | | 118,166 | |
Series 2015-NXS3 A4 3.617% 9/15/57 | | | 90,000 | | | | 93,854 | |
Series 2016-BNK1 A3 2.652% 8/15/49 | | | 155,000 | | | | 150,382 | |
Series 2017-C38 A5 3.453% 7/15/50 | | | 90,000 | | | | 92,606 | |
Series 2017-RB1 XA 1.287% 3/15/50 ● | | | 998,903 | | | | 97,203 | |
WF-RBS Commercial Mortgage Trust | | | | | | | | |
Series 2012-C10 A3 2.875% 12/15/45 | | | 135,000 | | | | 137,246 | |
| | | | | | | | |
Total Non-Agency Commercial Mortgage-Backed Securities
(cost $5,723,843) | | | | | | | 5,647,033 | |
| | | | | | | | |
|
| |
Regional Bond – 0.16%r | | | | | | | | |
| |
Argentina – 0.16% | | | | | | | | |
Provincia de Cordoba 144A 7.125% 6/10/21 # | | | 150,000 | | | | 157,275 | |
| | | | | | | | |
Total Regional Bond (cost $157,650) | | | | | | | 157,275 | |
| | | | | | | | |
|
| |
Loan Agreements – 1.72%« | | | | | | | | |
| |
Accudyne Industries Borrower 1st Lien 4.234% 12/13/19 | | | 14,445 | | | | 14,425 | |
Applied Systems 2nd Lien 7.796% 1/23/22 | | | 124,435 | | | | 126,016 | |
BJ’s Wholesale Club 2nd Lien 8.71% 1/27/25 | | | 96,000 | | | | 93,960 | |
Blue Ribbon 1st Lien 5.299% 11/13/21 | | | 129,020 | | | | 127,192 | |
inVentiv Group Holdings Tranche B 1st Lien 4.952% 11/30/23 | | | 228,850 | | | | 229,626 | |
JC Penney Tranche B 1st Lien 5.45% 6/23/23 | | | 121,323 | | | | 120,337 | |
Kronos 2nd Lien 9.561% 11/1/24 | | | 150,000 | | | | 155,594 | |
PQ 1st Lien 5.561% 11/4/22 | | | 243,163 | | | | 245,379 | |
Russell Investments US Institutional Holdco Tranche B 1st Lien 6.972% 6/1/23 | | | 274,307 | | | | 277,565 | |
Summit Midstream Partners Holdings Tranche B 1st Lien 7.234% 5/21/22 | | | 250,000 | | | | 254,688 | |
| | | | | | | | |
Total Loan Agreements (cost $1,658,549) | | | | | | | 1,644,782 | |
| | | | | | | | |
|
| |
Sovereign Bonds – 5.10%r | | | | | | | | |
| |
Argentina – 0.72% | | | | | | | | |
Argentine Bonos del Tesoro | | | | | | | | |
15.50% 10/17/26 | | | ARS 3,093,000 | | | | 203,789 | |
16.00% 10/17/23 | | | ARS 2,057,000 | | | | 125,329 | |
22.75% 3/5/18 | | | ARS 1,100,000 | | | | 67,987 | |
Argentine Republic Government International Bond | | | | | | | | |
5.625% 1/26/22 | | | 175,000 | | | | 179,813 | |
| | | | | | | | |
| | | Principal amount° | | | Value (US $) | |
Sovereign Bondsr (continued) | | | | | | | | |
| |
Argentina (continued) | | | | | | | | |
Argentine Republic Government International Bond | | | | | | | | |
144A 7.125% 6/28/17 # | | | 120,000 | | | $ | 109,140 | |
| | | | | | | | |
| | | | | | | 686,058 | |
| | | | | | | | |
Bahrain – 0.21% | | | | | | | | |
Bahrain Government International Bond 144A | | | | | | | | |
7.00% 10/12/28 # | | | 200,000 | | | | 206,025 | |
| | | | | | | | |
| | | | | | | 206,025 | |
| | | | | | | | |
Bermuda – 0.21% | | | | | | | | |
Bermuda Government International Bond 144A | | | | | | | | |
3.717% 1/25/27 # | | | 200,000 | | | | 202,734 | |
| | | | | | | | |
| | | | | | | 202,734 | |
| | | | | | | | |
Brazil – 0.13% | | | | | | | | |
Brazil Notas do Tesouro Nacional | | | | | | | | |
Series F 10.00% 1/1/25 | | | BRL 394,000 | | | | 127,471 | |
| | | | | | | | |
| | | | | | | 127,471 | |
| | | | | | | | |
Colombia – 0.21% | | | | | | | | |
Colombia Government International Bond 5.00% 6/15/45 | | | 200,000 | | | | 203,900 | |
| | | | | | | | |
| | | | | | | 203,900 | |
| | | | | | | | |
Croatia – 0.23% | | | | | | | | |
Croatia Government International Bond 144A | | | | | | | | |
5.50% 4/4/23 # | | | 200,000 | | | | 222,489 | |
| | | | | | | | |
| | | | | | | 222,489 | |
| | | | | | | | |
Ecuador – 0.21% | | | | | | | | |
Ecuador Government International Bond 144A | | | | | | | | |
8.75% 6/2/23 # | | | 200,000 | | | | 200,500 | |
| | | | | | | | |
| | | | | | | 200,500 | |
| | | | | | | | |
Egypt – 0.23% | | | | | | | | |
Egypt Government International Bond 144A | | | | | | | | |
8.50% 1/31/47 # | | | 200,000 | | | | 217,911 | |
| | | | | | | | |
| | | | | | | 217,911 | |
| | | | | | | | |
Hungary – 0.44% | | | | | | | | |
Hungary Government Bond 3.00% 6/26/24 | | | HUF 32,020,000 | | | | 129,229 | |
Hungary Government International Bond 5.75% 11/22/23 | | | 250,000 | | | | 288,599 | |
| | | | | | | | |
| | | | | | | 417,828 | |
| | | | | | | | |
Indonesia – 0.20% | | | | | | | | |
Indonesia Treasury Bond 7.50% 8/15/32 | | | IDR 2,486,000,000 | | | | 188,913 | |
| | | | | | | | |
| | | | | | | 188,913 | |
| | | | | | | | |
Ivory Coast – 0.20% | | | | | | | | |
Ivory Coast Government International Bond 144A | | | | | | | | |
6.125% 6/15/33 # | | | 200,000 | | | | 196,459 | |
| | | | | | | | |
| | | | | | | 196,459 | |
| | | | | | | | |
| | |
| Schedule of investments | | |
| Delaware Strategic Income Fund | | |
| | | | | | | | |
| | | Principal amount° | | | Value (US $) | |
Sovereign Bondsr (continued) | | | | | | | | |
Mexico – 0.41% | | | | | | | | |
Mexican Bonos | | | | | | | | |
5.75% 3/5/26 | | MXN | 2,821,000 | | | $ | 147,321 | |
6.50% 6/9/22 | | MXN | 4,331,000 | | | | 241,006 | |
| | | | | | | | |
| | | | | | | 388,327 | |
| | | | | | | | |
New Zealand – 0.10% | | | | | | | | |
New Zealand Government Bond 2.75% 4/15/25 | | NZD | 124,000 | | | | 92,641 | |
| | | | | | | | |
| | | | | | | 92,641 | |
| | | | | | | | |
Nigeria – 0.23% | | | | | | | | |
Nigeria Government International Bond | | | | | | | | |
144A 7.875% 2/16/32 # | | | 200,000 | | | | 221,435 | |
| | | | | | | | |
| | | | | | | 221,435 | |
| | | | | | | | |
Peru – 0.28% | | | | | | | | |
Peruvian Government International Bond 6.95% 8/12/31 | | PEN | 800,000 | | | | 273,312 | |
| | | | | | | | |
| | | | | | | 273,312 | |
| | | | | | | | |
Russia – 0.22% | | | | | | | | |
Russian Foreign Bond – Eurobond 144A 4.75% 5/27/26 # | | | 200,000 | | | | 209,770 | |
| | | | | | | | |
| | | | | | | 209,770 | |
| | | | | | | | |
South Africa – 0.33% | | | | | | | | |
Republic of South Africa Government Bond | | | | | | | | |
8.00% 1/31/30 | | ZAR | 3,664,000 | | | | 254,570 | |
8.75% 1/31/44 | | ZAR | 862,000 | | | | 58,482 | |
| | | | | | | | |
| | | | | | | 313,052 | |
| | | | | | | | |
Turkey – 0.36% | | | | | | | | |
Turkey Government Bond 8.00% 3/12/25 | | TRY | 1,378,000 | | | | 344,759 | |
| | | | | | | | |
| | | | | | | 344,759 | |
| | | | | | | | |
Uruguay – 0.18% | | | | | | | | |
Uruguay Government International Bond 144A | | | | | | | | |
9.875% 6/20/22 # | | UYU | 4,538,000 | | | | 171,124 | |
| | | | | | | | |
| | | | | | | 171,124 | |
| | | | | | | | |
Total Sovereign Bonds (cost $4,805,496) | | | | | | | 4,884,708 | |
| | | | | | | | |
|
| |
Supranational Banks – 0.83% | | | | | | | | |
| |
Asian Development Bank 6.00% 2/24/21 | | INR | 2,380,000 | | | | 37,622 | |
Banque Ouest Africaine de Developpement 144A | | | | | | | | |
5.00% 7/27/27 # | | | 200,000 | | | | 200,460 | |
Inter-American Development Bank 6.25% 6/15/21 | | IDR | 2,900,000,000 | | | | 217,517 | |
International Bank for Reconstruction & Development | | | | | | | | |
3.50% 1/22/21 | | NZD | 180,000 | | | | 138,279 | |
International Finance 6.30% 11/25/24 | | INR | 12,870,000 | | | | 203,867 | |
| | | | | | | | |
Total Supranational Banks (cost $780,986) | | | | | | | 797,745 | |
| | | | | | | | |
| | | | | | | | |
| | | Principal amount° | | | Value (US $) | |
US Treasury Obligation – 0.05% | | | | | | | | |
US Treasury Note | | | | | | | | |
2.375% 5/15/27 | | | 45,000 | | | $ | 45,343 | |
| | | | | | | | |
Total US Treasury Obligation (cost $45,294) | | | | | | | 45,343 | |
| | | | | | | | |
| | |
| | | Number of shares | | | | |
Convertible Preferred Stock – 0.03% | | | | | | | | |
Bank of America 7.25% exercise price $50.00y | | | 7 | | | | 9,086 | |
Wells Fargo & Co. 7.50% exercise price $156.71y | | | 14 | | | | 18,585 | |
| | | | | | | | |
Total Convertible Preferred Stock (cost $26,268) | | | | | | | 27,671 | |
| | | | | | | | |
|
| |
Preferred Stock – 2.02% | | | | | | | | |
| |
Bank of America 6.50% ● | | | 700,000 | | | | 791,000 | |
General Electric 5.00% ● | | | 591,000 | | | | 623,824 | |
Integrys Holdings 6.00% ● | | | 4,400 | | | | 116,325 | |
US Bancorp 3.50% ● | | | 350 | | | | 309,957 | |
USB Realty 144A 2.451% #● | | | 100,000 | | | | 89,000 | |
| | | | | | | | |
Total Preferred Stock (cost $1,797,020) | | | | | | | 1,930,106 | |
| | | | | | | | |
| | |
| | | Number of
contracts | | | | |
Options Purchased – 0.00% | | | | | | | | |
Currency Call Option – 0.00% | | | | | | | | |
USD vs JPY strike price JPY 109.00, expiration date 9/27/17 (BAML) | | | 200,000 | | | | 2,141 | |
| | |
| | | | | | | | |
| | | | | | | 2,141 | |
| | | | | | | | |
Currency Put Options – 0.00% | | | | | | | | |
USD vs BRL strike price BRL 3.50, expiration date 9/27/17 (BAML) | | | 100,000 | | | | 193 | |
USD vs KRW strike price KRW 1,160.00, expiration date 9/27/17 (BAML) | | | 100,000 | | | | 426 | |
USD vs MXN strike price MXN 18.50, expiration date 9/27/17 (BAML) | | | 100,000 | | | | 791 | |
USD vs TRY strike price TRY 3.75, expiration date 09/27/17 (BAML) | | | 100,000 | | | | 481 | |
USD vs TWD strike price TWD 30.50, expiration date 9/27/17 (BAML) | | | 100,000 | | | | 429 | |
| | | | | | | | |
| | | | | | | 2,320 | |
| | | | | | | | |
Total Options Purchased (cost $7,903) | | | | | | | 4,461 | |
| | | | | | | | |
| | |
| Schedule of investments | | |
| Delaware Strategic Income Fund | | |
| | | | | | | | |
| | | Principal amount° | | | Value (US $) | |
Short-Term Investments – 0.68% | | | | | | | | |
Repurchase Agreements – 0.68% | | | | | | | | |
Bank of America Merrill Lynch
0.97%, dated 7/31/17, to be repurchased on 8/1/17,
repurchase price $119,122 (collateralized by US
government obligations 0.125% 4/15/18; market value
$121,502) | | | 119,119 | | | | $ 119,119 | |
Bank of Montreal
0.90%, dated 7/31/17, to be repurchased on 8/1/17,
repurchase price $297,805 (collateralized by US
government obligations 0.00%-4.375%
1/11/18-8/15/40; market value $303,754) | | | 297,798 | | | | 297,798 | |
BNP Paribas
1.04%, dated 7/31/17, to be repurchased on 8/1/17,
repurchase price $234,090 (collateralized by US
government obligations 0.00%-2.50%
10/12/17-8/15/46; market value $238,765) | | | 234,083 | | | | 234,083 | |
| | | | | | | | |
Total Short-Term Investments (cost $651,000) | | | | | | | 651,000 | |
| | | | | | | | |
Total Value of Securities – 99.91%
(cost $94,227,465) | | | | | | | $95,678,015 | |
| | | | | | | | |
| # | Security exempt from registration under Rule 144A of the Securities Act of 1933, as amended. At July 31, 2017, the aggregate value of Rule 144A securities was $37,986,125, which represents 39.67% of the Fund’s net assets. See Note 11 in “Notes to financial statements.” |
| ¨ | Pass Through Agreement. Security represents the contractual right to receive a proportionate amount of underlying payments due to the counterparty pursuant to various agreements related to the rescheduling of obligations and the exchange of certain notes. |
| « | Loan agreements generally pay interest at rates which are periodically reset by reference to a base lending rate plus a premium. These base lending rates are generally: (i) the prime rate offered by one or more US banks, (ii) the lending rate offered by one or more European banks such as the London Interbank Offered Rate (LIBOR), and (iii) the certificate of deposit rate. Loan agreements may be subject to restrictions on resale. Stated rate in effect at July 31, 2017. |
| ° | Principal amount shown is stated in US dollars unless noted that the security is denominated in another currency. |
| r | Securities have been classified by country of origin. |
| S | Interest only security. An interest only security is the interest only portion of a fixed income security, which is separated and sold individually from the principal portion of the security. |
| y | No contractual maturity date. |
| ● | Variable rate security. Each rate shown is as of July 31, 2017. Interest rates reset periodically. |
| f | Step coupon bond. Coupon increases or decreases periodically based on a predetermined schedule. Stated rate in effect at July 31, 2017. |
The following foreign currency exchange contracts, futures contracts, and swap contracts were outstanding at July 31, 2017:1
Foreign Currency Exchange Contracts
| | | | | | | | | | | | | | | | | | | | | | | | |
| | | | | | | | | | | | | | | | | | Unrealized | |
| | | Contracts to | | | | | | | | | | | | Appreciation | |
Counterparty | | Receive (Deliver) | | | In Exchange For | | | Settlement Date | | | (Depreciation) | |
BAML | | | COP | | | | 647,348,881 | | | | USD | | | | (212,698 | ) | | | 9/1/17 | | | $ | 3,214 | |
BNP | | | NOK | | | | 972,966 | | | | USD | | | | (119,278 | ) | | | 9/1/17 | | | | 4,561 | |
BNP | | | NZD | | | | (91,130 | ) | | | USD | | | | 66,827 | | | | 9/1/17 | | | | (1,568 | ) |
HSBC | | | INR | | | | 7,816,545 | | | | USD | | | | (120,971 | ) | | | 9/1/17 | | | | 484 | |
TD | | | AUD | | | | 118,765 | | | | USD | | | | (94,009 | ) | | | 9/1/17 | | | | 962 | |
TD | | | NZD | | | | (91,130 | ) | | | USD | | | | 66,823 | | | | 9/1/17 | | | | (1,572 | ) |
TD | | | ZAR | | | | (231,027 | ) | | | USD | | | | 17,718 | | | | 9/1/17 | | | | 291 | |
| | | | | | | | | | | | | | | | | | | | | | | | |
| | | | | | | | | | | | | | | | | | | | | | $ | 6,372 | |
| | | | | | | | | | | | | | | | | | | | | | | | |
Futures Contracts
| | | | | | | | | | | | | | | | | | |
| | | Contracts to Buy (Sell) | | Notional
Cost
(Proceeds) | | | Notional
Value | | | Expiration
Date | | | Unrealized
Appreciation
(Depreciation) | |
(16) | | Euro-Bund | | $ | (3,123,853 | ) | | $ | (3,067,463 | ) | | | 9/8/17 | | | $ | 56,390 | |
21 | | US Treasury 10 yr Notes | | | 2,652,294 | | | | 2,643,703 | | | | 9/21/17 | | | | (8,591 | ) |
| | | | | | | | | | | | | | | | | | |
| | | | $ | (471,559 | ) | | | | | | | | | | $ | 47,799 | |
| | | | | | | | | | | | | | | | | | |
Swap Contracts
CDS Contracts2
| | | | | | | | | | | | | | | | | | | | | | |
Counterparty | | Swap Referenced Obligation/ Moody’s ratings | | Notional
Amount3 | | | Annual
Protection
Payments | | | Termination
Date | | | Upfront
Payments
Paid
(Received) | | | Unrealized
Appreciation
(Depreciation)4 | |
| | Protection Sold/
Moody’s Rating: | | | | | | | | | | | | | | | | | | | | |
MSC | | CMBX.NA.BBB-.65 | | | 400,000 | | | | 3.00% | | | | 5/11/63 | | | $ | (44,889 | ) | | | $(485) | |
The use of foreign currency exchange contracts, futures contracts, and swap contracts involves elements of market risk and risks in excess of the amounts disclosed in the financial statements. The notional values, notional amounts and foreign currency exchange contracts presented above represent the Fund’s total exposure in such contracts, whereas only the net unrealized appreciation (depreciation) is reflected in the Fund’s net assets.
1See Note 8 in “Notes to financial statements.“
2A CDS contract is a risk-transfer instrument through which one party (purchaser of protection) transfers to another party (seller of protection) the financial risk of a credit event (as defined in the CDS agreement), as it relates to a particular reference security or basket of securities (such as an index). Periodic payments (receipts) on such contracts are accrued daily and recorded as unrealized losses (gains) on swap contracts. Upon payment (receipt), such amounts are recorded as realized losses (gains) on swap contracts. Upfront payments made or received in connection with CDS contracts are
| | |
| Schedule of investments | | |
| Delaware Strategic Income Fund | | |
amortized over the expected life of the CDS contracts as unrealized losses (gains) on swap contracts. The change in value of CDS contracts is recorded daily as unrealized appreciation or depreciation. A realized gain or loss is recorded upon a credit event (as defined in the CDS agreement) or the maturity or termination of the agreement.
3Notional value/amount shown is stated in US dollars unless noted that the swap is denominated in another currency.
4Unrealized appreciation (depreciation) does not include periodic interest payments (receipt) on swap contracts accrued daily in the amount of $516.
5Markit’s CMBX Index or the CMBX.NA Index is a synthetic tradable index referencing a basket of 25 commercial mortgage-backed securities in North America. Credit-quality rating are measured on a scale that generally ranges from AAA (highest) to BB (lowest). US Agency and US Agency mortgage-backed securities appear under US Government.
Summary of abbreviations:
ARS – Argentine Peso
AUD – Australian Dollar
BAML – Bank of America Merrill Lynch
BB – Barclays Bank
BNP – BNP Paribas
BRL – Brazilian Real
CDO – Collateralized Debt Obligation CDS – Credit Default Swap
CLO – Collateralized Loan Obligation
CMBX.NA – Commercial Mortgaged-Backed Securities Index North America
COP – Colombian Peso DB – Deutsche Bank
FREMF – Freddie Mac Multifamily
GNMA – Government National Mortgage Association
GS – Goldman Sachs
GSMPS – Goldman Sachs Reperforming Mortgage Securities
HSBC – Hong Kong Shanghai Bank
HUF – Hungarian Forint
IDR – Indonesian Rupiah
INR – Indian Rupee
JPM – JPMorgan
JPY – Japanese Yen
KRW – South Korean Won
LB – Lehman Brothers
MSC – Morgan Stanley Capital
MXN – Mexican Peso
NOK – Norwegian Krone
NZD – New Zealand Dollar
PEN – Peruvian Nuevo Sol
Summary of abbreviations (continued):
RBS – Royal Bank of Scotland
REIT – Real Estate Investment Trust
REMIC – Real Estate Mortgage Investment Conduit
S.F. – Single Family
TD – Toronto Dominion Bank
TRY – Turkish Lira
TWD – Taiwan Dollar
USD – US Dollar
UYU – Uruguay Peso
WF – Wells Fargo
yr – Year
ZAR – South African Rand
See accompanying notes, which are an integral part of the financial statements.
| | |
| Statement of assets and liabilities | | |
| Delaware Strategic Income Fund | | July 31, 2017 |
| | | | |
Assets: | | | | |
Investments, at value1 | | $ | 95,022,554 | |
Short-term investments, at value2 | | | 651,000 | |
Foreign currencies, at value3 | | | 318,767 | |
Options purchased, at value4 | | | 4,461 | |
Cash | | | 64,896 | |
Receivable for securities sold | | | 1,293,057 | |
Interest receivable | | | 1,067,614 | |
Cash collateral due from brokers on futures contracts | | | 75,000 | |
Receivable for fund shares sold | | | 55,845 | |
Receivable from investment manager | | | 24,608 | |
Unrealized appreciation on foreign currency exchange contracts | | | 9,512 | |
Swap payments receivable | | | 336 | |
Other assets5 | | | 97,871 | |
| | | | |
Total assets | | | 98,685,521 | |
| | | | |
Liabilities: | | | | |
Payable for securities purchased | | | 2,263,504 | |
Distribution payable | | | 109,545 | |
Other accrued expenses | | | 93,849 | |
Audit and tax fees payable | | | 52,408 | |
Upfront payments received on credit default swap contracts | | | 44,889 | |
Distribution fees payable to affiliates | | | 17,865 | |
Payable for fund shares redeemed | | | 9,618 | |
Unrealized depreciation on foreign currency exchange contracts | | | 3,140 | |
Dividend disbursing and transfer agent fees and expenses payable to affiliates | | | 1,619 | |
Unrealized depreciation on credit default swap contracts | | | 485 | |
Accounting and administration expenses payable to affiliates | | | 377 | |
Variation margin due to broker on futures contracts | | | 372 | |
Deferred capital gains tax payable | | | 364 | |
Trustees’ fees and expenses payable to affiliates | | | 240 | |
Legal fees payable to affiliates | | | 99 | |
Reports and statements to shareholders expenses payable to affiliates | | | 83 | |
Contingent liabilities5 | | | 326,237 | |
| | | | |
Total liabilities | | | 2,924,694 | |
| | | | |
Total Net Assets | | $ | 95,760,827 | |
| | | | |
| | | | |
Net Assets Consist of: | | | | |
Paid-in capital | | $ | 97,873,980 | |
Distributions in excess of net investment income | | | (104,228 | ) |
Accumulated net realized loss | | | (3,512,649 | ) |
Net unrealized appreciation of investments | | | 1,453,628 | |
Net unrealized depreciation of foreign currencies | | | (664 | ) |
Net unrealized appreciation of foreign currency exchange contracts | | | 6,372 | |
Net unrealized appreciation of futures contracts | | | 47,799 | |
Net unrealized depreciation of options purchased | | | (3,442 | ) |
Net unrealized appreciation of swap contracts | | | 31 | |
| | | | |
Total Net Assets | | $ | 95,760,827 | |
| | | | |
| |
Net Asset Value | | | | |
Class A: | | | | |
Net assets | | $ | 51,219,676 | |
Shares of beneficial interest outstanding, unlimited authorization, no par | | | 6,090,366 | |
Net asset value per share | | $ | 8.41 | |
Sales charge | | | 4.50 | % |
Offering price per share, equal to net asset value per share / (1 – sales charge) | | $ | 8.81 | |
| |
Class C: | | | | |
Net assets | | $ | 4,996,276 | |
Shares of beneficial interest outstanding, unlimited authorization, no par | | | 593,457 | |
Net asset value per share | | $ | 8.42 | |
| |
Class R: | | | | |
Net assets | | $ | 5,725,342 | |
Shares of beneficial interest outstanding, unlimited authorization, no par | | | 678,559 | |
Net asset value per share | | $ | 8.44 | |
| |
Institutional Class: | | | | |
Net assets | | $ | 33,819,533 | |
Shares of beneficial interest outstanding, unlimited authorization, no par | | | 4,017,239 | |
Net asset value per share | | $ | 8.42 | |
| | | | |
1Investments, at cost | | $ | 93,568,562 | |
2Short-term investments, at cost | | | 651,000 | |
3Foreign currencies, at cost | | | 318,210 | |
4Options purchased, at cost | | | 7,903 | |
5See Note 13 in “Notes to financial statements.” | | | | |
See accompanying notes, which are an integral part of the financial statements.
| | |
| Statement of operations | | |
| Delaware Strategic Income Fund | | Year ended July 31, 2017 |
| | | | |
Investment Income: | | | | |
Interest | | $ | 4,332,091 | |
Dividends | | | 25,016 | |
Foreign tax withheld | | | (118 | ) |
| | | | |
| | | 4,356,989 | |
| | | | |
Expenses: | | | | |
Management fees | | | 640,543 | |
Distribution expenses – Class A | | | 147,486 | |
Distribution expenses – Class C | | | 75,391 | |
Distribution expenses – Class R | | | 31,571 | |
Dividend disbursing and transfer agent fees and expenses | | | 148,411 | |
Legal fees | | | 128,833 | |
Registration fees | | | 69,303 | |
Audit and tax fees | | | 54,802 | |
Reports and statements to shareholders expenses | | | 47,780 | |
Accounting and administration expenses | | | 37,302 | |
Custodian fees | | | 22,469 | |
Trustees’ fees and expenses | | | 5,768 | |
Other | | | 57,900 | |
| | | | |
| | | 1,467,559 | |
Less expenses waived | | | (454,018 | ) |
Less expense paid indirectly | | | (222 | ) |
| | | | |
Total operating expenses | | | 1,013,319 | |
| | | | |
Net Investment Income | | | 3,343,670 | |
| | | | |
| | | | |
Net Realized and Unrealized Gain (Loss): | | | | |
Net realized gain (loss) on: | | | | |
Investments | | $ | (332,387 | ) |
Foreign currencies | | | (4,446 | ) |
Foreign currency exchange contracts | | | (2,144 | ) |
Futures contracts | | | (161,680 | ) |
Options purchased | | | 22,753 | |
Swap contracts | | | (36,771 | ) |
| | | | |
Net realized loss | | | (514,675 | ) |
| | | | |
Net change in unrealized appreciation (depreciation) of: | | | | |
Investments1 | | | (1,669,645 | ) |
Foreign currencies | | | (486 | ) |
Foreign currency exchange contracts | | | 6,372 | |
Futures contracts | | | (207,348 | ) |
Options purchased | | | (3,442 | ) |
Swap contracts | | | 5,377 | |
| | | | |
Net change in unrealized appreciation (depreciation) | | | (1,869,172 | ) |
| | | | |
Net Realized and Unrealized Loss | | | (2,383,847 | ) |
| | | | |
Net Increase in Net Assets Resulting from Operations | | $ | 959,823 | |
| | | | |
1Includes $364 capital gains tax accrued.
See accompanying notes, which are an integral part of the financial statements.
| | |
| Statements of changes in net assets | | |
| Delaware Strategic Income Fund | | |
| | | | | | | | |
| | | Year ended | |
| | | 7/31/17 | | | 7/31/16 | |
Increase (Decrease) in Net Assets from Operations: | | | | | | | | |
Net investment income | | $ | 3,343,670 | | | $ | 2,372,697 | |
Net realized gain (loss) | | | (514,675 | ) | | | 468,130 | |
Net change in unrealized appreciation (depreciation) | | | (1,869,172 | ) | | | 2,558,214 | |
| | | | | | | | |
Net increase in net assets resulting from operations | | | 959,823 | | | | 5,399,041 | |
| | | | | | | | |
| | |
Dividends and Distributions to Shareholders from: | | | | | | | | |
Net investment income: | | | | | | | | |
Class A | | | (2,072,447 | ) | | | (1,595,501 | ) |
Class C | | | (205,608 | ) | | | (145,027 | ) |
Class R | | | (209,798 | ) | | | (136,982 | ) |
Institutional Class | | | (1,646,207 | ) | | | (1,167,961 | ) |
| | |
Return of capital: | | | | | | | | |
Class A | | | — | | | | (64,610 | ) |
Class C | | | — | | | | (8,809 | ) |
Class R | | | — | | | | (6,292 | ) |
Institutional Class | | | — | | | | (48,347 | ) |
| | | | | | | | |
| | | (4,134,060 | ) | | | (3,173,529 | ) |
| | | | | | | | |
| | |
Capital Share Transactions: | | | | | | | | |
Proceeds from shares sold: | | | | | | | | |
Class A | | | 6,369,718 | | | | 26,720,996 | |
Class C | | | 1,282,218 | | | | 3,897,214 | |
Class R | | | 689,331 | | | | 1,324,152 | |
Institutional Class | | | 22,005,985 | | | | 20,253,016 | |
| | | | | | | | |
| | | Year ended | |
| | | 7/31/17 | | | 7/31/16 | |
Capital Share Transactions (continued): | | | | | | | | |
Net asset value of shares issued upon reinvestment of dividends and distributions: | | | | | | | | |
Class A | | $ | 1,879,296 | | | $ | 1,520,870 | |
Class C | | | 189,278 | | | | 142,343 | |
Class R | | | 206,676 | | | | 143,695 | |
Institutional Class | | | 1,580,499 | | | | 1,206,863 | |
| | | | | | | | |
| | | 34,203,001 | | | | 55,209,149 | |
| | | | | | | | |
Cost of shares redeemed: | | | | | | | | |
Class A | | | (24,891,676 | ) | | | (23,861,526 | ) |
Class C | | | (5,731,991 | ) | | | (3,104,476 | ) |
Class R | | | (1,826,644 | ) | | | (1,640,481 | ) |
Institutional Class | | | (40,705,695 | ) | | | (16,401,880 | ) |
| | | | | | | | |
| | | (73,156,006 | ) | | | (45,008,363 | ) |
| | | | | | | | |
Increase (Decrease) in net assets derived from capital share transactions | | | (38,953,005 | ) | | | 10,200,786 | |
| | | | | | | | |
Net Increase (Decrease) in Net Assets | | | (42,127,242 | ) | | | 12,426,298 | |
| | |
Net Assets: | | | | | | | | |
Beginning of year | | | 137,888,069 | | | | 125,461,771 | |
| | | | | | | | |
End of year | | $ | 95,760,827 | | | $ | 137,888,069 | |
| | | | | | | | |
Distributions in excess of net investment income | | $ | (104,228 | ) | | $ | (106,250 | ) |
| | | | | | | | |
See accompanying notes, which are an integral part of the financial statements.
Financial highlights
Delaware Strategic Income Fund Class A
Selected data for each share of the Fund outstanding throughout each period were as follows:
|
| |
|
| |
|
Net asset value, beginning of period |
|
Income (loss) from investment operations: |
Net investment income1 |
Net realized and unrealized gain (loss) |
|
Total from investment operations. |
|
|
Less dividends and distributions from: |
Net investment income |
Return of capital |
Net realized gain |
|
Total dividends and distributions |
|
|
Net asset value, end of period |
|
|
Total return2 |
|
Ratios and supplemental data: |
Net assets, end of period (000 omitted) |
Ratio of expenses to average net assets |
Ratio of expenses to average net assets prior to fees waived |
Ratio of net investment income to average net assets |
Ratio of net investment income to average net assets prior to fees waived |
Portfolio turnover |
|
|
| 1 | The average shares outstanding method has been applied for per share information. |
| 2 | Total investment return is based on the change in net asset value of a share during the period and assumes reinvestment of dividends and distributions at net asset value and does not reflect the impact of a sales charge. Total investment return during all of the periods shown reflects waivers by the manager and/or distributor. Performance would have been lower had the waivers not been in effect. |
See accompanying notes, which are an integral part of the financial statements.
| | | | | | | | | | | | | | | | | | | | | | | | | | | | |
| Year ended | |
| |
| | | 7/31/17 | | | | | 7/31/16 | | | | | 7/31/15 | | | | | 7/31/14 | | | | | 7/31/13 | |
| |
| | $ | 8.57 | | | | | $ | 8.43 | | | | | $ | 8.53 | | | | | $ | 8.34 | | | | | $ | 8.75 | |
| | | | | | | | | |
| | | | | | | | | | | | | | | | | | | | | | | | | | | | |
| | | 0.24 | | | | | | 0.15 | | | | | | 0.20 | | | | | | 0.23 | | | | | | 0.20 | |
| | | (0.10 | ) | | | | | 0.20 | | | | | | (0.06 | ) | | | | | 0.23 | | | | | | (0.32 | ) |
| | | | | | | | | | | | | | | | | | | | | | | | | | | | |
| | | 0.14 | | | | | | 0.35 | | | | | | 0.14 | | | | | | 0.46 | | | | | | (0.12 | ) |
| | | | | | | | | | | | | | | | | | | | | | | | | | | | |
| | | | | | | | | |
| | | | | | | | | | | | | | | | | | | | | | | | | | | | |
| | | (0.30 | ) | | | | | (0.20 | ) | | | | | (0.23 | ) | | | | | (0.23 | ) | | | | | (0.27 | ) |
| | | — | | | | | | (0.01 | ) | | | | | (0.01 | ) | | | | | (0.04 | ) | | | | | — | |
| | | — | | | | | | — | | | | | | — | | | | | | — | | | | | | (0.02 | ) |
| | | | | | | | | | | | | | | | | | | | | | | | | | | | |
| | | (0.30 | ) | | | | | (0.21 | ) | | | | | (0.24 | ) | | | | | (0.27 | ) | | | | | (0.29 | ) |
| | | | | | | | | | | | | | | | | | | | | | | | | | | | |
| | | | | | | | | |
| | $ | 8.41 | | | | | $ | 8.57 | | | | | $ | 8.43 | | | | | $ | 8.53 | | | | | $ | 8.34 | |
| | | | | | | | | | | | | | | | | | | | | | | | | | | | |
| | | | | | | | | |
| | | 1.73% | | | | | | 4.15% | | | | | | 1.65% | | | | | | 5.60% | | | | | | (1.51% | ) |
| | | | | | | | | |
| | | | | | | | | | | | | | | | | | | | | | | | | | | | |
| | | $51,220 | | | | | | $69,524 | | | | | | $64,069 | | | | | | $65,466 | | | | | | $81,042 | |
| | | 0.90% | | | | | | 0.90% | | | | | | 0.91% | | | | | | 0.90% | | | | | | 0.90% | |
| | | 1.29% | | | | | | 1.21% | | | | | | 1.21% | | | | | | 1.19% | | | | | | 1.17% | |
| | | 2.84% | | | | | | 1.80% | | | | | | 2.30% | | | | | | 2.70% | | | | | | 2.33% | |
| | | 2.45% | | | | | | 1.49% | | | | | | 2.00% | | | | | | 2.41% | | | | | | 2.06% | |
| | | 210% | | | | | | 316% | | | | | | 313% | | | | | | 273% | | | | | | 340% | |
| | | | | | | | | | | | | | | | | | | | | | | | | | | | |
| |
Financial highlights
Delaware Strategic Income Fund Class C
Selected data for each share of the Fund outstanding throughout each period were as follows:
|
| |
|
| |
|
Net asset value, beginning of period |
|
Income (loss) from investment operations: |
Net investment income1 |
Net realized and unrealized gain (loss) |
|
Total from investment operations |
|
|
Less dividends and distributions from: |
Net investment income |
Return of capital |
Net realized gain |
|
Total dividends and distributions |
|
|
Net asset value, end of period |
|
|
Total return2 |
|
Ratios and supplemental data: |
Net assets, end of period (000 omitted) |
Ratio of expenses to average net assets |
Ratio of expenses to average net assets prior to fees waived |
Ratio of net investment income to average net assets |
Ratio of net investment income to average net assets prior to fees waived |
Portfolio turnover |
|
|
| 1 | The average shares outstanding method has been applied for per share information. |
| 2 | Total investment return is based on the change in net asset value of a share during the period and assumes reinvestment of dividends and distributions at net asset value and does not reflect the impact of a sales charge. Total investment return during all of the periods shown reflects a waiver by the manager. Performance would have been lower had the waiver not been in effect. |
See accompanying notes, which are an integral part of the financial statements.
| | | | | | | | | | | | | | | | | | | | | | | | | | | | |
| Year ended | |
| |
| | | 7/31/17 | | | | | 7/31/16 | | | | | 7/31/15 | | | | | 7/31/14 | | | | | 7/31/13 | |
| |
| | $ | 8.58 | | | | | $ | 8.44 | | | | | $ | 8.54 | | | | | $ | 8.35 | | | | | $ | 8.76 | |
| | | | | | | | | |
| | | | | | | | | | | | | | | | | | | | | | | | | | | | |
| | | 0.18 | | | | | | 0.09 | | | | | | 0.13 | | | | | | 0.16 | | | | | | 0.14 | |
| | | (0.10 | ) | | | | | 0.19 | | | | | | (0.05 | ) | | | | | 0.24 | | | | | | (0.33 | ) |
| | | | | | | | | | | | | | | | | | | | | | | | | | | | |
| | | 0.08 | | | | | | 0.28 | | | | | | 0.08 | | | | | | 0.40 | | | | | | (0.19 | ) |
| | | | | | | | | | | | | | | | | | | | | | | | | | | | |
| | | | | | | | | |
| | | | | | | | | | | | | | | | | | | | | | | | | | | | |
| | | (0.24 | ) | | | | | (0.13 | ) | | | | | (0.17 | ) | | | | | (0.17 | ) | | | | | (0.20 | ) |
| | | — | | | | | | (0.01 | ) | | | | | (0.01 | ) | | | | | (0.04 | ) | | | | | — | |
| | | — | | | | | | — | | | | | | — | | | | | | — | | | | | | (0.02 | ) |
| | | | | | | | | | | | | | | | | | | | | | | | | | | | |
| | | (0.24 | ) | | | | | (0.14 | ) | | | | | (0.18 | ) | | | | | (0.21 | ) | | | | | (0.22 | ) |
| | | | | | | | | | | | | | | | | | | | | | | | | | | | |
| | | | | | | | | |
| | $ | 8.42 | | | | | $ | 8.58 | | | | | $ | 8.44 | | | | | $ | 8.54 | | | | | $ | 8.35 | |
| | | | | | | | | | | | | | | | | | | | | | | | | | | | |
| | | | | | | | | |
| | | 0.97% | | | | | | 3.37% | | | | | | 0.89% | | | | | | 4.81% | | | | | | (2.24% | ) |
| | | | | | | | | |
| | | | | | | | | | | | | | | | | | | | | | | | | | | | |
| | $ | 4,996 | | | | | $ | 9,490 | | | | | $ | 8,375 | | | | | $ | 8,572 | | | | | $ | 10,990 | |
| | | 1.65% | | | | | | 1.65% | | | | | | 1.66% | | | | | | 1.65% | | | | | | 1.65% | |
| | | 2.04% | | | | | | 1.96% | | | | | | 1.96% | | | | | | 1.93% | | | | | | 1.87% | |
| | | 2.09% | | | | | | 1.05% | | | | | | 1.55% | | | | | | 1.95% | | | | | | 1.58% | |
| | | 1.70% | | | | | | 0.74% | | | | | | 1.25% | | | | | | 1.67% | | | | | | 1.36% | |
| | | 210% | | | | | | 316% | | | | | | 313% | | | | | | 273% | | | | | | 340% | |
| | | | | | | | | | | | | | | | | | | | | | | | | | | | |
| |
Financial highlights
Delaware Strategic Income Fund Class R
Selected data for each share of the Fund outstanding throughout each period were as follows:
|
| |
|
| |
|
Net asset value, beginning of period |
|
Income (loss) from investment operations: |
Net investment income1 |
Net realized and unrealized gain (loss) |
|
Total from investment operations |
|
|
Less dividends and distributions from: |
Net investment income |
Return of capital |
Net realized gain |
|
Total dividends and distributions |
|
|
Net asset value, end of period |
|
|
Total return2 |
|
Ratios and supplemental data: |
Net assets, end of period (000 omitted) |
Ratio of expenses to average net assets |
Ratio of expenses to average net assets prior to fees waived |
Ratio of net investment income to average net assets |
Ratio of net investment income to average net assets prior to fees waived |
Portfolio turnover |
|
|
| 1 | The average shares outstanding method has been applied for per share information. |
| 2 | Total investment return is based on the change in net asset value of a share during the period and assumes reinvestment of dividends and distributions at net asset value. Total investment return during all of the periods shown reflects waivers by the manager and/or distributor. Performance would have been lower had the waivers not been in effect. |
See accompanying notes, which are an integral part of the financial statements.
| | | | | | | | | | | | | | | | | | | | | | | | | | | | |
| Year ended | |
| |
| | | 7/31/17 | | | | | 7/31/16 | | | | | 7/31/15 | | | | | 7/31/14 | | | | | 7/31/13 | |
| |
| | $ | 8.60 | | | | | $ | 8.46 | | | | | $ | 8.56 | | | | | $ | 8.37 | | | | | $ | 8.78 | |
| | | | | | | | | |
| | | | | | | | | | | | | | | | | | | | | | | | | | | | |
| | | 0.22 | | | | | | 0.13 | | | | | | 0.18 | | | | | | 0.21 | | | | | | 0.18 | |
| | | (0.10 | ) | | | | | 0.19 | | | | | | (0.06 | ) | | | | | 0.23 | | | | | | (0.33 | ) |
| | | | | | | | | | | | | | | | | | | | | | | | | | | | |
| | | 0.12 | | | | | | 0.32 | | | | | | 0.12 | | | | | | 0.44 | | | | | | (0.15 | ) |
| | | | | | | | | | | | | | | | | | | | | | | | | | | | |
| | | | | | | | | |
| | | | | | | | | | | | | | | | | | | | | | | | | | | | |
| | | (0.28 | ) | | | | | (0.17 | ) | | | | | (0.21 | ) | | | | | (0.21 | ) | | | | | (0.24 | ) |
| | | — | | | | | | (0.01 | ) | | | | | (0.01 | ) | | | | | (0.04 | ) | | | | | — | |
| | | — | | | | | | — | | | | | | — | | | | | | — | | | | | | (0.02 | ) |
| | | | | | | | | | | | | | | | | | | | | | | | | | | | |
| | | (0.28 | ) | | | | | (0.18 | ) | | | | | (0.22 | ) | | | | | (0.25 | ) | | | | | (0.26 | ) |
| | | | | | | | | | | | | | | | | | | | | | | | | | | | |
| | | | | | | | | |
| | $ | 8.44 | | | | | $ | 8.60 | | | | | $ | 8.46 | | | | | $ | 8.56 | | | | | $ | 8.37 | |
| | | | | | | | | | | | | | | | | | | | | | | | | | | | |
| | | | | | | | | |
| | | 1.48% | | | | | | 3.88% | | | | | | 1.40% | | | | | | 5.32% | | | | | | (1.74% | ) |
| | | | | | | | | |
| | | | | | | | | | | | | | | | | | | | | | | | | | | | |
| | $ | 5,725 | | | | | $ | 6,793 | | | | | $ | 6,863 | | | | | $ | 7,793 | | | | | $ | 8,077 | |
| | | 1.15% | | | | | | 1.15% | | | | | | 1.16% | | | | | | 1.15% | | | | | | 1.15% | |
| | | 1.54% | | | | | | 1.46% | | | | | | 1.46% | | | | | | 1.45% | | | | | | 1.47% | |
| | | 2.59% | | | | | | 1.55% | | | | | | 2.05% | | | | | | 2.45% | | | | | | 2.08% | |
| | | 2.20% | | | | | | 1.24% | | | | | | 1.75% | | | | | | 2.15% | | | | | | 1.76% | |
| | | 210% | | | | | | 316% | | | | | | 313% | | | | | | 273% | | | | | | 340% | |
| | | | | | | | | | | | | | | | | | | | | | | | | | | | |
| |
Financial highlights
Delaware Strategic Income Fund Institutional Class
Selected data for each share of the Fund outstanding throughout each period were as follows:
|
| |
|
| |
|
Net asset value, beginning of period |
|
Income (loss) from investment operations: |
Net investment income1 |
Net realized and unrealized gain (loss) |
|
Total from investment operations |
|
|
Less dividends and distributions from: |
Net investment income |
Return of capital |
Net realized gain |
|
Total dividends and distributions |
|
|
Net asset value, end of period |
|
|
Total return2 |
|
Ratios and supplemental data: |
Net assets, end of period (000 omitted) |
Ratio of expenses to average net assets |
Ratio of expenses to average net assets prior to fees waived |
Ratio of net investment income to average net assets |
Ratio of net investment income to average net assets prior to fees waived |
Portfolio turnover |
|
|
| 1 | The average shares outstanding method has been applied for per share information. |
| 2 | Total investment return is based on the change in net asset value of a share during the period and assumes reinvestment of dividends and distributions at net asset value. Total investment return during all of the periods shown reflects a waiver by the manager. Performance would have been lower had the waiver not been in effect. |
See accompanying notes, which are an integral part of the financial statements.
| | | | | | | | | | | | | | | | | | | | | | | | | | | | |
| Year ended | |
| |
| | | 7/31/17 | | | | | 7/31/16 | | | | | 7/31/15 | | | | | 7/31/14 | | | | | 7/31/13 | |
| |
| | $ | 8.58 | | | | | $ | 8.44 | | | | | $ | 8.54 | | | | | $ | 8.35 | | | | | $ | 8.76 | |
| | | | | | | | | |
| | | | | | | | | | | | | | | | | | | | | | | | | | | | |
| | | 0.26 | | | | | | 0.17 | | | | | | 0.22 | | | | | | 0.25 | | | | | | 0.22 | |
| | | (0.10 | ) | | | | | 0.20 | | | | | | (0.05 | ) | | | | | 0.24 | | | | | | (0.32 | ) |
| | | | | | | | | | | | | | | | | | | | | | | | | | | | |
| | | 0.16 | | | | | | 0.37 | | | | | | 0.17 | | | | | | 0.49 | | | | | | (0.10 | ) |
| | | | | | | | | | | | | | | | | | | | | | | | | | | | |
| | | | | | | | | |
| | | | | | | | | | | | | | | | | | | | | | | | | | | | |
| | | (0.32 | ) | | | | | (0.22 | ) | | | | | (0.26 | ) | | | | | (0.26 | ) | | | | | (0.29 | ) |
| | | — | | | | | | (0.01 | ) | | | | | (0.01 | ) | | | | | (0.04 | ) | | | | | — | |
| | | — | | | | | | — | | | | | | — | | | | | | — | | | | | | (0.02 | ) |
| | | | | | | | | | | | | | | | | | | | | | | | | | | | |
| | | (0.32 | ) | | | | | (0.23 | ) | | | | | (0.27 | ) | | | | | (0.30 | ) | | | | | (0.31 | ) |
| | | | | | | | | | | | | | | | | | | | | | | | | | | | |
| | | | | | | | | |
| | $ | 8.42 | | | | | $ | 8.58 | | | | | $ | 8.44 | | | | | $ | 8.54 | | | | | $ | 8.35 | |
| | | | | | | | | | | | | | | | | | | | | | | | | | | | |
| | | | | | | | | |
| | | 1.99% | | | | | | 4.40% | | | | | | 1.90% | | | | | | 5.86% | | | | | | (1.26% | ) |
| | | | | | | | | |
| | | | | | | | | | | | | | | | | | | | | | | | | | | | |
| | $ | 33,820 | | | | | $ | 52,081 | | | | | $ | 46,155 | | | | | $ | 30,241 | | | | | $ | 60,210 | |
| | | 0.65% | | | | | | 0.65% | | | | | | 0.66% | | | | | | 0.65% | | | | | | 0.65% | |
| | | 1.04% | | | | | | 0.96% | | | | | | 0.96% | | | | | | 0.93% | | | | | | 0.87% | |
| | | 3.09% | | | | | | 2.05% | | | | | | 2.55% | | | | | | 2.95% | | | | | | 2.58% | |
| | | 2.70% | | | | | | 1.74% | | | | | | 2.25% | | | | | | 2.67% | | | | | | 2.36% | |
| | | 210% | | | | | | 316% | | | | | | 313% | | | | | | 273% | | | | | | 340% | |
| | | | | | | | | | | | | | | | | | | | | | | | | | | | |
| |
| | |
| Notes to financial statements | | |
| Delaware Strategic Income Fund | | July 31, 2017 |
Delaware Group® Government Fund (Trust) is organized as a Delaware statutory trust and offers two series: Delaware Emerging Markets Debt Fund and Delaware Strategic Income Fund (formerly, Delaware Core Plus Bond Fund). These financial statements and the related notes pertain to Delaware Strategic Income Fund (Fund). The Trust is an open-end investment company. The Fund is considered diversified under the Investment Company Act of 1940, as amended (1940 Act), and offers Class A, Class C, Class R, and Institutional Class shares. Class A shares are sold with a maximum front-end sales charge of 4.50%. Class A share purchases of $1,000,000 or more will incur a contingent deferred sales charge (CDSC) of 1.00% if redeemed during the first year, and 0.50% during the second year, provided that Delaware Distributors, L.P. (DDLP) paid a financial advisor a commission on the purchase of those shares. Class C shares are sold with a CDSC of 1.00%, if redeemed during the first 12 months. Class R and Institutional Class shares are not subject to a sales charge and are offered for sale exclusively to certain eligible investors.
The investment objective of the Fund is to seek high current income and, secondarily, long-term total return.
1. Significant Accounting Policies
The following accounting policies are in accordance with US generally accepted accounting principles (US GAAP) and are consistently followed by the Fund.
Security Valuation — Equity securities, except those traded on the Nasdaq Stock Market LLC (Nasdaq), are valued at the last quoted sales price as of the time of the regular close of the New York Stock Exchange on the valuation date. Equity securities traded on the Nasdaq are valued in accordance with the Nasdaq Official Closing Price, which may not be the last sales price. If, on a particular day, an equity security does not trade, the mean between the bid and ask prices will be used, which approximates fair value. US government and agency securities are valued at the mean between the bid and ask prices, which approximates fair value. Equity securities listed on a foreign exchange are normally valued at the last quoted sales price on the valuation date. Other debt securities, credit default swap (CDS) contracts, and interest rate swap contracts are valued based upon valuations provided by an independent pricing service or broker/counterparty and reviewed by management. To the extent current market prices are not available, the pricing service may take into account developments related to the specific security, as well as transactions in comparable securities. Valuations for fixed income securities utilize matrix systems, which reflect such factors as security prices, yields, maturities, and ratings, and are supplemented by dealer and exchange quotations. For asset-backed securities, collateralized mortgage obligations, commercial mortgage securities, and US government agency mortgage securities, pricing vendors utilize matrix pricing which considers prepayment speed, attributes of the collateral, yield or price of bonds of comparable quality, coupon, maturity, and type as well as broker/dealer-supplied prices. Swap prices are derived using daily swap curves and models that incorporate a number of market data factors, such as discounted cash flows, trades, and values of the underlying reference instruments. Foreign currency exchange contracts and foreign cross currency exchange contracts are valued at the mean between the bid and ask prices, which approximates fair value. Interpolated values are derived when the settlement date of the contract is an interim date for which quotations are not available. Futures contracts and options on futures contracts are valued at the daily quoted settlement prices. Generally, other securities and assets for which market quotations are not readily available are
valued at fair value as determined in good faith under the direction of the Trust’s Board of Trustees (Board). In determining whether market quotations are readily available or fair valuation will be used, various factors will be taken into consideration, such as market closures or suspension of trading in a security.
Federal and Foreign Income Taxes – No provision for federal income taxes has been made as the Fund intends to continue to qualify for federal income tax purposes as a regulated investment company under Subchapter M of the Internal Revenue Code of 1986, as amended, and make the requisite distributions to shareholders. The Fund evaluates tax positions taken or expected to be taken in the course of preparing the Fund’s tax returns to determine whether the tax positions are “more-likely-than-not” of being sustained by the applicable tax authority. Tax positions not deemed to meet the “more-likely-than-not” threshold are recorded as a tax benefit or expense in the current year. Management has analyzed the Fund’s tax positions taken or to be taken on the Fund’s federal income tax returns through the year ended July 31, 2017 and for all open tax years (years ended July 31, 2014–July 31, 2016), and has concluded that no provision for federal income tax is required in the Fund’s financial statements. In regard to foreign taxes only, the Fund has open tax years in certain foreign countries in which it invests that may date back to the inception of the Fund. If applicable, the Fund recognizes interest accrued on unrecognized tax benefits in interest expense and penalties in other expenses on the “Statement of operations.” During the year ended July 31, 2017, the Fund did not incur any interest or tax penalties.
Class Accounting – Investment income and common expenses are allocated to the various classes of the Fund on the basis of “settled shares” of each class in relation to the net assets of the Fund. Realized and unrealized gain (loss) on investments are allocated to the various classes of the Fund on the basis of daily net assets of each class. Distribution expenses relating to a specific class are charged directly to that class.
Repurchase Agreements – The Fund may purchase certain US government securities subject to the counterparty’s agreement to repurchase them at an agreed upon date and price. The counterparty will be required on a daily basis to maintain the value of the collateral subject to the agreement at not less than the repurchase price (including accrued interest). The agreements are conditioned upon the collateral being deposited under the Federal Reserve book-entry system with the Fund’s custodian or a third party sub-custodian. In the event of default or bankruptcy by the other party to the agreement, retention of the collateral may be subject to legal proceedings. All open repurchase agreements as of the date of this report were entered into on July 31, 2017 and matured on the next business day.
To Be Announced Trades (TBA) – The Fund may contract to purchase or sell securities for a fixed price at a transaction date beyond the customary settlement period (examples: when issued, delayed delivery, forward commitment, or TBA transactions) consistent with the Fund’s ability to manage its investment portfolio and meet redemption requests. These transactions involve a commitment by the Fund to purchase or deliver securities for a predetermined price or yield with payment and delivery taking place more than three days in the future, or after a period longer than the customary settlement period for that type of security. No interest will be earned by the Fund on such purchases until the securities are delivered or transaction is completed; however, the market value may change prior to delivery.
| | |
| Notes to financial statements | | |
| Delaware Strategic Income Fund | | |
1. Significant Accounting Policies (continued)
Foreign Currency Transactions – Transactions denominated in foreign currencies are recorded at the prevailing exchange rates on the valuation date in accordance with the Fund’s prospectus. The value of all assets and liabilities denominated in foreign currencies is translated daily into US dollars at the exchange rate of such currencies against the US dollar. Transaction gains or losses resulting from changes in exchange rates during the reporting period or upon settlement of the foreign currency transaction are reported in operations for the current period. The Fund generally bifurcates that portion of realized gains and losses on investments in debt securities which is due to changes in foreign exchange rates from that which is due to changes in market prices of debt securities. That portion of gains (losses), which is due to changes in foreign exchange rates, is included on the “Statement of operations” under “Net realized gain (loss) on foreign currencies.” The Fund reports certain foreign currency related transactions as components of realized gains (losses) for financial reporting purposes, whereas such components are treated as ordinary income (loss) for federal income tax purposes.
Use of Estimates – The Fund is an investment company, whose financial statements are prepared in conformity with US GAAP. Therefore, the Fund follows the accounting and reporting guidelines for investment companies. The preparation of financial statements in conformity with US GAAP requires management to make estimates and assumptions that affect the fair value of investments, the reported amounts of assets and liabilities and disclosure of contingent assets and liabilities at the date of the financial statements, and the reported amounts of revenues and expenses during the reporting period. Actual results could differ from those estimates and the differences could be material.
Other – Expenses directly attributable to the Fund are charged directly to the Fund. Other expenses common to various funds within the Delaware FundsSM by Macquarie (Delaware Funds) are generally allocated among such funds on the basis of average net assets. Management fees and certain other expenses are paid monthly. Security transactions are recorded on the date the securities are purchased or sold (trade date) for financial reporting purposes. Costs used in calculating realized gains and losses on the sale of investment securities are those of the specific securities sold. Dividend income is recorded on the ex-dividend date and interest income is recorded on the accrual basis. Discounts and premiums on debt securities are accreted or amortized to interest income, respectively, over the lives of the respective securities using the effective interest method. Realized gains (losses) on paydowns of asset-and mortgage-backed securities are classified as interest income. Withholding taxes and reclaims on foreign dividends and interest have been recorded in accordance with the Fund’s understanding of the applicable country’s tax rules and rates. The Fund may pay foreign capital gains taxes on certain foreign securities held, which are reported as components of realized losses for financial reporting purposes, whereas such components are treated as ordinary loss for federal income tax purposes. The Fund declares dividends daily from net investment income and pays the dividends monthly and declares and pays distributions from net realized gain on investments, if any, annually. The Fund may distribute more frequently, if necessary for tax purposes. Dividends and distributions, if any, are recorded on the ex-dividend date.
The Fund may receive earnings credits from its custodian when positive cash balances are maintained, which may be used to offset custody fees. There were no such earnings credits for the year ended July 31, 2017.
The Fund receives earnings credits from its transfer agent when positive cash balances are maintained, which may be used to offset transfer agent fees. If the amount earned is greater than $1, the expense paid under this arrangement is included on the “Statement of operations” under “Dividend disbursing and transfer agent fees and expenses” with the corresponding expense offset shown under “Less expense paid indirectly.” For the year ended July 31, 2017, the Fund earned $222 under this agreement.
2. Investment Management, Administration Agreements, and Other Transactions with Affiliates
In accordance with the terms of its investment management agreement, the Fund pays Delaware Management Company (DMC), a series of Macquarie Investment Management Business Trust (formerly, Delaware Management Business Trust), and the investment manager, an annual fee which is calculated daily and paid monthly at the rate of 0.55% on the first $500 million of average daily net assets of the Fund, 0.50% on the next $500 million, 0.45% on the next $1.5 billion, and 0.425% on average daily net assets in excess of $2.5 billion.
DMC has contractually agreed to waive all or a portion of its investment advisory fees and/or pay/reimburse the Fund to the extent necessary to prevent total annual operating expenses (excluding any distribution and service (12b-1) fees, acquired fund fees and expenses, taxes, interest, short sale and dividend interest expenses, brokerage fees, certain insurance costs, and nonroutine expenses or costs, including, but not limited to, those relating to reorganizations, litigation, conducting shareholder meetings, and liquidations (collectively, nonroutine expenses)), from exceeding 0.65% of the Fund’s average daily net assets from Aug. 1, 2016 through July 31, 2017.* These waivers and reimbursements may only be terminated by agreement of DMC and the Fund.
Delaware Investments Fund Services Company (DIFSC), an affiliate of DMC, provides fund accounting and financial administration oversight services to the Fund. For these services, DIFSC’s fees are calculated daily and paid monthly based on the aggregate daily net assets of the Delaware Funds at the following annual rate: 0.0050% of the first $30 billion; 0.0045% of the next $10 billion; 0.0040% of the next $10 billion; and 0.0025% of aggregate average daily net assets in excess of $50 billion. The fees payable to DIFSC under the service agreement described above are allocated among all funds in the Delaware Funds on a relative net asset value (NAV) basis. For the year ended July 31, 2017, the Fund was charged $5,432 for these services. This amount is included on the “Statement of operations” under “Accounting and administration expenses.”
DIFSC is also the transfer agent and dividend disbursing agent of the Fund. For these services, DIFSC’s fees are calculated daily and paid monthly based on the aggregate daily net assets of the retail funds within the Delaware Funds at the following annual rate: 0.025% of the first $20 billion; 0.020% of the next $5 billion; 0.015% of the next $5 billion; and 0.013% on average daily net assets in excess of $30 billion. The fees payable to DIFSC under the service agreement described above are allocated among all retail funds in the Delaware Funds on a relative NAV basis. This amount is included on the “Statement of operations” under “Dividend disbursing and transfer agent fees and expenses.” For the year ended July 31, 2017, the Fund was charged $23,337 for these services. Pursuant to a sub-transfer agency agreement between DIFSC and BNY Mellon Investment Servicing (US) Inc. (BNYMIS), BNYMIS provides certain sub-transfer agency services to the Fund. Sub-transfer agency fees are paid
| | |
| Notes to financial statements | | |
| Delaware Strategic Income Fund | | |
2. Investment Management, Administration Agreements, and Other Transactions with Affiliates (continued)
by the Fund and are also included on the “Statement of operations” under “Dividend disbursing and transfer agent fees and expenses.”
Pursuant to a distribution agreement and distribution plan, the Fund pays DDLP, the distributor and an affiliate of DMC, an annual 12b-1 fees of 0.25% of the average daily net assets of the Class A shares, 1.00% of the average daily net assets of the Class C shares, and 0.50% of the average daily net assets of the Class R shares. The Board has adopted a formula for calculating 12b-1 fees for the Fund’s Class A shares that went into effect on June 1, 1992. The Fund’s Class A shares are currently subject to a blended 12b-1 fees equal to the sum of: (i) 0.10% of the average daily net assets representing shares acquired prior to June 1, 1992, and (ii) 0.25% of the average daily net assets representing shares acquired on or after June 1, 1992. All Class A shareholders currently bear 12b-1 fees at the same rate, the blended rate based on the formula described above. This method of calculating Class A 12b-1 fees may be discontinued at the sole discretion of the Board. Institutional Class shares pay no 12b-1 fees.
As provided in the investment management agreement, the Fund bears a portion of the cost of certain resources shared with DMC, including the cost of internal personnel of DMC and/or its affiliates that provide legal, tax, and regulatory reporting services to the Fund. For the year ended July 31, 2017, the Fund was charged $2,404 for internal legal, tax, and regulatory reporting services provided by DMC and/or its affiliates’ employees. This amount is included on the “Statement of operations” under “Legal fees.”
For the year ended July 31, 2017, DDLP earned $2,331 for commissions on sales of the Fund’s Class A shares. For the year ended July 31, 2017, DDLP received gross CDSC commissions of $49 and $318 on redemptions of the Fund’s Class A and Class C shares, respectively, and these commissions were entirely used to offset upfront commissions previously paid by DDLP to broker/dealers on sales of those shares.
Trustees’ fees include expenses accrued by the Fund for each Trustee’s retainer and meeting fees. Certain officers of DMC, DIFSC, and DDLP are officers and/or Trustees of the Trust. These officers and Trustees are paid no compensation by the Fund.
Cross trades for the year ended July 31, 2017 were executed by the Fund pursuant to procedures adopted by the Board designed to ensure compliance with Rule 17a-7 under the 1940 Act. Cross trading is the buying or selling of portfolio securities between funds of investment companies, or between a fund of an investment company and another entity, that are or could be considered affiliates by virtue of having a common investment advisor (or affiliated investment advisors), common directors/trustees and/or common officers. At its regularly scheduled meetings, the Board reviews such transactions for compliance with the procedures adopted by the Board. Pursuant to these procedures, for the year ended July 31, 2017, the Fund engaged in securities purchases of $2,384,912 and securities sales of $5,188,491, which resulted in net realized losses of $(2).
*The aggregate contractual waiver period covering this report is from Nov. 27, 2015, through Jan. 31, 2018.
3. Investments
For the year ended July 31, 2017, the Fund made purchases and sales of investment securities other than short-term investments as follows:
| | | | |
Purchases other than US government securities | | $ | 211,580,540 | |
Purchases of US government securities | | | 29,924,401 | |
Sales other than US government securities | | | 242,237,348 | |
Sales of US government securities | | | 32,417,293 | |
At July 31, 2017, the cost and unrealized appreciation (depreciation) of investments for federal income tax purposes for the fund were as follows:
| | | | |
Cost of investments | | $ | 94,423,812 | |
| | | | |
Aggregate unrealized appreciation of investments | | $ | 2,354,474 | |
Aggregate unrealized depreciation of investments | | | (1,100,271 | ) |
| | | | |
Net unrealized appreciation of investments | | $ | 1,254,203 | |
| | | | |
US GAAP defines fair value as the price that the Fund would receive to sell an asset or pay to transfer a liability in an orderly transaction between market participants at the measurement date under current market conditions. A three-level hierarchy for fair value measurements has been established based upon the transparency of inputs to the valuation of an asset or liability.
Inputs may be observable or unobservable and refer broadly to the assumptions that market participants would use in pricing the asset or liability. Observable inputs reflect the assumptions market participants would use in pricing the asset or liability based on market data obtained from sources independent of the reporting entity. Unobservable inputs reflect the reporting entity’s own assumptions about the assumptions that market participants would use in pricing the asset or liability based on the best information available under the circumstances. The Fund’s investment in its entirety is assigned a level based upon the observability of the inputs which are significant to the overall valuation. The three-level hierarchy of inputs is summarized below.
| | |
| Level 1 – | | Inputs are quoted prices in active markets for identical investments. (Examples: equity securities, open-end investment companies, futures contracts, exchange-traded options contracts) |
| |
| Level 2 – | | Other observable inputs, including, but not limited to: quoted prices for similar assets or liabilities in markets that are active, quoted prices for identical or similar assets or liabilities in markets that are not active, inputs other than quoted prices that are observable for the assets or liabilities (such as interest rates, yield curves, volatilities, prepayment speeds, loss severities, credit risks, and default rates), or other market-corroborated inputs. (Examples: debt securities, government securities, swap contracts, foreign currency exchange contracts, foreign securities utilizing international fair value pricing, broker-quoted securities, fair valued securities) |
| |
| Level 3 – | | Significant unobservable inputs, including the Fund’s own assumptions used to determine the fair value of investments. (Examples: broker-quoted securities, fair valued securities) |
Level 3 investments are valued using significant unobservable inputs. The Fund may also use an income-based valuation approach in which the anticipated future cash flows of the investment are
| | |
| Notes to financial statements | | |
| Delaware Strategic Income Fund | | |
3. Investments (continued)
discounted to calculate fair value. Discounts may also be applied due to the nature or duration of any restrictions on the disposition of the investments. Valuations may also be based upon current market prices of securities that are comparable in coupon, rating, maturity, and industry. The derived value of a Level 3 investment may not represent the value which is received upon disposition and this could impact the results of operations.
The following table summarizes the valuation of the Fund’s investments by fair value hierarchy levels as of July 31, 2017:
| | | | | | | | | | | | | | | | |
Securities | | Level 1 | | | Level 2 | | | Level 3 | | | Total | |
| | | | |
Assets: | | | | | | | | | | | | |
Agency, Asset-& Mortgage-Backed Securities1 | | $ | — | | | $ | 24,062,794 | | | $ | 44,870 | | | $ | 24,107,664 | |
Corporate Debt | | | — | | | | 59,325,254 | | | | — | | | | 59,325,254 | |
Municipal Bonds | | | — | | | | 2,102,006 | | | | — | | | | 2,102,006 | |
Foreign Bonds | | | — | | | | 5,839,728 | | | | — | | | | 5,839,728 | |
Loan Agreements | | | — | | | | 1,644,782 | | | | — | | | | 1,644,782 | |
US Treasury Obligation | | | — | | | | 45,343 | | | | — | | | | 45,343 | |
Convertible Preferred Stock | | | 27,671 | | | | — | | | | — | | | | 27,671 | |
Preferred Stock1 | | | 309,957 | | | | 1,620,149 | | | | — | | | | 1,930,106 | |
Short-Term Investments | | | — | | | | 651,000 | | | | — | | | | 651,000 | |
Options Purchased | | | — | | | | 4,461 | | | | — | | | | 4,461 | |
| | | | | | | | | | | | | | | | |
Total Value of Securities | | $ | 337,628 | | | $ | 95,295,517 | | | $ | 44,870 | | | $ | 95,678,015 | |
| | | | | | | | | | | | | | | | |
| | | | |
Derivatives: | | | | | | | | | | | | |
Foreign Currency Exchange Contracts | | $ | — | | | $ | 6,372 | | | $ | — | | | $ | 6,372 | |
Futures Contracts | | | 47,799 | | | | — | | | | — | | | | 47,799 | |
Swap Contracts | | | — | | | | (485 | ) | | | — | | | | (485 | ) |
1Security type is valued across multiple levels. Level 1 investments represent exchange-traded investments, Level 2 investments represent investments with observable inputs or matrix-priced investments, and Level 3 investments represent investments without observable inputs. The amounts attributed to Level 1 investments, Level 2 investments, and Level 3 investments represent the following percentages of the total market value of these security types:
| | | | | | | | | | | | | | | | |
| | | Level 1 | | | Level 2 | | | Level 3 | | | Total | |
Agency, Asset-& Mortgage-Backed Securities | | | — | | | | 99.81 | % | | | 0.19 | % | | | 100.00 | % |
Preferred Stock | | | 16.06 | % | | | 83.94 | % | | | — | | | | 100.00 | % |
During the year ended July 31, 2017, there were no transfers between Level 1 investments, Level 2 investments, or Level 3 investments that had a significant impact to the Fund. The Fund’s policy is to recognize transfers between levels based on fair value at the beginning of the reporting period.
A reconciliation of Level 3 investments is presented when the Fund has a significant amount of Level 3 investments at the beginning, interim, or end of period in relation to the Fund’s net assets. Management has determined not to provide a reconciliation of Level 3 investments as they are not considered significant to the Fund’s net assets at the beginning, interim, or end of the period. Management has determined not to provide additional disclosure on Level 3 inputs since the Level 3 investments are not considered significant to the Fund’s net assets at the end of the year.
4. Dividend and Distribution Information
Income and long-term capital gain distributions are determined in accordance with federal income tax regulations, which may differ from US GAAP. Additionally, distributions from net gains on foreign currency transactions and net short-term gains on sales of investment securities are treated as ordinary income for federal income tax purposes. The tax character of dividends and distributions paid during the years ended July 31, 2017 and 2016 was as follows:
| | | | | | | | | | | | |
| | | Year ended | |
| | | 7/31/17 | | | | | | 7/31/16 | |
Ordinary income | | $ | 4,134,060 | | | | | | | $ | 3,045,471 | |
Return of capital | | | — | | | | | | | | 128,058 | |
| | | | | | | | | | | | |
Total | | $ | 4,134,060 | | | | | | | $ | 3,173,529 | |
| | | | | | | | | | | | |
5. Components of Net Assets on a Tax Basis
As of July 31, 2017, the components of net assets on a tax basis were as follows:
| | | | |
Shares of beneficial interest | | $ | 97,873,980 | |
Undistributed ordinary income | | | 39,503 | |
Distributions payable | | | (109,545 | ) |
Troubled debt litigation | | | (228,366 | ) |
Capital loss carryforwards | | | (3,067,920 | ) |
Unrealized appreciation of investments, foreign currencies and derivatives | | | 1,253,175 | |
| | | | |
Net assets | | $ | 95,760,827 | |
| | | | |
The differences between book basis and tax basis components of net assets are primarily attributable to tax deferral of losses on wash sales, tax deferral of straddle losses, mark-to-market of futures contracts, mark-to-market on foreign currency exchange contracts, tax treatment of market discount and premium on debt instruments, deemed dividend on convertible debt, contingent payment debt instruments, and CDS contracts.
For financial reporting purposes, capital accounts are adjusted to reflect the tax character of permanent book/tax differences. Reclassifications are primarily due to tax treatment of gain (loss) on foreign currency transactions, market discount and premium on debt instruments, paydowns of asset- and mortgage-backed securities, deemed dividend on convertible debt, contingent payment debt instruments, and CDS contracts. Results of operations and net assets were not affected by these reclassifications. For the year ended July 31, 2017, the Fund recorded the following reclassifications:
| | | | |
Distributions in excess of net investment income | | $ | 792,412 | |
Accumulated net realized loss | | | (792,412 | ) |
| | |
| Notes to financial statements | | |
| Delaware Strategic Income Fund | | |
5. Components of Net Assets on a Tax Basis (continued)
Under the Regulated Investment Company Modernization Act of 2010 (Act), net capital losses recognized for tax years beginning after Dec. 22, 2010 may be carried forward indefinitely, and their character is retained as short-term and/or long-term losses. At July 31, 2017, capital loss carryforwards available to offset future realized capital gains as follows:
| | | | | | | | |
| | | No Expiration
Loss carryforward character | |
| | | Short-term | | | Long-term | |
| | $ | 1,770,197 | | | $ | 1,297,723 | |
6. Capital Shares
Transactions in capital shares were as follows:
| | | | | | | | |
| | | Year ended | |
| | | 7/31/17 | | | 7/31/16 | |
Shares sold: | | | | | | | | |
Class A | | | 763,586 | | | | 3,171,785 | |
Class C | | | 153,560 | | | | 466,751 | |
Class R | | | 82,402 | | | | 156,819 | |
Institutional Class | | | 2,624,716 | | | | 2,416,690 | |
| | |
| Shares issued upon reinvestment of dividends and distributions: | | | | | | | | |
Class A | | | 225,335 | | | | 181,533 | |
Class C | | | 22,672 | | | | 16,964 | |
Class R | | | 24,712 | | | | 17,085 | |
Institutional Class | | | 189,351 | | | | 143,761 | |
| | | | | | | | |
| | | 4,086,334 | | | | 6,571,388 | |
| | | | | | | | |
| | |
Shares redeemed: | | | | | | | | |
Class A | | | (3,009,513 | ) | | | (2,841,943 | ) |
Class C | | | (688,622 | ) | | | (370,047 | ) |
Class R | | | (218,457 | ) | | | (195,284 | ) |
Institutional Class | | | (4,866,090 | ) | | | (1,959,593 | ) |
| | | | | | | | |
| | | (8,782,682 | ) | | | (5,366,867 | ) |
| | | | | | | | |
Net increase (decrease) | | | (4,696,348 | ) | | | 1,204,521 | |
| | | | | | | | |
Certain shareholders may exchange shares of one class for shares of another class in the same fund. For the year ended July 31, 2017 and 2016, 71,413 Class A shares were exchanged to 71,479 Institutional Class shares valued at $591,575 and 444,706 Class A shares were exchanged to 444,814 Institutional Class shares valued at $3,772,744, respectively. The exchange transactions are included as subscriptions and redemptions in the table above and the “Statements of changes in net assets.”
7. Line of Credit
The Fund, along with certain other funds in the Delaware Funds (Participants), was a participant in a $155,000,000 revolving line of credit intended to be used for temporary or emergency purposes as an additional source of liquidity to fund redemptions of investor shares. Under the agreement, the Participants were charged an annual commitment fee of 0.10%, which was allocated across the Participants on the basis of relative net assets of each Participant’s allocation of the entire facility. The Participants were permitted to borrow up to a maximum of one-third of their net assets under the agreement. Each Participant was individually, and not jointly, liable for its particular advances, if any, under the line of credit. The line of credit available under the agreement expired on Nov. 7, 2016.
On Nov. 7, 2016, the Fund, along with the other Participants, entered into an amendment to the agreement for a $155,000,000 revolving line of credit. The line of credit is to be used as described above and operates in substantially the same manner as the original agreement, with the exception of the annual commitment fee. Under the amendment to the agreement, the Participants are charged an annual commitment fee of 0.15%, which is allocated across the Participants on the basis of relative net assets of each Participant’s allocation of the entire facility. The line of credit available under the agreement expires on Nov. 6, 2017.
The Fund had no amounts outstanding as of July 31, 2017, or at any time during the year then ended.
8. Derivatives
US GAAP requires disclosures that enable investors to understand: 1) how and why an entity uses derivatives; 2) how they are accounted for; and 3) how they affect an entity’s results of operations and financial position.
Foreign Currency Exchange Contracts – The Fund may enter into foreign currency exchange contracts and foreign cross currency exchange contracts as a way of managing foreign exchange rate risk. The Fund may enter into these contracts to fix the US dollar value of securities that it has agreed to buy or sell for the period between the date the trade was entered into and the date the security is delivered and paid for. The Fund may also use these contracts to hedge the US dollar value of securities it already owns that are denominated in foreign currencies. In addition, the Fund may enter into these contracts to facilitate or expedite the settlement of portfolio transactions. The change in value is recorded as an unrealized gain or loss. When the contract is closed, a realized gain or loss is recorded equal to the difference between the value of the contract at the time it was opened and the value at the time it was closed.
The use of foreign currency exchange contracts and foreign cross currency exchange contracts does not eliminate fluctuations in the underlying prices of the securities, but does establish a rate of exchange that can be achieved in the future. Although foreign currency exchange contracts and foreign cross currency exchange contracts limit the risk of loss due to an unfavorable change in the value of the hedged currency, they also limit any potential gain that might result should the value of the currency change favorably. In addition, the Fund could be exposed to risks if the counterparties to the contracts are unable to meet the terms of their contracts. The Fund’s maximum risk of loss from counterparty credit risk is the value of its currency exchanged with the counterparty. The risk is generally mitigated by having
| | |
| Notes to financial statements | | |
| Delaware Strategic Income Fund | | |
8. Derivatives (continued)
a netting arrangement between the Fund and the counterparty and by the posting of collateral by the counterparty to the Fund to cover the Fund’s exposure to the counterparty.
During the year ended July 31, 2017, the Fund used foreign currency exchange contracts to hedge the US dollar value of securities it already owned that were denominated in foreign currencies.
Futures Contracts – A futures contract is an agreement in which the writer (or seller) of the contract agrees to deliver to the buyer an amount of cash or securities equal to a specific dollar amount times the difference between the value of a specific security or index at the close of the last trading day of the contract and the price at which the agreement is made. The Fund may use futures contracts in the normal course of pursuing its investment objective. The Fund may invest in futures contracts to hedge its existing portfolio securities against fluctuations in value caused by changes in interest rates or market conditions. Upon entering into a futures contract, the Fund deposits cash or pledges US government securities to a broker, equal to the minimum “initial margin” requirements of the exchange on which the contract is traded. Subsequent payments are received from the broker or paid to the broker each day, based on the daily fluctuation in the market value of the contract. These receipts or payments are known as “variation margin” and are recorded daily by the Fund as unrealized gains or losses until the contracts are closed. When the contracts are closed, the Fund records a realized gain or loss equal to the difference between the value of the contract at the time it was opened and the value at the time it was closed. Risks of entering into futures contracts include potential imperfect correlation between the futures contracts and the underlying securities and the possibility of an illiquid secondary market for these instruments. When investing in futures, there is reduced counterparty credit risk to the Fund because futures are exchange-traded and the exchange’s clearinghouse, as counterparty to all exchange-traded futures, guarantees against default. At July 31, 2017, the Fund posted $75,000 in cash as collateral for open futures contracts, which is presented as “Cash collateral due from brokers on futures contracts” on the “Statement of assets and liabilities.”
During the year ended July 31, 2017, the Fund used futures contracts to hedge the Fund’s existing portfolio securities against fluctuations in value caused by changes in interest rates or market conditions and to facilitate investments in portfolio securities.
Options Contracts – The Fund may enter into options contracts in the normal course of pursuing its investment objective. The Fund may buy or write options contracts for any number of reasons, including without limitation: to manage the Fund’s exposure to changes in securities prices caused by interest rates or market conditions and foreign currencies; as an efficient means of adjusting the Fund’s overall exposure to certain markets; to protect the value of portfolio securities; and as a cash management tool. The Fund may buy or write call or put options on securities, futures, swaps, swaptions, financial indices, and foreign currencies. When the Fund buys an option, a premium is paid and an asset is recorded and adjusted on a daily basis to reflect the current market value of the option purchased. When the Fund writes an option, a premium is received and a liability is recorded and adjusted on a daily basis to reflect the current market value of the option written. Premiums received from writing options that expire unexercised are treated by the Fund on the expiration date as realized gains. The difference between the premium received and the amount paid on effecting a closing purchase transaction, including brokerage commissions, is treated as realized gain or loss. If a call option is exercised, the premium is added to the
proceeds from the sale of the underlying security in determining whether the Fund has a realized gain or loss. If a put option is exercised, the premium reduces the cost basis of the securities purchased by the Fund. The Fund, as writer of an option, bears the market risk of an unfavorable change in the price of the security underlying the written option. When writing options, the Fund is subject to minimal counterparty risk because the counterparty is only obligated to pay premiums and does not bear the market risk of an unfavorable market change. There were no transactions in options written during the year ended July 31, 2017.
During the year ended July 31, 2017, the Fund used options purchased contracts to manage the Fund’s exposure to changes in securities prices caused by interest rates or market conditions and to adjust the Fund’s overall exposure to certain markets.
Swap Contracts – The Fund may enter into interest rate swap contracts and CDS contracts in the normal course of pursuing its investment objective. The Fund may enter interest rate swap contracts to manage the Fund’s sensitivity to interest rates or hedge against changes in interest rates. The Fund may enter into CDS contracts in order to hedge against a credit event, to enhance total return or to gain exposure to certain securities or markets. The Fund will not be permitted to enter into any swap transactions unless, at the time of entering into such transactions, the unsecured long-term debt of the actual counterparty, combined with any credit enhancements, is rated at least BBB- by Standard & Poor’s Financial Services LLC (S&P) or Baa3 by Moody’s Investors Service, Inc. (Moody’s) or is determined to be of equivalent quality by DMC.
Interest Rate Swaps. An interest rate swap contract is an exchange of interest rates between counterparties. In one instance, an interest rate swap involves payments received by the Fund from another party based on a variable or floating interest rate, in return for making payments based on a fixed interest rate. An interest rate swap can also work in reverse with the Fund receiving payments based on a fixed interest rate and making payments based on a variable or floating interest rate. Interest rate swaps may be used to adjust the Fund’s sensitivity to interest rates or to hedge against changes in interest rates. Periodic payments on such contracts are accrued daily and recorded as unrealized appreciation (depreciation) on swap contracts. Upon periodic payments (receipt) or termination of the contract, such amounts are recorded as realized gains or losses on swap contracts. The Fund’s maximum risk of loss from counterparty credit risk is the discounted net value of the cash flows to be received from/paid to the counterparty over the interest rate swap contract’s remaining life, to the extent that the amount is positive. This risk is mitigated by (1) for bilateral swap contracts, having a netting arrangement between the Fund and the counterparty and by the posting of collateral by the counterparty to the Fund to cover the Fund’s exposure to the counterparty, and (2) for cleared swaps, trading these instruments through a central counterparty. No interest rate swap contracts were outstanding at July 31, 2017.
During the year ended July 31, 2017, the Fund used interest rate swap contracts to manage the Fund’s sensitivity to interest rates or to hedge against changes in interest rates.
Credit Default Swaps. A CDS contract is a risk-transfer instrument through which one party (purchaser of protection) transfers to another party (seller of protection) the financial risk of a credit event (as defined in the CDS agreement), as it relates to a particular reference security or basket of securities (such as an index). In exchange for the protection offered by the seller of protection, the purchaser of protection
| | |
| Notes to financial statements | | |
| Delaware Strategic Income Fund | | |
8. Derivatives (continued)
agrees to pay the seller of protection a periodic amount at a stated rate that is applied to the notional amount of the CDS contract. In addition, an upfront payment may be made or received by the Fund in connection with an unwinding or assignment of a CDS contract. Upon the occurrence of a credit event, the seller of protection would pay the par (or other agreed-upon) value of the reference security (or basket of securities) to the counterparty. Credit events generally include, among others, bankruptcy, failure to pay, and obligation default.
During the year ended July 31, 2017, the Fund entered into CDS contracts as a purchaser and seller of protection, as a hedge against credit events. Periodic payments (receipts) on such contracts are accrued daily and recorded as unrealized losses (gains) on swap contracts. Upon payment (receipt), such amounts are recorded as realized losses (gains) on swap contracts. Upfront payments made or received in connection with CDS contracts are amortized over the expected life of the CDS contracts as unrealized losses (gains) on swap contracts. The change in value of CDS contracts is recorded daily as unrealized appreciation or depreciation. A realized gain or loss is recorded upon a credit event (as defined in the CDS agreement) or the maturity or termination of the agreement. Initial margin and variation margin are posted to central counterparties for centrally cleared CDS basket trades, as determined by the applicable central counterparty.
As disclosed in the footnotes to the “Schedules of investments” at July 31, 2017, the notional amount of the protection sold was $400,000, which reflects the maximum potential amount the Fund would have been required to make as a seller of credit protection if a credit event had occurred. In addition to serving as the source of the current value of the securities, the quoted market prices and resulting market values for credit default swap agreements on securities and credit indices serve as an indicator of the current status of the payment/performance risk and represent the likelihood of an expected liability (or profit) for the credit derivative if the swap agreement has been closed/sold as of the period end. Increasing market values, in absolute terms when compared to the notional amount of the swap, represent a deterioration of the reference entity’s credit soundness and a greater likelihood of risk of default or other credit event occurring as defined under the terms of the agreement. At July 31, 2017, net unrealized depreciation of the protection sold was $(485).
CDS contracts may involve greater risks than if the Fund had invested in the reference obligation directly. CDS contracts are subject to general market risk, liquidity risk, counterparty risk, and credit risk. The Fund’s maximum risk of loss from counterparty credit risk, either as the seller of protection or the buyer of protection, is the fair value of the contract. This risk is mitigated by (1) for bilateral swap contracts, having a netting arrangement between the Fund and the counterparty and by the posting of collateral by the counterparty to the Fund to cover the Fund’s exposure to the counterparty, and (2) for cleared swaps, trading these instruments through a central counterparty.
During the year ended July 31, 2017, the Fund used CDS contracts to hedge against credit events.
Swaps Generally. The value of open swaps may differ from that which would be realized in the event the Fund terminated its position in the contract on a given day. Risks of entering into these contracts include the potential inability of the counterparty to meet the terms of the contracts. This type of risk is generally limited to the amount of favorable movement in the value of the underlying security, instrument, or
basket of instruments, if any, at the day of default. Risks also arise from potential losses from adverse market movements and such losses could exceed the unrealized amounts shown on the “Schedule of investments.”
Fair values of derivative instruments as of July 31, 2017 was as follows:
| | | | | | | | |
| | | | | | Asset Derivatives Fair Value |
Statement of Assets and Liabilities Location | | Currency
Contracts | | | Interest Rate
Contracts | | Total |
Unrealized appreciation on foreign currency exchange contracts | | $ | 9,512 | | | $ — | | $ 9,512 |
Variation margin due to broker on futures contracts* | | | — | | | 56,390 | | 56,390 |
Options purchased, at value | | | 4,461 | | | — | | 4,461 |
| | | | | | | | |
Total | | $ | 13,973 | | | $56,390 | | $70,363 |
| | | | | | | | |
| | | | | | | | | | |
| | | Liability Derivatives Fair Value | | | |
Statement of Assets and Liabilities Location | | Currency
Contracts | | Interest Rate
Contracts | | Credit
Contracts | | Total | |
Unrealized depreciation on foreign currency exchange contracts | | $3,140 | | $ — | | $ — | | $ | 3,140 | |
Variation margin due to broker on futures contracts* | | — | | 8,591 | | — | | | 8,591 | |
Unrealized depreciation on credit default swap contracts | | — | | — | | 485 | | | 485 | |
| | | | | | | | | | |
Total | | $3,140 | | $8,591 | | $485 | | $ | 12,216 | |
| | | | | | | | | | |
*Includes cumulative appreciation/depreciation of futures contracts from the date the contracts were opened through July 31, 2017. Only current day variation margin is reported on the Fund’s “Statement of assets and liabilities.”
The effect of derivative instruments on the “Statement of operations” for the year ended July 31, 2017 was as follows:
| | | | | | | | | | | | | | | | | | | | |
| | | Net Realized Gain (Loss) on: | |
| | | Foreign
Currency
Exchange
Contracts | | | Futures
Contracts | | | Options
Purchased | | | Swap Contracts | | | Total | |
Currency contracts | | $ | (2,144 | ) | | $ | — | | | $ | — | | | $ | — | | | $ | (2,144 | ) |
Interest rate contracts | | | — | | | | (106,666 | ) | | | 22,753 | | | | 5,249 | | | | (78,664 | ) |
Equity contracts | | | — | | | | (55,014 | ) | | | — | | | | — | | | | (55,014 | ) |
Credit contracts | | | — | | | | — | | | | — | | | | (42,020 | ) | | | (42,020 | ) |
| | | | | | | | | | | | | | | | | | | | |
Total | | $ | (2,144 | ) | | $ | (161,680 | ) | | $ | 22,753 | | | $ | (36,771 | ) | | $ | (177,842 | ) |
| | | | | | | | | | | | | | | | | | | | |
| | |
| Notes to financial statements | | |
| Delaware Strategic Income Fund | | |
8. Derivatives (continued)
The effect of derivative instruments on the “Statement of operations” for the year ended July 31, 2017 was as follows:
| | | | | | | | | | | | | | | | | | | | |
| | | Net Change in Unrealized Appreciation (Depreciation) of: | |
| | | Foreign
Currency
Exchange
Contracts | | | Futures
Contracts | | | Options
Purchased | | | Swap
Contracts | | | Total | |
Currency contracts | | $ | 6,372 | | | $ | — | | | $ | — | | | $ | — | | | $ | 6,372 | |
Interest rate contracts | | | — | | | | 46,315 | | | | (3,442 | ) | | | — | | | | 42,873 | |
Equity contracts | | | — | | | | (253,663 | ) | | | — | | | | — | | | | (253,663 | ) |
Credit contracts | | | — | | | | — | | | | — | | | | 5,377 | | | | 5,377 | |
| | | | | | | | | | | | | | | | | | | | |
Total | | $ | 6,372 | | | $ | (207,348 | ) | | $ | (3,442 | ) | | $ | 5,377 | | | $ | (199,041 | ) |
| | | | | | | | | | | | | | | | | | | | |
Derivatives Generally. The table below summarizes the average balance of derivative holdings by the Fund during the year ended July 31, 2017:
| | | | | | | | | | | | | | | | |
| | | | | | Long
Derivative
Volume | | | | | | Short Derivative Volume | |
Foreign currency exchange contracts (average cost) | | | USD | | | | 460,874 | | | | USD | | | | 50,350 | |
Futures contracts (average notional value) | | | | | | | 4,666,269 | | | | | | | | 6,727,751 | |
Options contracts (average notional value) | | | | | | | 2,089 | | | | | | | | — | |
CDS contracts (average notional value)* | | | | | | | 279,623 | | | | | | | | 92,282 | |
Interest rate swap contracts (average notional value)** | | | | | | | — | | | | | | | | 287,778 | |
*Long represents buying protection and short represents selling protection.
**Long represents paying fixed interest payments and short represents receiving fixed interest payments.
9. Offsetting
The Fund entered into an International Swaps and Derivatives Association, Inc. Master Agreement (ISDA Master Agreement) or a similar agreement with certain of its derivative contract counterparties in order to better define its contractual rights and to secure rights that will help the Fund mitigate its counterparty risk. An ISDA Master Agreement is a bilateral agreement between the Fund and a counterparty that governs over-the-counter (OTC) derivatives and foreign exchange contracts and typically contains, among other things, collateral posting items and netting provisions in the event of a default and/or termination event. Under an ISDA Master Agreement, the Fund may, under certain circumstances, offset with the counterparty certain derivative financial instruments’ payables and/or receivables with collateral held and/or posted and create one single net payment. The provisions of the ISDA Master Agreement typically permit a single net payment in the event of default (close-out), including the bankruptcy or insolvency of the counterparty. However, bankruptcy or insolvency laws of a particular jurisdiction may impose restrictions on or prohibitions against the right of offset in bankruptcy, insolvency, or other events.
For financial reporting purposes, the Fund does not offset derivative assets and derivative liabilities that are subject to netting arrangements on the “Statement of assets and liabilities.”
At July 31, 2017, the Fund had the following assets and liabilities subject to offsetting provisions:
Offsetting of Financial Assets and Liabilities and Derivative Assets and Liabilities
| | | | | | |
Counterparty | | Gross Value of
Derivative Asset | | Gross Value of
Derivative Liability | | Net Position |
Bank of America Merrill Lynch | | $ 3,740 | | $(3,968) | | $(228) |
BNP Paribas | | 4,561 | | (1,568) | | 2,993 |
Hong Kong Shanghai Bank | | 484 | | — | | 484 |
Morgan Stanley Capital | | — | | (485) | | (485) |
Toronto Dominion Bank | | 1,253 | | (1,572) | | (319) |
Total | | $10,038 | | $(7,593) | | $2,445 |
| | | | | | | | | | | | | | | | |
Counterparty | | Net
Position | | | Fair Value of
Non-Cash
Collateral
Received | | Cash
Collateral
Received | | Fair Value of
Non-Cash
Collateral
Pledged | | Cash Collateral
Pledged | | Net
Exposure (a) | |
Bank of America Merrill Lynch | | $ | (228 | ) | | $— | | $— | | $— | | $— | | $ | (228 | ) |
BNP Paribas | | | 2,993 | | | — | | — | | — | | — | | | 2,993 | |
Hong Kong Shanghai Bank | | | 484 | | | — | | — | | — | | — | | | 484 | |
Morgan Stanley Capital | | | (485 | ) | | — | | — | | — | | — | | | (485 | ) |
Toronto Dominion Bank | | | (319 | ) | | — | | — | | — | | — | | | (319 | ) |
| | | | | | | | | | | | | | | | |
Total | | $ | 2,445 | | | $— | | $— | | $— | | $— | | $ | 2,445 | |
| | | | | | | | | | | | | | | | |
Master Repurchase Agreements
| | | | | | | | | | | | | | |
Counterparty | | Repurchase
Agreements | | | Fair Value of
Non-Cash
Collateral Received (b) | | Cash Collateral
Received | | Net Collateral
Received | | | Net
Exposure (a) |
Bank of America Merrill Lynch | | | $119,119 | | | $(119,119) | | $— | | | $(119,119) | | | $— |
Bank of Montreal | | | 297,798 | | | (297,798) | | — | | | (297,798) | | | — |
BNP Paribas | | | 234,083 | | | (234,083) | | — | | | (234,083) | | | — |
Total | | | $651,000 | | | $(651,000) | | $— | | | $(651,000) | | | $— |
(a)Net exposure represents the receivable (payable) that would be due from (to) the counterparty in the event of default.
(b)The value of the related collateral received exceeded the value of the repurchase agreements as of July 31, 2017.
10. Securities Lending
The Fund, along with other funds in the Delaware Funds, may lend its securities pursuant to a security lending agreement (Lending Agreement) with The Bank of New York Mellon (BNY Mellon). At the time a security is loaned, the borrower must post collateral equal to the required percentage of the market value of the loaned security, including any accrued interest. The required percentage is: (1) 102% with respect to US securities and foreign securities that are denominated and payable in US dollars; and (2) 105% with respect to foreign securities. With respect to each loan, if on any business day, the aggregate market value of securities collateral plus cash collateral held is less than the aggregate market value of
| | |
| Notes to financial statements | | |
| Delaware Strategic Income Fund | | |
10. Securities Lending (continued)
the securities which are the subject of such loan, the borrower will be notified to provide additional collateral by the end of the following business day, which, together with the collateral already held, will be not less than the applicable initial collateral requirements for such security loan. If the aggregate market value of securities collateral and cash collateral held with respect to a security loan exceeds the applicable initial collateral requirement, upon request of the borrower, BNY Mellon must return enough collateral to the borrower by the end of the following business day to reduce the value of the remaining collateral to the applicable initial collateral requirement for such security loan. As a result of the foregoing, the value of the collateral held with respect to a loaned security on any particular day may be more or less than the value of the security on loan.
Cash collateral received by the Fund of the Trust is generally invested in a series of individual separate accounts, each corresponding to a fund. The investment guidelines permit each separate account to hold certain securities that would be considered eligible securities for a money market fund. Cash collateral received is generally invested in government securities; certain obligations issued by government sponsored enterprises; repurchase agreements collateralized by US Treasury securities; obligations issued by the central government of any Organization for Economic Cooperation and Development (OECD) country or its agencies, instrumentalities, or establishments; obligations of supranational organizations; commercial paper, notes, bonds, and other debt obligations; certificates of deposit, time deposits, and other bank obligations; and asset-backed securities. A Fund can also accept US government securities and letters of credit (non-cash collateral) in connection with securities loans.
In the event of default or bankruptcy by the lending agent, realization and/or retention of the collateral may be subject to legal proceedings. In the event the borrower fails to return loaned securities and the collateral received is insufficient to cover the value of the loaned securities and provided such collateral shortfall is not the result of investment losses, the lending agent has agreed to pay the amount of the shortfall to the Fund or, at the discretion of the lending agent, replace the loaned securities. The Fund continues to record dividends or interest, as applicable, on the securities loaned and is subject to changes in value of the securities loaned that may occur during the term of the loan. The Fund has the right under the Lending Agreement to recover the securities from the borrower on demand. With respect to security loans collateralized by non-cash collateral, the Fund receives loan premiums paid by the borrower. With respect to security loans collateralized by cash collateral, the earnings from the collateral investments are shared among the Fund, the security lending agent, and the borrower. The Fund records security lending income net of allocations to the security lending agent, and the borrower.
The Fund may incur investment losses as a result of investing securities lending collateral. This could occur if an investment in the collateral investment account defaulted or became impaired. Under those circumstances, the value of a Fund’s cash collateral account may be less than the amount the Fund would be required to return to the borrowers of the securities and the Fund would be required to make up for this shortfall.
During the year ended July 31, 2017, the Fund had no securities out on loan.
11. Credit and Market Risk
Some countries in which the Fund may invest require governmental approval for the repatriation of investment income, capital, or the proceeds of sales of securities by foreign investors. In addition, if there is deterioration in a country’s balance of payments or for other reasons, a country may impose temporary restrictions on foreign capital remittances abroad.
The securities exchanges of certain foreign markets are substantially smaller, less liquid, and more volatile than the major securities markets in the US. Consequently, acquisition and disposition of securities by the Fund may be inhibited. In addition, a significant portion of the aggregate market value of equity securities listed on the major securities exchanges in emerging markets is held by a smaller number of investors. This may limit the number of shares available for acquisition or disposition by the Fund.
The Fund invests a portion of its assets in high yield fixed income securities, which are securities rated lower than BBB- by S&P and lower than Baa3 by Moody’s, or similarly rated by another nationally recognized statistical rating organization. Investments in these higher yielding securities are generally accompanied by a greater degree of credit risk than higher rated securities. Additionally, lower rated securities may be more susceptible to adverse economic and competitive industry conditions than investment grade securities.
The Fund invests in fixed income securities whose value is derived from an underlying pool of mortgages or consumer loans. The value of these securities is sensitive to changes in economic conditions, including delinquencies and/or defaults, and may be adversely affected by shifts in the market’s perception of the issuers and changes in interest rates. Investors receive principal and interest payments as the underlying mortgages and consumer loans are paid back. Some of these securities are collateralized mortgage obligations (CMOs). CMOs are debt securities issued by US government agencies or by financial institutions and other mortgage lenders, which are collateralized by a pool of mortgages held under an indenture. Prepayment of mortgages may shorten the stated maturity of the obligations and can result in a loss of premium, if any has been paid. Certain of these securities may be stripped (securities which provide only the principal or interest feature of the underlying security). The yield to maturity on an interest-only CMO is extremely sensitive not only to changes in prevailing interest rates, but also to the rate of principal payments (including prepayments) on the related underlying mortgage assets. A rapid rate of principal payments may have a material adverse effect on the Fund’s yield to maturity. If the underlying mortgage assets experience greater than anticipated prepayments of principal, the Fund may fail to fully recoup its initial investment in these securities even if the securities are rated in the highest rating categories.
The Fund invests in bank loans and other securities that may subject it to direct indebtedness risk, the risk that the Fund will not receive payment of principal, interest, and other amounts due in connection with these investments and will depend primarily on the financial condition of the borrower. Loans that are fully secured offer the Fund more protection than unsecured loans in the event of nonpayment of scheduled interest or principal, although there is no assurance that the liquidation of collateral from a secured loan would satisfy the corporate borrower’s obligation, or that the collateral can be liquidated. Some loans or claims may be in default at the time of purchase. Certain of the loans and the other direct indebtedness acquired by the Fund may involve revolving credit facilities or other standby financing
| | |
| Notes to financial statements | | |
| Delaware Strategic Income Fund | | |
11. Credit and Market Risk (continued)
commitments that obligate the Fund to pay additional cash on a certain date or on demand. These commitments may require the Fund to increase its investment in a company at a time when the Fund might not otherwise decide to do so (including at a time when the company’s financial condition makes it unlikely that such amounts will be repaid). To the extent that the Fund is committed to advance additional funds, it will at all times hold and maintain cash or other high grade debt obligations in an amount sufficient to meet such commitments. When a loan agreement is purchased, the Fund may pay an assignment fee. On an ongoing basis, the Fund may receive a commitment fee based on the undrawn portion of the underlying line of credit portion of a loan agreement. Prepayment penalty fees are received upon the prepayment of a loan agreement by the borrower. Prepayment penalty, facility, commitment, consent, and amendment fees are recorded to income as earned or paid.
As the Fund may be required to rely upon another lending institution to collect and pass on to the Fund amounts payable with respect to the loan and to enforce the Fund’s rights under the loan and other direct indebtedness, an insolvency, bankruptcy, or reorganization of the lending institution may delay or prevent the Fund from receiving such amounts. The highly leveraged nature of many loans may make them especially vulnerable to adverse changes in economic or market conditions. Investments in such loans and other direct indebtedness may involve additional risk to the Fund.
The Fund invests in certain obligations that may have liquidity protection designed to ensure that the receipt of payments due on the underlying security is timely. Such protection may be provided through guarantees, insurance policies, or letters of credit obtained by the issuer or sponsor through third parties, through various means of structuring the transaction or through a combination of such approaches. The Fund will not pay any additional fees for such credit support, although the existence of credit support may increase the price of the security.
The Fund may invest up to 15% of its net assets in illiquid securities, which may include securities with contractual restrictions on resale, securities exempt from registration under Rule 144A promulgated under the Securities Act of 1933, as amended, and other securities which may not be readily marketable. The relative illiquidity of these securities may impair the Fund from disposing of them in a timely manner and at a fair price when it is necessary or desirable to do so. While maintaining oversight, the Fund’s Board has delegated to DMC, the day-to-day functions of determining whether individual securities are liquid for purposes of the Fund’s limitation on investments in illiquid securities. Securities eligible for resale pursuant to Rule 144A, which are determined to be liquid, are not subject to the Fund’s 15% limit on investments in illiquid securities. Rule 144A securities have been identified on the “Schedule of investments.”
12. Contractual Obligations
The Fund enters into contracts in the normal course of business that contain a variety of indemnifications. The Fund’s maximum exposure under these arrangements is unknown. However, the Fund has not had prior claims or losses pursuant to these contracts. Management has reviewed the Fund’s existing contracts and expects the risk of loss to be remote.
13. General Motors Term Loan Litigation
The Fund received notice of a litigation proceeding related to a General Motors Corporation (G.M.) term loan participation previously held by the Fund in 2009. We believe the matter subject to the litigation notice will likely lead to a recovery from the Fund of certain amounts received by the Fund because a US Court of Appeals has ruled that the Fund and similarly situated investors were unsecured creditors rather than secured lenders of G.M. as a result of an erroneous Uniform Commercial Code filing made by a third party. The Fund received the full principal on the loans in 2009 after the G.M. bankruptcy. However, based upon the court ruling the estate is seeking to recover such amounts arguing that, as unsecured creditors, the Fund should not have received payment in full. Based upon currently available information related to the litigation and the Fund’s potential exposure, the Fund recorded a contingent liability of $326,237 and an asset of $97,871 based on the expected recoveries to unsecured creditors as of July 31, 2017 that resulted in a net decrease in the Fund’s NAV to reflect this likely recovery.
14. Recent Accounting Pronouncements
In Oct. 2016, the Securities and Exchange Commission released its Final Rule on Investment Company Reporting Modernization (the “Rule”). The Rule contains amendments to Regulation S-X which impact financial statement preparation, particularly the presentation of derivative investments. Although it is still evaluating the impact of the Rule, management believes that many of the Regulation S-X amendments are materially consistent with the Fund’s current financial statement presentation and expects that the Fund will comply with the Rule’s Regulation S-X amendments by the Aug. 1, 2017 compliance date.
15. Fund Repositioning
Effective Jan. 31, 2017, the investment strategies for Delaware Core Plus Bond Fund changed and the Fund was repositioned as a strategic income fund. In connection with the repositioning, the Fund’s name changed to Delaware Strategic Income Fund.
16. Subsequent Events
From Sept. 1, 2017, DIFSC’s fees are calculated daily and paid monthly based on the aggregate daily net assets of the Delaware Funds at the following annual rate: 0.00475% of the first $35 billion; 0.0040% of the next $10 billion; and 0.0025% of aggregate average daily net assets in excess of $45 billion (the “Total Fee”). Each Fund in the Delaware Funds pays a minimum of $4,000, which, in aggregate, is subtracted from the Total Fee. Each Fund in Delaware Funds then pays its relative portion of the remainder of the Total Fee on a relative NAV basis.
Management has determined that no other material events or transactions occurred subsequent to July 31, 2017 that would require recognition or disclosure in the Fund’s financial statements.
Report of independent
registered public accounting firm
To the Board of Trustees of Delaware Group® Government Fund and Shareholders of Delaware Strategic Income Fund:
In our opinion, the accompanying statement of assets and liabilities, including the schedule of investments, and the related statements of operations and of changes in net assets and the financial highlights present fairly, in all material respects, the financial position of the Delaware Strategic Income Fund (formerly, Delaware Core Plus Bond Fund) (one of the series constituting Delaware Group® Government Fund, hereafter referred to as the “Fund”) as of July 31, 2017, the results of its operations for the year then ended, the changes in its net assets for each of the two years in the period then ended and the financial highlights for each of the five years in the period then ended, in conformity with accounting principles generally accepted in the United States of America. These financial statements and financial highlights (hereafter referred to as “financial statements”) are the responsibility of the Fund’s management. Our responsibility is to express an opinion on these financial statements based on our audits. We conducted our audits of these financial statements in accordance with the standards of the Public Company Accounting Oversight Board (United States). Those standards require that we plan and perform the audit to obtain reasonable assurance about whether the financial statements are free of material misstatement. An audit includes examining, on a test basis, evidence supporting the amounts and disclosures in the financial statements, assessing the accounting principles used and significant estimates made by management, and evaluating the overall financial statement presentation. We believe that our audits, which included confirmation of securities as of July 31, 2017 by correspondence with the custodian and brokers, provide a reasonable basis for our opinion.
PricewaterhouseCoopers LLP
Philadelphia, Pennsylvania
September 18, 2017
Other Fund information (Unaudited)
Delaware Strategic Income Fund
Tax Information
The information set forth below is for the Fund’s fiscal year as required by federal income tax laws. Shareholders, however, must report distributions on a calendar year basis for income tax purposes, which may include distributions for portions of two fiscal years of the Fund. Accordingly, the information needed by shareholders for income tax purposes will be sent to them in January of each year. Please consult your tax advisor for proper treatment of this information.
All disclosures are based on financial information available as of the date of this annual report and, accordingly are subject to change. For any and all items requiring reporting, it is the intention of the Fund to report the maximum amount permitted under the Internal Revenue Code and the regulations thereunder.
For the fiscal year ended July 31, 2017, the Fund reports distributions paid during the year as follows:
| | | | |
(A) Ordinary Income Distributions (Tax Basis) | | | 100.00 | % |
(A) is based on a percentage of the Fund’s total distributions.
Board of trustees / directors and officers addendum
Delaware FundsSM by Macquarie
A mutual fund is governed by a Board of Trustees/Directors (“Trustees”), which has oversight responsibility for the management of a fund’s business affairs. Trustees establish procedures and oversee and review the performance of the investment manager, the distributor, and others who perform services for the fund. The independent fund trustees, in particular, are advocates
| | | | |
Name, Address, and Birth Date | | Position(s) Held with Fund(s) | | Length of Time Served |
Interested Trustee | | |
Shawn K. Lytle1, 2 | | President, | | Trustee since |
2005 Market Street | | Chief Executive Officer, | | September 2015 |
Philadelphia, PA 19103 | | and Trustee | | |
February 1970 | | | | President and |
| | | | Chief Executive Officer |
| | | | since August 2015 |
| | | | |
Independent Trustees | | |
Thomas L. Bennett | | Chairman and Trustee | | Trustee since |
2005 Market Street | | | | March 2005 |
Philadelphia, PA 19103 | | | | |
October 1947 | | | | Chairman since |
| | | | | March 2015 |
Ann D. Borowiec | | Trustee | | Since March 2015 |
2005 Market Street | | | | |
Philadelphia, PA 19103 | | | | |
November 1958 | | | | |
| | | | |
| | | | |
| | | | | |
Joseph W. Chow | | Trustee | | Since January 2013 |
2005 Market Street | | | | |
Philadelphia, PA 19103 | | | | |
January 1953 | | | | |
| | | | |
| | | | | |
| 1 | Shawn K. Lytle is considered to be an “Interested Trustee” because he is an executive officer of the Fund’s(s’) investment advisor. |
| 2 | Shawn K. Lytle, David F. Connor, Daniel V. Geatens, and Richard Salus serve in similar capacities for the six portfolios of the Optimum Fund Trust, which have the same investment advisor, principal underwriter, and transfer agent as the registrant. |
for shareholder interests. Each trustee has served in that capacity since he or she was elected to or appointed to the Board of Trustees, and will continue to serve until his or her retirement or the election of a new trustee in his or her place. The following is a list of the Trustees and Officers with certain background and related information.
| | | | |
Principal Occupation(s) During the Past Five Years | | Number of Portfolios in Fund Complex Overseen by Trustee or Officer | | Other Directorships Held by Trustee or Officer |
| | | | |
Shawn K. Lytle has served as | | 62 | | Trustee — UBS |
President of | | | | Relationship Funds, |
Macquarie Investment | | | | SMA Relationship |
Management3 | | | | Trust, and UBS Funds |
since June 2015 and was the | | | | (May 2010–April 2015) |
Regional Head of Americas for | | | | |
UBS Global Asset | | | | |
Management from 2010 through 2015. | | | | |
| | | | |
Private Investor | | 62 | | None |
(March 2004–Present) | | | | |
| | | | |
| | | | |
| | | | | |
Chief Executive Officer, | | 62 | | Director — |
Private Wealth Management | | | | Banco Santander International |
(2011–2013) and | | | | |
Market Manager, | | | | Director — |
New Jersey Private | | | | Santander Bank, N.A. |
Bank (2005–2011) — | | | | |
J.P. Morgan Chase & Co. | | | | |
Executive Vice President | | 62 | | Director and Audit Committee |
| (Emerging Economies | | | | Member — Hercules |
| Strategies, Risks, and | | | | Technology Growth |
Corporate Administration) | | | | Capital, Inc. |
State Street Corporation | | | | (2004–2014) |
(July 2004–March 2011) | | | | |
| 3 | Macquarie Investment Management (formerly known as Delaware Investments) is the marketing name for Macquarie Management Holdings, Inc. (formerly known as Delaware Management Holdings, Inc.) and its subsidiaries, including the Fund’s(s’) investment advisor, principal underwriter, and its transfer agent. |
Board of trustees / directors and officers addendum
Delaware FundsSM by Macquarie
| | | | |
Name, Address, and Birth Date | | Position(s) Held with Fund(s) | | Length of Time Served |
Independent Trustees (continued) | | |
John A. Fry | | Trustee | | Since January 2001 |
2005 Market Street | | | | |
Philadelphia, PA 19103 | | | | |
May 1960 | | | | |
| | | | |
| | | | |
| | | | |
| | | | | |
| | |
Lucinda S. Landreth | | Trustee | | Since March 2005 |
2005 Market Street | | | | |
Philadelphia, PA 19103 | | | | |
June 1947 | | | | |
Frances A. Sevilla-Sacasa | | Trustee | | Since September 2011 |
2005 Market Street | | | | |
Philadelphia, PA 19103 | | | | |
January 1956 | | | | |
| | | | |
| | | | |
| | | | |
| | | | |
| | | | |
| | | | |
| | | | |
| | | | |
| | | | |
| | | | |
| | | | |
| | | | |
| | | | | |
| | | | |
Principal Occupation(s) During the Past Five Years | | Number of Portfolios in Fund Complex Overseen by Trustee or Officer | | Other Directorships Held by Trustee or Officer |
| | | | |
President — | | 62 | | Director, Audit Committee, |
Drexel University | | | | and Governance Committee |
(August 2010–Present) | | | | Member — Community |
| | | | Health Systems |
President — | | | | |
Franklin & Marshall College | | | | Director — Drexel |
(July 2002–July 2010) | | | | Morgan & Co. |
| | | | |
| | | | Director, Audit Committee |
| | | | Member — vTv |
| | | | Therapeutics LLC |
| | | | |
| | | | Director — FS Credit Real |
| | | | | Estate Income Trust, Inc. |
Private Investor | | 62 | | None |
(2004–Present) | | | | |
| | | | |
| | | | |
| | | | | |
Chief Executive Officer — | | 62 | | Trust Manager and |
Banco Itaú | | | | Audit Committee |
International | | | | Member — Camden |
(April 2012–December 2016) | | | | Property Trust |
| | |
Executive Advisor to Dean | | | | |
(August 2011–March 2012) and Interim Dean | | | | |
(January 2011–July 2011) — | | | | |
University of Miami School of | | | | |
Business Administration | | | | |
| | |
President — U.S. Trust, | | | | |
Bank of America Private | | | | |
Wealth Management | | | | |
(Private Banking) | | | | |
(July 2007–December 2008) | | | | |
Board of trustees / directors and officers addendum
Delaware FundsSM by Macquarie
| | | | |
Name, Address, and Birth Date | | Position(s) Held with Fund(s) | | Length of Time Served |
Independent Trustees (continued) | | |
Thomas K. Whitford | | Trustee | | Since January 2013 |
2005 Market Street | | | | |
Philadelphia, PA 19103 | | | | |
March 1956 | | | | |
| | | | |
| | | | |
| | | | | |
Janet L. Yeomans | | Trustee | | Since April 1999 |
2005 Market Street | | | | |
Philadelphia, PA 19103 | | | | |
July 1948 | | | | |
| | | | |
| | | | |
| | | | |
| | | | |
| | | | |
Officers | | |
| David F. Connor | | Senior Vice President, | | Senior Vice President |
| 2005 Market Street | | General Counsel, | | since May 2013; |
| Philadelphia, PA 19103 | | and Secretary | | General Counsel |
| December 1963 | | | | since May 2015; |
| | | | Secretary since |
| | | | | October 2005 |
Daniel V. Geatens | | Vice President | | Treasurer since October 2007 |
| 2005 Market Street | | and Treasurer | | |
| Philadelphia, PA 19103 | | | | |
| October 1972 | | | | |
| | | | |
| | | | | |
Richard Salus | | Senior Vice President | | Chief Financial Officer |
| 2005 Market Street | | and Chief Financial Officer | | since November 2006 |
| Philadelphia, PA 19103 | | | | |
| October 1963 | | | | |
| | | | |
| | | | | |
The Statement of Additional Information for the Fund(s) includes additional information about the Trustees and Officers and is available, without charge, upon request by calling 800 523-1918.
| | | | |
Principal Occupation(s) During the Past Five Years | | Number of Portfolios in Fund Complex Overseen by Trustee or Officer | | Other Directorships Held by Trustee or Officer |
| | |
Vice Chairman | | 62 | | Director — HSBC Finance |
(2010–April 2013) — | | | | Corporation and HSBC |
PNC Financial | | | | North America Holdings Inc. |
Services Group | | | | |
| | | | Director — |
| | | | | HSBC USA Inc. |
Vice President and Treasurer | | 62 | | Director, Personnel and |
(January 2006–July 2012), | | | | Compensation Committee |
Vice President — | | | | Chair, and Member of |
Mergers & Acquisitions | | | | Nominating, Investments, and |
(January 2003–January 2006), | | | | Audit Committees — |
and Vice President | | | | Okabena Company |
and Treasurer | | | | (2009–2014) |
(July 1995–January 2003) — | | | | |
3M Company | | | | |
| | | | |
David F. Connor has served | | 62 | | None2 |
in various capacities at different times at | | | | |
Macquarie Investment | | | | |
Management. | | | | |
| | | | |
| | | | | |
Daniel V. Geatens has served | | 62 | | None2 |
in various capacities at different times at | | | | |
Macquarie Investment | | | | |
Management. | | | | |
Richard Salus has served | | 62 | | None2 |
in various executive capacities at different times at | | | | |
Macquarie Investment | | | | |
Management. | | | | |
| | | | | |
About the organization
| | | | | | |
Board of trustees Shawn K. Lytle President and Chief Executive Officer Delaware FundsSM by Macquarie Philadelphia, PA Thomas L. Bennett Chairman of the Board Delaware Funds by Macquarie Private Investor Rosemont, PA | | Ann D. Borowiec Former Chief Executive Officer Private Wealth Management J.P. Morgan Chase & Co. New York, NY Joseph W. Chow Former Executive Vice President State Street Corporation Boston, MA | | John A. Fry President Drexel University Philadelphia, PA Lucinda S. Landreth Former Chief Investment Officer Assurant, Inc. New York, NY | | Frances A. Sevilla-Sacasa Former Chief Executive Officer Banco Itaú International Miami, FL Thomas K. Whitford Former Vice Chairman PNC Financial Services Group Pittsburgh, PA Janet L. Yeomans Former Vice President and Treasurer 3M Company St. Paul, MN |
| |
| Affiliated officers | | |
| | | |
David F. Connor Senior Vice President, General Counsel, and Secretary Delaware Funds by Macquarie Philadelphia, PA | | Daniel V. Geatens Vice President and Treasurer Delaware Funds by Macquarie Philadelphia, PA | | Richard Salus Senior Vice President and Chief Financial Officer Delaware Funds by Macquarie Philadelphia, PA | | |
This annual report is for the information of Delaware Strategic Income Fund shareholders, but it may be used with prospective investors when preceded or accompanied by the Delaware Fund fact sheet for the most recently completed calendar quarter. These documents are available at delawarefunds.com/literature.
The Fund files its complete schedule of portfolio holdings with the Securities and Exchange Commission (SEC) for the first and third quarters of each fiscal year on Form N-Q. The Fund’s Forms N-Q, as well as a description of the policies and procedures that the Fund uses to determine how to vote proxies (if any) relating to portfolio securities are available without charge (i) upon request, by calling 800 523-1918; and (ii) on the SEC’s website at sec.gov. In addition, a description of the policies and procedures that the Fund uses to determine how to vote proxies (if any) relating to portfolio securities and the Schedule of Investments included in the Fund’s most recent Form N-Q are available without charge on the Fund’s website at delawarefunds.com/literature. The Fund’s Forms N-Q may be reviewed and copied at the SEC’s Public Reference Room in Washington, D.C.; information on the operation of the Public Reference Room may be obtained by calling 800 SEC-0330.
Information (if any) regarding how the Fund voted proxies relating to portfolio securities during the most recently disclosed 12-month period ended June 30 is available without charge (i) through the Fund’s website at delawarefunds.com/proxy; and (ii) on the SEC’s website at sec.gov.
Item 2. Code of Ethics
The registrant has adopted a code of ethics that applies to the registrant’s principal executive officer, principal financial officer, principal accounting officer or controller, or persons performing similar functions, regardless of whether these individuals are employed by the registrant or a third party. A copy of the registrant’s Code of Business Ethics has been posted on the Delaware FundsSM by Macquarie Internet Web site at www.delawarefunds.com. Any amendments to the Code of Business Ethics, and information on any waiver from its provisions granted by the registrant, will also be posted on this Web site within five business days of such amendment or waiver and will remain on the Web site for at least 12 months.
Item 3. Audit Committee Financial Expert
The registrant’s Board of Trustees/Directors has determined that certain members of the registrant’s Audit Committee are audit committee financial experts, as defined below. For purposes of this item, an “audit committee financial expert” is a person who has the following attributes:
a. An understanding of generally accepted accounting principles and financial statements;
b. The ability to assess the general application of such principles in connection with the accounting for estimates, accruals, and reserves;
c. Experience preparing, auditing, analyzing, or evaluating financial statements that present a breadth and level of complexity of accounting issues that are generally comparable to the breadth and complexity of issues that can reasonably be expected to be raised by the registrant’s financial statements, or experience actively supervising one or more persons engaged in such activities;
d. An understanding of internal controls and procedures for financial reporting; and
e. An understanding of audit committee functions.
An “audit committee financial expert” shall have acquired such attributes through:
a. Education and experience as a principal financial officer, principal accounting officer, controller, public accountant, or auditor or experience in one or more positions that involve the performance of similar functions;
b. Experience actively supervising a principal financial officer, principal accounting officer, controller, public accountant, auditor, or person performing similar functions;
c. Experience overseeing or assessing the performance of companies or public accountants with respect to the preparation, auditing, or evaluation of financial statements; or
d. Other relevant experience.
The registrant’s Board of Trustees/Directors has also determined that each member of the registrant’s Audit Committee is independent. In order to be “independent” for purposes of this item, the Audit Committee member may not: (i) other than in his or her capacity as a member of the Board of Trustees/Directors or any committee thereof, accept directly or indirectly any consulting, advisory or other compensatory fee from the issuer; or (ii) be an “interested person” of the registrant as defined in Section 2(a)(19) of the Investment Company Act of 1940.
The names of the audit committee financial experts on the registrant’s Audit Committee are set forth below:
Joseph W. Chow
John A. Fry
Lucinda S. Landreth
Thomas K. Whitford
Item 4. Principal Accountant Fees and Services
(a) Audit fees.
The aggregate fees billed for services provided to the registrant by its independent auditors for the audit of the registrant’s annual financial statements and for services normally provided by the independent auditors in connection with statutory and regulatory filings or engagements were $88,050 for the fiscal year ended July 31, 2017.
The aggregate fees billed for services provided to the registrant by its independent auditors for the audit of the registrant’s annual financial statements and for services normally provided by the independent auditors in connection with statutory and regulatory filings or engagements were $88,050 for the fiscal year ended July 31, 2016.
(b) Audit-related fees.
The aggregate fees billed by the registrant’s independent auditors for services relating to the performance of the audit of the registrant’s financial statements and not reported under paragraph (a) of this Item were $0 for the fiscal year ended July 31, 2017.
The aggregate fees billed by the registrant’s independent auditors for services relating to the performance of the audit of the financial statements of the registrant’s investment adviser and other service providers under common control with the adviser and that relate directly to the operations or financial reporting of the registrant were $640,000 for the registrant’s fiscal year ended July 31, 2017. The percentage of these fees relating to services approved by the registrant’s Audit Committee pursuant to the de minimis exception from the pre-approval requirement in Rule 2-01(c)(7)(i)(C) of Regulation S-X was 0%. These audit-related services were as follows: year end audit procedures; group reporting and subsidiary statutory audits.
The aggregate fees billed by the registrant’s independent auditors for services relating to the performance of the audit of the registrant’s financial statements and not reported under paragraph (a) of this Item were $0 for the fiscal year ended July 31, 2016.
The aggregate fees billed by the registrant’s independent auditors for services relating to the performance of the audit of the financial statements of the registrant’s investment adviser and other service providers under common control with the adviser and that relate directly to the operations or financial reporting of the registrant were $667,000 for the registrant’s fiscal year ended July 31, 2016. The percentage of these fees relating to services approved by the registrant’s Audit Committee pursuant to the de minimis exception from the pre-approval requirement in Rule 2-01(c)(7)(i)(C) of Regulation S-X was 0%. These audit-related services were as follows: year end audit procedures; group reporting and subsidiary statutory audits.
(c) Tax fees.
The aggregate fees billed by the registrant’s independent auditors for tax-related services provided to the registrant were $11,464 for the fiscal year ended July 31, 2017. The percentage of these fees relating to services approved by the registrant’s Audit Committee pursuant to the de minimis exception from the pre-approval requirement in Rule 2-01(c)(7)(i)(C) of Regulation S-X was 0%. These tax-related services were as follows: review of income tax returns and review of annual excise distribution calculations.
The aggregate fees billed by the registrant’s independent auditors for tax-related services provided to the registrant’s investment adviser and other service providers under common control with the adviser and that relate directly to the operations or financial reporting of the registrant were $0 for the registrant’s fiscal year ended July 31, 2017.
The aggregate fees billed by the registrant’s independent auditors for tax-related services provided to the registrant were $11,116 for the fiscal year ended July 31, 2016. The percentage of these fees relating to services approved by the registrant’s Audit Committee pursuant to the de minimis exception from the pre-approval requirement in Rule 2-01(c)(7)(i)(C) of Regulation S-X was 0%. These tax-related services were as follows: review of income tax returns and review of annual excise distribution calculations.
The aggregate fees billed by the registrant’s independent auditors for tax-related services provided to the registrant’s investment adviser and other service providers under common control with the adviser and that relate directly to the operations or financial reporting of the registrant were $0 for the registrant’s fiscal year ended July 31, 2016.
(d) All other fees.
The aggregate fees billed for all services provided by the independent auditors to the registrant other than those set forth in paragraphs (a), (b) and (c) of this Item were $0 for the fiscal year ended July 31, 2017.
The aggregate fees billed for all services other than those set forth in paragraphs (b) and (c) of this Item provided by the registrant’s independent auditors to the registrant’s adviser and other service providers under common control with the adviser and that relate directly to the operations or financial reporting of the registrant were $0 for the registrant’s fiscal year ended July 31, 2017. The percentage of these fees relating to services approved by the registrant’s Audit Committee pursuant to the de minimis exception from the pre-approval requirement in Rule 2-01(c)(7)(i)(C) of Regulation S-X was 0%.
The aggregate fees billed for all services provided by the independent auditors to the registrant other than those set forth in paragraphs (a), (b) and (c) of this Item were $0 for the fiscal year ended July 31, 2016.
The aggregate fees billed for all services other than those set forth in paragraphs (b) and (c) of this Item provided by the registrant’s independent auditors to the registrant’s adviser and other service providers under common control with the adviser and that relate directly to the operations or financial reporting of the registrant were $0 for the registrant’s fiscal year ended July 31, 2016. The percentage of these fees relating to services approved by the registrant’s Audit Committee pursuant to the de minimis exception from the pre-approval requirement in Rule 2-01(c)(7)(i)(C) of Regulation S-X was 0%.
(e) The registrant’s Audit Committee has established pre-approval policies and procedures as permitted by Rule 2-01(c)(7)(i)(B) of Regulation S-X (the “Pre-Approval Policy”) with respect to services provided by the registrant’s independent auditors. Pursuant to the Pre-Approval Policy, the Audit Committee has pre-approved the services set forth in the table below with respect to the registrant up to the specified fee limits. Certain fee limits are based on aggregate fees to the registrant and other registrants within the Delaware Investments Family of Funds.
| Service | Range of Fees |
Audit Services | |
Statutory audits or financial audits for new Funds | up to $40,000 per Fund |
Services associated with SEC registration statements (e.g., Form N-1A, Form N-14, etc.), periodic reports and other documents filed with the SEC or other documents issued in connection with securities offerings (e.g., comfort letters for closed-end Fund offerings, consents), and assistance in responding to SEC comment letters | up to $10,000 per Fund |
Consultations by Fund management as to the accounting or disclosure treatment of transactions or events and/or the actual or potential impact of final or proposed rules, standards or interpretations by the SEC, FASB, or other regulatory or standard-setting bodies (Note: Under SEC rules, some consultations may be considered “audit-related services” rather than “audit services”) | up to $25,000 in the aggregate |
Audit-Related Services | |
Consultations by Fund management as to the accounting or disclosure treatment of transactions or events and/or the actual or potential impact of final or proposed rules, standards or interpretations by the SEC, FASB, or other regulatory or standard-setting bodies (Note: Under SEC rules, some consultations may be considered “audit services” rather than “audit-related services”) | up to $25,000 in the aggregate |
Tax Services | |
U.S. federal, state and local and international tax planning and advice (e.g., consulting on statutory, regulatory or administrative developments, evaluation of Funds’ tax compliance function, etc.) | up to $25,000 in the aggregate |
U.S. federal, state and local tax compliance (e.g., excise distribution reviews, etc.) | up to $5,000 per Fund |
Review of federal, state, local and international income, franchise and other tax returns | up to $5,000 per Fund |
Under the Pre-Approval Policy, the Audit Committee has also pre-approved the services set forth in the table below with respect to the registrant’s investment adviser and other entities controlling, controlled by or under common control with the investment adviser that provide ongoing services to the registrant (the “Control Affiliates”) up to the specified fee limit. This fee limit is based on aggregate fees to the investment adviser and its Control Affiliates.
| Service | Range of Fees |
Non-Audit Services | |
Services associated with periodic reports and other documents filed with the SEC and assistance in responding to SEC comment letters | up to $10,000 in the aggregate |
The Pre-Approval Policy requires the registrant’s independent auditors to report to the Audit Committee at each of its regular meetings regarding all services initiated since the last such report was rendered, including those services authorized by the Pre-Approval Policy.
(f) Not applicable.
(g) The aggregate non-audit fees billed by the registrant’s independent auditors for services rendered to the registrant and to its investment adviser and other service providers under common control with the adviser were $11,180,000 and $10,036,000 for the registrant’s fiscal years ended July 31, 2017 and July 31, 2016, respectively.
(h) In connection with its selection of the independent auditors, the registrant’s Audit Committee has considered the independent auditors’ provision of non-audit services to the registrant’s investment adviser and other service providers under common control with the adviser that were not required to be pre-approved pursuant to Rule 2-01(c)(7)(ii) of Regulation S-X. The Audit Committee has determined that the independent auditors’ provision of these services is compatible with maintaining the auditors’ independence.
Item 5. Audit Committee of Listed Registrants
Not applicable.
Item 6. Investments
(a) Included as part of report to shareholders filed under Item 1 of this Form N-CSR.
(b) Divestment of securities in accordance with Section 13(c) of the Investment Company Act of 1940.
Not applicable.
Item 7. Disclosure of Proxy Voting Policies and Procedures for Closed-End Management Investment Companies
Not applicable.
Item 8. Portfolio Managers of Closed-End Management Investment Companies
Not applicable.
Item 9. Purchases of Equity Securities by Closed-End Management Investment Company and Affiliated Purchasers
Not applicable.
Item 10. Submission of Matters to a Vote of Security Holders
Not applicable.
Item 11. Controls and Procedures
The registrant’s principal executive officer and principal financial officer have evaluated the registrant’s disclosure controls and procedures within 90 days of the filing of this report and have concluded that they are effective in providing reasonable assurance that the information required to be disclosed by the registrant in its reports or statements filed under the Securities Exchange Act of 1934 is recorded, processed, summarized and reported within the time periods specified in the rules and forms of the Securities and Exchange Commission.
There were no significant changes in the registrant’s internal control over financial reporting that occurred during the second fiscal quarter of the period covered by the report to stockholders included herein (i.e., the registrant’s fourth fiscal quarter) that have materially affected, or are reasonably likely to materially affect, the registrant’s internal control over financial reporting.
Item 12. Exhibits
(a) (1) Code of Ethics
Not applicable.
(2) Certifications of Principal Executive Officer and Principal Financial Officer pursuant to Rule 30a-2 under the Investment Company Act of 1940 are attached hereto as Exhibit 99.CERT.
(3) Written solicitations to purchase securities pursuant to Rule 23c-1 under the Securities Exchange Act of 1934.
Not applicable.
(b) Certifications pursuant to Section 906 of the Sarbanes-Oxley Act of 2002 are furnished herewith as Exhibit 99.906CERT.
SIGNATURES
Pursuant to the requirements of the Securities Exchange Act of 1934 and the Investment Company Act of 1940, the registrant has duly caused this report to be signed on its behalf, by the undersigned, thereunto duly authorized.
DELAWARE GROUP® GOVERNMENT FUND
| SHAWN K. LYTLE |
| By: | Shawn K. Lytle |
| Title: | President and Chief Executive Officer |
| Date: | October 4, 2017 |
Pursuant to the requirements of the Securities Exchange Act of 1934 and the Investment Company Act of 1940, this report has been signed below by the following persons on behalf of the registrant and in the capacities and on the dates indicated.
| SHAWN K. LYTLE |
| By: | Shawn K. Lytle |
| Title: | President and Chief Executive Officer |
| Date: | October 4, 2017 |
| |
| |
| RICHARD SALUS |
| By: | Richard Salus |
| Title: | Chief Financial Officer |
| Date: | October 4, 2017 |