UNITED STATES SECURITIES AND EXCHANGE COMMISSION
Washington, D.C. 20549
FORM N-CSR
CERTIFIED SHAREHOLDER REPORT OF REGISTERED MANAGEMENT
INVESTMENT COMPANIES
| Investment Company Act file number: | | 811-04304 |
| | |
| Exact name of registrant as specified in charter: | | Delaware Group® Government Fund |
| | |
| Address of principal executive offices: | | 2005 Market Street |
| | Philadelphia, PA 19103 |
| | |
| Name and address of agent for service: | | David F. Connor, Esq. |
| | | 2005 Market Street |
| | Philadelphia, PA 19103 |
| | |
| Registrant’s telephone number, including area code: | | (800) 523-1918 |
| | |
| Date of fiscal year end: | | July 31 |
| | |
| Date of reporting period: | | July 31, 2014 |
Item 1. Reports to Stockholders

Annual report
Fixed income mutual fund
Delaware Core Plus Bond Fund
July 31, 2014
Carefully consider the Fund’s investment objectives, risk factors, charges, and expenses before investing. This and other information can be found in the Fund’s prospectus and its summary prospectus, which may be obtained by visiting delawareinvestments.com or calling 800 523-1918. Investors should read the prospectus and the summary prospectus carefully before investing.
You can obtain shareholder reports and prospectuses online instead of in the mail.
Visit delawareinvestments.com/edelivery.
Experience Delaware Investments
Delaware Investments is committed to the pursuit of consistently superior asset management and unparalleled client service. We believe in our investment processes, which seek to deliver consistent results, and in convenient services that help add value for our clients.
If you are interested in learning more about creating an investment plan, contact your financial advisor.
You can learn more about Delaware Investments or obtain a prospectus for Delaware Core Plus Bond Fund at delawareinvestments.com.
Manage your investments online
| — | | 24-hour access to your account information |
| — | | Check your account balance and recent transactions |
| — | | Request statements or literature |
| — | | Make purchases and redemptions |
Delaware Management Holdings, Inc. and its subsidiaries (collectively known by the marketing name of Delaware Investments) are wholly owned subsidiaries of Macquarie Group Limited, a global provider of banking, financial, advisory, investment and funds management services.
Investments in Delaware Core Plus Bond Fund are not and will not be deposits with or liabilities of Macquarie Bank Limited ABN 46 008 583 542 and its holding companies, including their subsidiaries or related companies (Macquarie Group), and are subject to investment risk, including possible delays in repayment and loss of income and capital invested. No Macquarie Group company guarantees or will guarantee the performance of the Fund, the repayment of capital from the Fund, or any particular rate of return.
Table of contents
Unless otherwise noted, views expressed herein are current as of July 31, 2014, and subject to change.
Funds are not FDIC insured and are not guaranteed. It is possible to lose the principal amount invested.
Mutual fund advisory services provided by Delaware Management Company, a series of Delaware Management Business Trust, which is a registered investment advisor. Delaware Investments, a member of Macquarie Group, refers to Delaware Management Holdings, Inc. and its subsidiaries, including the Fund’s distributor, Delaware Distributors, L.P. Macquarie Group refers to Macquarie Group Limited and its subsidiaries and affiliates worldwide.
© 2014 Delaware Management Holdings, Inc.
All third-party marks cited are the property of their respective owners.
| | |
| Portfolio management review | | |
Delaware Core Plus Bond Fund | | August 12, 2014 |
| | | | |
Performance preview (for the year ended July 31, 2014) | | | | |
Delaware Core Plus Bond Fund (Class A shares) | | 1-year return | | +5.60% |
Barclays U.S. Aggregate Index (benchmark) | | 1-year return | | +3.97% |
Past performance does not guarantee future results.
For complete, annualized performance for Delaware Core Plus Bond Fund, please see the table on page 4.
The performance of Class A shares excludes the applicable sales charge and reflects the reinvestment of all distributions. Index performance returns do not reflect any management fees, transaction costs, or expenses. Indices are unmanaged and one cannot invest directly in an index.
| | |
Unusually stable and exceptionally accommodative monetary policy helped the domestic fixed income market post solid gains overall for the Fund’s fiscal year ended July 31, 2014. As the period began, many investors had positioned their portfolios in anticipation of higher benchmark interest rates, especially in light of U.S. Federal Reserve Chair Ben Bernanke’s surprising announcement in June 2013 that the central bank would begin to wind down its third round of bond buying (known as quantitative easing) in late 2013, and perhaps end it altogether by the fall of 2014. Although Bernanke’s successor, Janet Yellen, has implemented this plan, she has repeatedly emphasized that any increase in benchmark rates — the Fed’s traditional lever for influencing economic growth and inflation — would be “data dependent” and unlikely to begin before mid-2015. Nonetheless, sustained signs of significant healing in the long-suffering labor market between January and July 2014 implied that the first rate hike could come sooner than Yellen had suggested, or sooner than investors had previously believed. As a result, the yield on the 2-year Treasury note (which we view as being very sensitive to perceived changes in Fed policy) moved higher by 22 basis points over the fiscal period. (One basis point equals one one-hundredth of a percentage point.) Further out on the yield curve, however, rates moved in the | |  |
1
Portfolio management review
Delaware Core Plus Bond Fund
opposite direction: The yield on the 10-year Treasury was virtually unchanged while the 30-year Treasury yield actually fell by 32 basis points (source: Bloomberg). We believe the flattening of the Treasury yield curve (short rates higher, long rates lower) was caused by a weak weather-related U.S. gross domestic product number in the first quarter of 2014, continued benign inflation, and deteriorating economic fundamentals in the euro zone. We believe the sharp rise in geopolitical tensions in Eastern Europe and the Middle East late in the fiscal period also contributed to a “flight to safety,” which translated into strong demand for intermediate- and longer-term U.S. government debt and a mild correction in below-investment-grade bonds.
For the Fund’s fiscal year, investment grade corporates posted the largest gains among sectors within the benchmark, while Treasury securities lagged due to the heavy representation of shorter-term maturities in the index. In a clear reflection of growing investor confidence in the domestic economic recovery, lower-quality credits (BBB-rated corporates, for example) sharply outperformed their higher-quality counterparts. Finally, credit spreads tightened significantly, especially in the financial sector. Overall, the yield spread between BBB-rated corporate bonds and equivalent-maturity Treasurys fell from 130 basis points to 95 basis points during the fiscal year (source: Bloomberg).
Fund performance
For its fiscal year ended July 31, 2014, Delaware Core Plus Bond Fund (Class A shares) returned +5.60% at net asset value and +0.88% at maximum offer price (both returns reflect all distributions reinvested). In comparison, the Fund’s benchmark, the Barclays U.S. Aggregate Index, returned +3.97% during the same period. For complete annualized performance of Delaware Core Plus Bond Fund, please see table on page 4.
The Fund’s significant overweight to investment grade corporate bonds – as well as high yield bonds – contributed to relative performance. In addition, the Fund benefited from its large underweight to Treasury securities, which lagged the credit sector as spreads tightened and rates on short-term Treasurys inched higher. (Note: The long-term portion of the Treasury yield curve – the primary beneficiary of the global flight to safety that unfolded late in the Fund’s fiscal year – does not account for a large portion of the Barclays U.S. Aggregate Index.)
The underweight to U.S. Treasury notes and bonds slightly detracted from performance in 2014 as this market rallied back from its 2013 selloff. Investments in agency mortgage-backed securities (MBS) detracted from performance as the Fund’s portfolio construction was hurt by the yield curve twist to a more flat shape. Fifteen-year mortgages and some premiums underperformed as their cash flows are sensitive to yield changes in short-maturity instruments. Additionally, they typically do not benefit as much from rallies in longer maturity bonds.
Among the Fund’s derivative positions, we used interest rate futures in an attempt to make the Fund’s duration (which determines how a bond’s price is affected by interest rate changes) more neutral versus the benchmark. In addition, though we kept the Fund’s currency exposure relatively low over the course of the fiscal year, we did employ currency hedging (specifically, foreign currency exchange (FX) forwards) in an attempt to scale back the Fund’s foreign exchange risk. The Fund also employed credit default swap baskets to help reduce the credit risk associated with the Fund’s significant allocation to the below-investment-grade sector. As of the end of the fiscal year, the Fund had the following derivatives in the portfolio: a small credit default swap position (about 20 basis points) on emerging market debt, and Treasury futures totaling 1.9% of assets. None of the Fund’s derivative positions
2
during the fiscal year had a material impact on portfolio performance; that is, none affected returns by greater than 50 basis points.
Positioning
As the fiscal year ended, the Fund continued to maintain a large overweight to the corporate sector. Investment grade corporate bonds, for example, accounted for approximately 37% of Fund assets, compared to the 23% weighting in the Fund’s benchmark. Additionally, the Fund maintained the following allocations to sectors not represented in the Barclays U.S. Aggregate Index: 10% to bank loans, 8% to traditional high yield debt, 5% to emerging market bonds, and 1% to convertible securities. The Fund’s slight overweight allocations to commercial mortgage-backed securities and asset-backed securities were balanced by an underweight position in
agency MBS and a large underweight to Treasury securities.
The Fund ended the fiscal year with a duration about 0.3% below that of the benchmark, indicating an essentially neutral positioning with respect to interest rate risk. Notably, the benchmark’s current duration of 5.7 years is at or near its highest-ever reading, a result of the issuance of more lower-coupon bonds in recent years. That issuance effectively lowers the index’s average coupon while extending its average maturity, causing the duration to rise. As noted earlier, we have chosen to potentially mitigate that elevated duration risk through the limited use of Treasury interest rate futures. As always, the Fund generally focuses on individual credit selection while avoiding large interest rate bets.
3
| | |
| Performance summary | | |
| Delaware Core Plus Bond Fund | | July 31, 2014 |
The performance data quoted represent past performance; past performance does not guarantee future results. Investment return and principal value will fluctuate so your shares, when redeemed, may be worth more or less than their original cost. Please obtain the performance data current for the most recent month end by calling 800 523-1918 or visiting our website at delawareinvestments.com/performance. Current performance may be lower or higher than the performance data quoted.
| | | | | | |
| Fund and benchmark performance1,2 | | Average annual total returns through July 31, 2014 |
| | | 1 year | | 5 years | | 10 years |
| Class A (Est. Aug. 16, 1985) | | | | | | |
| Excluding sales charge | | +5.60% | | +5.99% | | +5.37% |
| Including sales charge | | +0.88% | | +5.01% | | +4.89% |
| Class B (Est. May 2, 1994) | | | | | | |
| Excluding sales charge | | +5.60% | | +5.41% | | +4.76% |
| Including sales charge | | +1.60% | | +5.17% | | +4.76% |
| Class C (Est. Nov. 29, 1995) | | | | | | |
| Excluding sales charge | | +4.81% | | +5.22% | | +4.61% |
| Including sales charge | | +3.81% | | +5.22% | | +4.61% |
| Class R (Est. June 2, 2003) | | | | | | |
| Excluding sales charge | | +5.32% | | +5.77% | | +5.15% |
| Including sales charge | | +5.32% | | +5.77% | | +5.15% |
| Institutional Class (Est. June 1, 1992) | | | | | | |
| Excluding sales charge | | +5.86% | | +6.25% | | +5.66% |
| Including sales charge | | +5.86% | | +6.25% | | +5.66% |
| Barclays U.S. Aggregate Index | | +3.97% | | +4.47% | | +4.80% |
1 Returns reflect the reinvestment of all distributions and are presented both with and without the applicable sales charges described below. Returns do not reflect the deduction of taxes the shareholder would pay on Fund distributions or redemptions of Fund shares.
Expense limitations were in effect for certain classes during some or all of the periods shown in the “Fund and benchmark performance” table. Expenses for each class are listed on the “Fund expense ratios” table on page 6. Performance would have been lower had expense limitations not been in effect.
Class A shares are sold with a maximum front-end sales charge of 4.50%, and have an annual distribution and service fee of 0.25% of average daily net assets. The Board has adopted a formula for calculating 12b-1 plan fees for the Fund’s Class A shares. The Fund’s Class A shares are currently subject to a blended 12b-1 fee equal to the sum of: (i) 0.10% of average daily net assets representing shares acquired prior to June 1, 1992, and (ii) 0.25% of average daily net assets representing shares acquired on or after June 1, 1992. All Class A shares currently bear 12b-1 fees at the same rate, the blended rate, currently 0.25% of average daily net assets, based on the
4
formula described above. This method of calculating Class A 12b-1 fees may be discontinued at the sole discretion of the Board. Performance for Class A shares, excluding sales charges, assumes that no front-end sales charge applied.
Prior to Oct. 1, 2013, Class A shares had an annual distribution and service fee of 0.30% of average daily net assets. This fee was contractually limited to 0.25% from Nov. 28, 2012, until Oct. 1, 2013. Prior to Oct. 1, 2013, the Fund’s Class A shares were subject to a blended 12b-1 fee equal to the sum of: (i) 0.10% of average daily net assets representing shares acquired prior to June 1, 1992, and (ii) 0.30% (which had been limited to 0.25%) of average daily net assets representing shares acquired on or after June 1, 1992.
All remaining Class B shares were converted to Class A shares on Sept. 25, 2014. Prior to Sept. 25, 2014, Class B shares were available for purchase only through dividend reinvestment and certain permitted exchanges as was described in the prospectus. Class B shares had a contingent deferred sales charge that declined from 4.00% to zero depending on the period of time the shares were held. They were also subject to an annual distribution and service fee of 1.00% of average daily net assets. This fee was contractually limited to 0.25% of average daily net assets from Aug. 1, 2013, through July 31, 2014.* Please see Note 14 in “Notes to financial statements” for more information. Ten-year performance figures for Class B shares reflect conversion to Class A shares after approximately eight years.
Class C shares are sold with a contingent deferred sales charge of 1.00% if redeemed during the first 12 months. They are also subject to an annual distribution and service fee of 1.00% of average daily net assets.
*The contractual waiver period is from March 1, 2013, through Nov. 28, 2014.
Performance for Class B and C shares, excluding sales charges, assumes either that contingent deferred sales charges did not apply or that the investment was not redeemed.
Class R shares are available only for certain retirement plan products. They are sold without a sales charge and have an annual distribution and service fee of 0.50% of average daily net assets. Prior to Oct. 1, 2013, Class R shares had an annual distribution and service fee of 0.60% of average daily net assets. This fee was contractually limited to 0.50% during the period from Nov. 28, 2012, through Oct. 1, 2013.
Institutional Class shares are available without sales or asset-based distribution charges only to certain eligible institutional accounts.
The “Fund and benchmark performance” table and the “Performance of a $10,000 investment” graph do not reflect the deduction of taxes the shareholder would pay on Fund distributions or redemptions of Fund shares.
Fixed income securities and bond funds can lose value, and investors can lose principal, as interest rates rise. They also may be affected by economic conditions that hinder an issuer’s ability to make interest and principal payments on its debt.
The Fund may also be subject to prepayment risk, the risk that the principal of a fixed income security that is held by the Fund may be prepaid prior to maturity, potentially forcing the Fund to reinvest that money at a lower interest rate.
High yielding, noninvestment grade bonds (junk bonds) involve higher risk than investment grade bonds. The high yield secondary market is particularly susceptible to liquidity problems when institutional investors, such as mutual funds and certain other financial institutions, temporarily stop buying bonds for regulatory, financial, or other reasons. In addition, a less liquid secondary market makes it more difficult for the Fund to obtain precise valuations of the high yield securities in its portfolio.
5
Performance summary
Delaware Core Plus Bond Fund
The Fund may invest in derivatives, which may involve additional expenses and are subject to risk, including the risk that an underlying security or securities index moves in the opposite direction from what the portfolio manager anticipated. A derivative transaction depends upon the counterparties’ ability to fulfill their contractual obligations.
International investments entail risks not ordinarily associated with U.S. investments including fluctuation in currency values, differences in accounting principles, or economic or political instability in other nations.
Investing in emerging markets can be riskier than investing in established foreign markets due to increased volatility and lower trading volume.
If and when the Fund invests in forward foreign currency contracts or uses other investments to hedge against currency risks, the Fund will be subject to special risks, including counterparty risk.
The Fund may experience portfolio turnover in excess of 100%, which could result in higher transaction costs and tax liability.
Per Standard & Poor’s credit rating agency, bonds rated AA and A are more susceptible to the adverse effects of changes in circumstances and economic conditions than those in the higher-rated AAA category, but the obligor’s capacity to meet its financial commitment on the obligation is still strong. Bonds rated BBB exhibit adequate protection parameters, although adverse economic conditions or changing circumstances are more likely to lead to a weakened capacity of the obligor to meet its financial commitments. Bonds rated BB, B, and CCC are regarded as having significant speculative characteristics, with BB indicating the least degree of speculation of the three.
2 The Fund’s expense ratios, as described in the most recent prospectus, are disclosed in the following “Fund expense ratios” table. Delaware Management Company has agreed to reimburse certain expenses and/or waive certain fees in order to prevent total annual fund operating expenses (excluding any 12b-1 plan, taxes, interest, inverse floater program expenses, short sale and dividend interest expenses, brokerage fees, certain insurance costs, acquired fund fees and expenses, and nonroutine expenses or costs, including, but not limited to, those relating to reorganizations, litigation, conducting shareholder meetings, and liquidations (collectively, nonroutine expenses)) from exceeding 0.65% of the Fund’s average daily net assets during the period from Aug. 1, 2013, through July 31, 2014.** Please see the most recent prospectus and any applicable supplement(s) for additional information on these fee waivers and/or reimbursements.
| | | | | | | | | | |
| Fund expense ratios | | Class A | | Class B† | | Class C | | Class R | | Institutional Class |
Total annual operating expenses (without fee waivers) | | 1.12% | | 1.87% | | 1.87% | | 1.37% | | 0.87% |
Net expenses (including fee waivers, if any) | | 0.90% | | 0.90% | | 1.65% | | 1.15% | | 0.65% |
Type of waiver | | Contractual | | Contractual | | Contractual | | Contractual | | Contractual |
**The contractual waiver period is from Nov. 28, 2012, through Nov. 28, 2014.
† See Note 14 in “Notes to financial statements.”
6
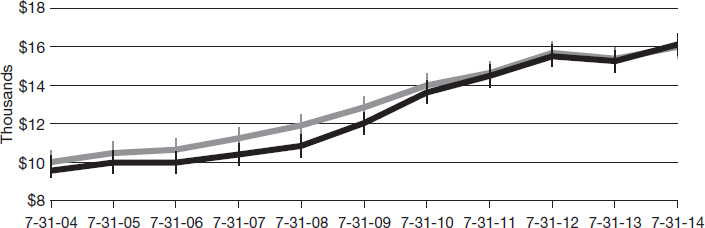
Performance of a $10,000 investment1
Average annual total returns from July 31, 2004, through July 31, 2014
| | | | | | | | | | |
| For period beginning July 31, 2004, through July 31, 2014 | | Starting value | | | Ending value | |

| | Delaware Core Plus Bond Fund — Class A shares | | | $9,550 | | | | $16,119 | |
| | Barclays U.S. Aggregate Index | | | $10,000 | | | | $15,987 | |
1The “Performance of a $10,000 investment” graph assumes $10,000 invested in Class A shares of the Fund on July 31, 2004, and includes the effect of a 4.50% front-end sales charge and the reinvestment of all distributions. The graph does not reflect the deduction of taxes the shareholders would pay on Fund distributions or redemptions of Fund shares. Expense limitations were in effect for some or all of the periods shown. Performance would have been lower had expense limitations not been in effect. Expenses are listed in the “Fund expense ratios” table on page 6. Please note additional details on pages 4 through 7.
The graph also assumes $10,000 invested in the Barclays U.S. Aggregate Index as of
July 31, 2004. The Barclays U.S. Aggregate Index measures the performance of publicly issued investment grade (Baa3/BBB- or better) corporate, U.S. government, mortgage- and asset-backed securities with at least one year to maturity and at least $250 million par amount outstanding.
Index performance returns do not reflect any management fees, transaction costs, or expenses. Indices are unmanaged and one cannot invest directly in an index. Past performance does not guarantee future results.
Performance of other Fund classes will vary due to different charges and expenses.
| | | | | | | | |
| | | Nasdaq symbols | | CUSIPs | |
Class A | | | | DEGGX | | | 246094205 | |
Class B | | | | DEGBX | | | 246094601 | |
Class C | | | | DUGCX | | | 246094700 | |
Class R | | | | DUGRX | | | 246094809 | |
Institutional Class | | | | DUGIX | | | 246094502 | |
7
Disclosure of Fund expenses
For the six-month period from February 1, 2014 to July 31, 2014 (Unaudited)
As a shareholder of the Fund, you incur two types of costs: (1) transaction costs, including sales charges (loads) on purchase payments, reinvested dividends, or other distributions; redemption fees; and exchange fees; and (2) ongoing costs, including management fees; distribution and/or service (12b-1) fees; and other Fund expenses. This example is intended to help you understand your ongoing costs (in dollars) of investing in the Fund and to compare these costs with the ongoing costs of investing in other mutual funds.
The example is based on an investment of $1,000 invested at the beginning of the period and held for the entire
six-month period from Feb. 1, 2014 to July 31, 2014.
Actual expenses
The first section of the table shown, “Actual Fund return,” provides information about actual account values and actual expenses. You may use the information in this section of the table, together with the amount you invested, to estimate the expenses that you paid over the period. Simply divide your account value by $1,000 (for example, an $8,600 account value divided by $1,000 = 8.6), then multiply the result by the number in the first section under the heading entitled “Expenses Paid During Period” to estimate the expenses you paid on your account during this period.
Hypothetical example for comparison purposes
The second section of the table shown, “Hypothetical 5% return,” provides information about hypothetical account values and hypothetical expenses based on the Fund’s actual expense ratio and an assumed rate of return of 5% per year before expenses, which is not the Fund’s actual return. The hypothetical account values and expenses may not be used to estimate the actual ending account balance or expenses you paid for the period. You may use this information to compare the ongoing costs of investing in the Fund and other funds. To do so, compare this 5% hypothetical example with the 5% hypothetical examples that appear in the shareholder reports of the other funds.
Please note that the expenses shown in the table are meant to highlight your ongoing costs only and do not reflect any transactional costs, such as sales charges (loads), redemption fees, or exchange fees. Therefore, the second section of the table is useful in comparing ongoing costs only, and will not help you determine the relative total costs of owning different funds. In addition, if these transactional costs were included, your costs would have been higher. The Fund’s expenses shown in the table reflect fee waivers in effect. The expenses shown in the table assume reinvestment of all dividends and distributions.
8
Delaware Core Plus Bond Fund
Expense analysis of an investment of $1,000
| | | | | | | | | | | | | | | | | | | | |
| | | Beginning | | Ending | | | | Expenses |
| | | | |
| | | Account Value | | Account Value | | Annualized | | Paid During Period |
| | | | |
| | | 2/1/14 | | 7/31/14 | | Expense Ratio | | 2/1/14 to 7/31/14* |
Actual Fund return† | | | | | | | | | | | | | | | | | | | | |
Class A | | | $ | 1,000.00 | | | | $ | 1,030.70 | | | | | 0.90 | % | | | | $4.53 | |
Class B** | | | | 1,000.00 | | | | | 1,030.70 | | | | | 0.90 | % | | | | 4.53 | |
Class C | | | | 1,000.00 | | | | | 1,026.90 | | | | | 1.65 | % | | | | 8.29 | |
Class R | | | | 1,000.00 | | | | | 1,029.40 | | | | | 1.15 | % | | | | 5.79 | |
Institutional Class | | | | 1,000.00 | | | | | 1,032.00 | | | | | 0.65 | % | | | | 3.27 | |
Hypothetical 5% return (5% return before expenses) | | | | | | | | | | | | | | | | | | | | |
Class A | | | $ | 1,000.00 | | | | $ | 1,020.33 | | | | | 0.90 | % | | | | $4.51 | |
Class B** | | | | 1,000.00 | | | | | 1,020.33 | | | | | 0.90 | % | | | | 4.51 | |
Class C | | | | 1,000.00 | | | | | 1,016.61 | | | | | 1.65 | % | | | | 8.25 | |
Class R | | | | 1,000.00 | | | | | 1,019.09 | | | | | 1.15 | % | | | | 5.76 | |
Institutional Class | | | | 1,000.00 | | | | | 1,021.57 | | | | | 0.65 | % | | | | 3.26 | |
| * | “Expenses Paid During Period” are equal to the Fund’s annualized expense ratio, multiplied by the average account value over the period, multiplied by 181/365 (to reflect the one-half year period). |
| ** | See Note 14 in “Notes to financial statements.” |
| † | Because actual returns reflect only the most recent six-month period, the returns shown may differ significantly from fiscal year returns. |
9
Security type / sector allocation
| | |
| Delaware Core Plus Bond Fund | | As of July 31, 2014 (Unaudited) |
Sector designations may be different than the sector designations presented in other fund materials. The sector designations may represent the investment manager’s internal sector classifications, which may result in the sector designations for one fund being different than another fund’s sector designations.
| | | | |
Security type / sector | | | Percentage of net assets | |
Agency Collateralized Mortgage Obligations | | | 3.66% | |
Agency Mortgage-Backed Securities | | | 21.50% | |
Commercial Mortgage-Backed Securities | | | 2.78% | |
Convertible Bonds | | | 0.56% | |
Corporate Bonds | | | 48.60% | |
Banking | | | 8.02% | |
Basic Industry | | | 4.05% | |
Brokerage | | | 0.75% | |
Capital Goods | | | 1.22% | |
Communications | | | 7.58% | |
Consumer Cyclical | | | 2.70% | |
Consumer Non-Cyclical | | | 3.11% | |
Electric | | | 4.70% | |
Energy | | | 8.03% | |
Finance Companies | | | 0.74% | |
Insurance | | | 2.46% | |
REITs | | | 1.33% | |
Technology | | | 3.39% | |
Transportation | | | 0.52% | |
Municipal Bonds | | | 0.46% | |
Non-Agency Asset-Backed Securities | | | 3.53% | |
Non-Agency Collateralized Mortgage Obligations | | | 0.76% | |
Senior Secured Loans | | | 10.02% | |
Sovereign Bonds | | | 0.20% | |
U.S. Treasury Obligations | | | 3.90% | |
Convertible Preferred Stock | | | 0.11% | |
Preferred Stock | | | 0.71% | |
Short-Term Investments | | | 14.56% | |
Total Value of Securities | | | 111.35% | |
Liabilities Net of Receivables and Other Assets | | | (11.35%) | |
Total Net Assets | | | 100.00% | |
10
Schedule of investments
| | |
| Delaware Core Plus Bond Fund | | July 31, 2014 |
| | | | | | | | |
| | | Principal amount° | | | Value (U.S. $) | |
| |
Agency Collateralized Mortgage Obligations – 3.66% | | | | | | | | |
| |
Fannie Mae Grantor Trust | | | | | | | | |
Series 2002-T1 A2 7.00% 11/25/31 | | | 47,273 | | | $ | 55,366 | |
Fannie Mae Interest Strip | | | | | | | | |
Series 35 2 12.00% 7/1/18 | | | 13,983 | | | | 15,436 | |
Fannie Mae REMIC Trust | | | | | | | | |
Series 2002-W1 2A 6.566% 2/25/42 — | | | 63,396 | | | | 73,722 | |
Fannie Mae REMICs | | | | | | | | |
Series 1988-15 A 9.00% 6/25/18 | | | 293 | | | | 321 | |
Series 1996-46 ZA 7.50% 11/25/26 | | | 51,651 | | | | 58,691 | |
Series 2002-83 GH 5.00% 12/25/17 | | | 141,706 | | | | 148,954 | |
Series 2011-80 CB 4.00% 8/25/26 | | | 1,953,713 | | | | 2,076,076 | |
Series 2012-122 SD 5.945% 11/25/42 —S | | | 212,919 | | | | 43,133 | |
Series 2013-38 AI 3.00% 4/25/33 S | | | 570,677 | | | | 93,105 | |
Series 2013-44 DI 3.00% 5/25/33 S | | | 855,043 | | | | 145,926 | |
Freddie Mac REMICs | | | | | | | | |
Series 2557 WE 5.00% 1/15/18 | | | 121,682 | | | | 128,009 | |
Series 3656 PM 5.00% 4/15/40 | | | 235,000 | | | | 258,952 | |
Series 4185 LI 3.00% 3/15/33 S | | | 215,327 | | | | 37,232 | |
Series 4191 CI 3.00% 4/15/33 S | | | 92,277 | | | | 15,558 | |
Freddie Mac Structured Pass Through Securities | | | | | | | | |
Series T-42 A5 7.50% 2/25/42 ¿ | | | 25,351 | | | | 29,503 | |
GNMA | | | | | | | | |
Series 2010-42 PC 5.00% 7/20/39 | | | 545,000 | | | | 591,226 | |
Series 2010-113 KE 4.50% 9/20/40 | | | 245,000 | | | | 263,138 | |
NCUA Guaranteed Notes Trust | | | | | | | | |
Series 2010-C1 A2 2.90% 10/29/20 | | | 80,000 | | | | 82,698 | |
| | | | | | | | |
Total Agency Collateralized Mortgage Obligations (cost $4,062,919) | | | | | | | 4,117,046 | |
| | | | | | | | |
|
| |
Agency Mortgage-Backed Securities – 21.50% | | | | | | | | |
| |
Fannie Mae | | | | | | | | |
10.50% 6/1/30 | | | 10,481 | | | | 10,722 | |
Fannie Mae ARM | | | | | | | | |
2.412% 7/1/36 — | | | 59,151 | | | | 64,399 | |
2.415% 5/1/43 — | | | 72,305 | | | | 71,819 | |
2.44% 11/1/35 — | | | 26,736 | | | | 28,708 | |
2.546% 6/1/43 — | | | 24,953 | | | | 24,943 | |
3.201% 4/1/44 — | | | 69,087 | | | | 71,029 | |
3.279% 3/1/44 — | | | 94,519 | | | | 97,649 | |
3.296% 9/1/43 — | | | 88,289 | | | | 90,714 | |
5.142% 8/1/35 — | | | 19,851 | | | | 21,281 | |
Fannie Mae S.F. 15 yr | | | | | | | | |
2.50% 7/1/27 | | | 14,565 | | | | 14,675 | |
2.50% 10/1/27 | | | 75,630 | | | | 76,205 | |
11
Schedule of investments
Delaware Core Plus Bond Fund
| | | | | | | | |
| | | Principal amount° | | | Value (U.S. $) | |
| |
Agency Mortgage-Backed Securities (continued) | |
| |
Fannie Mae S.F. 15 yr | | | | | | | | |
2.50% 2/1/28 | | | 331,658 | | | $ | 334,180 | |
2.50% 5/1/28 | | | 43,917 | | | | 44,346 | |
3.00% 11/1/27 | | | 29,317 | | | | 30,298 | |
3.50% 7/1/26 | | | 101,379 | | | | 107,022 | |
4.00% 4/1/24 | | | 37,935 | | | | 40,438 | |
4.00% 5/1/24 | | | 110,767 | | | | 118,080 | |
4.00% 5/1/25 | | | 40,424 | | | | 43,259 | |
4.00% 6/1/25 | | | 132,610 | | | | 141,847 | |
4.00% 11/1/25 | | | 194,805 | | | | 208,485 | |
4.00% 12/1/26 | | | 68,279 | | | | 72,821 | |
4.00% 5/1/27 | | | 133,052 | | | | 142,360 | |
4.50% 4/1/18 | | | 7,882 | | | | 8,332 | |
5.00% 12/1/20 | | | 8,356 | | | | 8,980 | |
5.00% 5/1/21 | | | 51,538 | | | | 55,023 | |
5.00% 6/1/23 | | | 15,346 | | | | 16,643 | |
8.00% 10/1/16 | | | 11,299 | | | | 11,663 | |
Fannie Mae S.F. 15 yr TBA | | | | | | | | |
2.50% 8/1/29 | | | 859,000 | | | | 864,208 | |
3.00% 8/1/29 | | | 1,275,000 | | | | 1,314,445 | |
3.50% 8/1/29 | | | 587,000 | | | | 618,634 | |
Fannie Mae S.F. 20 yr | | | | | | | | |
3.00% 8/1/33 | | | 44,345 | | | | 44,901 | |
3.00% 9/1/33 | | | 83,647 | | | | 84,696 | |
3.50% 8/1/32 | | | 51,087 | | | | 53,083 | |
3.50% 9/1/33 | | | 48,415 | | | | 50,205 | |
4.00% 1/1/31 | | | 12,497 | | | | 13,326 | |
4.00% 2/1/31 | | | 52,647 | | | | 56,135 | |
5.00% 11/1/23 | | | 7,144 | | | | 7,879 | |
5.50% 8/1/28 | | | 126,786 | | | | 140,980 | |
5.50% 12/1/29 | | | 11,097 | | | | 12,337 | |
6.00% 12/1/21 | | | 4,807 | | | | 5,395 | |
Fannie Mae S.F. 30 yr | | | | | | | | |
3.00% 7/1/42 | | | 64,762 | | | | 63,689 | |
3.00% 10/1/42 | | | 1,012,743 | | | | 995,967 | |
3.00% 12/1/42 | | | 171,203 | | | | 168,346 | |
3.00% 1/1/43 | | | 376,420 | | | | 369,938 | |
3.00% 2/1/43 | | | 37,006 | | | | 36,376 | |
3.00% 4/1/43 | | | 271,818 | | | | 267,028 | |
3.00% 5/1/43 | | | 497,498 | | | | 488,680 | |
3.50% 1/1/43 | | | 276,946 | | | | 282,454 | |
4.00% 8/1/43 | | | 29,170 | | | | 30,764 | |
4.50% 7/1/36 | | | 33,024 | | | | 35,563 | |
12
| | | | | | | | |
| | | Principal amount° | | | Value (U.S. $) | |
| |
Agency Mortgage-Backed Securities (continued) | |
| |
Fannie Mae S.F. 30 yr | | | | | | | | |
4.50% 11/1/40 | | | 96,245 | | | $ | 103,867 | |
4.50% 3/1/41 | | | 201,132 | | | | 217,106 | |
4.50% 4/1/41 | | | 148,871 | | | | 160,741 | |
4.50% 10/1/41 | | | 120,130 | | | | 129,695 | |
4.50% 11/1/41 | | | 102,132 | | | | 110,276 | |
4.50% 12/1/43 | | | 17,839 | | | | 19,244 | |
4.50% 5/1/44 | | | 72,795 | | | | 78,545 | |
5.00% 7/1/35 | | | 28,076 | | | | 31,018 | |
5.00% 10/1/35 | | | 67,227 | | | | 74,269 | |
5.00% 11/1/35 | | | 20,167 | | | | 22,293 | |
5.00% 2/1/36 | | | 30,381 | | | | 33,566 | |
5.00% 4/1/37 | | | 17,989 | | | | 19,862 | |
5.00% 8/1/37 | | | 5,589 | | | | 6,178 | |
5.00% 2/1/38 | | | 17,916 | | | | 19,787 | |
5.50% 12/1/32 | | | 3,773 | | | | 4,222 | |
5.50% 2/1/33 | | | 58,381 | | | | 65,355 | |
5.50% 4/1/34 | | | 20,605 | | | | 23,081 | |
5.50% 11/1/34 | | | 20,199 | | | | 22,627 | |
5.50% 12/1/34 | | | 36,663 | | | | 41,016 | |
5.50% 3/1/35 | | | 41,182 | | | | 45,992 | |
5.50% 5/1/35 | | | 34,806 | | | | 38,941 | |
5.50% 6/1/35 | | | 17,857 | | | | 19,778 | |
5.50% 12/1/35 | | | 20,011 | | | | 22,263 | |
5.50% 1/1/36 | | | 13,358 | | | | 14,940 | |
5.50% 4/1/36 | | | 10,348 | | | | 11,491 | |
5.50% 5/1/36 | | | 10,291 | | | | 11,480 | |
5.50% 7/1/36 | | | 5,768 | | | | 6,454 | |
5.50% 1/1/37 | | | 1,335 | | | | 1,495 | |
5.50% 2/1/37 | | | 51,961 | | | | 57,618 | |
5.50% 8/1/37 | | | 56,116 | | | | 62,692 | |
5.50% 1/1/38 | | | 1,712 | | | | 1,895 | |
5.50% 2/1/38 | | | 20,013 | | | | 22,378 | |
5.50% 6/1/38 | | | 4,220 | | | | 4,672 | |
5.50% 9/1/38 | | | 147,362 | | | | 164,384 | |
5.50% 10/1/39 | | | 177,206 | | | | 196,203 | |
5.50% 7/1/40 | | | 57,011 | | | | 63,123 | |
6.00% 6/1/36 | | | 6,918 | | | | 7,800 | |
6.00% 2/1/37 | | | 23,715 | | | | 26,708 | |
6.00% 8/1/37 | | | 92,061 | | | | 103,720 | |
6.00% 9/1/37 | | | 8,003 | | | | 9,017 | |
6.00% 11/1/37 | | | 9,445 | | | | 10,636 | |
6.00% 5/1/38 | | | 96,399 | | | | 108,348 | |
13
Schedule of investments
Delaware Core Plus Bond Fund
| | | | | | | | |
| | | Principal amount° | | | Value (U.S. $) | |
| |
Agency Mortgage-Backed Securities (continued) | |
| |
Fannie Mae S.F. 30 yr | | | | | | | | |
6.00% 7/1/38 | | | 2,794 | | | $ | 3,134 | |
6.00% 10/1/38 | | | 89,111 | | | | 100,003 | |
6.00% 1/1/39 | | | 36,493 | | | | 41,032 | |
6.00% 9/1/39 | | | 308,566 | | | | 346,595 | |
6.00% 3/1/40 | | | 32,482 | | | | 36,461 | |
6.00% 9/1/40 | | | 30,362 | | | | 34,215 | |
6.00% 5/1/41 | | | 43,331 | | | | 48,748 | |
8.00% 2/1/30 | | | 18,566 | | | | 19,024 | |
10.00% 7/1/20 | | | 4,299 | | | | 4,851 | |
10.00% 5/1/22 | | | 3,476 | | | | 3,825 | |
10.00% 2/1/25 | | | 59,432 | | | | 65,630 | |
Fannie Mae S.F. 30 yr TBA | | | | | | | | |
3.00% 10/1/44 | | | 2,461,000 | | | | 2,398,149 | |
3.50% 8/1/44 | | | 781,000 | | | | 795,729 | |
3.50% 9/1/44 | | | 370,000 | | | | 375,908 | |
4.00% 8/1/44 | | | 1,121,000 | | | | 1,178,596 | |
4.00% 9/1/44 | | | 3,246,000 | | | | 3,403,140 | |
4.50% 8/1/44 | | | 552,000 | | | | 594,319 | |
4.50% 9/1/44 | | | 2,251,000 | | | | 2,418,031 | |
5.00% 9/1/44 | | | 196,000 | | | | 215,171 | |
5.50% 9/1/44 | | | 135,000 | | | | 149,505 | |
Freddie Mac ARM | | | | | | | | |
2.252% 7/1/36 — | | | 24,967 | | | | 26,666 | |
2.265% 10/1/36 — | | | 46,906 | | | | 49,941 | |
Freddie Mac S.F. 15 yr | | | | | | | | |
4.00% 12/1/24 | | | 32,078 | | | | 33,985 | |
4.00% 8/1/25 | | | 44,142 | | | | 47,106 | |
4.00% 4/1/26 | | | 45,977 | | | | 49,040 | |
4.50% 8/1/24 | | | 60,080 | | | | 64,446 | |
4.50% 7/1/25 | | | 12,219 | | | | 13,085 | |
4.50% 6/1/26 | | | 27,207 | | | | 29,056 | |
5.00% 6/1/18 | | | 20,387 | | | | 21,508 | |
5.50% 6/1/20 | | | 7,267 | | | | 7,770 | |
Freddie Mac S.F. 30 yr | | | | | | | | |
3.00% 10/1/42 | | | 76,372 | | | | 75,098 | |
3.00% 11/1/42 | | | 103,141 | | | | 101,609 | |
4.50% 10/1/39 | | | 51,988 | | | | 55,934 | |
4.50% 3/1/42 | | | 409,571 | | | | 440,750 | |
5.50% 12/1/34 | | | 7,543 | | | | 8,451 | |
5.50% 6/1/36 | | | 5,145 | | | | 5,714 | |
5.50% 11/1/36 | | | 12,797 | | | | 14,193 | |
5.50% 12/1/36 | | | 2,529 | | | | 2,794 | |
14
| | | | | | | | |
| | | Principal amount° | | | Value (U.S. $) | |
| |
Agency Mortgage-Backed Securities (continued) | |
| |
Freddie Mac S.F. 30 yr | | | | | | | | |
5.50% 6/1/38 | | | 7,568 | | | $ | 8,359 | |
5.50% 3/1/40 | | | 27,799 | | | | 30,699 | |
5.50% 8/1/40 | | | 131,635 | | | | 145,367 | |
5.50% 1/1/41 | | | 33,659 | | | | 37,170 | |
6.00% 2/1/36 | | | 17,167 | | | | 19,417 | |
6.00% 1/1/38 | | | 11,683 | | | | 13,091 | |
6.00% 6/1/38 | | | 31,762 | | | | 35,624 | |
6.00% 8/1/38 | | | 179,812 | | | | 203,082 | |
6.00% 5/1/40 | | | 13,568 | | | | 15,214 | |
8.00% 5/1/31 | | | 52,171 | | | | 59,161 | |
10.00% 1/1/19 | | | 6,055 | | | | 6,699 | |
11.50% 6/1/15 | | | 168 | | | | 169 | |
11.50% 8/1/15 | | | 241 | | | | 242 | |
11.50% 2/1/16 | | | 595 | | | | 604 | |
11.50% 3/1/16 | | | 500 | | | | 504 | |
GNMA I S.F. 30 yr | | | | | | | | |
5.00% 6/15/40 | | | 17,018 | | | | 18,696 | |
7.50% 1/15/32 | | | 8,831 | | | | 10,741 | |
8.00% 5/15/30 | | | 12,432 | | | | 12,738 | |
9.50% 10/15/19 | | | 2,386 | | | | 2,396 | |
9.50% 8/15/21 | | | 7,235 | | | | 8,431 | |
9.50% 3/15/23 | | | 9,150 | | | | 10,470 | |
10.00% 9/15/18 | | | 5,472 | | | | 5,495 | |
12.00% 6/15/15 | | | 2,767 | | | | 2,799 | |
12.50% 1/15/16 | | | 3,479 | | | | 3,495 | |
GNMA II S.F. 30 yr | | | | | | | | |
7.50% 9/20/30 | | | 12,871 | | | | 15,380 | |
8.00% 6/20/30 | | | 7,456 | | | | 9,230 | |
10.00% 11/20/15 | | | 80 | | | | 80 | |
10.00% 6/20/20 | | | 2,568 | | | | 2,878 | |
10.00% 8/20/20 | | | 1,496 | | | | 1,694 | |
10.00% 1/20/21 | | | 2,287 | | | | 2,605 | |
10.00% 2/20/21 | | | 7,048 | | | | 7,837 | |
10.00% 5/20/21 | | | 2,996 | | | | 3,381 | |
10.00% 6/20/21 | | | 454 | | | | 475 | |
10.50% 3/20/16 | | | 234 | | | | 237 | |
10.50% 1/20/18 | | | 218 | | | | 219 | |
10.50% 12/20/18 | | | 271 | | | | 299 | |
10.50% 2/20/19 | | | 105 | | | | 105 | |
10.50% 6/20/19 | | | 199 | | | | 208 | |
10.50% 9/20/19 | | | 294 | | | | 329 | |
10.50% 5/20/20 | | | 4,819 | | | | 4,925 | |
15
Schedule of investments
Delaware Core Plus Bond Fund
| | | | | | | | |
| | | Principal amount° | | | Value (U.S. $) | |
| |
Agency Mortgage-Backed Securities (continued) | |
| |
GNMA II S.F. 30 yr | | | | | | | | |
10.50% 8/20/20 | | | 416 | | | $ | 418 | |
10.50% 10/20/20 | | | 3,940 | | | | 4,408 | |
10.50% 2/20/21 | | | 16,409 | | | | 16,485 | |
11.00% 5/20/15 | | | 101 | | | | 101 | |
11.00% 7/20/19 | | | 374 | | | | 376 | |
12.00% 5/20/15 | | | 31 | | | | 31 | |
| | | | | | | | |
Total Agency Mortgage-Backed Securities (cost $24,105,059) | | | | | | | 24,157,302 | |
| | | | | | | | |
|
| |
Commercial Mortgage-Backed Securities – 2.78% | | | | | | | | |
| |
Banc of America Commercial Mortgage Trust | | | | | | | | |
Series 2007-4 AM 5.822% 2/10/51 — | | | 30,000 | | | | 33,353 | |
CD1 Commercial Mortgage Trust | | | | | | | | |
Series 2005-CD1 C 5.226% 7/15/44 — | | | 65,000 | | | | 67,339 | |
Citigroup Commercial Mortgage Trust | | | | | | | | |
Series 2014-GC23 AS 3.863% 7/10/47 | | | 45,000 | | | | 46,346 | |
Credit Suisse Commercial Mortgage Trust | | | | | | | | |
Series 2006-C1 AAB 5.463% 2/15/39 — | | | 21,453 | | | | 21,673 | |
DB-UBS Mortgage Trust | | | | | | | | |
Series 2011-LC1A C 144A 5.557% 11/10/46 #— | | | 110,000 | | | | 124,221 | |
FREMF Mortgage Trust | | | | | | | | |
Series 2010-K7 B 144A 5.435% 4/25/20 #— | | | 43,000 | | | | 48,029 | |
Series 2011-K10 B 144A 4.615% 11/25/49 #— | | | 150,000 | | | | 160,875 | |
Series 2012-K19 B 144A 4.036% 5/25/45 #— | | | 20,000 | | | | 20,565 | |
Series 2012-K708 B 144A 3.759% 2/25/45 #— | | | 190,000 | | | | 196,807 | |
Series 2013-K712 B 144A 3.368% 5/25/45 #— | | | 300,000 | | | | 303,859 | |
Series 2013-K713 B 144A 3.165% 4/25/46 #— | | | 165,000 | | | | 164,538 | |
Goldman Sachs Mortgage Securities Trust | | | | | | | | |
Series 2010-C1 A2 144A 4.592% 8/10/43 # | | | 245,000 | | | | 269,954 | |
Series 2010-C1 C 144A 5.635% 8/10/43 #— | | | 150,000 | | | | 165,146 | |
Grace Mortgage Trust | | | | | | | | |
Series 2014-GRCE A 144A 3.369% 6/10/28 # | | | 100,000 | | | | 102,704 | |
Hilton USA Trust | | | | | | | | |
Series 2013-HLT AFX 144A 2.662% 11/5/30 # | | | 200,000 | | | | 201,323 | |
Series 2013-HLT BFX 144A 3.367% 11/5/30 # | | | 100,000 | | | | 101,607 | |
JPMorgan Chase Commercial Mortgage Securities Trust | | | | | | | | |
Series 2005-CB11 E 5.477% 8/12/37 — | | | 35,000 | | | | 37,565 | |
Series 2005-LDP5 D 5.392% 12/15/44 — | | | 60,000 | | | | 62,313 | |
Series 2011-C5 B 144A 5.323% 8/15/46 #— | | | 100,000 | | | | 112,971 | |
Series 2014-C21 AS 3.997% 8/15/47 | | | 45,000 | | | | 46,089 | |
Lehman Brothers-UBS Commercial Mortgage Trust | | | | | | | | |
Series 2004-C1 A4 4.568% 1/15/31 | | | 14,504 | | | | 14,945 | |
Series 2005-C3 B 4.895% 7/15/40 — | | | 60,000 | | | | 61,143 | |
16
| | | | | | | | |
| | | Principal amount° | | | Value (U.S. $) | |
| |
Commercial Mortgage-Backed Securities (continued) | |
| |
Morgan Stanley Capital I Trust | | | | | | | | |
Series 2005-HQ7 AJ 5.204% 11/14/42 — | | | 85,000 | | | $ | 88,532 | |
Series 2005-HQ7 C 5.204% 11/14/42 — | | | 480,000 | | | | 474,741 | |
TimberStar Trust 1 | | | | | | | | |
Series 2006-1A A 144A 5.668% 10/15/36 # | | | 185,000 | | | | 200,335 | |
| | | | | | | | |
Total Commercial Mortgage-Backed Securities (cost $3,136,364) | | | | | | | 3,126,973 | |
| | | | | | | | |
| | | | | | | | |
| |
Convertible Bonds – 0.56% | | | | | | | | |
| |
Alaska Communications Systems Group 6.25% exercise price $10.28, expiration date 4/27/18 | | | 24,000 | | | | 19,515 | |
Ares Capital 5.75% exercise price $19.13, expiration date 2/1/16 | | | 20,000 | | | | 21,387 | |
ArvinMeritor 4.00% exercise price $26.73, expiration date 2/12/27 f | | | 39,000 | | | | 41,291 | |
BGC Partners 4.50% exercise price $9.84, expiration date 7/13/16 | | | 25,000 | | | | 26,859 | |
Blucora 144A 4.25% exercise price $21.66, expiration date 3/29/19 # | | | 5,000 | | | | 5,231 | |
Chesapeake Energy 2.50% exercise price $47.77, expiration date 5/15/37 | | | 11,000 | | | | 11,646 | |
Ciena 144A 3.75% exercise price $20.17, expiration date 10/15/18 # | | | 14,000 | | | | 18,147 | |
Dendreon 2.875% exercise price $51.24, expiration date 1/13/16 | | | 15,000 | | | | 10,359 | |
Equinix 4.75% exercise price $84.32, expiration date 6/13/16 | | | 5,000 | | | | 12,981 | |
General Cable 4.50% exercise price $35.64, expiration date 11/15/29 f | | | 28,000 | | | | 25,620 | |
Gilead Sciences 1.625% exercise price $22.71, expiration date 4/29/16 | | | 7,000 | | | | 28,158 | |
Helix Energy Solutions Group 3.25% exercise price $25.02, expiration date 3/12/32 | | | 9,000 | | | | 11,869 | |
Hologic 2.00% exercise price $31.17, expiration date 2/27/42 f | | | 19,000 | | | | 20,912 | |
Illumina 0.25% exercise price $83.55, expiration date 3/11/16 | | | 11,000 | | | | 21,326 | |
Intel 3.25% exercise price $21.71, expiration date 8/1/39 | | | 19,000 | | | | 31,516 | |
Jefferies Group 3.875% exercise price $45.29, expiration date 10/31/29 | | | 32,000 | | | | 34,260 | |
Lexington Realty Trust 144A 6.00% exercise price $6.68, expiration date 1/11/30 # | | | 10,000 | | | | 16,131 | |
Liberty Interactive 0.75% exercise price $1,000.00, expiration date 3/30/43 | | | 23,000 | | | | 32,143 | |
MGM Resorts International 4.25% exercise price $18.58, expiration date 4/10/15 | | | 11,000 | | | | 16,356 | |
17
Schedule of investments
Delaware Core Plus Bond Fund
| | | | | | | | |
| | | Principal amount° | | | Value (U.S. $) | |
| |
Convertible Bonds (continued) | |
| |
Mylan 3.75% exercise price $13.32, expiration date 9/15/15 | | | 6,000 | | | $ | 22,290 | |
Nuance Communications 2.75% exercise price $32.30, expiration date 11/1/31 | | | 27,000 | | | | 27,000 | |
NuVasive 2.75% exercise price $42.13, expiration date 6/30/17 | | | 44,000 | | | | 51,315 | |
Peabody Energy 4.75% exercise price $57.62, expiration date 12/15/41 | | | 19,000 | | | | 13,680 | |
Ryman Hospitality Properties 144A 3.75% exercise price $20.84, expiration date 9/29/14 # | | | 7,000 | | | | 15,964 | |
SanDisk 1.50% exercise price $51.69, expiration date 8/11/17 | | | 17,000 | | | | 31,099 | |
SBA Communications 4.00% exercise price $30.38, expiration date 9/29/14 | | | 8,000 | | | | 28,085 | |
Titan Machinery 3.75% exercise price $43.17, expiration date 4/30/19 | | | 26,000 | | | | 22,604 | |
Vector Group 2.50% exercise price $17.62, expiration date 1/14/19 — | | | 8,000 | | | | 10,687 | |
| | | | | | | | |
Total Convertible Bonds (cost $534,440) | | | | | | | 628,431 | |
| | | | | | | | |
|
| |
Corporate Bonds – 48.60% | | | | | | | | |
| |
Banking – 8.02% | | | | | | | | |
Bancolombia 5.95% 6/3/21 | | | 180,000 | | | | 199,350 | |
Bank of America 4.00% 4/1/24 | | | 285,000 | | | | 289,536 | |
Barclays Bank 7.625% 11/21/22 | | | 400,000 | | | | 452,250 | |
BB&T 5.25% 11/1/19 | | | 377,000 | | | | 425,787 | |
Capital One 2.95% 7/23/21 | | | 250,000 | | | | 247,605 | |
Citigroup 4.00% 8/5/24 | | | 155,000 | | | | 152,601 | |
City National 5.25% 9/15/20 | | | 110,000 | | | | 122,704 | |
Credit Suisse 144A 6.50% 8/8/23 # | | | 250,000 | | | | 276,875 | |
Credit Suisse Group 144A 7.50% 12/31/49 #— | | | 200,000 | | | | 220,000 | |
Export-Import Bank of China 144A 2.50% 7/31/19 # | | | 200,000 | | | | 198,536 | |
Fifth Third Bancorp 4.30% 1/16/24 | | | 385,000 | | | | 401,251 | |
Goldman Sachs Group 3.85% 7/8/24 | | | 60,000 | | | | 59,797 | |
HSBC Holdings 4.25% 3/14/24 | | | 200,000 | | | | 204,173 | |
ING Bank 144A 5.80% 9/25/23 # | | | 200,000 | | | | 223,568 | |
JPMorgan Chase | | | | | | | | |
4.85% 2/1/44 | | | 115,000 | | | | 120,627 | |
6.75% 8/29/49 — | | | 240,000 | | | | 257,400 | |
KeyBank 5.45% 3/3/16 | | | 250,000 | | | | 267,848 | |
Lloyds Banking Group 7.50% 4/30/49 — | | | 400,000 | | | | 421,000 | |
Morgan Stanley | | | | | | | | |
2.375% 7/23/19 | | | 120,000 | | | | 119,128 | |
5.00% 11/24/25 | | | 480,000 | | | | 511,970 | |
18
| | | | | | | | |
| | | Principal amount° | | | Value (U.S. $) | |
| |
Corporate Bonds (continued) | |
| |
Banking (continued) | | | | | | | | |
Northern Trust 3.95% 10/30/25 | | | 80,000 | | | $ | 83,196 | |
Oversea-Chinese Banking 144A 4.00% 10/15/24 #— | | | 200,000 | | | | 202,708 | |
PNC Financial Services Group 3.90% 4/29/24 | | | 55,000 | | | | 55,701 | |
PNC Preferred Funding Trust II 144A 1.453% 3/29/49 #— | | | 300,000 | | | | 296,250 | |
Rabobank 4.625% 12/1/23 | | | 250,000 | | | | 262,026 | |
Royal Bank of Scotland Group 5.125% 5/28/24 | | | 215,000 | | | | 215,378 | |
Santander UK 144A 5.00% 11/7/23 # | | | 225,000 | | | | 242,021 | |
SVB Financial Group 5.375% 9/15/20 | | | 150,000 | | | | 168,768 | |
U.S. Bank North America 4.95% 10/30/14 | | | 250,000 | | | | 252,782 | |
USB Capital IX 3.50% 10/29/49 — | | | 705,000 | | | | 608,063 | |
USB Realty 144A 1.381% 12/22/49 #— | | | 100,000 | | | | 92,500 | |
Wells Fargo | | | | | | | | |
4.10% 6/3/26 | | | 210,000 | | | | 212,131 | |
4.48% 1/16/24 | | | 108,000 | | | | 114,433 | |
5.90% 12/29/49 — | | | 225,000 | | | | 235,575 | |
Woori Bank | | | | | | | | |
144A 2.875% 10/2/18 # | | | 200,000 | | | | 204,069 | |
144A 4.75% 4/30/24 # | | | 200,000 | | | | 202,569 | |
Zions Bancorp | | | | | | | | |
4.50% 3/27/17 | | | 160,000 | | | | 169,913 | |
4.50% 6/13/23 | | | 115,000 | | | | 118,546 | |
7.75% 9/23/14 | | | 95,000 | | | | 95,946 | |
| | | | | | | | |
| | | | | | | 9,004,581 | |
| | | | | | | | |
Basic Industry – 4.05% | | | | | | | | |
ArcelorMittal 10.35% 6/1/19 | | | 330,000 | | | | 412,500 | |
Braskem Finance 6.45% 2/3/24 | | | 200,000 | | | | 210,440 | |
CF Industries | | | | | | | | |
5.15% 3/15/34 | | | 80,000 | | | | 85,137 | |
6.875% 5/1/18 | | | 210,000 | | | | 244,948 | |
7.125% 5/1/20 | | | 275,000 | | | | 334,435 | |
Dow Chemical 8.55% 5/15/19 | | | 479,000 | | | | 610,662 | |
Eastman Chemical 4.65% 10/15/44 | | | 145,000 | | | | 143,670 | |
Fibria Overseas Finance 5.25% 5/12/24 | | | 70,000 | | | | 69,580 | |
FMG Resources August 2006 144A 6.875% 4/1/22 # | | | 160,000 | | | | 170,800 | |
Georgia-Pacific 8.00% 1/15/24 | | | 100,000 | | | | 134,569 | |
International Paper | | | | | | | | |
4.80% 6/15/44 | | | 85,000 | | | | 84,500 | |
7.50% 8/15/21 | | | 205,000 | | | | 259,477 | |
Monsanto 4.40% 7/15/44 | | | 385,000 | | | | 385,806 | |
Mosaic 5.625% 11/15/43 | | | 320,000 | | | | 361,146 | |
Office Cherifien 144A 5.625% 4/25/24 # | | | 200,000 | | | | 210,000 | |
Plains Exploration & Production 6.50% 11/15/20 | | | 86,000 | | | | 95,890 | |
19
Schedule of investments
Delaware Core Plus Bond Fund
| | | | | | | | |
| | | Principal amount° | | | Value (U.S. $) | |
| |
Corporate Bonds (continued) | |
| |
Basic Industry (continued) | | | | | | | | |
Rio Tinto Finance USA 3.50% 11/2/20 | | | 110,000 | | | $ | 114,689 | |
Rock-Tenn | | | | | | | | |
3.50% 3/1/20 | | | 90,000 | | | | 92,078 | |
4.00% 3/1/23 | | | 85,000 | | | | 86,807 | |
Vedanta Resources 144A 6.00% 1/31/19 # | | | 200,000 | | | | 206,500 | |
Weyerhaeuser 4.625% 9/15/23 | | | 130,000 | | | | 139,786 | |
Yamana Gold 144A 4.95% 7/15/24 # | | | 95,000 | | | | 95,207 | |
| | | | | | | | |
| | | | | | | 4,548,627 | |
| | | | | | | | |
Brokerage – 0.75% | | | | | | | | |
Jefferies Group | | | | | | | | |
5.125% 1/20/23 | | | 285,000 | | | | 304,625 | |
6.45% 6/8/27 | | | 60,000 | | | | 67,878 | |
6.50% 1/20/43 | | | 50,000 | | | | 56,544 | |
Lazard Group 6.85% 6/15/17 | | | 366,000 | | | | 415,888 | |
| | | | | | | | |
| | | | | | | 844,935 | |
| | | | | | | | |
Capital Goods – 1.22% | | | | | | | | |
Algeco Scotsman Global Finance 144A 8.50% 10/15/18 # | | | 545,000 | | | | 561,350 | |
Caterpillar 3.40% 5/15/24 | | | 105,000 | | | | 105,757 | |
Cemex 144A 9.50% 6/15/18 # | | | 200,000 | | | | 224,000 | |
Crane | | | | | | | | |
2.75% 12/15/18 | | | 35,000 | | | | 35,647 | |
4.45% 12/15/23 | | | 145,000 | | | | 152,303 | |
Ingersoll-Rand Global Holding 4.25% 6/15/23 | | | 55,000 | | | | 58,049 | |
URS 3.85% 4/1/17 | | | 25,000 | | | | 25,921 | |
Votorantim Cimentos 144A 7.25% 4/5/41 # | | | 200,000 | | | | 209,250 | |
| | | | | | | | |
| | | | | | | 1,372,277 | |
| | | | | | | | |
Communications – 7.58% | | | | | | | | |
American Tower Trust I | | | | | | | | |
144A 1.551% 3/15/43 # | | | 85,000 | | | | 84,339 | |
144A 3.07% 3/15/23 # | | | 210,000 | | | | 206,611 | |
AT&T 4.80% 6/15/44 | | | 495,000 | | | | 503,506 | |
Bharti Airtel International Netherlands 144A | | | | | | | | |
5.35% 5/20/24 # | | | 200,000 | | | | 210,416 | |
CC Holdings GS V 3.849% 4/15/23 | | | 100,000 | | | | 99,834 | |
CenturyLink 5.80% 3/15/22 | | | 265,000 | | | | 272,950 | |
Columbus International 144A 7.375% 3/30/21 # | | | 200,000 | | | | 211,750 | |
Crown Castle Towers 144A 4.883% 8/15/20 # | | | 505,000 | | | | 559,389 | |
Digicel Group 144A 8.25% 9/30/20 # | | | 200,000 | | | | 216,500 | |
DIRECTV Holdings | | | | | | | | |
4.45% 4/1/24 | | | 325,000 | | | | 341,092 | |
5.15% 3/15/42 | | | 30,000 | | | | 31,071 | |
DISH DBS 5.00% 3/15/23 | | | 655,000 | | | | 643,537 | |
20
| | | | | | | | |
| | | Principal amount° | | | Value (U.S. $) | |
| |
Corporate Bonds (continued) | | | | | | | | |
| |
Communications (continued) | | | | | | | | |
Grupo Televisa 5.00% 5/13/45 | | | 200,000 | | | $ | 200,152 | |
Intelsat Luxembourg 8.125% 6/1/23 | | | 470,000 | | | | 490,563 | |
Nielsen Finance 4.50% 10/1/20 | | | 735,000 | | | | 731,325 | |
SBA Tower Trust 144A 2.24% 4/16/18 # | | | 160,000 | | | | 158,544 | |
SES Global Americas Holdings 144A 5.30% 3/25/44 # | | | 430,000 | | | | 456,922 | |
Sinclair Television Group 6.125% 10/1/22 | | | 430,000 | | | | 446,125 | |
Sprint 144A 7.125% 6/15/24 # | | | 160,000 | | | | 163,800 | |
Telefonica Emisiones 4.57% 4/27/23 | | | 400,000 | | | | 423,254 | |
Telemar Norte Leste 144A 5.50% 10/23/20 # | | | 165,000 | | | | 162,938 | |
Time Warner 3.55% 6/1/24 | | | 170,000 | | | | 167,757 | |
Time Warner Cable 8.25% 4/1/19 | | | 335,000 | | | | 421,216 | |
Verizon Communications | | | | | | | | |
5.15% 9/15/23 | | | 190,000 | | | | 210,655 | |
6.40% 9/15/33 | | | 55,000 | | | | 68,403 | |
6.55% 9/15/43 | | | 135,000 | | | | 170,160 | |
Viacom 5.25% 4/1/44 | | | 120,000 | | | | 126,336 | |
Zayo Group 10.125% 7/1/20 | | | 645,000 | | | | 734,494 | |
| | | | | | | | |
| | | | | | | 8,513,639 | |
| | | | | | | | |
Consumer Cyclical – 2.70% | | | | | | | | |
Bed Bath & Beyond | | | | | | | | |
4.915% 8/1/34 | | | 110,000 | | | | 111,208 | |
5.165% 8/1/44 | | | 95,000 | | | | 94,965 | |
Delphi 4.15% 3/15/24 | | | 140,000 | | | | 143,374 | |
eBay 3.45% 8/1/24 | | | 225,000 | | | | 222,914 | |
General Motors 3.50% 10/2/18 | | | 115,000 | | | | 116,150 | |
Historic TW 6.875% 6/15/18 | | | 220,000 | | | | 259,820 | |
Host Hotels & Resorts | | | | | | | | |
3.75% 10/15/23 | | | 230,000 | | | | 227,591 | |
4.75% 3/1/23 | | | 175,000 | | | | 185,858 | |
5.875% 6/15/19 | | | 75,000 | | | | 80,142 | |
Hyundai Capital America 144A 2.125% 10/2/17 # | | | 130,000 | | | | 131,574 | |
International Game Technology 5.35% 10/15/23 | | | 170,000 | | | | 176,343 | |
Magna International 3.625% 6/15/24 | | | 130,000 | | | | 130,830 | |
Marriott International 3.375% 10/15/20 | | | 100,000 | | | | 103,064 | |
QVC 4.375% 3/15/23 | | | 270,000 | | | | 271,801 | |
Signet UK Finance 4.70% 6/15/24 | | | 155,000 | | | | 157,665 | |
Target | | | | | | | | |
2.30% 6/26/19 | | | 65,000 | | | | 65,325 | |
3.50% 7/1/24 | | | 80,000 | | | | 80,458 | |
TRW Automotive 144A 4.45% 12/1/23 # | | | 270,000 | | | | 275,400 | |
Wyndham Worldwide | | | | | | | | |
4.25% 3/1/22 | | | 100,000 | | | | 102,014 | |
21
Schedule of investments
Delaware Core Plus Bond Fund
| | | | | | | | |
| | | Principal amount° | | | Value (U.S. $) | |
| |
Corporate Bonds (continued) | | | | | | | | |
| |
Consumer Cyclical (continued) | | | | | | | | |
Wyndham Worldwide | | | | | | | | |
5.625% 3/1/21 | | | 90,000 | | | $ | 101,021 | |
| | | | | | | | |
| | | | | | | 3,037,517 | |
| | | | | | | | |
Consumer Non-Cyclical – 3.11% | | | | | | | | |
Actavis Funding 144A 3.85% 6/15/24 # | | | 290,000 | | | | 289,967 | |
Amgen 3.625% 5/22/24 | | | 280,000 | | | | 281,098 | |
Boston Scientific 6.00% 1/15/20 | | | 240,000 | | | | 278,113 | |
BRF 144A 3.95% 5/22/23 # | | | 255,000 | | | | 239,623 | |
CareFusion 6.375% 8/1/19 | | | 185,000 | | | | 215,299 | |
Celgene | | | | | | | | |
3.625% 5/15/24 | | | 15,000 | | | | 15,029 | |
3.95% 10/15/20 | | | 245,000 | | | | 256,705 | |
4.625% 5/15/44 | | | 35,000 | | | | 34,986 | |
Constellation Brands 4.25% 5/1/23 | | | 75,000 | | | | 74,250 | |
Cosan Luxembourg 144A 5.00% 3/14/23 # | | | 200,000 | | | | 189,500 | |
Express Scripts Holding | | | | | | | | |
2.25% 6/15/19 | | | 95,000 | | | | 94,147 | |
3.50% 6/15/24 | | | 205,000 | | | | 202,614 | |
Forest Laboratories 144A 4.375% 2/1/19 # | | | 70,000 | | | | 75,145 | |
Gilead Sciences 3.70% 4/1/24 | | | 185,000 | | | | 190,018 | |
Immucor 11.125% 8/15/19 | | | 30,000 | | | | 33,150 | |
JBS Investments 144A 7.75% 10/28/20 # | | | 200,000 | | | | 215,500 | |
McKesson 3.796% 3/15/24 | | | 230,000 | | | | 233,995 | |
Mylan 144A 6.00% 11/15/18 # | | | 245,000 | | | | 255,230 | |
Quest Diagnostics 2.70% 4/1/19 | | | 70,000 | | | | 70,360 | |
Thermo Fisher Scientific 2.40% 2/1/19 | | | 250,000 | | | | 251,097 | |
| | | | | | | | |
| | | | | | | 3,495,826 | |
| | | | | | | | |
Electric – 4.70% | | | | | | | | |
AES 7.375% 7/1/21 | | | 135,000 | | | | 154,575 | |
AES Gener 144A 8.375% 12/18/73 #— | | | 200,000 | | | | 225,200 | |
Ameren Illinois 9.75% 11/15/18 | | | 389,000 | | | | 508,412 | |
American Transmission Systems 144A 5.25% 1/15/22 # | | | 100,000 | | | | 109,113 | |
Cleveland Electric Illuminating 5.50% 8/15/24 | | | 230,000 | | | | 265,963 | |
CMS Energy 6.25% 2/1/20 | | | 190,000 | | | | 224,711 | |
ComEd Financing III 6.35% 3/15/33 | | | 190,000 | | | | 196,175 | |
Electricite de France | | | | | | | | |
144A 4.60% 1/27/20 # | | | 30,000 | | | | 33,252 | |
144A 5.25% 12/29/49 #— | | | 425,000 | | | | 432,918 | |
Enel 144A 8.75% 9/24/73 #— | | | 200,000 | | | | 237,000 | |
Entergy Arkansas 3.70% 6/1/24 | | | 45,000 | | | | 46,724 | |
Great Plains Energy 5.292% 6/15/22 | | | 230,000 | | | | 262,667 | |
Integrys Energy Group 6.11% 12/1/66 — | | | 195,000 | | | | 199,046 | |
22
| | | | | | | | |
| | | Principal amount° | | | Value (U.S. $) | |
| |
Corporate Bonds (continued) | | | | | | | | |
| |
Electric (continued) | | | | | | | | |
ITC Holdings 3.65% 6/15/24 | | | 80,000 | | | $ | 79,727 | |
LG&E & KU Energy 4.375% 10/1/21 | | | 380,000 | | | | 408,063 | |
Metropolitan Edison 144A 4.00% 4/15/25 # | | | 50,000 | | | | 50,777 | |
National Rural Utilities Cooperative Finance | | | | | | | | |
4.75% 4/30/43 — | | | 190,000 | | | | 189,639 | |
NextEra Energy Capital Holdings | | | | | | | | |
2.40% 9/15/19 | | | 155,000 | | | | 155,583 | |
3.625% 6/15/23 | | | 65,000 | | | | 65,459 | |
NV Energy 6.25% 11/15/20 | | | 100,000 | | | | 118,581 | |
Pennsylvania Electric 5.20% 4/1/20 | | | 175,000 | | | | 192,537 | |
Puget Energy 6.00% 9/1/21 | | | 65,000 | | | | 76,184 | |
SCANA 4.125% 2/1/22 | | | 85,000 | | | | 88,240 | |
State Grid Overseas Investment 2014 144A | | | | | | | | |
4.125% 5/7/24 # | | | 200,000 | | | | 207,211 | |
Transelec 144A 4.25% 1/14/25 # | | | 200,000 | | | | 198,831 | |
Wisconsin Energy 6.25% 5/15/67 — | | | 535,000 | | | | 551,480 | |
| | | | | | | | |
| | | | | | | 5,278,068 | |
| | | | | | | | |
Energy – 8.03% | | | | | | | | |
Anadarko Petroleum 3.45% 7/15/24 | | | 125,000 | | | | 124,050 | |
Cimarex Energy 4.375% 6/1/24 | | | 80,000 | | | | 81,900 | |
CNOOC Nexen Finance 2014 4.25% 4/30/24 | | | 200,000 | | | | 205,109 | |
Continental Resources 4.50% 4/15/23 | | | 320,000 | | | | 341,504 | |
Ecopetrol 5.875% 5/28/45 | | | 70,000 | | | | 73,500 | |
El Paso Pipeline Partners Operating 4.30% 5/1/24 | | | 145,000 | | | | 145,716 | |
Enbridge Energy Partners 8.05% 10/1/37 — | | | 245,000 | | | | 277,463 | |
Energy Transfer Partners | | | | | | | | |
5.15% 2/1/43 | | | 100,000 | | | | 100,785 | |
5.95% 10/1/43 | | | 140,000 | | | | 156,172 | |
9.70% 3/15/19 | | | 127,000 | | | | 165,083 | |
EnLink Midstream Partners 4.40% 4/1/24 | | | 235,000 | | | | 246,135 | |
Enterprise Products Operating 7.034% 1/15/68 — | | | 450,000 | | | | 512,835 | |
KazMunayGas National 144A 9.125% 7/2/18 # | | | 210,000 | | | | 254,887 | |
Kinder Morgan Energy Partners 9.00% 2/1/19 | | | 415,000 | | | | 527,418 | |
Newfield Exploration 5.625% 7/1/24 | | | 175,000 | | | | 189,875 | |
Odebrecht Offshore Drilling Finance 144A | | | | | | | | |
6.625% 10/1/22 # | | | 197,780 | | | | 208,905 | |
Oleoducto Central 144A 4.00% 5/7/21 # | | | 200,000 | | | | 202,750 | |
ONGC Videsh 2.50% 5/7/18 | | | 200,000 | | | | 196,986 | |
Pacific Rubiales Energy | | | | | | | | |
144A 5.375% 1/26/19 # | | | 100,000 | | | | 102,250 | |
144A 7.25% 12/12/21 # | | | 100,000 | | | | 109,500 | |
23
Schedule of investments
Delaware Core Plus Bond Fund
| | | | | | | | |
| | | Principal amount° | | | Value (U.S. $) | |
| |
Corporate Bonds (continued) | | | | | | | | |
| |
Energy (continued) | | | | | | | | |
Petrobras Global Finance | | | | | | | | |
4.875% 3/17/20 | | | 60,000 | | | $ | 61,278 | |
6.25% 3/17/24 | | | 60,000 | | | | 63,485 | |
Petrobras International Finance 5.375% 1/27/21 | | | 135,000 | | | | 139,733 | |
Petrohawk Energy 7.25% 8/15/18 | | | 340,000 | | | | 352,940 | |
Petroleos de Venezuela 9.00% 11/17/21 | | | 70,000 | | | | 59,850 | |
Plains All American Pipeline 8.75% 5/1/19 | | | 195,000 | | | | 249,319 | |
Pride International 6.875% 8/15/20 | | | 475,000 | | | | 571,979 | |
PTT Exploration & Production 144A 4.875% 12/29/49 #— | | | 200,000 | | | | 202,700 | |
QEP Resources 5.375% 10/1/22 | | | 645,000 | | | | 659,513 | |
Samson Investment 144A 10.75% 2/15/20 # | | | 425,000 | | | | 432,438 | |
SandRidge Energy 8.125% 10/15/22 | | | 235,000 | | | | 251,450 | |
Sunoco Logistics Partners Operations 3.45% 1/15/23 | | | 165,000 | | | | 161,314 | |
Talisman Energy 5.50% 5/15/42 | | | 375,000 | | | | 407,296 | |
TransCanada PipeLines 6.35% 5/15/67 — | | | 290,000 | | | | 302,905 | |
Williams 4.55% 6/24/24 | | | 90,000 | | | | 89,847 | |
Williams Partners 7.25% 2/1/17 | | | 535,000 | | | | 607,773 | |
Woodside Finance 144A 8.75% 3/1/19 # | | | 115,000 | | | | 145,121 | |
YPF 144A 8.75% 4/4/24 # | | | 40,000 | | | | 41,700 | |
| | | | | | | | |
| | | | | | | 9,023,464 | |
| | | | | | | | |
Finance Companies – 0.74% | | | | | | | | |
General Electric Capital | | | | | | | | |
2.10% 12/11/19 | | | 65,000 | | | | 64,777 | |
3.45% 5/15/24 | | | 300,000 | | | | 301,184 | |
7.125% 12/29/49 — | | | 400,000 | | | | 468,722 | |
| | | | | | | | |
| | | | | | | 834,683 | |
| | | | | | | | |
Insurance – 2.46% | | | | | | | | |
Allstate 5.75% 8/15/53 — | | | 185,000 | | | | 199,337 | |
American International Group | | | | | | | | |
8.175% 5/15/58 — | | | 200,000 | | | | 277,250 | |
8.25% 8/15/18 | | | 100,000 | | | | 123,146 | |
Chubb 6.375% 3/29/67 — | | | 480,000 | | | | 531,600 | |
Five Corners Funding Trust 144A 4.419% 11/15/23 # | | | 100,000 | | | | 104,948 | |
Highmark | | | | | | | | |
144A 4.75% 5/15/21 # | | | 200,000 | | | | 203,394 | |
144A 6.125% 5/15/41 # | | | 30,000 | | | | 29,793 | |
ING U.S. 5.65% 5/15/53 — | | | 220,000 | | | | 224,950 | |
Liberty Mutual Group 144A 4.25% 6/15/23 # | | | 200,000 | | | | 206,037 | |
MetLife 3.60% 4/10/24 | | | 170,000 | | | | 172,694 | |
Prudential Financial | | | | | | | | |
3.875% 1/14/15 | | | 65,000 | | | | 66,014 | |
24
| | | | | | | | |
| | | Principal amount° | | | Value (U.S. $) | |
| |
Corporate Bonds (continued) | | | | | | | | |
| |
Insurance (continued) | | | | | | | | |
Prudential Financial | | | | | | | | |
4.50% 11/15/20 | | | 50,000 | | | $ | 54,555 | |
5.625% 6/15/43 — | | | 95,000 | | | | 102,125 | |
5.875% 9/15/42 — | | | 245,000 | | | | 266,438 | |
6.00% 12/1/17 | | | 40,000 | | | | 45,491 | |
XL Group 6.50% 12/29/49 — | | | 160,000 | | | | 157,200 | |
| | | | | | | | |
| | | | | | | 2,764,972 | |
| | | | | | | | |
REITs – 1.33% | | | | | | | | |
Alexandria Real Estate Equities | | | | | | | | |
3.90% 6/15/23 | | | 30,000 | | | | 29,819 | |
4.50% 7/30/29 | | | 60,000 | | | | 60,574 | |
Carey (W.P.) 4.60% 4/1/24 | | | 90,000 | | | | 92,905 | |
CBL & Associates 5.25% 12/1/23 | | | 95,000 | | | | 101,491 | |
Corporate Office Properties | | | | | | | | |
3.60% 5/15/23 | | | 150,000 | | | | 143,858 | |
5.25% 2/15/24 | | | 85,000 | | | | 90,919 | |
DDR | | | | | | | | |
4.75% 4/15/18 | | | 80,000 | | | | 86,592 | |
7.875% 9/1/20 | | | 90,000 | | | | 113,154 | |
9.625% 3/15/16 | | | 150,000 | | | | 170,404 | |
Digital Realty Trust 5.875% 2/1/20 | | | 95,000 | | | | 105,769 | |
Excel Trust 4.625% 5/15/24 | | | 65,000 | | | | 66,375 | |
Healthcare Trust of America Holdings 3.375% 7/15/21 | | | 55,000 | | | | 54,731 | |
Regency Centers | | | | | | | | |
4.80% 4/15/21 | | | 55,000 | | | | 60,155 | |
5.875% 6/15/17 | | | 95,000 | | | | 106,285 | |
Trust F/1401 144A 5.25% 12/15/24 # | | | 200,000 | | | | 209,750 | |
| | | | | | | | |
| | | | | | | 1,492,781 | |
| | | | | | | | |
Technology – 3.39% | | | | | | | | |
Apple 3.45% 5/6/24 | | | 445,000 | | | | 448,623 | |
Baidu 3.25% 8/6/18 | | | 245,000 | | | | 252,746 | |
BMC Software Finance 144A 8.125% 7/15/21 # | | | 550,000 | | | | 550,000 | |
Broadcom | | | | | | | | |
3.50% 8/1/24 | | | 45,000 | | | | 44,752 | |
4.50% 8/1/34 | | | 95,000 | | | | 96,583 | |
International Business Machines 3.625% 2/12/24 | | | 605,000 | | | | 619,404 | |
National Semiconductor 6.60% 6/15/17 | | | 255,000 | | | | 293,160 | |
NetApp 3.25% 12/15/22 | | | 45,000 | | | | 43,425 | |
Oracle | | | | | | | | |
3.40% 7/8/24 | | | 220,000 | | | | 219,518 | |
4.50% 7/8/44 | | | 75,000 | | | | 75,769 | |
Samsung Electronics America 144A 1.75% 4/10/17 # | | | 200,000 | | �� | | 200,810 | |
25
Schedule of investments
Delaware Core Plus Bond Fund
| | | | | | | | |
| | | Principal amount° | | | Value (U.S. $) | |
| |
Corporate Bonds (continued) | | | | | | | | |
| |
Technology (continued) | | | | | | | | |
Seagate HDD Cayman 144A 4.75% 1/1/25 # | | | 195,000 | | | $ | 193,050 | |
Tencent Holdings 144A 3.375% 5/2/19 # | | | 200,000 | | | | 203,332 | |
Xerox 6.35% 5/15/18 | | | 490,000 | | | | 564,432 | |
| | | | | | | | |
| | | | | | | 3,805,604 | |
| | | | | | | | |
Transportation – 0.52% | | | | | | | | |
Brambles USA 144A 3.95% 4/1/15 # | | | 80,000 | | | | 81,626 | |
DP World 144A 6.85% 7/2/37 # | | | 100,000 | | | | 112,000 | |
ERAC USA Finance 144A 5.25% 10/1/20 # | | | 220,000 | | | | 249,072 | |
United Airlines 2014-1 Class A Pass Through Trust | | | | | | | | |
4.00% 4/11/26 ¿ | | | 45,000 | | | | 45,619 | |
United Airlines 2014-2 Class A Pass Through Trust | | | | | | | | |
3.75% 9/3/26 ¿ | | | 100,000 | | | | 99,972 | |
| | | | | | | | |
| | | | | | | 588,289 | |
| | | | | | | | |
Total Corporate Bonds (cost $52,500,040) | | | | | | | 54,605,263 | |
| | | | | | | | |
|
| |
Municipal Bonds – 0.46% | | | | | | | | |
| |
Golden State, California Tobacco Securitization Corporation Settlement Revenue (Asset-Backed Senior Notes) Series A-1 | | | | | | | | |
5.125% 6/1/47 | | | 80,000 | | | | 59,134 | |
5.75% 6/1/47 | | | 30,000 | | | | 24,138 | |
New Jersey Transportation Trust Fund Authority Series AA 5.00% 6/15/44 | | | 130,000 | | | | 137,285 | |
New York City, New York | | | | | | | | |
Series I 5.00% 8/1/22 | | | 50,000 | | | | 59,719 | |
New York State Thruway Authority Revenue | | | | | | | | |
Series A 5.00% 5/1/19 | | | 60,000 | | | | 69,578 | |
State of Maryland Local Facilities | | | | | | | | |
Series A 5.00% 8/1/21 | | | 85,000 | | | | 103,215 | |
Texas Private Activity Bond Surface Transportation Senior Lien Revenue Bond | | | | | | | | |
6.75% 6/30/43 (AMT) | | | 55,000 | | | | 65,521 | |
| | | | | | | | |
Total Municipal Bonds (cost $480,638) | | | | | | | 518,590 | |
| | | | | | | | |
|
| |
Non-Agency Asset-Backed Securities – 3.53% | | | | | | | | |
| |
AEP Texas Central Transition Funding II | | | | | | | | |
Series 2006-A A4 5.17% 1/1/18 | | | 100,000 | | | | 108,693 | |
Ally Master Owner Trust | | | | | | | | |
Series 2013-1 A2 1.00% 2/15/18 | | | 100,000 | | | | 100,157 | |
Series 2013-2 A 0.602% 4/15/18 — | | | 200,000 | | | | 200,345 | |
Series 2014-2 A 0.522% 1/16/18 — | | | 280,000 | | | | 280,165 | |
26
| | | | | | | | |
| | | Principal amount° | | | Value (U.S. $) | |
| |
Non-Agency Asset-Backed Securities (continued) | | | | | | | | |
| |
American Express Credit Account Master Trust | | | | | | | | |
Series 2013-2 A 0.572% 5/17/21 — | | | 100,000 | | | $ | 100,378 | |
Avis Budget Rental Car Funding AESOP | | | | | | | | |
Series 2011-3A A 144A 3.41% 11/20/17 # | | | 100,000 | | | | 104,279 | |
Series 2013-1A A 144A 1.92% 9/20/19 # | | | 120,000 | | | | 118,948 | |
Series 2014-1A A 144A 2.46% 7/20/20 # | | | 200,000 | | | | 199,967 | |
California Republic Auto Receivables Trust | | | | | | | | |
Series 2013-1 A2 144A 1.41% 9/17/18 # | | | 70,906 | | | | 71,479 | |
Capital One Multi-Asset Execution Trust | | | | | | | | |
Series 2007-A7 A7 5.75% 7/15/20 | | | 100,000 | | | | 112,866 | |
Series 2013-A2 A2 0.332% 2/15/19 — | | | 440,000 | | | | 439,924 | |
Chase Issuance Trust | | | | | | | | |
Series 2013-A6 A6 0.572% 7/15/20 — | | | 150,000 | | | | 150,551 | |
Citibank Credit Card Issuance Trust | | | | | | | | |
Series 2013-A4 A4 0.575% 7/24/20 — | | | 100,000 | | | | 100,521 | |
Series 2014-A6 A6 2.15% 7/15/21 | | | 100,000 | | | | 99,954 | |
Dell Equipment Finance Trust | | | | | | | | |
Series 2014-1 A3 144A 0.94% 6/22/20 # | | | 100,000 | | | | 100,000 | |
Discover Card Execution Note Trust | | | | | | | | |
Series 2014-A3 A3 1.22% 10/15/19 | | | 200,000 | | | | 199,621 | |
Series 2014-A4 A4 2.12% 12/15/21 | | | 400,000 | | | | 399,587 | |
General Electric Capital Credit Card Master Note Trust | | | | | | | | |
Series 2012-7 A 1.76% 9/15/22 | | | 100,000 | | | | 96,633 | |
Golden Credit Card Trust | | | | | | | | |
Series 2014-2A A 144A 0.602% 3/15/21 #— | | | 300,000 | | | | 300,830 | |
GreatAmerica Leasing Receivables | | | | | | | | |
Series 2014-1 A3 144A 0.89% 7/15/17 # | | | 100,000 | | | | 99,903 | |
Hyundai Auto Lease Securitization Trust | | | | | | | | |
Series 2014-A A4 144A 1.01% 9/15/17 # | | | 125,000 | | | | 125,213 | |
MMAF Equipment Finance | | | | | | | | |
Series 2014-AA A4 144A 1.59% 2/8/22 # | | | 110,000 | | | | 109,294 | |
Trafigura Securitisation Finance | | | | | | | | |
Series 2012-1A A 144A 2.552% 10/15/15 #— | | | 160,000 | | | | 161,206 | |
Volvo Financial Equipment | | | | | | | | |
Series 2014-1A A3 144A 0.82% 4/16/18 # | | | 80,000 | | | | 79,870 | |
World Omni Automobile Lease Securitization Trust | | | | | | | | |
Series 2012-A A3 0.93% 11/16/15 | | | 101,291 | | | | 101,363 | |
| | | | | | | | |
Total Non-Agency Asset-Backed Securities
(cost $3,973,157) | | | | | | | 3,961,747 | |
| | | | | | | | |
|
| |
Non-Agency Collateralized Mortgage Obligations – 0.76% | | | | | | | | |
| |
American Home Mortgage Investment Trust | | | | | | | | |
Series 2005-2 5A1 5.064% 9/25/35 f | | | 9,050 | | | | 8,997 | |
27
Schedule of investments
Delaware Core Plus Bond Fund
| | | | | | | | |
| | | Principal amount° | | | Value (U.S. $) | |
| |
Non-Agency Collateralized Mortgage Obligations (continued) | | | | | | | | |
| |
Citicorp Residential Mortgage Trust | | | | | | | | |
Series 2006-3 A5 5.948% 11/25/36 f | | | 300,000 | | | $ | 300,222 | |
Credit Suisse First Boston Mortgage Securities | | | | | | | | |
Series 2005-5 6A3 5.00% 7/25/35 | | | 125,880 | | | | 126,131 | |
GSMPS Mortgage Loan Trust | | | | | | | | |
Series 1998-2 A 144A 7.62% 5/19/27 #— | | | 59,982 | | | | 60,812 | |
JPMorgan Mortgage Trust | | | | | | | | |
Series 2006-S1 1A1 6.00% 4/25/36 | | | 73,044 | | | | 73,763 | |
Series 2007-A1 7A4 2.558% 7/25/35 — | | | 179,932 | | | | 162,265 | |
Structured Asset Securities Corporation Mortgage Pass Through Certificates | | | | | | | | |
Series 2004-20 2A1 5.50% 11/25/34 t | | | 44,763 | | | | 45,703 | |
Washington Mutual Alternative Mortgage Pass Through Certificates | | | | | | | | |
Series 2005-1 5A2 6.00% 3/25/35 t | | | 108,146 | | | | 55,738 | |
Wells Fargo Mortgage-Backed Securities Trust | | | | | | | | |
Series 2006-AR5 2A1 2.615% 4/25/36 — | | | 22,809 | | | | 22,019 | |
| | | | | | | | |
Total Non-Agency Collateralized Mortgage Obligations (cost $879,914) | | | | | | | 855,650 | |
| | | | | | | | |
|
| |
Senior Secured Loans – 10.02%« | | | | | | | | |
| |
Activision Blizzard Tranche B 1st Lien 3.25% 9/12/20 | | | 292,388 | | | | 292,388 | |
ARAMARK Tranche E 3.25% 9/7/19 | | | 169,575 | | | | 168,501 | |
Azure Midstream Tranche B 6.50% 10/21/18 | | | 56,896 | | | | 57,251 | |
BJ’s Wholesale Club 2nd Lien 8.50% 3/31/20 | | | 160,000 | | | | 162,550 | |
BJ’s Wholesale Club Tranche B 1st Lien 4.50% 9/26/19 | | | 317,975 | | | | 317,801 | |
Burlington Coat Factory Warehouse Tranche B2 | | | | | | | | |
4.25% 2/23/17 | | | 664,433 | | | | 666,509 | |
Caesars Growth Partners Tranche B 1st Lien | | | | | | | | |
6.25% 5/8/21 | | | 115,000 | | | | 114,749 | |
Calpine Construction Finance Tranche B2 3.25% 1/31/22 | | | 288,547 | | | | 285,632 | |
Chrysler Group Tranche B 1st Lien 3.50% 5/24/17 | | | 167,837 | | | | 168,099 | |
Clear Channel Communications Tranche B 3.65% 1/29/16 | | | 226,352 | | | | 224,682 | |
DaVita Healthcare Partners Tranche B 3.50% 6/19/21 | | | 570,000 | | | | 569,847 | |
DrillShips Financing Holding Tranche B1 6.00% 2/17/21 | | | 168,300 | | | | 169,983 | |
Emdeon 1st Lien 3.75% 11/2/18 | | | 575,468 | | | | 575,684 | |
Energy Transfer Equity 1st Lien 3.25% 12/2/19 | | | 125,000 | | | | 123,482 | |
First Data Tranche B 1st Lien 4.00% 3/24/21 | | | 300,857 | | | | 301,019 | |
Hilton Worldwide Finance Tranche B2 3.50% 9/23/20 | | | 608,400 | | | | 606,341 | |
Houghton International 2nd Lien 9.50% 11/20/20 | | | 475,000 | | | | 484,500 | |
IASIS Healthcare Tranche B 1st Lien 4.50% 5/3/18 | | | 205,283 | | | | 206,021 | |
Immucor Tranche B2 5.00% 8/19/18 | | | 492,164 | | | | 494,933 | |
Infor U.S. Tranche B5 1st Lien 3.75% 6/3/20 | | | 176,730 | | | | 175,515 | |
Intelsat Jackson Holdings Tranche B2 3.75% 6/30/19 | | | 519,117 | | | | 519,117 | |
Landry’s Tranche B 4.00% 4/24/18 | | | 173,236 | | | | 173,843 | |
28
| | | | | | | | | | | | |
| | | | | | Principal amount° | | | Value (U.S. $) | |
| |
Senior Secured Loans« (continued) | | | | | | | | | | | | |
| |
Level 3 Financing Tranche B 4.00% 1/15/20 | | | | | | | 250,000 | | | $ | 249,766 | |
Novelis Tranche B 3.75% 3/10/17 | | | | | | | 181,189 | | | | 181,482 | |
Nuveen Investments 1st Lien 4.00% 5/13/17 | | | | | | | 550,000 | | | | 550,650 | |
Nuveen Investments 2nd Lien 6.50% 2/28/19 | | | | | | | 870,000 | | | | 872,538 | |
Samson Investment 2nd Lien 5.00% 9/25/18 | | | | | | | 345,000 | | | | 344,631 | |
Scientific Games International 4.25% 5/22/20 | | | | | | | 268,650 | | | | 265,220 | |
Smart & Final Tranche B 1st Lien 4.75% 11/15/19 | | | | | | | 191,093 | | | | 191,511 | |
Sprouts Farmers 4.00% 4/12/20 | | | | | | | 148,528 | | | | 148,590 | |
Univision Communications Tranche C4 4.00% 3/1/20 | | | | | | | 556,503 | | | | 553,720 | |
USI Insurance Services | | | | | | | | | | | | |
Tranche B 1st Lien 4.25% 12/3/18 | | | | | | | 187,161 | | | | 187,434 | |
Valeant Pharmaceuticals International Tranche BE | | | | | | | | | | | | |
3.75% 8/5/20 | | | | | | | 199,049 | | | | 198,897 | |
Vantage Drilling Tranche B 1st Lien 5.00% 10/25/17 | | | | | | | 154,245 | | | | 153,763 | |
Zayo Group Tranche B 1st Lien 4.00% 7/2/19 | | | | | | | 504,738 | | | | 503,042 | |
| | | | | | | | | | | | |
Total Senior Secured Loans (cost $11,206,851) | | | | | | | | | | | 11,259,691 | |
| | | | | | | | | | | | |
|
| |
Sovereign Bonds – 0.20%D | |
| |
Brazil – 0.03% | | | | | | | | | | | | |
Brazil Notas do Tesouro Nacional Series F 10.00% 1/1/25 | | | BRL | | | | 94,000 | | | | 36,750 | |
| | | | | | | | | | | | |
| | | | | | | | | | | 36,750 | |
| | | | | | | | | | | | |
Colombia – 0.03% | | | | | | | | | | | | |
Colombia Government International Bond 9.85% 6/28/27 | | | COP | | | | 43,000,000 | | | | 29,673 | |
| | | | | | | | | | | | |
| | | | | | | | | | | 29,673 | |
| | | | | | | | | | | | |
Mexico – 0.03% | | | | | | | | | | | | |
Mexican Bonos 7.75% 5/29/31 | | | MXN | | | | 402,000 | | | | 34,258 | |
| | | | | | | | | | | | |
| | | | | | | | | | | 34,258 | |
| | | | | | | | | | | | |
Romania – 0.07% | | | | | | | | | | | | |
Romanian Government International Bond 144A | | | | | | | | | | | | |
4.875% 1/22/24 # | | | | | | | 72,000 | | | | 76,950 | |
| | | | | | | | | | | | |
| | | | | | | | | | | 76,950 | |
| | | | | | | | | | | | |
South Africa – 0.04% | | | | | | | | | | | | |
South Africa Government Bond 8.00% 1/31/30 | | | ZAR | | | | 507,000 | | | | 44,402 | |
| | | | | | | | | | | | |
| | | | | | | | | | | 44,402 | |
| | | | | | | | | | | | |
Total Sovereign Bonds (cost $219,694) | | | | | | | | | | | 222,033 | |
| | | | | | | | | | | | |
29
Schedule of investments
Delaware Core Plus Bond Fund
| | | | | | | | |
| | | Principal amount° | | | Value (U.S. $) | |
| |
U.S. Treasury Obligations – 3.90% | | | | | | | | |
| |
U.S. Treasury Bond | | | | | | | | |
3.375% 5/15/44 ¥ | | | 3,365,000 | | | $ | 3,406,013 | |
U.S. Treasury Notes | | | | | | | | |
1.625% 6/30/19 | | | 80,000 | | | | 79,516 | |
2.50% 5/15/24 | | | 900,000 | | | | 895,711 | |
| | | | | | | | |
Total U.S. Treasury Obligations (cost $4,414,370) | | | | | | | 4,381,240 | |
| | | | | | | | |
| | |
| | | Number of
Shares | | | | |
| |
Convertible Preferred Stock – 0.11% | | | | | | | | |
| |
ArcelorMittal 6.00% exercise price $20.36, expiration date 12/21/15 | | | 475 | | | | 11,036 | |
Bank of America 7.25% exercise price $50.00, expiration date 12/31/49 | | | 7 | | | | 8,087 | |
Chesapeake Energy 144A 5.75% exercise price $26.14,expiration date 12/31/49 # | | | 16 | | | | 18,800 | |
Dominion Resources 6.125% exercise price $65.21,expiration date 4/1/16 | | | 180 | | | | 9,972 | |
HealthSouth 6.50% exercise price $30.01, expiration date 12/31/49 | | | 10 | | | | 13,603 | |
Intelsat 5.75% exercise price $22.05, expiration date 5/1/16 | | | 405 | | | | 19,946 | |
SandRidge Energy 8.50% exercise price $8.01, expiration date 12/31/49 | | | 280 | | | | 29,155 | |
Wells Fargo 7.50% exercise price $156.71, expiration date 12/31/49 | | | 14 | | | | 16,940 | |
| | | | | | | | |
Total Convertible Preferred Stock (cost $129,783) | | | | | | | 127,539 | |
| | | | | | | | |
|
| |
Preferred Stock – 0.71% | | | | | | | | |
| |
Alabama Power 5.625% | | | 3,715 | | | | 91,166 | |
Integrys Energy Group 6.00% — | | | 4,400 | | | | 113,212 | |
MetLife 5.00% | | | 550 | | | | 16,643 | |
National Retail Properties 5.70% | | | 4,225 | | | | 98,992 | |
Public Storage 5.20% | | | 4,400 | | | | 98,868 | |
Regions Financial 6.375% — | | | 3,200 | | | | 81,440 | |
U.S. Bancorp 3.50% — | | | 350 | | | | 293,298 | |
| | | | | | | | |
Total Preferred Stock (cost $756,638) | | | | | | | 793,619 | |
| | | | | | | | |
| | |
| | | Principal amount° | | | | |
| |
Short-Term Investments – 14.56% | | | | | | | | |
| |
Discount Notes – 5.80%≠ | | | | | | | | |
Federal Home Loan Bank | | | | | | | | |
0.05% 8/14/14 | | | 2,957,854 | | | | 2,957,833 | |
30
| | | | | | | | |
| | | Principal amount° | | | Value (U.S. $) | |
| |
Short-Term Investments (continued) | | | | | | | | |
| |
Discount Notes≠ (continued) | | | | | | | | |
Federal Home Loan Bank | | | | | | | | |
0.05% 8/15/14 | | | 455,284 | | | $ | 455,280 | |
0.06% 8/18/14 | | | 1,673,565 | | | | 1,673,550 | |
0.075% 11/19/14 | | | 1,429,730 | | | | 1,429,425 | |
| | | | | | | | |
| | | | | | | 6,516,088 | |
| | | | | | | | |
Repurchase Agreements – 7.74% | | | | | | | | |
Bank of America Merrill Lynch
0.04%, dated 7/31/14, to be repurchased on 8/1/14,
repurchase price $2,713,688 (collateralized by U.S.
government obligations 0.00%–0.375%
6/25/15–2/15/24; market value $2,767,960) | | | 2,713,685 | | | | 2,713,685 | |
Bank of Montreal
0.07%, dated 7/31/14, to be repurchased on 8/1/14,
repurchase price $904,564 (collateralized by U.S.
government obligations 0.00%–4.375%
8/21/14–11/15/43; market value $922,653) | | | 904,562 | | | | 904,562 | |
BNP Paribas
0.07%, dated 7/31/14, to be repurchased on 8/1/14,
repurchase price $5,076,763 (collateralized by U.S.
government obligations 0.00%–2.75%
8/7/14–11/15/23; market value $5,178,288) | | | 5,076,753 | | | | 5,076,753 | |
| | | | | | | | |
| | | | | | | 8,695,000 | |
| | | | | | | | |
U.S. Treasury Obligation – 1.02%≠ | | | | | | | | |
U.S. Treasury Bill 0.093% 11/13/14 | | | 1,151,561 | | | | 1,151,452 | |
| | | | | | | | |
| | | | | | | 1,151,452 | |
| | | | | | | | |
Total Short-Term Investments (cost $16,362,248) | | | | | | | 16,362,540 | |
| | | | | | | | |
| | |
Total Value of Securities – 111.35% | | | | | | | | |
(cost $122,762,115) | | | | | | $ | 125,117,664 | |
| | | | | | | | |
| # | Security exempt from registration under Rule 144A of the Securities Act of 1933, as amended. At July 31, 2014, the aggregate value of Rule 144A securities was $17,333,674, which represented 15.43% of the Fund’s net assets. See Note 11 in “Notes to financial statements.” |
| ¿ | Pass Through Agreement. Security represents the contractual right to receive a proportionate amount of underlying payments due to the counterparty pursuant to various agreements related to the rescheduling of obligations and the exchange of certain notes. |
| ≠ | The rate shown is the effective yield at the time of purchase. |
| ° | Principal amount shown is stated in U.S. dollars unless noted that the security is denominated in another currency. |
| — | Variable rate security. The rate shown is the rate as of July 31, 2014. Interest rates reset periodically. |
| ¥ | Fully or partially pledged as collateral for futures contracts. |
31
Schedule of investments
Delaware Core Plus Bond Fund
| D | Securities have been classified by country of origin. |
| S | Interest only security. An interest only security is the interest only portion of a fixed income security which is separated and sold individually from the principal portion of the security. |
| « | Senior secured loans generally pay interest at rates which are periodically redetermined by reference to a base lending rate plus a premium. These base lending rates are generally: (i) the prime rate offered by one or more United States banks, (ii) the lending rate offered by one or more European banks such as the London Inter-Bank Offered Rate (LIBOR), and (iii) the certificate of deposit rate. Senior secured loans may be subject to restrictions on resale. Stated rate in effect at July 31, 2014. |
| f | Step coupon bond. Coupon increases or decreases periodically based on a predetermined schedule. Stated rate in effect at July 31, 2014. |
The following futures contracts and swap contracts were outstanding at July 31, 2014:1
Futures Contracts
| | | | | | | | | | | | | | | | | | |
| Contracts to Buy (Sell) | | Notional
Cost
(Proceeds) | | | Notional
Value | | | Expiration
Date | | Unrealized
Appreciation
(Depreciation) | |
| | (38) | | | U.S. Treasury 5 yr Notes | | $ | (4,545,053 | ) | | $ | (4,515,765 | ) | | 10/6/14 | | $ | 29,288 | |
| | 1 | | | U.S. Treasury 10 yr Notes | | | 125,081 | | | | 124,609 | | | 9/22/14 | | | (472 | ) |
| | 16 | | | U.S. Treasury Long Bonds | | | 2,206,420 | | | | 2,198,500 | | | 9/22/14 | | | (7,920 | ) |
| | | | | | | | | | | | | | | | | | |
| | | | | | $ | (2,213,552 | ) | | | | | | | | $ | 20,896 | |
| | | | | | | | | | | | | | | | | | |
Swap Contracts
CDS Contracts2
| | | | | | | | | | | | | | | | |
Counterparty | | Swap Referenced Obligation | | Notional Value | | | Annual
Protection
Payments | | | Termination Date | | Unrealized
Appreciation
(Depreciation) | |
| | Protection Purchased: | | | | | | | | | | | | | | |
MSC | | CDX.EM.21 | | $ | 230,000 | | | | 5.00 | % | | 6/20/19 | | $ | 98 | |
The use of futures contracts and swap contracts involves elements of market risk and risks in excess of the amounts disclosed in the financial statements. The notional values presented above represent the Fund’s total exposure in such contracts, whereas only the net unrealized appreciation (depreciation) is reflected in the Fund’s net assets.
1See Note 8 in “Notes to financial statements.”
2A CDS contract is a risk-transfer instrument through which one party (purchaser of protection) transfers to another party (seller of protection) the financial risk of a credit event (as defined in the CDS agreement), as it relates to a particular reference security or basket of securities (such as an index). Periodic payments (receipts) on such contracts are accrued daily and recorded as unrealized losses (gains) on swap contracts. Upon payment (receipt), such amounts are recorded as realized losses (gains) on swap contracts. Upfront payments made or received in connection with CDS contracts are amortized over the expected life of the CDS contracts as unrealized losses (gains) on swap contracts. The change in value of CDS contracts is recorded as unrealized appreciation or depreciation daily. A realized gain or loss is recorded upon a credit event (as defined in the CDS agreement) or the maturity or termination of the agreement.
32
Summary of abbreviations:
AMT – Subject to Alternative Minimum Tax
ARM – Adjustable Rate Mortgage
BRL – Brazilian Real
CDS – Credit Default Swap
CDX.EM – Credit Default Swap Index Emerging Markets
COP – Colombian Peso
GNMA – Government National Mortgage Association
GSMPS – Goldman Sachs Reperforming Mortgage Securities
HSBC – Hong Kong Shanghai Bank
MSC – Morgan Stanley Capital
MXN – Mexican Peso
NCUA – National Credit Union Administration
REIT – Real Estate Investment Trust
REMIC – Real Estate Mortgage Investment Conduit
S.F. – Single Family
TBA – To be announced
UBS – Union Bank of Switzerland
yr – Year
ZAR – South African Rand
See accompanying notes, which are an integral part of the financial statements.
33
Statement of assets and liabilities
| | |
| Delaware Core Plus Bond Fund | | July 31, 2014 |
| | | | |
Assets: | | | | |
Investments, at value1 | | $ | 108,755,124 | |
Short-term investments, at value2 | | | 16,362,540 | |
Cash | | | 200,935 | |
Foreign currencies, at value3 | | | 668 | |
Receivable for securities sold | | | 10,585,584 | |
Dividends and interest receivable | | | 891,167 | |
Receivable for fund shares sold | | | 83,849 | |
Unrealized gain on credit default swap contracts | | | 98 | |
| | | | |
Total assets | | | 136,879,965 | |
| | | | |
Liabilities: | | | | |
Payable for securities purchased | | | 24,125,439 | |
Payable for fund shares redeemed | | | 103,695 | |
Distribution payable | | | 84,379 | |
Variation margin due to broker on futures contracts | | | 2,734 | |
Swap payments payable | | | 1,342 | |
Other accrued expenses | | | 117,558 | |
Investment management fees payable | | | 28,679 | |
Distribution fees payable to affiliates | | | 24,797 | |
Other affiliates payable | | | 6,648 | |
Trustees’ fees and expenses payable | | | 265 | |
Upfront payment paid on credit default swap contracts | | | 23,262 | |
| | | | |
Total liabilities | | | 24,518,798 | |
| | | | |
Total Net Assets | | $ | 112,361,167 | |
| | | | |
| |
Net Assets Consist of: | | | | |
Paid-in capital | | $ | 112,212,343 | |
Distributions in excess of net investment income | | | (98,954 | ) |
Accumulated net realized loss on investments | | | (2,126,697 | ) |
Net unrealized appreciation of investments, foreign currencies, and derivatives | | | 2,374,475 | |
| | | | |
Total Net Assets | | $ | 112,361,167 | |
| | | | |
34
| | | | |
Net Asset Value | | | | |
Class A: | | | | |
Net assets | | $ | 65,465,539 | |
Shares of beneficial interest outstanding, unlimited authorization, no par | | | 7,676,965 | |
Net asset value per share | | $ | 8.53 | |
Sales charge | | | 4.50 | % |
Offering price per share, equal to net asset value per share/(1 – sales charge) | | $ | 8.93 | |
| |
Class B: | | | | |
Net assets | | $ | 288,989 | |
Shares of beneficial interest outstanding, unlimited authorization, no par | | | 33,889 | |
Net asset value per share | | $ | 8.53 | |
| |
Class C: | | | | |
Net assets | | $ | 8,571,862 | |
Shares of beneficial interest outstanding, unlimited authorization, no par | | | 1,003,993 | |
Net asset value per share | | $ | 8.54 | |
| |
Class R: | | | | |
Net assets | | $ | 7,793,315 | |
Shares of beneficial interest outstanding, unlimited authorization, no par | | | 910,861 | |
Net asset value per share | | $ | 8.56 | |
| |
Institutional Class: | | | | |
Net assets | | $ | 30,241,462 | |
Shares of beneficial interest outstanding, unlimited authorization, no par | | | 3,542,365 | |
Net asset value per share | | $ | 8.54 | |
| | | | |
| |
1Investments, at cost | | $ | 106,399,867 | |
| |
2Short-term investments, at cost | | | 16,362,248 | |
| |
3Foreign currencies, at cost | | | 680 | |
See accompanying notes, which are an integral part of the financial statements.
35
Statement of operations
| | |
| Delaware Core Plus Bond Fund | | Year ended July 31, 2014 |
| | | | |
Investment Income: | | | | |
Interest | | $ | 4,126,244 | |
Dividends | | | 69,146 | |
Securities lending income | | | 95 | |
| | | | |
| | | 4,195,485 | |
| | | | |
| |
Expenses: | | | | |
Management fees | | | 641,384 | |
Distribution expenses – Class A | | | 185,234 | |
Distribution expenses – Class B | | | 4,608 | |
Distribution expenses – Class C | | | 94,117 | |
Distribution expenses – Class R | | | 40,173 | |
Dividend disbursing and transfer agent fees and expenses | | | 166,119 | |
Registration fees | | | 70,789 | |
Audit and tax | | | 46,763 | |
Accounting and administration expenses | | | 41,868 | |
Reports and statements to shareholders | | | 33,519 | |
Legal fees | | | 23,519 | |
Custodian fees | | | 21,773 | |
Trustees’ fees and expenses | | | 6,020 | |
Other | | | 38,069 | |
| | | | |
| | | 1,413,955 | |
Less expenses waived | | | (329,818 | ) |
Less waived distribution expenses – Class A | | | (6,552 | ) |
Less waived distribution expenses – Class B | | | (3,456 | ) |
Less waived distribution expenses – Class R | | | (1,328 | ) |
Less expense paid indirectly | | | (105 | ) |
| | | | |
Total operating expenses | | | 1,072,696 | |
| | | | |
Net Investment Income | | | 3,122,789 | |
| | | | |
36
| | | | |
| |
Net Realized and Unrealized Gain (Loss): | | | | |
Net realized gain (loss) on: | | | | |
Investments | | $ | 1,109,013 | |
Foreign currencies | | | (236,578 | ) |
Foreign currency exchange contracts | | | (148,143 | ) |
Futures contracts | | | 249,719 | |
Swap contracts | | | (243,370 | ) |
| | | | |
Net realized gain | | | 730,641 | |
| | | | |
Net change in unrealized appreciation (depreciation) of: | | | | |
Investments | | | 1,639,798 | |
Foreign currencies | | | 2,052 | |
Foreign currency exchange contracts | | | 13,290 | |
Futures contracts | | | 52,963 | |
Swap contracts | | | 123,678 | |
| | | | |
Net change in unrealized appreciation (depreciation) | | | 1,831,781 | |
| | | | |
Net Realized and Unrealized Gain | | | 2,562,422 | |
| | | | |
Net Increase in Net Assets Resulting from Operations | | $ | 5,685,211 | |
| | | | |
See accompanying notes, which are an integral part of the financial statements.
37
Statements of changes in net assets
Delaware Core Plus Bond Fund
| | | | | | | | |
| | | Year ended | |
| | | 7/31/14 | | | 7/31/13 | |
| | |
Increase (Decrease) in Net Assets from Operations: | | | | | | | | |
Net investment income | | $ | 3,122,789 | | | $ | 4,349,887 | |
Net realized gain (loss) | | | 730,641 | | | | (591,593 | ) |
Net change in unrealized appreciation (depreciation) | | | 1,831,781 | | | | (6,043,856 | ) |
| | | | | | | | |
Net increase (decrease) in net assets resulting from operations | | | 5,685,211 | | | | (2,285,562 | ) |
| | | | | | | | |
| | |
Dividends and Distributions to Shareholders from: | | | | | | | | |
Net investment income: | | | | | | | | |
Class A | | | (2,013,571 | ) | | | (2,730,485 | ) |
Class B | | | (13,455 | ) | | | (25,033 | ) |
Class C | | | (195,214 | ) | | | (289,681 | ) |
Class R | | | (196,604 | ) | | | (235,625 | ) |
Institutional Class | | | (840,683 | ) | | | (2,405,977 | ) |
| | |
Return of capital: | | | | | | | | |
Class A | | | (271,322 | ) | | | — | |
Class B | | | (1,198 | ) | | | — | |
Class C | | | (35,483 | ) | | | — | |
Class R | | | (32,192 | ) | | | — | |
Institutional Class | | | (125,196 | ) | | | — | |
| | |
Net realized gain: | | | | | | | | |
Class A | | | — | | | | (198,651 | ) |
Class B | | | — | | | | (2,416 | ) |
Class C | | | — | | | | (27,998 | ) |
Class R | | | — | | | | (18,246 | ) |
Institutional Class | | | — | | | | (168,817 | ) |
| | | | | | | | |
| | | (3,724,918 | ) | | | (6,102,929 | ) |
| | | | | | | | |
| | |
Capital Share Transactions: | | | | | | | | |
Proceeds from shares sold: | | | | | | | | |
Class A | | | 7,627,435 | | | | 12,632,942 | |
Class B | | | 415 | | | | 58,051 | |
Class C | | | 1,356,183 | | | | 1,698,682 | |
Class R | | | 1,503,884 | | | | 2,441,868 | |
Institutional Class | | | 18,421,281 | | | | 17,622,719 | |
38
| | | | | | | | |
| | | Year ended | |
| | | 7/31/14 | | | 7/31/13 | |
| | |
Capital Share Transactions (continued): | | | | | | | | |
Net asset value of shares issued upon reinvestment of dividends and distributions: | | | | | | | | |
Class A | | $ | 2,056,563 | | | $ | 2,618,546 | |
Class B | | | 12,120 | | | | 20,024 | |
Class C | | | 221,061 | | | | 292,656 | |
Class R | | | 228,482 | | | | 251,017 | |
Institutional Class | | | 965,879 | | | | 2,519,552 | |
| | | | | | | | |
| | | 32,393,303 | | | | 40,156,057 | |
| | | | | | | | |
Cost of shares redeemed: | | | | | | | | |
Class A | | | (26,761,534 | ) | | | (21,141,396 | ) |
Class B | | | (418,556 | ) | | | (562,194 | ) |
Class C | | | (4,197,775 | ) | | | (3,407,300 | ) |
Class R | | | (2,185,999 | ) | | | (3,397,339 | ) |
Institutional Class | | | (49,434,542 | ) | | | (32,201,742 | ) |
| | | | | | | | |
| | | (82,998,406 | ) | | | (60,709,971 | ) |
| | | | | | | | |
Decrease in net assets derived from capital share transactions | | | (50,605,103 | ) | | | (20,553,914 | ) |
| | | | | | | | |
Net Decrease in Net Assets | | | (48,644,810 | ) | | | (28,942,405 | ) |
| | |
Net Assets: | | | | | | | | |
Beginning of year | | | 161,005,977 | | | | 189,948,382 | |
| | | | | | | | |
End of year | | $ | 112,361,167 | | | $ | 161,005,977 | |
| | | | | | | | |
| | |
Distributions in excess of net investment income | | $ | (98,954 | ) | | $ | (86,491 | ) |
| | | | | | | | |
See accompanying notes, which are an integral part of the financial statements.
39
Financial highlights
Delaware Core Plus Bond Fund Class A
Selected data for each share of the Fund outstanding throughout each period were as follows:
|
| |
| |
Net asset value, beginning of period |
|
Income (loss) from investment operations: |
Net investment income1 |
Net realized and unrealized gain (loss) |
Total from investment operations |
|
Less dividends and distributions from: |
Net investment income |
Return of capital |
Net realized gain |
Total dividends and distributions |
|
Net asset value, end of period |
|
Total return2 |
|
Ratios and supplemental data: |
Net assets, end of period (000 omitted) |
Ratio of expenses to average net assets |
Ratio of expenses to average net assets prior to fees waived |
Ratio of net investment income to average net assets |
Ratio of net investment income to average net assets prior to fees waived |
Portfolio turnover |
| 1 | The average shares outstanding method has been applied for per share information. |
| 2 | Total investment return is based on the change in net asset value of a share during the period and assumes reinvestment of dividends and distributions at net asset value and does not reflect the impact of a sales charge. Total investment return during all of the periods shown reflects waivers by the manager and distributor. Performance would have been lower had the waivers not been in effect. |
See accompanying notes, which are an integral part of the financial statements.
40
| | | | | | | | | | | | | | | | | | | | |
| | | Year ended | |
| | | | 7/31/14 | | | | 7/31/13 | | | | 7/31/12 | | | | 7/31/11 | | | | 7/31/10 | |
| | | $8.340 | | | $ | 8.750 | | | $ | 8.420 | | | $ | 8.220 | | | $ | 7.620 | |
| | | | | |
| | | | | | | | | | | | | | | | | | | | |
| | | 0.226 | | | | 0.202 | | | | 0.205 | | | | 0.264 | | | | 0.366 | |
| | | 0.233 | | | | (0.328 | ) | | | 0.375 | | | | 0.244 | | | | 0.606 | |
| | | | | | | | | | | | | | | | | | | | |
| | | 0.459 | | | | (0.126 | ) | | | 0.580 | | | | 0.508 | | | | 0.972 | |
| | | | | | | | | | | | | | | | | | | | |
| | | | | |
| | | | | | | | | | | | | | | | | | | | |
| | | (0.234) | | | | (0.265 | ) | | | (0.250 | ) | | | (0.308 | ) | | | (0.372 | ) |
| | | (0.035) | | | | — | | | | — | | | | — | | | | — | |
| | | — | | | | (0.019 | ) | | | — | | | | — | | | | — | |
| | | | | | | | | | | | | | | | | | | | |
| | | (0.269) | | | | (0.284 | ) | | | (0.250 | ) | | | (0.308 | ) | | | (0.372 | ) |
| | | | | | | | | | | | | | | | | | | | |
| | | | | |
| | | $8.530 | | | $ | 8.340 | | | $ | 8.750 | | | $ | 8.420 | | | $ | 8.220 | |
| | | | | | | | | | | | | | | | | | | | |
| | | | | |
| | | 5.60% | | | | (1.51% | ) | | | 7.01% | | | | 6.32% | | | | 13.03% | |
| | | | | |
| | | | | | | | | | | | | | | | | | | | |
| | | $65,466 | | | $ | 81,042 | | | $ | 91,099 | | | $ | 74,107 | | | $ | 72,618 | |
| | | 0.90% | | | | 0.90% | | | | 0.90% | | | | 0.90% | | | | 0.91% | |
| | | 1.19% | | | | 1.17% | | | | 1.18% | | | | 1.29% | | | | 1.34% | |
| | | 2.70% | | | | 2.33% | | | | 2.41% | | | | 3.20% | | | | 4.60% | |
| | | 2.41% | | | | 2.06% | | | | 2.13% | | | | 2.81% | | | | 4.17% | |
| | | | 273% | | | | 340% | | | | 422% | | | | 293% | | | | 264% | |
41
Financial highlights
Delaware Core Plus Bond Fund Class B
Selected data for each share of the Fund outstanding throughout each period were as follows:
|
Net asset value, beginning of period |
|
Income (loss) from investment operations: |
Net investment income1 |
Net realized and unrealized gain (loss) |
Total from investment operations |
|
Less dividends and distributions from: |
Net investment income |
Return of capital |
Net realized gain |
Total dividends and distributions |
|
Net asset value, end of period |
|
Total return2 |
|
Ratios and supplemental data: |
Net assets, end of period (000 omitted) |
Ratio of expenses to average net assets |
Ratio of expenses to average net assets prior to fees waived |
Ratio of net investment income to average net assets |
Ratio of net investment income to average net assets prior to fees waived |
Portfolio turnover |
| 1 | The average shares outstanding method has been applied for per share information. |
| 2 | Total investment return is based on the change in net asset value of a share during the period and assumes reinvestment of dividends and distributions at net asset value and does not reflect the impact of a sales charge. Total investment return during all of the periods shown reflects waivers by the manager and/or the distributor. Performance would have been lower had the waivers not been in effect. |
See accompanying notes, which are an integral part of the financial statements.
42
| | | | | | | | | | | | | | | | | | | | | | |
| |
| | | | Year ended | |
| | | | | | |
| | | | | | 7/31/14 | | | | 7/31/13 | | | | 7/31/12 | | | | 7/31/11 | | | | 7/31/10 | |
| | | | $ | 8.340 | | | $ | 8.750 | | | $ | 8.420 | | | $ | 8.220 | | | $ | 7.620 | |
| | | | | |
| | | | | | | | | | | | | | | | | | | | | | |
| | | | | 0.226 | | | | 0.160 | | | | 0.141 | | | | 0.202 | | | | 0.305 | |
| | | | | 0.233 | | | | (0.328 | ) | | | 0.375 | | | | 0.245 | | | | 0.608 | |
| | | | | | | | | | | | | | | | | | | | | | |
| | | | | 0.459 | | | | (0.168 | ) | | | 0.516 | | | | 0.447 | | | | 0.913 | |
| | | | | | | | | | | | | | | | | | | | | | |
| | | | | |
| | | | | | | | | | | | | | | | | | | | | | | |
| | | | | (0.234 | ) | | | (0.223 | ) | | | (0.186 | ) | | | (0.247 | ) | | | (0.313 | ) |
| | | | | (0.035 | ) | | | — | | | | — | | | | — | | | | — | |
| | | | | — | | | | (0.019 | ) | | | — | | | | — | | | | — | |
| | | | | | | | | | | | | | | | | | | | | | |
| | | | | (0.269 | ) | | | (0.242 | ) | | | (0.186 | ) | | | (0.247 | ) | | | (0.313 | ) |
| | | | | | | | | | | | | | | | | | | | | | |
| | | | | |
| | | | $ | 8.530 | | | $ | 8.340 | | | $ | 8.750 | | | $ | 8.420 | | | $ | 8.220 | |
| | | | | | | | | | | | | | | | | | | | | | |
| | | | | |
| | | | | 5.60% | | | | (1.97% | ) | | | 6.21% | | | | 5.53% | | | | 12.19% | |
| | | | | |
| | | | | | | | | | | | | | | | | | | | | | | |
| | | | $ | 289 | | | $ | 687 | | | $ | 1,211 | | | $ | 1,921 | | | $ | 3,197 | |
| | | | | 0.90% | | | | 1.39% | | | | 1.65% | | | | 1.65% | | | | 1.66% | |
| | | | | 1.93% | | | | 1.87% | | | | 1.88% | | | | 1.99% | | | | 2.04% | |
| | | | | 2.70% | | | | 1.84% | | | | 1.66% | | | | 2.45% | | | | 3.85% | |
| | | | | 1.67% | | | | 1.36% | | | | 1.43% | | | | 2.11% | | | | 3.47% | |
| | | | | 273% | | | | 340% | | | | 422% | | | | 293% | | | | 264% | |
43
Financial highlights
Delaware Core Plus Bond Fund Class C
Selected data for each share of the Fund outstanding throughout each period were as follows:
|
Net asset value, beginning of period |
|
Income (loss) from investment operations: |
Net investment income1 |
Net realized and unrealized gain (loss) |
Total from investment operations |
|
Less dividends and distributions from: |
Net investment income |
Return of capital |
Net realized gain |
Total dividends and distributions |
|
Net asset value, end of period |
|
Total return2 |
|
Ratios and supplemental data: |
Net assets, end of period (000 omitted) |
Ratio of expenses to average net assets |
Ratio of expenses to average net assets prior to fees waived |
Ratio of net investment income to average net assets |
Ratio of net investment income to average net assets prior to fees waived |
Portfolio turnover |
| 1 | The average shares outstanding method has been applied for per share information. |
| 2 | Total investment return is based on the change in net asset value of a share during the period and assumes reinvestment of dividends and distributions at net asset value and does not reflect the impact of a sales charge. Total investment return during all of the periods shown reflects a waiver by the manager. Performance would have been lower had the waiver not been in effect. |
See accompanying notes, which are an integral part of the financial statements.
44
| | | | | | | | | | | | | | | | | | | | | | |
| |
| | | | Year ended | |
| | | | | | |
| | | | | | 7/31/14 | | | | 7/31/13 | | | | 7/31/12 | | | | 7/31/11 | | | | 7/31/10 | |
| | | | $ | 8.350 | | | $ | 8.760 | | | $ | 8.430 | | | $ | 8.230 | | | $ | 7.620 | |
| | | | | |
| | | | | | | | | | | | | | | | | | | | | | |
| | | | | 0.164 | | | | 0.137 | | | | 0.142 | | | | 0.203 | | | | 0.307 | |
| | | | | 0.232 | | | | (0.328 | ) | | | 0.374 | | | | 0.244 | | | | 0.616 | |
| | | | | | | | | | | | | | | | | | | | | | |
| | | | | 0.396 | | | | (0.191 | ) | | | 0.516 | | | | 0.447 | | | | 0.923 | |
| | | | | | | | | | | | | | | | | | | | | | |
| | | | | |
| | | | | | | | | | | | | | | | | | | | | | | |
| | | | | (0.171 | ) | | | (0.200 | ) | | | (0.186 | ) | | | (0.247 | ) | | | (0.313 | ) |
| | | | | (0.035 | ) | | | — | | | | — | | | | — | | | | — | |
| | | | | — | | | | (0.019 | ) | | | — | | | | — | | | | — | |
| | | | | | | | | | | | | | | | | | | | | | |
| | | | | (0.206 | ) | | | (0.219 | ) | | | (0.186 | ) | | | (0.247 | ) | | | (0.313 | ) |
| | | | | | | | | | | | | | | | | | | | | | |
| | | | | |
| | | | $ | 8.540 | | | $ | 8.350 | | | $ | 8.760 | | | $ | 8.430 | | | $ | 8.230 | |
| | | | | | | | | | | | | | | | | | | | | | |
| | | | | |
| | | | | 4.81% | | | | (2.24% | ) | | | 6.20% | | | | 5.53% | | | | 12.32% | |
| | | | | |
| | | | | | | | | | | | | | | | | | | | | | | |
| | | | $ | 8,572 | | | $ | 10,990 | | | $ | 12,989 | | | $ | 10,147 | | | $ | 10,022 | |
| | | | | 1.65% | | | | 1.65% | | | | 1.65% | | | | 1.65% | | | | 1.66% | |
| | | | | 1.93% | | | | 1.87% | | | | 1.88% | | | | 1.99% | | | | 2.04% | |
| | | | | 1.95% | | | | 1.58% | | | | 1.66% | | | | 2.45% | | | | 3.85% | |
| | | | | 1.67% | | | | 1.36% | | | | 1.43% | | | | 2.11% | | | | 3.47% | |
| | | | | 273% | | | | 340% | | | | 422% | | | | 293% | | | | 264% | |
45
Financial highlights
Delaware Core Plus Bond Fund Class R
Selected data for each share of the Fund outstanding throughout each period were as follows:
|
Net asset value, beginning of period |
|
Income (loss) from investment operations: |
Net investment income1 |
Net realized and unrealized gain (loss) |
Total from investment operations |
|
Less dividends and distributions from: |
Net investment income |
Return of capital |
Net realized gain |
Total dividends and distributions |
|
Net asset value, end of period |
|
Total return2 |
|
Ratios and supplemental data: |
Net assets, end of period (000 omitted) |
Ratio of expenses to average net assets |
Ratio of expenses to average net assets prior to fees waived |
Ratio of net investment income to average net assets |
Ratio of net investment income to average net assets prior to fees waived |
Portfolio turnover |
| 1 | The average shares outstanding method has been applied for per share information. |
| 2 | Total investment return is based on the change in net asset value of a share during the period and assumes reinvestment of dividends and distributions at net asset value. Total investment return during all of the periods shown reflects waivers by the manager and distributor. Performance would have been lower had the waivers not been in effect. |
See accompanying notes, which are an integral part of the financial statements.
46
| | | | | | | | | | | | | | | | | | | | |
| |
| | | Year ended | |
| | | | |
| | | | 7/31/14 | | | | 7/31/13 | | | | 7/31/12 | | | | 7/31/11 | | | | 7/31/10 | |
| | $ | 8.370 | | | $ | 8.780 | | | $ | 8.450 | | | $ | 8.240 | | | $ | 7.630 | |
| | | | | |
| | | | | | | | | | | | | | | | | | | | |
| | | 0.206 | | | | 0.181 | | | | 0.185 | | | | 0.244 | | | | 0.350 | |
| | | 0.233 | | | | (0.328 | ) | | | 0.374 | | | | 0.255 | | | | 0.613 | |
| | | | | | | | | | | | | | | | | | | | |
| | | 0.439 | | | | (0.147 | ) | | | 0.559 | | | | 0.499 | | | | 0.963 | |
| | | | | | | | | | | | | | | | | | | | |
| | | | | |
| | | | | | | | | | | | | | | | | | | | |
| | | (0.214 | ) | | | (0.244 | ) | | | (0.229 | ) | | | (0.289 | ) | | | (0.353 | ) |
| | | (0.035 | ) | | | — | | | | — | | | | — | | | | — | |
| | | — | | | | (0.019 | ) | | | — | | | | — | | | | — | |
| | | | | | | | | | | | | | | | | | | | |
| | | (0.249 | ) | | | (0.263 | ) | | | (0.229 | ) | | | (0.289 | ) | | | (0.353 | ) |
| | | | | | | | | | | | | | | | | | | | |
| | | | | |
| | $ | 8.560 | | | $ | 8.370 | | | $ | 8.780 | | | $ | 8.450 | | | $ | 8.240 | |
| | | | | | | | | | | | | | | | | | | | |
| | | | | |
| | | 5.32% | | | | (1.74% | ) | | | 6.73% | | | | 6.17% | | | | 12.87% | |
| | | | | |
| | | | | | | | | | | | | | | | | | | | |
| | $ | 7,793 | | | $ | 8,077 | | | $ | 9,180 | | | $ | 6,789 | | | $ | 6,031 | |
| | | 1.15% | | | | 1.15% | | | | 1.15% | | | | 1.15% | | | | 1.16% | |
| | | 1.45% | | | | 1.47% | | | | 1.48% | | | | 1.59% | | | | 1.64% | |
| | | 2.45% | | | | 2.08% | | | | 2.16% | | | | 2.95% | | | | 4.35% | |
| | | 2.15% | | | | 1.76% | | | | 1.83% | | | | 2.51% | | | | 3.87% | |
| | | 273% | | | | 340% | | | | 422% | | | | 293% | | | | 264% | |
47
Financial highlights
Delaware Core Plus Bond Fund Institutional Class
Selected data for each share of the Fund outstanding throughout each period were as follows:
|
Net asset value, beginning of period |
|
Income (loss) from investment operations: |
Net investment income1 |
Net realized and unrealized gain (loss) |
Total from investment operations |
|
Less dividends and distributions from: |
Net investment income |
Return of capital |
Net realized gain |
Total dividends and distributions |
|
Net asset value, end of period |
|
Total return2 |
|
Ratios and supplemental data: |
Net assets, end of period (000 omitted) |
Ratio of expenses to average net assets |
Ratio of expenses to average net assets prior to fees waived |
Ratio of net investment income to average net assets |
Ratio of net investment income to average net assets prior to fees waived |
Portfolio turnover |
| 1 | The average shares outstanding method has been applied for per share information. |
| 2 | Total investment return is based on the change in net asset value of a share during the period and assumes reinvestment of dividends and distributions at net asset value. Total investment return during all of the periods shown reflects a waiver by the manager. Performance would have been lower had the waiver not been in effect. |
See accompanying notes, which are an integral part of the financial statements.
48
| | | | | | | | | | | | | | | | | | | | | | |
| |
| | | | Year ended | |
| | | | | | |
| | | | | | 7/31/14 | | | | 7/31/13 | | | | 7/31/12 | | | | 7/31/11 | | | | 7/31/10 | |
| | | | $ | 8.350 | | | $ | 8.760 | | | $ | 8.430 | | | $ | 8.230 | | | $ | 7.630 | |
| | | | | |
| | | | | | | | | | | | | | | | | | | | | | | |
| | | | | 0.248 | | | | 0.224 | | | | 0.228 | | | | 0.285 | | | | 0.388 | |
| | | | | 0.233 | | | | (0.328 | ) | | | 0.373 | | | | 0.245 | | | | 0.605 | |
| | | | | | | | | | | | | | | | | | | | | | |
| | | | | 0.481 | | | | (0.104 | ) | | | 0.601 | | | | 0.530 | | | | 0.993 | |
| | | | | | | | | | | | | | | | | | | | | | |
| | | | | |
| | | | | | | | | | | | | | | | | | | | | | | |
| | | | | (0.256 | ) | | | (0.287 | ) | | | (0.271 | ) | | | (0.330 | ) | | | (0.393 | ) |
| | | | | (0.035 | ) | | | — | | | | — | | | | — | | | | — | |
| | | | | — | | | | (0.019 | ) | | | — | | | | — | | | | — | |
| | | | | | | | | | | | | | | | | | | | | | |
| | | | | (0.291 | ) | | | (0.306 | ) | | | (0.271 | ) | | | (0.330 | ) | | | (0.393 | ) |
| | | | | | | | | | | | | | | | | | | | | | |
| | | | | |
| | | | $ | 8.540 | | | $ | 8.350 | | | $ | 8.760 | | | $ | 8.430 | | | $ | 8.230 | |
| | | | | | | | | | | | | | | | | | | | | | |
| | | | | |
| | | | | 5.86% | | | | (1.26% | ) | | | 7.27% | | | | 6.58% | | | | 13.30% | |
| | | | | |
| | | | | | | | | | | | | | | | | | | | | | | |
| | | | $ | 30,241 | | | $ | 60,210 | | | $ | 75,469 | | | $ | 10,205 | | | $ | 8,640 | |
| | | | | 0.65% | | | | 0.65% | | | | 0.65% | | | | 0.65% | | | | 0.66% | |
| | | | | 0.93% | | | | 0.87% | | | | 0.88% | | | | 0.99% | | | | 1.04% | |
| | | | | 2.95% | | | | 2.58% | | | | 2.66% | | | | 3.45% | | | | 4.85% | |
| | | | | 2.67% | | | | 2.36% | | | | 2.43% | | | | 3.11% | | | | 4.47% | |
| | | | | 273% | | | | 340% | | | | 422% | | | | 293% | | | | 264% | |
49
Notes to financial statements
| | |
| Delaware Core Plus Bond Fund | | July 31, 2014 |
Delaware Group® Government Fund (Trust) is organized as a Delaware statutory trust and offers three series: Delaware Core Plus Bond Fund, Delaware Emerging Markets Debt Fund and Delaware Inflation Protected Bond Fund. These financial statements and the related notes pertain to Delaware Core Plus Bond Fund (Fund). The Trust is an open-end investment company. The Fund is considered diversified under the Investment Company Act of 1940, as amended, and offers Class A, Class B,* Class C, Class R, and Institutional Class shares. Class A shares are sold with a maximum front-end sales charge of 4.50%. Class A share purchases of $1,000,000 or more will incur a contingent deferred sales charge (CDSC) of 1.00% if redeemed during the first year and 0.50% during the second year, provided that Delaware Distributors, L.P. (DDLP) paid a financial advisor a commission on the purchase of those shares. Class B shares may be purchased only through dividend reinvestment and certain permitted exchanges. Prior to June 1, 2007, Class B shares were sold with a CDSC that declined from 4.00% to zero depending upon the period of time the shares were held. Class B shares will automatically convert to Class A shares on a quarterly basis approximately eight years after purchase.* Class C shares are sold with a CDSC of 1.00%, if redeemed during the first 12 months. Class R and Institutional Class shares are not subject to a sales charge and are offered for sale exclusively to certain eligible investors.
The investment objective of the Fund is to seek maximum long-term total return, consistent with reasonable risk.
* See Note 14.
1. Significant Accounting Policies
The following accounting policies are in accordance with U.S. generally accepted accounting principles (U.S. GAAP) and are consistently followed by the Fund.
Security Valuation – Equity securities, except those traded on the Nasdaq Stock Market, Inc. (Nasdaq), are valued at the last quoted sales price as of the time of the regular close of the New York Stock Exchange on the valuation date. Securities traded on the Nasdaq are valued in accordance with the Nasdaq Official Closing Price, which may not be the last sales price. If, on a particular day, an equity security does not trade, then the mean between the bid and ask prices will be used, which approximates fair value. Debt securities, credit default swap (CDS) contracts and interest rate swap contracts are valued based upon valuations provided by an independent pricing service or broker/counterparty and reviewed by management. To the extent current market prices are not available, the pricing service may take into account developments related to the specific security, as well as transactions in comparable securities. U.S. government and agency securities are valued at the mean between the bid and ask prices, which approximates fair value. Valuations for fixed income securities utilize matrix systems, which reflect such factors as security prices, yields, maturities, and ratings, and are supplemented by dealer and exchange quotations. For asset-backed securities, collateralized mortgage obligations, commercial mortgage securities, and U.S. government agency mortgage securities, pricing vendors utilize matrix pricing which considers prepayment speed, attributes of the collateral, yield or price of bonds of comparable quality, coupon, maturity and type as well as broker/dealer-supplied prices. Swap prices are derived using daily swap curves and models that incorporate a number of market data factors, such as discounted cash flows, trades and values of the underlying reference instruments. Investment company securities are valued at net asset value per share, as reported by the underlying investment company.
50
Foreign currency exchange contracts and foreign cross currency exchange contracts are valued at the mean between the bid and ask prices, which approximates fair value. Interpolated values are derived when the settlement date of the contract is an interim date for which quotations are not available. Futures contracts and options on futures contracts are valued at the daily quoted settlement prices. Exchange-traded options are valued at the last reported sale price or, if no sales are reported, at the mean between the last reported bid and ask prices, which approximates fair value. Generally, other securities and assets for which market quotations are not readily available are valued at fair value as determined in good faith under the direction of the Fund’s Board of Trustees (Board). In determining whether market quotations are readily available or fair valuation will be used, various factors will be taken into consideration, such as market closures or suspension of trading in a security.
Federal and Foreign Income Taxes – No provision for federal income taxes has been made as the Fund intends to continue to qualify for federal income tax purposes as a regulated investment company under Subchapter M of the Internal Revenue Code of 1986, as amended, and make the requisite distributions to shareholders. The Fund evaluates tax positions taken or expected to be taken in the course of preparing the Fund’s tax returns to determine whether the tax positions are “more-likely-than-not” of being sustained by the applicable tax authority. Tax positions not deemed to meet the “more-likely-than-not” threshold are recorded as a tax benefit or expense in the current year. Management has analyzed the Fund’s tax positions taken for all open federal income tax years (July 31, 2011–July 31, 2014), and has concluded that no provision for federal income tax is required in the Fund’s financial statements. In regard to foreign taxes only, the Fund has open tax years in certain foreign countries it invests in that may date back to the inception of the Fund.
Class Accounting – Investment income and common expenses are allocated to the various classes of the Fund on the basis of “settled shares” of each class in relation to the net assets of the Fund. Realized and unrealized gain (loss) on investments are allocated to the various classes of the Fund on the basis of daily net assets of each class. Distribution expenses relating to a specific class are charged directly to that class.
Repurchase Agreements – The Fund may purchase certain U.S. government securities subject to the counterparty’s agreement to repurchase them at an agreed upon date and price. The counterparty will be required on a daily basis to maintain the value of the collateral subject to the agreement at not less than the repurchase price (including accrued interest). The agreements are conditioned upon the collateral being deposited under the Federal Reserve book-entry system with the Fund’s custodian or a third party sub-custodian. In the event of default or bankruptcy by the other party to the agreement, retention of the collateral may be subject to legal proceedings. All open repurchase agreements as of the date of this report were entered into on July 31, 2014.
To Be Announced Trades (TBA) – The Fund may contract to purchase securities for a fixed price at a transaction date beyond the customary settlement period (example: when issued, delayed delivery, forward commitment, or TBA transactions) consistent with the Fund’s ability to manage its investment portfolio and meet redemption requests. These transactions involve a commitment by the Fund to purchase or sell securities for a predetermined price or yield with payment and delivery taking place more than three days in the future, or after a period longer than the customary settlement period for that
51
Notes to financial statements
Delaware Core Plus Bond Fund
1. Significant Accounting Policies (continued)
type of security. No interest will be earned by the Fund on such purchases until the securities are delivered or transaction is completed; however, the market value may change prior to delivery.
Foreign Currency Transactions – Transactions denominated in foreign currencies are recorded at the prevailing exchange rates on the valuation date in accordance with the Fund’s prospectus. The value of all assets and liabilities denominated in foreign currencies is translated daily into U.S. dollars at the exchange rate of such currencies against the U.S. dollar. Transaction gains or losses resulting from changes in exchange rates during the reporting period or upon settlement of the foreign currency transaction are reported in operations for the current period. The Fund generally bifurcates that portion of realized gains and losses on investments in debt securities which is due to changes in foreign exchange rates from that which is due to changes in market prices of debt securities. That portion of gains (losses) is included on the “Statement of operations” under “Net realized gain (loss) on foreign currencies.” The Fund reports certain foreign currency related transactions as components of realized gains (losses) for financial reporting purposes, whereas such components are treated as ordinary income (loss) for federal income tax purposes.
Use of Estimates – The preparation of financial statements in conformity with U.S. GAAP requires management to make estimates and assumptions that affect the fair value of investments, the reported amounts of assets and liabilities and disclosure of contingent assets and liabilities at the date of the financial statements, and the reported amounts of revenues and expenses during the reporting period. Actual results could differ from those estimates and the differences could be material.
Other – Expenses directly attributable to the Fund are charged directly to the Fund. Other expenses common to various funds within the Delaware Investments® Family of Funds are generally allocated among such funds on the basis of average net assets. Management fees and some other expenses are paid monthly. Security transactions are recorded on the date the securities are purchased or sold (trade date) for financial reporting purposes. Costs used in calculating realized gains and losses on the sale of investment securities are those of the specific securities sold. Dividend income is recorded on the ex-dividend date and interest income is recorded on the accrual basis. Discounts and premiums on debt securities are amortized to interest income over the lives of the respective securities using the effective interest method. Realized gains (losses) on paydowns of asset- and mortgage-backed securities are classified as interest income. The Fund declares dividends daily from net investment income and pays the dividends monthly and declares and pays distributions from net realized gain on investments, if any, annually. The Fund may distribute more frequently, if necessary for tax purposes. Dividends and distributions, if any, are recorded on the ex-dividend date.
The Fund may receive earnings credits from its custodian when positive cash balances are maintained, which may be used to offset custody fees. There were no earnings credits for the year ended July 31, 2014.
The Fund receives earnings credits from its transfer agent when positive cash balances are maintained, which may be used to offset transfer agent fees. If the amount earned is greater than one dollar, the expense paid under this arrangement is included on the “Statement of operations” under “Dividend disbursing and transfer agent fees and expenses” with the corresponding expense offset
52
shown under “Less expense paid indirectly.” For the year ended July 31, 2014, the Fund earned $105 under this agreement.
2. Investment Management, Administration Agreements and Other Transactions with Affiliates
In accordance with the terms of its investment management agreement, the Fund pays Delaware Management Company (DMC), a series of Delaware Management Business Trust and the investment manager, an annual fee which is calculated daily at the rate of 0.55% on the first $500 million of average daily net assets of the Fund, 0.50% on the next $500 million, 0.45% on the next $1.5 billion, and 0.425% on average daily net assets in excess of $2.5 billion.
DMC has contractually agreed to waive that portion, if any, of its management fee and/or pay/reimburse the Fund to the extent necessary to prevent that total annual operating expenses (excluding any 12b-1 fees, acquired fund fees and expenses, taxes, interest, inverse floater program expenses, short sale and dividend interest expenses, brokerage fees, certain insurance costs, and nonroutine expenses or costs including, but not limited to, those relating to reorganizations, litigation, conducting shareholder meetings, and liquidations (collectively, nonroutine expenses)), do not exceed 0.65% of the Fund’s average daily net assets from Aug. 1, 2013 through July 31, 2014.** For purposes of this waiver and reimbursement, nonroutine expenses may also include such additional costs and expenses, as may be agreed upon from time to time by the Fund’s Board and DMC. This expense waiver and reimbursement apply only to expenses paid directly by the Fund and may only be terminated by agreement of DMC and the Fund.
Delaware Service Company, Inc. (DSC), an affiliate of DMC, provides fund accounting and financial administration oversight services to the Fund. For these services, the Fund pays DSC fees based on the aggregate daily net assets of the Delaware Investments® Family of Funds at the following annual rate: 0.0050% of the first $30 billion; 0.0045% of the next $10 billion; 0.0040% of the next $10 billion; and 0.0025% of aggregate average daily net assets in excess of $50 billion. The fees payable to DSC under the service agreement described above are allocated among all Funds in the Delaware Investments Family of Funds on a relative net asset value basis. For the year ended July 31, 2014, the Fund was charged $5,622 for these services.
DSC is also the transfer agent and dividend disbursing agent of the Fund. For these services, the Fund pays DSC fees based on the aggregate daily net assets of the retail funds within the Delaware Investments Family of Funds at the following annual rate: 0.025% of the first $20 billion; 0.020% of the next $5 billion; 0.015% of the next $5 billion; and 0.013% on average daily net assets in excess of $30 billion. This amount is included on the “Statement of operations” under “Dividend disbursing and transfer agent fees and expenses.” For the year ended July 31, 2014, the amount charged by DSC was $25,573. Pursuant to a sub-transfer agency agreement between DSC and BNY Mellon Investment Servicing (US) Inc. (BNYMIS), BNYMIS provides certain sub-transfer agency services to the Fund. Sub-transfer agency fees are passed on to and paid directly by the Fund.
Pursuant to a distribution agreement and distribution plan, the Fund pays DDLP, the distributor and an affiliate of DMC, an annual distribution and service fees of 1.00% of the average daily net assets of the Class B and Class C shares. Effective Oct. 1, 2013, the Fund pays DDLP the annual distribution and
53
Notes to financial statements
Delaware Core Plus Bond Fund
2. Investment Management, Administration Agreements and Other Transactions with Affiliates (continued)
service fees of 0.25% and 0.50% of the average daily net assets of the Class A and Class R shares, respectively. Prior to Oct. 1, 2013, the annual distribution and service fees for the Fund’s Class A and Class R shares were 0.30% and 0.60% of the average daily net assets, respectively, but were contractually limited to 0.25% and 0.50% of the classes’ average daily net assets. The distribution and service fees for Class B shares were contractually limited to 0.25% of average daily net assets from Aug. 1, 2013 through July 31, 2014.*** These waivers and reimbursements may only be terminated by agreement of DDLP and the Fund. Institutional Class shares pay no distribution and service fees.
The Board has adopted a formula for calculating 12b-1 plan fees for the Fund’s Class A shares that went into effect on June 1, 1992. The Fund’s Class A shares are currently subject to a blended 12b-1 fee equal to the sum of: (i) 0.10% of the average daily net assets representing shares that were acquired prior to June 1, 1992, and (ii) 0.30% (currently limited to 0.25% through Nov. 28, 2014) of the average daily net assets representing shares acquired on or after June 1, 1992. All Class A shareholders currently bear 12b-1 fees at the same rate, the blended rate based on the formula described above. This method of calculating Class A 12b-1 fees may be discontinued at the sole discretion of the Board.
As provided in the investment management agreement, the Fund bears a portion of the cost of certain resources shared with DMC, including the cost of internal personnel of DMC and/or its affiliates that provide legal, tax, and regulatory reporting services to the Fund. For the year ended July 31, 2014, the Fund was charged $3,403 for internal legal, tax, and regulatory reporting provided by DMC and/or its affiliates’ employees.
For the year ended July 31, 2014, DDLP earned $2,823 for commissions on sales of the Fund’s Class A shares. For the year ended July 31, 2014, DDLP received gross CDSC commissions of $38 on redemptions of the Fund’s Class C shares, and these commissions were entirely used to offset upfront commissions previously paid by DDLP to broker/dealers on sales of those shares.
Trustees’ fees include expenses accrued by the Fund for each Trustee’s retainer and meeting fees. Certain officers of DMC, DSC, and DDLP are officers and/or Trustees of the Trust. These officers and Trustees are paid no compensation by the Fund.
** The contractual waiver period is Nov. 28, 2012 through Nov. 28, 2014.
*** The contractual waiver period is March 1, 2013 through Nov. 28, 2014.
3. Investments
For the year ended July 31, 2014, the Fund made purchases and sales of investment securities other than short-term investments as follows:
| | | | |
Purchases other than U.S. government securities | | $ | 276,356,931 | |
Purchases of U.S. government securities | | | 41,491,404 | |
Sales other than U.S. government securities | | | 327,523,489 | |
Sales of U.S. government securities | | | 42,830,345 | |
54
At July 31, 2014, the cost of investments and unrealized appreciation (depreciation) for federal income tax purposes were as follows:
| | | | |
Cost of investments | | $ | 123,585,185 | |
| | | | |
Aggregate unrealized appreciation | | $ | 3,034,982 | |
Aggregate unrealized depreciation | | | (1,502,503 | ) |
| | | | |
Net unrealized appreciation | | $ | 1,532,479 | |
| | | | |
U.S. GAAP defines fair value as the price that the Fund would receive to sell an asset or pay to transfer a liability in an orderly transaction between market participants at the measurement date under current market conditions. A three-level hierarchy for fair value measurements has been established based upon the transparency of inputs to the valuation of an asset or liability. Inputs may be observable or unobservable and refer broadly to the assumptions that market participants would use in pricing the asset or liability. Observable inputs reflect the assumptions market participants would use in pricing the asset or liability based on market data obtained from sources independent of the reporting entity. Unobservable inputs reflect the reporting entity’s own assumptions about the assumptions that market participants would use in pricing the asset or liability developed based on the best information available under the circumstances. The Fund’s investment in its entirety is assigned a level based upon the observability of the inputs which are significant to the overall valuation. The three-level hierarchy of inputs is summarized below.
| | |
| Level 1 – | | Inputs are quoted prices in active markets for identical investments. (Examples: equity securities, open-end investment companies, futures contracts, exchange-traded options contracts) |
| |
| Level 2 – | | Other observable inputs, including, but not limited to: quoted prices for similar assets or liabilities in markets that are active, quoted prices for identical or similar assets or liabilities in markets that are not active, inputs other than quoted prices that are observable for the assets or liabilities (such as interest rates, yield curves, volatilities, prepayment speeds, loss severities, credit risks, and default rates), or other market-corroborated inputs. (Examples: debt securities, government securities, swap contracts, foreign currency exchange contracts, foreign securities utilizing international fair value pricing, broker-quoted securities, fair valued securities) |
| |
| Level 3 – | | Significant unobservable inputs, including the Fund’s own assumptions used to determine the fair value of investments. (Examples: broker-quoted securities, fair valued securities) |
Level 3 investments are valued using significant unobservable inputs. The Fund may also use an income-based valuation approach in which the anticipated future cash flows of the investment are discounted to calculate fair value. Discounts may also be applied due to the nature or duration of any restrictions on the disposition of the investments. Valuations may also be based upon current market prices of securities that are comparable in coupon, rating, maturity, and industry. The derived value of a Level 3 investment may not represent the value which is received upon disposition and this could impact the results of operations.
55
Notes to financial statements
Delaware Core Plus Bond Fund
3. Investments (continued)
The following table summarizes the valuation of the Fund’s investments by fair value hierarchy levels as of July 31, 2014:
| | | | | | | | | | | | | | | | |
| | | Level 1 | | | Level 2 | | | Level 3 | | | Total | |
Agency, Asset- & Mortgage-Backed Securities1 | | $ | — | | | $ | 36,072,418 | | | $ | 146,300 | | | $ | 36,218,718 | |
Corporate Debt | | | — | | | | 55,233,694 | | | | — | | | | 55,233,694 | |
Municipal Bonds | | | — | | | | 518,590 | | | | — | | | | 518,590 | |
Sovereign Bonds | | | — | | | | 222,033 | | | | — | | | | 222,033 | |
Senior Secured Loans | | | — | | | | 11,259,691 | | | | — | | | | 11,259,691 | |
U.S. Treasury Obligations | | | — | | | | 4,381,240 | | | | — | | | | 4,381,240 | |
Convertible Preferred Stock1 | | | 46,858 | | | | 80,681 | | | | — | | | | 127,539 | |
Preferred Stock | | | 793,619 | | | | — | | | | — | | | | 793,619 | |
Short-Term Investments | | | — | | | | 16,362,540 | | | | — | | | | 16,362,540 | |
| | | | | | | | | | | | | | | | |
Total | | $ | 840,477 | | | $ | 124,130,887 | | | $ | 146,300 | | | $ | 125,117,664 | |
| | | | | | | | | | | | | | | | |
Futures Contracts | | $ | 20,896 | | | $ | — | | | $ | — | | | $ | 20,896 | |
Swap Contracts | | | — | | | | 98 | | | | — | | | | 98 | |
1Security type is valued across multiple levels. Level 1 investments represent exchange-traded investments, Level 2 investments represent investments with observable inputs or matrix-priced investments, and Level 3 investments represent investments without observable inputs. The amounts attributed to Level 1 investments, Level 2 investments, and Level 3 investments represent the following percentages of the total market value of these security types: | |
| | | Level 1 | | | Level 2 | | | Level 3 | | | Total | |
Agency, Asset- & Mortgage-Backed Securities | | | — | | | | 99.60% | | | | 0.40% | | | | 100.00% | |
Convertible Preferred Stock | | | 36.74% | | | | 63.26% | | | | — | | | | 100.00% | |
During the year ended July 31, 2014, there were no transfers between Level 1 investments, Level 2 investments, or Level 3 investments that had a significant impact to the Fund. The Fund’s policy is to recognize transfers between levels at the beginning of the reporting period.
A reconciliation of Level 3 investments is presented when the Fund has a significant amount of Level 3 investments at the beginning, interim, or end of period in relation to net assets. Management has determined not to provide additional disclosure on Level 3 inputs under ASU No. 2011-04 since the Level 3 investments are not considered significant to the Fund’s net assets at the end of the year.
56
4. Dividend and Distribution Information
Income and long-term capital gain distributions are determined in accordance with federal income tax regulations, which may differ from U.S. GAAP. Additionally, distributions from net gains on foreign currency transactions and net short-term gains on sales of investment securities are treated as ordinary income for federal income tax purposes. The tax character of dividends and distributions paid during the years ended July 31, 2014 and 2013 were as follows:
| | | | | | | | |
| | | Year ended | |
| | | 7/31/14 | | | 7/31/13 | |
Ordinary income | | $ | 3,259,527 | | | $ | 5,463,711 | |
Return of capital | | | 465,391 | | | | — | |
Long-term capital gains | | | — | | | | 639,218 | |
| | | | | | | | |
Total | | $ | 3,724,918 | | | $ | 6,102,929 | |
| | | | | | | | |
5. Components of Net Assets on a Tax Basis
As of July 31, 2014, the components of net assets on a tax basis were as follows:
| | | | |
Shares of beneficial interest | | $ | 112,212,343 | |
Distributions payable | | | (84,379 | ) |
Capital loss carryforwards | | | (1,298,550 | ) |
Unrealized appreciation | | | 1,531,753 | |
| | | | |
Net assets | | $ | 112,361,167 | |
| | | | |
The differences between book basis and tax basis components of net assets are primarily attributable to tax deferral of losses on wash sales, mark-to-market of futures contracts, tax treatment of market discount and premium on debt instruments, contingent payment debt instruments and CDS contracts.
For financial reporting purposes, capital accounts are adjusted to reflect the tax character of permanent book/tax differences. Reclassifications are primarily due to tax treatment of gain (loss) on foreign currency transactions, market discount and premium on debt instruments, and paydowns of asset- and mortgage-backed securities, contingent payment debt instruments, and CDS contracts. Results of operations and net assets were not affected by these reclassifications. For the year ended July 31, 2014, the Fund recorded the following reclassifications:
| | | | |
Distributions in excess of net investment income | | $ | 124,275 | |
Accumulated net realized loss | | | (124,275 | ) |
On Dec. 22, 2010, the Regulated Investment Company Modernization Act of 2010 (Act) was enacted, which changed various technical rules governing the tax treatment of regulated investment companies. The changes were generally effective for taxable years beginning after the date of enactment. Under the Act, the Fund is permitted to carry forward capital losses incurred in taxable years beginning after the date of enactment for an unlimited period. Additionally, post-enactment capital loss carryforwards will retain their character as either short-term or long-term capital losses rather than being considered all short-term as permitted under previous regulation.
57
Notes to financial statements
Delaware Core Plus Bond Fund
5. Components of Net Assets on a Tax Basis (continued)
Losses incurred that will be carried forward under the Act are as follows:
| | | | | | | | |
| | | Loss carryforward character | |
| | | Short-term | | | Long-term | |
| | | $1,298,550 | | | | $— | |
6. Capital Shares
Transactions in capital shares were as follows:
| | | | | | | | |
| | | Year ended | |
| | | 7/31/14 | | | 7/31/13 | |
Shares sold: | | | | | | | | |
Class A | | | 909,421 | | | | 1,456,098 | |
Class B | | | 49 | | | | 6,686 | |
Class C | | | 161,531 | | | | 195,769 | |
Class R | | | 178,678 | | | | 279,660 | |
Institutional Class | | | 2,183,678 | | | | 2,041,700 | |
| | |
Shares issued upon reinvestment of dividends and distributions: | | | | | | | | |
Class A | | | 244,808 | | | | 302,922 | |
Class B | | | 1,446 | | | | 2,317 | |
Class C | | | 26,274 | | | | 33,814 | |
Class R | | | 27,088 | | | | 28,950 | |
Institutional Class | | | 115,672 | | | | 290,999 | |
| | | | | | | | |
| | | 3,848,645 | | | | 4,638,915 | |
| | | | | | | | |
| | |
Shares redeemed: | | | | | | | | |
Class A | | | (3,195,906 | ) | | | (2,454,528 | ) |
Class B | | | (50,030 | ) | | | (65,057 | ) |
Class C | | | (500,117 | ) | | | (396,361 | ) |
Class R | | | (260,263 | ) | | | (389,173 | ) |
Institutional Class | | | (5,968,776 | ) | | | (3,737,933 | ) |
| | | | | | | | |
| | | (9,975,092 | ) | | | (7,043,052 | ) |
| | | | | | | | |
Net decrease | | | (6,126,447 | ) | | | (2,404,137 | ) |
| | | | | | | | |
For the years ended July 31, 2014 and 2013, 11,208 Class B shares were converted to 11,215 Class A shares valued at $94,252 and 23,025 Class B shares were converted to 23,044 Class A shares valued at $198,965, respectively. The respective amounts are included in Class B redemptions and Class A subscriptions in the table above and the “Statements of changes in net assets.”
7. Line of Credit
The Fund, along with certain other funds in the Delaware Investments® Family of Funds (Participants), was a participant in a $125,000,000 revolving line of credit to be used for temporary or emergency
58
purposes as an additional source of liquidity to fund redemptions of investor shares. Under the agreement, the Participants were charged an annual commitment fee of 0.08%, which was allocated across the Participants on the basis of each Participant’s allocation of the entire facility. The Participants were permitted to borrow up to a maximum of one third of their net assets under the agreement. Each Participant was individually, and not jointly, liable for its particular advances, if any, under the line of credit. The line of credit under the agreement expired on Nov. 12, 2013.
On Nov. 12, 2013, the Fund, along with the other Participants, entered into an amendment to the agreement for a $225,000,000 revolving line of credit. The line of credit is to be used as described above and operates in substantially the same manner as the original agreement. The line of credit available under the agreement expires on Nov. 10, 2014.
The Fund had no amounts outstanding as of July 31, 2014 or at any time during the year then ended.
8. Derivatives
U.S. GAAP requires disclosures that enable investors to understand: 1) how and why an entity uses derivatives; 2) how they are accounted for; and 3) how they affect an entity’s results of operations and financial position.
Foreign Currency Exchange Contracts — The Fund may enter into foreign currency exchange contracts and foreign cross currency exchange contracts as a way of managing foreign exchange rate risk. The Fund may enter into these contracts to fix the U.S. dollar value of securities that it agreed to buy or sell for the period between the date the trade was entered into and the date the security is delivered and paid for. The Fund may also enter into these contracts to hedge the U.S. dollar value of securities it already owns that are denominated in foreign currencies. In addition, the Fund may enter into these contracts to facilitate or expedite the settlement of portfolio transactions. The change in value is recorded as an unrealized gain or loss. When the contract is closed, a realized gain or loss is recorded equal to the difference between the value of the contract at the time it was opened and the value at the time it was closed.
The use of foreign currency exchange contracts and foreign cross currency exchange contracts does not eliminate fluctuations in the underlying prices of the securities, but does establish a rate of exchange that can be achieved in the future. Although foreign currency exchange contracts and foreign cross currency exchange contracts limit the risk of loss due to an unfavorable change in the value of the hedged currency, they also limit any potential gain that might result should the value of the currency change favorably. In addition, the Fund could be exposed to risks if the counterparties to the contracts are unable to meet the terms of their contracts. The Fund’s maximum risk of loss from counterparty credit risk is the value of its currency exchanged with the counterparty. The risk is generally mitigated by having a netting arrangement between the Fund and the counterparty and by the posting of collateral by the counterparty to the Fund to cover the Fund’s exposure to the counterparty. No foreign currency exchange contracts were outstanding at July 31, 2014.
During the year ended July 31, 2014, the Fund used foreign currency exchange contracts to hedge the U.S. dollar value of securities it already owns that are denominated in foreign currencies.
59
Notes to financial statements
Delaware Core Plus Bond Fund
8. Derivatives (continued)
Futures Contracts — A futures contract is an agreement in which the writer (or seller) of the contract agrees to deliver to the buyer an amount of cash or securities equal to a specific dollar amount times the difference between the value of a specific security or index at the close of the last trading day of the contract and the price at which the agreement is made. The Fund may use futures in the normal course of pursuing its investment objective. The Fund may invest in futures contracts to hedge its existing portfolio securities against fluctuations in fair value caused by changes in interest rates or market conditions. Upon entering into a futures contract, the Fund deposits cash or pledges U.S. government securities to a broker, equal to the minimum “initial margin” requirements of the exchange on which the contract is traded. Subsequent payments are received from the broker or paid to the broker each day, based on the daily fluctuation in the market value of the contract. These receipts or payments are known as “variation margin” and are recorded daily by the Fund as unrealized gains or losses until the contracts are closed. When the contracts are closed, the Fund records a realized gain or loss equal to the difference between the value of the contract at the time it was opened and the value at the time it was closed. Risks of entering into futures contracts include potential imperfect correlation between the futures contracts and the underlying securities and the possibility of an illiquid secondary market for these instruments. When investing in futures, there is reduced counterparty credit risk to the Fund because futures are exchange-traded and the exchange’s clearinghouse, as counterparty to all exchange-traded futures, guarantees against default.
During the year ended July 31, 2014, the Fund used futures contracts to hedge the Fund’s existing portfolio securities against fluctuations in value caused by changes in interest rates or market conditions.
Options Contracts — During the year ended July 31, 2014, the Fund entered into options contracts in the normal course of pursuing its investment objective. The Fund may buy or write options contracts for any number of reasons, including without limitation: to manage the Fund’s exposure to changes in securities prices caused by interest rates or market conditions and foreign currencies; to earn income; as an efficient means of adjusting the Fund’s overall exposure to certain markets; to protect the value of portfolio securities; and as a cash management tool. The Fund may buy or write call or put options on securities, futures, swaps, “swaptions,” financial indices, and foreign currencies. When the Fund buys an option, a premium is paid and an asset is recorded and adjusted on a daily basis to reflect the current market value of the option purchased. When the Fund writes an option, a premium is received and a liability is recorded and adjusted on a daily basis to reflect the current market value of the option written. Premiums received from writing options that expire unexercised are treated by the Fund on the expiration date as realized gains. The difference between the premium received and the amount paid on effecting a closing purchase transaction, including brokerage commissions, is treated as realized gain or loss. If a call option is exercised, the premium is added to the proceeds from the sale of the underlying security in determining whether the Fund has a realized gain or loss. If a put option is exercised, the premium reduces the cost basis of the securities purchased by the Fund. The Fund, as writer of an option, bears the market risk of an unfavorable change in the price of the security underlying the written option. When writing options, the Fund is subject to minimal counterparty risk because the counterparty is only obligated to pay premiums and does not bear the market risk of an unfavorable market change. There were no transactions in options written during the year ended July 31, 2014.
60
During the year ended July 31, 2014. the Fund used options contracts to manage the Fund’s exposure to changes in securities prices caused by interest rates or market conditions.
Swap Contracts — The Fund may enter into interest rate swaps and CDS contracts in the normal course of pursuing its investment objective. The Fund may use interest rate swaps to adjust the Fund’s sensitivity to interest rates or to hedge against changes in interest rates. The Fund may enter into CDS contracts in order to hedge against a credit event, to enhance total return or to gain exposure to certain securities or markets. The Fund will not be permitted to enter into any swap transactions unless, at the time of entering into such transactions, the unsecured long-term debt of the actual counterparty, combined with any credit enhancements, is rated at least BBB- by Standard & Poor’s Financial Services LLC (S&P) or Baa3 by Moody’s Investors Service Inc. (Moody’s) or is determined to be of equivalent credit quality by DMC.
Interest Rate Swaps. An interest rate swap contract is an exchange of interest rates between counterparties. In one instance, an interest rate swap involves payments received by the Fund from another party based on a variable or floating interest rate, in return for making payments based on a fixed interest rate. An interest rate swap can also work in reverse with the Fund receiving payments based on a fixed interest rate and making payments based on a variable or floating interest rate. Interest rate swaps may be used to adjust the Fund’s sensitivity to interest rates or to hedge against changes in interest rates. Periodic payments on such contracts are accrued daily and recorded as unrealized appreciation/depreciation on swap contracts. Upon periodic payment/receipt or termination of the contract, such amounts are recorded as realized gains or losses on swap contracts. The Fund’s maximum risk of loss from counterparty credit risk is the discounted net value of the cash flows to be received from/paid to the counterparty over the interest rate swap contract’s remaining life, to the extent that the amount is positive. This risk is mitigated by (1) for bilateral swap contracts, having a netting arrangement between the Fund and the counterparty and by the posting of collateral by the counterparty to the Fund to cover the Fund’s exposure to the counterparty, and (2) for cleared swaps, trading these instruments through a central counterparty. No interest rate swap contracts were outstanding at July 31, 2014.
During the year ended July 31, 2014, the Fund used interest rate swap contracts to manage the Fund’s sensitivity to interest rates or to hedge against changes in interest rates.
Credit Default Swaps. A CDS contract is a risk-transfer instrument through which one party (purchaser of protection) transfers to another party (seller of protection) the financial risk of a credit event (as defined in the CDS agreement), as it relates to a particular reference security or basket of securities (such as an index). In exchange for the protection offered by the seller of protection, the purchaser of protection agrees to pay the seller of protection a periodic amount at a stated rate that is applied to the notional amount of the CDS contract. In addition, an upfront payment may be made or received by the Fund in connection with an unwinding or assignment of a CDS contract. Upon the occurrence of a credit event, the seller of protection would pay the par (or other agreed-upon) value of the reference security (or basket of securities) to the counterparty. Credit events generally include, among others, bankruptcy, failure to pay, and obligation default.
During the year ended July 31, 2014, the Fund entered into CDS contracts as a purchaser of protection. Periodic payments (receipts) on such contracts are accrued daily and recorded as unrealized losses
61
Notes to financial statements
Delaware Core Plus Bond Fund
8. Derivatives (continued)
(gains) on swap contracts. Upon payment (receipt), such amounts are recorded as realized losses (gains) on swap contracts. Upfront payments made or received in connection with CDS contracts are amortized over the expected life of the CDS contracts as unrealized losses (gains) on swap contracts. The change in value of CDS contracts is recorded daily as unrealized appreciation or depreciation. A realized gain or loss is recorded upon a credit event (as defined in the CDS agreement) or the maturity or termination of the agreement. Initial margin and variation margin is posted to central counterparties for CDS basket trades, as determined by the applicable central counterparty.
CDS contracts may involve greater risks than if the Fund had invested in the reference obligation directly. CDS contracts are subject to general market risk, liquidity risk, counterparty risk, and credit risk. The Fund’s maximum risk of loss from counterparty credit risk, either as the seller of protection or the buyer of protection, is the fair value of the contract. This risk is mitigated by (1) for bilateral swap contracts, having a netting arrangement between the Fund and the counterparty and by the posting of collateral by the counterparty to the Fund to cover the Fund’s exposure to the counterparty, and (2) for cleared swaps, trading these instruments through a central counterparty.
During the year ended July 31, 2014, the Fund used CDS contracts to hedge against a credit event.
Swaps Generally. The value of open swaps may differ from that which would be realized in the event the Fund terminated its position in the contract on a given day. Risks of entering into these contracts include the potential inability of the counterparty to meet the terms of the contracts. This type of risk is generally limited to the amount of favorable movement in the value of the underlying security, instrument, or basket of instruments, if any, at the day of default. Risks also arise from potential losses from adverse market movements and such losses could exceed the unrealized amounts shown on the “Schedule of investments.”
Fair value of derivative instruments as July 31, 2014 was as follows:
| | | | | | | | | | | | | | | | |
| | | Asset Derivatives | | | Liability Derivatives | |
| | | Statement of
Assets and
Liabilities Location | | | Fair Value | | | Statement of
Assets and
Liabilities Location | | | Fair Value | |
Interest rate contracts (Futures contracts) | |
| Variation margin
due to broker on
futures contracts |
| | $ | 29,288 | * | |
| Variation margin
due to broker on
futures contracts |
| | $ | (8,392 | )* |
Credit contracts (Swap contracts) | |
| Unrealized gain
on credit default
swap contracts |
| | | 98 | | |
| Unrealized loss
on credit default
swap contracts |
| | | — | |
| | | | | | | | | | | | | | | | |
Total | | | | | | $ | 29,386 | | | | | | | $ | (8,392 | ) |
| | | | | | | | | | | | | | | | |
*Includes cumulative appreciation (depreciation) of futures contracts from the date the contracts are opened through July 31, 2014. Only current day variation margin is reported on the Fund’s “Statement of assets and liabilities.”
62
The effect of derivative instruments on the “Statement of operations” for the year ended July 31, 2014 was as follows:
| | | | | | | | | | | | | | | | |
| | | Net Realized Gain (Loss) on: | |
| | | Foreign
Currency
Exchange
Contracts | | | Futures
Contracts | | | Swap
Contracts | | | Total | |
Forward currency exchange contracts | | $ | (148,143 | ) | | $ | — | | | $ | — | | | $ | (148,143 | ) |
Equity contracts | | | — | | | | (28,338 | ) | | | — | | | | (28,338 | ) |
Interest rate contracts | | | — | | | | 278,057 | | | | (52,250 | ) | | | 225,807 | |
Credit contracts | | | — | | | | — | | | | (191,120 | ) | | | (191,120 | ) |
| | | | | | | | | | | | | | | | |
Total | | $ | (148,143 | ) | | $ | 249,719 | | | $ | (243,370 | ) | | $ | (141,794 | ) |
| | | | | | | | | | | | | | | | |
| | | | | | | | | | | | | | | | |
| | | Net Change in Unrealized Appreciation
(Depreciation) of: | |
| | | Foreign
Currency
Exchange
Contracts | | | Futures
Contracts | | | Swap
Contracts | | | Total | |
Forward currency exchange contracts | | $ | 13,290 | | | $ | — | | | $ | — | | | $ | 13,290 | |
Equity contracts | | | — | | | | 17,234 | | | | — | | | | 17,234 | |
Interest rate contracts | | | — | | | | 35,729 | | | | 12,697 | | | | 48,426 | |
Credit contracts | | | — | | | | — | | | | 110,981 | | | | 110,981 | |
| | | | | | | | | | | | | | | | |
Total | | $ | 13,290 | | | $ | 52,963 | | | $ | 123,678 | | | $ | 189,931 | |
| | | | | | | | | | | | | | | | |
Derivatives Generally. The table below summarizes the average balance of derivative holdings by the Fund during the year ended July 31, 2014.
| | | | | | | | | | | | | | | | |
| | | Long Derivative
Volume | | | Short Derivative
Volume | |
Foreign currency exchange contracts (average cost) | | | USD | | | | 338,291 | | | | USD | | | | 1,033,035 | |
Futures contracts (average notional value) | | | | | | | 6,153,945 | | | | | | | | 4,586,122 | |
Options contracts (average notional value) | | | | | | | 1,032 | | | | | | | | — | |
CDS contracts (average notional value)* | | | | | | | 505,379 | | | | | | | | 68,775 | |
| | | EUR | | | | 238,755 | | | | | | | | — | |
Interest rate contracts (average notional value)** | | | USD | | | | 422,530 | | | | | | | | — | |
*Long represents buying protection and short represents selling protection.
**Long represents receiving fixed interest payments and short represents paying fixed interest payments.
9. Offsetting
In December 2011, the Financial Accounting Standards Board (FASB) issued guidance that expands current disclosure requirements on the offsetting of certain assets and liabilities. The new disclosures are required for investments and derivative financial instruments subject to master netting or similar agreements which are eligible for offset on the “Statement of assets and liabilities” and will require an entity to disclose both gross and net information about such investments and transactions in the
63
Notes to financial statements
Delaware Core Plus Bond Fund
9. Offsetting (continued)
financial statements. In January 2013, the FASB issued guidance that clarifies which investments and transactions are subject to the offsetting disclosure requirements. The scope of the disclosure requirements for offsetting is limited to derivative instruments, repurchase agreements and reverse repurchase agreements, and securities borrowing. The guidance is effective for financial statements with fiscal years beginning on or after Jan. 1, 2013, and interim periods within those fiscal years. The Fund adopted the disclosure provisions on offsetting during the current reporting period.
In order to better define its contractual rights and to secure rights that will help the Fund mitigate its counterparty risk, the Fund entered into an International Swaps and Derivatives Association, Inc. Master Agreement (ISDA Master Agreement) or similar agreement with each of their derivative contract counterparties. An ISDA Master Agreement is a bilateral agreement between the Fund and a counterparty that governs over-the-counter (OTC) derivatives and foreign exchange contracts and typically contains, among other things, collateral posting items and netting provisions in the event of a default and/or termination event. Under an ISDA Master Agreement, the Fund may, under certain circumstances, offset with the counterparty certain derivative financial instrument’s payables and/or receivables with collateral held and/or posted and create one single net payment. The provisions of the ISDA Master Agreement typically permit a single net payment in the event of default (close-out) netting including the bankruptcy or insolvency of the counterparty. However, bankruptcy or insolvency laws of a particular jurisdiction may impose restrictions on or prohibitions against the right of offset in bankruptcy, insolvency or other events.
For financial reporting purposes, the Fund does not offset derivative assets and derivative liabilities that are subject to netting arrangements on the “Statement of assets and liabilities.”
At July 31, 2014, the Fund had the following assets and liabilities subject to offsetting provisions:
Offsetting of Financial Assets and Liabilities and Derivative Assets and Liabilities
| | | | | | | | | | | | | | | | | | | | | | | | |
| Counterparty | | | | | | | | | | | Gross Value of
Derivative Asset | | | Gross Value of
Derivative Liability | | | Net Position | |
Morgan Stanley Capital | | | | | | | | | | | | | | | $98 | | | | $— | | | | $98 | |
| | | | | | |
| Counterparty | | Net
Position | | | Fair Value of
Non-Cash
Collateral
Received | | | Cash
Collateral
Received | | | Fair Value of
Non-Cash
Collateral
Pledged | | | Cash Collateral
Pledged | | | Net
Amount(a) | |
Morgan Stanley Capital | | | $98 | | | | $— | | | | $— | | | | $— | | | | $— | | | | $98 | |
64
| | | | | | | | | | | | | | | | |
| Counterparty | | Repurchase
Agreements | | | Fair Value of
Non-Cash
Collateral Received | | | Cash Collateral
Received | | | Net
Amount(a) | |
Bank of America
Merrill Lynch | | $ | 2,713,685 | | | | $(2,713,685) | | | | $— | | | | $— | |
Bank of Montreal | | | 904,562 | | | | (904,562) | | | | — | | | | — | |
BNP Paribas | | | 5,076,753 | | | | (5,076,753) | | | | — | | | | — | |
| | | | | | | | | | | | | | | | |
Total | | $ | 8,695,000 | | | | $(8,695,000) | | | | $— | | | | $— | |
| | | | | | | | | | | | | | | | |
(a) Net amount represents the receivable/(payable) that would be due from/(to) the counterparty in the event of default.
10. Securities Lending
The Fund, along with other funds in the Delaware Investments® Family of Funds, may lend its securities pursuant to a security lending agreement (Lending Agreement) with The Bank of New York Mellon (BNY Mellon). At the time a security is loaned, the borrower must post collateral equal to the required percentage of the market value of the loaned security, including any accrued interest. The required percentage is: (1) 102% with respect to U.S. securities and foreign securities that are denominated and payable in U.S. dollars; and (2) 105% with respect to foreign securities. With respect to each loan, if on any business day the aggregate market value of securities collateral plus cash collateral held is less than the aggregate market value of the securities which are the subject of such loan, the borrower will be notified to provide additional collateral by the end of the following business day which, together with the collateral already held, will be not less than the applicable initial collateral requirements for such security loan. If the aggregate market value of securities collateral and cash collateral held with respect to a security loan exceeds the applicable initial collateral requirement, upon request of the borrower, BNY Mellon must return enough collateral to the borrower by the end of the following business day to reduce the value of the remaining collateral to the applicable initial collateral requirement for such security loan. As a result of the foregoing, the value of the collateral held with respect to a loaned security on any particular day may be more or less than the value of the security on loan.
Cash collateral received is generally invested in the Delaware Investments Collateral Fund No. 1 (Collective Trust) established by BNY Mellon for the purpose of investment on behalf of funds managed by DMC that participate in BNY Mellon’s securities lending program. The Collective Trust may invest in U.S. government securities and high-quality corporate debt, asset-backed and other money market securities, and in repurchase agreements collateralized by such securities, provided that the Collective Trust will generally have a dollar-weighted average portfolio maturity of 60 days or less. The Fund can also accept U.S. government securities and letters of credit (non-cash collateral) in connection with securities loans. In the event of default or bankruptcy by the lending agent, realization and/or retention of the collateral may be subject to legal proceedings. In the event the borrower fails to return loaned securities and the collateral received is insufficient to cover the value of the loaned securities and provided such collateral shortfall is not the result of investment losses, the lending agent has agreed to pay the amount of the shortfall to the Fund or, at the discretion of the lending agent, replace the loaned securities. The Fund continues to record dividends or interest, as applicable, on the securities loaned and is subject to changes in value of the securities loaned that may occur during the term of the loan. The Fund has the right under the Lending Agreement to recover the securities from the borrower on demand. With respect to security loans collateralized by non-cash collateral, the Fund receives loan
65
Notes to financial statements
Delaware Core Plus Bond Fund
10. Securities Lending (continued)
premiums paid by the borrower. With respect to security loans collateralized by cash collateral, the earnings from the collateral investments are shared among the Fund, the security lending agent and the borrower. The Fund records security lending income net of allocations to the security lending agent and the borrower.
The Collective Trust used for the investment of cash collateral received from borrowers of securities seeks to maintain a net asset value per unit of $1.00, but there can be no assurance that it will always be able to do so. The Fund may incur investment losses as a result of investing securities lending collateral in the Collective Trust. This could occur if an investment in the Collective Trust defaulted or if it were necessary to liquidate assets in the Collective Trust to meet returns on outstanding security loans at a time when the Collective Trust’s net asset value per unit was less than $1.00. Under those circumstances, the Fund may not receive an amount from the Collective Trust that is equal in amount to the collateral the Fund would be required to return to the borrower of the securities and the Fund would be required to make up for this shortfall.
At July 31, 2014, the Fund had no securities out on loan.
11. Credit and Market Risk
The Fund invests a portion of its assets in high yield fixed income securities, which are securities rated lower than BBB- by S&P and lower than Baa3 by Moody’s, or similarly rated by another nationally recognized statistical rating organization. Investments in these higher yielding securities are generally accompanied by a greater degree of credit risk than higher rated securities. Additionally, lower rated securities may be more susceptible to adverse economic and competitive industry conditions than investment grade securities.
The Fund invests in fixed income securities whose value is derived from an underlying pool of mortgages or consumer loans. The value of these securities is sensitive to changes in economic conditions, including delinquencies and/or defaults, and may be adversely affected by shifts in the market’s perception of the issuers and changes in interest rates. Investors receive principal and interest payments as the underlying mortgages and consumer loans are paid back. Some of these securities are collateralized mortgage obligations (CMOs). CMOs are debt securities issued by U.S. government agencies or by financial institutions and other mortgage lenders, which are collateralized by a pool of mortgages held under an indenture. Prepayment of mortgages may shorten the stated maturity of the obligations and can result in a loss of premium, if any has been paid. Certain of these securities may be stripped (securities which provide only the principal or interest feature of the underlying security). The yield to maturity on an interest-only CMO is extremely sensitive not only to changes in prevailing interest rates, but also to the rate of principal payments (including prepayments) on the related underlying mortgage assets. A rapid rate of principal payments may have a material adverse effect on the Fund’s yield to maturity. If the underlying mortgage assets experience greater-than-anticipated prepayments of principal, the Fund may fail to fully recoup its initial investment in these securities even if the securities are rated in the highest rating categories.
The Fund invests in certain obligations that may have liquidity protection to ensure that the receipt of payments due on the underlying security is timely. Such protection may be provided through guarantees,
66
insurance policies or letters of credit obtained by the issuer or sponsor through third parties, through various means of structuring the transaction or through a combination of such approaches. The Fund will not pay any additional fees for such credit support, although the existence of credit support may increase the price of a security.
The Fund may invest up to 15% of its net assets in illiquid securities, which may include securities with contractual restrictions on resale, securities exempt from registration under Rule 144A of the Securities Act of 1933, as amended, and other securities which may not be readily marketable. The relative illiquidity of these securities may impair the Fund from disposing of them in a timely manner and at a fair price when it is necessary or desirable to do so. While maintaining oversight, the Fund’s Board has delegated to DMC, the day-to-day functions of determining whether individual securities are liquid for purposes of the Fund’s limitation on investments in illiquid securities. Securities eligible for resale pursuant to Rule 144A, which are determined to be liquid, are not subject to the Fund’s 15% limit on investments in illiquid securities. As of July 31, 2014, no securities held by the Fund have been determined to be illiquid under the Fund’s Liquidity Procedures. Rule 144A securities have been identified on the “Schedule of investments.”
12. Contractual Obligations
The Fund enters into contracts in the normal course of business that contain a variety of indemnifications. The Fund’s maximum exposure under these arrangements is unknown. However, the Fund has not had prior claims or losses pursuant to these contracts. Management has reviewed the Fund’s existing contracts and expects the risk of loss to be remote.
13. Recent Accounting Pronouncements
In June 2014, the FASB issued guidance to improve the financial reporting of reverse repurchase agreements and other similar transactions. The guidance includes expanded disclosure requirements for entities that enter into reverse repurchase agreements and similar transactions accounted for as secured borrowings. The guidance is effective for financial statements with fiscal years beginning on or after December 15, 2014 and interim periods within those fiscal years. Management is evaluating the impact, if any, of this guidance on the Fund’s financial statement disclosures.
14. Subsequent Events
Effective Sept. 25, 2014, all remaining shares of Class B were converted to Class A shares.
Management has determined that no other material events or transactions occurred subsequent to July 31, 2014 that would require recognition or disclosure in the Fund’s financial statements.
67
Report of independent
registered public accounting firm
To the Board of Trustees of Delaware Group® Government Fund
and the Shareholders of Delaware Core Plus Bond Fund:
In our opinion, the accompanying statement of assets and liabilities, including the schedule of investments, and the related statements of operations and of changes in net assets and the financial highlights present fairly, in all material respects, the financial position of Delaware Core Plus Bond Fund (one of the series constituting Delaware Group® Government Fund, hereinafter referred to as the “Fund”) at July 31, 2014, the results of its operations for the year then ended, the changes in its net assets for each of the two years in the period then ended and the financial highlights for each of the five years in the period then ended, in conformity with accounting principles generally accepted in the United States of America. These financial statements and financial highlights (hereafter referred to as “financial statements”) are the responsibility of the Fund’s management. Our responsibility is to express an opinion on these financial statements based on our audit. We conducted our audit of these financial statements in accordance with the standards of the Public Company Accounting Oversight Board (United States). Those standards require that we plan and perform the audit to obtain reasonable assurance about whether the financial statements are free of material misstatement. An audit includes examining, on a test basis, evidence supporting the amounts and disclosures in the financial statements, assessing the accounting principles used and significant estimates made by management, and evaluating the overall financial statement presentation. We believe that our audit, which included confirmation of securities at July 31, 2014 by correspondence with the custodian and brokers, and the application of alternative auditing procedures where confirmations of security purchases had not been received, provides a reasonable basis for our opinion.
PricewaterhouseCoopers LLP
Philadelphia, Pennsylvania
September 19, 2014
68
Other Fund information (Unaudited)
Delaware Core Plus Bond Fund
Tax Information
The information set forth below is for the Fund’s fiscal year as required by federal income tax laws. Shareholders, however, must report distributions on a calendar year basis for income tax purposes, which may include distributions for portions of two fiscal years of the Fund. Accordingly, the information needed by shareholders for income tax purposes will be sent to them in January of each year. Please consult your tax advisor for proper treatment of this information.
All disclosures are based on financial information available as of the date of this annual report and, accordingly are subject to change. For any and all items requiring reporting, it is the intention of the Fund to report the maximum amount permitted under the Internal Revenue Code and the regulations thereunder.
For the fiscal year ended July 31, 2014, the Fund reports distributions paid during the year as follows:
| | | | |
(A) Long-Term Capital Gain Distributions (Tax Basis) | | | — | |
(B) Ordinary Income Distributions (Tax Basis)* | | | 87.51 | % |
(C) Return of Capital (Tax Basis) | | | 12.49 | % |
Total Distributions (Tax Basis) | | | 100.00 | % |
(D) Qualifying Dividends1 | | | 1.81 | % |
(A), (B) and (C) are based on a percentage of the Fund’s total distributions.
(D) is based on a percentage of the Fund’s ordinary income distributions.
1Qualifying dividends represent dividends which qualify for the corporate dividends received deduction.
*For the fiscal year ended July 31, 2014, certain dividends paid by the Fund may be subject to a maximum tax rate of 15%, as provided for by the Jobs and Growth Tax Relief Reconciliation Act of 2003, as extended by the Tax Relief, Unemployment Insurance Reauthorization and Jobs Creation Act of 2010, and made permanent by the American Taxpayer Relief Act of 2012. The Fund intends to report up to a maximum of 2.05% to be taxed at a maximum rate of 15%. Complete information will be computed and reported in conjunction with your 2014 Form 1099-DIV.
69
Board of trustees / directors and officers addendum
Delaware Investments® Family of Funds
A mutual fund is governed by a Board of Trustees / Directors (“Trustees”), which has oversight responsibility for the management of a fund’s business affairs. Trustees establish procedures and oversee and review the performance of the investment manager, the distributor, and others who perform services for the fund. The independent fund trustees, in particular, are advocates
| | | | |
Name, Address, and Birth Date | | Position(s) Held with Fund(s) | | Length of Time Served |
| Interested Trustees | | | | |
Patrick P. Coyne1 2005 Market Street Philadelphia, PA 19103 April 1963 | | Chairman, President, Chief Executive Officer, and Trustee | | Chairman and Trustee since August 16, 2006 President and Chief Executive Officer since August 1, 2006 |
| Independent Trustees | | | | |
Thomas L. Bennett 2005 Market Street Philadelphia, PA 19103 October 1947 | | Trustee | | Since March 2005 |
Joseph W. Chow 2005 Market Street Philadelphia, PA 19103 January 1953 | | Trustee | | Since January 2013 |
John A. Fry 2005 Market Street Philadelphia, PA 19103 May 1960 | | Trustee | | Since January 2001 |
| 1 | Patrick P.Coyne is considered to be an “Interested Trustee” because he is an executive officer of the Fund’s(s’) investment advisor. |
for shareholder interests. Each trustee has served in that capacity since he or she was elected to or appointed to the Board of Trustees, and will continue to serve until his or her retirement or the election of a new trustee in his or her place. The following is a list of the Trustees and Officers with certain background and related information.
| | | | |
Principal Occupation(s)
During Past 5 Years | | Number of Portfolios in
Fund Complex Overseen
by Trustee or Officer | | Other Directorships
Held by Trustee or Officer |
| | | | | |
Patrick P. Coyne has served in
various executive capacities
at different times at
Delaware Investments.2 | | 70 | | Board of Governors Member
Investment Company
Institute (ICI) Director and Audit Committee Member Kaydon Corp. (2007–2013) |
| | | | | |
Private Investor
(March 2004–Present) | | 70 | | Director
Bryn Mawr Bank Corp. (BMTC)
(2007–2011) |
Executive Vice President
(Emerging Economies
Strategies, Risk and
Corporate Administration)
State Street Corporation
(July 2004–March 2011) | | 70 | | Director and Audit Committee
Member — Hercules
Technology Growth
Capital, Inc. |
President
Drexel University
(August 2010–Present) President
Franklin & Marshall College
(July 2002–July 2010) | | 70 | | Director — Hershey Trust Director and Audit
Committee Member
Community Health Systems |
| 2 | Delaware Investments is the marketing name for Delaware Management Holdings, Inc. and its subsidiaries, including the Fund’s(s’) investment advisor, principal underwriter, and its transfer agent. |
71
Board of trustees / directors and officers addendum
Delaware Investments® Family of Funds
| | | | |
Name, Address,
and Birth Date | | Position(s)
Held with Fund(s) | | Length of
Time Served |
| Independent Trustees (continued) | | | | |
Lucinda S. Landreth 2005 Market Street Philadelphia, PA 19103 June 1947 | | Trustee | | Since March 2005 |
Frances A. Sevilla-Sacasa 2005 Market Street Philadelphia, PA 19103 January 1956 | | Trustee | | Since September 2011 |
Thomas K. Whitford 2005 Market Street Philadelphia, PA 19103 March 1956 | | Trustee | | Since January 2013 |
72
| | | | |
Principal Occupation(s) During Past 5 Years | | Number of Portfolios in Fund Complex Overseen by Trustee or Officer | | Other Directorships Held by Trustee or Officer |
| | | | | |
Private Investor
(2004–Present) | | 70 | | None |
Chief Executive Officer —
Banco Itaú
International
(April 2012–Present) | | 70 | | Trust Manager and
Audit Committee
Member — Camden
Property Trust |
Executive Advisor to Dean
(August 2011–March 2012)
and Interim Dean
(January 2011–July 2011) —
University of Miami School of
Business Administration | | | | |
President — U.S. Trust,
Bank of America Private
Wealth Management
(Private Banking)
(July 2007–December 2008) | | | | |
Vice Chairman
(2010–April 2013)
Chief Administrative
Officer (2008–2010)
and Executive Vice
President and Chief
Administrative Officer
(2007–2009) —
PNC Financial
Services Group | | 70 | | Director — HSBC Finance
Corporation and HSBC
North America Holdings Inc. |
73
Board of trustees / directors and officers addendum
Delaware Investments® Family of Funds
| | | | |
Name, Address,
and Birth Date | | Position(s)
Held with Fund(s) | | Length of
Time Served |
| Independent Trustees (continued) | | | | |
Janet L. Yeomans 2005 Market Street Philadelphia, PA 19103 July 1948 | | Trustee | | Since April 1999 |
J. Richard Zecher 2005 Market Street Philadelphia, PA 19103 July 1940 | | Trustee | | Since March 2005 |
74
| | | | |
Principal Occupation(s) During Past 5 Years | | Number of Portfolios in Fund Complex Overseen by Trustee or Officer | | Other Directorships Held by Trustee or Officer |
| | | | |
Vice President and Treasurer (January 2006–July 2012) Vice President — Mergers & Acquisitions (January 2003–January 2006), and Vice President and Treasurer (July 1995–January 2003) 3M Corporation | | 70 | | Director, Audit Committee Chair, Investment Committee Member, and Governance Committee Member Okabena Company Chair — 3M Investment Management Company (2005–2012) |
Founder Investor Analytics (Risk Management) (May 1999–Present) Founder P/E Investments (Hedge Fund) (September 1996–Present) | | 70 | | Director and Compensation Committee Member Investor Analytics Director — P/E Investments |
75
Board of trustees / directors and officers addendum
Delaware Investments® Family of Funds
| | | | |
Name, Address, and Birth Date | | Position(s) Held with Fund(s) | | Length of Time Served |
| Officers | | | | |
David F. Connor 2005 Market Street Philadelphia, PA 19103 December 1963 | | Senior Vice President, Deputy General Counsel, and Secretary | | Senior Vice President, Deputy General Counsel since May 2013; Vice President, Deputy General Counsel September 2000– May 2013; Secretary since October 2005 |
Daniel V. Geatens 2005 Market Street Philadelphia, PA 19103 October 1972 | | Vice President and Treasurer | | Treasurer since October 2007 |
David P. O’Connor 2005 Market Street Philadelphia, PA 19103 February 1966 | | Executive Vice President, General Counsel and Chief Legal Officer | | Executive Vice President since February 2012; Senior Vice President October 2005– February 2012; General Counsel and Chief Legal Officer since October 2005 |
Richard Salus 2005 Market Street Philadelphia, PA 19103 October 1963 | | Senior Vice President and Chief Financial Officer | | Chief Financial Officer since November 2006 |
The Statement of Additional Information for the Fund(s) includes additional information about the Trustees and Officers and is available, without charge, upon request by calling 800 523-1918.
76
| | | | |
Principal Occupation(s) During Past 5 Years | | Number of Portfolios in Fund Complex Overseen by Trustee or Officer | | Other Directorships Held by Trustee or Officer |
| | | | |
David F. Connor has served as Deputy General Counsel of Delaware Investments since 2000. | | 70 | | None3 |
Daniel V. Geatens has served in various capacities at different times at Delaware Investments. | | 70 | | None3 |
David P. O’Connor has served in various executive and legal capacities at different times at Delaware Investments. | | 70 | | None3 |
Richard Salus has served in various executive capacities at different times at Delaware Investments. | | 70 | | None3 |
| 3 | David F. Connor, Daniel V. Geatens, David P. O’Connor, and Richard Salus serve in similar capacities for the six portfolios of the Optimum Fund Trust, which have the same investment advisor, principal underwriter, and transfer agent as the registrant. |
77
About the organization
Board of trustees
| | | | | | |
Patrick P. Coyne Chairman, President, and Chief Executive Officer Delaware Investments ® Family of Funds Philadelphia, PA Thomas L. Bennett Private Investor Rosemont, PA | | Joseph W. Chow Former Executive Vice President State Street Corporation Brookline, MA John A. Fry President Drexel University Philadelphia, PA | | Lucinda S. Landreth Former Chief Investment Officer Assurant, Inc. Philadelphia, PA Frances A. Sevilla-Sacasa Chief Executive Officer Banco Itaú International Miami, FL | | Thomas K. Whitford Former Vice Chairman PNC Financial Services Group Pittsburgh, PA Janet L. Yeomans Former Vice President and Treasurer 3M Corporation St. Paul, MN J. Richard Zecher Founder Investor Analytics Scottsdale, AZ |
| | | |
Affiliated officers | | | | | | |
| | | |
David F. Connor Senior Vice President, Deputy General Counsel, and Secretary Delaware Investments Family of Funds Philadelphia, PA | | Daniel V. Geatens Vice President and Treasurer Delaware Investments Family of Funds Philadelphia, PA | | David P. O’Connor Executive Vice President, General Counsel, and Chief Legal Officer Delaware Investments Family of Funds Philadelphia, PA | | Richard Salus Senior Vice President and Chief Financial Officer Delaware Investments Family of Funds Philadelphia, PA |
This annual report is for the information of Delaware Core Plus Bond Fund shareholders, but it may be used with prospective investors when preceded or accompanied by the Delaware Investments Fund fact sheet for the most recently completed calendar quarter. These documents are available at delawareinvestments.com.
Delaware Investments is the marketing name of Delaware Management Holdings, Inc. and its subsidiaries.
The Fund files its complete schedule of portfolio holdings with the Securities and Exchange Commission (SEC) for the first and third quarters of each fiscal year on Form N-Q. The Fund’s Forms N-Q, as well as a description of the policies and procedures that the Fund uses to determine how to vote proxies (if any) relating to portfolio securities are available without charge (i) upon request, by calling 800 523-1918; and (ii) on the SEC’s website at sec.gov. In addition, a description of the policies and procedures that the Fund uses to determine how to vote proxies (if any) relating to portfolio securities and the Fund’s Schedule of Investments are available without charge on the Fund’s website at delawareinvestments.com. The Fund’s Forms N-Q may be reviewed and copied at the SEC’s Public Reference Room in Washington, D.C.; information on the operation of the Public Reference Room may be obtained by calling 800 SEC-0330.
Information (if any) regarding how the Fund voted proxies relating to portfolio securities during the most recently disclosed 12-month period ended June 30 is available without charge (i) through the Fund’s website at delawareinvestments.com; and (ii) on the SEC’s website at sec.gov.
78

Annual report
Fixed income mutual fund
Delaware Emerging Markets Debt Fund
July 31, 2014
Carefully consider the Fund’s investment objectives, risk factors, charges, and expenses before investing. This and other information can be found in the Fund’s prospectus and, if available, its summary prospectus, which may be obtained by visiting delawareinvestments.com or calling 800 523-1918. Investors should read the prospectus and, if available, the summary prospectus carefully before investing.
You can obtain shareholder reports and prospectuses online instead of in the mail. Visit delawareinvestments.com/edelivery.
Experience Delaware Investments
Delaware Investments is committed to the pursuit of consistently superior asset management and unparalleled client service. We believe in our investment processes, which seek to deliver consistent results, and in convenient services that help add value for our clients.
If you are interested in learning more about creating an investment plan, contact your financial advisor.
You can learn more about Delaware Investments or obtain a prospectus for Delaware Emerging Markets Debt Fund at delawareinvestments.com.
Manage your investments online
| • | | 24-hour access to your account information |
| • | | Check your account balance and recent transactions |
| • | | Request statements or literature |
| • | | Make purchases and redemptions |
Delaware Management Holdings, Inc. and its subsidiaries (collectively known by the marketing name of Delaware Investments) are wholly owned subsidiaries of Macquarie Group Limited, a global provider of banking, financial, advisory, investment and funds management services.
Investments in Delaware Emerging Markets Debt Fund are not and will not be deposits with or liabilities of Macquarie Bank Limited ABN 46 008 583 542 and its holding companies, including their subsidiaries or related companies (Macquarie Group), and are subject to investment risk, including possible delays in repayment and loss of income and capital invested. No Macquarie Group company guarantees or will guarantee the performance of the Fund, the repayment of capital from the Fund, or any particular rate of return.
Table of contents
Unless otherwise noted, views expressed herein are current as of July 31, 2014, and subject to change.
Funds are not FDIC insured and are not guaranteed. It is possible to lose the principal amount invested.
Mutual fund advisory services provided by Delaware Management Company, a series of Delaware Management Business Trust, which is a registered investment advisor. Delaware Investments, a member of Macquarie Group, refers to Delaware Management Holdings, Inc. and its subsidiaries, including the Fund’s distributor, Delaware Distributors, L.P. Macquarie Group refers to Macquarie Group Limited and its subsidiaries and affiliates worldwide.
© 2014 Delaware Management Holdings, Inc.
All third-party marks cited are the property of their respective owners.
Portfolio management review
| | |
| Delaware Emerging Markets Debt Fund | | August 12, 2014 |
Performance preview (for the 10-month period ended July 31, 2014)
| | | | | | |
Delaware Emerging Markets Debt Fund (Class A shares) | | return since Sept. 30, 2013 (inception) | | | +7.86 | % |
J.P. Morgan Corporate Emerging Markets Bond Index (CEMBI) Broad Diversified (benchmark) | | return since Sept. 30, 2013 | | | +8.40 | % |
Past performance does not guarantee future results.
For complete, annualized performance for Delaware Emerging Markets Debt Fund, please see the table on page 4.
The performance of Class A shares excludes the applicable sales charge and reflects the reinvestment of all distributions. Index performance returns do not reflect any management fees, transaction costs, or expenses. Indices are unmanaged and one cannot invest directly in an index.
When the Fund’s 10-month fiscal period began on Oct. 1, 2013, emerging market bond prices had endured a steep decline in previous months, triggered by the U.S. Federal Reserve’s hints in June 2013 that it would wind down its third major asset purchase program sooner than expected. In our opinion, that selloff had the effect of creating attractive valuations within the sector, but a lingering atmosphere of negative sentiment toward spread products motivated fund redemptions that delayed a rally for several more months.
By February 2014, sentiment toward risk assets had begun to improve to the point that investors acted on the favorable absolute and relative valuations (both on a yield and a spread basis) in emerging market debt, driving prices sharply higher through the end of the Fund’s fiscal period. Although the Fed put into effect its plans to conclude its bond-buying program by October 2014, capital markets nonetheless remained awash in central-bank liquidity, the residue of seven years of policy rates being at virtually zero.
That sea of liquidity – combined with a renewed appetite for emerging market debt among many retail investors – initially functioned to tighten credit spreads in high-quality debt, then in high yield debt, and finally in the emerging market sector. Of course, the emerging market asset class comprises both investment grade (roughly 70%) and high yield bonds. For the 10-month reporting period, high yield outperformed its
investment grade counterparts by slightly more than 300 basis points on a total return basis. (One basis point equals one one-hundredth of a percentage point.) Relative strength was concentrated in Latin America and Africa on a regional basis, and in conglomerates and industrials on a sector basis. Meanwhile, Russia and Eastern European credit markets lagged, as did individual transportation and energy issues. (Source: Bloomberg.)
Notably, the outbreak of geopolitical violence in Ukraine failed to derail the strong overall rally then under way in emerging market debt. We view the ability of investors to distinguish between events affecting countries, regions, sectors, and issuers differently as evidence of the potential maturation of the emerging debt asset class.
Fund performance
For its fiscal period from Sept. 30, 2013, through July 31, 2014, Delaware Emerging Markets Debt Fund returned +7.86% at net asset value and +3.02% at maximum offer price (both figures reflect Class A shares with all distributions reinvested). During the same period, the Fund’s benchmark, the J.P. Morgan Corporate Emerging Markets Bond Index (CEMBI) Broad Diversified, returned +8.40%. For complete annualized performance of Delaware Emerging Markets Debt Fund, please see the table on page 4.
1
Portfolio management review
Delaware Emerging Markets Debt Fund
The Fund’s overweight to Latin America contributed to relative performance. In fact, Latin America was the top performer within the sovereign sector of emerging market debt and the number-two performer on the corporate side. The Fund also benefited from an overweight to African debt.
In addition, the Fund benefited from a large overweight to high yield bonds. During the fiscal period, the Fund’s high yield allocation ranged from 43% to 63% of assets, compared to 32% for the Fund’s benchmark. In general, the Fund was more active in corporate debt than sovereign debt, which we believe took advantage of the team’s skills in fundamental, bottom-up (bond by bond) credit analysis.
Meanwhile, the Fund’s overweight exposure to Russian debt detracted from relative performance. As the fiscal period began, spreads on Russian debt were unusually wide, a reflection of generalized weakness in the European economy and the tighter-than-ideal monetary policy employed by the European Central Bank. It’s important to note that the distinction between public and private Russian companies is murky, meaning that Russia’s business sector could potentially rely on some degree of government support in the event of a sharp economic downturn. Of course, this overweight allocation hurt Fund performance as tensions between Russia and Ukraine erupted into violence in spring 2014.
Among the Fund’s individual holdings, a dollar-denominated position in Vingroup contributed to outperformance. The company is a Vietnam-based property developer that enjoys strong Western equity sponsorship — specifically, a partnership between an investment management company and an established local property developer. We believed the bond offered significant value relative to Chinese property developers. From its purchase in October 2013, the yield spread on the Vingroup position tightened by about 300 basis
points from its initial 950-basis-point spread relative to Treasurys.
The Fund’s position in Turkish Finansbank also outperformed. The bank is owned by the National Bank of Greece, and its bonds sold off to levels that we believed offered significant relative value after the euro-zone financial crisis.
Finally, the Fund’s position in African Export-Import Bank (also known as Afreximbank) also generated solid outperformance. The bank is based in Cairo and owned by a consortium of African central banks. We viewed Afreximbank securities as having the potential to similarly benefit from the favorable trends evident in Finansbank: a growing preference for shorter-dated paper as well as political and economic challenges that temporarily discouraged potential buyers. As investors dug deeper into the story, however (aside from its Cairo headquarters, the bank is not connected to Egypt), the value in Afreximbank debt became apparent, boosting the bond’s price and tightening its spread.
Conversely, two Fund positions in Argentine debt — one sovereign and one from the province of Buenos Aires — underperformed. In general, we continue to believe that Argentina represents one of the more attractive areas within the emerging market debt sector. During the Fund’s fiscal period, however, those positions lagged the benchmark amid the broad selloff in Argentine debt late in 2013. In effect, our presence there was premature, though we see opportunity to take substantial tactical positions in that country’s sovereign and corporate bonds going forward.
The Fund’s position in Gazprom — the giant Russian energy producer — also underperformed amid the repricing of Russian debt that accompanied that country’s military provocations in Ukraine. The potential effect of economic sanctions against Russia also played a role in the bond’s underperformance. As the fiscal period ended, the Fund held no Gazprom debt, and we
2
focused the Fund’s Russian debt positions in more defensive sectors.
During the fiscal period, the Fund invested in the following derivative types: credit default swaps, futures, and currency hedges. Credit default swaps were generally used in order to hedge against a credit event or to gain exposure to certain securities or markets. Futures and currency derivatives were generally used for hedging purposes and to facilitate the ability to manage duration risk and currency exposures. None of those three derivative positions had a material effect on the Fund’s performance. As of the end of the fiscal period, the Fund’s only
remaining derivative position was in credit default swaps.
Positioning
As the fiscal period ended, the Fund was not as aggressively positioned as it was during the rally in emerging market bonds that took root in February and lasted through early July. We also reduced the Fund’s high yield weighting from a peak of 63% to about 46%, while increasing the Fund’s allocation to high-quality bonds from 37% to about 55%. In terms of regional weighting, we continue to favor Latin America at 45% of assets, followed by Asia at 32% and the Middle East and Africa at 7%.
3
Performance summary
| | |
Delaware Emerging Markets Debt Fund | | July 31, 2014 |
The performance data quoted represent past performance; past performance does not guarantee future results. Investment return and principal value will fluctuate so your shares, when redeemed, may be worth more or less than their original cost. Please obtain the performance data current for the most recent month end by calling 800 523-1918 or visiting our website at delawareinvestments.com/performance. Current performance may be lower or higher than the performance data quoted.
| | | | | | | | |
| Fund and benchmark performance1, 2, 3 | | Average annual total returns through July 31, 2014 |
| | | | |
| | | Since inception | | 1 year | | 3 years | | Lifetime |
Class A (Est. Sept. 30, 2013) | | | | | | | | |
Excluding sales charge | | +7.86% | | +7.35% | | +8.29% | | +8.60% |
Including sales charge | | +3.02% | | +2.52% | | +6.64% | | +7.27% |
Class C (Est. Sept. 30, 2013) | | | | | | | | |
Excluding sales charge | | +7.22% | | +6.57% | | +7.49% | | +7.80% |
Including sales charge | | +6.22% | | +5.57% | | +7.49% | | +7.80% |
Class R (Est. Sept. 30, 2013) | | | | | | | | |
Excluding sales charge | | +7.64% | | +7.08% | | +8.02% | | +8.33% |
Including sales charge | | +7.64% | | +7.08% | | +8.02% | | +8.33% |
Institutional Class (Est. Sept. 30, 2013) | | | | | | | | |
Excluding sales charge | | +8.08% | | +7.61% | | +8.56% | | +8.87% |
Including sales charge | | +8.08% | | +7.61% | | +8.56% | | +8.87% |
J.P. Morgan Corporate Emerging Markets | | | | | | | | |
Bond Index (CEMBI) Broad Diversified | | +8.40% | | +8.67% | | +5.84% | | +5.75% |
1 A privately offered fund managed by the Fund’s portfolio manager was reorganized into the Fund and the Fund commenced operations on Sept. 30, 2013. This privately offered fund commenced operations on Nov. 3, 2010 and had an investment objective and strategies that were, in all material respects, the same as those of the Fund, and was managed in a manner that, in all material respects, complied with the investment guidelines and restrictions of the Fund. However, the privately offered fund was not registered as an investment under the Investment Company Act of 1940 (1940 Act). As a result, the privately offered fund was not subject to certain investment limitations, diversification requirements, liquidity requirements, and other restrictions imposed by the 1940 Act and the Internal Revenue Code of
1986, as amended, which, if applicable, may have adversely affected its performance.
The Fund’s performance for the periods prior to its commencement of operations on Sept. 30, 2013 is that of the privately offered fund. Because the privately offered fund was a master fund that did not charge any management or other asset-based fees, the privately offered fund’s performance shown above has been restated, on a one-time basis, to reflect the fees, expenses, and waivers and reimbursements for each class of the Fund at the commencement of the Fund’s operations. If the performance of the privately offered fund had not been restated, the performance for such classes may have been higher than the performance shown in the average annual total returns table above.
4
2 Returns reflect the reinvestment of all distributions and are presented both with and without the applicable sales charges described below. Returns do not reflect the deduction of taxes the shareholder would pay on Fund distributions or redemptions of Fund shares.
Expense limitations were in effect for certain classes during some or all of the periods shown in the “Fund and benchmark performance” table. The current expenses for each class are listed on the “Fund expense ratios” table on page 6. Performance would have been lower had expense limitations not been in effect.
Class A shares are sold with a maximum front-end sales charge of 4.50%, and have an annual distribution and service fee of 0.25% of average daily net assets. Performance for Class A shares, excluding sales charges, assumes that no front-end sales charge applied.
Class C shares are sold with a contingent deferred sales charge of 1.00% if redeemed during the first 12 months. They are also subject to an annual distribution and service fee of 1.00% of average daily net assets.
Performance for Class C shares, excluding sales charges, assumes either that contingent deferred sales charges did not apply or that the investment was not redeemed.
Class R shares are available only for certain retirement plan products. They are sold without a sales charge and have an annual distribution and service fee of 0.50% of average daily net assets.
Institutional Class shares are available without sales or asset-based distribution charges only to certain eligible institutional accounts.
The “Fund and benchmark performance” table and the “Performance of a $10,000 investment” graph on page 7 do not reflect the deduction of taxes the shareholder would pay on Fund distributions or redemptions of Fund shares.
Fixed income securities and bond funds can lose value, and investors can lose principal, as interest rates rise. They also may be affected by economic conditions that hinder an issuer’s ability to make interest and principal payments on its debt.
High yielding, noninvestment grade bonds (junk bonds) involve higher risk than investment grade bonds.
The high yield secondary market is particularly susceptible to liquidity problems when institutional investors, such as mutual funds and certain other financial institutions, temporarily stop buying bonds for regulatory, financial, or other reasons. In addition, a less liquid secondary market makes it more difficult for the Fund to obtain precise valuations of the high yield securities in its portfolio.
The Fund may also be subject to prepayment risk, the risk that the principal of a fixed income security that is held by the Fund may be prepaid prior to maturity, potentially forcing the Fund to reinvest that money at a lower interest rate.
The Fund may invest in derivatives, which may involve additional expenses and are subject to risk, including the risk that an underlying security or securities index moves in the opposite direction from what the portfolio manager anticipated. A derivative transaction depends upon the counterparties’ ability to fulfill their contractual obligations.
If and when the Fund invests in forward foreign currency contracts or uses other investments to hedge against currency risks, the Fund will be subject to special risks, including counterparty risk.
Diversification may not protect against market risk.
International investments entail risks not ordinarily associated with U.S. investments including fluctuation in currency values, differences in accounting principles, or economic or political instability in other nations.
5
Performance summary
Delaware Emerging Markets Debt Fund
Investing in emerging markets can be riskier than investing in established foreign markets due to increased volatility and lower trading volume.
The Fund may experience portfolio turnover in excess of 100%, which could result in higher transaction costs and tax liability.
Short sales risk is the risk that a fund may lose more money than the actual cost of its investment and that the third party to the short sale may fail to honor its contract terms, causing a loss to the fund.
Leveraging risk is the risk that certain fund transactions, such as reverse repurchase agreements, short sales, loans of portfolio securities, and the use of when-issued, delayed delivery or forward commitment transactions, or derivative instruments, may give rise to leverage, causing a fund to be more volatile than if it had not been leveraged.
3 The Fund’s expense ratios, as described in the most recent prospectus, are disclosed in the following “Fund expense ratios” table. Delaware Management Company has agreed to reimburse certain expenses and/or waive certain fees in order to prevent total fund operating expenses (excluding any 12b-1 fees, acquired fund fees and expenses, taxes, interest, short sale and dividend interest expenses, brokerage fees, certain insurance costs, and nonroutine expenses or costs, including, but not limited to, those relating to reorganizations, litigation, conducting shareholder meetings, and liquidations (collectively, nonroutine expenses)) from exceeding 1.00% of the Fund’s average daily net assets during the period from Sept. 30, 2013, through July 31, 2014.* In addition, the Fund’s distributor has voluntarily agreed to waive all 12b-1 fees for Class A, Class C, and Class R shares from July 22, 2014 until such time as the voluntary expense cap is discontinued. Please see the most recent prospectus and any applicable supplement(s) for additional information on these fee waivers and/or reimbursements.
| | | | | | | | |
| Fund expense ratios | | Class A | | Class C | | Class R | | Institutional Class |
Total annual operating expenses (without fee waivers) | | 2.19% | | 2.94% | | 2.44% | | 1.94% |
Net expenses (including fee waivers, if any) | | 1.00% | | 1.00% | | 1.00% | | 1.00% |
Type of waiver | | Contractual (Investment manager waiver); Voluntary (12b-1 fee waiver) | | Contractual (Investment manager waiver); Voluntary (12b-1 fee waiver) | | Contractual (Investment manager waiver); Voluntary (12b-1 fee waiver) | | Contractual |
* The contractual waiver period is from Sept. 30, 2013 through Nov. 28, 2014.
6
Performance of a $10,000 investment1
Average annual total returns from Sept. 30, 2013 (Fund’s inception), through July 31, 2014
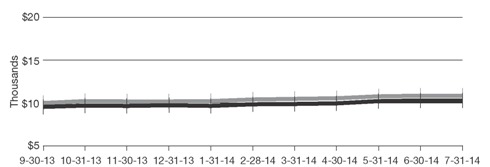
| | | | | | | | | | |
| For period beginning Sept. 30, 2013, through July 31, 2014 | | Starting value | | | Ending value | |

| | J.P. Morgan Corporate Emerging Markets Bond Index Broad Diversified | | | $10,000 | | | | $10,841 | |

| | Delaware Emerging Markets Debt Fund — Class A shares | | | $9,550 | | | | $10,301 | |
1 The “Performance of a $10,000 investment” graph assumes $10,000 invested in Class A shares of the Fund on Sept. 30, 2013, and includes the effect of a 4.50% front-end sales charge and the reinvestment of all distributions. The graph does not reflect the deduction of taxes the shareholders would pay on Fund distributions or redemptions of Fund shares. Expense limitations were in effect for some or all of the periods shown. Performance would have been lower had expense limitations not been in effect. Expenses are listed in the “Fund expense ratios” table on page 6. Please note additional details on pages 4 through 7.
The graph also assumes $10,000 invested in the J.P. Morgan Corporate Emerging Markets Bond Index (CEMBI) Broad Diversified as of
Sept. 30, 2013. The J.P. Morgan Corporate Emerging Markets Bond Index (CEMBI) Broad Diversified tracks U.S. dollar–denominated emerging market corporate bonds, limiting the weights of countries with larger corporate debt stocks by including only a specified portion of those countries’ eligible current face amounts of debt outstanding.
Index performance returns do not reflect any management fees, transaction costs, or expenses. Indices are unmanaged and one cannot invest directly in an index. Past performance is not a guarantee of future results.
Performance of other Fund classes will vary due to different charges and expenses.
| | | | | | |
| | | Nasdaq symbols | | CUSIPs | | |
Class A | | DEDAX | | 246094841 | | |
Class C | | DEDCX | | 246094833 | | |
Class R | | DEDRX | | 246094825 | | |
Institutional Class | | DEDIX | | 246094817 | | |
7
Disclosure of Fund expenses
For the six-month period February 1, 2014 to July 31, 2014 (Unaudited)
As a shareholder of the Fund, you incur two types of costs: (1) transaction costs, including sales charges (loads) on purchase payments, reinvested dividends, or other distributions; redemption fees; and exchange fees; and (2) ongoing costs, including management fees; distribution and/or service (12b-1) fees; and other Fund expenses. This example is intended to help you understand your ongoing costs (in dollars) of investing in the Fund and to compare these costs with the ongoing costs of investing in other mutual funds.
The example is based on an investment of $1,000 invested at the beginning of the period and held for the entire six-month period from Feb. 1, 2014 to July 31, 2014.
Actual expenses
The first section of the table shown, “Actual Fund return,” provides information about actual account values and actual expenses. You may use the information in this section of the table, together with the amount you invested, to estimate the expenses that you paid over the period. Simply divide your account value by $1,000 (for example, an $8,600 account value divided by $1,000 = 8.6), then multiply the result by the number in the first section under the heading entitled “Expenses Paid During Period” to estimate the expenses you paid on your account during this period.
Hypothetical example for comparison purposes
The second section of the table shown, “Hypothetical 5% return,” provides information about hypothetical account values and hypothetical expenses based on the Fund’s actual expense ratio and an assumed rate of return of 5% per year before expenses, which is not the Fund’s actual return. The hypothetical account values and expenses may not be used to estimate the actual ending account balance or expenses you paid for the period. You may use this information to compare the ongoing costs of investing in the Fund and other funds. To do so, compare this 5% hypothetical example with the 5% hypothetical examples that appear in the shareholder reports of the other funds.
Please note that the expenses shown in the table are meant to highlight your ongoing costs only and do not reflect any transactional costs, such as sales charges (loads), redemption fees, or exchange fees. Therefore, the second section of the table is useful in comparing ongoing costs only, and will not help you determine the relative total costs of owning different funds. In addition, if these transactional costs were included, your costs would have been higher. The Fund’s expenses shown in the table reflect fee waivers in effect. The expenses shown in the table assume reinvestment of all dividends and distributions.
8
Delaware Emerging Markets Debt Fund
Expense analysis of an investment of $1,000
| | | | | | | | | | | | | | | | | | | | |
| | Beginning
Account Value
2/1/14 | | Ending
Account Value
7/31/14 | | Annualized
Expense Ratio | | Expenses
Paid During Period
2/1/14 to 7/31/14* |
Actual Fund return† | | | | | | | | | | | | | | |
Class A | | | $ | 1,000.00 | | | | $ | 1,065.30 | | | 1.61% | | $9.87 |
Class C | | | | 1,000.00 | | | | | 1,061.60 | | | 2.31% | | 14.13 |
Class R | | | | 1,000.00 | | | | | 1,064.10 | | | 1.84% | | 11.27 |
Institutional Class | | | | 1,000.00 | | | | | 1,066.50 | | | 1.38% | | 8.46 |
Hypothetical 5% return (5% return before expenses) |
Class A | | | $ | 1,000.00 | | | | $ | 1,020.12 | | | 1.61% | | $9.65 |
Class C | | | | 1,000.00 | | | | | 1,015.96 | | | 2.31% | | 13.82 |
Class R | | | | 1,000.00 | | | | | 1,018.75 | | | 1.84% | | 11.02 |
Institutional Class | | | | 1,000.00 | | | | | 1,021.48 | | | 1.38% | | 8.28 |
| * | “Expenses Paid During Period” are equal to the Fund’s annualized expense ratio, multiplied by the average account value over the period, multiplied by 181/365 (to reflect the one-half year period). |
| † | Because actual returns reflect only the most recent six-month period, the returns shown may differ significantly from fiscal year returns. |
9
| | |
Security type / sector allocation | | |
| Delaware Emerging Markets Debt Fund | | As of July 31, 2014 (Unaudited) |
Sector designations may be different than the sector designations presented in other fund materials. The sector designations may represent the investment manager’s internal sector classifications, which may result in the sector designations for one fund being different than another fund’s sector designations.
| | | | | |
| Security type / sector | | Percentage of net assets |
Corporate Bonds | | | | 94.98 | % |
Banking | | | | 18.93 | % |
Basic Industry | | | | 11.72 | % |
Capital Goods | | | | 7.96 | % |
Communications | | | | 17.40 | % |
Consumer Non-Cyclical | | | | 2.94 | % |
Electric | | | | 7.21 | % |
Energy | | | | 17.24 | % |
Finance Companies. | | | | 5.95 | % |
Media | | | | 1.11 | % |
Natural Gas | | | | 1.06 | % |
Technology | | | | 1.57 | % |
Transportation | | | | 1.89 | % |
Senior Secured Loan | | | | 2.68 | % |
Sovereign Bonds | | | | 9.69 | % |
Supranational Banks | | | | 3.71 | % |
Short-Term Investments | | | | 4.98 | % |
Securities Sold Short | | | | (5.01 | %) |
Total Value of Securities | | | | 111.03 | % |
Liabilities Net of Receivables and Other Assets | | | | (11.03 | %) |
Total Net Assets | | | | 100.00 | % |
10
Schedule of investments
| | |
| Delaware Emerging Markets Debt Fund | | July 31, 2014 |
| | | | | | | | |
| | | Principal amount° | | | Value (U.S. $) | |
Corporate Bonds – 94.98% | | | | | | | | |
Banking – 18.93% | | | | | | | | |
Alfa Bank 7.875% 9/25/17 | | | 250,000 | | | $ | 261,250 | |
Banco Santander Mexico 144A 5.95% 1/30/24 #—¥ | | | 200,000 | | | | 212,500 | |
Bank of Georgia 144A 7.75% 7/5/17 # | | | 300,000 | | | | 323,250 | |
BBVA Bancomer 6.50% 3/10/21 ¥ | | | 250,000 | | | | 282,500 | |
Finansbank AS 144A 5.15% 11/1/17 #¥ | | | 700,000 | | | | 719,950 | |
Oversea-Chinese Banking 144A 4.00% 10/15/24 #— | | | 375,000 | | | | 380,077 | |
Siam Commercial Bank 144A 3.50% 4/7/19 # | | | 250,000 | | | | 255,083 | |
Turkiye Garanti Bankasi 144A 4.75% 10/17/19 # | | | 500,000 | | | | 508,000 | |
Woori Bank 144A 4.75% 4/30/24 # | | | 295,000 | | | | 298,789 | |
Yapi ve Kredi Bankasi 5.188% 10/13/15 | | | 350,000 | | | | 361,060 | |
| | | | | | | | |
| | | | | | | 3,602,459 | |
| | | | | | | | |
Basic Industry – 11.72% | | | | | | | | |
Alpek 4.50% 11/20/22 ¥ | | | 250,000 | | | | 252,475 | |
Cia Minera Ares 144A 7.75% 1/23/21 #¥ | | | 200,000 | | | | 217,000 | |
Fibria Overseas Finance 5.25% 5/12/24 | | | 200,000 | | | | 198,800 | |
GTL Trade Finance 144A 7.25% 4/16/44 #¥ | | | 300,000 | | | | 310,500 | |
OCP | | | | | | | | |
144A 5.625% 4/25/24 # | | | 300,000 | | | | 315,000 | |
144A 6.875% 4/25/44 # | | | 200,000 | | | | 213,500 | |
Tupy Overseas 144A 6.625% 7/17/24 # | | | 200,000 | | | | 206,000 | |
Vedanta Resources 6.00% 1/31/19 ¥ | | | 500,000 | | | | 516,250 | |
| | | | | | | | |
| | | | | | | 2,229,525 | |
| | | | | | | | |
Capital Goods – 7.96% | | | | | | | | |
Cemex 9.50% 6/15/18 ¥ | | | 500,000 | | | | 560,000 | |
Metalloinvest Finance 5.625% 4/17/20 | | | 250,000 | | | | 229,375 | |
OAS Finance 144A 8.00% 7/2/21 # | | | 200,000 | | | | 200,000 | |
OAS Investments | | | | | | | | |
8.25% 10/19/19 ¥ | | | 313,000 | | | | 320,043 | |
144A 8.25% 10/19/19 #¥ | | | 200,000 | | | | 204,500 | |
| | | | | | | | |
| | | | | | | 1,513,918 | |
| | | | | | | | |
Communications – 17.40% | | | | | | | | |
Bharti Airtel International Netherlands 144A 5.35% 5/20/24 #¥ | | | 200,000 | | | | 210,416 | |
Comcel Trust 144A 6.875% 2/6/24 # | | | 200,000 | | | | 215,500 | |
Digicel Group 144A 8.25% 9/30/20 #¥ | | | 500,000 | | | | 541,250 | |
Grupo Televisa 5.00% 5/13/45 ¥ | | | 200,000 | | | | 200,152 | |
Millicom International Cellular 144A 6.625% 10/15/21 #¥ | | | 200,000 | | | | 213,500 | |
Myriad International Holdings 6.00% 7/18/20 ¥ | | | 250,000 | | | | 276,875 | |
TBG Global PTE 144A 4.625% 4/3/18 # | | | 300,000 | | | | 305,250 | |
Telemar Norte Leste 144A 5.50% 10/23/20 #¥ | | | 300,000 | | | | 296,250 | |
Tencent Holdings 144A 3.375% 5/2/19 # | | | 235,000 | | | | 238,916 | |
Turk Telekomunikasyon 144A 3.75% 6/19/19 # | | | 300,000 | | | | 298,987 | |
11
Schedule of investments
Delaware Emerging Markets Debt Fund
| | | | | | | | |
| | Principal amount° | | | Value (U.S. $) | |
Corporate Bonds (continued) | | | | | | | | |
Communications (continued) | | | | | | | | |
VimpelCom Holdings 144A 6.255% 3/1/17 #¥ | | | 300,000 | | | $ | 304,875 | |
VTR Finance 144A 6.875% 1/15/24 #¥ | | | 200,000 | | | | 207,750 | |
| | | | | | | | |
| | | | | | | 3,309,721 | |
| | | | | | | | |
Consumer Non-Cyclical – 2.94% | | | | | | | | |
ENA Norte Trust 4.95% 4/25/23 | | | 229,312 | | | | 236,765 | |
JBS Investments 144A 7.75% 10/28/20 #¥ | | | 200,000 | | | | 215,500 | |
Marfrig Overseas 144A 9.50% 5/4/20 #¥ | | | 100,000 | | | | 106,970 | |
| | | | | | | | |
| | | | | | | 559,235 | |
| | | | | | | | |
Electric – 7.21% | | | | | | | | |
AES Gener 144A 8.375% 12/18/73 #—¥ | | | 200,000 | | | | 225,200 | |
Samruk-Energy 3.75% 12/20/17 | | | 250,000 | | | | 252,500 | |
Saudi Electricity Global Sukuk 3 144A 4.00% 4/8/24 # | | | 200,000 | | | | 204,250 | |
State Grid Overseas Investment 2014 | | | | | | | | |
144A 2.75% 5/7/19 # | | | 200,000 | | | | 200,903 | |
144A 4.125% 5/7/24 # | | | 280,000 | | | | 290,095 | |
Transelec 144A 4.25% 1/14/25 # | | | 200,000 | | | | 198,831 | |
| | | | | | | | |
| | | | | | | 1,371,779 | |
| | | | | | | | |
Energy – 17.24% | | | | | | | | |
CNOOC Nexen Finance 2014 4.25% 4/30/24 ¥ | | | 500,000 | | | | 512,773 | |
Ecopetrol 5.875% 5/28/45 | | | 245,000 | | | | 257,250 | |
Lukoil International Finance 144A 6.125% 11/9/20 #¥ | | | 200,000 | | | | 205,660 | |
MIE Holdings 144A 7.50% 4/25/19 # | | | 250,000 | | | | 264,687 | |
Odebrecht Offshore Drilling Finance 144A 6.625% 10/1/22 # | | | 197,780 | | | | 208,905 | |
Oleoducto Central 144A 4.00% 5/7/21 # | | | 300,000 | | | | 304,125 | |
ONGC Videsh 2.50% 5/7/18 ¥ | | | 200,000 | | | | 196,986 | |
Pacific Rubiales Energy 7.25% 12/12/21 ¥ | | | 400,000 | | | | 438,000 | |
Petroleos de Venezuela 9.00% 11/17/21 | | | 350,000 | | | | 299,250 | |
PTT Exploration & Production 144A 4.875% 12/29/49 #— | | | 400,000 | | | | 405,400 | |
YPF 144A 8.75% 4/4/24 # | | | 180,000 | | | | 187,650 | |
| | | | | | | | |
| | | | | | | 3,280,686 | |
| | | | | | | | |
Finance Companies – 5.95% | | | | | | | | |
Corp Financiera de Desarrollo 144A 5.25% 7/15/29 #— | | | 200,000 | | | | 203,500 | |
Export-Import Bank of China 144A 2.50% 7/31/19 # | | | 250,000 | | | | 248,170 | |
InRetail Shopping Malls 144A 6.50% 7/9/21 # | | | 200,000 | | | | 209,000 | |
Rio Oil Finance Trust Series 2014-1 144A 6.25% 7/6/24 #¥ | | | 250,000 | | | | 260,828 | |
Trust F 144A 5.25% 12/15/24 #¥ | | | 200,000 | | | | 209,750 | |
| | | | | | | | |
| | | | | | | 1,131,248 | |
| | | | | | | | |
Media – 1.11% | | | | | | | | |
Columbus International 144A 7.375% 3/30/21 # | | | 200,000 | | | | 211,750 | |
| | | | | | | | |
| | | | | | | 211,750 | |
| | | | | | | | |
12
| | | | | | | | | | | | |
| | | | | | Principal amount° | | | Value (U.S. $) | |
Corporate Bonds (continued) | | | | | | | | | | | | |
Natural Gas – 1.06% | | | | | | | | | | | | |
GNL Quintero 144A 4.634% 7/31/29 # | | | | | | | 200,000 | | | $ | 202,221 | |
| | | | | | | | | | | | |
| | | | | | | | | | | 202,221 | |
| | | | | | | | | | | | |
Technology – 1.57% | | | | | | | | | | | | |
Baidu 2.75% 6/9/19 ¥ | | | | | | | 298,000 | | | | 298,249 | |
| | | | | | | | | | | | |
| | | | | | | | | | | 298,249 | |
| | | | | | | | | | | | |
Transportation – 1.89% | | | | | | | | | | | | |
Red de Carreteras de Occidente SAPIB de CV 9.00% 6/10/28 | | | MXN | | | | 5,000,000 | | | | 359,530 | |
| | | | | | | | | | | | |
| | | | | | | | | | | 359,530 | |
| | | | | | | | | | | | |
Total Corporate Bonds (cost $17,523,566) | | | | | | | | | | | 18,070,321 | |
| | | | | | | | | | | | |
| | | | | | | | | | | | |
Senior Secured Loan – 2.68%« | | | | | | | | | | | | |
Republic of Angola 6.25% 12/16/23 | | | | | | | 510,000 | | | | 510,000 | |
| | | | | | | | | | | | |
Total Senior Secured Loan (cost $510,000) | | | | | | | | | | | 510,000 | |
| | | | | | | | | | | | |
| | | | | | | | | | | | |
Sovereign Bonds – 9.69%D | | | | | | | | | | | | |
Azerbaijan – 1.42% | | | | | | | | | | | | |
Republic of Azerbaijan International Bond 144A 4.75% 3/18/24 # | | | | | | | 261,000 | | | | 270,787 | |
| | | | | | | | | | | | |
| | | | | | | | | | | 270,787 | |
| | | | | | | | | | | | |
Brazil – 0.32% | | | | | | | | | | | | |
Brazil Notas do Tesouro Nacional Series F 10.00% 1/1/25 | | | BRL | | | | 154,000 | | | | 60,207 | |
| | | | | | | | | | | | |
| | | | | | | | | | | 60,207 | |
| | | | | | | | | | | | |
Colombia – 0.26% | | | | | | | | | | | | |
Colombia Government International Bond 9.85% 6/28/27 | | | COP | | | | 72,000,000 | | | | 49,686 | |
| | | | | | | | | | | | |
| | | | | | | | | | | 49,686 | |
| | | | | | | | | | | | |
Iceland – 1.16% | | | | | | | | | | | | |
Republic of Iceland 144A 5.875% 5/11/22 # | | | | | | | 200,000 | | | | 220,809 | |
| | | | | | | | | | | | |
| | | | | | | | | | | 220,809 | |
| | | | | | | | | | | | |
Kenya – 1.08% | | | | | | | | | | | | |
Kenya Government International Bond 144A 5.875% 6/24/19 # | | | | | | | 200,000 | | | | 206,540 | |
| | | | | | | | | | | | |
| | | | | | | | | | | 206,540 | |
| | | | | | | | | | | | |
Mexico – 0.09% | | | | | | | | | | | | |
Mexican Bonos 7.75% 5/29/31 | | | MXN | | | | 208,000 | | | | 17,726 | |
| | | | | | | | | | | | |
| | | | | | | | | | | 17,726 | |
| | | | | | | | | | | | |
Pakistan – 1.10% | | | | | | | | | | | | |
Pakistan Government International Bond 144A 7.25% 4/15/19 # | | | | | | | 200,000 | | | | 208,988 | |
| | | | | | | | | | | | |
| | | | | | | | | | | 208,988 | |
| | | | | | | | | | | | |
13
Schedule of investments
Delaware Emerging Markets Debt Fund
| | | | | | | | | | | | |
| | | | | | Principal amount° | | | Value (U.S. $) | |
Sovereign BondsD (continued) | | | | | | | | | | | | |
Philippines – 1.32% | | | | | | | | | | | | |
Philippine Government International Bond 6.25% 1/14/36 | | | PHP | | | | 10,000,000 | | | $ | 250,487 | |
| | | | | | | | | | | | |
| | | | | | | | | | | 250,487 | |
| | | | | | | | | | | | |
Senegal – 1.06% | | | | | | | | | | | | |
Senegal Government International Bond 144A 6.25% 7/30/24 # | | | | | | | 200,000 | | | | 201,000 | |
| | | | | | | | | | | | |
| | | | | | | | | | | 201,000 | |
| | | | | | | | | | | | |
South Africa – 0.71% | | | | | | | | | | | | |
South Africa Government Bond 8.00% 1/31/30 | | | ZAR | | | | 1,555,000 | | | | 136,183 | |
| | | | | | | | | | | | |
| | | | | | | | | | | 136,183 | |
| | | | | | | | | | | | |
Sri Lanka – 1.17% | | | | | | | | | | | | |
Sri Lanka Government International Bond 144A 6.00% 1/14/19 # | | | | | | | 209,000 | | | | 222,063 | |
| | | | | | | | | | | | |
| | | | | | | | | | | 222,063 | |
| | | | | | | | | | | | |
Total Sovereign Bonds (cost $1,795,950) | | | | | | | | | | | 1,844,476 | |
| | | | | | | | | | | | |
| | | | | | | | | | | | |
Supranational Banks – 3.71% | | | | | | | | | | | | |
African Export-Import Bank 3.875% 6/4/18 | | | | | | | 300,000 | | | | 295,812 | |
Eurasian Development Bank 144A 5.00% 9/26/20 #@¥ | | | | | | | 400,000 | | | | 410,000 | |
| | | | | | | | | | | | |
Total Supranational Banks (cost $702,910) | | | | | | | | | | | 705,812 | |
| | | | | | | | | | | | |
| | | | | | | | | | | | |
Short-Term Investments – 4.98% | | | | | | | | | | | | |
Repurchase Agreements – 4.98% | | | | | | | | | | | | |
Bank of America Merrill Lynch
0.04%, dated 7/31/14, to be repurchased on 8/1/14,
repurchase price $295,556 (collateralized by U.S.
government obligations 0.00%-0.375%
6/25/15-2/15/24; market value $301,467) | | | | | | | 295,556 | | | | 295,556 | |
Bank of Montreal
0.07%, dated 7/31/14, to be repurchased on 8/1/14,
repurchase price $98,519 (collateralized by U.S.
government obligations 0.00%-4.375% 8/21/14-11/15/43;
market value $100,489) | | | | | | | 98,519 | | | | 98,519 | |
BNP Paribas
0.07%, dated 7/31/14, to be repurchased on 8/1/14,
repurchase price $552,926 (collateralized by U.S.
government obligations 0.00%-2.75% 8/7/14-11/15/23;
market value $563,984) | | | | | | | 552,925 | | | | 552,925 | |
| | | | | | | | | | | | |
Total Short-Term Investments (cost $947,000) | | | | | | | | | | | 947,000 | |
| | | | | | | | | | | | |
| | | |
Total Value of Securities Before Securities | | | | | | | | | | | | |
Sold Short – 116.04%
(cost $21,479,426) | | | | | | | | | | | 22,077,609 | |
| | | | | | | | | | | | |
14
| | | | | | | | |
| | | Number of shares | | | Value (U.S. $) | |
Securities Sold Short – (5.01%) | | | | | | | | |
iShares JP Morgan USD Emerging Markets Bond ETF | | | (2,500) | | | $ | (286,450) | |
PowerShares Emerging Markets Sovereign Debt Portfolio | | | (15,000) | | | | (433,950) | |
WisdomTree Emerging Markets Local Debt Fund | | | (5,000) | | | | (233,850) | |
| | | | | | | | |
Total Securities Sold Short
(proceeds $960,886) | | | | | | | (954,250) | |
| | | | | | | | |
| | |
Total Value of Securities – 111.03%
(cost $20,518,540) | | | | | | $ | 21,123,359 | |
| | | | | | | | |
| # | Security exempt from registration under Rule 144A of the Securities Act of 1933, as amended. At July 31, 2014, the aggregate value of Rule 144A securities was $13,500,425, which represents 70.96% of the Fund’s net assets. See Note 11 in “Notes to financial statements.” |
| @ | Illiquid security. At July 31, 2014, the aggregate value of illiquid securities was $410,000, which represents 2.15% of the Fund’s net assets. See Note 11 in “Notes to financial statements.” |
| ° | Principal amount shown is stated in U.S. dollars unless noted that the security is denominated in another currency. |
| — | Variable rate security. The rate shown is the rate as of July 31, 2014. Interest rates reset periodically. |
| ¥ | Fully or partially pledged as collateral for borrowing transactions. |
| D | Securities have been classified by country of origin. |
| « | Senior secured loans generally pay interest at rates which are periodically redetermined by reference to a base lending rate plus a premium. These base lending rates are generally: (i) the prime rate offered by one or more United States banks, (ii) the lending rate offered by one or more European banks such as the London Inter-Bank Offered Rate (LIBOR), and (iii) the certificate of deposit rate. Senior secured loans may be subject to restrictions on resale. Stated rate in effect at July 31, 2014. |
The following swap contracts were outstanding at July 31, 2014:1
Swap Contracts
CDS Contracts2
| | | | | | | | | | |
Counterparty | | Swap Referenced Obligation | | Notional Value | | Annual Protection
Payments | | Termination Date | | Unrealized
Appreciation
(Depreciation) |
| | Protection Purchased: | | | | | | | | |
MSC | | CDX.EM.21 | | $ 1,000,000 | | 5.00% | | 6/20/19 | | $ 425 |
The use of swap contracts involve elements of market risk and risks in excess of the amounts recognized in the financial statements. The notional values presented above represent the Fund’s total exposure in such contracts, whereas only the net unrealized appreciation (depreciation) is reflected in the Fund’s net assets.
1See Note 8 in “Notes to financial statements.”
15
Schedule of investments
Delaware Emerging Markets Debt Fund
2A CDS contract is a risk-transfer instrument through which one party (purchaser of protection) transfers to another party (seller of protection) the financial risk of a credit event (as defined in the CDS agreement), as it relates to a particular reference security or basket of securities (such as an index). Periodic payments (receipts) on such contracts are accrued daily and recorded as unrealized losses (gains) on swap contracts. Upon payment (receipt), such amounts are recorded as realized losses (gains) on swap contracts. Upfront payments made or received in connection with CDS contracts are amortized over the expected life of the CDS contracts as unrealized losses (gains) on swap contracts. The change in value of CDS contracts is recorded as unrealized appreciation or depreciation daily. A realized gain or loss is recorded upon a credit event (as defined in the CDS agreement) or the maturity or termination of the agreement.
Summary of abbreviations:
BRL – Brazilian Real
CDX.EM – Credit Default Swap Index Emerging Markets
COP – Colombian Peso
MSC – Morgan Stanley Capital
MXN – Mexican Peso
PHP – Philippine Peso
ZAR – South African Rand
See accompanying notes, which are an integral part of the financial statements.
16
Statement of assets and liabilities
| | |
| Delaware Emerging Markets Debt Fund | | July 31, 2014 |
| | | | |
Assets: | | | | |
Investments, at value1 | | $ | 21,130,609 | |
Short-term investments, at value2 | | | 947,000 | |
Cash collateral due from brokers | | | 120,000 | |
Foreign currencies, at value3 | | | 3,125 | |
Receivable for securities sold | | | 1,610,433 | |
Interest receivable | | | 246,241 | |
Due from investment manager | | | 13,541 | |
Unrealized gain on credit default swap contracts | | | 425 | |
| | | | |
Total assets | | | 24,071,374 | |
| | | | |
Liabilities: | | | | |
Margin payable | | | 3,551,342 | |
Securities sold short, at value4 | | | 954,250 | |
Cash overdraft | | | 137,497 | |
Payable for securities purchased | | | 249,731 | |
Swap payments payable | | | 5,833 | |
Interest payable for margin | | | 861 | |
Other accrued expenses | | | 43,243 | |
Other affiliates payable | | | 1,820 | |
Trustees’ fees and expenses payable | | | 44 | |
Distribution fees payable | | | 2 | |
Upfront payments on credit default swap contracts | | | 101,183 | |
| | | | |
Total liabilities | | | 5,045,806 | |
| | | | |
Total Net Assets | | $ | 19,025,568 | |
| | | | |
| |
Net Assets Consist of: | | | | |
Paid-in capital | | $ | 18,302,043 | |
Undistributed net investment income | | | 17,835 | |
Accumulated net realized gain on investments | | | 104,969 | |
Net unrealized appreciation of investments, foreign currencies, and derivatives | | | 600,721 | |
| | | | |
Total Net Assets | | $ | 19,025,568 | |
| | | | |
17
| | | | |
Class A: | | | | |
Net assets | | $ | 2,182 | |
Shares of beneficial interest outstanding, unlimited authorization, no par | | | 246.8 | |
Net asset value per share | | $ | 8.84 | |
Sales charge | | | 4.50 | % |
Offering price per share, equal to net asset value per share/(1 – sales charge) | | $ | 9.26 | |
| |
Class C: | | | | |
Net assets | | $ | 2,170 | |
Shares of beneficial interest outstanding, unlimited authorization, no par | | | 245.4 | |
Net asset value per share | | $ | 8.84 | |
| |
Class R: | | | | |
Net assets | | $ | 2,178 | |
Shares of beneficial interest outstanding, unlimited authorization, no par | | | 246.3 | |
Net asset value per share | | $ | 8.84 | |
| |
Institutional Class: | | | | |
Net assets | | $ | 19,019,038 | |
Shares of beneficial interest outstanding, unlimited authorization, no par | | | 2,150,983 | |
Net asset value per share | | $ | 8.84 | |
| | | | |
1Investments, at cost | | $ | 20,532,426 | |
2Short-term investments, at cost | | | 947,000 | |
3Foreign currencies, at cost | | | 3,166 | |
4Securities sold short, proceeds | | | (960,886 | ) |
See accompanying notes, which are an integral part of the financial statements.
18
Statement of operations
| | |
| Delaware Emerging Markets Debt Fund | | September 30, 2013* to July 31, 2014 |
| | | | |
Investment Income: | | | | |
Interest | | $ | 907,180 | |
| | | | |
Expenses: | | | | |
Management fees | | | 113,959 | |
Distribution expenses — Class A | | | 4 | |
Distribution expenses — Class C | | | 17 | |
Distribution expenses — Class R | | | 8 | |
Legal fees | | | 96,902 | |
Audit and tax | | | 39,520 | |
Reports and statements to shareholders | | | 23,547 | |
Custodian fees | | | 9,114 | |
Dividend disbursing and transfer agent fees and expenses | | | 5,653 | |
Accounting and administration expenses | | | 5,335 | |
Registration fees | | | 770 | |
Trustees’ fees and expenses | | | 727 | |
Other | | | 5,647 | |
| | | | |
Expenses before dividends on short sales and interest expense | | | 301,203 | |
Dividends on short sales | | | 10,115 | |
Interest expense | | | 29,667 | |
| | | | |
| | | 340,985 | |
Less expenses waived | | | (149,245 | ) |
| | | | |
Total operating expenses | | | 191,740 | |
| | | | |
Net Investment Income | | | 715,440 | |
| | | | |
Net Realized and Unrealized Gain (Loss): | | | | |
Net realized gain (loss) on: | | | | |
Investments | | | 137,553 | |
Foreign currencies | | | 7,813 | |
Foreign currency exchange contracts | | | (12,328 | ) |
Futures contracts | | | (12,903 | ) |
Swap contracts | | | (11,161 | ) |
| | | | |
Net realized gain | | | 108,974 | |
| | | | |
Net change in unrealized appreciation (depreciation) of: | | | | |
Investments | | | 604,819 | |
Foreign currencies | | | 1,310 | |
Swap contracts | | | (5,408 | ) |
| | | | |
Net change in unrealized appreciation (depreciation) | | | 600,721 | |
| | | | |
Net Realized and Unrealized Gain | | | 709,695 | |
| | | | |
Net Increase in Net Assets Resulting from Operations | | $ | 1,425,135 | |
| | | | |
* Date of commencement of operations.
See accompanying notes, which are an integral part of the financial statements.
19
Statement of changes in net assets
Delaware Emerging Markets Debt Fund
| | | | |
| | | 9/30/13* to 7/31/14 | |
Increase in Net Assets from Operations: | | | | |
Net investment income | | $ | 715,440 | |
Net realized gain | | | 108,974 | |
Net change in unrealized appreciation (depreciation) | | | 600,721 | |
| | | | |
Net increase in net assets resulting from operations | | | 1,425,135 | |
| | | | |
| |
Dividends and Distributions to Shareholders from: | | | | |
Net investment income: | | | | |
Class A | | | (76 | ) |
Class C | | | (64 | ) |
Class R | | | (72 | ) |
Institutional Class | | | (701,408 | ) |
| | | | |
| | | (701,620 | ) |
| | | | |
| |
Capital Share Transactions: | | | | |
Proceeds from shares sold: | | | | |
Class A | | | 2,025 | |
Class C | | | 2,026 | |
Class R | | | 2,026 | |
Institutional Class | | | 28 | |
| |
Proceeds from shares issued upon transfer: | | | | |
Institutional Class | | | 17,600,000 | |
| |
Net asset value of shares issued upon reinvestment of dividends and distributions: | | | | |
Class A | | | 76 | |
Class C | | | 63 | |
Class R | | | 71 | |
Institutional Class | | | 701,408 | |
| | | | |
| | | 18,307,723 | |
| | | | |
20
| | | | |
| | | 9/30/13* to 7/31/14 | |
Capital Share Transactions (continued): | | | | |
Cost of shares redeemed: | | | | |
Institutional Class | | $ | (5,670 | ) |
Increase in net assets derived from capital share transactions | | | 18,302,053 | |
| | | | |
Net Increase in Net Assets | | | 19,025,568 | |
| |
Net Assets: | | | | |
Beginning of period | | | — | |
| | | | |
End of period | | $ | 19,025,568 | |
| | | | |
| |
Undistributed net investment income | | $ | 17,835 | |
| | | | |
* Date of commencement of operations.
See accompanying notes, which are an integral part of the financial statements.
21
Statement of cash flows
| | |
| Delaware Emerging Markets Debt Fund | | September 30, 2013* to July 31, 2014 |
| | | | |
Net Cash Provided by (Used for) Operating Activities: | | | | |
Net increase in net assets resulting from operations | | $ | 1,425,135 | |
| | | | |
| |
Adjustments to reconcile net increase in net assets from operations to cash provided by (used for) operating activities: | | | | |
Amortization of premium and discount on investments purchased | | | 51,883 | |
Purchase of investment securities | | | (26,633,340 | ) |
Proceeds from sale of investment securities | | | 21,685,955 | |
Proceeds from securities sold short | | | 8,222,951 | |
Purchase of securities to close short sales | | | (7,304,885 | ) |
Purchase of short-term investment securities, net | | | (947,000 | ) |
Upfront payments received on swaps | | | 101,183 | |
Net realized gain on investments and currencies | | | (145,366 | ) |
Net change in net unrealized appreciation (depreciation) | | | (600,721 | ) |
Increase in receivable for investments sold | | | (1,610,433 | ) |
Increase in interest receivable | | | (246,241 | ) |
Increase in due from investment manager | | | (13,541 | ) |
Increase in cash collateral for swaps | | | (120,000 | ) |
Increase in payable for investments purchased | | | 249,731 | |
Increase in swap payments payable | | | 5,833 | |
Increase in interest payable for margin | | | 861 | |
Increase in distribution fees payable | | | 2 | |
Increase in Trustees’ fees and expenses payable | | | 44 | |
Increase in other affiliates payable | | | 1,820 | |
Increase in other accrued expenses | | | 43,243 | |
| | | | |
Total adjustments | | | (7,258,021 | ) |
| | | | |
Net cash used for operating activities | | | (5,832,886 | ) |
| | | | |
22
| | | | |
Cash Flows Used for Financing Activities: | | | | |
Proceeds from shares sold | | $ | 2,152,885 | |
Cost of shares redeemed | | | (5,670 | ) |
Cash dividends and distributions paid | | | (2 | ) |
Net cash receipts from borrowing transactions | | | 3,551,342 | |
| | | | |
Net cash used for financing activities | | | 5,698,555 | |
| | | | |
Effect of exchange rates on cash | | | (41 | ) |
| | | | |
Net decrease in cash | | | (134,372 | ) |
Cash overdraft and foreign currencies, at value at beginning of period | | | — | |
| | | | |
Cash overdraft and foreign currencies, at value at end of period | | $ | (134,372 | ) |
| | | | |
| |
Non-Cash Financing Activities: | | | | |
Fair value of investments acquired through transfer | | $ | 15,453,220 | |
| | | | |
| |
Cash paid for interest expense for leverage | | $ | 28,806 | |
| | | | |
* Date of commencement of operations.
See accompanying notes, which are an integral part of the financial statements.
23
Financial highlights
Delaware Emerging Markets Debt Fund
Selected data for each share of the Fund outstanding throughout each period were as follows:
|
Net asset value, beginning of period |
Income from investment operations: |
Net investment income2 |
Net realized and unrealized gain |
Total from investment operations |
|
Less dividends and distributions from: |
Net investment income |
Total dividends and distributions |
|
Net asset value, end of period |
|
Total return3 |
|
Ratios and supplemental data: |
Net assets, end of period (000 omitted) |
Ratio of expenses to average net assets excluding interest expenses |
Ratio of expenses to average net assets |
Ratio of expenses to average net assets prior to fees waived |
Ratio of net investment income to average net assets excluding interest expenses |
Ratio of net investment income to average net assets |
Ratio of net investment income to average net assets prior to fees waived |
Portfolio turnover |
| 1 | Date of commencement of operations; ratios have been annualized and total return and portfolio turnover have not been annualized. |
| 2 | The average shares outstanding method has been applied for per share information. |
| 3 | Total investment return is based on the change in net asset value of a share during the period and assumes reinvestment of dividends and distributions at net asset value and does not reflect the impact of a sales charge. Total investment return reflects a waiver by the manager. Performance would have been lower had the waiver not been in effect. |
See accompanying notes, which are an integral part of the financial statements.
24
| | | | | | | | |
| | | Class A 9/30/131 to 7/31/14 | | Class C 9/30/131 to 7/31/14 | | Class R 9/30/131 to 7/31/14 | | Institutional Class 9/30/131 to 7/31/14 |
| | $ 8.500 | | $ 8.500 | | $ 8.500 | | $ 8.500 |
| | | | | | | | |
| | 0.323 | | 0.271 | | 0.306 | | 0.340 |
| | 0.333 | | 0.333 | | 0.332 | | 0.333 |
| | 0.656 | | 0.604 | | 0.638 | | 0.673 |
| | | | |
| | | | | | | | |
| | (0.316) | | (0.264) | | (0.298) | | (0.333) |
| | (0.316) | | (0.264) | | (0.298) | | (0.333) |
| | | | |
| | $ 8.840 | | $ 8.840 | | $ 8.840 | | $ 8.840 |
| | | | |
| | 7.86% | | 7.22% | | 7.64% | | 8.08% |
| | | | |
| | | | | | | | |
| | $ 2 | | $ 2 | | $ 2 | | $ 19,020 |
| | 1.31% | | 2.03% | | 1.55% | | 1.07% |
| | 1.50% | | 2.22% | | 1.74% | | 1.26% |
| | 2.48% | | 3.20% | | 2.72% | | 2.24% |
| | 4.66% | | 3.94% | | 4.42% | | 4.90% |
| | 4.47% | | 3.75% | | 4.23% | | 4.71% |
| | 3.49% | | 2.77% | | 3.25% | | 3.73% |
| | 152% | | 152% | | 152% | | 152% |
25
Notes to financial statements
| | |
| Delaware Emerging Markets Debt Fund | | July 31, 2014 |
Delaware Group® Government Fund (Trust) is organized as a Delaware statutory trust and offers three series: Delaware Core Plus Bond Fund, Delaware Emerging Markets Debt Fund and Delaware Inflation Protected Bond Fund. These financial statements and the related notes pertains to Delaware Emerging Markets Debt Fund (Fund). The Trust is an open-end investment company. The Fund is considered diversified under the Investment Company Act of 1940, as amended, and offers Class A, Class C, Class R and Institutional Class shares. Class A shares are sold with a maximum front-end sales charge of 4.50%. Class A share purchases of $1,000,000 or more will incur a contingent deferred sales charge (CDSC) of 1.00% if redeemed during the first year and 0.50% during the second year, provided that Delaware Distributors, L.P. (DDLP) paid a financial advisor a commission on the purchase of those shares. Class C shares are sold with a CDSC charge of 1.00%, if redeemed during the first twelve months. Class R and Institutional Class shares are not subject to a sales charge and are offered for sale exclusively to certain eligible investors.
The investment objective of the Fund is to primarily seek current income and secondarily capital appreciation.
1. Significant Accounting Policies
The following accounting policies are in accordance with U.S. generally accepted accounting principles (U.S. GAAP) and are consistently followed by the Fund.
Security Valuation — Equity securities and exchange-traded funds (ETFs), except those traded on the Nasdaq Stock Market, Inc. (Nasdaq), are valued at the last quoted sales price as of the time of the regular close of the New York Stock Exchange on the valuation date. Securities and ETFs traded on the Nasdaq are valued in accordance with the Nasdaq Official Closing Price, which may not be the last sales price. If, on a particular day, an equity security or ETF does not trade, then the mean between the bid and ask prices will be used, which approximates fair value. Securities listed on a foreign exchange are normally valued at the last quoted sales price on the valuation date. Debt securities and credit default swap (CDS) contracts are valued based upon valuations provided by an independent pricing service or broker/counterparty and reviewed by management. To the extent current market prices are not available, the pricing service may take into account developments related to the specific security, as well as transactions in comparable securities. U.S. government and agency securities are valued at the mean between the bid and ask prices, which approximates fair value. Valuations for fixed income securities utilize matrix systems, which reflect such factors as security prices, yields, maturities, and ratings, and are supplemented by dealer and exchange quotations. Swap prices are derived using daily swap curves and models that incorporate a number of market data factors, such as discounted cash flows, trades, and values of the underlying reference instruments. Foreign currency exchange contracts and foreign cross currency exchange contracts are valued at the mean between the bid and ask prices, which approximates fair value. Interpolated values are derived when the settlement date of the contract is an interim date for which quotations are not available. Futures contracts and options on futures contracts are valued at the daily quoted settlement prices. Generally, other securities and assets for which market quotations are not readily available are valued at fair value as determined in good faith under the direction of the Fund’s Board of Trustees (Board). In determining whether market quotations are readily available or fair valuation will be used, various factors will be taken into consideration, such as market closures or suspension of trading in a security.
26
Federal Income Taxes — No provision for federal income taxes has been made as the Fund intends to qualify for federal income tax purposes as a regulated investment company under Subchapter M of the Internal Revenue Code of 1986, as amended, and make the requisite distributions to shareholders. The Fund evaluates tax positions taken or expected to be taken in the course of preparing the Fund’s tax returns to determine whether the tax positions are “more-likely- than-not” of being sustained by the applicable tax authority. Tax positions not deemed to meet the “more-likely-than-not” threshold are recorded as a tax benefit or expense in the current year. Management has analyzed the Fund’s tax positions taken for the open federal income tax year July 31, 2014, and has concluded that no provision for federal income tax is required in the Fund’s financial statements.
Class Accounting — Investment income, common expenses and realized and unrealized gain (loss) on investments are allocated to the various classes of the Fund on the basis of daily net assets of each class. Distribution expenses relating to a specific class are charged directly to that class.
Repurchase Agreements — The Fund may purchase certain U.S. government securities subject to the counterparty’s agreement to repurchase them at an agreed upon date and price. The counterparty will be required on a daily basis to maintain the value of the collateral subject to the agreement at not less than the repurchase price (including accrued interest). The agreements are conditioned upon the collateral being deposited under the Federal Reserve book-entry system with the Fund’s custodian or a third party sub-custodian. In the event of default or bankruptcy by the other party to the agreement, retention of the collateral may be subject to legal proceedings. All open repurchase agreements as of the date of this report were entered into on July 31, 2014.
Reverse Repurchase Agreements — The Fund may enter into reverse repurchase agreements. In a reverse repurchase agreement, the Fund sells securities to a bank or broker/dealer and agrees to repurchase the securities at an agreed upon date and price. The Fund will maintain, in a segregated account with its custodian, cash, cash equivalents, or U.S. government securities in an amount sufficient to cover its obligations under reverse repurchase agreements. The Fund will subject its investments in reverse repurchase agreements to the borrowing provisions set forth in the 1940 Act. The use of reverse repurchase agreements by the Fund creates leverage, which increases the Fund’s investment risk. If the income and gains on securities purchased with the proceeds of reverse repurchase agreements exceed the costs of the agreements, the Fund’s earnings or NAV will increase faster than otherwise would be the case; conversely, if the income and gains fail to exceed the costs, earnings or NAV would decline faster than otherwise would be the case. For the period Sept. 30, 2013* through July 31, 2014, the Fund had average reverse repurchase agreements of $104,420, for which it paid interest at an average rate of 0.38%.
Short Sales — The Fund may make short sales in an attempt to protect against declines in an individual security or the overall market, to manage duration, or for such other purposes consistent with the Fund’s investment objectives and strategies. Typically, short sales are transactions in which the Fund sells a security it does not own and, at the time a short sale is effected, the Fund incurs an obligation to replace the security borrowed at whatever its price may be at the time the Fund purchases it for delivery to the lender. The price at such time may be more or less than the price at which the security was sold by the Fund. When a short sale transaction is closed out by delivery of the security, any gain or loss on the transaction generally is taxable as short-term capital gain or loss. Until the security is replaced, the
27
Notes to financial statements
Delaware Emerging Markets Debt Fund
1. Significant Accounting Policies (continued)
Fund is required to pay to the lender amounts equal to any dividends or interest that accrue during the period of the loan. To borrow the security, the Fund also may be required to pay a premium, which would increase the cost of the security sold. The proceeds of the short sale, and potentially additional margin, will be retained by the broker from whom the security is borrowed, to the extent necessary to meet margin requirements, until the short position is closed out.
Leverage — The Fund may employ leverage to attempt to take advantage of or increase the total return of attractive investment opportunities. The Fund may initiate leverage to the extent that the sum of aggregate borrowed funds and the notional value plus any gain or minus any loss of derivatives positions may not exceed an amount equal to 33 1/3 per cent of the Fund’s total assets, measured at the time the leverage is employed. To the extent that the Fund initiates leverage, such leverage may include borrowing through a margin account maintained with a broker. At July 31, 2014, the Fund had borrowed $3,551,342, which is included on the “Statement of assets and liabilities” under “Margin payable.” Securities pledged as collateral for these transactions have been identified in the “Schedule of investments.” For the period Sept. 30, 2013* through July 31, 2014, the Fund had average borrowing of $1,433,587 for which it paid interest at an average rate of 2.45%.
Foreign Currency Transactions — Transactions denominated in foreign currencies are recorded at the prevailing exchange rates on the valuation date in accordance with the Fund’s prospectus. The value of all assets and liabilities denominated in foreign currencies is translated daily into U.S. dollars at the exchange rate of such currencies against the U.S. dollar. Transaction gains or losses resulting from changes in exchange rates during the reporting period or upon settlement of the foreign currency transaction are reported in operations for the current period. The Fund generally bifurcates that portion of realized gains and losses on investments in debt securities which is due to changes in foreign exchange rates from that which is due to changes in market prices of debt securities. That portion of gains (losses) is included on the “Statement of operations” under “Net realized gain (loss) on foreign currencies.” The Fund reports certain foreign currency related transactions as components of realized gains (losses) for financial reporting purposes, whereas such components are treated as ordinary income (loss) for federal income tax purposes.
Use of Estimates — The preparation of financial statements in conformity with U.S. GAAP requires management to make estimates and assumptions that affect the fair value of investments, the reported amounts of assets and liabilities and disclosure of contingent assets and liabilities at the date of the financial statements, and the reported amounts of revenues and expenses during the reporting period. Actual results could differ from those estimates and the differences could be material.
Other — Expenses directly attributable to the Fund are charged directly to the Fund. Other expenses common to various funds within the Delaware Investments® Family of Funds are generally allocated among such funds on the basis of average net assets. Management fees and some other expenses are paid monthly. Security transactions are recorded on the date the securities are purchased or sold (trade date) for financial reporting purposes. Costs used in calculating realized gains and losses on the sale of investment securities are those of the specific securities sold. Dividend income is recorded on the ex-dividend date and interest income is recorded on the accrual basis. Discounts and premiums on debt securities are amortized to interest income over the lives of the respective securities using the effective
28
interest method. The Fund declares and pays dividends from net investment income monthly and pays distributions from net realized gain on investments, if any, annually. The Fund may distribute more frequently, if necessary for tax purposes. Dividends and distributions, if any, are recorded on the ex-dividend date.
The Fund may receive earnings credits from its custodian when positive cash balances are maintained, which may be used to offset custody fees. There were no earnings credits for the period Sept. 30, 2013* through July 31, 2014.
The Fund receives earnings credits from its transfer agent when positive cash balances are maintained, which may be used to offset transfer agent fees. If the amount earned is greater than one dollar, the expense paid under this arrangement is included on the “Statement of operations” under “Dividend disbursing and transfer agent fees and expenses” with the corresponding expense offset shown under “Less expense paid indirectly.” There were no earnings credits for the period Sept. 30, 2013* through July 31, 2014.
* Date of commencement of operations.
2. Investment Management, Administration Agreements and Other Transactions with Affiliates
In accordance with the terms of its investment management agreement, the Fund pays Delaware Management Company (DMC), a series of Delaware Management Business Trust and the investment manager, an annual fee which is calculated daily at the rate of 0.75% on the first $500 million of average daily net assets of the Fund, 0.70% on the next $500 million, 0.65% on the next $1.5 billion, and 0.60% on average daily net assets in excess of $2.5 billion.
DMC has contractually agreed to waive all or a portion, if any, of its management fee and/or pay/ reimburse the Fund to the extent necessary to limit annual operating expenses (excluding any 12b-1 fees, taxes, interest, short sale dividend and interest expenses, brokerage fees, certain insurance costs, acquired fund fees and expenses, and nonroutine expenses or costs including, but not limited to, those relating to reorganizations, litigation, conducting shareholder meetings, and liquidations) (collectively nonroutine expenses), to 1.00% of average daily net assets of the Fund from Sept. 30, 2013* through July 31, 2014.** For purposes of this waiver and reimbursement, nonroutine expenses may also include such additional costs and expenses, as may be agreed upon from time to time by the Fund’s Board and DMC. This expense waiver and reimbursement may be terminated only by agreement of the Fund’s Board and DMC and apply only to expenses paid directly by the Fund.
Delaware Service Company, Inc. (DSC), an affiliate of DMC, provides fund accounting and financial administration oversight services to the Fund. For these services, the Fund pays DSC fees based on the aggregate daily net assets of the Delaware Investments® Family of Funds at the following annual rate: 0.0050% of the first $30 billion; 0.0045% of the next $10 billion; 0.0040% of the next $10 billion; and 0.0025% of aggregate average daily net assets in excess of $50 billion. The fees payable to DSC under the service agreement described above are allocated among all Funds in the Delaware Investments Family of Funds on a relative net asset value basis. For the period Sept. 30, 2013* through July 31, 2014, the Fund was charged $731 for these services.
29
Notes to financial statements
Delaware Emerging Markets Debt Fund
2. Investment Management, Administration Agreements and Other Transactions with Affiliates (continued)
DSC is also the transfer agent and dividend disbursing agent of the Fund. For these services, the Fund pays DSC fees based on the aggregate daily net assets of the Delaware Investments Family of Funds at the following annual rate: 0.025% of the first $20 billion; 0.020% of the next $5 billion; 0.015% of the next $5 billion; and 0.013% on average daily net assets in excess of $30 billion. This amount is included on the “Statement of operations” under “Dividend disbursing and transfer agent fees and expenses.” For the period Sept. 30, 2013* through July 31, 2014, the amount charged by DSC was $3,319. Pursuant to a sub-transfer agency agreement between DSC and BNY Mellon Investment Servicing (US) Inc. (BNYMIS), BNYMIS provides certain sub-transfer agency services to the Fund. Sub-transfer agency fees are passed on to and paid directly by the Fund.
Pursuant to a distribution agreement and distribution plan, the Fund pays DDLP, the distributor and an affiliate of DMC, an annual distribution and service fee of 0.25% of the average daily net assets of the Class A shares, 1.00% of the average daily net assets of the Class C shares, and 0.50% of the average daily net assets of the Class R shares. Institutional Class shares pay no distribution and service expenses. Effective July 22, 2014, DDLP agreed to voluntarily suspend the distribution and service fees for Class A, Class C, and Class R shares. The suspension of the distribution and service fees will remain in effect while the Fund is not broadly distributed.
As provided in the investment management agreement, the Fund bears the cost of certain resources shared with DMC, including the cost of internal personnel of DMC and/or its affiliates that provide legal, tax and regulatory reporting services to the Fund. For the period Sept. 30, 2013* through July 31, 2014, the Fund was charged $27,022 for internal legal, tax and regulatory reporting services provided by DMC and/or its affiliates’ employees.
For the period Sept. 30, 2013* through July 31, 2014, DDLP earned less than $1 for commissions on sales of the Fund’s Class A shares. For the period Sept. 30, 2013* through July 31, 2014, DDLP received no gross CDSC commissions on redemption of the Fund’s Class A and Class C shares.
Trustees’ fees include expenses accrued by the Fund for each Trustee’s retainer and meeting fees. Certain officers of DMC, DSC, and DDLP are officers and/or Trustees of the Trust. These officers and Trustees are paid no compensation by the Fund.
* Date of commencement of operations.
** The contractual waiver period is Sept. 30, 2013 through Nov. 28, 2014.
3. Investments
For the period Sept. 30, 2013* through July 31, 2014, the Fund made purchases and sales of investment securities other than short-term investments as follows:
| | | | |
Purchases | | $ | 33,938,225 | |
Sales | | | 29,908,906 | |
30
At July 31, 2014, the cost of investments and unrealized appreciation (depreciation) for federal income tax purposes for the Fund were as follows:
| | | | |
Cost of investments | | $ | 20,528,976 | |
| | | | |
Aggregate unrealized appreciation | | $ | 681,910 | |
Aggregate unrealized depreciation | | | (87,527 | ) |
| | | | |
Net unrealized appreciation | | $ | 594,383 | |
| | | | |
U.S. GAAP defines fair value as the price that the Fund would receive to sell an asset or pay to transfer a liability in an orderly transaction between market participants at the measurement date under current market conditions. A three-level hierarchy for fair value measurements has been established based upon the transparency of inputs to the valuation of an asset or liability. Inputs may be observable or unobservable and refer broadly to the assumptions that market participants would use in pricing the asset or liability. Observable inputs reflect the assumptions market participants would use in pricing the asset or liability based on market data obtained from sources independent of the reporting entity. Unobservable inputs reflect the reporting entity’s own assumptions about the assumptions that market participants would use in pricing the asset or liability developed based on the best information available under the circumstances. The Fund’s investment in its entirety is assigned a level based upon the observability of the inputs which are significant to the overall valuation. The three-level hierarchy of inputs is summarized below.
| | | | |
Level 1 | | – | | Inputs are quoted prices in active markets for identical investments. (Examples: equity securities, open-end investment companies, futures contracts, exchange-traded options contracts) |
| | |
Level 2 | | – | | Other observable inputs, including, but not limited to: quoted prices for similar assets or liabilities in markets that are active, quoted prices for identical or similar assets or liabilities in markets that are not active, inputs other than quoted prices that are observable for the assets or liabilities (such as interest rates, yield curves, volatilities, prepayment speeds, loss severities, credit risks and default rates) or other market-corroborated inputs. (Examples: debt securities, government securities, swap contracts, foreign currency exchange contracts, foreign securities utilizing international fair value pricing, broker-quoted securities, fair valued securities) |
| | |
Level 3 | | – | | Significant unobservable inputs, including the Fund’s own assumptions used to determine the fair value of investments. (Examples: broker-quoted securities, fair valued securities) |
Level 3 investments are valued using significant unobservable inputs. The Fund may also use an income-based valuation approach in which the anticipated future cash flows of the investment are discounted to calculate fair value. Discounts may also be applied due to the nature or duration of any restrictions on the disposition of the investments. Valuations may also be based upon current market prices of securities that are comparable in coupon, rating, maturity, and industry. The derived value of a Level 3 investment may not represent the value which is received upon disposition and this could impact the results of operations.
31
Notes to financial statements
Delaware Emerging Markets Debt Fund
3. Investments (continued)
The following table summarizes the valuation of the Fund’s investments by fair value hierarchy levels as of July 31, 2014:
| | | | | | | | | | | | | | | | |
| | | Level 1 | | | Level 2 | | | Level 3 | | | Total | |
Assets: | | | | | | | | | | | | | | | | |
Corporate Debt | | $ | — | | | $ | 18,070,321 | | | $ | — | | | $ | 18,070,321 | |
Foreign Debt | | | — | | | | 2,550,288 | | | | — | | | | 2,550,288 | |
Senior Secured Loans | | | — | | | | — | | | | 510,000 | | | | 510,000 | |
Short-Term Investments | | | — | | | | 947,000 | | | | — | | | | 947,000 | |
Liabilities: | | | | | | | | | | | | | | | | |
Securities Sold Short | | $ | (954,250 | ) | | $ | — | | | $ | — | | | $ | (954,250 | ) |
| | | | | | | | | | | | | | | | |
| | | | |
Total | | $ | (954,250 | ) | | $ | 21,567,609 | | | $ | 510,000 | | | $ | 21,123,359 | |
| | | | | | | | | | | | | | | | |
| | | | |
Derivatives: | | | | | | | | | | | | | | | | |
Swap Contracts | | $ | — | | | $ | 425 | | | $ | — | | | $ | 425 | |
During the period Sept. 30, 2013* through July 31, 2014, there were no transfers between Level 1 investments, Level 2 investments or Level 3 investments that had a significant impact to the Fund. The Fund’s policy is to recognize transfers between levels at the beginning of the reporting period.
The following is a reconciliation of investments in which significant unobservable inputs (Level 3) were used in determining fair value:
| | | | | |
| | | Senior Secured Loans |
Balance as of 9/30/13* | | | $ | — | |
Purchases | | | | 510,000 | |
| | | | | |
Balance as of 7/31/14 | | | $ | 510,000 | |
| | | | | |
Sensitivity Analysis
Valuation: US GAAP defines fair value as the price that the Fund would receive to sell an asset or pay to transfer a liability in an orderly transaction between market participants at the measurement date. The Fund fair values its financial instruments at fair value using independent pricing sources under the policies approved by the Board. The Pricing Committee is the committee formed by the advisor to develop pricing policies and procedures and to provide oversight of the pricing function for the Funds.
When market quotations are not readily available for one or more portfolio securities, the Fund’s NAV shall be calculated by using the “fair value” of the securities as determined by the Pricing Committee. Such “fair value” is the amount that a Fund might reasonably expect to receive for the security (or asset) upon its current sale. Each such determination should be based on a consideration of all relevant factors, which are likely to vary from one pricing context to another. Examples of such factors may include, but are not limited to: (1) the type of security, (2) the size of the holding, (3) the initial cost of the security, (4) the existence of any contractual restrictions of the security’s disposition, (5) the price and extent of public trading in similar securities of the issuer or of comparable companies, (6) quotations or
32
evaluated prices from broker-dealers and/or pricing services, (7) information obtained from the issuer, analysts, and/or appropriate stock exchange (for exchange-traded securities), (8) an analysis of the company’s financial statements, and (9) an evaluation of the forces that influence the issuer and the market(s) in which the security is purchased and sold.
The Pricing Committee, or its delegate, employs various methods for calibrating these valuation approaches, including due diligence of the Fund’s pricing vendors and periodic back-testing of the prices that are fair valued under these procedures and reviews of any market related activity. The pricing of all securities fair valued by the Pricing Committee is subsequently reported to and approved by the Board on a quarterly basis.
Quantitative Information about Level 3 Fair Value Measurements
| | | | | | |
Fair Value at 7/31/14 | | Valuation Technique(s) | | Unobservable Input | | Range (Weighted
Average) |
Senior Secured
Loans $510,000 | | Broker Quote | | Market pricing of
securities | | N/A |
* Date of commencement of operations.
4. Dividend and Distribution Information
Income and long-term capital gain distributions are determined in accordance with federal income tax regulations, which may differ from U.S. GAAP. Additionally, distributions from net gains on foreign currency transactions and net short-term gains on sales of investment securities are treated as ordinary income for federal income tax purposes. The tax character of dividends and distributions paid during the period Sept. 30, 2013* through July 31, 2014 was as follows:
| | | | |
| | | 9/30/13* to 7/31/14 | |
Ordinary income | | | $701,620 | |
* Date of commencement of operations.
5. Components of Net Assets on a Tax Basis
As of July 31, 2014, the components of net assets on a tax basis were as follows:
| | | | |
Shares of beneficial interest | | | $18,302,043 | |
Undistributed ordinary income | | | 127,832 | |
Unrealized appreciation | | | 595,693 | |
| | | | |
Net assets | | | $19,025,568 | |
| | | | |
The differences between book basis and tax basis components of the net assets are primarily attributable to tax deferral of losses on wash sales and tax treatment of CDS contracts.
For financial reporting purposes, capital accounts are adjusted to reflect the tax character of permanent book/tax differences. Reclassifications are primarily due to tax treatment of gain (loss) on foreign currency transactions, tax treatment of CDS contracts, Brazilian IOF Tax, non-deductible offering costs, and non-deductible short sale dividend expense. Results of operations and net assets were not affected
33
Notes to financial statements
Delaware Emerging Markets Debt Fund
by these reclassifications. For the period Sept. 30, 2013* through July 31, 2014, the Fund recorded the following reclassifications:
| | | | |
Undistributed net investment income | | $ | 4,015 | |
Accumulated net realized loss | | | (4,005 | ) |
Paid-in capital | | | (10 | ) |
* Date of commencement of operations.
6. Capital Shares
Transactions in capital shares were as follows:
| | | | |
| | | 9/30/13* to 7/31/14 | |
| |
Shares sold: | | | | |
Class A | | | 238 | |
Class C | | | 238 | |
Class R | | | 238 | |
Institutional Class | | | 3 | |
| |
Shares issued upon transfer: | | | | |
Institutional Class | | | 2,070,588 | |
| |
Shares issued upon reinvestment of dividends and distributions: | | | | |
Class A | | | 9 | |
Class C | | | 7 | |
Class R | | | 8 | |
Institutional Class | | | 81,097 | |
| | | | |
| | | 2,152,426 | |
| | | | |
| |
Shares redeemed: | | | | |
Institutional Class | | | (705 | ) |
| | | | |
Net increase | | | 2,151,721 | |
| | | | |
* Date of commencement of operations.
7. Line of Credit
On Nov. 12, 2013, the Fund, along with certain other funds in the Delaware Investments® Family of Funds (Participants), entered into a $225,000,000 revolving line of credit to be used for temporary or emergency purposes as an additional source of liquidity to fund redemptions of investor shares. Under the agreement, the Participants are charged an annual commitment fee of 0.08%, which is allocated across the Participants on the basis of each Participant’s allocation of the entire facility. The Participants are permitted to borrow up to a maximum of one third of their net assets under the agreement. Each
34
Participant is individually, and not jointly, liable for its particular advances, if any, under the line of credit. The line of credit under the agreement will expire on Nov. 10, 2014. Prior to Nov. 12, 2013, the Fund was not a participant in a line of credit agreement.
The Fund had no amounts outstanding as of July 31, 2014 or at any time during the period then ended.
8. Derivatives
U.S. GAAP requires disclosures that enable investors to understand: (1) how and why an entity uses derivatives, (2) how they are accounted for, and (3) how they affect an entity’s results of operations and financial position.
Foreign Currency Exchange Contracts — The Fund may enter into foreign currency exchange contracts and foreign cross currency exchange contracts as a way of managing foreign exchange rate risk. The Fund may enter into these contracts to fix the U.S. dollar value of a security that it has agreed to buy or sell for the period between the date the trade was entered into and the date the security is delivered and paid for. The Fund may also use these contracts to hedge the U.S. dollar value of securities it already owns that are denominated in foreign currencies. In addition, the Fund may enter into these contracts to facilitate or expedite the settlement of portfolio transactions. The change in value is recorded as an unrealized gain or loss. When the contract is closed, a realized gain or loss is recorded equal to the difference between the value of the contract at the time it was opened and the value at the time it was closed.
The use of foreign currency exchange contracts and foreign cross currency exchange contracts does not eliminate fluctuations in the underlying prices of the securities, but does establish a rate of exchange that can be achieved in the future. Although foreign currency exchange contracts limit the risk of loss due to an unfavorable change in the value of the hedged currency, they also limit any potential gain that might result should the value of the currency change favorably. In addition, the Fund could be exposed to risks if the counterparties to the contracts are unable to meet the terms of their contracts. The Fund’s maximum risk of loss from counterparty credit risk is the value of its currency exchanged with the counterparty. The risk is generally mitigated by having a netting arrangement between the Fund and the counterparty and by the posting of collateral by the counterparty to the Fund to cover the Fund’s exposure to the counterparty.
During the period Sept. 30, 2013* through July 31, 2014, the Fund entered into foreign currency exchange contracts and cross currency exchange contracts to hedge the U.S. dollar value of securities it already owns that are denominated in foreign currencies and to protect against currency fluctuations.
Futures Contracts — A futures contract is an agreement in which the writer (or seller) of the contract agrees to deliver to the buyer an amount of cash or securities equal to a specific dollar amount times the difference between the value of a specific security or index at the close of the last trading day of the contract and the price at which the agreement is made. The Fund may use futures in the normal course of pursuing its investment objective. The Fund may invest in futures contracts to hedge its existing portfolio securities against fluctuations in fair value caused by changes in interest rates or market conditions. Upon entering into a futures contract, the Fund deposits cash or pledges U.S. government securities to a broker, equal to the minimum “initial margin” requirements of the exchange on which the contract is traded. Subsequent payments are received from the broker or paid to the broker each day,
35
Notes to financial statements
Delaware Emerging Markets Debt Fund
8. Derivatives (continued)
based on the daily fluctuation in the market value of the contract. These receipts or payments are known as “variation margin” and are recorded daily by the Fund as unrealized gains or losses until the contracts are closed. When the contracts are closed, the Fund records a realized gain or loss equal to the difference between the value of the contract at the time it was opened and the value at the time it was closed. Risks of entering into futures contracts include potential imperfect correlation between the futures contracts and the underlying securities and the possibility of an illiquid secondary market for these instruments. When investing in futures, there is reduced counterparty credit risk to the Fund because futures are exchange-traded and the exchange’s clearinghouse, as counterparty to all exchange-traded futures, guarantees against default. No futures contracts were outstanding at July 31, 2014.
During the period Sept. 30, 2013* through July 31, 2014, the Fund used futures contracts to hedge the Fund’s existing portfolio securities against fluctuations in value caused by changes in interest rates or market conditions and to hedge currency risks associated with the Fund’s investments.
Swap Contracts – The Fund may enter into CDS contracts in the normal course of pursuing its investment objective. The Fund may enter into CDS contracts in order to hedge against a credit event, to enhance total return or to gain exposure to certain securities or markets. The Fund will not be permitted to enter into any swap transactions unless, at the time of entering into such transactions, the unsecured long-term debt of the actual counterparty, combined with any credit enhancements, is rated at least BBB- by Standard & Poor’s Financial Services LLC (S&P) or at least Baa3 by Moody’s Investors Service Inc. (Moody’s) or is determined to be of equivalent credit quality by DMC.
Credit Default Swaps. A CDS contract is a risk-transfer instrument through which one party (purchaser of protection) transfers to another party (seller of protection) the financial risk of a credit event (as defined in the CDS agreement), as it relates to a particular reference security or basket of securities (such as an index). In exchange for the protection offered by the seller of protection, the purchaser of protection agrees to pay the seller of protection a periodic amount at a stated rate that is applied to the notional amount of the CDS contract. In addition, an upfront payment may be made or received by the Fund in connection with an unwinding or assignment of a CDS contract. Upon the occurrence of a credit event, the seller of protection would pay the par (or other agreed-upon) value of the reference security (or basket of securities) to the counterparty. Credit events generally include, among others, bankruptcy, failure to pay, and obligation default.
During the period Sept. 30, 2013* through July 31, 2014, the Fund entered into CDS contracts as a purchaser and seller of protection. Periodic payments (receipts) on such contracts are accrued daily and recorded as unrealized losses on swap contracts. Upon payment (receipt), such amounts are recorded as realized losses (gains) on swap contracts. Upfront payments made or received in connection with CDS contracts are amortized over the expected life of the CDS contracts as unrealized losses (gains) on swap contracts. The change in value of CDS contracts is recorded daily as unrealized appreciation or depreciation. A realized gain or loss is recorded upon a credit event (as defined in the CDS agreement) or the maturity or termination of the agreement. Initial margin and variation margin is posted to central counterparties for CDS basket trades, as determined by the applicable central
36
counterparty. The Fund posted $120,000 in cash collateral for swap contracts, which is included on the “Statement of assets and liabilities” under “Cash collateral due from brokers.”
CDS contracts may involve greater risks than if the Fund had invested in the reference obligation directly. CDS contracts are subject to general market risk, liquidity risk, counterparty risk and credit risk. The Fund’s maximum risk of loss from counterparty credit risk, either as the seller of protection or the buyer of protection, is the fair value of the contract. This risk is mitigated by (1) for bilateral swap contracts, having a netting arrangement between the Fund and the counterparty and by the posting of collateral by the counterparty to the Fund to cover the Fund’s exposure to the counterparty or (2) for cleared swaps, trading these instruments through a central counterparty.
During the period Sept. 30, 2013* through July 31, 2014, the Fund used CDS contracts to hedge against a credit event.
Swaps Generally. The value of open swaps may differ from that which would be realized in the event the Fund terminated its position in the contract on a given day. Risks of entering into these contracts include the potential inability of the counterparty to meet the terms of the contracts. This type of risk is generally limited to the amount of favorable movement in the value of the underlying security, instrument or basket of instruments, if any, at the day of default. Risks also arise from potential losses from adverse market movements and such losses could exceed the unrealized amounts shown on the “Schedule of investments.”
Fair value of derivative instruments as of July 31, 2014 was as follows:
| | | | | | | | |
| | | Asset Derivatives | | Liability Derivatives |
| | | Statement of Assets and Liabilities Location | | Fair Value | | Statement of Assets and Liabilities Location | | Fair Value |
Credit contracts (Swap contracts) | | Unrealized gain
on credit default
swap contracts | | $425 | | Unrealized loss
on
credit default
swap contracts | | $— |
The effect of derivative instruments on the “Statement of operations” for the period Sept. 30, 2013* through July 31, 2014 was as follows:
| | | | | | | | | | | | | | | | |
| | | | | | Net Realized Loss on: | | | | |
| | | Foreign
Currency
Transactions | | | Financial
Futures
Contracts | | | Swaps | | | Total | |
Forward currency exchange contracts | | $ | (12,328 | ) | | $ | (1,705 | ) | | $ | — | | | $ | (14,033 | ) |
Interest rate contracts | | | — | | | | (11,198 | ) | | | — | | | | (11,198 | ) |
Credit contracts | | | — | | | | — | | | | (11,161 | ) | | | (11,161 | ) |
| | | | | | | | | | | | | | | | |
Total | | $ | (12,328 | ) | | $ | (12,903 | ) | | $ | (11,161 | ) | | $ | (36,392 | ) |
| | | | | | | | | | | | | | | | |
37
Notes to financial statements
Delaware Emerging Markets Debt Fund
8. Derivatives (continued)
| | | | | | | | | | | | | | | | |
| | | Net Change in Unrealized Depreciation of: | |
| | | Foreign
Currency
Transactions | | | Financial
Futures
Contracts | | | Swaps | | | Total | |
Credit contracts | | $ | — | | | $ | — | | | $ | (5,408 | ) | | $ | (5,408 | ) |
Derivatives Generally. The table below summarizes the average balance of derivative holdings by the Fund during the period Sept. 30, 2013* through July 31, 2014.
| | | | | | | | |
| | | Long Derivative
Volume | | | Short Derivative
Volume | |
Foreign currency exchange contracts (average cost) | | USD | 83,980 | | | USD | 181,079 | |
Futures contracts (average notional value) | | | 7,295 | | | | 1,120,159 | |
CDS contracts (average notional value)** | | | 250,000 | | | | 18,868 | |
* Date of commencement of operations.
**Long represents buying protection and short represents selling protection.
9. Offsetting
In December 2011, the Financial Accounting Standards Board (FASB) issued guidance that expands current disclosure requirements on the offsetting of certain assets and liabilities. The new disclosures are required for investments and derivative financial instruments subject to master netting or similar agreements which are eligible for offset in the “Statement of assets and liabilities” and will require an entity to disclose both gross and net information about such investments and transactions in the financial statements. In January 2013, the FASB issued guidance that clarifies which investments and transactions are subject to the offsetting disclosure requirements. The scope of the disclosure requirements for offsetting is limited to derivative instruments, repurchase agreements and reverse repurchase agreements, and securities borrowing and securities lending transactions. The guidance is effective for financial statements with fiscal years beginning on or after Jan. 1, 2013, and interim periods within those fiscal years. The Fund adopted the disclosure provisions on offsetting during the current reporting period.
In order to better define its contractual rights and to secure rights that will help the Fund mitigate its counterparty risk, the Fund entered into an International Swaps and Derivatives Association, Inc. Master Agreement (ISDA Master Agreement) or similar agreement with their derivative contract counterparties. An ISDA Master Agreement is a bilateral agreement between the Fund and a counterparty that governs over-the-counter (OTC) derivatives and foreign exchange contracts and typically contains, among other things, collateral posting items and netting provisions in the event of a default and/or termination event. Under an ISDA Master Agreement, the Fund may, under certain circumstances, offset with the counterparty certain derivative financial instrument’s payables and/or receivables with collateral held and/or posted and create one single net payment. The provisions of the ISDA Master Agreement typically permit a single net payment in the event of default (close-out) netting including the bankruptcy or insolvency of the counterparty. However, bankruptcy or insolvency laws of a particular jurisdiction may impose restrictions on or prohibitions against the right of offset in bankruptcy, insolvency or other events.
38
For financial reporting purposes, the Fund does not offset derivative assets and derivative liabilities that are subject to netting arrangements in the “Statement of assets and liabilities.”
At July 31, 2014, the Fund had the following assets and liabilities subject to offsetting provisions:
Offsetting of Financial Assets and Liabilities and Derivatives Assets and Liabilities
| | | | | | |
Counterparty | | Gross Value of
Derivative Asset | | Gross Value of
Derivative Liability | | Net Position |
Morgan Stanley Capital | | $425 | | $— | | $425 |
| | | | | | | | | | | | |
Counterparty | | Net Position | | Fair Value of
Non-Cash
Collateral Received | | Cash Collateral
Received | | Fair Value of
Non-Cash
Collateral Pledged | | Cash Collateral
Pledged | | Net Amount(a) |
Morgan Stanley Capital | | $425 | | $— | | $— | | $— | | $— | | $425 |
| | | | | | | | | | | | | | | | | | | | |
Counterparty | | Repurchase Agreements | | Fair Value of
Non-Cash
Collateral Received | | Cash Collateral
Received | | Net Amount(a) |
Bank of America Merrill Lynch | | | $ | 295,556 | | | | $ | (295,556 | ) | | | $ | — | | | | $ | — | |
Bank of Montreal | | | | 98,519 | | | | | (98,519 | ) | | | | — | | | | | — | |
BNP Paribas | | | | 552,925 | | | | | (552,925 | ) | | | | — | | | | | — | |
| | | | | | | | | | | | | | | | | | | | |
Total | | | $ | 947,000 | | | | $ | (947,000 | ) | | | $ | — | | | | $ | — | |
| | | | | | | | | | | | | | | | | | | | |
(a)Net amount represents the receivable/(payable) that would be due from/(to) the counterparty in the event of default.
10. Securities Lending
The Fund, along with other funds in the Delaware Investments® Family of Funds, may lend its securities pursuant to a security lending agreement (Lending Agreement) with The Bank of New York Mellon (BNY Mellon). At the time a security is loaned, the borrower must post collateral equal to the required percentage of the market value of the loaned security, including any accrued interest. The required percentage is: (1) 102% with respect to U.S. securities and foreign securities that are denominated and payable in U.S. dollars; and (2) 105% with respect to foreign securities. With respect to each loan, if on any business day the aggregate market value of securities collateral plus cash collateral held is less than the aggregate market value of the securities which are the subject of such loan, the borrower will be notified to provide additional collateral by the end of the following business day which, together with the collateral already held, will be not less than the applicable initial collateral requirements for such security loan. If the aggregate market value of securities collateral and cash collateral held with respect to a security loan exceeds the applicable initial collateral requirement, upon request of the borrower, BNY Mellon must return enough collateral to the borrower by the end of the following business day to reduce the value of the remaining collateral to the applicable initial collateral requirement for such security loan. As a result of the foregoing, the value of the collateral held with respect to a loaned security on any particular day may be more or less than the value of the security on loan.
Cash collateral received is generally invested in the Delaware Investments Collateral Fund No. 1 (Collective Trust) established by BNY Mellon for the purpose of investment on behalf of funds managed
39
Notes to financial statements
Delaware Emerging Markets Debt Fund
10. Securities Lending (continued)
by DMC that participate in BNY Mellon’s securities lending program. The Collective Trust may invest in U.S. government securities and high quality corporate debt, asset-backed and other money market securities and in repurchase agreements collateralized by such securities, provided that the Collective Trust will generally have a dollar-weighted average portfolio maturity of 60 days or less. The Fund can also accept U.S. government securities and letters of credit (non-cash collateral) in connection with securities loans. In the event of default or bankruptcy by the lending agent, realization and/or retention of the collateral may be subject to legal proceedings. In the event the borrower fails to return loaned securities and the collateral received is insufficient to cover the value of the loaned securities and provided such collateral shortfall is not the result of investment losses, the lending agent has agreed to pay the amount of the shortfall to the Fund, or at the discretion of the lending agent, replace the loaned securities. The Fund continues to record dividends or interest, as applicable, on the securities loaned and is subject to changes in value of the securities loaned that may occur during the term of the loan. The Fund has the right under the Lending Agreement to recover the securities from the borrower on demand. With respect to security loans collateralized by non-cash collateral, the Fund receives loan premiums paid by the borrower. With respect to security loans collateralized by cash collateral, the earnings from the collateral investments are shared among the Fund, the security lending agent and the borrower. The Fund records security lending income net of allocations to the security lending agent and the borrower.
The Collective Trust used for the investment of cash collateral received from borrowers of securities seeks to maintain a net asset value per unit of $1.00, but there can be no assurance that it will always be able to do so. The Fund may incur investment losses as a result of investing securities lending collateral in the Collective Trust. This could occur if an investment in the Collective Trust defaulted or if it were necessary to liquidate assets in the Collective Trust to meet returns on outstanding security loans at a time when the Collective Trust’s net asset value per unit was less than $1.00. Under those circumstances, the Fund may not receive an amount from the Collective Trust that is equal in amount to the collateral the Fund would be required to return to the borrower of the securities and the Fund would be required to make up for this shortfall.
At July 31, 2014, the Fund had no securities on loan.
11. Credit and Market Risk
Some countries in which the Fund may invest require governmental approval for the repatriation of investment income, capital or the proceeds of sales of securities by foreign investors. In addition, if there is deterioration in a country’s balance of payments or for other reasons, a country may impose temporary restrictions on foreign capital remittances abroad.
The securities exchanges of certain foreign markets are substantially smaller, less liquid and more volatile than the major securities markets in the United States. Consequently, acquisition and disposition of securities by the Fund may be inhibited. In addition, a significant portion of the aggregate market value of equity securities listed on the major securities exchanges in emerging markets is held by a smaller number of investors. This may limit the number of shares available for acquisition or disposition by the Fund.
40
The Fund invests in high yield, fixed income securities, which are securities rated lower than BBB- by S&P and lower than Baa3 by Moody’s, or similarly rated by another nationally recognized statistical rating organization. Investments in these higher yielding securities are generally accompanied by a greater degree of credit risk than higher rated securities. Additionally, lower rated securities may be more susceptible to adverse economic and competitive industry conditions than investment-grade securities.
The Fund invests in certain obligations that may have liquidity protection designed to ensure that the receipt of payments due on the underlying security is timely. Such protection may be provided through guarantees, insurance policies or letter of credit obtained by the issuer or sponsor through third parties, through various means of structuring the transaction or through a combination of such approaches. The Fund will not pay any additional fees for such credit support, although the existence of credit support may increase the price of the security.
The Fund may invest up to 15% of its net assets in illiquid securities, which may include securities with contractual restrictions on resale, securities exempt from registration under Rule 144A of the Securities Act of 1933, as amended, and other securities which may not be readily marketable. The relative illiquidity of these securities may impair the Fund from disposing of them in a timely manner and at a fair price when it is necessary or desirable to do so. While maintaining oversight, the Fund’s Board has delegated to DMC, the day-to-day functions of determining whether individual securities are liquid for purposes of the Fund’s limitation on investments in illiquid securities. Securities eligible for resale pursuant to Rule 144A, which are determined to be liquid, are not subject to the Fund’s 15% limit on investments in illiquid securities. Rule 144A and illiquid securities have been identified in the “Schedule of investments.”
12. Contractual Obligations
The Fund enters into contracts in the normal course of business that contain a variety of indemnifications. The Fund’s maximum exposure under these arrangements is unknown. However, the Fund has not had prior claims or losses pursuant to these contracts. Management has reviewed the Fund’s existing contracts and expects the risk of loss to be remote.
13. Transfer
On Sept. 30, 2013, the Fund acquired all of the investment portfolio of a privately offered unregistered fund (a Cayman Islands exempted limited partnership that is exempt from the provisions of the 1940 Act) managed by the Fund’s portfolio manager in exchange for Institutional Class shares of the Fund. The investment portfolio of the privately offered unregistered fund, consisting of cash of $2,146,780 and securities with a market value of $15,453,220, was transferred to the Fund in exchange for 2,070,588 Institutional Class shares. The net assets of the Fund immediately after the reorganization were $17,600,000. The Fund had no net assets or liabilities prior to the reorganization.
14. Recent Accounting Pronouncements
In June 2014, the Financial Accounting Standards Board issued guidance to improve the financial reporting of reverse repurchase agreements and other similar transactions. The guidance includes expanded disclosure requirements for entities that enter into reverse repurchase agreements and similar transactions accounted for as secured borrowings. The guidance is effective for financial statements with
41
Notes to financial statements
Delaware Emerging Markets Debt Fund
14. Recent Accounting Pronouncements (continued)
fiscal years beginning on or after Dec. 15, 2014 and interim periods within those fiscal years. Management is evaluating the impact, if any, of this guidance on the Fund’s financial statement disclosures.
15. Subsequent Events
Management has determined that no material events or transactions occurred subsequent to July 31, 2014 that would require recognition or disclosure in the Fund’s financial statements.
42
Report of independent
registered public accounting firm
To the Board of Trustees Delaware Group® Government Fund
and the Shareholders of Delaware Emerging Markets Debt Fund:
In our opinion, the accompanying statement of assets and liabilities, including the schedule of investments, and the related statements of operations, of changes in net assets and of cash flows, and the financial highlights present fairly, in all material respects, the financial position of Delaware Emerging Markets Debt Fund (one of the series constituting Delaware Group® Government Fund, hereinafter referred to as the “Fund”) at July 31, 2014, the results of its operations and its cash flows, the changes in its net assets and the financial highlights for the period September 30, 2013 (commencement of operations) through July 31, 2014, in conformity with accounting principles generally accepted in the United States of America. These financial statements and financial highlights (hereafter referred to as “financial statements”) are the responsibility of the Fund’s management. Our responsibility is to express an opinion on these financial statements based on our audit. We conducted our audit of these financial statements in accordance with the standards of the Public Company Accounting Oversight Board (United States). Those standards require that we plan and perform the audit to obtain reasonable assurance about whether the financial statements are free of material misstatement. An audit includes examining, on a test basis, evidence supporting the amounts and disclosures in the financial statements, assessing the accounting principles used and significant estimates made by management, and evaluating the overall financial statement presentation. We believe that our audit, which included confirmation of securities at July 31, 2014 by correspondence with the custodian and brokers, provides a reasonable basis for our opinion.
PricewaterhouseCoopers LLP
Philadelphia, Pennsylvania
September 19, 2014
43
Other Fund information (Unaudited)
Delaware Emerging Markets Debt Fund
Tax Information
The information set forth below is for the Fund’s fiscal year as required by federal laws. Shareholders, however, must report distributions on a calendar year basis for income tax purposes, which may include distributions for portions of two fiscal years of a fund. Accordingly, the information needed by shareholders for income tax purposes will be sent to them in January of each year. Please consult your tax advisor for proper treatment of this information.
All disclosures are based on financial information available as of the date of this annual report and, accordingly are subject to change. For any and all items requiring reporting, it is the intention of the Fund to report the maximum amount permitted under the Internal Revenue Code and the regulations thereunder.
For the period Sept. 30, 2013* through July 31, 2014, the Fund reports distributions paid during the period as follows:
| | | | |
(A) Ordinary Income Distribution (Tax Basis) | | | 100.00% | |
(A) is based on a percentage of the Fund’s total distributions.
44
Board of trustees / directors and officers addendum
Delaware Investments® Family of Funds
A mutual fund is governed by a Board of Trustees / Directors (“Trustees”), which has oversight responsibility for the management of a fund’s business affairs. Trustees establish procedures and oversee and review the performance of the investment manager, the distributor, and others who perform services for the fund. The independent fund trustees, in particular, are advocates
| | | | |
Name, Address, and Birth Date | | Position(s) Held with Fund(s) | | Length of Time Served |
Interested Trustees | | | | |
Patrick P. Coyne1 | | Chairman, President, | | Chairman and Trustee |
2005 Market Street | | Chief Executive Officer, | | since August 16, 2006 |
Philadelphia, PA 19103 | | and Trustee | | |
April 1963 | | | | President and |
| | | | Chief Executive Officer |
| | | | since August 1, 2006 |
| | |
| | | | |
Independent Trustees | | | | |
Thomas L. Bennett | | Trustee | | Since March 2005 |
2005 Market Street | | | | |
Philadelphia, PA 19103 | | | | |
October 1947 | | | | |
Joseph W. Chow | | Trustee | | Since January 2013 |
2005 Market Street | | | | |
Philadelphia, PA 19103 | | | | |
January 1953 | | | | |
| | |
| | | | |
John A. Fry | | Trustee | | Since January 2001 |
2005 Market Street | | | | |
Philadelphia, PA 19103 | | | | |
May 1960 | | | | |
| | |
| | | | | |
| 1 | Patrick P.Coyne is considered to be an “Interested Trustee” because he is an executive officer of the Fund’s(s’) investment advisor. |
45
for shareholder interests. Each trustee has served in that capacity since he or she was elected to or appointed to the Board of Trustees, and will continue to serve until his or her retirement or the election of a new trustee in his or her place. The following is a list of the Trustees and Officers with certain background and related information.
| | | | |
Principal Occupation(s) During Past 5 Years | | Number of Portfolios in Fund Complex Overseen by Trustee or Officer | | Other Directorships Held by Trustee or Officer |
| | | | |
Patrick P. Coyne has served in | | 70 | | Board of Governors Member |
various executive capacities | | | | Investment Company |
at different times at | | | | Institute (ICI) |
Delaware Investments.2 | | | | |
| | |
| | | | Director and Audit |
| | | | Committee Member |
| | | | Kaydon Corp. |
| | | | (2007–2013) |
| | | | |
Private Investor | | 70 | | Director |
(March 2004–Present) | | | | Bryn Mawr Bank Corp. (BMTC) |
| | | | (2007–2011) |
| | |
| | | | | |
Executive Vice President | | 70 | | Director and Audit Committee |
(Emerging Economies | | | | Member — Hercules |
Strategies, Risk and | | | | Technology Growth |
Corporate Administration) | | | | Capital, Inc. |
State Street Corporation | | | | |
(July 2004–March 2011) | | | | |
President | | 70 | | Director — Hershey Trust |
Drexel University | | | | |
(August 2010–Present) | | | | Director and Audit |
| | | | Committee Member |
President | | | | Community Health Systems |
Franklin & Marshall College | | | | |
(July 2002–July 2010) | | | | |
| | | | | |
| 2 | Delaware Investments is the marketing name for Delaware Management Holdings, Inc. and its subsidiaries, including the Fund’s(s’) investment advisor, principal underwriter, and its transfer agent. |
46
Board of trustees / directors and officers addendum
Delaware Investments® Family of Funds
| | | | |
Name, Address, and Birth Date | | Position(s) Held with Fund(s) | | Length of Time Served |
Independent Trustees (continued) | | | | |
Lucinda S. Landreth | | Trustee | | Since March 2005 |
2005 Market Street | | | | |
Philadelphia, PA 19103 | | | | |
June 1947 | | | | |
Frances A. Sevilla-Sacasa | | Trustee | | Since September 2011 |
2005 Market Street | | | | |
Philadelphia, PA 19103 | | | | |
January 1956 | | | | |
| | |
| | | | | |
Thomas K. Whitford | | Trustee | | Since January 2013 |
2005 Market Street | | | | |
Philadelphia, PA 19103 | | | | |
March 1956 | | | | |
| | |
| | | | | |
47
| | | | |
Principal Occupation(s) During Past 5 Years | | Number of Portfolios in Fund Complex Overseen by Trustee or Officer | | Other Directorships Held by Trustee or Officer |
| | | | |
Private Investor | | 70 | | None |
(2004–Present) | | | | |
| | |
| | | | | |
Chief Executive Officer — | | 70 | | Trust Manager and |
Banco Itaú | | | | Audit Committee |
International | | | | Member — Camden |
(April 2012–Present) | | | | Property Trust |
| | |
Executive Advisor to Dean | | | | |
(August 2011–March 2012) and Interim Dean | | | | |
(January 2011–July 2011) — | | | | |
University of Miami School of | | | | |
Business Administration | | | | |
| | |
President — U.S. Trust, | | | | |
Bank of America Private | | | | |
Wealth Management | | | | |
(Private Banking) | | | | |
(July 2007–December 2008) | | | | |
Vice Chairman | | 70 | | Director — HSBC Finance |
(2010–April 2013) | | | | Corporation and HSBC |
Chief Administrative | | | | North America Holdings Inc. |
Officer (2008–2010) and Executive Vice | | | | |
President and Chief | | | | |
Administrative Officer | | | | |
(2007–2009) — | | | | |
PNC Financial | | | | |
Services Group | | | | |
48
Board of trustees / directors and officers addendum
Delaware Investments® Family of Funds
| | | | |
Name, Address, and Birth Date | | Position(s) Held with Fund(s) | | Length of Time Served |
Independent Trustees (continued) | | | | |
Janet L. Yeomans | | Trustee | | Since April 1999 |
2005 Market Street | | | | |
Philadelphia, PA 19103 | | | | |
July 1948 | | | | |
| | |
| | | | | |
J. Richard Zecher | | Trustee | | Since March 2005 |
2005 Market Street | | | | |
Philadelphia, PA 19103 | | | | |
July 1940 | | | | |
| | |
| | | | | |
49
| | | | |
| | | Number of Portfolios in | | |
| Principal Occupation(s) | | Fund Complex Overseen | | Other Directorships |
| During Past 5 Years | | by Trustee or Officer | | Held by Trustee or Officer |
| | | | |
Vice President and Treasurer | | 70 | | Director, Audit |
(January 2006–July 2012) | | | | Committee Chair, Investment |
Vice President — | | | | Committee Member, |
Mergers & Acquisitions | | | | and Governance |
(January 2003–January 2006), | | | | Committee Member |
and Vice President | | | | Okabena Company |
and Treasurer | | | | |
(July 1995–January 2003) | | | | Chair — 3M |
3M Corporation | | | | Investment Management |
| | | | Company |
| | | | | (2005–2012) |
Founder | | 70 | | Director and Compensation |
Investor Analytics | | | | Committee Member |
(Risk Management) | | | | Investor Analytics |
(May 1999–Present) | | | | |
| | | | Director — P/E Investments |
Founder | | | | |
P/E Investments | | | | |
(Hedge Fund) | | | | |
(September 1996–Present) | | | | |
| | | | | |
50
Board of trustees / directors and officers addendum
Delaware Investments® Family of Funds
| | | | |
| Name, Address, | | Position(s) | | Length of |
| and Birth Date | | Held with Fund(s) | | Time Served |
Officers | | | | |
David F. Connor | | Senior Vice President, | | Senior Vice President, |
2005 Market Street | | Deputy General | | Deputy General Counsel |
Philadelphia, PA 19103 | | Counsel, and Secretary | | since May 2013; |
December 1963 | | | | Vice President, Deputy |
| | | | General Counsel |
| | | | September 2000 – |
| | | | May 2013; Secretary since |
| | | | | October 2005 |
Daniel V. Geatens | | Vice President | | Treasurer since October 2007 |
2005 Market Street | | and Treasurer | | |
Philadelphia, PA 19103 | | | | |
October 1972 | | | | |
David P. O’Connor | | Executive Vice President, | | Executive Vice President |
2005 Market Street | | General Counsel | | since February 2012; |
Philadelphia, PA 19103 | | and Chief Legal Officer | | Senior Vice President |
February 1966 | | | | October 2005 – |
| | | | February 2012; |
| | | | General Counsel and |
| | | | Chief Legal Officer |
| | | | since October 2005 |
| | | | | |
Richard Salus | | Senior Vice President | | Chief Financial Officer |
2005 Market Street | | and Chief Financial Officer | | since November 2006 |
Philadelphia, PA 19103 | | | | |
October 1963 | | | | |
The Statement of Additional Information for the Fund(s) includes additional information about the Trustees and Officers and is available, without charge, upon request by calling 800 523-1918.
51
| | | | |
| | | Number of Portfolios in | | |
| Principal Occupation(s) | | Fund Complex Overseen | | Other Directorships |
| During Past 5 Years | | by Trustee or Officer | | Held by Trustee or Officer |
| | | | |
David F. Connor has served as | | 70 | | None3 |
Deputy General Counsel of | | | | |
Delaware Investments since 2000. | | | | |
Daniel V. Geatens has served | | 70 | | None3 |
in various capacities at different times at | | | | |
Delaware Investments. | | | | |
David P. O’Connor has served | | 70 | | None3 |
in various executive and legal capacities at different times at Delaware Investments. | | | | |
| | | | | |
Richard Salus has served in | | 70 | | None3 |
various executive capacities at different times at | | | | |
Delaware Investments. | | | | |
| 3 | David F. Connor, Daniel V. Geatens, David P. O’Connor, and Richard Salus serve in similar capacities for the six portfolios of the Optimum Fund Trust, which have the same investment advisor, principal underwriter, and transfer agent as the registrant. |
52
About the organization
| | | | | | |
| Board of trustees | | | | | | |
Patrick P. Coyne Chairman, President, and Chief Executive Officer Delaware Investments® Family of Funds Philadelphia, PA Thomas L. Bennett Private Investor Rosemont, PA | | Joseph W. Chow Former Executive Vice President State Street Corporation Brookline, MA John A. Fry President Drexel University Philadelphia, PA | | Lucinda S. Landreth Former Chief Investment Officer Assurant, Inc. Philadelphia, PA Frances A. Sevilla-Sacasa
Chief Executive Officer Banco Itaú International Miami, FL | | Thomas K. Whitford Former Vice Chairman PNC Financial Services Group Pittsburgh, PA Janet L. Yeomans Former Vice President and Treasurer 3M Corporation St. Paul, MN J. Richard Zecher Founder Investor Analytics Scottsdale, AZ |
Affiliated officers
| | | | | | |
| David F. Connor | | Daniel V. Geatens | | David P. O’Connor | | Richard Salus |
| Senior Vice President, | | Vice President and | | Executive Vice President, | | Senior Vice President and |
| Deputy General Counsel, | | Treasurer | | General Counsel, | | Chief Financial Officer |
| and Secretary | | Delaware Investments | | and Chief Legal Officer | | Delaware Investments |
| Delaware Investments | | Family of Funds | | Delaware Investments | | Family of Funds |
| Family of Funds | | Philadelphia, PA | | Family of Funds | | Philadelphia, PA |
| Philadelphia, PA | | | | Philadelphia, PA | | |
This annual report is for the information of Delaware Emerging Markets Debt Fund shareholders, but it may be used with prospective investors when preceded or accompanied by the Delaware Investments Fund fact sheet for the most recently completed calendar quarter. These documents are available at delawareinvestments.com.
Delaware Investments is the marketing name of Delaware Management Holdings, Inc. and its subsidiaries.
The Fund files its complete schedule of portfolio holdings with the Securities and Exchange Commission (SEC) for the first and third quarters of each fiscal year on Form N-Q. The Fund’s Forms N-Q, as well as a description of the policies and procedures that the Fund uses to determine how to vote proxies (if any) relating to portfolio securities are available without charge (i) upon request, by calling 800 523-1918; and (ii) on the SEC’s website at sec.gov. In addition, a description of the policies and procedures that the Fund uses to determine how to vote proxies (if any) relating to portfolio securities and the Fund’s Schedule of Investments are available without charge on the Fund’s website at delawareinvestments.com. The Fund’s Forms N-Q may be reviewed and copied at the SEC’s Public Reference Room in Washington, D.C.; information on the operation of the Public Reference Room may be obtained by calling 800 SEC-0330. Information (if any) regarding how the Fund voted proxies relating to portfolio securities during the most recently disclosed 12-month period ended June 30 is available without charge (i) through the Fund’s website at delawareinvestments.com; and (ii) on the SEC’s website at sec.gov.
53

Annual report
Fixed income mutual fund
Delaware Inflation Protected Bond Fund
July 31, 2014
Carefully consider the Fund’s investment objectives, risk factors, charges, and expenses before investing. This and other information can be found in the Fund’s prospectus and its summary prospectus, which may be obtained by visiting delawareinvestments.com or calling 800 523-1918. Investors should read the prospectus and the summary prospectus carefully before investing.
You can obtain shareholder reports and prospectuses online instead of in the mail.
Visit delawareinvestments.com/edelivery.
Experience Delaware Investments
Delaware Investments is committed to the pursuit of consistently superior asset management and unparalleled client service. We believe in our investment processes, which seek to deliver consistent results, and in convenient services that help add value for our clients.
If you are interested in learning more about creating an investment plan, contact your financial advisor.
You can learn more about Delaware Investments or obtain a prospectus for Delaware Inflation Protected Bond Fund at delawareinvestments.com.
Manage your investments online
| — | | 24-hour access to your account information |
| — | | Check your account balance and recent transactions |
| — | | Request statements or literature |
| — | | Make purchases and redemptions |
Delaware Management Holdings, Inc. and its subsidiaries (collectively known by the marketing name of Delaware Investments) are wholly owned subsidiaries of Macquarie Group Limited, a global provider of banking, financial, advisory, investment and funds management services.
Investments in Delaware Inflation Protected Bond Fund are not and will not be deposits with or liabilities of Macquarie Bank Limited ABN 46 008 583 542 and its holding companies, including their subsidiaries or related companies (Macquarie Group), and are subject to investment risk, including possible delays in repayment and loss of income and capital invested. No Macquarie Group company guarantees or will guarantee the performance of the Fund, the repayment of capital from the Fund, or any particular rate of return.
Unless otherwise noted, views expressed herein are current as of July 31, 2014, and subject to change.
Funds are not FDIC insured and are not guaranteed. It is possible to lose the principal amount invested.
Mutual fund advisory services provided by Delaware Management Company, a series of Delaware Management Business Trust, which is a registered investment advisor. Delaware Investments, a member of Macquarie Group, refers to Delaware Management Holdings, Inc. and its subsidiaries, including the Fund’s distributor, Delaware Distributors, L.P. Macquarie Group refers to Macquarie Group Limited and its subsidiaries and affiliates worldwide.
© 2014 Delaware Management Holdings, Inc.
All third-party marks cited are the property of their respective owners.
| | | | |
Portfolio management review | | | | |
Delaware Inflation Protected Bond Fund | | | August 12, 2014 | |
| | | | | | | | |
| Performance preview (for the year ended July 31, 2014) | | | | | | | | |
Delaware Inflation Protected Bond Fund (Class A shares) | | | 1-year return | | | | +1.44% | |
Barclays U.S. Treasury Inflation-Protected Securities (TIPS) Index (benchmark) | | | 1-year return | | | | +3.71% | |
Past performance does not guarantee future results.
For complete, annualized performance for Delaware Inflation Protected Bond Fund, please see the table on page 4. The performance of Class A shares excludes the applicable sales charge and reflects the reinvestment of all distributions. Index performance returns do not reflect any management fees, transaction costs, or expenses. Indices are unmanaged and one cannot invest directly in an index.
Moderate economic growth in late 2013 gave way to a harsher economic climate as a series of persistent weather storms swept across North America in early 2014, essentially bringing consumer spending and housing activity to a halt. According to estimates released in late July, gross domestic product growth recovered somewhat toward the end of spring 2014 and into early summer (source: U.S. Commerce Department).
In late 2013, the U.S. Federal Reserve announced a tapering of the Fed’s long-standing $85 billion per month quantitative easing (QE3) strategy. This triggered a spike in interest rates, particularly among long maturity bonds. As we moved into 2014, there were several occasions when the Fed trimmed its monthly purchases of U.S. Treasurys and mortgage-backed securities (MBS) by $10 billion per month. Short-term rates responded to the shift in Fed policy with volatility. The 2-year to 10-year portion of the Treasury curve flattened by 35 basis points in the first quarter and then by another 23 basis points in the second (source: Bloomberg). Note that one basis point equals one one-hundredth of a percentage point.
During the fiscal year, nominal Treasurys generally traded in lockstep with Treasury inflation-protected securities (TIPS). Break-even rates were fractionally higher on 10-year securities, had virtually no change in the 5-year market, and were fractionally lower on 30-year bonds. Likewise, there was virtually no change in real rates on
1
Portfolio management review
Delaware Inflation Protected Bond Fund
10-year TIPS during the period. Real rates in the 30-year TIPS market experienced a much more meaningful change, starting the year at 1.25% and ending at 0.90%. (Source: Bloomberg.)
Outside the United States, geopolitical tensions in Ukraine, Iraq, and Gaza added to an already fragile economic environment. Continued outbreaks in the Middle East enhanced concerns about increasing global oil prices. Upon threat of a potential energy disruption within the euro zone, we believe the European Union (EU) sought to reduce energy dependence on imports, particularly from Russia. Further, economic growth within the EU has been almost nonexistent for the past several years. Despite a recent rebound within several EU financial markets, there are continued concerns about potential deflationary pressures within the single-currency bloc.
Fund performance
For the fiscal year ended July 31, 2014, Delaware Inflation Protected Bond Fund returned +1.44% at net asset value and -3.10% at maximum offer price (both figures reflect Class A shares with all distributions reinvested). During the same period, the Barclays U.S. TIPS Index returned +3.71%. For complete, annualized performance of Delaware Inflation Protected Bond Fund, please see the table on page 4.
The Fund’s performance during the fiscal year was based primarily on the portfolio’s focus on intermediate duration securities versus the benchmark. While we have generally positioned the Fund’s portfolio to be defensive in duration (shorter than the benchmark), we were substantially underexposed to longer-duration TIPS during the fiscal year. At the same time, we also avoided exposure to shorter-maturity TIPS during most of the fiscal year, where we saw excessive break-even rate volatility. (A break-even rate refers to a measure of inflation expectations and is determined by calculating the difference between the nominal yield on a conventional
Treasury security and the real yield on a TIPS bond.) Our focus on inflation protection and avoidance of interest rate volatility came at the expense of lower income generation than what was seen from the longer duration TIPS within the benchmark.
To a lesser extent, relative performance was affected by the Fund’s exposure to currency volatility, primarily within the U.K. market. Historically, we have sourced duration measurements and hedged against domestic economic conditions by taking full advantage of the Fund’s 10% allowable allotment to non-U.S. inflation-protected securities. Midway through the fiscal year, we reduced the Fund’s 10% position to zero as we attempted to avoid excessive potential currency volatility. The elimination of currency exposure did help the Fund to avoid continued volatility in the global currency markets.
Our security selection within the TIPS market was a contributor to relative performance. Even so, it’s worth noting that positive performance within the intermediate market could not offset opportunities missed by a lack of exposure to the high-performing, long-duration portion of the TIPS yield curve.
Finally, we held several derivatives as a hedge against interest rate risk during the fiscal year. In an attempt to mitigate the volatility risks we generally see within break-even rates for short-duration TIPS, we replaced a portion of the Fund’s short-duration holdings with floating-rate AAA-rated asset-backed bonds (as rated by Standard & Poor’s). We then combined these holdings with the purchase of inflation swaps that are linked to the U.S. Consumer Price Index. These positions detracted slightly from relative performance during the fiscal year.
With regard to duration, which determines how a bond’s price is affected by interest rate changes, we remained fairly consistent throughout the fiscal year. Duration declined to 5.8 years from 6.0 years
2
at the start of the fiscal year. We saw a meaningful shift in the shape of the yield curve as rates fell sharply on 30-year securities, remained fairly flat on 10-year bonds, and rose slightly on short and intermediate holdings. The Fund’s duration allocation reflects an attempt to avoid excessive breakeven rate volatility in shorter-maturity TIPS, particularly in the current market environment where we believe they are already fully priced as a result of the recent spike in energy prices.
During the fiscal year, the Fund’s allocation to asset-backed securities was increased to 21%, which was overlaid with a 25% allocation to inflation swaps. At the end of this period, the Fund’s portfolio held 3% of total assets in corporate bonds and 67% in TIPS. There was zero international exposure at the end of the fiscal year.
A word on derivatives
As discussed previously, the Fund invested in several types of derivatives during the fiscal year. The market value of the inflation swaps and financial futures that the Fund held made up a nominal percentage (less than 1% each) of the overall Fund’s portfolio. However, each position had a significant effect on adding inflation protection to the overall portfolio. Likewise, the Fund’s position in interest rate swaps also represented a nominal market value but added a significant position regarding its hedging capabilities. We also held foreign currency exchange (FX) forwards during the fiscal year – they represented a position of 1% or less each.
Several of these instruments had meaningful negative effects on the Fund’s return during the fiscal year. In particular, the Fund’s hedging of interest rate risk was the primary source of negative absolute performance within its derivatives investments. Inflation swaps had an impact of -0.10%, financial futures had an impact of -0.88%, interest rate swaps had an impact of -0.13%, and FX forwards had an impact of -0.13%.
3
| | | | |
| Performance summary | | | |
Delaware Inflation Protected Bond Fund | | | July 31, 2014 | |
The performance data quoted represent past performance; past performance does not guarantee future results. Investment return and principal value will fluctuate so your shares, when redeemed, may be worth more or less than their original cost. Please obtain the performance data current for the most recent month end by calling 800 523-1918 or visiting our website at delawareinvestments.com/performance. Current performance may be lower or higher than the performance data quoted.
| | | | | | | | |
| Fund and benchmark performance1,2 | | Average annual total returns through July 31, 2014 |
| | | | |
| | | 1 year | | 3 years | | 5 years | | Lifetime |
Class A (Est. Dec. 1, 2004) | | | | | | | | |
Excluding sales charge | | +1.44% | | -1.03% | | +3.20% | | +3.86% |
Including sales charge | | -3.10% | | -2.54% | | +2.27% | | +3.37% |
Class B (Est. Dec. 1, 2004) | | | | | | | | |
Excluding sales charge | | +1.51% | | -1.41% | | +2.66% | | +3.24% |
Including sales charge | | -2.49% | | -2.06% | | +2.41% | | +3.24% |
Class C (Est. Dec. 1, 2004) | | | | | | | | |
Excluding sales charge | | +0.66% | | -1.76% | | +2.44% | | +3.12% |
Including sales charge | | -0.34% | | -1.76% | | +2.44% | | +3.12% |
Institutional Class (Est. Dec. 1, 2004) | | | | | | | | |
Excluding sales charge | | +1.75% | | -0.75% | | +3.48% | | +4.12% |
Including sales charge | | +1.75% | | -0.75% | | +3.48% | | +4.12% |
Barclays U.S. TIPS Index | | +3.71% | | +2.25% | | +5.54% | | +4.94% |
1 Returns reflect the reinvestment of all distributions and are presented both with and without the applicable sales charges described below. Returns do not reflect the deduction of taxes the shareholder would pay on Fund distributions or redemptions of Fund shares.
Expense limitations were in effect for certain classes during some or all of the periods shown in the “Fund and benchmark performance” table. Expenses for each class are listed on the “Fund expense ratios” table on page 6. Performance would have been lower had expense limitations not been in effect.
Class A shares are sold with a maximum front-end sales charge of 4.50%, and have an annual distribution and service fee of 0.25% of average daily net assets. Performance for Class A shares, excluding sales charges, assumes that no front-end sales charge applied.
All remaining Class B shares were converted to Class A shares on Sept. 25, 2014. Prior to Sept. 25, 2014, Class B shares were available for purchase only through dividend reinvestment and certain permitted exchanges as was described in the prospectus. Class B shares had a contingent deferred sales charge that declined from 4.00% to zero depending on the period of
4
time the shares were held. They were also subject to an annual distribution and service fee of 1.00% of average daily net assets. This fee was contractually limited to 0.25% of average daily net assets from Aug. 1, 2013, through July 31, 2014.* Please see Note 14 in “Notes to financial statements” for more information. Lifetime performance figures for Class B shares reflect conversion to Class A shares after approximately eight years.
Class C shares are sold with a contingent deferred sales charge of 1.00% if redeemed during the first 12 months. They are also subject to an annual distribution and service fee of 1.00% of average daily net assets.
Performance for Class B and C shares, excluding sales charges, assumes either that contingent deferred sales charges did not apply or that the investment was not redeemed.
Institutional Class shares are available without sales or asset-based distribution charges only to certain eligible institutional accounts.
The “Fund and benchmark performance” table and the “Performance of a $10,000 investment” graph on page 7 do not reflect the deduction of taxes the shareholder would pay on Fund distributions or redemptions of Fund shares.
Fixed income securities and bond funds can lose value, and investors can lose principal, as interest rates rise. They also may be affected by economic conditions that hinder an issuer’s ability to make interest and principal payments on its debt.
The Fund may also be subject to prepayment risk, the risk that the principal of a fixed income security that is held by the Fund may be prepaid prior to maturity, potentially forcing the Fund to reinvest that money at a lower interest rate.
Interest payments on inflation-indexed debt securities will vary as the principal and/or interest is adjusted for inflation.
The Fund may experience portfolio turnover in excess of 100%, which could result in higher transaction costs and tax liability.
The Fund may invest in derivatives, which may involve additional expenses and are subject to risk, including the risk that an underlying security or securities index moves in the opposite direction from what the portfolio manager anticipated. A derivative transaction depends upon the counterparties’ ability to fulfill their contractual obligations.
International investments entail risks not ordinarily associated with U.S. investments including fluctuation in currency values, differences in accounting principles, or economic or political instability in other nations.
Investing in emerging markets can be riskier than investing in established foreign markets due to increased volatility and lower trading volume.
*The contractual waiver period is from March 31, 2013 through Nov. 28, 2014.
5
Performance summary
Delaware Inflation Protected Bond Fund
2 The Fund’s expense ratios, as described in the most recent prospectus, are disclosed in the following “Fund expense ratios” table. Delaware Management Company has agreed to reimburse certain expenses and/or waive certain fees in order to prevent total annual fund operating expenses (excluding any 12b-1 plan, taxes, interest, inverse floater program expenses, short sale and dividend interest expenses, brokerage fees, certain insurance costs, acquired fund fees and expenses, and nonroutine expenses or costs, including, but not limited to, those relating to reorganizations, litigation, conducting shareholder meetings, and liquidations (collectively, nonroutine expenses)) from exceeding 0.59% of the Fund’s average daily net assets from Aug. 1, 2013, through July 31, 2014.** Please see the most recent prospectus and any applicable supplement(s) for additional information on these fee waivers and/or reimbursements.
| | | | | | | | |
| | | | | | | | | Institutional |
| Fund expense ratios | | Class A | | Class B† | | Class C | | Class |
Total annual operating expenses (without fee waivers) | | 0.98% | | 1.73% | | 1.73% | | 0.73% |
Net expenses (including fee waivers, if any) | | 0.84% | | 0.84% | | 1.59% | | 0.59% |
Type of waiver | | Contractual | | Contractual | | Contractual | | Contractual |
**The contractual waiver period is from Nov. 28, 2012, through Nov. 28, 2014.
†See Note 14 in “Notes to financial statements.”
6
Performance of a $10,000 investment1
Average annual total returns from Dec. 1, 2004 (Fund’s inception), through July 31, 2014
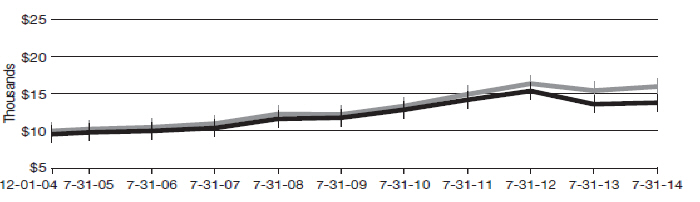
| | | | | | | | |
For period beginning Dec. 1, 2004, through July 31, 2014 | | | Starting value | | | | Ending value | |
 Barclays U.S. TIPS Index Barclays U.S. TIPS Index
| | | $10,000 | | | | $15,981 | |
 Delaware Inflation Protected Delaware Inflation Protected
Bond Fund — Class A shares | | | $9,550 | | | | $13,776 | |
1The “Performance of a $10,000 investment” graph assumes $10,000 invested in Class A shares of the Fund on Dec. 1, 2004, and includes the effect of a 4.50% front-end sales charge and the reinvestment of all distributions. The graph does not reflect the deduction of taxes the shareholders would pay on Fund distributions or redemptions of Fund shares. Expense limitations were in effect for some or all of the periods shown. Performance would have been lower had expense limitations not been in effect. Expenses are listed in the “Fund expense ratios” table on page 6. Please note additional details on pages 4 through 7.
The graph also assumes $10,000 invested in the Barclays U.S. TIPS Index as of Dec. 1, 2004. The
Barclays U.S. TIPS Index measures the total return performance of the market for inflation-protected securities issued by the U.S. Treasury.
The U.S. Consumer Price Index, referenced on page 2, is a measure of inflation that is calculated by the U.S. Department of Labor, representing changes in prices of all goods and services purchased for consumption by urban households.
Index performance returns do not reflect any management fees, transaction costs, or expenses. Indices are unmanaged and one cannot invest directly in an index. Past performance is not a guarantee of future results.
Performance of other Fund classes will vary due to different charges and expenses.
| | | | | | |
| | | Nasdaq symbols | | CUSIPs | | |
Class A | | DIPAX | | 246094882 | | |
Class B | | DIPBX | | 246094874 | | |
Class C | | DIPCX | | 246094866 | | |
Institutional Class | | DIPIX | | 246094858 | | |
7
Disclosure of Fund expenses
For the six-month period from February 1, 2014 to July 31, 2014 (Unaudited)
As a shareholder of the Fund, you incur two types of costs: (1) transaction costs, including sales charges (loads) on purchase payments, reinvested dividends, or other distributions; redemption fees; and exchange fees; and (2) ongoing costs, including management fees; distribution and/or service (12b-1) fees; and other Fund expenses. This example is intended to help you understand your ongoing costs (in dollars) of investing in the Fund and to compare these costs with the ongoing costs of investing in other mutual funds.
The example is based on an investment of $1,000 invested at the beginning of the period and held for the entire six-month period from Feb. 1, 2014 to July 31, 2014.
Actual expenses
The first section of the table shown, “Actual Fund return,” provides information about actual account values and actual expenses. You may use the information in this section of the table, together with the amount you invested, to estimate the expenses that you paid over the period. Simply divide your account value by $1,000 (for example, an $8,600 account value divided by $1,000 = 8.6), then multiply the result by the number in the first section under the heading entitled “Expenses Paid During Period” to estimate the expenses you paid on your account during this period.
Hypothetical example for comparison purposes
The second section of the table shown, “Hypothetical 5% return,” provides information about hypothetical account values and hypothetical expenses based on the Fund’s actual expense ratio and an assumed rate of return of 5% per year before expenses, which is not the Fund’s actual return. The hypothetical account values and expenses may not be used to estimate the actual ending account balance or expenses you paid for the period. You may use this information to compare the ongoing costs of investing in the Fund and other funds. To do so, compare this 5% hypothetical example with the 5% hypothetical examples that appear in the shareholder reports of the other funds.
Please note that the expenses shown in the table are meant to highlight your ongoing costs only and do not reflect any transactional costs, such as sales charges (loads), redemption fees, or exchange fees. Therefore, the second section of the table is useful in comparing ongoing costs only, and will not help you determine the relative total costs of owning different funds. In addition, if these transactional costs were included, your costs would have been higher. The Fund’s expenses shown in the table reflect fee waivers in effect. The expenses shown in the table assume reinvestment of all dividends and distributions.
8
Delaware Inflation Protected Bond Fund
Expense analysis of an investment of $1,000
| | | | | | | | |
| | | Beginning
Account Value
2/1/14 | | Ending
Account Value
7/31/14 | | Annualized
Expense Ratio | | Expenses
Paid During Period
2/1/14 to 7/31/14* |
Actual Fund return† | | | | | | | | |
Class A | | $1,000.00 | | $1,033.50 | | 0.84% | | $4.24 |
Class B** | | 1,000.00 | | 1,034.30 | | 0.84% | | 4.24 |
Class C | | 1,000.00 | | 1,030.20 | | 1.59% | | 8.00 |
Institutional Class | | 1,000.00 | | 1,035.50 | | 0.59% | | 2.98 |
Hypothetical 5% return (5% return before expenses) |
Class A | | $1,000.00 | | $1,020.63 | | 0.84% | | $4.21 |
Class B** | | 1,000.00 | | 1,020.63 | | 0.84% | | 4.21 |
Class C | | 1,000.00 | | 1,016.91 | | 1.59% | | 7.95 |
Institutional Class | | 1,000.00 | | 1,021.87 | | 0.59% | | 2.96 |
| * | “Expenses Paid During Period” are equal to the Fund’s annualized expense ratio, multiplied by the average account value over the period, multiplied by 181/365 (to reflect the one-half year period). |
| † | Because actual returns reflect only the most recent six-month period, the returns shown may differ significantly from fiscal year returns. |
| ** | See Note 14 in “Notes to financial statements.” |
9
| | |
| Security type / sector allocation | | |
Delaware Inflation Protected Bond Fund | | As of July 31, 2014 (Unaudited) |
Sector designations may be different than the sector designations presented in other Fund materials. The sector designations may represent the investment manager’s internal sector classifications, which may result in the sector designations for one fund being different than another fund’s sector designations.
| | |
Security type / sector | | Percentage of net assets |
Corporate Bond | | 3.46% |
Non-Agency Asset-Backed Securities | | 21.23% |
U.S. Treasury Obligations | | 66.64% |
Short-Term Investments | | 0.53% |
Total Value of Securities | | 91.86% |
Receivables and Other Assets Net of Liabilities | | 8.14% |
Total Net Assets | | 100.00% |
10
| | |
| Schedule of investments | | |
| Delaware Inflation Protected Bond Fund | | July 31, 2014 |
| | | | | | | | |
| | | Principal amount° | | | Value (U.S. $) | |
| |
Corporate Bond – 3.46% | | | | | | | | |
| |
Banking – 3.46% | | | | | | | | |
PNC Preferred Funding Trust II 144A 1.453% 3/29/49 #• | | | 3,000,000 | | | $ | 2,962,500 | |
| | | | | | | | |
Total Corporate Bond (cost $2,898,750) | | | | | | | 2,962,500 | |
| | | | | | | | |
| | | | | | | | |
| |
Non-Agency Asset-Backed Securities – 21.23% | | | | | | | | |
| |
American Express Credit Account Master Trust | | | | | | | | |
Series 2013-1 A 0.572% 2/16/21 — | | | 1,345,000 | | | | 1,350,650 | |
Cabela’s Master Credit Card Trust | | | | | | | | |
Series 2012-1A A2 144A 0.682% 2/18/20 #— | | | 3,000,000 | | | | 3,023,286 | |
Chase Issuance Trust | | | | | | | | |
Series 2012-A2 A2 0.422% 5/15/19 — | | | 1,000,000 | | | | 1,002,484 | |
Series 2012-A10 A10 0.412% 12/16/19 — | | | 3,000,000 | | | | 3,000,000 | |
Series 2013-A3 A3 0.432% 4/15/20 — | | | 3,000,000 | | | | 3,003,249 | |
Chesapeake Funding | | | | | | | | |
Series 2012-2A A 144A 0.606% 5/7/24 #— | | | 1,728,448 | | | | 1,731,093 | |
Citibank Credit Card Issuance Trust | | | | | | | | |
Series 2013-A7 A7 0.583% 9/10/20 — | | | 515,000 | | | | 518,185 | |
Navistar Financial Dealer Note Master Trust | | | | | | | | |
Series 2013-2 A 144A 0.835% 9/25/18 #— | | | 1,000,000 | | | | 1,002,679 | |
Nissan Master Owner Trust Receivables | | | | | | | | |
Series 2012-A A 0.622% 5/15/17 — | | | 1,800,000 | | | | 1,804,027 | |
Volkswagen Auto Lease Trust | | | | | | | | |
Series 2014-A A2B 0.366% 10/20/16 — | | | 1,750,000 | | | | 1,750,691 | |
| | | | | | | | |
Total Non-Agency Asset-Backed Securities
(cost $17,852,882) | | | | | | | 18,186,344 | |
| | | | | | | | |
| | | | | | | | |
| |
U.S. Treasury Obligations – 66.64% | | | | | | | | |
| |
U.S. Treasury Inflation Indexed Bonds | | | | | | | | |
1.125% 1/15/21 | | | 18,868,646 | | | | 20,303,700 | |
1.375% 2/15/44 | | | 11,527,556 | | | | 12,828,002 | |
2.375% 1/15/25 | | | 12,873,318 | | | | 15,558,615 | |
2.50% 1/15/29 | | | 3,324,180 | | | | 4,207,814 | |
U.S. Treasury Inflation Indexed Note | | | | | | | | |
0.125% 1/15/23 | | | 4,215,399 | | | | 4,187,902 | |
| | | | | | | | |
Total U.S. Treasury Obligations (cost $55,551,524) | | | | | | | 57,086,033 | |
| | | | | | | | |
| | | | | | | | |
| |
Short-Term Investments – 0.53% | | | | | | | | |
| |
Repurchase Agreements – 0.53% | | | | | | | | |
Bank of America Merrill Lynch | | | | | | | | |
0.04%, dated 7/31/14, to be repurchased on 8/1/14, repurchase price $142,316 (collateralized by U.S. government obligations 0.00%–0.375% 6/25/15–2/15/24; market value $145,163) | | | 142,316 | | | | 142,316 | |
11
Schedule of investments
Delaware Inflation Protected Bond Fund
| | | | | | | | |
| | | Principal amount° | | | Value (U.S. $) | |
| |
Short-Term Investments (continued) | | | | | | | | |
| |
Repurchase Agreements (continued) | | | | | | | | |
Bank of Montreal | | | | | | | | |
0.07%, dated 7/31/14, to be repurchased on 8/1/14, repurchase price $47,439 (collateralized by U.S. government obligations 0.00%–4.375% 8/21/14–11/15/43; market value $48,388) | | | 47,439 | | | $ | 47,439 | |
BNP Paribas | | | | | | | | |
0.07%, dated 7/31/14, to be repurchased on 8/1/14, repurchase price $266,245 (collateralized by U.S. government obligations 0.00%-2.75% 8/7/14–11/15/23; market value $271,570) | | | 266,245 | | | | 266,245 | |
| | | | | | | | |
Total Short-Term Investments (cost $456,000) | | | | | | | 456,000 | |
| | | | | | | | |
| | |
Total Value of Securities – 91.86%
(cost $76,759,156) | | | | | | | $78,690,877 | |
| | | | | | | | |
| # | Security exempt from registration under Rule 144A of the Securities Act of 1933, as amended. At July 31, 2014, the aggregate value of Rule 144A securities was $8,719,558, which represented 10.18% of the Fund’s net assets. See Note 11 in “Notes to financial statements.” |
| ° | Principal amount shown is stated in U.S. dollars unless noted that the security is denominated in another currency. |
| — | Variable rate security. The rate shown is the rate as of July 31, 2014. Interest rates reset periodically. |
The following swap contracts were outstanding at July 31, 2014:1
Swap Contracts
Inflation Swap Contracts2
| | | | | | | | | | | | | | |
| Notional Value | | | | Expiration
Date | | | | Description | | | | Unrealized
Appreciation
(Depreciation) | |
| | | | | | | | | | | | | | |
$ 7,200,000 | | | | 4/24/43 | | | | Agreement with Barclays to receive the notional amount multiplied by the non-revised CPI and to pay the notional amount multiplied by the fixed rate of 2.866% | | | | $ | (239,848 | ) |
| 14,400,000 | | | | 6/5/43 | | | | Agreement with MSC to receive the notional amount multiplied by the non-revised CPI and to pay the notional amount multiplied by the fixed rate of 2.835% | | | | | (320,856 | ) |
| | | | | | | | | | | | | | |
| $ 21,600,000 | | | | | | | | | | | | $ | (560,704 | ) |
| | | | | | | | | | | | | | |
12
Interest Rate Swap Contracts3
| | | | | | | | | | | | | | | | |
Counterparty & Referenced Obligation | | | | Notional Value | | | Fixed
Interest Rate
Paid | | Floating
Interest Rate
Received | | Termination
Date | | Unrealized
Appreciation
(Depreciation) | |
| GSC | | | | | | | | | | | | | | | | |
5 yr | | | | $ | 18,100,000 | | | 0.868% | | 0.234% | | 4/25/18 | | $ | 416,052 | |
| MSC | | | | | | | | | | | | | | | | |
5 yr | | | | | 18,100,000 | | | 0.873% | | 0.235% | | 4/26/18 | | | 413,690 | |
| | | | | | | | | | | | | | | | |
| | | | | | | | | | | | | | $ | 829,742 | |
| | | | | | | | | | | | | | | | |
The use of swap contracts involves elements of market risk and risks in excess of the amounts disclosed in the financial statements. The notional values presented above represent the Fund’s total exposure in such contracts, whereas only the net unrealized appreciation (depreciation) is reflected in the Fund’s net assets.
1See Note 8 in “Notes to financial statements.”
2An inflation swap contract is a commitment to pay a regular stream of inflation-indexed cash payments in exchange for receiving a stream of nominal interest payments, where both payment streams are based on notional amounts, between counterparties. The change in value of inflation swap contracts is recorded as unrealized appreciation or depreciation daily. A realized gain or loss is recorded on maturity or termination of the swap contract.
3An interest rate swap agreement is an exchange of interest rates between counterparties. Periodic payments on such contracts are accrued daily and recorded as unrealized appreciation/depreciation on swap contracts. Upon periodic payment/receipt or termination of the contract, such amounts are recorded as realized gains or losses on swap contracts.
Summary of abbreviations:
|
| CPI – Consumer Price Index |
| GSC – Goldman Sachs Capital |
| MSC – Morgan Stanley Capital |
| yr – Year |
See accompanying notes, which are an integral part of the financial statements.
13
| | |
| Statement of assets and liabilities | | |
Delaware Inflation Protected Bond Fund | | July 31, 2014 |
| | | | |
Assets: | | | | |
Investments, at value1 | | $ | 78,234,877 | |
Short-term investments, at value2 | | | 456,000 | |
Cash | | | 3,305,975 | |
Cash collateral due from broker | | | 280,000 | |
Foreign currencies, at value3 | | | 3 | |
Receivables for securities sold | | | 4,059,033 | |
Dividends and interest receivable | | | 111,832 | |
Receivables for fund shares sold | | | 61,241 | |
Swap payment receivable | | | 1,623 | |
Unrealized gain on interest rate swaps | | | 829,742 | |
| | | | |
Total assets | | | 87,340,326 | |
| | | | |
Liabilities: | | | | |
Payable for fund shares redeemed | | | 520,411 | |
Cash collateral due to broker | | | 300,000 | |
Swap payment payable | | | 83,897 | |
Other accrued expenses | | | 130,219 | |
Investment management fees payable | | | 51,374 | |
Distribution fees payable | | | 27,453 | |
Other affiliates payable | | | 6,628 | |
Trustees’ fees and expenses payable | | | 219 | |
Unrealized loss on inflation swaps | | | 560,704 | |
| | | | |
Total liabilities | | | 1,680,905 | |
| | | | |
Total Net Assets | | $ | 85,659,421 | |
| | | | |
| |
Net Assets Consist of: | | | | |
Paid-in capital | | $ | 126,137,761 | |
Undistributed net investment income | | | 82,274 | |
Accumulated net realized loss on investments | | | (42,679,861 | ) |
Net unrealized appreciation of investments, foreign currencies, and derivatives | | | 2,119,247 | |
| | | | |
Total Net Assets | | $ | 85,659,421 | |
| | | | |
14
| | | | |
Net Asset Value | | | | |
Class A: | | | | |
Net assets | | $ | 35,231,954 | |
Shares of beneficial interest outstanding, unlimited authorization, no par | | | 3,815,372 | |
Net asset value per share | | $ | 9.23 | |
Sales charge | | | 4.50 | % |
Offering price per share, equal to net asset value per share/(1 – sales charge) | | $ | 9.66 | |
| |
Class B: | | | | |
Net assets | | $ | 128,448 | |
Shares of beneficial interest outstanding, unlimited authorization, no par | | | 13,904 | |
Net asset value per share | | $ | 9.24 | |
| |
Class C: | | | | |
Net assets | | $ | 23,070,801 | |
Shares of beneficial interest outstanding, unlimited authorization, no par | | | 2,506,520 | |
Net asset value per share | | $ | 9.20 | |
| |
Institutional Class: | | | | |
Net assets | | $ | 27,228,218 | |
Shares of beneficial interest outstanding, unlimited authorization, no par | | | 2,947,492 | |
Net asset value per share | | $ | 9.24 | |
| |
1Investments, at cost | | $ | 76,303,156 | |
| 2Short-term investments, at cost | | | 456,000 | |
| 3Foreign currencies, at cost | | | 3 | |
See accompanying notes, which are an integral part of the financial statements.
15
| | |
| Statement of operations | | |
Delaware Inflation Protected Bond Fund | | Year ended July 31, 2014 |
| | | | |
Investment Income: | | | | |
Interest | | $ | 1,657,357 | |
Foreign tax withheld | | | (554 | ) |
| | | | |
| | | 1,656,803 | |
| | | | |
Expenses: | | | | |
Management fees | | | 710,109 | |
Distribution expenses – Class A | | | 162,010 | |
Distribution expenses – Class B | | | 1,881 | |
Distribution expenses – Class C | | | 311,521 | |
Dividend disbursing and transfer agent fees and expenses | | | 289,036 | |
Reports and statements to shareholders | | | 84,198 | |
Registration fees | | | 61,598 | |
Accounting and administration expenses | | | 57,607 | |
Audit and tax | | | 41,059 | |
Legal fees | | | 34,553 | |
Custodian fees | | | 11,280 | |
Trustees’ fees and expenses | | | 8,604 | |
Other | | | 20,523 | |
| | | | |
| | | 1,793,979 | |
Less expenses waived | | | (381,817 | ) |
Less waived distribution expenses – Class B | | | (1,410 | ) |
Less expense paid indirectly | | | (282 | ) |
| | | | |
Total operating expenses | | | 1,410,470 | |
| | | | |
Net Investment Income | | | 246,333 | |
| | | | |
16
| | | | |
Net Realized and Unrealized Gain (Loss): | | | | |
Net realized loss on: | | | | |
Investments | | $ | (8,326,094 | ) |
Foreign currencies | | | (432,243 | ) |
Foreign currency exchange contracts | | | (541,064 | ) |
Futures contracts | | | (1,015,327 | ) |
Swap contracts | | | (916,469 | ) |
| | | | |
Net realized loss | | | (11,231,197 | ) |
| | | | |
Net change in unrealized appreciation (depreciation) of: | | | | |
Investments | | | 9,899,238 | |
Foreign currencies | | | 5,048 | |
Foreign currency exchange contracts | | | 378,392 | |
Futures contracts | | | (431,014 | ) |
Swap contracts | | | (106,802 | ) |
| | | | |
Net change in unrealized appreciation (depreciation) | | | 9,744,862 | |
| | | | |
Net Realized and Unrealized Loss | | | (1,486,335 | ) |
| | | | |
Net Decrease in Net Assets Resulting from Operations | | $ | (1,240,002 | ) |
| | | | |
See accompanying notes, which are an integral part of the financial statements.
17
Statements of changes in net assets
Delaware Inflation Protected Bond Fund
| | | | | | | | |
| | | Year ended | |
| | | 7/31/14 | | | | 7/31/13 | |
| | |
Increase (Decrease) in Net Assets from Operations: | | | | | | | | |
Net investment income (loss) | | $ | 246,333 | | | $ | (2,147,417 | ) |
Net realized loss | | | (11,231,197 | ) | | | (13,514,550 | ) |
Net change in unrealized appreciation (depreciation) | | | 9,744,862 | | | | (29,052,318 | ) |
| | | | | | | | |
Net decrease in net assets resulting from operations | | | (1,240,002 | ) | | | (44,714,285 | ) |
| | | | | | | | |
| | |
Dividends and Distributions to Shareholders from: | | | | | | | | |
Net investment income: | | | | | | | | |
Class A | | | (276 | ) | | | (1,957,864 | ) |
Class B | | | (1 | ) | | | (4,340 | ) |
Class C | | | — | | | | (523,224 | ) |
Institutional Class | | | (213 | ) | | | (1,631,163 | ) |
| | |
Net realized gain: | | | | | | | | |
Class A | | | — | | | | (15,833,227 | ) |
Class B | | | — | | | | (54,606 | ) |
Class C | | | — | | | | (6,609,350 | ) |
Institutional Class | | | — | | | | (11,814,965 | ) |
| | |
Return of capital: | | | | | | | | |
Class A | | | (412,175 | ) | | | (14,911 | ) |
Class B | | | (804 | ) | | | (50 | ) |
Class C | | | — | | | | (5,977 | ) |
Institutional Class | | | (498,842 | ) | | | (11,270 | ) |
| | | | | | | | |
| | | (912,311 | ) | | | (38,460,947 | ) |
| | | | | | | | |
18
| | | | | | | | |
| | | Year ended | |
| | | 7/31/14 | | | | 7/31/13 | |
| | |
Capital Share Transactions: | | | | | | | | |
Proceeds from shares sold: | | | | | | | | |
Class A | | $ | 11,320,667 | | | $ | 67,045,204 | |
Class C | | | 824,835 | | | | 10,007,061 | |
Institutional Class | | | 15,835,304 | | | | 69,941,512 | |
| | |
Net asset value of shares based upon reinvestment of dividends and distributions: | | | | | | | | |
Class A | | | 396,631 | | | | 16,323,964 | |
Class B | | | 805 | | | | 58,996 | |
Class C | | | — | | | | 6,732,473 | |
Institutional Class | | | 484,910 | | | | 12,118,017 | |
| | | | | | | | |
| | | 28,863,152 | | | | 182,227,227 | |
| | | | | | | | |
Cost of shares redeemed: | | | | | | | | |
Class A | | | (82,235,618 | ) | | | (198,677,459 | ) |
Class B | | | (195,162 | ) | | | (474,467 | ) |
Class C | | | (25,093,923 | ) | | | (46,296,114 | ) |
Institutional Class | | | (97,450,081 | ) | | | (105,805,890 | ) |
| | | | | | | | |
| | | (204,974,784 | ) | | | (351,253,930 | ) |
| | | | | | | | |
Decrease in net assets derived from capital share transactions | | | (176,111,632 | ) | | | (169,026,703 | ) |
| | | | | | | | |
Net Decrease in Net Assets | | | (178,263,945 | ) | | | (252,201,935 | ) |
| | |
Net Assets: | | | | | | | | |
Beginning of year | | | 263,923,366 | | | | 516,125,301 | |
| | | | | | | | |
End of year | | $ | 85,659,421 | | | $ | 263,923,366 | |
| | | | | | | | |
Undistributed (distributions in excess of) net investment income | | $ | 82,274 | | | $ | (242,442 | ) |
| | | | | | | | |
See accompanying notes, which are an integral part of the financial statements.
19
Financial highlights
Delaware Inflation Protected Bond Fund Class A
Selected data for each share of the Fund outstanding throughout each period were as follows:
|
Net asset value, beginning of period |
|
Income (loss) from investment operations: |
Net investment income (loss)1 |
Net realized and unrealized gain (loss) |
Total from investment operations |
|
Less dividends and distributions from: |
Net investment income |
Net realized gain |
Return of capital |
Total dividends and distributions |
|
Net asset value, end of period |
|
Total return3 |
|
Ratios and supplemental data: |
Net assets, end of period (000 omitted) |
Ratio of expenses to average net assets |
Ratio of expenses to average net assets prior to fees waived |
Ratio of net investment income (loss) to average net assets |
Ratio of net investment income (loss) to average net assets prior to fees waived |
Portfolio turnover |
| 1 | The average shares outstanding method has been applied for per share information. |
| 2 | For the year ended July 31, 2014, dividends from net investment income were calculated to a de minimis amount of $0.000 per share. |
| 3 | Total investment return is based on the change in net asset value of a share during the period and assumes reinvestment of dividends and distributions at net asset value and does not reflect the impact of a sales charge. Total investment return during all of the periods shown reflects a waiver by the manager. Performance would have been lower had the waiver not been in effect. |
See accompanying notes, which are an integral part of the financial statements.
20
| | | | | | | | | | | | | | | | | | |
| | | | | | | | | | | | | | |
| | | | | | | | | | | | | | |
| | | | | | | Year ended | | | | | | | |
| | |
| 7/31/14 | | | 7/31/13 | | | 7/31/12 | | | 7/31/11 | | | 7/31/10 | |
| | |
| $ | 9.190 | | | $ | 11.330 | | | $ | 11.040 | | | $ | 10.630 | | | $ | 10.080 | |
| | | | |
| | | | | | | | | | | | | | | | | | |
| | 0.019 | | | | (0.048 | ) | | | 0.025 | | | | 0.291 | | | | 0.314 | |
| | 0.112 | | | | (1.189 | ) | | | 0.860 | | | | 0.787 | | | | 0.603 | |
| | | | | | | | | | | | | | | | | | |
| | 0.131 | | | | (1.237 | ) | | | 0.885 | | | | 1.078 | | | | 0.917 | |
| | | | | | | | | | | | | | | | | | |
| | | | |
| | | | | | | | | | | | | | | | | | |
| | — | 2 | | | (0.099 | ) | | | (0.192 | ) | | | (0.325 | ) | | | (0.367 | ) |
| | — | | | | (0.803 | ) | | | (0.403 | ) | | | (0.343 | ) | | | — | |
| | (0.091 | ) | | | (0.001 | ) | | | — | | | | — | | | | — | |
| | | | | | | | | | | | | | | | | | |
| | (0.091 | ) | | | (0.903 | ) | | | (0.595 | ) | | | (0.668 | ) | | | (0.367 | ) |
| | | | | | | | | | | | | | | | | | |
| | | | |
| $ | 9.230 | | | $ | 9.190 | | | $ | 11.330 | | | $ | 11.040 | | | $ | 10.630 | |
| | | | | | | | | | | | | | | | | | |
| | | | |
| | 1.44% | | | | (11.80% | ) | | | 8.35% | | | | 10.55% | | | | 9.25% | |
| | | | |
| | | | | | | | | | | | | | | | | | |
| $ | 35,232 | | | $ | 106,686 | | | $ | 259,303 | | | $ | 189,624 | | | $ | 156,345 | |
| | 0.84% | | | | 0.82% | | | | 0.81% | | | | 0.80% | | | | 0.78% | |
| | 1.09% | | | | 0.97% | | | | 0.94% | | | | 0.97% | | | | 0.94% | |
| | 0.21% | | | | (0.46% | ) | | | 0.23% | | | | 2.72% | | | | 3.00% | |
| | (0.04% | ) | | | (0.61% | ) | | | 0.10% | | | | 2.55% | | | | 2.84% | |
| | 128% | | | | 322% | | | | 225% | | | | 157% | | | | 118% | |
21
Financial highlights
Delaware Inflation Protected Bond Fund Class B
Selected data for each share of the Fund outstanding throughout each period were as follows:
|
Net asset value, beginning of period |
|
Income (loss) from investment operations: |
Net investment income (loss)1 |
Net realized and unrealized gain (loss) |
Total from investment operations |
|
Less dividends and distributions from: |
Net investment income |
Net realized gain |
Return of capital |
Total dividends and distributions |
|
Net asset value, end of period |
|
Total return3 |
|
Ratios and supplemental data: |
Net assets, end of period (000 omitted) |
Ratio of expenses to average net assets |
Ratio of expenses to average net assets prior to fees waived |
Ratio of net investment income (loss) to average net assets |
Ratio of net investment income (loss) to average net assets prior to fees waived |
Portfolio turnover |
| 1 | The average shares outstanding method has been applied for per share information. |
| 2 | For the year ended July 31, 2014, dividends from net investment income were calculated to a de minimis amount of $0.000 per share. |
| 3 | Total investment return is based on the change in net asset value of a share during the period and assumes reinvestment of dividends and distributions at net asset value and does not reflect the impact of a sales charge. Total investment return during all of the periods shown reflects a waiver by the manager and/or the distributor. Performance would have been lower had the waivers not been in effect. |
See accompanying notes, which are an integral part of the financial statements.
22
| | | | | | | | | | | | | | | | | | |
| | | | | | | | | | | | | | |
| | | | | | | | | | | | | | |
| | | | | | | Year ended | | | | | | | |
| | |
| 7/31/14 | | | 7/31/13 | | | 7/31/12 | | | 7/31/11 | | | 7/31/10 | |
| | |
| $ | 9.160 | | | $ | 11.310 | | | $ | 11.030 | | | $ | 10.620 | | | $ | 10.020 | |
| | | | |
| | | | | | | | | | | | | | | | | | |
| | 0.019 | | | | (0.104 | ) | | | (0.058 | ) | | | 0.210 | | | | 0.235 | |
| | 0.119 | | | | (1.178 | ) | | | 0.857 | | | | 0.789 | | | | 0.600 | |
| | | | | | | | | | | | | | | | | | |
| | 0.138 | | | | (1.282 | ) | | | 0.799 | | | | 0.999 | | | | 0.835 | |
| | | | | | | | | | | | | | | | | | |
| | | | |
| | | | | | | | | | | | | | | | | | |
| | — | 2 | | | (0.064 | ) | | | (0.116 | ) | | | (0.246 | ) | | | (0.235 | ) |
| | — | | | | (0.803 | ) | | | (0.403 | ) | | | (0.343 | ) | | | — | |
| | (0.058 | ) | | | (0.001 | ) | | | — | | | | — | | | | — | |
| | | | | | | | | | | | | | | | | | |
| | (0.058 | ) | | | (0.868 | ) | | | (0.519 | ) | | | (0.589 | ) | | | (0.235 | ) |
| | | | | | | | | | | | | | | | | | |
| | | | |
| $ | 9.240 | | | $ | 9.160 | | | $ | 11.310 | | | $ | 11.030 | | | $ | 10.620 | |
| | | | | | | | | | | | | | | | | | |
| | | | |
| | 1.51% | | | | (12.20% | ) | | | 7.52% | | | | 9.74% | | | | 8.40% | |
| | | | |
| | | | | | | | | | | | | | | | | | |
| $ | 128 | | | $ | 324 | | | $ | 861 | | | $ | 1,121 | | | $ | 1,806 | |
| | 0.84% | | | | 1.36% | | | | 1.56% | | | | 1.55% | | | | 1.53% | |
| | 1.84% | | | | 1.73% | | | | 1.69% | | | | 1.72% | | | | 1.69% | |
| | 0.21% | | | | (1.00% | ) | | | (0.52% | ) | | | 1.97% | | | | 2.25% | |
| | (0.79% | ) | | | (1.37% | ) | | | (0.65% | ) | | | 1.80% | | | | 2.09% | |
| | 128% | | | | 322% | | | | 225% | | | | 157% | | | | 118% | |
23
Financial highlights
Delaware Inflation Protected Bond Fund Class C
Selected data for each share of the Fund outstanding throughout each period were as follows:
|
Net asset value, beginning of period |
|
Income (loss) from investment operations: |
Net investment income (loss)1 |
Net realized and unrealized gain (loss) |
Total from investment operations |
|
Less dividends and distributions from: |
Net investment income |
Net realized gain |
Return of capital |
Total dividends and distributions |
|
Net asset value, end of period |
|
Total return2 |
|
Ratios and supplemental data: |
Net assets, end of period (000 omitted) |
Ratio of expenses to average net assets |
Ratio of expenses to average net assets prior to fees waived |
Ratio of net investment income (loss) to average net assets |
Ratio of net investment income (loss) to average net assets prior to fees waived |
Portfolio turnover |
| 1 | The average shares outstanding method has been applied for per share information. |
| 2 | Total investment return is based on the change in net asset value of a share during the period and assumes reinvestment of dividends and distributions at net asset value and does not reflect the impact of a sales charge. Total investment return during all of the periods shown reflects a waiver by the manager. Performance would have been lower had the waiver not been in effect. |
See accompanying notes, which are an integral part of the financial statements.
24
| | | | | | | | | | | | | | | | | | |
| | | | |
| | | | | | | | | | | | | | | | | | |
| | | | | | | | | | | | | | |
| | | | | | | Year ended | | | | | | | |
| | |
| 7/31/14 | | | 7/31/13 | | | 7/31/12 | | | 7/31/11 | | | 7/31/10 | |
| | |
| $ | 9.140 | | | $ | 11.310 | | | $ | 11.030 | | | $ | 10.620 | | | $ | 10.020 | |
| | | | |
| | | | | | | | | | | | | | | | | | |
| | (0.049 | ) | | | (0.127 | ) | | | (0.058 | ) | | | 0.210 | | | | 0.235 | |
| | 0.109 | | | | (1.175 | ) | | | 0.857 | | | | 0.789 | | | | 0.600 | |
| | | | | | | | | | | | | | | | | | |
| | 0.060 | | | | (1.302 | ) | | | 0.799 | | | | 0.999 | | | | 0.835 | |
| | | | | | | | | | | | | | | | | | |
| | | | |
| | | | | | | | | | | | | | | | | | |
| | — | | | | (0.064 | ) | | | (0.116 | ) | | | (0.246 | ) | | | (0.235 | ) |
| | — | | | | (0.803 | ) | | | (0.403 | ) | | | (0.343 | ) | | | — | |
| | — | | | | (0.001 | ) | | | — | | | | — | | | | — | |
| | | | | | | | | | | | | | | | | | |
| | — | | | | (0.868 | ) | | | (0.519 | ) | | | (0.589 | ) | | | (0.235 | ) |
| | | | | | | | | | | | | | | | | | |
| | | | |
| $ | 9.200 | | | $ | 9.140 | | | $ | 11.310 | | | $ | 11.030 | | | $ | 10.620 | |
| | | | | | | | | | | | | | | | | | |
| | | | |
| | 0.66% | | | | (12.39% | ) | | | 7.52% | | | | 9.74% | | | | 8.40% | |
| | | | |
| | | | | | | | | | | | | | | | | | |
| $ | 23,071 | | | $ | 47,629 | | | $ | 93,561 | | | $ | 89,740 | | | $ | 71,866 | |
| | 1.59% | | | | 1.58% | | | | 1.56% | | | | 1.55% | | | | 1.53% | |
| | 1.84% | | | | 1.73% | | | | 1.69% | | | | 1.72% | | | | 1.69% | |
| | (0.54% | ) | | | (1.22% | ) | | | (0.52% | ) | | | 1.97% | | | | 2.25% | |
| | (0.79% | ) | | | (1.37% | ) | | | (0.65% | ) | | | 1.80% | | | | 2.09% | |
| | 128% | | | | 322% | | | | 225% | | | | 157% | | | | 118% | |
25
Financial highlights
Delaware Inflation Protected Bond Fund Institutional Class
Selected data for each share of the Fund outstanding throughout each period were as follows:
|
Net asset value, beginning of period |
|
Income (loss) from investment operations: |
Net investment income (loss)1 |
Net realized and unrealized gain (loss) |
Total from investment operations |
|
Less dividends and distributions from: |
Net investment income |
Net realized gain |
Return of capital |
Total dividends and distributions |
|
Net asset value, end of period |
|
Total return3 |
|
Ratios and supplemental data: |
Net assets, end of period (000 omitted) |
Ratio of expenses to average net assets |
Ratio of expenses to average net assets prior to fees waived |
Ratio of net investment income (loss) to average net assets |
Ratio of net investment income (loss) to average net assets prior to fees waived |
Portfolio turnover |
| 1 | The average shares outstanding method has been applied for per share information. |
| 2 | For the year ended July 31, 2014, dividends from net investment income were calculated to a de minimis amount of $0.000 per share. |
| 3 | Total investment return is based on the change in net asset value of a share during the period and assumes reinvestment of dividends and distributions at net asset value. Total investment return during all of the periods shown reflects a waiver by the manager. Performance would have been lower had the waiver not been in effect. |
See accompanying notes, which are an integral part of the financial statements.
26
| | | | | | | | | | | | | | | | | | |
| | | | | | | | | | | | | | |
| | | | | | | | | | | | | | |
| | | | | | | Year ended | | | | | | | |
| | |
| 7/31/14 | | | 7/31/13 | | | 7/31/12 | | | 7/31/11 | | | 7/31/10 | |
| | |
| $ | 9.210 | | | $ | 11.340 | | | $ | 11.040 | | | $ | 10.630 | | | $ | 10.100 | |
| | | | |
| | | | | | | | | | | | | | | | | | |
| | 0.041 | | | | (0.023 | ) | | | 0.053 | | | | 0.317 | | | | 0.339 | |
| | 0.119 | | | | (1.192 | ) | | | 0.867 | | | | 0.788 | | | | 0.603 | |
| | | | | | | | | | | | | | | | | | |
| | 0.160 | | | | (1.215 | ) | | | 0.920 | | | | 1.105 | | | | 0.942 | |
| | | | | | | | | | | | | | | | | | |
| | | | |
| | | | | | | | | | | | | | | | | | |
| | — | 2 | | | (0.111 | ) | | | (0.217 | ) | | | (0.352 | ) | | | (0.412 | ) |
| | — | | | | (0.803 | ) | | | (0.403 | ) | | | (0.343 | ) | | | — | |
| | (0.130 | ) | | | (0.001 | ) | | | — | | | | — | | | | — | |
| | | | | | | | | | | | | | | | | | |
| | (0.130 | ) | | | (0.915 | ) | | | (0.620 | ) | | | (0.695 | ) | | | (0.412 | ) |
| | | | | | | | | | | | | | | | | | |
| | | | |
| $ | 9.240 | | | $ | 9.210 | | | $ | 11.340 | | | $ | 11.040 | | | $ | 10.630 | |
| | | | | | | | | | | | | | | | | | |
| | | | |
| | 1.75% | | | | (11.51% | ) | | | 8.59% | | | | 10.83% | | | | 9.51% | |
| | | | |
| | | | | | | | | | | | | | | | | | |
| $ | 27,228 | | | $ | 109,284 | | | $ | 162,400 | | | $ | 140,221 | | | $ | 42,418 | |
| | 0.59% | | | | 0.58% | | | | 0.56% | | | | 0.55% | | | | 0.53% | |
| | 0.84% | | | | 0.73% | | | | 0.69% | | | | 0.72% | | | | 0.69% | |
| | 0.46% | | | | (0.22% | ) | | | 0.48% | | | | 2.97% | | | | 3.25% | |
| | 0.21% | | | | (0.37% | ) | | | 0.35% | | | | 2.80% | | | | 3.09% | |
| | 128% | | | | 322% | | | | 225% | | | | 157% | | | | 118% | |
27
| | |
| Notes to financial statements | | |
Delaware Inflation Protected Bond Fund | | July 31, 2014 |
Delaware Group® Government Fund (Trust) is organized as a Delaware statutory trust and offers three series: Delaware Core Plus Bond Fund, Delaware Emerging Markets Debt Fund and Delaware Inflation Protected Bond Fund. These financial statements and the related notes pertain to Delaware Inflation Protected Bond Fund (Fund). The Trust is an open-end investment company. The Fund is considered diversified under the Investment Company Act of 1940, as amended, and offers Class A, Class B,* Class C, and Institutional Class shares. Class A shares are sold with a maximum front-end sales charge of 4.50%. Class A share purchases of $1,000,000 or more will incur a contingent deferred sales charge (CDSC) of 1.00% if redeemed during the first year and 0.50% during the second year, provided that Delaware Distributors, L.P. (DDLP) paid a financial advisor a commission on the purchase of those shares. Class B shares may be purchased only through dividend reinvestment and certain permitted exchanges. Prior to June 1, 2007, Class B shares were sold with a CDSC that declined from 4.00% to zero depending upon the period of time the shares were held. Class B shares will automatically convert to Class A shares on a quarterly basis approximately eight years after purchase.* Class C shares are sold with a CDSC of 1.00%, if redeemed during the first 12 months. Institutional Class shares are not subject to a sales charge and are offered for sale exclusively to certain eligible investors.
The investment objective of the Fund is to seek to provide inflation protection and current income.
* See Note 14.
1. Significant Accounting Policies
The following accounting policies are in accordance with U.S. generally accepted accounting principles
(U.S. GAAP) and are consistently followed by the Fund.
Security Valuation – Debt securities, credit default swap (CDS) contracts, inflation swap contracts, and interest rate swap contracts are valued based upon valuations provided by an independent pricing service or broker/counterparty and reviewed by management. To the extent current market prices are not available, the pricing service may take into account developments related to the specific security, as well as transactions in comparable securities. U.S. government securities are valued at the mean between the bid and ask prices, which approximates fair value. Valuations for fixed income securities utilize matrix systems, which reflect such factors as security prices, yields, maturities, and ratings, and are supplemented by dealer and exchange quotations. For asset-backed securities and U.S. government securities, pricing vendors utilize matrix pricing which considers prepayment speed; attributes of the collateral; yield or price of bonds of comparable quality, coupon, maturity, and type as well as broker/dealer-supplied prices. Swap prices are derived using daily swap curves and models that incorporate a number of market data factors, such as discounted cash flows, trades, and values of the underlying reference instruments. Foreign currency exchange contracts and foreign cross currency exchange contracts are valued at the mean between the bid and ask prices, which approximates fair value. Interpolated values are derived when the settlement date of the contract is an interim date for which quotations are not available. Futures contracts and options on futures contracts are valued at the daily quoted settlement prices. Generally, other securities and assets for which market quotations are not readily available are valued at fair value as determined in good faith under the direction of the Fund’s Board of Trustees (Board). In determining whether market quotations are readily available or fair valuation will be used, various factors will be taken into consideration, such as market closures or suspension of trading in a security.
28
Federal and Foreign Income Taxes – No provision for federal income taxes has been made as the Fund intends to continue to qualify for federal income tax purposes as a regulated investment company under Subchapter M of the Internal Revenue Code of 1986, as amended, and make the requisite distributions to shareholders. The Fund evaluates tax positions taken or expected to be taken in the course of preparing the Fund’s tax returns to determine whether the tax positions are “more-likely-than-not” of being sustained by the applicable tax authority. Tax positions not deemed to meet the “more-likely-than-not” threshold are recorded as a tax benefit or expense in the current year.
Management has analyzed the Fund’s tax positions taken for all open federal income tax years (July 31, 2011–July 31, 2014), and has concluded that no provision for federal income tax is required in the Fund’s financial statements. In regard to foreign taxes only, the Fund has open tax years in certain foreign countries it invests in that may date back to the inception of the Fund.
Class Accounting – Investment income, common expenses, and realized and unrealized gain (loss) on investments are allocated to the various classes of the Fund on the basis of daily net assets of each class. Distribution expenses relating to a specific class are charged directly to that class.
Repurchase Agreements – The Fund may purchase certain U.S. government securities subject to the counterparty’s agreement to repurchase them at an agreed upon date and price. The counterparty will be required on a daily basis to maintain the value of the collateral subject to the agreement at not less than the repurchase price (including accrued interest). The agreements are conditioned upon the collateral being deposited under the Federal Reserve book-entry system with the Fund’s custodian or a third-party sub-custodian. In the event of default or bankruptcy by the other party to the agreement, retention of the collateral may be subject to legal proceedings. All open repurchase agreements as of the date of this report were entered into on July 31, 2014.
To Be Announced Trades (TBA) – The Fund may contract to purchase or sell securities for a fixed price at a transaction date beyond the customary settlement period (examples: when issued, delayed delivery, forward commitment, or TBA transactions) consistent with the Fund’s ability to manage its investment portfolio and meet redemption requests. These transactions involve a commitment by the Fund to purchase or sell securities for a predetermined price or yield with payment and delivery taking place more than three days in the future, or after a period longer than the customary settlement period for that type of security. No interest will be earned by the Fund on such purchases until the securities are delivered or the transaction is completed; however, the market value may change prior to delivery.
Inflation-Indexed Bonds – The Fund invests in inflation-indexed bonds. Inflation-indexed bonds are fixed income securities whose principal value is periodically adjusted to the rate of inflation. The interest rate on these bonds is generally fixed at issuance at a rate lower than typical bonds. Over the life of an inflation-indexed bond, however, interest will be paid based on a principal value, which is adjusted for inflation. Any increase or decrease in the principal amount of an inflation-indexed bond will be included as interest income on the Statement of operations, even though investors do not receive their principal until maturity.
Foreign Currency Transactions – Transactions denominated in foreign currencies are recorded at the prevailing exchange rates on the valuation date in accordance with the Fund’s prospectus. The value of all assets and liabilities denominated in foreign currencies is translated daily into U.S. dollars at the exchange rate of such currencies against the U.S. dollar. Transaction gains or losses resulting from
29
Notes to financial statements
Delaware Inflation Protected Bond Fund
1. Significant Accounting Policies (continued)
changes in exchange rates during the reporting period or upon settlement of the foreign currency transaction are reported in operations for the current period. The Fund generally bifurcates that portion of realized gains and losses on investments in debt securities which is due to changes in foreign exchange rates from that which is due to changes in market prices of debt securities. That portion of gains (losses) is included in the “Statement of operations” under “Net realized loss on foreign currencies.” The Fund reports certain foreign currency related transactions as components of realized gains (losses) for financial reporting purposes, whereas such components are treated as ordinary income (loss) for federal income tax purposes.
Use of Estimates – The preparation of financial statements in conformity with U.S. GAAP requires management to make estimates and assumptions that affect the fair value of investments, the reported amounts of assets and liabilities and disclosure of contingent assets and liabilities at the date of the financial statements, and the reported amounts of revenues and expenses during the reporting period. Actual results could differ from those estimates and the differences could be material.
Other – Expenses directly attributable to the Fund are charged directly to the Fund. Other expenses common to various funds within the Delaware Investments® Family of Funds are generally allocated among such funds on the basis of average net assets. Management fees and some other expenses are paid monthly. Security transactions are recorded on the date the securities are purchased or sold (trade date) for financial reporting purposes. Costs used in calculating realized gains and losses on the sale of investment securities are those of the specific securities sold. Interest income is recorded on the accrual basis. Discounts and premiums on debt securities are amortized to interest income over the lives of the respective securities using the effective interest method. Realized gains (losses) on paydowns of mortgage- and asset-backed securities are classified as interest income. Withholding taxes and reclaims on foreign interest have been recorded in accordance with the Fund’s understanding of the applicable country’s tax rules and rates. The Fund expects to declare and pay dividends from net investment income monthly and distributions from net realized gain on investments, if any, at least annually, usually in December. The Fund may distribute more frequently, if necessary for tax purposes. Dividends and distributions, if any, are recorded on the ex-dividend date.
The Fund may receive earnings credits from its custodian when positive cash balances are maintained, which may be used to offset custody fees. There were no earnings credits for the year ended July 31, 2014.
The Fund receives earnings credits from its transfer agent when positive cash balances are maintained, which may be used to offset transfer agent fees. If the amount earned is greater than one dollar, the expense paid under this arrangement is included on the “Statement of operations” under “Dividend disbursing and transfer agent fees and expenses” with the corresponding expense offset shown under “Less expense paid indirectly.” For the year ended July 31, 2014, the Fund earned $282 under this agreement.
2. Investment Management, Administration Agreements and Other Transactions with Affiliates
In accordance with the terms of its investment management agreement, the Fund pays Delaware Management Company (DMC), a series of Delaware Management Business Trust and the investment
30
manager, an annual fee which is calculated daily at the rate of 0.45% on the first $500 million of average daily net assets of the Fund, 0.40% on the next $500 million, 0.35% on the next $1.5 billion, and 0.30% on average daily net assets in excess of $2.5 billion.
DMC has contractually agreed to waive that portion, if any, of its management fee and/or pay/reimburse the Fund to the extent necessary to limit annual operating expenses (excluding any 12b-1 fees, acquired fund fees and expenses, taxes, interest, inverse floater program expenses, short sale and dividend interest expenses, brokerage fees, certain insurance costs, and nonroutine expenses or costs including, but not limited to, those relating to reorganizations, litigation, conducting shareholder meetings, and liquidations), to 0.59% of average daily net assets of the Fund from Aug. 1, 2013 through July 31, 2014.** For purposes of this waiver and reimbursement, nonroutine expenses may also include such additional costs and expenses, as may be agreed upon from time to time by the Fund’s Board and DMC. This expense waiver and reimbursement apply only to expenses paid directly by the Fund and may only be terminated by agreement of DMC and the Fund.
Delaware Service Company, Inc. (DSC), an affiliate of DMC, provides fund accounting and financial administration oversight services to the Fund. For these services, the Fund pays DSC fees based on the aggregate daily net assets of the Delaware Investments® Family of Funds at the following annual rate: 0.0050% of the first $30 billion; 0.0045% of the next $10 billion; 0.0040% of the next $10 billion; and 0.0025% of aggregate average daily net assets in excess of $50 billion. The fees payable to DSC under the service agreement described above are allocated among all Funds in the Delaware Investments Family of Funds on a relative net asset value basis. For the year ended July 31, 2014, the Fund was charged $7,616 for these services.
DSC is also the transfer agent and dividend disbursing agent of the Fund. For these services, the Fund pays DSC fees based on the aggregate daily net assets of the retail funds within the Delaware Investments Family of Funds at the following annual rate: 0.025% of the first $20 billion; 0.020% of the next $5 billion; 0.015% of the next $5 billion; and 0.013% on average daily net assets in excess of $30 billion. This amount is included on the “Statement of operations” under “Dividend disbursing and transfer agent fees and expenses.” For the year ended July 31, 2014, the amount charged by DSC was $34,705. Pursuant to a sub-transfer agency agreement between DSC and BNY Mellon Investment Servicing (US) Inc. (BNYMIS), BNYMIS provides certain sub-transfer agency services to the Fund. Sub-transfer agency fees are passed on to and paid directly by the Fund.
Pursuant to a distribution agreement and distribution plan, the Fund pays DDLP, the distributor and an affiliate of DMC, an annual distribution and service fee of 0.25% of the average daily net assets of the Class A shares and 1.00% of the average daily net assets of the Class B and C shares. Institutional Class shares pay no distribution and service expenses. DDLP has contracted to waive distribution and service fees from Aug. 1, 2013 through July 31, 2014** in order to limit distribution and service fees of Class B shares to 0.25% of average daily net assets.
As provided in the investment management agreement, the Fund bears a portion of the cost of certain resources shared with DMC, including the cost of internal personnel of DMC and/or its affiliates that provide legal, tax, and regulatory reporting services to the Fund. For the year ended July 31, 2014, the
31
Notes to financial statements
Delaware Inflation Protected Bond Fund
2. Investment Management, Administration Agreements and Other Transactions with Affiliates (continued)
Fund was charged $4,773 for internal legal, tax, and regulatory reporting services provided by DMC and/ or its affiliates’ employees.
For the year ended July 31, 2014, DDLP earned $1,274 for commissions on sales of the Fund’s Class A shares. For the year ended July 31, 2014, DDLP received gross CDSC commissions of $217 and $483 on redemptions of the Fund’s Class A and Class C shares, respectively, and these commissions were entirely used to offset upfront commissions previously paid by DDLP to broker/dealers on sales of those shares.
Trustees’ fees include expenses accrued by the Fund for each Trustee’s retainer and meeting fees. Certain officers of DMC, DSC, and DDLP are officers and/or Trustees of the Trust. These officers and Trustees are paid no compensation by the Fund.
** The contractual waiver period is Nov. 28, 2012 through Nov. 28, 2014.
3. Investments
For the year ended July 31, 2014, the Fund made purchases and sales of investment securities other than short-term investments as follows:
| | | | |
Purchases other than U.S. government securities | | $ | 30,457,262 | |
Purchases of U.S. government securities | | | 161,137,758 | |
Sales other than U.S. government securities | | | 75,196,144 | |
Sales of U.S. government securities | | | 303,083,318 | |
At July 31, 2014, the cost of investments and unrealized appreciation (depreciation) for federal income tax purposes were as follows:
| | | | |
Cost of investments | | $ | 77,463,333 | |
| | | | |
Aggregate unrealized appreciation | | $ | 2,427,405 | |
Aggregate unrealized depreciation | | | (1,199,861 | ) |
| | | | |
Net unrealized appreciation | | $ | 1,227,544 | |
| | | | |
U.S. GAAP defines fair value as the price that the Fund would receive to sell an asset or pay to transfer a liability in an orderly transaction between market participants at the measurement date under current market conditions. A three-level hierarchy for fair value measurements has been established based upon the transparency of inputs to the valuation of an asset or liability. Inputs may be observable or unobservable and refer broadly to the assumptions that market participants would use in pricing the asset or liability. Observable inputs reflect the assumptions market participants would use in pricing the asset or liability based on market data obtained from sources independent of the reporting entity. Unobservable inputs reflect the reporting entity’s own assumptions about the assumptions that market participants would use in pricing the asset or liability developed based on the best information available under the circumstances. The Fund’s investment in its entirety is assigned a level based upon the observability of the inputs which are significant to the overall valuation. The three-level hierarchy of inputs is summarized on the next page.
32
| | |
Level 1 – | | Inputs are quoted prices in active markets for identical investments. (Examples: equity securities, open-end investment companies, futures contracts, exchange-traded options contracts) |
| |
Level 2 – | | Other observable inputs, including, but not limited to: quoted prices for similar assets or liabilities in markets that are active, quoted prices for identical or similar assets or liabilities in markets that are not active, inputs other than quoted prices that are observable for the assets or liabilities (such as interest rates, yield curves, volatilities, prepayment speeds, loss severities, credit risks, and default rates) or other market-corroborated inputs. (Examples: debt securities, government securities, swap contracts, foreign currency exchange contracts, foreign securities utilizing international fair value pricing, broker-quoted securities, fair valued securities) |
| |
Level 3 – | | Significant unobservable inputs, including the Fund’s own assumptions used to determine the fair value of investments. (Examples: broker-quoted securities, fair valued securities) |
Level 3 investments are valued using significant unobservable inputs. The Fund may also use an income-based valuation approach in which the anticipated future cash flows of the investment are discounted to calculate fair value. Discounts may also be applied due to the nature or duration of any restrictions on the disposition of the investments. Valuations may also be based upon current market prices of securities that are comparable in coupon, rating, maturity, and industry. The derived value of a Level 3 investment may not represent the value which is received upon disposition and this could impact the results of operations.
The following table summarizes the valuation of the Fund’s investments by fair value hierarchy levels as of July 31, 2014:
| | | | |
| | | Level 2 | |
Agency, Asset-Backed & Mortgage-Backed Securities | | $ | 18,186,344 | |
Corporate Debt | | | 2,962,500 | |
Short-Term Investments | | | 456,000 | |
U.S. Treasury Obligations | | | 57,086,033 | |
| | | | |
| |
Total | | $ | 78,690,877 | |
| | | | |
Swap Contracts | | $ | 269,038 | |
During the year ended July 31, 2014, there were no transfers between Level 1 investments, Level 2 investments, or Level 3 investments that had a significant impact to the Fund. The Fund’s policy is to recognize transfers between levels at the beginning of the reporting period.
A reconciliation of Level 3 investments is presented when the Fund has a significant amount of Level 3 investments at the beginning, interim, or end of the period in relation to net assets. At July 31, 2014, there were no Level 3 investments.
33
Notes to financial statements
Delaware Inflation Protected Bond Fund
4. Dividend and Distribution Information
Income and long-term capital gain distributions are determined in accordance with federal income tax regulations, which may differ from U.S. GAAP. Additionally, distributions from net gains on foreign currency transactions and net short-term gains on sales of investment securities are treated as ordinary income for federal income tax purposes. The tax character of dividends and distributions paid during the years ended July 31, 2014 and 2013 was as follows:
| | | | | | | | |
| | | Year ended | |
| | | 7/31/14 | | | | 7/31/13 | |
Ordinary income | | $ | 490 | | | $ | 29,645,157 | |
Long-term capital gains | | | — | | | | 8,783,582 | |
Return of capital | | | 911,821 | | | | 32,208 | |
| | | | | | | | |
Total | | $ | 912,311 | | | $ | 38,460,947 | |
| | | | | | | | |
5. Components of Net Assets on a Tax Basis
As of July 31, 2014, the components of net assets on a tax basis were as follows:
| | | | |
Shares of beneficial interest | | $ | 126,137,761 | |
Other temporary differences | | | (1,015,771 | ) |
Capital loss carryforwards | | | (40,959,913 | ) |
Unrealized appreciation | | | 1,497,344 | |
| | | | |
Net assets | | $ | 85,659,421 | |
| | | | |
The differences between book basis and tax basis components of the net assets are primarily attributable to tax deferral of losses on wash sales, straddles, tax treatment of CDS contracts, and tax treatment of market discount and premium on debt instruments.
For financial reporting purposes, capital accounts are adjusted to reflect the tax character of permanent book/tax differences. Reclassifications are primarily due to tax treatment of gain (loss) on foreign currency transactions, tax treatment of swap contracts, market discount and premium on debt instruments, and paydowns of mortgage- and asset-backed securities. Results of operations and net assets were not affected by these reclassifications. For the year ended July 31, 2014, the Fund recorded the following reclassifications.
| | | | |
| Undistributed net investment income | | $ | 78,873 | |
| Accumulated net realized loss | | | (78,873 | ) |
On Dec. 22, 2010, the Regulated Investment Company Modernization Act of 2010 (Act) was enacted, which changed various technical rules governing the tax treatment of regulated investment companies. The changes were generally effective for taxable years beginning after the date of enactment. Under the Act, the Fund is permitted to carry forward capital losses incurred in taxable years beginning after the date of enactment for an unlimited period.
Losses incurred that will be carried forward under the Act are as follows:
| | | | | | |
| | Loss carryforward character | |
| | Short-term | | | Long-term | |
| | $32,217,679 | | $ | 8,742,234 | |
34
6. Capital Shares
Transactions in capital shares were as follows:
| | | | | | | | |
| | | Year ended | | | Year ended | |
| | | 7/31/14 | | | 7/31/13 | |
| | |
Shares sold: | | | | | | | | |
Class A | | | 1,249,269 | | | | 6,308,439 | |
Class B | | | — | | | | — | |
Class C | | | 90,388 | | | | 938,451 | |
Institutional Class | | | 1,743,455 | | | | 6,627,766 | |
| | |
Shares issued upon reinvestment of dividends and distributions: | | | | | | | | |
Class A | | | 43,218 | | | | 1,576,996 | |
Class B | | | 87 | | | | 5,717 | |
Class C | | | — | | | | 652,371 | |
Institutional Class | | | 52,888 | | | | 1,170,367 | |
| | | | | | | | |
| | | 3,179,305 | | | | 17,280,107 | |
| | | | | | | | |
| | |
Shares redeemed: | | | | | | | | |
Class A | | | (9,083,615 | ) | | | (19,166,367 | ) |
Class B | | | (21,579 | ) | | | (46,480 | ) |
Class C | | | (2,795,967 | ) | | | (4,647,848 | ) |
Institutional Class | | | (10,714,907 | ) | | | (10,258,132 | ) |
| | | | | | | | |
| | | (22,616,068 | ) | | | (34,118,827 | ) |
| | | | | | | | |
Net decrease | | | (19,436,763 | ) | | | (16,838,720 | ) |
| | | | | | | | |
For the years ended July 31, 2014 and July 31, 2013, 3,058 Class B shares were converted to 3,052 Class A shares valued at $27,610 and 18,091 Class B shares were converted to 18,045 Class A shares valued at $186,379, respectively. The respective amounts are included in Class B redemptions and Class A subscriptions in the table above and the “Statements of changes in net assets.”
7. Line of Credit
The Fund, along with certain other funds in the Delaware Investments® Family of Funds (Participants), was a participant in a $125,000,000 revolving line of credit to be used for temporary or emergency purposes as an additional source of liquidity to fund redemptions of investor shares. Under the agreement, the Participants were charged an annual commitment fee of 0.08%, which was allocated across the Participants on the basis of each Participant’s allocation of the entire facility. The Participants were permitted to borrow up to a maximum of one third of their net assets under the agreement. Each Participant was individually, and not jointly, liable for its particular advances, if any, under the line of credit. The line of credit under the agreement expired on Nov. 12, 2013.
On Nov. 12, 2013, the Fund, along with the other Participants, entered into an amendment to the agreement for a $225,000,000 revolving line of credit. The line of credit is to be used as described above
35
Notes to financial statements
Delaware Inflation Protected Bond Fund
7. Line of Credit (continued)
and operates in substantially the same manner as the original agreement. The line of credit available under the agreement will expire on Nov. 10, 2014.
The Fund had no amounts outstanding as of July 31, 2014, or at any time during the year then ended.
8. Derivatives
U.S. GAAP requires disclosures that enable investors to understand: (1) how and why an entity uses derivatives; (2) how they are accounted for; and (3) how they affect an entity’s results of operations and financial position.
Foreign Currency Exchange Contracts – The Fund may enter into foreign currency exchange contracts and foreign cross currency exchange contracts as a way of managing foreign exchange rate risk. The Fund may enter into these contracts to fix the U.S. dollar value of a security that it has agreed to buy or sell for the period between the date the trade was entered into and the date the security is delivered and paid for. The Fund may also use these contracts to hedge the U.S. dollar value of securities it already owns that are denominated in foreign currencies. In addition, the Fund may enter into these contracts to facilitate or expedite the settlement of portfolio transactions. The change in value is recorded as an unrealized gain or loss. When the contract is closed, a realized gain or loss is recorded equal to the difference between the value of the contract at the time it was opened and the value at the time it was closed.
The use of foreign currency exchange contracts and foreign cross currency exchange contracts does not eliminate fluctuations in the underlying prices of the securities, but does establish a rate of exchange that can be achieved in the future. Although foreign currency exchange and foreign cross currency exchange contracts limit the risk of loss due to an unfavorable change in the value of the hedged currency, they also limit any potential gain that might result should the value of the currency change favorably. In addition, the Fund could be exposed to risks if the counterparties to the contracts are unable to meet the terms of their contracts. The Fund’s maximum risk of loss from counterparty credit risk is the value of its currency exchanged with the counterparty. The risk is generally mitigated by having a netting arrangement between the Fund and the counterparty and by the posting of collateral by the counterparty to the Fund to cover the Fund’s exposure to the counterparty.
During the year ended July 31, 2014, the Fund entered into foreign currency exchange contracts to hedge the U.S. dollar value of securities it already owns that are denominated in foreign currencies.
No foreign currency exchange contracts were outstanding at July 31, 2014.
Futures Contracts – A futures contract is an agreement in which the writer (or seller) of the contract agrees to deliver to the buyer an amount of cash or securities equal to a specific dollar amount times the difference between the value of a specific security or index at the close of the last trading day of the contract and the price at which the agreement is made. The Fund may use futures in the normal course of pursuing its investment objectives. The Fund may invest in futures contracts to hedge its existing portfolio securities against fluctuations in value caused by changes in interest rates or market conditions. Upon entering into a futures contract, the Fund deposits cash or pledges U.S. government securities to a broker, equal to the minimum “initial margin” requirements of the exchange on which the contract is
36
traded. Subsequent payments are received from the broker or paid to the broker each day, based on the daily fluctuation in the market value of the contract. These receipts or payments are known as “variation margin” and are recorded daily by the Fund as unrealized gains or losses until the contracts are closed. When the contracts are closed, the Fund records a realized gain or loss equal to the difference between the value of the contract at the time it was opened and the value at the time it was closed. Risks of entering into futures contracts include potential imperfect correlation between the futures contracts and the underlying securities and the possibility of an illiquid secondary market for these instruments. When investing in futures, there is reduced counterparty credit risk to the Fund because futures are exchange-traded and the exchange’s clearinghouse, as counterparty to all exchange-traded futures, guarantees against default.
During the year ended July 31, 2014, the Fund entered into futures contracts to hedge the Fund’s existing portfolio securities against fluctuations in value caused by changes in interest rates or market conditions.
At July 31, 2014, there were no futures contracts outstanding.
Swap Contracts – The Fund may enter into interest rate swap contracts, inflation swap contracts and CDS contracts in the normal course of pursuing its investment objectives. The Fund may use interest rate swaps to adjust the Fund’s sensitivity to interest rates or to hedge against changes in interest rates. The Fund may use inflation swaps to hedge the inflation risk in nominal bonds, thereby creating synthetic inflation-indexed bonds. The Fund may enter into CDS contracts in order to hedge against a credit event, to enhance total return, or to gain exposure to certain securities or markets. The Fund will not be permitted to enter into any swap transactions unless, at the time of entering into such transactions, the unsecured long-term debt of the actual counterparty, combined with any credit enhancements, is rated at least BBB- by Standard & Poor’s Financial Services LLC (S&P) or Baa3 by Moody’s Investors Service Inc. (Moody’s) or is determined to be of equivalent credit quality by DMC.
Interest Rate Swaps. An interest rate swap contract is an exchange of interest rates between counterparties. In one instance, an interest rate swap involves payments received by the Fund from another party based on a variable or floating interest rate, in return for making payments based on a fixed interest rate. An interest rate swap can also work in reverse with the Fund receiving payments based on a fixed interest rate and making payments based on a variable or floating interest rate. Interest rate swaps may be used to adjust the Fund’s sensitivity to interest rates or to hedge against changes in interest rates. Periodic payments on such contracts are accrued daily and recorded as unrealized appreciation/depreciation on swap contracts. Upon periodic payment/receipt or termination of the contract, such amounts are recorded as realized gains or losses on swap contracts. The Fund’s maximum risk of loss from counterparty credit risk is the discounted net value of the cash flows to be received from/paid to the counterparty over the interest rate swap contract’s remaining life, to the extent that the amount is positive. This risk is mitigated by (1) for bilateral swap contracts, having a netting arrangement between the Fund and the counterparty and by the posting of collateral by the counterparty to the Fund to cover the Fund’s exposure to the counterparty, and (2) for cleared swaps, trading these instruments through a central counterparty. The Fund received $300,000 cash collateral, which is included on the “Statement of assets and liabilities” under “Cash collateral due to broker.”
37
Notes to financial statements
Delaware Inflation Protected Bond Fund
8. Derivatives (continued)
During the year ended July 31, 2014, the Fund entered into interest rate swap contracts to manage the Fund’s sensitivity to interest rates or to hedge against changes in interest rates.
Inflation Swaps. Inflation swap agreements involve commitments to pay a regular stream of inflation-indexed cash payments in exchange for receiving a stream of nominal interest payments (or vice versa), where both payment streams are based on notional amounts. The nominal interest payments may be based on either a fixed interest rate or variable interest rate such as the London Interbank Offered Rate (LIBOR). The change in value of swap contracts outstanding, if any, is recorded as unrealized appreciation or depreciation. A realized gain or loss is recorded on maturity or termination of the swap contract. The Fund’s maximum risk of loss from counterparty credit risk is the discounted net value of the cash flows to be received from/paid to the counterparty over the swap contract’s remaining life, to the extent that the amount is positive. This risk is mitigated, for bilateral swap contracts, by having a netting arrangement between the Fund and the counterparty and by the posting of collateral by the counterparty to the Fund to cover the Fund’s exposure to the counterparty. The Fund posted $280,000 in cash collateral, which is included on the “Statement of assets and liabilities” under “Cash collateral due from broker.”
During the year ended July 31, 2014, the Fund entered into inflation swap agreements to hedge the inflation risk in nominal bonds (example: non-inflation protected bonds), thereby creating “synthetic” inflation-indexed bonds.
Credit Default Swaps. A CDS contract is a risk-transfer instrument through which one party (purchaser of protection) transfers to another party (seller of protection) the financial risk of a credit event (as defined in the CDS agreement), as it relates to a particular reference security or basket of securities (such as an index). In exchange for the protection offered by the seller of protection, the purchaser of protection agrees to pay the seller of protection a periodic amount at a stated rate that is applied to the notional amount of the CDS contract. In addition, an upfront payment may be made or received by the Fund in connection with an unwinding or assignment of a CDS contract. Upon the occurrence of a credit event, the seller of protection would pay the par (or other agreed-upon) value of the referenced security (or basket of securities) to the counterparty. Credit events generally include, among others, bankruptcy, failure to pay and obligation default.
During the year ended July 31, 2014, the Fund entered into CDS contracts as a purchaser of protection. Periodic payments (receipts) on such contracts are accrued daily and recorded as unrealized losses (gains) on swap contracts. Upon payment (receipt), such amounts are recorded as realized losses (gains) on swap contracts. Upfront payments made or received in connection with CDS contracts are amortized over the expected life of the CDS contracts as unrealized losses (gains) on swap contracts. The change in value of CDS contracts is recorded daily as unrealized appreciation or depreciation. A realized gain or loss is recorded upon a credit event (as defined in the CDS agreement) or the maturity or termination of the agreement. For the year ended July 31, 2014, the Fund did not enter into any CDS contracts as a seller of protection.
CDS contracts may involve greater risks than if the Fund had invested in the referenced obligation directly. CDS contracts are subject to general market risk, liquidity risk, counterparty risk and credit risk. The Fund’s maximum risk of loss from counterparty credit risk, either as the seller of protection or the
38
buyer of protection, is the fair value of the contract. This risk is mitigated by (1) for bilateral swap contracts, having a netting arrangement between the Fund and the counterparty and by the posting of collateral by the counterparty to the Fund to cover the Fund’s exposure to the counterparty or (2) for cleared swaps, trading these instruments through a central counterparty.
During the year ended July 31, 2014, the Fund entered into CDS contracts to hedge against a credit event.
No CDS contracts were outstanding at July 31, 2014.
Swaps Generally. The value of open swaps may differ from that which would be realized in the event the Fund terminated its position in the contract on a given day. Risks of entering into these contracts include the potential inability of the counterparty to meet the terms of the contracts. This type of risk is generally limited to the amount of favorable movement in the value of the underlying security, instrument, or basket of instruments, if any, at the day of default. Risks also arise from potential losses from adverse market movements and such losses could exceed the unrealized amounts shown on the “Schedule of investments.”
Fair value of derivative instruments as of July 31, 2014 was as follows:
| | | | | | | | | | | | |
| | Asset Derivatives | | | Liability Derivatives | |
| | Statement of | | | | | | Statement of | | | | |
| | Assets and | | | | | | Assets and | | | | |
| | Liabilities Location | | | Fair Value | | | Liabilities Location | | | Fair Value | |
Interest rate contracts
(Inflation and interest rate
swap contracts) | | Unrealized gain
on inflation and
interest rate swap
contracts | | | $829,742 | | | Unrealized loss
on inflation and
interest rate swap
contracts | | | $(560,704 | ) |
| | | | | | | | | | | | |
Total | | | | | $829,742 | | | | | | $(560,704) | |
| | | | | | | | | | | | |
The effect of derivative instruments on the Statement of operations for the year ended July 31, 2014 was as follows:
| | | | | | | | | | | | | | | | |
| | | Net Realized Loss on: | |
| | | | |
| | | Foreign | | | | | | | | | | | | | |
| | | Currency | | | | Futures | | | | Swap | | | | | |
| | | Contracts | | | | Contracts | | | | Contracts | | | | Total | |
Forward currency exchange contracts | | $ | (541,064 | ) | | $ | — | | | $ | — | | | $ | (541,064 | ) |
Interest rate contracts | | | — | | | | (1,015,327 | ) | | | (680,145 | ) | | | (1,695,472 | ) |
Credit contracts | | | — | | | | — | | | | (236,324 | ) | | | (236,324 | ) |
| | | | | | | | | | | | | | | | |
Total | | $ | (541,064 | ) | | $ | (1,015,327 | ) | | $ | (916,469 | ) | | $ | (2,472,860 | ) |
| | | | | | | | | | | | | | | | |
39
Notes to financial statements
Delaware Inflation Protected Bond Fund
8. Derivatives (continued)
| | | | | | | | | | | | | | | | |
| | | Net Change in Unrealized Appreciation (Depreciation) of: | |
| | | Foreign | | | | | | | | | | | | | |
| | | Currency | | | | Futures | | | | Swap | | | | | |
| | | Contracts | | | | Contracts | | | | Contracts | | | | Total | |
Forward currency exchange contracts | | $ | 378,392 | | | $ | — | | | $ | — | | | $ | 378,392 | |
Interest rate contracts | | | — | | | | (431,014 | ) | | | (279,220 | ) | | | (710,234 | ) |
Credit contracts | | | — | | | | — | | | | 172,418 | | | | 172,418 | |
| | | | | | | | | | | | | | | | |
Total | | $ | 378,392 | | | $ | (431,014 | ) | | $ | (106,802 | ) | | $ | (159,424 | ) |
| | | | | | | | | | | | | | | | |
Derivatives Generally. The table below summarizes the average balance of derivative holdings by the Fund during the year ended July 31, 2014.
| | | | | | | | |
| | | Long Derivative | | | Short Derivative | |
| | | Volume | | | Volume | |
Foreign currency exchange contracts (average cost) | | | USD 204,762 | | | | USD 5,448,704 | |
Futures contracts (average notional value) | | | — | | | | 17,001,426 | |
CDS contracts (average notional value)* | | | 1,414,032 | | | | — | |
Interest rate contracts (average notional value) | | | 43,425,692 | | | | — | |
*Long represents buying protection and short represents selling protection.
9. Offsetting
In December 2011, the Financial Accounting Standards Board (FASB) issued guidance that expands disclosure requirements on the offsetting of certain assets and liabilities. The new disclosures are required for investments and derivative financial instruments subject to master netting or similar agreements which are eligible for offset in the “Statement of assets and liabilities” and require an entity to disclose both gross and net information about such investments and transactions in the financial statements. In January 2013, the FASB issued guidance that clarifies which investments and transactions are subject to the offsetting disclosure requirements. The scope of the disclosure requirements for offsetting is limited to derivative instruments, repurchase agreements and reverse repurchase agreements, and securities borrowing. The guidance is effective for financial statements with fiscal years beginning on or after Jan. 1, 2013, and interim periods within those fiscal years. The Fund adopted the disclosure provisions on offsetting during the current reporting period.
In order to better define its contractual rights and to secure rights that will help the Fund mitigate its counterparty risk, the Fund entered into an International Swaps and Derivatives Association, Inc. Master Agreement (ISDA Master Agreement) or similar agreement with each of its derivative contract counterparties. An ISDA Master Agreement is a bilateral agreement between the Fund and a counterparty that governs over-the-counter (OTC) derivatives and foreign exchange contracts and typically contains, among other things, collateral posting items and netting provisions in the event of a default and/or termination event. Under an ISDA Master Agreement, the Fund may, under certain circumstances, offset with the counterparty certain derivative financial instrument’s payables and/or receivables with collateral held and/or posted and create one single net payment. The provisions of the ISDA Master Agreement typically permit a single net payment in the event of default (close-out) netting
40
including the bankruptcy or insolvency of the counterparty. However, bankruptcy or insolvency laws of a particular jurisdiction may impose restrictions on or prohibitions against the right of offset in bankruptcy, insolvency or other events.
For financial reporting purposes, the Fund does not offset derivative assets and liabilities that are subject to netting arrangements in the “Statement of assets and liabilities.”
At July 31, 2014, the Fund had the following assets and liabilities subject to offsetting provisions:
Offsetting of Financial Assets and Liabilities and Derivative Assets and Liabilities
| | | | | | | | | | | | |
Counterparty | | Gross Value of
Derivative Asset | | | Gross Value of
Derivative Liability | | | Net Position | |
Barclays Bank | | $ | — | | | $ | (239,848 | ) | | $ | (239,848 | ) |
Goldman Sachs Capital | | | 416,052 | | | | — | | | | 416,052 | |
Morgan Stanley Capital | | | 413,690 | | | | (320,856 | ) | | | 92,834 | |
| | | | | | | | | | | | |
Total | | $ | 829,742 | | | $ | (560,704 | ) | | $ | 269,038 | |
| | | | | | | | | | | | |
| | | | | | | | | | | | | | | | | | | | | | | | | | | | | | |
Counterparty | | Net
Position | | Fair Value
of
Non-Cash
Collateral
Received | | Cash
Collateral
Received | | Fair Value
of
Non-Cash
Collateral
Pledged | | Collateral
Pledged | | Net
Amount(a) |
Barclays Bank | | | $ | (239,848 | ) | | | $ | — | | | | $ | — | | | | $ | — | | | | $ | 239,848 | | | | $ | — | |
Goldman Sachs Capital | | | | 416,052 | | | | | — | | | | | (300,000 | ) | | | | — | | | | | — | | | | | 116,052 | |
Morgan Stanley Capital | | | | 92,834 | | | | | — | | | | | — | | | | | — | | | | | — | | | | | 92,834 | |
| | | | | | | | | | | | | | | | | | | | | | | | | | | | | | |
Total | | | $ | 269,038 | | | | $ | — | | | | $ | (300,000 | ) | | | $ | — | | | | $ | 239,848 | | | | $ | 208,886 | |
| | | | | | | | | | | | | | | | | | | | | | | | | | | | | | |
| | | | | | | | | | | | | | | | | | | | |
Counterparty | | Repurchase Agreements | | Fair Value of
Non-Cash
Collateral Received | | Cash Collateral
Received | | Net Amount(a) |
Bank of America | | | | | | | | | | | | | | | | | | | | |
Merrill Lynch | | | $ | 142,316 | | | | $ | (142,316 | ) | | | $ | — | | | | $ | — | |
Bank of Montreal | | | | 47,439 | | | | | (47,439 | ) | | | | — | | | | | — | |
BNP Paribas | | | | 266,245 | | | | | (266,245 | ) | | | | — | | | | | — | |
| | | | | | | | | | | | | | | | | | | | |
Total | | | $ | 456,000 | | | | $ | (456,000 | ) | | | $ | — | | | | $ | — | |
| | | | | | | | | | | | | | | | | | | | |
(a)Net represents the receivable/(payable) that would be due from/(to) the counterparty in the event of default.
10. Securities Lending
The Fund, along with other funds in the Delaware Investments® Family of Funds, may lend its securities pursuant to a security lending agreement (Lending Agreement) with The Bank of New York Mellon (BNY Mellon). At the time a security is loaned, the borrower must post collateral equal to the required percentage of the market value of the loaned security, including any accrued interest. The required percentage is: (1) 102% with respect to U.S. securities and foreign securities that are denominated and payable in U.S. dollars; and (2) 105% with respect to foreign securities. With respect to each loan, if on
41
Notes to financial statements
Delaware Inflation Protected Bond Fund
10. Securities Lending (continued)
any business day the aggregate market value of securities collateral plus cash collateral held is less than the aggregate market value of the securities which are the subject of such loan, the borrower will be notified to provide additional collateral by the end of the following business day which, together with the collateral already held, will be not less than the applicable initial collateral requirements for such security loan. If the aggregate market value of securities collateral and cash collateral held with respect to a security loan exceeds the applicable initial collateral requirement, upon the request of the borrower, BNY Mellon must return enough collateral to the borrower by the end of the following business day to reduce the value of the remaining collateral to the applicable initial collateral requirement for such security loan. As a result of the foregoing, the value of the collateral held with respect to a loaned security on any particular day may be more or less than the value of the security on loan.
Cash collateral received is generally invested in the Delaware Investments® Collateral Fund No. 1 (Collective Trust) established by BNY Mellon for the purpose of investment on behalf of funds managed by DMC that participate in BNY Mellon’s securities lending program. The Collective Trust may invest in U.S. government securities and high quality corporate debt, asset-backed and other money market securities, and in repurchase agreements collateralized by such securities, provided that the Collective Trust will generally have a dollar-weighted average portfolio maturity of 60 days or less. The Fund can also accept U.S. government securities and letters of credit (non-cash collateral) in connection with securities loans. In the event of default or bankruptcy by the lending agent, realization and/or retention of the collateral may be subject to legal proceedings. In the event the borrower fails to return loaned securities and the collateral received is insufficient to cover the value of the loaned securities and provided such collateral shortfall is not the result of investment losses, the lending agent has agreed to pay the amount of the shortfall to the Fund or, at the discretion of the lending agent, replace the loaned securities. The Fund continues to record dividends or interest, as applicable, on the securities loaned and is subject to changes in value of the securities loaned that may occur during the term of the loan. The Fund has the right under the Lending Agreement to recover the securities from the borrower on demand. With respect to security loans collateralized by non-cash collateral, the Fund receives loan premiums paid by the borrower. With respect to security loans collateralized by cash collateral, the earnings from the collateral investments are shared among the Fund, the security lending agent and the borrower. The Fund records security lending income net of allocations to the security lending agent and the borrower.
The Collective Trust used for the investment of cash collateral received from borrowers of securities seeks to maintain a net asset value per unit of $1.00, but there can be no assurance that it will always be able to do so. The Fund may incur investment losses as a result of investing securities lending collateral in the Collective Trust. This could occur if an investment in the Collective Trust defaulted or if it were necessary to liquidate assets in the Collective Trust to meet returns on outstanding security loans at a time when the Collective Trust’s net asset value per unit was less than $1.00. Under those circumstances, the Fund may not receive an amount from the Collective Trust that is equal in amount to the collateral the Fund would be required to return to the borrower of the securities and the Fund would be required to make up for this shortfall.
At July 31, 2014, the Fund had no securities out on loan.
42
11. Credit and Market Risk
The Fund primarily invests in inflation-protected debt securities whose principal and/or interest payments are adjusted for inflation, unlike traditional debt securities that make fixed principal and interest payments. Under normal circumstances, the Fund will invest at least 80% of its net assets in inflation-protected bonds issued by the U.S. government, its agencies or instrumentalities, foreign governments, and corporations, which may include synthetic investments such as options, forwards, futures contracts, or swap agreements that, when combined with non-inflation-indexed bonds, have economic characteristics similar to inflation-indexed bonds.
Some countries in which the Fund may invest require governmental approval for the repatriation of investment income, capital or the proceeds of sales of securities by foreign investors. In addition, if there is deterioration in a country’s balance of payments or for other reasons, a country may impose temporary restrictions on foreign capital remittances abroad. The securities exchanges of certain foreign markets are substantially smaller, less liquid and more volatile than the major securities markets in the United States. Consequently, acquisition and disposition of securities by the Fund may be inhibited.
The Fund may invest up to 10% of its net assets in high yield, fixed income securities, which are securities rated lower than BBB- by S&P and lower than Baa3 by Moody’s, or similarly rated by another nationally recognized statistical rating organization. Investments in these higher yielding securities are generally accompanied by a greater degree of credit risk than higher rated securities. Additionally, lower rated securities may be more susceptible to adverse economic and competitive industry conditions than investment grade securities.
The Fund invests in fixed income securities whose value is derived from an underlying pool of mortgages or consumer loans. The value of these securities is sensitive to changes in economic conditions, including delinquencies and/or defaults, and may be adversely affected by shifts in the market’s perception of the issuers and changes in interest rates. Investors receive principal and interest payments as the underlying mortgages and consumer loans are paid back. Some of these securities are collateralized mortgage obligations (CMOs). CMOs are debt securities issued by U.S. government agencies or by financial institutions and other mortgage lenders, which are collateralized by a pool of mortgages held under an indenture. Prepayment of mortgages may shorten the stated maturity of the obligations and can result in a loss of premium, if any has been paid. Certain of these securities may be stripped (securities which provide only the principal or interest feature of the underlying security). The yield to maturity on an interest-only CMO is extremely sensitive not only to changes in prevailing interest rates, but also to the rate of principal payments (including prepayments) on the related underlying mortgage assets. A rapid rate of principal payments may have a material adverse effect on the Fund’s yield to maturity. If the underlying mortgage assets experience greater than anticipated prepayments of principal, the Fund may fail to fully recoup its initial investment in these securities even if the securities are rated in the highest rating categories.
The Fund invests in certain obligations that may have liquidity protection designed to ensure that the receipt of payments due on the underlying security is timely. Such protection may be provided through guarantees, insurance policies or letters of credit obtained by the issuer or sponsor through third parties, through various means of structuring the transaction, or through a combination of such approaches. The
43
Notes to financial statements
Delaware Inflation Protected Bond Fund
11. Credit and Market Risk (continued)
Fund will not pay any additional fees for such credit support, although the existence of credit support may increase the price of a security.
The Fund may invest up to 15% of its net assets in illiquid securities, which may include securities with contractual restrictions on resale, securities exempt from registration under Rule 144A of the Securities Act of 1933, as amended, and other securities which may not be readily marketable. The relative illiquidity of these securities may impair the Fund from disposing of them in a timely manner and at a fair price when it is necessary or desirable to do so. While maintaining oversight, the Fund’s Board has delegated to DMC, the day-to-day functions of determining whether individual securities are liquid for purposes of the Fund’s limitation on investments in illiquid securities. Securities eligible for resale pursuant to Rule 144A, which are determined to be liquid, are not subject to the Fund’s 15% limit on investments in illiquid securities. As of July 31, 2014, no securities held by the Fund have been determined to be illiquid under the Fund’s Liquidity Procedures. Rule 144A securities have been identified on the “Schedule of investments.”
12. Contractual Obligations
The Fund enters into contracts in the normal course of business that contain a variety of indemnifications. The Fund’s maximum exposure under these arrangements is unknown. However, the Fund has not had prior claims or losses pursuant to these contracts. Management has reviewed the Fund’s existing contracts and expects the risk of loss to be remote.
13. Recent Accounting Pronouncements
In June 2014, the Financial Accounting Standards Board issued guidance to improve the financial reporting of reverse repurchase agreements and other similar transactions. The guidance includes expanded disclosure requirements for entities that enter into reverse repurchase agreements and similar transactions accounted for as secured borrowings. The guidance is effective for financial statements with fiscal years beginning on or after December 15, 2014 and interim periods within those fiscal years. Management is evaluating the impact, if any, of this guidance on the Fund’s financial statement disclosures.
14. Subsequent Events
Effective Sept. 25, 2014, all remaining shares of Class B were converted to Class A shares.
Management has determined that no other material events or transactions occurred subsequent to July 31, 2014 that would require recognition or disclosure in the Fund’s financial statements.
44
Report of independent
registered public accounting firm
To the Board of Trustees of Delaware Group® Government Fund
and the Shareholders of Delaware Inflation Protected Bond Fund:
In our opinion, the accompanying statement of assets and liabilities, including the schedule of investments, and the related statements of operations and of changes in net assets and the financial highlights present fairly, in all material respects, the financial position of Delaware Inflation Protected Bond Fund (one of the series constituting Delaware Group® Government Fund, hereinafter referred to as the “Fund”) at July 31, 2014, the results of its operations for the year then ended, the changes in its net assets for each of the two years in the period then ended and the financial highlights for each of the five years in the period then ended, in conformity with accounting principles generally accepted in the United States of America. These financial statements and financial highlights (hereafter referred to as “financial statements”) are the responsibility of the Fund’s management. Our responsibility is to express an opinion on these financial statements based on our audit. We conducted our audit of these financial statements in accordance with the standards of the Public Company Accounting Oversight Board (United States). Those standards require that we plan and perform the audit to obtain reasonable assurance about whether the financial statements are free of material misstatement. An audit includes examining, on a test basis, evidence supporting the amounts and disclosures in the financial statements, assessing the accounting principles used and significant estimates made by management, and evaluating the overall financial statement presentation. We believe that our audit, which included confirmation of securities at July 31, 2014 by correspondence with the custodian and brokers, provides a reasonable basis for our opinion.
PricewaterhouseCoopers LLP
Philadelphia, Pennsylvania
September 19, 2014
45
Other Fund information (Unaudited)
Delaware Inflation Protected Bond Fund
Tax Information
The information set forth below is for the Fund’s fiscal year as required by federal income tax laws. Shareholders, however, must report distributions on a calendar year basis for income tax purposes, which may include distributions for portions of two fiscal years of a fund. Accordingly, the information needed by shareholders for income tax purposes will be sent to them in January of each year. Please consult your tax advisor for proper treatment of this information.
All disclosures are based on financial information available as of the date of this annual report and, accordingly are subject to change. For any and all items requiring reporting, it is the intention of the Fund to report the maximum amount permitted under the Internal Revenue Code and the regulations thereunder.
For the fiscal year ended July 31, 2014, the Fund reports distributions paid during the year as follows:
| | | | |
(A) Ordinary Income Distributions (Tax Basis) | | | 0.05 | % |
(B) Return of Capital (Tax Basis) | | | 99.95 | % |
Total Distributions (Tax Basis) | | | 100.00 | % |
(A) and (B) are based on a percentage of the Fund’s total distributions.
46
Board of trustees / directors and officers addendum
Delaware Investments® Family of Funds
A mutual fund is governed by a Board of Trustees / Directors (“Trustees”), which has oversight responsibility for the management of a fund’s business affairs. Trustees establish procedures and oversee and review the performance of the investment manager, the distributor, and others who perform services for the fund. The independent fund trustees, in particular, are advocates
| | | | |
Name, Address, and Birth Date | | Position(s) Held with Fund(s) | | Length of Time Served |
Interested Trustees | | | | |
| | |
Patrick P. Coyne1 2005 Market Street Philadelphia, PA 19103 | | Chairman, President, Chief Executive Officer, and Trustee | | Chairman and Trustee since August 16, 2006 |
April 1963 | | | | President and Chief Executive Officer since August 1, 2006 |
Independent Trustees | | | | |
| | |
Thomas L. Bennett 2005 Market Street Philadelphia, PA 19103 October 1947 | | Trustee | | Since March 2005 |
Joseph W. Chow 2005 Market Street Philadelphia, PA 19103 January 1953 | | Trustee | | Since January 2013 |
John A. Fry 2005 Market Street Philadelphia, PA 19103 May 1960 | | Trustee | | Since January 2001 |
| 1 | Patrick P. Coyne is considered to be an “Interested Trustee “because he is an executive officer of the Fund’s(s’) investment advisor. |
47
for shareholder interests. Each trustee has served in that capacity since he or she was elected to or appointed to the Board of Trustees, and will continue to serve until his or her retirement or the election of a new trustee in his or her place. The following is a list of the Trustees and Officers with certain background and related information.
| | | | |
Principal Occupation(s) During Past 5 Years | | Number of Portfolios in Fund Complex Overseen by Trustee or Officer | | Other Directorships Held by Trustee or Officer |
| | | | |
Patrick P. Coyne has served in various executive capacities at different times at Delaware Investments.2 | | 70 | | Board of Governors Member Investment Company Institute (ICI) Director and Audit Committee Member Kaydon Corp. (2007–2013) |
| | | | |
Private Investor (March 2004–Present) | | 70 | | Director Bryn Mawr Bank Corp. (BMTC) (2007–2011) |
Executive Vice President (Emerging Economies Strategies, Risk and Corporate Administration) State Street Corporation (July 2004–March 2011) | | 70 | | Director and Audit Committee Member — Hercules Technology Growth Capital, Inc. |
President Drexel University (August 2010–Present) President Franklin & Marshall College (July 2002–July 2010) | | 70 | | Director — Hershey Trust Director and Audit Committee Member Community Health Systems |
| 2 | Delaware Investments is the marketing name for Delaware Management Holdings, Inc. and its subsidiaries, including the Fund’s(s’) investment advisor, principal underwriter, and its transfer agent. |
48
Board of trustees / directors and officers addendum
Delaware Investments® Family of Funds
| | | | |
Name, Address, and Birth Date | | Position(s) Held with Fund(s) | | Length of
Time Served |
Independent Trustees (continued) |
Lucinda S. Landreth | | Trustee | | Since March 2005 |
2005 Market Street | | | | |
Philadelphia, PA 19103 | | | | |
June 1947 | | | | |
Frances A. Sevilla-Sacasa | | Trustee | | Since September 2011 |
2005 Market Street | | | | |
Philadelphia, PA 19103 | | | | |
January 1956 | | | | |
| | |
| | | | | |
Thomas K. Whitford | | Trustee | | Since January 2013 |
2005 Market Street | | | | |
Philadelphia, PA 19103 | | | | |
March 1956 | | | | |
| | |
| | | | | |
49
| | | | |
| | Number of Portfolios in | | |
Principal Occupation(s) | | Fund Complex Overseen | | Other Directorships |
During Past 5 Years | | by Trustee or Officer | | Held by Trustee or Officer |
| | |
| | | | |
| | |
Private Investor (2004–Present) | | 70 | | None |
| | |
Chief Executive Officer — Banco Itaú International (April 2012–Present) | | 70 | | Trust Manager and Audit Committee Member — Camden Property Trust |
| | |
Executive Advisor to Dean (August 2011–March 2012) and Interim Dean | | | | |
(January 2011–July 2011) — University of Miami School of Business Administration | | | | |
| | |
President — U.S. Trust, Bank of America Private Wealth Management (Private Banking) (July 2007–December 2008) | | | | |
| | |
Vice Chairman (2010–April 2013) Chief Administrative Officer (2008–2010) and Executive Vice President and Chief Administrative Officer (2007–2009) — PNC Financial Services Group | | 70 | | Director — HSBC Finance Corporation and HSBC North America Holdings Inc. |
50
Board of trustees / directors and officers addendum
Delaware Investments® Family of Funds
| | | | |
Name, Address, | | Position(s) | | Length of |
and Birth Date | | Held with Fund(s) | | Time Served |
Independent Trustees (continued) | | | | |
Janet L. Yeomans | | Trustee | | Since April 1999 |
2005 Market Street | | | | |
Philadelphia, PA 19103 | | | | |
July 1948 | | | | |
| | |
| | | | |
J. Richard Zecher | | Trustee | | Since March 2005 |
2005 Market Street | | | | |
Philadelphia, PA 19103 | | | | |
July 1940 | | | | |
| | |
| | | | | |
51
| | | | |
| | Number of Portfolios in | | |
Principal Occupation(s) | | Fund Complex Overseen | | Other Directorships |
During Past 5 Years | | by Trustee or Officer | | Held by Trustee or Officer |
| | | | |
| | | | |
Vice President and Treasurer | | 70 | | Director, Audit |
(January 2006–July 2012) | | | | Committee Chair, Investment |
Vice President — | | | | Committee Member, |
Mergers & Acquisitions | | | | and Governance |
(January 2003–January 2006), | | | | Committee Member |
and Vice President | | | | Okabena Company |
and Treasurer | | | | |
(July 1995–January 2003) | | | | Chair — 3M |
3M Corporation | | | | Investment Management |
| | | | Company |
| | | | | (2005–2012) |
Founder | | 70 | | Director and Compensation |
Investor Analytics | | | | Committee Member |
(Risk Management) | | | | Investor Analytics |
(May 1999–Present) | | | | |
| | |
| | | | Director — P/E Investments |
| | |
Founder | | | | |
P/E Investments | | | | |
(Hedge Fund) | | | | |
(September 1996–Present) | | | | |
52
Board of trustees / directors and officers addendum
Delaware Investments® Family of Funds
| | | | |
Name, Address, and Birth Date | | Position(s) Held with Fund(s) | | Length of Time Served |
Officers | | | | |
| | |
David F. Connor | | Senior Vice President, | | Senior Vice President, |
2005 Market Street | | Deputy General | | Deputy General Counsel |
Philadelphia, PA 19103 | | Counsel, and Secretary | | since May 2013; |
December 1963 | | | | Vice President, Deputy |
| | | | General Counsel |
| | | | September 2000 – |
| | | | May 2013; Secretary since |
| | | | | October 2005 |
Daniel V. Geatens | | Vice President | | Treasurer since October 2007 |
2005 Market Street | | and Treasurer | | |
Philadelphia, PA 19103 | | | | |
October 1972 | | | | |
David P. O’Connor | | Executive Vice President, | | Executive Vice President |
2005 Market Street | | General Counsel | | since February 2012; |
Philadelphia, PA 19103 | | and Chief Legal Officer | | Senior Vice President |
February 1966 | | | | October 2005 – |
| | | | February 2012; |
| | | | General Counsel and |
| | | | Chief Legal Officer |
| | | | | since October 2005 |
Richard Salus | | Senior Vice President | | Chief Financial Officer |
2005 Market Street | | and Chief Financial Officer | | since November 2006 |
Philadelphia, PA 19103 | | | | |
October 1963 | | | | |
The Statement of Additional Information for the Fund(s) includes additional information about the Trustees and Officers and is available, without charge, upon request by calling 800 523-1918.
53
| | | | |
Principal Occupation(s) During Past 5 Years | | Number of Portfolios in Fund Complex Overseen by Trustee or Officer | | Other Directorships Held by Trustee or Officer |
| | | | |
David F. Connor has served as | | 70 | | None3 |
Deputy General Counsel of | | | | |
Delaware Investments since 2000. | | | | |
Daniel V. Geatens has served | | 70 | | None3 |
in various capacities at different times at | | | | |
Delaware Investments. | | | | |
David P. O’Connor has served | | 70 | | None3 |
in various executive and legal capacities at different times at Delaware Investments. | | | | |
Richard Salus has served in | | 70 | | None3 |
various executive capacities at different times at Delaware Investments. | | | | |
| 3 | David F. Connor, Daniel V. Geatens, David P. O’Connor, and Richard Salus serve in similar capacities for the six portfolios of the Optimum Fund Trust, which have the same investment advisor, principal underwriter, and transfer agent as the registrant. |
54
About the organization
| | | | | | |
Board of trustees | | | | |
| Patrick P. Coyne | | Joseph W. Chow | | Lucinda S. Landreth | | Thomas K. Whitford |
| Chairman, President, and | | Former Executive Vice | | Former Chief Investment | | Former Vice Chairman |
| Chief Executive Officer | | President | | Officer | | PNC Financial Services Group |
| Delaware Investments® | | State Street Corporation | | Assurant, Inc. | | Pittsburgh, PA |
| Family of Funds | | Brookline, MA | | Philadelphia, PA | | |
| Philadelphia, PA | | | | | | Janet L. Yeomans |
| | John A. Fry | | Frances A. | | Former Vice President |
| Thomas L. Bennett | | President | | Sevilla-Sacasa | | and Treasurer |
| Private Investor | | Drexel University | | Chief Executive Officer | | 3M Corporation |
| Rosemont, PA | | Philadelphia, PA | | Banco Itaú | | St. Paul, MN |
| | | | International Miami, FL | | J. Richard Zecher |
| | | | | Founder |
| | | | | | Investor Analytics |
| | | | | | Scottsdale, AZ |
| | |
| Affiliated officers | | | | |
| | | |
| David F. Connor | | Daniel V. Geatens | | David P. O’Connor | | Richard Salus |
| Senior Vice President, | | Vice President and | | Executive Vice President, | | Senior Vice President and |
| Deputy General Counsel, | | Treasurer | | General Counsel, | | Chief Financial Officer |
| and Secretary | | Delaware Investments | | and Chief Legal Officer | | Delaware Investments |
| Delaware Investments | | Family of Funds | | Delaware Investments | | Family of Funds |
| Family of Funds | | Philadelphia, PA | | Family of Funds | | Philadelphia, PA |
| Philadelphia, PA | | | | Philadelphia, PA | | |
This annual report is for the information of Delaware Inflation Protected Bond Fund shareholders, but it may be used with prospective investors when preceded or accompanied by the Delaware Investments Fund fact sheet for the most recently completed calendar quarter. These documents are available at delawareinvestments.com.
Delaware Investments is the marketing name of Delaware Management Holdings, Inc. and its subsidiaries.
The Fund files its complete schedule of portfolio holdings with the Securities and Exchange Commission (SEC) for the first and third quarters of each fiscal year on Form N-Q. The Fund’s Forms N-Q, as well as a description of the policies and procedures that the Fund uses to determine how to vote proxies (if any) relating to portfolio securities are available without charge (i) upon request, by calling 800 523-1918; and (ii) on the SEC’s website at sec.gov. In addition, a description of the policies and procedures that the Fund uses to determine how to vote proxies (if any) relating to portfolio securities and the Fund’s Schedule of Investments are available without charge on the Fund’s website at delawareinvestments.com. The Fund’s Forms N-Q may be reviewed and copied at the SEC’s Public Reference Room in Washington, D.C.; information on the operation of the Public Reference Room may be obtained by calling 800 SEC-0330.
Information (if any) regarding how the Fund voted proxies relating to portfolio securities during the most recently disclosed 12-month period ended June 30 is available without charge (i) through the Fund’s website at delawareinvestments.com; and (ii) on the SEC’s website at sec.gov.
55
Item 2. Code of Ethics
The registrant has adopted a code of ethics that applies to the registrant’s principal executive officer, principal financial officer, principal accounting officer or controller, or persons performing similar functions, regardless of whether these individuals are employed by the registrant or a third party. A copy of the registrant’s Code of Business Ethics has been posted on the Delaware Investments Internet Web site at www.delawareinvestments.com. Any amendments to the Code of Business Ethics, and information on any waiver from its provisions granted by the registrant, will also be posted on this Web site within five business days of such amendment or waiver and will remain on the Web site for at least 12 months.
Item 3. Audit Committee Financial Expert
The registrant’s Board of Trustees/Directors has determined that certain members of the registrant’s Audit Committee are audit committee financial experts, as defined below. For purposes of this item, an “audit committee financial expert” is a person who has the following attributes:
a. An understanding of generally accepted accounting principles and financial statements;
b. The ability to assess the general application of such principles in connection with the accounting for estimates, accruals, and reserves;
c. Experience preparing, auditing, analyzing, or evaluating financial statements that present a breadth and level of complexity of accounting issues that are generally comparable to the breadth and complexity of issues that can reasonably be expected to be raised by the registrant’s financial statements, or experience actively supervising one or more persons engaged in such activities;
d. An understanding of internal controls and procedures for financial reporting; and
e. An understanding of audit committee functions.
An “audit committee financial expert” shall have acquired such attributes through:
a. Education and experience as a principal financial officer, principal accounting officer, controller, public accountant, or auditor or experience in one or more positions that involve the performance of similar functions;
b. Experience actively supervising a principal financial officer, principal accounting officer, controller, public accountant, auditor, or person performing similar functions;
c. Experience overseeing or assessing the performance of companies or public accountants with respect to the preparation, auditing, or evaluation of financial statements; or
d. Other relevant experience.
The registrant’s Board of Trustees/Directors has also determined that each member of the registrant’s Audit Committee is independent. In order to be “independent” for purposes of this item, the Audit Committee member may not: (i) other than in his or her capacity as a member of the Board of Trustees/Directors or any committee thereof, accept directly or indirectly any consulting, advisory or other compensatory fee from the issuer; or (ii) be an “interested person” of the registrant as defined in Section 2(a)(19) of the Investment Company Act of 1940.
The names of the audit committee financial experts on the registrant’s Audit Committee are set forth below:
Joseph W. Chow
Lucinda S. Landreth1
Frances A. Sevilla-Sacasa
Janet L. Yeomans
Item 4. Principal Accountant Fees and Services
(a) Audit fees.
The aggregate fees billed for services provided to the registrant by its independent auditors for the audit of the registrant’s annual financial statements and for services normally provided by the independent auditors in connection with statutory and regulatory filings or engagements were $114,005 for the fiscal year ended July 31, 2014.
The aggregate fees billed for services provided to the registrant by its independent auditors for the audit of the registrant’s annual financial statements and for services normally provided by the independent auditors in connection with statutory and regulatory filings or engagements were $67,970 for the fiscal year ended July 31, 2013.
(b) Audit-related fees.
The aggregate fees billed by the registrant’s independent auditors for services relating to the performance of the audit of the registrant’s financial statements and not reported under paragraph (a) of this Item were $0 for the fiscal year ended July 31, 2014.
The aggregate fees billed by the registrant’s independent auditors for services relating to the performance of the audit of the financial statements of the registrant’s investment adviser and other service providers under common control with the adviser and that relate directly to the operations or financial reporting of the registrant were $618,000 for the registrant’s fiscal year ended July 31, 2014. The percentage of these fees relating to services approved by the registrant’s Audit Committee pursuant to the de minimis exception from the pre-approval requirement in Rule 2-01(c)(7)(i)(C) of Regulation S-X was 0%. These audit-related services were as follows: year end audit procedures; group reporting and subsidiary statutory audits.
The aggregate fees billed by the registrant’s independent auditors for services relating to the performance of the audit of the registrant’s financial statements and not reported under paragraph (a) of this Item were $0 for the fiscal year ended July 31, 2013.
____________________
1 The instructions to Form N-CSR require disclosure on the relevant experience of persons who qualify as audit committee financial experts based on “other relevant experience.” The Board of Trustees/Directors has determined that Ms. Landreth qualifies as an audit committee financial expert by virtue of her experience as a financial analyst, her Chartered Financial Analyst (CFA) designation and her service as an audit committee chairperson for a non-profit organization.
The aggregate fees billed by the registrant’s independent auditors for services relating to the performance of the audit of the financial statements of the registrant’s investment adviser and other service providers under common control with the adviser and that relate directly to the operations or financial reporting of the registrant were $618,000 for the registrant’s fiscal year ended July 31, 2013. The percentage of these fees relating to services approved by the registrant’s Audit Committee pursuant to the de minimis exception from the pre-approval requirement in Rule 2-01(c)(7)(i)(C) of Regulation S-X was 0%. These audit-related services were as follows: year end audit procedures; group reporting and subsidiary statutory audits.
(c) Tax fees.
The aggregate fees billed by the registrant’s independent auditors for tax-related services provided to the registrant were $13,218 for the fiscal year ended July 31, 2014. The percentage of these fees relating to services approved by the registrant’s Audit Committee pursuant to the de minimis exception from the pre-approval requirement in Rule 2-01(c)(7)(i)(C) of Regulation S-X was 0%. These tax-related services were as follows: review of income tax returns and review of annual excise distribution calculations.
The aggregate fees billed by the registrant’s independent auditors for tax-related services provided to the registrant’s investment adviser and other service providers under common control with the adviser and that relate directly to the operations or financial reporting of the registrant were $0 for the registrant’s fiscal year ended July 31, 2014.
The aggregate fees billed by the registrant’s independent auditors for tax-related services provided to the registrant were $9,700 for the fiscal year ended July 31, 2013. The percentage of these fees relating to services approved by the registrant’s Audit Committee pursuant to the de minimis exception from the pre-approval requirement in Rule 2-01(c)(7)(i)(C) of Regulation S-X was 0%. These tax-related services were as follows: review of income tax returns and review of annual excise distribution calculations.
The aggregate fees billed by the registrant’s independent auditors for tax-related services provided to the registrant’s investment adviser and other service providers under common control with the adviser and that relate directly to the operations or financial reporting of the registrant were $0 for the registrant’s fiscal year ended July 31, 2013.
(d) All other fees.
The aggregate fees billed for all services provided by the independent auditors to the registrant other than those set forth in paragraphs (a), (b) and (c) of this Item were $0 for the fiscal year ended July 31, 2014.
The aggregate fees billed for all services other than those set forth in paragraphs (b) and (c) of this Item provided by the registrant’s independent auditors to the registrant’s adviser and other service providers under common control with the adviser and that relate directly to the operations or financial reporting of the registrant were $0 for the registrant’s fiscal year ended July 31, 2014. The percentage of these fees relating to services approved by the registrant’s Audit Committee pursuant to the de minimis exception from the pre-approval requirement in Rule 2-01(c)(7)(i)(C) of Regulation S-X was 0%.
The aggregate fees billed for all services provided by the independent auditors to the registrant other than those set forth in paragraphs (a), (b) and (c) of this Item were $0 for the fiscal year ended July 31, 2013.
The aggregate fees billed for all services other than those set forth in paragraphs (b) and (c) of this Item provided by the registrant’s independent auditors to the registrant’s adviser and other service providers under common control with the adviser and that relate directly to the operations or financial reporting of the registrant were $0 for the registrant’s fiscal year ended July 31, 2013. The percentage of these fees relating to services approved by the registrant’s Audit Committee pursuant to the de minimis exception from the pre-approval requirement in Rule 2-01(c)(7)(i)(C) of Regulation S-X was 0%.
(e) The registrant’s Audit Committee has established pre-approval policies and procedures as permitted by Rule 2-01(c)(7)(i)(B) of Regulation S-X (the “Pre-Approval Policy”) with respect to services provided by the registrant’s independent auditors. Pursuant to the Pre-Approval Policy, the Audit Committee has pre-approved the services set forth in the table below with respect to the registrant up to the specified fee limits. Certain fee limits are based on aggregate fees to the registrant and other registrants within the Delaware Investments Family of Funds.
| Service | Range of Fees |
| Audit Services | |
| Statutory audits or financial audits for new Funds | up to $40,000 per Fund |
| Services associated with SEC registration statements (e.g., Form N-1A, Form N-14, etc.), periodic reports and other documents filed with the SEC or other documents issued in connection with securities offerings (e.g., comfort letters for closed-end Fund offerings, consents), and assistance in responding to SEC comment letters | up to $10,000 per Fund |
| Consultations by Fund management as to the accounting or disclosure treatment of transactions or events and/or the actual or potential impact of final or proposed rules, standards or interpretations by the SEC, FASB, or other regulatory or standard-setting bodies (Note: Under SEC rules, some consultations may be considered “audit-related services” rather than “audit services”) | up to $25,000 in the aggregate |
| Audit-Related Services | |
| Consultations by Fund management as to the accounting or disclosure treatment of transactions or events and /or the actual or potential impact of final or proposed rules, standards or interpretations by the SEC, FASB, or other regulatory or standard-setting bodies (Note: Under SEC rules, some consultations may be considered “audit services” rather than “audit-related services”) | up to $25,000 in the aggregate |
| Tax Services | |
| U.S. federal, state and local and international tax planning and advice (e.g., consulting on statutory, regulatory or administrative developments, evaluation of Funds’ tax compliance function, etc.) | up to $25,000 in the aggregate |
| U.S. federal, state and local tax compliance (e.g., excise distribution reviews, etc.) | up to $5,000 per Fund |
| Review of federal, state, local and international income, franchise and other tax returns | up to $5,000 per Fund |
Under the Pre-Approval Policy, the Audit Committee has also pre-approved the services set forth in the table below with respect to the registrant’s investment adviser and other entities controlling, controlled by or under common control with the investment adviser that provide ongoing services to the registrant (the “Control Affiliates”) up to the specified fee limit. This fee limit is based on aggregate fees to the investment adviser and its Control Affiliates.
| Service | Range of Fees |
| Non-Audit Services | |
| Services associated with periodic reports and other documents filed with the SEC and assistance in responding to SEC comment letters | up to $10,000 in the aggregate |
The Pre-Approval Policy requires the registrant’s independent auditors to report to the Audit Committee at each of its regular meetings regarding all services initiated since the last such report was rendered, including those services authorized by the Pre-Approval Policy.
(f) Not applicable.
(g) The aggregate non-audit fees billed by the registrant’s independent auditors for services rendered to the registrant and to its investment adviser and other service providers under common control with the adviser were $8,090,937 and $8,891,311 for the registrant’s fiscal years ended July 31, 2014 and July 31, 2013, respectively.
(h) In connection with its selection of the independent auditors, the registrant’s Audit Committee has considered the independent auditors’ provision of non-audit services to the registrant’s investment adviser and other service providers under common control with the adviser that were not required to be pre-approved pursuant to Rule 2-01(c)(7)(ii) of Regulation S-X. The Audit Committee has determined that the independent auditors’ provision of these services is compatible with maintaining the auditors’ independence.
Item 5. Audit Committee of Listed Registrants
Not applicable.
Item 6. Investments
(a) Included as part of report to shareholders filed under Item 1 of this Form N-CSR.
(b) Divestment of securities in accordance with Section 13(c) of the Investment Company Act of 1940.
Not applicable.
Item 7. Disclosure of Proxy Voting Policies and Procedures for Closed-End Management Investment Companies
Not applicable.
Item 8. Portfolio Managers of Closed-End Management Investment Companies
Not applicable.
Item 9. Purchases of Equity Securities by Closed-End Management Investment Company and Affiliated Purchasers
Not applicable.
Item 10. Submission of Matters to a Vote of Security Holders
Not applicable.
Item 11. Controls and Procedures
The registrant’s principal executive officer and principal financial officer have evaluated the registrant’s disclosure controls and procedures within 90 days of the filing of this report and have concluded that they are effective in providing reasonable assurance that the information required to be disclosed by the registrant in its reports or statements filed under the Securities Exchange Act of 1934 is recorded, processed, summarized and reported within the time periods specified in the rules and forms of the Securities and Exchange Commission.
There were no significant changes in the registrant’s internal control over financial reporting that occurred during the second fiscal quarter of the period covered by the report to stockholders included herein (i.e., the registrant’s fourth fiscal quarter) that have materially affected, or are reasonably likely to materially affect, the registrant’s internal control over financial reporting.
Item 12. Exhibits
| (a) | (1) Code of Ethics |
| |
| Not applicable. |
| |
| (2) Certifications of Principal Executive Officer and Principal Financial Officer pursuant to Rule 30a-2 under the Investment Company Act of 1940 are attached hereto as Exhibit 99.CERT. |
| | |
| (3) Written solicitations to purchase securities pursuant to Rule 23c-1 under the Securities Exchange Act of 1934. |
| |
| Not applicable. |
| |
| (b) | Certifications pursuant to Section 906 of the Sarbanes-Oxley Act of 2002 are furnished herewith as Exhibit 99.906CERT. |
SIGNATURES
Pursuant to the requirements of the Securities Exchange Act of 1934 and the Investment Company Act of 1940, the registrant has duly caused this report to be signed on its behalf, by the undersigned, thereunto duly authorized.
DELAWARE GROUP® GOVERNMENT FUND
| /s/ PATRICK P. COYNE |
| By: | | Patrick P. Coyne |
| Title: | | Chief Executive Officer |
| Date: | | October 1, 2014 |
Pursuant to the requirements of the Securities Exchange Act of 1934 and the Investment Company Act of 1940, this report has been signed below by the following persons on behalf of the registrant and in the capacities and on the dates indicated.
| /s/ PATRICK P. COYNE |
| By: | | Patrick P. Coyne |
| Title: | | Chief Executive Officer |
| Date: | | October 1, 2014 |
| |
| /s/ RICHARD SALUS |
| By: | | Richard Salus |
| Title: | | Chief Financial Officer |
| Date: | | October 1, 2014 |