UNITED STATES SECURITIES AND EXCHANGE COMMISSION
Washington, D.C. 20549
FORM N-CSR
CERTIFIED SHAREHOLDER REPORT OF REGISTERED MANAGEMENT
INVESTMENT COMPANIES
| Investment Company Act file number: | 811-04304 | |
| Exact name of registrant as specified in charter: | Delaware Group® Government Fund | |
| Address of principal executive offices: | 2005 Market Street | |
| Philadelphia, PA 19103 | ||
| Name and address of agent for service: | David F. Connor, Esq. | |
| 2005 Market Street | ||
| Philadelphia, PA 19103 | ||
| Registrant’s telephone number, including area code: | (800) 523-1918 | |
| Date of fiscal year end: | July 31 | |
| Date of reporting period: | July 31, 2015 |
Item 1. Reports to Stockholders
Table of Contents

Annual report
Fixed income mutual fund
Delaware Core Plus Bond Fund
July 31, 2015
Carefully consider the Fund’s investment objectives, risk factors, charges, and expenses before investing. This and other information can be found in the Fund’s prospectus and its summary prospectus, which may be obtained by visiting delawareinvestments.com or calling 800 523-1918. Investors should read the prospectus and the summary prospectus carefully before investing.
You can obtain shareholder reports and prospectuses online instead of in the mail.
Visit delawareinvestments.com/edelivery.
Table of Contents
Experience Delaware Investments
Delaware Investments is committed to the pursuit of consistently superior asset management and unparalleled client service. We believe in our investment processes, which seek to deliver consistent results, and in convenient services that help add value for our clients.
If you are interested in learning more about creating an investment plan, contact your financial advisor.
You can learn more about Delaware Investments or obtain a prospectus for Delaware Core Plus Bond Fund at delawareinvestments.com.
Manage your investments online
| ● | 24-hour access to your account information |
| ● | Obtain share prices |
| ● | Check your account balance and recent transactions |
| ● | Request statements or literature |
| ● | Make purchases and redemptions |
Delaware Management Holdings, Inc. and its subsidiaries (collectively known by the marketing name of Delaware Investments) are wholly owned subsidiaries of Macquarie Group Limited, a global provider of banking, financial, advisory, investment, and funds management services.
Neither Delaware Investments nor its affiliates noted in this document are authorized deposit-taking institutions for the purpose of the Banking Act 1959 (Commonwealth of Australia). The obligations of these entities do not represent deposits or other liabilities of Macquarie Bank Limited (MBL). MBL does not guarantee or otherwise provide assurance in respect of the obligations of these entities, unless noted otherwise.
| 1 | ||||
| 3 | ||||
| 7 | ||||
| 9 | ||||
| 10 | ||||
| 38 | ||||
| 40 | ||||
| 42 | ||||
| 44 | ||||
| 52 | ||||
| 71 | ||||
| 72 | ||||
| 78 | ||||
| 86 |
Unless otherwise noted, views expressed herein are current as of July 31, 2015, and subject to change for events occurring after such date.
Funds are not FDIC insured and are not guaranteed. It is possible to lose the principal amount invested.
Mutual fund advisory services provided by Delaware Management Company, a series of Delaware Management Business Trust, which is a registered investment advisor. Delaware Investments, a member of Macquarie Group, refers to Delaware Management Holdings, Inc. and its subsidiaries, including the Fund’s distributor, Delaware Distributors, L.P. Macquarie Group refers to Macquarie Group Limited and its subsidiaries and affiliates worldwide.
© 2015 Delaware Management Holdings, Inc.
All third-party marks cited are the property of their respective owners.
Table of Contents
| Portfolio management review | ||
| Delaware Core Plus Bond Fund | August 11, 2015 | |
| Performance preview (for the year ended July 31, 2015) | ||||||||
Delaware Core Plus Bond Fund (Class A shares) | 1-year return | +1.65% | ||||||
Barclays U.S. Aggregate Index (benchmark) | 1-year return | +2.82% | ||||||
Past performance does not guarantee future results.
For complete, annualized performance for Delaware Core Plus Bond Fund, please see the table on page 3.
The performance of Class A shares excludes the applicable sales charge and reflects the reinvestment of all distributions.
For a description of the index, please see page 6.
Index performance returns do not reflect any management fees, transaction costs, or expenses. Indices are unmanaged and one cannot invest directly in an index.
The significant downturn in oil and oil-related products and services took a toll on high yield bonds in the second half of 2014. With energy-related issues accounting for approximately 15% of the high yield market, the increased risk of these investments resulted in yield premiums widening significantly on high yield bonds. The high yield sector steadied somewhat as oil partly recovered in the first half of 2015. However, toward the end of the Fund’s fiscal year ended July 31, 2015, oil renewed its downturn, this time driving a widening spread of risk premiums on high-quality corporate bonds as well.
An increase in equity-friendly activity has hurt debt markets. Companies have been issuing debt to pay larger dividends to shareholders or to buy back stock. Additionally, recent mergers and acquisitions have generally been financed with debt rather than cash. The resulting increase in debt issues drove down prices and credit quality.
Within the Fund
For the fiscal year ended July 31, 2015, Delaware Core Plus Bond Fund (Class A shares) returned +1.65% at net asset value and -2.91% at maximum offer price (both returns reflect all distributions reinvested). During the same period, the Fund’s benchmark, the Barclays U.S. Aggregate Index, returned +2.82%. For complete annualized performance of Delaware Core Plus Bond Fund, please see the table on page 3.
The largest detractors from the Fund’s performance included both its high yield exposure and energy sector allocation. We entered the fiscal year with 24% allocated to high yield investments (rated BB and below). As the high yield market deteriorated, we reduced the Fund’s allocation and ended 2014 with 13% in high yield issues, a level that we then maintained through the remainder of the fiscal year. Because the benchmark index doesn’t include high yield bonds, the Fund’s high yield assets generally hurt relative performance.
Energy-related assets made up 9% of the Fund at the start of the fiscal year. To attempt to manage risk, we reduced that allocation to 6% by December and 4.5% by the end of the period. Energy holdings cost the Fund 0.4% relative to the index. Specific energy holdings that detracted from performance included SandRidge Energy, Samson, and Talisman, which we are in the process of exiting. Within the metals and mining sector, FMG Resources also hurt performance.
Additionally, the Fund’s emerging markets exposure averaged approximately 5%. During the fiscal year, the Fund’s holdings in that asset class declined 1%, detracting from performance compared to the Barclays U.S. Aggregate Index. The Fund also had a small amount of local currency exposure, ranging between 1% and 2% of the Fund’s portfolio. Given the strength of the U.S. dollar during the fiscal year, any exposure to other currencies tended to hurt overall returns.
1
Table of Contents
Portfolio management review
Delaware Core Plus Bond Fund
Convertible bonds made up only 1% of holdings, but the sector’s exposure detracted slightly, declining 1.5%. Additionally, an underweight in U.S. Treasurys detracted from performance; however, curve position helped somewhat as the yield curve flattened.
The Fund also lost nearly 0.2% of relative performance after providing for a potential loss on a General Motors term loan dating back to the firm’s 2009 bankruptcy. Investors – including the Fund – were initially paid 100 cents on the dollar for the loan and the matter was thought to have been settled. However, a creditor group later found a clerical error in the classification of these loans, which initially were considered senior loans with an attachment to assets. The creditors claimed that because of the clerical error, the loans were never attached to GM assets. A recent court ruling upheld that claim, and we made a provision for a possible loss as an extraordinary item.
The Fund’s high-quality investment grade corporate bonds outperformed the benchmark’s sub-sector during the fiscal year. Finance, industrials, and utilities all contributed to the Fund’s performance.
An overweight to banks helped the Fund’s financial holdings outpace the benchmark’s sector by nearly a percentage point, including JPMorgan Chase & Co., Wells Fargo, and Morgan Stanley. The Fund’s real estate investment trust (REIT) exposure helped as well. Electric utilities generated almost 0.2% of outperformance for the Fund, in part due to holdings in AES Gener and Enel.
Mortgage-backed securities also contributed to performance. The Fund benefited from both our allocation and our barbell approach (that is, combining long-term bonds and short-term bonds in an attempt to seek better risk-adjusted returns in the process). With the yield curve flattening and interest rates coming down, especially in the 5-and 10-year areas of the yield curve, mortgage rates came down a bit and prepayment
opportunities increased slightly. Because the middle range of the market had greater exposure to prepayment risk, we effectively positioned the Fund’s holdings to either side, thus largely avoiding the middle range.
As we enter the new fiscal year, the Fund is heading toward a more conservative allocation. We are lowering the Fund’s exposure to traditional high yield bonds, and we are applying some credit default swap index protection to lower that exposure even further. We reduced the Fund’s emerging market bond holdings near the end of the fiscal year. Slower global growth has depressed the price of commodities. Another downturn in the energy complex, particularly in oil, has hurt the companies involved as well as emerging market nations, particularly those that produce oil. All of this, in our view, underscores the need for the Fund to be more conservatively positioned.
Additionally, earnings growth has slowed significantly at the same time that it has become more challenging for companies to grow revenue. Year-over-year corporate revenue has declined for both high yield and investment grade firms, which we believe presents another challenge for the Fund.
About derivatives use
The Fund used several forms of derivatives; however, they did not have a material effect on performance (that is, more than 0.50 percentage points). The Fund used interest rate futures to hedge for a short period when interest rates climbed modestly. We also used futures in an effort to hedge or neutralize the Fund’s exposure to corporate investments, including 5-, 7-, and 10-year corporate maturities, which could heighten risk as the yield curve flattens. These Treasury futures added 0.13% of relative performance. We also used credit default swap protection near the end of the fiscal year in an effort to reduce risk exposure in the high yield space and in emerging markets.
2
Table of Contents
| Performance summary | ||
| Delaware Core Plus Bond Fund | July 31, 2015 | |
The performance data quoted represent past performance; past performance does not guarantee future results. Investment return and principal value will fluctuate so your shares, when redeemed, may be worth more or less than their original cost. Please obtain the performance data current for the most recent month end by calling 800 523-1918 or visiting our website at delawareinvestments.com/performance. Current performance may be lower or higher than the performance data quoted.
Fund and benchmark performance1,2
| Average annual total returns through July 31, 2015
| |||||||||||
| 1 year | 5 years | 10 years | ||||||||||
Class A (Est. Aug. 16, 1985) | ||||||||||||
Excluding sales charge | +1.65% | +3.76% | +5.07% | |||||||||
Including sales charge | –2.91% | +2.80% | +4.59% | |||||||||
Class C (Est. Nov. 29, 1995) | ||||||||||||
Excluding sales charge | +0.89% | +2.99% | +4.31% | |||||||||
Including sales charge | –0.10% | +2.99% | +4.31% | |||||||||
Class R (Est. June 2, 2003) | ||||||||||||
Excluding sales charge | +1.40% | +3.52% | +4.84% | |||||||||
Including sales charge | +1.40% | +3.52% | +4.84% | |||||||||
Institutional Class (Est. June 1, 1992) | ||||||||||||
Excluding sales charge | +1.90% | +4.02% | +5.35% | |||||||||
Including sales charge | +1.90% | +4.02% | +5.35% | |||||||||
Barclays U.S. Aggregate Index | +2.82% | +3.27% | +4.61% | |||||||||
1 Returns reflect the reinvestment of all distributions and are presented both with and without the applicable sales charges described below. Returns do not reflect the deduction of taxes the shareholder would pay on Fund distributions or redemptions of Fund shares.
Expense limitations were in effect for certain classes during some or all of the periods shown in the “Fund and benchmark performance” table. Expenses for each class are listed on the “Fund expense ratios” table on page 5. Performance would have been lower had expense limitations not been in effect.
Class A shares are sold with a maximum front-end sales charge of 4.50%, and have an annual distribution and service fee of 0.25% of average daily net assets. The Board has adopted a formula for calculating 12b-1 plan fees for the Fund’s Class A shares. The Fund’s Class A shares are
currently subject to a blended 12b-1 fee equal to the sum of: (i) 0.10% of average daily net assets representing shares acquired prior to June 1, 1992, and (ii) 0.25% of average daily net assets representing shares acquired on or after June 1, 1992. All Class A shares currently bear 12b-1 fees at the same rate, the blended rate, currently 0.25% of average daily net assets, based on the formula described above. This method of calculating Class A 12b-1 fees may be discontinued at the sole discretion of the Board. Performance for Class A shares, excluding sales charges, assumes that no front-end sales charge applied.
Class C shares are sold with a contingent deferred sales charge of 1.00% if redeemed during the first 12 months. They are also subject to an annual distribution and service fee of 1.00% of average daily net assets. Performance for Class C shares,
3
Table of Contents
Performance summary
Delaware Core Plus Bond Fund
excluding sales charges, assumes either that contingent deferred sales charges did not apply or that the investment was not redeemed.
Class R shares are available only for certain retirement plan products. They are sold without a sales charge and have an annual distribution and service fee of 0.50% of average daily net assets.
Institutional Class shares are available without sales or asset-based distribution charges only to certain eligible institutional accounts.
Fixed income securities and bond funds can lose value, and investors can lose principal, as interest rates rise. They also may be affected by economic conditions that hinder an issuer’s ability to make interest and principal payments on its debt.
The Fund may also be subject to prepayment risk, the risk that the principal of a fixed income security that is held by the Fund may be prepaid prior to maturity, potentially forcing the Fund to reinvest that money at a lower interest rate.
High yielding, noninvestment grade bonds (junk bonds) involve higher risk than investment grade bonds. The high yield secondary market is particularly susceptible to liquidity problems when institutional investors, such as mutual funds and certain other financial institutions, temporarily stop buying bonds for regulatory, financial, or other reasons. In addition, a less liquid secondary market makes it more difficult for the Fund to obtain precise valuations of the high yield securities in its portfolio.
The Fund may invest in derivatives, which may involve additional expenses and are subject to risk, including the risk that an underlying security or securities index moves in the opposite direction from what the portfolio manager anticipated. A derivative transaction depends upon the counterparties’ ability to fulfill their contractual obligations.
International investments entail risks not ordinarily associated with U.S. investments including fluctuation in currency values, differences in
accounting principles, or economic or political instability in other nations.
Investing in emerging markets can be riskier than investing in established foreign markets due to increased volatility and lower trading volume.
If and when the Fund invests in forward foreign currency contracts or uses other investments to hedge against currency risks, the Fund will be subject to special risks, including counterparty risk.
The Fund may experience portfolio turnover in excess of 100%, which could result in higher transaction costs and tax liability.
Per Standard & Poor’s credit rating agency, bonds rated AA and A are more susceptible to the adverse effects of changes in circumstances and economic conditions than those in the higher-rated AAA category, but the obligor’s capacity to meet its financial commitment on the obligation is still strong. Bonds rated BBB exhibit adequate protection parameters, although adverse economic conditions or changing circumstances are more likely to lead to a weakened capacity of the obligor to meet its financial commitments. Bonds rated BB, B, and CCC are regarded as having significant speculative characteristics, with BB indicating the least degree of speculation of the three.
4
Table of Contents
2The Fund’s expense ratios, as described in the most recent prospectus, are disclosed in the following “Fund expense ratios” table. Delaware Management Company has agreed to reimburse certain expenses and/or waive certain fees in order to prevent total annual fund operating expenses (excluding any 12b-1 fees, taxes, interest, short sale and dividend interest expenses, brokerage fees, certain insurance costs, acquired fund fees and expenses, and nonroutine expenses or costs, including, but not limited to, those relating to reorganizations, litigation, conducting shareholder meetings, and liquidations (collectively, nonroutine expenses)) from exceeding 0.65% of the Fund’s average daily net assets during the period from Aug. 1, 2014 through July 31, 2015.* Please see the most recent prospectus and any applicable supplement(s) for additional information on these fee waivers and/or reimbursements.
| Fund expense ratios | Class A | Class C | Class R | Institutional Class | ||||||||||
Total annual operating expenses | 1.18% | 1.93% | 1.43% | 0.93% | ||||||||||
(without fee waivers) | ||||||||||||||
Net expenses | 0.90% | 1.65% | 1.15% | 0.65% | ||||||||||
(including fee waivers, if any) | ||||||||||||||
Type of waiver
| Contractual
| Contractual
| Contractual
| Contractual
|
*The contractual waiver period is from Nov. 27, 2013, through Nov. 30, 2015.
5
Table of Contents
Performance summary
Delaware Core Plus Bond Fund
Performance of a $10,000 investment1
Average annual total returns from July 31, 2005, through July 31, 2015
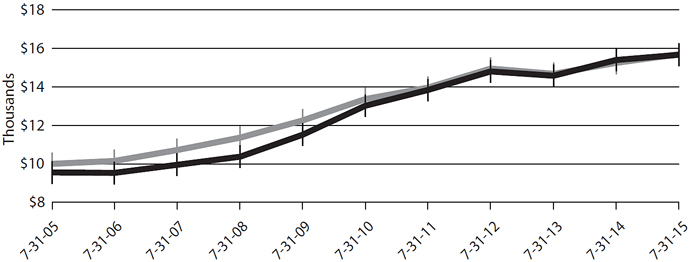
| For period beginning July 31, 2005, through July 31, 2015 | Starting value | Ending value | ||||||||
| $10,000 | $15,687 | ||||||||
| $9,550 | $15,665 | ||||||||
 Barclays U.S. Aggregate Index
 Delaware Core Plus Bond Fund — Class A shares
1The “Performance of a $10,000 investment” graph assumes $10,000 invested in Class A shares of the Fund on July 31, 2005, and includes the effect of a 4.50% front-end sales charge and the reinvestment of all distributions. The graph does not reflect the deduction of taxes the shareholders would pay on Fund distributions or redemptions of Fund shares. Expense limitations were in effect for some or all of the periods shown. Performance would have been lower had expense limitations not been in effect. Expenses are listed in the “Fund expense ratios” table on page 5. Please note additional details on pages 3 through 6.
The graph also assumes $10,000 invested in the Barclays U.S. Aggregate Index as of July 31, 2005. The Barclays U.S. Aggregate Index is a broad composite that tracks the investment grade domestic bond market.
Index performance returns do not reflect any management fees, transaction costs, or expenses. Indices are unmanaged and one cannot invest directly in an index. Past performance does not guarantee future results.
Performance of other Fund classes will vary due to different charges and expenses.
| Nasdaq symbols | CUSIPs | |||||||
Class A | DEGGX | 246094205 | ||||||
Class C | DUGCX | 246094700 | ||||||
Class R | DUGRX | 246094809 | ||||||
Institutional Class
| DUGIX
| 246094502
|
6
Table of Contents
For the six-month period from February 1, 2015 to July 31, 2015 (Unaudited)
As a shareholder of the Fund, you incur two types of costs: (1) transaction costs, including sales charges (loads) on purchase payments, reinvested dividends, or other distributions; redemption fees; and exchange fees; and (2) ongoing costs, including management fees; distribution and/or service (12b-1) fees; and other Fund expenses. This example is intended to help you understand your ongoing costs (in dollars) of investing in the Fund and to compare these costs with the ongoing costs of investing in other mutual funds.
The example is based on an investment of $1,000 invested at the beginning of the period and held for the entire six-month period from Feb. 1, 2015 to July 31, 2015.
Actual expenses
The first section of the table shown, “Actual Fund return,” provides information about actual account values and actual expenses. You may use the information in this section of the table, together with the amount you invested, to estimate the expenses that you paid over the period. Simply divide your account value by $1,000 (for example, an $8,600 account value divided by $1,000 = 8.6), then multiply the result by the number in the first section under the heading entitled “Expenses Paid During Period” to estimate the expenses you paid on your account during this period.
Hypothetical example for comparison purposes
The second section of the table shown, “Hypothetical 5% return,” provides information about hypothetical account values and hypothetical expenses based on the Fund’s actual expense ratio and an assumed rate of return of 5% per year before expenses, which is not the Fund’s actual return. The hypothetical account values and expenses may not be used to estimate the actual ending account balance or expenses you paid for the period. You may use this information to compare the ongoing costs of investing in the Fund and other funds. To do so, compare this 5% hypothetical example with the 5% hypothetical examples that appear in the shareholder reports of the other funds.
Please note that the expenses shown in the table are meant to highlight your ongoing costs only and do not reflect any transactional costs, such as sales charges (loads), redemption fees, or exchange fees. Therefore, the second section of the table is useful in comparing ongoing costs only, and will not help you determine the relative total costs of owning different funds. In addition, if these transactional costs were included, your costs would have been higher. The Fund’s expenses shown in the table reflect fee waivers in effect. The expenses shown in the table assume reinvestment of all dividends and distributions.
7
Table of Contents
Disclosure of Fund expenses
For the six-month period from February 1, 2015 to July 31, 2015 (Unaudited)
Delaware Core Plus Bond Fund
Expense analysis of an investment of $1,000
Beginning
Account Value
2/1/15 | Ending
Account Value
7/31/15 | Annualized
Expense Ratio | Expenses
Paid During Period
2/1/15 to 7/31/15* | |||||||||||||||||
Actual Fund return† | ||||||||||||||||||||
Class A | $1,000.00 | $983.60 | 0.92% | $4.52 | ||||||||||||||||
Class C | 1,000.00 | 980.00 | 1.67% | 8.20 | ||||||||||||||||
Class R | 1,000.00 | 982.50 | 1.17% | 5.75 | ||||||||||||||||
Institutional Class | 1,000.00 | 984.90 | 0.67% | 3.30 | ||||||||||||||||
Hypothetical 5% return (5% return before expenses) | ||||||||||||||||||||
Class A | $1,000.00 | $1,020.23 | 0.92% | $4.61 | ||||||||||||||||
Class C | 1,000.00 | 1,016.51 | 1.67% | 8.35 | ||||||||||||||||
Class R | 1,000.00 | 1,018.99 | 1.17% | 5.86 | ||||||||||||||||
Institutional Class | 1,000.00 | 1,021.47 | 0.67% | 3.36 | ||||||||||||||||
| * | “Expenses Paid During Period” are equal to the Fund’s annualized expense ratio, multiplied by the average account value over the period, multiplied by 181/365 (to reflect the one-half year period). |
| † | Because actual returns reflect only the most recent six-month period, the returns shown may differ significantly from fiscal year returns. |
8
Table of Contents
| Security type / sector allocation | ||
| Delaware Core Plus Bond Fund | As of July 31, 2015 (Unaudited) | |
Sector designations may be different than the sector designations presented in other fund materials. The sector designations may represent the investment manager’s internal sector classifications, which may result in the sector designations for one fund being different than another fund’s sector designations.
| Security type / sector | Percentage of net assets | ||||
Agency Collateralized Mortgage Obligations | 3.09 | % | |||
Agency Mortgage-Backed Securities | 24.91 | % | |||
Collateralized Debt Obligations | 1.39 | % | |||
Commercial Mortgage-Backed Securities | 6.37 | % | |||
Convertible Bonds | 0.38 | % | |||
Corporate Bonds | 40.19 | % | |||
Banking | 6.40 | % | |||
Basic Industry | 2.39 | % | |||
Brokerage | 0.48 | % | |||
Capital Goods | 1.21 | % | |||
Communications | 6.43 | % | |||
Consumer Cyclical | 3.41 | % | |||
Consumer Non-Cyclical | 2.73 | % | |||
Electric | 5.21 | % | |||
Energy | 5.07 | % | |||
Finance Companies | 0.56 | % | |||
Insurance | 1.68 | % | |||
REITs | 1.51 | % | |||
Technology | 2.50 | % | |||
Transportation | 0.53 | % | |||
Utilities | 0.08 | % | |||
Municipal Bonds | 1.22 | % | |||
Non-Agency Asset-Backed Securities | 6.14 | % | |||
Non-Agency Collateralized Mortgage Obligations | 1.16 | % | |||
Senior Secured Loans | 5.75 | % | |||
Sovereign Bonds | 0.99 | % | |||
Supranational Banks | 0.32 | % | |||
U.S. Treasury Obligations | 4.38 | % | |||
Convertible Preferred Stock | 0.04 | % | |||
Preferred Stock | 0.99 | % | |||
Short-Term Investments | 15.62 | % | |||
Total Value of Securities | 112.94 | % | |||
Liabilities Net of Receivables and Other Assets | (12.94 | %) | |||
Total Net Assets | 100.00 | % | |||
9
Table of Contents
| Schedule of investments | ||
| Delaware Core Plus Bond Fund | July 31, 2015 | |
| Principal amount° | Value (U.S. $) | |||||||
| ||||||||
Agency Collateralized Mortgage Obligations – 3.09% | ||||||||
| ||||||||
Fannie Mae Grantor Trust | ||||||||
Series 2002-T1 A2 7.00% 11/25/31 | 42,813 | $ | 50,403 | |||||
Fannie Mae Interest Strip | ||||||||
Series 35 2 12.00% 7/25/18 | 9,128 | 9,915 | ||||||
Fannie Mae REMIC Trust | ||||||||
Series 2002-W1 2A 6.418% 2/25/42 ● | 55,450 | 64,633 | ||||||
Fannie Mae REMICs | ||||||||
Series 1988-15 A 9.00% 6/25/18 | 169 | 181 | ||||||
Series 1996-46 ZA 7.50% 11/25/26 | 42,266 | 48,035 | ||||||
Series 2002-83 GH 5.00% 12/25/17 | 78,483 | 81,343 | ||||||
Series 2005-70 PA 5.50% 8/25/35 | 11,864 | 13,409 | ||||||
Series 2011-80 CB 4.00% 8/25/26 | 1,953,713 | 2,140,875 | ||||||
Series 2012-122 SD 5.91% 11/25/42 ●S | 195,094 | 46,278 | ||||||
Series 2013-38 AI 3.00% 4/25/33 S | 508,485 | 79,830 | ||||||
Series 2013-44 DI 3.00% 5/25/33 S | 769,046 | 113,142 | ||||||
Freddie Mac REMICs | ||||||||
Series 2557 WE 5.00% 1/15/18 | 68,441 | 70,964 | ||||||
Series 3656 PM 5.00% 4/15/40 | 186,492 | 206,232 | ||||||
Series 4185 LI 3.00% 3/15/33 S | 190,771 | 28,983 | ||||||
Series 4191 CI 3.00% 4/15/33 S | 83,437 | 11,774 | ||||||
Freddie Mac Structured Pass Through Securities | ||||||||
Series T-42 A5 7.50% 2/25/42 ¿ | 23,051 | 27,462 | ||||||
GNMA | ||||||||
Series 2010-42 PC 5.00% 7/20/39 | 545,000 | 616,345 | ||||||
Series 2010-113 KE 4.50% 9/20/40 | 245,000 | 272,258 | ||||||
|
| |||||||
Total Agency Collateralized Mortgage Obligations (cost $3,777,347) | 3,882,062 | |||||||
|
| |||||||
Agency Mortgage-Backed Securities – 24.91% | ||||||||
Fannie Mae | ||||||||
10.50% 6/1/30 | 10,261 | 10,472 | ||||||
Fannie Mae ARM | ||||||||
2.315% 11/1/35 ● | 21,414 | 22,812 | ||||||
2.375% 7/1/36 ● | 56,999 | 60,679 | ||||||
2.415% 5/1/43 ● | 67,374 | 68,562 | ||||||
2.546% 6/1/43 ● | 21,858 | 22,351 | ||||||
3.191% 4/1/44 ● | 54,282 | 56,318 | ||||||
3.261% 3/1/44 ● | 88,912 | 92,208 | ||||||
3.293% 9/1/43 ● | 68,143 | 71,026 | ||||||
4.914% 8/1/35 ● | 18,950 | 20,042 | ||||||
Fannie Mae S.F. 15 yr | ||||||||
2.50% 2/1/28 | 297,272 | 304,548 | ||||||
2.50% 5/1/28 | 39,025 | 39,979 | ||||||
3.50% 7/1/26 | 81,089 | 85,751 | ||||||
10
Table of Contents
| Principal amount° | Value (U.S. $) | |||||||
| ||||||||
Agency Mortgage-Backed Securities (continued) | ||||||||
| ||||||||
Fannie Mae S.F. 15 yr | ||||||||
4.00% 4/1/24 | 28,134 | $ | 29,796 | |||||
4.00% 5/1/24 | 242,337 | 254,596 | ||||||
4.00% 5/1/25 | 31,447 | 33,553 | ||||||
4.00% 11/1/25 | 156,073 | 166,563 | ||||||
4.00% 12/1/26 | 51,483 | 54,527 | ||||||
4.00% 1/1/27 | 359,078 | 382,967 | ||||||
4.50% 4/1/18 | 4,769 | 4,974 | ||||||
5.00% 12/1/20 | 5,912 | 6,357 | ||||||
5.00% 6/1/23 | 11,446 | 12,419 | ||||||
8.00% 10/1/16 | 1,945 | 1,979 | ||||||
Fannie Mae S.F. 20 yr | ||||||||
3.00% 2/1/33 | 7,249 | 7,514 | ||||||
3.00% 8/1/33 | 39,870 | 41,329 | ||||||
4.00% 1/1/31 | 13,566 | 14,538 | ||||||
4.00% 2/1/31 | 42,149 | 45,180 | ||||||
5.00% 11/1/23 | 5,411 | 5,981 | ||||||
5.50% 12/1/29 | 8,166 | 9,157 | ||||||
6.00% 12/1/21 | 3,768 | 4,269 | ||||||
Fannie Mae S.F. 30 yr | ||||||||
3.00% 7/1/42 | 57,057 | 57,685 | ||||||
3.00% 10/1/42 | 929,799 | 939,820 | ||||||
3.00% 12/1/42 | 72,200 | 72,974 | ||||||
3.00% 1/1/43 | 336,370 | 339,888 | ||||||
3.00% 4/1/43 | 248,324 | 250,855 | ||||||
3.00% 5/1/43 | 457,888 | 462,522 | ||||||
4.50% 7/1/36 | 31,676 | 34,481 | ||||||
4.50% 11/1/40 | 74,871 | 81,377 | ||||||
4.50% 3/1/41 | 152,517 | 165,958 | ||||||
4.50% 4/1/41 | 116,561 | 126,631 | ||||||
4.50% 7/1/41 | 41,166 | 44,782 | ||||||
4.50% 1/1/42 | 1,278,598 | 1,389,823 | ||||||
4.50% 9/1/42 | 869,708 | 948,217 | ||||||
4.50% 6/1/44 | 92,807 | 100,864 | ||||||
5.00% 10/1/35 | 51,893 | 57,429 | ||||||
5.00% 11/1/35 | 26,501 | 29,343 | ||||||
5.00% 2/1/36 | 23,108 | 25,577 | ||||||
5.00% 4/1/37 | 14,829 | 16,425 | ||||||
5.00% 8/1/37 | 4,107 | 4,549 | ||||||
5.00% 2/1/38 | 13,667 | 15,116 | ||||||
5.50% 12/1/32 | 2,863 | 3,239 | ||||||
5.50% 2/1/33 | 39,337 | 44,107 | ||||||
5.50% 4/1/34 | 15,581 | 17,625 | ||||||
11
Table of Contents
Schedule of investments
Delaware Core Plus Bond Fund
| Principal amount° | Value (U.S. $) | |||||||
| ||||||||
Agency Mortgage-Backed Securities (continued) | ||||||||
| ||||||||
Fannie Mae S.F. 30 yr | ||||||||
5.50% 11/1/34 | 15,428 | $ | 17,454 | |||||
5.50% 12/1/34 | 328,553 | 371,241 | ||||||
5.50% 3/1/35 | 31,206 | 35,170 | ||||||
5.50% 4/1/35 | 98,967 | 111,225 | ||||||
5.50% 5/1/35 | 26,692 | 30,068 | ||||||
5.50% 6/1/35 | 12,066 | 13,584 | ||||||
5.50% 12/1/35 | 15,570 | 17,510 | ||||||
5.50% 1/1/36 | 70,456 | 79,397 | ||||||
5.50% 4/1/36 | 322,355 | 361,581 | ||||||
5.50% 5/1/36 | 7,560 | 8,496 | ||||||
5.50% 7/1/36 | 4,420 | 4,987 | ||||||
5.50% 9/1/36 | 14,678 | 16,604 | ||||||
5.50% 11/1/36 | 13,555 | 15,207 | ||||||
5.50% 1/1/37 | 56,664 | 63,591 | ||||||
5.50% 2/1/37 | 38,343 | 43,011 | ||||||
5.50% 4/1/37 | 113,520 | 127,434 | ||||||
5.50% 8/1/37 | 43,084 | 48,530 | ||||||
5.50% 1/1/38 | 1,265 | 1,419 | ||||||
5.50% 2/1/38 | 120,698 | 136,355 | ||||||
5.50% 6/1/38 | 122,149 | 136,961 | ||||||
5.50% 9/1/38 | 113,030 | 127,048 | ||||||
5.50% 12/1/38 | 499,972 | 565,089 | ||||||
5.50% 1/1/39 | 55,330 | 62,189 | ||||||
5.50% 2/1/39 | 192,465 | 216,356 | ||||||
5.50% 7/1/40 | 111,418 | 125,742 | ||||||
5.50% 9/1/41 | 616,974 | 692,183 | ||||||
6.00% 6/1/36 | 5,260 | 5,982 | ||||||
6.00% 12/1/36 | 5,448 | 6,172 | ||||||
6.00% 2/1/37 | 17,943 | 20,397 | ||||||
6.00% 6/1/37 | 3,068 | 3,507 | ||||||
6.00% 7/1/37 | 3,186 | 3,634 | ||||||
6.00% 8/1/37 | 268,414 | 305,068 | ||||||
6.00% 9/1/37 | 5,841 | 6,630 | ||||||
6.00% 11/1/37 | 7,164 | 8,119 | ||||||
6.00% 5/1/38 | 6,894 | 7,835 | ||||||
6.00% 7/1/38 | 1,982 | 2,245 | ||||||
6.00% 9/1/38 | 216,103 | 246,174 | ||||||
6.00% 10/1/38 | 8,179 | 9,278 | ||||||
6.00% 9/1/39 | 162,066 | 184,068 | ||||||
6.00% 3/1/40 | 23,128 | 26,249 | ||||||
6.00% 4/1/40 | 41,749 | 47,365 | ||||||
6.00% 9/1/40 | 22,225 | 25,261 | ||||||
12
Table of Contents
| Principal amount° | Value (U.S. $) | |||||||
| ||||||||
Agency Mortgage-Backed Securities (continued) | ||||||||
| ||||||||
Fannie Mae S.F. 30 yr | ||||||||
6.00% 11/1/40 | 8,288 | $ | 9,498 | |||||
6.00% 5/1/41 | 501,317 | 569,816 | ||||||
8.00% 2/1/30 | 17,490 | 17,845 | ||||||
10.00% 7/1/20 | 2,881 | 3,207 | ||||||
10.00% 5/1/22 | 1,965 | 2,135 | ||||||
10.00% 2/1/25 | 38,818 | 42,450 | ||||||
Fannie Mae S.F. 30 yr TBA | ||||||||
3.00% 9/1/45 | 11,758,000 | 11,797,306 | ||||||
4.50% 9/1/45 | 4,710,000 | 5,101,335 | ||||||
Freddie Mac ARM | ||||||||
2.277% 10/1/36 ● | 44,089 | 47,044 | ||||||
2.474% 7/1/36 ● | 20,298 | 21,636 | ||||||
Freddie Mac S.F. 15 yr | ||||||||
3.50% 11/1/25 | 13,686 | 14,460 | ||||||
3.50% 6/1/26 | 15,163 | 16,018 | ||||||
3.50% 1/1/27 | 12,397 | 13,094 | ||||||
4.00% 12/1/24 | 24,171 | 25,525 | ||||||
4.00% 5/1/25 | 8,887 | 9,469 | ||||||
4.00% 8/1/25 | 32,371 | 34,495 | ||||||
4.00% 4/1/26 | 36,007 | 38,350 | ||||||
4.50% 8/1/24 | 51,151 | 54,851 | ||||||
4.50% 6/1/26 | 23,190 | 24,872 | ||||||
4.50% 9/1/26 | 37,533 | 40,091 | ||||||
Freddie Mac S.F. 20 yr | ||||||||
3.00% 6/1/34 | 21,043 | 21,672 | ||||||
Freddie Mac S.F. 30 yr | ||||||||
3.00% 10/1/42 | 68,920 | 69,341 | ||||||
3.00% 11/1/42 | 95,159 | 95,946 | ||||||
4.50% 10/1/39 | 40,732 | 44,191 | ||||||
4.50% 4/1/41 | 186,079 | 202,274 | ||||||
4.50% 3/1/42 | 327,400 | 356,417 | ||||||
5.50% 3/1/34 | 6,084 | 6,832 | ||||||
5.50% 12/1/34 | 5,836 | 6,567 | ||||||
5.50% 6/1/36 | 3,827 | 4,283 | ||||||
5.50% 11/1/36 | 9,047 | 10,108 | ||||||
5.50% 7/1/37 | 5,751 | 6,427 | ||||||
5.50% 9/1/37 | 8,497 | 9,486 | ||||||
5.50% 4/1/38 | 177,817 | 198,494 | ||||||
5.50% 7/1/38 | 31,022 | 34,629 | ||||||
5.50% 8/1/38 | 19,904 | 22,219 | ||||||
5.50% 6/1/39 | 32,816 | 36,638 | ||||||
5.50% 3/1/40 | 20,641 | 23,042 | ||||||
13
Table of Contents
Schedule of investments
Delaware Core Plus Bond Fund
| Principal amount° | Value (U.S. $) | |||||||
| ||||||||
Agency Mortgage-Backed Securities (continued) | ||||||||
| ||||||||
Freddie Mac S.F. 30 yr | ||||||||
5.50% 8/1/40 | 77,264 | $ | 86,248 | |||||
5.50% 1/1/41 | 24,412 | 27,251 | ||||||
5.50% 6/1/41 | 145,025 | 161,889 | ||||||
6.00% 2/1/36 | 13,051 | 14,857 | ||||||
6.00% 1/1/38 | 8,091 | 9,137 | ||||||
6.00% 6/1/38 | 22,720 | 25,653 | ||||||
6.00% 8/1/38 | 133,973 | 153,095 | ||||||
6.00% 5/1/40 | 9,835 | 11,118 | ||||||
6.00% 7/1/40 | 54,441 | 61,464 | ||||||
8.00% 5/1/31 | 43,527 | 49,783 | ||||||
10.00% 1/1/19 | 3,253 | 3,530 | ||||||
11.50% 3/1/16 | 42 | 42 | ||||||
GNMA I S.F. 30 yr | ||||||||
5.00% 6/15/40 | 11,459 | 12,709 | ||||||
7.50% 1/15/32 | 7,844 | 9,788 | ||||||
8.00% 5/15/30 | 11,998 | 12,259 | ||||||
9.50% 10/15/19 | 2,006 | 2,016 | ||||||
9.50% 8/15/21 | 5,575 | 6,414 | ||||||
9.50% 3/15/23 | 6,140 | 6,925 | ||||||
10.00% 9/15/18 | 4,088 | 4,109 | ||||||
12.50% 1/15/16 | 504 | 505 | ||||||
GNMA II S.F. 30 yr | ||||||||
7.50% 9/20/30 | 11,153 | 13,710 | ||||||
8.00% 6/20/30 | 6,466 | 8,170 | ||||||
10.00% 6/20/20 | 1,480 | 1,625 | ||||||
10.00% 8/20/20 | 1,294 | 1,446 | ||||||
10.00% 1/20/21 | 2,022 | 2,281 | ||||||
10.00% 2/20/21 | 5,823 | 6,300 | ||||||
10.00% 5/20/21 | 2,620 | 2,924 | ||||||
10.00% 6/20/21 | 391 | 398 | ||||||
10.50% 3/20/16 | 37 | 37 | ||||||
10.50% 1/20/18 | 150 | 150 | ||||||
10.50% 12/20/18 | 209 | 224 | ||||||
10.50% 2/20/19 | 86 | 86 | ||||||
10.50% 6/20/19 | 74 | 74 | ||||||
10.50% 9/20/19 | 242 | 268 | ||||||
10.50% 5/20/20 | 4,094 | 4,150 | ||||||
10.50% 8/20/20 | 353 | 355 | ||||||
10.50% 10/20/20 | 3,354 | 3,657 | ||||||
10.50% 2/20/21 | 14,473 | 14,554 | ||||||
11.00% 7/20/19 | 295 | 296 | ||||||
|
| |||||||
Total Agency Mortgage-Backed Securities (cost $30,937,729) | 31,247,710 | |||||||
|
| |||||||
14
Table of Contents
| Principal amount° | Value (U.S. $) | |||||||
| ||||||||
Collateralized Debt Obligations – 1.39% | ||||||||
| ||||||||
Avery Point III CLO | ||||||||
Series 2013-3A A 144A 1.687% 1/18/25 #● | 250,000 | $ | 248,275 | |||||
Benefit Street Partners CLO IV | ||||||||
Series 2014-IVA A1A 144A 1.777% 7/20/26 #● | 500,000 | 498,900 | ||||||
Cent CLO 21 | ||||||||
Series 2014-21A A1B 144A 1.685% 7/27/26 #● | 250,000 | 248,625 | ||||||
Magnetite IX | ||||||||
Series 2014-9A A1 144A 1.715% 7/25/26 #● | 495,000 | 493,911 | ||||||
Neuberger Berman CLO XIX | ||||||||
Series 2015-19A A1 144A 1.718% 7/15/27 #● | 250,000 | 248,875 | ||||||
|
| |||||||
Total Collateralized Debt Obligations (cost $1,743,540) | 1,738,586 | |||||||
|
| |||||||
| ||||||||
Commercial Mortgage-Backed Securities – 6.37% | ||||||||
| ||||||||
Banc of America Commercial Mortgage Trust | ||||||||
Series 2006-1 AM 5.421% 9/10/45 ● | 180,000 | 181,698 | ||||||
Series 2007-4 AM 5.808% 2/10/51 ● | 80,000 | 85,645 | ||||||
Bear Stearns Commercial Mortgage Securities Trust | ||||||||
Series 2007-PWR18 A4 5.70% 6/11/50 | 65,000 | 69,300 | ||||||
CD Commercial Mortgage Trust | ||||||||
Series 2005-CD1 AJ 5.202% 7/15/44 ● | 145,000 | 145,583 | ||||||
Series 2005-CD1 AM 5.202% 7/15/44 ● | 75,000 | 75,169 | ||||||
Series 2005-CD1 C 5.202% 7/15/44 ● | 30,000 | 30,163 | ||||||
CFCRE Commercial Mortgage Trust | ||||||||
Series 2011-C1 144A 3.759% 4/15/44 # | 92,196 | 93,059 | ||||||
Citigroup Commercial Mortgage Trust | ||||||||
Series 2007-C6 AM 5.711% 12/10/49 ● | 65,000 | 68,574 | ||||||
Series 2014-GC25 A4 3.635% 10/10/47 | 120,000 | 124,207 | ||||||
Series 2015-GC27 A5 3.137% 2/10/48 | 45,000 | 44,602 | ||||||
COMM Mortgage Trust | ||||||||
Series 2014-CR19 A5 3.796% 8/10/47 | 90,000 | 94,601 | ||||||
Series 2014-CR20 A4 3.59% 11/10/47 | 95,000 | 98,142 | ||||||
Series 2014-CR20 AM 3.938% 11/10/47 | 410,000 | 425,573 | ||||||
Series 2014-CR21 A3 3.528% 12/10/47 | 30,000 | 30,834 | ||||||
Series 2015-3BP A 144A 3.178% 2/10/35 # | 190,000 | 187,935 | ||||||
Commercial Mortgage Trust | ||||||||
Series 2007-GG9 AM 5.475% 3/10/39 | 80,000 | 83,288 | ||||||
Credit Suisse First Boston Mortgage Securities | ||||||||
Series 2005-C5 AM 5.10% 8/15/38 ● | 75,000 | 74,904 | ||||||
DB-UBS Mortgage Trust | ||||||||
Series 2011-LC1A A3 144A 5.002% 11/10/46 # | 200,000 | 224,432 | ||||||
Series 2011-LC1A C 144A 5.557% 11/10/46 #● | 145,000 | 162,148 | ||||||
FREMF Mortgage Trust | ||||||||
Series 2011-K10 B 144A 4.622% 11/25/49 #● | 210,000 | 225,841 | ||||||
Series 2011-K13 B 144A 4.60% 1/25/48 #● | 100,000 | 108,368 | ||||||
15
Table of Contents
Schedule of investments
Delaware Core Plus Bond Fund
| Principal amount° | Value (U.S. $) | |||||||
| ||||||||
Commercial Mortgage-Backed Securities (continued) | ||||||||
| ||||||||
FREMF Mortgage Trust | ||||||||
Series 2011-K15 B 144A 4.949% 8/25/44 #● | 75,000 | $ | 82,331 | |||||
Series 2011-K703 B 144A 4.881% 7/25/44 #● | 30,000 | 31,788 | ||||||
Series 2012-K18 B 144A 4.265% 1/25/45 #● | 55,000 | 58,330 | ||||||
Series 2012-K19 B 144A 4.036% 5/25/45 #● | 20,000 | 21,079 | ||||||
Series 2012-K22 B 144A 3.687% 8/25/45 #● | 85,000 | 87,113 | ||||||
Series 2012-K22 C 144A 3.687% 8/25/45 #● | 70,000 | 69,949 | ||||||
Series 2012-K707 B 144A 3.883% 1/25/47 #● | 35,000 | 36,110 | ||||||
Series 2012-K708 B 144A 3.755% 2/25/45 #● | 155,000 | 160,926 | ||||||
Series 2012-K708 C 144A 3.755% 2/25/45 #● | 25,000 | 25,451 | ||||||
Series 2012-K711 B 144A 3.562% 8/25/45 #● | 265,000 | 274,977 | ||||||
Series 2013-K26 C 144A 3.60% 12/25/45 #● | 45,000 | 43,392 | ||||||
Series 2013-K30 C 144A 3.556% 6/25/45 #● | 85,000 | 82,623 | ||||||
Series 2013-K31 C 144A 3.627% 7/25/46 #● | 255,003 | 250,591 | ||||||
Series 2013-K33 B 144A 3.503% 8/25/46 #● | 65,000 | 64,533 | ||||||
Series 2013-K33 C 144A 3.503% 8/25/46 #● | 25,000 | 23,791 | ||||||
Series 2013-K712 B 144A 3.368% 5/25/45 #● | 245,000 | 249,909 | ||||||
Series 2013-K712 C 144A 3.368% 5/25/45 #● | 300,000 | 297,811 | ||||||
Series 2013-K713 B 144A 3.165% 4/25/46 #● | 290,000 | 292,992 | ||||||
Series 2013-K713 C 144A 3.165% 4/25/46 #● | 140,000 | 138,172 | ||||||
Series 2014-K716 C 144A 3.954% 8/25/47 #● | 60,000 | 60,811 | ||||||
Series 2015-K47 B 144A 3.723% 6/25/48 #● | 25,000 | 23,100 | ||||||
GRACE Mortgage Trust | ||||||||
Series 2014-GRCE A 144A 3.369% 6/10/28 # | 300,000 | 310,977 | ||||||
GS Mortgage Securities Trust | ||||||||
Series 2010-C1 A2 144A 4.592% 8/10/43 # | 245,000 | 268,785 | ||||||
Series 2010-C1 C 144A 5.635% 8/10/43 #● | 150,000 | 166,800 | ||||||
Series 2015-GC32 A4 3.764% 7/10/48 | 55,000 | 57,288 | ||||||
Hilton USA Trust | ||||||||
Series 2013-HLT AFX 144A 2.662% 11/5/30 # | 100,000 | 100,223 | ||||||
Series 2013-HLT BFX 144A 3.367% 11/5/30 # | 115,000 | 115,677 | ||||||
Houston Galleria Mall Trust | ||||||||
Series 2015-HGLR A1A2 144A 3.087% 3/5/37 # | 185,000 | 182,483 | ||||||
JPMBB Commercial Mortgage Securities Trust | ||||||||
Series 2014-C18 A1 1.254% 2/15/47 | 62,411 | 62,380 | ||||||
Series 2014-C22 B 4.561% 9/15/47 ● | 35,000 | 36,372 | ||||||
JPMorgan Chase Commercial Mortgage Securities Trust | ||||||||
Series 2005-CB11 E 5.495% 8/12/37 ● | 35,000 | 38,151 | ||||||
Series 2005-LDP4 AJ 5.04% 10/15/42 ● | 100,000 | 100,063 | ||||||
Series 2005-LDP5 D 5.394% 12/15/44 ● | 60,000 | 60,073 | ||||||
Series 2006-LDP8 AM 5.44% 5/15/45 | 100,000 | 103,534 | ||||||
LB-UBS Commercial Mortgage Trust | ||||||||
Series 2004-C1 A4 4.568% 1/15/31 | 12,375 | 12,493 | ||||||
16
Table of Contents
| Principal amount° | Value (U.S. $) | |||||||
| ||||||||
Commercial Mortgage-Backed Securities (continued) | ||||||||
| ||||||||
LB-UBS Commercial Mortgage Trust | ||||||||
Series 2006-C6 AJ 5.452% 9/15/39 ● | 115,000 | $ | 119,495 | |||||
Series 2006-C6 AM 5.413% 9/15/39 | 350,000 | 364,082 | ||||||
Morgan Stanley Bank of America Merrill Lynch Trust | ||||||||
Series 2014-C19 AS 3.832% 12/15/47 | 30,000 | 30,717 | ||||||
Series 2015-C22 A3 3.046% 4/15/48 | 60,000 | 59,263 | ||||||
Series 2015-C23 A4 3.719% 7/15/50 | 215,000 | 223,426 | ||||||
Morgan Stanley Capital I Trust | ||||||||
Series 2005-HQ7 AJ 5.19% 11/14/42 ● | 85,000 | 85,339 | ||||||
Series 2005-HQ7 C 5.19% 11/14/42 ● | 120,000 | 120,195 | ||||||
Series 2006-T21 AM 5.204% 10/12/52 ● | 75,000 | 75,949 | ||||||
Series 2006-T23 A4 5.835% 8/12/41 ● | 71,468 | 73,402 | ||||||
TimberStar Trust I | ||||||||
Series 2006-1A A 144A 5.668% 10/15/36 # | 110,000 | 114,741 | ||||||
Wells Fargo Commercial Mortgage Trust | ||||||||
Series 2012-LC5 A3 2.918% 10/15/45 | 65,000 | 65,500 | ||||||
WF-RBS Commercial Mortgage Trust | ||||||||
Series 2014-C23 A5 3.917% 10/15/57 | 30,000 | 31,726 | ||||||
|
| |||||||
Total Commercial Mortgage-Backed Securities (cost $8,049,862) | 7,988,979 | |||||||
|
| |||||||
| ||||||||
Convertible Bonds – 0.38% | ||||||||
| ||||||||
Alaska Communications Systems Group 6.25% exercise price $10.28, expiration date 4/27/18 | 24,000 | 23,955 | ||||||
Ares Capital 5.75% exercise price $19.13, expiration date 2/1/16 | 20,000 | 20,325 | ||||||
BGC Partners 4.50% exercise price $9.84, expiration date 7/13/16 | 25,000 | 27,328 | ||||||
Blucora 4.25% exercise price $21.66, expiration date 3/29/19 | 5,000 | 4,875 | ||||||
Chesapeake Energy 2.50% exercise price $47.55, expiration date 5/15/37 | 11,000 | 9,927 | ||||||
Ciena 144A 3.75% exercise price $20.17, expiration date 10/15/18 # | 14,000 | 20,055 | ||||||
General Cable 4.50% exercise price $34.17, expiration date 11/15/29 f | 28,000 | 21,053 | ||||||
Gilead Sciences 1.625% exercise price $22.71, expiration date 4/29/16 | 7,000 | 36,382 | ||||||
Helix Energy Solutions Group 3.25% exercise price $25.02, expiration date 3/12/32 | 9,000 | 7,740 | ||||||
Hologic 2.00% exercise price $31.17, expiration date 2/27/42 f | 19,000 | 26,778 | ||||||
Illumina 0.25% exercise price $83.55, expiration date 3/11/16 | 11,000 | 28,793 | ||||||
Intel 3.25% exercise price $21.47, expiration date 8/1/39 | 19,000 | 27,657 | ||||||
17
Table of Contents
Schedule of investments
Delaware Core Plus Bond Fund
| Principal amount° | Value (U.S. $) | |||||||
| ||||||||
Convertible Bonds (continued) | ||||||||
| ||||||||
Jefferies Group 3.875% exercise price $44.83, expiration date 10/31/29 | 32,000 | $ | 33,060 | |||||
Meritor 4.00% exercise price $26.73, expiration date 2/12/27 f | 39,000 | 40,731 | ||||||
Mylan 3.75% exercise price $13.32, expiration date 9/10/15 | 6,000 | 26,224 | ||||||
Nuance Communications 2.75% exercise price $32.30, expiration date 11/1/31 | 27,000 | 27,557 | ||||||
NuVasive 2.75% exercise price $42.13, expiration date 6/30/17 | 44,000 | 61,847 | ||||||
Titan Machinery 3.75% exercise price $43.17, expiration date 4/30/19 | 26,000 | 21,369 | ||||||
Vector Group 2.50% exercise price $16.78, expiration date 1/14/19 ● | 8,000 | 12,509 | ||||||
|
| |||||||
Total Convertible Bonds (cost $386,714) | 478,165 | |||||||
|
| |||||||
| ||||||||
Corporate Bonds – 40.19% | ||||||||
| ||||||||
Banking – 6.40% | ||||||||
Banco Bilbao Vizcaya Argentaria Colombia 144A | ||||||||
4.875% 4/21/25 # | 150,000 | 149,925 | ||||||
Bank of America | ||||||||
3.875% 8/1/25 | 80,000 | 80,930 | ||||||
3.95% 4/21/25 | 335,000 | 325,532 | ||||||
Bank of New York Mellon 2.15% 2/24/20 | 30,000 | 29,791 | ||||||
BB&T 5.25% 11/1/19 | 322,000 | 355,677 | ||||||
BBVA Bancomer 144A 7.25% 4/22/20 # | 100,000 | 112,300 | ||||||
Branch Banking & Trust 3.80% 10/30/26 | 250,000 | 254,968 | ||||||
City National 5.25% 9/15/20 | 110,000 | 124,838 | ||||||
Compass Bank 3.875% 4/10/25 | 250,000 | 237,488 | ||||||
Cooperatieve Centrale Raiffeisen-Boerenleenbank | ||||||||
4.625% 12/1/23 | 250,000 | 259,013 | ||||||
Credit Suisse 144A 6.50% 8/8/23 # | 250,000 | 276,875 | ||||||
Export-Import Bank of China 144A 2.50% 7/31/19 # | 200,000 | 202,148 | ||||||
Fifth Third Bancorp 2.875% 7/27/20 | 50,000 | 50,216 | ||||||
Finnvera 144A 2.375% 6/4/25 # | 200,000 | 196,441 | ||||||
Goldman Sachs Group | ||||||||
5.20% 12/17/19 | NZD | 43,000 | 29,688 | |||||
5.375% 12/29/49 ● | 215,000 | 213,979 | ||||||
ING Groep 6.50% 12/29/49 ● | 200,000 | 197,250 | ||||||
Itau Unibanco Holding 144A 2.85% 5/26/18 # | 200,000 | 197,700 | ||||||
JPMorgan Chase | ||||||||
3.90% 7/15/25 | 190,000 | 193,903 | ||||||
4.125% 12/15/26 | 105,000 | 104,580 | ||||||
4.95% 6/1/45 | 120,000 | 120,451 | ||||||
18
Table of Contents
| Principal amount° | Value (U.S. $) | |||||||
| ||||||||
Corporate Bonds (continued) | ||||||||
| ||||||||
Banking (continued) | ||||||||
JPMorgan Chase | ||||||||
6.75% 1/29/49 ● | 25,000 | $ | 26,516 | |||||
KeyBank | ||||||||
3.30% 6/1/25 | 250,000 | 245,389 | ||||||
5.45% 3/3/16 | 250,000 | 257,003 | ||||||
Lloyds Banking Group 4.50% 11/4/24 | 200,000 | 202,296 | ||||||
Morgan Stanley | ||||||||
2.80% 6/16/20 | 150,000 | 150,921 | ||||||
4.00% 7/23/25 | 130,000 | 132,710 | ||||||
4.35% 9/8/26 | 360,000 | 360,125 | ||||||
MUFG Americas Holdings | ||||||||
2.25% 2/10/20 | 80,000 | 79,550 | ||||||
3.00% 2/10/25 | 185,000 | 176,220 | ||||||
Nordea Bank 144A 6.125% 12/29/49 #● | 200,000 | 199,750 | ||||||
Northern Trust 3.95% 10/30/25 | 80,000 | 83,153 | ||||||
PNC Bank | ||||||||
1.85% 7/20/18 | 250,000 | 250,534 | ||||||
2.30% 6/1/20 | 335,000 | 332,819 | ||||||
Santander UK 144A 5.00% 11/7/23 # | 200,000 | 207,698 | ||||||
U.S. Bancorp 3.60% 9/11/24 | 125,000 | 126,061 | ||||||
USB Capital IX 3.50% 10/29/49 ● | 705,000 | 581,625 | ||||||
Wells Fargo | ||||||||
4.30% 7/22/27 | 325,000 | 331,228 | ||||||
5.875% 12/29/49 ● | 50,000 | 51,250 | ||||||
Woori Bank | ||||||||
144A 2.875% 10/2/18 # | 200,000 | 204,485 | ||||||
144A 4.75% 4/30/24 # | 200,000 | 208,907 | ||||||
Zions Bancorporation 4.50% 6/13/23 | 105,000 | 108,272 | ||||||
|
| |||||||
| 8,030,205 | ||||||||
|
| |||||||
Basic Industry – 2.39% | ||||||||
ArcelorMittal 10.60% 6/1/19 | 330,000 | 395,175 | ||||||
CF Industries | ||||||||
6.875% 5/1/18 | 210,000 | 235,557 | ||||||
7.125% 5/1/20 | 275,000 | 326,730 | ||||||
Dow Chemical 8.55% 5/15/19 | 479,000 | 582,933 | ||||||
Freeport-McMoran Oil & Gas 6.50% 11/15/20 | 86,000 | 83,635 | ||||||
Georgia-Pacific | ||||||||
144A 2.539% 11/15/19 # | 165,000 | 165,786 | ||||||
8.00% 1/15/24 | 100,000 | 129,519 | ||||||
Gerdau Holdings 144A 7.00% 1/20/20 # | 100,000 | 105,750 | ||||||
Grace (W.R.) 144A 5.125% 10/1/21 # | 60,000 | 60,750 | ||||||
International Paper 5.00% 9/15/35 | 80,000 | 78,898 | ||||||
19
Table of Contents
Schedule of investments
Delaware Core Plus Bond Fund
| Principal amount° | Value (U.S. $) | |||||||
| ||||||||
Corporate Bonds (continued) | ||||||||
| ||||||||
Basic Industry (continued) | ||||||||
INVISTA Finance 144A 4.25% 10/15/19 # | 120,000 | $ | 118,200 | |||||
Methanex 4.25% 12/1/24 | 150,000 | 149,212 | ||||||
NOVA Chemicals 144A 5.00% 5/1/25 # | 60,000 | 59,550 | ||||||
OCP 144A 4.50% 10/22/25 # | 200,000 | 192,750 | ||||||
PPG Industries 2.30% 11/15/19 | 85,000 | 84,782 | ||||||
Rockwood Specialties Group 4.625% 10/15/20 | 85,000 | 88,663 | ||||||
Weyerhaeuser 4.625% 9/15/23 | 130,000 | 139,029 | ||||||
|
| |||||||
| 2,996,919 | ||||||||
|
| |||||||
Brokerage – 0.48% | ||||||||
Jefferies Group | ||||||||
5.125% 1/20/23 | 285,000 | 291,191 | ||||||
6.45% 6/8/27 | 60,000 | 66,099 | ||||||
6.50% 1/20/43 | 50,000 | 50,234 | ||||||
Lazard Group | ||||||||
3.75% 2/13/25 | 125,000 | 120,420 | ||||||
6.85% 6/15/17 | 64,000 | 69,574 | ||||||
|
| |||||||
| 597,518 | ||||||||
|
| |||||||
Capital Goods – 1.21% | ||||||||
AECOM 144A 5.875% 10/15/24 # | 600,000 | 610,500 | ||||||
Algeco Scotsman Global Finance 144A 8.50% 10/15/18 # | 325,000 | 304,927 | ||||||
Cemex Finance 144A 9.375% 10/12/22 # | 200,000 | 224,690 | ||||||
Embraer Netherlands Finance 5.05% 6/15/25 | 65,000 | 63,700 | ||||||
Fortune Brands Home & Security 3.00% 6/15/20 | 70,000 | 70,269 | ||||||
Masco 4.45% 4/1/25 | 75,000 | 75,375 | ||||||
Parker-Hannifin 3.30% 11/21/24 | 10,000 | 10,134 | ||||||
Union Andina de Cementos 144A 5.875% 10/30/21 # | 150,000 | 153,750 | ||||||
|
| |||||||
| 1,513,345 | ||||||||
|
| |||||||
Communications – 6.43% | ||||||||
American Tower Trust I 144A 3.07% 3/15/23 # | 210,000 | 207,562 | ||||||
AT&T | ||||||||
3.40% 5/15/25 | 325,000 | 311,097 | ||||||
4.50% 5/15/35 | 145,000 | 134,590 | ||||||
4.75% 5/15/46 | 200,000 | 185,181 | ||||||
Bharti Airtel International Netherlands 144A | ||||||||
5.35% 5/20/24 # | 200,000 | 217,004 | ||||||
CBS 4.00% 1/15/26 | 170,000 | 168,317 | ||||||
CC Holdings GS V 3.849% 4/15/23 | 100,000 | 99,342 | ||||||
CCO Safari II | ||||||||
144A 3.579% 7/23/20 # | 80,000 | 80,308 | ||||||
144A 4.908% 7/23/25 # | 240,000 | 240,907 | ||||||
Columbus International 144A 7.375% 3/30/21 # | 200,000 | 213,250 | ||||||
Crown Castle Towers 144A 4.883% 8/15/20 # | 505,000 | 544,104 | ||||||
20
Table of Contents
| Principal amount° | Value (U.S. $) | |||||||
| ||||||||
Corporate Bonds (continued) | ||||||||
| ||||||||
Communications (continued) | ||||||||
CSC Holdings 5.25% 6/1/24 | 525,000 | $ | 487,594 | |||||
Digicel Group 144A 8.25% 9/30/20 # | 200,000 | 198,500 | ||||||
DISH DBS 5.00% 3/15/23 | 655,000 | 614,881 | ||||||
Grupo Televisa 5.00% 5/13/45 | 200,000 | 191,236 | ||||||
GTP Acquisition Partners I 144A 2.35% 6/15/20 # | 100,000 | 99,455 | ||||||
Intelsat Luxembourg 8.125% 6/1/23 | 625,000 | 500,000 | ||||||
Millicom International Cellular 144A 6.00% 3/15/25 # | 200,000 | 198,500 | ||||||
Myriad International Holdings 144A 5.50% 7/21/25 # | 200,000 | 203,600 | ||||||
Netflix 144A 5.875% 2/15/25 # | 520,000 | 548,600 | ||||||
SBA Tower Trust 144A 2.24% 4/16/18 # | 160,000 | 159,061 | ||||||
Scripps Networks Interactive 3.95% 6/15/25 | 80,000 | 78,769 | ||||||
SES GLOBAL Americas Holdings 144A 5.30% 3/25/44 # | 420,000 | 423,158 | ||||||
Sirius XM Radio 144A 6.00% 7/15/24 # | 180,000 | 188,100 | ||||||
Sprint 7.125% 6/15/24 | 660,000 | 605,550 | ||||||
Telemar Norte Leste 144A 5.50% 10/23/20 # | 100,000 | 86,500 | ||||||
Time Warner | ||||||||
3.60% 7/15/25 | 295,000 | 285,784 | ||||||
4.85% 7/15/45 | 260,000 | 256,377 | ||||||
Time Warner Cable 5.50% 9/1/41 | 70,000 | 64,358 | ||||||
Verizon Communications | ||||||||
4.40% 11/1/34 | 100,000 | 94,041 | ||||||
4.862% 8/21/46 | 285,000 | 270,491 | ||||||
WPP Finance 2010 5.625% 11/15/43 | 100,000 | 107,105 | ||||||
|
| |||||||
| 8,063,322 | ||||||||
|
| |||||||
Consumer Cyclical – 3.41% | ||||||||
Alibaba Group Holding 144A 3.125% 11/28/21 # | 400,000 | 393,688 | ||||||
CDK Global 4.50% 10/15/24 | 115,000 | 114,836 | ||||||
Cencosud 144A 5.15% 2/12/25 # | 200,000 | 201,381 | ||||||
CVS Health 3.875% 7/20/25 | 270,000 | 275,206 | ||||||
Daimler Finance North America 144A 3.50% 8/3/25 # | 190,000 | 190,374 | ||||||
Ford Motor Credit 2.24% 6/15/18 | 455,000 | 454,823 | ||||||
General Motors Financial | ||||||||
3.20% 7/13/20 | 10,000 | 9,896 | ||||||
3.45% 4/10/22 | 160,000 | 154,377 | ||||||
4.00% 1/15/25 | 135,000 | 130,087 | ||||||
4.30% 7/13/25 | 30,000 | 29,665 | ||||||
4.375% 9/25/21 | 90,000 | 92,369 | ||||||
Harman International Industries 4.15% 5/15/25 | 205,000 | 204,221 | ||||||
Hyundai Capital America 144A 2.125% 10/2/17 # | 130,000 | 130,794 | ||||||
Kohl’s 4.25% 7/17/25 | 135,000 | 135,276 | ||||||
Magna International 3.625% 6/15/24 | 195,000 | 191,621 | ||||||
Marriott International 3.375% 10/15/20 | 100,000 | 103,283 | ||||||
21
Table of Contents
Schedule of investments
Delaware Core Plus Bond Fund
| Principal amount° | Value (U.S. $) | |||||||
| ||||||||
Corporate Bonds (continued) | ||||||||
| ||||||||
Consumer Cyclical (continued) | ||||||||
MGM Resorts International 6.00% 3/15/23 | 310,000 | $ | 316,200 | |||||
QVC | ||||||||
4.375% 3/15/23 | 270,000 | 265,781 | ||||||
5.45% 8/15/34 | 130,000 | 120,081 | ||||||
Signet UK Finance 4.70% 6/15/24 | 155,000 | 158,641 | ||||||
Starwood Hotels & Resorts Worldwide | ||||||||
3.75% 3/15/25 | 210,000 | 204,719 | ||||||
4.50% 10/1/34 | 20,000 | 18,376 | ||||||
Target 2.30% 6/26/19 | 50,000 | 50,889 | ||||||
Toyota Motor Credit 2.80% 7/13/22 | 135,000 | 135,099 | ||||||
Tupy Overseas 144A 6.625% 7/17/24 # | 200,000 | 193,000 | ||||||
|
| |||||||
| 4,274,683 | ||||||||
|
| |||||||
Consumer Non-Cyclical – 2.73% | ||||||||
Actavis Funding 3.80% 3/15/25 | 175,000 | 170,941 | ||||||
Baxalta 144A 4.00% 6/23/25 # | 105,000 | 104,184 | ||||||
Becton Dickinson 6.375% 8/1/19 | 185,000 | 211,816 | ||||||
Boston Scientific 6.00% 1/15/20 | 240,000 | 270,985 | ||||||
Campbell Soup 3.30% 3/19/25 | 160,000 | 157,679 | ||||||
Community Health Systems 6.875% 2/1/22 | 590,000 | 632,775 | ||||||
EMD Finance | ||||||||
144A 2.95% 3/19/22 # | 80,000 | 78,512 | ||||||
144A 3.25% 3/19/25 # | 95,000 | 91,961 | ||||||
Express Scripts Holding | ||||||||
2.25% 6/15/19 | 95,000 | 94,352 | ||||||
3.50% 6/15/24 | 55,000 | 53,641 | ||||||
JB 144A 3.75% 5/13/25 # | 150,000 | 147,078 | ||||||
JBS Investments 144A 7.75% 10/28/20 # | 200,000 | 217,000 | ||||||
Omnicare 5.00% 12/1/24 | 555,000 | 591,075 | ||||||
Perrigo Finance 3.50% 12/15/21 | 400,000 | 399,510 | ||||||
Reynolds American 2.30% 6/12/18 | 120,000 | 121,148 | ||||||
Thermo Fisher Scientific 3.30% 2/15/22 | 35,000 | 34,682 | ||||||
Zimmer Biomet Holdings 3.15% 4/1/22 | 50,000 | 48,739 | ||||||
|
| |||||||
| 3,426,078 | ||||||||
|
| |||||||
Electric – 5.21% | ||||||||
AES 5.50% 4/15/25 | 135,000 | 129,937 | ||||||
AES Gener 144A 8.375% 12/18/73 #● | 200,000 | 219,500 | ||||||
Ameren Illinois | ||||||||
3.25% 3/1/25 | 110,000 | 110,279 | ||||||
9.75% 11/15/18 | 389,000 | 485,797 | ||||||
American Transmission Systems 144A 5.25% 1/15/22 # | 100,000 | 110,374 | ||||||
Appalachian Power 3.40% 6/1/25 | 330,000 | 328,121 | ||||||
Cleveland Electric Illuminating 5.50% 8/15/24 | 230,000 | 262,695 | ||||||
22
Table of Contents
| Principal amount° | Value (U.S. $) | |||||||
| ||||||||
Corporate Bonds (continued) | ||||||||
| ||||||||
Electric (continued) | ||||||||
CMS Energy 6.25% 2/1/20 | 190,000 | $ | 219,012 | |||||
ComEd Financing III 6.35% 3/15/33 | 190,000 | 199,169 | ||||||
Dominion Resources 1.90% 6/15/18 | 400,000 | 400,877 | ||||||
DTE Energy 144A 3.30% 6/15/22 # | 115,000 | 116,351 | ||||||
Dynegy 144A 7.625% 11/1/24 # | 295,000 | 306,063 | ||||||
Electricite de France 144A 5.25% 1/29/49 #● | 125,000 | 128,594 | ||||||
Enel 144A 8.75% 9/24/73 #● | 200,000 | 235,200 | ||||||
Entergy 4.00% 7/15/22 | 305,000 | 311,271 | ||||||
Entergy Arkansas 3.70% 6/1/24 | 45,000 | 47,071 | ||||||
Exelon 3.95% 6/15/25 | 90,000 | 91,402 | ||||||
Integrys Energy Group 6.11% 12/1/66 ● | 195,000 | 171,651 | ||||||
IPALCO Enterprises 144A 3.45% 7/15/20 # | 125,000 | 125,313 | ||||||
ITC Holdings 3.65% 6/15/24 | 145,000 | 144,687 | ||||||
LG&E and KU Energy 4.375% 10/1/21 | 380,000 | 411,335 | ||||||
Metropolitan Edison 144A 4.00% 4/15/25 # | 50,000 | 50,485 | ||||||
National Rural Utilities Cooperative Finance | ||||||||
4.75% 4/30/43 ● | 190,000 | 189,810 | ||||||
NextEra Energy Capital Holdings | ||||||||
2.40% 9/15/19 | 265,000 | 265,183 | ||||||
3.625% 6/15/23 | 65,000 | 65,589 | ||||||
NV Energy 6.25% 11/15/20 | 100,000 | 116,216 | ||||||
Pennsylvania Electric 5.20% 4/1/20 | 175,000 | 192,236 | ||||||
Puget Energy 6.00% 9/1/21 | 65,000 | 74,949 | ||||||
SCANA 4.125% 2/1/22 | 85,000 | 85,917 | ||||||
Southern 2.75% 6/15/20 | 500,000 | 505,075 | ||||||
Trans-Allegheny Interstate Line 144A 3.85% 6/1/25 # | 115,000 | 115,202 | ||||||
WEC Energy Group | ||||||||
2.45% 6/15/20 | 40,000 | 40,155 | ||||||
3.55% 6/15/25 | 60,000 | 60,202 | ||||||
Xcel Energy 3.30% 6/1/25 | 230,000 | 226,948 | ||||||
|
| |||||||
| 6,542,666 | ||||||||
|
| |||||||
Energy – 5.07% | ||||||||
CNOOC Finance 2015 Australia 2.625% 5/5/20 | 200,000 | 197,247 | ||||||
Columbia Pipeline Group | ||||||||
144A 2.45% 6/1/18 # | 40,000 | 40,285 | ||||||
144A 3.30% 6/1/20 # | 60,000 | 60,347 | ||||||
144A 4.50% 6/1/25 # | 60,000 | 59,815 | ||||||
Continental Resources 4.50% 4/15/23 | 250,000 | 232,517 | ||||||
Ecopetrol 5.375% 6/26/26 | 80,000 | 77,720 | ||||||
Enbridge Energy Partners 8.05% 10/1/37 ● | 245,000 | 251,493 | ||||||
Energy Transfer Partners | ||||||||
4.75% 1/15/26 | 105,000 | 102,842 | ||||||
23
Table of Contents
Schedule of investments
Delaware Core Plus Bond Fund
| Principal amount° | Value (U.S. $) | |||||||
| ||||||||
Corporate Bonds (continued) | ||||||||
| ||||||||
Energy (continued) | ||||||||
Energy Transfer Partners | ||||||||
9.70% 3/15/19 | 127,000 | $ | 154,390 | |||||
EnLink Midstream Partners 4.15% 6/1/25 | 105,000 | 99,301 | ||||||
Ensco 4.70% 3/15/21 | 270,000 | 265,651 | ||||||
Enterprise Products Operating 7.034% 1/15/68 ● | 405,000 | 434,363 | ||||||
Exxon Mobil 2.397% 3/6/22 | 75,000 | 73,863 | ||||||
Kinder Morgan 144A 5.00% 2/15/21 # | 65,000 | 68,011 | ||||||
Kinder Morgan Energy Partners 9.00% 2/1/19 | 415,000 | 494,891 | ||||||
Marathon Oil 3.85% 6/1/25 | 205,000 | 199,294 | ||||||
Newfield Exploration 5.625% 7/1/24 | 175,000 | 172,375 | ||||||
Noble Energy 5.05% 11/15/44 | 90,000 | 84,451 | ||||||
Noble Holding International 4.00% 3/16/18 | 20,000 | 19,982 | ||||||
ONGC Videsh 3.25% 7/15/19 | 200,000 | 201,602 | ||||||
Petrobras Global Finance 4.875% 3/17/20 | 78,000 | 72,666 | ||||||
Petroleos Mexicanos 144A 4.25% 1/15/25 # | 50,000 | 48,825 | ||||||
Petronas Global Sukuk 144A 2.707% 3/18/20 # | 200,000 | 199,112 | ||||||
Plains All American Pipeline 8.75% 5/1/19 | 195,000 | 237,592 | ||||||
Pride International 6.875% 8/15/20 | 205,000 | 229,937 | ||||||
QEP Resources 5.375% 10/1/22 | 645,000 | 606,300 | ||||||
Regency Energy Partners 5.875% 3/1/22 | 165,000 | 174,991 | ||||||
Sunoco Logistics Partners Operations 3.45% 1/15/23 | 165,000 | 154,854 | ||||||
Talisman Energy 5.50% 5/15/42 | 185,000 | 166,720 | ||||||
Valero Energy 4.90% 3/15/45 | 70,000 | 66,287 | ||||||
Weatherford International 4.50% 4/15/22 | 65,000 | 59,087 | ||||||
Western Gas Partners 3.95% 6/1/25 | 80,000 | 76,658 | ||||||
Williams Partners 7.25% 2/1/17 | 535,000 | 575,796 | ||||||
Woodside Finance | ||||||||
144A 3.65% 3/5/25 # | 145,000 | 140,277 | ||||||
144A 8.75% 3/1/19 # | 125,000 | 149,636 | ||||||
YPF | ||||||||
144A 8.75% 4/4/24 # | 80,000 | 79,176 | ||||||
144A 8.875% 12/19/18 # | 35,000 | 36,487 | ||||||
|
| |||||||
| 6,364,841 | ||||||||
|
| |||||||
Finance Companies – 0.56% | ||||||||
Affiliated Managers Group 3.50% 8/1/25 | 110,000 | 106,403 | ||||||
Aviation Capital Group 144A 6.75% 4/6/21 # | 90,000 | 102,519 | ||||||
General Electric Capital | ||||||||
2.10% 12/11/19 | 65,000 | 65,575 | ||||||
7.125% 12/29/49 ● | 200,000 | 231,500 | ||||||
Peachtree Corners Funding Trust 144A 3.976% 2/15/25 # | 200,000 | 200,619 | ||||||
|
| |||||||
| 706,616 | ||||||||
|
| |||||||
24
Table of Contents
| Principal amount° | Value (U.S. $) | |||||||
| ||||||||
Corporate Bonds (continued) | ||||||||
| ||||||||
Insurance – 1.68% | ||||||||
American International Group 3.75% 7/10/25 | 105,000 | $ | 105,209 | |||||
Highmark | ||||||||
144A 4.75% 5/15/21 # | 200,000 | 206,301 | ||||||
144A 6.125% 5/15/41 # | 30,000 | 30,259 | ||||||
MetLife 5.25% 12/29/49 ● | 200,000 | 200,000 | ||||||
Prudential Financial | ||||||||
4.50% 11/15/20 | 50,000 | 54,753 | ||||||
5.375% 5/15/45 ● | 95,000 | 93,931 | ||||||
5.625% 6/15/43 ● | 95,000 | 98,900 | ||||||
5.875% 9/15/42 ● | 245,000 | 260,313 | ||||||
TIAA Asset Management Finance | ||||||||
144A 2.95% 11/1/19 # | 95,000 | 96,079 | ||||||
144A 4.125% 11/1/24 # | 425,000 | 433,717 | ||||||
UnitedHealth Group 3.75% 7/15/25 | 145,000 | 147,954 | ||||||
Voya Financial 5.65% 5/15/53 ● | 120,000 | 123,192 | ||||||
XLIT | ||||||||
4.45% 3/31/25 | 185,000 | 184,439 | ||||||
6.50% 10/29/49 ● | 80,000 | 68,000 | ||||||
|
| |||||||
| 2,103,047 | ||||||||
|
| |||||||
REITs – 1.51% | ||||||||
AvalonBay Communities | ||||||||
3.45% 6/1/25 | 75,000 | 74,701 | ||||||
3.50% 11/15/24 | 130,000 | 129,692 | ||||||
CBL & Associates | ||||||||
4.60% 10/15/24 | 140,000 | 139,438 | ||||||
5.25% 12/1/23 | 20,000 | 20,761 | ||||||
Corporate Office Properties | ||||||||
3.60% 5/15/23 | 150,000 | 138,908 | ||||||
5.25% 2/15/24 | 85,000 | 87,835 | ||||||
DDR | ||||||||
7.875% 9/1/20 | 90,000 | 109,828 | ||||||
9.625% 3/15/16 | 150,000 | 157,498 | ||||||
Education Realty Operating Partnership 4.60% 12/1/24 | 115,000 | 116,246 | ||||||
Excel Trust 4.625% 5/15/24 | 65,000 | 62,373 | ||||||
Hospitality Properties Trust 4.50% 3/15/25 | 100,000 | 98,229 | ||||||
Host Hotels & Resorts | ||||||||
3.75% 10/15/23 | 135,000 | 133,324 | ||||||
4.75% 3/1/23 | 150,000 | 158,268 | ||||||
Regency Centers 5.875% 6/15/17 | 95,000 | 102,399 | ||||||
Trust F/1401 144A 5.25% 12/15/24 # | 200,000 | 210,440 | ||||||
Ventas Realty 4.125% 1/15/26 | 65,000 | 65,252 | ||||||
25
Table of Contents
Schedule of investments
Delaware Core Plus Bond Fund
| Principal amount° | Value (U.S. $) | |||||||
| ||||||||
Corporate Bonds (continued) | ||||||||
| ||||||||
REITs (continued) | ||||||||
WP Carey 4.60% 4/1/24 | 90,000 | $ | 91,137 | |||||
| 1,896,329 | ||||||||
Technology – 2.50% | ||||||||
Apple 3.45% 2/9/45 | 240,000 | 206,315 | ||||||
Baidu 2.75% 6/9/19 | 245,000 | 245,289 | ||||||
Cisco Systems | ||||||||
1.65% 6/15/18 | 145,000 | 145,656 | ||||||
2.45% 6/15/20 | 65,000 | 65,653 | ||||||
3.50% 6/15/25 | 40,000 | 40,688 | ||||||
Flextronics International 144A 4.75% 6/15/25 # | 140,000 | 137,025 | ||||||
Intel 3.70% 7/29/25 | 50,000 | 50,535 | ||||||
Molex Electronic Technologies | ||||||||
144A 2.878% 4/15/20 # | 140,000 | 138,426 | ||||||
144A 3.90% 4/15/25 # | 110,000 | 107,147 | ||||||
Motorola Solutions 4.00% 9/1/24 | 150,000 | 146,884 | ||||||
Oracle | ||||||||
2.50% 5/15/22 | 60,000 | 58,361 | ||||||
3.25% 5/15/30 | 100,000 | 92,917 | ||||||
4.125% 5/15/45 | 125,000 | 118,338 | ||||||
4.30% 7/8/34 | 175,000 | 175,764 | ||||||
QUALCOMM | ||||||||
3.00% 5/20/22 | 105,000 | 102,207 | ||||||
3.45% 5/20/25 | 95,000 | 90,072 | ||||||
Samsung Electronics America 144A 1.75% 4/10/17 # | 200,000 | 201,096 | ||||||
Seagate HDD Cayman | ||||||||
4.75% 1/1/25 | 215,000 | 213,267 | ||||||
144A 4.875% 6/1/27 # | 60,000 | 57,845 | ||||||
Tencent Holdings 144A 3.375% 5/2/19 # | 200,000 | 204,846 | ||||||
Xerox 6.35% 5/15/18 | 490,000 | 544,018 | ||||||
|
| |||||||
| 3,142,349 | ||||||||
|
| |||||||
Transportation – 0.53% | ||||||||
Air Canada 2015-1 Class A Pass Through Trust 144A | ||||||||
3.60% 3/15/27 # ¿ | 70,000 | 67,914 | ||||||
American Airlines 2014-1 Class A Pass Through Trust | ||||||||
3.70% 10/1/26 ¿ | 53,388 | 53,052 | ||||||
American Airlines 2015-1 Class A Pass Through Trust | ||||||||
3.375% 5/1/27 ¿ | 90,000 | 87,525 | ||||||
HPHT Finance 15 144A 2.875% 3/17/20 # | 200,000 | 199,243 | ||||||
Trinity Industries 4.55% 10/1/24 | 115,000 | 112,689 | ||||||
United Airlines 2014-1 Class A Pass Through Trust | ||||||||
4.00% 4/11/26 ¿ | 45,000 | 45,337 | ||||||
26
Table of Contents
| Principal amount° | Value (U.S. $) | |||||||
| ||||||||
Corporate Bonds (continued) | ||||||||
| ||||||||
Transportation (continued) | ||||||||
United Airlines 2014-2 Class A Pass Through Trust | ||||||||
3.75% 9/3/26 ¿ | 100,000 | $ | 99,250 | |||||
|
| |||||||
| 665,010 | ||||||||
|
| |||||||
Utilities – 0.08% | ||||||||
American Water Capital 3.40% 3/1/25 | 100,000 | 100,571 | ||||||
|
| |||||||
| 100,571 | ||||||||
|
| |||||||
Total Corporate Bonds (cost $50,231,681) | 50,423,499 | |||||||
|
| |||||||
| ||||||||
| ||||||||
Municipal Bonds – 1.22% | ||||||||
| ||||||||
Atlanta, Georgia Water & Wastewater Revenue | ||||||||
5.00% 11/1/40 | 70,000 | 79,039 | ||||||
California State Various Purpose | ||||||||
5.00% 3/1/45 | 125,000 | 141,675 | ||||||
Chicago, Illinois | ||||||||
(Taxable Build America Bond) Series B 7.75% 1/1/42 | 150,000 | 148,219 | ||||||
Golden State, California Tobacco Securitization Enhanced | ||||||||
(Asset-Backed) Series A | ||||||||
5.00% 6/1/40 | 215,000 | 238,603 | ||||||
5.00% 6/1/45 | 70,000 | 77,198 | ||||||
Golden State, California Tobacco Securitization Settlement | ||||||||
Revenue (Asset-Backed Senior Notes) Series A-1 | ||||||||
5.125% 6/1/47 | 80,000 | 62,554 | ||||||
5.75% 6/1/47 | 30,000 | 25,675 | ||||||
Maryland State Local Facilities 2nd Loan | ||||||||
Series A 5.00% 8/1/21 | 85,000 | 101,606 | ||||||
New Jersey Transportation Trust Fund Authority | ||||||||
(Transportation Program) Series AA 5.00% 6/15/44 | 130,000 | 132,621 | ||||||
New York City, New York | ||||||||
Series I 5.00% 8/1/22 | 50,000 | 59,411 | ||||||
New York City, New York Water & Sewer System | ||||||||
Series EE 5.00% 6/15/45 | 110,000 | 123,244 | ||||||
New York State Thruway Authority Revenue | ||||||||
Series A 5.00% 5/1/19 | 60,000 | 68,182 | ||||||
Texas Private Activity Bond Surface Transportation | ||||||||
Revenue Bond (Senior Lien NTE Mobility Partners Segments 3) | ||||||||
6.75% 6/30/43 (AMT) | 55,000 | 66,883 | ||||||
Texas State Transportation Commission | ||||||||
(Senior Lien Mobility Fund) Series A 5.00% 10/1/44 | 180,000 | 204,637 | ||||||
|
| |||||||
Total Municipal Bonds (cost $1,507,571) | 1,529,547 | |||||||
|
| |||||||
27
Table of Contents
Schedule of investments
Delaware Core Plus Bond Fund
| Principal amount° | Value (U.S. $) | |||||||
| ||||||||
Non-Agency Asset-Backed Securities – 6.14% | ||||||||
| ||||||||
AEP Texas Central Transition Funding II | ||||||||
Series 2006-A A4 5.17% 1/1/18 | 87,013 | $ | 91,915 | |||||
Ally Master Owner Trust | ||||||||
Series 2012-5 A 1.54% 9/15/19 | 365,000 | 365,247 | ||||||
Series 2014-4 A2 1.43% 6/17/19 | 180,000 | 180,308 | ||||||
American Express Credit Account Master Trust | ||||||||
Series 2013-2 A 0.607% 5/17/21 ● | 100,000 | 100,220 | ||||||
Series 2014-3 A 1.49% 4/15/20 | 100,000 | 100,634 | ||||||
American Express Credit Account Secured Note Trust | ||||||||
Series 2012-4 A 0.427% 5/15/20 ● | 360,000 | 359,677 | ||||||
American Homes 4 Rent Trust | ||||||||
Series 2014-SFR2 A 144A 3.786% 10/17/36 # | 98,774 | 101,763 | ||||||
ARI Fleet Lease Trust | ||||||||
Series 2015-A A2 144A 1.11% 11/15/18 # | 100,000 | 100,049 | ||||||
Avis Budget Rental Car Funding AESOP | ||||||||
Series 2011-3A A 144A 3.41% 11/20/17 # | 100,000 | 102,513 | ||||||
Series 2013-1A A 144A 1.92% 9/20/19 # | 120,000 | 119,399 | ||||||
Series 2014-1A A 144A 2.46% 7/20/20 # | 200,000 | 200,927 | ||||||
Bank of America Credit Card Trust | ||||||||
Series 2014-A3 A 0.477% 1/15/20 ● | 265,000 | 265,059 | ||||||
Series 2015-A1 A 0.517% 6/15/20 ● | 360,000 | 360,270 | ||||||
Cabela’s Credit Card Master Note Trust | ||||||||
Series 2012-2A A1 144A 1.45% 6/15/20 # | 120,000 | 120,344 | ||||||
California Republic Auto Receivables Trust | ||||||||
Series 2013-1 A2 144A 1.41% 9/17/18 # | 35,858 | 35,991 | ||||||
Capital One Multi-Asset Execution Trust | ||||||||
Series 2007-A2 A2 0.267% 12/16/19 ● | 110,000 | 109,671 | ||||||
Series 2007-A5 A5 0.227% 7/15/20 ● | 155,000 | 153,999 | ||||||
Series 2014-A4 A 0.547% 6/15/22 ● | 120,000 | 119,796 | ||||||
Chase Issuance Trust | ||||||||
Series 2013-A6 A6 0.607% 7/15/20 ● | 150,000 | 150,360 | ||||||
Series 2014-A5 A5 0.557% 4/15/21 ● | 125,000 | 124,913 | ||||||
Series 2015-A4 A 1.84% 4/15/22 | 140,000 | 139,422 | ||||||
Chesapeake Funding | ||||||||
Series 2014-1A A 144A 0.608% 3/7/26 #● | 177,909 | 177,496 | ||||||
Citibank Credit Card Issuance Trust | ||||||||
Series 2013-A4 A4 0.607% 7/24/20 ● | 100,000 | 100,300 | ||||||
Series 2014-A9 A9 0.435% 11/23/18 ● | 280,000 | 279,552 | ||||||
Dell Equipment Finance Trust | ||||||||
Series 2014-1 A3 144A 0.94% 6/22/20 # | 100,000 | 100,079 | ||||||
Discover Card Execution Note Trust | ||||||||
Series 2013-A1 A1 0.487% 8/17/20 ● | 200,000 | 200,010 | ||||||
Series 2014-A1 A1 0.617% 7/15/21 ● | 200,000 | 200,208 | ||||||
Series 2014-A3 A3 1.22% 10/15/19 | 200,000 | 200,305 | ||||||
28
Table of Contents
| Principal amount° | Value (U.S. $) | |||||||
| ||||||||
Non-Agency Asset-Backed Securities (continued) | ||||||||
| ||||||||
Discover Card Execution Note Trust | ||||||||
Series 2015-A2 A 1.90% 10/17/22 | 110,000 | $ | 109,181 | |||||
FirstKey Lending Trust | ||||||||
Series 2015-SFR1 A 144A 2.553% 3/9/47 # | 99,372 | 98,755 | ||||||
Ford Credit Auto Lease Trust | ||||||||
Series 2015-A A3 1.13% 6/15/18 | 90,000 | 89,762 | ||||||
Ford Credit Auto Owner Trust | ||||||||
Series 2015-2 A 144A 2.44% 1/15/27 # | 190,000 | 191,461 | ||||||
GE Dealer Floorplan Master Note Trust | ||||||||
Series 2014-2 A 0.638% 10/20/19 ● | 30,000 | 29,951 | ||||||
Golden Credit Card Trust | ||||||||
Series 2014-2A A 144A 0.637% 3/15/21 #● | 500,000 | 498,409 | ||||||
GreatAmerica Leasing Receivables | ||||||||
Series 2014-1 A3 144A 0.89% 7/15/17 # | 100,000 | 99,967 | ||||||
HOA Funding | ||||||||
Series 2014-1A A2 144A 4.846% 8/20/44 # | 49,250 | 48,594 | ||||||
Hyundai Auto Lease Securitization Trust | ||||||||
Series 2014-A A4 144A 1.01% 9/15/17 # | 125,000 | 125,207 | ||||||
MMAF Equipment Finance | ||||||||
Series 2014-AA A4 144A 1.59% 2/8/22 # | 110,000 | 109,709 | ||||||
Nissan Auto Lease Trust | ||||||||
Series 2014-A A4 1.04% 10/15/19 | 160,000 | 159,875 | ||||||
Penarth Master Issuer | ||||||||
Series 2015-1A A1 144A 0.588% 3/18/19 #● | 150,000 | 149,691 | ||||||
PFS Financing | ||||||||
Series 2015-AA A 144A 0.807% 4/15/20 #● | 100,000 | 99,173 | ||||||
Porsche Innovative Lease Owner Trust | ||||||||
Series 2015-1 A3 144A 1.19% 7/23/18 # | 100,000 | 99,947 | ||||||
Progress Residential Trust | ||||||||
Series 2015-SFR2 A 144A 2.74% 6/12/32 # | 100,000 | 99,102 | ||||||
Synchrony Credit Card Master Note Trust | ||||||||
Series 2012-6 A 1.36% 8/17/20 | 100,000 | 100,156 | ||||||
Series 2015-2 A 1.60% 4/15/21 | 155,000 | 155,142 | ||||||
Trade MAPS 1 | ||||||||
Series 2013-1A A 144A 0.889% 12/10/18 #● | 250,000 | 250,022 | ||||||
Volkswagen Auto Lease Trust | ||||||||
Series 2015-A A3 1.25% 12/20/17 | 95,000 | 95,118 | ||||||
Volkswagen Credit Auto Master Trust | ||||||||
Series 2014-1A A2 144A 1.40% 7/22/19 # | 265,000 | 266,097 | ||||||
Volvo Financial Equipment | ||||||||
Series 2014-1A A3 144A 0.82% 4/16/18 # | 80,000 | 79,888 | ||||||
World Financial Network Credit Card Master Trust | ||||||||
Series 2015-A A 0.667% 2/15/22 ● | 85,000 | 84,972 | ||||||
|
| |||||||
Total Non-Agency Asset-Backed Securities | 7,700,606 | |||||||
|
| |||||||
29
Table of Contents
Schedule of investments
Delaware Core Plus Bond Fund
| Principal amount° | Value (U.S. $) | |||||||
| ||||||||
Non-Agency Collateralized Mortgage Obligations – 1.16% | ||||||||
| ||||||||
American Home Mortgage Investment Trust | ||||||||
Series 2005-2 5A1 5.064% 9/25/35 f | 6,172 | $ | 6,286 | |||||
Citicorp Residential Mortgage Trust | ||||||||
Series 2006-3 A5 5.948% 11/25/36 f | 300,000 | 298,621 | ||||||
Credit Suisse First Boston Mortgage Securities | ||||||||
Series 2005-5 6A3 5.00% 7/25/35 | 98,307 | 98,480 | ||||||
GSMPS Mortgage Loan Trust | ||||||||
Series 1998-2 A 144A 7.294% 5/19/27 #● | 49,756 | 52,974 | ||||||
JPMorgan Mortgage Trust | ||||||||
Series 2006-S1 1A1 6.00% 4/25/36 | 63,458 | 65,465 | ||||||
Series 2007-A1 7A4 2.612% 7/25/35 ● | 137,944 | 121,537 | ||||||
Series 2014-2 B1 144A 3.427% 6/25/29 #● | 92,166 | 92,853 | ||||||
Series 2014-2 B2 144A 3.427% 6/25/29 #● | 92,166 | 91,394 | ||||||
Series 2014-IVR6 2A4 144A 2.50% 7/25/44 #● | 100,000 | 100,700 | ||||||
Series 2015-4 B1 144A 3.637% 6/25/45 #● | 100,000 | 97,211 | ||||||
Series 2015-4 B2 144A 3.637% 6/25/45 #● | 100,000 | 95,094 | ||||||
Sequoia Mortgage Trust | ||||||||
Series 2013-11 B1 144A 3.693% 9/25/43 #● | 95,940 | 95,498 | ||||||
Series 2014-2 A4 144A 3.50% 7/25/44 #● | 88,683 | 89,625 | ||||||
Series 2015-1 B2 144A 3.898% 1/25/45 #● | 49,454 | 49,113 | ||||||
Structured Asset Securities Mortgage Pass Through Certificates | ||||||||
Series 2004-20 2A1 5.50% 11/25/34 ¿ | 36,856 | 37,615 | ||||||
Washington Mutual Alternative Mortgage Pass Through Trust | ||||||||
Series 2005-1 5A2 6.00% 3/25/35 ¿ | 86,824 | 41,336 | ||||||
Wells Fargo Mortgage-Backed Securities Trust | ||||||||
Series 2006-AR5 2A1 2.713% 4/25/36 ● | 19,356 | 18,172 | ||||||
|
| |||||||
Total Non-Agency Collateralized Mortgage Obligations | 1,451,974 | |||||||
|
| |||||||
| ||||||||
Senior Secured Loans – 5.75%« | ||||||||
| ||||||||
Activision Blizzard 3.25% 10/11/20 | 257,888 | 259,217 | ||||||
Aramark Tranche E 3.25% 9/7/19 | 164,900 | 165,189 | ||||||
BJ’s Wholesale Club | ||||||||
4.50% 9/26/19 | 315,051 | 315,985 | ||||||
8.50% 3/31/20 | 160,000 | 161,500 | ||||||
Communications Sales & Leasing Tranche B 1st Lien | ||||||||
5.00% 10/24/22 | 135,000 | 131,794 | ||||||
DaVita Healthcare Partners Tranche B 3.50% 6/24/21 | 564,300 | 566,299 | ||||||
Emdeon 3.75% 11/2/18 | 570,192 | 569,954 | ||||||
Energy Transfer Equity 3.25% 12/2/19 | 125,000 | 124,512 | ||||||
FCA U.S. (Chrysler) 3.50% 5/24/17 | 166,107 | 166,273 | ||||||
First Data Tranche B 1st Lien 4.187% 3/24/21 | 300,857 | 302,257 | ||||||
Hilton Worldwide Finance 3.50% 10/25/20 | 487,283 | 488,844 | ||||||
30
Table of Contents
| Principal amount° | Value (U.S. $) | |||||||||||
| ||||||||||||
Senior Secured Loans« (continued) | ||||||||||||
| ||||||||||||
Houghton International 9.75% 12/21/20 | 475,000 | $ | 476,187 | |||||||||
IASIS Healthcare Tranche B 1st Lien 4.50% 5/3/18 | 203,199 | 203,961 | ||||||||||
Immucor 5.00% 8/19/18 | 487,168 | 488,995 | ||||||||||
Intelsat Jackson Holdings 3.75% 6/30/19 | 519,117 | 514,656 | ||||||||||
Landry’s Tranche B 4.00% 4/24/18 | 158,319 | 159,082 | ||||||||||
Level 3 Financing 4.00% 1/15/20 | 250,000 | 250,977 | ||||||||||
Neiman Marcus Group 1st Lien 4.25% 10/25/20 | 194,015 | 193,570 | ||||||||||
Numericable U.S. 4.50% 5/21/20 | 165,377 | 166,169 | ||||||||||
Numericable U.S. Tranche B2 1st Lien 4.50% 5/21/20 | 143,073 | 143,670 | ||||||||||
Offshore Group Investment (Vantage Drilling) Tranche B 1st Lien 5.00% 10/25/17 | 540 | 333 | ||||||||||
Scientific Games International 6.00% 10/18/20 | 265,950 | 267,372 | ||||||||||
Smart & Final Stores Tranche B 1st Lien 4.00% 11/15/19 | 160,029 | 160,303 | ||||||||||
Univision Communications Tranche C4 4.00% 3/1/20 | 550,753 | 551,135 | ||||||||||
USI 4.25% 12/27/19 | 185,275 | 185,545 | ||||||||||
Valeant Pharmaceuticals International 3.50% 8/5/20 | 199,049 | 199,493 | ||||||||||
|
| |||||||||||
Total Senior Secured Loans (cost $7,175,338) | 7,213,272 | |||||||||||
|
| |||||||||||
| ||||||||||||
| ||||||||||||
Sovereign Bonds – 0.99%D | ||||||||||||
| ||||||||||||
Australia – 0.02% | ||||||||||||
Australia Government Bond 3.25% 4/21/25 | AUD | 39,000 | 29,685 | |||||||||
|
| |||||||||||
| 29,685 | ||||||||||||
|
| |||||||||||
Dominican Republic – 0.08% | ||||||||||||
Dominican Republic International Bond 144A | ||||||||||||
5.50% 1/27/25 # | 100,000 | 101,000 | ||||||||||
|
| |||||||||||
| 101,000 | ||||||||||||
|
| |||||||||||
Germany – 0.03% | ||||||||||||
Bundesrepublik Deutschland 0.50% 2/15/25 | EUR | 37,000 | 40,208 | |||||||||
|
| |||||||||||
| 40,208 | ||||||||||||
|
| |||||||||||
Indonesia – 0.21% | ||||||||||||
Indonesia Government International Bond 144A | ||||||||||||
4.625% 4/15/43 # | 200,000 | 181,500 | ||||||||||
Indonesia Treasury Bond 8.375% 3/15/24 | IDR | 1,085,000,000 | 79,305 | |||||||||
|
| |||||||||||
| 260,805 | ||||||||||||
|
| |||||||||||
Italy – 0.12% | ||||||||||||
Italy Buoni Poliennali Del Tesoro 1.35% 4/15/22 | EUR | 136,000 | 150,135 | |||||||||
|
| |||||||||||
| 150,135 | ||||||||||||
|
| |||||||||||
Kazakhstan – 0.16% | ||||||||||||
Kazakhstan Government International Bond 144A | ||||||||||||
5.125% 7/21/25 # | 200,000 | 198,424 | ||||||||||
|
| |||||||||||
| 198,424 | ||||||||||||
|
| |||||||||||
31
Table of Contents
Schedule of investments
Delaware Core Plus Bond Fund
| Principal amount° | Value (U.S. $) | |||||||||||
| ||||||||||||
Sovereign BondsD (continued) | ||||||||||||
| ||||||||||||
Mexico – 0.06% | ||||||||||||
Mexican Bonos 7.50% 6/3/27 | MXN | 1,102,000 | $ | 75,511 | ||||||||
|
| |||||||||||
| 75,511 | ||||||||||||
|
| |||||||||||
Norway – 0.17% | ||||||||||||
Kommunalbanken 144A 2.125% 4/23/25 # | 214,000 | 207,089 | ||||||||||
|
| |||||||||||
| 207,089 | ||||||||||||
|
| |||||||||||
Poland – 0.03% | ||||||||||||
Poland Government Bond 3.25% 7/25/25 | PLN | 155,000 | 42,261 | |||||||||
|
| |||||||||||
| 42,261 | ||||||||||||
|
| |||||||||||
South Africa – 0.11% | ||||||||||||
South Africa Government Bond 8.00% 1/31/30 | ZAR | 1,840,000 | 138,146 | |||||||||
|
| |||||||||||
| 138,146 | ||||||||||||
|
| |||||||||||
Total Sovereign Bonds (cost $1,298,883) | 1,243,264 | |||||||||||
|
| |||||||||||
| ||||||||||||
| ||||||||||||
Supranational Banks – 0.32% | ||||||||||||
| ||||||||||||
European Bank for Reconstruction & Development | ||||||||||||
6.00% 3/3/16 | INR | 2,600,000 | 40,519 | |||||||||
7.375% 4/15/19 | IDR | 360,000,000 | 25,420 | |||||||||
Inter-American Development Bank | ||||||||||||
6.00% 9/5/17 | INR | 3,900,000 | 60,431 | |||||||||
7.25% 7/17/17 | IDR | 360,000,000 | 25,783 | |||||||||
International Bank for Reconstruction & Development | ||||||||||||
2.50% 7/29/25 | 205,000 | 205,523 | ||||||||||
4.625% 10/6/21 | NZD | 40,000 | 28,001 | |||||||||
International Finance 3.625% 5/20/20 | NZD | 20,000 | 13,361 | |||||||||
|
| |||||||||||
Total Supranational Banks (cost $416,257) | 399,038 | |||||||||||
|
| |||||||||||
| ||||||||||||
| ||||||||||||
U.S. Treasury Obligations – 4.38% | ||||||||||||
| ||||||||||||
U.S. Treasury Bond | ||||||||||||
3.00% 5/15/45 | 3,000,000 | 3,042,186 | ||||||||||
U.S. Treasury Notes | ||||||||||||
1.625% 6/30/20 | 39,000 | 39,164 | ||||||||||
1.625% 7/31/20 | 1,165,000 | 1,169,460 | ||||||||||
2.125% 5/15/25 ¥ | 1,255,000 | 1,246,470 | ||||||||||
|
| |||||||||||
Total U.S. Treasury Obligations (cost $5,443,058) | 5,497,280 | |||||||||||
|
| |||||||||||
Number of Shares | ||||||||||||
| ||||||||||||
Convertible Preferred Stock – 0.04% | ||||||||||||
| ||||||||||||
Bank of America 7.25% exercise price $50.00, expiration date 12/31/49 | 7 | 7,789 | ||||||||||
32
Table of Contents
Number of Shares | Value (U.S. $) | |||||||
| ||||||||
Convertible Preferred Stock (continued) | ||||||||
| ||||||||
Chesapeake Energy 5.75% exercise price $26.10, expiration date 12/31/49 | 16 | $ | 8,292 | |||||
Dominion Resources 6.125% exercise price $64.99, expiration date 4/1/16 | 180 | 10,166 | ||||||
Intelsat 5.75% exercise price $22.05, expiration date 5/1/16 | 405 | 10,980 | ||||||
Wells Fargo 7.50% exercise price $156.71, expiration date 12/31/49 | 14 | 16,690 | ||||||
|
| |||||||
Total Convertible Preferred Stock (cost $77,970) | 53,917 | |||||||
|
| |||||||
| ||||||||
| ||||||||
Preferred Stock – 0.99% | ||||||||
| ||||||||
Bank of America 6.10% ● | 80,000 | 79,740 | ||||||
Integrys Energy Group 6.00% ● | 4,400 | 121,572 | ||||||
Morgan Stanley 5.55% ● | 185,000 | 184,306 | ||||||
National Retail Properties 5.70% | 4,225 | 104,104 | ||||||
PNC Preferred Funding Trust II 1.508% #● | 300,000 | 276,750 | ||||||
Public Storage 5.20% | 4,400 | 105,688 | ||||||
U.S. Bancorp 3.50% ● | 350 | 282,998 | ||||||
USB Realty 1.436% #● | 100,000 | 92,250 | ||||||
|
| |||||||
Total Preferred Stock (cost $1,203,506) | 1,247,408 | |||||||
|
| |||||||
| Principal amount° | ||||||||
| ||||||||
Short-Term Investments – 15.62% | ||||||||
| ||||||||
Discount Notes – 6.49%≠ | ||||||||
Federal Home Loan Bank | ||||||||
0.05% 8/14/15 | 704,321 | 704,319 | ||||||
0.065% 8/5/15 | 492,908 | 492,908 | ||||||
0.065% 9/2/15 | 1,523,236 | 1,523,185 | ||||||
0.07% 8/11/15 | 984,461 | 984,459 | ||||||
0.075% 9/18/15 | 524,489 | 524,463 | ||||||
0.10% 10/23/15 | 1,523,236 | 1,523,063 | ||||||
0.105% 11/3/15 | 486,640 | 486,528 | ||||||
Freddie Mac 0.075% 10/1/15 | 1,904,900 | 1,904,743 | ||||||
|
| |||||||
| 8,143,668 | ||||||||
|
| |||||||
Repurchase Agreements – 9.13% | ||||||||
Bank of America Merrill Lynch | ||||||||
0.06%, dated 7/31/15, to be repurchased on 8/3/15, repurchase price $1,756,868 (collateralized by U.S. government obligations 0.50%–2.00% 1/31/17–5/31/21; market value $1,791,996) | 1,756,859 | 1,756,859 | ||||||
33
Table of Contents
Schedule of investments
Delaware Core Plus Bond Fund
| Principal amount° | Value (U.S. $) | |||||||
| ||||||||
Short-Term Investments (continued) | ||||||||
| ||||||||
Repurchase Agreements (continued) | ||||||||
Bank of Montreal | ||||||||
0.13%, dated 7/31/15, to be repurchased on 8/3/15, repurchase price $2,928,129 (collateralized by U.S. government obligations 1.25%–4.625% 9/30/16–2/15/40; market value $2,986,660) | 2,928,097 | $ | 2,928,097 | |||||
BNP Paribas | ||||||||
0.12%, dated 7/31/15, to be repurchased on 8/3/15, repurchase price $6,767,112 (collateralized by U.S. government obligations 0.00%–7.50% 1/28/16–11/15/44; market value $6,902,385) | 6,767,044 | 6,767,044 | ||||||
|
| |||||||
| 11,452,000 | ||||||||
|
| |||||||
Total Short-Term Investments (cost $19,595,288) | 19,595,668 | |||||||
|
| |||||||
Total Value of Securities – 112.94% | $ | 141,690,975 | ||||||
|
| |||||||
| # | Security exempt from registration under Rule 144A of the Securities Act of 1933, as amended. At July 31, 2015, the aggregate value of Rule 144A securities was $25,483,939, which represents 20.31% of the Fund’s net assets. See Note 11 in “Notes to financial statements.” |
| ¨ | Pass Through Agreement. Security represents the contractual right to receive a proportionate amount of underlying payments due to the counterparty pursuant to various agreements related to the rescheduling of obligations and the exchange of certain notes. |
| ≠ | The rate shown is the effective yield at the time of purchase. |
| ° | Principal amount shown is stated in U.S. dollars unless noted that the security is denominated in another currency. |
| ● | Variable rate security. The rate shown is the rate as of July 31, 2015. Interest rates reset periodically. |
| ¥ | Fully or partially pledged as collateral for futures contracts. |
| D | Securities have been classified by country of origin. |
| S | Interest only security. An interest only security is the interest only portion of a fixed income security which is separated and sold individually from the principal portion of the security. |
| « | Senior secured loans generally pay interest at rates which are periodically redetermined by reference to a base lending rate plus a premium. These base lending rates are generally: (i) the prime rate offered by one or more U.S. banks, (ii) the lending rate offered by one or more European banks such as the London Interbank Offered Rate (LIBOR), and (iii) the certificate of deposit rate. Senior secured loans may be subject to restrictions on resale. Stated rate in effect at July 31, 2015. |
| f | Step coupon bond. Coupon increases or decreases periodically based on a predetermined schedule. Stated rate in effect at July 31, 2015. |
34
Table of Contents
The following foreign currency exchange contracts, futures contracts and swap contracts were outstanding at July 31, 2015:1
Foreign Currency Exchange Contracts
Counterparty | Contracts to Receive (Deliver) | In Exchange For | Settlement Date | Unrealized Appreciation (Depreciation) | ||||||||||
BNYM | BRL | (150,845 | ) | USD | 44,612 | 8/4/15 | $ | 629 | ||||||
TD | MXN | 356,553 | USD | (22,177 | ) | 8/4/15 | (55 | ) | ||||||
|
| |||||||||||||
| $ | 574 | |||||||||||||
|
| |||||||||||||
Futures Contracts
| Contracts to Buy (Sell) | Notional Cost (Proceeds) | Notional Value | Expiration Date | Unrealized Appreciation (Depreciation) | ||||||||||||||||
| 27 | Euro-Bund | $ | 4,521,730 | $ | 4,576,925 | 9/9/15 | $ | 55,195 | ||||||||||||
| (2 | ) | S&P 500 Index E-mini | (205,851 | ) | (209,840 | ) | 9/21/15 | (3,989 | ) | |||||||||||
| (13 | ) | U.S. Treasury 5 yr Notes | (1,551,916 | ) | (1,557,969 | ) | 9/30/15 | (6,053 | ) | |||||||||||
| (44 | ) | U.S. Treasury 10 yr Notes | (5,541,834 | ) | (5,607,250 | ) | 9/21/15 | (65,416 | ) | |||||||||||
| 43 | U.S. Treasury Long Bonds | 6,525,073 | 6,705,313 | 9/21/15 | 180,240 | |||||||||||||||
|
|
|
| |||||||||||||||||
| $ | 3,747,202 | $ | 159,977 | |||||||||||||||||
|
|
|
| |||||||||||||||||
Swap Contracts
CDS Contracts2
Counterparty | Swap Referenced Obligation | Annual | Termination | Unrealized | ||||||||||||
Notional Value3 | Payments | Date | (Depreciation)4 | |||||||||||||
| Protection Purchased: | ||||||||||||||||
CITI | CDX.EM.23 | 320,000 | 1.00% | 6/20/20 | $ | 3,770 | ||||||||||
HSBC | CDX.EM.23 | 155,000 | 1.00% | 6/20/20 | 300 | |||||||||||
ICE | JPMC - CDX.NA.HY.24 | 618,750 | 5.00% | 6/20/20 | (2,495 | ) | ||||||||||
JPMC - iTraxx Europe Crossover | ||||||||||||||||
ICE | Series 23 Version 1 | EUR | 575,000 | 5.00% | 6/20/20 | (1,438 | ) | |||||||||
JPMC | CDX.EM.23 | 626,000 | 1.00% | 6/20/20 | (1,608 | ) | ||||||||||
|
| |||||||||||||||
| $ | (1,471 | ) | ||||||||||||||
|
| |||||||||||||||
The use of foreign currency exchange contracts, futures contracts and swap contracts involves elements of market risk and risks in excess of the amounts disclosed in the financial statements. The notional values and foreign currency exchange contracts presented above represent the Fund’s total exposure in such contracts, whereas only the net unrealized appreciation (depreciation) is reflected in the Fund’s net assets.
1See Note 8 in “Notes to financial statements.”
2A CDS contract is a risk-transfer instrument through which one party (purchaser of protection) transfers to another party (seller of protection) the financial risk of a credit event (as defined in the CDS agreement), as it relates to a particular reference security or basket of securities (such as an index). Periodic payments (receipts) on such contracts are accrued
35
Table of Contents
Schedule of investments
Delaware Core Plus Bond Fund
daily and recorded as unrealized losses (gains) on swap contracts. Upon payment (receipt), such amounts are recorded as realized losses (gains) on swap contracts. Upfront payments made or received in connection with CDS contracts are amortized over the expected life of the CDS contracts as unrealized losses (gains) on swap contracts. The change in value of CDS contracts is recorded daily as unrealized appreciation or depreciation. A realized gain or loss is recorded upon a credit event (as defined in the CDS agreement) or the maturity or termination of the agreement.
3Notional value shown is stated in U.S. dollars unless noted that the swap is denominated in another currency.
4Unrealized appreciation (depreciation) does not include periodic interest payments on swap contracts accrued daily in the amount of ($6,184).
Summary of abbreviations:
AMT – Subject to Alternative Minimum Tax
ARM – Adjustable Rate Mortgage
AUD – Australian Dollar
BNYM – Bank of New York Mellon
BRL – Brazilian Real
CDS – Credit Default Swap
CDX.EM – Credit Default Swap Index Emerging Markets
CDX.NA.HY – Credit Default Swap Index North America High Yield
CITI – Citigroup Global Markets
CLO – Collateralized Loan Obligation
DB – Deutsche Bank
EUR – European Monetary Unit
GE – General Electric
GNMA – Government National Mortgage Association
GS – Goldman Sachs
GSMPS – Goldman Sachs Reperforming Mortgage Securities
HSBC – Hong Kong Shanghai Bank
ICE – Intercontinental Exchange, Inc.
IDR – Indonesian Rupiah
INR – Indian Rupee
JPMBB – JPMorgan Barclays Bank
JPMC – JPMorgan Chase Bank
LB – Lehman Brothers
MXN – Mexican Peso
NZD – New Zealand Dollar
PLN – Polish Zloty
RBS – Royal Bank of Scotland
REIT – Real Estate Investment Trust
REMIC – Real Estate Mortgage Investment Conduit
S.F. – Single Family
TBA – To be announced
TD – Toronto Dominion Bank
36
Table of Contents
Summary of abbreviations: (continued)
UBS – Union Bank of Switzerland
USD – U.S. Dollar
WF – Wells Fargo
yr – Year
ZAR – South African Rand
See accompanying notes, which are an integral part of the financial statements.
37
Table of Contents
| Statement of assets and liabilities | ||
| Delaware Core Plus Bond Fund | July 31, 2015 |
Assets: | ||||
Investments, at value1 | $ | 122,095,307 | ||
Short-term investments, at value2 | 19,595,668 | |||
Cash collateral due from brokers | 144,709 | |||
Cash | 110,364 | |||
Foreign currencies, at value3 | 31,256 | |||
Receivable for securities sold | 12,225,378 | |||
Dividends and interest receivable | 828,217 | |||
Upfront payments paid on credit default swap contracts | 100,551 | |||
Receivable for fund shares sold | 28,517 | |||
Variation margin due from broker on futures contracts | 4,236 | |||
Unrealized appreciation on credit default swap contracts | 4,070 | |||
Unrealized appreciation on foreign currency exchange contracts | 629 | |||
Other assets4 | 97,871 | |||
|
| |||
Total assets | 155,266,773 | |||
|
| |||
Liabilities: | ||||
Payable for securities purchased | 28,985,376 | |||
Other accrued expenses | 163,661 | |||
Upfront payments received on credit default swap contracts | 94,857 | |||
Distribution payable | 86,298 | |||
Payable for fund shares redeemed | 84,736 | |||
Distribution fees payable to affiliates | 23,671 | |||
Investment management fees payable | 14,604 | |||
Other affiliates payable | 11,503 | |||
Swap payments payable | 8,168 | |||
Unrealized depreciation on credit default swap contracts | 3,598 | |||
Variation margin due to broker on centrally cleared credit default swap contracts | 1,943 | |||
Trustees’ fees and expenses payable | 295 | |||
Unrealized depreciation on foreign currency exchange contracts | 55 | |||
Other liabilities4 | 326,237 | |||
|
| |||
Total liabilities | 29,805,002 | |||
|
| |||
Total Net Assets | $ | 125,461,771 | ||
|
|
38
Table of Contents
Net Assets Consist of: | ||||
Paid-in capital | $ | 126,754,257 | ||
Distributions in excess of net investment income | (104,321 | ) | ||
Accumulated net realized loss on investments | (2,002,847 | ) | ||
Net unrealized appreciation of investments | 665,195 | |||
Net unrealized depreciation of foreign currencies | (3,409 | ) | ||
Net unrealized appreciation of foreign currency exchange contracts | 574 | |||
Net unrealized appreciation of futures contracts | 159,977 | |||
Net unrealized depreciation of swap contracts | (7,655 | ) | ||
|
| |||
Total Net Assets | $ | 125,461,771 | ||
|
| |||
Net Asset Value | ||||
Class A: | ||||
Net assets | $ | 64,069,564 | ||
Shares of beneficial interest outstanding, unlimited authorization, no par | 7,599,583 | |||
Net asset value per share | $ | 8.43 | ||
Sales charge | 4.50 | % | ||
Offering price per share, equal to net asset value per share / (1 – sales charge) | $ | 8.83 | ||
Class C: | ||||
Net assets | $ | 8,374,683 | ||
Shares of beneficial interest outstanding, unlimited authorization, no par | 992,179 | |||
Net asset value per share | $ | 8.44 | ||
Class R: | ||||
Net assets | $ | 6,862,632 | ||
Shares of beneficial interest outstanding, unlimited authorization, no par | 811,282 | |||
Net asset value per share | $ | 8.46 | ||
Institutional Class: | ||||
Net assets | $ | 46,154,892 | ||
Shares of beneficial interest outstanding, unlimited authorization, no par | 5,468,404 | |||
Net asset value per share | $ | 8.44 | ||
| ||||
1Investments, at cost | $ | 121,430,492 | ||
2Short-term investments, at cost | 19,595,288 | |||
3Foreign currencies, at cost | 31,309 | |||
4See Note 14 in “Notes to financial statements.” | ||||
See accompanying notes, which are an integral part of the financial statements.
39
Table of Contents
| Statement of operations | ||
| Delaware Core Plus Bond Fund | Year ended July 31, 2015 |
Investment Income: | ||||
Interest | $ | 3,854,684 | ||
Dividends | 43,645 | |||
|
| |||
| 3,898,329 | ||||
|
| |||
Expenses: | ||||
Management fees | 669,643 | |||
Distribution expenses – Class A | 164,039 | |||
Distribution expenses – Class B | 458 | |||
Distribution expenses – Class C | 87,482 | |||
Distribution expenses – Class R | 37,297 | |||
Dividend disbursing and transfer agent fees and expenses | 162,532 | |||
Reports and statements to shareholders | 67,250 | |||
Registration fees | 64,253 | |||
Legal fees | 47,067 | |||
Audit and tax fees | 47,052 | |||
Accounting and administration expenses | 39,032 | |||
Custodian fees | 27,238 | |||
Trustees’ fees and expenses | 5,608 | |||
Other | 46,637 | |||
|
| |||
| 1,465,588 | ||||
Less expenses waived | (366,915 | ) | ||
Less waived distribution expenses – Class B | (348 | ) | ||
Less expense paid indirectly | (68 | ) | ||
|
| |||
Total operating expenses | 1,098,257 | |||
|
| |||
Net Investment Income | 2,800,072 | |||
|
|
40
Table of Contents
Net Realized and Unrealized Gain (Loss): | ||||
Net realized gain (loss) on: | ||||
Investments1,2 | $ | 746,124 | ||
Foreign currencies | (118,936 | ) | ||
Foreign currency exchange contracts | 174 | |||
Futures contracts | 54,677 | |||
Swap contracts | (16,027 | ) | ||
|
| |||
Net realized gain | 666,012 | |||
|
| |||
Net change in unrealized appreciation (depreciation) of: | ||||
Investments | (1,690,354 | ) | ||
Foreign currencies | (2,683 | ) | ||
Foreign currency exchange contracts | 574 | |||
Futures contracts | 139,081 | |||
Swap contracts | (6,411 | ) | ||
|
| |||
Net change in unrealized appreciation (depreciation) | (1,559,793 | ) | ||
|
| |||
Net Realized and Unrealized Loss | (893,781 | ) | ||
|
| |||
Net Increase in Net Assets Resulting from Operations | $ | 1,906,291 | ||
|
|
1Includes $395 capital gains taxes paid.
2Includes $228,366 loss contingencies on General Motors term loan litigation. See Note 14 in “Notes to financial statements.”
See accompanying notes, which are an integral part of the financial statements.
41
Table of Contents
Statements of changes in net assets
Delaware Core Plus Bond Fund
| Year ended | ||||||||
| 7/31/15 | 7/31/14 | |||||||
Increase (Decrease) in Net Assets from Operations: | ||||||||
Net investment income | $ | 2,800,072 | $ | 3,122,789 | ||||
Net realized gain | 666,012 | 730,641 | ||||||
Net change in unrealized appreciation (depreciation) | (1,559,793 | ) | 1,831,781 | |||||
|
|
|
| |||||
Net increase in net assets resulting from operations | 1,906,291 | 5,685,211 | ||||||
|
|
|
| |||||
Dividends and Distributions to Shareholders from: | ||||||||
Net investment income: | ||||||||
Class A | (1,801,805 | ) | (2,013,571 | ) | ||||
Class B | (1,451 | ) | (13,455 | ) | ||||
Class C | (174,573 | ) | (195,214 | ) | ||||
Class R | (186,474 | ) | (196,604 | ) | ||||
Institutional Class | (1,183,298 | ) | (840,683 | ) | ||||
Return of capital: | ||||||||
Class A | (46,183 | ) | (271,322 | ) | ||||
Class B | — | (1,198 | ) | |||||
Class C | (6,030 | ) | (35,483 | ) | ||||
Class R | (4,930 | ) | (32,192 | ) | ||||
Institutional Class | (33,232 | ) | (125,196 | ) | ||||
|
|
|
| |||||
| (3,437,976 | ) | (3,724,918 | ) | |||||
|
|
|
| |||||
Capital Share Transactions: | ||||||||
Proceeds from shares sold: | ||||||||
Class A | 11,057,627 | 7,627,435 | ||||||
Class B | 89 | 415 | ||||||
Class C | 2,288,758 | 1,356,183 | ||||||
Class R | 1,277,507 | 1,503,884 | ||||||
Institutional Class | 21,004,192 | 18,421,281 | ||||||
42
Table of Contents
| Year ended | ||||||||
| 7/31/15 | 7/31/14 | |||||||
Capital Share Transactions (continued): | ||||||||
Net asset value of shares issued upon reinvestment of dividends and distributions: | ||||||||
Class A | $ | 1,670,136 | $ | 2,056,563 | ||||
Class B | 1,131 | 12,120 | ||||||
Class C | 169,730 | 221,061 | ||||||
Class R | 192,500 | 228,482 | ||||||
Institutional Class | 1,192,045 | 965,879 | ||||||
|
|
|
| |||||
| 38,853,715 | 32,393,303 | |||||||
|
|
|
| |||||
Cost of shares redeemed: | ||||||||
Class A | (13,368,386 | ) | (26,761,534 | ) | ||||
Class B | (289,338 | ) | (418,556 | ) | ||||
Class C | (2,562,532 | ) | (4,197,775 | ) | ||||
Class R | (2,320,453 | ) | (2,185,999 | ) | ||||
Institutional Class | (5,680,717 | ) | (49,434,542 | ) | ||||
|
|
|
| |||||
| (24,221,426 | ) | (82,998,406 | ) | |||||
|
|
|
| |||||
Increase (Decrease) in net assets derived from capital share transactions | 14,632,289 | (50,605,103 | ) | |||||
|
|
|
| |||||
Net Increase (Decrease) in Net Assets | 13,100,604 | (48,644,810 | ) | |||||
Net Assets: | ||||||||
Beginning of year | 112,361,167 | 161,005,977 | ||||||
|
|
|
| |||||
End of year | $ | 125,461,771 | $ | 112,361,167 | ||||
|
|
|
| |||||
Distributions in excess of net investment income | $ | (104,321 | ) | $ | (98,954 | ) | ||
|
|
|
| |||||
See accompanying notes, which are an integral part of the financial statements.
43
Table of Contents
Delaware Core Plus Bond Fund Class A
Selected data for each share of the Fund outstanding throughout each period were as follows:
|
Net asset value, beginning of period |
Income (loss) from investment operations: |
Net investment income1 |
Net realized and unrealized gain (loss) |
Total from investment operations |
Less dividends and distributions from: |
Net investment income |
Return of capital |
Net realized gain |
Total dividends and distributions |
Net asset value, end of period |
Total return2 |
Ratios and supplemental data: |
Net assets, end of period (000 omitted) |
Ratio of expenses to average net assets |
Ratio of expenses to average net assets prior to fees waived |
Ratio of net investment income to average net assets |
Ratio of net investment income to average net assets prior to fees waived |
Portfolio turnover |
| 1 | The average shares outstanding method has been applied for per share information. |
| 2 | Total investment return is based on the change in net asset value of a share during the period and assumes reinvestment of dividends and distributions at net asset value and does not reflect the impact of a sales charge. Total investment return during all of the periods shown reflects waivers by the manager and/or distributor. Performance would have been lower had the waivers not been in effect. |
See accompanying notes, which are an integral part of the financial statements.
44
Table of Contents
Year ended | ||||||||||||||||||||||
|
| |||||||||||||||||||||
| 7/31/15 | 7/31/14 | 7/31/13 | 7/31/12 | 7/31/11 | ||||||||||||||||||
|
| |||||||||||||||||||||
| $ | 8.530 | $ | 8.340 | $ | 8.750 | $ | 8.420 | $ | 8.220 | |||||||||||||
| 0.196 | 0.226 | 0.202 | 0.205 | 0.264 | ||||||||||||||||||
| (0.056 | ) | 0.233 | (0.328 | ) | 0.375 | 0.244 | ||||||||||||||||
|
|
|
|
|
|
|
|
|
| |||||||||||||
| 0.140 | 0.459 | (0.126 | ) | 0.580 | 0.508 | |||||||||||||||||
|
|
|
|
|
|
|
|
|
| |||||||||||||
| (0.234 | ) | (0.234 | ) | (0.265 | ) | (0.250 | ) | (0.308 | ) | |||||||||||||
| (0.006 | ) | (0.035 | ) | — | — | — | ||||||||||||||||
| — | — | (0.019 | ) | — | — | |||||||||||||||||
|
|
|
|
|
|
|
|
|
| |||||||||||||
| (0.240 | ) | (0.269 | ) | (0.284 | ) | (0.250 | ) | (0.308 | ) | |||||||||||||
|
|
|
|
|
|
|
|
|
| |||||||||||||
| $ | 8.430 | $ | 8.530 | $ | 8.340 | $ | 8.750 | $ | 8.420 | |||||||||||||
|
|
|
|
|
|
|
|
|
| |||||||||||||
| 1.65% | 5.60% | (1.51% | ) | 7.01% | 6.32% | |||||||||||||||||
| $ | 64,069 | $ | 65,466 | $ | 81,042 | $ | 91,099 | $ | 74,107 | |||||||||||||
| 0.91% | 0.90% | 0.90% | 0.90% | 0.90% | ||||||||||||||||||
| 1.21% | 1.19% | 1.17% | 1.18% | 1.29% | ||||||||||||||||||
| 2.30% | 2.70% | 2.33% | 2.41% | 3.20% | ||||||||||||||||||
| 2.00% | 2.41% | 2.06% | 2.13% | 2.81% | ||||||||||||||||||
| 313% | 273% | 340% | 422% | 293% | ||||||||||||||||||
45
Table of Contents
Financial highlights
Delaware Core Plus Bond Fund Class C
Selected data for each share of the Fund outstanding throughout each period were as follows:
|
Net asset value, beginning of period |
Income (loss) from investment operations: |
Net investment income1 |
Net realized and unrealized gain (loss) |
Total from investment operations |
Less dividends and distributions from: |
Net investment income |
Return of capital |
Net realized gain |
Total dividends and distributions |
Net asset value, end of period |
Total return2 |
Ratios and supplemental data: |
Net assets, end of period (000 omitted) |
Ratio of expenses to average net assets |
Ratio of expenses to average net assets prior to fees waived |
Ratio of net investment income to average net assets |
Ratio of net investment income to average net assets prior to fees waived |
Portfolio turnover |
| 1 | The average shares outstanding method has been applied for per share information. |
| 2 | Total investment return is based on the change in net asset value of a share during the period and assumes reinvestment of dividends and distributions at net asset value and does not reflect the impact of a sales charge. Total investment return during all of the periods shown reflects a waiver by the manager. Performance would have been lower had the waiver not been in effect. |
See accompanying notes, which are an integral part of the financial statements.
46
Table of Contents
| Year ended | ||||||||||||||||||||
| ||||||||||||||||||||
| 7/31/15 | 7/31/14 | 7/31/13 | 7/31/12 | 7/31/11 | ||||||||||||||||
| ||||||||||||||||||||
| $ | 8.540 | $ | 8.350 | $ | 8.760 | $ | 8.430 | $ | 8.230 | |||||||||||
| 0.132 | 0.164 | 0.137 | 0.142 | 0.203 | ||||||||||||||||
| (0.056 | ) | 0.232 | (0.328 | ) | 0.374 | 0.244 | ||||||||||||||
|
|
|
|
|
|
|
|
|
| |||||||||||
| 0.076 | 0.396 | (0.191 | ) | 0.516 | 0.447 | |||||||||||||||
|
|
|
|
|
|
|
|
|
| |||||||||||
| (0.170 | ) | (0.171 | ) | (0.200 | ) | (0.186 | ) | (0.247 | ) | |||||||||||
| (0.006 | ) | (0.035 | ) | — | — | — | ||||||||||||||
| — | — | (0.019 | ) | — | — | |||||||||||||||
|
|
|
|
|
|
|
|
|
| |||||||||||
| (0.176 | ) | (0.206 | ) | (0.219 | ) | (0.186 | ) | (0.247 | ) | |||||||||||
|
|
|
|
|
|
|
|
|
| |||||||||||
| $ | 8.440 | $ | 8.540 | $ | 8.350 | $ | 8.760 | $ | 8.430 | |||||||||||
|
|
|
|
|
|
|
|
|
| |||||||||||
| 0.89% | 4.81% | (2.24% | ) | 6.20% | 5.53% | |||||||||||||||
| $ | 8,375 | $ | 8,572 | $ | 10,990 | $ | 12,989 | $ | 10,147 | |||||||||||
| 1.66% | 1.65% | 1.65% | 1.65% | 1.65% | ||||||||||||||||
| 1.96% | 1.93% | 1.87% | 1.88% | 1.99% | ||||||||||||||||
| 1.55% | 1.95% | 1.58% | 1.66% | 2.45% | ||||||||||||||||
| 1.25% | 1.67% | 1.36% | 1.43% | 2.11% | ||||||||||||||||
| 313% | 273% | 340% | 422% | 293% | ||||||||||||||||
47
Table of Contents
Financial highlights
Delaware Core Plus Bond Fund Class R
Selected data for each share of the Fund outstanding throughout each period were as follows:
|
Net asset value, beginning of period |
Income (loss) from investment operations: |
Net investment income1 |
Net realized and unrealized gain (loss) |
Total from investment operations |
Less dividends and distributions from: |
Net investment income |
Return of capital |
Net realized gain |
Total dividends and distributions |
Net asset value, end of period |
Total return2 |
Ratios and supplemental data: |
Net assets, end of period (000 omitted) |
Ratio of expenses to average net assets |
Ratio of expenses to average net assets prior to fees waived |
Ratio of net investment income to average net assets |
Ratio of net investment income to average net assets prior to fees waived |
Portfolio turnover |
| 1 | The average shares outstanding method has been applied for per share information. |
| 2 | Total investment return is based on the change in net asset value of a share during the period and assumes reinvestment of dividends and distributions at net asset value. Total investment return during all of the periods shown reflects waivers by the manager and/or distributor. Performance would have been lower had the waivers not been in effect. |
See accompanying notes, which are an integral part of the financial statements.
48
Table of Contents
| Year ended | ||||||||||||||||||||||
|
| |||||||||||||||||||||
| 7/31/15 | 7/31/14 | 7/31/13 | 7/31/12 | 7/31/11 | ||||||||||||||||||
|
| |||||||||||||||||||||
| $ | 8.560 | $ | 8.370 | $ | 8.780 | $ | 8.450 | $ | 8.240 | |||||||||||||
| 0.176 | 0.206 | 0.181 | 0.185 | 0.244 | ||||||||||||||||||
| (0.056 | ) | 0.233 | (0.328 | ) | 0.374 | 0.255 | ||||||||||||||||
|
|
|
|
|
|
|
|
|
| |||||||||||||
| 0.120 | 0.439 | (0.147 | ) | 0.559 | 0.499 | |||||||||||||||||
|
|
|
|
|
|
|
|
|
| |||||||||||||
| (0.214 | ) | (0.214 | ) | (0.244 | ) | (0.229 | ) | (0.289 | ) | |||||||||||||
| (0.006 | ) | (0.035 | ) | — | — | — | ||||||||||||||||
| — | — | (0.019 | ) | — | — | |||||||||||||||||
|
|
|
|
|
|
|
|
|
| |||||||||||||
| (0.220 | ) | (0.249 | ) | (0.263 | ) | (0.229 | ) | (0.289 | ) | |||||||||||||
|
|
|
|
|
|
|
|
|
| |||||||||||||
| $ | 8.460 | $ | 8.560 | $ | 8.370 | $ | 8.780 | $ | 8.450 | |||||||||||||
|
|
|
|
|
|
|
|
|
| |||||||||||||
| 1.40% | 5.32% | (1.74% | ) | 6.73% | 6.17% | |||||||||||||||||
| $ | 6,863 | $ | 7,793 | $ | 8,077 | $ | 9,180 | $ | 6,789 | |||||||||||||
| 1.16% | 1.15% | 1.15% | 1.15% | 1.15% | ||||||||||||||||||
| 1.46% | 1.45% | 1.47% | 1.48% | 1.59% | ||||||||||||||||||
| 2.05% | 2.45% | 2.08% | 2.16% | 2.95% | ||||||||||||||||||
| 1.75% | 2.15% | 1.76% | 1.83% | 2.51% | ||||||||||||||||||
| 313% | 273% | 340% | 422% | 293% | ||||||||||||||||||
49
Table of Contents
Financial highlights
Delaware Core Plus Bond Fund Institutional Class
Selected data for each share of the Fund outstanding throughout each period were as follows:
|
Net asset value, beginning of period |
Income (loss) from investment operations: |
Net investment income1 |
Net realized and unrealized gain (loss) |
Total from investment operations |
Less dividends and distributions from: |
Net investment income |
Return of capital |
Net realized gain |
Total dividends and distributions |
Net asset value, end of period |
Total return2 |
Ratios and supplemental data: |
Net assets, end of period (000 omitted) |
Ratio of expenses to average net assets |
Ratio of expenses to average net assets prior to fees waived |
Ratio of net investment income to average net assets |
Ratio of net investment income to average net assets prior to fees waived |
Portfolio turnover |
| 1 | The average shares outstanding method has been applied for per share information. |
| 2 | Total investment return is based on the change in net asset value of a share during the period and assumes reinvestment of dividends and distributions at net asset value. Total investment return during all of the periods shown reflects a waiver by the manager. Performance would have been lower had the waiver not been in effect. |
See accompanying notes, which are an integral part of the financial statements.
50
Table of Contents
| Year ended | ||||||||||||||||||||
| ||||||||||||||||||||
| 7/31/15 | 7/31/14 | 7/31/13 | 7/31/12 | 7/31/11 | ||||||||||||||||
| ||||||||||||||||||||
| $ | 8.540 | $ | 8.350 | $ | 8.760 | $ | 8.430 | $ | 8.230 | |||||||||||
| 0.215 | 0.248 | 0.224 | 0.228 | 0.285 | ||||||||||||||||
| (0.053 | ) | 0.233 | (0.328 | ) | 0.373 | 0.245 | ||||||||||||||
|
|
|
|
|
|
|
|
|
| |||||||||||
| 0.162 | 0.481 | (0.104 | ) | 0.601 | 0.530 | |||||||||||||||
|
|
|
|
|
|
|
|
|
| |||||||||||
| (0.256 | ) | (0.256 | ) | (0.287 | ) | (0.271 | ) | (0.330 | ) | |||||||||||
| (0.006 | ) | (0.035 | ) | — | — | — | ||||||||||||||
| — | — | (0.019 | ) | — | — | |||||||||||||||
|
|
|
|
|
|
|
|
|
| |||||||||||
| (0.262 | ) | (0.291 | ) | (0.306 | ) | (0.271 | ) | (0.330 | ) | |||||||||||
|
|
|
|
|
|
|
|
|
| |||||||||||
| $ | 8.440 | $ | 8.540 | $ | 8.350 | $ | 8.760 | $ | 8.430 | |||||||||||
|
|
|
|
|
|
|
|
|
| |||||||||||
| 1.90% | 5.86% | (1.26% | ) | 7.27% | 6.58% | |||||||||||||||
| $ | 46,155 | $ | 30,241 | $ | 60,210 | $ | 75,469 | $ | 10,205 | |||||||||||
| 0.66% | 0.65% | 0.65% | 0.65% | 0.65% | ||||||||||||||||
| 0.96% | 0.93% | 0.87% | 0.88% | 0.99% | ||||||||||||||||
| 2.55% | 2.95% | 2.58% | 2.66% | 3.45% | ||||||||||||||||
| 2.25% | 2.67% | 2.36% | 2.43% | 3.11% | ||||||||||||||||
| 313% | 273% | 340% | 422% | 293% | ||||||||||||||||
51
Table of Contents
| Delaware Core Plus Bond Fund | July 31, 2015 |
Delaware Group® Government Fund (Trust) is organized as a Delaware statutory trust and offers two series: Delaware Core Plus Bond Fund and Delaware Emerging Markets Debt Fund. These financial statements and the related notes pertain to Delaware Core Plus Bond Fund (Fund). The Trust is an open-end investment company. The Fund is considered diversified under the Investment Company Act of 1940, as amended, and offers Class A, Class C, Class R, and Institutional Class shares. Class A shares are sold with a maximum front-end sales charge of 4.50%. Class A share purchases of $1,000,000 or more will incur a contingent deferred sales charge (CDSC) of 1.00% if redeemed during the first year, and 0.50% during the second year, provided that Delaware Distributors, L.P. (DDLP) paid a financial advisor a commission on the purchase of those shares. Effective Sept. 25, 2014, all remaining shares of Class B were converted to Class A shares. Between June 1, 2007 and Sept. 25, 2014, Class B shares could be purchased only through dividend reinvestment and certain permitted exchanges. Class B shares automatically converted to Class A shares on a quarterly basis approximately eight years after purchase. Class C shares are sold with a CDSC of 1.00%, if redeemed during the first 12 months. Class R and Institutional Class shares are not subject to a sales charge and are offered for sale exclusively to certain eligible investors.
The investment objective of the Fund is to seek maximum long-term total return, consistent with reasonable risk.
1. Significant Accounting Policies
The following accounting policies are in accordance with U.S. generally accepted accounting principles (U.S. GAAP) and are consistently followed by the Fund.
Security Valuation – Equity securities, except those traded on The Nasdaq Stock Market LLC (Nasdaq), are valued at the last quoted sales price as of the time of the regular close of the New York Stock Exchange on the valuation date. Securities traded on the Nasdaq are valued in accordance with the Nasdaq Official Closing Price, which may not be the last sales price. If, on a particular day, an equity security does not trade, the mean between the bid and ask prices will be used, which approximates fair value. U.S. government and agency securities are valued at the mean between the bid and ask prices, which approximates fair value. Debt securities and credit default swap (CDS) contracts are valued based upon valuations provided by an independent pricing service or broker/counterparty and reviewed by management. To the extent current market prices are not available, the pricing service may take into account developments related to the specific security, as well as transactions in comparable securities. For asset-backed securities, collateralized mortgage obligations, commercial mortgage securities, and U.S. government agency mortgage securities, pricing vendors utilize matrix pricing which considers prepayment speed, attributes of the collateral, yield or price of bonds of comparable quality, coupon, maturity, and type as well as broker/dealer-supplied prices. Valuations for fixed income securities utilize matrix systems, which reflect such factors as security prices, yields, maturities, and ratings, and are supplemented by dealer and exchange quotations. Swap prices are derived using daily swap curves and models that incorporate a number of market data factors, such as discounted cash flows, trades, and values of the underlying reference instruments. Foreign currency exchange contracts and foreign cross currency exchange contracts are valued at the mean between the bid and ask prices, which approximates fair value. Interpolated values are derived when the settlement date of the contract is an interim date for which quotations are not available. Futures contracts and options on futures contracts
52
Table of Contents
are valued at the daily quoted settlement prices. Generally, other securities and assets for which market quotations are not readily available are valued at fair value as determined in good faith under the direction of the Fund’s Board of Trustees (Board). In determining whether market quotations are readily available or fair valuation will be used, various factors will be taken into consideration, such as market closures or suspension of trading in a security.
Federal and Foreign Income Taxes – No provision for federal income taxes has been made as the Fund intends to continue to qualify for federal income tax purposes as a regulated investment company under Subchapter M of the Internal Revenue Code of 1986, as amended, and make the requisite distributions to shareholders. The Fund evaluates tax positions taken or expected to be taken in the course of preparing the Fund’s tax returns to determine whether the tax positions are “more-likely-than-not” of being sustained by the applicable tax authority. Tax positions not deemed to meet the “more-likely-than-not” threshold are recorded as a tax benefit or expense in the current year. Management has analyzed the Fund’s tax positions taken for all open federal income tax years (July 31, 2012–July 31, 2015), and has concluded that no provision for federal income tax is required in the Fund’s financial statements. In regard to foreign taxes only, the Fund has open tax years in certain foreign countries in which it invests that may date back to the inception of the Fund.
Class Accounting – Investment income and common expenses are allocated to the various classes of the Fund on the basis of “settled shares” of each class in relation to the net assets of the Fund. Realized and unrealized gain (loss) on investments are allocated to the various classes of the Fund on the basis of daily net assets of each class. Distribution expenses relating to a specific class are charged directly to that class.
Repurchase Agreements – The Fund may purchase certain U.S. government securities subject to the counterparty’s agreement to repurchase them at an agreed upon date and price. The counterparty will be required on a daily basis to maintain the value of the collateral subject to the agreement at not less than the repurchase price (including accrued interest). The agreements are conditioned upon the collateral being deposited under the Federal Reserve book-entry system with the Fund’s custodian or a third party sub-custodian. In the event of default or bankruptcy by the other party to the agreement, retention of the collateral may be subject to legal proceedings. All open repurchase agreements as of the date of this report were entered into on July 31, 2015.
To Be Announced Trades (TBA) – The Fund may contract to purchase or sell securities for a fixed price at a transaction date beyond the customary settlement period (examples: when issued, delayed delivery, forward commitment, or TBA transactions) consistent with the Fund’s ability to manage its investment portfolio and meet redemption requests. These transactions involve a commitment by the Fund to purchase or sell securities for a predetermined price or yield with payment and delivery taking place more than three days in the future, or after a period longer than the customary settlement period for that type of security. No interest will be earned by the Fund on such purchases until the securities are delivered or transaction is completed; however, the market value may change prior to delivery.
Foreign Currency Transactions – Transactions denominated in foreign currencies are recorded at the prevailing exchange rates on the valuation date in accordance with the Fund’s prospectus. The value of all assets and liabilities denominated in foreign currencies is translated daily into U.S. dollars at the exchange rate of such currencies against the U.S. dollar. Transaction gains or losses resulting from
53
Table of Contents
Notes to financial statements
Delaware Core Plus Bond Fund
1. Significant Accounting Policies (continued)
changes in exchange rates during the reporting period or upon settlement of the foreign currency transaction are reported in operations for the current period. The Fund generally bifurcates that portion of realized gains and losses on investments in debt securities which is due to changes in foreign exchange rates from that which is due to changes in market prices of debt securities. That portion of gains (losses, which are due to changes in foreign exchange rates) is included on the “Statement of operations” under “Net realized gain (loss) on foreign currencies.” The Fund reports certain foreign currency related transactions as components of realized gains (losses) for financial reporting purposes, whereas such components are treated as ordinary income (loss) for federal income tax purposes.
Use of Estimates – The Fund is an investment company, whose financial statements are prepared in conformity with U.S. GAAP. Therefore, the Fund follows the accounting and reporting guidelines for investment companies. The preparation of financial statements in conformity with U.S. GAAP requires management to make estimates and assumptions that affect the fair value of investments, the reported amounts of assets and liabilities and disclosure of contingent assets and liabilities at the date of the financial statements, and the reported amounts of revenues and expenses during the reporting period. Actual results could differ from those estimates and the differences could be material.
Other – Expenses directly attributable to the Fund are charged directly to the Fund. Other expenses common to various funds within the Delaware Investments® Family of Funds are generally allocated among such funds on the basis of average net assets. Management fees and some other expenses are paid monthly. Security transactions are recorded on the date the securities are purchased or sold (trade date) for financial reporting purposes. Costs used in calculating realized gains and losses on the sale of investment securities are those of the specific securities sold. Dividend income is recorded on the ex-dividend date and interest income is recorded on the accrual basis. Discounts and premiums on debt securities are accreted or amortized to interest income, respectively, over the lives of the respective securities using the effective interest method. Realized gains (losses) on paydowns of asset- and mortgage-backed securities are classified as interest income. The Fund declares dividends daily from net investment income and pays the dividends monthly and declares and pays distributions from net realized gain on investments, if any, annually. The Fund may distribute more frequently, if necessary for tax purposes. Dividends and distributions, if any, are recorded on the ex-dividend date.
The Fund may receive earnings credits from its custodian when positive cash balances are maintained, which may be used to offset custody fees. There were no such earnings credits for the year ended July 31, 2015.
The Fund receives earnings credits from its transfer agent when positive cash balances are maintained, which may be used to offset transfer agent fees. If the amount earned is greater than one dollar, the expense paid under this arrangement is included on the “Statement of operations” under “Dividend disbursing and transfer agent fees and expenses” with the corresponding expense offset shown under “Less expense paid indirectly.” For the year ended July 31, 2015, the Fund earned $68 under this agreement.
54
Table of Contents
2. Investment Management, Administration Agreements, and Other Transactions with Affiliates
In accordance with the terms of its investment management agreement, the Fund pays Delaware Management Company (DMC), a series of Delaware Management Business Trust and the investment manager, an annual fee which is calculated daily at the rate of 0.55% on the first $500 million of average daily net assets of the Fund, 0.50% on the next $500 million, 0.45% on the next $1.5 billion, and 0.425% on average daily net assets in excess of $2.5 billion.
DMC has contractually agreed to waive that portion, if any, of its management fee and/or pay/reimburse the Fund to the extent necessary to ensure total annual operating expenses (excluding any 12b-1 fees, acquired fund fees and expenses, taxes, interest, short sale and dividend interest expenses, brokerage fees, certain insurance costs, and nonroutine expenses or costs, including, but not limited to, those relating to reorganizations, litigation, conducting shareholder meetings, and liquidations (collectively, nonroutine expenses)), from exceeding 0.65% of the Fund’s average daily net assets from Aug. 1, 2014 through July 31, 2015.* These waivers and reimbursements apply only to expenses paid directly by the Fund and may only be terminated by agreement of DMC and the Fund.
Effective Nov. 1, 2014, Delaware Investments Fund Services Company (DIFSC), an affiliate of DMC, provides fund accounting and financial administration oversight services to the Fund. Prior to this time, Delaware Service Company, Inc. (DSC), an affiliate of DMC, provided fund accounting and financial administration oversight services to the Fund under a substantially identical agreement with an identical fee schedule. For these services, DIFSC’s fees are calculated based on the aggregate daily net assets of the Delaware Investments® Family of Funds at the following annual rate: 0.0050% of the first $30 billion; 0.0045% of the next $10 billion; 0.0040% of the next $10 billion; and 0.0025% of aggregate average daily net assets in excess of $50 billion. The fees payable to DIFSC under the service agreement described above are allocated among all funds in the Delaware Investments Family of Funds on a relative net asset value basis. For the year ended July 31, 2015, the Fund was charged $5,765 for these services. This amount is included on the “Statement of operations” under “Accounting and administration expenses.”
Effective Nov. 1, 2014, DIFSC also became the transfer agent and dividend disbursing agent of the Fund. Prior to this time, Delaware Service Company, Inc. (DSC), an affiliate of DMC, provided fund accounting and financial administration oversight services to the Fund under a substantially identical agreement with an identical fee schedule. For these services, DIFSC’s fees are calculated based on the aggregate daily net assets of the retail funds within the Delaware Investments Family of Funds at the following annual rate: 0.025% of the first $20 billion, 0.020% of the next $5 billion; 0.015% of the next $5 billion; and 0.013% of average daily net assets in excess of $30 billion. The fees payable to DIFSC under the service agreement described above are allocated among all retail Funds in the Delaware Investments Family of Funds on a relative net asset value basis. For the year ended July 31, 2015, the Fund was charged $25,355 for these services. This amount is included on the “Statement of operations” under “Dividend disbursing and transfer agent fees and expenses.” Pursuant to a sub-transfer agency agreement between DIFSC and BNY Mellon Investment Servicing (US) Inc. (BNYMIS), BNYMIS provides certain sub-transfer agency services to the Fund. Sub-transfer agency fees are passed on to and paid by the Fund.
55
Table of Contents
Notes to financial statements
Delaware Core Plus Bond Fund
2. Investment Management, Administration Agreements, and Other Transactions with Affiliates (continued)
Pursuant to a distribution agreement and distribution plan, the Fund pays DDLP, the distributor and an affiliate of DMC, an annual distribution and service fee of 0.25% of the average daily net assets of the Class A shares, 1.00% of the average daily net assets of the Class C shares, and 0.50% of the average daily net assets of the Class R shares. The Fund’s Class B shares were subject to a 12b-1 fee of 1.00% of the average daily net assets, which was contractually waived to 0.25% of the average daily net assets from Aug. 1, 2014 through Sept. 25, 2014. The Board has adopted a formula for calculating 12b-1 fees for the Fund’s Class A shares that went into effect on June 1, 1992. The Fund’s Class A shares are currently subject to a blended 12b-1 fees equal to the sum of: (i) 0.10% of the average daily net assets representing shares that were acquired prior to June 1, 1992, and (ii) 0.25% of the average daily net assets representing shares that were acquired on or after June 1, 1992. All Class A shareholders currently bear 12b-1 fees at the same rate, the blended rate based on the formula described above. This method of calculating Class A 12b-1 fees may be discontinued at the sole discretion of the Board. Institutional Class shares pay no distribution and service fees.
As provided in the investment management agreement, the Fund bears a portion of the cost of certain resources shared with DMC, including the cost of internal personnel of DMC and/or its affiliates that provide legal, tax, and regulatory reporting services to the Fund. For the year ended July 31, 2015, the Fund was charged $3,022 for internal legal, tax, and regulatory reporting provided by DMC and/or its affiliates’ employees. This amount is included on the “Statement of operations” under “Legal fees.”
For the year ended July 31, 2015, DDLP earned $4,138 for commissions on sales of the Fund’s Class A shares. For the year ended July 31, 2015, DDLP received gross CDSC commissions of $30 on redemptions of the Fund’s Class C shares, and these commissions were entirely used to offset upfront commissions previously paid by DDLP to broker/dealers on sales of those shares.
Trustees’ fees include expenses accrued by the Fund for each Trustee’s retainer and meeting fees. Certain officers of DMC, DIFSC, and DDLP are officers and/or Trustees of the Trust. These officers and Trustees are paid no compensation by the Fund.
* The contractual waiver period is from Nov. 27, 2013, through Nov. 30, 2015.
3. Investments
For the year ended July 31, 2015, the Fund made purchases and sales of investment securities other than short-term investments as follows:
Purchases other than U.S. government securities | $320,870,058 | |||
Purchases of U.S. government securities | 65,640,660 | |||
Sales other than U.S. government securities | 307,026,128 | |||
Sales of U.S. government securities | 64,864,057 |
56
Table of Contents
At July 31, 2015, the cost and unrealized appreciation (depreciation) of investments for federal income tax purposes for the Fund were as follows:
Cost of investments | $ | 141,943,201 | ||
|
| |||
Aggregate unrealized appreciation of investments | $ | 2,366,670 | ||
Aggregate unrealized depreciation of investments | (2,618,896 | ) | ||
|
| |||
Net unrealized depreciation of investments | $ | (252,226 | ) | |
|
|
U.S. GAAP defines fair value as the price that the Fund would receive to sell an asset or pay to transfer a liability in an orderly transaction between market participants at the measurement date under current market conditions. A three-level hierarchy for fair value measurements has been established based upon the transparency of inputs to the valuation of an asset or liability. Inputs may be observable or unobservable and refer broadly to the assumptions that market participants would use in pricing the asset or liability. Observable inputs reflect the assumptions market participants would use in pricing the asset or liability based on market data obtained from sources independent of the reporting entity. Unobservable inputs reflect the reporting entity’s own assumptions about the assumptions that market participants would use in pricing the asset or liability based on the best information available under the circumstances. The Fund’s investment in its entirety is assigned a level based upon the observability of the inputs which are significant to the overall valuation. The three-level hierarchy of inputs is summarized below.
| Level 1 – | Inputs are quoted prices in active markets for identical investments. (Examples: equity securities, open-end investment companies, futures contracts, exchange-traded options contracts) | |
| Level 2 – | Other observable inputs, including, but not limited to: quoted prices for similar assets or liabilities in markets that are active, quoted prices for identical or similar assets or liabilities in markets that are not active, inputs other than quoted prices that are observable for the assets or liabilities (such as interest rates, yield curves, volatilities, prepayment speeds, loss severities, credit risks, and default rates), or other market-corroborated inputs. (Examples: debt securities, government securities, swap contracts, foreign currency exchange contracts, foreign securities utilizing international fair value pricing, broker-quoted securities, fair valued securities) | |
| Level 3 – | Significant unobservable inputs, including the Fund’s own assumptions used to determine the fair value of investments. (Examples: broker-quoted securities, fair valued securities) | |
Level 3 investments are valued using significant unobservable inputs. The Fund may also use an income-based valuation approach in which the anticipated future cash flows of the investment are discounted to calculate fair value. Discounts may also be applied due to the nature or duration of any restrictions on the disposition of the investments. Valuations may also be based upon current market prices of securities that are comparable in coupon, rating, maturity, and industry. The derived value of a Level 3 investment may not represent the value which is received upon disposition and this could impact the results of operations.
57
Table of Contents
Notes to financial statements
Delaware Core Plus Bond Fund
3. Investments (continued)
The following table summarizes the valuation of the Fund’s investments by fair value hierarchy levels as of July 31, 2015:
Securities | Level 1 | Level 2 | Level 3 | Total | ||||||||||||
Agency, Asset- & Mortgage-Backed Securities1 | $ | — | $ | 52,079,026 | $ | 192,305 | $ | 52,271,331 | ||||||||
Corporate Debt | — | 52,640,250 | — | 52,640,250 | ||||||||||||
Municipal Bonds | — | 1,529,547 | — | 1,529,547 | ||||||||||||
Foreign Bonds | — | 1,642,302 | — | 1,642,302 | ||||||||||||
Senior Secured Loans | — | 7,213,272 | — | 7,213,272 | ||||||||||||
U.S. Treasury Obligations | — | 5,497,280 | — | 5,497,280 | ||||||||||||
Convertible Preferred Stock1 | 46,128 | 7,789 | — | 53,917 | ||||||||||||
Preferred Stock1 | 614,362 | 633,046 | — | 1,247,408 | ||||||||||||
Short-Term Investments | — | 19,595,668 | — | 19,595,668 | ||||||||||||
|
|
|
|
|
|
|
| |||||||||
Total Value of Securities | $ | 660,490 | $ | 140,838,180 | $ | 192,305 | $ | 141,690,975 | ||||||||
|
|
|
|
|
|
|
| |||||||||
Foreign Currency Exchange Contracts | $ | — | $ | 574 | $ | — | $ | 574 | ||||||||
Futures Contracts | 159,977 | — | — | 159,977 | ||||||||||||
Swap Contracts | — | (1,471 | ) | — | (1,471 | ) | ||||||||||
1Security type is valued across multiple levels. Level 1 investments represent exchange-traded investments, and Level 2 investments represent investments with observable inputs or matrix-priced investments. The amounts attributed to Level 1 investments and Level 2 investments represent the following percentages of the total market value of these security types:
Level 1 | Level 2 | Level 3 | Total | |||||||||||
Agency, Asset- & Mortgage-Backed Securities | — | 99.63 | % | 0.37% | 100.00 | % | ||||||||
Convertible Preferred Stock | 85.55 | % | 14.45 | % | — | 100.00 | % | |||||||
Preferred Stock | 49.25 | % | 50.75 | % | — | 100.00 | % | |||||||
During the year ended July 31, 2015, there were no transfers between Level 1 investments, Level 2 investments, or Level 3 investments that had a significant impact to the Fund. The Fund’s policy is to recognize transfers between levels at the beginning of the reporting period.
A reconciliation of Level 3 investments is presented when the Fund has a significant amount of Level 3 investments at the beginning, interim, or end of period in relation to net assets. Management has determined not to provide additional disclosure on Level 3 inputs since the Level 3 investments are not considered significant to the Fund’s net assets at the end of the year.
4. Dividend and Distribution Information
Income and long-term capital gain distributions are determined in accordance with federal income tax regulations, which may differ from U.S. GAAP. Additionally, distributions from net gains on foreign currency transactions and net short-term gains on sales of investment securities are treated as ordinary
58
Table of Contents
income for federal income tax purposes. The tax character of dividends and distributions paid during the years ended July 31, 2015 and 2014 was as follows:
| Year ended | ||||||||
| 7/31/15 | 7/31/14 | |||||||
Ordinary | $ | 3,347,601 | $ | 3,259,527 | ||||
Return of capital | 90,375 | 465,391 | ||||||
|
|
|
| |||||
Total | $ | 3,437,976 | $ | 3,724,918 | ||||
|
|
|
| |||||
5. Components of Net Assets on a Tax Basis
As of July 31, 2015, the components of net assets on a tax basis were as follows:
Shares of beneficial interest | $ | 126,754,257 | ||
Distributions payable | (86,298 | ) | ||
Capital loss carryforwards | (678,954 | ) | ||
Other temporary differences | (271,544 | ) | ||
Unrealized depreciation of investments, foreign currencies and derivatives | (255,690 | ) | ||
|
| |||
Net assets | $ | 125,461,771 | ||
|
|
The differences between book basis and tax basis components of net assets are primarily attributable to tax deferral of losses on wash sales, tax deferral of straddle losses, mark-to-market of futures contracts, mark-to-market of foreign currency exchange contracts, tax treatment of market discount and premium on debt instruments, contingent payment debt instruments, CDS contracts, and troubled debt.
For financial reporting purposes, capital accounts are adjusted to reflect the tax character of permanent book/tax differences. Reclassifications are primarily due to tax treatment of gain (loss) on foreign currency transactions, foreign capital gains tax, market discount and premium on debt instruments, paydowns of asset- and mortgage-backed securities, contingent payment debt instruments, and CDS contracts. Results of operations and net assets were not affected by these reclassifications. For the year ended July 31, 2015, the Fund recorded the following reclassifications:
Distributions in excess of net investment income | $ | 542,162 | ||
Accumulated net realized loss | (542,162 | ) |
On Dec. 22, 2010, the Regulated Investment Company Modernization Act of 2010 (Act) was enacted, which changed various technical rules governing the tax treatment of regulated investment companies. The changes were generally effective for taxable years beginning after the date of enactment. Under the Act, the Fund is permitted to carry forward capital losses incurred in taxable years beginning after the date of enactment for an unlimited period. Additionally, post-enactment capital loss carryforwards will retain their character as either short-term or long-term capital losses rather than being considered all short-term as permitted under previous regulation.
59
Table of Contents
Notes to financial statements
Delaware Core Plus Bond Fund
5. Components of Net Assets on a Tax Basis (continued)
Losses incurred that will be carried forward under the Act are as follows:
| Loss carryforward character | ||
| Short-term | Long-term | |
| $678,954 | $ — | |
For federal income tax purposes, $619,596 of capital loss carryforwards from prior year was utilized in 2015.
6. Capital Shares
Transactions in capital shares were as follows:
| Year ended | ||||||||
| 7/31/15 | 7/31/14 | |||||||
Shares sold: | ||||||||
Class A | 1,291,198 | 909,421 | ||||||
Class B | 11 | 49 | ||||||
Class C | 268,164 | 161,531 | ||||||
Class R | 148,788 | 178,678 | ||||||
Institutional Class | 2,452,865 | 2,183,678 | ||||||
Shares issued upon reinvestment of dividends and distributions: | ||||||||
Class A | 195,628 | 244,808 | ||||||
Class B | 132 | 1,446 | ||||||
Class C | 19,856 | 26,274 | ||||||
Class R | 22,471 | 27,088 | ||||||
Institutional Class | 139,520 | 115,672 | ||||||
| 4,538,633 | 3,848,645 | |||||||
Shares redeemed: | ||||||||
Class A | (1,564,208 | ) | (3,195,906 | ) | ||||
Class B | (34,032 | ) | (50,030 | ) | ||||
Class C | (299,834 | ) | (500,117 | ) | ||||
Class R | (270,838 | ) | (260,263 | ) | ||||
Institutional Class | (666,346 | ) | (5,968,776 | ) | ||||
| (2,835,258 | ) | (9,975,092 | ) | |||||
Net increase (decrease) | 1,703,375 | (6,126,447 | ) | |||||
For the years ended July 31, 2015 and 2014, 10,479 Class B shares were converted to 10,481 Class A shares valued at $89,090 and 11,208 Class B shares were converted to 11,215 Class A shares valued at $94,252, respectively. The respective amounts are included in Class B redemptions and Class A subscriptions in the tables above and the “Statements of changes in net assets.”
60
Table of Contents
7. Line of Credit
The Fund, along with certain other funds in the Delaware Investments® Family of Funds (Participants), was a participant in a $225,000,000 revolving line of credit intended to be used for temporary or emergency purposes as an additional source of liquidity to fund redemptions of investor shares. Under the agreement, the Participants were charged an annual commitment fee of 0.08%, which was allocated across the Participants on the basis of each Participant’s allocation of the entire facility. The Participants were permitted to borrow up to a maximum of one third of their net assets under the agreement. Each Participant was individually, and not jointly, liable for its particular advances, if any, under the line of credit. The line of credit available under the agreement expired on Nov. 10, 2014.
On Nov. 10, 2014, the Fund, along with the other Participants, entered into an amendment to the agreement for a $275,000,000 revolving line of credit. The line of credit is to be used as described above and operates in substantially the same manner as the agreement described above. The line of credit available under the agreement expires on Nov. 9, 2015.
The Fund had no amounts outstanding as of July 31, 2015 or at any time during the year then ended.
8. Derivatives
U.S. GAAP requires disclosures that enable investors to understand: 1) how and why an entity uses derivatives; 2) how they are accounted for; and 3) how they affect an entity’s results of operations and financial position.
Foreign Currency Exchange Contracts – The Fund may enter into foreign currency exchange contracts and foreign cross currency exchange contracts as a way of managing foreign exchange rate risk. The Fund may enter into these contracts to fix the U.S. dollar value of securities that it agreed to buy or sell for the period between the date the trade was entered into and the date the security is delivered and paid for. The Fund may also use these contracts to hedge the U.S. dollar value of securities it already owns that are denominated in foreign currencies. In addition, the Fund may enter into these contracts to facilitate or expedite the settlement of portfolio transactions. The change in value is recorded as an unrealized gain or loss. When the contract is closed, a realized gain or loss is recorded equal to the difference between the value of the contract at the time it was opened and the value at the time it was closed.
The use of foreign currency exchange contracts and foreign cross currency exchange contracts does not eliminate fluctuations in the underlying prices of the securities, but does establish a rate of exchange that can be achieved in the future. Although foreign currency exchange contracts and foreign cross currency exchange contracts limit the risk of loss due to an unfavorable change in the value of the hedged currency, they also limit any potential gain that might result should the value of the currency change favorably. In addition, the Fund could be exposed to risks if the counterparties to the contracts are unable to meet the terms of their contracts. The Fund’s maximum risk of loss from counterparty credit risk is the value of its currency exchanged with the counterparty. The risk is generally mitigated by having a netting arrangement between the Fund and the counterparty and by the posting of collateral by the counterparty to the Fund to cover the Fund’s exposure to the counterparty.
61
Table of Contents
Notes to financial statements
Delaware Core Plus Bond Fund
8. Derivatives (continued)
During the year ended July 31, 2015, the Fund used foreign currency exchange contracts to hedge the U.S. dollar value of securities it already owned that were denominated in foreign currencies.
Futures Contracts – A futures contract is an agreement in which the writer (or seller) of the contract agrees to deliver to the buyer an amount of cash or securities equal to a specific dollar amount times the difference between the value of a specific security or index at the close of the last trading day of the contract and the price at which the agreement is made. The Fund may use futures in the normal course of pursuing its investment objective. The Fund may invest in futures contracts to hedge its existing portfolio securities against fluctuations in fair value caused by changes in interest rates or market conditions. Upon entering into a futures contract, the Fund deposits cash or pledges U.S. government securities to a broker, equal to the minimum “initial margin” requirements of the exchange on which the contract is traded. Subsequent payments are received from the broker or paid to the broker each day, based on the daily fluctuation in the market value of the contract. These receipts or payments are known as “variation margin” and are recorded daily by the Fund as unrealized gains or losses until the contracts are closed. When the contracts are closed, the Fund records a realized gain or loss equal to the difference between the value of the contract at the time it was opened and the value at the time it was closed. Risks of entering into futures contracts include potential imperfect correlation between the futures contracts and the underlying securities and the possibility of an illiquid secondary market for these instruments. When investing in futures, there is reduced counterparty credit risk to the Fund because futures are exchange-traded and the exchange’s clearinghouse, as counterparty to all exchange-traded futures, guarantees against default. The Fund posted $248,301 in securities as margin for open futures contracts, which is presented on the “Schedule of Investments.”
During the year ended July 31, 2015, the Fund used futures contracts to hedge the Fund’s existing portfolio securities against fluctuations in value caused by changes in interest rates or market conditions.
Options Contracts – During the year ended July 31, 2015, the Fund entered into options contracts in the normal course of pursuing its investment objective. The Fund may buy or write options contracts for any number of reasons, including without limitation: to manage the Fund’s exposure to changes in securities prices caused by interest rates or market conditions and foreign currencies; as an efficient means of adjusting the Fund’s overall exposure to certain markets; to protect the value of portfolio securities; and as a cash management tool. The Fund may buy or write call or put options on securities, futures, swaps, swaptions, financial indices, and foreign currencies. When the Fund buys an option, a premium is paid and an asset is recorded and adjusted on a daily basis to reflect the current market value of the option purchased. When the Fund writes an option, a premium is received and a liability is recorded and adjusted on a daily basis to reflect the current market value of the option written. Premiums received from writing options that expire unexercised are treated by the Fund on the expiration date as realized gains. The difference between the premium received and the amount paid on effecting a closing purchase transaction, including brokerage commissions, is treated as realized gain or loss. If a call option is exercised, the premium is added to the proceeds from the sale of the underlying security in determining whether the Fund has a realized gain or loss. If a put option is exercised, the premium reduces the cost basis of the securities purchased by the Fund. The Fund, as writer of an option, bears the market risk of an unfavorable change in the price of the security underlying the written option. When writing options, the Fund is subject to minimal counterparty risk because the counterparty
62
Table of Contents
is only obligated to pay premiums and does not bear the market risk of an unfavorable market change. There were no transactions in options written during the year ended July 31, 2015.
During the year ended July 31, 2015, the Fund purchased options contracts to manage the Fund’s exposure to changes in securities prices caused by interest rates or market conditions.
Swap Contracts – The Fund may enter into CDS contracts in the normal course of pursuing its investment objective. The Fund may enter into CDS contracts in order to hedge against a credit event, to enhance total return or to gain exposure to certain securities or markets. The Fund will not be permitted to enter into any swap transactions unless, at the time of entering into such transactions, the unsecured long-term debt of the actual counterparty, combined with any credit enhancements, is rated at least BBB- by Standard & Poor’s Financial Services LLC (S&P) or Baa3 by Moody’s Investors Service, Inc. (Moody’s) or is determined to be of equivalent credit quality by DMC.
Credit Default Swaps. A CDS contract is a risk-transfer instrument through which one party (purchaser of protection) transfers to another party (seller of protection) the financial risk of a credit event (as defined in the CDS agreement), as it relates to a particular reference security or basket of securities (such as an index). In exchange for the protection offered by the seller of protection, the purchaser of protection agrees to pay the seller of protection a periodic amount at a stated rate that is applied to the notional amount of the CDS contract. In addition, an upfront payment may be made or received by the Fund in connection with an unwinding or assignment of a CDS contract. Upon the occurrence of a credit event, the seller of protection would pay the par (or other agreed-upon) value of the reference security (or basket of securities) to the counterparty. Credit events generally include, among others, bankruptcy, failure to pay, and obligation default.
During the year ended July 31, 2015, the Fund entered into CDS contracts as a purchaser of protection. Periodic payments (receipts) on such contracts are accrued daily and recorded as unrealized losses (gains) on swap contracts. Upon payment (receipt), such amounts are recorded as realized losses (gains) on swap contracts. Upfront payments made or received in connection with CDS contracts are amortized over the expected life of the CDS contracts as unrealized losses (gains) on swap contracts. The change in value of CDS contracts is recorded daily as unrealized appreciation or depreciation. A realized gain or loss is recorded upon a credit event (as defined in the CDS agreement) or the maturity or termination of the agreement. Initial margin and variation margin are posted to central counterparties for CDS basket trades, as determined by the applicable central counterparty. During the year ended July 31, 2015, the Fund did not enter into any CDS contracts as a seller of protection.
CDS contracts may involve greater risks than if the Fund had invested in the reference obligation directly. CDS contracts are subject to general market risk, liquidity risk, counterparty risk, and credit risk. The Fund’s maximum risk of loss from counterparty credit risk, either as the seller of protection or the buyer of protection, is the fair value of the contract. This risk is mitigated by (1) for bilateral swap contracts, having a netting arrangement between the Fund and the counterparty and by the posting of collateral by the counterparty to the Fund to cover the Fund’s exposure to the counterparty or (2) for cleared swaps, trading these instruments through a central counterparty.
During the year ended July 31, 2015, the Fund used CDS contracts to hedge against credit events.
63
Table of Contents
Notes to financial statements
Delaware Core Plus Bond Fund
8. Derivatives (continued)
Swaps Generally. The value of open swaps may differ from that which would be realized in the event the Fund terminated its position in the contract on a given day. Risks of entering into these contracts include the potential inability of the counterparty to meet the terms of the contracts. This type of risk is generally limited to the amount of favorable movement in the value of the underlying security, instrument, or basket of instruments, if any, at the day of default. Risks also arise from potential losses from adverse market movements and such losses could exceed the unrealized amounts shown on the “Schedule of investments.”
The Fund posted $144,709 as cash collateral, which is included on the “Statement of assets and liabilities” under “Cash collateral due from brokers.”
Fair value of derivative instruments as of July 31, 2015 was as follows:
Asset Derivatives | Liability Derivatives | |||||||||||
Statement of | Fair Value | Statement of | Fair Value | |||||||||
Forward currency exchange contracts (Foreign currency exchange contracts) | Unrealized appreciation on foreign currency exchange contracts | $ | 629 | Unrealized depreciation on foreign currency exchange contracts | $ | (55 | ) | |||||
Equity contracts (Futures contracts) | Variation margin due from broker on futures contracts | — | * | Variation margin due from broker on futures contracts | (3,989 | )* | ||||||
Interest rate contracts (Futures contracts) | Variation margin due from broker on futures contracts | 235,435 | * | Variation margin due from broker on futures contracts | (71,469 | )* | ||||||
Credit contracts (Swap contracts) | Unrealized appreciation on credit default swap contracts | 4,070 | Unrealized depreciation on credit default swap contracts | (3,598 | ) | |||||||
Credit contracts (Swap contracts) | Variation margin due to broker on centrally cleared credit default swap contracts | — | Variation margin due to broker on centrally cleared credit default swap contracts | (1,943 | ) | |||||||
|
|
|
| |||||||||
Total | $ | 240,134 | $ | (81,054 | ) | |||||||
|
|
|
| |||||||||
*Includes cumulative appreciation (depreciation) of futures contracts from the date the contracts are opened through July 31, 2015. Only current day variation margin is reported on the Fund’s “Statement of assets and liabilities.”
64
Table of Contents
The effect of derivative instruments on the “Statement of operations” for the year ended July 31, 2015 was as follows:
Net Realized Gain (Loss) on: | ||||||||||||||||||||
Foreign Currency | Futures | Swap | Total | |||||||||||||||||
Forward currency exchange contracts | $174 | $ — | $ — | $ 174 | ||||||||||||||||
Interest rate contracts | — | 54,677 | — | 54,677 | ||||||||||||||||
Credit contracts | — | — | (16,027 | ) | (16,027 | ) | ||||||||||||||
Total | $174 | $54,677 | $(16,027 | ) | $ 38,824 | |||||||||||||||
| Net Change in Unrealized Appreciation (Depreciation) of: | ||||||||||||||||||||
Foreign Currency | Futures | Swap | Total | |||||||||||||||||
Forward currency exchange contracts | $574 | $ — | $ — | $ 574 | ||||||||||||||||
Equity contracts | — | (3,989 | ) | — | (3,989 | ) | ||||||||||||||
Interest rate contracts | — | 143,070 | — | 143,070 | ||||||||||||||||
Credit contracts | — | — | (6,411 | ) | (6,411 | ) | ||||||||||||||
Total | $574 | $139,081 | $(6,411 | ) | $133,244 | |||||||||||||||
Derivatives Generally. The table below summarizes the average balance of derivative holdings by the Fund during the year ended July 31, 2015:
| Long Derivative Volume | Short Derivative Volume | |||||||||||||
Foreign currency exchange contracts (average cost) | USD | 10,987 | USD | 154,669 | ||||||||||
Futures contracts (average notional value) | 3,793,088 | 6,260,020 | ||||||||||||
Options contracts (average notional value) | 2,524 | — | ||||||||||||
CDS contracts (average notional value)* | EUR | 93,552 | — | |||||||||||
| USD | 211,864 | — | ||||||||||||
*Long represents buying protection and short represents selling protection.
9. Offsetting
In December 2011, the Financial Accounting Standards Board (FASB) issued guidance that expanded disclosure requirements on the offsetting of certain assets and liabilities. The disclosures are required for investments and derivative financial instruments subject to master netting or similar agreements which are eligible for offset on the “Statement of assets and liabilities” and require an entity to disclose both gross and net information about such investments and transactions in the financial statements. In January 2013, the FASB issued guidance that clarified which investments and transactions are subject to the offsetting disclosure requirements. The scope of the disclosure requirements for offsetting is limited to derivative instruments, repurchase agreements and reverse repurchase agreements, and securities borrowing. The guidance is effective for financial statements with fiscal years beginning on or after Jan. 1, 2013, and interim periods within those fiscal years.
65
Table of Contents
Notes to financial statements
Delaware Core Plus Bond Fund
9. Offsetting (continued)
In order to better define its contractual rights and to secure rights that will help the Fund mitigate its counterparty risk, the Fund entered into an International Swaps and Derivatives Association, Inc. Master Agreement (ISDA Master Agreement) or a similar agreement with certain of its derivative contract counterparties. An ISDA Master Agreement is a bilateral agreement between the Fund and a counterparty that governs certain over-the-counter (OTC) derivatives and foreign exchange contracts and typically contains, among other things, collateral posting items and netting provisions in the event of a default and/or termination event. Under an ISDA Master Agreement, the Fund may, under certain circumstances, offset with the counterparty certain derivative financial instruments’ payables and/or receivables with collateral held and/or posted and create one single net payment. The provisions of the ISDA Master Agreement typically permit a single net payment in the event of default (close-out) including the bankruptcy or insolvency of the counterparty. However, bankruptcy or insolvency laws of a particular jurisdiction may impose restrictions on or prohibitions against the right of offset in bankruptcy, insolvency or other events.
For financial reporting purposes, the Fund does not offset derivative assets and derivative liabilities that are subject to netting arrangements on the “Statement of assets and liabilities.”
At July 31, 2015, the Fund had the following assets and liabilities subject to offsetting provisions:
Offsetting of Financial Assets and Liabilities and Derivative Assets and Liabilities
Counterparty | Gross Value of | Gross Value of | Net Position | ||||||||||||
BNY Mellon | $ | 629 | — | 629 | |||||||||||
Citigroup Global Markets | 3,770 | — | 3,770 | ||||||||||||
Hong Kong Shanghai Bank | 300 | — | 300 | ||||||||||||
JPMorgan Chase Bank | — | (1,608 | ) | (1,608) | |||||||||||
Toronto Dominion Bank | — | (55 | ) | (55) | |||||||||||
|
|
|
| ||||||||||||
Total | $ | 4,699 | $ | (1,663 | ) | $ 3,036 | |||||||||
|
|
|
| ||||||||||||
Gross Amounts Not Offset in the Statement of Assets and Liabilities | ||||||||||||||||||||||||||||||
Counterparty | Net Position | Fair Value of Non-Cash Collateral Received | Cash Collateral | Fair Value of Non-Cash Collateral Pledged | Cash Collateral Pledged | Net | ||||||||||||||||||||||||
BNY Mellon | $ | 629 | — | — | — | — | 629 | |||||||||||||||||||||||
Citigroup Global Markets | 3,770 | — | — | — | — | 3,770 | ||||||||||||||||||||||||
Hong Kong Shanghai Bank | 300 | — | — | — | — | 300 | ||||||||||||||||||||||||
JPMorgan Chase Bank | (1,608 | ) | — | — | — | 1,608 | — | |||||||||||||||||||||||
Toronto Dominion Bank | (55 | ) | — | — | — | — | (55 | ) | ||||||||||||||||||||||
|
|
|
|
|
|
|
|
|
|
|
| |||||||||||||||||||
Total | $ | 3,036 | $ | — | $ | — | $ | — | $ | 1,608 | $ | 4,644 | ||||||||||||||||||
|
|
|
|
|
|
|
|
|
|
|
| |||||||||||||||||||
66
Table of Contents
Master Repurchase Agreements
Counterparty | Repurchase Agreements | Fair Value of Non-Cash Collateral Received | Cash Collateral Received | Net | ||||||||||||||||
Bank of America Merrill Lynch | $ | 1,756,859 | $ | (1,756,859 | ) | $ | — | $ | — | |||||||||||
Bank of Montreal | 2,928,097 | (2,928,097 | ) | — | — | |||||||||||||||
BNP Paribas | 6,767,044 | (6,767,044 | ) | — | — | |||||||||||||||
|
|
|
|
|
|
|
| |||||||||||||
Total | $ | 11,452,000 | $ | (11,452,000 | ) | $ | — | $ | — | |||||||||||
|
|
|
|
|
|
|
| |||||||||||||
(a)Net amount represents the receivable/(payable) that would be due from/(to) the counterparty in the event of default.
10. Securities Lending
The Fund, along with other funds in the Delaware Investments® Family of Funds, may lend its securities pursuant to a security lending agreement (Lending Agreement) with The Bank of New York Mellon (BNY Mellon). At the time a security is loaned, the borrower must post collateral equal to the required percentage of the market value of the loaned security, including any accrued interest. The required percentage is: (1) 102% with respect to U.S. securities and foreign securities that are denominated and payable in U.S. dollars; and (2) 105% with respect to foreign securities. With respect to each loan, if on any business day the aggregate market value of securities collateral plus cash collateral held is less than the aggregate market value of the securities which are the subject of such loan, the borrower will be notified to provide additional collateral by the end of the following business day which, together with the collateral already held, will be not less than the applicable initial collateral requirements for such security loan. If the aggregate market value of securities collateral and cash collateral held with respect to a security loan exceeds the applicable initial collateral requirement, upon request of the borrower, BNY Mellon must return enough collateral to the borrower by the end of the following business day to reduce the value of the remaining collateral to the applicable initial collateral requirement for such security loan. As a result of the foregoing, the value of the collateral held with respect to a loaned security on any particular day may be more or less than the value of the security on loan.
Cash collateral received is generally invested in the Delaware Investments Collateral Fund No. 1 (Collective Trust) established by BNY Mellon for the purpose of investment on behalf of funds managed by DMC that participate in BNY Mellon’s securities lending program. The Collective Trust may invest in U.S. government securities, and high-quality corporate debt, asset-backed and other money market securities, and in repurchase agreements collateralized by such securities, provided that the Collective Trust will generally have a dollar-weighted average portfolio maturity of 60 days or less. The Fund can also accept U.S. government securities and letters of credit (non-cash collateral) in connection with securities loans. In the event of default or bankruptcy by the lending agent, realization and/or retention of the collateral may be subject to legal proceedings. In the event the borrower fails to return the loaned securities and the collateral received is insufficient to cover the value of the loaned securities and provided such collateral shortfall is not the result of investment losses, the lending agent has agreed to pay the amount of the shortfall to the Fund or, at the discretion of the lending agent, replace the loaned securities. The Fund continues to record dividends or interest, as applicable, on the securities loaned and is subject to changes in value of the securities loaned that may occur during the term of the loan. The Fund has the right under the Lending Agreement to recover the securities from the borrower on
67
Table of Contents
Notes to financial statements
Delaware Core Plus Bond Fund
10. Securities Lending (continued)
demand. With respect to security loans collateralized by non-cash collateral, the Fund receives loan premiums paid by the borrower. With respect to security loans collateralized by cash collateral, the earnings from the collateral investments are shared among the Fund, the security lending agent, and the borrower. The Fund records security lending income net of allocations to the security lending agent, and the borrower.
The Collective Trust used for the investment of cash collateral received from borrowers of securities seeks to maintain a net asset value per unit of $1.00, but there can be no assurance that it will always be able to do so. The Fund may incur investment losses as a result of investing securities lending collateral in the Collective Trust. This could occur if an investment in the Collective Trust defaulted or if it were necessary to liquidate assets in the Collective Trust to meet returns on outstanding security loans at a time when the Collective Trust’s net asset value per unit was less than $1.00. Under those circumstances, the Fund may not receive an amount from the Collective Trust that is equal in amount to the collateral the Fund would be required to return to the borrower of the securities and the Fund would be required to make up for this shortfall.
During the year ended July 31, 2015, the Fund had no securities out on loan.
11. Credit and Market Risk
The Fund invests a portion of its assets in high yield fixed income securities, which are securities rated lower than BBB- by S&P and lower than Baa3 by Moody’s, or similarly rated by another nationally recognized statistical rating organization. Investments in these higher yielding securities are generally accompanied by a greater degree of credit risk than higher rated securities. Additionally, lower rated securities may be more susceptible to adverse economic and competitive industry conditions than investment grade securities.
The Fund invests in fixed income securities whose value is derived from an underlying pool of mortgages or consumer loans. The value of these securities is sensitive to changes in economic conditions, including delinquencies and/or defaults, and may be adversely affected by shifts in the market’s perception of the issuers and changes in interest rates. Investors receive principal and interest payments as the underlying mortgages and consumer loans are paid back. Some of these securities are collateralized mortgage obligations (CMOs). CMOs are debt securities issued by U.S. government agencies or by financial institutions and other mortgage lenders, which are collateralized by a pool of mortgages held under an indenture. Prepayment of mortgages may shorten the stated maturity of the obligations and can result in a loss of premium, if any has been paid. Certain of these securities may be stripped (securities which provide only the principal or interest feature of the underlying security). The yield to maturity on an interest-only CMO is extremely sensitive not only to changes in prevailing interest rates, but also to the rate of principal payments (including prepayments) on the related underlying mortgage assets. A rapid rate of principal payments may have a material adverse effect on the Fund’s yield to maturity. If the underlying mortgage assets experience greater-than-anticipated prepayments of principal, the Fund may fail to fully recoup its initial investment in these securities even if the securities are rated in the highest rating categories.
68
Table of Contents
The Fund invests in bank loans and other securities that may subject it to direct indebtedness risk, the risk that the Fund will not receive payment of principal, interest, and other amounts due in connection with these investments and will depend primarily on the financial condition of the borrower. Loans that are fully secured offer the Fund more protection than unsecured loans in the event of nonpayment of scheduled interest or principal, although there is no assurance that the liquidation of collateral from a secured loan would satisfy the corporate borrower’s obligation, or that the collateral can be liquidated. Some loans or claims may be in default at the time of purchase. Certain of the loans and the other direct indebtedness acquired by the Fund may involve revolving credit facilities or other standby financing commitments that obligate the Fund to pay additional cash on a certain date or on demand. These commitments may require the Fund to increase its investment in a company at a time when the Fund might not otherwise decide to do so (including at a time when the company’s financial condition makes it unlikely that such amounts will be repaid). To the extent that the Fund is committed to advance additional funds, it will at all times hold and maintain cash or other high grade debt obligations in an amount sufficient to meet such commitments.
As the Fund may be required to rely upon another lending institution to collect and pass on to the Fund amounts payable with respect to the loan and to enforce the Fund’s rights under the loan and other direct indebtedness, an insolvency, bankruptcy, or reorganization of the lending institution may delay or prevent the Fund from receiving such amounts. The highly leveraged nature of many loans may make them especially vulnerable to adverse changes in economic or market conditions. Investments in such loans and other direct indebtedness may involve additional risk to the Fund.
The Fund invests in certain obligations that may have liquidity protection designed to ensure that the receipt of payments due on the underlying security is timely. Such protection may be provided through guarantees, insurance policies, or letters of credit obtained by the issuer or sponsor through third parties, through various means of structuring the transaction or through a combination of such approaches. The Fund will not pay any additional fees for such credit support, although the existence of credit support may increase the price of a security.
The Fund may invest up to 15% of its net assets in illiquid securities, which may include securities with contractual restrictions on resale, securities exempt from registration under Rule 144A promulgated under the Securities Act of 1933, as amended, and other securities which may not be readily marketable. The relative illiquidity of these securities may impair the Fund from disposing of them in a timely manner and at a fair price when it is necessary or desirable to do so. While maintaining oversight, the Fund’s Board has delegated to DMC, the day-to-day functions of determining whether individual securities are liquid for purposes of the Fund’s limitation on investments in illiquid securities. Securities eligible for resale pursuant to Rule 144A, which are determined to be liquid, are not subject to the Fund’s 15% limit on investments in illiquid securities. As of July 31, 2015, no securities held by the Fund have been determined to be illiquid under the Fund’s Liquidity Procedures. Rule 144A securities have been identified on the “Schedule of investments.”
12. Contractual Obligations
The Fund enters into contracts in the normal course of business that contain a variety of indemnifications. The Fund’s maximum exposure under these arrangements is unknown. However, the
69
Table of Contents
Notes to financial statements
Delaware Core Plus Bond Fund
12. Contractual Obligations (continued)
Fund has not had prior claims or losses pursuant to these contracts. Management has reviewed the Fund’s existing contracts and expects the risk of loss to be remote.
13. Recent Accounting Pronouncements
In June 2014, the FASB issued guidance to improve the financial reporting of reverse repurchase agreements and other similar transactions. The guidance includes expanded disclosure requirements for entities that enter into reverse repurchase agreements and similar transactions accounted for as secured borrowings. The guidance is effective for financial statements with fiscal years beginning on or after Dec.15, 2014 and interim periods within those fiscal years. Management has determined that this pronouncement has no impact to the Fund’s financial statements.
In May 2015, the FASB issued Accounting Standards Update (“ASU”) No. 2015-07 regarding “Disclosures for Investments in Certain Entities That Calculate Net Asset Value per Share”. The amendments in this update are effective for the Funds for fiscal years beginning after Dec. 15, 2015, and interim periods within those fiscal years. ASU No. 2015-07 will eliminate the requirement to categorize investments in the fair value hierarchy if their fair value is measured at net asset value (“NAV”) per share (or its equivalent) using the practical expedient in the FASB’s fair value measurement guidance. At this time, management is evaluating the implications of ASU No. 2015-07 and its impact on the financial statement disclosures has not yet been determined.
14. General Motors Term Loan Litigation
Delaware Core Plus Bond Fund received notice of a litigation proceeding related to a General Motors Corporation (G.M.) term loan participation previously held by the Fund in 2009. We believe the matter subject to the litigation notice will likely lead to a recovery from the Fund of certain amounts received by the Fund because a U.S. Court of Appeals has ruled that the Fund and similarly situated investors were unsecured creditors rather than secured lenders of G. M. as a result of an erroneous UCC filing made by a third party. The Fund received the full principal on the loans in 2009 after the G.M. bankruptcy. However, based upon the court ruling the estate is seeking to recover such amounts arguing that, as unsecured creditors, the Fund should not have received payment in full. Based upon currently available information related to the litigation and the Fund’s potential exposure, the Fund booked a net liability of $228,366 that resulted in a decrease in the Fund’s net asset value to reflect this likely recovery.
15. Subsequent Events
Management has determined that no material events or transactions occurred subsequent to July 31, 2015 that would require recognition or disclosure in the Fund’s financial statements.
70
Table of Contents
registered public accounting firm
To the Board of Trustees of Delaware Group® Government Fund
and the Shareholders of Delaware Core Plus Bond Fund:
In our opinion, the accompanying statement of assets and liabilities, including the schedule of investments, and the related statements of operations and of changes in net assets and the financial highlights present fairly, in all material respects, the financial position of Delaware Core Plus Bond Fund (one of the series constituting Delaware Group® Government Fund, hereinafter referred to as the “Fund”) at July 31, 2015, the results of its operations for the year then ended, the changes in its net assets for each of the two years in the period then ended and the financial highlights for each of the five years in the period then ended, in conformity with accounting principles generally accepted in the United States of America. These financial statements and financial highlights (hereafter referred to as “financial statements”) are the responsibility of the Fund’s management. Our responsibility is to express an opinion on these financial statements based on our audits. We conducted our audits of these financial statements in accordance with the standards of the Public Company Accounting Oversight Board (United States). Those standards require that we plan and perform the audit to obtain reasonable assurance about whether the financial statements are free of material misstatement. An audit includes examining, on a test basis, evidence supporting the amounts and disclosures in the financial statements, assessing the accounting principles used and significant estimates made by management, and evaluating the overall financial statement presentation. We believe that our audits, which included confirmation of securities at July 31, 2015 by correspondence with the custodian and brokers and the application of alternative auditing procedures where confirmations of securities purchased had not been received, provide a reasonable basis for our opinion.
PricewaterhouseCoopers LLP
Philadelphia, Pennsylvania
September 22, 2015
71
Table of Contents
Other Fund information (Unaudited)
Delaware Core Plus Bond Fund
Tax Information
The information set forth below is for the Fund’s fiscal year as required by federal income tax laws. Shareholders, however, must report distributions on a calendar year basis for income tax purposes, which may include distributions for portions of two fiscal years of the Fund. Accordingly, the information needed by shareholders for income tax purposes will be sent to them in January of each year. Please consult your tax advisor for proper treatment of this information.
All disclosures are based on financial information available as of the date of this annual report and, accordingly are subject to change. For any and all items requiring reporting, it is the intention of the Fund to report the maximum amount permitted under the Internal Revenue Code and the regulations thereunder.
For the fiscal year ended July 31, 2015, the Fund reports distributions paid during the year as follows:
(A) Ordinary Income Distributions (Tax Basis)* | 97.37 | % | ||
(B) Return of Capital (Tax Basis) | 2.63 | % | ||
Total Distributions (Tax Basis) | 100.00 | % | ||
(C) Qualifying Dividends1 | 0.95 | % |
(A) and (B) are based on a percentage of the Fund’s total distributions.
(C) is based on a percentage of the Fund’s ordinary income distributions.
1Qualifying dividends represent dividends which qualify for the corporate dividends received deduction.
*For the fiscal year ended July 31, 2015, certain dividends paid by the Fund may be subject to a maximum tax rate of 20%. The percentage of dividends paid by the Fund from ordinary income reported as qualified income is 1.00%. Complete information will be computed and reported in conjunction with your 2015 Form 1099-DIV.
Proxy Results
At Joint Special Meetings of Shareholders of Delaware Group® Government Fund (the “Trust”), on behalf of Delaware Core Plus Bond Fund, Delaware Emerging Markets Debt Fund, and Delaware Inflation Protected Bond Fund1 (each, a “Fund” and together, the “Funds”), held on March 31, 2015 the shareholders of the Trust/the Funds voted to: (i) elect a Board of Trustees for the Trust; (ii) approve the implementation of a new “manager of managers” order for Delaware Core Plus Bond Fund and Delaware Emerging Markets Debt Fund; (iii) revise the fundamental investment restriction relating to lending for Delaware Core Plus Bond Fund and Delaware Emerging Markets Debt Fund; and (iv)(a) revise provisions of the Trust’s Agreement and Declaration of Trust related to documenting the transfer of shares, (iv)(b) revise provisions of the Trust’s Agreement and Declaration of Trust related to shareholder disclosure of certain information upon board demand, and (iv)(c) revise provisions of the Trust’s By-Laws so that Delaware law will apply to matters related to proxies. At the meeting, the following people were elected to serve as Independent Trustees: Thomas L. Bennett, Ann D. Borowiec, Joseph W. Chow, John A. Fry, Lucinda S. Landreth, Frances A. Sevilla-Sacasa, Thomas K. Whitford, Janet L. Yeomans, and J. Richard Zecher. In addition, Patrick P. Coyne was elected to serve as an Interested Trustee.
72
Table of Contents
The following proposals were submitted for a vote of the shareholders:
1. To elect a Board of Trustees for the Trust.
A quorum of shares outstanding of the Funds of the Trust was present, and the votes passed with a plurality of these Shares.
Shares Voted For | % of Outstanding Shares | % of Shares Voted | Shares Withheld | % of Outstanding Shares | % of Shares Voted | |||||||||||||||||||||||||
Thomas L. Bennett | 12,217,712.264 | 52.084 | % | 98.441 | % | 193,553.188 | 0.825 | % | 1.559 | % | ||||||||||||||||||||
Ann D. Borowiec | 12,216,554.881 | 52.079 | % | 98.431 | % | 194,710.571 | 0.830 | % | 1.569 | % | ||||||||||||||||||||
Joseph W. Chow | 12,217,065.881 | 52.082 | % | 98.435 | % | 194,199.571 | 0.828 | % | 1.565 | % | ||||||||||||||||||||
Patrick P. Coyne | 12,217,856.083 | 52.085 | % | 98.442 | % | 193,409.369 | 0.825 | % | 1.558 | % | ||||||||||||||||||||
John A. Fry | 12,217,712.264 | 52.084 | % | 98.441 | % | 193,553.188 | 0.825 | % | 1.559 | % | ||||||||||||||||||||
Lucinda S. Landreth | 12,214,285.264 | 52.070 | % | 98.413 | % | 196,980.188 | 0.840 | % | 1.587 | % | ||||||||||||||||||||
Frances A. Sevilla-Sacasa | 12,214,285.264 | 52.070 | % | 98.413 | % | 196,980.188 | 0.840 | % | 1.587 | % | ||||||||||||||||||||
Thomas K. Whitford | 12,209,449.751 | 52.049 | % | 98.374 | % | 201,815.701 | 0.860 | % | 1.626 | % | ||||||||||||||||||||
Janet L. Yeomans | 12,211,966.537 | 52.060 | % | 98.394 | % | 199,298.915 | 0.850 | % | 1.606 | % | ||||||||||||||||||||
J. Richard Zecher | 12,217,065.881 | 52.082 | % | 98.435 | % | 194,199.571 | 0.828 | % | 1.565 | % | ||||||||||||||||||||
1Delaware Inflation Protected Bond Fund liquidated on June 12, 2015.
2. To approve the implementation of a new “manager of managers” order. A quorum of the shares outstanding of the Fund was present, and the votes passed with the required majority of those shares. The results were as follows:
Delaware Core Plus Bond Fund
Shares voted for | 6,009,616.983 | |||
Percentage of outstanding shares | 42.471 | % | ||
Percentage of shares voted | 75.909 | % | ||
Shares voted against | 179,888.548 | |||
Percentage of outstanding shares | 1.271 | % | ||
Percentage of shares voted | 2.272 | % | ||
Shares abstained | 116,676.569 | |||
Percentage of outstanding shares | 0.825 | % | ||
Percentage of shares voted | 1.474 | % | ||
Broker non-votes | 1,610,654.000 |
73
Table of Contents
Other Fund information (Unaudited)
Delaware Core Plus Bond Fund
Proxy Results (continued)
Delaware Emerging Markets Debt Fund
Shares voted for | 2,227,764.675 | |||
Percentage of outstanding shares | 100.000 | % | ||
Percentage of shares voted | 100.000 | % | ||
Shares voted against | — | |||
Percentage of outstanding shares | — | |||
Percentage of shares voted | — | |||
Shares abstained | — | |||
Percentage of outstanding shares | — | |||
Percentage of shares voted | — | |||
Broker non-votes | — |
3. To revise the fundamental investment restriction relating to lending.
A quorum of the shares outstanding of the Fund was present, and the votes passed with the required majority of those shares. The results were as follows:
Delaware Core Plus Bond Fund
Shares voted for | 5,984,905.343 | |||
Percentage of outstanding shares | 42.296 | % | ||
Percentage of shares voted | 75.597 | % | ||
Shares voted against | 174,786.466 | |||
Percentage of outstanding shares | 1.235 | % | ||
Percentage of shares voted | 2.208 | % | ||
Shares abstained | 146,488.291 | |||
Percentage of outstanding shares | 1.035 | % | ||
Percentage of shares voted | 1.850 | % | ||
Broker non-votes | 1,610,656.000 |
Delaware Emerging Markets Debt Fund
Shares voted for | 2,227,764.675 | |||
Percentage of outstanding shares | 100.000 | % | ||
Percentage of shares voted | 100.000 | % | ||
Shares voted against | — | |||
Percentage of outstanding shares | — | |||
Percentage of shares voted | — | |||
Shares abstained | — | |||
Percentage of outstanding shares | — | |||
Percentage of shares voted | — | |||
Broker non-votes | — |
74
Table of Contents
4. (a) To revise provisions of the Trust’s Agreement and Declaration of Trust related to documenting the transfer of shares.
A quorum of the shares outstanding of the Trust was present, and the votes passed with a majority of those shares. The results were as follows:
Delaware Group® Government Fund
Shares voted for | 9,079,255.833 | |||
Percentage of outstanding shares | 38.705 | % | ||
Percentage of shares voted | 73.153 | % | ||
Shares voted against | 161,109.991 | |||
Percentage of outstanding shares | 0.687 | % | ||
Percentage of shares voted | 1.298 | % | ||
Shares abstained | 208,315.628 | |||
Percentage of outstanding shares | 0.888 | % | ||
Percentage of shares voted | 1.678 | % | ||
Broker non-votes | 2,962,584.000 |
4. (b) To revise provisions of the Trust’s Agreement and Declaration of Trust related to shareholder disclosure of certain information upon board demand.
A quorum of the shares outstanding of the Trust was present, and the votes passed with a majority of those shares. The results were as follows:
Delaware Group Government Fund
Shares voted for | 9,076,717.809 | |||
Percentage of outstanding shares | 38.694 | % | ||
Percentage of shares voted | 73.133 | % | ||
Shares voted against | 170,967.090 | |||
Percentage of outstanding shares | 0.729 | % | ||
Percentage of shares voted | 1.378 | % | ||
Shares abstained | 200,997.553 | |||
Percentage of outstanding shares | 0.857 | % | ||
Percentage of shares voted | 1.619 | % | ||
Broker non-votes | 2,962,583.000 |
75
Table of Contents
Other Fund information (Unaudited)
Delaware Core Plus Bond Fund
Proxy Results (continued)
4. (c) To revise provisions of the Trust’s By-Laws so that Delaware law will apply to matters related to proxies.
A quorum of the shares outstanding of the Trust was present, and the votes passed with a majority of those shares. The results were as follows:
Delaware Group® Government Fund
Shares voted for | 9,135,316.759 | |||
Percentage of outstanding shares | 38.944 | % | ||
Percentage of shares voted | 73.605 | % | ||
Shares voted against | 121,685.413 | |||
Percentage of outstanding shares | 0.519 | % | ||
Percentage of shares voted | 0.980 | % | ||
Shares abstained | 191,684.280 | |||
Percentage of outstanding shares | 0.817 | % | ||
Percentage of shares voted | 1.544 | % | ||
Broker non-votes | 2,962,579.000 |
76
Table of Contents
This page intentionally left blank.
Table of Contents
Board of trustees / directors and officers addendum
Delaware Investments® Family of Funds
A mutual fund is governed by a Board of Trustees/Directors (“Trustees”), which has oversight responsibility for the management of a fund’s business affairs. Trustees establish procedures and oversee and review the performance of the investment manager, the distributor, and others who perform services for the fund. The independent fund trustees, in particular, are advocates
Name, Address, and Birth Date | Position(s) Held with Fund(s) | Length of Time Served | ||
Interested Trustee
| ||||
Shawn K. Lytle1 | President, | Trustee since | ||
2005 Market Street | Chief Executive Officer, | September 1, 2015 | ||
Philadelphia, PA 19103 | and Trustee | |||
February 1970 | President and | |||
| Chief Executive Officer | ||||
since August 20, 2015
| ||||
Independent Trustees
| ||||
Thomas L. Bennett | Chairman and Trustee | Trustee since | ||
2005 Market Street | March 2005 | |||
Philadelphia, PA 19103 | ||||
October 1947 | Chairman since | |||
March 1, 2015
| ||||
Ann D. Borowiec | Trustee | Since March 31, 2015 | ||
2005 Market Street | ||||
Philadelphia, PA 19103 | ||||
November 1958 | ||||
Joseph W. Chow | Trustee | Since January 2013 | ||
2005 Market Street | ||||
Philadelphia, PA 19103 | ||||
January 1953 | ||||
| 1 | Shawn K. Lytle is considered to be an “Interested Trustee “because he is an executive officer of the Fund’s(s’) investment advisor. |
78
Table of Contents
for shareholder interests. Each trustee has served in that capacity since he or she was elected to or appointed to the Board of Trustees, and will continue to serve until his or her retirement or the election of a new trustee in his or her place. The following is a list of the Trustees and Officers with certain background and related information.
Principal Occupation(s) During the Past Five Years | Number of Portfolios in Fund Complex Overseen by Trustee or Officer | Other Directorships Held by Trustee or Officer | ||
Shawn K. Lytle has served as | 64 | Trustee — UBS | ||
President of | Relationship Funds, | |||
Delaware Investments2 | SMA Relationship | |||
since June 2015 and was the | Trust, and UBS Funds | |||
Regional Head of Americas for | (May 2010-April 2015) | |||
UBS Global Asset | ||||
Management from | ||||
2010 through 2015. | ||||
Private Investor | 64 | Director — | ||
(March 2004-Present) | Bryn Mawr Bank Corp. (BMTC) | |||
| (2007-2011) | ||||
Chief Executive Officer | 64 | None | ||
Private Wealth Management | ||||
(2011-2013) and | ||||
Market Manager, | ||||
New Jersey Private | ||||
Bank (2005-2011) – | ||||
J.P. Morgan Chase & Co.
| ||||
Executive Vice President | 64 | Director and Audit Committee | ||
(Emerging Economies | Member — Hercules | |||
Strategies, Risks, and | Technology Growth | |||
Corporate Administration) | Capital, Inc. | |||
State Street Corporation | (2004-2014) | |||
(July 2004-March 2011)
|
| 2 | Delaware Investments is the marketing name for Delaware Management Holdings, Inc. and its subsidiaries, including the Fund’s(s’) investment advisor, principal underwriter, and its transfer agent. |
79
Table of Contents
Board of trustees / directors and officers addendum
Delaware Investments® Family of Funds
Name, Address, and Birth Date | Position(s) Held with Fund(s) | Length of Time Served | ||
Independent Trustees (continued) | ||||
John A. Fry | Trustee | Since January 2001 | ||
2005 Market Street | ||||
Philadelphia, PA 19103 | ||||
May 1960 | ||||
Lucinda S. Landreth | Trustee | Since March 2005 | ||
2005 Market Street | ||||
Philadelphia, PA 19103 | ||||
June 1947
| ||||
Frances A. Sevilla-Sacasa | Trustee | Since September 2011 | ||
2005 Market Street | ||||
Philadelphia, PA 19103 | ||||
January 1956 | ||||
80
Table of Contents
Principal Occupation(s) During the Past Five Years | Number of Portfolios in Fund Complex Overseen by Trustee or Officer | Other Directorships Held by Trustee or Officer | ||
President — | 64 | Director — Hershey Trust | ||
Drexel University | Company | |||
(August 2010-Present) | ||||
| Director, Audit Committee, | ||||
President — | and Governance Committee | |||
Franklin & Marshall College | Member — Community | |||
(July 2002-July 2010) | Health Systems | |||
| Director — Drexel | ||||
| Morgan & Co. | ||||
Private Investor | 64 | None | ||
(2004-Present) | ||||
Chief Executive Officer — | 64 | Trust Manager and | ||
Banco Itaú | Audit Committee | |||
International | Member — Camden | |||
(April 2012-Present) | Property Trust | |||
Executive Advisor to Dean | ||||
(August 2011-March 2012) and Interim Dean | ||||
(January 2011-July 2011) — | ||||
University of Miami School of | ||||
Business Administration | ||||
President — U.S. Trust, | ||||
Bank of America Private | ||||
Wealth Management | ||||
(Private Banking) | ||||
(July 2007-December 2008)
|
81
Table of Contents
Board of trustees / directors and officers addendum
Delaware Investments® Family of Funds
Name, Address, and Birth Date | Position(s) Held with Fund(s) | Length of Time Served | ||
Independent Trustees (continued) | ||||
Thomas K. Whitford | Trustee | Since January 2013 | ||
2005 Market Street | ||||
Philadelphia, PA 19103 | ||||
March 1956 | ||||
Janet L. Yeomans | Trustee | Since April 1999 | ||
2005 Market Street | ||||
Philadelphia, PA 19103 | ||||
July 1948 | ||||
82
Table of Contents
Principal Occupation(s) During the Past Five Years | Number of Portfolios in Fund Complex Overseen by Trustee or Officer | Other Directorships Held by Trustee or Officer | ||
Vice Chairman | 64 | Director — HSBC Finance | ||
(2010-April 2013), | Corporation and HSBC | |||
Chief Administrative | North America Holdings Inc. | |||
Officer (2008-2010), | ||||
and Executive Vice | Director — | |||
President and Chief | HSBC Bank | |||
Administrative Officer | ||||
(2007-2009) — | ||||
PNC Financial | ||||
Services Group
| ||||
Vice President and Treasurer | 64 | Director, Audit and | ||
(January 2006-July 2012) | Compliance Committee Chair, | |||
Vice President — | Investment Committee | |||
Mergers & Acquisitions | Member, and Governance | |||
(January 2003-January 2006), | Committee Member — | |||
and Vice President | Okabena Company | |||
and Treasurer | ||||
(July 1995-January 2003) | Chair — 3M | |||
3M Corporation | Investment Management | |||
| Company | ||||
(2005-2012)
|
83
Table of Contents
Board of trustees / directors and officers addendum
Delaware Investments® Family of Funds
Name, Address, and Birth Date | Position(s) Held with Fund(s) | Length of Time Served | ||
Officers | ||||
David F. Connor | Senior Vice President, | Senior Vice President | ||
2005 Market Street | General Counsel, | since May 2013; | ||
Philadelphia, PA 19103 | and Secretary | General Counsel | ||
December 1963 | since May 2015; | |||
| Secretary since | ||||
| October 2005 | ||||
Daniel V. Geatens | Vice President | Treasurer since October 2007 | ||
2005 Market Street | and Treasurer | |||
Philadelphia, PA 19103 | ||||
October 1972 | ||||
Richard Salus | Senior Vice President | Chief Financial Officer | ||
2005 Market Street | and Chief Financial Officer | since November 2006 | ||
Philadelphia, PA 19103 | ||||
October 1963 | ||||
The Statement of Additional Information for the Fund(s) includes additional information about the Trustees and Officers and is available, without charge, upon request by calling 800 523-1918.
84
Table of Contents
Principal Occupation(s) During the Past Five Years | Number of Portfolios in Fund Complex Overseen by Trustee or Officer | Other Directorships Held by Trustee or Officer | ||
David F. Connor has served as | 64 | None3 | ||
Senior Vice President of the Fund(s) and the investment advisor since 2013, General Counsel of the Fund(s) and the investment advisor since 2015, and Secretary of the Fund(s) and the investment advisor since 2005.
| ||||
Daniel V. Geatens has served | 64 | None3 | ||
as Vice President and | ||||
Treasurer of the Fund(s) since 2007 and Vice President and Director of Financial | ||||
Administration of the investment advisor since 2010.
| ||||
Richard Salus has served as | 64 | None3 | ||
Senior Vice President and Chief Financial Officer of the Fund(s) and the investment advisor since 2006.
|
| 3 | David F. Connor, Daniel V. Geatens, and Richard Salus serve in similar capacities for the six portfolios of the Optimum Fund Trust, which have the same investment advisor, principal underwriter, and transfer agent as the registrant. |
85
Table of Contents
| Board of trustees | ||||||
Shawn K. Lytle President and Chief Executive Officer Delaware Investments® Family of Funds Philadelphia, PA
Thomas L. Bennett Chairman of the Board Delaware Investments Family of Funds Private Investor Rosemont, PA | Ann D. Borowiec Former Chief Executive Officer Private Wealth Management J.P. Morgan Chase & Co. New York, NY
Joseph W. Chow Former Executive Vice President State Street Corporation Brookline, MA | John A. Fry President Drexel University Philadelphia, PA
Lucinda S. Landreth Former Chief Investment Officer Assurant, Inc. New York, NY | Frances A. Sevilla-Sacasa Chief Executive Officer Banco Itaú International Miami, FL
Thomas K. Whitford Former Vice Chairman PNC Financial Services Group Pittsburgh, PA
Janet L. Yeomans Former Vice President and Treasurer 3M Corporation St. Paul, MN | |||
| Affiliated officers | ||||||
David F. Connor Senior Vice President, General Counsel, and Secretary Delaware Investments Family of Funds Philadelphia, PA | Daniel V. Geatens Vice President and Treasurer Delaware Investments Family of Funds Philadelphia, PA | Richard Salus Senior Vice President and Chief Financial Officer Delaware Investments Family of Funds Philadelphia, PA | ||||
This annual report is for the information of Delaware Core Plus Bond Fund shareholders, but it may be used with prospective investors when preceded or accompanied by the Delaware Investments Fund fact sheet for the most recently completed calendar quarter. These documents are available at delawareinvestments.com.
Delaware Investments is the marketing name of Delaware Management Holdings, Inc. and its subsidiaries.
The Fund files its complete schedule of portfolio holdings with the Securities and Exchange Commission (SEC) for the first and third quarters of each fiscal year on Form N-Q. The Fund’s Forms N-Q, as well as a description of the policies and procedures that the Fund uses to determine how to vote proxies (if any) relating to portfolio securities are available without charge (i) upon request, by calling 800 523-1918; and (ii) on the SEC’s website at sec.gov. In addition, a description of the policies and procedures that the Fund uses to determine how to vote proxies (if any) relating to portfolio securities and the Schedule of Investments included in the Fund’s most recent Form N-Q are available without charge on the Fund’s website at delawareinvestments.com. The Fund’s Forms N-Q may be reviewed and copied at the SEC’s Public Reference Room in Washington, D.C.; information on the operation of the Public Reference Room may be obtained by calling 800 SEC-0330.
Information (if any) regarding how the Fund voted proxies relating to portfolio securities during the most recently disclosed 12-month period ended June 30 is available without charge (i) through the Fund’s website at delawareinvestments.com; and (ii) on the SEC’s website at sec.gov.
86
Table of Contents

Annual report
Fixed income mutual fund
Delaware Emerging Markets Debt Fund
July 31, 2015
Carefully consider the Fund’s investment objectives, risk factors, charges, and expenses before investing. This and other information can be found in the Fund’s prospectus and its summary prospectus, which may be obtained by visiting delawareinvestments.com or calling 800 523-1918. Investors should read the prospectus and the summary prospectus carefully before investing.
You can obtain shareholder reports and prospectuses online instead of in the mail.
Visit delawareinvestments.com/edelivery.
Table of Contents
Experience Delaware Investments
Delaware Investments is committed to the pursuit of consistently superior asset management and unparalleled client service. We believe in our investment processes, which seek to deliver consistent results, and in convenient services that help add value for our clients.
If you are interested in learning more about creating an investment plan, contact your financial advisor.
You can learn more about Delaware Investments or obtain a prospectus for Delaware Emerging Markets Debt Fund at delawareinvestments.com.
Manage your investments online
| ● | 24-hour access to your account information |
| ● | Obtain share prices |
| ● | Check your account balance and recent transactions |
| ● | Request statements or literature |
| ● | Make purchases and redemptions |
Delaware Management Holdings, Inc. and its subsidiaries (collectively known by the marketing name of Delaware Investments) are wholly owned subsidiaries of Macquarie Group Limited, a global provider of banking, financial, advisory, investment and funds management services.
Neither Delaware Investments nor its affiliates noted in this document are authorized deposit-taking institutions for the purposes of the Banking Act 1959 (Commonwealth of Australia). The obligations of these entities do not represent deposits or other liabilities of Macquarie Bank Limited (MBL). MBL does not guarantee or otherwise provide assurance in respect of the obligations of these entities, unless noted otherwise.
| 1 | ||||
| 4 | ||||
| 9 | ||||
| 11 | ||||
| 12 | ||||
| 18 | ||||
| 20 | ||||
| 22 | ||||
| 24 | ||||
| 25 | ||||
| 29 | ||||
| 45 | ||||
| 46 | ||||
| 52 | ||||
| 60 |
Unless otherwise noted, views expressed herein are current as of July 31, 2015, and subject to change for events occurring after such date.
Funds are not FDIC insured and are not guaranteed. It is possible to lose the principal amount invested.
Mutual fund advisory services provided by Delaware Management Company, a series of Delaware Management Business Trust, which is a registered investment advisor. Delaware Investments, a member of Macquarie Group, refers to Delaware Management Holdings, Inc. and its subsidiaries, including the Fund’s distributor, Delaware Distributors, L.P. Macquarie Group refers to Macquarie Group Limited and its subsidiaries and affiliates worldwide.
© 2015 Delaware Management Holdings, Inc.
All third-party marks cited are the property of their respective owners.
Table of Contents
| Delaware Emerging Markets Debt Fund | August 11, 2015 |
| Performance preview (for the 1-year period ended July 31, 2015) | ||||||
| ||||||
Delaware Emerging Markets Debt Fund (Class A shares) | 1-year return | -2.65% | ||||
| ||||||
J.P. Morgan Corporate Emerging Markets Bond Index (CEMBI) Broad Diversified (benchmark) | 1-year return | +2.33% | ||||
| ||||||
Past performance does not guarantee future results.
For complete, annualized performance for Delaware Emerging Markets Debt Fund, please see the table on page 4.
The performance of Class A shares excludes the applicable sales charge and reflects the reinvestment of all distributions.
For a description of the index, please see page 7.
Index performance returns do not reflect any management fees, transaction costs, or expenses. Indices are unmanaged and one cannot invest directly in an index.
Several economic factors had an effect on emerging market bonds during the fiscal year ended July 31, 2015. Growth in emerging market countries declined somewhat while inflation rates averaged about twice that of the global inflation rate. Emerging market currencies experienced a double-digit drop and even equity securities from developing nations declined. Against a backdrop of dramatically declining oil and commodity prices (almost half of emerging market countries export commodities), it was a challenging year for emerging market securities all around.
Throughout the fiscal year, mounting geopolitical tensions within and between Ukraine and Russia, as well as continued economic sanctions applied by the European Union, added to downward pressure on oil and commodity prices.
At the same time, the impact of the Greek fiscal and economic crisis had a dramatic effect on European growth and the prospects for future unity within the entire block.
In China, economic data indicated a material deceleration of growth, which may point to an equity bubble and potential collapse: Several days after the close of the fiscal year, the Chinese government devalued its currency by roughly 2% relative to the U.S. dollar, a move that triggered the yuan’s largest one-day drop in more than two decades (source: Bloomberg).
In South America, a corruption scandal in Brazil weighed heavily on the nation’s economy. Semi-public multinational energy corporation Petrobras – the largest single non-sovereign emerging market debt issuer – owns all of the nation’s refineries and operates more than 21,000 miles of pipelines, and was implicated in the scandal. It also has strong ties with dozens of local drilling and construction companies, many of which were also implicated in the scandal.
Within North America, as markets anticipated an end to the Federal Reserve’s seven-year-old near zero interest rate policy, U.S. rates continued to have an effect on emerging market rates, particularly investment grade emerging market securities.
The combination of sanctions against Russia and the repercussions from Brazil’s corruption scandal led to a 27% decline in emerging market corporate debt issuance during the first half of 2015, relative to a year ago. Despite deteriorating credit quality, decreasing supply led to a sharp tightening of emerging market credit spreads. Subsequently, corporate debt dramatically outperformed noncorporate debt.
Fund performance
For the fiscal year ended July 31, 2015, Delaware Emerging Markets Debt Fund (Class A shares) returned -2.65% at net asset value and -7.03% at
1
Table of Contents
Portfolio management review
Delaware Emerging Markets Debt Fund
maximum offer price (both returns reflect all distributions reinvested). For the same period, the Fund’s benchmark, the J.P. Morgan Corporate Emerging Markets Bond Index (CEMBI) Broad Diversified rose +2.33%. For complete, annualized performance for Delaware Emerging Markets Debt Fund, please see the table on page 4.
To put performance in perspective, the Fund is diversified across securities in emerging markets corporate, sovereign, and local debt, while the benchmark is concentrated solely on corporate issues.
During the fiscal year, reduced supply led emerging market corporate debt to post uncharacteristically strong relative performance. At the same time, sovereign debt (bonds issued by a national government in a foreign currency) and local debt underperformed. When compared to the -7.99% average return of the Fund’s Morningstar peer group, the Morningstar Emerging Markets Bond category, and the -4.33% average return of its Lipper peer group, the Lipper Emerging Markets Hard Currency Debt Funds Average, Delaware Emerging Markets Debt Fund performed more in line with expectations for these similar investment vehicles.
From a sector perspective, finance, telecommunications, media, and technology (TMT) and consumer credit companies were the largest contributors to performance. Finance holdings contributed 0.90 percentage points to overall return, while TMT generated 0.92 percentage points and consumer credit holdings added 0.29 percentage points.
The largest sector detractors came from the industrial, oil and gas, and metals and mining sectors. The dramatic decline in oil prices had a dampening effect on Fund returns. During the fiscal year, we dramatically reduced the Fund’s position to the latter two sectors and have no expectation of an increase in the immediate future.
Individual holdings that contributed to performance included South Korean AA-rated Woori Bank, which trades in close relationship to U.S. rates. The bank performed well during a period marked by demand for high-quality paper, particularly while U.S. rates declined.
Garanti Bank, the second largest private bank in Turkey, benefited from improving credit metrics. During the fiscal year, we were able to capitalize on a brief but significant improvement in the Turkish political environment that supported both sovereign and corporate debt issues within the nation.
Despite the decline in energy prices, another contributor to performance was domiciled methanol producer Consolidated Energy, located in Trinidad. The company benefited from the expiration of a number of long-term contracts, set in place when the cost of the commodity was substantially lower than today’s value. Revalued contracts led to an improved revenue stream, and consequently led to enhanced credit quality.
Among individual names, Brazilian construction giant OAS Petroleum was responsible for the largest drag on Fund performance. OAS is among more than a dozen companies that were found to be involved in the wide-reaching major corruption scandal that also included the state-owned Brazilian oil giant, Petrobras (also a portfolio holding). Corporate leaders from many of Brazil’s largest organizations (OAS included) were implicated in the ongoing systematic corruption scheme, which included money-laundering, conspiracy to commit crimes and the bribing of government officials. Repercussions echoed throughout most of the nation, affecting the overall performance of Brazil’s sovereign debt as well as the vast number of drilling, construction, and engineering companies with which Petrobras does business. We sold OAS during the fiscal year and substantially reduced the Fund’s position in Petrobras, which remains the largest corporate debt issuer within the emerging debt universe.
2
Table of Contents
Colombian exploration and production company Pacific Rubiales Energy, which experienced deteriorating credit quality and price as energy prices dropped throughout the fiscal year, also detracted from Fund performance. Quasi-sovereign, government-owned Venezuelan global oil giant PDVSA also declined as oil prices collapsed and political and economic conditions deteriorated in Venezuela. As of the end of the fiscal year, we no longer held Pacific Rubiales Energy and PDVSA in the Fund.
With regard to credit quality, we increased the Fund’s allocation to investment grade securities by slightly more than 15%, as we believed many high yield securities were becoming overvalued. At the end of the fiscal year, investment grade holdings represented 61% of the portfolio while high yield issues made up most of the remainder.
Regionally, we believe there may be potential value opportunities within Russia and increased the Fund’s allocation within the area, while selling troubled Brazilian holdings. We reduced the Fund’s small exposure to Venezuela, as conditions within the nation continued to deteriorate, and we increased exposure to Argentinian securities.
A word on derivatives
During the fiscal year, Delaware Emerging Markets Debt Fund invested in derivatives. The Fund held a small position (0.50 percentage points) in a credit default swap basket that we sold after about 45 days. The Fund also had a 0.05 percentage point allocation to a derivative position and held currency hedges in FX forwards, which made up about 0.04% of the portfolio.
3
Table of Contents
| Performance summary | ||
| Delaware Emerging Markets Debt Fund | July 31, 2015 |
The performance data quoted represent past performance; past performance does not guarantee future results. Investment return and principal value will fluctuate so your shares, when redeemed, may be worth more or less than their original cost. Please obtain the performance data current for the most recent month end by calling 800 523-1918 or visiting our website at delawareinvestments.com/performance. Current performance may be lower or higher than the performance data quoted.
| Fund and benchmark performance1, 2, 3 | Average annual total returns through July 31, 2015 | |||||
1 year |
3 years |
Lifetime | ||||
Class A (Est. Sept. 30, 2013) | ||||||
Excluding sales charge | -2.65% | +4.17% | +6.12% | |||
Including sales charge | -7.03% | +2.59% | +5.10% | |||
Class C (Est. Sept. 30, 2013) | ||||||
Excluding sales charge | -2.53% | +3.71% | +5.53% | |||
Including sales charge | -3.46% | +3.71% | +5.53% | |||
Class R (Est. Sept. 30, 2013) | ||||||
Excluding sales charge | -2.53% | +4.04% | +5.94% | |||
Including sales charge | -2.53% | +4.04% | +5.94% | |||
Institutional Class (Est. Sept. 30, 2013) | ||||||
Excluding sales charge | -2.53% | +4.39% | +6.36% | |||
Including sales charge | -2.53% | +4.39% | +6.36% | |||
J.P. Morgan Corporate Emerging Markets Bond Index (CEMBI) Broad Diversified | +2.33% | +4.40% | +5.02% | |||
1 A privately offered fund managed by the Fund’s portfolio manager was reorganized into the Fund and the Fund commenced operations on Sept. 30, 2013. This privately offered fund commenced operations on Nov. 3, 2010 and had an investment objective and strategies that were, in all material respects, the same as those of the Fund, and was managed in a manner that, in all material respects, complied with the investment guidelines and restrictions of the Fund. However, the privately offered fund was not registered as an investment under the Investment Company Act of 1940 (1940 Act). As a result, the privately offered fund was not subject to certain investment limitations, diversification requirements, liquidity requirements, and other restrictions imposed by the 1940 Act and the Internal Revenue Code of
1986, as amended, which, if applicable, may have adversely affected its performance.
The Fund’s performance for the periods prior to its commencement of operations on Sept. 30, 2013 is that of the privately offered fund. Because the privately offered fund was a master fund that did not charge any management or other asset-based fees, the privately offered fund’s performance shown above has been restated, on a one-time basis, to reflect the fees, expenses, and waivers and reimbursements for each class of the Fund at the commencement of the Fund’s operations. If the performance of the privately offered fund had not been restated, the performance for such classes may have been higher than the performance shown in the average annual total returns table above.
4
Table of Contents
2 Returns reflect the reinvestment of all distributions and are presented both with and without the applicable sales charges described below. Returns do not reflect the deduction of taxes the shareholder would pay on Fund distributions or redemptions of Fund shares.
Expense limitations were in effect for certain classes during some or all of the periods shown in the “Fund and benchmark performance” table. Expenses for each class are listed on the “Fund expense ratios” table on page 6. Performance would have been lower had expense limitations not been in effect.
Class A shares are sold with a maximum front-end sales charge of 4.50%, and have an annual distribution and service fee of 0.25% of average daily net assets. Performance for Class A shares, excluding sales charges, assumes that no front-end sales charge applied.
Class C shares are sold with a contingent deferred sales charge of 1.00% if redeemed during the first 12 months. They are also subject to an annual distribution and service fee of 1.00% of average daily net assets. Performance for Class C shares, excluding sales charges, assumes either that contingent deferred sales charges did not apply or that the investment was not redeemed.
Class R shares are available only for certain retirement plan products. They are sold without a sales charge and have an annual distribution and service fee of 0.50% of average daily net assets.
Institutional Class shares are available without sales or asset-based distribution charges only to certain eligible institutional accounts.
Fixed income securities and bond funds can lose value, and investors can lose principal, as interest rates rise. They also may be affected by economic conditions that hinder an issuer’s ability to make interest and principal payments on its debt.
High yielding, noninvestment grade bonds (junk bonds) involve higher risk than investment grade bonds.
The high yield secondary market is particularly susceptible to liquidity problems when institutional investors, such as mutual funds and certain other financial institutions, temporarily stop buying bonds for regulatory, financial, or other reasons. In addition, a less liquid secondary market makes it more difficult for the Fund to obtain precise valuations of the high yield securities in its portfolio.
The Fund may also be subject to prepayment risk, the risk that the principal of a fixed income security that is held by the Fund may be prepaid prior to maturity, potentially forcing the Fund to reinvest that money at a lower interest rate.
The Fund may invest in derivatives, which may involve additional expenses and are subject to risk, including the risk that an underlying security or securities index moves in the opposite direction from what the portfolio manager anticipated. A derivative transaction depends upon the counterparties’ ability to fulfill their contractual obligations.
If and when the Fund invests in forward foreign currency contracts or uses other investments to hedge against currency risks, the Fund will be subject to special risks, including counterparty risk.
Diversification may not protect against market risk.
International investments entail risks not ordinarily associated with U.S. investments including fluctuation in currency values, differences in accounting principles, or economic or political instability in other nations.
Investing in emerging markets can be riskier than investing in established foreign markets due to increased volatility and lower trading volume.
The Fund may experience portfolio turnover in excess of 100%, which could result in higher transaction costs and tax liability.
Short sales risk is the risk that a fund may lose more money than the actual cost of its investment
5
Table of Contents
Performance summary
Delaware Emerging Markets Debt Fund
and that the third party to the short sale may fail to honor its contract terms, causing a loss to the fund.
Leveraging risk is the risk that certain fund transactions, such as reverse repurchase agreements, short sales, loans of portfolio
securities, and the use of when-issued, delayed delivery or forward commitment transactions, or derivative instruments, may give rise to leverage, causing a fund to be more volatile than if it had not been leveraged.
3 The Fund’s expense ratios, as described in the most recent prospectus, are disclosed in the following “Fund expense ratios” table. Delaware Management Company has agreed to reimburse certain expenses and/or waive certain fees in order to prevent total annual fund operating expenses (excluding any 12b-1 fees, taxes, interest, short sale dividend and interest expenses, brokerage fees, certain insurance costs, acquired fund fees and expenses, and nonroutine expenses or costs, including, but not limited to, those relating to reorganizations, litigation, conducting shareholder meetings, and liquidations (collectively, nonroutine expenses)) from exceeding 1.00% of the Fund’s average daily net assets during the period from Aug. 1, 2014 through July 31, 2015.* Please see the most recent prospectus and any applicable supplement(s) for additional information on these fee waivers and/or reimbursements.
| Fund expense ratios | Class A | Class C | Class R | Institutional Class | ||||
Total annual operating expenses (without fee waivers) | 2.49% | 3.24% | 2.74% | 2.24% | ||||
Net expenses (including fee waivers, if any) | 1.51% | 2.26% | 1.76% | 1.26% | ||||
Type of waiver | Contractual (Investment manager waiver); Voluntary (12b-1 fee waiver) | Contractual (Investment manager waiver); Voluntary (12b-1 fee waiver) | Contractual (Investment manager waiver); Voluntary (12b-1 fee waiver) | Contractual |
* The contractual waiver period is from Nov. 27, 2013, through Nov. 30, 2015.
6
Table of Contents
Performance of a $10,000 investment1
Average annual total returns from Sept. 30, 2013 (Fund’s inception), through July 31, 2015
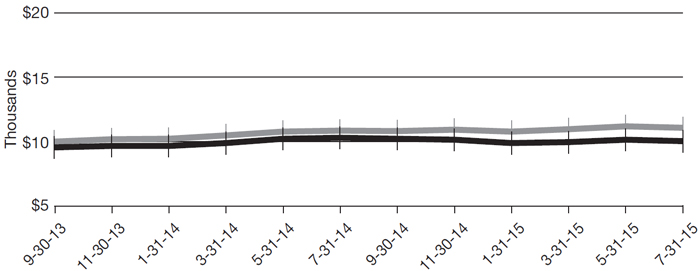
| ||||||
| For period beginning Sept. 30, 2013, through July 31, 2015 | Starting value | Ending value | ||||
| ||||||
| $10,000 | $11,093 | ||||
| $9,550 | $10,029 | ||||
| ||||||
 J.P. Morgan Corporate Emerging Markets
 Delaware Emerging Markets
1 The “Performance of a $10,000 investment” graph assumes $10,000 invested in Class A shares of the Fund on Sept. 30, 2013, and includes the effect of a 4.50% front-end sales charge and the reinvestment of all distributions. The graph does not reflect the deduction of taxes the shareholders would pay on Fund distributions or redemptions of Fund shares. Expense limitations were in effect for some or all of the periods shown. Performance would have been lower had expense limitations not been in effect. Expenses are listed in the “Fund expense ratios” table on page 6. Please note additional details on pages 4 through 8.
The graph also assumes $10,000 invested in the J.P. Morgan Corporate Emerging Markets Bond Index (CEMBI) Broad Diversified as of Sept. 30, 2013. The J.P. Morgan Corporate Emerging Markets Bond Index (CEMBI) Broad Diversified tracks U.S. dollar–denominated emerging market corporate bonds, limiting the weights of countries with larger corporate debt
stocks by including only a specified portion of those countries’ eligible current face amounts of debt outstanding.
The Lipper Emerging Markets Hard Currency Debt Funds Average, mentioned on page 2, compares funds that seek either current income or total return by investing at least 65% of total assets in emerging market debt securities.
The Morningstar Emerging Markets Bond category, also mentioned on page 2, includes emerging markets bond funds that invest more than 65% of their assets in foreign bonds from developing countries.
Index performance returns do not reflect any management fees, transaction costs, or expenses. Indices are unmanaged and one cannot invest directly in an index. Past performance is not a guarantee of future results.
Performance of other Fund classes will vary due to different charges and expenses.
7
Table of Contents
Performance summary
Delaware Emerging Markets Debt Fund
| Nasdaq symbols | CUSIPs | |||||||
Class A | DEDAX | 246094841 | ||||||
Class C | DEDCX | 246094833 | ||||||
Class R | DEDRX | 246094825 | ||||||
Institutional Class
| DEDIX
| 246094817
|
8
Table of Contents
For the six-month period February 1, 2015 to July 31, 2015 (Unaudited)
As a shareholder of the Fund, you incur two types of costs: (1) transaction costs, including sales charges (loads) on purchase payments, reinvested dividends, or other distributions; redemption fees; and exchange fees; and (2) ongoing costs, including management fees; distribution and/or service (12b-1) fees; and other Fund expenses. This example is intended to help you understand your ongoing costs (in dollars) of investing in the Fund and to compare these costs with the ongoing costs of investing in other mutual funds.
The example is based on an investment of $1,000 invested at the beginning of the period and held for the entire six-month period from Feb. 1, 2015 to July 31, 2015.
Actual expenses
The first section of the table shown, “Actual Fund return,” provides information about actual account values and actual expenses. You may use the information in this section of the table, together with the amount you invested, to estimate the expenses that you paid over the period. Simply divide your account value by $1,000 (for example, an $8,600 account value divided by $1,000 = 8.6), then multiply the result by the number in the first section under the heading entitled “Expenses Paid During Period” to estimate the expenses you paid on your account during this period.
Hypothetical example for comparison purposes
The second section of the table shown, “Hypothetical 5% return,” provides information about hypothetical account values and hypothetical expenses based on the Fund’s actual expense ratio and an assumed rate of return of 5% per year before expenses, which is not the Fund’s actual return. The hypothetical account values and expenses may not be used to estimate the actual ending account balance or expenses you paid for the period. You may use this information to compare the ongoing costs of investing in the Fund and other funds. To do so, compare this 5% hypothetical example with the 5% hypothetical examples that appear in the shareholder reports of the other funds.
Please note that the expenses shown in the table are meant to highlight your ongoing costs only and do not reflect any transactional costs, such as sales charges (loads), redemption fees, or exchange fees. Therefore, the second section of the table is useful in comparing ongoing costs only, and will not help you determine the relative total costs of owning different funds. In addition, if these transactional costs were included, your costs would have been higher. The Fund’s expenses shown in the table reflect fee waivers in effect. The expenses shown in the table assume reinvestment of all dividends and distributions.
9
Table of Contents
Disclosure of Fund expenses
For the six-month period February 1, 2015 to July 31, 2015 (Unaudited)
Delaware Emerging Markets Debt Fund
Expense analysis of an investment of $1,000
Beginning
Account Value
2/1/15 | Ending
Account Value
7/31/15 | Annualized
Expense Ratio | Expenses
Paid During Period
2/1/15 to 7/31/15* | |||||||||||||||||
Actual Fund return† | ||||||||||||||||||||
Class A | $1,000.00 | $1,014.90 | 1.13% | $5.64 | ||||||||||||||||
Class C | 1,000.00 | 1,016.20 | 1.13% | 5.65 | ||||||||||||||||
Class R | 1,000.00 | 1,016.20 | 1.13% | 5.65 | ||||||||||||||||
Institutional Class | 1,000.00 | 1,016.20 | 1.13% | 5.65 | ||||||||||||||||
Hypothetical 5% return (5% return before expenses) |
| |||||||||||||||||||
Class A | $1,000.00 | $1,019.19 | 1.13% | $5.66 | ||||||||||||||||
Class C | 1,000.00 | 1,019.19 | 1.13% | 5.66 | ||||||||||||||||
Class R | 1,000.00 | 1,019.19 | 1.13% | 5.66 | ||||||||||||||||
Institutional Class | 1,000.00 | 1,019.19 | 1.13% | 5.66 | ||||||||||||||||
| * | “Expenses Paid During Period” are equal to the Fund’s annualized expense ratio, multiplied by the average account value over the period, multiplied by 181/365 (to reflect the one-half year period). |
| † | Because actual returns reflect only the most recent six-month period, the returns shown may differ significantly from fiscal year returns. |
10
Table of Contents
| Security type / sector allocation | ||
| Delaware Emerging Markets Debt Fund | As of July 31, 2015 (Unaudited) |
Sector designations may be different than the sector designations presented in other fund materials. The sector designations may represent the investment manager’s internal sector classifications, which may result in the sector designations for one fund being different than another fund’s sector designations.
| Security type / sector | Percentage of net assets | ||||
Corporate Bonds | 78.70 | % | |||
Banking | 12.27 | % | |||
Basic Industry | 7.07 | % | |||
Capital Goods | 3.98 | % | |||
Communications. | 18.09 | % | |||
Consumer Cyclical | 2.97 | % | |||
Consumer Non-Cyclical | 4.22 | % | |||
Electric | 8.35 | % | |||
Energy | 12.46 | % | |||
Finance Companies. | 2.18 | % | |||
Real Estate | 1.13 | % | |||
Technology | 2.65 | % | |||
Transportation | 3.33 | % | |||
Regional Bond | 1.32 | % | |||
Senior Secured Loan | 2.67 | % | |||
Sovereign Bonds | 9.56 | % | |||
Supranational Banks | 1.85 | % | |||
Exchange-Traded Funds | 1.02 | % | |||
Short-Term Investments | 1.70 | % | |||
Total Value of Securities | 96.82 | % | |||
Receivables and Other Assets Net of Liabilities | 3.18 | % | |||
Total Net Assets | 100.00 | % | |||
11
Table of Contents
| Schedule of investments | ||
| Delaware Emerging Markets Debt Fund | July 31, 2015 |
| Principal amount° | Value (U.S. $) | |||||||
| ||||||||
Corporate Bonds – 78.70% | ||||||||
| ||||||||
Banking – 12.27% | ||||||||
Akbank 144A 4.00% 1/24/20 # | 300,000 | $ | 292,950 | |||||
Banco Bilbao Vizcaya Argentaria Colombia 144A | ||||||||
4.875% 4/21/25 # | 300,000 | 299,850 | ||||||
BBVA Bancomer | ||||||||
6.50% 3/10/21 ¥ | 250,000 | 277,500 | ||||||
144A 7.25% 4/22/20 # | 100,000 | 112,300 | ||||||
Itau Unibanco Holding 144A 2.85% 5/26/18 # | 375,000 | 370,687 | ||||||
Trade & Development Bank of Mongolia 144A | ||||||||
9.375% 5/19/20 # | 300,000 | 308,550 | ||||||
Turkiye Garanti Bankasi 144A 4.75% 10/17/19 # | 300,000 | 305,325 | ||||||
Woori Bank 144A 4.75% 4/30/24 # | 295,000 | 308,137 | ||||||
|
| |||||||
| 2,275,299 | ||||||||
|
| |||||||
Basic Industry – 7.07% | ||||||||
Gerdau Trade 144A 5.75% 1/30/21 # | 100,000 | 99,300 | ||||||
Mexichem 144A 5.875% 9/17/44 # | 300,000 | 281,625 | ||||||
MMC Norilsk Nickel 144A 5.55% 10/28/20 # | 250,000 | 251,063 | ||||||
OCP 144A 4.50% 10/22/25 # | 500,000 | 481,875 | ||||||
Phosagro 144A 4.204% 2/13/18 # | 200,000 | 197,250 | ||||||
|
| |||||||
| 1,311,113 | ||||||||
|
| |||||||
Capital Goods – 3.98% | ||||||||
Cemex Finance 144A 9.375% 10/12/22 # | 250,000 | 280,863 | ||||||
Embraer Netherlands Finance 5.05% 6/15/25 | 310,000 | 303,800 | ||||||
Union Andina de Cementos 144A 5.875% 10/30/21 # | 150,000 | 153,750 | ||||||
|
| |||||||
| 738,413 | ||||||||
|
| |||||||
Communications – 18.09% | ||||||||
Bharti Airtel International Netherlands 144A | ||||||||
5.35% 5/20/24 #¥ | 200,000 | 217,004 | ||||||
Colombia Telecomunicaciones 144A 5.375% 9/27/22 # | 200,000 | 199,600 | ||||||
Columbus International 144A 7.375% 3/30/21 # | 250,000 | 266,563 | ||||||
Digicel Group 144A 8.25% 9/30/20 #¥ | 500,000 | 496,250 | ||||||
Grupo Televisa 5.00% 5/13/45 ¥ | 200,000 | 191,236 | ||||||
Millicom International Cellular | ||||||||
144A 6.00% 3/15/25 # | 200,000 | 198,500 | ||||||
144A 6.625% 10/15/21 # | 200,000 | 209,000 | ||||||
MTS International Funding 144A 5.00% 5/30/23 # | 200,000 | 182,000 | ||||||
Myriad International Holdings 144A 5.50% 7/21/25 # | 200,000 | 203,600 | ||||||
Sable International Finance 144A 6.875% 8/1/22 # | 200,000 | 197,288 | ||||||
TBG Global PTE 144A 4.625% 4/3/18 # | 300,000 | 302,250 | ||||||
Telemar Norte Leste 144A 5.50% 10/23/20 #¥ | 200,000 | 173,000 | ||||||
VimpelCom Holdings 144A 6.255% 3/1/17 #¥ | 300,000 | 312,330 | ||||||
VTR Finance 144A 6.875% 1/15/24 #¥ | 200,000 | 204,000 | ||||||
|
| |||||||
| 3,352,621 | ||||||||
|
| |||||||
12
Table of Contents
| Principal amount° | Value (U.S. $) | |||||||
| ||||||||
Corporate Bonds (continued) | ||||||||
| ||||||||
Consumer Cyclical – 2.97% | ||||||||
Cencosud 144A 5.15% 2/12/25 # | 355,000 | $ | 357,450 | |||||
Tupy Overseas 144A 6.625% 7/17/24 #¥ | 200,000 | 193,000 | ||||||
|
| |||||||
| 550,450 | ||||||||
|
| |||||||
Consumer Non-Cyclical – 4.22% | ||||||||
BRF 144A 3.95% 5/22/23 # | 200,000 | 186,000 | ||||||
ENA Norte Trust 4.95% 4/25/23 | 220,127 | 229,482 | ||||||
JBS Investments 144A 7.75% 10/28/20 #¥ | 200,000 | 217,000 | ||||||
JBS USA 144A 5.75% 6/15/25 # | 150,000 | 149,017 | ||||||
|
| |||||||
| 781,499 | ||||||||
|
| |||||||
Electric – 8.35% | ||||||||
AES Gener | ||||||||
144A 5.00% 7/14/25 # | 200,000 | 204,418 | ||||||
144A 5.25% 8/15/21 #¥ | 200,000 | 214,349 | ||||||
144A 8.375% 12/18/73 #●¥ | 200,000 | 219,500 | ||||||
Comision Federal de Electricidad 144A 4.875% 1/15/24 # | 250,000 | 260,937 | ||||||
Eskom Holdings 144A 7.125% 2/11/25 # | 200,000 | 202,520 | ||||||
Lamar Funding 144A 3.958% 5/7/25 # | 250,000 | 242,813 | ||||||
State Grid Overseas Investment 2014 144A | ||||||||
2.75% 5/7/19 # | 200,000 | 203,767 | ||||||
|
| |||||||
| 1,548,304 | ||||||||
|
| |||||||
Energy – 12.46% | ||||||||
CNOOC Finance 2015 Australia 2.625% 5/5/20 | 200,000 | 197,247 | ||||||
CNOOC Finance 2015 USA 3.50% 5/5/25 | 200,000 | 193,640 | ||||||
Ecopetrol 5.375% 6/26/26 | 195,000 | 189,443 | ||||||
KazMunayGas National 144A 6.375% 4/9/21 # | 200,000 | 208,500 | ||||||
Lukoil International Finance 144A 3.416% 4/24/18 # | 200,000 | 192,817 | ||||||
ONGC Videsh 2.50% 5/7/18 ¥ | 200,000 | 200,280 | ||||||
Petrobras Global Finance | ||||||||
4.875% 3/17/20 | 170,000 | 158,374 | ||||||
6.25% 3/17/24 | 150,000 | 140,760 | ||||||
Petroleos Mexicanos 144A 4.25% 1/15/25 # | 190,000 | 185,535 | ||||||
Petronas Global Sukuk 144A 2.707% 3/18/20 # | 205,000 | 204,090 | ||||||
YPF | ||||||||
144A 8.75% 4/4/24 # | 285,000 | 282,065 | ||||||
144A 8.875% 12/19/18 # | 150,000 | 156,375 | ||||||
|
| |||||||
| 2,309,126 | ||||||||
|
| |||||||
Finance Companies – 2.18% | ||||||||
Corp Financiera de Desarrollo | ||||||||
144A 4.75% 7/15/25 # | 200,000 | 203,000 | ||||||
144A 5.25% 7/15/29 #●¥ | 200,000 | 201,440 | ||||||
|
| |||||||
| 404,440 | ||||||||
|
| |||||||
13
Table of Contents
Schedule of investments
Delaware Emerging Markets Debt Fund
| Principal amount° | Value (U.S. $) | |||||||
| ||||||||
Corporate Bonds (continued) | ||||||||
| ||||||||
Real Estate – 1.13% | ||||||||
Trust F/1401 144A 5.25% 12/15/24 #¥ | 200,000 | $ | 210,440 | |||||
|
| |||||||
| 210,440 | ||||||||
|
| |||||||
Technology – 2.65% | ||||||||
Baidu 2.75% 6/9/19 | 250,000 | 250,295 | ||||||
Tencent Holdings 144A 3.375% 5/2/19 # | 235,000 | 240,693 | ||||||
|
| |||||||
| 490,988 | ||||||||
|
| |||||||
Transportation – 3.33% | ||||||||
DP World 144A 6.85% 7/2/37 # | 100,000 | 111,250 | ||||||
HPHT Finance 15 144A 2.875% 3/17/20 # | 200,000 | 199,243 | ||||||
Red de Carreteras de Occidente 9.00% 6/10/28 | MXN | 5,000,000 | 306,246 | |||||
|
| |||||||
| 616,739 | ||||||||
|
| |||||||
Total Corporate Bonds (cost $14,534,270) | 14,589,432 | |||||||
|
| |||||||
| ||||||||
| ||||||||
Regional Bond – 1.32%D | ||||||||
| ||||||||
Argentina – 1.32% | ||||||||
Provincia de Buenos Aires 144A 9.95% 6/9/21 # | 245,000 | 244,484 | ||||||
|
| |||||||
Total Regional Bond (cost $241,972) | 244,484 | |||||||
|
| |||||||
| ||||||||
| ||||||||
Senior Secured Loan – 2.67%« | ||||||||
| ||||||||
Republic of Angola (Unsecured) 6.25% 12/16/23 | 510,000 | 495,975 | ||||||
|
| |||||||
Total Senior Secured Loan (cost $510,000) | 495,975 | |||||||
|
| |||||||
| ||||||||
| ||||||||
Sovereign Bonds – 9.56%D | ||||||||
| ||||||||
Costa Rica – 0.91% | ||||||||
Costa Rica Government International Bond | ||||||||
5.625% 4/30/43 | 200,000 | 168,500 | ||||||
|
| |||||||
| 168,500 | ||||||||
|
| |||||||
Dominican Republic – 1.10% | ||||||||
Dominican Republic International Bond | ||||||||
144A 5.50% 1/27/25 # | 100,000 | 101,000 | ||||||
144A 6.85% 1/27/45 # | 100,000 | 102,000 | ||||||
|
| |||||||
| 203,000 | ||||||||
|
| |||||||
Indonesia – 1.18% | ||||||||
Indonesia Government International Bond 144A | ||||||||
4.625% 4/15/43 # | 200,000 | 181,500 | ||||||
Indonesia Treasury Bond 8.375% 3/15/24 | IDR | 517,000,000 | 37,788 | |||||
|
| |||||||
| 219,288 | ||||||||
|
| |||||||
Jamaica – 1.08% | ||||||||
Jamaica Government International Bond 6.75% 4/28/28 | 200,000 | 201,000 | ||||||
|
| |||||||
| 201,000 | ||||||||
|
| |||||||
14
Table of Contents
| Principal amount° | Value (U.S. $) | |||||||
| ||||||||
Sovereign BondsD (continued) | ||||||||
| ||||||||
Kazakhstan – 2.14% | ||||||||
Kazakhstan Government International Bond | ||||||||
144A 5.125% 7/21/25 # | 200,000 | $ | 198,424 | |||||
144A 6.50% 7/21/45 # | 200,000 | 199,200 | ||||||
|
| |||||||
| 397,624 | ||||||||
|
| |||||||
Pakistan – 1.04% | ||||||||
Pakistan Government International Bond 144A | ||||||||
7.875% 3/31/36 # | 200,000 | 192,040 | ||||||
|
| |||||||
| 192,040 | ||||||||
|
| |||||||
Sri Lanka – 1.07% | ||||||||
Sri Lanka Government International Bond 144A | ||||||||
6.125% 6/3/25 # | 200,000 | 197,500 | ||||||
|
| |||||||
| 197,500 | ||||||||
|
| |||||||
Zambia – 1.04% | ||||||||
Zambia Government International Bond 144A | ||||||||
8.97% 7/30/27 # | 200,000 | 193,000 | ||||||
|
| |||||||
| 193,000 | ||||||||
|
| |||||||
Total Sovereign Bonds (cost $1,793,174) | 1,771,952 | |||||||
|
| |||||||
| ||||||||
| ||||||||
Supranational Banks – 1.85% | ||||||||
| ||||||||
African Export-Import Bank 3.875% 6/4/18 | 300,000 | 303,549 | ||||||
European Bank for Reconstruction & Development | ||||||||
7.375% 4/15/19 | IDR | 550,000,000 | 38,836 | |||||
|
| |||||||
Total Supranational Banks (cost $347,477) | 342,385 | |||||||
|
| |||||||
| Number of shares | ||||||||
| ||||||||
Exchange-Traded Funds – 1.02% | ||||||||
| ||||||||
Market Vectors Emerging Markets Local Currency Bond ETF | 5,000 | 94,750 | ||||||
WisdomTree Emerging Markets Local Debt Fund ETF | 2,500 | 94,050 | ||||||
|
| |||||||
Total Exchange-Traded Funds (cost $190,197) | 188,800 | |||||||
|
| |||||||
| Principal amount° | ||||||||
| ||||||||
Short-Term Investments – 1.70% | ||||||||
| ||||||||
Repurchase Agreements – 1.70% | ||||||||
Bank of America Merrill Lynch | ||||||||
0.06%, dated 7/31/15, to be repurchased on 8/3/15, repurchase price $48,324 (collateralized by U.S. government obligations 0.50%–2.00% 1/31/17–5/31/21; market value $49,291) | 48,324 | 48,324 | ||||||
15
Table of Contents
Schedule of investments
Delaware Emerging Markets Debt Fund
| Principal amount° | Value (U.S. $) | |||||||
| ||||||||
Short-Term Investments (continued) | ||||||||
| ||||||||
Repurchase Agreements (continued) | ||||||||
Bank of Montreal | ||||||||
0.13%, dated 7/31/15, to be repurchased on 8/3/15, repurchase price $80,542 (collateralized by U.S. government obligations 1.25%–4.625% 9/30/16–2/15/40; | 80,541 | $ | 80,541 | |||||
BNP Paribas | ||||||||
0.12%, dated 7/31/15, to be repurchased on 8/3/15, repurchase price $186,137 (collateralized by U.S. government obligations 0.00%–7.50% 1/28/16–11/15/44; | 186,135 | 186,135 | ||||||
|
| |||||||
Total Short-Term Investments (cost $315,000) | 315,000 | |||||||
|
| |||||||
| ||||||||
Total Value of Securities – 96.82% | $ | 17,948,028 | ||||||
|
| |||||||
| # | Security exempt from registration under Rule 144A of the Securities Act of 1933, as amended. At July 31, 2015, the aggregate value of Rule 144A securities was $13,560,277, which represents 73.15% of the Fund’s net assets. See Note 11 in “Notes to financial statements.” |
| ° | Principal amount shown is stated in U.S. dollars unless noted that the security is denominated in another currency. |
| ● | Variable rate security. The rate shown is the rate as of July 31, 2015. Interest rates reset periodically. |
| ¥ | Fully or partially pledged as collateral for borrowing transactions. |
| D | Securities have been classified by country of origin. |
| « | Senior secured loans generally pay interest at rates which are periodically redetermined by reference to a base lending rate plus a premium. These base lending rates are generally: (i) the prime rate offered by one or more U.S. banks, (ii) the lending rate offered by one or more European banks such as the London Interbank Offered Rate (LIBOR), and (iii) the certificate of deposit rate. Senior secured loans may be subject to restrictions on resale. Stated rate in effect at July 31, 2015. |
16
Table of Contents
The following foreign currency exchange contracts were outstanding at July 31, 2015:1
Foreign Currency Exchange Contracts
Counterparty | Contracts to Receive (Deliver) | In Exchange For | Settlement Date | Unrealized Appreciation (Depreciation) | ||||||||||||||
BNYM | BRL | (42,853 | ) | USD | 12,674 | 8/4/15 | $ | 178 | ||||||||||
TD | MXN | 118,856 | USD | (7,392 | ) | 8/4/15 | (18 | ) | ||||||||||
|
| |||||||||||||||||
| $ | 160 | |||||||||||||||||
|
| |||||||||||||||||
The use of foreign currency exchange contracts involves elements of market risk and risks in excess of the amounts recognized in the financial statements. The foreign currency exchange contracts presented above represent the Fund’s total exposure in such contracts, whereas only the net unrealized appreciation (depreciation) is reflected in the Fund’s net assets.
1See Note 8 in “Notes to financial statements.”
Summary of abbreviations:
BNYM – BNY Mellon
BRL – Brazilian Real
IDR – Indonesian Rupiah
MXN – Mexican Peso
TD – Toronto Dominion Bank
USD – U.S. Dollar
See accompanying notes, which are an integral part of the financial statements.
17
Table of Contents
| Statement of assets and liabilities | ||
| Delaware Emerging Markets Debt Fund | July 31, 2015 | |
Assets: | ||||
Investments, at value1 | $ | 17,633,028 | ||
Short-term investments, at value2 | 315,000 | |||
Cash | 888,911 | |||
Foreign currencies, at value3 | 579 | |||
Receivable for securities sold | 1,122,442 | |||
Interest receivable | 215,324 | |||
Receivable from investment manager | 17,837 | |||
Unrealized appreciation on foreign currency exchange contracts | 178 | |||
|
| |||
Total assets | 20,193,299 | |||
|
| |||
Liabilities: | ||||
Payable for securities purchased | 1,616,000 | |||
Other accrued expenses | 38,996 | |||
Other affiliates payable | 721 | |||
Trustees’ fees and expenses payable | 44 | |||
Unrealized depreciation on foreign currency exchange contracts | 18 | |||
|
| |||
Total liabilities | 1,655,779 | |||
|
| |||
Total Net Assets | $ | 18,537,520 | ||
|
| |||
Net Assets Consist of: | ||||
Paid-in capital | $ | 19,173,252 | ||
Distributions in excess of net investment income | (5,467 | ) | ||
Accumulated net realized loss on investments | (646,011 | ) | ||
Net unrealized appreciation of investments | 15,938 | |||
Net unrealized depreciation of foreign currencies | (352 | ) | ||
Net unrealized appreciation of foreign currency exchange contracts | 160 | |||
|
| |||
Total Net Assets | $ | 18,537,520 | ||
|
| |||
18
Table of Contents
Class A: | ||||
Net assets | $ | 2,126 | ||
Shares of beneficial interest outstanding, unlimited authorization, no par | 259 | |||
Net asset value per share | $ | 8.21 | ||
Sales charge | 4.50 | % | ||
Offering price per share, equal to net asset value per share/(1 – sales charge) | $ | 8.60 | ||
Class C: | ||||
Net assets | $ | 2,113 | ||
Shares of beneficial interest outstanding, unlimited authorization, no par | 257 | |||
Net asset value per share | $ | 8.22 | ||
Class R: | ||||
Net assets | $ | 2,122 | ||
Shares of beneficial interest outstanding, unlimited authorization, no par | 258 | |||
Net asset value per share | $ | 8.22 | ||
Institutional Class: | ||||
Net assets | $ | 18,531,159 | ||
Shares of beneficial interest outstanding, unlimited authorization, no par | 2,254,712 | |||
Net asset value per share | $ | 8.22 | ||
| ||||
1Investments, at cost | $ | 17,617,090 | ||
2Short-term investments, at cost | 315,000 | |||
3Foreign currencies, at cost | 577 | |||
See accompanying notes, which are an integral part of the financial statements.
19
Table of Contents
| Delaware Emerging Markets Debt Fund | Year ended July 31, 2015 |
Investment Income: | ||||
Interest | $ | 1,021,625 | ||
Dividends | 10,177 | |||
|
| |||
| 1,031,802 | ||||
|
| |||
Expenses: | ||||
Management fees | 139,737 | |||
Distribution expenses — Class A | 5 | |||
Distribution expenses — Class C | 21 | |||
Distribution expenses — Class R | 11 | |||
Registration fees | 48,326 | |||
Audit and tax fees | 40,510 | |||
Reports and statements to shareholders | 26,358 | |||
Legal fees | 24,515 | |||
Dividend disbursing and transfer agent fees and expenses | 6,274 | |||
Accounting and administration expenses | 5,980 | |||
Custodian fees | 5,569 | |||
Trustees’ fees and expenses | 866 | |||
Other | 10,155 | |||
|
| |||
Expenses before dividends on short sales and interest expense | 308,327 | |||
Dividends on short sales | 12,155 | |||
Interest expense | 10,325 | |||
|
| |||
| 330,807 | ||||
Less expenses waived | (119,190 | ) | ||
Less waived distribution expenses — Class A | (5 | ) | ||
Less waived distribution expenses — Class C | (21 | ) | ||
Less waived distribution expenses — Class R | (11 | ) | ||
|
| |||
Total operating expenses | 211,580 | |||
|
| |||
Net Investment Income | 820,222 | |||
|
|
20
Table of Contents
Net Realized and Unrealized Gain (Loss): | ||||
Net realized gain (loss) on: | ||||
Investments | $ | (594,951 | ) | |
Foreign currencies | (130,515 | ) | ||
Foreign currency exchange contracts | (45,396 | ) | ||
Securities sold short | 53,290 | |||
Swap contracts | (5,723 | ) | ||
|
| |||
Net realized loss | (723,295 | ) | ||
|
| |||
Net change in unrealized appreciation (depreciation) of: | ||||
Investments | (582,245 | ) | ||
Foreign currencies | (1,662 | ) | ||
Foreign currency exchange contracts | 160 | |||
Securities sold short | (6,636 | ) | ||
Swap contracts | 5,408 | |||
|
| |||
Net change in unrealized appreciation (depreciation) | (584,975 | ) | ||
|
| |||
Net Realized and Unrealized Loss | (1,308,270 | ) | ||
|
| |||
Net Decrease in Net Assets Resulting from Operations | $ | (488,048 | ) | |
|
|
See accompanying notes, which are an integral part of the financial statements.
21
Table of Contents
Statements of changes in net assets
Delaware Emerging Markets Debt Fund
Year ended | 9/30/13* to 7/31/14 | |||||||
Increase (Decrease) in Net Assets from Operations: | ||||||||
Net investment income | $ | 820,222 | $ | 715,440 | ||||
Net realized gain (loss) | (723,295 | ) | 108,974 | |||||
Net change in unrealized appreciation (depreciation) | (584,975 | ) | 600,721 | |||||
|
|
|
| |||||
Net increase (decrease) in net assets resulting from operations | (488,048 | ) | 1,425,135 | |||||
|
|
|
| |||||
Dividends and Distributions to Shareholders from: | ||||||||
Net investment income: | ||||||||
Class A | (76 | ) | (76 | ) | ||||
Class C | (76 | ) | (64 | ) | ||||
Class R | (76 | ) | (72 | ) | ||||
Institutional Class | (665,411 | ) | (701,408 | ) | ||||
Net realized gain: | ||||||||
Class A | (24 | ) | — | |||||
Class C | (23 | ) | — | |||||
Class R | (24 | ) | — | |||||
Institutional Class | (205,499 | ) | — | |||||
|
|
|
| |||||
| (871,209 | ) | (701,620 | ) | |||||
|
|
|
| |||||
22
Table of Contents
Year ended 7/31/15 | 9/30/13* to 7/31/14 | |||||||
Capital Share Transactions: | ||||||||
Proceeds from shares sold: | ||||||||
Class A | $ | – | $ | 2,025 | ||||
Class C | — | 2,026 | ||||||
Class R | — | 2,026 | ||||||
Institutional Class | — | 28 | ||||||
Proceeds from shares issued upon transfer: | ||||||||
Institutional Class | — | 17,600,000 | ||||||
Net asset value of shares issued upon reinvestment of dividends and distributions: | ||||||||
Class A | 100 | 76 | ||||||
Class C | 99 | 63 | ||||||
Class R | 100 | 71 | ||||||
Institutional Class | 870,910 | 701,408 | ||||||
|
|
|
| |||||
| 871,209 | 18,307,723 | |||||||
|
|
|
| |||||
Cost of shares redeemed: | ||||||||
Institutional Class | — | (5,670 | ) | |||||
|
|
|
| |||||
Increase in net assets derived from capital share transactions | 871,209 | 18,302,053 | ||||||
|
|
|
| |||||
Net Increase (Decrease) in Net Assets | (488,048 | ) | 19,025,568 | |||||
Net Assets: | ||||||||
Beginning of year | 19,025,568 | — | ||||||
|
|
|
| |||||
End of year | $ | 18,537,520 | $ | 19,025,568 | ||||
|
|
|
| |||||
Undistributed (distributions in excess of) net investment income | $ | (5,467 | ) | $ | 17,835 | |||
|
|
|
| |||||
* Date of commencement of operations.
See accompanying notes, which are an integral part of the financial statements.
23
Table of Contents
| Statement of cash flows | ||
| Delaware Emerging Markets Debt Fund | July 31, 2015 | |
Net Cash (including Foreign Currency) Provided by Operating Activities: | ||||
Net decrease in net assets resulting from operations | $ | (488,048 | ) | |
|
| |||
Adjustments to reconcile net decrease in net assets from operations to cash provided by (used for) operating activities: | ||||
Amortization of premium and discount on investments purchased, net | 7,026 | |||
Purchase of investment securities | (39,236,014 | ) | ||
Proceeds from sale of investment securities | 41,809,908 | |||
Proceeds from securities sold short | 12,571,366 | |||
Purchase of securities to close short sales | (13,478,940 | ) | ||
Proceeds from sale of short-term investment securities, net | 238,362 | |||
Net realized loss on investments | 726,437 | |||
Net realized gain on securities sold short | (53,290 | ) | ||
Net realized loss on swap contracts | 5,723 | |||
Net change in unrealized appreciation (depreciation) | 584,975 | |||
Decrease in cash collateral due from brokers | 120,000 | |||
Decrease in receivable for investments sold | 487,991 | |||
Decrease in interest receivable | 30,917 | |||
Increase in payable for investments purchased | 1,366,269 | |||
Decrease in interest payable | (861 | ) | ||
Increase in due from investment manager | (4,296 | ) | ||
Decrease in other affiliates payable | (1,099 | ) | ||
Decrease in other accrued expenses | (4,247 | ) | ||
Decrease in distribution fees payable | (2 | ) | ||
Decrease in upfront payments on credit default swap contracts | (101,183 | ) | ||
Decrease in swap payments payable | (5,833 | ) | ||
|
| |||
Total adjustments | 5,063,209 | |||
|
| |||
Net cash provided for operating activities | 4,575,161 | |||
|
| |||
Cash Flows Used for Financing Activities: | ||||
Decrease in margin payable | (3,551,342 | ) | ||
|
| |||
Net cash used for financing activities | (3,551,342 | ) | ||
|
| |||
Effect of exchange rates on cash | 43 | |||
|
| |||
Net decrease in cash | 1,023,862 | |||
Cash overdraft and foreign currencies, at value at beginning of period | (134,372 | ) | ||
|
| |||
Cash and foreign currencies, at value at end of period | $ | 889,490 | ||
|
| |||
Non-Cash Financing Activities: | ||||
Cash paid for interest expense for leverage | $ | 11,186 | ||
|
| |||
See accompanying notes, which are an integral part of the financial statements.
24
Table of Contents
Delaware Emerging Markets Debt Fund Class A
Selected data for each share of the Fund outstanding throughout each period were as follows:
| Year ended 7/31/15 | 9/30/131 to 7/31/14 | |||||||
| ||||||||
Net asset value, beginning of period | $ | 8.840 | $ | 8.500 | ||||
Income (loss) from investment operations: | ||||||||
Net investment income2 | 0.371 | 0.323 | ||||||
Net realized and unrealized gain (loss) | (0.604 | ) | 0.333 | |||||
|
|
|
| |||||
Total from investment operations | (0.233 | ) | 0.656 | |||||
|
|
|
| |||||
Less dividends and distributions from: | ||||||||
Net investment income | (0.303 | ) | (0.316 | ) | ||||
Net realized gain | (0.094 | ) | — | |||||
|
|
|
| |||||
Total dividends and distributions | (0.397 | ) | (0.316 | ) | ||||
|
|
|
| |||||
Net asset value, end of period | $ | 8.210 | $ | 8.840 | ||||
|
|
|
| |||||
Total return3 | (2.65% | ) | 7.86% | |||||
Ratios and supplemental data: | ||||||||
Net assets, end of period (000 omitted) | $ | 2 | $ | 2 | ||||
Ratio of expenses to average net assets excluding interest expenses | 1.08% | 1.31% | ||||||
Ratio of expenses to average net assets | 1.14% | 1.50% | ||||||
Ratio of expenses to average net assets prior to fees waived | 2.03% | 2.48% | ||||||
Ratio of net investment income to average net assets excluding interest expenses | 4.46% | 4.66% | ||||||
Ratio of net investment income to average net assets | 4.40% | 4.47% | ||||||
Ratio of net investment income to average net assets prior to fees waived | 3.51% | 3.49% | ||||||
Portfolio turnover | 288% | 152% | ||||||
| ||||||||
| 1 | Date of commencement of operations; ratios have been annualized and total return has not been annualized. |
| 2 | The average shares outstanding method has been applied for per share information. |
| 3 | Total investment return is based on the change in net asset value of a share during the period and assumes reinvestment of dividends and distributions at net asset value and does not reflect the impact of a sales charge. Total investment return during all of the periods shown reflects waivers by the manager and/or distributor. Performance would have been lower had the waivers not been in effect. |
See accompanying notes, which are an integral part of the financial statements.
25
Table of Contents
Financial highlights
Delaware Emerging Markets Debt Fund Class C
Selected data for each share of the Fund outstanding throughout each period were as follows:
| Year ended 7/31/15 | 9/30/131 to 7/31/14 | |||||||
| ||||||||
Net asset value, beginning of period | $ | 8.840 | $ | 8.500 | ||||
Income (loss) from investment operations: | ||||||||
Net investment income2 | 0.371 | 0.271 | ||||||
Net realized and unrealized gain (loss) | (0.594 | ) | 0.333 | |||||
|
|
|
| |||||
Total from investment operations | (0.223 | ) | 0.604 | |||||
|
|
|
| |||||
Less dividends and distributions from: | ||||||||
Net investment income | (0.303 | ) | (0.264 | ) | ||||
Net realized gain | (0.094 | ) | — | |||||
|
|
|
| |||||
Total dividends and distributions | (0.397 | ) | (0.264 | ) | ||||
|
|
|
| |||||
Net asset value, end of period | $ | 8.220 | $ | 8.840 | ||||
|
|
|
| |||||
Total return3 | (2.53% | ) | 7.22% | |||||
Ratios and supplemental data: | ||||||||
Net assets, end of period (000 omitted) | $ | 2 | $ | 2 | ||||
Ratio of expenses to average net assets excluding interest expense | 1.08% | 2.03% | ||||||
Ratio of expenses to average net assets | 1.14% | 2.22% | ||||||
Ratio of expenses to average net assets prior to fees waived | 2.78% | 3.20% | ||||||
Ratio of net investment income to average net assets excluding interest expense | 4.46% | 3.94% | ||||||
Ratio of net investment income to average net assets | 4.40% | 3.75% | ||||||
Ratio of net investment income to average net assets prior to fees waived | 2.76% | 2.77% | ||||||
Portfolio turnover | 288% | 152% | ||||||
| ||||||||
| 1 | Date of commencement of operations; ratios have been annualized and total return and portfolio turnover have not been annualized. |
| 2 | The average shares outstanding method has been applied for per share information. |
| 3 | Total investment return is based on the change in net asset value of a share during the period and assumes reinvestment of dividends and distributions at net asset value and does not reflect the impact of a sales charge. Total investment return during all of the periods shown reflects waivers by the manager and/or distributor. Performance would have been lower had the waivers not been in effect. |
See accompanying notes, which are an integral part of the financial statements.
26
Table of Contents
Financial highlights
Delaware Emerging Markets Debt Fund Class R
Selected data for each share of the Fund outstanding throughout each period were as follows:
| Year ended 7/31/15 | 9/30/131 to 7/31/14 | |||||||
| ||||||||
Net asset value, beginning of period | $ | 8.840 | $ | 8.500 | ||||
Income (loss) from investment operations: | ||||||||
Net investment income2 | 0.371 | 0.306 | ||||||
Net realized and unrealized gain (loss) | (0.594 | ) | 0.332 | |||||
|
|
|
| |||||
Total from investment operations | (0.223 | ) | 0.638 | |||||
|
|
|
| |||||
Less dividends and distributions from: | ||||||||
Net investment income | (0.303 | ) | (0.298 | ) | ||||
Net realized gain | (0.094 | ) | — | |||||
|
|
|
| |||||
Total dividends and distributions | (0.397 | ) | (0.298 | ) | ||||
|
|
|
| |||||
Net asset value, end of period | $ | 8.220 | $ | 8.840 | ||||
|
|
|
| |||||
Total return3 | (2.53% | ) | 7.64% | |||||
Ratios and supplemental data: | ||||||||
Net assets, end of period (000 omitted) | $ | 2 | $ | 2 | ||||
Ratio of expenses to average net assets excluding interest expense | 1.08% | 1.55% | ||||||
Ratio of expenses to average net assets | 1.14% | 1.74% | ||||||
Ratio of expenses to average net assets prior to fees waived | 2.28% | 2.72% | ||||||
Ratio of net investment income to average net assets excluding interest expense | 4.46% | 4.42% | ||||||
Ratio of net investment income to average net assets | 4.40% | 4.23% | ||||||
Ratio of net investment income to average net assets prior to fees waived | 3.26% | 3.25% | ||||||
Portfolio turnover | 288% | 152% | ||||||
| ||||||||
| 1 | Date of commencement of operations; ratios have been annualized and total return and portfolio turnover have not been annualized. |
| 2 | The average shares outstanding method has been applied for per share information. |
| 3 | Total investment return is based on the change in net asset value of a share during the period and assumes reinvestment of dividends and distributions at net asset value. Total investment return during all of the periods shown reflects a waiver by the manager and/or distributor. Performance would have been lower had the waivers not been in effect. |
See accompanying notes, which are an integral part of the financial statements.
27
Table of Contents
Financial highlights
Delaware Emerging Markets Debt Fund Institutional Class
Selected data for each share of the Fund outstanding throughout each period were as follows:
| Year ended 7/31/15 | 9/30/131 7/31/14 | |||||||
| ||||||||
Net asset value, beginning of period | $ | 8.840 | $ | 8.500 | ||||
Income (loss) from investment operations: | ||||||||
Net investment income2 | 0.371 | 0.340 | ||||||
Net realized and unrealized gain (loss) | (0.594 | ) | 0.333 | |||||
|
|
|
| |||||
Total from investment operations | (0.223 | ) | 0.673 | |||||
|
|
|
| |||||
Less dividends and distributions from: | ||||||||
Net investment income | (0.303 | ) | (0.333 | ) | ||||
Net realized gain | (0.094 | ) | — | |||||
|
|
|
| |||||
Total dividends and distributions | (0.397 | ) | (0.333 | ) | ||||
|
|
|
| |||||
Net asset value, end of period | $ | 8.220 | $ | 8.840 | ||||
|
|
|
| |||||
Total return3 | (2.53% | ) | 8.08% | |||||
Ratios and supplemental data: | ||||||||
Net assets, end of period (000 omitted) | $ | 18,532 | $ | 19,020 | ||||
Ratio of expenses to average net assets excluding interest expense | 1.08% | 1.07% | ||||||
Ratio of expenses to average net assets | 1.14% | 1.26% | ||||||
Ratio of expenses to average net assets prior to fees waived | 1.78% | 2.24% | ||||||
Ratio of net investment income to average net assets excluding interest expense | 4.46% | 4.90% | ||||||
Ratio of net investment income to average net assets | 4.40% | 4.71% | ||||||
Ratio of net investment income to average net assets prior to fees waived | 3.76% | 3.73% | ||||||
Portfolio turnover | 288% | 152% | ||||||
| ||||||||
| 1 | Date of commencement of operations; ratios have been annualized and total return and portfolio turnover have not been annualized. |
| 2 | The average shares outstanding method has been applied for per share information. |
| 3 | Total investment return is based on the change in net asset value of a share during the period and assumes reinvestment of dividends and distributions at net asset value. Total investment return during all of the periods shown reflects a waiver by the manager. Performance would have been lower had the waiver not been in effect. |
See accompanying notes, which are an integral part of the financial statements.
28
Table of Contents
| Notes to financial statements | ||
| Delaware Emerging Markets Debt Fund | July 31, 2015 | |
Delaware Group® Government Fund (Trust) is organized as a Delaware statutory trust and offers two series: Delaware Core Plus Bond Fund and Delaware Emerging Markets Debt Fund. These financial statements and the related notes pertains to Delaware Emerging Markets Debt Fund (Fund). The Trust is an open-end investment company. The Fund is considered diversified under the Investment Company Act of 1940, as amended, and offers Class A, Class C, Class R, and Institutional Class shares. Class A shares are sold with a maximum front-end sales charge of 4.50%. Class A share purchases of $1,000,000 or more will incur a contingent deferred sales charge (CDSC) of 1.00% if redeemed during the first year and 0.50% during the second year, provided that Delaware Distributors, L.P. (DDLP) paid a financial advisor a commission on the purchase of those shares. Class C shares are sold with a CDSC charge of 1.00%, if redeemed during the first 12 months. Class R and Institutional Class shares are not subject to a sales charge and are offered for sale exclusively to certain eligible investors.
The investment objective of the Fund is to primarily seek current income and secondarily capital appreciation.
1. Significant Accounting Policies
The following accounting policies are in accordance with U.S. generally accepted accounting principles (U.S. GAAP) and are consistently followed by the Fund.
Security Valuation – Equity securities and exchange-traded funds (ETFs), except those traded on The Nasdaq Stock Market LLC (Nasdaq), are valued at the last quoted sales price as of the time of the regular close of the New York Stock Exchange on the valuation date. Securities and ETFs traded on the Nasdaq are valued in accordance with the Nasdaq Official Closing Price, which may not be the last sales price. If, on a particular day, an equity security or ETF does not trade, the mean between the bid and ask prices will be used, which approximates fair value. Securities listed on a foreign exchange are normally valued at the last quoted sales price on the valuation date. Debt securities and credit default swap (CDS) contracts are valued based upon valuations provided by an independent pricing service or broker/ counterparty and reviewed by management. To the extent current market prices are not available, the pricing service may take into account developments related to the specific security, as well as transactions in comparable securities. U.S. government and agency securities are valued at the mean between the bid and ask prices, which approximates fair value. Valuations for fixed income securities utilize matrix systems, which reflect such factors as security prices, yields, maturities, and ratings, and are supplemented by dealer and exchange quotations. Swap prices are derived using daily swap curves and models that incorporate a number of market data factors, such as discounted cash flows, trades, and values of the underlying reference instruments. Foreign currency exchange contracts and foreign cross currency exchange contracts are valued at the mean between the bid and ask prices, which approximates fair value. Interpolated values are derived when the settlement date of the contract is an interim date for which quotations are not available. Generally, other securities and assets for which market quotations are not readily available are valued at fair value as determined in good faith under the direction of the Fund’s Board of Trustees (Board). In determining whether market quotations are readily available or fair valuation will be used, various factors will be taken into consideration, such as market closures or suspension of trading in a security.
Federal Income Taxes – No provision for federal income taxes has been made as the Fund intends to continue to qualify for federal income tax purposes as a regulated investment company under
29
Table of Contents
Notes to financial statements
Delaware Emerging Markets Debt Fund
1. Significant Accounting Policies (continued)
Subchapter M of the Internal Revenue Code of 1986, as amended, and make the requisite distributions to shareholders. The Fund evaluates tax positions taken or expected to be taken in the course of preparing the Fund’s tax returns to determine whether the tax positions are “more-likely-than-not” of being sustained by the applicable tax authority. Tax positions not deemed to meet the “more-likely-than-not” threshold are recorded as a tax benefit or expense in the current year. Management has analyzed the Fund’s tax positions taken on the federal income tax return for the open tax years (July 31, 2014-July 31, 2015) and has concluded that no provision for federal income tax is required in the Fund’s financial statements. In regard to foreign taxes only, the Fund has open tax years in certain foreign countries in which it invests that may date back to the inception of the Fund.
Class Accounting – Investment income, common expenses and realized and unrealized gain (loss) on investments are allocated to the various classes of the Fund on the basis of daily net assets of each class. Distribution expenses relating to a specific class are charged directly to that class.
Repurchase Agreements – The Fund may purchase certain U.S. government securities subject to the counterparty’s agreement to repurchase them at an agreed upon date and price. The counterparty will be required on a daily basis to maintain the value of the collateral subject to the agreement at not less than the repurchase price (including accrued interest). The agreements are conditioned upon the collateral being deposited under the Federal Reserve book-entry system with the Fund’s custodian or a third party sub-custodian. In the event of default or bankruptcy by the other party to the agreement, retention of the collateral may be subject to legal proceedings. All open repurchase agreements as of the date of this report were entered into on July 31, 2015.
Reverse Repurchase Agreements – The Fund may enter into reverse repurchase agreements. In a reverse repurchase agreement, the Fund sells securities to a bank or broker/dealer and agrees to repurchase the securities at an agreed upon date and price. The Fund will maintain, in a segregated account with its custodian, cash, cash equivalents, or U.S. government securities in an amount sufficient to cover its obligations under reverse repurchase agreements. The Fund will subject its investments in reverse repurchase agreements to the borrowing provisions set forth in the 1940 Act. The use of reverse repurchase agreements by the Fund creates leverage, which increases the Fund’s investment risk. If the income and gains on securities purchased with the proceeds of reverse repurchase agreements exceed the costs of the agreements, the Fund’s earnings or NAV will increase faster than otherwise would be the case; conversely, if the income and gains fail to exceed the costs, earnings or NAV would decline faster than otherwise would be the case. For the year ended July 31, 2015, the Fund did not enter into any reverse repurchase agreements.
Short Sales – The Fund may make short sales in an attempt to protect against declines in an individual security or the overall market, to manage duration, or for such other purposes consistent with the Fund’s investment objectives and strategies. Typically, short sales are transactions in which the Fund sells a security it does not own and, at the time a short sale is effected, the Fund incurs an obligation to replace the security borrowed at whatever its price may be at the time the Fund purchases it for delivery to the lender. The price at such time may be more or less than the price at which the security was sold by the Fund. When a short sale transaction is closed out by delivery of the security, any gain or loss on the transaction generally is taxable as short-term capital gain or loss. Until the security is replaced, the
30
Table of Contents
Fund is required to pay to the lender amounts equal to any dividends or interest that accrue during the period of the loan. To borrow the security, the Fund also may be required to pay a premium, which would increase the cost of the security sold. The proceeds of the short sale, and potentially additional margin, will be retained by the broker from whom the security is borrowed, to the extent necessary to meet margin requirements, until the short position is closed out.
Leverage – The Fund may employ leverage to attempt to take advantage of or increase the total return of attractive investment opportunities. The Fund may initiate leverage to the extent that the sum of aggregate borrowed funds and the notional value plus any gain or minus any loss of derivatives positions may not exceed an amount equal to 33 1/3% of the Fund’s total assets, measured at the time the leverage is employed. When the Fund initiates leverage, the leverage may include borrowing through a margin account maintained with a broker. At July 31, 2015, the Fund had no outstanding borrowing. For the year ended July 31, 2015, the Fund had average borrowing of $683,924 for which it paid interest at an average rate of 1.51%.
Foreign Currency Transactions – Transactions denominated in foreign currencies are recorded at the prevailing exchange rates on the valuation date in accordance with the Fund’s prospectus. The value of all assets and liabilities denominated in foreign currencies is translated daily into U.S. dollars at the exchange rate of such currencies against the U.S. dollar. Transaction gains or losses resulting from changes in exchange rates during the reporting period or upon settlement of the foreign currency transaction are reported in operations for the current period. The Fund generally bifurcates that portion of realized gains and losses on investments in debt securities which is due to changes in foreign exchange rates from that which is due to changes in market prices of debt securities. That portion of gains (losses) due to changes in foreign exchange rates is included on the “Statement of operations” under “Net realized gain (loss) on foreign currencies.” The Fund reports certain foreign currency related transactions as components of realized gains (losses) for financial reporting purposes, whereas such components are treated as ordinary income (loss) for federal income tax purposes.
Use of Estimates – The Fund is an investment company, whose financial statements are prepared in conformity with U.S. GAAP. Therefore, the Fund follows the accounting and reporting guidelines for investment companies. The preparation of financial statements in conformity with U.S. GAAP requires management to make estimates and assumptions that affect the fair value of investments, the reported amounts of assets and liabilities and disclosure of contingent assets and liabilities at the date of the financial statements, and the reported amounts of revenues and expenses during the reporting period. Actual results could differ from those estimates and the differences could be material.
Other – Expenses directly attributable to the Fund are charged directly to the Fund. Other expenses common to various funds within the Delaware Investments® Family of Funds are generally allocated among such funds on the basis of average net assets. Management fees and some other expenses are paid monthly. Security transactions are recorded on the date the securities are purchased or sold (trade date) for financial reporting purposes. Costs used in calculating realized gains and losses on the sale of investment securities are those of the specific securities sold. Dividend income is recorded on the ex-dividend date and interest income is recorded on the accrual basis. Discounts and premiums on debt securities are accreted or amortized to interest income, respectively over the lives of the respective securities using the effective interest method. The Fund declares and pays dividends from net
31
Table of Contents
Notes to financial statements
Delaware Emerging Markets Debt Fund
1. Significant Accounting Policies (continued)
investment income monthly and pays distributions from net realized gain on investments, if any, annually. The Fund may distribute more frequently, if necessary for tax purposes. Dividends and distributions, if any, are recorded on the ex-dividend date.
The Fund may receive earnings credits from its custodian when positive cash balances are maintained, which may be used to offset custody fees. There were no such earnings credits for the year ended July 31, 2015.
The Fund may receive earnings credits from its transfer agent when positive cash balances are maintained, which may be used to offset transfer agent fees. If the amount earned is greater than one dollar, the expense paid under this arrangement is included on the “Statement of operations” under “Dividend disbursing and transfer agent fees and expenses” with the corresponding expense offset shown under “Less expense paid indirectly.” For the year ended July 31, 2015, the Fund earned less than one dollar under this agreement.
2. Investment Management, Administration Agreements and Other Transactions with Affiliates
In accordance with the terms of its investment management agreement, the Fund pays Delaware Management Company (DMC), a series of Delaware Management Business Trust and the investment manager, an annual fee which is calculated daily at the rate of 0.75% on the first $500 million of average daily net assets of the Fund, 0.70% on the next $500 million, 0.65% on the next $1.5 billion, and 0.60% on average daily net assets in excess of $2.5 billion.
DMC has contractually agreed to waive all or a portion, if any, of its management fee and/or pay/ reimburse the Fund to the extent necessary to limit annual operating expenses (excluding any 12b-1 fees, taxes, interest, short sale dividend and interest expenses, brokerage fees, certain insurance costs, acquired fund fees and expenses, and nonroutine expenses or costs including, but not limited to, those relating to reorganizations, litigation, conducting shareholder meetings, and liquidations (collectively nonroutine expenses)), to 1.00% of average daily net assets of the Fund from Aug. 1, 2014 through July 31, 2015.* For purposes of this waiver and reimbursement, nonroutine expenses may also include such additional costs and expenses, as may be agreed upon from time to time by the Fund’s Board and DMC. This expense waiver and reimbursement may be terminated only by agreement of the Fund’s Board and DMC and apply only to expenses paid directly by the Fund.
Effective Nov. 1, 2014, Delaware Investments Fund Services Company (DIFSC), an affiliate of DMC, provides fund accounting and financial administration oversight services to the Fund. Prior to this time, Delaware Service Company, Inc. (DSC), an affiliate of DMC, provided fund accounting and financial administration oversight services to the Fund under a substantially identical agreement with an identical fee schedule. For these services, DIFSC’s fees are calculated based on the aggregate daily net assets of the Delaware Investments® Family of Funds at the following annual rate: 0.0050% of the first $30 billion; 0.0045% of the next $10 billion; 0.0040% of the next $10 billion; and 0.0025% of aggregate average daily net assets in excess of $50 billion. The fees payable to DIFSC under the service agreement described above are allocated among all funds in the Delaware Investments Family of Funds on a relative
32
Table of Contents
net asset value basis. This amount is included on the “Statement of operations” under “Accounting and administration expenses.” For the year ended July 31, 2015, the Fund was charged $882 for these services.
Effective Nov. 1, 2014, DIFSC also became the transfer agent and dividend disbursing agent of the Fund. Prior to this time, DSC was the transfer agent and dividend disbursing agent of the Fund under a substantially identical agreement with an identical fee schedule. For these services, DIFSC’s fees are calculated based on the aggregate daily net assets of the retail funds within the Delaware Investments® Family of Funds at the following annual rate: 0.025% of the first $20 billion; 0.020% of the next $5 billion; 0.015% of the next $5 billion; and 0.013% of average daily net assets in excess of $30 billion. The fees payable to DIFSC under the service agreement described above are allocated among all retail funds in the Delaware Investments Family of Funds on a relative net asset value basis. This amount is included on the “Statement of operations” under “Dividend disbursing and transfer agent fees and expenses.” For the year ended July 31, 2015, the Fund was charged $3,884 for these services. Pursuant to a sub-transfer agency agreement between DIFSC and BNY Mellon Investment Servicing (US) Inc. (BNYMIS), BNYMIS provides certain sub-transfer agency services to the Fund. Sub-transfer agency fees are passed on to and paid by the Fund.
Pursuant to a distribution agreement and distribution plan, the Fund pays DDLP, the distributor and an affiliate of DMC, an annual distribution and service fee of 0.25% of the average daily net assets of the Class A shares, 1.00% of the average daily net assets of the Class C shares, and 0.50% of the average daily net assets of the Class R shares. Institutional Class shares pay no distribution and service expenses. Effective July 22, 2014, DDLP agreed to voluntarily suspend the distribution and service fees for Class A, Class C, and Class R shares. The suspension of the distribution and service fees will remain in effect while the Fund is not broadly distributed.
As provided in the investment management agreement, the Fund bears a portion of the cost of certain resources shared with DMC, including the cost of internal personnel of DMC and/or its affiliates that provide legal, tax, and regulatory reporting services to the Fund. For the year ended July 31, 2015, the Fund was charged $4,846 for internal legal, tax, and regulatory reporting services provided by DMC and/or its affiliates’ employees. This amount is included on the “Statement of operations” under “Legal fees.”
For the year ended July 31, 2015, DDLP earned no commissions on sales of the Fund’s Class A shares. For the year ended July 31, 2015, DDLP received no gross CDSC commissions on redemption of the Fund’s Class A and Class C shares.
Trustees’ fees include expenses accrued by the Fund for each Trustee’s retainer and meeting fees. Certain officers of DMC, DIFSC, and DDLP are officers and/or Trustees of the Trust. These officers and Trustees are paid no compensation by the Fund.
* The contractual waiver period is from Nov. 27, 2013, through Nov. 30, 2015.
33
Table of Contents
Notes to financial statements
Delaware Emerging Markets Debt Fund
3. Investments
For the year ended July 31, 2015, the Fund made purchases and sales of investment securities other than short-term investments as follows:
Purchases | $ | 52,714,954 | ||
Sales | 54,381,274 |
At July 31, 2015, the cost and unrealized appreciation (depreciation) of investments for federal income tax purposes for the Fund were as follows:
Cost of investments | $ | 17,934,534 | ||
|
| |||
Aggregate unrealized appreciation of investments | $ | 265,083 | ||
Aggregate unrealized depreciation of investments | (251,589 | ) | ||
|
| |||
Net unrealized appreciation of investments | $ | 13,494 | ||
|
|
U.S. GAAP defines fair value as the price that the Fund would receive to sell an asset or pay to transfer a liability in an orderly transaction between market participants at the measurement date under current market conditions. A three-level hierarchy for fair value measurements has been established based upon the transparency of inputs to the valuation of an asset or liability. Inputs may be observable or unobservable and refer broadly to the assumptions that market participants would use in pricing the asset or liability. Observable inputs reflect the assumptions market participants would use in pricing the asset or liability based on market data obtained from sources independent of the reporting entity. Unobservable inputs reflect the reporting entity’s own assumptions about the assumptions that market participants would use in pricing the asset or liability based on the best information available under the circumstances. The Fund’s investment in its entirety is assigned a level based upon the observability of the inputs which are significant to the overall valuation. The three-level hierarchy of inputs is summarized below.
| Level 1 – | Inputs are quoted prices in active markets for identical investments. (Examples: equity securities, open-end investment companies, futures contracts, exchange-traded options contracts) | |
| Level 2 – | Other observable inputs, including, but not limited to: quoted prices for similar assets or liabilities in markets that are active, quoted prices for identical or similar assets or liabilities in markets that are not active, inputs other than quoted prices that are observable for the assets or liabilities (such as interest rates, yield curves, volatilities, prepayment speeds, loss severities, credit risks and default rates) or other market-corroborated inputs. (Examples: debt securities, government securities, swap contracts, foreign currency exchange contracts, foreign securities utilizing international fair value pricing, broker-quoted securities, fair valued securities) | |
| Level 3 – | Significant unobservable inputs, including the Fund’s own assumptions used to determine the fair value of investments. (Examples: broker-quoted securities, fair valued securities) | |
Level 3 investments are valued using significant unobservable inputs. The Fund may also use an income-based valuation approach in which the anticipated future cash flows of the investment are discounted to calculate fair value. Discounts may also be applied due to the nature or duration of any restrictions on the disposition of the investments. Valuations may also be based upon current market prices of securities that are comparable in coupon, rating, maturity, and industry. The derived value of a Level 3
34
Table of Contents
investment may not represent the value which is received upon disposition and this could impact the results of operations.
The following table summarizes the valuation of the Fund’s investments by fair value hierarchy levels as of July 31, 2015:
Securities | Level 1 | Level 2 | Level 3 | Total | ||||||||||||
Corporate Debt | $ | — | $ | 14,589,432 | $ | — | $ | 14,589,432 | ||||||||
Foreign Debt | — | 2,358,821 | — | 2,358,821 | ||||||||||||
Senior Secured Loan | — | — | 495,975 | 495,975 | ||||||||||||
Exchange-Traded Funds | 188,800 | — | — | 188,800 | ||||||||||||
Short-Term Investments | — | 315,000 | — | 315,000 | ||||||||||||
|
|
|
|
|
|
|
| |||||||||
Total Value of Securities | $ | 188,800 | $ | 17,263,253 | $ | 495,975 | $ | 17,948,028 | ||||||||
|
|
|
|
|
|
|
| |||||||||
Foreign Currency Exchange Contracts | $ | — | $ | 160 | $ | — | $ | 160 | ||||||||
During the year ended July 31, 2015, there were no transfers between Level 1 investments, Level 2 investments or Level 3 investments that had a significant impact to the Fund. The Fund’s policy is to recognize transfers between levels at the beginning of the reporting period.
The following is a reconciliation of investments in which significant unobservable inputs (Level 3) were used in determining fair value:
| Senior Secured Loan | ||||
Balance as of 7/31/14 | $510,000 | |||
Net change in unrealized appreciation (depreciation) | (14,025) | |||
Balance as of 7/31/15 | $495,975 | |||
Sensitivity Analysis
Valuation: U.S. GAAP defines fair value as the price that the Fund would receive to sell an asset or pay to transfer a liability in an orderly transaction between market participants at the measurement date. The Fund values its financial instruments at fair value using independent pricing sources under the policies approved by the Board. The Pricing Committee is the committee formed by the advisor to develop pricing policies and procedures and to provide oversight of the pricing function for the Funds.
When market quotations are not readily available for one or more portfolio securities, the Fund’s NAV shall be calculated by using the “fair value” of the securities as determined by the Pricing Committee. Such “fair value” is the amount that a Fund might reasonably expect to receive for the security (or asset) upon its current sale. Each such determination should be based on a consideration of all relevant factors, which are likely to vary from one pricing context to another. Examples of such factors may include, but are not limited to: (1) the type of security, (2) the size of the holding, (3) the initial cost of the security, (4) the existence of any contractual restrictions of the security’s disposition, (5) the price and extent of public trading in similar securities of the issuer or of comparable companies, (6) quotations or evaluated prices from broker-dealers and/or pricing services, (7) information obtained from the issuer, analysts, and/or appropriate stock exchange (for exchange-traded securities), (8) an analysis of the
35
Table of Contents
Notes to financial statements
Delaware Emerging Markets Debt Fund
3. Investments (continued)
company’s financial statements, and (9) an evaluation of the forces that influence the issuer and the market(s) in which the security is purchased and sold.
The Pricing Committee, or its delegate, employs various methods for calibrating these valuation approaches, including due diligence of the Fund’s pricing vendors and periodic back-testing of the prices that are fair valued under these procedures and reviews of any market related activity. The pricing of all securities fair valued by the Pricing Committee is subsequently reported to and approved by the Board on a quarterly basis.
Quantitative Information about Level 3 Fair Value Measurements
Fair Value at 7/31/15 | Valuation Technique(s) | Unobservable Input | Range (Weighted Average) | |||
Senior Secured Loan $495,975 | Broker Quote |
Market pricing of | N/A |
4. Dividend and Distribution Information
Income and long-term capital gain distributions are determined in accordance with federal income tax regulations, which may differ from U.S. GAAP. Additionally, distributions from net gains on foreign currency transactions and net short-term gains on sales of investment securities are treated as ordinary income for federal income tax purposes. The tax character of dividends and distributions paid during the years ended July 31, 2015 and 2014 was as follows:
Year ended | 9/30/13* to 7/31/14 | |||||||||
Ordinary income | $ | 851,429 | $ | 701,620 | ||||||
Long term capital gains | 19,780 | — | ||||||||
|
|
|
| |||||||
Total | $ | 871,209 | $ | 701,620 | ||||||
|
|
|
| |||||||
* Date of commencement of operations.
5. Components of Net Assets on a Tax Basis
As of July 31, 2015, the components of net assets on a tax basis were as follows:
Shares of beneficial interest | $ | 19,173,252 | ||
Qualified late year loss deferrals | (648,856 | ) | ||
Unrealized appreciation of investments, foreign currencies and derivatives | 13,124 | |||
|
| |||
Net assets | $ | 18,537,520 | ||
|
|
The differences between book basis and tax basis components of the net assets are primarily attributable to tax deferral of losses on wash sales, and mark-to-market of forward foreign currency contracts.
Qualified late year capital losses (including currency and specified gain/loss items) represent losses realized from Nov. 1, 2014 through July 31, 2015, that in accordance with federal income tax regulations, the Fund has elected to defer and treat as having arisen in the following fiscal year.
36
Table of Contents
For financial reporting purposes, capital accounts are adjusted to reflect the tax character of permanent book/tax differences. Reclassifications are primarily due to tax treatment of gain (loss) on foreign currency transactions, tax treatment of CDS contracts, foreign capital gains tax, redesignation of dividends and distributions, return of capital, and non-deductible short sale dividend expense. Results of operations and net assets were not affected by these reclassifications. For the year ended July 31, 2015, the Fund recorded the following reclassifications:
Undistributed net investment loss | $ | (177,885 | ) | |
Accumulated net realized loss | 177,885 |
6. Capital Shares
Transactions in capital shares were as follows:
| Year | 9/30/13* | |||||||||
| ended | to | |||||||||
| 7/31/15 | 7/31/14 | |||||||||
Shares sold: | ||||||||||
Class A | — | 238 | ||||||||
Class C | — | 238 | ||||||||
Class R | — | 238 | ||||||||
Institutional Class | — | 3 | ||||||||
Shares issued upon transfer: | ||||||||||
Institutional Class | — | 2,070,588 | ||||||||
Shares issued upon reinvestment of dividends and distributions: | ||||||||||
Class A | 12 | 9 | ||||||||
Class C | 12 | 7 | ||||||||
Class R | 12 | 8 | ||||||||
Institutional Class | 103,729 | 81,097 | ||||||||
|
|
|
| |||||||
| 103,765 | 2,152,426 | |||||||||
|
|
|
| |||||||
Shares redeemed: | ||||||||||
Institutional Class | — | (705 | ) | |||||||
|
|
|
| |||||||
Net increase | 103,765 | 2,151,721 | ||||||||
|
|
|
| |||||||
* Date of commencement of operations.
7. Line of Credit
The Fund, along with certain other funds in the Delaware Investments® Family of Funds (Participants), was a participant in a $225,000,000 revolving line of credit intended to be used for temporary or emergency purposes as an additional source of liquidity to fund redemptions of investor shares. Under the agreement, the Participants were charged an annual commitment fee of 0.08%, which was allocated across the Participants on the basis of each Participant’s allocation of the entire facility.
37
Table of Contents
Notes to financial statements
Delaware Emerging Markets Debt Fund
7. Line of Credit (continued)
The Participants were permitted to borrow up to a maximum of one third of their net assets under the agreement. Each Participant was individually, and not jointly, liable for its particular advances, if any, under the line of credit. The line of credit under the agreement expired on Nov. 10, 2014.
On Nov. 10, 2014, the Fund, along with the other Participants, entered into an amendment to the agreement for a $275,000,000 revolving line of credit. The line of credit is to be used as described above and operates in substantially the same manner as the original agreement described above. The line of credit available under the agreement expires on Nov. 9, 2015.
The Fund had no amounts outstanding as of July 31, 2015 or at any time during the year then ended.
8. Derivatives
U.S. GAAP requires disclosures that enable investors to understand: (1) how and why an entity uses derivatives; (2) how they are accounted for; and (3) how they affect an entity’s results of operations and financial position.
Foreign Currency Exchange Contracts – The Fund may enter into foreign currency exchange contracts and foreign cross currency exchange contracts as a way of managing foreign exchange rate risk. The Fund may enter into these contracts to fix the U.S. dollar value of a security that it has agreed to buy or sell for the period between the date the trade was entered into and the date the security is delivered and paid for. The Fund may also use these contracts to hedge the U.S. dollar value of securities it already owns that are denominated in foreign currencies. In addition, the Fund may enter into these contracts to facilitate or expedite the settlement of portfolio transactions. The change in value is recorded as an unrealized gain or loss. When the contract is closed, a realized gain or loss is recorded equal to the difference between the value of the contract at the time it was opened and the value at the time it was closed.
The use of foreign currency exchange contracts and foreign cross currency exchange contracts does not eliminate fluctuations in the underlying prices of the securities, but does establish a rate of exchange that can be achieved in the future. Although foreign currency exchange contracts and foreign cross currency exchange contracts limit the risk of loss due to an unfavorable change in the value of the hedged currency, they also limit any potential gain that might result should the value of the currency change favorably. In addition, the Fund could be exposed to risks if the counterparties to the contracts are unable to meet the terms of their contracts. The Fund’s maximum risk of loss from counterparty credit risk is the value of its currency exchanged with the counterparty. The risk is generally mitigated by having a netting arrangement between the Fund and the counterparty and by the posting of collateral by the counterparty to the Fund to cover the Fund’s exposure to the counterparty.
During the year ended July 31, 2015, the Fund entered into foreign currency exchange contracts and cross currency exchange contracts to hedge the U.S. dollar value of securities it already owns that are denominated in foreign currencies.
Swap Contracts – The Fund may enter into CDS contracts in the normal course of pursuing its investment objective. The Fund may enter into CDS contracts in order to hedge against credit events, to enhance total return, or to gain exposure to certain securities or markets. The Fund will not be permitted
38
Table of Contents
to enter into any swap transactions unless, at the time of entering into such transactions, the unsecured long-term debt of the actual counterparty, combined with any credit enhancements, is rated at least BBB- by Standard & Poor’s Financial Services LLC (S&P) or at least Baa3 by Moody’s Investors Service, Inc. (Moody’s) or is determined to be of equivalent credit quality by DMC.
Credit Default Swaps. A CDS contract is a risk-transfer instrument through which one party (purchaser of protection) transfers to another party (seller of protection) the financial risk of a credit event (as defined in the CDS agreement), as it relates to a particular reference security or basket of securities (such as an index). In exchange for the protection offered by the seller of protection, the purchaser of protection agrees to pay the seller of protection a periodic amount at a stated rate that is applied to the notional amount of the CDS contract. In addition, an upfront payment may be made or received by the Fund in connection with an unwinding or assignment of a CDS contract. Upon the occurrence of a credit event, the seller of protection would pay the par (or other agreed-upon) value of the reference security (or basket of securities) to the counterparty. Credit events generally include, among others, bankruptcy, failure to pay, and obligation default.
During the year ended July 31, 2015, the Fund entered into CDS contracts as a purchaser of protection. Periodic payments (receipts) on such contracts are accrued daily and recorded as unrealized losses (gains) on swap contracts. Upon payment (receipt), such amounts are recorded as realized losses (gains) on swap contracts. Upfront payments made or received in connection with CDS contracts are amortized over the expected life of the CDS contracts as unrealized losses (gains) on swap contracts. The change in value of CDS contracts is recorded daily as unrealized appreciation or depreciation. A realized gain or loss is recorded upon a credit event (as defined in the CDS agreement) or the maturity or termination of the agreement. Initial margin and variation margin are posted to central counterparties for CDS basket trades, as determined by the applicable central counterparty.
CDS contracts may involve greater risks than if the Fund had invested in the reference obligation directly. CDS contracts are subject to general market risk, liquidity risk, counterparty risk and credit risk. The Fund’s maximum risk of loss from counterparty credit risk, either as the seller of protection or the buyer of protection, is the fair value of the contract. This risk is mitigated by (1) for bilateral swap contracts, having a netting arrangement between the Fund and the counterparty and by the posting of collateral by the counterparty to the Fund to cover the Fund’s exposure to the counterparty or (2) for cleared swaps, trading these instruments through a central counterparty.
During the year ended July 31, 2015, the Fund used CDS contracts to hedge against credit events.
Swaps Generally. The value of open swaps may differ from that which would be realized in the event the Fund terminated its position in the contract on a given day. Risks of entering into these contracts include the potential inability of the counterparty to meet the terms of the contracts. This type of risk is generally limited to the amount of favorable movement in the value of the underlying security, instrument or basket of instruments, if any, at the day of default. Risks also arise from potential losses from adverse market movements and such losses could exceed the unrealized amounts shown on the “Schedule of investments.”
39
Table of Contents
Notes to financial statements
Delaware Emerging Markets Debt Fund
8. Derivatives (continued)
Fair value of derivative instruments as of July 31, 2015 was as follows:
| Asset Derivatives | Liability Derivatives | |||||||
Statement of | Fair Value | Statement of | Fair Value | |||||
Forward currency exchange contracts (Foreign currency exchange contracts) |
Unrealized | $178 |
Unrealized | $(18) | ||||
The effect of derivative instruments on the “Statement of operations” for the year ended July 31, 2015 was as follows:
Net Realized Loss on: | ||||||||||||
Foreign Currency Transactions | Swaps | Total | ||||||||||
Forward currency exchange contracts | $(45,396 | ) | $ — | $(45,396 | ) | |||||||
Credit contracts | — | (5,723 | ) | (5,723 | ) | |||||||
|
|
|
|
|
| |||||||
Total | $(45,396 | ) | $(5,723 | ) | $(51,119 | ) | ||||||
|
|
|
|
|
| |||||||
Net Change in Unrealized Appreciation (Depreciation) of: | ||||||||||||
Foreign Currency | Swaps | Total | ||||||||||
Forward currency exchange contracts | $160 | $ — | $ 160 | |||||||||
Credit contracts | — | 5,408 | 5,408 | |||||||||
|
|
|
|
|
| |||||||
Total | $160 | $5,408 | $5,568 | |||||||||
|
|
|
|
|
| |||||||
Derivatives Generally. The table below summarizes the average balance of derivative holdings by the Fund during the year ended July 31, 2015.
| Long Derivative Volume | Short Derivative Volume | |||||||
Foreign currency exchange contracts (average cost) | $ 7,924 | $280,749 | ||||||
CDS contracts (average notional value)* | 91,270 | — | ||||||
*Long represents buying protection and short represents selling protection.
9. Offsetting
In December 2011, the Financial Accounting Standards Board (FASB) issued guidance that expanded disclosure requirements on the offsetting of certain assets and liabilities. The disclosures are required for investments and derivative financial instruments subject to master netting or similar
40
Table of Contents
agreements which are eligible for offset in the “Statement of assets and liabilities” and require an entity to disclose both gross and net information about such investments and transactions in the financial statements. In January 2013, the FASB issued guidance that clarified which investments and transactions are subject to the offsetting disclosure requirements. The scope of the disclosure requirements for offsetting is limited to derivative instruments, repurchase agreements and reverse repurchase agreements, and securities borrowing. The guidance is effective for financial statements with fiscal years beginning on or after Jan. 1, 2013, and interim periods within those fiscal years.
In order to better define its contractual rights and to secure rights that will help the Fund mitigate its counterparty risk, the Fund entered into an International Swaps and Derivatives Association, Inc. Master Agreement (ISDA Master Agreement) or a similar agreement with certain of its derivative contract counterparties. An ISDA Master Agreement is a bilateral agreement between the Fund and a counterparty that governs over-the-counter (OTC) derivatives and foreign exchange contracts and typically contains, among other things, collateral posting items and netting provisions in the event of a default and/or termination event. Under an ISDA Master Agreement, the Fund may, under certain circumstances, offset with the counterparty certain derivative financial instrument’s payables and/or receivables with collateral held and/or posted and create one single net payment. The provisions of the ISDA Master Agreement typically permit a single net payment in the event of default (close-out), including the bankruptcy or insolvency of the counterparty. However, bankruptcy or insolvency laws of a particular jurisdiction may impose restrictions on or prohibitions against the right of offset in bankruptcy, insolvency or other events.
For financial reporting purposes, the Fund does not offset derivative assets and derivative liabilities that are subject to netting arrangements in the “Statement of assets and liabilities.”
At July 31, 2015, the Fund had the following assets and liabilities subject to offsetting provisions:
Offsetting of Financial Assets and Liabilities and Derivatives Assets and Liabilities
Counterparty | Gross Value of Derivative Asset | Gross Value of Derivative Liability | Net Position | ||||||||||||
BNY Mellon | $ | 178 | $ | — | $ | 178 | |||||||||
Toronto Dominion Bank | — | (18 | ) | (18 | ) | ||||||||||
|
|
|
|
|
| ||||||||||
Total | $ | 178 | $ | (18 | ) | $ | 160 | ||||||||
|
|
|
|
|
| ||||||||||
Counterparty | Net Position | Fair Value of Non-Cash Collateral Received | Cash Collateral Received | Fair Value of Non-Cash Collateral Pledged | Cash Collateral Pledged | Net Amount(a) | ||||||||||||||||||||||||
BNY Mellon | $ | 178 | $ | — | $ | — | $ | — | $ | — | $ | 178 | ||||||||||||||||||
Toronto Dominion | ||||||||||||||||||||||||||||||
Bank | (18 | ) | — | — | — | — | (18 | ) | ||||||||||||||||||||||
|
|
|
|
|
|
|
|
|
|
|
| |||||||||||||||||||
Total | $ | 160 | $ | — | $ | — | $ | — | $ | — | $ | 160 | ||||||||||||||||||
|
|
|
|
|
|
|
|
|
|
|
| |||||||||||||||||||
41
Table of Contents
Notes to financial statements
Delaware Emerging Markets Debt Fund
9. Offsetting (continued)
Master Repurchase Agreements
Counterparty | Repurchase Agreements | Fair Value of Non-Cash Collateral Received | Cash Collateral Received | Net Amount(a) | ||||||||||||||||
Bank of America | ||||||||||||||||||||
Merrill Lynch | $ | 48,324 | $ | (48,324 | ) | $ | — | $ | — | |||||||||||
Bank of Montreal | 80,541 | (80,541 | ) | — | — | |||||||||||||||
BNP Paribas | 186,135 | (186,135 | ) | — | — | |||||||||||||||
|
|
|
|
|
|
|
| |||||||||||||
Total | $ | 315,000 | $ | (315,000 | ) | $ | — | $ | — | |||||||||||
|
|
|
|
|
|
|
| |||||||||||||
(a)Net amount represents the receivable/(payable) that would be due from/(to) the counterparty in the event of default.
10. Securities Lending
The Fund, along with other funds in the Delaware Investments® Family of Funds, may lend its securities pursuant to a security lending agreement (Lending Agreement) with The Bank of New York Mellon (BNY Mellon). At the time a security is loaned, the borrower must post collateral equal to the required percentage of the market value of the loaned security, including any accrued interest. The required percentage is: (1) 102% with respect to U.S. securities and foreign securities that are denominated and payable in U.S. dollars; and (2) 105% with respect to foreign securities. With respect to each loan, if on any business day the aggregate market value of securities collateral plus cash collateral held is less than the aggregate market value of the securities which are the subject of such loan, the borrower will be notified to provide additional collateral by the end of the following business day which, together with the collateral already held, will be not less than the applicable initial collateral requirements for such security loan. If the aggregate market value of securities collateral and cash collateral held with respect to a security loan exceeds the applicable initial collateral requirement, upon request of the borrower, BNY Mellon must return enough collateral to the borrower by the end of the following business day to reduce the value of the remaining collateral to the applicable initial collateral requirement for such security loan. As a result of the foregoing, the value of the collateral held with respect to a loaned security on any particular day may be more or less than the value of the security on loan.
Cash collateral received is generally invested in the Delaware Investments Collateral Fund No. 1 (Collective Trust) established by BNY Mellon for the purpose of investment on behalf of funds managed by DMC that participate in BNY Mellon’s securities lending program. The Collective Trust may invest in U.S. government securities and high quality corporate debt, asset-backed and other money market securities, and in repurchase agreements collateralized by such securities, provided that the Collective Trust will generally have a dollar-weighted average portfolio maturity of 60 days or less. The Fund can also accept U.S. government securities and letters of credit (non-cash collateral) in connection with securities loans. In the event of default or bankruptcy by the lending agent, realization and/or retention of the collateral may be subject to legal proceedings. In the event the borrower fails to return loaned securities and the collateral received is insufficient to cover the value of the loaned securities and provided such collateral shortfall is not the result of investment losses, the lending agent has agreed to pay the amount of the shortfall to the Fund, or at the discretion of the lending agent, replace the loaned securities. The Fund continues to record dividends or interest, as applicable, on the securities loaned
42
Table of Contents
and is subject to changes in value of the securities loaned that may occur during the term of the loan. The Fund has the right under the Lending Agreement to recover the securities from the borrower on demand. With respect to security loans collateralized by non-cash collateral, the Fund receives loan premiums paid by the borrower. With respect to security loans collateralized by cash collateral, the earnings from the collateral investments are shared among the Fund, the security lending agent, and the borrower. The Fund records security lending income net of allocations to the security lending agent and the borrower.
The Collective Trust used for the investment of cash collateral received from borrowers of securities seeks to maintain a net asset value per unit of $1.00, but there can be no assurance that it will always be able to do so. The Fund may incur investment losses as a result of investing securities lending collateral in the Collective Trust. This could occur if an investment in the Collective Trust defaulted or if it were necessary to liquidate assets in the Collective Trust to meet returns on outstanding security loans at a time when the Collective Trust’s net asset value per unit was less than $1.00. Under those circumstances, the Fund may not receive an amount from the Collective Trust that is equal in amount to the collateral the Fund would be required to return to the borrower of the securities and the Fund would be required to make up for this shortfall.
During the year ended July 31, 2015, the Fund had no securities on loan.
11. Credit and Market Risk
Some countries in which the Fund may invest require governmental approval for the repatriation of investment income, capital or the proceeds of sales of securities by foreign investors. In addition, if there is deterioration in a country’s balance of payments or for other reasons, a country may impose temporary restrictions on foreign capital remittances abroad.
The securities exchanges of certain foreign markets are substantially smaller, less liquid, and more volatile than the major securities markets in the United States. Consequently, acquisition and disposition of securities by the Fund may be inhibited. In addition, a significant portion of the aggregate market value of equity securities listed on the major securities exchanges in emerging markets is held by a smaller number of investors. This may limit the number of shares available for acquisition or disposition by the Fund.
The Fund invests a portion of its assets in high-yield, fixed income securities, which are securities rated lower than BBB- by S&P and lower than Baa3 by Moody’s, or similarly rated by another nationally recognized statistical rating organization. Investments in these higher yielding securities are generally accompanied by a greater degree of credit risk than higher rated securities. Additionally, lower rated securities may be more susceptible to adverse economic and competitive industry conditions than investment-grade securities.
The Fund invests in certain obligations that may have liquidity protection designed to ensure that the receipt of payments due on the underlying security is timely. Such protection may be provided through guarantees, insurance policies, or letters of credit obtained by the issuer or sponsor through third parties, through various means of structuring the transaction, or through a combination of such approaches. The Fund will not pay any additional fees for such credit support, although the existence of credit support may increase the price of the security.
43
Table of Contents
Notes to financial statements
Delaware Emerging Markets Debt Fund
11. Credit and Market Risk (continued)
The Fund may invest up to 15% of its net assets in illiquid securities, which may include securities with contractual restrictions on resale, securities exempt from registration under Rule 144A promulgated under the Securities Act of 1933, as amended, and other securities which may not be readily marketable. The relative illiquidity of these securities may impair the Fund from disposing of them in a timely manner and at a fair price when it is necessary or desirable to do so. While maintaining oversight, the Fund’s Board has delegated to DMC, the day-to-day functions of determining whether individual securities are liquid for purposes of the Fund’s limitation on investments in illiquid securities. Securities eligible for resale pursuant to Rule 144A, which are determined to be liquid, are not subject to the Fund’s 15% limit on investments in illiquid securities. As of July 31, 2015, no securities have been determined to be illiquid under the Fund’s Liquidity Procedures. Rule 144A securities have been identified on the “Schedule of investments.”
12. Contractual Obligations
The Fund enters into contracts in the normal course of business that contain a variety of indemnifications. The Fund’s maximum exposure under these arrangements is unknown. However, the Fund has not had prior claims or losses pursuant to these contracts. Management has reviewed the Fund’s existing contracts and expects the risk of loss to be remote.
13. Recent Accounting Pronouncements
In June 2014, the FASB issued guidance to improve the financial reporting of reverse repurchase agreements and other similar transactions. The guidance includes expanded disclosure requirements for entities that enter into reverse repurchase agreements and similar transactions accounted for as secured borrowings. The guidance is effective for financial statements with fiscal years beginning on or after Dec. 15, 2014 and interim periods within those fiscal years. Management has determined that this pronouncement has no impact on the Fund’s financial statements.
In May 2015, the FASB issued Accounting Standards Update (“ASU”) No. 2015-07 regarding “Disclosures for Investments in Certain Entities That Calculate Net Asset Value per Share.” The amendments in this update are effective for the Fund for fiscal years beginning after Dec. 15, 2015, and interim periods within those fiscal years. ASU No. 2015-07 will eliminate the requirement to categorize investments in the fair value hierarchy if their fair value is measured at net asset value (“NAV”) per share (or its equivalent) using the practical expedient in the FASB’s fair value measurement guidance. At this time, management is evaluating the implications of ASU No. 2015-07 and its impact on the financial statement disclosures has not yet been determined.
14. Subsequent Events
Management has determined that no material events or transactions occurred subsequent to July 31, 2015 that would require recognition or disclosure in the Fund’s financial statements.
44
Table of Contents
registered public accounting firm
To the Board of Trustees of Delaware Group® Government Fund
and the Shareholders of Delaware Emerging Markets Debt Fund:
In our opinion, the accompanying statement of assets and liabilities, including the schedule of investments, and the related statements of operations, of changes in net assets, and of cash flows and the financial highlights present fairly, in all material respects, the financial position of Delaware Emerging Markets Debt Fund (one of the series constituting Delaware Group® Government Fund, hereinafter referred to as the “Fund”) at July 31, 2015, the results of its operations and its cash flows for the year then ended and the changes in its net assets and the financial highlights for the periods presented, in conformity with accounting principles generally accepted in the United States of America. These financial statements and financial highlights (hereafter referred to as “financial statements”) are the responsibility of the Fund’s management. Our responsibility is to express an opinion on these financial statements based on our audits. We conducted our audits of these financial statements in accordance with the standards of the Public Company Accounting Oversight Board (United States). Those standards require that we plan and perform the audit to obtain reasonable assurance about whether the financial statements are free of material misstatement. An audit includes examining, on a test basis, evidence supporting the amounts and disclosures in the financial statements, assessing the accounting principles used and significant estimates made by management, and evaluating the overall financial statement presentation. We believe that our audits, which included confirmation of securities at July 31, 2015 by correspondence with the custodian and brokers and the application of alternative auditing procedures where confirmations of securities purchased had not been received, provide a reasonable basis for our opinion.
PricewaterhouseCoopers LLP
Philadelphia, Pennsylvania
September 22, 2015
45
Table of Contents
Other Fund information (Unaudited)
Delaware Emerging Markets Debt Fund
Tax Information
The information set forth below is for the Fund’s fiscal year as required by federal laws. Shareholders, however, must report distributions on a calendar year basis for income tax purposes, which may include distributions for portions of two fiscal years of a fund. Accordingly, the information needed by shareholders for income tax purposes will be sent to them in January of each year. Please consult your tax advisor for proper treatment of this information.
All disclosures are based on financial information available as of the date of this annual report and, accordingly are subject to change. For any and all items requiring reporting, it is the intention of the Fund to report the maximum amount permitted under the Internal Revenue Code and the regulations thereunder.
For the fiscal year ended July 31, 2015, the Fund reports distributions paid during the year as follows:
(A) Long-Term Capital Gain Distributions (Tax Basis) | 2.27 | % | ||
(B) Ordinary Income Distribution (Tax Basis) | 97.73 | % | ||
Total Distributions (Tax Basis) | 100.00 | % |
(A) and (B) are based on a percentage of the Fund’s total distributions.
46
Table of Contents
Proxy Results
At Joint Special Meetings of Shareholders of Delaware Group® Government Fund (the “Trust”), on behalf of Delaware Core Plus Bond Fund, Delaware Emerging Markets Debt Fund, and Delaware Inflation Protected Bond Fund1 (each, a “Fund” and together, the “Funds”), held on March 31, 2015 the shareholders of the Trust/the Funds voted to: (i) elect a Board of Trustees for the Trust; (ii) approve the implementation of a new “manager of managers” order for Delaware Core Plus Bond Fund and Delaware Emerging Markets Debt Fund; (iii) revise the fundamental investment restriction relating to lending for Delaware Core Plus Bond Fund and Delaware Emerging Markets Debt Fund; and (iv)(a) revise provisions of the Trust’s Agreement and Declaration of Trust related to documenting the transfer of shares, (iv)(b) revise provisions of the Trust’s Agreement and Declaration of Trust related to shareholder disclosure of certain information upon board demand, and (iv)(c) revise provisions of the Trust’s By-Laws so that Delaware law will apply to matters related to proxies. At the meeting, the following people were elected to serve as Independent Trustees: Thomas L. Bennett, Ann D. Borowiec, Joseph W. Chow, John A. Fry, Lucinda S. Landreth, Frances A. Sevilla-Sacasa, Thomas K. Whitford, Janet L. Yeomans, and J. Richard Zecher. In addition, Patrick P. Coyne was elected to serve as an Interested Trustee.
The following proposals were submitted for a vote of the shareholders:
1. To elect a Board of Trustees for the Trust.
A quorum of shares outstanding of the Funds of the Trust was present, and the votes passed with a plurality of these Shares.
Shares Voted For | % of Outstanding Shares | % of Shares Voted | Shares | % of Outstanding Shares | % of Shares Voted | |||||||||||||||||||||||||
Thomas L. Bennett | 12,217,712.264 | 52.084 | % | 98.441 | % | 193,553.188 | 0.825 | % | 1.559 | % | ||||||||||||||||||||
Ann D. Borowiec | 12,216,554.881 | 52.079 | % | 98.431 | % | 194,710.571 | 0.830 | % | 1.569 | % | ||||||||||||||||||||
Joseph W. Chow | 12,217,065.881 | 52.082 | % | 98.435 | % | 194,199.571 | 0.828 | % | 1.565 | % | ||||||||||||||||||||
Patrick P. Coyne | 12,217,856.083 | 52.085 | % | 98.442 | % | 193,409.369 | 0.825 | % | 1.558 | % | ||||||||||||||||||||
John A. Fry | 12,217,712.264 | 52.084 | % | 98.441 | % | 193,553.188 | 0.825 | % | 1.559 | % | ||||||||||||||||||||
Lucinda S. Landreth | 12,214,285.264 | 52.070 | % | 98.413 | % | 196,980.188 | 0.840 | % | 1.587 | % | ||||||||||||||||||||
Frances A. Sevilla-Sacasa | 12,214,285.264 | 52.070 | % | 98.413 | % | 196,980.188 | 0.840 | % | 1.587 | % | ||||||||||||||||||||
Thomas K. Whitford | 12,209,449.751 | 52.049 | % | 98.374 | % | 201,815.701 | 0.860 | % | 1.626 | % | ||||||||||||||||||||
Janet L. Yeomans | 12,211,966.537 | 52.060 | % | 98.394 | % | 199,298.915 | 0.850 | % | 1.606 | % | ||||||||||||||||||||
J. Richard Zecher | 12,217,065.881 | 52.082 | % | 98.435 | % | 194,199.571 | 0.828 | % | 1.565 | % | ||||||||||||||||||||
1 Delaware Inflation Protected Bond Fund liquidated on June 12, 2015.
47
Table of Contents
Other Fund information (Unaudited)
Delaware Emerging Markets Debt Fund
Proxy results (continued)
2. To approve the implementation of a new “manager of managers” order.
A quorum of the shares outstanding of the Funds was present, and the votes passed with the required majority of those shares. The results were as follows:
Delaware Core Plus Bond Fund
Shares voted for | 6,009,616.983 | |||
Percentage of outstanding shares | 42.471 | % | ||
Percentage of shares voted | 75.909 | % | ||
Shares voted against | 179,888.548 | |||
Percentage of outstanding shares | 1.271 | % | ||
Percentage of shares voted | 2.272 | % | ||
Shares abstained | 116,676.569 | |||
Percentage of outstanding shares | 0.825 | % | ||
Percentage of shares voted | 1.474 | % | ||
Broker non-votes | 1,610,654.000 |
Delaware Emerging Markets Debt Fund
Shares voted for | 2,227,764.675 | |||
Percentage of outstanding shares | 100.000 | % | ||
Percentage of shares voted | 100.000 | % | ||
Shares voted against | — | |||
Percentage of outstanding shares | 0.000 | % | ||
Percentage of shares voted | 0.000 | % | ||
Shares abstained | — | |||
Percentage of outstanding shares | 0.000 | % | ||
Percentage of shares voted | 0.000 | % | ||
Broker non-votes | — |
48
Table of Contents
3. To revise the fundamental investment restriction relating to lending.
A quorum of the shares outstanding of the Funds was present, and the votes passed with the required majority of those shares. The results were as follows:
Delaware Core Plus Bond Fund
Shares voted for | 5,984,905.343 | |||
Percentage of outstanding shares | 42.296 | % | ||
Percentage of shares voted | 75.597 | % | ||
Shares voted against | 174,786.466 | |||
Percentage of outstanding shares | 1.235 | % | ||
Percentage of shares voted | 2.208 | % | ||
Shares abstained | 146,488.291 | |||
Percentage of outstanding shares | 1.035 | % | ||
Percentage of shares voted | 1.850 | % | ||
Broker non-votes | 1,610,656.000 |
Delaware Emerging Markets Debt Fund
Shares voted for | 2,227,764.675 | |||
Percentage of outstanding shares | 100.000 | % | ||
Percentage of shares voted | 100.000 | % | ||
Shares voted against | — | |||
Percentage of outstanding shares | 0.000 | % | ||
Percentage of shares voted | 0.000 | % | ||
Shares abstained | — | |||
Percentage of outstanding shares | 0.000 | % | ||
Percentage of shares voted | 0.000 | % | ||
Broker non-votes | — |
49
Table of Contents
Other Fund information (Unaudited)
Delaware Emerging Markets Debt Fund
Proxy results (continued)
4. (a) To revise provisions of the Trust’s Agreement and Declaration of Trust related to documenting the transfer of shares.
A quorum of the shares outstanding of the Trust was present, and the votes passed with a majority of those shares. The results were as follows:
Delaware Group® Government Fund
Shares voted for | 9,079,255.833 | |||
Percentage of outstanding shares | 38.705 | % | ||
Percentage of shares voted | 73.153 | % | ||
Shares voted against | 161,109.991 | |||
Percentage of outstanding shares | 0.687 | % | ||
Percentage of shares voted | 1.298 | % | ||
Shares abstained | 208,315.628 | |||
Percentage of outstanding shares | 0.888 | % | ||
Percentage of shares voted | 1.678 | % | ||
Broker non-votes | 2,962,584.000 |
4. (b) To revise provisions of the Trust’s Agreement and Declaration of Trust related to shareholder disclosure of certain information upon board demand.
A quorum of the shares outstanding of the Trust was present, and the votes passed with a majority of those shares. The results were as follows:
Delaware Group Government Fund
Shares voted for | 9,076,717.809 | |||
Percentage of outstanding shares | 38.694 | % | ||
Percentage of shares voted | 73.133 | % | ||
Shares voted against | 170,967.090 | |||
Percentage of outstanding shares | 0.729 | % | ||
Percentage of shares voted | 1.378 | % | ||
Shares abstained | 200,997.553 | |||
Percentage of outstanding shares | 0.857 | % | ||
Percentage of shares voted | 1.619 | % | ||
Broker non-votes | 2,962,583.000 |
50
Table of Contents
4. (c) To revise provisions of the Trust’s By-Laws so that Delaware law will apply to matters related to proxies.
A quorum of the shares outstanding of the Trust was present, and the votes passed with a majority of those shares. The results were as follows:
Delaware Group® Government Fund
Shares voted for | 9,135,316.759 | |||
Percentage of outstanding shares | 38.944 | % | ||
Percentage of shares voted | 73.605 | % | ||
Shares voted against | 121,685.413 | |||
Percentage of outstanding shares | 0.519 | % | ||
Percentage of shares voted | 0.980 | % | ||
Shares abstained | 191,684.280 | |||
Percentage of outstanding shares | 0.817 | % | ||
Percentage of shares voted | 1.544 | % | ||
Broker non-votes | 2,962,579.000 |
51
Table of Contents
Board of trustees / directors and officers addendum
Delaware Investments® Family of Funds
A mutual fund is governed by a Board of Trustees/Directors (“Trustees”), which has oversight responsibility for the management of a fund’s business affairs. Trustees establish procedures and oversee and review the performance of the investment manager, the distributor, and others who perform services for the fund. The independent fund trustees, in particular, are advocates
Name, Address, and Birth Date | Position(s) Held with Fund(s) | Length of Time Served | ||
Interested Trustee
| ||||
Shawn K. Lytle1 | President, | Trustee since | ||
2005 Market Street | Chief Executive Officer, | September 1, 2015 | ||
Philadelphia, PA 19103 | and Trustee | |||
February 1970 | President and | |||
| Chief Executive Officer | ||||
| since August 20, 2015 | ||||
Independent Trustees | ||||
Thomas L. Bennett | Chairman and Trustee | Trustee since | ||
2005 Market Street | March 2005 | |||
Philadelphia, PA 19103 | ||||
October 1947 | Chairman since | |||
March 1, 2015
| ||||
Ann D. Borowiec | Trustee | Since March 31, 2015 | ||
2005 Market Street | ||||
Philadelphia, PA 19103 | ||||
November 1958 | ||||
Joseph W. Chow | Trustee | Since January 2013 | ||
2005 Market Street | ||||
Philadelphia, PA 19103 | ||||
January 1953 | ||||
| 1 | Shawn K. Lytle is considered to be an “Interested Trustee” because he is an executive officer of the Fund’s(s’) investment advisor. |
52
Table of Contents
for shareholder interests. Each trustee has served in that capacity since he or she was elected to or appointed to the Board of Trustees, and will continue to serve until his or her retirement or the election of a new trustee in his or her place. The following is a list of the Trustees and Officers with certain background and related information.
Principal Occupation(s) During the Past Five Years | Number of Portfolios in Fund Complex Overseen by Trustee or Officer | Other Directorships Held by Trustee or Officer | ||
Shawn K. Lytle has served as | 64 | Trustee — UBS | ||
President of | Relationship Funds, | |||
Delaware Investments2 | SMA Relationship | |||
since June 2015 and was the | Trust, and UBS Funds | |||
Regional Head of Americas for | (May 2010–April 2015) | |||
UBS Global Asset | ||||
Management from | ||||
2010 through 2015. | ||||
Private Investor | 64 | Director — | ||
(March 2004–Present) | Bryn Mawr Bank Corp. (BMTC) | |||
| (2007–2011) | ||||
Chief Executive Officer | 64 | None | ||
Private Wealth Management | ||||
(2011–2013) and | ||||
Market Manager, | ||||
New Jersey Private | ||||
Bank (2005–2011) – | ||||
J.P. Morgan Chase & Co.
| ||||
Executive Vice President | 64 | Director and Audit Committee | ||
(Emerging Economies | Member — Hercules | |||
Strategies, Risks, and | Technology Growth | |||
Corporate Administration) | Capital, Inc. | |||
State Street Corporation | (2004–2014) | |||
(July 2004–March 2011)
|
| 2 | Delaware Investments is the marketing name for Delaware Management Holdings, Inc. and its subsidiaries, including the Fund’s(s’) investment advisor, principal underwriter, and its transfer agent. |
53
Table of Contents
Board of trustees / directors and officers addendum
Delaware Investments® Family of Funds
Name, Address, and Birth Date | Position(s) Held with Fund(s) | Length of Time Served | ||
Independent Trustees (continued) | ||||
John A. Fry | Trustee | Since January 2001 | ||
2005 Market Street | ||||
Philadelphia, PA 19103 | ||||
May 1960 | ||||
Lucinda S. Landreth | Trustee | Since March 2005 | ||
2005 Market Street | ||||
Philadelphia, PA 19103 | ||||
June 1947
| ||||
Frances A. Sevilla-Sacasa | Trustee | Since September 2011 | ||
2005 Market Street | ||||
Philadelphia, PA 19103 | ||||
January 1956 | ||||
54
Table of Contents
Principal Occupation(s) During the Past Five Years | Number of Portfolios in Fund Complex Overseen by Trustee or Officer | Other Directorships Held by Trustee or Officer | ||
President — | 64 | Director — Hershey Trust | ||
Drexel University | Company | |||
(August 2010–Present) | ||||
| Director, Audit Committee, | ||||
President — | and Governance Committee | |||
Franklin & Marshall College | Member — Community | |||
(July 2002–July 2010) | Health Systems | |||
| Director — Drexel | ||||
| Morgan & Co. | ||||
Private Investor | 64 | None | ||
(2004–Present) | ||||
Chief Executive Officer — | 64 | Trust Manager and | ||
Banco Itaú | Audit Committee | |||
International | Member — Camden | |||
(April 2012–Present) | Property Trust | |||
Executive Advisor to Dean | ||||
(August 2011–March 2012) and Interim Dean | ||||
(January 2011–July 2011) — | ||||
University of Miami School of | ||||
Business Administration | ||||
President — U.S. Trust, | ||||
Bank of America Private | ||||
Wealth Management | ||||
(Private Banking) | ||||
(July 2007–December 2008)
|
55
Table of Contents
Board of trustees / directors and officers addendum
Delaware Investments® Family of Funds
Name, Address, and Birth Date | Position(s) Held with Fund(s) | Length of Time Served | ||
Independent Trustees (continued) | ||||
Thomas K. Whitford | Trustee | Since January 2013 | ||
2005 Market Street | ||||
Philadelphia, PA 19103 | ||||
March 1956 | ||||
Janet L. Yeomans | Trustee | Since April 1999 | ||
2005 Market Street | ||||
Philadelphia, PA 19103 | ||||
July 1948 | ||||
56
Table of Contents
Principal Occupation(s) During the Past Five Years | Number of Portfolios in Fund Complex Overseen by Trustee or Officer | Other Directorships Held by Trustee or Officer | ||
Vice Chairman | 64 | Director — HSBC Finance | ||
(2010–April 2013), | Corporation and HSBC | |||
Chief Administrative | North America Holdings Inc. | |||
Officer (2008–2010), | ||||
and Executive Vice | Director — | |||
President and Chief | HSBC Bank | |||
Administrative Officer | ||||
(2007–2009) — | ||||
PNC Financial | ||||
Services Group
| ||||
Vice President and Treasurer | 64 | Director, Audit and | ||
(January 2006–July 2012) | Compliance Committee Chair, | |||
Vice President — | Investment Committee | |||
Mergers & Acquisitions | Member, and Governance | |||
(January 2003–January 2006), | Committee Member — | |||
and Vice President | Okabena Company | |||
and Treasurer | ||||
(July 1995–January 2003) | Chair — 3M | |||
3M Corporation | Investment Management | |||
| Company | ||||
(2005–2012)
|
57
Table of Contents
Board of trustees / directors and officers addendum
Delaware Investments® Family of Funds
Name, Address, and Birth Date | Position(s) Held with Fund(s) | Length of Time Served | ||
Officers | ||||
David F. Connor | Senior Vice President, | Senior Vice President | ||
2005 Market Street | General Counsel, | since May 2013; | ||
Philadelphia, PA 19103 | and Secretary | General Counsel | ||
December 1963 | since May 2015; | |||
| Secretary since | ||||
| October 2005 | ||||
Daniel V. Geatens | Vice President | Treasurer since October 2007 | ||
2005 Market Street | and Treasurer | |||
Philadelphia, PA 19103 | ||||
October 1972 | ||||
Richard Salus | Senior Vice President | Chief Financial Officer | ||
2005 Market Street | and Chief Financial Officer | since November 2006 | ||
Philadelphia, PA 19103 | ||||
October 1963 | ||||
The Statement of Additional Information for the Fund(s) includes additional information about the Trustees and Officers and is available, without charge, upon request by calling 800 523-1918.
58
Table of Contents
Principal Occupation(s) During the Past Five Years | Number of Portfolios in Fund Complex Overseen by Trustee or Officer | Other Directorships Held by Trustee or Officer | ||
David F. Connor has served as | 64 | None3 | ||
Senior Vice President of the Fund(s) and the investment advisor since 2013, General Counsel of the Fund(s) and the investment advisor since 2015, and Secretary of the Fund(s) and the investment advisor since 2005.
| ||||
Daniel V. Geatens has served | 64 | None3 | ||
as Vice President and | ||||
Treasurer of the Fund(s) since 2007 and Vice President and Director of Financial | ||||
Administration of the investment advisor since 2010.
| ||||
Richard Salus has served as | 64 | None3 | ||
Senior Vice President and Chief Financial Officer of the Fund(s) and the investment advisor since 2006.
|
| 3 | David F. Connor, Daniel V. Geatens, and Richard Salus serve in similar capacities for the six portfolios of the Optimum Fund Trust, which have the same investment advisor, principal underwriter, and transfer agent as the registrant. |
59
Table of Contents
| Board of trustees | ||||||
Shawn K. Lytle President and Chief Executive Officer Delaware Investments® Family of Funds Philadelphia, PA
Thomas L. Bennett Chairman of the Board Delaware Investments Family of Funds Private Investor Rosemont, PA | Ann D. Borowiec Former Chief Executive Officer Private Wealth Management J.P. Morgan Chase & Co. New York, NY
Joseph W. Chow Former Executive Vice President State Street Corporation Brookline, MA | John A. Fry President Drexel University Philadelphia, PA
Lucinda S. Landreth Former Chief Investment Officer Assurant, Inc. New York, NY | Frances A. Sevilla-Sacasa Chief Executive Officer Banco Itaú International Miami, FL
Thomas K. Whitford Former Vice Chairman PNC Financial Services Group Pittsburgh, PA
Janet L. Yeomans Former Vice President and Treasurer 3M Corporation St. Paul, MN | |||
| Affiliated officers | ||||||
David F. Connor Senior Vice President, General Counsel, and Secretary Delaware Investments Family of Funds Philadelphia, PA | Daniel V. Geatens Vice President and Treasurer Delaware Investments Family of Funds Philadelphia, PA | Richard Salus Senior Vice President and Chief Financial Officer Delaware Investments Family of Funds Philadelphia, PA | ||||
This annual report is for the information of Delaware Emerging Markets Debt Fund shareholders, but it may be used with prospective investors when preceded or accompanied by the Delaware Investments Fund fact sheet for the most recently completed calendar quarter. These documents are available at delawareinvestments.com.
Delaware Investments is the marketing name of Delaware Management Holdings, Inc. and its subsidiaries.
The Fund files its complete schedule of portfolio holdings with the Securities and Exchange Commission (SEC) for the first and third quarters of each fiscal year on Form N-Q. The Fund’s Forms N-Q, as well as a description of the policies and procedures that the Fund uses to determine how to vote proxies (if any) relating to portfolio securities are available without charge (i) upon request, by calling 800 523-1918; and (ii) on the SEC’s website at sec.gov. In addition, a description of the policies and procedures that the Fund uses to determine how to vote proxies (if any) relating to portfolio securities and the Schedule of Investments included in the Fund’s most recent Form N-Q are available without charge on the Fund’s website at delawareinvestments.com. The Fund’s Forms N-Q may be reviewed and copied at the SEC’s Public Reference Room in Washington, D.C.; information on the operation of the Public Reference Room may be obtained by calling 800 SEC-0330.
Information (if any) regarding how the Fund voted proxies relating to portfolio securities during the most recently disclosed 12-month period ended June 30 is available without charge (i) through the Fund’s website at delawareinvestments.com; and (ii) on the SEC’s website at sec.gov.
60
Item 2. Code of Ethics
The registrant has adopted a code of ethics that applies to the registrant’s principal executive officer, principal financial officer, principal accounting officer or controller, or persons performing similar functions, regardless of whether these individuals are employed by the registrant or a third party. A copy of the registrant’s Code of Business Ethics has been posted on the Delaware Investments Internet Web site at www.delawareinvestments.com. Any amendments to the Code of Business Ethics, and information on any waiver from its provisions granted by the registrant, will also be posted on this Web site within five business days of such amendment or waiver and will remain on the Web site for at least 12 months.
Item 3. Audit Committee Financial Expert
The registrant’s Board of Trustees/Directors has determined that certain members of the registrant’s Audit Committee are audit committee financial experts, as defined below. For purposes of this item, an “audit committee financial expert” is a person who has the following attributes:
a. An understanding of generally accepted accounting principles and financial statements;
b. The ability to assess the general application of such principles in connection with the accounting for estimates, accruals, and reserves;
c. Experience preparing, auditing, analyzing, or evaluating financial statements that present a breadth and level of complexity of accounting issues that are generally comparable to the breadth and complexity of issues that can reasonably be expected to be raised by the registrant’s financial statements, or experience actively supervising one or more persons engaged in such activities;
d. An understanding of internal controls and procedures for financial reporting; and
e. An understanding of audit committee functions.
An “audit committee financial expert” shall have acquired such attributes through:
a. Education and experience as a principal financial officer, principal accounting officer, controller, public accountant, or auditor or experience in one or more positions that involve the performance of similar functions;
b. Experience actively supervising a principal financial officer, principal accounting officer, controller, public accountant, auditor, or person performing similar functions;
c. Experience overseeing or assessing the performance of companies or public accountants with respect to the preparation, auditing, or evaluation of financial statements; or
d. Other relevant experience.
The registrant’s Board of Trustees/Directors has also determined that each member of the registrant’s Audit Committee is independent. In order to be “independent” for purposes of this item, the Audit Committee member may not: (i) other than in his or her capacity as a member of the Board of Trustees/Directors or any committee thereof, accept directly or indirectly any consulting, advisory or other compensatory fee from the issuer; or (ii) be an “interested person” of the registrant as defined in Section 2(a)(19) of the Investment Company Act of 1940.
The names of the audit committee financial experts on the registrant’s Audit Committee are set forth below:
Ann D. Borowiec
Joseph W. Chow
Lucinda S. Landreth1
Frances A. Sevilla-Sacasa
Item 4. Principal Accountant Fees and Services
(a) Audit fees.
The aggregate fees billed for services provided to the registrant by its independent auditors for the audit of the registrant’s annual financial statements and for services normally provided by the independent auditors in connection with statutory and regulatory filings or engagements were $84,705 for the fiscal year ended July 31, 2015.
The aggregate fees billed for services provided to the registrant by its independent auditors for the audit of the registrant’s annual financial statements and for services normally provided by the independent auditors in connection with statutory and regulatory filings or engagements were $114,005 for the fiscal year ended July 31, 2014.
(b) Audit-related fees.
The aggregate fees billed by the registrant’s independent auditors for services relating to the performance of the audit of the registrant’s financial statements and not reported under paragraph (a) of this Item were $0 for the fiscal year ended July 31, 2015.
The aggregate fees billed by the registrant’s independent auditors for services relating to the performance of the audit of the financial statements of the registrant’s investment adviser and other service providers under common control with the adviser and that relate directly to the operations or financial reporting of the registrant were $612,000 for the registrant’s fiscal year ended July 31, 2015. The percentage of these fees relating to services approved by the registrant’s Audit Committee pursuant to the de minimis exception from the pre-approval requirement in Rule 2-01(c)(7)(i)(C) of Regulation S-X was 0%. These audit-related services were as follows: year end audit procedures; group reporting and subsidiary statutory audits.
The aggregate fees billed by the registrant’s independent auditors for services relating to the performance of the audit of the registrant’s financial statements and not reported under paragraph (a) of this Item were $0 for the fiscal year ended July 31, 2014.
____________________
1 The instructions to Form N-CSR require disclosure on the relevant experience of persons who qualify as audit committee financial experts based on “other relevant experience.” The Board of Trustees/Directors has determined that Ms. Landreth qualifies as an audit committee financial expert by virtue of her experience as a financial analyst, her Chartered Financial Analyst (CFA) designation and her service as an audit committee chairperson for a non-profit organization.
The aggregate fees billed by the registrant’s independent auditors for services relating to the performance of the audit of the financial statements of the registrant’s investment adviser and other service providers under common control with the adviser and that relate directly to the operations or financial reporting of the registrant were $618,000 for the registrant’s fiscal year ended July 31, 2014. The percentage of these fees relating to services approved by the registrant’s Audit Committee pursuant to the de minimis exception from the pre-approval requirement in Rule 2-01(c)(7)(i)(C) of Regulation S-X was 0%. These audit-related services were as follows: year end audit procedures; group reporting and subsidiary statutory audits.
(c) Tax fees.
The aggregate fees billed by the registrant’s independent auditors for tax-related services provided to the registrant were $14,376 for the fiscal year ended July 31, 2015. The percentage of these fees relating to services approved by the registrant’s Audit Committee pursuant to the de minimis exception from the pre-approval requirement in Rule 2-01(c)(7)(i)(C) of Regulation S-X was 0%. These tax-related services were as follows: review of income tax returns and review of annual excise distribution calculations.
The aggregate fees billed by the registrant’s independent auditors for tax-related services provided to the registrant’s investment adviser and other service providers under common control with the adviser and that relate directly to the operations or financial reporting of the registrant were $0 for the registrant’s fiscal year ended July 31, 2015.
The aggregate fees billed by the registrant’s independent auditors for tax-related services provided to the registrant were $13,218 for the fiscal year ended July 31, 2014. The percentage of these fees relating to services approved by the registrant’s Audit Committee pursuant to the de minimis exception from the pre-approval requirement in Rule 2-01(c)(7)(i)(C) of Regulation S-X was 0%. These tax-related services were as follows: review of income tax returns and review of annual excise distribution calculations.
The aggregate fees billed by the registrant’s independent auditors for tax-related services provided to the registrant’s investment adviser and other service providers under common control with the adviser and that relate directly to the operations or financial reporting of the registrant were $0 for the registrant’s fiscal year ended July 31, 2014.
(d) All other fees.
The aggregate fees billed for all services provided by the independent auditors to the registrant other than those set forth in paragraphs (a), (b) and (c) of this Item were $0 for the fiscal year ended July 31, 2015.
The aggregate fees billed for all services other than those set forth in paragraphs (b) and (c) of this Item provided by the registrant’s independent auditors to the registrant’s adviser and other service providers under common control with the adviser and that relate directly to the operations or financial reporting of the registrant were $0 for the registrant’s fiscal year ended July 31, 2015. The percentage of these fees relating to services approved by the registrant’s Audit Committee pursuant to the de minimis exception from the pre-approval requirement in Rule 2-01(c)(7)(i)(C) of Regulation S-X was 0%.
The aggregate fees billed for all services provided by the independent auditors to the registrant other than those set forth in paragraphs (a), (b) and (c) of this Item were $0 for the fiscal year ended July 31, 2014.
The aggregate fees billed for all services other than those set forth in paragraphs (b) and (c) of this Item provided by the registrant’s independent auditors to the registrant’s adviser and other service providers under common control with the adviser and that relate directly to the operations or financial reporting of the registrant were $0 for the registrant’s fiscal year ended July 31, 2014. The percentage of these fees relating to services approved by the registrant’s Audit Committee pursuant to the de minimis exception from the pre-approval requirement in Rule 2-01(c)(7)(i)(C) of Regulation S-X was 0%.
(e) The registrant’s Audit Committee has established pre-approval policies and procedures as permitted by Rule 2-01(c)(7)(i)(B) of Regulation S-X (the “Pre-Approval Policy”) with respect to services provided by the registrant’s independent auditors. Pursuant to the Pre-Approval Policy, the Audit Committee has pre-approved the services set forth in the table below with respect to the registrant up to the specified fee limits. Certain fee limits are based on aggregate fees to the registrant and other registrants within the Delaware Investments Family of Funds.
| Service | Range of Fees |
| Audit Services | |
| Statutory audits or financial audits for new Funds | up to $40,000 per Fund |
| Services associated with SEC registration statements (e.g., Form N-1A, Form N-14, etc.), periodic reports and other documents filed with the SEC or other documents issued in connection with securities offerings (e.g., comfort letters for closed-end Fund offerings, consents), and assistance in responding to SEC comment letters | up to $10,000 per Fund |
| Consultations by Fund management as to the accounting or disclosure treatment of transactions or events and/or the actual or potential impact of final or proposed rules, standards or interpretations by the SEC, FASB, or other regulatory or standard-setting bodies (Note: Under SEC rules, some consultations may be considered “audit-related services” rather than “audit services”) | up to $25,000 in the aggregate |
| Audit-Related Services | |
| Consultations by Fund management as to the accounting or disclosure treatment of transactions or events and /or the actual or potential impact of final or proposed rules, standards or interpretations by the SEC, FASB, or other regulatory or standard-setting bodies (Note: Under SEC rules, some consultations may be considered “audit services” rather than “audit-related services”) | up to $25,000 in the aggregate |
| Tax Services | |
| U.S. federal, state and local and international tax planning and advice (e.g., consulting on statutory, regulatory or administrative developments, evaluation of Funds’ tax compliance function, etc.) | up to $25,000 in the aggregate |
| U.S. federal, state and local tax compliance (e.g., excise distribution reviews, etc.) | up to $5,000 per Fund |
| Review of federal, state, local and international income, franchise and other tax returns | up to $5,000 per Fund |
Under the Pre-Approval Policy, the Audit Committee has also pre-approved the services set forth in the table below with respect to the registrant’s investment adviser and other entities controlling, controlled by or under common control with the investment adviser that provide ongoing services to the registrant (the “Control Affiliates”) up to the specified fee limit. This fee limit is based on aggregate fees to the investment adviser and its Control Affiliates.
| Service | Range of Fees |
| Non-Audit Services | |
| Services associated with periodic reports and other documents filed with the SEC and assistance in responding to SEC comment letters | up to $10,000 in the aggregate |
The Pre-Approval Policy requires the registrant’s independent auditors to report to the Audit Committee at each of its regular meetings regarding all services initiated since the last such report was rendered, including those services authorized by the Pre-Approval Policy.
(f) Not applicable.
(g) The aggregate non-audit fees billed by the registrant’s independent auditors for services rendered to the registrant and to its investment adviser and other service providers under common control with the adviser were $7,530,526 and $8,090,937 for the registrant’s fiscal years ended July 31, 2015 and July 31, 2014, respectively.
(h) In connection with its selection of the independent auditors, the registrant’s Audit Committee has considered the independent auditors’ provision of non-audit services to the registrant’s investment adviser and other service providers under common control with the adviser that were not required to be pre-approved pursuant to Rule 2-01(c)(7)(ii) of Regulation S-X. The Audit Committee has determined that the independent auditors’ provision of these services is compatible with maintaining the auditors’ independence.
Item 5. Audit Committee of Listed Registrants
Not applicable.
Item 6. Investments
(a) Included as part of report to shareholders filed under Item 1 of this Form N-CSR.
(b) Divestment of securities in accordance with Section 13(c) of the Investment Company Act of 1940.
Not applicable.
Item 7. Disclosure of Proxy Voting Policies and Procedures for Closed-End Management Investment Companies
Not applicable.
Item 8. Portfolio Managers of Closed-End Management Investment Companies
Not applicable.
Item 9. Purchases of Equity Securities by Closed-End Management Investment Company and Affiliated Purchasers
Not applicable.
Item 10. Submission of Matters to a Vote of Security Holders
Not applicable.
Item 11. Controls and Procedures
The registrant’s principal executive officer and principal financial officer have evaluated the registrant’s disclosure controls and procedures within 90 days of the filing of this report and have concluded that they are effective in providing reasonable assurance that the information required to be disclosed by the registrant in its reports or statements filed under the Securities Exchange Act of 1934 is recorded, processed, summarized and reported within the time periods specified in the rules and forms of the Securities and Exchange Commission.
There were no significant changes in the registrant’s internal control over financial reporting that occurred during the second fiscal quarter of the period covered by the report to stockholders included herein (i.e., the registrant’s fourth fiscal quarter) that have materially affected, or are reasonably likely to materially affect, the registrant’s internal control over financial reporting.
Item 12. Exhibits
(a) (1) Code of Ethics
Not applicable.
(2) Certifications of Principal Executive Officer and Principal Financial Officer pursuant to Rule 30a-2 under the Investment Company Act of 1940 are attached hereto as Exhibit 99.CERT.
(3) Written solicitations to purchase securities pursuant to Rule 23c-1 under the Securities Exchange Act of 1934.
Not applicable.
(b) Certifications pursuant to Section 906 of the Sarbanes-Oxley Act of 2002 are furnished herewith as Exhibit 99.906CERT.
SIGNATURES
Pursuant to the requirements of the Securities Exchange Act of 1934 and the Investment Company Act of 1940, the registrant has duly caused this report to be signed on its behalf, by the undersigned, thereunto duly authorized.
DELAWARE GROUP® GOVERNMENT FUND
| /s/ SHAWN LYTLE | |
| By: | Shawn Lytle |
| Title: | Chief Executive Officer |
| Date: | October 5, 2015 |
Pursuant to the requirements of the Securities Exchange Act of 1934 and the Investment Company Act of 1940, this report has been signed below by the following persons on behalf of the registrant and in the capacities and on the dates indicated.
| /s/ SHAWN LYTLE | |
| By: | Shawn Lytle |
| Title: | Chief Executive Officer |
| Date: | October 5, 2015 |
| /s/ RICHARD SALUS | |
| By: | Richard Salus |
| Title: | Chief Financial Officer |
| Date: | October 5, 2015 |