UNITED STATES
SECURITIES AND EXCHANGE COMMISSION
Washington, D.C. 20549
FORM N-CSR
Certified Shareholder Report of
Registered Management Investment Companies
Investment Company Act File Number: 811-04318
The American Funds Income Series
(Exact Name of Registrant as Specified in Charter)
333 South Hope Street
Los Angeles, California 90071
(Address of Principal Executive Offices)
Registrant's telephone number, including area code: (213) 486-9200
Date of fiscal year end: August 31
Date of reporting period: August 31, 2014
Courtney R. Taylor
The American Funds Income Series
333 South Hope Street
Los Angeles, California 90071
(Name and Address of Agent for Service)
Copies to:
Michael Glazer
Bingham McCutchen LLP
355 South Grand Avenue, Suite 4400
Los Angeles, California 90071
(Counsel for the Registrant)
ITEM 1 – Reports to Stockholders
![]()
Focus on
stability
Special feature page 4
 | U.S. Government Securities Fund® |
| Annual report for the year ended August 31, 2014 |
U.S. Government Securities Fund seeks a high level of current income, as well as preservation of capital, by investing at least 80% of the fund’s assets in securities guaranteed or sponsored by the United States government.
This fund is one of more than 40 offered by one of the nation’s largest mutual fund families, American Funds, from Capital Group. For more than 80 years, Capital has invested with a long-term focus based on thorough research and attention to risk.
Fund results shown in this report, unless otherwise indicated, are for Class A shares at net asset value. If a sales charge (maximum 3.75%) had been deducted, the results would have been lower. Results are for past periods and are not predictive of results for future periods. Current and future results may be lower or higher than those shown. Share prices and returns will vary, so investors may lose money. Investing for short periods makes losses more likely. Investments are not FDIC-insured, nor are they deposits of or guaranteed by a bank or any other entity, so they may lose value. For current information and month-end results, visit americanfunds.com.
Here are the average annual total returns on a $1,000 investment with all distributions reinvested for periods ended September 30, 2014 (the most recent calendar quarter-end):
| Class A shares | 1 year | 5 years | 10 years | |||
| Reflecting 3.75% maximum sales charge | –1.32% | 2.27% | 3.39% |
For other share class results, visit americanfunds.com and americanfundsretirement.com.
The total annual fund operating expense ratio is 0.64% for Class A shares as of the prospectus dated November 1, 2014 (unaudited).
Investment results assume all distributions are reinvested and reflect applicable fees and expenses. When applicable, investment results reflect fee waivers, without which results would have been lower. Visit americanfunds.com for more information.
The fund’s 30-day yield for Class A shares as of September 30, 2014, calculated in accordance with the U.S. Securities and Exchange Commission (SEC) formula, was 0.67%. The fund’s 12-month distribution rate for Class A shares as of that date was 1.06%. Both reflect the 3.75% maximum sales charge. The SEC yield reflects the rate at which the fund is earning income on its current portfolio of securities while the distribution rate reflects the fund’s past dividends paid to shareholders. Accordingly, the fund’s SEC yield and distribution rate may differ.
The return of principal for bond funds and for funds with significant underlying bond holdings is not guaranteed. Fund shares are subject to the same interest rate, inflation and credit risks associated with the underlying bond holdings. Refer to the fund prospectus and the Risk Factors section of this report for more information on these and other risks associated with investing in the fund.

For the 12 months ended August 31, 2014, the U.S. Government Securities Fund produced a total return of 4.32%. In comparison, the unmanaged Barclays U.S. Government/Mortgage-Backed Securities Index gained 4.33%. The Lipper General U.S. Government Funds Average (a peer group of funds) rose 4.38%.
Income is a key element of the fund’s total return. The fund provides income in the form of monthly dividends, which totaled about 15 cents a share for the 12-month period. This amounts to an income return of 1.12% for investors who reinvested dividends. A capital gain distribution of 12.2 cents a share was paid in December.
Bond market overview
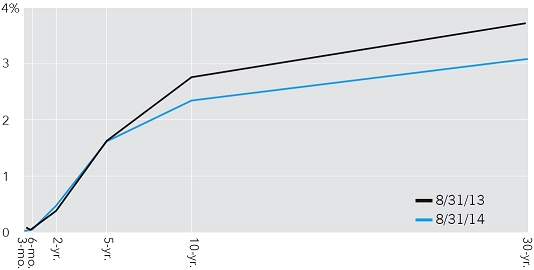
Bonds have recovered from the losses they suffered during 2013. While many investors anticipated interest rates continuing to rise in 2014, they have actually declined. This has occurred despite the Federal Reserve continuing to “taper” or scale back its monthly bond buying program. Bond prices rise as interest rates decline and vice versa.
As you can see from the yield curve chart (see page 2), Treasury yields of short maturities remained quite low for the period, with yields for longer maturity Treasuries declining from a year ago. The 10-year yielded 2.35% at the end of the period versus 2.78% at the start of the period, while the 30-year yielded 3.09% at the end of the period versus 3.70% at the start of the period.
Yields have declined partly because of a harsh winter in much of the country, which contributed to slower economic activity. While the second quarter of 2014 produced more robust growth, it still wasn’t enough to push interest rates higher. So whether by means of a vigilant Fed or through insufficient growth, the long end of the yield curve has “flattened.”
Results at a glance
For periods ended August 31, 2014, with all distributions reinvested
| Cumulative total returns | Average annual total returns | |||||||||||||||
| Lifetime | ||||||||||||||||
| 1 year | 5 years | 10 years | (since 10/17/85) | |||||||||||||
| U.S. Government Securities Fund (Class A shares) | 4.32 | % | 3.33 | % | 3.87 | % | 6.05 | % | ||||||||
| Barclays U.S. Government/ Mortgage-Backed Securities Index* | 4.33 | 3.51 | 4.46 | 6.95 | ||||||||||||
| Lipper General U.S. Government Funds Average | 4.38 | 3.17 | 3.67 | 5.89 | ||||||||||||
| * | The index is unmanaged and, therefore, has no expenses. Investors cannot invest directly in an index. |
| U.S. Government Securities Fund | 1 |
A flatter curve
A flatter yield curve reflects some caution regarding the economy. A bondholder accepts a lower return or yield to lend money for a longer period of time if he or she thinks yields, in general, will go lower still or at least not move higher in response to inflation and economic growth. Indeed wage growth and capital spending by companies have been disappointing.
Still, while corporate investment since the recession has been disappointing, a bright spot is that companies are engaging in merger and acquisition (M&A) activity. M&A activity, although not immediately beneficial for job creation and wage increases, is partly how the economy optimizes the way it delivers goods and services. We think companies spending more directly to grow their businesses, instead of spending simply to make acquisitions, will follow M&A activity.
Inside the portfolio
Because rates are so low, and we have a generally positive economic outlook, we have been conservatively positioned. The duration of the fund is a modest 4.8 years as of June 30, keeping it in what’s considered the intermediate range. We have also increased the fund’s position in agency mortgage-backed securities over the past six months from around 19% of assets to around 29%. As the Fed embarked on its course to lower its monthly purchases of mortgage-backed bonds, investors sold them. Consequently, we were able to buy some at attractive prices.
An additional tool to control risk
The fund has also made use of interest rate swaps for the first time recently, which is related to its increased exposure to agency mortgage-backed securities. Although swaps entail the risk of loss if we incorrectly anticipate interest rate changes, they may be thought of as tools to help soften the effects of interest rate risk.
Mortgage-backed securities differ from other bonds in that their durations may change as interest rates change, making the use of swaps attractive. More specifically, if rates fall, more homeowners refinance their mortgages. This means that prepayments can occur on the fund’s mortgage-backed securities, shortening their duration. If rates increase, the opposite happens – fewer homeowners refinance, and the duration of mortgage-backed securities may lengthen.
In addition to using swaps to help maintain its desired duration, the fund has gently increased its exposure to Treasury Inflation-Protected Securities (TIPS) from around 7% to around 11% over the past six months. TIPS function as inflation hedges because their principal and interest payments fluctuate with the Consumer Price Index (an inflation indicator that measures the changes in the price of certain goods and services).
Looking ahead
We are prepared for a stronger economy, but also one in which rates will likely rise modestly rather than powerfully. A lot of deleveraging has occurred, and we think the economy will resume modest growth as a result.
Additionally, the Fed is expected to proceed with the discontinuation of its bond purchase program in the near future. We are particularly focused on how that discontinuation will affect mortgage-backed security prices. Although we think the markets have mostly accounted for the Fed’s reduction of mortgage-backed security purchases, it’s possible that a potential sale of mortgage-backed securities could send their prices down.
We think the prudent use of swaps and TIPS to govern the fund’s duration should help protect investors in the event of an increase in rates. Of course, the use of swaps and TIPS entails certain risks, such as losses, if interest rate changes are not correctly anticipated.
Finally, we believe government securities will remain an important component of a diversified portfolio even if interest rates do eventually trend higher. We strive to maintain a very high-quality portfolio that can help protect against economic uncertainties as they impact other portions of investors’ individual portfolios. (For more about the role of a government securities fund in a diversified portfolio, please see our feature on page 4.)
We thank you for your continued confidence and support and look forward to reporting to you again in six months.
Cordially,

Thomas H. Høgh
President
October 14, 2014
For current information about the fund, visit americanfunds.com.
Treasury yield curves at the beginning and end of the fiscal year
| Source: Treasury.gov | ||
 |
| 2 | U. S. Government Securities Fund |
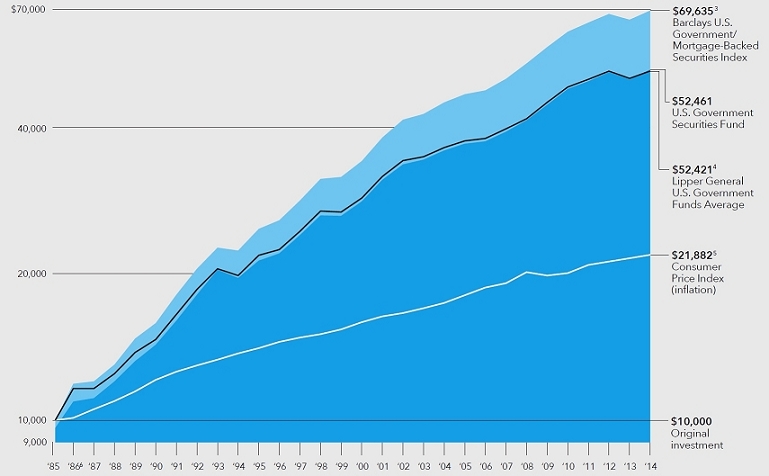
The value of a long-term perspective
How a $10,000 investment has grown (for the period October 17, 1985, to August 31, 2014, with distributions reinvested)
Fund results shown reflect deduction of the maximum sales charge of 3.75% on the $10,000 investment.1 Thus, the net amount invested was $9,625.2
| 1 | As outlined in the prospectus, the sales charge is reduced for accounts (and aggregated investments) of $100,000 or more and is eliminated for purchases of $1 million or more. There is no sales charge on dividends or capital gain distributions that are reinvested in additional shares. |
| 2 | The maximum initial sales charge was 4.75% prior to January 10, 2000. |
| 3 | The index is unmanaged and, therefore, has no expenses. Investors cannot invest directly in an index. |
| 4 | Results of the Lipper General U.S. Government Funds Average, represented by the black line, do not reflect any sales charges. |
| 5 | Computed from data supplied by the U.S. Department of Labor, Bureau of Labor Statistics. |
| 6 | For the period October 17, 1985, commencement of operations, through August 31, 1986. |
Past results are not predictive of results for future periods. The results shown are before taxes on fund distributions and sale of fund shares.
Average annual total returns based on a $1,000 investment (for periods ended August 31, 2014)*
| 1 year | 5 years | 10 years | ||||
| Class A shares | 0.43% | 2.54% | 3.47% |
| * | Assumes reinvestment of all distributions and payment of the maximum 3.75% sales charge. |
Investment results assume all distributions are reinvested and reflect applicable fees and expenses. When applicable, investment results reflect fee waivers, without which results would have been lower. Visit americanfunds.com for more information.
| U.S. Government Securities Fund | 3 |

| 4 | U.S. Government Securities Fund |
U.S. Government Securities Fund has fulfilled its functions of stability and maintenance of purchasing power. The fund has returned 3.33% annualized over the past five years through August 31, despite a loss of 3.37% for the fund’s fiscal year in 2013 as bond markets wobbled slightly in preparation of the Federal Reserve “tapering” or reducing its bond purchasing activities. This result has exceeded inflation (1.96% annualized, measured by CPI) and kept purchasing power intact.
As solid as these results are, it’s tempting to overlook them given that global stock markets have had a powerful surge after the financial crisis. For the five year period through August 31, 2014, the unmanaged Standard & Poor’s 500 Composite Index has returned 16.87% annualized. That average annual return is significantly higher than the stock market’s average for nearly the past century. Foreign stock markets did less well, but still posted very strong returns, with the MSCI All Country World Index (ACWI) ex USA* gaining 8.17% annualized over the five-year period.
Five years of strong stock returns
Five years of strong stock returns, albeit after wrenching losses during the financial crisis, have reminded us of how stocks can outperform bonds in powerful bull markets. Indeed, in investment parlance stocks and government bonds are said to have “negative correlation,” meaning they often produce significantly different returns both year-to-year and over the longer haul, and some investors may be tempted to neglect or even sell some of their government bond holdings when stock markets surge.
However, this could be a mistake because low or negative correlation also means that government bonds tend to hold up well when stocks are slumping and investors are seeking safety. So after the stock market’s rally since 2009, we think it’s a good time to remind investors of U.S. Government Securities Fund’s solid results during stock market declines. After all, behavioral finance has shown that investors suffer from “recency bias” among other things, which encourages them to extrapolate five years of strong performance in stocks (or any asset class) far into the future without interruption. In other words, just when investors are likely to forget the benefits of owning a government bond fund may be the right time to remind them.
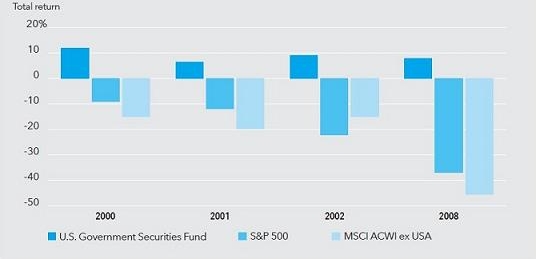
U.S. Government Securities Fund has provided stability
We are not making short-term predictions about markets, and we still think stocks will outpace inflation over the long run, but we present the bar chart above to show investors how U.S. Government Securities Fund has provided stability during the worst four calendar years for stocks over the past 20 years.
As the chart shows, in 2008 the S&P 500 dropped 36.99% and the MSCI ACWI ex USA (a measure of stock markets outside the U.S.) dropped 45.53%. However, U.S. Government Securities Fund gained 7.73%.
Fund results shown are for Class A shares at net asset value. If a sales charge (maximum 3.75%) had been deducted, the results would have been lower. Results are for past periods and are not predictive of results for future periods. Current and future results may be lower or higher than those shown. Share prices and returns will vary, so investors may lose money. For current information and month-end results, visit americanfunds.com.
| * | Results for MSCI ACWI ex USA reflect dividends gross of withholding taxes through December 31, 2000, and dividends net of withholding taxes thereafter. |
U.S. Government Securities Fund during recent stock market declines
| U.S. Government Securities Fund | 5 |
The case for investing in U.S. Government Securities Fund consists of its usually negative correlation to equities and high-yield corporate bonds, its limited interest rate sensitivity and its credit safety.
Additionally, during the bursting of the technology bubble, the S&P 500 dropped 9.10%, 11.88% and 22.09% in 2000, 2001 and 2002, respectively. The MSCI ACWI ex USA dropped 15.09%, 19.73% and 14.95% during those years. By contrast, when the world’s stock markets were plunging, U.S. Government Securities Fund posted returns of 11.93%, 6.41% and 9.02% in 2000, 2001 and 2002, respectively.
While owners of stocks suffered dramatically in 2000-2002 and again in 2008, there is little doubt that portfolios that had exposure to government bonds fared less poorly and helped investors sleep better at night. For example, although it is impossible to invest directly in an index, a simple hypothetical portfolio comprised of 50% in the S&P 500 and 50% in U.S. Government Securities Fund dropped by 14.63% in 2008 instead of the full 36.99% of the index. While a 15% drop in one’s portfolio is unpleasant, it pales in comparison to a 37% plunge. This hypothetical portfolio mix is not necessarily correct for many investors, but it illustrates how government bonds can cushion the bumpy ride of the stock market. Somewhat paradoxically, holding government bonds, which tend to perform well when stocks drop, can help an investor tolerate the volatility of stocks, which usually outpace inflation over long periods of time.
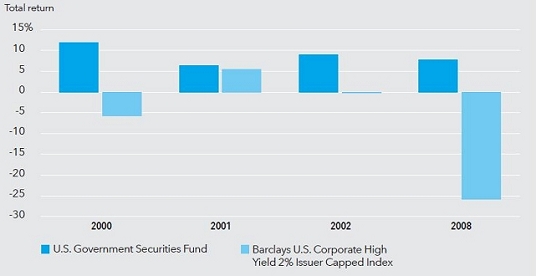
Not all bonds are created equal
Furthermore, it’s important to note that not all bonds provide the ballast against stocks that government bonds from developed countries have done. As portfolio manager Thomas Høgh notes, “Not all bonds are created equal.” To illustrate this, we compare U.S. Government Securities Fund to high-yield corporate bonds in the bar chart, below left. This comparison of U.S. Government Securities Fund to the Barclays U.S. Corporate High Yield 2% Issuer Capped Index (a high-yield corporate bond index) looks a bit like the bar chart on page 5, because high-yield corporate bonds exhibit price movements similar to stocks. That means they have not provided the downside protection in difficult markets that government bonds have. Indeed, in every year the stock market declined over the past 20 years except for one (2001), high-yield corporate bonds also fell. In other words, high-yield corporate bonds haven’t provided the stability to investors in times of market stress that government bonds have.
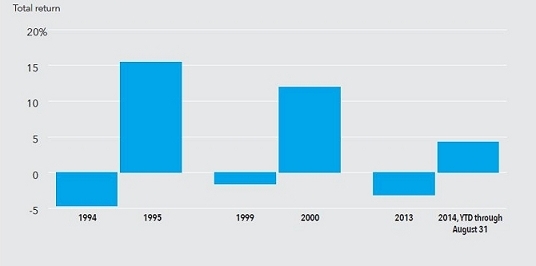
Bouncing back from rate hikes
Finally, although high-quality government bonds of developed countries tend to provide good support to portfolios when stocks and high-yield bonds are faring poorly, they entail an important risk – interest rate risk. This risk has to do with the fact that bonds are essentially loans and, as such, pay a fixed-dollar interest return to an investor.
If interest rates move higher from the time the investor buys his or her bonds or bond mutual fund, the prices of existing bonds or a bond mutual fund decline. Assuming the bonds remain credit-worthy, the investor will get paid all
Not all bonds are created equal
| 6 | U.S. Government Securities Fund |

interest and face value due, but he or she will face price declines in the interim and the opportunity cost of having money earn a lower rate than it could otherwise. This risk can be mitigated, though not eliminated, by owning bonds that mature relatively quickly or are said to have a low “duration.”
In light of this risk, we wanted to show the fund’s returns during rising interest rate environments, and how long the fund has taken to recover losses incurred during rising-rate periods. The bar chart, below right, shows the fund’s returns for the three years of the past 20 years when rates have risen and bonds have generally declined –1994, 1999 and 2013. The chart also shows how the fund rebounded the year after the declines. In 1994 and 1999, the fund declined 4.65% and 1.59%, respectively. However, powerful rebounds in 1995 and 2000 more than made up for those negative returns, as the fund rose 15.46% and 11.93%, respectively, in those years. In 2013, as the Federal Reserve contemplated its “taper” or scaling back of its monthly bond purchases, the fund declined 3.16%. It subsequently rebounded 4.26% through August 31, 2014, producing a total return that negated the loss of 2013.
Finally, although interest rate spikes send bond prices down, gently rising rates provide the opportunity of investing interest payments in bonds with higher yields.
Helping keep portfolios stable
Not only did the fund avoid severe declines in each instance due to its limited duration, but it also rebounded quickly, helping keep portfolios stable and allowing investors with shorter time horizons to keep their investment intact. Past return characteristics are not a guarantee of future results, and a protracted period of interest rate increases could hurt the fund more significantly. However, barring dramatic inflation and interest rate spikes, the fund has the potential to provide decent downside protection in stock market downdrafts.
In conclusion, as Thomas Høgh notes, “The case for investing in U.S. Government Securities Fund consists of its usually negative correlation to equities and high-yield corporate bonds, its high credit quality, its history of low volatility and its limited interest rate sensitivity.” While these characteristics may seem stodgy to investors, they have combined to provide diversification, keep long-term portfolios stable and help investors with shorter term time horizons. Investors tend to underappreciate these stable characteristics just before their benefits become more apparent. ■
How the fund rebounded a year after a decline
| U.S. Government Securities Fund | 7 |
Summary investment portfolio August 31, 2014
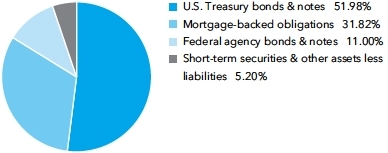
| Investment mix by security type | Percent of net assets |
| Percent of | ||||||||
| Mortgage-backed obligations summary | net assets | |||||||
| 30-year pass-throughs: | ||||||||
| Fannie Mae | 22.09 | % | ||||||
| Ginnie Mae | 2.56 | |||||||
| Freddie Mac | 1.66 | 26.31 | % | |||||
| 15-year pass-throughs | .57 | |||||||
| Other | 4.94 | |||||||
| Total | 31.82 | % | ||||||
| Percent of | ||||
| Portfolio quality summary* | net assets | |||
| U.S. Treasury and agency bonds & notes† | 62.98 | % | ||
| AAA/Aaa | 31.82 | |||
| Short-term securities & other assets less liabilities | 5.20 | |||
Long-term obligations of the U.S. government and federal agencies are currently rated AAA by at least one rating agency. These obligations are currently rated AA+ by Standard & Poor’s.
| * | Bond ratings, which typically range from AAA/Aaa (highest) to D (lowest), are assigned by credit rating agencies such as Standard & Poor’s, Moody’s and/or Fitch as an indication of an issuer’s creditworthiness. In assigning a credit rating to a security, the fund looks specifically to the ratings assigned to the issuer of the security by Standard & Poor’s, Moody’s and Fitch. If agency ratings differ, the security will be considered to have received the highest of those ratings, consistent with the fund’s investment policies. The information in the Portfolio quality summary table is not covered by the Report of Independent Registered Public Accounting Firm. |
| † | These securities are guaranteed by the full faith and credit of the United States government. |
| Bonds, notes & other debt instruments 94.80% | Principal amount (000) | Value (000) | ||||||
| U.S. Treasury bonds & notes 51.98% | ||||||||
| U.S. Treasury 41.27% | ||||||||
| U.S. Treasury 11.25% 2015 | $ | 45,265 | $ | 47,549 | ||||
| U.S. Treasury 1.50% 2016 | 94,050 | 95,859 | ||||||
| U.S. Treasury 1.50% 20161 | 49,925 | 50,874 | ||||||
| U.S. Treasury 2.125% 2016 | 58,100 | 59,679 | ||||||
| U.S. Treasury 4.625% 2016 | 49,175 | 53,470 | ||||||
| U.S. Treasury 0.625% 2017 | 44,250 | 43,785 | ||||||
| U.S. Treasury 0.75% 2017 | 44,000 | 43,811 | ||||||
| U.S. Treasury 2.75% 2017 | 41,000 | 43,090 | ||||||
| U.S. Treasury 4.625% 2017 | 39,725 | 43,483 | ||||||
| U.S. Treasury 1.25% 2018 | 48,350 | 47,972 | ||||||
| U.S. Treasury 1.50% 2019 | 138,750 | 138,133 | ||||||
| U.S. Treasury 1.50% 2019 | 45,250 | 45,216 | ||||||
| U.S. Treasury 1.625% 2019 | 230,000 | 230,189 | ||||||
| U.S. Treasury 1.625% 2019 | 88,900 | 88,911 | ||||||
| U.S. Treasury 3.625% 2019 | 36,000 | 39,424 | ||||||
| U.S. Treasury 1.25% 2020 | 56,500 | 54,959 | ||||||
| U.S. Treasury 2.25% 2021 | 224,250 | 227,903 | ||||||
| U.S. Treasury 1.625% 2022 | 80,258 | 76,834 | ||||||
| U.S. Treasury 1.625% 2022 | 71,479 | 68,721 | ||||||
| U.S. Treasury 1.75% 2022 | 125,000 | 121,621 | ||||||
| U.S. Treasury 2.00% 2023 | 51,498 | 50,617 | ||||||
| U.S. Treasury 2.50% 2023 | 49,475 | 50,413 | ||||||
| U.S. Treasury 2.75% 2023 | 218,900 | 227,271 | ||||||
| U.S. Treasury 2.75% 2024 | 192,700 | 199,845 | ||||||
| U.S. Treasury 2.875% 2043 | 52,609 | 50,509 | ||||||
| U.S. Treasury 3.625% 2043 | 35,000 | 38,741 | ||||||
| U.S. Treasury 0.38%—8.75% 2015—2044 | 351,275 | 360,911 | ||||||
| 2,599,790 | ||||||||
| 8 | U.S. Government Securities Fund |
| Principal amount (000) | Value (000) | |||||||
| U.S. Treasury inflation-protected securities 10.71% | ||||||||
| U.S. Treasury Inflation-Protected Security 1.875% 20152 | $ | 44,772 | $ | 46,026 | ||||
| U.S. Treasury Inflation-Protected Security 0.125% 20162 | 44,534 | 45,326 | ||||||
| U.S. Treasury Inflation-Protected Security 0.125% 20172 | 73,311 | 75,056 | ||||||
| U.S. Treasury Inflation-Protected Security 0.125% 20192 | 82,656 | 84,188 | ||||||
| U.S. Treasury Inflation-Protected Security 0.625% 20242 | 113,415 | 117,458 | ||||||
| U.S. Treasury Inflation-Protected Security 1.375% 20442 | 166,830 | 190,647 | ||||||
| U.S. Treasury Inflation-Protected Security 0.12%—2.40% 2015—20412 | 109,617 | 116,225 | ||||||
| 674,926 | ||||||||
| Total U.S. Treasury bonds & notes | 3,274,716 | |||||||
| Mortgage-backed obligations 31.82% | ||||||||
| Federal agency mortgage-backed obligations 31.82% | ||||||||
| Fannie Mae 4.00% 20433 | 42,745 | 45,610 | ||||||
| Fannie Mae 3.50% 20443,4 | 168,796 | 173,789 | ||||||
| Fannie Mae 3.50% 20443,4 | 41,574 | 42,674 | ||||||
| Fannie Mae 4.50% 20443,4 | 544,071 | 586,162 | ||||||
| Fannie Mae 4.50% 20443,4 | 336,108 | 362,997 | ||||||
| Fannie Mae 0%—10.52% 2017—20473,4,5 | 234,396 | 250,935 | ||||||
| Freddie Mac 0%—10.14% 2016—20443,4,5 | 151,404 | 160,753 | ||||||
| Government National Mortgage Assn. 4.00% 20443 | 96,430 | 102,743 | ||||||
| Government National Mortgage Assn. 4.00% 20443 | 45,551 | 48,610 | ||||||
| Government National Mortgage Assn. 3.00%—10.00% 2019—20583,5 | 157,062 | 170,173 | ||||||
| Other securities | 60,027 | |||||||
| Total mortgage-backed obligations | 2,004,473 | |||||||
| Federal agency bonds & notes 11.00% | ||||||||
| Fannie Mae 0.46%—7.13% 2015—20333,5 | 45,439 | 48,921 | ||||||
| Federal Farm Credit Banks 0.60% 2017 | 74,292 | 73,747 | ||||||
| Federal Farm Credit Banks 0.20%—1.63% 2014—20175 | 52,911 | 53,010 | ||||||
| Federal Home Loan Bank 0.375% 2015 | 61,000 | 61,089 | ||||||
| Federal Home Loan Bank, Series 2816, 1.00% 2017 | 43,705 | 43,762 | ||||||
| Federal Home Loan Bank 0.37%—5.50% 2015—2036 | 71,450 | 72,606 | ||||||
| Freddie Mac 1.25% 2019 | 51,820 | 50,394 | ||||||
| Freddie Mac 0.54%—3.39% 2015—20243,5 | 109,553 | 110,997 | ||||||
| Tennessee Valley Authority 1.88%—5.88% 2021—2048 | 62,500 | 67,168 | ||||||
| TVA Southaven 3.846% 20333 | 2,978 | 3,144 | ||||||
| United States Agency for International Development, Jordan (Kingdom of) 1.945% 2019 | 38,500 | 38,885 | ||||||
| United States Agency for International Development, Jordan (Kingdom of) 2.503% 2020 | 8,200 | 8,323 | ||||||
| United States Agency for International Development, Republic of Egypt 4.45% 2015 | 19,000 | 19,802 | ||||||
| United States Agency for International Development, State of Israel, Class 1-A, 5.50% 2023 | 5,000 | 6,144 | ||||||
| United States Agency for International Development, Ukraine, 1.844% 2019 | 2,890 | 2,868 | ||||||
| Other securities | 32,393 | |||||||
| 693,253 | ||||||||
| Total bonds, notes & other debt instruments (cost: $5,864,630,000) | 5,972,442 | |||||||
| Short-term securities 27.07% | ||||||||
| Bank of New York Mellon Corp. 0.04% due 9/2/20146 | 50,000 | 50,000 | ||||||
| E.I. duPont de Nemours and Co. 0.07% due 9/4/2014—9/26/20146 | 61,000 | 60,998 | ||||||
| Fannie Mae 0.06%—0.14% due 9/8/2014—6/1/2015 | 551,200 | 551,019 | ||||||
| Federal Home Loan Bank 0.05%—0.16% due 9/12/2014—8/3/2015 | 721,000 | 720,871 | ||||||
| Freddie Mac 0.08%—0.13% due 9/16/2014—3/10/2015 | 143,000 | 142,958 | ||||||
| Merck & Co. Inc. 0.07%—0.08% due 9/3/2014—9/9/20146 | 85,700 | 85,699 | ||||||
| Other securities | 93,597 | |||||||
| Total short-term securities (cost: $1,704,995,000) | 1,705,142 | |||||||
| Total investment securities 121.87% (cost: $7,569,625,000) | 7,677,584 | |||||||
| Other assets less liabilities (21.87%) | (1,377,743 | ) | ||||||
| Net assets 100.00% | $ | 6,299,841 | ||||||
This summary investment portfolio is designed to streamline the report and help investors better focus on the fund’s principal holdings. See page 32 for details on how to obtain a complete schedule of portfolio holdings.
“Other securities” includes all issues that are not disclosed separately in the summary investment portfolio.
| U.S. Government Securities Fund | 9 |
Interest rate swaps
The fund has entered into interest rate swaps as shown in the following table. The average notional amount of interest rate swaps was $719,600,000 over the prior 10-month period.
| Unrealized | ||||||||||||||||
| appreciation | ||||||||||||||||
| Notional | (depreciation) at | |||||||||||||||
| Pay/receive | Floating rate | Fixed | Expiration | amount | 8/31/2014 | |||||||||||
| floating rate | index | rate | date | (000 | ) | (000 | ) | |||||||||
| Pay | 3-month USD-LIBOR | 0.4975 | % | 1/8/2016 | $ | 50,000 | $32 | |||||||||
| Receive | 3-month USD-LIBOR | 1.32125 | 1/8/2018 | 30,000 | (35 | ) | ||||||||||
| Receive | 3-month USD-LIBOR | 1.314 | 5/20/2018 | 35,000 | 130 | |||||||||||
| Receive | 3-month USD-LIBOR | 1.49 | 11/29/2018 | 50,000 | 184 | |||||||||||
| Pay | 3-month USD-LIBOR | 1.7905 | 6/20/2019 | 58,600 | 180 | |||||||||||
| Pay | 3-month USD-LIBOR | 1.789 | 6/20/2019 | 234,800 | 707 | |||||||||||
| Pay | 3-month USD-LIBOR | 1.7945 | 6/20/2019 | 146,600 | 479 | |||||||||||
| Pay | 3-month USD-LIBOR | 1.732 | 6/27/2019 | 115,000 | 14 | |||||||||||
| Pay | 3-month USD-LIBOR | 1.8065 | 7/29/2019 | 120,000 | 322 | |||||||||||
| Pay | 3-month USD-LIBOR | 1.821 | 7/31/2019 | 108,000 | 362 | |||||||||||
| Pay | 3-month USD-LIBOR | 1.799 | 8/8/2019 | 112,000 | 224 | |||||||||||
| Pay | 3-month USD-LIBOR | 1.773 | 8/11/2019 | 108,000 | 65 | |||||||||||
| Pay | 3-month USD-LIBOR | 1.7725 | 8/11/2019 | 112,000 | 64 | |||||||||||
| Receive | 3-month USD-LIBOR | 2.33565 | 4/11/2021 | 60,000 | (962 | ) | ||||||||||
| Receive | 3-month USD-LIBOR | 2.205 | 7/23/2021 | 105,000 | (550 | ) | ||||||||||
| Receive | 3-month USD-LIBOR | 2.7343 | 11/22/2023 | 100,000 | (2,686 | ) | ||||||||||
| Receive | 3-month USD-LIBOR | 2.74125 | 11/22/2023 | 79,000 | (2,169 | ) | ||||||||||
| Receive | 3-month USD-LIBOR | 2.7395 | 6/11/2024 | 61,000 | (1,456 | ) | ||||||||||
| Receive | 3-month USD-LIBOR | 2.683 | 8/4/2024 | 63,000 | (1,116 | ) | ||||||||||
| Receive | 3-month USD-LIBOR | 3.34 | 6/27/2044 | 80,000 | (4,537 | ) | ||||||||||
| Receive | 3-month USD-LIBOR | 3.206 | 7/31/2044 | 27,000 | (794 | ) | ||||||||||
| Receive | 3-month USD-LIBOR | 3.238 | 8/8/2044 | 28,000 | (998 | ) | ||||||||||
| $(12,540 | ) | |||||||||||||||
The following footnotes apply to either the individual securities noted or one or more of the securities aggregated and listed as a single line item.
| 1 | A portion of this security was pledged as collateral. The total value of pledged collateral was $21,280,000, which represented .34% of the net assets of the fund. |
| 2 | Index-linked bond whose principal amount moves with a government price index. |
| 3 | Principal payments may be made periodically. Therefore, the effective maturity date may be earlier than the stated maturity date. |
| 4 | A portion or all of the security purchased on a TBA basis. |
| 5 | Coupon rate may change periodically. |
| 6 | Acquired in a transaction exempt from registration under Rule 144A or Section 4(2) of the Securities Act of 1933. May be resold in the U.S. in transactions exempt from registration, normally to qualified institutional buyers. The total value of all such securities, including those in “Other securities,” was $255,487,000, which represented 4.06% of the net assets of the fund. |
Key to abbreviation
TBA = To be announced
See Notes to Financial Statements
| 10 | U.S. Government Securities Fund |
| Statement of assets and liabilities at August 31, 2014 | (dollars in thousands) |
| Assets: | ||||||||
| Investment securities, at value (cost: $7,569,625) | $ | 7,677,584 | ||||||
| Cash | 124 | |||||||
| Receivables for: | ||||||||
| Sales of investments | $ | 1,419,835 | ||||||
| Sales of fund’s shares | 8,048 | |||||||
| Interest | 22,120 | 1,450,003 | ||||||
| 9,127,711 | ||||||||
| Liabilities: | ||||||||
| Payables for: | ||||||||
| Purchases of investments | 2,815,716 | |||||||
| Repurchases of fund’s shares | 4,971 | |||||||
| Dividends on fund’s shares | 157 | |||||||
| Investment advisory services | 1,101 | |||||||
| Services provided by related parties | 3,000 | |||||||
| Trustees’ deferred compensation | 244 | |||||||
| Variation margin | 2,547 | |||||||
| Other | 134 | 2,827,870 | ||||||
| Net assets at August 31, 2014 | $ | 6,299,841 | ||||||
| Net assets consist of: | ||||||||
| Capital paid in on shares of beneficial interest | $ | 6,252,377 | ||||||
| Undistributed net investment income | 1,341 | |||||||
| Distributions in excess of net realized gain | (49,295 | ) | ||||||
| Net unrealized appreciation | 95,418 | |||||||
| Net assets at August 31, 2014 | $ | 6,299,841 |
(dollars and shares in thousands, except per-share amounts)
Shares of beneficial interest issued and outstanding (no stated par value) —
unlimited shares authorized (450,369 total shares outstanding)
| Shares | Net asset value | |||||||||||
| Net assets | outstanding | per share | ||||||||||
| Class A | $ | 2,653,898 | 189,705 | $ | 13.99 | |||||||
| Class B | 37,236 | 2,664 | 13.98 | |||||||||
| Class C | 272,460 | 19,496 | 13.98 | |||||||||
| Class F-1 | 163,646 | 11,698 | 13.99 | |||||||||
| Class F-2 | 70,661 | 5,051 | 13.99 | |||||||||
| Class 529-A | 138,085 | 9,871 | 13.99 | |||||||||
| Class 529-B | 3,376 | 242 | 13.97 | |||||||||
| Class 529-C | 60,994 | 4,366 | 13.97 | |||||||||
| Class 529-E | 8,045 | 575 | 13.99 | |||||||||
| Class 529-F-1 | 10,182 | 728 | 13.99 | |||||||||
| Class R-1 | 14,165 | 1,013 | 13.98 | |||||||||
| Class R-2 | 146,953 | 10,514 | 13.98 | |||||||||
| Class R-2E | 10 | 1 | 13.99 | |||||||||
| Class R-3 | 142,210 | 10,166 | 13.99 | |||||||||
| Class R-4 | 120,130 | 8,587 | 13.99 | |||||||||
| Class R-5 | 100,776 | 7,203 | 13.99 | |||||||||
| Class R-6 | 2,357,014 | 168,489 | 13.99 | |||||||||
See Notes to Financial Statements
| U.S. Government Securities Fund | 11 |
| Statement of operations | |
| for the year ended August 31, 2014 | (dollars in thousands) |
| Investment income: | ||||||||
| Income: | ||||||||
| Interest | $ | 107,892 | ||||||
| Fees and expenses*: | ||||||||
| Investment advisory services | $ | 13,058 | ||||||
| Distribution services | 14,010 | |||||||
| Transfer agent services | 6,903 | |||||||
| Administrative services | 1,892 | |||||||
| Reports to shareholders | 322 | |||||||
| Registration statement and prospectus | 217 | |||||||
| Trustees’ compensation | 73 | |||||||
| Auditing and legal | 107 | |||||||
| Custodian | 13 | |||||||
| Other | 309 | 36,904 | ||||||
| Net investment income | 70,988 | |||||||
| Net realized gain and unrealized appreciation on investments and interest rate swaps: | ||||||||
| Net realized gain (loss) on: | ||||||||
| Investments | 72,263 | |||||||
| Interest rate swaps | (4,576 | ) | 67,687 | |||||
| Net unrealized appreciation (depreciation) on: | ||||||||
| Investments | 135,892 | |||||||
| Interest rate swaps | (12,540 | ) | 123,352 | |||||
| Net realized gain and unrealized appreciation on investments and interest rate swaps | 191,039 | |||||||
| Net increase in net assets resulting from operations | $ | 262,027 |
| * | Additional information related to class-specific fees and expenses is included in the Notes to Financial Statements. |
| Statements of changes in net assets | |
| (dollars in thousands) |
| Year ended August 31 | ||||||||
| 2014 | 2013 | |||||||
| Operations: | ||||||||
| Net investment income | $ | 70,988 | $ | 22,654 | ||||
| Net realized gain (loss) on investments and interest rate swaps | 67,687 | (655 | ) | |||||
| Net unrealized appreciation (depreciation) on investments and interest rate swaps | 123,352 | (259,367 | ) | |||||
| Net increase (decrease) in net assets resulting from operations | 262,027 | (237,368 | ) | |||||
| Dividends and distributions paid or accrued to shareholders: | ||||||||
| Dividends from net investment income | (68,869 | ) | (57,650 | ) | ||||
| Distributions from net realized gain on investments | (52,846 | ) | (176,821 | ) | ||||
| Total dividends and distributions paid or accrued to shareholders | (121,715 | ) | (234,471 | ) | ||||
| Net capital share transactions | (123,408 | ) | (581,810 | ) | ||||
| Total increase (decrease) in net assets | 16,904 | (1,053,649 | ) | |||||
| Net assets: | ||||||||
| Beginning of year | 6,282,937 | 7,336,586 | ||||||
| End of year (including undistributed and distributions in excess of net investment income: $1,341 and $(380), respectively) | $ | 6,299,841 | $ | 6,282,937 | ||||
See Notes to Financial Statements
| 12 | U.S. Government Securities Fund |
Notes to financial statements
1. Organization
The American Funds Income Series (the “trust”) is registered under the Investment Company Act of 1940 as an open-end, diversified management investment company and has initially issued one series of shares, U.S. Government Securities Fund (the “fund”). The fund seeks a high level of current income, as well as preservation of capital, by investing at least 80% of the fund’s assets in securities guaranteed or sponsored by the United States government.
The fund has 17 share classes consisting of five retail share classes (Classes A, B and C, as well as two F share classes, F-1 and F-2), five 529 college savings plan share classes (Classes 529-A, 529-B, 529-C, 529-E and 529-F-1) and seven retirement plan share classes (Classes R-1, R-2, R-2E, R-3, R-4, R-5 and R-6). The 529 college savings plan share classes can be used to save for college education. The retirement plan share classes are generally offered only through eligible employer-sponsored retirement plans. The fund’s share classes are described further in the following table:
| Share class | Initial sales charge | Contingent deferred sales charge upon redemption | Conversion feature | ||||
| Classes A and 529-A | Up to 3.75% | None (except 1% for certain redemptions within one year of purchase without an initial sales charge) | None | ||||
| Classes B and 529-B* | None | Declines from 5% to 0% for redemptions within six years of purchase | Classes B and 529-B convert to Classes A and 529-A, respectively, after eight years | ||||
| Class C | None | 1% for redemptions within one year of purchase | Class C converts to Class F-1 after 10 years | ||||
| Class 529-C | None | 1% for redemptions within one year of purchase | None | ||||
| Class 529-E | None | None | None | ||||
| Classes F-1, F-2 and 529-F-1 | None | None | None | ||||
| Classes R-1, R-2, R-2E, R-3, R-4, R-5 and R-6 | None | None | None |
* Class B and 529-B shares of the fund are not available for purchase.
On August 29, 2014, the fund made an additional retirement plan share class (Class R-2E) available for sale pursuant to an amendment to its registration statement filed with the U.S. Securities and Exchange Commission. Refer to the fund’s prospectus for more details.
Holders of all share classes have equal pro rata rights to the assets, dividends and liquidation proceeds of the fund. Each share class has identical voting rights, except for the exclusive right to vote on matters affecting only its class. Share classes have different fees and expenses (“class-specific fees and expenses”), primarily due to different arrangements for distribution, transfer agent and administrative services. Differences in class-specific fees and expenses will result in differences in net investment income and, therefore, the payment of different per-share dividends by each share class.
2. Significant accounting policies
The fund is an investment company that applies the accounting and reporting guidance issued in Topic 946 by the U.S. Financial Accounting Standards Board. The fund’s financial statements have been prepared to comply with U.S. generally accepted accounting principles (“U.S. GAAP”). These principles require the fund’s investment adviser to make estimates and assumptions that affect reported amounts and disclosures. Actual results could differ from those estimates. The fund follows the significant accounting policies described in this section, as well as the valuation policies described in the next section on valuation.
Security transactions and related investment income — Security transactions are recorded by the fund as of the date the trades are executed with brokers. Realized gains and losses from security transactions are determined based on the specific identified cost of the securities. In the event a security is purchased with a delayed payment date, the fund will segregate liquid assets sufficient to meet its payment obligations. Interest income is recognized on an accrual basis. Market discounts, premiums and original issue discounts on fixed-income securities are amortized daily over the expected life of the security.
| U.S. Government Securities Fund | 13 |
Class allocations — Income, fees and expenses (other than class-specific fees and expenses) are allocated daily among the various share classes based on the relative value of their settled shares. Realized and unrealized gains and losses are allocated daily among the various share classes based on their relative net assets. Class-specific fees and expenses, such as distribution, transfer agent and administrative services, are charged directly to the respective share class.
Dividends and distributions to shareholders — Dividends to shareholders are declared daily after the determination of the fund’s net investment income and are paid to shareholders monthly. Distributions to shareholders are recorded on the ex-dividend date.
3. Valuation
Capital Research and Management Company (“CRMC”), the fund’s investment adviser, values the fund’s investments at fair value as defined by U.S. GAAP. The net asset value of each share class of the fund is generally determined as of approximately 4:00 p.m. New York time each day the New York Stock Exchange is open.
Methods and inputs — The fund’s investment adviser uses the following methods and inputs to establish the fair value of the fund’s assets and liabilities. Use of particular methods and inputs may vary over time based on availability and relevance as market and economic conditions evolve.
Fixed-income securities, including short-term securities, are generally valued at prices obtained from one or more pricing vendors. Vendors value such securities based on one or more of the inputs described in the following table. The table provides examples of inputs that are commonly relevant for valuing particular classes of fixed-income securities in which the fund is authorized to invest. However, these classifications are not exclusive, and any of the inputs may be used to value any other class of fixed-income security.
| Fixed-income class | Examples of standard inputs | |
| All | Benchmark yields, transactions, bids, offers, quotations from dealers and trading systems, new issues, spreads and other relationships observed in the markets among comparable securities; and proprietary pricing models such as yield measures calculated using factors such as cash flows, financial or collateral performance and other reference data (collectively referred to as “standard inputs”) | |
| Bonds & notes of governments & government agencies | Standard inputs and interest rate volatilities | |
| Mortgage-backed; asset-backed obligations | Standard inputs and cash flows, prepayment information, default rates, delinquency and loss assumptions, collateral characteristics, credit enhancements and specific deal information |
When the fund’s investment adviser deems it appropriate to do so (such as when vendor prices are unavailable or deemed to be not representative), fixed-income securities will be valued in good faith at the mean quoted bid and ask prices that are reasonably and timely available (or bid prices, if ask prices are not available) or at prices for securities of comparable maturity, quality and type. Interest rate swaps are generally valued by pricing vendors based on market inputs that include the index and term of index, reset frequency, payer/receiver, currency and pay frequency.
Securities and other assets for which representative market quotations are not readily available or are considered unreliable by the fund’s investment adviser are fair valued as determined in good faith under fair valuation guidelines adopted by authority of the fund’s board of trustees as further described. The investment adviser follows fair valuation guidelines, consistent with U.S. Securities and Exchange Commission rules and guidance, to consider relevant principles and factors when making fair value determinations. The investment adviser considers relevant indications of value that are reasonably and timely available to it in determining the fair value to be assigned to a particular security, such as the type and cost of the security; contractual or legal restrictions on resale of the security; relevant financial or business developments of the issuer; actively traded similar or related securities; conversion or exchange rights on the security; related corporate actions; significant events occurring after the close of trading in the security; and changes in overall market conditions. Fair valuations and valuations of investments that are not actively trading involve judgment and may differ materially from valuations that would have been used had greater market activity occurred.
Processes and structure — The fund’s board of trustees has delegated authority to the fund’s investment adviser to make fair value determinations, subject to board oversight. The investment adviser has established a Joint Fair Valuation Committee (the “Fair Valuation Committee”) to administer, implement and oversee the fair valuation process, and to make fair value decisions. The Fair Valuation Committee regularly reviews its own fair value decisions, as well as decisions made under its standing instructions to the investment adviser’s valuation teams. The Fair Valuation Committee reviews changes in fair value measurements from period to period and may, as
| 14 | U.S. Government Securities Fund |
deemed appropriate, update the fair valuation guidelines to better reflect the results of back testing and address new or evolving issues. The Fair Valuation Committee reports any changes to the fair valuation guidelines to the board of trustees with supplemental information to support the changes. The fund’s board and audit committee also regularly review reports that describe fair value determinations and methods.
The fund’s investment adviser has also established a Fixed-Income Pricing Review Group to administer and oversee the fixed-income valuation process, including the use of fixed-income pricing vendors. This group regularly reviews pricing vendor information and market data. Pricing decisions, processes and controls over security valuation are also subject to additional internal reviews, including an annual control self-evaluation program facilitated by the investment adviser’s compliance group.
Classifications — The fund’s investment adviser classifies the fund’s assets and liabilities into three levels based on the inputs used to value the assets or liabilities. Level 1 values are based on quoted prices in active markets for identical securities. Level 2 values are based on significant observable market inputs, such as quoted prices for similar securities and quoted prices in inactive markets. Level 3 values are based on significant unobservable inputs that reflect the investment adviser’s determination of assumptions that market participants might reasonably use in valuing the securities. The valuation levels are not necessarily an indication of the risk or liquidity associated with the underlying investment. For example, U.S. government securities are reflected as Level 2 because the inputs used to determine fair value may not always be quoted prices in an active market. At August 31, 2014, all of the fund’s investments were classified as Level 2.
4. Risk factors
Investing in the fund may involve certain risks including, but not limited to, those described below.
Market conditions — The prices of, and the income generated by, the securities held by the fund may decline — sometimes rapidly or unpredictably — due to various factors, including events or conditions affecting the general economy or particular industries; overall market changes; local, regional or global political, social or economic instability; governmental or governmental agency responses to economic conditions; and currency, interest rate and commodity price fluctuations.
Issuer risks — The prices of, and the income generated by, securities held by the fund may also decline in response to various factors directly related to the issuers of such securities, including reduced demand for an issuer’s goods or services, poor management performance and strategic initiatives such as mergers, acquisitions or dispositions and the market response to any such initiatives.
Investing in debt instruments — The prices of, and the income generated by, bonds and other debt securities held by the fund may be affected by changing interest rates and by changes in the effective maturities and credit ratings of these securities.
Rising interest rates will generally cause the prices of bonds and other debt securities to fall. Falling interest rates may cause an issuer to redeem, call or refinance a debt security before its stated maturity, which may result in the fund having to reinvest the proceeds in lower yielding securities. Longer maturity debt securities generally have greater sensitivity to changes in interest rates and may be subject to greater price fluctuations than shorter maturity debt securities.
Bonds and other debt securities are also subject to credit risk, which is the possibility that the credit strength of an issuer will weaken and/or an issuer of a debt security will fail to make timely payments of principal or interest and the security will go into default. Lower quality debt securities generally have higher rates of interest and may be subject to greater price fluctuations than higher quality debt securities. Credit risk is gauged, in part, by the credit ratings of the debt securities in which the fund invests. However, ratings are only the opinions of the rating agencies issuing them and are not guarantees as to credit quality or an evaluation of market risk. The fund’s investment adviser relies on its own credit analysts to research issuers and issues in seeking to mitigate various credit and default risks.
Investing in securities backed by the U.S. government — Securities backed by the U.S. Treasury or the full faith and credit of the U.S. government are guaranteed only as to the timely payment of interest and principal when held to maturity. Accordingly, the current market values for these securities will fluctuate with changes in interest rates. Securities issued by government-sponsored entities and federal agencies and instrumentalities that are not backed by the full faith and credit of the U.S. government are neither issued nor guaranteed by the U.S. government.
Investing in mortgage-related and other asset-backed securities — Mortgage-related securities, such as mortgage-backed securities, and other asset-backed securities, include debt obligations that represent interests in pools of mortgages or other income-bearing assets, such as consumer loans or receivables. Such securities often involve risks that are different from or more acute than the risks associated with investing in other types of debt securities. Mortgage-backed and other asset-backed securities are subject to changes in the payment patterns of borrowers of the underlying debt. When interest rates fall, borrowers are more likely to refinance or prepay their debt before its stated maturity. This may result in the fund having to reinvest the proceeds in lower yielding securities, effectively reducing
| U.S. Government Securities Fund | 15 |
the fund’s income. Conversely, if interest rates rise and borrowers repay their debt more slowly than expected, the time in which the mortgage-backed and other asset-backed securities are paid off could be extended, reducing the fund’s cash available for reinvestment in higher yielding securities.
Investing in future delivery contracts — The fund may enter into contracts, such as to-be-announced contracts and mortgage dollar rolls, that involve the fund selling mortgage-related securities and simultaneously contracting to repurchase similar securities for delivery at a future date at a predetermined price. This can increase the fund’s market exposure, and the market price of the securities that the fund contracts to repurchase could drop below their purchase price. While the fund can preserve and generate capital through the use of such contracts by, for example, realizing the difference between the sale price and the future purchase price, the income generated by the fund may be reduced by engaging in such transactions. In addition, these transactions may increase the turnover rate of the fund.
Investing in inflation linked bonds — The values of inflation linked bonds generally fluctuate in response to changes in real interest rates —i.e., rates of interest after factoring in inflation. A rise in real interest rates may cause the prices of inflation linked securities to fall, while a decline in real interest rates may cause the prices to increase. Inflation linked bonds may experience greater losses than other debt securities with similar durations when real interest rates rise faster than nominal interest rates. There can be no assurance that the value of an inflation linked security will be directly correlated to changes in interest rates; for example, if interest rates rise for reasons other than inflation, the increase may not be reflected in the security’s inflation measure.
Investing in inflation linked bonds may also reduce the fund’s distributable income during periods of extreme deflation. If prices for goods and services decline throughout the economy, the principal and income on inflation linked securities may decline and result in losses to the fund.
Investing in interest rate swaps — The use of interest rate swaps involves the risk that the investment adviser will not accurately predict anticipated changes in interest rates, which may result in losses to the fund. Interest rate swaps also involve the possible failure of a counterparty to perform in accordance with the terms of the swap agreement. If a counterparty defaults on its obligations under a swap agreement, the fund may lose any amount it expected to receive from the counterparty, potentially including amounts in excess of the fund’s initial investment.
Management — The investment adviser to the fund actively manages the fund’s investments. Consequently, the fund is subject to the risk that the methods and analyses employed by the investment adviser in this process may not produce the desired results. This could cause the fund to lose value or its investment results to lag relevant benchmarks or other funds with similar objectives.
5. Certain investment techniques
Mortgage dollar rolls — The fund has entered into mortgage dollar roll transactions in which the fund sells a mortgage-backed security to a counterparty and simultaneously enters into an agreement with the same counterparty to buy back a similar security on a specific future date at a predetermined price. Mortgage dollar rolls are accounted for as purchase and sale transactions, which may increase the fund’s portfolio turnover rate.
Interest rate swaps — The fund has entered into interest rate swap contracts, which are agreements to exchange one stream of future interest payments for another based on a specified notional amount. Typically, interest rate swaps exchange a fixed interest rate for a payment that floats relative to a benchmark or vice versa. The fund’s investment adviser uses interest rate swaps to manage the interest rate sensitivity of the fund by increasing or decreasing the duration of the fund or a portion of the fund’s portfolio. Risks may arise as a result of the fund’s investment adviser incorrectly anticipating changes in interest rates, increased volatility, reduced liquidity and the potential inability of counterparties to meet the terms of their agreements.
Upon entering into an interest rate swap contract, the fund is required to deposit cash, U.S. government securities or other liquid securities, which is known as “initial margin.” Generally, the initial margin required for a particular interest rate swap is set and held as collateral by the clearinghouse on which the contract is cleared. The amount of initial margin required may be significantly modified from time to time by the clearinghouse during the term of the contract.
On a daily basis, the fund’s investment adviser records daily interest accruals related to the exchange of future payments as a receivable and payable in the fund’s statement of assets and liabilities. The fund also pays or receives a “variation margin” based on the increase or decrease in the value of the interest rate swaps, including accrued interest, and records variation margin on interest rate swaps in the statement of assets and liabilities. The fund records realized gains and losses on both the net accrued interest and any gain or loss recognized at the time the interest rate swap is closed or expires. Net realized gains or losses, as well as any net unrealized appreciation or depreciation, from interest rate swaps are recorded in the fund’s statement of operations.
| 16 | U.S. Government Securities Fund |
The following tables present the financial statement impacts resulting from the fund’s use of interest rate swaps as of August 31, 2014 (dollars in thousands):
| Assets | Liabilities | |||||||||||
| Contract | Location on statement of assets and liabilities | Value | Location on statement of assets and liabilities | Value | ||||||||
| Interest rate swaps | Variation margin | $ | — | Variation margin | $ | 2,547 | ||||||
| Net realized loss | Net unrealized depreciation | |||||||||||
| Contract | Location on statement of operations | Value | Location on statement of operations | Value | ||||||||
| Interest rate swaps | Net realized loss on interest rate swaps | $ | (4,576 | ) | Net unrealized depreciation on interest rate swaps | $ | (12,540 | ) | ||||
Collateral — The fund participates in a collateral program due to its use of interest rate swaps. The program calls for the fund to pledge collateral for initial and variation margin by contract. The purpose of the collateral is to cover potential losses that could occur in the event that either party cannot meet its contractual obligations.
6. Taxation and distributions
Federal income taxation — The fund complies with the requirements under Subchapter M of the Internal Revenue Code applicable to mutual funds and intends to distribute substantially all of its net taxable income and net capital gains each year. The fund is not subject to income taxes to the extent such distributions are made. Therefore, no federal income tax provision is required.
As of and during the period ended August 31, 2014, the fund did not have a liability for any unrecognized tax benefits. The fund recognizes interest and penalties, if any, related to unrecognized tax benefits as income tax expense in the statement of operations. During the period, the fund did not incur any interest or penalties.
The fund is not subject to examination by U.S. federal tax authorities for tax years before 2010 and by state tax authorities for tax years before 2009.
Distributions — Distributions paid to shareholders are based on net investment income and net realized gains determined on a tax basis, which may differ from net investment income and net realized gains for financial reporting purposes. These differences are due primarily to different treatment for items such as short-term capital gains and losses; capital losses related to sales of certain securities within 30 days of purchase; deferred expenses; paydowns on fixed-income securities; net capital losses and income on certain investments. The fiscal year in which amounts are distributed may differ from the year in which the net investment income and net realized gains are recorded by the fund for financial reporting purposes.
During the year ended August 31, 2014, the fund reclassified $4,000 from undistributed net investment income to capital paid in on shares of beneficial interest and $394,000 from undistributed net investment income to accumulated net realized loss to align financial reporting with tax reporting.
As of August 31, 2014, the tax basis components of distributable earnings, unrealized appreciation (depreciation) and cost of investment securities were as follows (dollars in thousands):
| Undistributed ordinary income | $ | 1,741 | ||
| Capital loss carryforward* | (44,282 | ) | ||
| Gross unrealized appreciation on investment securities | 110,478 | |||
| Gross unrealized depreciation on investment securities | (7,532 | ) | ||
| Net unrealized appreciation on investment securities | 102,946 | |||
| Cost of investment securities | 7,574,638 |
| * | The capital loss carryforward will be used to offset any capital gains realized by the fund in future years. The fund will not make distributions from capital gains while a capital loss carryforward remains. |
| U.S. Government Securities Fund | 17 |
The tax character of distributions paid or accrued to shareholders was as follows (dollars in thousands):
| Year ended August 31, 2014 | Year ended August 31, 2013 | |||||||||||||||||||||||
| Share class | Ordinary income | Long-term capital gains | Total distributions paid or accrued | Ordinary income | Long-term capital gains | Total distributions paid or accrued | ||||||||||||||||||
| Class A | $ | 30,658 | $ | 25,210 | $ | 55,868 | $ | 89,191 | $ | 44,126 | $ | 133,317 | ||||||||||||
| Class B | 174 | 455 | 629 | 1,437 | 1,013 | 2,450 | ||||||||||||||||||
| Class C | 992 | 2,788 | 3,780 | 7,578 | 5,459 | 13,037 | ||||||||||||||||||
| Class F-1 | 1,825 | 1,433 | 3,258 | 4,224 | 2,056 | 6,280 | ||||||||||||||||||
| Class F-2 | 784 | 482 | 1,266 | 1,691 | 758 | 2,449 | ||||||||||||||||||
| Class 529-A | 1,495 | 1,341 | 2,836 | 4,175 | 2,125 | 6,300 | ||||||||||||||||||
| Class 529-B | 12 | 43 | 55 | 129 | 94 | 223 | ||||||||||||||||||
| Class 529-C | 187 | 619 | 806 | 1,382 | 1,015 | 2,397 | ||||||||||||||||||
| Class 529-E | 68 | 78 | 146 | 234 | 134 | 368 | ||||||||||||||||||
| Class 529-F-1 | 131 | 92 | 223 | 289 | 134 | 423 | ||||||||||||||||||
| Class R-1 | 50 | 126 | 176 | 272 | 193 | 465 | ||||||||||||||||||
| Class R-2 | 518 | 1,400 | 1,918 | 3,284 | 2,302 | 5,586 | ||||||||||||||||||
| Class R-2E* | — | — | — | |||||||||||||||||||||
| Class R-3 | 1,147 | 1,334 | 2,481 | 3,872 | 2,231 | 6,103 | ||||||||||||||||||
| Class R-4 | 1,368 | 1,096 | 2,464 | 3,672 | 1,777 | 5,449 | ||||||||||||||||||
| Class R-5 | 1,674 | 1,158 | 2,832 | 4,124 | 1,802 | 5,926 | ||||||||||||||||||
| Class R-6 | 27,786 | 15,191 | 42,977 | 31,337 | 12,361 | 43,698 | ||||||||||||||||||
| Total | $ | 68,869 | $ | 52,846 | $ | 121,715 | $ | 156,891 | $ | 77,580 | $ | 234,471 | ||||||||||||
| * | Class R-2E shares were offered beginning August 29, 2014. |
7. Fees and transactions with related parties
CRMC, the fund’s investment adviser, is the parent company of American Funds Distributors,® Inc. (“AFD”), the principal underwriter of the fund’s shares, and American Funds Service Company® (“AFS”), the fund’s transfer agent. CRMC, AFD and AFS are considered related parties to the fund.
Investment advisory services — The fund has an investment advisory and service agreement with CRMC that provides for monthly fees accrued daily. These fees are based on a series of decreasing annual rates beginning with 0.300% on the first $60 million of daily net assets and decreasing to 0.140% on such assets in excess of $10 billion. The agreement also provides for monthly fees, accrued daily, based on a series of decreasing rates beginning with 3.00% on the first $3,333,333 of the fund’s monthly gross income and decreasing to 2.00% on such income in excess of $8,333,333. For the year ended August 31, 2014, the investment advisory services fee was $13,058,000, which was equivalent to an annualized rate of 0.215% of average daily net assets.
Class-specific fees and expenses — Expenses that are specific to individual share classes are accrued directly to the respective share class. The principal class-specific fees and expenses are further described below:
Distribution services — The fund has plans of distribution for all share classes, except Class F-2, R-5 and R-6 shares. Under the plans, the board of trustees approves certain categories of expenses that are used to finance activities primarily intended to sell fund shares and service existing accounts. The plans provide for payments, based on an annualized percentage of average daily net assets, ranging from 0.30% to 1.00% as noted in this section. In some cases, the board of trustees has limited the amounts that may be paid to less than the maximum allowed by the plans. All share classes with a plan may use up to 0.25% of average daily net assets to pay service fees, or to compensate AFD for paying service fees, to firms that have entered into agreements with AFD to provide certain shareholder services. The remaining amounts available to be paid under each plan are paid to dealers to compensate them for their sales activities.
| 18 | U.S. Government Securities Fund |
For Class A and 529-A shares, distribution-related expenses include the reimbursement of dealer and wholesaler commissions paid by AFD for certain shares sold without a sales charge. These share classes reimburse AFD for amounts billed within the prior 15 months but only to the extent that the overall annual expense limit of 0.30% is not exceeded. As of August 31, 2014, there were no unreimbursed expenses subject to reimbursement for Class A or 529-A shares.
| Share class | Currently approved limits | Plan limits | ||||||
| Class A | 0.30 | % | 0.30 | % | ||||
| Class 529-A | 0.30 | 0.50 | ||||||
| Classes B and 529-B | 1.00 | 1.00 | ||||||
| Classes C, 529-C and R-1 | 1.00 | 1.00 | ||||||
| Class R-2 | 0.75 | 1.00 | ||||||
| Class R-2E | 0.60 | 0.85 | ||||||
| Classes 529-E and R-3 | 0.50 | 0.75 | ||||||
| Classes F-1, 529-F-1 and R-4 | 0.25 | 0.50 | ||||||
Transfer agent services — The fund has a shareholder services agreement with AFS under which the fund compensates AFS for providing transfer agent services to each of the fund’s share classes. These services include recordkeeping, shareholder communications and transaction processing. In addition, the fund reimburses AFS for amounts paid to third parties for performing transfer agent services on behalf of fund shareholders.
Administrative services — The fund has an administrative services agreement with CRMC under which the fund compensates CRMC for providing administrative services to Class A, C, F, 529 and R shares. These services include, but are not limited to, coordinating, monitoring, assisting and overseeing third parties that provide services to fund shareholders. Under the agreement, Class A shares pay an annual fee of 0.01% and Class C, F, 529 and R shares pay an annual fee of 0.05% of their respective average daily net assets.
529 plan services — Each 529 share class is subject to service fees to compensate the Virginia College Savings Plan (“Virginia529”) for its oversight and administration of the 529 college savings plan. During the period September 1, 2013, to March 31, 2014, the quarterly fee was based on a series of decreasing annual rates beginning with 0.10% on the first $30 billion of the net assets invested in Class 529 shares of the American Funds and decreasing to 0.06% on such assets between $120 billion and $150 billion. Effective April 1, 2014, the quarterly fee was amended to provide for reduced annual rates of 0.07%, 0.06% and 0.05% over $30 billion, $50 billion and $70 billion, respectively, of the net assets invested in Class 529 shares of the American Funds. The fee for any given calendar quarter is accrued and calculated on the basis of the average net assets of Class 529 shares of the American Funds for the last month of the prior calendar quarter. The fee is included in other expenses in the fund’s statement of operations. Virginia529 is not considered a related party to the fund.
For the year ended August 31, 2014, class-specific expenses under the agreements were as follows (dollars in thousands):
| Share class | Distribution services | Transfer agent services | Administrative services | 529 plan services | ||||
| Class A | $ 6,698 | $4,642 | $ 280 | Not applicable | ||||
| Class B | 471 | 76 | Not applicable | Not applicable | ||||
| Class C | 3,001 | 476 | 151 | Not applicable | ||||
| Class F-1 | 413 | 179 | 83 | Not applicable | ||||
| Class F-2 | Not applicable | 63 | 29 | Not applicable | ||||
| Class 529-A | 335 | 197 | 74 | $140 | ||||
| Class 529-B | 44 | 7 | 2 | 4 | ||||
| Class 529-C | 666 | 95 | 34 | 64 | ||||
| Class 529-E | 43 | 9 | 4 | 8 | ||||
| Class 529-F-1 | — | 14 | 5 | 10 | ||||
| Class R-1 | 144 | 19 | 7 | Not applicable | ||||
| Class R-2 | 1,146 | 640 | 78 | Not applicable | ||||
| Class R-2E* | — | — | — | Not applicable | ||||
| Class R-3 | 740 | 289 | 75 | Not applicable | ||||
| Class R-4 | 309 | 132 | 62 | Not applicable | ||||
| Class R-5 | Not applicable | 62 | 60 | Not applicable | ||||
| Class R-6 | Not applicable | 3 | 948 | Not applicable | ||||
| Total class-specific expenses | $14,010 | $6,903 | $1,892 | $226 |
| * | Class R-2E shares were offered beginning August 29, 2014. |
| U.S. Government Securities Fund | 19 |
Trustees’ deferred compensation — Trustees who are unaffiliated with CRMC may elect to defer the cash payment of part or all of their compensation. These deferred amounts, which remain as liabilities of the fund, are treated as if invested in shares of the fund or other American Funds. These amounts represent general, unsecured liabilities of the fund and vary according to the total returns of the selected funds. Trustees’ compensation of $73,000 in the fund’s statement of operations includes $41,000 in current fees (either paid in cash or deferred) and a net increase of $32,000 in the value of the deferred amounts.
Affiliated officers and trustees — Officers and certain trustees of the fund are or may be considered to be affiliated with CRMC, AFD and AFS. No affiliated officers or trustees received any compensation directly from the fund.
8. Capital share transactions
Capital share transactions in the fund were as follows (dollars and shares in thousands):
| Sales* | Reinvestments of dividends and distributions | Repurchases* | Net (decrease) increase | |||||||||||||||||||||||||||||
| Share class | Amount | Shares | Amount | Shares | Amount | Shares | Amount | Shares | ||||||||||||||||||||||||
| Year ended August 31, 2014 | ||||||||||||||||||||||||||||||||
| Class A | $ | 321,711 | 23,312 | $ | 54,586 | 3,991 | $ | (926,465 | ) | (67,291 | ) | $ | (550,168 | ) | (39,988 | ) | ||||||||||||||||
| Class B | 1,037 | 75 | 614 | 45 | (25,867 | ) | (1,880 | ) | (24,216 | ) | (1,760 | ) | ||||||||||||||||||||
| Class C | 33,011 | 2,393 | 3,686 | 271 | (132,518 | ) | (9,638 | ) | (95,821 | ) | (6,974 | ) | ||||||||||||||||||||
| Class F-1 | 66,515 | 4,814 | 3,226 | 236 | (81,214 | ) | (5,880 | ) | (11,473 | ) | (830 | ) | ||||||||||||||||||||
| Class F-2 | 37,903 | 2,739 | 1,174 | 86 | (31,149 | ) | (2,261 | ) | 7,928 | 564 | ||||||||||||||||||||||
| Class 529-A | 18,381 | 1,333 | 2,833 | 207 | (49,500 | ) | (3,595 | ) | (28,286 | ) | (2,055 | ) | ||||||||||||||||||||
| Class 529-B | 240 | 18 | 55 | 4 | (2,963 | ) | (216 | ) | (2,668 | ) | (194 | ) | ||||||||||||||||||||
| Class 529-C | 8,215 | 597 | 806 | 59 | (26,334 | ) | (1,915 | ) | (17,313 | ) | (1,259 | ) | ||||||||||||||||||||
| Class 529-E | 1,544 | 112 | 145 | 10 | (3,989 | ) | (290 | ) | (2,300 | ) | (168 | ) | ||||||||||||||||||||
| Class 529-F-1 | 3,548 | 258 | 221 | 16 | (4,961 | ) | (360 | ) | (1,192 | ) | (86 | ) | ||||||||||||||||||||
| Class R-1 | 2,937 | 213 | 176 | 13 | (4,753 | ) | (345 | ) | (1,640 | ) | (119 | ) | ||||||||||||||||||||
| Class R-2 | 33,310 | 2,418 | 1,917 | 141 | (65,528 | ) | (4,763 | ) | (30,301 | ) | (2,204 | ) | ||||||||||||||||||||
| Class R-2E† | 10 | 1 | — | — | — | — | 10 | 1 | ||||||||||||||||||||||||
| Class R-3 | 38,735 | 2,810 | 2,472 | 181 | (69,900 | ) | (5,074 | ) | (28,693 | ) | (2,083 | ) | ||||||||||||||||||||
| Class R-4 | 36,252 | 2,629 | 2,464 | 180 | (55,050 | ) | (3,994 | ) | (16,334 | ) | (1,185 | ) | ||||||||||||||||||||
| Class R-5 | 29,865 | 2,166 | 2,832 | 207 | (66,962 | ) | (4,858 | ) | (34,265 | ) | (2,485 | ) | ||||||||||||||||||||
| Class R-6 | 859,991 | 62,357 | 43,156 | 3,146 | (189,823 | ) | (13,742 | ) | 713,324 | 51,761 | ||||||||||||||||||||||
| Total net increase (decrease) | $ | 1,493,205 | 108,245 | $ | 120,363 | 8,793 | $ | (1,736,976 | ) | (126,102 | ) | $ | (123,408 | ) | (9,064 | ) | ||||||||||||||||
| Year ended August 31, 2013 | ||||||||||||||||||||||||||||||||
| Class A | $ | 667,177 | 46,607 | $ | 130,263 | 9,170 | $ | (1,643,270 | ) | (116,315 | ) | $ | (845,830 | ) | (60,538 | ) | ||||||||||||||||
| Class B | 4,884 | 339 | 2,390 | 168 | (50,942 | ) | (3,590 | ) | (43,668 | ) | (3,083 | ) | ||||||||||||||||||||
| Class C | 81,040 | 5,664 | 12,648 | 890 | (236,212 | ) | (16,728 | ) | (142,524 | ) | (10,174 | ) | ||||||||||||||||||||
| Class F-1 | 114,181 | 8,116 | 6,118 | 431 | (135,866 | ) | (9,679 | ) | (15,567 | ) | (1,132 | ) | ||||||||||||||||||||
| Class F-2 | 36,223 | 2,542 | 2,313 | 163 | (35,602 | ) | (2,531 | ) | 2,934 | 174 | ||||||||||||||||||||||
| Class 529-A | 31,673 | 2,220 | 6,284 | 442 | (63,969 | ) | (4,543 | ) | (26,012 | ) | (1,881 | ) | ||||||||||||||||||||
| Class 529-B | 659 | 46 | 223 | 16 | (4,721 | ) | (332 | ) | (3,839 | ) | (270 | ) | ||||||||||||||||||||
| Class 529-C | 14,433 | 1,014 | 2,393 | 168 | (33,984 | ) | (2,408 | ) | (17,158 | ) | (1,226 | ) | ||||||||||||||||||||
| Class 529-E | 2,130 | 150 | 367 | 26 | (4,262 | ) | (303 | ) | (1,765 | ) | (127 | ) | ||||||||||||||||||||
| Class 529-F-1 | 2,888 | 203 | 417 | 29 | (3,951 | ) | (279 | ) | (646 | ) | (47 | ) | ||||||||||||||||||||
| Class R-1 | 4,073 | 286 | 462 | 33 | (7,274 | ) | (513 | ) | (2,739 | ) | (194 | ) | ||||||||||||||||||||
| Class R-2 | 67,143 | 4,706 | 5,570 | 392 | (108,941 | ) | (7,684 | ) | (36,228 | ) | (2,586 | ) | ||||||||||||||||||||
| Class R-3 | 81,114 | 5,694 | 6,068 | 427 | (120,051 | ) | (8,479 | ) | (32,869 | ) | (2,358 | ) | ||||||||||||||||||||
| Class R-4 | 66,797 | 4,677 | 5,441 | 383 | (133,760 | ) | (9,378 | ) | (61,522 | ) | (4,318 | ) | ||||||||||||||||||||
| Class R-5 | 47,999 | 3,363 | 5,920 | 417 | (81,246 | ) | (5,748 | ) | (27,327 | ) | (1,968 | ) | ||||||||||||||||||||
| Class R-6 | 725,526 | 51,222 | 43,601 | 3,075 | (96,177 | ) | (6,773 | ) | 672,950 | 47,524 | ||||||||||||||||||||||
| Total net increase (decrease) | $ | 1,947,940 | 136,849 | $ | 230,478 | 16,230 | $ | (2,760,228 | ) | (195,283 | ) | $ | (581,810 | ) | (42,204 | ) | ||||||||||||||||
| * | Includes exchanges between share classes of the fund. |
| † | Class R-2E shares were offered beginning August 29, 2014. |
9. Investment transactions
The fund made purchases and sales of investment securities, excluding short-term securities and U.S. government obligations, if any, of $19,244,782,000 and $20,042,651,000, respectively, during the year ended August 31, 2014.
| 20 | U.S. Government Securities Fund |
Financial highlights
| Income (loss) from investment operations1 | Dividends and distributions | ||||||||||||||||||||||||||||||||||||||||||||||||
| Net asset value, beginning of period | Net investment income (loss) | Net gains (losses) on securities (both realized and unrealized) | Total from investment operations | Dividends (from net investment income) | Distributions (from capital gains) | Total dividends and distributions | Net asset value, end of period | Total return2,3 | Net assets, end of period (in millions) | Ratio of expenses to average net assets before reimbursements | Ratio of expenses to average net assets after reimbursements3 | Ratio of net income (loss) to average net assets3 | |||||||||||||||||||||||||||||||||||||
| Class A: | |||||||||||||||||||||||||||||||||||||||||||||||||
| Year ended 8/31/2014 | $ | 13.68 | $ | .16 | $ | .42 | $ | .58 | $ | (.15 | ) | $ | (.12 | ) | $ | (.27 | ) | $ | 13.99 | 4.32 | % | $ | 2,654 | .64 | % | .64 | % | 1.13 | % | ||||||||||||||||||||
| Year ended 8/31/2013 | 14.63 | .05 | (.53 | ) | (.48 | ) | (.12 | ) | (.35 | ) | (.47 | ) | 13.68 | (3.37 | ) | 3,141 | .61 | .61 | .36 | ||||||||||||||||||||||||||||||
| Year ended 8/31/2012 | 14.48 | .12 | .52 | .64 | (.18 | ) | (.31 | ) | (.49 | ) | 14.63 | 4.50 | 4,245 | .60 | .60 | .82 | |||||||||||||||||||||||||||||||||
| Year ended 8/31/2011 | 14.76 | .28 | .23 | .51 | (.30 | ) | (.49 | ) | (.79 | ) | 14.48 | 3.73 | 3,915 | .61 | .61 | 1.92 | |||||||||||||||||||||||||||||||||
| Year ended 8/31/2010 | 14.11 | .38 | .70 | 1.08 | (.39 | ) | (.04 | ) | (.43 | ) | 14.76 | 7.81 | 4,891 | .62 | .62 | 2.66 | |||||||||||||||||||||||||||||||||
| Class B: | |||||||||||||||||||||||||||||||||||||||||||||||||
| Year ended 8/31/2014 | 13.67 | .05 | .43 | .48 | (.05 | ) | (.12 | ) | (.17 | ) | 13.98 | 3.58 | 37 | 1.38 | 1.38 | .38 | |||||||||||||||||||||||||||||||||
| Year ended 8/31/2013 | 14.63 | (.06 | ) | (.53 | ) | (.59 | ) | (.02 | ) | (.35 | ) | (.37 | ) | 13.67 | (4.10 | ) | 60 | 1.35 | 1.35 | (.40 | ) | ||||||||||||||||||||||||||||
| Year ended 8/31/2012 | 14.48 | .01 | .52 | .53 | (.07 | ) | (.31 | ) | (.38 | ) | 14.63 | 3.73 | 110 | 1.35 | 1.35 | .10 | |||||||||||||||||||||||||||||||||
| Year ended 8/31/2011 | 14.76 | .17 | .23 | .40 | (.19 | ) | (.49 | ) | (.68 | ) | 14.48 | 2.95 | 154 | 1.37 | 1.37 | 1.16 | |||||||||||||||||||||||||||||||||
| Year ended 8/31/2010 | 14.11 | .27 | .70 | .97 | (.28 | ) | (.04 | ) | (.32 | ) | 14.76 | 7.00 | 267 | 1.38 | 1.38 | 1.92 | |||||||||||||||||||||||||||||||||
| Class C: | |||||||||||||||||||||||||||||||||||||||||||||||||
| Year ended 8/31/2014 | 13.67 | .05 | .43 | .48 | (.05 | ) | (.12 | ) | (.17 | ) | 13.98 | 3.46 | 272 | 1.43 | 1.43 | .34 | |||||||||||||||||||||||||||||||||
| Year ended 8/31/2013 | 14.63 | (.06 | ) | (.53 | ) | (.59 | ) | (.02 | ) | (.35 | ) | (.37 | ) | 13.67 | (4.13 | ) | 362 | 1.40 | 1.40 | (.45 | ) | ||||||||||||||||||||||||||||
| Year ended 8/31/2012 | 14.48 | — | 4 | .52 | .52 | (.06 | ) | (.31 | ) | (.37 | ) | 14.63 | 3.68 | 536 | 1.40 | 1.40 | .02 | ||||||||||||||||||||||||||||||||
| Year ended 8/31/2011 | 14.76 | .16 | .23 | .39 | (.18 | ) | (.49 | ) | (.67 | ) | 14.48 | 2.90 | 497 | 1.42 | 1.42 | 1.12 | |||||||||||||||||||||||||||||||||
| Year ended 8/31/2010 | 14.11 | .26 | .70 | .96 | (.27 | ) | (.04 | ) | (.31 | ) | 14.76 | 6.95 | 669 | 1.43 | 1.43 | 1.85 | |||||||||||||||||||||||||||||||||
| Class F-1: | |||||||||||||||||||||||||||||||||||||||||||||||||
| Year ended 8/31/2014 | 13.68 | .16 | .42 | .58 | (.15 | ) | (.12 | ) | (.27 | ) | 13.99 | 4.33 | 164 | .64 | .64 | 1.14 | |||||||||||||||||||||||||||||||||
| Year ended 8/31/2013 | 14.63 | .05 | (.53 | ) | (.48 | ) | (.12 | ) | (.35 | ) | (.47 | ) | 13.68 | (3.38 | ) | 171 | .62 | .62 | .35 | ||||||||||||||||||||||||||||||
| Year ended 8/31/2012 | 14.48 | .12 | .52 | .64 | (.18 | ) | (.31 | ) | (.49 | ) | 14.63 | 4.51 | 200 | .61 | .61 | .81 | |||||||||||||||||||||||||||||||||
| Year ended 8/31/2011 | 14.76 | .27 | .23 | .50 | (.29 | ) | (.49 | ) | (.78 | ) | 14.48 | 3.70 | 172 | .63 | .63 | 1.90 | |||||||||||||||||||||||||||||||||
| Year ended 8/31/2010 | 14.11 | .37 | .70 | 1.07 | (.38 | ) | (.04 | ) | (.42 | ) | 14.76 | 7.78 | 206 | .65 | .65 | 2.62 | |||||||||||||||||||||||||||||||||
| Class F-2: | |||||||||||||||||||||||||||||||||||||||||||||||||
| Year ended 8/31/2014 | 13.68 | .19 | .43 | .62 | (.19 | ) | (.12 | ) | (.31 | ) | 13.99 | 4.59 | 71 | .39 | .39 | 1.39 | |||||||||||||||||||||||||||||||||
| Year ended 8/31/2013 | 14.63 | .08 | (.53 | ) | (.45 | ) | (.15 | ) | (.35 | ) | (.50 | ) | 13.68 | (3.15 | ) | 61 | .38 | .38 | .59 | ||||||||||||||||||||||||||||||
| Year ended 8/31/2012 | 14.48 | .15 | .52 | .67 | (.21 | ) | (.31 | ) | (.52 | ) | 14.63 | 4.76 | 63 | .37 | .37 | 1.04 | |||||||||||||||||||||||||||||||||
| Year ended 8/31/2011 | 14.76 | .31 | .23 | .54 | (.33 | ) | (.49 | ) | (.82 | ) | 14.48 | 3.96 | 51 | .38 | .38 | 2.13 | |||||||||||||||||||||||||||||||||
| Year ended 8/31/2010 | 14.11 | .41 | .70 | 1.11 | (.42 | ) | (.04 | ) | (.46 | ) | 14.76 | 8.06 | 66 | .39 | .39 | 2.86 | |||||||||||||||||||||||||||||||||
| Class 529-A: | |||||||||||||||||||||||||||||||||||||||||||||||||
| Year ended 8/31/2014 | 13.68 | .14 | .43 | .57 | (.14 | ) | (.12 | ) | (.26 | ) | 13.99 | 4.23 | 138 | .73 | .73 | 1.04 | |||||||||||||||||||||||||||||||||
| Year ended 8/31/2013 | 14.63 | .04 | (.53 | ) | (.49 | ) | (.11 | ) | (.35 | ) | (.46 | ) | 13.68 | (3.46 | ) | 163 | .69 | .69 | .27 | ||||||||||||||||||||||||||||||
| Year ended 8/31/2012 | 14.48 | .11 | .52 | .63 | (.17 | ) | (.31 | ) | (.48 | ) | 14.63 | 4.42 | 202 | .69 | .69 | .72 | |||||||||||||||||||||||||||||||||
| Year ended 8/31/2011 | 14.76 | .27 | .23 | .50 | (.29 | ) | (.49 | ) | (.78 | ) | 14.48 | 3.64 | 172 | .69 | .69 | 1.84 | |||||||||||||||||||||||||||||||||
| Year ended 8/31/2010 | 14.11 | .37 | .70 | 1.07 | (.38 | ) | (.04 | ) | (.42 | ) | 14.76 | 7.73 | 175 | .70 | .70 | 2.57 | |||||||||||||||||||||||||||||||||
| Class 529-B: | |||||||||||||||||||||||||||||||||||||||||||||||||
| Year ended 8/31/2014 | 13.66 | .04 | .43 | .47 | (.04 | ) | (.12 | ) | (.16 | ) | 13.97 | 3.48 | 3 | 1.50 | 1.50 | .26 | |||||||||||||||||||||||||||||||||
| Year ended 8/31/2013 | 14.63 | (.08 | ) | (.53 | ) | (.61 | ) | (.01 | ) | (.35 | ) | (.36 | ) | 13.66 | (4.23 | ) | 6 | 1.47 | 1.47 | (.52 | ) | ||||||||||||||||||||||||||||
| Year ended 8/31/2012 | 14.48 | (.01 | ) | .52 | .51 | (.05 | ) | (.31 | ) | (.36 | ) | 14.63 | 3.60 | 10 | 1.48 | 1.48 | (.03 | ) | |||||||||||||||||||||||||||||||
| Year ended 8/31/2011 | 14.76 | .15 | .23 | .38 | (.17 | ) | (.49 | ) | (.66 | ) | 14.48 | 2.83 | 14 | 1.48 | 1.48 | 1.04 | |||||||||||||||||||||||||||||||||
| Year ended 8/31/2010 | 14.11 | .25 | .70 | .95 | (.26 | ) | (.04 | ) | (.30 | ) | 14.76 | 6.87 | 23 | 1.50 | 1.50 | 1.79 | |||||||||||||||||||||||||||||||||
| U.S. Government Securities Fund | 21 |
Financial highlights
| Income (loss) from investment operations1 | Dividends and distributions | ||||||||||||||||||||||||||||||||||||||||||||||||
| Net asset value, beginning of period | Net investment income (loss) | Net gains (losses) on securities (both realized and unrealized) | Total from investment operations | Dividends (from net investment income) | Distributions (from capital gains) | Total dividends and distributions | Net asset value, end of period | Total return2,3 | Net assets, end of period (in millions) | Ratio of expenses to average net assets before reimbursements | Ratio of expenses to average net assets after reimbursements3 | Ratio of net income (loss) to average net assets3 | |||||||||||||||||||||||||||||||||||||
| Class 529-C: | |||||||||||||||||||||||||||||||||||||||||||||||||
| Year ended 8/31/2014 | $ | 13.66 | $ | .04 | $ | .43 | $ | .47 | $ | (.04 | ) | $ | (.12 | ) | $ | (.16 | ) | $ | 13.97 | 3.48 | % | $ | 61 | 1.49 | % | 1.49 | % | .28 | % | ||||||||||||||||||||
| Year ended 8/31/2013 | 14.63 | (.08 | ) | (.53 | ) | (.61 | ) | (.01 | ) | (.35 | ) | (.36 | ) | 13.66 | (4.23 | ) | 77 | 1.47 | 1.47 | (.51 | ) | ||||||||||||||||||||||||||||
| Year ended 8/31/2012 | 14.48 | (.01 | ) | .52 | .51 | (.05 | ) | (.31 | ) | (.36 | ) | 14.63 | 3.62 | 100 | 1.47 | 1.47 | (.05 | ) | |||||||||||||||||||||||||||||||
| Year ended 8/31/2011 | 14.76 | .15 | .23 | .38 | (.17 | ) | (.49 | ) | (.66 | ) | 14.48 | 2.83 | 90 | 1.48 | 1.48 | 1.06 | |||||||||||||||||||||||||||||||||
| Year ended 8/31/2010 | 14.11 | .25 | .70 | .95 | (.26 | ) | (.04 | ) | (.30 | ) | 14.76 | 6.87 | 95 | 1.49 | 1.49 | 1.78 | |||||||||||||||||||||||||||||||||
| Class 529-E: | |||||||||||||||||||||||||||||||||||||||||||||||||
| Year ended 8/31/2014 | 13.68 | .09 | .45 | .54 | (.11 | ) | (.12 | ) | (.23 | ) | 13.99 | 3.99 | 8 | .97 | .97 | .81 | |||||||||||||||||||||||||||||||||
| Year ended 8/31/2013 | 14.63 | — | 4 | (.53 | ) | (.53 | ) | (.07 | ) | (.35 | ) | (.42 | ) | 13.68 | (3.69 | ) | 10 | .94 | .94 | .03 | |||||||||||||||||||||||||||||
| Year ended 8/31/2012 | 14.48 | .07 | .52 | .59 | (.13 | ) | (.31 | ) | (.44 | ) | 14.63 | 4.16 | 13 | .94 | .94 | .46 | |||||||||||||||||||||||||||||||||
| Year ended 8/31/2011 | 14.76 | .23 | .23 | .46 | (.25 | ) | (.49 | ) | (.74 | ) | 14.48 | 3.36 | 10 | .97 | .97 | 1.57 | |||||||||||||||||||||||||||||||||
| Year ended 8/31/2010 | 14.11 | .33 | .70 | 1.03 | (.34 | ) | (.04 | ) | (.38 | ) | 14.76 | 7.42 | 12 | .98 | .98 | 2.28 | |||||||||||||||||||||||||||||||||
| Class 529-F-1: | |||||||||||||||||||||||||||||||||||||||||||||||||
| Year ended 8/31/2014 | 13.68 | .21 | .39 | .60 | (.17 | ) | (.12 | ) | (.29 | ) | 13.99 | 4.46 | 10 | .51 | .51 | 1.28 | |||||||||||||||||||||||||||||||||
| Year ended 8/31/2013 | 14.63 | .07 | (.53 | ) | (.46 | ) | (.14 | ) | (.35 | ) | (.49 | ) | 13.68 | (3.24 | ) | 11 | .47 | .47 | .49 | ||||||||||||||||||||||||||||||
| Year ended 8/31/2012 | 14.48 | .14 | .52 | .66 | (.20 | ) | (.31 | ) | (.51 | ) | 14.63 | 4.65 | 13 | .47 | .47 | .94 | |||||||||||||||||||||||||||||||||
| Year ended 8/31/2011 | 14.76 | .30 | .23 | .53 | (.32 | ) | (.49 | ) | (.81 | ) | 14.48 | 3.87 | 10 | .48 | .48 | 2.06 | |||||||||||||||||||||||||||||||||
| Year ended 8/31/2010 | 14.11 | .40 | .70 | 1.10 | (.41 | ) | (.04 | ) | (.45 | ) | 14.76 | 7.95 | 12 | .49 | .49 | 2.78 | |||||||||||||||||||||||||||||||||
| Class R-1: | |||||||||||||||||||||||||||||||||||||||||||||||||
| Year ended 8/31/2014 | 13.67 | .05 | .43 | .48 | (.05 | ) | (.12 | ) | (.17 | ) | 13.98 | 3.55 | 14 | 1.40 | 1.40 | .37 | |||||||||||||||||||||||||||||||||
| Year ended 8/31/2013 | 14.63 | (.06 | ) | (.53 | ) | (.59 | ) | (.02 | ) | (.35 | ) | (.37 | ) | 13.67 | (4.12 | ) | 16 | 1.38 | 1.38 | (.41 | ) | ||||||||||||||||||||||||||||
| Year ended 8/31/2012 | 14.48 | .01 | .52 | .53 | (.07 | ) | (.31 | ) | (.38 | ) | 14.63 | 3.70 | 19 | 1.38 | 1.38 | .04 | |||||||||||||||||||||||||||||||||
| Year ended 8/31/2011 | 14.76 | .16 | .23 | .39 | (.18 | ) | (.49 | ) | (.67 | ) | 14.48 | 2.91 | 17 | 1.41 | 1.41 | 1.13 | |||||||||||||||||||||||||||||||||
| Year ended 8/31/2010 | 14.11 | .26 | .70 | .96 | (.27 | ) | (.04 | ) | (.31 | ) | 14.76 | 6.94 | 21 | 1.44 | 1.44 | 1.81 | |||||||||||||||||||||||||||||||||
| Class R-2: | |||||||||||||||||||||||||||||||||||||||||||||||||
| Year ended 8/31/2014 | 13.67 | .05 | .43 | .48 | (.05 | ) | (.12 | ) | (.17 | ) | 13.98 | 3.54 | 147 | 1.43 | 1.43 | .34 | |||||||||||||||||||||||||||||||||
| Year ended 8/31/2013 | 14.63 | (.06 | ) | (.53 | ) | (.59 | ) | (.02 | ) | (.35 | ) | (.37 | ) | 13.67 | (4.09 | ) | 174 | 1.35 | 1.35 | (.39 | ) | ||||||||||||||||||||||||||||
| Year ended 8/31/2012 | 14.48 | .01 | .52 | .53 | (.07 | ) | (.31 | ) | (.38 | ) | 14.63 | 3.71 | 224 | 1.37 | 1.37 | .05 | |||||||||||||||||||||||||||||||||
| Year ended 8/31/2011 | 14.76 | .16 | .23 | .39 | (.18 | ) | (.49 | ) | (.67 | ) | 14.48 | 2.91 | 211 | 1.41 | 1.40 | 1.13 | |||||||||||||||||||||||||||||||||
| Year ended 8/31/2010 | 14.11 | .26 | .70 | .96 | (.27 | ) | (.04 | ) | (.31 | ) | 14.76 | 6.95 | 241 | 1.45 | 1.43 | 1.85 | |||||||||||||||||||||||||||||||||
| Class R-2E: | |||||||||||||||||||||||||||||||||||||||||||||||||
| Period from 8/29/2014 to 8/31/20145,6 | 13.99 | — | — | — | — | — | — | 13.99 | — | — | 7 | — | — | — | |||||||||||||||||||||||||||||||||||
| Class R-3: | |||||||||||||||||||||||||||||||||||||||||||||||||
| Year ended 8/31/2014 | 13.68 | .11 | .43 | .54 | (.11 | ) | (.12 | ) | (.23 | ) | 13.99 | 3.99 | 142 | .97 | .97 | .80 | |||||||||||||||||||||||||||||||||
| Year ended 8/31/2013 | 14.63 | — | 4 | (.53 | ) | (.53 | ) | (.07 | ) | (.35 | ) | (.42 | ) | 13.68 | (3.69 | ) | 168 | .94 | .94 | .02 | |||||||||||||||||||||||||||||
| Year ended 8/31/2012 | 14.48 | .07 | .52 | .59 | (.13 | ) | (.31 | ) | (.44 | ) | 14.63 | 4.14 | 214 | .95 | .95 | .47 | |||||||||||||||||||||||||||||||||
| Year ended 8/31/2011 | 14.76 | .22 | .23 | .45 | (.24 | ) | (.49 | ) | (.73 | ) | 14.48 | 3.34 | 191 | .98 | .98 | 1.55 | |||||||||||||||||||||||||||||||||
| Year ended 8/31/2010 | 14.11 | .32 | .70 | 1.02 | (.33 | ) | (.04 | ) | (.37 | ) | 14.76 | 7.39 | 201 | 1.01 | 1.01 | 2.26 | |||||||||||||||||||||||||||||||||
| 22 | U.S. Government Securities Fund |
| Income (loss) from investment operations1 | Dividends and distributions | ||||||||||||||||||||||||||||||||||||||||||||||||
| Net asset value, beginning of period | Net investment income (loss) | Net gains (losses) on securities (both realized and unrealized) | Total from investment operations | Dividends (from net investment income) | Distributions (from capital gains) | Total dividends and distributions | Net asset value, end of period | Total return2,3 | Net assets, end of period (in millions) | Ratio of expenses to average net assets before reimbursements | Ratio of expenses to average net assets after reimbursements3 | Ratio of net income (loss) to average net assets3 | |||||||||||||||||||||||||||||||||||||
| Class R-4: | |||||||||||||||||||||||||||||||||||||||||||||||||
| Year ended 8/31/2014 | $ | 13.68 | $ | .16 | $ | .42 | $ | .58 | $ | (.15 | ) | $ | (.12 | ) | $ | (.27 | ) | $ | 13.99 | 4.33 | % | $ | 120 | .63 | % | .63 | % | 1.14 | % | ||||||||||||||||||||
| Year ended 8/31/2013 | 14.63 | .05 | (.53 | ) | (.48 | ) | (.12 | ) | (.35 | ) | (.47 | ) | 13.68 | (3.38 | ) | 134 | .61 | .61 | .34 | ||||||||||||||||||||||||||||||
| Year ended 8/31/2012 | 14.48 | .12 | .52 | .64 | (.18 | ) | (.31 | ) | (.49 | ) | 14.63 | 4.50 | 206 | .61 | .61 | .80 | |||||||||||||||||||||||||||||||||
| Year ended 8/31/2011 | 14.76 | .27 | .23 | .50 | (.29 | ) | (.49 | ) | (.78 | ) | 14.48 | 3.69 | 181 | .64 | .64 | 1.89 | |||||||||||||||||||||||||||||||||
| Year ended 8/31/2010 | 14.11 | .37 | .70 | 1.07 | (.38 | ) | (.04 | ) | (.42 | ) | 14.76 | 7.76 | 167 | .67 | .67 | 2.61 | |||||||||||||||||||||||||||||||||
| Class R-5: | |||||||||||||||||||||||||||||||||||||||||||||||||
| Year ended 8/31/2014 | 13.68 | .20 | .42 | .62 | (.19 | ) | (.12 | ) | (.31 | ) | 13.99 | 4.65 | 101 | .33 | .33 | 1.44 | |||||||||||||||||||||||||||||||||
| Year ended 8/31/2013 | 14.63 | .09 | (.53 | ) | (.44 | ) | (.16 | ) | (.35 | ) | (.51 | ) | 13.68 | (3.08 | ) | 133 | .31 | .31 | .65 | ||||||||||||||||||||||||||||||
| Year ended 8/31/2012 | 14.48 | .16 | .52 | .68 | (.22 | ) | (.31 | ) | (.53 | ) | 14.63 | 4.80 | 170 | .32 | .32 | 1.09 | |||||||||||||||||||||||||||||||||
| Year ended 8/31/2011 | 14.76 | .31 | .23 | .54 | (.33 | ) | (.49 | ) | (.82 | ) | 14.48 | 4.01 | 128 | .34 | .34 | 2.19 | |||||||||||||||||||||||||||||||||
| Year ended 8/31/2010 | 14.11 | .41 | .70 | 1.11 | (.42 | ) | (.04 | ) | (.46 | ) | 14.76 | 8.09 | 134 | .36 | .36 | 2.86 | |||||||||||||||||||||||||||||||||
| Class R-6: | |||||||||||||||||||||||||||||||||||||||||||||||||
| Year ended 8/31/2014 | 13.68 | .21 | .42 | .63 | (.20 | ) | (.12 | ) | (.32 | ) | 13.99 | 4.70 | 2,357 | .28 | .28 | 1.51 | |||||||||||||||||||||||||||||||||
| Year ended 8/31/2013 | 14.63 | .10 | (.53 | ) | (.43 | ) | (.17 | ) | (.35 | ) | (.52 | ) | 13.68 | (3.03 | ) | 1,596 | .26 | .26 | .72 | ||||||||||||||||||||||||||||||
| Year ended 8/31/2012 | 14.48 | .17 | .52 | .69 | (.23 | ) | (.31 | ) | (.54 | ) | 14.63 | 4.86 | 1,012 | .27 | .27 | 1.14 | |||||||||||||||||||||||||||||||||
| Year ended 8/31/2011 | 14.76 | .32 | .23 | .55 | (.34 | ) | (.49 | ) | (.83 | ) | 14.48 | 4.06 | 786 | .29 | .29 | 2.25 | |||||||||||||||||||||||||||||||||
| Year ended 8/31/2010 | 14.11 | .42 | .70 | 1.12 | (.43 | ) | (.04 | ) | (.47 | ) | 14.76 | 8.14 | 645 | .31 | .31 | 2.94 | |||||||||||||||||||||||||||||||||
| Year ended August 31 | ||||||||||||||||||||
| 2014 | 2013 | 2012 | 2011 | 2010 | ||||||||||||||||
| Portfolio turnover rate for all share classes | 423 | % | 488 | % | 353 | % | 212 | % | 95 | % | ||||||||||
| 1 | Based on average shares outstanding. |
| 2 | Total returns exclude any applicable sales charges, including contingent deferred sales charges. |
| 3 | This column reflects the impact, if any, of certain reimbursements from CRMC. During one of the periods shown, CRMC paid a portion of the fund’s transfer agent fees for certain retirement plan share classes. |
| 4 | Amount less than $.01. |
| 5 | Based on operations for the period shown and, accordingly, is not representative of a full year. |
| 6 | Class R-2E shares were offered beginning August 29, 2014. |
| 7 | Amount less than $1 million. |
See Notes to Financial Statements
| U.S. Government Securities Fund | 23 |
Report of Independent Registered Public Accounting Firm
To the Shareholders and Board of Trustees of The American Funds Income Series — U.S. Government Securities Fund:
We have audited the accompanying statement of assets and liabilities of The American Funds Income Series — U.S. Government Securities Fund (the “Fund”), including the summary investment portfolio, as of August 31, 2014, and the related statement of operations for the year then ended, the statements of changes in net assets for each of the two years in the period then ended, and the financial highlights for each of the periods presented. These financial statements and financial highlights are the responsibility of the Fund’s management. Our responsibility is to express an opinion on these financial statements and financial highlights based on our audits.
We conducted our audits in accordance with the standards of the Public Company Accounting Oversight Board (United States). Those standards require that we plan and perform the audit to obtain reasonable assurance about whether the financial statements and financial highlights are free of material misstatement. The Fund is not required to have, nor were we engaged to perform, an audit of its internal control over financial reporting. Our audits included consideration of internal control over financial reporting as a basis for designing audit procedures that are appropriate in the circumstances, but not for the purpose of expressing an opinion on the effectiveness of the Fund’s internal control over financial reporting. Accordingly, we express no such opinion. An audit also includes examining, on a test basis, evidence supporting the amounts and disclosures in the financial statements, assessing the accounting principles used and significant estimates made by management, as well as evaluating the overall financial statement presentation. Our procedures included confirmation of securities owned as of August 31, 2014, by correspondence with the custodian and brokers; where replies were not received from brokers, we performed other auditing procedures. We believe that our audits provide a reasonable basis for our opinion.
In our opinion, such financial statements and financial highlights referred to above present fairly, in all material respects, the financial position of The American Funds Income Series — U.S. Government Securities Fund as of August 31, 2014, the results of its operations for the year then ended, the changes in its net assets for each of the two years in the period then ended, and the financial highlights for each of the periods presented, in conformity with accounting principles generally accepted in the United States of America.
Deloitte & Touche LLP
Costa Mesa, California
October 14, 2014
| 24 | U.S. Government Securities Fund |
| Expense example | unaudited |
As a fund shareholder, you incur two types of costs: (1) transaction costs, such as initial sales charges on purchase payments and contingent deferred sales charges on redemptions (loads), and (2) ongoing costs, including management fees, distribution and service (12b-1) fees, and other expenses. This example is intended to help you understand your ongoing costs (in dollars) of investing in the fund so you can compare these costs with the ongoing costs of investing in other mutual funds. The example is based on an investment of $1,000 invested at the beginning of the period and held for the entire six-month period (March 1, 2014, through August 31, 2014).
Actual expenses:
The first line of each share class in the table on the following page provides information about actual account values and actual expenses. You may use the information in this line, together with the amount you invested, to estimate the expenses that you paid over the period. Simply divide your account value by $1,000 (for example, an $8,600 account value divided by $1,000 = 8.6), then multiply the result by the number in the first line under the heading entitled “Expenses paid during period” to estimate the expenses you paid on your account during this period.
Hypothetical example for comparison purposes:
The second line of each share class in the table on the following page provides information about hypothetical account values and hypothetical expenses based on the actual expense ratio for the share class and an assumed rate of return of 5.00% per year before expenses, which is not the actual return of the share class. The hypothetical account values and expenses may not be used to estimate the actual ending account balance or expenses you paid for the period. You may use this information to compare the ongoing costs of investing in the fund and other funds. To do so, compare this 5.00% hypothetical example with the 5.00% hypothetical examples that appear in the shareholder reports of the other funds.
Notes:
Retirement plan participants may be subject to certain fees charged by the plan sponsor, and Class F-1, F-2 and 529-F-1 shareholders may be subject to fees charged by financial intermediaries, typically ranging from 0.75% to 1.50% of assets annually depending on services offered. You can estimate the impact of these fees by adding the amount of the fees to the total estimated expenses you paid on your account during the period as calculated above. In addition, your ending account value would be lower by the amount of these fees.
Note that the expenses shown in the table on the following page are meant to highlight your ongoing costs only and do not reflect any transactional costs, such as sales charges (loads). Therefore, the second line of each share class in the table is useful in comparing ongoing costs only and will not help you determine the relative total costs of owning different funds. In addition, if these transactional costs were included, your costs would have been higher.
| U.S. Government Securities Fund | 25 |
| Beginning account value 3/1/2014 | Ending account value 8/31/2014 | Expenses paid during period* | Annualized expense ratio | |||||||||||||
| Class A – actual return | $ | 1,000.00 | $ | 1,021.83 | $ | 3.31 | .65 | % | ||||||||
| Class A – assumed 5% return | 1,000.00 | 1,021.93 | 3.31 | .65 | ||||||||||||
| Class B – actual return | 1,000.00 | 1,018.08 | 7.02 | 1.38 | ||||||||||||
| Class B – assumed 5% return | 1,000.00 | 1,018.25 | 7.02 | 1.38 | ||||||||||||
| Class C – actual return | 1,000.00 | 1,017.11 | 7.27 | 1.43 | ||||||||||||
| Class C – assumed 5% return | 1,000.00 | 1,018.00 | 7.27 | 1.43 | ||||||||||||
| Class F-1 – actual return | 1,000.00 | 1,021.90 | 3.21 | .63 | ||||||||||||
| Class F-1 – assumed 5% return | 1,000.00 | 1,022.03 | 3.21 | .63 | ||||||||||||
| Class F-2 – actual return | 1,000.00 | 1,023.17 | 1.99 | .39 | ||||||||||||
| Class F-2 – assumed 5% return | 1,000.00 | 1,023.24 | 1.99 | .39 | ||||||||||||
| Class 529-A – actual return | 1,000.00 | 1,021.40 | 3.72 | .73 | ||||||||||||
| Class 529-A – assumed 5% return | 1,000.00 | 1,021.53 | 3.72 | .73 | ||||||||||||
| Class 529-B – actual return | 1,000.00 | 1,017.53 | 7.58 | 1.49 | ||||||||||||
| Class 529-B – assumed 5% return | 1,000.00 | 1,017.69 | 7.58 | 1.49 | ||||||||||||
| Class 529-C – actual return | 1,000.00 | 1,017.56 | 7.58 | 1.49 | ||||||||||||
| Class 529-C – assumed 5% return | 1,000.00 | 1,017.69 | 7.58 | 1.49 | ||||||||||||
| Class 529-E – actual return | 1,000.00 | 1,020.22 | 4.89 | .96 | ||||||||||||
| Class 529-E – assumed 5% return | 1,000.00 | 1,020.37 | 4.89 | .96 | ||||||||||||
| Class 529-F-1 – actual return | 1,000.00 | 1,022.57 | 2.55 | .50 | ||||||||||||
| Class 529-F-1 – assumed 5% return | 1,000.00 | 1,022.68 | 2.55 | .50 | ||||||||||||
| Class R-1 – actual return | 1,000.00 | 1,017.94 | 7.12 | 1.40 | ||||||||||||
| Class R-1 – assumed 5% return | 1,000.00 | 1,018.15 | 7.12 | 1.40 | ||||||||||||
| Class R-2 – actual return | 1,000.00 | 1,017.79 | 7.27 | 1.43 | ||||||||||||
| Class R-2 – assumed 5% return | 1,000.00 | 1,018.00 | 7.27 | 1.43 | ||||||||||||
| Class R-3 – actual return | 1,000.00 | 1,020.16 | 4.94 | .97 | ||||||||||||
| Class R-3 – assumed 5% return | 1,000.00 | 1,020.32 | 4.94 | .97 | ||||||||||||
| Class R-4 – actual return | 1,000.00 | 1,021.89 | 3.26 | .64 | ||||||||||||
| Class R-4 – assumed 5% return | 1,000.00 | 1,021.98 | 3.26 | .64 | ||||||||||||
| Class R-5 – actual return | 1,000.00 | 1,023.44 | 1.68 | .33 | ||||||||||||
| Class R-5 – assumed 5% return | 1,000.00 | 1,023.54 | 1.68 | .33 | ||||||||||||
| Class R-6 – actual return | 1,000.00 | 1,023.70 | 1.43 | .28 | ||||||||||||
| Class R-6 – assumed 5% return | 1,000.00 | 1,023.79 | 1.43 | .28 | ||||||||||||
| * | The “expenses paid during period” are equal to the “annualized expense ratio,” multiplied by the average account value over the period, multiplied by the number of days in the period, and divided by 365 (to reflect the one-half year period). |
| Tax information | unaudited |
We are required to advise you of the federal tax status of certain distributions received by shareholders during the fiscal year. The fund hereby designates the following amounts for the fund’s fiscal year ended August 31, 2014:
| Long-term capital gains | $ | 52,710,000 | |
| U.S. government income that may be exempt from state taxation | $ | 43,480,000 |
Individual shareholders should refer to their Form 1099 or other tax information, which will be mailed in January 2015, to determine the calendar year amounts to be included on their 2014 tax returns. Shareholders should consult their tax advisors.
| 26 | U.S. Government Securities Fund |
Approval of Investment Advisory and Service Agreement
The U.S. Government Securities Fund’s board has approved the fund’s Investment Advisory and Service Agreement (the “agreement”) with Capital Research and Management Company (“CRMC”) for an additional one-year term through March 31, 2015. The board approved the agreement following the recommendation of the fund’s Contracts Committee (the “committee”), which is composed of all of the fund’s independent board members. The board and the committee determined that the fund’s advisory fee structure was fair and reasonable in relation to the services provided and that approving the agreement was in the best interests of the fund and its shareholders.
In reaching this decision, the board and the committee took into account information furnished to them throughout the year and otherwise provided to them, as well as information prepared specifically in connection with their review of the agreement, and were advised by their independent counsel. They considered the following factors, among others, but did not identify any single issue or particular piece of information that, in isolation, was the controlling factor, and each board and committee member did not necessarily attribute the same weight to each factor.
1. Nature, extent and quality of services
The board and the committee considered the depth and quality of CRMC’s investment management process, including its global research capabilities; the experience, capability and integrity of its senior management and other personnel; the low turnover rates of its key personnel; the overall financial strength and stability of CRMC and the Capital Group organization; and the ongoing evolution of CRMC’s organizational structure designed to maintain and strengthen these qualities. The board and the committee also considered the nature, extent and quality of administrative, compliance and shareholder services provided by CRMC to the fund under the agreement and other agreements, as well as the benefits to fund shareholders from investing in a fund that is part of a large family of funds. The board and the committee concluded that the nature, extent and quality of the services provided by CRMC have benefited and should continue to benefit the fund and its shareholders.
2. Investment results
The board and the committee considered the investment results of the fund in light of its objective of providing a high level of current income consistent with prudent investment risk and preservation of capital. They compared the fund’s investment results with those of other relevant funds (including funds that form the basis of the Lipper index for the category in which the fund is included), and data such as relevant market and fund indexes, over various periods through September 30, 2013. This report, including the letter to shareholders and related disclosures, contains certain information about the fund’s investment results. The board and the committee reviewed the fund’s investment results measured against the Lipper General U.S. Government Funds Average and the Barclays U.S. Government/Mortgage-Backed Securities Index. They noted that the investment results of the fund were above the results of the Lipper average for the nine-month, one-, three-, five-, 10-year and lifetime periods (although below the results of the Barclays index for the same periods). The board and the committee concluded that the fund’s investment results have been satisfactory for renewal of the agreement and that CRMC’s record in managing the fund indicated that its continued management should benefit the fund and its shareholders.
3. Advisory fees and total expenses
The board and the committee compared the advisory fees and total expense levels of the fund to those of other relevant funds. They observed that the fund’s advisory fees and expenses were substantially below the median fees and expenses of the other funds included in the Lipper General U.S. Government Funds category. The board and the committee also considered the breakpoint discounts in the fund’s advisory fee structure that reduce the level of fees charged by CRMC to the fund as fund assets increase. In addition, they reviewed information regarding the effective advisory fees charged to non-mutual fund clients by CRMC and its affiliates. They noted that, to the extent there were differences between the advisory fees paid by the fund and the advisory fees paid by those clients, the differences appropriately reflected the investment, operational and regulatory differences between advising the fund and the other clients. The board and the committee concluded that the fund’s cost structure was fair and reasonable in relation to the services provided, and that the fund’s shareholders receive reasonable value in return for the advisory fees and other amounts paid to CRMC by the fund.
| U.S. Government Securities Fund | 27 |
4. Ancillary benefits
The board and the committee considered a variety of other benefits that CRMC and its affiliates receive as a result of CRMC’s relationship with the fund and the other American Funds, including fees for administrative services provided to certain share classes; fees paid to CRMC’s affiliated transfer agent; sales charges and distribution fees received and retained by the fund’s principal underwriter, an affiliate of CRMC; and possible ancillary benefits to CRMC and its institutional management affiliates in managing other investment vehicles. The board and the committee reviewed CRMC’s portfolio trading practices, noting that while CRMC receives the benefit of research provided by broker-dealers executing portfolio transactions on behalf of the fund, it does not obtain third-party research or other services in return for allocating brokerage to such broker-dealers. The board and the committee took these ancillary benefits into account in evaluating the reasonableness of the advisory fees and other amounts paid to CRMC by the fund.
5. Adviser financial information
The board and the committee reviewed information regarding CRMC’s costs of providing services to the American Funds, including personnel, systems and resources of investment, compliance, trading, accounting and other administrative operations. They considered CRMC’s costs and willingness to invest in technology, infrastructure and staff to maintain and expand services and capabilities, respond to industry and regulatory developments, and attract and retain qualified personnel. They noted information regarding the compensation structure for CRMC’s investment professionals. The board and the committee also compared CRMC’s profitability and compensation data to the reported results and data of several large, publicly-held investment management companies. The board and the committee noted the competitiveness and cyclicality of both the mutual fund industry and the capital markets, and the importance in that environment of CRMC’s long-term profitability for maintaining its independence, company culture and management continuity. They further considered the breakpoint discounts in the fund’s advisory fee structure. The board and the committee concluded that the fund’s advisory fee structure reflected a reasonable sharing of benefits between CRMC and the fund’s shareholders.
| 28 | U.S. Government Securities Fund |
Board of trustees and other officers
“Independent” trustees1
| Name and age | Year first elected a trustee of the fund2 | Principal occupation(s) during past five years | Number of portfolios in fund complex overseen by trustee | Other directorships3 held by trustee | ||||
| William H. Baribault, 69 | 2010 | CEO and President, Richard Nixon Foundation; former Chairman of the Board and CEO, Oakwood Enterprises (private investment and consulting) | 70 | None | ||||
| James G. Ellis, 67 | 2006 | Dean and Professor of Marketing, Marshall School of Business, University of Southern California | 70 | Mercury General Corp. | ||||
| Leonard R. Fuller, 68 | 1994 | President and CEO, Fuller Consulting (financial management consulting firm) | 70 | None | ||||
| R. Clark Hooper, 68 Chairman of the Board (Independent and Non-Executive) | 2005 | Private investor | 72 | The Swiss Helvetia Fund, Inc. | ||||
| Merit E. Janow, 56 | 2010 | Dean and Professor, Columbia University, School of International and Public Affairs | 69 | MasterCard Incorporated; The NASDAQ Stock Market LLC; Trimble Navigation Limited | ||||
| Laurel B. Mitchell, Ph.D., 59 | 2010 | Clinical Professor and Director, Accounting Program, University of Redlands | 66 | None | ||||
| Frank M. Sanchez, 71 | 1999 | Principal, The Sanchez Family Corporation dba McDonald’s Restaurants (McDonald’s licensee) | 66 | None | ||||
| Margaret Spellings, 56 | 2010 | President, George W. Bush Foundation; former President and CEO, Margaret Spellings & Company (public policy and strategic consulting); former President, U.S. Chamber Foundation and Senior Advisor to the President and CEO, U.S. Chamber of Commerce; former U.S. Secretary of Education, U.S. Department of Education | 70 | None | ||||
| Steadman Upham, Ph.D., 65 | 2007 | President and University Professor, The University of Tulsa | 69 | None |
We are saddened by the loss of W. Scott Hedrick who passed away on November 3, 2013. Mr. Hedrick served as an independent board member on the boards of various American Funds since 2007. His wise counsel and friendship will be missed.
“Interested” trustee4,5
| Name, age and position with fund | Year first elected a trustee or officer of the fund2 | Principal occupation(s) during past five years and positions held with affiliated entities or the principal underwriter of the fund | Number of portfolios in fund complex overseen by trustee | Other directorships3 held by trustee | ||||
| John H. Smet, 58 Vice Chairman of the Board | 1993 | Senior Vice President — Capital Fixed Income Investors, Capital Research and Management Company; Director, Capital Research and Management Company | 20 | None |
The fund’s statement of additional information includes further details about fund trustees and is available without charge upon request by calling American Funds Service Company at (800) 421-4225 or by visiting the American Funds website at americanfunds.com. The address for all trustees and officers of the fund is 333 South Hope Street, Los Angeles, CA 90071, Attention: Secretary.
See page 30 for footnotes.
| U.S. Government Securities Fund | 29 |
Other officers5
| Name, age and position with fund | Year first elected an officer of the fund2 | Principal occupation(s) during past five years and positions held with affiliated entities or the principal underwriter of the fund | ||
| Thomas H. Høgh, 51 President | 2004 | Senior Vice President — Capital Fixed Income Investors, Capital Research Company6 | ||
| Kristine M. Nishiyama, 44 Senior Vice President | 2003 | Senior Vice President and Senior Counsel — Fund Business Management Group, Capital Research and Management Company; Senior Vice President and General Counsel, Capital Bank and Trust Company6 | ||
| Fergus N. MacDonald, 44 Vice President | 2011 | Senior Vice President — Capital Fixed Income Investors, Capital Research and Management Company | ||
| Wesley K.-S. Phoa, 48 Vice President | 2011 | Senior Vice President — Capital Fixed Income Investors, Capital Research and Management Company; Senior Vice President — Capital Fixed Income Investors, Capital Bank and Trust Company;6 Vice President, Capital Strategy Research, Inc.6 | ||
| Courtney R. Taylor, 39 Secretary | 2006 | Assistant Vice President — Fund Business Management Group, Capital Research and Management Company | ||
| Karl C. Grauman, 46 Treasurer | 2012 | Vice President — Investment Operations, Capital Research and Management Company | ||
| Steven I. Koszalka, 50 Assistant Secretary | 2010 | Vice President — Fund Business Management Group, Capital Research and Management Company | ||
| Dori Laskin, 63 Assistant Treasurer | 2010 | Vice President — Investment Operations, Capital Research and Management Company | ||
| Ari M. Vinocor, 39 Assistant Treasurer | 2007 | Vice President — Investment Operations, Capital Research and Management Company |
| 1 | The term “independent” trustee refers to a trustee who is not an “interested person” of the fund within the meaning of the Investment Company Act of 1940. |
| 2 | Trustees and officers of the fund serve until their resignation, removal or retirement. |
| 3 | This includes all directorships/trusteeships (other than those in the American Funds or other funds managed by Capital Research and Management Company or its affiliates) that are held by each trustee as a trustee or director of a public company or a registered investment company. |
| 4 | The term “interested” trustee refers to a trustee who is an “interested person” within the meaning of the Investment Company Act of 1940, on the basis of their affiliation with the fund’s investment adviser, Capital Research and Management Company, or affiliated entities (including the fund’s principal underwriter). |
| 5 | All of the directors/trustees and/or officers listed are officers and/or directors/trustees of one or more of the other funds for which Capital Research and Management Company serves as investment adviser. |
| 6 | Company affiliated with Capital Research and Management Company. |
| 30 | U.S. Government Securities Fund |
Offices of the fund and of the investment adviser
Capital Research and Management Company
333 South Hope Street
Los Angeles, CA 90071-1406
6455 Irvine Center Drive
Irvine, CA 92618-4518
Transfer agent for shareholder accounts
American Funds Service Company
(Write to the address near you.)
P.O. Box 6007
Indianapolis, IN 46206-6007
P.O. Box 2280
Norfolk, VA 23501-2280
Custodian of assets
JPMorgan Chase Bank
270 Park Avenue
New York, NY 10017-2070
Counsel
Bingham McCutchen LLP
355 South Grand Avenue, Suite 4400
Los Angeles, CA 90071-3106
Independent registered public accounting firm
Deloitte & Touche LLP
695 Town Center Drive
Suite 1200
Costa Mesa, CA 92626-7188
Principal underwriter
American Funds Distributors, Inc.
333 South Hope Street
Los Angeles, CA 90071-1406
| U.S. Government Securities Fund | 31 |
Investors should carefully consider investment objectives, risks, charges and expenses. This and other important information is contained in the fund prospectus and summary prospectus, which can be obtained from your financial professional and should be read carefully before investing. You may also call American Funds Service Company (AFS) at (800) 421-4225 or visit the American Funds website at americanfunds.com.
“American Funds Proxy Voting Procedures and Principles” — which describes how we vote proxies relating to portfolio securities — is available on the American Funds website or upon request by calling AFS. The fund files its proxy voting record with the U.S. Securities and Exchange Commission (SEC) for the 12 months ended June 30 by August 31. The proxy voting record is available free of charge on the SEC website at sec.gov and on the American Funds website.
A complete August 31, 2014, portfolio of U.S. Government Securities Fund’s investments is available free of charge by calling AFS or visiting the SEC website (where it is part of Form N-CSR).
U.S. Government Securities Fund files a complete list of its portfolio holdings with the SEC for the first and third quarters of each fiscal year on Form N-Q. This filing is available free of charge on the SEC website. You may also review or, for a fee, copy this filing at the SEC’s Public Reference Room in Washington, D.C. Additional information regarding the operation of the Public Reference Room may be obtained by calling the SEC’s Office of Investor Education and Advocacy at (800) SEC-0330. Additionally, the list of portfolio holdings is available by calling AFS.
This report is for the information of shareholders of U.S. Government Securities Fund, but it also may be used as sales literature when preceded or accompanied by the current prospectus or summary prospectus, which gives details about charges, expenses, investment objectives and operating policies of the fund. If used as sales material after December 31, 2014, this report must be accompanied by an American Funds statistical update for the most recently completed calendar quarter.
| 32 | U.S. Government Securities Fund |
The American Funds Advantage
Since 1931, American Funds, part of Capital Group, has helped investors pursue long-term investment success. Our consistent approach — in combination with The Capital SystemSM — has resulted in a superior long-term track record.
| Aligned with investor success | |
| We base our decisions on a long-term perspective, which we believe aligns our goals with the interests of our clients. Our portfolio managers average 26 years of investment experience, including 21 years at our company, reflecting a career commitment to our long-term approach.1 | |
| The Capital SystemSM | |
| Our investment process, The Capital System, combines individual accountability with teamwork. Each fund is divided into portions that are managed independently by investment professionals with diverse backgrounds, ages and investment approaches. An extensive global research effort is the backbone of our system. | |
| Superior long-term track record | |
| Our equity funds have beaten their Lipper peer indexes in 90% of 10-year periods and 96% of 20-year periods. Our fixed-income funds have beaten their Lipper indexes in 56% of 10-year periods and 57% of 20-year periods.2 Our fund management fees have been among the lowest in the industry.3 |
| 1 | Portfolio manager experience as of December 31, 2013. | |
| 2 | Based on Class A share results for rolling periods through December 31, 2013. Periods covered are the shorter of the fund’s lifetime or since the comparable Lipper index inception date (except SMALLCAP World Fund, for which the Lipper average was used). | |
| 3 | Based on management fees for the 20-year period ended December 31, 2013, versus comparable Lipper categories, excluding funds of funds. |

ITEM 2 – Code of Ethics
The Registrant has adopted a Code of Ethics that applies to its Principal Executive Officer and Principal Financial Officer. The Registrant undertakes to provide to any person without charge, upon request, a copy of the Code of Ethics. Such request can be made to American Funds Service Company at 800/421-9225 or to the Secretary of the Registrant, 333 South Hope Street, Los Angeles, California 90071.
ITEM 3 – Audit Committee Financial Expert
The Registrant’s board has determined that Laurel B. Mitchell, a member of the Registrant’s audit committee, is an “audit committee financial expert” and "independent," as such terms are defined in this Item. This designation will not increase the designee’s duties, obligations or liability as compared to his or her duties, obligations and liability as a member of the audit committee and of the board, nor will it reduce the responsibility of the other audit committee members. There may be other individuals who, through education or experience, would qualify as "audit committee financial experts" if the board had designated them as such. Most importantly, the board believes each member of the audit committee contributes significantly to the effective oversight of the Registrant’s financial statements and condition.
ITEM 4 – Principal Accountant Fees and Services
| Registrant: | ||||
| a) Audit Fees: | ||||
| 2013 | $95,000 | |||
| 2014 | $91,000 | |||
| b) Audit-Related Fees: | ||||
| 2013 | $2,000 | |||
| 2014 | $2,000 | |||
| The audit-related fees consist of assurance and related services relating to the examination of the Registrant’s investment adviser conducted in accordance with Statement on Standards for Attestation Engagements Number 16 issued by the American Institute of Certified Public Accountants. | ||||
| c) Tax Fees: | ||||
| 2013 | $7,000 | |||
| 2014 | $8,000 | |||
| The tax fees consist of professional services relating to the preparation of the Registrant’s tax returns. | ||||
| d) All Other Fees: | ||||
| 2013 | None | |||
| 2014 | None | |||
| Adviser and affiliates (includes only fees for non-audit services billed to the adviser and affiliates for engagements that relate directly to the operations and financial reporting of the Registrant and were subject to the pre-approval policies described below): | ||||
| a) Audit Fees: | ||||
| Not Applicable | ||||
| b) Audit-Related Fees: | ||||
| 2013 | $1,011,000 | |||
| 2014 | $970,000 | |||
| The audit-related fees consist of assurance and related services relating to the examination of the Registrant’s transfer agent, principal underwriter and investment adviser conducted in accordance with Statement on Standards for Attestation Engagements Number 16 issued by the American Institute of Certified Public Accountants. | ||||
| c) Tax Fees: | ||||
| 2013 | $28,000 | |||
| 2014 | $41,000 | |||
| The tax fees consist of consulting services relating to the Registrant’s investments. | ||||
| d) All Other Fees: | ||||
| 2013 | $2,000 | |||
| 2014 | $3,000 | |||
| The other fees consist of subscription services related to an accounting research tool. | ||||
All audit and permissible non-audit services that the Registrant’s audit committee considers compatible with maintaining the independent registered public accounting firm’s independence are required to be pre-approved by the committee. The pre-approval requirement will extend to all non-audit services provided to the Registrant, the investment adviser, and any entity controlling, controlled by, or under common control with the investment adviser that provides ongoing services to the Registrant, if the engagement relates directly to the operations and financial reporting of the Registrant. The committee will not delegate its responsibility to pre-approve these services to the investment adviser. The committee may delegate to one or more committee members the authority to review and pre-approve audit and permissible non-audit services. Actions taken under any such delegation will be reported to the full committee at its next meeting. The pre-approval requirement is waived with respect to non-audit services if certain conditions are met. The pre-approval requirement was not waived for any of the non-audit services listed above provided to the Registrant, adviser and affiliates.
Aggregate non-audit fees paid to the Registrant’s auditors, including fees for all services billed to the Registrant, adviser and affiliates that provide ongoing services to the Registrant, were $1,449,000 for fiscal year 2013 and $1,402,000 for fiscal year 2014. The non-audit services represented by these amounts were brought to the attention of the committee and considered to be compatible with maintaining the auditors’ independence.
ITEM 5 – Audit Committee of Listed Registrants
Not applicable to this Registrant, insofar as the Registrant is not a listed issuer as defined in Rule 10A-3 under the Securities Exchange Act of 1934.
ITEM 6 – Schedule of Investments

| Bonds, notes & other debt instruments 94.80% U.S. Treasury bonds & notes 51.98% U.S. Treasury 41.27% | Principal amount (000) | Value (000) |
| U.S. Treasury 0.375% 2015 | $9,250 | $9,274 |
| U.S. Treasury 11.25% 2015 | 45,265 | 47,549 |
| U.S. Treasury 0.625% 2016 | 7,340 | 7,358 |
| U.S. Treasury 0.875% 2016 | 10,500 | 10,571 |
| U.S. Treasury 1.00% 2016 | 10,750 | 10,847 |
| U.S. Treasury 1.50% 2016 | 94,050 | 95,859 |
| U.S. Treasury 1.50% 20161 | 49,925 | 50,874 |
| U.S. Treasury 2.125% 2016 | 58,100 | 59,679 |
| U.S. Treasury 4.50% 2016 | 14,950 | 15,859 |
| U.S. Treasury 4.625% 2016 | 49,175 | 53,470 |
| U.S. Treasury 7.50% 2016 | 26,275 | 30,228 |
| U.S. Treasury 0.625% 2017 | 44,250 | 43,785 |
| U.S. Treasury 0.75% 2017 | 44,000 | 43,811 |
| U.S. Treasury 0.875% 2017 | 21,750 | 21,837 |
| U.S. Treasury 1.00% 2017 | 27,000 | 27,143 |
| U.S. Treasury 2.75% 2017 | 41,000 | 43,090 |
| U.S. Treasury 4.625% 2017 | 39,725 | 43,483 |
| U.S. Treasury 1.25% 2018 | 48,350 | 47,972 |
| U.S. Treasury 1.25% 2018 | 22,000 | 21,820 |
| U.S. Treasury 1.375% 2018 | 28,855 | 28,760 |
| U.S. Treasury 1.375% 2018 | 17,150 | 17,123 |
| U.S. Treasury 1.50% 2018 | 21,750 | 21,845 |
| U.S. Treasury 2.375% 2018 | 14,050 | 14,602 |
| U.S. Treasury 1.50% 2019 | 138,750 | 138,133 |
| U.S. Treasury 1.50% 2019 | 45,250 | 45,216 |
| U.S. Treasury 1.50% 2019 | 16,500 | 16,476 |
| U.S. Treasury 1.625% 2019 | 230,000 | 230,189 |
| U.S. Treasury 1.625% 2019 | 88,900 | 88,911 |
| U.S. Treasury 1.625% 2019 | 16,500 | 16,549 |
| U.S. Treasury 3.625% 2019 | 36,000 | 39,424 |
| U.S. Treasury 1.125% 2020 | 22,875 | 22,069 |
| U.S. Treasury 1.25% 2020 | 56,500 | 54,959 |
| U.S. Treasury 1.375% 2020 | 22,600 | 22,057 |
| U.S. Treasury 2.00% 2020 | 3,400 | 3,420 |
| U.S. Treasury 8.75% 2020 | 5,255 | 7,316 |
| U.S. Treasury 2.25% 2021 | 224,250 | 227,903 |
| U.S. Treasury 8.00% 2021 | 350 | 491 |
| U.S. Treasury 1.625% 2022 | 80,258 | 76,834 |
| U.S. Treasury 1.625% 2022 | 71,479 | 68,721 |
| U.S. Treasury 1.75% 2022 | 125,000 | 121,621 |
| U.S. Treasury 2.00% 2023 | 51,498 | 50,617 |
| U.S. Treasury 2.50% 2023 | 49,475 | 50,413 |
| U.S. Treasury 2.75% 2023 | 218,900 | 227,271 |
| U.S. Treasury 2.75% 2024 | 192,700 | 199,845 |
| U.S. Treasury 6.25% 2030 | 5,250 | 7,639 |
| U.S. Treasury 2.875% 2043 | 52,609 | 50,509 |
| Bonds, notes & other debt instruments U.S. Treasury bonds & notes (continued) U.S. Treasury (continued) | Principal amount (000) | Value (000) |
| U.S. Treasury 3.125% 2043 | $21,250 | $21,456 |
| U.S. Treasury 3.625% 2043 | 35,000 | 38,741 |
| U.S. Treasury 3.375% 2044 | 2,275 | 2,407 |
| U.S. Treasury 3.625% 2044 | 3,400 | 3,764 |
| 2,599,790 | ||
| U.S. Treasury inflation-protected securities 10.71% | ||
| U.S. Treasury Inflation-Protected Security 0.50% 20152 | 22,366 | 22,485 |
| U.S. Treasury Inflation-Protected Security 1.875% 20152 | 44,772 | 46,026 |
| U.S. Treasury Inflation-Protected Security 0.125% 20162 | 44,534 | 45,326 |
| U.S. Treasury Inflation-Protected Security 2.00% 20162 | 24,013 | 25,034 |
| U.S. Treasury Inflation-Protected Security 0.125% 20172 | 73,311 | 75,056 |
| U.S. Treasury Inflation-Protected Security 0.125% 20192 | 82,656 | 84,188 |
| U.S. Treasury Inflation-Protected Security 0.125% 20222 | 7,844 | 7,868 |
| U.S. Treasury Inflation-Protected Security 0.125% 20232 | 7,640 | 7,594 |
| U.S. Treasury Inflation-Protected Security 0.375% 20232 | 21,104 | 21,489 |
| U.S. Treasury Inflation-Protected Security 0.125% 20242 | 10,463 | 10,369 |
| U.S. Treasury Inflation-Protected Security 0.625% 20242 | 113,415 | 117,458 |
| U.S. Treasury Inflation-Protected Security 2.125% 20412 | 16,187 | 21,386 |
| U.S. Treasury Inflation-Protected Security 1.375% 20442 | 166,830 | 190,647 |
| 674,926 | ||
| Total U.S. Treasury bonds & notes | 3,274,716 | |
| Mortgage-backed obligations 31.82% Federal agency mortgage-backed obligations 31.82% | ||
| Fannie Mae 3.306% 20173,4 | 3,965 | 4,172 |
| Fannie Mae 10.50% 20184 | 301 | 341 |
| Fannie Mae 5.50% 20234 | 1,392 | 1,515 |
| Fannie Mae 6.00% 20244 | 770 | 868 |
| Fannie Mae 10.524% 20253,4 | 504 | 564 |
| Fannie Mae 6.00% 20264 | 44 | 49 |
| Fannie Mae 2.50% 20274 | 4,384 | 4,452 |
| Fannie Mae 2.50% 20274 | 2,098 | 2,131 |
| Fannie Mae 6.50% 20274 | 1,550 | 1,759 |
| Fannie Mae 6.50% 20274 | 600 | 681 |
| Fannie Mae 5.00% 20284 | 737 | 812 |
| Fannie Mae 8.00% 20314 | 860 | 1,013 |
| Fannie Mae 6.50% 20374 | 581 | 652 |
| Fannie Mae 6.50% 20374 | 550 | 618 |
| Fannie Mae 6.50% 20374 | 167 | 188 |
| Fannie Mae 7.00% 20374 | 690 | 779 |
| Fannie Mae 7.00% 20374 | 364 | 411 |
| Fannie Mae 7.00% 20374 | 12 | 13 |
| Fannie Mae 7.50% 20374 | 102 | 117 |
| Fannie Mae 5.50% 20384 | 8,711 | 9,671 |
| Fannie Mae 6.00% 20384 | 446 | 500 |
| Fannie Mae 7.00% 20384 | 1,338 | 1,511 |
| Fannie Mae 3.251% 20403,4 | 6,027 | 6,434 |
| Fannie Mae 3.561% 20403,4 | 822 | 881 |
| Fannie Mae 4.195% 20403,4 | 2,154 | 2,293 |
| Fannie Mae 4.379% 20403,4 | 3,403 | 3,623 |
| Fannie Mae 5.00% 20404 | 962 | 1,073 |
| Fannie Mae 3.226% 20413,4 | 5,549 | 5,878 |
| Bonds, notes & other debt instruments Mortgage-backed obligations (continued) Federal agency mortgage-backed obligations (continued) | Principal amount (000) | Value (000) |
| Fannie Mae 3.44% 20413,4 | $2,882 | $3,040 |
| Fannie Mae 3.526% 20413,4 | 4,273 | 4,487 |
| Fannie Mae 3.761% 20413,4 | 4,157 | 4,448 |
| Fannie Mae 4.00% 20414 | 20,674 | 22,080 |
| Fannie Mae 4.00% 20414 | 5,771 | 6,123 |
| Fannie Mae 4.50% 20414 | 3,898 | 4,245 |
| Fannie Mae 5.00% 20414 | 2,988 | 3,350 |
| Fannie Mae 5.00% 20414 | 2,286 | 2,563 |
| Fannie Mae 5.00% 20414 | 1,499 | 1,681 |
| Fannie Mae 5.00% 20414 | 961 | 1,071 |
| Fannie Mae 2.945% 20423,4 | 5,206 | 5,385 |
| Fannie Mae 3.50% 20424 | 10,395 | 10,734 |
| Fannie Mae 3.50% 20424 | 8,188 | 8,440 |
| Fannie Mae 4.00% 20424 | 14,536 | 15,523 |
| Fannie Mae 4.00% 20424 | 846 | 903 |
| Fannie Mae 2.515% 20433,4 | 4,158 | 4,194 |
| Fannie Mae 4.00% 20434 | 42,745 | 45,610 |
| Fannie Mae 4.00% 20434 | 6,797 | 7,259 |
| Fannie Mae 3.50% 20444,5 | 168,796 | 173,789 |
| Fannie Mae 3.50% 20444,5 | 41,574 | 42,674 |
| Fannie Mae 4.00% 20444 | 12,921 | 13,788 |
| Fannie Mae 4.00% 20444,5 | 11,740 | 12,441 |
| Fannie Mae 4.00% 20444,5 | 6,260 | 6,612 |
| Fannie Mae 4.00% 20444 | 6,082 | 6,496 |
| Fannie Mae 4.50% 20444,5 | 544,071 | 586,162 |
| Fannie Mae 4.50% 20444,5 | 336,108 | 362,997 |
| Fannie Mae 5.00% 20444,5 | 32,850 | 36,228 |
| Fannie Mae 7.075% 20473,4 | 246 | 266 |
| Fannie Mae, Series 2001-4, Class NA, 10.217% 20253,4 | 123 | 136 |
| Fannie Mae, Series 2001-25, Class ZA, 6.50% 20314 | 423 | 473 |
| Fannie Mae, Series 2001-20, Class E, 9.56% 20313,4 | 18 | 20 |
| Fannie Mae, Series 2005-29, Class AK, 4.50% 20354 | 510 | 511 |
| Fannie Mae, Series 2005-68, Class PG, 5.50% 20354 | 5,997 | 6,775 |
| Fannie Mae, Series 2006-83, Class AO, principal only, 0% 20364 | 1,924 | 1,703 |
| Fannie Mae, Series 2006-56, Class OG, principal only, 0% 20364 | 1,359 | 1,240 |
| Fannie Mae, Series 2006-65, Class PF, 0.435% 20363,4 | 1,683 | 1,686 |
| Fannie Mae, Series 2006-49, Class PA, 6.00% 20364 | 260 | 286 |
| Fannie Mae, Series 2007-33, Class HE, 5.50% 20374 | 2,037 | 2,245 |
| Fannie Mae, Series 2007-40, Class PT, 5.50% 20374 | 944 | 1,034 |
| Fannie Mae, Series 1999-T2, Class A-1, 7.50% 20393,4 | 421 | 470 |
| FDIC Structured Sale Guaranteed Notes, Series 2010-S1, Class 1-A, 0.701% 20483,4,6 | 591 | 591 |
| Freddie Mac 10.00% 20254 | 232 | 258 |
| Freddie Mac 6.00% 20264 | 579 | 652 |
| Freddie Mac 6.00% 20274 | 2,816 | 3,165 |
| Freddie Mac 2.375% 20363,4 | 770 | 822 |
| Freddie Mac 2.07% 20373,4 | 294 | 312 |
| Freddie Mac 5.50% 20374 | 82 | 91 |
| Freddie Mac 6.50% 20374 | 242 | 272 |
| Freddie Mac 4.824% 20383,4 | 677 | 727 |
| Freddie Mac 5.50% 20384 | 7,445 | 8,248 |
| Freddie Mac 5.50% 20384 | 260 | 288 |
| Freddie Mac 5.50% 20394 | 7,023 | 7,781 |
| Freddie Mac 3.243% 20413,4 | 4,113 | 4,365 |
| Freddie Mac 3.402% 20413,4 | 5,575 | 5,886 |
| Bonds, notes & other debt instruments Mortgage-backed obligations (continued) Federal agency mortgage-backed obligations (continued) | Principal amount (000) | Value (000) |
| Freddie Mac 5.00% 20414 | $7,162 | $8,006 |
| Freddie Mac 2.57% 20423,4 | 6,384 | 6,454 |
| Freddie Mac 2.584% 20423,4 | 2,696 | 2,768 |
| Freddie Mac 2.078% 20433,4 | 2,173 | 2,221 |
| Freddie Mac 2.351% 20433,4 | 12,319 | 12,323 |
| Freddie Mac 2.429% 20433,4 | 4,714 | 4,746 |
| Freddie Mac 4.00% 20434 | 11,108 | 11,830 |
| Freddie Mac 4.00% 20434 | 5,353 | 5,701 |
| Freddie Mac 4.00% 20434 | 4,273 | 4,555 |
| Freddie Mac 4.00% 20434 | 2,653 | 2,826 |
| Freddie Mac 4.00% 20434 | 1,925 | 2,050 |
| Freddie Mac 4.00% 20444,5 | 10,400 | 10,999 |
| Freddie Mac 4.00% 20444 | 4,470 | 4,764 |
| Freddie Mac 4.50% 20444,5 | 30,475 | 32,903 |
| Freddie Mac, Series 2356, Class GD, 6.00% 20164 | 389 | 405 |
| Freddie Mac, Series 2289, Class NA, 10.1354% 20203,4 | 59 | 63 |
| Freddie Mac, Series 2289, Class NB, 9.613% 20223,4 | 28 | 32 |
| Freddie Mac, Series 1567, Class A, 0.555% 20233,4 | 17 | 17 |
| Freddie Mac, Series 2626, Class NG, 3.50% 20234 | 77 | 79 |
| Freddie Mac, Series 1617, Class PM, 6.50% 20234 | 402 | 452 |
| Freddie Mac, Series 2153, Class GG, 6.00% 20294 | 754 | 849 |
| Freddie Mac, Series 3061, Class PN, 5.50% 20354 | 870 | 970 |
| Freddie Mac, Series 3156, Class PO, principal only, 0% 20364 | 2,434 | 2,285 |
| Freddie Mac, Series 3146, Class PO, principal only, 0% 20364 | 1,165 | 1,064 |
| Freddie Mac, Series 3213, Class OG, principal only, 0% 20364 | 959 | 873 |
| Freddie Mac, Series 3156, Class PF, 0.405% 20363,4 | 2,890 | 2,891 |
| Freddie Mac, Series 3257, Class PA, 5.50% 20364 | 1,580 | 1,760 |
| Freddie Mac, Series 3233, Class PA, 6.00% 20364 | 1,859 | 2,089 |
| Freddie Mac, Series 3272, Class PA, 6.00% 20374 | 1,708 | 1,911 |
| Government National Mortgage Assn. 10.00% 20194 | 195 | 220 |
| Government National Mortgage Assn. 10.00% 20214 | 80 | 93 |
| Government National Mortgage Assn. 3.00% 20264 | 20,274 | 21,324 |
| Government National Mortgage Assn. 3.00% 20274 | 5,934 | 6,242 |
| Government National Mortgage Assn. 6.50% 20294 | 1,062 | 1,212 |
| Government National Mortgage Assn. 6.50% 20324 | 819 | 939 |
| Government National Mortgage Assn. 6.50% 20374 | 707 | 801 |
| Government National Mortgage Assn. 5.50% 20384 | 1,048 | 1,166 |
| Government National Mortgage Assn. 5.50% 20384 | 128 | 138 |
| Government National Mortgage Assn. 6.00% 20384 | 1,076 | 1,216 |
| Government National Mortgage Assn. 6.50% 20384 | 690 | 781 |
| Government National Mortgage Assn. 6.50% 20384 | 558 | 634 |
| Government National Mortgage Assn. 6.50% 20384 | 550 | 623 |
| Government National Mortgage Assn. 6.50% 20384 | 404 | 458 |
| Government National Mortgage Assn. 3.50% 20393,4 | 3,204 | 3,371 |
| Government National Mortgage Assn. 4.00% 20394 | 1,052 | 1,125 |
| Government National Mortgage Assn. 5.00% 20394 | 3,228 | 3,557 |
| Government National Mortgage Assn. 6.00% 20394 | 6,762 | 7,696 |
| Government National Mortgage Assn. 6.50% 20394 | 1,071 | 1,252 |
| Government National Mortgage Assn. 4.50% 20404 | 2,354 | 2,568 |
| Government National Mortgage Assn. 5.00% 20404 | 1,555 | 1,713 |
| Government National Mortgage Assn. 5.00% 20404 | 733 | 807 |
| Government National Mortgage Assn. 5.50% 20404 | 9,486 | 10,700 |
| Government National Mortgage Assn. 3.50% 20414 | 1,050 | 1,079 |
| Government National Mortgage Assn. 4.00% 20414 | 358 | 372 |
| Bonds, notes & other debt instruments Mortgage-backed obligations (continued) Federal agency mortgage-backed obligations (continued) | Principal amount (000) | Value (000) |
| Government National Mortgage Assn. 4.50% 20414 | $27,133 | $29,613 |
| Government National Mortgage Assn. 5.00% 20414 | 15,074 | 16,567 |
| Government National Mortgage Assn. 5.00% 20414 | 234 | 250 |
| Government National Mortgage Assn. 5.50% 20414 | 1,094 | 1,176 |
| Government National Mortgage Assn. 5.50% 20414 | 541 | 583 |
| Government National Mortgage Assn. 5.50% 20414 | 352 | 380 |
| Government National Mortgage Assn. 6.00% 20414 | 94 | 103 |
| Government National Mortgage Assn. 6.50% 20414 | 6,448 | 7,315 |
| Government National Mortgage Assn. 3.50% 20424 | 821 | 857 |
| Government National Mortgage Assn. 4.00% 20424 | 5,804 | 6,125 |
| Government National Mortgage Assn. 4.00% 20424 | 2,943 | 3,105 |
| Government National Mortgage Assn. 3.50% 20434 | 7,360 | 7,667 |
| Government National Mortgage Assn. 4.00% 20444 | 96,430 | 102,743 |
| Government National Mortgage Assn. 4.00% 20444 | 45,551 | 48,610 |
| Government National Mortgage Assn. 5.922% 20584 | 12,126 | 12,875 |
| Government National Mortgage Assn. 6.172% 20584 | 187 | 198 |
| Government National Mortgage Assn. 6.22% 20584 | 2,752 | 2,914 |
| Government National Mortgage Assn., Series 2003-116, Class JD, 5.00% 20324 | 2,667 | 2,756 |
| Government National Mortgage Assn., Series 2003-46, 5.00% 20334 | 4,364 | 4,726 |
| Government National Mortgage Assn., Series 2003, 6.116% 20584 | 2,690 | 2,876 |
| National Credit Union Administration, Series 2010-R2, Class 1A, 0.527% 20173,4 | 683 | 685 |
| National Credit Union Administration, Series 2011-R3, Class 1A, 0.557% 20203,4 | 1,458 | 1,464 |
| National Credit Union Administration, Series 2011-R1, Class 1A, 0.607% 20203,4 | 880 | 886 |
| Vendee Mortgage Trust, Series 2011-2, Class V, 3.75% 20284 | 13,814 | 14,440 |
| Vendee Mortgage Trust, Series 2008-1, Class GD, 5.25% 20324 | 18,250 | 20,387 |
| Vendee Mortgage Trust, Series 2011-2, Class DA, 3.75% 20334 | 14,735 | 15,570 |
| Vendee Mortgage Trust, Series 2010-1, Class DA, 4.25% 20354 | 5,589 | 6,004 |
| Total mortgage-backed obligations | 2,004,473 | |
| Federal agency bonds & notes 11.00% | ||
| Export-Import Bank of the United States-Guaranteed, Ethiopian Leasing 2012 LLC 2.646% 20264 | 1,963 | 1,976 |
| Export-Import Bank of the United States-Guaranteed, VCK Lease SA 2.591% 20264 | 2,000 | 2,012 |
| Fannie Mae 5.00% 2017 | 4,410 | 4,859 |
| Fannie Mae 7.125% 2030 | 3,000 | 4,492 |
| Fannie Mae, Series 2014-M2, Class A-S-Q2, multifamily 0.478% 20154 | 3,963 | 3,967 |
| Fannie Mae, Series 2014-M6, Class FA, multifamily 0.4588% 20173,4 | 1,128 | 1,131 |
| Fannie Mae, Series 2013-M4, multifamily 2.608% 20224 | 4,225 | 4,224 |
| Fannie Mae, Series 2012-M2, Class A2, multifamily 2.717% 20224 | 4,325 | 4,387 |
| Fannie Mae, Series 2012-M3, Class 1-A2, multifamily 3.044% 20224 | 3,500 | 3,613 |
| Fannie Mae, Series 2013-M14, Class A2, multifamily 3.329% 20233,4 | 3,075 | 3,228 |
| Fannie Mae, Series 2014-M1, multifamily 3.502% 20233,4 | 3,600 | 3,777 |
| Fannie Mae, Series 2014-M9, multifamily 3.103% 20243,4 | 2,620 | 2,667 |
| Fannie Mae, Series 2014-M3, Class A2, multifamily 3.501% 20243,4 | 6,525 | 6,931 |
| Fannie Mae, Series 2003-M2, Class D, multifamily 4.68% 20333,4 | 5,068 | 5,645 |
| Federal Farm Credit Banks 1.625% 2014 | 33,225 | 33,320 |
| Federal Farm Credit Banks 0.205% 20173 | 10,825 | 10,827 |
| Federal Farm Credit Banks 0.21% 20173 | 8,861 | 8,863 |
| Federal Farm Credit Banks 0.60% 2017 | 74,292 | 73,747 |
| Federal Home Loan Bank 0.375% 2015 | 61,000 | 61,089 |
| Federal Home Loan Bank 2.75% 2015 | 8,500 | 8,618 |
| Federal Home Loan Bank 0.375% 2016 | 28,875 | 28,854 |
| Federal Home Loan Bank 0.50% 2016 | 11,605 | 11,578 |
| Federal Home Loan Bank 0.625% 2016 | 7,610 | 7,591 |
| Federal Home Loan Bank 3.375% 2023 | 14,160 | 15,040 |
| Bonds, notes & other debt instruments Federal agency bonds & notes (continued) | Principal amount (000) | Value (000) |
| Federal Home Loan Bank 5.50% 2036 | $700 | $925 |
| Federal Home Loan Bank, Series 2816, 1.00% 2017 | 43,705 | 43,762 |
| Freddie Mac 1.75% 2015 | 33,375 | 33,862 |
| Freddie Mac 1.00% 2017 | 18,525 | 18,531 |
| Freddie Mac 1.25% 2019 | 51,820 | 50,394 |
| Freddie Mac, Series KF02, Class A3, multifamily 0.785% 20203,4 | 2,582 | 2,591 |
| Freddie Mac, Series K015, Class A1, multifamily 2.257% 20204 | 2,954 | 3,022 |
| Freddie Mac, Series K009, Class A1, multifamily 2.757% 20204 | 1,313 | 1,363 |
| Freddie Mac, Series K013, Class A1, multifamily 2.902% 20204 | 3,521 | 3,664 |
| Freddie Mac, Series K010, Class A1, multifamily 3.32% 20204 | 2,663 | 2,804 |
| Freddie Mac, Series K019, Class A1, multifamily 1.459% 20214 | 1,984 | 1,966 |
| Freddie Mac, Series K017, Class A2, multifamily 2.873% 20214 | 4,300 | 4,426 |
| Freddie Mac, Series K022, Class A2, multifamily 2.355% 20224 | 4,425 | 4,357 |
| Freddie Mac, Series K020, Class A2, multifamily 2.373% 20224 | 4,425 | 4,385 |
| Freddie Mac, Series K031, Class A1, multifamily 2.778% 20224 | 2,649 | 2,744 |
| Freddie Mac, Series KS01, Class A2, multifamily 2.522% 20234 | 3,185 | 3,155 |
| Freddie Mac, Series K031, Class A2, multifamily 3.30% 20233,4 | 1,995 | 2,083 |
| Freddie Mac, Series K029, Class A2, multifamily 3.32% 20233,4 | 1,200 | 1,257 |
| Freddie Mac, Series K038, Class A2, multifamily 3.389% 20244 | 2,620 | 2,744 |
| Freddie Mac, Series K501, Class A1, multifamily 1.337% 20164 | 2,826 | 2,834 |
| Freddie Mac, Series K705, Class A2, multifamily 2.303% 20184 | 2,112 | 2,158 |
| Freddie Mac, Series K706, Class A2, multifamily 2.323% 20184 | 3,300 | 3,373 |
| Freddie Mac, Series K704, Class A2, multifamily 2.412% 20184 | 3,225 | 3,313 |
| Freddie Mac, Series K712, Class A2, multifamily 1.869% 20194 | 3,250 | 3,229 |
| Freddie Mac, Series KGRP, Class A, multifamily 0.535% 20203,4 | 3,124 | 3,136 |
| Private Export Funding Corp. 1.375% 2017 | 3,750 | 3,799 |
| Private Export Funding Corp. 1.45% 2019 | 5,250 | 5,146 |
| Private Export Funding Corp. 3.55% 2024 | 8,510 | 9,097 |
| Small Business Administration, Series SBIC-PS 2006-10A, Participating Securities, 5.408% 20164 | 185 | 191 |
| Small Business Administration, Series 2001-20K, 5.34% 20214 | 488 | 526 |
| Small Business Administration, Series 2001-20J, 5.76% 20214 | 208 | 224 |
| Small Business Administration, Series 2001-20F, 6.44% 20214 | 720 | 789 |
| Small Business Administration, Series 2003-20B, 4.84% 20234 | 2,013 | 2,167 |
| Tennessee Valley Authority, Series A, 3.875% 2021 | 8,500 | 9,388 |
| Tennessee Valley Authority 1.875% 2022 | 18,350 | 17,714 |
| Tennessee Valley Authority 4.65% 2035 | 3,930 | 4,569 |
| Tennessee Valley Authority 5.88% 2036 | 2,750 | 3,674 |
| Tennessee Valley Authority 5.25% 2039 | 11,000 | 13,782 |
| Tennessee Valley Authority, Series B, 3.50% 2042 | 14,670 | 14,137 |
| Tennessee Valley Authority, Series 2008, Class A, 4.875% 2048 | 3,300 | 3,904 |
| TVA Southaven 3.846% 20334 | 2,978 | 3,144 |
| United States Agency for International Development, Jordan (Kingdom of) 1.945% 2019 | 38,500 | 38,885 |
| United States Agency for International Development, Jordan (Kingdom of) 2.503% 2020 | 8,200 | 8,323 |
| United States Agency for International Development, Republic of Egypt 4.45% 2015 | 19,000 | 19,802 |
| United States Agency for International Development, State of Israel, Class 1-A, 5.50% 2023 | 5,000 | 6,144 |
| United States Agency for International Development, Ukraine, 1.844% 2019 | 2,890 | 2,868 |
| United States Government-Guaranteed Certificates of Participation, Overseas Private Investment Corp, 0% 2016 | 983 | 990 |
| United States Government-Guaranteed Certificates of Participation, Overseas Private Investment Corp, 3.49% 20294 | 1,765 | 1,836 |
| Bonds, notes & other debt instruments Federal agency bonds & notes (continued) | Principal amount (000) | Value (000) |
| United States Government-Guaranteed Certificates of Participation, Overseas Private Investment Corp, 3.82% 20324 | $1,930 | $2,042 |
| United States Government-Guaranteed Certificates of Participation, Overseas Private Investment Corp, 3.938% 20324 | 1,522 | 1,598 |
| 693,253 | ||
| Total bonds, notes & other debt instruments (cost: $5,864,630,000) | 5,972,442 | |
| Short-term securities 27.07% | ||
| Bank of New York Mellon Corp. 0.04% due 9/2/20146 | 50,000 | 50,000 |
| E.I. duPont de Nemours and Co. 0.07% due 9/4/2014—9/26/20146 | 61,000 | 60,998 |
| Fannie Mae 0.06%—0.14% due 9/8/2014—6/1/2015 | 551,200 | 551,019 |
| Federal Home Loan Bank 0.05%—0.16% due 9/12/2014—8/3/2015 | 721,000 | 720,871 |
| Freddie Mac 0.08%—0.13% due 9/16/2014—3/10/2015 | 143,000 | 142,958 |
| General Electric Co. 0.06% due 9/2/2014 | 5,400 | 5,400 |
| John Deere Financial Ltd. 0.08% due 9/10/2014—9/22/20146 | 36,800 | 36,798 |
| Merck & Co. Inc. 0.07%—0.08% due 9/3/2014—9/9/20146 | 85,700 | 85,699 |
| National Rural Utilities Cooperative Finance Corp. 0.10% due 9/8/2014 | 30,000 | 29,999 |
| PepsiCo Inc. 0.06% due 9/5/20146 | 21,400 | 21,400 |
| Total short-term securities (cost: $1,704,995,000) | 1,705,142 | |
| Total investment securities 121.87% (cost: $7,569,625,000) | 7,677,584 | |
| Other assets less liabilities (21.87)% | (1,377,743) | |
| Net assets 100.00% | $6,299,841 |
| 1 | A portion of this security was pledged as collateral. The total value of pledged collateral was $21,280,000, which represented .34% of the net assets of the fund. |
| 2 | Index-linked bond whose principal amount moves with a government price index. |
| 3 | Coupon rate may change periodically. |
| 4 | Principal payments may be made periodically. Therefore, the effective maturity date may be earlier than the stated maturity date. |
| 5 | A portion or all of the security purchased on a TBA basis. |
| 6 | Acquired in a transaction exempt from registration under Rule 144A or Section 4(2) of the Securities Act of 1933. May be resold in the U.S. in transactions exempt from registration, normally to qualified institutional buyers. The total value of all such securities was $255,487,000, which represented 4.06% of the net assets of the fund. |
| Key to abbreviation |
| TBA = To be announced |
| MFGEFPX-022-1014O-S42238 | U.S. Government Securities Fund — Page 7 of 7 |
REPORT OF INDEPENDENT REGISTERED PUBLIC ACCOUNTING FIRM
To the Shareholders and Board of Trustees of
The American Funds Income Series – U.S. Government Securities Fund:
We have audited the accompanying statement of assets and liabilities of The American Funds Income Series – U.S. Government Securities Fund, including the summary schedule of investments, as of August 31, 2014, and the related statements of operations for the year then ended, the statements of changes in net assets for each of the two years in the period then ended (collectively, the “financial statements”), the financial highlights for each of the five years in the period then ended (the financial statements and financial highlights are included in Item 1 of this Form N-CSR), and the schedule of investments in securities as of August 31, 2014 (included in Item 6 of this Form N-CSR). These financial statements, financial highlights, and schedule of investments in securities are the responsibility of the Company’s management. Our responsibility is to express an opinion on these financial statements, financial highlights, and schedule of investments in securities based on our audits.
We conducted our audits in accordance with the standards of the Public Company Accounting Oversight Board (United States). Those standards require that we plan and perform the audit to obtain reasonable assurance about whether the financial statements, financial highlights, and schedule of investments in securities are free of material misstatement. An audit includes examining, on a test basis, evidence supporting the amounts and disclosures in the financial statements and schedule of investments in securities. Our procedures included confirmation of securities owned as of August 31, 2014, by correspondence with the custodian and brokers; where replies were not received from brokers, we performed other auditing procedures. An audit also includes assessing the accounting principles used and significant estimates made by management, as well as evaluating the overall financial statement presentation. We believe that our audits provide a reasonable basis for our opinion.
In our opinion, the financial statements, financial highlights, and schedule of investments in securities referred to above present fairly, in all material respects, the financial position of The American Funds Income Series – U.S. Government Securities Fund as of August 31, 2014, and the results of its operations for the year then ended, the changes in its net assets for each of the two years in the period then ended, and the financial highlights for each of the five years in the period then ended, in conformity with accounting principles generally accepted in the United States of America.
DELOITTE & TOUCHE LLP
Costa Mesa, California
October 14, 2014
ITEM 7 – Disclosure of Proxy Voting Policies and Procedures for Closed-End Management Investment Companies
Not applicable to this Registrant, insofar as the Registrant is not a closed-end management investment company.
ITEM 8 – Portfolio Managers of Closed-End Management Investment Companies
Not applicable to this Registrant, insofar as the Registrant is not a closed-end management investment company.
ITEM 9 – Purchases of Equity Securities by Closed-End Management Investment Company and Affiliated Purchasers
Not applicable to this Registrant, insofar as the Registrant is not a closed-end management investment company.
ITEM 10 – Submission of Matters to a Vote of Security Holders
There have been no material changes to the procedures by which shareholders may recommend nominees to the Registrant’s board of trustees since the Registrant last submitted a proxy statement to its shareholders. The procedures are as follows. The Registrant has a nominating and governance committee comprised solely of persons who are not considered ‘‘interested persons’’ of the Registrant within the meaning of the Investment Company Act of 1940, as amended. The committee periodically reviews such issues as the board’s composition, responsibilities, committees, compensation and other relevant issues, and recommends any appropriate changes to the full board of trustees. While the committee normally is able to identify from its own resources an ample number of qualified candidates, it will consider shareholder suggestions of persons to be considered as nominees to fill future vacancies on the board. Such suggestions must be sent in writing to the nominating and governance committee of the Registrant, c/o the Registrant’s Secretary, and must be accompanied by complete biographical and occupational data on the prospective nominee, along with a written consent of the prospective nominee for consideration of his or her name by the nominating and governance committee.
ITEM 11 – Controls and Procedures
| (a) | The Registrant’s Principal Executive Officer and Principal Financial Officer have concluded, based on their evaluation of the Registrant’s disclosure controls and procedures (as such term is defined in Rule 30a-3 under the Investment Company Act of 1940), that such controls and procedures are adequate and reasonably designed to achieve the purposes described in paragraph (c) of such rule. |
| (b) | There were no changes in the Registrant’s internal controls over financial reporting (as defined in Rule 30a-3(d) under the Investment Company Act of 1940) that occurred during the Registrant’s second fiscal quarter of the period covered by this report that has materially affected, or is reasonably likely to materially affect, the Registrant’s internal control over financial reporting. |
ITEM 12 – Exhibits
| (a)(1) | The Code of Ethics that is the subject of the disclosure required by Item 2 is attached as an exhibit hereto. |
| (a)(2) | The certifications required by Rule 30a-2 of the Investment Company Act of 1940 and Sections 302 and 906 of the Sarbanes-Oxley Act of 2002 are attached as exhibits hereto. |
SIGNATURES
Pursuant to the requirements of the Securities Exchange Act of 1934 and the Investment Company Act of 1940, the Registrant has duly caused this report to be signed on its behalf by the undersigned, thereunto duly authorized.
| THE AMERICAN FUNDS INCOME SERIES | |
| By /s/ Thomas H. Høgh | |
Thomas H. Høgh, President and Principal Executive Officer | |
| Date: October 31, 2014 |
Pursuant to the requirements of the Securities Exchange Act of 1934 and the Investment Company Act of 1940, this report has been signed below by the following persons on behalf of the Registrant and in the capacities and on the dates indicated.
| By /s/ Thomas H. Høgh |
Thomas H. Høgh, President and Principal Executive Officer |
| Date: October 31, 2014 |
| By /s/ Karl C. Grauman |
Karl C. Grauman, Treasurer and Principal Financial Officer |
| Date: October 31, 2014 |