UNITED STATES
SECURITIES AND EXCHANGE COMMISSION
Washington, D.C. 20549
FORM N-CSR
Certified Shareholder Report of
Registered Management Investment Companies
Investment Company Act File Number: 811-04318
The American Funds Income Series
(Exact Name of Registrant as Specified in Charter)
333 South Hope Street
Los Angeles, California 90071
(Address of Principal Executive Offices)
Registrant's telephone number, including area code: (213) 486-9200
Date of fiscal year end: August 31
Date of reporting period: August 31, 2015
Steven I. Koszalka
The American Funds Income Series
333 South Hope Street
Los Angeles, California 90071
(Name and Address of Agent for Service)
ITEM 1 – Reports to Stockholders
![]()
Seeking stability in
uncertain markets.
Special feature page 4
 | U.S. Government
Annual report |
U.S. Government Securities Fund seeks to provide a high level of current income consistent with prudent investment risk and preservation of capital.
This fund is one of more than 40 offered by one of the nation’s largest mutual fund families, American Funds, from Capital Group. For more than 80 years, Capital has invested with a long-term focus based on thorough research and attention to risk.
Fund results shown in this report, unless otherwise indicated, are for Class A shares at net asset value. If a sales charge (maximum 3.75%) had been deducted, the results would have been lower. Results are for past periods and are not predictive of results for future periods. Current and future results may be lower or higher than those shown. Share prices and returns will vary, so investors may lose money. Investing for short periods makes losses more likely. Investments are not FDIC-insured, nor are they deposits of or guaranteed by a bank or any other entity, so they may lose value. For current information and month-end results, visit americanfunds.com.
Here are the average annual total returns on a $1,000 investment with all distributions reinvested for periods ended September 30, 2015 (the most recent calendar quarter-end):
| Class A shares | 1 year | 5 years | 10 years | |||
| Reflecting 3.75% maximum sales charge | –0.46% | 1.59% | 3.53% |
For other share class results, visit americanfunds.com and americanfundsretirement.com.
The total annual fund operating expense ratio is 0.65% for Class A shares as of the prospectus dated November 1, 2015 (unaudited).
Investment results assume all distributions are reinvested and reflect applicable fees and expenses. When applicable, investment results reflect fee waivers, without which results would have been lower. Visit americanfunds.com for more information.
The fund’s 30-day yield for Class A shares as of September 30, 2015, calculated in accordance with the U.S. Securities and Exchange Commission (SEC) formula, was 1.94%. The fund’s 12-month distribution rate for Class A shares as of that date was 1.10%. Both reflect the 3.75% maximum sales charge. The SEC yield reflects the rate at which the fund is earning income on its current portfolio of securities while the distribution rate reflects the fund’s past dividends paid to shareholders. Accordingly, the fund’s SEC yield and distribution rate may differ.
The return of principal for bond funds and for funds with significant underlying bond holdings is not guaranteed. Fund shares are subject to the same interest rate, inflation and credit risks associated with the underlying bond holdings. Refer to the fund prospectus and the Risk Factors section of this report for more information on these and other risks associated with investing in the fund.

Fellow investors:
For the 12 months ended August 31, 2015, U.S. Government Securities Fund produced a total return of 1.82%. By comparison, the unmanaged Barclays U.S. Government/Mortgage-Backed Securities Index gained 2.43%. The Lipper General U.S. Government Funds Average (a peer group of funds) rose 1.41%.
Income is an important element of the fund’s total return. The fund provides income in the form of monthly dividends, which totaled about 15 cents a share for the 12-month period. This amounts to an income return of 1.11% for investors who reinvested dividends.
Bond market overview
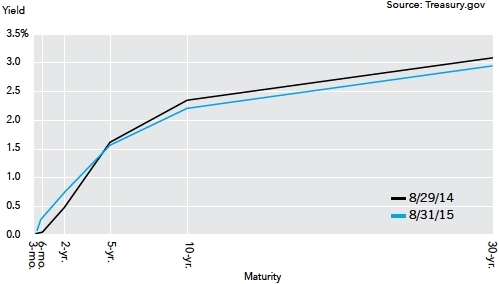
In 2014 yields for long maturity U.S. Treasury bonds fell significantly, whereas yields for short maturity U.S. Treasury bonds increased. These yield moves resulted in what is known as a flattening of the yield curve. Early in 2014 longer maturity yields fell as the markets worried about a U.S. growth slowdown and an increase in rates by the Federal Reserve (Fed) in early 2015. The fall in long maturity yields continued in the second half of 2014 as oil prices fell dramatically and concerns increased about slowing global growth. Yields did not change much for intermediate maturities in 2014 as the downward pressure on yields in general from weak growth concerns was offset by the market’s expectation that the Fed would begin raising rates in early 2015.
So far in 2015, the Fed has not raised rates and the yield curve has reversed some of the flattening in 2014, largely driven by a rise in long maturity yields. While the yield curve moves have been quite significant during the fiscal year (first flattening and then steepening) the point to point change over the year has been quite small. Over the fiscal year the yield curve has flattened somewhat with a pivot around the five-year maturity (see yield chart on page 2).
Many market participants expected the Fed to raise rates at their September 2015 meeting, but the Fed chose again not to take any action.
Results at a glance
For periods ended August 31, 2015, with dividends reinvested
| Cumulative total returns | Average annual total returns | |||||||||||||||
| Lifetime | ||||||||||||||||
| 1 year | 5 years | 10 years | (since 10/17/85) | |||||||||||||
| U.S. Government Securities Fund (Class A shares) | 1.82 | % | 2.16 | % | 3.73 | % | 5.91 | % | ||||||||
| Barclays U.S. Government/Mortgage-Backed Securities Index* | 2.43 | 2.52 | 4.30 | 6.80 | ||||||||||||
| Lipper General U.S. Government Funds Average† | 1.41 | 1.97 | 3.46 | 5.73 | ||||||||||||
| * | The index is unmanaged and, therefore, has no expenses. Investors cannot invest directly in an index. |
| † | Lipper averages reflect the current composition of all eligible mutual funds (all share classes) within a given category. |
| U.S. Government Securities Fund | 1 |
Influencing Fed caution is the deteriorating economic conditions in emerging countries like China, the strong U.S. dollar, increased market volatility and the current low level of consumer price inflation in the U.S. While the Fed still expects to raise rates in 2015, the market is now only partially pricing in a quarter-point rate increase in 2015.
Possibly the most important move in markets during the fiscal year has been the almost 15% appreciation of the U.S. dollar versus a trade-weighted basket of currencies. Driving the U.S. dollar higher is the combination of safe-haven capital flows into the U.S., due to deteriorating economic conditions in emerging countries like China, and the position of the Fed as the only major central bank preparing to increase interest rates.
This capital flow trend, coupled with weak growth and continued Fed inaction, should be constructive for the fund going forward.
Inside the portfolio
U.S. Government Securities Fund is managed to invest in bonds backed implicitly or explicitly by the U.S. government. In addition to U.S. Treasury securities, the fund invests in agency mortgage-backed securities (MBS), various other government agency securities, and Treasury Inflation Protected Securities (TIPS), which have interest and principal payments tied to the consumer price index (CPI).
The fund makes strategic and tactical adjustments as market conditions change. During this reporting period we have moved to a neutral position in mortgages and maintained an overweight position in long-maturity TIPS.
We expect CPI inflation will stay low in the near term, but we anticipate CPI inflation expectations to increase. The longer maturity TIPS the fund holds likely will benefit from an increase in inflation expectations, and are less negatively impacted by current low realized inflation.
The fund continues to be overweight in the five-year part of the yield curve, a position that helped relative returns against the benchmark during our 12-month reporting period. Our view is that yields in this part of the curve will remain stable or fall as the market increasingly prices in a more cautious Fed.
To further support our cautious Fed view, the fund currently emphasizes a longer duration and a steeper yield curve beyond five years.
The summary portfolio, beginning on page 8, offers more complete details of the various government securities and sectors held by the fund as of August 31, 2015.
Treasury yield curves at the beginning and end of the fiscal year
Looking ahead
As noted, our fund positioning anticipates a steepening yield curve and a more-cautious Fed than the market expects. The Fed’s cautious press release from their September meeting and additional market volatility since the meeting provide support for our views, and the fund’s positioning, going forward.
The market is currently pricing in a lower federal funds rate path than the Fed is projecting. We are positioning for an even lower federal funds rate path than the market. We do not believe the economy can withstand a normalization of interest rates without causing economic conditions to slow and market stresses to increase considerably.
In our view, the extraordinarily accommodative monetary policy we have experienced globally since 2009 has created a very weak foundation for growth. As the Fed tries to raise rates, we believe economies and markets will start to struggle, and in our view the Fed will quickly have to step back from further increases and possibly even reverse course.
For more on the rationale for our views, the managers of the fund, and the tools we use to seek to maximize total return, go to page 4 for this year’s feature article, “Seeking stability in uncertain markets.”
We thank you for your continued support and look forward to reporting to you again in six months.
Cordially,

Fergus MacDonald
President
October 14, 2015
For current information about the fund, visit americanfunds.com.
| 2 | U.S. Government Securities Fund |
The value of a long-term perspective
How a $10,000 investment has grown (for the period October 17, 1985, to August 31, 2015, with distributions reinvested)
Fund results shown are for Class A shares and reflect deduction of the maximum sales charge of 3.75% on the $10,000 investment.1 Thus, the net amount invested was $9,625.2 Results are for past periods and are not predictive of results for future periods. Current and future results may be lower or higher than those shown. Share prices and returns will vary, so investors may lose money. For current information and month-end results, visit americanfunds.com.
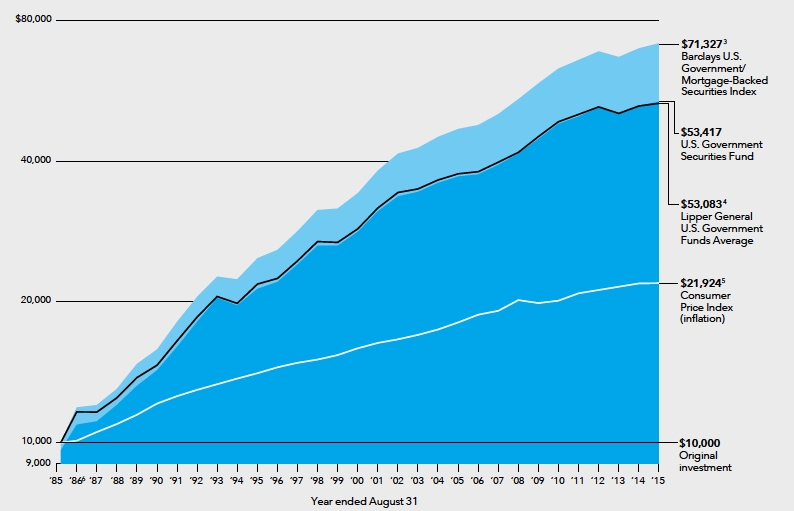
| 1 | As outlined in the prospectus, the sales charge is reduced for accounts (and aggregated investments) of $100,000 or more and is eliminated for purchases of $1 million or more. There is no sales charge on dividends or capital gain distributions that are reinvested in additional shares. |
| 2 | The maximum initial sales charge was 4.75% prior to January 10, 2000. |
| 3 | The index is unmanaged and, therefore, has no expenses. Investors cannot invest directly in an index. |
| 4 | Results of the Lipper General U.S. Government Funds Average, represented by the black line, do not reflect any sales charges. |
| 5 | Computed from data supplied by the U.S. Department of Labor, Bureau of Labor Statistics. |
| 6 | For the period October 17, 1985, commencement of operations, through August 31, 1986. |
The results shown are before taxes on fund distributions and sale of fund shares.
Average annual total returns based on a $1,000 investment (for periods ended August 31, 2015)*
| 1 year | 5 years | 10 years | ||||
| Class A shares | –2.03% | 1.37% | 3.33% |
*Assumes reinvestment of all distributions and payment of the maximum 3.75% sales charge.
Investment results assume all distributions are reinvested and reflect applicable fees and expenses. When applicable, investment results reflect fee waivers, without which results would have been lower. Visit americanfunds.com for more information.
| U.S. Government Securities Fund | 3 |

For 30 years, U.S. Government Securities Fund has helped provide a buffer against unexpected market volatility. The fund has offered shareholders a measure of protection against such market events as the Black Monday stock market crash (1987), the 1990 junk bond collapse, the 1994 great bond massacre, the 1997-1998 Asian financial crisis, the 2000 dot-com collapse, and the Great Recession (2007-2008). Here the fund’s three portfolio managers discuss how the fund is managed for today’s markets.
This year equity markets became quite volatile, up on news U.S. economic growth was accelerating, down on news that it was slowing. What is your analysis of the situation?
Fergus MacDonald: My view is that underlying growth is weaker than the consensus opinion. It continues to be a very weak business investment recovery. I expect we will continue to get negative surprises on a regular basis because I think monetary policy has damaged the prospects for global growth. The growth problems we are now experiencing are to some extent a direct result of those policies.
Ritchie Tuazon: It’s unclear what the ramifications of unconventional easing are. The growth numbers have not been great, which makes me question the effectiveness of the policy going forward. I’m leaning toward a 1.5% to 2.0% growth rate the next couple of years, a bit lower than the consensus.
How do the current problems in China affect the fund?
Fergus: When the markets are stressed because of problems overseas, capital tends to flow into the U.S. dollar and Treasuries. So in the near term, problems
| 4 | U.S. Government Securities Fund |

in China could have a positive impact on the value of the fund’s holdings.
Ritchie: The problems in Europe have been well advertised but the problems in China are just starting to unfold. When you have so many glaring global obstacles it’s generally prudent to have a part of your portfolio in U.S. government securities.
David Betanzos: Reduced economic activity both in China and its trading partners probably reduces inflationary pressures and economic growth rates within the U.S., which is supportive of U.S. government securities valuations.
Why does demand for Treasuries stay so strong in a long-term low-rate environment?
Fergus: One of the things a very low-rate environment signals is that the economy is not very healthy and there is not a lot of growth. In such situations people become more risk-averse and invest in Treasuries because of the certainty of the Treasury security cash flows.
Ritchie: The question almost answers itself because in a long-term low-rate environment there aren’t that many better opportunities.
What are your thoughts on the likelihood of the Federal Reserve raising rates in the next 12 months?
Fergus: The Fed’s mandate is maximum employment and a 2% rate of inflation. It’s arguably close now on its employment goals but is missing badly on inflation, with core inflation currently measuring around 1.2%. The Fed said it would raise rates this year if inflation moves closer to its 2% target, but core inflation is trending lower. So I think the prospects for the Fed raising rates this year are lower than the market expects. If it does raise rates, I’d expect the Fed to be very cautious, and communicate a very shallow path of future rate increases.
David: The Fed’s most likely course of action, in my view, is either no hike at all over the coming year or only a small series of hikes totaling at most 0.5%. Even if it does raise rates by that amount, future increases likely would be on hold for some time thereafter, due to their effect on government debt and economic growth.
What is the impact of rising rates on U.S. government securities? How does the fund mitigate that impact?
David: Higher interest rates result in lower prices for bonds, so the fund’s total return would be negatively affected. There are things we can do, however. For example, we can increase our holdings of shorter maturity U.S. Treasury securities that are less sensitive to interest rate changes than longer maturity securities. If we have an investment view on the prospective shape of the yield curve, we can use interest rate swaps to implement this view. We can also buy TIPS, which can help protect the fund from rising interest rates caused by higher inflation.
Have there been bond markets similar to the current one?
Fergus: For me the most similar period was the Great Depression of the 1930s. Then, interest rates stayed extremely low, until the 1950s. There are many parallels between the 1930s and the current period, and for me the experience of the 1930s provides context for today’s low rate levels.
How is the fund managed to provide preservation of capital and consistency of returns despite volatile and unpredictable markets?
Fergus: We have three managers who each independently manage their own portion of the portfolio. Each has their own investment style and the complementary styles add diversity to the investment portfolio. We meet regularly on an informal and formal basis to debate positioning, review risk reports for the fund, and make sure we agree on the major investment themes that will be reflected in our portfolio positioning. We also have a Portfolio Strategy Group that provides guidance that helps to shape the overall medium and longer term positioning of the fund.
Agency mortgages make up a large portion of the fund. How do they fit in the portfolio?
Fergus: Agency mortgages from a credit perspective are very similar to Treasuries. Fannie Mae and Freddie Mac mortgages are government agency securities, but are not full faith and credit obligations of the U.S. government. The government owns Fannie and Freddie, and mortgage investors assume implicit government support. Ginnie Mae mortgages are full faith and credit obligations of the U.S. government. Agency mortgages are extremely liquid — probably only second to Treasuries in terms of liquidity. Agency mortgages are higher yielding
| U.S. Government Securities Fund | 5 |
than Treasuries due to the embedded prepayment and reinvestment risk of the securities. Agency mortgages will be a large portion of the fund when we think the extra yield of agency mortgages compared to Treasuries will more than compensate for the expected prepayment and reinvestment risk.
Treasury Inflation Protected Securities (TIPS) have become a key strategic component of the fund. What are they, and how do they help you manage the fund?
Ritchie: TIPS are securities backed by the full faith and credit of the U.S. government. Unlike nominal Treasury securities where the income and principal repayment at maturity are fixed, the income and principal of TIPS are scaled up (and down) by increases (and decreases) in the Consumer Price Index (CPI). In this fund we use TIPS opportunistically. We’ll own TIPS when we believe inflation is going to be higher than the difference in yield between TIPS and nominal U.S. Treasuries. This is the case at the moment. The TIPS market is currently pricing in only about a 1.6% annual rate of inflation over the next 10 years, and given the Fed’s goal of 2% inflation (approximately equivalent to 2.4% CPI), we think that offers excellent value.
How would you describe the management process of the fund?
Ritchie: The three of us sit within a few feet of each other, continually bouncing ideas off each other in constant dialogue. Before I make an investment of any significance I talk to David and Fergus to see if there’s anything I might be missing. We’re not going to agree 100% of the time, but that’s why we have the multiple portfolio manager system, The Capital System,SM to allow us to express our own views.
David: Everyone does a great job of being critical of their own work and of each other’s work. So when you have a process where someone really challenges you on your thinking, it really forces you to crystalize your argument. That really elevates the level of debate so that we are thoughtful about the risks we are taking and why.
How can U.S. government securities help diversify portfolios?
Fergus: In general when investors are optimistic, they will reduce their Treasury holdings and buy riskier assets such as equities and corporate bonds because these securities offer higher prospective returns. When investors become more risk averse and reduce their return expectations they will put a higher value on the certainty of their investment returns and increase their Treasury holdings. Therefore, Treasuries and other government securities tend to have positive returns when the returns of risk assets are negative. This countercyclical feature of government securities helps to add diversity to portfolios.
Ritchie: In times of turmoil, investors will flee risky assets. I don’t see any reason for U.S. government securities to lose their status as the most favored asset in these circumstances.
What role does the fund serve in an investor’s portfolio today?
Fergus: It could be part of a balanced portfolio where the fund is used to cushion some of the return volatility from the equity and corporate bond components of the overall portfolio.
David: It can deliver returns in excess of money market returns over short- and long-term periods of time while simultaneously being a cushion against falling prices from risk assets in one’s portfolio, whether they are corporate bonds or equities. n

Three decades of diversification
Long-term investors use U.S. Government Securities Fund to help stay on track with their goals because the fund historically has helped offset negative years in the stock and credit markets. Here’s how the fund did during the stock market’s five worst years over the past three decades. Although past results are not predictive of future results, you can see that the fund tended to do well when the stock market returns were negative. Of course, there are times when the stock market has had much higher returns than the fund.
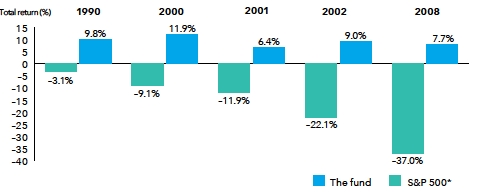
| * | Standard & Poor’s 500 Composite Index is unmanaged and, therefore, has no expenses. |
| Investors cannot invest directly in an index. |
| 6 | U.S. Government Securities Fund |
Meet the portfolio managers
Each of the fund’s three managers oversees a portion of the fund, bringing diverse backgrounds to the common goal of seeking superior results through in-depth analysis of the U.S. government securities market. They blend their sophisticated understanding of the worldwide drivers of growth and debt with the skill and tools to help investors pursue their long-term objectives. As manager David Betanzos says, “We have more tools now than ever before, and are more equipped to handle any environment than ever before.”

Fergus N. MacDonald, Principal Investment Officer, has 22 years of investment experience, 11 with Capital Group. He has fixed-income experience at Goldman Sachs, Morgan Stanley and Hewitt Bacon & Woodrow in London, and holds a graduate degree in applied mathematics and theoretical physics from Cambridge University. Fergus also serves on Capital Group’s Fixed Income Management Committee.
“I am a macro-focused investor. I tend to take longer term positions and am willing to bear short-term volatility when I have strong conviction. I follow the markets every day but I tend to require bigger cumulative market moves before I change my investment positioning.
“As PIO, I make sure the fund is positioned the way we agree it should be based on our longer term views, and I also make sure I understand the more granular risk positions in the fund. I review daily risk reports at the fund level and keep track of fund returns. Importantly, it is also my responsibility to make sure the fund has all the investment tools necessary to produce superior long term results.”

Ritchie Tuazon has 14 years of investment experience, four with Capital Group. Formerly a trader at Goldman Sachs, Ritchie is the team specialist in TIPS and interest rate swaps. He holds an MBA from MIT Sloan School of Management and a master’s degree in public administration from Harvard’s John F. Kennedy School of Government.
“Between TIPS, mortgages, interest-rate swaps, longer term maturity Treasuries and agency debentures we have a lot of different toggles that we are actively using to maximize our individual portfolios. Within the fund you have someone like Fergus, who uses all the toggles and moves around them less frequently, and then you have someone like me, who has a different style and will use the same toggles but move around them more frequently.
“I try to have a longer term view, around which I will optimize my portfolio frequently. I constantly try to recalibrate my positions to take advantage of asymmetric opportunities that can occur around things like Fed meetings and economic data releases. I do this while trying to make sure I don’t veer too far off from my longer term positioning.”

David J. Betanzos, CFA, has 15 years of investment experience, 13 with Capital Group. A specialist in mortgage securities, he holds an MBA from the University of Chicago Booth School of Business.
“I completely reoriented my understanding of the way the world works after the global financial crisis, when I saw how poor a job traditional macro-economists did of perceiving the magnitude of the crisis, if they even perceived there was a problem at all. What was missing in my opinion was a deeper understanding of debt and its role in the economic system. Even today much economic analysis downplays debt as a factor. I see debt dynamics as an important driver of economic activity and it is, in turn, a large factor in shaping my investment views and portfolio positioning.”
| U.S. Government Securities Fund | 7 |
Summary investment portfolio August 31, 2015
| Investment mix by security type | Percent of net assets |
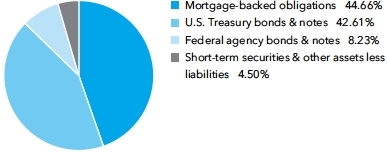
| Mortgage-backed obligations summary | Percent of net assets | ||||
| 30-year pass-throughs: | |||||
| Ginnie Mae | 38.74 | % | |||
| Freddie Mac | 2.06 | ||||
| Fannie Mae | 1.74 | 42.54 | % | ||
| 15-year pass-throughs | .01 | ||||
| Other | 2.11 | ||||
| Total | 44.66 | % | |||
| Portfolio quality summary* | Percent of net assets | ||
| U.S. Treasury and agency† | 50.84 | % | |
| AAA/Aaa | 43.72 | ||
| Unrated | .94 | ||
| Short-term securities & other assets less liabilities | 4.50 | ||
Long-term obligations of the U.S. government and federal agencies are currently rated AAA by at least one rating agency. These obligations are currently rated AA+ by Standard & Poor’s.
| * | Bond ratings, which typically range from AAA/Aaa (highest) to D (lowest), are assigned by credit rating agencies such as Standard & Poor’s, Moody’s and/or Fitch as an indication of an issuer’s creditworthiness. In assigning a credit rating to a security, the fund looks specifically to the ratings assigned to the issuer of the security by Standard & Poor’s, Moody’s and/or Fitch. If agency ratings differ, the security will be considered to have received the highest of those ratings, consistent with the fund’s investment policies. The ratings are not covered by the Report of Independent Registered Public Accounting Firm. |
| † | These securities are guaranteed by the full faith and credit of the United States government. |
| Bonds, notes & other debt instruments 95.50% | Principal amount (000) | Value (000) | ||||||
| Mortgage-backed obligations 44.66% | ||||||||
| Federal agency mortgage-backed obligations 44.66% | ||||||||
| Fannie Mae 3.00% 20351 | $ | 32,133 | $ | 32,850 | ||||
| Fannie Mae 0%–10.50% 2017–20441,2 | 91,653 | 97,479 | ||||||
| Freddie Mac 3.50% 20351 | 37,499 | 39,247 | ||||||
| Freddie Mac 0%–10.00% 2020–20441,2 | 104,962 | 110,219 | ||||||
| Government National Mortgage Assn. 4.00% 20441 | 23,483 | 24,916 | ||||||
| Government National Mortgage Assn. 3.50% 20451 | 684,950 | 714,586 | ||||||
| Government National Mortgage Assn. 3.50% 20451,3 | 264,450 | 275,369 | ||||||
| Government National Mortgage Assn. 4.00% 20451,3 | 1,378,429 | 1,461,324 | ||||||
| Government National Mortgage Assn. 4.00% 20451 | 53,136 | 56,390 | ||||||
| Government National Mortgage Assn. 4.00% 20451 | 21,950 | 23,290 | ||||||
| Government National Mortgage Assn., Series 2010-H23, Class PT, 5.426% 20601,2 | 41,670 | 45,134 | ||||||
| Government National Mortgage Assn. 3.50%–10.00% 2019–20591,3 | 158,658 | 169,965 | ||||||
| Other securities | 51,141 | |||||||
| Total mortgage-backed obligations | 3,101,910 | |||||||
| U.S. Treasury bonds & notes 42.61% | ||||||||
| U.S. Treasury 31.68% | ||||||||
| U.S. Treasury 0.875% 2018 | 65,000 | 64,688 | ||||||
| U.S. Treasury 1.00% 2018 | 40,000 | 39,939 | ||||||
| U.S. Treasury 1.50% 20194 | 303,000 | 303,945 | ||||||
| U.S. Treasury 1.625% 20194 | 52,900 | 53,437 | ||||||
| U.S. Treasury 1.625% 2019 | 50,000 | 50,367 | ||||||
| U.S. Treasury 1.75% 2019 | 74,000 | 75,026 | ||||||
| U.S. Treasury 3.625% 2019 | 36,000 | 39,128 | ||||||
| U.S. Treasury 1.25% 2020 | 90,500 | 89,687 | ||||||
| U.S. Treasury 1.375% 2020 | 120,000 | 119,063 | ||||||
| U.S. Treasury 1.375% 2020 | 36,000 | 35,798 | ||||||
| U.S. Treasury 1.375% 2020 | 27,000 | 26,894 | ||||||
| U.S. Treasury 1.625% 2020 | 157,500 | 158,116 | ||||||
| U.S. Treasury 2.25% 2021 | 154,600 | 158,802 | ||||||
| U.S. Treasury 1.625% 2022 | 83,758 | 81,775 | ||||||
| 8 | U.S. Government Securities Fund |
| Principal amount | Value | |||||||
| (000) | (000) | |||||||
| U.S. Treasury 1.75% 2022 | $ | 186,000 | $ | 184,157 | ||||
| U.S. Treasury 1.75% 2022 | 47,000 | 46,491 | ||||||
| U.S. Treasury 2.00% 2022 | 60,000 | 60,268 | ||||||
| U.S. Treasury 2.50% 2023 | 31,325 | 32,314 | ||||||
| U.S. Treasury 2.75% 2023 | 150,650 | 158,259 | ||||||
| U.S. Treasury 2.75% 2024 | 112,700 | 118,253 | ||||||
| U.S. Treasury 2.00% 2025 | 133,000 | 130,476 | ||||||
| U.S. Treasury 2.125% 2025 | 30,000 | 29,736 | ||||||
| U.S. Treasury 2.875% 2043 | 26,609 | 26,112 | ||||||
| U.S. Treasury 0.63%–8.75% 2016–2045 | 109,845 | 117,705 | ||||||
| 2,200,436 | ||||||||
| U.S. Treasury inflation-protected securities 10.93% | ||||||||
| U.S. Treasury Inflation-Protected Security 2.00% 20165 | 24,044 | 24,020 | ||||||
| U.S. Treasury Inflation-Protected Security 0.125% 20245 | 217,664 | 209,167 | ||||||
| U.S. Treasury Inflation-Protected Security 0.25% 20255 | 96,712 | 93,319 | ||||||
| U.S. Treasury Inflation-Protected Security 0.375% 20255 | 68,421 | 67,119 | ||||||
| U.S. Treasury Inflation-Protected Security 2.375% 20255 | 60,128 | 69,748 | ||||||
| U.S. Treasury Inflation-Protected Security 0.75% 20455 | 273,436 | 246,119 | ||||||
| U.S. Treasury Inflation-Protected Securities 0.13%–2.00% 2016–20445 | 50,025 | 49,743 | ||||||
| 759,235 | ||||||||
| Total U.S. Treasury bonds & notes | 2,959,671 | |||||||
| Federal agency bonds & notes 8.23% | ||||||||
| Fannie Mae 0.48%–7.12% 2015–20301,2 | 68,012 | 70,588 | ||||||
| Federal Farm Credit Banks 0.25% 20172 | 19,686 | 19,706 | ||||||
| Federal Farm Credit Banks 0.60% 2017 | 74,292 | 74,160 | ||||||
| Federal Home Loan Bank 0.375% 2016 | 28,875 | 28,855 | ||||||
| Federal Home Loan Bank, Series 2816, 1.00% 2017 | 43,705 | 43,962 | ||||||
| Federal Home Loan Bank 0.50%–5.50% 2016–2036 | 26,465 | �� | 27,665 | |||||
| Freddie Mac 1.75% 2015 | 33,375 | 33,386 | ||||||
| Freddie Mac 1.25% 2019 | 51,820 | 51,264 | ||||||
| Freddie Mac 0.57%–3.32% 2017–20241,2 | 38,144 | 38,649 | ||||||
| United States Agency for International Development, Jordan (Kingdom of) 1.945% 2019 | 31,500 | 31,965 | ||||||
| United States Agency for International Development, Jordan (Kingdom of) 2.50%–3.00% 2020–2025 | 16,700 | 17,209 | ||||||
| United States Agency for International Development, Republic of Egypt 4.45% 2015 | 19,000 | 19,028 | ||||||
| United States Agency for International Development, State of Israel, Class 1-A, 5.50% 2023 | 5,000 | 6,077 | ||||||
| United States Agency for International Development, Ukraine 1.84%–1.85% 2019–2020 | 22,890 | 23,007 | ||||||
| Other securities | 86,282 | |||||||
| 571,803 | ||||||||
| Total bonds, notes & other debt instruments (cost: $6,600,782,000) | 6,633,384 | |||||||
| Short -term securities 30.31% | ||||||||
| Fannie Mae 0.13%–0.21% due 9/14/2015–1/4/2016 | 319,100 | 319,050 | ||||||
| Federal Farm Credit Banks 0.16%–0.19% due 12/21/2015–1/4/2016 | 45,000 | 44,980 | ||||||
| Federal Home Loan Bank 0.09%–0.20% due 9/1/2015–1/20/2016 | 1,124,200 | 1,123,984 | ||||||
| Freddie Mac 0.06%–0.18% due 9/2/2015–1/5/2016 | 464,650 | 464,562 | ||||||
| General Electric Co. 0.10% due 9/1/2015 | 68,400 | 68,400 | ||||||
| U.S. Treasury Bills 0.10% due 11/12/2015–11/19/2015 | 84,200 | 84,198 | ||||||
| Total short-term securities (cost: $2,104,843,000) | 2,105,174 | |||||||
| Total investment securities 125.81% (cost: $8,705,625,000) | 8,738,558 | |||||||
| Other assets less liabilities (25.81%) | (1,792,560 | ) | ||||||
| Net assets 100.00% | $ | 6,945,998 | ||||||
This summary investment portfolio is designed to streamline the report and help investors better focus on the fund’s principal holdings. See the inside back cover for details on how to obtain a complete schedule of portfolio holdings.
“Other securities” includes all issues that are not disclosed separately in the summary investment portfolio. A security within “Other securities” (with a value of $354,000, which represented .01% of the net assets of the fund) was acquired in transactions exempt from registration under Rule 144A of the Securities Act of 1933 and may be resold in the U.S. in transactions exempt from registration, normally to qualified institutional buyers.
| U.S. Government Securities Fund | 9 |
Interest rate swaps
The fund has entered into interest rate swaps as shown in the following table. The average month-end notional amount of interest rate swaps while held was $9,128,480,000.
| Unrealized | ||||||||||||||||||
| (depreciation) | ||||||||||||||||||
| appreciation | ||||||||||||||||||
| Pay/receive | Fixed | Expiration | Notional | at 8/31/2015 | ||||||||||||||
| fixed rate | Clearinghouse | Floating rate index | rate | date | (000) | (000) | ||||||||||||
| Pay | LCH.Clearnet | 3-month USD-LIBOR | 0.317 | % | 9/17/2015 | $ | 8,200,000 | $ | (82 | ) | ||||||||
| Receive | LCH.Clearnet | 3-month USD-LIBOR | 0.8975 | 7/1/2017 | 830,000 | 963 | ||||||||||||
| Receive | LCH.Clearnet | 3-month USD-LIBOR | 0.8875 | 7/2/2017 | 363,000 | 356 | ||||||||||||
| Receive | LCH.Clearnet | 3-month USD-LIBOR | 0.827 | 7/10/2017 | 420,000 | (97 | ) | |||||||||||
| Receive | LCH.Clearnet | 3-month USD-LIBOR | 0.924 | 7/15/2017 | 300,000 | 438 | ||||||||||||
| Receive | LCH.Clearnet | 3-month USD-LIBOR | 0.9215 | 7/15/2017 | 300,000 | 423 | ||||||||||||
| Pay | LCH.Clearnet | 3-month USD-LIBOR | 0.9645 | 8/6/2017 | 150,000 | (285 | ) | |||||||||||
| Pay | LCH.Clearnet | 3-month USD-LIBOR | 0.964 | 8/6/2017 | 250,000 | (473 | ) | |||||||||||
| Receive | LCH.Clearnet | 3-month USD-LIBOR | 0.988 | 8/12/2017 | 300,000 | 669 | ||||||||||||
| Pay | LCH.Clearnet | 3-month USD-LIBOR | 0.8325 | 9/1/2017 | 360,000 | 396 | ||||||||||||
| Receive | LCH.Clearnet | 3-month USD-LIBOR | 0.874 | 9/2/2017 | 300,000 | (111 | ) | |||||||||||
| Receive | LCH.Clearnet | 3-month USD-LIBOR | 1.515 | 6/4/2019 | 120,000 | 594 | ||||||||||||
| Receive | LCH.Clearnet | 3-month USD-LIBOR | 1.789 | 6/20/2019 | 234,800 | 3,489 | ||||||||||||
| Receive | LCH.Clearnet | 3-month USD-LIBOR | 1.7945 | 6/20/2019 | 146,600 | 2,208 | ||||||||||||
| Receive | LCH.Clearnet | 3-month USD-LIBOR | 1.7905 | 6/20/2019 | 58,600 | 874 | ||||||||||||
| Receive | LCH.Clearnet | 3-month USD-LIBOR | 1.732 | 6/27/2019 | 115,000 | 1,452 | ||||||||||||
| Receive | LCH.Clearnet | 3-month USD-LIBOR | 1.821 | 7/31/2019 | 108,000 | 1,689 | ||||||||||||
| Receive | LCH.Clearnet | 3-month USD-LIBOR | 1.799 | 8/8/2019 | 112,000 | 1,631 | ||||||||||||
| Receive | LCH.Clearnet | 3-month USD-LIBOR | 1.7725 | 8/11/2019 | 112,000 | 1,506 | ||||||||||||
| Receive | LCH.Clearnet | 3-month USD-LIBOR | 1.773 | 8/11/2019 | 108,000 | 1,455 | ||||||||||||
| Receive | LCH.Clearnet | 3-month USD-LIBOR | 1.9225 | 9/25/2019 | 132,000 | 2,474 | ||||||||||||
| Receive | LCH.Clearnet | 3-month USD-LIBOR | 1.785 | 1/2/2020 | 90,000 | 1,043 | ||||||||||||
| Receive | LCH.Clearnet | 3-month USD-LIBOR | 1.45 | 2/2/2020 | 670,000 | (2,312 | ) | |||||||||||
| Receive | LCH.Clearnet | 3-month USD-LIBOR | 1.655 | 2/11/2020 | 160,000 | 832 | ||||||||||||
| Receive | LCH.Clearnet | 3-month USD-LIBOR | 1.672 | 2/26/2020 | 90,000 | 505 | ||||||||||||
| Receive | LCH.Clearnet | 3-month USD-LIBOR | 1.739 | 3/6/2020 | 216,000 | 1,819 | ||||||||||||
| Receive | LCH.Clearnet | 3-month USD-LIBOR | 1.6115 | 3/23/2020 | 133,000 | 321 | ||||||||||||
| Receive | LCH.Clearnet | 3-month USD-LIBOR | 1.665 | 5/18/2020 | 180,000 | 626 | ||||||||||||
| Receive | LCH.Clearnet | 3-month USD-LIBOR | 1.8315 | 6/10/2020 | 150,000 | 1,598 | ||||||||||||
| Receive | LCH.Clearnet | 3-month USD-LIBOR | 1.86375 | 6/11/2020 | 225,000 | 2,731 | ||||||||||||
| Receive | LCH.Clearnet | 3-month USD-LIBOR | 1.86 | 6/19/2020 | 120,000 | 1,418 | ||||||||||||
| Receive | LCH.Clearnet | 3-month USD-LIBOR | 1.7755 | 7/14/2020 | 200,000 | 1,476 | ||||||||||||
| Receive | LCH.Clearnet | 3-month USD-LIBOR | 1.607 | 8/14/2020 | 120,000 | (169 | ) | |||||||||||
| Receive | LCH.Clearnet | 3-month USD-LIBOR | 1.703 | 8/20/2020 | 165,000 | 497 | ||||||||||||
| Pay | LCH.Clearnet | 3-month USD-LIBOR | 1.6305 | 9/2/2020 | 180,000 | — | ||||||||||||
| Pay | LCH.Clearnet | 3-month USD-LIBOR | 1.6345 | 9/2/2020 | 180,000 | — | ||||||||||||
| Pay | LCH.Clearnet | 3-month USD-LIBOR | 1.785 | 3/27/2022 | 163,000 | 1,275 | ||||||||||||
| Pay | LCH.Clearnet | 3-month USD-LIBOR | 1.75918 | 4/29/2022 | 187,000 | 1,928 | ||||||||||||
| Receive | LCH.Clearnet | 3-month USD-LIBOR | 2.138 | 6/22/2022 | 50,000 | 630 | ||||||||||||
| Pay | LCH.Clearnet | 3-month USD-LIBOR | 2.05875 | 7/31/2022 | 21,000 | (143 | ) | |||||||||||
| Pay | LCH.Clearnet | 3-month USD-LIBOR | 1.9605 | 8/5/2022 | 83,000 | — | ||||||||||||
| Receive | LCH.Clearnet | 3-month USD-LIBOR | 1.9405 | 9/1/2022 | 130,000 | (256 | ) | |||||||||||
| Receive | LCH.Clearnet | 3-month USD-LIBOR | 2.8 | 9/2/2022 | 560,000 | — | ||||||||||||
| Pay | LCH.Clearnet | 3-month USD-LIBOR | 2.74125 | 11/22/2023 | 79,000 | (3,828 | ) | |||||||||||
| Pay | LCH.Clearnet | 3-month USD-LIBOR | 2.7343 | 11/22/2023 | 100,000 | (4,791 | ) | |||||||||||
| Pay | LCH.Clearnet | 3-month USD-LIBOR | 2.683 | 8/4/2024 | 63,000 | (2,628 | ) | |||||||||||
| Pay | LCH.Clearnet | 3-month USD-LIBOR | 1.90125 | 2/2/2025 | 150,000 | 4,212 | ||||||||||||
| Receive | LCH.Clearnet | 3-month USD-LIBOR | 2.217 | 2/23/2025 | 67,900 | (67 | ) | |||||||||||
| Pay | LCH.Clearnet | 3-month USD-LIBOR | 2.469 | 6/9/2025 | 23,000 | (453 | ) | |||||||||||
| Pay | LCH.Clearnet | 3-month USD-LIBOR | 2.469 | 7/17/2025 | 140,000 | (2,689 | ) | |||||||||||
| Receive | LCH.Clearnet | 3-month USD-LIBOR | 2.183 | 8/14/2025 | 100,000 | (737 | ) | |||||||||||
| Receive | LCH.Clearnet | 3-month USD-LIBOR | 2.2215 | 9/2/2025 | 50,000 | (215 | ) | |||||||||||
| Pay | LCH.Clearnet | 3-month USD-LIBOR | 3.005 | 9/2/2030 | 124,000 | — | ||||||||||||
| Pay | LCH.Clearnet | 3-month USD-LIBOR | 3.34 | 6/27/2044 | 80,000 | (10,395 | ) | |||||||||||
| Pay | LCH.Clearnet | 3-month USD-LIBOR | 3.206 | 7/31/2044 | 27,000 | (2,765 | ) | |||||||||||
| Pay | LCH.Clearnet | 3-month USD-LIBOR | 3.238 | 8/8/2044 | 28,000 | (3,044 | ) | |||||||||||
| Pay | LCH.Clearnet | 3-month USD-LIBOR | 2.7045 | 1/2/2045 | 38,500 | 141 | ||||||||||||
| Pay | LCH.Clearnet | 3-month USD-LIBOR | 2.94625 | 7/1/2045 | 30,000 | (1,426 | ) | |||||||||||
| Pay | LCH.Clearnet | 3-month USD-LIBOR | 2.86 | 7/9/2045 | 51,000 | (1,484 | ) | |||||||||||
| 10 | U.S. Government Securities Fund |
| Unrealized | ||||||||||||||||||
| (depreciation) | ||||||||||||||||||
| appreciation | ||||||||||||||||||
| Pay/receive | Fixed | Expiration | Notional | at 8/31/2015 | ||||||||||||||
| fixed rate | Clearinghouse | Floating rate index | rate | date | (000) | (000) | ||||||||||||
| Pay | LCH.Clearnet | 3-month USD-LIBOR | 2.962 | % | 7/14/2045 | $ | 46,000 | $ | (2,343 | ) | ||||||||
| Receive | LCH.Clearnet | 3-month USD-LIBOR | 2.9 | 7/22/2045 | 30,000 | 1,130 | ||||||||||||
| Pay | LCH.Clearnet | 3-month USD-LIBOR | 2.7995 | 7/31/2045 | 20,000 | (329 | ) | |||||||||||
| Pay | LCH.Clearnet | 3-month USD-LIBOR | 2.616 | 8/28/2045 | 30,000 | 688 | ||||||||||||
| Receive | LCH.Clearnet | 3-month USD-LIBOR | 2.697 | 9/2/2045 | 40,000 | — | ||||||||||||
| $ | 2,365 | |||||||||||||||||
The following footnotes apply to either the individual securities noted or one or more of the securities aggregated and listed as a single line item.
| 1 | Principal payments may be made periodically. Therefore, the effective maturity date may be earlier than the stated maturity date. |
| 2 | Coupon rate may change periodically. |
| 3 | Purchased on a TBA basis. |
| 4 | A portion of this security was pledged as collateral. The total value of pledged collateral was $87,686,000, which represented 1.26% of the net assets of the fund. |
| 5 | Index-linked bond whose principal amount moves with a government price index. |
Key to abbreviation
TBA = To be announced
See Notes to Financial Statements
| U.S. Government Securities Fund | 11 |
Statement of assets and liabilities
| at August 31, 2015 | (dollars in thousands) |
| Assets: | ||||||||
| Investment securities, at value (cost: $8,705,625) | $ | 8,738,558 | ||||||
| Cash | 751 | |||||||
| Receivables for: | ||||||||
| Sales of investments | $ | 1,641,831 | ||||||
| Sales of fund’s shares | 9,183 | |||||||
| Variation margin | 6,393 | |||||||
| Interest | 19,816 | |||||||
| Other | 22 | 1,677,245 | ||||||
| 10,416,554 | ||||||||
| Liabilities: | ||||||||
| Payables for: | ||||||||
| Purchases of investments | 3,447,796 | |||||||
| Repurchases of fund’s shares | 10,434 | |||||||
| Dividends on fund’s shares | 219 | |||||||
| Investment advisory services | 1,214 | |||||||
| Services provided by related parties | 2,492 | |||||||
| Trustees’ deferred compensation | 250 | |||||||
| Variation margin | 8,021 | |||||||
| Other | 130 | 3,470,556 | ||||||
| Net assets at August 31, 2015 | $ | 6,945,998 | ||||||
| Net assets consist of: | ||||||||
| Capital paid in on shares of beneficial interest | $ | 6,857,931 | ||||||
| Undistributed net investment income | 1,572 | |||||||
| Undistributed net realized gain | 51,198 | |||||||
| Net unrealized appreciation | 35,297 | |||||||
| Net assets at August 31, 2015 | $ | 6,945,998 |
(dollars and shares in thousands, except per-share amounts)
Shares of beneficial interest issued and outstanding (no stated par value) —
unlimited shares authorized (493,065 total shares outstanding)
| Shares | Net asset value | |||||||||||
| Net assets | outstanding | per share | ||||||||||
| Class A | $ | 2,655,263 | 188,463 | $ | 14.09 | |||||||
| Class B | 23,591 | 1,676 | 14.07 | |||||||||
| Class C | 260,130 | 18,491 | 14.07 | |||||||||
| Class F-1 | 146,189 | 10,376 | 14.09 | |||||||||
| Class F-2 | 117,320 | 8,327 | 14.09 | |||||||||
| Class 529-A | 131,265 | 9,317 | 14.09 | |||||||||
| Class 529-B | 1,874 | 133 | 14.06 | |||||||||
| Class 529-C | 54,221 | 3,857 | 14.06 | |||||||||
| Class 529-E | 8,503 | 604 | 14.09 | |||||||||
| Class 529-F-1 | 10,834 | 769 | 14.09 | |||||||||
| Class R-1 | 11,796 | 838 | 14.07 | |||||||||
| Class R-2 | 134,175 | 9,536 | 14.07 | |||||||||
| Class R-2E | 10 | 1 | 14.09 | |||||||||
| Class R-3 | 140,021 | 9,939 | 14.09 | |||||||||
| Class R-4 | 123,747 | 8,783 | 14.09 | |||||||||
| Class R-5 | 113,214 | 8,035 | 14.09 | |||||||||
| Class R-6 | 3,013,845 | 213,920 | 14.09 | |||||||||
See Notes to Financial Statements
| 12 | U.S. Government Securities Fund |
Statement of operations
| for the year ended August 31, 2015 | (dollars in thousands) |
| Investment income: | ||||||||
| Income: | ||||||||
| Interest | $ | 90,481 | ||||||
| Fees and expenses*: | ||||||||
| Investment advisory services | $ | 13,436 | ||||||
| Distribution services | 13,009 | |||||||
| Transfer agent services | 6,312 | |||||||
| Administrative services | 2,224 | |||||||
| Reports to shareholders | 329 | |||||||
| Registration statement and prospectus | 381 | |||||||
| Trustees’ compensation | 62 | |||||||
| Auditing and legal | 129 | |||||||
| Custodian | 19 | |||||||
| Other | 262 | 36,163 | ||||||
| Net investment income | 54,318 | |||||||
| Net realized gain and unrealized depreciation: | ||||||||
| Net realized gain on: | ||||||||
| Investments | 96,155 | |||||||
| Interest rate swaps | 33,376 | 129,531 | ||||||
| Net unrealized (depreciation) appreciation on: | ||||||||
| Investments | (75,026 | ) | ||||||
| Interest rate swaps | 14,905 | (60,121 | ) | |||||
| Net realized gain and unrealized depreciation | 69,410 | |||||||
| Net increase in net assets resulting from operations | $ | 123,728 |
*Additional information related to class-specific fees and expenses is included in the Notes to Financial Statements.
| Statements of changes in net assets | |
| (dollars in thousands) |
| Year ended August 31 | ||||||||
| 2015 | 2014 | |||||||
| Operations: | ||||||||
| Net investment income | $ | 54,318 | $ | 70,988 | ||||
| Net realized gain | 129,531 | 67,687 | ||||||
| Net unrealized (depreciation) appreciation | (60,121 | ) | 123,352 | |||||
| Net increase in net assets resulting from operations | 123,728 | 262,027 | ||||||
| Dividends and distributions paid or accrued to shareholders: | ||||||||
| Dividends from net investment income | (79,225 | ) | (68,869 | ) | ||||
| Distributions from net realized gain on investments | — | (52,846 | ) | |||||
| Total dividends and distributions paid or accrued to shareholders | (79,225 | ) | (121,715 | ) | ||||
| Net capital share transactions | 601,654 | (123,408 | ) | |||||
| Total increase in net assets | 646,157 | 16,904 | ||||||
| Net assets: | ||||||||
| Beginning of year | 6,299,841 | 6,282,937 | ||||||
| End of year (including undistributed net investment income: $1,572 and $1,341, respectively) | $ | 6,945,998 | $ | 6,299,841 | ||||
See Notes to Financial Statements
| U.S. Government Securities Fund | 13 |
Notes to financial statements
1. Organization
The American Funds Income Series (the “trust”) is registered under the Investment Company Act of 1940 as an open-end, diversified management investment company and has initially issued one series of shares, U.S. Government Securities Fund (the “fund”). The fund seeks to provide a high level of current income consistent with prudent investment risk and preservation of capital.
The fund has 17 share classes consisting of five retail share classes (Classes A, B and C, as well as two F share classes, F-1 and F-2), five 529 college savings plan share classes (Classes 529-A, 529-B, 529-C, 529-E and 529-F-1) and seven retirement plan share classes (Classes R-1, R-2, R-2E, R-3, R-4, R-5 and R-6). The 529 college savings plan share classes can be used to save for college education. The retirement plan share classes are generally offered only through eligible employer-sponsored retirement plans. The fund’s share classes are described further in the following table:
| Contingent deferred sales | ||||||
| Share class | Initial sales charge | charge upon redemption | Conversion feature | |||
| Classes A and 529-A | Up to 3.75% | None (except 1% for certain redemptions within one year of purchase without an initial sales charge) | None | |||
| Classes B and 529-B* | None | Declines from 5% to 0% for redemptions within six years of purchase | Classes B and 529-B convert to Classes A and 529-A, respectively, after eight years | |||
| Class C | None | 1% for redemptions within one year of purchase | Class C converts to Class F-1 after 10 years | |||
| Class 529-C | None | 1% for redemptions within one year of purchase | None | |||
| Class 529-E | None | None | None | |||
| Classes F-1, F-2 and 529-F-1 | None | None | None | |||
| Classes R-1, R-2, R-2E, R-3, R-4, R-5 and R-6 | None | None | None |
| *Class B and 529-B shares of the fund are not available for purchase. |
Holders of all share classes have equal pro rata rights to the assets, dividends and liquidation proceeds of the fund. Each share class has identical voting rights, except for the exclusive right to vote on matters affecting only its class. Share classes have different fees and expenses (“class-specific fees and expenses”), primarily due to different arrangements for distribution, transfer agent and administrative services. Differences in class-specific fees and expenses will result in differences in net investment income and, therefore, the payment of different per-share dividends by each share class.
2. Significant accounting policies
The fund is an investment company that applies the accounting and reporting guidance issued in Topic 946 by the U.S. Financial Accounting Standards Board. The fund’s financial statements have been prepared to comply with U.S. generally accepted accounting principles (“U.S. GAAP”). These principles require the fund’s investment adviser to make estimates and assumptions that affect reported amounts and disclosures. Actual results could differ from those estimates. Subsequent events, if any, have been evaluated through the date of issuance in the preparation of the financial statements. The fund follows the significant accounting policies described in this section, as well as the valuation policies described in the next section on valuation.
Security transactions and related investment income — Security transactions are recorded by the fund as of the date the trades are executed with brokers. Realized gains and losses from security transactions are determined based on the specific identified cost of the securities. In the event a security is purchased with a delayed payment date, the fund will segregate liquid assets sufficient to meet its payment obligations. Interest income is recognized on an accrual basis. Market discounts, premiums and original issue discounts on fixed-income securities are amortized daily over the expected life of the security.
Class allocations — Income, fees and expenses (other than class-specific fees and expenses) are allocated daily among the various share classes based on the relative value of their settled shares. Realized and unrealized gains and losses are allocated daily among the various share classes based on their relative net assets. Class-specific fees and expenses, such as distribution, transfer agent and administrative services, are charged directly to the respective share class.
| 14 | U.S. Government Securities Fund |
Dividends and distributions to shareholders — Dividends to shareholders are declared daily after the determination of the fund’s net investment income and are paid to shareholders monthly. Distributions to shareholders are recorded on the ex-dividend date.
3. Valuation
Capital Research and Management Company (“CRMC”), the fund’s investment adviser, values the fund’s investments at fair value as defined by U.S. GAAP. The net asset value of each share class of the fund is generally determined as of approximately 4:00 p.m. New York time each day the New York Stock Exchange is open.
Methods and inputs — The fund’s investment adviser uses the following methods and inputs to establish the fair value of the fund’s assets and liabilities. Use of particular methods and inputs may vary over time based on availability and relevance as market and economic conditions evolve.
Fixed-income securities, including short-term securities, are generally valued at prices obtained from one or more pricing vendors. Vendors value such securities based on one or more of the inputs described in the following table. The table provides examples of inputs that are commonly relevant for valuing particular classes of fixed-income securities in which the fund is authorized to invest. However, these classifications are not exclusive, and any of the inputs may be used to value any other class of fixed-income security.
| Fixed-income class | Examples of standard inputs | |
| All | Benchmark yields, transactions, bids, offers, quotations from dealers and trading systems, new issues, spreads and other relationships observed in the markets among comparable securities; and proprietary pricing models such as yield measures calculated using factors such as cash flows, financial or collateral performance and other reference data (collectively referred to as “standard inputs”) | |
| Bonds & notes of governments & government agencies | Standard inputs and interest rate volatilities | |
| Mortgage-backed; asset-backed obligations | Standard inputs and cash flows, prepayment information, default rates, delinquency and loss assumptions, collateral characteristics, credit enhancements and specific deal information |
When the fund’s investment adviser deems it appropriate to do so (such as when vendor prices are unavailable or deemed to be not representative), fixed-income securities will be valued in good faith at the mean quoted bid and ask prices that are reasonably and timely available (or bid prices, if ask prices are not available) or at prices for securities of comparable maturity, quality and type. Interest rate swaps are generally valued by pricing vendors based on market inputs that include the index and term of index, reset frequency, payer/receiver, currency and pay frequency.
Securities and other assets for which representative market quotations are not readily available or are considered unreliable by the fund’s investment adviser are fair valued as determined in good faith under fair valuation guidelines adopted by authority of the fund’s board of trustees as further described. The investment adviser follows fair valuation guidelines, consistent with U.S. Securities and Exchange Commission rules and guidance, to consider relevant principles and factors when making fair value determinations. The investment adviser considers relevant indications of value that are reasonably and timely available to it in determining the fair value to be assigned to a particular security, such as the type and cost of the security; contractual or legal restrictions on resale of the security; relevant financial or business developments of the issuer; actively traded similar or related securities; conversion or exchange rights on the security; related corporate actions; significant events occurring after the close of trading in the security; and changes in overall market conditions. In addition, the closing prices of equity securities that trade in markets outside U.S. time zones may be adjusted to reflect significant events that occur after the close of local trading but before the net asset value of each share class of the fund is determined. Fair valuations and valuations of investments that are not actively trading involve judgment and may differ materially from valuations that would have been used had greater market activity occurred.
Processes and structure — The fund’s board of trustees has delegated authority to the fund’s investment adviser to make fair value determinations, subject to board oversight. The investment adviser has established a Joint Fair Valuation Committee (the “Fair Valuation Committee”) to administer, implement and oversee the fair valuation process, and to make fair value decisions. The Fair Valuation Committee regularly reviews its own fair value decisions, as well as decisions made under its standing instructions to the investment adviser’s valuation teams. The Fair Valuation Committee reviews changes in fair value measurements from period to period and may, as
| U.S. Government Securities Fund | 15 |
deemed appropriate, update the fair valuation guidelines to better reflect the results of back testing and address new or evolving issues. The Fair Valuation Committee reports any changes to the fair valuation guidelines to the board of trustees with supplemental information to support the changes. The fund’s board and audit committee also regularly review reports that describe fair value determinations and methods.
The fund’s investment adviser has also established a Fixed-Income Pricing Review Group to administer and oversee the fixed-income valuation process, including the use of fixed-income pricing vendors. This group regularly reviews pricing vendor information and market data. Pricing decisions, processes and controls over security valuation are also subject to additional internal reviews, including an annual control self-evaluation program facilitated by the investment adviser’s compliance group.
Classifications — The fund’s investment adviser classifies the fund’s assets and liabilities into three levels based on the inputs used to value the assets or liabilities. Level 1 values are based on quoted prices in active markets for identical securities. Level 2 values are based on significant observable market inputs, such as quoted prices for similar securities and quoted prices in inactive markets. Certain securities trading outside the U.S. may transfer between Level 1 and Level 2 due to valuation adjustments resulting from significant market movements following the close of local trading. Level 3 values are based on significant unobservable inputs that reflect the investment adviser’s determination of assumptions that market participants might reasonably use in valuing the securities. The valuation levels are not necessarily an indication of the risk or liquidity associated with the underlying investment. For example, U.S. government securities are reflected as Level 2 because the inputs used to determine fair value may not always be quoted prices in an active market. At August 31, 2015, all of the fund’s investments were classified as Level 2.
4. Risk factors
Investing in the fund may involve certain risks including, but not limited to, those described below.
Market conditions — The prices of, and the income generated by, the securities held by the fund may decline — sometimes rapidly or unpredictably — due to various factors, including events or conditions affecting the general economy or particular industries; overall market changes; local, regional or global political, social or economic instability; governmental or governmental agency responses to economic conditions; and currency exchange rate, interest rate and commodity price fluctuations.
Issuer risks — The prices of, and the income generated by, securities held by the fund may decline in response to various factors directly related to the issuers of such securities, including reduced demand for an issuer’s goods or services, poor management performance and strategic initiatives such as mergers, acquisitions or dispositions and the market response to any such initiatives.
Investing in debt instruments — The prices of, and the income generated by, bonds and other debt securities held by the fund may be affected by changing interest rates and by changes in the effective maturities and credit ratings of these securities.
Rising interest rates will generally cause the prices of bonds and other debt securities to fall. Falling interest rates may cause an issuer to redeem, call or refinance a debt security before its stated maturity, which may result in the fund having to reinvest the proceeds in lower yielding securities. Longer maturity debt securities generally have greater sensitivity to changes in interest rates and may be subject to greater price fluctuations than shorter maturity debt securities.
Bonds and other debt securities are also subject to credit risk, which is the possibility that the credit strength of an issuer will weaken and/or an issuer of a debt security will fail to make timely payments of principal or interest and the security will go into default. Credit risk is gauged, in part, by the credit ratings of the debt securities in which the fund invests. However, ratings are only the opinions of the rating agencies issuing them and are not guarantees as to credit quality or an evaluation of market risk. The fund’s investment adviser relies on its own credit analysts to research issuers and issues in seeking to mitigate various credit and default risks.
Investing in securities backed by the U.S. government — Securities backed by the U.S. Treasury or the full faith and credit of the U.S. government are guaranteed only as to the timely payment of interest and principal when held to maturity. Accordingly, the current market values for these securities will fluctuate with changes in interest rates. Securities issued by government-sponsored entities and federal agencies and instrumentalities that are not backed by the full faith and credit of the U.S. government are neither issued nor guaranteed by the U.S. government.
Investing in mortgage-related and other asset-backed securities — Mortgage-related securities, such as mortgage-backed securities, and other asset-backed securities, include debt obligations that represent interests in pools of mortgages or other income-bearing assets, such as consumer loans or receivables. Such securities often involve risks that are different from or more acute than the risks associated with investing in other types of debt securities. Mortgage-backed and other asset-backed securities are subject to changes in the payment patterns of borrowers of the underlying debt. When interest rates fall, borrowers are more likely to refinance or prepay their
| 16 | U.S. Government Securities Fund |
debt before its stated maturity. This may result in the fund having to reinvest the proceeds in lower yielding securities, effectively reducing the fund’s income. Conversely, if interest rates rise and borrowers repay their debt more slowly than expected, the time in which the mortgage-backed and other asset-backed securities are paid off could be extended, reducing the fund’s cash available for reinvestment in higher yielding securities.
Investing in future delivery contracts — The fund may enter into contracts, such as to-be-announced contracts and mortgage dollar rolls, that involve the fund selling mortgage-related securities and simultaneously contracting to repurchase similar securities for delivery at a future date at a predetermined price. This can increase the fund’s market exposure, and the market price of the securities that the fund contracts to repurchase could drop below their purchase price. While the fund can preserve and generate capital through the use of such contracts by, for example, realizing the difference between the sale price and the future purchase price, the income generated by the fund may be reduced by engaging in such transactions. In addition, these transactions may increase the turnover rate of the fund.
Investing in inflation linked bonds — The values of inflation linked bonds generally fluctuate in response to changes in real interest rates —i.e., rates of interest after factoring in inflation. A rise in real interest rates may cause the prices of inflation linked securities to fall, while a decline in real interest rates may cause the prices to increase. Inflation linked bonds may experience greater losses than other debt securities with similar durations when real interest rates rise faster than nominal interest rates. There can be no assurance that the value of an inflation linked security will be directly correlated to changes in interest rates; for example, if interest rates rise for reasons other than inflation, the increase may not be reflected in the security’s inflation measure.
Investing in inflation linked bonds may also reduce the fund’s distributable income during periods of extreme deflation. If prices for goods and services decline throughout the economy, the principal and income on inflation linked securities may decline and result in losses to the fund.
Investing in derivatives — The use of derivatives involves a variety of risks, which may be different from, or greater than, the risks associated with investing in traditional cash securities, such as stocks and bonds. Changes in the value of a derivative may not correlate perfectly with, and may be more sensitive to market events than, the underlying asset, rate or index, and a derivative instrument may expose the fund to losses in excess of its initial investment. Derivatives may be difficult for the fund to buy or sell at an opportune time or price and may be difficult to terminate or otherwise offset. The fund’s use of derivatives may result in losses to the fund, and investing in derivatives may reduce the fund’s returns and increase the fund’s price volatility. The fund’s counterparty to a derivative transaction (including, if applicable, the fund’s clearing broker, the derivatives exchange or the clearinghouse) may be unable or unwilling to honor its financial obligations in respect of the transaction.
Management — The investment adviser to the fund actively manages the fund’s investments. Consequently, the fund is subject to the risk that the methods and analyses employed by the investment adviser in this process may not produce the desired results. This could cause the fund to lose value or its investment results to lag relevant benchmarks or other funds with similar objectives.
5. Certain investment techniques
Mortgage dollar rolls — The fund has entered into mortgage dollar roll transactions in which the fund sells a mortgage-backed security to a counterparty and simultaneously enters into an agreement with the same counterparty to buy back a similar security on a specific future date at a predetermined price. Mortgage dollar rolls are accounted for as purchase and sale transactions, which may increase the fund’s portfolio turnover rate.
Interest rate swaps — The fund has entered into interest rate swap contracts, which are agreements to exchange one stream of future interest payments for another based on a specified notional amount. Typically, interest rate swaps exchange a fixed interest rate for a payment that floats relative to a benchmark or vice versa. The fund’s investment adviser uses interest rate swaps to seek to manage the interest rate sensitivity of the fund by increasing or decreasing the duration of the fund or a portion of the fund’s portfolio. Risks may arise as a result of the fund’s investment adviser incorrectly anticipating changes in interest rates, increased volatility, reduced liquidity and the potential inability of counterparties to meet the terms of their agreements.
Upon entering into an interest rate swap contract, the fund is required to deposit cash, U.S. government securities or other liquid securities, which is known as “initial margin.” Generally, the initial margin required for a particular interest rate swap is set and held as collateral by the clearinghouse on which the contract is cleared. The amount of initial margin required may be significantly modified from time to time by the clearinghouse during the term of the contract.
On a daily basis, the fund’s investment adviser records daily interest accruals related to the exchange of future payments as a receivable and payable in the fund’s statement of assets and liabilities. The fund also pays or receives a “variation margin” based on the increase or decrease in the value of the interest rate swaps, including accrued interest, and records variation margin on interest rate swaps in the
| U.S. Government Securities Fund | 17 |
statement of assets and liabilities. The fund records realized gains and losses on both the net accrued interest and any gain or loss recognized at the time the interest rate swap is closed or expires. Net realized gains or losses, as well as any net unrealized appreciation or depreciation, from interest rate swaps are recorded in the fund’s statement of operations.
The following tables present the financial statement impacts resulting from the fund’s use of interest rate swaps as of, or for the year ended August 31, 2015 (dollars in thousands):
| Assets | Liabilities | ||||||||||||
| Location on statement of | Location on statement of | ||||||||||||
| Contract | Risk type | assets and liabilities | Value | assets and liabilities | Value | ||||||||
| Interest rate swaps | Interest | Net unrealized appreciation* | $43,487 | Net unrealized depreciation* | $41,122 | ||||||||
| Net realized gain | Net unrealized appreciation | ||||||||||||
| Location on statement of | Location on statement of | ||||||||||||
| Contract | Risk type | operations | Value | operations | Value | ||||||||
| Interest rate swaps | Interest | Net realized gain on interest rate swaps | $33,376 | Net unrealized appreciation on interest rate swaps | $14,905 | ||||||||
| * | Includes cumulative appreciation (depreciation) on interest rate swaps as reported in the applicable table following the fund’s investment portfolio. Only the current day’s variation margin is reported within the statement of assets and liabilities. |
Collateral — The fund participates in a collateral program due to its use of interest rate swaps. The program calls for the fund to pledge collateral for initial and variation margin by contract. The purpose of the collateral is to cover potential losses that could occur in the event that either party cannot meet its contractual obligations.
6. Taxation and distributions
Federal income taxation — The fund complies with the requirements under Subchapter M of the Internal Revenue Code applicable to mutual funds and intends to distribute substantially all of its net taxable income and net capital gains each year. The fund is not subject to income taxes to the extent such distributions are made. Therefore, no federal income tax provision is required.
As of and during the period ended August 31, 2015, the fund did not have a liability for any unrecognized tax benefits. The fund recognizes interest and penalties, if any, related to unrecognized tax benefits as income tax expense in the statement of operations. During the period, the fund did not incur any interest or penalties.
The fund is not subject to examination by U.S. federal tax authorities for tax years before 2011 and by state tax authorities for tax years before 2010.
Distributions — Distributions paid to shareholders are based on net investment income and net realized gains determined on a tax basis, which may differ from net investment income and net realized gains for financial reporting purposes. These differences are due primarily to different treatment for items such as short-term capital gains and losses; capital losses related to sales of certain securities within 30 days of purchase; cost of investments sold; paydowns on fixed-income securities; net capital losses; and amortization of premiums and discounts. The fiscal year in which amounts are distributed may differ from the year in which the net investment income and net realized gains are recorded by the fund for financial reporting purposes. The fund may also designate a portion of the amount paid to redeeming shareholders as a distribution for tax purposes.
During the year ended August 31, 2015, the fund reclassified $2,000 from undistributed net investment income to capital paid in on shares of beneficial interest, $25,140,000 from undistributed net realized gain to undistributed net investment income and $3,898,000 from undistributed net realized gain to capital paid in on shares of beneficial interest to align financial reporting with tax reporting.
| 18 | U.S. Government Securities Fund |
As of August 31, 2015, the tax-basis components of distributable earnings, unrealized appreciation (depreciation) and cost of investment securities were as follows (dollars in thousands):
| Undistributed ordinary income | $ | 10,845 | ||
| Undistributed long-term capital gains | 52,225 | |||
| Gross unrealized appreciation on investment securities | 112,144 | |||
| Gross unrealized depreciation on investment securities | (89,044 | ) | ||
| Net unrealized appreciation on investment securities | 23,100 | |||
| Cost of investment securities | 8,715,458 |
The tax character of distributions paid or accrued to shareholders was as follows (dollars in thousands):
| Year ended August 31, 2015 | Year ended August 31, 2014 | |||||||||||||||||||||||
| Total | Total | |||||||||||||||||||||||
| dividends and | dividends and | |||||||||||||||||||||||
| Ordinary | Long-term | distributions paid | Ordinary | Long-term | distributions paid | |||||||||||||||||||
| Share class | income | capital gains | or accrued | income | capital gains | or accrued | ||||||||||||||||||
| Class A | $ | 28,691 | $ | — | $ | 28,691 | $ | 30,658 | $ | 25,210 | $ | 55,868 | ||||||||||||
| Class B | 108 | — | 108 | 174 | 455 | 629 | ||||||||||||||||||
| Class C | 949 | — | 949 | 992 | 2,788 | 3,780 | ||||||||||||||||||
| Class F-1 | 1,694 | — | 1,694 | 1,825 | 1,433 | 3,258 | ||||||||||||||||||
| Class F-2 | 1,314 | — | 1,314 | 784 | 482 | 1,266 | ||||||||||||||||||
| Class 529-A | 1,388 | — | 1,388 | 1,495 | 1,341 | 2,836 | ||||||||||||||||||
| Class 529-B | 8 | — | 8 | 12 | 43 | 55 | ||||||||||||||||||
| Class 529-C | 190 | — | 190 | 187 | 619 | 806 | ||||||||||||||||||
| Class 529-E | 64 | — | 64 | 68 | 78 | 146 | ||||||||||||||||||
| Class 529-F-1 | 135 | — | 135 | 131 | 92 | 223 | ||||||||||||||||||
| Class R-1 | 50 | — | 50 | 50 | 126 | 176 | ||||||||||||||||||
| Class R-2 | 553 | — | 553 | 518 | 1,400 | 1,918 | ||||||||||||||||||
| Class R-2E* | — | † | — | — | † | — | — | — | ||||||||||||||||
| Class R-3 | 1,123 | — | 1,123 | 1,147 | 1,334 | 2,481 | ||||||||||||||||||
| Class R-4 | 1,347 | — | 1,347 | 1,368 | 1,096 | 2,464 | ||||||||||||||||||
| Class R-5 | 1,534 | — | 1,534 | 1,674 | 1,158 | 2,832 | ||||||||||||||||||
| Class R-6 | 40,077 | — | 40,077 | 27,786 | 15,191 | 42,977 | ||||||||||||||||||
| Total | $ | 79,225 | $ | — | $ | 79,225 | $ | 68,869 | $ | 52,846 | $ | 121,715 | ||||||||||||
| * | Class R-2E shares were offered beginning August 29, 2014. |
| † | Amount less than one thousand. |
7. Fees and transactions with related parties
CRMC, the fund’s investment adviser, is the parent company of American Funds Distributors,® Inc. (“AFD”), the principal underwriter of the fund’s shares, and American Funds Service Company® (“AFS”), the fund’s transfer agent. CRMC, AFD and AFS are considered related parties to the fund.
Investment advisory services — The fund has an investment advisory and service agreement with CRMC that provides for monthly fees accrued daily. These fees are based on a series of decreasing annual rates beginning with 0.300% on the first $60 million of daily net assets and decreasing to 0.140% on such assets in excess of $10 billion. The agreement also provides for monthly fees, accrued daily, based on a series of decreasing rates beginning with 3.00% on the first $3,333,333 of the fund’s monthly gross income and decreasing to 2.00% on such income in excess of $8,333,333. For the year ended August 31, 2015, the investment advisory services fee was $13,436,000, which was equivalent to an annualized rate of 0.204% of average daily net assets.
Class-specific fees and expenses — Expenses that are specific to individual share classes are accrued directly to the respective share class. The principal class-specific fees and expenses are further described below:
Distribution services — The fund has plans of distribution for all share classes, except Class F-2, R-5 and R-6 shares. Under the plans, the board of trustees approves certain categories of expenses that are used to finance activities primarily intended to sell fund shares and service existing accounts. The plans provide for payments, based on an annualized percentage of average daily net assets, ranging from 0.30% to 1.00% as noted in this section. In some cases, the board of trustees has limited the amounts that may be paid
| U.S. Government Securities Fund | 19 |
to less than the maximum allowed by the plans. All share classes with a plan may use up to 0.25% of average daily net assets to pay service fees, or to compensate AFD for paying service fees, to firms that have entered into agreements with AFD to provide certain shareholder services. The remaining amounts available to be paid under each plan are paid to dealers to compensate them for their sales activities.
For Class A and 529-A shares, distribution-related expenses include the reimbursement of dealer and wholesaler commissions paid by AFD for certain shares sold without a sales charge. These share classes reimburse AFD for amounts billed within the prior 15 months but only to the extent that the overall annual expense limit of 0.30% is not exceeded. As of August 31, 2015, there were no unreimbursed expenses subject to reimbursement for Class A or 529-A shares.
| Share class | Currently approved limits | Plan limits | ||||||
| Class A | 0.30 | % | 0.30 | % | ||||
| Class 529-A | 0.30 | 0.50 | ||||||
| Classes B and 529-B | 1.00 | 1.00 | ||||||
| Classes C, 529-C and R-1 | 1.00 | 1.00 | ||||||
| Class R-2 | 0.75 | 1.00 | ||||||
| Class R-2E | 0.60 | 0.85 | ||||||
| Classes 529-E and R-3 | 0.50 | 0.75 | ||||||
| Classes F-1, 529-F-1 and R-4 | 0.25 | 0.50 | ||||||
Transfer agent services — The fund has a shareholder services agreement with AFS under which the fund compensates AFS for providing transfer agent services to each of the fund’s share classes. These services include recordkeeping, shareholder communications and transaction processing. In addition, the fund reimburses AFS for amounts paid to third parties for performing transfer agent services on behalf of fund shareholders.
Administrative services — The fund has an administrative services agreement with CRMC under which the fund compensates CRMC for providing administrative services to Class A, C, F, 529 and R shares. These services include, but are not limited to, coordinating, monitoring, assisting and overseeing third parties that provide services to fund shareholders. Under the agreement, Class A shares pay an annual fee of 0.01% and Class C, F, 529 and R shares pay an annual fee of 0.05% of their respective average daily net assets.
529 plan services — Each 529 share class is subject to service fees to compensate the Virginia College Savings Plan (“Virginia529”) for its oversight and administration of the 529 college savings plan. The quarterly fee is based on a series of decreasing annual rates beginning with 0.10% on the first $30 billion of the net assets invested in Class 529 shares of the American Funds and decreasing to 0.05% on such assets in excess of $70 billion. The fee for any given calendar quarter is accrued and calculated on the basis of the average net assets of Class 529 shares of the American Funds for the last month of the prior calendar quarter. The fee is included in other expenses in the fund’s statement of operations. Virginia529 is not considered a related party to the fund.
For the year ended August 31, 2015, class-specific expenses under the agreements were as follows (dollars in thousands):
| Distribution | Transfer agent | Administrative | 529 plan | |||||||||||
| Share class | services | services | services | services | ||||||||||
| Class A | $6,636 | $4,323 | $262 | Not applicable | ||||||||||
| Class B | 295 | 48 | Not applicable | Not applicable | ||||||||||
| Class C | 2,602 | 415 | 131 | Not applicable | ||||||||||
| Class F-1 | 384 | 163 | 77 | Not applicable | ||||||||||
| Class F-2 | Not applicable | 104 | 47 | Not applicable | ||||||||||
| Class 529-A | 302 | 182 | 68 | $120 | ||||||||||
| Class 529-B | 25 | 4 | 1 | 2 | ||||||||||
| Class 529-C | 565 | 82 | 29 | 51 | ||||||||||
| Class 529-E | 39 | 8 | 4 | 7 | ||||||||||
| Class 529-F-1 | — | 14 | 5 | 10 | ||||||||||
| Class R-1 | 130 | 16 | 7 | Not applicable | ||||||||||
| Class R-2 | 1,042 | 530 | 71 | Not applicable | ||||||||||
| Class R-2E | — | — | * | — | * | Not applicable | ||||||||
| Class R-3 | 694 | 251 | 70 | Not applicable | ||||||||||
| Class R-4 | 295 | 117 | 60 | Not applicable | ||||||||||
| Class R-5 | Not applicable | 51 | 53 | Not applicable | ||||||||||
| Class R-6 | Not applicable | 4 | 1,339 | Not applicable | ||||||||||
| Total class-specific expenses | $13,009 | $6,312 | $2,224 | $190 | ||||||||||
| *Amount less than one thousand. |
| 20 | U.S. Government Securities Fund |
Trustees’ deferred compensation — Trustees who are unaffiliated with CRMC may elect to defer the cash payment of part or all of their compensation. These deferred amounts, which remain as liabilities of the fund, are treated as if invested in shares of the fund or other American Funds. These amounts represent general, unsecured liabilities of the fund and vary according to the total returns of the selected funds. Trustees’ compensation of $62,000 in the fund’s statement of operations includes $47,000 in current fees (either paid in cash or deferred) and a net increase of $15,000 in the value of the deferred amounts.
Affiliated officers and trustees — Officers and certain trustees of the fund are or may be considered to be affiliated with CRMC, AFD and AFS. No affiliated officers or trustees received any compensation directly from the fund.
8. Capital share transactions
Capital share transactions in the fund were as follows (dollars and shares in thousands):
| Sales1 | Reinvestments of dividends and distributions | Repurchases1 | Net (decrease) increase | |||||||||||||||||||||||||||||
| Share class | Amount | Shares | Amount | Shares | Amount | Shares | Amount | Shares | ||||||||||||||||||||||||
| Year ended August 31, 2015 | ||||||||||||||||||||||||||||||||
| Class A | $ | 597,008 | 42,381 | $ | 27,788 | 1,971 | $ | (641,323 | ) | (45,594 | ) | $ | (16,527 | ) | (1,242 | ) | ||||||||||||||||
| Class B | 1,879 | 133 | 104 | 7 | (15,839 | ) | (1,128 | ) | (13,856 | ) | (988 | ) | ||||||||||||||||||||
| Class C | 63,388 | 4,505 | 919 | 65 | (78,301 | ) | (5,575 | ) | (13,994 | ) | (1,005 | ) | ||||||||||||||||||||
| Class F-1 | 136,310 | 9,709 | 1,663 | 118 | (156,771 | ) | (11,149 | ) | (18,798 | ) | (1,322 | ) | ||||||||||||||||||||
| Class F-2 | 79,714 | 5,648 | 1,248 | 88 | (34,618 | ) | (2,460 | ) | 46,344 | 3,276 | ||||||||||||||||||||||
| Class 529-A | 22,459 | 1,596 | 1,381 | 98 | (31,605 | ) | (2,248 | ) | (7,765 | ) | (554 | ) | ||||||||||||||||||||
| Class 529-B | 111 | 8 | 7 | — | 2 | (1,638 | ) | (117 | ) | (1,520 | ) | (109 | ) | |||||||||||||||||||
| Class 529-C | 9,543 | 679 | 189 | 14 | (16,890 | ) | (1,202 | ) | (7,158 | ) | (509 | ) | ||||||||||||||||||||
| Class 529-E | 2,403 | 170 | 64 | 5 | (2,058 | ) | (146 | ) | 409 | 29 | ||||||||||||||||||||||
| Class 529-F-1 | 3,159 | 224 | 134 | 9 | (2,707 | ) | (192 | ) | 586 | 41 | ||||||||||||||||||||||
| Class R-1 | 3,386 | 241 | 49 | 4 | (5,884 | ) | (420 | ) | (2,449 | ) | (175 | ) | ||||||||||||||||||||
| Class R-2 | 37,010 | 2,633 | 547 | 39 | (51,308 | ) | (3,650 | ) | (13,751 | ) | (978 | ) | ||||||||||||||||||||
| Class R-2E | — | — | — | — | — | — | — | — | ||||||||||||||||||||||||
| Class R-3 | 48,591 | 3,452 | 1,112 | 79 | (52,822 | ) | (3,758 | ) | (3,119 | ) | (227 | ) | ||||||||||||||||||||
| Class R-4 | 43,636 | 3,099 | 1,342 | 95 | (42,160 | ) | (2,998 | ) | 2,818 | 196 | ||||||||||||||||||||||
| Class R-5 | 47,571 | 3,375 | 1,531 | 109 | (37,347 | ) | (2,652 | ) | 11,755 | 832 | ||||||||||||||||||||||
| Class R-6 | 853,962 | 60,667 | 40,064 | 2,841 | (255,347 | ) | (18,077 | ) | 638,679 | 45,431 | ||||||||||||||||||||||
| Total net increase (decrease) | $ | 1,950,130 | 138,520 | $ | 78,142 | 5,542 | $ | (1,426,618 | ) | (101,366 | ) | $ | 601,654 | 42,696 | ||||||||||||||||||
| Year ended August 31, 2014 | ||||||||||||||||||||||||||||||||
| Class A | $ | 321,711 | 23,312 | $ | 54,586 | 3,991 | $ | (926,465 | ) | (67,291 | ) | $ | (550,168 | ) | (39,988 | ) | ||||||||||||||||
| Class B | 1,037 | 75 | 614 | 45 | (25,867 | ) | (1,880 | ) | (24,216 | ) | (1,760 | ) | ||||||||||||||||||||
| Class C | 33,011 | 2,393 | 3,686 | 271 | (132,518 | ) | (9,638 | ) | (95,821 | ) | (6,974 | ) | ||||||||||||||||||||
| Class F-1 | 66,515 | 4,814 | 3,226 | 236 | (81,214 | ) | (5,880 | ) | (11,473 | ) | (830 | ) | ||||||||||||||||||||
| Class F-2 | 37,903 | 2,739 | 1,174 | 86 | (31,149 | ) | (2,261 | ) | 7,928 | 564 | ||||||||||||||||||||||
| Class 529-A | 18,381 | 1,333 | 2,833 | 207 | (49,500 | ) | (3,595 | ) | (28,286 | ) | (2,055 | ) | ||||||||||||||||||||
| Class 529-B | 240 | 18 | 55 | 4 | (2,963 | ) | (216 | ) | (2,668 | ) | (194 | ) | ||||||||||||||||||||
| Class 529-C | 8,215 | 597 | 806 | 59 | (26,334 | ) | (1,915 | ) | (17,313 | ) | (1,259 | ) | ||||||||||||||||||||
| Class 529-E | 1,544 | 112 | 145 | 10 | (3,989 | ) | (290 | ) | (2,300 | ) | (168 | ) | ||||||||||||||||||||
| Class 529-F-1 | 3,548 | 258 | 221 | 16 | (4,961 | ) | (360 | ) | (1,192 | ) | (86 | ) | ||||||||||||||||||||
| Class R-1 | 2,937 | 213 | 176 | 13 | (4,753 | ) | (345 | ) | (1,640 | ) | (119 | ) | ||||||||||||||||||||
| Class R-2 | 33,310 | 2,418 | 1,917 | 141 | (65,528 | ) | (4,763 | ) | (30,301 | ) | (2,204 | ) | ||||||||||||||||||||
| Class R-2E3 | 10 | 1 | — | — | — | — | 10 | 1 | ||||||||||||||||||||||||
| Class R-3 | 38,735 | 2,810 | 2,472 | 181 | (69,900 | ) | (5,074 | ) | (28,693 | ) | (2,083 | ) | ||||||||||||||||||||
| Class R-4 | 36,252 | 2,629 | 2,464 | 180 | (55,050 | ) | (3,994 | ) | (16,334 | ) | (1,185 | ) | ||||||||||||||||||||
| Class R-5 | 29,865 | 2,166 | 2,832 | 207 | (66,962 | ) | (4,858 | ) | (34,265 | ) | (2,485 | ) | ||||||||||||||||||||
| Class R-6 | 859,991 | 62,357 | 43,156 | 3,146 | (189,823 | ) | (13,742 | ) | 713,324 | 51,761 | ||||||||||||||||||||||
| Total net increase (decrease) | $ | 1,493,205 | 108,245 | $ | 120,363 | 8,793 | $ | (1,736,976 | ) | (126,102 | ) | $ | (123,408 | ) | (9,064 | ) | ||||||||||||||||
| 1 | Includes exchanges between share classes of the fund. |
| 2 | Amount less than one thousand. |
| 3 | Class R-2E shares were offered beginning August 29, 2014. |
| U.S. Government Securities Fund | 21 |
9. Investment transactions
The fund made purchases and sales of investment securities, excluding short-term securities and U.S. government obligations, if any, of $33,325,093,000 and $32,791,925,000, respectively, during the year ended August 31, 2015.
| 22 | U.S. Government Securities Fund |
Financial highlights
| Income (loss) from investment operations1 | Dividends and distributions | |||||||||||||||||||||||||||||||||||||||||||||||||||
| Net asset value, beginning of period | Net investment income (loss) | Net gains (losses) on securities (both realized and unrealized) | Total from investment operations | Dividends (from net investment income) | Distributions (from capital gains) | Total dividends and distributions | Net asset value, end of period | Total return2,3 | Net assets, end of period (in millions) | Ratio of expenses to average net assets before reimbursements | Ratio of expenses to average net assets after reimbursements2 | Ratio of net income (loss) to average net assets2 | ||||||||||||||||||||||||||||||||||||||||
| Class A: | ||||||||||||||||||||||||||||||||||||||||||||||||||||
| Year ended 8/31/2015 | $ | 13.99 | $ | .10 | $ | .15 | $ | .25 | $ | (.15 | ) | $ | — | $ | (.15 | ) | $ | 14.09 | 1.82 | % | $ | 2,655 | .65 | % | .65 | % | .72 | % | ||||||||||||||||||||||||
| Year ended 8/31/2014 | 13.68 | .16 | .42 | .58 | (.15 | ) | (.12 | ) | (.27 | ) | 13.99 | 4.32 | 2,654 | .64 | .64 | 1.13 | ||||||||||||||||||||||||||||||||||||
| Year ended 8/31/2013 | 14.63 | .05 | (.53 | ) | (.48 | ) | (.12 | ) | (.35 | ) | (.47 | ) | 13.68 | (3.37 | ) | 3,141 | .61 | .61 | .36 | |||||||||||||||||||||||||||||||||
| Year ended 8/31/2012 | 14.48 | .12 | .52 | .64 | (.18 | ) | (.31 | ) | (.49 | ) | 14.63 | 4.50 | 4,245 | .60 | .60 | .82 | ||||||||||||||||||||||||||||||||||||
| Year ended 8/31/2011 | 14.76 | .28 | .23 | .51 | (.30 | ) | (.49 | ) | (.79 | ) | 14.48 | 3.73 | 3,915 | .61 | .61 | 1.92 | ||||||||||||||||||||||||||||||||||||
| Class B: | ||||||||||||||||||||||||||||||||||||||||||||||||||||
| Year ended 8/31/2015 | 13.98 | — | 4 | .15 | .15 | (.06 | ) | — | (.06 | ) | 14.07 | 1.05 | 24 | 1.37 | 1.37 | (.03 | ) | |||||||||||||||||||||||||||||||||||
| Year ended 8/31/2014 | 13.67 | .05 | .43 | .48 | (.05 | ) | (.12 | ) | (.17 | ) | 13.98 | 3.58 | 37 | 1.38 | 1.38 | .38 | ||||||||||||||||||||||||||||||||||||
| Year ended 8/31/2013 | 14.63 | (.06 | ) | (.53 | ) | (.59 | ) | (.02 | ) | (.35 | ) | (.37 | ) | 13.67 | (4.10 | ) | 60 | 1.35 | 1.35 | (.40 | ) | |||||||||||||||||||||||||||||||
| Year ended 8/31/2012 | 14.48 | .01 | .52 | .53 | (.07 | ) | (.31 | ) | (.38 | ) | 14.63 | 3.73 | 110 | 1.35 | 1.35 | .10 | ||||||||||||||||||||||||||||||||||||
| Year ended 8/31/2011 | 14.76 | .17 | .23 | .40 | (.19 | ) | (.49 | ) | (.68 | ) | 14.48 | 2.95 | 154 | 1.37 | 1.37 | 1.16 | ||||||||||||||||||||||||||||||||||||
| Class C: | ||||||||||||||||||||||||||||||||||||||||||||||||||||
| Year ended 8/31/2015 | 13.98 | (.01 | ) | .15 | .14 | (.05 | ) | — | (.05 | ) | 14.07 | 1.09 | 260 | 1.42 | 1.42 | (.05 | ) | |||||||||||||||||||||||||||||||||||
| Year ended 8/31/2014 | 13.67 | .05 | .43 | .48 | (.05 | ) | (.12 | ) | (.17 | ) | 13.98 | 3.46 | 272 | 1.43 | 1.43 | .34 | ||||||||||||||||||||||||||||||||||||
| Year ended 8/31/2013 | 14.63 | (.06 | ) | (.53 | ) | (.59 | ) | (.02 | ) | (.35 | ) | (.37 | ) | 13.67 | (4.13 | ) | 362 | 1.40 | 1.40 | (.45 | ) | |||||||||||||||||||||||||||||||
| Year ended 8/31/2012 | 14.48 | — | 4 | .52 | .52 | (.06 | ) | (.31 | ) | (.37 | ) | 14.63 | 3.68 | 536 | 1.40 | 1.40 | .02 | |||||||||||||||||||||||||||||||||||
| Year ended 8/31/2011 | 14.76 | .16 | .23 | .39 | (.18 | ) | (.49 | ) | (.67 | ) | 14.48 | 2.90 | 497 | 1.42 | 1.42 | 1.12 | ||||||||||||||||||||||||||||||||||||
| Class F-1: | ||||||||||||||||||||||||||||||||||||||||||||||||||||
| Year ended 8/31/2015 | 13.99 | .11 | .15 | .26 | (.16 | ) | — | (.16 | ) | 14.09 | 1.85 | 146 | .62 | .62 | .74 | |||||||||||||||||||||||||||||||||||||
| Year ended 8/31/2014 | 13.68 | .16 | .42 | .58 | (.15 | ) | (.12 | ) | (.27 | ) | 13.99 | 4.33 | 164 | .64 | .64 | 1.14 | ||||||||||||||||||||||||||||||||||||
| Year ended 8/31/2013 | 14.63 | .05 | (.53 | ) | (.48 | ) | (.12 | ) | (.35 | ) | (.47 | ) | 13.68 | (3.38 | ) | 171 | .62 | .62 | .35 | |||||||||||||||||||||||||||||||||
| Year ended 8/31/2012 | 14.48 | .12 | .52 | .64 | (.18 | ) | (.31 | ) | (.49 | ) | 14.63 | 4.51 | 200 | .61 | .61 | .81 | ||||||||||||||||||||||||||||||||||||
| Year ended 8/31/2011 | 14.76 | .27 | .23 | .50 | (.29 | ) | (.49 | ) | (.78 | ) | 14.48 | 3.70 | 172 | .63 | .63 | 1.90 | ||||||||||||||||||||||||||||||||||||
| Class F-2: | ||||||||||||||||||||||||||||||||||||||||||||||||||||
| Year ended 8/31/2015 | 13.99 | .14 | .15 | .29 | (.19 | ) | — | (.19 | ) | 14.09 | 2.09 | 117 | .38 | .38 | 1.01 | |||||||||||||||||||||||||||||||||||||
| Year ended 8/31/2014 | 13.68 | .19 | .43 | .62 | (.19 | ) | (.12 | ) | (.31 | ) | 13.99 | 4.59 | 71 | .39 | .39 | 1.39 | ||||||||||||||||||||||||||||||||||||
| Year ended 8/31/2013 | 14.63 | .08 | (.53 | ) | (.45 | ) | (.15 | ) | (.35 | ) | (.50 | ) | 13.68 | (3.15 | ) | 61 | .38 | .38 | .59 | |||||||||||||||||||||||||||||||||
| Year ended 8/31/2012 | 14.48 | .15 | .52 | .67 | (.21 | ) | (.31 | ) | (.52 | ) | 14.63 | 4.76 | 63 | .37 | .37 | 1.04 | ||||||||||||||||||||||||||||||||||||
| Year ended 8/31/2011 | 14.76 | .31 | .23 | .54 | (.33 | ) | (.49 | ) | (.82 | ) | 14.48 | 3.96 | 51 | .38 | .38 | 2.13 | ||||||||||||||||||||||||||||||||||||
| Class 529-A: | ||||||||||||||||||||||||||||||||||||||||||||||||||||
| Year ended 8/31/2015 | 13.99 | .09 | .15 | .24 | (.14 | ) | — | (.14 | ) | 14.09 | 1.75 | 131 | .72 | .72 | .65 | |||||||||||||||||||||||||||||||||||||
| Year ended 8/31/2014 | 13.68 | .14 | .43 | .57 | (.14 | ) | (.12 | ) | (.26 | ) | 13.99 | 4.23 | 138 | .73 | .73 | 1.04 | ||||||||||||||||||||||||||||||||||||
| Year ended 8/31/2013 | 14.63 | .04 | (.53 | ) | (.49 | ) | (.11 | ) | (.35 | ) | (.46 | ) | 13.68 | (3.46 | ) | 163 | .69 | .69 | .27 | |||||||||||||||||||||||||||||||||
| Year ended 8/31/2012 | 14.48 | .11 | .52 | .63 | (.17 | ) | (.31 | ) | (.48 | ) | 14.63 | 4.42 | 202 | .69 | .69 | .72 | ||||||||||||||||||||||||||||||||||||
| Year ended 8/31/2011 | 14.76 | .27 | .23 | .50 | (.29 | ) | (.49 | ) | (.78 | ) | 14.48 | 3.64 | 172 | .69 | .69 | 1.84 | ||||||||||||||||||||||||||||||||||||
| Class 529-B: | ||||||||||||||||||||||||||||||||||||||||||||||||||||
| Year ended 8/31/2015 | 13.97 | (.01 | ) | .15 | .14 | (.05 | ) | — | (.05 | ) | 14.06 | .98 | 2 | 1.48 | 1.48 | (.15 | ) | |||||||||||||||||||||||||||||||||||
| Year ended 8/31/2014 | 13.66 | .04 | .43 | .47 | (.04 | ) | (.12 | ) | (.16 | ) | 13.97 | 3.48 | 3 | 1.50 | 1.50 | .26 | ||||||||||||||||||||||||||||||||||||
| Year ended 8/31/2013 | 14.63 | (.08 | ) | (.53 | ) | (.61 | ) | (.01 | ) | (.35 | ) | (.36 | ) | 13.66 | (4.23 | ) | 6 | 1.47 | 1.47 | (.52 | ) | |||||||||||||||||||||||||||||||
| Year ended 8/31/2012 | 14.48 | (.01 | ) | .52 | .51 | (.05 | ) | (.31 | ) | (.36 | ) | 14.63 | 3.60 | 10 | 1.48 | 1.48 | (.03 | ) | ||||||||||||||||||||||||||||||||||
| Year ended 8/31/2011 | 14.76 | .15 | .23 | .38 | (.17 | ) | (.49 | ) | (.66 | ) | 14.48 | 2.83 | 14 | 1.48 | 1.48 | 1.04 | ||||||||||||||||||||||||||||||||||||
See page 25 for footnotes.
| U.S. Government Securities Fund | 23 |
Financial highlights (continued)
| Income (loss) from investment operations1 | Dividends and distributions | |||||||||||||||||||||||||||||||||||||||||||||||||||
| Net asset value, beginning of period | Net investment income (loss) | Net gains (losses) on securities (both realized and unrealized) | Total from investment operations | Dividends (from net investment income) | Distributions (from capital gains) | Total dividends and distributions | Net asset value, end of period | Total return2,3 | Net assets, end of period (in millions) | Ratio of expenses to average net assets before reimbursements | Ratio of expenses to average net assets after reimbursements2 | Ratio of net income (loss) to average net assets2 | ||||||||||||||||||||||||||||||||||||||||
| Class 529-C: | ||||||||||||||||||||||||||||||||||||||||||||||||||||
| Year ended 8/31/2015 | $ | 13.97 | $ | (.01 | ) | $ | .15 | $ | .14 | $ | (.05 | ) | $ | — | $ | (.05 | ) | $ | 14.06 | .98 | % | $ | 54 | 1.47 | % | 1.47 | % | (.11 | )% | |||||||||||||||||||||||
| Year ended 8/31/2014 | 13.66 | .04 | .43 | .47 | (.04 | ) | (.12 | ) | (.16 | ) | 13.97 | 3.48 | 61 | 1.49 | 1.49 | .28 | ||||||||||||||||||||||||||||||||||||
| Year ended 8/31/2013 | 14.63 | (.08 | ) | (.53 | ) | (.61 | ) | (.01 | ) | (.35 | ) | (.36 | ) | 13.66 | (4.23 | ) | 77 | 1.47 | 1.47 | (.51 | ) | |||||||||||||||||||||||||||||||
| Year ended 8/31/2012 | 14.48 | (.01 | ) | .52 | .51 | (.05 | ) | (.31 | ) | (.36 | ) | 14.63 | 3.62 | 100 | 1.47 | 1.47 | (.05 | ) | ||||||||||||||||||||||||||||||||||
| Year ended 8/31/2011 | 14.76 | .15 | .23 | .38 | (.17 | ) | (.49 | ) | (.66 | ) | 14.48 | 2.83 | 90 | 1.48 | 1.48 | 1.06 | ||||||||||||||||||||||||||||||||||||
| Class 529-E: | ||||||||||||||||||||||||||||||||||||||||||||||||||||
| Year ended 8/31/2015 | 13.99 | .06 | .15 | .21 | (.11 | ) | — | (.11 | ) | 14.09 | 1.52 | 9 | .95 | .95 | .42 | |||||||||||||||||||||||||||||||||||||
| Year ended 8/31/2014 | 13.68 | .09 | .45 | .54 | (.11 | ) | (.12 | ) | (.23 | ) | 13.99 | 3.99 | 8 | .97 | .97 | .81 | ||||||||||||||||||||||||||||||||||||
| Year ended 8/31/2013 | 14.63 | — | 4 | (.53 | ) | (.53 | ) | (.07 | ) | (.35 | ) | (.42 | ) | 13.68 | (3.69 | ) | 10 | .94 | .94 | .03 | ||||||||||||||||||||||||||||||||
| Year ended 8/31/2012 | 14.48 | .07 | .52 | .59 | (.13 | ) | (.31 | ) | (.44 | ) | 14.63 | 4.16 | 13 | .94 | .94 | .46 | ||||||||||||||||||||||||||||||||||||
| Year ended 8/31/2011 | 14.76 | .23 | .23 | .46 | (.25 | ) | (.49 | ) | (.74 | ) | 14.48 | 3.36 | 10 | .97 | .97 | 1.57 | ||||||||||||||||||||||||||||||||||||
| Class 529-F-1: | ||||||||||||||||||||||||||||||||||||||||||||||||||||
| Year ended 8/31/2015 | 13.99 | .13 | .15 | .28 | (.18 | ) | — | (.18 | ) | 14.09 | 1.98 | 11 | .49 | .49 | .89 | |||||||||||||||||||||||||||||||||||||
| Year ended 8/31/2014 | 13.68 | .21 | .39 | .60 | (.17 | ) | (.12 | ) | (.29 | ) | 13.99 | 4.46 | 10 | .51 | .51 | 1.28 | ||||||||||||||||||||||||||||||||||||
| Year ended 8/31/2013 | 14.63 | .07 | (.53 | ) | (.46 | ) | (.14 | ) | (.35 | ) | (.49 | ) | 13.68 | (3.24 | ) | 11 | .47 | .47 | .49 | |||||||||||||||||||||||||||||||||
| Year ended 8/31/2012 | 14.48 | .14 | .52 | .66 | (.20 | ) | (.31 | ) | (.51 | ) | 14.63 | 4.65 | 13 | .47 | .47 | .94 | ||||||||||||||||||||||||||||||||||||
| Year ended 8/31/2011 | 14.76 | .30 | .23 | .53 | (.32 | ) | (.49 | ) | (.81 | ) | 14.48 | 3.87 | 10 | .48 | .48 | 2.06 | ||||||||||||||||||||||||||||||||||||
| Class R-1: | ||||||||||||||||||||||||||||||||||||||||||||||||||||
| Year ended 8/31/2015 | 13.98 | — | 4 | .15 | .15 | (.06 | ) | — | (.06 | ) | 14.07 | 1.04 | 12 | 1.39 | 1.39 | (.03 | ) | |||||||||||||||||||||||||||||||||||
| Year ended 8/31/2014 | 13.67 | .05 | .43 | .48 | (.05 | ) | (.12 | ) | (.17 | ) | 13.98 | 3.55 | 14 | 1.40 | 1.40 | .37 | ||||||||||||||||||||||||||||||||||||
| Year ended 8/31/2013 | 14.63 | (.06 | ) | (.53 | ) | (.59 | ) | (.02 | ) | (.35 | ) | (.37 | ) | 13.67 | (4.12 | ) | 16 | 1.38 | 1.38 | (.41 | ) | |||||||||||||||||||||||||||||||
| Year ended 8/31/2012 | 14.48 | .01 | .52 | .53 | (.07 | ) | (.31 | ) | (.38 | ) | 14.63 | 3.70 | 19 | 1.38 | 1.38 | .04 | ||||||||||||||||||||||||||||||||||||
| Year ended 8/31/2011 | 14.76 | .16 | .23 | .39 | (.18 | ) | (.49 | ) | (.67 | ) | 14.48 | 2.91 | 17 | 1.41 | 1.41 | 1.13 | ||||||||||||||||||||||||||||||||||||
| Class R-2: | ||||||||||||||||||||||||||||||||||||||||||||||||||||
| Year ended 8/31/2015 | 13.98 | — | 4 | .15 | .15 | (.06 | ) | — | (.06 | ) | 14.07 | 1.05 | 134 | 1.38 | 1.38 | (.02 | ) | |||||||||||||||||||||||||||||||||||
| Year ended 8/31/2014 | 13.67 | .05 | .43 | .48 | (.05 | ) | (.12 | ) | (.17 | ) | 13.98 | 3.54 | 147 | 1.43 | 1.43 | .34 | ||||||||||||||||||||||||||||||||||||
| Year ended 8/31/2013 | 14.63 | (.06 | ) | (.53 | ) | (.59 | ) | (.02 | ) | (.35 | ) | (.37 | ) | 13.67 | (4.09 | ) | 174 | 1.35 | 1.35 | (.39 | ) | |||||||||||||||||||||||||||||||
| Year ended 8/31/2012 | 14.48 | .01 | .52 | .53 | (.07 | ) | (.31 | ) | (.38 | ) | 14.63 | 3.71 | 224 | 1.37 | 1.37 | .05 | ||||||||||||||||||||||||||||||||||||
| Year ended 8/31/2011 | 14.76 | .16 | .23 | .39 | (.18 | ) | (.49 | ) | (.67 | ) | 14.48 | 2.91 | 211 | 1.41 | 1.40 | 1.13 | ||||||||||||||||||||||||||||||||||||
| Class R-2E: | ||||||||||||||||||||||||||||||||||||||||||||||||||||
| Year ended 8/31/2015 | 13.99 | .12 | .15 | .27 | (.17 | ) | — | (.17 | ) | 14.09 | 1.95 | 5 | — | 6 | .51 | 5 | .51 | 5 | .86 | 5 | ||||||||||||||||||||||||||||||||
| Period from 8/29/2014 to 8/31/20147,8 | 13.99 | — | — | — | — | — | — | 13.99 | — | — | 6 | — | — | — | ||||||||||||||||||||||||||||||||||||||
| Class R-3: | ||||||||||||||||||||||||||||||||||||||||||||||||||||
| Year ended 8/31/2015 | 13.99 | .06 | .15 | .21 | (.11 | ) | — | (.11 | ) | 14.09 | 1.53 | 140 | .94 | .94 | .43 | |||||||||||||||||||||||||||||||||||||
| Year ended 8/31/2014 | 13.68 | .11 | .43 | .54 | (.11 | ) | (.12 | ) | (.23 | ) | 13.99 | 3.99 | 142 | .97 | .97 | .80 | ||||||||||||||||||||||||||||||||||||
| Year ended 8/31/2013 | 14.63 | — | 4 | (.53 | ) | (.53 | ) | (.07 | ) | (.35 | ) | (.42 | ) | 13.68 | (3.69 | ) | 168 | .94 | .94 | .02 | ||||||||||||||||||||||||||||||||
| Year ended 8/31/2012 | 14.48 | .07 | .52 | .59 | (.13 | ) | (.31 | ) | (.44 | ) | 14.63 | 4.14 | 214 | .95 | .95 | .47 | ||||||||||||||||||||||||||||||||||||
| Year ended 8/31/2011 | 14.76 | .22 | .23 | .45 | (.24 | ) | (.49 | ) | (.73 | ) | 14.48 | 3.34 | 191 | .98 | .98 | 1.55 | ||||||||||||||||||||||||||||||||||||
| 24 | U.S. Government Securities Fund |
| Income (loss) from investment operations1 | Dividends and distributions | |||||||||||||||||||||||||||||||||||||||||||||||||||
| Net asset value, beginning of period | Net investment income (loss) | Net gains (losses) on securities (both realized and unrealized) | Total from investment operations | Dividends (from net investment income) | Distributions (from capital gains) | Total dividends and distributions | Net asset value, end of period | Total return2,3 | Net assets, end of period (in millions) | Ratio of expenses to average net assets before reimbursements | Ratio of expenses to average net assets after reimbursements2 | Ratio of net income (loss) to average net assets2 | ||||||||||||||||||||||||||||||||||||||||
| Class R-4: | ||||||||||||||||||||||||||||||||||||||||||||||||||||
| Year ended 8/31/2015 | $ | 13.99 | $ | .11 | $ | .15 | $ | .26 | $ | (.16 | ) | $ | — | $ | (.16 | ) | $ | 14.09 | 1.86 | % | $ | 124 | .61 | % | .61 | % | .76 | % | ||||||||||||||||||||||||
| Year ended 8/31/2014 | 13.68 | .16 | .42 | .58 | (.15 | ) | (.12 | ) | (.27 | ) | 13.99 | 4.33 | 120 | .63 | .63 | 1.14 | ||||||||||||||||||||||||||||||||||||
| Year ended 8/31/2013 | 14.63 | .05 | (.53 | ) | (.48 | ) | (.12 | ) | (.35 | ) | (.47 | ) | 13.68 | (3.38 | ) | 134 | .61 | .61 | .34 | |||||||||||||||||||||||||||||||||
| Year ended 8/31/2012 | 14.48 | .12 | .52 | .64 | (.18 | ) | (.31 | ) | (.49 | ) | 14.63 | 4.50 | 206 | .61 | .61 | .80 | ||||||||||||||||||||||||||||||||||||
| Year ended 8/31/2011 | 14.76 | .27 | .23 | .50 | (.29 | ) | (.49 | ) | (.78 | ) | 14.48 | 3.69 | 181 | .64 | .64 | 1.89 | ||||||||||||||||||||||||||||||||||||
| Class R-5: | ||||||||||||||||||||||||||||||||||||||||||||||||||||
| Year ended 8/31/2015 | 13.99 | .15 | .15 | .30 | (.20 | ) | — | (.20 | ) | 14.09 | 2.15 | 113 | .32 | .32 | 1.06 | |||||||||||||||||||||||||||||||||||||
| Year ended 8/31/2014 | 13.68 | .20 | .42 | .62 | (.19 | ) | (.12 | ) | (.31 | ) | 13.99 | 4.65 | 101 | .33 | .33 | 1.44 | ||||||||||||||||||||||||||||||||||||
| Year ended 8/31/2013 | 14.63 | .09 | (.53 | ) | (.44 | ) | (.16 | ) | (.35 | ) | (.51 | ) | 13.68 | (3.08 | ) | 133 | .31 | .31 | .65 | |||||||||||||||||||||||||||||||||
| Year ended 8/31/2012 | 14.48 | .16 | .52 | .68 | (.22 | ) | (.31 | ) | (.53 | ) | 14.63 | 4.80 | 170 | .32 | .32 | 1.09 | ||||||||||||||||||||||||||||||||||||
| Year ended 8/31/2011 | 14.76 | .31 | .23 | .54 | (.33 | ) | (.49 | ) | (.82 | ) | 14.48 | 4.01 | 128 | .34 | .34 | 2.19 | ||||||||||||||||||||||||||||||||||||
| Class R-6: | ||||||||||||||||||||||||||||||||||||||||||||||||||||
| Year ended 8/31/2015 | 13.99 | .16 | .15 | .31 | (.21 | ) | — | (.21 | ) | 14.09 | 2.20 | 3,014 | .27 | .27 | 1.12 | |||||||||||||||||||||||||||||||||||||
| Year ended 8/31/2014 | 13.68 | .21 | .42 | .63 | (.20 | ) | (.12 | ) | (.32 | ) | 13.99 | 4.70 | 2,357 | .28 | .28 | 1.51 | ||||||||||||||||||||||||||||||||||||
| Year ended 8/31/2013 | 14.63 | .10 | (.53 | ) | (.43 | ) | (.17 | ) | (.35 | ) | (.52 | ) | 13.68 | (3.03 | ) | 1,596 | .26 | .26 | .72 | |||||||||||||||||||||||||||||||||
| Year ended 8/31/2012 | 14.48 | .17 | .52 | .69 | (.23 | ) | (.31 | ) | (.54 | ) | 14.63 | 4.86 | 1,012 | .27 | .27 | 1.14 | ||||||||||||||||||||||||||||||||||||
| Year ended 8/31/2011 | 14.76 | .32 | .23 | .55 | (.34 | ) | (.49 | ) | (.83 | ) | 14.48 | 4.06 | 786 | .29 | .29 | 2.25 | ||||||||||||||||||||||||||||||||||||
| Year ended August 31 | ||||||||||||||||||||
| Portfolio turnover rate for all share classes9 | 2015 | 2014 | 2013 | 2012 | 2011 | |||||||||||||||
| Including mortgage dollar roll transactions | 771 | % | 423 | % | 488 | % | 353 | % | 212 | % | ||||||||||
| Excluding mortgage dollar roll transactions | 263 | % | Not available | |||||||||||||||||
| 1 | Based on average shares outstanding. |
| 2 | This column reflects the impact, if any, of certain reimbursements from CRMC. During one of the years shown, CRMC paid a portion of the fund’s transfer agent fees for certain retirement plan share classes. |
| 3 | Total returns exclude any applicable sales charges, including contingent deferred sales charges. |
| 4 | Amount less than $.01. |
| 5 | This class consisted solely of seed capital invested by CRMC; therefore, certain fees were not accrued. |
| 6 | Amount less than $1 million. |
| 7 | Based on operations for the period shown and, accordingly, is not representative of a full year. |
| 8 | Class R-2E shares were offered beginning August 29, 2014. |
| 9 | Refer to Note 5 for more information on mortgage dollar rolls. |
See Notes to Financial Statements
| U.S. Government Securities Fund | 25 |
Report of Independent Registered Public Accounting Firm
To the Shareholders and Board of Trustees of The American Funds Income Series - U.S. Government Securities Fund:
We have audited the accompanying statement of assets and liabilities of The American Funds Income Series - U.S. Government Securities Fund (the “Fund”), including the summary investment portfolio, as of August 31, 2015, and the related statement of operations for the year then ended, the statements of changes in net assets for each of the two years in the period then ended, and the financial highlights for each of the periods presented. These financial statements and financial highlights are the responsibility of the Fund’s management. Our responsibility is to express an opinion on these financial statements and financial highlights based on our audits.
We conducted our audits in accordance with the standards of the Public Company Accounting Oversight Board (United States). Those standards require that we plan and perform the audit to obtain reasonable assurance about whether the financial statements and financial highlights are free of material misstatement. The Fund is not required to have, nor were we engaged to perform, an audit of its internal control over financial reporting. Our audits included consideration of internal control over financial reporting as a basis for designing audit procedures that are appropriate in the circumstances, but not for the purpose of expressing an opinion on the effectiveness of the Fund’s internal control over financial reporting. Accordingly, we express no such opinion. An audit also includes examining, on a test basis, evidence supporting the amounts and disclosures in the financial statements, assessing the accounting principles used and significant estimates made by management, as well as evaluating the overall financial statement presentation. Our procedures included confirmation of securities owned as of August 31, 2015, by correspondence with the custodian and brokers; where replies were not received from brokers, we performed other auditing procedures. We believe that our audits provide a reasonable basis for our opinion.
In our opinion, such financial statements and financial highlights referred to above present fairly, in all material respects, the financial position of The American Funds Income Series - U.S. Government Securities Fund as of August 31, 2015, the results of its operations for the year then ended, the changes in its net assets for each of the two years in the period then ended, and the financial highlights for each of the periods presented, in conformity with accounting principles generally accepted in the United States of America.
Deloitte & Touche LLP
Costa Mesa, California
October 14, 2015
| 26 | U.S. Government Securities Fund |
| Expense example | unaudited |
As a fund shareholder, you incur two types of costs: (1) transaction costs, such as initial sales charges on purchase payments and contingent deferred sales charges on redemptions (loads), and (2) ongoing costs, including management fees, distribution and service (12b-1) fees, and other expenses. This example is intended to help you understand your ongoing costs (in dollars) of investing in the fund so you can compare these costs with the ongoing costs of investing in other mutual funds. The example is based on an investment of $1,000 invested at the beginning of the period and held for the entire six-month period (March 1, 2015, through August 31, 2015).
Actual expenses:
The first line of each share class in the table on the following page provides information about actual account values and actual expenses. You may use the information in this line, together with the amount you invested, to estimate the expenses that you paid over the period. Simply divide your account value by $1,000 (for example, an $8,600 account value divided by $1,000 = 8.6), then multiply the result by the number in the first line under the heading entitled “Expenses paid during period” to estimate the expenses you paid on your account during this period.
Hypothetical example for comparison purposes:
The second line of each share class in the table on the following page provides information about hypothetical account values and hypothetical expenses based on the actual expense ratio for the share class and an assumed rate of return of 5.00% per year before expenses, which is not the actual return of the share class. The hypothetical account values and expenses may not be used to estimate the actual ending account balance or expenses you paid for the period. You may use this information to compare the ongoing costs of investing in the fund and other funds. To do so, compare this 5.00% hypothetical example with the 5.00% hypothetical examples that appear in the shareholder reports of the other funds.
Notes:
Retirement plan participants may be subject to certain fees charged by the plan sponsor, and Class F-1, F-2 and 529-F-1 shareholders may be subject to fees charged by financial intermediaries, typically ranging from 0.75% to 1.50% of assets annually depending on services offered. You can estimate the impact of these fees by adding the amount of the fees to the total estimated expenses you paid on your account during the period as calculated above. In addition, your ending account value would be lower by the amount of these fees.
Note that the expenses shown in the table on the following page are meant to highlight your ongoing costs only and do not reflect any transactional costs, such as sales charges (loads). Therefore, the second line of each share class in the table is useful in comparing ongoing costs only and will not help you determine the relative total costs of owning different funds. In addition, if these transactional costs were included, your costs would have been higher.
| U.S. Government Securities Fund | 27 |
| Beginning | Ending | |||||||||||||||
| account value | account value | Expenses paid | Annualized | |||||||||||||
| 3/1/2015 | 8/31/2015 | during period* | expense ratio | |||||||||||||
| Class A - actual return | $ | 1,000.00 | $ | 1,003.48 | $ | 3.23 | .64 | % | ||||||||
| Class A - assumed 5% return | 1,000.00 | 1,021.98 | 3.26 | .64 | ||||||||||||
| Class B - actual return | 1,000.00 | 999.93 | 6.81 | 1.35 | ||||||||||||
| Class B - assumed 5% return | 1,000.00 | 1,018.40 | 6.87 | 1.35 | ||||||||||||
| Class C - actual return | 1,000.00 | 999.63 | 7.11 | 1.41 | ||||||||||||
| Class C - assumed 5% return | 1,000.00 | 1,018.10 | 7.17 | 1.41 | ||||||||||||
| Class F-1 - actual return | 1,000.00 | 1,003.57 | 3.13 | .62 | ||||||||||||
| Class F-1 - assumed 5% return | 1,000.00 | 1,022.08 | 3.16 | .62 | ||||||||||||
| Class F-2 - actual return | 1,000.00 | 1,004.73 | 1.97 | .39 | ||||||||||||
| Class F-2 - assumed 5% return | 1,000.00 | 1,023.24 | 1.99 | .39 | ||||||||||||
| Class 529-A - actual return | 1,000.00 | 1,003.17 | 3.53 | .70 | ||||||||||||
| Class 529-A - assumed 5% return | 1,000.00 | 1,021.68 | 3.57 | .70 | ||||||||||||
| Class 529-B - actual return | 1,000.00 | 1,000.07 | 7.36 | 1.46 | ||||||||||||
| Class 529-B - assumed 5% return | 1,000.00 | 1,017.85 | 7.43 | 1.46 | ||||||||||||
| Class 529-C - actual return | 1,000.00 | 999.37 | 7.36 | 1.46 | ||||||||||||
| Class 529-C - assumed 5% return | 1,000.00 | 1,017.85 | 7.43 | 1.46 | ||||||||||||
| Class 529-E - actual return | 1,000.00 | 1,001.95 | 4.74 | .94 | ||||||||||||
| Class 529-E - assumed 5% return | 1,000.00 | 1,020.47 | 4.79 | .94 | ||||||||||||
| Class 529-F-1 - actual return | 1,000.00 | 1,004.26 | 2.42 | .48 | ||||||||||||
| Class 529-F-1 - assumed 5% return | 1,000.00 | 1,022.79 | 2.45 | .48 | ||||||||||||
| Class R-1 - actual return | 1,000.00 | 999.73 | 7.01 | 1.39 | ||||||||||||
| Class R-1 - assumed 5% return | 1,000.00 | 1,018.20 | 7.07 | 1.39 | ||||||||||||
| Class R-2 - actual return | 1,000.00 | 999.90 | 6.91 | 1.37 | ||||||||||||
| Class R-2 - assumed 5% return | 1,000.00 | 1,018.30 | 6.97 | 1.37 | ||||||||||||
| Class R-2E - actual return | 1,000.00 | 1,003.63 | 2.83 | .56 | ||||||||||||
| Class R-2E - assumed 5% return | 1,000.00 | 1,022.38 | 2.85 | .56 | ||||||||||||
| Class R-3 - actual return | 1,000.00 | 1,002.02 | 4.74 | .94 | ||||||||||||
| Class R-3 - assumed 5% return | 1,000.00 | 1,020.47 | 4.79 | .94 | ||||||||||||
| Class R-4 - actual return | 1,000.00 | 1,003.60 | 3.08 | .61 | ||||||||||||
| Class R-4 - assumed 5% return | 1,000.00 | 1,022.13 | 3.11 | .61 | ||||||||||||
| Class R-5 - actual return | 1,000.00 | 1,005.10 | 1.62 | .32 | ||||||||||||
| Class R-5 - assumed 5% return | 1,000.00 | 1,023.59 | 1.63 | .32 | ||||||||||||
| Class R-6 - actual return | 1,000.00 | 1,005.34 | 1.36 | .27 | ||||||||||||
| Class R-6 - assumed 5% return | 1,000.00 | 1,023.84 | 1.38 | .27 | ||||||||||||
| * | The “expenses paid during period” are equal to the “annualized expense ratio,” multiplied by the average account value over the period, multiplied by the number of days in the period, and divided by 365 (to reflect the one-half year period). |
| Tax information | unaudited |
We are required to advise you of the federal tax status of certain distributions received by shareholders during the fiscal year. The fund hereby designates the following amount for the fund’s fiscal year ended August 31, 2015:
| U.S. government income that may be exempt from state taxation | $ | 50,303,000 |
Individual shareholders should refer to their Form 1099 or other tax information, which will be mailed in January 2016, to determine the calendar year amounts to be included on their 2015 tax returns. Shareholders should consult their tax advisors.
| 28 | U.S. Government Securities Fund |
Approval of Investment Advisory and Service Agreement
The U.S. Government Securities Fund’s board has approved the fund’s Investment Advisory and Service Agreement (the “agreement”) with Capital Research and Management Company (“CRMC”) through April 30, 2016. The board approved the agreement following the recommendation of the fund’s Contracts Committee (the “committee”), which is composed of all of the fund’s independent board members. The board and the committee determined that the fund’s advisory fee structure was fair and reasonable in relation to the services provided and that approving the agreement was in the best interests of the fund and its shareholders.
In reaching this decision, the board and the committee took into account information furnished to them throughout the year and otherwise provided to them, as well as information prepared specifically in connection with their review of the agreement, and were advised by their independent counsel. They considered the following factors, among others, but did not identify any single issue or particular piece of information that, in isolation, was the controlling factor, and each board and committee member did not necessarily attribute the same weight to each factor.
1. Nature, extent and quality of services
The board and the committee considered the depth and quality of CRMC’s investment management process, including its global research capabilities; the experience, capability and integrity of its senior management and other personnel; the low turnover rates of its key personnel; the overall financial strength and stability of CRMC and the Capital Group organization; and the ongoing evolution of CRMC’s organizational structure designed to maintain and strengthen these qualities. The board and the committee also considered the nature, extent and quality of administrative, compliance and shareholder services provided by CRMC to the fund under the agreement and other agreements, as well as the benefits to fund shareholders from investing in a fund that is part of a large family of funds. The board and the committee concluded that the nature, extent and quality of the services provided by CRMC have benefited and should continue to benefit the fund and its shareholders.
2. Investment results
The board and the committee considered the investment results of the fund in light of its objective of providing a high level of current income consistent with prudent investment risk and preservation of capital. They compared the fund’s investment results with those of other relevant funds (including funds that form the basis of the Lipper index for the category in which the fund is included), and data such as relevant market and fund indexes, over various periods through September 30, 2014. This report, including the letter to shareholders and related disclosures, contains certain information about the fund’s investment results. The board and the committee reviewed the fund’s investment results measured against the Lipper General U.S. Government Funds Average and the Barclays U.S. Government/Mortgage Backed Securities Index. They noted that the investment results of the fund were above the results of the Lipper average for the three-year, five-year, 10-year and lifetime periods (although below the results of the average for the nine-month and one-year periods) and above the results of the Barclays index for the nine-month period (while below the results for the one-year, three-year, five-year, ten-year and lifetime periods). The board and the committee concluded that the fund’s investment results have been satisfactory for renewal of the agreement and that CRMC’s record in managing the fund indicated that its continued management should benefit the fund and its shareholders.
3. Advisory fees and total expenses
The board and the committee compared the advisory fees and total expense levels of the fund to those of other relevant funds. They observed that the fund’s advisory fees and total expenses were below the median advisory fees and total expenses of the other funds included in the Lipper General U.S. Government Funds category. The board and the committee also considered the breakpoint discounts in the fund’s advisory fee structure that reduce the level of fees charged by CRMC to the fund as fund assets increase. In addition, they reviewed information regarding the effective advisory fees charged to non-mutual fund clients by CRMC and its affiliates. They noted that, to the extent there were differences between the advisory fees paid by the fund and the advisory fees paid by those clients, the differences appropriately reflected the investment, operational and regulatory differences between advising the fund and the other clients. The board and the committee concluded that the fund’s cost structure was fair and reasonable in relation to the services provided, and that the fund’s shareholders receive reasonable value in return for the advisory fees and other amounts paid to CRMC by the fund.
| U.S. Government Securities Fund | 29 |
4. Ancillary benefits
The board and the committee considered a variety of other benefits that CRMC and its affiliates receive as a result of CRMC’s relationship with the fund and the other American Funds, including fees for administrative services provided to certain share classes; fees paid to CRMC’s affiliated transfer agent; sales charges and distribution fees received and retained by the fund’s principal underwriter, an affiliate of CRMC; and possible ancillary benefits to CRMC and its institutional management affiliates in managing other investment vehicles. The board and the committee reviewed CRMC’s portfolio trading practices, noting the potential benefits CRMC receives from the research obtained with commissions from portfolio transactions made on behalf of the fund. The board and the committee took these ancillary benefits into account in evaluating the reasonableness of the advisory fees and other amounts paid to CRMC by the fund.
5. Adviser financial information
The board and the committee reviewed information regarding CRMC’s costs of providing services to the American Funds, including personnel, systems and resources of investment, compliance, trading, accounting and other administrative operations. They considered CRMC’s costs and willingness to invest in technology, infrastructure and staff to maintain and expand services and capabilities, respond to industry and regulatory developments, and attract and retain qualified personnel. They noted information regarding the compensation structure for CRMC’s investment professionals. The board and the committee also compared CRMC’s profitability and compensation data to the reported results and data of several large, publicly-held investment management companies. The board and the committee noted the competitiveness and cyclicality of both the mutual fund industry and the capital markets, and the importance in that environment of CRMC’s long-term profitability for maintaining its independence, company culture and management continuity. They further considered the breakpoint discounts in the fund’s advisory fee structure. The board and the committee concluded that the fund’s advisory fee structure reflected a reasonable sharing of benefits between CRMC and the fund’s shareholders.
| 30 | U.S. Government Securities Fund |
Board of trustees and other officers
Independent trustees1
| Name and year of birth | Year first elected a trustee of the fund2 | Principal occupation(s) during past five years | Number of portfolios in fund complex overseen by trustee | Other directorships3 held by trustee | ||||
| William H. Baribault, 1945 | 2010 | CEO and President, Richard Nixon Foundation; Chairman of the Board and CEO, Oakwood Enterprises (private investment and consulting) | 79 | None | ||||
| James G. Ellis, 1947 | 2006 | Dean and Professor of Marketing, Marshall School of Business, University of Southern California | 79 | Mercury General Corporation | ||||
| Leonard R. Fuller, 1946 | 1994 | Private investor; former President and CEO, Fuller Consulting (financial management consulting firm) | 79 | None | ||||
| Mary Davis Holt, 1950 | 2015 | Partner, Flynn Heath Holt Leadership, LLC (leadership consulting); former COO, Time Life Inc. (1993–2003) | 76 | None | ||||
| R. Clark Hooper, 1946 Chairman of the Board (Independent and Non-Executive) | 2005 | Private investor | 81 | The Swiss Helvetia Fund, Inc. | ||||
| Merit E. Janow, 1958 | 2010 | Dean and Professor, Columbia University, School of International and Public Affairs | 78 | MasterCard Incorporated; The NASDAQ Stock Market LLC; Trimble Navigation Limited | ||||
| Laurel B. Mitchell, PhD, 1955 | 2010 | Distinguished Professor of Accounting, University of Redlands; former Director, Accounting Program, University of Redlands | 75 | None | ||||
| Frank M. Sanchez, 1943 | 1999 | Principal, The Sanchez Family Corporation dba McDonald’s Restaurants (McDonald’s licensee) | 75 | None | ||||
| Margaret Spellings, 1957 | 2010 | President, George W. Bush Foundation; former President and CEO, Margaret Spellings & Company (public policy and strategic consulting); former President, U.S. Chamber Foundation and Senior Advisor to the President and CEO, U.S. Chamber of Commerce | 79 | ClubCorp Holdings, Inc. | ||||
| Steadman Upham, PhD, 1949 | 2007 | President and University Professor, The University of Tulsa | 78 | None |
Interested trustee4,5
| Name, year of birth and position with fund | Year first elected a trustee or officer of the fund2 | Principal occupation(s) during past five years and positions held with affiliated entities or the principal underwriter of the fund | Number of portfolios in fund complex overseen by trustee | Other directorships3 held by trustee | ||||
| John H. Smet, 1956 Vice Chairman of the Board | 1993 | Partner — Capital Fixed Income Investors, Capital Research and Management Company; Director, Capital Research and Management Company | 21 | None |
The fund’s statement of additional information includes further details about fund trustees and is available without charge upon request by calling American Funds Service Company at (800) 421-4225 or by visiting the American Funds website at americanfunds.com. The address for all trustees and officers of the fund is 333 South Hope Street, Los Angeles, CA 90071, Attention: Secretary.
See page 32 for footnotes.
| U.S. Government Securities Fund | 31 |
Other officers5
| Name, year of birth and position with fund | Year first elected an officer of the fund2 | Principal occupation(s) during past five years and positions held with affiliated entities or the principal underwriter of the fund | ||
| Fergus N. MacDonald, 1969 President | 2011 | Partner — Capital Fixed Income Investors, Capital Research and Management Company | ||
| Kristine M. Nishiyama, 1970 Senior Vice President | 2003 | Senior Vice President and Senior Counsel — Fund Business Management Group, Capital Research and Management Company; Senior Vice President and General Counsel, Capital Bank and Trust Company6 | ||
| Wesley K.-S. Phoa, 1966 Vice President | 2011 | Partner — Capital Fixed Income Investors, Capital Research and Management Company; Partner — Capital Fixed Income Investors, Capital Bank and Trust Company;6 Vice President, Capital Strategy Research, Inc.6 | ||
| Steven I. Koszalka, 1964 Secretary | 2010 | Vice President — Fund Business Management Group, Capital Research and Management Company | ||
| Brian C. Janssen, 1972 Treasurer | 2015 | Vice President — Investment Operations, Capital Research and Management Company | ||
| Jane Y. Chung, 1974 Assistant Secretary | 2014 | Associate — Fund Business Management Group, Capital Research and Management Company | ||
| Dori Laskin, 1951 Assistant Treasurer | 2010 | Vice President — Investment Operations, Capital Research and Management Company | ||
| Gregory F. Niland, 1971 Assistant Treasurer | 2015 | Vice President — Investment Operations, Capital Research and Management Company |
| 1 | The term independent trustee refers to a trustee who is not an “interested person” of the fund within the meaning of the Investment Company Act of 1940. |
| 2 | Trustees and officers of the fund serve until their resignation, removal or retirement. |
| 3 | This includes all directorships/trusteeships (other than those in the American Funds or other funds managed by Capital Research and Management Company or its affiliates) that are held by each trustee as a trustee or director of a public company or a registered investment company. |
| 4 | The term interested trustee refers to a trustee who is an “interested person” within the meaning of the Investment Company Act of 1940, on the basis of their affiliation with the fund’s investment adviser, Capital Research and Management Company, or affiliated entities (including the fund’s principal underwriter). |
| 5 | All of the directors/trustees and/or officers listed are officers and/or directors/trustees of one or more of the other funds for which Capital Research and Management Company serves as investment adviser. |
| 6 | Company affiliated with Capital Research and Management Company. |
| 32 | U.S. Government Securities Fund |
Offices of the fund and of the investment adviser
Capital Research and Management Company
333 South Hope Street
Los Angeles, CA 90071-1406
6455 Irvine Center Drive
Irvine, CA 92618-4518
Transfer agent for shareholder accounts
American Funds Service Company
(Write to the address near you.)
P.O. Box 6007
Indianapolis, IN 46206-6007
P.O. Box 2280
Norfolk, VA 23501-2280
Custodian of assets
JPMorgan Chase Bank
270 Park Avenue
New York, NY 10017-2070
Counsel
Morgan, Lewis & Bockius LLP
355 South Grand Avenue, Suite 4400
Los Angeles, CA 90071-3106
Independent registered public accounting firm
Deloitte & Touche LLP
695 Town Center Drive
Suite 1200
Costa Mesa, CA 92626-7188
Principal underwriter
American Funds Distributors, Inc.
333 South Hope Street
Los Angeles, CA 90071-1406
Investors should carefully consider investment objectives, risks, charges and expenses. This and other important information is contained in the fund prospectus and summary prospectus, which can be obtained from your financial professional and should be read carefully before investing. You may also call American Funds Service Company (AFS) at (800) 421-4225 or visit the American Funds website at americanfunds.com.
“American Funds Proxy Voting Procedures and Principles” — which describes how we vote proxies relating to portfolio securities — is available on the American Funds website or upon request by calling AFS. The fund files its proxy voting record with the U.S. Securities and Exchange Commission (SEC) for the 12 months ended June 30 by August 31. The proxy voting record is available free of charge on the SEC website at sec.gov and on the American Funds website.
A complete August 31, 2015, portfolio of U.S. Government Securities Fund’s investments is available free of charge by calling AFS or visiting the SEC website (where it is part of Form N-CSR).
U.S. Government Securities Fund files a complete list of its portfolio holdings with the SEC for the first and third quarters of each fiscal year on Form N-Q. This filing is available free of charge on the SEC website. You may also review or, for a fee, copy this filing at the SEC’s Public Reference Room in Washington, D.C. Additional information regarding the operation of the Public Reference Room may be obtained by calling the SEC’s Office of Investor Education and Advocacy at (800) SEC-0330. Additionally, the list of portfolio holdings is available by calling AFS.
This report is for the information of shareholders of U.S. Government Securities Fund, but it also may be used as sales literature when preceded or accompanied by the current prospectus or summary prospectus, which gives details about charges, expenses, investment objectives and operating policies of the fund. If used as sales material after December 31, 2015, this report must be accompanied by an American Funds statistical update for the most recently completed calendar quarter.
The American Funds Advantage
Since 1931, American Funds, part of Capital Group, has helped investors pursue long-term investment success. Our consistent approach — in combination with The Capital SystemSM — has resulted in a superior long-term track record.
Aligned with investor success
We base our decisions on a long-term perspective, which we believe aligns our goals with the interests of our clients. Our portfolio managers average 27 years of investment experience, including 22 years at our company, reflecting a career commitment to our long-term approach.1
The Capital SystemSM
Our investment process, The Capital System, combines individual accountability with teamwork. Each fund is divided into portions that are managed independently by investment professionals with diverse backgrounds, ages and investment approaches. An extensive global research effort is the backbone of our system.
Superior long-term track record
Our equity funds have beaten their Lipper peer indexes in 91% of 10-year periods and 96% of 20-year periods. Our fixed-income funds have beaten their Lipper indexes in 54% of 10-year periods and 57% of 20-year periods.2 Our fund management fees have been among the lowest in the industry.3
| 1 | Portfolio manager experience as of December 31, 2014. |
| 2 | Based on Class A share results for rolling periods through December 31, 2014. Periods covered are the shorter of the fund’s lifetime or since the comparable Lipper index inception date (except SMALLCAP World Fund, for which the Lipper average was used). |
| 3 | On average, our management fees were in the lowest quintile 70% of the time, based on the 20-year period ended December 31, 2014, versus comparable Lipper categories, excluding funds of funds. |

ITEM 2 – Code of Ethics
The Registrant has adopted a Code of Ethics that applies to its Principal Executive Officer and Principal Financial Officer. The Registrant undertakes to provide to any person without charge, upon request, a copy of the Code of Ethics. Such request can be made to American Funds Service Company at 800/421-9225 or to the Secretary of the Registrant, 333 South Hope Street, Los Angeles, California 90071.
ITEM 3 – Audit Committee Financial Expert
The Registrant’s board has determined that Laurel B. Mitchell, a member of the Registrant’s audit committee, is an “audit committee financial expert” and "independent," as such terms are defined in this Item. This designation will not increase the designee’s duties, obligations or liability as compared to his or her duties, obligations and liability as a member of the audit committee and of the board, nor will it reduce the responsibility of the other audit committee members. There may be other individuals who, through education or experience, would qualify as "audit committee financial experts" if the board had designated them as such. Most importantly, the board believes each member of the audit committee contributes significantly to the effective oversight of the Registrant’s financial statements and condition.
ITEM 4 – Principal Accountant Fees and Services
| Registrant: | ||||
| a) Audit Fees: | ||||
| 2014 | $91,000 | |||
| 2015 | $120,000 | |||
| b) Audit-Related Fees: | ||||
| 2014 | $2,000 | |||
| 2015 | $2,000 | |||
| The audit-related fees consist of assurance and related services relating to the examination of the Registrant’s investment adviser conducted in accordance with Statement on Standards for Attestation Engagements Number 16 issued by the American Institute of Certified Public Accountants. | ||||
| c) Tax Fees: | ||||
| 2014 | $8,000 | |||
| 2015 | None | |||
| The tax fees consist of professional services relating to the preparation of the Registrant’s tax returns. | ||||
| d) All Other Fees: | ||||
| 2014 | None | |||
| 201 | None | |||
| Adviser and affiliates (includes only fees for non-audit services billed to the adviser and affiliates for engagements that relate directly to the operations and financial reporting of the Registrant and were subject to the pre-approval policies described below): | ||||
| a) Audit Fees: | ||||
| Not Applicable | ||||
| b) Audit-Related Fees: | ||||
| 2014 | $970,000 | |||
| 2015 | $1,176,000 | |||
| The audit-related fees consist of assurance and related services relating to the examination of the Registrant’s transfer agent, principal underwriter and investment adviser conducted in accordance with Statement on Standards for Attestation Engagements Number 16 issued by the American Institute of Certified Public Accountants. | ||||
| c) Tax Fees: | ||||
| 2014 | $41,000 | |||
| 2015 | None | |||
| The tax fees consist of consulting services relating to the Registrant’s investments. | ||||
| d) All Other Fees: | ||||
| 2014 | $3,000 | |||
| 2015 | $5,000 | |||
| The other fees consist of subscription services related to an accounting research tool. | ||||
All audit and permissible non-audit services that the Registrant’s audit committee considers compatible with maintaining the independent registered public accounting firm’s independence are required to be pre-approved by the committee. The pre-approval requirement will extend to all non-audit services provided to the Registrant, the investment adviser, and any entity controlling, controlled by, or under common control with the investment adviser that provides ongoing services to the Registrant, if the engagement relates directly to the operations and financial reporting of the Registrant. The committee will not delegate its responsibility to pre-approve these services to the investment adviser. The committee may delegate to one or more committee members the authority to review and pre-approve audit and permissible non-audit services. Actions taken under any such delegation will be reported to the full committee at its next meeting. The pre-approval requirement is waived with respect to non-audit services if certain conditions are met. The pre-approval requirement was not waived for any of the non-audit services listed above provided to the Registrant, adviser and affiliates.
Aggregate non-audit fees paid to the Registrant’s auditors, including fees for all services billed to the Registrant, adviser and affiliates that provide ongoing services to the Registrant, were $1,402,000 for fiscal year 2014 and $1,436,000 for fiscal year 2015. The non-audit services represented by these amounts were brought to the attention of the committee and considered to be compatible with maintaining the auditors’ independence.
ITEM 5 – Audit Committee of Listed Registrants
Not applicable to this Registrant, insofar as the Registrant is not a listed issuer as defined in Rule 10A-3 under the Securities Exchange Act of 1934.
ITEM 6 – Schedule of Investments

| Bonds, notes & other debt instruments 95.50% Mortgage-backed obligations 44.66% Federal agency mortgage-backed obligations 44.66% | Principal amount (000) | Value (000) |
| Fannie Mae 3.347% 20171 | $3,179 | $3,308 |
| Fannie Mae 10.50% 20181 | 208 | 235 |
| Fannie Mae 5.50% 20231 | 1,034 | 1,134 |
| Fannie Mae 6.00% 20241 | 624 | 703 |
| Fannie Mae 10.489% 20251,2 | 302 | 330 |
| Fannie Mae 6.00% 20261 | 34 | 39 |
| Fannie Mae 6.50% 20271 | 1,140 | 1,304 |
| Fannie Mae 6.50% 20271 | 423 | 484 |
| Fannie Mae 5.00% 20281 | 535 | 589 |
| Fannie Mae 8.00% 20311 | 697 | 813 |
| Fannie Mae 3.00% 20351 | 32,133 | 32,850 |
| Fannie Mae 3.00% 20351 | 19,825 | 20,268 |
| Fannie Mae 3.00% 20351 | 5,831 | 5,961 |
| Fannie Mae 6.50% 20371 | 381 | 435 |
| Fannie Mae 6.50% 20371 | 377 | 416 |
| Fannie Mae 6.50% 20371 | 152 | 174 |
| Fannie Mae 7.00% 20371 | 518 | 575 |
| Fannie Mae 7.00% 20371 | 294 | 327 |
| Fannie Mae 7.00% 20371 | 12 | 13 |
| Fannie Mae 7.50% 20371 | 75 | 85 |
| Fannie Mae 6.00% 20381 | 222 | 252 |
| Fannie Mae 7.00% 20381 | 805 | 896 |
| Fannie Mae 4.00% 20411 | 18,220 | 19,708 |
| Fannie Mae 5.00% 20411 | 2,487 | 2,795 |
| Fannie Mae 5.00% 20411 | 1,818 | 2,036 |
| Fannie Mae 5.00% 20411 | 1,323 | 1,487 |
| Fannie Mae 5.00% 20411 | 882 | 991 |
| Fannie Mae 4.00% 20421 | 12,837 | 13,880 |
| Fannie Mae 4.00% 20421 | 752 | 813 |
| Fannie Mae 4.00% 20431 | 6,343 | 6,859 |
| Fannie Mae 4.00% 20441 | 5,610 | 6,068 |
| Fannie Mae, Series 2001-4, Class NA, 9.747% 20251,2 | 69 | 77 |
| Fannie Mae, Series 2001-25, Class ZA, 6.50% 20311 | 363 | 406 |
| Fannie Mae, Series 2001-20, Class E, 9.568% 20311,2 | 13 | 14 |
| Fannie Mae, Series 2006-83, Class AO, principal only, 0% 20361 | 1,560 | 1,381 |
| Fannie Mae, Series 2006-56, Class OG, principal only, 0% 20361 | 1,033 | 909 |
| Fannie Mae, Series 2006-65, Class PF, 0.479% 20361,2 | 1,312 | 1,315 |
| Fannie Mae, Series 1999-T2, Class A-1, 7.50% 20391,2 | 363 | 399 |
| FDIC Structured Sale Guaranteed Notes, Series 2010-S1, Class 1-A, 0.730% 20481,2,3 | 354 | 354 |
| Freddie Mac 10.00% 20251 | 160 | 173 |
| Freddie Mac 6.00% 20261 | 443 | 501 |
| Freddie Mac 6.00% 20271 | 2,233 | 2,529 |
| Freddie Mac 3.50% 20341 | 10,865 | 11,407 |
| Freddie Mac 3.00% 20351 | 22,341 | 22,875 |
| Freddie Mac 3.50% 20351 | 37,499 | 39,247 |
| Freddie Mac 3.50% 20351 | 21,802 | 22,892 |
| Bonds, notes & other debt instruments Mortgage-backed obligations (continued) Federal agency mortgage-backed obligations (continued) | Principal amount (000) | Value (000) |
| Freddie Mac 3.50% 20351 | $7,243 | $7,581 |
| Freddie Mac 2.406% 20361,2 | 677 | 726 |
| Freddie Mac 6.50% 20371 | 155 | 178 |
| Freddie Mac 5.00% 20411 | 6,040 | 6,759 |
| Freddie Mac 4.00% 20431 | 9,581 | 10,309 |
| Freddie Mac 4.00% 20431 | 5,013 | 5,398 |
| Freddie Mac 4.00% 20431 | 3,984 | 4,296 |
| Freddie Mac 4.00% 20431 | 2,457 | 2,645 |
| Freddie Mac 4.00% 20431 | 1,669 | 1,797 |
| Freddie Mac 4.00% 20441 | 4,185 | 4,511 |
| Freddie Mac, Series 2289, Class NA, 9.954% 20201,2 | 35 | 36 |
| Freddie Mac, Series 2289, Class NB, 9.00% 20221,2 | 17 | 19 |
| Freddie Mac, Series 1567, Class A, 0.598% 20231,2 | 14 | 14 |
| Freddie Mac, Series 2626, Class NG, 3.50% 20231 | 43 | 45 |
| Freddie Mac, Series 3156, Class PO, principal only, 0% 20361 | 1,985 | 1,713 |
| Freddie Mac, Series 3146, Class PO, principal only, 0% 20361 | 876 | 747 |
| Freddie Mac, Series 3213, Class OG, principal only, 0% 20361 | 787 | 710 |
| Freddie Mac, Series 3156, Class PF, 0.448% 20361,2 | 2,357 | 2,358 |
| Government National Mortgage Assn. 10.00% 20191 | 124 | 137 |
| Government National Mortgage Assn. 10.00% 20211 | 57 | 64 |
| Government National Mortgage Assn. 6.50% 20291 | 783 | 890 |
| Government National Mortgage Assn. 6.50% 20321 | 790 | 904 |
| Government National Mortgage Assn. 6.50% 20371 | 543 | 615 |
| Government National Mortgage Assn. 5.50% 20381 | 617 | 695 |
| Government National Mortgage Assn. 5.50% 20381 | 97 | 105 |
| Government National Mortgage Assn. 6.00% 20381 | 790 | 912 |
| Government National Mortgage Assn. 6.50% 20381 | 480 | 542 |
| Government National Mortgage Assn. 6.50% 20381 | 270 | 309 |
| Government National Mortgage Assn. 6.50% 20381 | 212 | 239 |
| Government National Mortgage Assn. 6.50% 20381 | 197 | 223 |
| Government National Mortgage Assn. 4.00% 20391 | 1,016 | 1,084 |
| Government National Mortgage Assn. 5.00% 20391 | 2,267 | 2,499 |
| Government National Mortgage Assn. 6.00% 20391 | 4,298 | 4,870 |
| Government National Mortgage Assn. 6.50% 20391 | 922 | 1,074 |
| Government National Mortgage Assn. 4.50% 20401 | 1,783 | 1,938 |
| Government National Mortgage Assn. 5.00% 20401 | 1,013 | 1,126 |
| Government National Mortgage Assn. 5.00% 20401 | 631 | 694 |
| Government National Mortgage Assn. 5.50% 20401 | 6,973 | 7,879 |
| Government National Mortgage Assn. 3.50% 20411 | 1,029 | 1,060 |
| Government National Mortgage Assn. 4.00% 20411 | 351 | 362 |
| Government National Mortgage Assn. 4.50% 20411 | 21,155 | 22,785 |
| Government National Mortgage Assn. 5.00% 20411 | 11,834 | 12,846 |
| Government National Mortgage Assn. 5.00% 20411 | 214 | 226 |
| Government National Mortgage Assn. 5.50% 20411 | 535 | 577 |
| Government National Mortgage Assn. 5.50% 20411 | 416 | 449 |
| Government National Mortgage Assn. 5.50% 20411 | 250 | 270 |
| Government National Mortgage Assn. 6.00% 20411 | 90 | 98 |
| Government National Mortgage Assn. 6.50% 20411 | 3,465 | 3,819 |
| Government National Mortgage Assn. 3.50% 20421 | 569 | 594 |
| Government National Mortgage Assn. 4.00% 20421 | 4,619 | 4,876 |
| Government National Mortgage Assn. 4.00% 20421 | 2,502 | 2,641 |
| Government National Mortgage Assn. 3.50% 20431 | 5,953 | 6,211 |
| Government National Mortgage Assn. 4.00% 20441 | 23,483 | 24,916 |
| Government National Mortgage Assn. 4.00% 20441 | 14,916 | 15,826 |
| Bonds, notes & other debt instruments Mortgage-backed obligations (continued) Federal agency mortgage-backed obligations (continued) | Principal amount (000) | Value (000) |
| Government National Mortgage Assn. 4.00% 20441 | $546 | $580 |
| Government National Mortgage Assn. 4.00% 20441 | 209 | 222 |
| Government National Mortgage Assn. 3.50% 20451 | 684,950 | 714,586 |
| Government National Mortgage Assn. 3.50% 20451,4 | 264,450 | 275,369 |
| Government National Mortgage Assn. 3.50% 20451,4 | 9,000 | 9,349 |
| Government National Mortgage Assn. 4.00% 20451,4 | 1,378,429 | 1,461,324 |
| Government National Mortgage Assn. 4.00% 20451 | 53,136 | 56,390 |
| Government National Mortgage Assn. 4.00% 20451 | 21,950 | 23,290 |
| Government National Mortgage Assn. 4.00% 20451 | 4,528 | 4,826 |
| Government National Mortgage Assn. 4.50% 20451 | 16,905 | 18,195 |
| Government National Mortgage Assn. 4.50% 20451,4 | 2,200 | 2,362 |
| Government National Mortgage Assn. 4.50% 20451 | 1,943 | 2,086 |
| Government National Mortgage Assn. 5.922% 20581 | 6,735 | 7,051 |
| Government National Mortgage Assn. 6.172% 20581 | 130 | 135 |
| Government National Mortgage Assn. 6.22% 20581 | 1,106 | 1,149 |
| Government National Mortgage Assn., Series 2003-116, Class JD, 5.00% 20321 | 1,175 | 1,199 |
| Government National Mortgage Assn., Series 2003-46, 5.00% 20331 | 2,885 | 3,108 |
| Government National Mortgage Assn., Series 2003, 6.116% 20581 | 1,603 | 1,691 |
| Government National Mortgage Assn., Series 2010-H13, Class JA, 5.46% 20591 | 17,932 | 18,573 |
| Government National Mortgage Assn., Series 2010-H23, Class PT, 5.426% 20601,2 | 41,670 | 45,134 |
| National Credit Union Administration, Series 2010-R2, Class 1A, 0.558% 20171,2 | 546 | 547 |
| National Credit Union Administration, Series 2011-R3, Class 1A, 0.591% 20201,2 | 1,231 | 1,235 |
| National Credit Union Administration, Series 2011-R1, Class 1A, 0.638% 20201,2 | 755 | 759 |
| Vendee Mortgage Trust, Series 2011-2, Class V, 3.75% 20281 | 13,007 | 13,609 |
| Vendee Mortgage Trust, Series 2008-1, Class GD, 5.25% 20321 | 15,405 | 17,085 |
| Vendee Mortgage Trust, Series 2011-2, Class DA, 3.75% 20331 | 12,046 | 12,594 |
| Vendee Mortgage Trust, Series 2010-1, Class DA, 4.25% 20351 | 4,639 | 4,958 |
| Total mortgage-backed obligations | 3,101,910 | |
| U.S. Treasury bonds & notes 42.61% U.S. Treasury 31.68% | ||
| U.S. Treasury 0.625% 2016 | 8,890 | 8,907 |
| U.S. Treasury 4.50% 2016 | 14,950 | 15,237 |
| U.S. Treasury 0.875% 2018 | 65,000 | 64,688 |
| U.S. Treasury 1.00% 2018 | 40,000 | 39,939 |
| U.S. Treasury 1.50% 20195 | 303,000 | 303,945 |
| U.S. Treasury 1.50% 2019 | 17,000 | 17,048 |
| U.S. Treasury 1.625% 20195 | 52,900 | 53,437 |
| U.S. Treasury 1.625% 2019 | 50,000 | 50,367 |
| U.S. Treasury 1.75% 2019 | 74,000 | 75,026 |
| U.S. Treasury 3.625% 2019 | 36,000 | 39,128 |
| U.S. Treasury 1.25% 2020 | 90,500 | 89,687 |
| U.S. Treasury 1.375% 2020 | 120,000 | 119,063 |
| U.S. Treasury 1.375% 2020 | 36,000 | 35,798 |
| U.S. Treasury 1.375% 2020 | 27,000 | 26,894 |
| U.S. Treasury 1.625% 2020 | 157,500 | 158,116 |
| U.S. Treasury 8.75% 2020 | 5,255 | 7,057 |
| U.S. Treasury 2.00% 2021 | 550 | 555 |
| U.S. Treasury 2.25% 2021 | 154,600 | 158,802 |
| U.S. Treasury 8.00% 2021 | 3,400 | 4,638 |
| U.S. Treasury 1.625% 2022 | 83,758 | 81,775 |
| U.S. Treasury 1.75% 2022 | 186,000 | 184,157 |
| U.S. Treasury 1.75% 2022 | 47,000 | 46,491 |
| U.S. Treasury 1.875% 2022 | 2,250 | 2,243 |
| Bonds, notes & other debt instruments U.S. Treasury bonds & notes (continued) U.S. Treasury (continued) | Principal amount (000) | Value (000) |
| U.S. Treasury 2.00% 2022 | $60,000 | $60,268 |
| U.S. Treasury 2.125% 2022 | 1,500 | 1,520 |
| U.S. Treasury 2.50% 2023 | 31,325 | 32,314 |
| U.S. Treasury 2.75% 2023 | 150,650 | 158,259 |
| U.S. Treasury 2.375% 2024 | 4,200 | 4,268 |
| U.S. Treasury 2.75% 2024 | 112,700 | 118,253 |
| U.S. Treasury 2.00% 2025 | 133,000 | 130,476 |
| U.S. Treasury 2.00% 2025 | 1,750 | 1,717 |
| U.S. Treasury 2.125% 2025 | 30,000 | 29,736 |
| U.S. Treasury 6.25% 2030 | 5,250 | 7,664 |
| U.S. Treasury 2.875% 2043 | 26,609 | 26,112 |
| U.S. Treasury 3.125% 2043 | 17,450 | 17,978 |
| U.S. Treasury 3.625% 2043 | 12,900 | 14,600 |
| U.S. Treasury 2.875% 2045 | 14,500 | 14,273 |
| 2,200,436 | ||
| U.S. Treasury inflation-protected securities 10.93% | ||
| U.S. Treasury Inflation-Protected Security 0.125% 20166 | 21,620 | 21,424 |
| U.S. Treasury Inflation-Protected Security 2.00% 20166 | 24,044 | 24,020 |
| U.S. Treasury Inflation-Protected Security 0.125% 20226 | 7,855 | 7,684 |
| U.S. Treasury Inflation-Protected Security 0.125% 20236 | 7,650 | 7,409 |
| U.S. Treasury Inflation-Protected Security 0.375% 20236 | 6,418 | 6,342 |
| U.S. Treasury Inflation-Protected Security 0.125% 20246 | 217,664 | 209,167 |
| U.S. Treasury Inflation-Protected Security 0.25% 20256 | 96,712 | 93,319 |
| U.S. Treasury Inflation-Protected Security 0.375% 20256 | 68,421 | 67,119 |
| U.S. Treasury Inflation-Protected Security 2.375% 20256 | 60,128 | 69,748 |
| U.S. Treasury Inflation-Protected Security 2.00% 20266 | 902 | 1,020 |
| U.S. Treasury Inflation-Protected Security 1.375% 20446 | 5,580 | 5,864 |
| U.S. Treasury Inflation-Protected Security 0.75% 20456 | 273,436 | 246,119 |
| 759,235 | ||
| Total U.S. Treasury bonds & notes | 2,959,671 | |
| Federal agency bonds & notes 8.23% | ||
| Export-Import Bank of the United States-Guaranteed, Ethiopian Leasing 2012 LLC 2.646% 20261 | 1,815 | 1,838 |
| Export-Import Bank of the United States-Guaranteed, VCK Lease SA 2.591% 20261 | 1,856 | 1,881 |
| Fannie Mae 1.25% 2017 | 7,610 | 7,674 |
| Fannie Mae 5.00% 2017 | 4,410 | 4,681 |
| Fannie Mae 1.50% 2020 | 15,000 | 14,862 |
| Fannie Mae 2.625% 2024 | 19,065 | 19,221 |
| Fannie Mae 7.125% 2030 | 3,000 | 4,429 |
| Fannie Mae, Series 2014-M2, Class A-S-Q2, multifamily 0.478% 20151 | 106 | 106 |
| Fannie Mae, Series 2014-M6, Class FA, multifamily 0.477% 20171,2 | 871 | 872 |
| Fannie Mae, Series 2012-M2, Class A2, multifamily 2.717% 20221 | 4,325 | 4,432 |
| Fannie Mae, Series 2012-M3, Class 1-A2, multifamily 3.044% 20221 | 3,500 | 3,644 |
| Fannie Mae, Series 2014-M1, multifamily 3.432% 20231,2 | 3,600 | 3,762 |
| Fannie Mae, Series 2014-M3, Class A2, multifamily 3.501% 20241,2 | 6,525 | 6,905 |
| Federal Farm Credit Banks 0.248% 20172 | 10,825 | 10,833 |
| Federal Farm Credit Banks 0.253% 20172 | 8,861 | 8,873 |
| Federal Farm Credit Banks 0.60% 2017 | 74,292 | 74,160 |
| Federal Home Loan Bank 0.375% 2016 | 28,875 | 28,855 |
| Federal Home Loan Bank 0.50% 2016 | 11,605 | 11,597 |
| Federal Home Loan Bank 3.375% 2023 | 14,160 | 15,153 |
| Federal Home Loan Bank 5.50% 2036 | 700 | 915 |
| Bonds, notes & other debt instruments Federal agency bonds & notes (continued) | Principal amount (000) | Value (000) |
| Federal Home Loan Bank, Series 2816, 1.00% 2017 | $43,705 | $43,962 |
| Freddie Mac 1.75% 2015 | 33,375 | 33,386 |
| Freddie Mac 1.00% 2017 | 13,025 | 13,084 |
| Freddie Mac 1.00% 2017 | 5,355 | 5,378 |
| Freddie Mac 1.25% 2019 | 51,820 | 51,264 |
| Freddie Mac, Series KGRP, Class A, multifamily 0.567% 20201,2 | 3,077 | 3,093 |
| Freddie Mac, Series K013, Class A1, multifamily 2.902% 20201 | 2,863 | 2,940 |
| Freddie Mac, Series K010, Class A1, multifamily 3.32% 20201 | 2,108 | 2,187 |
| Freddie Mac, Series K019, Class A1, multifamily 1.459% 20211 | 1,780 | 1,770 |
| Freddie Mac, Series K031, Class A1, multifamily 2.778% 20221 | 2,476 | 2,572 |
| Freddie Mac, Series KS01, Class A2, multifamily 2.522% 20231 | 3,185 | 3,208 |
| Freddie Mac, Series K029, Class A2, multifamily 3.32% 20231 | 1,200 | 1,262 |
| Freddie Mac, Series K041, Class A2, multifamily 3.171% 20241 | 3,075 | 3,155 |
| Private Export Funding Corp. 1.45% 2019 | 5,250 | 5,230 |
| Private Export Funding Corp. 2.25% 2020 | 10,000 | 10,251 |
| Private Export Funding Corp. 3.55% 2024 | 11,150 | 11,929 |
| Small Business Administration, Series SBIC-PS 2006-10A, Participating Securities, 5.408% 20161 | 4 | 4 |
| Small Business Administration, Series 2001-20K, 5.34% 20211 | 343 | 367 |
| Small Business Administration, Series 2001-20J, 5.76% 20211 | 149 | 161 |
| Small Business Administration, Series 2001-20F, 6.44% 20211 | 473 | 516 |
| Small Business Administration, Series 2003-20B, 4.84% 20231 | 1,427 | 1,532 |
| Tennessee Valley Authority 1.875% 2022 | 18,350 | 17,944 |
| Tennessee Valley Authority 4.65% 2035 | 3,930 | 4,495 |
| Tennessee Valley Authority 5.88% 2036 | 2,750 | 3,634 |
| Tennessee Valley Authority, Series A, 3.875% 2021 | 8,500 | 9,366 |
| Tennessee Valley Authority, Series B, 3.50% 2042 | 4,185 | 4,029 |
| Tennessee Valley Authority, Series 2008, Class A, 4.875% 2048 | 3,300 | 3,809 |
| TVA Southaven 3.846% 20331 | 2,824 | 2,922 |
| United States Agency for International Development, Jordan (Kingdom of) 1.945% 2019 | 31,500 | 31,965 |
| United States Agency for International Development, Jordan (Kingdom of) 2.503% 2020 | 8,200 | 8,559 |
| United States Agency for International Development, Jordan (Kingdom of) 2.578% 2022 | 6,000 | 6,088 |
| United States Agency for International Development, Jordan (Kingdom of) 3.00% 2025 | 2,500 | 2,562 |
| United States Agency for International Development, Republic of Egypt 4.45% 2015 | 19,000 | 19,028 |
| United States Agency for International Development, State of Israel, Class 1-A, 5.50% 2023 | 5,000 | 6,077 |
| United States Agency for International Development, Ukraine, 1.844% 2019 | 2,890 | 2,926 |
| United States Agency for International Development, Ukraine, 1.847% 2020 | 20,000 | 20,081 |
| United States Government-Guaranteed Certificates of Participation, Overseas Private Investment Corp, 0% 2016 | 983 | 994 |
| United States Government-Guaranteed Certificates of Participation, Overseas Private Investment Corp, 3.49% 20291 | 1,708 | 1,772 |
| United States Government-Guaranteed Certificates of Participation, Overseas Private Investment Corp, 3.82% 20321 | 1,897 | 2,022 |
| United States Government-Guaranteed Certificates of Participation, Overseas Private Investment Corp, 3.938% 20321 | 1,496 | 1,586 |
| 571,803 | ||
| Total bonds, notes & other debt instruments (cost: $6,600,782,000) | 6,633,384 |
| Short-term securities 30.31% | Principal amount (000) | Value (000) |
| Fannie Mae 0.13%–0.21% due 9/14/2015–1/4/2016 | $319,100 | $319,050 |
| Federal Farm Credit Banks 0.16%–0.19% due 12/21/2015–1/4/2016 | 45,000 | 44,980 |
| Federal Home Loan Bank 0.09%–0.20% due 9/1/2015–1/20/2016 | 1,124,200 | 1,123,984 |
| Freddie Mac 0.06%–0.18% due 9/2/2015–1/5/2016 | 464,650 | 464,562 |
| General Electric Co. 0.10% due 9/1/2015 | 68,400 | 68,400 |
| U.S. Treasury Bills 0.10% due 11/12/2015–11/19/2015 | 84,200 | 84,198 |
| Total short-term securities (cost: $2,104,843,000) | 2,105,174 | |
| Total investment securities 125.81% (cost: $8,705,625,000) | 8,738,558 | |
| Other assets less liabilities (25.81)% | (1,792,560) | |
| Net assets 100.00% | $6,945,998 |
| Pay/receive fixed rate | Clearinghouse | Floating rate index | Fixed rate | Expiration date | Notional (000) | Unrealized (depreciation) appreciation at 8/31/2015 (000) |
| Pay | LCH.Clearnet | 3-month USD-LIBOR | 0.317% | 9/17/2015 | $8,200,000 | $(82) |
| Receive | LCH.Clearnet | 3-month USD-LIBOR | 0.8975 | 7/1/2017 | 830,000 | 963 |
| Receive | LCH.Clearnet | 3-month USD-LIBOR | 0.8875 | 7/2/2017 | 363,000 | 356 |
| Receive | LCH.Clearnet | 3-month USD-LIBOR | 0.827 | 7/10/2017 | 420,000 | (97) |
| Receive | LCH.Clearnet | 3-month USD-LIBOR | 0.924 | 7/15/2017 | 300,000 | 438 |
| Receive | LCH.Clearnet | 3-month USD-LIBOR | 0.9215 | 7/15/2017 | 300,000 | 423 |
| Pay | LCH.Clearnet | 3-month USD-LIBOR | 0.9645 | 8/6/2017 | 150,000 | (285) |
| Pay | LCH.Clearnet | 3-month USD-LIBOR | 0.964 | 8/6/2017 | 250,000 | (473) |
| Receive | LCH.Clearnet | 3-month USD-LIBOR | 0.988 | 8/12/2017 | 300,000 | 669 |
| Pay | LCH.Clearnet | 3-month USD-LIBOR | 0.8325 | 9/1/2017 | 360,000 | 396 |
| Receive | LCH.Clearnet | 3-month USD-LIBOR | 0.874 | 9/2/2017 | 300,000 | (111) |
| Receive | LCH.Clearnet | 3-month USD-LIBOR | 1.515 | 6/4/2019 | 120,000 | 594 |
| Receive | LCH.Clearnet | 3-month USD-LIBOR | 1.789 | 6/20/2019 | 234,800 | 3,489 |
| Receive | LCH.Clearnet | 3-month USD-LIBOR | 1.7945 | 6/20/2019 | 146,600 | 2,208 |
| Receive | LCH.Clearnet | 3-month USD-LIBOR | 1.7905 | 6/20/2019 | 58,600 | 874 |
| Receive | LCH.Clearnet | 3-month USD-LIBOR | 1.732 | 6/27/2019 | 115,000 | 1,452 |
| Receive | LCH.Clearnet | 3-month USD-LIBOR | 1.821 | 7/31/2019 | 108,000 | 1,689 |
| Receive | LCH.Clearnet | 3-month USD-LIBOR | 1.799 | 8/8/2019 | 112,000 | 1,631 |
| Receive | LCH.Clearnet | 3-month USD-LIBOR | 1.7725 | 8/11/2019 | 112,000 | 1,506 |
| Receive | LCH.Clearnet | 3-month USD-LIBOR | 1.773 | 8/11/2019 | 108,000 | 1,455 |
| Receive | LCH.Clearnet | 3-month USD-LIBOR | 1.9225 | 9/25/2019 | 132,000 | 2,474 |
| Receive | LCH.Clearnet | 3-month USD-LIBOR | 1.785 | 1/2/2020 | 90,000 | 1,043 |
| Receive | LCH.Clearnet | 3-month USD-LIBOR | 1.45 | 2/2/2020 | 670,000 | (2,312) |
| Receive | LCH.Clearnet | 3-month USD-LIBOR | 1.655 | 2/11/2020 | 160,000 | 832 |
| Receive | LCH.Clearnet | 3-month USD-LIBOR | 1.672 | 2/26/2020 | 90,000 | 505 |
| Receive | LCH.Clearnet | 3-month USD-LIBOR | 1.739 | 3/6/2020 | 216,000 | 1,819 |
| Receive | LCH.Clearnet | 3-month USD-LIBOR | 1.6115 | 3/23/2020 | 133,000 | 321 |
| Receive | LCH.Clearnet | 3-month USD-LIBOR | 1.665 | 5/18/2020 | 180,000 | 626 |
| Receive | LCH.Clearnet | 3-month USD-LIBOR | 1.8315 | 6/10/2020 | 150,000 | 1,598 |
| Receive | LCH.Clearnet | 3-month USD-LIBOR | 1.86375 | 6/11/2020 | 225,000 | 2,731 |
| Receive | LCH.Clearnet | 3-month USD-LIBOR | 1.86 | 6/19/2020 | 120,000 | 1,418 |
| Receive | LCH.Clearnet | 3-month USD-LIBOR | 1.7755 | 7/14/2020 | 200,000 | 1,476 |
| Receive | LCH.Clearnet | 3-month USD-LIBOR | 1.607 | 8/14/2020 | 120,000 | (169) |
| Pay/receive fixed rate | Clearinghouse | Floating rate index | Fixed rate | Expiration date | Notional (000) | Unrealized (depreciation) appreciation at 8/31/2015 (000) |
| Receive | LCH.Clearnet | 3-month USD-LIBOR | 1.703% | 8/20/2020 | $165,000 | $497 |
| Pay | LCH.Clearnet | 3-month USD-LIBOR | 1.6305 | 9/2/2020 | 180,000 | — |
| Pay | LCH.Clearnet | 3-month USD-LIBOR | 1.6345 | 9/2/2020 | 180,000 | — |
| Pay | LCH.Clearnet | 3-month USD-LIBOR | 1.785 | 3/27/2022 | 163,000 | 1,275 |
| Pay | LCH.Clearnet | 3-month USD-LIBOR | 1.75918 | 4/29/2022 | 187,000 | 1,928 |
| Receive | LCH.Clearnet | 3-month USD-LIBOR | 2.138 | 6/22/2022 | 50,000 | 630 |
| Pay | LCH.Clearnet | 3-month USD-LIBOR | 2.05875 | 7/31/2022 | 21,000 | (143) |
| Pay | LCH.Clearnet | 3-month USD-LIBOR | 1.9605 | 8/5/2022 | 83,000 | — |
| Receive | LCH.Clearnet | 3-month USD-LIBOR | 1.9405 | 9/1/2022 | 130,000 | (256) |
| Receive | LCH.Clearnet | 3-month USD-LIBOR | 2.8 | 9/2/2022 | 560,000 | — |
| Pay | LCH.Clearnet | 3-month USD-LIBOR | 2.74125 | 11/22/2023 | 79,000 | (3,828) |
| Pay | LCH.Clearnet | 3-month USD-LIBOR | 2.7343 | 11/22/2023 | 100,000 | (4,791) |
| Pay | LCH.Clearnet | 3-month USD-LIBOR | 2.683 | 8/4/2024 | 63,000 | (2,628) |
| Pay | LCH.Clearnet | 3-month USD-LIBOR | 1.90125 | 2/2/2025 | 150,000 | 4,212 |
| Receive | LCH.Clearnet | 3-month USD-LIBOR | 2.217 | 2/23/2025 | 67,900 | (67) |
| Pay | LCH.Clearnet | 3-month USD-LIBOR | 2.469 | 6/9/2025 | 23,000 | (453) |
| Pay | LCH.Clearnet | 3-month USD-LIBOR | 2.469 | 7/17/2025 | 140,000 | (2,689) |
| Receive | LCH.Clearnet | 3-month USD-LIBOR | 2.183 | 8/14/2025 | 100,000 | (737) |
| Receive | LCH.Clearnet | 3-month USD-LIBOR | 2.2215 | 9/2/2025 | 50,000 | (215) |
| Pay | LCH.Clearnet | 3-month USD-LIBOR | 3.005 | 9/2/2030 | 124,000 | — |
| Pay | LCH.Clearnet | 3-month USD-LIBOR | 3.34 | 6/27/2044 | 80,000 | (10,395) |
| Pay | LCH.Clearnet | 3-month USD-LIBOR | 3.206 | 7/31/2044 | 27,000 | (2,765) |
| Pay | LCH.Clearnet | 3-month USD-LIBOR | 3.238 | 8/8/2044 | 28,000 | (3,044) |
| Pay | LCH.Clearnet | 3-month USD-LIBOR | 2.7045 | 1/2/2045 | 38,500 | 141 |
| Pay | LCH.Clearnet | 3-month USD-LIBOR | 2.94625 | 7/1/2045 | 30,000 | (1,426) |
| Pay | LCH.Clearnet | 3-month USD-LIBOR | 2.86 | 7/9/2045 | 51,000 | (1,484) |
| Pay | LCH.Clearnet | 3-month USD-LIBOR | 2.962 | 7/14/2045 | 46,000 | (2,343) |
| Receive | LCH.Clearnet | 3-month USD-LIBOR | 2.9 | 7/22/2045 | 30,000 | 1,130 |
| Pay | LCH.Clearnet | 3-month USD-LIBOR | 2.7995 | 7/31/2045 | 20,000 | (329) |
| Pay | LCH.Clearnet | 3-month USD-LIBOR | 2.616 | 8/28/2045 | 30,000 | 688 |
| Receive | LCH.Clearnet | 3-month USD-LIBOR | 2.697 | 9/2/2045 | 40,000 | — |
| $2,365 |
| 1 | Principal payments may be made periodically. Therefore, the effective maturity date may be earlier than the stated maturity date. |
| 2 | Coupon rate may change periodically. |
| 3 | Acquired in a transaction exempt from registration under Rule 144A of the Securities Act of 1933. May be resold in the U.S. in transactions exempt from registration, normally to qualified institutional buyers. The total value of all such securities was $354,000, which represented .01% of the net assets of the fund. |
| 4 | Purchased on a TBA basis. |
| 5 | A portion of this security was pledged as collateral. The total value of pledged collateral was $87,686,000, which represented 1.26% of the net assets of the fund. |
| 6 | Index-linked bond whose principal amount moves with a government price index. |
| Key to abbreviation |
| TBA = To be announced |
| MFGEFPX-022-1015O-S49151 | U.S. Government Securities Fund — Page 8 of 8 |
REPORT OF INDEPENDENT REGISTERED PUBLIC ACCOUNTING FIRM
To the Shareholders and Board of Trustees of
The American Funds Income Series – U.S. Government Securities Fund:
We have audited the accompanying statement of assets and liabilities of The American Funds Income Series – U.S. Government Securities Fund (the “Fund”), including the summary schedule of investments, as of August 31, 2015, and the related statements of operations for the year then ended, the statements of changes in net assets for each of the two years in the period then ended (collectively, the “financial statements”), the financial highlights for each of the five years in the period then ended (the financial statements and financial highlights are included in Item 1 of this Form N-CSR), and the schedule of investments in securities as of August 31, 2015 (included in Item 6 of this Form N-CSR). These financial statements, financial highlights, and schedule of investments in securities are the responsibility of the Fund’s management. Our responsibility is to express an opinion on these financial statements, financial highlights, and schedule of investments in securities based on our audits.
We conducted our audits in accordance with the standards of the Public Company Accounting Oversight Board (United States). Those standards require that we plan and perform the audit to obtain reasonable assurance about whether the financial statements, financial highlights, and schedule of investments in securities are free of material misstatement. An audit includes examining, on a test basis, evidence supporting the amounts and disclosures in the financial statements and schedule of investments in securities, assessing the accounting principles used and significant estimates made by management, as well as evaluating the overall financial statement presentation. Our procedures included confirmation of securities owned as of August 31, 2015, by correspondence with the custodian and brokers; where replies were not received from brokers, we performed other auditing procedures. We believe that our audits provide a reasonable basis for our opinion.
In our opinion, the financial statements, financial highlights, and schedule of investments in securities referred to above present fairly, in all material respects, the financial position of The American Funds Income Series – U.S. Government Securities Fund as of August 31, 2015, and the results of its operations for the year then ended, the changes in its net assets for each of the two years in the period then ended, and the financial highlights for each of the five years in the period then ended, in conformity with accounting principles generally accepted in the United States of America.
DELOITTE & TOUCHE LLP
Costa Mesa, California
October 14, 2015
ITEM 7 – Disclosure of Proxy Voting Policies and Procedures for Closed-End Management Investment Companies
Not applicable to this Registrant, insofar as the Registrant is not a closed-end management investment company.
ITEM 8 – Portfolio Managers of Closed-End Management Investment Companies
Not applicable to this Registrant, insofar as the Registrant is not a closed-end management investment company.
ITEM 9 – Purchases of Equity Securities by Closed-End Management Investment Company and Affiliated Purchasers
Not applicable to this Registrant, insofar as the Registrant is not a closed-end management investment company.
ITEM 10 – Submission of Matters to a Vote of Security Holders
There have been no material changes to the procedures by which shareholders may recommend nominees to the Registrant’s board of trustees since the Registrant last submitted a proxy statement to its shareholders. The procedures are as follows. The Registrant has a nominating and governance committee comprised solely of persons who are not considered ‘‘interested persons’’ of the Registrant within the meaning of the Investment Company Act of 1940, as amended. The committee periodically reviews such issues as the board’s composition, responsibilities, committees, compensation and other relevant issues, and recommends any appropriate changes to the full board of trustees. While the committee normally is able to identify from its own resources an ample number of qualified candidates, it will consider shareholder suggestions of persons to be considered as nominees to fill future vacancies on the board. Such suggestions must be sent in writing to the nominating and governance committee of the Registrant, c/o the Registrant’s Secretary, and must be accompanied by complete biographical and occupational data on the prospective nominee, along with a written consent of the prospective nominee for consideration of his or her name by the nominating and governance committee.
ITEM 11 – Controls and Procedures
| (a) | The Registrant’s Principal Executive Officer and Principal Financial Officer have concluded, based on their evaluation of the Registrant’s disclosure controls and procedures (as such term is defined in Rule 30a-3 under the Investment Company Act of 1940), that such controls and procedures are adequate and reasonably designed to achieve the purposes described in paragraph (c) of such rule. |
| (b) | There were no changes in the Registrant’s internal controls over financial reporting (as defined in Rule 30a-3(d) under the Investment Company Act of 1940) that occurred during the Registrant’s second fiscal quarter of the period covered by this report that has materially affected, or is reasonably likely to materially affect, the Registrant’s internal control over financial reporting. |
ITEM 12 – Exhibits
| (a)(1) | The Code of Ethics that is the subject of the disclosure required by Item 2 is attached as an exhibit hereto. |
| (a)(2) | The certifications required by Rule 30a-2 of the Investment Company Act of 1940 and Sections 302 and 906 of the Sarbanes-Oxley Act of 2002 are attached as exhibits hereto. |
SIGNATURES
Pursuant to the requirements of the Securities Exchange Act of 1934 and the Investment Company Act of 1940, the Registrant has duly caused this report to be signed on its behalf by the undersigned, thereunto duly authorized.
| THE AMERICAN FUNDS INCOME SERIES | |
| By /s/ Fergus N. MacDonald | |
Fergus N. MacDonald, President and Principal Executive Officer | |
| Date: October 30, 2015 |
Pursuant to the requirements of the Securities Exchange Act of 1934 and the Investment Company Act of 1940, this report has been signed below by the following persons on behalf of the Registrant and in the capacities and on the dates indicated.
| By /s/ Fergus N. MacDonald |
Fergus N. MacDonald, President and Principal Executive Officer |
| Date: October 30, 2015 |
| By /s/ Brian C. Janssen |
Brian C. Janssen, Treasurer and Principal Financial Officer |
| Date: October 30, 2015 |