UNITED STATES
SECURITIES AND EXCHANGE COMMISSION
Washington, D.C. 20549
FORM N-CSR
CERTIFIED SHAREHOLDER REPORT OF REGISTERED
MANAGEMENT INVESTMENT COMPANIES
Investment Company Act file number: 811-04323
Natixis Funds Trust I
(Exact name of Registrant as specified in charter)
399 Boylston Street, Boston, Massachusetts 02116
(Address of principal executive offices) (Zip code)
Coleen Downs Dinneen, Esq.
NGAM Distribution, L.P.
399 Boylston Street
Boston, Massachusetts 02116
(Name and address of agent for service)
Registrant’s telephone number, including area code: (617) 449-2810
Date of fiscal year end: December 31
Date of reporting period: December 31, 2013
| Item 1. | Reports to Stockholders. |
The Registrant’s annual report transmitted to shareholders pursuant to Rule 30e-1 under the Investment Company Act of 1940 is as follows:
ANNUAL REPORT
December 31, 2013

CGM Advisor Targeted Equity Fund
Harris Associates Large Cap Value Fund
Natixis Oakmark International Fund
Vaughan Nelson Small Cap Value Fund
Vaughan Nelson Value Opportunity Fund

TABLE OF CONTENTS
Portfolio Review page 1
Portfolio of Investments page 24
Financial Statements page 41
Notes to Financial Statementspage 61
Barron’s/Lipper 2013 one-year fund family ranking based on 64 qualifying U.S. fund companies. Each fund family must have at least three funds in Lipper’s general U.S.-stock category, one world (global and international), one mixed-asset/balanced (stocks and bonds), two taxable bond and one tax-exempt bond fund. Past performance is no guarantee of future results.
For more details visit ngam.natixis.com/TopFundFamily
CGM ADVISOR TARGETED EQUITY FUND
| | |
| Manager | | Symbols |
| G. Kenneth Heebner, CFA | | Class A NEFGX |
| Capital Growth Management Limited Partnership | | Class B NEBGX |
| | Class C NEGCX |
| | Class Y NEGYX |
Objective
The Fund seeks long-term growth of capital through investments in equity securities of companies whose earnings are expected to grow at a faster rate than that of the overall United States economy.
Market Conditions
The U.S. stock market wrapped up its best year since 1997, defying skeptics as investor fears gave way to a belief in the recovery. Any number of things could have derailed the market’s rally: the U.S. government’s partial shutdown, the possibility of a default on federal government debt, the threat of military action in Syria, federal budget cuts and new worries about European government debt. Instead, the stock market just kept on climbing. Stock prices rose to an all-time high on the final trading day of 2013. This bull market approaches its fifth birthday in March 2014.
Performance Results
For the 12 months ended December 31, 2013, Class A shares of CGM Advisor Targeted Equity Fund returned 29.01% at net asset value. It trailed its benchmark, the S&P 500® Index, which returned 32.39%.
Explanation of Fund Performance
In a year of impressive gains, the fund’s modest shortfall against the benchmark was generally stock specific. Detractors included Herbalife, eBay and Microsoft. Nutritional supplement and weight management company Herbalife saw its share price fall because of negative publicity generated by a major hedge fund that shorted the stock. (Shorting is a technique that benefits an investor if a security loses value.) Claims by the hedge fund manager about the company’s allegedly abusive business practices pushed stock prices lower. We sold the issue.
During the year, shares of online auction giant eBay suffered as concern mounted about the impact of a new “digital wallet” fee on the company’s PayPal business. Many investors are worried that this move is part of a broader effort by credit card companies to target PayPal, which has recently become more of a direct competitor. We sold shares of eBay to fund other opportunities.
Software giant Microsoft has struggled as the world has moved away from the PC-centric version of computing to a more mobile platform. Unfortunately, the Windows Phone has yet to take off, and the Surface, Microsoft’s answer to the iPad, is a disappointment.
1 |
The fund was positioned throughout the year to benefit from healthy economic growth. In an environment of healthy economic growth, the portfolio maintained significant concentrations in investment banks and homebuilders, which lifted performance. Large investment banks profit from many financial transactions associated with a strengthening economy. Meanwhile, homebuilders are rewarded by increasing employment and consumer confidence. Leading contributors included Morgan Stanley and Citigroup. Morgan Stanley, one of the world’s largest diversified financial services companies, benefitted from the further consolidation of Salomon Smith Barney’s global wealth management business with its own operations. The acquisition, which closed with the purchase of the remaining one-third interest in Salomon Smith Barney, helped the firm take advantage of increased efficiencies. Morgan Stanley also experienced improving results in equity trading and investment banking and scaled back its underperforming fixed income operation.
Citigroup, a global financial services powerhouse, continued to make strong earnings progress as management disposed of unprofitable operations and reduced costs from non-performing assets. The company retains a leadership position in global banking, which is poised to profit from an expanding economy worldwide.
All sectors of the stock market ended the year with positive returns, but among the year’s biggest gainers were companies most exposed to the U.S. economy. In this environment, the fund benefited from its exposure to economically sensitive stocks, including automobile, airline and technology companies, which helped boost fund performance. Delta Airlines enjoyed solid earnings growth due to greater demand and significant industry reconstruction and consolidation. In recent years, the domestic airline industry has become progressively more efficient, reducing costs through bankruptcy and increased pricing power at major cities. For the first time since airline deregulation in the late 1970s, pricing has benefitted from concentration of industry capacity among several large carriers in key markets.
Outlook
We are optimistic about the U.S. economy in 2014. Several factors that have held back growth appear to be lessening. U.S. household finances have improved, and the outlook for home sales is brighter. While the stock market may not provide gains comparable to 2013, we see the potential for further gains as the economy continues to expand. With those expectations in mind, we have positioned CGM Advisor Targeted Equity Fund to continue to benefit from increasing strength in the U.S. economy. As always, we will maintain a portfolio focused on individual stocks with the potential to grow earnings at a rate faster than that of the overall economy.
| 2
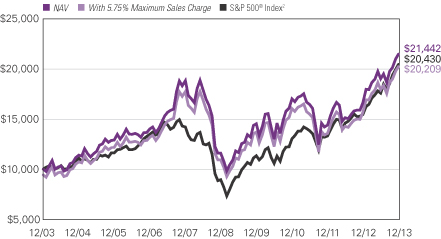
CGM ADVISOR TARGETED EQUITY FUND
Growth of $10,000 Investment in Class A Shares
December 31, 2003 through December 31, 2013
3 |
Average Annual Total Returns — December 31, 2013
| | | | | | | | | | | | |
| | | | |
| | | 1 Year | | | 5 Years | | | 10 Years | |
| | | | |
Class A (Inception 11/27/68) | | | | | | | | | | | | |
NAV | | | 29.01 | % | | | 13.07 | % | | | 7.93 | % |
With 5.75% Maximum Sales Charge | | | 21.63 | | | | 11.74 | | | | 7.29 | |
| | | | |
Class B (Inception 2/28/97) | | | | | | | | | | | | |
NAV | | | 28.06 | | | | 12.26 | | | | 7.13 | |
With CDSC1 | | | 23.06 | | | | 12.00 | | | | 7.13 | |
| | | | |
Class C (Inception 9/1/98) | | | | | | | | | | | | |
NAV | | | 28.13 | | | | 12.25 | | | | 7.13 | |
With CDSC1 | | | 27.13 | | | | 12.25 | | | | 7.13 | |
| | | | |
Class Y (Inception 6/30/99) | | | | | | | | | | | | |
NAV | | | 29.34 | | | | 13.38 | | | | 8.22 | |
| | | | |
Comparative Performance | | | | | | | | | | | | |
S&P 500® Index2 | | | 32.39 | | | | 17.94 | | | | 7.41 | |
Past performance does not guarantee future results. The table does not reflect taxes shareholders might owe on any fund distributions or when they redeem their shares. Performance for periods less than one year is cumulative, not annualized. Returns reflect changes in share price and reinvestment of dividends and capital gains, if any. Unlike a fund, an index is not managed and does not reflect fees and expenses.
| 1 | Performance for Class B shares assumes a maximum 5.00% contingent deferred sales charge (“CDSC”) applied when you sell shares, which declines annually between years 1-6 according to the following schedule: 5, 4, 3, 3, 2, 1, 0%. Class C share performance assumes a 1.00% CDSC applied when you sell shares within one year of purchase. |
| 2 | S&P 500® Index is a widely recognized measure of U.S. stock market performance. It is an unmanaged index of 500 common stocks chosen for market size, liquidity, and industry group representation, among other factors. |
| 4
HARRIS ASSOCIATES LARGE CAP VALUE FUND
| | |
| Managers | | Symbols |
| Edward S. Loeb, CFA | | Class A NEFOX |
| Michael J. Mangan, CFA | | Class B NEGBX |
| Diane L. Mustain, CFA | | Class C NECOX |
| Harris Associates L.P. | | Class Y NEOYX |
Objective
The Fund seeks opportunities for long-term capital growth and income
Market Conditions
In many ways, it was tough to say farewell to 2013. The S&P 500® Index’s 32% total return was the best in more than a decade-and-a-half, adding meaningfully to the market’s remarkable recovery from the financial crisis five years ago. Although the year started with legitimate concerns regarding new tax hikes and a budget sequester, it ended with reassuring answers to both concerns. As 2014 gets underway, we’re impressed by the broadening strength of both the economy and markets. Many varied economic indicators, such as industrial production, retail sales, auto production, exports and energy production recently approached or reached new highs. More important, we’ve seen impressive corporate performance from the companies we follow. The equity market is also – finally – gaining support from investors reconsidering their own asset allocations.
Performance Results
For the 12 months ended December 31, 2013, Class A shares of Harris Associates Large Cap Value Fund returned 37.82% at net asset value. The fund outperformed its benchmark, the Russell 1000® Value Index, which returned 32.53%.
Explanation of Fund Performance
Because we are value investors with an emphasis on individual stock selection, the fund’s country and sector weights are a byproduct of our bottom-up investment process. Sector-wise, the fund’s relative overweight in consumer discretionary holdings, plus stock selection within the sector, contributed the most to relative performance in the year. The fund also benefited from stock selection in the financials sector. An underweight in health care holdings detracted from fund performance.
The leading contributors to fund performance in 2013 were MasterCard, Applied Materials and Wells Fargo. MasterCard reported what we consider to be strong earnings throughout the year. We recently met with MasterCard’s management, which stated that the company remains focused on “digital conversion” (paper to electronic forms of spending) and expanding market share through new co-branded products and commercial cards, along with other initiatives. Management continues to repurchase shares and increase its dividend to reward shareholders, which remains a priority at MasterCard. We continue to believe that MasterCard has a unique combination of competitive strength, secular growth and low capital intensity. Applied Materials experienced a number of positive events that boosted its
5 |
stock price during the year. The company experienced strengthening sales and gross margins along with market share increases and announced a new long-term growth and profitability strategy and financial model. Also, investors responded positively to news that Applied Materials is acquiring competitor Tokyo Electron in an all-stock transaction. Wells Fargo continues to build its credit quality, and its balance sheet remains strong in our view. Wells Fargo also announced earlier in the year that it is raising its dividend more than 80% (from $0.48 to $0.88 per share for the year). We think Wells Fargo continues to execute quite well in an environment of low interest rates, which has been challenging to many banks.
The holdings with the lowest returns in 2013 were Apache, Caterpillar and Unilever. Apache was the largest detractor from fund performance, and was sold from the portfolio during the first quarter of the year. When investors consider exploration and production company stocks, they are increasingly looking for companies that can find and produce oil and gas efficiently and at low cost. For many years, Apache was seen as a cost leader by its peers. However, the company’s statistics have been eroding meaningfully, which has limited its ability to grow intrinsic value per share, a characteristic that we demand in our investments. Caterpillar released weaker-than-expected earnings per share early in the year, which affected its share price. However, our investment thesis remains intact: Caterpillar’s strong brand is built on tangible product benefits, it offers unique customer-specific cost analysis, and its dealer network is a significant and often overlooked asset. We met with Caterpillar’s CEO Doug Oberhelman during the year. Going forward, he thinks miners will focus more intensely on improving productivity at existing mines. This works to Caterpillar’s advantage, as the company is the industry technology leader with a substantial dealer service/support network. Unilever’s fiscal first-half results included revenue growth of 5% (constant currency) including strong emerging markets growth of 10% (the ninth straight quarter of double-digit growth). However, overall organic growth was short of the company’s estimate (+5.5%) for the period. Nonetheless, margins improved by what we consider to be a notable amount from a combination of both product mix and cost savings across multiple aspects of the business. We think Unilever has the potential to maintain its steady value growth through a high quality formula of end market demand.
Outlook
Our basic fundamental outlook assumes continued company-specific progress on profitability, albeit at a more moderate pace than we’ve recently witnessed. The economy’s long-term potential may have suffered due to too much economic and legislative uncertainty and too much hunger for near-term return of capital. A meaningful increase in sensible long-term capital spending to promote real growth would likely deliver higher profitability than we currently project. It’s possible we’re closer to a change, with less uncertainty in Washington, more stability in Europe and Japan, a more secure and lower-cost energy outlook, rising consumer confidence and a more synchronized global economy as we enter 2014.
| 6
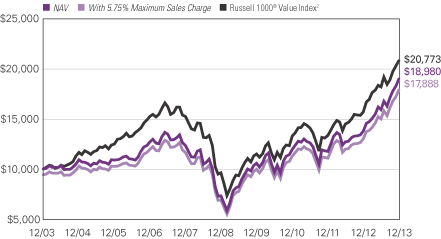
HARRIS ASSOCIATES LARGE CAP VALUE FUND
Growth of $10,000 Investment in Class A Shares3
December 31, 2003 through December 31, 2013
7 |
Average Annual Total Returns — December 31, 20133
| | | | | | | | | | | | |
| | | | |
| | | 1 Year | | | 5 Years | | | 10 Years | |
| | | | |
Class A (Inception 5/6/31) | | | | | | | | | | | | |
NAV | | | 37.82 | % | | | 20.93 | % | | | 6.61 | % |
With 5.75% Maximum Sales Charge | | | 29.91 | | | | 19.49 | | | | 5.98 | |
| | | | |
Class B (Inception 9/13/93) | | | | | | | | | | | | |
NAV | | | 36.75 | | | | 20.02 | | | | 5.82 | |
With CDSC1 | | | 31.75 | | | | 19.83 | | | | 5.82 | |
| | | | |
Class C (Inception 5/1/95) | | | | | | | | | | | | |
NAV | | | 36.88 | | | | 20.04 | | | | 5.81 | |
With CDSC1 | | | 35.88 | | | | 20.04 | | | | 5.81 | |
| | | | |
Class Y (Inception 11/18/98) | | | | | | | | | | | | |
NAV | | | 38.21 | | | | 21.24 | | | | 6.94 | |
| | | | |
Comparative Performance | | | | | | | | | | | | |
Russell 1000® Value Index2 | | | 32.53 | | | | 16.67 | | | | 7.58 | |
Past performance does not guarantee future results. The table does not reflect taxes shareholders might owe on any fund distributions or when they redeem their shares. Performance for periods less than one year is cumulative, not annualized. Returns reflect changes in share price and reinvestment of dividends and capital gains, if any. Unlike a fund, an index is not managed and does not reflect fees and expenses.
| 1 | Performance for Class B shares assumes a maximum 5.00% contingent deferred sales charge (“CDSC”) applied when you sell shares, which declines annually between years 1-6 according to the following schedule: 5, 4, 3, 3, 2, 1, 0%. Class C share performance assumes a 1.00% CDSC applied when you sell shares within one year of purchase. |
| 2 | Russell 1000® Value Index is an unmanaged index that measures the performance of the large-cap value segment of the U.S. equity universe. It includes those Russell 1000® companies with lower price-to-book ratios and lower expected growth values. |
| 3 | Fund performance has been increased by fee waivers and/or expense reimbursements, if any, without which performance would have been lower. |
| 8
NATIXIS OAKMARK INTERNATIONAL FUND
| | |
| Managers | | Symbols |
| David G. Herro, CFA | | Class A NOIAX |
| Robert A. Taylor, CFA | | Class C NOICX |
| Harris Associates L.P. | | |
Objective
The Fund seeks long-term capital appreciation
Market Conditions
2013 started with an abundance of negative news, including continued structural issues in Europe, slowed growth in the emerging markets and a questionable reform plan in Japan. However, foreign equity markets performed well in 2013. As the year progressed, it became evident that Europe would begin to recover slowly, partially because of self-help initiatives. Japan, too, was seriously tackling its deflation issue, which partially caused a strong yen, weak share prices and slow growth. As a result, both European and Japanese equity markets, which had been aggressively sold-off due to macro fears, began to recover.
Performance Results
For the 12 months ended December 31, 2013, Class A shares of Natixis Oakmark International Fund returned 28.13% at net asset value. The fund outperformed its benchmark, the MSCI World ex USA Index (Net), which returned 21.02%.
Explanation of Fund Performance
As of December 31, 2013, the fund’s European holdings totaled 79% of the portfolio, and 12% of the portfolio was invested in Japanese holdings. The remaining positions were in Australia, Canada, South Korea and the Middle East. Because we are value investors with an emphasis on individual stock selection, country and sector weights are a byproduct of our bottom-up investment process.
By sector, financials holdings contributed the most value relative to the benchmark, primarily due to stock selection. Both the fund’s overweight and stock selection in the consumer discretionary sector aided relative performance during the year. The fund’s lack of exposure to the telecommunications services sector detracted relative to the benchmark.
The top contributors to the yearly return were Daiwa Securities, Daimler and Intesa Sanpaolo. Daiwa released its fiscal first-half results during the quarter that showed pre-tax profit at the highest level since the company started reporting in 1995. Revenues rose across the board in retail, wholesale and asset management, and in total they are on track to meet full-year estimates. Of special note, the wholesale banking division became profitable for the first time since 2009. Another top contributor for the year was Daimler, the global auto manufacturer of the Mercedes brand. Shares reacted positively to the company’s 2012 results, which included higher profits than we expected for the company’s Mercedes-Benz Car and Truck divisions. More recently, Daimler announced significantly improved
9 |
earnings and net profits for the second quarter of 2013. Intesa Sanpaolo was another top contributor in 2013. Its fee generation was strong across the board, with fee growth in the commercial banking, portfolio management, insurance distribution and deal/placement fee areas. In addition, cost controls are intact and Intesa Sanpaolo’s capital ratios remain solid in our view and have improved since the end of last year.
The largest detractors from return were Orica, AMP and Canon. Orica’s shares were weakened by a reduction in guidance in July and by the market’s anticipation that the company would miss its 2013 fiscal-year targets. However, shares rebounded when Orica’s fiscal-year results showed 3% revenue growth and relatively flat margins, which put the company in line with expectations. This demonstrated that Orica’s explosives business is much more resilient than most other areas of mining services. We expect Orica to continue its capital-light strategy and that it will produce better cash flow in the future. AMP preannounced its earnings results late in June, which included AUD $32 million worth of losses in its Contemporary Wealth Protection (CWP) business during the first five months of the year. This news sent the share price tumbling. In May, the company noted that investor sentiment, market performance and the economic climate were particularly bad in Australia and had driven up claims and lapse rates. To address the problems in the CWP division, the company is raising its claims assumptions, believing some of its problems are structural. Canon also was a detractor from the yearly return, which was largely the result of the downgrade of the ILC business (digital SLRs and lenses). This business has lagged enough that management has lowered fiscal-year volume estimates from 9 million to 8 million. Despite falling prices due to uncertain consumer markets in developed economies and from trading down in emerging markets, management indicates pricing is normalizing. In addition, print volumes are growing again, and Canon is taking market share. We continue to believe that Canon is a compelling investment opportunity that will reward shareholders in the long term.
We no longer believe the yen to be overvalued and therefore closed the fund’s hedge of the underlying currency. The Australian dollar also weakened in 2013, but we still believe it to be overvalued. As of year end, we hedged 30% of the Australian dollar, 31% of the Swiss franc and 30% of the Swedish krona exposure.
Outlook
Despite strong past performance, we believe there is still value in global equity markets. Certainly, stocks are not selling at the incredible bargains they were in early 2009 or even early 2012, but with global economic growth appearing to be poised to accelerate, and with stock valuations that are still attractive, we believe there are reasons to be confident that global equities will continue to be an attractive asset class.
| 10
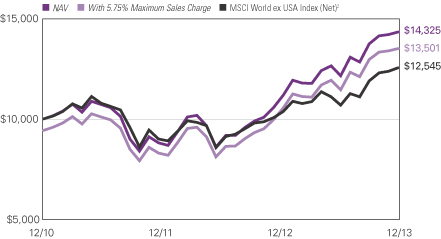
NATIXIS OAKMARK INTERNATIONAL FUND
Growth of $10,000 Investment in Class A Shares3
December 15, 2010 (inception) through December 31, 2013
Average Annual Total Returns — December 31, 20133
| | | | | | | | |
| | | |
| | | 1 Year | | | Life of Fund | |
| | | |
Class A (Inception 12/15/10) | | | | | | | | |
NAV | | | 28.13 | % | | | 12.54 | % |
With 5.75% Maximum Sales Charge | | | 20.72 | | | | 10.37 | |
| | | |
Class C (Inception 12/15/10) | | | | | | | | |
NAV | | | 27.13 | | | | 11.71 | |
With CDSC1 | | | 26.13 | | | | 11.71 | |
| | | |
Comparative Performance | | | | | | | | |
MSCI World ex USA Index (Net)2 | | | 21.02 | | | | 7.73 | |
Past performance does not guarantee future results. The table does not reflect taxes shareholders might owe on any fund distributions or when they redeem their shares. Performance for periods less than one year is cumulative, not annualized. Returns reflect changes in share price and reinvestment of dividends and capital gains, if any. Unlike a fund, an index is not managed and does not reflect fees and expenses.
| 1 | Performance for Class C shares assumes a 1.00% contingent deferred sales charge (“CDSC”) applied when you sell shares within one year of purchase. |
| 2 | MSCI World ex USA Index (Net) is an unmanaged index that is designed to measure the equity market performance of developed markets, excluding the United States. The index calculates reinvested dividends net of withholding taxes using Luxembourg tax rates. |
| 3 | Fund performance has been increased by fee waivers and/or expense reimbursements, if any, without which performance would have been lower. |
11 |
VAUGHAN NELSON SMALL CAP VALUE FUND
| | |
| Managers | | Symbols |
| Dennis G. Alff, CFA | | Class A NEFJX |
| Chad D. Fargason | | Class B NEJBX |
| Chris D. Wallis, CFA | | Class C NEJCX |
| Scott J. Weber, CFA | | Class Y NEJYX |
| Vaughan Nelson Investment Management, L.P. |
Effective July 31, 2009, the fund was closed to new investors.
Objective
The Fund seeks capital appreciation
Market Conditions
Against a backdrop of stable earnings growth, low inflation and easy money, the U.S. equity markets continued a broad advance, which began in the fourth quarter of 2012. However, the nature of its ascent changed dramatically after the Federal Reserve (the Fed) announced in May that it would begin tapering its monthly bond purchases, a program known as quantitative easing (QE). Prior to the tapering announcement, the equity market rally was led by stocks that were termed “bond proxies,” because of their dividend yields, and by cyclical sectors that responded to the ultra low interest rates, ample liquidity and credit availability. After the Fed’s announcement, these sectors came under pressure as 10-year Treasury rates rose from a low of approximately 1.4% to 3.0%. Despite the Fed’s claim otherwise, tapering QE does represent a tightening of monetary policy. The increase in interest rates across the entire Treasury curve represented an increase in overall real interest rates within the capital markets. (The Treasury curve is a graph that shows interest rates on U.S. Treasury securities across maturities, from short to long.) Given the significant expansion in the equity market’s valuation multiples, coupled with the declining impact of QE on corporate earnings and economic activity, we continue to expect the rate of return for the broader equity indices to moderate materially over the next three years.
Performance Results
For the 12 months ended December 31, 2013, Class A shares of Vaughan Nelson Small Cap Value Fund returned 39.01% at net asset value. The fund outperformed its benchmark, the Russell 2000® Value Index, which returned 34.52%.
Explanation of Fund Performance
Stock selection drove the overwhelming majority of the portfolio’s performance over the past year with broad based expansion of price-to-earnings multiples, a common measure of valuation, providing a healthy tailwind. Cyclical stocks disproportionately benefited the portfolio due to their leverage to an economic recovery. The cyclical exposure stemmed from our team’s focus on company-specific valuations and fundamentals as opposed to any targeted sector exposure. Consequently, the portfolio was materially underweight relative to its benchmark in real estate investment trusts (REITs) and utilities because both sectors
| 12
VAUGHAN NELSON SMALL CAP VALUE FUND
appeared overvalued. Industrials, financials, technology and consumer discretionary stocks were the biggest contributors to the fund’s performance, while no single sector detracted from results.
Stock selection drove returns in the industrials sector. Notable standouts included Towers Watson and KAR Auction Services. Towers Watson began to earn market recognition for its health care exchange investments, as private exchanges are now a practical solution for employers to reduce healthcare costs. We sold the stock as expectations of broad private exchange proliferation were reflected in the stock price. KAR Auction Services stock appreciated as new vehicle sales in the United States continued to recover from the 2009 trough. This is an important indicator for whole car auction volumes, because there is a two to four year lag between new car sales and auction volumes.
Stock selection stood out as a driver in the financials sector, with FirstMerit and CNO Financial Group making the most significant contributions to performance. FirstMerit acquired peer bank Citizens Republic Bancorp in 2013 and realized 40% of its targeted cost savings by the end of the third quarter. Further, organic loan growth rebounded as the economy continued to recover. CNO Financial Group benefited from management’s plan to improve operating efficiency, run off low return blocks of business and return cash to shareholders through share repurchases—all of which contributed to improved returns. Also, management significantly improved CNO’s capital structure by issuing new debt to pay off the existing credit facility, retire expensive debt and repurchase the outstanding convertible bonds.
Strong stock selection also benefited the fund’s technology holdings, with SS&C Technologies and Broadridge Financial Services leading the way. SS&C provides software solutions to the financial services industry to automate client reporting, reconciliation and portfolio and investment accounting. The company has benefitted from the recovery in the stock market since a portion of its revenues is tied to client assets under management. This revenue growth, coupled with SS&C’s effort to pay down debt, has improved profit margins. Broadridge is the leading provider of investor communications and third-party trade processing services. The company has benefited from tighter regulation within the financial services industry and from the recovery in trading volumes.
The consumer discretionary sector was the only sector that detracted from relative performance during the year. Stock selection within specialty retail was the main detractor to relative performance with Aaron’s and Abercrombie & Fitch lagging the most. Both Aaron’s and Abercrombie were impacted by a weak macroeconomic environment that impacted store traffic and resulted in a highly promotional environment. On the other hand, Harman International was the greatest contributor to performance. Harman International enjoyed success as its leadership in automotive infotainment coincided with increased auto sales. Additionally, the company’s margin profile continues to improve as their backlog is becoming increasingly comprised of standardized products as opposed to custom designs.
Other notable performers during the year included: Packaging Corporation of America, LPL Financial Holdings, Oasis Petroleum and Health Management Associates. The
13 |
greatest increases in sector weights were in technology, consumer staples and energy. The rise in technology holdings was primarily the result of adding exposure to software and information technology services, through ACI Worldwide, Fair Isaac, Broadridge and Jack Henry. GNC Holdings and Rite Aid boosted the consumer staples weight, while Forum Energy accounted for most of the increase in the energy weight.
The largest reductions in sector weights were in financials, industrials and materials. The weight in financials was primarily driven by our decision to underweight REITs because valuations looked stretched. We also lowered the fund’s exposure to industrials and materials by reducing building products stocks and chemical stocks, respectively.
Outlook
Despite the rise in real interest rates, we continue to expect modest economic growth as the fiscal drags from government spending reductions will no longer be a headwind in 2014. The continued recovery in capital spending, residential construction, nonresidential construction and the elimination of the fiscal drags have the potential to drive real gross domestic product growth to between 2.5% and 3.5% in 2014. The primary risks to this outlook would be a flare up in the European credit markets, a significant slowdown in China’s economic growth or instability emanating from Japanese credit markets. As we enter 2014, we believe the U.S. equity markets will rely less on the Federal Reserve’s stimulus and more on individual company fundamentals. This will represent an incremental headwind to the broad averages but will have varying effects across individual securities. There are still individual stocks that will perform well despite the lowered return expectations for the general market. This positive outlook continues to be stock-specific and not reflective of opportunities in specific industries or regions of the world.
Growth of $10,000 Investment in Class A Shares4
December 31, 2003 through December 31, 2013
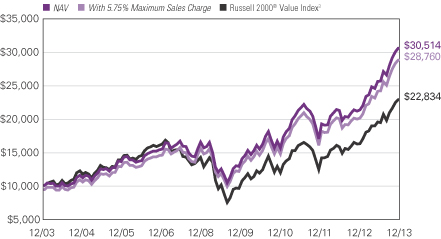
See notes to chart on page 15.
| 14
Average Annual Total Returns — December 31, 20134
| | | | | | | | | | | | |
| | | | |
| | | 1 Year | | | 5 Years | | | 10 Years | |
| | | | |
Class A (Inception 12/31/96) | | | | | | | | | | | | |
NAV | | | 39.01 | % | | | 19.53 | % | | | 11.81 | % |
With 5.75% Maximum Sales Charge | | | 31.00 | | | | 18.12 | | | | 11.15 | |
| | | | |
Class B (Inception 12/31/96) | | | | | | | | | | | | |
NAV | | | 38.03 | | | | 18.64 | | | | 10.99 | |
With CDSC1 | | | 33.03 | | | | 18.44 | | | | 10.99 | |
| | | | |
Class C (Inception 12/31/96) | | | | | | | | | | | | |
NAV | | | 37.99 | | | | 18.64 | | | | 10.98 | |
With CDSC1 | | | 36.99 | | | | 18.64 | | | | 10.98 | |
| | | | |
Class Y (Inception 8/31/06)2 | | | | | | | | | | | | |
NAV | | | 39.43 | | | | 19.83 | | | | 12.03 | |
| | | | |
Comparative Performance | | | | | | | | | | | | |
Russell 2000® Value Index3 | | | 34.52 | | | | 17.64 | | | | 8.61 | |
Past performance does not guarantee future results. The table does not reflect taxes shareholders might owe on any fund distributions or when they redeem their shares. Performance for periods less than one year is cumulative, not annualized. Returns reflect changes in share price and reinvestment of dividends and capital gains, if any. Unlike a fund, an index is not managed and does not reflect fees and expenses.
| 1 | Performance for Class B shares assumes a maximum 5.00% contingent deferred sales charge (“CDSC”) applied when you sell shares, which declines annually between years 1-6 according to the following schedule: 5, 4, 3, 3, 2, 1, 0%. Class C share performance assumes a 1.00% CDSC applied when you sell shares within one year of purchase. |
| 2 | Prior to the inception of Class Y shares (8/31/06), performance is that of Class A shares and reflects the higher net expenses of that share class. |
| 3 | Russell 2000® Value Index is an unmanaged index that measures the performance of the small-cap value segment of the U.S. equity universe. It includes those Russell 2000® companies with lower price-to-book ratios and lower forecasted growth values. |
| 4 | Fund performance has been increased by fee waivers and/or expense reimbursements, if any, without which performance would have been lower. |
15 |
VAUGHAN NELSON VALUE OPPORTUNITY FUND
| | |
| Managers | | Symbols |
| Dennis G. Alff, CFA | | Class A VNVAX |
| Chad D. Fargason | | Class C VNVCX |
| Chris D. Wallis, CFA | | Class N VNVNX |
| Scott J. Weber, CFA | | Class Y VNVYX |
| Vaughan Nelson Investment Management, L.P. |
Objective
The Fund seeks long-term capital appreciation
Market Conditions
Against a backdrop of stable earnings growth, low inflation and easy money, the U.S. equity markets continued a broad advance, which began in the fourth quarter of 2012. However, the nature of its ascent changed dramatically after the Federal Reserve (the Fed) announced in May that it would begin tapering its monthly bond purchases, a program known as quantitative easing (QE). Prior to the tapering announcement, the equity market rally was led by stocks that were termed “bond proxies,” because of their dividend yields, and by cyclical sectors that responded to the ultra low interest rates, ample liquidity and credit availability. After the Fed’s announcement, these sectors came under pressure as 10-year Treasury rates rose from a low of approximately 1.4% to 3.0%. Despite the Fed’s claim otherwise, tapering QE does represent a tightening of monetary policy. The increase in interest rates across the entire Treasury curve represented an increase in overall real interest rates within the capital markets. (The U.S. Treasury curve is a graph that shows interest rates on U.S. Treasury securities across maturities, from short to long.) Given the significant expansion in the equity market’s valuation multiples, coupled with the declining impact of QE on corporate earnings and economic activity, we continue to expect the rate of return for the broader equity indices to moderate materially over the next three years.
Performance Results
For the 12 months ended December 31, 2013, Class A shares of Vaughan Nelson Value Opportunity Fund returned 41.22% at net asset value. The fund outperformed its benchmark, the Russell Midcap® Value Index, which returned 33.46%.
Explanation of Fund Performance
Stock selection drove the overwhelming majority of the portfolio’s performance over the past year with broad based expansion of price-to-earnings multiples, a common measure of valuation, providing a healthy tailwind. Cyclical stocks disproportionately benefited the portfolio due to their leverage to an economic recovery. The cyclical exposure stemmed from our team’s focus on company-specific valuations and fundamentals as opposed to any targeted sector exposure. Consequently, the portfolio was materially underweight in real estate investment trusts (REITs) and utilities because both sectors appeared overvalued. Industrials, financials, technology and consumer discretionary stocks were the biggest contributors to performance, while no single sector detracted from results.
| 16
VAUGHAN NELSON VALUE OPPORTUNITY FUND
Stock selection drove returns in the industrials sector. Notable standouts included Towers Watson and United Rentals. Towers Watson began to earn market recognition for its health care exchange investments, as private exchanges are now a practical solution for employers to reduce healthcare costs. We sold the stock as expectations of broad private exchange proliferation were reflected in the stock price. United Rentals, the largest equipment rental company in the world, performed well in light of the economic recovery and the synergies gained from its acquisition of RSC. We believe that United Rentals should continue to benefit from the recovery in non-residential construction and from the industry trend toward rental versus owned equipment.
Stock selection stood out as a driver in the financials sector, with The Hartford and Huntington Bancshares making the most significant contributions to performance. The Hartford executed on a turnaround plan that included selling non-core businesses, placing the U.S. annuity business into run-off, refinancing high cost debt and returning cash to shareholders. The implementation of this plan improved shareholder returns, and the market rewarded Hartford shares with a higher valuation. Huntington Bancshares completed a small acquisition during the year and benefited from organic loan growth and better credit.
The technology sector detracted from relative performance during the year. The biggest detractor to relative performance was stock selection within software. Specifically Nuance Communications, a speech recognition software provider, performed poorly during the year due to weak international sales, sluggish Windows-based software sales, and due to a slowdown in its health care business. Further, the company lowered 2014 earnings guidance due to the company’s ongoing transition to on-demand offerings, which will require more investment than originally anticipated. While relative performance lagged the benchmark the portfolio benefitted from owning Avago Technologies and Fiserv, which were strong performers during the year. Avago, an analog semiconductor manufacturer, has benefitted from strong demand for its products in the wireless communications market, which represents fifty percent of the company’s revenue. The company is positioned to benefit from several secular trends including: increased penetration of smart phone handsets, increased complexity in handsets as we move to 4G/LTE, and stronger demand for technology and equipment within the industrial and auto markets. Fiserv is a provider of financial services technology including core bank processing systems, electronic payments products, mobile and internet banking solutions, and loan processing systems. The company has benefited from increased regulation within the financial services industry and from the trend to online banking.
In the consumer discretionary sector, Harman International and Delphi Automotive were the greatest contributors to performance. Harman International enjoyed success as its leadership in automotive “infotainment” coincided with higher auto sales. Additionally, the company’s profit margin profile continues to improve as its backlog is shifting toward standardized products as opposed to custom designs. Delphi Automotive is a supplier of electrical systems, safety products, powertrain systems and thermal management products. The company benefited from the recovery in auto sales.
17 |
Other notable performers during the year were Warner Chilcott, Valeant Pharmaceuticals and HCA Holdings in the health care sector and GNC Holdings and Rite Aid in the consumer staples sector. The greatest additions to sector weights were in consumer staples, industrials, materials and consumer discretionary. The largest reductions in sector weights were in financials, technology and energy. The fund’s financials exposure was primarily driven by our decision to avoid REITs because valuations looked stretched.
Outlook
Despite the rise in real interest rates, we continue to expect modest economic growth as the fiscal drags from government spending reductions will no longer be a headwind in 2014. The continued recovery in capital spending, residential construction, nonresidential construction and the elimination of the fiscal drags have the potential to drive real GDP growth between 2.5% and 3.5% in 2014. We believe the primary risks to this outlook would be a flare up in the European credit markets, a significant slowdown in China’s economic growth or instability emanating from Japanese credit markets. As we enter 2014, we believe the U.S. equity markets will rely less on Federal Reserve stimulus and more on individual company fundamentals. This will represent an incremental headwind to the broad averages, but will have varying effects across individual securities. There are still individual stocks that will perform well despite the lowered return expectations for the general market. This positive outlook continues to be stock-specific and not reflective of opportunities in specific industries or regions of the world.
Growth of $10,000 Investment in Class A Shares3
October 31, 2008 (inception) through December 31, 2013
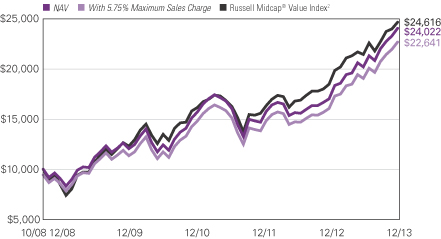
See notes to chart on page 19.
| 18
Average Annual Total Returns — December 31, 20133
| | | | | | | | | | | | | | | | |
| | | | |
| | | 1 Year | | | 5 Year | | | Life of Class | |
| | | | | |
| | | | | | | | | | | | Class A/C/Y | | | | Class N | |
| | | | | |
Class A (Inception 10/31/08) | | | | | | | | | | | | | | | | |
NAV | | | 41.22 | % | | | 20.07 | % | | | 18.48 | % | | | — | |
With 5.75% Maximum Sales Charge | | | 33.06 | | | | 18.65 | | | | 17.13 | | | | — | |
| | | | | |
Class C (Inception 10/31/08) | | | | | | | | | | | | | | | | |
NAV | | | 40.13 | | | | 19.19 | | | | 17.61 | | | | — | |
With CDSC1 | | | 39.13 | | | | 19.19 | | | | 17.61 | | | | — | |
| | | | | |
Class N (Inception 5/1/13) | | | | | | | | | | | | | | | | |
NAV | | | — | | | | — | | | | — | | | | 24.70 | % |
| | | | | |
Class Y (Inception 10/31/08) | | | | | | | | | | | | | | | | |
NAV | | | 41.52 | | | | 20.38 | | | | 18.78 | | | | — | |
| | | | | |
Comparative Performance | | | | | | | | | | | | | | | | |
Russell Midcap® Value Index2 | | | 33.46 | | | | 21.16 | | | | 19.07 | | | | 17.05 | |
Past performance does not guarantee future results. The table does not reflect taxes shareholders might owe on any fund distributions or when they redeem their shares. Performance for periods less than one year is cumulative, not annualized. Returns reflect changes in share price and reinvestment of dividends and capital gains, if any. Unlike a fund, an index is not managed and does not reflect fees and expenses.
| 1 | Performance for Class C shares assumes a 1.00% contingent deferred sales charge (“CDSC”) applied when you sell shares within one year of purchase. |
| 2 | Russell Midcap® Value Index is an unmanaged index that measures the performance of the mid-cap value segment of the U.S. equity universe. It includes those Russell Midcap® Index companies with lower price-to-book ratios and lower forecasted growth values. |
| 3 | Fund performance has been increased by fee waivers and/or expense reimbursements, if any, without which performance would have been lower. |
19 |
ADDITIONAL INFORMATION
The views expressed in this report reflect those of the portfolio managers as of the dates indicated. The managers’ views are subject to change at any time without notice based on changes in market or other conditions. References to specific securities or industries should not be regarded as investment advice. Because the funds are actively managed, there is no assurance that they will continue to invest in the securities or industries mentioned.
ADDITIONAL INDEX INFORMATION
This document may contain references to third party copyrights, indexes, and trademarks, each of which is the property of its respective owner. Such owner is not affiliated with Natixis Global Asset Management or any of its related or affiliated companies (collectively “NGAM”) and does not sponsor, endorse or participate in the provision of any NGAM services, funds or other financial products.
The index information contained herein is derived from third parties and is provided on an “as is” basis. The user of this information assumes the entire risk of use of this information. Each of the third party entities involved in compiling, computing or creating index information disclaims all warranties (including, without limitation, any warranties of originality, accuracy, completeness, timeliness, non-infringement, merchantability and fitness for a particular purpose) with respect to such information.
PROXY VOTING INFORMATION
A description of the funds’ proxy voting policies and procedures is available without charge, upon request, by calling Natixis Funds at 800-225-5478; on the funds’ website at ngam.natixis.com; and on the Securities and Exchange Commission’s (SEC) website at www.sec.gov. Information regarding how the funds voted proxies relating to portfolio securities during the 12-month period ended June 30, 2013 is available from the funds’ website and the SEC’s website.
QUARTERLY PORTFOLIO SCHEDULES
The funds file a complete schedule of portfolio holdings with the SEC for the first and third quarters of each fiscal year on Form N-Q. The funds’ Forms N-Q are available on the SEC’s website at www.sec.gov and may be reviewed and copied at the SEC’s Public Reference Room in Washington, DC. Information on the operation of the Public
Reference Room may be obtained by calling 800-SEC-0330.
| 20
UNDERSTANDING FUND EXPENSES
As a mutual fund shareholder, you incur different costs: transaction costs, including sales charges (loads) on purchases and contingent deferred sales charges on redemptions, and ongoing costs, including management fees, distribution and/or service fees (12b-1 fees), and other fund expenses. Certain exemptions may apply. These costs are described in more detail in the funds’ prospectus. The following examples are intended to help you understand the ongoing costs of investing in the funds and help you compare these with the ongoing costs of investing in other mutual funds.
The first line in the table of each class of fund shares shows the actual account values and actual fund expenses you would have paid on a $1,000 investment in the fund from July 1, 2013 through December 31, 2013. To estimate the expenses you paid over the period, simply divide your account value by $1,000 (for example $8,600 account value divided by $1,000 = 8.60) and multiply the result by the number in the Expenses Paid During Period column as shown for your class.
The second line in the table for each class of fund shares provides information about hypothetical account values and hypothetical expenses based on the fund’s actual expense ratios and an assumed rate of return of 5% per year before expenses, which is not the fund’s actual return. The hypothetical account values and expenses may not be used to estimate the actual ending account balance or expenses you paid on your investment for the period. You may use this information to compare the ongoing costs of investing in the fund and other funds. To do so, compare this 5% hypothetical example with the 5% hypothetical examples that appear in the shareholder reports of the other funds.
Please note that the expenses shown reflect ongoing costs only, and do not include any transaction costs, such as sales charges. Therefore, the second line in the table of each fund is useful in comparing ongoing costs only, and will not help you determine the relative costs of owning different funds. If transaction costs were included, total costs would be higher.
| | | | | | | | | | | | |
| CGM ADVISOR TARGETED EQUITY FUND | | BEGINNING
ACCOUNT VALUE
7/1/2013 | | | ENDING
ACCOUNT VALUE
12/31/2013 | | | EXPENSES PAID
DURING PERIOD*
7/1/2013 – 12/31/2013 | |
Class A | | | | | | | | | | | | |
Actual | | | $1,000.00 | | | | $1,128.00 | | | | $6.33 | |
Hypothetical (5% return before expenses) | | | $1,000.00 | | | | $1,019.26 | | | | $6.01 | |
Class B | | | | | | | | | | | | |
Actual | | | $1,000.00 | | | | $1,123.40 | | | | $10.28 | |
Hypothetical (5% return before expenses) | | | $1,000.00 | | | | $1,015.53 | | | | $9.75 | |
Class C | | | | | | | | | | | | |
Actual | | | $1,000.00 | | | | $1,124.20 | | | | $10.33 | |
Hypothetical (5% return before expenses) | | | $1,000.00 | | | | $1,015.48 | | | | $9.80 | |
Class Y | | | | | | | | | | | | |
Actual | | | $1,000.00 | | | | $1,129.70 | | | | $4.99 | |
Hypothetical (5% return before expenses) | | | $1,000.00 | | | | $1,020.52 | | | | $4.74 | |
| * | Expenses are equal to the Fund's annualized expense ratio: 1.18%, 1.92%, 1.93% and 0.93% for Class A, B, C and Y, respectively, multiplied by the average account value over the period, multiplied by the number of days in the most recent fiscal half-year (184), divided by 365 (to reflect the half-year period). |
21 |
| | | | | | | | | | | | |
| HARRIS ASSOCIATES LARGE CAP VALUE FUND | | BEGINNING
ACCOUNT VALUE
7/1/2013 | | | ENDING
ACCOUNT VALUE
12/31/2013 | | | EXPENSES PAID
DURING PERIOD*
7/1/2013 – 12/31/2013 | |
Class A | | | | | | | | | | | | |
Actual | | | $1,000.00 | | | | $1,192.20 | | | | $7.18 | |
Hypothetical (5% return before expenses) | | | $1,000.00 | | | | $1,018.65 | | | | $6.61 | |
Class B | | | | | | | | | | | | |
Actual | | | $1,000.00 | | | | $1,187.30 | | | | $11.30 | |
Hypothetical (5% return before expenses) | | | $1,000.00 | | | | $1,014.87 | | | | $10.41 | |
Class C | | | | | | | | | | | | |
Actual | | | $1,000.00 | | | | $1,187.60 | | | | $11.30 | |
Hypothetical (5% return before expenses) | | | $1,000.00 | | | | $1,014.87 | | | | $10.41 | |
Class Y | | | | | | | | | | | | |
Actual | | | $1,000.00 | | | | $1,193.40 | | | | $5.80 | |
Hypothetical (5% return before expenses) | | | $1,000.00 | | | | $1,019.91 | | | | $5.35 | |
| * | Expenses are equal to the Fund's annualized expense ratio: 1.30%, 2.05%, 2.05% and 1.05% for Class A, B, C and Y, respectively, multiplied by the average account value over the period, multiplied by the number of days in the most recent fiscal half-year (184), divided by 365 (to reflect the half-year period). |
| | | | | | | | | | | | |
| NATIXIS OAKMARK INTERNATIONAL FUND | | BEGINNING
ACCOUNT VALUE
7/1/2013 | | | ENDING
ACCOUNT VALUE
12/31/2013 | | | EXPENSES PAID
DURING PERIOD*
7/1/2013 – 12/31/2013 | |
Class A | | | | | | | | | | | | |
Actual | | | $1,000.00 | | | | $1,179.00 | | | | $7.91 | |
Hypothetical (5% return before expenses) | | | $1,000.00 | | | | $1,017.95 | | | | $7.32 | |
Class C | | | | | | | | | | | | |
Actual | | | $1,000.00 | | | | $1,174.90 | | | | $12.01 | |
Hypothetical (5% return before expenses) | | | $1,000.00 | | | | $1,014.17 | | | | $11.12 | |
| * | Expenses are equal to the Fund’s annualized expense ratio: 1.44% and 2.19% for Class A and C, respectively, multiplied by the average account value over the period, multiplied by the number of days in the most recent fiscal half-year (184), divided by 365 (to reflect the half-year period). |
| 22
| | | | | | | | | | | | |
| VAUGHAN NELSON SMALL CAP VALUE FUND | | BEGINNING
ACCOUNT VALUE
7/1/2013 | | | ENDING
ACCOUNT VALUE
12/31/2013 | | | EXPENSES PAID
DURING PERIOD*
7/1/2013 – 12/31/2013 | |
Class A | | | | | | | | | | | | |
Actual | | | $1,000.00 | | | | $1,191.90 | | | | $7.62 | |
Hypothetical (5% return before expenses) | | | $1,000.00 | | | | $1,018.25 | | | | $7.02 | |
Class B | | | | | | | | | | | | |
Actual | | | $1,000.00 | | | | $1,188.00 | | | | $11.75 | |
Hypothetical (5% return before expenses) | | | $1,000.00 | | | | $1,014.47 | | | | $10.82 | |
Class C | | | | | | | | | | | | |
Actual | | | $1,000.00 | | | | $1,187.50 | | | | $11.74 | |
Hypothetical (5% return before expenses) | | | $1,000.00 | | | | $1,014.47 | | | | $10.82 | |
Class Y | | | | | | | | | | | | |
Actual | | | $1,000.00 | | | | $1,193.60 | | | | $6.25 | |
Hypothetical (5% return before expenses) | | | $1,000.00 | | | | $1,019.51 | | | | $5.75 | |
| * | Expenses are equal to the Fund's annualized expense ratio: 1.38%, 2.13%, 2.13% and 1.13% for Class A, B, C and Y, respectively, multiplied by the average account value over the period, multiplied by the number of days in the most recent fiscal half-year (184), divided by 365 (to reflect the half-year period). |
| | | | | | | | | | | | |
| VAUGHAN NELSON VALUE OPPORTUNITY FUND | | BEGINNING
ACCOUNT VALUE
7/1/2013 | | | ENDING
ACCOUNT VALUE
12/31/2013 | | | EXPENSES PAID
DURING PERIOD*
7/1/2013 – 12/31/2013 | |
Class A | | | | | | | | | | | | |
Actual | | | $1,000.00 | | | | $1,190.40 | | | | $7.01 | |
Hypothetical (5% return before expenses) | | | $1,000.00 | | | | $1,018.80 | | | | $6.46 | |
Class C | | | | | | | | | | | | |
Actual | | | $1,000.00 | | | | $1,185.60 | | | | $11.13 | |
Hypothetical (5% return before expenses) | | | $1,000.00 | | | | $1,015.02 | | | | $10.26 | |
Class N | | | | | | | | | | | | |
Actual | | | $1,000.00 | | | | $1,191.30 | | | | $5.63 | |
Hypothetical (5% return before expenses) | | | $1,000.00 | | | | $1,020.06 | | | | $5.19 | |
Class Y | | | | | | | | | | | | |
Actual | | | $1,000.00 | | | | $1,191.90 | | | | $5.64 | |
Hypothetical (5% return before expenses) | | | $1,000.00 | | | | $1,020.06 | | | | $5.19 | |
| * | Expenses are equal to the Fund's annualized expense ratio (after waiver/reimbursement): 1.27%, 2.02%, 1.02% and 1.02% for Class A, C, N and Y, respectively, multiplied by the average account value over the period, multiplied by the number of days in the most recent fiscal half-year (184), divided by 365 (to reflect the half-year period). |
23 |
Portfolio of Investments – as of December 31, 2013
CGM Advisor Targeted Equity Fund
| | | | | | | | |
Shares | | | Description | | Value (†) | |
| | Common Stocks — 99.3% of Net Assets | | | | |
| | | | Aerospace & Defense — 1.3% | | | | |
| | 55,000 | | | Boeing Co. (The) | | $ | 7,506,950 | |
| | | | | | | | |
| | | | Airlines — 4.7% | | | | |
| | 990,000 | | | Delta Air Lines, Inc. | | | 27,195,300 | |
| | | | | | | | |
| | | | Automobiles — 8.7% | | | | |
| | 800,000 | | | General Motors Co.(b) | | | 32,696,000 | |
| | 145,000 | | | Toyota Motor Corp., Sponsored ADR | | | 17,678,400 | |
| | | | | | | | |
| | | | | | | 50,374,400 | |
| | | | | | | | |
| | | | Capital Markets — 17.4% | | | | |
| | 89,000 | | | BlackRock, Inc. | | | 28,165,830 | |
| | 2,330,000 | | | Morgan Stanley | | | 73,068,800 | |
| | | | | | | | |
| | | | | | | 101,234,630 | |
| | | | | | | | |
| | | | Computers & Peripherals — 5.5% | | | | |
| | 380,000 | | | Western Digital Corp. | | | 31,882,000 | |
| | | | | | | | |
| | | | Diversified Financial Services — 6.9% | | | | |
| | 765,000 | | | Citigroup, Inc. | | | 39,864,150 | |
| | | | | | | | |
| | | | Hotels, Restaurants & Leisure — 5.3% | | | | |
| | 160,000 | | | Wynn Resorts Ltd. | | | 31,073,600 | |
| | | | | | | | |
| | | | Household Durables — 17.0% | | | | |
| | 1,470,000 | | | DR Horton, Inc. | | | 32,810,400 | |
| | 810,000 | | | Lennar Corp., Class A | | | 32,043,600 | |
| | 920,000 | | | Toll Brothers, Inc.(b) | | | 34,040,000 | |
| | | | | | | | |
| | | | | | | 98,894,000 | |
| | | | | | | | |
| | | | Insurance — 4.8% | | | | |
| | 305,000 | | | Prudential Financial, Inc. | | | 28,127,100 | |
| | | | | | | | |
| | | | Internet & Catalog Retail — 5.3% | | | | |
| | 26,600 | | | priceline.com, Inc.(b) | | | 30,919,840 | |
| | | | | | | | |
| | | | Internet Software & Services — 5.8% | | | | |
| | 30,300 | | | Google, Inc., Class A(b) | | | 33,957,513 | |
| | | | | | | | |
| | | | IT Services — 7.2% | | | | |
| | 29,000 | | | MasterCard, Inc., Class A | | | 24,228,340 | |
| | 80,000 | | | Visa, Inc., Class A | | | 17,814,400 | |
| | | | | | | | |
| | | | | | | 42,042,740 | |
| | | | | | | | |
| | | | Semiconductors & Semiconductor Equipment — 4.5% | | | | |
| | 1,200,000 | | | Micron Technology, Inc.(b) | | | 26,112,000 | |
| | | | | | | | |
| | | | Tobacco — 4.9% | | | | |
| | 565,000 | | | Lorillard, Inc. | | | 28,634,200 | |
| | | | | | | | |
| | | | Total Common Stocks
(Identified Cost $486,204,657) | | | 577,818,423 | |
| | | | | | | | |
See accompanying notes to financial statements.
| 24
Portfolio of Investments – as of December 31, 2013
CGM Advisor Targeted Equity Fund – (continued)
| | | | | | | | |
Principal
Amount | | | Description | | Value (†) | |
| | Short-Term Investments — 1.8% | | | | |
| $ | 10,675,000 | | | Tri-Party Repurchase Agreement with Fixed Income Clearing Corporation, dated 12/31/2013 at 0.000% to be repurchased at $10,675,000 on 1/02/2014 collateralized by $10,075,000 U.S. Treasury Note, 3.250% due 7/31/2016 valued at $10,893,594 including accrued interest (Note 2 of Notes to Financial Statements) (Identified Cost $10,675,000) | | $ | 10,675,000 | |
| | | | | | | | |
| | | | Total Investments — 101.1%
(Identified Cost $496,879,657)(a) | | | 588,493,423 | |
| | | | Other assets less liabilities — (1.1)% | | | (6,672,741 | ) |
| | | | | | | | |
| | | | Net Assets — 100.0% | | $ | 581,820,682 | |
| | | | | | | | |
| | | | | | | | |
| | (†) | | | See Note 2 of Notes to Financial Statements. | | | | |
| | (a) | | | Federal Tax Information: | | | | |
| | | | At December 31, 2013, the net unrealized appreciation on investments based on a cost of $497,291,038 for federal income tax purposes was as follows: | | | | |
| | | | Aggregate gross unrealized appreciation for all investments in which there is an excess of value over tax cost | | $ | 91,657,972 | |
| | | | Aggregate gross unrealized depreciation for all investments in which there is an excess of tax cost over value | | | (455,587 | ) |
| | | | | | | | |
| | | | Net unrealized appreciation | | $ | 91,202,385 | |
| | | | | | | | |
| | (b) | | | Non-income producing security. | | | | |
| | | | | | | | |
| | ADR | | | An American Depositary Receipt is a certificate issued by a custodian bank representing the right to receive securities of the foreign issuer described. The values of ADRs may be significantly influenced by trading on exchanges not located in the United States. | |
Industry Summary at December 31, 2013 (Unaudited)
| | | | |
Capital Markets | | | 17.4 | % |
Household Durables | | | 17.0 | |
Automobiles | | | 8.7 | |
IT Services | | | 7.2 | |
Diversified Financial Services | | | 6.9 | |
Internet Software & Services | | | 5.8 | |
Computers & Peripherals | | | 5.5 | |
Hotels, Restaurants & Leisure | | | 5.3 | |
Internet & Catalog Retail | | | 5.3 | |
Tobacco | | | 4.9 | |
Insurance | | | 4.8 | |
Airlines | | | 4.7 | |
Semiconductors & Semiconductor Equipment | | | 4.5 | |
Other Investments, less than 2% each | | | 1.3 | |
Short-Term Investments | | | 1.8 | |
| | | | |
Total Investments | | | 101.1 | |
Other assets less liabilities | | | (1.1 | ) |
| | | | |
Net Assets | | | 100.0 | % |
| | | | |
See accompanying notes to financial statements.
25 |
Portfolio of Investments – as of December 31, 2013
Harris Associates Large Cap Value Fund
| | | | | | | | |
Shares | | | Description | | Value (†) | |
| | Common Stocks — 95.2% of Net Assets | | | | |
| | | | Air Freight & Logistics — 3.6% | | | | |
| | 41,900 | | | FedEx Corp. | | $ | 6,023,963 | |
| | | | | | | | |
| | | | Auto Components — 6.0% | | | | |
| | 33,800 | | | Autoliv, Inc. | | | 3,102,840 | |
| | 70,500 | | | Delphi Automotive PLC | | | 4,239,165 | |
| | 37,200 | | | TRW Automotive Holdings Corp.(b) | | | 2,767,308 | |
| | | | | | | | |
| | | | | | | 10,109,313 | |
| | | | | | | | |
| | | | Automobiles — 4.1% | | | | |
| | 167,900 | | | General Motors Co.(b) | | | 6,862,073 | |
| | | | | | | | |
| | | | Capital Markets — 8.8% | | | | |
| | 14,000 | | | BlackRock, Inc. | | | 4,430,580 | |
| | 89,600 | | | Franklin Resources, Inc. | | | 5,172,608 | |
| | 29,500 | | | Goldman Sachs Group, Inc. (The) | | | 5,229,170 | |
| | | | | | | | |
| | | | | | | 14,832,358 | |
| | | | | | | | |
| | | | Commercial Banks — 6.7% | | | | |
| | 76,600 | | | US Bancorp | | | 3,094,640 | |
| | 180,100 | | | Wells Fargo & Co. | | | 8,176,540 | |
| | | | | | | | |
| | | | | | | 11,271,180 | |
| | | | | | | | |
| | | | Consumer Finance — 2.4% | | | | |
| | 53,400 | | | Capital One Financial Corp. | | | 4,090,974 | |
| | | | | | | | |
| | | | Diversified Financial Services — 3.9% | | | | |
| | 113,800 | | | JPMorgan Chase & Co. | | | 6,655,024 | |
| | | | | | | | |
| | | | Electrical Equipment — 0.8% | | | | |
| | 10,800 | | | Rockwell Automation, Inc. | | | 1,276,128 | |
| | | | | | | | |
| | | | Energy Equipment & Services — 2.8% | | | | |
| | 60,500 | | | National Oilwell Varco, Inc. | | | 4,811,565 | |
| | | | | | | | |
| | | | Food Products — 1.8% | | | | |
| | 74,300 | | | Unilever PLC, Sponsored ADR | | | 3,061,160 | |
| | | | | | | | |
| | | | Health Care Equipment & Supplies — 1.0% | | | | |
| | 29,200 | | | Medtronic, Inc. | | | 1,675,788 | |
| | | | | | | | |
| | | | Hotels, Restaurants & Leisure — 6.2% | | | | |
| | 111,600 | | | Marriott International, Inc., Class A | | | 5,508,576 | |
| | 27,000 | | | McDonald’s Corp. | | | 2,619,810 | |
| | 29,900 | | | Starwood Hotels & Resorts Worldwide, Inc. | | | 2,375,555 | |
| | | | | | | | |
| | | | | | | 10,503,941 | |
| | | | | | | | |
| | | | Insurance — 6.8% | | | | |
| | 127,400 | | | American International Group, Inc. | | | 6,503,770 | |
| | 60,400 | | | Aon PLC | | | 5,066,956 | |
| | | | | | | | |
| | | | | | | 11,570,726 | |
| | | | | | | | |
| | | | Internet Software & Services — 1.1% | | | | |
| | 1,700 | | | Google, Inc., Class A(b) | | | 1,905,207 | |
| | | | | | | | |
See accompanying notes to financial statements.
| 26
Portfolio of Investments – as of December 31, 2013
Harris Associates Large Cap Value Fund – (continued)
| | | | | | | | |
Shares | | | Description | | Value (†) | |
| | | | IT Services — 5.2% | | | | |
| | 5,400 | | | MasterCard, Inc., Class A | | $ | 4,511,484 | |
| | 19,200 | | | Visa, Inc., Class A | | | 4,275,456 | |
| | | | | | | | |
| | | | | | | 8,786,940 | |
| | | | | | | | |
| | | | Machinery — 6.2% | | | | |
| | 28,600 | | | Caterpillar, Inc. | | | 2,597,166 | |
| | 18,100 | | | Cummins, Inc. | | | 2,551,557 | |
| | 64,700 | | | Illinois Tool Works, Inc. | | | 5,439,976 | |
| | | | | | | | |
| | | | | | | 10,588,699 | |
| | | | | | | | |
| | | | Media — 4.1% | | | | |
| | 83,800 | | | Comcast Corp., Special Class A | | | 4,179,944 | |
| | 37,200 | | | Omnicom Group, Inc. | | | 2,766,564 | |
| | | | | | | | |
| | | | | | | 6,946,508 | |
| | | | | | | | |
| | | | Multiline Retail — 1.1% | | | | |
| | 29,600 | | | Family Dollar Stores, Inc. | | | 1,923,112 | |
| | | | | | | | |
| | | | Oil, Gas & Consumable Fuels — 2.1% | | | | |
| | 35,300 | | | ExxonMobil Corp. | | | 3,572,360 | |
| | | | | | | | |
| | | | Road & Rail — 2.4% | | | | |
| | 23,900 | | | Union Pacific Corp. | | | 4,015,200 | |
| | | | | | | | |
| | | | Semiconductors & Semiconductor Equipment — 9.2% | | | | |
| | 301,400 | | | Applied Materials, Inc. | | | 5,331,766 | |
| | 242,100 | | | Intel Corp. | | | 6,284,916 | |
| | 57,000 | | | Lam Research Corp.(b) | | | 3,103,650 | |
| | 19,200 | | | Texas Instruments, Inc. | | | 843,072 | |
| | | | | | | | |
| | | | | | | 15,563,404 | |
| | | | | | | | |
| | | | Software — 3.6% | | | | |
| | 160,200 | | | Oracle Corp. | | | 6,129,252 | |
| | | | | | | | |
| | | | Specialty Retail — 4.2% | | | | |
| | 28,600 | | | Advance Auto Parts, Inc. | | | 3,165,448 | |
| | 29,900 | | | CarMax, Inc.(b) | | | 1,405,898 | |
| | 28,200 | | | Tiffany & Co. | | | 2,616,396 | |
| | | | | | | | |
| | | | | | | 7,187,742 | |
| | | | | | | | |
| | | | Textiles, Apparel & Luxury Goods — 1.1% | | | | |
| | 23,500 | | | NIKE, Inc., Class B | | | 1,848,040 | |
| | | | | | | | |
| | | | Total Common Stocks (Identified Cost $107,796,432) | | | 161,210,657 | |
| | | | | | | | |
Principal
Amount | | | | | | |
| | Short-Term Investments — 4.8% | | | | |
| $ | 8,230,632 | | | Tri-Party Repurchase Agreement with Fixed Income Clearing Corporation, dated 12/31/2013 at 0.000% to be repurchased at $8,230,632 on 1/02/2014 collateralized by $8,505,000 U.S. Treasury Note, 0.625% due 5/31/2017 valued at $8,399,079 including accrued interest (Note 2 of Notes to Financial Statements) (Identified Cost $8,230,632) | | | 8,230,632 | |
| | | | | | | | |
See accompanying notes to financial statements.
27 |
Portfolio of Investments – as of December 31, 2013
Harris Associates Large Cap Value Fund – (continued)
| | | | | | |
| | | Description | | Value (†) | |
| | Total Investments — 100.0% (Identified Cost $116,027,064)(a) | | $ | 169,441,289 | |
| | Other assets less liabilities — (0.0)% | | | (38,909 | ) |
| | | | | | |
| | Net Assets — 100.0% | | $ | 169,402,380 | |
| | | | | | |
| (†) | | See Note 2 of Notes to Financial Statements. | | | | |
| (a) | | Federal Tax Information: | | | | |
| | At December 31, 2013, the net unrealized appreciation on investments based on a cost of $116,679,438 for federal income tax purposes was as follows: | | | | |
| | Aggregate gross unrealized appreciation for all investments in which there is an excess of value over tax cost | | $ | 52,761,851 | |
| | Aggregate gross unrealized depreciation for all investments in which there is an excess of tax cost over value | | | — | |
| | | | | | |
| | Net unrealized appreciation | | $ | 52,761,851 | |
| | | | | | |
| (b) | | Non-income producing security. | | | | |
| | | | | | |
| ADR | | An American Depositary Receipt is a certificate issued by a custodian bank representing the right to receive securities of the foreign issuer described. The values of ADRs may be significantly influenced by trading on exchanges not located in the United States. | | | | |
Industry Summary at December 31, 2013 (Unaudited)
| | | | |
Semiconductors & Semiconductor Equipment | | | 9.2 | % |
Capital Markets | | | 8.8 | |
Insurance | | | 6.8 | |
Commercial Banks | | | 6.7 | |
Machinery | | | 6.2 | |
Hotels, Restaurants & Leisure | | | 6.2 | |
Auto Components | | | 6.0 | |
IT Services | | | 5.2 | |
Specialty Retail | | | 4.2 | |
Media | | | 4.1 | |
Automobiles | | | 4.1 | |
Diversified Financial Services | | | 3.9 | |
Software | | | 3.6 | |
Air Freight & Logistics | | | 3.6 | |
Energy Equipment & Services | | | 2.8 | |
Consumer Finance | | | 2.4 | |
Road & Rail | | | 2.4 | |
Oil, Gas & Consumable Fuels | | | 2.1 | |
Other Investments, less than 2% each | | | 6.9 | |
Short-Term Investments | | | 4.8 | |
| | | | |
Total Investments | | | 100.0 | |
Other assets less liabilities | | | (0.0 | ) |
| | | | |
Net Assets | | | 100.0 | % |
| | | | |
See accompanying notes to financial statements.
| 28
Portfolio of Investments – as of December 31, 2013
Natixis Oakmark International Fund
| | | | | | | | |
Shares | | | Description | | Value (†) | |
| | Common Stocks — 91.7% of Net Assets | | | | |
| | | | Australia — 4.9% | | | | |
| | 3,102,168 | | | AMP Ltd. | | $ | 12,192,845 | |
| | 682,390 | | | Orica Ltd. | | | 14,592,039 | |
| | | | | | | | |
| | | | | | | 26,784,884 | |
| | | | | | | | |
| | | | Canada — 1.0% | | | | |
| | 153,000 | | | Thomson Reuters Corp. | | | 5,785,841 | |
| | | | | | | | |
| | | | France — 14.3% | | | | |
| | 228,842 | | | BNP Paribas S.A. | | | 17,851,335 | |
| | 23,500 | | | Christian Dior S.A. | | | 4,448,101 | |
| | 153,600 | | | Danone S.A. | | | 11,080,988 | |
| | 69,350 | | | Kering | | | 14,659,233 | |
| | 57,200 | | | LVMH Moet Hennessy Louis Vuitton S.A. | | | 10,450,092 | |
| | 99,800 | | | Pernod-Ricard S.A. | | | 11,370,326 | |
| | 51,729 | | | Publicis Groupe S.A. | | | 4,739,681 | |
| | 38,400 | | | Sanofi | | | 4,100,920 | |
| | | | | | | | |
| | | | | | | 78,700,676 | |
| | | | | | | | |
| | | | Germany — 11.0% | | | | |
| | 107,930 | | | Allianz SE, (Registered) | | | 19,419,376 | |
| | 110,000 | | | Bayerische Motoren Werke AG | | | 12,917,591 | |
| | 9,400 | | | Continental AG | | | 2,065,079 | |
| | 193,100 | | | Daimler AG, (Registered) | | | 16,758,072 | |
| | 107,000 | | | SAP AG | | | 9,279,206 | |
| | | | | | | | |
| | | | | | | 60,439,324 | |
| | | | | | | | |
| | | | Ireland — 2.0% | | | | |
| | 607,200 | | | Experian PLC | | | 11,216,412 | |
| | | | | | | | |
| | | | Israel — 0.8% | | | | |
| | 71,900 | | | Check Point Software Technologies Ltd.(b) | | | 4,638,988 | |
| | | | | | | | |
| | | | Italy — 3.4% | | | | |
| | 7,711,500 | | | Intesa Sanpaolo SpA | | | 18,967,973 | |
| | | | | | | | |
| | | | Japan — 11.1% | | | | |
| | 477,500 | | | Canon, Inc. | | | 15,236,259 | |
| | 1,163,000 | | | Daiwa Securities Group, Inc. | | | 11,648,073 | |
| | 3,500 | | | FANUC Corp. | | | 641,342 | |
| | 243,200 | | | Honda Motor Co. Ltd. | | | 10,038,591 | |
| | 30,000 | | | Meitec Corp. | | | 813,296 | |
| | 265,000 | | | Olympus Corp.(b) | | | 8,404,936 | |
| | 4,800 | | | Omron Corp. | | | 212,128 | |
| | 11,700 | | | Secom Co. Ltd. | | | 705,919 | |
| | 223,800 | | | Toyota Motor Corp. | | | 13,646,219 | |
| | | | | | | | |
| | | | | | | 61,346,763 | |
| | | | | | | | |
| | | | Korea — 1.0% | | | | |
| | 4,400 | | | Samsung Electronics Co. Ltd. | | | 5,733,407 | |
| | | | | | | | |
| | | | Netherlands — 7.3% | | | | |
| | 72,994 | | | Akzo Nobel NV | | | 5,660,385 | |
| | 1,299,400 | | | CNH Industrial NV(b) | | | 14,810,131 | |
| | 111,200 | | | Heineken Holding NV | | | 7,038,932 | |
See accompanying notes to financial statements.
29 |
Portfolio of Investments – as of December 31, 2013
Natixis Oakmark International Fund – (continued)
| | | | | | | | |
Shares | | | Description | | Value (†) | |
| | | | Netherlands — continued | | | | |
| | 306,200 | | | Koninklijke Ahold NV | | $ | 5,502,761 | |
| | 195,089 | | | Koninklijke Philips Electronics | | | 7,183,402 | |
| | | | | | | | |
| | | | | | | 40,195,611 | |
| | | | | | | | |
| | | | Sweden — 4.1% | | | | |
| | 295,600 | | | Atlas Copco AB, Series B | | | 7,514,537 | |
| | 141,300 | | | Hennes & Mauritz AB, Series B | | | 6,507,775 | |
| | 322,800 | | | SKF AB, Series B | | | 8,465,554 | |
| | | | | | | | |
| | | | | | | 22,487,866 | |
| | | | | | | | |
| | | | Switzerland — 16.3% | | | | |
| | 89,900 | | | Adecco S.A., (Registered) | | | 7,136,862 | |
| | 115,200 | | | Cie Financiere Richemont S.A., (Registered) | | | 11,508,179 | |
| | 837,958 | | | Credit Suisse Group AG, (Registered) | | | 25,862,194 | |
| | 625 | | | Geberit AG, (Registered) | | | 189,613 | |
| | 3,580 | | | Givaudan S.A., (Registered) | | | 5,121,422 | |
| | 178,600 | | | Holcim Ltd., (Registered) | | | 13,352,964 | |
| | 83,300 | | | Kuehne & Nagel International AG, (Registered) | | | 10,948,898 | |
| | 145,500 | | | Nestle S.A., (Registered) | | | 10,663,698 | |
| | 61,200 | | | Novartis AG, (Registered) | | | 4,905,137 | |
| | 1,800 | | | Schindler Holding AG | | | 264,985 | |
| | | | | | | | |
| | | | | | | 89,953,952 | |
| | | | | | | | |
| | | | United Kingdom — 14.3% | | | | |
| | 383,400 | | | Diageo PLC | | | 12,705,329 | |
| | 393,800 | | | GlaxoSmithKline PLC | | | 10,521,339 | |
| | 9,820,300 | | | Lloyds Banking Group PLC(b) | | | 12,886,063 | |
| | 193,500 | | | Schroders PLC | | | 8,345,512 | |
| | 100 | | | Schroders PLC, (Non Voting) | | | 3,346 | |
| | 300,000 | | | Smiths Group PLC | | | 7,366,681 | |
| | 2,405,300 | | | Tesco PLC | | | 13,357,430 | |
| | 270,300 | | | Willis Group Holdings PLC | | | 12,112,143 | |
| | 10,796 | | | Wolseley PLC | | | 613,787 | |
| | 44,200 | | | WPP PLC | | | 1,012,354 | |
| | | | | | | | |
| | | | | | | 78,923,984 | |
| | | | | | | | |
| | | | United States — 0.2% | | | | |
| | 14,900 | | | Signet Jewelers Ltd. | | | 1,172,630 | |
| | | | | | | | |
| | | | Total Common Stocks (Identified Cost $462,251,426) | | | 506,348,311 | |
| | | | | | | | |
Principal
Amount | | | | | | |
| | Short-Term Investments — 9.3% | | | | |
| $ | 51,123,893 | | | Tri-Party Repurchase Agreement with Fixed Income Clearing Corporation, dated 12/31/2013 at 0.000% to be repurchased at $51,123,893 on 01/02/2014 collateralized by $48,230,000 U.S. Treasury Note, 3.250% due 7/31/2016 valued at $52,148,688 including accrued interest (Note 2 of Notes to Financial Statements) (Identified Cost $51,123,893) | | | 51,123,893 | |
| | | | | | | | |
| | | | Total Investments — 101.0% (Identified Cost $513,375,319)(a) | | | 557,472,204 | |
| | | | Other assets less liabilities — (1.0)% | | | (5,643,904 | ) |
| | | | | | | | |
| | | | Net Assets — 100.0% | | $ | 551,828,300 | |
| | | | | | | | |
See accompanying notes to financial statements.
| 30
Portfolio of Investments – as of December 31, 2013
Natixis Oakmark International Fund – (continued)
| | | | | | | | |
| | (†) | | | See Note 2 of Notes to Financial Statements. | | | | |
| | (a) | | | Federal Tax Information: | | | | |
| | | | At December 31, 2013, the net unrealized appreciation on investments based on a cost of $514,843,814 for federal income tax purposes was as follows: | | | | |
| | | | Aggregate gross unrealized appreciation for all investments in which there is an excess of value over tax cost | | $ | 45,828,169 | |
| | | | Aggregate gross unrealized depreciation for all investments in which there is an excess of tax cost over value | | | (3,199,779 | ) |
| | | | | | | | |
| | | | Net unrealized appreciation | | $ | 42,628,390 | |
| | | | | | | | |
| | (b) | | | Non-income producing security. | | | | |
At December 31, 2013, the Fund had the following open forward foreign currency contracts:
| | | | | | | | | | | | | | | | | | |
Contract to Buy/Sell1 | | Delivery
Date | | | Currency | | Units of
Currency | | | Notional
Value | | | Unrealized
Appreciation
(Depreciation) | |
| Sell | | | 9/17/2014 | | | Australian Dollar | | | 9,100,000 | | | $ | 7,989,760 | | | $ | 19,150 | |
| Sell | | | 6/18/2014 | | | Swedish Krona | | | 6,700,000 | | | | 1,038,784 | | | | 8 | |
| Sell | | | 6/18/2014 | | | Swedish Krona | | | 37,200,000 | | | | 5,767,574 | | | | (93,349 | ) |
| Sell | | | 3/19/2014 | | | Swiss Franc | | | 500,000 | | | | 560,838 | | | | 1,212 | |
| Sell | | | 3/19/2014 | | | Swiss Franc | | | 24,390,000 | | | | 27,357,694 | | | | (653,369 | ) |
| | | | | | | | | | | | | | | | | | |
| Total | | | | | | | | | | | | | | | | $ | (726,348 | ) |
| | | | | | | | | | | | | | | | | | |
1Counterparty is State Street Bank and Trust Company.
Industry Summary at December 31, 2013 (Unaudited)
| | | | |
Automobiles | | | 9.7 | % |
Commercial Banks | | | 9.0 | |
Capital Markets | | | 8.3 | |
Insurance | | | 7.9 | |
Textiles, Apparel & Luxury Goods | | | 7.5 | |
Machinery | | | 5.8 | |
Beverages | | | 5.7 | |
Chemicals | | | 4.6 | |
Food Products | | | 3.9 | |
Pharmaceuticals | | | 3.5 | |
Professional Services | | | 3.5 | |
Food & Staples Retailing | | | 3.4 | |
Office Electronics | | | 2.8 | |
Industrial Conglomerates | | | 2.6 | |
Software | | | 2.5 | |
Construction Materials | | | 2.4 | |
Media | | | 2.1 | |
Marine | | | 2.0 | |
Other Investments, less than 2% each | | | 4.5 | |
Short-Term Investments | | | 9.3 | |
| | | | |
Total Investments | | | 101.0 | |
Other assets less liabilities (including open forward foreign currency contracts) | | | (1.0 | ) |
| | | | |
Net Assets | | | 100.0 | % |
| | | | |
See accompanying notes to financial statements.
31 |
Portfolio of Investments – as of December 31, 2013
Natixis Oakmark International Fund – (continued)
Currency Exposure Summary at December 31, 2013 (Unaudited)
| | | | |
Euro | | | 36.0 | % |
Swiss Franc | | | 16.3 | |
British Pound | | | 14.1 | |
United States Dollar | | | 12.5 | |
Japanese Yen | | | 11.1 | |
Australian Dollar | | | 4.9 | |
Swedish Krona | | | 4.1 | |
Other, less than 2% each | | | 2.0 | |
| | | | |
Total Investments | | | 101.0 | |
Other assets less liabilities (including open forward foreign currency contracts) | | | (1.0 | ) |
| | | | |
Net Assets | | | 100.0 | % |
| | | | |
See accompanying notes to financial statements.
| 32
Portfolio of Investments – as of December 31, 2013
Vaughan Nelson Small Cap Value Fund
| | | | | | | | |
Shares | | | Description | | Value (†) | |
| | Common Stocks — 96.3% of Net Assets | | | | |
| | | | Aerospace & Defense — 1.5% | | | | |
| | 52,325 | | | Esterline Technologies Corp.(b) | | $ | 5,335,057 | |
| | | | | | | | |
| | | | Building Products — 1.6% | | | | |
| | 65,700 | | | Lennox International, Inc. | | | 5,588,442 | |
| | | | | | | | |
| | | | Capital Markets — 2.9% | | | | |
| | 158,650 | | | LPL Financial Holdings, Inc. | | | 7,461,309 | |
| | 162,725 | | | TCP Capital Corp. | | | 2,730,526 | |
| | | | | | | | |
| | | | | | | 10,191,835 | |
| | | | | | | | |
| | | | Commercial Banks — 10.6% | | | | |
| | 122,400 | | | Associated Banc-Corp | | | 2,129,760 | |
| | 144,425 | | | Capital Bank Financial Corp., Class A(b) | | | 3,285,669 | |
| | 391,730 | | | FirstMerit Corp. | | | 8,708,158 | |
| | 138,800 | | | Fulton Financial Corp. | | | 1,815,504 | |
| | 108,750 | | | Hancock Holding Co. | | | 3,988,950 | |
| | 104,375 | | | Prosperity Bancshares, Inc. | | | 6,616,331 | |
| | 116,550 | | | Union First Market Bankshares Corp. | | | 2,891,605 | |
| | 241,800 | | | Webster Financial Corp. | | | 7,539,324 | |
| | | | | | | | |
| | | | | | | 36,975,301 | |
| | | | | | | | |
| | | | Commercial Services & Supplies — 2.4% | | | | |
| | 236,625 | | | KAR Auction Services, Inc. | | | 6,992,269 | |
| | 36,400 | | | McGrath Rentcorp | | | 1,448,720 | |
| | | | | | | | |
| | | | | | | 8,440,989 | |
| | | | | | | | |
| | | | Communications Equipment — 0.5% | | | | |
| | 127,450 | | | Ixia(b) | | | 1,696,360 | |
| | | | | | | | |
| | | | Construction & Engineering — 1.7% | | | | |
| | 186,325 | | | MasTec, Inc.(b) | | | 6,096,554 | |
| | | | | | | | |
| | | | Consumer Finance — 1.2% | | | | |
| | 70,250 | | | First Cash Financial Services, Inc.(b) | | | 4,344,260 | |
| | | | | | | | |
| | | | Containers & Packaging — 4.7% | | | | |
| | 590,225 | | | Graphic Packaging Holding Co.(b) | | | 5,666,160 | |
| | 71,225 | | | Packaging Corp. of America | | | 4,507,118 | |
| | 128,375 | | | Silgan Holdings, Inc. | | | 6,164,567 | |
| | | | | | | | |
| | | | | | | 16,337,845 | |
| | | | | | | | |
| | | | Diversified Consumer Services — 1.4% | | | | |
| | 165,275 | | | Hillenbrand, Inc. | | | 4,862,390 | |
| | | | | | | | |
| | | | Electrical Equipment — 0.9% | | | | |
| | 116,275 | | | Thermon Group Holdings, Inc.(b) | | | 3,177,796 | |
| | | | | | | | |
| | | | Electronic Equipment, Instruments & Components — 1.8% | | | | |
| | 68,950 | | | Littelfuse, Inc. | | | 6,407,523 | |
| | | | | | | | |
| | | | Energy Equipment & Services — 3.3% | | | | |
| | 104,575 | | | Atwood Oceanics, Inc.(b) | | | 5,583,259 | |
| | 207,200 | | | Forum Energy Technologies, Inc.(b) | | | 5,855,472 | |
| | | | | | | | |
| | | | | | | 11,438,731 | |
| | | | | | | | |
See accompanying notes to financial statements.
33 |
Portfolio of Investments – as of December 31, 2013
Vaughan Nelson Small Cap Value Fund – (continued)
| | | | | | | | |
Shares | | | Description | | Value (†) | |
| | | | Food & Staples Retailing — 1.0% | | | | |
| | 711,375 | | | Rite Aid Corp.(b) | | $ | 3,599,558 | |
| | | | | | | | |
| | | | Gas Utilities — 1.2% | | | | |
| | 90,775 | | | Atmos Energy Corp. | | | 4,123,001 | |
| | | | | | | | |
| | | | Health Care Equipment & Supplies — 3.8% | | | | |
| | 125,775 | | | Integra LifeSciences Holdings Corp.(b) | | | 6,000,725 | |
| | 19,675 | | | Sirona Dental Systems, Inc.(b) | | | 1,381,185 | |
| | 62,950 | | | Teleflex, Inc. | | | 5,908,487 | |
| | | | | | | | |
| | | | | | | 13,290,397 | |
| | | | | | | | |
| | | | Health Care Providers & Services — 1.9% | | | | |
| | 116,875 | | | Community Health Systems, Inc.(b) | | | 4,589,681 | |
| | 41,525 | | | LifePoint Hospitals, Inc.(b) | | | 2,194,181 | |
| | | | | | | | |
| | | | | | | 6,783,862 | |
| | | | | | | | |
| | | | Health Care Technology — 1.3% | | | | |
| | 223,900 | | | MedAssets, Inc.(b) | | | 4,439,937 | |
| | | | | | | | |
| | | | Hotels, Restaurants & Leisure — 1.3% | | | | |
| | 90,575 | | | Jack in the Box, Inc.(b) | | | 4,530,561 | |
| | | | | | | | |
| | | | Household Durables — 2.8% | | | | |
| | 102,800 | | | Harman International Industries, Inc. | | | 8,414,180 | |
| | 33,875 | | | Ryland Group, Inc. (The) | | | 1,470,514 | |
| | | | | | | | |
| | | | | | | 9,884,694 | |
| | | | | | | | |
| | | | Insurance — 8.2% | | | | |
| | 161,425 | | | American Equity Investment Life Holding Co. | | | 4,258,391 | |
| | 117,350 | | | Aspen Insurance Holdings Ltd. | | | 4,847,728 | |
| | 336,275 | | | CNO Financial Group, Inc. | | | 5,948,705 | |
| | 160,762 | | | HCC Insurance Holdings, Inc. | | | 7,417,559 | |
| | 237,175 | | | Maiden Holdings Ltd. | | | 2,592,323 | |
| | 59,250 | | | Platinum Underwriters Holdings Ltd. | | | 3,630,840 | |
| | | | | | | | |
| | | | | | | 28,695,546 | |
| | | | | | | | |
| | | | IT Services — 4.0% | | | | |
| | 168,875 | | | Broadridge Financial Solutions, Inc. | | | 6,673,940 | |
| | 91,100 | | | EPAM Systems, Inc.(b) | | | 3,183,034 | |
| | 72,075 | | | Jack Henry & Associates, Inc. | | | 4,267,561 | |
| | | | | | | | |
| | | | | | | 14,124,535 | |
| | | | | | | | |
| | | | Machinery — 2.4% | | | | |
| | 131,525 | | | Actuant Corp., Class A | | | 4,819,076 | |
| | 303,025 | | | Wabash National Corp.(b) | | | 3,742,359 | |
| | | | | | | | |
| | | | | | | 8,561,435 | |
| | | | | | | | |
| | | | Metals & Mining — 1.7% | | | | |
| | 63,950 | | | Globe Specialty Metals, Inc. | | | 1,151,739 | |
| | 63,400 | | | Reliance Steel & Aluminum Co. | | | 4,808,256 | |
| | | | | | | | |
| | | | | | | 5,959,995 | |
| | | | | | | | |
| | | | Oil, Gas & Consumable Fuels — 2.2% | | | | |
| | 163,114 | | | Oasis Petroleum, Inc.(b) | | | 7,661,465 | |
| | | | | | | | |
See accompanying notes to financial statements.
| 34
Portfolio of Investments – as of December 31, 2013
Vaughan Nelson Small Cap Value Fund – (continued)
| | | | | | | | |
Shares | | | Description | | Value (†) | |
| | | | Paper & Forest Products — 0.8% | | | | |
| | 56,750 | | | Clearwater Paper Corp.(b) | | $ | 2,979,375 | |
| | | | | | | | |
| | | | Personal Products — 0.9% | | | | |
| | 87,925 | | | Elizabeth Arden, Inc.(b) | | | 3,116,941 | |
| | | | | | | | |
| | | | Professional Services — 1.2% | | | | |
| | 121,525 | | | ICF International, Inc.(b) | | | 4,218,133 | |
| | | | | | | | |
| | | | REITs - Hotels — 0.8% | | | | |
| | 473,275 | | | Hersha Hospitality Trust | | | 2,636,142 | |
| | | | | | | | |
| | | | REITs - Office Property — 0.6% | | | | |
| | 62,875 | | | Highwoods Properties, Inc. | | | 2,274,189 | |
| | | | | | | | |
| | | | REITs - Shopping Centers — 0.9% | | | | |
| | 272,975 | | | Excel Trust, Inc. | | | 3,109,185 | |
| | | | | | | | |
| | | | Road & Rail — 1.4% | | | | |
| | 62,275 | | | Celadon Group, Inc. | | | 1,213,117 | |
| | 94,350 | | | Con-way, Inc. | | | 3,746,638 | |
| | | | | | | | |
| | | | | | | 4,959,755 | |
| | | | | | | | |
| | | | Semiconductors & Semiconductor Equipment — 2.0% | | | | |
| | 246,200 | | | Skyworks Solutions, Inc.(b) | | | 7,031,472 | |
| | | | | | | | |
| | | | Software — 8.4% | | | | |
| | 91,100 | | | ACI Worldwide, Inc.(b) | | | 5,921,500 | |
| | 83,600 | | | BroadSoft, Inc.(b) | | | 2,285,624 | |
| | 52,525 | | | Ellie Mae, Inc.(b) | | | 1,411,347 | |
| | 97,150 | | | Fair Isaac Corp. | | | 6,104,906 | |
| | 172,125 | | | SS&C Technologies Holdings, Inc.(b) | | | 7,618,252 | |
| | 142,625 | | | Verint Systems, Inc.(b) | | | 6,124,318 | |
| | | | | | | | |
| | | | | | | 29,465,947 | |
| | | | | | | | |
| | | | Specialty Retail — 8.2% | | | | |
| | 141,697 | | | Aaron’s, Inc. | | | 4,165,892 | |
| | 56,825 | | | Abercrombie & Fitch Co., Class A | | | 1,870,111 | |
| | 251,800 | | | Chico’s FAS, Inc. | | | 4,743,912 | |
| | 94,225 | | | GNC Holdings, Inc., Class A | | | 5,507,451 | |
| | 84,600 | | | Group 1 Automotive, Inc. | | | 6,008,292 | |
| | 123,050 | | | Men’s Wearhouse, Inc. (The) | | | 6,285,394 | |
| | | | | | | | |
| | | | | | | 28,581,052 | |
| | | | | | | | |
| | | | Textiles, Apparel & Luxury Goods — 1.1% | | | | |
| | 108,400 | | | Wolverine World Wide, Inc. | | | 3,681,264 | |
| | | | | | | | |
| | | | Trading Companies & Distributors — 3.7% | | | | |
| | 39,500 | | | DXP Enterprises, Inc.(b) | | | 4,550,400 | |
| | 53,000 | | | United Rentals, Inc.(b) | | | 4,131,350 | |
| | 46,125 | | | WESCO International, Inc.(b) | | | 4,200,604 | |
| | | | | | | | |
| | | | | | | 12,882,354 | |
| | | | | | | | |
| | | | Total Common Stocks
(Identified Cost $249,563,234) | | | 337,483,878 | |
| | | | | | | | |
| | Closed-End Investment Companies — 2.4% | | | | |
| | 464,975 | | | Ares Capital Corp.
(Identified Cost $7,448,797) | | | 8,262,606 | |
| | | | | | | | |
See accompanying notes to financial statements.
35 |
Portfolio of Investments – as of December 31, 2013
Vaughan Nelson Small Cap Value Fund – (continued)
| | | | | | | | |
Principal
Amount | | | Description | | Value (†) | |
| | Short-Term Investments — 1.2% | | | | |
| $ | 4,393,645 | | | Tri-Party Repurchase Agreement with Fixed Income Clearing Corporation, dated 12/31/2013 at 0.000% to be repurchased at $4,393,645 on 1/02/2014 collateralized by $4,660,000 Federal National Mortgage Association, Zero Coupon due 6/01/2017 valued at $4,485,250 including accrued interest (Note 2 of Notes to Financial Statements)
(Identified Cost $4,393,645) | | $ | 4,393,645 | |
| | | | | | | | |
| | | | Total Investments — 99.9%
(Identified Cost $261,405,676)(a) | | | 350,140,129 | |
| | | | Other assets less liabilities — 0.1% | | | 203,089 | |
| | | | | | | | |
| | | | Net Assets — 100.0% | | $ | 350,343,218 | |
| | | | | | | | |
| | | | | | | | |
| | (†) | | | See Note 2 of Notes to Financial Statements. | | | | |
| | (a) | | | Federal Tax Information: | | | | |
| | | | At December 31, 2013, the net unrealized appreciation on investments based on a cost of $262,746,874 for federal income tax purposes was as follows: | | | | |
| | | | Aggregate gross unrealized appreciation for all investments in which there is an excess of value over tax cost | | $ | 89,928,935 | |
| | | | Aggregate gross unrealized depreciation for all investments in which there is an excess of tax cost over value | | | (2,535,680 | ) |
| | | | | | | | |
| | | | Net unrealized appreciation | | $ | 87,393,255 | |
| | | | | | | | |
| | (b) | | | Non-income producing security. | | | | |
| | | | | | | | |
| | REITs | | | Real Estate Investment Trusts | | | | |
Industry Summary at December 31, 2013 (Unaudited)
| | | | |
Commercial Banks | | | 10.6 | % |
Software | | | 8.4 | |
Insurance | | | 8.2 | |
Specialty Retail | | | 8.2 | |
Containers & Packaging | | | 4.7 | |
IT Services | | | 4.0 | |
Health Care Equipment & Supplies | | | 3.8 | |
Trading Companies & Distributors | | | 3.7 | |
Energy Equipment & Services | | | 3.3 | |
Capital Markets | | | 2.9 | |
Household Durables | | | 2.8 | |
Machinery | | | 2.4 | |
Commercial Services & Supplies | | | 2.4 | |
Closed End Investment Companies | | | 2.4 | |
Oil, Gas & Consumable Fuels | | | 2.2 | |
Semiconductors & Semiconductor Equipment | | | 2.0 | |
Other Investments, less than 2% each | | | 26.7 | |
Short-Term Investments | | | 1.2 | |
| | | | |
Total Investments | | | 99.9 | |
Other assets less liabilities | | | 0.1 | |
| | | | |
Net Assets | | | 100.0 | % |
| | | | |
See accompanying notes to financial statements.
| 36
Portfolio of Investments – as of December 31, 2013
Vaughan Nelson Value Opportunity Fund
| | | | | | | | |
Shares | | | Description | | Value (†) | |
| | Common Stocks — 96.6% of Net Assets | | | | |
| | | | Aerospace & Defense — 1.2% | | | | |
| | 62,775 | | | B/E Aerospace, Inc.(b) | | $ | 5,463,308 | |
| | | | | | | | |
| | | | Auto Components — 2.3% | | | | |
| | 98,650 | | | Delphi Automotive PLC | | | 5,931,825 | |
| | 80,725 | | | Tenneco, Inc.(b) | | | 4,566,613 | |
| | | | | | | | |
| | | | | | | 10,498,438 | |
| | | | | | | | |
| | | | Capital Markets — 1.3% | | | | |
| | 165,925 | | | SEI Investments Co. | | | 5,762,575 | |
| | | | | | | | |
| | | | Chemicals — 4.0% | | | | |
| | 42,275 | | | Airgas, Inc. | | | 4,728,459 | |
| | 91,625 | | | FMC Corp. | | | 6,914,022 | |
| | 89,050 | | | Rockwood Holdings, Inc. | | | 6,404,476 | |
| | | | | | | | |
| | | | | | | 18,046,957 | |
| | | | | | | | |
| | | | Commercial Banks — 7.0% | | | | |
| | 116,600 | | | CIT Group, Inc. | | | 6,078,358 | |
| | 329,300 | | | Fifth Third Bancorp | | | 6,925,179 | |
| | 555,450 | | | First Niagara Financial Group, Inc. | | | 5,898,879 | |
| | 717,525 | | | Huntington Bancshares, Inc. | | | 6,924,116 | |
| | 548,400 | | | Regions Financial Corp. | | | 5,423,676 | |
| | | | | | | | |
| | | | | | | 31,250,208 | |
| | | | | | | | |
| | | | Commercial Services & Supplies — 0.9% | | | | |
| | 131,975 | | | KAR Auction Services, Inc. | | | 3,899,861 | |
| | | | | | | | |
| | | | Computers & Peripherals — 2.1% | | | | |
| | 279,975 | | | NCR Corp.(b) | | | 9,535,949 | |
| | | | | | | | |
| | | | Construction & Engineering — 1.5% | | | | |
| | 213,975 | | | Quanta Services, Inc.(b) | | | 6,753,051 | |
| | | | | | | | |
| | | | Containers & Packaging — 5.9% | | | | |
| | 193,475 | | | Crown Holdings, Inc.(b) | | | 8,623,181 | |
| | 852,075 | | | Graphic Packaging Holding Co.(b) | | | 8,179,920 | |
| | 170,425 | | | Owens-Illinois, Inc.(b) | | | 6,097,806 | |
| | 58,950 | | | Packaging Corp. of America | | | 3,730,356 | |
| | | | | | | | |
| | | | | | | 26,631,263 | |
| | | | | | | | |
| | | | Energy Equipment & Services — 3.9% | | | | |
| | 137,100 | | | Atwood Oceanics, Inc.(b) | | | 7,319,769 | |
| | 50,600 | | | Helmerich & Payne, Inc. | | | 4,254,448 | |
| | 224,875 | | | Superior Energy Services, Inc.(b) | | | 5,983,924 | |
| | | | | | | | |
| | | | | | | 17,558,141 | |
| | | | | | | | |
| | | | Food & Staples Retailing — 1.2% | | | | |
| | 1,076,925 | | | Rite Aid Corp.(b) | | | 5,449,241 | |
| | | | | | | | |
| | | | Food Products — 1.1% | | | | |
| | 71,100 | | | Ingredion, Inc. | | | 4,867,506 | |
| | | | | | | | |
See accompanying notes to financial statements.
37 |
Portfolio of Investments – as of December 31, 2013
Vaughan Nelson Value Opportunity Fund – (continued)
| | | | | | | | |
Shares | | | Description | | Value (†) | |
| | | | Health Care Providers & Services — 3.8% | | | | |
| | 192,200 | | | Community Health Systems, Inc.(b) | | $ | 7,547,694 | |
| | 196,050 | | | HCA Holdings, Inc.(b) | | | 9,353,546 | |
| | | | | | | | |
| | | | | | | 16,901,240 | |
| | | | | | | | |
| | | | Health Care Technology — 1.4% | | | | |
| | 322,250 | | | MedAssets, Inc.(b) | | | 6,390,218 | |
| | | | | | | | |
| | | | Household Durables — 3.4% | | | | |
| | 115,325 | | | Harman International Industries, Inc. | | | 9,439,351 | |
| | 144,150 | | | Lennar Corp., Class A | | | 5,702,574 | |
| | | | | | | | |
| | | | | | | 15,141,925 | |
| | | | | | | | |
| | | | Household Products — 0.5% | | | | |
| | 32,675 | | | Spectrum Brands Holdings, Inc. | | | 2,305,221 | |
| | | | | | | | |
| | | | Insurance — 7.3% | | | | |
| | 213,975 | | | First American Financial Corp. | | | 6,034,095 | |
| | 233,200 | | | Hartford Financial Services Group, Inc. (The) | | | 8,448,836 | |
| | 85,200 | | | Reinsurance Group of America, Inc., Class A | | | 6,595,332 | |
| | 56,375 | | | RenaissanceRe Holdings Ltd. | | | 5,487,543 | |
| | 153,750 | | | Validus Holdings Ltd. | | | 6,194,587 | |
| | | | | | | | |
| | | | | | | 32,760,393 | |
| | | | | | | | |
| | | | Internet & Catalog Retail — 1.6% | | | | |
| | 117,875 | | | HSN, Inc. | | | 7,343,613 | |
| | | | | | | | |
| | | | Internet Software & Services — 1.8% | | | | |
| | 116,600 | | | IAC/InterActiveCorp | | | 8,009,254 | |
| | | | | | | | |
| | | | IT Services — 3.4% | | | | |
| | 128,775 | | | Fiserv, Inc.(b) | | | 7,604,164 | |
| | 115,325 | | | Global Payments, Inc. | | | 7,494,972 | |
| | | | | | | | |
| | | | | | | 15,099,136 | |
| | | | | | | | |
| | | | Machinery — 4.4% | | | | |
| | 58,950 | | | Flowserve Corp. | | | 4,647,028 | |
| | 103,150 | | | Navistar International Corp.(b) | | | 3,939,299 | |
| | 87,775 | | | Pentair Ltd. (Registered) | | | 6,817,484 | |
| | 41,000 | | | Snap-on, Inc. | | | 4,490,320 | |
| | | | | | | | |
| | | | | | | 19,894,131 | |
| | | | | | | | |
| | | | Media — 1.5% | | | | |
| | 96,100 | | | AMC Networks, Inc., Class A(b) | | | 6,545,371 | �� |
| | | | | | | | |
| | | | Metals & Mining — 5.3% | | | | |
| | 126,200 | | | Carpenter Technology Corp. | | | 7,849,640 | |
| | 417,075 | | | Constellium NV, Class A(b) | | | 9,705,335 | |
| | 85,200 | | | Reliance Steel & Aluminum Co. | | | 6,461,568 | |
| | | | | | | | |
| | | | | | | 24,016,543 | |
| | | | | | | | |
| | | | Oil, Gas & Consumable Fuels — 2.6% | | | | |
| | 91,625 | | | Noble Energy, Inc. | | | 6,240,579 | |
| | 30,100 | | | Pioneer Natural Resources Co. | | | 5,540,507 | |
| | | | | | | | |
| | | | | | | 11,781,086 | |
| | | | | | | | |
See accompanying notes to financial statements.
| 38
Portfolio of Investments – as of December 31, 2013
Vaughan Nelson Value Opportunity Fund – (continued)
| | | | | | | | |
Shares | | | Description | | Value (†) | |
| | | | Personal Products — 1.2% | | | | |
| | 148,000 | | | Elizabeth Arden, Inc.(b) | | $ | 5,246,600 | |
| | | | | | | | |
| | | | Pharmaceuticals — 3.0% | | | | |
| | 36,877 | | | Actavis PLC(b) | | | 6,195,336 | |
| | 62,186 | | | Valeant Pharmaceuticals International, Inc.(b) | | | 7,300,636 | |
| | | | | | | | |
| | | | | | | 13,495,972 | |
| | | | | | | | |
| | | | Road & Rail — 3.5% | | | | |
| | 144,150 | | | Con-way, Inc. | | | 5,724,197 | |
| | 348,525 | | | Hertz Global Holdings, Inc.(b) | | | 9,974,785 | |
| | | | | | | | |
| | | | | | | 15,698,982 | |
| | | | | | | | |
| | | | Semiconductors & Semiconductor Equipment — 4.6% | | | | |
| | 116,600 | | | Avago Technologies Ltd. | | | 6,166,974 | |
| | 301,750 | | | Micron Technology, Inc.(b) | | | 6,566,080 | |
| | 283,800 | | | Skyworks Solutions, Inc.(b) | | | 8,105,328 | |
| | | | | | | | |
| | | | | | | 20,838,382 | |
| | | | | | | | |
| | | | Software — 4.0% | | | | |
| | 105,700 | | | Check Point Software Technologies Ltd.(b) | | | 6,819,764 | |
| | 295,975 | | | Nuance Communications, Inc.(b) | | | 4,498,820 | |
| | 331,850 | | | Rovi Corp.(b) | | | 6,534,126 | |
| | | | | | | | |
| | | | | | | 17,852,710 | |
| | | | | | | | |
| | | | Specialty Retail — 5.0% | | | | |
| | 168,500 | | | Abercrombie & Fitch Co., Class A | | | 5,545,335 | |
| | 142,875 | | | GNC Holdings, Inc., Class A | | | 8,351,044 | |
| | 134,525 | | | Rent-A-Center, Inc. | | | 4,485,063 | |
| | 51,900 | | | Signet Jewelers Ltd. | | | 4,084,530 | |
| | | | | | | | |
| | | | | | | 22,465,972 | |
| | | | | | | | |
| | | | Textiles, Apparel & Luxury Goods — 1.5% | | | | |
| | 50,600 | | | PVH Corp. | | | 6,882,612 | |
| | | | | | | | |
| | | | Trading Companies & Distributors — 4.4% | | | | |
| | 238,975 | | | MRC Global, Inc.(b) | | | 7,709,333 | |
| | 96,100 | | | United Rentals, Inc.(b) | | | 7,490,995 | |
| | 49,325 | | | WESCO International, Inc.(b) | | | 4,492,028 | |
| | | | | | | | |
| | | | | | | 19,692,356 | |
| | | | | | | | |
| | | | Total Common Stocks
(Identified Cost $344,499,269) | | | 434,078,215 | |
| | | | | | | | |
| | | | | | | | |
| | Closed-End Investment Companies — 1.6% | | | | |
| | 392,075 | | | Ares Capital Corp.
(Identified Cost $6,482,848) | | | 6,967,173 | |
| | | | | | | | |
See accompanying notes to financial statements.
39 |
Portfolio of Investments – as of December 31, 2013
Vaughan Nelson Value Opportunity Fund – (continued)
| | | | | | | | |
Principal
Amount | | | Description | | Value (†) | |
| | Short-Term Investments — 2.7% | | | | |
| $ | 12,338,308 | | | Tri-Party Repurchase Agreement with Fixed Income Clearing Corporation, dated 12/31/2013 at 0.000% to be repurchased at $12,338,308 on 1/02/2014 collateralized by $13,080,000 Federal National Mortgage Association, Zero Coupon due 6/01/2017 valued at $12,589,500 including accrued interest (Note 2 of Notes to Financial Statements)
(Identified Cost $12,338,308) | | $ | 12,338,308 | |
| | | | | | | | |
| | | | Total Investments — 100.9%
(Identified Cost $363,320,425)(a) | | | 453,383,696 | |
| | | | Other assets less liabilities — (0.9)% | | | (3,840,454 | ) |
| | | | | | | | |
| | | | Net Assets — 100.0% | | $ | 449,543,242 | |
| | | | | | | | |
| | | | | | | | |
| | (†) | | | See Note 2 of Notes to Financial Statements. | | | | |
| | (a) | | | Federal Tax Information: | | | | |
| | | | At December 31, 2013, the net unrealized appreciation on investments based on a cost of $364,589,128 for federal income tax purposes was as follows: | |
| | | | Aggregate gross unrealized appreciation for all investments in which there is an excess of value over tax cost | | $ | 94,677,067 | |
| | | | Aggregate gross unrealized depreciation for all investments in which there is an excess of tax cost over value | | | (5,882,499 | ) |
| | | | | | | | |
| | | | Net unrealized appreciation | | $ | 88,794,568 | |
| | | | | | | | |
| | | | | | | | |
| | (b) | | | Non-income producing security. | | | | |
Industry Summary at December 31, 2013 (Unaudited)
| | | | |
Insurance | | | 7.3 | % |
Commercial Banks | | | 7.0 | |
Containers & Packaging | | | 5.9 | |
Metals & Mining | | | 5.3 | |
Specialty Retail | | | 5.0 | |
Semiconductors & Semiconductor Equipment | | | 4.6 | |
Machinery | | | 4.4 | |
Trading Companies & Distributors | | | 4.4 | |
Chemicals | | | 4.0 | |
Software | | | 4.0 | |
Energy Equipment & Services | | | 3.9 | |
Health Care Providers & Services | | | 3.8 | |
Road & Rail | | | 3.5 | |
Household Durables | | | 3.4 | |
IT Services | | | 3.4 | |
Pharmaceuticals | | | 3.0 | |
Oil, Gas & Consumable Fuels | | | 2.6 | |
Auto Components | | | 2.3 | |
Computers & Peripherals | | | 2.1 | |
Other Investments, less than 2% each | | | 18.3 | |
Short-Term Investments | | | 2.7 | |
| | | | |
Total Investments | | | 100.9 | |
Other assets less liabilities | | | (0.9 | ) |
| | | | |
Net Assets | | | 100.0 | % |
| | | | |
See accompanying notes to financial statements.
| 40
Statements of Assets and Liabilities
December 31, 2013
| | | | | | | | | | | | | | | | | | | | |
| | | CGM
Advisor
Targeted
Equity Fund | | | Harris
Associates
Large Cap
Value Fund | | | Natixis
Oakmark
International
Fund | | | Vaughan
Nelson
Small Cap
Value Fund | | | Vaughan
Nelson
Value
Opportunity
Fund | |
ASSETS | | | | | | | | | | | | | | | | | | | | |
Investments at cost | | $ | 496,879,657 | | | $ | 116,027,064 | | | $ | 513,375,319 | | | $ | 261,405,676 | | | $ | 363,320,425 | |
Net unrealized appreciation | | | 91,613,766 | | | | 53,414,225 | | | | 44,096,885 | | | | 88,734,453 | | | | 90,063,271 | |
| | | | | | | | | | | | | | | | | | | | |
Investments at value | | | 588,493,423 | | | | 169,441,289 | | | | 557,472,204 | | | | 350,140,129 | | | | 453,383,696 | |
Cash | | | 3,450 | | | | — | | | | — | | | | 197,495 | | | | 166,174 | |
Foreign currency at value (identified cost $0, $0, $173, $0 and $0) | | | — | | | | — | | | | 173 | | | | — | | | | — | |
Receivable for Fund shares sold | | | 58,498 | | | | 290,765 | | | | 14,263,436 | | | | 218,546 | | | | 3,069,660 | |
Receivable for securities sold | | | 9,175,780 | | | | 223,777 | | | | 112,795 | | | | 348,453 | | | | — | |
Dividends receivable | | | 198,375 | | | | 144,877 | | | | 569,057 | | | | 330,033 | | | | 296,721 | |
Unrealized appreciation on forward foreign currency contracts (Note 2) | | | — | | | | — | | | | 20,370 | | | | — | | | | — | |
Tax reclaims receivable | | | — | | | | — | | | | 124,097 | | | | — | | | | — | |
| | | | | | | | | | | | | | | | | | | | |
TOTAL ASSETS | | | 597,929,526 | | | | 170,100,708 | | | | 572,562,132 | | | | 351,234,656 | | | | 456,916,251 | |
| | | | | | | | | | | | | | | | | | | | |
LIABILITIES | | | | | | | | | | | | | | | | | | | | |
Payable for securities purchased | | | 12,060,716 | | | | — | | | | 18,115,790 | | | | — | | | | 6,380,187 | |
Payable for Fund shares redeemed | | | 2,621,454 | | | | 18,587 | | | | 1,258,405 | | | | 302,178 | | | | 543,845 | |
Unrealized depreciation on forward foreign currency contracts (Note 2) | | | — | | | | — | | | | 746,718 | | | | — | | | | — | |
Management fees payable (Note 6) | | | 347,546 | | | | 100,158 | | | | 457,476 | | | | 267,335 | | | | 290,881 | |
Deferred Trustees’ fees (Note 6) | | | 899,985 | | | | 472,053 | | | | 29,006 | | | | 215,121 | | | | 57,126 | |
Administrative fees payable (Note 6) | | | 21,504 | | | | 6,148 | | | | 18,432 | | | | 13,065 | | | | 15,992 | |
Payable to distributor (Note 6d) | | | 2,644 | | | | 719 | | | | 3,793 | | | | 3,213 | | | | 3,878 | |
Other accounts payable and accrued expenses | | | 154,995 | | | | 100,663 | | | | 104,212 | | | | 90,526 | | | | 81,100 | |
| | | | | | | | | | | | | | | | | | | | |
TOTAL LIABILITIES | | | 16,108,844 | | | | 698,328 | | | | 20,733,832 | | | | 891,438 | | | | 7,373,009 | |
| | | | | | | | | | | | | | | | | | | | |
NET ASSETS | | $ | 581,820,682 | | | $ | 169,402,380 | | | $ | 551,828,300 | | | $ | 350,343,218 | | | $ | 449,543,242 | |
| | | | | | | | | | | | | | | | | | | | |
NET ASSETS CONSIST OF: | | | | | | | | | | | | | | | | | | | | |
Paid-in capital | | $ | 474,358,487 | | | $ | 112,816,158 | | | $ | 507,910,164 | | | $ | 252,353,001 | | | $ | 355,310,377 | |
Undistributed (Distributions in excess of) net investment income | | | (899,985 | ) | | | (472,053 | ) | | | 844,145 | | | | (213,083 | ) | | | (57,126 | ) |
Accumulated net realized gain (loss) on investments and foreign currency transactions | | | 16,748,414 | | | | 3,644,050 | | | | (294,570 | ) | | | 9,468,847 | | | | 4,226,720 | |
Net unrealized appreciation on investments and foreign currency translations | | | 91,613,766 | | | | 53,414,225 | | | | 43,368,561 | | | | 88,734,453 | | | | 90,063,271 | |
| | | | | | | | | | | | | | | | | | | | |
NET ASSETS | | $ | 581,820,682 | | | $ | 169,402,380 | | | $ | 551,828,300 | | | $ | 350,343,218 | | | $ | 449,543,242 | |
| | | | | | | | | | | | | | | | | | | | |
See accompanying notes to financial statements.
41 |
Statements of Assets and Liabilities (continued)
December 31, 2013
| | | | | | | | | | | | | | | | | | | | |
| | | CGM
Advisor
Targeted
Equity Fund | | | Harris
Associates
Large Cap
Value Fund | | | Natixis
Oakmark
International
Fund | | | Vaughan
Nelson
Small Cap
Value Fund | | | Vaughan
Nelson
Value
Opportunity
Fund | |
COMPUTATION OF NET ASSET VALUE AND OFFERING PRICE: | | | | | | | | | | | | | | | | | | | | |
Class A shares: | | | | | | | | | | | | | | | | | | | | |
Net assets | | $ | 493,102,202 | | | $ | 145,270,297 | | | $ | 314,578,665 | | | $ | 152,791,916 | | | $ | 67,716,268 | |
| | | | | | | | | | | | | | | | | | | | |
Shares of beneficial interest | | | 43,032,090 | | | | 6,787,540 | | | | 22,901,357 | | | | 6,838,052 | | | | 3,282,582 | |
| | | | | | | | | | | | | | | | | | | | |
Net asset value and redemption price per share | | $ | 11.46 | | | $ | 21.40 | | | $ | 13.74 | | | $ | 22.34 | | | $ | 20.63 | |
| | | | | | | | | | | | | | | | | | | | |
Offering price per share (100/94.25 of net asset value) (Note 1) | | $ | 12.16 | | | $ | 22.71 | | | $ | 14.58 | | | $ | 23.70 | | | $ | 21.89 | |
| | | | | | | | | | | | | | | | | | | | |
Class B shares: (redemption price per share is equal to net asset value less any applicable contingent deferred sales charge) (Note 1) | | | | | | | | | | | | | | | | | | | | |
Net assets | | $ | 2,205,318 | | | $ | 1,531,723 | | | $ | — | | | $ | 2,238,963 | | | $ | — | |
| | | | | | | | | | | | | | | | | | | | |
Shares of beneficial interest | | | 221,025 | | | | 78,260 | | | | — | | | | 127,030 | | | | — | |
| | | | | | | | | | | | | | | | | | | | |
Net asset value and offering price per share | | $ | 9.98 | | | $ | 19.57 | | | $ | — | | | $ | 17.63 | | | $ | — | |
| | | | | | | | | | | | | | | | | | | | |
Class C shares: (redemption price per share is equal to net asset value less any applicable contingent deferred sales charge) (Note 1) | | | | | | | | | | | | | | | | | | | | |
Net assets | | $ | 36,417,287 | | | $ | 8,424,812 | | | $ | 237,249,635 | | | $ | 31,475,936 | | | $ | 21,005,498 | |
| | | | | | | | | | | | | | | | | | | | |
Shares of beneficial interest | | | 3,676,584 | | | | 432,527 | | | | 17,532,615 | | | | 1,787,430 | | | | 1,046,535 | |
| | | | | | | | | | | | | | | | | | | | |
Net asset value and offering price per share | | $ | 9.91 | | | $ | 19.48 | | | $ | 13.53 | | | $ | 17.61 | | | $ | 20.07 | |
| | | | | | | | | | | | | | | | | | | | |
Class N shares: | | | | | | | | | | | | | | | | | | | | |
Net assets | | $ | — | | | $ | — | | | $ | — | | | $ | — | | | $ | 1,247 | |
| | | | | | | | | | | | | | | | | | | | |
Shares of beneficial interest | | | — | | | | — | | | | — | | | | — | | | | 60 | |
| | | | | | | | | | | | | | | | | | | | |
Net asset value, offering and redemption price per share | | $ | — | | | $ | — | | | $ | — | | | $ | — | | | $ | 20.76 | * |
| | | | | | | | | | | | | | | | | | | | |
Class Y shares: | | | | | | | | | | | | | | | | | | | | |
Net assets | | $ | 50,095,875 | | | $ | 14,175,548 | | | $ | — | | | $ | 163,836,403 | | | $ | 360,820,229 | |
| | | | | | | | | | | | | | | | | | | | |
Shares of beneficial interest | | | 4,235,723 | | | | 639,619 | | | | — | | | | 7,207,873 | | | | 17,361,782 | |
| | | | | | | | | | | | | | | | | | | | |
Net asset value, offering and redemption price per share | | $ | 11.83 | | | $ | 22.16 | | | $ | — | | | $ | 22.73 | | | $ | 20.78 | |
| | | | | | | | | | | | | | | | | | | | |
| * | Net asset value calculations reflect fractional share and dollar amounts. |
See accompanying notes to financial statements.
| 42
Statements of Operations
For the Year Ended December 31, 2013
| | | | | | | | | | | | |
| | | CGM
Advisor
Targeted
Equity Fund | | | Harris
Associates
Large Cap
Value Fund | | | Natixis
Oakmark
International
Fund | |
INVESTMENT INCOME | | | | | | | | | | | | |
Dividends | | $ | 5,760,050 | | | $ | 2,468,763 | | | $ | 4,839,589 | |
Interest | | | 363 | | | | 255 | | | | 3,938 | |
Less net foreign taxes withheld | | | (101,133 | ) | | | (1,871 | ) | | | (373,838 | ) |
| | | | | | | | | | | | |
| | | 5,659,280 | | | | 2,467,147 | | | | 4,469,689 | |
| | | | | | | | | | | | |
Expenses | | | | | | | | | | | | |
Management fees (Note 6) | | | 4,052,633 | | | | 1,064,864 | | | | 1,891,496 | |
Service and distribution fees (Note 6) | | | 1,586,068 | | | | 410,771 | | | | 1,397,724 | |
Administrative fees (Note 6) | | | 251,461 | | | | 67,152 | | | | 98,162 | |
Trustees’ fees and expenses (Note 6) | | | 169,857 | | | | 90,909 | | | | 24,758 | |
Transfer agent fees and expenses (Note 6) | | | 529,170 | | | | 214,131 | | | | 173,056 | |
Audit and tax services fees | | | 48,828 | | | | 43,537 | | | | 44,709 | |
Custodian fees and expenses | | | 27,643 | | | | 21,877 | | | | 207,472 | |
Legal fees | | | 7,460 | | | | 1,941 | | | | 1,972 | |
Registration fees | | | 65,249 | | | | 65,038 | | | | 68,121 | |
Shareholder reporting expenses | | | 36,051 | | | | 11,562 | | | | 21,655 | |
Miscellaneous expenses | | | 23,810 | | | | 13,986 | | | | 23,531 | |
| | | | | | | | | | | | |
Total expenses | | | 6,798,230 | | | | 2,005,768 | | | | 3,952,656 | |
Fee/expense recovery (Note 6) | | | — | | | | 2,299 | | | | 101,206 | |
| | | | | | | | | | | | |
Net expenses | | | 6,798,230 | | | | 2,008,067 | | | | 4,053,862 | |
| | | | | | | | | | | | |
Net investment income (loss) | | | (1,138,950 | ) | | | 459,080 | | | | 415,827 | |
| | | | | | | | | | | | |
NET REALIZED AND UNREALIZED GAIN (LOSS) ON INVESTMENTS AND FOREIGN CURRENCY TRANSACTIONS | | | | | | | | | | | | |
Net realized gain on: | | | | | | | | | | | | |
Investments | | | 98,423,009 | | | | 16,250,184 | | | | 9,808,782 | |
Foreign currency transactions | | | 874 | | | | — | | | | 1,592,426 | |
Net change in unrealized appreciation (depreciation) on: | | | | | | | | | | | | |
Investments | | | 46,132,544 | | | | 32,080,893 | | | | 37,675,478 | |
Foreign currency translations | | | — | | | | — | | | | (1,078,978 | ) |
| | | | | | | | | | | | |
Net realized and unrealized gain on investments and foreign currency transactions | | | 144,556,427 | | | | 48,331,077 | | | | 47,997,708 | |
| | | | | | | | | | | | |
NET INCREASE IN NET ASSETS RESULTING FROM OPERATIONS | | $ | 143,417,477 | | | $ | 48,790,157 | | | $ | 48,413,535 | |
| | | | | | | | | | | | |
See accompanying notes to financial statements.
43 |
Statements of Operations (continued)
For the Year Ended December 31, 2013
| | | | | | | | |
| | | Vaughan
Nelson
Small Cap
Value Fund | | | Vaughan
Nelson
Value
Opportunity
Fund | |
INVESTMENT INCOME | | | | | | | | |
Dividends | | $ | 5,827,956 | (a) | | $ | 3,525,745 | |
Interest | | | 269 | | | | 215 | |
Less net foreign taxes withheld | | | (3,715 | ) | | | — | |
| | | | | | | | |
| | | 5,824,510 | | | | 3,525,960 | |
| | | | | | | | |
Expenses | | | | | | | | |
Management fees (Note 6) | | | 3,031,921 | | | | 2,480,359 | |
Service and distribution fees (Note 6) | | | 696,361 | | | | 218,949 | |
Administrative fees (Note 6) | | | 148,719 | | | | 136,839 | |
Trustees’ fees and expenses (Note 6) | | | 56,539 | | | | 30,420 | |
Transfer agent fees and expenses (Note 6) | | | 408,918 | | | | 284,955 | |
Audit and tax services fees | | | 41,527 | | | | 40,306 | |
Custodian fees and expenses | | | 27,677 | | | | 32,425 | |
Legal fees | | | 4,228 | | | | 3,580 | |
Registration fees | | | 59,987 | | | | 92,586 | |
Shareholder reporting expenses | | | 38,123 | | | | 45,628 | |
Miscellaneous expenses | | | 20,450 | | | | 18,802 | |
| | | | | | | | |
Total expenses | | | 4,534,450 | | | | 3,384,849 | |
Less waiver and/or expense reimbursement (Note 6) | | | — | | | | (20 | ) |
| | | | | | | | |
Net expenses | | | 4,534,450 | | | | 3,384,829 | |
| | | | | | | | |
Net investment income | | | 1,290,060 | | | | 141,131 | |
| | | | | | | | |
NET REALIZED AND UNREALIZED GAIN (LOSS) ON INVESTMENTS AND FOREIGN CURRENCY TRANSACTIONS | | | | | | | | |
Net realized gain (loss) on: | | | | | | | | |
Investments | | | 58,527,993 | | | | 26,959,140 | |
Foreign currency transactions | | | (7 | ) | | | — | |
Net change in unrealized appreciation (depreciation) on: | | | | | | | | |
Investments | | | 50,817,080 | | | | 76,536,470 | |
| | | | | | | | |
Net realized and unrealized gain on investments and foreign currency transactions | | | 109,345,066 | | | | 103,495,610 | |
| | | | | | | | |
NET INCREASE IN NET ASSETS RESULTING FROM OPERATIONS | | $ | 110,635,126 | | | $ | 103,636,741 | |
| | | | | | | | |
| (a) | Includes a non-recurring dividend of $1,084,329. |
See accompanying notes to financial statements.
| 44
Statements of Changes in Net Assets
| | | | | | | | |
| | | CGM Advisor
Targeted Equity Fund | |
| | | Year Ended
December 31,
2013 | | | Year Ended
December 31,
2012 | |
FROM OPERATIONS: | | | | | | | | |
Net investment income (loss) | | $ | (1,138,950 | ) | | $ | 4,315,207 | |
Net realized gain on investments and foreign currency transactions | | | 98,423,883 | | | | 47,298,215 | |
Net change in unrealized appreciation (depreciation) on investments | | | 46,132,544 | | | | 31,061,066 | |
| | | | | | | | |
Net increase in net assets resulting from operations | | | 143,417,477 | | | | 82,674,488 | |
| | | | | | | | |
FROM DISTRIBUTIONS TO SHAREHOLDERS: | | | | | | | | |
Net investment income | | | | | | | | |
Class A | | | (4,304 | ) | | | (3,813,264 | ) |
Class B | | | (97 | ) | | | (610 | ) |
Class C | | | (360 | ) | | | (31,566 | ) |
Class Y | | | (464 | ) | | | (557,124 | ) |
Net realized capital gains | | | | | | | | |
Class A | | | (64,422,015 | ) | | | (19,506,253 | ) |
Class B | | | (319,115 | ) | | | (170,718 | ) |
Class C | | | (5,418,797 | ) | | | (1,766,210 | ) |
Class Y | | | (6,313,726 | ) | | | (2,163,006 | ) |
| | | | | | | | |
Total distributions | | | (76,478,878 | ) | | | (28,008,751 | ) |
| | | | | | | | |
NET DECREASE IN NET ASSETS FROM CAPITAL SHARE TRANSACTIONS (NOTE 12) | | | (11,961,194 | ) | | | (140,868,009 | ) |
| | | | | | | | |
Net increase (decrease) in net assets | | | 54,977,405 | | | | (86,202,272 | ) |
NET ASSETS | | | | | | | | |
Beginning of the year | | | 526,843,277 | | | | 613,045,549 | |
| | | | | | | | |
End of the year | | $ | 581,820,682 | | | $ | 526,843,277 | |
| | | | | | | | |
DISTRIBUTIONS IN EXCESS OF NET INVESTMENT INCOME | | $ | (899,985 | ) | | $ | (765,786 | ) |
| | | | | | | | |
See accompanying notes to financial statements.
45 |
Statements of Changes in Net Assets (continued)
| | | | | | | | |
| | | Harris Associates
Large Cap Value Fund | |
| | | Year Ended
December 31,
2013 | | | Year Ended
December 31,
2012 | |
FROM OPERATIONS: | | | | | | | | |
Net investment income | | $ | 459,080 | | | $ | 996,366 | |
Net realized gain on investments | | | 16,250,184 | | | | 3,988,484 | |
Net change in unrealized appreciation (depreciation) on investments | | | 32,080,893 | | | | 15,718,145 | |
| | | | | | | | |
Net increase in net assets resulting from operations | | | 48,790,157 | | | | 20,702,995 | |
| | | | | | | | |
FROM DISTRIBUTIONS TO SHAREHOLDERS: | | | | | | | | |
Net investment income | | | | | | | | |
Class A | | | (432,563 | ) | | | (913,298 | ) |
Class C | | | — | | | | (8,756 | ) |
Class Y | | | (70,778 | ) | | | (122,737 | ) |
Net realized capital gains | | | | | | | | |
Class A | | | (4,641,585 | ) | | | — | |
Class B | | | (53,345 | ) | | | — | |
Class C | | | (294,950 | ) | | | — | |
Class Y | | | (435,710 | ) | | | — | |
| | | | | | | | |
Total distributions | | | (5,928,931 | ) | | | (1,044,791 | ) |
| | | | | | | | |
NET DECREASE IN NET ASSETS FROM CAPITAL SHARE TRANSACTIONS (NOTE 12) | | | (7,589,261 | ) | | | (10,081,022 | ) |
| | | | | | | | |
Net increase in net assets | | | 35,271,965 | | | | 9,577,182 | |
NET ASSETS | | | | | | | | |
Beginning of the year | | | 134,130,415 | | | | 124,553,233 | |
| | | | | | | | |
End of the year | | $ | 169,402,380 | | | $ | 134,130,415 | |
| | | | | | | | |
DISTRIBUTIONS IN EXCESS OF NET INVESTMENT INCOME | | $ | (472,053 | ) | | $ | (405,387 | ) |
| | | | | | | | |
See accompanying notes to financial statements.
| 46
Statements of Changes in Net Assets (continued)
| | | | | | | | |
| | | Natixis Oakmark
International Fund | |
| | | Year Ended
December 31,
2013 | | | Year Ended
December 31,
2012 | |
FROM OPERATIONS: | | | | | | | | |
Net investment income | | $ | 415,827 | | | $ | 598,170 | |
Net realized gain (loss) on investments and foreign currency transactions | | | 11,401,208 | | | | (573,920 | ) |
Net change in unrealized appreciation (depreciation) on investments and foreign currency translations | | | 36,596,500 | | | | 13,239,495 | |
| | | | | | | | |
Net increase in net assets resulting from operations | | | 48,413,535 | | | | 13,263,745 | |
| | | | | | | | |
FROM DISTRIBUTIONS TO SHAREHOLDERS: | | | | | | | | |
Net investment income | | | | | | | | |
Class A | | | (1,179,127 | ) | | | (784,779 | ) |
Class C | | | (154,136 | ) | | | (464,918 | ) |
Net realized capital gains | | | | | | | | |
Class A | | | (3,755,164 | ) | | | — | |
Class C | | | (2,995,185 | ) | | | — | |
| | | | | | | | |
Total distributions | | | (8,083,612 | ) | | | (1,249,697 | ) |
| | | | | | | | |
NET INCREASE IN NET ASSETS FROM CAPITAL SHARE TRANSACTIONS (NOTE 12) | | | 441,801,535 | | | | 10,329,896 | |
| | | | | | | | |
Net increase in net assets | | | 482,131,458 | | | | 22,343,944 | |
NET ASSETS | | | | | | | | |
Beginning of the year | | | 69,696,842 | | | | 47,352,898 | |
| | | | | | | | |
End of the year | | $ | 551,828,300 | | | $ | 69,696,842 | |
| | | | | | | | |
UNDISTRIBUTED (DISTRIBUTIONS IN EXCESS OF) NET INVESTMENT INCOME | | $ | 844,145 | | | $ | (84,170 | ) |
| | | | | | | | |
See accompanying notes to financial statements.
47 |
Statements of Changes in Net Assets (continued)
| | | | | | | | |
| | | Vaughan Nelson
Small Cap Value Fund | |
| | | Year Ended
December 31,
2013 | | | Year Ended
December 31,
2012 | |
FROM OPERATIONS: | | | | | | | | |
Net investment income | | $ | 1,290,060 | | | $ | 2,665,810 | |
Net realized gain on investments and foreign currency transactions | | | 58,527,986 | | | | 25,929,887 | |
Net change in unrealized appreciation (depreciation) on investments | | | 50,817,080 | | | | 24,173,221 | |
| | | | | | | | |
Net increase in net assets resulting from operations | | | 110,635,126 | | | | 52,768,918 | |
| | | | | | | | |
FROM DISTRIBUTIONS TO SHAREHOLDERS: | | | | | | | | |
Net investment income | | | | | | | | |
Class A | | | (368,339 | ) | | | (1,095,844 | ) |
Class B | | | (812 | ) | | | — | |
Class C | | | (8,031 | ) | | | (23,674 | ) |
Class Y | | | (821,635 | ) | | | (1,287,864 | ) |
Net realized capital gains | | | | | | | | |
Class A | | | (23,147,106 | ) | | | (11,383,253 | ) |
Class B | | | (433,209 | ) | | | (256,797 | ) |
Class C | | | (5,802,683 | ) | | | (2,136,731 | ) |
Class Y | | | (25,293,191 | ) | | | (8,612,912 | ) |
| | | | | | | | |
Total distributions | | | (55,875,006 | ) | | | (24,797,075 | ) |
| | | | | | | | |
NET DECREASE IN NET ASSETS FROM CAPITAL SHARE TRANSACTIONS (NOTE 12) | | | (27,872,472 | ) | | | (98,018,043 | ) |
| | | | | | | | |
Net increase (decrease) in net assets | | | 26,887,648 | | | | (70,046,200 | ) |
NET ASSETS | | | | | | | | |
Beginning of the year | | | 323,455,570 | | | | 393,501,770 | |
| | | | | | | | |
End of the year | | $ | 350,343,218 | | | $ | 323,455,570 | |
| | | | | | | | |
DISTRIBUTIONS IN EXCESS OF NET INVESTMENT INCOME | | $ | (213,083 | ) | | $ | (129,472 | ) |
| | | | | | | | |
See accompanying notes to financial statements.
| 48
Statements of Changes in Net Assets (continued)
| | | | | | | | |
| | | Vaughan Nelson
Value Opportunity Fund | |
| | | Year Ended
December 31,
2013 | | | Year Ended
December 31,
2012 | |
FROM OPERATIONS: | | | | | | | | |
Net investment income | | $ | 141,131 | | | $ | 2,073,764 | |
Net realized gain on investments | | | 26,959,140 | | | | 6,478,478 | |
Net change in unrealized appreciation (depreciation) on investments | | | 76,536,470 | | | | 14,399,847 | |
| | | | | | | | |
Net increase in net assets resulting from operations | | | 103,636,741 | | | | 22,952,089 | |
| | | | | | | | |
FROM DISTRIBUTIONS TO SHAREHOLDERS: | | | | | | | | |
Net investment income | | | | | | | | |
Class A | | | — | | | | (246,978 | ) |
Class C | | | — | | | | (7,944 | ) |
Class N | | | (1 | ) | | | — | |
Class Y | | | (163,927 | ) | | | (1,789,205 | ) |
Net realized capital gains | | | | | | | | |
Class A | | | (3,567,518 | ) | | | (707,026 | ) |
Class C | | | (1,069,705 | ) | | | (78,628 | ) |
Class N | | | (60 | ) | | | — | |
Class Y | | | (18,839,663 | ) | | | (4,019,631 | ) |
| | | | | | | | |
Total distributions | | | (23,640,874 | ) | | | (6,849,412 | ) |
| | | | | | | | |
NET INCREASE IN NET ASSETS FROM CAPITAL SHARE TRANSACTIONS (NOTE 12) | | | 174,487,517 | | | | 46,408,042 | |
| | | | | | | | |
Net increase in net assets | | | 254,483,384 | | | | 62,510,719 | |
NET ASSETS | | | | | | | | |
Beginning of the year | | | 195,059,858 | | | | 132,549,139 | |
| | | | | | | | |
End of the year | | $ | 449,543,242 | | | $ | 195,059,858 | |
| | | | | | | | |
DISTRIBUTIONS IN EXCESS OF NET INVESTMENT INCOME | | $ | (57,126 | ) | | $ | (40,624 | ) |
| | | | | | | | |
See accompanying notes to financial statements.
49 |
This Page Intentionally Left Blank
| 50
Financial Highlights
For a share outstanding throughout each period.
| | | | | | | | | | | | | | | | | | | | | | | | | | | | |
| | | | | | Income (Loss) from Investment
Operations: | | | Less Distributions: | |
| | | Net asset
value,
beginning
of the
period | | | Net
investment
income
(loss) (a)(b) | | | Net realized
and
unrealized
gain (loss) | | | Total from
investment
operations | | | Dividends
from net
investment
income (b) | | | Distributions
from net
realized
capital
gains | | | Total
distributions (b) | |
| CGM ADVISOR TARGETED EQUITY FUND | | | | | | | | | | | | | | | | |
Class A | | | | | | | | | | | | | | | | | | | | | | | | | |
12/31/2013 | | $ | 10.23 | | | $ | (0.02 | ) | | $ | 2.94 | | | $ | 2.92 | | | $ | (0.00 | ) | | $ | (1.69 | ) | | $ | (1.69 | ) |
12/31/2012 | | | 9.36 | | | | 0.08 | (g) | | | 1.36 | | | | 1.44 | | | | (0.09 | ) | | | (0.48 | ) | | | (0.57 | ) |
12/31/2011 | | | 11.12 | | | | 0.05 | | | | (1.76 | ) | | | (1.71 | ) | | | (0.05 | ) | | | — | | | | (0.05 | ) |
12/31/2010 | | | 9.54 | | | | 0.05 | (h) | | | 1.58 | | | | 1.63 | | | | (0.05 | ) | | | — | | | | (0.05 | ) |
12/31/2009 | | | 7.66 | | | | 0.05 | | | | 1.88 | | | | 1.93 | | | | (0.05 | ) | | | — | | | | (0.05 | ) |
Class B | | | | | | | | | | | | | | | | | | | | | | | | | |
12/31/2013 | | | 9.15 | | | | (0.10 | ) | | | 2.62 | | | | 2.52 | | | | (0.00 | ) | | | (1.69 | ) | | | (1.69 | ) |
12/31/2012 | | | 8.41 | | | | (0.00 | )(g) | | | 1.22 | | | | 1.22 | | | | (0.00 | ) | | | (0.48 | ) | | | (0.48 | ) |
12/31/2011 | | | 10.01 | | | | (0.03 | ) | | | (1.57 | ) | | | (1.60 | ) | | | — | | | | — | | | | — | |
12/31/2010 | | | 8.61 | | | | (0.02 | )(h) | | | 1.42 | | | | 1.40 | | | | (0.00 | ) | | | — | | | | (0.00 | ) |
12/31/2009 | | | 6.92 | | | | (0.01 | ) | | | 1.70 | | | | 1.69 | | | | — | | | | — | | | | — | |
Class C | | | | | | | | | | | | | | | | | | | | | | | | | |
12/31/2013 | | | 9.09 | | | | (0.10 | ) | | | 2.61 | | | | 2.51 | | | | (0.00 | ) | | | (1.69 | ) | | | (1.69 | ) |
12/31/2012 | | | 8.37 | | | | (0.00 | )(g) | | | 1.20 | | | | 1.20 | | | | (0.00 | ) | | | (0.48 | ) | | | (0.48 | ) |
12/31/2011 | | | 9.96 | | | | (0.03 | ) | | | (1.56 | ) | | | (1.59 | ) | | | — | | | | — | | | | — | |
12/31/2010 | | | 8.57 | | | | (0.02 | )(h) | | | 1.41 | | | | 1.39 | | | | (0.00 | ) | | | — | | | | (0.00 | ) |
12/31/2009 | | | 6.89 | | | | (0.01 | ) | | | 1.69 | | | | 1.68 | | | | (0.00 | ) | | | — | | | | (0.00 | ) |
Class Y | | | | | | | | | | | | | | | | | | | | | | | | |
12/31/2013 | | | 10.49 | | | | 0.01 | | | | 3.02 | | | | 3.03 | | | | (0.00 | ) | | | (1.69 | ) | | | (1.69 | ) |
12/31/2012 | | | 9.59 | | | | 0.11 | (g) | | | 1.39 | | | | 1.50 | | | | (0.12 | ) | | | (0.48 | ) | | | (0.60 | ) |
12/31/2011 | | | 11.40 | | | | 0.07 | | | | (1.80 | ) | | | (1.73 | ) | | | (0.08 | ) | | | — | | | | (0.08 | ) |
12/31/2010 | | | 9.78 | | | | 0.07 | (h) | | | 1.63 | | | | 1.70 | | | | (0.08 | ) | | | — | | | | (0.08 | ) |
12/31/2009 | | | 7.84 | | | | 0.06 | | | | 1.96 | | | | 2.02 | | | | (0.08 | ) | | | — | | | | (0.08 | ) |
| (a) | Per share net investment income (loss) has been calculated using the average shares outstanding during the period. |
| (b) | Amount rounds to less than $0.01 per share, if applicable. |
| (c) | Had certain expenses not been waived/reimbursed during the period, if applicable, total returns would have been lower. |
| (d) | A sales charge for Class A shares and a contingent deferred sales charge for Class B and Class C shares are not reflected in total return calculations. Periods less than one year, if applicable, are not annualized. |
| (e) | The investment adviser agreed to waive its fees and/or reimburse a portion of the Fund’s expenses during the period, if applicable. Without this waiver/reimbursement, expenses would have been higher. |
| (f) | Computed on an annualized basis for periods less than one year, if applicable. |
See accompanying notes to financial statements.
51 |
| | | | | | | | | | | | | | | | | | | | | | | | | | |
| | | | | | | | | |
Ratios to Average Net Assets: | | | | |
Net asset
value,
end of
the period | | | Total
return
(%) (c)(d) | | | Net assets,
end of
the period
(000’s) | | | Net
expenses
(%) (e)(f) | | | Gross
expenses
(%) (f) | | | Net investment
income (loss)
(%) (f) | | | Portfolio
turnover
rate (%) | |
| | | | | | | | | | | | | | | | | | | | | | | | | | |
| | | | | | | | | | | | | | | | | | | | | | | | | | |
| $ | 11.46 | | | | 29.01 | | | $ | 493,102 | | | | 1.17 | | | | 1.17 | | | | (0.17 | ) | | | 205 | |
| | 10.23 | | | | 15.44 | (g) | | | 438,288 | | | | 1.18 | | | | 1.18 | | | | 0.78 | (g) | | | 192 | |
| | 9.36 | | | | (15.36 | ) | | | 503,330 | | | | 1.13 | | | | 1.13 | | | | 0.45 | | | | 236 | |
| | 11.12 | | | | 17.14 | | | | 753,518 | | | | 1.16 | | | | 1.16 | | | | 0.52 | (h) | | | 146 | |
| | 9.54 | | | | 25.19 | | | | 693,386 | | | | 1.19 | | | | 1.19 | | | | 0.69 | | | | 170 | |
| | | | | | | | | | | | | | | | | | | | | | | | | | |
| | 9.98 | | | | 28.06 | | | | 2,205 | | | | 1.91 | | | | 1.91 | | | | (0.94 | ) | | | 205 | |
| | 9.15 | | | | 14.54 | (g) | | | 3,447 | | | | 1.93 | | | | 1.93 | | | | (0.05 | )(g) | | | 192 | |
| | 8.41 | | | | (15.98 | ) | | | 5,296 | | | | 1.88 | | | | 1.88 | | | | (0.32 | ) | | | 236 | |
| | 10.01 | | | | 16.26 | | | | 9,934 | | | | 1.91 | | | | 1.91 | | | | (0.28 | )(h) | | | 146 | |
| | 8.61 | | | | 24.42 | | | | 12,401 | | | | 1.94 | | | | 1.94 | | | | (0.11 | ) | | | 170 | |
| | | | | | | | | | | | | | | | | | | | | | | | | | |
| | 9.91 | | | | 28.13 | | | | 36,417 | | | | 1.91 | | | | 1.91 | | | | (0.92 | ) | | | 205 | |
| | 9.09 | | | | 14.45 | (g) | | | 35,225 | | | | 1.93 | | | | 1.93 | | | | (0.02 | )(g) | | | 192 | |
| | 8.37 | | | | (15.96 | ) | | | 47,416 | | | | 1.88 | | | | 1.88 | | | | (0.32 | ) | | | 236 | |
| | 9.96 | | | | 16.22 | | | | 81,291 | | | | 1.91 | | | | 1.91 | | | | (0.23 | )(h) | | | 146 | |
| | 8.57 | | | | 24.42 | | | | 75,098 | | | | 1.95 | | | | 1.95 | | | | (0.14 | ) | | | 170 | |
| | | | | | | | | | | | | | | | | | | | | | | | | | |
| | 11.83 | | | | 29.34 | | | | 50,096 | | | | 0.91 | | | | 0.91 | | | | 0.08 | | | | 205 | |
| | 10.49 | | | | 15.69 | (g) | | | 49,884 | | | | 0.93 | | | | 0.93 | | | | 1.02 | (g) | | | 192 | |
| | 9.59 | | | | (15.16 | ) | | | 57,003 | | | | 0.87 | | | | 0.87 | | | | 0.62 | | | | 236 | |
| | 11.40 | | | | 17.39 | | | | 137,631 | | | | 0.91 | | | | 0.91 | | | | 0.69 | (h) | | | 146 | |
| | 9.78 | | | | 25.75 | | | | 265,441 | | | | 0.94 | | | | 0.94 | | | | 0.64 | | | | 170 | |
| (g) | Includes non-recurring dividends. Without these dividends, net investment income (loss) per share would have been $0.02, $(0.05), $(0.05) and $0.05 for Class A, Class B, Class C and Class Y shares, respectively, total returns would have been 14.81%, 13.83%, 13.86% and 14.96% for Class A, Class B, Class C and Class Y shares, respectively and the ratios of net investment income (loss) to average net assets would have been 0.21%, (0.56)%, (0.55)% and 0.47% for Class A, Class B, Class C and Class Y shares, respectively. |
| (h) | Includes a non-recurring dividend. Without this dividend, net investment income (loss) per share would have been $0.02, $(0.05), $(0.05) and $0.05 for Class A, Class B, Class C and Class Y shares, respectively, and the ratio of net investment income (loss) to average net assets would have been 0.23%, (0.53)%, (0.52)% and 0.48% for Class A, Class B, Class C and Class Y shares, respectively. |
See accompanying notes to financial statements.
| 52
Financial Highlights (continued)
For a share outstanding throughout each period.
| | | | | | | | | | | | | | | | | | | | | | | | | | | | |
| | | | | | Income (Loss) from Investment
Operations: | | | Less Distributions: | |
| | | Net asset
value,
beginning
of the
period | | | Net
investment
income
(loss) (a)(b) | | | Net realized
and
unrealized
gain (loss) | | | Total from
investment
operations | | | Dividends
from net
investment
income (b) | | | Distributions
from net
realized
capital
gains | | | Total
distributions (b) | |
| HARRIS ASSOCIATES LARGE CAP VALUE FUND | | | | | | | | | | | | | |
Class A | | | | | | | | | | | | | | | | | | | | | | | | | | | | |
12/31/2013 | | $ | 16.09 | | | $ | 0.06 | | | $ | 6.03 | | | $ | 6.09 | | | $ | (0.07 | ) | | $ | (0.71 | ) | | $ | (0.78 | ) |
12/31/2012 | | | 13.86 | | | | 0.12 | | | | 2.24 | | | | 2.36 | | | | (0.13 | ) | | | — | | | | (0.13 | ) |
12/31/2011 | | | 14.17 | | | | 0.08 | | | | (0.30 | ) | | | (0.22 | ) | | | (0.09 | ) | | | — | | | | (0.09 | ) |
12/31/2010 | | | 12.58 | | | | 0.05 | | | | 1.60 | | | | 1.65 | | | | (0.06 | ) | | | — | | | | (0.06 | ) |
12/31/2009 | | | 8.77 | | | | 0.05 | (i) | | | 3.81 | | | | 3.86 | | | | (0.05 | ) | | | — | | | | (0.05 | ) |
Class B | | | | | | | | | | | | | | | | | | | | | | | | | | | | |
12/31/2013 | | | 14.83 | | | | (0.07 | ) | | | 5.52 | | | | 5.45 | | | | — | | | | (0.71 | ) | | | (0.71 | ) |
12/31/2012 | | | 12.76 | | | | (0.01 | ) | | | 2.08 | | | | 2.07 | | | | — | | | | — | | | | — | |
12/31/2011 | | | 13.07 | | | | (0.03 | ) | | | (0.28 | ) | | | (0.31 | ) | | | (0.00 | ) | | | — | | | | (0.00 | ) |
12/31/2010 | | | 11.65 | | | | (0.05 | ) | | | 1.48 | | | | 1.43 | | | | (0.01 | ) | | | — | | | | (0.01 | ) |
12/31/2009 | | | 8.16 | | | | (0.02 | )(i) | | | 3.52 | | | | 3.50 | | | | (0.01 | ) | | | — | | | | (0.01 | ) |
Class C | | | | | | | | | | | | | | | | | | | | | | | | | | | | |
12/31/2013 | | | 14.75 | | | | (0.07 | ) | | | 5.51 | | | | 5.44 | | | | — | | | | (0.71 | ) | | | (0.71 | ) |
12/31/2012 | | | 12.72 | | | | 0.00 | | | | 2.05 | | | | 2.05 | | | | (0.02 | ) | | | — | | | | (0.02 | ) |
12/31/2011 | | | 13.02 | | | | (0.03 | ) | | | (0.27 | ) | | | (0.30 | ) | | | (0.00 | ) | | | — | | | | (0.00 | ) |
12/31/2010 | | | 11.61 | | | | (0.05 | ) | | | 1.47 | | | | 1.42 | | | | (0.01 | ) | | | — | | | | (0.01 | ) |
12/31/2009 | | | 8.13 | | | | (0.02 | )(i) | | | 3.51 | | | | 3.49 | | | | (0.01 | ) | | | — | | | | (0.01 | ) |
Class Y | | | | | | | | | | | | | | | | | | | | | | | | | | | | |
12/31/2013 | | | 16.63 | | | | 0.11 | | | | 6.24 | | | | 6.35 | | | | (0.11 | ) | | | (0.71 | ) | | | (0.82 | ) |
12/31/2012 | | | 14.32 | | | | 0.17 | | | | 2.31 | | | | 2.48 | | | | (0.17 | ) | | | — | | | | (0.17 | ) |
12/31/2011 | | | 14.65 | | | | 0.12 | | | | (0.33 | ) | | | (0.21 | ) | | | (0.12 | ) | | | — | | | | (0.12 | ) |
12/31/2010 | | | 12.99 | | | | 0.08 | | | | 1.67 | | | | 1.75 | | | | (0.09 | ) | | | — | | | | (0.09 | ) |
12/31/2009 | | | 9.05 | | | | 0.08 | (i) | | | 3.93 | | | | 4.01 | | | | (0.07 | ) | | | — | | | | (0.07 | ) |
| (a) | Per share net investment income (loss) has been calculated using the average shares outstanding during the period. |
| (b) | Amount rounds to less than $0.01 per share, if applicable. |
| (c) | A sales charge for Class A shares and a contingent deferred sales charge for Class B and Class C shares are not reflected in total return calculations. Periods less than one year, if applicable, are not annualized. |
| (d) | Had certain expenses not been waived/reimbursed during the period, if applicable, total returns would have been lower. |
| (e) | The investment adviser agreed to waive its fees and/or reimburse a portion of the Fund’s expenses during the period, if applicable. Without this waiver/reimbursement, expenses would have been higher. |
| (f) | Computed on an annualized basis for periods less than one year, if applicable. |
| (g) | Includes fee/expense recovery of less than 0.01%. |
| (h) | Includes fee/expense recovery of 0.01%. |
| (i) | Includes a non-recurring dividend of $0.01 per share. |
See accompanying notes to financial statements.
53 |
| | | | | | | | | | | | | | | | | | | | | | | | | | | | | | |
| | | | | |
| | | | | | | | | | | | | Ratios to Average Net Assets: | | | | |
| | | | | | | |
Increase from
regulatory
settlements (b) | | | Net asset
value,
end of
the period | | | Total
return
(%) (c)(d) | | | Net assets,
end of
the period
(000’s) | | | Net
expenses
(%) (e)(f) | | | Gross
expenses
(%) (f) | | | Net investment
income (loss)
(%) (f) | | | Portfolio
turnover
rate (%) | |
| | | | | | | | | | | | | | | | | | | | | | | | | | | | | | |
| | | | | | | | | | | | | | | | | | | | | | | | | | | | | | |
| $ | — | | | $ | 21.40 | | | | 37.82 | | | $ | 145,270 | | | | 1.30 | (g) | | | 1.30 | (g) | | | 0.33 | | | | 29 | |
| | — | | | | 16.09 | | | | 17.03 | | | | 113,870 | | | | 1.30 | | | | 1.33 | | | | 0.77 | | | | 25 | |
| | — | | | | 13.86 | | | | (1.56 | ) | | | 107,978 | | | | 1.30 | (h) | | | 1.30 | (h) | | | 0.57 | | | | 36 | |
| | — | | | | 14.17 | | | | 13.08 | | | | 118,938 | | | | 1.30 | | | | 1.39 | | | | 0.36 | | | | 32 | |
| | 0.00 | | | | 12.58 | | | | 44.03 | | | | 113,309 | | | | 1.30 | | | | 1.50 | | | | 0.53 | | | | 131 | |
| | | | | | | | | | | | | | | | | | | | | | | | | | | | | | |
| | — | | | | 19.57 | | | | 36.75 | | | | 1,532 | | | | 2.05 | (g) | | | 2.05 | (g) | | | (0.43 | ) | | | 29 | |
| | — | | | | 14.83 | | | | 16.22 | | | | 2,145 | | | | 2.05 | | | | 2.08 | | | | (0.04 | ) | | | 25 | |
| | — | | | | 12.76 | | | | (2.34 | ) | | | 3,341 | | | | 2.05 | (h) | | | 2.05 | (h) | | | (0.21 | ) | | | 36 | |
| | — | | | | 13.07 | | | | 12.31 | | | | 5,614 | | | | 2.05 | | | | 2.13 | | | | (0.40 | ) | | | 32 | |
| | 0.00 | | | | 11.65 | | | | 42.88 | | | | 7,864 | | | | 2.05 | | | | 2.25 | | | | (0.22 | ) | | | 131 | |
| | | | | | | | | | | | | | | | | | | | | | | | | | | | | | |
| | — | | | | 19.48 | | | | 36.88 | | | | 8,425 | | | | 2.05 | (g) | | | 2.05 | (g) | | | (0.42 | ) | | | 29 | |
| | — | | | | 14.75 | | | | 16.13 | | | | 6,016 | | | | 2.05 | | | | 2.08 | | | | 0.02 | | | | 25 | |
| | — | | | | 12.72 | | | | (2.28 | ) | | | 5,667 | | | | 2.05 | (h) | | | 2.05 | (h) | | | (0.19 | ) | | | 36 | |
| | — | | | | 13.02 | | | | 12.26 | | | | 7,399 | | | | 2.05 | | | | 2.14 | | | | (0.39 | ) | | | 32 | |
| | 0.00 | | | | 11.61 | | | | 42.91 | | | | 7,208 | | | | 2.05 | | | | 2.25 | | | | (0.22 | ) | | | 131 | |
| | | | | | | | | | | | | | | | | | | | | | | | | | | | | | |
| | — | | | | 22.16 | | | | 38.21 | | | | 14,176 | | | | 1.05 | (g) | | | 1.05 | (g) | | | 0.54 | | | | 29 | |
| | — | | | | 16.63 | | | | 17.33 | | | | 12,100 | | | | 1.05 | | | | 1.09 | | | | 1.04 | | | | 25 | |
| | — | | | | 14.32 | | | | (1.40 | ) | | | 7,567 | | | | 1.05 | (h) | | | 1.05 | (h) | | | 0.80 | | | | 36 | |
| | — | | | | 14.65 | | | | 13.47 | | | | 9,586 | | | | 1.05 | | | | 1.14 | | | | 0.61 | | | | 32 | |
| | 0.00 | | | | 12.99 | | | | 44.39 | | | | 7,450 | | | | 1.05 | | | | 1.12 | | | | 0.77 | | | | 131 | |
See accompanying notes to financial statements.
| 54
Financial Highlights (continued)
For a share outstanding throughout each period.
| | | | | | | | | | | | | | | | | | | | | | | | | | | | |
| | | | | | Income (Loss) from Investment
Operations: | | | Less Distributions: | |
| | | Net asset
value,
beginning
of the
period | | | Net
investment
income
(loss) (a)(b) | | | Net realized
and
unrealized
gain (loss) | | | Total from
investment
operations | | | Dividends
from net
investment
income (b) | | | Distributions
from net
realized
capital
gains (b) | | | Total
distributions (b) | |
| NATIXIS OAKMARK INTERNATIONAL FUND | | | | | | | | | | | | | |
Class A | | | | | | | | | | | | | | | | | | | | | | | | | | | | |
12/31/2013 | | $ | 10.94 | | | $ | 0.07 | | | $ | 2.99 | | | $ | 3.06 | | | $ | (0.08 | ) | | $ | (0.18 | ) | | $ | (0.26 | ) |
12/31/2012 | | | 8.68 | | | | 0.14 | | | | 2.35 | | | | 2.49 | | | | (0.23 | ) | | | — | | | | (0.23 | ) |
12/31/2011 | | | 10.16 | | | | 0.09 | (h) | | | (1.57 | ) | | | (1.48 | ) | | | (0.00 | ) | | | (0.00 | ) | | | (0.00 | ) |
12/31/2010(i) | | | 10.00 | | | | 0.00 | | | | 0.16 | | | | 0.16 | | | | (0.00 | ) | | | — | | | | (0.00 | ) |
Class C | | | | | | | | | | | | | | | | | | | | | | | | | | | | |
12/31/2013 | | | 10.82 | | | | (0.02 | ) | | | 2.94 | | | | 2.92 | | | | (0.03 | ) | | | (0.18 | ) | | | (0.21 | ) |
12/31/2012 | | | 8.61 | | | | 0.06 | | | | 2.34 | | | | 2.40 | | | | (0.19 | ) | | | — | | | | (0.19 | ) |
12/31/2011 | | | 10.15 | | | | 0.02 | (h) | | | (1.56 | ) | | | (1.54 | ) | | | (0.00 | ) | | | (0.00 | ) | | | (0.00 | ) |
12/31/2010(i) | | | 10.00 | | | | (0.00 | ) | | | 0.15 | | | | 0.15 | | | | (0.00 | ) | | | — | | | | (0.00 | ) |
| (a) | Per share net investment income (loss) has been calculated using the average shares outstanding during the period. |
| (b) | Amount rounds to less than $0.01 per share, if applicable. |
| (c) | Had certain expenses not been waived/reimbursed during the period, if applicable, total returns would have been lower. Periods less than one year, if applicable, are not annualized. |
| (d) | A sales charge for Class A shares and a contingent deferred sales charge for Class C shares are not reflected in total return calculations. Periods less than one year, if applicable, are not annualized. |
| (e) | The investment adviser agreed to waive its fees and/or reimburse a portion of the Fund’s expenses during the period, if applicable. Without this waiver/reimbursement, expenses would have been higher. |
| (f) | Computed on an annualized basis for periods less than one year, if applicable. |
| (g) | Includes fee/expense recovery of 0.05% and 0.04% for Class A and Class C, respectively. |
| (h) | Includes a non-recurring dividend. Without this dividend, net investment income per share would have been $0.08 and $0.01 for Class A and Class C shares, respectively, total return would have been (14.65)% and (15.27)% for Class A and Class C shares, respectively, the ratio of net investment income to average net assets would have been 0.81% and 0.08% for Class A and Class C shares, respectively. |
| (i) | From commencement of operations on December 15, 2010 through December 31, 2010. |
| (j) | Amount rounds to less than 1%. |
See accompanying notes to financial statements.
55 |
| | | | | | | | | | | | | | | | | | | | | | | | | | |
| | | | |
| | | | | | | | | | Ratios to Average Net Assets: | | | | |
| | | | | | |
Net asset
value,
end of
the period | | | Total
return
(%) (c)(d) | | | Net assets,
end of
the period
(000’s) | | | Net
expenses
(%) (e)(f) | | | Gross
expenses
(%) (f) | | | Net investment
income (loss)
(%) (f) | | | Portfolio
turnover
rate (%) | |
| | | | | | | | | | | | | | | | | | | | | | | | | | |
| | | | | | | | | | | | | | | | | | | | | | | | | | |
| $ | 13.74 | | | | 28.13 | | | $ | 314,579 | | | | 1.44 | (g) | | | 1.44 | (g) | | | 0.52 | | | | 20 | |
| | 10.94 | | | | 28.78 | | | | 35,555 | | | | 1.45 | | | | 1.64 | | | | 1.50 | | | | 53 | |
| | 8.68 | | | | (14.55 | )(h) | | | 33,852 | | | | 1.45 | | | | 1.87 | | | | 0.93 | (h) | | | 48 | |
| | 10.16 | | | | 1.62 | | | | 5,487 | | | | 1.45 | | | | 22.77 | | | | 0.23 | | | | 0 | (j) |
| | | | | | | | | | | | | | | | | | | | | | | | | | |
| | 13.53 | | | | 27.13 | | | | 237,250 | | | | 2.19 | (g) | | | 2.19 | (g) | | | (0.14 | ) | | | 20 | |
| | 10.82 | | | | 27.93 | | | | 34,142 | | | | 2.20 | | | | 2.39 | | | | 0.59 | | | | 53 | |
| | 8.61 | | | | (15.17 | )(h) | | | 13,501 | | | | 2.20 | | | | 2.59 | | | | 0.20 | (h) | | | 48 | |
| | 10.15 | | | | 1.52 | | | | 700 | | | | 2.20 | | | | 25.08 | | | | (0.08 | ) | | | 0 | (j) |
See accompanying notes to financial statements.
| 56
Financial Highlights (continued)
For a share outstanding throughout each period.
| | | | | | | | | | | | | | | | | | | | | | | | | | | | |
| | | | | | Income (Loss) from Investment
Operations: | | | Less Distributions: | |
| | | Net asset
value,
beginning
of the
period | | | Net
investment
income
(loss) (a) | | | Net realized
and
unrealized
gain (loss) | | | Total from
investment
operations | | | Dividends
from net
investment
income (b) | | | Distributions
from net
realized
capital
gains | | | Total
distributions | |
| VAUGHAN NELSON SMALL CAP VALUE FUND | | | | | | | | | | | | | |
Class A | | | | | | | | | | | | | | | | | | | | | | | | | | | | |
12/31/2013 | | $ | 18.97 | | | $ | 0.07 | (g) | | $ | 7.14 | | | $ | 7.21 | | | $ | (0.06 | ) | | $ | (3.78 | ) | | $ | (3.84 | ) |
12/31/2012 | | | 17.74 | | | | 0.13 | (i) | | | 2.50 | | | | 2.63 | | | | (0.14 | ) | | | (1.26 | ) | | | (1.40 | ) |
12/31/2011 | | | 22.69 | | | | 0.10 | | | | (0.83 | ) | | | (0.73 | ) | | | (0.09 | ) | | | (4.13 | ) | | | (4.22 | ) |
12/31/2010 | | | 22.31 | | | | (0.01 | ) | | | 5.27 | | | | 5.26 | | | | — | | | | (4.90 | ) | | | (4.90 | ) |
12/31/2009 | | | 17.42 | | | | 0.05 | (j) | | | 4.88 | | | | 4.93 | | | | (0.04 | ) | | | — | | | | (0.04 | ) |
Class B | | | | | | | | | | | | | | | | | | | | | | | | | | | | |
12/31/2013 | | | 15.65 | | | | (0.07 | )(g) | | | 5.84 | | | | 5.77 | | | | (0.01 | ) | | | (3.78 | ) | | | (3.79 | ) |
12/31/2012 | | | 14.84 | | | | (0.02 | )(i) | | | 2.09 | | | | 2.07 | | | | — | | | | (1.26 | ) | | | (1.26 | ) |
12/31/2011 | | | 19.73 | | | | (0.07 | ) | | | (0.69 | ) | | | (0.76 | ) | | | (0.00 | ) | | | (4.13 | ) | | | (4.13 | ) |
12/31/2010 | | | 20.06 | | | | (0.17 | ) | | | 4.72 | | | | 4.55 | | | | — | | | | (4.90 | ) | | | (4.90 | ) |
12/31/2009 | | | 15.76 | | | | (0.09 | )(j) | | | 4.39 | | | | 4.30 | | | | — | | | | — | | | | — | |
Class C | | | | | | | | | | | | | | | | | | | | | | | | | | | | |
12/31/2013 | | | 15.64 | | | | (0.07 | )(g) | | | 5.83 | | | | 5.76 | | | | (0.01 | ) | | | (3.78 | ) | | | (3.79 | ) |
12/31/2012 | | | 14.85 | | | | (0.01 | )(i) | | | 2.08 | | | | 2.07 | | | | (0.02 | ) | | | (1.26 | ) | | | (1.28 | ) |
12/31/2011 | | | 19.74 | | | | (0.06 | ) | | | (0.70 | ) | | | (0.76 | ) | | | — | | | | (4.13 | ) | | | (4.13 | ) |
12/31/2010 | | | 20.07 | | | | (0.16 | ) | | | 4.71 | | | | 4.55 | | | | — | | | | (4.90 | ) | | | (4.90 | ) |
12/31/2009 | | | 15.76 | | | | (0.08 | )(j) | | | 4.39 | | | | 4.31 | | | | — | | | | — | | | | — | |
Class Y | | | | | | | | | | | | | | | | | | | | | | | | | | | | |
12/31/2013 | | | 19.24 | | | | 0.13 | (g) | | | 7.26 | | | | 7.39 | | | | (0.12 | ) | | | (3.78 | ) | | | (3.90 | ) |
12/31/2012 | | | 17.99 | | | | 0.18 | (i) | | | 2.53 | | | | 2.71 | | | | (0.20 | ) | | | (1.26 | ) | | | (1.46 | ) |
12/31/2011 | | | 22.96 | | | | 0.15 | | | | (0.84 | ) | | | (0.69 | ) | | | (0.15 | ) | | | (4.13 | ) | | | (4.28 | ) |
12/31/2010 | | | 22.47 | | | | 0.06 | | | | 5.31 | | | | 5.37 | | | | — | | | | (4.90 | ) | | | (4.90 | ) |
12/31/2009 | | | 17.55 | | | | 0.12 | (j) | | | 4.90 | | | | 5.02 | | | | (0.10 | ) | | | — | | | | (0.10 | ) |
| (a) | Per share net investment income (loss) has been calculated using the average shares outstanding during the period. |
| (b) | Amount rounds to less than $0.01 per share, if applicable. |
| (c) | A sales charge for Class A shares and a contingent deferred sales charge for Class B and Class C shares are not reflected in total return calculations. Periods less than one year, if applicable, are not annualized. |
| (d) | Had certain expenses not been waived/reimbursed during the period, if applicable, total returns would have been lower. |
| (e) | The investment adviser agreed to waive its fees and/or reimburse a portion of the Fund’s expenses during the period, if applicable. Without this waiver/reimbursement, expenses would have been higher. |
| (f) | Computed on an annualized basis for periods less than one year, if applicable. |
| (g) | Includes a non-recurring dividend. Without this dividend, net investment income (loss) per share would have been $0.00, $(0.14), $(0.13) and $0.06 for Class A, Class B, Class C and Class Y shares, respectively, total return would have been 38.63%, 37.63%, 37.59% and 39.06% for Class A, Class B, Class C and Class Y shares, respectively, and the ratio of net investment income (loss) to average net assets would have been 0.02%, (0.77)%, (0.73)% and 0.27% for Class A, Class B, Class C and Class Y shares, respectively. |
See accompanying notes to financial statements.
57 |
| | | | | | | | | | | | | | | | | | | | | | | | | | | | | | |
| | | | | |
| | | | | | | | | | | | | Ratios to Average Net Assets: | | | | |
| | | | | | | |
Increase from
regulatory
settlements | | | Net asset
value,
end of
the period | | | Total
return
(%) (c)(d) | | | Net assets,
end of
the period
(000’s) | | | Net
expenses
(%) (e)(f) | | | Gross
expenses
(%) (f) | | | Net investment
income (loss)
(%) (f) | | | Portfolio
turnover
rate (%) | |
| | | | | | | | | | | | | | | | | | | | | | | | | | | | | | |
| | | | | | | | | | | | | | | | | | | | | | | | | | | | | | |
| $ | — | | | $ | 22.34 | | | | 39.01 | (g) | | $ | 152,792 | | | | 1.39 | (h) | | | 1.39 | (h) | | | 0.33 | (g) | | | 58 | |
| | — | | | | 18.97 | | | | 14.93 | (i) | | | 160,400 | | | | 1.39 | | | | 1.39 | | | | 0.67 | (i) | | | 73 | |
| | — | | | | 17.74 | | | | (3.77 | ) | | | 228,445 | | | | 1.36 | | | | 1.36 | | | | 0.44 | | | | 88 | |
| | 0.02 | | | | 22.69 | | | | 23.67 | | | | 267,192 | | | | 1.41 | | | | 1.41 | | | | (0.03 | ) | | | 80 | |
| | — | | | | 22.31 | | | | 28.30 | | | | 322,961 | | | | 1.45 | | | | 1.49 | | | | 0.27 | | | | 102 | |
| | | | | | | | | | | | | | | | | | | | | | | | | | | | | | |
| | — | | | | 17.63 | | | | 38.03 | (g) | | | 2,239 | | | | 2.14 | (h) | | | 2.14 | (h) | | | (0.40 | )(g) | | | 58 | |
| | — | | | | 15.65 | | | | 14.12 | (i) | | | 3,106 | | | | 2.14 | | | | 2.14 | | | | (0.14 | )(i) | | | 73 | |
| | — | | | | 14.84 | | | | (4.51 | ) | | | 4,657 | | | | 2.11 | | | | 2.11 | | | | (0.38 | ) | | | 88 | |
| | 0.02 | | | | 19.73 | | | | 22.78 | | | | 7,996 | | | | 2.16 | | | | 2.16 | | | | (0.78 | ) | | | 80 | |
| | — | | | | 20.06 | | | | 27.28 | | | | 10,630 | | | | 2.20 | | | | 2.24 | | | | (0.56 | ) | | | 102 | |
| | | | | | | | | | | | | | | | | | | | | | | | | | | | | | |
| | — | | | | 17.61 | | | | 37.99 | (g) | | | 31,476 | | | | 2.14 | (h) | | | 2.14 | (h) | | | (0.40 | )(g) | | | 58 | |
| | — | | | | 15.64 | | | | 14.08 | (i) | | | 26,980 | | | | 2.14 | | | | 2.14 | | | | (0.07 | )(i) | | | 73 | |
| | — | | | | 14.85 | | | | (4.51 | ) | | | 30,284 | | | | 2.11 | | | | 2.11 | | | | (0.33 | ) | | | 88 | |
| | 0.02 | | | | 19.74 | | | | 22.78 | | | | 38,855 | | | | 2.16 | | | | 2.16 | | | | (0.76 | ) | | | 80 | |
| | — | | | | 20.07 | | | | 27.35 | | | | 39,238 | | | | 2.20 | | | | 2.24 | | | | (0.48 | ) | | | 102 | |
| | | | | | | | | | | | | | | | | | | | | | | | | | | | | | |
| | — | | | | 22.73 | | | | 39.43 | (g) | | | 163,836 | | | | 1.14 | (h) | | | 1.14 | (h) | | | 0.59 | (g) | | | 58 | |
| | — | | | | 19.24 | | | | 15.18 | (i) | | | 132,970 | | | | 1.14 | | | | 1.14 | | | | 0.95 | (i) | | | 73 | |
| | — | | | | 17.99 | | | | (3.54 | ) | | | 130,115 | | | | 1.10 | | | | 1.10 | | | | 0.65 | | | | 88 | |
| | 0.02 | | | | 22.96 | | | | 24.00 | | | | 217,305 | | | | 1.16 | | | | 1.16 | | | | 0.24 | | | | 80 | |
| | — | | | | 22.47 | | | | 28.61 | | | | 232,903 | | | | 1.18 | (k) | | | 1.18 | (k) | | | 0.60 | | | | 102 | |
| (h) | Includes interest expense of less than 0.01%. |
| (i) | Includes a non-recurring dividend. Without this dividend, net investment income (loss) per share would have been $0.04, $(0.09), $(0.08) and $0.10 for Class A , Class B, Class C and Class Y shares, respectively, total return would have been 14.42%, 13.64%, 13.52% and 14.73% for Class A, Class B, Class C and Class Y shares, respectively and the ratio of net investment income (loss) to average net assets would have been 0.22%, (0.56)%, (0.51)% and 0.50% for Class A, Class B, Class C and Class Y shares, respectively. |
| (j) | Includes a non-recurring dividend of $0.03 per share. |
| (k) | Includes fee/expense recovery of less than 0.01%. |
See accompanying notes to financial statements.
| 58
Financial Highlights (continued)
For a share outstanding throughout each period.
| | | | | | | | | | | | | | | | | | | | | | | | | | | | |
| | | | | | Income (Loss) from Investment
Operations: | | | Less Distributions: | |
| | | Net asset
value,
beginning
of the
period | | | Net
investment
income
(loss) (a) | | | Net realized
and
unrealized
gain (loss) | | | Total from
investment
operations | | | Dividends
from net
investment
income (b) | | | Distributions
from net
realized
capital
gains | | | Distributions
from paid-in
capital | |
| VAUGHAN NELSON VALUE OPPORTUNITY FUND | | | | | | | | | | | | | |
Class A | | | | | | | | | | | | | | | | | | | | | | | | | | | | |
12/31/2013 | | $ | 15.49 | | | $ | (0.03 | ) | | $ | 6.36 | | | $ | 6.33 | | | $ | — | | | $ | (1.19 | ) | | $ | — | |
12/31/2012 | | | 13.83 | | | | 0.15 | (g) | | | 2.05 | | | | 2.20 | | | | (0.14 | ) | | | (0.40 | ) | | | — | |
12/31/2011 | | | 14.75 | | | | (0.01 | ) | | | (0.39 | ) | | | (0.40 | ) | | | — | | | | (0.52 | ) | | | — | |
12/31/2010 | | | 12.46 | | | | 0.08 | (i) | | | 2.36 | | | | 2.44 | | | | (0.07 | ) | | | (0.02 | ) | | | (0.06 | ) |
12/31/2009 | | | 9.60 | | | | 0.09 | | | | 2.88 | | | | 2.97 | | | | (0.04 | ) | | | (0.07 | ) | | | — | |
Class C | | | | | | | | | | | | | | | | | | | | | | | | | | | | |
12/31/2013 | | | 15.21 | | | | (0.17 | ) | | | 6.22 | | | | 6.05 | | | | — | | | | (1.19 | ) | | | — | |
12/31/2012 | | | 13.60 | | | | 0.04 | (g) | | | 2.01 | | | | 2.05 | | | | (0.04 | ) | | | (0.40 | ) | | | — | |
12/31/2011 | | | 14.63 | | | | (0.12 | ) | | | (0.39 | ) | | | (0.51 | ) | | | — | | | | (0.52 | ) | | | — | |
12/31/2010 | | | 12.39 | | | | (0.03 | )(i) | | | 2.36 | | | | 2.33 | | | | (0.04 | ) | | | (0.02 | ) | | | (0.03 | ) |
12/31/2009 | | | 9.59 | | | | (0.02 | ) | | | 2.89 | | | | 2.87 | | | | (0.00 | ) | | | (0.07 | ) | | | — | |
Class N | | | | | | | | | | | | | | | | | | | | | | | | | | | | |
12/31/2013(j) | | | 17.53 | | | | (0.04 | ) | | | 4.35 | | | | 4.31 | | | | (0.02 | ) | | | (1.06 | ) | | | — | |
Class Y | | | | | | | | | | | | | | | | | | | | | | | | | | | | |
12/31/2013 | | | 15.57 | | | | 0.02 | | | | 6.39 | | | | 6.41 | | | | (0.01 | ) | | | (1.19 | ) | | | — | |
12/31/2012 | | | 13.89 | | | | 0.18 | (g) | | | 2.08 | | | | 2.26 | | | | (0.18 | ) | | | (0.40 | ) | | | — | |
12/31/2011 | | | 14.80 | | | | 0.03 | | | | (0.41 | ) | | | (0.38 | ) | | | (0.01 | ) | | | (0.52 | ) | | | — | |
12/31/2010 | | | 12.49 | | | | 0.12 | (i) | | | 2.37 | | | | 2.49 | | | | (0.09 | ) | | | (0.02 | ) | | | (0.07 | ) |
12/31/2009 | | | 9.60 | | | | 0.10 | | | | 2.90 | | | | 3.00 | | | | (0.04 | ) | | | (0.07 | ) | | | — | |
| (a) | Per share net investment income (loss) has been calculated using the average shares outstanding during the period. |
| (b) | Amount rounds to less than $0.01 per share, if applicable. |
| (c) | A sales charge for Class A shares and a contingent deferred sales charge for Class C shares are not reflected in total return calculations. Periods less than one year, if applicable, are not annualized. |
| (d) | Had certain expenses not been waived/reimbursed during the period, if applicable, total returns would have been lower. |
| (e) | The investment adviser agreed to waive its fees and/or reimburse a portion of the Fund’s expenses during the period, if applicable. Without this waiver/reimbursement, expenses would have been higher. |
| (f) | Computed on an annualized basis for periods less than one year, if applicable. |
See accompanying notes to financial statements.
59 |
| | | | | | | | | | | | | | | | | | | | | | | | | | | | | | |
| | | | | |
| | | | | | | | | | | | | Ratios to Average Net Assets: | | | | |
| | | | | | | |
Total
distributions | | | Net asset
value,
end of
the period | | | Total
return
(%) (c)(d) | | | Net assets,
end of
the period
(000’s) | | | Net
expenses
(%) (e)(f) | | | Gross
expenses
(%) (f) | | | Net investment
income (loss)
(%) (f) | | | Portfolio
turnover
rate (%) | |
| | | | | | | | | | | | | | | | | | | | | | | | | | | | | | |
| | | | | | | | | | | | | | | | | | | | | | | | | | | | | | |
| $ | (1.19) | | | $ | 20.63 | | | | 41.22 | | | $ | 67,716 | | | | 1.27 | | | | 1.27 | | | | (0.13 | ) | | | 39 | |
| | (0.54) | | | | 15.49 | | | | 15.93 | (g) | | | 28,381 | | | | 1.31 | | | | 1.31 | | | | 0.97 | (g) | | | 65 | |
| | (0.52) | | | | 13.83 | | | | (2.71 | ) | | | 21,308 | | | | 1.40 | (h) | | | 1.40 | (h) | | | (0.07 | ) | | | 75 | |
| | (0.15) | | | | 14.75 | | | | 19.64 | | | | 11,268 | | | | 1.40 | | | | 1.69 | | �� | | 0.62 | (i) | | | 143 | |
| | (0.11) | | | | 12.46 | | | | 30.98 | | | | 3,645 | | | | 1.40 | | | | 5.24 | | | | 0.79 | | | | 45 | |
| | | | | | | | | | | | | | | | | | | | | | | | | | | | | | |
| | (1.19) | | | | 20.07 | | | | 40.13 | | | | 21,005 | | | | 2.02 | | | | 2.02 | | | | (0.89 | ) | | | 39 | |
| | (0.44) | | | | 15.21 | | | | 15.10 | (g) | | | 3,090 | | | | 2.06 | | | | 2.06 | | | | 0.24 | (g) | | | 65 | |
| | (0.52) | | | | 13.60 | | | | (3.48 | ) | | | 1,822 | | | | 2.15 | (h) | | | 2.15 | (h) | | | (0.83 | ) | | | 75 | |
| | (0.09) | | | | 14.63 | | | | 18.85 | | | | 824 | | | | 2.15 | | | | 2.46 | | | | (0.23 | )(i) | | | 143 | |
| | (0.07) | | | | 12.39 | | | | 30.01 | | | | 370 | | | | 2.15 | | | | 8.54 | | | | (0.14 | ) | | | 45 | |
| | | | | | | | | | | | | | | | | | | | | | | | | | | | | | |
| | (1.08) | | | | 20.76 | | | | 24.70 | | | | 1 | | | | 1.03 | | | | 2.07 | | | | (0.33 | ) | | | 39 | |
| | | | | | | | | | | | | | | | | | | | | | | | | | | | | | |
| | (1.20) | | | | 20.78 | | | | 41.52 | | | | 360,820 | | | | 1.02 | | | | 1.02 | | | | 0.12 | | | | 39 | |
| | (0.58) | | | | 15.57 | | | | 16.28 | (g) | | | 163,589 | | | | 1.06 | | | | 1.06 | | | | 1.22 | (g) | | | 65 | |
| | (0.53) | | | | 13.89 | | | | (2.53 | ) | | | 109,419 | | | | 1.15 | (h) | | | 1.15 | (h) | | | 0.23 | | | | 75 | |
| | (0.18) | | | | 14.80 | | | | 19.96 | | | | 40,715 | | | | 1.15 | | | | 1.43 | | | | 0.92 | (i) | | | 143 | |
| | (0.11) | | | | 12.49 | | | | 31.37 | | | | 8,626 | | | | 1.15 | | | | 7.22 | | | | 0.90 | | | | 45 | |
| (g) | Includes non-recurring dividends. Without these dividends, net investment income (loss) per share would have been $0.02, $(0.08) and $0.06 for Class A, Class C and Class Y shares, respectively, total returns would have been 15.06%, 14.21% and 15.41% for Class A, Class C and Class Y shares, respectively and the ratios of net investment income (loss) to average net assets would have been 0.16%, (0.57)% and 0.42% for Class A, Class C and Class Y shares, respectively. |
| (h) | Includes fee/expense recovery of 0.01%. |
| (i) | Includes non-recurring dividends. Without this dividend, net investment income (loss) per share would have been $0.01, $(0.09) and $0.04 for Class A, Class C and Class Y shares, respectively, and the ratio of net investment income (loss) to average net assets would have been 0.07%, (0.74)% and 0.34% for Class A, Class C and Class Y shares, respectively. |
| (j) | From commencement of Class operations on May 1, 2013 through December 31, 2013. |
See accompanying notes to financial statements.
| 60
Notes to Financial Statements
December 31, 2013
1. Organization. Natixis Funds Trust I and Natixis Funds Trust II (the “Trusts” and each a “Trust”) are each organized as a Massachusetts business trust. Each Trust is registered under the Investment Company Act of 1940, as amended (the “1940 Act”), as an open-end management investment company. Each Declaration of Trust permits the Board of Trustees to authorize the issuance of an unlimited number of shares of the Trust in multiple series. The financial statements for certain funds of the Trusts are presented in separate reports. The following funds (individually, a “Fund” and collectively, the “Funds”) are included in this report:
Natixis Funds Trust I:
CGM Advisor Targeted Equity Fund (the “Targeted Equity Fund”)
Natixis Oakmark International Fund
Vaughan Nelson Small Cap Value Fund (the “Small Cap Value Fund”)
Natixis Funds Trust II:
Harris Associates Large Cap Value Fund (the “Large Cap Value Fund”)
Vaughan Nelson Value Opportunity Fund (the “Value Opportunity Fund”)
Each Fund is a diversified investment company.
Each Fund offers Class A and Class C shares. Targeted Equity Fund, Small Cap Value Fund, Large Cap Value Fund and Value Opportunity Fund also offer Class Y shares. Effective May 1, 2013, Value Opportunity Fund began offering Class N shares. Effective October 12, 2007, Class B shares of Targeted Equity Fund, Large Cap Value Fund and Small Cap Value Fund are no longer offered. Existing Class B shareholders may continue to reinvest dividends into Class B shares and exchange their Class B shares for Class B shares of other Natixis Funds subject to existing exchange privileges as described in the prospectus.
Effective July 31, 2009, the Small Cap Value Fund was closed to new investors. The Fund continues to offer Class A, Class C and Class Y shares to existing investors. The Fund, in its sole discretion, may permit an investor in another Vaughan Nelson-managed fund or product that follows the same investment strategy as the Fund to transfer assets from that fund or product into the Fund.
Class A shares are sold with a maximum front-end sales charge of 5.75%. Class B shares do not pay a front-end sales charge; however, they are charged higher Rule 12b-1 fees, and are subject to a contingent deferred sales charge (“CDSC”) if such shares are redeemed within six years of purchase. After eight years of ownership, Class B shares convert to Class A shares. Class C shares do not pay a front-end sales charge, do not convert to any other class of shares, pay higher Rule 12b-1 fees than Class A shares and may be subject to a CDSC of 1.00% if those shares are redeemed within one year of acquisition, except for reinvested distributions. Class N and Class Y shares do not pay a front-end sales charge, a CDSC or Rule 12b-1 fees. Class N shares are offered exclusively through intermediaries primarily intended for employer-sponsored
61 |
Notes to Financial Statements (continued)
December 31, 2013
retirement plans. Class Y shares are intended for institutional investors with a minimum initial investment of $100,000, though some categories of investors are exempted from the minimum investment amount as outlined in the Funds’ prospectus.
Most expenses of the Trusts can be directly attributed to a fund. Expenses which cannot be directly attributed to a fund are generally apportioned based on the relative net assets of each of the funds in the Trusts. Expenses of a Fund are borne pro rata by the holders of each class of shares, except that each class bears expenses unique to that class (including the Rule 12b-1 service and distribution fees and, for Value Opportunity Fund, transfer agent fees). In addition, each class votes as a class only with respect to its own Rule 12b-1 Plan. Shares of each class would receive their pro rata share of the net assets of a Fund if the Fund were liquidated. The Trustees approve separate distributions from net investment income on each class of shares.
2. Significant Accounting Policies. The following is a summary of significant accounting policies consistently followed by each Fund in the preparation of its financial statements. The Funds’ financial statements are prepared in accordance with accounting principles generally accepted in the United States of America which require the use of management estimates that affect the reported amounts and disclosures in the financial statements. Actual results could differ from those estimates. Management has evaluated the events and transactions subsequent to year-end through the date the financial statements were issued and has determined that there were no material events that would require disclosure in the Funds’ financial statements.
a. Valuation. Fund securities and other investments are valued at market value based on market quotations obtained or determined by independent pricing services recommended by the adviser and subadviser and approved by the Board of Trustees. Fund securities and other investments for which market quotations are not readily available are valued at fair value as determined in good faith by the adviser or subadviser pursuant to procedures approved by the Board of Trustees, as described below. Market value is determined as follows:
Equity securities (including closed-end investment companies and exchange-traded funds) are valued at the last sale price quoted on the exchange or market where traded most extensively or, if there is no reported sale during the day, the closing bid quotation as reported by an independent pricing service. Securities traded on the NASDAQ Global Select Market, NASDAQ Global Market and NASDAQ Capital Market are valued at the NASDAQ Official Closing Price (“NOCP”), or if lacking an NOCP, at the most recent bid quotations on the applicable NASDAQ Market. In some foreign markets, an official close price and a last sale price may be available from the foreign exchange or market. In those cases, the official close price is used. Debt securities (other than short-term obligations purchased with an original or remaining maturity of sixty days or less) and unlisted equity securities are valued based on evaluated bids furnished to the Funds by an independent pricing service using market information, transactions for comparable
| 62
Notes to Financial Statements (continued)
December 31, 2013
securities and various relationships between securities, if available, or bid prices obtained from broker-dealers. Broker-dealer bid prices may be used to value debt and equity securities where an independent pricing service is unable to price a security or where an independent pricing service does not provide a reliable price for the security. Forward foreign currency contracts are valued utilizing interpolated rates determined based on information provided by an independent pricing service. Short-term obligations (purchased with an original or remaining maturity of sixty days or less) are valued at amortized cost (which approximates market value).
Fund securities and other investments for which market quotations are not readily available are valued at fair value as determined in good faith by the adviser or subadviser pursuant to procedures approved by the Board of Trustees. The Funds may also value securities and other investments at fair value in other circumstances such as when extraordinary events occur after the close of a foreign market but prior to the close of the New York Stock Exchange (“NYSE”). This may include situations relating to a single issuer (such as a declaration of bankruptcy or a delisting of the issuer’s security from the primary market on which it has traded) as well as events affecting the securities markets in general (such as market disruptions or closings and significant fluctuations in U.S. and/or foreign markets). When fair valuing its securities or other investments, the Funds may, among other things, use modeling tools or other processes that may take into account factors such as securities or other market activity and/or significant events that occur after the close of the foreign market and before the time the Fund’s NAV is calculated. Fair value pricing may require subjective determinations about the value of a security, and fair values used to determine a Fund’s NAV may differ from quoted or published prices, or from prices that are used by others, for the same securities. In addition, the use of fair value pricing may not always result in adjustments to the prices of securities held by a Fund.
As of December 31, 2013, approximately 84% of the market value of Natixis Oakmark International Fund’s investments was fair valued pursuant to procedures approved by the Board of Trustees as events occurring after the close of the foreign market were believed to materially affect the value of those securities.
b. Investment Transactions and Related Investment Income. Investment transactions are accounted for on a trade date plus one day basis for daily net asset value calculation. However, for financial reporting purposes, investment transactions are reported on trade date. Dividend income is recorded on ex-dividend date, or in the case of certain foreign securities, as soon as a Fund is notified, and interest income is recorded on an accrual basis. Interest income is increased by the accretion of discount and decreased by the amortization of premium. Distributions received from investments in securities that represent a return of capital or capital gain are recorded as a reduction of cost of investments or as a realized gain, respectively. The calendar year-end amounts of ordinary income, capital gains, and return of capital included in distributions received
63 |
Notes to Financial Statements (continued)
December 31, 2013
from the Funds’ investments in real estate investment trusts (“REITs”) are reported to the Funds after the end of the fiscal year; accordingly, the Funds estimate these amounts for accounting purposes until the characterization of REIT distributions is reported to the Funds after the end of the fiscal year. Estimates are based on the most recent REIT distribution information available. In determining net gain or loss on securities sold, the cost of securities has been determined on an identified cost basis. Investment income, non-class specific expenses and realized and unrealized gains and losses are allocated on a pro rata basis to each class based on the relative net assets of each class to the total net assets of the Fund.
c. Foreign Currency Translation. The books and records of the Funds are maintained in U.S. dollars. The values of securities, currencies and other assets and liabilities denominated in currencies other than U.S. dollars are translated into U.S. dollars based upon foreign exchange rates prevailing at the end of the period. Purchases and sales of investment securities, income and expenses are translated on the respective dates of such transactions.
Since the values of investment securities are presented at the foreign exchange rates prevailing at the end of the period, it is not practical to isolate that portion of the results of operations arising from changes in exchange rates from fluctuations which arise due to changes in market prices of investment securities. Such changes are included with the net realized and unrealized gain or loss on investments.
Net realized foreign exchange gains or losses arise from sales of foreign currency, currency gains or losses realized between the trade and settlement dates on securities transactions and the difference between the amounts of dividends, interest and foreign withholding taxes recorded on the Funds’ books and the U.S. dollar equivalent of the amounts actually received or paid. Net unrealized foreign exchange gains and losses arise from changes in the value of assets and liabilities, other than investment securities, at the end of the fiscal period, resulting from changes in exchange rates.
Certain Funds may use foreign currency exchange contracts to facilitate transactions in foreign-denominated investments. Losses may arise from changes in the value of the foreign currency or if the counterparties do not perform under the contracts’ terms.
d. Forward Foreign Currency Contracts. Certain Funds may enter into forward foreign currency contracts, including forward foreign cross currency contracts, to acquire exposure to foreign currencies or to hedge the Fund’s investments against currency fluctuation. A contract can also be used to offset a previous contract. These contracts involve market risk in excess of the unrealized gain or loss reflected in the Funds’ Statements of Assets and Liabilities. The U.S. dollar value of the currencies a Fund has committed to buy or sell represents the aggregate exposure to each currency a Fund has acquired or hedged through currency contracts outstanding at period end. Gains or losses are recorded for financial statement purposes as unrealized until settlement
| 64
Notes to Financial Statements (continued)
December 31, 2013
date. Contracts are traded over-the-counter directly with a counterparty. Risks may arise upon entering into these contracts from the potential inability of counterparties to meet the terms of their contracts and from unanticipated movements in the value of a foreign currency relative to the U.S. dollar. Certain contracts may require the movement of cash and/or securities as collateral for the Fund’s or counterparty’s net obligations under the contracts.
e. Federal and Foreign Income Taxes. Each Trust treats each fund as a separate entity for federal income tax purposes. Each Fund intends to meet the requirements of the Internal Revenue Code of 1986, as amended, applicable to regulated investment companies, and to distribute to its shareholders substantially all of its net investment income and any net realized capital gains at least annually. Management has performed an analysis of each Fund’s tax positions for the open tax years as of December 31, 2013 and has concluded that no provisions for income tax are required. The Funds’ federal tax returns for the prior three fiscal years remain subject to examination by the Internal Revenue Service. Management is not aware of any events that are reasonably possible to occur in the next twelve months that would result in the amounts of any unrecognized tax benefits significantly increasing or decreasing for the Funds. However, management’s conclusions regarding tax positions taken may be subject to review and adjustment at a later date based on factors including, but not limited to, new tax laws and accounting regulations and interpretations thereof.
A Fund may be subject to foreign withholding taxes on investment income and taxes on capital gains on investments that are accrued and paid based upon the Fund’s understanding of the tax rules and regulations that exist in the countries in which the Fund invests. Foreign withholding taxes on dividend and interest income are reflected on the Statements of Operations as a reduction of investment income, net of amounts eligible to be reclaimed. Dividends and interest receivable on the Statements of Assets and Liabilities are net of foreign withholding taxes. Foreign withholding taxes eligible to be reclaimed are reflected on the Statements of Assets and Liabilities as tax reclaims receivable. Capital gains taxes paid are included in net realized gain (loss) on investments in the Statements of Operations. Accrued but unpaid capital gains taxes are reflected as foreign taxes payable on the Statements of Assets and Liabilities, if applicable, and reduce unrealized gains on investments. In the event that realized gains on investments are subsequently offset by realized losses, taxes paid on realized gains may be returned to a Fund. Such amounts, if applicable, are reflected as foreign tax rebates receivable on the Statements of Assets and Liabilities and are recorded as a realized gain when received.
f. Dividends and Distributions to Shareholders. Dividends and distributions are recorded on ex-dividend date. The timing and characterization of certain income and capital gain distributions are determined annually in accordance with federal tax regulations, which may differ from accounting principles generally accepted in the
65 |
Notes to Financial Statements (continued)
December 31, 2013
United States of America. Permanent differences are primarily due to differing treatments for book and tax purposes of items such as net operating losses, distribution redesignations, return of capital and capital gain distributions received, foreign currency gains and losses, distributions in excess of current earnings, passive foreign investment companies adjustment and deferred Trustees’ fees. Permanent book and tax basis differences relating to shareholder distributions, net investment income and net realized gains will result in reclassifications to capital accounts. Temporary differences between book and tax distributable earnings are primarily due to deferred Trustees’ fees, wash sales, return of capital distributions received and forward foreign currency contract mark to market. Distributions from net investment income and short-term capital gains are considered to be distributed from ordinary income for tax purposes.
The tax characterization of distributions is determined on an annual basis. The tax character of distributions paid to shareholders during the years ended December 31, 2013 and 2012 was as follows:
| | | | | | | | | | | | | | | | | | | | | | | | |
| | | 2013 Distributions Paid From: | | | 2012 Distributions Paid From: | |
Fund | | Ordinary
Income | | | Long-Term
Capital Gains | | | Total | | | Ordinary
Income | | | Long-Term
Capital Gains | | | Total | |
Target Equity Fund | | $ | 37,213,633 | | | $ | 39,265,245 | | | $ | 76,478,878 | | | $ | 4,402,564 | | | $ | 23,606,187 | | | $ | 28,008,751 | |
Large Cap Value Fund | | | 503,341 | | | | 5,425,590 | | | | 5,928,931 | | | | 1,044,791 | | | | — | | | | 1,044,791 | |
Natixis Oakmark International Fund | | | 1,974,167 | | | | 6,109,445 | | | | 8,083,612 | | | | 1,249,697 | | | | — | | | | 1,249,697 | |
Small Cap Value Fund | | | 14,068,610 | | | | 41,806,396 | | | | 55,875,006 | | | | 4,733,385 | | | | 20,063,690 | | | | 24,797,075 | |
Value Opportunity Fund | | | 4,109,936 | | | | 19,530,938 | | | | 23,640,874 | | | | 4,894,888 | | | | 1,954,524 | | | | 6,849,412 | |
Differences between these amounts and those reported in the Statements of Changes in Net Assets are primarily attributable to different book and tax treatment for short-term capital gains.
As of December 31, 2013, the components of distributable earnings on a tax basis were as follows:
| | | | | | | | | | | | | | | | | | | | |
| | | Targeted
Equity Fund | | | Large Cap
Value Fund | | | Natixis
Oakmark
International
Fund | | | Small Cap
Value Fund | | | Value
Opportunity
Fund | |
Undistributed ordinary income | | $ | 15,826,541 | | | $ | — | | | $ | 558,540 | | | $ | 2,446,452 | | | $ | 1,633,290 | |
Undistributed long-term capital gains | | | 1,333,254 | | | | 4,296,424 | | | | 760,996 | | | | 8,365,631 | | | | 3,862,133 | |
| | | | | | | | | | | | | | | | | | | | |
Total undistributed earnings | | | 17,159,795 | | | | 4,296,424 | | | | 1,319,536 | | | | 10,812,083 | | | | 5,495,423 | |
| | | | | | | | | | | | | | | | | | | | |
Unrealized appreciation | | | 91,202,385 | | | | 52,761,851 | | | | 42,627,606 | | | | 87,393,255 | | | | 88,794,568 | |
| | | | | | | | | | | | | | | | | | | | |
Total accumulated earnings | | $ | 108,362,180 | | | $ | 57,058,275 | | | $ | 43,947,142 | | | $ | 98,205,338 | | | $ | 94,289,991 | |
| | | | | | | | | | | | | | | | | | | | |
Capital loss carryforward utilized in the current year | | $ | — | | | $ | 6,087,105 | | | $ | 1,048,759 | | | $ | — | | | $ | — | |
| | | | | | | | | | | | | | | | | | | | |
| 66
Notes to Financial Statements (continued)
December 31, 2013
g. Repurchase Agreements. Each Fund may enter into repurchase agreements, under the terms of a Master Repurchase Agreement, under which each Fund acquires securities as collateral and agrees to resell the securities at an agreed upon time and at an agreed upon price. It is each Fund’s policy that the market value of the collateral for repurchase agreements be at least equal to 102% of the repurchase price, including interest. Certain repurchase agreements are tri-party arrangements whereby the collateral is held in a segregated account for the benefit of the Fund and on behalf of the counterparty. Repurchase agreements could involve certain risks in the event of default or insolvency of the counterparty, including possible delays or restrictions upon a Fund’s ability to dispose of the underlying securities. As of December 31, 2013, each Fund had investments in repurchase agreements for which the value of the related collateral exceeded the value of the repurchase agreement. The gross value of repurchase agreements is included in the Statements of Assets and Liabilities for financial reporting purposes.
h. Securities Lending. Certain Funds have entered into an agreement with State Street Bank and Trust Company (“State Street Bank”), as agent of the Funds, to lend securities to certain designated borrowers. The loans are collateralized with cash or securities in an amount equal to at least 105% or 102% of the market value (including accrued interest) of the loaned international or domestic securities, respectively, when the loan is initiated. Thereafter, the value of the collateral must remain at least 102% of the market value (including accrued interest) of loaned securities for U.S. equities and U.S. corporate debt; at least 105% of the market value (including accrued interest) of loaned securities for non-U.S. equities; and at least 100% of the market value (including accrued interest) of loaned securities for U.S. Government securities, sovereign debt issued by non-U.S. Governments and non-U.S. corporate debt. In the event that the market value of the collateral falls below the required percentages described above, the borrower will deliver additional collateral on the next business day. As with other extensions of credit, the Funds may bear the risk of loss with respect to the investment of the collateral. The Funds invest cash collateral in short-term investments, a portion of the income from which is remitted to the borrowers and the remainder allocated between the Funds and State Street Bank as lending agent.
For the year ended December 31, 2013, none of the Funds had loaned securities under this agreement.
i. Indemnifications. Under the Trusts’ organizational documents, their officers and Trustees are indemnified against certain liabilities arising out of the performance of their duties to the Funds. Additionally, in the normal course of business, the Funds enter into contracts with service providers that contain general indemnification clauses. The Funds’ maximum exposure under these arrangements is unknown as this would involve future claims that may be made against the Funds that have not yet occurred. However, based on experience, the Funds expect the risk of loss to be remote.
67 |
Notes to Financial Statements (continued)
December 31, 2013
3. Fair Value Measurements. In accordance with accounting standards related to fair value measurements and disclosures, the Funds have categorized the inputs utilized in determining the value of each Fund’s assets or liabilities. These inputs are summarized in the three broad levels listed below:
| | • | | Level 1 – quoted prices in active markets for identical assets or liabilities; |
| | • | | Level 2 – prices determined using other significant inputs that are observable either directly, or indirectly through corroboration with observable market data (which could include quoted prices for similar assets or liabilities, interest rates, credit risk, etc.); and |
| | • | | Level 3 – prices determined using significant unobservable inputs when quoted prices or observable inputs are unavailable such as when there is little or no market activity for an asset or liability (unobservable inputs reflect each Fund’s own assumptions in determining the fair value of assets or liabilities and would be based on the best information available). |
The inputs or methodology used for valuing securities are not necessarily an indication of the risk associated with investing in those securities.
The following is a summary of the inputs used to value the Funds’ investments as of December 31, 2013, at value:
Targeted Equity Fund
Asset Valuation Inputs
| | | | | | | | | | | | | | | | |
Description | | Level 1 | | | Level 2 | | | Level 3 | | | Total | |
Common Stocks(a) | | $ | 577,818,423 | | | $ | — | | | $ | — | | | $ | 577,818,423 | |
Short-Term Investments | | | — | | | | 10,675,000 | | | | — | | | | 10,675,000 | |
| | | | | | | | | | | | | | | | |
Total | | $ | 577,818,423 | | | $ | 10,675,000 | | | $ | — | | | $ | 588,493,423 | |
| | | | | | | | | | | | | | | | |
| (a) | Details of the major categories of the Fund’s investments are reflected within the Portfolio of Investments. |
For the year ended December 31, 2013, there were no transfers among Levels 1, 2 and 3.
Large Cap Value Fund
Asset Valuation Inputs
| | | | | | | | | | | | | | | | |
Description | | Level 1 | | | Level 2 | | | Level 3 | | | Total | |
Common Stocks(a) | | $ | 161,210,657 | | | $ | — | | | $ | — | | | $ | 161,210,657 | |
Short-Term Investments | | | — | | | | 8,230,632 | | | | — | | | | 8,230,632 | |
| | | | | | | | | | | | | | | | |
Total | | $ | 161,210,657 | | | $ | 8,230,632 | | | $ | — | | | $ | 169,441,289 | |
| | | | | | | | | | | | | | | | |
| (a) | Details of the major categories of the Fund’s investments are reflected within the Portfolio of Investments. |
| 68
Notes to Financial Statements (continued)
December 31, 2013
For the year ended December 31, 2013, there were no transfers among Levels 1, 2 and 3.
Natixis Oakmark International Fund
Asset Valuation Inputs
| | | | | | | | | | | | | | | | |
Description | | Level 1 | | | Level 2 | | | Level 3 | | | Total | |
Common Stocks | | | | | | | | | | | | | | | | |
Australia | | $ | — | | | $ | 26,784,884 | | | $ | — | | | $ | 26,784,884 | |
France | | | — | | | | 78,700,676 | | | | — | | | | 78,700,676 | |
Germany | | | — | | | | 60,439,324 | | | | — | | | | 60,439,324 | |
Ireland | | | — | | | | 11,216,412 | | | | — | | | | 11,216,412 | |
Italy | | | — | | | | 18,967,973 | | | | — | | | | 18,967,973 | |
Japan | | | — | | | | 61,346,763 | | | | — | | | | 61,346,763 | |
Korea | | | — | | | | 5,733,407 | | | | — | | | | 5,733,407 | |
Netherlands | | | 14,810,131 | | | | 25,385,480 | | | | — | | | | 40,195,611 | |
Sweden | | | — | | | | 22,487,866 | | | | — | | | | 22,487,866 | |
Switzerland | | | — | | | | 89,953,952 | | | | — | | | | 89,953,952 | |
United Kingdom | | | 12,112,143 | | | | 66,811,841 | | | | — | | | | 78,923,984 | |
All Other Common Stocks(a) | | | 11,597,459 | | | | — | | | | — | | | | 11,597,459 | |
| | | | | | | | | | | | | | | | |
Total Common Stocks | | | 38,519,733 | | | | 467,828,578 | | | | — | | | | 506,348,311 | |
| | | | | | | | | | | | | | | | |
Short-Term Investments | | | — | | | | 51,123,893 | | | | — | | | | 51,123,893 | |
| | | | | | | | | | | | | | | | |
Total Investments | | | 38,519,733 | | | | 518,952,471 | | | | — | | | | 557,472,204 | |
| | | | | | | | | | | | | | | | |
Forward Foreign Currency Contracts (unrealized appreciation) | | | — | | | | 20,370 | | | | — | | | | 20,370 | |
| | | | | | | | | | | | | | | | |
Total | | $ | 38,519,733 | | | $ | 518,972,841 | | | $ | — | | | $ | 557,492,574 | |
| | | | | | | | | | | | | | | | |
Liability Valuation Inputs
| | | | | | | | | | | | | | | | |
Description | | Level 1 | | | Level 2 | | | Level 3 | | | Total | |
Forward Foreign Currency Contracts (unrealized depreciation) | | $ | — | | | $ | (746,718 | ) | | $ | — | | | $ | (746,718 | ) |
| | | | | | | | | | | | | | | | |
| (a) | Details of the major categories of the Fund’s investments are reflected within the Portfolio of Investments. |
69 |
Notes to Financial Statements (continued)
December 31, 2013
For the year ended December 31, 2013, there were no transfers among Levels 1, 2 and 3.
Small Cap Value Fund
Asset Valuation Inputs
| | | | | | | | | | | | | | | | |
Description | | Level 1 | | | Level 2 | | | Level 3 | | | Total | |
Common Stocks(a) | | $ | 337,483,878 | | | $ | — | | | $ | — | | | $ | 337,483,878 | |
Closed End Investment Companies | | | 8,262,606 | | | | — | | | | — | | | | 8,262,606 | |
Short-Term Investments | | | — | | | | 4,393,645 | | | | — | | | | 4,393,645 | |
| | | | | | | | | | | | | | | | |
Total | | $ | 345,746,484 | | | $ | 4,393,645 | | | $ | — | | | $ | 350,140,129 | |
| | | | | | | | | | | | | | | | |
| (a) | Details of the major categories of the Fund’s investments are reflected within the Portfolio of Investments. |
For the year ended December 31, 2013, there were no transfers among Levels 1, 2 and 3.
Value Opportunity Fund
Asset Valuation Inputs
| | | | | | | | | | | | | | | | |
Description | | Level 1 | | | Level 2 | | | Level 3 | | | Total | |
Common Stocks(a) | | $ | 434,078,215 | | | $ | — | | | $ | — | | | $ | 434,078,215 | |
Closed End Investment Companies | | | 6,967,173 | | | | — | | | | — | | | | 6,967,173 | |
Short-Term Investments | | | — | | | | 12,338,308 | | | | — | | | | 12,338,308 | |
| | | | | | | | | | | | | | | | |
Total | | $ | 441,045,388 | | | $ | 12,338,308 | | | $ | — | | | $ | 453,383,696 | |
| | | | | | | | | | | | | | | | |
| (a) | Details of the major categories of the Fund’s investments are reflected within the Portfolio of Investments. |
For the year ended December 31, 2013, there were no transfers among Levels 1, 2 and 3.
4. Derivatives. Derivative instruments are defined as financial instruments whose value and performance are based on the value and performance of another security or financial instrument. Derivative instruments that Natixis Oakmark International Fund used during the period include forward foreign currency contracts.
The Fund is subject to the risk that changes in foreign currency exchange rates will have an unfavorable effect on the value of Fund assets denominated in foreign currencies. The Fund may enter into forward foreign currency contracts for hedging purposes to protect the value of the Fund’s holdings of foreign securities. During the year ended December 31, 2013, the Fund engaged in forward foreign currency transactions for hedging purposes.
| 70
Notes to Financial Statements (continued)
December 31, 2013
The following is a summary of derivative instruments for Natixis Oakmark International Fund as of December 31, 2013, as reflected within the Statements of Assets and Liabilities:
| | | | |
Assets | | Unrealized appreciation on forward foreign currency contracts | |
Over-the-counter asset derivatives | | | | |
Foreign exchange contracts | | $ | 20,370 | |
| |
Liabilities | | Unrealized depreciation on forward foreign currency contracts | |
Over-the-counter liability derivatives | | | | |
Foreign exchange contracts | | $ | (746,718 | ) |
Transactions in derivative instruments for Natixis Oakmark International Fund during the year ended December 31, 2013, as reflected within the Statements of Operations were as follows:
| | | | |
Net Realized Gain (Loss) on: | | Foreign currency transactions1 | |
Foreign exchange contracts | | $ | 1,628,302 | |
| |
Net Change in Unrealized
Appreciation (Depreciation) on: | | Foreign currency translations1 | |
Foreign exchange contracts | | $ | (1,075,141 | ) |
| 1 | Represents realized gain and change in unrealized appreciation (depreciation), respectively, for forward foreign currency contracts during the period. Does not include other foreign currency gains or losses included in the Statements of Operations. |
As the Fund values its derivatives at fair value and recognizes changes in fair value through the Statement of Operations, it does not qualify for hedge accounting under authoritative guidance for derivative instruments. The Fund’s investments in derivatives may represent an economic hedge; however, they are considered to be non-hedge transactions for the purpose of these disclosures.
The Fund enters into over-the-counter derivatives, including forward foreign currency contracts, pursuant to an International Swaps and Derivatives Association, Inc. (“ISDA”) agreement between the Fund and its counterparty. ISDA agreements typically contain, master netting provisions in the event of a default or other termination event. Master netting provisions allow the Fund and the counterparty, in the event of a default or other termination event, to offset amounts owed by each related to derivative contracts, to one net amount payable by either the Fund or the counterparty. For financial reporting purposes, the Fund does not offset derivative assets and liabilities on the Statement of Assets and Liabilities.
71 |
Notes to Financial Statements (continued)
December 31, 2013
As of December 31, 2013, gross amounts of derivative assets and liabilities not offset in the Statement of Assets & Liabilities and the related net amounts after taking into account master netting arrangements, by counterparty, are as follows:
Natixis Oakmark International Fund
| | | | | | | | | | | | |
Counterparty | | Gross Amounts of
Derivative Assets | | | Offset
Amount | | | Net
Amount | |
State Street Bank and Trust Company | | $ | 20,370 | | | $ | (20,370 | ) | | $ | — | |
| | | | | | | | | | | | |
| | | |
Counterparty | | Gross Amounts of
Derivative Liabilities | | | Offset
Amount | | | Net
Amount | |
State Street Bank and Trust Company | | $ | (746,718 | ) | | $ | 20,370 | | | $ | (726,348 | ) |
| | | | | | | | | | | | |
Counterparty risk is managed based on policies and procedures established by the Fund’s adviser. Such policies and procedures include, but are not limited to, minimum counterparty credit rating requirements and monitoring of counterparty credit default swap spreads. Based on balances reflected on the Fund’s Statement of Assets and Liabilities, the maximum amount of loss the Fund would incur if the counterparty failed to meet its obligations is $20,370 and the amount of loss that the Fund would incur after taking into account master netting arrangements is $0.
The volume of forward foreign currency contract activity, as a percentage of net assets, for Natixis Oakmark International Fund, based on gross month-end notional amounts outstanding during the period, including long and short positions at absolute value, was as follows for the year ended December 31, 2013:
| | | | |
Natixis Oakmark International Fund | | Forwards | |
Average Notional Amount Outstanding | | | 8.31 | % |
Highest Notional Amount Outstanding | | | 11.93 | % |
Lowest Notional Amount Outstanding | | | 6.01 | % |
Notional Amount Outstanding as of December 31, 2013 | | | 7.74 | % |
Notional amounts outstanding at the end of the prior period for forward currency contracts are included in the average notional amount outstanding.
Unrealized gain and/or loss on open forwards is recorded in the Statements of Assets and Liabilities. The aggregate notional values of forward contracts are not recorded in the Statements of Assets and Liabilities, and therefore are not included in the Fund’s net assets.
| 72
Notes to Financial Statements (continued)
December 31, 2013
5. Purchases and Sales of Securities. For the year ended December 31, 2013, purchases and sales of securities (excluding short-term investments and U.S. Government/Agency securities and including paydowns) were as follows:
| | | | | | | | |
Fund | | Purchases | | | Sales | |
Targeted Equity Fund | | $ | 1,136,482,110 | | | $ | 1,214,971,936 | |
Large Cap Value Fund | | | 41,652,800 | | | | 57,771,161 | |
Natixis Oakmark International Fund | | | 437,708,044 | | | | 41,831,229 | |
Small Cap Value Fund | | | 191,546,889 | | | | 275,806,382 | |
Value Opportunity Fund | | | 270,060,081 | | | | 119,436,641 | |
6. Management Fees and Other Transactions with Affiliates.
a. Management Fees. NGAM Advisors, L.P. (“NGAM Advisors”), serves as investment adviser to each Fund except the Targeted Equity Fund. Capital Growth Management Limited Partnership (“CGM”) is the investment adviser to the Targeted Equity Fund. Under the terms of the management agreements, each Fund pays a management fee at the following annual rates, calculated daily and payable monthly, based on each Fund’s average daily net assets:
| | | | | | | | | | | | | | | | | | | | |
| | | Percentage of Average Daily Net Assets | |
Fund | | First $200 million | | | Next $300 million | | | Next $500 million | | | Next $1 billion | | | Over $2 billion | |
Targeted Equity Fund | | | 0.75 | % | | | 0.70 | % | | | 0.65 | % | | | 0.65 | % | | | 0.60 | % |
Large Cap Value Fund | | | 0.70 | % | | | 0.65 | % | | | 0.60 | % | | | 0.60 | % | | | 0.60 | % |
Natixis Oakmark International Fund | | | 0.85 | % | | | 0.85 | % | | | 0.85 | % | | | 0.85 | % | | | 0.85 | % |
Small Cap Value Fund | | | 0.90 | % | | | 0.90 | % | | | 0.90 | % | | | 0.90 | % | | | 0.90 | % |
Value Opportunity Fund | | | 0.80 | % | | | 0.80 | % | | | 0.80 | % | | | 0.80 | % | | | 0.80 | % |
NGAM Advisors has entered into subadvisory agreements for each Fund as listed below.
| | |
Large Cap Value Fund | | Harris Associates L.P. (“Harris”) |
Natixis Oakmark International Fund | | Harris |
Small Cap Value Fund | | Vaughan Nelson Investment Management, L.P. (“Vaughan Nelson”) |
Value Opportunity Fund | | Vaughan Nelson |
73 |
Notes to Financial Statements (continued)
December 31, 2013
Under the terms of the subadvisory agreements, each Fund has agreed to pay its respective subadviser a subadvisory fee at the following annual rates, calculated daily and payable monthly, based on each Fund’s average daily net assets:
| | | | | | | | | | | | |
| | | | | | Percentage of Average
Daily Net Assets | |
Fund | | Subadviser | | | First
$250 Million | | | Over
$250 Million | |
Large Cap Value Fund | | | Harris | | | | 0.45 | % | | | 0.40 | % |
Natixis Oakmark International Fund | | | Harris | | | | 0.60 | % | | | 0.60 | % |
Small Cap Value Fund | | | Vaughan Nelson | | | | 0.55 | % | | | 0.55 | % |
Value Opportunity Fund | | | Vaughan Nelson | | | | 0.50 | % | | | 0.50 | % |
Payments to NGAM Advisors are reduced by the amount of payments to the subadvisers, as calculated based on the table above.
NGAM Advisors has given binding undertakings to certain Funds to waive management fees and/or reimburse certain expenses to limit the Funds’ operating expenses, exclusive of acquired fund fees and expenses, brokerage expenses, interest expense, taxes and extraordinary expenses. These undertakings are in effect until April 30, 2014 and are reevaluated on an annual basis. Management fees payable, as reflected on the Statements of Assets and Liabilities, is net of waivers and/or expense reimbursements, if any, pursuant to these undertakings.
For the year ended December 31, 2013, the expense limits as a percentage of average daily net assets under the expense limitation agreements were as follows:
| | | | | | | | | | | | | | | | | | | | |
| | | Expense limit as a Percentage of Average
Daily Net Assets | |
Fund | | Class A | | | Class B | | | Class C | | | Class N | | | Class Y | |
Large Cap Value Fund | | | 1.30 | % | | | 2.05 | % | | | 2.05 | % | | | — | | | | 1.05 | % |
Natixis Oakmark International Fund | | | 1.45 | % | | | — | | | | 2.20 | % | | | — | | | | — | |
Small Cap Value Fund | | | 1.45 | % | | | 2.20 | % | | | 2.20 | % | | | — | | | | 1.20 | % |
Value Opportunity Fund | | | 1.40 | % | | | — | | | | 2.15 | % | | | 1.10 | % | | | 1.15 | % |
NGAM Advisors shall be permitted to recover expenses it has borne under the expense limitation agreements (whether through waiver of its management fees or otherwise) on a class by class basis in later periods to the extent the annual operating expenses of a class fall below a class’ expense limits, provided, however, that a class is not obligated to pay such waived/reimbursed fees or expenses more than one year after the end of the fiscal year in which the fees or expenses were waived/reimbursed.
| 74
Notes to Financial Statements (continued)
December 31, 2013
For the year ended December 31, 2013, the management fees and waivers of management fees for each Fund were as follows:
| | | | | | | | | | | | | | | | | | | | |
Fund | | Gross
Management
Fees | | | Waivers of
Management
Fees | | | Net
Management
Fees | | | Percentage of
Average
Daily Net Assets | |
| | | | | Gross | | | Net | |
Targeted Equity Fund | | $ | 4,052,633 | | | $ | — | | | $ | 4,052,633 | | | | 0.71 | % | | | 0.71 | % |
Large Cap Value Fund | | | 1,064,864 | | | | — | | | | 1,064,864 | | | | 0.70 | % | | | 0.70 | % |
Natixis Oakmark International Fund | | | 1,891,496 | | | | — | | | | 1,891,496 | | | | 0.85 | % | | | 0.85 | % |
Small Cap Value Fund | | | 3,031,921 | | | | — | | | | 3,031,921 | | | | 0.90 | % | | | 0.90 | % |
Value Opportunity Fund | | | 2,480,359 | | | | — | | | | 2,480,359 | | | | 0.80 | % | | | 0.80 | % |
For the period ended December 31, 2013 class specific expenses have been reimbursed as follows:
| | | | |
Fund | | Reimbursement1
Class N | |
Value Opportunity Fund | | $ | 20 | |
| 1 | Expense reimbursements are subject to possible recovery until December 31, 2014. |
For the year ended December 31, 2013, expense reimbursements related to the prior fiscal year were recovered as follows:
| | | | |
Fund | | Recovered
Expenses | |
Large Cap Value Fund | | $ | 2,299 | |
Natixis Oakmark International Fund | | | 101,206 | |
Certain officers and directors of NGAM Advisors and its affiliates are also officers or Trustees of the Funds. NGAM Advisors, CGM, Harris and Vaughan Nelson are subsidiaries of Natixis US, which is part of Natixis Global Asset Management, an international asset management group based in Paris, France.
b. Service and Distribution Fees. NGAM Distribution, L.P. (“NGAM Distribution”), which is a wholly-owned subsidiary of Natixis US, has entered into a distribution agreement with the Trusts. Pursuant to this agreement, NGAM Distribution serves as principal underwriter of the Funds of the Trusts.
Pursuant to Rule 12b-1 under the 1940 Act, the Trusts have adopted a Service Plan relating to each Fund’s Class A shares (the “Class A Plans”) and a Distribution and Service Plan relating to each Fund’s Class B (if applicable) and Class C shares (the “Class B and Class C Plans”).
75 |
Notes to Financial Statements (continued)
December 31, 2013
Under the Class A Plans, each Fund pays NGAM Distribution a monthly service fee at an annual rate not to exceed 0.25% of the average daily net assets attributable to the Funds’ Class A shares, as reimbursement for expenses incurred by NGAM Distribution in providing personal services to investors in Class A shares and/or the maintenance of shareholder accounts.
Under the Class B (if applicable) and Class C Plans, each Fund pays NGAM Distribution a monthly service fee at an annual rate not to exceed 0.25% of the average daily net assets attributable to the Funds’ Class B (if applicable) and Class C shares, as compensation for services provided by NGAM Distribution in providing personal services to investors in Class B (if applicable) and Class C shares and/or the maintenance of shareholder accounts.
Also under the Class B (if applicable) and Class C Plans, each Fund pays NGAM Distribution a monthly distribution fee at an annual rate of 0.75% of the average daily net assets attributable to the Funds’ Class B (if applicable) and Class C shares, as compensation for services provided by NGAM Distribution in connection with the marketing or sale of Class B (if applicable) and Class C shares.
For the year ended December 31, 2013, the service and distribution fees for each Fund were as follows:
| | | | | | | | | | | | | | | | | | | | |
| | | Service Fees | | | Distribution Fees | |
Fund | | Class A | | | Class B | | | Class C | | | Class B | | | Class C | |
Targeted Equity Fund | | $ | 1,193,175 | | | $ | 6,905 | | | $ | 91,318 | | | $ | 20,715 | | | $ | 273,955 | |
Large Cap Value Fund | | | 321,486 | | | | 4,567 | | | | 17,755 | | | | 13,700 | | | | 53,263 | |
Natixis Oakmark International Fund | | | 275,855 | | | | — | | | | 280,467 | | | | — | | | | 841,402 | |
Small Cap Value Fund | | | 378,960 | | | | 6,576 | | | | 72,775 | | | | 19,727 | | | | 218,323 | |
Value Opportunity Fund | | | 117,078 | | | | — | | | | 25,468 | | | | — | | | | 76,403 | |
c. Administrative Fees. NGAM Advisors provides certain administrative services for the Funds and contracts with State Street Bank to serve as sub-administrator. NGAM Advisors is a wholly-owned subsidiary of Natixis US. Pursuant to an agreement among Natixis Funds Trust I, Natixis Funds Trust II, Natixis Funds Trust IV, Gateway Trust (“Natixis Funds Trusts”), Loomis Sayles Funds I, Loomis Sayles Funds II (“Loomis Sayles Funds Trusts”), Hansberger International Series and NGAM Advisors, each Fund pays NGAM Advisors monthly its pro rata portion of fees equal to an annual rate of 0.0575% of the first $15 billion of the average daily net assets of the Natixis Funds Trusts, Loomis Sayles Funds Trusts and Hansberger International Series, 0.0500% of the next $15 billion, 0.0400% of the next $30 billion and 0.0350% of such assets in excess of $60 billion, subject to an annual aggregate minimum fee for the Natixis Funds Trusts, Loomis Sayles Funds Trusts and Hansberger International Series of $10 million, which is reevaluated on an annual basis.
| 76
Notes to Financial Statements (continued)
December 31, 2013
For the year ended December 31, 2013, the administrative fees for each Fund were as follows:
| | | | |
Fund | | Administrative
Fees | |
Targeted Equity Fund | | $ | 251,461 | |
Large Cap Value Fund | | | 67,152 | |
Natixis Oakmark International Fund | | | 98,162 | |
Small Cap Value Fund | | | 148,719 | |
Value Opportunity Fund | | | 136,839 | |
d. Sub-Transfer Agent Fees. NGAM Distribution has entered into agreements, which include servicing agreements, with financial intermediaries that provide recordkeeping, processing, shareholder communications and other services to customers of the intermediaries that hold positions in the Funds and has agreed to compensate the intermediaries for providing those services. Intermediaries transact with the Funds primarily through the use of omnibus accounts on behalf of their customers who hold positions in the Funds. These services would have been provided by the Funds’ transfer agent and other service providers if the shareholders’ accounts were maintained directly at the Funds’ transfer agent. Accordingly, the Funds have agreed to reimburse NGAM Distribution for all or a portion of the servicing fees paid to these intermediaries. The reimbursement amounts (sub-transfer agent fees) paid to NGAM Distribution are subject to a current per-account equivalent fee limit approved by the Funds’ Board, which is based on fees for similar services paid to the Funds’ transfer agent and other service providers. Class N shares do not bear such expenses.
For the year ended December 31, 2013, the sub-transfer agent fees (which are reflected in transfer agent fees and expenses in the Statements of Operations) for each Fund were the following:
| | | | |
Fund | | Sub-Transfer
Agent Fees | |
Targeted Equity Fund | | $ | 208,556 | |
Large Cap Value Fund | | | 54,434 | |
Natixis Oakmark International Fund | | | 160,744 | |
Small Cap Value Fund | | | 294,608 | |
Value Opportunity Fund | | | 275,125 | |
77 |
Notes to Financial Statements (continued)
December 31, 2013
As of December 31, 2013, the Funds owe NGAM Distribution the following reimbursements for sub-transfer agent fees (which are reflected in the Statements of Assets and Liabilities as payable to distributor):
| | | | |
Fund | | Reimbursements
of Sub-Transfer
Agent Fees | |
Targeted Equity Fund | | $ | 2,644 | |
Large Cap Value Fund | | | 719 | |
Natixis Oakmark International Fund | | | 3,793 | |
Small Cap Value Fund | | | 3,213 | |
Value Opportunity Fund | | | 3,878 | |
Sub-transfer agent fees attributable to Class A, Class B, Class C and Class Y, are allocated on a pro rata basis to each class based on the relative net assets of each class to the total net assets of those classes.
e. Commissions. Commissions (including CDSCs) on Fund shares retained by NGAM Distribution during the year ended December 31, 2013, were as follows:
| | | | |
Fund | | Commissions | |
Targeted Equity Fund | | $ | 137,517 | |
Large Cap Value Fund | | | 34,710 | |
Natixis Oakmark International Fund | | | 1,423,008 | |
Small Cap Value Fund | | | 24,744 | |
Value Opportunity Fund | | | 87,029 | |
f. Trustees Fees and Expenses. The Trusts do not pay any compensation directly to their officers or Trustees who are directors, officers or employees of NGAM Advisors, NGAM Distribution, Natixis US or their affiliates. The Chairperson of the Board receives a retainer fee at the annual rate of $285,000. The Chairperson does not receive any meeting attendance fees for Board of Trustees meetings or committee meetings that she attends. Each Independent Trustee (other than the Chairperson) receives, in the aggregate, a retainer fee at the annual rate of $115,000. Each Independent Trustee also receives a meeting attendance fee of $10,000 for each meeting of the Board of Trustees that he or she attends in person and $5,000 for each meeting of the Board of Trustees that he or she attends telephonically. In addition, each committee chairperson receives an additional retainer fee at an annual rate of $17,500. Each Contract Review and Governance Committee member is compensated $6,000 for each Committee meeting that he or she attends in person and $3,000 for each meeting that he or she attends telephonically. Each Audit Committee member is compensated $6,000 for each Committee meeting that he or she attends in person and $3,000 for each meeting that he or she attends telephonically. These fees are allocated among the funds in the Natixis Funds Trusts, Loomis Sayles Funds Trusts and Hansberger International Series based
| 78
Notes to Financial Statements (continued)
December 31, 2013
on a formula that takes into account, among other factors, the relative net assets of each fund. Trustees are reimbursed for travel expenses in connection with attendance at meetings.
Effective January 1, 2014, the Chairperson of the Board will receive a retainer fee at the annual rate of $300,000 and each Independent Trustee (other than the Chairperson) will receive, in the aggregate, a retainer fee at the annual rate of $130,000. All other Trustee fees will remain unchanged.
A deferred compensation plan (the “Plan”) is available to the Trustees on a voluntary basis. Deferred amounts remain in the Funds until distributed in accordance with the provisions of the Plan. The value of a participating Trustee’s deferral account is based on theoretical investments of deferred amounts, on the normal payment dates, in certain funds of the Natixis Funds Trusts, Loomis Sayles Funds Trusts and Hansberger International Series as designated by the participating Trustees. Changes in the value of participants’ deferral accounts are allocated pro rata among the funds in the Natixis Funds Trusts, Loomis Sayles Funds Trusts, and Hansberger International Series, and are normally reflected as Trustees’ fees and expenses in the Statements of Operations. The portions of the accrued obligations allocated to the Funds under the Plan are reflected as Deferred Trustees’ fees on the Statements of Assets and Liabilities.
g. Affiliated Ownership. At December 31, 2013, Natixis US held shares of Value Opportunity Fund representing less than 0.01% of the Fund’s net assets. Investment activities of affiliated shareholders could have material impacts on the Funds.
7. Class-Specific Transfer Agent Fees and Expenses. For the period from May 1, 2013 through December 31, 2013, Value Opportunity Fund incurred the following class-specific expenses (including sub-transfer agent fees, where applicable):
| | | | | | | | | | | | | | | | |
| | | Class A | | | Class C | | | Class Y | | | Class N | |
Transfer Agent Fees and Expenses | | $ | 42,906 | | | $ | 9,270 | | | $ | 232,759 | | | $ | 20 | |
Sub-transfer agent fees attributable to Class A, Class C and Class Y are allocated on a pro rata basis to each class based on the relative net assets of each class to the total net assets of those classes.
8. Line of Credit. Each Fund, together with certain other funds of Natixis Funds Trusts, Loomis Sayles Funds Trusts and Hansberger International Series, participates in a $200,000,000 committed unsecured line of credit provided by State Street Bank, with an individual limit of $125,000,000 for each fund that participates in the line of credit. Interest is charged to each participating fund based on its borrowings at a rate per annum equal to the greater of the Federal Funds rate or overnight LIBOR, plus 1.25%. In addition, a commitment fee of 0.10% per annum, payable at the end of each calendar quarter, is accrued and apportioned among the participating funds based on their average daily unused portion of the line of credit.
79 |
Notes to Financial Statements (continued)
December 31, 2013
During the year ended December 31, 2013, Small Cap Value Fund had an average daily balance on the line of credit (for those days on which there were borrowings) of $20,519,304 at a weighted average interest rate of 1.42%. Interest expense incurred was $2,428.
9. Brokerage Commission Recapture. Certain Funds have entered into agreements with certain brokers whereby the brokers will rebate a portion of brokerage commissions. All amounts rebated by the brokers are returned to the Funds under such agreements and are included in realized gains on investments in the Statements of Operations. For the year ended December 31, 2013, amounts rebated under these agreements were as follows:
| | | | |
Fund | | Rebates | |
Targeted Equity Fund | | $ | 295,793 | |
10. Concentration of Risk. The Natixis Oakmark International Fund’s investments in foreign securities are subject to foreign currency fluctuations, higher volatility than U.S. securities, varying degrees of regulation and limited liquidity. Greater political, economic, credit and information risks are also associated with foreign securities.
11. Concentration of Ownership. From time to time, a Fund may have a concentration of one or more accounts constituting a significant percentage of shares outstanding. Investment activities by holders of such accounts could have material impacts on the Funds. As of December 31, 2013, based on management’s evaluation of the shareholder account base, the Funds had accounts representing controlling ownership of more than 5% of the Fund’s total outstanding shares. The number of such accounts, based on accounts that represent more than 5% of an individual class of shares, and the aggregate percentage of net assets represented by such holdings was as follows:
| | | | | | | | | | | | | | | | |
Fund | | Number of > 5% Non-Affiliated Account Holders | | | Percentage of Non-Affiliated Ownership | | | Percentage of Affiliated Ownership (Note 6) | | | Total Percentage of Ownership | |
Large Cap Value Fund | | | 1 | | | | 6.41 | % | | | — | | | | 6.41 | % |
Small Cap Value Fund | | | 2 | | | | 13.22 | % | | | — | | | | 13.22 | % |
Value Opportunity Fund | | | 1 | | | | 9.24 | % | | | 0.00 | %* | | | 9.24 | % |
Omnibus shareholders accounts for which NGAM Advisors understands that the intermediary has discretion over the underlying shareholder accounts are included in the table above. For other omnibus accounts, the Funds do not have information on the individual shareholder accounts underlying omnibus accounts; therefore, there could be other 5% shareholders in addition to those disclosed in the table above.
| * | Represents less than 0.01%. |
| 80
Notes to Financial Statements (continued)
December 31, 2013
12. Capital Shares. Each Fund may issue an unlimited number of shares of beneficial interest, without par value. Transactions in capital shares were as follows:
| | | | | | | | | | | | | | | | |
| |
| Year Ended
December 31, 2013 |
| |
| Year Ended
December 31, 2012 |
|
Targeted Equity Fund | | | Shares | | | | Amount | | | | Shares | | | | Amount | |
| Class A | | | | | | | | | | | | | | | | |
Issued from the sale of shares | | | 1,458,995 | | | $ | 16,947,507 | | | | 1,244,172 | | | $ | 12,681,069 | |
Issued in connection with the reinvestment of distributions | | | 5,498,306 | | | | 61,361,100 | | | | 2,186,579 | | | | 22,106,299 | |
Redeemed | | | (6,773,819 | ) | | | (79,452,307 | ) | | | (14,333,293 | ) | | | (145,957,912 | ) |
| | | | | | | | | | | | | | | | |
Net change | | | 183,482 | | | $ | (1,143,700 | ) | | | (10,902,542 | ) | | $ | (111,170,544 | ) |
| | | | | | | | | | | | | | | | |
| Class B | | | | | | | | | | | | | | | | |
Issued from the sale of shares | | | 9,622 | | | $ | 104,266 | | | | 11,137 | | | $ | 102,054 | |
Issued in connection with the reinvestment of distributions | | | 31,669 | | | | 307,820 | | | | 17,902 | | | | 161,835 | |
Redeemed | | | (197,033 | ) | | | (2,058,965 | ) | | | (282,048 | ) | | | (2,571,222 | ) |
| | | | | | | | | | | | | | | | |
Net change | | | (155,742 | ) | | $ | (1,646,879 | ) | | | (253,009 | ) | | $ | (2,307,333 | ) |
| | | | | | | | | | | | | | | | |
| Class C | | | | | | | | | | | | | | | | |
Issued from the sale of shares | | | 346,867 | | | $ | 3,419,390 | | | | 354,260 | | | $ | 3,184,715 | |
Issued in connection with the reinvestment of distributions | | | 357,986 | | | | 3,454,570 | | | | 128,372 | | | | 1,154,067 | |
Redeemed | | | (902,542 | ) | | | (9,267,379 | ) | | | (2,275,351 | ) | | | (20,591,593 | ) |
| | | | | | | | | | | | | | | | |
Net change | | | (197,689 | ) | | $ | (2,393,419 | ) | | | (1,792,719 | ) | | $ | (16,252,811 | ) |
| | | | | | | | | | | | | | | | |
| Class Y | | | | | | | | | | | | | | | | |
Issued from the sale of shares | | | 1,018,288 | | | $ | 12,174,489 | | | | 2,271,561 | | | $ | 24,317,133 | |
Issued in connection with the reinvestment of distributions | | | 385,629 | | | | 4,442,449 | | | | 177,324 | | | | 1,838,849 | |
Redeemed | | | (1,924,481 | ) | | | (23,394,134 | ) | | | (3,636,450 | ) | | | (37,293,303 | ) |
| | | | | | | | | | | | | | | | |
Net change | | | (520,564 | ) | | $ | (6,777,196 | ) | | | (1,187,565 | ) | | $ | (11,137,321 | ) |
| | | | | | | | | | | | | | | | |
Increase (decrease) from capital share transactions | | | (690,513 | ) | | $ | (11,961,194 | ) | | | (14,135,835 | ) | | $ | (140,868,009 | ) |
| | | | | | | | | | | | | | | | |
81 |
Notes to Financial Statements (continued)
December 31, 2013
12. Capital Shares (continued).
| | | | | | | | | | | | | | | | |
| |
| Year Ended
December 31, 2013 |
| |
| Year Ended
December 31, 2012 |
|
Large Cap Value Fund | | | Shares | | | | Amount | | | | Shares | | | | Amount | |
| Class A | | | | | | | | | | | | | | | | |
Issued from the sale of shares | | | 594,097 | | | $ | 11,371,063 | | | | 571,312 | | | $ | 8,808,474 | |
Issued in connection with the reinvestment of distributions | | | 206,364 | | | | 4,393,477 | | | | 48,834 | | | | 781,803 | |
Redeemed | | | (1,091,588 | ) | | | (20,603,657 | ) | | | (1,333,266 | ) | | | (20,652,590 | ) |
| | | | | | | | | | | | | | | | |
Net change | | | (291,127 | ) | | $ | (4,839,117 | ) | | | (713,120 | ) | | $ | (11,062,313 | ) |
| | | | | | | | | | | | | | | | |
| Class B | | | | | | | | | | | | | | | | |
Issued from the sale of shares | | | 2,215 | | | $ | 39,142 | | | | 5,514 | | | $ | 79,569 | |
Issued in connection with the reinvestment of distributions | | | 2,720 | | | | 52,955 | | | | — | | | | — | |
Redeemed | | | (71,336 | ) | | | (1,232,916 | ) | | | (122,644 | ) | | | (1,722,972 | ) |
| | | | | | | | | | | | | | | | |
Net change | | | (66,401 | ) | | $ | (1,140,819 | ) | | | (117,130 | ) | | $ | (1,643,403 | ) |
| | | | | | | | | | | | | | | | |
| Class C | | | | | | | | | | | | | | | | |
Issued from the sale of shares | | | 77,627 | | | $ | 1,397,844 | | | | 44,036 | | | $ | 614,371 | |
Issued in connection with the reinvestment of distributions | | | 10,127 | | | | 196,273 | | | | 374 | | | | 5,481 | |
Redeemed | | | (63,084 | ) | | | (1,112,010 | ) | | | (82,147 | ) | | | (1,165,567 | ) |
| | | | | | | | | | | | | | | | |
Net change | | | 24,670 | | | $ | 482,107 | | | | (37,737 | ) | | $ | (545,715 | ) |
| | | | | | | | | | | | | | | | |
| Class Y | | | | | | | | | | | | | | | | |
Issued from the sale of shares | | | 423,721 | | | $ | 8,459,458 | | | | 446,523 | | | $ | 7,104,087 | |
Issued in connection with the reinvestment of distributions | | | 20,978 | | | | 462,557 | | | | 6,927 | | | | 114,635 | |
Redeemed | | | (532,575 | ) | | | (11,013,447 | ) | | | (254,239 | ) | | | (4,048,313 | ) |
| | | | | | | | | | | | | | | | |
Net change | | | (87,876 | ) | | $ | (2,091,432 | ) | | | 199,211 | | | $ | 3,170,409 | |
| | | | | | | | | | | | | | | | |
Increase (decrease) from capital share transactions | | | (420,734 | ) | | $ | (7,589,261 | ) | | | (668,776 | ) | | $ | (10,081,022 | ) |
| | | | | | | | | | | | | | | | |
| 82
Notes to Financial Statements (continued)
December 31, 2013
12. Capital Shares (continued).
| | | | | | | | | | | | | | | | |
| |
| Year Ended
December 31, 2013 |
| |
| Year Ended
December 31, 2012 |
|
Natixis Oakmark International Fund | | | Shares | | | | Amount | | | | Shares | | | | Amount | |
| Class A | | | | | | | | | | | | | | | | |
Issued from the sale of shares | | | 21,056,422 | | | $ | 277,082,046 | | | | 2,642,366 | | | $ | 26,019,184 | |
Issued in connection with the reinvestment of distributions | | | 319,731 | | | | 4,302,790 | | | | 74,189 | | | | 751,291 | |
Redeemed | | | (1,725,547 | ) | | | (21,871,254 | ) | | | (3,366,763 | ) | | | (32,086,386 | ) |
| | | | | | | | | | | | | | | | |
Net change | | | 19,650,606 | | | $ | 259,513,582 | | | | (650,208 | ) | | $ | (5,315,911 | ) |
| | | | | | | | | | | | | | | | |
| Class C | | | | | | | | | | | | | | | | |
Issued from the sale of shares | | | 14,898,386 | | | $ | 188,703,775 | | | | 1,911,903 | | | $ | 18,721,734 | |
Issued in connection with the reinvestment of distributions | | | 162,333 | | | | 2,145,259 | | | | 39,078 | | | | 395,921 | |
Redeemed | | | (684,178 | ) | | | (8,561,081 | ) | | | (362,158 | ) | | | (3,471,848 | ) |
| | | | | | | | | | | | | | | | |
Net change | | | 14,376,541 | | | $ | 182,287,953 | | | | 1,588,823 | | | $ | 15,645,807 | |
| | | | | | | | | | | | | | | | |
Increase (decrease) from capital share transactions | | | 34,027,147 | | | $ | 441,801,535 | | | | 938,615 | | | $ | 10,329,896 | |
| | | | | | | | | | | | | | | | |
| | | | |
Small Cap Value Fund | | | | | | | | | | | | | | | | |
| Class A | | | | | | | | | | | | | | | | |
Issued from the sale of shares | | | 599,022 | | | $ | 13,053,903 | | | | 905,472 | | | $ | 16,716,388 | |
Issued in connection with the reinvestment of distributions | | | 912,982 | | | | 19,850,490 | | | | 438,554 | | | | 8,273,160 | |
Redeemed | | | (3,131,075 | ) | | | (66,811,043 | ) | | | (5,765,681 | ) | | | (110,211,901 | ) |
| | | | | | | | | | | | | | | | |
Net change | | | (1,619,071 | ) | | $ | (33,906,650 | ) | | | (4,421,655 | ) | | $ | (85,222,353 | ) |
| | | | | | | | | | | | | | | | |
| Class B | | | | | | | | | | | | | | | | |
Issued from the sale of shares | | | 11,456 | | | $ | 209,832 | | | | 16,274 | | | $ | 256,874 | |
Issued in connection with the reinvestment of distributions | | | 25,074 | | | | 431,817 | | | | 16,395 | | | | 255,633 | |
Redeemed | | | (108,007 | ) | | | (1,942,239 | ) | | | (147,930 | ) | | | (2,337,894 | ) |
| | | | | | | | | | | | | | | | |
Net change | | | (71,477 | ) | | $ | (1,300,590 | ) | | | (115,261 | ) | | $ | (1,825,387 | ) |
| | | | | | | | | | | | | | | | |
| Class C | | | | | | | | | | | | | | | | |
Issued from the sale of shares | | | 129,833 | | | $ | 2,289,227 | | | | 87,893 | | | $ | 1,380,808 | |
Issued in connection with the reinvestment of distributions | | | 252,715 | | | | 4,356,398 | | | | 100,469 | | | | 1,566,065 | |
Redeemed | | | (320,688 | ) | | | (5,693,761 | ) | | | (502,562 | ) | | | (7,960,221 | ) |
| | | | | | | | | | | | | | | | |
Net change | | | 61,860 | | | $ | 951,864 | | | | (314,200 | ) | | $ | (5,013,348 | ) |
| | | | | | | | | | | | | | | | |
| Class Y | | | | | | | | | | | | | | | | |
Issued from the sale of shares | | | 1,039,846 | | | $ | 23,037,927 | | | | 1,264,819 | | | $ | 24,842,034 | |
Issued in connection with the reinvestment of distributions | | | 785,493 | | | | 17,359,014 | | | | 390,474 | | | | 7,473,169 | |
Redeemed | | | (1,527,529 | ) | | | (34,014,037 | ) | | | (1,978,724 | ) | | | (38,272,158 | ) |
| | | | | | | | | | | | | | | | |
Net change | | | 297,810 | | | $ | 6,382,904 | | | | (323,431 | ) | | $ | (5,956,955 | ) |
| | | | | | | | | | | | | | | | |
Increase (decrease) from capital share transactions | | | (1,330,878 | ) | | $ | (27,872,472 | ) | | | (5,174,547 | ) | | $ | (98,018,043 | ) |
| | | | | | | | | | | | | | | | |
83 |
Notes to Financial Statements (continued)
December 31, 2013
12. Capital Shares (continued).
| | | | | | | | | | | | | | | | |
| |
| Year Ended
December 31, 2013 |
| |
| Year Ended
December 31, 2012 |
|
Value Opportunity Fund | | | Shares | | | | Amount | | | | Shares | | | | Amount | |
| Class A | | | | | | | | | | | | | | | | |
Issued from the sale of shares | | | 1,783,255 | | | $ | 33,448,462 | | | | 1,004,548 | | | $ | 15,213,332 | |
Issued in connection with the reinvestment of distributions | | | 173,512 | | | | 3,452,669 | | | | 61,029 | | | | 941,234 | |
Redeemed | | | (506,160 | ) | | | (9,482,644 | ) | | | (774,396 | ) | | | (11,761,310 | ) |
| | | | | | | | | | | | | | | | |
Net change | | | 1,450,607 | | | $ | 27,418,487 | | | | 291,181 | | | $ | 4,393,256 | |
| | | | | | | | | | | | | | | | |
| Class C | | | | | | | | | | | | | | | | |
Issued from the sale of shares | | | 851,169 | | | $ | 15,880,914 | | | | 126,208 | | | $ | 1,867,002 | |
Issued in connection with the reinvestment of distributions | | | 45,963 | | | | 896,367 | | | | 5,492 | | | | 83,139 | |
Redeemed | | | (53,768 | ) | | | (967,373 | ) | | | (62,517 | ) | | | (925,300 | ) |
| | | | | | | | | | | | | | | | |
Net change | | | 843,364 | | | $ | 15,809,908 | | | | 69,183 | | | $ | 1,024,841 | |
| | | | | | | | | | | | | | | | |
| Class N* | | | | | | | | | | | | | | | | |
Issued from the sale of shares | | | 57 | | | $ | 1,892 | | | | — | | | $ | — | |
Issued in connection with the reinvestment of distributions | | | 3 | | | | 61 | | | | — | | | | — | |
Redeemed | | | — | | | | — | | | | — | | | | — | |
| | | | | | | | | | | | | | | | |
Net change | | | 60 | | | $ | 1,953 | | | | — | | | $ | — | |
| | | | | | | | | | | | | | | | |
| Class Y | | | | | | | | | | | | | | | | |
Issued from the sale of shares | | | 9,218,173 | | | $ | 175,491,968 | | | | 5,743,517 | | | $ | 87,929,210 | |
Issued in connection with the reinvestment of distributions | | | 775,935 | | | | 15,564,482 | | | | 280,268 | | | | 4,346,477 | |
Redeemed | | | (3,139,077 | ) | | | (59,799,281 | ) | | | (3,392,058 | ) | | | (51,285,742 | ) |
| | | | | | | | | | | | | | | | |
Net change | | | 6,855,031 | | | $ | 131,257,169 | | | | 2,631,727 | | | $ | 40,989,945 | |
| | | | | | | | | | | | | | | | |
Increase (decrease) from capital share transactions | | | 9,149,062 | | | $ | 174,487,517 | | | | 2,992,091 | | | $ | 46,408,042 | |
| | | | | | | | | | | | | | | | |
| * | From commencement of Class operations on May 1, 2013 through December 31, 2013. |
13. Subsequent Event. Effective at the close of business on February 28, 2014, Harris Associates Large Cap Value Fund will change its name to Natixis Oakmark Fund and the Fund’s principal investment strategies will be amended and restated as described in the Supplement dated December 16, 2013 to the Prospectus and Summary Prospectus of Harris Associates Large Cap Value Fund.
| 84
Report of Independent Registered Public
Accounting Firm
To the Trustees of Natixis Funds Trust I and Natixis Funds Trust II and Shareholders of CGM Advisor Targeted Equity Fund, Harris Associates Large Cap Value Fund, Natixis Oakmark International Fund, Vaughan Nelson Small Cap Value Fund and Vaughan Nelson Value Opportunity Fund:
In our opinion, the accompanying statements of assets and liabilities, including the portfolios of investments, and the related statements of operations and of changes in net assets and the financial highlights present fairly, in all material respects, the financial position of the CGM Advisor Targeted Equity Fund, Natixis Oakmark International Fund, and Vaughan Nelson Small Cap Value Fund, each a series of Natixis Funds Trust I; and the Harris Associates Large Cap Value Fund and Vaughan Nelson Value Opportunity Fund, each a series of Natixis Funds Trust II (collectively, the “Funds”), at December 31, 2013, and the results of each of their operations, the changes in each of their net assets and the financial highlights for each of the periods indicated, in conformity with accounting principles generally accepted in the United States of America. These financial statements and financial highlights (hereafter referred to as “financial statements”) are the responsibility of the Funds’ management; our responsibility is to express an opinion on these financial statements based on our audits. We conducted our audits of these financial statements in accordance with the standards of the Public Company Accounting Oversight Board (United States). Those standards require that we plan and perform the audits to obtain reasonable assurance about whether the financial statements are free of material misstatement. An audit includes examining, on a test basis, evidence supporting the amounts and disclosures in the financial statements, assessing the accounting principles used and significant estimates made by management, and evaluating the overall financial statement presentation. We believe that our audits, which included confirmation of securities at December 31, 2013 by correspondence with the custodian and brokers, provide a reasonable basis for our opinion.
PricewaterhouseCoopers LLP
Boston, MA
February 24, 2014
85 |
2013 U.S. Tax Distribution Information to Shareholders (Unaudited)
Corporate Dividends Received Deduction. For the fiscal year ended December 31, 2013, a percentage of dividends distributed by the Funds listed below qualify for the dividends received deduction for corporate shareholders. These percentages are as follows:
| | | | |
Fund | | Qualifying
Percentage | |
Targeted Equity | | | 8.10 | % |
Large Cap Value | | | 100.00 | % |
Small Cap Value | | | 33.13 | % |
Value Opportunity | | | 43.11 | % |
Capital Gains Distributions. Pursuant to Internal Revenue Section 852(b), the following Funds paid distributions, which have been designated as capital gains distributions for the fiscal year ended December 31, 2013.
| | | | |
Fund | | Amount | |
Targeted Equity | | $ | 39,265,245 | |
Large Cap Value | | | 5,425,590 | |
Natixis Oakmark International | | | 6,109,445 | |
Small Cap Value | | | 41,806,396 | |
Value Opportunity | | | 19,530,938 | |
Qualified Dividend Income. For the fiscal year ended December 31, 2013, a percentage of the ordinary income dividends paid by the Funds are considered qualified dividend income eligible for reduced tax rates. These lower rates range from 0% to 20% depending on an individual’s tax bracket. If the Funds paid a distribution during calendar year 2013, complete information will be reported in conjunction with Form 1099-DIV. These percentages are noted below:
| | | | |
Fund | | Qualifying
Percentage | |
Targeted Equity | | | 14.82 | % |
Large Cap Value | | | 100.00 | % |
Natixis Oakmark International | | | 100.00 | % |
Small Cap Value | | | 21.98 | % |
Value Opportunity | | | 68.31 | % |
Foreign Tax Credit. For the year ended December 31, 2013, the Natixis Oakmark International Fund intends to pass through foreign tax credits and have derived gross income from sources within foreign countries amounting to:
| | | | | | | | |
Fund | | Foreign Tax
Credit Pass-Through | | | Foreign Source
Income | |
Natixis Oakmark International | | $ | 348,312 | | | $ | 4,839,589 | |
| 86
Trustee and Officer Information
The tables below provide certain information regarding the trustees and officers of Natixis Funds Trust I and Natixis Funds Trust II (the “Trusts”). Unless otherwise indicated, the address of all persons below is 399 Boylston Street, Boston, MA 02116. The Funds’ Statements of Additional Information include additional information about the trustees of the Trusts and are available by calling Natixis Funds at 800-225-5478.
| | | | | | | | |
Name and Year of
Birth | | Position(s) Held
with the Trusts,
Length of Time
Served and Term
of Office1 | | Principal
Occupation(s)
During Past
5 Years | | Number of
Portfolios in
Fund Complex
Overseen2
and Other
Directorships Held
During Past
5 Years | | Experience,
Qualifications,
Attributes, Skills
for Board
Membership |
| | | |
| INDEPENDENT TRUSTEES | | | | | | |
| | | | |
Daniel M. Cain (1945) | | Trustee Since 1996 Chairman of the Contract Review and Governance Committee | | Chairman of Cain Brothers & Company, Incorporated (investment banking) | | 42 Director, Sheridan Healthcare Inc. (physician practice management) | | Significant experience on the Board and on the board of other business organizations (including at a health care organization); experience in the financial industry (including roles as chairman and former chief executive officer of an investment banking firm) |
| | | | |
Kenneth A. Drucker (1945) | | Trustee Since 2008 Chairman of the Audit Committee | | Retired | | 42 None | | Significant experience on the Board and on the board of other business organizations (including at investment companies); executive experience (including as treasurer of an aerospace, automotive, and metal manufacturing corporation) |
87 |
Trustee and Officer Information
| | | | | | | | |
Name and Year of
Birth | | Position(s) Held
with the Trusts,
Length of Time
Served and Term
of Office1 | | Principal
Occupation(s)
During Past
5 Years | | Number of
Portfolios in
Fund Complex
Overseen2
and Other
Directorships Held
During Past
5 Years | | Experience,
Qualifications,
Attributes, Skills
for Board
Membership |
| | | |
INDEPENDENT TRUSTEES continued | | | | | | |
| | | | |
| Edmond J. English (1953) | | Trustee Since 2013 Contract Review and Governance Committee Member | | Chief Executive Officer of Bob’s Discount Furniture (retail) | | 42 Formerly, Director, BJ’s Wholesale Club (retail); formerly, Director, Citizens Financial Group (bank) | | Significant experience on the board of other business organizations (including at a retail company and a bank); executive experience (including at a retail company) |
| | | | |
Wendell J. Knox (1948) | | Trustee Since 2009 Audit Committee Member | | Director (formerly, President and Chief Executive Officer) of Abt Associates Inc. (research and consulting) | | 42 Director, Eastern Bank (bank); Director, The Hanover Insurance Group (property and casualty insurance) | | Significant experience on the Board and on the board of other business organizations (including at a bank and at a property and casualty insurance firm); executive experience (including roles as president and chief executive officer of a research and consulting company) |
| 88
Trustee and Officer Information
| | | | | | | | |
Name and Year of
Birth | | Position(s) Held
with the Trusts,
Length of Time
Served and Term
of Office1 | | Principal
Occupation(s)
During Past
5 Years | | Number of
Portfolios in
Fund Complex
Overseen2
and Other
Directorships Held
During Past
5 Years | | Experience,
Qualifications,
Attributes, Skills
for Board
Membership |
| | | |
INDEPENDENT TRUSTEES continued | | | | | | |
| | | | |
| Martin T. Meehan (1956) | | Trustee Since 2012 Contract Review and Governance Committee Member | | Chancellor and faculty member, University of Massachusetts Lowell | | 42 None | | Experience on the Board and on the board of other business organizations; experience as Chancellor of the University of Massachusetts Lowell; government experience (including as a member of the U.S. House of Representatives); academic experience |
| | | | |
Sandra O. Moose (1942) | | Chairperson of the Board of Trustees since November 2005 Trustee Since 1982 for Natixis Funds Trust I (including its predecessors); and since 1993 for Natixis Funds Trust II Ex officio member of the Audit Committee and Contract Review and Governance Committee | | President, Strategic Advisory Services (management consulting) | | 42 Director, Verizon Communications (telecommunications company); Director, AES Corporation (international power company); formerly, Director, Rohm and Haas Company (specialty chemicals) | | Significant experience on the Board and on the board of other business organizations (including at a telecommunications company, an international power company and a specialty chemicals corporation); executive experience (including at a management consulting company) |
89 |
Trustee and Officer Information
| | | | | | | | |
Name and Year of
Birth | | Position(s) Held
with the Trusts,
Length of Time
Served and Term
of Office1 | | Principal
Occupation(s)
During Past
5 Years | | Number of
Portfolios in
Fund Complex
Overseen2
and Other
Directorships Held
During Past
5 Years | | Experience,
Qualifications,
Attributes, Skills
for Board
Membership |
| | | |
INDEPENDENT TRUSTEES continued | | | | | | |
| | | | |
Erik R. Sirri (1958) | | Trustee Since 2009 Audit Committee Member | | Professor of Finance at Babson College; formerly, Director of the Division of Trading and Markets at the Securities and Exchange Commission | | 42 None | | Significant experience on the Board; experience as Director of the Division of Trading and Markets at the Securities and Exchange Commission; academic experience; training as an economist |
| | | | |
Peter J. Smail (1952) | | Trustee Since 2009 Audit Committee Member | | Retired | | 42 None | | Significant experience on the Board; mutual fund industry and executive experience (including roles as president and chief executive officer for an investment adviser) |
| | | | |
Cynthia L. Walker
(1956) | | Trustee Since 2005 Contract Review and Governance Committee Member | | Deputy Dean for Finance and Administration, Yale University School of Medicine | | 42 None | | Significant experience on the Board; executive experience in a variety of academic organizations (including roles as dean for finance and administration) |
| 90
Trustee and Officer Information
| | | | | | | | |
Name and Year of
Birth | | Position(s) Held
with the Trusts,
Length of Time
Served and Term
of Office1 | | Principal
Occupation(s)
During Past
5 Years | | Number of
Portfolios in
Fund Complex
Overseen2
and Other
Directorships Held
During Past
5 Years | | Experience,
Qualifications,
Attributes, Skills
for Board
Membership |
| | | |
| INTERESTED TRUSTEES | | | | | | |
| | | | |
Robert J. Blanding3
(1947)
555 California Street
San Francisco, CA 94104 | | Trustee Since 2003 | | President, Chairman, Director and Chief Executive Officer, Loomis, Sayles & Company, L.P. | | 42 None | | Significant experience on the Board; continuing service as President, Chairman, and Chief Executive Officer of Loomis, Sayles & Company, L.P. |
| | | | |
| David L. Giunta4 (1965) | | Trustee Since 2011 President and Chief Executive Officer | | President and Chief Executive Officer, NGAM Distribution Corporation, NGAM Advisors, L.P. and NGAM Distribution, L.P. | | 42 None | | Experience on the Board; continuing experience as President and Chief Executive Officer of NGAM Distribution Corporation, NGAM Advisors, L.P. and NGAM Distribution, L.P. |
| | | | |
John T. Hailer5
(1960) | | Trustee Since 2000 | | President and Chief Executive Officer – U.S. and Asia, Natixis Global Asset Management, L.P. | | 42 None | | Significant experience on the Board; continuing experience as President and Chief Executive Officer – U.S. and Asia, Natixis Global Asset Management, L.P. |
| 1 | Each trustee serves until retirement, resignation or removal from the Board. The current retirement age is 75. The position of Chairperson of the Board is appointed for a three-year term. Ms. Moose was appointed to serve an additional three-year term as the Chairperson of the Board on December 13, 2013. |
| 2 | The trustees of the Trusts serve as trustees of a fund complex that includes all series of the Natixis Funds Trust I, Natixis Funds Trust II, Natixis Funds Trust IV and Gateway Trust (collectively, the “Natixis Funds Trusts”), Loomis Sayles Funds I and Loomis Sayles Funds II (collectively, the “Loomis Sayles Funds Trusts”), and Hansberger International Series (collectively, the “Fund Complex”). |
91 |
Trustee and Officer Information
| 3 | Mr. Blanding is deemed an “interested person” of the Trusts because he holds the following positions with an affiliated person of the Trusts: President, Chairman, Director and Chief Executive Officer of Loomis, Sayles & Company, L.P. and Director of Loomis Sayles Investment Asia Pte., Ltd. |
| 4 | Mr. Giunta is deemed an “interested person” of the Trusts because he holds the following positions with an affiliated person of the Trusts: President and Chief Executive Officer of NGAM Distribution Corporation, NGAM Advisors, L.P. and NGAM Distribution, L.P. |
| 5 | Mr. Hailer is deemed an “interested person” of the Trusts because he holds the following positions with an affiliated person of the Trusts: President and Chief Executive Officer – U.S. and Asia, Natixis Global Asset Management, L.P. |
| 92
Trustee and Officer Information
| | | | | | |
Name and Year of Birth | | Position(s) Held
with the Trusts | | Term of Office1 and
Length of Time Served | | Principal Occupation(s)
During Past 5 Years2 |
|
| OFFICERS OF THE TRUSTS |
| | | |
Coleen Downs Dinneen
(1960) | | Secretary, Clerk and Chief Legal Officer | | Since September 2004 | | Executive Vice President, General Counsel, Secretary and Clerk, NGAM Distribution Corporation, NGAM Advisors, L.P. and NGAM Distribution, L.P. |
| | | |
Russell L. Kane
(1969) | | Chief Compliance Officer, Assistant Secretary and Anti-Money Laundering Officer | | Chief Compliance Officer since May 2006; Assistant Secretary since June 2004; and Anti-Money Laundering Officer since April 2007 | | Chief Compliance Officer for Mutual Funds, Senior Vice President, Deputy General Counsel, Assistant Secretary and Assistant Clerk, NGAM Distribution Corporation, NGAM Advisors, L.P. and NGAM Distribution, L.P. |
| | | |
Michael C. Kardok
(1959) | | Treasurer, Principal Financial and Accounting Officer | | Since October 2004 | | Senior Vice President, NGAM Advisors, L.P. and NGAM Distribution, L.P. |
| 1 | Each officer of the Trusts serves for an indefinite term in accordance with the Trusts’ current by-laws until the date his or her successor is elected and qualified, or until he or she sooner dies, retires, is removed or becomes disqualified. |
| 2 | Each person listed above, except as noted, holds the same position(s) with the Fund Complex. Previous positions during the past five years with NGAM Distribution, L.P., NGAM Advisors, L.P. or Loomis, Sayles & Company, L.P. are omitted, if not materially different from a trustee’s or officer’s current position with such entity. |
93 |
ANNUAL REPORT
December 31, 2013

McDonnell Intermediate Municipal Bond Fund
Natixis Diversified Income Fund
Natixis U.S. Multi-Cap Equity Fund

TABLE OF CONTENTS
Portfolio Review page 1
Portfolio of Investments page 19
Financial Statements page 52
Notes to Financial Statements page 65
Barron’s/Lipper 2013 one-year fund family ranking based on 64 qualifying U.S. fund companies. Each fund family must have at least three funds in Lipper’s general U.S.-stock category, one world (global and international), one mixed-asset/balanced (stocks and bonds), two taxable bond and one tax-exempt bond fund. Past performance is no guarantee of future results.
For more details visit ngam.natixis.com/TopFundFamily
MCDONNELL INTERMEDIATE MUNICIPAL BOND FUND
| | |
| Managers | | Symbols |
Dawn Mangerson | | Class A MIMAX |
James Grabovac, CFA | | Class C MIMCX |
Lawrence Jones | | Class Y MIMYX |
| Steve Wlodarski, CFA | | |
| McDonnell Investment Management, LLC | | |
Objective
Seeks a high level of federal tax-exempt current income, consistent with the preservation of capital
Market Conditions
Higher interest rates and a steepening yield curve (a graph of Treasury yields, from short-term to long-term) characterized much of the year, and most areas of the municipal market registered modestly negative returns for the first time since 2008. Much of the pressure during 2013 was driven by fears of the Federal Reserve (the Fed) ‘tapering’ its bond-buying program, which was initiated in September of 2012. The issue of on-again, off-again tapering was closely correlated with most of the interest rate volatility that the bond market experienced during the second and third quarters. During the past year, yields in the municipal market rose by more than 100 basis points from the 10-year part of the curve and longer, while yields rose more modestly on the shorter part of the curve. Municipals outperformed Treasuries across much of the curve, with the exception of the longer-end, which bore the brunt of mutual fund liquidations stemming from a steady drumbeat of shareholder redemptions. In addition to the rate increases of the past year, the market has been characterized by strong investor preference for shorter maturity securities inside of 10 years. Despite well-publicized fiscal woes facing a few high profile issuers, the credit environment broadly continued to improve. Alongside improving credit fundamentals, spreads (the yield difference between U.S, Treasuries and other fixed-income sectors) have narrowed, particularly on the shorter-end of the curve, where the limited availability of investment grade municipals continues to be met with strong demand from investors seeking additional yield.
Performance Results
For the 12 months ended December 31, 2013, Class A shares of McDonnell Intermediate Municipal Bond Fund returned -2.66% at net asset value. The fund underperformed its benchmark, the Barclays 3-15 Year Blend Municipal Bond Index, which returned -1.24%.
Explanation of Fund Performance
Fund performance was hurt by generally rising interest rates across the bond market. The municipal market, in particular, faced pressure from mutual fund liquidations necessitated by a significant level of shareholder redemptions that occurred during the year. The municipal market this past year was in some ways a mirror image of the market in the
1 |
previous year. In 2013, rates rose and the yield curve steepened, in contrast to 2012 when rates fell and the yield curve flattened. Also, investors reversed course with mutual fund outflows that exceeded 2012 inflows by a comfortable margin.
The fund underperformed the benchmark in large part because of an overweight in the 10- to 15-year portion of the curve, as well as a portfolio structure that was somewhat more sensitive to changes in interest rates due to holding fewer shorter duration callable bonds than the index. With regard to exposure to various states, the fund benefited significantly from lack of exposure to Commonwealth of Puerto Rico issuers, whose bonds severely underperformed the broad market during the period. In addition, fund performance was hurt somewhat by an underweight relative to the index in California exposure, as valuations tightened following the passage of California Proposition 30, which temporarily boosted marginal tax rates for higher income residents.
With a significant rise in interest rates during the year, the fund actively executed tax loss harvesting trades, repositioned along the yield curve and increased its income component. Tax loss harvesting allows the fund to carry forward losses realized to offset potential future gains in an effort to reduce negative tax consequences. With respect to yield curve positioning, at the beginning of the year, the fund was positioned with a considerable overweight versus its benchmark in the 6- to 7-year portion of the yield curve. Given a significant rise in interest rates, particularly in the long end of the curve during the second and third quarters, the fund reduced its weight in the middle portion of the intermediate curve and extended further out on the yield curve to take advantage of relative underperformance, attractive security valuations and higher yields. The result of tax loss harvesting and yield curve repositioning enhanced the income component of the fund by increasing the average acquisition yield of fund holdings.
Outlook
The economic recovery is in its fifth year, and we expect that it will continue and perhaps accelerate modestly in 2014 as fiscal drag at the federal level moderates. The Fed, while announcing its intention to reduce its bond purchases, has also strengthened forward guidance, indicating the expectation that near-zero short-term rates would likely be in place well into 2015. The global credit crisis and subsequent Great Recession coincided with massive private deleveraging and credit contraction. There is little evidence to suggest that re-leveraging, tight labor markets or accelerating inflation are anywhere on the near-term horizon. Last year’s rate rise, while painful to endure, has resulted in a significant improvement in fixed-income valuation metrics, as higher rates provide more potential cushion should rates continue to drift higher.
| 2
MCDONNELL INTERMEDIATE MUNICIPAL BOND FUND
Growth of $10,000 Investment in Class A Shares4
December 31, 2012 (inception) through December 31, 2013
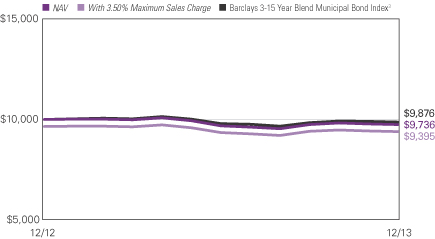
3 |
Average Annual Total Returns — December 31, 20134
| | | | | | | | |
| | | |
| | | 1 Year | | | Life of
Fund | |
| | | |
| Class A (Inception 12/31/12)1 | | | | | | | | |
| NAV | | | -2.66 | % | | | -2.66 | % |
| With 3.50% Maximum Sales Charge | | | -6.08 | | | | -6.08 | |
| | | |
| Class C (Inception 12/31/12)1 | | | | | | | | |
| NAV | | | -3.35 | | | | -3.35 | |
| With CDSC2 | | | -4.32 | | | | -4.32 | |
| | | |
| Class Y (Inception 12/31/12)1 | | | | | | | | |
| NAV | | | -2.31 | | | | -2.31 | |
| | | |
| Comparative Performance | | | | | | | | |
| Barclays 3-15 Year Blend Municipal Bond Index3 | | | -1.24 | | | | -1.24 | |
Past performance does not guarantee future results. The table does not reflect taxes shareholders might owe on any fund distributions or when they redeem their shares. Performance for periods less than one year is cumulative, not annualized. Returns reflect changes in share price and reinvestment of dividends and capital gains, if any. Unlike a fund, an index is not managed and does not reflect fees and expenses.
| 1 | 12/31/12 represents the date shares were first registered for public sale under the Securities Act of 1933. 11/16/12 represents commencement of operations for accounting and financial reporting purposes only. |
| 2 | Performance for Class C shares assumes a 1.00% contingent deferred sales charge (“CDSC”) applied when you sell shares within one year of purchase. |
| 3 | Barclays 3-15 Year Blend Municipal Bond Index tracks the performance of municipal bonds issued after December 31, 1990 with remaining maturities between 2 and 17 years and at least $5 million in principal amount outstanding. |
| 4 | Fund performance has been increased by fee waivers and/or expense reimbursements, if any, without which performance would have been lower. |
| 4
NATIXIS DIVERSIFIED INCOME FUND
| | |
| Managers | | Symbols |
| Dividend Equity Segment | | Class A IIDPX |
| Active Investment Advisors | | Class C CIDPX |
(a division of NGAM Advisors, L.P.) | | Class Y YIDPX |
| Diversified REIT Segment | | |
| AEW Capital Management, L.P. |
| Inflation Protected Securities Segment |
| Multi-Sector Bond Segment |
| Loomis, Sayles & Company, L.P. |
Objective
Seeks current income with a secondary objective of capital appreciation
Market Conditions
Economic growth picked up in the United States in 2013, and the global economy showed signs of recovery, as the euro zone emerged from recession and key emerging markets stabilized in the second half of the year. Solid new job growth helped bolster U.S. consumer confidence, and the nation’s housing market continued to heal despite rising mortgage rates. Robust durable goods production, supported by rising auto sales, contributed to solid manufacturing activity. Despite a host of concerns over spending cuts, budget and debt ceiling standoffs and a Federal Reserve (the Fed) poised to begin its wind down of stimulus measures in 2014, investors bid stocks and other risky assets higher over the course of the year. Convertible bonds and high-yield bonds, both domestic and foreign, delivered modest gains. However, the threat of rising interest rates weighed on U.S. government bond sectors and real estate investment trusts (REITs), which lost some ground in 2013. Treasury Inflation Protected Securities (TIPS) was the weakest fixed-income sector for the year.
Performance Results
For the 12 months ended December 31, 2013, Class A shares of Natixis Diversified Income Fund returned 5.84% at net asset value. The portfolio outperformed its primary benchmark, the Barclays U.S. Aggregate Bond Index, which returned -2.02%. The fund also outperformed its secondary benchmark, which returned 3.83% for the period. This benchmark is a blended, unmanaged index composed of 40% Barclays U.S. Aggregate Bond Index, 25% MSCI US REIT Index, 20% Dow Jones U.S. Select Dividend™ Index and 15% Barclays U.S. TIPS Index.
Explanation of Fund Performance
Natixis Diversified Income Fund allows investors to participate in four income-oriented market segments, each featuring a different investment discipline. They are:
| · | | Active Dividend Equity Segment, an indexed portfolio of dividend-paying common stocks, based on the Dow Jones U.S. Select Dividend™ Index, and tracked by Active Investment Advisors (AIA), a division of NGAM Advisors, L.P. |
5 |
| · | | AEW Diversified REIT Segment, composed of REITs. This segment is managed by AEW Capital Management, L.P. (“AEW”), a specialist in this income-producing equity field. |
| · | | Loomis Sayles Inflation Protected Securities Segment, a portfolio of TIPS. The segment is managed by Loomis, Sayles & Company, L.P. (“Loomis Sayles”). |
| · | | Loomis Sayles Multi-Sector Bond Segment, a portfolio composed of domestic and foreign bonds also managed by Loomis Sayles. |
The Loomis Sayles Multi-Sector Bond segment most contributed to the fund’s outperformance relative to its secondary benchmark for the 12 months ended December 31, 2013.
Active Dividend Equity Segment
This segment is designed to replicate the Dow Jones U.S. Select Dividend™ Index by holding substantially all of the securities in the index in the same proportions. The benchmark is composed of 100 of the highest dividend-paying equity securities (other than REITs) in the Dow Jones U.S. Total Stock Market Index — a broad based index designed to represent the total market for U.S. equity securities.
The Dow Jones U.S. Select Dividend™ Index returned 29.06% for the 12-month period ended December 31, 2013. Industrials, utilities and financials made the strongest contribution to index gains, while telecommunications, technology and energy were the weakest performers for the period. Telecommunications was the only sector with a negative return for the year. As of December 31, 2013, the largest sectors in the index were generally the same as at the beginning of the period: utilities, industrials and consumer staples.
During the course of the year, 12 stocks were deleted from the index and 12 replacements were named. Heinz and NYSE Euronext were both acquired and therefore dropped from the index. Briggs & Stratton was also removed. Philip Morris, Old Republic International and Intel were added to the index. As a result of year-end index rebalancing, Allstate, Hubbell, Hudson City Bancorp, International Flavors & Fragrances, McGraw Hill Financial, Mondelez International, PPG Industries, Sensient Technologies and Watsco were removed from the index and replaced with Campbell Soup, Ensco, Federated Investors, HollyFrontier, IDACORP, Questar, Staples, Wisconsin Energy and Xcel Energy.
AEW Diversified REIT Segment
The U.S. REIT sector returned 2.47%, as measured by the MSCI U.S. REIT Index, for the 12-month period ended December 31, 2013. Despite suffering through what was a volatile year, some uncertainty over the Fed’s tapering timetable was reduced as the Fed announced in December that it would be taking the first steps toward normalizing monetary policy by reducing its bond purchases beginning in January. The fund’s REIT segment benefited from solid sector allocation, which was partially offset by negative stock selection results in
| 6
NATIXIS DIVERSIFIED INCOME FUND
the industrial, healthcare and diversified sectors. Among the strongest contributors were healthcare REIT Omega Healthcare Investors and hotel REITs Pebblebrook and RLJ Lodging. Detractors from performance were American Campus Communities, Armada Hoffler Properties and HCP.
While the overall economic outlook has improved, this also makes rising interest rates more likely as we begin 2014. Key determinants of where REIT values are headed are how fast and far interest rates rise, and how much improving economic fundamentals offset the impact of any rate increases. Interest rates are not the only factor determining REIT performance, as REITs benefit from income growth as property fundamentals improve. This should allow REITs to deliver positive returns under most scenarios where interest rates rise at a slow to moderate pace, though a large, rapid increase would likely be a negative. REIT valuations are back in line with historical averages after several years at elevated valuations. AEW’s U.S. Relative Value Index begins the year at fair value, the most attractive valuations have looked at the start of a year since 2009.
Loomis Sayles Inflation Protected Securities Segment
Treasury inflation-protected securities (TIPS) posted negative total returns during the year, as interest rates moved higher and inflation remained tepid. Although short-term interest rates remained anchored by Fed policy, intermediate- to long-term yields began to shift higher in anticipation of a wind down in the Fed’s bond-buying program and an eventual tightening of monetary policy. Both observed inflation and inflation expectations trended lower during the year, negatively influencing TIPS (whose coupon payments are adjusted for inflation). The year-over-year change in the Consumer Price Index remained below the Fed’s target of 2% throughout much of the year, and forward-looking inflation expectations (as measured by forward breakeven rates) trended lower.
As a means to generate returns, the Inflation Protected Securities segment used interest rate swaps and swaptions (options on interest rate swaps). As a whole, these instruments aided performance during the year. The swaptions, which expressed our view that the yield curve (a curve that shows the relationship among bond yields across the maturity spectrum) would steepen, were particularly beneficial. The Fund also utilized interest rate futures during the year to manage duration. The futures were additive & performed as expected.
Loomis Sayles Multi-Sector Bond Segment
The Multi-Sector Bond segment benefited from strong showings by individual convertible names, which allowed the sector to contribute positively to return. A considerable rally in the stock market during much of the year, specifically late in the fourth quarter, also buoyed equity-sensitive issues. In addition, the majority of the segment’s high yield holdings produced strong positive returns throughout the year, as investors continued to favor higher-beta (higher risk/reward potential) assets in their search for yield. Industrial names generally were the biggest contributors to performance, while financial and utility names also aided results.
The segment held a basket of common stocks and American depositary receipts (ADRs, which are certificates issued by U.S. banks in U.S. dollars that represent shares in foreign companies) during the year. This allocation boosted performance, as the stocks benefited
7 |
from a strong equity market rally in 2013. Equity holdings in the oil refining, natural gas and automotive industries were the allocation’s largest contributors.
The segment’s underweight in U.S. Treasuries relative to the benchmark aided performance, as investors moved away from traditional “safe-haven” investments and toward higher-beta issues. Expectations for rising interest rates also prompted investors to move away from Treasuries.
The U.S. dollar’s value fluctuated during the year but trended toward appreciation, particularly in the latter half of 2013. The segment’s allocations to non-U.S.-dollar-denominated issues — particularly those denominated in the Brazilian real, Mexican peso and Canadian dollar — weighed on performance.
Growth of $10,000 Investment in Class A Shares5
November 17, 2005 (inception) through December 31, 2013
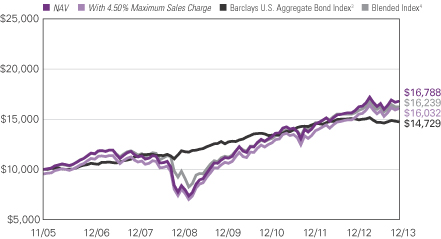
| 8
NATIXIS DIVERSIFIED INCOME FUND
Average Annual Total Returns — December 31, 20135
| | | | | | | | | | | | | | | | |
| | | | | |
| | | 1 Year | | | 5 Year | | | Life of Class A, C | | | Life of Class Y | |
| | | | | |
| Class A (Inception 11/17/05) | | | | | | | | | | | | | | | | |
| NAV | | | 5.84 | % | | | 14.86 | % | | | 6.59 | % | | | — | |
| With 4.50% Maximum Sales Charge | | | 1.05 | | | | 13.81 | | | | 5.98 | | | | — | |
| | | | | |
| Class C (Inception 11/17/05) | | | | | | | | | | | | | | | | |
| NAV | | | 4.98 | | | | 13.98 | | | | 5.78 | | | | — | |
| With CDSC2 | | | 3.98 | | | | 13.98 | | | | 5.78 | | | | — | |
| | | | | |
| Class Y (Inception 12/3/12)1 | | | | | | | | | | | | | | | | |
| NAV | | | 5.93 | | | | 14.89 | | | | — | | | | 6.82 | % |
| | | | | |
| Comparative Performance | | | | | | | | | | | | | | | | |
| Barclays U.S. Aggregate Bond Index3 | | | -2.02 | | | | 4.44 | | | | 4.88 | | | | -1.98 | |
| Blended Index4 | | | 3.83 | | | | 10.61 | | | | 6.15 | | | | 4.34 | |
Past performance does not guarantee future results. The table does not reflect taxes shareholders might owe on any fund distributions or when they redeem their shares. Performance for periods less than one year is cumulative, not annualized. Returns reflect changes in share price and reinvestment of dividends and capital gains, if any. Unlike a fund, an index is not managed and does not reflect fees and expenses.
| 1 | Prior to the inception of Class Y shares (12/3/2012), performance is that of Class A shares and reflects the higher net expenses of that share class. |
| 2 | Class C share performance assumes a 1.00% contingent deferred sales charge (“CDSC”) applied when you sell shares within one year of purchase. |
| 3 | Barclays U.S. Aggregate Bond Index is an unmanaged index that covers the U.S.-dollar denominated, investment grade, fixed-rate, taxable bond market of SEC-registered securities. The index includes bonds from the Treasury, government-related, corporate, mortgage-backed securities, asset-backed securities, and collateralized mortgage-backed securities sectors. |
| 4 | Blended Index is an unmanaged, blended index composed of the following weights: 40% Barclays U.S. Aggregate Bond Index, 25% MSCI US REIT Index, 20% Dow Jones U.S. Select Dividend™ Index, and 15% Barclays U.S. TIPS Index. The four indices composing the Blended Index measure, respectively, the performance of investment-grade fixed-income securities, equity REIT securities, dividend-yielding equity securities, and Treasury inflation-protected securities. The weightings of the indices that compose the Blended Index are rebalanced on a monthly basis to maintain the allocations as described above. These rebalancings will not necessarily correspond to the rebalancings of the fund’s investment portfolio, and the relative weightings of the asset classes in the fund will generally differ to some extent from the weightings in the Blended Index. |
| 5 | Fund performance has been increased by fee waivers and/or expense reimbursements, if any, without which performance would have been lower. |
9 |
NATIXIS U.S. MULTI-CAP EQUITY FUND
| | |
| Managers | | Symbols |
| Harris Associates Segment | | Class A NEFSX |
| Harris Associates L.P. | | Class B NESBX |
| Large Cap Growth Segment | | Class C NECCX |
| Mid Cap Growth Segment | | Class Y NESYX |
| Small/Mid Cap Core Segment | | |
| Loomis, Sayles & Company, L.P. | | |
Objective
Seeks long-term growth of capital
Market Conditions
Economic growth picked up in the United States in 2013, and the global economy showed signs of recovery, as the euro zone emerged from recession and key emerging markets stabilized in the second half of the year. Solid new job growth helped bolster U.S. consumer confidence, and the nation’s housing market continued to heal despite rising mortgage rates. Robust durable goods production, supported by rising auto sales, contributed to solid manufacturing activity. Despite a host of concerns over spending cuts, budget and debt ceiling standoffs and a Federal Reserve (the Fed) poised to begin its wind down of stimulus measures in 2014, investors bid stocks and other risky assets higher over the course of the year. Small-cap growth stocks were the period’s strongest performers, with a nearly 10 percentage point advantage over large-cap growth stocks. Overall, small-caps outperformed large- and mid-cap stocks, and growth stocks edged out value stocks.
Performance Results
For the 12 months ended December 31, 2013, Class A shares of Natixis U.S. Multi-Cap Equity Fund returned 35.75% at net asset value. For the same period, the S&P 500® Index (the Fund’s primary benchmark) returned 32.39%, the Wilshire 4500 Index returned 38.39% and the S&P MidCap 400® Index returned 33.50%.
Explanation of Fund Performance
Each of the portfolio’s segments uses a distinct investment style, providing shareholders with exposure to a variety of different stocks and strategies:
| · | | The Harris Associates L.P. segment invests primarily in common stocks of large- and mid-cap companies that they believe are trading at a substantial discount to their “true business value.” |
| · | | Loomis, Sayles & Company, L.P. manages three segments. One invests in mid-cap growth stocks, one invests in large-cap growth stocks and one focuses on small/mid-cap core stocks. |
��
| 10
NATIXIS U.S. MULTI-CAP EQUITY FUND
Each fund segment contributed 30%+ returns for the period, led by the Harris Associates segment and the Loom Sayles is Large Cap Growth segment on the strength of superior stock selection. Commentary on each segment follows below.
The Harris Associates Segment
Because we are value investors with an emphasis on individual stock selection, the segment’s sector weights are a byproduct of our bottom-up investment process. Sector-wise, industrials gained the most value during the year, followed by consumer discretionary shares. Securities held in the consumer staples sector posted the lowest collective return for the period.
The leading contributors to the segment’s performance in 2013 were MasterCard, Applied Materials and Wells Fargo. MasterCard reported what we consider to be strong earnings throughout the year. We recently met with MasterCard’s management, which stated that the company remains focused on “digital conversion” (paper to electronic forms of spending) and expanding market share through new co-branded products and commercial cards, along with other initiatives. Management continues to repurchase shares and increase its dividend to reward shareholders, which remains a priority at MasterCard. We continue to believe that MasterCard has a unique combination of competitive strength, secular growth, and low capital intensity. Applied Materials experienced a number of positive events during the year that boosted its stock price. The company experienced strengthening sales and gross margins along with market share increases during the year, and announced a new long-term growth and profitability strategy and financial model. Also, investors responded positively to news that Applied Materials is acquiring competitor Tokyo Electron in an all-stock transaction. Wells Fargo continues to build its credit quality, and its balance sheet remains strong in our view. Wells Fargo also announced earlier in the year that it is raising its dividend more than 80% (from $0.48 to $0.88 per share for the year). We think Wells Fargo continues to execute quite well in an environment of low interest rates, which has proved challenging to many banks.
The segment’s holdings with the lowest returns in 2013 were Apache, Caterpillar and Unilever. Apache was the largest detractor from the segment’s performance, and was sold from the portfolio during the first quarter of the year. When investors consider exploration and production company stocks, they are increasingly looking for companies that can find and produce oil and gas efficiently and at low cost. For many years, Apache was seen by its peers as a cost leader, but the company’s statistics have been eroding meaningfully, which limited its ability to grow intrinsic value per share, a characteristic that we demand in our investments. Caterpillar released weaker-than-expected earnings per share early in the year, which hurt its share price. However, our investment thesis remains intact: Caterpillar’s strong brand is built on tangible product benefits, it offers unique customer-specific cost analysis and its dealer network is a significant and often overlooked asset. We met with Caterpillar’s management during the year. Going forward, management believes miners will focus more intensely on improving productivity at existing mines. This works to Caterpillar’s advantage, as the company is the industry technology leader with a substantial dealer service/support network. Unilever’s fiscal first-half results included revenue growth of 5% (constant currency) including strong emerging markets growth of 10% (the ninth
11 |
straight quarter of double-digit growth). However, overall organic growth was short of the company’s estimate (+5.5%) for the period. Nonetheless, margins improved by what we consider to be a notable amount from a combination of both product mix and cost savings across multiple aspects of the business. We think Unilever has the potential to maintain its steady value growth through a high quality formula of end market demand.
Loomis Sayles Large Cap Growth Segment
The Growth segment posted robust performance for the 12-month period, primarily due to stock selection in the information technology and financials sectors. Stock selection in the healthcare, industrials and consumer staples sectors, along with the allocation to consumer discretionary, detracted from performance.
Social networking company Facebook, one of the segment’s top ten holdings, was the largest contributor to performance. We first purchased Facebook in the second quarter of 2012 at the company’s initial public offering and have since added to our position on price weakness. Facebook reported strong results throughout the year, with key metrics above consensus expectation. The company’s mobile platform was the primary driver of performance. Facebook also continued to demonstrate strong user growth, positive engagement trends, product innovation and strong financials. Additionally, in December Standard & Poor’s announced it would add Facebook to the broad S&P 500® Index. We believe Facebook continues to offer a compelling reward-to-risk opportunity.
Global online search and advertising leader Google, another top ten holding, was also a top contributor to performance. Google reported solid results with strong revenue and margin growth, driven by increased advertising revenue through mobile, video and online channels. We believe Google continues to offer a disruptive business model in the advertising and technology industries, allowing it to persistently gain market share. Because market expectations continue to discount Google’s ability to deliver long-term sustainable growth, we believe the company is selling at a meaningful discount to intrinsic value.
Blue Nile, a major online jewelry retailer, was the largest performance detractor. Blue Nile’s new management team has been shifting its strategic focus to the fashion jewelry segment, away from its core diamond engagement business. With fewer competitive advantages and increased business risk due to required inventory, the cash flow characteristics of the company’s new business model became less attractive and lowered our intrinsic value estimate. We were further concerned this strategic shift signaled management’s lack of conviction in the growth prospects for the diamond business. Given the negative structural changes in Blue Nile’s strategy, we sold the position during the second quarter of 2013 and reallocated the capital to more compelling reward-to-risk opportunities.
In addition, semiconductor company Altera slightly detracted from performance, reporting mixed quarterly results, due in part to a shortfall in emerging market mobile technology advancements. The semiconductor industry as a whole experienced similar weakness, but we believe the downturn is short term and shares of Altera are trading at a discount to our estimate of intrinsic value.
| 12
NATIXIS U.S. MULTI-CAP EQUITY FUND
Loomis Sayles Mid Cap Growth Segment
The Mid Cap Growth segment generated strong performance during the 12-month period, primarily due to solid results in the consumer discretionary, technology and healthcare sectors.
Consumer discretionary made the largest contribution to returns. The segment’s two strongest performers in the sector were Melco Crown Entertainment (Melco), an operator of three casinos in Macau, and Lions Gate Entertainment, a leading independent film and television producer and distributor. Visitation to Macau has been robust, and Melco has been gaining market share in the lucrative mass-market segment. It also entered into a joint venture to open a casino in the Philippines. For Lions Gate, the company has strung together several strong quarters on both the top and bottom line. In addition, the stock rose on high expectations for the November release of Catching Fire, the next installment of the Hunger Games franchise. Within the technology sector, LinkedIn, a leading online professional network, was the top contributor. The company has increased user engagement with its platform by offering new features and functionality, and it continues to report strong results.
The segment’s weakest holding was Ulta Salon Cosmetics & Fragrance, a beauty products retailer that has been gaining share from department store competitors as it continues to expand its product offerings and move into new geographies. The stock sold off in the first quarter of 2013 following the unexpected departure of the CEO, and again in the third quarter after reporting weak results and providing disappointing guidance for 2014.
After a strong fourth quarter in 2012, the segment’s homebuilders experienced a modest correction during the spring of 2013, followed by a more severe selloff that began in late June, as mortgage rates rose after the Fed warned it might begin to taper the pace of mortgage-backed bond purchases. The fund’s position in D.R. Horton, the nation’s largest homebuilder, was a primary detractor. The company reported a mixed fiscal year third quarter (strong margins but disappointing orders), and management noted sales had moderated in response to higher mortgage rates. Finally, a position in Rackspace Hosting, a provider of outsourced IT infrastructure and cloud computing solutions, also detracted from performance. The company has been migrating its cloud customers to its next-generation platform, which was disruptive to operations and revenues.
The segment owned out-of-the-money puts on Medivation, a biopharmaceutical company, as a hedge against the risk of failure in a key clinical trial. For the reporting period, Medivation puts were a small drag on performance, as implied volatility declined once the clinical events transpired. We also owned calls on Cobalt International Energy to gain investment exposure to several high-impact exploratory drilling programs. Cobalt calls declined in value when the drilling programs had disappointing results. While the segment’s derivative positions detracted modestly from return, all instruments behaved as expected. We no longer own the puts on Medivation or the calls on Cobalt.
13 |
Loomis Sayles Small/Mid Cap Core Segment
Small cap stocks were the strongest-performing segment of the U.S. equity market during the 12-month period. In this environment, the Small/Mid Cap segment posted strong performance, led by robust results from Alliance Data Systems Corporation, Jarden Corporation and Avis Budget Group. Alliance Data Systems, a provider of co-branded credit cards and customer loyalty programs, had a strong year due to excellent credit performance in the private label business, strong receivable growth and stable earnings from its loyalty programs. Jarden, a consumer products company with more than 120 brands, continued to show solid earnings growth. Further, the company recently added the Yankee Candle Company to its portfolio. Avis Budget Group, a leading provider of vehicle rental services in North America, Europe and Australia, rose on continued structural improvements in the car rental industry.
A position in NETGEAR, a provider of networking equipment to small businesses, consumers and telecom carriers, was a primary detractor from performance. The company reported disappointing earnings and provided lower revenue guidance for the first quarter of 2014. In addition, positions in two real estate investment trusts (REITs) — Digital Realty Trust, which owns and manages technology-related real estate, and American Campus Communities, an owner, operator and developer of student housing projects, detracted from performance. Rising interest rates weighed on both REITs. We sold our positions in NETGEAR, Digital Realty Trust and American Campus Communities during 2013.
Growth of $10,000 Investment in Class A Shares5
December 31, 2003 through December 31, 2013
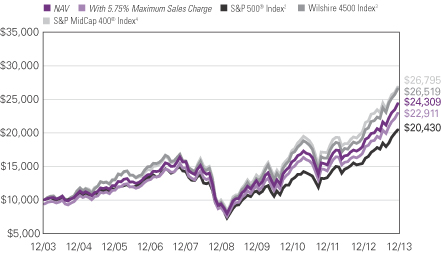
See notes to chart on page 15.
| 14
NATIXIS U.S. MULTI-CAP EQUITY FUND
Average Annual Total Returns — December 31, 20135
| | | | | | | | | | | | |
| | | | |
| | | 1 Year | | | 5 Years | | | 10 Years | |
| | | | |
| Class A (Inception 7/7/94) | | | | | | | | | | | | |
| NAV | | | 35.75 | % | | | 20.92 | % | | | 9.29 | % |
| With 5.75% Maximum Sales Charge | | | 27.93 | | | | 19.50 | | | | 8.65 | |
| | | | |
| Class B (Inception 7/7/94) | | | | | | | | | | | | |
| NAV | | | 34.70 | | | | 20.01 | | | | 8.48 | |
| With CDSC1 | | | 29.70 | | | | 19.81 | | | | 8.48 | |
| | | | |
| Class C (Inception 7/7/94) | | | | | | | | | | | | |
| NAV | | | 34.69 | | | | 20.01 | | | | 8.47 | |
| With CDSC1 | | | 33.69 | | | | 20.01 | | | | 8.47 | |
| | | | |
| Class Y (Inception 11/15/94) | | | | | | | | | | | | |
| NAV | | | 36.06 | | | | 21.22 | | | | 9.65 | |
| | | | |
| Comparative Performance | | | | | | | | | | | | |
| S&P 500® Index2 | | | 32.39 | | | | 17.94 | | | | 7.41 | |
| Wilshire 4500 Index3 | | | 38.39 | | | | 22.47 | | | | 10.24 | |
| S&P MidCap 400® Index4 | | | 33.50 | | | | 21.89 | | | | 10.36 | |
Past performance does not guarantee future results. The table does not reflect taxes shareholders might owe on any fund distributions or when they redeem their shares. Performance for periods less than one year is cumulative, not annualized. Returns reflect changes in share price and reinvestment of dividends and capital gains, if any. Unlike a fund, an index is not managed and does not reflect fees and expenses.
| 1 | Performance for Class B shares assumes a maximum 5.00% contingent deferred sales charge (“CDSC”) applied when you sell shares, which declines annually between years 1-6 according to the following schedule: 5, 4, 3, 3, 2, 1, 0%. Class C share performance assumes a 1.00% CDSC applied when you sell shares within one year of purchase. |
| 2 | S&P 500® Index is a widely recognized measure of U.S. stock market performance. It is an unmanaged index of 500 common stocks chosen for market size, liquidity, and industry group representation, among other factors. |
| 3 | Wilshire 4500 Index is an unmanaged index that measures the performance of U.S. small- and mid-cap stocks. |
| 4 | S&P MidCap 400® Index is an unmanaged index that measures the performance of the mid-cap segment of the U.S. equities market. |
| 5 | Fund performance has been increased by fee waivers and/or expense reimbursements, if any, without which performance would have been lower. |
15 |
ADDITIONAL INFORMATION
The views expressed in this report reflect those of the portfolio managers as of the dates indicated. The managers’ views are subject to change at any time without notice based on changes in market or other conditions. References to specific securities or industries should not be regarded as investment advice. Because the funds are actively managed, there is no assurance that they will continue to invest in the securities or industries mentioned.
ADDITIONAL INDEX INFORMATION
This document may contain references to third party copyrights, indexes, and trademarks, each of which is the property of its respective owner. Such owner is not affiliated with Natixis Global Asset Management or any of its related or affiliated companies (collectively “NGAM”) and does not sponsor, endorse or participate in the provision of any NGAM services, funds or other financial products.
The index information contained herein is derived from third parties and is provided on an “as is” basis. The user of this information assumes the entire risk of use of this information. Each of the third party entities involved in compiling, computing or creating index information, disclaims all warranties (including, without limitation, any warranties of originality, accuracy, completeness, timeliness, non-infringement, merchantability and fitness for a particular purpose) with respect to such information.
PROXY VOTING INFORMATION
A description of the funds’ proxy voting policies and procedures is available without charge, upon request, by calling Natixis Funds at 800-225-5478; on the funds’ website at ngam.natixis.com; and on the Securities and Exchange Commission’s (SEC) website at www.sec.gov. Information regarding how the funds voted proxies relating to portfolio securities during the 12-month period ended June 30, 2013 is available from the funds’ website and the SEC’s website.
QUARTERLY PORTFOLIO SCHEDULES
The funds file a complete schedule of portfolio holdings with the SEC for the first and third quarters of each fiscal year on Form N-Q. The funds’ Forms N-Q are available on the SEC’s website at www.sec.gov and may be reviewed and copied at the SEC’s Public Reference Room in Washington, DC. Information on the operation of the Public Reference Room may be obtained by calling 800-SEC-0330.
| 16
UNDERSTANDING FUND EXPENSES
As a mutual fund shareholder, you incur different costs: transaction costs, including sales charges (loads) on purchases and contingent deferred sales charges on redemptions, and ongoing costs, including management fees, distribution and/or service fees (12b-1 fees), and other fund expenses. Certain exemptions may apply. These costs are described in more detail in the funds’ prospectus. The following examples are intended to help you understand the ongoing costs of investing in the funds and help you compare these with the ongoing costs of investing in other mutual funds.
The first line in the table of each class of fund shares shows the actual account values and actual fund expenses you would have paid on a $1,000 investment in the fund from July 1, 2013 through December 31, 2013. To estimate the expenses you paid over the period, simply divide your account value by $1,000 (for example $8,600 account value divided by $1,000 = 8.60) and multiply the result by the number in the Expenses Paid During Period column as shown for your class.
The second line in the table for each class of fund shares provides information about hypothetical account values and hypothetical expenses based on the fund’s actual expense ratios and an assumed rate of return of 5% per year before expenses, which is not the fund’s actual return. The hypothetical account values and expenses may not be used to estimate the actual ending account balance or expenses you paid on your investment for the period. You may use this information to compare the ongoing costs of investing in the fund and other funds. To do so, compare this 5% hypothetical example with the 5% hypothetical examples that appear in the shareholder reports of the other funds.
Please note that the expenses shown reflect ongoing costs only, and do not include any transaction costs, such as sales charges. Therefore, the second line in the table of each fund is useful in comparing ongoing costs only, and will not help you determine the relative costs of owning different funds. If transaction costs were included, total costs would be higher.
| | | | | | | | | | | | |
MCDONNELL INTERMEDIATE MUNICIPAL
BOND FUND | | BEGINNING
ACCOUNT VALUE
7/1/2013 | | | ENDING
ACCOUNT VALUE
12/31/2013 | | | EXPENSES PAID
DURING PERIOD*
7/1/2013 – 12/31/2013 | |
| Class A | | | | | | | | | | | | |
| Actual | | | $1,000.00 | | | | $1,005.80 | | | | $4.04 | |
| Hypothetical (5% return before expenses) | | | $1,000.00 | | | | $1,021.17 | | | | $4.08 | |
| Class C | | | | | | | | | | | | |
| Actual | | | $1,000.00 | | | | $1,003.10 | | | | $7.83 | |
| Hypothetical (5% return before expenses) | | | $1,000.00 | | | | $1,017.39 | | | | $7.88 | |
| Class Y | | | | | | | | | | | | |
| Actual | | | $1,000.00 | | | | $1,007.10 | | | | $2.78 | |
| Hypothetical (5% return before expenses) | | | $1,000.00 | | | | $1,022.43 | | | | $2.80 | |
| * | Expenses are equal to the Fund’s annualized expense ratio (after waiver/reimbursement): 0.80%, 1.55% and 0.55% for Class A, C and Y, respectively, multiplied by the average account value over the period, multiplied by the number of days in the most recent half-year (184), divided by 365 (to reflect the half-year period). |
17 |
| | | | | | | | | | | | |
| NATIXIS DIVERSIFIED INCOME FUND | | BEGINNING
ACCOUNT VALUE
7/1/2013 | | | ENDING
ACCOUNT VALUE
12/31/2013 | | | EXPENSES PAID
DURING PERIOD*
7/1/2013 – 12/31/2013 | |
| Class A | | | | | | | | | | | | |
| Actual | | | $1,000.00 | | | | $1,031.70 | | | | $5.68 | |
| Hypothetical (5% return before expenses) | | | $1,000.00 | | | | $1,019.61 | | | | $5.65 | |
| Class C | | | | | | | | | | | | |
| Actual | | | $1,000.00 | | | | $1,027.00 | | | | $9.50 | |
| Hypothetical (5% return before expenses) | | | $1,000.00 | | | | $1,015.83 | | | | $9.45 | |
| Class Y | | | | | | | | | | | | |
| Actual | | | $1,000.00 | | | | $1,032.20 | | | | $4.41 | |
| Hypothetical (5% return before expenses) | | | $1,000.00 | | | | $1,020.87 | | | | $4.38 | |
| * | Expenses are equal to the Fund’s annualized expense ratio (after waiver/reimbursement): 1.11%, 1.86% and 0.86% for Class A, C and Y, respectively, multiplied by the average account value over the period, multiplied by the number of days in the most recent fiscal half-year (184), divided by 365 (to reflect the half-year period). |
| | | | | | | | | | | | |
| NATIXIS U.S. MULTI-CAP EQUITY FUND | | BEGINNING
ACCOUNT VALUE
7/1/2013 | | | ENDING
ACCOUNT VALUE
12/31/2013 | | | EXPENSES PAID
DURING PERIOD*
7/1/2013 – 12/31/2013 | |
| Class A | | | | | | | | | | | | |
| Actual | | | $1,000.00 | | | | $1,195.00 | | | | $7.19 | |
| Hypothetical (5% return before expenses) | | | $1,000.00 | | | | $1,018.65 | | | | $6.61 | |
| Class B | | | | | | | | | | | | |
| Actual | | | $1,000.00 | | | | $1,190.30 | | | | $11.32 | |
| Hypothetical (5% return before expenses) | | | $1,000.00 | | | | $1,014.87 | | | | $10.41 | |
| Class C | | | | | | | | | | | | |
| Actual | | | $1,000.00 | | | | $1,190.30 | | | | $11.32 | |
| Hypothetical (5% return before expenses) | | | $1,000.00 | | | | $1,014.87 | | | | $10.41 | |
| Class Y | | | | | | | | | | | | |
| Actual | | | $1,000.00 | | | | $1,196.50 | | | | $5.81 | |
| Hypothetical (5% return before expenses) | | | $1,000.00 | | | | $1,019.91 | | | | $5.35 | |
| * | Expenses are equal to the Fund’s annualized expense ratio (after waiver/reimbursement): 1.30%, 2.05%, 2.05% and 1.05% for Class A, B, C and Y, respectively, multiplied by the average account value over the period, multiplied by the number of days in the most recent fiscal half-year (184), divided by 365 (to reflect the half-year period). |
| 18
Portfolio of Investments – as of December 31, 2013
McDonnell Intermediate Municipal Bond Fund
| | | | | | | | |
Principal
Amount | | | Description | | Value (†) | |
| | Bonds and Notes — 89.2% of Net Assets | | | | |
| | Municipals — 89.2% | | | | |
| | | | Arizona — 3.5% | | | | |
| $ | 300,000 | | | Phoenix Civic Improvement, Corporate Excise Tax Revenue, Series A, 5.000%, 7/01/2024 | | $ | 335,595 | |
| | 400,000 | | | Pima County Sewer System Revenue, Series A, 5.000%, 7/01/2022 | | | 454,728 | |
| | | | | | | | |
| | | | | | | 790,323 | |
| | | | | | | | |
| | | | California — 7.6% | | | | |
| | 250,000 | | | Alameda Corridor Transportation Authority Revenue, Senior Lien, Refunding, Series A, 5.000%, 10/01/2024 | | | 278,300 | |
| | 380,000 | | | Bay Area Water Supply & Conservation Agency Revenue, Series A,
5.000%, 10/01/2024 | | | 437,585 | |
| | 500,000 | | | Kern High School District, GO, Refunding, 5.000%, 8/01/2023 | | | 572,840 | |
| | 400,000 | | | Tehachapi Valley Healthcare District, GO, 5.000%, 11/01/2025 | | | 442,844 | |
| | | | | | | | |
| | | | | | | 1,731,569 | |
| | | | | | | | |
| | | | Colorado — 9.1% | | | | |
| | 260,000 | | | Colorado Springs Utilities System Revenue, Series B-2, 5.000%, 11/15/2033 | | | 276,853 | |
| | 400,000 | | | Colorado State Health Facilities Authority Revenue, Craig Hospital Project, 5.000%, 12/01/2028 | | | 414,820 | |
| | 400,000 | | | Denver City & County School District No. 1, GO, Series B, (State Aid Withholding), 5.000%, 12/01/2026 | | | 446,880 | |
| | 400,000 | | | Denver City & County, Airport System Revenue, Series B, 5.000%, 11/15/2029 | | | 420,724 | |
| | 450,000 | | | University of Colorado Revenue, Refunding, Series B, 5.000%, 6/01/2019 | | | 526,455 | |
| | | | | | | | |
| | | | | | | 2,085,732 | |
| | | | | | | | |
| | | | Connecticut — 3.6% | | | | |
| | 375,000 | | | Connecticut State Health & Educational Facility Authority Revenue,
Yale-New Haven Hospital, Series N, 5.000%, 7/01/2024 | | | 418,466 | |
| | 375,000 | | | State of Connecticut Special Tax Revenue, Second Lien, Transportation Infrastructure, Refunding, Series 1, 5.000%, 2/01/2016 | | | 409,943 | |
| | | | | | | | |
| | | | | | | 828,409 | |
| | | | | | | | |
| | | | Florida — 9.5% | | | | |
| | 500,000 | | | Fernandina Beach Utility System Revenue, Refunding, Series A,
5.000%, 9/01/2027 | | | 535,550 | |
| | 250,000 | | | Florida State Board of Education, GO, Capital Outlay 2011, Refunding,
Series B, 5.000%, 6/01/2015 | | | 266,752 | |
| | 400,000 | | | Florida State Board of Governors, University System Improvement Revenue, Refunding, Series A, 5.000%, 7/01/2018 | | | 461,460 | |
| | 400,000 | | | Orlando & Orange County Expressway Authority Revenue, Refunding, 5.000%, 7/01/2023 | | | 444,340 | |
| | 400,000 | | | Sarasota County Utility System Revenue, 5.000%, 10/01/2023 | | | 466,360 | |
| | | | | | | | |
| | | | | | | 2,174,462 | |
| | | | | | | | |
| | | | Georgia — 3.7% | | | | |
| | 500,000 | | | Municipal Electric Authority of Georgia Revenue, Series B, 5.000%, 1/01/2021 | | | 568,000 | |
| | 250,000 | | | Savannah Hospital Authority Revenue, St. Joseph’s/Candler Health System Obligated Group, Series A, 5.500%, 7/01/2027 | | | 266,543 | |
| | | | | | | | |
| | | | | | | 834,543 | |
| | | | | | | | |
See accompanying notes to financial statements.
19 |
Portfolio of Investments – as of December 31, 2013
McDonnell Intermediate Municipal Bond Fund – (continued)
| | | | | | | | |
Principal
Amount | | | Description | | Value (†) | |
| | | | Hawaii — 2.0% | | | | |
| $ | 400,000 | | | Honolulu City and County, GO, Series B, 5.000%, 8/01/2016 | | $ | 445,280 | |
| | | | | | | | |
| | | | Illinois — 3.7% | | | | |
| | 370,000 | | | Illinois Finance Authority Revenue, Children’s Memorial Hospital, Series B, 5.500%, 8/15/2028 | | | 398,127 | |
| | 100,000 | | | Illinois Finance Authority Revenue, Loyola University Chicago, Series B, 5.000%, 7/01/2021 | | | 112,464 | |
| | 320,000 | | | Illinois State Toll Highway Authority Revenue, Senior Priority, Series A, (AGM insured), 5.000%, 1/01/2017 | | | 342,634 | |
| | | | | | | | |
| | | | | | | 853,225 | |
| | | | | | | | |
| | | | Kentucky — 1.4% | | | | |
| | 275,000 | | | Louisville & Jefferson County, Metropolitan Government Revenue, Jewish Hospital St. Mary’s Healthcare, Prerefunded 02/01/2018@100,
6.125%, 2/01/2037 | | | 331,185 | |
| | | | | | | | |
| | | | Massachusetts — 0.7% | | | | |
| | 150,000 | | | Massachusetts State Development Finance Agency Revenue, Massachusetts College of Pharmacy Allied Health Science, Series F,
4.000%, 7/01/2018 | | | 165,798 | |
| | | | | | | | |
| | | | Michigan — 2.6% | | | | |
| | 545,000 | | | State of Michigan, GO, Prerefunded 11/01/2015@100, Series A, (NATL-RE insured), 5.000%, 11/01/2018 | | | 591,652 | |
| | | | | | | | |
| | | | Minnesota — 3.7% | | | | |
| | 250,000 | | | Minneapolis-St. Paul Metropolitan Airports Commission Revenue, Refunding, 5.000%, 1/01/2017 | | | 277,940 | |
| | 300,000 | | | Minnesota State Higher Education Facilities Authority Revenue, University of St. Thomas, Series 7-U, 5.000%, 4/01/2017 | | | 334,248 | |
| | 200,000 | | | Northern Municipal Power Agency Electric System Revenue, Series A, 5.000%, 1/01/2023 | | | 223,286 | |
| | | | | | | | |
| | | | | | | 835,474 | |
| | | | | | | | |
| | | | Missouri — 2.4% | | | | |
| | 500,000 | | | Southeast Missouri State University Revenue, Series A, 5.000%, 4/01/2016 | | | 544,925 | |
| | | | | | | | |
| | | | New Jersey — 5.9% | | | | |
| | 400,000 | | | New Jersey Economic Development Authority Revenue, School Facilities Construction, Prerefunded 03/01/2015@100, Series O, 5.125%, 3/01/2030 | | | 422,528 | |
| | 265,000 | | | New Jersey Health Care Facilities Financing Authority Revenue, Refunding, Virtual Health, Inc., 5.000%, 7/01/2023 | | | 292,796 | |
| | 580,000 | | | New Jersey State Transportation Trust Fund Authority Revenue, Prerefunded 06/15/2015@100, Series D, (AGM Insured), 5.000%, 6/15/2019 | | | 619,359 | |
| | | | | | | | |
| | | | | | | 1,334,683 | |
| | | | | | | | |
| | | | New York — 1.7% | | | | |
| | 350,000 | | | New York State Dormitory Authority Revenue, Mental Health Services Facility Improvements, (State Appropriation), 5.000%, 2/15/2017 | | | 392,966 | |
| | | | | | | | |
| | | | Ohio — 6.8% | | | | |
| | 400,000 | | | American Municipal Power Revenue, Hydroelectric Projects, Refunding, Series CA, (AGM insured), 5.000%, 2/15/2021 | | | 444,336 | |
See accompanying notes to financial statements.
| 20
Portfolio of Investments – as of December 31, 2013
McDonnell Intermediate Municipal Bond Fund – (continued)
| | | | | | | | |
Principal
Amount | | | Description | | Value (†) | |
| | | | Ohio — continued | | | | |
| $ | 500,000 | | | Columbus, GO, Various Purpose, Series A, 5.000%, 8/15/2023 | | $ | 587,550 | |
| | 500,000 | | | Ohio State Higher Educational Facility Commission Revenue, University of Dayton, 5.000%, 12/01/2030 | | | 520,010 | |
| | | | | | | | |
| | | | | | | 1,551,896 | |
| | | | | | | | |
| | | | Pennsylvania — 5.1% | | | | |
| | 335,000 | | | Delaware County Authority Revenue, Villanova University, 5.000%, 8/01/2019 | | | 384,858 | |
| | 285,000 | | | Delaware River Joint Toll Bridge Commission Revenue, Refunding, Series A, 4.000%, 7/01/2027 | | | 282,652 | |
| | 450,000 | | | Philadelphia Airport Revenue, Refunding, Series D, AMT, 5.000%, 6/15/2016 | | | 491,935 | |
| | | | | | | | |
| | | | | | | 1,159,445 | |
| | | | | | | | |
| | | | Texas — 9.7% | | | | |
| | 250,000 | | | Corpus Christi Utility System Revenue, Junior Lien Improvement,
5.000%, 7/15/2021 | | | 285,625 | |
| | 400,000 | | | Garland, GO, Refunding, (AGM insured), 5.000%, 2/15/2016 | | | 437,228 | |
| | 500,000 | | | Harris County Health Facilities Development Corp. Revenue, Memorial Hermann Healthcare System, Prerefunded 12/01/2018@100, Series B,
7.125%, 12/01/2031 | | | 636,805 | |
| | 350,000 | | | State of Texas Water Financial Assistance, GO, Series B, 5.000%, 8/01/2022 | | | 405,604 | |
| | 400,000 | | | Tarrant County Cultural Education Facilities Finance Corp. Revenue, Methodist Hospitals of Dallas, 5.000%, 10/01/2024 | | | 443,892 | |
| | | | | | | | |
| | | | | | | 2,209,154 | |
| | | | | | | | |
| | | | Utah — 1.2% | | | | |
| | 250,000 | | | Utah State Transit Authority Sales Tax Revenue, Refunding, 5.000%, 6/15/2024 | | | 275,663 | |
| | | | | | | | |
| | | | Washington — 5.3% | | | | |
| | 500,000 | | | Port of Seattle Revenue, AMT, 5.000%, 7/01/2029 | | | 512,525 | |
| | 400,000 | | | Port of Seattle Special Facility Revenue, Refunding, AMT, SEATAC Fuel Facility LLC, 5.000%, 6/01/2020 | | | 442,592 | |
| | 250,000 | | | Spokane County, GO, Limited Tax, Refunding, 4.000%, 12/01/2014 | | | 258,668 | |
| | | | | | | | |
| | | | | | | 1,213,785 | |
| | | | | | | | |
| | | | Total Bonds and Notes
(Identified Cost $20,855,117) | | | 20,350,169 | |
| | | | | | | | |
| | Short-Term Investments — 11.8% | | | | |
| | 2,681,354 | | | Tri-Party Repurchase Agreement with Fixed Income Clearing Corporation, dated 12/31/2013 at 0.000% to be repurchased at $2,681,354 on 1/02/2014 collateralized by $2,400,000 Federal Farm Credit Bank, 4.875% due 1/17/2017 valued at $2,737,303 including accrued interest (Note 2 of Notes to Financial Statements) (Identified Cost $2,681,354) | | | 2,681,354 | |
| | | | | | | | |
| | | | | | | | |
| | | | Total Investments — 101.0%
(Identified Cost $23,536,471)(a) | | | 23,031,523 | |
| | | | Other assets less liabilities — (1.0)% | | | (225,997 | ) |
| | | | | | | | |
| | | | Net Assets — 100.0% | | $ | 22,805,526 | |
| | | | | | | | |
| | | | | | | | |
See accompanying notes to financial statements.
21 |
Portfolio of Investments – as of December 31, 2013
McDonnell Intermediate Municipal Bond Fund – (continued)
| | | | | | | | |
| | | | | | | | |
| | (†) | | | See Note 2 of Notes to Financial Statements. | | | | |
| | (a) | | | Federal Tax Information: | | | | |
| | | | At December 31, 2013, the net unrealized depreciation on investments based on a cost of $23,536,471 for federal income tax purposes was as follows: | | | | |
| | | | Aggregate gross unrealized appreciation for all investments in which there is an excess of value over tax cost | | $ | 35,395 | |
| | | | Aggregate gross unrealized depreciation for all investments in which there is an excess of tax cost over value | | | (540,343 | ) |
| | | | | | | | |
| | | | Net unrealized depreciation | | $ | (504,948 | ) |
| | | | | | | | |
| | | | | | | | |
| | AGM | | | Assured Guaranty Municipal Corporation | | | | |
| | AMT | | | Alternative Minimum Tax | | | | |
| | GO | | | General Obligation | | | | |
| | NATL-RE | | | National Public Finance Guarantee Corporation | | | | |
Holdings Summary at December 31, 2013 (Unaudited)
| | | | |
Medical | | | 17.7 | % |
Higher Education | | | 13.4 | |
General Obligation | | | 13.1 | |
General | | | 9.4 | |
Water | | | 8.3 | |
Transportation | | | 7.9 | |
Airport | | | 5.2 | |
School District | | | 4.5 | |
Power | | | 4.4 | |
Utilities | | | 3.4 | |
Education | | | 1.9 | |
Short-Term Investments | | | 11.8 | |
| | | | |
Total Investments | | | 101.0 | |
Other assets less liabilities | | | (1.0 | ) |
| | | | |
Net Assets | | | 100.0 | % |
| | | | |
See accompanying notes to financial statements.
| 22
Portfolio of Investments – as of December 31, 2013
Natixis Diversified Income Fund
| | | | | | | | |
| Shares | | | Description | | Value (†) | |
| | Common Stocks — 50.6% of Net Assets | | | | |
| | | | Aerospace & Defense — 1.8% | | | | |
| | 4,667 | | | General Dynamics Corp. | | $ | 445,932 | |
| | 3,892 | | | Honeywell International, Inc. | | | 355,612 | |
| | 7,234 | | | Lockheed Martin Corp. | | | 1,075,406 | |
| | 4,242 | | | Northrop Grumman Corp. | | | 486,176 | |
| | | | | | | | |
| | | | | | | 2,363,126 | |
| | | | | | | | |
| | | | Automobiles — 0.8% | | | | |
| | 10,180 | | | Ford Motor Co. | | | 157,077 | |
| | 21,908 | | | General Motors Co.(b) | | | 895,380 | |
| | | | | | | | |
| | | | | | | 1,052,457 | |
| | | | | | | | |
| | | | Beverages — 0.2% | | | | |
| | 5,217 | | | Coca-Cola Co. (The) | | | 215,514 | |
| | | | | | | | |
| | | | Biotechnology — 0.1% | | | | |
| | 13,804 | | | PDL BioPharma, Inc. | | | 116,506 | |
| | | | | | | | |
| | | | Capital Markets — 0.2% | | | | |
| | 7,285 | | | Federated Investors, Inc., Class B | | | 209,808 | |
| | | | | | | | |
| | | | Chemicals — 0.3% | | | | |
| | 5,459 | | | Olin Corp. | | | 157,492 | |
| | 4,534 | | | RPM International, Inc. | | | 188,207 | |
| | | | | | | | |
| | | | | | | 345,699 | |
| | | | | | | | |
| | | | Commercial Banks — 1.0% | | | | |
| | 5,901 | | | Bank of Hawaii Corp. | | | 348,985 | |
| | 4,959 | | | BB&T Corp. | | | 185,070 | |
| | 7,200 | | | F.N.B. Corp. | | | 90,864 | |
| | 5,590 | | | First Niagara Financial Group, Inc. | | | 59,366 | |
| | 5,471 | | | FirstMerit Corp. | | | 121,620 | |
| | 6,481 | | | Trustmark Corp. | | | 173,950 | |
| | 7,693 | | | United Bankshares, Inc. | | | 241,945 | |
| | 8,444 | | | Valley National Bancorp | | | 85,453 | |
| | | | | | | | |
| | | | | | | 1,307,253 | |
| | | | | | | | |
| | | | Commercial Services & Supplies — 0.8% | | | | |
| | 3,816 | | | Deluxe Corp. | | | 199,157 | |
| | 6,361 | | | Pitney Bowes, Inc. | | | 148,211 | |
| | 10,221 | | | R.R. Donnelley & Sons Co. | | | 207,282 | |
| | 5,733 | | | Republic Services, Inc. | | | 190,336 | |
| | 6,236 | | | Waste Management, Inc. | | | 279,809 | |
| | | | | | | | |
| | | | | | | 1,024,795 | |
| | | | | | | | |
| | | | Computers & Peripherals — 0.3% | | | | |
| | 6,486 | | | Seagate Technology PLC | | | 364,254 | |
| | | | | | | | |
| | | | Containers & Packaging — 0.5% | | | | |
| | 4,505 | | | Avery Dennison Corp. | | | 226,106 | |
| | 5,350 | | | MeadWestvaco Corp. | | | 197,576 | |
| | 5,757 | | | Sonoco Products Co. | | | 240,182 | |
| | | | | | | | |
| | | | | | | 663,864 | |
| | | | | | | | |
See accompanying notes to financial statements.
23 |
Portfolio of Investments – as of December 31, 2013
Natixis Diversified Income Fund – (continued)
| | | | | | | | |
| Shares | | | Description | | Value (†) | |
| | | | Distributors — 0.3% | | | | |
| | 4,923 | | | Genuine Parts Co. | | $ | 409,544 | |
| | | | | | | | |
| | | | Diversified Telecommunication Services — 0.7% | | | | |
| | 9,911 | | | AT&T, Inc. | | | 348,471 | |
| | 13,148 | | | CenturyLink, Inc. | | | 418,764 | |
| | 7,493 | | | Telefonica S.A., Sponsored ADR | | | 122,435 | |
| | | | | | | | |
| | | | | | | 889,670 | |
| | | | | | | | |
| | | | Electric Utilities — 3.8% | | | | |
| | 8,167 | | | American Electric Power Co., Inc. | | | 381,726 | |
| | 6,010 | | | Cleco Corp. | | | 280,186 | |
| | 5,579 | | | Edison International | | | 258,308 | |
| | 10,200 | | | Entergy Corp. | | | 645,354 | |
| | 8,275 | | | Exelon Corp. | | | 226,652 | |
| | 12,800 | | | FirstEnergy Corp. | | | 422,144 | |
| | 6,364 | | | IDACORP, Inc. | | | 329,910 | |
| | 5,989 | | | NextEra Energy, Inc. | | | 512,778 | |
| | 6,709 | | | Northeast Utilities | | | 284,394 | |
| | 4,648 | | | OGE Energy Corp. | | | 157,567 | |
| | 8,075 | | | Pinnacle West Capital Corp. | | | 427,329 | |
| | 9,375 | | | PPL Corp. | | | 282,094 | |
| | 7,095 | | | UNS Energy Corp. | | | 424,636 | |
| | 7,586 | | | Xcel Energy, Inc. | | | 211,953 | |
| | | | | | | | |
| | | | | | | 4,845,031 | |
| | | | | | | | |
| | | | Electrical Equipment — 0.5% | | | | |
| | 4,425 | | | Eaton Corp. PLC | | | 336,831 | |
| | 4,842 | | | Emerson Electric Co. | | | 339,812 | |
| | | | | | | | |
| | | | | | | 676,643 | |
| | | | | | | | |
| | | | Energy Equipment & Services — 0.4% | | | | |
| | 9,685 | | | Ensco PLC, Class A | | | 553,788 | |
| | | | | | | | |
| | | | Food & Staples Retailing — 0.2% | | | | |
| | 5,870 | | | Sysco Corp. | | | 211,907 | |
| | | | | | | | |
| | | | Food Products — 0.4% | | | | |
| | 5,741 | | | Campbell Soup Co. | | | 248,470 | |
| | 5,616 | | | General Mills, Inc. | | | 280,295 | |
| | | | | | | | |
| | | | | | | 528,765 | |
| | | | | | | | |
| | | | Gas Utilities — 1.1% | | | | |
| | 7,778 | | | AGL Resources, Inc. | | | 367,355 | |
| | 4,250 | | | National Fuel Gas Co. | | | 303,450 | |
| | 7,201 | | | New Jersey Resources Corp. | | | 332,974 | |
| | 4,875 | | | Oneok, Inc. | | | 303,128 | |
| | 6,082 | | | Questar Corp. | | | 139,825 | |
| | | | | | | | |
| | | | | | | 1,446,732 | |
| | | | | | | | |
| | | | Hotels, Restaurants & Leisure — 1.0% | | | | |
| | 7,990 | | | Darden Restaurants, Inc. | | | 434,416 | |
| | 13,100 | | | Hilton Worldwide Holdings, Inc.(b) | | | 291,475 | |
See accompanying notes to financial statements.
| 24
Portfolio of Investments – as of December 31, 2013
Natixis Diversified Income Fund – (continued)
| | | | | | | | |
| Shares | | | Description | | Value (†) | |
| | | | Hotels, Restaurants & Leisure — continued | | | | |
| | 6,358 | | | McDonald’s Corp. | | $ | 616,917 | |
| | | | | | | | |
| | | | | | | 1,342,808 | |
| | | | | | | | |
| | | | Household Durables — 1.0% | | | | |
| | 6,985 | | | Garmin Ltd. | | | 322,847 | |
| | 10,525 | | | KB Home | | | 192,397 | |
| | 7,751 | | | Leggett & Platt, Inc. | | | 239,816 | |
| | 4,919 | | | Tupperware Brands Corp. | | | 464,993 | |
| | | | | | | | |
| | | | | | | 1,220,053 | |
| | | | | | | | |
| | | | Household Products — 0.9% | | | | |
| | 5,611 | | | Clorox Co. (The) | | | 520,476 | |
| | 5,747 | | | Kimberly-Clark Corp. | | | 600,332 | |
| | | | | | | | |
| | | | | | | 1,120,808 | |
| | | | | | | | |
| | | | Industrial Conglomerates — 0.1% | | | | |
| | 5,348 | | | General Electric Co. | | | 149,904 | |
| | | | | | | | |
| | | | Insurance — 0.9% | | | | |
| | 5,690 | | | Arthur J. Gallagher & Co. | | | 267,032 | |
| | 6,110 | | | Cincinnati Financial Corp. | | | 319,981 | |
| | 9,626 | | | Mercury General Corp. | | | 478,508 | |
| | 8,272 | | | Old Republic International Corp. | | | 142,857 | |
| | | | | | | | |
| | | | | | | 1,208,378 | |
| | | | | | | | |
| | | | Leisure Equipment & Products — 0.2% | | | | |
| | 5,925 | | | Mattel, Inc. | | | 281,912 | |
| | | | | | | | |
| | | | Media — 0.4% | | | | |
| | 5,721 | | | Cinemark Holdings, Inc. | | | 190,681 | |
| | 6,179 | | | Meredith Corp. | | | 320,072 | |
| | | | | | | | |
| | | | | | | 510,753 | |
| | | | | | | | |
| | | | Metals & Mining — 0.2% | | | | |
| | 4,671 | | | Cliffs Natural Resources, Inc. | | | 122,427 | |
| | 4,613 | | | Commercial Metals Co. | | | 93,782 | |
| | | | | | | | |
| | | | | | | 216,209 | |
| | | | | | | | |
| | | | Multi Utilities — 3.8% | | | | |
| | 6,959 | | | Alliant Energy Corp. | | | 359,085 | |
| | 8,481 | | | Avista Corp. | | | 239,079 | |
| | 5,715 | | | Black Hills Corp. | | | 300,095 | |
| | 6,794 | | | CenterPoint Energy, Inc. | | | 157,485 | |
| | 7,342 | | | CMS Energy Corp. | | | 196,545 | |
| | 6,654 | | | Dominion Resources, Inc. | | | 430,447 | |
| | 7,421 | | | DTE Energy Co. | | | 492,680 | |
| | 9,615 | | | Integrys Energy Group, Inc. | | | 523,152 | |
| | 6,069 | | | NiSource, Inc. | | | 199,549 | |
| | 8,450 | | | PG&E Corp. | | | 340,366 | |
| | 8,446 | | | Public Service Enterprise Group, Inc. | | | 270,610 | |
| | 8,198 | | | SCANA Corp. | | | 384,732 | |
| | 5,428 | | | Sempra Energy | | | 487,217 | |
See accompanying notes to financial statements.
25 |
Portfolio of Investments – as of December 31, 2013
Natixis Diversified Income Fund – (continued)
| | | | | | | | |
| Shares | | | Description | | Value (†) | |
| | | | Multi Utilities — continued | | | | |
| | 9,780 | | | TECO Energy, Inc. | | $ | 168,607 | |
| | 7,050 | | | Wisconsin Energy Corp. | | | 291,447 | |
| | | | | | | | |
| | | | | | | 4,841,096 | |
| | | | | | | | |
| | | | Oil, Gas & Consumable Fuels — 1.5% | | | | |
| | 6,124 | | | Chevron Corp. | | | 764,949 | |
| | 7,465 | | | ConocoPhillips | | | 527,402 | |
| | 13,029 | | | HollyFrontier Corp. | | | 647,411 | |
| | | | | | | | |
| | | | | | | 1,939,762 | |
| | | | | | | | |
| | | | Pharmaceuticals — 0.9% | | | | |
| | 5,166 | | | Bristol-Myers Squibb Co. | | | 274,573 | |
| | 7,330 | | | Eli Lilly & Co. | | | 373,830 | |
| | 6,568 | | | Merck & Co., Inc. | | | 328,728 | |
| | 5,859 | | | Pfizer, Inc. | | | 179,461 | |
| | | | | | | | |
| | | | | | | 1,156,592 | |
| | | | | | | | |
| | | | Real Estate Management & Development — 0.5% | | | | |
| | 1,500 | | | Alexander & Baldwin, Inc. | | | 62,595 | |
| | 27,500 | | | Forest City Enterprises, Inc., Class A(b) | | | 525,250 | |
| | | | | | | | |
| | | | | | | 587,845 | |
| | | | | | | | |
| | | | Real Estate Management/Services — 0.1% | | | | |
| | 11,700 | | | American Homes 4 Rent, Class A | | | 189,540 | |
| | | | | | | | |
| | | | REITs – Apartments — 3.6% | | | | |
| | 12,100 | | | American Campus Communities, Inc. | | | 389,741 | |
| | 11,700 | | | AvalonBay Communities, Inc. | | | 1,383,291 | |
| | 6,800 | | | BRE Properties, Inc. | | | 372,028 | |
| | 10,000 | | | Camden Property Trust | | | 568,800 | |
| | 37,100 | | | Equity Residential | | | 1,924,377 | |
| | | | | | | | |
| | | | | | | 4,638,237 | |
| | | | | | | | |
| | | | REITs – Diversified — 2.5% | | | | |
| | 13,200 | | | American Assets Trust, Inc. | | | 414,876 | |
| | 21,500 | | | DuPont Fabros Technology, Inc. | | | 531,265 | |
| | 14,700 | | | EPR Properties | | | 722,652 | |
| | 16,700 | | | First Potomac Realty Trust | | | 194,221 | |
| | 17,700 | | | Liberty Property Trust | | | 599,499 | |
| | 7,900 | | | Vornado Realty Trust | | | 701,441 | |
| | | | | | | | |
| | | | | | | 3,163,954 | |
| | | | | | | | |
| | | | REITs – Healthcare — 2.6% | | | | |
| | 34,000 | | | HCP, Inc. | | | 1,234,880 | |
| | 17,300 | | | Health Care REIT, Inc. | | | 926,761 | |
| | 19,800 | | | Ventas, Inc. | | | 1,134,144 | |
| | | | | | | | |
| | | | | | | 3,295,785 | |
| | | | | | | | |
| | | | REITs – Hotels — 1.4% | | | | |
| | 70,700 | | | Host Hotels & Resorts, Inc. | | | 1,374,408 | |
| | 18,600 | | | RLJ Lodging Trust | | | 452,352 | |
| | | | | | | | |
| | | | | | | 1,826,760 | |
| | | | | | | | |
See accompanying notes to financial statements.
| 26
Portfolio of Investments – as of December 31, 2013
Natixis Diversified Income Fund – (continued)
| | | | | | | | |
| Shares | | | Description | | Value (†) | |
| | | | REITs – Manufactured Homes — 0.4% | | | | |
| | 12,800 | | | Equity Lifestyle Properties, Inc. | | $ | 463,744 | |
| | | | | | | | |
| | | | REITs – Multi Asset Class — 0.1% | | | | |
| | 11,600 | | | Armada Hoffler Properties, Inc. | | | 107,648 | |
| | | | | | | | |
| | | | REITs – Office Property — 3.5% | | | | |
| | 8,500 | | | Alexandria Real Estate Equities, Inc. | | | 540,770 | |
| | 27,000 | | | BioMed Realty Trust, Inc. | | | 489,240 | |
| | 15,600 | | | Boston Properties, Inc. | | | 1,565,772 | |
| | 14,800 | | | Douglas Emmett, Inc. | | | 344,692 | |
| | 22,800 | | | Empire State Realty Trust, Inc., Class A | | | 348,840 | |
| | 19,900 | | | Kilroy Realty Corp. | | | 998,582 | |
| | 11,000 | | | Piedmont Office Realty Trust, Inc., Class A | | | 181,720 | |
| | | | | | | | |
| | | | | | | 4,469,616 | |
| | | | | | | | |
| | | | REITs – Regional Malls — 3.8% | | | | |
| | 12,800 | | | Macerich Co. (The) | | | 753,792 | |
| | 24,000 | | | Simon Property Group, Inc. | | | 3,651,840 | |
| | 7,700 | | | Taubman Centers, Inc. | | | 492,184 | |
| | | | | | | | |
| | | | | | | 4,897,816 | |
| | | | | | | | |
| | | | REITs – Shopping Centers — 2.3% | | | | |
| | 11,700 | | | Acadia Realty Trust | | | 290,511 | |
| | 37,200 | | | DDR Corp. | | | 571,764 | |
| | 8,200 | | | Federal Realty Investment Trust | | | 831,562 | |
| | 18,500 | | | Ramco-Gershenson Properties Trust | | | 291,190 | |
| | 12,400 | | | Regency Centers Corp. | | | 574,120 | |
| | 22,200 | | | Retail Opportunity Investments Corp. | | | 326,784 | |
| | | | | | | | |
| | | | | | | 2,885,931 | |
| | | | | | | | |
| | | | REITs – Single Tenant — 0.3% | | | | |
| | 10,700 | | | National Retail Properties, Inc. | | | 324,531 | |
| | | | | | | | |
| | | | REITs – Storage — 2.0% | | | | |
| | 17,200 | | | CubeSmart | | | 274,168 | |
| | 17,000 | | | Extra Space Storage, Inc. | | | 716,210 | |
| | 10,300 | | | Public Storage | | | 1,550,356 | |
| | | | | | | | |
| | | | | | | 2,540,734 | |
| | | | | | | | |
| | | | REITs – Warehouse/Industrials — 1.3% | | | | |
| | 45,900 | | | ProLogis, Inc. | | | 1,696,005 | |
| | | | | | | | |
| | | | Semiconductors & Semiconductor Equipment — 0.1% | | | | |
| | 6,889 | | | Intel Corp. | | | 178,838 | |
| | | | | | | | |
| | | | Specialty Retail — 0.1% | | | | |
| | 5,650 | | | Staples, Inc. | | | 89,779 | |
| | | | | | | | |
| | | | Thrifts & Mortgage Finance — 0.2% | | | | |
| | 11,603 | | | New York Community Bancorp, Inc. | | | 195,511 | |
| | 8,283 | | | People’s United Financial, Inc. | | | 125,239 | |
| | | | | | | | |
| | | | | | | 320,750 | |
| | | | | | | | |
See accompanying notes to financial statements.
27 |
Portfolio of Investments – as of December 31, 2013
Natixis Diversified Income Fund – (continued)
| | | | | | | | |
| Shares | | | Description | | Value (†) | |
| | | | Tobacco — 1.5% | | | | |
| | 9,528 | | | Altria Group, Inc. | | $ | 365,780 | |
| | 8,132 | | | Lorillard, Inc. | | | 412,130 | |
| | 8,181 | | | Philip Morris International, Inc. | | | 712,811 | |
| | 7,524 | | | Universal Corp. | | | 410,810 | |
| | | | | | | | |
| | | | | | | 1,901,531 | |
| | | | | | | | |
| | | | Trading Companies & Distributors — 0.0% | | | | |
| | 176 | | | United Rentals, Inc.(b) | | | 13,719 | |
| | | | | | | | |
| | | | Total Common Stocks
(Identified Cost $60,482,343) | | | 64,806,394 | |
| | | | | | | | |
| | | | | | | | |
Principal
Amount (‡) | | | | | | |
| | Bonds and Notes — 45.6% | | | | |
| | Non-Convertible Bonds — 42.2% | | | | |
| | | | ABS Car Loan — 0.9% | | | | |
| $ | 100,000 | | | Ford Credit Auto Owner Trust, Series 2011-B, Class A4, 1.350%, 12/15/2016 | | | 100,653 | |
| | 160,000 | | | Ford Credit Auto Owner Trust, Series 2013-B, Class A3, 0.570%, 10/15/2017 | | | 160,188 | |
| | 310,000 | | | Honda Auto Receivables Owner Trust, Series 2013-2, Class A3, 0.530%, 2/16/2017 | | | 309,899 | |
| | 80,000 | | | Nissan Auto Receivables Owner Trust, Series 2011-A, Class A4, 1.940%, 9/15/2017 | | | 80,982 | |
| | 48,000 | | | Nissan Auto Receivables Owner Trust, Series 2013-A, Class A3, 0.500%, 5/15/2017 | | | 47,975 | |
| | 325,000 | | | Nissan Auto Receivables Owner Trust, Series 2013-C, Class A3, 0.670%, 8/15/2018 | | | 324,133 | |
| | 94,000 | | | World Omni Auto Receivables Trust, Series 2013-A, Class A3, 0.640%, 4/16/2018 | | | 93,969 | |
| | | | | | | | |
| | | | | | | 1,117,799 | |
| | | | | | | | |
| | | | ABS Credit Card — 0.6% | | | | |
| | 300,000 | | | American Express Credit Account Secured Note Trust, Series 2012-4, Class A, 0.407%, 5/15/2020(c) | | | 299,017 | |
| | 100,000 | | | Chase Issuance Trust, Series 2012-A5, Class A5, 0.590%, 8/15/2017 | | | 100,011 | |
| | 100,000 | | | Chase Issuance Trust, Series 2012-A8, Class A8, 0.540%, 10/16/2017 | | | 99,864 | |
| | 298,000 | | | Citibank Credit Card Issuance Trust, Series 2013-A2, Class A2, 0.444%, 5/26/2020(c) | | | 296,609 | |
| | | | | | | | |
| | | | | | | 795,501 | |
| | | | | | | | |
| | | | ABS Home Equity — 2.4% | | | | |
| | 57,222 | | | Alternative Loan Trust, Series 2003-20CB, Class 2A1, 5.750%, 10/25/2033 | | | 59,412 | |
| | 62,705 | | | Banc of America Alternative Loan Trust, Series 2003-10, Class 1A1, 5.500%, 12/25/2033 | | | 63,618 | |
| | 101,950 | | | Banc of America Alternative Loan Trust, Series 2003-10, Class 3A1, 5.500%, 12/25/2033 | | | 103,092 | |
| | 140,302 | | | Banc of America Funding Trust, Series 2004-B, Class 4A2, 2.583%, 11/20/2034(c) | | | 131,169 | |
| | 41,550 | | | Banc of America Funding Trust, Series 2005-4, Class 1A3, 5.500%, 8/25/2035 | | | 41,913 | |
See accompanying notes to financial statements.
| 28
Portfolio of Investments – as of December 31, 2013
Natixis Diversified Income Fund – (continued)
| | | | | | | | |
Principal
Amount (‡) | | | Description | | Value (†) | |
| | | | ABS Home Equity — continued | | | | |
| $ | 78,995 | | | Banc of America Funding Trust, Series 2005-7, Class 3A1, 5.750%, 11/25/2035 | | $ | 79,167 | |
| | 79,918 | | | Banc of America Mortgage Securities, Inc., Series 2004-8, Class 1A19, 5.500%, 10/25/2034 | | | 82,294 | |
| | 107,970 | | | Banc of America Mortgage Securities, Inc., Series 2004-A, Class 2A2, 2.910%, 2/25/2034(c) | | | 106,519 | |
| | 34,724 | | | Banc of America Mortgage Securities, Inc., Series 2005-A, Class 2A1, 2.944%, 2/25/2035(c) | | | 34,431 | |
| | 4,313 | | | Bear Stearns Adjustable Rate Mortgage Trust, Series 2004-10, Class 11A1, 2.686%, 1/25/2035(c) | | | 4,179 | |
| | 13,740 | | | Bear Stearns Adjustable Rate Mortgage Trust, Series 2004-3, Class 2A, 2.595%, 7/25/2034(c) | | | 13,486 | |
| | 117,739 | | | Countrywide Alternative Loan Trust, Series 2003-4CB, Class 1A1, 5.750%, 4/25/2033 | | | 121,059 | |
| | 188,981 | | | Countrywide Alternative Loan Trust, Series 2004-27CB, Class A1, 6.000%, 12/25/2034 | | | 181,646 | |
| | 51,595 | | | Countrywide Alternative Loan Trust, Series 2004-J3, Class 1A1, 5.500%, 4/25/2034 | | | 52,651 | |
| | 25,000 | | | Countrywide Asset-Backed Certificates, Series 2004-13, Class AF5B, 5.103%, 5/25/2035 | | | 24,207 | |
| | 59,644 | | | Countrywide Home Loan Mortgage Pass Through Trust, Series 2003-57, Class A11, 5.500%, 1/25/2034 | | | 61,346 | |
| | 26,810 | | | Countrywide Home Loan Mortgage Pass Through Trust, Series 2004-HYB4, Class 2A1, 2.503%, 9/20/2034(c) | | | 25,588 | |
| | 39,801 | | | Countrywide Home Loan Mortgage Pass Through Trust, Series 2005-11, Class 4A1, 0.435%, 4/25/2035(c) | | | 32,464 | |
| | 12,219 | | | Countrywide Home Loan Mortgage Pass Through Trust, Series 2005-13, Class A3, 5.500%, 6/25/2035 | | | 12,180 | |
| | 17,901 | | | Credit Suisse First Boston Mortgage Securities Corp., Series 2005-1, Class 3A4, 5.250%, 5/25/2028 | | | 18,199 | |
| | 14,809 | | | GMAC Mortgage Corp. Loan Trust, Series 2003-J7, Class A7, 5.000%, 11/25/2033 | | | 15,068 | |
| | 78,530 | | | GMAC Mortgage Corp. Loan Trust, Series 2005-AR4, Class 3A1, 3.102%, 7/19/2035(c) | | | 71,676 | |
| | 72,223 | | | GSR Mortgage Loan Trust, Series 2004-14, Class 3A1, 2.761%, 12/25/2034(c) | | | 65,000 | |
| | 108,076 | | | GSR Mortgage Loan Trust, Series 2004-14, Class 5A1, 2.742%, 12/25/2034(c) | | | 106,771 | |
| | 200,000 | | | GSR Mortgage Loan Trust, Series 2005-AR6, Class 4A5, 2.676%, 9/25/2035(c) | | | 195,582 | |
| | 125,864 | | | HarborView Mortgage Loan Trust, Series 2004-3, Class 1A, 2.590%, 5/19/2034(c) | | | 123,210 | |
| | 11,661 | | | IndyMac Index Mortgage Loan Trust, Series 2005-16IP, Class A1, 0.805%, 7/25/2045(c) | | | 10,931 | |
| | 49,825 | | | JPMorgan Mortgage Trust, Series 2007-A1, Class 5A1, 2.753%, 7/25/2035(c) | | | 49,969 | |
| | 50,694 | | | MASTR Adjustable Rate Mortgages Trust, Series 2007-1, Class I2A1, 0.325%, 1/25/2047(c) | | | 36,366 | |
| | 53,131 | | | MASTR Alternative Loan Trust, Series 2003-9, Class 4A1, 5.250%, 11/25/2033 | | | 55,225 | |
| | 52,292 | | | MASTR Alternative Loan Trust, Series 2004-5, Class 2A1, 6.000%, 6/25/2034 | | | 53,959 | |
| | 75,000 | | | Morgan Stanley Mortgage Loan Trust, Series 2005-7, Class 7A5, 5.500%, 11/25/2035 | | | 74,868 | |
| | 56,491 | | | New York Mortgage Trust, Series 2006-1, Class 2A2, 2.755%, 5/25/2036(c) | | | 49,306 | |
See accompanying notes to financial statements.
29 |
Portfolio of Investments – as of December 31, 2013
Natixis Diversified Income Fund – (continued)
| | | | | | | | |
Principal
Amount (‡) | | | Description | | Value (†) | |
| | | | ABS Home Equity — continued | | | | |
| $ | 75,000 | | | Residential Accredit Loans, Inc., Series 2003-QS17, Class CB5, 5.500%, 9/25/2033 | | $ | 77,719 | |
| | 42,964 | | | Structured Adjustable Rate Mortgage Loan Trust, Series 2004-12, Class 6A, 2.656%, 9/25/2034(c) | | | 42,034 | |
| | 157,192 | | | Structured Asset Securities Corp. Mortgage Pass Through Certificates, Series 2004-20, Class 8A7, 5.750%, 11/25/2034 | | | 165,923 | |
| | 41,083 | | | Structured Asset Securities Corp. Mortgage Pass Through Certificates, Series 2004-21XS, Class 1A5, 5.000%, 12/25/2034 | | | 41,327 | |
| | 36,662 | | | WaMu Mortgage Pass Through Certificates, Series 2004-AR1, Class A, 2.530%, 3/25/2034(c) | | | 36,364 | |
| | 123,341 | | | WaMu Mortgage Pass Through Certificates, Series 2004-AR14, Class A1, 2.406%, 1/25/2035(c) | | | 122,661 | |
| | 85,957 | | | WaMu Mortgage Pass Through Certificates, Series 2004-CB2, Class 2A, 5.500%, 7/25/2034 | | | 88,595 | |
| | 11,348 | | | WaMu Mortgage Pass Through Certificates, Series 2006-AR17, Class 1A1A, 0.949%, 12/25/2046(c) | | | 10,684 | |
| | 23,792 | | | WaMu Mortgage Pass Through Certificates, Series 2007-OA3, Class 2A1A, 0.899%, 4/25/2047(c) | | | 20,951 | |
| | 44,473 | | | Wells Fargo Mortgage Backed Securities, Series 2003-N, Class 1A2, 2.484%, 12/25/2033(c) | | | 45,302 | |
| | 59,224 | | | Wells Fargo Mortgage Backed Securities Trust, Series 2003-M, Class A1, 2.619%, 12/25/2033(c) | | | 59,887 | |
| | 99,554 | | | Wells Fargo Mortgage Backed Securities Trust, Series 2004-A, Class A1, 3.305%, 2/25/2034(c) | | | 100,075 | |
| | 53,989 | | | Wells Fargo Mortgage Backed Securities Trust, Series 2005-12, Class 1A2, 5.500%, 11/25/2035 | | | 54,407 | |
| | | | | | | | |
| | | | | | | 3,022,480 | |
| | | | | | | | |
| | | | ABS Other — 0.2% | | | | |
| | 280,000 | | | Springleaf Funding Trust, Series 2013-BA, Class A, 3.920%, 1/16/2023, 144A | | | 284,200 | |
| | | | | | | | |
| | | | Aerospace & Defense — 0.4% | | | | |
| | 200,000 | | | Meccanica Holdings USA, Inc., 6.250%, 1/15/2040, 144A | | | 169,261 | |
| | 300,000 | | | Meccanica Holdings USA, Inc., 7.375%, 7/15/2039, 144A | | | 281,411 | |
| | | | | | | | |
| | | | | | | 450,672 | |
| | | | | | | | |
| | | | Airlines — 1.5% | | | | |
| | 50,000 | | | Air Canada Pass Through Trust, Series 2013-1, Class A, 4.125%, 11/15/2026, 144A | | | 48,750 | |
| | 35,000 | | | Air Canada Pass Through Trust, Series 2013-1, Class B, 5.375%, 11/15/2022, 144A | | | 34,037 | |
| | 200,000 | | | American Airlines Pass Through Trust, Series 2013-2, Class C, 6.000%, 1/15/2017, 144A | | | 204,048 | |
| | 180,000 | | | British Airways Pass Through Trust, Series 2013-1, Class B, 5.625%, 12/20/2021, 144A | | | 187,951 | |
| | 20,000 | | | Continental Airlines Pass Through Certificates, Series 2012-2, Class B, 5.500%, 4/29/2022 | | | 20,600 | |
| | 80,000 | | | Continental Airlines Pass Through Certificates, Series 2012-3, Class C, 6.125%, 4/29/2018 | | | 83,600 | |
See accompanying notes to financial statements.
| 30
Portfolio of Investments – as of December 31, 2013
Natixis Diversified Income Fund – (continued)
| | | | | | | | |
Principal
Amount (‡) | | | Description | | Value (†) | |
| | | | Airlines — continued | | | | |
| $ | 38,491 | | | Continental Airlines Pass Through Trust, Series 2000-1, Class A-1, 8.048%, 5/01/2022 | | $ | 44,022 | |
| | 12,900 | | | Continental Airlines Pass Through Trust, Series 2007-1, Class A, 5.983%, 10/19/2023 | | | 14,093 | |
| | 755,597 | | | UAL Pass Through Trust, Series 2007-1, Class A, 6.636%, 1/02/2024(d) | | | 800,933 | |
| | 124,860 | | | US Airways Pass Through Trust, Series 2012-1A, Class A, 5.900%, 4/01/2026 | | | 136,098 | |
| | 110,207 | | | US Airways Pass Through Trust, Series 2012-1B, Class B, 8.000%, 4/01/2021 | | | 122,880 | |
| | 172,602 | | | US Airways Pass Through Trust, Series 2012-1C, Class C, 9.125%, 10/01/2015 | | | 182,095 | |
| | | | | | | | |
| | | | | | | 1,879,107 | |
| | | | | | | | |
| | | | Automotive — 0.0% | | | | |
| | 40,000 | | | Goodyear Tire & Rubber Co. (The), 7.000%, 3/15/2028 | | | 40,000 | |
| | | | | | | | |
| | | | Banking — 3.3% | | | | |
| | 64,000 | | | Ally Financial, Inc., 8.000%, 11/01/2031 | | | 76,560 | |
| | 600,000 | | | Banco Santander Brasil S.A./Cayman Islands, 8.000%, 3/18/2016, 144A, (BRL) | | | 235,244 | |
| | 500,000 | | | Bank of Montreal, 1.950%, 1/30/2018 | | | 512,592 | |
| | 500,000 | | | Bank of Nova Scotia, 1.950%, 1/30/2017 | | | 512,700 | |
| | 355,000 | | | Citigroup, Inc., 5.500%, 9/13/2025 | | | 373,900 | |
| | 105,000 | | | Citigroup, Inc., 5.875%, 2/22/2033 | | | 107,921 | |
| | 25,000 | | | Citigroup, Inc., 6.000%, 10/31/2033 | | | 26,356 | |
| | 20,000 | | | Citigroup, Inc., 6.125%, 8/25/2036 | | | 21,323 | |
| | 250,000 | | | Cooperatieve Centrale Raiffeisen-Boerenleenbank BA/Netherlands, 4.625%, 12/01/2023 | | | 251,755 | |
| | 100,000 | | | HBOS PLC, 6.000%, 11/01/2033, 144A | | | 96,387 | |
| | 200,000 | | | ING Bank NV, 5.800%, 9/25/2023, 144A | | | 209,119 | |
| | 100,000 | | | Intesa Sanpaolo S.p.A., 6.500%, 2/24/2021, 144A | | | 109,498 | |
| | 120,000 | | | JPMorgan Chase & Co., 4.250%, 11/02/2018, (NZD) | | | 93,021 | |
| | 400,000 | | | Merrill Lynch & Co., Inc., 6.110%, 1/29/2037 | | | 431,388 | |
| | 100,000 | | | Merrill Lynch & Co., Inc., Series C, MTN, 6.050%, 6/01/2034 | | | 104,248 | |
| | 65,000 | | | Morgan Stanley, 5.000%, 11/24/2025 | | | 65,194 | |
| | 175,000 | | | Morgan Stanley, 8.000%, 5/09/2017, (AUD) | | | 171,588 | |
| | 100,000 | | | Morgan Stanley, GMTN, 7.625%, 3/03/2016, (AUD) | | | 95,045 | |
| | 720,000 | | | Morgan Stanley, MTN, 4.100%, 5/22/2023(d) | | | 696,781 | |
| | 40,000 | | | Royal Bank of Scotland Group PLC, 5.500%, (EUR)(g) | | | 46,499 | |
| | | | | | | | |
| | | | | | | 4,237,119 | |
| | | | | | | | |
| | | | Brokerage — 0.5% | | | | |
| | 140,000 | | | Jefferies Group LLC, 5.125%, 1/20/2023 | | | 141,605 | |
| | 45,000 | | | Jefferies Group LLC, 6.250%, 1/15/2036 | | | 43,425 | |
| | 20,000 | | | Jefferies Group LLC, 6.450%, 6/08/2027 | | | 20,781 | |
| | 295,000 | | | Jefferies Group LLC, 6.500%, 1/20/2043 | | | 292,518 | |
| | 95,000 | | | Jefferies Group LLC, 6.875%, 4/15/2021 | | | 108,208 | |
| | | | | | | | |
| | | | | | | 606,537 | |
| | | | | | | | |
| | | | Building Materials — 0.3% | | | | |
| | 25,000 | | | HD Supply, Inc., 7.500%, 7/15/2020 | | | 26,938 | |
| | 170,000 | | | Masco Corp., 5.850%, 3/15/2017 | | | 186,575 | |
| | 40,000 | | | Masco Corp., 6.500%, 8/15/2032 | | | 39,300 | |
See accompanying notes to financial statements.
31 |
Portfolio of Investments – as of December 31, 2013
Natixis Diversified Income Fund – (continued)
| | | | | | | | |
Principal
Amount (‡) | | | Description | | Value (†) | |
| | | | Building Materials — continued | | | | |
| $ | 15,000 | | | Masco Corp., 7.750%, 8/01/2029 | | $ | 16,472 | |
| | 300,000 | | | Odebrecht Finance Ltd., 8.250%, 4/25/2018, 144A, (BRL) | | | 105,224 | |
| | | | | | | | |
| | | | | | | 374,509 | |
| | | | | | | | |
| | | | Chemicals — 0.2% | | | | |
| | 200,000 | | | Hercules, Inc., 6.500%, 6/30/2029 | | | 174,000 | |
| | 25,000 | | | Methanex Corp., 5.250%, 3/01/2022 | | | 26,467 | |
| | | | | | | | |
| | | | | | | 200,467 | |
| | | | | | | | |
| | | | Collateralized Mortgage Obligations — 0.0% | | | | |
| | 24,866 | | | MASTR Adjustable Rate Mortgages Trust, Series 2006-2, Class 3A1, 2.652%, 1/25/2036(c) | | | 23,522 | |
| | | | | | | | |
| | | | Commercial Mortgage-Backed Securities — 1.5% | | | | |
| | 265,000 | | | Credit Suisse Mortgage Capital Certificates, Series 2007-C5, Class A4, 5.695%, 9/15/2040 | | | 292,660 | |
| | 75,000 | | | CW Capital Cobalt Ltd., Series 2006-C1, Class AM, 5.254%, 8/15/2048 | | | 77,015 | |
| | 200,000 | | | DBUBS Mortgage Trust, Series 2011-LC1A, Class E, 5.557%, 11/10/2046, 144A(c) | | | 203,442 | |
| | 400,000 | | | Extended Stay America Trust, Series 2013-ESH7, Class D7, 5.053%, 12/05/2031, 144A(c) | | | 401,424 | |
| | 185,000 | | | GS Mortgage Securities Corp. II, Series 2007-GG10, Class AM, 5.804%, 8/10/2045(c) | | | 187,968 | |
| | 100,000 | | | Hilton USA Trust, Series 2013-HLT, Class DFX, 4.407%, 11/05/2030, 144A | | | 100,082 | |
| | 25,000 | | | JPMorgan Chase Commercial Mortgage Securities Trust, Series 2007-LDPX, Class AM, 5.464%, 1/15/2049 | | | 25,827 | |
| | 100,000 | | | Morgan Stanley Capital I Trust, Series 2007-HQ12, Class AM, 5.597%, 4/12/2049(c) | | | 109,119 | |
| | 100,000 | | | Morgan Stanley Re-REMIC Trust, Series 2009-GG10, Class A4B, 5.804%, 8/12/2045, 144A(c) | | | 109,233 | |
| | 100,000 | | | Motel 6 Trust, Series 2012-MTL6, Class D, 3.781%, 10/05/2025, 144A | | | 99,033 | |
| | 130,000 | | | Wachovia Bank Commercial Mortgage Trust, Series 2006-C28, Class AM, 5.603%, 10/15/2048 | | | 139,548 | |
| | 125,000 | | | WF-RBS Commercial Mortgage Trust, Series 2011-C2, Class D, 5.465%, 2/15/2044, 144A(c) | | | 126,286 | |
| | | | | | | | |
| | | | | | | 1,871,637 | |
| | | | | | | | |
| | | | Consumer Products — 0.1% | | | | |
| | 160,000 | | | Avon Products, Inc., 5.000%, 3/15/2023 | | | 155,555 | |
| | | | | | | | |
| | | | Diversified Manufacturing — 0.1% | | | | |
| | 200,000 | | | Votorantim Cimentos S.A., 7.250%, 4/05/2041, 144A | | | 190,000 | |
| | | | | | | | |
| | | | Electric — 0.9% | | | | |
| | 500,000 | | | EDP Finance BV, 4.900%, 10/01/2019, 144A | | | 508,750 | |
| | 115,000,000 | | | Emgesa S.A. E.S.P., 8.750%, 1/25/2021, 144A, (COP) | | | 62,881 | |
| | 88,000,000 | | | Empresas Publicas de Medellin E.S.P., 8.375%, 2/01/2021, 144A, (COP) | | | 47,214 | |
| | 100,000 | | | Enel Finance International NV, 5.125%, 10/07/2019, 144A | | | 106,765 | |
| | 300,000 | | | Enel Finance International NV, 6.000%, 10/07/2039, 144A | | | 287,740 | |
See accompanying notes to financial statements.
| 32
Portfolio of Investments – as of December 31, 2013
Natixis Diversified Income Fund – (continued)
| | | | | | | | |
Principal
Amount (‡) | | | Description | | Value (†) | |
| | | | Electric — continued | | | | |
| $ | 265,975 | | | Energy Future Intermediate Holding Co. LLC/EFIH Finance, Inc., 11.250% (12.250% PIK), 12/01/2018, 144A(e) | | $ | 184,853 | |
| | | | | | | | |
| | | | | | | 1,198,203 | |
| | | | | | | | |
| | | | Financial Other — 0.1% | | | | |
| | 200,000 | | | Cielo S.A./Cielo USA, Inc., 3.750%, 11/16/2022, 144A | | | 178,000 | |
| | | | | | | | |
| | | | Food & Beverage — 0.0% | | | | |
| | 50,000 | | | Viterra, Inc., 6.406%, 2/16/2021, 144A, (CAD) | | | 51,089 | |
| | | | | | | | |
| | | | Government Guaranteed — 0.1% | | | | |
| | 165,000 | | | Queensland Treasury Corp., 7.125%, 9/18/2017, 144A, (NZD) | | | 146,559 | |
| | | | | | | | |
| | | | Government Owned – No Guarantee — 0.5% | | | | |
| | 59,000 | | | Ecopetrol S.A., 5.875%, 9/18/2023 | | | 62,245 | |
| | 600,000 | | | Pertamina Persero PT, 4.300%, 5/20/2023, 144A | | | 522,000 | |
| | | | | | | | |
| | | | | | | 584,245 | |
| | | | | | | | |
| | | | Healthcare — 1.2% | | | | |
| | 25,000 | | | HCA, Inc., 7.050%, 12/01/2027 | | | 24,625 | |
| | 75,000 | | | HCA, Inc., 7.500%, 12/15/2023 | | | 81,000 | |
| | 520,000 | | | HCA, Inc., 7.500%, 11/06/2033 | | | 520,000 | |
| | 310,000 | | | HCA, Inc., 7.690%, 6/15/2025 | | | 323,950 | |
| | 20,000 | | | HCA, Inc., 8.360%, 4/15/2024 | | | 22,000 | |
| | 140,000 | | | HCA, Inc., MTN, 7.580%, 9/15/2025 | | | 145,250 | |
| | 50,000 | | | HCA, Inc., MTN, 7.750%, 7/15/2036 | | | 49,750 | |
| | 345,000 | | | Owens & Minor, Inc., 6.350%, 4/15/2016 | | | 376,421 | |
| | | | | | | | |
| | | | | | | 1,542,996 | |
| | | | | | | | |
| | | | Home Construction — 0.8% | | | | |
| | 40,000 | | | Beazer Homes USA, Inc., 7.250%, 2/01/2023 | | | 40,000 | |
| | 80,000 | | | Beazer Homes USA, Inc., 9.125%, 5/15/2019 | | | 85,600 | |
| | 80,000 | | | Desarrolladora Homex SAB de CV, 9.750%, 3/25/2020, 144A(f) | | | 9,000 | |
| | 105,000 | | | KB Home, 7.250%, 6/15/2018 | | | 115,763 | |
| | 150,000 | | | KB Home, 7.500%, 9/15/2022 | | | 157,875 | |
| | 145,000 | | | Lennar Corp., 4.750%, 11/15/2022 | | | 134,487 | |
| | 80,000 | | | Pulte Group, Inc., 6.000%, 2/15/2035 | | | 67,800 | |
| | 515,000 | | | Pulte Group, Inc., 6.375%, 5/15/2033 | | | 466,075 | |
| | | | | | | | |
| | | | | | | 1,076,600 | |
| | | | | | | | |
| | | | Independent Energy — 0.8% | | | | |
| | 60,000 | | | Connacher Oil and Gas Ltd., 8.500%, 8/01/2019, 144A | | | 41,250 | |
| | 85,000 | | | Continental Resources, Inc., 4.500%, 4/15/2023 | | | 86,169 | |
| | 240,000 | | | Newfield Exploration Co., 5.625%, 7/01/2024 | | | 238,800 | |
| | 400,000 | | | OGX Austria GmbH, 8.375%, 4/01/2022, 144A(f) | | | 32,000 | |
| | 200,000 | | | OGX Austria GmbH, 8.500%, 6/01/2018, 144A(f) | | | 16,000 | |
| | 142,000 | | | Pioneer Natural Resources Co., 7.200%, 1/15/2028 | | | 170,738 | |
| | 50,000 | | | SandRidge Energy, Inc., 7.500%, 2/15/2023 | | | 50,750 | |
| | 45,000 | | | SandRidge Energy, Inc., 8.125%, 10/15/2022 | | | 47,700 | |
| | 105,000 | | | Southwestern Energy Co., 4.100%, 3/15/2022 | | | 104,088 | |
| | 125,000 | | | Talisman Energy, Inc., 3.750%, 2/01/2021 | | | 121,019 | |
See accompanying notes to financial statements.
33 |
Portfolio of Investments – as of December 31, 2013
Natixis Diversified Income Fund – (continued)
| | | | | | | | |
Principal
Amount (‡) | | | Description | | Value (†) | |
| | | | Independent Energy — continued | | | | |
| $ | 100,000 | | | Whiting Petroleum Corp., 5.750%, 3/15/2021 | | $ | 103,500 | |
| | | | | | | | |
| | | | | | | 1,012,014 | |
| | | | | | | | |
| | | | Life Insurance — 0.4% | | | | |
| | 85,000 | | | American International Group, Inc., 4.875%, 6/01/2022 | | | 91,360 | |
| | 300,000 | | | American International Group, Inc., (fixed rate to 5/15/2038, variable rate thereafter), 8.175%, 5/15/2068 | | | 363,000 | |
| | | | | | | | |
| | | | | | | 454,360 | |
| | | | | | | | |
| | | | Local Authorities — 1.0% | | | | |
| | 260,000 | | | Autonomous Community of Madrid Spain, 4.300%, 9/15/2026, 144A, (EUR) | | | 334,164 | |
| | 780,000 | | | Province of Ontario, Canada, 4.200%, 3/08/2018, (CAD)(d) | | | 793,951 | |
| | 140,000 | | | Province of Quebec, Canada, Series QC, 6.750%, 11/09/2015, (NZD) | | | 119,951 | |
| | | | | | | | |
| | | | | | | 1,248,066 | |
| | | | | | | | |
| | | | Lodging — 0.0% | | | | |
| | 35,000 | | | Royal Caribbean Cruises Ltd., 7.500%, 10/15/2027 | | | 37,363 | |
| | 1,000 | | | Wyndham Worldwide Corp., 6.000%, 12/01/2016 | | | 1,103 | |
| | | | | | | | |
| | | | | | | 38,466 | |
| | | | | | | | |
| | | | Media Cable — 0.1% | | | | |
| | 10,000 | | | CCO Holdings LLC/CCO Holdings Capital Corp., 5.125%, 2/15/2023 | | | 9,275 | |
| | 40,000 | | | Time Warner Cable, Inc., 4.500%, 9/15/2042 | | | 30,303 | |
| | 30,000 | | | Time Warner Cable, Inc., 5.500%, 9/01/2041 | | | 24,858 | |
| | | | | | | | |
| | | | | | | 64,436 | |
| | | | | | | | |
| | | | Metals & Mining — 1.5% | | | | |
| | 255,000 | | | Alcoa, Inc., 5.900%, 2/01/2027 | | | 249,856 | |
| | 40,000 | | | Alcoa, Inc., 6.750%, 1/15/2028 | | | 41,980 | |
| | 100,000 | | | AngloGold Ashanti Holdings PLC, 5.125%, 8/01/2022 | | | 86,250 | |
| | 245,000 | | | ArcelorMittal, 6.000%, 3/01/2021 | | | 259,700 | |
| | 135,000 | | | ArcelorMittal, 6.750%, 2/25/2022 | | | 146,813 | |
| | 225,000 | | | ArcelorMittal, 7.250%, 3/01/2041 | | | 214,875 | |
| | 100,000 | | | ArcelorMittal, 7.500%, 10/15/2039 | | | 98,250 | |
| | 75,000 | | | Barrick North America Finance LLC, 4.400%, 5/30/2021 | | | 72,214 | |
| | 250,000 | | | Newcrest Finance Pty Ltd., 4.200%, 10/01/2022, 144A | | | 199,749 | |
| | 200,000 | | | Rain CII Carbon LLC/CII Carbon Corp., 8.250%, 1/15/2021, 144A | | | 204,000 | |
| | 200,000 | | | Samarco Mineracao S.A., 4.125%, 11/01/2022, 144A | | | 180,000 | |
| | 10,000 | | | United States Steel Corp., 6.650%, 6/01/2037 | | | 8,600 | |
| | 145,000 | | | Xstrata Finance Canada Ltd., 4.950%, 11/15/2021, 144A | | | 146,875 | |
| | | | | | | | |
| | | | | | | 1,909,162 | |
| | | | | | | | |
| | | | Non-Captive Consumer — 1.0% | | | | |
| | 15,000 | | | SLM Corp., 4.875%, 6/17/2019 | | | 14,947 | |
| | 412,000 | | | SLM Corp., 5.500%, 1/25/2023 | | | 389,180 | |
| | 5,000 | | | SLM Corp., MTN, 5.500%, 1/15/2019 | | | 5,189 | |
| | 180,000 | | | SLM Corp., MTN, 7.250%, 1/25/2022 | | | 190,350 | |
| | 65,000 | | | SLM Corp., Series A, MTN, 5.000%, 6/15/2018 | | | 63,684 | |
| | 95,000 | | | SLM Corp., Series A, MTN, 8.450%, 6/15/2018 | | | 110,675 | |
| | 280,000 | | | Springleaf Finance Corp., 7.750%, 10/01/2021 | | | 302,400 | |
See accompanying notes to financial statements.
| 34
Portfolio of Investments – as of December 31, 2013
Natixis Diversified Income Fund – (continued)
| | | | | | | | |
Principal
Amount (‡) | | | Description | | Value (†) | |
| | | | Non-Captive Consumer — continued | | | | |
| $ | 110,000 | | | Springleaf Finance Corp., 8.250%, 10/01/2023 | | $ | 119,075 | |
| | 115,000 | | | Springleaf Finance Corp., Series J, MTN, 6.900%, 12/15/2017 | | | 125,695 | |
| | | | | | | | |
| | | | | | | 1,321,195 | |
| | | | | | | | |
| | | | Non-Captive Diversified — 1.1% | | | | |
| | 165,000 | | | Aviation Capital Group Corp., 4.625%, 1/31/2018, 144A | | | 170,811 | |
| | 110,000 | | | Aviation Capital Group Corp., 6.750%, 4/06/2021, 144A | | | 119,618 | |
| | 25,000 | | | CIT Group, Inc., 5.000%, 8/15/2022 | | | 24,375 | |
| | 30,000 | | | CIT Group, Inc., 5.000%, 8/01/2023 | | | 28,875 | |
| | 400,000 | | | General Electric Capital Corp., Series A, (fixed rate to 6/15/2022, variable rate thereafter), 7.125%(g) | | | 447,000 | |
| | 15,000 | | | General Electric Capital Corp., Series A, GMTN, 7.625%, 12/10/2014, (NZD) | | | 12,731 | |
| | 80,000 | | | International Lease Finance Corp., 5.875%, 4/01/2019 | | | 85,200 | |
| | 80,000 | | | International Lease Finance Corp., 6.250%, 5/15/2019 | | | 86,600 | |
| | 35,000 | | | International Lease Finance Corp., 8.250%, 12/15/2020 | | | 40,950 | |
| | 105,000 | | | International Lease Finance Corp., 8.625%, 1/15/2022 | | | 124,084 | |
| | 140,000 | | | iStar Financial, Inc., 7.125%, 2/15/2018 | | | 154,350 | |
| | 70,000 | | | Ladder Capital Finance Holdings LLLP/Ladder Capital Finance Corp., 7.375%, 10/01/2017 | | | 73,500 | |
| | | | | | | | |
| | | | | | | 1,368,094 | |
| | | | | | | | |
| | | | Oil Field Services — 0.0% | | | | |
| | 28,000 | | | Hercules Offshore, Inc., 7.500%, 10/01/2021, 144A | | | 29,680 | |
| | | | | | | | |
| | | | Packaging — 0.1% | | | | |
| | 65,000 | | | Sealed Air Corp., 6.500%, 12/01/2020, 144A | | | 69,875 | |
| | | | | | | | |
| | | | Paper — 0.2% | | | | |
| | 205,000 | | | Weyerhaeuser Co., 6.875%, 12/15/2033 | | | 241,788 | |
| | 5,000 | | | Weyerhaeuser Co., 6.950%, 10/01/2027 | | | 5,768 | |
| | 30,000 | | | Weyerhaeuser Co., 7.375%, 3/15/2032 | | | 36,710 | |
| | | | | | | | |
| | | | | | | 284,266 | |
| | | | | | | | |
| | | | Pharmaceuticals — 0.5% | | | | |
| | 620,000 | | | Valeant Pharmaceuticals International, 6.375%, 10/15/2020, 144A | | | 653,325 | |
| | 15,000 | | | Valeant Pharmaceuticals International, 6.750%, 8/15/2021, 144A | | | 15,900 | |
| | 10,000 | | | Valeant Pharmaceuticals International, 7.250%, 7/15/2022, 144A | | | 10,763 | |
| | | | | | | | |
| | | | | | | 679,988 | |
| | | | | | | | |
| | | | Pipelines — 0.1% | | | | |
| | 70,000 | | | Energy Transfer Partners LP, 5.200%, 2/01/2022 | | | 73,696 | |
| | 100,000 | | | IFM US Colonial Pipeline 2 LLC, 6.450%, 5/01/2021, 144A | | | 105,313 | |
| | | | | | | | |
| | | | | | | 179,009 | |
| | | | | | | | |
| | | | Retailers — 1.5% | | | | |
| | 125,000 | | | Advance Auto Parts, Inc., 4.500%, 12/01/2023 | | | 124,939 | |
| | 215,000 | | | Best Buy Co., Inc., 5.000%, 8/01/2018 | | | 225,213 | |
| | 255,000 | | | CVS Pass Through Trust, 4.704%, 1/10/2036, 144A | | | 254,668 | |
| | 211,250 | | | CVS Pass Through Trust, 7.507%, 1/10/2032, 144A | | | 251,827 | |
| | 400,000 | | | Dillard’s, Inc., 6.625%, 1/15/2018 | | | 443,000 | |
| | 205,000 | | | Dillard’s, Inc., 7.000%, 12/01/2028 | | | 209,100 | |
See accompanying notes to financial statements.
35 |
Portfolio of Investments – as of December 31, 2013
Natixis Diversified Income Fund – (continued)
| | | | | | | | |
Principal
Amount (‡) | | | Description | | Value (†) | |
| | | | Retailers — continued | | | | |
| $ | 100,000 | | | Macy’s Retail Holdings, Inc., 6.790%, 7/15/2027 | | $ | 111,428 | |
| | 225,000 | | | Macy’s Retail Holdings, Inc., 6.900%, 4/01/2029 | | | 255,325 | |
| | 55,000 | | | Toys R Us, Inc., 7.375%, 10/15/2018 | | | 40,700 | |
| | 65,000 | | | William Carter Co. (The), 5.250%, 8/15/2021, 144A | | | 65,975 | |
| | | | | | | | |
| | | | | | | 1,982,175 | |
| | | | | | | | |
| | | | Sovereigns — 0.2% | | | | |
| | 700,000 | | | Republic of Brazil, 8.500%, 1/05/2024, (BRL) | | | 259,616 | |
| | | | | | | | |
| | | | Supermarkets — 0.4% | | | | |
| | 35,000 | | | Delhaize Group S.A., 5.700%, 10/01/2040 | | | 33,184 | |
| | 320,000 | | | New Albertson’s, Inc., Series C, MTN, 6.625%, 6/01/2028 | | | 230,400 | |
| | 260,000 | | | SUPERVALU, Inc., 6.750%, 6/01/2021 | | | 256,750 | |
| | | | | | | | |
| | | | | | | 520,334 | |
| | | | | | | | |
| | | | Supranational — 0.1% | | | | |
| | 400,000 | | | European Bank for Reconstruction & Development, EMTN, 9.000%, 4/28/2014, (BRL) | | | 169,122 | |
| | | | | | | | |
| | | | Technology — 1.4% | | | | |
| | 470,000 | | | Alcatel-Lucent USA, Inc., 6.450%, 3/15/2029 | | | 415,950 | |
| | 390,000 | | | Alcatel-Lucent USA, Inc., 6.500%, 1/15/2028 | | | 341,250 | |
| | 110,000 | | | Arrow Electronics, Inc., 3.000%, 3/01/2018 | | | 110,057 | |
| | 195,000 | | | Flextronics International Ltd., 5.000%, 2/15/2023 | | | 182,812 | |
| | 280,000 | | | Hewlett-Packard Co., 4.650%, 12/09/2021 | | | 288,309 | |
| | 415,000 | | | Jabil Circuit, Inc., 4.700%, 9/15/2022 | | | 398,400 | |
| | | | | | | | |
| | | | | | | 1,736,778 | |
| | | | | | | | |
| | | | Treasuries — 13.1% | | | | |
| | 240,000 | | | Canadian Government, 2.750%, 9/01/2016, (CAD)(d) | | | 234,813 | |
| | 515,000 | | | Canadian Government, 3.000%, 12/01/2015, (CAD) | | | 501,987 | |
| | 15,000 | | | Italy Buoni Poliennali Del Tesoro, 5.250%, 11/01/2029, (EUR) | | | 22,264 | |
| | 160,000 | | | Italy Buoni Poliennali Del Tesoro, 5.500%, 11/01/2022, (EUR) | | | 247,714 | |
| | 140,000(††) | | | Mexican Fixed Rate Bonds, Series M, 6.500%, 6/10/2021, (MXN) | | | 1,100,105 | |
| | 31,500(††) | | | Mexican Fixed Rate Bonds, Series M, 7.750%, 11/13/2042, (MXN) | | | 246,289 | |
| | 7,300(††) | | | Mexican Fixed Rate Bonds, Series M-20, 10.000%, 12/05/2024, (MXN) | | | 71,394 | |
| | 10,000,000 | | | Philippine Government International Bond, 6.250%, 1/14/2036, (PHP) | | | 238,833 | |
| | 205,000 | | | Portugal Obrigacoes do Tesouro OT, 4.950%, 10/25/2023, 144A, (EUR) | | | 259,884 | |
| | 180,000 | | | Spain Government Bond, 4.650%, 7/30/2025, (EUR) | | | 254,168 | |
| | 965,111 | | | U.S. Treasury Inflation Indexed Bond, 0.625%, 2/15/2043(h) | | | 742,079 | |
| | 1,669,880 | | | U.S. Treasury Inflation Indexed Bond, 2.500%, 1/15/2029(d)(h) | | | 1,962,370 | |
| | 4,745,743 | | | U.S. Treasury Inflation Indexed Note, 0.125%, 4/15/2017(h) | | | 4,877,732 | |
| | 171,770 | | | U.S. Treasury Inflation Indexed Note, 0.125%, 4/15/2018(h) | | | 175,192 | |
| | 3,003,003 | | | U.S. Treasury Inflation Indexed Note, 0.125%, 1/15/2022(h) | | | 2,886,168 | |
| | 2,671,212 | | | U.S. Treasury Inflation Indexed Note, 0.125%, 7/15/2022(h) | | | 2,558,730 | |
| | 182,140 | | | U.S. Treasury Inflation Indexed Note, 0.125%, 1/15/2023(h) | | | 172,023 | |
| | 85,309 | | | U.S. Treasury Inflation Indexed Note, 0.375%, 7/15/2023(h) | | | 82,277 | |
| | 1,960,000 | | | Uruguay Government International Bond, 4.375%, 12/15/2028, (UYU) | | | 110,827 | |
| | | | | | | | |
| | | | | | | 16,744,849 | |
| | | | | | | | |
See accompanying notes to financial statements.
| 36
Portfolio of Investments – as of December 31, 2013
Natixis Diversified Income Fund – (continued)
| | | | | | | | |
Principal
Amount (‡) | | | Description | | Value (†) | |
| | | | Wireless — 1.2% | | | | |
| | 4,000,000 | | | America Movil SAB de CV, 8.460%, 12/18/2036, (MXN) | | $ | 288,703 | |
| | 230,000 | | | American Tower Corp., 4.700%, 3/15/2022 | | | 229,896 | |
| | 495,000 | | | Sprint Capital Corp., 6.875%, 11/15/2028 | | | 466,538 | |
| | 20,000 | | | Sprint Capital Corp., 8.750%, 3/15/2032 | | | 21,450 | |
| | 480,000 | | | Sprint Corp., 7.875%, 9/15/2023, 144A | | | 516,000 | |
| | | | | | | | |
| | | | | | | 1,522,587 | |
| | | | | | | | |
| | | | Wirelines — 1.9% | | | | |
| | 10,000 | | | CenturyLink, Inc., 5.625%, 4/01/2020 | | | 10,175 | |
| | 80,000 | | | CenturyLink, Inc., 7.650%, 3/15/2042 | | | 71,400 | |
| | 240,000 | | | CenturyLink, Inc., Series P, 7.600%, 9/15/2039 | | | 213,600 | |
| | 75,000 | | | Embarq Corp., 7.995%, 6/01/2036 | | | 75,933 | |
| | 175,000 | | | Frontier Communications Corp., 7.125%, 3/15/2019 | | | 188,562 | |
| | 35,000 | | | Level 3 Financing, Inc., 6.125%, 1/15/2021, 144A | | | 35,350 | |
| | 75,000 | | | Level 3 Financing, Inc., 7.000%, 6/01/2020 | | | 79,500 | |
| | 70,000 | | | Level 3 Financing, Inc., 8.125%, 7/01/2019 | | | 76,650 | |
| | 85,000 | | | Level 3 Financing, Inc., 8.625%, 7/15/2020 | | | 95,200 | |
| | 400,000 | | | Oi S.A., 9.750%, 9/15/2016, 144A, (BRL) | | | 152,591 | |
| | 15,000 | | | Qwest Capital Funding, Inc., 7.625%, 8/03/2021 | | | 15,750 | |
| | 269,000 | | | Telecom Italia Capital S.A., 6.000%, 9/30/2034 | | | 233,021 | |
| | 402,000 | | | Telecom Italia Capital S.A., 6.375%, 11/15/2033 | | | 363,810 | |
| | 40,000 | | | Telecom Italia Capital S.A., 7.200%, 7/18/2036 | | | 38,500 | |
| | 45,000 | | | Telecom Italia Capital S.A., 7.721%, 6/04/2038 | | | 45,000 | |
| | 75,000 | | | Telefonica Emisiones SAU, 5.134%, 4/27/2020 | | | 79,677 | |
| | 75,000 | | | Telefonica Emisiones SAU, 5.462%, 2/16/2021 | | | 79,136 | |
| | 75,000 | | | Telefonica Emisiones SAU, 7.045%, 6/20/2036 | | | 82,676 | |
| | 100,000 | | | Telefonica Emisiones SAU, EMTN, 5.597%, 3/12/2020, (GBP) | | | 176,665 | |
| | 205,000 | | | Verizon Communications, Inc., 5.150%, 9/15/2023 | | | 220,107 | |
| | 110,000 | | | Verizon Communications, Inc., 6.400%, 9/15/2033 | | | 126,513 | |
| | | | | | | | |
| | | | | | | 2,459,816 | |
| | | | | | | | |
| | | | Total Non-Convertible Bonds
(Identified Cost $54,865,091) | | | 54,080,685 | |
| | | | | | | | |
| | | | | | | | |
| | Convertible Bonds — 3.4% | | | | |
| | | | Automotive — 0.2% | | | | |
| | 115,000 | | | Ford Motor Co., 4.250%, 11/15/2016 | | | 212,175 | |
| | | | | | | | |
| | | | Construction Machinery — 0.2% | | | | |
| | 190,000 | | | Ryland Group, Inc. (The), 1.625%, 5/15/2018 | | | 289,631 | |
| | 20,000 | | | Trinity Industries, Inc., 3.875%, 6/01/2036 | | | 26,338 | |
| | | | | | | | |
| | | | | | | 315,969 | |
| | | | | | | | |
| | | | Healthcare — 0.1% | | | | |
| | 95,000 | | | Hologic, Inc., Series 2010, (accretes to principal after 12/15/2016), 2.000%, 12/15/2037(i) | | | 110,734 | |
| | | | | | | | |
| | | | Home Construction — 0.8% | | | | |
| | 160,000 | | | Lennar Corp., 2.750%, 12/15/2020, 144A | | | 294,500 | |
| | 240,000 | | | Lennar Corp., 3.250%, 11/15/2021, 144A | | | 431,400 | |
See accompanying notes to financial statements.
37 |
Portfolio of Investments – as of December 31, 2013
Natixis Diversified Income Fund – (continued)
| | | | | | | | |
Principal
Amount (‡) | | | Description | | Value (†) | |
| | | | Home Construction — continued | | | | |
| $ | 220,000 | | | Standard Pacific Corp., 1.250%, 8/01/2032 | | $ | 291,225 | |
| | | | | | | | |
| | | | | | | 1,017,125 | |
| | | | | | | | |
| | | | Independent Energy — 0.1% | | | | |
| | 75,000 | | | Chesapeake Energy Corp., 2.500%, 5/15/2037 | | | 76,125 | |
| | | | | | | | |
| | | | Life Insurance — 0.1% | | | | |
| | 100,000 | | | Old Republic International Corp., 3.750%, 3/15/2018 | | | 124,375 | |
| | | | | | | | |
| | | | Metals & Mining — 0.2% | | | | |
| | 135,000 | | | Peabody Energy Corp., 4.750%, 12/15/2066 | | | 106,734 | |
| | 85,000 | | | United States Steel Corp., 2.750%, 4/01/2019 | | | 112,519 | |
| | | | | | | | |
| | | | | | | 219,253 | |
| | | | | | | | |
| | | | Oil Field Services — 0.1% | | | | |
| | 135,000 | | | Hornbeck Offshore Services, Inc., 1.500%, 9/01/2019 | | | 160,059 | |
| | | | | | | | |
| | | | Pharmaceuticals — 0.4% | | | | |
| | 8,000 | | | BioMarin Pharmaceutical, Inc., 0.750%, 10/15/2018 | | | 8,475 | |
| | 12,000 | | | BioMarin Pharmaceutical, Inc., 1.500%, 10/15/2020 | | | 12,833 | |
| | 75,000 | | | Gilead Sciences, Inc., Series D, 1.625%, 5/01/2016 | | | 247,359 | |
| | 65,000 | | | Mylan, Inc., 3.750%, 9/15/2015 | | | 213,119 | |
| | | | | | | | |
| | | | | | | 481,786 | |
| | | | | | | | |
| | | | REITs – Mortgage — 0.1% | | | | |
| | 70,000 | | | iStar Financial, Inc., 3.000%, 11/15/2016 | | | 95,550 | |
| | | | | | | | |
| | | | Retailers — 0.2% | | | | |
| | 246,000 | | | priceline.com, Inc., 0.350%, 6/15/2020, 144A | | | 280,286 | |
| | 20,000 | | | priceline.com, Inc., 1.000%, 3/15/2018 | | | 27,575 | |
| | | | | | | | |
| | | | | | | 307,861 | |
| | | | | | | | |
| | | | Technology — 0.9% | | | | |
| | 65,000 | | | Ciena Corp., 3.750%, 10/15/2018, 144A | | | 93,641 | |
| | 300,000 | | | Intel Corp., 2.950%, 12/15/2035 | | | 336,000 | |
| | 150,000 | | | Micron Technology, Inc., Series C, 2.375%, 5/01/2032 | | | 346,969 | |
| | 35,000 | | | Micron Technology, Inc., Series D, 3.125%, 5/01/2032 | | | 79,691 | |
| | 72,000 | | | Micron Technology, Inc., Series G, 3.000%, 11/15/2043 | | | 70,875 | |
| | 70,000 | | | Novellus Systems, Inc., 2.625%, 5/15/2041 | | | 116,987 | |
| | 80,000 | | | Xilinx, Inc., 2.625%, 6/15/2017 | | | 127,600 | |
| | | | | | | | |
| | | | | | | 1,171,763 | |
| | | | | | | | |
| | | | Textile — 0.0% | | | | |
| | 45,000 | | | Iconix Brand Group, Inc., 2.500%, 6/01/2016 | | | 61,847 | |
| | | | | | | | |
| | | | Total Convertible Bonds
(Identified Cost $3,339,386) | | | 4,354,622 | |
| | | | | | | | |
See accompanying notes to financial statements.
| 38
Portfolio of Investments – as of December 31, 2013
Natixis Diversified Income Fund – (continued)
| | | | | | | | |
Principal
Amount (‡) | | | Description | | Value (†) | |
| | Municipals — 0.0% | | | | |
| | | | Michigan — 0.0% | | | | |
| $ | 45,000 | | | Michigan Tobacco Settlement Finance Authority Taxable Turbo, Series A, 7.309%, 6/01/2034
(Identified Cost $44,998) | | $ | 35,146 | |
| | | | | | | | |
| | | | Total Bonds and Notes
(Identified Cost $58,249,475) | | | 58,470,453 | |
| | | | | | | | |
| | | | | | | | |
| Shares | | | | | | |
| | Preferred Stocks — 1.4% | | | | |
| | Non-Convertible Preferred Stocks — 0.7% | | | | |
| | | | Banking — 0.7% | | | | |
| | 4,375 | | | Ally Financial, Inc., Series A, (fixed rate to 5/15/2016, variable rate thereafter), 8.500% | | | 117,469 | |
| | 288 | | | Ally Financial, Inc., Series G, 7.000%, 144A | | | 275,067 | |
| | 4,125 | | | Countrywide Capital IV, 6.750% | | | 102,671 | |
| | 20,424 | | | SunTrust Banks, Inc., Series E, 5.875% | | | 428,904 | |
| | | | | | | | |
| | | | Total Non-Convertible Preferred Stocks
(Identified Cost $879,854) | | | 924,111 | |
| | | | | | | | |
| | | | | | | | |
| | Convertible Preferred Stocks — 0.7% | | | | |
| | | | Banking — 0.1% | | | | |
| | 70 | | | Wells Fargo & Co., Series L, Class A, 7.500% | | | 77,350 | |
| | | | | | | | |
| | | | Electric — 0.0% | | | | |
| | 276 | | | NextEra Energy, Inc., 5.889% | | | 15,630 | |
| | | | | | | | |
| | | | Independent Energy — 0.0% | | | | |
| | 45 | | | Chesapeake Energy Corp., Series A, 5.750%, 144A | | | 52,144 | |
| | | | | | | | |
| | | | Metals & Mining — 0.1% | | | | |
| | 3,937 | | | Cliffs Natural Resources, Inc., 7.000% | | | 90,393 | |
| | | | | | | | |
| | | | Non-Captive Diversified — 0.0% | | | | |
| | 19 | | | Bank of America Corp., Series L, 7.250% | | | 20,159 | |
| | | | | | | | |
| | | | REITs – Healthcare — 0.1% | | | | |
| | 2,311 | | | Health Care REIT, Inc., Series I, 6.500% | | | 118,462 | |
| | | | | | | | |
| | | | REITs – Mortgage — 0.1% | | | | |
| | 1,780 | | | iStar Financial, Inc., Series J, 4.500% | | | 110,360 | |
| | | | | | | | |
| | | | Utility Other — 0.2% | | | | |
| | 2,409 | | | Dominion Resources, Inc., Series A, 6.125% | | | 130,375 | |
| | 2,890 | | | Dominion Resources, Inc., Series B, 6.000% | | | 156,667 | |
| | | | | | | | |
| | | | | | | 287,042 | |
| | | | | | | | |
| | | | Wireless — 0.1% | | | | |
| | 890 | | | Crown Castle International Corp., Series A, 4.500% | | | 89,334 | |
| | | | | | | | |
| | | | Total Convertible Preferred Stocks
(Identified Cost $820,440) | | | 860,874 | |
| | | | | | | | |
| | | | Total Preferred Stocks
(Identified Cost $1,700,294) | | | 1,784,985 | |
| | | | | | | | |
| | | | | | | | |
See accompanying notes to financial statements.
39 |
Portfolio of Investments – as of December 31, 2013
Natixis Diversified Income Fund – (continued)
| | | | | | | | |
National
Amount | | | Description | | Value (†) | |
| | Purchased Swaptions — 0.8% | | | | |
| | | | Interest Rate Swaptions — 0.8% | | | | |
| $ | 10,500,000 | | | 2-year Interest Rate Swap Put, expiring 3/11/2014, Pay 3-month LIBOR, Receive 0.674%(j) | | $ | 26,481 | |
| | 6,000,000 | | | 2-year Interest Rate Swap Put, expiring 9/19/2014, Pay 3-month LIBOR, Receive 1.080%(k) | | | 37,218 | |
| | 6,950,000 | | | 5-year Interest Rate Swap Put, expiring 3/27/2014, Pay 3-month LIBOR, Receive 1.378%(j) | | | 528 | |
| | 17,500,000 | | | 10-year Interest Rate Swap Call, expiring 6/22/2015, Pay 3.440%, Receive 3-month LIBOR(j) | | | 957,110 | |
| | | | | | | | |
| | | | Total Purchased Swaptions
(Identified Cost $1,007,753) | | | 1,021,337 | |
| | | | | | | | |
| | | | | | | | |
Principal
Amount (‡) | | | | | | |
| | Short-Term Investments — 1.5% | | | | |
| | 1,849,768 | | | Tri-Party Repurchase Agreement with Fixed Income Clearing Corporation, dated 12/31/2013 at 0.000% to be repurchased at $1,849,768 on 1/02/2014 collateralized by $1,750,000 U.S. Treasury Note, 3.250% due 7/31/2016 valued at $1,892,188 including accrued interest (Note 2 of Notes to Financial Statements) | | | 1,849,768 | |
| | 125,000 | | | U.S. Treasury Bill, 0.097%, 7/24/2014(l)(m) | | | 124,946 | |
| | | | | | | | |
| | | | Total Short-Term Investments
(Identified Cost $1,974,700) | | | 1,974,714 | |
| | | | | | | | |
| | | | | | | | |
| | | | Total Investments — 99.9%
(Identified Cost $123,414,565)(a) | | | 128,057,883 | |
| | | | Other assets less liabilities — 0.1% | | | 121,427 | |
| | | | | | | | |
| | | | Net Assets — 100.0% | | $ | 128,179,310 | |
| | | | | | | | |
| | | | | | | | |
Notional
Amount | | | | | | |
| | Written Swaptions — (0.5)% | | | | |
| | | | Interest Rate Swaptions — (0.5)% | | | | |
| $ | 10,500,000 | | | 2-year Interest Rate Swap Put, expiring 3/11/2014, Pay 0.398%, Receive 3-month LIBOR(j) | | $ | (326 | ) |
| | 6,950,000 | | | 5-year Interest Rate Swap Put, expiring 3/27/2014, Pay 0.957%, Receive 3-month LIBOR(j) | | | — | |
| | 17,500,000 | | | 10-year Interest Rate Swap Call, expiring 6/22/2015, Pay 3-month LIBOR, Receive 3.940%(j) | | | (593,477 | ) |
| | | | | | | | |
| | | | Total Written Swaptions
(Premiums Received $588,139) | | $ | (593,803 | ) |
| | | | | | | | |
| | | | | | | | |
| | (‡) | | | Principal Amount stated in U.S. dollars unless otherwise noted. | |
| | (†) | | | See Note 2 of Notes to Financial Statements. | |
| | (††) | | | Amount shown represents units. One unit represents a principal amount of 100. | |
See accompanying notes to financial statements.
| 40
Portfolio of Investments – as of December 31, 2013
Natixis Diversified Income Fund – (continued)
| | | | | | | | |
| | | | | | | | |
| | (a) | | | Federal Tax Information: | |
| | | | At December 31, 2013, the net unrealized appreciation on investments based on a cost of $123,854,048 for federal income tax purposes was as follows: | |
| | | | Aggregate gross unrealized appreciation for all investments in which there is an excess of value over tax cost | | $ | 11,024,014 | |
| | | | Aggregate gross unrealized depreciation for all investments in which there is an excess of tax cost over value | | | (6,820,179 | ) |
| | | | | | | | |
| | | | Net unrealized appreciation | | $ | 4,203,835 | |
| | | | | | | | |
| | | | | | | | |
| | (b) | | | Non-income producing security. | |
| | (c) | | | Variable rate security. Rate as of December 31, 2013 is disclosed. | |
| | (d) | | | All or a portion of this security has been designated to cover the Fund’s obligations under open forward foreign currency contracts, futures contracts or swaptions. | |
| | (e) | | | Payment-in-kind security for which the issuer has the option at each interest payment date of making interest payments in cash or additional debt securities. For the period ended December 31, 2013, the issuer has paid 100% of the interest payments in-kind. | |
| | (f) | | | The issuer is in default with respect to interest and/or principal payments. Income is not being accrued. | |
| | (g) | | | Perpetual bond with no specified maturity date. | |
| | (h) | | | Treasury Inflation Protected Security (TIPS). | |
| | (i) | | | Coupon rate is a fixed rate for an initial period then resets at a specified date and rate. | |
| | (j) | | | Counterparty is Citibank, N.A. | |
| | (k) | | | Counterparty is Credit Suisse International. | |
| | (l) | | | Interest rate represents discount rate at time of purchase; not a coupon rate. | |
| | (m) | | | A portion of this security has been pledged as initial margin for open futures contracts. | |
| | | | | | | | |
| | 144A | | | All or a portion of these securities are exempt from registration under Rule 144A of the Securities Act of 1933. These securities may be resold in transactions exempt from registration, normally to qualified institutional buyers. At December 31, 2013, the value of Rule 144A holdings amounted to $10,592,137 or 8.3% of net assets. | |
| | ADR | | | An American Depositary Receipt is a certificate issued by a custodian bank representing the right to receive securities of the foreign issuer described. The values of ADRs may be significantly influenced by trading on exchanges not located in the United States. | |
| | ABS | | | Asset-Backed Securities | | | | |
| | ARMs | | | Adjustable Rate Mortgages | | | | |
| | EMTN | | | Euro Medium Term Note | | | | |
| | GMTN | | | Global Medium Term Note | | | | |
| | MTN | | | Medium Term Note | | | | |
| | PIK | | | Payment-in-Kind | | | | |
| | REITs | | | Real Estate Investment Trusts | | | | |
| | REMIC | | | Real Estate Mortgage Investment Conduit | | | | |
| | | | | | | | |
| | AUD | | | Australian Dollar | | | | |
| | BRL | | | Brazilian Real | | | | |
| | CAD | | | Canadian Dollar | | | | |
| | COP | | | Colombian Peso | | | | |
| | EUR | | | Euro | | | | |
| | GBP | | | British Pound | | | | |
| | MXN | | | Mexican Peso | | | | |
| | NZD | | | New Zealand Dollar | | | | |
| | PHP | | | Philippine Peso | | | | |
| | UYU | | | Uruguayan Peso | | | | |
See accompanying notes to financial statements.
41 |
Portfolio of Investments – as of December 31, 2013
Natixis Diversified Income Fund – (continued)
At December 31, 2013, the Fund had the following open forward foreign currency contracts:
| | | | | | | | | | | | | | | | | | |
Contract
to
Buy/Sell | | Delivery
Date | | | Currency | | Units
of
Currency | | | Notional
Value | | | Unrealized
Appreciation
(Depreciation) | |
| Sell1 | | | 3/04/2014 | | | British Pound | | | 67,000 | | | $ | 110,902 | | | $ | (2,791 | ) |
| Sell2 | | | 1/31/2014 | | | Euro | | | 838,000 | | | | 1,152,821 | | | | 4,072 | |
| | | | | | | | | | | | | | | | | | |
| Total | | | | | | | | | | | | | | | | $ | 1,281 | |
| | | | | | | | | | | | | | | | | | |
1 Counterparty is Credit Suisse International.
2 Counterparty is Barclays Bank PLC.
At December 31, 2013, open short futures contracts were as follows:
| | | | | | | | | | | | | | | | |
| Financial Futures | | Expiration
Date | | | Contracts | | | Notional
Value | | | Unrealized
Appreciation
(Depreciation) | |
30 Year U.S. Treasury Bond | | | 3/20/2014 | | | | 2 | | | $ | 256,625 | | | $ | 3,871 | |
| | | | | | | | | | | | | | | | |
Industry Summary at December 31, 2013 (Unaudited)
| | | | |
Treasuries | | | 13.1 | % |
Banking | | | 4.1 | |
REITs – Regional Malls | | | 3.8 | |
Electric Utilities | | | 3.8 | |
Multi Utilities | | | 3.8 | |
REITs – Apartments | | | 3.6 | |
REITs – Office Property | | | 3.5 | |
REITs – Healthcare | | | 2.7 | |
REITs – Diversified | | | 2.5 | |
ABS Home Equity | | | 2.4 | |
REITs – Shopping Centers | | | 2.3 | |
Technology | | | 2.2 | |
Aerospace & Defense | | | 2.2 | |
REITs – Storage | | | 2.0 | |
Metals & Mining | | | 2.0 | |
Other Investments, less than 2% each | | | 44.4 | |
Short-Term Investments | | | 1.5 | |
| | | | |
Total Investments | | | 99.9 | |
Other assets less liabilities (including open written swaptions, forward foreign currency contracts and futures contracts) | | | 0.1 | |
| | | | |
Net Assets | | | 100.0 | % |
| | | | |
See accompanying notes to financial statements.
| 42
Portfolio of Investments – as of December 31, 2013
Natixis U.S. Multi-Cap Equity Fund
| | | | | | | | |
| Shares | | | Description | | Value (†) | |
| | Common Stocks — 96.7% of Net Assets | | | | |
| | | | Air Freight & Logistics — 2.2% | | | | |
| | 53,610 | | | Expeditors International of Washington, Inc. | | $ | 2,372,242 | |
| | 34,600 | | | FedEx Corp. | | | 4,974,442 | |
| | 22,384 | | | United Parcel Service, Inc., Class B | | | 2,352,111 | |
| | | | | | | | |
| | | | | | | 9,698,795 | |
| | | | | | | | |
| | | | Auto Components — 2.4% | | | | |
| | 28,200 | | | Autoliv, Inc. | | | 2,588,760 | |
| | 58,700 | | | Delphi Automotive PLC | | | 3,529,631 | |
| | 31,138 | | | Lear Corp. | | | 2,521,244 | |
| | 31,000 | | | TRW Automotive Holdings Corp.(b) | | | 2,306,090 | |
| | | | | | | | |
| | | | | | | 10,945,725 | |
| | | | | | | | |
| | | | Automobiles — 1.3% | | | | |
| | 139,400 | | | General Motors Co.(b) | | | 5,697,278 | |
| | | | | | | | |
| | | | Beverages — 1.3% | | | | |
| | 16,658 | | | Beam, Inc. | | | 1,133,744 | |
| | 31,057 | | | Coca-Cola Co. (The) | | | 1,282,965 | |
| | 1,793 | | | Diageo PLC, Sponsored ADR | | | 237,429 | |
| | 28,582 | | | Monster Beverage Corp.(b) | | | 1,937,002 | |
| | 27,415 | | | SABMiller PLC, Sponsored ADR | | | 1,405,841 | |
| | | | | | | | |
| | | | | | | 5,996,981 | |
| | | | | | | | |
| | | | Biotechnology — 1.9% | | | | |
| | 9,803 | | | Alexion Pharmaceuticals, Inc.(b) | | | 1,304,387 | |
| | 13,672 | | | Amgen, Inc. | | | 1,560,796 | |
| | 22,323 | | | Incyte Corp. Ltd.(b) | | | 1,130,213 | |
| | 15,064 | | | Intercept Pharmaceuticals, Inc.(b) | | | 1,028,570 | |
| | 10,415 | | | Isis Pharmaceuticals, Inc.(b) | | | 414,934 | |
| | 8,003 | | | Pharmacyclics, Inc.(b) | | | 846,557 | |
| | 10,718 | | | Puma Biotechnology, Inc.(b) | | | 1,109,635 | |
| | 3,904 | | | Regeneron Pharmaceuticals, Inc.(b) | | | 1,074,537 | |
| | | | | | | | |
| | | | | | | 8,469,629 | |
| | | | | | | | |
| | | | Building Products — 0.7% | | | | |
| | 28,098 | | | Armstrong World Industries, Inc.(b) | | | 1,618,726 | |
| | 32,545 | | | Fortune Brands Home & Security, Inc. | | | 1,487,306 | |
| | | | | | | | |
| | | | | | | 3,106,032 | |
| | | | | | | | |
| | | | Capital Markets — 4.9% | | | | |
| | 9,119 | | | Affiliated Managers Group, Inc.(b) | | | 1,977,729 | |
| | 13,394 | | | Artisan Partners Asset Management, Inc. | | | 873,155 | |
| | 11,500 | | | BlackRock, Inc. | | | 3,639,405 | |
| | 90,998 | | | Franklin Resources, Inc. | | | 5,253,315 | |
| | 24,500 | | | Goldman Sachs Group, Inc. (The) | | | 4,342,870 | |
| | 16,295 | | | Greenhill & Co., Inc. | | | 944,132 | |
| | 43,234 | | | Raymond James Financial, Inc. | | | 2,256,382 | |
See accompanying notes to financial statements.
43 |
Portfolio of Investments – as of December 31, 2013
Natixis U.S. Multi-Cap Equity Fund – (continued)
| | | | | | | | |
| Shares | | | Description | | Value (†) | |
| | | | Capital Markets — continued | | | | |
| | 55,881 | | | SEI Investments Co. | | $ | 1,940,747 | |
| | 4,169 | | | Virtus Investment Partners, Inc.(b) | | | 834,008 | |
| | | | | | | | |
| | | | | | | 22,061,743 | |
| | | | | | | | |
| | | | Chemicals — 1.9% | | | | |
| | 30,604 | | | Axiall Corp. | | | 1,451,854 | |
| | 25,721 | | | Cytec Industries, Inc. | | | 2,396,168 | |
| | 16,499 | | | Westlake Chemical Corp. | | | 2,014,033 | |
| | 25,658 | | | WR Grace & Co.(b) | | | 2,536,807 | |
| | | | | | | | |
| | | | | | | 8,398,862 | |
| | | | | | | | |
| | | | Commercial Banks — 4.0% | | | | |
| | 186,528 | | | KeyCorp | | | 2,503,206 | |
| | 36,557 | | | Prosperity Bancshares, Inc. | | | 2,317,348 | |
| | 17,143 | | | Signature Bank(b) | | | 1,841,501 | |
| | 28,175 | | | Texas Capital Bancshares, Inc.(b) | | | 1,752,485 | |
| | 63,600 | | | US Bancorp | | | 2,569,440 | |
| | 149,400 | | | Wells Fargo & Co. | | | 6,782,760 | |
| | | | | | | | |
| | | | | | | 17,766,740 | |
| | | | | | | | |
| | | | Commercial Services & Supplies — 0.7% | | | | |
| | 28,237 | | | ADT Corp. (The) | | | 1,142,751 | |
| | 27,917 | | | Rollins, Inc. | | | 845,606 | |
| | 11,610 | | | Stericycle, Inc.(b) | | | 1,348,734 | |
| | | | | | | | |
| | | | | | | 3,337,091 | |
| | | | | | | | |
| | | | Communications Equipment — 1.7% | | | | |
| | 153,206 | | | Cisco Systems, Inc. | | | 3,439,475 | |
| | 23,178 | | | Palo Alto Networks, Inc.(b) | | | 1,332,040 | |
| | 36,574 | | | QUALCOMM, Inc. | | | 2,715,619 | |
| | | | | | | | |
| | | | | | | 7,487,134 | |
| | | | | | | | |
| | | | Computers & Peripherals — 0.3% | | | | |
| | 15,855 | | | 3D Systems Corp.(b) | | | 1,473,405 | |
| | | | | | | | |
| | | | Consumer Finance — 1.2% | | | | |
| | 23,168 | | | American Express Co. | | | 2,102,033 | |
| | 44,600 | | | Capital One Financial Corp. | | | 3,416,806 | |
| | | | | | | | |
| | | | | | | 5,518,839 | |
| | | | | | | | |
| | | | Diversified Consumer Services — 0.3% | | | | |
| | 18,230 | | | Ascent Media Corp., Class A(b) | | | 1,559,759 | |
| | | | | | | | |
| | | | Diversified Financial Services — 3.1% | | | | |
| | 36,557 | | | CBOE Holdings, Inc. | | | 1,899,502 | |
| | 8,676 | | | IntercontinentalExchange Group, Inc. | | | 1,951,406 | |
| | 94,800 | | | JPMorgan Chase & Co. | | | 5,543,904 | |
| | 20,180 | | | MarketAxess Holdings, Inc. | | | 1,349,437 | |
| | 79,457 | | | NASDAQ OMX Group, Inc. (The) | | | 3,162,388 | |
| | | | | | | | |
| | | | | | | 13,906,637 | |
| | | | | | | | |
See accompanying notes to financial statements.
| 44
Portfolio of Investments – as of December 31, 2013
Natixis U.S. Multi-Cap Equity Fund – (continued)
| | | | | | | | |
| Shares | | | Description | | Value (†) | |
| | | | Electric Utilities — 0.3% | | | | |
| | 16,225 | | | ITC Holdings Corp. | | $ | 1,554,679 | |
| | | | | | | | |
| | | | Electrical Equipment — 0.7% | | | | |
| | 62,555 | | | Babcock & Wilcox Co. | | | 2,138,755 | |
| | 9,000 | | | Rockwell Automation, Inc. | | | 1,063,440 | |
| | | | | | | | |
| | | | | | | 3,202,195 | |
| | | | | | | | |
| | | | Electronic Equipment, Instruments & Components — 1.4% | | | | |
| | 26,712 | | | Amphenol Corp., Class A | | | 2,382,176 | |
| | 41,093 | | | Avnet, Inc. | | | 1,812,612 | |
| | 32,301 | | | Belden, Inc. | | | 2,275,606 | |
| | | | | | | | |
| | | | | | | 6,470,394 | |
| | | | | | | | |
| | | | Energy Equipment & Services — 3.0% | | | | |
| | 6,969 | | | Dril-Quip, Inc.(b) | | | 766,102 | |
| | 79,572 | | | Helix Energy Solutions Group, Inc.(b) | | | 1,844,479 | |
| | 50,000 | | | National Oilwell Varco, Inc. | | | 3,976,500 | |
| | 41,945 | | | Oceaneering International, Inc. | | | 3,308,622 | |
| | 16,591 | | | Oil States International, Inc.(b) | | | 1,687,636 | |
| | 22,819 | | | Schlumberger Ltd. | | | 2,056,220 | |
| | | | | | | | |
| | | | | | | 13,639,559 | |
| | | | | | | | |
| | | | Food Products — 2.2% | | | | |
| | 184,427 | | | Danone, Sponsored ADR | | | 2,677,880 | |
| | 66,721 | | | Darling International, Inc.(b) | | | 1,393,134 | |
| | 15,483 | | | Hain Celestial Group, Inc. (The)(b) | | | 1,405,547 | |
| | 13,014 | | | Ingredion, Inc. | | | 890,938 | |
| | 10,943 | | | J.M. Smucker Co. (The) | | | 1,133,914 | |
| | 61,300 | | | Unilever PLC, Sponsored ADR | | | 2,525,560 | |
| | | | | | | | |
| | | | | | | 10,026,973 | |
| | | | | | | | |
| | | | Health Care Equipment & Supplies — 3.4% | | | | |
| | 58,620 | | | CareFusion Corp.(b) | | | 2,334,249 | |
| | 32,774 | | | DexCom, Inc.(b) | | | 1,160,527 | |
| | 63,738 | | | Hologic, Inc.(b) | | | 1,424,544 | |
| | 26,429 | | | Insulet Corp.(b) | | | 980,516 | |
| | 24,600 | | | Medtronic, Inc. | | | 1,411,794 | |
| | 19,280 | | | Sirona Dental Systems, Inc.(b) | | | 1,353,456 | |
| | 20,168 | | | Teleflex, Inc. | | | 1,892,969 | |
| | 24,196 | | | Varian Medical Systems, Inc.(b) | | | 1,879,787 | |
| | 29,086 | | | Zimmer Holdings, Inc. | | | 2,710,524 | |
| | | | | | | | |
| | | | | | | 15,148,366 | |
| | | | | | | | |
| | | | Health Care Providers & Services — 1.3% | | | | |
| | 40,466 | | | MEDNAX, Inc.(b) | | | 2,160,075 | |
| | 22,531 | | | Universal Health Services, Inc., Class B | | | 1,830,869 | |
| | 24,789 | | | WellCare Health Plans, Inc.(b) | | | 1,745,642 | |
| | | | | | | | |
| | | | | | | 5,736,586 | |
| | | | | | | | |
See accompanying notes to financial statements.
45 |
Portfolio of Investments – as of December 31, 2013
Natixis U.S. Multi-Cap Equity Fund – (continued)
| | | | | | | | |
| Shares | | | Description | | Value (†) | |
| | | | Health Care Technology — 0.5% | | | | |
| | 8,625 | | | athenahealth, Inc.(b) | | $ | 1,160,062 | |
| | 14,524 | | | Medidata Solutions, Inc.(b) | | | 879,719 | |
| | | | | | | | |
| | | | | | | 2,039,781 | |
| | | | | | | | |
| | | | Hotels, Restaurants & Leisure — 4.5% | | | | |
| | 3,144 | | | Chipotle Mexican Grill, Inc.(b) | | | 1,675,060 | |
| | 35,430 | | | Dunkin’ Brands Group, Inc. | | | 1,707,726 | |
| | 33,689 | | | Interval Leisure Group, Inc. | | | 1,040,990 | |
| | 87,500 | | | Marriott International, Inc., Class A | | | 4,319,000 | |
| | 22,500 | | | McDonald’s Corp. | | | 2,183,175 | |
| | 75,472 | | | Melco Crown Entertainment Ltd., Sponsored ADR(b) | | | 2,960,012 | |
| | 42,600 | | | Six Flags Entertainment Corp. | | | 1,568,532 | |
| | 24,700 | | | Starwood Hotels & Resorts Worldwide, Inc. | | | 1,962,415 | |
| | 34,527 | | | Wyndham Worldwide Corp. | | | 2,544,295 | |
| | | | | | | | |
| | | | | | | 19,961,205 | |
| | | | | | | | |
| | | | Household Durables — 1.1% | | | | |
| | 18,023 | | | Harman International Industries, Inc. | | | 1,475,183 | |
| | 53,527 | | | Jarden Corp.(b) | | | 3,283,881 | |
| | | | | | | | |
| | | | | | | 4,759,064 | |
| | | | | | | | |
| | | | Household Products — 0.4% | | | | |
| | 21,844 | | | Procter & Gamble Co. (The) | | | 1,778,320 | |
| | | | | | | | |
| | | | Industrial Conglomerates — 0.2% | | | | |
| | 18,595 | | | Raven Industries, Inc. | | | 764,998 | |
| | | | | | | | |
| | | | Insurance — 2.5% | | | | |
| | 105,800 | | | American International Group, Inc. | | | 5,401,090 | |
| | 50,000 | | | Aon PLC | | | 4,194,500 | |
| | 52,529 | | | Brown & Brown, Inc. | | | 1,648,885 | |
| | | | | | | | |
| | | | | | | 11,244,475 | |
| | | | | | | | |
| | | | Internet & Catalog Retail — 2.7% | | | | |
| | 11,449 | | | Amazon.com, Inc.(b) | | | 4,565,747 | |
| | 79,569 | | | Liberty Interactive Corp., Class A(b) | | | 2,335,350 | |
| | 20,154 | | | Liberty Ventures, Series A(b) | | | 2,470,679 | |
| | 7,371 | | | Netflix, Inc.(b) | | | 2,713,781 | |
| | | | | | | | |
| | | | | | | 12,085,557 | |
| | | | | | | | |
| | | | Internet Software & Services — 4.1% | | | | |
| | 37,415 | | | Cornerstone OnDemand, Inc.(b) | | | 1,995,716 | |
| | 60,018 | | | Facebook, Inc., Class A(b) | | | 3,280,584 | |
| | 5,695 | | | Google, Inc., Class A(b) | | | 6,382,443 | |
| | 30,988 | | | IAC/InterActiveCorp | | | 2,128,566 | |
| | 10,904 | | | LinkedIn Corp., Class A(b) | | | 2,364,314 | |
| | 39,149 | | | Pandora Media, Inc.(b) | | | 1,041,363 | |
| | 16,309 | | | Yelp, Inc.(b) | | | 1,124,506 | |
| | | | | | | | |
| | | | | | | 18,317,492 | |
| | | | | | | | |
See accompanying notes to financial statements.
| 46
Portfolio of Investments – as of December 31, 2013
Natixis U.S. Multi-Cap Equity Fund – (continued)
| | | | | | | | |
| Shares | | | Description | | Value (†) | |
| | | | IT Services — 4.3% | | | | |
| | 11,986 | | | Alliance Data Systems Corp.(b) | | $ | 3,151,479 | |
| | 12,309 | | | Automatic Data Processing, Inc. | | | 994,690 | |
| | 4,500 | | | MasterCard, Inc., Class A | | | 3,759,570 | |
| | 35,182 | | | Teradata Corp.(b) | | | 1,600,429 | |
| | 31,607 | | | Visa, Inc., Class A | | | 7,038,247 | |
| | 25,541 | | | WEX, Inc.(b) | | | 2,529,325 | |
| | | | | | | | |
| | | | | | | 19,073,740 | |
| | | | | | | | |
| | | | Life Sciences Tools & Services — 0.6% | | | | |
| | 11,740 | | | Mettler-Toledo International, Inc.(b) | | | 2,848,007 | |
| | | | | | | | |
| | | | Machinery — 4.9% | | | | |
| | 17,989 | | | Actuant Corp., Class A | | | 659,117 | |
| | 23,500 | | | Caterpillar, Inc. | | | 2,134,035 | |
| | 15,000 | | | Cummins, Inc. | | | 2,114,550 | |
| | 17,390 | | | Flowserve Corp. | | | 1,370,854 | |
| | 53,500 | | | Illinois Tool Works, Inc. | | | 4,498,280 | |
| | 59,407 | | | ITT Corp. | | | 2,579,452 | |
| | 16,766 | | | Kadant, Inc. | | | 679,358 | |
| | 5,585 | | | Middleby Corp. (The)(b) | | | 1,340,232 | |
| | 11,207 | | | RBC Bearings, Inc.(b) | | | 792,895 | |
| | 56,658 | | | TriMas Corp.(b) | | | 2,260,088 | |
| | 26,594 | | | Trinity Industries, Inc. | | | 1,449,905 | |
| | 23,686 | | | WABCO Holdings, Inc.(b) | | | 2,212,509 | |
| | | | | | | | |
| | | | | | | 22,091,275 | |
| | | | | | | | |
| | | | Marine — 0.5% | | | | |
| | 22,571 | | | Kirby Corp.(b) | | | 2,240,172 | |
| | | | | | | | |
| | | | Media — 3.7% | | | | |
| | 69,200 | | | Comcast Corp., Special Class A | | | 3,451,696 | |
| | 9,988 | | | Discovery Communications, Inc., Class A(b) | | | 903,115 | |
| | 93,915 | | | Entravision Communications Corp. | | | 571,942 | |
| | 20,500 | | | Liberty Media Corp., Class A(b) | | | 3,002,225 | |
| | 44,494 | | | Lions Gate Entertainment Corp. | | | 1,408,680 | |
| | 57,664 | | | Live Nation Entertainment, Inc.(b) | | | 1,139,441 | |
| | 30,700 | | | Omnicom Group, Inc. | | | 2,283,159 | |
| | 38,115 | | | Sinclair Broadcast Group, Inc., Class A | | | 1,361,849 | |
| | 31,121 | | | Starz, Class A(b) | | | 909,978 | |
| | 18,050 | | | Tribune Co.(b) | | | 1,397,070 | |
| | | | | | | | |
| | | | | | | 16,429,155 | |
| | | | | | | | |
| | | | Metals & Mining — 0.5% | | | | |
| | 27,193 | | | Reliance Steel & Aluminum Co. | | | 2,062,317 | |
| | | | | | | | |
| | | | Multi Utilities — 0.3% | | | | |
| | 44,872 | | | CMS Energy Corp. | | | 1,201,223 | |
| | | | | | | | |
| | | | Multiline Retail — 0.7% | | | | |
| | 23,179 | | | Dollar Tree, Inc.(b) | | | 1,307,759 | |
| | 24,800 | | | Family Dollar Stores, Inc. | | | 1,611,256 | |
| | | | | | | | |
| | | | | | | 2,919,015 | |
| | | | | | | | |
See accompanying notes to financial statements.
47 |
Portfolio of Investments – as of December 31, 2013
Natixis U.S. Multi-Cap Equity Fund – (continued)
| | | | | | | | |
| Shares | | | Description | | Value (†) | |
| | | | Oil, Gas & Consumable Fuels — 2.7% | | | | |
| | 20,129 | | | Antero Resources Corp.(b) | | $ | 1,276,984 | |
| | 33,878 | | | Cheniere Energy, Inc.(b) | | | 1,460,819 | |
| | 16,107 | | | Clayton Williams Energy, Inc.(b) | | | 1,319,969 | |
| | 21,848 | | | Diamondback Energy, Inc.(b) | | | 1,154,885 | |
| | 29,500 | | | ExxonMobil Corp. | | | 2,985,400 | |
| | 34,203 | | | Gulfport Energy Corp.(b) | | | 2,159,920 | |
| | 51,171 | | | QEP Resources, Inc. | | | 1,568,391 | |
| | | | | | | | |
| | | | | | | 11,926,368 | |
| | | | | | | | |
| | | | Pharmaceuticals — 2.3% | | | | |
| | 14,112 | | | Actavis PLC(b) | | | 2,370,816 | |
| | 14,137 | | | Jazz Pharmaceuticals PLC(b) | | | 1,789,179 | |
| | 28,010 | | | Mallinckrodt PLC(b) | | | 1,463,802 | |
| | 20,619 | | | Merck & Co., Inc. | | | 1,031,981 | |
| | 25,574 | | | Novartis AG, ADR | | | 2,055,638 | |
| | 44,396 | | | Prestige Brands Holdings, Inc.(b) | | | 1,589,377 | |
| | | | | | | | |
| | | | | | | 10,300,793 | |
| | | | | | | | |
| | | | REITs – Diversified — 0.3% | | | | |
| | 35,995 | | | Potlatch Corp. | | | 1,502,431 | |
| | | | | | | | |
| | | | REITs – Healthcare — 0.4% | | | | |
| | 75,111 | | | Sabra Healthcare REIT, Inc. | | | 1,963,402 | |
| | | | | | | | |
| | | | REITs – Office Property — 0.3% | | | | |
| | 62,121 | | | BioMed Realty Trust, Inc. | | | 1,125,633 | |
| | | | | | | | |
| | | | REITs – Shopping Centers — 0.2% | | | | |
| | 36,500 | | | Brixmor Property Group, Inc. | | | 742,045 | |
| | | | | | | | |
| | | | REITs – Storage — 0.3% | | | | |
| | 18,646 | | | Sovran Self Storage, Inc. | | | 1,215,160 | |
| | | | | | | | |
| | | | Road & Rail — 2.3% | | | | |
| | 53,069 | | | Avis Budget Group, Inc.(b) | | | 2,145,049 | |
| | 43,081 | | | Celadon Group, Inc. | | | 839,218 | |
| | 11,312 | | | Genesee & Wyoming, Inc., Class A(b) | | | 1,086,518 | |
| | 14,115 | | | J.B. Hunt Transport Services, Inc. | | | 1,091,089 | |
| | 15,523 | | | Kansas City Southern | | | 1,922,213 | |
| | 19,700 | | | Union Pacific Corp. | | | 3,309,600 | |
| | | | | | | | |
| | | | | | | 10,393,687 | |
| | | | | | | | |
| | | | Semiconductors & Semiconductor Equipment — 5.5% | | | | |
| | 4,926 | | | Altera Corp. | | | 160,243 | |
| | 5,891 | | | Analog Devices, Inc. | | | 300,029 | |
| | 253,200 | | | Applied Materials, Inc. | | | 4,479,108 | |
| | 38,408 | | | ARM Holdings PLC, Sponsored ADR | | | 2,102,454 | |
| | 16,821 | | | Hittite Microwave Corp.(b) | | | 1,038,360 | |
| | 201,100 | | | Intel Corp. | | | 5,220,556 | |
| | 93,013 | | | Kulicke & Soffa Industries, Inc.(b) | | | 1,237,073 | |
| | 47,200 | | | Lam Research Corp.(b) | | | 2,570,040 | |
| | 80,458 | | | LSI Corp. | | | 886,647 | |
| | 33,860 | | | Microchip Technology, Inc. | | | 1,515,235 | |
See accompanying notes to financial statements.
| 48
Portfolio of Investments – as of December 31, 2013
Natixis U.S. Multi-Cap Equity Fund – (continued)
| | | | | | | | |
Shares | | | Description | | Value (†) | |
| | | | Semiconductors & Semiconductor Equipment — continued | | | | |
| | 70,853 | | | NXP Semiconductors NV(b) | | $ | 3,254,278 | |
| | 15,700 | | | Texas Instruments, Inc. | | | 689,387 | |
| | 28,029 | | | Xilinx, Inc. | | | 1,287,092 | |
| | | | | | | | |
| | | | | | | 24,740,502 | |
| | | | | | | | |
| | | | Software — 5.2% | | | | |
| | 38,279 | | | Autodesk, Inc.(b) | | | 1,926,582 | |
| | 12,172 | | | FactSet Research Systems, Inc. | | | 1,321,636 | |
| | 21,772 | | | FireEye, Inc.(b) | | | 949,477 | |
| | 35,692 | | | Informatica Corp.(b) | | | 1,481,218 | |
| | 24,242 | | | MICROS Systems, Inc.(b) | | | 1,390,764 | |
| | 39,912 | | | Microsoft Corp. | | | 1,493,906 | |
| | 13,336 | | | NetSuite, Inc.(b) | | | 1,373,875 | |
| | 211,509 | | | Oracle Corp. | | | 8,092,334 | |
| | 25,714 | | | ServiceNow, Inc.(b) | | | 1,440,241 | |
| | 31,721 | | | Splunk, Inc.(b) | | | 2,178,281 | |
| | 40,472 | | | Synopsys, Inc.(b) | | | 1,641,949 | |
| | | | | | | | |
| | | | | | | 23,290,263 | |
| | | | | | | | |
| | | | Specialty Retail — 2.9% | | | | |
| | 23,800 | | | Advance Auto Parts, Inc. | | | 2,634,184 | |
| | 24,600 | | | CarMax, Inc.(b) | | | 1,156,692 | |
| | 9,795 | | | Conn’s, Inc.(b) | | | 771,748 | |
| | 49,778 | | | Lowe’s Cos., Inc. | | | 2,466,500 | |
| | 67,252 | | | Sally Beauty Holdings, Inc.(b) | | | 2,033,028 | |
| | 23,300 | | | Tiffany & Co. | | | 2,161,774 | |
| | 23,478 | | | Tractor Supply Co. | | | 1,821,423 | |
| | | | | | | | |
| | | | | | | 13,045,349 | |
| | | | | | | | |
| | | | Textiles, Apparel & Luxury Goods — 0.8% | | | | |
| | 26,356 | | | Michael Kors Holdings Ltd.(b) | | | 2,139,844 | |
| | 19,400 | | | NIKE, Inc., Class B | | | 1,525,616 | |
| | | | | | | | |
| | | | | | | 3,665,460 | |
| | | | | | | | |
| | | | Trading Companies & Distributors — 0.7% | | | | |
| | 23,068 | | | United Rentals, Inc.(b) | | | 1,798,150 | |
| | 14,066 | | | WESCO International, Inc.(b) | | | 1,280,991 | |
| | | | | | | | |
| | | | | | | 3,079,141 | |
| | | | | | | | |
| | | | Transportation Infrastructure — 0.4% | | | | |
| | 31,213 | | | Macquarie Infrastructure Co. LLC | | | 1,698,924 | |
| | | | | | | | |
| | | | Water Utilities — 0.7% | | | | |
| | 75,869 | | | American Water Works Co., Inc. | | | 3,206,224 | |
| | | | | | | | |
| | | | Total Common Stocks
(Identified Cost $283,593,444) | | | 432,914,580 | |
| | | | | | | | |
| | | | | | | | |
| | Closed-End Investment Companies — 0.5% | | | | |
| | 106,323 | | | Ares Capital Corp.
(Identified Cost $1,497,686) | | | 1,889,360 | |
| | | | | | | | |
See accompanying notes to financial statements.
49 |
Portfolio of Investments – as of December 31, 2013
Natixis U.S. Multi-Cap Equity Fund – (continued)
| | | | | | | | |
Principal
Amount | | | Description | | Value (†) | |
| | Short-Term Investments — 3.0% | | | | |
| $ | 13,506,279 | | | Tri-Party Repurchase Agreement with Fixed Income Clearing Corporation, dated 12/31/2013 at 0.000% to be repurchased at $13,506,279 on 1/02/2014 collateralized by $7,660,000 U.S. Treasury Note, 0.625% due 5/31/2017 valued at $7,564,602; $5,755,000 U.S. Treasury Note, 3.250% due 7/31/2016 valued at $6,222,594 including accrued interest (Note 2 of Notes to Financial Statements)
(Identified Cost $13,506,279) | | $ | 13,506,279 | |
| | | | | | | | |
| | | | | | | | |
| | | | Total Investments — 100.2%
(Identified Cost $298,597,409)(a) | | | 448,310,219 | |
| | | | Other assets less liabilities — (0.2)% | | | (689,125 | ) |
| | | | | | | | |
| | | | Net Assets — 100.0% | | $ | 447,621,094 | |
| | | | | | | | |
| | | | | | | | |
| | (†) | | | See Note 2 of Notes to Financial Statements. | | | | |
| | (a) | | | Federal Tax Information: | |
| | | | At December 31, 2013, the net unrealized appreciation on investments based on a cost of $299,249,838 for federal income tax purposes was as follows: | |
| | | | Aggregate gross unrealized appreciation for all investments in which there is an excess of value over tax cost | | $ | 149,496,828 | |
| | | | Aggregate gross unrealized depreciation for all investments in which there is an excess of tax cost over value | | | (436,447 | ) |
| | | | | | | | |
| | | | Net unrealized appreciation | | $ | 149,060,381 | |
| | | | | | | | |
| | | | | | | | |
| | (b) | | | Non-income producing security. | |
| | | | | | | | |
| | ADR | | | An American Depositary Receipt is a certificate issued by a custodian bank representing the right to receive securities of the foreign issuer described. The values of ADRs may be significantly influenced by trading on exchanges not located in the United States. | |
| | REITs | | | Real Estate Investment Trusts | |
See accompanying notes to financial statements.
| 50
Portfolio of Investments – as of December 31, 2013
Natixis U.S. Multi-Cap Equity Fund – (continued)
Industry Summary at December 31, 2013 (Unaudited)
| | | | |
Semiconductors & Semiconductor Equipment | | | 5.5 | % |
Software | | | 5.2 | |
Machinery | | | 4.9 | |
Capital Markets | | | 4.9 | |
Hotels, Restaurants & Leisure | | | 4.5 | |
IT Services | | | 4.3 | |
Internet Software & Services | | | 4.1 | |
Commercial Banks | | | 4.0 | |
Media | | | 3.7 | |
Health Care Equipment & Supplies | | | 3.4 | |
Diversified Financial Services | | | 3.1 | |
Energy Equipment & Services | | | 3.0 | �� |
Specialty Retail | | | 2.9 | |
Internet & Catalog Retail | | | 2.7 | |
Oil, Gas & Consumable Fuels | | | 2.7 | |
Insurance | | | 2.5 | |
Auto Components | | | 2.4 | |
Road & Rail | | | 2.3 | |
Pharmaceuticals | | | 2.3 | |
Food Products | | | 2.2 | |
Air Freight & Logistics | | | 2.2 | |
Other Investments, less than 2% each | | | 24.4 | |
Short-Term Investments | | | 3.0 | |
| | | | |
Total Investments | | | 100.2 | |
Other assets less liabilities | | | (0.2 | ) |
| | | | |
Net Assets | | | 100.0 | % |
| | | | |
See accompanying notes to financial statements.
51 |
Statements of Assets and Liabilities
December 31, 2013
| | | | | | | | | | | | |
| | | McDonnell
Intermediate
Municipal Bond
Fund | | | Natixis
Diversified
Income
Fund | | | Natixis U.S.
Multi-Cap
Equity
Fund | |
ASSETS | | | | | | | | | | | | |
Investments at cost | | $ | 20,855,117 | | | $ | 121,564,797 | | | $ | 285,091,130 | |
Repurchase agreement(s) at cost | | | 2,681,354 | | | | 1,849,768 | | | | 13,506,279 | |
Net unrealized appreciation (depreciation) | | | (504,948 | ) | | | 4,643,318 | | | | 149,712,810 | |
| | | | | | | | | | | | |
Investments at value | | | 23,031,523 | | | | 128,057,883 | | | | 448,310,219 | |
Cash | | | — | | | | 48,012 | | | | 45,738 | |
Foreign currency at value (identified cost $0, $16,271 and $0) | | | — | | | | 16,202 | | | | — | |
Receivable for Fund shares sold | | | 199,994 | | | | 133,489 | | | | 271,313 | |
Receivable from investment adviser (Note 6) | | | 17,350 | | | | — | | | | — | |
Receivable for securities sold | | | — | | | | 222,574 | | | | 167,832 | |
Collateral received for open interest rate swaptions (Notes 2 and 4) | | | — | | | | 260,000 | | | | — | |
Dividends and interest receivable | | | 254,173 | | | | 805,952 | | | | 237,037 | |
Unrealized appreciation on forward foreign currency contracts (Note 2) | | | — | | | | 4,072 | | | | — | |
Tax reclaims receivable | | | — | | | | 314 | | | | — | |
Receivable for variation margin on futures contracts (Note 2) | | | — | | | | 938 | | | | — | |
| | | | | | | | | | | | |
TOTAL ASSETS | | | 23,503,040 | | | | 129,549,436 | | | | 449,032,139 | |
| | | | | | | | | | | | |
LIABILITIES | | | | | | | | | | | | |
Swaptions written, at value (premiums received $0, $588,139 and $0) (Note 2) | | | — | | | | 593,803 | | | | — | |
Payable for securities purchased | | | 641,084 | | | | 24,869 | | | | 93,950 | |
Payable for Fund shares redeemed | | | 52 | | | | 266,472 | | | | 313,008 | |
Unrealized depreciation on forward foreign currency contracts (Note 2) | | | — | | | | 2,791 | | | | — | |
Due to broker (Note 2) | | | — | | | | 260,000 | | | | — | |
Distributions payable | | | 408 | | | | — | | | | — | |
Management fees payable (Note 6) | | | — | | | | 59,155 | | | | 266,521 | |
Deferred Trustees’ fees (Note 6) | | | 8,723 | | | | 87,994 | | | | 533,755 | |
Administrative fees payable (Note 6) | | | 806 | | | | 4,789 | | | | 16,203 | |
Payable to distributor (Note 6d) | | | 3 | | | | 1,051 | | | | 1,882 | |
Other accounts payable and accrued expenses | | | 46,438 | | | | 69,202 | | | | 185,726 | |
| | | | | | | | | | | | |
TOTAL LIABILITIES | | | 697,514 | | | | 1,370,126 | | | | 1,411,045 | |
| | | | | | | | | | | | |
NET ASSETS | | $ | 22,805,526 | | | $ | 128,179,310 | | | $ | 447,621,094 | |
| | | | | | | | | | | | |
NET ASSETS CONSIST OF: | | | | | | | | | | | | |
Paid-in capital | | $ | 23,659,126 | | | $ | 134,172,757 | | | $ | 292,408,289 | |
Distributions in excess of net investment income | | | (326 | ) | | | (165,741 | ) | | | (533,755 | ) |
Accumulated net realized gain (loss) on investments, futures contracts, swaptions written, swap agreements and foreign currency transactions | | | (348,326 | ) | | | (10,468,946 | ) | | | 6,033,750 | |
Net unrealized appreciation (depreciation) on investments, futures contracts, swaptions written and foreign currency translations | | | (504,948 | ) | | | 4,641,240 | | | | 149,712,810 | |
| | | | | | | | | | | | |
NET ASSETS | | $ | 22,805,526 | | | $ | 128,179,310 | | | $ | 447,621,094 | |
| | | | | | | | | | | | |
See accompanying notes to financial statements.
| 52
Statements of Assets and Liabilities (continued)
December 31, 2013
| | | | | | | | | | | | |
| | | McDonnell
Intermediate
Municipal Bond
Fund | | | Natixis
Diversified
Income
Fund | | | Natixis U.S.
Multi-Cap
Equity
Fund | |
COMPUTATION OF NET ASSET VALUE AND OFFERING PRICE: | | | | | | | | | | | | |
Class A shares: | | | | | | | | | | | | |
Net assets | | $ | 1,046,988 | | | $ | 79,038,962 | | | $ | 371,101,597 | |
| | | | | | | | | | | | |
Shares of beneficial interest | | | 109,710 | | | | 6,475,015 | | | | 11,223,091 | |
| | | | | | | | | | | | |
Net asset value and redemption price per share | | $ | 9.54 | | | $ | 12.21 | | | $ | 33.07 | |
| | | | | | | | | | | | |
Offering price per share (100/[100-maximum sales charge] of net asset value) (Note 1) | | $ | 9.89 | | | $ | 12.79 | | | $ | 35.09 | |
| | | | | | | | | | | | |
Class B shares: (redemption price per share is equal to net asset value less any applicable contingent deferred sales charge) (Note 1) | | | | | | | | | | | | |
Net assets | | $ | — | | | $ | — | | | $ | 7,707,956 | |
| | | | | | | | | | | | |
Shares of beneficial interest | | | — | | | | — | | | | 286,423 | |
| | | | | | | | | | | | |
Net asset value and offering price per share | | $ | — | | | $ | — | | | $ | 26.91 | |
| | | | | | | | | | | | |
Class C shares: (redemption price per share is equal to net asset value less any applicable contingent deferred sales charge) (Note 1) | | | | | | | | | | | | |
Net assets | | $ | 55,038 | | | $ | 48,511,894 | | | $ | 44,150,444 | |
| | | | | | | | | | | | |
Shares of beneficial interest | | | 5,772 | | | | 3,985,803 | | | | 1,640,094 | |
| | | | | | | | | | | | |
Net asset value and offering price per share | | $ | 9.54 | | | $ | 12.17 | | | $ | 26.92 | |
| | | | | | | | | | | | |
Class Y shares: | | | | | | | | | | | | |
Net assets | | $ | 21,703,500 | | | $ | 628,454 | | | $ | 24,661,097 | |
| | | | | | | | | | | | |
Shares of beneficial interest | | | 2,274,594 | | | | 51,545 | | | | 679,052 | |
| | | | | | | | | | | | |
Net asset value, offering and redemption price per share | | $ | 9.54 | | | $ | 12.19 | | | $ | 36.32 | |
| | | | | | | | | | | | |
See accompanying notes to financial statements.
53 |
Statements of Operations
For the Year Ended December 31, 2013
| | | | | | | | | | | | |
| | | McDonnell
Intermediate
Municipal
Bond Fund | | | Natixis
Diversified
Income
Fund | | | Natixis U.S.
Multi-Cap
Equity Fund | |
INVESTMENT INCOME | | | | | | | | | | | | |
Dividends | | $ | — | | | $ | 2,236,615 | | | $ | 4,696,408 | |
Interest | | | 328,976 | | | | 2,514,144 | | | | 391 | |
Less net foreign taxes withheld | | | — | | | | (1,392 | ) | | | (21,657 | ) |
| | | | | | | | | | | | |
| | | 328,976 | | | | 4,749,367 | | | | 4,675,142 | |
| | | | | | | | | | | | |
Expenses | | | | | | | | | | | | |
Management fees (Note 6) | | | 78,518 | | | | 761,527 | | | | 3,162,705 | |
Service and distribution fees (Note 6) | | | 1,204 | | | | 744,634 | | | | 1,286,352 | |
Administrative fees (Note 6) | | | 8,665 | | | | 61,123 | | | | 174,513 | |
Trustees’ fees and expenses (Note 6) | | | 18,059 | | | | 32,859 | | | | 108,418 | |
Transfer agent fees and expenses (Note 6) | | | 718 | | | | 99,417 | | | | 552,211 | |
Audit and tax services fees | | | 43,492 | | | | 49,195 | | | | 58,746 | |
Custodian fees and expenses | | | 12,516 | | | | 49,931 | | | | 33,487 | |
Legal fees | | | 248 | | | | 1,864 | | | | 5,007 | |
Registration fees | | | 32,616 | | | | 59,482 | | | | 69,002 | |
Shareholder reporting expenses | | | 1,158 | | | | 33,263 | | | | 41,423 | |
Miscellaneous expenses | | | 8,608 | | | | 16,008 | | | | 16,957 | |
| | | | | | | | | | | | |
Total expenses | | | 205,802 | | | | 1,909,303 | | | | 5,508,821 | |
Less waiver and/or expense reimbursement (Note 6) | | | (96,635 | ) | | | (2,263 | ) | | | (71,229 | ) |
| | | | | | | | | | | | |
Net expenses | | | 109,167 | | | | 1,907,040 | | | | 5,437,592 | |
| | | | | | | | | | | | |
Net investment income (loss) | | | 219,809 | | | | 2,842,327 | | | | (762,450 | ) |
| | | | | | | | | | | | |
NET REALIZED AND UNREALIZED GAIN (LOSS) ON INVESTMENTS, FUTURES CONTRACTS, SWAPTIONS WRITTEN, SWAP AGREEMENTS AND FOREIGN CURRENCY TRANSACTIONS | | | | | | | | | | | | |
Net realized gain (loss) on: | | | | | | | | | | | | |
Investments | | | (348,326 | ) | | | 7,138,276 | | | | 37,957,408 | |
Futures contracts | | | — | | | | 2,463 | | | | — | |
Swaptions written | | | — | | | | (213,115 | ) | | | — | |
Swap agreements | | | — | | | | (5,600 | ) | | | — | |
Foreign currency transactions | | | — | | | | (105,061 | ) | | | — | |
Net change in unrealized appreciation (depreciation) on: | | | | | | | | | | | | |
Investments | | | (347,464 | ) | | | (2,947,754 | ) | | | 82,618,997 | |
Futures contracts | | | — | | | | 3,871 | | | | — | |
Swaptions written | | | — | | | | (7,069 | ) | | | — | |
Foreign currency translations | | | — | | | | 28,602 | | | | — | |
| | | | | | | | | | | | |
Net realized and unrealized gain (loss) on investments, futures contracts, swaptions written, swap agreements and foreign currency transactions | | | (695,790 | ) | | | 3,894,613 | | | | 120,576,405 | |
| | | | | | | | | | | | |
NET INCREASE (DECREASE) IN NET ASSETS RESULTING FROM OPERATIONS | | $ | (475,981 | ) | | $ | 6,736,940 | | | $ | 119,813,955 | |
| | | | | | | | | | | | |
See accompanying notes to financial statements.
| 54
Statements of Changes in Net Assets
| | | | | | | | |
| | | McDonnell Intermediate
Municipal Bond Fund | |
| | | Year Ended
December 31,
2013 | | | Period Ended
December 31,
2012(a) | |
FROM OPERATIONS: | | | | | | | | |
Net investment income (loss) | | $ | 219,809 | | | $ | (15,423 | ) |
Net realized gain (loss) on investments | | | (348,326 | ) | | | — | |
Net change in unrealized appreciation (depreciation) on investments | | | (347,464 | ) | | | (157,484 | ) |
| | | | | | | | |
Net decrease in net assets resulting from operations | | | (475,981 | ) | | | (172,907 | ) |
| | | | | | | | |
FROM DISTRIBUTIONS TO SHAREHOLDERS: | | | | | | | | |
Net investment income | | | | | | | | |
Class A | | | (3,763 | ) | | | — | |
Class C | | | (41 | ) | | | — | |
Class Y | | | (222,054 | ) | | | — | |
| | | | | | | | |
Total distributions | | | (225,858 | ) | | | — | |
| | | | | | | | |
NET INCREASE IN NET ASSETS FROM CAPITAL SHARE TRANSACTIONS
(NOTE 10) | | | 8,678,272 | | | | 15,002,000 | |
| | | | | | | | |
Net increase in net assets | | | 7,976,433 | | | | 14,829,093 | |
NET ASSETS | | | | | | | | |
Beginning of the year | | | 14,829,093 | | | | — | |
| | | | | | | | |
End of the year | | $ | 22,805,526 | | | $ | 14,829,093 | |
| | | | | | | | |
DISTRIBUTIONS IN EXCESS OF NET INVESTMENT INCOME | | $ | (326 | ) | | $ | — | |
| | | | | | | | |
| (a) | From commencement of operations on November 16, 2012 through December 31, 2012. |
See accompanying notes to financial statements.
55 |
Statements of Changes in Net Assets (continued)
| | | | | | | | |
| | | Natixis Diversified Income
Fund | |
| | | Year Ended
December 31,
2013 | | | Year Ended
December 31,
2012 | |
FROM OPERATIONS: | | | | | | | | |
Net investment income | | $ | 2,842,327 | | | $ | 2,365,007 | |
Net realized gain on investments, futures contracts, swaptions written, swap agreements and foreign currency transactions | | | 6,816,963 | | | | 3,192,967 | |
Net change in unrealized appreciation (depreciation) on investments, futures contracts, swaptions written and foreign currency translations | | | (2,922,350 | ) | | | 6,339,253 | |
| | | | | | | | |
Net increase in net assets resulting from operations | | | 6,736,940 | | | | 11,897,227 | |
| | | | | | | | |
FROM DISTRIBUTIONS TO SHAREHOLDERS: | | | | | | | | |
Net investment income | | | | | | | | |
Class A | | | (2,123,101 | ) | | | (1,812,951 | ) |
Class C | | | (943,848 | ) | | | (841,232 | ) |
Class Y | | | (21,931 | ) | | | (4 | ) |
| | | | | | | | |
Total distributions | | | (3,088,880 | ) | | | (2,654,187 | ) |
| | | | | | | | |
NET INCREASE (DECREASE) IN NET ASSETS FROM CAPITAL SHARE TRANSACTIONS (NOTE 10) | | | (3,382,992 | ) | | | 43,646,015 | |
| | | | | | | | |
Net increase in net assets | | | 265,068 | | | | 52,889,055 | |
NET ASSETS | | | | | | | | |
Beginning of the year | | | 127,914,242 | | | | 75,025,187 | |
| | | | | | | | |
End of the year | | $ | 128,179,310 | | | $ | 127,914,242 | |
| | | | | | | | |
DISTRIBUTIONS IN EXCESS OF NET INVESTMENT INCOME | | $ | (165,741 | ) | | $ | (111,602 | ) |
| | | | | | | | |
See accompanying notes to financial statements.
| 56
Statements of Changes in Net Assets (continued)
| | | | | | | | |
| | | Natixis U.S. Multi-Cap Equity
Fund | |
| | | Year Ended
December 31,
2013 | | | Year Ended
December 31,
2012 | |
FROM OPERATIONS: | | | | | | | | |
Net investment income (loss) | | $ | (762,450 | ) | | $ | 573,658 | |
Net realized gain on investments | | | 37,957,408 | | | | 21,303,004 | |
Net change in unrealized appreciation (depreciation) on investments | | | 82,618,997 | | | | 33,931,856 | |
| | | | | | | | |
Net increase in net assets resulting from operations | | | 119,813,955 | | | | 55,808,518 | |
| | | | | | | | |
FROM DISTRIBUTIONS TO SHAREHOLDERS: | | | | | | | | |
Net investment income | | | | | | | | |
Class A | | | — | | | | (729,498 | ) |
Class Y | | | — | | | | (50,735 | ) |
Net realized capital gains | | | | | | | | |
Class A | | | (27,351,336 | ) | | | (14,045,378 | ) |
Class B | | | (739,952 | ) | | | (644,004 | ) |
Class C | | | (3,885,125 | ) | | | (1,754,423 | ) |
Class Y | | | (1,541,929 | ) | | | (486,679 | ) |
| | | | | | | | |
Total distributions | | | (33,518,342 | ) | | | (17,710,717 | ) |
| | | | | | | | |
NET INCREASE (DECREASE) IN NET ASSETS FROM CAPITAL SHARE TRANSACTIONS (NOTE 10) | | | 18,695,182 | | | | (24,263,141 | ) |
| | | | | | | | |
Net increase in net assets | | | 104,990,795 | | | | 13,834,660 | |
NET ASSETS | | | | | | | | |
Beginning of the year | | | 342,630,299 | | | | 328,795,639 | |
| | | | | | | | |
End of the year | | $ | 447,621,094 | | | $ | 342,630,299 | |
| | | | | | | | |
DISTRIBUTIONS IN EXCESS OF NET INVESTMENT INCOME | | $ | (533,755 | ) | | $ | (450,777 | ) |
| | | | | | | | |
See accompanying notes to financial statements.
57 |
This Page Intentionally Left Blank
| 58
Financial Highlights
For a share outstanding throughout each period.
| | | | | | | | | | | | | | | | | | | | | | | | | | | | |
| | | | | | Income (Loss) from Investment
Operations: | | | Less Distributions: | |
| | | | | | | |
| | | Net asset
value,
beginning
of the
period | | | Net
investment
income
(loss)(a) | | | Net realized
and
unrealized
gain (loss) | | | Total from
investment
operations | | | Dividends
from net
investment
income | | | Distributions
from net
realized
capital
gains | | | Total
distributions | |
| MCDONNELL INTERMEDIATE MUNICIPAL BOND FUND | | | | | | | | | | | | | |
Class A | | | | | | | | | | | | | | | | | | | | | | | | | | | | |
12/31/2013 | | $ | 9.89 | | | $ | 0.09 | | | $ | (0.35 | ) | | $ | (0.26 | ) | | $ | (0.09 | ) | | $ | — | | | $ | (0.09 | ) |
12/31/2012(f) | | | 10.00 | | | | (0.01 | ) | | | (0.10 | ) | | | (0.11 | ) | | | — | | | | — | | | | — | |
Class C | | | | | | | | | | | | | | | | | | | | | | | | | | | | |
12/31/2013 | | | 9.89 | | | | 0.01 | | | | (0.34 | ) | | | (0.33 | ) | | | (0.02 | ) | | | — | | | | (0.02 | ) |
12/31/2012(f) | | | 10.00 | | | | (0.01 | ) | | | (0.10 | ) | | | (0.11 | ) | | | — | | | | — | | | | — | |
Class Y | | | | | | | | | | | | | | | | | | | | | | | | | | | | |
12/31/2013 | | | 9.88 | | | | 0.11 | | | | (0.34 | ) | | | (0.23 | ) | | | (0.11 | ) | | | — | | | | (0.11 | ) |
12/31/2012(f) | | | 10.00 | | | | (0.01 | ) | | | (0.11 | ) | | | (0.12 | ) | | | — | | | | — | | | | — | |
| (a) | Per share net investment income (loss) has been calculated using the average shares outstanding during the period. |
| (b) | A sales charge for Class A shares and a contingent deferred sales charge for Class C shares are not reflected in total return calculations. Periods less than one year, if applicable, are not annualized. |
| (c) | Had certain expenses not been waived/reimbursed during the period, if applicable, total returns would have been lower. |
| (d) | The investment adviser agreed to waive its fees and/or reimburse a portion of the Fund’s expenses during the period, if applicable. Without this waiver/reimbursement, expenses would have been higher. |
| (e) | Computed on an annualized basis for periods less than one year, if applicable. |
| (f) | From commencement of operations on November 16, 2012 through December 31, 2012. |
| (g) | Prior to December 31, 2012, there was no expense limitation agreement in place for the Fund. |
See accompanying notes to financial statements.
59 |
| | | | | | | | | | | | | | | | | | | | | | | | | | |
| | | | | | | | | | Ratios to Average Net Assets: | | | | |
| | | | | | |
Net asset
value,
end of
the period | | | Total
return
(%)(b)(c) | | | Net assets,
end of
the period
(000’s) | | | Net
expenses
(%)(d)(e) | | | Gross
expenses
(%)(e) | | | Net investment
income
(loss) (%)(e) | | | Portfolio
turnover
rate(%) | |
| | | | | | | | | | | | | | | | | | | | | | | | | | |
| | | | | | | | | | | | | | | | | | | | | | | | | | |
| $ | 9.54 | | | | (2.66 | ) | | $ | 1,047 | | | | 0.80 | | | | 1.37 | | | | 0.90 | | | | 37 | |
| | 9.89 | | | | (1.10 | ) | | | 1 | | | | 2.19 | (g) | | | 2.23 | | | | (0.71 | ) | | | 0 | |
| | | | | | | | | | | | | | | | | | | | | | | | | | |
| | 9.54 | | | | (3.35 | ) | | | 55 | | | | 1.55 | | | | 2.08 | | | | 0.14 | | | | 37 | |
| | 9.89 | | | | (1.10 | ) | | | 1 | | | | 2.20 | (g) | | | 2.24 | | | | (0.73 | ) | | | 0 | |
| | | | | | | | | | | | | | | | | | | | | | | | | | |
| | 9.54 | | | | (2.31 | ) | | | 21,704 | | | | 0.55 | | | | 1.04 | | | | 1.13 | | | | 37 | |
| | 9.88 | | | | (1.20 | ) | | | 14,827 | | | | 2.33 | (g) | | | 2.37 | | | | (0.84 | ) | | | 0 | |
See accompanying notes to financial statements.
| 60
Financial Highlights (continued)
For a share outstanding throughout each period.
| | | | | | | | | | | | | | | | | | | | | | | | | | | | |
| | | | | | Income (Loss) from Investment
Operations: | | | Less Distributions: | |
| | | Net asset
value,
beginning
of the
period | | | Net
investment
income
(loss) (a) | | | Net realized
and
unrealized
gain (loss) | | | Total from
investment
operations | | | Dividends
from net
investment
income | | | Distributions
from net
realized
capital
gains | | | Total
distributions | |
| NATIXIS DIVERSIFIED INCOME FUND | | | | | | | | | | | | | | | | |
Class A | | | | | | | | | | | | | | | | | | | | | | | | | | | | |
12/31/2013 | | $ | 11.83 | | | $ | 0.29 | | | $ | 0.40 | | | $ | 0.69 | | | $ | (0.31 | ) | | $ | — | | | $ | (0.31 | ) |
12/31/2012 | | | 10.74 | | | | 0.29 | | | | 1.12 | | | | 1.41 | | | | (0.32 | ) | | | — | | | | (0.32 | ) |
12/31/2011 | | | 10.41 | | | | 0.34 | | | | 0.40 | | | | 0.74 | | | | (0.41 | ) | | | — | | | | (0.41 | ) |
12/31/2010 | | | 9.22 | | | | 0.34 | | | | 1.18 | | | | 1.52 | | | | (0.33 | ) | | | — | | | | (0.33 | ) |
12/31/2009 | | | 7.18 | | | | 0.36 | | | | 1.97 | | | | 2.33 | | | | (0.29 | ) | | | — | | | | (0.29 | ) |
Class C | | | | | | | | | | | | | | | | | | | | | | | | | | | | |
12/31/2013 | | | 11.80 | | | | 0.19 | | | | 0.39 | | | | 0.58 | | | | (0.21 | ) | | | — | | | | (0.21 | ) |
12/31/2012 | | | 10.71 | | | | 0.20 | | | | 1.12 | | | | 1.32 | | | | (0.23 | ) | | | — | | | | (0.23 | ) |
12/31/2011 | | | 10.39 | | | | 0.26 | | | | 0.39 | | | | 0.65 | | | | (0.33 | ) | | | — | | | | (0.33 | ) |
12/31/2010 | | | 9.20 | | | | 0.27 | | | | 1.17 | | | | 1.44 | | | | (0.25 | ) | | | — | | | | (0.25 | ) |
12/31/2009 | | | 7.17 | | | | 0.30 | | | | 1.97 | | | | 2.27 | | | | (0.24 | ) | | | — | | | | (0.24 | ) |
Class Y | | | | | | | | | | | | | | | | | | | | | | | | | | | | |
12/31/2013 | | | 11.83 | | | | 0.33 | | | | 0.37 | | | | 0.70 | | | | (0.34 | ) | | | — | | | | (0.34 | ) |
12/31/2012(f) | | | 11.72 | | | | (0.02 | ) | | | 0.18 | | | | 0.16 | | | | (0.05 | ) | | | — | | | | (0.05 | ) |
| (a) | Per share net investment income (loss) has been calculated using the average shares outstanding during the period. |
| (b) | A sales charge for Class A shares and a contingent deferred sales charge for Class C shares are not reflected in total return calculations. Periods less than one year, if applicable, are not annualized. |
| (c) | Had certain expenses not been waived/reimbursed during the period, if applicable, total returns would have been lower. |
| (d) | The investment adviser agreed to waive its fees and/or reimburse a portion of the Fund’s expenses during the period, if applicable. Without this waiver/reimbursement, expenses would have been higher. |
| (e) | Computed on an annualized basis for periods less than one year, if applicable. |
| (f) | From commencement of Class operations on December 3, 2012, through December 31, 2012. |
See accompanying notes to financial statements.
| 61
| | | | | | | | | | | | | | | | | | | | | | | | | | |
| | | | | | | | | | Ratios to Average Net Assets: | | | | |
Net asset
value,
end of
the period | | | Total
return
(%) (b)(c) | | | Net assets,
end of
the period
(000’s) | | | Net
expenses
(%) (d)(e) | | | Gross
expenses
(%) (e) | | | Net investment
income
(loss) (%) (e) | | | Portfolio
turnover
rate (%) | |
| | | | | | | | | | | | | | | | | | | | | | | | | | |
| | | | | | | | | | | | | | | | | | | | | | | | | | |
| $ | 12.21 | | | | 5.84 | | | $ | 79,039 | | | | 1.09 | | | | 1.09 | | | | 2.34 | | | | 41 | |
| | 11.83 | | | | 13.22 | | | | 78,216 | | | | 1.11 | | | | 1.11 | | | | 2.53 | | | | 29 | |
| | 10.74 | | | | 7.21 | | | | 45,211 | | | | 1.13 | | | | 1.13 | | | | 3.17 | | | | 20 | |
| | 10.41 | | | | 16.73 | | | | 35,787 | | | | 1.19 | | | | 1.19 | | | | 3.51 | | | | 28 | |
| | 9.22 | | | | 33.32 | | | | 33,796 | | | | 1.21 | | | | 1.21 | | | | 4.67 | | | | 22 | |
| | | | | | | | | | | | | | | | | | | | | | | | | | |
| | 12.17 | | | | 4.98 | | | | 48,512 | | | | 1.84 | | | | 1.84 | | | | 1.59 | | | | 41 | |
| | 11.80 | | | | 12.43 | | | | 49,697 | | | | 1.86 | | | | 1.86 | | | | 1.79 | | | | 29 | |
| | 10.71 | | | | 6.33 | | | | 29,814 | | | | 1.88 | | | | 1.88 | | | | 2.42 | | | | 20 | |
| | 10.39 | | | | 15.90 | | | | 27,355 | | | | 1.94 | | | | 1.94 | | | | 2.76 | | | | 28 | |
| | 9.20 | | | | 32.24 | | | | 25,301 | | | | 1.96 | | | | 1.96 | | | | 3.90 | | | | 22 | |
| | | | | | | | | | | | | | | | | | | | | | | | | | |
| | 12.19 | | | | 5.93 | | | | 628 | | | | 0.83 | | | | 0.83 | | | | 2.71 | | | | 41 | |
| | 11.83 | | | | 1.35 | | | | 1 | | | | 1.00 | | | | 1.00 | | | | (2.37 | ) | | | 29 | |
See accompanying notes to financial statements.
| 62
Financial Highlights (continued)
For a share outstanding throughout each period.
| | | | | | | | | | | | | | | | | | | | | | | | | | | | |
| | | | | | Income (Loss) from Investment
Operations: | | | Less Distributions: | |
| | | | | | | |
| | | Net asset
value,
beginning
of the
period | | | Net
investment
income
(loss)(a) | | | Net realized
and
unrealized
gain (loss) | | | Total from
investment
operations | | | Dividends
from net
investment
income | | | Distributions
from net
realized
capital
gains | | | Total
distributions | |
| NATIXIS U.S. MULTI-CAP EQUITY FUND | | | | | | | | | | | | | | | | |
Class A | | | | | | | | | | | | | | | | | | | | | | | | | | | | |
12/31/2013 | | $ | 26.35 | | | $ | (0.04 | ) | | $ | 9.34 | | | $ | 9.30 | | | $ | — | | | $ | (2.58 | ) | | $ | (2.58 | ) |
12/31/2012 | | | 23.56 | | | | 0.07 | | | | 4.12 | | | | 4.19 | | | | (0.07 | ) | | | (1.33 | ) | | | (1.40 | ) |
12/31/2011 | | | 25.17 | | | | (0.04 | ) | | | (0.69 | ) | | | (0.73 | ) | | | — | | | | (0.88 | ) | | | (0.88 | ) |
12/31/2010 | | | 20.68 | | | | 0.03 | (h) | | | 4.50 | | | | 4.53 | | | | (0.04 | ) | | | — | | | | (0.04 | ) |
12/31/2009 | | | 15.16 | | | | (0.01 | ) | | | 5.53 | | | | 5.52 | | | | — | | | | — | | | | — | |
Class B | | | | | | | | | | | | | | | | | | | | | | | | | | | | |
12/31/2013 | | | 21.98 | | | | (0.22 | ) | | | 7.73 | | | | 7.51 | | | | — | | | | (2.58 | ) | | | (2.58 | ) |
12/31/2012 | | | 19.93 | | | | (0.12 | ) | | | 3.50 | | | | 3.38 | | | | — | | | | (1.33 | ) | | | (1.33 | ) |
12/31/2011 | | | 21.60 | | | | (0.21 | ) | | | (0.58 | ) | | | (0.79 | ) | | | — | | | | (0.88 | ) | | | (0.88 | ) |
12/31/2010 | | | 17.85 | | | | (0.12 | )(h) | | | 3.87 | | | | 3.75 | | | | — | | | | — | | | | — | |
12/31/2009 | | | 13.19 | | | | (0.12 | ) | | | 4.78 | | | | 4.66 | | | | — | | | | — | | | | — | |
Class C | | | | | | | | | | | | | | | | | | | | | | | | | | | | |
12/31/2013 | | | 21.99 | | | | (0.22 | ) | | | 7.73 | | | | 7.51 | | | | — | | | | (2.58 | ) | | | (2.58 | ) |
12/31/2012 | | | 19.94 | | | | (0.11 | ) | | | 3.49 | | | | 3.38 | | | | — | | | | (1.33 | ) | | | (1.33 | ) |
12/31/2011 | | | 21.61 | | | | (0.20 | ) | | | (0.59 | ) | | | (0.79 | ) | | | — | | | | (0.88 | ) | | | (0.88 | ) |
12/31/2010 | | | 17.86 | | | | (0.12 | )(h) | | | 3.87 | | | | 3.75 | | | | — | | | | — | | | | — | |
12/31/2009 | | | 13.19 | | | | (0.12 | ) | | | 4.79 | | | | 4.67 | | | | — | | | | — | | | | — | |
Class Y | | | | | | | | | | | | | | | | | | | | | | | | | | | | |
12/31/2013 | | | 28.68 | | | | 0.05 | | | | 10.17 | | | | 10.22 | | | | — | | | | (2.58 | ) | | | (2.58 | ) |
12/31/2012 | | | 25.52 | | | | 0.17 | | | | 4.46 | | | | 4.63 | | | | (0.14 | ) | | | (1.33 | ) | | | (1.47 | ) |
12/31/2011 | | | 27.12 | | | | 0.04 | | | | (0.76 | ) | | | (0.72 | ) | | | — | | | | (0.88 | ) | | | (0.88 | ) |
12/31/2010 | | | 22.27 | | | | 0.05 | (h) | | | 4.90 | | | | 4.95 | | | | (0.10 | ) | | | — | | | | (0.10 | ) |
12/31/2009 | | | 16.29 | | | | 0.04 | | | | 5.94 | | | | 5.98 | | | | — | | | | — | | | | — | |
| (a) | Per share net investment income (loss) has been calculated using the average shares outstanding during the period. |
| (b) | Amount rounds to less than $0.01 per share, if applicable. |
| (c) | Had certain expenses not been waived/reimbursed during the period, if applicable, total returns would have been lower. |
| (d) | A sales charge for Class A shares and a contingent deferred sales charge for Class B and Class C shares are not reflected in total return calculations. Periods less than one year, if applicable, are not annualized. |
| (e) | The investment adviser agreed to waive its fees and/or reimburse a portion of the Fund’s expenses during the period, if applicable. Without this waiver/reimbursement, expenses would have been higher. |
| (f) | Computed on an annualized basis for periods less than one year, if applicable. |
| (g) | Effective June 1, 2011, the expense limit decreased to 1.30%, 2.05%, 2.05% and 1.05% for Class A, Class B, Class C and Class Y shares, respectively. |
| (h) | Includes non-recurring dividends. Without this dividend, net investment loss per share would have been $(0.04), $(0.18), $(0.18) and $(0.02) for Class A, Class B, Class C and Class Y shares, respectively, and the ratio of net investment loss to average net assets would have been (0.19)%, (0.98)%, (0.94)% and (0.08)% for Class A, Class B, Class C and Class Y shares, respectively. |
See accompanying notes to financial statements.
63 |
| | | | | | | | | | | | | | | | | | | | | | | | | | | | | | |
| | | | | | | | | | | | | Ratios to Average Net Assets: | | | | |
| | | | | | | |
Increase from
regulatory
settlements(b) | | | Net asset
value,
end of
the period | | | Total
return
(%)(c)(d) | | | Net assets,
end of the
period
(000’s) | | | Net
expenses
(%)(e)(f) | | | Gross
expenses
(%)(f) | | | Net investment
income (loss)
(%)(f) | | | Portfolio
turnover
rate(%) | |
| | | | | | | | | | | | | | | | | | | | | | | | | | | | | | |
| | | | | | | | | | | | | | | | | | | | | | | | | | | | | | |
| $ | — | | | $ | 33.07 | | | | 35.75 | | | $ | 371,102 | | | | 1.30 | | | | 1.32 | | | | (0.12 | ) | | | 50 | |
| | — | | | | 26.35 | | | | 17.79 | | | | 289,898 | | | | 1.30 | | | | 1.35 | | | | 0.25 | | | | 52 | |
| | — | | | | 23.56 | | | | (2.79 | ) | | | 281,467 | | | | 1.34 | (g) | | | 1.38 | | | | (0.15 | ) | | | 97 | |
| | 0.00 | | | | 25.17 | | | | 21.90 | | | | 314,384 | | | | 1.40 | | | | 1.50 | | | | 0.14 | (h) | | | 79 | |
| | — | | | | 20.68 | | | | 36.41 | | | | 280,846 | | | | 1.40 | | | | 1.56 | | | | (0.05 | ) | | | 115 | |
| | | | | | | | | | | | | | | | | | | | | | | | | | | | | | |
| | — | | | | 26.91 | | | | 34.70 | | | | 7,708 | | | | 2.05 | | | | 2.07 | | | | (0.89 | ) | | | 50 | |
| | — | | | | 21.98 | | | | 16.97 | | | | 11,172 | | | | 2.05 | | | | 2.10 | | | | (0.55 | ) | | | 52 | |
| | — | | | | 19.93 | | | | (3.53 | ) | | | 16,820 | | | | 2.10 | (g) | | | 2.13 | | | | (0.94 | ) | | | 97 | |
| | 0.00 | | | | 21.60 | | | | 21.01 | | | | 28,787 | | | | 2.15 | | | | 2.25 | | | | (0.66 | )(h) | | | 79 | |
| | — | | | | 17.85 | | | | 35.33 | | | | 37,406 | | | | 2.15 | | | | 2.31 | | | | (0.80 | ) | | | 115 | |
| | | | | | | | | | | | | | | | | | | | | | | | | | | | | | |
| | — | | | | 26.92 | | | | 34.69 | | | | 44,150 | | | | 2.05 | | | | 2.07 | | | | (0.86 | ) | | | 50 | |
| | — | | | | 21.99 | | | | 16.96 | | | | 30,525 | | | | 2.05 | | | | 2.10 | | | | (0.49 | ) | | | 52 | |
| | — | | | | 19.94 | | | | (3.53 | ) | | | 28,462 | | | | 2.09 | (g) | | | 2.13 | | | | (0.90 | ) | | | 97 | |
| | 0.00 | | | | 21.61 | | | | 21.00 | | | | 30,912 | | | | 2.15 | | | | 2.25 | | | | (0.62 | )(h) | | | 79 | |
| | — | | | | 17.86 | | | | 35.41 | | | | 28,580 | | | | 2.15 | | | | 2.31 | | | | (0.80 | ) | | | 115 | |
| | | | | | | | | | | | | | | | | | | | | | | | | | | | | | |
| | — | | | | 36.32 | | | | 36.06 | | | | 24,661 | | | | 1.05 | | | | 1.07 | | | | 0.13 | | | | 50 | |
| | — | | | | 28.68 | | | | 18.15 | | | | 11,035 | | | | 1.05 | | | | 1.10 | | | | 0.61 | | | | 52 | |
| | — | | | | 25.52 | | | | (2.56 | ) | | | 2,047 | | | | 1.09 | (g) | | | 1.14 | | | | 0.16 | | | | 97 | |
| | 0.00 | | | | 27.12 | | | | 22.21 | | | | 1,317 | | | | 1.15 | | | | 1.24 | | | | 0.22 | (h) | | | 79 | |
| | — | | | | 22.27 | | | | 36.71 | | | | 5,325 | | | | 1.15 | | | | 1.22 | | | | 0.20 | | | | 115 | |
See accompanying notes to financial statements.
| 64
Notes to Financial Statements
December 31, 2013
1. Organization. Natixis Funds Trust I and Natixis Funds Trust II (the “Trusts” and each a “Trust”) are each organized as a Massachusetts business trust. Each Trust is registered under the Investment Company Act of 1940, as amended (the “1940 Act”), as an open-end management investment company. Each Declaration of Trust permits the Board of Trustees to authorize the issuance of an unlimited number of shares of the Trust in multiple series. The financial statements for certain funds of the Trusts are presented in separate reports. The following funds (individually, a “Fund” and collectively, the “Funds”) are included in this report:
Natixis Funds Trust I:
Natixis Diversified Income Fund (the “Diversified Income Fund”)
Natixis U.S. Multi-Cap Equity Fund (the “U.S. Multi-Cap Equity Fund”)
Natixis Funds Trust II:
McDonnell Intermediate Municipal Bond Fund (the “Intermediate Municipal Bond Fund”)
On February 14, 2013, Natixis Global Asset Management, L.P. (“Natixis US”) made an additional seed money investment of $5,000,000 in Intermediate Municipal Bond Fund.
Each Fund is a diversified investment company.
Each Fund offers Class A, Class C and Class Y shares. Effective October 12, 2007, Class B shares of U.S. Multi-Cap Equity Fund are no longer offered. Existing Class B shareholders may continue to reinvest dividends into Class B shares and exchange their Class B shares for Class B shares of other Natixis Funds subject to existing exchange privileges as described in the prospectus.
Class A shares are sold with a maximum front-end sales charge of 3.50%, 4.50% and 5.75%, for Intermediate Municipal Bond Fund, Diversified Income Fund and U.S. Multi-Cap Equity Fund, respectively. Class B shares do not pay a front-end sales charge; however, they are charged higher Rule 12b-1 fees, and are subject to a contingent deferred sales charge (“CDSC”) if such shares are redeemed within six years of purchase. After eight years of ownership, Class B shares convert to Class A shares. Class C shares do not pay a front-end sales charge, do not convert to any other class of shares, pay higher ongoing Rule 12b-1 fees than Class A shares and may be subject to a CDSC of 1.00% if those shares are redeemed within one year. Class Y shares do not pay a front-end sales charge, a CDSC or Rule 12b-1 fees. Class Y shares are generally intended for institutional investors with a minimum initial investment of $100,000, though some categories of investors are exempted from the minimum investment amount as outlined in Funds’ prospectus.
Most expenses of the Trusts can be directly attributed to a fund. Expenses which cannot be directly attributed to a fund are generally apportioned based on the relative net assets of each of the funds in the Trusts. Expenses of a Fund are borne pro rata by the holders of each class of shares, except that each class bears expenses unique to that class (including the Rule 12b-1 service and distribution fees). In addition, each class votes as a class only with respect to its own Rule 12b-1 Plan. Shares of each
65 |
Notes to Financial Statements (continued)
December 31, 2013
class would receive their pro rata share of the net assets of a Fund if the Fund were liquidated. The Trustees approve separate distributions from net investment income on each class of shares.
2. Significant Accounting Policies. The following is a summary of significant accounting policies consistently followed by each Fund in the preparation of its financial statements. The Funds’ financial statements are prepared in accordance with accounting principles generally accepted in the United States of America which require the use of management estimates that affect the reported amounts and disclosures in the financial statements. Actual results could differ from those estimates. Management has evaluated the events and transactions subsequent to year-end through the date the financial statements were issued and has determined that there were no material events that would require disclosure in the Funds’ financial statements.
a. Valuation. Fund securities and other investments are valued at market value based on market quotations obtained or determined by independent pricing services recommended by the adviser and subadvisers and approved by the Board of Trustees. Fund securities and other investments for which market quotations are not readily available are valued at fair value as determined in good faith by the adviser or subadviser pursuant to procedures approved by the Board of Trustees, as described below. Market value is determined as follows:
Equity securities (including closed-end investment companies and exchange-traded funds) are valued at the last sale price quoted on the exchange or market where traded most extensively or, if there is no reported sale during the day, the closing bid quotation as reported by an independent pricing service. Securities traded on the NASDAQ Global Select Market, NASDAQ Global Market and NASDAQ Capital Market are valued at the NASDAQ Official Closing Price (“NOCP”), or if lacking an NOCP, at the most recent bid quotations on the applicable NASDAQ Market. Debt securities (other than short-term obligations purchased with an original or remaining maturity of sixty days or less) and unlisted equity securities are valued based on evaluated bids furnished to the Funds by an independent pricing service using market information, transactions for comparable securities and various relationships between securities, if available, or bid prices obtained from broker-dealers. Broker-dealer bid prices may be used to value debt and equity securities where an independent pricing service is unable to price a security or where an independent pricing service does not provide a reliable price for the security. Forward foreign currency contracts are valued utilizing interpolated rates determined based on information provided by an independent pricing service. Futures contracts are valued at the current settlement price on the exchange on which the adviser or subadviser believes that, over time, they are traded most extensively. Domestic exchange-traded single equity option contracts are valued at the mean of the National Best Bid and Offer quotations. Bilateral interest rate swaps are valued based on prices supplied by an independent pricing service, if available, or prices obtained from broker-dealers. Centrally cleared interest rate swaps are valued at settlement prices of the
| 66
Notes to Financial Statements (continued)
December 31, 2013
clearinghouse on which the contracts were traded, if available, or prices obtained from broker-dealers. Interest rate swaptions are valued at mid prices (between the bid and the ask price) supplied by an independent pricing service, if available, or prices obtained from broker-dealers. Short-term obligations (purchased with an original or remaining maturity of sixty days or less) are valued at amortized cost (which approximates market value).
Fund securities and other investments for which market quotations are not readily available are valued at fair value as determined in good faith by the adviser or subadviser pursuant to procedures approved by the Board of Trustees. The Funds may also value securities and other investments at fair value in other circumstances such as when extraordinary events occur after the close of a foreign market but prior to the close of the New York Stock Exchange (“NYSE”). This may include situations relating to a single issuer (such as a declaration of bankruptcy or a delisting of the issuer’s security from the primary market on which it has traded) as well as events affecting the securities markets in general (such as market disruptions or closings and significant fluctuations in U.S. and/or foreign markets). When fair valuing its securities or other investments, the Funds may, among other things, use modeling tools or other processes that may take into account factors such as securities or other market activity and/or significant events that occur after the close of the foreign market and before the time a Fund’s NAV is calculated. Fair value pricing may require subjective determinations about the value of a security, and fair values used to determine a Fund’s NAV may differ from quoted or published prices, or from prices that are used by others, for the same securities. In addition, the use of fair value pricing may not always result in adjustments to the prices of securities held by a Fund.
b. Investment Transactions and Related Investment Income. Investment transactions are accounted for on a trade date plus one day basis for daily net asset value calculation. However, for financial reporting purposes, investment transactions are reported on trade date. Dividend income is recorded on ex-dividend date, or in the case of certain foreign securities, as soon as a Fund is notified, and interest income is recorded on an accrual basis. Interest income is increased by the accretion of discount and decreased by the amortization of premium. Periodic principal adjustments for inflation-protected securities are recorded to interest income. Negative principal adjustments (in the event of deflation) are recorded as reductions of interest income to the extent of interest income earned, not to exceed the amount of positive principal adjustments on a cumulative basis. Distributions received from investments in securities that represent a return of capital or capital gain are recorded as a reduction of cost of the investments or as a realized gain, respectively. The calendar year-end amounts of ordinary income, capital gains, and return of capital included in distributions received from the Funds’ investments in real estate investment trusts (“REITs”) are reported to the Funds after the end of the fiscal year; accordingly, the Funds estimate these amounts for accounting purposes until the characterization of REIT distributions
67 |
Notes to Financial Statements (continued)
December 31, 2013
is reported to the Funds after the end of the fiscal year. Estimates are based on the most recent REIT distribution information available. In determining net gain or loss on securities sold, the cost of securities has been determined on an identified cost basis. Investment income, non-class specific expenses and realized and unrealized gains and losses are allocated on a pro rata basis to each class based on the relative net assets of each class to the total net assets of the Fund.
c. Foreign Currency Translation. The books and records of the Funds are maintained in U.S. dollars. The values of securities, currencies and other assets and liabilities denominated in currencies other than U.S. dollars are translated into U.S. dollars based upon foreign exchange rates prevailing at the end of the period. Purchases and sales of investment securities, income and expenses are translated on the respective dates of such transactions.
Since the values of investment securities are presented at the foreign exchange rates prevailing at the end of the period, it is not practical to isolate that portion of the results of operations arising from changes in exchange rates from fluctuations which arise due to changes in market prices of investment securities. Such changes are included with the net realized and unrealized gain or loss on investments.
Net realized foreign exchange gains or losses arise from sales of foreign currency, currency gains or losses realized between the trade and settlement dates on securities transactions and the difference between the amounts of dividends, interest and foreign withholding taxes recorded on the Funds’ books and the U.S. dollar equivalent of the amounts actually received or paid. Net unrealized foreign exchange gains and losses arise from changes in the value of assets and liabilities, other than investment securities, at the end of the fiscal period, resulting from changes in exchange rates.
Each Fund may use foreign currency exchange contracts to facilitate transactions in foreign-denominated investments. Losses may arise from changes in the value of the foreign currency or if the counterparties do not perform under the contracts’ terms.
d. Forward Foreign Currency Contracts. Certain Funds may enter into forward foreign currency contracts, including forward foreign cross currency contracts, to acquire exposure to foreign currencies or to hedge the Fund’s investments against currency fluctuation. A contract can also be used to offset a previous contract. These contracts involve market risk in excess of the unrealized gain or loss reflected in the Funds’ Statements of Assets and Liabilities. The U.S. dollar value of the currencies a Fund has committed to buy or sell represents the aggregate exposure to each currency a Fund has acquired or hedged through currency contracts outstanding at period end. Gains or losses are recorded for financial statement purposes as unrealized until settlement date. Contracts are traded over-the-counter directly with a counterparty. Risks may arise upon entering into these contracts from the potential inability of counterparties to meet the terms of their contracts and from unanticipated movements in the value of a foreign currency relative to the U.S. dollar. Certain contracts may require the movement of cash and/or securities as collateral for the Fund’s or counterparty’s net obligations under the contracts.
| 68
Notes to Financial Statements (continued)
December 31, 2013
e. Futures Contracts. Certain Funds may enter into futures contracts. Futures contracts are agreements between two parties to buy and sell a particular commodity, instrument or index for a specified price on a specified future date.
When a Fund enters into a futures contract, it is required to deposit with (or for the benefit of) its broker an amount of cash or short-term high-quality securities as “initial margin.” As the value of the contract changes, the value of the futures contract position increases or declines. Subsequent payments, known as “variation margin,” are made or received by a Fund, depending on the price fluctuations in the fair value of the contract and the value of cash or securities on deposit with the broker. The aggregate principal amounts of the contracts are not recorded in the financial statements. Fluctuations in the value of the contracts are recorded in the Statements of Assets and Liabilities as an asset (liability) and in the Statements of Operations as unrealized appreciation (depreciation) until the contracts are closed, when they are recorded as realized gains (losses). Realized gain or loss on a futures position is equal to the difference between the value of the contract at the time it was opened and the value at the time it was closed, minus brokerage commissions. When a Fund enters into a futures contract certain risks may arise, such as illiquidity in the futures market, which may limit a Fund’s ability to close out a futures contract prior to settlement date, and unanticipated movements in the value of securities or interest rates.
Futures contracts are exchange-traded. Exchange-traded futures contracts are standardized and are settled through a clearing house with fulfillment supported by the credit of the exchange. Therefore, counterparty credit risks to the Funds are reduced; however, in the event that a counterparty enters into bankruptcy, the Fund’s claim against initial/variation margin on deposit with the counterparty may be subject to terms of a final settlement in bankruptcy court.
f. Option Contracts. Certain Funds may enter into option contracts. When a Fund purchases an option, it pays a premium and the option is subsequently marked to market to reflect current value. Premiums paid for purchasing options which expire are treated as realized losses. Premiums paid for purchasing options which are exercised are added to the cost or deducted from the proceeds on the underlying instrument to determine the realized gain or loss. If the Fund enters into a closing sale transaction, the difference between the premium paid and the proceeds of the closing sale transaction is treated as a realized gain or loss. The risk associated with purchasing options is limited to the premium paid.
When a Fund writes an option, an amount equal to the net premium received (the premium less commission) is recorded as a liability and is subsequently adjusted to the current value. Net premiums received for written options which expire are treated as realized gains. Net premiums received for written options which are exercised are deducted from the cost or added to the proceeds on the underlying instrument to determine the realized gain or loss. If the Fund enters into a closing purchase
69 |
Notes to Financial Statements (continued)
December 31, 2013
transaction, the difference between the net premium received and any amount paid on effecting a closing purchase transaction, including commissions, is treated as a realized gain or, if the net premium received is less than the amount paid, as a realized loss. The Fund, as writer of a written option, bears the risk of an unfavorable change in the market value of the equity underlying the written option.
Exchange-traded options contracts are standardized and are settled through a clearing house with fulfillment supported by the credit of the exchange. Therefore, counterparty credit risks to the Funds are reduced. Over-the-counter (“OTC”) options are subject to the risk that the counterparty is unable or unwilling to meet its obligations under the option.
For the year ended December 31, 2013, the Funds were not party to any OTC options.
g. Swaptions. Diversified Income Fund may enter into interest rate swaptions. An interest rate swaption gives the holder the right, but not the obligation, to enter into or cancel an interest rate swap agreement at a future date. Interest rate swaptions may be either purchased or written. The buyer of an interest rate swaption may purchase either the right to receive a fixed rate in the underlying swap (known as a “receiver swaption”) or to pay a fixed rate (known as a “payer swaption”), based on the notional amount of the swap agreement, in exchange for a floating rate. The notional amounts of swaptions are not recorded in the financial statements.
When a Fund purchases an interest rate swaption, it pays a premium and the swaption is subsequently marked to market to reflect current value. Premiums paid for purchasing interest rate swaptions which expire are treated as realized losses. Premiums paid for purchasing interest rate swaptions which are exercised are added to the cost or deducted from the proceeds on the underlying swap to determine the realized gain or loss. If a Fund enters into a closing sale transaction, the difference between the premium paid and the proceeds of the closing sale transaction is treated as a realized gain or loss. The risk associated with purchasing interest rate swaptions is limited to the premium paid.
When a Fund writes an interest rate swaption, an amount equal to the premium received is recorded as a liability and is subsequently adjusted to the current value. Premiums received for written interest rate swaptions which expire are treated as realized gains. Premiums received for written interest rate swaptions which are exercised are deducted from the cost or added to the proceeds on the underlying swap to determine the realized gain or loss. If a Fund enters into a closing purchase transaction, the difference between the premium received and any amount paid on effecting a closing purchase transaction, including commission, is treated as a realized gain or, if the premium received is less than the amount paid, as a realized loss. A Fund, as writer of a written interest rate swaption, bears the risk of an unfavorable change in the market value of the swap underlying the written interest rate swaption.
OTC interest rate swaptions are subject to the risk that the counterparty is unable or unwilling to meet its obligations under the swaption.
| 70
Notes to Financial Statements (continued)
December 31, 2013
h. Swap Agreements. Diversified Income Fund may enter into interest rate swaps.
An interest rate swap is an agreement with another party to receive or pay interest (e.g., an exchange of fixed rate payments for floating rate payments) to protect themselves from interest rate fluctuations. This type of swap is an agreement that obligates two parties to exchange a series of cash flows at specified intervals based upon or calculated by reference to a specified interest rate(s) for a specified amount. The payment flows are usually netted against each other, with the difference being paid by one party to the other.
The notional amounts of swap agreements are not recorded in the financial statements. Swap agreements are valued daily and fluctuations in the value are recorded in the Statements of Operations as change in unrealized appreciation (depreciation) on swap agreements. Fees are accrued in accordance with the terms of the agreement and are recorded in the Statements of Operations as realized gain or loss when received or paid. Upfront premiums paid or received by the Funds are recorded on the Statements of Assets and Liabilities as an asset or liability, respectively, and are amortized or accreted over the term of the agreement and recorded as realized gain or loss. Payments made or received by the Funds as a result of a credit event or termination of the agreement are recorded as realized gain or loss.
Swap agreements are privately negotiated and traded between counterparties and, as such, are subject to the risk that a party to the agreement will not be able to meet its obligations. The Funds cover their net obligations under outstanding swap agreements by segregating or earmarking liquid assets or cash.
i. Due to Brokers. Transactions and positions in certain interest rate swaptions are maintained and cleared by registered U.S. broker/dealers pursuant to customer agreements between the Fund and the various broker/dealers. The due to broker balance in the Statements of Assets and Liabilities for Diversified Income Fund represents cash received as collateral for open interest rate swaptions. In certain circumstances the Fund’s use of cash and/or securities pledged as collateral is restricted by regulation or broker mandated limits.
j. Federal and Foreign Income Taxes. Each Trust treats each fund as a separate entity for federal income tax purposes. Each Fund intends to meet the requirements of the Internal Revenue Code of 1986, as amended, applicable to regulated investment companies, and to distribute to its shareholders substantially all of its net investment income and any net realized capital gains at least annually. Management has performed an analysis of each Fund’s tax positions for the open tax years as of December 31, 2013 and has concluded that no provisions for income tax are required. The Funds’ federal tax returns for the prior three fiscal years, where applicable, remain subject to examination by the Internal Revenue Service. Management is not aware of any events that are reasonably possible to occur in the next twelve months that would result in the amounts of any unrecognized tax benefits significantly increasing or
71 |
Notes to Financial Statements (continued)
December 31, 2013
decreasing for the Funds. However, management’s conclusions regarding tax positions taken may be subject to review and adjustment at a later date based on factors including, but not limited to, new tax laws and accounting regulations and interpretations thereof.
A Fund may be subject to foreign withholding taxes on investment income and taxes on capital gains on investments that are accrued and paid based upon the Fund’s understanding of the tax rules and regulations that exist in the countries in which the Fund invests. Foreign withholding taxes on dividend and interest income are reflected on the Statements of Operations as a reduction of investment income, net of amounts eligible to be reclaimed. Dividends and interest receivable on the Statements of Assets and Liabilities are net of foreign withholding taxes. Foreign withholding taxes eligible to be reclaimed are reflected on the Statements of Assets and Liabilities as tax reclaims receivable. Capital gains taxes paid are included in net realized gain (loss) on investments in the Statements of Operations. Accrued but unpaid capital gains taxes are reflected as foreign taxes payable on the Statements of Assets and Liabilities, if applicable, and reduce unrealized gains on investments. In the event that realized gains on investments are subsequently offset by realized losses, taxes paid on realized gains may be returned to a Fund. Such amounts, if applicable, are reflected as foreign tax rebates receivable on the Statements of Assets and Liabilities and are recorded as a realized gain when received.
k. Dividends and Distributions to Shareholders. Dividends and distributions are recorded on ex-dividend date. The timing and characterization of certain income and capital gain distributions are determined annually in accordance with federal tax regulations, which may differ from accounting principles generally accepted in the United States of America. Permanent differences are primarily due to differing treatments for book and tax purposes of items such as net operating losses, inflation protected securities, contingent payment debt instruments, premium amortization, paydown gains and losses, defaulted bonds, interest rate swap adjustments, return of capital and capital gain distributions received, foreign currency transactions and deferred Trustees’ fees. Permanent book and tax basis differences relating to shareholder distributions, net investment income and net realized gains will result in reclassifications to capital accounts. Temporary differences between book and tax distributable earnings are primarily due to deferred Trustees’ fees, premium amortization, defaulted bonds, trust preferred securities, contingent payment debt instruments, return of capital distributions received, wash sales and futures and forward foreign currency contract mark to market. Distributions from net investment income and short-term capital gains are considered to be distributed from ordinary income for tax purposes.
| 72
Notes to Financial Statements (continued)
December 31, 2013
The tax characterization of distributions is determined on an annual basis. The tax character of distributions paid to shareholders during the years ended December 31, 2013 and 2012 were as follows:
| | | | | | | | | | | | | | | | |
| | | 2013 Distributions Paid From: | |
Fund | | Ordinary Income | | | Tax
Exempt Income | | | Long-Term Capital
Gains | | | Total | |
Intermediate Municipal Bond Fund | | $ | — | | | $ | 225,858 | | | $ | — | | | $ | 225,858 | |
Diversified Income Fund | | | 3,088,880 | | | | — | | | | — | | | | 3,088,880 | |
U.S Multi-Cap Equity Fund | | | 2,591,791 | | | | — | | | | 30,926,551 | | | | 33,518,342 | |
| |
| | | 2012 Distributions Paid From: | |
Fund | | Ordinary Income | | | Long-Term Capital
Gains | | | Total | | | | |
Intermediate Municipal Bond Fund | | $ | — | | | $ | — | | | $ | — | | | | | |
Diversified Income Fund | | | 2,654,187 | | | | — | | | | 2,654,187 | | | | | |
U.S Multi-Cap Equity Fund | | | 3,574,177 | | | | 14,136,540 | | | | 17,710,717 | | | | | |
Differences between these amounts and those reported in the Statements of Changes in Net Assets are primarily attributable to different book and tax treatment for short-term capital gains.
As of December 31, 2013, the components of distributable earnings on a tax basis were as follows:
| | | | | | | | | | | | |
| | | Intermediate
Municipal
Bond Fund | | | Diversified
Income Fund | | | U.S. Multi-Cap
Equity Fund | |
Undistributed ordinary income | | $ | — | | | $ | 37,265 | | | $ | 95,386 | |
Undistributed tax exempt income | | | 8,397 | | | | — | | | | — | |
Undistributed long-term capital gains | | | — | | | | — | | | | 6,590,793 | |
| | | | | | | | | | | | |
Total undistributed earnings | | | 8,397 | | | | 37,265 | | | | 6,686,179 | |
| | | | | | | | | | | | |
Capital loss carryforward: | | | | | | | | | | | | |
Short-term: | | | | | | | | | | | | |
Expires December 31, 2017 | | | — | | | | (10,106,858 | ) | | | — | |
No expiration date | | | (342,616 | ) | | | — | | | | — | |
Long-term: | | | | | | | | | | | | |
No expiration date | | | (5,710 | ) | | | — | | | | — | |
| | | | | | | | | | | | |
Total capital loss carryforward | | | (348,326 | ) | | | (10,106,858 | ) | | | — | |
Unrealized appreciation (depreciation) | | | (504,948 | ) | | | 4,196,605 | | | | 149,060,381 | |
| | | | | | | | | | | | |
Total accumulated earnings (losses) | | $ | (844,877 | ) | | $ | (5,872,988 | ) | | $ | 155,746,560 | |
| | | | | | | | | | | | |
Capital loss carryforward utilized in the current year | | $ | — | | | $ | 6,557,308 | | | $ | — | |
| | | | | | | | | | | | |
73 |
Notes to Financial Statements (continued)
December 31, 2013
Capital losses may be utilized to offset future capital gains until expiration. The Regulated Investment Company Modernization Act of 2010 (the “Act”) allows capital loss carryforwards to be carried forward indefinitely. Rules in effect previously limited the carryforward period to eight years. Capital loss carryforwards generated in taxable years beginning after the effective date of the Act must be fully used before capital loss carryforwards generated in years prior to the effective date of the Act; therefore, under certain circumstances, capital loss carryforwards available as of the report date may expire unused.
l. Repurchase Agreements. Each Fund may enter into repurchase agreements, under the terms of a Master Repurchase Agreement, under which each Fund acquires securities as collateral and agrees to resell the securities at an agreed upon time and at an agreed upon price. It is each Fund’s policy that the market value of the collateral for repurchase agreements be at least equal to 102% of the repurchase price, including interest. Certain repurchase agreements are tri-party arrangements whereby the collateral is held in a segregated account for the benefit of the Fund and on behalf of the counterparty. Repurchase agreements could involve certain risks in the event of default or insolvency of the counterparty, including possible delays or restrictions upon a Fund’s ability to dispose of the underlying securities. As of December 31, 2013, each Fund had investments in repurchase agreements for which the value of the related collateral exceeded the value of the repurchase agreement. The gross value of repurchase agreements is included in the Statements of Assets and Liabilities for financial reporting purposes.
m. Delayed Delivery Commitments. The Funds may purchase securities, including those designated as TBAs in the Portfolio of Investments, for which delivery or payment will occur at a later date, beyond the normal settlement period. The price of the security and the date when the security will be delivered and paid for are fixed at the time the transaction is negotiated. The security and the obligation to pay for it are recorded by the Fund at the time the commitment is entered into. The actual security that will be delivered to fulfill a TBA trade is not designated at the time of the trade. The security is “to be announced” 48 hours prior to the established trade settlement date. The value of the security may vary with market fluctuations during the time before the Fund takes delivery of the security. When the Fund enters into such a transaction, collateral consisting of liquid securities or cash and cash equivalents is required to be segregated or earmarked at the custodian in an amount at least equal to the amount of the Fund’s commitment. No interest accrues to the Fund until the transaction settles.
Purchases of delayed delivery securities may have a similar effect on the Fund’s net asset value as if the Fund had created a degree of leverage in the portfolio. Risks may arise upon entering into such transactions from the potential inability of counterparties to meet their obligations under the transactions. Additionally, losses may arise due to changes in the value of the underlying securities.
No delayed delivery securities were held by the Funds as of December 31, 2013.
n. Securities Lending. The Funds have entered into an agreement with State Street Bank and Trust Company (“State Street Bank”), as agent of the Funds, to lend securities to certain designated borrowers. The loans are collateralized with cash or securities in
| 74
Notes to Financial Statements (continued)
December 31, 2013
an amount equal to at least 105% or 102% of the market value (including accrued interest) of the loaned international or domestic securities, respectively, when the loan is initiated. Thereafter, the value of the collateral must remain at least 102% of the market value (including accrued interest) of loaned securities for U.S. equities and U.S. corporate debt; at least 105% of the market value (including accrued interest) of loaned securities for non-U.S. equities; and at least 100% of the market value (including accrued interest) of loaned securities for U.S. Government securities, sovereign debt issued by non-U.S. Governments and non-U.S. corporate debt. In the event that the market value of the collateral falls below the required percentages described above, the borrower will deliver additional collateral on the next business day. As with other extensions of credit, the Funds may bear the risk of loss with respect to the investment of the collateral. The Funds invest cash collateral in short-term investments, a portion of the income from which is remitted to the borrowers and the remainder allocated between the Funds and State Street Bank as lending agent.
For the year ended December 31, 2013, none of the Funds had loaned securities under this agreement.
o. Indemnifications. Under the Trusts’ organizational documents, their officers and Trustees are indemnified against certain liabilities arising out of the performance of their duties to the Funds. Additionally, in the normal course of business, the Funds enter into contracts with service providers that contain general indemnification clauses. The Funds’ maximum exposure under these arrangements is unknown as this would involve future claims that may be made against the Funds that have not yet occurred. However, based on experience, the Funds expect the risk of loss to be remote.
3. Fair Value Measurements. In accordance with accounting standards related to fair value measurements and disclosures, the Funds have categorized the inputs utilized in determining the value of each Fund’s assets or liabilities. These inputs are summarized in the three broad levels listed below:
| | • | | Level 1 – quoted prices in active markets for identical assets or liabilities; |
| | • | | Level 2 – prices determined using other significant inputs that are observable either directly, or indirectly through corroboration with observable market data (which could include quoted prices for similar assets or liabilities, interest rates, credit risk, etc.); and |
| | • | | Level 3 – prices determined using significant unobservable inputs when quoted prices or observable inputs are unavailable such as when there is little or no market activity for an asset or liability (unobservable inputs reflect each Fund’s own assumptions in determining the fair value of assets or liabilities and would be based on the best information available). |
The inputs or methodology used for valuing securities are not necessarily an indication of the risk associated with investing in those securities.
75 |
Notes to Financial Statements (continued)
December 31, 2013
The following is a summary of the inputs used to value the Funds’ investments as of December 31, 2013, at value:
Intermediate Municipal Bond Fund
Asset Valuation Inputs
| | | | | | | | | | | | | | | | |
Description | | Level 1 | | | Level 2 | | | Level 3 | | | Total | |
Bonds and Notes(a) | | $ | — | | | $ | 20,350,169 | | | $ | — | | | $ | 20,350,169 | |
Short-Term Investments | | | — | | | | 2,681,354 | | | | — | | | | 2,681 ,354 | |
| | | | | | | | | | | | | | | | |
Total | | $ | — | | | $ | 23,031,523 | | | $ | — | | | $ | 23,031,523 | |
| | | | | | | | | | | | | | | | |
| (a) | Details of the major categories of the Fund’s investments are reflected within the Portfolio of Investments. |
For the year ended December 31, 2013, there were no transfers among Levels 1, 2 and 3.
Diversified Income Fund
Asset Valuation Inputs
| | | | | | | | | | | | | | | | |
Description | | Level 1 | | | Level 2 | | | Level 3 | | | Total | |
Common Stocks(a) | | $ | 64,806,394 | | | $ | — | | | $ | — | | | $ | 64,806,394 | |
Bonds and Notes | | | | | | | | | | | | | | | | |
Non-Convertible Bonds | | | | | | | | | | | | | | | | |
ABS Other | | | — | | | | — | | | | 284,200 | (b) | | | 284,200 | |
Airlines | | | — | | | | 391,999 | | | | 1,487,108 | (b) | | | 1,879,107 | |
Retailers | | | — | | | | 1,727,507 | | | | 254,668 | (b) | | | 1,982,175 | |
All Other Non-Convertible Bonds(a) | | | — | | | | 49,935,203 | | | | — | | | | 49,935,203 | |
| | | | | | | | | | | | | | | | |
Total Non-Convertible Bonds | | | — | | | | 52,054,709 | | | | 2,025,976 | | | | 54,080,685 | |
| | | | | | | | | | | | | | | | |
Convertible Bonds(a) | | | — | | | | 4,354,622 | | | | — | | | | 4,354,622 | |
Municipals(a) | | | — | | | | 35,146 | | | | — | | | | 35,146 | |
| | | | | | | | | | | | | | | | |
Total Bonds and Notes | | | — | | | | 56,444,477 | | | | 2,025,976 | | | | 58,470,453 | |
| | | | | | | | | | | | | | | | |
Preferred Stocks | | | | | | | | | | | | | | | | |
Non-Convertible Preferred Stocks(a) | | | 924,111 | | | | — | | | | — | | | | 924,111 | |
Convertible Preferred Stocks | | | | | | | | | | | | | | | | |
REITs — Mortgage | | | — | | | | 110,360 | | | | — | | | | 110,360 | |
Wireless | | | — | | | | 89,334 | | | | — | | | | 89,334 | |
All Other Convertible Preferred Stocks(a) | | | 661,180 | | | | — | | | | — | | | | 661,180 | |
| | | | | | | | | | | | | | | | |
Total Convertible Preferred Stocks | | | 661,180 | | | | 199,694 | | | | — | | | | 860,874 | |
| | | | | | | | | | | | | | | | |
Total Preferred Stocks | | | 1,585,291 | | | | 199,694 | | | | — | | | | 1,784,985 | |
| | | | | | | | | | | | | | | | |
| 76
Notes to Financial Statements (continued)
December 31, 2013
Diversified Income Fund (continued)
Asset Valuation Inputs (continued)
| | | | | | | | | | | | | | | | |
Description | | Level 1 | | | Level 2 | | | Level 3 | | | Total | |
Purchased Swaptions(a) | | $ | — | | | $ | 1,021,337 | | | $ | — | | | $ | 1,021,337 | |
Short-Term Investments | | | — | | | | 1,974,714 | | | | — | | | | 1,974,714 | |
| | | | | | | | | | | | | | | | |
Total Investments | | | 66,391,685 | | | | 59,640,222 | | | | 2,025,976 | | | | 128,057,883 | |
| | | | | | | | | | | | | | | | |
Forward Foreign Currency Contracts (unrealized appreciation) | | | — | | | | 4,072 | | | | — | | | | 4,072 | |
Futures Contracts (unrealized appreciation) | | | 3,871 | | | | — | | | | — | | | | 3,871 | |
| | | | | | | | | | | | | | | | |
Total | | $ | 66,395,556 | | | $ | 59,644,294 | | | $ | 2,025,976 | | | $ | 128,065,826 | |
| | | | | | | | | | | | | | | | |
| | | | |
| Liability Valuation Inputs | | | | | | | | | | | | |
Description | | Level 1 | | | Level 2 | | | Level 3 | | | Total | |
Written Swaptions(a) | | $ | — | | | $ | (593,803 | ) | | $ | — | | | $ | (593,803 | ) |
Forward Foreign Currency Contracts (unrealized depreciation) | | | — | | | | (2,791 | ) | | | — | | | | (2,791 | ) |
| | | | | | | | | | | | | | | | |
Total | | $ | — | | | $ | (596,594 | ) | | $ | — | | | $ | (596,594 | ) |
| | | | | | | | | | | | | | | | |
| (a) | Details of the major categories of the Fund’s investments are reflected within the Portfolio of Investments. |
| (b) | Valued using broker-dealer bid prices where the inputs are unobservable. |
Preferred stocks valued at $166,664 were transferred from Level 2 to Level 1 during the period ended December 31, 2013. At December 31, 2013, these securities were valued at the last sale price in accordance with the Fund’s valuation policies.
All transfers are recognized as of the beginning of the reporting period.
The Fund’s pricing policies and procedures are recommended by the investment adviser and approved by the Board of Trustees. Debt securities are generally valued on the basis of evaluated bids furnished to the Fund by an independent pricing service. Broker-dealer bid prices may be used if an independent pricing service either is unable to price a security or does not provide a reliable price for a security. Broker-dealer bid prices for which the Fund does not have knowledge of the inputs used by the broker-dealer are categorized in Level 3. All security prices, including those obtained from an independent pricing service and broker-dealer bid prices, are reviewed on a daily basis by the investment adviser, subject to oversight by Fund management and the Board of Trustees. If the investment adviser, in good faith, believes that the price provided by an independent pricing service is unreliable, broker-dealer bid prices may be used until the price provided by the independent pricing service is considered to be reliable. Reliability of all security prices, including those obtained from an independent pricing service and broker-dealer bid prices, is tested in a variety of ways, including comparison to recent transaction prices and daily fluctuations, amongst other validation procedures in place.
77 |
Notes to Financial Statements (continued)
December 31, 2013
U.S. Multi-Cap Equity Fund
Asset Valuation Inputs
| | | | | | | | | | | | | | | | |
Description | | Level 1 | | | Level 2 | | | Level 3 | | | Total | |
Common Stocks(a) | | $ | 432,914,580 | | | $ | — | | | $ | — | | | $ | 432,914,580 | |
Closed End Investment Companies | | | 1,889,360 | | | | — | | | | — | | | | 1,889,360 | |
Short-Term Investments | | | — | | | | 13,506,279 | | | | — | | | | 13,506,279 | |
| | | | | | | | | | | | | | | | |
Total | | $ | 434,803,940 | | | $ | 13,506,279 | | | $ | — | | | $ | 448,310,219 | |
| | | | | | | | | | | | | | | | |
| (a) | Details of the major categories of the Fund’s investments are reflected within the Portfolio of Investments. |
For the year ended December 31, 2013, there were no transfers among Levels 1, 2 and 3.
The following is a reconciliation of Level 3 investments for which significant unobservable inputs were used to determine fair value as of December 31, 2012 and/or December 31, 2013:
Diversified Income Fund
Asset Valuation Inputs
| | | | | | | | | | | | | | | | | | | | |
Investments in Securities | | Balance as of
December 31,
2012 | | | Accrued
Discounts
(Premiums) | | | Realized
Gain
(Loss) | | | Change in
Unrealized
Appreciation
(Depreciation) | | | Purchases | |
Bonds and Notes | | | | | | | | | | | | | | | | | | | | |
Non-Convertible Bonds | | | | | | | | | | | | | | | | | | | | |
ABS Other | | $ | — | | | $ | — | | | $ | — | | | $ | 4,632 | | | $ | 279,568 | |
Airlines | | | — | | | | 69 | | | | 35 | | | | (6,819 | ) | | | 85,000 | |
Retailers | | | — | | | | — | | | | — | | | | (332 | ) | | | 255,000 | |
| | | | | | | | | | | | | | | | | | | | |
Total | | $ | — | | | $ | 69 | | | $ | 35 | | | $ | (2,519 | ) | | $ | 619,568 | |
| | | | | | | | | | | | | | | | | | | | |
| | | | | |
Investments in Securities | | Sales | | | Transfers
into
Level 3 | | | Transfers
out of
Level 3 | | | Balance as of
December 31,
2013 | | | Change in
Unrealized
Appreciation
(Depreciation)
from
Investments
Still Held at
December 31,
2013 | |
Bonds and Notes | | | | | | | | | | | | | | | | | | | | |
Non-Convertible Bonds | | | | | | | | | | | | | | | | | | | | |
ABS Other | | $ | — | | | $ | — | | | $ | — | | | $ | 284,200 | | | $ | 4,632 | |
Airlines | | | (88,455 | ) | | | 1,497,278 | | | | — | | | | 1,487,108 | | | | (6,819 | ) |
Retailers | | | — | | | | — | | | | — | | | | 254,668 | | | | (332 | ) |
| | | | | | | | | | | | | | | | | | | | |
Total | | $ | (88,455 | ) | | $ | 1,497,278 | | | $ | — | | | $ | 2,025,976 | | | $ | (2,519 | ) |
| | | | | | | | | | | | | | | | | | | | |
| 78
Notes to Financial Statements (continued)
December 31, 2013
Debt securities valued at $1,497,278 were transferred from Level 2 to Level 3 during the period ended December 31, 2013. At December 31, 2013, these securities were valued using broker-dealer bid prices based on inputs unobservable to the Fund as an independent pricing service was unable to price the securities.
All transfers are recognized as of the beginning of the reporting period.
4. Derivatives. Derivative instruments are defined as financial instruments whose value and performance are based on the value and performance of another security or financial instrument. Derivative instruments that Diversified Income Fund and U.S. Multi-Cap Equity Fund used during the period include forward foreign currency contracts, futures contracts, option contracts and interest rate swaps and swaptions.
Diversified Income Fund may use interest rate swaps and interest rate swaptions to gain exposure, such as to enter into a contract to benefit from a rise or fall in interest rates. During the year ended December 31, 2013, the Fund engaged in interest rate swaps and interest rate swaptions for this purpose.
Diversified Income Fund is subject to the risk that changes in foreign currency exchange rates will have an unfavorable effect on the value of Fund assets denominated in foreign currencies. The Fund may enter into forward foreign currency contracts for hedging purposes to protect the value of the Fund’s holdings of foreign securities. During the year ended December 31, 2013, the Fund engaged in forward foreign currency transactions for hedging purposes.
Diversified Income Fund is subject to the risk that changes in interest rates will affect the value of the Fund’s investments in fixed income securities. The Fund will be subject to increased interest rate risk to the extent that it invests in fixed-income securities with longer maturities or durations, as compared to investing in fixed-income securities with shorter maturities or durations. The Fund may use futures contracts, interest rate swaps and interest rate swaptions to hedge against changes in interest rates and to manage its duration without having to buy or sell portfolio securities. During the year ended December 31, 2013, the Fund used futures contracts, interest rate swaps and interest rate swaptions for hedging purposes and to manage duration.
The Funds are subject to the risk of unpredictable declines in the value of individual equity securities and periods of below average performance in individual securities or in the equity market as a whole. U.S. Multi-Cap Equity Fund may use purchased put options and written call options to hedge against a decline in value of an equity security that it owns and may use written put options to offset the cost of options used for hedging purposes. The Fund may also use purchased call options and written put options for investment purposes. During the year ended December 31, 2013, the Fund engaged in purchased put option transactions for hedging purposes and purchased call option transactions for investment purposes.
79 |
Notes to Financial Statements (continued)
December 31, 2013
The following is a summary of derivative instruments for Diversified Income Fund as of December 31, 2013, as reflected within the Statements of Assets and Liabilities:
| | | | | | | | | | | | | | | | |
Assets | | Investments at value1 | | | Unrealized
appreciation on
forward foreign
currency contracts | | | Unrealized
appreciation on
futures contracts2 | | | Total | |
Over-the-counter asset derivatives | | | | | | | | | | | | | | | | |
Interest rate contracts | | $ | 1,021,337 | | | $ | — | | | $ | — | | | $ | 1,021,337 | |
Foreign exchange contracts | | | — | | | | 4,072 | | | | — | | | | 4,072 | |
| | | | | | | | | | | | | | | | |
Total over-the-counter asset derivatives | | $ | 1,021,337 | | | $ | 4,072 | | | $ | — | | | $ | 1,025,409 | |
| | | | | | | | | | | | | | | | |
Exchange traded/cleared asset derivatives | | | | | | | | | | | | | | | | |
Interest rate contracts | | | — | | | | — | | | | 3,871 | | | | 3,871 | |
| | | | | | | | | | | | | | | | |
Total asset derivatives | | $ | 1,021,337 | | | $ | 4,072 | | | $ | 3,871 | | | $ | 1,029,280 | |
| | | | | | | | | | | | | | | | |
| | | | |
Liabilities | | Swaptions written at value | | | Unrealized
depreciation on
forward foreign
currency contracts | | | Total | | | | |
Over-the-counter liability derivatives | | | | | | | | | | | | | | | | |
Interest rate contracts | | $ | (593,803 | ) | | $ | — | | | $ | (593,803 | ) | | | | |
Foreign exchange contracts | | | — | | | | (2,791 | ) | | | (2,791 | ) | | | | |
| | | | | | | | | | | | | | | | |
Total over-the-counter liability derivatives | | $ | (593,803 | ) | | $ | (2,791 | ) | | $ | (596,594 | ) | | | | |
| | | | | | | | | | | | | | | | |
Total liability derivatives | | $ | (593,803 | ) | | $ | (2,791 | ) | | $ | (596,594 | ) | | | | |
| | | | | | | | | | | | | | | | |
| 1 | Represents purchased swaptions, at value. |
| 2 | Represents cumulative unrealized appreciation (depreciation) on futures contracts. Only the current day’s variation margin on futures contracts is reported within the Statement of Assets and Liabilities as receivable or payable for variation margin, as applicable. |
Transactions in derivative instruments for Diversified Income Fund during the year ended December 31, 2013 as reflected within the Statements of Operations were as follows:
| | | | | | | | | | | | | | | | | | | | |
Net Realized Gain (Loss) on: | | Investments3 | | | Futures
contracts | | | Swaptions
written | | | Swap
agreements | | | Foreign
currency
transactions4 | |
Interest rate contracts | | $ | 347,887 | | | $ | 2,463 | | | $ | (213,115 | ) | | $ | (5,600 | ) | | $ | — | |
Foreign exchange contracts | | | — | | | | — | | | | — | | | | — | | | | (102,163 | ) |
| | | | | |
Net Change in Unrealized
Appreciation (Depreciation) on: | | Investments3 | | | Futures
contracts | | | Swaptions
written | | | Foreign
currency
translations4 | | | | |
Interest rate contracts | | $ | (2,642 | ) | | $ | 3,871 | | | $ | (7,069 | ) | | $ | — | | | | | |
Foreign exchange contracts | | | — | | | | — | | | | | | | | 32,372 | | | | | |
| 3 | Represents realized gain and change in unrealized appreciation (depreciation), respectively, for purchased swaptions during the period. |
| 4 | Represents realized loss and change in unrealized appreciation (depreciation), respectively, for forward foreign currency contracts during the period. Does not include other foreign currency gains or losses included in the Statements of Operations. |
| 80
Notes to Financial Statements (continued)
December 31, 2013
Transactions in derivative instruments for U.S. Multi-Cap Equity Fund during the year ended December 31, 2013 as reflected within the Statements of Operations were as follows:
| | | | |
Net Realized Gain (Loss) on: | | Investments1 | |
Equity contracts | | $ | (283,328 | ) |
| 1 | Represents realized loss for purchased options during the period. |
As the Funds value their derivatives at fair value and recognize changes in fair value through the Statements of Operations, they do not qualify for hedge accounting under authoritative guidance for derivative instruments. The Funds’ investments in derivatives may represent an economic hedge; however, they are considered to be non-hedge transactions for the purpose of these disclosures.
Diversified Income Fund enters into over-the counter derivatives, including forward foreign currency contracts, interest rate swaps, and interest rate swaptions, pursuant to International Swaps and Derivatives Association, Inc. (“ISDA”) agreements between the Fund and its counterparties. ISDA agreements typically contain, among other things, terms for the posting of collateral and master netting provisions in the event of a default or other termination event. Collateral is posted by Diversified Income Fund or the counterparty to the extent of the net mark-to-market exposure to the other party of all open contracts under the agreement, subject to minimum transfer requirements. Master netting provisions allow the Fund and the counterparty, in the event of a default or other termination event, to offset amounts owed by each related to derivative contracts, including any posted collateral, to one net amount payable by either the Fund or the counterparty. The Diversified Income Fund’s ISDA agreements typically contain provisions that allow a counterparty to terminate open contracts early if the net asset value of the Fund declines beyond a certain threshold. For financial reporting purposes, the Fund does not offset derivative assets and liabilities, and any related collateral received or pledged, on the Statement of Assets and Liabilities.
As of December 31, 2013, gross amounts of over-the-counter derivative assets and liabilities not offset in the Statement of Assets & Liabilities and the related net amounts after taking into account master netting arrangements for Diversified Income Fund, by counterparty, are as follows:
| | | | | | | | | | | | | | | | | | | | |
Counterparty | | Gross Amounts
of Derivative
Assets | | | Offset
Amount | | | Net
Asset
Balance | | | Collateral
(Received)/
Pledged | | | Net
Amount | |
Barclays Bank PLC | | $ | 4,072 | | | $ | — | | | $ | 4,072 | | | $ | — | | | $ | 4,072 | |
Citibank, N.A. | | | 984,119 | | | | (593,803 | ) | | | 390,316 | | | | (260,000 | ) | | | 130,316 | |
Credit Suisse International | | | 37,218 | | | | (2,791 | ) | | | 34,427 | | | | — | | | | 34,427 | |
| | | | | | | | | | | | | | | | | | | | |
| | $ | 1,025,409 | | | $ | (596,594 | ) | | $ | 428,815 | | | $ | (260,000 | ) | | $ | 168,815 | |
| | | | | | | | | | | | | | | | | | | | |
81 |
Notes to Financial Statements (continued)
December 31, 2013
| | | | | | | | | | | | | | | | | | | | |
Counterparty | | Gross Amounts
of Derivative
Liabilities | | | Offset
Amount | | | Net
Liability
Balance | | | Collateral
(Received)/
Pledged | | | Net
Amount | |
Citibank, N.A. | | $ | (593,803 | ) | | $ | 593,803 | | | $ | — | | | $ | — | | | $ | — | |
Credit Suisse International | | | (2,791 | ) | | | 2,791 | | | | — | | | | — | | | | — | |
| | | | | | | | | | | | | | | | | | | | |
| | $ | (596,594 | ) | | $ | 596,594 | | | $ | — | | | $ | — | | | $ | — | |
| | | | | | | | | | | | | | | | | | | | |
The actual collateral received or pledged may exceed the amounts shown in the table due to overcollateralization. Timing differences may exist between when contracts under the ISDA agreement are marked-to-market and when collateral moves. The ISDA agreements for Diversified Income Fund include tri-party control agreements under which collateral is held for the benefit of the secured party at a third party custodian, State Street Bank.
Counterparty risk is managed based on policies and procedures established by the Fund’s adviser. Such policies and procedures include, but are not limited to, minimum counterparty credit rating requirements, monitoring of counterparty credit default swap spreads and posting of collateral. The risk of loss to the Fund from counterparty default should be limited to the extent the Fund is undercollateralized for over-the-counter derivatives; however, final settlement of the Fund’s claim against any collateral received may be subject to bankruptcy court proceedings. Additionally, cash or securities held at or pledged to counterparties for initial/variation margin for futures contracts or as collateral for over-the-counter derivatives may be subject to bankruptcy court proceedings. Based on balances reflected on the Fund’s Statement of Assets and Liabilities, including securities held at or pledged to counterparties for initial/variation margin that could be subject to the terms of a final settlement in a bankruptcy court proceeding, the maximum amount of loss that the Fund would incur if counterparties failed to meet their obligations is $1,046,338 and the amount of loss that the Fund would incur after taking into account master netting arrangements pursuant to ISDA agreements is $189,744.
These amounts include cash received as collateral for Diversified Income Fund of $260,000.
The volume of forward foreign currency contract, futures contract and swap agreement activity, as a percentage of net assets, for Diversified Income Fund, based on gross month-end and/or daily notional amounts outstanding during the period, including long and short positions at absolute value, was as follows for the year ended December 31, 2013:
| | | | | | | | | | | | |
Diversified Income Fund | | Forwards | | | Futures | | | Swaps | |
Average Notional Amount Outstanding | | | 1.30 | % | | | 0.08 | % | | | 0.03 | % |
Highest Notional Amount Outstanding | | | 1.58 | % | | | 0.92 | % | | | 1.44 | % |
Lowest Notional Amount Outstanding | | | 0.95 | % | | | 0.00 | % | | | 0.00 | % |
Notional Amount Outstanding as of December 31, 2013 | | | 0.99 | % | | | 0.20 | % | | | 0.00 | % |
| 82
Notes to Financial Statements (continued)
December 31, 2013
Notional amounts outstanding at the end of the prior period are included in the average notional amount outstanding.
Unrealized gain and/or loss on open forwards, futures and swaps is recorded in the Statements of Assets and Liabilities. The aggregate notional values of forward, futures and swap contracts are not recorded in the Statements of Assets and Liabilities, and therefore are not included in the Fund’s net assets.
The volume of interest rate swaption activity, as a percentage of net assets, for Diversified Income Fund, based on average premiums paid or received during the period, including long and short positions, at absolute value, was as follows for the year ended December 31, 2013:
| | | | | | | | | | | | | | | | |
Diversified Income Fund | | Interest Rate Put Swaptions
Written | | | Interest Rate Call
Swaptions Written | | | Interest Rate Call
Swaptions Purchased | | | Interest Rate Put
Swaptions
Purchased | |
Average Premium Paid/Received | | | 0.03 | % | | | 0.32 | % | | | 0.51 | % | | | 0.10 | % |
Highest Premium Paid/Received | | | 0.05 | % | | | 0.44 | % | | | 0.67 | % | | | 0.12 | % |
Lowest Premium Paid/Received | | | 0.02 | % | | | 0.20 | % | | | 0.33 | % | | | 0.08 | % |
Premium Paid/Received as of December 31, 2013 | | | 0.02 | % | | | 0.44 | % | | | 0.67 | % | | | 0.12 | % |
The volume of option contract activity, as a percentage of net assets, for U.S. Multi-Cap Equity Fund, based on month-end market values of equity securities underlying purchased options, at absolute value, was as follows for the year ended December 31, 2013:
| | | | | | | | |
U.S. Multi-Cap Equity Fund* | | Call
Options
Purchased | | | Put
Options
Purchased | |
Average Market Value of Underlying Securities | | | 0.19 | % | | | 0.04 | % |
Highest Market Value of Underlying Securities | | | 0.86 | % | | | 0.20 | % |
Lowest Market Value of Underlying Securities | | | 0.00 | % | | | 0.00 | % |
Market Value of Underlying Securities as of December 31, 2013 | | | 0.00 | % | | | 0.00 | % |
| * | Market value of underlying securities is determined by multiplying option shares by the price of the option’s underlying security, as determined by the Fund’s Pricing Policies and Procedures. |
Market value of underlying securities at the end of the prior period are included in the averages above.
83 |
Notes to Financial Statements (continued)
December 31, 2013
The following is a summary of Diversified Income Fund’s written swaption activity:
| | | | | | | | |
| | | Notional Amount | | | Premiums | |
Outstanding at December 31, 2012 | | $ | 77,000,000 | | | $ | 397,200 | |
Swaptions written | | | 41,950,000 | | | | 879,806 | |
Swaptions terminated in closing purchase transactions | | | (84,000,000 | ) | | | (688,867 | ) |
| | | | | | | | |
Outstanding at December 31, 2013 | | $ | 34,950,000 | | | $ | 588,139 | |
| | | | | | | | |
5. Purchases and Sales of Securities. For the year ended December 31, 2013, purchases and sales of securities (excluding short-term investments and U.S. Government/Agency securities and including paydowns) were as follows:
| | | | | | | | |
Fund | | Purchases | | | Sales | |
Intermediate Municipal Bond Fund | | $ | 13,714,169 | | | $ | 6,666,326 | |
Diversified Income Fund | | | 46,213,301 | | | | 41,606,665 | |
U.S. Multi-Cap Equity Fund | | | 191,206,621 | | | | 213,278,550 | |
For the year ended December 31, 2013, purchases and sales of U.S. Government/Agency securities by Diversified Income Fund were $8,183,856 and $13,262,119, respectively.
6. Management Fees and Other Transactions with Affiliates.
a. Management Fees. NGAM Advisors, L.P. (“NGAM Advisors”) serves as investment adviser to each Fund. Under the terms of the management agreements, each Fund pays a management fee at the following annual rates, calculated daily and payable monthly, based on each Fund’s average daily net assets:
| | | | | | | | | | | | |
| | | Percentage of Average Daily Net Assets | |
Fund | | First $200 million | | | Next $800 million | | | Over $1 billion | |
Intermediate Municipal Bond Fund | | | 0.40 | % | | | 0.40 | % | | | 0.40 | % |
Diversified Income Fund | | | 0.55 | % | | | 0.55 | % | | | 0.50 | % |
U.S. Multi-Cap Equity Fund | | | 0.80 | % | | | 0.80 | % | | | 0.80 | % |
NGAM Advisors has entered into subadvisory agreements for each Fund as listed below.
| | |
Intermediate Municipal Bond Fund | | McDonnell Investment Management, LLC (“McDonnell”) |
Diversified Income Fund | | AEW Capital Management, L.P. (“AEW”) |
| | Loomis, Sayles & Company, L.P. (“Loomis Sayles”) |
U.S. Multi-Cap Equity Fund | | Harris |
| | Loomis Sayles |
| 84
Notes to Financial Statements (continued)
December 31, 2013
Under the terms of the subadvisory agreements, each Fund has agreed to pay its respective subadviser(s) a subadvisory fee at the following annual rates, calculated daily and payable monthly, based on each Fund’s/Segment’s average daily net assets:
| | | | | | | | | | |
| | | | | Percentage of Average
Daily Net Assets | |
Fund | | Subadviser | | First
$250 Million | | | Over
$250 Million | |
Intermediate Municipal Bond Fund | | McDonnell | | | 0.20 | % | | | 0.20 | % |
Diversified Income Fund | | | | | | | | | | |
Diversified REIT Segment | | AEW | | | 0.45 | % | | | 0.40 | % |
Inflation Protected Securities Segment | | Loomis Sayles | | | 0.25 | % | | | 0.20 | % |
Multi-Sector Bond Segment | | Loomis Sayles | | | 0.35 | % | | | 0.30 | % |
U.S. Multi-Cap Equity Fund | | | | | | | | | | |
Harris Associates Segment | | Harris | | | 0.45 | % | | | 0.40 | % |
Large Cap Growth Segment | | Loomis Sayles | | | 0.25 | % | | | 0.25 | % |
Mid Cap Growth Segment | | Loomis Sayles | | | 0.50 | % | | | 0.45 | % |
Small/Mid Core Segment | | Loomis Sayles | | | 0.50 | % | | | 0.45 | % |
Payments to NGAM Advisors are reduced by the amounts of payments to the subadvisers, as calculated based on the table above.
NGAM Advisors has given binding undertakings to the Funds to waive management fees and/or reimburse certain expenses to limit the Funds’ operating expenses, exclusive of acquired fund fees and expenses, brokerage expenses, interest expense, taxes and extraordinary expenses. These undertakings are in effect until April 30, 2014 and are reevaluated on an annual basis. Management fees payable, as reflected on the Statements of Assets and Liabilities, is net of waivers and/or expense reimbursements, if any, pursuant to these undertakings.
For the year ended December 31, 2013, the expense limits as a percentage of average daily net assets under the expense limitation agreements were as follows:
| | | | | | | | | | | | | | | | |
| | | Expense limit as a Percentage of
Average Daily Net Assets | |
Fund | | Class A | | | Class B | | | Class C | | | Class Y | |
Intermediate Municipal Bond Fund | | | 0.80 | % | | | — | | | | 1.55 | % | | | 0.55 | % |
Diversified Income Fund | | | 1.25 | % | | | — | | | | 2.00 | % | | | 1.00 | % |
U.S. Multi-Cap Equity Fund | | | 1.30 | % | | | 2.05 | % | | | 2.05 | % | | | 1.05 | % |
NGAM Advisors shall be permitted to recover expenses it has borne under the expense limitation agreements (whether through waiver of its management fees or otherwise) on a class by class basis in later periods to the extent the annual operating expenses of a class fall below a class’ expense limits, provided, however, that a class is not obligated to pay such waived/reimbursed fees or expenses more than one year after the end of the fiscal year in which the fees or expenses were waived/reimbursed.
85 |
Notes to Financial Statements (continued)
December 31, 2013
For the year ended December 31, 2013, the management fees and waivers of management fees for each Fund were as follows:
| | | | | | | | | | | | | | | | | | | | | | | | |
Fund | | Gross
Management
Fees | | | Contractual Waivers of
Management
Fees1 | | | Voluntary Waiver of
Management
Fee | | | Net
Management
Fees | | | Percentage of
Average Daily
Net Assets | |
| | | | | | Gross | | | Net | |
Intermediate Municipal Bond Fund | | $ | 78,518 | | | $ | 78,518 | | | $ | — | | | $ | — | | | | 0.40 | % | | | — | |
Diversified Income Fund | | | 761,527 | | | | — | | | | 2,263 | | | | 759,264 | | | | 0.55 | % | | | 0.55 | % |
U.S. Multi-Cap Equity Fund | | | 3,162,705 | | | | 71,229 | | | | — | | | | 3,091,476 | | | | 0.80 | % | | | 0.78 | % |
| 1 | Management fee waivers are subject to possible recovery until December 31, 2014. |
For the year ended December 31, 2013, expenses have been reimbursed as follows:
| | | | |
Fund | | Reimbursement2 | |
Intermediate Municipal Bond Fund | | $ | 18,117 | |
| 2 | Expense reimbursements are subject to possible recovery until December 31, 2014. |
No expenses were recovered for any of the Funds during the year ended December 31, 2013 under the terms of the expense limitation agreements.
Certain officers and directors of NGAM Advisors and its affiliates are also officers or Trustees of the Funds. NGAM Advisors, AEW, McDonnell, Hansberger, Loomis Sayles and Harris are subsidiaries of Natixis Global Asset Management, L.P. (“Natixis US”), which is part of Natixis Global Asset Management, an international asset management group based in Paris, France.
b. Service and Distribution Fees. NGAM Distribution, L.P. (“NGAM Distribution”), which is a wholly-owned subsidiary of Natixis US, has entered into a distribution agreement with the Trusts. Pursuant to this agreement, NGAM Distribution serves as principal underwriter of the Funds of the Trusts.
Pursuant to Rule 12b-1 under the 1940 Act, the Trusts have adopted a Service Plan relating to each Fund’s Class A shares (the “Class A Plans”) and a Distribution and Service Plan relating to each Fund’s Class B (if applicable) and Class C shares (the “Class B and Class C Plans”).
Under the Class A Plans, each Fund pays NGAM Distribution a monthly service fee at an annual rate not to exceed 0.25% of the average daily net assets attributable to the Funds’ Class A shares, as reimbursement for expenses incurred by NGAM Distribution in providing personal services to investors in Class A shares and/or the maintenance of shareholder accounts.
Under the Class B (if applicable) and Class C Plans, each Fund pays NGAM Distribution a monthly service fee at an annual rate not to exceed 0.25% of the average daily net assets attributable to the Funds’ Class B (if applicable) and Class C shares, as compensation for services provided by NGAM Distribution in providing personal services to investors in Class B (if applicable) and Class C shares and/or the maintenance of shareholder accounts.
| 86
Notes to Financial Statements (continued)
December 31, 2013
Also under the Class B (if applicable) and Class C Plans, each Fund pays NGAM Distribution a monthly distribution fee at an annual rate of 0.75% of the average daily net assets attributable to the Funds’ Class B (if applicable) and Class C shares, as compensation for services provided by NGAM Distribution in connection with the marketing or sale of Class B (if applicable) and Class C shares.
For the year ended December 31, 2013, the service and distribution fees for each Fund were as follows:
| | | | | | | | | | | | | | | | | | | | |
| | | Service Fees | | | Distribution Fees | |
Fund | | Class A | | | Class B | | | Class C | | | Class B | | | Class C | |
Intermediate Municipal Bond Fund | | $ | 1,009 | | | $ | — | | | $ | 49 | | | $ | — | | | $ | 146 | |
Diversified Income Fund | | | 210,953 | | | | — | | | | 133,420 | | | | — | | | | 400,261 | |
U.S. Multi-Cap Equity Fund | | | 828,113 | | | | 23,137 | | | | 91,423 | | | | 69,411 | | | | 274,268 | |
c. Administrative Fees. NGAM Advisors provides certain administrative services for the Funds and contracts with State Street Bank to serve as sub-administrator. Pursuant to an agreement among Natixis Funds Trust I, Natixis Funds Trust II, Natixis Funds Trust IV, Gateway Trust (“Natixis Funds Trusts”), Loomis Sayles Funds I, Loomis Sayles Funds II (“Loomis Sayles Funds Trusts”), Hansberger International Series and NGAM Advisors, each Fund pays NGAM Advisors monthly its pro rata portion of fees equal to an annual rate of 0.0575% of the first $15 billion of the average daily net assets of the Natixis Funds Trusts, Loomis Sayles Funds Trusts and Hansberger International Series, 0.0500% of the next $15 billion, 0.0400% of the next $30 billion and 0.0350% of such assets in excess of $60 billion, subject to an annual aggregate minimum fee for the Natixis Funds Trusts, Loomis Sayles Funds Trusts and Hansberger International Series of $10 million, which is reevaluated on an annual basis.
For the year ended December 31, 2013, the administrative fees for each Fund were as follows:
| | | | |
Fund | | Administrative
Fees | |
Intermediate Municipal Bond Fund | | $ | 8,665 | |
Diversified Income Fund | | | 61,123 | |
U.S. Multi-Cap Equity Fund | | | 174,513 | |
d. Sub-Transfer Agent Fees. NGAM Distribution has entered into agreements, which include servicing agreements, with financial intermediaries that provide recordkeeping, processing, shareholder communications and other services to customers of the intermediaries that hold positions in the Funds and has agreed to compensate the intermediaries for providing those services. Intermediaries transact with the Funds primarily through the use of omnibus accounts on behalf of their customers who hold positions in the Funds. These services would have been provided by the Funds’ transfer agent and other service providers if the shareholders’ accounts were maintained directly at the Funds’ transfer agent. Accordingly, the Funds have agreed to reimburse NGAM Distribution for all or a portion of the servicing fees paid to these intermediaries. The reimbursement amounts (sub-transfer agent fees) paid to NGAM Distribution are subject to a current per-account equivalent fee limit approved by the Funds’ Board,
87 |
Notes to Financial Statements (continued)
December 31, 2013
which is based on fees for similar services paid to the Funds’ transfer agent and other service providers.
For the year ended December 31, 2013, the sub-transfer agent fees (which are reflected in transfer agent fees and expenses in the Statements of Operations) for each Fund were as follows:
| | | | |
Fund | | Sub-Transfer
Agent Fees | |
Intermediate Municipal Bond Fund | | $ | 131 | |
Diversified Income Fund | | | 88,429 | |
U.S. Multi-Cap Equity Fund | | | 140,306 | |
As of December 31, 2013, the Funds owe NGAM Distribution the following reimbursements for sub-transfer agent fees (which are reflected in the Statements of Assets and Liabilities as payable to distributor):
| | | | |
Fund | | Reimbursements
of Sub-Transfer
Agent Fees | |
Intermediate Municipal Bond Fund | | $ | 3 | |
Diversified Income Fund | | | 1,051 | |
U.S. Multi-Cap Equity Fund | | | 1,882 | |
e. Commissions. Commissions (including CDSCs) on Fund shares retained by NGAM Distribution during the year ended December 31, 2013 were as follows:
| | | | |
Fund | | Commissions | |
Intermediate Municipal Bond Fund | | $ | 3,255 | |
Diversified Income Fund | | | 91,555 | |
U.S. Multi-Cap Equity Fund | | | 170,573 | |
f. Trustees Fees and Expenses. The Trusts do not pay any compensation directly to their officers or Trustees who are directors, officers or employees of NGAM Advisors, NGAM Distribution, Natixis US or their affiliates. The Chairperson of the Board receives a retainer fee at the annual rate of $285,000. The Chairperson does not receive any meeting attendance fees for Board of Trustees meetings or committee meetings that she attends. Each Independent Trustee (other than the Chairperson) receives, in the aggregate, a retainer fee at the annual rate of $115,000. Each Independent Trustee also receives a meeting attendance fee of $10,000 for each meeting of the Board of Trustees that he or she attends in person and $5,000 for each meeting of the Board of Trustees that he or she attends telephonically. In addition, each committee chairperson receives an additional retainer fee at an annual rate of $17,500. Each Contract Review and Governance Committee member is compensated $6,000 for each Committee meeting that he or she attends in person and $3,000 for each meeting that he or she attends telephonically. Each Audit Committee member is compensated $6,000 for each Committee meeting that he or she attends in person and $3,000 for each meeting that he or she attends telephonically. These fees are allocated among the funds in the Natixis Funds Trusts, Loomis Sayles Funds Trusts and Hansberger International Series based
| 88
Notes to Financial Statements (continued)
December 31, 2013
on a formula that takes into account, among other factors, the relative net assets of each fund. Trustees are reimbursed for travel expenses in connection with attendance at meetings.
Effective January 1, 2014, the Chairperson of the Board will receive a retainer fee at the annual rate of $300,000 and each Independent Trustee (other than the Chairperson) will receive, in the aggregate, a retainer fee at the annual rate of $130,000. All other Trustee fees will remain unchanged.
A deferred compensation plan (the “Plan”) is available to the Trustees on a voluntary basis. Deferred amounts remain in the Funds until distributed in accordance with the provisions of the Plan. The value of a participating Trustee’s deferral account is based on theoretical investments of deferred amounts, on the normal payment dates, in certain funds of the Natixis Funds Trusts, Loomis Sayles Funds Trusts and Hansberger International Series as designated by the participating Trustees. Changes in the value of participants’ deferral accounts are allocated pro rata among the funds in the Natixis Funds Trusts, Loomis Sayles Funds Trusts, and Hansberger International Series, and are normally reflected as Trustees’ fees and expenses in the Statements of Operations. The portions of the accrued obligations allocated to the Funds under the Plan are reflected as Deferred Trustees’ fees on the Statements of Assets and Liabilities.
g. Affiliated Ownership. At December 31, 2013, Natixis US held shares of Intermediate Municipal Bond Fund representing 84.77% of the Fund’s net assets. Investment activities of affiliated shareholders could have material impacts on the Funds.
7. Line of Credit. Each Fund, together with certain other funds of Natixis Funds Trusts, Loomis Sayles Funds Trusts and Hansberger International Series, participates in a $200,000,000 committed unsecured line of credit provided by State Street Bank, with an individual limit of $125,000,000 for each fund that participates in the line of credit. Interest is charged to each participating fund based on its borrowings at a rate per annum equal to the greater of the Federal Funds rate or overnight LIBOR, plus 1.25%. In addition, a commitment fee of 0.10% per annum, payable at the end of each calendar quarter, is accrued and apportioned among the participating funds based on their average daily unused portion of the line of credit.
For the six months ended December 31, 2013, none of the Funds had borrowings under this agreement.
8. Brokerage Commission Recapture. Certain Funds have entered into agreements with certain brokers whereby the brokers will rebate a portion of brokerage commissions. All amounts rebated by the brokers are returned to the Funds under such agreements and are included in realized gains on investments in the Statements of Operations. For the year ended December 31, 2013, amounts rebated under these agreements were as follows:
| | | | |
Fund | | Rebates | |
Diversified Income Fund | | $ | 1,123 | |
U.S. Multi-Cap Equity Fund | | | 19,338 | |
9. Concentration of Risk. Each Fund’s investments in foreign securities are subject to foreign currency fluctuations, higher volatility than U.S. securities, varying degrees of
89 |
Notes to Financial Statements (continued)
December 31, 2013
regulation and limited liquidity. Greater political, economic, credit and information risks are also associated with foreign securities.
10. Capital Shares. Each Fund may issue an unlimited number of shares of beneficial interest, without par value. Transactions in capital shares were as follows:
| | | | | | | | | | | | | | | | |
| |
| Year Ended
December 31, 2013 |
| |
| Year Ended
December 31, 2012* |
|
Intermediate Municipal Bond Fund | | | Shares | | | | Amount | | | | Shares | | | | Amount | |
| Class A | | | | | | | | | | | | | | | | |
Issued from the sale of shares | | | 110,750 | | | $ | 1,054,332 | | | | 100 | | | $ | 1,000 | |
Issued in connection with the reinvestment of distributions | | | 394 | | | | 3,760 | | | | — | | | | — | |
Redeemed | | | (1,534 | ) | | | (14,587 | ) | | | — | | | | — | |
| | | | | | | | | | | | | | | | |
Net change | | | 109,610 | | | $ | 1,043,505 | | | | 100 | | | $ | 1,000 | |
| | | | | | | | | | | | | | | | |
| Class C | | | | | | | | | | | | | | | | |
Issued from the sale of shares | | | 5,672 | | | $ | 54,216 | | | | 100 | | | $ | 1,000 | |
Issued in connection with the reinvestment of distributions | | | 3 | | | | 32 | | | | — | | | | — | |
Redeemed | | | (3 | ) | | | (30 | ) | | | — | | | | — | |
| | | | | | | | | | | | | | | | |
Net change | | | 5,672 | | | $ | 54,218 | | | | 100 | | | $ | 1,000 | |
| | | | | | | | | | | | | | | | |
| Class Y | | | | | | | | | | | | | | | | |
Issued from the sale of shares | | | 764,014 | | | $ | 7,476,085 | | | | 1,500,000 | | | $ | 15,000,000 | |
Issued in connection with the reinvestment of distributions | | | 22,939 | | | | 221,518 | | | | — | | | | — | |
Redeemed | | | (12,359 | ) | | | (117,054 | ) | | | — | | | | — | |
| | | | | | | | | | | | | | | | |
Net change | | | 774,594 | | | $ | 7,580,549 | | | | 1,500,000 | | | $ | 15,000,000 | |
| | | | | | | | | | | | | | | | |
Increase (decrease) from capital share transactions | | | 889,876 | | | $ | 8,678,272 | | | | 1,500,200 | | | $ | 15,002,000 | |
| | | | | | | | | | | | | | | | |
| * | From commencement of operations on November 16, 2012 through December 31, 2012. |
| | | | | | | | | | | | | | | | |
| |
| Year Ended
December 31, 2013 |
| |
| Year Ended
December 31, 2012* |
|
Diversified Income Fund | | | Shares | | | | Amount | | | | Shares | | | | Amount | |
| Class A | | | | | | | | | | | | | | | | |
Issued from the sale of shares | | | 2,296,819 | | | $ | 28,186,176 | | | | 3,830,370 | | | $ | 43,949,653 | |
Issued in connection with the reinvestment of distributions | | | 143,499 | | | | 1,747,254 | | | | 126,943 | | | | 1,459,732 | |
Redeemed | | | (2,574,911 | ) | | | (31,275,395 | ) | | | (1,556,939 | ) | | | (18,059,938 | ) |
| | | | | | | | | | | | | | | | |
Net change | | | (134,593 | ) | | $ | (1,341,965 | ) | | | 2,400,374 | | | $ | 27,349,447 | |
| | | | | | | | | | | | | | | | |
| Class C | | | | | | | | | | | | | | | | |
Issued from the sale of shares | | | 1,235,545 | | | $ | 15,057,397 | | | | 1,866,725 | | | $ | 21,303,074 | |
Issued in connection with the reinvestment of distributions | | | 44,750 | | | | 543,265 | | | | 39,405 | | | | 452,182 | |
Redeemed | | | (1,505,441 | ) | | | (18,273,142 | ) | | | (477,710 | ) | | | (5,459,692 | ) |
| | | | | | | | | | | | | | | | |
Net change | | | (225,146 | ) | | $ | (2,672,480 | ) | | | 1,428,420 | | | $ | 16,295,564 | |
| | | | | | | | | | | | | | | | |
| Class Y | | | | | | | | | | | | | | | | |
Issued from the sale of shares | | | 101,531 | | | $ | 1,240,996 | | | | 85 | | | $ | 1,000 | |
Issued in connection with the reinvestment of distributions | | | 1,769 | | | | 21,605 | | | | 1 | | | | 4 | |
Redeemed | | | (51,841 | ) | | | (631,148 | ) | | | — | | | | — | |
| | | | | | | | | | | | | | | | |
Net change | | | 51,459 | | | $ | 631,453 | | | | 86 | | | $ | 1,004 | |
| | | | | | | | | | | | | | | | |
Increase (decrease) from capital share transactions | | | (308,280 | ) | | $ | (3,382,992 | ) | | | 3,828,880 | | | $ | 43,646,015 | |
| | | | | | | | | | | | | | | | |
| * | From commencement of operations on December 3, 2012 through December 31, 2012 for Class Y Shares. |
| 90
Notes to Financial Statements (continued)
December 31, 2013
10. Capital Shares (continued).
| | | | | | | | | | | | | | | | |
| |
| Year Ended
December 31, 2013 |
| |
| Year Ended
December 31, 2012 |
|
U.S. Multi-Cap Equity Fund | | | Shares | | | | Amount | | | | Shares | | | | Amount | |
| Class A | | | | | | | | | | | | | | | | |
Issued from the sale of shares | | | 758,252 | | | $ | 23,078,823 | | | | 489,422 | | | $ | 12,752,911 | |
Issued in connection with the reinvestment of distributions | | | 830,421 | | | | 26,527,755 | | | | 545,630 | | | | 14,382,807 | |
Redeemed | | | (1,366,195 | ) | | | (41,781,217 | ) | | | (1,981,672 | ) | | | (51,920,694 | ) |
| | | | | | | | | | | | | | | | |
Net change | | | 222,478 | | | $ | 7,825,361 | | | | (946,620 | ) | | $ | (24,784,976 | ) |
| | | | | | | | | | | | | | | | |
| Class B | | | | | | | | | | | | | | | | |
Issued from the sale of shares | | | 8,879 | | | $ | 231,157 | | | | 8,494 | | | $ | 188,334 | |
Issued in connection with the reinvestment of distributions | | | 28,040 | | | | 726,359 | | | | 28,842 | | | | 634,251 | |
Redeemed | | | (258,805 | ) | | | (6,503,881 | ) | | | (372,827 | ) | | | (8,159,137 | ) |
| | | | | | | | | | | | | | | | |
Net change | | | (221,886 | ) | | $ | (5,546,365 | ) | | | (335,491 | ) | | $ | (7,336,552 | ) |
| | | | | | | | | | | | | | | | |
| Class C | | | | | | | | | | | | | | | | |
Issued from the sale of shares | | | 328,959 | | | $ | 8,489,719 | | | | 89,119 | | | $ | 1,971,424 | |
Issued in connection with the reinvestment of distributions | | | 131,853 | | | | 3,444,408 | | | | 70,199 | | | | 1,544,393 | |
Redeemed | | | (209,109 | ) | | | (5,252,836 | ) | | | (198,142 | ) | | | (4,360,005 | ) |
| | | | | | | | | | | | | | | | |
Net change | | | 251,703 | | | $ | 6,681,291 | | | | (38,824 | ) | | $ | (844,188 | ) |
| | | | | | | | | | | | | | | | |
| Class Y | | | | | | | | | | | | | | | | |
Issued from the sale of shares | | | 696,498 | | | $ | 23,425,027 | | | | 427,922 | | | $ | 12,215,388 | |
Issued in connection with the reinvestment of distributions | | | 39,615 | | | | 1,392,630 | | | | 17,974 | | | | 515,680 | |
Redeemed | | | (441,890 | ) | | | (15,082,762 | ) | | | (141,281 | ) | | | (4,028,493 | ) |
| | | | | | | | | | | | | | | | |
Net change | | | 294,223 | | | $ | 9,734,895 | | | | 304,615 | | | $ | 8,702,575 | |
| | | | | | | | | | | | | | | | |
Increase (decrease) from capital share transactions | | | 546,518 | | | $ | 18,695,182 | | | | (1,016,320 | ) | | $ | (24,263,141 | ) |
| | | | | | | | | | | | | | | | |
11. Subsequent Event. Effective at the close of business on February 28, 2014, Natixis U.S. Multi-Cap Equity Fund will change its name to Natixis U.S. Equity Opportunities Fund and the Fund’s principal investment strategies will be amended and restated as described in the Supplement dated December 16, 2013 to the Prospectus and Summary Prospectus of Natixis U.S. Multi-Cap Equity Fund.
91 |
Report of Independent Registered Public
Accounting Firm
To the Trustees of Natixis Funds Trust I, Natixis Funds Trust II and Shareholders of Natixis Diversified Income Fund, Natixis U.S. Multi-Cap Equity Fund, and McDonnell Intermediate Municipal Bond:
In our opinion, the accompanying statements of assets and liabilities, including the portfolios of investments, and the related statements of operations and of changes in net assets and the financial highlights present fairly, in all material respects, the financial position of the Natixis Diversified Income Fund and Natixis U.S. Multi-Cap Equity Fund each a series of Natixis Funds Trust I; and the McDonnell Intermediate Municipal Bond Fund, a series of Natixis Funds Trust II (collectively, the “Funds”), at December 31, 2013, and the results of each of their operations, the changes in each of their net assets and their financial highlights for each of the periods indicated, in conformity with accounting principles generally accepted in the United States of America. These financial statements and financial highlights (hereafter referred to as “financial statements”) are the responsibility of the Funds’ management; our responsibility is to express an opinion on these financial statements based on our audits. We conducted our audits of these financial statements in accordance with the standards of the Public Company Accounting Oversight Board (United States). Those standards require that we plan and perform the audit to obtain reasonable assurance about whether the financial statements are free of material misstatement. An audit includes examining, on a test basis, evidence supporting the amounts and disclosures in the financial statements, assessing the accounting principles used and significant estimates made by management, and evaluating the overall financial statement presentation. We believe that our audits, which included confirmation of securities at December 31, 2013 by correspondence with the custodian and brokers, provide a reasonable basis for our opinion.
PricewaterhouseCoopers LLP
Boston, MA
February 24, 2014
| 92
2013 U.S. Tax Distribution Information to
Shareholders (Unaudited)
Corporate Dividends Received Deduction. For the fiscal year ended December 31, 2013, a percentage of dividends distributed by the Funds listed below qualify for the dividends received deduction for corporate shareholders. These percentages are as follows:
| | | | |
Fund | | Qualifying
Percentage | |
Diversified Income | | | 40.38 | % |
U.S. Multi-Cap Equity | | | 100.00 | % |
Capital Gains Distributions. Pursuant to Internal Revenue Section 852(b), the following Funds paid distributions, which have been designated as capital gains distributions for the fiscal year ended December 31, 2013.
| | | | |
Fund | | Amount | |
U.S. Multi-Cap Equity | | $ | 30,926,551 | |
Qualified Dividend Income. For the fiscal year ended December 31, 2013, a percentage of the ordinary income dividends paid by the Funds are considered qualified dividend income eligible for reduced tax rates. These lower rates range from 0% to 20% depending on an individual’s tax bracket. If the Funds paid a distribution during calendar year 2013, complete information will be reported in conjunction with Form 1099-DIV. These percentages are noted below:
| | | | |
Fund | | Qualifying
Percentage | |
Diversified Income | | | 42.46 | % |
U.S. Multi-Cap Equity | | | 100.00 | % |
93 |
Trustee and Officer Information
The tables below provide certain information regarding the trustees and officers of Natixis Funds Trust I and Natixis Funds Trust II (the “Trusts”). Unless otherwise indicated, the address of all persons below is 399 Boylston Street, Boston, MA 02116. The Funds’ Statements of Additional Information include additional information about the trustees of the Trusts and are available by calling Natixis Funds at 800-225-5478.
| | | | | | | | |
Name and Year of
Birth | | Position(s) Held
with the Trust(s),
Length of Time
Served and Term
of Office1 | | Principal
Occupation(s)
During Past
5 Years | | Number of
Portfolios in
Fund Complex
Overseen2 and
Other
Directorships Held
During Past
5 Years | | Experience,
Qualifications,
Attributes, Skills
for Board
Membership |
| | | |
| INDEPENDENT TRUSTEES | | | | | | |
| | | | |
Daniel M. Cain (1945) | | Trustee Since 1996 for Natixis Funds Trust I and Natixis Funds Trust II Chairman of the Contract Review and Governance Committee | | Chairman of Cain Brothers & Company, Incorporated (investment banking) | | 42 Director, Sheridan Healthcare Inc. (physician practice management) | | Significant experience on the Board and on the board of other business organizations (including at a health care organization); experience in the financial industry (including roles as chairman and former chief executive officer of an investment banking firm) |
| | | | |
Kenneth A. Drucker (1945) | | Trustee Since 2008 for Natixis Funds Trust I and Natixis Funds Trust II Chairman of the Audit Committee | | Retired | | 42 None | | Significant experience on the Board and on the board of other business organizations (including at investment companies); executive experience (including as treasurer of an aerospace, automotive, and metal manufacturing corporation) |
| 94
Trustee and Officer Information
| | | | | | | | |
Name and Year of
Birth | | Position(s) Held
with the Trust(s),
Length of Time
Served and Term
of Office1 | | Principal
Occupation(s)
During Past
5 Years | | Number of
Portfolios in
Fund Complex
Overseen2 and
Other
Directorships Held
During Past
5 Years | | Experience,
Qualifications,
Attributes, Skills
for Board
Membership |
| | | |
INDEPENDENT TRUSTEES continued | | | | | | |
| | | | |
| Edmond J. English (1953) | | Trustee Since 2013 for Natixis Funds Trust I and Natixis Funds Trust II Contract Review and Governance Committee Member | | Chief Executive Officer of Bob’s Discount Furniture (retail) | | 42 Formerly, Director, BJ’s Wholesale Club (retail); formerly, Director, Citizens Financial Group (bank) | | Significant experience on the board of other business organizations (including at a retail company and a bank); executive experience (including at a retail company) |
| | | | |
Wendell J. Knox (1948) | | Trustee Since 2009 for Natixis Funds Trust I and Natixis Funds Trust II Audit Committee Member | | Director (formerly, President and Chief Executive Officer) of Abt Associates Inc. (research and consulting) | | 42 Director, Eastern Bank (bank); Director, The Hanover Insurance Group (property and casualty insurance) | | Significant experience on the Board and on the board of other business organizations (including at a bank and at a property and casualty insurance firm); executive experience (including roles as president and chief executive officer of a research and consulting company) |
95 |
Trustee and Officer Information
| | | | | | | | |
Name and Year of
Birth | | Position(s) Held
with the Trust(s),
Length of Time
Served and Term
of Office1 | | Principal
Occupation(s)
During Past
5 Years | | Number of
Portfolios in
Fund Complex
Overseen2 and
Other
Directorships Held
During Past
5 Years | | Experience,
Qualifications,
Attributes, Skills
for Board
Membership |
| | | |
INDEPENDENT TRUSTEES continued | | | | | | |
| | | | |
| Martin T. Meehan (1956) | | Trustee Since 2012 for Natixis Funds Trust I and Natixis Funds Trust II Contract Review and Governance Committee Member | | Chancellor and faculty member, University of Massachusetts Lowell | | 42 None | | Experience on the Board and on the board of other business organizations; experience as Chancellor of the University of Massachusetts Lowell; government experience (including as a member of the U.S. House of Representatives); academic experience |
| | | | |
Sandra O. Moose (1942) | | Chairperson of the Board of Trustees since November 2005 Trustee Since 1982 for Natixis Funds Trust I (including its predecessors); since 1993 for Natixis Funds Trust II Ex officio member of the Audit Committee and Contract Review and Governance Committee | | President, Strategic Advisory Services (management consulting) | | 42 Director, Verizon Communications (telecommunications company); Director, AES Corporation (international power company); formerly, Director, Rohm and Haas Company (specialty chemicals) | | Significant experience on the Board and on the board of other business organizations (including at a telecommunications company, an international power company and a specialty chemicals corporation); executive experience (including at a management consulting company) |
| 96
Trustee and Officer Information
| | | | | | | | |
Name and Year of
Birth | | Position(s) Held
with the Trust(s),
Length of Time
Served and Term
of Office1 | | Principal
Occupation(s)
During Past
5 Years | | Number of
Portfolios in
Fund Complex
Overseen2 and
Other
Directorships Held
During Past
5 Years | | Experience,
Qualifications,
Attributes, Skills
for Board
Membership |
| | | |
INDEPENDENT TRUSTEES continued | | | | | | |
| | | | |
Erik R. Sirri (1958) | | Trustee Since 2009 for Natixis Funds Trust I and Natixis Funds Trust II Audit Committee Member | | Professor of Finance at Babson College; formerly, Director of the Division of Trading and Markets at the Securities and Exchange Commission | | 42 None | | Significant experience on the Board; experience as Director of the Division of Trading and Markets at the Securities and Exchange Commission; academic experience; training as an economist |
| | | | |
Peter J. Smail (1952) | | Trustee Since 2009 for Natixis Funds Trust I and Natixis Funds Trust II Audit Committee Member | | Retired | | 42 None | | Significant experience on the Board; mutual fund industry and executive experience (including roles as president and chief executive officer for an investment adviser) |
| | | | |
Cynthia L. Walker (1956) | | Trustee Since 2005 for Natixis Funds Trust I and Natixis Funds Trust II Contract Review and Governance Committee Member | | Deputy Dean for Finance and Administration, Yale University School of Medicine | | 42 None | | Significant experience on the Board; executive experience in a variety of academic organizations (including roles as dean for finance and administration) |
97 |
Trustee and Officer Information
| | | | | | | | |
Name and Year of
Birth | | Position(s) Held
with the Trust(s),
Length of Time
Served and Term
of Office1 | | Principal
Occupation(s)
During Past
5 Years | | Number of
Portfolios in
Fund Complex
Overseen2 and
Other
Directorships Held
During Past
5 Years | | Experience,
Qualifications,
Attributes, Skills
for Board
Membership |
|
| INTERESTED TRUSTEES |
| | | | |
Robert J. Blanding3 (1947) 555 California Street San Francisco, CA 94104 | | Trustee Since 2003 for Natixis Funds Trust I and Natixis Funds Trust II | | President, Chairman, Director and Chief Executive Officer, Loomis, Sayles & Company, L.P. | | 42 None | | Significant experience on the Board; continuing service as President, Chairman, and Chief Executive Officer of Loomis, Sayles & Company, L.P. |
| | | | |
David L. Giunta4
(1965) | | Trustee Since 2011 for Natixis Funds Trust I and Natixis Funds Trust II President and Chief Executive Officer of Natixis Funds Trust I and Natixis Funds Trust II since 2008 | | President and Chief Executive Officer, NGAM Distribution Corporation, NGAM Advisors, L.P. and NGAM Distribution, L.P. | | 42 None | | Experience on the Board; continuing experience as President and Chief Executive Officer of NGAM Distribution Corporation, NGAM Advisors, L.P. and NGAM Distribution, L.P. |
| | | | |
John T. Hailer5 (1960) | | Trustee Since 2000 for Natixis Funds Trust I and Natixis Funds Trust II | | President and Chief Executive Officer – U.S. and Asia, Natixis Global Asset Management, L.P. | | 42 None | | Significant experience on the Board; continuing experience as President and Chief Executive Officer – U.S. and Asia, Natixis Global Asset
Management, L.P. |
| 1 | Each trustee serves until retirement, resignation or removal from the Board. The current retirement age is 75. The position of Chairperson of the Board is appointed for a three-year term. Ms. Moose was appointed to serve an additional three-year term as the Chairperson of the Board on December 13, 2013. |
| 2 | The trustees of the Trusts serve as trustees of a fund complex that includes all series of the Natixis Funds Trust I, Natixis Funds Trust II, Natixis Funds Trust IV and Gateway Trust (collectively, the “Natixis Funds Trusts”), Loomis Sayles Funds I and Loomis Sayles Funds II (collectively, the “Loomis Sayles Funds Trusts”), and Hansberger International Series (collectively, the “Fund Complex”). |
| 98
Trustee and Officer Information
| 3 | Mr. Blanding is deemed an “interested person” of the Trusts because he holds the following positions with an affiliated person of the Trusts: President, Chairman, Director and Chief Executive Officer of Loomis, Sayles & Company, L.P. and Director of Loomis Sayles Investment Asia Pte., Ltd. |
| 4 | Mr. Giunta is deemed an “interested person” of the Trusts because he holds the following positions with an affiliated person of the Trusts: President and Chief Executive Officer of NGAM Distribution Corporation, NGAM Advisors, L.P. and NGAM Distribution, L.P. |
| 5 | Mr. Hailer is deemed an “interested person” of the Trusts because he holds the following positions with an affiliated person of the Trusts: President and Chief Executive Officer – U.S. and Asia, Natixis Global Asset Management, L.P. |
99 |
Trustee and Officer Information
| | | | | | |
Name and Year of Birth | | Position(s) Held
with the Trust(s) | | Term of Office1 and
Length of Time Served | | Principal Occupation(s)
During Past 5 Years2 |
|
| OFFICERS OF THE TRUST |
| | | |
Coleen Downs Dinneen (1960) | | Secretary, Clerk and Chief Legal Officer | | Since September 2004 | | Executive Vice President, General Counsel, Secretary and Clerk, NGAM Distribution Corporation, NGAM Advisors, L.P. and NGAM Distribution, L.P. |
| | | |
Russell L. Kane (1969) | | Chief Compliance Officer, Assistant Secretary and Anti-Money Laundering Officer | | Chief Compliance Officer since May 2006; Assistant Secretary since June 2004; and Anti-Money Laundering Officer since April 2007 | | Chief Compliance Officer for Mutual Funds, Senior Vice President, Deputy General Counsel, Assistant Secretary and Assistant Clerk, NGAM Distribution Corporation, NGAM Advisors, L.P. and NGAM Distribution, L.P. |
| | | |
Michael C. Kardok (1959) | | Treasurer, Principal Financial and Accounting Officer | | Since October 2004 | | Senior Vice President, NGAM Advisors, L.P. and NGAM Distribution, L.P. |
| 1 | Each officer of the Trusts serves for an indefinite term in accordance with the Trusts’ current by-laws until the date his or her successor is elected and qualified, or until he or she sooner dies, retires, is removed or becomes disqualified. |
| 2 | Each person listed above, except as noted, holds the same position(s) with the Fund Complex. Previous positions during the past five years with NGAM Distribution, L.P., NGAM Advisors, L.P. or Loomis, Sayles & Company, L.P. are omitted, if not materially different from a trustee’s or officer’s current position with such entity. |
| 100
The Registrant has adopted a code of ethics that applies to the Registrant’s principal executive officer, principal financial officer and persons performing similar functions. There have been no amendments or waivers of the Registrant’s code of ethics during the period.
| Item 3. | Audit Committee Financial Expert. |
The Board of Trustees of the Registrant has established an audit committee. Mr. Kenneth A. Drucker, Mr. Wendell J. Knox, Mr. Erik R. Sirri and Mr. Peter J. Smail are members of the audit committee and have been designated as “audit committee financial experts” by the Board of Trustees. Each of these individuals is also an Independent Trustee of the Registrant.
| Item 4. | Principal Accountant Fees and Services. |
Fees billed by the Principal Accountant for services rendered to the Registrant.
The table below sets forth fees billed by the principal accountant, PricewaterhouseCoopers LLP, for the past two fiscal years for professional services rendered in connection with a) the audit of the Registrant’s annual financial statements and services provided in connection with regulatory filings; b) audit-related services (including services that are reasonably related to the performance of the audit of the Registrant’s financial statements but not reported under “Audit Fees”); c) tax compliance, tax advice and tax planning and d) all other fees billed for professional services rendered by the principal accountant to the Registrant, other than the services provided as reported as a part of (a) through (c) of this Item.
| | | | | | | | | | | | | | | | | | | | | | | | | | | | | | | | |
| | | Audit fees | | | Audit-related fees1 | | | Tax fees2 | | | All other fees | |
| | | 1/1/12 –
12/31/12 | | | 1/1/13 –
12/31/13 | | | 1/1/12 –
12/31/12 | | | 1/1/13 –
12/31/13 | | | 1/1/12 –
12/31/12 | | | 1/1/13 –
12/31/13 | | | 1/1/12 –
12/31/12 | | | 1/1/13 –
12/31/13 | |
Natixis Funds Trust I | | $ | 232,539 | | | $ | 190,779 | | | $ | 287 | | | $ | 4,429 | | | $ | 68,620 | | | $ | 52,933 | | | $ | — | | | $ | — | |
| | 1. | Audit-related fees consist of: |
2012 – performance of agreed-upon procedures related to the Registrant’s deferred compensation plan.
2013 – performance of agreed-upon procedures related to the Registrant’s deferred compensation plan and review of Form N-1A filings.
2012 & 2013 – review of the Registrant’s tax returns, quarterly review of asset diversification tests.
Aggregate fees billed to the Registrant for non-audit services during 2012 and 2013 were $68,907 and $57,362, respectively.
Fees billed by the Principal Accountant for services rendered to the Adviser and Control Affiliates.
The following table sets forth the fees billed by the Registrant’s principal accountant for non-audit services rendered to Capital Growth Management Limited Partnership (“CGM”), Hansberger Global Investors, Inc. (“HGI”), Loomis, Sayles & Company, L.P. (“Loomis”), NGAM Advisors, L.P. (“NGAM”) and entities controlling, controlled by or under common control with CGM, HGI, Loomis and NGAM (“Control Affiliates”) that provide ongoing services to the Registrant, for engagements that related directly to the operations and financial reporting of the Registrant for the last two fiscal years.
| | | | | | | | | | | | | | | | | | | | | | | | |
| | | Audit-related fees | | | Tax fees | | | All other fees | |
| | | 1/1/12 –
12/31/12 | | | 1/1/13 –
12/31/13 | | | 1/1/12 –
12/31/12 | | | 1/1/13 –
12/31/13 | | | 1/1/12 –
12/31/12 | | | 1/1/13 –
12/31/13 | |
Control Affiliates | | $ | — | | | $ | — | | | $ | — | | | $ | — | | | $ | — | | | $ | — | |
The following table sets forth the aggregate fees billed by the Registrant’s principal accountant for non-audit services rendered to CGM, HGI, Loomis, NGAM and Control Affiliates that provide ongoing services to the Registrant, for the last two fiscal years, including the fees disclosed in the table above.
| | | | | | | | |
| | | Aggregate Non-Audit Fees | |
| | | 1/1/12 –
12/31/12 | | | 1/1/13 –
12/31/13 | |
Control Affiliates | | $ | 321,228 | | | $ | 281,800 | |
None of the services described above were approved pursuant to (c)(7)(i)(C) of Regulation S-X.
Audit Committee Pre Approval Policies.
Annually, the Registrant’s Audit Committee reviews the audit, audit-related, tax and other non-audit services together with the projected fees, for services proposed to be rendered to the Trust and/or other entities for which pre-approval is required during the upcoming year. Any subsequent revisions to already pre-approved services or fees (including fee increases) and requests for pre-approval of new services would be presented for consideration quarterly as needed.
If, in the opinion of management, a proposed engagement by the Registrant’s independent accountants needs to commence before the next regularly scheduled Audit Committee meeting, any member of the Audit Committee who is an independent Board member is authorized to pre-approve the engagement, but only for engagements to provide audit, audit related and tax services. This approval is subject to review of the full Audit Committee at its next quarterly meeting. All other engagements require the approval of all the members of the Audit Committee.
| Item 5. | Audit Committee of Listed Registrants. |
Not applicable.
| Item 6. | Schedule of Investments. |
Included as part of the Report to Shareholders filed as Item 1 herewith.
| Item 7. | Disclosure of Proxy Voting Policies and Procedures for Closed-End Management Investment Companies. |
Not applicable.
| Item 8. | Portfolio Managers of Closed-End Management Investment Companies. |
Not applicable.
| Item 9. | Purchases of Equity Securities by Closed-End Management Investment Companies and Affiliated Purchasers. |
Not applicable.
| Item 10. | Submission of Matters to a Vote of Securities Holders. |
There were no material changes to the procedures by which shareholders may recommend nominees to the Registrant’s Board of Trustees.
| Item 11. | Controls and Procedures. |
The Registrant’s principal executive officer and principal financial officer have concluded that the Registrant’s disclosure controls and procedures are sufficient to ensure that information required to be disclosed by the Registrant in this Form N-CSR was recorded, processed, summarized and reported within the time periods specified in the Securities and Exchange Commission’s rules and forms, based upon such officers’ evaluation of these controls and procedures as of a date within 90 days of the filing date of the report.
There were no changes in the Registrant’s internal control over financial reporting that occurred during the Registrant’s last fiscal quarter of the period covered by this report that has materially affected, or is reasonably likely to materially affect, the Registrant’s internal control over financial reporting.
| | | | | | |
| | (a) | | (1) | | Code of Ethics required by Item 2 hereof, filed herewith as exhibit (a)(1). |
| | (a) | | (2) | | Certifications of Principal Executive Officer and Principal Financial Officer pursuant to Rule 30a-2(a) under the Investment Company Act of 1940 [17 CFR 270.30a-2(a)], filed herewith as Exhibits (a)(2)(1) and (a)(2)(2), respectively. |
| | (a) | | (3) | | Not applicable. |
| | (b) | | | | Certifications of Principal Executive Officer and Principal Financial Officer pursuant to Section 906 of Sarbanes-Oxley Act of 2002 are filed herewith as Exhibit (b). |
SIGNATURES
Pursuant to the requirements of the Securities Exchange Act of 1934 and the Investment Company Act of 1940, the Registrant has duly caused this report to be signed on its behalf by the undersigned, thereunto duly authorized.
| | |
Natixis Funds Trust I |
| |
| By: | | /s/ David L. Giunta |
| | |
| |
Name: | | David L. Giunta |
Title: | | President and Chief Executive Officer |
Date: | | February 24, 2014 |
Pursuant to the requirements of the Securities Exchange Act of 1934 and the Investment Company Act of 1940, this report has been signed by the following persons on behalf of the Registrant and in the capacities and on the dates indicated.
| | |
| |
Name: | | David L. Giunta |
Title: | | President and Chief Executive Officer |
Date: | | February 24, 2014 |
| | |
| |
| By: | | /s/ Michael C. Kardok |
| | |
| |
Name: | | Michael C. Kardok |
Title: | | Treasurer |
Date: | | February 24, 2014 |