UNITED STATES
SECURITIES AND EXCHANGE COMMISSION
Washington, D.C. 20549
FORM N-CSR
CERTIFIED SHAREHOLDER REPORT OF REGISTERED
MANAGEMENT INVESTMENT COMPANIES
Investment Company Act file number: 811-04323
Natixis Funds Trust I
(Exact name of Registrant as specified in charter)
399 Boylston Street, Boston, Massachusetts 02116
(Address of principal executive offices) (Zip code)
Coleen Downs Dinneen, Esq.
NGAM Distribution, L.P.
399 Boylston Street
Boston, Massachusetts 02116
(Name and address of agent for service)
Registrant’s telephone number, including area code: (617) 449-2810
Date of fiscal year end: December 31
Date of reporting period: December 31, 2014
| Item 1. | Reports to Stockholders. |
The Registrant’s annual report transmitted to shareholders pursuant to Rule 30e-1 under the Investment Company Act of 1940 is as follows:
ANNUAL REPORT
December 31, 2014

CGM Advisor Targeted Equity Fund
Natixis Oakmark Fund
Natixis Oakmark International Fund
Vaughan Nelson Small Cap Value Fund
Vaughan Nelson Value Opportunity Fund
TABLE OF CONTENTS
Portfolio Review page 1
Portfolio of Investments page 24
Financial Statements page 43
Notes to Financial Statements page 72
CGM ADVISOR TARGETED EQUITY FUND
| | |
| Manager | | Symbols |
| G. Kenneth Heebner, CFA® | | Class A NEFGX |
| Capital Growth Management Limited Partnership | | Class B NEBGX |
| | Class C NEGCX |
| | Class Y NEGYX |
Objective
The Fund seeks long-term growth of capital through investments in equity securities of companies whose earnings are expected to grow at a faster rate than that of the overall U.S. economy.
Market Conditions
At the start of 2014, cold weather gripped most of the country, slowing retail and auto sales, and putting a damper on hiring. As the winter drew to a close, however, both the weather and the economy began to warm up. The economy gained momentum in the latter half of the year, growing by a 5% annual rate in the third quarter, recording the strongest growth in more than a decade according to the U.S. Commerce Department. Meanwhile, as labor market conditions improved based on solid job gains and a lower unemployment rate, consumer spending took off and the stock market continued to rise to new heights. While a major decline in oil prices late in the period raised questions about energy-related employment in the United States, falling gasoline and heating oil prices provided a significant boost to the domestic economy by increasing disposable consumer income, and therefore, consumer spending.
In contrast, foreign economic activity proved generally disappointing during the period. Chinese economic growth, in particular, slowed appreciably, due primarily to speculative investment in residential real estate development, which created overcapacity and negatively impacted construction activity. Elsewhere, Russia slipped into recession as a result of declining oil prices and sanctions. European economic activity, for the most part, was mixed, while developing countries were hard hit by weakening commodity prices.
Performance Results
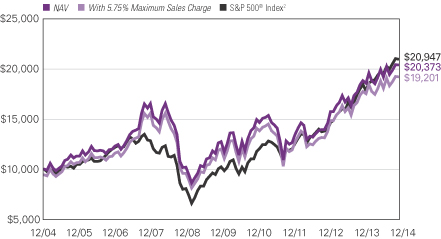
For the 12 months ended December 31, 2014, Class A shares of CGM Advisor Targeted Equity Fund returned 8.27% at net asset value. The Fund underperformed its benchmark, the S&P 500® Index, which returned 13.69% for the year.
Explanation of Fund Performance
In anticipation of significant U.S. economic growth, the Fund remained fully invested throughout 2014. The U.S. economy did not disappoint, as growth remained brisk throughout the period, showing signs of even greater expansion at year-end. We believed the Fund was positioned to benefit from an improving business climate, yet lagged its benchmark because of a major concentration in underperforming homebuilding stocks, as well as disappointments in several individual securities.
1 |
During the period, the homebuilding industry uncharacteristically lagged the economic recovery. Mortgage companies became increasingly conservative in their lending decisions based on past experience with the housing collapse as well as stricter U.S. government-mandated lending requirements. Despite strong corporate earnings growth, our homebuilding stocks underperformed broad market indices.
Individual detractors to fund performance included Itau Unibanco, Ford Motor Company, and Tenet Healthcare. Shares of Itau Unibanco, the leading bank in Latin America as well as one of the world’s largest, fell as the Brazilian Stock Market weakened. Brazilian equities tumbled as declining commodity prices had a negative impact on the Brazilian economy and currency. We continue to own this stock. Automobile giant Ford Motor Company was adversely affected when management announced that the introduction costs for the all new aluminum F-150 pick-up truck would run higher than anticipated. We continue to own Ford. Tenet Healthcare Corporation, one of the country’s leading and most comprehensive health care services companies, suffered a drop in stock price when the firm revealed that the company’s financial benefits from the Affordable Care Act were below investor expectations. We sold the issue at a loss.
The Fund realized a major gain in Atlanta-based Delta Airlines, as the industry benefited from consolidation and strong business travel. Gilead Sciences, a leading American biotechnology company, also appreciated significantly as sales of its new Hepatitis C drug, Sovaldi, exceeded expectations. Both Delta and Gilead Sciences were sold.
Meanwhile, shares of Micron Technology, one of the world’s top five semiconductor producers, rose substantially as healthy earnings reflected the benefits of industry consolidation and better-than-expected demand for DRAM chips. DRAM, or dynamic random-access memory, is the main memory used in desktops, laptops and workstation computers as well as some video game consoles. We continue to hold this issue.
Outlook
We are optimistic about the outlook for the U.S. economy in 2015, as it continues to gain strength and momentum. While the forecast for many foreign economies remains questionable, the future of the U.S. economy should continue to benefit from rising consumer confidence and spending, sharply lower energy prices, and re-liquefied consumer balance sheets. Although the Federal Reserve (Fed) concluded its quantitative easing program in October 2014, it has shown no sign of pulling back from its pledge of patience regarding interest rate hikes. Based on these factors, the U.S. economy should continue to expand as utilization of manufacturing capacity increases and corporations are motivated to make capital expenditures to provide for additional demand. With expectations for a favorable economic environment ahead, CGM Advisor Targeted Equity Fund will continue to focus on individual stocks with the potential to grow earnings at a faster rate than that of the overall U.S. economy.
| 2
CGM ADVISOR TARGETED EQUITY FUND
Growth of $10,000 Investment in Class A Shares
December 31, 2004 through December 31, 2014
Average Annual Total Returns — December 31, 2014
| | | | | | | | | | | | |
| | | | |
| | | 1 Year | | | 5 Years | | | 10 Years | |
| | | | |
| Class A (Inception 11/27/68) | | | | | | | | | | | | |
| NAV | | | 8.27 | % | | | 9.84 | % | | | 7.37 | % |
| With 5.75% Maximum Sales Charge | | | 2.04 | | | | 8.55 | | | | 6.74 | |
| | | | |
| Class B (Inception 2/28/97) | | | | | | | | | | | | |
| NAV | | | 7.47 | | | | 9.02 | | | | 6.59 | |
| With CDSC1 | | | 2.94 | | | | 8.73 | | | | 6.59 | |
| | | | |
| Class C (Inception 9/1/98) | | | | | | | | | | | | |
| NAV | | | 7.43 | | | | 9.00 | | | | 6.58 | |
| With CDSC1 | | | 6.52 | | | | 9.00 | | | | 6.58 | |
| | | | |
| Class Y (Inception 6/30/99) | | | | | | | | | | | | |
| NAV | | | 8.52 | | | | 10.09 | | | | 7.65 | |
| | | | |
| Comparative Performance | | | | | | | | | | | | |
| S&P 500® Index2 | | | 13.69 | | | | 15.45 | | | | 7.67 | |
Past performance does not guarantee future results. The table(s) does not reflect taxes shareholders might owe on any fund distributions or when they redeem their shares. Performance for periods less than one year is cumulative, not annualized. Returns reflect changes in share price and reinvestment of dividends and capital gains, if any. Unlike a fund, an index is not managed and does not reflect fees and expenses.
| 1 | Performance for Class B shares assumes a maximum 5.00% contingent deferred sales charge (“CDSC”) applied when you sell shares, which declines annually between years 1-6 according to the following schedule: 5, 4, 3, 3, 2, 1, 0%. Class C share performance assumes a 1.00% CDSC applied when you sell shares within one year of purchase. |
| 2 | S&P 500® Index is a widely recognized measure of U.S. stock market performance. It is an unmanaged index of 500 common stocks chosen for market size, liquidity, and industry group representation, among other factors. |
3 |
NATIXIS OAKMARK FUND
| | |
| Managers | | Symbols |
| William C. Nygren, CFA® | | Class A NEFOX |
| Kevin G. Grant, CFA® | | Class B NEGBX |
| M. Colin Hudson, CFA® | | Class C NECOX |
| Michael J. Mangan, CFA® | | Class Y NEOYX |
| Harris Associates L.P. | | |
| * | Michael J. Mangan became a portfolio manager of the Fund effective August 1, 2014. |
Objective
The Fund seeks long-term capital appreciation.
Market Conditions
As we head into 2015, we are faced with a varied and interesting investment landscape. Oil prices are down by more than half from their peak, commodity prices are off by more than one-third since June, the U.S. dollar is up double digits and emerging markets are down. And amidst all of this, the U.S. stock market recovered and ended the year within decimal points of its all-time high. Strong corporate fundamentals and reasonable market valuations continued to provide a sound argument and reward for focused investment portfolios with long-term orientations.
The unfolding story in energy and commodity markets is an important one. The sharp decline in oil prices creates serious fiscal challenges for some countries—Russia, Venezuela and Iran come immediately to mind. New, hopefully better geopolitical realities will undoubtedly emerge over the long run, although the near-term fallout in these countries is much less predictable. While energy producers now face a more hostile economic environment (this will also reverse at some point as consumption eventually rises), there are dramatic positive benefits for individuals and most businesses. Retail gas prices are headed toward less than $2 a gallon, a consumer benefit projected by some analysts to equal the effect of a $200 billion tax cut. And while reduced capital spending and employment by energy producers will offset some of the good news, the energy story is an unmistakable positive for consumer confidence/spending and fundamental business profitability.
Performance Results
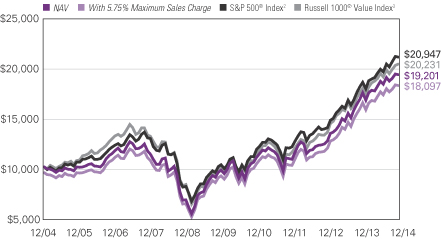
For the 12 months ended December 31, 2014, Class A shares of the Natixis Oakmark Fund returned 10.43% at net asset value. The Fund underperformed its benchmark, the S&P 500® Index, which returned 13.69%.
Explanation of Fund Performance
On February 28, 2014, Bill Nygren, Kevin Grant and Colin Hudson assumed portfolio management responsibilities for the Fund. The Fund was renamed the “Natixis Oakmark Fund.” In addition, Michael Mangan became a manager of the Fund on August 1, 2014. Due to these changes in management, an explanation of performance before and after February 28, 2014, is provided below.
| 4
NATIXIS OAKMARK FUND
As value investors with an emphasis on individual stock selection, our sector weights are a by-product of our bottom-up process. For the period from January 1, 2014 to February 28, 2014, holdings in the consumer discretionary sector contributed the most to the return, while holdings in the financials sector detracted the most from the return. For the period from March 1, 2014, to December 31, 2014, shares in the technology and financials sectors added the most value. Holdings in the energy and materials sectors detracted the most value during the period.
Apache was the largest detractor to fund performance from March 1, 2014 to December 31, 2014. Recent weakness in energy spot prices caused Apache’s share price to decline during the fourth quarter. However, the company recently entered into an agreement to sell its Kitimat and Wheatstone LNG projects for $3.7 billion, which will provide the company with cash for share repurchases. The deal shows Apache’s intent to follow through on a plan originally introduced in 2013 to divest its fully valued oil and gas assets and subsequently spinoff or sell all of its international assets. In a recent meeting with the company, we confirmed that Apache is on track to complete this process by mid-2015. Furthermore, newly appointed COO John Christmann recently changed the capital allocation process and implemented a system for ranking the internal rates of return on wells across North America to ensure a more efficient use of capital. Christmann also replaced the operating heads of each region, changing their compensation metrics to focus on returns, and put in place a new geoscience team, which he considers to be the “best in the business.” In our view, these improvements are strengthening Apache’s underlying value, and we believe the true quality of this company is currently under-appreciated by the market.
Google was also a detractor to the Fund’s performance during this period. Investors appear concerned over Google’s decelerating revenue growth and profit margins, which pressured its share price in the fourth quarter. In light of the fact that the company’s revenue has grown 20% year to date through the third quarter, we believe that some deceleration is expected. The possible implementation of new European Union regulations and the company’s announcement that it would retire its digital goods application Google Wallet (which gives competitor Apple an advantage in the mobile pay space and takes Google out of contention as a third-party payment processing solution for online merchants) also troubled investors. However, we believe that Google maintains very strong momentum to support continued growth and is well positioned to take advantage of the shift in advertising dollars to online outlets. Google’s third-quarter profit grew 10%, which to us is indicative of a healthy business. We continue to believe the valuation for this high-quality company with dominant market share remains attractive, offering a compelling reason to own.
The leading contributors to fund performance from March 1, 2014 to December 31, 2014, were Intel and Apple. Intel’s market dominance in many fast-growing areas such as cloud, storage, and high-performance computing continues to benefit its long-term growth prospects. The company recently announced that it would expand the adoption of Intel-based chips in mobile devices in China. We believe this move provides direct access to a large new market and demonstrates new Intel CEO Brian Krzanich’s creative, pragmatic approach to maximizing the value of the company. Management continues to return capital to shareholders by lowering cash balances and increasing the pace of buybacks. Apple’s
5 |
fourth-quarter earnings results were solid, which included a 20% rise in earnings per share and a 12% increase in sales. The company generated $13.3 billion in cash during the quarter and returned $20 billion to shareholders via buybacks and dividends. Furthermore, holiday sales results showed new-device activations for Apple iPhones for the week prior to Christmas bested all others combined. We are enthusiastic about the direction the management team is taking given its ability to maintain and grow Apple’s devoted client base, which is evidenced most recently by the rollout of Apple Pay. Our investment thesis for this company is intact, as we believe Apple’s capital position is solid and its management team is working to enhance shareholder value.
Outlook
All things considered, we find that company valuations are still compelling; genuine reform in two of the larger emerging market economies, China and India, should help to rekindle the global economy; and the stronger U.S. dollar should help generate positive earnings in most foreign companies.
Growth of $10,000 Investment in Class A Shares4
December 31, 2004 through December 31, 2014
See notes to chart on page 7.
| 6
NATIXIS OAKMARK FUND
Average Annual Total Returns — December 31, 20144
| | | | | | | | | | | | |
| | | | |
| | | 1 Year | | | 5 Years | | | 10 Years | |
| | | | |
| Class A (Inception 5/6/31) | | | | | | | | | | | | |
| NAV | | | 10.43 | % | | | 14.67 | % | | | 6.74 | % |
| With 5.75% Maximum Sales Charge | | | 4.06 | | | | 13.32 | | | | 6.10 | |
| | | | |
| Class B (Inception 9/13/93) | | | | | | | | | | | | |
| NAV | | | 9.56 | | | | 13.81 | | | | 5.93 | |
| With CDSC1 | | | 4.88 | | | | 13.57 | | | | 5.93 | |
| | | | |
| Class C (Inception 5/1/95) | | | | | | | | | | | | |
| NAV | | | 9.55 | | | | 13.82 | | | | 5.93 | |
| With CDSC1 | | | 8.62 | | | | 13.82 | | | | 5.93 | |
| | | | |
| Class Y (Inception 11/18/98) | | | | | | | | | | | | |
| NAV | | | 10.70 | | | | 14.97 | | | | 7.05 | |
| | | | |
| Comparative Performance | | | | | | | | | | | | |
| S&P 500® Index2 | | | 13.69 | | | | 15.45 | | | | 7.67 | |
| Russell 1000® Value Index3 | | | 13.45 | | | | 15.42 | | | | 7.30 | |
Past performance does not guarantee future results. The table(s) does not reflect taxes shareholders might owe on any fund distributions or when they redeem their shares. Performance for periods less than one year is cumulative, not annualized. Returns reflect changes in share price and reinvestment of dividends and capital gains, if any. Unlike a fund, an index is not managed and does not reflect fees and expenses.
| 1 | Performance for Class B shares assumes a maximum 5.00% contingent deferred sales charge (“CDSC”) applied when you sell shares, which declines annually between years 1-6 according to the following schedule: 5, 4, 3, 3, 2, 1, 0%. Class C share performance assumes a 1.00% CDSC applied when you sell shares within one year of purchase. |
| 2 | S&P 500® Index is a widely recognized measure of U.S. stock market performance. It is an unmanaged index of 500 common stocks chosen for market size, liquidity, and industry group representation, among other factors. Effective at the close of business on February 28, 2014, the S&P 500® Index replaced the Russell 1000® Value Index as the Fund’s primary benchmark because Harris Associates believes the S&P 500® Index is a more appropriate representation of the universe of securities in which the Fund may invest. |
| 3 | Russell 1000® Value Index is an unmanaged index that measures the performance of the large-cap value segment of the U.S. equity universe. It includes those Russell 1000® companies with lower price-to-book ratios and lower expected growth values. |
| 4 | Fund performance has been increased by fee waivers and/or expense reimbursements, if any, without which performance would have been lower. |
7 |
NATIXIS OAKMARK INTERNATIONAL FUND
| | |
| Managers | | Symbols |
| David G. Herro, CFA® | | Class A NOIAX |
| Robert A. Taylor, CFA® | | Class C NOICX |
| Harris Associates L.P. | | |
Objective
The Fund seeks long-term capital appreciation.
Market Conditions
Over the course of 2014, major global markets were affected by a variety of factors including currency movement, the rapid decline in oil prices, and continuing unrest in Ukraine. From December 31, 2013 to December 31, 2014, the value of the U.S. dollar increased over 9% compared to the Australian dollar; 14% compared to the euro; and close to 14% versus the yen. The immediate impact of a strong U.S. dollar on foreign share prices is lower U.S. dollar returns of share prices as the currency declines are absorbed. However, over the medium-term, the weak currency effect should begin to positively affect the earnings results and share prices of most foreign-based multinational companies.
The rapid decline of oil prices resulted in both the Brent and West Texas Intermediate (WTI) crude oil benchmarks plummeting around 50% in 2014. Overall, this drop has translated to measurable positives for global economic growth and corporate earnings, most especially for users of transportation fuels, petrochemicals, plastics and fertilizers. However, it has also proved challenging for energy companies and those countries that depend on oil exports.
Lastly, markets were challenged by the ongoing situation in Ukraine, as sanctions on imports from and exports to Russia saw businesses struggle to maintain normal operations and unload a surplus of stock that would have otherwise been dealt to Russia. This example demonstrates why a company’s nation of domicile is far less important than where it derives its revenues. We believe our analysis of the economics of a business, the company’s ownership structure, and the alignment of management with shareholders, are more important considerations. In 2014, it appears the U.S.-domiciled companies trumped all others, but the investing world has a history of restoring equilibrium to such imbalances. With that in mind, we continue to seek out value wherever we may find it.
Performance Results
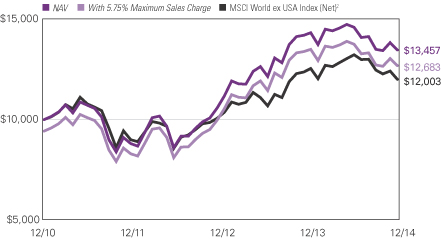
For the 12 months ended December 31, 2014, Class A shares of Natixis Oakmark International Fund returned -6.05% at net asset value. The Fund underperformed its benchmark, the MSCI World ex USA Index (Net), which returned -4.32%.
Explanation of Fund Performance
Geographically we ended the year with 81% of our holdings in Europe, 11% in Japan and 4% in Australia. The remaining positions are in North America (Canada), South Korea,
| 8
NATIXIS OAKMARK INTERNATIONAL FUND
Hong Kong, and the Middle East (Israel). As value investors with an emphasis on individual stock selection, our country and sector weights are a byproduct of our bottom-up process.
On an absolute basis, shares in the technology sector produced the best collective return. Holdings in the consumer staples and industrials sectors declined the most during the year.
The largest detractors from return were Tesco and Honda Motor. Tesco was the largest detractor for the calendar year and was a major cause of the Fund’s underperformance for the year. The unexpected departure of the CEO, a large profit warning and an accounting discrepancy led us to sell our shares in the stock. Honda Motor’s second-quarter operating profit was below investors’ expectations, partially due to costs associated with a vehicle recall in Japan. During the fourth quarter, the National Highway Traffic Safety Administration opened a probe into whether Honda failed to report incidents involving air bag malfunctions that resulted in injuries or deaths. Subsequently, Honda launched its own independent audit of “potential inaccuracies” related to under-reporting. Because an outside company manufactured the airbags, we believe that company may be held partially responsible for any liability claims made against Honda. Based on similar circumstances involving vehicle manufacturers recalls, we assess that Honda’s liability will not materially affect its shareholders. Global auto demand remains strong, which we think will benefit Honda, and we expect the company’s performance will improve.
The top contributors to return were Intesa Sanpaolo and AMP. Intesa’s share price has rebounded as fears over Italy’s banking system and government have subsided. We have always believed these fears were overblown and that Italy was in much better long-term fiscal health than many of its periphery countries. The new CEO has committed to return EUR 10 billion to shareholders via dividends over the next four years. This constitutes a cumulative payout ratio in excess of 70%. Even with this return of capital to shareholders, Intesa should be over-capitalized compared with Basel III requirements, leaving the door open for additional capital returns. We believe management has a solid plan for the future and believe the investment will continue to provide value for our shareholders. AMP’s new CEO Craig Meller is committed to a continued focus on reducing expenses via a cost-out plan, reinforcing customer relationships, and boosting retention by way of better product targeting and omnichannel distribution. We believe AMP is well positioned in the market to benefit from expected increases in retirement savings and wage growth in Australia.
While the U.S. dollar appreciated versus many foreign currencies during the fourth quarter, we continue to believe some currencies are overvalued. Based on the increased strength of the U.S. dollar, we decreased our defensive currency hedges. As of year-end approximately 25% of the Swiss franc, 23% of the Australian dollar and 15% of the Swedish krona held by the Fund were hedged.
Outlook
All things considered, we find that company valuations are still compelling; genuine reform in two of the larger emerging market economies, China and India, should help to rekindle the global economy; and the stronger U.S. dollar should help generate positive earnings in most foreign companies.
9 |
Growth of $10,000 Investment in Class A Shares3
December 15, 2010 (inception) through December 31, 2014
Average Annual Total Returns — December 31, 20143
| | | | | | | | |
| | | |
| | | 1 Year | | | Life of Fund | |
| | | |
| Class A (Inception 12/15/10) | | | | | | | | |
| NAV | | | -6.05 | % | | | 7.63 | % |
| With 5.75% Maximum Sales Charge | | | -11.46 | | | | 6.06 | |
| | | |
| Class C (Inception 12/15/10) | | | | | | | | |
| NAV | | | -6.67 | | | | 6.85 | |
| With CDSC1 | | | -7.57 | | | | 6.85 | |
| | | |
| Comparative Performance | | | | | | | | |
| MSCI World ex USA Index (Net)2 | | | -4.32 | | | | 4.62 | |
Past performance does not guarantee future results. The table(s) does not reflect taxes shareholders might owe on any fund distributions or when they redeem their shares. Performance for periods less than one year is cumulative, not annualized. Returns reflect changes in share price and reinvestment of dividends and capital gains, if any. Unlike a fund, an index is not managed and does not reflect fees and expenses.
| 1 | Performance for Class C shares assumes a 1.00% contingent deferred sales charge (“CDSC”) applied when you sell shares within one year of purchase. |
| 2 | MSCI World ex USA Index (Net) is an unmanaged index that is designed to measure the equity market performance of developed markets, excluding the United States. The index calculates reinvested dividends net of withholding taxes using Luxembourg tax rates. |
| 3 | Fund performance has been increased by fee waivers and/or expense reimbursements, if any, without which performance would have been lower. |
| 10
VAUGHAN NELSON SMALL CAP VALUE FUND
| | |
| Managers | | Symbols |
| Dennis G. Alff, CFA® | | Class A NEFJX |
| Chad D. Fargason | | Class B NEJBX |
| Chris D. Wallis, CFA® | | Class C NEJCX |
| Scott J. Weber, CFA® | | Class Y NEJYX |
| Vaughan Nelson Investment Management, L.P. |
Effective July 31, 2009, the fund was closed to new investors.
Objective
The Fund seeks capital appreciation.
Market Conditions
The equity markets continued to advance even as the Federal Reserve (the Fed) ended the quantitative easing (QE) program that began in 2009. Current volatility and deteriorating market breadth may continue as capital markets adjust to global shifts in central bank policy and to escalating geopolitical tensions. The European Central Bank (ECB) has committed to easier monetary policy while the Fed is planning to raise interest rates in 2015. We believe the market is discounting continued modest improvement in earnings growth and an environment where deflationary risks are modestly higher than inflationary risks. We continue to expect U.S. companies to face margin pressures as the Fed raises interest rates, as capital expenditures accelerate, and as rising operating costs challenge modest revenue growth.
Performance Results
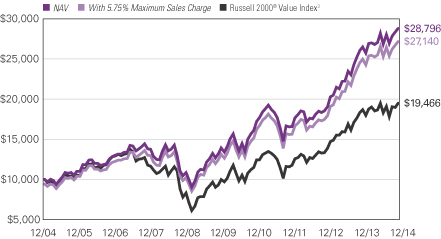
For the 12 months ended December 31, 2014, Class A shares of Vaughan Nelson Small Cap Value Fund returned 8.79% at net asset value. The Fund outperformed its benchmark, the Russell 2000® Value Index, which returned 4.22%.
Explanation of Fund Performance
Portfolio performance benefitted primarily from stock selection during the past year. However, a general rise in equity markets also helped returns. The best-performing stocks in the portfolio were those with the ability to grow their revenues and earnings despite the tepid economic recovery. These high-quality, well-managed businesses, many of which benefit from long-term secular tailwinds, are a natural fit with our returns-focused philosophy and were uncovered through our company-specific stock selection process. The portfolio continued to be materially underweight in REITs and utilities during the year in comparison to its benchmark, as both sectors were expensive and did not meet our return criteria. Information technology, consumer discretionary, healthcare and industrial stocks were the biggest contributors to fund performance, while energy stocks detracted.
Stock selection drove performance in the information technology sector with Skyworks Solutions, Verint Systems and SS&C Technologies making the most significant contributions to performance. Skyworks benefited from global growth in mobile devices
11 |
and connected products, as well as improved capital allocation by management. The company continued to return cash to shareholders via share repurchases and also initiated a quarterly dividend. We exited our position in Skyworks during the year. Verint Systems completed an accretive acquisition of KANA Software during the first quarter of 2014, which helped supplement the company’s core enterprise software offering and accelerate revenue and earnings growth. Verint also won several large cyber security contracts during the year, which provided a new avenue of future growth not discounted by the market. SS&C Technologies continued to show strength in its core business, and benefited from the fund administration-outsourcing trend. Additionally an acquisition completed in the fourth quarter should expand its international presence and create new cross-selling opportunities.
Stock selection also drove performance in the consumer discretionary sector, with Jack in the Box, Inc. and Harman International making significant contributions to performance. Jack in the Box benefited from a continued turnaround in its Qdoba Mexican Grille restaurants, as well as market share gains at its Jack in the Box venues. The company also returned cash to shareholders via stock buybacks and initiated a quarterly dividend. Harman International showed improved margins and earnings growth by recognizing higher margin revenues from backlog built on a scalable platform. We exited our position in Harman during the year.
Performance in the healthcare sector was driven by allocation and stock selection. In comparison with its benchmark, the portfolio was materially overweight in the sector as companies with attractive fundamentals and valuations continued to emerge. The largest contributors to performance were Teleflex Inc. and AmSurg Corp. Teleflex showed improved top line growth during the year driven by geographic expansion and the acquisition of a complementary business. The company also continues to make progress on restructuring its cost base to improve margins. AmSurg acquired faster-growing Sheridan Healthcare during the year, and the stock benefited as investors began to recognize the attractiveness of the deal.
Industrial sector performance was driven by broad-based positive stock selection, with KAR Auction Services as the largest contributor to performance. KAR Auction Services started to benefit from the ramp-up in whole car auction volume that typically follows the cyclical rebound in new car sales. Also, management committed to returning more excess cash to shareholders via share repurchases and an increased dividend.
The energy sector detracted from performance as exploration and production companies Oasis Petroleum and Bonanza Creek Energy were hurt by the fall in oil prices during the second half of the year. Performance at Oasis was also hurt by higher than expected capital outlays at recently acquired acreage and overall poor cost control. We exited our positions in both Oasis and Bonanza Creek during the year.
Other notable performers during the year include Rite Aid Corp and Graphic Packaging Corp. Rite Aid continued to show progress on its turnaround strategy and demonstrated improving same-store sales metrics. In addition, an expanded drug distribution agreement with McKesson Corp should meaningfully reduce drug-related costs when fully
| 12
VAUGHAN NELSON SMALL CAP VALUE FUND
implemented. We exited our position in Rite Aid during the year. Graphic Packaging Corp completed several small acquisitions and divestitures during the year, while also improving productivity in its core business. Strong cash generation allowed the company to reduce its debt levels, while also returning cash to shareholders via share repurchases.
The largest increases in sector weightings were in healthcare and consumer discretionary. The increase in healthcare is attributable to the additions of AmSurg Corp, Alere Inc., Haemonetics Corp, and Merit Medical Systems. In consumer discretionary, new holdings include Home Shopping Network, Steve Madden Ltd, ServiceMaster Global, and Tenneco Inc. as we selectively added exposure to this slowly recovering area of the economy.
The largest decreases in sector weightings were in energy, financials, industrials, and consumer staples. The reduction in energy holdings was due to exiting our positions in Atwood Oceanics and Oasis Petroleum, while reducing our position in Forum Energy. In financials, we reduced our exposure to the banking sector by exiting positions in Associated Bancorp, Fulton Financial, and Hancock Holding Co. In industrials, we exited all of our positions in distributors, selling DXP Enterprises, United Rentals, and WESCO International. We also exited positions in Rite Aid and Elizabeth Arden within the consumer staples sector, and remain underweight the sector.
Outlook
Despite the potential for a correction in equity markets, we expect the credit market to remain supportive of equity values over the medium term and will welcome any correction as an opportunity to make attractive investments. Even without a broader equity market correction, we expect market breadth to continue to narrow. Companies can no longer rely on a recovery in consumption, lower interest rates, share repurchases, and delayed capital expenditures to drive earnings growth. Going forward, companies will be required to increase capital expenditures, research and development, and other operating costs in order to sustain or grow earnings. Further, the strengthening U.S. dollar is likely to impact top line sales growth, especially for the multinationals that generate a significant portion of their revenues outside of the U.S. While the nature of the bull market is changing, there are still individual stocks that will perform well despite the increasing market headwinds. We continue to seek investments in companies that have better pricing power, lower earnings variability, higher profitability, and stronger balance sheets than the broader investment universe. We still do not favor any single industry or sector, and continue to look for companies with the characteristics noted above that trade at attractive valuations.
13 |
Growth of $10,000 Investment in Class A Shares4
December 31, 2004 through December 31, 2014
See notes to chart on page 15.
| 14
VAUGHAN NELSON SMALL CAP VALUE FUND
Average Annual Total Returns — December 31, 20144
| | | | | | | | | | | | |
| | | | |
| | | 1 Year | | | 5 Years | | | 10 Years | |
| | | | |
| Class A (Inception 12/31/96) | | | | | | | | | | | | |
| NAV | | | 8.79 | % | | | 15.65 | % | | | 11.16 | % |
| With 5.75% Maximum Sales Charge | | | 2.54 | | | | 14.29 | | | | 10.50 | |
| | | | |
| Class B (Inception 12/31/96) | | | | | | | | | | | | |
| NAV | | | 7.87 | | | | 14.78 | | | | 10.33 | |
| With CDSC1 | | | 3.51 | | | | 14.60 | | | | 10.33 | |
| | | | |
| Class C (Inception 12/31/96) | | | | | | | | | | | | |
| NAV | | | 7.94 | | | | 14.78 | | | | 10.33 | |
| With CDSC1 | | | 7.07 | | | | 14.78 | | | | 10.33 | |
| | | | |
| Class Y (Inception 8/31/06)2 | | | | | | | | | | | | |
| NAV | | | 9.04 | | | | 15.94 | | | | 11.41 | |
| | | | |
| Comparative Performance | | | | | | | | | | | | |
| Russell 2000® Value Index3 | | | 4.22 | | | | 14.26 | | | | 6.89 | |
Past performance does not guarantee future results. The table(s) does not reflect taxes shareholders might owe on any fund distributions or when they redeem their shares. Performance for periods less than one year is cumulative, not annualized. Returns reflect changes in share price and reinvestment of dividends and capital gains, if any. Unlike a fund, an index is not managed and does not reflect fees and expenses.
| 1 | Performance for Class B shares assumes a maximum 5.00% contingent deferred sales charge (“CDSC”) applied when you sell shares, which declines annually between years 1-6 according to the following schedule: 5, 4, 3, 3, 2, 1, 0%. Class C share performance assumes a 1.00% CDSC applied when you sell shares within one year of purchase. |
| 2 | Prior to the inception of Class Y shares (8/31/06), performance is that of Class A shares and reflects the higher net expenses of that share class. |
| 3 | Russell 2000® Value Index is an unmanaged index that measures the performance of the small-cap value segment of the U.S. equity universe. It includes those Russell 2000® companies with lower price-to-book ratios and lower forecasted growth values. |
| 4 | Fund performance has been increased by fee waivers and/or expense reimbursements, if any, without which performance would have been lower. |
15 |
VAUGHAN NELSON VALUE OPPORTUNITY FUND
| | |
| Managers | | Symbols |
| Dennis G. Alff, CFA® | | Class A VNVAX |
| Chad D. Fargason | | Class C VNVCX |
| Chris D. Wallis, CFA® | | Class N VNVNX |
| Scott J. Weber, CFA® | | Class Y VNVYX |
| Vaughan Nelson Investment Management, L.P. |
Objective
The Fund seeks long-term capital appreciation.
Market Conditions
The equity markets continued to advance even as the Federal Reserve (the Fed) ended the quantitative easing (QE) program that began in 2009. Current volatility and deteriorating market breadth may continue as capital markets adjust to global shifts in central bank policy and to escalating geopolitical tensions. The European Central Bank (ECB) has committed to easier monetary policy while the Fed is planning to raise interest rates in 2015. We believe the market is discounting continued modest improvement in earnings growth and an environment where deflationary risks are modestly higher than inflationary risks. We continue to expect U.S. companies to face margin pressures as the Fed raises interest rates, as capital expenditures accelerate, and as rising operating costs challenge modest revenue growth.
Performance Results
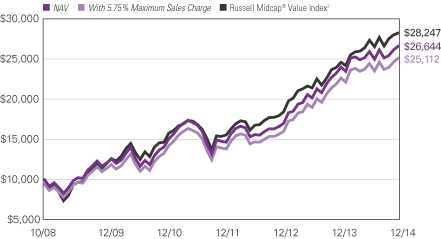
For the 12 months ended December 31, 2014, Class A shares of Vaughan Nelson Value Opportunity Fund returned 10.92% at net asset value. The Fund underperformed its benchmark, the Russell Midcap® Value Index, which returned 14.75%.
Explanation of Fund Performance
Stock and sector selection contributed evenly to the Fund’s underperformance for the year. The majority of the Fund’s underperformance stems from the decision to underweight REITs and utilities coupled with the dramatic selloff in energy and commodity-related stocks. The portfolio remains significantly underweight REITs and Utilities relative to its benchmark, as both sectors are expensive and do not meet our return criteria. While this increases the portfolio’s cyclicality, we believe the positioning is warranted. We are confident that the portfolio’s individual companies have competitive positions or secular opportunities that will allow their stocks to materially outperform the market over time. We are also willing to accept the modestly higher level of cyclicality versus the risk of timing the market or maintaining exposures to less cyclical areas that appear overvalued. Technology, healthcare, industrials, consumer discretionary, and consumer staples stocks were the biggest contributors to absolute performance, while only energy and materials detracted. On a relative basis, technology, healthcare, and industrials contributed the most to returns while REITs, utilities, materials, and energy were the greatest detractors.
| 16
VAUGHAN NELSON VALUE OPPORTUNITY FUND
Stock selection primarily drove the strong returns and relative performance in the technology sector. However, the portfolio also benefited from being overweight in semiconductors and IT services companies as compared to the benchmark. To that end, notable standouts for the year include Skyworks Solutions, Avago Technologies, and Micron Technology. Skyworks and Avago benefited from global growth in mobile devices and connected products, and from new design wins and content gains on mobile platforms. The companies are positioned to benefit from several secular trends, including increased penetration of smart phone handsets, increased complexity in handsets as we move to 4G/LTE, and stronger demand for technology and equipment within the industrial and auto markets. Micron benefited from better volume growth and from its acquisition of Elpida, which further consolidated the semiconductor manufacturing industry which is now behaving more rationally by limiting capacity growth.
Stock selection stood out as the driver in the healthcare sector with HCA Holdings and Community Health Systems contributing the most to the sector’s outperformance. HCA and Community Health are acute-care hospitals that benefited from the passage of the Affordable Care Act by realizing higher volumes and lower bad debt expense due to a larger insured population base. Further, both companies have been actively acquiring other hospital systems to layer on their networks. Community Health completed a large acquisition of Health Management Associates, an operator of 71 hospitals in 15 states, in 2014.
The industrials sector also benefited from strong stock selection during the year. Top-performing companies included United Rentals and Spectrum Brands. United Rentals was aided by strong demand for rental equipment and by continued synergies from the RSC Holdings acquisition that was completed in 2012. Spectrum Brands benefited from a recovering economic environment, market share gains, and its strong free cash flow generation, which was used for acquisitions and to pay down debt.
Financials, materials, utilities, and energy detracted from relative performance during the year. The majority of the underperformance in financials can be explained by the decision to underweight REITs, which performed very well in 2014. Similarly, the decision to underweight utilities in 2014 was costly since utilities performed well for the year. Materials and energy also detracted from performance, primarily due to the dramatic decline in commodities and commodity-related stocks during the fourth quarter. Specifically, exploration and production companies Gulfport Energy, Noble Energy, Whiting Petroleum, and contract driller Atwood Oceanics were weak performers as oil prices declined sharply. We reduced the portfolio’s exposure to the energy sector by trimming our positions and by exiting Atwood. Our holdings in the materials sector were also weak as the selloff in commodities spilled over to the steel and specialty aluminum manufacturers such as Reliance Steel and Constellium. While the performance of the materials holdings was disappointing, the portfolio did benefit greatly from being overweight in containers and packaging stocks such as Crown Holdings, Graphic Packaging, and Packaging Corporation of America.
Other notable performers during the year were Rite Aid in the consumer staples sector; Harman International, Signet, and Jarden in consumer discretionary; Actavis in healthcare; and NASDAQ and First American Financial in the financials sector. The greatest increases
17 |
in weightings by sector were technology, healthcare, and consumer discretionary. The largest reductions in weightings by sector were in materials, energy, and industrials. The portfolio is underweight in financials, utilities, and energy. These underweights are offset by overweights in technology, consumer discretionary, industrials, healthcare, materials, and consumer staples. The underweight to financials is primarily driven by our decision to avoid REITs since valuations look expensive.
Outlook
Despite the potential for a correction in equity markets, we expect the credit market to remain supportive of equity values over the medium term and will welcome any correction as an opportunity to make attractive investments. Even without a broader equity market correction, we expect market breadth to continue to narrow. Companies can no longer rely on a recovery in consumption, lower interest rates, share repurchases, and delayed capital expenditures to drive earnings growth. Going forward, companies will be required to increase capital expenditures, research and development, and other operating costs in order to sustain or grow earnings. Further, the strengthening U.S. dollar is likely to impact top line sales growth, especially for the multinationals that generate a significant portion of their revenues outside of the U.S. While the nature of the bull market is changing, there are still individual stocks that will perform well despite the increasing market headwinds. We continue to seek investments in companies that have better pricing power, lower earnings variability, higher profitability, and stronger balance sheets than the broader investment universe. We still do not favor any single industry or sector, and continue to look for companies with the characteristics noted above that trade at attractive valuations.
Growth of $10,000 Investment in Class A Shares3
October 31, 2008 (inception) through December 31, 2014
See notes to chart on page 19.
| 18
VAUGHAN NELSON VALUE OPPORTUNITY FUND
Average Annual Total Returns — December 31, 20143
| | | | | | | | | | | | | | | | |
| | | | |
| | | 1 Year | | | 5 Years | | | Life of Fund | |
| | | | | | | | | Class A/C/Y | | | Class N | |
| Class A (Inception 10/31/08) | | | | | | | | | | | | | | | | |
| NAV | | | 10.92 | % | | | 16.15 | % | | | 17.22 | % | | | — | |
| With 5.75% Maximum Sales Charge | | | 4.54 | | | | 14.78 | | | | 16.10 | | | | | |
| | | | | |
| Class C (Inception 10/31/08) | | | | | | | | | | | | | | | | |
| NAV | | | 10.12 | | | | 15.30 | | | | 16.36 | | | | — | |
| With CDSC1 | | | 9.12 | | | | 15.30 | | | | 16.36 | | | | | |
| | | | | |
| Class N (Inception 5/1/13) | | | | | | | | | | | | | | | | |
| NAV | | | 11.24 | | | | — | | | | — | | | | 21.67 | % |
| | | | | |
| Class Y (Inception 10/31/08) | | | | | | | | | | | | | | | | |
| NAV | | | 11.23 | | | | 16.44 | | | | 17.52 | | | | — | |
| | | | | |
| Comparative Performance | | | | | | | | | | | | | | | | |
| Russell Midcap® Value Index2 | | | 14.75 | | | | 17.43 | | | | 18.36 | | | | 19.35 | |
Past performance does not guarantee future results. The table(s) does not reflect taxes shareholders might owe on any fund distributions or when they redeem their shares. Performance for periods less than one year is cumulative, not annualized. Returns reflect changes in share price and reinvestment of dividends and capital gains, if any. Unlike a fund, an index is not managed and does not reflect fees and expenses.
| 1 | Performance for Class C shares assumes a 1.00% contingent deferred sales charge (“CDSC”) applied when you sell shares within one year of purchase. |
| 2 | Russell Midcap® Value Index is an unmanaged index that measures the performance of the mid-cap value segment of the U.S. equity universe. It includes those Russell Midcap® Index companies with lower price-to-book ratios and lower forecasted growth values. |
| 3 | Fund performance has been increased by fee waivers and/or expense reimbursements, if any, without which performance would have been lower. |
19 |
ADDITIONAL INFORMATION
The views expressed in this report reflect those of the portfolio managers as of the dates indicated. The managers’ views are subject to change at any time without notice based on changes in market or other conditions. References to specific securities or industries should not be regarded as investment advice. Because the Funds are actively managed, there is no assurance that they will continue to invest in the securities or industries mentioned.
ADDITIONAL INDEX INFORMATION
This document may contain references to third party copyrights, indexes, and trademarks, each of which is the property of its respective owner. Such owner is not affiliated with Natixis Global Asset Management or any of its related or affiliated companies (collectively “NGAM”) and does not sponsor, endorse or participate in the provision of any NGAM services, funds or other financial products.
The index information contained herein is derived from third parties and is provided on an “as is” basis. The user of this information assumes the entire risk of use of this information. Each of the third party entities involved in compiling, computing or creating index information disclaims all warranties (including, without limitation, any warranties of originality, accuracy, completeness, timeliness, non-infringement, merchantability and fitness for a particular purpose) with respect to such information.
PROXY VOTING INFORMATION
A description of the Funds’ proxy voting policies and procedures is available without charge, upon request, by calling Natixis Funds at 800-225-5478; on the Funds’ website at ngam.natixis.com; and on the Securities and Exchange Commission’s (SEC) website at www.sec.gov. Information regarding how the funds voted proxies relating to portfolio securities during the 12-months ended June 30, 2014 is available from the Funds’ website and the SEC’s website.
QUARTERLY PORTFOLIO SCHEDULES
The Funds file a complete schedule of portfolio holdings with the SEC for the first and third quarters of each fiscal year on Form N-Q. The Funds’ Forms N-Q are available on the SEC’s website at www.sec.gov and may be reviewed and copied at the SEC’s Public Reference Room in Washington, DC. Information on the operation of the Public
Reference Room may be obtained by calling 800-SEC-0330.
| 20
UNDERSTANDING FUND EXPENSES
As a mutual fund shareholder, you incur different costs: transaction costs, including sales charges (loads) on purchases and contingent deferred sales charges on redemptions, and ongoing costs, including management fees, distribution and/or service fees (12b-1 fees), and other fund expenses. Certain exemptions may apply. These costs are described in more detail in the Funds’ prospectus. The following examples are intended to help you understand the ongoing costs of investing in the Funds and help you compare these with the ongoing costs of investing in other mutual funds.
The first line in the table of each class of Fund shares shows the actual account values and actual Fund expenses you would have paid on a $1,000 investment in the Fund from July 1, 2014 through December 31, 2014. To estimate the expenses you paid over the period, simply divide your account value by $1,000 (for example $8,600 account value divided by $1,000 = 8.60) and multiply the result by the number in the Expenses Paid During Period column as shown for your class.
The second line in the table for each class of fund shares provides information about hypothetical account values and hypothetical expenses based on the Fund’s actual expense ratios and an assumed rate of return of 5% per year before expenses, which is not the Fund’s actual return. The hypothetical account values and expenses may not be used to estimate the actual ending account balance or expenses you paid on your investment for the period. You may use this information to compare the ongoing costs of investing in the Fund and other funds. To do so, compare this 5% hypothetical example with the 5% hypothetical examples that appear in the shareholder reports of the other funds.
Please note that the expenses shown reflect ongoing costs only, and do not include any transaction costs, such as sales charges. Therefore, the second line in the table of each fund is useful in comparing ongoing costs only, and will not help you determine the relative costs of owning different funds. If transaction costs were included, total costs would be higher.
| | | | | | | | | | | | |
| CGM ADVISOR TARGETED EQUITY FUND | | BEGINNING
ACCOUNT VALUE
7/1/2014 | | | ENDING
ACCOUNT VALUE
12/31/2014 | | | EXPENSES PAID
DURING PERIOD*
7/1/2014 – 12/31/2014 | |
| Class A | | | | | | | | | | | | |
| Actual | | | $1,000.00 | | | | $1,023.00 | | | | $5.91 | |
| Hypothetical (5% return before expenses) | | | $1,000.00 | | |
| $1,019.36
|
| |
| $5.90
|
|
| Class B | | | | | | | | | | | | |
| Actual | | | $1,000.00 | | | | $1,019.80 | | | | $9.72 | |
| Hypothetical (5% return before expenses) | | | $1,000.00 | | | | $1,015.58 | | | | $9.70 | |
| Class C | | | | | | | | | | | | |
| Actual | | | $1,000.00 | | | | $1,018.90 | | | | $9.72 | |
| Hypothetical (5% return before expenses) | | | $1,000.00 | | | | $1,015.58 | | | | $9.70 | |
| Class Y | | | | | | | | | | | | |
| Actual | | | $1,000.00 | | | | $1,024.70 | | | | $4.64 | |
| Hypothetical (5% return before expenses) | | | $1,000.00 | | | | $1,020.62 | | | | $4.63 | |
| * | Expenses are equal to the Fund’s annualized expense ratio: 1.16%, 1.91%, 1.91% and 0.91% for Class A, B, C and Y, respectively, multiplied by the average account value over the period, multiplied by the number of days in the most recent fiscal half-year (184), divided by 365 (to reflect the half-year period). |
21 |
| | | | | | | | | | | | |
| NATIXIS OAKMARK FUND | | BEGINNING
ACCOUNT VALUE
7/1/2014 | | | ENDING
ACCOUNT VALUE
12/31/2014 | | | EXPENSES PAID
DURING PERIOD*
7/1/2014 – 12/31/2014 | |
| Class A | | | | | | | | | | | | |
| Actual | | | $1,000.00 | | | | $1,036.50 | | | | $6.16 | |
| Hypothetical (5% return before expenses) | | | $1,000.00 | | | | $1,019.16 | | | | $6.11 | |
| Class B | | | | | | | | | | | | |
| Actual | | | $1,000.00 | | | | $1,032.30 | | | | $9.94 | |
| Hypothetical (5% return before expenses) | | | $1,000.00 | | | | $1,015.43 | | | | $9.86 | |
| Class C | | | | | | | | | | | | |
| Actual | | | $1,000.00 | | | | $1,032.50 | | | | $10.04 | |
| Hypothetical (5% return before expenses) | | | $1,000.00 | | | | $1,015.32 | | | | $9.96 | |
| Class Y | | | | | | | | | | | | |
| Actual | | | $1,000.00 | | | | $1,038.10 | | | | $4.88 | |
| Hypothetical (5% return before expenses) | | | $1,000.00 | | | | $1,020.42 | | | | $4.84 | |
| * | Expenses are equal to the Fund’s annualized expense ratio: 1.20%, 1.94%, 1.96% and 0.95% for Class A, B, C and Y, respectively, multiplied by the average account value over the period, multiplied by the number of days in the most recent fiscal half-year (184), divided by 365 (to reflect the half-year period). |
| | | | | | | | | | | | |
| NATIXIS OAKMARK INTERNATIONAL FUND | | BEGINNING
ACCOUNT VALUE
7/1/2014 | | | ENDING
ACCOUNT VALUE
12/31/2014 | | | EXPENSES PAID
DURING PERIOD*
7/1/2014 – 12/31/2014 | |
| Class A | | | | | | | | | | | | |
| Actual | | | $1,000.00 | | | | $922.60 | | | | $6.35 | |
| Hypothetical (5% return before expenses) | | | $1,000.00 | | | | $1,018.60 | | | | $6.67 | |
| Class C | | | | | | | | | | | | |
| Actual | | | $1,000.00 | | | | $919.60 | | | | $9.97 | |
| Hypothetical (5% return before expenses) | | | $1,000.00 | | | | $1,014.82 | | | | $10.46 | |
| * | Expenses are equal to the Fund’s annualized expense ratio: 1.31% and 2.06% for Class A and C, respectively, multiplied by the average account value over the period, multiplied by the number of days in the most recent fiscal half-year (184), divided by 365 (to reflect the half-year period). |
| 22
| | | | | | | | | | | | |
| VAUGHAN NELSON SMALL CAP VALUE FUND | | BEGINNING
ACCOUNT VALUE
7/1/2014 | | | ENDING
ACCOUNT VALUE
12/31/2014 | | | EXPENSES PAID
DURING PERIOD*
7/1/2014 – 12/31/2014 | |
| Class A | | | | | | | | | | | | |
| Actual | | | $1,000.00 | | | | $1,021.90 | | | | $7.03 | |
| Hypothetical (5% return before expenses) | | | $1,000.00 | | | | $1,018.25 | | | | $7.02 | |
| Class B | | | | | | | | | | | | |
| Actual | | | $1,000.00 | | | | $1,018.00 | | | | $10.78 | |
| Hypothetical (5% return before expenses) | | | $1,000.00 | | | | $1,014.52 | | | | $10.76 | |
| Class C | | | | | | | | | | | | |
| Actual | | | $1,000.00 | | | | $1,018.10 | | | | $10.83 | |
| Hypothetical (5% return before expenses) | | | $1,000.00 | | | | $1,014.47 | | | | $10.82 | |
| Class Y | | | | | | | | | | | | |
| Actual | | | $1,000.00 | | | | $1,023.20 | | | | $5.76 | |
| Hypothetical (5% return before expenses) | | | $1,000.00 | | | | $1,019.51 | | | | $5.75 | |
| * | Expenses are equal to the Fund’s annualized expense ratio: 1.38%, 2.12%, 2.13% and 1.13% for Class A, B, C and Y, respectively, multiplied by the average account value over the period, multiplied by the number of days in the most recent fiscal half-year (184), divided by 365 (to reflect the half-year period). |
| | | | | | | | | | | | |
| VAUGHAN NELSON VALUE OPPORTUNITY FUND | | BEGINNING
ACCOUNT VALUE
7/1/2014 | | | ENDING
ACCOUNT VALUE
12/31/2014 | | | EXPENSES PAID
DURING PERIOD*
7/1/2014 –12/31/2014 | |
| Class A | | | | | | | | | | | | |
| Actual | | | $1,000.00 | | | | $1,027.30 | | | | $6.29 | |
| Hypothetical (5% return before expenses) | | | $1,000.00 | | | | $1,019.00 | | | | $6.26 | |
| Class C | | | | | | | | | | | | |
| Actual | | | $1,000.00 | | | | $1,023.50 | | | | $10.15 | |
| Hypothetical (5% return before expenses) | | | $1,000.00 | | | | $1,015.17 | | | | $10.11 | |
| Class N | | | | | | | | | | | | |
| Actual | | | $1,000.00 | | | | $1,029.40 | | | | $4.60 | |
| Hypothetical (5% return before expenses) | | | $1,000.00 | | | | $1,020.67 | | | | $4.58 | |
| Class Y | | | | | | | | | | | | |
| Actual | | | $1,000.00 | | | | $1,028.90 | | | | $5.06 | |
| Hypothetical (5% return before expenses) | | | $1,000.00 | | | | $1,020.21 | | | | $5.04 | |
| * | Expenses are equal to the Fund’s annualized expense ratio: 1.23%, 1.99%, 0.90% and 0.99% for Class A, C, N and Y, respectively, multiplied by the average account value over the period, multiplied by the number of days in the most recent fiscal half-year (184), divided by 365 (to reflect the half-year period). |
23 |
Portfolio of Investments – as of December 31, 2014
CGM Advisor Targeted Equity Fund
| | | | | | | | |
Shares | | | Description | | Value (†) | |
| | Common Stocks — 97.4% of Net Assets | | | | |
| | | | Air Freight & Logistics — 3.2% | | | | |
| | 150,000 | | | United Parcel Service, Inc., Class B | | $ | 16,675,500 | |
| | | | | | | | |
| | | | Automobiles — 5.2% | | | | |
| | 1,750,000 | | | Ford Motor Co. | | | 27,125,000 | |
| | | | | | | | |
| | | | Banks — 16.0% | | | | |
| | 1,550,000 | | | Bank of America Corp. | | | 27,729,500 | |
| | 620,000 | | | Citigroup, Inc. | | | 33,548,200 | |
| | 1,780,000 | | | Itau Unibanco Holding S.A., Preference ADR | | | 23,157,800 | |
| | | | | | | | |
| | | | | | | 84,435,500 | |
| | | | | | | | |
| | | | Capital Markets — 19.0% | | | | |
| | 230,000 | | | Ameriprise Financial, Inc. | | | 30,417,500 | |
| | 68,000 | | | BlackRock, Inc. | | | 24,314,080 | |
| | 1,170,000 | | | Morgan Stanley | | | 45,396,000 | |
| | | | | | | | |
| | | | | | | 100,127,580 | |
| | | | | | | | |
| | | | Hotels, Restaurants & Leisure — 3.2% | | | | |
| | 215,000 | | | Marriott International, Inc., Class A | | | 16,776,450 | |
| | | | | | | | |
| | | | Household Durables — 24.5% | | | | |
| | 1,470,000 | | | DR Horton, Inc. | | | 37,176,300 | |
| | 810,000 | | | Lennar Corp., Class A | | | 36,296,100 | |
| | 920,000 | | | Toll Brothers, Inc.(b) | | | 31,528,400 | |
| | 125,000 | | | Whirlpool Corp. | | | 24,217,500 | |
| | | | | | | | |
| | | | | | | 129,218,300 | |
| | | | | | | | |
| | | | IT Services — 9.8% | | | | |
| | 280,000 | | | MasterCard, Inc., Class A | | | 24,124,800 | |
| | 105,000 | | | Visa, Inc., Class A | | | 27,531,000 | |
| | | | | | | | |
| | | | | | | 51,655,800 | |
| | | | | | | | |
| | | | Media — 6.4% | | | | |
| | 360,000 | | | Walt Disney Co. (The) | | | 33,908,400 | |
| | | | | | | | |
| | | | Semiconductors & Semiconductor Equipment — 4.7% | | | | |
| | 700,000 | | | Micron Technology, Inc.(b) | | | 24,507,000 | |
| | | | | | | | |
| | | | Textiles, Apparel & Luxury Goods — 5.4% | | | | |
| | 295,000 | | | NIKE, Inc., Class B | | | 28,364,250 | |
| | | | | | | | |
| | | | Total Common Stocks (Identified Cost $442,524,544) | | | 512,793,780 | |
| | | | | | | | |
| | | | | | | | |
Principal
Amount | | | | | | |
| | Short-Term Investments — 2.9% | | | | |
| $ | 15,050,000 | | | Tri-Party Repurchase Agreement with Fixed Income Clearing Corporation, dated 12/31/2014 at 0.010% to be repurchased at $15,050,008 on 1/02/2015 collateralized by $14,945,000 U.S. Treasury Note, 2.375% due 8/15/2024 valued at $15,355,988 including accrued interest (Note 2 of Notes to Financial Statements)
(Identified Cost $15,050,000) | | | 15,050,000 | |
| | | | | | | | |
See accompanying notes to financial statements.
| 24
Portfolio of Investments – as of December 31, 2014
CGM Advisor Targeted Equity Fund – (continued)
| | | | | | | | |
| | | | Description | | Value (†) | |
| | | | Total Investments — 100.3% (Identified Cost $457,574,544)(a) | | $ | 527,843,780 | |
| | | | Other assets less liabilities — (0.3)% | | | (1,545,133 | ) |
| | | | | | | | |
| | | | Net Assets — 100.0% | | $ | 526,298,647 | |
| | | | | | | | |
| | | | | | | | |
| | (†) | | | See Note 2 of Notes to Financial Statements. | |
| | (a) | | | Federal Tax Information: | |
| | | | At December 31, 2014, the net unrealized appreciation on investments based on a cost of $457,574,544 for federal income tax purposes was as follows: | |
| | | | Aggregate gross unrealized appreciation for all investments in which there is an excess of value over tax cost | | $ | 76,729,626 | |
| | | | Aggregate gross unrealized depreciation for all investments in which there is an excess of tax cost over value | | | (6,460,390 | ) |
| | | | | | | | |
| | | | Net unrealized appreciation | | $ | 70,269,236 | |
| | | | | | | | |
| | (b) | | | Non-income producing security. | |
| | | | | | | | |
| | ADR | | | An American Depositary Receipt is a certificate issued by a custodian bank representing the right to receive securities of the foreign issuer described. The values of ADRs may be significantly influenced by trading on exchanges not located in the United States. | |
Industry Summary at December 31, 2014
| | | | |
Household Durables | | | 24.5 | % |
Capital Markets | | | 19.0 | |
Banks | | | 16.0 | |
IT Services | | | 9.8 | |
Media | | | 6.4 | |
Textiles, Apparel & Luxury Goods | | | 5.4 | |
Automobiles | | | 5.2 | |
Semiconductors & Semiconductor Equipment | | | 4.7 | |
Hotels, Restaurants & Leisure | | | 3.2 | |
Air Freight & Logistics | | | 3.2 | |
Short-Term Investments | | | 2.9 | |
| | | | |
Total Investments | | | 100.3 | |
Other assets less liabilities | | | (0.3 | ) |
| | | | |
Net Assets | | | 100.0 | % |
| | | | |
See accompanying notes to financial statements.
25 |
Portfolio of Investments – as of December 31, 2014
Natixis Oakmark Fund
| | | | | | | | |
Shares | | | Description | | Value (†) | |
| | Common Stocks — 93.3% of Net Assets | | | | |
| | | | Air Freight & Logistics — 2.0% | | | | |
| | 32,700 | | | FedEx Corp. | | $ | 5,678,682 | |
| | | | | | | | |
| | | | Automobiles — 1.9% | | | | |
| | 123,300 | | | General Motors Co. | | | 4,304,403 | |
| | 17,800 | | | Harley-Davidson, Inc. | | | 1,173,198 | |
| | | | | | | | |
| | | | | | | 5,477,601 | |
| | | | | | | | |
| | | | Banks — 9.1% | | | | |
| | 513,800 | | | Bank of America Corp. | | | 9,191,882 | |
| | 115,200 | | | Citigroup, Inc. | | | 6,233,472 | |
| | 94,700 | | | JPMorgan Chase & Co. | | | 5,926,326 | |
| | 84,300 | | | Wells Fargo & Co. | | | 4,621,326 | |
| | | | | | | | |
| | | | | | | 25,973,006 | |
| | | | | | | | |
| | | | Beverages — 1.4% | | | | |
| | 36,400 | | | Diageo PLC, Sponsored ADR | | | 4,152,876 | |
| | | | | | | | |
| | | | Capital Markets — 8.2% | | | | |
| | 104,600 | | | Bank of New York Mellon Corp. (The) | | | 4,243,622 | |
| | 88,000 | | | Franklin Resources, Inc. | | | 4,872,560 | |
| | 28,100 | | | Goldman Sachs Group, Inc. (The) | | | 5,446,623 | |
| | 69,600 | | | State Street Corp. | | | 5,463,600 | |
| | 38,000 | | | T. Rowe Price Group, Inc. | | | 3,262,680 | |
| | | | | | | | |
| | | | | | | 23,289,085 | |
| | | | | | | | |
| | | | Chemicals — 1.6% | | | | |
| | 37,200 | | | Monsanto Co. | | | 4,444,284 | |
| | | | | | | | |
| | | | Communications Equipment — 1.7% | | | | |
| | 67,300 | | | QUALCOMM, Inc. | | | 5,002,409 | |
| | | | | | | | |
| | | | Consumer Finance — 1.9% | | | | |
| | 66,500 | | | Capital One Financial Corp. | | | 5,489,575 | |
| | | | | | | | |
| | | | Electronic Equipment, Instruments & Components — 1.8% | | | | |
| | 79,900 | | | TE Connectivity Ltd. | | | 5,053,675 | |
| | | | | | | | |
| | | | Energy Equipment & Services — 2.4% | | | | |
| | 81,000 | | | Halliburton Co. | | | 3,185,730 | |
| | 55,600 | | | National Oilwell Varco, Inc. | | | 3,643,468 | |
| | | | | | | | |
| | | | | | | 6,829,198 | |
| | | | | | | | |
| | | | Food & Staples Retailing — 1.5% | | | | |
| | 48,500 | | | Wal-Mart Stores, Inc. | | | 4,165,180 | |
| | | | | | | | |
| | | | Food Products — 4.5% | | | | |
| | 91,900 | | | General Mills, Inc. | | | 4,901,027 | |
| | 57,000 | | | Nestle S.A., Sponsored ADR | | | 4,158,150 | |
| | 91,300 | | | Unilever PLC, Sponsored ADR | | | 3,695,824 | |
| | | | | | | | |
| | | | | | | 12,755,001 | |
| | | | | | | | |
| | | | Health Care Equipment & Supplies — 1.8% | | | | |
| | 72,900 | | | Medtronic, Inc. | | | 5,263,380 | |
| | | | | | | | |
See accompanying notes to financial statements.
| 26
Portfolio of Investments – as of December 31, 2014
Natixis Oakmark Fund – (continued)
| | | | | | | | |
Shares | | | Description | | Value (†) | |
| | | | Health Care Providers & Services — 2.0% | | | | |
| | 55,800 | | | UnitedHealth Group, Inc. | | $ | 5,640,822 | |
| | | | | | | | |
| | | | Hotels, Restaurants & Leisure — 1.2% | | | | |
| | 60,900 | | | Las Vegas Sands Corp. | | | 3,541,944 | |
| | | | | | | | |
| | | | Household Durables — 1.2% | | | | |
| | 17,850 | | | Whirlpool Corp. | | | 3,458,259 | |
| | | | | | | | |
| | | | Industrial Conglomerates — 1.5% | | | | |
| | 166,800 | | | General Electric Co. | | | 4,215,036 | |
| | | | | | | | |
| | | | Insurance — 6.9% | | | | |
| | 81,700 | | | Aflac, Inc. | | | 4,991,053 | |
| | 114,900 | | | American International Group, Inc. | | | 6,435,549 | |
| | 49,200 | | | Aon PLC | | | 4,665,636 | |
| | 72,000 | | | Principal Financial Group, Inc. | | | 3,739,680 | |
| | | | | | | | |
| | | | | | | 19,831,918 | |
| | | | | | | | |
| | | | Internet & Catalog Retail — 3.7% | | | | |
| | 19,660 | | | Amazon.com, Inc.(b) | | | 6,101,481 | |
| | 148,600 | | | Liberty Interactive Corp., Class A(b) | | | 4,371,812 | |
| | | | | | | | |
| | | | | | | 10,473,293 | |
| | | | | | | | |
| | | | Internet Software & Services — 2.2% | | | | |
| | 11,620 | | | Google, Inc., Class A(b) | | | 6,166,269 | |
| | | | | | | | |
| | | | IT Services — 7.5% | | | | |
| | 33,200 | | | Accenture PLC, Class A | | | 2,965,092 | |
| | 66,000 | | | Automatic Data Processing, Inc. | | | 5,502,420 | |
| | 80,400 | | | MasterCard, Inc., Class A | | | 6,927,264 | |
| | 22,930 | | | Visa, Inc., Class A | | | 6,012,246 | |
| | | | | | | | |
| | | | | | | 21,407,022 | |
| | | | | | | | |
| | | | Machinery — 3.0% | | | | |
| | 48,800 | | | Illinois Tool Works, Inc. | | | 4,621,360 | |
| | 30,500 | | | Parker Hannifin Corp. | | | 3,932,975 | |
| | | | | | | | |
| | | | | | | 8,554,335 | |
| | | | | | | | |
| | | | Media — 4.6% | |
| | 61,500 | | | Comcast Corp., Special Class A | | | 3,540,248 | |
| | 313,100 | | | News Corp., Class A(b) | | | 4,912,539 | |
| | 59,800 | | | Omnicom Group, Inc. | | | 4,632,706 | |
| | | | | | | | |
| | | | | | | 13,085,493 | |
| | | | | | | | |
| | | | Metals & Mining — 1.2% | | | | |
| | 740,200 | | | Glencore PLC | | | 3,447,185 | |
| | | | | | | | |
| | | | Oil, Gas & Consumable Fuels — 3.3% | | | | |
| | 96,900 | | | Apache Corp. | | | 6,072,723 | |
| | 172,600 | | | Chesapeake Energy Corp. | | | 3,377,782 | |
| | | | | | | | |
| | | | | | | 9,450,505 | |
| | | | | | | | |
| | | | Pharmaceuticals — 1.4% | | | | |
| | 88,300 | | | Sanofi, ADR | | | 4,027,363 | |
| | | | | | | | |
See accompanying notes to financial statements.
27 |
Portfolio of Investments – as of December 31, 2014
Natixis Oakmark Fund – (continued)
| | | | | | | | |
Shares | | | Description | | Value (†) | |
| | | | Road & Rail — 1.2% | | | | |
| | 27,800 | | | Union Pacific Corp. | | $ | 3,311,814 | |
| | | | | | | | |
| | | | Semiconductors & Semiconductor Equipment — 4.7% | | | | |
| | 112,800 | | | Applied Materials, Inc. | | | 2,810,976 | |
| | 168,000 | | | Intel Corp. | | | 6,096,720 | |
| | 86,700 | | | Texas Instruments, Inc. | | | 4,635,416 | |
| | | | | | | | |
| | | | | | | 13,543,112 | |
| | | | | | | | |
| | | | Software — 4.0% | |
| | 97,700 | | | Microsoft Corp. | | | 4,538,165 | |
| | 152,200 | | | Oracle Corp. | | | 6,844,434 | |
| | | | | | | | |
| | | | | | | 11,382,599 | |
| | | | | | | | |
| | | | Specialty Retail — 2.1% | | | | |
| | 57,500 | | | Home Depot, Inc. (The) | | | 6,035,775 | |
| | | | | | | | |
| | | | Technology Hardware, Storage & Peripherals — 1.8% | | | | |
| | 46,600 | | | Apple, Inc. | | | 5,143,708 | |
| | | | | | | | |
| | | | Total Common Stocks (Identified Cost $225,810,769) | | | 266,290,404 | |
| | | | | | | | |
| | | | | | | | |
Principal
Amount | | | | | | |
| | Short-Term Investments — 5.8% | | | | |
| $ | 16,533,486 | | | Tri-Party Repurchase Agreement with Fixed Income Clearing Corporation, dated 12/31/2014 at 0.010% to be repurchased at $16,533,495 on 1/02/2015 collateralized by $16,355,000 U.S. Treasury Note, 2.500% due 5/15/2024 valued at $16,865,888 including accrued interest (Note 2 of Notes to Financial Statements)
(Identified Cost $16,533,486) | | | 16,533,486 | |
| | | | | | | | |
| | | | Total Investments — 99.1% (Identified Cost $242,344,255)(a) | | | 282,823,890 | |
| | | | Other assets less liabilities — 0.9% | | | 2,540,371 | |
| | | | | | | | |
| | | | Net Assets — 100.0% | | $ | 285,364,261 | |
| | | | | | | | |
| | | | | | | | |
| | (†) | | | See Note 2 of Notes to Financial Statements. | |
| | (a) | | | Federal Tax Information: | |
| | | | At December 31, 2014, the net unrealized appreciation on investments based on a cost of $242,805,431 for federal income tax purposes was as follows: | |
| | | | Aggregate gross unrealized appreciation for all investments in which there is an excess of value over tax cost | | $ | 45,524,180 | |
| | | | Aggregate gross unrealized depreciation for all investments in which there is an excess of tax cost over value | | | (5,505,721 | ) |
| | | | | | | | |
| | | | Net unrealized appreciation | | $ | 40,018,459 | |
| | | | | | | | |
| | (b) | | | Non-income producing security. | |
| | | | | | | | |
| | ADR | | | An American Depositary Receipt is a certificate issued by a custodian bank representing the right to receive securities of the foreign issuer described. The values of ADRs may be significantly influenced by trading on exchanges not located in the United States. | |
See accompanying notes to financial statements.
| 28
Portfolio of Investments – as of December 31, 2014
Natixis Oakmark Fund – (continued)
Industry Summary at December 31, 2014
| | | | |
Banks | | | 9.1 | % |
Capital Markets | | | 8.2 | |
IT Services | | | 7.5 | |
Insurance | | | 6.9 | |
Semiconductors & Semiconductor Equipment | | | 4.7 | |
Media | | | 4.6 | |
Food Products | | | 4.5 | |
Software | | | 4.0 | |
Internet & Catalog Retail | | | 3.7 | |
Oil, Gas & Consumable Fuels | | | 3.3 | |
Machinery | | | 3.0 | |
Energy Equipment & Services | | | 2.4 | |
Internet Software & Services | | | 2.2 | |
Specialty Retail | | | 2.1 | |
Air Freight & Logistics | | | 2.0 | |
Health Care Providers & Services | | | 2.0 | |
Other Investments, less than 2% each | | | 23.1 | |
Short-Term Investments | | | 5.8 | |
| | | | |
Total Investments | | | 99.1 | |
Other assets less liabilities | | | 0.9 | |
| | | | |
Net Assets | | | 100.0 | % |
| | | | |
See accompanying notes to financial statements.
29 |
Portfolio of Investments – as of December 31, 2014
Natixis Oakmark International Fund
| | | | | | | | |
Shares | | | Description | | Value (†) | |
| | Common Stocks — 97.3% of Net Assets | | | | |
| | | | Australia — 3.5% | | | | |
| | 3,395,268 | | | AMP Ltd. | | $ | 15,121,712 | |
| | 1,194,862 | | | Orica Ltd. | | | 18,309,572 | |
| | | | | | | | |
| | | | | | | 33,431,284 | |
| | | | | | | | |
| | | | Canada — 0.1% | | | | |
| | 34,400 | | | Thomson Reuters Corp. | | | 1,387,784 | |
| | | | | | | | |
| | | | France — 14.4% | | | | |
| | 598,700 | | | BNP Paribas S.A. | | | 35,343,697 | |
| | 32,600 | | | Christian Dior S.A. | | | 5,579,101 | |
| | 315,058 | | | Danone | | | 20,597,879 | |
| | 115,000 | | | Kering | | | 22,099,617 | |
| | 100,400 | | | LVMH Moet Hennessy Louis Vuitton S.A. | | | 15,903,525 | |
| | 125,200 | | | Pernod-Ricard S.A. | | | 13,914,432 | |
| | 114,076 | | | Publicis Groupe S.A. | | | 8,180,999 | |
| | 228,900 | | | Safran S.A. | | | 14,121,974 | |
| | | | | | | | |
| | | | | | | 135,741,224 | |
| | | | | | | | |
| | | | Germany — 11.2% | | | | |
| | 201,300 | | | Allianz SE, (Registered) | | | 33,340,548 | |
| | 277,200 | | | Bayerische Motoren Werke AG | | | 29,914,920 | |
| | 2,700 | | | Continental AG | | | 569,491 | |
| | 375,300 | | | Daimler AG, (Registered) | | | 31,170,190 | |
| | 157,500 | | | SAP SE | | | 10,997,967 | |
| | | | | | | | |
| | | | | | | 105,993,116 | |
| | | | | | | | |
| | | | Hong Kong — 1.4% | | | | |
| | 526,600 | | | Melco Crown Entertainment Ltd., Sponsored ADR | | | 13,375,640 | |
| | | | | | | | |
| | | | Ireland — 2.9% | | | | |
| | 1,629,131 | | | Experian PLC | | | 27,462,185 | |
| | | | | | | | |
| | | | Israel — 0.2% | | | | |
| | 27,900 | | | Check Point Software Technologies Ltd.(b) | | | 2,192,103 | |
| | | | | | | | |
| | | | Italy — 5.6% | | | | |
| | 82,200 | | | Exor SpA | | | 3,372,812 | |
| | 10,201,800 | | | Intesa Sanpaolo SpA | | | 29,594,407 | |
| | 3,512,300 | | | Prada SpA | | | 19,835,131 | |
| | | | | | | | |
| | | | | | | 52,802,350 | |
| | | | | | | | |
| | | | Japan — 10.8% | | | | |
| | 191,400 | | | Canon, Inc. | | | 6,083,409 | |
| | 3,493,000 | | | Daiwa Securities Group, Inc. | | | 27,350,666 | |
| | 1,047,300 | | | Honda Motor Co. Ltd. | | | 30,725,975 | |
| | 73,200 | | | Meitec Corp. | | | 2,163,892 | |
| | 142,700 | | | Olympus Corp.(b) | | | 4,998,828 | |
| | 67,000 | | | Secom Co. Ltd. | | | 3,849,458 | |
| | 429,200 | | | Toyota Motor Corp. | | | 26,746,604 | |
| | | | | | | | |
| | | | | | | 101,918,832 | |
| | | | | | | | |
See accompanying notes to financial statements.
| 30
Portfolio of Investments – as of December 31, 2014
Natixis Oakmark International Fund – (continued)
| | | | | | | | |
Shares | | | Description | | Value (†) | |
| | | | Korea — 2.7% | | | | |
| | 21,140 | | | Samsung Electronics Co. Ltd. | | $ | 25,415,438 | |
| | | | | | | | |
| | | | Netherlands — 6.6% | | | | |
| | 66,731 | | | Akzo Nobel NV | | | 4,617,119 | |
| | 3,447,900 | | | CNH Industrial NV | | | 27,911,017 | |
| | 90,700 | | | Heineken Holding NV | | | 5,677,957 | |
| | 126,746 | | | Koninklijke Ahold NV | | | 2,252,639 | |
| | 753,924 | | | Koninklijke Philips NV | | | 21,853,247 | |
| | | | | | | | |
| | | | | | | 62,311,979 | |
| | | | | | | | |
| | | | Sweden — 4.2% | | | | |
| | 398,300 | | | Atlas Copco AB, Series B | | | 10,195,605 | |
| | 186,900 | | | Hennes & Mauritz AB, Series B | | | 7,764,762 | |
| | 876,500 | | | SKF AB, Series B | | | 18,463,928 | |
| | 106,911 | | | Swedish Match AB | | | 3,350,004 | |
| | | | | | | | |
| | | | | | | 39,774,299 | |
| | | | | | | | |
| | | | Switzerland — 18.3% | | | | |
| | 290,100 | | | Adecco S.A., (Registered) | | | 19,941,261 | |
| | 360,200 | | | Cie Financiere Richemont S.A., (Registered) | | | 31,934,831 | |
| | 1,925,858 | | | Credit Suisse Group AG, (Registered) | | | 48,379,949 | |
| | 342,900 | | | Holcim Ltd., (Registered) | | | 24,511,908 | |
| | 154,300 | | | Kuehne & Nagel International AG, (Registered) | | | 20,959,398 | |
| | 200,600 | | | Nestle S.A., (Registered) | | | 14,623,938 | |
| | 85,900 | | | Schindler Holding AG | | | 12,400,879 | |
| | | | | | | | |
| | | | | | | 172,752,164 | |
| | | | | | | | |
| | | | United Kingdom — 15.4% | | | | |
| | 892,500 | | | Diageo PLC | | | 25,567,506 | |
| | 574,600 | | | G4S PLC | | | 2,478,608 | |
| | 671,600 | | | GlaxoSmithKline PLC | | | 14,408,237 | |
| | 18,905,400 | | | Lloyds Banking Group PLC(b) | | | 22,237,648 | |
| | 1,470,804 | | | Meggitt PLC | | | 11,831,506 | |
| | 439,400 | | | Schroders PLC | | | 18,262,461 | |
| | 100 | | | Schroders PLC, (Non Voting) | | | 3,218 | |
| | 631,000 | | | Smiths Group PLC | | | 10,729,598 | |
| | 421,900 | | | Willis Group Holdings PLC | | | 18,905,339 | |
| | 119,896 | | | Wolseley PLC | | | 6,854,671 | |
| | 662,700 | | | WPP PLC | | | 13,778,635 | |
| | | | | | | | |
| | | | | | | 145,057,427 | |
| | | | | | | | |
| | | | Total Common Stocks (Identified Cost $979,923,073) | | | 919,615,825 | |
| | | | | | | | |
See accompanying notes to financial statements.
31 |
Portfolio of Investments – as of December 31, 2014
Natixis Oakmark International Fund – (continued)
| | | | | | | | |
Principal
Amount | | | Description | | Value (†) | |
| | Short-Term Investments — 1.6% | | | | |
| $ | 14,806,514 | | | Tri-Party Repurchase Agreement with Fixed Income Clearing Corporation, dated 12/31/2014 at 0.010% to be repurchased at $14,806,522 on 1/02/2015 collateralized by $12,720,000 U.S. Treasury Bond, 3.625% due 8/15/2043 valued at $15,105,000 including accrued interest (Note 2 of Notes to Financial Statements)
(Identified Cost $14,806,514) | | $ | 14,806,514 | |
| | | | | | | | |
| | | | Total Investments — 98.9% (Identified Cost $994,729,587)(a) | | | 934,422,339 | |
| | | | Other assets less liabilities — 1.1% | | | 10,279,400 | |
| | | | | | | | |
| | | | Net Assets — 100.0% | | $ | 944,701,739 | |
| | | | | | | | |
| | | | | | | | |
| | (†) | | | See Note 2 of Notes to Financial Statements. | |
| | (a) | | | Federal Tax Information: | |
| | | | At December 31, 2014, the net unrealized depreciation on investments based on a cost of $997,470,184 for federal income tax purposes was as follows: | |
| | | | Aggregate gross unrealized appreciation for all investments in which there is an excess of value over tax cost | | $ | 11,417,325 | |
| | | | Aggregate gross unrealized depreciation for all investments in which there is an excess of tax cost over value | | | (74,465,170 | ) |
| | | | | | | | |
| | | | Net unrealized depreciation | | $ | (63,047,845 | ) |
| | | | | | | | |
| | (b) | | | Non-income producing security. | |
| | | | | | | | |
| | ADR | | | An American Depositary Receipt is a certificate issued by a custodian bank representing the right to receive securities of the foreign issuer described. The values of ADRs may be significantly influenced by trading on exchanges not located in the United States. | |
At December 31, 2014, the Fund had the following open forward foreign currency contracts:
| | | | | | | | | | | | | | | | | | |
Contract to Buy/Sell1 | | Delivery Date | | | Currency | | Units of Currency | | | Notional Value | | | Unrealized Appreciation (Depreciation) | |
| Buy | | | 6/17/2015 | | | Australian Dollar | | | 8,794,000 | | | $ | 7,098,206 | | | $ | (232,820 | ) |
| Sell | | | 6/17/2015 | | | Australian Dollar | | | 18,264,000 | | | | 14,742,056 | | | | 1,583,403 | |
| Buy | | | 3/18/2015 | | | Swedish Krona | | | 46,890,000 | | | | 6,016,558 | | | | (228,354 | ) |
| Sell | | | 3/18/2015 | | | Swedish Krona | | | 92,571,000 | | | | 11,877,987 | | | | 1,910,098 | |
| Sell | | | 9/16/2015 | | | Swiss Franc | | | 43,799,000 | | | | 44,318,373 | | | | 1,088,013 | |
| | | | | | | | | | | | | | | | | | |
| Total | | | | | | | | | | | | | | | | $ | 4,120,340 | |
| | | | | | | | | | | | | | | | | | |
1 Counterparty is State Street Bank and Trust Company.
See accompanying notes to financial statements.
| 32
Portfolio of Investments – as of December 31, 2014
Natixis Oakmark International Fund – (continued)
Industry Summary at December 31, 2014
| | | | |
Automobiles | | | 12.6 | % |
Textiles, Apparel & Luxury Goods | | | 10.1 | |
Capital Markets | | | 9.9 | |
Banks | | | 9.2 | |
Machinery | | | 7.3 | |
Insurance | | | 7.1 | |
Professional Services | | | 5.2 | |
Beverages | | | 4.8 | |
Food Products | | | 3.8 | |
Industrial Conglomerates | | | 3.4 | |
Technology Hardware, Storage & Peripherals | | | 3.4 | |
Aerospace & Defense | | | 2.8 | |
Construction Materials | | | 2.6 | |
Media | | | 2.5 | |
Chemicals | | | 2.4 | |
Marine | | | 2.2 | |
Other Investments, less than 2% each | | | 8.0 | |
Short-Term Investments | | | 1.6 | |
| | | | |
Total Investments | | | 98.9 | |
Other assets less liabilities (including forward foreign currency contracts) | | | 1.1 | |
| | | | |
Net Assets | | | 100.0 | % |
| | | | |
Currency Exposure Summary at December 31, 2014
| | | | |
Euro | | | 35.7 | % |
Swiss Franc | | | 18.3 | |
British Pound | | | 16.3 | |
Japanese Yen | | | 10.8 | |
United States Dollar | | | 5.2 | |
Swedish Krona | | | 4.2 | |
Australian Dollar | | | 3.5 | |
South Korean Won | | | 2.7 | |
Hong Kong Dollar | | | 2.1 | |
Canadian Dollar | | | 0.1 | |
| | | | |
Total Investments | | | 98.9 | |
Other assets less liabilities (including forward foreign currency contracts) | | | 1.1 | |
| | | | |
Net Assets | | | 100.0 | % |
| | | | |
See accompanying notes to financial statements.
33 |
Portfolio of Investments – as of December 31, 2014
Vaughan Nelson Small Cap Value Fund
| | | | | | | | |
Shares | | | Description | | Value (†) | |
| | Common Stocks — 96.0% of Net Assets | | | | |
| | | | Aerospace & Defense — 2.0% | | | | |
| | 61,075 | | | Esterline Technologies Corp.(b) | | $ | 6,698,706 | |
| | | | | | | | |
| | | | Auto Components — 1.2% | | | | |
| | 69,200 | | | Tenneco, Inc.(b) | | | 3,917,412 | |
| | | | | | | | |
| | | | Banks — 8.5% | | | | |
| | 147,375 | | | Capital Bank Financial Corp., Class A(b) | | | 3,949,650 | |
| | 397,380 | | | FirstMerit Corp. | | | 7,506,508 | |
| | 58,125 | | | Prosperity Bancshares, Inc. | | | 3,217,800 | |
| | 202,250 | | | Union Bankshares Corp. | | | 4,870,180 | |
| | 262,600 | | | Webster Financial Corp. | | | 8,542,378 | |
| | | | | | | | |
| | | | | | | 28,086,516 | |
| | | | | | | | |
| | | | Biotechnology — 0.6% | | | | |
| | 47,725 | | | AMAG Pharmaceuticals, Inc.(b) | | | 2,034,040 | |
| | | | | | | | |
| | | | Building Products — 1.5% | | | | |
| | 53,750 | | | Lennox International, Inc. | | | 5,110,013 | |
| | | | | | | | |
| | | | Capital Markets — 2.6% | | | | |
| | 111,325 | | | LPL Financial Holdings, Inc. | | | 4,959,529 | |
| | 211,775 | | | TCP Capital Corp. | | | 3,553,584 | |
| | | | | | | | |
| | | | | | | 8,513,113 | |
| | | | | | | | |
| | | | Commercial Services & Supplies — 2.7% | | | | |
| | 258,650 | | | KAR Auction Services, Inc. | | | 8,962,223 | |
| | | | | | | | |
| | | | Consumer Finance — 1.6% | | | | |
| | 96,500 | | | First Cash Financial Services, Inc.(b) | | | 5,372,155 | |
| | | | | | | | |
| | | | Containers & Packaging — 4.4% | | | | |
| | 536,525 | | | Graphic Packaging Holding Co.(b) | | | 7,307,470 | |
| | 132,950 | | | Silgan Holdings, Inc. | | | 7,126,120 | |
| | | | | | | | |
| | | | | | | 14,433,590 | |
| | | | | | | | |
| | | | Diversified Consumer Services — 1.9% | | | | |
| | 232,000 | | | ServiceMaster Global Holdings, Inc.(b) | | | 6,210,640 | |
| | | | | | | | |
| | | | Electrical Equipment — 0.9% | | | | |
| | 126,125 | | | Thermon Group Holdings, Inc.(b) | | | 3,050,964 | |
| | | | | | | | |
| | | | Electronic Equipment, Instruments & Components — 1.8% | | | | |
| | 60,850 | | | Littelfuse, Inc. | | | 5,882,370 | |
| | | | | | | | |
| | | | Energy Equipment & Services — 1.3% | | | | |
| | 205,350 | | | Forum Energy Technologies, Inc.(b) | | | 4,256,906 | |
| | | | | | | | |
| | | | Health Care Equipment & Supplies — 7.9% | | | | |
| | 147,675 | | | Alere, Inc.(b) | | | 5,611,650 | |
| | 147,350 | | | Haemonetics Corp.(b) | | | 5,513,837 | |
| | 117,725 | | | Integra LifeSciences Holdings Corp.(b) | | | 6,384,227 | |
| | 174,650 | | | Merit Medical Systems, Inc.(b) | | | 3,026,685 | |
| | 49,875 | | | Teleflex, Inc. | | | 5,726,647 | |
| | | | | | | | |
| | | | | | | 26,263,046 | |
| | | | | | | | |
See accompanying notes to financial statements.
| 34
Portfolio of Investments – as of December 31, 2014
Vaughan Nelson Small Cap Value Fund – (continued)
| | | | | | | | |
Shares | | | Description | | Value (†) | |
| | | | Health Care Providers & Services — 4.8% | | | | |
| | 164,550 | | | Amsurg Corp.(b) | | $ | 9,005,821 | |
| | 28,900 | | | Civitas Solutions, Inc.(b) | | | 492,167 | |
| | 88,600 | | | LifePoint Hospitals, Inc.(b) | | | 6,371,226 | |
| | | | | | | | |
| | | | | | | 15,869,214 | |
| | | | | | | | |
| | | | Hotels, Restaurants & Leisure — 2.7% | | | | |
| | 145,075 | | | Bloomin’ Brands, Inc.(b) | | | 3,592,057 | |
| | 65,175 | | | Jack in the Box, Inc. | | | 5,211,393 | |
| | | | | | | | |
| | | | | | | 8,803,450 | |
| | | | | | | | |
| | | | Household Durables — 1.1% | | | | |
| | 91,375 | | | Ryland Group, Inc. (The) | | | 3,523,420 | |
| | | | | | | | |
| | | | Insurance — 8.3% | | | | |
| | 141,075 | | | American Equity Investment Life Holding Co. | | | 4,117,979 | |
| | 117,200 | | | Aspen Insurance Holdings Ltd. | | | 5,129,844 | |
| | 274,325 | | | CNO Financial Group, Inc. | | | 4,723,877 | |
| | 156,762 | | | HCC Insurance Holdings, Inc. | | | 8,389,902 | |
| | 68,975 | | | Platinum Underwriters Holdings Ltd. | | | 5,064,144 | |
| | | | | | | | |
| | | | | | | 27,425,746 | |
| | | | | | | | |
| | | | Internet & Catalog Retail — 1.9% | | | | |
| | 83,025 | | | HSN, Inc. | | | 6,309,900 | |
| | | | | | | | |
| | | | IT Services — 6.4% | | | | |
| | 183,400 | | | Broadridge Financial Solutions, Inc. | | | 8,469,412 | |
| | 59,575 | | | CACI International, Inc., Class A(b) | | | 5,134,173 | |
| | 189,475 | | | iGATE Corp.(b) | | | 7,480,473 | |
| | | | | | | | |
| | | | | | | 21,084,058 | |
| | | | | | | | |
| | | | Life Sciences Tools & Services — 3.4% | | | | |
| | 112,525 | | | Albany Molecular Research, Inc.(b) | | | 1,831,907 | |
| | 164,625 | | | PRA Health Sciences, Inc.(b) | | | 3,987,218 | |
| | 214,550 | | | VWR Corp.(b) | | | 5,550,408 | |
| | | | | | | | |
| | | | | | | 11,369,533 | |
| | | | | | | | |
| | | | Machinery — 4.6% | | | | |
| | 26,650 | | | Barnes Group, Inc. | | | 986,317 | |
| | 178,500 | | | Hillenbrand, Inc. | | | 6,158,250 | |
| | 174,825 | | | Rexnord Corp.(b) | | | 4,931,813 | |
| | 38,675 | | | Standex International Corp. | | | 2,988,030 | |
| | | | | | | | |
| | | | | | | 15,064,410 | |
| | | | | | | | |
| | | | Metals & Mining — 2.0% | | | | |
| | 98,775 | | | Globe Specialty Metals, Inc. | | | 1,701,893 | |
| | 83,100 | | | Reliance Steel & Aluminum Co. | | | 5,091,537 | |
| | | | | | | | |
| | | | | | | 6,793,430 | |
| | | | | | | | |
| | | | Paper & Forest Products — 1.3% | | | | |
| | 142,375 | | | KapStone Paper and Packaging Corp. | | | 4,173,011 | |
| | | | | | | | |
See accompanying notes to financial statements.
35 |
Portfolio of Investments – as of December 31, 2014
Vaughan Nelson Small Cap Value Fund – (continued)
| | | | | | | | |
Shares | | | Description | | Value (†) | |
| | | | Professional Services — 3.2% | | | | |
| | 52,200 | | | Dun & Bradstreet Corp. (The) | | $ | 6,314,112 | |
| | 101,900 | | | ICF International, Inc.(b) | | | 4,175,862 | |
| | | | | | | | |
| | | | | | | 10,489,974 | |
| | | | | | | | |
| | | | REITs – Hotels — 1.4% | | | | |
| | 677,250 | | | Hersha Hospitality Trust | | | 4,761,068 | |
| | | | | | | | |
| | | | Road & Rail — 0.5% | | | | |
| | 32,350 | | | Con-way, Inc. | | | 1,590,973 | |
| | | | | | | | |
| | | | Software — 7.6% | | | | |
| | 67,425 | | | BroadSoft, Inc.(b) | | | 1,956,673 | |
| | 87,775 | | | CommVault Systems, Inc.(b) | | | 4,537,090 | |
| | 64,275 | | | Ellie Mae, Inc.(b) | | | 2,591,568 | |
| | 130,100 | | | SS&C Technologies Holdings, Inc. | | | 7,609,549 | |
| | 144,225 | | | Verint Systems, Inc.(b) | | | 8,405,433 | |
| | | | | | | | |
| | | | | | | 25,100,313 | |
| | | | | | | | |
| | | | Specialty Retail — 4.9% | | | | |
| | 148,675 | | | GNC Holdings, Inc., Class A | | | 6,981,778 | |
| | 43,875 | | | Group 1 Automotive, Inc. | | | 3,932,078 | |
| | 121,875 | | | Men’s Wearhouse, Inc. (The) | | | 5,380,781 | |
| | | | | | | | |
| | | | | | | 16,294,637 | |
| | | | | | | | |
| | | | Textiles, Apparel & Luxury Goods — 3.0% | | | | |
| | 154,175 | | | Steven Madden Ltd.(b) | | | 4,907,390 | |
| | 166,175 | | | Wolverine World Wide, Inc. | | | 4,897,177 | |
| | | | | | | | |
| | | | | | | 9,804,567 | |
| | | | | | | | |
| | | | Total Common Stocks (Identified Cost $247,924,369) | | | 317,249,398 | |
| | | | | | | | |
| | | | | | | | |
Principal
Amount | | | | | | |
| | Short-Term Investments — 1.8% | | | | |
| $ | 5,717,818 | | | Tri-Party Repurchase Agreement with Fixed Income Clearing Corporation, dated 12/31/2014 at 0.010% to be repurchased at $5,717,821 on 1/02/2015 collateralized by $5,680,000 U.S. Treasury Note, 2.375% due 8/15/2024 valued at $5,836,200 including accrued interest (Note 2 of Notes to Financial Statements)
(Identified Cost $5,717,818) | | | 5,717,818 | |
| | | | | | | | |
| | | | Total Investments — 97.8% (Identified Cost $253,642,187)(a) | | | 322,967,216 | |
| | | | Other assets less liabilities — 2.2% | | | 7,398,632 | |
| | | | | | | | |
| | | | Net Assets — 100.0% | | $ | 330,365,848 | |
| | | | | | | | |
See accompanying notes to financial statements.
| 36
Portfolio of Investments – as of December 31, 2014
Vaughan Nelson Small Cap Value Fund – (continued)
| | | | | | | | |
| | (†) | | | See Note 2 of Notes to Financial Statements. | |
| | (a) | | | Federal Tax Information: | |
| | | | At December 31, 2014, the net unrealized appreciation on investments based on a cost of $254,525,600 for federal income tax purposes was as follows: | |
| | | | Aggregate gross unrealized appreciation for all investments in which there is an excess of value over tax cost | | $ | 69,981,136 | |
| | | | Aggregate gross unrealized depreciation for all investments in which there is an excess of tax cost over value | | | (1,539,520 | ) |
| | | | | | | | |
| | | | Net unrealized appreciation | | $ | 68,441,616 | |
| | | | | | | | |
| | (b) | | | Non-income producing security. | |
| | | | | | | | |
| | REITs | | | Real Estate Investment Trusts | |
Industry Summary at December 31, 2014
| | | | |
Banks | | | 8.5 | % |
Insurance | | | 8.3 | |
Health Care Equipment & Supplies | | | 7.9 | |
Software | | | 7.6 | |
IT Services | | | 6.4 | |
Specialty Retail | | | 4.9 | |
Health Care Providers & Services | | | 4.8 | |
Machinery | | | 4.6 | |
Containers & Packaging | | | 4.4 | |
Life Sciences Tools & Services | | | 3.4 | |
Professional Services | | | 3.2 | |
Textiles, Apparel & Luxury Goods | | | 3.0 | |
Commercial Services & Supplies | | | 2.7 | |
Hotels, Restaurants & Leisure | | | 2.7 | |
Capital Markets | | | 2.6 | |
Metals & Mining | | | 2.0 | |
Aerospace & Defense | | | 2.0 | |
Other Investments, less than 2% each | | | 17.0 | |
Short-Term Investments | | | 1.8 | |
| | | | |
Total Investments | | | 97.8 | |
Other assets less liabilities | | | 2.2 | |
| | | | |
Net Assets | | | 100.0 | % |
| | | | |
See accompanying notes to financial statements.
37 |
Portfolio of Investments – as of December 31, 2014
Vaughan Nelson Value Opportunity Fund
| | | | | | | | |
Shares | | | Description | | Value (†) | |
| | Common Stocks — 97.6% of Net Assets | | | | |
| | | | Auto Components — 3.1% | | | | |
| | 175,075 | | | Delphi Automotive PLC | | $ | 12,731,454 | |
| | 198,000 | | | Tenneco, Inc.(b) | | | 11,208,780 | |
| | | | | | | | |
| | | | | | | 23,940,234 | |
| | | | | | | | |
| | | | Banks — 5.7% | | | | |
| | 305,350 | | | CIT Group, Inc. | | | 14,604,891 | |
| | 1,247,450 | | | Investors Bancorp, Inc. | | | 14,002,626 | |
| | 344,950 | | | PacWest Bancorp | | | 15,681,427 | |
| | | | | | | | |
| | | | | | | 44,288,944 | |
| | | | | | | | |
| | | | Capital Markets — 3.1% | | | | |
| | 268,875 | | | LPL Financial Holdings, Inc. | | | 11,978,381 | |
| | 303,250 | | | SEI Investments Co. | | | 12,142,130 | |
| | | | | | | | |
| | | | | | | 24,120,511 | |
| | | | | | | | |
| | | | Commercial Services & Supplies — 1.1% | | | | |
| | 248,025 | | | KAR Auction Services, Inc. | | | 8,594,066 | |
| | | | | | | | |
| | | | Communications Equipment — 1.7% | | | | |
| | 592,975 | | | CommScope Holding Co., Inc.(b) | | | 13,537,619 | |
| | | | | | | | |
| | | | Consumer Finance — 1.8% | | | | |
| | 241,775 | | | PRA Group, Inc.(b) | | | 14,006,026 | |
| | | | | | | | |
| | | | Containers & Packaging — 5.6% | | | | |
| | 231,350 | | | Avery Dennison Corp. | | | 12,002,438 | |
| | 353,275 | | | Crown Holdings, Inc.(b) | | | 17,981,698 | |
| | 170,900 | | | Packaging Corp. of America | | | 13,338,745 | |
| | | | | | | | |
| | | | | | | 43,322,881 | |
| | | | | | | | |
| | | | Diversified Consumer Services — 1.8% | | | | |
| | 509,600 | | | ServiceMaster Global Holdings, Inc.(b) | | | 13,641,992 | |
| | | | | | | | |
| | | | Diversified Financial Services — 2.0% | | | | |
| | 324,100 | | | NASDAQ OMX Group, Inc. (The) | | | 15,543,836 | |
| | | | | | | | |
| | | | Energy Equipment & Services — 0.3% | | | | |
| | 128,175 | | | Superior Energy Services, Inc. | | | 2,582,726 | |
| | | | | | | | |
| | | | Food & Staples Retailing — 2.6% | | | | |
| | 2,640,775 | | | Rite Aid Corp.(b) | | | 19,858,628 | |
| | | | | | �� | | |
| | | | Health Care Equipment & Supplies — 1.2% | | | | |
| | 256,375 | | | Alere, Inc.(b) | | | 9,742,250 | |
| | | | | | | | |
| | | | Health Care Providers & Services — 6.7% | | | | |
| | 301,175 | | | Amsurg Corp.(b) | | | 16,483,308 | |
| | 288,675 | | | Community Health Systems, Inc.(b) | | | 15,565,356 | |
| | 268,875 | | | HCA Holdings, Inc.(b) | | | 19,732,736 | |
| | | | | | | | |
| | | | | | | 51,781,400 | |
| | | | | | | | |
See accompanying notes to financial statements.
| 38
Portfolio of Investments – as of December 31, 2014
Vaughan Nelson Value Opportunity Fund – (continued)
| | | | | | | | |
Shares | | | Description | | Value (†) | |
| | | | Household Durables — 4.5% | | | | |
| | 65,650 | | | Harman International Industries, Inc. | | $ | 7,005,511 | |
| | 372,037 | | | Jarden Corp.(b) | | | 17,813,108 | |
| | 220,925 | | | Lennar Corp., Class A | | | 9,899,649 | |
| | | | | | | | |
| | | | | | | 34,718,268 | |
| | | | | | | | |
| | | | Household Products — 1.4% | | | | |
| | 117,750 | | | Spectrum Brands Holdings, Inc. | | | 11,266,320 | |
| | | | | | | | |
| | | | Insurance — 3.5% | | | | |
| | 423,100 | | | First American Financial Corp. | | | 14,343,090 | |
| | 149,025 | | | Reinsurance Group of America, Inc., Class A | | | 13,057,571 | |
| | | | | | | | |
| | | | | | | 27,400,661 | |
| | | | | | | | |
| | | | Internet & Catalog Retail — 1.9% | | | | |
| | 198,000 | | | HSN, Inc. | | | 15,048,000 | |
| | | | | | | | |
| | | | IT Services — 10.1% | | | | |
| | 218,850 | | | Broadridge Financial Solutions, Inc. | | | 10,106,493 | |
| | 177,175 | | | CACI International, Inc., Class A(b) | | | 15,268,941 | |
| | 198,000 | | | Fiserv, Inc.(b) | | | 14,052,060 | |
| | 149,025 | | | Global Payments, Inc. | | | 12,030,788 | |
| | 696,150 | | | Sabre Corp. | | | 14,110,961 | |
| | 383,500 | | | Total System Services, Inc. | | | 13,023,660 | |
| | | | | | | | |
| | | | | | | 78,592,903 | |
| | | | | | | | |
| | | | Machinery — 3.0% | | | | |
| | 69,825 | | | Snap-on, Inc. | | | 9,547,871 | |
| | 130,275 | | | WABCO Holdings, Inc.(b) | | | 13,650,214 | |
| | | | | | | | |
| | | | | | | 23,198,085 | |
| | | | | | | | |
| | | | Metals & Mining — 4.3% | | | | |
| | 260,525 | | | Carpenter Technology Corp. | | | 12,830,856 | |
| | 547,125 | | | Constellium NV, Class A(b) | | | 8,989,264 | |
| | 185,500 | | | Reliance Steel & Aluminum Co. | | | 11,365,585 | |
| | | | | | | | |
| | | | | | | 33,185,705 | |
| | | | | | | | |
| | | | Oil, Gas & Consumable Fuels — 1.9% | | | | |
| | 157,375 | | | Gulfport Energy Corp.(b) | | | 6,568,833 | |
| | 88,575 | | | Noble Energy, Inc. | | | 4,201,112 | |
| | 113,600 | | | Whiting Petroleum Corp.(b) | | | 3,748,800 | |
| | | | | | | | |
| | | | | | | 14,518,745 | |
| | | | | | | | |
| | | | Pharmaceuticals — 4.7% | | | | |
| | 534,625 | | | Catalent, Inc.(b) | | | 14,905,345 | |
| | 101,075 | | | Mallinckrodt PLC(b) | | | 10,009,457 | |
| | 82,411 | | | Valeant Pharmaceuticals International, Inc.(b) | | | 11,793,838 | |
| | | | | | | | |
| | | | | | | 36,708,640 | |
| | | | | | | | |
| | | | Professional Services — 1.4% | | | | |
| | 357,450 | | | TriNet Group, Inc.(b) | | | 11,181,036 | |
| | | | | | | | |
See accompanying notes to financial statements.
39 |
Portfolio of Investments – as of December 31, 2014
Vaughan Nelson Value Opportunity Fund – (continued)
| | | | | | | | |
Shares | | | Description | | Value (†) | |
| | | | Road & Rail — 2.6% | | | | |
| | 216,775 | | | Con-way, Inc. | | $ | 10,660,994 | |
| | 387,675 | | | Hertz Global Holdings, Inc.(b) | | | 9,668,615 | |
| | | | | | | | |
| | | | | | | 20,329,609 | |
| | | | | | | | |
| | | | Semiconductors & Semiconductor Equipment — 5.3% | | | | |
| | 128,175 | | | Avago Technologies Ltd. | | | 12,893,123 | |
| | 381,425 | | | Micron Technology, Inc.(b) | | | 13,353,689 | |
| | 208,425 | | | Skyworks Solutions, Inc. | | | 15,154,582 | |
| | | | | | | | |
| | | | | | | 41,401,394 | |
| | | | | | | | |
| | | | Software — 1.4% | | | | |
| | 138,600 | | | Check Point Software Technologies Ltd.(b) | | | 10,889,802 | |
| | | | | | | | |
| | | | Specialty Retail — 6.2% | | | | |
| | 191,750 | | | Cabela’s, Inc.(b) | | | 10,107,143 | |
| | 270,950 | | | GNC Holdings, Inc., Class A | | | 12,723,812 | |
| | 314,075 | | | Men’s Wearhouse, Inc. (The) | | | 13,866,411 | |
| | 88,575 | | | Signet Jewelers Ltd. | | | 11,653,813 | |
| | | | | | | | |
| | | | | | | 48,351,179 | |
| | | | | | | | |
| | | | Technology Hardware, Storage & Peripherals — 2.0% | | | | |
| | 522,100 | | | NCR Corp.(b) | | | 15,213,994 | |
| | | | | | | | |
| | | | Textiles, Apparel & Luxury Goods — 3.8% | | | | |
| | 256,375 | | | Gildan Activewear, Inc. | | | 14,498,006 | |
| | 115,675 | | | PVH Corp. | | | 14,826,065 | |
| | | | | | | | |
| | | | | | | 29,324,071 | |
| | | | | | | | |
| | | | Trading Companies & Distributors — 2.9% | | | | |
| | 473,125 | | | HD Supply Holdings, Inc.(b) | | | 13,952,457 | |
| | 82,325 | | | United Rentals, Inc.(b) | | | 8,397,973 | |
| | | | | | | | |
| | | | | | | 22,350,430 | |
| | | | | | | | |
| | | | Total Common Stocks (Identified Cost $650,778,624) | | | 758,639,955 | |
| | | | | | | | |
| | Closed-End Investment Companies — 1.8% | | | | |
| | 889,975 | | | Ares Capital Corp. (Identified Cost $14,908,810) | | | 13,888,060 | |
| | | | | | | | |
| | | | | | | | |
Principal
Amount | | | | | | |
| | Short-Term Investments — 0.7% | | | | |
| $ | 5,455,986 | | | Tri-Party Repurchase Agreement with Fixed Income Clearing Corporation, dated 12/31/2014 at 0.010% to be repurchased at $5,455,989 on 1/02/2015 collateralized by $5,450,000 Federal Home Loan Bank, 2.875% due 6/14/2024 valued at $5,565,813 including accrued interest (Note 2 of Notes to Financial Statements)
(Identified Cost $5,455,986) | | | 5,455,986 | |
| | | | | | | | |
See accompanying notes to financial statements.
| 40
Portfolio of Investments – as of December 31, 2014
Vaughan Nelson Value Opportunity Fund – (continued)
| | | | | | | | |
| | | | Description | | Value (†) | |
| | | | Total Investments — 100.1% (Identified Cost $671,143,420)(a) | | $ | 777,984,001 | |
| | | | Other assets less liabilities — (0.1)% | | | (758,381 | ) |
| | | | | | | | |
| | | | Net Assets — 100.0% | | $ | 777,225,620 | |
| | | | | | | | |
| | | | | | | | |
| | (†) | | | See Note 2 of Notes to Financial Statements. | |
| | (a) | | | Federal Tax Information: | |
| | | | At December 31, 2014, the net unrealized appreciation on investments based on a cost of $671,778,562 for federal income tax purposes was as follows: | |
| | | | Aggregate gross unrealized appreciation for all investments in which there is an excess of value over tax cost | | $ | 128,311,600 | |
| | | | Aggregate gross unrealized depreciation for all investments in which there is an excess of tax cost over value | | | (22,106,161 | ) |
| | | | | | | | |
| | | | Net unrealized appreciation | | $ | 106,205,439 | |
| | | | | | | | |
| | (b) | | | Non-income producing security. | |
Industry Summary at December 31, 2014
| | | | |
IT Services | | | 10.1 | % |
Health Care Providers & Services | | | 6.7 | |
Specialty Retail | | | 6.2 | |
Banks | | | 5.7 | |
Containers & Packaging | | | 5.6 | |
Semiconductors & Semiconductor Equipment | | | 5.3 | |
Pharmaceuticals | | | 4.7 | |
Household Durables | | | 4.5 | |
Metals & Mining | | | 4.3 | |
Textiles, Apparel & Luxury Goods | | | 3.8 | |
Insurance | | | 3.5 | |
Capital Markets | | | 3.1 | |
Auto Components | | | 3.1 | |
Machinery | | | 3.0 | |
Trading Companies & Distributors | | | 2.9 | |
Road & Rail | | | 2.6 | |
Food & Staples Retailing | | | 2.6 | |
Diversified Financial Services | | | 2.0 | |
Technology Hardware, Storage & Peripherals | | | 2.0 | |
Other Investments, less than 2% each | | | 17.7 | |
Short-Term Investments | | | 0.7 | |
| | | | |
Total Investments | | | 100.1 | |
Other assets less liabilities | | | (0.1 | ) |
| | | | |
Net Assets | | | 100.0 | % |
| | | | |
See accompanying notes to financial statements.
41 |
This Page Intentionally Left Blank
| 42
Statements of Assets and Liabilities
December 31, 2014
| | | | | | | | | | | | |
| | | CGM Advisor
Targeted Equity
Fund | | | Natixis
Oakmark
Fund | | | Natixis
Oakmark
International
Fund | |
ASSETS | | | | | | | | | | | | |
Investments at cost | | $ | 457,574,544 | | | $ | 242,344,255 | | | $ | 994,729,587 | |
Net unrealized appreciation (depreciation) | | | 70,269,236 | | | | 40,479,635 | | | | (60,307,248 | ) |
| | | | | | | | | | | | |
Investments at value | | | 527,843,780 | | | | 282,823,890 | | | | 934,422,339 | |
Cash | | | 1,282 | | | | 6,498 | | | | — | |
Foreign currency at value (identified cost $0, $0, and $90,640, respectively) | | | — | | | | — | | | | 90,640 | |
Receivable for Fund shares sold | | | 46,708 | | | | 2,768,208 | | | | 15,679,107 | |
Receivable for securities sold | | | — | | | | 1,146,461 | | | | 1,676,291 | |
Dividends and interest receivable | | | 605,594 | | | | 271,144 | | | | 618,748 | |
Unrealized appreciation on forward foreign currency contracts (Note 2) | | | — | | | | — | | | | 4,581,514 | |
Tax reclaims receivable | | | — | | | | — | | | | 747,054 | |
| | | | | | | | | | | | |
TOTAL ASSETS | | | 528,497,364 | | | | 287,016,201 | | | | 957,815,693 | |
| | | | | | | | | | | | |
LIABILITIES | | | | | | | | | | | | |
Payable for securities purchased | | | — | | | | — | | | | 494,511 | |
Payable for Fund shares redeemed | | | 840,260 | | | | 851,360 | | | | 11,174,092 | |
Unrealized depreciation on forward foreign currency contracts (Note 2) | | | — | | | | — | | | | 461,174 | |
Management fees payable (Note 6) | | | 317,706 | | | | 162,774 | | | | 707,765 | |
Deferred Trustees’ fees (Note 6) | | | 875,037 | | | | 511,788 | | | | 44,371 | |
Administrative fees payable (Note 6) | | | 18,941 | | | | 10,143 | | | | 35,580 | |
Payable to distributor (Note 6d) | | | 1,813 | | | | 1,508 | | | | 7,740 | |
Other accounts payable and accrued expenses | | | 144,960 | | | | 114,367 | | | | 188,721 | |
| | | | | | | | | | | | |
TOTAL LIABILITIES | | | 2,198,717 | | | | 1,651,940 | | | | 13,113,954 | |
| | | | | | | | | | | | |
NET ASSETS | | $ | 526,298,647 | | | $ | 285,364,261 | | | $ | 944,701,739 | |
| | | | | | | | | | | | |
NET ASSETS CONSIST OF: | | | | | | | | | | | | |
Paid-in capital | | $ | 449,975,018 | | | $ | 244,981,047 | | | $ | 1,001,387,724 | |
Distributions in excess of net investment income/Accumulated net investment loss | | | (875,037 | ) | | | (490,709 | ) | | | (1,601,585 | ) |
Accumulated net realized gain on investments and foreign currency transactions | | | 6,929,430 | | | | 394,288 | | | | 1,192,979 | |
Net unrealized appreciation (depreciation) on investments and foreign currency translations | | | 70,269,236 | | | | 40,479,635 | | | | (56,277,379 | ) |
| | | | | | | | | | | | |
NET ASSETS | | $ | 526,298,647 | | | $ | 285,364,261 | | | $ | 944,701,739 | |
| | | | | | | | | | | | |
See accompanying notes to financial statements.
43 |
Statements of Assets and Liabilities (continued)
December 31, 2014
| | | | | | | | | | | | |
| | | CGM Advisor
Targeted Equity
Fund | | | Natixis
Oakmark
Fund | | | Natixis
Oakmark
International
Fund | |
COMPUTATION OF NET ASSET VALUE AND
OFFERING PRICE: | | | | | | | | | | | | |
Class A shares: | | | | | | | | | | | | |
Net assets | | $ | 458,974,964 | | | $ | 195,060,718 | | | $ | 617,382,804 | |
| | | | | | | | | | | | |
Shares of beneficial interest | | | 42,783,090 | | | | 9,548,955 | | | | 49,622,011 | |
| | | | | | | | | | | | |
Net asset value and redemption price per share | | $ | 10.73 | | | $ | 20.43 | | | $ | 12.44 | |
| | | | | | | | | | | | |
Offering price per share (100/94.25 of net asset value)
(Note 1) | | $ | 11.38 | | | $ | 21.68 | | | $ | 13.20 | |
| | | | | | | | | | | | |
Class B shares: (redemption price per share is equal to
net asset value less any applicable contingent
deferred sales charge) (Note 1) | | | | | | | | | | | | |
Net assets | | $ | 931,658 | | | $ | 668,804 | | | $ | — | |
| | | | | | | | | | | | |
Shares of beneficial interest | | | 102,997 | | | | 36,518 | | | | — | |
| | | | | | | | | | | | |
Net asset value and offering price per share | | $ | 9.05 | | | $ | 18.31 | | | $ | — | |
| | | | | | | | | | | | |
Class C shares: (redemption price per share is equal to
net asset value less any applicable contingent
deferred sales charge) (Note 1) | | | | | | | | | | | | |
Net assets | | $ | 31,461,526 | | | $ | 62,940,913 | | | $ | 327,318,935 | |
| | | | | | | | | | | | |
Shares of beneficial interest | | | 3,508,327 | | | | 3,459,369 | | | | 26,730,277 | |
| | | | | | | | | | | | |
Net asset value and offering price per share | | $ | 8.97 | | | $ | 18.19 | | | $ | 12.25 | |
| | | | | | | | | | | | |
Class Y shares: | | | | | | | | | | | | |
Net assets | | $ | 34,930,499 | | | $ | 26,693,826 | | | $ | — | |
| | | | | | | | | | | | |
Shares of beneficial interest | | | 3,129,647 | | | | 1,254,504 | | | | — | |
| | | | | | | | | | | | |
Net asset value, offering and redemption price
per share | | $ | 11.16 | | | $ | 21.28 | | | $ | — | |
| | | | | | | | | | | | |
See accompanying notes to financial statements.
| 44
Statements of Assets and Liabilities (continued)
December 31, 2014
| | | | | | | | |
| | | Vaughan Nelson
Small Cap
Value
Fund | | | Vaughan Nelson
Value
Opportunity
Fund | |
ASSETS | | | | | | | | |
Investments at cost | | $ | 253,642,187 | | | $ | 671,143,420 | |
Net unrealized appreciation | | | 69,325,029 | | | | 106,840,581 | |
| | | | | | | | |
Investments at value | | | 322,967,216 | | | | 777,984,001 | |
Receivable for Fund shares sold | | | 109,969 | | | | 2,790,548 | |
Receivable for securities sold | | | 8,712,987 | | | | — | |
Dividends and interest receivable | | | 274,338 | | | | 338,661 | |
| | | | | | | | |
TOTAL ASSETS | | | 332,064,510 | | | | 781,113,210 | |
| | | | | | | | |
LIABILITIES | | | | | | | | |
Payable for securities purchased | | | 322,911 | | | | — | |
Payable for Fund shares redeemed | | | 801,437 | | | | 3,132,423 | |
Management fees payable (Note 6) | | | 252,866 | | | | 526,400 | |
Deferred Trustees’ fees (Note 6) | | | 218,039 | | | | 75,573 | |
Administrative fees payable (Note 6) | | | 12,008 | | | | 28,121 | |
Payable to distributor (Note 6d) | | | 3,313 | | | | 8,415 | |
Other accounts payable and accrued expenses | | | 88,088 | | | | 116,658 | |
| | | | | | | | |
TOTAL LIABILITIES | | | 1,698,662 | | | | 3,887,590 | |
| | | | | | | | |
NET ASSETS | | $ | 330,365,848 | | | $ | 777,225,620 | |
| | | | | | | | |
NET ASSETS CONSIST OF: | | | | | | | | |
Paid-in capital | | $ | 257,283,799 | | | $ | 665,842,911 | |
Distributions in excess of net investment income/
Accumulated net investment loss | | | (218,038 | ) | | | (75,573 | ) |
Accumulated net realized gain on investments | | | 3,975,058 | | | | 4,617,701 | |
Net unrealized appreciation on | | | 69,325,029 | | | | 106,840,581 | |
| | | | | | | | |
NET ASSETS | | $ | 330,365,848 | | | $ | 777,225,620 | |
| | | | | | | | |
See accompanying notes to financial statements.
45 |
Statements of Assets and Liabilities (continued)
December 31, 2014
| | | | | | | | |
| | | Vaughan Nelson
Small Cap
Value
Fund | | | Vaughan Nelson
Value
Opportunity
Fund | |
COMPUTATION OF NET ASSET VALUE AND
OFFERING PRICE: | | | | | | | | |
Class A shares: | | | | | | | | |
Net assets | | $ | 125,200,967 | | | $ | 73,236,830 | |
| | | | | | | | |
Shares of beneficial interest | | | 6,064,450 | | | | 3,439,845 | |
| | | | | | | | |
Net asset value and redemption price per share | | $ | 20.65 | | | $ | 21.29 | |
| | | | | | | | |
Offering price per share (100/94.25 of net asset value)
(Note 1) | | $ | 21.91 | | | $ | 22.59 | |
| | | | | | | | |
Class B shares: (redemption price per share is equal to
net asset value less any applicable contingent
deferred sales charge) (Note 1) | | | | | | | | |
Net assets | | $ | 967,478 | | | $ | — | |
| | | | | | | | |
Shares of beneficial interest | | | 62,929 | | | | — | |
| | | | | | | | |
Net asset value and offering price per share | | $ | 15.37 | | | $ | — | |
| | | | | | | | |
Class C shares: (redemption price per share is equal to
net asset value less any applicable contingent
deferred sales charge) (Note 1) | | | | | | | | |
Net assets | | $ | 27,292,407 | | | $ | 35,893,876 | |
| | | | | | | | |
Shares of beneficial interest | | | 1,777,162 | | | | 1,750,339 | |
| | | | | | | | |
Net asset value and offering price per share | | $ | 15.36 | | | $ | 20.51 | |
| | | | | | | | |
Class N shares: | | | | | | | | |
Net assets | | $ | — | | | $ | 12,024,110 | |
| | | | | | | | |
Shares of beneficial interest | | | — | | | | 559,344 | |
| | | | | | | | |
Net asset value, offering and redemption price
per share | | $ | — | | | $ | 21.50 | |
| | | | | | | | |
Class Y shares: | | | | | | | | |
Net assets | | $ | 176,904,996 | | | $ | 656,070,804 | |
| | | | | | | | |
Shares of beneficial interest | | | 8,373,892 | | | | 30,490,683 | |
| | | | | | | | |
Net asset value, offering and redemption price
per share | | $ | 21.13 | | | $ | 21.52 | |
| | | | | | | | |
See accompanying notes to financial statements.
| 46
Statements of Operations
For the Year Ended December 31, 2014
| | | | | | | | | | | | |
| | | CGM Advisor
Targeted Equity
Fund | | | Natixis
Oakmark
Fund | | | Natixis
Oakmark
International
Fund | |
INVESTMENT INCOME | | | | | | | | | | | | |
Dividends | | $ | 5,170,842 | | | $ | 3,634,934 | | | $ | 26,512,627 | |
Interest | | | 187 | | | | 389 | | | | 519 | |
Less net foreign taxes withheld | | | (4,490 | ) | | | (28,169 | ) | | | (2,406,735 | ) |
| | | | | | | | | | | | |
| | | 5,166,539 | | | | 3,607,154 | | | | 24,106,411 | |
| | | | | | | | | | | | |
Expenses | | | | | | | | | | | | |
Management fees (Note 6) | | | 3,950,271 | | | | 1,511,982 | | | | 7,726,791 | |
Service and distribution fees (Note 6) | | | 1,538,621 | | | | 718,374 | | | | 4,689,805 | |
Administrative fees (Note 6) | | | 239,450 | | | | 94,112 | | | | 392,411 | |
Trustees’ fees and expenses (Note 6) | | | 85,335 | | | | 53,577 | | | | 34,449 | |
Transfer agent fees and expenses (Note 6) | | | 466,399 | | | | 240,836 | | | | 747,651 | |
Audit and tax services fees | | | 48,430 | | | | 40,097 | | | | 41,749 | |
Custodian fees and expenses | | | 25,297 | | | | 24,205 | | | | 379,432 | |
Legal fees | | | 4,474 | | | | 1,722 | | | | 8,007 | |
Registration fees | | | 79,985 | | | | 92,669 | | | | 134,034 | |
Shareholder reporting expenses | | | 45,482 | | | | 30,931 | | | | 86,648 | |
Miscellaneous expenses | | | 22,970 | | | | 17,254 | | | | 41,039 | |
| | | | | | | | | | | | |
Total expenses | | | 6,506,714 | | | | 2,825,759 | | | | 14,282,016 | |
| | | | | | | | | | | | |
Net investment income (loss) | | | (1,340,175 | ) | | | 781,395 | | | | 9,824,395 | |
| | | | | | | | | | | | |
NET REALIZED AND UNREALIZED GAIN (LOSS) ON
INVESTMENTS AND FOREIGN CURRENCY
TRANSACTIONS | | | | | | | | | | | | |
Net realized gain on: | | | | | | | | | | | | |
Investments | | | 65,609,793 | | | | 33,601,811 | | | | 17,864,400 | |
Foreign currency transactions | | | 161 | | | | 5,418 | | | | 4,030,315 | |
Net change in unrealized appreciation (depreciation) on: | | | | | | | | | | | | |
Investments | | | (21,344,530 | ) | | | (12,934,590 | ) | | | (104,404,133 | ) |
Foreign currency translations | | | — | | | | — | | | | 4,758,193 | |
| | | | | | | | | | | | |
Net realized and unrealized gain (loss) on investments and foreign currency transactions | | | 44,265,424 | | | | 20,672,639 | | | | (77,751,225 | ) |
| | | | | | | | | | | | |
NET INCREASE (DECREASE) IN NET ASSETS
RESULTING FROM OPERATIONS | | $ | 42,925,249 | | | $ | 21,454,034 | | | $ | (67,926,830 | ) |
| | | | | | | | | | | | |
See accompanying notes to financial statements.
47 |
Statements of Operations (continued)
For the Year Ended December 31, 2014
| | | | | | | | |
| | | Vaughan Nelson
Small Cap
Value
Fund | | | Vaughan Nelson
Value
Opportunity
Fund | |
INVESTMENT INCOME | | | | | | | | |
Dividends | | $ | 3,741,949 | | | $ | 5,964,263 | |
Interest | | | 252 | | | | 378 | |
Less net foreign taxes withheld | | | — | | | | (5,079 | ) |
| | | | | | | | |
| | | 3,742,201 | | | | 5,959,562 | |
| | | | | | | | |
Expenses | | | | | | | | |
Management fees (Note 6) | | | 3,045,023 | | | | 5,277,503 | |
Service and distribution fees (Note 6) | | | 661,962 | | | | 504,859 | |
Administrative fees (Note 6) | | | 146,250 | | | | 284,742 | |
Trustees’ fees and expenses (Note 6) | | | 37,234 | | | | 32,194 | |
Transfer agent fees and expenses (Notes 6 and 7) | | | 363,591 | | | | 648,576 | |
Audit and tax services fees | | | 40,122 | | | | 40,995 | |
Custodian fees and expenses | | | 29,010 | | | | 34,753 | |
Legal fees | | | 2,774 | | | | 5,514 | |
Registration fees | | | 79,332 | | | | 199,073 | |
Shareholder reporting expenses | | | 34,042 | | | | 60,230 | |
Miscellaneous expenses | | | 21,534 | | | | 25,804 | |
| | | | | | | | |
Total expenses | | | 4,460,874 | | | | 7,114,243 | |
Fee/expense recovery (Note 6) | | | — | | | | 20 | |
Less waiver and/or expense reimbursement (Note 6) | | | — | | | | (153 | ) |
| | | | | | | | |
Net expenses | | | 4,460,874 | | | | 7,114,110 | |
| | | | | | | | |
Net investment loss | | | (718,673 | ) | | | (1,154,548 | ) |
| | | | | | | | |
NET REALIZED AND UNREALIZED GAIN (LOSS) ON
INVESTMENTS | | | | | | | | |
Net realized gain on: | | | | | | | | |
Investments | | | 48,304,361 | | | | 54,468,033 | |
Net change in unrealized appreciation (depreciation) on: | | | | | | | | |
Investments | | | (19,409,424 | ) | | | 16,777,310 | |
| | | | | | | | |
Net realized and unrealized gain on investments | | | 28,894,937 | | | | 71,245,343 | |
| | | | | | | | |
NET INCREASE IN NET ASSETS
RESULTING FROM OPERATIONS | | $ | 28,176,264 | | | $ | 70,090,795 | |
| | | | | | | | |
See accompanying notes to financial statements.
| 48
Statements of Changes in Net Assets
| | | | | | | | |
| | | CGM Advisor Targeted Equity Fund | |
| | | Year Ended
December 31,
2014 | | | Year Ended
December 31,
2013 | |
FROM OPERATIONS: | | | | | | | | |
Net investment loss | | $ | (1,340,175 | ) | | $ | (1,138,950 | ) |
Net realized gain on investments and foreign
currency transactions | | | 65,609,954 | | | | 98,423,883 | |
Net change in unrealized appreciation (depreciation)
on investments | | | (21,344,530 | ) | | | 46,132,544 | |
| | | | | | | | |
Net increase in net assets resulting from operations | | | 42,925,249 | | | | 143,417,477 | |
| | | | | | | | |
FROM DISTRIBUTIONS TO SHAREHOLDERS: | | | | | | | | |
Net investment income | | | | | | | | |
Class A | | | — | | | | (4,304 | ) |
Class B | | | — | | | | (97 | ) |
Class C | | | — | | | | (360 | ) |
Class Y | | | — | | | | (464 | ) |
Net realized capital gains | | | | | | | | |
Class A | | | (63,610,439 | ) | | | (64,422,015 | ) |
Class B | | | (177,582 | ) | | | (319,115 | ) |
Class C | | | (5,241,159 | ) | | | (5,418,797 | ) |
Class Y | | | (5,034,635 | ) | | | (6,313,726 | ) |
| | | | | | | | |
Total distributions | | | (74,063,815 | ) | | | (76,478,878 | ) |
| | | | | | | | |
NET DECREASE IN NET ASSETS FROM
CAPITAL SHARE TRANSACTIONS (NOTE 12) | | | (24,383,469 | ) | | | (11,961,194 | ) |
| | | | | | | | |
Net increase (decrease) in net assets | | | (55,522,035 | ) | | | 54,977,405 | |
NET ASSETS | | | | | | | | |
Beginning of the year | | | 581,820,682 | | | | 526,843,277 | |
| | | | | | | | |
End of the year | | $ | 526,298,647 | | | $ | 581,820,682 | |
| | | | | | | | |
DISTRIBUTIONS IN EXCESS OF NET INVESTMENT
INCOME/ACCUMULATED NET INVESTMENT LOSS | | $ | (875,037 | ) | | $ | (899,985 | ) |
| | | | | | | | |
See accompanying notes to financial statements.
49 |
Statements of Changes in Net Assets (continued)
| | | | | | | | |
| | | Natixis Oakmark Fund | |
| | | Year Ended
December 31,
2014 | | | Year Ended
December 31,
2013 | |
FROM OPERATIONS: | | | | | | | | |
Net investment income | | $ | 781,395 | | | $ | 459,080 | |
Net realized gain on investments and foreign
currency transactions | | | 33,607,229 | | | | 16,250,184 | |
Net change in unrealized appreciation (depreciation)
on investments | | | (12,934,590 | ) | | | 32,080,893 | |
| | | | | | | | |
Net increase in net assets resulting from operations | | | 21,454,034 | | | | 48,790,157 | |
| | | | | | | | |
FROM DISTRIBUTIONS TO SHAREHOLDERS: | | | | | | | | |
Net investment income | | | | | | | | |
Class A | | | (582,642 | ) | | | (432,563 | ) |
Class C | | | (61,330 | ) | | | — | |
Class Y | | | (130,544 | ) | | | (70,778 | ) |
Net realized capital gains | | | | | | | | |
Class A | | | (25,448,063 | ) | | | (4,641,585 | ) |
Class B | | | (115,777 | ) | | | (53,345 | ) |
Class C | | | (7,987,538 | ) | | | (294,950 | ) |
Class Y | | | (3,299,099 | ) | | | (435,710 | ) |
| | | | | | | | |
Total distributions | | | (37,624,993 | ) | | | (5,928,931 | ) |
| | | | | | | | |
NET INCREASE (DECREASE) IN NET ASSETS FROM
CAPITAL SHARE TRANSACTIONS (NOTE 12) | | | 132,132,840 | | | | (7,589,261 | ) |
| | | | | | | | |
Net increase in net assets | | | 115,961,881 | | | | 35,271,965 | |
NET ASSETS | | | | | | | | |
Beginning of the year | | | 169,402,380 | | | | 134,130,415 | |
| | | | | | | | |
End of the year | | $ | 285,364,261 | | | $ | 169,402,380 | |
| | | | | | | | |
DISTRIBUTIONS IN EXCESS OF NET INVESTMENT INCOME | | $ | (490,709 | ) | | $ | (472,053 | ) |
| | | | | | | | |
See accompanying notes to financial statements.
| 50
Statements of Changes in Net Assets (continued)
| | | | | | | | |
| | | Natixis Oakmark International Fund | |
| | | Year Ended
December 31,
2014 | | | Year Ended
December 31,
2013 | |
FROM OPERATIONS: | | | | | | | | |
Net investment income | | $ | 9,824,395 | | | $ | 415,827 | |
Net realized gain on investments and foreign
currency transactions | | | 21,894,715 | | | | 11,401,208 | |
Net change in unrealized appreciation (depreciation)
on investments and foreign currency translations | | | (99,645,940 | ) | | | 36,596,500 | |
| | | | | | | | |
Net increase (decrease) in net assets resulting from operations | | | (67,926,830 | ) | | | 48,413,535 | |
| | | | | | | | |
FROM DISTRIBUTIONS TO SHAREHOLDERS: | | | | | | | | |
Net investment income | | | | | | | | |
Class A | | | (12,092,911 | ) | | | (1,179,127 | ) |
Class C | | | (4,207,529 | ) | | | (154,136 | ) |
Net realized capital gains | | | | | | | | |
Class A | | | (10,563,438 | ) | | | (3,755,164 | ) |
Class C | | | (5,813,413 | ) | | | (2,995,185 | ) |
| | | | | | | | |
Total distributions | | | (32,677,291 | ) | | | (8,083,612 | ) |
| | | | | | | | |
NET INCREASE IN NET ASSETS FROM
CAPITAL SHARE TRANSACTIONS (NOTE 12) | | | 493,477,560 | | | | 441,801,535 | |
| | | | | | | | |
Net increase in net assets | | | 392,873,439 | | | | 482,131,458 | |
NET ASSETS | | | | | | | | |
Beginning of the year | | | 551,828,300 | | | | 69,696,842 | |
| | | | | | | | |
End of the year | | $ | 944,701,739 | | | $ | 551,828,300 | |
| | | | | | | | |
UNDISTRIBUTED (DISTRIBUTIONS IN EXCESS OF)
NET INVESTMENT INCOME | | $ | (1,601,585 | ) | | $ | 844,145 | |
| | | | | | | | |
See accompanying notes to financial statements.
51 |
Statements of Changes in Net Assets (continued)
| | | | | | | | |
| | | Vaughan Nelson Small Cap
Value Fund | |
| | | Year Ended
December 31,
2014 | | | Year Ended
December 31,
2013 | |
FROM OPERATIONS: | | | | | | | | |
Net investment income (loss) | | $ | (718,673 | ) | | $ | 1,290,060 | |
Net realized gain on investments | | | 48,304,361 | | | | 58,527,986 | |
Net change in unrealized appreciation (depreciation)
on investments | | | (19,409,424 | ) | | | 50,817,080 | |
| | | | | | | | |
Net increase in net assets resulting from operations | | | 28,176,264 | | | | 110,635,126 | |
| | | | | | | | |
FROM DISTRIBUTIONS TO SHAREHOLDERS: | | | | | | | | |
Net investment income | | | | | | | | |
Class A | | | — | | | | (368,339 | ) |
Class B | | | — | | | | (812 | ) |
Class C | | | — | | | | (8,031 | ) |
Class Y | | | — | | | | (821,635 | ) |
Net realized capital gains | | | | | | | | |
Class A | | | (20,240,252 | ) | | | (23,147,106 | ) |
Class B | | | (221,933 | ) | | | (433,209 | ) |
Class C | | | (5,709,846 | ) | | | (5,802,683 | ) |
Class Y | | | (26,912,401 | ) | | | (25,293,191 | ) |
| | | | | | | | |
Total distributions | | | (53,084,432 | ) | | | (55,875,006 | ) |
| | | | | | | | |
NET INCREASE (DECREASE) IN NET ASSETS FROM
CAPITAL SHARE TRANSACTIONS (NOTE 12) | | | 4,930,798 | | | | (27,872,472 | ) |
| | | | | | | | |
Net increase (decrease) in net assets | | | (19,977,370 | ) | | | 26,887,648 | |
NET ASSETS | | | | | | | | |
Beginning of the year | | | 350,343,218 | | | | 323,455,570 | |
| | | | | | | | |
End of the year | | $ | 330,365,848 | | | $ | 350,343,218 | |
| | | | | | | | |
DISTRIBUTIONS IN EXCESS OF NET INVESTMENT
INCOME/ACCUMULATED NET INVESTMENT LOSS | | $ | (218,038 | ) | | $ | (213,083 | ) |
| | | | | | | | |
See accompanying notes to financial statements.
| 52
Statements of Changes in Net Assets (continued)
| | | | | | | | |
| | | Vaughan Nelson Value
Opportunity Fund | |
| | | Year Ended
December 31,
2014 | | | Year Ended
December 31,
2013 | |
FROM OPERATIONS: | | | | | | | | |
Net investment income (loss) | | $ | (1,154,548 | ) | | $ | 141,131 | |
Net realized gain on investments | | | 54,468,033 | | | | 26,959,140 | |
Net change in unrealized appreciation (depreciation)
on investments | | | 16,777,310 | | | | 76,536,470 | |
| | | | | | | | |
Net increase in net assets resulting from operations | | | 70,090,795 | | | | 103,636,741 | |
| | | | | | | | |
FROM DISTRIBUTIONS TO SHAREHOLDERS: | | | | | | | | |
Net investment income | | | | | | | | |
Class N | | | — | | | | (1 | ) |
Class Y | | | — | | | | (163,927 | ) |
Net realized capital gains | | | | | | | | |
Class A | | | (5,399,669 | ) | | | (3,567,518 | ) |
Class C | | | (2,482,970 | ) | | | (1,069,705 | ) |
Class N | | | (785,557 | ) | | | (60 | ) |
Class Y | | | (44,268,540 | ) | | | (18,839,663 | ) |
| | | | | | | | |
Total distributions | | | (52,936,736 | ) | | | (23,640,874 | ) |
| | | | | | | | |
NET INCREASE IN NET ASSETS FROM
CAPITAL SHARE TRANSACTIONS (NOTE 12) | | | 310,528,319 | | | | 174,487,517 | |
| | | | | | | | |
Net increase in net assets | | | 327,682,378 | | | | 254,483,384 | |
NET ASSETS | | | | | | | | |
Beginning of the year | | | 449,543,242 | | | | 195,059,858 | |
| | | | | | | | |
End of the year | | $ | 777,225,620 | | | $ | 449,543,242 | |
| | | | | | | | |
DISTRIBUTIONS IN EXCESS OF NET INVESTMENT
INCOME/ACCUMULATED NET INVESTMENT LOSS | | $ | (75,573 | ) | | $ | (57,126 | ) |
| | | | | | | | |
See accompanying notes to financial statements.
53 |
Financial Highlights
For a share outstanding throughout each period.
| | | | | | | | | | | | | | | | | | | | |
| | | CGM Advisor Targeted Equity Fund—Class A | |
| | | Year Ended
December 31,
2014 | | | Year Ended
December 31,
2013 | | | Year Ended
December 31,
2012 | | | Year Ended
December 31,
2011 | | | Year Ended
December 31,
2010 | |
Net asset value, beginning of the period | | $ | 11.46 | | | $ | 10.23 | | | $ | 9.36 | | | $ | 11.12 | | | $ | 9.54 | |
| | | | | | | | | | | | | | | | | | | | |
INCOME (LOSS) FROM INVESTMENT OPERATIONS: | | | | | | | | | | | | | | | | | | | | |
Net investment income (loss)(a) | | | (0.02 | ) | | | (0.02 | ) | | | 0.08 | (b) | | | 0.05 | | | | 0.05 | (c) |
Net realized and unrealized gain (loss) | | | 0.91 | | | | 2.94 | | | | 1.36 | | | | (1.76 | ) | | | 1.58 | |
| | | | | | | | | | | | | | | | | | | | |
Total from Investment Operations | | | 0.89 | | | | 2.92 | | | | 1.44 | | | | (1.71 | ) | | | 1.63 | |
| | | | | | | | | | | | | | | | | | | | |
LESS DISTRIBUTIONS FROM: | | | | | | | | | | | | | | | | | | | | |
Net investment income | | | — | | | | (0.00 | )(d) | | | (0.09 | ) | | | (0.05 | ) | | | (0.05 | ) |
Net realized capital gains | | | (1.62 | ) | | | (1.69 | ) | | | (0.48 | ) | | | — | | | | — | |
| | | | | | | | | | | | | | | | | | | | |
Total Distributions | | | (1.62 | ) | | | (1.69 | ) | | | (0.57 | ) | | | (0.05 | ) | | | (0.05 | ) |
| | | | | | | | | | | | | | | | | | | | |
Net asset value, end of the period | | $ | 10.73 | | | $ | 11.46 | | | $ | 10.23 | | | $ | 9.36 | | | $ | 11.12 | |
| | | | | | | | | | | | | | | | | | | | |
Total return(e) | | | 8.27 | % | | | 29.01 | % | | | 15.44 | %(b) | | | (15.36 | )% | | | 17.14 | % |
RATIOS TO AVERAGE NET ASSETS: | | | | | | | | | | | | | | | | | | | | |
Net assets, end of the period (000’s) | | $ | 458,975 | | | $ | 493,102 | | | $ | 438,288 | | | $ | 503,330 | | | $ | 753,518 | |
Net expenses | | | 1.15 | % | | | 1.17 | % | | | 1.18 | % | | | 1.13 | % | | | 1.16 | % |
Gross expenses | | | 1.15 | % | | | 1.17 | % | | | 1.18 | % | | | 1.13 | % | | | 1.16 | % |
Net investment income (loss) | | | (0.21 | )% | | | (0.17 | )% | | | 0.78 | %(b) | | | 0.45 | % | | | 0.52 | %(c) |
Portfolio turnover rate | | | 229 | % | | | 205 | % | | | 192 | % | | | 236 | % | | | 146 | % |
| (a) | Per share net investment income (loss) has been calculated using the average shares outstanding during the period. |
| (b) | Includes non-recurring dividends. Without these dividends, net investment income per share would have been $0.02, total return would have been 14.81% and the ratio of net investment income to average net assets would have been 0.21%. |
| (c) | Includes a non-recurring dividend. Without this dividend, net investment income per share would have been $0.02 and the ratio of net investment income to average net assets would have been 0.23%. |
| (d) | Amount rounds to less than $0.01 per share. |
| (e) | A sales charge for Class A shares is not reflected in total return calculations. |
See accompanying notes to financial statements.
| 54
Financial Highlights (continued)
For a share outstanding throughout each period.
| | | | | | | | | | | | | | | | | | | | |
| | | CGM Advisor Targeted Equity Fund—Class B | |
| | | Year Ended
December 31,
2014 | | | Year Ended
December 31,
2013 | | | Year Ended
December 31,
2012 | | | Year Ended
December 31,
2011 | | | Year Ended
December 31,
2010 | |
Net asset value, beginning of the period | | $ | 9.98 | | | $ | 9.15 | | | $ | 8.41 | | | $ | 10.01 | | | $ | 8.61 | |
| | | | | | | | | | | | | | | | | | | | |
INCOME (LOSS) FROM INVESTMENT OPERATIONS: | | | | | | | | | | | | | | | | | | | | |
Net investment loss(a) | | | (0.10 | ) | | | (0.10 | ) | | | (0.00 | )(b)(c) | | | (0.03 | ) | | | (0.02 | )(d) |
Net realized and unrealized gain (loss) | | | 0.79 | | | | 2.62 | | | | 1.22 | | | | (1.57 | ) | | | 1.42 | |
| | | | | | | | | | | | | | | | | | | | |
Total from Investment Operations | | | 0.69 | | | | 2.52 | | | | 1.22 | | | | (1.60 | ) | | | 1.40 | |
| | | | | | | | | | | | | | | | | | | | |
LESS DISTRIBUTIONS FROM: | | | | | | | | | | | | | | | | | | | | |
Net investment income | | | — | | | | (0.00 | )(b) | | | (0.00 | )(b) | | | — | | | | (0.00 | )(b) |
Net realized capital gains | | | (1.62 | ) | | | (1.69 | ) | | | (0.48 | ) | | | — | | | | — | |
| | | | | | | | | | | | | | | | | | | | |
Total Distributions | | | (1.62 | ) | | | (1.69 | ) | | | (0.48 | ) | | | — | | | | (0.00 | ) |
| | | | | | | | | | | | | | | | | | | | |
Net asset value, end of the period | | $ | 9.05 | | | $ | 9.98 | | | $ | 9.15 | | | $ | 8.41 | | | $ | 10.01 | |
| | | | | | | | | | | | | | | | | | | | |
Total return(e) | | | 7.47 | % | | | 28.06 | % | | | 14.54 | %(c) | | | (15.98 | )% | | | 16.26 | % |
RATIOS TO AVERAGE NET ASSETS: | | | | | | | | | | | | | | | | | | | | |
Net assets, end of the period (000’s) | | $ | 932 | | | $ | 2,205 | | | $ | 3,447 | | | $ | 5,296 | | | $ | 9,934 | |
Net expenses | | | 1.89 | % | | | 1.91 | % | | | 1.93 | % | | | 1.88 | % | | | 1.91 | % |
Gross expenses | | | 1.89 | % | | | 1.91 | % | | | 1.93 | % | | | 1.88 | % | | | 1.91 | % |
Net investment loss | | | (0.98 | )% | | | (0.94 | )% | | | (0.05 | )%(c) | | | (0.32 | )% | | | (0.28 | )%(d) |
Portfolio turnover rate | | | 229 | % | | | 205 | % | | | 192 | % | | | 236 | % | | | 146 | % |
| (a) | Per share net investment loss has been calculated using the average shares outstanding during the period. |
| (b) | Amount rounds to less than $0.01 per share. |
| (c) | Includes non-recurring dividends. Without these dividends, net investment loss per share would have been $(0.05), total return would have been 13.83% and the ratio of net investment loss to average net assets would have been (0.56)%. |
| (d) | Includes a non-recurring dividend. Without this dividend, net investment loss per share would have been $(0.05) and the ratio of net investment loss to average net assets would have been (0.53)%. |
| (e) | A contingent deferred sales charge for Class B shares is not reflected in total return calculations. |
See accompanying notes to financial statements.
55 |
Financial Highlights (continued)
For a share outstanding throughout each period.
| | | | | | | | | | | | | | | | | | | | |
| | | CGM Advisor Targeted Equity Fund—Class C | |
| | | Year Ended
December 31,
2014 | | | Year Ended
December 31,
2013 | | | Year Ended
December 31,
2012 | | | Year Ended
December 31,
2011 | | | Year Ended
December 31,
2010 | |
Net asset value, beginning of the period | | $ | 9.91 | | | $ | 9.09 | | | $ | 8.37 | | | $ | 9.96 | | | $ | 8.57 | |
| | | | | | | | | | | | | | | | | | | | |
INCOME (LOSS) FROM INVESTMENT OPERATIONS: | | | | | | | | | | | | | | | | | | | | |
Net investment loss(a) | | | (0.09 | ) | | | (0.10 | ) | | | (0.00 | )(b)(c) | | | (0.03 | ) | | | (0.02 | )(d) |
Net realized and unrealized gain (loss) | | | 0.77 | | | | 2.61 | | | | 1.20 | | | | (1.56 | ) | | | 1.41 | |
| | | | | | | | | | | | | | | | | | | | |
Total from Investment Operations | | | 0.68 | | | | 2.51 | | | | 1.20 | | | | (1.59 | ) | | | 1.39 | |
| | | | | | | | | | | | | | | | | | | | |
LESS DISTRIBUTIONS FROM: | | | | | | | | | | | | | | | | | | | | |
Net investment income | | | — | | | | (0.00 | )(b) | | | (0.00 | )(b) | | | — | | | | (0.00 | )(b) |
Net realized capital gains | | | (1.62 | ) | | | (1.69 | ) | | | (0.48 | ) | | | — | | | | — | |
| | | | | | | | | | | | | | | | | | | | |
Total Distributions | | | (1.62 | ) | | | (1.69 | ) | | | (0.48 | ) | | | — | | | | (0.00 | ) |
| | | | | | | | | | | | | | | | | | | | |
Net asset value, end of the period | | $ | 8.97 | | | $ | 9.91 | | | $ | 9.09 | | | $ | 8.37 | | | $ | 9.96 | |
| | | | | | | | | | | | | | | | | | | | |
Total return(e) | | | 7.43 | % | | | 28.13 | % | | | 14.45 | %(c) | | | (15.96 | )% | | | 16.22 | % |
RATIOS TO AVERAGE NET ASSETS: | | | | | | | | | | | | | | | | | | | | |
Net assets, end of the period (000’s) | | $ | 31,462 | | | $ | 36,417 | | | $ | 35,225 | | | $ | 47,416 | | | $ | 81,291 | |
Net expenses | | | 1.90 | % | | | 1.91 | % | | | 1.93 | % | | | 1.88 | % | | | 1.91 | % |
Gross expenses | | | 1.90 | % | | | 1.91 | % | | | 1.93 | % | | | 1.88 | % | | | 1.91 | % |
Net investment loss | | | (0.96 | )% | | | (0.92 | )% | | | (0.02 | )%(c) | | | (0.32 | )% | | | (0.23 | )%(d) |
Portfolio turnover rate | | | 229 | % | | | 205 | % | | | 192 | % | | | 236 | % | | | 146 | % |
| (a) | Per share net investment loss has been calculated using the average shares outstanding during the period. |
| (b) | Amount rounds to less than $0.01 per share. |
| (c) | Includes non-recurring dividends. Without these dividends, net investment loss per share would have been $(0.05), total return would have been 13.86% and the ratio of net investment loss to average net assets would have been (0.55)%. |
| (d) | Includes a non-recurring dividend. Without this dividend, net investment loss per share would have been $(0.05) and the ratio of net investment loss to average net assets would have been (0.52)%. |
| (e) | A contingent deferred sales charge for Class C shares is not reflected in total return calculations. |
See accompanying notes to financial statements.
| 56
Financial Highlights (continued)
For a share outstanding throughout each period.
| | | | | | | | | | | | | | | | | | | | |
| | | CGM Advisor Targeted Equity Fund—Class Y | |
| | | Year Ended
December 31,
2014 | | | Year Ended
December 31,
2013 | | | Year Ended
December 31,
2012 | | | Year Ended
December 31,
2011 | | | Year Ended
December 31,
2010 | |
Net asset value, beginning of the period | | $ | 11.83 | | | $ | 10.49 | | | $ | 9.59 | | | $ | 11.40 | | | $ | 9.78 | |
| | | | | | | | | | | | | | | | | | | | |
INCOME (LOSS) FROM INVESTMENT OPERATIONS: | | | | | | | | | | | | | | | | | | | | |
Net investment income(a) | | | 0.00 | (b) | | | 0.01 | | | | 0.11 | (c) | | | 0.07 | | | | 0.07 | (d) |
Net realized and unrealized gain (loss) | | | 0.95 | | | | 3.02 | | | | 1.39 | | | | (1.80 | ) | | | 1.63 | |
| | | | | | | | | | | | | | | | | | | | |
Total from Investment Operations | | | 0.95 | | | | 3.03 | | | | 1.50 | | | | (1.73 | ) | | | 1.70 | |
| | | | | | | | | | | | | | | | | | | | |
LESS DISTRIBUTIONS FROM: | | | | | | | | | | | | | | | | | | | | |
Net investment income | | | — | | | | (0.00 | )(b) | | | (0.12 | ) | | | (0.08 | ) | | | (0.08 | ) |
Net realized capital gains | | | (1.62 | ) | | | (1.69 | ) | | | (0.48 | ) | | | — | | | | — | |
| | | | | | | | | | | | | | | | | | | | |
Total Distributions | | | (1.62 | ) | | | (1.69 | ) | | | (0.60 | ) | | | (0.08 | ) | | | (0.08 | ) |
| | | | | | | | | | | | | | | | | | | | |
Net asset value, end of the period | | $ | 11.16 | | | $ | 11.83 | | | $ | 10.49 | | | $ | 9.59 | | | $ | 11.40 | |
| | | | | | | | | | | | | | | | | | | | |
Total return | | | 8.52 | % | | | 29.34 | % | | | 15.69 | %(c) | | | (15.16 | )% | | | 17.39 | % |
RATIOS TO AVERAGE NET ASSETS: | | | | | | | | | | | | | | | | | | | | |
Net assets, end of the period (000’s) | | $ | 34,930 | | | $ | 50,096 | | | $ | 49,884 | | | $ | 57,003 | | | $ | 137,631 | |
Net expenses | | | 0.89 | % | | | 0.91 | % | | | 0.93 | % | | | 0.87 | % | | | 0.91 | % |
Gross expenses | | | 0.89 | % | | | 0.91 | % | | | 0.93 | % | | | 0.87 | % | | | 0.91 | % |
Net investment income | | | 0.04 | % | | | 0.08 | % | | | 1.02 | %(c) | | | 0.62 | % | | | 0.69 | %(d) |
Portfolio turnover rate | | | 229 | % | | | 205 | % | | | 192 | % | | | 236 | % | | | 146 | % |
| (a) | Per share net investment income has been calculated using the average shares outstanding during the period. |
| (b) | Amount rounds to less than $0.01 per share. |
| (c) | Includes non-recurring dividends. Without these dividends, net investment income per share would have been $0.05, total return would have been 14.96% and the ratio of net investment income to average net assets would have been 0.47%. |
| (d) | Includes a non-recurring dividend. Without this dividend, net investment income per share would have been $0.05 and the ratio of net investment income to average net assets would have been 0.48%. |
See accompanying notes to financial statements.
57 |
Financial Highlights (continued)
For a share outstanding throughout each period.
| | | | | | | | | | | | | | | | | | | | |
| | | Natixis Oakmark Fund—Class A | |
| | | Year Ended
December 31,
2014 | | | Year Ended
December 31,
2013 | | | Year Ended
December 31,
2012 | | | Year Ended
December 31,
2011 | | | Year Ended
December 31,
2010 | |
Net asset value, beginning of the period | | $ | 21.40 | | | $ | 16.09 | | | $ | 13.86 | | | $ | 14.17 | | | $ | 12.58 | |
| | | | | | | | | | | | | | | | | | | | |
INCOME (LOSS) FROM INVESTMENT OPERATIONS: | | | | | | | | | | | | | | | | | | | | |
Net investment income(a) | | | 0.10 | | | | 0.06 | | | | 0.12 | | | | 0.08 | | | | 0.05 | |
Net realized and unrealized gain (loss) | | | 2.11 | | | | 6.03 | | | | 2.24 | | | | (0.30 | ) | | | 1.60 | |
| | | | | | | | | | | | | | | | | | | | |
Total from Investment Operations | | | 2.21 | | | | 6.09 | | | | 2.36 | | | | (0.22 | ) | | | 1.65 | |
| | | | | | | | | | | | | | | | | | | | |
LESS DISTRIBUTIONS FROM: | | | | | | | | | | | | | | | | | | | | |
Net investment income | | | (0.07 | ) | | | (0.07 | ) | | | (0.13 | ) | | | (0.09 | ) | | | (0.06 | ) |
Net realized capital gains | | | (3.11 | ) | | | (0.71 | ) | | | — | | | | — | | | | — | |
| | | | | | | | | | | | | | | | | | | | |
Total Distributions | | | (3.18 | ) | | | (0.78 | ) | | | (0.13 | ) | | | (0.09 | ) | | | (0.06 | ) |
| | | | | | | | | | | | | | | | | | | | |
Net asset value, end of the period | | $ | 20.43 | | | $ | 21.40 | | | $ | 16.09 | | | $ | 13.86 | | | $ | 14.17 | |
| | | | | | | | | | | | | | | | | | | | |
Total return(b) | | | 10.43 | % | | | 37.82 | % | | | 17.03 | %(c) | | | (1.56 | )% | | | 13.08 | %(c) |
RATIOS TO AVERAGE NET ASSETS: | | | | | | | | | | | | | | | | | | | | |
Net assets, end of the period (000’s) | | $ | 195,061 | | | $ | 145,270 | | | $ | 113,870 | | | $ | 107,978 | | | $ | 118,938 | |
Net expenses | | | 1.22 | % | | | 1.30 | %(d) | | | 1.30 | %(e) | | | 1.30 | %(f) | | | 1.30 | %(e) |
Gross expenses | | | 1.22 | % | | | 1.30 | %(d) | | | 1.33 | % | | | 1.30 | %(f) | | | 1.39 | % |
Net investment income | | | 0.44 | % | | | 0.33 | % | | | 0.77 | % | | | 0.57 | % | | | 0.36 | % |
Portfolio turnover rate | | | 64 | %(g) | | | 29 | % | | | 25 | % | | | 36 | % | | | 32 | % |
| (a) | Per share net investment income has been calculated using the average shares outstanding during the period. |
| (b) | A sales charge for Class A shares is not reflected in total return calculations. |
| (c) | Had certain expenses not been waived/reimbursed during the period, total returns would have been lower. |
| (d) | Includes fee/expense recovery of less than 0.01%. |
| (e) | The investment adviser agreed to waive its fees and/or reimburse a portion of the Fund’s expenses during the period. Without this waiver/reimbursement, expenses would have been higher. |
| (f) | Includes fee/expense recovery of 0.01%. |
| (g) | The variation in the Fund’s turnover rate from 2013 to 2014 was primarily due to a change in the portfolio management team. |
See accompanying notes to financial statements.
| 58
Financial Highlights (continued)
For a share outstanding throughout each period.
| | | | | | | | | | | | | | | | | | | | |
| | | Natixis Oakmark Fund—Class B | |
| | | Year Ended
December 31,
2014 | | | Year Ended
December 31,
2013 | | | Year Ended
December 31,
2012 | | | Year Ended
December 31,
2011 | | | Year Ended
December 31,
2010 | |
Net asset value, beginning of the period | | $ | 19.57 | | | $ | 14.83 | | | $ | 12.76 | | | $ | 13.07 | | | $ | 11.65 | |
| | | | | | | | | | | | | | | | | | | | |
INCOME (LOSS) FROM INVESTMENT OPERATIONS: | | | | | | | | | | | | | | | | | | | | |
Net investment loss(a) | | | (0.06 | ) | | | (0.07 | ) | | | (0.01 | ) | | | (0.03 | ) | | | (0.05 | ) |
Net realized and unrealized gain (loss) | | | 1.91 | | | | 5.52 | | | | 2.08 | | | | (0.28 | ) | | | 1.48 | |
| | | | | | | | | | | | | | | | | | | | |
Total from Investment Operations | | | 1.85 | | | | 5.45 | | | | 2.07 | | | | (0.31 | ) | | | 1.43 | |
| | | | | | | | | | | | | | | | | | | | |
LESS DISTRIBUTIONS FROM: | | | | | | | | | | | | | | | | | | | | |
Net investment income | | | — | | | | — | | | | — | | | | (0.00 | )(b) | | | (0.01 | ) |
Net realized capital gains | | | (3.11 | ) | | | (0.71 | ) | | | — | | | | — | | | | — | |
| | | | | | | | | | | | | | | | | | | | |
Total Distributions | | | (3.11 | ) | | | (0.71 | ) | | | — | | | | (0.00 | ) | | | (0.01 | ) |
| | | | | | | | | | | | | | | | | | | | |
Net asset value, end of the period | | $ | 18.31 | | | $ | 19.57 | | | $ | 14.83 | | | $ | 12.76 | | | $ | 13.07 | |
| | | | | | | | | | | | | | | | | | | | |
Total return(c) | | | 9.56 | % | | | 36.75 | % | | | 16.22 | %(d) | | | (2.34 | )% | | | 12.31 | %(d) |
RATIOS TO AVERAGE NET ASSETS: | | | | | | | | | | | | | | | | | | | | |
Net assets, end of the period (000’s) | | $ | 669 | | | $ | 1,532 | | | $ | 2,145 | | | $ | 3,341 | | | $ | 5,614 | |
Net expenses | | | 1.97 | % | | | 2.05 | %(e) | | | 2.05 | %(f) | | | 2.05 | %(g) | | | 2.05 | %(f) |
Gross expenses | | | 1.97 | % | | | 2.05 | %(e) | | | 2.08 | % | | | 2.05 | %(g) | | | 2.13 | % |
Net investment loss | | | (0.31 | )% | | | (0.43 | )% | | | (0.04 | )% | | | (0.21 | )% | | | (0.40 | )% |
Portfolio turnover rate | | | 64 | %(h) | | | 29 | % | | | 25 | % | | | 36 | % | | | 32 | % |
| (a) | Per share net investment loss has been calculated using the average shares outstanding during the period. |
| (b) | Amount rounds to less than $0.01 per share. |
| (c) | A contingent deferred sales charge for Class B shares is not reflected in total return calculations. |
| (d) | Had certain expenses not been waived/reimbursed during the period, total returns would have been lower. |
| (e) | Includes fee/expense recovery of less than 0.01%. |
| (f) | The investment adviser agreed to waive its fees and/or reimburse a portion of the Fund’s expenses during the period. Without this waiver/reimbursement, expenses would have been higher. |
| (g) | Includes fee/expense recovery of 0.01%. |
| (h) | The variation in the Fund’s turnover rate from 2013 to 2014 was primarily due to a change in the portfolio management team. |
See accompanying notes to financial statements.
59 |
Financial Highlights (continued)
For a share outstanding throughout each period.
| | | | | | | | | | | | | | | | | | | | |
| | | Natixis Oakmark Fund—Class C | |
| | | Year Ended
December 31,
2014 | | | Year Ended
December 31,
2013 | | | Year Ended
December 31,
2012 | | | Year Ended
December 31,
2011 | | | Year Ended
December 31,
2010 | |
Net asset value, beginning of the period | | $ | 19.48 | | | $ | 14.75 | | | $ | 12.72 | | | $ | 13.02 | | | $ | 11.61 | |
| | | | | | | | | | | | | | | | | | | | |
INCOME (LOSS) FROM INVESTMENT OPERATIONS: | | | | | | | | | | | | | | | | | | | | |
Net investment income (loss)(a) | | | (0.06 | ) | | | (0.07 | ) | | | 0.00 | (b) | | | (0.03 | ) | | | (0.05 | ) |
Net realized and unrealized gain (loss) | | | 1.90 | | | | 5.51 | | | | 2.05 | | | | (0.27 | ) | | | 1.47 | |
| | | | | | | | | | | | | | | | | | | | |
Total from Investment Operations | | | 1.84 | | | | 5.44 | | | | 2.05 | | | | (0.30 | ) | | | 1.42 | |
| | | | | | | | | | | | | | | | | | | | |
LESS DISTRIBUTIONS FROM: | | | | | | | | | | | | | | | | | | | | |
Net investment income | | | (0.02 | ) | | | — | | | | (0.02 | ) | | | (0.00 | )(b) | | | (0.01 | ) |
Net realized capital gains | | | (3.11 | ) | | | (0.71 | ) | | | — | | | | — | | | | — | |
| | | | | | | | | | | | | | | | | | | | |
Total Distributions | | | (3.13 | ) | | | (0.71 | ) | | | (0.02 | ) | | | (0.00 | ) | | | (0.01 | ) |
| | | | | | | | | | | | | | | | | | | | |
Net asset value, end of the period | | $ | 18.19 | | | $ | 19.48 | | | $ | 14.75 | | | $ | 12.72 | | | $ | 13.02 | |
| | | | | | | | | | | | | | | | | | | | |
Total return(c) | | | 9.55 | % | | | 36.88 | % | | | 16.13 | %(d) | | | (2.28 | )% | | | 12.26 | %(d) |
RATIOS TO AVERAGE NET ASSETS: | | | | | | | | | | | | | | | | | | | | |
Net assets, end of the period (000’s) | | $ | 62,941 | | | $ | 8,425 | | | $ | 6,016 | | | $ | 5,667 | | | $ | 7,399 | |
Net expenses | | | 1.97 | % | | | 2.05 | %(e) | | | 2.05 | %(f) | | | 2.05 | %(g) | | | 2.05 | %(f) |
Gross expenses | | | 1.97 | % | | | 2.05 | %(e) | | | 2.08 | % | | | 2.05 | %(g) | | | 2.14 | % |
Net investment income (loss) | | | (0.30 | )% | | | (0.42 | )% | | | 0.02 | % | | | (0.19 | )% | | | (0.39 | )% |
Portfolio turnover rate | | | 64 | %(h) | | | 29 | % | | | 25 | % | | | 36 | % | | | 32 | % |
| (a) | Per share net investment income (loss) has been calculated using the average shares outstanding during the period. |
| (b) | Amount rounds to less than $0.01 per share. |
| (c) | A contingent deferred sales charge for Class C shares is not reflected in total return calculations. |
| (d) | Had certain expenses not been waived/reimbursed during the period, total returns would have been lower. |
| (e) | Includes fee/expense recovery of less than 0.01%. |
| (f) | The investment adviser agreed to waive its fees and/or reimburse a portion of the Fund’s expenses during the period. Without this waiver/reimbursement, expenses would have been higher. |
| (g) | Includes fee/expense recovery of 0.01%. |
| (h) | The variation in the Fund’s turnover rate from 2013 to 2014 was primarily due to a change in the portfolio management team. |
See accompanying notes to financial statements.
| 60
Financial Highlights (continued)
For a share outstanding throughout each period.
| | | | | | | | | | | | | | | | | | | | |
| | | Natixis Oakmark Fund—Class Y | |
| | | Year Ended
December 31,
2014 | | | Year Ended
December 31,
2013 | | | Year Ended
December 31,
2012 | | | Year Ended
December 31,
2011 | | | Year Ended
December 31,
2010 | |
Net asset value, beginning of the period | | $ | 22.16 | | | $ | 16.63 | | | $ | 14.32 | | | $ | 14.65 | | | $ | 12.99 | |
| | | | | | | | | | | | | | | | | | | | |
INCOME (LOSS) FROM INVESTMENT OPERATIONS: | | | | | | | | | | | | | | | | | | | | |
Net investment income(a) | | | 0.15 | | | | 0.11 | | | | 0.17 | | | | 0.12 | | | | 0.08 | |
Net realized and unrealized gain (loss) | | | 2.20 | | | | 6.24 | | | | 2.31 | | | | (0.33 | ) | | | 1.67 | |
| | | | | | | | | | | | | | | | | | | | |
Total from Investment Operations | | | 2.35 | | | | 6.35 | | | | 2.48 | | | | (0.21 | ) | | | 1.75 | |
| | | | | | | | | | | | | | | | | | | | |
LESS DISTRIBUTIONS FROM: | | | | | | | | | | | | | | | | | | | | |
Net investment income | | | (0.12 | ) | | | (0.11 | ) | | | (0.17 | ) | | | (0.12 | ) | | | (0.09 | ) |
Net realized capital gains | | | (3.11 | ) | | | (0.71 | ) | | | — | | | | — | | | | — | |
| | | | | | | | | | | | | | | | | | | | |
Total Distributions | | | (3.23 | ) | | | (0.82 | ) | | | (0.17 | ) | | | (0.12 | ) | | | (0.09 | ) |
| | | | | | | | | | | | | | | | | | | | |
Net asset value, end of the period | | $ | 21.28 | | | $ | 22.16 | | | $ | 16.63 | | | $ | 14.32 | | | $ | 14.65 | |
| | | | | | | | | | | | | | | | | | | | |
Total return | | | 10.70 | % | | | 38.21 | % | | | 17.33 | %(b) | | | (1.40 | )% | | | 13.47 | %(b) |
RATIOS TO AVERAGE NET ASSETS: | | | | | | | | | | | | | | | | | | | | |
Net assets, end of the period (000’s) | | $ | 26,694 | | | $ | 14,176 | | | $ | 12,100 | | | $ | 7,567 | | | $ | 9,586 | |
Net expenses | | | 0.97 | % | | | 1.05 | %(c) | | | 1.05 | %(d) | | | 1.05 | %(e) | | | 1.05 | %(d) |
Gross expenses | | | 0.97 | % | | | 1.05 | %(c) | | | 1.09 | % | | | 1.05 | %(e) | | | 1.14 | % |
Net investment income | | | 0.67 | % | | | 0.54 | % | | | 1.04 | % | | | 0.80 | % | | | 0.61 | % |
Portfolio turnover rate | | | 64 | %(f) | | | 29 | % | | | 25 | % | | | 36 | % | | | 32 | % |
| (a) | Per share net investment income has been calculated using the average shares outstanding during the period. |
| (b) | Had certain expenses not been waived/reimbursed during the period, total returns would have been lower. |
| (c) | Includes fee/expense recovery of less than 0.01%. |
| (d) | The investment adviser agreed to waive its fees and/or reimburse a portion of the Fund’s expenses during the period. Without this waiver/reimbursement, expenses would have been higher. |
| (e) | Includes fee/expense recovery of 0.01%. |
| (f) | The variation in the Fund’s turnover rate from 2013 to 2014 was primarily due to a change in the portfolio management team. |
See accompanying notes to financial statements.
61 |
Financial Highlights (continued)
For a share outstanding throughout each period.
| | | | | | | | | | | | | | | | | | | | |
| | | Natixis Oakmark International Fund—Class A | |
| | | Year Ended
December 31,
2014 | | | Year Ended
December 31,
2013 | | | Year Ended
December 31,
2012 | | | Year Ended
December 31,
2011 | | | Period Ended
December 31,
2010* | |
Net asset value, beginning of the period | | $ | 13.74 | | | $ | 10.94 | | | $ | 8.68 | | | $ | 10.16 | | | $ | 10.00 | |
| | | | | | | | | | | | | | | | | | | | |
INCOME (LOSS) FROM INVESTMENT OPERATIONS: | | | | | | | | | | | | | | | | | | | | |
Net investment income(a) | | | 0.18 | | | | 0.07 | | | | 0.14 | | | | 0.09 | (b) | | | 0.00 | (c) |
Net realized and unrealized gain (loss) | | | (1.01 | ) | | | 2.99 | | | | 2.35 | | | | (1.57 | ) | | | 0.16 | |
| | | | | | | | | | | | | | | | | | | | |
Total from Investment Operations | | | (0.83 | ) | | | 3.06 | | | | 2.49 | | | | (1.48 | ) | | | 0.16 | |
| | | | | | | | | | | | | | | | | | | | |
LESS DISTRIBUTIONS FROM: | | | | | | | | | | | | | | | | | | | | |
Net investment income | | | (0.25 | ) | | | (0.08 | ) | | | (0.23 | ) | | | (0.00 | )(c) | | | (0.00 | )(c) |
Net realized capital gains | | | (0.22 | ) | | | (0.18 | ) | | | — | | | | (0.00 | )(c) | | | — | |
| | | | | | | | | | | | | | | | | | | | |
Total Distributions | | | (0.47 | ) | | | (0.26 | ) | | | (0.23 | ) | | | (0.00 | ) | | | (0.00 | ) |
| | | | | | | | | | | | | | | | | | | | |
Net asset value, end of the period | | $ | 12.44 | | | $ | 13.74 | | | $ | 10.94 | | | $ | 8.68 | | | $ | 10.16 | |
| | | | | | | | | | | | | | | | | | | | |
Total return(d) | | | (6.05 | )% | | | 28.13 | % | | | 28.78 | %(e) | | | (14.55 | )%(b)(e) | | | 1.62 | %(e) |
RATIOS TO AVERAGE NET ASSETS: | | | | | | | | | | | | | | | | | | | | |
Net assets, end of the period (000’s) | | $ | 617,383 | | | $ | 314,579 | | | $ | 35,555 | | | $ | 33,852 | | | $ | 5,487 | |
Net expenses | | | 1.31 | % | | | 1.44 | %(f) | | | 1.45 | %(g) | | | 1.45 | %(g) | | | 1.45 | %(g)(h) |
Gross expenses | | | 1.31 | % | | | 1.44 | %(f) | | | 1.64 | % | | | 1.87 | % | | | 22.77 | %(h) |
Net investment income | | | 1.34 | % | | | 0.52 | % | | | 1.50 | % | | | 0.93 | %(b) | | | 0.23 | %(h) |
Portfolio turnover rate | | | 31 | % | | | 20 | % | | | 53 | % | | | 48 | % | | | 0 | %(i) |
| * | From commencement of operations on December 15, 2010 through December 31, 2010. |
| (a) | Per share net investment income has been calculated using the average shares outstanding during the period. |
| (b) | Includes a non-recurring dividend. Without this dividend, net investment income per share would have been $0.08, total return would have been (14.65)% and the ratio of net investment income to average net assets would have been 0.81%. |
| (c) | Amount rounds to less than $0.01 per share. |
| (d) | A sales charge for Class A shares is not reflected in total return calculations. |
| (e) | Had certain expenses not been waived/reimbursed during the period, total returns would have been lower. Periods less than one year are not annualized. |
| (f) | Includes fee/expense recovery of 0.05%. |
| (g) | The investment adviser agreed to waive its fees and/or reimburse a portion of the Fund’s expenses during the period. Without this waiver/reimbursement, expenses would have been higher. |
| (h) | Computed on an annualized basis for periods less than one year. |
| (i) | Amount rounds to less than 1%. |
See accompanying notes to financial statements.
| 62
Financial Highlights (continued)
For a share outstanding throughout each period.
| | | | | | | | | | | | | | | | | | | | |
| | | Natixis Oakmark International Fund—Class C | |
| | | Year Ended
December 31,
2014 | | | Year Ended
December 31,
2013 | | | Year Ended
December 31,
2012 | | | Year Ended
December 31,
2011 | | | Period Ended
December 31,
2010* | |
Net asset value, beginning of the period | | $ | 13.53 | | | $ | 10.82 | | | $ | 8.61 | | | $ | 10.15 | | | $ | 10.00 | |
| | | | | | | | | | | | | | | | | | | | |
INCOME (LOSS) FROM INVESTMENT OPERATIONS: | | | | | | | | | | | | | | | | | | | | |
Net investment income (loss)(a) | | | 0.08 | | | | (0.02 | ) | | | 0.06 | | | | 0.02 | (b) | | | (0.00 | )(c) |
Net realized and unrealized gain (loss) | | | (0.98 | ) | | | 2.94 | | | | 2.34 | | | | (1.56 | ) | | | 0.15 | |
| | | | | | | | | | | | | | | | | | | | |
Total from Investment Operations | | | (0.90 | ) | | | 2.92 | | | | 2.40 | | | | (1.54 | ) | | | 0.15 | |
| | | | | | | | | | | | | | | | | | | | |
LESS DISTRIBUTIONS FROM: | | | | | | | | | | | | | | | | | | | | |
Net investment income | | | (0.16 | ) | | | (0.03 | ) | | | (0.19 | ) | | | (0.00 | )(c) | | | (0.00 | )(c) |
Net realized capital gains | | | (0.22 | ) | | | (0.18 | ) | | | — | | | | (0.00 | )(c) | | | — | |
| | | | | | | | | | | | | | | | | | | | |
Total Distributions | | | (0.38 | ) | | | (0.21 | ) | | | (0.19 | ) | | | (0.00 | ) | | | (0.00 | ) |
| | | | | | | | | | | | | | | | | | | | |
Net asset value, end of the period | | $ | 12.25 | | | $ | 13.53 | | | $ | 10.82 | | | $ | 8.61 | | | $ | 10.15 | |
| | | | | | | | | | | | | | | | | | | | |
Total return(d) | | | (6.67 | )% | | | 27.13 | % | | | 27.93 | %(e) | | | (15.17 | )%(b)(e) | | | 1.52 | %(e) |
RATIOS TO AVERAGE NET ASSETS: | | | | | | | | | | | | | | | | | | | | |
Net assets, end of the period (000’s) | | $ | 327,319 | | | $ | 237,250 | | | $ | 34,142 | | | $ | 13,501 | | | $ | 700 | |
Net expenses | | | 2.05 | % | | | 2.19 | %(f) | | | 2.20 | %(g) | | | 2.20 | %(g) | | | 2.20 | %(g)(h) |
Gross expenses | | | 2.05 | % | | | 2.19 | %(f) | | | 2.39 | % | | | 2.59 | % | | | 25.08 | %(h) |
Net investment income (loss) | | | 0.61 | % | | | (0.14 | )% | | | 0.59 | % | | | 0.20 | %(b) | | | (0.08 | )%(h) |
Portfolio turnover rate | | | 31 | % | | | 20 | % | | | 53 | % | | | 48 | % | | | 0 | %(i) |
| * | From commencement of operations on December 15, 2010 through December 31, 2010. |
| (a) | Per share net investment income (loss) has been calculated using the average shares outstanding during the period. |
| (b) | Includes a non-recurring dividend. Without this dividend, net investment income per share would have been $0.01, total return would have been (15.27)% and the ratio of net investment income to average net assets would have been 0.08%. |
| (c) | Amount rounds to less than $0.01 per share. |
| (d) | A contingent deferred sales charge for Class C shares is not reflected in total return calculations. |
| (e) | Had certain expenses not been waived/reimbursed during the period, total returns would have been lower. Periods less than one year are not annualized. |
| (f) | Includes fee/expense recovery of 0.04%. |
| (g) | The investment adviser agreed to waive its fees and/or reimburse a portion of the Fund’s expenses during the period. Without this waiver/reimbursement, expenses would have been higher. |
| (h) | Computed on an annualized basis for periods less than one year. |
| (i) | Amount rounds to less than 1%. |
See accompanying notes to financial statements.
63 |
Financial Highlights (continued)
For a share outstanding throughout each period.
| | | | | | | | | | | | | | | | | | | | |
| | | Vaughan Nelson Small Cap Value Fund—Class A | |
| | | Year Ended
December 31,
2014 | | | Year Ended
December 31,
2013 | | | Year Ended
December 31,
2012 | | | Year Ended
December 31,
2011 | | | Year Ended
December 31,
2010 | |
Net asset value, beginning of the period | | $ | 22.34 | | | $ | 18.97 | | | $ | 17.74 | | | $ | 22.69 | | | $ | 22.31 | |
| | | | | | | | | | | | | | | | | | | | |
INCOME (LOSS) FROM INVESTMENT OPERATIONS: | | | | | | | | | | | | | | | | | | | | |
Net investment income (loss)(a) | | | (0.06 | ) | | | 0.07 | (b) | | | 0.13 | (c) | | | 0.10 | | | | (0.01 | ) |
Net realized and unrealized gain (loss) | | | 1.95 | | | | 7.14 | | | | 2.50 | | | | (0.83 | ) | | | 5.27 | |
| | | | | | | | | | | | | | | | | | | | |
Total from Investment Operations | | | 1.89 | | | | 7.21 | | | | 2.63 | | | | (0.73 | ) | | | 5.26 | |
| | | | | | | | | | | | | | | | | | | | |
LESS DISTRIBUTIONS FROM: | | | | | | | | | | | | | | | | | | | | |
Net investment income | | | — | | | | (0.06 | ) | | | (0.14 | ) | | | (0.09 | ) | | | — | |
Net realized capital gains | | | (3.58 | ) | | | (3.78 | ) | | | (1.26 | ) | | | (4.13 | ) | | | (4.90 | ) |
| | | | | | | | | | | | | | | | | | | | |
Total Distributions | | | (3.58 | ) | | | (3.84 | ) | | | (1.40 | ) | | | (4.22 | ) | | | (4.90 | ) |
| | | | | | | | | | | | | | | | | | | | |
Increase from regulatory settlements | | | — | | | | — | | | | — | | | | — | | | | 0.02 | |
| | | | | | | | | | | | | | | | | | | | |
Net asset value, end of the period | | $ | 20.65 | | | $ | 22.34 | | | $ | 18.97 | | | $ | 17.74 | | | $ | 22.69 | |
| | | | | | | | | | | | | | | | | | | | |
Total return(d) | | | 8.79 | % | | | 39.01 | %(b) | | | 14.93 | %(c) | | | (3.77 | )% | | | 23.67 | % |
RATIOS TO AVERAGE NET ASSETS: | | | | | | | | | | | | | | | | | | | | |
Net assets, end of the period (000’s) | | $ | 125,201 | | | $ | 152,792 | | | $ | 160,400 | | | $ | 228,445 | | | $ | 267,192 | |
Net expenses | | | 1.37 | % | | | 1.39 | %(e) | | | 1.39 | % | | | 1.36 | % | | | 1.41 | % |
Gross expenses | | | 1.37 | % | | | 1.39 | %(e) | | | 1.39 | % | | | 1.36 | % | | | 1.41 | % |
Net investment income (loss) | | | (0.27 | )% | | | 0.33 | %(b) | | | 0.67 | %(c) | | | 0.44 | % | | | (0.03 | )% |
Portfolio turnover rate | | | 58 | % | | | 58 | % | | | 73 | % | | | 88 | % | | | 80 | % |
| (a) | Per share net investment income (loss) has been calculated using the average shares outstanding during the period. |
| (b) | Includes a non-recurring dividend. Without this dividend, net investment income per share would have been $0.00, total return would have been 38.63% and the ratio of net investment income to average net assets would have been 0.02%. |
| (c) | Includes a non-recurring dividend. Without this dividend, net investment income per share would have been $0.04, total return would have been 14.42% and the ratio of net investment income to average net assets would have been 0.22%. |
| (d) | A sales charge for Class A shares is not reflected in total return calculations. |
| (e) | Includes interest expense of less than 0.01%. |
See accompanying notes to financial statements.
| 64
Financial Highlights (continued)
For a share outstanding throughout each period.
| | | | | | | | | | | | | | | | | | | | |
| | | Vaughan Nelson Small Cap Value Fund—Class B | |
| | | Year Ended
December 31,
2014 | | | Year Ended
December 31,
2013 | | | Year Ended
December 31,
2012 | | | Year Ended
December 31,
2011 | | | Year Ended
December 31,
2010 | |
Net asset value, beginning of the period | | $ | 17.63 | | | $ | 15.65 | | | $ | 14.84 | | | $ | 19.73 | | | $ | 20.06 | |
| | | | | | | | | | | | | | | | | | | | |
INCOME (LOSS) FROM INVESTMENT OPERATIONS: | | | | | | | | | | | | | | | | | | | | |
Net investment loss(a) | | | (0.19 | ) | | | (0.07 | )(b) | | | (0.02 | )(c) | | | (0.07 | ) | | | (0.17 | ) |
Net realized and unrealized gain (loss) | | | 1.51 | | | | 5.84 | | | | 2.09 | | | | (0.69 | ) | | | 4.72 | |
| | | | | | | | | | | | | | | | | | | | |
Total from Investment Operations | | | 1.32 | | | | 5.77 | | | | 2.07 | | | | (0.76 | ) | | | 4.55 | |
| | | | | | | | | | | | | | | | | | | | |
LESS DISTRIBUTIONS FROM: | | | | | | | | | | | | | | | | | | | | |
Net investment income | | | — | | | | (0.01 | ) | | | — | | | | (0.00 | )(d) | | | — | |
Net realized capital gains | | | (3.58 | ) | | | (3.78 | ) | | | (1.26 | ) | | | (4.13 | ) | | | (4.90 | ) |
| | | | | | | | | | | | | | | | | | | | |
Total Distributions | | | (3.58 | ) | | | (3.79 | ) | | | (1.26 | ) | | | (4.13 | ) | | | (4.90 | ) |
| | | | | | | | | | | | | | | | | | | | |
Increase from regulatory settlements | | | — | | | | — | | | | — | | | | — | | | | 0.02 | |
| | | | | | | | | | | | | | | | | | | | |
Net asset value, end of the period | | $ | 15.37 | | | $ | 17.63 | | | $ | 15.65 | | | $ | 14.84 | | | $ | 19.73 | |
| | | | | | | | | | | | | | | | | | | | |
Total return(e) | | | 7.87 | % | | | 38.03 | %(b) | | | 14.12 | %(c) | | | (4.51 | )% | | | 22.78 | % |
RATIOS TO AVERAGE NET ASSETS: | | | | | | | | | | | | | | | | | | | | |
Net assets, end of the period (000’s) | | $ | 967 | | | $ | 2,239 | | | $ | 3,106 | | | $ | 4,657 | | | $ | 7,996 | |
Net expenses | | | 2.12 | % | | | 2.14 | %(f) | | | 2.14 | % | | | 2.11 | % | | | 2.16 | % |
Gross expenses | | | 2.12 | % | | | 2.14 | %(f) | | | 2.14 | % | | | 2.11 | % | | | 2.16 | % |
Net investment loss | | | (1.08 | )% | | | (0.40 | )%(b) | | | (0.14 | )%(c) | | | (0.38 | )% | | | (0.78 | )% |
Portfolio turnover rate | | | 58 | % | | | 58 | % | | | 73 | % | | | 88 | % | | | 80 | % |
| (a) | Per share net investment loss has been calculated using the average shares outstanding during the period. |
| (b) | Includes a non-recurring dividend. Without this dividend, net investment loss per share would have been $(0.14), total return would have been 37.63% and the ratio of net investment income loss to average net assets would have been (0.77)%. |
| (c) | Includes a non-recurring dividend. Without this dividend, net investment loss per share would have been $(0.09), total return would have been 13.64% and the ratio of net investment income loss to average net assets would have been (0.56)%. |
| (d) | Amount rounds to less than $0.01 per share. |
| (e) | A contingent deferred sales charge for Class B shares is not reflected in total return calculations. |
| (f) | Includes interest expense of less than 0.01%. |
See accompanying notes to financial statements.
65 |
Financial Highlights (continued)
For a share outstanding throughout each period.
| | | | | | | | | | | | | | | | | | | | |
| | | Vaughan Nelson Small Cap Value Fund—Class C | |
| | | Year Ended
December 31,
2014 | | | Year Ended
December 31,
2013 | | | Year Ended
December 31,
2012 | | | Year Ended
December 31,
2011 | | | Year Ended
December 31,
2010 | |
Net asset value, beginning of the period | | $ | 17.61 | | | $ | 15.64 | | | $ | 14.85 | | | $ | 19.74 | | | $ | 20.07 | |
| | | | | | | | | | | | | | | | | | | | |
INCOME (LOSS) FROM INVESTMENT OPERATIONS: | | | | | | | | | | | | | | | | | | | | |
Net investment loss(a) | | | (0.18 | ) | | | (0.07 | )(b) | | | (0.01 | )(c) | | | (0.06 | ) | | | (0.16 | ) |
Net realized and unrealized gain (loss) | | | 1.51 | | | | 5.83 | | | | 2.08 | | | | (0.70 | ) | | | 4.71 | |
| | | | | | | | | | | | | | | | | | | | |
Total from Investment Operations | | | 1.33 | | | | 5.76 | | | | 2.07 | | | | (0.76 | ) | | | 4.55 | |
| | | | | | | | | | | | | | | | | | | | |
LESS DISTRIBUTIONS FROM: | | | | | | | | | | | | | | | | | | | | |
Net investment income | | | — | | | | (0.01 | ) | | | (0.02 | ) | | | — | | | | — | |
Net realized capital gains | | | (3.58 | ) | | | (3.78 | ) | | | (1.26 | ) | | | (4.13 | ) | | | (4.90 | ) |
| | | | | | | | | | | | | | | | | | | | |
Total Distributions | | | (3.58 | ) | | | (3.79 | ) | | | (1.28 | ) | | | (4.13 | ) | | | (4.90 | ) |
| �� | | | | | | | | | | | | | | | | | | | |
Increase from regulatory settlements | | | — | | | | — | | | | — | | | | — | | | | 0.02 | |
| | | | | | | | | | | | | | | | | | | | |
Net asset value, end of the period | | $ | 15.36 | | | $ | 17.61 | | | $ | 15.64 | | | $ | 14.85 | | | $ | 19.74 | |
| | | | | | | | | | | | | | | | | | | | |
Total return(d) | | | 7.94 | % | | | 37.99 | %(b) | | | 14.08 | %(c) | | | (4.51 | )% | | | 22.78 | % |
RATIOS TO AVERAGE NET ASSETS: | | | | | | | | | | | | | | | | | | | | |
Net assets, end of the period (000’s) | | $ | 27,292 | | | $ | 31,476 | | | $ | 26,980 | | | $ | 30,284 | | | $ | 38,855 | |
Net expenses | | | 2.12 | % | | | 2.14 | %(e) | | | 2.14 | % | | | 2.11 | % | | | 2.16 | % |
Gross expenses | | | 2.12 | % | | | 2.14 | %(e) | | | 2.14 | % | | | 2.11 | % | | | 2.16 | % |
Net investment loss | | | (1.02 | )% | | | (0.40 | )%(b) | | | (0.07 | )%(c) | | | (0.33 | )% | | | (0.76 | )% |
Portfolio turnover rate | | | 58 | % | | | 58 | % | | | 73 | % | | | 88 | % | | | 80 | % |
| (a) | Per share net investment loss has been calculated using the average shares outstanding during the period. |
| (b) | Includes a non-recurring dividend. Without this dividend, net investment loss per share would have been $(0.13), total return would have been 37.59% and the ratio of net investment income loss to average net assets would have been (0.73)%. |
| (c) | Includes a non-recurring dividend. Without this dividend, net investment loss per share would have been $(0.08), total return would have been 13.52% and the ratio of net investment income loss to average net assets would have been (0.51)%. |
| (d) | A contingent deferred sales charge for Class C shares is not reflected in total return calculations. |
| (e) | Includes interest expense of less than 0.01%. |
See accompanying notes to financial statements.
| 66
Financial Highlights (continued)
For a share outstanding throughout each period.
| | | | | | | | | | | | | | | | | | | | |
| | | Vaughan Nelson Small Cap Value Fund—Class Y | |
| | | Year Ended
December 31,
2014 | | | Year Ended
December 31,
2013 | | | Year Ended
December 31,
2012 | | | Year Ended
December 31,
2011 | | | Year Ended
December 31,
2010 | |
Net asset value, beginning of the period | | $ | 22.73 | | | $ | 19.24 | | | $ | 17.99 | | | $ | 22.96 | | | $ | 22.47 | |
| | | | | | | | | | | | | | | | | | | | |
INCOME (LOSS) FROM INVESTMENT OPERATIONS: | | | | | | | | | | | | | | | | | | | | |
Net investment income (loss)(a) | | | (0.00 | )(b) | | | 0.13 | (c) | | | 0.18 | (d) | | | 0.15 | | | | 0.06 | |
Net realized and unrealized gain (loss) | | | 1.98 | | | | 7.26 | | | | 2.53 | | | | (0.84 | ) | | | 5.31 | |
| | | | | | | | | | | | | | | | | | | | |
Total from Investment Operations | | | 1.98 | | | | 7.39 | | | | 2.71 | | | | (0.69 | ) | | | 5.37 | |
| | | | | | | | | | | | | | | | | | | | |
LESS DISTRIBUTIONS FROM: | | | | | | | | | | | | | | | | | | | | |
Net investment income | | | — | | | | (0.12 | ) | | | (0.20 | ) | | | (0.15 | ) | | | — | |
Net realized capital gains | | | (3.58 | ) | | | (3.78 | ) | | | (1.26 | ) | | | (4.13 | ) | | | (4.90 | ) |
| | | | | | | | | | | | | | | | | | | | |
Total Distributions | | | (3.58 | ) | | | (3.90 | ) | | | (1.46 | ) | | | (4.28 | ) | | | (4.90 | ) |
| | | | | | | | | | | | | | | | | | | | |
Increase from regulatory settlements | | | — | | | | — | | | | — | | | | — | | | | 0.02 | |
| | | | | | | | | | | | | | | | | | | | |
Net asset value, end of the period | | $ | 21.13 | | | $ | 22.73 | | | $ | 19.24 | | | $ | 17.99 | | | $ | 22.96 | |
| | | | | | | | | | | | | | | | | | | | |
Total return | | | 9.04 | % | | | 39.43 | %(c) | | | 15.18 | %(d) | | | (3.54 | )% | | | 24.00 | % |
RATIOS TO AVERAGE NET ASSETS: | | | | | | | | | | | | | | | | | | | | |
Net assets, end of the period (000’s) | | $ | 176,905 | | | $ | 163,836 | | | $ | 132,970 | | | $ | 130,115 | | | $ | 217,305 | |
Net expenses | | | 1.12 | % | | | 1.14 | %(e) | | | 1.14 | % | | | 1.10 | % | | | 1.16 | % |
Gross expenses | | | 1.12 | % | | | 1.14 | %(e) | | | 1.14 | % | | | 1.10 | % | | | 1.16 | % |
Net investment income (loss) | | | (0.01 | )% | | | 0.59 | %(c) | | | 0.95 | %(d) | | | 0.65 | % | | | 0.24 | % |
Portfolio turnover rate | | | 58 | % | | | 58 | % | | | 73 | % | | | 88 | % | | | 80 | % |
| (a) | Per share net investment income (loss) has been calculated using the average shares outstanding during the period. |
| (b) | Amount rounds to less than $0.01 per share. |
| (c) | Includes a non-recurring dividend. Without this dividend, net investment income per share would have been $0.06, total return would have been 39.06% and the ratio of net investment income to average net assets would have been 0.27%. |
| (d) | Includes a non-recurring dividend. Without this dividend, net investment income per share would have been $0.10, total return would have been 14.73% and the ratio of net investment income to average net assets would have been 0.50%. |
| (e) | Includes interest expense of less than 0.01%. |
See accompanying notes to financial statements.
67 |
Financial Highlights (continued)
For a share outstanding throughout each period.
| | | | | | | | | | | | | | | | | | | | |
| | | Vaughan Nelson Value Opportunity Fund—Class A | |
| | | Year Ended
December 31,
2014 | | | Year Ended
December 31,
2013 | | | Year Ended
December 31,
2012 | | | Year Ended
December 31,
2011 | | | Year Ended
December 31,
2010 | |
Net asset value, beginning of the period | | $ | 20.63 | | | $ | 15.49 | | | $ | 13.83 | | | $ | 14.75 | | | $ | 12.46 | |
| | | | | | | | | | | | | | | | | | | | |
INCOME (LOSS) FROM INVESTMENT OPERATIONS: | | | | | | | | | | | | | | | | | | | | |
Net investment income (loss)(a) | | | (0.08 | ) | | | (0.03 | ) | | | 0.15 | (b) | | | (0.01 | ) | | | 0.08 | (c) |
Net realized and unrealized gain (loss) | | | 2.31 | | | | 6.36 | | | | 2.05 | | | | (0.39 | ) | | | 2.36 | |
| | | | | | | | | | | | | | | | | | | | |
Total from Investment Operations | | | 2.23 | | | | 6.33 | | | | 2.20 | | | | (0.40 | ) | | | 2.44 | |
| | | | | | | | | | | | | | | | | | | | |
LESS DISTRIBUTIONS FROM: | | | | | | | | | | | | | | | | | | | | |
Net investment income | | | — | | | | — | | | | (0.14 | ) | | | — | | | | (0.07 | ) |
Net realized capital gains | | | (1.57 | ) | | | (1.19 | ) | | | (0.40 | ) | | | (0.52 | ) | | | (0.02 | ) |
Paid-in capital | | | — | | | | — | | | | — | | | | — | | | | (0.06 | ) |
| | | | | | | | | | | | | | | | | | | | |
Total Distributions | | | (1.57 | ) | | | (1.19 | ) | | | (0.54 | ) | | | (0.52 | ) | | | (0.15 | ) |
| | | | | | | | | | | | | | | | | | | | |
Net asset value, end of the period | | $ | 21.29 | | | $ | 20.63 | | | $ | 15.49 | | | $ | 13.83 | | | $ | 14.75 | |
| | | | | | | | | | | | | | | | | | | | |
Total return(d) | | | 10.92 | % | | | 41.22 | % | | | 15.93 | %(b) | | | (2.71 | )% | | | 19.64 | %(e) |
RATIOS TO AVERAGE NET ASSETS: | | | | | | | | | | | | | | | | | | | | |
Net assets, end of the period (000’s) | | $ | 73,237 | | | $ | 67,716 | | | $ | 28,381 | | | $ | 21,308 | | | $ | 11,268 | |
Net expenses | | | 1.25 | % | | | 1.27 | % | | | 1.31 | % | | | 1.40 | %(f) | | | 1.40 | %(g) |
Gross expenses | | | 1.25 | % | | | 1.27 | % | | | 1.31 | % | | | 1.40 | %(f) | | | 1.69 | % |
Net investment income (loss) | | | (0.37 | )% | | | (0.13 | )% | | | 0.97 | %(b) | | | (0.07 | )% | | | 0.62 | %(c) |
Portfolio turnover rate | | | 58 | % | | | 39 | % | | | 65 | % | | | 75 | % | | | 143 | % |
| (a) | Per share net investment income (loss) has been calculated using the average shares outstanding during the period. |
| (b) | Includes non-recurring dividends. Without these dividends, net investment income per share would have been $0.02, total return would have been 15.06% and the ratio of net investment income to average net assets would have been 0.16%. |
| (c) | Includes non-recurring dividends. Without these dividends, net investment income per share would have been $0.01 and the ratio of net investment income to average net assets would have been 0.07%. |
| (d) | A sales charge for Class A shares is not reflected in total return calculations. |
| (e) | Had certain expenses not been waived/reimbursed during the period, total returns would have been lower. |
| (f) | Includes fee/expense recovery of 0.01%. |
| (g) | The investment adviser agreed to waive its fees and/or reimburse a portion of the Fund’s expenses during the period. Without this waiver/reimbursement, expenses would have been higher. |
See accompanying notes to financial statements.
| 68
Financial Highlights (continued)
For a share outstanding throughout each period.
| | | | | | | | | | | | | | | | | | | | |
| | | Vaughan Nelson Value Opportunity Fund—Class C | |
| | | Year Ended
December 31,
2014 | | | Year Ended
December 31,
2013 | | | Year Ended
December 31,
2012 | | | Year Ended
December 31,
2011 | | | Year Ended
December 31,
2010 | |
Net asset value, beginning of the period | | $ | 20.07 | | | $ | 15.21 | | | $ | 13.60 | | | $ | 14.63 | | | $ | 12.39 | |
| | | | | | | | | | | | | | | | | | | | |
INCOME (LOSS) FROM INVESTMENT OPERATIONS: | | | | | | | | | | | | | | | | | | | | |
Net investment income (loss)(a) | | | (0.23 | ) | | | (0.17 | ) | | | 0.04 | (b) | | | (0.12 | ) | | | (0.03 | )(c) |
Net realized and unrealized gain (loss) | | | 2.24 | | | | 6.22 | | | | 2.01 | | | | (0.39 | ) | | | 2.36 | |
| | | | | | | | | | | | | | | | | | | | |
Total from Investment Operations | | | 2.01 | | | | 6.05 | | | | 2.05 | | | | (0.51 | ) | | | 2.33 | |
| | | | | | | | | | | | | | | | | | | | |
LESS DISTRIBUTIONS FROM: | | | | | | | | | | | | | | | | | | | | |
Net investment income | | | — | | | | — | | | | (0.04 | ) | | | — | | | | (0.04 | ) |
Net realized capital gains | | | (1.57 | ) | | | (1.19 | ) | | | (0.40 | ) | | | (0.52 | ) | | | (0.02 | ) |
Paid-in capital | | | — | | | | — | | | | — | | | | — | | | | (0.03 | ) |
| | | | | | | | | | | | | | | | | | | | |
Total Distributions | | | (1.57 | ) | | | (1.19 | ) | | | (0.44 | ) | | | (0.52 | ) | | | (0.09 | ) |
| | | | | | | | | | | | | | | | | | | | |
Net asset value, end of the period | | $ | 20.51 | | | $ | 20.07 | | | $ | 15.21 | | | $ | 13.60 | | | $ | 14.63 | |
| | | | | | | | | | | | | | | | | | | | |
Total return(d) | | | 10.12 | % | | | 40.13 | % | | | 15.10 | %(b) | | | (3.48 | )% | | | 18.85 | %(e) |
RATIOS TO AVERAGE NET ASSETS: | | | | | | | | | | | | | | | | | | | | |
Net assets, end of the period (000’s) | | $ | 35,894 | | | $ | 21,005 | | | $ | 3,090 | | | $ | 1,822 | | | $ | 824 | |
Net expenses | | | 2.00 | % | | | 2.02 | % | | | 2.06 | % | | | 2.15 | %(f) | | | 2.15 | %(g) |
Gross expenses | | | 2.00 | % | | | 2.02 | % | | | 2.06 | % | | | 2.15 | %(f) | | | 2.46 | % |
Net investment income (loss) | | | (1.10 | )% | | | (0.89 | )% | | | 0.24 | %(b) | | | (0.83 | )% | | | (0.23 | )%(c) |
Portfolio turnover rate | | | 58 | % | | | 39 | % | | | 65 | % | | | 75 | % | | | 143 | % |
| (a) | Per share net investment income (loss) has been calculated using the average shares outstanding during the period. |
| (b) | Includes non-recurring dividends. Without these dividends, net investment loss per share would have been $(0.08), total return would have been 14.21% and the ratio of net investment loss to average net assets would have been (0.57)%. |
| (c) | Includes non-recurring dividends. Without this dividend, net investment loss per share would have been $(0.09) and the ratio of net investment loss to average net assets would have been (0.74)%. |
| (d) | A contingent deferred sales charge for Class C shares is not reflected in total return calculations. |
| (e) | Had certain expenses not been waived/reimbursed during the period, total returns would have been lower. |
| (f) | Includes fee/expense recovery of 0.01%. |
| (g) | The investment adviser agreed to waive its fees and/or reimburse a portion of the Fund’s expenses during the period. Without this waiver/reimbursement, expenses would have been higher. |
See accompanying notes to financial statements.
69 |
Financial Highlights (continued)
For a share outstanding throughout each period.
| | | | | | | | |
| | | Vaughan Nelson Value
Opportunity Fund—Class N | |
| | | Year Ended
December 31,
2014 | | | Period Ended
December 31,
2013* | |
Net asset value, beginning of the period | | $ | 20.76 | | | $ | 17.53 | |
| | | | | | | | |
INCOME (LOSS) FROM INVESTMENT OPERATIONS: | | | | | | | | |
Net investment loss(a) | | | (0.00 | )(b) | | | (0.04 | ) |
Net realized and unrealized gain (loss) | | | 2.31 | | | | 4.35 | |
| | | | | | | | |
Total from Investment Operations | | | 2.31 | | | | 4.31 | |
| | | | | | | | |
LESS DISTRIBUTIONS FROM: | | | | | | | | |
Net investment income | | | — | | | | (0.02 | ) |
Net realized capital gains | | | (1.57 | ) | | | (1.06 | ) |
| | | | | | | | |
Total Distributions | | | (1.57 | ) | | | (1.08 | ) |
| | | | | | | | |
Net asset value, end of the period | | $ | 21.50 | | | $ | 20.76 | |
| | | | | | | | |
Total return | | | 11.24 | % | | | 24.70 | %(c) |
RATIOS TO AVERAGE NET ASSETS: | | | | | | | | |
Net assets, end of the period (000’s) | | $ | 12,024 | | | $ | 1 | |
Net expenses | | | 0.91 | %(d) | | | 1.03 | %(e)(f) |
Gross expenses | | | 0.91 | %(d) | | | 2.07 | %(f) |
Net investment loss | | | (0.00 | )%(g) | | | (0.33 | )%(f) |
Portfolio turnover rate | | | 58 | % | | | 39 | % |
| * | From commencement of operations on May 1, 2013 through December 31, 2013. |
| (a) | Per share net investment loss has been calculated using the average shares outstanding during the period. |
| (b) | Amount rounds to less than $0.01 per share. |
| (c) | Had certain expenses not been waived/reimbursed during the period, total returns would have been lower. Periods less than one year are not annualized. |
| (d) | Includes fee/expense recovery of less than 0.01%. |
| (e) | The investment adviser agreed to waive its fees and/or reimburse a portion of the Fund’s expenses during the period. Without this waiver/reimbursement, expenses would have been higher. |
| (f) | Computed on an annualized basis for periods less than one year. |
| (g) | Amount rounds to less than 0.01%. |
See accompanying notes to financial statements.
| 70
Financial Highlights (continued)
For a share outstanding throughout each period.
| | | | | | | | | | | | | | | | | | | | |
| | | Vaughan Nelson Value Opportunity Fund—Class Y | |
| | | Year Ended
December 31,
2014 | | | Year Ended
December 31,
2013 | | | Year Ended
December 31,
2012 | | | Year Ended
December 31,
2011 | | | Year Ended
December 31,
2010 | |
Net asset value, beginning of the period | | $ | 20.78 | | | $ | 15.57 | | | $ | 13.89 | | | $ | 14.80 | | | $ | 12.49 | |
| | | | | | | | | | | | | | | | | | | | |
INCOME (LOSS) FROM INVESTMENT OPERATIONS: | | | | | | | | | | | | | | | | | | | | |
Net investment income (loss)(a) | | | (0.02 | ) | | | 0.02 | | | | 0.18 | (b) | | | 0.03 | | | | 0.12 | (c) |
Net realized and unrealized gain (loss) | | | 2.33 | | | | 6.39 | | | | 2.08 | | | | (0.41 | ) | | | 2.37 | |
| | | | | | | | | | | | | | | | | | | | |
Total from Investment Operations | | | 2.31 | | | | 6.41 | | | | 2.26 | | | | (0.38 | ) | | | 2.49 | |
| | | | | | | | | | | | | | | | | | | | |
LESS DISTRIBUTIONS FROM: | | | | | | | | | | | | | | | | | | | | |
Net investment income | | | — | | | | (0.01 | ) | | | (0.18 | ) | | | (0.01 | ) | | | (0.09 | ) |
Net realized capital gains | | | (1.57 | ) | | | (1.19 | ) | | | (0.40 | ) | | | (0.52 | ) | | | (0.02 | ) |
Paid-in capital | | | — | | | | — | | | | — | | | | — | | | | (0.07 | ) |
| | | | | | | | | | | | | | | | | | | | |
Total Distributions | | | (1.57 | ) | | | (1.20 | ) | | | (0.58 | ) | | | (0.53 | ) | | | (0.18 | ) |
| | | | | | | | | | | | | | | | | | | | |
Net asset value, end of the period | | $ | 21.52 | | | $ | 20.78 | | | $ | 15.57 | | | $ | 13.89 | | | $ | 14.80 | |
| | | | | | | | | | | | | | | | | | | | |
Total return | | | 11.23 | % | | | 41.52 | % | | | 16.28 | %(b) | | | (2.53 | )% | | | 19.96 | %(d) |
RATIOS TO AVERAGE NET ASSETS: | | | | | | | | | | | | | | | | | | | | |
Net assets, end of the period (000’s) | | $ | 656,071 | | | $ | 360,820 | | | $ | 163,589 | | | $ | 109,419 | | | $ | 40,715 | |
Net expenses | | | 1.00 | % | | | 1.02 | % | | | 1.06 | % | | | 1.15 | %(e) | | | 1.15 | %(f) |
Gross expenses | | | 1.00 | % | | | 1.02 | % | | | 1.06 | % | | | 1.15 | %(e) | | | 1.43 | % |
Net investment income (loss) | | | (0.10 | )% | | | 0.12 | % | | | 1.22 | %(b) | | | 0.23 | % | | | 0.92 | %(c) |
Portfolio turnover rate | | | 58 | % | | | 39 | % | | | 65 | % | | | 75 | % | | | 143 | % |
| (a) | Per share net investment income (loss) has been calculated using the average shares outstanding during the period. |
| (b) | Includes non-recurring dividends. Without these dividends, net investment income per share would have been $0.06, total return would have been 15.41% and the ratio of net investment income to average net assets would have been 0.42%. |
| (c) | Includes a non-recurring dividend. Without this dividend, net investment income per share would have been $0.04 and the ratio of net investment income to average net assets would have been 0.34%. |
| (d) | Had certain expenses not been waived/reimbursed during the period, total returns would have been lower. |
| (e) | Includes fee/expense recovery of 0.01%. |
| (f) | The investment adviser agreed to waive its fees and/or reimburse a portion of the Fund’s expenses during the period. Without this waiver/reimbursement, expenses would have been higher. |
See accompanying notes to financial statements.
71 |
Notes to Financial Statements
December 31, 2014
1. Organization. Natixis Funds Trust I and Natixis Funds Trust II (the “Trusts” and each a “Trust”) are each organized as a Massachusetts business trust. Each Trust is registered under the Investment Company Act of 1940, as amended (the “1940 Act”), as an open-end management investment company. Each Declaration of Trust permits the Board of Trustees to authorize the issuance of an unlimited number of shares of the Trust in multiple series. The financial statements for certain funds of the Trusts are presented in separate reports. The following funds (individually, a “Fund” and collectively, the “Funds”) are included in this report:
Natixis Funds Trust I:
CGM Advisor Targeted Equity Fund (the “Targeted Equity Fund”)
Natixis Oakmark International Fund
Vaughan Nelson Small Cap Value Fund (the “Small Cap Value Fund”)
Natixis Funds Trust II:
Natixis Oakmark Fund
Vaughan Nelson Value Opportunity Fund (the “Value Opportunity Fund”)
Each Fund is a diversified investment company.
Each Fund offers Class A and Class C shares. Targeted Equity Fund, Small Cap Value Fund, Natixis Oakmark Fund and Value Opportunity Fund also offer Class Y shares. In addition, Value Opportunity Fund offers Class N shares. Effective October 12, 2007, Class B shares of Targeted Equity Fund, Natixis Oakmark Fund and Small Cap Value Fund are no longer offered. Existing Class B shareholders may continue to reinvest dividends into Class B shares and exchange their Class B shares for Class B shares of other Natixis Funds subject to existing exchange privileges as described in the prospectus.
Effective July 31, 2009, the Small Cap Value Fund was closed to new investors. The Fund continues to offer Class A, Class C and Class Y shares to existing investors. The Fund, in its sole discretion, may permit an investor in another Vaughan Nelson-managed fund or product that follows the same investment strategy as the Fund to transfer assets from that fund or product into the Fund.
Class A shares are sold with a maximum front-end sales charge of 5.75%. Class B shares do not pay a front-end sales charge; however, they are charged higher Rule 12b-1 fees, and are subject to a contingent deferred sales charge (“CDSC”) if such shares are redeemed within six years of purchase. After eight years of ownership, Class B shares convert to Class A shares. Class C shares do not pay a front-end sales charge, do not convert to any other class of shares, pay higher Rule 12b-1 fees than Class A shares and may be subject to a CDSC of 1.00% if those shares are redeemed within one year of acquisition, except for reinvested distributions. Class N and Class Y shares do not pay a front-end sales charge, a CDSC or Rule 12b-1 fees. Class N shares are offered exclusively through intermediaries primarily intended for employer-sponsored retirement plans. Class Y shares are intended for institutional investors with a minimum initial investment of $100,000, though some categories of investors are exempted from the minimum investment amount as outlined in the Funds’ prospectus.
| 72
Notes to Financial Statements (continued)
December 31, 2014
Most expenses can be directly attributed to a Fund. Expenses which cannot be directly attributed to a Fund are generally apportioned based on the relative net assets of each of the funds in the Natixis Funds Trust I, Natixis Funds Trust II, Natixis Funds Trust IV, Gateway Trust (“Natixis Funds Trusts”), Loomis Sayles Funds I and Loomis Sayles Funds II (“Loomis Sayles Funds Trusts”). Expenses of a Fund are borne pro rata by the holders of each class of shares, except that each class bears expenses unique to that class (including the Rule 12b-1 service and distribution fees and, for Value Opportunity Fund, transfer agent fees). In addition, each class votes as a class only with respect to its own Rule 12b-1 Plan. Shares of each class would receive their pro rata share of the net assets of a Fund if the Fund were liquidated. The Trustees approve separate distributions from net investment income on each class of shares.
2. Significant Accounting Policies. The following is a summary of significant accounting policies consistently followed by each Fund in the preparation of its financial statements. The Funds’ financial statements follow the accounting and reporting guidelines provided for investment companies and are prepared in accordance with accounting principles generally accepted in the United States of America which require the use of management estimates that affect the reported amounts and disclosures in the financial statements. Actual results could differ from those estimates. Management has evaluated the events and transactions subsequent to year-end through the date the financial statements were issued and has determined that there were no material events that would require disclosure in the Funds’ financial statements.
a. Valuation. Fund securities and other investments are valued at market value based on market quotations obtained or determined by independent pricing services recommended by the adviser and subadviser and approved by the Board of Trustees. Fund securities and other investments for which market quotations are not readily available are valued at fair value as determined in good faith by the adviser or subadviser pursuant to procedures approved by the Board of Trustees, as described below. Market value is determined as follows:
Equity securities (including closed-end investment companies and exchange-traded funds) are valued at the last sale price quoted on the exchange or market where traded most extensively or, if there is no reported sale during the day, the closing bid quotation as reported by an independent pricing service. Securities traded on the NASDAQ Global Select Market, NASDAQ Global Market and NASDAQ Capital Market are valued at the NASDAQ Official Closing Price (“NOCP”), or if lacking an NOCP, at the most recent bid quotations on the applicable NASDAQ Market. In some foreign markets, an official close price and a last sale price may be available from the foreign exchange or market. In those cases, the official close price is used. Debt securities and unlisted equity securities are valued based on evaluated bids furnished to the Funds by an independent pricing service using market information, transactions for comparable securities and various relationships between securities, if available, or bid prices obtained from
73 |
Notes to Financial Statements (continued)
December 31, 2014
broker-dealers. Broker-dealer bid prices may be used to value debt and equity securities where an independent pricing service is unable to price a security or where an independent pricing service does not provide a reliable price for the security. Forward foreign currency contracts are valued utilizing interpolated rates determined based on information provided by an independent pricing service.
Fund securities and other investments for which market quotations are not readily available are valued at fair value as determined in good faith by the adviser or subadviser pursuant to procedures approved by the Board of Trustees. The Funds may also value securities and other investments at fair value in other circumstances such as when extraordinary events occur after the close of a foreign market but prior to the close of the New York Stock Exchange (“NYSE”). This may include situations relating to a single issuer (such as a declaration of bankruptcy or a delisting of the issuer’s security from the primary market on which it has traded) as well as events affecting the securities markets in general (such as market disruptions or closings and significant fluctuations in U.S. and/or foreign markets). When fair valuing its securities or other investments, the Funds may, among other things, use modeling tools or other processes that may take into account factors such as securities or other market activity and/or significant events that occur after the close of the foreign market and before the time the Fund’s net asset value (“NAV”) is calculated. Fair value pricing may require subjective determinations about the value of a security, and fair values used to determine a Fund’s NAV may differ from quoted or published prices, or from prices that are used by others, for the same securities. In addition, the use of fair value pricing may not always result in adjustments to the prices of securities held by a Fund.
As of December 31, 2014, approximately 95% of the market value of Natixis Oakmark International Fund’s investments was fair valued pursuant to procedures approved by the Board of Trustees as events occurring after the close of the foreign market were believed to materially affect the value of those securities.
b. Investment Transactions and Related Investment Income. Investment transactions are accounted for on a trade date plus one day basis for daily NAV calculation. However, for financial reporting purposes, investment transactions are reported on trade date. Dividend income is recorded on ex-dividend date, or in the case of certain foreign securities, as soon as a Fund is notified, and interest income is recorded on an accrual basis. Interest income is increased by the accretion of discount and decreased by the amortization of premium. Distributions received from investments in securities that represent a return of capital or capital gain are recorded as a reduction of cost of investments or as a realized gain, respectively. The calendar year-end amounts of ordinary income, capital gains, and return of capital included in distributions received from the Funds’ investments in real estate investment trusts (“REITs”) are reported to the Funds after the end of the fiscal year; accordingly, the Funds estimate these amounts for accounting purposes until the characterization of REIT distributions is reported to the Funds after the end of the fiscal year. Estimates are based on the most
| 74
Notes to Financial Statements (continued)
December 31, 2014
recent REIT distribution information available. In determining net gain or loss on securities sold, the cost of securities has been determined on an identified cost basis. Investment income, non-class specific expenses and realized and unrealized gains and losses are allocated on a pro rata basis to each class based on the relative net assets of each class to the total net assets of the Fund.
c. Foreign Currency Translation. The books and records of the Funds are maintained in U.S. dollars. The values of securities, currencies and other assets and liabilities denominated in currencies other than U.S. dollars are translated into U.S. dollars based upon foreign exchange rates prevailing at the end of the period. Purchases and sales of investment securities, income and expenses are translated on the respective dates of such transactions.
Since the values of investment securities are presented at the foreign exchange rates prevailing at the end of the period, it is not practical to isolate that portion of the results of operations arising from changes in exchange rates from fluctuations which arise due to changes in market prices of investment securities. Such changes are included with the net realized and unrealized gain or loss on investments.
Net realized foreign exchange gains or losses arise from sales of foreign currency, currency gains or losses realized between the trade and settlement dates on securities transactions and the difference between the amounts of dividends, interest and foreign withholding taxes recorded on the Funds’ books and the U.S. dollar equivalent of the amounts actually received or paid. Net unrealized foreign exchange gains and losses arise from changes in the value of assets and liabilities, other than investment securities, at the end of the fiscal period, resulting from changes in exchange rates.
Certain Funds may use foreign currency exchange contracts to facilitate transactions in foreign-denominated investments. Losses may arise from changes in the value of the foreign currency or if the counterparties do not perform under the contracts’ terms.
d. Forward Foreign Currency Contracts. Certain Funds may enter into forward foreign currency contracts, including forward foreign cross currency contracts, to acquire exposure to foreign currencies or to hedge the Fund’s investments against currency fluctuation. A contract can also be used to offset a previous contract. These contracts involve market risk in excess of the unrealized gain or loss reflected in the Funds’ Statements of Assets and Liabilities. The U.S. dollar value of the currencies a Fund has committed to buy or sell represents the aggregate exposure to each currency a Fund has acquired or hedged through currency contracts outstanding at period end. Gains or losses are recorded for financial statement purposes as unrealized until settlement date. Contracts are traded over-the-counter directly with a counterparty. Risks may arise upon entering into these contracts from the potential inability of counterparties to meet the terms of their contracts and from unanticipated movements in the value of a foreign currency relative to the U.S. dollar. Certain contracts may require the movement of cash and/or securities as collateral for the Fund’s or counterparty’s net obligations under the contracts.
75 |
Notes to Financial Statements (continued)
December 31, 2014
e. Federal and Foreign Income Taxes. Each Trust treats each Fund as a separate entity for federal income tax purposes. Each Fund intends to meet the requirements of the Internal Revenue Code of 1986, as amended, applicable to regulated investment companies, and to distribute to its shareholders substantially all of its net investment income and any net realized capital gains at least annually. Management has performed an analysis of each Fund’s tax positions for the open tax years as of December 31, 2014 and has concluded that no provisions for income tax are required. The Funds’ federal tax returns for the prior three fiscal years remain subject to examination by the Internal Revenue Service. Management is not aware of any events that are reasonably possible to occur in the next twelve months that would result in the amounts of any unrecognized tax benefits significantly increasing or decreasing for the Funds. However, management’s conclusions regarding tax positions taken may be subject to review and adjustment at a later date based on factors including, but not limited to, new tax laws and accounting regulations and interpretations thereof.
A Fund may be subject to foreign withholding taxes on investment income and taxes on capital gains on investments that are accrued and paid based upon the Fund’s understanding of the tax rules and regulations that exist in the countries in which the Fund invests. Foreign withholding taxes on dividend and interest income are reflected on the Statements of Operations as a reduction of investment income, net of amounts eligible to be reclaimed. Dividends and interest receivable on the Statements of Assets and Liabilities are net of foreign withholding taxes. Foreign withholding taxes eligible to be reclaimed are reflected on the Statements of Assets and Liabilities as tax reclaims receivable. Capital gains taxes paid are included in net realized gain (loss) on investments in the Statements of Operations. Accrued but unpaid capital gains taxes are reflected as foreign taxes payable on the Statements of Assets and Liabilities, if applicable, and reduce unrealized gains on investments. In the event that realized gains on investments are subsequently offset by realized losses, taxes paid on realized gains may be returned to a Fund. Such amounts, if applicable, are reflected as foreign tax rebates receivable on the Statements of Assets and Liabilities and are recorded as a realized gain when received.
f. Dividends and Distributions to Shareholders. Dividends and distributions are recorded on ex-dividend date. The timing and characterization of certain income and capital gain distributions are determined annually in accordance with federal tax regulations, which may differ from accounting principles generally accepted in the United States of America. Permanent differences are primarily due to differing treatments for book and tax purposes of items such as net operating losses, return of capital and capital gain distributions received, foreign currency gains and losses and deferred Trustees’ fees. Permanent book and tax basis differences relating to shareholder distributions, net investment income and net realized gains will result in reclassifications to capital accounts. Temporary differences between book and tax distributable earnings are primarily due to deferred Trustees’ fees, wash sales, forward
| 76
Notes to Financial Statements (continued)
December 31, 2014
foreign currency contracts mark-to-market and return of capital distributions received. Distributions from net investment income and short-term capital gains are considered to be distributed from ordinary income for tax purposes.
The tax characterization of distributions is determined on an annual basis. The tax character of distributions paid to shareholders during the years ended December 31, 2014 and 2013 was as follows:
| | | | | | | | | | | | | | | | | | | | | | | | |
| | | 2014 Distributions Paid From: | | | 2013 Distributions Paid From: | |
Fund | | Ordinary
Income | | | Long-Term
Capital Gains | | | Total | | | Ordinary
Income | | | Long-Term
Capital Gains | | | Total | |
Targeted Equity Fund | | $ | 44,618,075 | | | $ | 29,445,740 | | | $ | 74,063,815 | | | $ | 37,213,633 | | | $ | 39,265,245 | | | $ | 76,478,878 | |
Natixis Oakmark Fund | | | 5,775,346 | | | | 31,849,647 | | | | 37,624,993 | | | | 503,341 | | | | 5,425,590 | | | | 5,928,931 | |
Natixis Oakmark International Fund | | | 19,465,727 | | | | 13,211,564 | | | | 32,677,291 | | | | 1,974,167 | | | | 6,109,445 | | | | 8,083,612 | |
Small Cap Value Fund | | | 3,773,025 | | | | 49,311,407 | | | | 53,084,432 | | | | 14,068,610 | | | | 41,806,396 | | | | 55,875,006 | |
Value Opportunity Fund | | | 7,850,454 | | | | 45,086,282 | | | | 52,936,736 | | | | 4,109,936 | | | | 19,530,938 | | | | 23,640,874 | |
Differences between these amounts and those reported in the Statements of Changes in Net Assets are primarily attributable to different book and tax treatment for short-term capital gains.
As of December 31, 2014, the components of distributable earnings on a tax basis were as follows:
| | | | | | | | | | | | | | | | | | | | |
| | | Targeted
Equity
Fund | | | Natixis
Oakmark
Fund | | | Natixis
Oakmark
International
Fund | | | Small Cap
Value Fund | | | Value
Opportunity
Fund | |
Undistributed ordinary income | | $ | 6,929,430 | | | $ | 240,770 | | | $ | 2,885,358 | | | $ | 1,126,946 | | | $ | 669,007 | |
Undistributed long-term capital gains | | | — | | | | 641,691 | | | | 3,607,649 | | | | 3,731,525 | | | | 4,583,836 | |
| | | | | | | | | | | | | | | | | | | | |
Total undistributed earnings | | | 6,929,430 | | | | 882,461 | | | | 6,493,007 | | | | 4,858,471 | | | | 5,252,843 | |
| | | | | | | | | | | | | | | | | | | | |
Unrealized appreciation (depreciation) | | | 70,269,236 | | | | 40,018,459 | | | | (63,134,621 | ) | | | 68,441,616 | | | | 106,205,439 | |
| | | | | | | | | | | | | | | | | | | | |
Total accumulated earnings (losses) | | $ | 77,198,666 | | | $ | 40,900,920 | | | $ | (56,641,614 | ) | | $ | 73,300,087 | | | $ | 111,458,282 | |
| | | | | | | | | | | | | | | | | | | | |
77 |
Notes to Financial Statements (continued)
December 31, 2014
g. Repurchase Agreements. Each Fund may enter into repurchase agreements, under the terms of a Master Repurchase Agreement, under which each Fund acquires securities as collateral and agrees to resell the securities at an agreed upon time and at an agreed upon price. It is each Fund’s policy that the market value of the collateral for repurchase agreements be at least equal to 102% of the repurchase price, including interest. Certain repurchase agreements are tri-party arrangements whereby the collateral is held in a segregated account for the benefit of the Fund and on behalf of the counterparty. Repurchase agreements could involve certain risks in the event of default or insolvency of the counterparty, including possible delays or restrictions upon a Fund’s ability to dispose of the underlying securities. As of December 31, 2014, each Fund, as applicable, had investments in repurchase agreements for which the value of the related collateral exceeded the value of the repurchase agreement. The gross value of repurchase agreements is included in the Statements of Assets and Liabilities for financial reporting purposes.
h. Securities Lending. Certain Funds have entered into an agreement with State Street Bank and Trust Company (“State Street Bank”), as agent of the Funds, to lend securities to certain designated borrowers. The loans are collateralized with cash or securities in an amount equal to at least 105% or 102% of the market value (including accrued interest) of the loaned international or domestic securities, respectively, when the loan is initiated. Thereafter, the value of the collateral must remain at least 102% of the market value (including accrued interest) of loaned securities for U.S. equities and U.S. corporate debt; at least 105% of the market value (including accrued interest) of loaned securities for non-U.S. equities; and at least 100% of the market value (including accrued interest) of loaned securities for U.S. Government securities, sovereign debt issued by non-U.S. Governments and non-U.S. corporate debt. In the event that the market value of the collateral falls below the required percentages described above, the borrower will deliver additional collateral on the next business day. As with other extensions of credit, the Funds may bear the risk of loss with respect to the investment of the collateral. The Funds invest cash collateral in short-term investments, a portion of the income from which is remitted to the borrowers and the remainder allocated between the Funds and State Street Bank as lending agent.
For the year ended December 31, 2014, none of the Funds had loaned securities under this agreement.
i. Indemnifications. Under the Trusts’ organizational documents, their officers and Trustees are indemnified against certain liabilities arising out of the performance of their duties to the Funds. Additionally, in the normal course of business, the Funds enter into contracts with service providers that contain general indemnification clauses. The Funds’ maximum exposure under these arrangements is unknown as this would involve future claims that may be made against the Funds that have not yet occurred. However, based on experience, the Funds expect the risk of loss to be remote.
| 78
Notes to Financial Statements (continued)
December 31, 2014
3. Fair Value Measurements. In accordance with accounting standards related to fair value measurements and disclosures, the Funds have categorized the inputs utilized in determining the value of each Fund’s assets or liabilities. These inputs are summarized in the three broad levels listed below:
| | • | | Level 1 – quoted prices in active markets for identical assets or liabilities; |
| | • | | Level 2 – prices determined using other significant inputs that are observable either directly, or indirectly through corroboration with observable market data (which could include quoted prices for similar assets or liabilities, interest rates, credit risk, etc.); and |
| | • | | Level 3 – prices determined using significant unobservable inputs when quoted prices or observable inputs are unavailable such as when there is little or no market activity for an asset or liability (unobservable inputs reflect each Fund’s own assumptions in determining the fair value of assets or liabilities and would be based on the best information available). |
The inputs or methodology used for valuing securities are not necessarily an indication of the risk associated with investing in those securities.
The following is a summary of the inputs used to value the Funds’ investments as of December 31, 2014, at value:
Targeted Equity Fund
Asset Valuation Inputs
| | | | | | | | | | | | | | | | |
Description | | Level 1 | | | Level 2 | | | Level 3 | | | Total | |
Common Stocks(a) | | $ | 512,793,780 | | | $ | — | | | $ | — | | | $ | 512,793,780 | |
Short-Term Investments | | | — | | | | 15,050,000 | | | | — | | | | 15,050,000 | |
| | | | | | | | | | | | | | | | |
Total | | $ | 512,793,780 | | | $ | 15,050,000 | | | $ | — | | | $ | 527,843,780 | |
| | | | | | | | | | | | | | | | |
| (a) | Details of the major categories of the Fund’s investments are reflected within the Portfolio of Investments. |
For the year ended December 31, 2014, there were no transfers among Levels 1, 2 and 3.
Natixis Oakmark Fund
Asset Valuation Inputs
| | | | | | | | | | | | | | | | |
Description | | Level 1 | | | Level 2 | | | Level 3 | | | Total | |
Common Stocks(a) | | $ | 266,290,404 | | | $ | — | | | $ | — | | | $ | 266,290,404 | |
Short-Term Investments | | | — | | | | 16,533,486 | | | | — | | | | 16,533,486 | |
| | | | | | | | | | | | | | | | |
Total | | $ | 266,290,404 | | | $ | 16,533,486 | | | $ | — | | | $ | 282,823,890 | |
| | | | | | | | | | | | | | | | |
| (a) | Details of the major categories of the Fund’s investments are reflected within the Portfolio of Investments. |
79 |
Notes to Financial Statements (continued)
December 31, 2014
For the year ended December 31, 2014, there were no transfers among Levels 1, 2 and 3.
Natixis Oakmark International Fund
Asset Valuation Inputs
| | | | | | | | | | | | | | | | |
Description | | Level 1 | | | Level 2 | | | Level 3 | | | Total | |
Common Stocks | | | | | | | | | | | | | | | | |
Australia | | $ | — | | | $ | 33,431,284 | | | $ | — | | | $ | 33,431,284 | |
France | | | — | | | | 135,741,224 | | | | — | | | | 135,741,224 | |
Germany | | | — | | | | 105,993,116 | | | | — | | | | 105,993,116 | |
Ireland | | | — | | | | 27,462,185 | | | | — | | | | 27,462,185 | |
Italy | | | — | | | | 52,802,350 | | | | — | | | | 52,802,350 | |
Japan | | | — | | | | 101,918,832 | | | | — | | | | 101,918,832 | |
Korea | | | — | | | | 25,415,438 | | | | — | | | | 25,415,438 | |
Netherlands | | | — | | | | 62,311,979 | | | | — | | | | 62,311,979 | |
Sweden | | | — | | | | 39,774,299 | | | | — | | | | 39,774,299 | |
Switzerland | | | — | | | | 172,752,164 | | | | — | | | | 172,752,164 | |
United Kingdom | | | 18,905,339 | | | | 126,152,088 | | | | — | | | | 145,057,427 | |
All Other Common Stocks(a) | | | 16,955,527 | | | | — | | | | — | | | | 16,955,527 | |
| | | | | | | | | | | | | | | | |
Total Common Stocks | | | 35,860,866 | | | | 883,754,959 | | | | — | | | | 919,615,825 | |
| | | | | | | | | | | | | | | | |
Short-Term Investments | | | — | | | | 14,806,514 | | | | — | | | | 14,806,514 | |
| | | | | | | | | | | | | | | | |
Total Investments | | | 35,860,866 | | | | 898,561,473 | | | | — | | | | 934,422,339 | |
| | | | | | | | | | | | | | | | |
Forward Foreign Currency Contracts (unrealized appreciation) | | | — | | | | 4,581,514 | | | | — | | | | 4,581,514 | |
| | | | | | | | | | | | | | | | |
Total | | $ | 35,860,866 | | | $ | 903,142,987 | | | $ | — | | | $ | 939,003,853 | |
| | | | | | | | | | | | | | | | |
Liability Valuation Inputs | |
Description | | Level 1 | | | Level 2 | | | Level 3 | | | Total | |
Forward Foreign Currency Contracts (unrealized depreciation) | | $ | — | | | $ | (461,174 | ) | | $ | — | | | $ | (461,174 | ) |
| | | | | | | | | | | | | | | | |
| (a) | Details of the major categories of the Fund’s investments are reflected within the Portfolio of Investments. |
A common stock valued at $14,810,131 was transferred from Level 1 to Level 2 during the period ended December 31, 2014. At December 31, 2013, this security was valued at the market price in the foreign market in accordance with the Fund’s valuation policies. At December 31, 2014, this security was fair valued pursuant to procedures approved by the Board of Trustees as events occurring after the close of the foreign market were believed to materially affect the value of the security.
All transfers are recognized as of the beginning of the reporting period.
| 80
Notes to Financial Statements (continued)
December 31, 2014
Small Cap Value Fund
Asset Valuation Inputs
| | | | | | | | | | | | | | | | |
Description | | Level 1 | | | Level 2 | | | Level 3 | | | Total | |
Common Stocks(a) | | $ | 317,249,398 | | | $ | — | | | $ | — | | | $ | 317,249,398 | |
Short-Term Investments | | | — | | | | 5,717,818 | | | | — | | | | 5,717,818 | |
| | | | | | | | | | | | | | | | |
Total | | $ | 317,249,398 | | | $ | 5,717,818 | | | $ | — | | | $ | 322,967,216 | |
| | | | | | | | | | | | | | | | |
| (a) | Details of the major categories of the Fund’s investments are reflected within the Portfolio of Investments. |
For the year ended December 31, 2014, there were no transfers among Levels 1, 2 and 3.
Value Opportunity Fund
Asset Valuation Inputs
| | | | | | | | | | | | | | | | |
Description | | Level 1 | | | Level 2 | | | Level 3 | | | Total | |
Common Stocks(a) | | $ | 758,639,955 | | | $ | — | | | $ | — | | | $ | 758,639,955 | |
Closed-End Investment Companies | | | 13,888,060 | | | | — | | | | — | | | | 13,888,060 | |
Short-Term Investments | | | — | | | | 5,455,986 | | | | — | | | | 5,455,986 | |
| | | | | | | | | | | | | | | | |
Total | | $ | 772,528,015 | | | $ | 5,455,986 | | | $ | — | | | $ | 777,984,001 | |
| | | | | | | | | | | | | | | | |
| (a) | Details of the major categories of the Fund’s investments are reflected within the Portfolio of Investments. |
For the year ended December 31, 2014, there were no transfers among Levels 1, 2 and 3.
4. Derivatives. Derivative instruments are defined as financial instruments whose value and performance are based on the value and performance of another security or financial instrument. Derivative instruments that Natixis Oakmark International Fund used during the period include forward foreign currency contracts.
The Fund is subject to the risk that changes in foreign currency exchange rates will have an unfavorable effect on the value of Fund assets denominated in foreign currencies. The Fund may enter into forward foreign currency contracts for hedging purposes to protect the value of the Fund’s holdings of foreign securities. During the year ended December 31, 2014, the Fund engaged in forward foreign currency transactions for hedging purposes.
The following is a summary of derivative instruments for Natixis Oakmark International Fund as of December 31, 2014, as reflected within the Statements of Assets and Liabilities:
| | | | |
Assets | | Unrealized appreciation on forward foreign currency contracts | |
Over-the-counter asset derivatives | | | | |
Foreign exchange contracts | | $ | 4,581,514 | |
81 |
Notes to Financial Statements (continued)
December 31, 2014
| | | | |
Liabilities | | Unrealized depreciation on forward foreign currency contracts | |
Over-the-counter liability derivatives | | | | |
Foreign exchange contracts | | $ | (461,174 | ) |
Transactions in derivative instruments for Natixis Oakmark International Fund during the year ended December 31, 2014, as reflected within the Statements of Operations were as follows:
| | | | |
Net Realized Gain on: | | Foreign currency transactions1 | |
Foreign exchange contracts | �� | $ | 4,389,133 | |
| | | | |
Net Change in Unrealized Appreciation (Depreciation) on: | | Foreign currency translations1 | |
Foreign exchange contracts | | $ | 4,846,688 | |
| 1 | Represents realized gain and change in unrealized appreciation (depreciation), respectively, for forward foreign currency contracts during the period. Does not include other foreign currency gains or losses included in the Statements of Operations. |
As the Fund values its derivatives at fair value and recognizes changes in fair value through the Statement of Operations, it does not qualify for hedge accounting under authoritative guidance for derivative instruments. The Fund’s investments in derivatives may represent an economic hedge; however, they are considered to be non-hedge transactions for the purpose of these disclosures.
The volume of forward foreign currency contract activity, as a percentage of net assets, for Natixis Oakmark International Fund, based on gross month-end notional amounts outstanding during the period, including long and short positions at absolute value, was as follows for the year ended December 31, 2014:
| | | | |
Natixis Oakmark International Fund | | Forwards | |
Average Notional Amount Outstanding | | | 7.88 | % |
Highest Notional Amount Outstanding | | | 8.90 | % |
Lowest Notional Amount Outstanding | | | 5.65 | % |
Notional Amount Outstanding as of December 31, 2014 | | | 8.90 | % |
Notional amounts outstanding at the end of the prior period are included in the average notional amount outstanding.
Unrealized gain and/or loss on open forwards is recorded in the Statements of Assets and Liabilities. The aggregate notional values of forward contracts are not recorded in the Statements of Assets and Liabilities, and therefore are not included in the Fund’s net assets.
The Fund enters into over-the-counter derivatives, including forward foreign currency contracts, pursuant to an International Swaps and Derivatives Association, Inc. (“ISDA”) agreement between the Fund and its counterparty. ISDA agreements typically
| 82
Notes to Financial Statements (continued)
December 31, 2014
contain master netting provisions in the event of a default or other termination event. Master netting provisions allow the Fund and the counterparty, in the event of a default or other termination event, to offset amounts owed by each related to derivative contracts to one net amount payable by either the Fund or the counterparty. For financial reporting purposes, the Fund does not offset derivative assets and liabilities on the Statements of Assets and Liabilities.
As of December 31, 2014, gross amounts of derivative assets and liabilities not offset in the Statement of Assets and Liabilities and the related net amounts after taking into account master netting arrangements, by counterparty, are as follows:
Natixis Oakmark International Fund
| | | | | | | | | | | | |
Counterparty | | Gross Amounts of Assets | | | Offset Amount | | | Net Amount | |
State Street Bank and Trust Company | | $ | 4,581,514 | | | $ | (461,174 | ) | | $ | 4,120,340 | |
| | | | | | | | | | | | |
| | | |
Counterparty | | Gross Amounts of Liabilities | | | Offset Amount | | | Net Amount | |
State Street Bank and Trust Company | | $ | (461,174 | ) | | $ | 461,174 | | | $ | — | |
| | | | | | | | | | | | |
Counterparty risk is managed based on policies and procedures established by each Fund’s adviser. Such policies and procedures may include, but are not limited to, minimum counterparty credit rating requirements and monitoring of counterparty credit default swap spreads. Based on balances reflected on the Fund’s Statement of Assets and Liabilities, the following table shows (i) the maximum amount of loss due to credit risk that, based on the gross fair value of the financial instrument, the Fund would incur if parties to the relevant financial instruments failed completely to perform according to the terms of the contracts and ii) the amount of loss that the Fund would incur after taking into account master netting provisions pursuant to ISDA agreements, as of December 31, 2014:
| | | | | | | | |
Fund | | Maximum Amount of
Loss - Gross | | | Maximum Amount of
Loss - Net | |
Natixis Oakmark International Fund | | $ | 4,581,514 | | | $ | 4,120,340 | |
5. Purchases and Sales of Securities. For the year ended December 31, 2014, purchases and sales of securities (excluding short-term investments and U.S. Government/Agency securities and including paydowns) were as follows:
| | | | | | | | |
Fund | | Purchases | | | Sales | |
Targeted Equity Fund | | $ | 1,252,067,989 | | | $ | 1,360,988,619 | |
Natixis Oakmark Fund | | | 215,496,380 | | | | 131,038,163 | |
Natixis Oakmark International Fund | | | 767,573,998 | | | | 267,764,205 | |
Small Cap Value Fund | | | 191,134,687 | | | | 248,324,223 | |
Value Opportunity Fund | | | 634,760,088 | | | | 374,522,551 | |
83 |
Notes to Financial Statements (continued)
December 31, 2014
6. Management Fees and Other Transactions with Affiliates.
a. Management Fees. NGAM Advisors, L.P. (“NGAM Advisors”), serves as investment adviser to each Fund except the Targeted Equity Fund. Capital Growth Management Limited Partnership (“CGM”) is the investment adviser to the Targeted Equity Fund. Under the terms of the management agreements, each Fund pays a management fee at the following annual rates, calculated daily and payable monthly, based on each Fund’s average daily net assets:
| | | | | | | | | | | | | | | | | | | | |
| | | Percentage of Average Daily Net Assets | |
Fund | | First $200 million | | | Next $300 million | | | Next $500 million | | | Next $1 billion | | | Over $2 billion | |
Targeted Equity Fund | | | 0.75 | % | | | 0.70 | % | | | 0.65 | % | | | 0.65 | % | | | 0.60 | % |
Natixis Oakmark Fund | | | 0.70 | % | | | 0.65 | % | | | 0.60 | % | | | 0.60 | % | | | 0.60 | % |
Natixis Oakmark International Fund | | | 0.85 | % | | | 0.85 | % | | | 0.85 | % | | | 0.85 | % | | | 0.85 | % |
Small Cap Value Fund | | | 0.90 | % | | | 0.90 | % | | | 0.90 | % | | | 0.90 | % | | | 0.90 | % |
Value Opportunity Fund | | | 0.80 | % | | | 0.80 | % | | | 0.80 | % | | | 0.80 | % | | | 0.80 | % |
NGAM Advisors has entered into subadvisory agreements for each Fund as listed below.
| | |
Natixis Oakmark Fund | | Harris Associates L.P. (“Harris”) |
Natixis Oakmark International Fund | | Harris |
Small Cap Value Fund | | Vaughan Nelson Investment Management, L.P. (“Vaughan Nelson”) |
Value Opportunity Fund | | Vaughan Nelson |
Under the terms of the subadvisory agreements, each Fund has agreed to pay its respective subadviser a subadvisory fee at the following annual rates, calculated daily and payable monthly, based on each Fund’s average daily net assets:
| | | | | | | | | | |
| | | | | Percentage of Average
Daily Net Assets | |
Fund | | Subadviser | | First $200 Million | | | Over $200 Million | |
Natixis Oakmark Fund | | Harris | | | 0.52 | % | | | 0.50 | % |
Natixis Oakmark International Fund | | Harris | | | 0.60 | % | | | 0.60 | % |
Small Cap Value Fund | | Vaughan Nelson | | | 0.55 | % | | | 0.55 | % |
Value Opportunity Fund | | Vaughan Nelson | | | 0.50 | % | | | 0.50 | % |
| 84
Notes to Financial Statements (continued)
December 31, 2014
Prior to February 28, 2014, Natixis Oakmark Fund paid a subadvisory fee at the following annual rates, calculated daily and payable monthly, based on the Fund’s average daily net assets:
| | | | | | | | | | |
| | | | | Percentage of Average
Daily Net Assets | |
Fund | | Subadviser | | First $250 Million | | | Over $250 Million | |
Natixis Oakmark Fund | | Harris | | | 0.45 | % | | | 0.40 | % |
Payments to NGAM Advisors are reduced by the amount of payments to the subadvisers, as calculated based on the table above.
NGAM Advisors has given binding undertakings to certain Funds to waive management fees and/or reimburse certain expenses to limit the Funds’ operating expenses, exclusive of acquired fund fees and expenses, brokerage expenses, interest expense, taxes and extraordinary expenses. These undertakings are in effect until April 30, 2015 and are reevaluated on an annual basis. Management fees payable, as reflected on the Statements of Assets and Liabilities, is net of waivers and/or expense reimbursements, if any, pursuant to these undertakings.
For the year ended December 31, 2014, the expense limits as a percentage of average daily net assets under the expense limitation agreements were as follows:
| | | | | | | | | | | | | | | | | | | | |
| | | Expense limit as a Percentage of Average
Daily Net Assets | |
Fund | | Class A | | | Class B | | | Class C | | | Class N | | | Class Y | |
Natixis Oakmark Fund | | | 1.30 | % | | | 2.05 | % | | | 2.05 | % | | | — | | | | 1.05 | % |
Natixis Oakmark International Fund | | | 1.45 | % | | | — | | | | 2.20 | % | | | — | | | | — | |
Small Cap Value Fund | | | 1.45 | % | | | 2.20 | % | | | 2.20 | % | | | — | | | | 1.20 | % |
Value Opportunity Fund | | | 1.40 | % | | | — | | | | 2.15 | % | | | 1.10 | % | | | 1.15 | % |
NGAM Advisors shall be permitted to recover expenses it has borne under the expense limitation agreements (whether through waiver of its management fees or otherwise) on a class by class basis in later periods to the extent the annual operating expenses of a class fall below a class’ expense limits, provided, however, that a class is not obligated to pay such waived/reimbursed fees or expenses more than one year after the end of the fiscal year in which the fees or expenses were waived/reimbursed.
85 |
Notes to Financial Statements (continued)
December 31, 2014
For the year ended December 31, 2014, the management fees and waivers of management fees for each Fund were as follows:
| | | | | | | | | | | | | | | | | | | | |
Fund | | Gross
Management
Fees | | | Waivers
of
Management
Fees | | | Net
Management
Fees | | | Percentage of
Average Daily
Net Assets | |
| | | | | Gross | | | Net | |
Targeted Equity Fund | | $ | 3,950,271 | | | $ | — | | | $ | 3,950,271 | | | | 0.71 | % | | | 0.71 | % |
Natixis Oakmark Fund | | | 1,511,982 | | | | — | | | | 1,511,982 | | | | 0.69 | % | | | 0.69 | % |
Natixis Oakmark International Fund | | | 7,726,791 | | | | — | | | | 7,726,791 | | | | 0.85 | % | | | 0.85 | % |
Small Cap Value Fund | | | 3,045,023 | | | | — | | | | 3,045,023 | | | | 0.90 | % | | | 0.90 | % |
Value Opportunity Fund | | | 5,277,503 | | | | — | | | | 5,277,503 | | | | 0.80 | % | | | 0.80 | % |
For the year ended December 31, 2014, expense reimbursements related to the prior fiscal year were recovered as follows:
| | | | |
Fund | | Recovered Expenses | |
Value Opportunity Fund | | $ | 20 | |
Certain officers and directors of NGAM Advisors and its affiliates are also officers or Trustees of the Funds. NGAM Advisors, CGM, Harris and Vaughan Nelson are subsidiaries of Natixis Global Asset Management, L.P. (“Natixis US”), which is part of Natixis Global Asset Management, an international asset management group based in Paris, France.
b. Service and Distribution Fees. NGAM Distribution, L.P. (“NGAM Distribution”), which is a wholly-owned subsidiary of Natixis US, has entered into a distribution agreement with the Trusts. Pursuant to this agreement, NGAM Distribution serves as principal underwriter of the Funds of the Trusts.
Pursuant to Rule 12b-1 under the 1940 Act, the Trusts have adopted a Service Plan relating to each Fund’s Class A shares (the “Class A Plans”) and a Distribution and Service Plan relating to each Fund’s Class B (if applicable) and Class C shares (the “Class B and Class C Plans”).
Under the Class A Plans, each Fund pays NGAM Distribution a monthly service fee at an annual rate not to exceed 0.25% of the average daily net assets attributable to the Funds’ Class A shares, as reimbursement for expenses incurred by NGAM Distribution in providing personal services to investors in Class A shares and/or the maintenance of shareholder accounts.
Under the Class B (if applicable) and Class C Plans, each Fund pays NGAM Distribution a monthly service fee at an annual rate not to exceed 0.25% of the average daily net assets attributable to the Funds’ Class B (if applicable) and Class C shares, as compensation for services provided by NGAM Distribution in providing personal
| 86
Notes to Financial Statements (continued)
December 31, 2014
services to investors in Class B (if applicable) and Class C shares and/or the maintenance of shareholder accounts.
Also under the Class B (if applicable) and Class C Plans, each Fund pays NGAM Distribution a monthly distribution fee at an annual rate of 0.75% of the average daily net assets attributable to the Funds’ Class B (if applicable) and Class C shares, as compensation for services provided by NGAM Distribution in connection with the marketing or sale of Class B (if applicable) and Class C shares.
For the year ended December 31, 2014, the service and distribution fees for each Fund were as follows:
| | | | | | | | | | | | | | | | | | | | |
| | | Service Fees | | | Distribution Fees | |
Fund | | Class A | | | Class B | | | Class C | | | Class B | | | Class C | |
Targeted Equity Fund | | $ | 1,187,445 | | | $ | 3,679 | | | $ | 84,115 | | | $ | 11,036 | | | $ | 252,346 | |
Natixis Oakmark Fund | | | 419,196 | | | | 2,546 | | | | 72,248 | | | | 7,639 | | | | 216,745 | |
Natixis Oakmark International Fund | | | 1,466,846 | | | | — | | | | 805,740 | | | | — | | | | 2,417,219 | |
Small Cap Value Fund | | | 351,225 | | | | 3,541 | | | | 74,143 | | | | 10,623 | | | | 222,430 | |
Value Opportunity Fund | | | 212,513 | | | | — | | | | 73,086 | | | | — | | | | 219,260 | |
c. Administrative Fees. NGAM Advisors provides certain administrative services for the Fund and contracts with State Street Bank and Trust Company (“State Street Bank”) to serve as sub-administrator. Pursuant to an agreement among Natixis Funds Trusts, Loomis Sayles Funds Trusts and NGAM Advisors, the Fund pays NGAM Advisors monthly its pro rata portion of fees equal to an annual rate of 0.0575% of the first $15 billion of the average daily net assets of the Natixis Funds Trusts and Loomis Sayles Funds Trusts, 0.0500% of the next $15 billion, 0.0400% of the next $30 billion, 0.0350% of the next $30 billion and 0.0325% of such assets in excess of $90 billion, subject to an annual aggregate minimum fee for the Natixis Funds Trusts and Loomis Sayles Funds Trusts of $10 million, which is reevaluated on an annual basis.
For the year ended December 31, 2014, the administrative fees for each Fund were as follows:
| | | | |
Fund | | Administrative
Fees | |
Targeted Equity Fund | | $ | 239,450 | |
Natixis Oakmark Fund | | | 94,112 | |
Natixis Oakmark International Fund | | | 392,411 | |
Small Cap Value Fund | | | 146,250 | |
Value Opportunity Fund | | | 284,742 | |
Prior to July 1, 2014, each Fund paid NGAM Advisors monthly its pro rata portion of fees equal to an annual rate of 0.0575% of the first $15 billion of the average daily net assets of the Natixis Funds Trusts, Loomis Sayles Funds Trusts and Hansberger International Series, 0.0500% of the next $15 billion, 0.0400% of the next $30 billion and 0.0350% of
87 |
Notes to Financial Statements (continued)
December 31, 2014
such assets in excess of $60 billion, subject to an annual aggregate minimum fee for the Natixis Funds Trusts, Loomis Sayles Funds Trusts and Hansberger International Series of $10 million.
d. Sub-Transfer Agent Fees. NGAM Distribution has entered into agreements, which include servicing agreements, with financial intermediaries that provide recordkeeping, processing, shareholder communications and other services to customers of the intermediaries that hold positions in the Funds and has agreed to compensate the intermediaries for providing those services. Intermediaries transact with the Funds primarily through the use of omnibus accounts on behalf of their customers who hold positions in the Funds. These services would have been provided by the Funds’ transfer agent and other service providers if the shareholders’ accounts were maintained directly at the Funds’ transfer agent. Accordingly, the Funds have agreed to reimburse NGAM Distribution for all or a portion of the servicing fees paid to these intermediaries. The reimbursement amounts (sub-transfer agent fees) paid to NGAM Distribution are subject to a current per-account equivalent fee limit approved by the Funds’ Board, which is based on fees for similar services paid to the Funds’ transfer agent and other service providers. Class N shares do not bear such expenses.
For the year ended December 31, 2014, the sub-transfer agent fees (which are reflected in transfer agent fees and expenses in the Statements of Operations) for each Fund were the following:
| | | | |
Fund | | Sub-Transfer
Agent Fees | |
Targeted Equity Fund | | $ | 173,548 | |
Natixis Oakmark Fund | | | 94,185 | |
Natixis Oakmark International Fund | | | 700,092 | |
Small Cap Value Fund | | | 265,697 | |
Value Opportunity Fund | | | 627,914 | |
As of December 31, 2014, the Funds owe NGAM Distribution the following reimbursements for sub-transfer agent fees (which are reflected in the Statements of Assets and Liabilities as payable to distributor):
| | | | |
Fund | | Reimbursements
of Sub-Transfer
Agent Fees | |
Targeted Equity Fund | | $ | 1,813 | |
Natixis Oakmark Fund | | | 1,508 | |
Natixis Oakmark International Fund | | | 7,740 | |
Small Cap Value Fund | | | 3,313 | |
Value Opportunity Fund | | | 8,415 | |
| 88
Notes to Financial Statements (continued)
December 31, 2014
Sub-transfer agent fees attributable to Class A, Class B, Class C and Class Y are allocated on a pro rata basis to each class based on the relative net assets of each class to the total net assets of those classes.
e. Commissions. Commissions (including CDSCs) on Fund shares retained by NGAM Distribution during the year ended December 31, 2014, were as follows:
| | | | |
Fund | | Commissions | |
Targeted Equity Fund | | $ | 119,415 | |
Natixis Oakmark Fund | | | 578,300 | |
Natixis Oakmark International Fund | | | 1,304,192 | |
Small Cap Value Fund | | | 15,311 | |
Value Opportunity Fund | | | 179,915 | |
f. Trustees Fees and Expenses. The Trusts do not pay any compensation directly to their officers or Trustees who are directors, officers or employees of NGAM Advisors, NGAM Distribution, Natixis US or their affiliates. Effective January 1, 2014, the Chairperson of the Board receives a retainer fee at the annual rate of $300,000. The Chairperson does not receive any meeting attendance fees for Board of Trustees meetings or committee meetings that she attends. Each Independent Trustee (other than the Chairperson) receives, in the aggregate, a retainer fee at the annual rate of $130,000. Each Independent Trustee also receives a meeting attendance fee of $10,000 for each meeting of the Board of Trustees that he or she attends in person and $5,000 for each meeting of the Board of Trustees that he or she attends telephonically. In addition, each committee chairperson (except for the Chairperson of the Governance Committee) receives an additional retainer fee at the annual rate of $17,500. Each Contract Review Committee member is compensated $6,000 for each Committee meeting that he or she attends in person and $3,000 for each meeting that he or she attends telephonically. Each Audit Committee member is compensated $6,000 for each Committee meeting that he or she attends in person and $3,000 for each meeting that he or she attends telephonically. These fees are allocated among the funds in the Natixis Funds Trusts and Loomis Sayles Funds Trusts based on a formula that takes into account, among other factors, the relative net assets of each fund. Trustees are reimbursed for travel expenses in connection with attendance at meetings.
Effective January 1, 2015, the chairperson of the Governance Committee receives an additional retainer fee at the annual rate of $5,000.
A deferred compensation plan (the “Plan”) is available to the Trustees on a voluntary basis. Deferred amounts remain in the Funds until distributed in accordance with the provisions of the Plan. The value of a participating Trustee’s deferral account is based on theoretical investments of deferred amounts, on the normal payment dates, in certain funds of the Natixis Funds Trusts and Loomis Sayles Funds Trusts as designated by the participating Trustees. Changes in the value of participants’ deferral accounts
89 |
Notes to Financial Statements (continued)
December 31, 2014
are allocated pro rata among the funds in the Natixis Funds Trusts and Loomis Sayles Funds Trusts, and are normally reflected as Trustees’ fees and expenses in the Statements of Operations. The portions of the accrued obligations allocated to the Funds under the Plan are reflected as Deferred Trustees’ fees on the Statements of Assets and Liabilities.
g. Reimbursement of Transfer Agent Fees and Expenses. Effective July 1, 2014, NGAM Advisors has given a binding contractual undertaking to the Value Opportunity Fund to reimburse any and all transfer agency expenses for the Fund’s Class N shares. This undertaking is in effect through April 30, 2016 and is not subject to recovery under the expense limitation agreement described above.
For the period July 1, 2014 to December 31, 2014, NGAM Advisors reimbursed the Fund $153 for transfer agency expenses related to Class N shares.
7. Class-Specific Transfer Agent Fees and Expenses. For the year ended December 31, 2014, Value Opportunity Fund incurred the following class-specific transfer agent fees and expenses (including sub-transfer agent fees, where applicable)
| | | | | | | | | | | | | | | | |
| | | Class A | | | Class C | | | Class N | | | Class Y | |
Transfer Agent Fees and Expenses | | $ | 85,837 | | | $ | 29,138 | | | $ | 166 | | | $ | 533,435 | |
Transfer agent fees and expenses attributable to Class A, Class C, and Class Y are allocated on a pro rata basis to each class based on the relative net assets of each class to the total net assets of those classes. Transfer agent fees and expenses attributable to Class N are allocated to Class N.
All other Funds in this report allocate transfer agent fees and expenses on a pro rata basis based on the relative net assets of each class to the total net assets of those classes.
8. Line of Credit. Each Fund, together with certain other funds of Natixis Funds Trusts and Loomis Sayles Funds Trusts, participates in a $200,000,000 committed unsecured line of credit provided by State Street Bank, with an individual limit of $125,000,000 for each fund that participates in the line of credit. Interest is charged to each participating fund based on its borrowings at a rate per annum equal to the greater of the Federal Funds rate or overnight LIBOR, plus 1.25%. In addition, a commitment fee of 0.10% per annum, payable at the end of each calendar quarter, is accrued and apportioned among the participating funds based on their average daily unused portion of the line of credit.
For the year ended December 31, 2014, none of the Funds had borrowings under this agreement.
9. Brokerage Commission Recapture. Certain Funds have entered into agreements with certain brokers whereby the brokers will rebate a portion of brokerage commissions. All amounts rebated by the brokers are returned to the Funds under such
| 90
Notes to Financial Statements (continued)
December 31, 2014
agreements and are included in realized gains on investments in the Statements of Operations. For the year ended December 31, 2014, amounts rebated under these agreements were as follows:
| | | | |
Fund | | Rebates | |
Targeted Equity Fund | | $ | 295,121 | |
10. Concentration of Risk. The Natixis Oakmark International Fund’s investments in foreign securities are subject to foreign currency fluctuations, higher volatility than U.S. securities, varying degrees of regulation and limited liquidity. Greater political, economic, credit and information risks are also associated with foreign securities.
11. Concentration of Ownership. From time to time, a fund may have a concentration of one or more accounts constituting a significant percentage of shares outstanding. Investment activities by holders of such accounts could have material impacts on the funds. As of December 31, 2014, based on management’s evaluation of the shareholder account base, the Funds had accounts representing controlling ownership of more than 5% of the Fund’s total outstanding shares. The number of such accounts, based on accounts that represent more than 5% of an individual class of shares, and the aggregate percentage of net assets represented by such holdings were as follows:
| | | | | | | | |
Fund | | Number of >5%
Non- Affiliated
Account Holders | | | Percentage of
Non-Affiliated
Ownership | |
Small Cap Value Fund | | | 2 | | | | 13.54 | % |
Value Opportunity Fund | | | 2 | | | | 19.37 | % |
Omnibus shareholder accounts for which NGAM Advisors understands that the intermediary has discretion over the underlying shareholder accounts or investment models where a shareholder account may be invested for a non-discretionary customer are included in the table above. For other omnibus accounts, the Funds do not have information on the individual shareholder accounts underlying omnibus accounts; therefore, there could be other 5% shareholders in addition to those disclosed in the table above.
91 |
Notes to Financial Statements (continued)
December 31, 2014
12. Capital Shares. Each Fund may issue an unlimited number of shares of beneficial interest, without par value. Transactions in capital shares were as follows:
| | | | | | | | | | | | | | | | |
| |
| Year Ended
December 31, 2014 |
| |
| Year Ended
December 31, 2013 |
|
Targeted Equity Fund | | | Shares | | | | Amount | | | | Shares | | | | Amount | |
| Class A | | | | | | | | | | | | | | | | |
Issued from the sale of shares | | | 2,382,713 | | | $ | 27,553,469 | | | | 1,458,995 | | | $ | 16,947,507 | |
Issued in connection with the reinvestment of distributions | | | 5,713,464 | | | | 60,881,859 | | | | 5,498,306 | | | | 61,361,100 | |
Redeemed | | | (8,345,177 | ) | | | (95,762,976 | ) | | | (6,773,819 | ) | | | (79,452,307 | ) |
| | | | | | | | | | | | | | | | |
| | | | | | | | | | | | | | | | |
Net change | | | (249,000 | ) | | $ | (7,327,648 | ) | | | 183,482 | | | $ | (1,143,700 | ) |
| | | | | | | | | | | | | | | | |
| Class B | | | | | | | | | | | | | | | | |
Issued from the sale of shares | | | 3,846 | | | $ | 36,977 | | | | 9,622 | | | $ | 104,266 | |
Issued in connection with the reinvestment of distributions | | | 19,323 | | | | 175,598 | | | | 31,669 | | | | 307,820 | |
Redeemed | | | (141,197 | ) | | | (1,397,515 | ) | | | (197,033 | ) | | | (2,058,965 | ) |
| | | | | | | | | | | | | | | | |
| | | | | | | | | | | | | | | | |
Net change | | | (118,028 | ) | | $ | (1,184,940 | ) | | | (155,742 | ) | | $ | (1,646,879 | ) |
| | | | | | | | | | | | | | | | |
| Class C | | | | | | | | | | | | | | | | |
Issued from the sale of shares | | | 417,975 | | | $ | 3,975,723 | | | | 346,867 | | | $ | 3,419,390 | |
Issued in connection with the reinvestment of distributions | | | 378,532 | | | | 3,392,074 | | | | 357,986 | | | | 3,454,570 | |
Redeemed | | | (964,764 | ) | | | (9,405,559 | ) | | | (902,542 | ) | | | (9,267,379 | ) |
| | | | | | | | | | | | | | | | |
| | | | | | | | | | | | | | | | |
Net change | | | (168,257 | ) | | $ | (2,037,762 | ) | | | (197,689 | ) | | $ | (2,393,419 | ) |
| | | | | | | | | | | | | | | | |
| Class Y | | | | | | | | | | | | | | | | |
Issued from the sale of shares | | | 1,277,719 | | | $ | 15,171,684 | | | | 1,018,288 | | | $ | 12,174,489 | |
Issued in connection with the reinvestment of distributions | | | 315,692 | | | | 3,498,909 | | | | 385,629 | | | | 4,442,449 | |
Redeemed | | | (2,699,487 | ) | | | (32,503,712 | ) | | | (1,924,481 | ) | | | (23,394,134 | ) |
| | | | | | | | | | | | | | | | |
| | | | | | | | | | | | | | | | |
Net change | | | (1,106,076 | ) | | $ | (13,833,119 | ) | | | (520,564 | ) | | $ | (6,777,196 | ) |
| | | | | | | | | | | | | | | | |
| | | | | | | | | | | | | | | | |
Increase (decrease) from capital share transactions | | | (1,641,361 | ) | | $ | (24,383,469 | ) | | | (690,513 | ) | | $ | (11,961,194 | ) |
| | | | | | | | | | | | | | | | |
| 92
Notes to Financial Statements (continued)
December 31, 2014
12. Capital Shares (continued).
| | | | | | | | | | | | | | | | |
| |
| Year Ended
December 31, 2014 |
| |
| Year Ended
December 31, 2013 |
|
Natixis Oakmark Fund | | | Shares | | | | Amount | | | | Shares | | | | Amount | |
| Class A | | | | | | | | | | | | | | | | |
Issued from the sale of shares | | | 3,668,913 | | | $ | 80,305,026 | | | | 594,097 | | | $ | 11,371,063 | |
Issued in connection with the reinvestment of distributions | | | 1,061,143 | | | | 21,984,956 | | | | 206,364 | | | | 4,393,477 | |
Redeemed | | | (1,968,641 | ) | | | (43,020,284 | ) | | | (1,091,588 | ) | | | (20,603,657 | ) |
| | | | | | | | | | | | | | | | |
Net change | | | 2,761,415 | | | $ | 59,269,698 | | | | (291,127 | ) | | $ | (4,839,117 | ) |
| | | | | | | | | | | | | | | | |
| Class B | | | | | | | | | | | | | | | | |
Issued from the sale of shares | | | 793 | | | $ | 15,447 | | | | 2,215 | | | $ | 39,142 | |
Issued in connection with the reinvestment of distributions | | | 6,139 | | | | 114,704 | | | | 2,720 | | | | 52,955 | |
Redeemed | | | (48,674 | ) | | | (958,785 | ) | | | (71,336 | ) | | | (1,232,916 | ) |
| | | | | | | | | | | | | | | | |
Net change | | | (41,742 | ) | | $ | (828,634 | ) | | | (66,401 | ) | | $ | (1,140,819 | ) |
| | | | | | | | | | | | | | | | |
| Class C | | | | | | | | | | | | | | | | |
Issued from the sale of shares | | | 3,014,013 | | | $ | 59,777,822 | | | | 77,627 | | | $ | 1,397,844 | |
Issued in connection with the reinvestment of distributions | | | 214,242 | | | | 3,952,587 | | | | 10,127 | | | | 196,273 | |
Redeemed | | | (201,413 | ) | | | (3,932,222 | ) | | | (63,084 | ) | | | (1,112,010 | ) |
| | | | | | | | | | | | | | | | |
Net change | | | 3,026,842 | | | $ | 59,798,187 | | | | 24,670 | | | $ | 482,107 | |
| | | | | | | | | | | | | | | | |
| Class Y | | | | | | | | | | | | | | | | |
Issued from the sale of shares | | | 762,265 | | | $ | 17,289,800 | | | | 423,721 | | | $ | 8,459,458 | |
Issued in connection with the reinvestment of distributions | | | 148,825 | | | | 3,209,042 | | | | 20,978 | | | | 462,557 | |
Redeemed | | | (296,205 | ) | | | (6,605,253 | ) | | | (532,575 | ) | | | (11,013,447 | ) |
| | | | | | | | | | | | | | | | |
Net change | | | 614,885 | | | $ | 13,893,589 | | | | (87,876 | ) | | $ | (2,091,432 | ) |
| | | | | | | | | | | | | | | | |
Increase (decrease) from capital share transactions | | | 6,361,400 | | | $ | 132,132,840 | | | | (420,734 | ) | | $ | (7,589,261 | ) |
| | | | | | | | | | | | | | | | |
93 |
Notes to Financial Statements (continued)
December 31, 2014
12. Capital Shares (continued).
| | | | | | | | | | | | | | | | |
| |
| Year Ended
December 31, 2014 |
| |
| Year Ended
December 31, 2013 |
|
Natixis Oakmark International Fund | | | Shares | | | | Amount | | | | Shares | | | | Amount | |
| Class A | | | | | | | | | | | | | | | | |
Issued from the sale of shares | | | 43,808,176 | | | $ | 590,904,771 | | | | 21,056,422 | | | $ | 277,082,046 | |
Issued in connection with the reinvestment of distributions | | | 1,654,360 | | | | 20,974,239 | | | | 319,731 | | | | 4,302,790 | |
Redeemed | | | (18,741,882 | ) | | | (243,326,691 | ) | | | (1,725,547 | ) | | | (21,871,254 | ) |
| | | | | | | | | | | | | | | | |
Net change | | | 26,720,654 | | | $ | 368,552,319 | | | | 19,650,606 | | | $ | 259,513,582 | |
| | | | | | | | | | | | | | | | |
| Class C | | | | | | | | | | | | | | | | |
Issued from the sale of shares | | | 13,563,541 | | | $ | 180,784,363 | | | | 14,898,386 | | | $ | 188,703,775 | |
Issued in connection with the reinvestment of distributions | | | 564,157 | | | | 7,051,208 | | | | 162,333 | | | | 2,145,259 | |
Redeemed | | | (4,930,036 | ) | | | (62,910,330 | ) | | | (684,178 | ) | | | (8,561,081 | ) |
| | | | | | | | | | | | | | | | |
Net change | | | 9,197,662 | | | $ | 124,925,241 | | | | 14,376,541 | | | $ | 182,287,953 | |
| | | | | | | | | | | | | | | | |
Increase (decrease) from capital share transactions | | | 35,918,316 | | | $ | 493,477,560 | | | | 34,027,147 | | | $ | 441,801,535 | |
| | | | | | | | | | | | | | | | |
| 94
Notes to Financial Statements (continued)
December 31, 2014
12. Capital Shares (continued).
| | | | | | | | | | | | | | | | |
| |
| Year Ended
December 31, 2014 |
| |
| Year Ended
December 31, 2013 |
|
Small Cap Value Fund | | | Shares | | | | Amount | | | | Shares | | | | Amount | |
| Class A | | | | | | | | | | | | | | | | |
Issued from the sale of shares | | | 447,060 | | | $ | 9,835,856 | | | | 599,022 | | | $ | 13,053,903 | |
Issued in connection with the reinvestment of distributions | | | 817,956 | | | | 17,011,106 | | | | 912,982 | | | | 19,850,490 | |
Redeemed | | | (2,038,618 | ) | | | (45,649,192 | ) | | | (3,131,075 | ) | | | (66,811,043 | ) |
| | | | | | | | | | | | | | | | |
Net change | | | (773,602 | ) | | $ | (18,802,230 | ) | | | (1,619,071 | ) | | $ | (33,906,650 | ) |
| | | | | | | | | | | | | | | | |
| Class B | | | | | | | | | | | | | | | | |
Issued from the sale of shares | | | 7,619 | | | $ | 133,164 | | | | 11,456 | | | $ | 209,832 | |
Issued in connection with the reinvestment of distributions | | | 13,951 | | | | 220,076 | | | | 25,074 | | | | 431,817 | |
Redeemed | | | (85,671 | ) | | | (1,490,851 | ) | | | (108,007 | ) | | | (1,942,239 | ) |
| | | | | | | | | | | | | | | | |
Net change | | | (64,101 | ) | | $ | (1,137,611 | ) | | | (71,477 | ) | | $ | (1,300,590 | ) |
| | | | | | | | | | | | | | | | |
| Class C | | | | | | | | | | | | | | | | |
Issued from the sale of shares | | | 109,154 | | | $ | 1,768,690 | | | | 129,833 | | | $ | 2,289,227 | |
Issued in connection with the reinvestment of distributions | | | 281,983 | | | | 4,396,718 | | | | 252,715 | | | | 4,356,398 | |
Redeemed | | | (401,405 | ) | | | (6,855,018 | ) | | | (320,688 | ) | | | (5,693,761 | ) |
| | | | | | | | | | | | | | | | |
Net change | | | (10,268 | ) | | $ | (689,610 | ) | | | 61,860 | | | $ | 951,864 | |
| | | | | | | | | | | | | | | | |
| Class Y | | | | | | | | | | | | | | | | |
Issued from the sale of shares | | | 1,798,226 | | | $ | 41,246,189 | | | | 1,039,846 | | | $ | 23,037,927 | |
Issued in connection with the reinvestment of distributions | | | 1,028,472 | | | | 21,777,987 | | | | 785,493 | | | | 17,359,014 | |
Redeemed | | | (1,660,679 | ) | | | (37,463,927 | ) | | | (1,527,529 | ) | | | (34,014,037 | ) |
| | | | | | | | | | | | | | | | |
Net change | | | 1,166,019 | | | $ | 25,560,249 | | | | 297,810 | | | $ | 6,382,904 | |
| | | | | | | | | | | | | | | | |
Increase (decrease) from capital share transactions | | | 318,048 | | | $ | 4,930,798 | | | | (1,330,878 | ) | | $ | (27,872,472 | ) |
| | | | | | | | | | | | | | | | |
95 |
Notes to Financial Statements (continued)
December 31, 2014
12. Capital Shares (continued).
| | | | | | | | | | | | | | | | |
| |
| Year Ended
December 31, 2014 |
| |
| Year Ended
December 31, 2013* |
|
Value Opportunity Fund | | | Shares | | | | Amount | | | | Shares | | | | Amount | |
| Class A | | | | | | | | | | | | | | | | |
Issued from the sale of shares | | | 3,237,031 | | | $ | 67,850,893 | | | | 1,783,255 | | | $ | 33,448,462 | |
Issued in connection with the reinvestment of distributions | | | 248,216 | | | | 5,263,321 | | | | 173,512 | | | | 3,452,669 | |
Redeemed | | | (3,327,984 | ) | | | (71,812,258 | ) | | | (506,160 | ) | | | (9,482,644 | ) |
| | | | | | | | | | | | | | | | |
Net change | | | 157,263 | | | $ | 1,301,956 | | | | 1,450,607 | | | $ | 27,418,487 | |
| | | | | | | | | | | | | | | | |
| Class C | | | | | | | | | | | | | | | | |
Issued from the sale of shares | | | 740,584 | | | $ | 15,300,207 | | | | 851,169 | | | $ | 15,880,914 | |
Issued in connection with the reinvestment of distributions | | | 97,107 | | | | 1,986,798 | | | | 45,963 | | | | 896,367 | |
Redeemed | | | (133,887 | ) | | | (2,764,527 | ) | | | (53,768 | ) | | | (967,373 | ) |
| | | | | | | | | | | | | | | | |
Net change | | | 703,804 | | | $ | 14,522,478 | | | | 843,364 | | | $ | 15,809,908 | |
| | | | | | | | | | | | | | | | |
| Class N | | | | | | | | | | | | | | | | |
Issued from the sale of shares | | | 561,402 | | | $ | 12,347,954 | | | | 57 | | | $ | 1,892 | |
Issued in connection with the reinvestment of distributions | | | 36,678 | | | | 785,557 | | | | 3 | | | | 61 | |
Redeemed | | | (38,796 | ) | | | (817,090 | ) | | | — | | | | — | |
| | | | | | | | | | | | | | | | |
Net change | | | 559,284 | | | $ | 12,316,421 | | | | 60 | | | $ | 1,953 | |
| | | | | | | | | | | | | | | | |
| Class Y | | | | | | | | | | | | | | | | |
Issued from the sale of shares | | | 17,284,818 | | | $ | 372,678,420 | | | | 9,218,173 | | | $ | 175,491,968 | |
Issued in connection with the reinvestment of distributions | | | 1,747,547 | | | | 37,469,538 | | | | 775,935 | | | | 15,564,482 | |
Redeemed | | | (5,903,464 | ) | | | (127,760,494 | ) | | | (3,139,077 | ) | | | (59,799,281 | ) |
| | | | | | | | | | | | | | | | |
Net change | | | 13,128,901 | | | $ | 282,387,464 | | | | 6,855,031 | | | $ | 131,257,169 | |
| | | | | | | | | | | | | | | | |
Increase (decrease) from capital share transactions | | | 14,549,252 | | | $ | 310,528,319 | | | | 9,149,062 | | | $ | 174,487,517 | |
| | | | | | | | | | | | | | | | |
| * | From commencement of operations on May 1, 2013 through December 31, 2013 for Class N shares. |
| 96
Report of Independent Registered Public Accounting Firm
To the Trustees of Natixis Funds Trust I and Natixis Funds Trust II and Shareholders of CGM Advisor Targeted Equity Fund, Natixis Oakmark Fund (formerly Harris Associates Large Cap Value Fund), Natixis Oakmark International Fund, Vaughan Nelson Small Cap Value Fund and Vaughan Nelson Value Opportunity Fund:
In our opinion, the accompanying statements of assets and liabilities, including the portfolios of investments, and the related statements of operations and of changes in net assets and the financial highlights present fairly, in all material respects, the financial position of the CGM Advisor Targeted Equity Fund, Natixis Oakmark International Fund, and Vaughan Nelson Small Cap Value Fund, each a series of Natixis Funds Trust I; and the Natixis Oakmark Fund (formerly Harris Associates Large Cap Value Fund) and Vaughan Nelson Value Opportunity Fund, each a series of Natixis Funds Trust II (collectively, the “Funds”), at December 31, 2014, and the results of each of their operations, the changes in each of their net assets and the financial highlights for each of the periods indicated, in conformity with accounting principles generally accepted in the United States of America. These financial statements and financial highlights (hereafter referred to as “financial statements”) are the responsibility of the Funds’ management; our responsibility is to express an opinion on these financial statements based on our audits. We conducted our audits of these financial statements in accordance with the standards of the Public Company Accounting Oversight Board (United States). Those standards require that we plan and perform the audits to obtain reasonable assurance about whether the financial statements are free of material misstatement. An audit includes examining, on a test basis, evidence supporting the amounts and disclosures in the financial statements, assessing the accounting principles used and significant estimates made by management, and evaluating the overall financial statement presentation. We believe that our audits, which included confirmation of securities at December 31, 2014 by correspondence with the custodian and brokers, provide a reasonable basis for our opinion.
PricewaterhouseCoopers LLP
Boston, MA
February 23, 2015
97 |
2014 U.S. Tax Distribution Information to Shareholders (Unaudited)
Corporate Dividends Received Deduction. For the fiscal year ended December 31, 2014, a percentage of dividends distributed by the Funds listed below qualify for the dividends received deduction for corporate shareholders. These percentages are as follows:
| | | | |
Fund | | Qualifying
Percentage | |
Targeted Equity | | | 9.93 | % |
Oakmark Fund | | | 51.50 | % |
Small Cap Value | | | 57.05 | % |
Value Opportunity | | | 57.30 | % |
Capital Gains Distributions. Pursuant to Internal Revenue Section 852(b), the following Funds paid distributions, which have been designated as capital gains distributions for the fiscal year ended December 31, 2014.
| | | | |
Fund | | Amount | |
Targeted Equity | | $ | 29,445,740 | |
Oakmark Fund | | | 31,849,647 | |
Natixis Oakmark International | | | 13,211,564 | |
Small Cap Value | | | 49,311,407 | |
Value Opportunity | | | 45,086,282 | |
Qualified Dividend Income. For the fiscal year ended December 31, 2014, a percentage of the ordinary income dividends paid by the Funds are considered qualified dividend income eligible for reduced tax rates. These lower rates range from 0% to 20% depending on an individual’s tax bracket. If the Funds paid a distribution during calendar year 2014, complete information will be reported in conjunction with Form 1099-DIV. These percentages are noted below:
| | | | |
Fund | | Qualifying
Percentage | |
Targeted Equity | | | 9.83 | % |
Oakmark Fund | | | 58.80 | % |
Natixis Oakmark International | | | 100.00 | % |
Small Cap Value | | | 74.11 | % |
Value Opportunity | | | 58.85 | % |
Foreign Tax Credit. For the year ended December 31, 2014, the Natixis Oakmark International Fund intends to pass through foreign tax credits and have derived gross income from sources within foreign countries amounting to:
| | | | | | | | |
Fund | | Foreign Tax
Credit Pass-Through | | | Foreign Source
Income | |
Natixis Oakmark International | | $ | 2,172,179 | | | $ | 26,512,627 | |
| 98
Trustee and Officer Information
The tables below provide certain information regarding the trustees and officers of Natixis Funds Trust I and Natixis Funds Trust II (the “Trusts”).] Unless otherwise indicated, the address of all persons below is 399 Boylston Street, Boston, MA 02116. The Funds’ Statements of Additional Information include additional information about the trustees of the Trusts and are available by calling Natixis Funds at 800-225-5478.
| | | | | | | | |
Name and Year of Birth | | Position(s) Held
with the Trusts,
Length of Time
Served and Term of Office1 | | Principal
Occupation(s)
During Past 5 Years | | Number of
Portfolios in
Fund Complex
Overseen2 and Other
Directorships Held
During Past 5 Years | | Experience,
Qualifications,
Attributes, Skills
for Board Membership |
| | | |
| INDEPENDENT TRUSTEES | | | | | | |
| | | | |
Kenneth A. Drucker (1945) | | Trustee since 2008 Chairperson of the Audit Committee and Governance Committee Member | | Retired | | 42 None | | Significant experience on the Board and on the boards of other business organizations (including at investment companies); executive experience (including as treasurer of an aerospace, automotive, and metal manufacturing corporation) |
| | | | |
Edmond J. English (1953) | | Trustee since 2013 Contract Review Committee Member | | Chief Executive Officer of Bob’s Discount Furniture (retail) | | 42 Formerly, Director, BJ’s Wholesale Club (retail); formerly, Director, Citizens Financial Group (bank) | | Experience on the Board and significant experience on the boards of other business organizations (including at a retail company and a bank); executive experience (including at a retail company) |
99 |
Trustee and Officer Information
| | | | | | | | |
Name and Year of Birth | | Position(s) Held
with the Trusts,
Length of Time
Served and Term of Office1 | | Principal
Occupation(s)
During Past 5 Years | | Number of
Portfolios in
Fund Complex
Overseen2 and Other
Directorships Held
During Past 5 Years | | Experience,
Qualifications,
Attributes, Skills
for Board Membership |
| | | |
INDEPENDENT TRUSTEES continued | | | | | | |
| | | | |
Richard A. Goglia (1951) | | Trustee since 2015 Audit Committee Member | | Vice President and Treasurer of Raytheon Company (defense) | | 42 None | | Experience on the Board and executive experience (including his role as vice president and treasurer of a defense company and experience at a financial services company) |
| | | | |
Wendell J. Knox (1948) | | Trustee since 2009 Audit Committee Member and Governance Committee Member | | Director of Abt Associates Inc. (research and consulting) | | 42 Director, Eastern Bank (bank); Director, The Hanover Insurance Group (property and casualty insurance) | | Significant experience on the Board and on the boards of other business organizations (including at a bank and at a property and casualty insurance firm); executive experience (including roles as president and chief executive officer of a research and consulting company) |
| 100
Trustee and Officer Information
| | | | | | | | |
Name and Year of Birth | | Position(s) Held
with the Trusts,
Length of Time
Served and Term of Office1 | | Principal
Occupation(s)
During Past 5 Years | | Number of
Portfolios in
Fund Complex
Overseen2 and Other
Directorships Held
During Past 5 Years | | Experience,
Qualifications,
Attributes, Skills
for Board Membership |
| | | |
INDEPENDENT TRUSTEES continued | | | | | | |
| | | | |
Martin T. Meehan (1956) | | Trustee since 2012 Contract Review Committee Member | | Chancellor and faculty member, University of Massachusetts Lowell | | 42 None | | Experience on the Board and on the boards of other business organizations; experience as Chancellor of the University of Massachusetts Lowell; government experience (including as a member of the U.S. House of Representatives); academic experience |
| | | | |
Sandra O. Moose (1942) | | Chairperson of the Board of Trustees since November 2005 Trustee since 1982 for Natixis Funds Trust I (including its predecessors) and since 1993 for Natixis Funds Trust II Ex Officio member of the Audit Committee, the Contract Review Committee and the Governance Committee | | President, Strategic Advisory Services (management consulting) | | 42 Director, AES Corporation (international power company); formerly, Director, Verizon Communications (telecommunications company) | | Significant experience on the Board and on the boards of other business organizations (including at a telecommunications company, an international power company and a specialty chemicals corporation); executive experience (including at a management consulting company) |
101 |
Trustee and Officer Information
| | | | | | | | |
Name and Year of Birth | | Position(s) Held
with the Trusts,
Length of Time
Served and Term of Office1 | | Principal
Occupation(s)
During Past 5 Years | | Number of
Portfolios in
Fund Complex
Overseen2 and Other
Directorships Held
During Past 5 Years | | Experience,
Qualifications,
Attributes, Skills
for Board Membership |
| | | |
INDEPENDENT TRUSTEES continued | | | | | | |
| | | | |
Erik R. Sirri (1958) | | Trustee since 2009 Audit Committee Member | | Professor of Finance at Babson College | | 42 None | | Significant experience on the Board; experience as Director of the Division of Trading and Markets at the Securities and Exchange Commission; academic experience; training as an economist |
| | | | |
Peter J. Smail (1952) | | Trustee since 2009 Chairperson of the Contract Review Committee and Governance Committee Member | | Retired | | 42 None | | Significant experience on the Board; mutual fund industry and executive experience (including roles as president and chief executive officer for an investment adviser) |
| | | | |
Cynthia L. Walker (1956) | | Trustee since 2005 Chairperson of the Governance Committee and Contract Review Committee Member | | Deputy Dean for Finance and Administration, Yale University School of Medicine | | 42 None | | Significant experience on the Board; executive experience in a variety of academic organizations (including roles as dean for finance and administration) |
| 102
Trustee and Officer Information
| | | | | | | | |
| |
Name and Year of Birth | | Position(s) Held
with the Trusts,
Length of Time
Served and Term of Office1 | | Principal
Occupation(s)
During Past 5 Years | | Number of
Portfolios in
Fund Complex
Overseen2 and Other
Directorships Held
During Past 5 Years | | Experience,
Qualifications,
Attributes, Skills
for Board Membership |
|
| INTERESTED TRUSTEES |
| | | | |
Robert J. Blanding3 (1947) 555 California Street San Francisco, CA 94104 | | Trustee since 2003 | | Chairman and Chief Executive Officer (formerly, President), Loomis, Sayles & Company, L.P. | | 42 None | | Significant experience on the Board; continuing service as Chairman and Chief Executive Officer of Loomis, Sayles & Company, L.P. |
| | | | |
David L. Giunta4 (1965) | | Trustee since 2011 | | President and Chief Executive Officer, NGAM Distribution Corporation, NGAM Advisors, L.P. and NGAM Distribution, L.P. | | 42 None | | Experience on the Board; continuing experience as President and Chief Executive Officer of NGAM Advisors, L.P. |
| | | | |
John T. Hailer5 (1960) | | Trustee since 2000 | | President and Chief Executive Officer – U.S. and Asia, Natixis Global Asset Management, L.P. | | 42 None | | Significant experience on the Board; continuing experience as President and Chief Executive Officer – U.S. and Asia, Natixis Global Asset Management, L.P. |
| 1 | Each trustee serves until retirement, resignation or removal from the Board. The current retirement age is 75. The position of Chairperson of the Board is appointed for a three-year term. Ms. Moose was appointed to serve an additional three-year term as the Chairperson of the Board on December 13, 2013. |
| 2 | The trustees of the Trusts serve as trustees of a fund complex that includes all series of the Natixis Funds Trust I, Natixis Funds Trust II, Natixis Funds Trust IV and Gateway Trust (collectively, the “Natixis Funds Trusts”), Loomis Sayles Funds I and Loomis Sayles Funds II (collectively, the “Loomis Sayles Funds Trusts”). |
103 |
Trustee and Officer Information
| 3 | Mr. Blanding is deemed an “interested person” of the Trusts because he holds the following positions with an affiliated person of the Trusts: Chairman and Chief Executive Officer of Loomis, Sayles & Company, L.P. and Director of Loomis Sayles Investment Asia Pte., Ltd. |
| 4 | Mr. Giunta is deemed an “interested person” of the Trusts because he holds the following positions with an affiliated person of the Trusts: President and Chief Executive Officer of NGAM Distribution Corporation, NGAM Advisors, L.P. and NGAM Distribution, L.P. |
| 5 | Mr. Hailer is deemed an “interested person” of the Trusts because he holds the following positions with an affiliated person of the Trusts: President and Chief Executive Officer – U.S. and Asia, Natixis Global Asset Management, L.P. |
| 104
Trustee and Officer Information
| | | | | | |
Name and Year of Birth | | Position(s) Held with the Trusts | | Term of Office1 and Length of Time Served | | Principal Occupation(s) During Past 5 Years2 |
|
| OFFICERS OF THE TRUST |
| | | |
Coleen Downs Dinneen (1960) | | Secretary, Clerk and Chief Legal Officer | | Since September 2004 | | Executive Vice President, General Counsel, Secretary and Clerk, NGAM Distribution Corporation, NGAM Advisors, L.P. and NGAM Distribution, L.P. |
| | | |
Russell L. Kane (1969) | | Chief Compliance Officer, Assistant Secretary and Anti-Money Laundering Officer | | Chief Compliance Officer since May 2006; Assistant Secretary since June 2004; and Anti-Money Laundering Officer since April 2007 | | Chief Compliance Officer for Mutual Funds, Senior Vice President, Deputy General Counsel, Assistant Secretary and Assistant Clerk, NGAM Distribution Corporation, NGAM Advisors, L.P. and NGAM Distribution, L.P. |
| | | |
Michael C. Kardok (1959) | | Treasurer, Principal Financial and Accounting Officer | | Since October 2004 | | Senior Vice President, NGAM Advisors, L.P. and NGAM Distribution, L.P. |
| 1 | Each officer of the Trusts serves for an indefinite term in accordance with the Trusts’ current by-laws until the date his or her successor is elected and qualified, or until he or she sooner dies, retires, is removed or becomes disqualified. |
| 2 | Each person listed above, except as noted, holds the same position(s) with the Fund Complex. Previous positions during the past five years with NGAM Distribution, L.P., NGAM Advisors, L.P. or Loomis, Sayles & Company, L.P. are omitted, if not materially different from a trustee’s or officer’s current position with such entity. |
105 |
ANNUAL REPORT
December 31, 2014

McDonnell Intermediate Municipal Bond Fund
Natixis Diversified Income Fund
Natixis U.S. Equity Opportunities Fund
SeeyondSM Multi-Asset Allocation Fund
TABLE OF CONTENTS
Portfolio Review page 1
Portfolio of Investments page 25
Financial Statements page 58
Notes to Financial Statements page 78
MCDONNELL INTERMEDIATE MUNICIPAL BOND FUND
| | |
| Managers | | Symbols |
| Dawn Mangerson | | Class A MIMAX |
| James Grabovac, CFA® | | Class C MIMCX |
| Lawrence Jones | | Class Y MIMYX |
| Steve Wlodarski, CFA® | | |
| McDonnell Investment Management, LLC | | |
Objective
The Fund seeks a high level of federal tax-exempt current income, consistent with the preservation of capital.
Market Conditions
Crude oil staged a stunning collapse, declining by more than 40% in the fourth quarter alone, capping a year of broad-based commodity price weakness. This represented only one of four strong, interrelated trends that occurred during the second half that greatly influenced fixed-income returns in 2014 and set the stage for the capital markets in 2015.
| · | | The U.S. bond market rallied impressively across most maturities and the yield curve (a graph of Treasury yields, from short-term to long-term) flattened sharply. |
| · | | Commodity prices, led by a stunning decline in crude oil and related energy market prices, sold off sharply and broadly |
| · | | Longer-term inflation expectations ratcheted lower as investors reacted to near deflationary conditions in the euro zone and renewed recession in Japan. |
| · | | The dollar rallied considerably against all major market currencies in anticipation of a directional change in monetary policy. |
The divergence of economic growth between the United States and the rest of the world underlies the dynamics of these relationships. Global growth has been decelerating while U.S. economic growth strengthened, laying the groundwork for divergence not only of economic performance but also of central bank policy as we move forward. This dominant trend drove asset market returns in 2014 and may well play a key role in market development in the year ahead, as we are perhaps approaching a policy inflection point whereby the U.S. Federal Reserve Board (the Fed) raises rates while other major central banks ease policy. The U.S. dollar, as the major reserve currency in global finance, occupies an outsized role not only in trade, but also in capital market valuations and returns. Whether global markets have fully discounted diverging monetary policy objectives or whether these trends have further room to run will be critical to market evolution going forward.
Performance Results
For the 12 months ended December 31, 2014, Class A shares of the McDonnell Intermediate Municipal Bond Fund returned 6.08% at net asset value.
1 |
The Fund underperformed its benchmark, the Barclays 3-15 Year Blend Municipal Bond Index, which returned 6.96%.
Explanation of Fund Performance
The higher credit quality bias of the Fund was the primary detractor to relative returns as ‘reach for yield’ behavior on the part of investors helped drive valuations of lower quality municipals higher. Lack of exposure to Commonwealth of Puerto Rico issuers, whose bonds significantly outperformed the broad market prior to their downgrade to sub-investment grade, was an example of spread compression across lower quality sectors of the market. In addition, Fund performance was modestly negatively impacted by an underweight relative to the index in longer maturity California exposure as valuations tightened amid continued strong investor demand.
Fund performance was positively impacted by generally falling interest rates across the bond market, and most significantly in the longer portion of the yield curve. Yields declined from 6 years and longer in the municipal market, and the yield curve flattened sharply. In contrast to the previous year, investor demand returned to the market and was reflected in consistently positive shareholder inflows into the municipal market throughout the past year. New issue supply was down drastically during the first half but recovered to end flat for the year as refunding issuance picked up in the second half amid the general decline in interest rates.
Positive contributors to performance included the Fund’s overweight in single A-rated securities across various sectors of the market. The portfolio overweight relative to the index in the hospital sector also aided performance as spread compression continued to benefit the riskier sectors of the market.
Finally, portfolio performance also benefited from yield curve repositioning emphasizing exposure to the longer end of the intermediate curve. Curve posture, shifted in 2014 to enhance exposure amid higher yields and more attractive valuations, contributed positively as the yield curve flattened.
Outlook
The outlook for the economy remains sound. The recovery, now in its sixth year, appears to be strengthening as employment growth improves while inflation remains quiescent. Market prices currently reflect a consensus expectation that the Fed will engineer a modest change in monetary policy by boosting short-term interest rates around mid-year. We believe that the Fed will seek to move off the zero lower bound rate policy at some point over the coming year, but with inflation decelerating and global growth slowing, the anticipated hike in short-term rates could prove to be more of a ‘token’ move rather than a sustained march higher in rates as the year unfolds. Municipal valuations versus Treasuries remain relatively attractive across the longer end of the intermediate curve, while U.S. yields, in general, are historically attractive relative to other major sovereign issuers.
| 2
MCDONNELL INTERMEDIATE MUNICIPAL BOND FUND
Growth of $10,000 Investment in Class A Shares4
December 31, 2012 (inception) through December 31, 2014
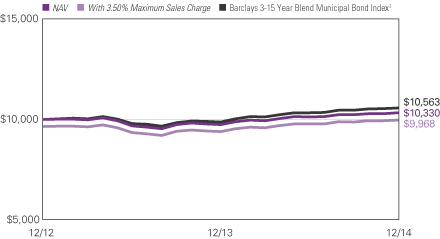
Average Annual Total Returns — December 31, 20144
| | | | | | | | |
| | | |
| | | 1 Year | | | Life of Fund | |
| | | |
| Class A (Inception 12/31/12)1 | | | | | | | | |
| NAV | | | 6.08 | % | | | 1.62 | % |
| With 3.50% Maximum Sales Charge | | | 2.33 | | | | -0.18 | |
| | | |
| Class C (Inception 12/31/12)1 | | | | | | | | |
| NAV | | | 5.18 | | | | 0.83 | |
| With CDSC2 | | | 4.18 | | | | 0.83 | |
| | | |
| Class Y (Inception 12/31/12)1 | | | | | | | | |
| NAV | | | 6.36 | | | | 1.93 | |
| | | |
| Comparative Performance | | | | | | | | |
| Barclays 3-15 Year Blend Municipal Bond Index3 | | | 6.96 | | | | 2.78 | |
Past performance does not guarantee future results. The table(s) do not reflect taxes shareholders might owe on any fund distributions or when they redeem their shares. Performance for periods less than one year is cumulative, not annualized. Returns reflect changes in share price and reinvestment of dividends and capital gains, if any. Unlike a fund, an index is not managed and does not reflect fees and expenses.
| 1 | 12/31/12 represents the date shares were first registered for public sale under the Securities Act of 1933. 11/16/12 represents commencement of operations for accounting and financial reporting purposes only. |
| 2 | Performance for Class C shares assumes a 1.00% contingent deferred sales charge (“CDSC”) applied when you sell shares within one year of purchase. |
| 3 | Barclays 3-15 Year Blend Municipal Bond Index tracks the performance of municipal bonds issued after December 31, 1990 with remaining maturities between 2 and 17 years and at least $5 million in principal amount outstanding. |
| 4 | Fund performance has been increased by fee waivers and/or expense reimbursements, if any, without which performance would have been lower. |
3 |
NATIXIS DIVERSIFIED INCOME FUND
| | |
| Managers | | Symbols |
| Dividend Equity Discipline | | Class A IIDPX |
| Active Investment Advisors | | Class C CIDPX |
(a division of NGAM Advisors, L.P.) | | Class Y YIDPX |
| Diversified REIT Discipline | | |
| AEW Capital Management, L.P. |
| Inflation Protected Securities Discipline |
| Multi-Sector Bond Discipline |
| Loomis, Sayles & Company, L.P. |
Objective
The Fund seeks current income with a secondary objective of capital appreciation.
Market Conditions
In the United States, economic growth continued to increase in 2014, driving unemployment down from 6.6% at the beginning of the year to a low of 5.6% in December. Divergence between the improving growth prospects of the U.S. economy and rest of the world became a major theme during the year, as European growth prospects fell and emerging market growth stumbled. Encouraged by falling unemployment and improving growth, the Federal Reserve Board (the Fed) discontinued its quantitative easing program and provided guidance that interest rates could begin to increase by mid-2015. Declining commodity prices, particularly oil prices, which fell by half during the second half of the year, also contributed significantly to the economic landscape. The U.S. dollar began a sustained rise, driven by these trends. Both U.S. equity and bond markets reached new highs towards the end of 2014, amid an increase in market volatility.
Performance Results
For the 12 months ended December 31, 2014, Class A shares of Natixis Diversified Income Fund returned 13.08% at net asset value. The portfolio outperformed its primary benchmark, the Barclays U.S. Aggregate Bond Index, which returned 5.97%. The Fund underperformed its secondary benchmark, which returned 13.34% for the period. This benchmark is a blended, unmanaged index composed of 40% Barclays U.S. Aggregate Bond Index, 25% MSCI US REIT Index, 20% Dow Jones U.S. Select Dividend™ Index and 15% Barclays U.S. TIPS Index.
Explanation of Fund Performance
Natixis Diversified Income Fund allows investors to participate in four income-oriented market segments, each featuring a different investment discipline. They are:
| · | | Active Dividend Equity Segment, an indexed portfolio of dividend-paying common stocks, based on the Dow Jones U.S. Select Dividend™ Index, and tracked by Active Investment Advisors (AIA), a division of NGAM Advisors, L.P. |
| 4
NATIXIS DIVERSIFIED INCOME FUND
| · | | AEW Diversified REIT Segment, composed of REITs. This segment is managed by AEW Capital Management, L.P. (“AEW”), a specialist in this income-producing equity field. |
| · | | Loomis Sayles Inflation Protected Securities Segment, a portfolio of Treasury Inflation Protected Securities (TIPS). The segment is managed by Loomis, Sayles & Company, L.P. (“Loomis Sayles”). |
| · | | Loomis Sayles Multi-Sector Bond Segment, a portfolio composed of domestic and foreign bonds also managed by Loomis Sayles. |
The AEW Diversified REIT segment was the largest contributor to the Fund’s outperformance for the 12 months ended December 31, 2014.
Active Dividend Equity Segment
This segment is designed to replicate the Dow Jones U.S. Select Dividend™ Index by holding substantially all of the securities in the index in the same proportions. The benchmark is composed of 100 of the highest dividend-paying equity securities (other than REITs) in the Dow Jones U.S. Total Stock Market Index — a broad based index designed to represent the total market for U.S. equity securities.
The Dow Jones U.S. Select Dividend™ Index returned 15.36% for the 12-month period ended December 31, 2014. Utilities, industrials, and consumer staples made the strongest contribution to index gains, while energy, materials, and consumer discretionary were the weakest performers for the period. Energy was the only sector with a negative return for the year. As of December 31, 2014, the largest sectors in the index were the same as at the beginning of the period: utilities, industrials and consumer staples.
During the course of the year, two stocks were deleted from the index and two replacements were named. UNS Energy was acquired and therefore dropped from the index. Noble was added as a replacement. Universal was deleted and replaced by Domtar. ONEOK and Kimberly Clark both spun off companies, which were not added to the index.
AEW Diversified REIT Segment
The U.S. REIT sector returned 30.38% for the 12-month period ended December 31, 2014, as measured by the MSCI U.S. REIT Index. The U.S. economy performed extremely well in 2014, with a trend of 11 consecutive months where at least 200,000 new jobs were created, the longest stretch since 1995. Meanwhile, REITs strongly outperformed the broader equity market, driven by the positive economic news in the U.S., as well as mergers and acquisitions sentiment and falling interest rates. The Fund’s REIT segment benefited from positive stock selection results and positive sector allocation results. Among the strongest individual contributors were apartment company Equity Residential, office company Kilroy Realty, and storage company Extra Space Storage. Detractors from performance included diversified companies Forest City Enterprises and Alexander & Baldwin and hotel company Extended Stay America.
Going forward, we expect REIT gains to be driven more by improving earnings fundamentals than by additional multiple expansion. We expect high single digit earnings
5 |
growth across the REIT sector in 2015, and we believe the prospect for competitive returns with improving diversification benefits should support REIT shares in the near term. During the longer term, when we eventually transition into an environment of higher interest rates, REITs will have benefitted from a series of moves that have strengthened balance sheets and improved average asset quality. Such moves provide the best defense against the potential for higher capitalization rates in the future, whether they come sooner or later.
Loomis Sayles Inflation Protected Securities Segment
Overall, U.S. Treasuries generated positive total returns during the year, which helped buoy the segment’s performance. Our TIPS position, which represented the segment’s largest allocation, was the most significant contributor to performance.
Yield curve (a curve that shows the relationship among bond yields across the maturity spectrum) trades, expressed with swaptions (option on interest rate swaps) and designed to benefit from a steepening yield curve, weighed the most on performance, as the yield curve flattened during the year. A small position in 30-year U.S. Treasuries supported results, given widespread global growth concerns helped fuel demand for longer-maturity nominal Treasuries.
Loomis Sayles Multi-Sector Bond Segment
The segment’s high-yield holdings generated strong returns during the 12-month period. Specifically, security selection among industrial issues aided results. Financial and utility names contributed positively. Investment-grade corporate bonds also generated robust returns, outperforming duration-matched Treasuries (Treasuries with similar duration, or price sensitivity to interest rate changes). Financial and industrial issues bolstered results, as selected names within the banking, insurance and basic industry space led the way. Within the utility industry, a small position in an electric company buoyed the sector into positive territory.
Our holdings in convertible issues mirrored the uptick in equity markets and were large contributors to return. In particular, a selected technology name generated positive results, boosting return. Also benefiting from the uptick in equity markets was the portfolio’s small position in preferred securities, as an individual banking name drove performance within the space.
Exposure to shorter-maturity U.S. Treasuries weighed on performance, as rates flattened throughout the one-year period. The portfolio’s hedged positions also weighed on return. Meanwhile, positioning among securitized credit generated mixed results. The commercial mortgage-backed securities (CMBS) sector was the strongest contributor in the group, while asset-backed securities (ABS) and residential mortgage-backed securities (RMBS) detracted from performance. Our yield curve positioning also weighed on returns within the securitized space.
| 6
NATIXIS DIVERSIFIED INCOME FUND
Growth of $10,000 Investment in Class A Shares5
November 17, 2005 (inception) through December 31, 2014
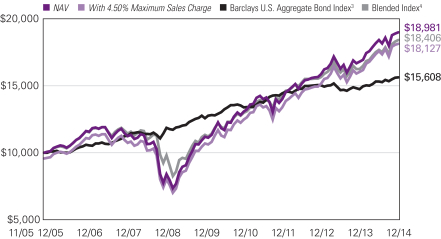
7 |
Average Annual Total Returns — December 31, 20145
| | | | | | | | | | | | | | | | |
| | | | |
| | | 1 Year | | | 5 Years | | | Life of Class | |
| Class A (Inception 11/17/05) | | | | | | | | Class A/C | | | Class Y | |
| NAV | | | 13.08 | % | | | 11.14 | % | | | 7.28 | % | | | — | % |
| With 4.50% Maximum Sales Charge | | | 7.96 | | | | 10.13 | | | | 6.74 | | | | — | |
| | | | | |
| Class C (Inception 11/17/05) | | | | | | | | | | | | | | | | |
| NAV | | | 12.28 | | | | 10.31 | | | | 6.47 | | | | — | |
| With CDSC2 | | | 11.28 | | | | 10.31 | | | | 6.47 | | | | — | |
| | | | | |
| Class Y (Inception 12/3/12)1 | | | | | | | | | | | | | | | | |
| NAV | | | 13.05 | | | | 11.16 | | | | — | | | | 9.78 | |
| | | | | |
| Comparative Performance | | | | | | | | | | | | | | | | |
| Barclays U.S. Aggregate Bond Index3 | | | 5.97 | | | | 4.45 | | | | 5.00 | | | | 1.77 | |
| Blended Index4 | | | 13.34 | | | | 10.21 | | | | 6.92 | | | | 8.59 | |
Past performance does not guarantee future results. The table(s) do not reflect taxes shareholders might owe on any fund distributions or when they redeem their shares. Performance for periods less than one year is cumulative, not annualized. Returns reflect changes in share price and reinvestment of dividends and capital gains, if any. Unlike a fund, an index is not managed and does not reflect fees and expenses.
| 1 | Prior to the inception of Class Y shares (12/3/2012), performance is that of Class A shares and reflects the higher net expenses of that share class. |
| 2 | Class C share performance assumes a 1.00% contingent deferred sales charge (“CDSC”) applied when you sell shares within one year of purchase. |
| 3 | The Barclays U.S. Aggregate Bond Index is an unmanaged index that covers the U.S.-dollar denominated, investment grade, fixed-rate, taxable bond market of SEC-registered securities. The index includes bonds from the Treasury, government-related, corporate, mortgage-backed securities, asset-backed securities, and collateralized mortgage-backed securities sectors. |
| 4 | The Blended Index is an unmanaged, blended index composed of the following weights: 40% Barclays U.S. Aggregate Bond Index, 25% MSCI US REIT Index, 20% Dow Jones U.S. Select Dividend™ Index, and 15% Barclays U.S. TIPS Index. The four indices composing the Blended Index measure, respectively, the performance of investment-grade fixed-income securities, equity REIT securities, dividend-yielding equity securities, and Treasury inflation-protected securities. The weightings of the indices that compose the Blended Index are rebalanced on a monthly basis to maintain the allocations as described above. These rebalancings will not necessarily correspond to the rebalancings of the fund’s investment portfolio, and the relative weightings of the asset classes in the fund will generally differ to some extent from the weightings in the Blended Index. |
| 5 | Fund performance has been increased by fee waivers and/or expense reimbursements, if any, without which performance would have been lower. |
| 8
NATIXIS U.S. EQUITY OPPORTUNITIES FUND
| | |
| Managers | | Symbols |
| Large Cap Value Segment | | Class A NEFSX |
| Harris Associates L.P. | | Class B NESBX |
| All Cap Growth Segment | | Class C NECCX |
| Loomis, Sayles & Company, L.P. | | Class Y NESYX |
Objective
The Fund seeks long-term growth of capital.
Market Conditions
Economic growth accelerated in the U.S. beginning in the second quarter, fueling a continued pickup in job creation and declines in unemployment. Several major themes dominated 2014, including a strengthening U.S. dollar, sharply falling oil prices and a divergence in growth between the U.S. economy and economies in Europe and emerging markets. After several rounds of quantitative easing that began in 2008, the U.S. Federal Reserve Board (the Fed) fully tapered the third round and indicated that interest rates were likely to increase at some point in 2015. Congress and the president averted a potential government shutdown in December by agreeing on a $1.1 trillion federal budget. Equity and fixed-income markets hit new highs in December as market volatility increased. Overall, equity outperformance rotated from small-caps to large- and mid-caps. Value slightly edged out growth.
Performance Results
For the 12 months ended December 31, 2014, Class A shares of Natixis U.S. Equity Opportunities Fund returned 12.94% at net asset value. The Fund underperformed its primary benchmark, the S&P 500® Index , which returned 13.69%. The Fund also underperformed its secondary benchmark, the Russell 1000® Index, which returned 13.24%.
Explanation of Fund Performance
Each of the portfolio’s segments uses a distinct investment style, providing shareholders with exposure to a variety of different stocks:
| · | | The Harris Associates L.P. Large Cap Value segment invests primarily in the common stocks of larger-capitalization companies that Harris Associates believes are trading at a substantial discount to the company’s “true business value.” |
| · | | The Loomis, Sayles & Company, L.P. All Cap Growth segment invests in equity securities, including common stocks, preferred stocks, convertible securities and warrants. This segment may invest in companies of any size. |
On February 28, 2014, the Fund was reduced from four segments to two segments. As part of this change, the Fund’s Loomis Sayles Mid Cap Growth and Loomis Sayles Small/Mid Cap Core segments were eliminated. The Loomis Sayles Large Cap Growth segment continued to be managed by Aziz Hamzaogullari, but became the Loomis Sayles All Cap Growth segment. Bill Nygren, Kevin Grant, and Colin Hudson of Harris Associates L.P.
9 |
assumed portfolio management responsibilities for the current Harris Associates Large Cap Value segment. In conjunction with these changes, the Fund was renamed to the “Natixis U.S. Equity Opportunities Fund.” In addition, Michael Mangan was added to the Harris Associates team as a manager of the Fund on August 1, 2014.
All segments contributed positively to the overall return of the Fund during the year.
Harris Associates Large Cap Value Segment
As value investors with an emphasis on individual stock selection, our country and sector weights are a by-product of our bottom-up process. For the time period of January 1, 2014 to February 28, 2014, the consumer discretionary and information technology sectors contributed most to the return of the fund while the financial sector was the largest detractor. From March 1, 2014 to December 31, 2014, information technology and financials contributed most to the return of the fund while energy was the sector that contributed the least.
Apache was the largest detractor in the segment from March 1, 2014 to December 31, 2014. Recent weakness in energy spot prices caused Apache’s share price to decline during the fourth quarter. However, the company recently entered into an agreement to sell its Kitimat and Wheatstone LNG projects for $3.7 billion, which will provide the company with cash for share repurchases. The deal shows Apache’s intent to follow through on a plan originally introduced in 2013 to divest its fully valued oil and gas assets and subsequently spin off or sell all of its international assets. In a recent meeting with the company, we confirmed that Apache is on track to complete this process by mid-2015. Furthermore, newly appointed COO John Christmann recently changed the capital allocation process and implemented a system for ranking the internal rates of return on wells across North America to ensure a more efficient use of capital. Christmann also replaced the operating heads of each region, changing their compensation metrics to focus on returns, and put in place a new geoscience team, which he considers to be the “best in the business.” In our view, these improvements are strengthening Apache’s underlying value, and we believe the true quality of this company is currently under-appreciated by the market.
Google was also a detractor to the Fund’s performance during this period. Investors appeared concerned over Google’s decelerating revenue growth and profit margins, which pressured its share price in the fourth quarter. In light of the fact that the company’s revenue has grown 20% year to date through the third quarter, we believe that some deceleration is expected. The possible implementation of new European Union regulations and the company’s announcement that it would retire its digital goods application Google Wallet (which gives competitor Apple an advantage in the mobile pay space and takes Google out of contention as a third-party payment processing solution for online merchants) also troubled investors. However, we believe that Google maintains very strong momentum to support continued growth and is well positioned to take advantage of the shift in advertising dollars to online outlets. Google’s third-quarter profit grew 10%, which to us is indicative of a healthy business. We continue to believe the valuation for this high-quality company with dominant market share remains attractive, offering a compelling reason to own.
| 10
NATIXIS U.S. EQUITY OPPORTUNITIES FUND
The leading contributors to the segment’s performance from March 1, 2014 to December 31, 2014 were Intel and Apple. Intel’s market dominance in many fast-growing areas continues to benefit its long-term growth prospects. Earlier this year, we met with Intel’s CFO Stacy Smith, who is pleased with the company’s strong performance in areas of cloud, storage and high-performance computing. The company recently announced that it would expand the adoption of Intel-based chips in mobile devices in China. We believe this move provides direct access to a large new market and demonstrates new Intel CEO Brian Krzanich’s creative, pragmatic approach to maximizing the value of the company. Management continues to return capital to shareholders by lowering cash balances and increasing the pace of buybacks. Apple’s fourth-quarter earnings results were solid, which included a 20% rise in earnings per share and a 12% increase in sales. Importantly, the company generated $13.3 billion in cash during the quarter and returned $20 billion to shareholders via buybacks and dividends. Furthermore, just released holiday sales results showed new-device activations for Apple phones for the week prior to Christmas bested all others combined. We recently met with Apple’s new CFO Luca Maestri and are enthusiastic about the direction the management team is taking given its ability to maintain and grow Apple’s devoted client base, which is evidenced most recently by the rollout of Apple Pay. Our investment thesis for this company is intact, as we believe Apple’s capital position is solid and its management team is working to enhance shareholder value.
The Loomis Sayles All Cap Growth Segment
In the first two months of the year, the Mid Cap Growth segment performed well due to strong stock selection. Specifically, shares of biotech company Intercept Pharmaceuticals rose on promising trials for its hepatitis treatment. FireEye, an information technology company that provides malware protection systems and network threat prevention solutions, saw strong growth and robust product development. On an absolute basis, positions in Kansas City Southern and 3D Systems detracted from results. Shares of Kansas City Southern, an owner and operator of railroad systems that provide rail freight services in the United States and Mexico, declined on guidance for tempered growth opportunities. 3D Systems, a developer and manufacturer of three-dimensional and solid imaging systems, reported weak earnings due to heavy research and development spending, causing share prices to tumble. The Small/Mid Cap Core and Large Cap Growth segments contributed marginally to annual results. During the transition from four segments to two, the segments experienced higher-than-average turnover.
For the remaining 10 months of the period, the All Cap Growth segment posted a positive absolute return. We are an active manager with a long-term, private equity approach to investing. Through our proprietary bottom-up research framework, we look to invest in those few high-quality businesses with sustainable competitive advantages and profitable growth when they trade at a significant discount to intrinsic value. Our sector positioning is a result of our stock selection. Stock selection in the consumer staples, industrials and energy sectors, as well as our allocations to the energy, consumer discretionary and information technology sectors, contributed to results. Stock selection in the healthcare, financials, consumer discretionary and information technology sectors detracted from the segment’s performance.
11 |
Monster Beverage, Cisco, and Oracle were among the largest contributors during the 10-month period. Monster Beverage, a global energy drink company, reported strong results throughout the year, outperforming its peers in major markets despite weakness in the global beverage industry. In August of 2014, Coca-Cola took a 16.7% equity stake and entered into an energy drink exclusivity deal with Monster. We believe Monster’s differentiated go-to-market strategy and high brand awareness should drive international sales growth and higher profitability. The deal with Coca-Cola may accelerate and solidify Monster’s international opportunity. Networking company Cisco Systems reported improving results throughout the year, with growth returning to its largest and most profitable switches business, even as the company navigates a major new product transition and temporary weakness in emerging markets. Cisco also reported increasing adoption of its next-generation software-defined networks, alleviating some of the competitive concerns. Improving gross margins and operating expense discipline delivered strong operating results. Leading enterprise software and database company Oracle reported year-over-year revenue growth in the mid-single digits due to strong performance in its core software and database businesses. Oracle also reported strong initial success in its cloud computing business making the company a sizable player just behind market leaders Microsoft, Salesforce.com and Amazon. We believe Oracle is executing well on its product transition while maintaining attractive profitability and strong free cash flow. We believe Monster Beverage, Cisco and Oracle continue to sell at meaningful discounts to their intrinsic value (our estimate of the true worth of a business, which we define as the present value of all expected future net cash flows to a company).
Amazon, Google and Greenhill & Co. were among the largest detractors during the 10-month period. Online retailer Amazon reported solid results with e-commerce and Amazon web services driving growth. Gross merchandise value steadily increased at more than double overall U.S. e-commerce growth while a steady shift to higher-margin categories such as third-party sales, AWS and advertising drove gross margin expansion during the period. A writedown on Amazon Fire negatively affected operating results. We understand Amazon invests cyclically in its underlying businesses, with a long-term perspective. With year-end management guidance below expectations, sentiment turned negative resulting in underperformance. Global online search and advertising leader Google reported robust organic growth of more than 20% during the period, which was greater than the overall online advertising industry. Successes in areas such as mobile, video and online channels continued to drive fundamentally strong revenue growth. Because the company is in a period of rapid investment to build out infrastructure for its cloud and core business on a global basis, capital expenditures remained elevated, most recently at nearly 18% of net sales versus the average of 12% from 2008 to 2013. We believe market expectations continue to underappreciate Google’s long-term growth rate. Despite a slow start to the year, independent investment bank Greenhill reported meaningful revenue growth during each of the last two quarters. Still, earned investment banking deal revenue tends to be lumpy from quarter to quarter, given the unpredictable nature of deal completions. Even with positive signs, the market appears to be skeptical of the recovery and reluctant to give Greenhill the credit for its ability to participate. We believe the company’s competitive advantages remain intact, and as mergers and acquisitions activity recovers, we expect Greenhill’s fundamentals will also improve. We believe Amazon, Google and Greenhill continue to sell at meaningful discounts to our estimates of their intrinsic value.
| 12
NATIXIS U.S. EQUITY OPPORTUNITIES FUND
Growth of $10,000 Investment in Class A Shares4
December 31, 2004 through December 31, 2014
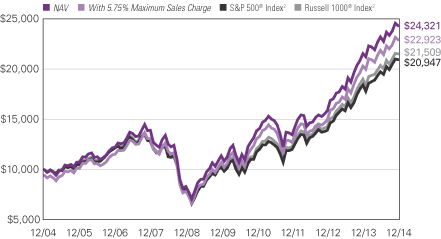
13 |
Average Annual Total Returns — December 31, 20144
| | | | | | | | | | | | |
| | | | |
| | | 1 Year | | | 5 Years | | | 10 Years | |
| | | | |
| Class A (Inception 7/7/94) | | | | | | | | | | | | |
| NAV | | | 12.94 | % | | | 16.43 | % | | | 9.30 | % |
| With 5.75% Maximum Sales Charge | | | 6.44 | | | | 15.06 | | | | 8.65 | |
| | | | |
| Class B (Inception 7/7/94) | | | | | | | | | | | | |
| NAV | | | 12.14 | | | | 15.58 | | | | 8.49 | |
| With CDSC1 | | | 8.38 | | | | 15.35 | | | | 8.49 | |
| | | | |
| Class C (Inception 7/7/94) | | | | | | | | | | | | |
| NAV | | | 12.12 | | | | 15.57 | | | | 8.48 | |
| With CDSC1 | | | 11.37 | | | | 15.57 | | | | 8.48 | |
| | | | |
| Class Y (Inception 11/15/94) | | | | | | | | | | | | |
| NAV | | | 13.25 | | | | 16.74 | | | | 9.62 | |
| | | | |
| Comparative Performance | | | | | | | | | | | | |
| S&P 500® Index2 | | | 13.69 | | | | 15.45 | | | | 7.67 | |
| Russell 1000® Index3 | | | 13.24 | | | | 15.64 | | | | 7.96 | |
Past performance does not guarantee future results. The table(s) do not reflect taxes shareholders might owe on any fund distributions or when they redeem their shares. Performance for periods less than one year is cumulative, not annualized. Returns reflect changes in share price and reinvestment of dividends and capital gains, if any. Unlike a fund, an index is not managed and does not reflect fees and expenses.
| 1 | Performance for Class B shares assumes a maximum 5.00% contingent deferred sales charge (“CDSC”) applied when you sell shares, which declines annually between years 1-6 according to the following schedule: 5, 4, 3, 3, 2, 1, 0%. Class C share performance assumes a 1.00% CDSC applied when you sell shares within one year of purchase. |
| 2 | S&P 500® Index is a widely recognized measure of U.S. stock market performance. It is an unmanaged index of 500 common stocks chosen for market size, liquidity, and industry group representation, among other factors. |
| 3 | Russell 1000® Index measures the performance of the large-cap segment of the U.S. equity universe. It is a subset of the Russell 3000® Index and includes approximately 1000 of the largest securities based on a combination of their market cap and current index membership. The Russell 1000�� Index represents approximately 92% of the U.S. market and is constructed to provide a comprehensive and unbiased barometer for the large-cap segment and is completely reconstituted annually to ensure new and growing equities are reflected. |
| 4 | Fund performance has been increased by fee waivers and/or expense reimbursements, if any, without which performance would have been lower. |
| 14
SEEYOND MULTI-ASSET ALLOCATION FUND
| | |
| Managers | | Symbols |
| Simon Aninat | | Class A SAFAX |
| Frédéric Babu | | Class C SAFCX |
| Stéphanie Bigou | | Class Y SAFYX |
| Jonathan M. Birtwell | | |
| Didier Jauneaux | | |
| Frank Trividic | | |
| Yufeng Xie | | |
| Natixis Asset Management U.S., LLC (“Natixis AM US”) |
Objective
The Fund seeks long-term growth of capital by investing in a range of securities and asset classes across global markets.
Market Conditions
Since the Fund’s launch in July 2014, global financial markets have been buffeted by conflicting influences: a backdrop of mounting headwinds on the one hand and support by central banks on the other. Both global stock markets and global bond markets offered little solace for investors, in spite of falling interest rates. The environment during the second half of 2014 was marked by increasing uncertainty including geopolitical tensions with Russia, plummeting oil prices and faltering growth in China and the euro zone in addition to the rising threat of deflation in the euro zone. Within this context investors’ hopes turned towards the United States, which posted impressive economic growth figures and robust job data. The natural consequence was monetary policy divergence between the United States and the rest of the world. The U.S. Federal Reserve Board (the Fed) is considering normalizing its interest rate policy. On the other hand Japan and the euro zone are in a very different situation with the need to significantly expand monetary stimulus to avoid the looming threat of deflation. One result of this divergence was a strengthening U.S. dollar during the period. Market volatility increased on average. A greater frequency and intensity of short-term market swings associated with liquidity disruption continued to highlight weaker investor sentiment, even as bond and equity markets in the United States reached new highs.
Performance Results
From Fund inception on July 23, 2014 through December 31, 2014, Class A shares of Seeyond Multi-Asset Allocation Fund returned -3.20% at net asset value. The Fund underperformed its benchmark, MSCI ACWI (Net), which returned -2.80%. The Fund outperformed its secondary benchmark, which returned -3.69% for the period. This benchmark is a blended, unmanaged index composed of 60% MSCI ACWI (Net) and 40% Citigroup World Government Bond Index. We believe that the blended benchmark represents a better comparison than the primary, pure equity, benchmark because the Fund invests in a variety of asset classes.
Explanation of Fund Performance
As the United States continued to support global growth and liquidity remained plentiful, the Fund has been overweight equities since launch, relative to its blended benchmark, with
15 |
exposures being actively managed over time. The Fund’s equity exposure through futures and ETFs resulted in a slight negative performance versus our blended benchmark. As of December 31, 2014, the Fund’s exposure to equity markets totaled 67.4% of its assets. On average over the period, the Fund has favored European equities, which contributed negatively to relative equity performance, while no geographic zone has been underweight. The only exception was in emerging markets, where the Fund has maintained an overweight in Asia at the expense of other emerging markets, in light of plummeting oil prices. This has resulted in a positive contribution to relative performance.
As the risk-reward profile did not point towards taking on additional interest rate risk at this point of the cycle, the Fund has maintained an overall small underweight to bonds (including both derivatives and physical instruments) versus its blended benchmark: overweight on European bonds, which contributed positively to relative performance, underweight in U. S. Treasuries and Japanese government bonds, which contributed negatively. The overall relative contribution from the bond allocation in the Fund was slightly negative. As it later appeared that heightened uncertainties and liquidity flowing from Japan could push interest rates to new lows, the Fund’s underweight position in U.S. Treasuries was closed and the Fund’s European overweight has been further increased. This change in allocation helped reduce the negative relative contribution from bonds. The Fund’s bond exposure was subsequently reduced in mid-December. As of December 31, 2014, the Fund’s duration was 3.1 years.
The Fund’s currency exposure (including both derivatives and physical instruments) was the largest positive contributor to relative performance, with a strong overweight in the U.S. dollar during the period, primarily versus the euro and the yen. As central bank policies began to diverge around the globe, relative U.S. dollar strength has been driven by both fundamentals and technicals. The Fund’s U.S. dollar overweight was subsequently reduced in mid-December, and as of December 31, 2014, the Fund’s exposure to non-U.S. dollar currencies was 45.3%.
The Fund’s volatility exposure contributed negatively to relative performance. On average the Fund has maintained a moderate short position on volatility and exposure has been managed actively. Our volatility positioning had briefly switched to positive during the October market downturn as equity and bond markets reached make or break levels. At the portfolio level, this long volatility positioning at that time was aimed at enabling the Fund to reasonably maintain a long U.S. dollar overweight and participate actively in the subsequent equity rally in an environment that we believe was very vulnerable and binary by nature: a liquidity trap.
Outlook
The Fed is considering removing accommodative monetary policy and the market has responded nervously. As such, any new hurdle along the road to sustainable global growth seems to be interpreted as an insurmountable obstacle: standoff with Russia, ISIS, a rising U.S. dollar, falling oil prices, faltering Chinese and European growth, rate hikes, deflation, and high yield liquidity risk. The list might look bleak, but looking at the broader picture, the U.S. economy does not seem too far away from being back on track. We expect the rest of the world is taking similar actions in an effort to follow the same path. This will have the potential to fuel risky assets as well as heighten volatility — as this liquidity switches from one asset class to the other. The path will likely be rockier than before. Investors will need to proceed with caution and account for potential sources of uncertainty that could affect their views of the world.
| 16
SEEYOND MULTI-ASSET ALLOCATION FUND
Total Returns — December 31, 20144
| | | | |
| | |
| | | Life of Fund | |
| | |
| Class A (Inception 7/23/14) | | | | |
| NAV | | | -3.20 | % |
| With 5.75% Maximum Sales Charge | | | -8.77 | |
| | |
| Class C (Inception 7/23/14) | | | | |
| NAV | | | -3.50 | |
| With CDSC1 | | | -4.47 | |
| | |
| Class Y (Inception 7/23/14) | | | | |
| NAV | | | -3.10 | |
| | |
| Comparative Performance | | | | |
| MSCI ACWI (Net)2 | | | -2.80 | |
| Blended Index3 | | | -3.69 | |
Past performance does not guarantee future results. The table(s) do not reflect taxes shareholders might owe on any fund distributions or when they redeem their shares. Performance for periods less than one year is cumulative, not annualized. Returns reflect changes in share price and reinvestment of dividends and capital gains, if any. Unlike a fund, an index is not managed and does not reflect fees and expenses.
| 1 | Performance for Class C shares assumes a 1% contingent deferred sales charge (“CDSC”) applied when you sell shares within one year of purchase. |
| 2 | The MSCI ACWI (Net) represents the performance of 47 markets in both the developed and emerging markets in Africa, Europe, North America and South America. |
| 3 | The Blended Index is an unmanaged, blended index composed of the following weights: 60% MSCI All Country World Index (Net)/40% Citigroup World Government Bond Index. The weightings of the indices that compose the Blended Index are rebalanced on a monthly basis to maintain the allocations as described above. These rebalancings will not necessarily correspond to the rebalancing of the Fund’s investment portfolio, and the relative weightings of the asset classes in the Fund will generally differ to some extent from the weightings in the Blended Index. You may not invest directly in an index. |
| 4 | Fund performance has been increased by fee waivers and/or expense reimbursements, if any, without which performance would have been lower. |
17 |
ADDITIONAL INFORMATION
The views expressed in this report reflect those of the portfolio managers as of the dates indicated. The managers’ views are subject to change at any time without notice based on changes in market or other conditions. References to specific securities or industries should not be regarded as investment advice. Because the Funds are actively managed, there is no assurance that they will continue to invest in the securities or industries mentioned.
ADDITIONAL INDEX INFORMATION
This document may contain references to third party copyrights, indexes, and trademarks, each of which is the property of its respective owner. Such owner is not affiliated with Natixis Global Asset Management or any of its related or affiliated companies (collectively “NGAM”) and does not sponsor, endorse or participate in the provision of any NGAM services, funds or other financial products.
The index information contained herein is derived from third parties and is provided on an “as is” basis. The user of this information assumes the entire risk of use of this information. Each of the third party entities involved in compiling, computing or creating index information, disclaims all warranties (including, without limitation, any warranties of originality, accuracy, completeness, timeliness, non-infringement, merchantability and fitness for a particular purpose) with respect to such information.
PROXY VOTING INFORMATION
A description of the Funds’ proxy voting policies and procedures is available without charge, upon request, by calling Natixis Funds at 800-225-5478; on the Funds’ website at ngam.natixis.com; and on the Securities and Exchange Commission’s (SEC) website at www.sec.gov. Information regarding how the Funds voted proxies relating to portfolio securities during the 12-months ended June 30, 2014 is available from the Funds’ website and the SEC’s website.
QUARTERLY PORTFOLIO SCHEDULES
The Funds file a complete schedule of portfolio holdings with the SEC for the first and third quarters of each fiscal year on Form N-Q. The Funds’ Forms N-Q are available on the SEC’s website at www.sec.gov and may be reviewed and copied at the SEC’s Public Reference Room in Washington, DC. Information on the operation of the Public Reference Room may be obtained by calling 800-SEC-0330.
| 18
UNDERSTANDING FUND EXPENSES
As a mutual fund shareholder, you incur different costs: transaction costs, including sales charges (loads) on purchases and contingent deferred sales charges on redemptions, and ongoing costs, including management fees, distribution and/or service fees (12b-1 fees), and other fund expenses. Certain exemptions may apply. These costs are described in more detail in the Funds’ prospectus. The following examples are intended to help you understand the ongoing costs of investing in the Funds and help you compare these with the ongoing costs of investing in other mutual funds.
The first line in the table of each class of Fund shares shows the actual account values and actual Fund expenses you would have paid on a $1,000 investment in the Fund from July 1, 2014 through December 31, 2014. To estimate the expenses you paid over the period, simply divide your account value by $1,000 (for example $8,600 account value divided by $1,000 = 8.60) and multiply the result by the number in the Expenses Paid During Period column as shown for your class.
The second line in the table for each class of Fund shares provides information about hypothetical account values and hypothetical expenses based on the Fund’s actual expense ratios and an assumed rate of return of 5% per year before expenses, which is not the Fund’s actual return. The hypothetical account values and expenses may not be used to estimate the actual ending account balance or expenses you paid on your investment for the period. You may use this information to compare the ongoing costs of investing in the Fund and other funds. To do so, compare this 5% hypothetical example with the 5% hypothetical examples that appear in the shareholder reports of the other funds.
Please note that the expenses shown reflect ongoing costs only, and do not include any transaction costs, such as sales charges. Therefore, the second line in the table of each Fund is useful in comparing ongoing costs only, and will not help you determine the relative costs of owning different funds. If transaction costs were included, total costs would be higher.
| | | | | | | | | | | | |
MCDONNELL INTERMEDIATE MUNICIPAL
BOND FUND | | BEGINNING
ACCOUNT VALUE
7/1/2014 | | | ENDING
ACCOUNT VALUE
12/31/2014 | | | EXPENSES PAID
DURING PERIOD*
7/1/2014 – 12/31/2014 | |
Class A | | | | | | | | | | | | |
Actual | | | $1,000.00 | | | | $1,020.10 | | | | $4.07 | |
Hypothetical (5% return before expenses) | | | $1,000.00 | | | | $1,021.17 | | | | $4.08 | |
Class C | | | | | | | | | | | | |
Actual | | | $1,000.00 | | | | $1,016.30 | | | | $7.88 | |
Hypothetical (5% return before expenses) | | | $1,000.00 | | | | $1,017.39 | | | | $7.88 | |
Class Y | | | | | | | | | | | | |
Actual | | | $1,000.00 | | | | $1,021.50 | | | | $2.80 | |
Hypothetical (5% return before expenses) | | | $1,000.00 | | | | $1,022.43 | | | | $2.80 | |
| * | Expenses are equal to the Fund’s annualized expense ratio (after waiver/reimbursement): 0.80%, 1.55% and 0.55% for Class A, C and Y, respectively, multiplied by the average account value over the period, multiplied by the number of days in the most recent half-year (184), divided by 365 (to reflect the half-year period). |
19 |
| | | | | | | | | | | | |
| NATIXIS DIVERSIFIED INCOME FUND | | BEGINNING
ACCOUNT VALUE
7/1/2014 | | | ENDING
ACCOUNT VALUE
12/31/2014 | | | EXPENSES PAID
DURING PERIOD*
7/1/2014 – 12/31/2014 | |
Class A | | | | | | | | | | | | |
Actual | | | $1,000.00 | | | | $1,031.20 | | | | $5.38 | |
Hypothetical (5% return before expenses) | | | $1,000.00 | | | | $1,019.91 | | | | $5.35 | |
Class C | | | | | | | | | | | | |
Actual | | | $1,000.00 | | | | $1,027.30 | | | | $9.20 | |
Hypothetical (5% return before expenses) | | | $1,000.00 | | | | $1,016.13 | | | | $9.15 | |
Class Y | | | | | | | | | | | | |
Actual | | | $1,000.00 | | | | $1,032.60 | | | | $4.20 | |
Hypothetical (5% return before expenses) | | | $1,000.00 | | | | $1,021.07 | | | | $4.18 | |
| * | Expenses are equal to the Fund’s annualized expense ratio (after waiver/reimbursement): 1.05%, 1.80% and 0.82% for Class A, C and Y, respectively, multiplied by the average account value over the period, multiplied by the number of days in the most recent fiscal half-year (184), divided by 365 (to reflect the half-year period). |
| | | | | | | | | | | | |
| NATIXIS U.S. EQUITY OPPORTUNITIES FUND | | BEGINNING
ACCOUNT VALUE
7/1/2014 | | | ENDING
ACCOUNT VALUE
12/31/2014 | | | EXPENSES PAID
DURING PERIOD*
7/1/2014 – 12/31/2014 | |
Class A | | | | | | | | | | | | |
Actual | | | $1,000.00 | | | | $1,048.50 | | | | $6.66 | |
Hypothetical (5% return before expenses) | | | $1,000.00 | | | | $1,018.70 | | | | $6.56 | |
Class B | | | | | | | | | | | | |
Actual | | | $1,000.00 | | | | $1,045.00 | | | | $10.52 | |
Hypothetical (5% return before expenses) | | | $1,000.00 | | | | $1,014.92 | | | | $10.36 | |
Class C | | | | | | | | | | | | |
Actual | | | $1,000.00 | | | | $1,044.80 | | | | $10.51 | |
Hypothetical (5% return before expenses) | | | $1,000.00 | | | | $1,014.92 | | | | $10.36 | |
Class Y | | | | | | | | | | | | |
Actual | | | $1,000.00 | | | | $1,050.10 | | | | $5.37 | |
Hypothetical (5% return before expenses) | | | $1,000.00 | | | | $1,019.96 | | | | $5.30 | |
| * | Expenses are equal to the Fund’s annualized expense ratio: 1.29%, 2.04%, 2.04% and 1.04% for Class A, B, C and Y, respectively, multiplied by the average account value over the period, multiplied by the number of days in the most recent fiscal half-year (184), divided by 365 (to reflect the half-year period). |
| 20
| | | | | | | | | | | | |
SEEYOND MULTI-ASSET ALLOCATION
FUND | | BEGINNING
ACCOUNT VALUE
7/1/20141 | | | ENDING
ACCOUNT VALUE
12/31/2014 | | | EXPENSES PAID
DURING PERIOD
7/1/20141 – 12/31/2014 | |
| Class A | | | | | | | | | | | | |
| Actual | | | $1,000.00 | | | | $968.00 | | | | $5.69 | 1 |
| Hypothetical (5% return before expenses) | | | $1,000.00 | | | | $1,018.60 | | | | $6.67 | * |
| Class C | | | | | | | | | | | | |
| Actual | | | $1,000.00 | | | | $965.00 | | | | $8.93 | 1 |
| Hypothetical (5% return before expenses) | | | $1,000.00 | | | | $1,014.82 | | | | $10.46 | * |
| Class Y | | | | | | | | | | | | |
| Actual | | | $1,000.00 | | | | $969.00 | | | | $4.56 | 1 |
| Hypothetical (5% return before expenses) | | | $1,000.00 | | | | $1,019.91 | | | | $5.35 | * |
| * | Hypothetical expenses are equal to the Fund’s annualized expense ratio (after waiver/reimbursement): 1.31%, 2.06% and 1.05% for Class A, C and Y, respectively, multiplied by the average account value over the period, multiplied by the number of days in the most recent half-year (184), divided by 365 (to reflect the half-year period). |
| 1 | Fund commenced operations on July 23, 2014. Actual expenses are equal to the Fund’s annualized expense ratio (after waiver/reimbursement): 1.31%, 2.06% and 1.05% for Class A, C and Y, respectively, multiplied by the average account value over the period, multiplied by the number of days in the most recent fiscal period (161), divided by 365 (to reflect the partial period). |
21 |
BOARD APPROVAL OF THE INITIAL
ADVISORY AGREEMENT
The Investment Company Act of 1940, as amended (the “1940 Act”), requires that both the full Board of Trustees of the Trust and a majority of the Trustees who are not “interested persons” (as defined in the 1940 Act) of the Trust (the “Independent Trustees”), voting separately, initially approve for a two-year term any new investment advisory and sub-advisory agreements for a registered investment company, including newly formed funds such as the Seeyond Multi-Asset Allocation Fund (the “Fund”). The Trustees, including the Independent Trustees, unanimously approved the proposed investment advisory agreement (the “Agreement”) for the Fund at an in-person meeting held on June 20, 2014.
In connection with this review, Fund management and other representatives of the Fund’s adviser, Natixis Asset Management U.S., LLC (“Natixis AM US” or “the Adviser”), distributed to the Trustees materials including, among other items, (i) information on the proposed advisory fees and other expenses to be charged to the Fund, including information comparing the Fund’s expenses to those of peer groups of funds and the proposed expense cap, (ii) the Fund’s investment objective and strategies, (iii) the size, education and experience of the Adviser’s investment staff and the investment strategies proposed to be used in managing the Fund, (iv) proposed arrangements for the distribution of the Fund’s shares, (v) the procedures proposed to be employed to determine the value of the Fund’s assets, (vi) the Fund’s investment policies and restrictions, policies on personal securities transactions and other compliance policies, and (vii) the general economic outlook with particular emphasis on the mutual fund industry. Because the Fund is newly formed and had not commenced operations at the time of the Trustees’ review, certain information, including data relating to Fund performance, was not available, and therefore could not be distributed to the Trustees. Throughout the process, the Trustees were afforded the opportunity to ask questions of, and request additional materials from, the Adviser.
In considering whether to initially approve the Agreement, the Board of Trustees, including the Independent Trustees, did not identify any single factor as determinative. Individual Trustees may have evaluated the information presented differently from one another, giving weight to various factors. Matters considered by the Trustees, including the Independent Trustees, in connection with their approval of the Agreement included, but were not limited to, the factors listed below:
The nature, extent and quality of the services to be provided to the Fund under the Agreement. The Trustees considered the nature, extent and quality of the services to be provided by the Adviser and its affiliates to the Fund, and the resources to be dedicated to the Fund by the Adviser and its affiliates. The Trustees considered the affiliation between the Adviser and Natixis Global Asset Management, L.P. (“Natixis US”), whose affiliates provide investment advisory services to other funds in the same family of mutual funds. In this regard, the Trustees considered not only the advisory services proposed to be provided by the Adviser to the Fund, but also the monitoring and administrative services proposed to be provided by NGAM Advisors, L.P. (“NGAM Advisors”) and its affiliates to the Fund.
The Trustees also considered the benefits to shareholders of investing in a mutual fund that is part of a family of funds that offers shareholders the right to exchange shares of one type
| 22
of fund for shares of another type of fund, and provides a variety of fund and shareholder services.
After reviewing these and related factors, the Trustees concluded, within the context of their overall conclusions regarding the Agreement, that the scope of the services to be provided to the Fund under the Agreement seemed consistent with the Fund’s operational requirements, and that the Adviser had the capabilities, resources and personnel necessary to provide the advisory services that would be required by the Fund. The Trustees determined that the nature, extent and quality of services proposed to be provided under the Agreement supported approval of the Agreement.
Investment performance of the Fund and the Adviser. Because the Fund had not yet commenced operations, performance information for the Fund was not considered; however, the Board reviewed simulated historical performance for the Fund’s proposed strategies. Based on this and other information, the Trustees concluded, within the context of their overall conclusions regarding the Agreement, that these relevant factors supported approval of the Agreement.
The costs of the services to be provided by the Adviser and its affiliates from its relationship with the Fund. Although the Fund had not yet commenced operations at the time of the Trustees’ review of the Agreement, the Trustees reviewed information comparing the proposed advisory fees and estimated total expenses of the Fund’s share classes with the fees and expenses of comparable share classes of comparable funds identified by the Adviser, as well as information about differences in such fees. The Trustees also noted that the Adviser does not have institutional accounts pursuing the Fund’s proposed strategy. In evaluating the fees charged to such comparable accounts, the Trustees considered, among other things, management’s representations about the differences between managing mutual funds as compared to other types of accounts, including the additional resources required to effectively manage, and the greater regulatory costs associated with the management of, mutual fund assets. In evaluating the Fund’s proposed advisory fees, the Trustees also took into account the demands, complexity and quality of the investment management of the Fund and the need for the Adviser to offer competitive compensation. The Trustees also noted that the Fund would have an expense cap in place. In addition, the Trustees considered information regarding the administrative and distribution fees to be paid by the Fund to the Adviser’s affiliates.
Because the Fund had not yet commenced operations, historical profitability information with respect to the Fund was not considered. However, the Trustees noted the information provided in court cases in which adviser profitability was an issue, the estimated expense level of the Fund, and that the Fund would be subject to an expense cap.
After reviewing these and related factors, the Trustees concluded, within the context of their overall conclusions regarding the Agreement, that the advisory fees and expenses proposed to be charged to the Fund were fair and reasonable, and supported the approval of the Agreement.
Economies of scale. The Trustees considered the extent to which the Adviser may realize economies of scale or other efficiencies in managing the Fund, and whether those economies could be shared with the Fund through breakpoints in the advisory fees or other means, such as expense waivers or caps. The Trustees noted that the Fund will be subject to
23 |
an expense cap. After reviewing these and related factors, the Trustees concluded, within the context of their overall conclusions regarding the Agreement, that the extent to which economies of scale might be shared with the Fund supported the approval of the Agreement.
The Trustees also considered other factors, which included but were not limited to the following:
| · | | The compliance-related resources the Adviser and its affiliates would provide to the Fund. |
| · | | So-called “fallout benefits” to the Adviser, such as the engagement of affiliates of the Adviser to provide distribution and administrative services to the Fund, the benefits to Natixis US, NGAM Advisors and the Adviser of being able to offer “alternative” products in the Natixis family of funds, and the benefits of research made available to the Adviser by reason of brokerage commissions (if any) generated by the Fund’s securities transactions. The Trustees also considered the benefits to the Natixis organization from the retention of the Adviser. The Trustees considered the possible conflicts of interest associated with these fallout and other benefits, and the reporting, disclosure and other processes in place to disclose and monitor such possible conflicts of interest. |
Based on their evaluation of all factors that they deemed to be material, including those factors described above, and assisted by the advice of independent counsel, the Trustees, including the Independent Trustees, concluded that the Agreement should be approved.
| 24
Portfolio of Investments – as of December 31, 2014
McDonnell Intermediate Municipal Bond Fund
| | | | | | | | |
Principal
Amount | | | Description | | Value (†) | |
| | Bonds and Notes — 94.5% of Net Assets | | | | |
| | Municipals — 94.5% | |
| | | | Alaska — 2.2% | | | | |
| $ | 600,000 | | | Alaska Municipal Bond Bank Authority Revenue, Refunding, 2011 Series Three, 5.000%, 9/01/2020 | | $ | 710,178 | |
| | | | | | | | |
| | | | California — 4.8% | | | | |
| | 250,000 | | | Alameda Corridor Transportation Authority Revenue, Senior Lien, Refunding, Series A, 5.000%, 10/01/2024 | | | 300,070 | |
| | 380,000 | | | Bay Area Water Supply & Conservation Agency Revenue, Series A, 5.000%, 10/01/2024 | | | 461,974 | |
| | 700,000 | | | Garden Grove Unified School District, 2010 Election, GO, Series C, 5.000%, 8/01/2035 | | | 805,658 | |
| | | | | | | | |
| | | | | | | 1,567,702 | |
| | | | | | | | |
| | | | Colorado — 7.3% | | | | |
| | 260,000 | | | Colorado Springs Utilities System Revenue, Series B-2, 5.000%, 11/15/2033 | | | 305,261 | |
| | 400,000 | | | Colorado State Health Facilities Authority Revenue, Craig Hospital Project, 5.000%, 12/01/2028 | | | 455,300 | |
| | 400,000 | | | Denver City & County School District No. 1, GO, Series B, (State Aid Withholding), 5.000%, 12/01/2026 | | | 479,864 | |
| | 500,000 | | | Regional Transportation District Sales Tax Revenue, Fastracks Project, Refunding, Series A, 5.000%, 11/01/2028 | | | 632,550 | |
| | 450,000 | | | University of Colorado Revenue, Refunding, Series B, 5.000%, 6/01/2019 | | | 520,600 | |
| | | | | | | | |
| | | | | | | 2,393,575 | |
| | | | | | | | |
| | | | Connecticut — 2.6% | | | | |
| | 375,000 | | | Connecticut State Health & Educational Facility Authority Revenue, Yale-New Haven Hospital, Series N, 5.000%, 7/01/2024 | | | 450,090 | |
| | 375,000 | | | State of Connecticut Special Tax Revenue, Second Lien, Transportation Infrastructure, Refunding, Series 1, 5.000%, 2/01/2016 | | | 393,971 | |
| | | | | | | | |
| | | | | | | 844,061 | |
| | | | | | | | |
| | | | Florida — 14.0% | | | | |
| | 500,000 | | | Fernandina Beach Utility System Revenue, Refunding, Series A,
5.000%, 9/01/2027 | | | 569,970 | |
| | 250,000 | | | Florida State Board of Education, GO, Capital Outlay 2011, Refunding, Series B, 5.000%, 6/01/2015 | | | 254,850 | |
| | 400,000 | | | Florida State Board of Governors, University System Improvement Revenue, Refunding, Series A, 5.000%, 7/01/2018 | | | 454,536 | |
| | 500,000 | | | JEA Water & Sewer System Revenue, Series A, 5.000%, 10/01/2016 | | | 539,205 | |
| | 250,000 | | | Miami Beach Health Facilities Authority Revenue, Mt. Sinai Medical Center, Refunding, 5.000%, 11/15/2025 | | | 288,925 | |
| | 750,000 | | | Miami-Dade County Aviation Revenue, Refunding, Series A, AMT, 5.000%, 10/01/2017 | | | 826,470 | |
| | 400,000 | | | Orlando & Orange County Expressway Authority Revenue, Refunding, 5.000%, 7/01/2023 | | | 479,664 | |
| | 600,000 | | | Sarasota County Infrastructure Sales Surtax Revenue, Refunding,
5.000%, 10/01/2022 | | | 726,966 | |
| | 400,000 | | | Sarasota County Utility System Revenue, 5.000%, 10/01/2023 | | | 488,560 | |
| | | | | | | | |
| | | | | | | 4,629,146 | |
| | | | | | | | |
See accompanying notes to financial statements.
25 |
Portfolio of Investments – as of December 31, 2014
McDonnell Intermediate Municipal Bond Fund – (continued)
| | | | | | | | |
Principal
Amount | | | Description | | Value (†) | |
| | | | Georgia — 2.7% | | | | |
| $ | 500,000 | | | Municipal Electric Authority of Georgia Revenue, Series B, 5.000%, 1/01/2021 | | $ | 587,930 | |
| | 250,000 | | | Savannah Hospital Authority Revenue, St. Joseph’s/Candler Health System Obligated Group, Series A, 5.500%, 7/01/2027 | | | 293,652 | |
| | | | | | | | |
| | | | | | | 881,582 | |
| | | | | | | | |
| | | | Hawaii — 1.3% | | | | |
| | 400,000 | | | Honolulu City and County, GO, Series B, 5.000%, 8/01/2016 | | | 428,628 | |
| | | | | | | | |
| | | | Illinois — 4.4% | | | | |
| | 370,000 | | | Illinois Finance Authority Revenue, Children’s Memorial Hospital, Series B, 5.500%, 8/15/2028 | | | 415,958 | |
| | 500,000 | | | Illinois Finance Authority Revenue, Loyola University Chicago, Series B, 5.000%, 7/01/2020 | | | 575,325 | |
| | 100,000 | | | Illinois Finance Authority Revenue, Loyola University Chicago, Series B, 5.000%, 7/01/2021 | | | 116,313 | |
| | 320,000 | | | Illinois State Toll Highway Authority Revenue, Senior Priority, Series A, (AGM insured), 5.000%, 1/01/2017 | | | 327,587 | |
| | | | | | | | |
| | | | | | | 1,435,183 | |
| | | | | | | | |
| | | | Kentucky — 1.0% | | | | |
| | 275,000 | | | Louisville & Jefferson County, Metropolitan Government Revenue, Jewish Hospital St. Mary’s Healthcare, Prerefunded 02/01/2018@100, 6.125%, 2/01/2037 | | | 318,494 | |
| | | | | | | | |
| | | | Massachusetts — 0.5% | | | | |
| | 150,000 | | | Massachusetts State Development Finance Agency Revenue, Massachusetts College of Pharmacy Allied Health Science, Series F, 4.000%, 7/01/2018 | | | 164,352 | |
| | | | | | | | |
| | | | Michigan — 1.7% | | | | |
| | 545,000 | | | State of Michigan, GO, Prerefunded 11/01/2015@100, Series A, (NATL-RE insured), 5.000%, 11/01/2018 | | | 566,544 | |
| | | | | | | | |
| | | | Minnesota — 2.5% | | | | |
| | 250,000 | | | Minneapolis-St. Paul Metropolitan Airports Commission Revenue, Refunding, 5.000%, 1/01/2017 | | | 271,217 | |
| | 300,000 | | | Minnesota State Higher Education Facilities Authority Revenue, University of St. Thomas, Series 7-U, 5.000%, 4/01/2017 | | | 327,654 | |
| | 200,000 | | | Northern Municipal Power Agency, Electric System Revenue, Series A, 5.000%, 1/01/2023 | | | 234,256 | |
| | | | | | | | |
| | | | | | | 833,127 | |
| | | | | | | | |
| | | | Missouri — 4.1% | | | | |
| | 700,000 | | | Missouri Joint Municipal Electric Utility Commission Power Project Revenue, Refunding, 5.000%, 1/01/2024 | | | 838,817 | |
| | 500,000 | | | Southeast Missouri State University Revenue, Series A, 5.000%, 4/01/2016 | | | 527,625 | |
| | | | | | | | |
| | | | | | | 1,366,442 | |
| | | | | | | | |
| | | | Nebraska — 1.8% | | | | |
| | 500,000 | | | Nebraska Public Power District, General Revenue, Refunding, Series A, 5.000%, 1/01/2028 | | | 581,755 | |
| | | | | | | | |
| | | | Nevada — 1.8% | | | | |
| | 500,000 | | | City of Henderson, GO, Various Purpose, Refunding, 5.000%, 6/01/2026 | | | 598,595 | |
| | | | | | | | |
See accompanying notes to financial statements.
| 26
Portfolio of Investments – as of December 31, 2014
McDonnell Intermediate Municipal Bond Fund – (continued)
| | | | | | | | |
Principal
Amount | | | Description | | Value (†) | |
| | | | New Jersey — 7.6% | | | | |
| $ | 400,000 | | | New Jersey Economic Development Authority Revenue, School Facilities Construction, Prerefunded 03/01/2015@100, Series O, 5.125%, 3/01/2030 | | $ | 403,044 | |
| | 265,000 | | | New Jersey Health Care Facilities Financing Authority Revenue, Refunding, Virtual Health, Inc., 5.000%, 7/01/2023 | | | 314,928 | |
| | 580,000 | | | New Jersey State Transportation Trust Fund Authority Revenue, Prerefunded 06/15/2015@100, Series D, (AGM insured), 5.000%, 6/15/2019 | | | 592,360 | |
| | 500,000 | | | New Jersey State Turnpike Authority Revenue, Series A, 5.000%, 1/01/2032 | | | 583,820 | |
| | 500,000 | | | Rutgers The State University of New Jersey, Refunding, Series J, 5.000%, 5/01/2024 | | | 606,315 | |
| | | | | | | | |
| | | | | | | 2,500,467 | |
| | | | | | | | |
| | | | New York — 1.1% | |
| | 350,000 | | | New York State Dormitory Authority Revenue, Mental Health Services Facility Improvements, (State Appropriation), 5.000%, 2/15/2017 | | | 380,363 | |
| | | | | | | | |
| | | | North Carolina — 1.7% | |
| | 450,000 | | | City of Raleigh, Limited Obligation, Revenue, Series A, 5.000%, 10/01/2024 | | | 557,645 | |
| | | | | | | | |
| | | | Ohio — 8.4% | |
| | 400,000 | | | American Municipal Power Revenue, Hydroelectric Projects, Refunding, Series CA, (AGM insured), 5.000%, 2/15/2021 | | | 453,828 | |
| | 500,000 | | | Columbus, GO, Various Purpose, Series A, 5.000%, 8/15/2023 | | | 616,735 | |
| | 500,000 | | | Hamilton County Hospital Facilities Revenue, UC Health Obligated Group, 5.000%, 2/01/2024 | | | 587,120 | |
| | 500,000 | | | Little Miami School District, GO, Prerefunded 12/01/2016 @ 100, (AGM insured), 5.000%, 12/01/2026 | | | 542,255 | |
| | 500,000 | | | Ohio State Higher Educational Facility Commission Revenue, University of Dayton, 5.000%, 12/01/2030 | | | 578,255 | |
| | | | | | | | |
| | | | | | | 2,778,193 | |
| | | | | | | | |
| | | | Pennsylvania — 3.5% | |
| | 335,000 | | | Delaware County Authority Revenue, Villanova University, 5.000%, 8/01/2019 | | | 385,153 | |
| | 285,000 | | | Delaware River Joint Toll Bridge Commission Revenue, Refunding, Series A, 4.000%, 7/01/2027 | | | 306,953 | |
| | 450,000 | | | Philadelphia Airport Revenue, Refunding, Series D, AMT, 5.000%, 6/15/2016 | | | 477,909 | |
| | | | | | | | |
| | | | | | | 1,170,015 | |
| | | | | | | | |
| | | | Rhode Island — 1.9% | | | | |
| | 500,000 | | | Rhode Island Clean Water Finance Agency Pollution Control Agency Revolving Fund-Pooled Loan, Series A, 5.000%, 10/01/2024 | | | 612,930 | |
| | | | | | | | |
| | | | South Dakota — 1.5% | | | | |
| | 465,000 | | | Sioux Falls Sales Tax Revenue, Series A-1, 4.750%, 11/15/2036 | | | 502,363 | |
| | | | | | | | |
| | | | Texas — 10.3% | | | | |
| | 250,000 | | | Corpus Christi Utility System Revenue, Junior Lien Improvement, 5.000%, 7/15/2021 | | | 295,328 | |
| | 400,000 | | | Garland, GO, Refunding, (AGM insured), 5.000%, 2/15/2016 | | | 420,052 | |
| | 500,000 | | | Harris County Health Facilities Development Authority Revenue, Memorial Hermann Healthcare System, Prerefunded 12/01/2018@100, Series B, 7.125%, 12/01/2031 | | | 614,550 | |
See accompanying notes to financial statements.
27 |
Portfolio of Investments – as of December 31, 2014
McDonnell Intermediate Municipal Bond Fund – (continued)
| | | | | | | | |
Principal
Amount | | | Description | | Value (†) | |
| | | | Texas — continued | | | | |
| $ | 500,000 | | | Keller Independent School District, GO, Refunding, Series A, (PSF-GTD), 5.000%, 8/15/2022 | | $ | 608,125 | |
| | 350,000 | | | State of Texas Water Financial Assistance, GO, Series B, 5.000%, 8/01/2022 | | | 419,576 | |
| | 400,000 | | | Tarrant County Cultural Education Facilities Finance Corp. Revenue, Methodist Hospitals of Dallas, 5.000%, 10/01/2024 | | | 480,812 | |
| | 500,000 | | | West Harris County Regional Water Authority, Water System Revenue, Refunding, (AGM insured), 4.000%, 12/15/2019 | | | 556,540 | |
| | | | | | | | |
| | | | | | | 3,394,983 | |
| | | | | | | | |
| | | | Utah — 0.9% | | | | |
| | 250,000 | | | Utah State Transit Authority Sales Tax Revenue, Refunding, 5.000%, 6/15/2024 | | | 291,090 | |
| | | | | | | | |
| | | | Washington — 4.9% | | | | |
| | 500,000 | | | Port of Seattle Revenue, AMT, 5.000%, 7/01/2029 | | | 562,860 | |
| | 400,000 | | | Port of Seattle Special Facility Revenue, Refunding, AMT, SEATAC Fuel Facility LLC, 5.000%, 6/01/2020 | | | 454,568 | |
| | 500,000 | | | Snohomish County School District No. 15 Edmonds, GO, 5.000%, 12/01/2031 | | | 599,515 | |
| | | | | | | | |
| | | | | | | 1,616,943 | |
| | | | | | | | |
| | | | Total Bonds and Notes
(Identified Cost $30,361,259) | | | 31,124,356 | |
| | | | | | | | |
| | Short-Term Investments — 4.5% | |
| | 1,481,381 | | | Tri-Party Repurchase Agreement with Fixed Income Clearing Corporation, dated 12/31/2014 at 0.010% to be repurchased at $1,481,382 on 1/02/2015 collateralized by $1,475,000 U.S. Treasury Note, 2.375% due 8/15/2024 valued at $1,515,563 including accrued interest (Note 2 of Notes to Financial Statements) (Identified Cost $1,481,381) | | | 1,481,381 | |
| | | | | | | | |
| | | | | | | | |
| | | | Total Investments — 99.0% (Identified Cost $31,842,640)(a) | | | 32,605,737 | |
| | | | Other assets less liabilities — 1.0% | | | 329,471 | |
| | | | | | | | |
| | | | Net Assets — 100.0% | | $ | 32,935,208 | |
| | | | | | | | |
| | . | | | | | | | |
| | (†) | | | See Note 2 of Notes to Financial Statements | |
| | (a) | | | Federal Tax Information: At December 31, 2014, the net unrealized appreciation on investments based on a cost of $31,842,640 for federal income tax purposes was as follows: | |
| | | | Aggregate gross unrealized appreciation for all investments in which there is an excess of value over tax cost | | $ | 783,276 | |
| | | | Aggregate gross unrealized depreciation for all investments in which there is an excess of tax cost over value | | | (20,179 | ) |
| | | | | | | | |
| | | | Net unrealized appreciation | | $ | 763,097 | |
| | | | | | | | |
| | | | | | | | |
| | AGM | | | Assured Guaranty Municipal Corporation | | | | |
| | AMT | | | Alternative Minimum Tax | | | | |
| | GO | | | General Obligation | | | | |
| | NATL-RE | | | National Public Finance Guarantee Corporation | | | | |
| | PSF-GTD | | | Permanent School Fund Guarantee Program | | | | |
See accompanying notes to financial statements.
| 28
Portfolio of Investments – as of December 31, 2014
McDonnell Intermediate Municipal Bond Fund – (continued)
Holdings Summary at December 31, 2014
| | | | | | |
Medical | | | 14.1 | % |
General | | | 12.9 | |
Higher Education | | | 12.9 | |
General Obligation | | | 10.1 | |
Water | | | 9.8 | |
School District | | | 9.2 | |
Power | | | 7.5 | |
Transportation | | | 7.4 | |
Airport | | | 4.7 | |
Utilities | | | 2.5 | |
Bond Bank | | | 2.2 | |
Education | | | 1.2 | |
Short-Term Investments | | | 4.5 | |
| | | | | | |
Total Investments | | | 99.0 | |
Other assets less liabilities | | | 1.0 | |
| | | | | | |
Net Assets | | | 100.0 | % |
| | | | | | |
See accompanying notes to financial statements.
29 |
Portfolio of Investments – as of December 31, 2014
Natixis Diversified Income Fund
| | | | | | | | |
| Shares | | | Description | | Value (†) | |
| | Common Stocks — 50.8% of Net Assets | | | | |
| | | | Aerospace & Defense — 2.1% | | | | |
| | 5,727 | | | General Dynamics Corp. | | $ | 788,150 | |
| | 4,775 | | | Honeywell International, Inc. | | | 477,118 | |
| | 8,876 | | | Lockheed Martin Corp. | | | 1,709,251 | |
| | 5,204 | | | Northrop Grumman Corp. | | | 767,018 | |
| | | | | | | | |
| | | | | | | 3,741,537 | |
| | | | | | | | |
| | | | Automobiles — 0.2% | | | | |
| | 7,584 | | | Ford Motor Co. | | | 117,552 | |
| | 7,408 | | | General Motors Co. | | | 258,613 | |
| | | | | | | | |
| | | | | | | 376,165 | |
| | | | | | | | |
| | | | Banks — 0.9% | | | | |
| | 7,240 | | | Bank of Hawaii Corp. | | | 429,404 | |
| | 6,067 | | | BB&T Corp. | | | 235,946 | |
| | 9,023 | | | F.N.B. Corp. | | | 120,186 | |
| | 6,764 | | | First Niagara Financial Group, Inc. | | | 57,021 | |
| | 6,694 | | | FirstMerit Corp. | | | 126,450 | |
| | 7,961 | | | Trustmark Corp. | | | 195,363 | |
| | 9,414 | | | United Bankshares, Inc. | | | 352,554 | |
| | 10,355 | | | Valley National Bancorp | | | 100,547 | |
| | | | | | | | |
| | | | | | | 1,617,471 | |
| | | | | | | | |
| | | | Beverages — 0.1% | | | | |
| | 6,383 | | | Coca-Cola Co. (The) | | | 269,490 | |
| | | | | | | | |
| | | | Biotechnology — 0.1% | | | | |
| | 16,879 | | | PDL BioPharma, Inc. | | | 130,137 | |
| | | | | | | | |
| | | | Capital Markets — 0.2% | | | | |
| | 8,913 | | | Federated Investors, Inc., Class B | | | 293,505 | |
| | | | | | | | |
| | | | Chemicals — 0.2% | | | | |
| | 6,798 | | | Olin Corp. | | | 154,790 | |
| | 5,549 | | | RPM International, Inc. | | | 281,390 | |
| | | | | | | | |
| | | | | | | 436,180 | |
| | | | | | | | |
| | | | Commercial Services & Supplies — 0.8% | | | | |
| | 4,669 | | | Deluxe Corp. | | | 290,645 | |
| | 7,783 | | | Pitney Bowes, Inc. | | | 189,672 | |
| | 12,506 | | | R.R. Donnelley & Sons Co. | | | 210,163 | |
| | 7,014 | | | Republic Services, Inc. | | | 282,314 | |
| | 7,631 | | | Waste Management, Inc. | | | 391,623 | |
| | | | | | | | |
| | | | | | | 1,364,417 | |
| | | | | | | | |
| | | | Containers & Packaging — 0.5% | | | | |
| | 5,512 | | | Avery Dennison Corp. | | | 285,963 | |
| | 6,542 | | | MeadWestvaco Corp. | | | 290,399 | |
| | 7,044 | | | Sonoco Products Co. | | | 307,823 | |
| | | | | | | | |
| | | | | | | 884,185 | |
| | | | | | | | |
See accompanying notes to financial statements.
| 30
Portfolio of Investments – as of December 31, 2014
Natixis Diversified Income Fund – (continued)
| | | | | | | | |
| Shares | | | Description | | Value (†) | |
| | | | Distributors — 0.4% | | | | |
| | 6,041 | | | Genuine Parts Co. | | $ | 643,789 | |
| | | | | | | | |
| | | | Diversified Telecommunication Services — 0.6% | | | | |
| | 12,159 | | | AT&T, Inc. | | | 408,421 | |
| | 16,130 | | | CenturyLink, Inc. | | | 638,425 | |
| | | | | | | | |
| | | | | | | 1,046,846 | |
| | | | | | | | |
| | | | Electric Utilities — 3.9% | | | | |
| | 10,019 | | | American Electric Power Co., Inc. | | | 608,354 | |
| | 7,354 | | | Cleco Corp. | | | 401,087 | |
| | 6,844 | | | Edison International | | | 448,145 | |
| | 12,514 | | | Entergy Corp. | | | 1,094,725 | |
| | 10,125 | | | Exelon Corp. | | | 375,435 | |
| | 15,702 | | | FirstEnergy Corp. | | | 612,221 | |
| | 7,806 | | | IDACORP, Inc. | | | 516,679 | |
| | 7,347 | | | NextEra Energy, Inc. | | | 780,913 | |
| | 8,230 | | | Northeast Utilities | | | 440,469 | |
| | 5,687 | | | OGE Energy Corp. | | | 201,775 | |
| | 9,906 | | | Pinnacle West Capital Corp. | | | 676,679 | |
| | 11,501 | | | PPL Corp. | | | 417,831 | |
| | 9,281 | | | Xcel Energy, Inc. | | | 333,373 | |
| | | | | | | | |
| | | | | | | 6,907,686 | |
| | | | | | | | |
| | | | Electrical Equipment — 0.4% | | | | |
| | 5,415 | | | Eaton Corp. PLC | | | 368,004 | |
| | 5,925 | | | Emerson Electric Co. | | | 365,750 | |
| | | | | | | | |
| | | | | | | 733,754 | |
| | | | | | | | |
| | | | Energy Equipment & Services — 0.3% | | | | |
| | 11,849 | | | Ensco PLC, Class A | | | 354,878 | |
| | 12,236 | | | Noble Corp. PLC | | | 202,750 | |
| | | | | | | | |
| | | | | | | 557,628 | |
| | | | | | | | |
| | | | Food & Staples Retailing — 0.2% | | | | |
| | 7,178 | | | Sysco Corp. | | | 284,895 | |
| | | | | | | | |
| | | | Food Products — 0.4% | | | | |
| | 7,024 | | | Campbell Soup Co. | | | 309,056 | |
| | 6,872 | | | General Mills, Inc. | | | 366,484 | |
| | | | | | | | |
| | | | | | | 675,540 | |
| | | | | | | | |
| | | | Gas Utilities — 0.7% | | | | |
| | 9,542 | | | AGL Resources, Inc. | | | 520,134 | |
| | 8,835 | | | New Jersey Resources Corp. | | | 540,702 | |
| | 7,441 | | | Questar Corp. | | | 188,109 | |
| | | | | | | | |
| | | | | | | 1,248,945 | |
| | | | | | | | |
| | | | Hotels, Restaurants & Leisure — 1.4% | | | | |
| | 9,803 | | | Darden Restaurants, Inc. | | | 574,750 | |
| | 27,200 | | | Extended Stay America, Inc. | | | 525,232 | |
| | 24,400 | | | Hilton Worldwide Holdings, Inc.(b) | | | 636,596 | |
| | 7,800 | | | McDonald’s Corp. | | | 730,860 | |
| | | | | | | | |
| | | | | | | 2,467,438 | |
| | | | | | | | |
See accompanying notes to financial statements.
31 |
Portfolio of Investments – as of December 31, 2014
Natixis Diversified Income Fund – (continued)
| | | | | | | | |
| Shares | | | Description | | Value (†) | |
| | | | Household Durables — 0.7% | | | | |
| | 8,564 | | | Garmin Ltd. | | $ | 452,436 | |
| | 9,508 | | | Leggett & Platt, Inc. | | | 405,136 | |
| | 6,018 | | | Tupperware Brands Corp. | | | 379,134 | |
| | | | | | | | |
| | | | | | | 1,236,706 | |
| | | | | | | | |
| | | | Household Products — 0.9% | | | | |
| | 6,884 | | | Clorox Co. (The) | | | 717,382 | |
| | 7,051 | | | Kimberly-Clark Corp. | | | 814,672 | |
| | | | | | | | |
| | | | | | | 1,532,054 | |
| | | | | | | | |
| | | | Industrial Conglomerates — 0.1% | | | | |
| | 6,539 | | | General Electric Co. | | | 165,241 | |
| | | | | | | | |
| | | | Insurance — 0.9% | | | | |
| | 6,963 | | | Arthur J. Gallagher & Co. | | | 327,818 | |
| | 7,477 | | | Cincinnati Financial Corp. | | | 387,533 | |
| | 11,817 | | | Mercury General Corp. | | | 669,670 | |
| | 10,121 | | | Old Republic International Corp. | | | 148,070 | |
| | | | | | | | |
| | | | | | | 1,533,091 | |
| | | | | | | | |
| | | | Leisure Products — 0.1% | | | | |
| | 7,249 | | | Mattel, Inc. | | | 224,320 | |
| | | | | | | | |
| | | | Media — 0.4% | | | | |
| | 7,001 | | | Cinemark Holdings, Inc. | | | 249,095 | |
| | 7,580 | | | Meredith Corp. | | | 411,746 | |
| | | | | | | | |
| | | | | | | 660,841 | |
| | | | | | | | |
| | | | Metals & Mining — 0.1% | | | | |
| | 5,731 | | | Cliffs Natural Resources, Inc. | | | 40,919 | |
| | 5,644 | | | Commercial Metals Co. | | | 91,941 | |
| | | | | | | | |
| | | | | | | 132,860 | |
| | | | | | | | |
| | | | Multi-Utilities — 4.2% | | | | |
| | 8,537 | | | Alliant Energy Corp. | | | 567,028 | |
| | 10,377 | | | Avista Corp. | | | 366,827 | |
| | 6,994 | | | Black Hills Corp. | | | 370,962 | |
| | 8,307 | | | CenterPoint Energy, Inc. | | | 194,633 | |
| | 8,983 | | | CMS Energy Corp. | | | 312,159 | |
| | 8,158 | | | Dominion Resources, Inc. | | | 627,350 | |
| | 9,104 | | | DTE Energy Co. | | | 786,312 | |
| | 11,797 | | | Integrys Energy Group, Inc. | | | 918,396 | |
| | 7,425 | | | NiSource, Inc. | | | 314,969 | |
| | 10,367 | | | PG&E Corp. | | | 551,939 | |
| | 10,362 | | | Public Service Enterprise Group, Inc. | | | 429,090 | |
| | 10,057 | | | SCANA Corp. | | | 607,443 | |
| | 6,655 | | | Sempra Energy | | | 741,101 | |
| | 11,966 | | | TECO Energy, Inc. | | | 245,183 | |
| | 8,648 | | | Wisconsin Energy Corp. | | | 456,096 | |
| | | | | | | | |
| | | | | | | 7,489,488 | |
| | | | | | | | |
See accompanying notes to financial statements.
| 32
Portfolio of Investments – as of December 31, 2014
Natixis Diversified Income Fund – (continued)
| | | | | | | | |
| Shares | | | Description | | Value (†) | |
| | | | Oil, Gas & Consumable Fuels — 1.3% | | | | |
| | 7,513 | | | Chevron Corp. | | $ | 842,808 | |
| | 9,159 | | | ConocoPhillips | | | 632,521 | |
| | 15,982 | | | HollyFrontier Corp. | | | 599,005 | |
| | 5,962 | | | ONEOK, Inc. | | | 296,848 | |
| | | | | | | | |
| | | | | | | 2,371,182 | |
| | | | | | | | |
| | | | Paper & Forest Products — 0.2% | | | | |
| | 9,783 | | | Domtar Corp. | | | 393,472 | |
| | | | | | | | |
| | | | Pharmaceuticals — 0.9% | | | | |
| | 6,322 | | | Bristol-Myers Squibb Co. | | | 373,188 | |
| | 8,993 | | | Eli Lilly & Co. | | | 620,427 | |
| | 8,058 | | | Merck & Co., Inc. | | | 457,614 | |
| | 7,163 | | | Pfizer, Inc. | | | 223,127 | |
| | | | | | | | |
| | | | | | | 1,674,356 | |
| | | | | | | | |
| | | | Real Estate — 0.1% | | | | |
| | 14,100 | | | American Homes 4 Rent, Class A | | | 240,123 | |
| | | | | | | | |
| | | | Real Estate Management & Development — 0.7% | | | | |
| | 12,200 | | | Alexander & Baldwin, Inc. | | | 478,972 | |
| | 36,600 | | | Forest City Enterprises, Inc., Class A(b) | | | 779,580 | |
| | | | | | | | |
| | | | | | | 1,258,552 | |
| | | | | | | | |
| | | | REITs – Apartments — 4.1% | | | | |
| | 15,600 | | | American Campus Communities, Inc. | | | 645,216 | |
| | 15,200 | | | AvalonBay Communities, Inc. | | | 2,483,528 | |
| | 12,600 | | | Camden Property Trust | | | 930,384 | |
| | 45,400 | | | Equity Residential | | | 3,261,536 | |
| | | | | | | | |
| | | | | | | 7,320,664 | |
| | | | | | | | |
| | | | REITs – Diversified — 1.9% | | | | |
| | 16,800 | | | American Assets Trust, Inc. | | | 668,808 | |
| | 26,200 | | | DuPont Fabros Technology, Inc. | | | 870,888 | |
| | 19,300 | | | Liberty Property Trust | | | 726,259 | |
| | 14,100 | | | STORE Capital Corp. | | | 304,701 | |
| | 6,300 | | | Vornado Realty Trust | | | 741,573 | |
| | | | | | | | |
| | | | | | | 3,312,229 | |
| | | | | | | | |
| | | | REITs – Health Care — 2.9% | | | | |
| | 40,000 | | | HCP, Inc. | | | 1,761,200 | |
| | 25,500 | | | Health Care REIT, Inc. | | | 1,929,585 | |
| | 21,500 | | | Ventas, Inc. | | | 1,541,550 | |
| | | | | | | | |
| | | | | | | 5,232,335 | |
| | | | | | | | |
| | | | REITs – Hotels — 1.3% | | | | |
| | 10,900 | | | Chatham Lodging Trust | | | 315,773 | |
| | 55,100 | | | Host Hotels & Resorts, Inc. | | | 1,309,727 | |
| | 23,200 | | | RLJ Lodging Trust | | | 777,896 | |
| | | | | | | | |
| | | | | | | 2,403,396 | |
| | | | | | | | |
See accompanying notes to financial statements.
33 |
Portfolio of Investments – as of December 31, 2014
Natixis Diversified Income Fund – (continued)
| | | | | | | | |
| Shares | | | Description | | Value (†) | |
| | | | REITs – Manufactured Homes — 0.4% | | | | |
| | 15,100 | | | Equity Lifestyle Properties, Inc. | | $ | 778,405 | |
| | | | | | | | |
| | | | REITs – Office Property — 4.2% | | | | |
| | 35,000 | | | BioMed Realty Trust, Inc. | | | 753,900 | |
| | 18,000 | | | Boston Properties, Inc. | | | 2,316,420 | |
| | 17,700 | | | Douglas Emmett, Inc. | | | 502,680 | |
| | 27,300 | | | Empire State Realty Trust, Inc., Class A | | | 479,934 | |
| | 100,600 | | | Gramercy Property Trust, Inc. | | | 694,140 | |
| | 24,600 | | | Kilroy Realty Corp. | | | 1,699,122 | |
| | 13,300 | | | Paramount Group, Inc.(b) | | | 247,247 | |
| | 47,200 | | | Piedmont Office Realty Trust, Inc., Class A | | | 889,248 | |
| | | | | | | | |
| | | | | | | 7,582,691 | |
| | | | | | | | |
| | | | REITs – Regional Malls — 3.9% | | | | |
| | 8,600 | | | Macerich Co. (The) | | | 717,326 | |
| | 27,500 | | | Simon Property Group, Inc. | | | 5,008,025 | |
| | 16,200 | | | Taubman Centers, Inc. | | | 1,238,004 | |
| | | | | | | | |
| | | | | | | 6,963,355 | |
| | | | | | | | |
| | | | REITs – Shopping Centers — 2.2% | | | | |
| | 23,100 | | | Acadia Realty Trust | | | 739,893 | |
| | 52,500 | | | DDR Corp. | | | 963,900 | |
| | 10,200 | | | Federal Realty Investment Trust | | | 1,361,292 | |
| | 19,900 | | | Ramco-Gershenson Properties Trust | | | 372,926 | |
| | 27,600 | | | Retail Opportunity Investments Corp. | | | 463,404 | |
| | | | | | | | |
| | | | | | | 3,901,415 | |
| | | | | | | | |
| | | | REITs – Single Tenant — 0.3% | | | | |
| | 13,200 | | | National Retail Properties, Inc. | | | 519,684 | |
| | | | | | | | |
| | | | REITs – Storage — 2.1% | | | | |
| | 25,100 | | | CubeSmart | | | 553,957 | |
| | 17,200 | | | Extra Space Storage, Inc. | | | 1,008,608 | |
| | 12,200 | | | Public Storage | | | 2,255,170 | |
| | | | | | | | |
| | | | | | | 3,817,735 | |
| | | | | | | | |
| | | | REITs – Warehouse/Industrials — 1.6% | | | | |
| | 53,600 | | | ProLogis, Inc. | | | 2,306,408 | |
| | 30,400 | | | Rexford Industrial Realty, Inc. | | | 477,584 | |
| | | | | | | | |
| | | | | | | 2,783,992 | |
| | | | | | | | |
| | | | Semiconductors & Semiconductor Equipment — 0.2% | | | | |
| | 8,429 | | | Intel Corp. | | | 305,888 | |
| | | | | | | | |
| | | | Specialty Retail — 0.1% | | | | |
| | 6,913 | | | Staples, Inc. | | | 125,264 | |
| | | | | | | | |
| | | | Technology Hardware, Storage & Peripherals — 0.3% | | | | |
| | 7,958 | | | Seagate Technology PLC | | | 529,207 | |
| | | | | | | | |
| | | | Thrifts & Mortgage Finance — 0.2% | | | | |
| | 14,197 | | | New York Community Bancorp, Inc. | | | 227,152 | |
| | 10,125 | | | People’s United Financial, Inc. | | | 153,697 | |
| | | | | | | | |
| | | | | | | 380,849 | |
| | | | | | | | |
See accompanying notes to financial statements.
| 34
Portfolio of Investments – as of December 31, 2014
Natixis Diversified Income Fund – (continued)
| | | | | | | | |
| | |
| Shares | | | Description | | Value (†) | |
| | | | Tobacco — 1.1% | | | | |
| | 11,689 | | | Altria Group, Inc. | | $ | 575,917 | |
| | 9,977 | | | Lorillard, Inc. | | | 627,953 | |
| | 10,036 | | | Philip Morris International, Inc. | | | 817,432 | |
| | | | | | | | |
| | | | | | | 2,021,302 | |
| | | | | | | | |
| | | | Trading Companies & Distributors — 0.0% | | | | |
| | 176 | | | United Rentals, Inc.(b) | | | 17,954 | |
| | | | | | | | |
| | | | Total Common Stocks (Identified Cost $75,086,154) | | | 90,588,259 | |
| | | | | | | | |
| | | | | | | | |
Principal
Amount (‡) | | | | | | |
| | Bonds and Notes — 43.7% | | | | |
| | Non-Convertible Bonds — 41.7% | | | | |
| | | | ABS Car Loan — 1.1% | | | | |
| $ | 125,000 | | | CarNow Auto Receivables Trust, Series 2014-1A, Class C, 2.810%, 11/15/2018, 144A | | | 124,329 | |
| | 100,000 | | | CPS Auto Receivables Trust, Series 2014-C, Class C, 3.770%, 8/17/2020, 144A | | | 99,914 | |
| | 160,000 | | | CPS Auto Trust, Series 2014-D, Class C, 4.350%, 11/16/2020, 144A | | | 159,982 | |
| | 135,000 | | | DT Auto Owner Trust, Series 2014-3A, Class D, 4.470%, 11/15/2021, 144A | | | 134,744 | |
| | 35,000 | | | First Investors Auto Owner Trust, Series 2014-1A, Class D, 3.280%, 4/15/2021, 144A | | | 34,545 | |
| | 65,000 | | | First Investors Auto Owner Trust, Series 2014-2A, Class D, 3.470%, 2/15/2021, 144A | | | 64,264 | |
| | 55,000 | | | First Investors Auto Owner Trust, Series 2014-3A, Class D, 3.850%, 2/15/2022, 144A | | | 54,901 | |
| | 90,000 | | | Flagship Credit Auto Trust, Series 2013-2, Class C, 4.420%, 12/16/2019, 144A | | | 91,909 | |
| | 40,000 | | | Flagship Credit Auto Trust, Series 2014-2, Class C, 3.950%, 12/15/2020, 144A | | | 40,025 | |
| | 37,059 | | | Ford Credit Auto Owner Trust, Series 2011-B, Class A4, 1.350%, 12/15/2016 | | | 37,154 | |
| | 145,435 | | | Ford Credit Auto Owner Trust, Series 2013-B, Class A3, 0.570%, 10/15/2017 | | | 145,428 | |
| | 310,000 | | | Honda Auto Receivables Owner Trust, Series 2013-2, Class A3, 0.530%, 2/16/2017 | | | 309,994 | |
| | 24,534 | | | Nissan Auto Receivables Owner Trust, Series 2011-A, Class A4, 1.940%, 9/15/2017 | | | 24,636 | |
| | 34,493 | | | Nissan Auto Receivables Owner Trust, Series 2013-A, Class A3, 0.500%, 5/15/2017 | | | 34,497 | |
| | 325,000 | | | Nissan Auto Receivables Owner Trust, Series 2013-C, Class A3, 0.670%, 8/15/2018 | | | 324,211 | |
| | 95,000 | | | Santander Drive Auto Receivables Trust, Series 2014-4, Class D, 3.100%, 11/16/2020 | | | 95,122 | |
| | 30,000 | | | SNAAC Auto Receivables Trust, Series 2014-1A, Class D, 2.880%, 1/15/2020, 144A | | | 30,170 | |
| | 94,000 | | | World Omni Auto Receivables Trust, Series 2013-A, Class A3, 0.640%, 4/16/2018 | | | 93,941 | |
| | | | | | | | |
| | | | | | | 1,899,766 | |
| | | | | | | | |
See accompanying notes to financial statements.
35 |
Portfolio of Investments – as of December 31, 2014
Natixis Diversified Income Fund – (continued)
| | | | | | | | |
Principal
Amount (‡) | | | Description | | Value (†) | |
| | | | ABS Credit Card — 0.4% | | | | |
| $ | 300,000 | | | American Express Credit Account Secured Note Trust, Series 2012-4, Class A, 0.401%, 5/15/2020(c) | | $ | 299,436 | |
| | 100,000 | | | Chase Issuance Trust, Series 2012-A5, Class A5, 0.590%, 8/15/2017 | | | 100,031 | |
| | 100,000 | | | Chase Issuance Trust, Series 2012-A8, Class A8, 0.540%, 10/16/2017 | | | 99,951 | |
| | 298,000 | | | Citibank Credit Card Issuance Trust, Series 2013-A2, Class A2, 0.447%, 5/26/2020(c) | | | 297,532 | |
| | | | | | | | |
| | | | | | | 796,950 | |
| | | | | | | | |
| | | | ABS Home Equity — 1.7% | | | | |
| | 51,464 | | | Alternative Loan Trust, Series 2003-20CB, Class 2A1, 5.750%, 10/25/2033 | | | 53,111 | |
| | 165,000 | | | American Homes 4 Rent, Series 2014-SFR1, Class D, 2.350%, 6/17/2031, 144A(c) | | | 160,359 | |
| | 52,898 | | | Banc of America Alternative Loan Trust, Series 2003-10, Class 1A1, 5.500%, 12/25/2033 | | | 54,413 | |
| | 88,427 | | | Banc of America Alternative Loan Trust, Series 2003-10, Class 3A1, 5.500%, 12/25/2033 | | | 90,714 | |
| | 121,855 | | | Banc of America Funding Trust, Series 2004-B, Class 4A2, 2.486%, 11/20/2034(c) | | | 115,610 | |
| | 24,418 | | | Banc of America Funding Trust, Series 2005-4, Class 1A3, 5.500%, 8/25/2035 | | | 24,973 | |
| | 64,774 | | | Banc of America Funding Trust, Series 2005-7, Class 3A1, 5.750%, 11/25/2035 | | | 66,407 | |
| | 86,704 | | | Banc of America Mortgage Securities, Inc., Series 2004-A, Class 2A2, 2.693%, 2/25/2034(c) | | | 85,930 | |
| | 30,271 | | | Banc of America Mortgage Securities, Inc., Series 2005-A, Class 2A1, 2.720%, 2/25/2035(c) | | | 29,289 | |
| | 11,792 | | | Bear Stearns Adjustable Rate Mortgage Trust, Series 2004-3, Class 2A, 2.446%, 7/25/2034(c) | | | 11,517 | |
| | 3,723 | | | Bear Stearns Adjustable Rate Mortgage Trust, Series 2004-10, Class 11A1, 2.618%, 1/25/2035(c) | | | 3,647 | |
| | 59,579 | | | Chase Mortgage Finance Trust, Series 2007-A1, Class 3A1, 2.541%, 2/25/2037(c) | | | 58,666 | |
| | 71,297 | | | Countrywide Alternative Loan Trust, Series 2003-4CB, Class 1A1, 5.750%, 4/25/2033 | | | 72,672 | |
| | 164,696 | | | Countrywide Alternative Loan Trust, Series 2004-27CB, Class A1, 6.000%, 12/25/2034 | | | 164,552 | |
| | 42,946 | | | Countrywide Alternative Loan Trust, Series 2004-J3, Class 1A1, 5.500%, 4/25/2034 | | | 44,311 | |
| | 25,000 | | | Countrywide Asset-Backed Certificates, Series 2004-13, Class AF5B, 5.103%, 5/25/2035 | | | 24,505 | |
| | 23,354 | | | Countrywide Home Loan Mortgage Pass Through Trust, Series 2004-HYB4, Class 2A1, 2.396%, 9/20/2034(c) | | | 22,237 | |
| | 36,965 | | | Countrywide Home Loan Mortgage Pass Through Trust, Series 2005-11, Class 4A1, 0.440%, 4/25/2035(c) | | | 31,875 | |
| | 10,235 | | | Credit Suisse First Boston Mortgage Securities Corp., Series 2005-1, Class 3A4, 5.250%, 5/25/2028 | | | 10,344 | |
| | 250,000 | | | Federal Home Loan Mortgage Corp., Series 2014-DN2, Class M2, 1.820%, 4/25/2024(c) | | | 242,193 | |
| | 11,628 | | | GMAC Mortgage Corp. Loan Trust, Series 2003-J7, Class A7, 5.000%, 11/25/2033 | | | 11,671 | |
See accompanying notes to financial statements.
| 36
Portfolio of Investments – as of December 31, 2014
Natixis Diversified Income Fund – (continued)
| | | | | | | | |
Principal
Amount (‡) | | | Description | | Value (†) | |
| | | | ABS Home Equity — continued | | | | |
| $ | 67,376 | | | GMAC Mortgage Corp. Loan Trust, Series 2005-AR4, Class 3A1, 2.959%, 7/19/2035(c) | | $ | 64,284 | |
| | 61,300 | | | GSR Mortgage Loan Trust, Series 2004-14, Class 3A1, 2.757%, 12/25/2034(c) | | | 58,724 | |
| | 88,788 | | | GSR Mortgage Loan Trust, Series 2004-14, Class 5A1, 2.733%, 12/25/2034(c) | | | 88,171 | |
| | 180,214 | | | GSR Mortgage Loan Trust, Series 2005-AR6, Class 4A5, 2.687%, 9/25/2035(c) | | | 181,217 | |
| | 109,612 | | | HarborView Mortgage Loan Trust, Series 2004-3, Class 1A, 2.582%, 5/19/2034(c) | | | 109,234 | |
| | 10,783 | | | IndyMac Index Mortgage Loan Trust, Series 2005-16IP, Class A1, 0.810%, 7/25/2045(c) | | | 9,471 | |
| | 100,000 | | | Invitation Homes Trust, Series 2014-SFR1, Class C, 2.254%, 6/17/2031, 144A(c) | | | 98,712 | |
| | 100,000 | | | Invitation Homes Trust, Series 2014-SFR3, Class D, 3.162%, 12/17/2031, 144A(c) | | | 100,554 | |
| | 41,934 | | | JPMorgan Mortgage Trust, Series 2005-A3, Class 4A1, 2.658%, 6/25/2035(c) | | | 42,434 | |
| | 46,319 | | | MASTR Adjustable Rate Mortgages Trust, Series 2007-1, Class I2A1, 0.330%, 1/25/2047(c) | | | 36,023 | |
| | 45,407 | | | MASTR Alternative Loan Trust, Series 2003-9, Class 4A1, 5.250%, 11/25/2033 | | | 47,054 | |
| | 45,393 | | | MASTR Alternative Loan Trust, Series 2004-5, Class 2A1, 6.000%, 6/25/2034 | | | 47,857 | |
| | 64,915 | | | Morgan Stanley Mortgage Loan Trust, Series 2005-7, Class 7A5, 5.500%, 11/25/2035 | | | 65,981 | |
| | 48,843 | | | New York Mortgage Trust, Series 2006-1, Class 2A2, 2.630%, 5/25/2036(c) | | | 44,061 | |
| | 63,908 | | | Residential Accredit Loans, Inc., Series 2003-QS17, Class CB5, 5.500%, 9/25/2033 | | | 65,150 | |
| | 37,663 | | | Structured Adjustable Rate Mortgage Loan Trust, Series 2004-12, Class 6A, 2.630%, 9/25/2034(c) | | | 37,314 | |
| | 105,462 | | | Structured Asset Securities Corp. Mortgage Pass Through Certificates, Series 2004-20, Class 8A7, 5.750%, 11/25/2034 | | | 110,880 | |
| | 17,977 | | | Structured Asset Securities Corp. Mortgage Pass Through Certificates, Series 2004-21XS, Class 1A5, 5.000%, 12/25/2034(i) | | | 18,198 | |
| | 30,387 | | | WaMu Mortgage Pass Through Certificates, Series 2004-AR1, Class A, 2.419%, 3/25/2034(c) | | | 30,445 | |
| | 103,003 | | | WaMu Mortgage Pass Through Certificates, Series 2004-AR14, Class A1, 2.395%, 1/25/2035(c) | | | 103,421 | |
| | 71,700 | | | WaMu Mortgage Pass Through Certificates, Series 2004-CB2, Class 2A, 5.500%, 7/25/2034 | | | 74,555 | |
| | 21,490 | | | WaMu Mortgage Pass Through Certificates, Series 2007-OA3, Class 2A1A, 0.873%, 4/25/2047(c) | | | 18,705 | |
| | 77,389 | | | Wells Fargo Mortgage Backed Securities Trust, Series 2004-A, Class A1, 2.637%, 2/25/2034(c) | | | 77,549 | |
| | 44,319 | | | Wells Fargo Mortgage Backed Securities Trust, Series 2005-12, Class 1A2, 5.500%, 11/25/2035 | | | 45,206 | |
| | 37,552 | | | Wells Fargo Mortgage Backed Securities Trust, Series 2005-AR10, Class 2A4, 2.614%, 6/25/2035(c) | | | 37,679 | |
| | | | | | | | |
| | | | | | | 2,991,875 | |
| | | | | | | | |
| | | | ABS Other — 0.7% | | | | |
| | 120,000 | | | OneMain Financial Issuance Trust, Series 2014-1A, Class A, 2.430%, 6/18/2024, 144A | | | 119,998 | |
| | 100,000 | | | OneMain Financial Issuance Trust, Series 2014-2A, Class B, 3.020%, 9/18/2024, 144A | | | 100,062 | |
See accompanying notes to financial statements.
37 |
Portfolio of Investments – as of December 31, 2014
Natixis Diversified Income Fund – (continued)
| | | | | | | | |
Principal
Amount (‡) | | | Description | | Value (†) | |
| | | | ABS Other — continued | | | | |
| $ | 205,000 | | | SpringCastle America Funding LLC, Series 2014-AA, Class B, 4.610%, 10/25/2027, 144A | | $ | 206,607 | |
| | 280,000 | | | Springleaf Funding Trust, Series 2013-BA, Class A, 3.920%, 1/16/2023, 144A | | | 282,968 | |
| | 170,000 | | | Springleaf Funding Trust, Series 2014-AA, Class A, 2.410%, 12/15/2022, 144A | | | 169,859 | |
| | 100,000 | | | Springleaf Funding Trust, Series 2014-AA, Class B, 3.450%, 12/15/2022, 144A | | | 100,049 | |
| | 198,333 | | | TAL Advantage V LLC, Series 2014-3A, Class A, 3.270%, 11/21/2039, 144A | | | 199,596 | |
| | | | | | | | |
| | | | | | | 1,179,139 | |
| | | | | | | | |
| | | | Aerospace & Defense — 0.3% | | | | |
| | 200,000 | | | Meccanica Holdings USA, Inc., 6.250%, 1/15/2040, 144A | | | 190,000 | |
| | 300,000 | | | Meccanica Holdings USA, Inc., 7.375%, 7/15/2039, 144A | | | 309,000 | |
| | | | | | | | |
| | | | | | | 499,000 | |
| | | | | | | | |
| | | | Airlines — 1.2% | | | | |
| | 47,615 | | | Air Canada Pass Through Trust, Series 2013-1, Class A, 4.125%, 11/15/2026, 144A | | | 48,091 | |
| | 200,000 | | | American Airlines Pass Through Trust, Series 2013-2, Class C, 6 .000%, 1/15/2017, 144A | | | 201,000 | |
| | 60,000 | | | American Airlines Pass Through Trust, Series 2014-1, Class B, 4.375%, 4/01/2024 | | | 60,879 | |
| | 171,040 | | | British Airways Pass Through Trust, Series 2013-1, Class B, 5.625%, 12/20/2021, 144A | | | 180,904 | |
| | 18,120 | | | Continental Airlines Pass Through Certificates, Series 2012-2, Class B, 5.500%, 4/29/2022 | | | 18,754 | |
| | 80,000 | | | Continental Airlines Pass Through Certificates, Series 2012-3, Class C, 6.125%, 4/29/2018 | | | 85,000 | |
| | 35,290 | | | Continental Airlines Pass Through Trust, Series 2000-1, Class A-1, 8.048%, 5/01/2022 | | | 40,008 | |
| | 12,384 | | | Continental Airlines Pass Through Trust, Series 2007-1, Class A, 5.983%, 10/19/2023 | | | 13,592 | |
| | 692,247 | | | UAL Pass Through Trust, Series 2007-1, Class A, 6.636%, 1/02/2024(d) | | | 747,627 | |
| | 195,000 | | | United Airlines Pass Through Trust, Series 2014-1, Class A, 4.000%, 10/11/2027 | | | 199,869 | |
| | 255,000 | | | United Airlines Pass Through Trust, Series 2014-2, Class A, 3.750%, 3/03/2028 | | | 256,086 | |
| | 116,261 | | | US Airways Pass Through Trust, Series 2012-1A, Class A, 5.900%, 4/01/2026 | | | 129,631 | |
| | 102,978 | | | US Airways Pass Through Trust, Series 2012-1B, Class B, 8.000%, 4/01/2021 | | | 114,306 | |
| | 114,450 | | | US Airways Pass Through Trust, Series 2012-1C, Class C, 9.125%, 10/01/2015 | | | 118,456 | |
| | | | | | | | |
| | | | | | | 2,214,203 | |
| | | | | | | | |
| | | | Automotive — 0.2% | | | | |
| | 165,000 | | | General Motors Co., 5.200%, 4/01/2045 | | | 174,075 | |
| | 150,000 | | | General Motors Financial Co., Inc., 4.375%, 9/25/2021 | | | 156,562 | |
| | 40,000 | | | Goodyear Tire & Rubber Co. (The), 7.000%, 3/15/2028 | | | 41,400 | |
| | 25,000 | | | Lear Corp., 5.375%, 3/15/2024 | | | 25,563 | |
| | | | | | | | |
| | | | | | | 397,600 | |
| | | | | | | | |
| | | | Banking — 2.9% | | | | |
| | 90,000 | | | Ally Financial, Inc., 5.125%, 9/30/2024 | | | 91,350 | |
| | 64,000 | | | Ally Financial, Inc., 8.000%, 11/01/2031 | | | 81,600 | |
See accompanying notes to financial statements.
| 38
Portfolio of Investments – as of December 31, 2014
Natixis Diversified Income Fund – (continued)
| | | | | | | | |
Principal
Amount (‡) | | | Description | | Value (†) | |
| | | | Banking — continued | | | | |
| | 600,000 | | | Banco Santander Brasil S.A., 8.000%, 3/18/2016, 144A, (BRL) | | $ | 215,672 | |
| | 200,000 | | | Bank of America Corp., MTN, 4.200%, 8/26/2024 | | | 203,745 | |
| | 116,000 | | | Bank of America Corp., MTN, 4.250%, 10/22/2026 | | | 115,740 | |
| | 500,000 | | | Bank of Montreal, 1.950%, 1/30/2018 | | | 508,444 | |
| | 500,000 | | | Bank of Nova Scotia, 1.950%, 1/30/2017 | | | 507,575 | |
| | 355,000 | | | Citigroup, Inc., 5.500%, 9/13/2025 | | | 392,809 | |
| | 105,000 | | | Citigroup, Inc., 5.875%, 2/22/2033 | | | 121,116 | |
| | 25,000 | | | Citigroup, Inc., 6.000%, 10/31/2033 | | | 29,501 | |
| | 20,000 | | | Citigroup, Inc., 6.125%, 8/25/2036 | | | 23,841 | |
| | 250,000 | | | Cooperatieve Centrale Raiffeisen-Boerenleenbank BA/Netherlands, 4.625%, 12/01/2023 | | | 265,179 | |
| | 100,000 | | | HBOS PLC, 6.000%, 11/01/2033, 144A | | | 112,932 | |
| | 200,000 | | | ING Bank NV, 5.800%, 9/25/2023, 144A | | | 221,856 | |
| | 520,000 | | | Intesa Sanpaolo SpA, 5.017%, 6/26/2024, 144A | | | 504,668 | |
| | 75,000 | | | JPMorgan Chase & Co., 4.125%, 12/15/2026 | | | 75,076 | |
| | 400,000 | | | JPMorgan Chase & Co., 3.875%, 9/10/2024 | | | 400,340 | |
| | 100,000 | | | Merrill Lynch & Co., Inc., Series C, MTN, 6.050%, 6/01/2034 | | | 120,153 | |
| | 65,000 | | | Morgan Stanley, 5.000%, 11/24/2025 | | | 69,362 | |
| | 175,000 | | | Morgan Stanley, 8.000%, 5/09/2017, (AUD) | | | 157,238 | |
| | 100,000 | | | Morgan Stanley, GMTN, 7.625%, 3/03/2016, (AUD) | | | 85,532 | |
| | 720,000 | | | Morgan Stanley, MTN, 4.100%, 5/22/2023(d) | | | 728,955 | |
| | 40,000 | | | Royal Bank of Scotland Group PLC, 5.500%, (EUR)(e) | | | 45,982 | |
| | | | | | | | |
| | | | | | | 5,078,666 | |
| | | | | | | | |
| | | | Brokerage — 0.3% | | | | |
| | 140,000 | | | Jefferies Group LLC, 5.125%, 1/20/2023 | | | 142,313 | |
| | 65,000 | | | Jefferies Group LLC, 6.250%, 1/15/2036 | | | 63,875 | |
| | 20,000 | | | Jefferies Group LLC, 6.450%, 6/08/2027 | | | 20,751 | |
| | 275,000 | | | Jefferies Group LLC, 6.500%, 1/20/2043 | | | 280,522 | |
| | 95,000 | | | Jefferies Group LLC, 6.875%, 4/15/2021 | | | 107,992 | |
| | | | | | | | |
| | | | | | | 615,453 | |
| | | | | | | | |
| | | | Building Materials — 0.4% | | | | |
| | 20,000 | | | HD Supply, Inc., 7.500%, 7/15/2020 | | | 20,950 | |
| | 170,000 | | | Masco Corp., 5.850%, 3/15/2017 | | | 182,325 | |
| | 30,000 | | | Masco Corp., 5.950%, 3/15/2022 | | | 33,300 | |
| | 40,000 | | | Masco Corp., 6.500%, 8/15/2032 | | | 40,900 | |
| | 20,000 | | | Masco Corp., 7.750%, 8/01/2029 | | | 23,000 | |
| | 200,000 | | | Odebrecht Finance Ltd., 4.375%, 4/25/2025, 144A | | | 171,500 | |
| | 300,000 | | | Odebrecht Finance Ltd., 8.250%, 4/25/2018, 144A, (BRL) | | | 95,365 | |
| | 190,000 | | | Owens Corning, 4.200%, 12/01/2024 | | | 187,505 | |
| | | | | | | | |
| | | | | | | 754,845 | |
| | | | | | | | |
| | | | Cable Satellite — 0.4% | | | | |
| | 10,000 | | | CCO Holdings LLC/CCO Holdings Capital Corp., 5.125%, 2/15/2023 | | | 9,775 | |
| | 315,000 | | | Cox Communications, Inc., 3.850%, 2/01/2025, 144A | | | 317,966 | |
| | 140,000 | | | Time Warner Cable, Inc., 4.500%, 9/15/2042 | | | 143,912 | |
| | 95,000 | | | Time Warner Cable, Inc., 5.500%, 9/01/2041 | | | 110,383 | |
| | 40,000 | | | Time Warner Cable, Inc., 5.875%, 11/15/2040 | | | 47,694 | |
| | | | | | | | |
| | | | | | | 629,730 | |
| | | | | | | | |
See accompanying notes to financial statements.
39 |
Portfolio of Investments – as of December 31, 2014
Natixis Diversified Income Fund – (continued)
| | | | | | | | |
Principal
Amount (‡) | | | Description | | Value (†) | |
| | | | Chemicals — 0.3% | | | | |
| $ | 120,000 | | | Albemarle Corp., 4.150%, 12/01/2024 | | $ | 121,921 | |
| | 200,000 | | | Hercules, Inc., 6.500%, 6/30/2029 | | | 180,000 | |
| | 275,000 | | | INVISTA Finance LLC, 4.250%, 10/15/2019, 144A | | | 275,000 | |
| | 25,000 | | | Methanex Corp., 5.250%, 3/01/2022 | | | 26,855 | |
| | | | | | | | |
| | | | | | | 603,776 | |
| | | | | | | | |
| | | | Consumer Cyclical Services — 0.2% | | | | |
| | 340,000 | | | Alibaba Group Holding Ltd., 3.600%, 11/28/2024, 144A | | | 337,227 | |
| | | | | | | | |
| | | | Consumer Products — 0.1% | | | | |
| | 160,000 | | | Avon Products, Inc., 5.000%, 3/15/2023 | | | 142,800 | |
| | 80,000 | | | Newell Rubbermaid, Inc., 4.000%, 12/01/2024 | | | 81,646 | |
| | | | | | | | |
| | | | | | | 224,446 | |
| | | | | | | | |
| | | | Diversified Manufacturing — 0.1% | | | | |
| | 200,000 | | | Votorantim Cimentos S.A., 7.250%, 4/05/2041, 144A | | | 206,000 | |
| | | | | | | | |
| | | | Electric — 0.5% | | | | |
| | 500,000 | | | EDP Finance BV, 4.900%, 10/01/2019, 144A | | | 520,410 | |
| | 115,000,000 | | | Emgesa S.A. E.S.P., 8.750%, 1/25/2021, 144A, (COP) | | | 52,093 | |
| | 88,000,000 | | | Empresas Publicas de Medellin E.S.P., 8.375%, 2/01/2021, 144A, (COP) | | | 38,910 | |
| | 300,000 | | | Enel SpA, (fixed rate to 9/24/2023, variable rate thereafter), 8.750%, 9/24/2073, 144A | | | 348,375 | |
| | | | | | | | |
| | | | | | | 959,788 | |
| | | | | | | | |
| | | | Finance Companies — 1.8% | | | | |
| | 170,000 | | | Air Lease Corp., 4.250%, 9/15/2024 | | | 171,275 | |
| | 165,000 | | | Aviation Capital Group Corp., 4.625%, 1/31/2018, 144A | | | 171,469 | |
| | 110,000 | | | Aviation Capital Group Corp., 6.750%, 4/06/2021, 144A | | | 124,575 | |
| | 25,000 | | | CIT Group, Inc., 5.000%, 8/15/2022 | | | 25,688 | |
| | 85,000 | | | CIT Group, Inc., 5.000%, 8/01/2023 | | | 87,337 | |
| | 400,000 | | | General Electric Capital Corp., Series A, (fixed rate to 6/15/2022, variable rate thereafter), 7.125%(e) | | | 465,500 | |
| | 80,000 | | | International Lease Finance Corp., 5.875%, 4/01/2019 | | | 86,200 | |
| | 80,000 | | | International Lease Finance Corp., 6.250%, 5/15/2019 | | | 87,400 | |
| | 35,000 | | | International Lease Finance Corp., 8.250%, 12/15/2020 | | | 42,175 | |
| | 105,000 | | | International Lease Finance Corp., 8.625%, 1/15/2022 | | | 130,200 | |
| | 115,000 | | | iStar Financial, Inc., 4.000%, 11/01/2017 | | | 111,837 | |
| | 95,000 | | | iStar Financial, Inc., 5.000%, 7/01/2019 | | | 92,150 | |
| | 140,000 | | | iStar Financial, Inc., 7.125%, 2/15/2018 | | | 147,000 | |
| | 160,000 | | | Ladder Capital Finance Holdings LLLP/Ladder Capital Finance Corp., 5.875%, 8/01/2021, 144A | | | 152,000 | |
| | 30,000 | | | Navient LLC, 4.875%, 6/17/2019 | | | 30,087 | |
| | 412,000 | | | Navient LLC, 5.500%, 1/25/2023 | | | 394,490 | |
| | 5,000 | | | Navient LLC, MTN, 5.500%, 1/15/2019 | | | 5,113 | |
| | 180,000 | | | Navient LLC, MTN, 7.250%, 1/25/2022 | | | 195,300 | |
| | 65,000 | | | Navient LLC, Series A, MTN, 5.000%, 6/15/2018 | | | 64,512 | |
| | 80,000 | | | Navient LLC, Series A, MTN, 8.450%, 6/15/2018 | | | 89,200 | |
| | 115,000 | | | Springleaf Finance Corp., 5.250%, 12/15/2019 | | | 112,700 | |
See accompanying notes to financial statements.
| 40
Portfolio of Investments – as of December 31, 2014
Natixis Diversified Income Fund – (continued)
| | | | | | | | |
Principal
Amount (‡) | | | Description | | Value (†) | |
| | | | Finance Companies — continued | | | | |
| $ | 280,000 | | | Springleaf Finance Corp., 7.750%, 10/01/2021 | | $ | 313,600 | |
| | 110,000 | | | Springleaf Finance Corp., 8.250%, 10/01/2023 | | | 123,200 | |
| | | | | | | | |
| | | | | | | 3,223,008 | |
| | | | | | | | |
| | | | Financial Other — 0.2% | | | | |
| | 200,000 | | | Cielo S.A./Cielo USA, Inc., 3.750%, 11/16/2022, 144A | | | 180,000 | |
| | 105,000 | | | Icahn Enterprises LP/Icahn Enterprises Finance Corp., 4.875%, 3/15/2019 | | | 104,737 | |
| | 50,000 | | | Icahn Enterprises LP/Icahn Enterprises Finance Corp., 5.875%, 2/01/2022 | | | 50,219 | |
| | | | | | | | |
| | | | | | | 334,956 | |
| | | | | | | | |
| | | | Food & Beverage — 0.3% | | | | |
| | 280,000 | | | BRF S.A., 3.950%, 5/22/2023, 144A | | | 258,860 | |
| | 240,000 | | | Tyson Foods, Inc., 3.950%, 8/15/2024 | | | 248,093 | |
| | | | | | | | |
| | | | | | | 506,953 | |
| | | | | | | | |
| | | | Government Owned – No Guarantee — 0.7% | | | | |
| | 59,000 | | | Ecopetrol S.A., 5.875%, 9/18/2023 | | | 62,466 | |
| | 85,000 | | | Ecopetrol S.A., 5.875%, 5/28/2045 | | | 78,625 | |
| | 600,000 | | | Pertamina Persero PT, 4.300%, 5/20/2023, 144A(d) | | | 573,000 | |
| | 315,000 | | | Petrobras Global Finance BV, 6.250%, 3/17/2024 | | | 299,735 | |
| | 250,000 | | | Rio Oil Finance Trust, Series 2014-1, 6.250%, 7/06/2024, 144A | | | 239,083 | |
| | | | | | | | |
| | | | | | | 1,252,909 | |
| | | | | | | | |
| | | | Healthcare — 1.0% | | | | |
| | 95,000 | | | Fresenius Medical Care U.S. Finance II, Inc., 4.125%, 10/15/2020, 144A | | | 95,475 | |
| | 45,000 | | | Fresenius Medical Care U.S. Finance II, Inc., 4.750%, 10/15/2024, 144A | | | 45,450 | |
| | 25,000 | | | HCA, Inc., 7.050%, 12/01/2027 | | | 25,375 | |
| | 75,000 | | | HCA, Inc., 7.500%, 12/15/2023 | | | 84,000 | |
| | 520,000 | | | HCA, Inc., 7.500%, 11/06/2033 | | | 546,000 | |
| | 310,000 | | | HCA, Inc., 7.690%, 6/15/2025 | | | 348,750 | |
| | 20,000 | | | HCA, Inc., 8.360%, 4/15/2024 | | | 23,500 | |
| | 140,000 | | | HCA, Inc., MTN, 7.580%, 9/15/2025 | | | 156,100 | |
| | 50,000 | | | HCA, Inc., MTN, 7.750%, 7/15/2036 | | | 53,500 | |
| | 10,000 | | | Omnicare, Inc., 4.750%, 12/01/2022 | | | 10,125 | |
| | 10,000 | | | Omnicare, Inc., 5.000%, 12/01/2024 | | | 10,250 | |
| | 255,000 | | | Tenet Healthcare Corp., 5.000%, 3/01/2019, 144A | | | 255,319 | |
| | 55,000 | | | Universal Health Services, Inc., 3.750%, 8/01/2019, 144A | | | 55,000 | |
| | 100,000 | | | Universal Health Services, Inc., 4.750%, 8/01/2022, 144A | | | 100,000 | |
| | | | | | | | |
| | | | | | | 1,808,844 | |
| | | | | | | | |
| | | | Home Construction — 0.4% | | | | |
| | 105,000 | | | KB Home, 7.250%, 6/15/2018 | | | 111,825 | |
| | 150,000 | | | KB Home, 7.500%, 9/15/2022 | | | 159,000 | |
| | 145,000 | | | Lennar Corp., 4.750%, 11/15/2022 | | | 142,100 | |
| | 80,000 | | | Pulte Group, Inc., 6.000%, 2/15/2035 | | | 76,400 | |
| | 175,000 | | | Pulte Group, Inc., 6.375%, 5/15/2033 | | | 175,000 | |
| | | | | | | | |
| | | | | | | 664,325 | |
| | | | | | | | |
See accompanying notes to financial statements.
41 |
Portfolio of Investments – as of December 31, 2014
Natixis Diversified Income Fund – (continued)
| | | | | | | | |
Principal
Amount (‡) | | | Description | | Value (†) | |
| | | | Independent Energy — 1.0% | | | | |
| $ | 10,000 | | | California Resources Corp., 5.000%, 1/15/2020, 144A | | $ | 8,675 | |
| | 125,000 | | | California Resources Corp., 5.500%, 9/15/2021, 144A | | | 106,875 | |
| | 120,000 | | | California Resources Corp., 6.000%, 11/15/2024, 144A | | | 101,400 | |
| | 140,000 | | | Chesapeake Energy Corp., 4.875%, 4/15/2022 | | | 136,150 | |
| | 5,000 | | | Chesapeake Energy Corp., 5.375%, 6/15/2021 | | | 4,997 | |
| | 290,000 | | | Continental Resources, Inc., 3.800%, 6/01/2024 | | | 259,418 | |
| | 105,000 | | | Continental Resources, Inc., 4.500%, 4/15/2023 | | | 99,871 | |
| | 35,000 | | | MEG Energy Corp., 6.375%, 1/30/2023, 144A | | | 31,238 | |
| | 25,000 | | | MEG Energy Corp., 6.500%, 3/15/2021, 144A | | | 22,813 | |
| | 35,000 | | | MEG Energy Corp., 7.000%, 3/31/2024, 144A | | | 31,675 | |
| | 240,000 | | | Newfield Exploration Co., 5.625%, 7/01/2024 | | | 237,450 | |
| | 35,000 | | | Newfield Exploration Co., 5.750%, 1/30/2022 | | | 34,650 | |
| | 75,000 | | | Noble Energy, Inc., 3.900%, 11/15/2024 | | | 74,126 | |
| | 50,000 | | | Oasis Petroleum, Inc., 6.875%, 3/15/2022 | | | 45,500 | |
| | 10,000 | | | Oasis Petroleum, Inc., 7.250%, 2/01/2019 | | | 9,550 | |
| | 142,000 | | | Pioneer Natural Resources Co., 7.200%, 1/15/2028 | | | 174,348 | |
| | 5,000 | | | QEP Resources, Inc., 5.375%, 10/01/2022 | | | 4,725 | |
| | 5,000 | | | Rosetta Resources, Inc., 5.625%, 5/01/2021 | | | 4,576 | |
| | 5,000 | | | Rosetta Resources, Inc., 5.875%, 6/01/2022 | | | 4,500 | |
| | 15,000 | | | Rosetta Resources, Inc., 5.875%, 6/01/2024 | | | 13,350 | |
| | 10,000 | | | SM Energy Co., 5.000%, 1/15/2024 | | | 8,650 | |
| | 30,000 | | | SM Energy Co., 6.125%, 11/15/2022, 144A | | | 28,200 | |
| | 105,000 | | | Southwestern Energy Co., 4.100%, 3/15/2022 | | | 103,046 | |
| | 100,000 | | | Talisman Energy, Inc., 3.750%, 2/01/2021 | | | 96,703 | |
| | 5,000 | | | Whiting Petroleum Corp., 5.000%, 3/15/2019 | | | 4,675 | |
| | 135,000 | | | Whiting Petroleum Corp., 5.750%, 3/15/2021 | | | 125,212 | |
| | | | | | | | |
| | | | | | | 1,772,373 | |
| | | | | | | | |
| | | | Life Insurance — 0.1% | | | | |
| | 85,000 | | | American International Group, Inc., 4.875%, 6/01/2022 | | | 95,484 | |
| | 21,000 | | | American International Group, Inc., (fixed rate to 5/15/2038, variable rate thereafter), 8.175%, 5/15/2068 | | | 28,455 | |
| | 95,000 | | | Genworth Holdings, Inc., 4.800%, 2/15/2024 | | | 77,010 | |
| | 5,000 | | | Genworth Holdings, Inc., 4.900%, 8/15/2023 | | | 4,028 | |
| | | | | | | | |
| | | | | | | 204,977 | |
| | | | | | | | |
| | | | Lodging — 0.0% | | | | |
| | 55,000 | | | Hilton Worldwide Finance LLC/Hilton Worldwide Finance Corp., 5.625%, 10/15/2021 | | | 57,475 | |
| | 1,000 | | | Wyndham Worldwide Corp., 6.000%, 12/01/2016 | | | 1,075 | |
| | | | | | | | |
| | | | | | | 58,550 | |
| | | | | | | | |
| | | | Media Entertainment — 0.1% | | | | |
| | 120,000 | | | CCOH Safari LLC, 5.500%, 12/01/2022 | | | 121,800 | |
| | 115,000 | | | CCOH Safari LLC, 5.750%, 12/01/2024 | | | 116,294 | |
| | | | | | | | |
| | | | | | | 238,094 | |
| | | | | | | | |
See accompanying notes to financial statements.
| 42
Portfolio of Investments – as of December 31, 2014
Natixis Diversified Income Fund – (continued)
| | | | | | | | |
Principal
Amount (‡) | | | Description | | Value (†) | |
| | | | Metals & Mining — 1.1% | | | | |
| $ | 255,000 | | | Alcoa, Inc., 5.900%, 2/01/2027 | | $ | 277,732 | |
| | 40,000 | | | Alcoa, Inc., 6.750%, 1/15/2028 | | | 44,983 | |
| | 435,000 | | | Allegheny Technologies, Inc., 5.950%, 1/15/2021 | | | 445,613 | |
| | 225,000 | | | ArcelorMittal, 7.250%, 3/01/2041 | | | 227,250 | |
| | 100,000 | | | ArcelorMittal, 7.500%, 10/15/2039 | | | 103,500 | |
| | 75,000 | | | Barrick North America Finance LLC, 4.400%, 5/30/2021 | | | 75,731 | |
| | 225,000 | | | Glencore Funding LLC, 4.625%, 4/29/2024, 144A | | | 226,080 | |
| | 85,000 | | | Newcrest Finance Pty Ltd., 4.200%, 10/01/2022, 144A | | | 76,692 | |
| | 200,000 | | | Rain CII Carbon LLC/CII Carbon Corp., 8.250%, 1/15/2021, 144A | | | 204,500 | |
| | 200,000 | | | Samarco Mineracao S.A., 4.125%, 11/01/2022, 144A | | | 176,000 | |
| | 145,000 | | | Xstrata Finance Canada Ltd., 4.950%, 11/15/2021, 144A | | | 152,972 | |
| | | | | | | | |
| | | | | | | 2,011,053 | |
| | | | | | | | |
| | | | Midstream — 0.6% | | | | |
| | 70,000 | | | Energy Transfer Partners LP, 5.200%, 2/01/2022 | | | 74,869 | |
| | 50,000 | | | EnLink Midstream Partners LP, 4.400%, 4/01/2024 | | | 50,652 | |
| | 100,000 | | | IFM U.S. Colonial Pipeline 2 LLC, 6.450%, 5/01/2021, 144A | | | 108,710 | |
| | 295,000 | | | Kinder Morgan, Inc., 4.300%, 6/01/2025 | | | 295,137 | |
| | 80,000 | | | Regency Energy Partners LP/Regency Energy Finance Corp., 4.500%, 11/01/2023 | | | 73,400 | |
| | 85,000 | | | Regency Energy Partners LP/Regency Energy Finance Corp., 5.750%, 9/01/2020 | | | 85,213 | |
| | 60,000 | | | Regency Energy Partners LP/Regency Energy Finance Corp., 5.875%, 3/01/2022 | | | 59,850 | |
| | 100,000 | | | Sunoco Logistics Partners Operations LP, 4.250%, 4/01/2024 | | | 101,125 | |
| | 130,000 | | | Targa Resources Partners LP/Targa Resources Partners Finance Corp., 4.125%, 11/15/2019, 144A | | | 125,125 | |
| | 5,000 | | | Targa Resources Partners LP/Targa Resources Partners Finance Corp., 4.250%, 11/15/2023 | | | 4,550 | |
| | 35,000 | | | Targa Resources Partners LP/Targa Resources Partners Finance Corp., 5.250%, 5/01/2023 | | | 33,775 | |
| | 85,000 | | | Targa Resources Partners LP/Targa Resources Partners Finance Corp., 6.375%, 8/01/2022 | | | 86,062 | |
| | 15,000 | | | Targa Resources Partners LP/Targa Resources Partners Finance Corp., 6.875%, 2/01/2021 | | | 15,338 | |
| | | | | | | | |
| | | | | | | 1,113,806 | |
| | | | | | | | |
| | | | Non-Agency Commercial Mortgage-Backed Securities — 0.9% | | | | |
| | 265,000 | | | Credit Suisse Mortgage Capital Certificates, Series 2007-C5, Class A4, 5.695%, 9/15/2040 | | | 285,842 | |
| | 100,000 | | | DBUBS Mortgage Trust, Series 2011-LC1A, Class E, 5.557%, 11/10/2046, 144A(c) | | | 108,341 | |
| | 400,000 | | | Extended Stay America Trust, Series 2013-ESH7, Class D7, 5.053%, 12/05/2031, 144A(c) | | | 411,120 | |
| | 260,000 | | | GS Mortgage Securities Corp. II, Series 2007-GG10, Class AM, 5.796%, 8/10/2045(c) | | | 265,641 | |
| | 100,000 | | | Hilton USA Trust, Series 2013-HLT, Class DFX, 4.407%, 11/05/2030, 144A | | | 102,279 | |
| | 25,000 | | | JPMorgan Chase Commercial Mortgage Securities Trust, Series 2007-LDPX, Class AM, 5.464%, 1/15/2049 | | | 25,913 | |
See accompanying notes to financial statements.
43 |
Portfolio of Investments – as of December 31, 2014
Natixis Diversified Income Fund – (continued)
| | | | | | | | |
Principal
Amount (‡) | | | Description | | Value (†) | |
| | | | Non-Agency Commercial Mortgage-Backed Securities — continued | | | | |
| $ | 100,000 | | | Morgan Stanley Capital I Trust, Series 2007-HQ12, Class AM, 5.592%, 4/12/2049(c) | | $ | 106,396 | |
| | 100,000 | | | Morgan Stanley Re-REMIC Trust, Series 2009-GG10, Class A4B, 5.796%, 8/12/2045, 144A(c) | | | 107,615 | |
| | 100,000 | | | Motel 6 Trust, Series 2012-MTL6, Class D, 3.781%, 10/05/2025, 144A | | | 98,882 | |
| | 60,000 | | | WFRBS Commercial Mortgage Trust, Series 2011-C2, Class D, 5.466%, 2/15/2044, 144A(c) | | | 64,578 | |
| | | | | | | | |
| | | | | | | 1,576,607 | |
| | | | | | | | |
| | | | Oil Field Services — 0.2% | | | | |
| | 300,000 | | | Rowan Cos., Inc., 4.750%, 1/15/2024 | | | 283,160 | |
| | 60,000 | | | Transocean, Inc., 3.800%, 10/15/2022 | | | 48,620 | |
| | 10,000 | | | Transocean, Inc., 6.375%, 12/15/2021 | | | 9,224 | |
| | | | | | | | |
| | | | | | | 341,004 | |
| | | | | | | | |
| | | | Paper — 0.2% | | | | |
| | 205,000 | | | Weyerhaeuser Co., 6.875%, 12/15/2033 | | | 267,998 | |
| | 5,000 | | | Weyerhaeuser Co., 6.950%, 10/01/2027 | | | 6,131 | |
| | 30,000 | | | Weyerhaeuser Co., 7.375%, 3/15/2032 | | | 39,941 | |
| | | | | | | | |
| | | | | | | 314,070 | |
| | | | | | | | |
| | | | Pharmaceuticals — 0.6% | | | | |
| | 300,000 | | | Perrigo Finance PLC, 3.900%, 12/15/2024 | | | 305,488 | |
| | 620,000 | | | Valeant Pharmaceuticals International, 6.375%, 10/15/2020, 144A(d) | | | 647,900 | |
| | 15,000 | | | Valeant Pharmaceuticals International, 6.750%, 8/15/2021, 144A | | | 15,675 | |
| | 10,000 | | | Valeant Pharmaceuticals International, 7.250%, 7/15/2022, 144A | | | 10,662 | |
| | | | | | | | |
| | | | | | | 979,725 | |
| | | | | | | | |
| | | | Property & Casualty Insurance — 0.1% | | | | |
| | 170,000 | | | Old Republic International Corp., 4.875%, 10/01/2024 | | | 177,459 | |
| | | | | | | | |
| | | | REITs – Health Care — 0.1% | | | | |
| | 245,000 | | | HCP, Inc., 3.875%, 8/15/2024 | | | 248,875 | |
| | | | | | | | |
| | | | REITs – Shopping Centers — 0.0% | | | | |
| | 60,000 | | | Retail Opportunity Investments Partnership LP, 4.000%, 12/15/2024 | | | 60,125 | |
| | | | | | | | |
| | | | Retailers — 1.1% | | | | |
| | 125,000 | | | Advance Auto Parts, Inc., 4.500%, 12/01/2023 | | | 132,454 | |
| | 55,000 | | | Best Buy Co., Inc., 5.000%, 8/01/2018 | | | 56,891 | |
| | 248,801 | | | CVS Pass Through Trust, 4.704%, 1/10/2036, 144A | | | 261,510 | |
| | 205,403 | | | CVS Pass Through Trust, 7.507%, 1/10/2032, 144A | | | 261,945 | |
| | 212,994 | | | CVS Pass Through Trust, Series 2014, 4.163%, 8/11/2036, 144A | | | 219,918 | |
| | 400,000 | | | Dillard’s, Inc., 6.625%, 1/15/2018 | | | 438,000 | |
| | 205,000 | | | Dillard’s, Inc., 7.000%, 12/01/2028 | | | 217,300 | |
| | 100,000 | | | Macy’s Retail Holdings, Inc., 6.790%, 7/15/2027 | | | 122,349 | |
| | 225,000 | | | Macy’s Retail Holdings, Inc., 6.900%, 4/01/2029 | | | 286,399 | |
| | 45,000 | | | Toys R Us, Inc., 7.375%, 10/15/2018 | | | 29,475 | |
| | | | | | | | |
| | | | | | | 2,026,241 | |
| | | | | | | | |
See accompanying notes to financial statements.
| 44
Portfolio of Investments – as of December 31, 2014
Natixis Diversified Income Fund – (continued)
| | | | | | | | |
Principal
Amount (‡) | | | Description | | Value (†) | |
| | | | Supermarkets — 0.3% | | | | |
| $ | 215,000 | | | Delhaize Group S.A., 5.700%, 10/01/2040 | | $ | 225,568 | |
| | 320,000 | | | New Albertson’s, Inc., Series C, MTN, 6.625%, 6/01/2028 | | | 254,400 | |
| | | | | | | | |
| | | | | | | 479,968 | |
| | | | | | | | |
| | | | Supranational — 0.5% | | | | |
| | 136,000,000 | | | International Bank for Reconstruction & Development, EMTN, 4.250%, 2/05/2016, (CLP) | | | 225,143 | |
| | 26,380,000 | | | International Finance Corp., 7.800%, 6/03/2019, (INR) | | | 455,467 | |
| | 435,000 | | | International Finance Corp., GMTN, 10.500%, 4/17/2018, (BRL) | | | 163,645 | |
| | | | | | | | |
| | | | | | | 844,255 | |
| | | | | | | | |
| | | | Technology — 1.4% | | | | |
| | 470,000 | | | Alcatel-Lucent USA, Inc., 6.450%, 3/15/2029 | | | 448,850 | |
| | 390,000 | | | Alcatel-Lucent USA, Inc., 6.500%, 1/15/2028 | | | 375,375 | |
| | 110,000 | | | Arrow Electronics, Inc., 3.000%, 3/01/2018 | | | 112,798 | |
| | 195,000 | | | Flextronics International Ltd., 5.000%, 2/15/2023 | | | 198,900 | |
| | 410,000 | | | Ingram Micro, Inc., 4.950%, 12/15/2024 | | | 409,865 | |
| | 415,000 | | | Jabil Circuit, Inc., 4.700%, 9/15/2022 | | | 412,925 | |
| | 295,000 | | | Keysight Technologies, Inc., 4.550%, 10/30/2024, 144A | | | 295,117 | |
| | 225,000 | | | KLA-Tencor Corp., 4.125%, 11/01/2021 | | | 230,475 | |
| | | | | | | | |
| | | | | | | 2,484,305 | |
| | | | | | | | |
| | | | Treasuries — 16.6% | | | | |
| | 15,000(††) | | | Mexican Fixed Rate Bonds, Series M, 4.750%, 6/14/2018, (MXN) | | | 101,443 | |
| | 60,000(††) | | | Mexican Fixed Rate Bonds, Series M, 6.500%, 6/10/2021, (MXN)(d) | | | 427,096 | |
| | 31,500(††) | | | Mexican Fixed Rate Bonds, Series M, 7.750%, 11/13/2042, (MXN) | | | 245,794 | |
| | 60,000(††) | | | Mexican Fixed Rate Bonds, Series M-30, 8.500%, 11/18/2038, (MXN) | | | 502,850 | |
| | 10,000,000 | | | Philippine Government International Bond, 6.250%, 1/14/2036, (PHP) | | | 251,271 | |
| | 700,000 | | | Republic of Brazil, 8.500%, 1/05/2024, (BRL) | | | 241,611 | |
| | 4,230,127 | | | U.S. Treasury Inflation Indexed Bond, 0.125%, 7/15/2024(f) | | | 4,073,811 | |
| | 1,142,131 | | | U.S. Treasury Inflation Indexed Bond, 1.375%, 2/15/2044(f) | | | 1,292,660 | |
| | 2,113,661 | | | U.S. Treasury Inflation Indexed Bond, 3.375%, 4/15/2032(f) | | | 2,997,765 | |
| | 1,392,033 | | | U.S. Treasury Inflation Indexed Note, 0.125%, 4/15/2016(f) | | | 1,387,792 | |
| | 9,231,801 | | | U.S. Treasury Inflation Indexed Note, 0.125%, 4/15/2019(f) | | | 9,130,103 | |
| | 1,185,000 | | | U.S. Treasury Note, 0.250%, 9/30/2015 | | | 1,185,370 | |
| | 1,485,000 | | | U.S. Treasury Note, 0.250%, 10/15/2015 | | | 1,485,116 | |
| | 2,260,000 | | | U.S. Treasury Note, 0.375%, 5/31/2016 | | | 2,258,588 | |
| | 2,570,000 | | | U.S. Treasury Note, 0.625%, 7/15/2016 | | | 2,575,019 | |
| | 400,000 | | | U.S. Treasury Note, 0.875%, 7/15/2017 | | | 399,531 | |
| | 990,000 | | | U.S. Treasury Note, 1.000%, 12/15/2017 | | | 987,679 | |
| | | | | | | | |
| | | | | | | 29,543,499 | |
| | | | | | | | |
| | | | Wireless — 0.3% | | | | |
| | 4,000,000 | | | America Movil SAB de CV, 8.460%, 12/18/2036, (MXN) | | | 271,907 | |
| | 190,000 | | | Crown Castle International Corp., 4.875%, 4/15/2022 | | | 191,900 | |
| | | | | | | | |
| | | | | | | 463,807 | |
| | | | | | | | |
See accompanying notes to financial statements.
45 |
Portfolio of Investments – as of December 31, 2014
Natixis Diversified Income Fund – (continued)
| | | | | | | | |
Principal
Amount (‡) | | | Description | | Value (†) | |
| | | | Wirelines — 1.3% | | | | |
| $ | 10,000 | | | CenturyLink, Inc., 5.625%, 4/01/2020 | | $ | 10,375 | |
| | 80,000 | | | CenturyLink, Inc., 7.650%, 3/15/2042 | | | 79,600 | |
| | 240,000 | | | CenturyLink, Inc., Series P, 7.600%, 9/15/2039 | | | 237,600 | |
| | 75,000 | | | Embarq Corp., 7.995%, 6/01/2036 | | | 83,813 | |
| | 55,000 | | | Level 3 Communications, Inc., 5.750%, 12/01/2022, 144A | | | 55,344 | |
| | 5,000 | | | Level 3 Escrow II, Inc., 5.375%, 8/15/2022, 144A | | | 5,025 | |
| | 35,000 | | | Level 3 Financing, Inc., 6.125%, 1/15/2021 | | | 36,225 | |
| | 75,000 | | | Level 3 Financing, Inc., 7.000%, 6/01/2020 | | | 79,031 | |
| | 70,000 | | | Level 3 Financing, Inc., 8.125%, 7/01/2019 | | | 74,375 | |
| | 85,000 | | | Level 3 Financing, Inc., 8.625%, 7/15/2020 | | | 91,694 | |
| | 400,000 | | | Oi S.A., 9.750%, 9/15/2016, 144A, (BRL) | | | 136,935 | |
| | 15,000 | | | Qwest Capital Funding, Inc., 7.625%, 8/03/2021 | | | 16,163 | |
| | 223,000 | | | Telecom Italia Capital S.A., 6.000%, 9/30/2034 | | | 223,000 | |
| | 402,000 | | | Telecom Italia Capital S.A., 6.375%, 11/15/2033 | | | 412,050 | |
| | 40,000 | | | Telecom Italia Capital S.A., 7.200%, 7/18/2036 | | | 43,000 | |
| | 45,000 | | | Telecom Italia Capital S.A., 7.721%, 6/04/2038 | | | 50,175 | |
| | 75,000 | | | Telefonica Emisiones SAU, 5.134%, 4/27/2020 | | | 83,025 | |
| | 75,000 | | | Telefonica Emisiones SAU, 5.462%, 2/16/2021 | | | 83,624 | |
| | 75,000 | | | Telefonica Emisiones SAU, 7.045%, 6/20/2036 | | | 98,661 | |
| | 100,000 | | | Telefonica Emisiones SAU, EMTN, 5.597%, 3/12/2020, (GBP) | | | 177,907 | |
| | 205,000 | | | Verizon Communications, Inc., 5.150%, 9/15/2023 | | | 226,368 | |
| | | | | | | | |
| | | | | | | 2,303,990 | |
| | | | | | | | |
| | | | Total Non-Convertible Bonds (Identified Cost $73,605,309) | | | 74,422,242 | |
| | | | | | | | |
| | | | | | | | |
| | Convertible Bonds — 2.0% | | | | |
| | | | Construction Machinery — 0.2% | | | | |
| | 190,000 | | | Ryland Group, Inc. (The), 1.625%, 5/15/2018 | | | 256,737 | |
| | 20,000 | | | Trinity Industries, Inc., 3.875%, 6/01/2036 | | | 26,275 | |
| | | | | | | | |
| | | | | | | 283,012 | |
| | | | | | | | |
| | | | Energy — 0.1% | | | | |
| | 135,000 | | | Hornbeck Offshore Services, Inc., 1.500%, 9/01/2019 | | | 112,219 | |
| | 85,000 | | | Peabody Energy Corp., 4.750%, 12/15/2066 | | | 44,625 | |
| | | | | | | | |
| | | | | | | 156,844 | |
| | | | | | | | |
| | | | Home Construction — 0.4% | | | | |
| | 85,000 | | | Lennar Corp., 2.750%, 12/15/2020, 144A | | | 171,700 | |
| | 160,000 | | | Lennar Corp., 3.250%, 11/15/2021, 144A | | | 310,400 | |
| | 220,000 | | | Standard Pacific Corp., 1.250%, 8/01/2032 | | | 246,675 | |
| | | | | | | | |
| | | | | | | 728,775 | |
| | | | | | | | |
| | | | Pharmaceuticals — 0.5% | | | | |
| | 83,000 | | | BioMarin Pharmaceutical, Inc., 0.750%, 10/15/2018 | | | 97,577 | |
| | 92,000 | | | BioMarin Pharmaceutical, Inc., 1.500%, 10/15/2020 | | | 112,758 | |
| | 115,000 | | | Emergent Biosolutions, Inc., 2.875%, 1/15/2021, 144A | | | 129,303 | |
| | 80,000 | | | Gilead Sciences, Inc., Series D, 1.625%, 5/01/2016 | | | 331,100 | |
| | 70,000 | | | Mylan, Inc., 3.750%, 9/15/2015 | | | 295,837 | |
| | | | | | | | |
| | | | | | | 966,575 | |
| | | | | | | | |
See accompanying notes to financial statements.
| 46
Portfolio of Investments – as of December 31, 2014
Natixis Diversified Income Fund – (continued)
| | | | | | | | |
Principal
Amount (‡) | | | Description | | Value (†) | |
| | | | Property & Casualty Insurance — 0.1% | | | | |
| $ | 100,000 | | | Old Republic International Corp., 3.750%, 3/15/2018 | | $ | 115,875 | |
| | | | | | | | |
| | | | REITs – Mortgage — 0.1% | | | | |
| | 70,000 | | | iStar Financial, Inc., 3.000%, 11/15/2016 | | | 88,506 | |
| | | | | | | | |
| | | | Retailers — 0.2% | | | | |
| | 45,000 | | | Iconix Brand Group, Inc., 2.500%, 6/01/2016 | | | 52,959 | |
| | 246,000 | | | Priceline Group, Inc. (The), 0.350%, 6/15/2020 | | | 274,290 | |
| | 45,000 | | | Priceline Group, Inc. (The), 0.900%, 9/15/2021, 144A | | | 42,863 | |
| | | | | | | | |
| | | | | | | 370,112 | |
| | | | | | | | |
| | | | Technology — 0.4% | | | | |
| | 215,000 | | | Ciena Corp., 3.750%, 10/15/2018, 144A | | | 266,197 | |
| | 105,000 | | | Intel Corp., 3.482%, 12/15/2035(c) | | | 137,944 | |
| | 70,000 | | | Novellus Systems, Inc., 2.625%, 5/15/2041 | | | 160,475 | |
| | 45,000 | | | Nuance Communications, Inc., 2.750%, 11/01/2031 | | | 44,859 | |
| | 35,000 | | | Palo Alto Networks, Inc., Zero Coupon, 7/01/2019, 144A | | | 44,209 | |
| | 55,000 | | | Xilinx, Inc., 2.625%, 6/15/2017 | | | 82,775 | |
| | | | | | | | |
| | | | | | | 736,459 | |
| | | | | | | | |
| | | | Transportation Services — 0.0% | | | | |
| | 30,000 | | | Macquarie Infrastructure Co. LLC, 2.875%, 7/15/2019 | | | 34,088 | |
| | | | | | | | |
| | | | Total Convertible Bonds (Identified Cost $2,849,811) | | | 3,480,246 | |
| | | | | | | | |
| | | | | | | | |
| | Municipals — 0.0% | | | | |
| | | | Michigan — 0.0% | | | | |
| | 45,000 | | | Michigan Tobacco Settlement Finance Authority Taxable Turbo, Series A, 7.309%, 6/01/2034 (Identified Cost $45,000) | | | 38,953 | |
| | | | | | | | |
| | | | Total Bonds and Notes (Identified Cost $76,500,120) | | | 77,941,441 | |
| | | | | | | | |
| | | | | | | | |
| Shares | | | | | | |
| | Preferred Stocks — 1.3% | | | | |
| | Non-Convertible Preferred Stocks — 0.5% | | | | |
| | | | Banking — 0.5% | | | | |
| | 4,375 | | | Ally Financial, Inc., Series A, (fixed rate to 5/15/2016, variable rate thereafter), 8.500% | | | 117,600 | |
| | 288 | | | Ally Financial, Inc., Series G, 7.000%, 144A | | | 287,883 | |
| | 4,125 | | | Countrywide Capital IV, 6.750% | | | 104,527 | |
| | 20,424 | | | SunTrust Banks, Inc., Series E, 5.875% | | | 490,401 | |
| | | | | | | | |
| | | | Total Non-Convertible Preferred Stocks (Identified Cost $879,854) | | | 1,000,411 | |
| | | | | | | | |
See accompanying notes to financial statements.
47 |
Portfolio of Investments – as of December 31, 2014
Natixis Diversified Income Fund – (continued)
| | | | | | | | |
| | |
| Shares | | | Description | | Value (†) | |
| | Convertible Preferred Stocks — 0.8% | | | | |
| | | | Banking — 0.1% | | | | |
| | 19 | | | Bank of America Corp., Series L, 7.250% | | $ | 22,096 | |
| | 70 | | | Wells Fargo & Co., Series L, Class A, 7.500% | | | 84,420 | |
| | | | | | | | |
| | | | | | | 106,516 | |
| | | | | | | | |
| | | | Electric — 0.1% | | | | |
| | 1,871 | | | NextEra Energy, Inc., 5.889% | | | 125,245 | |
| | | | | | | | |
| | | | Food Products — 0.1% | | | | |
| | 2,620 | | | Tyson Foods, Inc., 4.750% | | | 131,891 | |
| | | | | | | | |
| | | | Metals & Mining — 0.1% | | | | |
| | 2,888 | | | Alcoa, Inc., Series 1, 5.375% | | | 145,700 | |
| | | | | | | | |
| | | | REITs - Diversified — 0.3% | | | | |
| | 3,130 | | | Crown Castle International Corp., Series A, 4.500% | | | 322,359 | |
| | 2,293 | | | Weyerhaeuser Co., Series A, 6.375% | | | 132,306 | |
| | | | | | | | |
| | | | | | | 454,665 | |
| | | | | | | | |
| | | | REITs - Mortgage — 0.0% | | | | |
| | 1,780 | | | iStar Financial, Inc., Series J, 4.500%(i) | | | 105,234 | |
| | | | | | | | |
| | | | Utility Other — 0.1% | | | | |
| | 1,532 | | | Dominion Resources, Inc., 6.375% | | | 79,679 | |
| | 1,013 | | | Dominion Resources, Inc., Series A, 6.125% | | | 60,790 | |
| | 1,817 | | | Dominion Resources, Inc., Series B, 6.000% | | | 109,238 | |
| | | | | | | | |
| | | | | | | 249,707 | |
| | | | | | | | |
| | | | Total Convertible Preferred Stocks (Identified Cost $1,235,424) | | | 1,318,958 | |
| | | | | | | | |
| | | | Total Preferred Stocks (Identified Cost $2,115,278) | | | 2,319,369 | |
| | | | | | | | |
| | | | | | | | |
Principal
Amount (‡) | | | | | | |
| | Senior Loans — 0.1% | | | | |
| | | | Supermarkets — 0.1% | | | | |
| $ | 78,803 | | | New Albertson’s, Inc., Term Loan, 4.750%, 6/27/2021(c) | | | 77,276 | |
| | | | | | | | |
| | | | Transportation Services — 0.0% | | | | |
| | 24,875 | | | OSG Bulk Ships, Inc., Exit Term Loan, 5.250%, 8/05/2019(c) | | | 24,191 | |
| | | | | | | | |
| | | | Total Senior Loans (Identified Cost $103,075) | | | 101,467 | |
| | | | | | | | |
| | Short-Term Investments — 4.4% | | | | |
| | 7,611,155 | | | Tri-Party Repurchase Agreement with Fixed Income Clearing Corporation, dated 12/31/2014 at 0.010% to be repurchased at $7,611,159 on 1/02/2015 collateralized by $2,450,000 U.S. Treasury Note, 0.750% due 2/28/2018 valued at $2,416,313; $5,215,000 U.S. Treasury Note, 2.375% due 8/15/2024 valued at $5,358,413 including accrued interest (Note 2 of Notes to Financial Statements) | | | 7,611,155 | |
| | 130,000 | | | U.S. Treasury Bills, 0.037%, 2/05/2015(g)(h) | | | 129,997 | |
See accompanying notes to financial statements.
| 48
Portfolio of Investments – as of December 31, 2014
Natixis Diversified Income Fund – (continued)
| | | | | | | | |
Principal
Amount (‡) | | | Description | | Value (†) | |
| | Short-Term Investments — continued | | | | |
| $ | 35,000 | | | U.S. Treasury Bills, 0.055%, 1/02/2015(h) | | $ | 35,000 | |
| | 115,000 | | | U.S. Treasury Bills, 0.090%, 6/11/2015(h) | | | 114,967 | |
| | | | | | | | |
| | | | Total Short-Term Investments (Identified Cost $7,891,104) | | | 7,891,119 | |
| | | | | | | | |
| | | | | | | | |
| | | | Total Investments — 100.3% (Identified Cost $161,695,731)(a) | | | 178,841,655 | |
| | | | Other assets less liabilities — (0.3)% | | | (464,849 | ) |
| | | | | | | | |
| | | | Net Assets — 100.0% | | $ | 178,376,806 | |
| | | | | | | | |
| | | | | | | | |
| | (‡) | | | Principal Amount stated in U.S. dollars unless otherwise noted. | |
| | (†) | | | See Note 2 of Notes to Financial Statements. | |
| | (††) | | | Amount shown represents units. One unit represents a principal amount of 100. | |
| | (a) | | | Federal Tax Information: | |
| | | | At December 31, 2014, the net unrealized appreciation on investments based on a cost of $161,822,864 for federal income tax purposes was as follows: | |
| | | | Aggregate gross unrealized appreciation for all investments in which there is an excess of value over tax cost | | $ | 19,871,679 | |
| | | | Aggregate gross unrealized depreciation for all investments in which there is an excess of tax cost over value | | | (2,852,888 | ) |
| | | | | | | | |
| | | | Net unrealized appreciation | | $ | 17,018,791 | |
| | | | | | | | |
| | | | | | | | |
| | (b) | | | Non-income producing security. | |
| | (c) | | | Variable rate security. Rate as of December 31, 2014 is disclosed. | |
| | (d) | | | All of this security has been designated to cover the Fund’s obligations under open forward foreign currency and futures contracts. | |
| | (e) | | | Perpetual bond with no specified maturity date. | |
| | (f) | | | Treasury Inflation Protected Security (TIPS). | |
| | (g) | | | A portion of this security has been pledged as initial margin for open futures contracts. | |
| | (h) | | | Interest rate represents discount rate at time of purchase; not a coupon rate. | |
| | (i) | | | Fair valued by the Fund’s adviser or deemed to be fair valued pursuant to the Fund’s pricing policies and procedures. At December 31, 2014, the value of these securities amounted to $123,432 or 0.1% of net assets. | |
| | | | | | | | |
| | 144A | | | All or a portion of these securities are exempt from registration under Rule 144A of the Securities Act of 1933. These securities may be resold in transactions exempt from registration, normally to qualified institutional buyers. At December 31, 2014, the value of Rule 144A holdings amounted to $14,427,103 or 8.1% of net assets. | |
| | ABS | | | Asset-Backed Securities | |
| | EMTN | | | Euro Medium Term Note | |
| | GMTN | | | Global Medium Term Note | |
| | MTN | | | Medium Term Note | |
| | REITs | | | Real Estate Investment Trusts | |
| | REMIC | | | Real Estate Mortgage Investment Conduit | |
| | | | | | | | |
| | AUD | | | Australian Dollar | |
| | BRL | | | Brazilian Real | |
See accompanying notes to financial statements.
49 |
Portfolio of Investments – as of December 31, 2014
Natixis Diversified Income Fund – (continued)
| | | | | | |
| | | | | | |
| | CLP | | | Chilean Peso |
| | COP | | | Colombian Peso |
| | EUR | | | Euro |
| | GBP | | | British Pound |
| | INR | | | Indian Rupee |
| | MXN | | | Mexican Peso |
| | PHP | | | Philippine Peso |
At December 31, 2014, the Fund had the following open forward foreign currency contracts:
| | | | | | | | | | | | | | | | | | |
Contract
to
Buy/Sell | | Delivery
Date | | | Currency | | Units
of
Currency | | | Notional
Value | | | Unrealized
Appreciation
(Depreciation) | |
| Sell1 | | | 3/04/2015 | | | British Pound | | | 67,000 | | | $ | 104,378 | | | $ | 1,314 | |
| Sell2 | | | 1/23/2015 | | | Mexican Peso | | | 8,900,000 | | | | 602,579 | | | | 49,622 | |
| | | | | | | | | | | | | | | | | | |
| Total | | | $ | 50,936 | |
| | | | | | | | | | | | | | | | | | |
1 Counterparty is Credit Suisse International.
2 Counterparty is UBS AG.
At December 31, 2014, open short futures contracts were as follows:
| | | | | | | | | | | | | | | | | | |
| Financial Futures | | | | Expiration
Date | | | Contracts | | | Notional
Value | | | Unrealized
Appreciation
(Depreciation) | |
30 Year U.S. Treasury Bond | | | | | 3/20/2015 | | | | 14 | | | $ | 2,023,875 | | | $ | (55,028 | ) |
| | | | | | | | | | | | | | | | | | |
Industry Summary at December 31, 2014
| | | | |
Treasuries | | | 16.6 | % |
REITs – Office Property | | | 4.2 | |
Multi-Utilities | | | 4.2 | |
REITs – Apartments | | | 4.1 | |
REITs – Regional Malls | | | 3.9 | |
Electric Utilities | | | 3.9 | |
Banking | | | 3.5 | |
REITs – Health Care | | | 3.0 | |
Aerospace & Defense | | | 2.4 | |
REITs – Shopping Centers | | | 2.2 | |
REITs – Diversified | | | 2.2 | |
REITs – Storage | | | 2.1 | |
Pharmaceuticals | | | 2.0 | |
Other Investments, less than 2% each | | | 41.6 | |
Short-Term Investments | | | 4.4 | |
| | | | |
Total Investments | | | 100.3 | |
Other assets less liabilities (including forward foreign currency contracts and futures contracts) | | | (0.3 | ) |
| | | | |
Net Assets | | | 100.0 | % |
| | | | |
See accompanying notes to financial statements.
| 50
Portfolio of Investments – as of December 31, 2014
Natixis U.S. Equity Opportunities Fund
| | | | | | | | |
| Shares | | | Description | | Value (†) | |
| | Common Stocks — 97.5% of Net Assets | | | | |
| | | | Air Freight & Logistics — 4.7% | | | | |
| | 233,268 | | | Expeditors International of Washington, Inc. | | $ | 10,406,085 | |
| | 47,800 | | | FedEx Corp. | | | 8,300,948 | |
| | 40,516 | | | United Parcel Service, Inc., Class B | | | 4,504,164 | |
| | | | | | | | |
| | | | | | | 23,211,197 | |
| | | | | | | | |
| | | | Automobiles — 1.6% | | | | |
| | 231,700 | | | General Motors Co. | | | 8,088,647 | |
| | | | | | | | |
| | | | Banks — 6.4% | | | | |
| | 766,300 | | | Bank of America Corp. | | | 13,709,107 | |
| | 164,300 | | | Citigroup, Inc. | | | 8,890,273 | |
| | 145,000 | | | JPMorgan Chase & Co. | | | 9,074,100 | |
| | | | | | | | |
| | | | | | | 31,673,480 | |
| | | | | | | | |
| | | | Beverages — 6.2% | | | | |
| | 113,722 | | | Coca-Cola Co. (The) | | | 4,801,343 | |
| | 58,800 | | | Diageo PLC, Sponsored ADR | | | 6,708,492 | |
| | 143,972 | | | Monster Beverage Corp.(b) | | | 15,599,366 | |
| | 72,468 | | | SABMiller PLC, Sponsored ADR | | | 3,736,450 | |
| | | | | | | | |
| | | | | | | 30,845,651 | |
| | | | | | | | |
| | | | Biotechnology — 1.1% | | | | |
| | 32,527 | | | Amgen, Inc. | | | 5,181,226 | |
| | | | | | | | |
| | | | Capital Markets — 4.6% | | | | |
| | 139,800 | | | Franklin Resources, Inc. | | | 7,740,726 | |
| | 146,863 | | | Greenhill & Co., Inc. | | | 6,403,227 | |
| | 212,780 | | | SEI Investments Co. | | | 8,519,711 | |
| | | | | | | | |
| | | | | | | 22,663,664 | |
| | | | | | | | |
| | | | Communications Equipment — 6.2% | | | | |
| | 486,088 | | | Cisco Systems, Inc. | | | 13,520,538 | |
| | 230,987 | | | QUALCOMM, Inc. | | | 17,169,264 | |
| | | | | | | | |
| | | | | | | 30,689,802 | |
| | | | | | | | |
| | | | Consumer Finance — 2.1% | | | | |
| | 25,285 | | | American Express Co. | | | 2,352,517 | |
| | 99,700 | | | Capital One Financial Corp. | | | 8,230,235 | |
| | | | | | | | |
| | | | | | | 10,582,752 | |
| | | | | | | | |
| | | | Diversified Financial Services — 1.2% | | | | |
| | 127,902 | | | MSCI, Inc. | | | 6,067,671 | |
| | | | | | | | |
| | | | Energy Equipment & Services — 2.3% | | | | |
| | 106,000 | | | Halliburton Co. | | | 4,168,980 | |
| | 85,140 | | | Schlumberger Ltd. | | | 7,271,808 | |
| | | | | | | | |
| | | | | | | 11,440,788 | |
| | | | | | | | |
| | | | Food Products — 2.4% | | | | |
| | 509,479 | | | Danone, Sponsored ADR | | | 6,631,888 | |
| | 130,500 | | | Unilever PLC, Sponsored ADR | | | 5,282,640 | |
| | | | | | | | |
| | | | | | | 11,914,528 | |
| | | | | | | | |
See accompanying notes to financial statements.
51 |
Portfolio of Investments – as of December 31, 2014
Natixis U.S. Equity Opportunities Fund – (continued)
| | | | | | | | |
| Shares | | | Description | | Value (†) | |
| | | | Health Care Equipment & Supplies — 3.9% | |
| | 106,600 | | | Medtronic, Inc. | | $ | 7,696,520 | |
| | 103,743 | | | Varian Medical Systems, Inc.(b) | | | 8,974,807 | |
| | 22,058 | | | Zimmer Holdings, Inc. | | | 2,501,818 | |
| | | | | | | | |
| | | | | | | 19,173,145 | |
| | | | | | | | |
| | | | Health Care Providers & Services — 1.7% | |
| | 81,700 | | | UnitedHealth Group, Inc. | | | 8,259,053 | |
| | | | | | | | |
| | | | Hotels, Restaurants & Leisure — 0.9% | |
| | 60,064 | | | Yum! Brands, Inc. | | | 4,375,662 | |
| | | | | | | | |
| | | | Household Products — 1.0% | |
| | 56,084 | | | Procter & Gamble Co. (The) | | | 5,108,692 | |
| | | | | | | | |
| | | | Industrial Conglomerates — 0.6% | |
| | 117,100 | | | General Electric Co. | | | 2,959,117 | |
| | | | | | | | |
| | | | Insurance — 4.9% | |
| | 112,900 | | | Aflac, Inc. | | | 6,897,061 | |
| | 167,100 | | | American International Group, Inc. | | | 9,359,271 | |
| | 84,400 | | | Aon PLC | | | 8,003,652 | |
| | | | | | | | |
| | | | | | | 24,259,984 | |
| | | | | | | | |
| | | | Internet & Catalog Retail — 5.6% | |
| | 63,361 | | | Amazon.com, Inc.(b) | | | 19,664,086 | |
| | 277,900 | | | Liberty Interactive Corp., Class A(b) | | | 8,175,818 | |
| | | | | | | | |
| | | | | | | 27,839,904 | |
| | | | | | | | |
| | | | Internet Software & Services — 7.8% | |
| | 54,349 | | | Alibaba Group Holding Ltd., Sponsored ADR(b) | | | 5,649,035 | |
| | 157,947 | | | Facebook, Inc., Class A(b) | | | 12,323,025 | |
| | 26,599 | | | Google, Inc., Class A(b) | | | 14,115,025 | |
| | 9,526 | | | Google, Inc., Class C(b) | | | 5,014,487 | |
| | 53,512 | | | HomeAway, Inc.(b) | | | 1,593,587 | |
| | | | | | | | |
| | | | | | | 38,695,159 | |
| | | | | | | | |
| | | | IT Services — 5.9% | |
| | 30,508 | | | Automatic Data Processing, Inc. | | | 2,543,452 | |
| | 121,300 | | | MasterCard, Inc., Class A | | | 10,451,208 | |
| | 61,591 | | | Visa, Inc., Class A | | | 16,149,160 | |
| | | | | | | | |
| | | | | | | 29,143,820 | |
| | | | | | | | |
| | | | Machinery — 1.2% | |
| | 63,300 | | | Illinois Tool Works, Inc. | | | 5,994,510 | |
| | | | | | | | |
| | | | Media — 1.2% | |
| | 78,900 | | | Omnicom Group, Inc. | | | 6,112,383 | |
| | | | | | | | |
| | | | Metals & Mining — 0.5% | |
| | 30,025 | | | Compass Minerals International, Inc. | | | 2,607,071 | |
| | | | | | | | |
| | | | Oil, Gas & Consumable Fuels — 1.8% | |
| | 141,900 | | | Apache Corp. | | | 8,892,873 | |
| | | | | | | | |
See accompanying notes to financial statements.
| 52
Portfolio of Investments – as of December 31, 2014
Natixis U.S. Equity Opportunities Fund – (continued)
| | | | | | | | |
| Shares | | | Description | | Value (†) | |
| | | | Pharmaceuticals — 4.3% | |
| | 41,577 | | | Merck & Co., Inc. | | $ | 2,361,158 | |
| | 70,159 | | | Novartis AG, ADR | | | 6,500,933 | |
| | 157,758 | | | Novo Nordisk AS, Sponsored ADR | | | 6,676,318 | |
| | 129,500 | | | Sanofi, ADR | | | 5,906,495 | |
| | | | | | | | |
| | | | 21,444,904 | |
| | | | | | | | |
| | | | Semiconductors & Semiconductor Equipment — 3.7% | |
| | 7,989 | | | Altera Corp. | | | 295,114 | |
| | 14,919 | | | Analog Devices, Inc. | | | 828,303 | |
| | 154,464 | | | ARM Holdings PLC, Sponsored ADR | | | 7,151,683 | |
| | 246,200 | | | Intel Corp. | | | 8,934,598 | |
| | 22,041 | | | Linear Technology Corp. | | | 1,005,069 | |
| | | | | | | | |
| | | | 18,214,767 | |
| | | | | | | | |
| | | | Software — 9.5% | |
| | 135,218 | | | Autodesk, Inc.(b) | | | 8,121,193 | |
| | 48,985 | | | FactSet Research Systems, Inc. | | | 6,894,639 | |
| | 230,490 | | | Microsoft Corp. | | | 10,706,260 | |
| | 476,435 | | | Oracle Corp. | | | 21,425,282 | |
| | | | | | | | |
| | | | 47,147,374 | |
| | | | | | | | |
| | | | Specialty Retail — 2.7% | |
| | 84,000 | | | Home Depot, Inc. (The) | | | 8,817,480 | |
| | 63,874 | | | Lowe’s Cos., Inc. | | | 4,394,531 | |
| | | | | | | | |
| | | | 13,212,011 | |
| | | | | | | | |
| | | | Technology Hardware, Storage & Peripherals — 1.5% | |
| | 65,600 | | | Apple, Inc. | | | 7,240,928 | |
| | | | | | | | |
| | | | Total Common Stocks (Identified Cost $413,752,497) | | | 483,040,763 | |
| | | | | | | | |
| | | | | | | | |
Principal
Amount | | | | | | |
| | Short-Term Investments — 3.0% | |
| $ | 14,807,748 | | | Tri-Party Repurchase Agreement with Fixed Income Clearing Corporation, dated 12/31/2014 at 0.010% to be repurchased at $14,807,756 on 1/02/2015 collateralized by $14,635,000 U.S. Treasury Note, 2.500% due 5/15/2024 valued at $15,110,638 including accrued interest (Note 2 of Notes to Financial Statements) (Identified Cost $14,807,748) | | | 14,807,748 | |
| | | | | | | | |
| | | | | | | | |
| | | | Total Investments — 100.5% (Identified Cost $428,560,245)(a) | | | 497,848,511 | |
| | | | Other assets less liabilities — (0.5)% | | | (2,286,744 | ) |
| | | | | | | | |
| | | | Net Assets — 100.0% | | $ | 495,561,767 | |
| | | | | | | | |
| | | | | | | | |
| | (†) | | | See Note 2 of Notes to Financial Statements. | |
See accompanying notes to financial statements.
53 |
Portfolio of Investments – as of December 31, 2014
Natixis U.S. Equity Opportunities Fund – (continued)
| | | | | | | | |
| | | | | | | | |
| | (a) | | | Federal Tax Information: | |
| | | | At December 31, 2014, the net unrealized appreciation on investments based on a cost of $429,120,850 for federal income tax purposes was as follows: | |
| | | | Aggregate gross unrealized appreciation for all investments in which there is an excess of value over tax cost | | $ | 78,909,324 | |
| | | | Aggregate gross unrealized depreciation for all investments in which there is an excess of tax cost over value | | | (10,181,663 | ) |
| | | | | | | | |
| | | | Net unrealized appreciation | | $ | 68,727,661 | |
| | | | | | | | |
| | | | | | | | |
| | (b) | | | Non-income producing security. | |
| | | | | | | | |
| | ADR | | | An American Depositary Receipt is a certificate issued by a custodian bank representing the right to receive securities of the foreign issuer described. The values of ADRs may be significantly influenced by trading on exchanges not located in the United States. | |
Industry Summary at December 31, 2014
| | | | |
Software | | | 9.5 | % |
Internet Software & Services | | | 7.8 | |
Banks | | | 6.4 | |
Beverages | | | 6.2 | |
Communications Equipment | | | 6.2 | |
IT Services | | | 5.9 | |
Internet & Catalog Retail | | | 5.6 | |
Insurance | | | 4.9 | |
Air Freight & Logistics | | | 4.7 | |
Capital Markets | | | 4.6 | |
Pharmaceuticals | | | 4.3 | |
Health Care Equipment & Supplies | | | 3.9 | |
Semiconductors & Semiconductor Equipment | | | 3.7 | |
Specialty Retail | | | 2.7 | |
Food Products | | | 2.4 | |
Energy Equipment & Services | | | 2.3 | |
Consumer Finance | | | 2.1 | |
Other Investments, less than 2% each | | | 14.3 | |
Short-Term Investments | | | 3.0 | |
| | | | |
Total Investments | | | 100.5 | |
Other assets less liabilities | | | (0.5 | ) |
| | | | |
Net Assets | | | 100.0 | % |
| | | | |
See accompanying notes to financial statements.
| 54
Portfolio of Investments – as of December 31, 2014
SeeyondSM Multi-Asset Allocation Fund
| | | | | | | | |
Principal
Amount (‡) | | | Description | | Value (†) | |
| | Bonds and Notes — 13.8% of Net Assets | |
| | | | France — 2.6% | |
| $ | 900,000 | | | France Government Bond OAT, | |
| | | | 3.500%, 4/25/2020, (EUR)(b) | | $ | 1,277,284 | |
| | | | | | | | |
| | | | Germany — 2.8% | |
| | 390,000 | | | Bundesrepublik Deutschland, | |
| | | | 1.500%, 2/15/2023, (EUR)(b) | | | 516,054 | |
| | 600,000 | | | Bundesrepublik Deutschland, | |
| | | | 3.250%, 1/04/2020, (EUR)(b) | | | 843,487 | |
| | | | | | | | |
| | | | | | | 1,359,541 | |
| | | | | | | | |
| | | | Japan — 5.1% | |
| | 280,000,000 | | | Japan Government Ten Year Bond, | |
| | | | 1.000%, 3/20/2022, (JPY) | | | 2,486,493 | |
| | | | | | | | |
| | | | Spain — 2.6% | |
| | 850,000 | | | Spain Government Bond, | |
| | | | 4.400%, 10/31/2023, 144A, (EUR)(b) | | | 1,272,369 | |
| | | | | | | | |
| | | | United Kingdom — 0.7% | |
| | 200,000 | | | United Kingdom Gilt, | |
| | | | 2.250%, 9/07/2023, (GBP) | | | 326,620 | |
| | | | | | | | |
| | | | Total Bonds and Notes | |
| | | | (Identified Cost $6,988,888) | | | 6,722,307 | |
| | | | | | | | |
| | | | | | | | |
| Shares | | | | | | |
| | Exchange Traded Funds — 9.2% | |
| | | | United States — 9.2% | |
| | 10,000 | | | iShares® MSCI China ETF(b)(c) | | | 502,300 | |
| | 38,610 | | | iShares® MSCI Emerging Markets ETF(b)(c) | | | 1,516,987 | |
| | 5,900 | | | iShares® MSCI India ETF(b)(c) | | | 177,531 | |
| | 2,425 | | | iShares® MSCI Indonesia ETF(b)(c) | | | 66,542 | |
| | 6,350 | | | iShares® MSCI Malaysia ETF(b)(c) | | | 85,598 | |
| | 800 | | | iShares® MSCI Philippines ETF(b)(c) | | | 30,560 | |
| | 6,025 | | | iShares® MSCI South Korea Capped ETF(b)(c) | | | 333,183 | |
| | 45,000 | | | iShares® MSCI Switzerland Capped ETF(b)(c) | | | 1,426,050 | |
| | 19,530 | | | iShares® MSCI Taiwan ETF(b)(c) | | | 295,098 | |
| | 700 | | | iShares® MSCI Thailand Capped ETF(b)(c) | | | 54,222 | |
| | | | | | | | |
| | | | Total Exchange Traded Funds (Identified Cost $4,882,903) | | | 4,488,071 | |
| | | | | | | | |
| | | | | | | | |
Contracts | | | | | | |
| | Purchased Options — 0.0% | |
| | | | Options on Futures Contracts — 0.0% | |
| | 20 | | | 10 Year U.S. Treasury Note, Put expiring February 20, 2015 at 125 | | | 5,937 | |
| | 14 | | | E-mini S&P 500®, Call expiring January 16, 2015 at 2080 | | | 8,050 | |
| | | | | | | | |
| | | | Total Purchased Options (Identified Cost $26,174) | | | 13,987 | |
| | | | | | | | |
See accompanying notes to financial statements.
55 |
Portfolio of Investments – as of December 31, 2014
SeeyondSM Multi-Asset Allocation Fund – (continued)
| | | | | | | | |
Principal
Amount (‡) | | | Description | | Value (†) | |
| | Short-Term Investments — 59.0% | |
| $ | 13,667,631 | | | Tri-Party Repurchase Agreement with Fixed Income Clearing Corporation, dated 12/31/2014 at 0.010% to be repurchased at $13,667,639 on 1/02/2015 collateralized by $11,740,000 U.S. Treasury Bond, 3.625% due 8/15/2043 valued at $13,941,250 including accrued interest (Note 2 of Notes to Financial Statements) | | $ | 13,667,631 | |
| | 11,000,000 | | | Tri-Party Repurchase Agreement with Fixed Income Clearing Corporation, dated 12/31/2014 at 0.010% to be repurchased at $11,000,006 on 1/02/2015 collateralized by $11,320,000 Federal Farm Credit Banks, 2.700% due 12/02/2024 valued at $11,220,950 including accrued interest (Note 2 of Notes to Financial Statements)(b) | | | 11,000,000 | |
| | 1,100,000 | | | Spain Letras del Tesoro, 0.202%, 3/13/2015, (EUR)(d) | | | 1,329,406 | |
| | 1,800,000 | | | United Kingdom Treasury Bills, 0.387%, 3/16/2015, (GBP)(d) | | | 2,803,398 | |
| | | | | | | | |
| | | | Total Short-Term Investments (Identified Cost $28,837,208) | | | 28,800,435 | |
| | | | | | | | |
| | | | Total Investments — 82.0% (Identified Cost $40,735,173)(a) | | | 40,024,800 | |
| | | | Other assets less liabilities — 18.0% | | | 8,758,971 | |
| | | | | | | | |
| | | | Net Assets — 100.0% | | $ | 48,783,771 | |
| | | | | | | | |
| | | | | | | | |
Contracts | | | | | | |
| | Written Options — (0.0%) | |
| | | | Options on Futures Contracts — (0.0%) | |
| | 20 | | | 10 Year U.S. Treasury Note, Call expiring February 20, 2015 at 129
(Premiums Received $6,564) | | $ | (5,625 | ) |
| | | | | | | | |
| | | | | | | | |
| | (‡) | | | Principal Amount stated in U.S. dollars unless otherwise noted. | |
| | (†) | | | See Note 2 of Notes to Financial Statements. | |
| | (a) | | | Federal Tax Information: | |
| | | | At December 31, 2014, the net unrealized depreciation on investments based on a cost of $40,762,913 for federal income tax purposes was as follows: | |
| | | | Aggregate gross unrealized appreciation for all investments in which there is an excess of value over tax cost | | $ | 4,553 | |
| | | | Aggregate gross unrealized depreciation for all investments in which there is an excess of tax cost over value | | | (742,666 | ) |
| | | | | | | | |
| | | | Net unrealized depreciation | | $ | (738,113 | ) |
| | | | | | | | |
| | | | | | | | |
| | (b) | | | All of this security has been designated to cover the Fund’s obligations under open futures contracts or options. | |
| | (c) | | | iShares® is a registered trademark of BlackRock Institutional Trust Company, N.A. Neither BlackRock Institutional Trust Company, N.A. nor the iShares® Funds make any representations regarding the advisability of investing in the SeeyondSM Multi-Asset Allocation Fund. | |
| | (d) | | | Interest rate represents discount rate at time of purchase; not a coupon rate. | |
| | | | | | | | |
| | 144A | | | All or a portion of these securities are exempt from registration under Rule 144A of the Securities Act of 1933. These securities may be resold in transactions exempt from registration, normally to qualified institutional buyers. At December 31, 2014, the value of Rule 144A holdings amounted to $1,272,369 or 2.6% of net assets. | |
See accompanying notes to financial statements.
| 56
Portfolio of Investments – as of December 31, 2014
SeeyondSM Multi-Asset Allocation Fund – (continued)
| | | | | | |
| | | | | | |
| | ETF | | | Exchange Traded Fund |
| | EUR | | | Euro |
| | GBP | | | British Pound |
| | JPY | | | Japanese Yen |
At December 31, 2014, open long futures contracts were as follows:
| | | | | | | | | | | | | | | | |
| Financial Futures | | Expiration
Date | | | Contracts | | | Notional
Value | | | Unrealized
Appreciation
(Depreciation) | |
ASX SPI 200™ | | | 3/19/2015 | | | | 8 | | | $ | 878,936 | | | $ | 39,984 | |
E-mini NASDAQ 100 | | | 3/20/2015 | | | | 19 | | | | 1,608,445 | | | | 27,540 | |
E-mini S&P 500® | | | 3/20/2015 | | | | 130 | | | | 13,340,600 | | | | 449,149 | |
EURO STOXX 50® | | | 3/20/2015 | | | | 96 | | | | 3,639,444 | | | | 136,924 | |
Euro-BTP | | | 3/06/2015 | | | | 15 | | | | 2,461,242 | | | | 23,576 | |
FTSE 100 Index | | | 3/20/2015 | | | | 21 | | | | 2,134,855 | | | | 94,384 | |
FTSE MIB | | | 3/20/2015 | | | | 13 | | | | 1,499,839 | | | | 46,292 | |
German Euro Bund | | | 3/06/2015 | | | | 25 | | | | 4,715,263 | | | | 83,158 | |
German Euro Bund, Put options at 153* | | | 2/20/2015 | | | | 14 | | | | 4,066 | | | | (3,231 | ) |
IBEX 35 | | | 1/16/2015 | | | | 7 | | | | 867,728 | | | | 28,719 | |
Nikkei 225™ | | | 3/12/2015 | | | | 34 | | | | 2,958,000 | | | | (130,168 | ) |
S&P/TSX 60 Index | | | 3/19/2015 | | | | 7 | | | | 1,026,201 | | | | 64,357 | |
UK Long Gilt | | | 3/27/2015 | | | | 2 | | | | 372,599 | | | | 8,570 | |
Ultra Long U.S. Treasury Bond | | | 3/20/2015 | | | | 10 | | | | 1,651,875 | | | | 73,969 | |
10 Year Japan Government Bond | | | 3/11/2015 | | | | 2 | | | | 2,467,691 | | | | 13,525 | |
10 Year U.S. Treasury Note | | | 3/20/2015 | | | | 20 | | | | 2,535,937 | | | | 13,758 | |
| | | | | | | | | | | | | | | | |
Total | | | $ | 970,506 | |
| | | | | | | | | | | | | | | | |
At December 31, 2014, open short futures contracts were as follows:
| | | | | | | | | | | | | | | | |
| Financial Futures | | Expiration
Date | | | Contracts | | | Notional
Value | | | Unrealized
Appreciation
(Depreciation) | |
CBOE SPX Volatility Index | | | 1/21/2015 | | | | 13 | | | $ | 234,325 | | | $ | 15,691 | |
CBOE SPX Volatility Index | | | 2/18/2015 | | | | 25 | | | | 455,625 | | | | (30,810 | ) |
German Euro Bund, Call options at 157* | | | 2/20/2015 | | | | 14 | | | | 10,164 | | | | (2,384 | ) |
Swiss Franc | | | 3/16/2015 | | | | 3 | | | | 377,775 | | | | 10,304 | |
| | | | | | | | | | | | | | | | |
Total | | | $ | (7,199 | ) |
| | | | | | | | | | | | | | | | |
*Futures on German Euro Bund options are categorized as futures for valuation purposes but carry the risks associated with investments in options (see Note 2 of Notes to Financial Statements).
Industry Summary at December 31, 2014
| | | | |
Treasuries | | | 13.8 | % |
Exchange Traded Funds | | | 9.2 | |
Purchased Options | | | 0.0 | |
Short-Term Investments | | | 59.0 | |
| | | | |
Total Investments | | | 82.0 | |
Other assets less liabilities (including open written options and futures contracts) | | | 18.0 | |
| | | | |
Net Assets | | | 100.0 | % |
| | | | |
See accompanying notes to financial statements.
57 |
Statements of Assets and Liabilities
December 31, 2014
| | | | | | | | | | | | | | | | |
| | | McDonnell
Intermediate
Municipal Bond
Fund | | | Natixis
Diversified
Income
Fund | | | Natixis U.S.
Equity
Opportunities
Fund | | | SeeyondSM
Multi-Asset
Allocation
Fund | |
ASSETS | | | | | | | | | | | | | | | | |
Investments at cost | | $ | 30,361,259 | | | $ | 154,084,576 | | | $ | 413,752,497 | | | $ | 16,067,542 | |
Repurchase agreement(s) at cost | | | 1,481,381 | | | | 7,611,155 | | | | 14,807,748 | | | | 24,667,631 | |
Net unrealized appreciation (depreciation) | | | 763,097 | | | | 17,145,924 | | | | 69,288,266 | | | | (710,373 | ) |
| | | | | | | | | | | | | | | | |
Investments at value | | | 32,605,737 | | | | 178,841,655 | | | | 497,848,511 | | | | 40,024,800 | |
Cash | | | — | | | | 198 | | | | — | | | | — | |
Due from broker (including variation margin on futures contracts (Note 2) | | | — | | | | — | | | | — | | | | 875,752 | |
Foreign currency at value (identified cost $0, $2,674, $0 and $7,541,032, respectively) | | | — | | | | 2,662 | | | | — | | | | 6,946,988 | |
Receivable for Fund shares sold | | | 39,189 | | | | 432,153 | | | | 2,794,182 | | | | — | |
Receivable from investment adviser (Note 6) | | | 9,467 | | | | — | | | | — | | | | — | |
Receivable for securities sold | | | — | | | | 142,590 | | | | 1,577,040 | | | | — | |
Dividends and interest receivable | | | 376,654 | | | | 957,864 | | | | 331,207 | | | | 72,355 | |
Unrealized appreciation on forward foreign currency contracts (Note 2) | | | — | | | | 50,936 | | | | — | | | | — | |
Tax reclaims receivable | | | — | | | | 325 | | | | — | | | | — | |
Unrealized appreciation on futures contracts (Note 2) | | | — | | | | — | | | | — | | | | 1,129,900 | |
| | | | | | | | | | | | | | | | |
TOTAL ASSETS | | | 33,031,047 | | | | 180,428,383 | | | | 502,550,940 | | | | 49,049,795 | |
| | | | | | | | | | | | | | | | |
LIABILITIES | | | | | | | | | | | | | | | | |
Options written, at value (premiums received $0, $0, $0 and $6,564, respectively) (Note 2) | | | — | | | | — | | | | — | | | | 5,625 | |
Payable for securities purchased | | | — | | | | 1,413,151 | | | | 5,001,266 | | | | — | |
Payable for Fund shares redeemed | | | 3,448 | | | | 372,445 | | | | 859,204 | | | | — | |
Payable for variation margin on futures contracts (Note 2) | | | — | | | | 3,938 | | | | — | | | | — | |
Unrealized depreciation on futures contracts (Note 2) | | | — | | | | — | | | | — | | | | 166,593 | |
Distributions payable | | | 9,586 | | | | — | | | | — | | | | — | |
Management fees payable (Note 6) | | | — | | | | 80,856 | | | | 405,182 | | | | 18,387 | |
Deferred Trustees’ fees (Note 6) | | | 19,574 | | | | 94,947 | | | | 523,913 | | | | 4,229 | |
Administrative fees payable (Note 6) | | | 1,217 | | | | 6,308 | | | | 17,839 | | | | 1,773 | |
Payable to distributor (Note 6d) | | | 45 | | | | 1,197 | | | | 1,881 | | | | — | |
Other accounts payable and accrued expenses | | | 61,969 | | | | 78,735 | | | | 179,888 | | | | 69,417 | |
| | | | | | | | | | | | | | | | |
TOTAL LIABILITIES | | | 95,839 | | | | 2,051,577 | | | | 6,989,173 | | | | 266,024 | |
| | | | | | | | | | | | | | | | |
NET ASSETS | | $ | 32,935,208 | | | $ | 178,376,806 | | | $ | 495,561,767 | | | $ | 48,783,771 | |
| | | | | | | | | | | | | | | | |
NET ASSETS CONSIST OF: | | | | | | | | | | | | | | | | |
Paid-in capital | | $ | 32,574,881 | | | $ | 170,446,758 | | | $ | 420,757,348 | | | $ | 49,973,461 | |
Distributions in excess of net investment income/Accumulated net investment loss | | | (1,354 | ) | | | (199,276 | ) | | | (523,913 | ) | | | (763,696 | ) |
Accumulated net realized gain (loss) on investments, futures contracts, options/swaptions written and foreign currency transactions | | | (401,416 | ) | | | (9,006,745 | ) | | | 6,040,066 | | | | (128,073 | ) |
Net unrealized appreciation (depreciation) on investments, futures contracts, options/swaptions written and foreign currency translations | | | 763,097 | | | | 17,136,069 | | | | 69,288,266 | | | | (297,921 | ) |
| | | | | | | | | | | | | | | | |
NET ASSETS | | $ | 32,935,208 | | | $ | 178,376,806 | | | $ | 495,561,767 | | | $ | 48,783,771 | |
| | | | | | | | | | | | | | | | |
See accompanying notes to financial statements.
| 58
Statements of Assets and Liabilities (continued)
December 31, 2014
| | | | | | | | | | | | | | | | |
| | | McDonnell
Intermediate
Municipal Bond
Fund | | | Natixis
Diversified
Income
Fund | | | Natixis U.S.
Equity
Opportunities
Fund | | | SeeyondSM
Multi-Asset
Allocation
Fund | |
COMPUTATION OF NET ASSET VALUE AND OFFERING PRICE: | | | | | | | | | | | | | | | | |
Class A shares: | | | | | | | | | | | | | | | | |
Net assets | | $ | 2,398,766 | | | $ | 110,873,865 | | | $ | 400,677,630 | | | $ | 968 | |
| | | | | | | | | | | | | | | | |
Shares of beneficial interest | | | 239,969 | | | | 8,242,302 | | | | 14,621,284 | | | | 100 | |
| | | | | | | | | | | | | | | | |
Net asset value and redemption price per share | | $ | 10.00 | | | $ | 13.45 | | | $ | 27.40 | | | $ | 9.68 | |
| | | | | | | | | | | | | | | | |
Offering price per share (100/[100-maximum sales charge] of net asset value) (Note 1) | | $ | 10.36 | | | $ | 14.08 | | | $ | 29.07 | | | $ | 10.27 | |
| | | | | | | | | | | | | | | | |
Class B shares: (redemption price per share is equal to net asset value less any applicable contingent deferred sales charge) (Note 1) | | | | | | | | | | | | | | | | |
Net assets | | $ | — | | | $ | — | | | $ | 3,323,937 | | | $ | — | |
| | | | | | | | | | | | | | | | |
Shares of beneficial interest | | | — | | | | — | | | | 164,333 | | | | — | |
| | | | | | | | | | | | | | | | |
Net asset value and offering price per share | | $ | — | | | $ | — | | | $ | 20.23 | | | $ | — | |
| | | | | | | | | | | | | | | | |
Class C shares: (redemption price per share is equal to net asset value less any applicable contingent deferred sales charge) (Note 1) | | | | | | | | | | | | | | | | |
Net assets | | $ | 2,222,701 | | | $ | 53,074,494 | | | $ | 53,924,694 | | | $ | 27,210 | |
| | | | | | | | | | | | | | | | |
Shares of beneficial interest | | | 222,404 | | | | 3,957,538 | | | | 2,664,229 | | | | 2,821 | |
| | | | | | | | | | | | | | | | |
Net asset value and offering price per share | | $ | 9.99 | | | $ | 13.41 | | | $ | 20.24 | | | $ | 9.65 | |
| | | | | | | | | | | | | | | | |
Class Y shares: | | | | | | | | | | | | | | | | |
Net assets | | $ | 28,313,741 | | | $ | 14,428,447 | | | $ | 37,635,506 | | | $ | 48,755,593 | |
| | | | | | | | | | | | | | | | |
Shares of beneficial interest | | | 2,831,274 | | | | 1,077,654 | | | | 1,207,173 | | | | 5,033,632 | |
| | | | | | | | | | | | | | | | |
Net asset value, offering and redemption price per share | | $ | 10.00 | | | $ | 13.39 | | | $ | 31.18 | | | $ | 9.69 | |
| | | | | | | | | | | | | | | | |
See accompanying notes to financial statements.
59 |
Statements of Operations
For the Year Ended December 31, 2014
| | | | | | | | | | | | | | | | |
| | | McDonnell
Intermediate
Municipal Bond
Fund | | | Natixis
Diversified
Income
Fund | | | Natixis U.S.
Equity
Opportunities
Fund | | | SeeyondSM
Multi-Asset
Allocation
Fund (a) | |
INVESTMENT INCOME | | | | | | | | | | | | | | | | |
Dividends | | $ | — | | | $ | 2,348,142 | | | $ | 6,425,172 | | | $ | 37,908 | |
Interest | | | 559,106 | | | | 2,618,952 | | | | 257 | | | | 19,041 | |
Less net foreign taxes withheld | | | — | | | | — | | | | (58,305 | ) | | | — | |
| | | | | | | | | | | | | | | | |
| | | 559,106 | | | | 4,967,094 | | | | 6,367,124 | | | | 56,949 | |
| | | | | | | | | | | | | | | | |
Expenses | | | | | | | | | | | | | | | | |
Management fees (Note 6) | | | 111,610 | | | | 776,986 | | | | 3,741,002 | | | | 183,705 | |
Service and distribution fees (Note 6) | | | 11,025 | | | | 720,365 | | | | 1,493,685 | | | | 77 | |
Administrative fees (Note 6) | | | 12,046 | | | | 61,016 | | | | 202,052 | | | | 9,270 | |
Trustees’ fees and expenses (Note 6) | | | 19,000 | | | | 25,854 | | | | 60,049 | | | | 7,132 | |
Transfer agent fees and expenses (Note 6) | | | 3,321 | | | | 87,751 | | | | 526,450 | | | | 597 | |
Audit and tax services fees | | | 51,203 | | | | 47,825 | | | | 47,878 | | | | 54,381 | |
Custodian fees and expenses | | | 12,304 | | | | 47,364 | | | | 33,303 | | | | 9,293 | |
Interest expense (Note 10) | | | — | | | | — | | | | — | | | | 953 | |
Legal fees | | | 224 | | | | 1,089 | | | | 3,821 | | | | 109 | |
Registration fees | | | 62,131 | | | | 63,046 | | | | 87,603 | | | | 19,504 | |
Shareholder reporting expenses | | | 2,296 | | | | 15,094 | | | | 87,660 | | | | 2,098 | |
Miscellaneous expenses | | | 11,155 | | | | 17,397 | | | | 22,295 | | | | 5,542 | |
| | | | | | | | | | | | | | | | |
Total expenses | | | 296,315 | | | | 1,863,787 | | | | 6,305,798 | | | | 292,661 | |
Fee/expense recovery (Note 6) | | | — | | | | — | | | | 71,229 | | | | — | |
Less waiver and/or expense reimbursement (Note 6) | | | (131,826 | ) | | | (3,404 | ) | | | — | | | | (64,701 | ) |
| | | | | | | | | | | | | | | | |
Net expenses | | | 164,489 | | | | 1,860,383 | | | | 6,377,027 | | | | 227,960 | |
| | | | | | | | | | | | | | | | |
Net investment income (loss) | | | 394,617 | | | | 3,106,711 | | | | (9,903 | ) | | | (171,011 | ) |
| | | | | | | | | | | | | | | | |
NET REALIZED AND UNREALIZED GAIN (LOSS) ON INVESTMENTS, FUTURES CONTRACTS, OPTIONS/SWAPTIONS WRITTEN AND FOREIGN CURRENCY TRANSACTIONS | | | | | | | | | | | | | | | | |
Net realized gain (loss) on: | | | | | | | | | | | | | | | | |
Investments | | | (53,090 | ) | | | 1,110,316 | | | | 137,250,493 | | | | (233,868 | ) |
Futures contracts | | | — | | | | (170,733 | ) | | | 268,061 | | | | 25,499 | |
Options/swaptions written | | | — | | | | 620,081 | | | | (21,977 | ) | | | 110,045 | |
Foreign currency transactions | | | — | | | | 12,511 | | | | — | | | | (1,008,609 | ) |
Net change in unrealized appreciation (depreciation) on: | | | | | | | | | | | | | | | | |
Investments | | | 1,268,045 | | | | 12,502,606 | | | | (80,424,544 | ) | | | (710,373 | ) |
Futures contracts | | | — | | | | (58,899 | ) | | | — | | | | 963,307 | |
Options/Swaptions written | | | — | | | | 5,664 | | | | — | | | | 939 | |
Foreign currency translations | | | — | | | | 45,458 | | | | — | | | | (551,794 | ) |
| | | | | | | | | | | | | | | | |
Net realized and unrealized gain on investments, futures contracts, options/swaptions written and foreign currency transactions | | | 1,214,955 | | | | 14,067,004 | | | | 57,072,033 | | | | (1,404,854 | ) |
| | | | | | | | | | | | | | | | |
NET INCREASE (DECREASE) IN NET ASSETS RESULTING FROM OPERATIONS | | $ | 1,609,572 | | | $ | 17,173,715 | | | $ | 57,062,130 | | | $ | (1,575,865 | ) |
| | | | | | | | | | | | | | | | |
| (a) | From commencement of operations on July 23, 2014 through December 31, 2014 |
See accompanying notes to financial statements.
| 60
Statements of Changes in Net Assets
| | | | | | | | |
| | | McDonnell Intermediate
Municipal Bond Fund | |
| | | Year Ended
December 31,
2014 | | | Year Ended
December 31,
2013 | |
FROM OPERATIONS: | | | | | | | | |
Net investment income | | $ | 394,617 | | | $ | 219,809 | |
Net realized loss on investments | | | (53,090 | ) | | | (348,326 | ) |
Net change in unrealized appreciation (depreciation) on investments | | | 1,268,045 | | | | (347,464 | ) |
| | | | | | | | |
Net increase (decrease) in net assets resulting from operations | | | 1,609,572 | | | | (475,981 | ) |
| | | | | | | | |
FROM DISTRIBUTIONS TO SHAREHOLDERS: | | | | | | | | |
Net investment income | | | | | | | | |
Class A | | | (19,275 | ) | | | (3,763 | ) |
Class C | | | (2,856 | ) | | | (41 | ) |
Class Y | | | (372,573 | ) | | | (222,054 | ) |
| | | | | | | | |
Total distributions | | | (394,704 | ) | | | (225,858 | ) |
| | | | | | | | |
NET INCREASE IN NET ASSETS FROM CAPITAL SHARE TRANSACTIONS (NOTE 11) | | | 8,914,814 | | | | 8,678,272 | |
| | | | | | | | |
Net increase in net assets | | | 10,129,682 | | | | 7,976,433 | |
NET ASSETS | | | | | | | | |
Beginning of the year | | | 22,805,526 | | | | 14,829,093 | |
| | | | | | | | |
End of the year | | $ | 32,935,208 | | | $ | 22,805,526 | |
| | | | | | | | |
DISTRIBUTIONS IN EXCESS OF NET INVESTMENT INCOME | | $ | (1,354 | ) | | $ | (326 | ) |
| | | | | | | | |
See accompanying notes to financial statements.
61 |
Statements of Changes in Net Assets (continued)
| | | | | | | | |
| | | Natixis Diversified
Income Fund | |
| | | Year Ended
December 31,
2014 | | | Year Ended
December 31,
2013 | |
FROM OPERATIONS: | | | | | | | | |
Net investment income | | $ | 3,106,711 | | | $ | 2,842,327 | |
Net realized gain on investments, futures contracts, options written and foreign currency transactions | | | 1,572,175 | | | | 6,816,963 | |
Net change in unrealized appreciation (depreciation) on investments, futures contracts, options written and foreign currency translations | | | 12,494,829 | | | | (2,922,350 | ) |
| | | | | | | | |
Net increase in net assets resulting from operations | | | 17,173,715 | | | | 6,736,940 | |
| | | | | | | | |
FROM DISTRIBUTIONS TO SHAREHOLDERS: | | | | | | | | |
Net investment income | | | | | | | | |
Class A | | | (2,341,189 | ) | | | (2,123,101 | ) |
Class C | | | (952,028 | ) | | | (943,848 | ) |
Class Y | | | (147,181 | ) | | | (21,931 | ) |
| | | | | | | | |
Total distributions | | | (3,440,398 | ) | | | (3,088,880 | ) |
| | | | | | | | |
NET INCREASE (DECREASE) IN NET ASSETS FROM CAPITAL SHARE TRANSACTIONS (NOTE 11) | | | 36,464,179 | | | | (3,382,992 | ) |
| | | | | | | | |
Net increase in net assets | | | 50,197,496 | | | | 265,068 | |
NET ASSETS | | | | | | | | |
Beginning of the year | | | 128,179,310 | | | | 127,914,242 | |
| | | | | | | | |
End of the year | | $ | 178,376,806 | | | $ | 128,179,310 | |
| | | | | | | | |
DISTRIBUTIONS IN EXCESS OF NET INVESTMENT INCOME | | $ | (199,276 | ) | | $ | (165,741 | ) |
| | | | | | | | |
See accompanying notes to financial statements.
| 62
Statements of Changes in Net Assets (continued)
| | | | | | | | |
| | | Natixis U.S. Equity
Opportunities Fund | |
| | | Year Ended
December 31,
2014 | | | Year Ended
December 31,
2013 | |
FROM OPERATIONS: | | | | | | | | |
Net investment loss | | $ | (9,903 | ) | | $ | (762,450 | ) |
Net realized gain on investments, futures contracts and options written | | | 137,496,577 | | | | 37,957,408 | |
Net change in unrealized appreciation (depreciation) on investments | | | (80,424,544 | ) | | | 82,618,997 | |
| | | | | | | | |
Net increase in net assets resulting from operations | | | 57,062,130 | | | | 119,813,955 | |
| | | | | | | | |
FROM DISTRIBUTIONS TO SHAREHOLDERS: | | | | | | | | |
Net realized capital gains | | | | | | | | |
Class A | | | (108,546,162 | ) | | | (27,351,336 | ) |
Class B | | | (1,183,478 | ) | | | (739,952 | ) |
Class C | | | (18,242,647 | ) | | | (3,885,125 | ) |
Class Y | | | (9,498,229 | ) | | | (1,541,929 | ) |
| | | | | | | | |
Total distributions | | | (137,470,516 | ) | | | (33,518,342 | ) |
| | | | | | | | |
NET INCREASE IN NET ASSETS FROM CAPITAL SHARE TRANSACTIONS (NOTE 11) | | | 128,349,059 | | | | 18,695,182 | |
| | | | | | | | |
Net increase in net assets | | | 47,940,673 | | | | 104,990,795 | |
NET ASSETS | | | | | | | | |
Beginning of the year | | | 447,621,094 | | | | 342,630,299 | |
| | | | | | | | |
End of the year | | $ | 495,561,767 | | | $ | 447,621,094 | |
| | | | | | | | |
ACCUMULATED NET INVESTMENT LOSS | | $ | (523,913 | ) | | $ | (533,755 | ) |
| | | | | | | | |
See accompanying notes to financial statements.
63 |
Statements of Changes in Net Assets (continued)
| | | | |
| | | SeeyondSM Multi-Asset
Allocation Fund | |
| | | Period Ended
December 31,
2014(a) | |
FROM OPERATIONS: | | | | |
Net investment loss | | $ | (171,011 | ) |
Net realized loss on investments, futures contracts, options written and foreign currency transactions | | | (1,106,933 | ) |
Net change in unrealized appreciation (depreciation) on investments, futures contracts, options written and foreign currency translations | | | (297,921 | ) |
| | | | |
Net decrease in net assets resulting from operations | | | (1,575,865 | ) |
| | | | |
NET INCREASE IN NET ASSETS FROM CAPITAL SHARE TRANSACTIONS (NOTE 11) | | | 50,359,636 | |
| | | | |
Net increase in net assets | | | 48,783,771 | |
NET ASSETS | | | | |
Beginning of the year | | | — | |
| | | | |
End of the year | | $ | 48,783,771 | |
| | | | |
ACCUMULATED NET INVESTMENT LOSS | | $ | (763,696 | ) |
| | | | |
| (a) | From commencement of operations on July 23, 2014 through December 31, 2014. |
See accompanying notes to financial statements.
| 64
Financial Highlights
For a share outstanding throughout each period.
| | | | | | | | | | | | |
| | | McDonnell Intermediate
Municipal Bond Fund—Class A | |
| | | Year Ended
December 31,
2014 | | | Year Ended
December 31,
2013 | | | Period Ended
December 31,
2012* | |
Net asset value, beginning of the period | | $ | 9.54 | | | $ | 9.89 | | | $ | 10.00 | |
| | | | | | | | | | | | |
INCOME (LOSS) FROM INVESTMENT OPERATIONS: | | | | | | | | | | | | |
Net investment income (loss)(a) | | | 0.11 | | | | 0.09 | | | | (0.01 | ) |
Net realized and unrealized gain (loss) | | | 0.47 | | | | (0.35 | ) | | | (0.10 | ) |
| | | | | | | | | | | | |
Total from Investment Operations | | | 0.58 | | | | (0.26 | ) | | | (0.11 | ) |
| | | | | | | | | | | | |
LESS DISTRIBUTIONS FROM: | | | | | | | | | | | | |
Net investment income | | | (0.12 | ) | | | (0.09 | ) | | | — | |
Net realized capital gains | | | — | | | | — | | | | — | |
| | | | | | | | | | | | |
Total Distributions | | | (0.12 | ) | | | (0.09 | ) | | | — | |
| | | | | | | | | | | | |
Net asset value, end of the period | | $ | 10.00 | | | $ | 9.54 | | | $ | 9.89 | |
| | | | | | | | | | | | |
Total return(b)(c) | | | 6.08 | % | | | (2.66 | )% | | | (1.10 | )% |
RATIOS TO AVERAGE NET ASSETS: | | | | | | | | | | | | |
Net assets, end of the period (000’s) | | $ | 2,399 | | | $ | 1,047 | | | $ | 1 | |
Net expenses(d) | | | 0.80 | % | | | 0.80 | % | | | 2.19 | %(e)(f) |
Gross expenses | | | 1.26 | % | | | 1.37 | % | | | 2.23 | %(e) |
Net investment income (loss) | | | 1.15 | % | | | 0.90 | % | | | (0.71 | )%(e) |
Portfolio turnover rate | | | 10 | % | | | 37 | % | | | 0 | % |
| * | From commencement of operations on November 16, 2012 through December 31, 2012. |
| (a) | Per share net investment income (loss) has been calculated using the average shares outstanding during the period. |
| (b) | A sales charge for Class A shares is not reflected in total return calculations. |
| (c) | Had certain expenses not been waived/reimbursed during the period, total returns would have been lower. Periods less than one year are not annualized. |
| (d) | The investment adviser agreed to waive its fees and/or reimburse a portion of the Fund’s expenses during the period. Without this waiver/reimbursement, expenses would have been higher. |
| (e) | Computed on an annualized basis for periods less than one year. |
| (f) | Prior to December 31, 2012, there was no expense limitation agreement in place for the Fund. |
See accompanying notes to financial statements.
65 |
Financial Highlights (continued)
For a share outstanding throughout each period.
| | | | | | | | | | | | |
| | | McDonnell Intermediate
Municipal Bond Fund—Class C | |
| | | Year Ended
December 31,
2014 | | | Year Ended
December 31,
2013 | | | Period Ended
December 31,
2012* | |
Net asset value, beginning of the period | | $ | 9.54 | | | $ | 9.89 | | | $ | 10.00 | |
| | | | | | | | | | | | |
INCOME (LOSS) FROM INVESTMENT OPERATIONS: | | | | | | | | | | | | |
Net investment income (loss)(a) | | | 0.04 | | | | 0.01 | | | | (0.01 | ) |
Net realized and unrealized gain (loss) | | | 0.45 | | | | (0.34 | ) | | | (0.10 | ) |
| | | | | | | | | | | | |
Total from Investment Operations | | | 0.49 | | | | (0.33 | ) | | | (0.11 | ) |
| | | | | | | | | | | | |
LESS DISTRIBUTIONS FROM: | | | | | | | | | | | | |
Net investment income | | | (0.04 | ) | | | (0.02 | ) | | | — | |
Net realized capital gains | | | — | | | | — | | | | — | |
| | | | | | | | | | | | |
Total Distributions | | | (0.04 | ) | | | (0.02 | ) | | | — | |
| | | | | | | | | | | | |
Net asset value, end of the period | | $ | 9.99 | | | $ | 9.54 | | | $ | 9.89 | |
| | | | | | | | | | | | |
Total return(b)(c) | | | 5.18 | % | | | (3.35 | )% | | | (1.10 | )% |
RATIOS TO AVERAGE NET ASSETS: | | | | | | | | | | | | |
Net assets, end of the period (000’s) | | $ | 2,223 | | | $ | 55 | | | $ | 1 | |
Net expenses(d) | | | 1.55 | % | | | 1.55 | % | | | 2.20 | %(e)(f) |
Gross expenses | | | 2.04 | % | | | 2.08 | % | | | 2.24 | %(e) |
Net investment income (loss) | | | 0.41 | % | | | 0.14 | % | | | (0.73 | )%(e) |
Portfolio turnover rate | | | 10 | % | | | 37 | % | | | 0 | % |
| * | From commencement of operations on November 16, 2012 through December 31, 2012. |
| (a) | Per share net investment income (loss) has been calculated using the average shares outstanding during the period. |
| (b) | A contingent deferred sales charge for Class C shares is not reflected in total return calculations. |
| (c) | Had certain expenses not been waived/reimbursed during the period, total returns would have been lower. Periods less than one year are not annualized. |
| (d) | The investment adviser agreed to waive its fees and/or reimburse a portion of the Fund’s expenses during the period. Without this waiver/reimbursement, expenses would have been higher. |
| (e) | Computed on an annualized basis for periods less than one year. |
| (f) | Prior to December 31, 2012, there was no expense limitation agreement in place for the Fund. |
See accompanying notes to financial statements.
| 66
Financial Highlights (continued)
For a share outstanding throughout each period.
| | | | | | | | | | | | |
| | | McDonnell Intermediate
Municipal Bond Fund—Class Y | |
| | | Year Ended
December 31,
2014 | | | Year Ended
December 31,
2013 | | | Period Ended
December 31,
2012* | |
Net asset value, beginning of the period | | $ | 9.54 | | | $ | 9.88 | | | $ | 10.00 | |
| | | | | | | | | | | | |
INCOME (LOSS) FROM INVESTMENT OPERATIONS: | | | | | | | | | | | | |
Net investment income (loss)(a) | | | 0.14 | | | | 0.11 | | | | (0.01 | ) |
Net realized and unrealized gain (loss) | | | 0.46 | | | | (0.34 | ) | | | (0.11 | ) |
| | | | | | | | | | | | |
Total from Investment Operations | | | 0.60 | | | | (0.23 | ) | | | (0.12 | ) |
| | | | | | | | | | | | |
LESS DISTRIBUTIONS FROM: | | | | | | | | | | | | |
Net investment income | | | (0.14 | ) | | | (0.11 | ) | | | — | |
Net realized capital gains | | | — | | | | — | | | | — | |
| | | | | | | | | | | | |
Total Distributions | | | (0.14 | ) | | | (0.11 | ) | | | — | |
| | | | | | | | | | | | |
Net asset value, end of the period | | $ | 10.00 | | | $ | 9.54 | | | $ | 9.88 | |
| | | | | | | | | | | | |
Total return(b) | | | 6.36 | % | | | (2.31 | )% | | | (1.20 | )% |
RATIOS TO AVERAGE NET ASSETS: | | | | | | | | | | | | |
Net assets, end of the period (000’s) | | $ | 28,314 | | | $ | 21,704 | | | $ | 14,827 | |
Net expenses(c) | | | 0.55 | % | | | 0.55 | % | | | 2.33 | %(d)(e) |
Gross expenses | | | 1.02 | % | | | 1.04 | % | | | 2.37 | %(d) |
Net investment income (loss) | | | 1.46 | % | | | 1.13 | % | | | (0.84 | )%(d) |
Portfolio turnover rate | | | 10 | % | | | 37 | % | | | 0 | % |
| * | From commencement of operations on November 16, 2012 through December 31, 2012. |
| (a) | Per share net investment income (loss) has been calculated using the average shares outstanding during the period. |
| (b) | Had certain expenses not been waived/reimbursed during the period, total returns would have been lower. Periods less than one year are not annualized. |
| (c) | The investment adviser agreed to waive its fees and/or reimburse a portion of the Fund’s expenses during the period. Without this waiver/reimbursement, expenses would have been higher. |
| (d) | Computed on an annualized basis for periods less than one year. |
| (e) | Prior to December 31, 2012, there was no expense limitation agreement in place for the Fund. |
See accompanying notes to financial statements.
67 |
Financial Highlights (continued)
For a share outstanding throughout each period.
| | | | | | | | | | | | | | | | | | | | |
| |
| | | Natixis Diversified Income Fund—Class A | |
| | | Year Ended
December 31,
2014 | | | Year Ended
December 31,
2013 | | | Year Ended
December 31,
2012 | | | Year Ended
December 31,
2011 | | | Year Ended
December 31,
2010 | |
Net asset value, beginning of the period | | $ | 12.21 | | | $ | 11.83 | | | $ | 10.74 | | | $ | 10.41 | | | $ | 9.22 | |
| | | | | | | | | | | | | | | | | | | | |
INCOME (LOSS) FROM INVESTMENT OPERATIONS: | | | | | | | | | | | | | | | | | | | | |
Net investment income(a) | | | 0.32 | | | | 0.29 | | | | 0.29 | | | | 0.34 | | | | 0.34 | |
Net realized and unrealized gain (loss) | | | 1.26 | | | | 0.40 | | | | 1.12 | | | | 0.40 | | | | 1.18 | |
| | | | | | | | | | | | | | | | | | | | |
Total from Investment Operations | | | 1.58 | | | | 0.69 | | | | 1.41 | | | | 0.74 | | | | 1.52 | |
| | | | | | | | | | | | | | | | | | | | |
LESS DISTRIBUTIONS FROM: | | | | | | | | | | | | | | | | | | | | |
Net investment income | | | (0.34 | ) | | | (0.31 | ) | | | (0.32 | ) | | | (0.41 | ) | | | (0.33 | ) |
Net realized capital gains | | | — | | | | — | | | | — | | | | — | | | | — | |
| | | | | | | | | | | | | | | | | | | | |
Total Distributions | | | (0.34 | ) | | | (0.31 | ) | | | (0.32 | ) | | | (0.41 | ) | | | (0.33 | ) |
| | | | | | | | | | | | | | | | | | | | |
Net asset value, end of the period | | $ | 13.45 | | | $ | 12.21 | | | $ | 11.83 | | | $ | 10.74 | | | $ | 10.41 | |
| | | | | | | | | | | | | | | | | | | | |
Total return(b) | | | 13.08 | % | | | 5.84 | % | | | 13.22 | % | | | 7.21 | % | | | 16.73 | % |
RATIOS TO AVERAGE NET ASSETS: | | | | | | | | | | | | | | | | | | | | |
Net assets, end of the period (000’s) | | $ | 110,874 | | | $ | 79,039 | | | $ | 78,216 | | | $ | 45,211 | | | $ | 35,787 | |
Net expenses | | | 1.06 | % | | | 1.09 | % | | | 1.11 | % | | | 1.13 | % | | | 1.19 | % |
Gross expenses | | | 1.06 | % | | | 1.09 | % | | | 1.11 | % | | | 1.13 | % | | | 1.19 | % |
Net investment income | | | 2.46 | % | | | 2.34 | % | | | 2.53 | % | | | 3.17 | % | | | 3.51 | % |
Portfolio turnover rate | | | 41 | % | | | 41 | % | | | 29 | % | | | 20 | % | | | 28 | % |
| (a) | Per share net investment income has been calculated using the average shares outstanding during the period. |
| (b) | A sales charge for Class A shares is not reflected in total return calculations. |
See accompanying notes to financial statements.
| 68
Financial Highlights (continued)
For a share outstanding throughout each period.
| | | | | | | | | | | | | | | | | | | | |
| |
| | | Natixis Diversified Income Fund—Class C | |
| | | Year Ended
December 31,
2014 | | | Year Ended
December 31,
2013 | | | Year Ended
December 31,
2012 | | | Year Ended
December 31,
2011 | | | Year Ended
December 31,
2010 | |
Net asset value, beginning of the period | | $ | 12.17 | | | $ | 11.80 | | | $ | 10.71 | | | $ | 10.39 | | | $ | 9.20 | |
| | | | | | | | | | | | | | | | | | | | |
INCOME (LOSS) FROM INVESTMENT OPERATIONS: | | | | | | | | | | | | | | | | | | | | |
Net investment income(a) | | | 0.22 | | | | 0.19 | | | | 0.20 | | | | 0.26 | | | | 0.27 | |
Net realized and unrealized gain (loss) | | | 1.27 | | | | 0.39 | | | | 1.12 | | | | 0.39 | | | | 1.17 | |
| | | | | | | | | | | | | | | | | | | | |
Total from Investment Operations | | | 1.49 | | | | 0.58 | | | | 1.32 | | | | 0.65 | | | | 1.44 | |
| | | | | | | | | | | | | | | | | | | | |
LESS DISTRIBUTIONS FROM: | | | | | | | | | | | | | | | | | | | | |
Net investment income | | | (0.25 | ) | | | (0.21 | ) | | | (0.23 | ) | | | (0.33 | ) | | | (0.25 | ) |
Net realized capital gains | | | — | | | | — | | | | — | | | | — | | | | — | |
| | | | | | | | | | | | | | | | | | | | |
Total Distributions | | | (0.25 | ) | | | (0.21 | ) | | | (0.23 | ) | | | (0.33 | ) | | | (0.25 | ) |
| | | | | | | | | | | | | | | | | | | | |
Net asset value, end of the period | | $ | 13.41 | | | $ | 12.17 | | | $ | 11.80 | | | $ | 10.71 | | | $ | 10.39 | |
| | | | | | | | | | | | | | | | | | | | |
Total return(b) | | | 12.28 | % | | | 4.98 | % | | | 12.43 | % | | | 6.33 | % | | | 15.90 | % |
RATIOS TO AVERAGE NET ASSETS: | | | | | | | | | | | | | | | | | | | | |
Net assets, end of the period (000’s) | | $ | 53,074 | | | $ | 48,512 | | | $ | 49,697 | | | $ | 29,814 | | | $ | 27,355 | |
Net expenses | | | 1.81 | % | | | 1.84 | % | | | 1.86 | % | | | 1.88 | % | | | 1.94 | % |
Gross expenses | | | 1.81 | % | | | 1.84 | % | | | 1.86 | % | | | 1.88 | % | | | 1.94 | % |
Net investment income | | | 1.70 | % | | | 1.59 | % | | | 1.79 | % | | | 2.42 | % | | | 2.76 | % |
Portfolio turnover rate | | | 41 | % | | | 41 | % | | | 29 | % | | | 20 | % | | | 28 | % |
| (a) | Per share net investment income has been calculated using the average shares outstanding during the period. |
| (b) | A contingent deferred sales charge for Class C shares is not reflected in total return calculations. |
See accompanying notes to financial statements.
69 |
Financial Highlights (continued)
For a share outstanding throughout each period.
| | | | | | | | | | | | |
| |
| | | Natixis Diversified Income Fund—Class Y | |
| | | Year Ended
December 31,
2014 | | | Year Ended
December 31,
2013 | | | Period Ended
December 31,
2012* | |
Net asset value, beginning of the period | | $ | 12.19 | | | $ | 11.83 | | | $ | 11.72 | |
| | | | | | | | | | | | |
INCOME (LOSS) FROM INVESTMENT OPERATIONS: | | | | | | | | | | | | |
Net investment income (loss)(a) | | | 0.38 | | | | 0.33 | | | | (0.02 | ) |
Net realized and unrealized gain (loss) | | | 1.19 | | | | 0.37 | | | | 0.18 | |
| | | | | | | | | | | | |
Total from Investment Operations | | | 1.57 | | | | 0.70 | | | | 0.16 | |
| | | | | | | | | | | | |
LESS DISTRIBUTIONS FROM: | | | | | | | | | | | | |
Net investment income | | | (0.37 | ) | | | (0.34 | ) | | | (0.05 | ) |
Net realized capital gains | | | — | | | | — | | | | — | |
| | | | | | | | | | | | |
Total Distributions | | | (0.37 | ) | | | (0.34 | ) | | | (0.05 | ) |
| | | | | | | | | | | | |
Net asset value, end of the period | | $ | 13.39 | | | $ | 12.19 | | | $ | 11.83 | |
| | | | | | | | | | | | |
Total return | | | 13.05 | % | | | 5.93 | % | | | 1.35 | % |
RATIOS TO AVERAGE NET ASSETS: | | | | | | | | | | | | |
Net assets, end of the period (000’s) | | $ | 14,428 | | | $ | 628 | | | $ | 1 | |
Net expenses | | | 0.82 | % | | | 0.83 | % | | | 1.00 | %(b) |
Gross expenses | | | 0.82 | % | | | 0.83 | % | | | 1.00 | %(b) |
Net investment income (loss) | | | 2.92 | % | | | 2.71 | % | | | (2.37 | )%(b) |
Portfolio turnover rate | | | 41 | % | | | 41 | % | | | 29 | % |
| * | From commencement of operations on December 3, 2012, through December 31, 2012. |
| (a) | Per share net investment income (loss) has been calculated using the average shares outstanding during the period. |
| (b) | Computed on an annualized basis for periods less than one year. |
See accompanying notes to financial statements.
| 70
Financial Highlights (continued)
For a share outstanding throughout each period.
| | | | | | | | | | | | | | | | | | | | |
| |
| | | Natixis U.S. Equity Opportunities Fund—Class A | |
| | | Year Ended
December 31,
2014 | | | Year Ended
December 31,
2013 | | | Year Ended
December 31,
2012 | | | Year Ended
December 31,
2011 | | | Year Ended
December 31,
2010 | |
Net asset value, beginning of the period | | $ | 33.07 | | | $ | 26.35 | | | $ | 23.56 | | | $ | 25.17 | | | $ | 20.68 | |
| | | | | | | | | | | | | | | | | | | | |
INCOME (LOSS) FROM INVESTMENT OPERATIONS: | | | | | | | | | | | | | | | | | | | | |
Net investment income (loss)(a) | | | 0.02 | | | | (0.04 | ) | | | 0.07 | | | | (0.04 | ) | | | 0.03 | (b) |
Net realized and unrealized gain (loss) | | | 4.31 | | | | 9.34 | | | | 4.12 | | | | (0.69 | ) | | | 4.50 | |
| | | | | | | | | | | | | | | | | | | | |
Total from Investment Operations | | | 4.33 | | | | 9.30 | | | | 4.19 | | | | (0.73 | ) | | | 4.53 | |
| | | | | | | | | | | | | | | | | | | | |
LESS DISTRIBUTIONS FROM: | | | | | | | | | | | | | | | | | | | | |
Net investment income | | | — | | | | — | | | | (0.07 | ) | | | — | | | | (0.04 | ) |
Net realized capital gains | | | (10.00 | ) | | | (2.58 | ) | | | (1.33 | ) | | | (0.88 | ) | | | — | |
| | | | | | | | | | | | | | | | | | | | |
Total Distributions | | | (10.00 | ) | | | (2.58 | ) | | | (1.40 | ) | | | (0.88 | ) | | | (0.04 | ) |
| | | | | | | | | | | | | | | | | | | | |
Increase from regulatory settlements | | | — | | | | — | | | | — | | | | — | | | | 0.00 | (c) |
| | | | | | | | | | | | | | | | | | | | |
Net asset value, end of the period | | $ | 27.40 | | | $ | 33.07 | | | $ | 26.35 | | | $ | 23.56 | | | $ | 25.17 | |
| | | | | | | | | | | | | | | | | | | | |
Total return(d) | | | 12.94 | % | | | 35.75 | %(e) | | | 17.79 | %(e) | | | (2.79 | )%(e) | | | 21.90 | %(e) |
RATIOS TO AVERAGE NET ASSETS: | | | | | | | | | | | | | | | | | | | | |
Net assets, end of the period (000’s) | | $ | 400,678 | | | $ | 371,102 | | | $ | 289,898 | | | $ | 281,467 | | | $ | 314,384 | |
Net expenses | | | 1.29 | %(f) | | | 1.30 | %(g) | | | 1.30 | %(g) | | | 1.34 | %(g)(h) | | | 1.40 | %(g) |
Gross expenses | | | 1.29 | %(f) | | | 1.32 | % | | | 1.35 | % | | | 1.38 | % | | | 1.50 | % |
Net investment income (loss) | | | 0.07 | % | | | (0.12 | )% | | | 0.25 | % | | | (0.15 | )% | | | 0.14 | %(b) |
Portfolio turnover rate | | | 93 | %(i) | | | 50 | % | | | 52 | % | | | 97 | % | | | 79 | % |
| (a) | Per share net investment income (loss) has been calculated using the average shares outstanding during the period. |
| (b) | Includes non-recurring dividends. Without this dividend, net investment loss per share would have been $(0.04) and the ratio of net investment loss to average net assets would have been (0.19)%. |
| (c) | Amount rounds to less than $0.01 per share. |
| (d) | A sales charge for Class A shares is not reflected in total return calculations. |
| (e) | Had certain expenses not been waived/reimbursed during the period, total returns would have been lower. |
| (f) | Includes fee/expense recovery of 0.02%. |
| (g) | The investment adviser agreed to waive its fees and/or reimburse a portion of the Fund’s expenses during the period. Without this waiver/reimbursement, expenses would have been higher. |
| (h) | Effective June 1, 2011, the expense limit decreased to 1.30%. |
| (i) | The variation in the Fund’s turnover rate from 2013 to 2014 was primarily due to a change in the portfolio management team and a reduction from four segments to two segments. |
See accompanying notes to financial statements.
71 |
Financial Highlights (continued)
For a share outstanding throughout each period.
| | | | | | | | | | | | | | | | | | | | |
| |
| | | Natixis U.S. Equity Opportunities Fund—Class B | |
| | | Year Ended
December 31,
2014 | | | Year Ended
December 31,
2013 | | | Year Ended
December 31,
2012 | | | Year Ended
December 31,
2011 | | | Year Ended
December 31,
2010 | |
Net asset value, beginning of the period | | $ | 26.91 | | | $ | 21.98 | | | $ | 19.93 | | | $ | 21.60 | | | $ | 17.85 | |
| | | | | | | | | | | | | | | | | | | | |
INCOME (LOSS) FROM INVESTMENT OPERATIONS: | | | | | | | | | | | | | | | | | | | | |
Net investment loss(a) | | | (0.19 | ) | | | (0.22 | ) | | | (0.12 | ) | | | (0.21 | ) | | | (0.12 | )(b) |
Net realized and unrealized gain (loss) | | | 3.51 | | | | 7.73 | | | | 3.50 | | | | (0.58 | ) | | | 3.87 | |
| | | | | | | | | | | | | | | | | | | | |
Total from Investment Operations | | | 3.32 | | | | 7.51 | | | | 3.38 | | | | (0.79 | ) | | | 3.75 | |
| | | | | | | | | | | | | | | | | | | | |
LESS DISTRIBUTIONS FROM: | | | | | | | | | | | | | | | | | | | | |
Net investment income | | | — | | | | — | | | | — | | | | — | | | | — | |
Net realized capital gains | | | (10.00 | ) | | | (2.58 | ) | | | (1.33 | ) | | | (0.88 | ) | | | — | |
| | | | | | | | | | | | | | | | | | | | |
Total Distributions | | | (10.00 | ) | | | (2.58 | ) | | | (1.33 | ) | | | (0.88 | ) | | | — | |
| | | | | | | | | | | | | | | | | | | | |
Increase from regulatory settlements | | | — | | | | — | | | | — | | | | — | | | | 0.00 | (c) |
| | | | | | | | | | | | | | | | | | | | |
Net asset value, end of the period | | $ | 20.23 | | | $ | 26.91 | | | $ | 21.98 | | | $ | 19.93 | | | $ | 21.60 | |
| | | | | | | | | | | | | | | | | | | | |
Total return(d) | | | 12.14 | % | | | 34.70 | %(e) | | | 16.97 | %(e) | | | (3.53 | )%(e) | | | 21.01 | %(e) |
RATIOS TO AVERAGE NET ASSETS: | | | | | | | | | | | | | | | | | | | | |
Net assets, end of the period (000’s) | | $ | 3,324 | | | $ | 7,708 | | | $ | 11,172 | | | $ | 16,820 | | | $ | 28,787 | |
Net expenses | | | 2.04 | %(f) | | | 2.05 | %(g) | | | 2.05 | %(g) | | | 2.10 | %(g)(h) | | | 2.15 | %(g) |
Gross expenses | | | 2.04 | %(f) | | | 2.07 | % | | | 2.10 | % | | | 2.13 | % | | | 2.25 | % |
Net investment loss | | | (0.70 | )% | | | (0.89 | )% | | | (0.55 | )% | | | (0.94 | )% | | | (0.66 | )%(b) |
Portfolio turnover rate | | | 93 | %(i) | | | 50 | % | | | 52 | % | | | 97 | % | | | 79 | % |
| (a) | Per share net investment loss has been calculated using the average shares outstanding during the period. |
| (b) | Includes non-recurring dividends. Without this dividend, net investment loss per share would have been $(0.18) and the ratio of net investment loss to average net assets would have been (0.98)%. |
| (c) | Amount rounds to less than $0.01 per share. |
| (d) | A contingent deferred sales charge for Class B shares is not reflected in total return calculations. |
| (e) | Had certain expenses not been waived/reimbursed during the period, total returns would have been lower. |
| (f) | Includes fee/expense recovery of 0.02%. |
| (g) | The investment adviser agreed to waive its fees and/or reimburse a portion of the Fund’s expenses during the period. Without this waiver/reimbursement, expenses would have been higher. |
| (h) | Effective June 1, 2011, the expense limit decreased to 2.05%. |
| (i) | The variation in the Fund’s turnover rate from 2013 to 2014 was primarily due to a change in the portfolio management team and a reduction from four segments to two segments. |
See accompanying notes to financial statements.
| 72
Financial Highlights (continued)
For a share outstanding throughout each period.
| | | | | | | | | | | | | | | | | | | | |
| |
| | | Natixis U.S. Equity Opportunities Fund—Class C | |
| | | Year Ended
December 31,
2014 | | | Year Ended
December 31,
2013 | | | Year Ended
December 31,
2012 | | | Year Ended
December 31,
2011 | | | Year Ended
December 31,
2010 | |
Net asset value, beginning of the period | | $ | 26.92 | | | $ | 21.99 | | | $ | 19.94 | | | $ | 21.61 | | | $ | 17.86 | |
| | | | | | | | | | | | | | | | | | | | |
INCOME (LOSS) FROM INVESTMENT OPERATIONS: | | | | | | | | | | | | | | | | | | | | |
Net investment loss(a) | | | (0.19 | ) | | | (0.22 | ) | | | (0.11 | ) | | | (0.20 | ) | | | (0.12 | )(b) |
Net realized and unrealized gain (loss) | | | 3.51 | | | | 7.73 | | | | 3.49 | | | | (0.59 | ) | | | 3.87 | |
| | | | | | | | | | | | | | | | | | | | |
Total from Investment Operations | | | 3.32 | | | | 7.51 | | | | 3.38 | | | | (0.79 | ) | | | 3.75 | |
| | | | | | | | | | | | | | | | | | | | |
LESS DISTRIBUTIONS FROM: | | | | | | | | | | | | | | | | | | | | |
Net investment income | | | — | | | | — | | | | — | | | | ��� | | | | — | |
Net realized capital gains | | | (10.00 | ) | | | (2.58 | ) | | | (1.33 | ) | | | (0.88 | ) | | | — | |
| | | | | | | | | | | | | | | | | | | | |
Total Distributions | | | (10.00 | ) | | | (2.58 | ) | | | (1.33 | ) | | | (0.88 | ) | | | — | |
| | | | | | | | | | | | | | | | | | | | |
Increase from regulatory settlements | | | — | | | | — | | | | — | | | | — | | | | 0.00 | (c) |
| | | | | | | | | | | | | | | | | | | | |
Net asset value, end of the period | | $ | 20.24 | | | $ | 26.92 | | | $ | 21.99 | | | $ | 19.94 | | | $ | 21.61 | |
| | | | | | | | | | | | | | | | | | | | |
Total return(d) | | | 12.12 | % | | | 34.69 | %(e) | | | 16.96 | %(e) | | | (3.53 | )%(e) | | | 21.00 | %(e) |
RATIOS TO AVERAGE NET ASSETS: | | | | | | | | | | | | | | | | | | | | |
Net assets, end of the period (000’s) | | $ | 53,925 | | | $ | 44,150 | | | $ | 30,525 | | | $ | 28,462 | | | $ | 30,912 | |
Net expenses | | | 2.04 | %(f) | | | 2.05 | %(g) | | | 2.05 | %(g) | | | 2.09 | %(g)(h) | | | 2.15 | %(g) |
Gross expenses | | | 2.04 | %(f) | | | 2.07 | % | | | 2.10 | % | | | 2.13 | % | | | 2.25 | % |
Net investment loss | | | (0.68 | )% | | | (0.86 | )% | | | (0.49 | )% | | | (0.90 | )% | | | (0.62 | )%(b) |
Portfolio turnover rate | | | 93 | %(i) | | | 50 | % | | | 52 | % | | | 97 | % | | | 79 | % |
| (a) | Per share net investment loss has been calculated using the average shares outstanding during the period. |
| (b) | Includes non-recurring dividends. Without this dividend, net investment loss per share would have been $(0.18) and the ratio of net investment loss to average net assets would have been (0.94)%. |
| (c) | Amount rounds to less than $0.01 per share. |
| (d) | A contingent deferred sales charge for Class C shares is not reflected in total return calculations. |
| (e) | Had certain expenses not been waived/reimbursed during the period, total returns would have been lower. |
| (f) | Includes fee/expense recovery of 0.01%. |
| (g) | The investment adviser agreed to waive its fees and/or reimburse a portion of the Fund’s expenses during the period. Without this waiver/reimbursement, expenses would have been higher. |
| (h) | Effective June 1, 2011, the expense limit decreased to 2.05%. |
| (i) | The variation in the Fund’s turnover rate from 2013 to 2014 was primarily due to a change in the portfolio management team and a reduction from four segments to two segments. |
See accompanying notes to financial statements.
73 |
Financial Highlights (continued)
For a share outstanding throughout each period.
| | | | | | | | | | | | | | | | | | | | |
| |
| | | Natixis U.S. Equity Opportunities Fund—Class Y | |
| | | Year Ended
December 31,
2014 | | | Year Ended
December 31,
2013 | | | Year Ended
December 31,
2012 | | | Year Ended
December 31,
2011 | | | Year Ended
December 31,
2010 | |
Net asset value, beginning of the period | | $ | 36.32 | | | $ | 28.68 | | | $ | 25.52 | | | $ | 27.12 | | | $ | 22.27 | |
| | | | | | | | | | | | | | | | | | | | |
INCOME (LOSS) FROM INVESTMENT OPERATIONS: | | | | | | | | | | | | | | | | | | | | |
Net investment income(a) | | | 0.12 | | | | 0.05 | | | | 0.17 | | | | 0.04 | | | | 0.05 | (b) |
Net realized and unrealized gain (loss) | | | 4.74 | | | | 10.17 | | | | 4.46 | | | | (0.76 | ) | | | 4.90 | |
| | | | | | | | | | | | | | | | | | | | |
Total from Investment Operations | | | 4.86 | | | | 10.22 | | | | 4.63 | | | | (0.72 | ) | | | 4.95 | |
| | | | | | | | | | | | | | | | | | | | |
LESS DISTRIBUTIONS FROM: | | | | | | | | | | | | | | | | | | | | |
Net investment income | | | — | | | | — | | | | (0.14 | ) | | | — | | | | (0.10 | ) |
Net realized capital gains | | | (10.00 | ) | | | (2.58 | ) | | | (1.33 | ) | | | (0.88 | ) | | | — | |
| | | | | | | | | | | | | | | | | | | | |
Total Distributions | | | (10.00 | ) | | | (2.58 | ) | | | (1.47 | ) | | | (0.88 | ) | | | (0.10 | ) |
| | | | | | | | | | | | | | | | | | | | |
Increase from regulatory settlements | | | — | | | | — | | | | — | | | | — | | | | 0.00 | (c) |
| | | | | | | | | | | | | | | | | | | | |
Net asset value, end of the period | | $ | 31.18 | | | $ | 36.32 | | | $ | 28.68 | | | $ | 25.52 | | | $ | 27.12 | |
| | | | | | | | | | | | | | | | | | | | |
Total return | | | 13.25 | % | | | 36.06 | %(d) | | | 18.15 | %(d) | | | (2.56 | )%(d) | | | 22.21 | %(d) |
RATIOS TO AVERAGE NET ASSETS: | | | | | | | | | | | | | | | | | | | | |
Net assets, end of the period (000’s) | | $ | 37,636 | | | $ | 24,661 | | | $ | 11,035 | | | $ | 2,047 | | | $ | 1,317 | |
Net expenses | | | 1.05 | %(e) | | | 1.05 | %(f) | | | 1.05 | %(f) | | | 1.09 | %(f)(g) | | | 1.15 | %(f) |
Gross expenses | | | 1.05 | %(e) | | | 1.07 | % | | | 1.10 | % | | | 1.14 | % | | | 1.24 | % |
Net investment income | | | 0.32 | % | | | 0.13 | % | | | 0.61 | % | | | 0.16 | % | | | 0.22 | %(b) |
Portfolio turnover rate | | | 93 | %(h) | | | 50 | % | | | 52 | % | | | 97 | % | | | 79 | % |
| (a) | Per share net investment income has been calculated using the average shares outstanding during the period. |
| (b) | Includes non-recurring dividends. Without this dividend, net investment loss per share would have been $(0.02) and the ratio of net investment loss to average net assets would have been (0.08)%. |
| (c) | Amount rounds to less than $0.01 per share. |
| (d) | Had certain expenses not been waived/reimbursed during the period, total returns would have been lower. |
| (e) | Includes fee/expense recovery of 0.01%. |
| (f) | The investment adviser agreed to waive its fees and/or reimburse a portion of the Fund’s expenses during the period. Without this waiver/reimbursement, expenses would have been higher. |
| (g) | Effective June 1, 2011, the expense limit decreased to 1.05%. |
| (h) | The variation in the Fund’s turnover rate from 2013 to 2014 was primarily due to a change in the structure of the Fund from four segments to two segments. |
See accompanying notes to financial statements.
| 74
Financial Highlights (continued)
For a share outstanding throughout each period.
| | | | |
| | | SeeyondSM Multi-Asset
Allocation Fund—Class A | |
| | | Period Ended
December 31,
2014* | |
Net asset value, beginning of the period | | $ | 10.00 | |
| | | | |
INCOME (LOSS) FROM INVESTMENT OPERATIONS: | | | | |
Net investment loss(a) | | | (0.05 | ) |
Net realized and unrealized gain (loss) | | | (0.27 | ) |
| | | | |
Total from Investment Operations | | | (0.32 | ) |
| | | | |
Net asset value, end of the period | | $ | 9.68 | |
| | | | |
Total return(b)(c) | | | (3.20 | )% |
RATIOS TO AVERAGE NET ASSETS: | | | | |
Net assets, end of the period (000’s) | | $ | 1 | |
Net expenses(d)(e)(f) | | | 1.31 | % |
Gross expenses(e)(f) | | | 1.47 | % |
Net investment loss(e) | | | (1.05 | )% |
Portfolio turnover rate | | | 40 | % |
| * | From commencement of operations on July 23, 2014 through December 31, 2014. |
| (a) | Per share net investment loss has been calculated using the average shares outstanding during the period. |
| (b) | Had certain expenses not been waived/reimbursed during the period, total returns would have been lower. Periods less than one year are not annualized. |
| (c) | A sales charge for Class A shares is not reflected in total return calculations. |
| (d) | The investment adviser agreed to waive its fees and/or reimburse a portion of the Fund’s expenses during the period. Without this waiver/reimbursement, expenses would have been higher. |
| (e) | Computed on an annualized basis for periods less than one year. |
| (f) | Includes interest expense of 0.01%. Without this expense the ratio of net expenses would have been 1.30% and the ratio of gross expenses would have been 1.46%. |
See accompanying notes to financial statements.
75 |
Financial Highlights (continued)
For a share outstanding throughout each period.
| | | | |
| | | SeeyondSM Multi-Asset
Allocation Fund—Class C | |
| | | Period Ended
December 31,
2014* | |
Net asset value, beginning of the period | | $ | 10.00 | |
| | | | |
INCOME (LOSS) FROM INVESTMENT OPERATIONS: | | | | |
Net investment loss(a) | | | (0.07 | ) |
Net realized and unrealized gain (loss) | | | (0.28 | ) |
| | | | |
Total from Investment Operations | | | (0.35 | ) |
| | | | |
Net asset value, end of the period | | $ | 9.65 | |
| | | | |
Total return(b)(c) | | | (3.50 | )% |
RATIOS TO AVERAGE NET ASSETS: | | | | |
Net assets, end of the period (000’s) | | $ | 27 | |
Net expenses(d)(e)(f) | | | 2.06 | % |
Gross expenses(e)(f) | | | 2.38 | % |
Net investment loss(e) | | | (1.64 | )% |
Portfolio turnover rate | | | 40 | % |
| * | From commencement of operations on July 23, 2014 through December 31, 2014. |
| (a) | Per share net investment loss has been calculated using the average shares outstanding during the period. |
| (b) | Had certain expenses not been waived/reimbursed during the period, total returns would have been lower. Periods less than one year are not annualized. |
| (c) | A contingent deferred sales charge for Class C shares is not reflected in total return calculations. |
| (d) | The investment adviser agreed to waive its fees and/or reimburse a portion of the Fund’s expenses during the period. Without this waiver/reimbursement, expenses would have been higher. |
| (e) | Computed on an annualized basis for periods less than one year. |
| (f) | Includes interest expense of 0.01%. Without this expense the ratio of net expenses would have been 2.05% and the ratio of gross expenses would have been 2.37%. |
See accompanying notes to financial statements.
| 76
Financial Highlights (continued)
For a share outstanding throughout each period.
| | | | |
| | | SeeyondSM Multi-Asset
Allocation Fund—Class Y | |
| | | Period Ended
December 31,
2014* | |
Net asset value, beginning of the period | | $ | 10.00 | |
| | | | |
INCOME (LOSS) FROM INVESTMENT OPERATIONS: | | | | |
Net investment loss(a) | | | (0.03 | ) |
Net realized and unrealized gain (loss) | | | (0.28 | ) |
| | | | |
Total from Investment Operations | | | (0.31 | ) |
| | | | |
Net asset value, end of the period | | $ | 9.69 | |
| | | | |
Total return(b) | | | (3.10 | )% |
RATIOS TO AVERAGE NET ASSETS: | | | | |
Net assets, end of the period (000’s) | | $ | 48,756 | |
Net expenses(c)(d)(e) | | | 1.05 | % |
Gross expenses(d)(e) | | | 1.35 | % |
Net investment loss(d) | | | (0.79 | )% |
Portfolio turnover rate | | | 40 | % |
| * | From commencement of operations on July 23, 2014 through December 31, 2014. |
| (a) | Per share net investment loss has been calculated using the average shares outstanding during the period. |
| (b) | Had certain expenses not been waived/reimbursed during the period, total returns would have been lower. Periods less than one year are not annualized. |
| (c) | The investment adviser agreed to waive its fees and/or reimburse a portion of the Fund’s expenses during the period. Without this waiver/reimbursement, expenses would have been higher. |
| (d) | Computed on an annualized basis for periods less than one year. |
| (e) | Includes interest expense of less than 0.01%. |
See accompanying notes to financial statements.
77 |
Notes to Financial Statements
December 31, 2014
1. Organization. Natixis Funds Trust I and Natixis Funds Trust II (the “Trusts and each a Trust”) are each organized as a Massachusetts business trust. Each Trust is registered under the Investment Company Act of 1940, as amended (the “1940 Act”), as an open-end management investment company. Each Declaration of Trust permits the Board of Trustees to authorize the issuance of an unlimited number of shares of the Trust in multiple series. The financial statements for certain funds of the Trusts are presented in separate reports. The following funds (individually, a “Fund” and collectively, the “Funds”) are included in this report:
Natixis Funds Trust I:
Natixis Diversified Income Fund (the “Diversified Income Fund”)
Natixis U.S. Equity Opportunities Fund (the “U.S. Equity Opportunities Fund”)
Natixis Funds Trust II:
McDonnell Intermediate Municipal Bond Fund (the “Intermediate Municipal Bond Fund”)
SeeyondSM Multi-Asset Allocation Fund (the “Multi-Asset Allocation Fund”)
The Multi-Asset Allocation Fund commenced operations on July 23, 2014 via contribution to the Fund by Natixis Global Asset Management, L.P. (“Natixis US”) and affiliates of $50,002,000.
Each Fund is a diversified investment company, except for Multi-Asset Allocation Fund, which is a non-diversified investment company.
Each Fund offers Class A, Class C and Class Y shares. Effective October 12, 2007, Class B shares of U.S. Equity Opportunities Fund are no longer offered. Existing Class B shareholders may continue to reinvest dividends into Class B shares and exchange their Class B shares for Class B shares of other Natixis Funds subject to existing exchange privileges as described in the prospectus.
Class A shares are sold with a maximum front-end sales charge of 3.50% and 4.50% for Intermediate Municipal Bond Fund and Diversified Income Fund, respectively, and 5.75% for U.S. Equity Opportunities Fund and Multi-Asset Allocation Fund. Class B shares do not pay a front-end sales charge; however, they are charged higher Rule 12b-1 fees, and are subject to a contingent deferred sales charge (“CDSC”) if such shares are redeemed within six years of purchase. After eight years of ownership, Class B shares convert to Class A shares. Class C shares do not pay a front-end sales charge, do not convert to any other class of shares, pay higher ongoing Rule 12b-1 fees than Class A shares and may be subject to a CDSC of 1.00% if those shares are redeemed within one year. Class Y shares do not pay a front-end sales charge, a CDSC or Rule 12b-1 fees. Class Y shares are generally intended for institutional investors with a minimum initial investment of $100,000, though some categories of investors are exempted from the minimum investment amount as outlined in the Funds’ prospectus.
Most expenses can be directly attributed to a Fund. Expenses which cannot be directly attributed to a Fund are generally apportioned based on the relative net assets of each
| 78
Notes to Financial Statements (continued)
December 31, 2014
of the funds in Natixis Funds Trust I, Natixis Funds Trust II, Natixis Funds Trust IV, Gateway Trust (“Natixis Funds Trusts”), Loomis Sayles Funds I and Loomis Sayles Funds II (“Loomis Sayles Funds Trusts”). Expenses of a Fund are borne pro rata by the holders of each class of shares, except that each class bears expenses unique to that class (including the Rule 12b-1 service and distribution fees). In addition, each class votes as a class only with respect to its own Rule 12b-1 Plan. Shares of each class would receive their pro rata share of the net assets of a Fund if the Fund were liquidated. The Trustees approve separate distributions from net investment income on each class of shares.
2. Significant Accounting Policies. The following is a summary of significant accounting policies consistently followed by each Fund in the preparation of its financial statements. The Funds’ financial statements follow the accounting and reporting guidelines provided for investment companies and are prepared in accordance with accounting principles generally accepted in the United States of America which require the use of management estimates that affect the reported amounts and disclosures in the financial statements. Actual results could differ from those estimates. Management has evaluated the events and transactions subsequent to year-end through the date the financial statements were issued and has determined that there were no material events that would require disclosure in the Funds’ financial statements.
a. Valuation. Fund securities and other investments are valued at market value based on market quotations obtained or determined by independent pricing services recommended by the adviser and subadvisers and approved by the Board of Trustees. Fund securities and other investments for which market quotations are not readily available are valued at fair value as determined in good faith by the adviser or subadviser pursuant to procedures approved by the Board of Trustees, as described below. Market value is determined as follows:
Equity securities (including closed-end investment companies and exchange-traded funds) are valued at the last sale price quoted on the exchange or market where traded most extensively or, if there is no reported sale during the day, the closing bid quotation as reported by an independent pricing service. Securities traded on the NASDAQ Global Select Market, NASDAQ Global Market and NASDAQ Capital Market are valued at the NASDAQ Official Closing Price (“NOCP”), or if lacking an NOCP, at the most recent bid quotations on the applicable NASDAQ Market. In some foreign markets, an official close price and a last sale price may be available from the foreign exchange or market. In those cases, the official close price is used. Debt securities and unlisted equity securities are valued based on evaluated bids furnished to the Funds by an independent pricing service using market information, transactions for comparable securities and various relationships between securities, if available, or bid prices obtained from broker-dealers. Broker-dealer bid prices may be used to value debt and equity securities where an independent pricing service is unable to price a security or where
79 |
Notes to Financial Statements (continued)
December 31, 2014
an independent pricing service does not provide a reliable price for the security. Forward foreign currency contracts are valued utilizing interpolated rates determined based on information provided by an independent pricing service. Futures contracts and options on futures contracts are valued at the current settlement price on the exchange on which the adviser or subadviser believes that, over time, they are traded most extensively. Domestic exchange-traded single equity option contracts are valued at the mean of the National Best Bid and Offer quotations. Bilateral interest rate swaps are valued based on prices supplied by an independent pricing service, if available, or prices obtained from broker-dealers. Centrally cleared interest rate swaps are valued at settlement prices of the clearinghouse on which the contracts were traded, if available, or prices obtained from broker-dealers. Interest rate swaptions are valued at mid prices (between the bid and the ask price) supplied by an independent pricing service, if available, or prices obtained from broker-dealers.
Fund securities and other investments for which market quotations are not readily available are valued at fair value as determined in good faith by the adviser or subadviser pursuant to procedures approved by the Board of Trustees. The Funds may also value securities and other investments at fair value in other circumstances such as when extraordinary events occur after the close of a foreign market but prior to the close of the New York Stock Exchange (“NYSE”). This may include situations relating to a single issuer (such as a declaration of bankruptcy or a delisting of the issuer’s security from the primary market on which it has traded) as well as events affecting the securities markets in general (such as market disruptions or closings and significant fluctuations in U.S. and/or foreign markets). When fair valuing its securities or other investments, the Funds may, among other things, use modeling tools or other processes that may take into account factors such as securities or other market activity and/or significant events that occur after the close of the foreign market and before the time a Fund’s Net Asset Value (“NAV”) is calculated. Fair value pricing may require subjective determinations about the value of a security, and fair values used to determine a Fund’s NAV may differ from quoted or published prices, or from prices that are used by others, for the same securities. In addition, the use of fair value pricing may not always result in adjustments to the prices of securities held by a Fund.
b. Investment Transactions and Related Investment Income. Investment transactions are accounted for on a trade date plus one day basis for daily NAV calculation. However, for financial reporting purposes, investment transactions are reported on trade date. Dividend income is recorded on ex-dividend date, or in the case of certain foreign securities, as soon as a Fund is notified, and interest income is recorded on an accrual basis. Interest income is increased by the accretion of discount and decreased by the amortization of premium. Periodic principal adjustments for inflation-protected securities are recorded to interest income. Negative principal adjustments (in the event of deflation) are recorded as reductions of interest income to the extent of interest income earned, not to exceed the amount of positive principal adjustments on a
| 80
Notes to Financial Statements (continued)
December 31, 2014
cumulative basis. Distributions received from investments in securities that represent a return of capital or capital gain are recorded as a reduction of cost of the investments or as a realized gain, respectively. The calendar year-end amounts of ordinary income, capital gains, and return of capital included in distributions received from the Funds’ investments in real estate investment trusts (“REITs”) are reported to the Funds after the end of the fiscal year; accordingly, the Funds estimate these amounts for accounting purposes until the characterization of REIT distributions is reported to the Funds after the end of the fiscal year. Estimates are based on the most recent REIT distribution information available. In determining net gain or loss on securities sold, the cost of securities has been determined on an identified cost basis. Investment income, non-class specific expenses and realized and unrealized gains and losses are allocated on a pro rata basis to each class based on the relative net assets of each class to the total net assets of the Fund.
c. Foreign Currency Translation. The books and records of the Funds are maintained in U.S. dollars. The values of securities, currencies and other assets and liabilities denominated in currencies other than U.S. dollars are translated into U.S. dollars based upon foreign exchange rates prevailing at the end of the period. Purchases and sales of investment securities, income and expenses are translated on the respective dates of such transactions.
Since the values of investment securities are presented at the foreign exchange rates prevailing at the end of the period, it is not practical to isolate that portion of the results of operations arising from changes in exchange rates from fluctuations which arise due to changes in market prices of investment securities. Such changes are included with the net realized and unrealized gain or loss on investments.
Net realized foreign exchange gains or losses arise from sales of foreign currency, currency gains or losses realized between the trade and settlement dates on securities transactions and the difference between the amounts of dividends, interest and foreign withholding taxes recorded on the Funds’ books and the U.S. dollar equivalent of the amounts actually received or paid. Net unrealized foreign exchange gains and losses arise from changes in the value of assets and liabilities, other than investment securities, at the end of the fiscal period, resulting from changes in exchange rates.
Each Fund may use foreign currency exchange contracts to facilitate transactions in foreign-denominated investments. Losses may arise from changes in the value of the foreign currency or if the counterparties do not perform under the contracts’ terms.
d. Forward Foreign Currency Contracts. Certain Funds may enter into forward foreign currency contracts, including forward foreign cross currency contracts, to acquire exposure to foreign currencies or to hedge the Fund’s investments against currency fluctuation. A contract can also be used to offset a previous contract. These contracts involve market risk in excess of the unrealized gain or loss reflected in the Funds’
81 |
Notes to Financial Statements (continued)
December 31, 2014
Statements of Assets and Liabilities. The U.S. dollar value of the currencies a Fund has committed to buy or sell represents the aggregate exposure to each currency a Fund has acquired or hedged through currency contracts outstanding at period end. Gains or losses are recorded for financial statement purposes as unrealized until settlement date. Contracts are traded over-the-counter directly with a counterparty. Risks may arise upon entering into these contracts from the potential inability of counterparties to meet the terms of their contracts and from unanticipated movements in the value of a foreign currency relative to the U.S. dollar. Certain contracts may require the movement of cash and/or securities as collateral for the Fund’s or counterparty’s net obligations under the contracts.
e. Futures Contracts. The Funds may enter into futures contracts. Futures contracts are agreements between two parties to buy and sell a particular instrument or index for a specified price on a specified future date.
When a Fund enters into a futures contract, it is required to deposit with (or for the benefit of) its broker an amount of cash or short-term high-quality securities as “initial margin.” As the value of the contract changes, the value of the futures contract position increases or declines. Subsequent payments, known as “variation margin,” are made or received by a Fund, depending on the price fluctuations in the fair value of the contract and the value of cash or securities on deposit with the broker. The aggregate principal amounts of the contracts are not recorded in the financial statements. Fluctuations in the value of the contracts are recorded in the Statements of Assets and Liabilities as an asset (liability) and in the Statements of Operations as unrealized appreciation (depreciation) until the contracts are closed, when they are recorded as realized gains (losses). Realized gain or loss on a futures position is equal to the difference between the value of the contract at the time it was opened and the value at the time it was closed, minus brokerage commissions. When a Fund enters into a futures contract certain risks may arise, such as illiquidity in the futures market, which may limit a Fund’s ability to close out a futures contract prior to settlement date, and unanticipated movements in the value of securities or interest rates.
Futures contracts are exchange-traded. Exchange-traded futures contracts are standardized and are settled through a clearing house with fulfillment supported by the credit of the exchange. Therefore, counterparty credit risks to the Funds are reduced; however, in the event that a counterparty enters into bankruptcy, the Fund’s claim against initial/variation margin on deposit with the counterparty may be subject to terms of a final settlement in bankruptcy court.
f. Option Contracts. The Funds may enter into option contracts. When a Fund purchases an option, it pays a premium and the option is subsequently marked-to-market to reflect current value. Premiums paid for purchasing options which expire are treated as realized losses. Premiums paid for purchasing options which are exercised are added to the cost or deducted from the proceeds on the underlying instrument to
| 82
Notes to Financial Statements (continued)
December 31, 2014
determine the realized gain or loss. If the Fund enters into a closing sale transaction, the difference between the premium paid and the proceeds of the closing sale transaction is treated as a realized gain or loss. The risk associated with purchasing options is limited to the premium paid.
When a Fund writes an option, an amount equal to the net premium received (the premium less commission) is recorded as a liability and is subsequently adjusted to the current value. Net premiums received for written options which expire are treated as realized gains. Net premiums received for written options which are exercised are deducted from the cost or added to the proceeds on the underlying instrument to determine the realized gain or loss. If the Fund enters into a closing purchase transaction, the difference between the net premium received and any amount paid on effecting a closing purchase transaction, including commissions, is treated as a realized gain or, if the net premium received is less than the amount paid, as a realized loss. The Fund, as writer of a written option, bears the risk of an unfavorable change in the market value of the equity underlying the written option.
Exchange-traded options contracts are standardized and are settled through a clearing house with fulfillment supported by the credit of the exchange. Therefore, counterparty credit risks to the Funds are reduced. Over-the-counter (“OTC”) options are subject to the risk that the counterparty is unable or unwilling to meet its obligations under the option.
For the year ended December 31, 2014, the Funds were not party to any OTC options.
g. Swaptions. Certain funds may enter into interest rate swaptions. An interest rate swaption gives the holder the right, but not the obligation, to enter into or cancel an interest rate swap agreement at a future date. Interest rate swaptions may be either purchased or written. The buyer of an interest rate swaption may purchase either the right to receive a fixed rate in the underlying swap (known as a “receiver swaption”) or to pay a fixed rate (known as a “payer swaption”), based on the notional amount of the swap agreement, in exchange for a floating rate. The notional amounts of swaptions are not recorded in the financial statements.
When a Fund purchases an interest rate swaption, it pays a premium and the swaption is subsequently marked-to-market to reflect current value. Premiums paid for purchasing interest rate swaptions which expire are treated as realized losses. Premiums paid for purchasing interest rate swaptions which are exercised are added to the cost or deducted from the proceeds on the underlying swap to determine the realized gain or loss. If a Fund enters into a closing sale transaction, the difference between the premium paid and the proceeds of the closing sale transaction is treated as a realized gain or loss. The risk associated with purchasing interest rate swaptions is limited to the premium paid.
When a Fund writes an interest rate swaption, an amount equal to the premium received is recorded as a liability and is subsequently adjusted to the current value.
83 |
Notes to Financial Statements (continued)
December 31, 2014
Premiums received for written interest rate swaptions which expire are treated as realized gains. Premiums received for written interest rate swaptions which are exercised are deducted from the cost or added to the proceeds on the underlying swap to determine the realized gain or loss. If a Fund enters into a closing purchase transaction, the difference between the premium received and any amount paid on effecting a closing purchase transaction, including commission, is treated as a realized gain or, if the premium received is less than the amount paid, as a realized loss. A Fund, as writer of a written interest rate swaption, bears the risk of an unfavorable change in the market value of the swap underlying the written interest rate swaption.
OTC interest rate swaptions are subject to the risk that the counterparty is unable or unwilling to meet its obligations under the swaption.
h. Swap Agreements. Certain funds may enter into interest rate swaps.
An interest rate swap is an agreement with another party to receive or pay interest (e.g., an exchange of fixed rate payments for floating rate payments) to protect themselves from interest rate fluctuations. This type of swap is an agreement that obligates two parties to exchange a series of cash flows at specified intervals based upon or calculated by reference to a specified interest rate(s) for a specified amount. The payment flows are usually netted against each other, with the difference being paid by one party to the other.
The notional amounts of swap agreements are not recorded in the financial statements. Swap agreements are valued daily and fluctuations in the value are recorded in the Statements of Operations as change in unrealized appreciation (depreciation) on swap agreements. Fees are accrued in accordance with the terms of the agreement and are recorded in the Statements of Operations as realized gain or loss when received or paid. Upfront premiums paid or received by the Funds are recorded on the Statements of Assets and Liabilities as an asset or liability, respectively, and are amortized or accreted over the term of the agreement and recorded as realized gain or loss. Payments made or received by the Funds as a result of a credit event or termination of the agreement are recorded as realized gain or loss.
Swap agreements are privately negotiated and traded between counterparties and, as such, are subject to the risk that a party to the agreement will not be able to meet its obligations. The Funds cover their net obligations under outstanding swap agreements by segregating or earmarking liquid assets or cash.
For the year ended December 31, 2014, Diversified Income Fund was not party to any interest rate swaps.
i. Due from Brokers. Transactions and positions in futures and options contracts are maintained and cleared by registered U.S. broker/dealers pursuant to customer agreements between the Fund and the various broker/dealers. The due from broker
| 84
Notes to Financial Statements (continued)
December 31, 2014
balance in the Statements of Assets and Liabilities for Multi-Asset Allocation Fund represents cash on deposit with the broker for open futures and options contracts. In certain circumstances the Fund’s use of cash held at brokers is restricted by regulation or broker mandated limits.
j. Federal and Foreign Income Taxes. Each Trust treats each Fund as a separate entity for federal income tax purposes. Each Fund intends to meet the requirements of the Internal Revenue Code of 1986, as amended, applicable to regulated investment companies, and to distribute to its shareholders substantially all of its net investment income and any net realized capital gains at least annually. Management has performed an analysis of each Fund’s tax positions for the open tax years as of December 31, 2014 and has concluded that no provisions for income tax are required. The Funds’ federal tax returns for the prior three fiscal years, where applicable, remain subject to examination by the Internal Revenue Service. Management is not aware of any events that are reasonably possible to occur in the next twelve months that would result in the amounts of any unrecognized tax benefits significantly increasing or decreasing for the Funds. However, management’s conclusions regarding tax positions taken may be subject to review and adjustment at a later date based on factors including, but not limited to, new tax laws and accounting regulations and interpretations thereof.
A Fund may be subject to foreign withholding taxes on investment income and taxes on capital gains on investments that are accrued and paid based upon the Fund’s understanding of the tax rules and regulations that exist in the countries in which the Fund invests. Foreign withholding taxes on dividend and interest income are reflected on the Statements of Operations as a reduction of investment income, net of amounts eligible to be reclaimed. Dividends and interest receivable on the Statements of Assets and Liabilities are net of foreign withholding taxes. Foreign withholding taxes eligible to be reclaimed are reflected on the Statements of Assets and Liabilities as tax reclaims receivable. Capital gains taxes paid are included in net realized gain (loss) on investments in the Statements of Operations. Accrued but unpaid capital gains taxes are reflected as foreign taxes payable on the Statements of Assets and Liabilities, if applicable, and reduce unrealized gains on investments. In the event that realized gains on investments are subsequently offset by realized losses, taxes paid on realized gains may be returned to a Fund. Such amounts, if applicable, are reflected as foreign tax rebates receivable on the Statements of Assets and Liabilities and are recorded as a realized gain when received.
k. Dividends and Distributions to Shareholders. Dividends and distributions are recorded on ex-dividend date. The timing and characterization of certain income and capital gain distributions are determined annually in accordance with federal tax regulations, which may differ from accounting principles generally accepted in the United States of America. Permanent differences are primarily due to differing
85 |
Notes to Financial Statements (continued)
December 31, 2014
treatments for book and tax purposes of items such as net operating losses, contingent payment debt instruments, premium amortization, paydown gains and losses, defaulted and/or non-income producing securities, Treasury Inflation-Protected Securities (“TIPS”), distributions in excess of income and/or capital gain, return of capital and capital gain distributions received, non-deductible expenses, foreign currency gains and losses and deferred Trustees’ fees. Permanent book and tax basis differences relating to shareholder distributions, net investment income and net realized gains will result in reclassifications to capital accounts. Temporary differences between book and tax distributable earnings are primarily due to deferred Trustees’ fees, premium amortization, straddle adjustments, TIPS, trust preferred securities, contingent payment debt instruments, return of capital distributions received, wash sales and futures, forward foreign currency and options contract mark-to-market. Distributions from net investment income and short-term capital gains are considered to be distributed from ordinary income for tax purposes.
The tax characterization of distributions is determined on an annual basis. The tax character of distributions paid to shareholders during the years ended December 31, 2014 and 2013 were as follows:
| | | | | | | | | | | | | | | | | | | | | | | | | | | | | | | | |
| | | 2014 Distributions Paid From: | | | 2013 Distributions Paid From: | |
| | | Ordinary
Income | | | Tax
Exempt
Income | | | Long-Term
Capital
Gains | | | Total | | | Ordinary
Income | | | Tax
Exempt
Income | | | Long-Term
Capital
Gains | | | Total | |
Intermediate Municipal Bond Fund | | $ | — | | | $ | 394,704 | | | $ | — | | | $ | 394,704 | | | $ | — | | | $ | 225,858 | | | $ | — | | | $ | 225,858 | |
Diversified Income Fund | | | 3,440,398 | | | | — | | | | — | | | | 3,440,398 | | | | 3,088,880 | | | | — | | | | — | | | | 3,088,880 | |
U.S. Equity Opportunities Fund | | | 28,374,163 | | | | — | | | | 109,096,353 | | | | 137,470,516 | | | | 2,591,791 | | | | — | | | | 30,926,551 | | | | 33,518,342 | |
Multi-Asset Allocation Fund | | | — | | | | — | | | | — | | | | — | | | | — | | | | — | | | | — | | | | — | |
Differences between these amounts and those reported in the Statements of Changes in Net Assets are primarily attributable to different book and tax treatment for short-term capital gains.
| 86
Notes to Financial Statements (continued)
December 31, 2014
As of December 31, 2014, the components of distributable earnings on a tax basis were as follows:
| | | | | | | | | | | | | | | | |
| | | Intermediate
Municipal
Bond Fund | | | Diversified
Income
Fund | | | U.S. Equity
Opportunities
Fund | | | Multi-
Asset
Allocation
Fund | |
Undistributed ordinary income | | $ | — | | | $ | — | | | $ | 1,694,293 | | | $ | — | |
Undistributed tax exempt income | | | 18,220 | | | | — | | | | — | | | | — | |
Undistributed long-term capital gains | | | — | | | | — | | | | 4,906,378 | | | | 658,850 | |
| | | | | | | | | | | | | | | | |
Total undistributed earnings | | | 18,220 | | | | — | | | | 6,600,671 | | | | 658,850 | |
| | | | | | | | | | | | | | | | |
Capital loss carryforward: | | | — | | | | — | | | | — | | | | — | |
Short-term: | | | | | | | | | | | | | | | | |
Expires: | | | | | | | | | | | | | | | | |
December 31, 2017 | | | — | | | | (8,856,780 | ) | | | — | | | | — | |
No expiration date | | | (342,604 | ) | | | — | | | | — | | | | — | |
Long-term: | | | | | | | | | | | | | | | | |
No expiration date | | | (58,812 | ) | | | — | | | | — | | | | — | |
| | | | | | | | | | | | | | | | |
Total capital loss carryforward | | | (401,416 | ) | | | (8,856,780 | ) | | | — | | | | — | |
| | | | | | | | | | | | | | | | |
Post-October capital loss deferrals* | | | — | | | | (37,566 | ) | | | — | | | | (759,467 | ) |
| | | | | | | | | | | | | | | | |
Unrealized appreciation (depreciation) | | | 763,097 | | | | 16,919,341 | | | | 68,727,661 | | | | (1,084,844 | ) |
| | | | | | | | | | | | | | | | |
Total accumulated earnings (losses) | | $ | 379,901 | | | $ | 8,024,995 | | | $ | 75,328,332 | | | $ | (1,185,461 | ) |
| | | | | | | | | | | | | | | | |
Capital loss carryforward utilized in the current year | | $ | — | | | $ | 1,160,969 | | | $ | — | | | $ | — | |
| | | | | | | | | | | | | | | | |
| * | Under current tax law, capital losses, foreign currency losses, and losses on passive foreign investment companies and contingent payment debt instruments after October 31 or December 31, as applicable, may be deferred and treated as occurring on the first day of the following taxable year. |
Capital losses may be utilized to offset future capital gains until expiration. The Regulated Investment Company Modernization Act of 2010 (the “Act”) allows capital loss carryforwards to be carried forward indefinitely. Rules in effect previously limited the carryforward period to eight years. Capital loss carryforwards generated in taxable years beginning after the effective date of the Act must be fully used before capital loss carryforwards generated in years prior to the effective date of the Act; therefore, under certain circumstances, capital loss carryforwards available as of the report date may expire unused.
87 |
Notes to Financial Statements (continued)
December 31, 2014
l. Repurchase Agreements. Each Fund may enter into repurchase agreements, under the terms of a Master Repurchase Agreement, under which each Fund acquires securities as collateral and agrees to resell the securities at an agreed upon time and at an agreed upon price. It is each Fund’s policy that the market value of the collateral for repurchase agreements be at least equal to 102% of the repurchase price, including interest. Certain repurchase agreements are tri-party arrangements whereby the collateral is held in a segregated account for the benefit of the Fund and on behalf of the counterparty. Repurchase agreements could involve certain risks in the event of default or insolvency of the counterparty, including possible delays or restrictions upon a Fund’s ability to dispose of the underlying securities. As of December 31, 2014, each Fund, as applicable, had investments in repurchase agreements for which the value of the related collateral exceeded the value of the repurchase agreement. The gross value of repurchase agreements is included in the Statements of Assets and Liabilities for financial reporting purposes.
m. Delayed Delivery Commitments. The Funds may purchase securities, including those designated as To Be Announced (“TBAs”) in the Portfolio of Investments, for which delivery or payment will occur at a later date, beyond the normal settlement period. The price of the security and the date when the security will be delivered and paid for are fixed at the time the transaction is negotiated. The security and the obligation to pay for it are recorded by the Fund at the time the commitment is entered into. The actual security that will be delivered to fulfill a TBA trade is not designated at the time of the trade. The security is “to be announced” 48 hours prior to the established trade settlement date. The value of the security may vary with market fluctuations during the time before the Fund takes delivery of the security. When the Fund enters into such a transaction, collateral consisting of liquid securities or cash and cash equivalents is required to be segregated or earmarked at the custodian in an amount at least equal to the amount of the Fund’s commitment. No interest accrues to the Fund until the transaction settles.
Purchases of delayed delivery securities may have a similar effect on the Fund’s net asset value as if the Fund had created a degree of leverage in the portfolio. Risks may arise upon entering into such transactions from the potential inability of counterparties to meet their obligations under the transactions. Additionally, losses may arise due to changes in the value of the underlying securities.
No delayed delivery securities were held by the Funds as of December 31, 2014.
n. Securities Lending. The Funds have entered into an agreement with State Street Bank and Trust Company (“State Street Bank”), as agent of the Funds, to lend securities to certain designated borrowers. The loans are collateralized with cash or securities in an amount equal to at least 105% or 102% of the market value (including accrued interest) of the loaned international or domestic securities, respectively, when the loan is initiated. Thereafter, the value of the collateral must remain at least 102% of the
| 88
Notes to Financial Statements (continued)
December 31, 2014
market value (including accrued interest) of loaned securities for U.S. equities and U.S. corporate debt; at least 105% of the market value (including accrued interest) of loaned securities for non-U.S. equities; and at least 100% of the market value (including accrued interest) of loaned securities for U.S. Government securities, sovereign debt issued by non-U.S. Governments and non-U.S. corporate debt. In the event that the market value of the collateral falls below the required percentages described above, the borrower will deliver additional collateral on the next business day. As with other extensions of credit, the Funds may bear the risk of loss with respect to the investment of the collateral. The Funds invest cash collateral in short-term investments, a portion of the income from which is remitted to the borrowers and the remainder allocated between the Funds and State Street Bank as lending agent.
For the year ended December 31, 2014, none of the Funds had loaned securities under this agreement.
o. Indemnifications. Under the Trusts’ organizational documents, their officers and Trustees are indemnified against certain liabilities arising out of the performance of their duties to the Funds. Additionally, in the normal course of business, the Funds enter into contracts with service providers that contain general indemnification clauses. The Funds’ maximum exposure under these arrangements is unknown as this would involve future claims that may be made against the Funds that have not yet occurred. However, based on experience, the Funds expect the risk of loss to be remote.
3. Fair Value Measurements. In accordance with accounting standards related to fair value measurements and disclosures, the Funds have categorized the inputs utilized in determining the value of each Fund’s assets or liabilities. These inputs are summarized in the three broad levels listed below:
| | • | | Level 1 – quoted prices in active markets for identical assets or liabilities; |
| | • | | Level 2 – prices determined using other significant inputs that are observable either directly, or indirectly through corroboration with observable market data (which could include quoted prices for similar assets or liabilities, interest rates, credit risk, etc.); and |
| | • | | Level 3 – prices determined using significant unobservable inputs when quoted prices or observable inputs are unavailable such as when there is little or no market activity for an asset or liability (unobservable inputs reflect each Fund’s own assumptions in determining the fair value of assets or liabilities and would be based on the best information available). |
The inputs or methodology used for valuing securities are not necessarily an indication of the risk associated with investing in those securities.
89 |
Notes to Financial Statements (continued)
December 31, 2014
The following is a summary of the inputs used to value the Funds’ investments as of December 31, 2014, at value:
Intermediate Municipal Bond Fund
Asset Valuation Inputs
| | | | | | | | | | | | | | | | |
Description | | Level 1 | | | Level 2 | | | Level 3 | | | Total | |
Bonds and Notes(a) | | $ | — | | | $ | 31,124,356 | | | $ | — | | | $ | 31,124,356 | |
Short-Term Investments | | | — | | | | 1,481,381 | | | | — | | | | 1,481,381 | |
| | | | | | | | | | | | | | | | |
Total | | $ | — | | | $ | 32,605,737 | | | $ | — | | | $ | 32,605,737 | |
| | | | | | | | | | | | | | | | |
| (a) | Details of the major categories of the Fund’s investments are reflected within the Portfolio of Investments. |
For the year ended December 31, 2014, there were no transfers among Levels 1, 2 and 3.
Diversified Income Fund
Asset Valuation Inputs
| | | | | | | | | | | | | | | | |
Description | | Level 1 | | | Level 2 | | | Level 3 | | | Total | |
Common Stocks(a) | | $ | 90,588,259 | | | $ | — | | | $ | — | | | $ | 90,588,259 | |
Bonds and Notes | | | | | | | | | | | | | | | | |
Non-Convertible Bonds | | | | | | | | | | | | | | | | |
ABS Car Loan | | | — | | | | 1,605,040 | | | | 294,726 | (b) | | | 1,899,766 | |
ABS Home Equity | | | — | | | | 2,973,677 | | | | 18,198 | (c) | | | 2,991,875 | |
ABS Other | | | — | | | | 406,203 | | | | 772,936 | (b) | | | 1,179,139 | |
Airlines | | | — | | | | 898,738 | | | | 1,315,465 | (b) | | | 2,214,203 | |
All Other Non-Convertible Bonds(a) | | | — | | | | 66,137,259 | | | | — | | | | 66,137,259 | |
| | | | | | | | | | | | | | | | |
Total Non-Convertible Bonds | | | — | | | | 72,020,917 | | | | 2,401,325 | | | | 74,422,242 | |
| | | | | | | | | | | | | | | | |
Convertible Bonds(a) | | | — | | | | 3,480,246 | | | | — | | | | 3,480,246 | |
Municipals(a) | | | — | | | | 38,953 | | | | — | | | | 38,953 | |
| | | | | | | | | | | | | | | | |
Total Bonds and Notes | | | — | | | | 75,540,116 | | | | 2,401,325 | | | | 77,941,441 | |
| | | | | | | | | | | | | | | | |
Preferred Stocks | | | | | | | | | | | | | | | | |
Non-Convertible Preferred Stocks(a) | | | 1,000,411 | | | | — | | | | — | | | | 1,000,411 | |
Convertible Preferred Stocks | | | | | | | | | | | | | | | | |
REITs – Mortgage | | | — | | | | 105,234 | | | | — | | | | 105,234 | |
All Other Convertible Preferred Stocks(a) | | | 1,213,724 | | | | — | | | | — | | | | 1,213,724 | |
| | | | | | | | | | | | | | | | |
Total Convertible Preferred Stocks | | | 1,213,724 | | | | 105,234 | | | | — | | | | 1,318,958 | |
| | | | | | | | | | | | | | | | |
| 90
Notes to Financial Statements (continued)
December 31, 2014
Diversified Income Fund (continued)
Asset Valuation Inputs (continued)
| | | | | | | | | | | | | | | | |
Description | | Level 1 | | | Level 2 | | | Level 3 | | | Total | |
Total Preferred Stocks | | $ | 2,214,135 | | | $ | 105,234 | | | $ | — | | | $ | 2,319,369 | |
| | | | | | | | | | | | | | | | |
Senior Loans(a) | | | — | | | | 101,467 | | | | — | | | | 101,467 | |
Short-Term Investments | | | — | | | | 7,891,119 | | | | — | | | | 7,891,119 | |
| | | | | | | | | | | | | | | | |
Total Investments | | | 92,802,394 | | | | 83,637,936 | | | | 2,401,325 | | | | 178,841,655 | |
| | | | | | | | | | | | | | | | |
Forward Foreign Currency Contracts (unrealized appreciation) | | | — | | | | 50,936 | | | | — | | | | 50,936 | |
| | | | | | | | | | | | | | | | |
Total | | $ | 92,802,394 | | | $ | 83,688,872 | | | $ | 2,401,325 | | | $ | 178,892,591 | |
| | | | | | | | | | | | | | | | |
Liability Valuation Inputs
| | | | | | | | | | | | | | | | |
Description | | Level 1 | | | Level 2 | | | Level 3 | | | Total | |
Futures Contracts (unrealized depreciation) | | $ | (55,028 | ) | | $ | — | | | $ | — | | | $ | (55,028 | ) |
| | | | | | | | | | | | | | | | |
| (a) | Details of the major categories of the Fund’s investments are reflected within the Portfolio of Investments. |
| (b) | Valued using broker-dealer bid prices. |
| (c) | Fair valued by the Fund’s adviser. |
The Fund’s pricing policies and procedures are recommended by the adviser and approved by the Board of Trustees. Debt securities are valued based on evaluated bids furnished to the Fund by an independent pricing service. Broker-dealer bid prices may be used if an independent pricing service either is unable to price a security or does not provide a reliable price for a security. Broker-dealer bid prices for which the Fund does not have knowledge of the inputs used by the broker-dealer are categorized in Level 3. All security prices, including those obtained from an independent pricing service and broker-dealer bid prices, are reviewed on a daily basis by the adviser, subject to oversight by Fund management and the Board of Trustees. If the adviser, in good faith, believes that the price provided by an independent pricing service is unreliable, broker-dealer bid prices may be used until the price provided by the independent pricing service is considered to be reliable. Reliability of all security prices, including those obtained from an independent pricing service and broker-dealer bid prices, is tested in a variety of ways, including comparison to recent transaction prices and daily fluctuations, amongst other validation procedures in place. Securities for which market quotations are not readily available are valued at fair value as determined in good faith by the Fund’s adviser pursuant to procedures approved by the Board of Trustees. Fair valued securities may be categorized in Level 3.
91 |
Notes to Financial Statements (continued)
December 31, 2014
U.S. Equity Opportunities Fund
Asset Valuation Inputs
| | | | | | | | | | | | | | | | |
Description | | Level 1 | | | Level 2 | | | Level 3 | | | Total | |
Common Stocks(a) | | $ | 483,040,763 | | | $ | — | | | $ | — | | | $ | 483,040,763 | |
Short-Term Investments | | | — | | | | 14,807,748 | | | | — | | | | 14,807,748 | |
| | | | | | | | | | | | | | | | |
Total | | $ | 483,040,763 | | | $ | 14,807,748 | | | $ | — | | | $ | 497,848,511 | |
| | | | | | | | | | | | | | | | |
| (a) | Details of the major categories of the Fund’s investments are reflected within the Portfolio of Investments. |
For the year ended December 31, 2014, there were no transfers among Levels 1, 2 and 3.
Multi-Asset Allocation Fund
Asset Valuation Inputs
| | | | | | | | | | | | | | | | |
Description | | Level 1 | | | Level 2 | | | Level 3 | | | Total | |
Bonds and Notes(a) | | $ | — | | | $ | 6,722,307 | | | $ | — | | | $ | 6,722,307 | |
Exchange Traded Funds(a) | | | 4,488,071 | | | | — | | | | — | | | | 4,488,071 | |
Purchased Options(a) | | | 13,987 | | | | — | | | | — | | | | 13,987 | |
Short-Term Investments | | | — | | | | 28,800,435 | | | | — | | | | 28,800,435 | |
| | | | | | | | | | | | | | | | |
Total Investments | | | 4,502,058 | | | | 35,522,742 | | | | — | | | | 40,024,800 | |
| | | | | | | | | | | | | | | | |
Futures Contracts (unrealized appreciation) | | | 1,129,900 | | | | — | | | | — | | | | 1,129,900 | |
| | | | | | | | | | | | | | | | |
Total | | $ | 5,631,958 | | | $ | 35,522,742 | | | $ | — | | | $ | 41,154,700 | |
| | | | | | | | | | | | | | | | |
Liability Valuation Inputs
| | | | | | | | | | | | | | | | |
Description | | Level 1 | | | Level 2 | | | Level 3 | | | Total | |
Written Options(a) | | $ | (5,625 | ) | | $ | — | | | $ | — | | | $ | (5,625 | ) |
Futures Contracts (unrealized depreciation) | | | (166,593 | ) | | | — | | | | — | | | | (166,593 | ) |
| | | | | | | | | | | | | | | | |
Total | | $ | (172,218 | ) | | $ | — | | | $ | — | | | $ | (172,218 | ) |
| | | | | | | | | | | | | | | | |
| (a) | Details of the major categories of the Fund’s investments are reflected within the Portfolio of Investments. |
For the period ended December 31, 2014, there were no transfers among Levels 1, 2 and 3.
| 92
Notes to Financial Statements (continued)
December 31, 2014
The following is a reconciliation of Level 3 investments for which significant unobservable inputs were used to determine fair value as of December 31, 2013 and/or December 31, 2014:
Diversified Income Fund
Asset Valuation Inputs
| | | | | | | | | | | | | | | | | | | | |
Investments in
Securities | | Balance as of
December 31,
2013 | | | Accrued
Discounts
(Premiums) | | | Realized
Gain
(Loss) | | | Change in
Unrealized
Appreciation
(Depreciation) | | | Purchases | |
Bonds and Notes | | | | | | | | | | | | | | | | | | | | |
Non-Convertible Bonds | | | | | | | | | | | | | | | | | | | | |
ABS Car Loan | | $ | — | | | $ | — | | | $ | — | | | $ | (255 | ) | | $ | 294,981 | |
ABS Home Equity | | | — | | | | — | | | | (765 | ) | | | 742 | | | | — | |
ABS Other | | | 284,200 | | | | — | | | | — | | | | (1,203 | ) | | | 489,939 | |
Airlines | | | 1,487,108 | | | | 70 | | | | 975 | | | | 8,542 | | | | — | |
Retailers | | | 254,668 | | | | — | | | | — | | | | — | | | | — | |
| | | | | | | | | | | | | | | | | | | | |
Total | | $ | 2,025,976 | | | $ | 70 | | | $ | 210 | | | $ | 7,826 | | | $ | 784,920 | |
| | | | | | | | | | | | | | | | | | | | |
| | | | | | | | | | | | | | | | | | | | |
Investments in
Securities | | Sales | | | Transfers
into Level 3 | | | Transfers
out of
Level 3 | | | Balance as of
December 31,
2014 | | | Change in
Unrealized
Appreciation
(Depreciation)
from
Investments
Still Held at
December 31,
2014 | |
Bonds and Notes | | | | | | | | | | | | | | | | | | | | |
Non-Convertible Bonds | | | | | | | | | | | | | | | | | | | | |
ABS Car Loan | | $ | — | | | $ | — | | | $ | — | | | $ | 294,726 | | | $ | (255 | ) |
ABS Home Equity | | | (23,106 | ) | | | 41,327 | | | | — | | | | 18,198 | | | | 742 | |
ABS Other | | | — | | | | — | | | | — | | | | 772,936 | | | | (1,203 | ) |
Airlines | | | (181,230 | ) | | | — | | | | — | | | | 1,315,465 | | | | 16,814 | |
Retailers | | | — | | | | — | | | | (254,668 | ) | | | — | | | | — | |
| | | | | | | | | | | | | | | | | | | | |
Total | | $ | (204,336 | ) | | $ | 41,327 | | | $ | (254,668 | ) | | $ | 2,401,325 | | | $ | 16,098 | |
| | | | | | | | | | | | | | | | | | | | |
93 |
Notes to Financial Statements (continued)
December 31, 2014
A debt security valued at $41,327 was transferred from Level 2 to Level 3 during the period ended December 31, 2014. At December 31, 2013, this security was valued on the basis of evaluated bids furnished to the Fund by an independent pricing service in accordance with the Fund’s valuation policies. At December 31, 2014, this security was valued at fair value as determined in good faith by the Fund’s adviser as an independent pricing service did not provide a reliable price for the security.
A debt security valued at $254,668 was transferred from Level 3 to Level 2 during the period ended December 31, 2014. At December 31, 2013, this security was valued using broker-dealer bid prices based on inputs unobservable to the Fund as an independent pricing service was unable to price the security. At December 31, 2014, this security was valued on the basis of evaluated bids furnished to the Fund by an independent pricing service in accordance with the Fund’s valuation policies.
All transfers are recognized as of the beginning of the reporting period.
4. Derivatives. Derivative instruments are defined as financial instruments whose value and performance are based on the value and performance of another security or financial instrument. Derivative instruments that Diversified Income Fund, U.S. Equity Opportunities Fund and Multi-Asset Allocation Fund used during the period include forward foreign currency contracts, futures contracts, option contracts and interest rate swaptions.
Diversified Income Fund may use interest rate swaptions to gain exposure, such as to enter into a contract to benefit from a rise or fall in interest rates. During the year ended December 31, 2014, the Fund engaged in interest rate swaptions for this purpose.
Diversified Income Fund is subject to the risk that changes in foreign currency exchange rates will have an unfavorable effect on the value of Fund assets denominated in foreign currencies. The Fund may enter into forward foreign currency contracts for hedging purposes to protect the value of the Fund’s holdings of foreign securities. During the year ended December 31, 2014, the Fund engaged in forward foreign currency transactions for hedging purposes.
Diversified Income Fund is subject to the risk that changes in interest rates will affect the value of the Fund’s investments in fixed-income securities. The Fund will be subject to increased interest rate risk to the extent that it invests in fixed-income securities with longer maturities or durations, as compared to investing in fixed-income securities with shorter maturities or durations. The Fund may use futures contracts and interest rate swaptions to hedge against changes in interest rates and to manage its duration without having to buy or sell portfolio securities. During the year ended December 31, 2014, the Fund used futures contracts to manage duration and used interest rate swaptions for hedging purposes and to manage duration.
The Funds are subject to the risk of unpredictable declines in the value of individual equity securities and periods of below average performance in individual securities or
| 94
Notes to Financial Statements (continued)
December 31, 2014
in the equity market as a whole. U.S. Equity Opportunities Fund may use futures contracts, purchased put options and written call options to hedge against a decline in value of an equity security that it owns and may use written put options to offset the cost of options used for hedging purposes. The Fund may also use futures contracts, purchased call options and written put options for investment purposes. During the year ended December 31, 2014, the Fund engaged in futures contracts and purchased put option transactions for hedging purposes and futures contracts and written put option transactions for investment purposes.
Multi-Asset Allocation Fund seeks to gain exposure to a combination of four asset classes: equity, fixed income, currency and volatility. The Fund pursues its objective by utilizing a variety of listed and other liquid derivative instruments. The Fund’s equity exposure typically will be obtained through investments in broad, equity index listed futures and exchange-traded funds (“ETFs”). The Fund’s fixed income exposure may consist of, but is not limited to, U.S. and non-U.S. government bonds, listed bond futures and fixed income ETFs. The Fund’s currency exposure typically will be obtained through investments in non-dollar denominated investments, futures and forward foreign currency contracts. The Fund’s exposure to volatility assets will result from both “long” and “short” positions in index futures and options, such as futures contracts based on the Chicago Board Options Exchange Volatility Index (the “VIX”), listed equity index options and equity index futures. During the period ended December 31, 2014, the Fund used futures and options contracts to gain investment exposure in accordance with its objective.
The following is a summary of derivative instruments for Diversified Income Fund as of December 31, 2014, as reflected within the Statements of Assets and Liabilities:
| | | | |
Assets | | Unrealized
appreciation on
forward foreign
currency contracts | |
Over-the-counter asset derivatives | | | | |
Foreign exchange contracts | | $ | 50,936 | |
| |
Liabilities | | Unrealized
depreciation on
futures contracts1 | |
Exchange traded/cleared liability derivatives | | | | |
Interest rate contracts | | $ | (55,028 | ) |
| 1 | Represents cumulative unrealized appreciation (depreciation) on futures contracts. Only the current day’s variation margin on futures contracts is reported within the Statements of Assets and Liabilities as receivable or payable for variation margin, as applicable. |
95 |
Notes to Financial Statements (continued)
December 31, 2014
Transactions in derivative instruments for Diversified Income Fund during the year ended December 31, 2014 as reflected within the Statements of Operations were as follows:
| | | | | | | | | | | | | | | | |
Net Realized Gain (Loss) on: | | Investments2 | | | Futures
contracts | | | Swaptions
written | | | Foreign
currency
translations3 | |
Interest rate contracts | | $ | (884,404 | ) | | $ | (170,733 | ) | | $ | 620,081 | | | $ | — | |
Foreign exchange contracts | | | — | | | | — | | | | — | | | | 21,141 | |
| | | | |
Net Change in Unrealized
Appreciation (Depreciation) on: | | Investments2 | | | Futures
contracts | | | Swaptions
written | | | Foreign
currency
translations3 | |
Interest rate contracts | | $ | (13,584 | ) | | $ | (58,899 | ) | | $ | 5,664 | | | $ | — | |
Foreign exchange contracts | | | — | | | | — | | | | — | | | | 49,655 | |
| 2 | Represents realized loss and change in unrealized appreciation (depreciation), respectively, for purchased swaptions during the period. |
| 3 | Represents realized gain and change in unrealized appreciation (depreciation), respectively, for forward foreign currency contracts during the period. Does not include other foreign currency gains or losses included in the Statements of Operations. |
Transactions in derivative instruments for U.S. Equity Opportunities Fund during the year ended December 31, 2014 as reflected within the Statements of Operations were as follows:
| | | | | | | | | | | | |
Net Realized Gain (Loss) on: | | Investments1 | | | Futures
contracts | | | Options written | |
Equity contracts | | $ | 85,425 | | | $ | 268,061 | | | $ | (21,977) | |
| 1 | Represents realized gain for purchased options during the period. |
The following is a summary of derivative instruments for Multi-Asset Allocation Fund as of December 31, 2014, as reflected within the Statements of Assets and Liabilities:
| | | | | | | | | | | | |
Assets | | Investments at value1 | | | Unrealized
appreciation on
futures contracts | | | Total | |
Exchange traded/cleared asset derivatives | | | | | | | | |
Interest rate contracts | | $ | 5,937 | | | $ | 216,556 | | | $ | 222,493 | |
Foreign exchange contracts | | | — | | | | 10,304 | | | | 10,304 | |
Equity contracts | | | 8,050 | | | | 903,040 | | | | 911,090 | |
| | | | | | | | | | | | |
Total asset derivatives | | $ | 13,987 | | | $ | 1,129,900 | | | $ | 1,143,887 | |
| | | | | | | | | | | | |
| 96
Notes to Financial Statements (continued)
December 31, 2014
| | | | | | | | | | | | |
Liabilities | | Options written at value | | | Unrealized
depreciation on
futures contracts | | | Total | |
Exchange traded/cleared liability derivatives | | | | | | | | |
Interest rate contracts | | $ | (5,625 | ) | | $ | (5,615 | ) | | $ | (11,240 | ) |
Equity contracts | | | — | | | | (160,978 | ) | | | (160,978 | ) |
| | | | | | | | | | | | |
Total liability derivatives | | $ | (5,625 | ) | | $ | (166,593 | ) | | $ | (172,218 | ) |
| | | | | | | | | | | | |
| 1 | Represents purchased options, at value. |
Transactions in derivative instruments for Multi-Asset Allocation Fund during the period ended December 31, 2014 as reflected within the Statements of Operations were as follows:
| | | | | | | | | | | | |
Net Realized Gain (Loss) on: | | Investments2 | | | Futures
contracts | | | Options written | |
Interest rate contracts | | $ | — | | | $ | 327,453 | | | $ | 110,045 | |
Foreign exchange contracts | | | — | | | | 48,610 | | | | — | |
Equity contracts | | | (119,659 | ) | | | (350,564 | ) | | | — | |
| | | | | | | | | | | | |
Total | | $ | (119,659 | ) | | $ | 25,499 | | | $ | 110,045 | |
| | | | | | | | | | | | |
Net Change in Unrealized Appreciation
(Depreciation) on: | | Investments2 | | | Futures
contracts | | | Options written | |
Interest rate contracts | | $ | (3,437 | ) | | $ | 210,941 | | | $ | 939 | |
Foreign exchange contracts | | | — | | | | 10,304 | | | | — | |
Equity contracts | | | (8,750 | ) | | | 742,062 | | | | — | |
| | | | | | | | | | | | |
Total | | $ | (12,187 | ) | | $ | 963,307 | | | $ | 939 | |
| | | | | | | | | | | | |
| 2 | Represents realized loss and change in unrealized appreciation (depreciation), respectively, for purchased options during the period. |
As the Funds value their derivatives at fair value and recognize changes in fair value through the Statements of Operations, they do not qualify for hedge accounting under authoritative guidance for derivative instruments. The Funds’ investments in derivatives may represent an economic hedge; however, they are considered to be non-hedge transactions for the purpose of these disclosures.
97 |
Notes to Financial Statements (continued)
December 31, 2014
The volume of forward foreign currency contract and futures contract activity, as a percentage of net assets, for Diversified Income Fund, U.S. Equity Opportunities Fund and Multi-Asset Allocation Fund, based on gross month-end or daily (as applicable) notional amounts outstanding during the period, including long and short positions at absolute value, was as follows for the year ended December 31, 2014:
| | | | | | | | |
Diversified Income Fund | | Futures | | | Forwards | |
Average Notional Amount Outstanding | | | 1.18 | % | | | 0.77 | % |
Highest Notional Amount Outstanding | | | 1.42 | % | | | 1.32 | % |
Lowest Notional Amount Outstanding | | | 0.21 | % | | | 0.28 | % |
Notional Amount Outstanding as of December 31, 2014 | | | 1.13 | % | | | 0.40 | % |
| | |
U.S. Equity Opportunities Fund | | Futures | | | | |
Average Notional Amount Outstanding | | | 0.09 | % | | | | |
Highest Notional Amount Outstanding | | | 2.09 | % | | | | |
Lowest Notional Amount Outstanding | | | 0.00 | % | | | | |
Notional Amount Outstanding as of December 31, 2014 | | | 0.00 | % | | | | |
| | |
Multi-Asset Allocation Fund | | Futures | | | | |
Average Notional Amount Outstanding | | | 87.34 | % | | | | |
Highest Notional Amount Outstanding | | | 95.83 | % | | | | |
Lowest Notional Amount Outstanding | | | 80.61 | % | | | | |
Notional Amount Outstanding as of December 31, 2014 | | | 88.64 | % | | | | |
Notional amounts outstanding at the end of the prior period are included in the average notional amount outstanding.
Unrealized gain and/or loss on open forwards and futures is recorded in the Statements of Assets and Liabilities. The aggregate notional values of forward and futures are not recorded in the Statements of Assets and Liabilities, and therefore are not included in the Fund’s net assets.
The volume of interest rate swaption activity, as a percentage of net assets, for Diversified Income Fund, based on average premiums paid or received during the period, including long and short positions, at absolute value, was as follows for the year ended December 31, 2014:
| | | | | | | | | | | | | | | | |
Diversified Income Fund | | Interest Rate Call
Swaptions Purchased | | | Interest Rate Put
Swaptions
Purchased | | | Interest Rate Put Swaptions
Written | | | Interest Rate Call
Swaptions Written | |
Average Premium Paid/Received | | | 0.37 | % | | | 0.04 | % | | | 0.00 | %* | | | 0.23 | % |
Highest Premium Paid/Received | | | 0.67 | % | | | 0.12 | % | | | 0.02 | % | | | 0.44 | % |
Lowest Premium Paid/Received | | | 0.00 | % | | | 0.00 | % | | | 0.00 | % | | | 0.00 | % |
Premium Paid/Received as of December 31, 2014 | | | 0.00 | % | | | 0.00 | % | | | 0.00 | % | | | 0.00 | % |
| * | Amount rounds to less than 0.01%. |
| 98
Notes to Financial Statements (continued)
December 31, 2014
The volume of option contract activity, as a percentage of net assets, for U.S. Equity Opportunities Fund, based on daily market values of equity securities underlying purchased and written options, at absolute value, was as follows for the year ended December 31, 2014:
| | | | | | | | |
U.S. Equity Opportunities Fund* | | Put Options
Purchased | | | Put Options
Written | |
Average Market Value of Underlying Securities | | | 0.39 | % | | | 0.20 | % |
Highest Market Value of Underlying Securities | | | 4.41 | % | | | 2.78 | % |
Lowest Market Value of Underlying Securities | | | 0.00 | % | | | 0.00 | % |
Market Value of Underlying Securities as of December 31, 2014 | | | 0.00 | % | | | 0.00 | % |
| * | Market value of underlying securities is determined by multiplying option shares by the price of the option’s underlying security, as determined by the Fund’s Pricing Policies and Procedures. |
The volume of option contract activity, as a percentage of net assets, for Multi-Asset Allocation Fund, based on month-end market values of instruments underlying purchased and written options, at absolute value, was as follows for the period ended December 31, 2014:
| | | | | | | | | | | | |
Multi-Asset Allocation Fund* | | Call
Options
Purchased | | | Put
Options Purchased | | | Call Options Written | |
Average Market Value of Underlying Instruments | | | 3.02 | % | | | 1.17 | % | | | 1.17 | % |
Highest Market Value of Underlying Instruments | | | 14.90 | % | | | 5.20 | % | | | 5.20 | % |
Lowest Market Value of Underlying Instruments | | | 0.00 | % | | | 0.00 | % | | | 0.00 | % |
Market Value of Underlying Instruments as of December 31, 2014 | | | 2.94 | % | | | 5.20 | % | | | 5.20 | % |
| * | Market value of underlying instruments is determined as follows: for securities by multiplying option shares by the price of the option’s underlying security, for currencies by multiplying par value by the strike price and dividing by the foreign currency exchange rate and for futures by multiplying the number of contracts by the contract multiplier by the price of the underlying futures contract. |
Market value of underlying securities at the end of the prior period, if applicable, are included in the averages above.
The following is a summary of Diversified Income Fund’s written swaption activity:
| | | | | | | | |
| | | Notional Amount | | | Premiums | |
Outstanding at December 31, 2013 | | $ | 34,950,000 | | | $ | 588,139 | |
Swaptions written | | | 9,000,000 | | | | 212,040 | |
Swaptions expired | | | (17,450,000 | ) | | | (28,139 | ) |
Swaptions terminated in closing purchase transactions | | | (26,500,000 | ) | | | (772,040 | ) |
| | | | | | | | |
Outstanding at December 31, 2014 | | $ | — | | | $ | — | |
| | | | | | | | |
99 |
Notes to Financial Statements (continued)
December 31, 2014
The following is a summary of U.S. Equity Opportunities Fund’s written option activity:
| | | | | | | | |
| | | Contracts | | | Premiums | |
Outstanding at December 31, 2013 | | $ | — | | | $ | — | |
Options written | | | 486 | | | | 35,026 | |
Options terminated in closing purchase transactions | | | (486 | ) | | | (35,026 | ) |
| | | | | | | | |
Outstanding at December 31, 2014 | | $ | — | | | $ | — | |
| | | | | | | | |
The following is a summary of Multi-Asset Allocation Fund’s written option activity:
| | | | | | | | |
| | | Contracts | | | Premiums | |
Options written | | $ | 165 | | | $ | 179,484 | |
Options terminated in closing purchase transactions | | | (145 | ) | | | (172,920 | ) |
| | | | | | | | |
Outstanding at December 31, 2014 | | $ | 20 | | | $ | 6,564 | |
| | | | | | | | |
Diversified Income Fund enters into OTC derivatives, including forward foreign currency contracts and interest rate swaptions, pursuant to International Swaps and Derivatives Association, Inc. (“ISDA”) agreements negotiated between the Fund and its counterparties. ISDA agreements typically contain, among other things, terms for the posting of collateral and master netting provisions in the event of a default or other termination event. Collateral is posted by the Fund or the counterparty to the extent of the net mark-to-market exposure to the other party of all open contracts under the agreement, subject to minimum transfer requirements. Master netting provisions allow the Fund and the counterparty, in the event of a default or other termination event, to offset amounts owed by each related to derivative contracts, including any posted collateral, to one net amount payable by either the Fund or the counterparty. The Fund’s ISDA agreements typically contain provisions that allow a counterparty to terminate open contracts early if the net asset value of the Fund declines beyond a certain threshold. For financial reporting purposes, the Fund does not offset derivative assets and liabilities, and any related collateral received or pledged, on the Statements of Assets and Liabilities.
As of December 31, 2014, gross amounts of OTC derivative assets and liabilities not offset in the Statements of Assets and Liabilities and the related net amounts after taking into account master netting arrangements for Diversified Income Fund, by counterparty, are as follows:
| | | | | | | | | | | | | | | | | | | | |
Counterparty | | Gross
Amounts of
Assets | | | Offset
Amount | | | Net
Asset
Balance | | | Collateral
(Received)/
Pledged | | | Net
Amount | |
Credit Suisse International | | $ | 1,314 | | | $ | — | | | $ | 1,314 | | | $ | — | | | $ | 1,314 | |
UBS AG | | | 49,622 | | | | — | | | | 49,622 | | | | — | | | | 49,622 | |
| | | | | | | | | | | | | | | | | | | | |
| | $ | 50,936 | | | $ | — | | | $ | 50,936 | | | $ | — | | | $ | 50,936 | |
| | | | | | | | | | | | | | | | | | | | |
| 100
Notes to Financial Statements (continued)
December 31, 2014
The actual collateral received or pledged, if any, may exceed the amounts shown in the table due to overcollateralization. Timing differences may exist between when contracts under the ISDA agreement are marked-to-market and when collateral moves. The ISDA agreements for Diversified Income Fund include tri-party control agreements under which collateral is held for the benefit of the secured party at a third party custodian, State Street Bank.
Counterparty risk is managed based on policies and procedures established by each Fund’s adviser. Such policies and procedures may include, but are not limited to, minimum counterparty credit rating requirements, monitoring of counterparty credit default swap spreads and posting of collateral. A Fund’s risk of loss from counterparty credit risk on OTC derivatives is generally limited to the Fund’s aggregated unrealized gains and the amount of any collateral pledged to the counterparty, which may be offset by any collateral posted to the Fund by the counterparty. ISDA master agreements can help to manage counterparty risk by specifying collateral posting arrangements at pre-arranged exposure levels. Under these ISDA agreements, collateral is routinely transferred if the total net exposure in respect of certain transactions, net of existing collateral already in place, exceeds a specified amount (typically $250,000, depending on the counterparty). With exchange traded derivatives, there is minimal counterparty credit risk to the Fund because the exchange’s clearinghouse, as counterparty to these instruments, stands between the buyer and the seller of the contract. Credit risk still exists in exchange traded derivatives with respect to initial and variation margin that is held in a broker’s customer accounts. While brokers are required to segregate customer margin from their own assets, in the event that a broker becomes insolvent or goes into bankruptcy and at that time there is a shortfall in the aggregate amount of margin held by the broker for all its clients, U.S. bankruptcy laws will typically allocate that shortfall on a pro rata basis across all of the broker’s customers, potentially resulting in losses to the Fund. Based on balances reflected on each Fund’s Statement of Assets and Liabilities, the following table shows (i) the maximum amount of loss due to credit risk that, based on the gross fair value of the financial instrument, the applicable Fund would incur if parties to the relevant financial instruments failed completely to perform according to the terms of the contracts and the collateral or other security, if any, for the amount due proved to be of no value to the Fund, and (ii) the amount of loss that the applicable Fund would incur after taking into account master netting provisions pursuant to ISDA agreements, as of December 31, 2014:
| | | | | | | | |
Fund | | Maximum Amount
of Loss - Gross | | | Maximum Amount of Loss - Net | |
Diversified Income Fund | | $ | 85,935 | | | $ | 85,935 | |
Multi-Asset Allocation Fund | | | 2,005,652 | | | | 2,005,652 | |
101 |
Notes to Financial Statements (continued)
December 31, 2014
5. Purchases and Sales of Securities. For the year ended December 31, 2014, purchases and sales of securities (excluding short-term investments and U.S. Government/Agency securities and including paydowns) were as follows:
| | | | | | | | |
Fund | | Purchases | | | Sales | |
Intermediate Municipal Bond Fund | | $ | 12,676,262 | | | $ | 2,579,655 | |
Diversified Income Fund | | | 41,840,885 | | | | 23,986,443 | |
U.S. Equity Opportunities Fund | | | 426,752,437 | | | | 435,218,563 | |
Multi-Asset Allocation Fund | | | 17,221,840 | | | | 3,857,000 | |
For the year ended December 31, 2014, purchases and sales of U.S. Government/Agency securities by Diversified Income Fund were $45,841,412 and $31,877,194, respectively.
6. Management Fees and Other Transactions with Affiliates.
a. Management Fees. NGAM Advisors, L.P. (“NGAM Advisors”) serves as investment adviser to each Fund except the Multi-Asset Allocation Fund. Natixis Asset Management U.S., LLC (“Natixis AM US”) is the investment adviser to the Multi-Asset Allocation Fund. Under the terms of the management agreements, each Fund pays a management fee at the following annual rates, calculated daily and payable monthly, based on each Fund’s average daily net assets:
| | | | | | | | |
| | | Percentage of Average Daily Net Assets | |
Fund | | First $1 billion | | | Over $1 billion | |
Intermediate Municipal Bond Fund | | | 0.40 | % | | | 0.40 | % |
Diversified Income Fund | | | 0.55 | % | | | 0.50 | % |
U.S. Equity Opportunities Fund | | | 0.80 | % | | | 0.80 | % |
Multi-Asset Allocation Fund | | | 0.85 | % | | | 0.85 | % |
NGAM Advisors has entered into subadvisory agreements for each Fund as listed below.
| | |
Intermediate Municipal Bond Fund | | McDonnell Investment Management, LLC (“McDonnell”) |
Diversified Income Fund | | AEW Capital Management, L.P. (“AEW”) |
| | Loomis, Sayles & Company, L.P. (“Loomis Sayles”) |
U.S. Equity Opportunities Fund | | Harris Associates L.P. (“Harris”) |
| | Loomis Sayles |
| 102
Notes to Financial Statements (continued)
December 31, 2014
Under the terms of the subadvisory agreements, each Fund has agreed to pay its respective subadviser(s) a subadvisory fee at the following annual rates, calculated daily and payable monthly, based on each Fund’s/Segment’s average daily net assets:
| | | | | | | | | | | | |
| | | | | | Percentage of Average
Daily Net Assets | |
Fund | | Subadviser | | | First $250 million | | | Over $250 million | |
Intermediate Municipal Bond Fund | | | McDonnell | | | | 0.20 | % | | | 0.20 | % |
Diversified Income Fund | | | | | | | | | | | | |
Diversified REIT Discipline | | | AEW | | | | 0.45 | % | | | 0.40 | % |
Inflation Protected Securities Discipline | | | Loomis Sayles | | | | 0.25 | % | | | 0.20 | % |
Multi-Sector Bond Discipline | | | Loomis Sayles | | | | 0.35 | % | | | 0.30 | % |
U.S. Equity Opportunities Fund | | | | | | | | | | | | |
Large Cap Growth Segment | | | Harris | | | | 0.52 | % | | | 0.52 | % |
All Cap Growth Segment | | | Loomis Sayles | | | | 0.35 | % | | | 0.35 | % |
Prior to February 28, 2014, U.S. Equity Opportunities Fund paid a subadvisory fee at the following annual rates, calculated daily and payable monthly, based on each Fund’s/Segment’s average daily net assets:
| | | | | | | | | | |
| | | | | Percentage of Average
Daily Net Assets | |
Fund | | Subadviser | | First $250 million | | | Over $250 million | |
U.S. Equity Opportunities Fund | | | | | | | | | | |
Harris Associates Segment | | Harris | | | 0.45 | % | | | 0.40 | % |
Large Cap Growth Segment | | Loomis Sayles | | | 0.25 | % | | | 0.25 | % |
Mid Cap Growth Segment | | Loomis Sayles | | | 0.50 | % | | | 0.45 | % |
Small/Mid Core Segment | | Loomis Sayles | | | 0.50 | % | | | 0.45 | % |
Payments to NGAM Advisors are reduced by the amounts of payments to the subadvisers, as calculated based on the table above.
NGAM Advisors and Natixis AM US have given binding undertakings to the Funds to waive management fees and/or reimburse certain expenses to limit the Funds’ operating expenses, exclusive of acquired fund fees and expenses, brokerage expenses, interest expense, taxes and extraordinary expenses. These undertakings are in effect until April 30, 2015, except for Multi-Asset Allocation Fund, which is until April 30, 2016, and are reevaluated on an annual basis. Management fees payable, as reflected on the Statements of Assets and Liabilities, is net of waivers and/or expense reimbursements, if any, pursuant to these undertakings. Waivers/reimbursements that exceed management fees payable are reflected on the Statements of Assets and Liabilities as receivable from investment adviser.
103 |
Notes to Financial Statements (continued)
December 31, 2014
For the year ended December 31, 2014, the expense limits as a percentage of average daily net assets under the expense limitation agreements were as follows:
| | | | | | | | | | | | | | | | |
| | | Expense limit as a Percentage of
Average Daily Net Assets | |
Fund | | Class A | | | Class B | | | Class C | | | Class Y | |
Intermediate Municipal Bond Fund | | | 0.80 | % | | | — | | | | 1.55 | % | | | 0.55 | % |
Diversified Income Fund | | | 1.25 | % | | | — | | | | 2.00 | % | | | 1.00 | % |
U.S. Equity Opportunities Fund | | | 1.30 | % | | | 2.05 | % | | | 2.05 | % | | | 1.05 | % |
Multi-Asset Allocation Fund | | | 1.30 | % | | | — | | | | 2.05 | % | | | 1.05 | % |
NGAM Advisors and Natixis AM US shall be permitted to recover expenses they have borne under the expense limitation agreements (whether through waiver of its management fees or otherwise) on a class by class basis in later periods to the extent the annual operating expenses of a class fall below a class’ expense limits, provided, however, that a class is not obligated to pay such waived/reimbursed fees or expenses more than one year after the end of the fiscal year in which the fees or expenses were waived/reimbursed.
For the year ended December 31, 2014, the management fees and waivers of management fees for each Fund were as follows:
| | | | | | | | | | | | | | | | | | | | | | | | |
Fund | | Gross
Management
Fees | | | Contractual
Waivers of
Management
Fees 1 | | | Voluntary
Waivers of
Management
Fees | | | Net
Management
Fees | | | Percentage
of Average
Daily Net
Assets | |
| | | | | | Gross | | | Net | |
Intermediate Municipal Bond Fund | | $ | 111,610 | | | $ | 111,610 | | | $ | — | | | $ | — | | | | 0.40 | % | | | — | |
Diversified Income Fund | | | 776,986 | | | | — | | | | 3,404 | | | | 773,582 | | | | 0.55 | % | | | 0.55 | % |
U.S. Equity Opportunities Fund | | | 3,741,002 | | | | — | | | | — | | | | 3,741,002 | | | | 0.80 | % | | | 0.80 | % |
Multi-Asset Allocation Fund | | | 183,705 | | | | 64,701 | | | | — | | | | 119,004 | | | | 0.85 | % | | | 0.55 | % |
| 1 | Management fee waivers are subject to possible recovery until December 31, 2015. |
For the year ended December 31, 2014, expenses have been reimbursed as follows:
| | | | |
Fund | | Reimbursement2 | |
Intermediate Municipal Bond Fund | | $ | 20,216 | |
| 2 | Expense reimbursements are subject to possible recovery until December 31, 2015. |
| 104
Notes to Financial Statements (continued)
December 31, 2014
For the year ended December 31, 2014, expense reimbursements related to the prior fiscal year were recovered as follows:
| | | | | | | | | | | | | | | | |
| | | Recovered Expenses | |
Fund | | Class A | | | Class B | | | Class C | | | Class Y | |
U.S. Equity Opportunities Fund | | $ | 59,073 | | | $ | 1,031 | | | $ | 7,187 | | | $ | 3,938 | |
Certain officers and directors of NGAM Advisors and Natixis AM US and its affiliates are also officers or Trustees of the Funds. NGAM Advisors, Natixis AM US, AEW, McDonnell, Loomis Sayles and Harris are subsidiaries of Natixis US, which is part of Natixis Global Asset Management, an international asset management group based in Paris, France.
b. Service and Distribution Fees. NGAM Distribution, L.P. (“NGAM Distribution”), which is a wholly-owned subsidiary of Natixis US, has entered into a distribution agreement with the Trusts. Pursuant to this agreement, NGAM Distribution serves as principal underwriter of the Funds of the Trusts.
Pursuant to Rule 12b-1 under the 1940 Act, the Trusts have adopted a Service Plan relating to each Fund’s Class A shares (the “Class A Plans”) and a Distribution and Service Plan relating to each Fund’s Class B (if applicable) and Class C shares (the “Class B and Class C Plans”).
Under the Class A Plans, each Fund pays NGAM Distribution a monthly service fee at an annual rate not to exceed 0.25% of the average daily net assets attributable to the Funds’ Class A shares, as reimbursement for expenses incurred by NGAM Distribution in providing personal services to investors in Class A shares and/or the maintenance of shareholder accounts.
Under the Class B (if applicable) and Class C Plans, each Fund pays NGAM Distribution a monthly service fee at an annual rate not to exceed 0.25% of the average daily net assets attributable to the Funds’ Class B (if applicable) and Class C shares, as compensation for services provided by NGAM Distribution in providing personal services to investors in Class B (if applicable) and Class C shares and/or the maintenance of shareholder accounts.
Also under the Class B (if applicable) and Class C Plans, each Fund pays NGAM Distribution a monthly distribution fee at an annual rate of 0.75% of the average daily net assets attributable to the Funds’ Class B (if applicable) and Class C shares, as compensation for services provided by NGAM Distribution in connection with the marketing or sale of Class B (if applicable) and Class C shares.
105 |
Notes to Financial Statements (continued)
December 31, 2014
For the year ended December 31, 2014, the service and distribution fees for each Fund were as follows:
| | | | | | | | | | | | | | | | | | | | |
| | | Service Fees | | | Distribution Fees | |
Fund | | Class A | | | Class B | | | Class C | | | Class B | | | Class C | |
Intermediate Municipal Bond Fund | | $ | 4,171 | | | $ | — | | | $ | 1,713 | | | $ | — | | | $ | 5,141 | |
Diversified Income Fund | | | 217,684 | | | | — | | | | 125,670 | | | | — | | | | 377,011 | |
U.S. Equity Opportunities Fund | | | 958,774 | | | | 12,612 | | | | 121,115 | | | | 37,838 | | | | 363,346 | |
Multi-Asset Allocation Fund | | | 1 | | | | — | | | | 19 | | | | — | | | | 57 | |
c. Administrative Fees. NGAM Advisors provides certain administrative services for the Funds and contracts with State Street Bank to serve as sub-administrator. Pursuant to an agreement among Natixis Funds Trusts, Loomis Sayles Funds Trusts and NGAM Advisors, each Fund pays NGAM Advisors monthly its pro rata portion of fees equal to an annual rate of 0.0575% of the first $15 billion of the average daily net assets of the Natixis Funds Trusts and Loomis Sayles Funds Trusts, 0.0500% of the next $15 billion, 0.0400% of the next $30 billion, 0.0350% of the next $30 billion and 0.0325% of such assets in excess of $90 billion, subject to an annual aggregate minimum fee for the Natixis Funds Trusts and Loomis Sayles Funds Trusts of $10 million, which is reevaluated on an annual basis.
For the year ended December 31, 2014, the administrative fees for each Fund were as follows:
| | | | |
Fund | | Administrative
Fees | |
Intermediate Municipal Bond Fund | | $ | 12,046 | |
Diversified Income Fund | | | 61,016 | |
U.S. Equity Opportunities Fund | | | 202,052 | |
Multi-Asset Allocation Fund | | | 9,270 | |
Prior to July 1, 2014, each Fund paid NGAM Advisors monthly its pro rata portion of fees equal to an annual rate of 0.0575% of the first $15 billion of the average daily net assets of the Natixis Funds Trusts, Loomis Sayles Funds Trusts and Hansberger International Series, 0.0500% of the next $15 billion, 0.0400% of the next $30 billion and 0.0350% of such assets in excess of $60 billion, subject to an annual aggregate minimum fee for the Natixis Funds Trusts, Loomis Sayles Funds Trusts and Hansberger International Series of $10 million.
d. Sub-Transfer Agent Fees. NGAM Distribution has entered into agreements, which include servicing agreements, with financial intermediaries that provide recordkeeping, processing, shareholder communications and other services to customers of the intermediaries that hold positions in the Funds and has agreed to compensate the intermediaries for providing those services. Intermediaries transact with the Funds
| 106
Notes to Financial Statements (continued)
December 31, 2014
primarily through the use of omnibus accounts on behalf of their customers who hold positions in the Funds. These services would have been provided by the Funds’ transfer agent and other service providers if the shareholders’ accounts were maintained directly at the Funds’ transfer agent. Accordingly, the Funds have agreed to reimburse NGAM Distribution for all or a portion of the servicing fees paid to these intermediaries. The reimbursement amounts (sub-transfer agent fees) paid to NGAM Distribution are subject to a current per-account equivalent fee limit approved by the Funds’ Board, which is based on fees for similar services paid to the Funds’ transfer agent and other service providers.
For the year ended December 31, 2014, the sub-transfer agent fees (which are reflected in transfer agent fees and expenses in the Statements of Operations) for each Fund were as follows:
| | | | |
Fund | | Sub-Transfer
Agent Fees | |
Intermediate Municipal Bond Fund | | $ | 2,739 | |
Diversified Income Fund | | | 77,201 | |
U.S. Equity Opportunities Fund | | | 160,769 | |
Multi-Asset Allocation Fund | | | 29 | |
As of December 31, 2014, the Funds owe NGAM Distribution the following reimbursements for sub-transfer agent fees (which are reflected in the Statements of Assets and Liabilities as payable to distributor):
| | | | |
Fund | | Reimbursements
of Sub-Transfer
Agent Fees | |
Intermediate Municipal Bond Fund | | $ | 45 | |
Diversified Income Fund | | | 1,197 | |
U.S. Equity Opportunities Fund | | | 1,881 | |
Sub-transfer agent fees attributable to Class A, Class B, Class C and Class Y are allocated on a pro rata basis to each class based on the relative net assets of each class to the total net assets of those classes.
e. Commissions. Commissions (including CDSCs) on Fund shares retained by NGAM Distribution during the year ended December 31, 2014 were as follows:
| | | | |
Fund | | Commissions | |
Intermediate Municipal Bond Fund | | $ | 8,421 | |
Diversified Income Fund | | | 105,157 | |
U.S. Equity Opportunities Fund | | | 283,735 | |
f. Trustees Fees and Expenses. The Trusts do not pay any compensation directly to their officers or Trustees who are directors, officers or employees of NGAM Advisors,
107 |
Notes to Financial Statements (continued)
December 31, 2014
NGAM Distribution, Natixis US or their affiliates. The Chairperson of the Board receives a retainer fee at the annual rate of $300,000. The Chairperson does not receive any meeting attendance fees for Board of Trustees meetings or committee meetings that she attends. Each Independent Trustee (other than the Chairperson) receives, in the aggregate, a retainer fee at the annual rate of $130,000. Each Independent Trustee also receives a meeting attendance fee of $10,000 for each meeting of the Board of Trustees that he or she attends in person and $5,000 for each meeting of the Board of Trustees that he or she attends telephonically. In addition, each committee chairperson (except for the Chairperson of the Governance Committee) receives an additional retainer fee at the annual rate of $17,500. Each Contract Review Committee member is compensated $6,000 for each Committee meeting that he or she attends in person and $3,000 for each meeting that he or she attends telephonically. Each Audit Committee member is compensated $6,000 for each Committee meeting that he or she attends in person and $3,000 for each meeting that he or she attends telephonically. These fees are allocated among the funds in the Natixis Funds Trusts and Loomis Sayles Funds Trusts based on a formula that takes into account, among other factors, the relative net assets of each fund. Trustees are reimbursed for travel expenses in connection with attendance at meetings.
Effective January 1, 2015, the chairperson of the Governance Committee receives an additional retainer fee at the annual rate of $5,000.
A deferred compensation plan (the “Plan”) is available to the Trustees on a voluntary basis. Deferred amounts remain in the Funds until distributed in accordance with the provisions of the Plan. The value of a participating Trustee’s deferral account is based on theoretical investments of deferred amounts, on the normal payment dates, in certain funds of the Natixis Funds Trusts and Loomis Sayles Funds Trusts as designated by the participating Trustees. Changes in the value of participants’ deferral accounts are allocated pro rata among the funds in the Natixis Funds Trusts and Loomis Sayles Funds Trusts, and are normally reflected as Trustees’ fees and expenses in the Statements of Operations. The portions of the accrued obligations allocated to the Funds under the Plan are reflected as Deferred Trustees’ fees on the Statements of Assets and Liabilities.
g. Affiliated Ownership. As of December 31, 2014, Natixis US and affiliates held shares of Intermediate Municipal Bond Fund and Multi-Asset Allocation Fund representing 56.37% and 99.32% of the Fund’s net assets, respectively. Investment activities of affiliated shareholders could have material impacts on the Funds.
h. Payment by Affiliates. For the period ended December 31, 2014, Natixis AM US reimbursed Multi-Asset Allocation Fund $403 for losses incurred in connection with a trading error. This amount is included in realized gains on futures contracts in the Statements of Operations.
| 108
Notes to Financial Statements (continued)
December 31, 2014
7. Line of Credit. Each Fund, together with certain other funds of Natixis Funds Trusts and Loomis Sayles Funds Trusts, participates in a $200,000,000 committed unsecured line of credit provided by State Street Bank, with an individual limit of $125,000,000 for each Fund that participates in the line of credit. Interest is charged to each participating Fund based on its borrowings at a rate per annum equal to the greater of the Federal Funds rate or overnight LIBOR, plus 1.25%. In addition, a commitment fee of 0.10% per annum, payable at the end of each calendar quarter, is accrued and apportioned among the participating funds based on their average daily unused portion of the line of credit.
For the year ended December 31, 2014, none of the Funds had borrowings under this agreement.
8. Brokerage Commission Recapture. Certain Funds have entered into agreements with certain brokers whereby the brokers will rebate a portion of brokerage commissions. All amounts rebated by the brokers are returned to the Funds under such agreements and are included in realized gains on investments in the Statements of Operations. For the year ended December 31, 2014, amounts rebated under these agreements were as follows:
| | | | |
Fund | | Rebates | |
Diversified Income Fund | | $ | 388 | |
U.S. Equity Opportunities Fund | | | 7,416 | |
9. Concentration of Risk. Each Fund’s investments in foreign securities are subject to foreign currency fluctuations, higher volatility than U.S. securities, varying degrees of regulation and limited liquidity. Greater political, economic, credit and information risks are also associated with foreign securities.
The Multi-Asset Allocation Fund is non-diversified, which means that it is not limited under the 1940 Act to a percentage of assets that it may invest in any one issuer. Because the Fund may invest in the securities of a limited number of issuers, an investment in the Fund may involve a higher degrees of risk than would be present in a diversified portfolio.
10. Interest Expense. Multi-Asset Allocation Fund incurs interest expense on net cash and foreign currency debit balances, if any, for accounts held at brokers. Interest expense incurred for the year ended December 31, 2014 is reflected on the Statement of Operations.
109 |
Notes to Financial Statements (continued)
December 31, 2014
11. Capital Shares. Each Fund may issue an unlimited number of shares of beneficial interest, without par value. Transactions in capital shares were as follows:
| | | | | | | | | | | | | | | | |
| |
| Year Ended
December 31, 2014 |
| |
| Year Ended
December 31, 2013 |
|
Intermediate Municipal Bond Fund | | | Shares | | | | Amount | | | | Shares | | | | Amount | |
| Class A | | | | | | | | | | | | | | | | |
Issued from the sale of shares | | | 440,562 | | | $ | 4,404,696 | | | | 110,750 | | | $ | 1,054,332 | |
Issued in connection with the reinvestment of distributions | | | 1,807 | | | | 17,881 | | | | 394 | | | | 3,760 | |
Redeemed | | | (312,110 | ) | | | (3,108,236 | ) | | | (1,534 | ) | | | (14,587 | ) |
| | | | | | | | | | | | | | | | |
Net change | | | 130,259 | | | $ | 1,314,341 | | | | 109,610 | | | $ | 1,043,505 | |
| | | | | | | | | | | | | | | | |
| Class C | | | | | | | | | | | | | | | | |
Issued from the sale of shares | | | 221,952 | | | $ | 2,199,823 | | | | 5,672 | | | $ | 54,216 | |
Issued in connection with the reinvestment of distributions | | | 125 | | | | 1,241 | | | | 3 | | | | 32 | |
Redeemed | | | (5,445 | ) | | | (53,806 | ) | | | (3 | ) | | | (30 | ) |
| | | | | | | | | | | | | | | | |
Net change | | | 216,632 | | | $ | 2,147,258 | | | | 5,672 | | | $ | 54,218 | |
| | | | | | | | | | | | | | | | |
| Class Y | | | | | | | | | | | | | | | | |
Issued from the sale of shares | | | 874,599 | | | $ | 8,630,106 | | | | 764,014 | | | $ | 7,476,085 | |
Issued in connection with the reinvestment of distributions | | | 31,302 | | | | 308,641 | | | | 22,939 | | | | 221,518 | |
Redeemed | | | (349,221 | ) | | | (3,485,532 | ) | | | (12,359 | ) | | | (117,054 | ) |
| | | | | | | | | | | | | | | | |
Net change | | | 556,680 | | | $ | 5,453,215 | | | | 774,594 | | | $ | 7,580,549 | |
| | | | | | | | | | | | | | | | |
Increase (decrease) from capital share transactions | | | 903,571 | | | $ | 8,914,814 | | | | 889,876 | | | $ | 8,678,272 | |
| | | | | | | | | | | | | | | | |
| 110
Notes to Financial Statements (continued)
December 31, 2014
11. Capital Shares (continued).
| | | | | | | | | | | | | | | | |
| |
| Year Ended
December 31, 2014 |
| |
| Year Ended
December 31, 2013 |
|
Diversified Income Fund | | | Shares | | | | Amount | | | | Shares | | | | Amount | |
| Class A | | | | | | | | | | | | | | | | |
Issued from the sale of shares | | | 3,587,606 | | | $ | 46,772,806 | | | | 2,296,819 | | | $ | 28,186,176 | |
Issued in connection with the reinvestment of distributions | | | 145,859 | | | | 1,902,832 | | | | 143,499 | | | | 1,747,254 | |
Redeemed | | | (1,966,178 | ) | | | (25,485,685 | ) | | | (2,574,911 | ) | | | (31,275,395 | ) |
| | | | | | | | | | | | | | | | |
Net change | | | 1,767,287 | | | $ | 23,189,953 | | | | (134,593 | ) | | $ | (1,341,965 | ) |
| | | | | | | | | | | | | | | | |
| Class C | | | | | | | | | | | | | | | | |
Issued from the sale of shares | | | 641,777 | | | $ | 8,362,876 | | | | 1,235,545 | | | $ | 15,057,397 | |
Issued in connection with the reinvestment of distributions | | | 41,434 | | | | 539,625 | | | | 44,750 | | | | 543,265 | |
Redeemed | | | (711,476 | ) | | | (9,151,769 | ) | | | (1,505,441 | ) | | | (18,273,142 | ) |
| | | | | | | | | | | | | | | | |
Net change | | | (28,265 | ) | | $ | (249,268 | ) | | | (225,146 | ) | | $ | (2,672,480 | ) |
| | | | | | | | | | | | | | | | |
| Class Y | | | | | | | | | | | | | | | | |
Issued from the sale of shares | | | 1,164,871 | | | $ | 15,288,075 | | | | 101,531 | | | $ | 1,240,996 | |
Issued in connection with the reinvestment of distributions | | | 10,893 | | | | 143,867 | | | | 1,769 | | | | 21,605 | |
Redeemed | | | (149,655 | ) | | | (1,908,448 | ) | | | (51,841 | ) | | | (631,148 | ) |
| | | | | | | | | | | | | | | | |
Net change | | | 1,026,109 | | | $ | 13,523,494 | | | | 51,459 | | | $ | 631,453 | |
| | | | | | | | | | | | | | | | |
Increase (decrease) from capital share transactions | | | 2,765,131 | | | $ | 36,464,179 | | | | (308,280 | ) | | $ | (3,382,992 | ) |
| | | | | | | | | | | | | | | | |
111 |
Notes to Financial Statements (continued)
December 31, 2014
11. Capital Shares (continued).
| | | | | | | | | | | | | | | | |
| |
| Year Ended
December 31, 2014 |
| |
| Year Ended
December 31, 2013 |
|
U.S. Equity Opportunities Fund | | | Shares | | | | Amount | | | | Shares | | | | Amount | |
| Class A | | | | | | | | | | | | | | | | |
Issued from the sale of shares | | | 1,244,707 | | | $ | 40,683,381 | | | | 758,252 | | | $ | 23,078,823 | |
Issued in connection with the reinvestment of distributions | | | 3,733,383 | | | | 104,238,574 | | | | 830,421 | | | | 26,527,755 | |
Redeemed | | | (1,579,897 | ) | | | (53,911,455 | ) | | | (1,366,195 | ) | | | (41,781,217 | ) |
| | | | | | | | | | | | | | | | |
Net change | | | 3,398,193 | | | $ | 91,010,500 | | | | 222,478 | | | $ | 7,825,361 | |
| | | | | | | | | | | | | | | | |
| Class B | | | | | | | | | | | | | | | | |
Issued from the sale of shares | | | 4,557 | | | $ | 112,874 | | | | 8,879 | | | $ | 231,157 | |
Issued in connection with the reinvestment of distributions | | | 54,550 | | | | 1,140,434 | | | | 28,040 | | | | 726,359 | |
Redeemed | | | (181,197 | ) | | | (5,000,162 | ) | | | (258,805 | ) | | | (6,503,881 | ) |
| | | | | | | | | | | | | | | | |
Net change | | | (122,090 | ) | | $ | (3,746,854 | ) | | | (221,886 | ) | | $ | (5,546,365 | ) |
| | | | | | | | | | | | | | | | |
| Class C | | | | | | | | | | | | | | | | |
Issued from the sale of shares | | | 639,156 | | | $ | 16,511,165 | | | | 328,959 | | | $ | 8,489,719 | |
Issued in connection with the reinvestment of distributions | | | 756,094 | | | | 15,641,654 | | | | 131,853 | | | | 3,444,408 | |
Redeemed | | | (371,115 | ) | | | (9,752,500 | ) | | | (209,109 | ) | | | (5,252,836 | ) |
| | | | | | | | | | | | | | | | |
Net change | | | 1,024,135 | | | $ | 22,400,319 | | | | 251,703 | | | $ | 6,681,291 | |
| | | | | | | | | | | | | | | | |
| Class Y | | | | | | | | | | | | | | | | |
Issued from the sale of shares | | | 837,095 | | | $ | 31,611,584 | | | | 696,498 | | | $ | 23,425,027 | |
Issued in connection with the reinvestment of distributions | | | 262,503 | | | | 8,306,725 | | | | 39,615 | | | | 1,392,630 | |
Redeemed | | | (571,477 | ) | | | (21,233,215 | ) | | | (441,890 | ) | | | (15,082,762 | ) |
| | | | | | | | | | | | | | | | |
Net change | | | 528,121 | | | $ | 18,685,094 | | | | 294,223 | | | $ | 9,734,895 | |
| | | | | | | | | | | | | | | | |
Increase (decrease) from capital share transactions | | | 4,828,359 | | | $ | 128,349,059 | | | | 546,518 | | | $ | 18,695,182 | |
| | | | | | | | | | | | | | | | |
| 112
Notes to Financial Statements (continued)
December 31, 2014
11. Capital Shares (continued).
| | | | | | | | |
| |
| Period Ended
December 31, 2014(a) |
|
Multi-Asset Allocation Fund | | | Shares | | | | Amount | |
| Class A | | | | | | | | |
Issued from the sale of shares | | | 101 | | | $ | 1,011 | |
Redeemed | | | (1 | ) | | | (10 | ) |
| | | | | | | | |
Net change | | | 100 | | | $ | 1,001 | |
| | | | | | | | |
| Class C | | | | | | | | |
Issued from the sale of shares | | | 2,822 | | | $ | 27,973 | |
Redeemed | | | (1 | ) | | | (10 | ) |
| | | | | | | | |
Net change | | | 2,821 | | | $ | 27,963 | |
| | | | | | | | |
| Class Y | | | | | | | | |
Issued from the sale of shares | | | 5,033,633 | | | $ | 50,330,682 | |
Redeemed | | | (1 | ) | | | (10 | ) |
| | | | | | | | |
Net change | | | 5,033,632 | | | $ | 50,330,672 | |
| | | | | | | | |
Increase (decrease) from capital share transactions | | | 5,036,553 | | | $ | 50,359,636 | |
| | | | | | | | |
| (a) | From commencement of operations on July 23, 2014 through December 31, 2014. |
113 |
Report of Independent Registered Public Accounting Firm
To the Trustees of Natixis Funds Trust I, Natixis Funds Trust II and Shareholders of McDonnell Intermediate Municipal Bond Fund, Natixis Diversified Income Fund, Natixis U.S. Equity Opportunities Fund (formerly Natixis U.S. Multi-Cap Equity Fund), and SeeyondSM Multi-Asset Allocation Fund and:
In our opinion, the accompanying statements of assets and liabilities, including the portfolios of investments, and the related statements of operations and of changes in net assets and the financial highlights present fairly, in all material respects, the financial position of the Natixis Diversified Income Fund and Natixis U.S. Equity Opportunities Fund (formerly Natixis U.S. Multi-Cap Equity Fund), each a series of Natixis Funds Trust I; and the McDonnell Intermediate Municipal Bond Fund and SeeyondSM Multi-Asset Allocation Fund, each a series of Natixis Funds Trust II (collectively, the “Funds”), at December 31, 2014, and the results of each of their operations, the changes in each of their net assets and their financial highlights for each of the periods indicated, in conformity with accounting principles generally accepted in the United States of America. These financial statements and financial highlights (hereafter referred to as “financial statements”) are the responsibility of the Funds’ management; our responsibility is to express an opinion on these financial statements based on our audits. We conducted our audits of these financial statements in accordance with the standards of the Public Company Accounting Oversight Board (United States). Those standards require that we plan and perform the audit to obtain reasonable assurance about whether the financial statements are free of material misstatement. An audit includes examining, on a test basis, evidence supporting the amounts and disclosures in the financial statements, assessing the accounting principles used and significant estimates made by management, and evaluating the overall financial statement presentation. We believe that our audits, which included confirmation of securities at December 31, 2014 by correspondence with the custodian and brokers, provide a reasonable basis for our opinion.
PricewaterhouseCoopers LLP
Boston, MA
February 23, 2015
| 114
2014 U.S. Tax Distribution Information to Shareholders (Unaudited)
Corporate Dividends Received Deduction. For the fiscal year ended December 31, 2014, a percentage of dividends distributed by the Funds listed below qualify for the dividends received deduction for corporate shareholders. These percentages are as follows:
| | | | |
Fund | | Qualifying
Percentage | |
Diversified Income | | | 39.86 | % |
U.S. Equity Opportunities | | | 17.78 | % |
Capital Gains Distributions. Pursuant to Internal Revenue Section 852(b), the following Funds paid distributions, which have been designated as capital gains distributions for the fiscal year ended December 31, 2014.
| | | | |
Fund | | Amount | |
U.S. Equity Opportunities | | $ | 109,096,353 | |
Qualified Dividend Income. For the fiscal year ended December 31, 2014, a percentage of the ordinary income dividends paid by the Funds are considered qualified dividend income eligible for reduced tax rates. These lower rates range from 0% to 20% depending on an individual’s tax bracket. If the Funds paid a distribution during calendar year 2014, complete information will be reported in conjunction with Form 1099-DIV. These percentages are noted below:
| | | | |
Fund | | Qualifying
Percentage | |
Diversified Income | | | 40.12 | % |
U.S. Equity Opportunities | | | 21.39 | % |
Exempt Interest Dividends. During the year ended December 31, 2014, Intermediate Municipal Bond paid dividends to shareholders from net investment income, of which 100.0% are designated as exempt interest dividends for federal tax purposes. However, state and local taxes differ from state to state and a portion of the dividends may be subject to the individual Alternative Minimum Tax, so it is suggested that you consult your own tax adviser.
115 |
Trustee and Officer Information
The tables below provide certain information regarding the trustees and officers of Natixis Funds Trust I and Natixis Funds Trust II (the “Trusts”) Unless otherwise indicated, the address of all persons below is 399 Boylston Street, Boston, MA 02116. The Funds’ Statements of Additional Information include additional information about the trustees of the Trusts and are available by calling Natixis Funds at 800-225-5478.
| | | | | | | | |
Name and Year of Birth | | Position(s) Held
with the Trust(s),
Length of Time
Served and Term of Office1 | | Principal
Occupation(s)
During Past 5 Years | | Number of
Portfolios in
Fund Complex
Overseen2 and Other
Directorships Held
During Past 5 Years | | Experience,
Qualifications,
Attributes, Skills
for Board Membership |
| | | |
| INDEPENDENT TRUSTEES | | | | | | |
| | | | |
Kenneth A. Drucker (1945) | | Trustee since 2008 for Natixis Funds Trust I and Natixis Funds Trust II Chairperson of the Audit Committee and Governance Committee Member | | Retired | | 42 None | | Significant experience on the Board and on the boards of other business organizations (including at investment companies); executive experience (including as treasurer of an aerospace, automotive, and metal manufacturing corporation) |
| | | | |
Edmond J. English (1953) | | Trustee since 2013 for Natixis Funds Trust I and Natixis Funds Trust II Contract Review Committee Member | | Chief Executive Officer of Bob’s Discount Furniture (retail) | | 42 Formerly, Director, BJ’s Wholesale Club (retail); formerly, Director, Citizens Financial Group (bank) | | Experience on the Board and significant experience on the boards of other business organizations (including at a retail company and a bank); executive experience (including at a retail company) |
| 116
Trustee and Officer Information
| | | | | | | | |
Name and Year of Birth | | Position(s) Held
with the Trust(s),
Length of Time
Served and Term of Office1 | | Principal
Occupation(s)
During Past 5 Years | | Number of
Portfolios in
Fund Complex
Overseen2 and Other
Directorships Held
During Past 5 Years | | Experience,
Qualifications,
Attributes, Skills
for Board Membership |
| | | |
INDEPENDENT TRUSTEES continued | | | | | | |
| | | | |
Richard A. Goglia (1951) | | Trustee since 2015 for Natixis Funds Trust I and Natixis Funds Trust II Audit Committee Member | | Vice President and Treasurer of Raytheon Company (defense) | | 42 None | | Experience on the Board and executive experience (including his role as vice president and treasurer of a defense company and experience at a financial services company) |
| | | | |
Wendell J. Knox (1948) | | Trustee since 2009 for Natixis Funds Trust I and Natixis Funds Trust II Audit Committee Member and Governance Committee Member | | Director of Abt Associates Inc. (research and consulting) | | 42 Director, Eastern Bank (bank); Director, The Hanover Insurance Group (property and casualty insurance) | | Significant experience on the Board and on the boards of other business organizations (including at a bank and at a property and casualty insurance firm); executive experience (including roles as president and chief executive officer of a research and consulting company) |
117 |
Trustee and Officer Information
| | | | | | | | |
Name and Year of Birth | | Position(s) Held
with the Trust(s),
Length of Time
Served and Term of Office1 | | Principal
Occupation(s)
During Past 5 Years | | Number of
Portfolios in
Fund Complex
Overseen2 and Other
Directorships Held
During Past 5 Years | | Experience,
Qualifications,
Attributes, Skills
for Board Membership |
| | | |
INDEPENDENT TRUSTEES continued | | | | | | |
| | | | |
Martin T. Meehan (1956) | | Trustee since 2012 for Natixis Funds Trust I and Natixis Funds Trust II Contract Review Committee Member | | Chancellor and faculty member, University of Massachusetts Lowell | | 42 None | | Experience on the Board and on the boards of other business organizations; experience as Chancellor of the University of Massachusetts Lowell; government experience (including as a member of the U.S. House of Representatives); academic experience |
| | | | |
Sandra O. Moose (1942) | | Chairperson of the Board of Trustees since November 2005 Trustee since 1982 for Natixis Funds Trust I (including its predecessors) and since 1993 for Natixis Funds Trust II Ex Officio member of the Audit Committee, the Contract Review Committee and the Governance Committee | | President, Strategic Advisory Services (management consulting) | | 42 Director, AES Corporation (international power company); formerly, Director, Verizon Communications (telecommunications company) | | Significant experience on the Board and on the boards of other business organizations (including at a telecommunications company, an international power company and a specialty chemicals corporation); executive experience (including at a management consulting company) |
| 118
Trustee and Officer Information
| | | | | | | | |
Name and Year of Birth | | Position(s) Held
with the Trust(s),
Length of Time
Served and Term of Office1 | | Principal
Occupation(s)
During Past 5 Years | | Number of
Portfolios in
Fund Complex
Overseen2 and Other
Directorships Held
During Past 5 Years | | Experience,
Qualifications,
Attributes, Skills
for Board Membership |
| | | |
INDEPENDENT TRUSTEES continued | | | | | | |
| | | | |
Erik R. Sirri (1958) | | Trustee since 2009 for Natixis Funds Trust I and Natixis Funds Trust II Audit Committee Member | | Professor of Finance at Babson College | | 42 None | | Significant experience on the Board; experience as Director of the Division of Trading and Markets at the Securities and Exchange Commission; academic experience; training as an economist |
| | | | |
Peter J. Smail (1952) | | Trustee since 2009 for Natixis Funds Trust I and Natixis Funds Trust II Chairperson of the Contract Review Committee and Governance Committee Member | | Retired | | 42 None | | Significant experience on the Board; mutual fund industry and executive experience (including roles as president and chief executive officer for an investment adviser) |
| | | | |
Cynthia L. Walker (1956) | | Trustee since 2005 for Natixis Funds Trust I and Natixis Funds Trust II Chairperson of the Governance Committee and Contract Review Committee Member | | Deputy Dean for Finance and Administration, Yale University School of Medicine | | 42 None | | Significant experience on the Board; executive experience in a variety of academic organizations (including roles as dean for finance and administration) |
119 |
Trustee and Officer Information
| | | | | | | | |
Name and Year of Birth | | Position(s) Held
with the Trust(s),
Length of Time
Served and Term of Office1 | | Principal
Occupation(s)
During Past 5 Years | | Number of
Portfolios in
Fund Complex
Overseen2 and Other
Directorships Held
During Past 5 Years | | Experience,
Qualifications,
Attributes, Skills
for Board Membership |
| | | |
| INTERESTED TRUSTEES | | | | | | |
| | | | |
Robert J. Blanding3 (1947) 555 California Street San Francisco, CA 94104 | | Trustee since 2003 for Natixis Funds Trust I and Natixis Funds Trust II | | Chairman and Chief Executive Officer (formerly, President), Loomis, Sayles & Company, L.P. | | 42 None | | Significant experience on the Board; continuing service as Chairman and Chief Executive Officer of Loomis, Sayles & Company, L.P. |
| | | | |
David L. Giunta4 (1965) | | Trustee since 2011 for Natixis Funds Trust I and Natixis Funds Trust II President and Chief Executive Officer of Natixis Funds Trust I and Natixis Funds Trust II since 2008 | | President and Chief Executive Officer, NGAM Distribution Corporation, NGAM Advisors, L.P. and NGAM Distribution, L.P. | | 42 None | | Experience on the Board; continuing experience as President and Chief Executive Officer of NGAM Advisors, L.P. |
| | | | |
John T. Hailer5 (1960) | | Trustee since 2000 for Natixis Funds Trust I and Natixis Funds Trust II | | President and Chief Executive Officer – U.S. and Asia, Natixis Global Asset Management, L.P. | | 42 None | | Significant experience on the Board; continuing experience as President and Chief Executive Officer – U.S. and Asia, Natixis Global Asset Management, L.P. |
| 1 | Each trustee serves until retirement, resignation or removal from the Board. The current retirement age is 75. The position of Chairperson of the Board is appointed for a three-year term. Ms. Moose was appointed to serve an additional three-year term as the Chairperson of the Board on December 13, 2013. |
| 2 | The trustees of the Trusts serve as trustees of a fund complex that includes all series of the Natixis Funds Trust I, Natixis Funds Trust II, Natixis Funds Trust IV and Gateway Trust (collectively, the “Natixis Funds Trusts”), Loomis Sayles Funds I and Loomis Sayles Funds II (collectively, the “Loomis Sayles Funds Trusts”). |
| 3 | Mr. Blanding is deemed an “interested person” of the Trusts because he holds the following positions with an affiliated person of the Trusts: Chairman and Chief Executive Officer of Loomis, Sayles & Company, L.P. and Director of Loomis Sayles Investment Asia Pte., Ltd. |
| 4 | Mr. Giunta is deemed an “interested person” of the Trusts because he holds the following positions with an affiliated person of the Trusts: President and Chief Executive Officer of NGAM Distribution Corporation, NGAM Advisors, L.P. and NGAM Distribution, L.P. |
| 5 | Mr. Hailer is deemed an “interested person” of the Trusts because he holds the following positions with an affiliated person of the Trusts: President and Chief Executive Officer – U.S. and Asia, Natixis Global Asset Management, L.P. |
| 120
Trustee and Officer Information
| | | | | | |
Name and Year of Birth | | Position(s) Held with the Trust(s) | | Term of Office1 and Length of Time Served | | Principal Occupation(s) During Past 5 Years2 |
| | |
| OFFICERS OF THE TRUST | | | | |
| | | |
Coleen Downs Dinneen (1960) | | Secretary, Clerk and Chief Legal Officer | | Since September 2004 | | Executive Vice President, General Counsel, Secretary and Clerk, NGAM Distribution Corporation, NGAM Advisors, L.P. and NGAM Distribution, L.P. |
| | | |
Russell L. Kane (1969) | | Chief Compliance Officer, Assistant Secretary and Anti-Money Laundering Officer | | Chief Compliance Officer since May 2006; Assistant Secretary since June 2004; and Anti-Money Laundering Officer since April 2007 | | Chief Compliance Officer for Mutual Funds, Senior Vice President, Deputy General Counsel, Assistant Secretary and Assistant Clerk, NGAM Distribution Corporation, NGAM Advisors, L.P. and NGAM Distribution, L.P. |
| | | |
Michael C. Kardok (1959) | | Treasurer, Principal Financial and Accounting Officer | | Since October 2004 | | Senior Vice President, NGAM Advisors, L.P. and NGAM Distribution, L.P. |
| 1 | Each officer of the Trusts serves for an indefinite term in accordance with the Trusts’ current by-laws until the date his or her successor is elected and qualified, or until he or she sooner dies, retires, is removed or becomes disqualified. |
| 2 | Each person listed above, except as noted, holds the same position(s) with the Fund Complex. Previous positions during the past five years with NGAM Distribution, L.P., NGAM Advisors, L.P. or Loomis, Sayles & Company, L.P. are omitted, if not materially different from a trustee’s or officer’s current position with such entity. |
121 |
The Registrant has adopted a code of ethics that applies to the Registrant’s principal executive officer, principal financial officer and persons performing similar functions. There have been no amendments or waivers of the Registrant’s code of ethics during the period.
| Item 3. | Audit Committee Financial Expert. |
The Board of Trustees of the Registrant has established an audit committee. Mr. Kenneth A. Drucker, Mr. Richard A. Goglia, Mr. Wendell J. Knox and Mr. Erik R. Sirri are members of the audit committee and have been designated as “audit committee financial experts” by the Board of Trustees. Each of these individuals is also an Independent Trustee of the Registrant.
| Item 4. | Principal Accountant Fees and Services. |
Fees billed by the Principal Accountant for services rendered to the Registrant.
The table below sets forth fees billed by the principal accountant, PricewaterhouseCoopers LLP, for the past two fiscal years for professional services rendered in connection with a) the audit of the Registrant’s annual financial statements and services provided in connection with regulatory filings; b) audit-related services (including services that are reasonably related to the performance of the audit of the Registrant’s financial statements but not reported under “Audit Fees”); c) tax compliance, tax advice and tax planning and d) all other fees billed for professional services rendered by the principal accountant to the Registrant, other than the services provided as reported as a part of (a) through (c) of this Item.
| | | | | | | | | | | | | | | | | | | | | | | | | | | | | | | | |
| | | Audit fees | | | Audit-related fees1 | | | Tax fees2 | | | All other fees | |
| | | 1/1/13 –
12/31/13 | | | 1/1/14 –
12/31/14 | | | 1/1/13 –
12/31/13 | | | 1/1/14 –
12/31/14 | | | 1/1/13 –
12/31/13 | | | 1/1/14 –
12/31/14 | | | 1/1/13 –
12/31/13 | | | 1/1/14 –
12/31/14 | |
Natixis Funds Trust I | | $ | 190,779 | | | $ | 170,582 | | | $ | 4,429 | | | $ | 310 | | | $ | 52,933 | | | $ | 47,525 | | | $ | — | | | $ | — | |
| | 1. | Audit-related fees consist of: |
2013 & 2014 – performance of agreed-upon procedures related to the Registrant’s deferred compensation plan and review of Form N-1A filings (2013 only).
2013 & 2014 – review of the Registrant’s tax returns, quarterly review of asset diversification tests.
Aggregate fees billed to the Registrant for non-audit services during 2013 and 2014 were $57,362 and $47,835, respectively.
Fees billed by the Principal Accountant for services rendered to the Adviser and Control Affiliates.
The following table sets forth the fees billed by the Registrant’s principal accountant for non-audit services rendered to Capital Growth Management Limited Partnership (“CGM”), Hansberger Global Investors, Inc. (“HGI”), Loomis, Sayles & Company, L.P. (“Loomis”), NGAM Advisors, L.P. (“NGAM”) and entities controlling, controlled by or under common control with CGM, [HGI], Loomis and NGAM (“Control Affiliates”) that provide ongoing services to the Registrant, for engagements that related directly to the operations and financial reporting of the Registrant for the last two fiscal years.
| | | | | | | | | | | | | | | | | | | | | | | | |
| | | Audit-related fees | | | Tax fees | | | All other fees | |
| | | 1/1/13 –
12/31/13 | | | 1/1/14–
12/31/14 | | | 1/1/13 –
12/31/13 | | | 1/1/14 –
12/31/14 | | | 1/1/13 –
12/31/13 | | | 1/1/14 –
12/31/14 | |
Control Affiliates | | $ | — | | | $ | — | | | $ | — | | | $ | — | | | $ | — | | | $ | — | |
The following table sets forth the aggregate fees billed by the Registrant’s principal accountant for non-audit services rendered to CGM, HGI, Loomis, NGAM and Control Affiliates that provide ongoing services to the Registrant, for the last two fiscal years, including the fees disclosed in the table above.
| | | | | | | | |
| | | Aggregate Non-Audit Fees | |
| | | 1/1/13 –
12/31/13 | | | 1/1/14 –
12/31/14 | |
Control Affiliates | | $ | 281,800 | | | $ | 426,200 | |
None of the services described above were approved pursuant to (c)(7)(i)(C) of Regulation S-X.
Audit Committee Pre Approval Policies.
Annually, the Registrant’s Audit Committee reviews the audit, audit-related, tax and other non-audit services together with the projected fees, for services proposed to be rendered to the Trust and/or other entities for which pre-approval is required during the upcoming year. Any subsequent revisions to already pre-approved services or fees (including fee increases) and requests for pre-approval of new services would be presented for consideration quarterly as needed.
If, in the opinion of management, a proposed engagement by the Registrant’s independent accountants needs to commence before the next regularly scheduled Audit Committee meeting, any member of the Audit Committee who is an independent Board member is authorized to pre-approve the engagement, but only for engagements to provide audit, audit related and tax services. This approval is subject to review of the full Audit Committee at its next quarterly meeting. All other engagements require the approval of all the members of the Audit Committee.
| Item 5. | Audit Committee of Listed Registrants. |
Not applicable.
| Item 6. | Schedule of Investments. |
Included as part of the Report to Shareholders filed as Item 1 herewith.
| Item 7. | Disclosure of Proxy Voting Policies and Procedures for Closed-End Management Investment Companies. |
Not applicable.
| Item 8. | Portfolio Managers of Closed-End Management Investment Companies. |
Not applicable.
| Item 9. | Purchases of Equity Securities by Closed-End Management Investment Companies and Affiliated Purchasers. |
Not applicable.
| Item 10. | Submission of Matters to a Vote of Securities Holders. |
There were no material changes to the procedures by which shareholders may recommend nominees to the Registrant’s Board of Trustees.
| Item 11. | Controls and Procedures. |
The Registrant’s principal executive officer and principal financial officer have concluded that the Registrant’s disclosure controls and procedures are sufficient to ensure that information required to be disclosed by the Registrant in this Form N-CSR was recorded, processed, summarized and reported within the time periods specified in the Securities and Exchange Commission’s rules and forms, based upon such officers’ evaluation of these controls and procedures as of a date within 90 days of the filing date of the report.
There were no changes in the Registrant’s internal control over financial reporting that occurred during the Registrant’s last fiscal quarter of the period covered by this report that has materially affected, or is reasonably likely to materially affect, the Registrant’s internal control over financial reporting.
| | | | | | |
| | (a) | | (1) | | Code of Ethics required by Item 2 hereof, filed herewith as exhibit (a)(1). |
| | (a) | | (2) | | Certifications of Principal Executive Officer and Principal Financial Officer pursuant to Rule 30a-2(a) under the Investment Company Act of 1940 [17 CFR 270.30a-2(a)], filed herewith as Exhibits (a)(2)(1) and (a)(2)(2), respectively. |
| | (a) | | (3) | | Not applicable. |
| | (b) | | | | Certifications of Principal Executive Officer and Principal Financial Officer pursuant to Section 906 of Sarbanes-Oxley Act of 2002 are filed herewith as Exhibit (b). |
SIGNATURES
Pursuant to the requirements of the Securities Exchange Act of 1934 and the Investment Company Act of 1940, the Registrant has duly caused this report to be signed on its behalf by the undersigned, thereunto duly authorized.
| | |
Natixis Funds Trust I |
| |
| By: | | /s/ David L. Giunta |
| | |
| |
Name: | | David L. Giunta |
Title: | | President and Chief Executive Officer |
Date: | | February 23, 2015 |
Pursuant to the requirements of the Securities Exchange Act of 1934 and the Investment Company Act of 1940, this report has been signed by the following persons on behalf of the Registrant and in the capacities and on the dates indicated.
| | |
| |
Name: | | David L. Giunta |
Title: | | President and Chief Executive Officer |
Date: | | February 23, 2015 |
| | |
| |
Name: | | Michael C. Kardok |
Title: | | Treasurer |
Date: | | February 23, 2015 |