UNITED STATES
SECURITIES AND EXCHANGE COMMISSION
Washington, D.C. 20549
FORM N-CSR
CERTIFIED SHAREHOLDER REPORT OF REGISTERED
MANAGEMENT INVESTMENT COMPANIES
Investment Company Act file number: 811-04323
Natixis Funds Trust I
(Exact name of Registrant as specified in charter)
399 Boylston Street, Boston, Massachusetts 02116
(Address of principal executive offices) (Zip code)
Coleen Downs Dinneen, Esq.
NGAM Distribution, L.P.
399 Boylston Street
Boston, Massachusetts 02116
(Name and address of agent for service)
Registrant’s telephone number, including area code: (617) 449-2810
Date of fiscal year end: December 31
Date of reporting period: December 31, 2015
| Item 1. | Reports to Stockholders. |
The Registrant’s annual report transmitted to shareholders pursuant to Rule 30e-1 under the Investment Company Act of 1940 is as follows:
ANNUAL REPORT
December 31, 2015

CGM Advisor Targeted Equity Fund
Natixis Oakmark Fund
Natixis Oakmark International Fund
Vaughan Nelson Small Cap Value Fund
Vaughan Nelson Value Opportunity Fund

TABLE OF CONTENTS
Portfolio Review page 1
Portfolio of Investments page 22
Financial Statements page 41
Notes to Financial Statements page 70
CGM ADVISOR TARGETED EQUITY FUND
| | |
| Manager | | Symbols |
| G. Kenneth Heebner, CFA® | | Class A NEFGX |
| Capital Growth Management Limited Partnership | | Class B NEBGX |
| | Class C NEGCX |
| | Class Y NEGYX |
Objective
The Fund seeks long-term growth of capital through investments in equity securities of companies whose earnings are expected to grow at a faster rate than that of the overall U.S. economy.
Market Conditions
In 2015, the U.S. stock market delivered its worst return since 2008, ending the year basically flat and in sharp contrast to 2014’s double-digit gains. Throughout the period, worries about an economic slowdown in China, a weaker global economy, and the timing of interest rate increases by the Federal Reserve Board plagued the market. Another factor contributing to the market’s very modest return was plunging oil prices. While the consumer may benefit from lower energy prices, the collapse in oil prices is generally unwelcome news for large energy and industrial companies, whose stocks can significantly impact the market.
Overall uncertainty led to a wild ride in the stock market which reached new highs earlier in the year, but fell sharply in August as concerns over China’s slowdown mounted. The stock market recouped most of its lost ground late in the period, but investors had little to cheer about as the year came to a close.
Performance Results
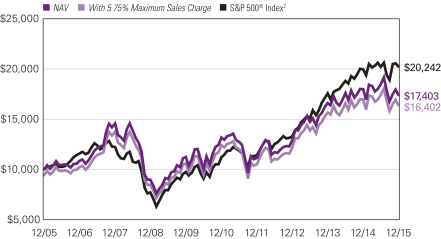
For the 12 months ended December 31, 2015, Class A shares of CGM Advisor Targeted Equity Fund returned -3.30% at net asset value. The Fund underperformed its benchmark, the S&P 500® Index, which returned 1.38%.
Explanation of Fund Performance
The Fund remained fully invested throughout 2015 in anticipation of strong U.S. economic growth, fueled by rising consumer spending. During the period, the U.S. consumer benefited from escalating housing prices as well as a significant reduction in personal debt, an ongoing trend since 2009.
Globally, the economic outlook was more uncertain. The Chinese economy in particular experienced a significant slowdown in 2015, which negatively impacted developing countries dependent on commodity exports. The major drop in oil prices worldwide further hobbled a number of developing economies. Ultimately, we believe that the impact of an optimistic outlook for domestic consumer spending is more crucial to U.S. economic growth than the limited impact of reduced exports to China and other developing nations.
1 |
Declining oil and gas prices were a boon to the U.S. consumer, sharply reducing transportation and home heating costs during the year, which translated into greater disposable income. These factors, coupled with rising employment and consumer confidence, stimulated consumer spending, the most critical factor in the economic growth equation.
During the period, the portfolio was focused on industries that would benefit from a stronger economy and rising interest rates, which typically accompany an economic upturn. The Fund’s largest concentrations were in homebuilders, financial stocks, and other economically sensitive industries. This group of stocks, however, lagged the market somewhat due to investor fears about the global economy.
Individual detractors to fund performance included apparel and footwear giant PVH Corp. (formerly Phillips-Van Heusen) which owns Calvin Klein, Tommy Hilfiger, Van Heusen, and other well-known brands. The stock suffered as a strong U.S. dollar negatively impacted revenues outside of the United States. Another apparel and footwear retailer, VF Corp., which owns Timberland, The North Face, Nautica and Vans as well as other internationally recognized labels, also struggled in the face of a stronger dollar and declining overseas revenues. We sold both stocks on the expectations of continued strength in the U.S. dollar.
Leading financial services firm Morgan Stanley also proved disappointing. Shares of the stock have been impaired by a weakness in commodity prices and bond prices, as well as the perception that the firm’s opportunities to benefit from rising interest rates are limited by market sentiment. We continue to hold this issue.
Among the stocks that delivered positive returns during the year was The Walt Disney Company (Disney). The company enjoyed continued success as a producer of top-grossing films, including the year-end blockbuster Star Wars. Shares of Disney also climbed in anticipation of the spring 2016 opening of its newest vacation destination, Shanghai Disney Resort. We sold the issue because of concerns about the negative impact of possible disruptions in the cable TV industry, which is critical to Disney’s business.
The Fund also realized a gain in financial services giant Visa which benefitted from increased processed transaction volume on its credit cards, along with a growth in gift cards and prepaid debit cards. Concerns over stock valuation, however, caused us to sell the stock. Meanwhile, D.R. Horton, a top homebuilder, also contributed positively to fund performance. Despite a sluggish homebuilding market, the firm enjoyed healthy earnings as it introduced new economy and luxury product lines which have proven highly successful. We continue to hold the stock. Home Depot was also a strong performer for the Fund. The Company benefitted from rising home improvement expenditures.
Outlook
On December 23, 2015, the Board of Trustees approved the liquidation of the CGM Advisor Targeted Equity Fund. Sale of the Fund’s assets and corresponding liquidating distributions to shareholders were completed on February 17, 2016.
| 2
CGM ADVISOR TARGETED EQUITY FUND
Growth of $10,000 investment in Class A Shares
December 31, 2005 through December 31, 2015
Average Annual Total Returns — December 31, 2015
| | | | | | | | | | | | |
| | | | |
| | | 1 Year | | | 5 Years | | | 10 Years | |
| Class A (Inception 11/27/68) | | | | | | | | | | | | |
| NAV | | | -3.30 | % | | | 5.71 | % | | | 5.70 | % |
| With 5.75% Maximum Sales Charge | | | -8.83 | | | | 4.46 | | | | 5.07 | |
| Class B (Inception 2/28/97) | | | | | | | | | | | | |
| NAV | | | -4.10 | | | | 4.90 | | | | 4.91 | |
| With CDSC1 | | | -8.74 | | | | 4.62 | | | | 4.91 | |
| Class C (Inception 9/1/98) | | | | | | | | | | | | |
| NAV | | | -4.02 | | | | 4.91 | | | | 4.91 | |
| With CDSC1 | | | -4.95 | | | | 4.91 | | | | 4.91 | |
| Class Y (Inception 6/30/99) | | | | | | | | | | | | |
| NAV | | | -3.01 | | | | 5.97 | | | | 5.98 | |
| Comparative Performance | | | | | | | | | | | | |
| S&P 500® Index2 | | | 1.38 | | | | 12.57 | | | | 7.31 | |
Performance data shown represents past performance and is no guarantee of, and not necessarily indicative of, future results. The table(s) does not reflect taxes shareholders might owe on any fund distributions or when they redeem their shares. Performance for periods less than one year is cumulative, not annualized. Returns reflect changes in share price and reinvestment of dividends and capital gains, if any. Unlike a fund, an index is not managed and does not reflect fees and expenses. It is not possible to invest directly in an index.
| 1 | Performance for Class B shares assumes a maximum 5.00% contingent deferred sales charge (“CDSC”) applied when you sell shares, which declines annually between years 1-6 according to the following schedule: 5, 4, 3, 3, 2, 1, 0%. Class C share performance assumes a 1.00% CDSC applied when you sell shares within one year of purchase. |
| 2 | S&P 500® Index is a widely recognized measure of U.S. stock market performance. It is an unmanaged index of 500 common stocks chosen for market size, liquidity, and industry group representation, among other factors. |
3 |
NATIXIS OAKMARK FUND
| | |
| Managers | | Symbols |
| William C. Nygren, CFA® | | Class A NEFOX |
| Kevin G. Grant, CFA® | | Class B NEGBX |
| M. Colin Hudson, CFA® | | Class C NECOX |
| Michael J. Mangan, CFA® | | Class Y NEOYX |
| Harris Associates L.P. | | |
Objective
The Fund seeks long-term capital appreciation.
Market Conditions
After almost a full year of speculation, the Federal Reserve (the “Fed”) finally lifted short-term interest rates in the fourth quarter. Investors appeared pleased by the news, concluding that the Fed’s decision points to a strengthening economy. Indeed, critical economic measures, such as employment and housing, have improved. New job creation in recent months met or exceeded economists’ forecasts, and the unemployment rate dropped throughout 2015 and reached the lowest level in more than seven years. Likewise, new housing permits rose more than industry projections, and single-family housing starts increased 10.5% in November to the highest level in nearly eight years.
Total consumer spending has similarly been on the rise, according to data compiled by the Bureau of Economic Analysis, and marked an all-time high in the third quarter of this year. However, consumer-friendly conditions, such as mild inflation and very low energy prices, have become concerning to the market. Investors worry that the long duration of these factors may lead to slowing economic growth and deflation. Falling energy prices in particular have severely impacted energy producers and related companies, resulting in reduced capital investment spending and depressed stock valuations across the sector. This scenario has also brought about some volatility in the broader market, as negative investor sentiment periodically pressured other equity prices in tandem with energy shares.
Performance Results
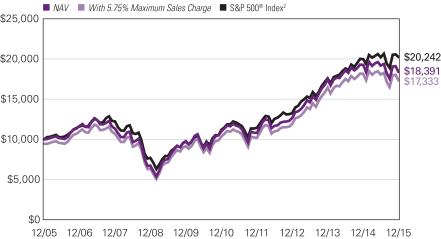
For the 12 months ended December 31, 2015, Class A shares of the Natixis Oakmark Fund returned -4.41% at net asset value. The Fund underperformed its benchmark, the S&P 500® Index, which returned 1.38%.
Explanation of Fund Performance
As value investors with an emphasis on individual stock selection, our sector weights are a byproduct of our bottom-up process. On an absolute-return basis, shares in the health care sector gained the most value, while holdings in the energy sector posted the lowest return for calendar 2015.
Chesapeake Energy and Glencore were the largest detractors to fund performance for the calendar year. Chesapeake Energy was no exception to the depressed energy stock prices that were seen across the sector this year, especially in oil. However, we still believe that this oil and natural gas company’s business is sound. The company plans to reduce its amount of capital leverage and improve liquidity by selling select assets, including $200-$300 million of non-core assets. In the meantime, Chesapeake’s third-quarter earnings release was not as bad as investors feared, as its earnings per share ($-0.05 vs. $-0.13) result was far ahead of
| 4
NATIXIS OAKMARK FUND
market expectations. Importantly, capital spending fell 47% from the previous quarter and about 60% year-over-year, which was better than forecasts, and management indicated further significant spending reductions through 2016. We are pleased that Chesapeake’s management team is focused on cutting costs and optimizing operational efficiencies, and we think these measures will strengthen Chesapeake Energy’s performance going forward.
Glencore’s share price came under pressure mainly in the latter half of the year, as commodity and energy prices declined significantly. We consider Glencore’s leadership team to be highly effective with a strong commitment to protecting and elevating shareholder value. In December, Glencore hosted a conference call to provide a review of the business and the progress made strengthening the balance sheet. Some key updates included management’s guidance for $2.3 billion of free cash flow and earnings (excluding depreciation and amortization) of roughly $7.7 billion in 2016 at current “spot” prices, which is ahead of market expectations. Management believes that strong unit cost and capital expenditure reductions along with stability in the marketing business will make these targets achievable. In addition, the company plans to reduce debt by another $3 billion, bringing total projected cost cuts to $13 billion. Of that amount, nearly $9 billion in savings has already been achieved or otherwise earmarked.
The leading contributors to fund performance for the year were Amazon and Alphabet (formerly Google). As of the end of October, Amazon had returned over 100% since the beginning of the fiscal year. A third-quarter earnings report released in October showed earnings per share ($0.17 vs. -$0.13) and revenue ($25.36 billion vs. $24.88 billion) figures that beat consensus outlook, which helped to make this name a top contributor based on excess return. We subsequently sold out of our position in the first week of November as it reached our estimation of its intrinsic value.
Google delivered a positive second-quarter earnings report in July, highlighted by an earnings per share result ($6.99 vs. $6.70) that handily beat market expectations. Aggregate paid clicks were up 18% and paid clicks on Google websites were up 30%. Additionally, Google announced the creation of a new public holding company, Alphabet, as well as a new corporate structure in August. The company’s share price also reacted positively to third-quarter results that showed earnings and revenues both increased more than market expectations. Importantly, Alphabet also reported accelerating constant currency revenue growth of 21%. In our view, this growth was high quality with gains across all important segments. The fastest growth was in Google Sites (Search, YouTube, Gmail, etc.), which is the most profitable revenue. It was also important that mobile search revenue experienced substantial growth, as this eases concerns that the shift to mobile computing will harm Alphabet’s profitability. We continue to believe that the company enjoys a very strong tailwind as advertising continues to move online.
Outlook
While economic growth in the U.S. persists at a moderate pace overall, going forward, the market faces new concerns, including possible actions the Fed may take regarding future interest rate increases and growing turmoil abroad which may continue to sway market behavior. Slowing growth in China remains at the forefront, as its government works to boost domestic consumption, and currency disparities still adversely affect businesses around the world. Lastly, in addition to causing real world destruction, the unpredictable timing and intensity of terrorists’ activities may also threaten market stability. Even in light of these considerations, we focus on making rational investment decisions for the benefit of our clients. As patient value investors, we choose to stay the course and remain committed to our investment philosophy and methodology.
5 |
Growth of $10,000 Investment in Class A Shares3
December 31, 2005 through December 31, 2015
Average Annual Total Returns — December 31, 20153
| | | | | | | | | | | | |
| | | | |
| | | 1 Year | | | 5 Years | | | 10 Years | |
| Class A (Inception 5/6/31) | | | | | | | | | | | | |
| NAV | | | -4.41 | % | | | 10.88 | % | | | 6.28 | % |
| With 5.75% Maximum Sales Charge | | | -9.92 | | | | 9.58 | | | | 5.65 | |
| Class B (Inception 9/13/93) | | | | | | | | | | | | |
| NAV | | | -5.11 | | | | 10.04 | | | | 5.48 | |
| With CDSC1 | | | -9.68 | | | | 9.77 | | | | 5.48 | |
| Class C (Inception 5/1/95) | | | | | | | | | | | | |
| NAV | | | -5.07 | | | | 10.07 | | | | 5.49 | |
| With CDSC1 | | | -5.99 | | | | 10.07 | | | | 5.49 | |
| Class Y (Inception 11/18/98) | | | | | | | | | | | | |
| NAV | | | -4.18 | | | | 11.15 | | | | 6.60 | |
| Comparative Performance | | | | | | | | | | | | |
| S&P 500® Index2 | | | 1.38 | | | | 12.57 | | | | 7.31 | |
Performance data shown represents past performance and is no guarantee of, and not necessarily indicative of, future results. The table(s) does not reflect taxes shareholders might owe on any fund distributions or when they redeem their shares. Performance for periods less than one year is cumulative, not annualized. Returns reflect changes in share price and reinvestment of dividends and capital gains, if any. Unlike a fund, an index is not managed and does not reflect fees and expenses. It is not possible to invest directly in an index.
| 1 | Performance for Class B shares assumes a maximum 5.00% contingent deferred sales charge (“CDSC”) applied when you sell shares, which declines annually between years 1-6 according to the following schedule: 5, 4, 3, 3, 2, 1, 0%. Class C share performance assumes a 1.00% CDSC applied when you sell shares within one year of purchase. |
| 2 | S&P 500® Index is a widely recognized measure of U.S. stock market performance. It is an unmanaged index of 500 common stocks chosen for market size, liquidity, and industry group representation, among other factors. |
| 3 | Fund performance has been increased by fee waivers and/or expense reimbursements, if any, without which performance would have been lower. |
| 6
NATIXIS OAKMARK INTERNATIONAL FUND
| | |
| Managers | | Symbols |
| David G. Herro, CFA® | | Class A NOIAX |
| Robert A. Taylor, CFA® | | Class C NOICX |
| Harris Associates L.P. | | |
Objective
The Fund seeks long-term capital appreciation.
Market Conditions
The year 2015 included terrorist attacks in France and the U.S., two elections in Greece, continued slowdown in the BRIC economies with slower growth in China causing the most concern, ongoing political crisis in Brazil, the rise of ISIS, concerns about too-low inflation and stalled growth in Japan, and depressed energy and commodity prices. Considering that share prices often reflect the mood of investors in the short term, the persistent bad news was perhaps another reason for the lack of buoyancy in global equity markets.
We still believe, however, there are reasons for optimism, including the eurozone which is slowly coming out of its funk led by some limited reforms (especially in the periphery countries), a stabilized situation in Greece, a weaker euro, and an easier monetary policy. Even in Latin America, reformers have won elections in Argentina and Venezuela. In Japan, the Abe administration is raising the minimum wage by 3% annually and easing regulations to encourage corporate investment. Furthermore, the unemployment rate in the U.S. dropped throughout 2015 and reached the lowest level in more than seven years, total consumer spending marked an all-time high in the third quarter, and the Federal Reserve finally lifted short-term interest rates in the fourth quarter. All things considered, the International Monetary Fund still expects the world to grow at a 3% rate. While this leaves room for improvement, it is still a level that allows for acceptable corporate profitability.
Performance Results
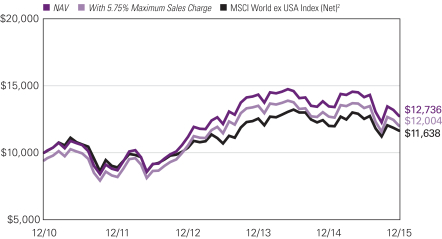
For the 12 months ended December 31, 2015, Class A shares of Natixis Oakmark International Fund returned -5.35% at net asset value. The Fund trailed its benchmark, the MSCI World ex USA Index (Net), which returned -3.04%.
Explanation of Fund Performance
Geographically, we ended the quarter with 65% of our holdings in Europe, 21% in Japan and 3% in Australia. The remaining positions are in the United States, South Korea, China, Hong Kong, Indonesia, Mexico and Israel. As value investors with an emphasis on individual stock selection, our country and sector weights are a byproduct of our bottom-up process.
On an absolute-return basis, shares in the health care sector produced the best collective return. Holdings in the materials sector declined the most during the year.
The largest detractors from return were Glencore and Prada. Glencore’s share price came under pressure mainly in the latter half of the year, as commodity and energy prices declined significantly. We consider Glencore’s leadership team to be highly effective and focused on elevating shareholder value. In December, Glencore hosted a conference call to provide a review of the business and the progress made strengthening the balance sheet. Some key updates included management’s guidance for $2.3 billion of free cash flow and earnings (excluding depreciation and amortization) of roughly $7.7 billion in 2016 at current “spot” prices, which is ahead of market expectations. Management believes that strong unit cost and capital expenditure reductions along with stability in the marketing business will make these
7 |
targets achievable. In addition, the company plans to reduce debt by another $3 billion, bringing total projected cost cuts to $13 billion. Of that amount, nearly $9 billion in savings has already been achieved or otherwise earmarked. Keeping in mind that members of the company’s management team are large stakeholders (having purchased 22% of the recent $2.5 billion equity offering), we think management’s actions remain aligned with all of Glencore’s shareholders as they navigate through these trying times.
Prada, the Italian fashion and luxury goods brand, was also a top detractor for the quarter. The company reported fiscal third-quarter results that disappointed investors, as revenue and earnings figures fell short of analysts’ expectations. Sales in China, particularly of leather goods, continued to decline, and the company has struggled to find the right product offering to generate top-line growth. Management believes that Chinese customers are transitioning from just wanting global products found in the West to wanting bespoke products and plans to tailor clothing by geographic region, which should appeal to Chinese consumers. Prada’s lean and efficient distribution network will enable the company to move new product offerings from the design stage to the retail floor quickly — approximately four to five weeks’ time. We think that while Prada may face some short-term obstacles, its long-term outlook is promising and it is trading at a meaningful discount to its intrinsic value.
The top contributors to the yearly return were Intesa Sanpaolo and Baidu. Intesa Sanpaolo, an Italian retail and commercial bank, was the top contributor to performance over the past 12 months. Intesa’s share price has rebounded as fears over Italy’s banking system and government have subsided. During the period of concern a few years ago, the share price of Intesa plummeted and it was a major detractor from performance. Nevertheless we maintained and added to our position, and our shareholders have benefited from the turnaround. This example illustrates why we often increase our holdings in quality companies whose stock prices suffer as a result of short-term fears. Investors reacted positively this year to Intesa’s impressive revenue growth numbers in spite of challenging headwinds: Italian GDP has been static and banking penetration remains low, while the household savings rate remains high. Management has announced additional returns of capital to shareholders in 2015 via an increased dividend, resulting in a payout ratio in excess of 70%.
Baidu, China’s largest Internet search engine that commands over 70% market share, saw shares react positively to the company’s nine-month earnings release in October and to the company’s plans to merge their majority-controlled travel business Qunar with Ctrip. This important deal will combine the top two online travel sites in China and should lead to significantly lower subsidies and higher profitability. Additionally, the shareholder-focused management team announced a new $2 billion share repurchase program during the fourth quarter. Finally, we believe that management’s significant investments in new businesses, such as online-to-offline services (e.g. food delivery, ride sharing, etc.), are masking the strength of the core search business, which continues to grow at a healthy rate and generates significant profits. For these reasons, we believe Baidu’s current valuation neither reflects the fair value of the company’s search business nor gives any credit for its many non-search businesses; therefore, the stock price underestimates Baidu’s true value.
We continue to believe some currencies are overvalued versus the U.S. dollar. We maintained our defensive currency hedges and ended the year with approximately 23% of the Swiss franc and 10% of the Australian dollar hedged.
Outlook
Although macro and geopolitical events dominated the news in 2015, we believe it is a mistake to focus on these factors when making investment decisions. We find that these events rarely impact long-term business value in a meaningful way. In fact, these events should be used to exploit short-term mispricing, as they enable investors to buy into businesses at low entry prices. We recognize that our job is to measure and determine intrinsic value, to buy when stock prices are low and to sell when stock prices are high. It is our belief that by focusing on this, rather than the exogenous events mentioned above, we will earn acceptable rates of return over time for those who entrust their funds with us.
| 8
NATIXIS OAKMARK INTERNATIONAL FUND
Growth of $10,000 Investment in Class A Shares
December 15, 2010 (inception) through December 31, 20153
Average Annual Total Returns — December 31, 2015
| | | | | | | | | | | | |
| | | | |
| | | 1 Year | | | 5 Years | | | Life of Fund | |
| | | | |
| Class A (Inception 12/15/10) | | | | | | | | | | | | |
| NAV | | | -5.35 | % | | | 4.63 | % | | | 4.92 | % |
| With 5.75% Maximum Sales Charge | | | -10.80 | | | | 3.39 | | | | 3.69 | |
| | | | |
| Class C (Inception 12/15/10) | | | | | | | | | | | | |
| NAV | | | -6.08 | | | | 3.88 | | | | 4.15 | |
| With CDSC1 | | | -7.00 | | | | 3.88 | | | | 4.15 | |
| | | | |
| Comparative Performance | | | | | | | | | | | | |
| MSCI World ex USA Index (Net)2 | | | -3.04 | | | | 2.79 | | | | 3.05 | |
Performance data shown represents past performance and is no guarantee of, and not necessarily indicative of, future results. The table(s) does not reflect taxes shareholders might owe on any fund distributions or when they redeem their shares. Performance for periods less than one year is cumulative, not annualized. Returns reflect changes in share price and reinvestment of dividends and capital gains, if any. Unlike a fund, an index is not managed and does not reflect fees and expenses. It is not possible to invest directly in an index.
| 1 | Performance for Class C shares assumes a 1.00% contingent deferred sales charge (“CDSC”) applied when you sell shares within one year of purchase. |
| 2 | MSCI World ex USA Index (Net) is an unmanaged index that is designed to measure the equity market performance of developed markets, excluding the United States. The index calculates reinvested dividends net of withholding taxes using Luxembourg tax rates. |
| 3 | Fund performance has been increased by fee waivers and/or expense reimbursements, if any, without which performance would have been lower. |
9 |
VAUGHAN NELSON SMALL CAP VALUE FUND
| | |
| Managers | | Symbols |
| Dennis G. Alff, CFA® | | Class A NEFJX |
| Chad D. Fargason | | Class B NEJBX |
| Chris D. Wallis, CFA® | | Class C NEJCX |
| Scott J. Weber, CFA® | | Class Y NEJYX |
| Vaughan Nelson Investment Management, L.P. |
Effective July 31, 2009, the fund was closed to new investors.
Objective
The Fund seeks capital appreciation.
Market Conditions
During the past twelve months, deteriorating market breadth resulted in increased equity market volatility. The current market volatility will likely continue as capital markets adjust to the shifts in central bank policy that are occurring globally. Specifically, the ongoing shift in U.S. monetary policy creates deflationary pressures as the dollar strengthens relative to those currencies whose monetary authorities are accelerating simulative policies. In typical business cycles, shifts in monetary policy that reduce liquidity occur when the economy is accelerating, profit margins are increasing, and inflation expectations are rising. Unfortunately, none of these conditions are currently present in the U.S., which is why we believe this market cycle will be materially different from market cycles experienced prior to the 2008 financial crisis.
Equity markets are digesting falling earnings growth estimates, declining profit margins, and rising credit costs. The recent volatility in the market is consistent with our view that, with valuations stretched, near term earnings estimates declining, and corporate borrowing rates likely beyond their cyclical lows, the market will present attractive investment opportunities.
Performance Results
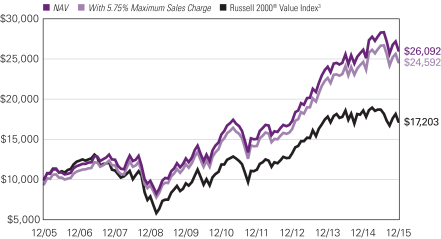
For the 12 months ended December 31, 2015, Class A shares of Vaughan Nelson Small Cap Value Fund returned -0.29% at net asset value. The Fund outperformed its benchmark, the Russell 2000® Value Index, which returned -7.47%.
Explanation of Fund Performance
Stock selection drove the majority of the portfolio’s relative outperformance over the past year while modest multiple contraction limited absolute returns. The best-performing stocks in the portfolio were mostly service-oriented businesses with the ability to grow their revenues and earnings despite the slowing economic recovery. These high-quality, well-managed businesses, many of which benefit from long-term secular tailwinds, are a natural fit with our returns-focused philosophy and were uncovered through our company-specific stock selection process. The portfolio continued to be materially underweight in REITs and utilities for most of the year, but our weighting to utilities increased in the fourth quarter as market volatility provided an opportunity to own high quality regulated assets. Healthcare, technology, and financial stocks were the biggest contributors to our performance, while consumer discretionary stocks and more cyclically exposed industrials were the largest performance detractors.
| 10
VAUGHAN NELSON SMALL CAP VALUE FUND
Stock selection drove performance in the health care sector with PRA Health Sciences, Amsurg, and Integra LifeSciences making the most significant contributions to performance. PRA Health Sciences benefited from the secular outsourcing of clinical trials by bio-pharmaceutical companies particularly by smaller and emerging companies searching for new molecular entities. Management continues to drive operating margins higher with internal efficiency programs and the company continues to seek new areas of business and engage more directly with its customers. We have trimmed our position on valuation concerns but still retain a positive view. Amsurg continues to benefit from the integration of its strategic acquisition of Sheridan Healthcare while also benefitting from the trend of patients moving to lower-cost outpatient settings in its core ambulatory surgery center business. Integra LifeSciences continues to optimize its portfolio of assets, spinning off SeaSpine during the year for example, and focusing on its core competencies. While the company has a number of new product launches coming in 2016-2017, management has continued to rationalize its cost footprint and sees margins moving higher over time.
The technology sector was also driven by stock selection, with Broadridge and IGATE as the greatest contributors to performance. Broadridge continued to drive higher levels of recurring revenue and grew backlog while introducing new products and ways to interact with customers. The company came off a year in which they made four acquisitions to bolster product capabilities in both the Investor Communications and Global Technology & Operation segments. Integrating these acquisitions will help drive new client growth, shed unnecessary costs, and help the company expand its market-leading positions. IGATE is an information technology outsourcing company that continued its multi-year investment in domain expertise and pruned unprofitable customers from its client list. Secular trends remain favorable in the business as evidenced by the acquisition by CapGemini in mid-2015.
Performance in the financials sector was driven by allocation and stock selection, as the portfolio was overweight insurance, underweight REITs, and exposed to stocks that performed well during the year. The largest contributors to performance were HCC Insurance and Webster Financial. HCC Insurance was acquired by Tokyo Marine at a healthy price-to-book multiple as HCC demonstrated great underwriting expertise in niche lines of specialty business that are not as price sensitive as the licensed market. The company had compounded its book value in the high single digits over the past five years while paying a healthy dividend, and consistently repurchased shares rather than allocating capital to inferior business lines with subpar returns. Webster Financial showed strong organic loan growth and synergies from the JP Morgan HSA business it acquired early in 2015. Management continues to look for ways to drive the efficiency ratio lower while expanding its loan footprint.
The consumer discretionary sector detracted from performance as traditional retail companies were faced with changing customer tastes and preferences while struggling to adapt to omni-channel supply chain and selling strategies. What is good for consumers — ubiquitous product distribution with constant markdowns — is bad for retailers if there is no compelling brand value proposition or reason to visit stores. Men’s Wearhouse was hurt by changing customer patterns at its Joseph A. Bank stores as the core customer failed to shop after a change in the assortment and marketing message. We sold most of our position in Men’s Wearhouse and exited other consumer retail names such as Fossil, Bloomin’ Brands, Wolverine Worldwide, and GNC Holdings during the second half of the year as it became evident consumers were spending their discretionary monies elsewhere.
11 |
The industrial sector also detracted from performance as the decline in commodity prices had negative direct and indirect effects on our names. Rexnord’s Process and Motion Control business suffered from a lack of new orders, and replacement and maintenance orders were materially reduced or pushed out. The Esterline Technologies management team executed poorly on their cost cutting rationalization plans while the aerospace and defense end market started to slow.
Other notable performers during the year include ServiceMaster Holdings and Renaissance Reinsurance. ServiceMaster continued to layer on additional services to its core residential and commercial insect and pest control offerings to drive incremental revenues. The company’s home warranty business continues to benefit from a rebounding housing market and it was able to successfully pass through price increases. ServiceMaster is also in the later stages of realizing shared services synergies to drive overhead costs lower. Renaissance Reinsurance continues to find synergies with the Platinum Underwriters acquisition and diversify its reinsurance operations. The company continues to be a front-runner in consolidating the reinsurance space and keeping overhead costs well contained in a soft pricing market.
The largest increases in sector and industry weightings were in utilities and IT services. We took advantage of the late summer sell-off to add regulated utility names with visible rate base reinvestment opportunities over the next 3-5 years. The increase in IT services weighting was driven by federal government IT contractor names. With government budgets set to increase in the near future and the need for heightened cyber security and intelligence, names like CACI International, Booz Allen Hamilton and Engility Holdings are poised to benefit.
The largest decreases in sector weightings were in consumer discretionary and healthcare. As discussed earlier, the reduction in consumer discretionary holdings was due to the stresses on consumers wallets and the team subsequently trimmed Men’s Wearhouse and sold Fossil, Bloomin’ Brands, Wolverine Worldwide, and GNC Holdings. In healthcare, our reduction in sector weighting was due mostly to profit taking as well as valuation concerns.
Outlook
Given current valuations in the equity market, sluggish growth, and the Federal Reserve moving off its zero interest rate policy, the equity markets are likely to be volatile and could experience a further correction. We would welcome any correction as an opportunity to make attractive investments.
We expect market volatility to remain elevated during the short term as levered investors unwind trading positions that were preconditioned on higher levels of liquidity and lower levels of volatility. The near term direction of U.S. equity markets will be dictated by the tug-of-war between an improving labor market, which will pressure corporate margins, and the potential reacceleration of top-line growth as wages rise and the employment base expands. Preconditions for rising equity markets are stability in credit markets combined with abating deflationary forces from overseas markets or a shift to more accommodative U.S. fiscal and monetary policies.
We continue to seek investments in companies that have better pricing power, lower earnings variability, higher profitability, and stronger balance sheets than the broader investment universe. We still do not favor any single industry or sector, and continue to look for companies with the characteristics noted above that trade at attractive valuations.
| 12
VAUGHAN NELSON SMALL CAP VALUE FUND
Growth of $10,000 Investment in Class A Shares4
December 31, 2005 through December 31, 2015
Average Annual Total Returns — December 31, 20154
| | | | | | | | | | | | |
| | | | |
| | | 1 Year | | | 5 Years | | | 10 Years | |
| Class A (Inception 12/31/96) | | | | | | | | | | | | |
| NAV | | | -0.29 | % | | | 10.77 | % | | | 10.07 | % |
| With 5.75% Maximum Sales Charge | | | -6.02 | | | | 9.47 | | | | 9.42 | |
| Class B (Inception 12/31/96) | | | | | | | | | | | | |
| NAV | | | -1.04 | | | | 9.93 | | | | 9.24 | |
| With CDSC1 | | | -5.07 | | | | 9.76 | | | | 9.24 | |
| Class C (Inception 12/31/96) | | | | | | | | | | | | |
| NAV | | | -1.02 | | | | 9.94 | | | | 9.24 | |
| With CDSC1 | | | -1.83 | | | | 9.94 | | | | 9.24 | |
| Class Y (Inception 8/31/06)2 | | | | | | | | | | | | |
| NAV | | | -0.05 | | | | 11.04 | | | | 10.34 | |
| Comparative Performance | | | | | | | | | | | | |
| Russell 2000® Value Index3 | | | -7.47 | | | | 7.67 | | | | 5.57 | |
Performance data shown represents past performance and is no guarantee of, and not necessarily indicative of, future results. The table(s) does not reflect taxes shareholders might owe on any fund distributions or when they redeem their shares. Performance for periods less than one year is cumulative, not annualized. Returns reflect changes in share price and reinvestment of dividends and capital gains, if any. Unlike a fund, an index is not managed and does not reflect fees and expenses. It is not possible to invest directly in an index.
| 1 | Performance for Class B shares assumes a maximum 5.00% contingent deferred sales charge (“CDSC”) applied when you sell shares, which declines annually between years 1-6 according to the following schedule: 5, 4, 3, 3, 2, 1, 0%. Class C share performance assumes a 1.00% CDSC applied when you sell shares within one year of purchase. |
| 2 | Prior to the inception of Class Y shares (8/31/06), performance is that of Class A shares and reflects the higher net expenses of that share class. |
| 3 | Russell 2000® Value Index is an unmanaged index that measures the performance of the small-cap value segment of the U.S. equity universe. It includes those Russell 2000® companies with lower price-to-book ratios and lower forecasted growth values. |
| 4 | Fund performance has been increased by fee waivers and/or expense reimbursements, if any, without which performance would have been lower. |
13 |
VAUGHAN NELSON VALUE OPPORTUNITY FUND
| | |
| Managers | | Symbols |
| Dennis G. Alff, CFA® | | Class A VNVAX |
| Chad D. Fargason | | Class C VNVCX |
| Chris D. Wallis, CFA® | | Class N VNVNX |
| Scott J. Weber, CFA® | | Class Y VNVYX |
| Vaughan Nelson Investment Management, L.P. |
Objective
The Fund seeks long-term capital appreciation.
Market Conditions
During the past twelve months, deteriorating market breadth resulted in increased equity market volatility. The current market volatility will likely continue as capital markets adjust to the shifts in central bank policy that are occurring globally. Specifically, the ongoing shift in U.S. monetary policy creates deflationary pressures as the dollar strengthens relative to those currencies whose monetary authorities are accelerating simulative policies. In typical business cycles, shifts in monetary policy that reduce liquidity occur when the economy is accelerating, profit margins are increasing, and inflation expectations are rising. Unfortunately, none of these conditions are currently present in the U.S., which is why we believe this market cycle will be materially different from market cycles experienced prior to the 2008 financial crisis.
Equity markets are digesting falling earnings growth estimates, declining profit margins, and rising credit costs. The recent volatility in the market is consistent with our view that, with valuations stretched, near term earnings estimates declining, and corporate borrowing rates likely beyond their cyclical lows, the market will present attractive investment opportunities.
Performance Results
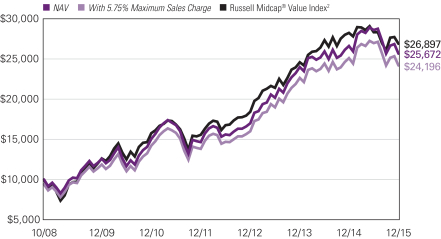
For the twelve months ended December 31, 2015, Class A shares of Vaughan Nelson Value Opportunity Fund returned -3.66% at net asset value. The Fund held up better than its benchmark, the Russell Midcap® Value Index, which returned -4.78%.
Explanation of Fund Performance
The portfolio declined primarily due to weakness in cyclical stocks within the consumer discretionary, materials, industrials, and energy sectors. On a relative basis, sector allocation was the primary driver of the Fund’s outperformance as compared to the benchmark, but stock selection contributed, too. The majority of the Fund’s relative outperformance for the year stems from the decision to overweight technology and underweight energy. The best performing stocks in the portfolio were mostly service-oriented businesses with the ability to grow their revenues and earnings despite the slowing economic recovery. These high-quality, well-managed businesses, many of which benefit from long-term secular tailwinds, are a natural fit with our returns-focused philosophy and were uncovered through our company-specific stock selection process. The portfolio remains significantly underweight in REITs and utilities based on valuation. We are confident that the portfolio’s individual companies have competitive positions or secular opportunities that will allow them to outperform the market over time. Technology, financials, and consumer staples were the biggest contributors to absolute performance, while consumer discretionary, healthcare, industrials, materials, and energy detracted from performance.
| 14
VAUGHAN NELSON VALUE OPPORTUNITY FUND
Stock selection primarily drove the strong returns and relative performance in the technology sector. However, the portfolio also benefitted from being materially overweight in IT services companies. Notable standouts for the year include IT services companies Global Payments, Total System Services, and Fiserv. These companies provide electronic payment processing services and solutions for financial institutions and merchants, and as such, they produce predictable, recurring revenue streams that are growing with credit and debit card usage, and as financial institutions automate operations. The market rewarded these companies in 2015 for their visible and consistent business models. Avago, an analog semiconductor company, was also a strong performer for the portfolio and continued to benefit from global growth in mobile devices and connected products, and from new design wins and content gains on mobile platforms.
The financials sector was a positive contributor to the portfolio on an absolute basis but lagged the benchmark on a relative basis primarily due to being underweight in REITs and insurance stocks during the year. The largest contributors to performance were SEI Investments and Nasdaq. SEI Investments provides investment processing, investment management, and investment operations solutions that help financial institutions and financial advisors manage client accounts. SEI benefits from a recurring business model with high incremental margins, which are characteristics the market favored in 2015. Nasdaq, a global securities exchange and listing provider, benefitted from better volumes and more volatility in 2015. Further, Nasdaq’s business model is also recurring in nature and management has been shareholder friendly by aggressively repurchasing shares and by increasing its dividend.
Energy detracted from absolute performance but as noted earlier the portfolio was materially underweight as compared to the benchmark. Therefore, on a relative basis, the portfolio’s underweight to the energy sector contributed significantly to relative performance for the year. The portfolio remains materially underweight in the sector, but we have indirect exposure to energy primarily through our materials and industrials holdings.
The consumer discretionary sector detracted from performance as traditional retail companies were faced with changing customer tastes and preferences while struggling to adapt to omni-channel supply chain and selling strategies. What is good for consumers — ubiquitous product distribution with constant markdowns — is bad for retailers if there is no compelling brand value proposition or reason to visit stores. Men’s Wearhouse was hurt by changing customer patterns at its Joseph A. Banks stores as the core customer failed to shop after a change in the assortment and marketing message. PVH Corporation, whose apparel portfolio includes Calvin Klein, Tommy Hilfiger, and Izod also performed poorly. Cabela’s, a hunting, camping and fishing outfitter, also experienced weak store traffic and apparel sales and we sold the stock.
The healthcare sector detracted from performance primarily due to stock selection within healthcare providers and services. Community Health Systems, an acute care hospital provider, declined sharply in the third and fourth quarters of 2015 due to renewed discussion around the outlook for the Affordable Care Act (ACA). The ACA has been favorable for Community given its exposure to states with a relatively higher percentage of uninsured population and given that Community has the most exposure to the states with the possibility of Medicaid expansion. Finally, Community is one of the more levered names in the hospital group, which made it an easy candidate for investors to sell. Amsurg, an ambulatory surgery center provider, offset some of the poor performance within the hospital group. The company continues to benefit from the integration of its strategic acquisition of Sheridan Healthcare while also benefitting from the trend of patients moving to lower-cost outpatient settings like its core ambulatory surgery center business.
15 |
The materials and industrials sectors also detracted from performance as the sharp decline in commodity prices directly and indirectly impacted portfolio holdings such as specialty alloy and aluminum manufacturers, Carpenter Technology and Constellium. One industrial, ServiceMaster, the operator of Terminix and American Home Shield, was one of the portfolio’s best performers in 2015. ServiceMaster continued to layer on additional services to its core residential and commercial insect and pest control offerings to drive incremental revenues. The company’s home warranty business continues to benefit from a rebounding housing market and it was able to successfully pass through price increases. ServiceMaster is also in the later stages of realizing shared services synergies to drive overhead costs lower.
Other notable performers during the year were Sabre in the technology sector; Jarden in consumer discretionary; Alere in healthcare; and Avery Dennison in the materials sector. The greatest increases in weightings by sector were in technology, materials, and financials. The largest reductions in weightings by sector were in consumer staples, energy, and industrials. The portfolio is underweight in consumer staples, energy, financials, and utilities. These underweights are offset by overweights in technology, consumer discretionary, industrials, healthcare, and materials. The underweight to financials is primarily driven by our decision to avoid REITs since valuations look expensive.
Outlook
Given current valuations in the equity market, sluggish growth, and the Federal Reserve moving off its zero interest rate policy, the equity markets are likely to be volatile and could experience a further correction. We would welcome any correction as an opportunity to make attractive investments.
We expect market volatility to remain elevated during the short term as levered investors unwind trading positions that were preconditioned on higher levels of liquidity and lower levels of volatility. The near term direction of U.S. equity markets will be dictated by the tug-of-war between an improving labor market, which will pressure corporate margins, and the potential reacceleration of top-line growth as wages rise and the employment base expands. Preconditions for rising equity markets are stability in credit markets combined with abating deflationary forces from overseas markets or a shift to more accommodative U.S. fiscal and monetary policies.
We continue to seek investments in companies that have better pricing power, lower earnings variability, higher profitability, and stronger balance sheets than the broader investment universe. We still do not favor any single industry or sector, and continue to look for companies with the characteristics noted above that trade at attractive valuations.
| 16
VAUGHAN NELSON VALUE OPPORTUNITY FUND
Growth of $10,000 Investment in Class A Shares3
October 31, 2008 (inception) through December 31, 2015
Average Annual Total Returns — December 31, 20153
| | | | | | | | | | | | | | | | |
| | | | | |
| | | 1 Year | | | 5 Years | | | Life of
Class A,C,Y | | | Life of
Class N | |
| Class A (Inception 10/31/08) | | | | | | | | | | | | |
| NAV | | | -3.66 | % | | | 11.22 | % | | | 14.06 | % | | | — | % |
| With 5.75% Maximum Sales Charge | | | -9.20 | | | | 9.91 | | | | 13.12 | | | | — | |
| Class C (Inception 10/31/08) | | | | | | | | | | | | | | | | |
| NAV | | | -4.39 | | | | 10.39 | | | | 13.21 | | | | — | |
| With CDSC1 | | | -5.32 | | | | 10.39 | | | | 13.21 | | | | — | |
| Class N (Inception 5/1/13) | | | | | | | | | | | | | | | | |
| NAV | | | -3.35 | | | | — | | | | — | | | | 11.61 | |
| Class Y (Inception 10/31/08) | | | | | | | | | | | | | | | | |
| NAV | | | -3.47 | | | | 11.48 | | | | 14.34 | | | | — | |
| Comparative Performance | | | | | | | | | | | | | | | | |
| Russell Midcap® Value Index2 | | | -4.78 | | | | 11.25 | | | | 14.82 | | | | 9.66 | |
Performance data shown represents past performance and is no guarantee of, and not necessarily indicative of, future results. The table(s) does not reflect taxes shareholders might owe on any fund distributions or when they redeem their shares. Performance for periods less than one year is cumulative, not annualized. Returns reflect changes in share price and reinvestment of dividends and capital gains, if any. Unlike a fund, an index is not managed and does not reflect fees and expenses. It is not possible to invest directly in an index.
| 1 | Performance for Class C shares assumes a 1.00% contingent deferred sales charge (“CDSC”) applied when you sell shares within one year of purchase. |
| 2 | Russell Midcap® Value Index is an unmanaged index that measures the performance of the mid-cap value segment of the U.S. equity universe. It includes those Russell Midcap® Index companies with lower price-to-book ratios and lower forecasted growth values. |
| 3 | Fund performance has been increased by fee waivers and/or expense reimbursements, if any, without which performance would have been lower. |
17 |
ADDITIONAL INFORMATION
The views expressed in this report reflect those of the portfolio managers as of the dates indicated. The managers’ views are subject to change at any time without notice based on changes in market or other conditions. References to specific securities or industries should not be regarded as investment advice. Because the Fund is actively managed, there is no assurance that they will continue to invest in the securities or industries mentioned.
ADDITIONAL INDEX INFORMATION
This document may contain references to third party copyrights, indexes, and trademarks, each of which is the property of its respective owner. Such owner is not affiliated with Natixis Global Asset Management or any of its related or affiliated companies (collectively “NGAM”) and does not sponsor, endorse or participate in the provision of any NGAM services, funds or other financial products.
The index information contained herein is derived from third parties and is provided on an “as is” basis. The user of this information assumes the entire risk of use of this information. Each of the third party entities involved in compiling, computing or creating index information disclaims all warranties (including, without limitation, any warranties of originality, accuracy, completeness, timeliness, non-infringement, merchantability and fitness for a particular purpose) with respect to such information.
PROXY VOTING INFORMATION
A description of the Natixis Funds’ proxy voting policies and procedures is available without charge, upon request, by calling Natixis Funds at 800-225-5478; on Natixis Funds’ website at ngam.natixis.com; and on the Securities and Exchange Commission’s (SEC) website at www.sec.gov. Information regarding how Natixis Funds voted proxies relating to portfolio securities during the 12-months ended June 30, 2015 is available from Natixis Funds’ website and the SEC’s website.
QUARTERLY PORTFOLIO SCHEDULES
Natixis Funds file a complete schedule of portfolio holdings with the SEC for the first and third quarters of each fiscal year on Form N-Q. The Funds’ Forms N-Q are available on the SEC’s website at www.sec.gov and may be reviewed and copied at the SEC’s Public Reference Room in Washington, DC. Information on the operation of the Public
Reference Room may be obtained by calling 800-SEC-0330.
| 18
UNDERSTANDING FUND EXPENSES
As a mutual fund shareholder, you incur different costs: transaction costs, including sales charges (loads) on purchases and contingent deferred sales charges on redemptions, and ongoing costs, including management fees, distribution and/or service fees (12b-1 fees), and other fund expenses. Certain exemptions may apply. These costs are described in more detail in the Funds’ prospectus. The following examples are intended to help you understand the ongoing costs of investing in the Funds and help you compare these with the ongoing costs of investing in other mutual funds.
The first line in the table of each class of Fund shares shows the actual account values and actual Fund expenses you would have paid on a $1,000 investment in the Fund from July 1, 2015 through December 31, 2015. To estimate the expenses you paid over the period, simply divide your account value by $1,000 (for example $8,600 account value divided by $1,000 = 8.60) and multiply the result by the number in the Expenses Paid During Period column as shown for your class.
The second line in the table for each class of fund shares provides information about hypothetical account values and hypothetical expenses based on the Fund’s actual expense ratios and an assumed rate of return of 5% per year before expenses, which is not the Fund’s actual return. The hypothetical account values and expenses may not be used to estimate the actual ending account balance or expenses you paid on your investment for the period. You may use this information to compare the ongoing costs of investing in the Fund and other funds. To do so, compare this 5% hypothetical example with the 5% hypothetical examples that appear in the shareholder reports of the other funds.
Please note that the expenses shown reflect ongoing costs only, and do not include any transaction costs, such as sales charges. Therefore, the second line in the table of each fund is useful in comparing ongoing costs only, and will not help you determine the relative costs of owning different funds. If transaction costs were included, total costs would be higher.
| | | | | | | | | | | | |
| CGM ADVISOR TARGETED EQUITY FUND | | BEGINNING
ACCOUNT VALUE
7/1/2015 | | | ENDING
ACCOUNT VALUE
12/31/2015 | | | EXPENSES PAID
DURING PERIOD*
7/1/2015 – 12/31/2015 | |
| Class A | | | | | | | | | | | | |
| Actual | | | $1,000.00 | | | | $942.60 | | | | $5.58 | |
| Hypothetical (5% return before expenses) | | | $1,000.00 | | | | $1,019.46 | | | | $5.80 | |
| Class B | | | | | | | | | | | | |
| Actual | | | $1,000.00 | | | | $938.60 | | | | $9.19 | |
| Hypothetical (5% return before expenses) | | | $1,000.00 | | | | $1,015.73 | | | | $9.55 | |
| Class C | | | | | | | | | | | | |
| Actual | | | $1,000.00 | | | | $939.20 | | | | $9.24 | |
| Hypothetical (5% return before expenses) | | | $1,000.00 | | | | $1,015.68 | | | | $9.60 | |
| Class Y | | | | | | | | | | | | |
| Actual | | | $1,000.00 | | | | $943.90 | | | | $4.36 | |
| Hypothetical (5% return before expenses) | | | $1,000.00 | | | | $1,020.72 | | | | $4.53 | |
| * | Expenses are equal to the Fund’s annualized expense ratio: 1.14%, 1.88%, 1.89% and 0.89% for Class A, B, C and Y, respectively, multiplied by the average account value over the period, multiplied by the number of days in the most recent fiscal half-year (184), divided by 365 (to reflect the half-year period). |
19 |
| | | | | | | | | | | | |
| NATIXIS OAKMARK FUND | | BEGINNING
ACCOUNT VALUE
7/1/2015 | | | ENDING
ACCOUNT VALUE
12/31/2015 | | | EXPENSES PAID
DURING PERIOD*
7/1/2015 – 12/31/2015 | |
| Class A | | | | | | | | | | | | |
| Actual | | | $1,000.00 | | | | $960.20 | | | | $5.68 | |
| Hypothetical (5% return before expenses) | | | $1,000.00 | | | | $1,019.41 | | | | $5.85 | |
| Class B | | | | | | | | | | | | |
| Actual | | | $1,000.00 | | | | $956.20 | | | | $9.27 | |
| Hypothetical (5% return before expenses) | | | $1,000.00 | | | | $1,015.73 | | | | $9.55 | |
| Class C | | | | | | | | | | | | |
| Actual | | | $1,000.00 | | | | $956.60 | | | | $9.37 | |
| Hypothetical (5% return before expenses) | | | $1,000.00 | | | | $1,015.63 | | | | $9.65 | |
| Class Y | | | | | | | | | | | | |
| Actual | | | $1,000.00 | | | | $961.40 | | | | $4.45 | |
| Hypothetical (5% return before expenses) | | | $1,000.00 | | | | $1,020.67 | | | | $4.58 | |
| * | Expenses are equal to the Fund’s annualized expense ratio: 1.15%, 1.88%, 1.90% and 0.90% for Class A, B, C and Y, respectively, multiplied by the average account value over the period, multiplied by the number of days in the most recent fiscal half-year (184), divided by 365 (to reflect the half-year period). |
| | | | | | | | | | | | |
| NATIXIS OAKMARK INTERNATIONAL FUND | | BEGINNING
ACCOUNT VALUE
7/1/2015 | | | ENDING
ACCOUNT VALUE
12/31/2015 | | | EXPENSES PAID
DURING PERIOD*
7/1/2015 – 12/31/2015 | |
| Class A | | | | | | | | | | | | |
| Actual | | | $1,000.00 | | | | $900.60 | | | | $6.32 | |
| Hypothetical (5% return before expenses) | | | $1,000.00 | | | | $1,018.55 | | | | $6.72 | |
| Class C | | | | | | | | | | | | |
| Actual | | | $1,000.00 | | | | $897.10 | | | | $9.90 | |
| Hypothetical (5% return before expenses) | | | $1,000.00 | | | | $1,014.77 | | | | $10.51 | |
| * | Expenses are equal to the Fund’s annualized expense ratio: 1.32% and 2.07% for Class A and C, respectively, multiplied by the average account value over the period, multiplied by the number of days in the most recent fiscal half-year (184), divided by 365 (to reflect the half-year period). |
| 20
| | | | | | | | | | | | |
| VAUGHAN NELSON SMALL CAP VALUE FUND | | BEGINNING
ACCOUNT VALUE
7/1/2015 | | | ENDING
ACCOUNT VALUE
12/31/2015 | | | EXPENSES PAID
DURING PERIOD*
7/1/2015 – 12/31/2015 | |
| Class A | | | | | | | | | | | | |
| Actual | | | $1,000.00 | | | | $921.90 | | | | $6.49 | |
| Hypothetical (5% return before expenses) | | | $1,000.00 | | | | $1,018.45 | | | | $6.82 | |
| Class B | | | | | | | | | | | | |
| Actual | | | $1,000.00 | | | | $917.70 | | | | $10.01 | |
| Hypothetical (5% return before expenses) | | | $1,000.00 | | | | $1,014.77 | | | | $10.51 | |
| Class C | | | | | | | | | | | | |
| Actual | | | $1,000.00 | | | | $918.40 | | | | $10.11 | |
| Hypothetical (5% return before expenses) | | | $1,000.00 | | | | $1,014.67 | | | | $10.61 | |
| Class Y | | | | | | | | | | | | |
| Actual | | | $1,000.00 | | | | $922.80 | | | | $5.28 | |
| Hypothetical (5% return before expenses) | | | $1,000.00 | | | | $1,019.71 | | | | $5.55 | |
| * | Expenses are equal to the Fund’s annualized expense ratio: 1.34%, 2.07%, 2.09% and 1.09% for Class A, B, C and Y, respectively, multiplied by the average account value over the period, multiplied by the number of days in the most recent fiscal half-year (184), divided by 365 (to reflect the half-year period). |
| | | | | | | | | | | | |
| VAUGHAN NELSON VALUE OPPORTUNITY FUND | | BEGINNING
ACCOUNT VALUE
7/1/2015 | | | ENDING
ACCOUNT VALUE
12/31/2015 | | | EXPENSES PAID
DURING PERIOD*
7/1/2015 – 12/31/2015 | |
| Class A | | | | | | | | | | | | |
| Actual | | | $1,000.00 | | | | $896.40 | | | | $5.88 | |
| Hypothetical (5% return before expenses) | | | $1,000.00 | | | | $1,019.00 | | | | $6.26 | |
| Class C | | | | | | | | | | | | |
| Actual | | | $1,000.00 | | | | $892.90 | | | | $9.49 | |
| Hypothetical (5% return before expenses) | | | $1,000.00 | | | | $1,015.17 | | | | $10.11 | |
| Class N | | | | | | | | | | | | |
| Actual | | | $1,000.00 | | | | $897.90 | | | | $4.26 | |
| Hypothetical (5% return before expenses) | | | $1,000.00 | | | | $1,020.72 | | | | $4.53 | |
| Class Y | | | | | | | | | | | | |
| Actual | | | $1,000.00 | | | | $897.30 | | | | $4.69 | |
| Hypothetical (5% return before expenses) | | | $1,000.00 | | | | $1,020.27 | | | | $4.99 | |
| * | Expenses are equal to the Fund’s annualized expense ratio: 1.23%, 1.99%, 0.89% and 0.98% for Class A, C, N and Y, respectively, multiplied by the average account value over the period, multiplied by the number of days in the most recent fiscal half-year (184), divided by 365 (to reflect the half-year period). |
21 |
Portfolio of Investments – as of December 31, 2015
CGM Advisor Targeted Equity Fund
| | | | | | | | |
| Shares | | | Description | |
Value (†) | |
| | Common Stocks — 88.8% of Net Assets | |
| | | | Automobiles — 8.0% | | | | |
| | 1,110,000 | | | Ford Motor Co. | | $ | 15,639,900 | |
| | 580,000 | | | General Motors Co. | | | 19,725,800 | |
| | | | | | | | |
| | | | | | | 35,365,700 | |
| | | | | | | | |
| | | | Banks — 15.6% | | | | |
| | 1,370,000 | | | Bank of America Corp. | | | 23,057,100 | |
| | 420,000 | | | Citigroup, Inc. | | | 21,735,000 | |
| | 360,000 | | | JPMorgan Chase & Co. | | | 23,770,800 | |
| | | | | | | | |
| | | | | | | 68,562,900 | |
| | | | | | | | |
| | | | Capital Markets — 14.1% | | | | |
| | 58,000 | | | BlackRock, Inc. | | | 19,750,160 | |
| | 610,000 | | | Charles Schwab Corp. (The) | | | 20,087,300 | |
| | 690,000 | | | Morgan Stanley | | | 21,948,900 | |
| | | | | | | | |
| | | | | | | 61,786,360 | |
| | | | | | | | |
| | | | Hotels, Restaurants & Leisure — 5.5% | | | | |
| | 240,000 | | | Royal Caribbean Cruises Ltd. | | | 24,290,400 | |
| | | | | | | | |
| | | | Household Durables — 27.6% | | | | |
| | 1,420,000 | | | DR Horton, Inc. | | | 45,482,600 | |
| | 770,000 | | | Lennar Corp., Class A | | | 37,660,700 | |
| | 860,000 | | | Toll Brothers, Inc.(b) | | | 28,638,000 | |
| | 65,000 | | | Whirlpool Corp. | | | 9,546,550 | |
| | | | | | | | |
| | | | | | | 121,327,850 | |
| | | | | | | | |
| | | | Insurance — 0.7% | | | | |
| | 65,000 | | | MetLife, Inc. | | | 3,133,650 | |
| | | | | | | | |
| | | | Internet Software & Services — 5.5% | | | | |
| | 32,000 | | | Alphabet, Inc., Class C(b) | | | 24,284,160 | |
| | | | | | | | |
| | | | Multiline Retail — 3.3% | | | | |
| | 200,000 | | | Dollar General Corp. | | | 14,374,000 | |
| | | | | | | | |
| | | | Specialty Retail — 8.5% | | | | |
| | 150,000 | | | Home Depot, Inc. (The) | | | 19,837,500 | |
| | 230,000 | | | Lowe’s Cos., Inc. | | | 17,489,200 | |
| | | | | | | | |
| | | | | | | 37,326,700 | |
| | | | | | | | |
| | | | Total Common Stocks
(Identified Cost $340,249,058) | | | 390,451,720 | |
| | | | | | | | |
| | | | | | | | |
See accompanying notes to financial statements.
| 22
Portfolio of Investments – as of December 31, 2015
CGM Advisor Targeted Equity Fund – (continued)
| | | | | | | | |
Principal
Amount | | | Description | | Value (†) | |
| | Short-Term Investments — 5.1% | |
| $ | 22,390,000 | | | Tri-Party Repurchase Agreement with Fixed Income Clearing Corporation, dated 12/31/2015 at 0.030% to be repurchased at $22,390,075 on 1/04/2016 collateralized by $22,095,000 Federal Home Loan Mortgage Corp., 4.125% due 10/11/2033 valued at $22,840,706 including accrued interest (Note 2 of Notes to Financial Statements) (Identified Cost $22,390,000) | | $ | 22,390,000 | |
| | | | | | | | |
| | | | | | | | |
| | | | Total Investments — 93.9%
(Identified Cost $362,639,058)(a) | | | 412,841,720 | |
| | | | Other assets less liabilities — 6.1% | | | 26,967,300 | |
| | | | | | | | |
| | | | Net Assets — 100.0% | | $ | 439,809,020 | |
| | | | | | | | |
| | | | | | | | |
| | (†) | | | See Note 2 of Notes to Financial Statements. | | | | |
| | (a) | | | Federal Tax Information: | | | | |
| | | | At December 31, 2015, the net unrealized appreciation on investments based on a cost of $363,429,779 for federal income tax purposes was as follows: | |
| | | | Aggregate gross unrealized appreciation for all investments in which there is an excess of value over tax cost | | $ | 53,600,673 | |
| | | | Aggregate gross unrealized depreciation for all investments in which there is an excess of tax cost over value | | | (4,188,732 | ) |
| | | | | | | | |
| | | | Net unrealized appreciation | | $ | 49,411,941 | |
| | | | | | | | |
| | | | | | | | |
| | (b) | | | Non-income producing security. | | | | |
Industry Summary at December 31, 2015
| | | | |
Household Durables | | | 27.6 | % |
Banks | | | 15.6 | |
Capital Markets | | | 14.1 | |
Specialty Retail | | | 8.5 | |
Automobiles | | | 8.0 | |
Hotels, Restaurants & Leisure | | | 5.5 | |
Internet Software & Services | | | 5.5 | |
Multiline Retail | | | 3.3 | |
Insurance | | | 0.7 | |
Short-Term Investments | | | 5.1 | |
| | | | |
Total Investments | | | 93.9 | |
Other assets less liabilities | | | 6.1 | |
| | | | |
Net Assets | | | 100.0 | % |
| | | | |
See accompanying notes to financial statements.
23 |
Portfolio of Investments – as of December 31, 2015
Natixis Oakmark Fund
| | | | | | | | |
| Shares | | | Description | | Value (†) | |
| | Common Stocks — 99.9% of Net Assets | |
| | | | Air Freight & Logistics — 2.0% | | | | |
| | 36,050 | | | FedEx Corp. | | $ | 5,371,089 | |
| | | | | | | | |
| | | | Automobiles — 3.9% | | | | |
| | 258,100 | | | Fiat Chrysler Automobiles NV(b) | | | 3,610,819 | |
| | 128,400 | | | General Motors Co. | | | 4,366,884 | |
| | 50,900 | | | Harley-Davidson, Inc. | | | 2,310,351 | |
| | | | | | | | |
| | | | | | | 10,288,054 | |
| | | | | | | | |
| | | | Banks — 11.0% | | | | |
| | 581,100 | | | Bank of America Corp. | | | 9,779,913 | |
| | 147,900 | | | Citigroup, Inc. | | | 7,653,825 | |
| | 110,100 | | | JPMorgan Chase & Co. | | | 7,269,903 | |
| | 87,000 | | | Wells Fargo & Co. | | | 4,729,320 | |
| | | | | | | | |
| | | | | | | 29,432,961 | |
| | | | | | | | |
| | | | Beverages — 1.5% | | | | |
| | 36,400 | | | Diageo PLC, Sponsored ADR | | | 3,970,148 | |
| | | | | | | | |
| | | | Capital Markets — 7.9% | | | | |
| | 104,600 | | | Bank of New York Mellon Corp. (The) | | | 4,311,612 | |
| | 88,000 | | | Franklin Resources, Inc. | | | 3,240,160 | |
| | 28,460 | | | Goldman Sachs Group, Inc. (The) | | | 5,129,346 | |
| | 84,500 | | | State Street Corp. | | | 5,607,420 | |
| | 38,000 | | | T. Rowe Price Group, Inc. | | | 2,716,620 | |
| | | | | | | | |
| | | | | | | 21,005,158 | |
| | | | | | | | |
| | | | Chemicals — 2.4% | | | | |
| | 64,600 | | | Monsanto Co. | | | 6,364,392 | |
| | | | | | | | |
| | | | Communications Equipment — 1.5% | | | | |
| | 77,900 | | | QUALCOMM, Inc. | | | 3,893,832 | |
| | | | | | | | |
| | | | Consumer Finance — 5.1% | | | | |
| | 175,600 | | | Ally Financial, Inc.(b) | | | 3,273,184 | |
| | 78,100 | | | American Express Co. | | | 5,431,855 | |
| | 67,300 | | | Capital One Financial Corp. | | | 4,857,714 | |
| | | | | | | | |
| | | | | | | 13,562,753 | |
| | | | | | | | |
| | | | Electronic Equipment, Instruments & Components — 2.0% | | | | |
| | 82,700 | | | TE Connectivity Ltd. | | | 5,343,247 | |
| | | | | | | | |
| | | | Energy Equipment & Services — 2.1% | | | | |
| | 111,600 | | | Halliburton Co. | | | 3,798,864 | |
| | 58,400 | | | National Oilwell Varco, Inc. | | | 1,955,816 | |
| | | | | | | | |
| | | | | | | 5,754,680 | |
| | | | | | | | |
| | | | Food Products — 3.0% | | | | |
| | 66,300 | | | General Mills, Inc. | | | 3,822,858 | |
| | 58,200 | | | Nestle S.A., Sponsored ADR | | | 4,331,244 | |
| | | | | | | | |
| | | | | | | 8,154,102 | |
| | | | | | | | |
| | | | Health Care Equipment & Supplies — 2.0% | | | | |
| | 68,300 | | | Medtronic PLC | | | 5,253,636 | |
| | | | | | | | |
See accompanying notes to financial statements.
| 24
Portfolio of Investments – as of December 31, 2015
Natixis Oakmark Fund – (continued)
| | | | | | | | |
| Shares | | | Description | | Value (†) | |
| | | | Health Care Providers & Services — 1.9% | | | | |
| | 42,200 | | | UnitedHealth Group, Inc. | | $ | 4,964,408 | |
| | | | | | | | |
| | | | Household Durables — 1.8% | | | | |
| | 32,750 | | | Whirlpool Corp. | | | 4,809,993 | |
| | | | | | | | |
| | | | Industrial Conglomerates — 3.0% | | | | |
| | 254,400 | | | General Electric Co. | | | 7,924,560 | |
| | | | | | | | |
| | | | Insurance — 7.9% | | | | |
| | 93,100 | | | Aflac, Inc. | | | 5,576,690 | |
| | 119,500 | | | American International Group, Inc. | | | 7,405,415 | |
| | 50,350 | | | Aon PLC | | | 4,642,773 | |
| | 76,100 | | | Principal Financial Group, Inc. | | | 3,422,978 | |
| | | | | | | | |
| | | | | | | 21,047,856 | |
| | | | | | | | |
| | | | Internet & Catalog Retail — 2.0% | | | | |
| | 193,600 | | | Liberty Interactive Corp./QVC Group, Class A(b) | | | 5,289,152 | |
| | | | | | | | |
| | | | Internet Software & Services — 3.4% | | | | |
| | 11,540 | | | Alphabet, Inc., Class A(b) | | | 8,978,235 | |
| | | | | | | | |
| | | | IT Services — 7.4% | | | | |
| | 70,900 | | | Automatic Data Processing, Inc. | | | 6,006,648 | |
| | 72,800 | | | MasterCard, Inc., Class A | | | 7,087,808 | |
| | 86,720 | | | Visa, Inc., Class A | | | 6,725,136 | |
| | | | | | | | |
| | | | | | | 19,819,592 | |
| | | | | | | | |
| | | | Machinery — 4.9% | | | | |
| | 70,700 | | | Caterpillar, Inc. | | | 4,804,772 | |
| | 48,800 | | | Cummins, Inc. | | | 4,294,888 | |
| | 40,500 | | | Parker Hannifin Corp. | | | 3,927,690 | |
| | | | | | | | |
| | | | | | | 13,027,350 | |
| | | | | | | | |
| | | | Media — 2.7% | | | | |
| | 49,100 | | | Comcast Corp., Class A | | | 2,770,713 | |
| | 323,800 | | | News Corp., Class A | | | 4,325,968 | |
| | | | | | | | |
| | | | | | | 7,096,681 | |
| | | | | | | | |
| | | | Oil, Gas & Consumable Fuels — 4.0% | | | | |
| | 78,400 | | | Anadarko Petroleum Corp. | | | 3,808,672 | |
| | 135,900 | | | Apache Corp. | | | 6,043,473 | |
| | 197,000 | | | Chesapeake Energy Corp. | | | 886,500 | |
| | | | | | | | |
| | | | | | | 10,738,645 | |
| | | | | | | | |
| | | | Personal Products — 1.5% | | | | |
| | 91,300 | | | Unilever PLC, Sponsored ADR | | | 3,936,856 | |
| | | | | | | | |
| | | | Pharmaceuticals — 1.5% | | | | |
| | 93,100 | | | Sanofi, Sponsored ADR | | | 3,970,715 | |
| | | | | | | | |
| | | | Road & Rail — 1.4% | | | | |
| | 48,100 | | | Union Pacific Corp. | | | 3,761,420 | |
| | | | | | | | |
| | | | Semiconductors & Semiconductor Equipment — 5.6% | | | | |
| | 144,200 | | | Applied Materials, Inc. | | | 2,692,214 | |
| | 189,700 | | | Intel Corp. | | | 6,535,165 | |
| | 103,500 | | | Texas Instruments, Inc. | | | 5,672,835 | |
| | | | | | | | |
| | | | | | | 14,900,214 | |
| | | | | | | | |
See accompanying notes to financial statements.
25 |
Portfolio of Investments – as of December 31, 2015
Natixis Oakmark Fund – (continued)
| | | | | | | | |
| Shares | | | Description | | Value (†) | |
| | | | Software — 4.4% | | | | |
| | 109,000 | | | Microsoft Corp. | | $ | 6,047,320 | |
| | 154,500 | | | Oracle Corp. | | | 5,643,885 | |
| | | | | | | | |
| | | | | | | 11,691,205 | |
| | | | | | | | |
| | | | Technology Hardware, Storage & Peripherals — 2.1% | | | | |
| | 53,950 | | | Apple, Inc. | | | 5,678,777 | |
| | | | | | | | |
| | | | Total Common Stocks
(Identified Cost $253,862,002) | | | 266,029,711 | |
| | | | | | | | |
| | | | | | | | |
Principal
Amount | | | | | | |
| | Short-Term Investments — 1.4% | |
| $ | 3,795,407 | | | Tri-Party Repurchase Agreement with Fixed Income Clearing Corporation, dated 12/31/2015 at 0.030% to be repurchased at $3,795,420 on 1/04/2016 collateralized by $3,910,000 U.S.Treasury Note, 1.750% due 2/28/2022 valued at $3,875,788 including accrued interest (Note 2 of Notes to Financial Statements) (Identified Cost $3,795,407) | | | 3,795,407 | |
| | | | | | | | |
| | | | | | | | |
| | | | Total Investments — 101.3%
(Identified Cost $257,657,409)(a) | | | 269,825,118 | |
| | | | Other assets less liabilities — (1.3)% | | | (3,556,837 | ) |
| | | | | | | | |
| | | | Net Assets — 100.0% | | $ | 266,268,281 | |
| | | | | | | | |
| | | | | | | | |
| | (†) | | | See Note 2 of Notes to Financial Statements. | | | | |
| | (a) | | | Federal Tax Information: | | | | |
| | | | At December 31, 2015, the net unrealized appreciation on investments based on a cost of $258,325,583 for federal income tax purposes was as follows: | |
| | | | Aggregate gross unrealized appreciation for all investments in which there is an excess of value over tax cost | | $ | 33,430,341 | |
| | | | Aggregate gross unrealized depreciation for all investments in which there is an excess of tax cost over value | | | (21,930,806 | ) |
| | | | | | | | |
| | | | Net unrealized appreciation | | $ | 11,499,535 | |
| | | | | | | | |
| | (b) | | | Non-income producing security. | | | | |
| | | | | | | | |
| | ADR | | | An American Depositary Receipt is a certificate issued by a custodian bank representing the right to receive securities of the foreign issuer described. The values of ADRs may be significantly influenced by trading on exchanges not located in the United States. | |
See accompanying notes to financial statements.
| 26
Portfolio of Investments – as of December 31, 2015
Natixis Oakmark Fund – (continued)
Industry Summary at December 31, 2015
| | | | |
Banks | | | 11.0 | % |
Insurance | | | 7.9 | |
Capital Markets | | | 7.9 | |
IT Services | | | 7.4 | |
Semiconductors & Semiconductor Equipment | | | 5.6 | |
Consumer Finance | | | 5.1 | |
Machinery | | | 4.9 | |
Software | | | 4.4 | |
Oil, Gas & Consumable Fuels | | | 4.0 | |
Automobiles | | | 3.9 | |
Internet Software & Services | | | 3.4 | |
Food Products | | | 3.0 | |
Industrial Conglomerates | | | 3.0 | |
Media | | | 2.7 | |
Chemicals | | | 2.4 | |
Energy Equipment & Services | | | 2.1 | |
Technology Hardware, Storage & Peripherals | | | 2.1 | |
Air Freight & Logistics | | | 2.0 | |
Electronic Equipment, Instruments & Components | | | 2.0 | |
Internet & Catalog Retail | | | 2.0 | |
Health Care Equipment & Supplies | | | 2.0 | |
Other Investments, less than 2% each | | | 11.1 | |
Short-Term Investments | | | 1.4 | |
| | | | |
Total Investments | | | 101.3 | |
Other assets less liabilities | | | (1.3 | ) |
| | | | |
Net Assets | | | 100.0 | % |
| | | | |
See accompanying notes to financial statements.
27 |
Portfolio of Investments – as of December 31, 2015
Natixis Oakmark International Fund
| | | | | | | | |
| Shares | | | Description | |
Value (†) | |
| | Common Stocks — 99.0% of Net Assets | | | | |
| | | | Australia — 3.1% | | | | |
| | 4,070,868 | | | AMP Ltd. | | $ | 17,152,503 | |
| | 1,459,626 | | | Orica Ltd. | | | 16,353,227 | |
| | | | | | | | |
| | | | | | | 33,505,730 | |
| | | | | | | | |
| | | | China — 1.3% | | | | |
| | 73,300 | | | Baidu, Inc., Sponsored ADR(b) | | | 13,856,632 | |
| | | | | | | | |
| | | | France — 13.6% | | | | |
| | 792,600 | | | BNP Paribas S.A.(c) | | | 44,843,183 | |
| | 950,200 | | | Bureau Veritas S.A. | | | 18,938,805 | |
| | 215,323 | | | Danone | | | 14,550,122 | |
| | 164,300 | | | Kering | | | 28,091,187 | |
| | 89,450 | | | LVMH Moet Hennessy Louis Vuitton SE | | | 14,049,932 | |
| | 109,400 | | | Pernod-Ricard S.A. | | | 12,476,455 | |
| | 18,900 | | | Safran S.A. | | | 1,298,482 | |
| | 71,800 | | | Valeo S.A. | | | 11,069,736 | |
| | | | | | | | |
| | | | | | | 145,317,902 | |
| | | | | | | | |
| | | | Germany — 9.4% | | | | |
| | 187,250 | | | Allianz SE, (Registered) | | | 33,008,054 | |
| | 292,600 | | | Bayerische Motoren Werke AG | | | 30,825,845 | |
| | 430,400 | | | Daimler AG, (Registered) | | | 35,961,623 | |
| | | | | | | | |
| | | | | | | 99,795,522 | |
| | | | | | | | |
| | | | Hong Kong — 1.9% | | | | |
| | 1,202,900 | | | Melco Crown Entertainment Ltd., Sponsored ADR | | | 20,208,720 | |
| | | | | | | | |
| | | | Indonesia — 2.1% | | | | |
| | 33,736,200 | | | Bank Mandiri Persero Tbk PT | | | 22,402,185 | |
| | | | | | | | |
| | | | Ireland — 1.7% | | | | |
| | 1,004,231 | | | Experian PLC | | | 17,749,186 | |
| | | | | | | | |
| | | | Israel — 0.1% | | | | |
| | 13,300 | | | Check Point Software Technologies Ltd.(b) | | | 1,082,354 | |
| | | | | | | | |
| | | | Italy — 5.2% | | | | |
| | 416,200 | | | Exor SpA | | | 18,889,930 | |
| | 5,371,800 | | | Intesa Sanpaolo SpA | | | 17,839,741 | |
| | 5,893,000 | | | Prada SpA | | | 18,325,211 | |
| | | | | | | | |
| | | | | | | 55,054,882 | |
| | | | | | | | |
| | | | Japan — 20.4% | | | | |
| | 5,549,000 | | | Daiwa Securities Group, Inc. | | | 33,924,882 | |
| | 1,338,600 | | | Honda Motor Co. Ltd.(c) | | | 42,783,682 | |
| | 1,484,800 | | | Komatsu Ltd. | | | 24,294,953 | |
| | 6,765,800 | | | Nomura Holdings, Inc. | | | 37,685,879 | |
| | 122,300 | | | Olympus Corp. | | | 4,814,788 | |
| | 744,800 | | | Omron Corp. | | | 24,836,771 | |
| | 32,300 | | | Secom Co. Ltd. | | | 2,188,963 | |
| | 295,300 | | | Sumitomo Mitsui Financial Group, Inc. | | | 11,144,927 | |
| | 579,100 | | | Toyota Motor Corp. | | | 35,660,379 | |
| | | | | | | | |
| | | | | | | 217,335,224 | |
| | | | | | | | |
See accompanying notes to financial statements.
| 28
Portfolio of Investments – as of December 31, 2015
Natixis Oakmark International Fund – (continued)
| | | | | | | | |
| Shares | | | Description | |
Value (†) | |
| | | | Korea — 2.6% | | | | |
| | 25,880 | | | Samsung Electronics Co. Ltd. | | $ | 27,603,138 | |
| | | | | | | | |
| | | | Mexico — 1.0% | | | | |
| | 395,100 | | | Grupo Televisa SAB, Sponsored ADR | | | 10,750,671 | |
| | | | | | | | |
| | | | Netherlands — 2.3% | | | | |
| | 35,531 | | | Akzo Nobel NV | | | 2,374,133 | |
| | 875,444 | | | Koninklijke Philips NV | | | 22,345,050 | |
| | | | | | | | |
| | | | | | | 24,719,183 | |
| | | | | | | | |
| | | | Sweden — 3.6% | | | | |
| | 501,500 | | | Atlas Copco AB, B Shares | | | 11,529,676 | |
| | 273,500 | | | Hennes & Mauritz AB, B Shares | | | 9,728,472 | |
| | 991,400 | | | SKF AB, B Shares | | | 16,012,388 | |
| | 17,511 | | | Swedish Match AB | | | 618,793 | |
| | | | | | | | |
| | | | | | | 37,889,329 | |
| | | | | | | | |
| | | | Switzerland — 15.5% | | | | |
| | 325,900 | | | Cie Financiere Richemont S.A., (Registered) | | | 23,325,617 | |
| | 2,443,887 | | | Credit Suisse Group AG, (Registered)(c) | | | 52,646,125 | |
| | 22,613,100 | | | Glencore PLC | | | 29,965,206 | |
| | 84,400 | | | Kuehne & Nagel International AG, (Registered) | | | 11,562,728 | |
| | 534,595 | | | LafargeHolcim Ltd., (Registered) | | | 26,769,745 | |
| | 21,000 | | | Nestle S.A., (Registered) | | | 1,558,940 | |
| | 10,100 | | | Schindler Holding AG | | | 1,689,719 | |
| | 50,770 | | | Swatch Group AG (The) | | | 17,630,632 | |
| | | | | | | | |
| | | | | | | 165,148,712 | |
| | | | | | | | |
| | | | United Kingdom — 13.1% | | | | |
| | 433,000 | | | Ashtead Group PLC | | | 7,126,239 | |
| | 506,600 | | | Burberry Group PLC | | | 8,913,129 | |
| | 4,271,900 | | | CNH Industrial NV | | | 29,257,967 | |
| | 751,500 | | | Diageo PLC | | | 20,521,765 | |
| | 2,802,100 | | | G4S PLC | | | 9,307,979 | |
| | 116,700 | | | GlaxoSmithKline PLC | | | 2,356,854 | |
| | 21,837,000 | | | Lloyds Banking Group PLC | | | 23,496,471 | |
| | 1,730,704 | | | Meggitt PLC | | | 9,555,663 | |
| | 219,700 | | | Schroders PLC | | | 9,622,634 | |
| | 100 | | | Schroders PLC, (Non Voting) | | | 3,324 | |
| | 927,800 | | | Smiths Group PLC | | | 12,830,457 | |
| | 22,200 | | | Wolseley PLC | | | 1,205,746 | |
| | 236,500 | | | WPP PLC | | | 5,439,918 | |
| | | | | | | | |
| | | | | | | 139,638,146 | |
| | | | | | | | |
| | | | United States — 2.1% | | | | |
| | 466,600 | | | Willis Group Holdings PLC | | | 22,662,762 | |
| | | | | | | | |
| | | | Total Common Stocks
(Identified Cost $1,224,187,689) | | | 1,054,720,278 | |
| | | | | | | | |
See accompanying notes to financial statements.
29 |
Portfolio of Investments – as of December 31, 2015
Natixis Oakmark International Fund – (continued)
| | | | | | | | |
Principal
Amount | | | Description | | Value (†) | |
| | Short-Term Investments — 0.2% | |
| $ | 2,029,248 | | | Tri-Party Repurchase Agreement with Fixed Income Clearing Corporation, dated 12/31/2015 at 0.030% to be repurchased at $2,029,255 on 1/04/2016 collateralized by $2,040,000 U.S.Treasury Note, 2.125% due 9/30/2021 valued at $2,070,600 including accrued interest (Note 2 of Notes to Financial Statements) (Identified Cost $2,029,248) | | $ | 2,029,248 | |
| | | | | | | | |
| | | | | | | | |
| | | | Total Investments — 99.2%
(Identified Cost $1,226,216,937)(a) | | | 1,056,749,526 | |
| | | | Other assets less liabilities — 0.8% | | | 8,015,042 | |
| | | | | | | | |
| | | | Net Assets — 100.0% | | $ | 1,064,764,568 | |
| | | | | | | | |
| | | | | | | | |
| | (†) | | | See Note 2 of Notes to Financial Statements. | | | | |
| | (a) | | | Federal Tax Information: | | | | |
| | | | At December 31, 2015, the net unrealized depreciation on investments based on a cost of $1,231,069,297 for federal income tax purposes was as follows: | |
| | | | Aggregate gross unrealized appreciation for all investments in which there is an excess of value over tax cost | | $ | 14,485,614 | |
| | | | Aggregate gross unrealized depreciation for all investments in which there is an excess of tax cost over value | | | (188,805,385 | ) |
| | | | | | | | |
| | | | Net unrealized depreciation | | $ | (174,319,771 | ) |
| | | | | | | | |
| | | | | | | | |
| | (b) | | | Non-income producing security. | | | | |
| | (c) | | | A portion of this security has been designated to cover the Fund’s obligations under open forward foreign currency contracts. | |
| | | | | | | | |
| | ADR | | | An American Depositary Receipt is a certificate issued by a custodian bank representing the right to receive securities of the foreign issuer described. The values of ADRs may be significantly influenced by trading on exchanges not located in the United States. | |
At December 31, 2015, the Fund had the following open forward foreign currency contracts:
| | | | | | | | | | | | | | | | | | |
Contract
to
Buy/Sell | | Delivery
Date | | | Currency | | Units of
Currency | | | Notional
Value | | | Unrealized
Appreciation
(Depreciation) | |
| Buy1 | | | 3/16/2016 | | | Australian Dollar | | | 1,920,000 | | | $ | 1,394,214 | | | $ | 29,069 | |
| Buy1 | | | 3/16/2016 | | | Australian Dollar | | | 2,349,000 | | | | 1,705,734 | | | | (7,392 | ) |
| Sell1 | | | 3/16/2016 | | | Australian Dollar | | | 8,984,000 | | | | 6,523,759 | | | | 284,855 | |
| Sell1 | | | 3/16/2016 | | | Swiss Franc | | | 31,157,000 | | | | 31,201,414 | | | | 1,144,627 | |
| | | | | | | | | | | | | | | | | | |
| Total | | | | | | | | | | | | | | | | $ | 1,451,159 | |
| | | | | | | | | | | | | | | | | | |
1 Counterparty is State Street Bank and Trust Company
See accompanying notes to financial statements.
| 30
Portfolio of Investments – as of December 31, 2015
Natixis Oakmark International Fund – (continued)
Industry Summary at December 31, 2015
| | | | |
Automobiles | | | 13.7 | % |
Capital Markets | | | 12.5 | |
Banks | | | 11.2 | |
Textiles, Apparel & Luxury Goods | | | 10.4 | |
Machinery | | | 7.8 | |
Insurance | | | 6.8 | |
Professional Services | | | 3.5 | |
Industrial Conglomerates | | | 3.3 | |
Beverages | | | 3.1 | |
Metals & Mining | | | 2.8 | |
Technology Hardware, Storage & Peripherals | | | 2.6 | |
Construction Materials | | | 2.5 | |
Electronic Equipment, Instruments & Components | | | 2.3 | |
Other Investments, less than 2% each | | | 16.5 | |
Short-Term Investments | | | 0.2 | |
| | | | |
Total Investments | | | 99.2 | |
Other assets less liabilities (including forward foreign currency contracts) | | | 0.8 | |
| | | | |
Net Assets | | | 100.0 | % |
| | | | |
Currency Exposure Summary at December 31, 2015
| | | | |
Euro | | | 31.6 | % |
Japanese Yen | | | 20.4 | |
British Pound | | | 14.9 | |
Swiss Franc | | | 12.7 | |
United States Dollar | | | 6.6 | |
Swedish Krona | | | 3.5 | |
Australian Dollar | | | 3.1 | |
South Korean Won | | | 2.6 | |
Indonesian Rupiah | | | 2.1 | |
Hong Kong Dollar | | | 1.7 | |
| | | | |
Total Investments | | | 99.2 | |
Other assets less liabilities (including forward foreign currency contracts) | | | 0.8 | |
| | | | |
Net Assets | | | 100.0 | % |
| | | | |
See accompanying notes to financial statements.
31 |
Portfolio of Investments – as of December 31, 2015
Vaughan Nelson Small Cap Value Fund
| | | | | | | | |
| Shares | | | Description | | Value (†) | |
| | Common Stocks — 94.3% of Net Assets | |
| | | | Aerospace & Defense — 1.5% | | | | |
| | 143,950 | | | Engility Holdings, Inc. | | $ | 4,675,496 | |
| | | | | | | | |
| | | | Auto Components — 1.7% | | | | |
| | 112,400 | | | Tenneco, Inc.(b) | | | 5,160,284 | |
| | | | | | | | |
| | | | Banks — 10.5% | | | | |
| | 63,575 | | | Capital Bank Financial Corp., Class A | | | 2,033,129 | |
| | 144,425 | | | First Merchants Corp. | | | 3,671,283 | |
| | 363,480 | | | FirstMerit Corp. | | | 6,778,902 | |
| | 41,325 | | | Lakeland Financial Corp. | | | 1,926,572 | |
| | 101,550 | | | Prosperity Bancshares, Inc. | | | 4,860,183 | |
| | 213,150 | | | Union Bankshares Corp. | | | 5,379,906 | |
| | 190,675 | | | Webster Financial Corp. | | | 7,091,203 | |
| | | | | | | | |
| | | | | | | 31,741,178 | |
| | | | | | | | |
| | | | Building Products — 0.8% | | | | |
| | 19,825 | | | Lennox International, Inc. | | | 2,476,143 | |
| | | | | | | | |
| | | | Capital Markets — 1.1% | | | | |
| | 241,050 | | | TCP Capital Corp. | | | 3,357,827 | |
| | | | | | | | |
| | | | Commercial Services & Supplies — 3.4% | | | | |
| | 208,075 | | | KAR Auction Services, Inc. | | | 7,705,017 | |
| | 79,050 | | | Team, Inc.(b) | | | 2,526,438 | |
| | | | | | | | |
| | | | | | | 10,231,455 | |
| | | | | | | | |
| | | | Consumer Finance — 1.4% | | | | |
| | 112,625 | | | First Cash Financial Services, Inc.(b) | | | 4,215,554 | |
| | | | | | | | |
| | | | Containers & Packaging — 5.9% | | | | |
| | 502,350 | | | Graphic Packaging Holding Co. | | | 6,445,150 | |
| | 225,500 | | | Multi Packaging Solutions International Ltd.(b) | | | 3,912,425 | |
| | 137,650 | | | Silgan Holdings, Inc. | | | 7,394,558 | |
| | | | | | | | |
| | | | | | | 17,752,133 | |
| | | | | | | | |
| | | | Diversified Consumer Services — 2.4% | | | | |
| | 188,925 | | | ServiceMaster Global Holdings, Inc.(b) | | | 7,413,417 | |
| | | | | | | | |
| | | | Electrical Equipment — 2.0% | | | | |
| | 123,725 | | | Franklin Electric Co., Inc. | | | 3,344,287 | |
| | 152,200 | | | Thermon Group Holdings, Inc.(b) | | | 2,575,224 | |
| | | | | | | | |
| | | | | | | 5,919,511 | |
| | | | | | | | |
| | | | Electronic Equipment, Instruments & Components — 0.4% | | | | |
| | 11,275 | | | Littelfuse, Inc. | | | 1,206,538 | |
| | | | | | | | |
| | | | Energy Equipment & Services — 2.1% | | | | |
| | 242,250 | | | Forum Energy Technologies, Inc.(b) | | | 3,018,435 | |
| | 207,975 | | | Newpark Resources, Inc.(b) | | | 1,098,108 | |
| | 162,700 | | | Superior Energy Services, Inc. | | | 2,191,569 | |
| | | | | | | | |
| | | | | | | 6,308,112 | |
| | | | | | | | |
| | | | Gas Utilities — 2.4% | | | | |
| | 124,775 | | | Laclede Group, Inc. (The) | | | 7,412,883 | |
| | | | | | | | |
See accompanying notes to financial statements.
| 32
Portfolio of Investments – as of December 31, 2015
Vaughan Nelson Small Cap Value Fund – (continued)
| | | | | | | | |
| Shares | | | Description | | Value (†) | |
| | | | Health Care Equipment & Supplies — 4.1% | | | | |
| | 127,650 | | | Alere, Inc.(b) | | $ | 4,989,838 | |
| | 61,300 | | | Integra LifeSciences Holdings Corp.(b) | | | 4,154,914 | |
| | 24,750 | | | Teleflex, Inc. | | | 3,253,388 | |
| | | | | | | | |
| | | | | | | 12,398,140 | |
| | | | | | | | |
| | | | Health Care Providers & Services — 4.8% | | | | |
| | 29,700 | | | Amsurg Corp.(b) | | | 2,257,200 | |
| | 120,875 | | | Civitas Solutions, Inc.(b) | | | 3,479,991 | |
| | 183,150 | | | Surgery Partners, Inc.(b) | | | 3,752,744 | |
| | 127,100 | | | Surgical Care Affiliates, Inc.(b) | | | 5,059,851 | |
| | | | | | | | |
| | | | | | | 14,549,786 | |
| | | | | | | | |
| | | | Household Durables — 1.2% | | | | |
| | 99,454 | | | CalAtlantic Group, Inc. | | | 3,771,296 | |
| | | | | | | | |
| | | | Insurance — 9.7% | | | | |
| | 141,300 | | | American Equity Investment Life Holding Co. | | | 3,395,439 | |
| | 123,725 | | | Aspen Insurance Holdings Ltd. | | | 5,975,918 | |
| | 258,775 | | | CNO Financial Group, Inc. | | | 4,940,015 | |
| | 189,575 | | | First American Financial Corp. | | | 6,805,742 | |
| | 73,816 | | | RenaissanceRe Holdings Ltd. | | | 8,355,233 | |
| | | | | | | | |
| | | | | | | 29,472,347 | |
| | | | | | | | |
| | | | Internet & Catalog Retail — 1.3% | | | | |
| | 78,450 | | | HSN, Inc. | | | 3,975,061 | |
| | | | | | | | |
| | | | IT Services — 6.6% | | | | |
| | 315,550 | | | Booz Allen Hamilton Holding Corp. | | | 9,734,717 | |
| | 75,350 | | | Broadridge Financial Solutions, Inc. | | | 4,048,556 | |
| | 66,850 | | | CACI International, Inc., Class A(b) | | | 6,202,343 | |
| | | | | | | | |
| | | | | | | 19,985,616 | |
| | | | | | | | |
| | | | Life Sciences Tools & Services — 5.4% | | | | |
| | 135,125 | | | Albany Molecular Research, Inc.(b) | | | 2,682,231 | |
| | 68,875 | | | PRA Health Sciences, Inc.(b) | | | 3,117,971 | |
| | 368,550 | | | VWR Corp.(b) | | | 10,433,651 | |
| | | | | | | | |
| | | | | | | 16,233,853 | |
| | | | | | | | |
| | | | Machinery — 2.9% | | | | |
| | 193,250 | | | Hillenbrand, Inc. | | | 5,725,997 | |
| | 31,250 | | | Lincoln Electric Holdings, Inc. | | | 1,621,563 | |
| | 17,875 | | | Standex International Corp. | | | 1,486,306 | |
| | | | | | | | |
| | | | | | | 8,833,866 | |
| | | | | | | | |
| | | | Marine — 1.1% | | | | |
| | 64,725 | | | Kirby Corp.(b) | | | 3,405,829 | |
| | | | | | | | |
| | | | Metals & Mining — 1.6% | | | | |
| | 84,075 | | | Reliance Steel & Aluminum Co. | | | 4,868,783 | |
| | | | | | | | |
| | | | Multi-Utilities — 4.8% | | | | |
| | 134,600 | | | NorthWestern Corp. | | | 7,302,050 | |
| | 173,250 | | | Vectren Corp. | | | 7,349,265 | |
| | | | | | | | |
| | | | | | | 14,651,315 | |
| | | | | | | | |
See accompanying notes to financial statements.
33 |
Portfolio of Investments – as of December 31, 2015
Vaughan Nelson Small Cap Value Fund – (continued)
| | | | | | | | |
| Shares | | | Description | | Value (†) | |
| | | | Oil, Gas & Consumable Fuels — 0.4% | | | | |
| | 140,775 | | | Laredo Petroleum, Inc.(b) | | $ | 1,124,792 | |
| | | | | | | | |
| | | | Paper & Forest Products — 1.7% | | | | |
| | 231,775 | | | KapStone Paper and Packaging Corp. | | | 5,235,797 | |
| | | | | | | | |
| | | | Professional Services — 5.7% | | | | |
| | 53,800 | | | Dun & Bradstreet Corp. (The) | | | 5,591,434 | |
| | 111,575 | | | ICF International, Inc.(b) | | | 3,967,607 | |
| | 214,675 | | | TransUnion(b) | | | 5,918,589 | |
| | 89,725 | | | TriNet Group, Inc.(b) | | | 1,736,179 | |
| | | | | | | | |
| | | | | | | 17,213,809 | |
| | | | | | | | |
| | | | REITs – Hotels — 1.3% | | | | |
| | 187,400 | | | Hersha Hospitality Trust | | | 4,077,824 | |
| | | | | | | | |
| | | | Semiconductors & Semiconductor Equipment — 1.4% | | | | |
| | 84,150 | | | Silicon Laboratories, Inc.(b) | | | 4,084,641 | |
| | | | | | | | |
| | | | Software — 3.4% | | | | |
| | 65,625 | | | BroadSoft, Inc.(b) | | | 2,320,500 | |
| | 113,200 | | | RingCentral, Inc., Class A(b) | | | 2,669,256 | |
| | 132,200 | | | Verint Systems, Inc.(b) | | | 5,362,032 | |
| | | | | | | | |
| | | | | | | 10,351,788 | |
| | | | | | | | |
| | | | Specialty Retail — 1.3% | | | | |
| | 40,150 | | | Group 1 Automotive, Inc. | | | 3,039,355 | |
| | 70,250 | | | Men’s Wearhouse, Inc. (The) | | | 1,031,270 | |
| | | | | | | | |
| | | | | | | 4,070,625 | |
| | | | | | | | |
| | | | Total Common Stocks
(Identified Cost $262,169,418) | | | 286,175,699 | |
| | | | | | | | |
| | | | | | | | |
| | Exchange-Traded Funds — 1.1% | |
| | 36,175 | | | iShares® Russell 2000 Value Index ETF
(Identified Cost $3,487,067) | | | 3,328,462 | |
| | | | | | | | |
| | | | | | | | |
Principal
Amount | | | | | | |
| | Short-Term Investments — 5.3% | |
| $ | 16,149,455 | | | Tri-Party Repurchase Agreement with Fixed Income Clearing Corporation, dated 12/31/2015 at 0.030% to be repurchased at $16,149,509 on 1/04/2016 collateralized by $16,620,000 U.S. Treasury Note, 1.750% due 2/28/2022 valued at $16,474,575 including accrued interest (Note 2 of Notes to Financial Statements) (Identified Cost $16,149,455) | | | 16,149,455 | |
| | | | | | | | |
| | | | | | | | |
| | | | Total Investments — 100.7%
(Identified Cost $281,805,940)(a) | | | 305,653,616 | |
| | | | Other assets less liabilities — (0.7)% | | | (2,029,079 | ) |
| | | | | | | | |
| | | | Net Assets — 100.0% | | $ | 303,624,537 | |
| | | | | | | | |
| | | | | | | | |
See accompanying notes to financial statements.
| 34
Portfolio of Investments – as of December 31, 2015
Vaughan Nelson Small Cap Value Fund – (continued)
| | | | | | | | |
| | | | | | | | |
| | (†) | | | See Note 2 of Notes to Financial Statements. | |
| | (a) | | | Federal Tax Information: | |
| | | | At December 31, 2015, the net unrealized appreciation on investments based on a cost of $283,249,624 for federal income tax purposes was as follows: | |
| | | | Aggregate gross unrealized appreciation for all investments in which there is an excess of value over tax cost | | $ | 35,551,521 | |
| | | | Aggregate gross unrealized depreciation for all investments in which there is an excess of tax cost over value | | | (13,147,529 | ) |
| | | | | | | | |
| | | | Net unrealized appreciation | | $ | 22,403,992 | |
| | | | | | | | |
| | | | | | | | |
| | (b) | | | Non-income producing security. | | | | |
| | | | | | | | |
| | ETF | | | Exchange-Traded Fund | | | | |
| | REITs | | | Real Estate Investment Trusts | | | | |
Industry Summary at December 31, 2015
| | | | |
Banks | | | 10.5 | % |
Insurance | | | 9.7 | |
IT Services | | | 6.6 | |
Containers & Packaging | | | 5.9 | |
Professional Services | | | 5.7 | |
Life Sciences Tools & Services | | | 5.4 | |
Multi-Utilities | | | 4.8 | |
Health Care Providers & Services | | | 4.8 | |
Health Care Equipment & Supplies | | | 4.1 | |
Software | | | 3.4 | |
Commercial Services & Supplies | | | 3.4 | |
Machinery | | | 2.9 | |
Diversified Consumer Services | | | 2.4 | |
Gas Utilities | | | 2.4 | |
Energy Equipment & Services | | | 2.1 | |
Electrical Equipment | | | 2.0 | |
Other Investments, less than 2% each | | | 19.3 | |
Short-Term Investments | | | 5.3 | |
| | | | |
Total Investments | | | 100.7 | |
Other assets less liabilities | | | (0.7 | ) |
| | | | |
Net Assets | | | 100.0 | % |
| | | | |
See accompanying notes to financial statements.
35 |
Portfolio of Investments – as of December 31, 2015
Vaughan Nelson Value Opportunity Fund
| | | | | | | | |
| Shares | | | Description | | Value (†) | |
| | Common Stocks — 94.8% of Net Assets | |
| | | | Auto Components — 2.3% | | | | |
| | 167,450 | | | Delphi Automotive PLC | | $ | 14,355,489 | |
| | 400,675 | | | Tenneco, Inc.(b) | | | 18,394,989 | |
| | | | | | | | |
| | | | | | | 32,750,478 | |
| | | | | | | | |
| | | | Banks — 4.7% | | | | |
| | 2,772,775 | | | Investors Bancorp, Inc. | | | 34,493,321 | |
| | 761,475 | | | PacWest Bancorp | | | 32,819,573 | |
| | | | | | | | |
| | | | | | | 67,312,894 | |
| | | | | | | | |
| | | | Capital Markets — 1.7% | | | | |
| | 476,425 | | | SEI Investments Co. | | | 24,964,670 | |
| | | | | | | | |
| | | | Commercial Services & Supplies — 1.2% | | | | |
| | 460,475 | | | KAR Auction Services, Inc. | | | 17,051,389 | |
| | | | | | | | |
| | | | Communications Equipment — 1.4% | | | | |
| | 789,375 | | | CommScope Holding Co., Inc.(b) | | | 20,436,919 | |
| | | | | | | | |
| | | | Consumer Finance — 2.5% | | | | |
| | 1,166,125 | | | Synchrony Financial(b) | | | 35,461,861 | |
| | | | | | | | |
| | | | Containers & Packaging — 6.3% | | | | |
| | 277,750 | | | Avery Dennison Corp. | | | 17,403,815 | |
| | 655,825 | | | Crown Holdings, Inc.(b) | | | 33,250,327 | |
| | 316,950 | | | Packaging Corp. of America | | | 19,983,698 | |
| | 444,525 | | | WestRock Co. | | | 20,279,230 | |
| | | | | | | | |
| | | | | | | 90,917,070 | |
| | | | | | | | |
| | | | Diversified Consumer Services — 4.3% | | | | |
| | 899,000 | | | Grand Canyon Education, Inc.(b) | | | 36,067,880 | |
| | 659,800 | | | ServiceMaster Global Holdings, Inc.(b) | | | 25,890,552 | |
| | | | | | | | |
| | | | | | | 61,958,432 | |
| | | | | | | | |
| | | | Diversified Financial Services — 2.1% | | | | |
| | 508,300 | | | Nasdaq, Inc. | | | 29,567,811 | |
| | | | | | | | |
| | | | Food & Staples Retailing — 1.7% | | | | |
| | 3,031,900 | | | Rite Aid Corp.(b) | | | 23,770,096 | |
| | | | | | | | |
| | | | Health Care Providers & Services — 5.9% | | | | |
| | 354,825 | | | Amsurg Corp.(b) | | | 26,966,700 | |
| | 938,875 | | | Community Health Systems, Inc.(b) | | | 24,908,354 | |
| | 476,425 | | | HCA Holdings, Inc.(b) | | | 32,220,622 | |
| | | | | | | | |
| | | | | | | 84,095,676 | |
| | | | | | | | |
| | | | Household Durables — 5.2% | | | | |
| | 113,625 | | | Harman International Industries, Inc. | | | 10,704,611 | |
| | 761,462 | | | Jarden Corp.(b) | | | 43,494,709 | |
| | 408,650 | | | Lennar Corp., Class A | | | 19,987,072 | |
| | | | | | | | |
| | | | | | | 74,186,392 | |
| | | | | | | | |
| | | | Household Products — 1.6% | | | | |
| | 219,275 | | | Spectrum Brands Holdings, Inc. | | | 22,322,195 | |
| | | | | | | | |
See accompanying notes to financial statements.
| 36
Portfolio of Investments – as of December 31, 2015
Vaughan Nelson Value Opportunity Fund – (continued)
| | | | | | | | |
| Shares | | | Description | | Value (†) | |
| | | | Insurance — 6.0% | | | | |
| | 797,350 | | | Arthur J. Gallagher & Co. | | $ | 32,643,509 | |
| | 753,500 | | | First American Financial Corp. | | | 27,050,650 | |
| | 312,950 | | | Reinsurance Group of America, Inc., Class A | | | 26,772,872 | |
| | | | | | | | |
| | | | | | | 86,467,031 | |
| | | | | | | | |
| | | | Internet & Catalog Retail — 1.5% | | | | |
| | 428,575 | | | HSN, Inc. | | | 21,715,895 | |
| | | | | | | | |
| | | | IT Services — 12.6% | | | | |
| | 444,525 | | | Broadridge Financial Solutions, Inc. | | | 23,884,328 | |
| | 215,275 | | | CACI International, Inc., Class A(b) | | | 19,973,215 | |
| | 396,675 | | | Fidelity National Information Services, Inc. | | | 24,038,505 | |
| | 2,144,850 | | | First Data Corp., Class A(b) | | | 34,360,497 | |
| | 187,375 | | | Fiserv, Inc.(b) | | | 17,137,318 | |
| | 312,950 | | | Global Payments, Inc. | | | 20,188,404 | |
| | 962,800 | | | Sabre Corp. | | | 26,929,516 | |
| | 277,700 | | | Total System Services, Inc. | | | 13,829,460 | |
| | | | | | | | |
| | | | | | | 180,341,243 | |
| | | | | | | | |
| | | | Life Sciences Tools & Services — 2.5% | | | | |
| | 1,243,850 | | | VWR Corp.(b) | | | 35,213,394 | |
| | | | | | | | |
| | | | Machinery — 4.3% | | | | |
| | 1,461,125 | | | Milacron Holdings Corp.(b) | | | 18,278,674 | |
| | 129,575 | | | Snap-on, Inc. | | | 22,213,042 | |
| | 199,325 | | | WABCO Holdings, Inc.(b) | | | 20,382,975 | |
| | | | | | | | |
| | | | | | | 60,874,691 | |
| | | | | | | | |
| | | | Metals & Mining — 4.2% | | | | |
| | 534,225 | | | Carpenter Technology Corp. | | | 16,170,991 | |
| | 3,179,425 | | | Constellium NV, Class A(b) | | | 24,481,572 | |
| | 344,850 | | | Reliance Steel & Aluminum Co. | | | 19,970,264 | |
| | | | | | | | |
| | | | | | | 60,622,827 | |
| | | | | | | | |
| | | | Oil, Gas & Consumable Fuels — 0.5% | | | | |
| | 293,025 | | | Gulfport Energy Corp.(b) | | | 7,199,624 | |
| | | | | | | | |
| | | | Pharmaceuticals — 3.8% | | | | |
| | 1,098,350 | | | Catalent, Inc.(b) | | | 27,491,700 | |
| | 444,525 | | | Endo International PLC(b) | | | 27,213,821 | |
| | | | | | | | |
| | | | | | | 54,705,521 | |
| | | | | | | | |
| | | | Professional Services — 0.8% | | | | |
| | 627,900 | | | TriNet Group, Inc.(b) | | | 12,149,865 | |
| | | | | | | | |
| | | | REITs – Diversified — 1.5% | | | | |
| | 1,792,625 | | | New Residential Investment Corp. | | | 21,798,320 | |
| | | | | | | | |
| | | | Road & Rail — 1.2% | | | | |
| | 1,233,900 | | | Hertz Global Holdings, Inc.(b) | | | 17,558,397 | |
| | | | | | | | |
| | | | Semiconductors & Semiconductor Equipment — 3.8% | | | | |
| | 121,600 | | | Avago Technologies Ltd. | | | 17,650,240 | |
| | 1,090,375 | | | Micron Technology, Inc.(b) | | | 15,439,710 | |
| | 271,100 | | | Skyworks Solutions, Inc. | | | 20,828,613 | |
| | | | | | | | |
| | | | | | | 53,918,563 | |
| | | | | | | | |
See accompanying notes to financial statements.
37 |
Portfolio of Investments – as of December 31, 2015
Vaughan Nelson Value Opportunity Fund – (continued)
| | | | | | | | |
| Shares | | | Description | | Value (†) | |
| | | | Software — 1.7% | | | | |
| | 125,575 | | | Check Point Software Technologies Ltd.(b) | | $ | 10,219,294 | |
| | 574,100 | | | RingCentral, Inc., Class A(b) | | | 13,537,278 | |
| | | | | | | | |
| | | | | | | 23,756,572 | |
| | | | | | | | |
| | | | Specialty Retail — 2.0% | | | | |
| | 602,000 | | | Men’s Wearhouse, Inc. (The) | | | 8,837,360 | |
| | 157,475 | | | Signet Jewelers Ltd. | | | 19,478,083 | |
| | | | | | | | |
| | | | | | | 28,315,443 | |
| | | | | | | | |
| | | | Technology Hardware, Storage & Peripherals — 1.6% | | | | |
| | 914,950 | | | NCR Corp.(b) | | | 22,379,677 | |
| | | | | | | | |
| | | | Textiles, Apparel & Luxury Goods — 3.3% | | | | |
| | 954,825 | | | Gildan Activewear, Inc. | | | 27,136,126 | |
| | 279,075 | | | PVH Corp. | | | 20,553,874 | |
| | | | | | | | |
| | | | | | | 47,690,000 | |
| | | | | | | | |
| | | | Trading Companies & Distributors — 2.6% | | | | |
| | 879,075 | | | HD Supply Holdings, Inc.(b) | | | 26,398,622 | |
| | 153,500 | | | United Rentals, Inc.(b) | | | 11,134,890 | |
| | | | | | | | |
| | | | | | | 37,533,512 | |
| | | | | | | | |
| | | | Total Common Stocks
(Identified Cost $1,390,797,719) | | | 1,357,036,458 | |
| | | | | | | | |
| | | | | | | | |
| | Closed-End Investment Companies — 2.3% | | | | |
| | 2,270,450 | | | Ares Capital Corp.
(Identified Cost $36,847,757) | | | 32,353,913 | |
| | | | | | | | |
| | | | | | | | |
Principal
Amount | | | | | | |
| | Short-Term Investments — 2.4% | | | | |
| $ | 34,085,699 | | | Tri-Party Repurchase Agreement with Fixed Income Clearing Corporation, dated 12/31/2015 at 0.030% to be repurchased at $34,085,813 on 1/04/2016 collateralized by $35,210,000 U.S. Treasury Note, 1.75% due 3/31/2022 valued at $34,769,875 including accrued interest (Note 2 of Notes to Financial Statements) (Identified Cost $34,085,699) | | | 34,085,699 | |
| | | | | | | | |
| | | | | | | | |
| | | | Total Investments — 99.5%
(Identified Cost $1,461,731,175)(a) | | | 1,423,476,070 | |
| | | | Other assets less liabilities — 0.5% | | | 7,284,388 | |
| | | | | | | | |
| | | | Net Assets — 100.0% | | $ | 1,430,760,458 | |
| | | | | | | | |
| | | | | | | | |
See accompanying notes to financial statements.
| 38
Portfolio of Investments – as of December 31, 2015
Vaughan Nelson Value Opportunity Fund – (continued)
| | | | | | | | |
| | | | | | | | |
| | (†) | | | See Note 2 of Notes to Financial Statements. | | | | |
| | (a) | | | Federal Tax Information: | | | | |
| | | | At December 31, 2015, the net unrealized depreciation on investments based on a cost of $1,461,941,582 for federal income tax purposes was as follows: | |
| | | | Aggregate gross unrealized appreciation for all investments in which there is an excess of value over tax cost | | $ | 96,897,730 | |
| | | | Aggregate gross unrealized depreciation for all investments in which there is an excess of tax cost over value | | | (135,363,242 | ) |
| | | | | | | | |
| | | | Net unrealized depreciation | | $ | (38,465,512 | ) |
| | | | | | | | |
| | | | | | | | |
| | (b) | | | Non-income producing security. | | | | |
| | | | | | | | |
| | REITs | | | Real Estate Investment Trusts | | | | |
Industry Summary at December 31, 2015
| | | | |
IT Services | | | 12.6 | % |
Containers & Packaging | | | 6.3 | |
Insurance | | | 6.0 | |
Health Care Providers & Services | | | 5.9 | |
Household Durables | | | 5.2 | |
Banks | | | 4.7 | |
Diversified Consumer Services | | | 4.3 | |
Machinery | | | 4.3 | |
Metals & Mining | | | 4.2 | |
Pharmaceuticals | | | 3.8 | |
Semiconductors & Semiconductor Equipment | | | 3.8 | |
Textiles, Apparel & Luxury Goods | | | 3.3 | |
Trading Companies & Distributors | | | 2.6 | |
Consumer Finance | | | 2.5 | |
Life Sciences Tools & Services | | | 2.5 | |
Auto Components | | | 2.3 | |
Closed-End Investment Companies | | | 2.3 | |
Diversified Financial Services | | | 2.1 | |
Specialty Retail | | | 2.0 | |
Other Investments, less than 2% each | | | 16.4 | |
Short-Term Investments | | | 2.4 | |
| | | | |
Total Investments | | | 99.5 | |
Other assets less liabilities | | | 0.5 | |
| | | | |
Net Assets | | | 100.0 | % |
| | | | |
See accompanying notes to financial statements.
39 |
This Page Intentionally Left Blank
| 40
Statements of Assets and Liabilities
December 31, 2015
| | | | | | | | | | | | |
| | | CGM Advisor
Targeted Equity
Fund | | | Natixis
Oakmark
Fund | | | Natixis
Oakmark
International
Fund | |
ASSETS | | | | | | | | | | | | |
Investments at cost | | $ | 362,639,058 | | | $ | 257,657,409 | | | $ | 1,226,216,937 | |
Net unrealized appreciation (depreciation) | | | 50,202,662 | | | | 12,167,709 | | | | (169,467,411 | ) |
| | | | | | | | | | | | |
Investments at value | | | 412,841,720 | | | | 269,825,118 | | | | 1,056,749,526 | |
Cash | | | 25,628,299 | | | | — | | | | — | |
Foreign currency at value (identified cost $0, $1 and $688, respectively) | | | — | | | | 1 | | | | 684 | |
Receivable for Fund shares sold | | | 34,707 | | | | 1,511,922 | | | | 9,934,246 | |
Receivable for securities sold | | | 4,451,085 | | | | 794,313 | | | | 12,039,235 | |
Dividends and interest receivable | | | 139,448 | | | | 175,629 | | | | 455,185 | |
Unrealized appreciation on forward foreign currency contracts (Note 2) | | | — | | | | — | | | | 1,458,551 | |
Tax reclaims receivable | | | — | | | | 25,949 | | | | 1,448,640 | |
| | | | | | | | | | | | |
TOTAL ASSETS | | | 443,095,259 | | | | 272,332,932 | | | | 1,082,086,067 | |
| | | | | | | | | | | | |
LIABILITIES | | | | | | | | | | | | |
Payable for securities purchased | | | — | | | | 1,496,375 | | | | 1,360,246 | |
Payable for Fund shares redeemed | | | 2,259,620 | | | | 3,870,848 | | | | 14,808,517 | |
Unrealized depreciation on forward foreign currency contracts (Note 2) | | | — | | | | — | | | | 7,392 | |
Management fees payable (Note 6) | | | 276,980 | | | | 160,972 | | | | 812,470 | |
Deferred Trustees’ fees (Note 6) | | | 602,921 | | | | 434,383 | | | | 48,766 | |
Administrative fees payable (Note 6) | | | 16,901 | | | | 10,333 | | | | 42,080 | |
Payable to distributor (Note 6d) | | | 1,406 | | | | 1,335 | | | | 8,386 | |
Other accounts payable and accrued expenses | | | 128,411 | | | | 90,405 | | | | 233,642 | |
| | | | | | | | | | | | |
TOTAL LIABILITIES | | | 3,286,239 | | | | 6,064,651 | | | | 17,321,499 | |
| | | | | | | | | | | | |
NET ASSETS | | $ | 439,809,020 | | | $ | 266,268,281 | | | $ | 1,064,764,568 | |
| | | | | | | | | | | | |
NET ASSETS CONSIST OF: | | | | | | | | | | | | |
Paid-in capital | | $ | 392,067,704 | | | $ | 249,482,056 | | | $ | 1,237,647,330 | |
Distributions in excess of net investment income | | | (584,402 | ) | | | (408,464 | ) | | | (1,505,467 | ) |
Accumulated net realized gain (loss) on investments and foreign currency transactions | | | (1,876,944 | ) | | | 5,026,980 | | | | (3,251,794 | ) |
Net unrealized appreciation (depreciation) on investments and foreign currency translations | | | 50,202,662 | | | | 12,167,709 | | | | (168,125,501 | ) |
| | | | | | | | | | | | |
NET ASSETS | | $ | 439,809,020 | | | $ | 266,268,281 | | | $ | 1,064,764,568 | |
| | | | | | | | | | | | |
See accompanying notes to financial statements.
41 |
Statements of Assets and Liabilities (continued)
December 31, 2015
| | | | | | | | | | | | |
| | | CGM��Advisor
Targeted Equity
Fund | | | Natixis
Oakmark
Fund | | | Natixis
Oakmark
International
Fund | |
COMPUTATION OF NET ASSET VALUE AND OFFERING PRICE: | | | | | | | | | |
Class A shares: | | | | | | | | | | | | |
Net assets | | $ | 391,569,951 | | | $ | 173,924,611 | | | $ | 722,805,305 | |
| | | | | | | | | | | | |
Shares of beneficial interest | | | 38,793,823 | | | | 9,256,470 | | | | 63,006,266 | |
| | | | | | | | | | | | |
Net asset value and redemption price per share | | $ | 10.09 | | | $ | 18.79 | | | $ | 11.47 | |
| | | | | | | | | | | | |
Offering price per share (100/94.25 of net asset value) (Note 1) | | $ | 10.71 | | | $ | 19.94 | | | $ | 12.17 | |
| | | | | | | | | | | | |
Class B shares: (redemption price per share is equal to net asset value less any applicable contingent deferred sales charge) (Note 1) | | | | | | | | | | | | |
Net assets | | $ | 71,337 | | | $ | 31,696 | | | $ | — | |
| | | | | | | | | | | | |
Shares of beneficial interest | | | 8,477 | | | | 1,891 | | | | — | |
| | | | | | | | | | | | |
Net asset value and offering price per share | | $ | 8.42 | | | $ | 16.76 | | | $ | — | |
| | | | | | | | | | | | |
Class C shares: (redemption price per share is equal to net asset value less any applicable contingent deferred sales charge) (Note 1) | | | | | | | | | | | | |
Net assets | | $ | 23,023,585 | | | $ | 70,615,807 | | | $ | 341,959,263 | |
| | | | | | | | | | | | |
Shares of beneficial interest | | | 2,760,015 | | | | 4,242,024 | | | | 30,291,328 | |
| | | | | | | | | | | | |
Net asset value and offering price per share | | $ | 8.34 | | | $ | 16.65 | | | $ | 11.29 | |
| | | | | | | | | | | | |
Class Y shares: | | | | | | | | | | | | |
Net assets | | $ | 25,144,147 | | | $ | 21,696,167 | | | $ | — | |
| | | | | | | | | | | | |
Shares of beneficial interest | | | 2,392,095 | | | | 1,106,800 | | | | — | |
| | | | | | | | | | | | |
Net asset value, offering and redemption price per share | | $ | 10.51 | | | $ | 19.60 | | | $ | — | |
| | | | | | | | | | | | |
See accompanying notes to financial statements.
| 42
Statements of Assets and Liabilities (continued)
December 31, 2015
| | | | | | | | |
| | | Vaughan Nelson
Small Cap Value
Fund | | | Vaughan Nelson
Value Opportunity
Fund | |
ASSETS | | | | | | | | |
Investments at cost | | $ | 281,805,940 | | | $ | 1,461,731,175 | |
Net unrealized appreciation (depreciation) | | | 23,847,676 | | | | (38,255,105 | ) |
| | | | | | | | |
Investments at value | | | 305,653,616 | | | | 1,423,476,070 | |
Receivable for Fund shares sold | | | 648,292 | | | | 9,633,765 | |
Receivable for securities sold | | | 237,363 | | | | 4,136,791 | |
Dividends and interest receivable | | | 298,113 | | | | 1,258,611 | |
| | | | | | | | |
TOTAL ASSETS | | | 306,837,384 | | | | 1,438,505,237 | |
| | | | | | | | |
LIABILITIES | | | | | | | | |
Payable for securities purchased | | | 82,860 | | | | 3,761,126 | |
Payable for Fund shares redeemed | | | 2,632,274 | | | | 2,704,144 | |
Management fees payable (Note 6) | | | 244,564 | | | | 965,140 | |
Deferred Trustees’ fees (Note 6) | | | 159,377 | | | | 80,475 | |
Administrative fees payable (Note 6) | | | 11,577 | | | | 53,073 | |
Payable to distributor (Note 6d) | | | 1,905 | | | | 22,980 | |
Other accounts payable and accrued expenses | | | 80,290 | | | | 157,841 | |
| | | | | | | | |
TOTAL LIABILITIES | | | 3,212,847 | | | | 7,744,779 | |
| | | | | | | | |
NET ASSETS | | $ | 303,624,537 | | | $ | 1,430,760,458 | |
| | | | | | | | |
NET ASSETS CONSIST OF: | | | | | | | | |
Paid-in capital | | $ | 277,383,287 | | | $ | 1,427,766,186 | |
Distributions in excess of net investment income | | | (159,376 | ) | | | (51,161 | ) |
Accumulated net realized gain on investments | | | 2,552,950 | | | | 41,300,538 | |
Net unrealized appreciation (depreciation) on investments | | | 23,847,676 | | | | (38,255,105 | ) |
| | | | | | | | |
NET ASSETS | | $ | 303,624,537 | | | $ | 1,430,760,458 | |
| | | | | | | | |
See accompanying notes to financial statements.
43 |
Statements of Assets and Liabilities (continued)
December 31, 2015
| | | | | | | | |
| | | Vaughan Nelson
Small Cap Value
Fund | | | Vaughan Nelson
Value Opportunity
Fund | |
COMPUTATION OF NET ASSET VALUE AND OFFERING PRICE: | | | | | |
Class A shares: | | | | | | | | |
Net assets | | $ | 103,091,689 | | | $ | 142,833,165 | |
| | | | | | | | |
Shares of beneficial interest | | | 5,812,741 | | | | 7,129,138 | |
| | | | | | | | |
Net asset value and redemption price per share | | $ | 17.74 | | | $ | 20.04 | |
| | | | | | | | |
Offering price per share (100/94.25 of net asset value) (Note 1) | | $ | 18.82 | | | $ | 21.26 | |
| | | | | | | | |
Class B shares: (redemption price per share is equal to net asset value less any applicable contingent deferred sales charge) (Note 1) | | | | | | | | |
Net assets | | $ | 22,216 | | | $ | — | |
| | | | | | | | |
Shares of beneficial interest | | | 1,791 | | | | — | |
| | | | | | | | |
Net asset value and offering price per share | | $ | 12.40 | | | $ | — | |
| | | | | | | | |
Class C shares: (redemption price per share is equal to net asset value less any applicable contingent deferred sales charge) (Note 1) | | | | | | | | |
Net assets | | $ | 21,188,155 | | | $ | 89,283,594 | |
| | | | | | | | |
Shares of beneficial interest | | | 1,710,656 | | | | 4,660,785 | |
| | | | | | | | |
Net asset value and offering price per share | | $ | 12.39 | | | $ | 19.16 | |
| | | | | | | | |
Class N shares: | | | | | | | | |
Net assets | | $ | — | | | $ | 65,009,872 | |
| | | | | | | | |
Shares of beneficial interest | | | — | | �� | | 3,208,891 | |
| | | | | | | | |
Net asset value, offering and redemption price per share | | $ | — | | | $ | 20.26 | |
| | | | | | | | |
Class Y shares: | | | | | | | | |
Net assets | | $ | 179,322,477 | | | $ | 1,133,633,827 | |
| | | | | | | | |
Shares of beneficial interest | | | 9,848,156 | | | | 55,917,937 | |
| | | | | | | | |
Net asset value, offering and redemption price per share | | $ | 18.21 | | | $ | 20.27 | |
| | | | | | | | |
See accompanying notes to financial statements.
| 44
Statements of Operations
For the Year Ended December 31, 2015
| | | | | | | | | | | | |
| | | CGM Advisor
Targeted Equity
Fund | | | Natixis
Oakmark
Fund | | | Natixis
Oakmark
International
Fund | |
INVESTMENT INCOME | | | | | | | | | | | | |
Dividends | | $ | 6,793,160 | | | $ | 5,276,355 | | | $ | 31,776,622 | |
Interest | | | 1,344 | | | | 1,622 | | | | 4,558 | |
Less net foreign taxes withheld | | | (49,560 | ) | | | (41,254 | ) | | | (2,837,548 | ) |
| | | | | | | | | | | | |
| | | 6,744,944 | | | | 5,236,723 | | | | 28,943,632 | |
| | | | | | | | | | | | |
Expenses | | | | | | | | | | | | |
Management fees (Note 6) | | | 3,534,392 | | | | 1,969,041 | | | | 9,977,749 | |
Service and distribution fees (Note 6) | | | 1,361,262 | | | | 1,206,613 | | | | 5,716,006 | |
Administrative fees (Note 6) | | | 210,159 | | | | 123,096 | | | | 502,634 | |
Trustees’ fees and expenses (Note 6) | | | 26,970 | | | | 18,470 | | | | 36,196 | |
Transfer agent fees and expenses (Note 6) | | | 410,971 | | | | 272,823 | | | | 1,130,450 | |
Audit and tax services fees | | | 45,714 | | | | 40,294 | | | | 71,701 | |
Custodian fees and expenses | | | 17,820 | | | | 15,800 | | | | 406,620 | |
Legal fees | | | 7,521 | | | | 4,347 | | | | 17,704 | |
Registration fees | | | 59,460 | | | | 68,318 | | | | 101,594 | |
Shareholder reporting expenses | | | 48,313 | | | | 35,735 | | | | 99,596 | |
Miscellaneous expenses | | | 18,974 | | | | 16,354 | | | | 42,403 | |
| | | | | | | | | | | | |
Total expenses | | | 5,741,556 | | | | 3,770,891 | | | | 18,102,653 | |
| | | | | | | | | | | | |
Net investment income | | | 1,003,388 | | | | 1,465,832 | | | | 10,840,979 | |
| | | | | | | | | | | | |
NET REALIZED AND UNREALIZED GAIN (LOSS) ON INVESTMENTS AND FOREIGN CURRENCY TRANSACTIONS | | | | | | | | | | | | |
Net realized gain on: | | | | | | | | | | | | |
Investments | | | 3,945,367 | | | | 13,619,744 | | | | 6,381,075 | |
Foreign currency transactions | | | — | | | | 724 | | | | 4,810,156 | |
Net change in unrealized appreciation (depreciation) on: | | | | | | | | | | | | |
Investments | | | (20,066,574 | ) | | | (28,311,926 | ) | | | (109,160,163 | ) |
Foreign currency translations | | | — | | | | — | | | | (2,687,959 | ) |
| | | | | | | | | | | | |
Net realized and unrealized loss on investments and foreign currency transactions | | | (16,121,207 | ) | | | (14,691,458 | ) | | | (100,656,891 | ) |
| | | | | | | | | | | | |
NET DECREASE IN NET ASSETS RESULTING FROM OPERATIONS | | $ | (15,117,819 | ) | | $ | (13,225,626 | ) | | $ | (89,815,912 | ) |
| | | | | | | | | | | | |
See accompanying notes to financial statements.
45 |
Statements of Operations (continued)
For the Year Ended December 31, 2015
| | | | | | | | |
| | | Vaughan Nelson
Small Cap Value
Fund | | | Vaughan Nelson
Value
Opportunity
Fund | |
INVESTMENT INCOME | | | | | | | | |
Dividends | | $ | 5,376,316 | (a) | | $ | 14,816,256 | (a) |
Interest | | | 1,578 | | | | 3,705 | |
Less net foreign taxes withheld | | | — | | | | (26,168 | ) |
| | | | | | | | |
| | | 5,377,894 | | | | 14,793,793 | |
| | | | | | | | |
Expenses | | | | | | | | |
Management fees (Note 6) | | | 3,014,191 | | | | 8,615,889 | |
Service and distribution fees (Note 6) | | | 561,370 | | | | 838,816 | |
Administrative fees (Note 6) | | | 142,998 | | | | 462,016 | |
Trustees’ fees and expenses (Note 6) | | | 23,564 | | | | 34,035 | |
Transfer agent fees and expenses (Notes 6 and 7) | | | 328,478 | | | | 942,137 | |
Audit and tax services fees | | | 40,278 | | | | 41,268 | |
Custodian fees and expenses | | | 21,881 | | | | 44,018 | |
Legal fees | | | 5,069 | | | | 15,113 | |
Registration fees | | | 62,220 | | | | 232,119 | |
Shareholder reporting expenses | | | 27,128 | | | | 86,428 | |
Miscellaneous expenses | | | 16,253 | | | | 31,346 | |
| | | | | | | | |
Total expenses | | | 4,243,430 | | | | 11,343,185 | |
Less waiver and/or expense reimbursement (Note 6) | | | — | | | | (434 | ) |
| | | | | | | | |
Net expenses | | | 4,243,430 | | | | 11,342,751 | |
| | | | | | | | |
Net investment income | | | 1,134,464 | | | | 3,451,042 | |
| | | | | | | | |
NET REALIZED AND UNREALIZED GAIN (LOSS) ON INVESTMENTS | | | | | | | | |
Net realized gain on: | | | | | | | | |
Investments | | | 43,233,709 | | | | 65,059,104 | |
Net change in unrealized appreciation (depreciation) on: | | | | | | | | |
Investments | | | (45,477,353 | ) | | | (145,095,686 | ) |
| | | | | | | | |
Net realized and unrealized loss on investments | | | (2,243,644 | ) | | | (80,036,582 | ) |
| | | | | | | | |
NET DECREASE IN NET ASSETS RESULTING FROM OPERATIONS | | $ | (1,109,180 | ) | | $ | (76,585,540 | ) |
| | | | | | | | |
| (a) | Includes non-recurring dividends of $1,495,750 and $1,989,000 for Vaughan Nelson Small Cap Value Fund and Vaughan Nelson Value Opportunity Fund, respectively. |
See accompanying notes to financial statements.
| 46
Statements of Changes in Net Assets
| | | | | | | | |
| | | CGM Advisor Targeted
Equity Fund | |
| | | Year Ended
December 31,
2015 | | | Year Ended
December 31,
2014 | |
FROM OPERATIONS: | | | | | | | | |
Net investment income (loss) | | $ | 1,003,388 | | | $ | (1,340,175 | ) |
Net realized gain on investments | | | 3,945,367 | | | | 65,609,954 | |
Net change in unrealized appreciation (depreciation) on investments | | | (20,066,574 | ) | | | (21,344,530 | ) |
| | | | | | | | |
Net increase (decrease) in net assets resulting from operations | | | (15,117,819 | ) | | | 42,925,249 | |
| | | | | | | | |
FROM DISTRIBUTIONS TO SHAREHOLDERS: | | | | | | | | |
Net investment income | | | | | | | | |
Class A | | | (607,041 | ) | | | — | |
Class Y | | | (105,565 | ) | | | — | |
Net realized capital gains | | | | | | | | |
Class A | | | (11,154,931 | ) | | | (63,610,439 | ) |
Class B | | | (11,078 | ) | | | (177,582 | ) |
Class C | | | (848,798 | ) | | | (5,241,159 | ) |
Class Y | | | (737,081 | ) | | | (5,034,635 | ) |
| | | | | | | | |
Total distributions | | | (13,464,494 | ) | | | (74,063,815 | ) |
| | | | | | | | |
NET DECREASE IN NET ASSETS FROM
CAPITAL SHARE TRANSACTIONS (NOTE 12) | | | (57,907,314 | ) | | | (24,383,469 | ) |
| | | | | | | | |
Net decrease in net assets | | | (86,489,627 | ) | | | (55,522,035 | ) |
NET ASSETS | | | | | | | | |
Beginning of the year | | | 526,298,647 | | | | 581,820,682 | |
| | | | | | | | |
End of the year | | $ | 439,809,020 | | | $ | 526,298,647 | |
| | | | | | | | |
DISTRIBUTIONS IN EXCESS OF NET INVESTMENT INCOME/ACCUMULATED NET INVESTMENT LOSS | | $ | (584,402 | ) | | $ | (875,037 | ) |
| | | | | | | | |
See accompanying notes to financial statements.
47 |
Statements of Changes in Net Assets (continued)
| | | | | | | | |
| | | Natixis Oakmark Fund | |
| | | Year Ended
December 31,
2015 | | | Year Ended
December 31,
2014 | |
FROM OPERATIONS: | | | | | | | | |
Net investment income | | $ | 1,465,832 | | | $ | 781,395 | |
Net realized gain on investments and foreign currency transactions | | | 13,620,468 | | | | 33,607,229 | |
Net change in unrealized appreciation (depreciation) on investments | | | (28,311,926 | ) | | | (12,934,590 | ) |
| | | | | | | | |
Net increase (decrease) in net assets resulting from operations | | | (13,225,626 | ) | | | 21,454,034 | |
| | | | | | | | |
FROM DISTRIBUTIONS TO SHAREHOLDERS: | | | | | | | | |
Net investment income | | | | | | | | |
Class A | | | (1,174,474 | ) | | | (582,642 | ) |
Class B | | | (41 | ) | | | — | |
Class C | | | (17,288 | ) | | | (61,330 | ) |
Class Y | | | (192,508 | ) | | | (130,544 | ) |
Net realized capital gains | | | | | | | | |
Class A | | | (5,783,752 | ) | | | (25,448,063 | ) |
Class B | | | (2,310 | ) | | | (115,777 | ) |
Class C | | | (2,542,676 | ) | | | (7,987,538 | ) |
Class Y | | | (658,314 | ) | | | (3,299,099 | ) |
| | | | | | | | |
Total distributions | | | (10,371,363 | ) | | | (37,624,993 | ) |
| | | | | | | | |
NET INCREASE IN NET ASSETS FROM
CAPITAL SHARE TRANSACTIONS (NOTE 12) | | | 4,501,009 | | | | 132,132,840 | |
| | | | | | | | |
Net increase (decrease) in net assets | | | (19,095,980 | ) | | | 115,961,881 | |
NET ASSETS | | | | | | | | |
Beginning of the year | | | 285,364,261 | | | | 169,402,380 | |
| | | | | | | | |
End of the year | | $ | 266,268,281 | | | $ | 285,364,261 | |
| | | | | | | | |
DISTRIBUTIONS IN EXCESS OF NET INVESTMENT INCOME | | $ | (408,464 | ) | | $ | (490,709 | ) |
| | | | | | | | |
See accompanying notes to financial statements.
| 48
Statements of Changes in Net Assets (continued)
| | | | | | | | |
| | | Natixis Oakmark International
Fund | |
| | | Year Ended
December 31,
2015 | | | Year Ended
December 31,
2014 | |
FROM OPERATIONS: | | | | | | | | |
Net investment income | | $ | 10,840,979 | | | $ | 9,824,395 | |
Net realized gain on investments and foreign currency transactions | | | 11,191,231 | | | | 21,894,715 | |
Net change in unrealized appreciation (depreciation) on investments and foreign currency translations | | | (111,848,122 | ) | | | (99,645,940 | ) |
| | | | | | | | |
Net decrease in net assets resulting from operations | | | (89,815,912 | ) | | | (67,926,830 | ) |
| | | | | | | | |
FROM DISTRIBUTIONS TO SHAREHOLDERS: | | | | | | | | |
Net investment income | | | | | | | | |
Class A | | | (12,403,954 | ) | | | (12,092,911 | ) |
Class C | | | (3,234,507 | ) | | | (4,207,529 | ) |
Net realized capital gains | | | | | | | | |
Class A | | | (7,266,683 | ) | | | (10,563,438 | ) |
Class C | | | (3,475,721 | ) | | | (5,813,413 | ) |
| | | | | | | | |
Total distributions | | | (26,380,865 | ) | | | (32,677,291 | ) |
| | | | | | | | |
NET INCREASE IN NET ASSETS FROM
CAPITAL SHARE TRANSACTIONS (NOTE 12) | | | 236,259,606 | | | | 493,477,560 | |
| | | | | | | | |
Net increase in net assets | | | 120,062,829 | | | | 392,873,439 | |
NET ASSETS | | | | | | | | |
Beginning of the year | | | 944,701,739 | | | | 551,828,300 | |
| | | | | | | | |
End of the year | | $ | 1,064,764,568 | | | $ | 944,701,739 | |
| | | | | | | | |
DISTRIBUTIONS IN EXCESS OF NET INVESTMENT INCOME | | $ | (1,505,467 | ) | | $ | (1,601,585 | ) |
| | | | | | | | |
See accompanying notes to financial statements.
49 |
Statements of Changes in Net Assets (continued)
| | | | | | | | |
| | | Vaughan Nelson Small Cap
Value Fund | |
| | | Year Ended
December 31,
2015 | | | Year Ended
December 31,
2014 | |
FROM OPERATIONS: | | | | | | | | |
Net investment income (loss) | | $ | 1,134,464 | | | $ | (718,673 | ) |
Net realized gain on investments | | | 43,233,709 | | | | 48,304,361 | |
Net change in unrealized appreciation (depreciation) on investments | | | (45,477,353 | ) | | | (19,409,424 | ) |
| | | | | | | | |
Net increase (decrease) in net assets resulting from operations | | | (1,109,180 | ) | | | 28,176,264 | |
| | | | | | | | |
FROM DISTRIBUTIONS TO SHAREHOLDERS: | | | | | | | | |
Net investment income | | | | | | | | |
Class A | | | (188,563 | ) | | | — | |
Class Y | | | (849,469 | ) | | | — | |
Net realized capital gains | | | | | | | | |
Class A | | | (15,119,557 | ) | | | (20,240,252 | ) |
Class B | | | (14,484 | ) | | | (221,933 | ) |
Class C | | | (4,223,610 | ) | | | (5,709,846 | ) |
Class Y | | | (25,335,936 | ) | | | (26,912,401 | ) |
| | | | | | | | |
Total distributions | | | (45,731,619 | ) | | | (53,084,432 | ) |
| | | | | | | | |
NET INCREASE IN NET ASSETS FROM
CAPITAL SHARE TRANSACTIONS (NOTE 12) | | | 20,099,488 | | | | 4,930,798 | |
| | | | | | | | |
Net decrease in net assets | | | (26,741,311 | ) | | | (19,977,370 | ) |
NET ASSETS | | | | | | | | |
Beginning of the year | | | 330,365,848 | | | | 350,343,218 | |
| | | | | | | | |
End of the year | | $ | 303,624,537 | | | $ | 330,365,848 | |
| | | | | | | | |
DISTRIBUTIONS IN EXCESS OF NET INVESTMENT INCOME/ ACCUMULATED NET INVESTMENT LOSS | | $ | (159,376 | ) | | $ | (218,038 | ) |
| | | | | | | | |
See accompanying notes to financial statements.
| 50
Statements of Changes in Net Assets (continued)
| | | | | | | | |
| | | Vaughan Nelson Value
Opportunity Fund | |
| | | Year Ended
December 31,
2015 | | | Year Ended
December 31,
2014 | |
FROM OPERATIONS: | | | | | | | | |
Net investment income (loss) | | $ | 3,451,042 | | | $ | (1,154,548 | ) |
Net realized gain on investments | | | 65,059,104 | | | | 54,468,033 | |
Net change in unrealized appreciation (depreciation) on investments | | | (145,095,686 | ) | | | 16,777,310 | |
| | | | | | | | |
Net increase (decrease) in net assets resulting from operations | | | (76,585,540 | ) | | | 70,090,795 | |
| | | | | | | | |
FROM DISTRIBUTIONS TO SHAREHOLDERS: | | | | | | | | |
Net investment income | | | | | | | | |
Class A | | | (144,297 | ) | | | — | |
Class N | | | (217,534 | ) | | | — | |
Class Y | | | (2,976,150 | ) | | | — | |
Net realized capital gains | | | | | | | | |
Class A | | | (2,753,605 | ) | | | (5,399,669 | ) |
Class C | | | (1,777,113 | ) | | | (2,482,970 | ) |
Class N | | | (1,365,729 | ) | | | (785,557 | ) |
Class Y | | | (22,568,470 | ) | | | (44,268,540 | ) |
| | | | | | | | |
Total distributions | | | (31,802,898 | ) | | | (52,936,736 | ) |
| | | | | | | | |
NET INCREASE IN NET ASSETS FROM
CAPITAL SHARE TRANSACTIONS (NOTE 12) | | | 761,923,276 | | | | 310,528,319 | |
| | | | | | | | |
Net increase in net assets | | | 653,534,838 | | | | 327,682,378 | |
NET ASSETS | | | | | | | | |
Beginning of the year | | | 777,225,620 | | | | 449,543,242 | |
| | | | | | | | |
End of the year | | $ | 1,430,760,458 | | | $ | 777,225,620 | |
| | | | | | | | |
DISTRIBUTIONS IN EXCESS OF NET INVESTMENT INCOME/ACCUMULATED NET INVESTMENT LOSS | | $ | (51,161 | ) | | $ | (75,573 | ) |
| | | | | | | | |
See accompanying notes to financial statements.
51 |
Financial Highlights
For a share outstanding throughout each period.
| | | | | | | | | | | | | | | | | | | | |
| | | CGM Advisor Targeted Equity Fund—Class A | |
| | | Year Ended
December 31,
2015 | | | Year Ended
December 31,
2014 | | | Year Ended
December 31,
2013 | | | Year Ended
December 31,
2012 | | | Year Ended
December 31,
2011 | |
Net asset value, beginning of the period | | $ | 10.73 | | | $ | 11.46 | | | $ | 10.23 | | | $ | 9.36 | | | $ | 11.12 | |
| | | | | | | | | | | | | | | | | | | | |
INCOME (LOSS) FROM INVESTMENT OPERATIONS: | | | | | | | | | | | | | | | | | | | | |
Net investment income (loss)(a) | | | 0.02 | | | | (0.02 | ) | | | (0.02 | ) | | | 0.08 | (b) | | | 0.05 | |
Net realized and unrealized gain (loss) | | | (0.36 | ) | | | 0.91 | | | | 2.94 | | | | 1.36 | | | | (1.76 | ) |
| | | | | | | | | | | | | | | | | | | | |
Total from Investment Operations | | | (0.34 | ) | | | 0.89 | | | | 2.92 | | | | 1.44 | | | | (1.71 | ) |
| | | | | | | | | | | | | | | | | | | | |
LESS DISTRIBUTIONS FROM: | | | | | | | | | | | | | | | | | | | | |
Net investment income | | | (0.02 | ) | | | — | | | | (0.00 | )(c) | | | (0.09 | ) | | | (0.05 | ) |
Net realized capital gains | | | (0.28 | ) | | | (1.62 | ) | | | (1.69 | ) | | | (0.48 | ) | | | — | |
| | | | | | | | | | | | | | | | | | | | |
Total Distributions | | | (0.30 | ) | | | (1.62 | ) | | | (1.69 | ) | | | (0.57 | ) | | | (0.05 | ) |
| | | | | | | | | | | | | | | | | | | | |
Net asset value, end of the period | | $ | 10.09 | | | $ | 10.73 | | | $ | 11.46 | | | $ | 10.23 | | | $ | 9.36 | |
| | | | | | | | | | | | | | | | | | | | |
Total return(d) | | | (3.30 | )% | | | 8.27 | % | | | 29.01 | % | | | 15.44 | %(b) | | | (15.36 | )% |
RATIOS TO AVERAGE NET ASSETS: | | | | | | | | | | | | | | | | | | | | |
Net assets, end of the period (000’s) | | $ | 391,570 | | | $ | 458,975 | | | $ | 493,102 | | | $ | 438,288 | | | $ | 503,330 | |
Net expenses | | | 1.14 | % | | | 1.15 | % | | | 1.17 | % | | | 1.18 | % | | | 1.13 | % |
Gross expenses | | | 1.14 | % | | | 1.15 | % | | | 1.17 | % | | | 1.18 | % | | | 1.13 | % |
Net investment income (loss) | | | 0.23 | % | | | (0.21 | )% | | | (0.17 | )% | | | 0.78 | %(b) | | | 0.45 | % |
Portfolio turnover rate | | | 145 | % | | | 229 | % | | | 205 | % | | | 192 | % | | | 236 | % |
| (a) | Per share net investment income (loss) has been calculated using the average shares outstanding during the period. |
| (b) | Includes non-recurring dividends. Without these dividends, net investment income per share would have been $0.02, total return would have been 14.81% and the ratio of net investment income to average net assets would have been 0.21%. |
| (c) | Amount rounds to less than $0.01 per share. |
| (d) | A sales charge for Class A shares is not reflected in total return calculations. |
See accompanying notes to financial statements.
| 52
Financial Highlights (continued)
For a share outstanding throughout each period.
| | | | | | | | | | | | | | | | | | | | |
| | | CGM Advisor Targeted Equity Fund—Class B | |
| | | Year Ended
December 31,
2015 | | | Year Ended
December 31,
2014 | | | Year Ended
December 31,
2013 | | | Year Ended
December 31,
2012 | | | Year Ended
December 31,
2011 | |
Net asset value, beginning of the period | | $ | 9.05 | | | $ | 9.98 | | | $ | 9.15 | | | $ | 8.41 | | | $ | 10.01 | |
| | | | | | | | | | | | | | | | | | | | |
INCOME (LOSS) FROM INVESTMENT OPERATIONS: | | | | | | | | | | | | | | | | | | | | |
Net investment loss(a) | | | (0.05 | ) | | | (0.10 | ) | | | (0.10 | ) | | | (0.00 | )(b)(c) | | | (0.03 | ) |
Net realized and unrealized gain (loss) | | | (0.30 | ) | | | 0.79 | | | | 2.62 | | | | 1.22 | | | | (1.57 | ) |
| | | | | | | | | | | | | | | | | | | | |
Total from Investment Operations | | | (0.35 | ) | | | 0.69 | | | | 2.52 | | | | 1.22 | | | | (1.60 | ) |
| | | | | | | | | | | | | | | | | | | | |
LESS DISTRIBUTIONS FROM: | | | | | | | | | | | | | | | | | | | | |
Net investment income | | | — | | | | — | | | | (0.00 | )(b) | | | (0.00 | )(b) | | | — | |
Net realized capital gains | | | (0.28 | ) | | | (1.62 | ) | | | (1.69 | ) | | | (0.48 | ) | | | — | |
| | | | | | | | | | | | | | | | | | | | |
Total Distributions | | | (0.28 | ) | | | (1.62 | ) | | | (1.69 | ) | | | (0.48 | ) | | | — | |
| | | | | | | | | | | | | | | | | | | | |
Net asset value, end of the period | | $ | 8.42 | | | $ | 9.05 | | | $ | 9.98 | | | $ | 9.15 | | | $ | 8.41 | |
| | | | | | | | | | | | | | | | | | | | |
Total return(d) | | | (4.10 | )% | | | 7.47 | % | | | 28.06 | % | | | 14.54 | %(c) | | | (15.98 | )% |
RATIOS TO AVERAGE NET ASSETS: | | | | | | | | | | | | | | | | | | | | |
Net assets, end of the period (000’s) | | $ | 71 | | | $ | 932 | | | $ | 2,205 | | | $ | 3,447 | | | $ | 5,296 | |
Net expenses | | | 1.89 | % | | | 1.89 | % | | | 1.91 | % | | | 1.93 | % | | | 1.88 | % |
Gross expenses | | | 1.89 | % | | | 1.89 | % | | | 1.91 | % | | | 1.93 | % | | | 1.88 | % |
Net investment loss | | | (0.51 | )% | | | (0.98 | )% | | | (0.94 | )% | | | (0.05 | )%(c) | | | (0.32 | )% |
Portfolio turnover rate | | | 145 | % | | | 229 | % | | | 205 | % | | | 192 | % | | | 236 | % |
| (a) | Per share net investment loss has been calculated using the average shares outstanding during the period. |
| (b) | Amount rounds to less than $0.01 per share. |
| (c) | Includes non-recurring dividends. Without these dividends, net investment loss per share would have been $(0.05), total return would have been 13.83% and the ratio of net investment loss to average net assets would have been (0.56)%. |
| (d) | A contingent deferred sales charge for Class B shares is not reflected in total return calculations. |
See accompanying notes to financial statements.
53 |
Financial Highlights (continued)
For a share outstanding throughout each period.
| | | | | | | | | | | | | | | | | | | | |
| | | CGM Advisor Targeted Equity Fund—Class C | |
| | | Year Ended
December 31,
2015 | | | Year Ended
December 31,
2014 | | | Year Ended
December 31,
2013 | | | Year Ended
December 31,
2012 | | | Year Ended
December 31,
2011 | |
Net asset value, beginning of the period | | $ | 8.97 | | | $ | 9.91 | | | $ | 9.09 | | | $ | 8.37 | | | $ | 9.96 | |
| | | | | | | | | | | | | | | | | | | | |
INCOME (LOSS) FROM INVESTMENT OPERATIONS: | | | | | | | | | | | | | | | | | | | | |
Net investment loss(a) | | | (0.05 | ) | | | (0.09 | ) | | | (0.10 | ) | | | (0.00 | )(b)(c) | | | (0.03 | ) |
Net realized and unrealized gain (loss) | | | (0.30 | ) | | | 0.77 | | | | 2.61 | | | | 1.20 | | | | (1.56 | ) |
| | | | | | | | | | | | | | | | | | | | |
Total from Investment Operations | | | (0.35 | ) | | | 0.68 | | | | 2.51 | | | | 1.20 | | | | (1.59 | ) |
| | | | | | | | | | | | | | | | | | | | |
LESS DISTRIBUTIONS FROM: | | | | | | | | | | | | | | | | | | | | |
Net investment income | | | — | | | | — | | | | (0.00 | )(b) | | | (0.00 | )(b) | | | — | |
Net realized capital gains | | | (0.28 | ) | | | (1.62 | ) | | | (1.69 | ) | | | (0.48 | ) | | | — | |
| | | | | | | | | | | | | | | | | | | | |
Total Distributions | | | (0.28 | ) | | | (1.62 | ) | | | (1.69 | ) | | | (0.48 | ) | | | — | |
| | | | | | | | | | | | | | | | | | | | |
Net asset value, end of the period | | $ | 8.34 | | | $ | 8.97 | | | $ | 9.91 | | | $ | 9.09 | | | $ | 8.37 | |
| | | | | | | | | | | | | | | | | | | | |
Total return(d) | | | (4.02 | )% | | | 7.43 | % | | | 28.13 | % | | | 14.45 | %(c) | | | (15.96 | )% |
RATIOS TO AVERAGE NET ASSETS: | | | | | | | | | | | | | | | | | | | | |
Net assets, end of the period (000’s) | | $ | 23,024 | | | $ | 31,462 | | | $ | 36,417 | | | $ | 35,225 | | | $ | 47,416 | |
Net expenses | | | 1.89 | % | | | 1.90 | % | | | 1.91 | % | | | 1.93 | % | | | 1.88 | % |
Gross expenses | | | 1.89 | % | | | 1.90 | % | | | 1.91 | % | | | 1.93 | % | | | 1.88 | % |
Net investment loss | | | (0.52 | )% | | | (0.96 | )% | | | (0.92 | )% | | | (0.02 | )%(c) | | | (0.32 | )% |
Portfolio turnover rate | | | 145 | % | | | 229 | % | | | 205 | % | | | 192 | % | | | 236 | % |
| (a) | Per share net investment loss has been calculated using the average shares outstanding during the period. |
| (b) | Amount rounds to less than $0.01 per share. |
| (c) | Includes non-recurring dividends. Without these dividends, net investment loss per share would have been $(0.05), total return would have been 13.86% and the ratio of net investment loss to average net assets would have been (0.55)%. |
| (d) | A contingent deferred sales charge for Class C shares is not reflected in total return calculations. |
See accompanying notes to financial statements.
| 54
Financial Highlights (continued)
For a share outstanding throughout each period.
| | | | | | | | | | | | | | | | | | | | |
| | | CGM Advisor Targeted Equity Fund—Class Y | |
| | | Year Ended
December 31,
2015 | | | Year Ended
December 31,
2014 | | | Year Ended
December 31,
2013 | | | Year Ended
December 31,
2012 | | | Year Ended
December 31,
2011 | |
Net asset value, beginning of the period | | $ | 11.16 | | | $ | 11.83 | | | $ | 10.49 | | | $ | 9.59 | | | $ | 11.40 | |
| | | | | | | | | | | | | | | | | | | | |
INCOME (LOSS) FROM INVESTMENT OPERATIONS: | | | | | | | | | | | | | | | | | | | | |
Net investment income(a) | | | 0.05 | | | | 0.00 | (b) | | | 0.01 | | | | 0.11 | (c) | | | 0.07 | |
Net realized and unrealized gain (loss) | | | (0.38 | ) | | | 0.95 | | | | 3.02 | | | | 1.39 | | | | (1.80 | ) |
| | | | | | | | | | | | | | | | | | | | |
Total from Investment Operations | | | (0.33 | ) | | | 0.95 | | | | 3.03 | | | | 1.50 | | | | (1.73 | ) |
| | | | | | | | | | | | | | | | | | | | |
LESS DISTRIBUTIONS FROM: | | | | | | | | | | | | | | | | | | | | |
Net investment income | | | (0.04 | ) | | | — | | | | (0.00 | )(b) | | | (0.12 | ) | | | (0.08 | ) |
Net realized capital gains | | | (0.28 | ) | | | (1.62 | ) | | | (1.69 | ) | | | (0.48 | ) | | | — | |
| | | | | | | | | | | | | | | | | | | | |
Total Distributions | | | (0.32 | ) | | | (1.62 | ) | | | (1.69 | ) | | | (0.60 | ) | | | (0.08 | ) |
| | | | | | | | | | | | | | | | | | | | |
Net asset value, end of the period | | $ | 10.51 | | | $ | 11.16 | | | $ | 11.83 | | | $ | 10.49 | | | $ | 9.59 | |
| | | | | | | | | | | | | | | | | | | | |
Total return | | | (3.01 | )% | | | 8.52 | % | | | 29.34 | % | | | 15.69 | %(c) | | | (15.16 | )% |
RATIOS TO AVERAGE NET ASSETS: | | | | | | | | | | | | | | | | | | | | |
Net assets, end of the period (000’s) | | $ | 25,144 | | | $ | 34,930 | | | $ | 50,096 | | | $ | 49,884 | | | $ | 57,003 | |
Net expenses | | | 0.89 | % | | | 0.89 | % | | | 0.91 | % | | | 0.93 | % | | | 0.87 | % |
Gross expenses | | | 0.89 | % | | | 0.89 | % | | | 0.91 | % | | | 0.93 | % | | | 0.87 | % |
Net investment income | | | 0.48 | % | | | 0.04 | % | | | 0.08 | % | | | 1.02 | %(c) | | | 0.62 | % |
Portfolio turnover rate | | | 145 | % | | | 229 | % | | | 205 | % | | | 192 | % | | | 236 | % |
| (a) | Per share net investment income has been calculated using the average shares outstanding during the period. |
| (b) | Amount rounds to less than $0.01 per share. |
| (c) | Includes non-recurring dividends. Without these dividends, net investment income per share would have been $0.05, total return would have been 14.96% and the ratio of net investment income to average net assets would have been 0.47%. |
See accompanying notes to financial statements.
55 |
Financial Highlights (continued)
For a share outstanding throughout each period.
| | | | | | | | | | | | | | | | | | | | |
| | | Natixis Oakmark Fund—Class A | |
| | | Year Ended
December 31,
2015 | | | Year Ended
December 31,
2014 | | | Year Ended
December 31,
2013 | | | Year Ended
December 31,
2012 | | | Year Ended
December 31,
2011 | |
Net asset value, beginning of the period | | $ | 20.43 | | | $ | 21.40 | | | $ | 16.09 | | | $ | 13.86 | | | $ | 14.17 | |
| | | | | | | | | | | | | | | | | | | | |
INCOME (LOSS) FROM INVESTMENT OPERATIONS: | | | | | | | | | | | | | | | | | | | | |
Net investment income(a) | | | 0.14 | | | | 0.10 | | | | 0.06 | | | | 0.12 | | | | 0.08 | |
Net realized and unrealized gain (loss) | | | (1.02 | ) | | | 2.11 | | | | 6.03 | | | | 2.24 | | | | (0.30 | ) |
| | | | | | | | | | | | | | | | | | | | |
Total from Investment Operations | | | (0.88 | ) | | | 2.21 | | | | 6.09 | | | | 2.36 | | | | (0.22 | ) |
| | | | | | | | | | | | | | | | | | | | |
LESS DISTRIBUTIONS FROM: | | | | | | | | | | | | | | | | | | | | |
Net investment income | | | (0.13 | ) | | | (0.07 | ) | | | (0.07 | ) | | | (0.13 | ) | | | (0.09 | ) |
Net realized capital gains | | | (0.63 | ) | | | (3.11 | ) | | | (0.71 | ) | | | — | | | | — | |
| | | | | | | | | | | | | | | | | | | | |
Total Distributions | | | (0.76 | ) | | | (3.18 | ) | | | (0.78 | ) | | | (0.13 | ) | | | (0.09 | ) |
| | | | | | | | | | | | | | | | | | | | |
Net asset value, end of the period | | $ | 18.79 | | | $ | 20.43 | | | $ | 21.40 | | | $ | 16.09 | | | $ | 13.86 | |
| | | | | | | | | | | | | | | | | | | | |
Total return(b) | | | (4.41 | )% | | | 10.43 | % | | | 37.82 | % | | | 17.03 | %(c) | | | (1.56 | )% |
RATIOS TO AVERAGE NET ASSETS: | | | | | | | | | | | | | | | | | | | | |
Net assets, end of the period (000’s) | | $ | 173,925 | | | $ | 195,061 | | | $ | 145,270 | | | $ | 113,870 | | | $ | 107,978 | |
Net expenses | | | 1.14 | % | | | 1.22 | % | | | 1.30 | %(d) | | | 1.30 | %(e) | | | 1.30 | %(f) |
Gross expenses | | | 1.14 | % | | | 1.22 | % | | | 1.30 | %(d) | | | 1.33 | % | | | 1.30 | %(f) |
Net investment income | | | 0.68 | % | | | 0.44 | % | | | 0.33 | % | | | 0.77 | % | | | 0.57 | % |
Portfolio turnover rate | | | 23 | % | | | 64 | %(g) | | | 29 | % | | | 25 | % | | | 36 | % |
| (a) | Per share net investment income has been calculated using the average shares outstanding during the period. |
| (b) | A sales charge for Class A shares is not reflected in total return calculations. |
| (c) | Had certain expenses not been waived/reimbursed during the period, total returns would have been lower. |
| (d) | Includes fee/expense recovery of less than 0.01%. |
| (e) | The investment adviser agreed to waive its fees and/or reimburse a portion of the Fund’s expenses during the period. Without this waiver/reimbursement, expenses would have been higher. |
| (f) | Includes fee/expense recovery of 0.01%. |
| (g) | The variation in the Fund’s turnover rate from 2013 to 2014 was primarily due to a change in the portfolio management team. |
See accompanying notes to financial statements.
| 56
Financial Highlights (continued)
For a share outstanding throughout each period.
| | | | | | | | | | | | | | | | | | | | |
| | | Natixis Oakmark Fund—Class B | |
| | | Year Ended
December 31,
2015 | | | Year Ended
December 31,
2014 | | | Year Ended
December 31,
2013 | | | Year Ended
December 31,
2012 | | | Year Ended
December 31,
2011 | |
Net asset value, beginning of the period | | $ | 18.31 | | | $ | 19.57 | | | $ | 14.83 | | | $ | 12.76 | | | $ | 13.07 | |
| | | | | | | | | | | | | | | | | | | | |
INCOME (LOSS) FROM INVESTMENT OPERATIONS: | | | | | | | | | | | | | | | | | | | | |
Net investment loss(a) | | | (0.02 | ) | | | (0.06 | ) | | | (0.07 | ) | | | (0.01 | ) | | | (0.03 | ) |
Net realized and unrealized gain (loss) | | | (0.90 | ) | | | 1.91 | | | | 5.52 | | | | 2.08 | | | | (0.28 | ) |
| | | | | | | | | | | | | | | | | | | | |
Total from Investment Operations | | | (0.92 | ) | | | 1.85 | | | | 5.45 | | | | 2.07 | | | | (0.31 | ) |
| | | | | | | | | | | | | | | | | | | | |
LESS DISTRIBUTIONS FROM: | | | | | | | | | | | | | | | | | | | | |
Net investment income | | | (0.00 | )(b) | | | — | | | | — | | | | — | | | | (0.00 | )(b) |
Net realized capital gains | | | (0.63 | ) | | | (3.11 | ) | | | (0.71 | ) | | | — | | | | — | |
| | | | | | | | | | | | | | | | | | | | |
Total Distributions | | | (0.63 | ) | | | (3.11 | ) | | | (0.71 | ) | | | — | | | | (0.00 | ) |
| | | | | | | | | | | | | | | | | | | | |
Net asset value, end of the period | | $ | 16.76 | | | $ | 18.31 | | | $ | 19.57 | | | $ | 14.83 | | | $ | 12.76 | |
| | | | | | | | | | | | | | | | | | | | |
Total return(c) | | | (5.11 | )% | | | 9.56 | % | | | 36.75 | % | | | 16.22 | %(d) | | | (2.34 | )% |
RATIOS TO AVERAGE NET ASSETS: | | | | | | | | | | | | | | | | | | | | |
Net assets, end of the period (000’s) | | $ | 32 | | | $ | 669 | | | $ | 1,532 | | | $ | 2,145 | | | $ | 3,341 | |
Net expenses | | | 1.88 | % | | | 1.97 | % | | | 2.05 | %(e) | | | 2.05 | %(f) | | | 2.05 | %(g) |
Gross expenses | | | 1.88 | % | | | 1.97 | % | | | 2.05 | %(e) | | | 2.08 | % | | | 2.05 | %(g) |
Net investment loss | | | (0.11 | )% | | | (0.31 | )% | | | (0.43 | )% | | | (0.04 | )% | | | (0.21 | )% |
Portfolio turnover rate | | | 23 | % | | | 64 | %(h) | | | 29 | % | | | 25 | % | | | 36 | % |
| (a) | Per share net investment loss has been calculated using the average shares outstanding during the period. |
| (b) | Amount rounds to less than $0.01 per share. |
| (c) | A contingent deferred sales charge for Class B shares is not reflected in total return calculations. |
| (d) | Had certain expenses not been waived/reimbursed during the period, total returns would have been lower. |
| (e) | Includes fee/expense recovery of less than 0.01%. |
| (f) | The investment adviser agreed to waive its fees and/or reimburse a portion of the Fund’s expenses during the period. Without this waiver/reimbursement, expenses would have been higher. |
| (g) | Includes fee/expense recovery of 0.01%. |
| (h) | The variation in the Fund’s turnover rate from 2013 to 2014 was primarily due to a change in the portfolio management team. |
See accompanying notes to financial statements.
57 |
Financial Highlights (continued)
For a share outstanding throughout each period.
| | | | | | | | | | | | | | | | | | | | |
| | | Natixis Oakmark Fund—Class C | |
| | | Year Ended
December 31,
2015 | | | Year Ended
December 31,
2014 | | | Year Ended
December 31,
2013 | | | Year Ended
December 31,
2012 | | | Year Ended
December 31,
2011 | |
Net asset value, beginning of the period | | $ | 18.19 | | | $ | 19.48 | | | $ | 14.75 | | | $ | 12.72 | | | $ | 13.02 | |
| | | | | | | | | | | | | | | | | | | | |
INCOME (LOSS) FROM INVESTMENT OPERATIONS: | | | | | | | | | | | | | | | | | | | | |
Net investment income (loss)(a) | | | (0.01 | ) | | | (0.06 | ) | | | (0.07 | ) | | | 0.00 | (b) | | | (0.03 | ) |
Net realized and unrealized gain (loss) | | | (0.90 | ) | | | 1.90 | | | | 5.51 | | | | 2.05 | | | | (0.27 | ) |
| | | | | | | | | | | | | | | | | | | | |
Total from Investment Operations | | | (0.91 | ) | | | 1.84 | | | | 5.44 | | | | 2.05 | | | | (0.30 | ) |
| | | | | | | | | | | | | | | | | | | | |
LESS DISTRIBUTIONS FROM: | | | | | | | | | | | | | | | | | | | | |
Net investment income | | | (0.00 | )(b) | | | (0.02 | ) | | | — | | | | (0.02 | ) | | | (0.00 | )(b) |
Net realized capital gains | | | (0.63 | ) | | | (3.11 | ) | | | (0.71 | ) | | | — | | | | — | |
| | | | | | | | | | | | | | | | | | | | |
Total Distributions | | | (0.63 | ) | | | (3.13 | ) | | | (0.71 | ) | | | (0.02 | ) | | | (0.00 | ) |
| | | | | | | | | | | | | | | | | | | | |
Net asset value, end of the period | | $ | 16.65 | | | $ | 18.19 | | | $ | 19.48 | | | $ | 14.75 | | | $ | 12.72 | |
| | | | | | | | | | | | | | | | | | | | |
Total return(c) | | | (5.07 | )% | | | 9.55 | % | | | 36.88 | % | | | 16.13 | %(d) | | | (2.28 | )% |
RATIOS TO AVERAGE NET ASSETS: | | | | | | | | | | | | | | | | | | | | |
Net assets, end of the period (000’s) | | $ | 70,616 | | | $ | 62,941 | | | $ | 8,425 | | | $ | 6,016 | | | $ | 5,667 | |
Net expenses | | | 1.89 | % | | | 1.97 | % | | | 2.05 | %(e) | | | 2.05 | %(f) | | | 2.05 | %(g) |
Gross expenses | | | 1.89 | % | | | 1.97 | % | | | 2.05 | %(e) | | | 2.08 | % | | | 2.05 | %(g) |
Net investment income (loss) | | | (0.07 | )% | | | (0.30 | )% | | | (0.42 | )% | | | 0.02 | % | | | (0.19 | )% |
Portfolio turnover rate | | | 23 | % | | | 64 | %(h) | | | 29 | % | | | 25 | % | | | 36 | % |
| (a) | Per share net investment income (loss) has been calculated using the average shares outstanding during the period. |
| (b) | Amount rounds to less than $0.01 per share. |
| (c) | A contingent deferred sales charge for Class C shares is not reflected in total return calculations. |
| (d) | Had certain expenses not been waived/reimbursed during the period, total returns would have been lower. |
| (e) | Includes fee/expense recovery of less than 0.01%. |
| (f) | The investment adviser agreed to waive its fees and/or reimburse a portion of the Fund’s expenses during the period. Without this waiver/reimbursement, expenses would have been higher. |
| (g) | Includes fee/expense recovery of 0.01%. |
| (h) | The variation in the Fund’s turnover rate from 2013 to 2014 was primarily due to a change in the portfolio management team. |
See accompanying notes to financial statements.
| 58
Financial Highlights (continued)
For a share outstanding throughout each period.
| | | | | | | | | | | | | | | | | | | | |
| | | Natixis Oakmark Fund—Class Y | |
| | | Year Ended
December 31,
2015 | | | Year Ended
December 31,
2014 | | | Year Ended
December 31,
2013 | | | Year Ended
December 31,
2012 | | | Year Ended
December 31,
2011 | |
Net asset value, beginning of the period | | $ | 21.28 | | | $ | 22.16 | | | $ | 16.63 | | | $ | 14.32 | | | $ | 14.65 | |
| | | | | | | | | | | | | | | | | | | | |
INCOME (LOSS) FROM INVESTMENT OPERATIONS: | | | | | | | | | | | | | | | | | | | | |
Net investment income(a) | | | 0.19 | | | | 0.15 | | | | 0.11 | | | | 0.17 | | | | 0.12 | |
Net realized and unrealized gain (loss) | | | (1.06 | ) | | | 2.20 | | | | 6.24 | | | | 2.31 | | | | (0.33 | ) |
| | | | | | | | | | | | | | | | | | | | |
Total from Investment Operations | | | (0.87 | ) | | | 2.35 | | | | 6.35 | | | | 2.48 | | | | (0.21 | ) |
| | | | | | | | | | | | | | | | | | | | |
LESS DISTRIBUTIONS FROM: | | | | | | | | | | | | | | | | | | | | |
Net investment income | | | (0.18 | ) | | | (0.12 | ) | | | (0.11 | ) | | | (0.17 | ) | | | (0.12 | ) |
Net realized capital gains | | | (0.63 | ) | | | (3.11 | ) | | | (0.71 | ) | | | — | | | | — | |
| | | | | | | | | | | | | | | | | | | | |
Total Distributions | | | (0.81 | ) | | | (3.23 | ) | | | (0.82 | ) | | | (0.17 | ) | | | (0.12 | ) |
| | | | | | | | | | | | | | | | | | | | |
Net asset value, end of the period | | $ | 19.60 | | | $ | 21.28 | | | $ | 22.16 | | | $ | 16.63 | | | $ | 14.32 | |
| | | | | | | | | | | | | | | | | | | | |
Total return | | | (4.18 | )% | | | 10.70 | % | | | 38.21 | % | | | 17.33 | %(b) | | | (1.40 | )% |
RATIOS TO AVERAGE NET ASSETS: | | | | | | | | | | | | | | | | | | | | |
Net assets, end of the period (000’s) | | $ | 21,696 | | | $ | 26,694 | | | $ | 14,176 | | | $ | 12,100 | | | $ | 7,567 | |
Net expenses | | | 0.89 | % | | | 0.97 | % | | | 1.05 | %(c) | | | 1.05 | %(d) | | | 1.05 | %(e) |
Gross expenses | | | 0.89 | % | | | 0.97 | % | | | 1.05 | %(c) | | | 1.09 | % | | | 1.05 | %(e) |
Net investment income | | | 0.92 | % | | | 0.67 | % | | | 0.54 | % | | | 1.04 | % | | | 0.80 | % |
Portfolio turnover rate | | | 23 | % | | | 64 | %(f) | | | 29 | % | | | 25 | % | | | 36 | % |
| (a) | Per share net investment income has been calculated using the average shares outstanding during the period. |
| (b) | Had certain expenses not been waived/reimbursed during the period, total returns would have been lower. |
| (c) | Includes fee/expense recovery of less than 0.01%. |
| (d) | The investment adviser agreed to waive its fees and/or reimburse a portion of the Fund’s expenses during the period. Without this waiver/reimbursement, expenses would have been higher. |
| (e) | Includes fee/expense recovery of 0.01%. |
| (f) | The variation in the Fund’s turnover rate from 2013 to 2014 was primarily due to a change in the portfolio management team. |
See accompanying notes to financial statements.
59 |
Financial Highlights (continued)
For a share outstanding throughout each period.
| | | | | | | | | | | | | | | | | | | | |
| | | Natixis Oakmark International Fund—Class A | |
| | | Year Ended
December 31,
2015 | | | Year Ended
December 31,
2014 | | | Year Ended
December 31,
2013 | | | Year Ended
December 31,
2012 | | | Year Ended
December 31,
2011 | |
Net asset value, beginning of the period | | $ | 12.44 | | | $ | 13.74 | | | $ | 10.94 | | | $ | 8.68 | | | $ | 10.16 | |
| | | | | | | | | | | | | | | | | | | | |
INCOME (LOSS) FROM INVESTMENT OPERATIONS: | | | | | | | | | | | | | | | | | | | | |
Net investment income(a) | | | 0.15 | | | | 0.18 | | | | 0.07 | | | | 0.14 | | | | 0.09 | (b) |
Net realized and unrealized gain (loss) | | | (0.80 | ) | | | (1.01 | ) | | | 2.99 | | | | 2.35 | | | | (1.57 | ) |
| | | | | | | | | | | | | | | | | | | | |
Total from Investment Operations | | | (0.65 | ) | | | (0.83 | ) | | | 3.06 | | | | 2.49 | | | | (1.48 | ) |
| | | | | | | | | | | | | | | | | | | | |
LESS DISTRIBUTIONS FROM: | | | | | | | | | | | | | | | | | | | | |
Net investment income | | | (0.20 | ) | | | (0.25 | ) | | | (0.08 | ) | | | (0.23 | ) | | | (0.00 | )(c) |
Net realized capital gains | | | (0.12 | ) | | | (0.22 | ) | | | (0.18 | ) | | | — | | | | (0.00 | )(c) |
| | | | | | | | | | | | | | | | | | | | |
Total Distributions | | | (0.32 | ) | | | (0.47 | ) | | | (0.26 | ) | | | (0.23 | ) | | | (0.00 | ) |
| | | | | | | | | | | | | | | | | | | | |
Net asset value, end of the period | | $ | 11.47 | | | $ | 12.44 | | | $ | 13.74 | | | $ | 10.94 | | | $ | 8.68 | |
| | | | | | | | | | | | | | | | | | | | |
Total return(d) | | | (5.35 | )% | | | (6.05 | )% | | | 28.13 | % | | | 28.78 | %(e) | | | (14.55 | )%(b)(e) |
RATIOS TO AVERAGE NET ASSETS: | | | | | | | | | | | | | | | | | | | | |
Net assets, end of the period (000’s) | | $ | 722,805 | | | $ | 617,383 | | | $ | 314,579 | | | $ | 35,555 | | | $ | 33,852 | |
Net expenses | | | 1.31 | % | | | 1.31 | % | | | 1.44 | %(f) | | | 1.45 | %(g) | | | 1.45 | %(g) |
Gross expenses | | | 1.31 | % | | | 1.31 | % | | | 1.44 | %(f) | | | 1.64 | % | | | 1.87 | % |
Net investment income | | | 1.17 | % | | | 1.34 | % | | | 0.52 | % | | | 1.50 | % | | | 0.93 | %(b) |
Portfolio turnover rate | | | 51 | % | | | 31 | % | | | 20 | % | | | 53 | % | | | 48 | % |
| (a) | Per share net investment income has been calculated using the average shares outstanding during the period. |
| (b) | Includes a non-recurring dividend. Without this dividend, net investment income per share would have been $0.08, total return would have been (14.65)% and the ratio of net investment income to average net assets would have been 0.81%. |
| (c) | Amount rounds to less than $0.01 per share. |
| (d) | A sales charge for Class A shares is not reflected in total return calculations. |
| (e) | Had certain expenses not been waived/reimbursed during the period, total returns would have been lower. |
| (f) | Includes fee/expense recovery of 0.05%. |
| (g) | The investment adviser agreed to waive its fees and/or reimburse a portion of the Fund’s expenses during the period. Without this waiver/reimbursement, expenses would have been higher. |
See accompanying notes to financial statements.
| 60
Financial Highlights (continued)
For a share outstanding throughout each period.
| | | | | | | | | | | | | | | | | | | | |
| | | Natixis Oakmark International Fund—Class C | |
| | | Year Ended
December 31,
2015 | | | Year Ended
December 31,
2014 | | | Year Ended
December 31,
2013 | | | Year Ended
December 31,
2012 | | | Year Ended
December 31,
2011 | |
Net asset value, beginning of the period | | $ | 12.25 | | | $ | 13.53 | | | $ | 10.82 | | | $ | 8.61 | | | $ | 10.15 | |
| | | | | | | | | | | | | | | | | | | | |
INCOME (LOSS) FROM INVESTMENT OPERATIONS: | | | | | | | | | | | | | | | | | | | | |
Net investment income (loss)(a) | | | 0.05 | | | | 0.08 | | | | (0.02 | ) | | | 0.06 | | | | 0.02 | (b) |
Net realized and unrealized gain (loss) | | | (0.78 | ) | | | (0.98 | ) | | | 2.94 | | | | 2.34 | | | | (1.56 | ) |
| | | | | | | | | | | | | | | | | | | | |
Total from Investment Operations | | | (0.73 | ) | | | (0.90 | ) | | | 2.92 | | | | 2.40 | | | | (1.54 | ) |
| | | | | | | | | | | | | | | | | | | | |
LESS DISTRIBUTIONS FROM: | | | | | | | | | | | | | | | | | | | | |
Net investment income | | | (0.11 | ) | | | (0.16 | ) | | | (0.03 | ) | | | (0.19 | ) | | | (0.00 | )(c) |
Net realized capital gains | | | (0.12 | ) | | | (0.22 | ) | | | (0.18 | ) | | | — | | | | (0.00 | )(c) |
| | | | | | | | | | | | | | | | | | | | |
Total Distributions | | | (0.23 | ) | | | (0.38 | ) | | | (0.21 | ) | | | (0.19 | ) | | | (0.00 | ) |
| | | | | | | | | | | | | | | | | | | | |
Net asset value, end of the period | | $ | 11.29 | | | $ | 12.25 | | | $ | 13.53 | | | $ | 10.82 | | | $ | 8.61 | |
| | | | | | | | | | | | | | | | | | | | |
Total return(d) | | | (6.08 | )% | | | (6.67 | )% | | | 27.13 | % | | | 27.93 | %(e) | | | (15.17 | )%(b)(e) |
RATIOS TO AVERAGE NET ASSETS: | | | | | | | | | | | | | | | | | | | | |
Net assets, end of the period (000’s) | | $ | 341,959 | | | $ | 327,319 | | | $ | 237,250 | | | $ | 34,142 | | | $ | 13,501 | |
Net expenses | | | 2.06 | % | | | 2.05 | % | | | 2.19 | %(f) | | | 2.20 | %(g) | | | 2.20 | %(g) |
Gross expenses | | | 2.06 | % | | | 2.05 | % | | | 2.19 | %(f) | | | 2.39 | % | | | 2.59 | % |
Net investment income (loss) | | | 0.39 | % | | | 0.61 | % | | | (0.14 | )% | | | 0.59 | % | | | 0.20 | %(b) |
Portfolio turnover rate | | | 51 | % | | | 31 | % | | | 20 | % | | | 53 | % | | | 48 | % |
| (a) | Per share net investment income (loss) has been calculated using the average shares outstanding during the period. |
| (b) | Includes a non-recurring dividend. Without this dividend, net investment income per share would have been $0.01, total return would have been (15.27)% and the ratio of net investment income to average net assets would have been 0.08%. |
| (c) | Amount rounds to less than $0.01 per share. |
| (d) | A contingent deferred sales charge for Class C shares is not reflected in total return calculations. |
| (e) | Had certain expenses not been waived/reimbursed during the period, total returns would have been lower. |
| (f) | Includes fee/expense recovery of 0.04%. |
| (g) | The investment adviser agreed to waive its fees and/or reimburse a portion of the Fund’s expenses during the period. Without this waiver/reimbursement, expenses would have been higher. |
See accompanying notes to financial statements.
61 |
Financial Highlights (continued)
For a share outstanding throughout each period.
| | | | | | | | | | | | | | | | | | | | |
| | | Vaughan Nelson Small Cap Value Fund—Class A | |
| | | Year Ended
December 31,
2015 | | | Year Ended
December 31,
2014 | | | Year Ended
December 31,
2013 | | | Year Ended
December 31,
2012 | | | Year Ended
December 31,
2011 | |
Net asset value, beginning of the period | | $ | 20.65 | | | $ | 22.34 | | | $ | 18.97 | | | $ | 17.74 | | | $ | 22.69 | |
| | | | | | | | | | | | | | | | | | | | |
INCOME (LOSS) FROM INVESTMENT OPERATIONS: | | | | | | | | | | | | | | | | | | | | |
Net investment income (loss)(a) | | | 0.06 | (b) | | | (0.06 | ) | | | 0.07 | (c) | | | 0.13 | (d) | | | 0.10 | |
Net realized and unrealized gain (loss) | | | (0.07 | ) | | | 1.95 | | | | 7.14 | | | | 2.50 | | | | (0.83 | ) |
| | | | | | | | | | | | | | | | | | | | |
Total from Investment Operations | | | (0.01 | ) | | | 1.89 | | | | 7.21 | | | | 2.63 | | | | (0.73 | ) |
| | | | | | | | | | | | | | | | | | | | |
LESS DISTRIBUTIONS FROM: | | | | | | | | | | | | | | | | | | | | |
Net investment income | | | (0.04 | ) | | | — | | | | (0.06 | ) | | | (0.14 | ) | | | (0.09 | ) |
Net realized capital gains | | | (2.86 | ) | | | (3.58 | ) | | | (3.78 | ) | | | (1.26 | ) | | | (4.13 | ) |
| | | | | | | | | | | | | | | | | | | | |
Total Distributions | | | (2.90 | ) | | | (3.58 | ) | | | (3.84 | ) | | | (1.40 | ) | | | (4.22 | ) |
| | | | | | | | | | | | | | | | | | | | |
Net asset value, end of the period | | $ | 17.74 | | | $ | 20.65 | | | $ | 22.34 | | | $ | 18.97 | | | $ | 17.74 | |
| | | | | | | | | | | | | | | | | | | | |
Total return(e) | | | (0.29 | )%(b) | | | 8.79 | % | | | 39.01 | %(c) | | | 14.93 | %(d) | | | (3.77 | )% |
RATIOS TO AVERAGE NET ASSETS: | | | | | | | | | | | | | | | | | | | | |
Net assets, end of the period (000’s) | | $ | 103,092 | | | $ | 125,201 | | | $ | 152,792 | | | $ | 160,400 | | | $ | 228,445 | |
Net expenses | | | 1.35 | % | | | 1.37 | % | | | 1.39 | %(f) | | | 1.39 | % | | | 1.36 | % |
Gross expenses | | | 1.35 | % | | | 1.37 | % | | | 1.39 | %(f) | | | 1.39 | % | | | 1.36 | % |
Net investment income (loss) | | | 0.26 | %(b) | | | (0.27 | )% | | | 0.33 | %(c) | | | 0.67 | %(d) | | | 0.44 | % |
Portfolio turnover rate | | | 62 | % | | | 58 | % | | | 58 | % | | | 73 | % | | | 88 | % |
| (a) | Per share net investment income (loss) has been calculated using the average shares outstanding during the period. |
| (b) | Includes non-recurring dividends. Without these dividends, net investment loss per share would have been $(0.04), total return would have been (0.77)% and the ratio of net investment loss to average net assets would have been (0.20)%. |
| (c) | Includes a non-recurring dividend. Without this dividend, net investment income per share would have been $0.00, total return would have been 38.63% and the ratio of net investment income to average net assets would have been 0.02%. |
| (d) | Includes a non-recurring dividend. Without this dividend, net investment income per share would have been $0.04, total return would have been 14.42% and the ratio of net investment income to average net assets would have been 0.22%. |
| (e) | A sales charge for Class A shares is not reflected in total return calculations. |
| (f) | Includes interest expense of less than 0.01%. |
See accompanying notes to financial statements.
| 62
Financial Highlights (continued)
For a share outstanding throughout each period.
| | | | | | | | | | | | | | | | | | | | |
| | | Vaughan Nelson Small Cap Value Fund—Class B | |
| | | Year Ended
December 31,
2015 | | | Year Ended
December 31,
2014 | | | Year Ended
December 31,
2013 | | | Year Ended
December 31,
2012 | | | Year Ended
December 31,
2011 | |
Net asset value, beginning of the period | | $ | 15.37 | | | $ | 17.63 | | | $ | 15.65 | | | $ | 14.84 | | | $ | 19.73 | |
| | | | | | | | | | | | | | | | | | | | |
INCOME (LOSS) FROM INVESTMENT OPERATIONS: | | | | | | | | | | | | | | | | | | | | |
Net investment loss(a) | | | (0.04 | )(b) | | | (0.19 | ) | | | (0.07 | )(c) | | | (0.02 | )(d) | | | (0.07 | ) |
Net realized and unrealized gain (loss) | | | (0.07 | ) | | | 1.51 | | | | 5.84 | | | | 2.09 | | | | (0.69 | ) |
| | | | | | | | | | | | | | | | | | | | |
Total from Investment Operations | | | (0.11 | ) | | | 1.32 | | | | 5.77 | | | | 2.07 | | | | (0.76 | ) |
| | | | | | | | | | | | | | | | | | | | |
LESS DISTRIBUTIONS FROM: | | | | | | | | | | | | | | | | | | | | |
Net investment income | | | — | | | | — | | | | (0.01 | ) | | | — | | | | (0.00 | )(e) |
Net realized capital gains | | | (2.86 | ) | | | (3.58 | ) | | | (3.78 | ) | | | (1.26 | ) | | | (4.13 | ) |
| | | | | | | | | | | | | | | | | | | | |
Total Distributions | | | (2.86 | ) | | | (3.58 | ) | | | (3.79 | ) | | | (1.26 | ) | | | (4.13 | ) |
| | | | | | | | | | | | | | | | | | | | |
Net asset value, end of the period | | $ | 12.40 | | | $ | 15.37 | | | $ | 17.63 | | | $ | 15.65 | | | $ | 14.84 | |
| | | | | | | | | | | | | | | | | | | | |
Total return(f) | | | (1.04 | )%(b) | | | 7.87 | % | | | 38.03 | %(c) | | | 14.12 | %(d) | | | (4.51 | )% |
RATIOS TO AVERAGE NET ASSETS: | | | | | | | | | | | | | | | | | | | | |
Net assets, end of the period (000’s) | | $ | 22 | | | $ | 967 | | | $ | 2,239 | | | $ | 3,106 | | | $ | 4,657 | |
Net expenses | | | 2.10 | % | | | 2.12 | % | | | 2.14 | %(g) | | | 2.14 | % | | | 2.11 | % |
Gross expenses | | | 2.10 | % | | | 2.12 | % | | | 2.14 | %(g) | | | 2.14 | % | | | 2.11 | % |
Net investment loss | | | (0.23 | )%(b) | | | (1.08 | )% | | | (0.40 | )%(c) | | | (0.14 | )%(d) | | | (0.38 | )% |
Portfolio turnover rate | | | 62 | % | | | 58 | % | | | 58 | % | | | 73 | % | | | 88 | % |
| (a) | Per share net investment loss has been calculated using the average shares outstanding during the period. |
| (b) | Includes non-recurring dividends. Without these dividends, net investment loss per share would have been $(0.19), total return would have been (1.49)% and the ratio of net investment loss to average net assets would have been (1.20)%. |
| (c) | Includes a non-recurring dividend. Without this dividend, net investment loss per share would have been $(0.14), total return would have been 37.63% and the ratio of net investment income loss to average net assets would have been (0.77)%. |
| (d) | Includes a non-recurring dividend. Without this dividend, net investment loss per share would have been $(0.09), total return would have been 13.64% and the ratio of net investment income loss to average net assets would have been (0.56)%. |
| (e) | Amount rounds to less than $0.01 per share. |
| (f) | A contingent deferred sales charge for Class B shares is not reflected in total return calculations. |
| (g) | Includes interest expense of less than 0.01%. |
See accompanying notes to financial statements.
63 |
Financial Highlights (continued)
For a share outstanding throughout each period.
| | | | | | | | | | | | | | | | | | | | |
| | | Vaughan Nelson Small Cap Value Fund—Class C | |
| | | Year Ended
December 31,
2015 | | | Year Ended
December 31,
2014 | | | Year Ended
December 31,
2013 | | | Year Ended
December 31,
2012 | | | Year Ended
December 31,
2011 | |
Net asset value, beginning of the period | | $ | 15.36 | | | $ | 17.61 | | | $ | 15.64 | | | $ | 14.85 | | | $ | 19.74 | |
| | | | | | | | | | | | | | | | | | | | |
INCOME (LOSS) FROM INVESTMENT OPERATIONS: | | | | | | | | | | | | | | | | | | | | |
Net investment loss(a) | | | (0.08 | )(b) | | | (0.18 | ) | | | (0.07 | )(c) | | | (0.01 | )(d) | | | (0.06 | ) |
Net realized and unrealized gain (loss) | | | (0.03 | ) | | | 1.51 | | | | 5.83 | | | | 2.08 | | | | (0.70 | ) |
| | | | | | | | | | | | | | | | | | | | |
Total from Investment Operations | | | (0.11 | ) | | | 1.33 | | | | 5.76 | | | | 2.07 | | | | (0.76 | ) |
| | | | | | | | | | | | | | | | | | | | |
LESS DISTRIBUTIONS FROM: | | | | | | | | | | | | | | | | | | | | |
Net investment income | | | — | | | | — | | | | (0.01 | ) | | | (0.02 | ) | | | — | |
Net realized capital gains | | | (2.86 | ) | | | (3.58 | ) | | | (3.78 | ) | | | (1.26 | ) | | | (4.13 | ) |
| | | | | | | | | | | | | | | | | | | | |
Total Distributions | | | (2.86 | ) | | | (3.58 | ) | | | (3.79 | ) | | | (1.28 | ) | | | (4.13 | ) |
| | | | | | | | | | | | | | | | | | | | |
Net asset value, end of the period | | $ | 12.39 | | | $ | 15.36 | | | $ | 17.61 | | | $ | 15.64 | | | $ | 14.85 | |
| | | | | | | | | | | | | | | | | | | | |
Total return(e) | | | (1.02 | )%(b) | | | 7.94 | % | | | 37.99 | %(c) | | | 14.08 | %(d) | | | (4.51 | )% |
RATIOS TO AVERAGE NET ASSETS: | | | | | | | | | | | | | | | | | | | | |
Net assets, end of the period (000’s) | | $ | 21,188 | | | $ | 27,292 | | | $ | 31,476 | | | $ | 26,980 | | | $ | 30,284 | |
Net expenses | | | 2.10 | % | | | 2.12 | % | | | 2.14 | %(f) | | | 2.14 | % | | | 2.11 | % |
Gross expenses | | | 2.10 | % | | | 2.12 | % | | | 2.14 | %(f) | | | 2.14 | % | | | 2.11 | % |
Net investment loss | | | (0.48 | )%(b) | | | (1.02 | )% | | | (0.40 | )%(c) | | | (0.07 | )%(d) | | | (0.33 | )% |
Portfolio turnover rate | | | 62 | % | | | 58 | % | | | 58 | % | | | 73 | % | | | 88 | % |
| (a) | Per share net investment loss has been calculated using the average shares outstanding during the period. |
| (b) | Includes non-recurring dividends. Without these dividends, net investment loss per share would have been $(0.15), total return would have been (1.48)% and the ratio of net investment loss to average net assets would have been (0.96)%. |
| (c) | Includes a non-recurring dividend. Without this dividend, net investment loss per share would have been $(0.13), total return would have been 37.59% and the ratio of net investment income loss to average net assets would have been (0.73)%. |
| (d) | Includes a non-recurring dividend. Without this dividend, net investment loss per share would have been $(0.08), total return would have been 13.52% and the ratio of net investment income loss to average net assets would have been (0.51)%. |
| (e) | A contingent deferred sales charge for Class C shares is not reflected in total return calculations. |
| (f) | Includes interest expense of less than 0.01%. |
See accompanying notes to financial statements.
| 64
Financial Highlights (continued)
For a share outstanding throughout each period.
| | | | | | | | | | | | | | | | | | | | |
| | | Vaughan Nelson Small Cap Value Fund—Class Y | |
| | | Year Ended
December 31,
2015 | | | Year Ended
December 31,
2014 | | | Year Ended
December 31,
2013 | | | Year Ended
December 31,
2012 | | | Year Ended
December 31,
2011 | |
Net asset value, beginning of the period | | $ | 21.13 | | | $ | 22.73 | | | $ | 19.24 | | | $ | 17.99 | | | $ | 22.96 | |
| | | | | | | | | | | | | | | | | | | | |
INCOME (LOSS) FROM INVESTMENT OPERATIONS: | | | | | | | | | | | | | | | | | | | | |
Net investment income (loss)(a) | | | 0.11 | (b) | | | (0.00 | )(c) | | | 0.13 | (d) | | | 0.18 | (e) | | | 0.15 | |
Net realized and unrealized gain (loss) | | | (0.07 | ) | | | 1.98 | | | | 7.26 | | | | 2.53 | | | | (0.84 | ) |
| | | | | | | | | | | | | | | | | | | | |
Total from Investment Operations | | | 0.04 | | | | 1.98 | | | | 7.39 | | | | 2.71 | | | | (0.69 | ) |
| | | | | | | | | | | | | | | | | | | | |
LESS DISTRIBUTIONS FROM: | | | | | | | | | | | | | | | | | | | | |
Net investment income | | | (0.10 | ) | | | — | | | | (0.12 | ) | | | (0.20 | ) | | | (0.15 | ) |
Net realized capital gains | | | (2.86 | ) | | | (3.58 | ) | | | (3.78 | ) | | | (1.26 | ) | | | (4.13 | ) |
| | | | | | | | | | | | | | | | | | | | |
Total Distributions | | | (2.96 | ) | | | (3.58 | ) | | | (3.90 | ) | | | (1.46 | ) | | | (4.28 | ) |
| | | | | | | | | | | | | | | | | | | | |
Net asset value, end of the period | | $ | 18.21 | | | $ | 21.13 | | | $ | 22.73 | | | $ | 19.24 | | | $ | 17.99 | |
| | | | | | | | | | | | | | | | | | | | |
Total return | | | (0.05 | )%(b) | | | 9.04 | % | | | 39.43 | %(d) | | | 15.18 | %(e) | | | (3.54 | )% |
RATIOS TO AVERAGE NET ASSETS: | | | | | | | | | | | | | | | | | | | | |
Net assets, end of the period (000’s) | | $ | 179,322 | | | $ | 176,905 | | | $ | 163,836 | | | $ | 132,970 | | | $ | 130,115 | |
Net expenses | | | 1.10 | % | | | 1.12 | % | | | 1.14 | %(f) | | | 1.14 | % | | | 1.10 | % |
Gross expenses | | | 1.10 | % | | | 1.12 | % | | | 1.14 | %(f) | | | 1.14 | % | | | 1.10 | % |
Net investment income (loss) | | | 0.50 | %(b) | | | (0.01 | )% | | | 0.59 | %(d) | | | 0.95 | %(e) | | | 0.65 | % |
Portfolio turnover rate | | | 62 | % | | | 58 | % | | | 58 | % | | | 73 | % | | | 88 | % |
| (a) | Per share net investment income (loss) has been calculated using the average shares outstanding during the period. |
| (b) | Includes non-recurring dividends. Without these dividends, net investment income per share would have been $0.02, total return would have been (0.53)% and the ratio of net investment income to average net assets would have been 0.07%. |
| (c) | Amount rounds to less than $0.01 per share. |
| (d) | Includes a non-recurring dividend. Without this dividend, net investment income per share would have been $0.06, total return would have been 39.06% and the ratio of net investment income to average net assets would have been 0.27%. |
| (e) | Includes a non-recurring dividend. Without this dividend, net investment income per share would have been $0.10, total return would have been 14.73% and the ratio of net investment income to average net assets would have been 0.50%. |
| (f) | Includes interest expense of less than 0.01%. |
See accompanying notes to financial statements.
65 |
Financial Highlights (continued)
For a share outstanding throughout each period.
| | | | | | | | | | | | | | | | | | | | |
| | | Vaughan Nelson Value Opportunity Fund—Class A | |
| | | Year Ended
December 31,
2015 | | | Year Ended
December 31,
2014 | | | Year Ended
December 31,
2013 | | | Year Ended
December 31,
2012 | | | Year Ended
December 31,
2011 | |
Net asset value, beginning of the period | | $ | 21.29 | | | $ | 20.63 | | | $ | 15.49 | | | $ | 13.83 | | | $ | 14.75 | |
| | | | | | | | | | | | | | | | | | | | |
INCOME (LOSS) FROM INVESTMENT OPERATIONS: | | | | | | | | | | | | | | | | | | | | |
Net investment income (loss)(a) | | | 0.03 | (b) | | | (0.08 | ) | | | (0.03 | ) | | | 0.15 | (c) | | | (0.01 | ) |
Net realized and unrealized gain (loss) | | | (0.79 | ) | | | 2.31 | | | | 6.36 | | | | 2.05 | | | | (0.39 | ) |
| | | | | | | | | | | | | | | | | | | | |
Total from Investment Operations | | | (0.76 | ) | | | 2.23 | | | | 6.33 | | | | 2.20 | | | | (0.40 | ) |
| | | | | | | | | | | | | | | | | | | | |
LESS DISTRIBUTIONS FROM: | | | | | | | | | | | | | | | | | | | | |
Net investment income | | | (0.02 | ) | | | — | | | | — | | | | (0.14 | ) | | | — | |
Net realized capital gains | | | (0.47 | ) | | | (1.57 | ) | | | (1.19 | ) | | | (0.40 | ) | | | (0.52 | ) |
| | | | | | | | | | | | | | | | | | | | |
Total Distributions | | | (0.49 | ) | | | (1.57 | ) | | | (1.19 | ) | | | (0.54 | ) | | | (0.52 | ) |
| | | | | | | | | | | | | | | | | | | | |
Net asset value, end of the period | | $ | 20.04 | | | $ | 21.29 | | | $ | 20.63 | | | $ | 15.49 | | | $ | 13.83 | |
| | | | | | | | | | | | | | | | | | | | |
Total return(d) | | | (3.66 | )%(b) | | | 10.92 | % | | | 41.22 | % | | | 15.93 | %(c) | | | (2.71 | )% |
RATIOS TO AVERAGE NET ASSETS: | | | | | | | | | | | | | | | | | | | | |
Net assets, end of the period (000’s) | | $ | 142,833 | | | $ | 73,237 | | | $ | 67,716 | | | $ | 28,381 | | | $ | 21,308 | |
Net expenses | | | 1.23 | % | | | 1.25 | % | | | 1.27 | % | | | 1.31 | % | | | 1.40 | %(e) |
Gross expenses | | | 1.23 | % | | | 1.25 | % | | | 1.27 | % | | | 1.31 | % | | | 1.40 | %(e) |
Net investment income (loss) | | | 0.16 | %(b) | | | (0.37 | )% | | | (0.13 | )% | | | 0.97 | %(c) | | | (0.07 | )% |
Portfolio turnover rate | | | 32 | % | | | 58 | % | | | 39 | % | | | 65 | % | | | 75 | % |
| (a) | Per share net investment income (loss) has been calculated using the average shares outstanding during the period. |
| (b) | Includes a non-recurring dividend. Without this dividend, net investment loss per share would have been $(0.01), total return would have been (3.94)% and the ratio of net investment loss to average net assets would have been (0.04)%. |
| (c) | Includes non-recurring dividends. Without these dividends, net investment income per share would have been $0.02, total return would have been 15.06% and the ratio of net investment income to average net assets would have been 0.16%. |
| (d) | A sales charge for Class A shares is not reflected in total return calculations. |
| (e) | Includes fee/expense recovery of 0.01%. |
See accompanying notes to financial statements.
| 66
Financial Highlights (continued)
For a share outstanding throughout each period.
| | | | | | | | | | | | | | | | | | | | |
| | | Vaughan Nelson Value Opportunity Fund—Class C | |
| | | Year Ended
December 31,
2015 | | | Year Ended
December 31,
2014 | | | Year Ended
December 31,
2013 | | | Year Ended
December 31,
2012 | | | Year Ended
December 31,
2011 | |
Net asset value, beginning of the period | | $ | 20.51 | | | $ | 20.07 | | | $ | 15.21 | | | $ | 13.60 | | | $ | 14.63 | |
| | | | | | | | | | | | | | | | | | | | |
INCOME (LOSS) FROM INVESTMENT OPERATIONS: | | | | | | | | | | | | | | | | | | | | |
Net investment income (loss)(a) | | | (0.13 | )(b) | | | (0.23 | ) | | | (0.17 | ) | | | 0.04 | (c) | | | (0.12 | ) |
Net realized and unrealized gain (loss) | | | (0.75 | ) | | | 2.24 | | | | 6.22 | | | | 2.01 | | | | (0.39 | ) |
| | | | | | | | | | | | | | | | | | | | |
Total from Investment Operations | | | (0.88 | ) | | | 2.01 | | | | 6.05 | | | | 2.05 | | | | (0.51 | ) |
| | | | | | | | | | | | | | | | | | | | |
LESS DISTRIBUTIONS FROM: | | | | | | | | | | | | | | | | | | | | |
Net investment income | | | — | | | | — | | | | — | | | | (0.04 | ) | | | — | |
Net realized capital gains | | | (0.47 | ) | | | (1.57 | ) | | | (1.19 | ) | | | (0.40 | ) | | | (0.52 | ) |
| | | | | | | | | | | | | | | | | | | | |
Total Distributions | | | (0.47 | ) | | | (1.57 | ) | | | (1.19 | ) | | | (0.44 | ) | | | (0.52 | ) |
| | | | | | | | | | | | | | | | | | | | |
Net asset value, end of the period | | $ | 19.16 | | | $ | 20.51 | | | $ | 20.07 | | | $ | 15.21 | | | $ | 13.60 | |
| | | | | | | | | | | | | | | | | | | | |
Total return(d) | | | (4.39 | )%(b) | | | 10.12 | % | | | 40.13 | % | | | 15.10 | %(c) | | | (3.48 | )% |
RATIOS TO AVERAGE NET ASSETS: | | | | | | | | | | | | | | | | | | | | |
Net assets, end of the period (000’s) | | $ | 89,284 | | | $ | 35,894 | | | $ | 21,005 | | | $ | 3,090 | | | $ | 1,822 | |
Net expenses | | | 1.98 | % | | | 2.00 | % | | | 2.02 | % | | | 2.06 | % | | | 2.15 | %(e) |
Gross expenses | | | 1.98 | % | | | 2.00 | % | | | 2.02 | % | | | 2.06 | % | | | 2.15 | %(e) |
Net investment income (loss) | | | (0.61 | )%(b) | | | (1.10 | )% | | | (0.89 | )% | | | 0.24 | %(c) | | | (0.83 | )% |
Portfolio turnover rate | | | 32 | % | | | 58 | % | | | 39 | % | | | 65 | % | | | 75 | % |
| (a) | Per share net investment income (loss) has been calculated using the average shares outstanding during the period. |
| (b) | Includes a non-recurring dividend. Without this dividend, net investment loss per share would have been $(0.16), total return would have been (4.68)% and the ratio of net investment loss to average net assets would have been (0.77)%. |
| (c) | Includes non-recurring dividends. Without these dividends, net investment loss per share would have been $(0.08), total return would have been 14.21% and the ratio of net investment loss to average net assets would have been (0.57)%. |
| (d) | A contingent deferred sales charge for Class C shares is not reflected in total return calculations. |
| (e) | Includes fee/expense recovery of 0.01%. |
See accompanying notes to financial statements.
67 |
Financial Highlights (continued)
For a share outstanding throughout each period.
| | | | | | | | | | | | |
| | | Vaughan Nelson Value Opportunity Fund—Class N | |
| | | Year Ended
December 31,
2015 | | | Year Ended
December 31,
2014 | | | Period Ended
December 31,
2013* | |
Net asset value, beginning of the period | | $ | 21.50 | | | $ | 20.76 | | | $ | 17.53 | |
| | | | | | | | | | | | |
INCOME (LOSS) FROM INVESTMENT OPERATIONS: | | | | | | | | | | | | |
Net investment income (loss)(a) | | | 0.11 | (b) | | | (0.00 | )(c) | | | (0.04 | ) |
Net realized and unrealized gain (loss) | | | (0.81 | ) | | | 2.31 | | | | 4.35 | |
| | | | | | | | | | | | |
Total from Investment Operations | | | (0.70 | ) | | | 2.31 | | | | 4.31 | |
| | | | | | | | | | | | |
LESS DISTRIBUTIONS FROM: | | | | | | | | | | | | |
Net investment income | | | (0.07 | ) | | | — | | | | (0.02 | ) |
Net realized capital gains | | | (0.47 | ) | | | (1.57 | ) | | | (1.06 | ) |
| | | | | | | | | | | | |
Total Distributions | | | (0.54 | ) | | | (1.57 | ) | | | (1.08 | ) |
| | | | | | | | | | | | |
Net asset value, end of the period | | $ | 20.26 | | | $ | 21.50 | | | $ | 20.76 | |
| | | | | | | | | | | | |
Total return | | | (3.35 | )%(b) | | | 11.24 | % | | | 24.70 | %(d) |
RATIOS TO AVERAGE NET ASSETS: | | | | | | | | | | | | |
Net assets, end of the period (000’s) | | $ | 65,010 | | | $ | 12,024 | | | $ | 1 | |
Net expenses | | | 0.89 | % | | | 0.91 | %(e) | | | 1.03 | %(f)(g) |
Gross expenses | | | 0.89 | % | | | 0.91 | %(e) | | | 2.07 | %(f) |
Net investment income (loss) | | | 0.50 | %(b) | | | (0.00 | )%(h) | | | (0.33 | )%(f) |
Portfolio turnover rate | | | 32 | % | | | 58 | % | | | 39 | % |
| * | From commencement of operations on May 1, 2013 through December 31, 2013. |
| (a) | Per share net investment income (loss) has been calculated using the average shares outstanding during the period. |
| (b) | Includes a non-recurring dividend. Without this dividend, net investment income per share would have been $0.08, total return would have been (3.59)% and the ratio of net investment income to average net assets would have been 0.35%. |
| (c) | Amount rounds to less than $0.01 per share. |
| (d) | Had certain expenses not been waived/reimbursed during the period, total returns would have been lower. Periods less than one year are not annualized. |
| (e) | Includes fee/expense recovery of less than 0.01%. |
| (f) | Computed on an annualized basis for periods less than one year. |
| (g) | The investment adviser agreed to waive its fees and/or reimburse a portion of the Fund’s expenses during the period. Without this waiver/reimbursement, expenses would have been higher. |
| (h) | Amount rounds to less than 0.01%. |
See accompanying notes to financial statements.
| 68
Financial Highlights (continued)
For a share outstanding throughout each period.
| | | | | | | | | | | | | | | | | | | | |
| | | Vaughan Nelson Value Opportunity Fund—Class Y | |
| | | Year Ended
December 31,
2015 | | | Year Ended
December 31,
2014 | | | Year Ended
December 31,
2013 | | | Year Ended
December 31,
2012 | | | Year Ended
December 31,
2011 | |
Net asset value, beginning of the period | | $ | 21.52 | | | $ | 20.78 | | | $ | 15.57 | | | $ | 13.89 | | | $ | 14.80 | |
| | | | | | | | | | | | | | | | | | | | |
INCOME (LOSS) FROM INVESTMENT OPERATIONS: | | | | | | | | | | | | | | | | | | | | |
Net investment income (loss)(a) | | | 0.09 | (b) | | | (0.02 | ) | | | 0.02 | | | | 0.18 | (c) | | | 0.03 | |
Net realized and unrealized gain (loss) | | | (0.82 | ) | | | 2.33 | | | | 6.39 | | | | 2.08 | | | | (0.41 | ) |
| | | | | | | | | | | | | | | | | | | | |
Total from Investment Operations | | | (0.73 | ) | | | 2.31 | | | | 6.41 | | | | 2.26 | | | | (0.38 | ) |
| | | | | | | | | | | | | | | | | | | | |
LESS DISTRIBUTIONS FROM: | | | | | | | | | | | | | | | | | | | | |
Net investment income | | | (0.05 | ) | | | — | | | | (0.01 | ) | | | (0.18 | ) | | | (0.01 | ) |
Net realized capital gains | | | (0.47 | ) | | | (1.57 | ) | | | (1.19 | ) | | | (0.40 | ) | | | (0.52 | ) |
| | | | | | | | | | | | | | | | | | | | |
Total Distributions | | | (0.52 | ) | | | (1.57 | ) | | | (1.20 | ) | | | (0.58 | ) | | | (0.53 | ) |
| | | | | | | | | | | | | | | | | | | | |
Net asset value, end of the period | | $ | 20.27 | | | $ | 21.52 | | | $ | 20.78 | | | $ | 15.57 | | | $ | 13.89 | |
| | | | | | | | | | | | | | | | | | | | |
Total return | | | (3.47 | )%(b) | | | 11.23 | % | | | 41.52 | % | | | 16.28 | %(c) | | | (2.53 | )% |
RATIOS TO AVERAGE NET ASSETS: | | | | | | | | | | | | | | | | | | | | |
Net assets, end of the period (000’s) | | $ | 1,133,634 | | | $ | 656,071 | | | $ | 360,820 | | | $ | 163,589 | | | $ | 109,419 | |
Net expenses | | | 0.98 | % | | | 1.00 | % | | | 1.02 | % | | | 1.06 | % | | | 1.15 | %(d) |
Gross expenses | | | 0.98 | % | | | 1.00 | % | | | 1.02 | % | | | 1.06 | % | | | 1.15 | %(d) |
Net investment income (loss) | | | 0.39 | %(b) | | | (0.10 | )% | | | 0.12 | % | | | 1.22 | %(c) | | | 0.23 | % |
Portfolio turnover rate | | | 32 | % | | | 58 | % | | | 39 | % | | | 65 | % | | | 75 | % |
| (a) | Per share net investment income (loss) has been calculated using the average shares outstanding during the period. |
| (b) | Includes a non-recurring dividend. Without this dividend, net investment income per share would have been $0.05, total return would have been (3.70)% and the ratio of net investment income to average net assets would have been 0.20%. |
| (c) | Includes non-recurring dividends. Without these dividends, net investment income per share would have been $0.06, total return would have been 15.41% and the ratio of net investment income to average net assets would have been 0.42%. |
| (d) | Includes fee/expense recovery of 0.01%. |
See accompanying notes to financial statements.
69 |
Notes to Financial Statements
December 31, 2015
1. Organization. Natixis Funds Trust I and Natixis Funds Trust II (the “Trusts” and each a “Trust”) are each organized as a Massachusetts business trust. Each Trust is registered under the Investment Company Act of 1940, as amended (the “1940 Act”), as an open-end management investment company. Each Declaration of Trust permits the Board of Trustees to authorize the issuance of an unlimited number of shares of the Trust in multiple series. The financial statements for certain funds of the Trusts are presented in separate reports. The following funds (individually, a “Fund” and collectively, the “Funds”) are included in this report:
Natixis Funds Trust I:
CGM Advisor Targeted Equity Fund (the “Targeted Equity Fund”)
Natixis Oakmark International Fund
Vaughan Nelson Small Cap Value Fund (the “Small Cap Value Fund”)
Natixis Funds Trust II:
Natixis Oakmark Fund
Vaughan Nelson Value Opportunity Fund (the “Value Opportunity Fund”)
Each Fund is a diversified investment company.
Each Fund offers Class A and Class C shares. Targeted Equity Fund, Small Cap Value Fund, Natixis Oakmark Fund and Value Opportunity Fund also offer Class Y shares. In addition, Value Opportunity Fund offers Class N shares. Effective October 12, 2007, Class B shares of Targeted Equity Fund, Natixis Oakmark Fund and Small Cap Value Fund are no longer offered. Existing Class B shareholders may continue to reinvest dividends into Class B shares and exchange their Class B shares for Class B shares of other Natixis Funds subject to existing exchange privileges as described in the prospectus.
Effective July 31, 2009, the Small Cap Value Fund was closed to new investors. The Fund continues to offer Class A, Class C and Class Y shares to existing investors. The Fund, in its sole discretion, may permit an investor in another Vaughan Nelson-managed fund or product that follows the same investment strategy as the Fund to transfer assets from that fund or product into the Fund.
Class A shares are sold with a maximum front-end sales charge of 5.75%. Class B shares do not pay a front-end sales charge; however, they are charged higher Rule 12b-1 fees, and are subject to a contingent deferred sales charge (“CDSC”) if such shares are redeemed within six years of purchase. After eight years of ownership, Class B shares convert to Class A shares. Class C shares do not pay a front-end sales charge, do not convert to any other class of shares, pay higher Rule 12b-1 fees than Class A shares and may be subject to a CDSC of 1.00% if those shares are redeemed within one year of acquisition, except for reinvested distributions. Class N and Class Y shares do not pay a front-end sales charge, a CDSC or Rule 12b-1 fees. Effective November 2, 2015, investors with an initial minimum investment of $1,000,000. Class Y
| 70
Notes to Financial Statements (continued)
December 31, 2015
shares are intended for institutional investors with a minimum initial investment of $100,000, though some categories of investors are exempted from the minimum investment amount as outlined in the Funds’ prospectus.
Most expenses can be directly attributed to a Fund. Expenses which cannot be directly attributed to a Fund are generally apportioned based on the relative net assets of each of the funds in Natixis Funds Trust I, Natixis Funds Trust II, Natixis Funds Trust IV, Gateway Trust (“Natixis Funds Trusts”), Loomis Sayles Funds I and Loomis Sayles Funds II (“Loomis Sayles Funds Trusts”). Expenses of a Fund are borne pro rata by the holders of each class of shares, except that each class bears expenses unique to that class (including the Rule 12b-1 service and distribution fees and, for Value Opportunity Fund Class A, Class C and Class Y, collectively, and Class N individually, transfer agent fees). In addition, each class votes as a class only with respect to its own Rule 12b-1 Plan. Shares of each class would receive their pro rata share of the net assets of a Fund if the Fund were liquidated. The Trustees approve separate distributions from net investment income on each class of shares.
2. Significant Accounting Policies. The following is a summary of significant accounting policies consistently followed by each Fund in the preparation of its financial statements. The Funds’ financial statements follow the accounting and reporting guidelines provided for investment companies and are prepared in accordance with accounting principles generally accepted in the United States of America which require the use of management estimates that affect the reported amounts and disclosures in the financial statements. Actual results could differ from those estimates. Management has evaluated the events and transactions subsequent to year-end through the date the financial statements were issued and has determined that there were no material events that would require disclosure in the Funds’ financial statements, except as disclosed in Note 13.
a. Valuation. Fund securities and other investments are valued at market value based on market quotations obtained or determined by independent pricing services recommended by the adviser and subadviser and approved by the Board of Trustees. Fund securities and other investments for which market quotations are not readily available are valued at fair value as determined in good faith by the adviser or subadviser pursuant to procedures approved by the Board of Trustees, as described below. Market value is determined as follows:
Listed equity securities (including shares of closed-end investment companies and exchange-traded funds) are valued at the last sale price quoted on the exchange where they are traded most extensively or, if there is no reported sale during the day, the closing bid quotation. Securities traded on the NASDAQ Global Select Market, NASDAQ Global Market and NASDAQ Capital Market are valued at the NASDAQ Official Closing Price (“NOCP”), or if lacking an NOCP, at the most recent bid quotations on the applicable
71 |
Notes to Financial Statements (continued)
December 31, 2015
NASDAQ Market. Unlisted equity securities (except unlisted preferred equity securities) are valued at the last sale price quoted in the market where they are traded most extensively or, if there is no reported sale during the day, the closing bid quotation as reported by an independent pricing service. If there is no last sale price or closing bid quotation available, unlisted equity securities will be valued using evaluated bids furnished by an independent pricing service, if available. In some foreign markets, an official close price and a last sale price may be available from the foreign exchange or market. In those cases, the official close price is used. Debt securities and unlisted preferred equity securities are valued based on evaluated bids furnished to the Funds by an independent pricing service or bid prices obtained from broker-dealers. Broker-dealer bid prices may be used to value debt and unlisted equity securities where an independent pricing service is unable to price a security or where an independent pricing service does not provide a reliable price for the security. Forward foreign currency contracts are valued utilizing interpolated rates determined based on information provided by an independent pricing service.
Fund securities and other investments for which market quotations are not readily available are valued at fair value as determined in good faith by the adviser or subadviser pursuant to procedures approved by the Board of Trustees. The Funds may also value securities and other investments at fair value in other circumstances such as when extraordinary events occur after the close of a foreign market but prior to the close of the New York Stock Exchange (“NYSE”). This may include situations relating to a single issuer (such as a declaration of bankruptcy or a delisting of the issuer’s security from the primary market on which it has traded) as well as events affecting the securities markets in general (such as market disruptions or closings and significant fluctuations in U.S. and/or foreign markets). When fair valuing its securities or other investments, the Funds may, among other things, use modeling tools or other processes that may take into account factors such as securities or other market activity and/or significant events that occur after the close of the foreign market and before the time the Fund’s net asset value (“NAV”) is calculated. Fair value pricing may require subjective determinations about the value of a security, and fair values used to determine a Fund’s NAV may differ from quoted or published prices, or from prices that are used by others, for the same securities. In addition, the use of fair value pricing may not always result in adjustments to the prices of securities held by a Fund.
As of December 31, 2015, securities of the funds included in net assets (reflected at absolute value) were fair valued as follows:
| | | | | | | | |
Fund | | Equity
securities1 | | | Percentage of
Net Assets | |
Natixis Oakmark International Fund | | $ | 967,833,928 | | | | 90.9 | % |
| 1 | Certain foreign equity securities were fair valued pursuant to procedures approved by the Board of Trustees as events occurring after the close of the foreign market were believed to materially affect the value of those securities. |
| 72
Notes to Financial Statements (continued)
December 31, 2015
b. Investment Transactions and Related Investment Income. Investment transactions are accounted for on a trade date plus one day basis for daily NAV calculation. However, for financial reporting purposes, investment transactions are reported on trade date. Dividend income is recorded on ex-dividend date, or in the case of certain foreign securities, as soon as a Fund is notified, and interest income is recorded on an accrual basis. Interest income is increased by the accretion of discount and decreased by the amortization of premium. Distributions received from investments in securities that represent a return of capital or capital gain are recorded as a reduction of cost of investments or as a realized gain, respectively. The calendar year-end amounts of ordinary income, capital gains, and return of capital included in distributions received from the Funds’ investments in real estate investment trusts (“REITs”) are reported to the Funds after the end of the fiscal year; accordingly, the Funds estimate these amounts for accounting purposes until the characterization of REIT distributions is reported to the Funds after the end of the fiscal year. Estimates are based on the most recent REIT distribution information available. In determining net gain or loss on securities sold, the cost of securities has been determined on an identified cost basis. Investment income, non-class specific expenses and realized and unrealized gains and losses are allocated on a pro rata basis to each class based on the relative net assets of each class to the total net assets of the Fund.
c. Foreign Currency Translation. The books and records of the Funds are maintained in U.S. dollars. The values of securities, currencies and other assets and liabilities denominated in currencies other than U.S. dollars are translated into U.S. dollars based upon foreign exchange rates prevailing at the end of the period. Purchases and sales of investment securities, income and expenses are translated into U.S. dollars on the respective dates of such transactions.
Net realized foreign exchange gains or losses arise from sales of foreign currency, changes in exchange rates between the trade and settlement dates on securities transactions and the difference between the amounts of dividends, interest and foreign withholding taxes recorded on the Fund’s books and the U.S. dollar equivalent of the amounts actually received or paid. Net unrealized foreign exchange gains or losses arise from changes in the value of assets and liabilities, other than investment securities, as of the end of the fiscal period, resulting from changes in exchange rates. Net realized foreign exchange gains or losses and the net change in unrealized foreign exchange gains or losses are disclosed in the Statements of Operations.
The values of investment securities are presented at the foreign exchange rates prevailing at the end of the period for financial reporting purposes. Net realized and unrealized gains or losses on investments reported in the Statements of Operations reflect gains or losses resulting from changes in exchange rates and fluctuations which arise due to changes in market prices of investment securities.
73 |
Notes to Financial Statements (continued)
December 31, 2015
The Funds may use foreign currency exchange contracts to facilitate transactions in foreign-denominated investments. Losses may arise from changes in the value of the foreign currency or if the counterparties do not perform under the contracts’ terms.
d. Forward Foreign Currency Contracts. Certain Funds may enter into forward foreign currency contracts, including forward foreign cross currency contracts, to acquire exposure to foreign currencies or to hedge the Fund’s investments against currency fluctuation. A contract can also be used to offset a previous contract. These contracts involve market risk in excess of the unrealized gain or loss reflected in the Funds’ Statements of Assets and Liabilities. The U.S. dollar value of the currencies a Fund has committed to buy or sell represents the aggregate exposure to each currency a Fund has acquired or hedged through currency contracts outstanding at period end. Gains or losses are recorded for financial statement purposes as unrealized until settlement date. Contracts are traded over-the-counter directly with a counterparty. Risks may arise upon entering into these contracts from the potential inability of counterparties to meet the terms of their contracts and from unanticipated movements in the value of a foreign currency relative to the U.S. dollar. Certain contracts may require the movement of cash and/or securities as collateral for the Fund’s or counterparty’s net obligations under the contracts.
e. Federal and Foreign Income Taxes. The Trusts treat each Fund as a separate entity for federal income tax purposes. Each Fund intends to meet the requirements of the Internal Revenue Code of 1986, as amended, applicable to regulated investment companies, and to distribute to its shareholders substantially all of its net investment income and any net realized capital gains at least annually. Management has performed an analysis of each Fund’s tax positions for the open tax years as of December 31, 2015 and has concluded that no provisions for income tax are required. The Funds’ federal tax returns for the prior three fiscal years remain subject to examination by the Internal Revenue Service. Management is not aware of any events that are reasonably possible to occur in the next twelve months that would result in the amounts of any unrecognized tax benefits significantly increasing or decreasing for the Funds. However, management’s conclusions regarding tax positions taken may be subject to review and adjustment at a later date based on factors including, but not limited to, new tax laws and accounting regulations and interpretations thereof.
A Fund may be subject to foreign withholding taxes on investment income and taxes on capital gains on investments that are accrued and paid based upon the Fund’s understanding of the tax rules and regulations that exist in the countries in which the Fund invests. Foreign withholding taxes on dividend and interest income are reflected on the Statements of Operations as a reduction of investment income, net of amounts eligible to be reclaimed. Dividends and interest receivable on the Statements of Assets and Liabilities are net of foreign withholding taxes. Foreign withholding taxes where reclaims have been or will be filed are reflected on the Statements of Assets and
| 74
Notes to Financial Statements (continued)
December 31, 2015
Liabilities as tax reclaims receivable. Capital gains taxes paid are included in net realized gain (loss) on investments in the Statements of Operations. Accrued but unpaid capital gains taxes are reflected as foreign taxes payable on the Statements of Assets and Liabilities, if applicable, and reduce unrealized gains on investments. In the event that realized gains on investments are subsequently offset by realized losses, taxes paid on realized gains may be returned to a Fund. Such amounts, if applicable, are reflected as foreign tax rebates receivable on the Statements of Assets and Liabilities and are recorded as a realized gain when received.
f. Dividends and Distributions to Shareholders. Dividends and distributions are recorded on ex-dividend date. The timing and characterization of certain income and capital gain distributions are determined in accordance with federal tax regulations, which may differ from accounting principles generally accepted in the United States of America. Permanent differences are primarily due to differing treatments for book and tax purposes of items such as return of capital and capital gain distributions received, foreign currency gains and losses and distribution redesignations. Permanent book and tax basis differences relating to shareholder distributions, net investment income and net realized gains will result in reclassifications to capital accounts reported on the Statements of Assets and Liabilities. Temporary differences between book and tax distributable earnings are primarily due to deferred Trustees’ fees, wash sales, forward foreign currency contracts mark-to-market and return of capital distributions received. Amounts of income and capital gain available to be distributed on a tax basis are determined annually, and at other times during the Funds’ fiscal year as may be necessary to avoid knowingly declaring and paying a return of capital distribution. Distributions from net investment income and short-term capital gains are considered to be distributed from ordinary income for tax purposes.
75 |
Notes to Financial Statements (continued)
December 31, 2015
The tax characterization of distributions is determined on an annual basis. The tax character of distributions paid to shareholders during the years ended December 31, 2015 and 2014 were as follows:
| | | | | | | | | | | | | | | | | | | | | | | | |
| | | 2015 Distributions Paid From: | | | 2014 Distributions Paid From: | |
Fund | | Ordinary
Income | | | Long-Term
Capital Gains | | | Total | | | Ordinary
Income | | | Long-Term
Capital Gains | | | Total | |
Targeted Equity Fund | | $ | 7,642,183 | | | $ | 5,822,311 | | | $ | 13,464,494 | | | $ | 44,618,075 | | | $ | 29,445,740 | | | $ | 74,063,815 | |
Natixis Oakmark Fund | | | 2,201,492 | | | | 8,169,871 | | | | 10,371,363 | | | | 5,775,346 | | | | 31,849,647 | | | | 37,624,993 | |
Natixis Oakmark International Fund | | | 19,403,163 | | | | 6,977,702 | | | | 26,380,865 | | | | 19,465,727 | | | | 13,211,564 | | | | 32,677,291 | |
Small Cap Value Fund | | | 8,983,694 | | | | 36,747,925 | | | | 45,731,619 | | | | 3,773,025 | | | | 49,311,407 | | | | 53,084,432 | |
Value Opportunity Fund | | | 8,555,915 | | | | 23,246,983 | | | | 31,802,898 | | | | 7,850,454 | | | | 45,086,282 | | | | 52,936,736 | |
Differences between these amounts and those reported in the Statements of Changes in Net Assets are primarily attributable to different book and tax treatment for short-term capital gains.
As of December 31, 2015, the components of distributable earnings on a tax basis were as follows:
| | | | | | | | | | | | | | | | | | | | |
| | | Targeted
Equity Fund | | | Natixis
Oakmark
Fund | | | Natixis
Oakmark
International
Fund | | | Small Cap
Value Fund | | | Value
Opportunity
Fund | |
Undistributed ordinary income | | $ | 18,519 | | | $ | 286,629 | | | $ | 4,039,339 | | | $ | — | | | $ | 127,026 | |
Undistributed long-term capital gains | | | — | | | | 5,434,444 | | | | — | | | | 5,707,255 | | | | 41,413,233 | |
| | | | | | | | | | | | | | | | | | | | |
Total undistributed earnings | | | 18,519 | | | | 5,721,073 | | | | 4,039,339 | | | | 5,707,255 | | | | 41,540,259 | |
| | | | | | | | | | | | | | | | | | | | |
Late-year ordinary and post-October capital loss deferrals* | | | (1,086,223 | ) | | | — | | | | (2,438,773 | ) | | | (1,710,621 | ) | | | — | |
| | | | | | | | | | | | | | | | | | | | |
Unrealized appreciation (depreciation) | | | 49,411,941 | | | | 11,499,535 | | | | (174,434,562 | ) | | | 22,403,992 | | | | (38,465,512 | ) |
| | | | | | | | | | | | | | | | | | | | |
Total accumulated earnings (losses) | | $ | 48,344,237 | | | $ | 17,220,608 | | | $ | (172,833,996 | ) | | $ | 26,400,626 | | | $ | 3,074,747 | |
| | | | | | | | | | | | | | | | | | | | |
| * | Under current tax law, capital losses, foreign currency losses, and losses on passive foreign investment companies and contingent payment debt instruments after October 31 or December 31, as applicable, may be deferred and treated as occurring on the first day of the following taxable year. |
| 76
Notes to Financial Statements (continued)
December 31, 2015
g. Repurchase Agreements. Each Fund may enter into repurchase agreements, under the terms of a Master Repurchase Agreement, under which each Fund acquires securities as collateral and agrees to resell the securities at an agreed upon time and at an agreed upon price. It is each Fund’s policy that the market value of the collateral for repurchase agreements be at least equal to 102% of the repurchase price, including interest. Certain repurchase agreements are tri-party arrangements whereby the collateral is held in a segregated account for the benefit of the Fund and on behalf of the counterparty. Repurchase agreements could involve certain risks in the event of default or insolvency of the counterparty, including possible delays or restrictions upon a Fund’s ability to dispose of the underlying securities. As of December 31, 2015, each Fund, as applicable, had investments in repurchase agreements for which the value of the related collateral exceeded the value of the repurchase agreement. The gross value of repurchase agreements is included in the Statements of Assets and Liabilities for financial reporting purposes.
h. Securities Lending. Certain Funds have entered into an agreement with State Street Bank and Trust Company (“State Street Bank”), as agent of the Funds, to lend securities to certain designated borrowers. The loans are collateralized with cash or securities in an amount equal to at least 105% or 102% of the market value (including accrued interest) of the loaned international or domestic securities, respectively, when the loan is initiated. Thereafter, the value of the collateral must remain at least 102% of the market value (including accrued interest) of loaned securities for U.S. equities and U.S. corporate debt; at least 105% of the market value (including accrued interest) of loaned securities for non-U.S. equities; and at least 100% of the market value (including accrued interest) of loaned securities for U.S. Government securities, sovereign debt issued by non-U.S. Governments and non-U.S. corporate debt. In the event that the market value of the collateral falls below the required percentages described above, the borrower will deliver additional collateral on the next business day. As with other extensions of credit, the Funds may bear the risk of loss with respect to the investment of the collateral. The Funds invest cash collateral in short-term investments, a portion of the income from which is remitted to the borrowers and the remainder allocated between the Funds and State Street Bank as lending agent.
For the year ended December 31, 2015, none of the Funds had loaned securities under this agreement.
i. Indemnifications. Under the Trusts’ organizational documents, their officers and Trustees are indemnified against certain liabilities arising out of the performance of their duties to the Funds. Additionally, in the normal course of business, the Funds enter into contracts with service providers that contain general indemnification clauses. The Funds’ maximum exposure under these arrangements is unknown as this would involve future claims that may be made against the Funds that have not yet occurred. However, based on experience, the Funds expect the risk of loss to be remote.
77 |
Notes to Financial Statements (continued)
December 31, 2015
3. Fair Value Measurements. In accordance with accounting standards related to fair value measurements and disclosures, the Funds have categorized the inputs utilized in determining the value of each Fund’s assets or liabilities. These inputs are summarized in the three broad levels listed below:
| | • | | Level 1 – quoted prices in active markets for identical assets or liabilities; |
| | • | | Level 2 – prices determined using other significant inputs that are observable either directly, or indirectly through corroboration with observable market data (which could include quoted prices for similar assets or liabilities, interest rates, credit risk, etc.); and |
| | • | | Level 3 – prices determined using significant unobservable inputs when quoted prices or observable inputs are unavailable such as when there is little or no market activity for an asset or liability (unobservable inputs reflect each Fund’s own assumptions in determining the fair value of assets or liabilities and would be based on the best information available). |
The inputs or methodology used for valuing securities are not necessarily an indication of the risk associated with investing in those securities.
The following is a summary of the inputs used to value the Funds’ investments as of December 31, 2015, at value:
CGM Advisor Targeted Equity Fund
Asset Valuation Inputs
| | | | | | | | | | | | | | | | |
Description | | Level 1 | | | Level 2 | | | Level 3 | | | Total | |
Common Stocks(a) | | $ | 390,451,720 | | | $ | — | | | $ | — | | | $ | 390,451,720 | |
Short-Term Investments | | | — | | | | 22,390,000 | | | | — | | | | 22,390,000 | |
| | | | | | | | | | | | | | | | |
Total | | $ | 390,451,720 | | | $ | 22,390,000 | | | $ | — | | | $ | 412,841,720 | |
| | | | | | | | | | | | | | | | |
| (a) | Details of the major categories of the Fund’s investments are reflected within the Portfolio of Investments. |
For the year ended December 31, 2015, there were no transfers among Levels 1, 2 and 3.
Natixis Oakmark Fund
Asset Valuation Inputs
| | | | | | | | | | | | | | | | |
Description | | Level 1 | | | Level 2 | | | Level 3 | | | Total | |
Common Stocks(a) | | $ | 266,029,711 | | | $ | — | | | $ | — | | | $ | 266,029,711 | |
Short-Term Investments | | | — | | | | 3,795,407 | | | | — | | | | 3,795,407 | |
| | | | | | | | | | | | | | | | |
Total | | $ | 266,029,711 | | | $ | 3,795,407 | | | $ | — | | | $ | 269,825,118 | |
| | | | | | | | | | | | | | | | |
| (a) | Details of the major categories of the Fund’s investments are reflected within the Portfolio of Investments. |
For the year ended December 31, 2015, there were no transfers among Levels 1, 2 and 3.
| 78
Notes to Financial Statements (continued)
December 31, 2015
Natixis Oakmark International Fund
Asset Valuation Inputs
| | | | | | | | | | | | | | | | |
Description | | Level 1 | | | Level 2 | | | Level 3 | | | Total | |
Common Stocks | | | | | | | | | | | | | | | | |
Australia | | $ | — | | | $ | 33,505,730 | | | $ | — | | | $ | 33,505,730 | |
China | | | 13,856,632 | | | | — | | | | — | | | | 13,856,632 | |
France | | | — | | | | 145,317,902 | | | | — | | | | 145,317,902 | |
Germany | | | — | | | | 99,795,522 | | | | — | | | | 99,795,522 | |
Hong Kong | | | 20,208,720 | | | | — | | | | — | | | | 20,208,720 | |
Indonesia | | | — | | | | 22,402,185 | | | | — | | | | 22,402,185 | |
Ireland | | | — | | | | 17,749,186 | | | | — | | | | 17,749,186 | |
Israel | | | 1,082,354 | | | | — | | | | — | | | | 1,082,354 | |
Italy | | | 18,325,211 | | | | 36,729,671 | | | | — | | | | 55,054,882 | |
Japan | | | — | | | | 217,335,224 | | | | — | | | | 217,335,224 | |
Korea | | | — | | | | 27,603,138 | | | | — | | | | 27,603,138 | |
Mexico | | | 10,750,671 | | | | — | | | | — | | | | 10,750,671 | |
Netherlands | | | — | | | | 24,719,183 | | | | — | | | | 24,719,183 | |
Sweden | | | — | | | | 37,889,329 | | | | — | | | | 37,889,329 | |
Switzerland | | | — | | | | 165,148,712 | | | | — | | | | 165,148,712 | |
United Kingdom | | | — | | | | 139,638,146 | | | | — | | | | 139,638,146 | |
United States | | | 22,662,762 | | | | — | | | | — | | | | 22,662,762 | |
| | | | | | | | | | | | | | | | |
Total Common Stocks | | | 86,886,350 | | | | 967,833,928 | | | | — | | | | 1,054,720,278 | |
| | | | | | | | | | | | | | | | |
Short-Term Investments | | | — | | | | 2,029,248 | | | | — | | | | 2,029,248 | |
Forward Foreign Currency Contracts (unrealized appreciation) | | | — | | | | 1,458,551 | | | | — | | | | 1,458,551 | |
| | | | | | | | | | | | | | | | |
Total | | $ | 86,886,350 | | | $ | 971,321,727 | | | $ | — | | | $ | 1,058,208,077 | |
| | | | | | | | | | | | | | | | |
Liability Valuation Inputs
| | | | | | | | | | | | | | | | |
Description | | Level 1 | | | Level 2 | | | Level 3 | | | Total | |
Forward Foreign Currency Contracts
(unrealized depreciation) | | $ | — | | | | $(7,392) | | | $ | — | | | | $(7,392) | |
| | | | | | | | | | | | | | | | |
A common stock valued at $19,835,131 was transferred from Level 2 to Level 1 during the period ended December 31, 2015. At December 31, 2014, this security was fair valued pursuant to procedures approved by the Board of Trustees as events occurring after the close of the foreign market were believed to materially affect the value of the security. At December 31, 2015 this security was valued at the market price in the foreign market in accordance with the Fund’s valuation policies.
All transfers are recognized as of the beginning of the reporting period.
79 |
Notes to Financial Statements (continued)
December 31, 2015
Vaughan Nelson Small Cap Value Fund
Asset Valuation Inputs
| | | | | | | | | | | | | | | | |
Description | | Level 1 | | | Level 2 | | | Level 3 | | | Total | |
Common Stocks(a) | | $ | 286,175,699 | | | $ | — | | | $ | — | | | $ | 286,175,699 | |
Exchange-Traded Funds | | | 3,328,462 | | | | — | | | | — | | | | 3,328,462 | |
Short-Term Investments | | | — | | | | 16,149,455 | | | | — | | | | 16,149,455 | |
| | | | | | | | | | | | | | | | |
Total | | $ | 289,504,161 | | | $ | 16,149,455 | | | $ | — | | | $ | 305,653,616 | |
| | | | | | | | | | | | | | | | |
| (a) | Details of the major categories of the Fund’s investments are reflected within the Portfolio of Investments. |
For the year ended December 31, 2015, there were no transfers among Levels 1, 2 and 3.
Vaughan Nelson Value Opportunity Fund
Asset Valuation Inputs
| | | | | | | | | | | | | | | | |
Description | | Level 1 | | | Level 2 | | | Level 3 | | | Total | |
Common Stocks(a) | | $ | 1,357,036,458 | | | $ | — | | | $ | — | | | $ | 1,357,036,458 | |
Closed-End Investment Companies | | | 32,353,913 | | | | — | | | | — | | | | 32,353,913 | |
Short-Term Investments | | | — | | | | 34,085,699 | | | | — | | | | 34,085,699 | |
| | | | | | | | | | | | | | | | |
Total | | $ | 1,389,390,371 | | | $ | 34,085,699 | | | $ | — | | | $ | 1,423,476,070 | |
| | | | | | | | | | | | | | | | |
| (a) | Details of the major categories of the Fund’s investments are reflected within the Portfolio of Investments. |
For the year ended December 31, 2015, there were no transfers among Levels 1, 2 and 3.
4. Derivatives. Derivative instruments are defined as financial instruments whose value and performance are based on the value and performance of an underlying asset, reference rate or index. Derivative instruments that Natixis Oakmark International Fund used during the period include forward foreign currency contracts.
The Fund is subject to the risk that changes in foreign currency exchange rates will have an unfavorable effect on the value of Fund assets denominated in foreign currencies. The Fund may enter into forward foreign currency contracts for hedging purposes to protect the value of the Fund’s holdings of foreign securities. During the year ended December 31, 2015, the Fund engaged in forward foreign currency transactions for hedging purposes.
The following is a summary of derivative instruments for Natixis Oakmark International Fund as of December 31, 2015, as reflected within the Statements of Assets and Liabilities:
| | |
Assets | | Unrealized appreciation on forward foreign currency contracts |
Over-the-counter asset derivatives | | |
Foreign exchange contracts | | $1,458,551 |
| 80
Notes to Financial Statements (continued)
December 31, 2015
| | |
Liabilities | | Unrealized depreciation on forward
foreign currency contracts |
Over-the-counter liability derivatives | | |
Foreign exchange contracts | | $(7,392) |
Transactions in derivative instruments for Natixis Oakmark International Fund during the year ended December 31, 2015, as reflected within the Statements of Operations were as follows:
| | |
Net Realized Gain on: | | Foreign currency transactions1 |
| Foreign exchange contracts | | $5,325,155 |
| | |
Net Change in Unrealized Appreciation
(Depreciation) on: | | Foreign currency translations1 |
| Foreign exchange contracts | | $(2,669,181) |
| 1 | Represents realized gain and change in unrealized appreciation (depreciation), respectively, for forward foreign currency contracts during the period. Does not include other foreign currency gains or losses included in the Statements of Operations. |
As the Fund values its derivatives at fair value and recognizes changes in fair value through the Statement of Operations, it does not qualify for hedge accounting under authoritative guidance for derivative instruments. The Fund’s investments in derivatives may represent an economic hedge; however, they are considered to be non-hedge transactions for the purpose of these disclosures.
The volume of forward foreign currency contract activity, as a percentage of net assets, for Natixis Oakmark International Fund, based on gross month-end notional amounts outstanding during the period, including long and short positions at absolute value, was as follows for the year ended December 31, 2015:
| | | | |
Natixis Oakmark International Fund | | Forwards | |
Average Notional Amount Outstanding | | | 5.83 | % |
Highest Notional Amount Outstanding | | | 10.26 | % |
Lowest Notional Amount Outstanding | | | 3.35 | % |
Notional Amount Outstanding as of
December 31, 2015 | | | 3.83 | % |
Notional amounts outstanding at the end of the prior period are included in the average notional amount outstanding.
Unrealized gain and/or loss on open forwards is recorded in the Statements of Assets and Liabilities. The aggregate notional values of forward contracts are not recorded in the Statements of Assets and Liabilities, and therefore are not included in the Fund’s net assets.
81 |
Notes to Financial Statements (continued)
December 31, 2015
The Fund enters into over-the-counter derivatives, including forward foreign currency contracts, pursuant to an International Swaps and Derivatives Association, Inc. (“ISDA”) agreement between the Fund and its counterparty. ISDA agreements typically contain master netting provisions in the event of a default or other termination event. Master netting provisions allow the Fund and the counterparty, in the event of a default or other termination event, to offset amounts owed by each related to derivative contracts to one net amount payable by either the Fund or the counterparty. For financial reporting purposes, the Fund does not offset derivative assets and liabilities on the Statements of Assets and Liabilities.
As of December 31, 2015, gross amounts of derivative assets and liabilities not offset in the Statement of Assets and Liabilities and the related net amounts after taking into account master netting arrangements, by counterparty, are as follows:
Natixis Oakmark International Fund
| | | | | | | | | | | | |
Counterparty | | Gross Amounts
of Assets | | | Offset
Amount | | | Net
Amount | |
State Street Bank and Trust Company | | $ | 1,458,551 | | | $ | (7,392 | ) | | $ | 1,451,159 | |
| | | |
Counterparty | | Gross Amounts
of Liabilities | | | Offset
Amount | | | Net
Amount | |
State Street Bank and Trust Company | | $ | (7,392 | ) | | $ | 7,392 | | | $ | — | |
Counterparty risk is managed based on policies and procedures established by each Fund’s adviser. Such policies and procedures may include, but are not limited to, minimum counterparty credit rating requirements and monitoring of counterparty credit default swap spreads. Based on balances reflected on the Fund’s Statement of Assets and Liabilities, the following table shows (i) the maximum amount of loss due to credit risk that, based on the gross fair value of the financial instrument, the Fund would incur if parties to the relevant financial instruments failed completely to perform according to the terms of the contracts and ii) the amount of loss that the Fund would incur after taking into account master netting provisions pursuant to ISDA agreements, as of December 31, 2015:
| | | | | | | | |
Fund | | Maximum Amount
of Loss - Gross | | | Maximum Amount
of Loss - Net | |
Natixis Oakmark International Fund | | $ | 1,458,551 | | | $ | 1,451,159 | |
| 82
Notes to Financial Statements (continued)
December 31, 2015
5. Purchases and Sales of Securities. For the year ended December 31, 2015, purchases and sales of securities (excluding short-term investments and U.S. Government/Agency securities and including paydowns) were as follows:
| | | | | | | | |
Fund | | Purchases | | | Sales | |
Targeted Equity Fund | | $ | 686,802,536 | | | $ | 792,692,783 | |
Natixis Oakmark Fund | | | 77,386,099 | | | | 62,954,599 | |
Natixis Oakmark International Fund | | | 801,775,683 | | | | 563,891,836 | |
Small Cap Value Fund | | | 196,269,288 | | | | 221,770,354 | |
Value Opportunity Fund | | | 1,029,794,707 | | | | 332,887,637 | |
6. Management Fees and Other Transactions with Affiliates.
a. Management Fees. NGAM Advisors, L.P. (“NGAM Advisors”), serves as investment adviser to each Fund except the Targeted Equity Fund. Capital Growth Management Limited Partnership (“CGM”) is the investment adviser to the Targeted Equity Fund. Under the terms of the management agreements, each Fund pays a management fee at the following annual rates, calculated daily and payable monthly, based on each Fund’s average daily net assets:
| | | | | | | | | | | | | | | | | | | | | | | | |
| | | Percentage of Average Daily Net Assets | |
Fund | | First $200 million | | | Next $300 million | | | Next $500 million | | | Next $500 million | | | Next $500 million | | | Over $2 billion | |
Targeted Equity Fund | | | 0.75 | % | | | 0.70 | % | | | 0.65 | % | | | 0.65 | % | | | 0.65 | % | | | 0.60 | % |
Natixis Oakmark Fund | | | 0.70 | % | | | 0.65 | % | | | 0.60 | % | | | 0.60 | % | | | 0.60 | % | | | 0.60 | % |
Natixis Oakmark International Fund | | | 0.85 | % | | | 0.85 | % | | | 0.85 | % | | | 0.85 | % | | | 0.85 | % | | | 0.85 | % |
Small Cap Value Fund | | | 0.90 | % | | | 0.90 | % | | | 0.90 | % | | | 0.90 | % | | | 0.90 | % | | | 0.90 | % |
Value Opportunity Fund | | | 0.80 | % | | | 0.80 | % | | | 0.80 | % | | | 0.80 | % | | | 0.75 | % | | | 0.75 | % |
83 |
Notes to Financial Statements (continued)
December 31, 2015
Prior to July 1, 2015, Value Opportunity Fund paid a management fee at the annual rate of 0.80%, calculated daily and payable monthly, based on the Fund’s average daily net assets:
NGAM Advisors has entered into subadvisory agreements for each Fund as listed below.
| | |
Natixis Oakmark Fund | | Harris Associates L.P. (“Harris”) |
Natixis Oakmark International Fund | | Harris |
Small Cap Value Fund | | Vaughan Nelson Investment Management, L.P. (“Vaughan Nelson”) |
Value Opportunity Fund | | Vaughan Nelson |
Under the terms of the subadvisory agreements, each Fund has agreed to pay its respective subadviser a subadvisory fee at the following annual rates, calculated daily and payable monthly, based on each Fund’s average daily net assets:
| | | | | | | | | | | | | | |
| | | | | Percentage of Average Daily Net
Assets | |
Fund | | Subadviser | | First $200 Million | | | Next $1.3 Billion | | | Over $1.5 Billion | |
Natixis Oakmark Fund | | Harris | | | 0.52 | % | | | 0.50 | % | | | 0.50 | % |
Natixis Oakmark International Fund | | Harris | | | 0.60 | % | | | 0.60 | % | | | 0.60 | % |
Small Cap Value Fund | | Vaughan Nelson | | | 0.55 | % | | | 0.55 | % | | | 0.55 | % |
Value Opportunity Fund | | Vaughan Nelson | | | 0.50 | % | | | 0.50 | % | | | 0.47 | % |
Prior to July 1, 2015, Value Opportunity Fund paid Vaughan Nelson a subadvisory fee at the annual rate of 0.50%, calculated daily and payable monthly, based on the Fund’s average daily net assets:
NGAM Advisors has given binding undertakings to certain Funds to waive management fees and/or reimburse certain expenses to limit the Funds’ operating expenses, exclusive of acquired fund fees and expenses, brokerage expenses, interest expense, taxes, organizational and extraordinary expenses, such as litigation and indemnification expenses. These undertakings are in effect until April 30, 2016, may be terminated before then only with the consent of the Funds’ Board of Trustees, and are reevaluated on an annual basis. Management fees payable, as reflected on the Statements of Assets and Liabilities, is net of waivers and/or expense reimbursements, if any, pursuant to these undertakings.
| 84
Notes to Financial Statements (continued)
December 31, 2015
For the year ended December 31, 2015, the expense limits as a percentage of average daily net assets under the expense limitation agreements were as follows:
| | | | | | | | | | | | | | | | | | | | |
| | | Expense Limit as a Percentage of Average
Daily Net Assets | |
Fund | | Class A | | | Class B | | | Class C | | | Class N | | | Class Y | |
Natixis Oakmark Fund | | | 1.30 | % | | | 2.05 | % | | | 2.05 | % | | | — | | | | 1.05 | % |
Natixis Oakmark International Fund | | | 1.45 | % | | | — | | | | 2.20 | % | | | — | | | | — | |
Small Cap Value Fund | | | 1.45 | % | | | 2.20 | % | | | 2.20 | % | | | — | | | | 1.20 | % |
Value Opportunity Fund | | | 1.40 | % | | | — | | | | 2.15 | % | | | 1.10 | % | | | 1.15 | % |
NGAM Advisors shall be permitted to recover expenses it has borne under the expense limitation agreements (whether through waiver of its management fees or otherwise) on a class by class basis in later periods to the extent the annual operating expenses of a class fall below a class’ expense limits, provided, however, that a class is not obligated to pay such waived/reimbursed fees or expenses more than one year after the end of the fiscal year in which the fees or expenses were waived/reimbursed.
For the year ended December 31, 2015, the management fees and waivers of management fees for each Fund were as follows:
| | | | | | | | | | | | | | | | | | | | |
| | | Gross
Management
Fees | | | Waivers
of
Management
Fees | | | Net
Management
Fees | | | Percentage of
Average
Daily Net Assets | |
Fund | | | | | Gross | | | Net | |
Targeted Equity Fund | | $ | 3,534,392 | | | | — | | | $ | 3,534,392 | | | | 0.72 | % | | | 0.72 | % |
Natixis Oakmark Fund | | | 1,969,041 | | | | — | | | | 1,969,041 | | | | 0.68 | % | | | 0.68 | % |
Natixis Oakmark International Fund | | | 9,977,749 | | | | — | | | | 9,977,749 | | | | 0.85 | % | | | 0.85 | % |
Small Cap Value Fund | | | 3,014,191 | | | | — | | | | 3,014,191 | | | | 0.90 | % | | | 0.90 | % |
Value Opportunity Fund | | | 8,615,889 | | | | — | | | | 8,615,889 | | | | 0.80 | % | | | 0.80 | % |
No expenses were recovered during the year ended December 31, 2015 under the terms of the expense limitation agreement.
Certain officers and directors of NGAM Advisors and its affiliates are also officers or Trustees of the Funds. NGAM Advisors, CGM, Harris and Vaughan Nelson are subsidiaries of Natixis Global Asset Management, L.P. (“Natixis US”), which is part of Natixis Global Asset Management, an international asset management group based in Paris, France.
b. Service and Distribution Fees. NGAM Distribution, L.P. (“NGAM Distribution”), which is a wholly-owned subsidiary of Natixis US, has entered into a distribution agreement with the Trusts. Pursuant to this agreement, NGAM Distribution serves as principal underwriter of the Funds of the Trusts.
85 |
Notes to Financial Statements (continued)
December 31, 2015
Pursuant to Rule 12b-1 under the 1940 Act, the Trusts have adopted a Service Plan relating to each Fund’s Class A shares (the “Class A Plans”) and a Distribution and Service Plan relating to each Fund’s Class B (if applicable) and Class C shares (the “Class B and Class C Plans”).
Under the Class A Plans, each Fund pays NGAM Distribution a monthly service fee at an annual rate not to exceed 0.25% of the average daily net assets attributable to the Funds’ Class A shares, as reimbursement for expenses incurred by NGAM Distribution in providing personal services to investors in Class A shares and/or the maintenance of shareholder accounts.
Under the Class B (if applicable) and Class C Plans, each Fund pays NGAM Distribution a monthly service fee at an annual rate not to exceed 0.25% of the average daily net assets attributable to the Funds’ Class B (if applicable) and Class C shares, as compensation for services provided by NGAM Distribution in providing personal services to investors in Class B (if applicable) and Class C shares and/or the maintenance of shareholder accounts.
Also under the Class B (if applicable) and Class C Plans, each Fund pays NGAM Distribution a monthly distribution fee at an annual rate of 0.75% of the average daily net assets attributable to the Funds’ Class B (if applicable) and Class C shares, as compensation for services provided by NGAM Distribution in connection with the marketing or sale of Class B (if applicable) and Class C shares.
For the year ended December 31, 2015, the service and distribution fees for each Fund were as follows:
| | | | | | | | | | | | | | | | | | | | |
| | | Service Fees | | | Distribution Fees | |
Fund | | Class A | | | Class B | | | Class C | | | Class B | | | Class C | |
Targeted Equity Fund | | $ | 1,082,371 | | | $ | 901 | | | $ | 68,822 | | | $ | 2,703 | | | $ | 206,465 | |
Natixis Oakmark Fund | | | 485,919 | | | | 597 | | | | 179,577 | | | | 1,789 | | | | 538,731 | |
Natixis Oakmark International Fund | | | 2,007,508 | | | | — | | | | 927,124 | | | | — | | | | 2,781,374 | |
Small Cap Value Fund | | | 305,246 | | | | 839 | | | | 63,193 | | | | 2,515 | | | | 189,577 | |
Value Opportunity Fund | | | 242,712 | | | | — | | | | 149,026 | | | | — | | | | 447,078 | |
c. Administrative Fees. NGAM Advisors provides certain administrative services for the Funds and contracts with State Street Bank to serve as sub-administrator. Pursuant to an agreement among Natixis Funds Trusts, Loomis Sayles Funds Trusts and NGAM Advisors, each Fund pays NGAM Advisors monthly its pro rata portion of fees equal to an annual rate of 0.0575% of the first $15 billion of the average daily net assets of the Natixis Funds Trusts and Loomis Sayles Funds Trusts, 0.0500% of the next $15 billion, 0.0400% of the next $30 billion, 0.0350% of the next $30 billion and 0.0325% of such assets in excess of $90 billion, subject to an annual aggregate minimum fee for the Natixis Funds Trusts and Loomis Sayles Funds Trusts of $10 million, which is reevaluated on an annual basis.
| 86
Notes to Financial Statements (continued)
December 31, 2015
For the year ended December 31, 2015, the administrative fees for each Fund were as follows:
| | | | |
Fund | | Administrative
Fees | |
Targeted Equity Fund | | $ | 210,159 | |
Natixis Oakmark Fund | | | 123,096 | |
Natixis Oakmark International Fund | | | 502,634 | |
Small Cap Value Fund | | | 142,998 | |
Value Opportunity Fund | | | 462,016 | |
d. Sub-Transfer Agent Fees. NGAM Distribution has entered into agreements, which include servicing agreements, with financial intermediaries that provide recordkeeping, processing, shareholder communications and other services to customers of the intermediaries that hold positions in the Funds and has agreed to compensate the intermediaries for providing those services. Intermediaries transact with the Funds primarily through the use of omnibus accounts on behalf of their customers who hold positions in the Funds. These services would have been provided by the Funds’ transfer agent and other service providers if the shareholders’ accounts were maintained directly at the Funds’ transfer agent. Accordingly, the Funds have agreed to reimburse NGAM Distribution for all or a portion of the servicing fees paid to these intermediaries. The reimbursement amounts (sub-transfer agent fees) paid to NGAM Distribution are subject to a current per-account equivalent fee limit approved by the Funds’ Board, which is based on fees for similar services paid to the Funds’ transfer agent and other service providers. Class N shares do not bear such expenses.
For the year ended December 31, 2015, the sub-transfer agent fees (which are reflected in transfer agent fees and expenses in the Statements of Operations) for each Fund were as follows:
| | | | |
Fund | | Sub-Transfer
Agent Fees | |
Targeted Equity Fund | | $ | 141,564 | |
Natixis Oakmark Fund | | | 128,806 | |
Natixis Oakmark International Fund | | | 1,070,746 | |
Small Cap Value Fund | | | 237,439 | |
Value Opportunity Fund | | | 904,057 | |
87 |
Notes to Financial Statements (continued)
December 31, 2015
As of December 31, 2015, the Funds owe NGAM Distribution the following reimbursements for sub-transfer agent fees (which are reflected in the Statements of Assets and Liabilities as payable to distributor):
| | | | |
Fund | | Reimbursements
of Sub-Transfer
Agent Fees | |
Targeted Equity Fund | | $ | 1,406 | |
Natixis Oakmark Fund | | | 1,335 | |
Natixis Oakmark International Fund | | | 8,386 | |
Small Cap Value Fund | | | 1,905 | |
Value Opportunity Fund | | | 22,980 | |
Sub-transfer agent fees attributable to Class A, Class B, Class C and Class Y are allocated on a pro rata basis to each class based on the relative net assets of each class to the total net assets of those classes.
e. Commissions. Commissions (including CDSCs) on Fund shares retained by NGAM Distribution during the year ended December 31, 2015, were as follows:
| | | | |
Fund | | Commissions | |
Targeted Equity Fund | | $ | 15,784 | |
Natixis Oakmark Fund | | | 60,413 | |
Natixis Oakmark International Fund | | | 217,558 | |
Small Cap Value Fund | | | 2,786 | |
Value Opportunity Fund | | | 77,739 | |
f. Trustees Fees and Expenses. The Trusts do not pay any compensation directly to their officers or Trustees who are directors, officers or employees of NGAM Advisors, NGAM Distribution, Natixis US or their affiliates. The Chairperson of the Board of Trustees receives a retainer fee at the annual rate of $300,000. The Chairperson does not receive any meeting attendance fees for Board of Trustees meetings or committee meetings that she attends. Each Independent Trustee (other than the Chairperson) receives, in the aggregate, a retainer fee at the annual rate of $130,000. Each Independent Trustee also receives a meeting attendance fee of $10,000 for each meeting of the Board of Trustees that he or she attends in person and $5,000 for each meeting of the Board of Trustees that he or she attends telephonically. In addition, the chairperson of the Contract Review Committee and the chairperson of the Audit Committee each receive an additional retainer fee at the annual rate of $17,500. The chairperson of the Governance Committee receives an additional retainer fee at the annual rate of $5,000. Each Contract Review Committee member is compensated $6,000 for each Committee meeting that he or she attends in person and $3,000 for each meeting that he or she attends telephonically. Each Audit Committee member is compensated $6,000 for each Committee meeting that he or she attends in person and
| 88
Notes to Financial Statements (continued)
December 31, 2015
$3,000 for each meeting that he or she attends telephonically. These fees are allocated among the funds in the Natixis Funds Trusts and Loomis Sayles Funds Trusts, based on a formula that takes into account, among other factors, the relative net assets of each fund. Trustees are reimbursed for travel expenses in connection with attendance at meetings.
Effective January 1, 2016, the Chairperson of the Board will receive a retainer fee at the annual rate of $325,000 and each Independent Trustee (other than the Chairperson) will receive, in the aggregate, a retainer fee at the annual rate of $155,000. The chairperson of the Governance Committee will receive an additional retainer fee at the annual rate of $10,000. All other Trustee fees will remain unchanged.
A deferred compensation plan (the “Plan”) is available to the Trustees on a voluntary basis. Deferred amounts remain in the Funds until distributed in accordance with the provisions of the Plan. The value of a participating Trustee’s deferral account is based on theoretical investments of deferred amounts, on the normal payment dates, in certain funds of the Natixis Funds Trusts and Loomis Sayles Funds Trusts as designated by the participating Trustees. Changes in the value of participants’ deferral accounts are allocated pro rata among the funds in the Natixis Funds Trusts and Loomis Sayles Funds Trusts, and are normally reflected as Trustees’ fees and expenses in the Statements of Operations. The portions of the accrued obligations allocated to the Funds under the Plan are reflected as Deferred Trustees’ fees in the Statements of Assets and Liabilities.
g. Reimbursement of Transfer Agent Fees and Expenses. NGAM Advisors has given a binding contractual undertaking to the Value Opportunity Fund to reimburse any and all transfer agency expenses for the Fund’s Class N shares. This undertaking is in effect through April 30, 2016 and is not subject to recovery under the expense limitation agreement described above.
For the year ended December 31, 2015, NGAM Advisors reimbursed the Fund $434 for transfer agency expenses related to Class N shares.
7. Class-Specific Transfer Agent Fees and Expenses. For the year ended December 31, 2015, Value Opportunity Fund incurred the following class-specific transfer agent fees and expenses (including sub-transfer agent fees, where applicable)
| | | | | | | | | | | | | | | | |
| | | Class A | | | Class C | | | Class N | | | Class Y | |
Transfer Agent Fees and Expenses | | $ | 89,077 | | | $ | 54,751 | | | $ | 434 | | | $ | 797,875 | |
Transfer agent fees and expenses attributable to Class A, Class C, and Class Y are allocated on a pro rata basis to each class based on the relative net assets of each class to the total net assets of those classes. Transfer agent fees and expenses attributable to Class N are allocated to Class N.
89 |
Notes to Financial Statements (continued)
December 31, 2015
All other Funds in this report allocate transfer agent fees and expenses on a pro rata basis based on the relative net assets of each class to the total net assets of those classes.
8. Line of Credit. Effective April 16, 2015, each Fund, together with certain other funds of Natixis Funds Trusts and Loomis Sayles Funds Trusts, participates in a $150,000,000 committed unsecured line of credit provided by State Street Bank. Any one Fund may borrow up to the full $150,000,000 under the line of credit (as long as all borrowings by all Funds in the aggregate do not exceed the $150,000,000 limit at any time). Interest is charged to each participating Fund based on its borrowings at a rate per annum equal to the greater of the Federal Funds rate or overnight LIBOR, plus 1.25%. In addition, a commitment fee of 0.15% per annum, payable at the end of each calendar quarter, is accrued and apportioned among the participating funds based on their average daily unused portion of the line of credit.
For the year ended December 31, 2015, none of the Funds had borrowings under this agreement.
Prior to April 16, 2015, the committed unsecured line of credit was $200,000,000 with an individual limit of $125,000,000 for each Fund that participated in the line of credit. In addition, the commitment fee was 0.10% per annum, payable at the end of each calendar quarter.
9. Brokerage Commission Recapture. Certain Funds have entered into agreements with certain brokers whereby the brokers will rebate a portion of brokerage commissions. All amounts rebated by the brokers are returned to the Funds under such agreements and are included in realized gains on investments in the Statements of Operations. For the year ended December 31, 2015, amounts rebated under these agreements were as follows:
| | | | |
Fund | | Rebates | |
Targeted Equity Fund | | $ | 102,858 | |
10. Concentration of Risk. The Natixis Oakmark International Fund’s investments in foreign securities are subject to foreign currency fluctuations, higher volatility than U.S. securities, varying degrees of regulation and limited liquidity. Greater political, economic, credit and information risks are also associated with foreign securities.
11. Concentration of Ownership. From time to time, a Fund may have a concentration of one or more accounts constituting a significant percentage of shares outstanding. Investment activities by holders of such accounts could have material impacts on the Funds. As of December 31, 2015, based on management’s evaluation of the shareholder account base, the Funds had accounts representing controlling ownership of more than 5% of the Fund’s total outstanding shares. The number of such accounts, based on
| 90
Notes to Financial Statements (continued)
December 31, 2015
accounts that represent more than 5% of an individual class of shares, and the aggregate percentage of net assets represented by such holdings were as follows:
| | | | | | | | |
Fund | | Number of 5%
Non-Affiliated
Account Holders | | | Percentage of
Non-Affiliated
Ownership | |
Natixis Oakmark International Fund | | | 1 | | | | 6.13 | % |
Small Cap Value Fund | | | 1 | | | | 5.87 | % |
Value Opportunity Fund | | | 1 | | | | 16.85 | %(a) |
Omnibus shareholder accounts for which NGAM Advisors understands that the intermediary has discretion over the underlying shareholder accounts or investment models where a shareholder account may be invested for a non-discretionary customer are included in the table above. For other omnibus accounts, the Funds do not have information on the individual shareholder accounts underlying the omnibus accounts; therefore, there could be other 5% shareholders in addition to those disclosed in the table above.
| (a) | Certain Fund shareholders are invested in the Fund as a result of the Fund’s inclusion in an investment portfolio model, utilized by certain third party intermediaries, developed by an affiliate of the Fund (AlphaSimplex Group, LLC, which is a subsidiary of Natixis US) (“ASG”). Without this model or as a result of changes in this model, these shareholder positions in the Fund may not exist or could change in a material amount. ASG has no involvement in the decisions to invest in the models provided. |
91 |
Notes to Financial Statements (continued)
December 31, 2015
12. Capital Shares. Each Fund may issue an unlimited number of shares of beneficial interest, without par value. Transactions in capital shares were as follows:
| | | | | | | | | | | | | | | | |
| |
| Year Ended
December 31, 2015 |
| |
| Year Ended
December 31, 2014 |
|
Targeted Equity Fund | | | Shares | | | | Amount | | | | Shares | | | | Amount | |
| Class A | | | | | | | | | | | | | | | | |
Issued from the sale of shares | | | 654,909 | | | $ | 7,039,908 | | | | 2,382,713 | | | $ | 27,553,469 | |
Issued in connection with the reinvestment of distributions | | | 1,072,995 | | | | 11,249,723 | | | | 5,713,464 | | | | 60,881,859 | |
Redeemed | | | (5,717,171 | ) | | | (60,604,843 | ) | | | (8,345,177 | ) | | | (95,762,976 | ) |
| | | | | | | | | | | | | | | | |
Net change | | | (3,989,267 | ) | | $ | (42,315,212 | ) | | | (249,000 | ) | | $ | (7,327,648 | ) |
| | | | | | | | | | | | | | | | |
| Class B | | | | | | | | | | | | | | | | |
Issued from the sale of shares | | | 2,533 | | | $ | 24,386 | | | | 3,846 | | | $ | 36,977 | |
Issued in connection with the reinvestment of distributions | | | 597 | | | | 5,227 | | | | 19,323 | | | | 175,598 | |
Redeemed | | | (97,650 | ) | | | (878,729 | ) | | | (141,197 | ) | | | (1,397,515 | ) |
| | | | | | | | | | | | | | | | |
Net change | | | (94,520 | ) | | $ | (849,116 | ) | | | (118,028 | ) | | $ | (1,184,940 | ) |
| | | | | | | | | | | | | | | | |
| Class C | | | | | | | | | | | | | | | | |
Issued from the sale of shares | | | 204,086 | | | $ | 1,809,390 | | | | 417,975 | | | $ | 3,975,723 | |
Issued in connection with the reinvestment of distributions | | | 65,121 | | | | 567,803 | | | | 378,532 | | | | 3,392,074 | |
Redeemed | | | (1,017,519 | ) | | | (8,976,826 | ) | | | (964,764 | ) | | | (9,405,559 | ) |
| | | | | | | | | | | | | | | | |
Net change | | | (748,312 | ) | | $ | (6,599,633 | ) | | | (168,257 | ) | | $ | (2,037,762 | ) |
| | | | | | | | | | | | | | | | |
| Class Y | | | | | | | | | | | | | | | | |
Issued from the sale of shares | | | 358,275 | | | $ | 3,920,602 | | | | 1,277,719 | | | $ | 15,171,684 | |
Issued in connection with the reinvestment of distributions | | | 54,283 | | | | 591,833 | | | | 315,692 | | | | 3,498,909 | |
Redeemed | | | (1,150,110 | ) | | | (12,655,788 | ) | | | (2,699,487 | ) | | | (32,503,712 | ) |
| | | | | | | | | | | | | | | | |
Net change | | | (737,552 | ) | | $ | (8,143,353 | ) | | | (1,106,076 | ) | | $ | (13,833,119 | ) |
| | | | | | | | | | | | | | | | |
Increase (decrease) from capital share transactions | | | (5,569,651 | ) | | $ | (57,907,314 | ) | | | (1,641,361 | ) | | $ | (24,383,469 | ) |
| | | | | | | | | | | | | | | | |
| 92
Notes to Financial Statements (continued)
December 31, 2015
12. Capital Shares (continued).
| | | | | | | | | | | | | | | | |
| |
| Year Ended
December 31, 2015 |
| |
| Year Ended
December 31, 2014 |
|
Natixis Oakmark Fund | | | Shares | | | | Amount | | | | Shares | | | | Amount | |
| Class A | | | | | | | | | | | | | | | | |
Issued from the sale of shares | | | 1,517,556 | | | $ | 30,354,006 | | | | 3,668,913 | | | $ | 80,305,026 | |
Issued in connection with the reinvestment of distributions | | | 313,620 | | | | 6,034,951 | | | | 1,061,143 | | | | 21,984,956 | |
Redeemed | | | (2,123,661 | ) | | | (41,948,388 | ) | | | (1,968,641 | ) | | | (43,020,284 | ) |
| | | | | | | | | | | | | | | | |
Net change | | | (292,485 | ) | | $ | (5,559,431 | ) | | | 2,761,415 | | | $ | 59,269,698 | |
| | | | | | | | | | | | | | | | |
| Class B | | | | | | | | | | | | | | | | |
Issued from the sale of shares | | | 94 | | | $ | 1,650 | | | | 793 | | | $ | 15,447 | |
Issued in connection with the reinvestment of distributions | | | 123 | | | | 2,182 | | | | 6,139 | | | | 114,704 | |
Redeemed | | | (34,844 | ) | | | (631,808 | ) | | | (48,674 | ) | | | (958,785 | ) |
| | | | | | | | | | | | | | | | |
Net change | | | (34,627 | ) | | $ | (627,976 | ) | | | (41,742 | ) | | $ | (828,634 | ) |
| | | | | | | | | | | | | | | | |
| Class C | | | | | | | | | | | | | | | | |
Issued from the sale of shares | | | 1,967,705 | | | $ | 34,953,476 | | | | 3,014,013 | | | $ | 59,777,822 | |
Issued in connection with the reinvestment of distributions | | | 88,208 | | | | 1,504,613 | | | | 214,242 | | | | 3,952,587 | |
Redeemed | | | (1,273,258 | ) | | | (22,539,155 | ) | | | (201,413 | ) | | | (3,932,222 | ) |
| | | | | | | | | | | | | | | | |
Net change | | | 782,655 | | | $ | 13,918,934 | | | | 3,026,842 | | | $ | 59,798,187 | |
| | | | | | | | | | | | | | | | |
| Class Y | | | | | | | | | | | | | | | | |
Issued from the sale of shares | | | 551,387 | | | $ | 11,590,333 | | | | 762,265 | | | $ | 17,289,800 | |
Issued in connection with the reinvestment of distributions | | | 37,938 | | | | 760,796 | | | | 148,825 | | | | 3,209,042 | |
Redeemed | | | (737,029 | ) | | | (15,581,647 | ) | | | (296,205 | ) | | | (6,605,253 | ) |
| | | | | | | | | | | | | | | | |
Net change | | | (147,704 | ) | | $ | (3,230,518 | ) | | | 614,885 | | | $ | 13,893,589 | |
| | | | | | | | | | | | | | | | |
Increase (decrease) from capital share transactions | | | 307,839 | | | $ | 4,501,009 | | | | 6,361,400 | | | $ | 132,132,840 | |
| | | | | | | | | | | | | | | | |
93 |
Notes to Financial Statements (continued)
December 31, 2015
12. Capital Shares (continued).
| | | | | | | | | | | | | | | | |
| |
| Year Ended
December 31, 2015 |
| |
| Year Ended
December 31, 2014 |
|
Natixis Oakmark International Fund | | | Shares | | | | Amount | | | | Shares | | | | Amount | |
| Class A | | | | | | | | | | | | | | | | |
Issued from the sale of shares | | | 40,727,220 | | | $ | 524,245,138 | | | | 43,808,176 | | | $ | 590,904,771 | |
Issued in connection with the reinvestment of distributions | | | 1,547,094 | | | | 18,551,475 | | | | 1,654,360 | | | | 20,974,239 | |
Redeemed | | | (28,890,059 | ) | | | (355,356,386 | ) | | | (18,741,882 | ) | | | (243,326,691 | ) |
| | | | | | | | | | | | | | | | |
Net change | | | 13,384,255 | | | $ | 187,440,227 | | | | 26,720,654 | | | $ | 368,552,319 | |
| | | | | | | | | | | | | | | | |
| Class C | | | | | | | | | | | | | | | | |
Issued from the sale of shares | | | 10,955,520 | | | $ | 138,511,592 | | | | 13,563,541 | | | $ | 180,784,363 | |
Issued in connection with the reinvestment of distributions | | | 408,992 | | | | 4,881,076 | | | | 564,157 | | | | 7,051,208 | |
Redeemed | | | (7,803,461 | ) | | | (94,573,289 | ) | | | (4,930,036 | ) | | | (62,910,330 | ) |
| | | | | | | | | | | | | | | | |
Net change | | | 3,561,051 | | | $ | 48,819,379 | | | | 9,197,662 | | | $ | 124,925,241 | |
| | | | | | | | | | | | | | | | |
Increase (decrease) from capital share transactions | | | 16,945,306 | | | $ | 236,259,606 | | | | 35,918,316 | | | $ | 493,477,560 | |
| | | | | | | | | | | | | | | | |
| 94
Notes to Financial Statements (continued)
December 31, 2015
12. Capital Shares (continued).
| | | | | | | | | | | | | | | | |
| |
| Year Ended
December 31, 2015 |
| |
| Year Ended
December 31, 2014 |
|
Small Cap Value Fund | | | Shares | | | | Amount | | | | Shares | | | | Amount | |
| Class A | | | | | | | | | | | | | | | | |
Issued from the sale of shares | | | 586,565 | | | $ | 12,199,067 | | | | 447,060 | | | $ | 9,835,856 | |
Issued in connection with the reinvestment of distributions | | | 718,326 | | | | 13,152,899 | | | | 817,956 | | | | 17,011,106 | |
Redeemed | | | (1,556,600 | ) | | | (32,314,146 | ) | | | (2,038,618 | ) | | | (45,649,192 | ) |
| | | | | | | | | | | | | | | | |
Net change | | | (251,709 | ) | | $ | (6,962,180 | ) | | | (773,602 | ) | | $ | (18,802,230 | ) |
| | | | | | | | | | | | | | | | |
| Class B | | | | | | | | | | | | | | | | |
Issued from the sale of shares | | | 1,259 | | | $ | 20,238 | | | | 7,619 | | | $ | 133,164 | |
Issued in connection with the reinvestment of distributions | | | 567 | | | | 8,015 | | | | 13,951 | | | | 220,076 | |
Redeemed | | | (62,964 | ) | | | (986,740 | ) | | | (85,671 | ) | | | (1,490,851 | ) |
| | | | | | | | | | | | | | | | |
Net change | | | (61,138 | ) | | $ | (958,487 | ) | | | (64,101 | ) | | $ | (1,137,611 | ) |
| | | | | | | | | | | | | | | | |
| Class C | | | | | | | | | | | | | | | | |
Issued from the sale of shares | | | 130,432 | | | $ | 1,823,149 | | | | 109,154 | | | $ | 1,768,690 | |
Issued in connection with the reinvestment of distributions | | | 255,701 | | | | 3,290,720 | | | | 281,983 | | | | 4,396,718 | |
Redeemed | | | (452,639 | ) | | | (6,920,026 | ) | | | (401,405 | ) | | | (6,855,018 | ) |
| | | | | | | | | | | | | | | | |
Net change | | | (66,506 | ) | | $ | (1,806,157 | ) | | | (10,268 | ) | | $ | (689,610 | ) |
| | | | | | | | | | | | | | | | |
| Class Y | | | | | | | | | | | | | | | | |
Issued from the sale of shares | | | 2,141,789 | | | $ | 46,690,758 | | | | 1,798,226 | | | $ | 41,246,189 | |
Issued in connection with the reinvestment of distributions | | | 1,198,310 | | | | 22,443,814 | | | | 1,028,472 | | | | 21,777,987 | |
Redeemed | | | (1,865,835 | ) | | | (39,308,260 | ) | | | (1,660,679 | ) | | | (37,463,927 | ) |
| | | | | | | | | | | | | | | | |
Net change | | | 1,474,264 | | | $ | 29,826,312 | | | | 1,166,019 | | | $ | 25,560,249 | |
| | | | | | | | | | | | | | | | |
Increase (decrease) from capital share transactions | | | 1,094,911 | | | $ | 20,099,488 | | | | 318,048 | | | $ | 4,930,798 | |
| | | | | | | | | | | | | | | | |
95 |
Notes to Financial Statements (continued)
December 31, 2015
12. Capital Shares (continued).
| | | | | | | | | | | | | | | | |
| |
| Year Ended
December 31, 2015 |
| |
| Year Ended
December 31, 2014 |
|
Value Opportunity Fund | | | Shares | | | | Amount | | | | Shares | | | | Amount | |
| Class A | | | | | | | | | | | | | | | | |
Issued from the sale of shares | | | 6,072,313 | | | $ | 131,319,540 | | | | 3,237,031 | | | $ | 67,850,893 | |
Issued in connection with the reinvestment of distributions | | | 125,012 | | | | 2,584,853 | | | | 248,216 | | | | 5,263,321 | |
Redeemed | | | (2,508,032 | ) | | | (53,811,968 | ) | | | (3,327,984 | ) | | | (71,812,258 | ) |
| | | | | | | | | | | | | | | | |
Net change | | | 3,689,293 | | | $ | 80,092,425 | | | | 157,263 | | | $ | 1,301,956 | |
| | | | | | | | | | | | | | | | |
| Class C | | | | | | | | | | | | | | | | |
Issued from the sale of shares | | | 3,368,669 | | | $ | 70,554,606 | | | | 740,584 | | | $ | 15,300,207 | |
Issued in connection with the reinvestment of distributions | | | 71,042 | | | | 1,402,692 | | | | 97,107 | | | | 1,986,798 | |
Redeemed | | | (529,265 | ) | | | (10,823,300 | ) | | | (133,887 | ) | | | (2,764,527 | ) |
| | | | | | | | | | | | | | | | |
Net change | | | 2,910,446 | | | $ | 61,133,998 | | | | 703,804 | | | $ | 14,522,478 | |
| | | | | | | | | | | | | | | | |
| Class N | | | | | | | | | | | | | | | | |
Issued from the sale of shares | | | 2,972,431 | | | $ | 65,031,583 | | | | 561,402 | | | $ | 12,347,954 | |
Issued in connection with the reinvestment of distributions | | | 75,531 | | | | 1,583,262 | | | | 36,678 | | | | 785,557 | |
Redeemed | | | (398,415 | ) | | | (8,784,271 | ) | | | (38,796 | ) | | | (817,090 | ) |
| | | | | | | | | | | | | | | | |
Net change | | | 2,649,547 | | | $ | 57,830,574 | | | | 559,284 | | | $ | 12,316,421 | |
| | | | | | | | | | | | | | | | |
| Class Y | | | | | | | | | | | | | | | | |
Issued from the sale of shares | | | 35,161,537 | | | $ | 775,069,318 | | | | 17,284,818 | | | $ | 372,678,420 | |
Issued in connection with the reinvestment of distributions | | | 1,024,181 | | | | 21,435,705 | | | | 1,747,547 | | | | 37,469,538 | |
Redeemed | | | (10,758,464 | ) | | | (233,638,744 | ) | | | (5,903,464 | ) | | | (127,760,494 | ) |
| | | | | | | | | | | | | | | | |
Net change | | | 25,427,254 | | | $ | 562,866,279 | | | | 13,128,901 | | | $ | 282,387,464 | |
| | | | | | | | | | | | | | | | |
Increase (decrease) from capital share transactions | | | 34,676,540 | | | $ | 761,923,276 | | | | 14,549,252 | | | $ | 310,528,319 | |
| | | | | | | | | | | | | | | | |
13. Subsequent Event. On September 10, 2015, the Board of Trustees approved the early conversion of all of the Funds’ remaining Class B shares into Class A shares, effective at the close of business on January 11, 2016, at which point Class B shares were terminated.
In addition, on December 23, 2015, the Board of Trustees approved the liquidation of the Targeted Equity Fund. Sale of the Fund’s assets and the corresponding liquidating distributions to shareholders were completed on February 17, 2016.
| 96
Report of Independent Registered Public Accounting Firm
To the Trustees of Natixis Funds Trust I and Natixis Funds Trust II and Shareholders of CGM Advisor Targeted Equity Fund, Natixis Oakmark Fund, Natixis Oakmark International Fund, Vaughan Nelson Small Cap Value Fund, and Vaughan Nelson Value Opportunity Fund:
In our opinion, the accompanying statements of assets and liabilities, including the portfolios of investments, and the related statements of operations and of changes in net assets and the financial highlights present fairly, in all material respects, the financial position of the CGM Advisor Targeted Equity Fund, Natixis Oakmark International Fund, and Vaughan Nelson Small Cap Value Fund, each a series of Natixis Funds Trust I; and the Natixis Oakmark Fund and Vaughan Nelson Value Opportunity Fund, each a series of Natixis Funds Trust II (collectively, the “Funds”) at December 31, 2015, and the results of each of their operations, the changes in each of their net assets and the financial highlights for each of the periods indicated, in conformity with accounting principles generally accepted in the United States of America. These financial statements and financial highlights (hereafter referred to as “financial statements”) are the responsibility of the Funds’ management. Our responsibility is to express an opinion on these financial statements based on our audits. We conducted our audits of these financial statements in accordance with the standards of the Public Company Accounting Oversight Board (United States). Those standards require that we plan and perform the audit to obtain reasonable assurance about whether the financial statements are free of material misstatement. An audit includes examining, on a test basis, evidence supporting the amounts and disclosures in the financial statements, assessing the accounting principles used and significant estimates made by management, and evaluating the overall financial statement presentation. We believe that our audits, which included confirmation of securities at December 31, 2015 by correspondence with the custodian and brokers, and the application of alternative auditing procedures where securities purchased had not been received, provide a reasonable basis for the opinion expressed above.
As discussed in Note 13 of the Notes to Financial Statements, the Board of Trustees of the CGM Advisor Targeted Equity Fund approved the liquidation of the Fund effective February 17, 2016.
PricewaterhouseCoopers LLP
Boston, Massachusetts
February 23, 2016
97 |
2015 U.S. Tax Distribution Information to Shareholders (Unaudited)
Corporate Dividends Received Deduction. For the fiscal year ended December 31, 2015, a percentage of dividends distributed by the Funds listed below qualify for the dividends received deduction for corporate shareholders. These percentages are as follows:
| | | | |
Fund | | Qualifying Percentage | |
Targeted Equity | | | 19.29 | % |
Natixis Oakmark | | | 94.71 | % |
Small Cap Value | | | 57.08 | % |
Value Opportunity | | | 96.93 | % |
Capital Gains Distributions. Pursuant to Internal Revenue Section 852(b), the following Funds paid distributions, which have been designated as capital gains distributions for the fiscal year ended December 31, 2015.
| | | | |
Fund | | Amount | |
Targeted Equity | | $ | 5,822,311 | |
Natixis Oakmark | | | 8,169,871 | |
Natixis Oakmark International | | | 6,977,702 | |
Small Cap Value | | | 36,747,925 | |
Value Opportunity | | | 23,246,983 | |
Qualified Dividend Income. For the fiscal year ended December 31, 2015, a percentage of the ordinary income dividends paid by the Funds are considered qualified dividend income eligible for reduced tax rates. These lower rates range from 0% to 20% depending on an individual’s tax bracket. If the Funds paid a distribution during calendar year 2015, complete information will be reported in conjunction with Form 1099-DIV. These percentages are noted below:
| | | | |
Fund | | Qualifying
Percentage | |
Targeted Equity | | | 80.42 | % |
Natixis Oakmark | | | 100.00 | % |
Natixis Oakmark International | | | 100.00 | % |
Small Cap Value | | | 51.24 | % |
Value Opportunity | | | 100.00 | % |
Foreign Tax Credit. For the year ended December 31, 2015, the Natixis Oakmark International Fund intends to pass through foreign tax credits and have derived gross income from sources within foreign countries amounting to:
| | | | | | | | |
Fund | | Foreign Tax
Credit Pass-Through | | | Foreign Source
Income | |
| | |
Natixis Oakmark International | | $ | 2,672,945 | | | $ | 31,776,622 | |
| 98
Trustee and Officer Information
The tables below provide certain information regarding the trustees and officers of Natixis Funds Trust I and Natixis Funds Trust II (the “Trusts”). Unless otherwise indicated, the address of all persons below is 399 Boylston Street, Boston, MA 02116. The Funds’ Statement of Additional Information includes additional information about the trustees of the Trust and is available by calling Natixis Funds at 800-225-5478.
| | | | | | | | |
Name and Year of Birth | | Position(s) Held
with the Trusts,
Length of Time
Served and Term
of Office1 | | Principal
Occupation(s)
During Past
5 Years | | Number of
Portfolios in
Fund Complex
Overseen2 and Other
Directorships Held
During Past
5 Years | | Experience,
Qualifications,
Attributes, Skills
for Board
Membership |
| | | |
| INDEPENDENT TRUSTEES | | | | | | |
| | | | |
Kenneth A. Drucker (1945) | | Trustee since 2008 Chairperson of the Audit Committee and Governance Committee Member | | Retired | | 42 None | | Significant experience on the Board and on the boards of other business organizations (including at investment companies); executive experience (including as treasurer of an aerospace, automotive, and metal manufacturing corporation) |
| | | | |
| Edmond J. English (1953) | | Trustee since 2013 Audit Committee Member | | Chief Executive Officer of Bob’s Discount Furniture (retail) | | 42 Formerly, Director, BJ’s Wholesale Club (retail) | | Experience on the Board and significant experience on the boards of other business organizations (including at a retail company and a bank); executive experience (including at a retail company) |
99 |
Trustee and Officer Information
| | | | | | | | |
Name and Year of Birth | | Position(s) Held
with the Trusts,
Length of Time
Served and Term
of Office1 | | Principal
Occupation(s)
During Past
5 Years | | Number of
Portfolios in
Fund Complex
Overseen2 and Other
Directorships Held
During Past
5 Years | | Experience,
Qualifications,
Attributes, Skills
for Board
Membership |
| | | |
INDEPENDENT TRUSTEES continued | | | | | | |
| | | | |
Richard A. Goglia (1951) | | Trustee since 2015 Audit Committee Member | | Retired; formerly Vice President and Treasurer of Raytheon Company (defense) | | 42 None | | Experience on the Board and executive experience (including his role as vice president and treasurer of a defense company and experience at a financial services company) |
| | | | |
Wendell J. Knox (1948) | | Trustee since 2009 Contract Review Committee Member and Governance Committee Member | | Director of Abt Associates Inc. (research and consulting) | | 42 Director, Eastern Bank (bank); Director, The Hanover Insurance Group (property and casualty insurance) | | Significant experience on the Board and on the boards of other business organizations (including at a bank and at a property and casualty insurance firm); executive experience (including roles as president and chief executive officer of a research and consulting company) |
| 100
Trustee and Officer Information
| | | | | | | | |
Name and Year of Birth | | Position(s) Held
with the Trusts,
Length of Time
Served and Term
of Office1 | | Principal
Occupation(s)
During Past
5 Years | | Number of
Portfolios in
Fund Complex
Overseen2 and Other
Directorships Held
During Past
5 Years | | Experience,
Qualifications,
Attributes, Skills
for Board
Membership |
| | | |
INDEPENDENT TRUSTEES continued | | | | | | |
| | | | |
Martin T. Meehan
(1956) | | Trustee since 2012 Contract Review Committee Member | | President, University of Massachusetts; formerly, Chancellor and faculty member, University of Massachusetts Lowell | | 42 None | | Experience on the Board and on the boards of other business organizations; experience as President of the University of Massachusetts; government experience (including as a member of the U.S. House of Representatives); academic experience |
| | | | |
Sandra O. Moose (1942) | | Chairperson of the Board of Trustees since November 2005 Trustee since 1982 for Natixis Funds Trust I (including its predecessors) and since 1993 for Natixis Funds Trust II Ex Officio member of the Audit Committee, the Contract Review Committee and the Governance Committee | | President, Strategic Advisory Services (management consulting) | | 42 Formerly, Director, AES Corporation (international power company); formerly, Director, Verizon Communications (telecommunications company) | | Significant experience on the Board and on the boards of other business organizations (including at a telecommunications company, an international power company and a specialty chemicals corporation); executive experience (including at a management consulting company) |
101 |
Trustee and Officer Information
| | | | | | | | |
Name and Year of Birth | | Position(s) Held
with the Trusts,
Length of Time
Served and Term
of Office1 | | Principal
Occupation(s)
During Past
5 Years | | Number of
Portfolios in
Fund Complex
Overseen2 and Other
Directorships Held
During Past
5 Years | | Experience,
Qualifications,
Attributes, Skills
for Board
Membership |
| | | |
INDEPENDENT TRUSTEES continued | | | | | | |
| | | | |
Erik R. Sirri (1958) | | Trustee since 2009 Audit Committee Member | | Professor of Finance at Babson College | | 42 None | | Significant experience on the Board; experience as Director of the Division of Trading and Markets at the Securities and Exchange Commission; academic experience; training as an economist |
| | | | |
Peter J. Smail (1952) | | Trustee since 2009 Chairperson of the Contract Review Committee and Governance Committee Member | | Retired | | 42 None | | Significant experience on the Board; mutual fund industry and executive experience (including roles as president and chief executive officer for an investment adviser) |
| | | | |
Cynthia L. Walker (1956) | | Trustee since 2005 Chairperson of the Governance Committee and Contract Review Committee Member | | Deputy Dean for Finance and Administration, Yale University School of Medicine | | 42 None | | Significant experience on the Board; executive experience in a variety of academic organizations (including roles as dean for finance and administration) |
| 102
Trustee and Officer Information
| | | | | | | | |
Name and Year of Birth | | Position(s) Held
with the Trusts,
Length of Time
Served and Term
of Office1 | | Principal
Occupation(s)
During Past
5 Years | | Number of
Portfolios in
Fund Complex
Overseen2 and Other
Directorships Held
During Past
5 Years | | Experience,
Qualifications,
Attributes, Skills
for Board
Membership |
| | |
| INTERESTED TRUSTEES | | | | |
| | | | |
Kevin P. Charleston3 (1965) One Financial Center Boston, MA 02111 | | Trustee since 2015 | | President, Chief Executive Officer and Director; formerly, Chief Financial Officer, Loomis, Sayles & Company, L.P. | | 42 None | | Continuing service as President, Chief Executive Officer and Director of Loomis, Sayles & Company, L.P. |
| | | | |
David L. Giunta4
(1965) | | Trustee since 2011 President and Chief Executive Officer since 2008 | | President and Chief Executive Officer, NGAM Distribution Corporation, NGAM Advisors, L.P. and NGAM Distribution, L.P. | | 42 None | | Significant experience on the Board; continuing experience as President and Chief Executive Officer of NGAM Advisors, L.P. |
| | | | |
John T. Hailer5 (1960) | | Trustee since 2000 | | President and Chief Executive Officer – U.S. and Asia, Natixis Global Asset Management, L.P. | | 42 None | | Significant experience on the Board; continuing experience as President and Chief Executive Officer – U.S. and Asia, Natixis Global Asset Management, L.P. |
| 1 | Each trustee serves until retirement, resignation or removal from the Board. The current retirement age is 75. The position of Chairperson of the Board is appointed for a three-year term. Ms. Moose was appointed to serve an additional three-year term as the Chairperson of the Board on December 13, 2013. |
| 2 | The trustees of the Trusts serve as trustees of a fund complex that includes all series of the Natixis Funds Trust I, Natixis Funds Trust II, Natixis Funds Trust IV and Gateway Trust (collectively, the “Natixis Funds Trusts”), Loomis Sayles Funds I and Loomis Sayles Funds II (collectively, the “Loomis Sayles Funds Trusts”) (collectively, the “Fund Complex”). |
| 3 | Mr. Charleston is deemed an “interested person” of the Trust because he holds the following positions with an affiliated person of the Trusts: President and Chief Executive Officer of Loomis, Sayles & Company, L.P. |
| 4 | Mr. Giunta is deemed an “interested person” of the Trust because he holds the following positions with an affiliated person of the Trusts: President and Chief Executive Officer of NGAM Distribution Corporation, NGAM Advisors, L.P. and NGAM Distribution, L.P. |
| 5 | Mr. Hailer is deemed an “interested person” of the Trust because he holds the following positions with an affiliated person of the Trusts: President and Chief Executive Officer – U.S. and Asia, Natixis Global Asset Management, L.P. |
103 |
Trustee and Officer Information
| | | | | | |
Name and Year of Birth | | Position(s) Held
with the Trust | | Term of Office1 and
Length of Time Served | | Principal Occupation(s)
During Past 5 Years2 |
| |
| OFFICERS OF THE TRUST | | |
| | | |
Coleen Downs Dinneen (1960) | | Secretary, Clerk and Chief Legal Officer | | Since
September
2004 | | Executive Vice
President, General
Counsel, Secretary
and Clerk,
NGAM Distribution
Corporation, NGAM
Advisors, L.P. and
NGAM Distribution,
L.P. |
| | | |
Russell L. Kane (1969) | | Chief Compliance Officer, Assistant Secretary and Anti-Money Laundering Officer | | Chief Compliance
Officer since
May 2006;
Assistant
Secretary since
June 2004; and
Anti-Money
Laundering
Officer since
April 2007 | | Chief Compliance
Officer for Mutual
Funds, Senior Vice
President, Deputy
General Counsel,
Assistant Secretary and
Assistant Clerk,
NGAM Distribution
Corporation, NGAM
Advisors, L.P.
and NGAM
Distribution, L.P. |
| | | |
Michael C. Kardok (1959) | | Treasurer, Principal Financial and Accounting Officer | | Since October
2004 | | Senior Vice President,
NGAM Advisors, L.P.
and NGAM
Distribution, L.P. |
| 1 | Each officer of the Trust serves for an indefinite term in accordance with the Trust’s current by-laws until the date his or her successor is elected and qualified, or until he or she sooner dies, retires, is removed or becomes disqualified. |
| 2 | Each person listed above, except as noted, holds the same position(s) with the Fund Complex. Previous positions during the past five years with NGAM Distribution, L.P., NGAM Advisors, L.P. or Loomis, Sayles & Company, L.P. are omitted, if not materially different from a trustee’s or officer’s current position with such entity. |
| 104
ANNUAL REPORT
December 31, 2015

Loomis Sayles Multi-Asset Income Fund
(formerly Natixis Diversified Income Fund)
McDonnell Intermediate Municipal Bond Fund
Natixis U.S. Equity Opportunities Fund
SeeyondSM Multi-Asset Allocation Fund

TABLE OF CONTENTS
Portfolio Review page 1
Portfolio of Investments page 25
Financial Statements page 51
Notes to Financial Statements page 72
LOOMIS SAYLES MULTI-ASSET INCOME FUND
(formerly Natixis Diversified Income Fund)
| | | | |
| Managers | | Symbols |
| Thomas Fahey | | Class A | | IIDPX |
| Kevin P. Kearns | | Class C | | CIDPX |
| Maura T. Murphy, CFA® | | Class N | | LMINX |
| Loomis, Sayles & Company, L.P. | | Class Y | | YIDPX |
Objective
The Fund seeks current income with a secondary objective of capital appreciation.
Market Conditions
Market observers and economists spent much of the year waiting for the U.S. Federal Reserve Board (Fed) to decide whether to normalize monetary policy after seven years of near zero interest rates. The Fed moved to increase the federal funds rate to 0.25% in December based on its belief that employment growth and overall U.S. economic growth were strong enough to withstand a rate increase. With that increase, the Fed formally diverged from the looser monetary policies undertaken by the European Central Bank and Bank of Japan. Weaker economic growth in Europe and Japan is the driver of accommodative monetary policies, which seek to stimulate growth.
Falling commodity prices caused by the strengthening U.S. dollar and slowing Chinese economy contributed to rising market volatility. Oil prices declined by more than 30% during 2015 and ended the year more than 70% off the highs achieved during 2008. While the U.S. economy reached growth rates in line with averages experienced since the financial crisis, growth lagged in both developed and emerging markets.
Performance Results
For the 12 months ended December 31, 2015, Class A shares of the Loomis Sayles Multi-Asset Income Fund returned -1.96% at net asset value. The portfolio underperformed its primary benchmark, the Barclays U.S. Aggregate Bond Index, which returned 0.55%.
Explanation of Fund Performance
On August 31, 2015 Loomis Sayles assumed portfolio management responsibilities for the entire Fund, replacing the segments previously managed by Active Investment Advisors, and AEW Capital Management, L.P. In conjunction with this change to its underlying investment strategy, the Fund changed its name to “Loomis Sayles Multi-Asset Income Fund.”
The explanation of Fund performance is described over two periods — the period from January 1, 2015 through August 31, 2015, during which the Fund was managed in four separate segments, and the period from September 1, 2015 through December 31, 2015, during which the Fund was sub-advised solely by Loomis Sayles and managed under its current investment strategy.
1 |
January 1, 2015 – August 31, 2015
Active Dividend Equity Segment
This segment was designed to replicate the Dow Jones U.S. Select Dividend™ Index by holding substantially all of the securities in the index in the same proportions. The benchmark is composed of 100 of the highest dividend-paying equity securities (other than REITs) in the Dow Jones U.S. Total Stock Market Index — a broadly-based index designed to represent the total market for U.S. equity securities.
The Dow Jones U.S. Select Dividend™ Index returned -5.68% for the 8-month period ending August 31, 2015. Consumer staples, health care and industrials made the strongest contribution to index gains, while utilities, energy and consumer discretionary were the weakest performers for the period. As of December 31, 2014, the largest sectors in the index were utilities, industrials and consumer staples, but these shifted to utilities, financials and consumer staples by August 31, 2015.
During the course of the year through August 31, 2015, there were ten deletions and nine additions to the index due to a combination of index rebalancing, elimination of dividend payments and acquisitions.
AEW Diversified REIT Segment
The U.S. REIT sector returned -7.07% for the 8-month period ended August 31, 2015, as measured by the MSCI U.S. REIT Index, lagging the S&P 500® Index, which returned -2.88% during the same period. The U.S. economy continued to perform well in 2015, with solid employment gains and robust GDP growth. However, concerns regarding a slowdown in China spurred volatility both domestically and abroad, particularly in July and August. Given the spike in market volatility, uncertainty regarding the timing of the initial hike in the federal funds rate also weighed on REITs, despite the fact that long-term yields were relatively flat during the year. Indeed, the 10-Year Treasury yield ended August at 2.22%, up only five basis points from year-end 2014 (a basis point is 1/100th of a percentage point). The segment’s REIT holdings benefited from positive stock selection results and positive sector allocation results. Among the strongest individual contributors were apartment company Equity Residential and storage companies Extra Space Storage and CubeSmart. Detractors from performance included apartment companies Essex Property Trust and UDR, Inc. and data center company DuPont Fabros Technology.
At the end of August, U.S. REITs traded on average at a 12% discount to net asset value, the lowest since 2009 during some of the worst days of the global financial crisis. This discount occurred even though the sector is much healthier due to a number of factors such as improving financial leverage, same-store net operating income (NOI) growth remaining above trend and the robust private real estate market. As a result of this disconnect between sector fundamentals and valuations, 29 U.S. real estate companies in 2015 announced share repurchase plans totaling $8.4 billion. Additionally, private equity firms announced the acquisition, on an all-cash basis, of five U.S. REITs.
| 2
LOOMIS SAYLES MULTI-ASSET INCOME FUND
(formerly Natixis Diversified Income Fund)
Loomis Sayles Inflation Protected Securities Segment
The Loomis Sayles Inflation Protected Securities segment was the largest contributor to the Fund’s performance for the eight months ended August 31, 2015. Treasury inflation-protected securities (TIPS), which represented the segment’s largest allocation, contributed positively to absolute performance. Five- and 10-year breakeven rates (the difference between yields on nominal Treasuries and TIPS of the same maturity) advanced during most of the period before steadily declining into August. However, breakeven rates rose again toward the end of August. Nominal Treasury yields sold off during the period, and the segment’s shorter duration (less price sensitivity to interest rate changes) position relative to the benchmark contributed to performance. Positioning along the yield curve (a curve that shows the relationship among bond yields across the maturity spectrum) also helped, largely due to a structural underweight to short-duration TIPS. This was where real rates underperformed the most on the yield curve.
Loomis Sayles Multi-Sector Bond Segment
For the period ended August 31, 2015, the segment posted a negative absolute return for the partial period, primarily due to non-U.S.-dollar securities and investment grade corporate bonds. The U.S. dollar continued to appreciate versus other currencies, and issues denominated in the Brazilian real, Mexican peso and Indian rupee lagged. Meanwhile, investment grade securities generated mixed results but largely detracted from performance due to security selection among industrials. The commodity-linked basic industry and energy sectors weighed heavily on returns. Financial issues produced positive returns but were unable to offset declines from the industrials sector. We held short-maturity Treasuries as reserves, which detracted from performance. In addition, convertibles holdings in the energy, basic industry and technology sectors diminished returns.
High yield industrials contributed to performance during the partial period, benefiting from security selection and exposure to the technology and consumer non-cyclical sectors. High yield utilities, bank loans and preferred issues also contributed positively to return.
September 1, 2015 – December 31, 2015
For the 4-months ended December 31, 2015, Class A shares of the Loomis Sayles Multi-Asset Income Fund returned 1.95% at net asset value. The Fund outperformed its Benchmark, the Barclays U.S. Aggregate Bond Index, which returned 0.10%.
Exposure to real estate investment trusts (REITs) and U.S. dividend-paying equities largely accounted for the Fund’s positive performance. In addition, our global dividend-paying equity holdings aided absolute return. These gains more than offset losses from our exposure to investment-grade and high-yield fixed income and master limited partnerships (MLPs).
Despite a noticeable increase in rates across the short to intermediate portions of the U.S. yield curve, the Fund’s REITs performed well. Market anticipation for a September Fed hike (which didn’t materialize) derailed the REIT market and knocked down valuations to attractive levels — such that many REITs were trading at discounts to their underlying net
3 |
asset values. As bargain hunters stepped in and provided support, continued improvement in the labor market further fueled the recovery in residential, industrial and retail REITs.
After a volatile close to the third quarter, U.S. equity markets started off the fourth quarter strong, lifting dividend-paying stocks. As markets rebounded, investors poured money into beaten-down defensive sectors, energy names and growth alternatives in the technology and communications spaces. Though renewed cautious sentiment in December halted the rally, U.S. dividend-paying equities produced strong results during the last three months of the year. Similar to their U.S. counterparts, the Fund’s global dividend-paying equities contributed to return, particularly selected consumer non-cyclical, communications and industrial holdings.
High yield corporate bonds detracted from return, as spreads widened, causing U.S. and European bond returns to decline. Performance began to unravel mid-year due to concerns about China’s economic slowdown, global growth and plummeting commodity and energy prices. Declining corporate profitability and uncertainty about the path for Fed rate hikes created additional headwinds. Selected holdings in the energy, capital goods and basic materials industries were the main detractors. Similar to high yield, investment grade corporate bonds weighed on performance. Though declines were muted for the overall sector, the lowest-rated investment grade corporates were hit hard. Heavy corporate supply ahead of Fed rate increases to fund mergers and acquisitions, weakening corporate fundamentals, China and global growth concerns and significant commodity price weakness contributed to the poor performance. Selected holdings in the energy and basic materials industries were the primary detractors.
After a weak September, MLPs had a strong October. However, investor concerns mounted during November and December about their ability to meet distribution requirements when factoring in the amount of debt on their books. The Fund’s exposure to MLPs through exchange traded notes (ETNs) suffered significant losses as the entire sector produced weak results.
Outlook
We believe the Fed will remain data dependent, watching for a pick up in inflation before hiking again. We do not believe rates will rise materially during the year given weaker global growth expectations.
We believe U.S. dividends will be a core source of income in 2016. Continued volatility calls for tactical asset allocation to generate optimal risk-adjusted income. The commodity bear market continues to weigh on aggregate earnings, but most of the weakness has been contained in energy and industrials. Corporate write-offs are rising, especially in the energy sector, depressing earnings. Nonetheless, we believe 2016 should be a year of growth in aggregate.
The United States has moved closer to the later stages of the credit cycle, a cyclical pattern that follows credit availability and corporate health, with high yield revenue growth weakening and corporate health showing early signs of deterioration. The world is adjusting to a slower, less commodity-intensive China and tightening U.S. monetary policy. The adjustment also includes a new regime of slowing of global trade, slowing credit growth across emerging markets and a stronger U.S. dollar.
| 4
LOOMIS SAYLES MULTI-ASSET INCOME FUND
(formerly Natixis Diversified Income Fund)
Growth of $10,000 Investment in Class A Shares4
December 31, 2005 through December 31, 2015
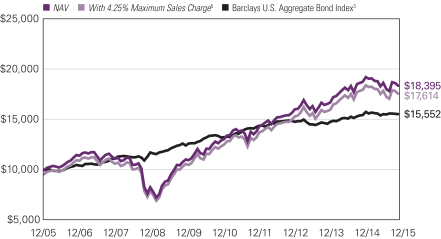
5 |
Average Annual Total Returns — December 31, 20154
| | | | | | | | | | | | | | | | |
| | | | | |
| | | 1 Year | | | 5 Years | | | 10 Years | | | Life of Class N | |
| | | | | |
| Class A (Inception 11/17/05) | | | | | | | | | | | | | | | | |
| NAV | | | -1.96 | % | | | 7.33 | % | | | 6.29 | % | | | — | % |
| With 4.25% Maximum Sales Charge5 | | | -6.15 | | | | 6.41 | | | | 5.82 | | | | — | |
| | | | | |
| Class C (Inception 11/17/05) | | | | | | | | | | | | | | | | |
| NAV | | | -2.73 | | | | 6.51 | | | | 5.48 | | | | — | |
| With CDSC2 | | | -3.69 | | | | 6.51 | | | | 5.48 | | | | — | |
| | | | | |
| Class N (Inception 8/31/15) | | | | | | | | | | | | | | | | |
| NAV | | | — | | | | — | | | | — | | | | 1.91 | |
| | | | | |
| Class Y (Inception 12/3/12)1 | | | | | | | | | | | | | | | | |
| NAV | | | -1.72 | | | | 7.40 | | | | 6.32 | | | | — | |
| | | | | |
| Comparative Performance | | | | | | | | | | | | | | | | |
| Barclays U.S. Aggregate Bond Index3 | | | 0.55 | | | | 3.25 | | | | 4.51 | % | | | 0.10 | |
Performance data shown represents past performance and is no guarantee of, and not necessarily indicative of, future results. The table(s) do not reflect taxes shareholders might owe on any fund distributions or when they redeem their shares. Performance for periods less than one year is cumulative, not annualized. Returns reflect changes in share price and reinvestment of dividends and capital gains, if any. Unlike a fund, an index is not managed and does not reflect fees and expenses. It is not possible to invest directly in an index.
| 1 | Prior to the inception of Class Y shares (12/3/2012), performance is that of Class A shares and reflects the higher net expenses of that share class. |
| 2 | Class C share performance assumes a 1.00% contingent deferred sales charge (“CDSC”) applied when you sell shares within one year of purchase. |
| 3 | The Barclays U.S. Aggregate Bond Index is an unmanaged index that covers the U.S.-dollar denominated, investment grade, fixed-rate, taxable bond market of SEC-registered securities. The index includes bonds from the Treasury, government-related, corporate, mortgage-backed securities, asset-backed securities, and collateralized mortgage-backed securities sectors. |
| 4 | Fund performance has been increased by fee waivers and/or expense reimbursements, if any, without which performance would have been lower. |
| 5 | The maximum sales charge on purchases of Class A shares was reduced from 4.50% to 4.25% on November 2, 2015. The Fund’s returns for Class A shares for all periods have been restated to reflect the current maximum applicable sales charge of 4.25%. |
| 6
MCDONNELL INTERMEDIATE MUNICIPAL BOND FUND
| | |
| Managers | | Symbols |
| Dawn Mangerson | | Class A MIMAX |
| James Grabovac, CFA® | | Class C MIMCX |
| Lawrence Jones | | Class Y MIMYX |
| Steve Wlodarski, CFA® | | |
| McDonnell Investment Management, LLC | | |
Objective
The Fund seeks a high level of federal tax-exempt current income, consistent with the preservation of capital.
Market Conditions
U.S. interest rates and market indexes finished the year near where they started. However, that simple narrative fails to capture the evolving dynamics that drove market and economic development as the recovery lengthens and policymakers shift direction. The narrative as we entered 2015 was fairly clear as the trends dominating valuations and returns were quite strong coming into the year. As we begin 2016 these major trends appear more likely to continue than to suffer imminent reversal, but, how they might evolve and which new factors will play an important role will be the focus for investors as the new year unfolds. A cooling global economy, economic slowdown in China, weaker commodity prices, a stronger dollar and resultant downward pressure on inflation all played fundamental roles in last year’s market development. Major market trends during the year included:
| · | | Treasury yields rose modestly and the yield curve continued to flatten. |
| · | | The municipal market outperformed as yields beyond the five-year portion of the curve declined modestly. |
| · | | The S&P 500® Index seemed to be treading water but the cap-weighted index was bolstered by strong performance from a narrow list of market leaders amid broadly declining earnings momentum. |
| · | | Commodity markets continued to weaken. Oil traded at an 11-year low and helped the broader Thomson Reuters Core Commodity CRB Index score a fresh 13-year low. |
| · | | The U.S. dollar continued to power higher against most major currencies. |
In a much anticipated move, the U.S. Federal Reserve (Fed) announced its first policy action to adjust short-term interest rates higher in nearly a decade. The Fed boosted its target for the federal funds rate to a range of 0.25% to 0.50%, marking the first move off the zero-lower bound in seven years. The statement accompanying the policy announcement noted that “in light of the current shortfall of inflation from 2%, the Committee will carefully monitor actual and expected progress toward its inflation goal.” This statement highlights an important divergence facing investors in the coming year. The median range of Fed member projections would place the federal funds rate at 1.4% at year-end 2016,
7 |
implying four additional quarter-point hikes while market-based estimates project only two additional moves. Whether the Fed or the markets have more accurately divined the future path of inflation and short-term interest rates will prove a critical development as the year unfolds. We expect a shallower and more gradual path of increase is more likely as expectations for a lift in inflation are based predominantly on a continuing drift higher in rent and medical care. While these price inputs are important factors they are not, in and of themselves, necessarily indicative of inflationary conditions. Unless and until wage pressures gather significant steam, it is difficult to envision an uptick in inflation developing from a blip into an embedded problem, particularly when placed within a broader context. The combination of weakening global growth and a strong dollar continue to favor a low level of U.S. inflation over the medium term.
Performance Results
For the 12 months ended December 31, 2015, Class A shares of the McDonnell Intermediate Municipal Bond Fund returned 2.28% at net asset value after fund expenses. The Fund underperformed its benchmark, the Barclays 3-15 Year Blend Municipal Bond Index, which returned 3.06%.
Explanation of Fund Performance
Fund performance was positively affected by continued spread compression in lower quality securities within higher yielding sectors, particularly in the longer portion of the yield curve. High grade yields remained relatively range bound, ending the year just slightly lower than where they started. Strong demand remained in the municipal market and was reflected in positive shareholder flows into the Fund during the past year. New issue supply surged at the start of the year as a wave of refunding issuance prompted by an unexpectedly low rate environment prevailed. Refunding issuance moderated by mid-year, however it contributed to an increase in supply for the year and comprised fully two-thirds of total annual issuance. Positive contributors to performance included the Fund’s overweight in single A-rated securities across various sectors of the market. Security selection within the hospital, local general obligation and transportation sectors benefited performance. Finally, portfolio performance was enhanced by increased exposure to the longer end of the intermediate yield curve. The Fund’s overweight to shorter, higher quality securities was a drag on performance. In addition, the Fund’s overweight posture relative to the pre-refunded sector along with an underweight in the industrial development revenue/pollution control revenue (IDR/PCR) sector hampered performance.
Outlook
We expect the economic recovery to continue into its 8th year. Labor markets have improved further and consumer spending is healthy. Business fixed-investment has been somewhat disappointing thus far despite record corporate borrowing as stock buybacks and merger and acquisition activity have predominated. Global economic health is less robust, however, particularly in emerging market economies. Investors will likely keep a keen eye on China as efforts at economic transition have, to date, proven challenging as well as volatility-inducing both for Chinese markets and other risk assets worldwide. Also of critical importance will be the relative valuation of the dollar. The dollar has marched
| 8
MCDONNELL INTERMEDIATE MUNICIPAL BOND FUND
higher against most currencies over the past year and a half. Whether this strength continues now that the Fed has embarked upon its effort to ‘normalize’ short-term rates or whether markets have already discounted future interest rate differentials remains to be seen. While rate markets may move higher in response to policy actions, we expect the environment will continue to favor limited potential for significant directional movement.
Municipal new issue volume going forward is expected to approximate last year’s range. Factors that could boost those totals include a flatter yield curve, recent strong outperformance of municipals versus U.S. Treasuries and perhaps somewhat lower interest rates than most analysts anticipate over the year ahead. Similarly, if rates were to move unexpectedly higher, it would likely dampen refunding issuance and curtail the principal source of recent supply. The credit quality of state and local issuers has broadly continued to improve as property markets rebound and the recovery continues. Historically, credit trends tend to lag developments in the broader economy and current developments have proven no exception. The Fund continues to implement a duration neutral posture while selectively pursuing investment in spread sectors such as hospital, transportation and higher education to enhance yield.
Growth of $10,000 Investment in Class A Shares4
December 31, 2012 (inception) through December 31, 2015
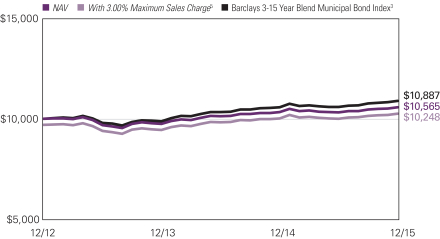
9 |
Average Annual Total Returns — December 31, 20154
| | | | | | | | |
| | | |
| | | 1 Year | | | Life of Fund | |
| | | |
| Class A (Inception 12/31/12)1 | | | | | | | | |
| NAV | | | 2.28 | % | | | 1.84 | % |
| With 3.00% Maximum Sales Charge5 | | | -0.80 | | | | 0.80 | |
| | | |
| Class C (Inception 12/31/12)1 | | | | | | | | |
| NAV | | | 1.63 | | | | 1.09 | |
| With CDSC2 | | | 0.63 | | | | 1.09 | |
| | | |
| Class Y (Inception 12/31/12)1 | | | | | | | | |
| NAV | | | 2.63 | | | | 2.17 | |
| | | |
| Comparative Performance | | | | | | | | |
| Barclays 3-15 Year Blend Municipal Bond Index3 | | | 3.06 | | | | 2.88 | |
Performance data shown represents past performance and is no guarantee of, and not necessarily indicative of, future results. The table(s) do not reflect taxes shareholders might owe on any fund distributions or when they redeem their shares. Performance for periods less than one year is cumulative, not annualized. Returns reflect changes in share price and reinvestment of dividends and capital gains, if any. Unlike a fund, an index is not managed and does not reflect fees and expenses. It is not possible to invest directly in an index.
| 1 | 12/31/2012 represents the date shares were first registered for public sale under the Securities Act of 1933. 11/16/2012 represents commencement of operations for accounting and financial reporting purposes only. |
| 2 | Performance for Class C shares assumes a 1.00% contingent deferred sales charge (“CDSC”) applied when you sell shares within one year of purchase. |
| 3 | Barclays 3-15 Year Blend Municipal Bond Index tracks the performance of municipal bonds issued after December 31, 1990 with remaining maturities between 2 and 17 years and at least $5 million in principal amount outstanding. |
| 4 | Fund performance has been increased by fee waivers and/or expense reimbursements, if any, without which performance would have been lower. |
| 5 | The maximum sales charge on purchases of Class A shares was reduced from 3.50% to 3.00% on November 2, 2015. The Fund’s returns for Class A shares for all periods have been restated to reflect the current maximum applicable sales charge of 3.00%. |
| 10
NATIXIS U.S. EQUITY OPPORTUNITIES FUND
| | |
| Managers | | Symbols |
| Large Cap Value Segment | | Class A NEFSX |
| Harris Associates L.P. | | Class B NESBX |
| All Cap Growth Segment | | Class C NECCX |
| Loomis, Sayles & Company, L.P. | | Class Y NESYX |
Objective
The Fund seeks long-term growth of capital.
Market Conditions
Market observers and economists spent much of the year waiting for the Federal Reserve Board (Fed) to decide whether to normalize monetary policy after seven years of near zero interest rates. The Fed moved to increase the federal funds rate to .25 percent in December based on its belief that employment growth and overall U.S. economic growth were strong enough to withstand a rate increase. With that increase, the Fed formally diverged from the looser monetary policies undertaken by the European Central Bank and Bank of Japan. Weaker economic growth in Europe and Japan is the driver of accommodative monetary policies, which seek to stimulate economic growth.
Falling commodity prices caused by the strengthening U.S. dollar and slowing Chinese economy contributed to rising market volatility. Oil prices declined by more than 30% during 2015 and ended the year more than 70% off the highs reached during 2008. While the U.S. economy achieved growth rates in line with averages experienced since the financial crisis, growth lagged in both developed and emerging markets.
Performance Results
For the 12 months ended December 31, 2015, Class A shares of the Natixis U.S. Equity Opportunities Fund returned 5.86% at net asset value. The Fund outperformed its primary benchmark, the S&P 500® Index, which returned 1.38%. The Fund also outperformed its secondary benchmark, the Russell 1000® Index, which returned 0.92%.
Explanation of Fund Performance
Each of the portfolio’s segments uses a distinct investment style, providing shareholders with exposure to a variety of different stocks:
| · | | The Harris Associates L.P. Large Cap Value segment invests primarily in the common stocks of larger-capitalization companies that Harris Associates believes are trading at a substantial discount to the company’s “true business value.” |
| · | | The Loomis, Sayles & Company, L.P. All Cap Growth segment invests in equity securities, including common stocks, preferred stocks, convertible securities and warrants. This segment may invest in companies of any size. |
Both segments contributed positively to the overall return of the Fund during the year.
11 |
Harris Associates Large Cap Value Segment
As value investors with an emphasis on individual stock selection, our sector weights are a byproduct of our bottom-up process. On an absolute-return basis, shares in the consumer discretionary sector gained the most value, while holdings in the energy sector posted the lowest return for calendar 2015.
The leading contributor to fund performance for the year was Amazon. As of the end of October, Amazon had returned over 100% since the beginning of the fiscal year. A third-quarter earnings report released in October showed earnings per share ($0.17 vs. -$0.13) and revenue ($25.36 billion vs. $24.88 billion) figures that beat consensus outlook, which helped to make this name a top contributor based on excess return. We subsequently sold out of our position in the first week of November as it reached our estimation of its intrinsic value.
Apache was the largest detractor from fund performance in the calendar year. The company saw shares fall 28% during 2015. As with most oil and gas exploration and production companies, Apache’s share price has been adversely affected by persistently weak oil and natural gas prices. In this challenging environment, the company is focused on improving capital efficiency, both through the efficient development of U.S. shale assets and the low-cost growth of international assets. Firm-wide operating costs continue to fall, and capital expenditure has decreased by almost 60% this year. We believe Apache’s capital productivity is improving at a faster pace than its global peers, which helps its position on the cost curve. Apache has what we consider to be a healthy balance sheet, which should allow the company to endure a prolonged downturn, and we expect that an eventual commodity price recovery will highlight the growing value of Apache’s underappreciated asset base.
Loomis Sayles All Cap Growth Segment
For the period, the All Cap Growth segment posted a positive absolute return. We are an active manager with a long-term, private equity approach to investing. Through our proprietary bottom-up research framework, we look to invest in those few high-quality businesses with sustainable competitive advantages and profitable growth when they trade at a significant discount to intrinsic value (our estimate of the true worth of a business, which we define as the present value of all expected future cash flows to a company). Holdings in the consumer discretionary, financials, consumer staples, energy and industrials sectors contributed to relative return, while holdings in the information technology and healthcare sectors detracted from relative performance.
Amazon.com, Monster Beverage and Alphabet were among the largest contributors to the Fund’s performance. Rebounding from lows in the previous period, Amazon was the top contributor this period, reporting strong 25% worldwide revenue growth year over year with gross merchandise volume growing at an even faster pace. With its growth more than two times that of the e-commerce market and several multiples higher than the low single-digit growth in the overall retail market, Amazon continued to take market share. Amazon’s third-party sales, one of the largest drivers of expanding gross margins, increased from 15% to 18% of total revenue, growing two to three times faster than Amazon’s first-party sales,
| 12
NATIXIS U.S. EQUITY OPPORTUNITIES FUND
which accounted for about 70% of total revenue. Amazon Web Services posted impressive growth and stronger-than-expected margins. Free cash flow increased significantly, by almost five-fold, to $5.4 billion compared with $1.1 billion a year ago. Energy drink company Monster Beverage was a top contributor and reported 10% year-over-year growth in net revenues. Robust 19% net revenue growth in the most recent quarter reflects the emergent positive impact of Monster’s strategic partnership with Coca-Cola, which took effect in June 2015. We believe Monster’s global distribution agreement with Coca-Cola will allow Monster to realize faster global expansion and profitability. Monster’s transition to Coca-Cola bottlers around the world is progressing steadily with reported share improvements in countries where the transition is complete. Gross and operating margins improved each quarter in the period compared with the year-ago quarter due to scale in new markets, an increase in lower cost local production, a positive mix of product sales and lower quarterly operating expenses. Alphabet, the parent company of Google, reported solid results throughout the period. The company’s core business, Google advertising (approximately 90% of total revenue), posted low- to mid-teen quarterly growth in reported revenue. YouTube delivered significant growth in advertising revenue and length of viewer watch sessions. Mobile search queries, another key driver of growth, represented more than 50% of total searches by the end of the period. Total acquisition costs declined during the period, margins improved, and free cash flow growth was robust. Capital expenditures remained somewhat elevated but declined throughout the period. We believe Amazon, Monster Beverage and Alphabet are well positioned to benefit from strong, sustained growth and continue to sell at meaningful discounts to intrinsic value.
Qualcomm, Greenhill & Co. and Oracle were among the largest detractors. Shares of mobile device chip designer and manufacturer Qualcomm came under pressure during the period. Although the company has signed deals with some of the largest smartphone manufacturers, implementation of new licensing agreements and improved device reporting progressed more slowly than anticipated following the company’s settlement with China’s antitrust regulators. In Qualcomm’s chipset business, the loss of market share in the premium-tier market and higher share in the low- and mid-tier markets negatively skewed near-term revenue. The company reported progress on its extensive strategic realignment plan to improve shareholder value. We believe the market remains focused on the volatility of Qualcomm’s chipset business performance and underestimates its licensing royalty business, which generates more than 60% of operating profits and an even greater portion of the company’s free cash flow. We took advantage of price weakness to add to our position. Investment bank Greenhill reported mergers and acquisitions deal volume growth during the period that expanded its market share. However, completed transaction volume was down significantly given the longer timeline for large, complex deals and the somewhat random nature of transaction completion. Pre-tax profit margins and earnings declined primarily due to expenses related to the acquisition of Cogent Partners. With completed transactions yet to peak, we believe Greenhill is well positioned to benefit from the mergers and acquisitions cycle. Oracle, a leader in enterprise software, reported weaker-than-expected results and near-term pressure on revenue as it transitions to a subscription-based
cloud computing solutions from its traditional offering in which revenue is paid upfront. Over time, we expect the shift to the cloud computing model will lead to faster growth
13 |
given its higher customer lifetime value. With robust growth of about 30% during the period, the cloud business grew from 3% to approximately 5% of total revenue. Oracle also remains the world leader in its traditional, on-premise data management offerings with solid margins and strong free cash flow. Given its high-quality business model, the long-term growth drivers of Oracle’s cloud transition and the stock’s attractive valuation, we increased our position. We believe Qualcomm, Greenhill and Oracle continue to sell at meaningful discounts to their intrinsic value.
Growth of $10,000 Investment in Class A Shares4
December 31, 2005 through December 31, 2015
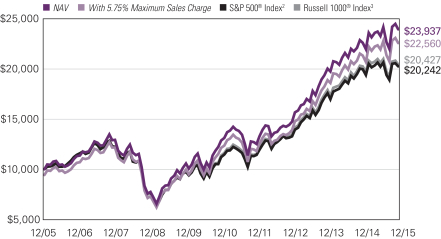
See notes to chart on page 15.
| 14
NATIXIS U.S. EQUITY OPPORTUNITIES FUND
Average Annual Total Returns — December 31, 20154
| | | | | | | | | | | | |
| | | | |
| | | 1 Year | | | 5 Years | | | 10 Years | |
| | | | |
| Class A (Inception 7/7/94) | | | | | | | | | | | | |
| NAV | | | 5.86 | % | | | 13.19 | % | | | 9.12 | % |
| With 5.75% Maximum Sales Charge | | | -0.22 | | | | 11.86 | | | | 8.48 | |
| | | | |
| Class B (Inception 7/7/94) | | | | | | | | | | | | |
| NAV | | | 5.06 | | | | 12.36 | | | | 8.32 | |
| With CDSC1 | | | 0.16 | | | | 12.13 | | | | 8.32 | |
| | | | |
| Class C (Inception 7/7/94) | | | | | | | | | | | | |
| NAV | | | 5.06 | | | | 12.35 | | | | 8.31 | |
| With CDSC1 | | | 4.08 | | | | 12.35 | | | | 8.31 | |
| | | | |
| Class Y (Inception 11/15/94) | | | | | | | | | | | | |
| NAV | | | 6.11 | | | | 13.48 | | | | 9.43 | |
| | | | |
| Comparative Performance | | | | | | | | | | | | |
| S&P 500® Index2 | | | 1.38 | | | | 12.57 | | | | 7.31 | |
| Russell 1000® Index3 | | | 0.92 | | | | 12.44 | | | | 7.40 | |
Performance data shown represents past performance and is no guarantee of, and not necessarily indicative of, future results. The table(s) do not reflect taxes shareholders might owe on any fund distributions or when they redeem their shares. Performance for periods less than one year is cumulative, not annualized. Returns reflect changes in share price and reinvestment of dividends and capital gains, if any. Unlike a fund, an index is not managed and does not reflect fees and expenses. It is not possible to invest directly in an index.
| 1 | Performance for Class B shares assumes a maximum 5.00% contingent deferred sales charge (“CDSC”) applied when you sell shares, which declines annually between years 1-6 according to the following schedule: 5, 4, 3, 3, 2, 1, 0%. Class C share performance assumes a 1.00% CDSC applied when you sell shares within one year of purchase. |
| 2 | S&P 500® Index is a widely recognized measure of U.S. stock market performance. It is an unmanaged index of 500 common stocks chosen for market size, liquidity, and industry group representation, among other factors. |
| 3 | Russell 1000® Index measures the performance of the large-cap segment of the U.S. equity universe. It is a subset of the Russell 3000® Index and includes approximately 1000 of the largest securities based on a combination of their market cap and current index membership. The Russell 1000® Index represents approximately 92% of the U.S. market and is constructed to provide a comprehensive and unbiased barometer for the large-cap segment and is completely reconstituted annually to ensure new and growing equities are reflected. |
| 4 | Fund performance has been increased by fee waivers and/or expense reimbursements, if any, without which performance would have been lower. |
15 |
SEEYOND MULTI-ASSET ALLOCATION FUND
| | |
| Managers | | Symbols |
| Simon Aninat | | Class A SAFAX |
| Frédéric Babu | | Class C SAFCX |
| Stéphanie Bigou | | Class Y SAFYX |
| Jonathan M. Birtwell | | |
| Didier Jauneaux | | |
| Frank Trividic | | |
| Yufeng Xie | | |
| Natixis Asset Management U.S., LLC (“Natixis AM US”) |
Objective
The Fund seeks long-term growth of capital by investing in a range of securities and asset classes across global markets.
Market Conditions
The first half of 2015 was characterized by cautious optimism as the U.S. recovery remained on solid enough footing for the U.S. Federal Reserve (Fed) to consider becoming the first major central bank to increase interest rates since 2011. China appeared to be skillfully threading the needle, avoiding a hard landing. European and Japanese central bankers made good on their rhetoric by adding further monetary, fiscal and structural stimulus to their economies. The U.S. dollar’s strength became the main headline, appreciating more than 8% (on a trade-weighted basis) through early July.
The second half of the year started on a different note as European leaders were mired in seemingly endless negotiations, attempting to agree on terms that would restructure Greek debt for a third time in almost as many years. Almost immediately after European officials were able to agree on terms for an additional Greek bailout, Chinese authorities surprised investors with currency devaluation in August, signaling that persistent growth concerns may indeed be warranted. Europe’s structural headwinds, combined with renewed Chinese growth concerns, directly influenced the market’s confidence in the Fed’s ability to increase interest rates. As if this were not enough uncertainty for investors to digest, geopolitical tensions came to a boil as we moved through 2015. Fringe social and political movements made meaningful gains in 2015, fueled by stagnating economic opportunity, heightened conflict in the Middle East and lower energy prices.
These macro risks, combined with a new, untested market structure borne out of the post global financial crisis regulatory environment, made for a rocky second half of 2015. More specifically, investors have witnessed market liquidity become increasingly fragile due to an abundance of issuance coupled with less market making activity, all within the context of complex, post-financial crisis regulatory schemes. As we learned in October of 2014 and August of 2015, this new and evolving market structure may not be fully prepared to withstand stressors that traditionally accompany healthy market corrections.
| 16
SEEYOND MULTI-ASSET ALLOCATION FUND
As a result, global asset prices realized higher volatility in 2015 as compared to recent years. With the removal of the implicit backstop of the Fed, renewed growth concerns across the world’s major economies, enhanced geopolitical instability and weaker asset market liquidity, there was ample fuel to fan the flames of uncertainty. Investors exited 2015 scratching their heads, with many more questions than answers.
Performance Results
For the period ended December 31, 2015, Class A shares of the Seeyond Multi-Asset Allocation Fund returned -5.39% at net asset value. The Fund underperformed its benchmark MSCI ACWI (Net), which returned -2.36%. The Fund underperformed its secondary benchmark, which returned -2.62%. This benchmark is a blended, unmanaged index composed of 60% MSCI ACWI (Net) and 40% Citigroup World Global Bond Index. We believe that the blended benchmark represents a better comparison than the primary, pure equity benchmark because of the Fund’s investments in a variety of asset classes.
Explanation of Fund Performance
The Fund entered the year overweight equities, specifically in Europe, which proved the main detractor to performance over the period. That said the Fund was well positioned to take advantage of the team’s core 2015 theme of reflation across other asset classes. The Fund’s overweight to the U.S. dollar produced strong results due to the fact that the majority of global central banks were working hard to stimulate demand via monetary policy and the U.S. was on the verge of normalizing interest rates. The Fund effectively steered clear of the weakness in emerging market equities, maintaining an underweight throughout the year on concerns of weak commodity prices, and the need to begin deleveraging in order to effectively rebalance emerging market economies.
The Fund maintained its overweight equity position into the second half of the year, navigated the summer’s Greek debt crisis skillfully. Drawing on the firm’s unique European expertise, the Fund was correctly positioned for a successful resolution between Greece and its European creditors. However, when Chinese officials announced a surprise yuan devaluation in August the Fund’s overweight in equities suffered as a result. What ended up being a relatively minor devaluation in the yuan triggered a sell-off of nearly 10% in the MSCI ACWI Index, with the market concluding that China was in need of a demand boost aided by a weaker currency. The devaluation and subsequent sell-off in risk assets set the tone for the remainder of 2015, as all assets became increasingly sensitive to perceived risks in the market. The Fund ended the period with a 61% weighting to equity securities.
The Fund maintained a neutral duration position over the course of 2015. With sovereign interest rates at historical lows, the Fund avoided outsized duration risk at this time, opting instead to take advantage of relative values found across developed market interest rate yield curves. On average, the Fund favored an overweight position at the long-end of the yield curve while remaining underweight the short-end in anticipation of U.S. short-term rate increases. At the end of the period, the Fund’s modified duration was 2.6 years.
17 |
The Fund’s currency positioning was again the largest positive contributor to relative performance. The Fund maintained its dollar overweight throughout the year, most notably versus the yen, euro, Canadian dollar and Australian dollar. As of December 31, 2015 the Fund’s exposure to non-U.S. dollar currencies accounted for 32.8% of the portfolio. The Fund’s volatility positioning was a small detractor to the portfolio’s performance over the period. It was a tough year for volatility trading as investors around the world were constantly on edge in anticipation of possible U.S. Fed rate hikes. This behavior caused short bursts of higher realized volatility with subsequent normalization, which tends to adversely affect the volatility strategy. The Fund ended the period with -0.05% sensitivity to a 1% move in volatility
Given our view on the global monetary cycle, the Fund remains overweight US dollars, while specifically avoiding commodity-linked assets which historically have been adversely affected by a strengthening dollar.
Outlook
The management team is hoping that 2016 will begin to answer many of the lingering questions that remain unresolved post global financial crisis. First and foremost, to what extent will the Fed be able to normalize interest rate policy without disrupting the fragile global economic recovery? Will China be able to effectively avoid a hard landing while simultaneously liberating its capital markets? We had a sneak peek of the challenges China faces this past summer when the market punished Chinese shares after the government announced it was stepping in to support equity prices. Will the European and Japanese structural recoveries finally start to emerge in sustainable form, resulting in improving long-term growth?
It is safe to say that there is no modern historical precedent for the current environment and therefore, we must remain modest in our forecasts. What we do know is that we are most likely in the later innings of an economic reflationary cycle and asset prices have responded as such. The United States has now begun normalizing interest rates, while most others remain accommodative to varying degrees. This should continue to bode well for assets priced in U.S. dollars. Given our view on the global monetary cycle, the Fund remains overweight US dollars, while specifically avoiding commodity-linked assets which historically have been adversely affected by a strengthening dollar. We see acute risks among the net commodity exporters and those who have issued large amounts of U.S. dollar-denominated debt such as much of Southeast Asia. Outside of the direct influence that a strong dollar has on the assets mentioned above, it should put additional downward pressure on corporate earnings in the United States while providing a tailwind to foreign issuers’ earnings with weakening currencies. Therefore, we continue to favor European and Japanese shares. We would expect that cheaper commodity prices should provide a nice tailwind to net commodity importers across the globe and specifically benefit U.S. consumers, who account for a large percentage of global output.
| 18
SEEYOND MULTI-ASSET ALLOCATION FUND
To summarize, we could draw an analogy between the current environment and a ship (the global economy) moored at sea. Up until very recently, this ship had a number of anchors cast, tethering it securely in place. Slowly, over time, these anchors have been lifted one by one, including the removal of the Fed’s backstop to the global economy, higher commodity prices that previously sustained emerging markets, the weaker dollar and a more robust liquidity environment. Without these anchors, the economy and markets may find themselves relatively unmoored, exposed to the uncertainty of the prevailing winds. This position is not necessarily fraught with danger, as long as we are able to effectively navigate the obstacles of choppier seas, which may lie ahead. Despite the challenges, we take solace in the fact that the Seeyond Multi-Asset Allocation Fund was built to take advantage of markets of this nature. We believe the Fund’s liquid, flexible nature and its volatility mandate is well positioned to take advantage of relative value across asset classes all while favoring a tactical approach given the complex environment.
Growth of $10,000 Investment in Class A Shares4
July 23, 2014 (inception) through December 31, 2015
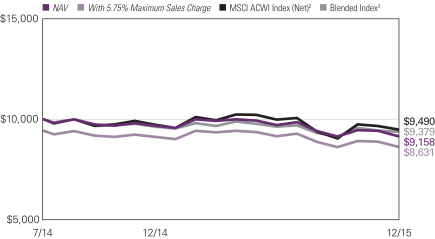
19 |
Average Annual Total Returns — December 31, 20154
| | | | | | | | |
| | | |
| | | 1 Year | | | Life of Fund | |
| | | |
| Class A (Inception 7/23/14) | | | | | | | | |
| NAV | | | -5.39 | % | | | -5.92 | % |
| With 5.75% Maximum Sales Charge | | | -10.82 | | | | -9.71 | |
| | | |
| Class C (Inception 7/23/14) | | | | | | | | |
| NAV | | | -6.14 | | | | -6.64 | |
| With CDSC1 | | | -7.06 | | | | -6.64 | |
| | | |
| Class Y (Inception 7/23/14) | | | | | | | | |
| NAV | | | -5.17 | | | | -5.70 | |
| | | |
| Comparative Performance | | | | | | | | |
| MSCI ACWI Index (Net)2 | | | -2.36 | | | | -3.57 | |
| Blended Index3 | | | -2.62 | | | | -4.36 | |
Performance data shown represents past performance and is no guarantee of, and not necessarily indicative of, future results. The table(s) do not reflect taxes shareholders might owe on any fund distributions or when they redeem their shares. Performance for periods less than one year is cumulative, not annualized. Returns reflect changes in share price and reinvestment of dividends and capital gains, if any. Unlike a fund, an index is not managed and does not reflect fees and expenses. It is not possible to invest directly in an index.
| 1 | Performance for Class C shares assumes a 1% contingent deferred sales charge (“CDSC”) applied when you sell shares within one year of purchase. |
| 2 | The MSCI ACWI Index (Net) represents the performance of 47 markets in both the developed and emerging markets in Africa, Europe, North America and South America. |
| 3 | The Blended Index is an unmanaged, blended index composed of the following weights: 60% MSCI All Country World Index (Net)/40% Citigroup World Government Bond Index. The weightings of the indices that compose the Blended Index are rebalanced on a monthly basis to maintain the allocations as described above. These rebalancings will not necessarily correspond to the rebalancing of the Fund’s investment portfolio, and the relative weightings of the asset classes in the Fund will generally differ to some extent from the weightings in the Blended Index. You may not invest directly in an index. |
| 4 | Fund performance has been increased by fee waivers and/or expense reimbursements, if any, without which performance would have been lower. |
| 20
ADDITIONAL INFORMATION
The views expressed in this report reflect those of the portfolio managers as of the dates indicated. The managers’ views are subject to change at any time without notice based on changes in market or other conditions. References to specific securities or industries should not be regarded as investment advice. Because the Funds are actively managed, there is no assurance that they will continue to invest in the securities or industries mentioned.
ADDITIONAL INDEX INFORMATION
This document may contain references to third party copyrights, indexes, and trademarks, each of which is the property of its respective owner. Such owner is not affiliated with Natixis Global Asset Management or any of its related or affiliated companies (collectively “NGAM”) and does not sponsor, endorse or participate in the provision of any NGAM services, funds or other financial products.
The index information contained herein is derived from third parties and is provided on an “as is” basis. The user of this information assumes the entire risk of use of this information. Each of the third party entities involved in compiling, computing or creating index information, disclaims all warranties (including, without limitation, any warranties of originality, accuracy, completeness, timeliness, non-infringement, merchantability and fitness for a particular purpose) with respect to such information.
PROXY VOTING INFORMATION
A description of the Natixis Funds’ proxy voting policies and procedures is available without charge, upon request, by calling Natixis Funds at 800-225-5478; on Natixis Funds’ website at ngam.natixis.com; and on the Securities and Exchange Commission’s (SEC) website at www.sec.gov. Information regarding how Natixis Funds voted proxies relating to portfolio securities during the 12-months ended June 30, 2015 is available from Natixis Funds’ website and the SEC’s website.
QUARTERLY PORTFOLIO SCHEDULES
Natixis Funds file a complete schedule of portfolio holdings with the SEC for the first and third quarters of each fiscal year on Form N-Q. The Funds’ Forms N-Q are available on the SEC’s website at www.sec.gov and may be reviewed and copied at the SEC’s Public Reference Room in Washington, DC. Information on the operation of the Public Reference Room may be obtained by calling 800-SEC-0330.
21 |
UNDERSTANDING FUND EXPENSES
As a mutual fund shareholder, you incur different costs: transaction costs, including sales charges (loads) on purchases and contingent deferred sales charges on redemptions, and ongoing costs, including management fees, distribution and/or service fees (12b-1 fees), and other fund expenses. Certain exemptions may apply. These costs are described in more detail in the Funds’ prospectus. The following examples are intended to help you understand the ongoing costs of investing in the Funds and help you compare these with the ongoing costs of investing in other mutual funds.
The first line in the table of each class of Fund shares shows the actual account values and actual Fund expenses you would have paid on a $1,000 investment in the Fund from July 1, 2015 through December 31, 2015. To estimate the expenses you paid over the period, simply divide your account value by $1,000 (for example $8,600 account value divided by $1,000 = 8.60) and multiply the result by the number in the Expenses Paid During Period column as shown for your class.
The second line in the table for each class of Fund shares provides information about hypothetical account values and hypothetical expenses based on the Fund’s actual expense ratios and an assumed rate of return of 5% per year before expenses, which is not the Fund’s actual return. The hypothetical account values and expenses may not be used to estimate the actual ending account balance or expenses you paid on your investment for the period. You may use this information to compare the ongoing costs of investing in the Fund and other funds. To do so, compare this 5% hypothetical example with the 5% hypothetical examples that appear in the shareholder reports of the other funds.
Please note that the expenses shown reflect ongoing costs only, and do not include any transaction costs, such as sales charges. Therefore, the second line in the table of each Fund is useful in comparing ongoing costs only, and will not help you determine the relative costs of owning different funds. If transaction costs were included, total costs would be higher.
| 22
| | | | | | | | | | | | |
LOOMIS SAYLES MULTI-ASSET INCOME
FUND (formerly Natixis Diversified
Income Fund) | | BEGINNING
ACCOUNT VALUE
7/1/2015 | | | ENDING
ACCOUNT VALUE
12/31/2015 | | | EXPENSES PAID
DURING PERIOD
7/1/2015 – 12/31/2015 | |
| Class A | | | | | | | | | | | | |
| Actual | | | $1,000.00 | | | | $1,002.80 | | | | $5.20 | 1 |
| Hypothetical (5% return before expenses) | | | $1,000.00 | | | | $1,020.01 | | | | $5.24 | * |
| Class C | | | | | | | | | | | | |
| Actual | | | $1,000.00 | | | | $998.90 | | | | $9.07 | 1 |
| Hypothetical (5% return before expenses) | | | $1,000.00 | | | | $1,016.13 | | | | $9.15 | * |
| Class N | | | | | | | | | | | | |
| Actual | | | $1,000.00 | | | | $1,019.10 | | | | $2.19 | 2 |
| Hypothetical (5% return before expenses) | | | $1,000.00 | | | | $1,021.93 | | | | $3.31 | * |
| Class Y | | | | | | | | | | | | |
| Actual | | | $1,000.00 | | | | $1,004.90 | | | | $4.04 | 1 |
| Hypothetical (5% return before expenses) | | | $1,000.00 | | | | $1,021.17 | | | | $4.08 | * |
| * | Hypothetical expenses are equal to the Fund's annualized expense ratio (after waiver/reimbursement): 1.03%, 1.80%, 0.65% and 0.80% for Class A, C, N and Y, respectively, multiplied by the average account value over the period, multiplied by the number of days in the most recent half-year (184), divided by 365 (to reflect the half-year period). |
| 1 | Actual expenses for Class A, C and Y are equal to the Fund's annualized expense ratio (after waiver/reimbursement): 1.03%, 1.80% and 0.80%, respectively, multiplied by the average account value over the period, multiplied by the number of days in the most recent fiscal half-year (184), divided by 365 (to reflect the half-year period). |
| 2 | Class N commenced operations on August 31, 2015. Actual expenses are equal to the Fund's annualized expense ratio (after waiver/reimbursement) of 0.65%, multiplied by the average account value over the period, multiplied by the number of days in the most recent fiscal period (122), divided by 365 (to reflect the partial period). |
| | | | | | | | | | | | |
MCDONNELL INTERMEDIATE MUNICIPAL
BOND FUND | | BEGINNING
ACCOUNT VALUE
7/1/2015 | | | ENDING
ACCOUNT VALUE
12/31/2015 | | | EXPENSES PAID
DURING PERIOD*
7/1/2015 – 12/31/2015 | |
| Class A | | | | | | | | | | | | |
| Actual | | | $1,000.00 | | | | $1,024.90 | | | | $3.57 | |
| Hypothetical (5% return before expenses) | | | $1,000.00 | | | | $1,021.68 | | | | $3.57 | |
| Class C | | | | | | | | | | | | |
| Actual | | | $1,000.00 | | | | $1,021.20 | | | | $7.39 | |
| Hypothetical (5% return before expenses) | | | $1,000.00 | | | | $1,017.90 | | | | $7.37 | |
| Class Y | | | | | | | | | | | | |
| Actual | | | $1,000.00 | | | | $1,026.10 | | | | $2.30 | |
| Hypothetical (5% return before expenses) | | | $1,000.00 | | | | $1,022.94 | | | | $2.29 | |
| * | Expenses are equal to the Fund's annualized expense ratio (after waiver/reimbursement): 0.70%, 1.45% and 0.45% for Class A, C and Y, respectively, multiplied by the average account value over the period, multiplied by the number of days in the most recent half-year (184), divided by 365 (to reflect the half-year period). |
23 |
| | | | | | | | | | | | |
NATIXIS U.S. EQUITY OPPORTUNITIES
FUND | | BEGINNING
ACCOUNT VALUE
7/1/2015 | | | ENDING
ACCOUNT VALUE
12/31/2015 | | | EXPENSES PAID
DURING PERIOD*
7/1/2015 – 12/31/2015 | |
| Class A | | | | | | | | | | | | |
| Actual | | | $1,000.00 | | | | $1,028.80 | | | | $6.39 | |
| Hypothetical (5% return before expenses) | | | $1,000.00 | | | | $1,018.90 | | | | $6.36 | |
| Class B | | | | | | | | | | | | |
| Actual | | | $1,000.00 | | | | $1,025.10 | | | | $10.16 | |
| Hypothetical (5% return before expenses) | | | $1,000.00 | | | | $1,015.17 | | | | $10.11 | |
| Class C | | | | | | | | | | | | |
| Actual | | | $1,000.00 | | | | $1,025.10 | | | | $10.21 | |
| Hypothetical (5% return before expenses) | | | $1,000.00 | | | | $1,015.12 | | | | $10.16 | |
| Class Y | | | | | | | | | | | | |
| Actual | | | $1,000.00 | | | | $1,030.20 | | | | $5.12 | |
| Hypothetical (5% return before expenses) | | | $1,000.00 | | | | $1,020.16 | | | | $5.09 | |
| * | Expenses are equal to the Fund's annualized expense ratio (after waiver/reimbursement): 1.25%, 1.99%, 2.00% and 1.00% for Class A, B, C and Y, respectively, multiplied by the average account value over the period, multiplied by the number of days in the most recent fiscal half-year (184), divided by 365 (to reflect the half-year period). |
| | | | | | | | | | | | |
SEEYOND MULTI-ASSET ALLOCATION
FUND | | BEGINNING
ACCOUNT VALUE
7/1/2015 | | | ENDING
ACCOUNT VALUE
12/31/2015 | | | EXPENSES PAID
DURING PERIOD*
7/1/2015 – 12/31/2015 | |
| Class A | | | | | | | | | | | | |
| Actual | | | $1,000.00 | | | | $942.60 | | | | $6.61 | |
| Hypothetical (5% return before expenses) | | | $1,000.00 | | | | $1,018.40 | | | | $6.87 | |
| Class C | | | | | | | | | | | | |
| Actual | | | $1,000.00 | | | | $939.10 | | | | $10.31 | |
| Hypothetical (5% return before expenses) | | | $1,000.00 | | | | $1,014.57 | | | | $10.71 | |
| Class Y | | | | | | | | | | | | |
| Actual | | | $1,000.00 | | | | $943.80 | | | | $5.44 | |
| Hypothetical (5% return before expenses) | | | $1,000.00 | | | | $1,019.61 | | | | $5.65 | |
| * | Expenses are equal to the Fund's annualized expense ratio (after waiver/reimbursement), including interest expense: 1.35%, 2.11% and 1.11% for Class A, C and Y, respectively, multiplied by the average account value over the period, multiplied by the number of days in the most recent half-year (184), divided by 365 (to reflect the half-year period). |
| 24
Portfolio of Investments – as of December 31, 2015
Loomis Sayles Multi-Asset Income Fund*
| | | | | | | | |
Shares | | | Description | | Value (†) | |
| | Common Stocks — 68.2% of Net Assets | |
| | | | Aerospace & Defense — 1.8% | | | | |
| | 642 | | | Boeing Co. (The) | | $ | 92,827 | |
| | 6,339 | | | Lockheed Martin Corp. | | | 1,376,514 | |
| | 7,009 | | | United Technologies Corp. | | | 673,354 | |
| | | | | | | | |
| | | | | | | 2,142,695 | |
| | | | | | | | |
| | | | Air Freight & Logistics — 0.2% | | | | |
| | 3,734 | | | bpost S.A. | | | 91,623 | |
| | 13,141 | | | Royal Mail PLC | | | 86,072 | |
| | 911 | | | United Parcel Service, Inc., Class B | | | 87,665 | |
| | | | | | | | |
| | | | | | | 265,360 | |
| | | | | | | | |
| | | | Auto Components — 0.1% | | | | |
| | 3,378 | | | Johnson Controls, Inc. | | | 133,397 | |
| | | | | | | | |
| | | | Automobiles — 0.2% | | | | |
| | 8,032 | | | General Motors Co. | | | 273,168 | |
| | | | | | | | |
| | | | Banks — 4.2% | | | | |
| | 27,000 | | | Aozora Bank Ltd. | | | 94,225 | |
| | 6,131 | | | Bank of Hawaii Corp. | | | 385,640 | |
| | 154 | | | Banque Cantonale Vaudoise | | | 97,700 | |
| | 14,337 | | | BB&T Corp. | | | 542,082 | |
| | 7,692 | | | F.N.B. Corp. | | | 102,611 | |
| | 7,448 | | | First Niagara Financial Group, Inc. | | | 80,811 | |
| | 7,652 | | | FirstMerit Corp. | | | 142,710 | |
| | 14,509 | | | JPMorgan Chase & Co. | | | 958,029 | |
| | 45,600 | | | Mizuho Financial Group, Inc. | | | 91,200 | |
| | 5,816 | | | PacWest Bancorp | | | 250,670 | |
| | 9,224 | | | People’s United Financial, Inc. | | | 148,968 | |
| | 3,340 | | | PNC Financial Services Group, Inc. (The) | | | 318,335 | |
| | 2,400 | | | Sumitomo Mitsui Financial Group, Inc. | | | 90,578 | |
| | 8,004 | | | Trustmark Corp. | | | 184,412 | |
| | 4,746 | | | U.S. Bancorp | | | 202,512 | |
| | 7,210 | | | United Bankshares, Inc. | | | 266,698 | |
| | 9,685 | | | Valley National Bancorp | | | 95,397 | |
| | 19,766 | | | Wells Fargo & Co. | | | 1,074,480 | |
| | | | | | | | |
| | | | | | | 5,127,058 | |
| | | | | | | | |
| | | | Beverages — 1.1% | | | | |
| | 8,878 | | | Britvic PLC | | | 95,121 | |
| | 6,836 | | | Coca-Cola Co. (The) | | | 293,674 | |
| | 1,039 | | | Dr Pepper Snapple Group, Inc. | | | 96,835 | |
| | 8,529 | | | PepsiCo, Inc. | | | 852,218 | |
| | | | | | | | |
| | | | | | | 1,337,848 | |
| | | | | | | | |
| | | | Biotechnology — 0.8% | | | | |
| | 5,961 | | | AbbVie, Inc. | | | 353,130 | |
| | 3,268 | | | Amgen, Inc. | | | 530,494 | |
See accompanying notes to financial statements.
25 |
Portfolio of Investments – as of December 31, 2015
Loomis Sayles Multi-Asset Income Fund* – (continued)
| | | | | | | | |
Shares | | | Description | | Value (†) | |
| | | | Biotechnology — continued | | | | |
| | 17,526 | | | PDL BioPharma, Inc. | | $ | 62,042 | |
| | | | | | | | |
| | | | | | | 945,666 | |
| | | | | | | | |
| | | | Capital Markets — 0.2% | | | | |
| | 6,101 | | | Federated Investors, Inc., Class B | | | 174,794 | |
| | 96,000 | | | Haitong International Securities Group Ltd. | | | 58,536 | |
| | | | | | | | |
| | | | | | | 233,330 | |
| | | | | | | | |
| | | | Chemicals — 0.7% | | | | |
| | 8,351 | | | Dow Chemical Co. (The) | | | 429,910 | |
| | 388 | | | LyondellBasell Industries NV, Class A | | | 33,717 | |
| | 5,624 | | | Olin Corp. | | | 97,070 | |
| | 2,380 | | | PPG Industries, Inc. | | | 235,192 | |
| | | | | | | | |
| | | | | | | 795,889 | |
| | | | | | | | |
| | | | Commercial Services & Supplies — 0.9% | | | | |
| | 2,752 | | | Intrum Justitia AB | | | 93,644 | |
| | 6,988 | | | Pitney Bowes, Inc. | | | 144,302 | |
| | 11,145 | | | R.R. Donnelley & Sons Co. | | | 164,054 | |
| | 5,797 | | | Republic Services, Inc. | | | 255,010 | |
| | 10,000 | | | Toppan Printing Co. Ltd. | | | 92,132 | |
| | 6,070 | | | Waste Management, Inc. | | | 323,956 | |
| | | | | | | | |
| | | | | | | 1,073,098 | |
| | | | | | | | |
| | | | Communications Equipment — 0.8% | | | | |
| | 18,214 | | | Cisco Systems, Inc. | | | 494,601 | |
| | 9,072 | | | QUALCOMM, Inc. | | | 453,464 | |
| | | | | | | | |
| | | | | | | 948,065 | |
| | | | | | | | |
| | | | Containers & Packaging — 0.8% | | | | |
| | 5,625 | | | Avery Dennison Corp. | | | 352,462 | |
| | 9,491 | | | Greif, Inc., Class A | | | 292,418 | |
| | 3,475 | | | International Paper Co. | | | 131,008 | |
| | 6,013 | | | Sonoco Products Co. | | | 245,751 | |
| | | | | | | | |
| | | | | | | 1,021,639 | |
| | | | | | | | |
| | | | Distributors — 0.6% | | | | |
| | 8,865 | | | Genuine Parts Co. | | | 761,415 | |
| | | | | | | | |
| | | | Diversified Financial Services — 0.6% | | | | |
| | 8,654 | | | CME Group, Inc. | | | 784,052 | |
| | | | | | | | |
| | | | Diversified Telecommunication Services — 1.9% | | | | |
| | 14,784 | | | AT&T, Inc. | | | 508,718 | |
| | 43,464 | | | Bezeq The Israeli Telecommunication Corp. Ltd. | | | 95,680 | |
| | 19,132 | | | CenturyLink, Inc. | | | 481,361 | |
| | 10,000 | | | HKT Trust & HKT Ltd. | | | 12,774 | |
| | 42,693 | | | Spark New Zealand Ltd. | | | 96,130 | |
| | 24,789 | | | Verizon Communications, Inc. | | | 1,145,748 | |
| | | | | | | | |
| | | | | | | 2,340,411 | |
| | | | | | | | |
See accompanying notes to financial statements.
| 26
Portfolio of Investments – as of December 31, 2015
Loomis Sayles Multi-Asset Income Fund* – (continued)
| | | | | | | | |
Shares | | | Description | | Value (†) | |
| | | | Electric Utilities — 2.1% | | | | |
| | 11,000 | | | CLP Holdings Ltd. | | $ | 93,236 | |
| | 3,906 | | | Edison International | | | 231,274 | |
| | 9,930 | | | Entergy Corp. | | | 678,815 | |
| | 8,245 | | | Exelon Corp. | | | 228,964 | |
| | 5,794 | | | NextEra Energy, Inc. | | | 601,939 | |
| | 3,836 | | | Pinnacle West Capital Corp. | | | 247,345 | |
| | 12,687 | | | PPL Corp. | | | 433,007 | |
| | 4,359 | | | SSE PLC | | | 97,876 | |
| | | | | | | | �� |
| | | | | | | 2,612,456 | |
| | | | | | | | |
| | | | Electrical Equipment — 0.9% | | | | |
| | 15,806 | | | Eaton Corp. PLC | | | 822,544 | |
| | 7,033 | | | Emerson Electric Co. | | | 336,389 | |
| | | | | | | | |
| | | | | | | 1,158,933 | |
| | | | | | | | |
| | | | Food & Staples Retailing — 0.7% | | | | |
| | 3,252 | | | CVS Health Corp. | | | 317,948 | |
| | 6,340 | | | Kroger Co. (The) | | | 265,202 | |
| | 6,490 | | | Sysco Corp. | | | 266,090 | |
| | | | | | | | |
| | | | | | | 849,240 | |
| | | | | | | | |
| | | | Food Products — 1.2% | | | | |
| | 1,780 | | | Cal-Maine Foods, Inc. | | | 82,485 | |
| | 5,798 | | | Campbell Soup Co. | | | 304,685 | |
| | 6,588 | | | General Mills, Inc. | | | 379,864 | |
| | 3,320 | | | Mead Johnson Nutrition Co. | | | 262,114 | |
| | 7,734 | | | Mondelez International, Inc., Class A | | | 346,793 | |
| | 11,321 | | | Orkla ASA | | | 89,310 | |
| | | | | | | | |
| | | | | | | 1,465,251 | |
| | | | | | | | |
| | | | Gas Utilities — 0.3% | | | | |
| | 2,331 | | | AmeriGas Partners LP | | | 79,883 | |
| | 24,000 | | | Osaka Gas Co. Ltd. | | | 86,687 | |
| | 12,707 | | | Questar Corp. | | | 247,532 | |
| | | | | | | | |
| | | | | | | 414,102 | |
| | | | | | | | |
| | | | Health Care Equipment & Supplies — 0.1% | | | | |
| | 1,199 | | | ResMed, Inc. | | | 64,374 | |
| | | | | | | | |
| | | | Health Care Providers & Services — 0.2% | | | | |
| | 1,085 | | | Cardinal Health, Inc. | | | 96,858 | |
| | 2,527 | | | HealthSouth Corp. | | | 87,965 | |
| | 1,397 | | | Quest Diagnostics, Inc. | | | 99,382 | |
| | | | | | | | |
| | | | | | | 284,205 | |
| | | | | | | | |
| | | | Hotels, Restaurants & Leisure — 1.6% | | | | |
| | 743 | | | Cracker Barrel Old Country Store, Inc. | | | 94,235 | |
| | 8,957 | | | Darden Restaurants, Inc. | | | 570,023 | |
| | 16,799 | | | Hilton Worldwide Holdings, Inc. | | | 359,499 | |
See accompanying notes to financial statements.
27 |
Portfolio of Investments – as of December 31, 2015
Loomis Sayles Multi-Asset Income Fund* – (continued)
| | | | | | | | |
Shares | | | Description | | Value (†) | |
| | | | Hotels, Restaurants & Leisure — continued | | | | |
| | 7,459 | | | McDonald’s Corp. | | $ | 881,206 | |
| | | | | | | | |
| | | | | | | 1,904,963 | |
| | | | | | | | |
| | | | Household Durables — 0.9% | | | | |
| | 8,052 | | | Garmin Ltd. | | | 299,293 | |
| | 7,877 | | | Leggett & Platt, Inc. | | | 330,992 | |
| | 8,514 | | | Tupperware Brands Corp. | | | 473,804 | |
| | | | | | | | |
| | | | | | | 1,104,089 | |
| | | | | | | | |
| | | | Household Products — 2.0% | | | | |
| | 6,479 | | | Clorox Co. (The) | | | 821,732 | |
| | 7,041 | | | Kimberly-Clark Corp. | | | 896,319 | |
| | 8,915 | | | Procter & Gamble Co. (The) | | | 707,940 | |
| | | | | | | | |
| | | | | | | 2,425,991 | |
| | | | | | | | |
| | | | Industrial Conglomerates — 1.4% | | | | |
| | 4,450 | | | Danaher Corp. | | | 413,316 | |
| | 43,246 | | | General Electric Co. | | | 1,347,113 | |
| | | | | | | | |
| | | | | | | 1,760,429 | |
| | | | | | | | |
| | | | Insurance — 1.7% | | | | |
| | 6,657 | | | Arthur J. Gallagher & Co. | | | 272,538 | |
| | 1,859 | | | Aspen Insurance Holdings Ltd. | | | 89,790 | |
| | 3,621 | | | Assured Guaranty Ltd. | | | 95,703 | |
| | 7,326 | | | Cincinnati Financial Corp. | | | 433,479 | |
| | 9,334 | | | Mercury General Corp. | | | 434,684 | |
| | 6,578 | | | MetLife, Inc. | | | 317,125 | |
| | 10,447 | | | Old Republic International Corp. | | | 194,628 | |
| | 2,304 | | | Prudential Financial, Inc. | | | 187,569 | |
| | 1,495 | | | RLI Corp. | | | 92,316 | |
| | | | | | | | |
| | | | | | | 2,117,832 | |
| | | | | | | | |
| | | | Internet Software & Services — 0.2% | | | | |
| | 2,200 | | | Mixi, Inc. | | | 82,287 | |
| | 19,233 | | | Moneysupermarket.com Group PLC | | | 104,043 | |
| | | | | | | | |
| | | | | | | 186,330 | |
| | | | | | | | |
| | | | IT Services — 0.6% | | | | |
| | 878 | | | Accenture PLC, Class A | | | 91,751 | |
| | 1,769 | | | Paychex, Inc. | | | 93,562 | |
| | 5,564 | | | Visa, Inc., Class A | | | 431,488 | |
| | 4,949 | | | Western Union Co. (The) | | | 88,637 | |
| | | | | | | | |
| | | | | | | 705,438 | |
| | | | | | | | |
| | | | Leisure Products — 0.4% | | | | |
| | 1,328 | | | Hasbro, Inc. | | | 89,454 | |
| | 12,822 | | | Mattel, Inc. | | | 348,374 | |
| | | | | | | | |
| | | | | | | 437,828 | |
| | | | | | | | |
See accompanying notes to financial statements.
| 28
Portfolio of Investments – as of December 31, 2015
Loomis Sayles Multi-Asset Income Fund* – (continued)
| | | | | | | | |
Shares | | | Description | | Value (†) | |
| | | | Media — 0.9% | | | | |
| | 5,033 | | | Cinemark Holdings, Inc. | | $ | 168,253 | |
| | 1,442 | | | Comcast Corp., Class A | | | 81,372 | |
| | 7,124 | | | Meredith Corp. | | | 308,113 | |
| | 1,136 | | | Omnicom Group, Inc. | | | 85,950 | |
| | 19,733 | | | TEGNA, Inc. | | | 503,586 | |
| | | | | | | | |
| | | | | | | 1,147,274 | |
| | | | | | | | |
| | | | Metals & Mining — 0.2% | | | | |
| | 6,800 | | | Commercial Metals Co. | | | 93,092 | |
| | 2,864 | | | Nucor Corp. | | | 115,419 | |
| | | | | | | | |
| | | | | | | 208,511 | |
| | | | | | | | |
| | | | Multi-Utilities — 0.9% | | | | |
| | 15,486 | | | CenterPoint Energy, Inc. | | | 284,323 | |
| | 2,842 | | | Dominion Resources, Inc. | | | 192,233 | |
| | 6,371 | | | National Grid PLC | | | 87,866 | |
| | 10,002 | | | PG&E Corp. | | | 532,006 | |
| | | | | | | | |
| | | | | | | 1,096,428 | |
| | | | | | | | |
| | | | Multiline Retail — 0.1% | | | | |
| | 1,290 | | | Target Corp. | | | 93,667 | |
| | | | | | | | |
| | | | Oil, Gas & Consumable Fuels — 4.0% | | | | |
| | 18,021 | | | Chevron Corp. | | | 1,621,169 | |
| | 17,738 | | | Columbia Pipeline Group, Inc. | | | 354,760 | |
| | 1,027 | | | CVR Energy, Inc. | | | 40,412 | |
| | 11,711 | | | Exxon Mobil Corp. | | | 912,872 | |
| | 3,783 | | | Hess Corp. | | | 183,400 | |
| | 6,839 | | | HollyFrontier Corp. | | | 272,808 | |
| | 8,079 | | | Occidental Petroleum Corp. | | | 546,221 | |
| | 10,900 | | | ONEOK, Inc. | | | 268,794 | |
| | 17,829 | | | Scorpio Tankers, Inc. | | | 142,989 | |
| | 10,000 | | | TonenGeneral Sekiyu KK | | | 84,420 | |
| | 6,052 | | | Valero Energy Corp. | | | 427,937 | |
| | | | | | | | |
| | | | | | | 4,855,782 | |
| | | | | | | | |
| | | | Paper & Forest Products — 0.2% | | | | |
| | 7,614 | | | Domtar Corp. | | | 281,337 | |
| | | | | | | | |
| | | | Pharmaceuticals — 3.3% | | | | |
| | 13,027 | | | Bristol-Myers Squibb Co. | | | 896,127 | |
| | 12,109 | | | Eli Lilly & Co. | | | 1,020,304 | |
| | 8,381 | | | Johnson & Johnson | | | 860,896 | |
| | 6,668 | | | Merck & Co., Inc. | | | 352,204 | |
| | 2,700 | | | Otsuka Holdings Co. Ltd. | | | 95,928 | |
| | 21,321 | | | Pfizer, Inc. | | | 688,242 | |
| | 1,455 | | | Teva Pharmaceutical Industries Ltd. | | | 94,926 | |
| | | | | | | | |
| | | | | | | 4,008,627 | |
| | | | | | | | |
| | | | Real Estate Management/Services — 0.1% | | | | |
| | 2,475 | | | Four Corners Property Trust, Inc.(b) | | | 59,796 | |
| | | | | | | | |
See accompanying notes to financial statements.
29 |
Portfolio of Investments – as of December 31, 2015
Loomis Sayles Multi-Asset Income Fund* – (continued)
| | | | | | | | |
Shares | | | Description | | Value (†) | |
| | | | REITs – Apartments — 5.9% | | | | |
| | 15,500 | | | American Campus Communities, Inc. | | $ | 640,770 | |
| | 13,300 | | | AvalonBay Communities, Inc. | | | 2,448,929 | |
| | 13,000 | | | Camden Property Trust | | | 997,880 | |
| | 38,500 | | | Equity Residential | | | 3,141,215 | |
| | | | | | | | |
| | | | | | | 7,228,794 | |
| | | | | | | | |
| | | | REITs – Diversified — 1.7% | | | | |
| | 16,500 | | | American Assets Trust, Inc. | | | 632,775 | |
| | 26,900 | | | DuPont Fabros Technology, Inc. | | | 855,151 | |
| | 15,600 | | | STORE Capital Corp. | | | 361,920 | |
| | 2,000 | | | Vornado Realty Trust | | | 199,920 | |
| | | | | | | | |
| | | | | | | 2,049,766 | |
| | | | | | | | |
| | | | REITs – Hotels — 1.0% | | | | |
| | 48,300 | | | Host Hotels & Resorts, Inc. | | | 740,922 | |
| | 21,100 | | | RLJ Lodging Trust | | | 456,393 | |
| | | | | | | | |
| | | | | | | 1,197,315 | |
| | | | | | | | |
| | | | REITs – Manufactured Homes — 0.8% | | | | |
| | 14,200 | | | Equity Lifestyle Properties, Inc. | | | 946,714 | |
| | | | | | | | |
| | | | REITs – Office Property — 1.8% | | | | |
| | 34,100 | | | BioMed Realty Trust, Inc. | | | 807,829 | |
| | 17,100 | | | Douglas Emmett, Inc. | | | 533,178 | |
| | 47,600 | | | Piedmont Office Realty Trust, Inc., Class A | | | 898,688 | |
| | | | | | | | |
| | | | | | | 2,239,695 | |
| | | | | | | | |
| | | | REITs – Regional Malls — 3.2% | | | | |
| | 11,900 | | | Simon Property Group, Inc. | | | 2,313,836 | |
| | 15,800 | | | Tanger Factory Outlet Centers, Inc. | | | 516,660 | |
| | 14,500 | | | Taubman Centers, Inc. | | | 1,112,440 | |
| | | | | | | | |
| | | | | | | 3,942,936 | |
| | | | | | | | |
| | | | REITs – Shopping Centers — 2.8% | | | | |
| | 22,000 | | | Acadia Realty Trust | | | 729,300 | |
| | 50,600 | | | DDR Corp. | | | 852,104 | |
| | 9,400 | | | Federal Realty Investment Trust | | | 1,373,340 | |
| | 27,100 | | | Retail Opportunity Investments Corp. | | | 485,090 | |
| | | | | | | | |
| | | | | | | 3,439,834 | |
| | | | | | | | |
| | | | REITs – Single Tenant — 0.4% | | | | |
| | 12,600 | | | National Retail Properties, Inc. | | | 504,630 | |
| | | | | | | | |
| | | | REITs – Storage — 3.4% | | | | |
| | 27,000 | | | CubeSmart | | | 826,740 | |
| | 5,400 | | | Extra Space Storage, Inc. | | | 476,334 | |
| | 11,500 | | | Public Storage | | | 2,848,550 | |
| | | | | | | | |
| | | | | | | 4,151,624 | |
| | | | | | | | |
| | | | REITs – Warehouse/Industrials — 2.3% | | | | |
| | 52,700 | | | ProLogis, Inc. | | | 2,261,884 | |
See accompanying notes to financial statements.
| 30
Portfolio of Investments – as of December 31, 2015
Loomis Sayles Multi-Asset Income Fund* – (continued)
| | | | | | | | |
Shares | | | Description | | Value (†) | |
| | | | REITs – Warehouse/Industrials — continued | | | | |
| | 35,800 | | | Rexford Industrial Realty, Inc. | | $ | 585,688 | |
| | | | | | | | |
| | | | | | | 2,847,572 | |
| | | | | | | | |
| | | | Road & Rail — 0.3% | | | | |
| | 11,357 | | | CSX Corp. | | | 294,714 | |
| | 18,915 | | | National Express Group PLC | | | 92,499 | |
| | | | | | | | |
| | | | | | | 387,213 | |
| | | | | | | | |
| | | | Semiconductors & Semiconductor Equipment — 0.9% | | | | |
| | 22,501 | | | Cypress Semiconductor Corp.(b) | | | 220,735 | |
| | 13,313 | | | Intel Corp. | | | 458,633 | |
| | 7,690 | | | Texas Instruments, Inc. | | | 421,489 | |
| | | | | | | | |
| | | | | | | 1,100,857 | |
| | | | | | | | |
| | | | Software — 1.0% | | | | |
| | 23,089 | | | Microsoft Corp. | | | 1,280,978 | |
| | | | | | | | |
| | | | Specialty Retail — 0.5% | | | | |
| | 6,099 | | | American Eagle Outfitters, Inc. | | | 94,534 | |
| | 474 | | | Best Buy Co., Inc. | | | 14,433 | |
| | 10,860 | | | Guess?, Inc. | | | 205,037 | |
| | 975 | | | L Brands, Inc. | | | 93,425 | |
| | 6,288 | | | Staples, Inc. | | | 59,547 | |
| | 6,000 | | | USS Co. Ltd. | | | 90,155 | |
| | | | | | | | |
| | | | | | | 557,131 | |
| | | | | | | | |
| | | | Technology Hardware, Storage & Peripherals — 0.4% | | | | |
| | 9,474 | | | EMC Corp. | | | 243,292 | |
| | 8,252 | | | Seagate Technology PLC | | | 302,519 | |
| | | | | | | | |
| | | | | | | 545,811 | |
| | | | | | | | |
| | | | Thrifts & Mortgage Finance — 0.2% | | | | |
| | 18,165 | | | New York Community Bancorp, Inc. | | | 296,453 | |
| | | | | | | | |
| | | | Tobacco — 2.5% | | | | |
| | 21,737 | | | Altria Group, Inc. | | | 1,265,311 | |
| | 1,620 | | | British American Tobacco PLC | | | 89,965 | |
| | 1,736 | | | Imperial Tobacco Group PLC | | | 91,691 | |
| | 2,600 | | | Japan Tobacco, Inc. | | | 95,456 | |
| | 16,516 | | | Philip Morris International, Inc. | | | 1,451,922 | |
| | 910 | | | Swedish Match AB | | | 32,157 | |
| | 3,673 | | | Vector Group Ltd. | | | 86,646 | |
| | | | | | | | |
| | | | | | | 3,113,148 | |
| | | | | | | | |
| | | | Transportation Infrastructure — 0.1% | | | | |
| | 32,100 | | | SATS Ltd. | | | 86,825 | |
| | | | | | | | |
| | | | Wireless Telecommunication Services — 0.1% | | | | |
| | 4,700 | | | NTT DOCOMO, Inc. | | | 96,405 | |
| | | | | | | | |
| | | | Total Common Stocks
(Identified Cost $77,936,192) | | | 83,439,675 | |
| | | | | | | | |
See accompanying notes to financial statements.
31 |
Portfolio of Investments – as of December 31, 2015
Loomis Sayles Multi-Asset Income Fund* – (continued)
| | | | | | | | |
Principal
Amount (‡) | | | Description | | Value (†) | |
| | Bonds and Notes — 20.6% | |
| | | | Aerospace & Defense — 1.4% | | | | |
| $ | 1,750,000 | | | KLX, Inc., 5.875%, 12/01/2022, 144A | | $ | 1,662,500 | |
| | | | | | | | |
| | | | Banking — 6.4% | | | | |
| | 600,000 | | | Banco Santander Brasil S.A., 8.000%, 3/18/2016, 144A, (BRL) | | | 148,830 | |
| | 2,800,000 | | | Deutsche Bank AG, (fixed rate to 4/30/2025, variable rate thereafter), 7.500%(c) | | | 2,730,000 | |
| | 1,955,000 | | | Intesa Sanpaolo SpA, (fixed rate to 9/17/2025, variable rate thereafter), 7.700%, 144A(c) | | | 1,989,213 | |
| | 175,000 | | | Morgan Stanley, 8.000%, 5/09/2017, (AUD) | | | 135,381 | |
| | 100,000 | | | Morgan Stanley, GMTN, 7.625%, 3/03/2016, (AUD) | | | 73,405 | |
| | 40,000 | | | Royal Bank of Scotland Group PLC, 5.500%, (EUR)(c) | | | 43,285 | |
| | 2,725,000 | | | Societe Generale S.A., (fixed rate to 12/18/2023, variable rate thereafter), 7.875%, 144A(c) | | | 2,714,918 | |
| | | | | | | | |
| | | | | | | 7,835,032 | |
| | | | | | | | |
| | | | Building Materials — 0.0% | | | | |
| | 300,000 | | | Odebrecht Finance Ltd., 8.250%, 4/25/2018, 144A, (BRL) | | | 40,758 | |
| | | | | | | | |
| | | | Chemicals — 0.3% | | | | |
| | 200,000 | | | Hercules, Inc., 6.500%, 6/30/2029 | | | 169,000 | |
| | 350,000 | | | Hexion, Inc., 8.875%, 2/01/2018 | | | 246,750 | |
| | | | | | | | |
| | | | | | | 415,750 | |
| | | | | | | | |
| | | | Electric — 0.3% | | | | |
| | 88,000,000 | | | Empresas Publicas de Medellin E.S.P., 8.375%, 2/01/2021, 144A, (COP) | | | 26,468 | |
| | 250,000 | | | Enel SpA, (fixed rate to 9/24/2023, variable rate thereafter), 8.750%, 9/24/2073, 144A | | | 284,687 | |
| | | | | | | | |
| | | | | | | 311,155 | |
| | | | | | | | |
| | | | Government Owned – No Guarantee — 0.2% | | | | |
| | 52,400(††) | | | Petroleos Mexicanos, 7.470%, 11/12/2026, (MXN) | | | 272,883 | |
| | | | | | | | |
| | | | Independent Energy — 1.2% | | | | |
| | 2,774,000 | | | Chesapeake Energy Corp., 8.000%, 12/15/2022, 144A | | | 1,345,390 | |
| | 40,000 | | | QEP Resources, Inc., 5.250%, 5/01/2023 | | | 28,400 | |
| | 100,000 | | | Whiting Petroleum Corp., 6.500%, 10/01/2018 | | | 75,750 | |
| | | | | | | | |
| | | | | | | 1,449,540 | |
| | | | | | | | |
| | | | Metals & Mining — 0.8% | | | | |
| | 1,020,000 | | | Freeport-McMoran Oil & Gas LLC/FCX Oil & Gas, Inc., 6.750%, 2/01/2022 | | | 627,300 | |
| | 440,000 | | | Glencore Finance Canada Ltd., 2.700%, 10/25/2017, 144A | | | 402,600 | |
| | | | | | | | |
| | | | | | | 1,029,900 | |
| | | | | | | | |
| | | | Midstream — 1.7% | | | | |
| | 2,250,000 | | | Targa Resources Partners LP/Targa Resources Partners Finance Corp., 5.000%, 1/15/2018, 144A | | | 2,081,250 | |
| | | | | | | | |
| | | | Refining — 1.6% | | | | |
| | 2,000,000 | | | Western Refining, Inc., 6.250%, 4/01/2021 | | | 1,920,000 | |
| | | | | | | | |
See accompanying notes to financial statements.
| 32
Portfolio of Investments – as of December 31, 2015
Loomis Sayles Multi-Asset Income Fund* – (continued)
| | | | | | | | |
Principal
Amount (‡) | | | Description | | Value (†) | |
| | | | Supranational — 1.3% | | | | |
| | 33,450,000 | | | European Bank for Reconstruction & Development, GMTN, 6.000%, 3/03/2016, (INR) | | $ | 504,918 | |
| | 1,440,000,000 | | | International Bank for Reconstruction & Development, 4.500%, 8/03/2017, (COP) | | | 444,543 | |
| | 136,000,000 | | | International Bank for Reconstruction & Development, EMTN, 4.250%, 2/05/2016, (CLP) | | | 191,728 | |
| | 26,380,000 | | | International Finance Corp., 7.800%, 6/03/2019, (INR) | | | 408,842 | |
| | 435,000 | | | International Finance Corp., GMTN, 10.500%, 4/17/2018, (BRL) | | | 105,774 | |
| | | | | | | | |
| | | | | | | 1,655,805 | |
| | | | | | | | |
| | | | Treasuries — 0.6% | | | | |
| | 20,000 | | | Hellenic Republic Government Bond, Series PSI, (Step to 3.650% on 2/24/2020), 3.000%, 2/24/2035, (EUR)(d) | | | 12,369 | |
| | 20,000 | | | Hellenic Republic Government Bond, Series PSI, (Step to 3.650% on 2/24/2020), 3.000%, 2/24/2036, (EUR)(d) | | | 12,248 | |
| | 10,000 | | | Hellenic Republic Government Bond, Series PSI, (Step to 3.650% on 2/24/2020), 3.000%, 2/24/2041, (EUR)(d) | | | 6,191 | |
| | 48,800(††) | | | Mexican Fixed Rate Bonds, Series M-30, 8.500%, 11/18/2038, (MXN) | | | 332,664 | |
| | 10,000,000 | | | Philippine Government International Bond, 6.250%, 1/14/2036, (PHP) | | | 234,566 | |
| | 700,000 | | | Republic of Brazil, 8.500%, 1/05/2024, (BRL) | | | 150,395 | |
| | | | | | | | |
| | | | | | | 748,433 | |
| | | | | | | | |
| | | | Wireless — 1.2% | | | | |
| | 4,000,000 | | | America Movil SAB de CV, 8.460%, 12/18/2036, (MXN) | | | 221,188 | |
| | 1,220,000 | | | Sprint Communications, Inc., 6.000%, 12/01/2016 | | | 1,217,712 | |
| | | | | | | | |
| | | | | | | 1,438,900 | |
| | | | | | | | |
| | | | Wirelines — 3.6% | | | | |
| | 1,355,000 | | | Frontier Communications Corp., 8.875%, 9/15/2020, 144A | | | 1,371,938 | |
| | 920,000 | | | Frontier Communications Corp., 10.500%, 9/15/2022, 144A | | | 916,550 | |
| | 400,000 | | | Oi S.A., 9.750%, 9/15/2016, 144A, (BRL) | | | 70,976 | |
| | 1,980,000 | | | Windstream Services LLC, 7.875%, 11/01/2017 | | | 2,025,560 | |
| | | | | | | | |
| | | | | | | 4,385,024 | |
| | | | | | | | |
| | | | Total Bonds and Notes
(Identified Cost $28,758,604) | | | 25,246,930 | |
| | | | | | | | |
| | | | | | | | |
| | Senior Loans — 3.2% | | | | |
| | | | Cable Satellite — 1.6% | | | | |
| | 2,047,300 | | | TWCC Holding Corp., 2nd Lien Term Loan, 6/26/2020(e) | | | 2,038,988 | |
| | | | | | | | |
| | | | Airlines — 1.5% | | | | |
| | 1,863,636 | | | Gol LuxCo S.A., 1st Lien Term Loan, 6.500%, 8/31/2020(f) | | | 1,807,727 | |
| | | | | | | | |
| | | | Retailers — 0.1% | | | | |
| | 124,796 | | | Staples, Inc., Term Loan B, 4/07/2021(e) | | | 123,184 | |
| | | | | | | | |
| | | | Total Senior Loans
(Identified Cost $3,898,447) | | | 3,969,899 | |
| | | | | | | | |
See accompanying notes to financial statements.
33 |
Portfolio of Investments – as of December 31, 2015
Loomis Sayles Multi-Asset Income Fund* – (continued)
| | | | | | | | |
Shares | | | Description | | Value (†) | |
| | Preferred Stocks — 2.8% | | | | |
| | Non-Convertible Preferred Stocks — 2.6% | | | | |
| | | | Banking — 2.6% | | | | |
| | 1,824 | | | Ally Financial, Inc., Series A, (fixed rate to 5/15/2016, variable rate thereafter), 8.500% | | $ | 46,986 | |
| | 45,000 | | | Citigroup, Inc., Series L, 6.875% | | | 1,233,900 | |
| | 4,125 | | | Countrywide Capital IV, 6.750% | | | 104,363 | |
| | 48,000 | | | JPMorgan Chase & Co., Series BB, 6.150% | | | 1,243,200 | |
| | 20,424 | | | SunTrust Banks, Inc., Series E, 5.875% | | | 528,777 | |
| | | | | | | | |
| | | | | | | 3,157,226 | |
| | | | | | | | |
| | | | Total Non-Convertible Preferred Stocks
(Identified Cost $3,063,118) | | | 3,157,226 | |
| | | | | | | | |
| | | | | | | | |
| | Convertible Preferred Stock — 0.2% | |
| | | | Metals & Mining — 0.2% | | | | |
| | 6,837 | | | Alcoa, Inc., Series 1, 5.375%
(Identified Cost $334,565) | | | 227,741 | |
| | | | | | | | |
| | | | Total Preferred Stocks
(Identified Cost $3,397,683) | | | 3,384,967 | |
| | | | | | | | |
| | | | | | | | |
| | Closed-End Investment Companies — 0.7% | |
| | 56,147 | | | Prudential Short Duration High Yield Fund, Inc.
(Identified Cost $822,202) | | | 819,746 | |
| | | | | | | | |
| | | | | | | | |
Principal
Amount (‡) | | | | | | |
| | Short-Term Investments — 5.8% | |
| $ | 7,050,949 | | | Tri-Party Repurchase Agreement with Fixed Income Clearing Corporation, dated 12/31/2015 at 0.030% to be repurchased at $7,050,973 on 1/04/2016 collateralized by $7,185,000 U.S. Treasury Note, 1.625% due 7/31/2020 valued at $7,193,981 including accrued interest (Note 2 of Notes to Financial Statements) (Identified Cost $7,050,949) | | | 7,050,949 | |
| | | | | | | | |
| | | | | | | | |
| | | | Total Investments — 101.3%
(Identified Cost $121,864,077)(a) | | | 123,912,166 | |
| | | | Other assets less liabilities — (1.3)% | | | (1,594,049 | ) |
| | | | | | | | |
| | | | Net Assets — 100.0% | | $ | 122,318,117 | |
| | | | | | | | |
| | | | | | | | |
| | * | | | Formerly Natixis Diversified Income Fund. | |
| | (‡) | | | Principal Amount stated in U.S. dollars unless otherwise noted. | |
| | (†) | | | See Note 2 of Notes to Financial Statements. | |
| | (††) | | | Amount shown represents units. One unit represents a principal amount of 100. | |
| | | | | | | | |
See accompanying notes to financial statements.
| 34
Portfolio of Investments – as of December 31, 2015
Loomis Sayles Multi-Asset Income Fund* – (continued)
| | | | | | | | |
| | | | | | | | |
| | (a) | | | Federal Tax Information: | | | | |
| | | | At December 31, 2015, the net unrealized appreciation on investments based on a cost of $121,989,021 for federal income tax purposes was as follows: | |
| | | | Aggregate gross unrealized appreciation for all investments in which there is an excess of value over tax cost | | $ | 8,460,475 | |
| | | | Aggregate gross unrealized depreciation for all investments in which there is an excess of tax cost over value | | | (6,537,330 | ) |
| | | | | | | | |
| | | | Net unrealized appreciation | | $ | 1,923,145 | |
| | | | | | | | |
| | | | | | | | |
| | (b) | | | Non-income producing security. | | | | |
| | (c) | | | Perpetual bond with no specified maturity date. | | | | |
| | (d) | | | Coupon rate is a fixed rate for an initial period then resets at a specified date and rate. | |
| | (e) | | | Position is unsettled. Contract rate was not determined at December 31, 2015 and does not take effect until settlement date. Maturity date is not finalized until settlement date. | |
| | (f) | | | Variable rate security. Rate as of December 31, 2015 is disclosed. | | | | |
| | | | | | | | |
| | 144A | | | All or a portion of these securities are exempt from registration under Rule 144A of the Securities Act of 1933. These securities may be resold in transactions exempt from registration, normally to qualified institutional buyers. At December 31, 2015, the value of Rule 144A holdings amounted to $13,056,078 or 10.7% of net assets. | |
| | EMTN | | | Euro Medium Term Note | | | | |
| | GMTN | | | Global Medium Term Note | | | | |
| | REITs | | | Real Estate Investment Trusts | | | | |
| | | | | | | | |
| | AUD | | | Australian Dollar | | | | |
| | BRL | | | Brazilian Real | | | | |
| | CLP | | | Chilean Peso | | | | |
| | COP | | | Colombian Peso | | | | |
| | EUR | | | Euro | | | | |
| | INR | | | Indian Rupee | | | | |
| | MXN | | | Mexican Peso | | | | |
| | PHP | | | Philippine Peso | | | | |
See accompanying notes to financial statements.
35 |
Portfolio of Investments – as of December 31, 2015
Loomis Sayles Multi-Asset Income Fund* – (continued)
Industry Summary at December 31, 2015
| | | | |
Banking | | | 9.0 | % |
REITs – Apartments | | | 5.9 | |
Banks | | | 4.2 | |
Oil, Gas & Consumable Fuels | | | 4.0 | |
Wirelines | | | 3.6 | |
REITs – Storage | | | 3.4 | |
Pharmaceuticals | | | 3.3 | |
REITs – Regional Malls | | | 3.2 | |
Aerospace & Defense | | | 3.2 | |
REITs – Shopping Centers | | | 2.8 | |
Tobacco | | | 2.5 | |
REITs – Warehouse/Industrials | | | 2.3 | |
Electric Utilities | | | 2.1 | |
Household Products | | | 2.0 | |
Other Investments, less than 2% each | | | 44.0 | |
Short-Term Investments | | | 5.8 | |
| | | | |
Total Investments | | | 101.3 | |
Other assets less liabilities | | | (1.3 | ) |
| | | | |
Net Assets | | | 100.0 | % |
| | | | |
See accompanying notes to financial statements.
| 36
Portfolio of Investments – as of December 31, 2015
McDonnell Intermediate Municipal Bond Fund
| | | | | | | | |
Principal
Amount | | | Description | | Value (†) | |
| | Bonds and Notes — 91.1% of Net Assets | |
| | Municipals — 91.1% | |
| | | | Arizona — 2.3% | | | | |
| $ | 750,000 | | | Arizona Board of Regents, State University System Revenue, Refunding, Series A, 5.000%, 7/01/2024(b) | | $ | 925,005 | |
| | 800,000 | | | Scottsdale Municipal Property Corp. Excise Tax Revenue, Water & Sewer Development Project, Prerefunded 07/01/2018@100, Series A, 5.000%, 7/01/2019 | | | 880,248 | |
| | | | | | | | |
| | | | | | | 1,805,253 | |
| | | | | | | | |
| | | | California — 4.0% | | | | |
| | 250,000 | | | Alameda Corridor Transportation Authority Revenue, Senior Lien, Refunding, Series A, 5.000%, 10/01/2024 | | | 303,102 | |
| | 380,000 | | | Bay Area Water Supply & Conservation Agency Revenue, Series A, 5.000%, 10/01/2024 | | | 466,773 | |
| | 700,000 | | | Garden Grove Unified School District, 2010 Election, GO, Series C, 5.000%, 8/01/2035(c) | | | 799,757 | |
| | 690,000 | | | San Gorgonio Memorial Health Care District, GO, Refunding, 4.000%, 8/01/2016 | | | 703,117 | |
| | 760,000 | | | San Gorgonio Memorial Health Care District, GO, Refunding, 5.000%, 8/01/2024 | | | 903,154 | |
| | | | | | | | |
| | | | | | | 3,175,903 | |
| | | | | | | | |
| | | | Colorado — 4.5% | | | | |
| | 1,000,000 | | | Adams & Weld Counties School District No. 27J Brighton, GO, (State Aid Withholding), 5.000%, 12/01/2028 | | | 1,234,880 | |
| | 260,000 | | | Colorado Springs Utilities System Revenue, Series B-2, 5.000%, 11/15/2033(c) | | | 302,078 | |
| | 400,000 | | | Colorado State Health Facilities Authority Revenue, Craig Hospital Project, 5.000%, 12/01/2028(c) | | | 456,492 | |
| | 400,000 | | | Denver City & County School District No. 1, GO, Series B, (State Aid Withholding), 5.000%, 12/01/2026 | | | 481,868 | |
| | 500,000 | | | Regional Transportation District Sales Tax Revenue, Fastracks Project, Refunding, Series A, 5.000%, 11/01/2028 | | | 626,985 | |
| | 450,000 | | | University of Colorado Revenue, Refunding, Series B, 5.000%, 6/01/2019 | | | 508,613 | |
| | | | | | | | |
| | | | | | | 3,610,916 | |
| | | | | | | | |
| | | | Connecticut — 2.7% | | | | |
| | 2,000,000 | | | State of Connecticut, GO, Refunding, Series B, (AMBAC insured), 5.250%, 6/01/2017 | | | 2,125,920 | |
| | | | | | | | |
| | | | District of Columbia — 1.1% | | | | |
| | 800,000 | | | District of Columbia Water & Sewer Authority Public Utility Revenue, Prerefunded 10/01/2018@100, Series A, 5.000%, 10/01/2024 | | | 887,064 | |
| | | | | | | | |
| | | | Florida — 9.5% | | | | |
| | 500,000 | | | Fernandina Beach Utility System Revenue, Refunding, Series A, 5.000%, 9/01/2027 | | | 587,700 | |
| | 400,000 | | | Florida State Board of Governors, University System Improvement Revenue, Refunding, Series A, 5.000%, 7/01/2018 | | | 437,740 | |
| | 1,000,000 | | | Lee County Transportation Facilities Revenue, Refunding, (AGM insured), 5.000%, 10/01/2022 | | | 1,195,110 | |
| | 750,000 | | | Miami-Dade County Aviation Revenue, Refunding, Series A, AMT, 5.000%, 10/01/2017 | | | 798,945 | |
See accompanying notes to financial statements.
37 |
Portfolio of Investments – as of December 31, 2015
McDonnell Intermediate Municipal Bond Fund – (continued)
| | | | | | | | |
Principal
Amount | | | Description | | Value (†) | |
| | | | Florida — continued | | | | |
| $ | 1,000,000 | | | Miami-Dade County Water & Sewer System Revenue, Refunding, 5.000%, 10/01/2023 | | $ | 1,218,000 | |
| | 400,000 | | | Orlando & Orange County Expressway Authority Revenue, Refunding, 5.000%, 7/01/2023 | | | 481,832 | |
| | 1,000,000 | | | Orlando & Orange County Expressway Authority, Refunding, (AGM insured), 5.000%, 7/01/2024 | | | 1,194,390 | |
| | 600,000 | | | Sarasota County Infrastructure Sales Surtax Revenue, Refunding, 5.000%, 10/01/2022 | | | 721,272 | |
| | 400,000 | | | Sarasota County Utility System Revenue, 5.000%, 10/01/2023 | | | 486,240 | |
| | 400,000 | | | Volusia County Educational Facility Authority Revenue, Embry-Riddle Aeronautical University, Inc., Series B, 5.000%, 10/15/2025(c) | | | 464,688 | |
| | | | | | | | |
| | | | | | | 7,585,917 | |
| | | | | | | | |
| | | | Georgia — 3.3% | | | | |
| | 500,000 | | | Municipal Electric Authority of Georgia Revenue, Series B, 5.000%, 1/01/2021 | | | 583,770 | |
| | 1,500,000 | | | Municipal Electric Authority of Georgia Revenue, Project One Subordinated Bonds, Refunding, Series A, 5.000%, 1/01/2032 | | | 1,742,460 | |
| | 250,000 | | | Savannah Hospital Authority Revenue, St. Joseph’s/Candler Health System Obligated Group, Series A, 5.500%, 7/01/2027 | | | 297,157 | |
| | | | | | | | |
| | | | | | | 2,623,387 | |
| | | | | | | | |
| | | | Hawaii — 4.3% | | | | |
| | 1,500,000 | | | Hawaii, Refunding, Series EZ, 5.000%, 10/01/2025 | | | 1,882,680 | |
| | 1,335,000 | | | Honolulu City & County, Prerefunded 4/01/2019@100, Series A, 5.000%, 4/01/2026 | | | 1,499,152 | |
| | | | | | | | |
| | | | | | | 3,381,832 | |
| | | | | | | | |
| | | | Illinois — 7.0% | | | | |
| | 2,000,000 | | | Chicago O’Hare International Airport, Revenue, Series D, 5.000%, 1/01/2026 | | | 2,377,140 | |
| | 370,000 | | | Illinois Finance Authority Revenue, Children’s Memorial Hospital, Series B, 5.500%, 8/15/2028(c) | | | 408,413 | |
| | 500,000 | | | Illinois Finance Authority Revenue, Loyola University Chicago, Series B, 5.000%, 7/01/2020 | | | 567,735 | |
| | 100,000 | | | Illinois Finance Authority Revenue, Loyola University Chicago, Series B, 5.000%, 7/01/2021 | | | 115,345 | |
| | 2,000,000 | | | Illinois Municipal Electric Agency Power Supply, Prerefunded 2/01/2017@100, Series A, 5.125%, 2/01/2029 | | | 2,095,660 | |
| | | | | | | | |
| | | | | | | 5,564,293 | |
| | | | | | | | |
| | | | Iowa — 0.4% | | | | |
| | 250,000 | | | City of Carter Lake Local Option Sales Tax Revenue, Prerefunded 06/01/2018@100, 5.500%, 6/01/2038 | | | 276,893 | |
| | | | | | | | |
| | | | Kentucky — 0.4% | | | | |
| | 275,000 | | | Louisville & Jefferson County, Metropolitan Government Revenue, Jewish Hospital St. Mary’s Healthcare, Prerefunded 02/01/2018@100, 6.125%, 2/01/2037 | | | 304,332 | |
| | | | | | | | |
| | | | Massachusetts — 0.6% | | | | |
| | 310,000 | | | Massachusetts State Development Finance Agency Revenue, Charles Stark Draper Laboratory, Prerefunded 09/01/2018@100, 5.500%, 9/01/2020 | | | 346,338 | |
See accompanying notes to financial statements.
| 38
Portfolio of Investments – as of December 31, 2015
McDonnell Intermediate Municipal Bond Fund – (continued)
| | | | | | | | |
Principal
Amount | | | Description | | Value (†) | |
| | | | Massachusetts — continued | | | | |
| $ | 150,000 | | | Massachusetts State Development Finance Agency Revenue, Massachusetts College of Pharmacy Allied Health Science, Series F, 4.000%, 7/01/2018 | | $ | 160,448 | |
| | | | | | | | |
| | | | | | | 506,786 | |
| | | | | | | | |
| | | | Minnesota — 1.0% | | | | |
| | 250,000 | | | Minneapolis-St. Paul Metropolitan Airports Commission Revenue, Refunding, 5.000%, 1/01/2017 | | | 260,268 | |
| | 300,000 | | | Minnesota State Higher Education Facilities Authority Revenue, University of St. Thomas, Series 7-U, 5.000%, 4/01/2017 | | | 315,426 | |
| | 200,000 | | | Northern Municipal Power Agency, Electric System Revenue, Series A, 5.000%, 1/01/2023 | | | 237,934 | |
| | | | | | | | |
| | | | | | | 813,628 | |
| | | | | | | | |
| | | | Missouri — 3.6% | | | | |
| | 665,000 | | | Missouri Highways & Transportation Commission, Revenue, First Lien, Prerefunded 05/01/2016@100, Series B, 5.000%, 5/01/2022 | | | 675,141 | |
| | 850,000 | | | Missouri Highways & Transportation Commission, Revenue, First Lien, Prerefunded 05/01/2016@100, Series B, 5.000%, 5/01/2024 | | | 862,963 | |
| | 700,000 | | | Missouri Joint Municipal Electric Utility Commission Power Project Revenue, Refunding, 5.000%, 1/01/2024 | | | 836,038 | |
| | 500,000 | | | Southeast Missouri State University Revenue, Series A, 5.000%, 4/01/2016 | | | 505,430 | |
| | | | | | | | |
| | | | | | | 2,879,572 | |
| | | | | | | | |
| | | | Nebraska — 3.6% | | | | |
| | 1,000,000 | | | Metropolitan Utilities District of Omaha Revenue, System Improvements, Refunding, 5.000%, 12/01/2022 | | | 1,201,790 | |
| | 1,000,000 | | | Nebraska Public Power District Revenue, Prerefunded 1/01/2018@100, Series C, 5.000%, 1/01/2024 | | | 1,082,390 | |
| | 500,000 | | | Nebraska Public Power District, General Revenue, Refunding, Series A, 5.000%, 1/01/2028(c) | | | 583,305 | |
| | | | | | | | |
| | | | | | | 2,867,485 | |
| | | | | | | | |
| | | | Nevada — 0.8% | | | | |
| | 500,000 | | | City of Henderson, GO, Various Purpose, Refunding, 5.000%, 6/01/2026 | | | 605,580 | |
| | | | | | | | |
| | | | New Jersey — 4.8% | | | | |
| | 500,000 | | | New Jersey Economic Development Authority, School Facilities, Prerefunded 09/01/2017@100, Series U, (AGM insured), 5.000%, 9/01/2022 | | | 534,580 | |
| | 265,000 | | | New Jersey Health Care Facilities Financing Authority Revenue, Refunding, Virtua Health, Inc., 5.000%, 7/01/2023 | | | 316,158 | |
| | 500,000 | | | New Jersey State Turnpike Authority Revenue, Series A, 5.000%, 1/01/2032(c) | | | 582,160 | |
| | 1,500,000 | | | New Jersey State Turnpike Authority Revenue, Series E, 5.000%, 1/01/2032 | | | 1,752,780 | |
| | 500,000 | | | Rutgers The State University of New Jersey, Refunding, Series J, 5.000%, 5/01/2024 | | | 602,405 | |
| | | | | | | | |
| | | | | | | 3,788,083 | |
| | | | | | | | |
| | | | New Mexico — 4.3% | | | | |
| | 2,500,000 | | | New Mexico Hospital Equipment Loan Council Revenue, Presbyterian Healthcare Services Obligated Group, Prerefunded 08/01/2018@100, Series A, 6.000%, 8/01/2023 | | | 2,812,200 | |
See accompanying notes to financial statements.
39 |
Portfolio of Investments – as of December 31, 2015
McDonnell Intermediate Municipal Bond Fund – (continued)
| | | | | | | | |
Principal
Amount | | | Description | | Value (†) | |
| | | | New Mexico — continued | | | | |
| $ | 500,000 | | | New Mexico Hospital Equipment Loan Council Revenue, Presbyterian Healthcare Services Obligated Group, Refunding, 5.000%, 8/01/2031(c) | | $ | 589,930 | |
| | | | | | | | |
| | | | | | | 3,402,130 | |
| | | | | | | | |
| | | | New York — 6.4% | | | | |
| | 2,000,000 | | | New York City Transitional Finance Authority Future Tax Secured Revenue, Sub-Fiscal 2016, Series A-1, 5.000%, 8/01/2032 | | | 2,385,600 | |
| | 1,025,000 | | | New York City, Fiscal 2015, GO, Refunding, Series A, 5.000%, 8/01/2021 | | | 1,213,579 | |
| | 1,120,000 | | | New York City, GO, Prerefunded 06/01/2016@100, Series J, 5.000%, 6/01/2022 | | | 1,140,888 | |
| | 350,000 | | | New York State Dormitory Authority Revenue, Mental Health Services Facility Improvements, (State Appropriation), 5.000%, 2/15/2017 | | | 366,545 | |
| | | | | | | | |
| | | | | | | 5,106,612 | |
| | | | | | | | |
| | | | Ohio — 2.8% | | | | |
| | 400,000 | | | American Municipal Power Revenue, Hydroelectric Projects, Refunding, Series CA, (AGM insured), 5.000%, 2/15/2021(c) | | | 448,776 | |
| | 500,000 | | | Columbus, GO, Various Purpose, Series A, 5.000%, 8/15/2023(c) | | | 616,480 | |
| | 500,000 | | | Hamilton County Hospital Facilities Revenue, UC Health Obligated Group, 5.000%, 2/01/2024(c) | | | 582,875 | |
| | 500,000 | | | Ohio State Higher Educational Facility Commission Revenue, University of Dayton, 5.000%, 12/01/2030 | | | 569,270 | |
| | | | | | | | |
| | | | | | | 2,217,401 | |
| | | | | | | | |
| | | | Pennsylvania — 1.4% | | | | |
| | 335,000 | | | Delaware County Authority Revenue, Villanova University, 5.000%, 8/01/2019 | | | 376,845 | |
| | 285,000 | | | Delaware River Joint Toll Bridge Commission Revenue, Refunding, Series A, 4.000%, 7/01/2027 | | | 310,627 | |
| | 450,000 | | | Philadelphia Airport Revenue, Refunding, Series D, AMT, 5.000%, 6/15/2016 | | | 458,757 | |
| | | | | | | | |
| | | | | | | 1,146,229 | |
| | | | | | | | |
| | | | Rhode Island — 0.8% | | | | |
| | 500,000 | | | Rhode Island Clean Water Finance Agency Pollution Control Agency Revolving Fund-Pooled Loan, Series A, 5.000%, 10/01/2024 | | | 617,080 | |
| | | | | | | | |
| | | | South Dakota — 0.6% | | | | |
| | 465,000 | | | Sioux Falls Sales Tax Revenue, Series A-1, 4.750%, 11/15/2036(c) | | | 491,003 | |
| | | | | | | | |
| | | | Tennessee — 0.9% | | | | |
| | 615,000 | | | Metropolitan Nashville Airport Authority (The) Revenue, Series B, AMT, 5.000%, 7/01/2023 | | | 733,258 | |
| | | | | | | | |
| | | | Texas — 9.0% | | | | |
| | 500,000 | | | City of Dallas, GO, Prerefunded 2/15/2018@100, 5.000%, 2/15/2024 | | | 542,605 | |
| | 700,000 | | | City of Denton, GO, Refunding, 5.000%, 2/15/2024(c) | | | 859,978 | |
| | 250,000 | | | Corpus Christi Utility System Revenue, Junior Lien Improvement, 5.000%, 7/15/2021 | | | 292,897 | |
| | 250,000 | | | Denton Independent School District, GO, Prerefunded 08/15/2017@100, (PSF-GTD), 5.000%, 8/15/2030 | | | 266,410 | |
| | 500,000 | | | Harris County Health Facilities Development Authority Revenue, Memorial Hermann Healthcare System, Prerefunded 12/01/2018@100, Series B, 7.125%, 12/01/2031 | | | 585,670 | |
See accompanying notes to financial statements.
| 40
Portfolio of Investments – as of December 31, 2015
McDonnell Intermediate Municipal Bond Fund – (continued)
| | | | | | | | |
Principal
Amount | | | Description | | Value (†) | |
| | | | Texas — continued | | | | |
| $ | 1,000,000 | | | Lancaster Independent School District, GO, Refunding, (BAM insured), 5.000%, 2/15/2026 | | $ | 1,212,470 | |
| | 940,000 | | | New Caney Independent School District, Refunding, Series A, (PSF-GTD), 5.000%, 2/15/2023 | | | 1,139,844 | |
| | 350,000 | | | State of Texas Water Financial Assistance, GO, Series B, 5.000%, 8/01/2022 | | | 415,835 | |
| | 1,275,000 | | | State of Texas, Transportation Commission Mobility Fund, GO, Prerefunded 4/01/2018@100, 5.000%, 4/01/2026 | | | 1,390,158 | |
| | 400,000 | | | Tarrant County Cultural Education Facilities Finance Corp. Revenue, Methodist Hospitals of Dallas, 5.000%, 10/01/2024(c) | | | 480,836 | |
| | | | | | | | |
| | | | | | | 7,186,703 | |
| | | | | | | | |
| | | | Utah — 2.0% | | | | |
| | 1,250,000 | | | Metropolitan Water District of Salt Lake & Sandy Water Revenue, Refunding, Series A, 4.000%, 7/01/2016 | | | 1,272,262 | |
| | 250,000 | | | Utah State Transit Authority Sales Tax Revenue, Refunding, 5.000%, 6/15/2024 | | | 297,445 | |
| | | | | | | | |
| | | | | | | 1,569,707 | |
| | | | | | | | |
| | | | Washington — 8.7% | | | | |
| | 1,430,000 | | | Energy Northwest Washington Electric Revenue, Columbia Station, Prerefunded 7/01/2016@100, Series A, (AMBAC insured), 5.000%, 7/01/2024 | | | 1,461,632 | |
| | 1,140,000 | | | Grant County Public Utility District No. 2, Refunding, Priest Rapids Hydroelectric Project, Series B, AMT, 5.000%, 1/01/2025 | | | 1,367,088 | |
| | 500,000 | | | King County Public Hospital District No. 2, GO, Evergreen Healthcare, Series B, 5.000%, 12/01/2032(c) | | | 577,610 | |
| | 1,500,000 | | | Pierce County School District No. 10 Tacoma, Refunding, 5.000%, 12/01/2026 | | | 1,867,335 | |
| | 500,000 | | | Port of Seattle Revenue, AMT, 5.000%, 7/01/2029 | | | 562,680 | |
| | 400,000 | | | Port of Seattle Special Facility Revenue, Refunding, AMT, SEATAC Fuel Facility LLC, 5.000%, 6/01/2020 | | | 453,576 | |
| | 500,000 | | | Snohomish County School District No. 15 Edmonds, GO, 5.000%, 12/01/2031(c) | | | 592,115 | |
| | | | | | | | |
| | | | | | | 6,882,036 | |
| | | | | | | | |
| | | | Wisconsin — 0.3% | | | | |
| | 225,000 | | | Wisconsin Health & Educational Facilities Authority Revenue, Aspirus, Inc. Obligated Group, Refunding, Series A, 5.000%, 8/15/2031 | | | 252,425 | |
| | | | | | | | |
| | | | Total Bonds and Notes
(Identified Cost $71,105,339) | | | 72,407,428 | |
| | | | | | | | |
| | | | | | | | |
| | Short-Term Investments — 7.9% | | | | |
| | 6,290,548 | | | Tri-Party Repurchase Agreement with Fixed Income Clearing Corporation, dated 12/31/2015 at 0.030% to be repurchased at $6,290,569 on 1/04/2016 collateralized by $6,385,000 Federal National Mortgage Association, 2.020% due 9/30/2021 valued at $6,416,925 including accrued interest (Note 2 of Notes to Financial Statements) (Identified Cost $6,290,548) | | | 6,290,548 | |
| | | | | | | | |
| | | | | | | | |
| | | | Total Investments — 99.0%
(Identified Cost $77,395,887)(a) | | | 78,697,976 | |
| | | | Other assets less liabilities — 1.0% | | | 797,570 | |
| | | | | | | | |
| | | | Net Assets — 100.0% | | $ | 79,495,546 | |
| | | | | | | | |
See accompanying notes to financial statements.
41 |
Portfolio of Investments – as of December 31, 2015
McDonnell Intermediate Municipal Bond Fund – (continued)
| | | | | | | | |
| | | | | | | | |
| | (†) | | | See Note 2 of Notes to Financial Statements. | | | | |
| | (a) | | | Federal Tax Information: | | | | |
| | | | At December 31, 2015, the net unrealized appreciation on investments based on a cost of $77,395,887 for federal income tax purposes was as follows: | |
| | | | Aggregate gross unrealized appreciation for all investments in which there is an excess of value over tax cost | | $ | 1,351,883 | |
| | | | Aggregate gross unrealized depreciation for all investments in which there is an excess of tax cost over value | | | (49,794 | ) |
| | | | | | | | |
| | | | Net unrealized appreciation | | $ | 1,302,089 | |
| | | | | | | | |
| | | | | | | | |
| | (b) | | | When-issued/delayed delivery. See Note 2 of Notes to Financial Statements. | | | | |
| | (c) | | | All of this security has been designated to cover the Fund’s obligations under when-issued/delayed delivery securities. | |
| | | | | | | | |
| | AGM | | | Assured Guaranty Municipal Corporation | | | | |
| | AMBAC | | | American Municipal Bond Assurance Corp. | | | | |
| | AMT | | | Alternative Minimum Tax | | | | |
| | BAM | | | Build America Mutual | | | | |
| | GO | | | General Obligation | | | | |
| | PSF-GTD | | | Permanent School Fund Guarantee Program | | | | |
Holdings Summary at December 31, 2015
| | | | |
General Obligation | | | 18.3 | % |
Power | | | 11.1 | |
Transportation | | | 9.8 | |
Medical | | | 9.8 | |
School District | | | 9.5 | |
Water | | | 8.4 | |
General | | | 7.9 | |
Higher Education | | | 7.0 | |
Airport | | | 5.8 | |
Utilities | | | 2.8 | |
Education | | | 0.7 | |
Short-Term Investments | | | 7.9 | |
| | | | |
Total Investments | | | 99.0 | |
Other assets less liabilities | | | 1.0 | |
| | | | |
Net Assets | | | 100.0 | % |
| | | | |
See accompanying notes to financial statements.
| 42
Portfolio of Investments – as of December 31, 2015
Natixis U.S. Equity Opportunities Fund
| | | | | | | | |
| Shares | | | Description | | Value (†) | |
| | Common Stocks — 97.7% of Net Assets | | | | |
| | | | Air Freight & Logistics — 4.1% | | | | |
| | 252,353 | | | Expeditors International of Washington, Inc. | | $ | 11,381,120 | |
| | 48,400 | | | FedEx Corp. | | | 7,211,116 | |
| | 43,831 | | | United Parcel Service, Inc., Class B | | | 4,217,857 | |
| | | | | | | | |
| | | | | | | 22,810,093 | |
| | | | | | | | |
| | | | Automobiles — 1.4% | | | | |
| | 231,700 | | | General Motors Co. | | | 7,880,117 | |
| | | | | | | | |
| | | | Banks — 6.5% | | | | |
| | 862,200 | | | Bank of America Corp. | | | 14,510,826 | |
| | 215,100 | | | Citigroup, Inc. | | | 11,131,425 | |
| | 154,700 | | | JPMorgan Chase & Co. | | | 10,214,841 | |
| | | | | | | | |
| | | | | | | 35,857,092 | |
| | | | | | | | |
| | | | Beverages — 6.6% | | | | |
| | 163,347 | | | Coca-Cola Co. (The) | | | 7,017,387 | |
| | 51,600 | | | Diageo PLC, Sponsored ADR | | | 5,628,012 | |
| | 120,827 | | | Monster Beverage Corp.(b) | | | 17,998,390 | |
| | 100,540 | | | SABMiller PLC, Sponsored ADR | | | 6,025,362 | |
| | | | | | | | |
| | | | | | | 36,669,151 | |
| | | | | | | | |
| | | | Biotechnology — 0.8% | | | | |
| | 28,111 | | | Amgen, Inc. | | | 4,563,259 | |
| | | | | | | | |
| | | | Capital Markets — 2.9% | | | | |
| | 158,050 | | | Greenhill & Co., Inc. | | | 4,521,811 | |
| | 221,946 | | | SEI Investments Co. | | | 11,629,970 | |
| | | | | | | | |
| | | | | | | 16,151,781 | |
| | | | | | | | |
| | | | Chemicals — 1.7% | | | | |
| | 93,050 | | | Monsanto Co. | | | 9,167,286 | |
| | | | | | | | |
| | | | Communications Equipment — 5.2% | | | | |
| | 518,736 | | | Cisco Systems, Inc. | | | 14,086,276 | |
| | 298,427 | | | QUALCOMM, Inc. | | | 14,916,874 | |
| | | | | | | | |
| | | | | | | 29,003,150 | |
| | | | | | | | |
| | | | Consumer Finance — 3.0% | | | | |
| | 139,029 | | | American Express Co. | | | 9,669,467 | |
| | 99,700 | | | Capital One Financial Corp. | | | 7,196,346 | |
| | | | | | | | |
| | | | | | | 16,865,813 | |
| | | | | | | | |
| | | | Diversified Financial Services — 2.1% | | | | |
| | 39,629 | | | FactSet Research Systems, Inc. | | | 6,442,487 | |
| | 70,357 | | | MSCI, Inc. | | | 5,074,850 | |
| | | | | | | | |
| | | | | | | 11,517,337 | |
| | | | | | | | |
| | | | Energy Equipment & Services — 2.3% | | | | |
| | 165,700 | | | Halliburton Co. | | | 5,640,428 | |
| | 103,173 | | | Schlumberger Ltd. | | | 7,196,317 | |
| | | | | | | | |
| | | | | | | 12,836,745 | |
| | | | | | | | |
See accompanying notes to financial statements.
43 |
Portfolio of Investments – as of December 31, 2015
Natixis U.S. Equity Opportunities Fund – (continued)
| | | | | | | | |
| Shares | | | Description | | Value (†) | |
| | | | Food Products — 1.4% | | | | |
| | 567,030 | | | Danone, Sponsored ADR | | $ | 7,717,278 | |
| | | | | | | | |
| | | | Health Care Equipment & Supplies — 2.3% | | | | |
| | 49,100 | | | Medtronic PLC | | | 3,776,772 | |
| | 112,232 | | | Varian Medical Systems, Inc.(b) | | | 9,068,346 | |
| | | | | | | | |
| | | | | | | 12,845,118 | |
| | | | | | | | |
| | | | Health Care Providers & Services — 1.3% | | | | |
| | 60,300 | | | UnitedHealth Group, Inc. | | | 7,093,692 | |
| | | | | | | | |
| | | | Health Care Technology — 0.8% | | | | |
| | 76,280 | | | Cerner Corp.(b) | | | 4,589,768 | |
| | | | | | | | |
| | | | Hotels, Restaurants & Leisure — 1.1% | | | | |
| | 79,870 | | | Yum! Brands, Inc. | | | 5,834,504 | |
| | | | | | | | |
| | | | Household Durables — 1.3% | | | | |
| | 47,500 | | | Whirlpool Corp. | | | 6,976,325 | |
| | | | | | | | |
| | | | Household Products — 1.1% | | | | |
| | 80,247 | | | Procter & Gamble Co. (The) | | | 6,372,414 | |
| | | | | | | | |
| | | | Industrial Conglomerates — 2.1% | | | | |
| | 381,000 | | | General Electric Co. | | | 11,868,150 | |
| | | | | | | | |
| | | | Insurance — 4.7% | | | | |
| | 123,700 | | | Aflac, Inc. | | | 7,409,630 | |
| | 178,400 | | | American International Group, Inc. | | | 11,055,448 | |
| | 84,400 | | | Aon PLC | | | 7,782,524 | |
| | | | | | | | |
| | | | | | | 26,247,602 | |
| | | | | | | | |
| | | | Internet & Catalog Retail — 5.2% | | | | |
| | 31,186 | | | Amazon.com, Inc.(b) | | | 21,078,306 | |
| | 277,900 | | | Liberty Interactive Corp./QVC Group, Class A(b) | | | 7,592,228 | |
| | | | | | | | |
| | | | | | | 28,670,534 | |
| | | | | | | | |
| | | | Internet Software & Services — 10.7% | | | | |
| | 148,733 | | | Alibaba Group Holding Ltd., Sponsored ADR(b) | | | 12,087,531 | |
| | 29,559 | | | Alphabet, Inc., Class A(b) | | | 22,997,197 | |
| | 10,191 | | | Alphabet, Inc., Class C(b) | | | 7,733,746 | |
| | 157,262 | | | Facebook, Inc., Class A(b) | | | 16,459,041 | |
| | | | | | | | |
| | | | | | | 59,277,515 | |
| | | | | | | | |
| | | | IT Services — 6.5% | | | | |
| | 33,006 | | | Automatic Data Processing, Inc. | | | 2,796,268 | |
| | 117,100 | | | MasterCard, Inc., Class A | | | 11,400,856 | |
| | 280,634 | | | Visa, Inc., Class A | | | 21,763,167 | |
| | | | | | | | |
| | | | | | | 35,960,291 | |
| | | | | | | | |
| | | | Machinery — 2.4% | | | | |
| | 102,300 | | | Caterpillar, Inc. | | | 6,952,308 | |
| | 70,900 | | | Cummins, Inc. | | | 6,239,909 | |
| | | | | | | | |
| | | | | | | 13,192,217 | |
| | | | | | | | |
| | | | Media — 1.2% | | | | |
| | 499,000 | | | News Corp., Class A | | | 6,666,640 | |
| | | | | | | | |
See accompanying notes to financial statements.
| 44
Portfolio of Investments – as of December 31, 2015
Natixis U.S. Equity Opportunities Fund – (continued)
| | | | | | | | |
| Shares | | | Description | | Value (†) | |
| | | | Metals & Mining — 0.4% | | | | |
| | 32,483 | | | Compass Minerals International, Inc. | | $ | 2,444,995 | |
| | | | | | | | |
| | | | Oil, Gas & Consumable Fuels — 1.6% | | | | |
| | 197,300 | | | Apache Corp. | | | 8,773,931 | |
| | | | | | | | |
| | | | Pharmaceuticals — 3.3% | | | | |
| | 44,982 | | | Merck & Co., Inc. | | | 2,375,949 | |
| | 67,992 | | | Novartis AG, Sponsored ADR | | | 5,850,032 | |
| | 169,592 | | | Novo Nordisk AS, Sponsored ADR | | | 9,849,903 | |
| | | | | | | | |
| | | | | | | 18,075,884 | |
| | | | | | | | |
| | | | Semiconductors & Semiconductor Equipment — 3.3% | | | | |
| | 16,144 | | | Analog Devices, Inc. | | | 893,086 | |
| | 150,391 | | | ARM Holdings PLC, Sponsored ADR | | | 6,803,689 | |
| | 278,700 | | | Intel Corp. | | | 9,601,215 | |
| | 23,850 | | | Linear Technology Corp. | | | 1,012,909 | |
| | | | | | | | |
| | | | | | | 18,310,899 | |
| | | | | | | | |
| | | | Software — 7.7% | | | | |
| | 144,100 | | | Autodesk, Inc.(b) | | | 8,780,013 | |
| | 257,340 | | | Microsoft Corp. | | | 14,277,223 | |
| | 531,514 | | | Oracle Corp. | | | 19,416,207 | |
| | | | | | | | |
| | | | | | | 42,473,443 | |
| | | | | | | | |
| | | | Specialty Retail — 0.2% | | | | |
| | 18,033 | | | Lowe’s Cos., Inc. | | | 1,371,229 | |
| | | | | | | | |
| | | | Technology Hardware, Storage & Peripherals — 1.5% | | | | |
| | 77,000 | | | Apple, Inc. | | | 8,105,020 | |
| | | | | | | | |
| | | | Textiles, Apparel & Luxury Goods — 1.0% | | | | |
| | 116,827 | | | adidas AG, Sponsored ADR | | | 5,667,278 | |
| | | | | | | | |
| | | | Total Common Stocks
(Identified Cost $468,971,832) | | | 541,856,551 | |
| | | | | | | | |
| | | | | | | | |
Principal
Amount | | | | | | |
| | Short-Term Investments — 2.1% | |
| $ | 11,678,956 | | | Tri-Party Repurchase Agreement with Fixed Income Clearing Corporation, dated 12/31/2015 at 0.030% to be repurchased at $11,678,995 on 1/04/2016 collateralized by $11,340,000 U.S. Treasury Note, 2.75% due 2/15/2024 valued at $11,921,175 including accrued interest (Note 2 of Notes to Financial Statements) (Identified Cost $11,678,956) | | | 11,678,956 | |
| | | | | | | | |
| | | | | | | | |
| | | | Total Investments — 99.8%
(Identified Cost $480,650,788)(a) | | | 553,535,507 | |
| | | | Other assets less liabilities — 0.2% | | | 1,208,245 | |
| | | | | | | | |
| | | | Net Assets — 100.0% | | $ | 554,743,752 | |
| | | | | | | | |
See accompanying notes to financial statements.
45 |
Portfolio of Investments – as of December 31, 2015
Natixis U.S. Equity Opportunities Fund – (continued)
| | | | | | | | |
| | | | | | | | |
| | (†) | | | See Note 2 of Notes to Financial Statements. | | | | |
| | (a) | | | Federal Tax Information: | | | | |
| | | | At December 31, 2015, the net unrealized appreciation on investments based on a cost of $481,197,851 for federal income tax purposes was as follows: | |
| | | | Aggregate gross unrealized appreciation for all investments in which there is an excess of value over tax cost | | $ | 100,276,534 | |
| | | | Aggregate gross unrealized depreciation for all investments in which there is an excess of tax cost over value | | | (27,938,878 | ) |
| | | | | | | | |
| | | | Net unrealized appreciation | | $ | 72,337,656 | |
| | | | | | | | |
| | | | | | | | |
| | (b) | | | Non-income producing security. | | | | |
| | | | | | | | |
| | ADR | | | An American Depositary Receipt is a certificate issued by a custodian bank representing the right to receive securities of the foreign issuer described. The values of ADRs may be significantly influenced by trading on exchanges not located in the United States. | |
Industry Summary at December 31, 2015
| | | | |
Internet Software & Services | | | 10.7 | % |
Software | | | 7.7 | |
Beverages | | | 6.6 | |
IT Services | | | 6.5 | |
Banks | | | 6.5 | |
Communications Equipment | | | 5.2 | |
Internet & Catalog Retail | | | 5.2 | |
Insurance | | | 4.7 | |
Air Freight & Logistics | | | 4.1 | |
Semiconductors & Semiconductor Equipment | | | 3.3 | |
Pharmaceuticals | | | 3.3 | |
Consumer Finance | | | 3.0 | |
Capital Markets | | | 2.9 | |
Machinery | | | 2.4 | |
Health Care Equipment & Supplies | | | 2.3 | |
Energy Equipment & Services | | | 2.3 | |
Industrial Conglomerates | | | 2.1 | |
Diversified Financial Services | | | 2.1 | |
Other Investments, less than 2% each | | | 16.8 | |
Short-Term Investments | | | 2.1 | |
| | | | |
Total Investments | | | 99.8 | |
Other assets less liabilities | | | 0.2 | |
| | | | |
Net Assets | | | 100.0 | % |
| | | | |
See accompanying notes to financial statements.
| 46
Portfolio of Investments – as of December 31, 2015
SeeyondSM Multi-Asset Allocation Fund
| | | | | | | | |
Principal
Amount (‡) | | | Description | | Value (†) | |
| | Bonds and Notes — 15.9% of Net Assets | |
| | | | France — 2.4% | | | | |
| | 900,000 | | | France Government Bond OAT, 3.500%, 4/25/2020, (EUR)(b) | | $ | 1,125,473 | |
| | | | | | | | |
| | | | Germany — 2.5% | | | | |
| | 390,000 | | | Bundesrepublik Deutschland, 1.500%, 2/15/2023, (EUR)(b) | | | 461,417 | |
| | 600,000 | | | Bundesrepublik Deutschland, 3.250%, 1/04/2020, (EUR)(b) | | | 741,196 | |
| | | | | | | | |
| | | | | | | 1,202,613 | |
| | | | | | | | |
| | | | Japan — 5.2% | | | | |
| | 280,000,000 | | | Japan Government Ten Year Bond, 1.000%, 3/20/2022, (JPY)(b) | | | 2,468,063 | |
| | | | | | | | |
| | | | Spain — 5.2% | | | | |
| | 1,850,000 | | | Spain Government Bond, 4.400%, 10/31/2023, 144A, (EUR)(b) | | | 2,455,398 | |
| | | | | | | | |
| | | | United Kingdom — 0.6% | | | | |
| | 200,000 | | | United Kingdom Gilt, 2.250%, 9/07/2023, (GBP)(b) | | | 305,145 | |
| | | | | | | | |
| | | | Total Bonds and Notes
(Identified Cost $8,234,400) | | | 7,556,692 | |
| | | | | | | | |
| | | | | | | | |
| Shares | | | | | | |
| | Exchange-Traded Funds — 5.0% | |
| | | | United States — 5.0% | | | | |
| | 2,910 | | | iShares® MSCI China ETF(c) | | | 129,844 | |
| | 26,610 | | | iShares® MSCI Emerging Markets ETF(b)(c) | | | 856,576 | |
| | 2,500 | | | iShares® MSCI India ETF(c) | | | 68,850 | |
| | 4,025 | | | iShares® MSCI South Korea Capped ETF(b)(c) | | | 199,922 | |
| | 29,600 | | | iShares® MSCI Switzerland Capped ETF(b)(c) | | | 918,784 | |
| | 13,030 | | | iShares® MSCI Taiwan ETF(b)(c) | | | 166,393 | |
| | 700 | | | iShares® MSCI Thailand Capped ETF(b)(c) | | | 41,048 | |
| | | | | | | | |
| | | | Total Exchange-Traded Funds
(Identified Cost $2,946,056) | | | 2,381,417 | |
| | | | | | | | |
| | | | | | | | |
| Contracts | | | | | | |
| | Purchased Options — 1.9% | |
| | | | Index Options — 1.6% | | | | |
| | 265 | | | EURO STOXX 50®, Call expiring March 18, 2016 at 3400 | | | 195,083 | |
| | 496 | | | EURO STOXX 50®, Put expiring March 18, 2016 at 3200 | | | 559,407 | |
| | | | | | | | |
| | | | | | | 754,490 | |
| | | | | | | | |
| | | | Options on Futures Contracts — 0.3% | | | | |
| | 38 | | | 10 Year U.S. Treasury Note, Put expiring January 22, 2016 at 125 | | | 8,906 | |
| | 105 | | | E-mini S&P 500®, Call expiring March 18, 2016 at 2100 | | | 143,063 | |
| | | | | | | | |
| | | | | | | 151,969 | |
| | | | | | | | |
| | | | Total Purchased Options
(Identified Cost $1,354,161) | | | 906,459 | |
| | | | | | | | |
| | | | | | | | |
See accompanying notes to financial statements.
47 |
Portfolio of Investments – as of December 31, 2015
SeeyondSM Multi-Asset Allocation Fund – (continued)
| | | | | | | | |
Principal
Amount (‡) | | | Description | | Value (†) | |
| | Short-Term Investments — 53.2% | |
| $ | 17,985,000 | | | Tri-Party Repurchase Agreement with Fixed Income Clearing Corporation, dated 12/31/2015 at 0.030% to be repurchased at $17,985,060 on 1/04/2016 collateralized by $17,750,000 Federal Home Loan Mortgage Corp., 4.125% due 10/11/2033 valued at $18,349,063 including accrued interest (Note 2 of Notes to Financial Statements)(b) | | $ | 17,985,000 | |
| | 2,178,334 | | | Tri-Party Repurchase Agreement with Fixed Income Clearing Corporation, dated 12/31/2015 at 0.030% to be repurchased at $2,178,341 on 1/04/2016 collateralized by $2,215,000 U.S. Treasury Note, 2.00% due 10/31/2021 valued at $2,223,306 including accrued interest (Note 2 of Notes to Financial Statements) | | | 2,178,334 | |
| | 1,800,000 | | | United Kingdom Treasury Bills, 0.450%, 2/15/2016, (GBP)(b)(d) | | | 2,652,387 | |
| | 2,500,000 | | | U.S. Treasury Bills, 0.071%, 1/07/2016(d) | | | 2,499,990 | |
| | | | | | | | |
| | | | Total Short-Term Investments
(Identified Cost $25,372,777) | | | 25,315,711 | |
| | | | | | | | |
| | | | | | | | |
| | | | Total Investments — 76.0%
(Identified Cost $37,907,394)(a) | | | 36,160,279 | |
| | | | Other assets less liabilities — 24.0% | | | 11,420,159 | |
| | | | | | | | |
| | | | Net Assets — 100.0% | | $ | 47,580,438 | |
| | | | | | | | |
| | | | | | | | |
| Contracts | | | | | | |
| | Written Options — (3.8%) | |
| | | | Index Options — (3.8%) | | | | |
| | 174 | | | EURO STOXX 50®, Call expiring December 16, 2016 at 3500 | | $ | (240,500 | ) |
| | 175 | | | EURO STOXX 50®, Put expiring December 16, 2016 at 3400 | | | (743,391 | ) |
| | 16 | | | S&P 500® Index, Call expiring March 18, 2016 at 2150 | | | (16,640 | ) |
| | 31 | | | S&P 500® Index, Call expiring December 16, 2016 at 2100 | | | (292,795 | ) |
| | 16 | | | S&P 500® Index, Put expiring March 18, 2016 at 2050 | | | (107,440 | ) |
| | 31 | | | S&P 500® Index, Put expiring December 16, 2016 at 2000 | | | (414,315 | ) |
| | | | | | | | |
| | | | (Premiums Received $1,982,375) | | $ | (1,815,081 | ) |
| | | | | | | | |
| | | | | | | | |
| | (‡) | | | Principal Amount stated in U.S. dollars unless otherwise noted. | | | | |
| | (†) | | | See Note 2 of Notes to Financial Statements. | | | | |
| | (a) | | | Federal Tax Information: | | | | |
| | | | At December 31, 2015, the net unrealized depreciation on investments based on a cost of $38,031,587 for federal income tax purposes was as follows: | |
| | | | Aggregate gross unrealized appreciation for all investments in which there is an excess of value over tax cost | | $ | 20 | |
| | | | Aggregate gross unrealized depreciation for all investments in which there is an excess of tax cost over value | | | (1,871,328 | ) |
| | | | | | | | |
| | | | Net unrealized depreciation | | $ | (1,871,308 | ) |
| | | | | | | | |
| | | | | | | | |
| | (b) | | | All of this security has been designated to cover the Fund’s obligations under open futures contracts or options. | |
See accompanying notes to financial statements.
| 48
Portfolio of Investments – as of December 31, 2015
SeeyondSM Multi-Asset Allocation Fund – (continued)
| | | | | | |
| | | | | | |
| | (c) | | | iShares® is a registered trademark of BlackRock Institutional Trust Company, N.A. Neither BlackRock Institutional Trust Company, N.A. nor the iShares® Funds make any representations regarding the advisability of investing in the SeeyondSM Multi-Asset Allocation Fund. |
| | (d) | | | Interest rate represents discount rate at time of purchase; not a coupon rate. | | |
| | | | | | |
| | 144A | | | All or a portion of these securities are exempt from registration under Rule 144A of the Securities Act of 1933. These securities may be resold in transactions exempt from registration, normally to qualified institutional buyers. At December 31, 2015, the value of Rule 144A holdings amounted to $2,455,398 or 5.2% of net assets. |
| | ETF | | | Exchange-Traded Fund | | |
| | | | | | |
| | EUR | | | Euro | | |
| | GBP | | | British Pound | | |
| | JPY | | | Japanese Yen | | |
At December 31, 2015, open long futures contracts were as follows:
| | | | | | | | | | | | | | | | |
| Financial Futures | | Expiration
Date | | | Contracts | | | Notional
Value | | | Unrealized
Appreciation
(Depreciation) | |
ASX SPI 200™ | | | 3/17/2016 | | | | 11 | | | $ | 1,045,476 | | | $ | 49,125 | |
E-mini NASDAQ 100 | | | 3/18/2016 | | | | 13 | | | | 1,192,815 | | | | 6,942 | |
Euro-BTP | | | 3/08/2016 | | | | 17 | | | | 2,548,037 | | | | 4,434 | |
EURO STOXX 50® | | | 3/18/2016 | | | | 413 | | | | 14,657,649 | | | | (71,473 | ) |
FTSE 100 Index | | | 3/18/2016 | | | | 7 | | | | 638,375 | | | | 16,785 | |
FTSE MIB | | | 3/18/2016 | | | | 13 | | | | 1,502,180 | | | | 400 | |
German Euro Bund | | | 3/08/2016 | | | | 12 | | | | 2,059,435 | | | | (4,641 | ) |
German Euro Bund, Put options at 157* | | | 1/22/2016 | | | | 25 | | | | 15,486 | | | | (10,053 | ) |
IBEX 35 | | | 1/15/2016 | | | | 3 | | | | 309,762 | | | | (5,259 | ) |
Nikkei 225™ | | | 3/10/2016 | | | | 45 | | | | 4,231,125 | | | | (145,125 | ) |
S&P/TSX 60 Index | | | 3/17/2016 | | | | 4 | | | | 439,922 | | | | 9,360 | |
UK Long Gilt | | | 3/29/2016 | | | | 4 | | | | 688,569 | | | | (3,243 | ) |
Ultra Long U.S. Treasury Bond | | | 3/21/2016 | | | | 16 | | | | 2,539,000 | | | | (1,203 | ) |
3 Year Australia Government Bond | | | 3/15/2016 | | | | 30 | | | | 2,436,783 | | | | 10,116 | |
10 Year Japan Government Bond | | | 3/14/2016 | | | | 1 | | | | 1,239,985 | | | | 2,745 | |
10 Year U.S. Treasury Note | | | 3/21/2016 | | | | 11 | | | | 1,384,969 | | | | (6,359 | ) |
| | | | | | | | | | | | | | | | |
Total | | | | | | | | | | | | | | $ | (147,449 | ) |
| | | | | | | | | | | | | | | | |
See accompanying notes to financial statements.
49 |
Portfolio of Investments – as of December 31, 2015
SeeyondSM Multi-Asset Allocation Fund – (continued)
At December 31, 2015, open short futures contracts were as follows:
| | | | | | | | | | | | | | | | |
| Financial Futures | | Expiration
Date | | | Contracts | | | Notional
Value | | | Unrealized
Appreciation
(Depreciation) | |
Australian Dollar | | | 3/14/2016 | | | | 7 | | | $ | 508,620 | | | $ | (910 | ) |
Canadian Dollar | | | 3/15/2016 | | | | 20 | | | | 1,446,600 | | | | (2,015 | ) |
CBOE SPX Volitility Index | | | 1/20/2016 | | | | 18 | | | | 333,450 | | | | (9,853 | ) |
E-mini S&P 500® | | | 3/18/2016 | | | | 4 | | | | 407,100 | | | | (4,600 | ) |
Euro | | | 3/14/2016 | | | | 7 | | | | 952,525 | | | | 6,913 | |
5 Year U.S. Treasury Note | | | 3/31/2016 | | | | 19 | | | | 2,248,086 | | | | 2,523 | |
| | | | | | | | | | | | | | | | |
Total | | | | | | | | | | | | | | $ | (7,942 | ) |
| | | | | | | | | | | | | | | | |
* Futures on German Euro Bund options are categorized as futures for valuation purposes but carry the risks associated with investments in options (see Note 2 of Notes to Financial Statements).
Industry Summary at December 31, 2015
| | | | |
Treasuries | | | 15.9 | % |
Exchange-Traded Funds | | | 5.0 | |
Purchased Options | | | 1.9 | |
Short-Term Investments | | | 53.2 | |
| | | | |
Total Investments | | | 76.0 | |
Other assets less liabilities (including open written options and futures contracts) | | | 24.0 | |
| | | | |
Net Assets | | | 100.0 | % |
| | | | |
Currency Exposure Summary at December 31, 2015
| | | | |
United States Dollar | | | 52.9 | % |
Euro | | | 11.7 | |
British Pound | | | 6.2 | |
Japanese Yen | | | 5.2 | |
| | | | |
Total Investments | | | 76.0 | |
Other assets less liabilities (including open written options and futures contracts) | | | 24.0 | |
| | | | |
Net Assets | | | 100.0 | % |
| | | | |
See accompanying notes to financial statements.
| 50
Statements of Assets and Liabilities
December 31, 2015
| | | | | | | | | | | | | | | | |
| | | Loomis Sayles
Multi-Asset
Income
Fund* | | | McDonnell
Intermediate
Municipal Bond
Fund | | | Natixis U.S.
Equity
Opportunities
Fund | | | SeeyondSM
Multi-Asset
Allocation
Fund | |
ASSETS | | | | | | | | | | | | | | | | |
Investments at cost | | $ | 114,813,128 | | | $ | 71,105,339 | | | $ | 468,971,832 | | | $ | 17,744,060 | |
Repurchase agreement(s) at cost | | | 7,050,949 | | | | 6,290,548 | | | | 11,678,956 | | | | 20,163,334 | |
Net unrealized appreciation (depreciation) | | | 2,048,089 | | | | 1,302,089 | | | | 72,884,719 | | | | (1,747,115 | ) |
| | | | | | | | | | | | | | | | |
Investments at value | | | 123,912,166 | | | | 78,697,976 | | | | 553,535,507 | | | | 36,160,279 | |
Cash | | | 4,696 | | | | — | | | | — | | | | — | |
Due from brokers (including variation margin on futures contracts) (Note 2) | | | — | | | | — | | | | — | | | | 6,423,392 | |
Foreign currency at value (identified cost $3,783, $0, $0 and $7,261,203, respectively) | | | 3,762 | | | | — | | | | — | | | | 6,892,556 | |
Receivable for Fund shares sold | | | 205,602 | | | | 2,267,143 | | | | 1,302,079 | | | | 110,000 | |
Receivable for securities sold | | | 2,473 | | | | — | | | | 7,326,137 | | | | — | |
Dividends and interest receivable | | | 857,574 | | | | 861,200 | | | | 268,590 | | | | 73,758 | |
Tax reclaims receivable | | | 1,504 | | | | — | | | | — | | | | — | |
Unrealized appreciation on futures contracts (Note 2) | | | — | | | | — | | | | — | | | | 109,343 | |
| | | | | | | | | | | | | | | | |
TOTAL ASSETS | | | 124,987,777 | | | | 81,826,319 | | | | 562,432,313 | | | | 49,769,328 | |
| | | | | | | | | | | | | | | | |
LIABILITIES | | | | | | | | | | | | | | | | |
Options written, at value (premiums received $0, $0, $0 and $1,982,375, respectively) (Note 2) | | | — | | | | — | | | | — | | | | 1,815,081 | |
Payable for securities purchased | | | 2,043,516 | | | | 1,240,462 | | | | 6,367,742 | | | | — | |
Payable for when-issued/delayed delivery securities purchased (Note 2) | | | — | | | | 923,693 | | | | — | | | | — | |
Payable for Fund shares redeemed | | | 441,645 | | | | 14,904 | | | | 375,803 | | | | — | |
Unrealized depreciation on futures contracts (Note 2) | | | — | | | | — | | | | — | | | | 264,734 | |
Distributions payable | | | — | | | | 61,420 | | | | — | | | | — | |
Management fees payable (Note 6) | | | 21,677 | | | | 4,584 | | | | 376,784 | | | | 23,470 | |
Deferred Trustees’ fees (Note 6) | | | 75,158 | | | | 26,426 | | | | 366,909 | | | | 13,846 | |
Administrative fees payable (Note 6) | | | 4,427 | | | | 2,785 | | | | 20,936 | | | | 1,787 | |
Payable to distributor (Note 6d) | | | 826 | | | | 202 | | | | 2,163 | | | | 7 | |
Other accounts payable and accrued expenses | | | 82,411 | | | | 56,297 | | | | 178,224 | | | | 69,965 | |
| | | | | | | | | | | | | | | | |
TOTAL LIABILITIES | | | 2,669,660 | | | | 2,330,773 | | | | 7,688,561 | | | | 2,188,890 | |
| | | | | | | | | | | | | | | | |
NET ASSETS | | $ | 122,318,117 | | | $ | 79,495,546 | | | $ | 554,743,752 | | | $ | 47,580,438 | |
| | | | | | | | | | | | | | | | |
NET ASSETS CONSIST OF: | | | | | | | | | | | | | | | | |
Paid-in capital | | $ | 121,588,132 | | | $ | 78,593,157 | | | $ | 477,476,978 | | | $ | 50,364,683 | |
Undistributed (Distributions in excess of) net investment income/Accumulated net investment loss | | | 15,241 | | | | (22,790 | ) | | | 131,902 | | | | (178,668 | ) |
Accumulated net realized gain (loss) on investments, futures contracts, options written and foreign currency transactions | | | (1,329,439 | ) | | | (376,910 | ) | | | 4,250,153 | | | | (683,484 | ) |
Net unrealized appreciation (depreciation) on investments, futures contracts, options written and foreign currency translations | | | 2,044,183 | | | | 1,302,089 | | | | 72,884,719 | | | | (1,922,093 | ) |
| | | | | | | | | | | | | | | | |
NET ASSETS | | $ | 122,318,117 | | | $ | 79,495,546 | | | $ | 554,743,752 | | | $ | 47,580,438 | |
| | | | | | | | | | | | | | | | |
See accompanying notes to financial statements.
51 |
Statements of Assets and Liabilities (continued)
December 31, 2015
| | | | | | | | | | | | | | | | |
| | | Loomis Sayles
Multi-Asset
Income
Fund* | | | McDonnell
Intermediate
Municipal Bond
Fund | | | Natixis U.S.
Equity
Opportunities
Fund | | | SeeyondSM
Multi-Asset
Allocation
Fund | |
COMPUTATION OF NET ASSET VALUE AND OFFERING PRICE: | | | | | | | | | | | | | | | | |
Class A shares: | | | | | | | | | | | | | | | | |
Net assets | | $ | 63,254,291 | | | $ | 6,427,349 | | | $ | 422,068,545 | | | $ | 246,147 | |
| | | | | | | | | | | | | | | | |
Shares of beneficial interest | | | 4,922,927 | | | | 636,997 | | | | 15,290,278 | | | | 27,229 | |
| | | | | | | | | | | | | | | | |
Net asset value and redemption price per share | | $ | 12.85 | | | $ | 10.09 | | | $ | 27.60 | | | $ | 9.04 | |
| | | | | | | | | | | | | | | | |
Offering price per share (100/[100-maximum sales charge] of net asset value) (Note 1) | | $ | 13.42 | | | $ | 10.40 | | | $ | 29.28 | | | $ | 9.59 | |
| | | | | | | | | | | | | | | | |
Class B shares: (redemption price per share is equal to net asset value less any applicable contingent deferred sales charge) (Note 1) | | | | | | | | | | | | | | | | |
Net assets | | $ | — | | | $ | — | | | $ | 168,054 | | | $ | — | |
| | | | | | | | | | | | | | | | |
Shares of beneficial interest | | | — | | | | — | | | | 8,466 | | | | — | |
| | | | | | | | | | | | | | | | |
Net asset value and offering price per share | | $ | — | | | $ | — | | | $ | 19.85 | | | $ | — | |
| | | | | | | | | | | | | | | | |
Class C shares: (redemption price per share is equal to net asset value less any applicable contingent deferred sales charge) (Note 1) | | | | | | | | | | | | | | | | |
Net assets | | $ | 47,791,065 | | | $ | 6,354,884 | | | $ | 61,863,967 | | | $ | 200,672 | |
| | | | | | | | | | | | | | | | |
Shares of beneficial interest | | | 3,733,672 | | | | 629,768 | | | | 3,114,658 | | | | 22,448 | |
| | | | | | | | | | | | | | | | |
Net asset value and offering price per share | | $ | 12.80 | | | $ | 10.09 | | | $ | 19.86 | | | $ | 8.94 | |
| | | | | | | | | | | | | | | | |
Class N shares: | | | | | | | | | | | | | | | | |
Net assets | | $ | 1,020 | | | $ | — | | | $ | — | | | $ | — | |
| | | | | | | | | | | | | | | | |
Shares of beneficial interest | | | 80 | | | | — | | | | — | | | | — | |
| | | | | | | | | | | | | | | | |
Net asset value, offering and redemption price per share | | $ | 12.77 | ** | | $ | — | | | $ | — | | | $ | — | |
| | | | | | | | | | | | | | | | |
Class Y shares: | | | | | | | | | | | | | | | | |
Net assets | | $ | 11,271,741 | | | $ | 66,713,313 | | | $ | 70,643,186 | | | $ | 47,133,619 | |
| | | | | | | | | | | | | | | | |
Shares of beneficial interest | | | 881,612 | | | | 6,605,900 | | | | 2,234,600 | | | | 5,196,571 | |
| | | | | | | | | | | | | | | | |
Net asset value, offering and redemption price per share | | $ | 12.79 | | | $ | 10.10 | | | $ | 31.61 | | | $ | 9.07 | |
| | | | | | | | | | | | | | | | |
| * | Formerly Natixis Diversified Income Fund. |
| ** | Net asset value calculations reflect fractional share and dollar amounts. |
See accompanying notes to financial statements.
| 52
Statements of Operations
For the Year Ended December 31, 2015
| | | | | | | | | | | | | | | | |
| | | Loomis Sayles
Multi-Asset
Income
Fund* | | | McDonnell
Intermediate
Municipal Bond
Fund | | | Natixis U.S.
Equity
Opportunities
Fund | | | SeeyondSM
Multi-Asset
Allocation
Fund | |
INVESTMENT INCOME | | | | | | | | | | | | | | | | |
Dividends | | $ | 2,884,643 | | | $ | — | | | $ | 8,051,873 | | | $ | 90,237 | |
Interest | | | 2,790,112 | | | | 769,129 | | | | 2,018 | | | | 79,628 | |
Less net foreign taxes withheld | | | (5,500 | ) | | | — | | | | (136,735 | ) | | | — | |
| | | | | | | | | | | | | | | | |
| | | 5,669,255 | | | | 769,129 | | | | 7,917,156 | | | | 169,865 | |
| | | | | | | | | | | | | | | | |
Expenses | | | | | | | | | | | | | | | | |
Management fees (Note 6) | | | 892,262 | | | | 155,126 | | | | 4,336,747 | | | | 421,990 | |
Service and distribution fees (Note 6) | | | 753,151 | | | | 34,070 | | | | 1,663,139 | | | | 1,363 | |
Administrative fees (Note 6) | | | 69,200 | | | | 16,653 | | | | 232,145 | | | | 21,255 | |
Trustees’ fees and expenses (Note 6) | | | 20,647 | | | | 18,450 | | | | 27,263 | | | | 18,732 | |
Transfer agent fees and expenses (Note 6) | | | 118,333 | | | | 13,922 | | | | 543,213 | | | | 5,330 | |
Audit and tax services fees | | | 62,947 | | | | 51,546 | | | | 47,826 | | | | 66,670 | |
Custodian fees and expenses | | | 89,422 | | | | 8,640 | | | | 30,693 | | | | 18,826 | |
Interest expense (Note 11) | | | — | | | | — | | | | — | | | | 19,764 | |
Legal fees | | | 2,551 | | | | 491 | | | | 8,078 | | | | 789 | |
Registration fees | | | 85,029 | | | | 53,569 | | | | 71,484 | | | | 51,704 | |
Shareholder reporting expenses | | | 42,802 | | | | 3,677 | | | | 101,467 | | | | 1,244 | |
Miscellaneous expenses | | | 19,186 | | | | 9,949 | | | | 19,674 | | | | 15,275 | |
| | | | | | | | | | | | | | | | |
Total expenses | | | 2,155,530 | | | | 366,093 | | | | 7,081,729 | | | | 642,942 | |
Less waiver and/or expense reimbursement (Note 6) | | | (113,144 | ) | | | (141,002 | ) | | | (2,238 | ) | | | (100,533 | ) |
| | | | | | | | | | | | | | | | |
Net expenses | | | 2,042,386 | | | | 225,091 | | | | 7,079,491 | | | | 542,409 | |
| | | | | | | | | | | | | | | | |
Net investment income (loss) | | | 3,626,869 | | | | 544,038 | | | | 837,665 | | | | (372,544 | ) |
| | | | | | | | | | | | | | | | |
NET REALIZED AND UNREALIZED GAIN (LOSS) ON INVESTMENTS, FUTURES CONTRACTS, OPTIONS WRITTEN AND FOREIGN CURRENCY TRANSACTIONS | | | | | | | | | | | | | | | | |
Net realized gain (loss) on: | | | | | | | | | | | | | | | | |
Investments | | | 7,718,745 | | | | 24,506 | | | | 26,118,486 | | | | (532,433 | ) |
Futures contracts | | | (92,523 | ) | | | — | | | | — | | | | 531,459 | |
Options written | | | — | | | | — | | | | — | | | | (15,550 | ) |
Foreign currency transactions | | | 92,481 | | | | — | | | | — | | | | (595,944 | ) |
Net change in unrealized appreciation (depreciation) on: | | | | | | | | | | | | | | | | |
Investments | | | (15,097,835 | ) | | | 538,992 | | | | 3,596,453 | | | | (1,036,742 | ) |
Futures contracts | | | 55,028 | | | | — | | | | — | | | | (1,118,698 | ) |
Options written | | | — | | | | — | | | | — | | | | 166,355 | |
Foreign currency translations | | | (49,079 | ) | | | — | | | | — | | | | 364,913 | |
| | | | | | | | | | | | | | | | |
Net realized and unrealized gain (loss) on investments, futures contracts, options written and foreign currency transactions | | | (7,373,183 | ) | | | 563,498 | | | | 29,714,939 | | | | (2,236,640 | ) |
| | | | | | | | | | | | | | | | |
NET INCREASE (DECREASE) IN NET ASSETS RESULTING FROM OPERATIONS | | $ | (3,746,314 | ) | | $ | 1,107,536 | | | $ | 30,552,604 | | | $ | (2,609,184 | ) |
| | | | | | | | | | | | | | | | |
| * | Formerly Natixis Diversified Income Fund. |
See accompanying notes to financial statements.
53 |
Statements of Changes in Net Assets
| | | | | | | | |
| | | Loomis Sayles Multi-Asset
Income Fund* | |
| | | Year Ended
December 31,
2015 | | | Year Ended
December 31,
2014 | |
FROM OPERATIONS: | | | | | | | | |
Net investment income | | $ | 3,626,869 | | | $ | 3,106,711 | |
Net realized gain on investments, futures contracts and foreign currency transactions | | | 7,718,703 | | | | 1,572,175 | |
Net change in unrealized appreciation (depreciation) on investments, futures contracts and foreign currency translations | | | (15,091,886 | ) | | | 12,494,829 | |
| | | | | | | | |
Net increase (decrease) in net assets resulting from operations | | | (3,746,314 | ) | | | 17,173,715 | |
| | | | | | | | |
FROM DISTRIBUTIONS TO SHAREHOLDERS: | | | | | | | | |
Net investment income | | | | | | | | |
Class A | | | (2,173,545 | ) | | | (2,341,189 | ) |
Class C | | | (937,937 | ) | | | (952,028 | ) |
Class N | | | (14 | ) | | | — | |
Class Y | | | (430,540 | ) | | | (147,181 | ) |
| | | | | | | | |
Total distributions | | | (3,542,036 | ) | | | (3,440,398 | ) |
| | | | | | | | |
NET INCREASE (DECREASE) IN NET ASSETS FROM CAPITAL SHARE TRANSACTIONS (NOTE 12) | | | (48,770,339 | ) | | | 36,464,179 | |
| | | | | | | | |
Net increase (decrease) in net assets | | | (56,058,689 | ) | | | 50,197,496 | |
NET ASSETS | | | | | | | | |
Beginning of the year | | | 178,376,806 | | | | 128,179,310 | |
| | | | | | | | |
End of the year | | $ | 122,318,117 | | | $ | 178,376,806 | |
| | | | | | | | |
UNDISTRIBUTED (DISTRIBUTIONS IN EXCESS OF) NET INVESTMENT INCOME | | $ | 15,241 | | | $ | (199,276 | ) |
| | | | | | | | |
| * | Formerly Natixis Diversified Income Fund. |
See accompanying notes to financial statements.
| 54
Statements of Changes in Net Assets (continued)
| | | | | | | | |
| | | McDonnell Intermediate
Municipal Bond Fund | |
| | | Year Ended
December 31,
2015 | | | Year Ended
December 31,
2014 | |
FROM OPERATIONS: | | | | | | | | |
Net investment income | | $ | 544,038 | | | $ | 394,617 | |
Net realized gain (loss) on investments | | | 24,506 | | | | (53,090 | ) |
Net change in unrealized appreciation (depreciation) on investments | | | 538,992 | | | | 1,268,045 | |
| | | | | | | | |
Net increase in net assets resulting from operations | | | 1,107,536 | | | | 1,609,572 | |
| | | | | | | | |
FROM DISTRIBUTIONS TO SHAREHOLDERS: | | | | | | | | |
Net investment income | | | | | | | | |
Class A | | | (46,261 | ) | | | (19,275 | ) |
Class C | | | (15,022 | ) | | | (2,856 | ) |
Class Y | | | (504,191 | ) | | | (372,573 | ) |
| | | | | | | | |
Total distributions | | | (565,474 | ) | | | (394,704 | ) |
| | | | | | | | |
NET INCREASE IN NET ASSETS FROM CAPITAL SHARE TRANSACTIONS (NOTE 12) | | | 46,018,276 | | | | 8,914,814 | |
| | | | | | | | |
Net increase in net assets | | | 46,560,338 | | | | 10,129,682 | |
NET ASSETS | | | | | | | | |
Beginning of the year | | | 32,935,208 | | | | 22,805,526 | |
| | | | | | | | |
End of the year | | $ | 79,495,546 | | | $ | 32,935,208 | |
| | | | | | | | |
DISTRIBUTIONS IN EXCESS OF NET INVESTMENT INCOME | | $ | (22,790 | ) | | $ | (1,354 | ) |
| | | | | | | | |
See accompanying notes to financial statements.
55 |
Statements of Changes in Net Assets (continued)
| | | | | | | | |
| | | Natixis U.S. Equity
Opportunities Fund | |
| | | Year Ended
December 31,
2015 | | | Year Ended
December 31,
2014 | |
FROM OPERATIONS: | | | | | | | | |
Net investment income (loss) | | $ | 837,665 | | | $ | (9,903 | ) |
Net realized gain on investments | | | 26,118,486 | | | | 137,496,577 | |
Net change in unrealized appreciation (depreciation) on investments | | | 3,596,453 | | | | (80,424,544 | ) |
| | | | | | | | |
Net increase in net assets resulting from operations | | | 30,552,604 | | | | 57,062,130 | |
| | | | | | | | |
FROM DISTRIBUTIONS TO SHAREHOLDERS: | | | | | | | | |
Net investment income | | | | | | | | |
Class Y | | | (147,433 | ) | | | — | |
Net realized capital gains | | | | | | | | |
Class A | | | (20,882,818 | ) | | | (108,546,162 | ) |
Class B | | | (45,584 | ) | | | (1,183,478 | ) |
Class C | | | (4,110,090 | ) | | | (18,242,647 | ) |
Class Y | | | (2,904,325 | ) | | | (9,498,229 | ) |
| | | | | | | | |
Total distributions | | | (28,090,250 | ) | | | (137,470,516 | ) |
| | | | | | | | |
NET INCREASE IN NET ASSETS FROM CAPITAL SHARE TRANSACTIONS (NOTE 12) | | | 56,719,631 | | | | 128,349,059 | |
| | | | | | | | |
Net increase in net assets | | | 59,181,985 | | | | 47,940,673 | |
NET ASSETS | | | | | | | | |
Beginning of the year | | | 495,561,767 | | | | 447,621,094 | |
| | | | | | | | |
End of the year | | $ | 554,743,752 | | | $ | 495,561,767 | |
| | | | | | | | |
ACCUMULATED NET INVESTMENT LOSS/UNDISTRIBUTED NET INVESTMENT INCOME | | $ | 131,902 | | | $ | (523,913 | ) |
| | | | | | | | |
See accompanying notes to financial statements.
| 56
Statements of Changes in Net Assets (continued)
| | | | | | | | |
| | | SeeyondSM Multi-Asset
Allocation Fund | |
| | | Year Ended
December 31,
2015 | | | Period Ended
December 31,
2014(a) | |
FROM OPERATIONS: | | | | | | | | |
Net investment loss | | $ | (372,544 | ) | | $ | (171,011 | ) |
Net realized loss on investments, futures contracts, options written and foreign currency transactions | | | (612,468 | ) | | | (1,106,933 | ) |
Net change in unrealized appreciation (depreciation) on investments, futures contracts, options written and foreign currency translations | | | (1,624,172 | ) | | | (297,921 | ) |
| | | | | | | | |
Net decrease in net assets resulting from operations | | | (2,609,184 | ) | | | (1,575,865 | ) |
| | | | | | | | |
FROM DISTRIBUTIONS TO SHAREHOLDERS: | | | | | | | | |
Net realized capital gains | | | | | | | | |
Class A | | | (453 | ) | | | — | |
Class C | | | (576 | ) | | | — | |
Class Y | | | (658,223 | ) | | | — | |
| | | | | | | | |
Total distributions | | | (659,252 | ) | | | — | |
| | | | | | | | |
NET INCREASE IN NET ASSETS FROM CAPITAL SHARE TRANSACTIONS (NOTE 12) | | | 2,065,103 | | | | 50,359,636 | |
| | | | | | | | |
Net increase (decrease) in net assets | | | (1,203,333 | ) | | | 48,783,771 | |
NET ASSETS | | | | | | | | |
Beginning of the year | | | 48,783,771 | | | | — | |
| | | | | | | | |
End of the year | | $ | 47,580,438 | | | $ | 48,783,771 | |
| | | | | | | | |
ACCUMULATED NET INVESTMENT LOSS | | $ | (178,668 | ) | | $ | (763,696 | ) |
| | | | | | | | |
| (a) | From commencement of operations on July 23, 2014 through December 31, 2014. |
See accompanying notes to financial statements.
57 |
Financial Highlights
For a share outstanding throughout each period.
| | | | | | | | | | | | | | | | | | | | |
| |
| | | Loomis Sayles Multi-Asset Income Fund*—Class A | |
| | | Year Ended
December 31,
2015 | | | Year Ended
December 31,
2014 | | | Year Ended
December 31,
2013 | | | Year Ended
December 31,
2012 | | | Year Ended
December 31,
2011 | |
Net asset value, beginning of the period | | $ | 13.45 | | | $ | 12.21 | | | $ | 11.83 | | | $ | 10.74 | | | $ | 10.41 | |
| | | | | | | | | | | | | | | | | | | | |
INCOME (LOSS) FROM INVESTMENT OPERATIONS: | | | | | | | | | | | | | | | | | | | | |
Net investment income(a) | | | 0.32 | | | | 0.32 | | | | 0.29 | | | | 0.29 | | | | 0.34 | |
Net realized and unrealized gain (loss) | | | (0.58 | ) | | | 1.26 | | | | 0.40 | | | | 1.12 | | | | 0.40 | |
| | | | | | | | | | | | | | | | | | | | |
Total from Investment Operations | | | (0.26 | ) | | | 1.58 | | | | 0.69 | | | | 1.41 | | | | 0.74 | |
| | | | | | | | | | | | | | | | | | | | |
LESS DISTRIBUTIONS FROM: | | | | | | | | | | | | | | | | | | | | |
Net investment income | | | (0.34 | ) | | | (0.34 | ) | | | (0.31 | ) | | | (0.32 | ) | | | (0.41 | ) |
Net realized capital gains | | | — | | | | — | | | | — | | | | — | | | | — | |
| | | | | | | | | | | | | | | | | | | | |
Total Distributions | | | (0.34 | ) | | | (0.34 | ) | | | (0.31 | ) | | | (0.32 | ) | | | (0.41 | ) |
| | | | | | | | | | | | | | | | | | | | |
Net asset value, end of the period | | $ | 12.85 | | | $ | 13.45 | | | $ | 12.21 | | | $ | 11.83 | | | $ | 10.74 | |
| | | | | | | | | | | | | | | | | | | | |
Total return(b) | | | (1.96 | )%(c) | | | 13.08 | % | | | 5.84 | % | | | 13.22 | % | | | 7.21 | % |
RATIOS TO AVERAGE NET ASSETS: | | | | | | | | | | | | | | | | | | | | |
Net assets, end of the period (000’s) | | $ | 63,254 | | | $ | 110,874 | | | $ | 79,039 | | | $ | 78,216 | | | $ | 45,211 | |
Net expenses | | | 1.04 | %(d)(e) | | | 1.06 | % | | | 1.09 | % | | | 1.11 | % | | | 1.13 | % |
Gross expenses | | | 1.11 | % | | | 1.06 | % | | | 1.09 | % | | | 1.11 | % | | | 1.13 | % |
Net investment income | | | 2.40 | % | | | 2.46 | % | | | 2.34 | % | | | 2.53 | % | | | 3.17 | % |
Portfolio turnover rate | | | 93 | %(f) | | | 41 | % | | | 41 | % | | | 29 | % | | | 20 | % |
| * | Formerly Natixis Diversified Income Fund. |
| (a) | Per share net investment income has been calculated using the average shares outstanding during the period. |
| (b) | A sales charge for Class A shares is not reflected in total return calculations. |
| (c) | Had certain expenses not been waived/reimbursed during the period, total returns would have been lower. |
| (d) | The investment adviser agreed to waive its fees and/or reimburse a portion of the Fund’s expenses during the period. Without this waiver/reimbursement, expenses would have been higher. |
| (e) | Effective September 1, 2015, the expense limit decreased from 1.25% to 0.95%. |
| (f) | The variation in the Fund’s turnover rate from 2014 to 2015 was primarily due to a change in the investment strategy and management structure of the Fund. |
See accompanying notes to financial statements.
| 58
Financial Highlights (continued)
For a share outstanding throughout each period.
| | | | | | | | | | | | | | | | | | | | |
| |
| | | Loomis Sayles Multi-Asset Income Fund*—Class C | |
| | | Year Ended
December 31,
2015 | | | Year Ended
December 31,
2014 | | | Year Ended
December 31,
2013 | | | Year Ended
December 31,
2012 | | | Year Ended
December 31,
2011 | |
Net asset value, beginning of the period | | $ | 13.41 | | | $ | 12.17 | | | $ | 11.80 | | | $ | 10.71 | | | $ | 10.39 | |
| | | | | | | | | | | | | | | | | | | | |
INCOME (LOSS) FROM INVESTMENT OPERATIONS: | | | | | | | | | | | | | | | | | | | | |
Net investment income(a) | | | 0.24 | | | | 0.22 | | | | 0.19 | | | | 0.20 | | | | 0.26 | |
Net realized and unrealized gain (loss) | | | (0.60 | ) | | | 1.27 | | | | 0.39 | | | | 1.12 | | | | 0.39 | |
| | | | | | | | | | | | | | | | | | | | |
Total from Investment Operations | | | (0.36 | ) | | | 1.49 | | | | 0.58 | | | | 1.32 | | | | 0.65 | |
| | | | | | | | | | | | | | | | | | | | |
LESS DISTRIBUTIONS FROM: | | | | | | | | | | | | | | | | | | | | |
Net investment income | | | (0.25 | ) | | | (0.25 | ) | | | (0.21 | ) | | | (0.23 | ) | | | (0.33 | ) |
Net realized capital gains | | | — | | | | — | | | | — | | | | — | | | | — | |
| | | | | | | | | | | | | | | | | | | | |
Total Distributions | | | (0.25 | ) | | | (0.25 | ) | | | (0.21 | ) | | | (0.23 | ) | | | (0.33 | ) |
| | | | | | | | | | | | | | | | | | | | |
Net asset value, end of the period | | $ | 12.80 | | | $ | 13.41 | | | $ | 12.17 | | | $ | 11.80 | | | $ | 10.71 | |
| | | | | | | | | | | | | | | | | | | | |
Total return(b) | | | (2.73 | )%(c) | | | 12.28 | % | | | 4.98 | % | | | 12.43 | % | | | 6.33 | % |
RATIOS TO AVERAGE NET ASSETS: | | | | | | | | | | | | | | | | | | | | |
Net assets, end of the period (000’s) | | $ | 47,791 | | | $ | 53,074 | | | $ | 48,512 | | | $ | 49,697 | | | $ | 29,814 | |
Net expenses | | | 1.80 | %(d)(e) | | | 1.81 | % | | | 1.84 | % | | | 1.86 | % | | | 1.88 | % |
Gross expenses | | | 1.87 | % | | | 1.81 | % | | | 1.84 | % | | | 1.86 | % | | | 1.88 | % |
Net investment income | | | 1.78 | % | | | 1.70 | % | | | 1.59 | % | | | 1.79 | % | | | 2.42 | % |
Portfolio turnover rate | | | 93 | %(f) | | | 41 | % | | | 41 | % | | | 29 | % | | | 20 | % |
| * | Formerly Natixis Diversified Income Fund. |
| (a) | Per share net investment income has been calculated using the average shares outstanding during the period. |
| (b) | A contingent deferred sales charge for Class C shares is not reflected in total return calculations. |
| (c) | Had certain expenses not been waived/reimbursed during the period, total returns would have been lower. |
| (d) | The investment adviser agreed to waive its fees and/or reimburse a portion of the Fund’s expenses during the period. Without this waiver/reimbursement, expenses would have been higher. |
| (e) | Effective September 1, 2015, the expense limit decreased from 2.00% to 1.70%. |
| (f) | The variation in the Fund’s turnover rate from 2014 to 2015 was primarily due to a change in the investment strategy and management structure of the Fund. |
See accompanying notes to financial statements.
59 |
Financial Highlights (continued)
For a share outstanding throughout each period.
| | | | |
| | | Loomis Sayles Multi-Asset
Income Fund*—Class N | |
| | | Period Ended
December 31,
2015** | |
Net asset value, beginning of the period | | $ | 12.70 | |
| | | | |
INCOME (LOSS) FROM INVESTMENT OPERATIONS: | | | | |
Net investment income(a) | | | 0.14 | |
Net realized and unrealized gain (loss) | | | 0.10 | |
| | | | |
Total from Investment Operations | | | 0.24 | |
| | | | |
LESS DISTRIBUTIONS FROM: | | | | |
Net investment income | | | (0.17 | ) |
Net realized capital gains | | | — | |
| | | | |
Total Distributions | | | (0.17 | ) |
| | | | |
Net asset value, end of the period | | $ | 12.77 | |
| | | | |
Total return(b)(c) | | | 1.91 | % |
RATIOS TO AVERAGE NET ASSETS: | | | | |
Net assets, end of the period (000’s) | | $ | 1 | |
Net expenses(d)(e) | | | 0.65 | % |
Gross expenses(e) | | | 13.66 | % |
Net investment income(e) | | | 3.22 | % |
Portfolio turnover rate | | | 93 | % |
| * | Formerly Natixis Diversified Income Fund. |
| ** | From commencement of Class operations on August 31, 2015 through December 31, 2015 for Class N shares. |
| (a) | Per share net investment income has been calculated using the average shares outstanding during the period. |
| (b) | Had certain expenses not been waived/reimbursed during the period, total returns would have been lower. |
| (c) | Periods less than one year are not annualized. |
| (d) | The investment adviser agreed to waive its fees and/or reimburse a portion of the Fund’s expenses during the period. Without this waiver/reimbursement, expenses would have been higher. |
| (e) | Computed on an annualized basis for periods less than one year. |
See accompanying notes to financial statements.
| 60
Financial Highlights (continued)
For a share outstanding throughout each period.
| | | | | | | | | | | | | | | | |
| |
| | | Loomis Sayles Multi-Asset Income Fund*—Class Y | |
| | | Year Ended
December 31,
2015 | | | Year Ended
December 31,
2014 | | | Year Ended
December 31,
2013 | | | Period Ended
December 31,
2012** | |
Net asset value, beginning of the period | | $ | 13.39 | | | $ | 12.19 | | | $ | 11.83 | | | $ | 11.72 | |
| | | | | | | | | | | | | | | | |
INCOME (LOSS) FROM INVESTMENT OPERATIONS: | | | | | | | | | | | | | | | | |
Net investment income (loss)(a) | | | 0.36 | | | | 0.38 | | | | 0.33 | | | | (0.02 | ) |
Net realized and unrealized gain (loss) | | | (0.59 | ) | | | 1.19 | | | | 0.37 | | | | 0.18 | |
| | | | | | | | | | | | | | | | |
Total from Investment Operations | | | (0.23 | ) | | | 1.57 | | | | 0.70 | | | | 0.16 | |
| | | | | | | | | | | | | | | | |
LESS DISTRIBUTIONS FROM: | | | | | | | | | | | | | | | | |
Net investment income | | | (0.37 | ) | | | (0.37 | ) | | | (0.34 | ) | | | (0.05 | ) |
Net realized capital gains | | | — | | | | — | | | | — | | | | — | |
| | | | | | | | | | | | | | | | |
Total Distributions | | | (0.37 | ) | | | (0.37 | ) | | | (0.34 | ) | | | (0.05 | ) |
| | | | | | | | | | | | | | | | |
Net asset value, end of the period | | $ | 12.79 | | | $ | 13.39 | | | $ | 12.19 | | | $ | 11.83 | |
| | | | | | | | | | | | | | | | |
Total return | | | (1.72 | )%(b) | | | 13.05 | % | | | 5.93 | % | | | 1.35 | %(c) |
RATIOS TO AVERAGE NET ASSETS: | | | | | | | | | | | | | | | | |
Net assets, end of the period (000’s) | | $ | 11,272 | | | $ | 14,428 | | | $ | 628 | | | $ | 1 | |
Net expenses | | | 0.80 | %(d)(e) | | | 0.82 | % | | | 0.83 | % | | | 1.00 | %(f) |
Gross expenses | | | 0.86 | % | | | 0.82 | % | | | 0.83 | % | | | 1.00 | %(f) |
Net investment income (loss) | | | 2.73 | % | | | 2.92 | % | | | 2.71 | % | | | (2.37 | )%(f) |
Portfolio turnover rate | | | 93 | %(g) | | | 41 | % | | | 41 | % | | | 29 | % |
| * | Formerly Natixis Diversified Income Fund. |
| ** | From commencement of operations on December 3, 2012, through December 31, 2012. |
| (a) | Per share net investment income (loss) has been calculated using the average shares outstanding during the period. |
| (b) | Had certain expenses not been waived/reimbursed during the period, total returns would have been lower. |
| (c) | Periods less than one year are not annualized. |
| (d) | The investment adviser agreed to waive its fees and/or reimburse a portion of the Fund’s expenses during the period. Without this waiver/reimbursement, expenses would have been higher. |
| (e) | Effective September 1, 2015, the expense limit decreased from 1.00% to 0.70%. |
| (f) | Computed on an annualized basis for periods less than one year. |
| (g) | The variation in the Fund’s turnover rate from 2014 to 2015 was primarily due to a change in the investment strategy and management structure of the Fund. |
See accompanying notes to financial statements.
61 |
Financial Highlights (continued)
For a share outstanding throughout each period.
| | | | | | | | | | | | | | | | |
| |
| | | McDonnell Intermediate Municipal Bond Fund—Class A | |
| | | Year Ended
December 31,
2015 | | | Year Ended
December 31,
2014 | | | Year Ended
December 31,
2013 | | | Period Ended
December 31,
2012* | |
Net asset value, beginning of the period | | $ | 10.00 | | | $ | 9.54 | | | $ | 9.89 | | | $ | 10.00 | |
| | | | | | | | | | | | | | | | |
INCOME (LOSS) FROM INVESTMENT OPERATIONS: | | | | | | | | | | | | | | | | |
Net investment income (loss)(a) | | | 0.13 | | | | 0.11 | | | | 0.09 | | | | (0.01 | ) |
Net realized and unrealized gain (loss) | | | 0.10 | | | | 0.47 | | | | (0.35 | ) | | | (0.10 | ) |
| | | | | | | | | | | | | | | | |
Total from Investment Operations | | | 0.23 | | | | 0.58 | | | | (0.26 | ) | | | (0.11 | ) |
| | | | | | | | | | | | | | | | |
LESS DISTRIBUTIONS FROM: | | | | | | | | | | | | | | | | |
Net investment income | | | (0.14 | ) | | | (0.12 | ) | | | (0.09 | ) | | | — | |
Net realized capital gains | | | — | | | | — | | | | — | | | | — | |
| | | | | | | | | | | | | | | | |
Total Distributions | | | (0.14 | ) | | | (0.12 | ) | | | (0.09 | ) | | | — | |
| | | | | | | | | | | | | | | | |
Net asset value, end of the period | | $ | 10.09 | | | $ | 10.00 | | | $ | 9.54 | | | $ | 9.89 | |
| | | | | | | | | | | | | | | | |
Total return(b)(c) | | | 2.28 | % | | | 6.08 | % | | | (2.66 | )% | | | (1.10 | )%(d) |
RATIOS TO AVERAGE NET ASSETS: | | | | | | | | | | | | | | | | |
Net assets, end of the period (000’s) | | $ | 6,427 | | | $ | 2,399 | | | $ | 1,047 | | | $ | 1 | |
Net expenses(e) | | | 0.74 | %(f) | | | 0.80 | % | | | 0.80 | % | | | 2.19 | %(g)(h) |
Gross expenses | | | 1.12 | % | | | 1.26 | % | | | 1.37 | % | | | 2.23 | %(g) |
Net investment income (loss) | | | 1.27 | % | | | 1.15 | % | | | 0.90 | % | | | (0.71 | )%(g) |
Portfolio turnover rate | | | 20 | % | | | 10 | % | | | 37 | % | | | 0 | % |
| * | From commencement of operations on November 16, 2012 through December 31, 2012. |
| (a) | Per share net investment income (loss) has been calculated using the average shares outstanding during the period. |
| (b) | Had certain expenses not been waived/reimbursed during the period, total returns would have been lower. |
| (c) | A sales charge for Class A shares is not reflected in total return calculations. |
| (d) | Periods less than one year are not annualized. |
| (e) | The investment adviser agreed to waive its fees and/or reimburse a portion of the Fund’s expenses during the period. Without this waiver/reimbursement, expenses would have been higher. |
| (f) | Effective July 1, 2015, the expense limit decreased from 0.80% to 0.70%. |
| (g) | Computed on an annualized basis for periods less than one year. |
| (h) | Prior to December 31, 2012, there was no expense limitation agreement in place for the Fund. |
See accompanying notes to financial statements.
| 62
Financial Highlights (continued)
For a share outstanding throughout each period.
| | | | | | | | | | | | | | | | |
| |
| | | McDonnell Intermediate Municipal Bond Fund—Class C | |
| | | Year Ended
December 31,
2015 | | | Year Ended
December 31,
2014 | | | Year Ended
December 31,
2013 | | | Period Ended
December 31,
2012* | |
Net asset value, beginning of the period | | $ | 9.99 | | | $ | 9.54 | | | $ | 9.89 | | | $ | 10.00 | |
| | | | | | | | | | | | | | | | |
INCOME (LOSS) FROM INVESTMENT OPERATIONS: | | | | | | | | | | | | | | | | |
Net investment income (loss)(a) | | | 0.05 | | | | 0.04 | | | | 0.01 | | | | (0.01 | ) |
Net realized and unrealized gain (loss) | | | 0.11 | | | | 0.45 | | | | (0.34 | ) | | | (0.10 | ) |
| | | | | | | | | | | | | | | | |
Total from Investment Operations | | | 0.16 | | | | 0.49 | | | | (0.33 | ) | | | (0.11 | ) |
| | | | | | | | | | | | | | | | |
LESS DISTRIBUTIONS FROM: | | | | | | | | | | | | | | | | |
Net investment income | | | (0.06 | ) | | | (0.04 | ) | | | (0.02 | ) | | | — | |
Net realized capital gains | | | — | | | | — | | | | — | | | | — | |
| | | | | | | | | | | | | | | | |
Total Distributions | | | (0.06 | ) | | | (0.04 | ) | | | (0.02 | ) | | | — | |
| | | | | | | | | | | | | | | | |
Net asset value, end of the period | | $ | 10.09 | | | $ | 9.99 | | | $ | 9.54 | | | $ | 9.89 | |
| | | | | | | | | | | | | | | | |
Total return(b)(c) | | | 1.63 | % | | | 5.18 | % | | | (3.35 | )% | | | (1.10 | )%(d) |
RATIOS TO AVERAGE NET ASSETS: | | | | | | | | | | | | | | | | |
Net assets, end of the period (000’s) | | $ | 6,355 | | | $ | 2,223 | | | $ | 55 | | | $ | 1 | |
Net expenses(e) | | | 1.49 | %(f) | | | 1.55 | % | | | 1.55 | % | | | 2.20 | %(g)(h) |
Gross expenses | | | 1.88 | % | | | 2.04 | % | | | 2.08 | % | | | 2.24 | %(g) |
Net investment income (loss) | | | 0.52 | % | | | 0.41 | % | | | 0.14 | % | | | (0.73 | )%(g) |
Portfolio turnover rate | | | 20 | % | | | 10 | % | | | 37 | % | | | 0 | % |
| * | From commencement of operations on November 16, 2012 through December 31, 2012. |
| (a) | Per share net investment income (loss) has been calculated using the average shares outstanding during the period. |
| (b) | Had certain expenses not been waived/reimbursed during the period, total returns would have been lower. |
| (c) | A contingent deferred sales charge for Class C shares is not reflected in total return calculations. |
| (d) | Periods less than one year are not annualized. |
| (e) | The investment adviser agreed to waive its fees and/or reimburse a portion of the Fund’s expenses during the period. Without this waiver/reimbursement, expenses would have been higher. |
| (f) | Effective July 1, 2015, the expense limit decreased from 1.55% to 1.45%. |
| (g) | Computed on an annualized basis for periods less than one year. |
| (h) | Prior to December 31, 2012, there was no expense limitation agreement in place for the Fund. |
See accompanying notes to financial statements.
63 |
Financial Highlights (continued)
For a share outstanding throughout each period.
| | | | | | | | | | | | | | | | |
| |
| | | McDonnell Intermediate Municipal Bond Fund—Class Y | |
| | | Year Ended
December 31,
2015 | | | Year Ended
December 31,
2014 | | | Year Ended
December 31,
2013 | | | Period Ended
December 31,
2012* | |
Net asset value, beginning of the period | | $ | 10.00 | | | $ | 9.54 | | | $ | 9.88 | | | $ | 10.00 | |
| | | | | | | | | | | | | | | | |
INCOME (LOSS) FROM INVESTMENT OPERATIONS: | | | | | | | | | | | | | | | | |
Net investment income (loss)(a) | | | 0.15 | | | | 0.14 | | | | 0.11 | | | | (0.01 | ) |
Net realized and unrealized gain (loss) | | | 0.11 | | | | 0.46 | | | | (0.34 | ) | | | (0.11 | ) |
| | | | | | | | | | | | | | | | |
Total from Investment Operations | | | 0.26 | | | | 0.60 | | | | (0.23 | ) | | | (0.12 | ) |
| | | | | | | | | | | | | | | | |
LESS DISTRIBUTIONS FROM: | | | | | | | | | | | | | | | | |
Net investment income | | | (0.16 | ) | | | (0.14 | ) | | | (0.11 | ) | | | — | |
Net realized capital gains | | | — | | | | — | | | | — | | | | — | |
| | | | | | | | | | | | | | | | |
Total Distributions | | | (0.16 | ) | | | (0.14 | ) | | | (0.11 | ) | | | — | |
| | | | | | | | | | | | | | | | |
Net asset value, end of the period | | $ | 10.10 | | | $ | 10.00 | | | $ | 9.54 | | | $ | 9.88 | |
| | | | | | | | | | | | | | | | |
Total return(b) | | | 2.63 | % | | | 6.36 | % | | | (2.31 | )% | | | (1.20 | )%(c) |
RATIOS TO AVERAGE NET ASSETS: | | | | | | | | | | | | | | | | |
Net assets, end of the period (000’s) | | $ | 66,713 | | | $ | 28,314 | | | $ | 21,704 | | | $ | 14,827 | |
Net expenses(d) | | | 0.49 | %(e) | | | 0.55 | % | | | 0.55 | % | | | 2.33 | %(f)(g) |
Gross expenses | | | 0.85 | % | | | 1.02 | % | | | 1.04 | % | | | 2.37 | %(f) |
Net investment income (loss) | | | 1.48 | % | | | 1.46 | % | | | 1.13 | % | | | (0.84 | )%(f) |
Portfolio turnover rate | | | 20 | % | | | 10 | % | | | 37 | % | | | 0 | % |
| * | From commencement of operations on November 16, 2012 through December 31, 2012. |
| (a) | Per share net investment income (loss) has been calculated using the average shares outstanding during the period. |
| (b) | Had certain expenses not been waived/reimbursed during the period, total returns would have been lower. |
| (c) | Periods less than one year are not annualized. |
| (d) | The investment adviser agreed to waive its fees and/or reimburse a portion of the Fund’s expenses during the period. Without this waiver/reimbursement, expenses would have been higher. |
| (e) | Effective July 1, 2015, the expense limit decreased from 0.55% to 0.45%. |
| (f) | Computed on an annualized basis for periods less than one year. |
| (g) | Prior to December 31, 2012, there was no expense limitation agreement in place for the Fund. |
See accompanying notes to financial statements.
| 64
Financial Highlights (continued)
For a share outstanding throughout each period.
| | | | | | | | | | | | | | | | | | | | |
| |
| | | Natixis U.S. Equity Opportunities Fund—Class A | |
| | | Year Ended
December 31,
2015 | | | Year Ended
December 31,
2014 | | | Year Ended
December 31,
2013 | | | Year Ended
December 31,
2012 | | | Year Ended
December 31,
2011 | |
Net asset value, beginning of the period | | $ | 27.40 | | | $ | 33.07 | | | $ | 26.35 | | | $ | 23.56 | | | $ | 25.17 | |
| | | | | | | | | | | | | | | | | | | | |
INCOME (LOSS) FROM INVESTMENT OPERATIONS: | | | | | | | | | | | | | | | | | | | | |
Net investment income (loss)(a) | | | 0.06 | | | | 0.02 | | | | (0.04 | ) | | | 0.07 | | | | (0.04 | ) |
Net realized and unrealized gain (loss) | | | 1.55 | | | | 4.31 | | | | 9.34 | | | | 4.12 | | | | (0.69 | ) |
| | | | | | | | | | | | | | | | | | | | |
Total from Investment Operations | | | 1.61 | | | | 4.33 | | | | 9.30 | | | | 4.19 | | | | (0.73 | ) |
| | | | | | | | | | | | | | | | | | | | |
LESS DISTRIBUTIONS FROM: | | | | | | | | | | | | | | | | | | | | |
Net investment income | | | — | | | | — | | | | — | | | | (0.07 | ) | | | — | |
Net realized capital gains | | | (1.41 | ) | | | (10.00 | ) | | | (2.58 | ) | | | (1.33 | ) | | | (0.88 | ) |
| | | | | | | | | | | | | | | | | | | | |
Total Distributions | | | (1.41 | ) | | | (10.00 | ) | | | (2.58 | ) | | | (1.40 | ) | | | (0.88 | ) |
| | | | | | | | | | | | | | | | | | | | |
Net asset value, end of the period | | $ | 27.60 | | | $ | 27.40 | | | $ | 33.07 | | | $ | 26.35 | | | $ | 23.56 | |
| | | | | | | | | | | | | | | | | | | | |
Total return(b) | | | 5.86 | % | | | 12.94 | % | | | 35.75 | %(c) | | | 17.79 | %(c) | | | (2.79 | )%(c) |
RATIOS TO AVERAGE NET ASSETS: | | | | | | | | | | | | | | | | | | | | |
Net assets, end of the period (000’s) | | $ | 422,069 | | | $ | 400,678 | | | $ | 371,102 | | | $ | 289,898 | | | $ | 281,467 | |
Net expenses | | | 1.25 | %(d) | | | 1.29 | %(e) | | | 1.30 | %(f) | | | 1.30 | %(f) | | | 1.34 | %(f)(g) |
Gross expenses | | | 1.25 | % | | | 1.29 | %(e) | | | 1.32 | % | | | 1.35 | % | | | 1.38 | % |
Net investment income (loss) | | | 0.21 | % | | | 0.07 | % | | | (0.12 | )% | | | 0.25 | % | | | (0.15 | )% |
Portfolio turnover rate | | | 20 | % | | | 93 | %(h) | | | 50 | % | | | 52 | % | | | 97 | % |
| (a) | Per share net investment income (loss) has been calculated using the average shares outstanding during the period. |
| (b) | A sales charge for Class A shares is not reflected in total return calculations. |
| (c) | Had certain expenses not been waived/reimbursed during the period, total returns would have been lower. |
| (d) | Effective July 1, 2015, the expense limit decreased from 1.30% to 1.25%. |
| (e) | Includes fee/expense recovery of 0.02%. |
| (f) | The investment adviser agreed to waive its fees and/or reimburse a portion of the Fund’s expenses during the period. Without this waiver/reimbursement, expenses would have been higher. |
| (g) | Effective June 1, 2011, the expense limit decreased to 1.30%. |
| (h) | The variation in the Fund’s turnover rate from 2013 to 2014 was primarily due to the change in the structure of the Fund from four segments to two segments. |
See accompanying notes to financial statements.
65 |
Financial Highlights (continued)
For a share outstanding throughout each period.
| | | | | | | | | | | | | | | | | | | | |
| |
| | | Natixis U.S. Equity Opportunities Fund—Class B | |
| | | Year Ended
December 31,
2015 | | | Year Ended
December 31,
2014 | | | Year Ended
December 31,
2013 | | | Year Ended
December 31,
2012 | | | Year Ended
December 31,
2011 | |
Net asset value, beginning of the period | | $ | 20.23 | | | $ | 26.91 | | | $ | 21.98 | | | $ | 19.93 | | | $ | 21.60 | |
| | | | | | | | | | | | | | | | | | | | |
INCOME (LOSS) FROM INVESTMENT OPERATIONS: | | | | | | | | | | | | | | | | | | | | |
Net investment loss(a) | | | (0.11 | ) | | | (0.19 | ) | | | (0.22 | ) | | | (0.12 | ) | | | (0.21 | ) |
Net realized and unrealized gain (loss) | | | 1.14 | | | | 3.51 | | | | 7.73 | | | | 3.50 | | | | (0.58 | ) |
| | | | | | | | | | | | | | | | | | | | |
Total from Investment Operations | | | 1.03 | | | | 3.32 | | | | 7.51 | | | | 3.38 | | | | (0.79 | ) |
| | | | | | | | | | | | | | | | | | | | |
LESS DISTRIBUTIONS FROM: | | | | | | | | | | | | | | | | | | | | |
Net investment income | | | — | | | | — | | | | — | | | | — | | | | — | |
Net realized capital gains | | | (1.41 | ) | | | (10.00 | ) | | | (2.58 | ) | | | (1.33 | ) | | | (0.88 | ) |
| | | | | | | | | | | | | | | | | | | | |
Total Distributions | | | (1.41 | ) | | | (10.00 | ) | | | (2.58 | ) | | | (1.33 | ) | | | (0.88 | ) |
| | | | | | | | | | | | | | | | | | | | |
Net asset value, end of the period | | $ | 19.85 | | | $ | 20.23 | | | $ | 26.91 | | | $ | 21.98 | | | $ | 19.93 | |
| | | | | | | | | | | | | | | | | | | | |
Total return(b) | | | 5.06 | % | | | 12.14 | % | | | 34.70 | %(c) | | | 16.97 | %(c) | | | (3.53 | )%(c) |
RATIOS TO AVERAGE NET ASSETS: | | | | | | | | | | | | | | | | | | | | |
Net assets, end of the period (000’s) | | $ | 168 | | | $ | 3,324 | | | $ | 7,708 | | | $ | 11,172 | | | $ | 16,820 | |
Net expenses | | | 1.99 | %(d) | | | 2.04 | %(e) | | | 2.05 | %(f) | | | 2.05 | %(f) | | | 2.10 | %(f)(g) |
Gross expenses | | | 1.99 | % | | | 2.04 | %(e) | | | 2.07 | % | | | 2.10 | % | | | 2.13 | % |
Net investment loss | | | (0.52 | )% | | | (0.70 | )% | | | (0.89 | )% | | | (0.55 | )% | | | (0.94 | )% |
Portfolio turnover rate | | | 20 | % | | | 93 | %(h) | | | 50 | % | | | 52 | % | | | 97 | % |
| (a) | Per share net investment loss has been calculated using the average shares outstanding during the period. |
| (b) | A contingent deferred sales charge for Class B shares is not reflected in total return calculations. |
| (c) | Had certain expenses not been waived/reimbursed during the period, total returns would have been lower. |
| (d) | Effective July 1, 2015, the expense limit decreased from 2.05% to 2.00%. |
| (e) | Includes fee/expense recovery of 0.02%. |
| (f) | The investment adviser agreed to waive its fees and/or reimburse a portion of the Fund’s expenses during the period. Without this waiver/reimbursement, expenses would have been higher. |
| (g) | Effective June 1, 2011, the expense limit decreased to 2.05%. |
| (h) | The variation in the Fund’s turnover rate from 2013 to 2014 was primarily due to the change in the structure of the Fund from four segments to two segments. |
See accompanying notes to financial statements.
| 66
Financial Highlights (continued)
For a share outstanding throughout each period.
| | | | | | | | | | | | | | | | | | | | |
| |
| | | Natixis U.S. Equity Opportunities Fund—Class C | |
| | | Year Ended
December 31,
2015 | | | Year Ended
December 31,
2014 | | | Year Ended
December 31,
2013 | | | Year Ended
December 31,
2012 | | | Year Ended
December 31,
2011 | |
Net asset value, beginning of the period | | $ | 20.24 | | | $ | 26.92 | | | $ | 21.99 | | | $ | 19.94 | | | $ | 21.61 | |
| | | | | | | | | | | | | | | | | | | | |
INCOME (LOSS) FROM INVESTMENT OPERATIONS: | | | | | | | | | | | | | | | | | | | | |
Net investment loss(a) | | | (0.11 | ) | | | (0.19 | ) | | | (0.22 | ) | | | (0.11 | ) | | | (0.20 | ) |
Net realized and unrealized gain (loss) | | | 1.14 | | | | 3.51 | | | | 7.73 | | | | 3.49 | | | | (0.59 | ) |
| | | | | | | | | | | | | | | | | | | | |
Total from Investment Operations | | | 1.03 | | | | 3.32 | | | | 7.51 | | | | 3.38 | | | | (0.79 | ) |
| | | | | | | | | | | | | | | | | | | | |
LESS DISTRIBUTIONS FROM: | | | | | | | | | | | | | | | | | | | | |
Net investment income | | | — | | | | — | | | | — | | | | — | | | | — | |
Net realized capital gains | | | (1.41 | ) | | | (10.00 | ) | | | (2.58 | ) | | | (1.33 | ) | | | (0.88 | ) |
| | | | | | | | | | | | | | | | | | | | |
Total Distributions | | | (1.41 | ) | | | (10.00 | ) | | | (2.58 | ) | | | (1.33 | ) | | | (0.88 | ) |
| | | | | | | | | | | | | | | | | | | | |
Net asset value, end of the period | | $ | 19.86 | | | $ | 20.24 | | | $ | 26.92 | | | $ | 21.99 | | | $ | 19.94 | |
| | | | | | | | | | | | | | | | | | | | |
Total return(b) | | | 5.06 | % | | | 12.12 | % | | | 34.69 | %(c) | | | 16.96 | %(c) | | | (3.53 | )%(c) |
RATIOS TO AVERAGE NET ASSETS: | | | | | | | | | | | | | | | | | | | | |
Net assets, end of the period (000’s) | | $ | 61,864 | | | $ | 53,925 | | | $ | 44,150 | | | $ | 30,525 | | | $ | 28,462 | |
Net expenses | | | 2.00 | %(d) | | | 2.04 | %(e) | | | 2.05 | %(f) | | | 2.05 | %(f) | | | 2.09 | %(f)(g) |
Gross expenses | | | 2.00 | % | | | 2.04 | %(e) | | | 2.07 | % | | | 2.10 | % | | | 2.13 | % |
Net investment loss | | | (0.54 | )% | | | (0.68 | )% | | | (0.86 | )% | | | (0.49 | )% | | | (0.90 | )% |
Portfolio turnover rate | | | 20 | % | | | 93 | %(h) | | | 50 | % | | | 52 | % | | | 97 | % |
| (a) | Per share net investment loss has been calculated using the average shares outstanding during the period. |
| (b) | A contingent deferred sales charge for Class C shares is not reflected in total return calculations. |
| (c) | Had certain expenses not been waived/reimbursed during the period, total returns would have been lower. |
| (d) | Effective July 1, 2015, the expense limit decreased from 2.05% to 2.00%. |
| (e) | Includes fee/expense recovery of 0.01%. |
| (f) | The investment adviser agreed to waive its fees and/or reimburse a portion of the Fund’s expenses during the period. Without this waiver/reimbursement, expenses would have been higher. |
| (g) | Effective June 1, 2011, the expense limit decreased to 2.05%. |
| (h) | The variation in the Fund’s turnover rate from 2013 to 2014 was primarily due to the change in the structure of the Fund from four segments to two segments. |
See accompanying notes to financial statements.
67 |
Financial Highlights (continued)
For a share outstanding throughout each period.
| | | | | | | | | | | | | | | | | | | | |
| |
| | | Natixis U.S. Equity Opportunities Fund—Class Y | |
| | | Year Ended
December 31,
2015 | | | Year Ended
December 31,
2014 | | | Year Ended
December 31,
2013 | | | Year Ended
December 31,
2012 | | | Year Ended
December 31,
2011 | |
Net asset value, beginning of the period | | $ | 31.18 | | | $ | 36.32 | | | $ | 28.68 | | | $ | 25.52 | | | $ | 27.12 | |
| | | | | | | | | | | | | | | | | | | | |
INCOME (LOSS) FROM INVESTMENT OPERATIONS: | | | | | | | | | | | | | | | | | | | | |
Net investment income(a) | | | 0.15 | | | | 0.12 | | | | 0.05 | | | | 0.17 | | | | 0.04 | |
Net realized and unrealized gain (loss) | | | 1.76 | | | | 4.74 | | | | 10.17 | | | | 4.46 | | | | (0.76 | ) |
| | | | | | | | | | | | | | | | | | | | |
Total from Investment Operations | | | 1.91 | | | | 4.86 | | | | 10.22 | | | | 4.63 | | | | (0.72 | ) |
| | | | | | | | | | | | | | | | | | | | |
LESS DISTRIBUTIONS FROM: | | | | | | | | | | | | | | | | | | | | |
Net investment income | | | (0.07 | ) | | | — | | | | — | | | | (0.14 | ) | | | — | |
Net realized capital gains | | | (1.41 | ) | | | (10.00 | ) | | | (2.58 | ) | | | (1.33 | ) | | | (0.88 | ) |
| | | | | | | | | | | | | | | | | | | | |
Total Distributions | | | (1.48 | ) | | | (10.00 | ) | | | (2.58 | ) | | | (1.47 | ) | | | (0.88 | ) |
| | | | | | | | | | | | | | | | | | | | |
Net asset value, end of the period | | $ | 31.61 | | | $ | 31.18 | | | $ | 36.32 | | | $ | 28.68 | | | $ | 25.52 | |
| | | | | | | | | | | | | | | | | | | | |
Total return | | | 6.11 | % | | | 13.25 | % | | | 36.06 | %(b) | | | 18.15 | %(b) | | | (2.56 | )%(b) |
RATIOS TO AVERAGE NET ASSETS: | | | | | | | | | | | | | | | | | | | | |
Net assets, end of the period (000’s) | | $ | 70,643 | | | $ | 37,636 | | | $ | 24,661 | | | $ | 11,035 | | | $ | 2,047 | |
Net expenses | | | 1.00 | %(c) | | | 1.05 | %(d) | | | 1.05 | %(e) | | | 1.05 | %(e) | | | 1.09 | %(e)(f) |
Gross expenses | | | 1.00 | % | | | 1.05 | %(d) | | | 1.07 | % | | | 1.10 | % | | | 1.14 | % |
Net investment income | | | 0.46 | % | | | 0.32 | % | | | 0.13 | % | | | 0.61 | % | | | 0.16 | % |
Portfolio turnover rate | | | 20 | % | | | 93 | %(g) | | | 50 | % | | | 52 | % | | | 97 | % |
| (a) | Per share net investment income has been calculated using the average shares outstanding during the period. |
| (b) | Had certain expenses not been waived/reimbursed during the period, total returns would have been lower. |
| (c) | Effective July 1, 2015, the expense limit decreased from 1.05% to 1.00%. |
| (d) | Includes fee/expense recovery of 0.01%. |
| (e) | The investment adviser agreed to waive its fees and/or reimburse a portion of the Fund’s expenses during the period. Without this waiver/reimbursement, expenses would have been higher. |
| (f) | Effective June 1, 2011, the expense limit decreased to 1.05%. |
| (g) | The variation in the Fund’s turnover rate from 2013 to 2014 was primarily due to the change in the structure of the Fund from four segments to two segments. |
See accompanying notes to financial statements.
| 68
Financial Highlights (continued)
For a share outstanding throughout each period.
| | | | | | | | |
| | | SeeyondSM Multi-Asset
Allocation Fund—Class A | |
| | | Year Ended
December 31,
2015 | | | Period Ended
December 31,
2014* | |
Net asset value, beginning of the period | | $ | 9.68 | | | $ | 10.00 | |
| | | | | | | | |
INCOME (LOSS) FROM INVESTMENT OPERATIONS: | | | | | | | | |
Net investment loss(a) | | | (0.09 | ) | | | (0.05 | ) |
Net realized and unrealized gain (loss) | | | (0.42 | ) | | | (0.27 | ) |
| | | | | | | | |
Total from Investment Operations | | | (0.51 | ) | | | (0.32 | ) |
| | | | | | | | |
LESS DISTRIBUTIONS FROM: | | | | | | | | |
Net investment income | | | — | | | | — | |
Net realized capital gains | | | (0.13 | ) | | | — | |
| | | | | | | | |
Total Distributions | | | (0.13 | ) | | | — | |
| | | | | | | | |
Net asset value, end of the period | | $ | 9.04 | | | $ | 9.68 | |
| | | | | | | | |
Total return(b)(c) | | | (5.39 | )% | | | (3.20 | )%(d) |
RATIOS TO AVERAGE NET ASSETS: | | | | | | | | |
Net assets, end of the period (000’s) | | $ | 246 | | | $ | 1 | |
Net expenses(e) | | | 1.35 | %(f) | | | 1.31 | %(g)(h) |
Gross expenses | | | 1.60 | %(f) | | | 1.47 | %(g)(h) |
Net investment loss | | | (0.90 | )% | | | (1.05 | )%(h) |
Portfolio turnover rate | | | 36 | % | | | 40 | % |
| * | From commencement of operations on July 23, 2014 through December 31, 2014. |
| (a) | Per share net investment loss has been calculated using the average shares outstanding during the period. |
| (b) | A sales charge for Class A shares is not reflected in total return calculations. |
| (c) | Had certain expenses not been waived/reimbursed during the period, total returns would have been lower. |
| (d) | Periods less than one year are not annualized. |
| (e) | The investment adviser agreed to waive its fees and/or reimburse a portion of the Fund’s expenses during the period. Without this waiver/reimbursement, expenses would have been higher. |
| (f) | Includes interest expense of 0.05%. Without this expense the ratio of net expenses would have been 1.30% and the ratio of gross expenses would have been 1.55%. |
| (g) | Includes interest expense of 0.01%. Without this expense the ratio of net expenses would have been 1.30% and the ratio of gross expenses would have been 1.46%. |
| (h) | Computed on an annualized basis for periods less than one year. |
See accompanying notes to financial statements.
69 |
Financial Highlights (continued)
For a share outstanding throughout each period.
| | | | | | | | |
| | | SeeyondSM Multi-Asset
Allocation Fund—Class C | |
| | | Year Ended
December 31,
2015 | | | Period Ended
December 31,
2014* | |
Net asset value, beginning of the period | | $ | 9.65 | | | $ | 10.00 | |
| | | | | | | | |
INCOME (LOSS) FROM INVESTMENT OPERATIONS: | | | | | | | | |
Net investment loss(a) | | | (0.16 | ) | | | (0.07 | ) |
Net realized and unrealized gain (loss) | | | (0.42 | ) | | | (0.28 | ) |
| | | | | | | | |
Total from Investment Operations | | | (0.58 | ) | | | (0.35 | ) |
| | | | | | | | |
LESS DISTRIBUTIONS FROM: | | | | | | | | |
Net investment income | | | — | | | | — | |
Net realized capital gains | | | (0.13 | ) | | | — | |
| | | | | | | | |
Total Distributions | | | (0.13 | ) | | | — | |
| | | | | | | | |
Net asset value, end of the period | | $ | 8.94 | | | $ | 9.65 | |
| | | | | | | | |
Total return(b)(c) | | | (6.14 | )% | | | (3.50 | )%(d) |
RATIOS TO AVERAGE NET ASSETS: | | | | | | | | |
Net assets, end of the period (000’s) | | $ | 201 | | | $ | 27 | |
Net expenses(e) | | | 2.10 | %(f) | | | 2.06 | %(g)(h) |
Gross expenses | | | 2.33 | %(f) | | | 2.38 | %(g)(h) |
Net investment loss | | | (1.67 | )% | | | (1.64 | )%(h) |
Portfolio turnover rate | | | 36 | % | | | 40 | % |
| * | From commencement of operations on July 23, 2014 through December 31, 2014. |
| (a) | Per share net investment loss has been calculated using the average shares outstanding during the period. |
| (b) | Had certain expenses not been waived/reimbursed during the period, total returns would have been lower. |
| (c) | A contingent deferred sales charge for Class C shares is not reflected in total return calculations. |
| (d) | Periods less than one year are not annualized. |
| (e) | The investment adviser agreed to waive its fees and/or reimburse a portion of the Fund’s expenses during the period. Without this waiver/reimbursement, expenses would have been higher. |
| (f) | Includes interest expense of 0.05%. Without this expense the ratio of net expenses would have been 2.05% and the ratio of gross expenses would have been 2.28%. |
| (g) | Includes interest expense of 0.01%. Without this expense the ratio of net expenses would have been 2.05% and the ratio of gross expenses would have been 2.37%. |
| (h) | Computed on an annualized basis for periods less than one year. |
See accompanying notes to financial statements.
| 70
Financial Highlights (continued)
For a share outstanding throughout each period.
| | | | | | | | |
| | | SeeyondSM Multi-Asset
Allocation Fund—Class Y | |
| | | Year Ended
December 31,
2015 | | | Period Ended
December 31,
2014* | |
Net asset value, beginning of the period | | $ | 9.69 | | | $ | 10.00 | |
| | | | | | | | |
INCOME (LOSS) FROM INVESTMENT OPERATIONS: | | | | | | | | |
Net investment loss(a) | | | (0.07 | ) | | | (0.03 | ) |
Net realized and unrealized gain (loss) | | | (0.42 | ) | | | (0.28 | ) |
| | | | | | | | |
Total from Investment Operations | | | (0.49 | ) | | | (0.31 | ) |
| | | | | | | | |
LESS DISTRIBUTIONS FROM: | | | | | | | | |
Net investment income | | | — | | | | — | |
Net realized capital gains | | | (0.13 | ) | | | — | |
| | | | | | | | |
Total Distributions | | | (0.13 | ) | | | — | |
| | | | | | | | |
Net asset value, end of the period | | $ | 9.07 | | | $ | 9.69 | |
| | | | | | | | |
Total return(b) | | | (5.17 | )% | | | (3.10 | )%(c) |
RATIOS TO AVERAGE NET ASSETS: | | | | | | | | |
Net assets, end of the period (000’s) | | $ | 47,134 | | | $ | 48,756 | |
Net expenses(d) | | | 1.09 | %(e) | | | 1.05 | %(f)(g) |
Gross expenses | | | 1.29 | %(e) | | | 1.35 | %(f)(g) |
Net investment loss | | | (0.75 | )% | | | (0.79 | )%(g) |
Portfolio turnover rate | | | 36 | % | | | 40 | % |
| * | From commencement of operations on July 23, 2014 through December 31, 2014. |
| (a) | Per share net investment loss has been calculated using the average shares outstanding during the period. |
| (b) | Had certain expenses not been waived/reimbursed during the period, total returns would have been lower. |
| (c) | Periods less than one year are not annualized. |
| (d) | The investment adviser agreed to waive its fees and/or reimburse a portion of the Fund’s expenses during the period. Without this waiver/reimbursement, expenses would have been higher. |
| (e) | Includes interest expense of 0.04%. Without this expense the ratio of net expenses would have been 1.05% and the ratio of gross expenses would have been 1.25%. |
| (f) | Includes interest expense of less than 0.01%. |
| (g) | Computed on an annualized basis for periods less than one year. |
See accompanying notes to financial statements.
71 |
Notes to Financial Statements
December 31, 2015
1. Organization. Natixis Funds Trust I and Natixis Funds Trust II (the “Trusts” and each a “Trust”) are each organized as a Massachusetts business trust. Each Trust is registered under the Investment Company Act of 1940, as amended (the “1940 Act”), as an open-end management investment company. Each Declaration of Trust permits the Board of Trustees to authorize the issuance of an unlimited number of shares of the Trust in multiple series. The financial statements for certain funds of the Trusts are presented in separate reports. The following funds (individually, a “Fund” and collectively, the “Funds”) are included in this report:
Natixis Funds Trust I:
Loomis Sayles Multi-Asset Income Fund (formerly Natixis Diversified Income Fund) (the “Multi-Asset Income Fund”)
Natixis U.S. Equity Opportunities Fund (the “U.S. Equity Opportunities Fund”)
Natixis Funds Trust II:
McDonnell Intermediate Municipal Bond Fund (the “Intermediate Municipal Bond Fund”)
SeeyondSM Multi-Asset Allocation Fund (the “Multi-Asset Allocation Fund”)
Each Fund is a diversified investment company, except for Multi-Asset Allocation Fund, which is a non-diversified investment company.
Each Fund offers Class A, Class C and Class Y shares. Effective August 31, 2015, Multi-Asset Income Fund began offering Class N shares. Effective October 12, 2007, Class B shares of U.S. Equity Opportunities Fund are no longer offered. Existing Class B shareholders may continue to reinvest dividends into Class B shares and exchange their Class B shares for Class B shares of other Natixis Funds subject to existing exchange privileges as described in the prospectus.
Class A shares are sold with a maximum front-end sales charge of 3.00% and 4.25% for Intermediate Municipal Bond Fund and Multi-Asset Income Fund, respectively, (3.50% and 4.50%, respectively prior to November 2, 2015), and 5.75% for U.S. Equity Opportunities Fund and Multi-Asset Allocation Fund. Class B shares do not pay a front-end sales charge; however, they are charged higher Rule 12b-1 fees, and are subject to a contingent deferred sales charge (“CDSC”) if such shares are redeemed within six years of purchase. After eight years of ownership, Class B shares convert to Class A shares. Class C shares do not pay a front-end sales charge, do not convert to any other class of shares, pay higher ongoing Rule 12b-1 fees than Class A shares and may be subject to a CDSC of 1.00% if those shares are redeemed within one year of acquisition, except for reinvested distributions. Class N and Class Y shares do not pay a front-end sales charge, a CDSC or Rule 12b-1 fees. Class N shares are offered exclusively through intermediaries and are intended for employer-sponsored retirement plans and, effective November 2, 2015, investors with an initial minimum investment of $1,000,000. Class Y shares are intended for institutional investors with a minimum initial investment of
| 72
Notes to Financial Statements (continued)
December 31, 2015
$100,000, though some categories of investors are exempted from the minimum investment amount as outlined in the Funds’ prospectus.
Most expenses can be directly attributed to a Fund. Expenses which cannot be directly attributed to a Fund are generally apportioned based on the relative net assets of each of the funds in Natixis Funds Trust I, Natixis Funds Trust II, Natixis Funds Trust IV, Gateway Trust (“Natixis Funds Trusts”), Loomis Sayles Funds I and Loomis Sayles Funds II (“Loomis Sayles Funds Trusts”). Expenses of a Fund are borne pro rata by the holders of each class of shares, except that each class bears expenses unique to that class (including the Rule 12b-1 service and distribution fees and, for Multi-Asset Income Fund, transfer agent fees). In addition, each class votes as a class only with respect to its own Rule 12b-1 Plan. Shares of each class would receive their pro rata share of the net assets of a Fund if the Fund were liquidated. The Trustees approve separate distributions from net investment income on each class of shares.
2. Significant Accounting Policies. The following is a summary of significant accounting policies consistently followed by each Fund in the preparation of its financial statements. The Funds’ financial statements follow the accounting and reporting guidelines provided for investment companies and are prepared in accordance with accounting principles generally accepted in the United States of America which require the use of management estimates that affect the reported amounts and disclosures in the financial statements. Actual results could differ from those estimates. Management has evaluated the events and transactions subsequent to year-end through the date the financial statements were issued and has determined that there were no material events that would require disclosure in the Funds’ financial statements, except as disclosed in Note 13.
a. Valuation. Fund securities and other investments are valued at market value based on market quotations obtained or determined by independent pricing services recommended by the adviser and subadvisers and approved by the Board of Trustees. Fund securities and other investments for which market quotations are not readily available are valued at fair value as determined in good faith by the adviser or subadviser pursuant to procedures approved by the Board of Trustees, as described below. Market value is determined as follows:
Listed equity securities (including shares of closed-end investment companies and exchange-traded funds) are valued at the last sale price quoted on the exchange where they are traded most extensively or, if there is no reported sale during the day, the closing bid quotation. Securities traded on the NASDAQ Global Select Market, NASDAQ Global Market and NASDAQ Capital Market are valued at the NASDAQ Official Closing Price (“NOCP”), or if lacking an NOCP, at the most recent bid quotations on the applicable NASDAQ Market. Unlisted equity securities (except unlisted preferred equity securities) are valued at the last sale price quoted in the market where they are traded most extensively or, if there is no reported sale during the day, the closing bid quotation
73 |
Notes to Financial Statements (continued)
December 31, 2015
as reported by an independent pricing service. If there is no last sale price or closing bid quotation available, unlisted equity securities will be valued using evaluated bids furnished by an independent pricing service, if available. In some foreign markets, an official close price and a last sale price may be available from the foreign exchange or market. In those cases, the official close price is used. Debt securities and unlisted preferred equity securities are valued based on evaluated bids furnished to the Fund by an independent pricing service or bid prices obtained from broker-dealers. Senior loans are valued at bid prices supplied by an independent pricing service, if available. Broker-dealer bid prices may be used to value debt and unlisted equity securities and senior loans where an independent pricing service is unable to price a security or where an independent pricing service does not provide a reliable price for the security. Forward foreign currency contracts are valued utilizing interpolated rates determined based on information provided by an independent pricing service. Futures contracts are valued at the most recent settlement price on the exchange on which the adviser or subadviser believes that, over time, they are traded most extensively. Domestic exchange-traded single name equity option contracts are valued at the mean of the National Best Bid and Offer quotations. Options on futures contracts are valued using the current settlement price on the exchange on which, over time, they are traded most extensively. Bilateral interest rate swaps are valued based on prices supplied by an independent pricing service, if available, or prices obtained from broker-dealers. Centrally cleared interest rate swaps are valued at settlement prices of the clearinghouse on which the contracts were traded, if available, or prices obtained from broker-dealers. Interest rate swaptions are valued at mid prices (between the bid and the ask price) supplied by an independent pricing service, if available, or prices obtained from broker-dealers.
Fund securities and other investments for which market quotations are not readily available are valued at fair value as determined in good faith by the adviser or subadviser pursuant to procedures approved by the Board of Trustees. The Funds may also value securities and other investments at fair value in other circumstances such as when extraordinary events occur after the close of a foreign market but prior to the close of the New York Stock Exchange (“NYSE”). This may include situations relating to a single issuer (such as a declaration of bankruptcy or a delisting of the issuer’s security from the primary market on which it has traded) as well as events affecting the securities markets in general (such as market disruptions or closings and significant fluctuations in U.S. and/or foreign markets). When fair valuing its securities or other investments, the Funds may, among other things, use modeling tools or other processes that may take into account factors such as securities or other market activity and/or significant events that occur after the close of the foreign market and before the time the Fund’s net asset value (“NAV”) is calculated. Fair value pricing may require subjective determinations about the value of a security, and fair values used to determine a Fund’s NAV may differ from quoted or published prices, or from prices that are used by others, for the same securities. In addition, the use of fair value pricing may not always result in adjustments to the prices of securities held by a Fund.
| 74
Notes to Financial Statements (continued)
December 31, 2015
As of December 31, 2015, securities and other investments of the funds included in net assets (reflected at absolute value) were fair valued as follows:
| | | | | | | | | | | | | | | | |
Fund | | Options
contracts1 | | | Percentage
of Net
Assets | | | Futures
contracts1 | | | Percentage of Net Assets | |
Multi-Asset Allocation Fund | | $ | 1,738,381 | | | | 3.65 | % | | $ | 143,042 | | | | 0.30 | % |
| 1 | Certain options and futures contracts were fair valued pursuant to procedures approved by the Board of Trustees as events occurring after the close of the foreign market were believed to materially affect the value of those contracts. |
b. Investment Transactions and Related Investment Income. Investment transactions are accounted for on a trade date plus one day basis for daily NAV calculation. However, for financial reporting purposes, investment transactions are reported on trade date. Dividend income is recorded on ex-dividend date, or in the case of certain foreign securities, as soon as a Fund is notified, and interest income is recorded on an accrual basis. Interest income is increased by the accretion of discount and decreased by the amortization of premium. Periodic principal adjustments for inflation-protected securities are recorded to interest income. Negative principal adjustments (in the event of deflation) are recorded as reductions of interest income to the extent of interest income earned, not to exceed the amount of positive principal adjustments on a cumulative basis. Distributions received from investments in securities that represent a return of capital or capital gain are recorded as a reduction of cost of the investments or as a realized gain, respectively. The calendar year-end amounts of ordinary income, capital gains, and return of capital included in distributions received from the Funds’ investments in real estate investment trusts (“REITs”) are reported to the Funds after the end of the fiscal year; accordingly, the Funds estimate these amounts for accounting purposes until the characterization of REIT distributions is reported to the Funds after the end of the fiscal year. Estimates are based on the most recent REIT distribution information available. In determining net gain or loss on securities sold, the cost of securities has been determined on an identified cost basis. Investment income, non-class specific expenses and realized and unrealized gains and losses are allocated on a pro rata basis to each class based on the relative net assets of each class to the total net assets of the Fund.
c. Foreign Currency Translation. The books and records of the Funds are maintained in U.S. dollars. The values of securities, currencies and other assets and liabilities denominated in currencies other than U.S. dollars are translated into U.S. dollars based upon foreign exchange rates prevailing at the end of the period. Purchases and sales of investment securities, income and expenses are translated into U.S. dollars on the respective dates of such transactions.
Net realized foreign exchange gains or losses arise from sales of foreign currency, changes in exchange rates between the trade and settlement dates on securities
75 |
Notes to Financial Statements (continued)
December 31, 2015
transactions and the difference between the amounts of interest and foreign withholding taxes recorded on the Fund’s books and the U.S. dollar equivalent of the amounts actually received or paid. Net unrealized foreign exchange gains or losses arise from changes in the value of assets and liabilities, other than investment securities, as of the end of the fiscal period, resulting from changes in exchange rates. Net realized foreign exchange gains or losses and the net change in unrealized foreign exchange gains or losses are disclosed in the Statements of Operations. For federal income tax purposes, net realized foreign exchange gains or losses are characterized as ordinary income, and may, if the Funds have net losses, reduce the amount of income available to be distributed by the Funds.
The values of investment securities are presented at the foreign exchange rates prevailing at the end of the period for financial reporting purposes. Net realized and unrealized gains or losses on investments reported in the Statements of Operations reflect gains or losses resulting from changes in exchange rates and fluctuations which arise due to changes in market prices of investment securities. For federal income tax purposes, a portion of the net realized gain or loss on investments arising from changes in exchange rates, which is reflected in the Statements of Operations, may be characterized as ordinary income and may, if the Funds have net losses, reduce the amount of income available to be distributed by the Funds.
During the year ended December 31, 2015, the amount of income available to be distributed by Multi-Asset Income Fund was reduced by $149,447 as a result of losses arising from changes in exchange rates.
The Funds may use foreign currency exchange contracts to facilitate transactions in foreign-denominated investments. Losses may arise from changes in the value of the foreign currency or if the counterparties do not perform under the contracts’ terms.
d. Forward Foreign Currency Contracts. Certain Funds may enter into forward foreign currency contracts, including forward foreign cross currency contracts, to acquire exposure to foreign currencies or to hedge the Fund’s investments against currency fluctuation. A contract can also be used to offset a previous contract. These contracts involve market risk in excess of the unrealized gain or loss reflected in the Funds’ Statements of Assets and Liabilities. The U.S. dollar value of the currencies a Fund has committed to buy or sell represents the aggregate exposure to each currency a Fund has acquired or hedged through currency contracts outstanding at period end. Gains or losses are recorded for financial statement purposes as unrealized until settlement date. Contracts are traded over-the-counter directly with a counterparty. Risks may arise upon entering into these contracts from the potential inability of counterparties to meet the terms of their contracts and from unanticipated movements in the value of a foreign currency relative to the U.S. dollar. Certain contracts may require the movement of cash and/or securities as collateral for the Fund’s or counterparty’s net obligations under the contracts.
| 76
Notes to Financial Statements (continued)
December 31, 2015
e. Futures Contracts. The Funds may enter into futures contracts. Futures contracts are agreements between two parties to buy and sell a particular instrument or index for a specified price on a specified future date.
When a Fund enters into a futures contract, it is required to deposit with (or for the benefit of) its broker an amount of cash or short-term high-quality securities as “initial margin.” As the value of the contract changes, the value of the futures contract position increases or declines. Subsequent payments, known as “variation margin,” are made or received by a Fund, depending on the price fluctuations in the fair value of the contract and the value of cash or securities on deposit with the broker. The aggregate principal amounts of the contracts are not recorded in the financial statements. Fluctuations in the value of the contracts are recorded in the Statements of Assets and Liabilities as an asset (liability) and in the Statements of Operations as unrealized appreciation (depreciation) until the contracts are closed, when they are recorded as realized gains (losses). Realized gain or loss on a futures position is equal to the difference between the value of the contract at the time it was opened and the value at the time it was closed, minus brokerage commissions. When a Fund enters into a futures contract certain risks may arise, such as illiquidity in the futures market, which may limit a Fund’s ability to close out a futures contract prior to settlement date, and unanticipated movements in the value of securities or interest rates.
Futures contracts are exchange-traded. Exchange-traded futures contracts are standardized and are settled through a clearing house with fulfillment supported by the credit of the exchange. Therefore, counterparty credit risks to the Funds are reduced; however, in the event that a counterparty enters into bankruptcy, a Fund’s claim against initial/variation margin on deposit with the counterparty may be subject to terms of a final settlement in bankruptcy court.
f. Option Contracts. The Funds may enter into option contracts. When a Fund purchases an option, it pays a premium and the option is subsequently marked-to-market to reflect current value. Premiums paid for purchasing options which expire are treated as realized losses. Premiums paid for purchasing options which are exercised are added to the cost or deducted from the proceeds on the underlying instrument to determine the realized gain or loss. If the Fund enters into a closing sale transaction, the difference between the premium paid and the proceeds of the closing sale transaction is treated as a realized gain or loss. The risk associated with purchasing options is limited to the premium paid.
When a Fund writes an option, an amount equal to the net premium received (the premium less commission) is recorded as a liability and is subsequently adjusted to the current value. Net premiums received for written options which expire are treated as realized gains. Net premiums received for written options which are exercised are deducted from the cost or added to the proceeds on the underlying instrument to determine the realized gain or loss. If the Fund enters into a closing purchase
77 |
Notes to Financial Statements (continued)
December 31, 2015
transaction, the difference between the net premium received and any amount paid on effecting a closing purchase transaction, including commissions, is treated as a realized gain or, if the net premium received is less than the amount paid, as a realized loss. The Fund, as writer of a written option, bears the risk of an unfavorable change in the market value of the equity underlying the written option.
Exchange-traded options contracts are standardized and are settled through a clearing house with fulfillment supported by the credit of the exchange. Therefore, counterparty credit risks to the Funds are reduced. Over-the-counter (“OTC”) options are subject to the risk that the counterparty is unable or unwilling to meet its obligations under the option.
For the year ended December 31, 2015, the Funds were not party to any OTC options.
g. Swaptions. Certain Funds may enter into interest rate swaptions. An interest rate swaption gives the holder the right, but not the obligation, to enter into or cancel an interest rate swap agreement at a future date. Interest rate swaptions may be either purchased or written. The buyer of an interest rate swaption may purchase either the right to receive a fixed rate in the underlying swap (known as a “receiver swaption”) or to pay a fixed rate (known as a “payer swaption”), based on the notional amount of the swap agreement, in exchange for a floating rate. The notional amounts of swaptions are not recorded in the financial statements.
When a Fund purchases an interest rate swaption, it pays a premium and the swaption is subsequently marked-to-market to reflect current value. Premiums paid for purchasing interest rate swaptions which expire are treated as realized losses. Premiums paid for purchasing interest rate swaptions which are exercised are added to the cost or deducted from the proceeds on the underlying swap to determine the realized gain or loss. If a Fund enters into a closing sale transaction, the difference between the premium paid and the proceeds of the closing sale transaction is treated as a realized gain or loss. The risk associated with purchasing interest rate swaptions is limited to the premium paid.
When a Fund writes an interest rate swaption, an amount equal to the premium received is recorded as a liability and is subsequently adjusted to the current value. Premiums received for written interest rate swaptions which expire are treated as realized gains. Premiums received for written interest rate swaptions which are exercised are deducted from the cost or added to the proceeds on the underlying swap to determine the realized gain or loss. If a Fund enters into a closing purchase transaction, the difference between the premium received and any amount paid on effecting a closing purchase transaction, including commission, is treated as a realized gain or, if the premium received is less than the amount paid, as a realized loss. A Fund, as writer of a written interest rate swaption, bears the risk of an unfavorable change in the market value of the swap underlying the written interest rate swaption.
| 78
Notes to Financial Statements (continued)
December 31, 2015
OTC interest rate swaptions are subject to the risk that the counterparty is unable or unwilling to meet its obligations under the swaption.
For the year ended December 31, 2015, the Funds were not party to any swaptions.
h. Swap Agreements. Multi-Asset Income Fund may enter into interest rate swaps. An interest rate swap is an agreement with another party to receive or pay interest (e.g., an exchange of fixed rate payments for floating rate payments) to protect themselves from interest rate fluctuations. This type of swap is an agreement that obligates two parties to exchange a series of cash flows at specified intervals based upon or calculated by reference to a specified interest rate(s) for a specified amount. The payment flows are usually netted against each other, with the difference being paid by one party to the other.
The notional amounts of swap agreements are not recorded in the financial statements. Swap agreements are valued daily and fluctuations in the value are recorded in the Statements of Operations as change in unrealized appreciation (depreciation) on swap agreements. Fees are accrued in accordance with the terms of the agreement and are recorded in the Statements of Operations as realized gain or loss when received or paid. Upfront premiums paid or received by the Funds are recorded on the Statements of Assets and Liabilities as an asset or liability, respectively, and are amortized or accreted over the term of the agreement and recorded as realized gain or loss. Payments made or received by the Funds as a result of a credit event or termination of the agreement are recorded as realized gain or loss.
Swap agreements are privately negotiated and traded between counterparties and, as such, are subject to the risk that a party to the agreement will not be able to meet its obligations. The Funds cover their net obligations under outstanding swap agreements by segregating or earmarking liquid assets or cash.
For the year ended December 31, 2015, Multi-Asset Income Fund was not party to any interest rate swaps.
i. Due from Brokers. Transactions and positions in futures and options contracts are maintained and cleared by registered U.S. broker/dealers pursuant to customer agreements between the Fund and the various broker/dealers. The due from broker balance in the Statement of Assets and Liabilities for Multi-Asset Allocation Fund represents cash, including foreign currency, on deposit with the broker for open futures and options contracts. In certain circumstances the Fund’s use of cash held at brokers is restricted by regulation or broker mandated limits.
j. Federal and Foreign Income Taxes. The Trusts treat each Fund as a separate entity for federal income tax purposes. Each Fund intends to meet the requirements of the Internal Revenue Code of 1986, as amended, applicable to regulated investment companies, and to distribute to its shareholders substantially all of its net investment
79 |
Notes to Financial Statements (continued)
December 31, 2015
income and any net realized capital gains at least annually. Management has performed an analysis of each Fund’s tax positions for the open tax years as of December 31, 2015 and has concluded that no provisions for income tax are required. The Funds’ federal tax returns for the prior three fiscal years, where applicable, remain subject to examination by the Internal Revenue Service. Management is not aware of any events that are reasonably possible to occur in the next twelve months that would result in the amounts of any unrecognized tax benefits significantly increasing or decreasing for the Funds. However, management’s conclusions regarding tax positions taken may be subject to review and adjustment at a later date based on factors including, but not limited to, new tax laws and accounting regulations and interpretations thereof.
A Fund may be subject to foreign withholding taxes on investment income and taxes on capital gains on investments that are accrued and paid based upon the Fund’s understanding of the tax rules and regulations that exist in the countries in which the Fund invests. Foreign withholding taxes on dividend and interest income are reflected on the Statements of Operations as a reduction of investment income, net of amounts eligible to be reclaimed. Dividends and interest receivable on the Statements of Assets and Liabilities are net of foreign withholding taxes. Foreign withholding taxes where reclaims have been or will be filed are reflected on the Statements of Assets and Liabilities as tax reclaims receivable. Capital gains taxes paid are included in net realized gain (loss) on investments in the Statements of Operations. Accrued but unpaid capital gains taxes are reflected as foreign taxes payable on the Statements of Assets and Liabilities, if applicable, and reduce unrealized gains on investments. In the event that realized gains on investments are subsequently offset by realized losses, taxes paid on realized gains may be returned to a Fund. Such amounts, if applicable, are reflected as foreign tax rebates receivable on the Statements of Assets and Liabilities and are recorded as a realized gain when received.
k. Dividends and Distributions to Shareholders. Dividends and distributions are recorded on ex-dividend date. The timing and characterization of certain income and capital gain distributions are determined in accordance with federal tax regulations, which may differ from accounting principles generally accepted in the United States of America. Permanent differences are primarily due to differing treatments for book and tax purposes of items such as net operating losses, contingent payment debt instruments, premium amortization, convertible bonds, paydown gains and losses, Treasury Inflation-Protected Securities (“TIPS”), distributions in excess of income and/or capital gain, return of capital distributions received, distribution redesignations and foreign currency gains and losses. Permanent book and tax basis differences relating to shareholder distributions, net investment income and net realized gains will result in reclassifications to capital accounts reported on the Statements of Assets and Liabilities. Temporary differences between book and tax distributable earnings are primarily due to deferred Trustees’ fees, premium amortization, trust preferred
| 80
Notes to Financial Statements (continued)
December 31, 2015
securities, return of capital distributions received, futures and options contract mark-to-market and wash sales. Amounts of income and capital gain available to be distributed on a tax basis are determined annually, and at other times during the Funds’ fiscal year as may be necessary to avoid knowingly declaring and paying a return of capital distribution. Distributions from net investment income and short-term capital gains are considered to be distributed from ordinary income for tax purposes.
The tax characterization of distributions is determined on an annual basis. The tax character of distributions paid to shareholders during the years ended December 31, 2015 and 2014 were as follows:
| | | | | | | | | | | | | | | | |
| | | 2015 Distributions Paid From: | |
| | | Ordinary
Income | | | Tax Exempt
Income | | | Long-Term
Capital Gains | | | Total | |
Multi-Asset Income Fund | | $ | 3,542,036 | | | $ | — | | | $ | — | | | $ | 3,542,036 | |
Intermediate Municipal Bond Fund | | | — | | | | 565,474 | | | | — | | | | 565,474 | |
U.S. Equity Opportunities Fund | | | 7,472,234 | | | | — | | | | 20,618,016 | | | | 28,090,250 | |
Multi-Asset Allocation Fund | | | — | | | | — | | | | 659,252 | | | | 659,252 | |
| |
| | | 2014 Distributions Paid From: | |
| | | Ordinary
Income | | | Tax Exempt
Income | | | Long-Term
Capital Gains | | | Total | |
Multi-Asset Income Fund | | $ | 3,440,398 | | | $ | — | | | $ | — | | | $ | 3,440,398 | |
Intermediate Municipal Bond Fund | | | — | | | | 394,704 | | | | — | | | | 394,704 | |
U.S. Equity Opportunities Fund | | | 28,374,163 | | | | — | | | | 109,096,353 | | | | 137,470,516 | |
Multi-Asset Allocation Fund | | | — | | | | — | | | | — | | | | — | |
Differences between these amounts and those reported in the Statements of Changes in Net Assets are primarily attributable to different book and tax treatment for short-term capital gains.
81 |
Notes to Financial Statements (continued)
December 31, 2015
As of December 31, 2015, the components of distributable earnings on a tax basis were as follows:
| | | | | | | | | | | | | | | | |
| | | Multi-Asset
Income Fund | | | Intermediate
Municipal
Bond Fund | | | U.S. Equity
Opportunities
Fund | | | Multi-Asset
Allocation
Fund | |
Undistributed ordinary income | | $ | 98,163 | | | $ | — | | | $ | 498,811 | | | $ | — | |
Undistributed tax exempt income | | | — | | | | 3,636 | | | | — | | | | — | |
Undistributed long-term capital gains | | | — | | | | — | | | | 4,797,216 | | | | — | |
| | | | | | | | | | | | | | | | |
Total undistributed earnings | | | 98,163 | | | | 3,636 | | | | 5,296,027 | | | | — | |
| | | | | | | | | | | | | | | | |
Capital loss carryforward: | | | | | | | | | | | | | | | | |
Short-term: | | | | | | | | | | | | | | | | |
December 31, 2017 | | | (1,209,090 | ) | | | — | | | | — | | | | — | |
No expiration date | | | — | | | | (332,683 | ) | | | — | | | | — | |
Long-term: | | | | | | | | | | | | | | | | |
No expiration date | | | — | | | | (44,227 | ) | | | — | | | | — | |
| | | | | | | | | | | | | | | | |
Total capital loss carryforward | | | (1,209,090 | ) | | | (376,910 | ) | | | — | | | | — | |
| | | | | | | | | | | | | | | | |
Late-year ordinary and post-October capital loss deferrals* | | | (3,169 | ) | | | — | | | | — | | | | (1,081,274 | ) |
| | | | | | | | | | | | | | | | |
Unrealized appreciation (depreciation) | | | | | | | | | | | | | | | | |
Investments | | | 2,866,273 | | | | 1,302,089 | | | | 72,337,656 | | | | (1,689,125 | ) |
Foreign currency translations | | | (947,034 | ) | | | — | | | | — | | | | — | |
| | | | | | | | | | | | | | | | |
Total Unrealized appreciation (depreciation) | | | 1,919,239 | | | | 1,302,089 | | | | 72,337,656 | | | | (1,689,125 | ) |
| | | | | | | | | | | | | | | | |
Total accumulated earnings (losses) | | $ | 805,143 | | | $ | 928,815 | | | $ | 77,633,683 | | | $ | (2,770,399 | ) |
| | | | | | | | | | | | | | | | |
Capital loss carryforward utilized in the current year | | $ | 7,534,544 | | | $ | 24,506 | | | $ | — | | | $ | — | |
| | | | | | | | | | | | | | | | |
| * | Under current tax law, capital losses, foreign currency losses, and losses on passive foreign investment companies and contingent payment debt instruments after October 31 or December 31, as applicable, may be deferred and treated as occurring on the first day of the following taxable year. Multi-Asset Income Fund is deferring capital losses that occurred after October 31, 2015. Multi-Asset Allocation Fund is deferring foreign currency losses and capital losses that occurred after October 31, 2015. |
| 82
Notes to Financial Statements (continued)
December 31, 2015
Capital losses may be utilized to offset future capital gains until expiration. The Regulated Investment Company Modernization Act of 2010 (the “Act”) allows capital loss carryforwards to be carried forward indefinitely. Rules in effect previously limited the carryforward period to eight years. Capital loss carryforwards generated in taxable years beginning after the effective date of the Act must be fully used before capital loss carryforwards generated in years prior to the effective date of the Act; therefore, under certain circumstances, capital loss carryforwards available as of the report date may expire unused.
l. Repurchase Agreements. Each Fund may enter into repurchase agreements, under the terms of a Master Repurchase Agreement, under which each Fund acquires securities as collateral and agrees to resell the securities at an agreed upon time and at an agreed upon price. It is each Fund’s policy that the market value of the collateral for repurchase agreements be at least equal to 102% of the repurchase price, including interest. Certain repurchase agreements are tri-party arrangements whereby the collateral is held in a segregated account for the benefit of the Fund and on behalf of the counterparty. Repurchase agreements could involve certain risks in the event of default or insolvency of the counterparty, including possible delays or restrictions upon a Fund’s ability to dispose of the underlying securities. As of December 31, 2015, each Fund, as applicable, had investments in repurchase agreements for which the value of the related collateral exceeded the value of the repurchase agreement. The gross value of repurchase agreements is included in the Statements of Assets and Liabilities for financial reporting purposes.
m. When-Issued and Delayed Delivery Transactions. The Funds may enter into when-issued or delayed delivery transactions. When-issued refers to transactions made conditionally because a security, although authorized, has not been issued. Delayed delivery refers to transactions for which delivery or payment will occur at a later date, beyond the normal settlement period. The price of when-issued and delayed delivery securities and the date when the securities will be delivered and paid for are fixed at the time the transaction is negotiated. The security and the obligation to pay for it are recorded by the Funds at the time the commitment is entered into. The value of the security may vary with market fluctuations during the time before the Funds take delivery of the security. No interest accrues to the Funds until the transaction settles.
Delayed delivery transactions include those designated as To Be Announced (“TBAs”) in the Portfolios of Investments. For TBAs, the actual security that will be delivered to fulfill the transaction is not designated at the time of the trade. The security is “to be announced” 48 hours prior to the established trade settlement date. Certain transactions require the Funds or counterparty to post cash and/or securities as collateral for the net mark-to-market exposure to the other party. The Funds cover their net obligations under outstanding delayed delivery commitments by segregating or earmarking cash or securities at the custodian.
83 |
Notes to Financial Statements (continued)
December 31, 2015
Purchases of when-issued or delayed delivery securities may have a similar effect on the Funds’ NAV as if the Funds’ had created a degree of leverage in the portfolio. Risks may arise upon entering into such transactions from the potential inability of counterparties to meet their obligations under the transactions. Additionally, losses may arise due to changes in the value of the underlying securities.
n. Securities Lending. The Funds have entered into an agreement with State Street Bank and Trust Company (“State Street Bank”), as agent of the Funds, to lend securities to certain designated borrowers. The loans are collateralized with cash or securities in an amount equal to at least 105% or 102% of the market value (including accrued interest) of the loaned international or domestic securities, respectively, when the loan is initiated. Thereafter, the value of the collateral must remain at least 102% of the market value (including accrued interest) of loaned securities for U.S. equities and U.S. corporate debt; at least 105% of the market value (including accrued interest) of loaned securities for non-U.S. equities; and at least 100% of the market value (including accrued interest) of loaned securities for U.S. Government securities, sovereign debt issued by non-U.S. Governments and non-U.S. corporate debt. In the event that the market value of the collateral falls below the required percentages described above, the borrower will deliver additional collateral on the next business day. As with other extensions of credit, the Funds may bear the risk of loss with respect to the investment of the collateral. The Funds invest cash collateral in short-term investments, a portion of the income from which is remitted to the borrowers and the remainder allocated between the Funds and State Street Bank as lending agent.
For the year ended December 31, 2015, none of the Funds had loaned securities under this agreement.
o. Indemnifications. Under the Trusts’ organizational documents, their officers and Trustees are indemnified against certain liabilities arising out of the performance of their duties to the Funds. Additionally, in the normal course of business, the Funds enter into contracts with service providers that contain general indemnification clauses. The Funds’ maximum exposure under these arrangements is unknown as this would involve future claims that may be made against the Funds that have not yet occurred. However, based on experience, the Funds expect the risk of loss to be remote.
3. Fair Value Measurements. In accordance with accounting standards related to fair value measurements and disclosures, the Funds have categorized the inputs utilized in determining the value of each Fund’s assets or liabilities. These inputs are summarized in the three broad levels listed below:
| | • | | Level 1 – quoted prices in active markets for identical assets or liabilities; |
| 84
Notes to Financial Statements (continued)
December 31, 2015
| | • | | Level 2 – prices determined using other significant inputs that are observable either directly, or indirectly through corroboration with observable market data (which could include quoted prices for similar assets or liabilities, interest rates, credit risk, etc.); and |
| | • | | Level 3 – prices determined using significant unobservable inputs when quoted prices or observable inputs are unavailable such as when there is little or no market activity for an asset or liability (unobservable inputs reflect each Fund’s own assumptions in determining the fair value of assets or liabilities and would be based on the best information available). |
The inputs or methodology used for valuing securities are not necessarily an indication of the risk associated with investing in those securities.
The Funds’ pricing policies and procedures are recommended by the adviser and approved by the Board of Trustees. Debt securities are valued based on evaluated bids furnished to the Funds by an independent pricing service. Broker-dealer bid prices may be used if an independent pricing service either is unable to price a security or does not provide a reliable price for a security. Broker-dealer bid prices for which the Funds do not have knowledge of the inputs used by the broker-dealer are categorized in Level 3. All security prices, including those obtained from an independent pricing service and broker-dealer bid prices, are reviewed on a daily basis by the adviser, subject to oversight by Fund management and the Board of Trustees. If the adviser, in good faith, believes that the price provided by an independent pricing service is unreliable, broker-dealer bid prices may be used until the price provided by the independent pricing service is considered to be reliable. Reliability of all security prices, including those obtained from an independent pricing service and broker-dealer bid prices, is tested in a variety of ways, including comparison to recent transaction prices and daily fluctuations, amongst other validation procedures in place. Securities for which market quotations are not readily available are valued at fair value as determined in good faith by the Funds’ adviser pursuant to procedures approved by the Board of Trustees. Fair valued securities may be categorized in Level 3.
85 |
Notes to Financial Statements (continued)
December 31, 2015
The following is a summary of the inputs used to value the Funds’ investments as of December 31, 2015, at value:
Multi-Asset Income Fund
Asset Valuation Inputs
| | | | | | | | | | | | | | | | |
Description | | Level 1 | | | Level 2 | | | Level 3 | | | Total | |
Common Stocks | | | | | | | | | | | | | | | | |
Air Freight & Logistics | | $ | 87,665 | | | $ | 177,695 | | | $ | — | | | $ | 265,360 | |
Banks | | | 4,753,355 | | | | 373,703 | | | | — | | | | 5,127,058 | |
Beverages | | | 1,242,727 | | | | 95,121 | | | | — | | | | 1,337,848 | |
Capital Markets | | | 174,794 | | | | 58,536 | | | | — | | | | 233,330 | |
Commercial Services & Supplies | | | 887,322 | | | | 185,776 | | | | — | | | | 1,073,098 | |
Diversified Telecommunication Services | | | 2,148,601 | | | | 191,810 | | | | — | | | | 2,340,411 | |
Electric Utilities | | | 2,421,344 | | | | 191,112 | | | | — | | | | 2,612,456 | |
Food Products | | | 1,375,941 | | | | 89,310 | | | | — | | | | 1,465,251 | |
Gas Utilities | | | 327,415 | | | | 86,687 | | | | — | | | | 414,102 | |
Internet Software & Services | | | — | | | | 186,330 | | | | — | | | | 186,330 | |
Multi-Utilities | | | 1,008,562 | | | | 87,866 | | | | — | | | | 1,096,428 | |
Oil, Gas & Consumable Fuels | | | 4,771,362 | | | | 84,420 | | | | — | | | | 4,855,782 | |
Pharmaceuticals | | | 3,817,773 | | | | 190,854 | | | | — | | | | 4,008,627 | |
Road & Rail | | | 294,714 | | | | 92,499 | | | | — | | | | 387,213 | |
Specialty Retail | | | 466,976 | | | | 90,155 | | | | — | | | | 557,131 | |
Tobacco | | | 2,803,879 | | | | 309,269 | | | | — | | | | 3,113,148 | |
Transportation Infrastructure | | | — | | | | 86,825 | | | | — | | | | 86,825 | |
Wireless Telecommunication Services | | | — | | | | 96,405 | | | | — | | | | 96,405 | |
All Other Common Stocks(a) | | | 54,182,872 | | | | — | | | | — | | | | 54,182,872 | |
| | | | | | | | | | | | | | | | |
Total Common Stocks | | | 80,765,302 | | | | 2,674,373 | | | | — | | | | 83,439,675 | |
| | | | | | | | | | | | | | | | |
Bonds and Notes | | | | | | | | | | | | | | | | |
Building Materials | | | — | | | | — | | | | 40,758 | (b) | | | 40,758 | |
All Other Bonds and Notes(a) | | | — | | | | 25,206,172 | | | | — | | | | 25,206,172 | |
| | | | | | | | | | | | | | | | |
Total Bonds and Notes | | | — | | | | 25,206,172 | | | | 40,758 | | | | 25,246,930 | |
| | | | | | | | | | | | | | | | |
Senior Loans(a) | | | — | | | | 3,969,899 | | | | — | | | | 3,969,899 | |
Preferred Stocks(a) | | | 3,384,967 | | | | — | | | | — | | | | 3,384,967 | |
Closed-End Investment Companies | | | 819,746 | | | | — | | | | — | | | | 819,746 | |
Short-Term Investments | | | — | | | | 7,050,949 | | | | — | | | | 7,050,949 | |
| | | | | | | | | | | | | | | | |
Total | | $ | 84,970,015 | | | $ | 38,901,393 | | | $ | 40,758 | | | $ | 123,912,166 | |
| | | | | | | | | | | | | | | | |
| (a) | Details of the major categories of the Fund’s investments are reflected within the Portfolio of Investments. |
| (b) | Valued using broker-dealer bid prices. |
| 86
Notes to Financial Statements (continued)
December 31, 2015
Intermediate Municipal Bond Fund
Asset Valuation Inputs
| | | | | | | | | | | | | | | | |
Description | | Level 1 | | | Level 2 | | | Level 3 | | | Total | |
Bonds and Notes(a) | | $ | — | | | $ | 72,407,428 | | | $ | — | | | $ | 72,407,428 | |
Short-Term Investments | | | — | | | | 6,290,548 | | | | — | | | | 6,290,548 | |
| | | | | | | | | | | | | | | | |
Total | | $ | — | | | $ | 78,697,976 | | | $ | — | | | $ | 78,697,976 | |
| | | | | | | | | | | | | | | | |
| (a) | Details of the major categories of the Fund’s investments are reflected within the Portfolio of Investments. |
For the year ended December 31, 2015, there were no transfers among Levels 1, 2 and 3.
Natixis U.S. Equity Opportunities Fund
Asset Valuation Inputs
| | | | | | | | | | | | | | | | |
Description | | Level 1 | | | Level 2 | | | Level 3 | | | Total | |
Common Stocks(a) | | $ | 541,856,551 | | | $ | — | | | $ | — | | | $ | 541,856,551 | |
Short-Term Investments | | | — | | | | 11,678,956 | | | | — | | | | 11,678,956 | |
| | | | | | | | | | | | | | | | |
Total | | $ | 541,856,551 | | | $ | 11,678,956 | | | $ | — | | | $ | 553,535,507 | |
| | | | | | | | | | | | | | | | |
| (a) | Details of the major categories of the Fund’s investments are reflected within the Portfolio of Investments. |
For the year ended December 31, 2015, there were no transfers among Levels 1, 2 and 3.
Multi-Asset Allocation Fund
Asset Valuation Inputs
| | | | | | | | | | | | | | | | |
Description | | Level 1 | | | Level 2 | | | Level 3 | | | Total | |
Bonds and Notes(a) | | $ | — | | | $ | 7,556,692 | | | $ | — | | | $ | 7,556,692 | |
Exchange-Traded Funds(a) | | | 2,381,417 | | | | — | | | | — | | | | 2,381,417 | |
Purchased Options(a) | | | 151,969 | | | | 754,490 | | | | — | | | | 906,459 | |
Short-Term Investments | | | — | | | | 25,315,711 | | | | — | | | | 25,315,711 | |
| | | | | | | | | | | | | | | | |
Total Investments | | | 2,533,386 | | | | 33,626,893 | | | | — | | | | 36,160,279 | |
| | | | | | | | | | | | | | | | |
Futures Contracts (unrealized appreciation) | | | 43,033 | | | | 66,310 | | | | — | | | | 109,343 | |
| | | | | | | | | | | | | | | | |
Total | | $ | 2,576,419 | | | $ | 33,693,203 | | | $ | — | | | $ | 36,269,622 | |
| | | | | | | | | | | | | | | | |
Liability Valuation Inputs
| | | | | | | | | | | | | | | | |
Description | | Level 1 | | | Level 2 | | | Level 3 | | | Total | |
Written Options(a) | | $ | — | | | $ | (1,815,081 | ) | | $ | — | | | $ | (1,815,081 | ) |
Futures Contracts (unrealized depreciation) | | | (188,002 | ) | | | (76,732 | ) | | | — | | | | (264,734 | ) |
| | | | | | | | | | | | | | | | |
Total | | $ | (188,002 | ) | | $ | (1,891,813 | ) | | $ | — | | | $ | (2,079,815 | ) |
| | | | | | | | | | | | | | | | |
| (a) | Details of the major categories of the Fund’s investments are reflected within the Portfolio of Investments. |
87 |
Notes to Financial Statements (continued)
December 31, 2015
For the year ended December 31, 2015, there were no transfers among Levels 1, 2 and 3.
The following is a reconciliation of Level 3 investments for which significant unobservable inputs were used to determine fair value as of December 31, 2014 and/or December 31, 2015:
Multi-Asset Income Fund
| | | | | | | | | | | | | | | | | | | | |
Investments in Securities | | Balance as of
December 31,
2014 | | | Accrued
Discounts
(Premiums) | | | Realized
Gain
(Loss) | | | Change in
Unrealized
Appreciation
(Depreciation) | | | Purchases | |
Bonds and Notes | | | | | | | | | | | | | | | | | | | | |
ABS Car Loan | | $ | 294,726 | | | $ | — | | | $ | 2,919 | | | $ | 256 | | | $ | — | |
ABS Home Equity | | | 18,198 | | | | — | | | | (534 | ) | | | 374 | | | | — | |
ABS Other | | | 772,936 | | | | — | | | | 1,497 | | | | (3,429 | ) | | | — | |
Airlines | | | 1,315,465 | | | | 41 | | | | 79,402 | | | | (96,872 | ) | | | — | |
Building Materials | | | — | | | | 89 | | | | — | | | | (54,696 | ) | | | — | |
| | | | | | | | | | | | | | | | | | | | |
Total | | $ | 2,401,325 | | | $ | 130 | | | $ | 83,284 | | | $ | (154,367 | ) | | $ | — | |
| | | | | | | | | | | | | | | | | | | | |
| | | | | |
Investments in Securities | | Sales | | | Transfers
into Level 3 | | | Transfers
out of
Level 3 | | | Balance as of
December 31,
2015 | | | Change in
Unrealized
Appreciation
(Depreciation)
from
Investments
Still Held at
December 31,
2015 | |
Bonds and Notes | | | | | | | | | | | | | | | | | | | | |
ABS Car Loan | | $ | (297,901 | ) | | $ | — | | | $ | — | | | $ | — | | | $ | — | |
ABS Home Equity | | | (18,038 | ) | | | — | | | | — | | | | — | | | | — | |
ABS Other | | | (771,004 | ) | | | — | | | | — | | | | — | | | | — | |
Airlines | | | (1,298,036 | ) | | | — | | | | — | | | | — | | | | — | |
Building Materials | | | — | | | | 95,365 | | | | — | | | | 40,758 | | | | (54,696 | ) |
| | | | | | | | | | | | | | | | | | | | |
Total | | $ | (2,384,979 | ) | | $ | 95,365 | | | $ | — | | | $ | 40,758 | | | $ | (54,696 | ) |
| | | | | | | | | | | | | | | | | | | | |
A debt security valued at $95,365 was transferred from Level 2 to Level 3 during the period ended December 31, 2015. At December 31, 2014, this security was valued on the basis of evaluated bids furnished to the Fund by an independent pricing service in accordance with the Fund’s valuation policies. At December 31, 2015, this security was valued using broker-dealer bid prices based on inputs unobservable to the Fund as an independent pricing service did not provide a reliable price for the security.
| 88
Notes to Financial Statements (continued)
December 31, 2015
All transfers are recognized as of the beginning of the reporting period.
4. Derivatives. Derivative instruments are defined as financial instruments whose value and performance are based on the value and performance of an underlying asset, reference rate or index. Derivative instruments that Multi-Asset Income Fund and Multi-Asset Allocation Fund used during the period include forward foreign currency contracts, futures contracts and option contracts.
Multi-Asset Income Fund is subject to the risk that changes in foreign currency exchange rates will have an unfavorable effect on the value of Fund assets denominated in foreign currencies. The Fund may enter into forward foreign currency contracts for hedging purposes to protect the value of the Fund’s holdings of foreign securities. During the year ended December 31, 2015, the Fund engaged in forward foreign currency transactions for hedging purposes.
Multi-Asset Income Fund is subject to the risk that changes in interest rates will affect the value of the Fund’s investments in fixed-income securities. The Fund will be subject to increased interest rate risk to the extent that it invests in fixed-income securities with longer maturities or durations, as compared to investing in fixed-income securities with shorter maturities or durations. The Fund may use futures contracts to hedge against changes in interest rates and to manage its duration without having to buy or sell portfolio securities. During the year ended December 31, 2015, the Fund used futures contracts to manage duration.
Multi-Asset Allocation Fund seeks to gain exposure to a combination of four asset classes: equity, fixed income, currency and volatility. The Fund pursues its objective by utilizing a variety of listed and other liquid derivative instruments. The Fund’s equity exposure typically will be obtained through investments in broad, equity index listed futures, equity index options, options on futures and exchange-traded funds (“ETFs”). The Fund’s fixed income exposure may consist of, but is not limited to, U.S. and non-U.S. government bonds, listed bond futures, options on futures and fixed income ETFs. The Fund’s currency exposure typically will be obtained through investments in non-dollar denominated investments and futures contracts. The Fund’s exposure to volatility assets will result from both “long” and “short” positions in futures and options, such as futures contracts based on the Chicago Board Options Exchange Volatility Index (the “VIX”), listed equity index options, options on futures and equity index futures. During the year ended December 31, 2015, the Fund used futures, equity index options and options on futures contracts to gain investment exposure in accordance with its objective.
89 |
Notes to Financial Statements (continued)
December 31, 2015
Transactions in derivative instruments for Multi-Asset Income Fund during the year ended December 31, 2015 as reflected within the Statements of Operations were as follows:
| | | | | | | | |
Net Realized Gain (Loss) on: | | Futures
contracts | | | Foreign
currency
transactions1 | |
Interest rate contracts | | $ | (92,523 | ) | | $ | — | |
Foreign exchange contracts | | | — | | | | 45,478 | |
| | |
Net Change in Unrealized Appreciation (Depreciation) on: | | Futures
contracts | | | Foreign
currency
translations1 | |
Interest rate contracts | | $ | 55,028 | | | $ | — | |
Foreign exchange contracts | | | — | | | | (50,936 | ) |
| 1 | Represents realized gain and change in unrealized appreciation (depreciation), respectively, for forward foreign currency contracts during the period. Does not include other foreign currency gains or losses included in the Statements of Operations. |
The following is a summary of derivative instruments for Multi-Asset Allocation Fund as of December 31, 2015, as reflected within the Statements of Assets and Liabilities:
| | | | | | | | | | | | |
Assets | | Investments at value1 | | | Unrealized
appreciation on
futures contracts | | | Total | |
Exchange-traded/cleared asset derivatives | | | | | | | | | | | | |
Interest rate contracts | | $ | 8,906 | | | $ | 19,818 | | | $ | 28,724 | |
Foreign exchange contracts | | | — | | | | 6,913 | | | | 6,913 | |
Equity contracts | | | 897,553 | | | | 82,612 | | | | 980,165 | |
| | | | | | | | | | | | |
Total asset derivatives | | $ | 906,459 | | | $ | 109,343 | | | $ | 1,015,802 | |
| | | | | | | | | | | | |
| | | |
Liabilities | | Options written at value | | | Unrealized
depreciation on
futures contracts | | | Total | |
Exchange-traded/cleared liability derivatives | | | | | | | | | | | | |
Interest rate contracts | | $ | — | | | $ | (25,499 | ) | | $ | (25,499 | ) |
Foreign exchange contracts | | | — | | | | (2,925 | ) | | | (2,925 | ) |
Equity contracts | | | (1,815,081 | ) | | | (236,310 | ) | | | (2,051,391 | ) |
| | | | | | | | | | | | |
Total liability derivatives | | $ | (1,815,081 | ) | | $ | (264,734 | ) | | $ | (2,079,815 | ) |
| | | | | | | | | | | | |
| 1 | Represents purchased options, at value. |
| 90
Notes to Financial Statements (continued)
December 31, 2015
Transactions in derivative instruments for Multi-Asset Allocation Fund during the year ended December 31, 2015 as reflected within the Statements of Operations were as follows:
| | | | | | | | | | | | |
Net Realized Gain (Loss) on: | | Investments2 | | | Futures
contracts | | | Options written | |
Interest rate contracts | | $ | 33,868 | | | $ | 92,085 | | | $ | 33,955 | |
Foreign exchange contracts | | | — | | | | (171,741 | ) | | | — | |
Equity contracts | | | (12,995 | ) | | | 611,115 | | | | (49,505 | ) |
| | | | | | | | | | | | |
Total | | $ | 20,873 | | | $ | 531,459 | | | $ | (15,550 | ) |
| | | | | | | | | | | | |
| | | |
Net Change in Unrealized Appreciation
(Depreciation) on: | | Investments2 | | | Futures
contracts | | | Options written | |
Interest rate contracts | | $ | (106,469 | ) | | $ | (216,622 | ) | | $ | (939 | ) |
Foreign exchange contracts | | | — | | | | (6,316 | ) | | | — | |
Equity contracts | | | (329,046 | ) | | | (895,760 | ) | | | 167,294 | |
| | | | | | | | | | | | |
Total | | $ | (435,515 | ) | | $ | (1,118,698 | ) | | $ | 166,355 | |
| | | | | | | | | | | | |
| 2 | Represents realized gain (loss) and change in unrealized appreciation (depreciation), respectively, for purchased options during the period. |
As the Funds value their derivatives at fair value and recognize changes in fair value through the Statements of Operations, they do not qualify for hedge accounting under authoritative guidance for derivative instruments. The Funds’ investments in derivatives may represent an economic hedge; however, they are considered to be non-hedge transactions for the purpose of these disclosures.
The volume of forward foreign currency contract and futures contract activity, as a percentage of net assets, for Multi-Asset Income Fund and Multi-Asset Allocation Fund, based on gross month-end or daily (as applicable) notional amounts outstanding during the period, including long and short positions at absolute value, was as follows for the year ended December 31, 2015:
| | | | | | | | |
Multi-Asset Income Fund | | Futures | | | Forwards | |
Average Notional Amount Outstanding | | | 0.20 | % | | | 0.30 | % |
Highest Notional Amount Outstanding | | | 1.08 | % | | | 1.19 | % |
Lowest Notional Amount Outstanding | | | 0.00 | % | | | 0.00 | % |
Notional Amount Outstanding as of December 31, 2015 | | | 0.00 | % | | | 0.00 | % |
| | |
Multi-Asset Allocation Fund | | Futures | | | | |
Average Notional Amount Outstanding | | | 79.96 | % | | | | |
Highest Notional Amount Outstanding | | | 90.01 | % | | | | |
Lowest Notional Amount Outstanding | | | 58.50 | % | | | | |
Notional Amount Outstanding as of December 31, 2015 | | | 90.01 | % | | | | |
91 |
Notes to Financial Statements (continued)
December 31, 2015
Notional amounts outstanding at the end of the prior period are included in the average notional amount outstanding.
Unrealized gain and/or loss on open forwards and futures is recorded in the Statements of Assets and Liabilities. The aggregate notional values of forward and futures are not recorded in the Statements of Assets and Liabilities, and therefore are not included in the Fund’s net assets.
The volume of option contract activity, as a percentage of net assets, for Multi-Asset Allocation Fund, based on month-end market values of instruments underlying purchased and written options, at absolute value, was as follows for the year ended December 31, 2015:
| | | | | | | | | | | | | | | | |
Multi-Asset Allocation Fund* | | Call
Options
Purchased | | | Put
Options
Purchased | | | Call
Options
Written | | | Put
Options
Written | |
Average Market Value of Underlying Instruments | | | 30.72 | % | | | 11.87 | % | | | 5.78 | % | | | 5.42 | % |
Highest Market Value of Underlying Instruments | | | 70.27 | % | | | 60.03 | % | | | 33.23 | % | | | 39.00 | % |
Lowest Market Value of Underlying Instruments | | | 7.51 | % | | | 0.00 | % | | | 0.00 | % | | | 0.00 | % |
Market Value of Underlying Instruments as of December 31, 2015 | | | 42.24 | % | | | 47.07 | % | | | 33.18 | % | | | 33.25 | % |
| * | Market value of underlying instruments is determined as follows: for domestic indices by multiplying contracts by the contract multiplier by the price of the option’s underlying index, for foreign indices by multiplying the number of contracts by the contract multiplier by the price of the underlying index and dividing by the foreign currency exchange rate and for futures by multiplying the number of contracts by the contract multiplier by the price of the underlying futures contract. |
Market value of underlying securities at the end of the prior period, if applicable, are included in the averages above.
The following is a summary of Multi-Asset Allocation Fund’s written option activity:
| | | | | | | | |
| | | Contracts | | | Premiums | |
Outstanding at December 31, 2014 | | | 20 | | | $ | 6,564 | |
Options written | | | 816 | | | | 2,796,867 | |
Options terminated in closing purchase transactions | | | (393 | ) | | | (821,056 | ) |
| | | | | | | | |
Outstanding at December 31, 2015 | | | 443 | | | $ | 1,982,375 | |
| | | | | | | | |
Counterparty risk is managed based on policies and procedures established by each Fund’s adviser. Such policies and procedures may include, but are not limited to, minimum counterparty credit rating requirements, monitoring of counterparty credit
| 92
Notes to Financial Statements (continued)
December 31, 2015
default swap spreads and posting of collateral. A Fund’s risk of loss from counterparty credit risk on OTC derivatives is generally limited to the Fund’s aggregated unrealized gains and the amount of any collateral pledged to the counterparty, which may be offset by any collateral posted to the Fund by the counterparty. International Swaps and Derivatives Association, Inc. (“ISDA”) master agreements can help to manage counterparty risk by specifying collateral posting arrangements at pre-arranged exposure levels. Under these ISDA agreements, collateral is routinely transferred if the total net exposure in respect of certain transactions, net of existing collateral already in place, exceeds a specified amount (typically $250,000, depending on the counterparty). With exchange-traded derivatives, there is minimal counterparty credit risk to the Fund because the exchange’s clearinghouse, as counterparty to these instruments, stands between the buyer and the seller of the contract. Credit risk still exists in exchange-traded derivatives with respect to initial and variation margin that is held in a broker’s customer accounts. While brokers are required to segregate customer margin from their own assets, in the event that a broker becomes insolvent or goes into bankruptcy and at that time there is a shortfall in the aggregate amount of margin held by the broker for all its clients, U.S. bankruptcy laws will typically allocate that shortfall on a pro rata basis across all of the broker’s customers, potentially resulting in losses to the Fund. Based on balances reflected on each Fund’s Statement of Assets and Liabilities, the following table shows (i) the maximum amount of loss due to credit risk that, based on the gross fair value of the financial instrument, the applicable Fund would incur if parties (including OTC derivative counterparties and brokers holding margin for exchange-traded derivatives) to the relevant financial instruments failed completely to perform according to the terms of the contracts and the collateral or other security, if any, for the amount due proved to be of no value to the Fund, and (ii) the amount of loss that the applicable Fund would incur after taking into account master netting provisions pursuant to ISDA agreements, if applicable, as of December 31, 2015:
| | | | | | | | |
Multi-Asset Allocation Fund | | Maximum Amount
of Loss - Gross | | | Maximum Amount of Loss - Net | |
Exchange-traded counterparty credit risk Futures contracts | | $ | 6,532,735 | | | $ | 6,532,735 | |
5. Purchases and Sales of Securities. For the year ended December 31, 2015, purchases and sales of securities (excluding short-term investments and U.S. Government/Agency securities and option contracts and including paydowns) were as follows:
| | | | | | | | |
Fund | | Purchases | | | Sales | |
Multi-Asset Income Fund | | $ | 134,246,730 | | | $ | 152,823,096 | |
Intermediate Municipal Bond Fund | | | 48,980,222 | | | | 7,515,608 | |
U.S. Equity Opportunities Fund | | | 133,558,009 | | | | 104,422,402 | |
Multi-Asset Allocation Fund | | | 3,967,947 | | | | 4,347,202 | |
93 |
Notes to Financial Statements (continued)
December 31, 2015
For the year ended December 31, 2015, purchases and sales of U.S. Government/Agency securities by Multi-Asset Income Fund were $11,493,317 and $39,246,635, respectively.
6. Management Fees and Other Transactions with Affiliates.
a. Management Fees. NGAM Advisors, L.P. (“NGAM Advisors”) serves as investment adviser to each Fund except the Multi-Asset Allocation Fund. Natixis Asset Management U.S., LLC (“Natixis AM US”) is the investment adviser to the Multi-Asset Allocation Fund. Under the terms of the management agreements, each Fund pays a management fee at the following annual rates, calculated daily and payable monthly, based on each Fund’s average daily net assets:
| | | | | | | | |
| | | Percentage of Average Daily Net Assets | |
Fund | | First $1 billion | | | Over $1 billion | |
Multi-Asset Income Fund | | | 0.55 | % | | | 0.50 | % |
Intermediate Municipal Bond Fund | | | 0.40 | % | | | 0.40 | % |
U.S. Equity Opportunities Fund | | | 0.80 | % | | | 0.80 | % |
Multi-Asset Allocation Fund | | | 0.85 | % | | | 0.85 | % |
NGAM Advisors has entered into subadvisory agreements for each Fund as listed below.
| | |
Multi-Asset Income Fund | | Loomis, Sayles & Company, L.P. (“Loomis Sayles”) |
Intermediate Municipal Bond Fund | | McDonnell Investment Management, LLC (“McDonnell”) |
U.S. Equity Opportunities Fund | | Harris Associates L.P. (“Harris”) |
| | Loomis Sayles |
Prior to August 31, 2015, NGAM Advisors had a subadvisory agreement for Multi-Asset Income Fund with AEW Capital Management, L.P. (“AEW”).
Under the terms of the subadvisory agreements, each Fund has agreed to pay its respective subadviser(s) a subadvisory fee at the following annual rates, calculated daily and payable monthly, based on each Fund’s/Segment’s average daily net assets:
| | | | | | | | | | |
| | | | | Percentage of Average
Daily Net Assets | |
Fund | | Subadviser | | First $1 billion | | | Over $1 billion | |
Multi-Asset Income Fund | | Loomis Sayles | | | 0.325 | % | | | 0.30 | % |
Intermediate Municipal Bond Fund | | McDonnell | | | 0.20 | % | | | 0.20 | % |
U.S. Equity Opportunities Fund | | | | | | | | | | |
Large Cap Growth Segment | | Harris | | | 0.52 | % | | | 0.52 | % |
All Cap Growth Segment | | Loomis Sayles | | | 0.35 | % | | | 0.35 | % |
| 94
Notes to Financial Statements (continued)
December 31, 2015
Prior to August 31, 2015, Under the terms of the subadvisory agreements, Multi-Asset Income Fund had agreed to pay its respective subadviser(s) a subadvisory fee at the following annual rates, calculated daily and payable monthly, based on the Fund’s/Segment’s average daily net assets:
| | | | | | | | | | |
| | | | | Percentage of Average
Daily Net Assets | |
Fund | | Subadviser | | First
$250 million | | | Over
$250 million | |
Multi-Asset Income Fund | | | | | | | | | | |
Diversified REIT Discipline | | AEW | | | 0.45 | % | | | 0.40 | % |
Inflation Protected Securities Discipline | | Loomis Sayles | | | 0.25 | % | | | 0.20 | % |
Multi-Sector Bond Discipline | | Loomis Sayles | | | 0.35 | % | | | 0.30 | % |
Payments to NGAM Advisors are reduced by the amounts of payments to the subadvisers, as calculated based on the table above.
NGAM Advisors and Natixis AM US have given binding undertakings to the Funds to waive management fees and/or reimburse certain expenses to limit the Funds’ operating expenses, exclusive of acquired fund fees and expenses, brokerage expenses, interest expense, taxes, organizational and extraordinary expenses such as litigation and indemnification expenses. These undertakings are in effect until April 30, 2016 for Multi-Asset Allocation Fund and April 30, 2017 for Multi-Asset Income Fund, Intermediate Municipal Bond Fund and U.S. Equity Opportunities Fund, may be terminated before then only with the consent of the Funds’ Board of Trustees, and are reevaluated on an annual basis. Management fees payable, as reflected on the Statements of Assets and Liabilities, is net of waivers and/or expense reimbursements, if any, pursuant to these undertakings.
For the year ended December 31, 2015, the expense limits as a percentage of average daily net assets under the expense limitation agreements were as follows:
| | | | | | | | | | | | | | | | | | | | |
| | | Expense Limit as a Percentage of
Average Daily Net Assets | |
Fund | | Class A | | | Class B | | | Class C | | | Class N | | | Class Y | |
Multi-Asset Income Fund | | | 0.95 | % | | | — | | | | 1.70 | % | | | 0.65 | % | | | 0.70 | % |
Intermediate Municipal Bond Fund | | | 0.70 | % | | | — | | | | 1.45 | % | | | — | | | | 0.45 | % |
U.S. Equity Opportunities Fund | | | 1.25 | % | | | 2.00 | % | | | 2.00 | % | | | — | | | | 1.00 | % |
Multi-Asset Allocation Fund | | | 1.30 | % | | | — | | | | 2.05 | % | | | — | | | | 1.05 | % |
95 |
Notes to Financial Statements (continued)
December 31, 2015
Prior to August 31, 2015, the expense limits as a percentage of average daily net assets under the expense limitation agreements for Multi-Asset Income Fund were as follows:
| | | | | | | | | | | | | | | | |
| | | Expense Limit as a Percentage of
Average Daily Net Assets | |
Fund | | Class A | | | Class C | | | Class N | | | Class Y | |
Multi-Asset Income Fund | | | 1.25 | % | | | 2.00 | % | | | — | | | | 1.00 | % |
Prior to July 1, 2015, the expense limits as a percentage of average daily net assets under the expense limitation agreements for Intermediate Municipal Bond Fund and U.S. Equity Opportunities Fund were as follows:
| | | | | | | | | | | | | | | | |
| | | Expense Limit as a Percentage of
Average Daily Net Assets | |
Fund | | Class A | | | Class B | | | Class C | | | Class Y | |
Intermediate Municipal Bond Fund | | | 0.80 | % | | | — | | | | 1.55 | % | | | 0.55 | % |
U.S. Equity Opportunities Fund | | | 1.30 | % | | | 2.05 | % | | | 2.05 | % | | | 1.05 | % |
NGAM Advisors and Natixis AM US shall be permitted to recover expenses they have borne under the expense limitation agreements (whether through waiver of its management fees or otherwise) on a class by class basis in later periods to the extent the annual operating expenses of a class fall below a class’ expense limits, provided, however, that a class is not obligated to pay such waived/reimbursed fees or expenses more than one year after the end of the fiscal year in which the fees or expenses were waived/reimbursed.
For the year ended December 31, 2015, the management fees and waivers of management fees for each Fund were as follows:
| | | | | | | | | | | | | | | | | | | | | | | | |
Fund | | Gross
Management
Fees | | | Contractual
Waivers of
Management
Fees1 | | | Voluntary
Waivers of
Management
Fees2 | | | Net
Management
Fees | | | Percentage
of Average
Daily Net
Assets | |
| | | | | | Gross | | | Net | |
Multi-Asset Income Fund | | $ | 892,262 | | | $ | 86,404 | | | $ | 1,209 | | | $ | 804,649 | | | | 0.55 | % | | | 0.50 | % |
Intermediate Municipal Bond Fund | | | 155,126 | | | | 141,002 | | | | — | | | | 14,124 | | | | 0.40 | % | | | 0.04 | % |
U.S. Equity Opportunities Fund | | | 4,336,747 | | | | 2,238 | | | | — | | | | 4,334,509 | | | | 0.80 | % | | | 0.80 | % |
Multi-Asset Allocation Fund | | | 421,990 | | | | 100,533 | | | | — | | | | 321,457 | | | | 0.85 | % | | | 0.65 | % |
| 1 | Contractual management fee waivers are subject to possible recovery until December 31, 2016. |
| 2 | Voluntary management fee waivers are not subject to recovery under the expense limitation agreement described above. |
| 96
Notes to Financial Statements (continued)
December 31, 2015
For the year ended December 31, 2015, class-specific expenses have been reimbursed as follows:
| | | | | | | | | | | | | | | | |
| | | Contractual Reimbursement3 | |
Fund | | Class A | | | Class C | | | Class N | | | Class Y | |
Multi-Asset Income Fund | | $ | 17,101 | | | $ | 6,153 | | | $ | — | | | $ | 2,233 | |
| 3 | Contractual expense reimbursements are subject to possible recovery until December 31, 2016, except as noted in Note 6g. |
No expenses were recovered during the year ended December 31, 2015 under the terms of the expense limitation agreements.
Certain officers and directors of NGAM Advisors and its affiliates are also officers or Trustees of the Funds. NGAM Advisors, AEW, McDonnell, Loomis Sayles and Harris are subsidiaries of Natixis Global Asset Management, L.P. (“Natixis US”), which is part of Natixis Global Asset Management, an international asset management group based in Paris, France. Natixis AM US is a subsidiary of Natixis Asset Management (“NAM”), which is in turn a subsidiary of Natixis Global Asset Management.
b. Service and Distribution Fees. NGAM Distribution, L.P. (“NGAM Distribution”), which is a wholly-owned subsidiary of Natixis US, has entered into a distribution agreement with the Trusts. Pursuant to this agreement, NGAM Distribution serves as principal underwriter of the Funds of the Trusts.
Pursuant to Rule 12b-1 under the 1940 Act, the Trusts have adopted a Service Plan relating to each Fund’s Class A shares (the “Class A Plans”) and a Distribution and Service Plan relating to each Fund’s Class B (if applicable) and Class C shares (the “Class B and Class C Plans”).
Under the Class A Plans, each Fund pays NGAM Distribution a monthly service fee at an annual rate not to exceed 0.25% of the average daily net assets attributable to the Funds’ Class A shares, as reimbursement for expenses incurred by NGAM Distribution in providing personal services to investors in Class A shares and/or the maintenance of shareholder accounts.
Under the Class B (if applicable) and Class C Plans, each Fund pays NGAM Distribution a monthly service fee at an annual rate not to exceed 0.25% of the average daily net assets attributable to the Funds’ Class B (if applicable) and Class C shares, as compensation for services provided by NGAM Distribution in providing personal services to investors in Class B (if applicable) and Class C shares and/or the maintenance of shareholder accounts.
Also under the Class B (if applicable) and Class C Plans, each Fund pays NGAM Distribution a monthly distribution fee at an annual rate of 0.75% of the average daily net assets attributable to the Funds’ Class B (if applicable) and Class C shares, as
97 |
Notes to Financial Statements (continued)
December 31, 2015
compensation for services provided by NGAM Distribution in connection with the marketing or sale of Class B (if applicable) and Class C shares.
For the year ended December 31, 2015, the service and distribution fees for each Fund were as follows:
| | | | | | | | | | | | | | | | | | | | |
| | | Service Fees | | | Distribution Fees | |
Fund | | Class A | | | Class B | | | Class C | | | Class B | | | Class C | |
Multi-Asset Income Fund | | $ | 235,490 | | | $ | — | | | $ | 129,415 | | | $ | — | | | $ | 388,246 | |
Intermediate Municipal Bond Fund | | | 8,717 | | | | — | | | | 6,338 | | | | — | | | | 19,015 | |
U.S. Equity Opportunities Fund | | | 1,057,216 | | | | 3,126 | | | | 148,355 | | | | 9,377 | | | | 445,065 | |
Multi-Asset Allocation Fund | | | 202 | | | | — | | | | 290 | | | | — | | | | 871 | |
c. Administrative Fees. NGAM Advisors provides certain administrative services for the Funds and contracts with State Street Bank to serve as sub-administrator. Pursuant to an agreement among Natixis Funds Trusts, Loomis Sayles Funds Trusts and NGAM Advisors, each Fund pays NGAM Advisors monthly its pro rata portion of fees equal to an annual rate of 0.0575% of the first $15 billion of the average daily net assets of the Natixis Funds Trusts and Loomis Sayles Funds Trusts, 0.0500% of the next $15 billion, 0.0400% of the next $30 billion, 0.0350% of the next $30 billion and 0.0325% of such assets in excess of $90 billion, subject to an annual aggregate minimum fee for the Natixis Funds Trusts and Loomis Sayles Funds Trusts of $10 million, which is reevaluated on an annual basis.
For the year ended December 31, 2015, the administrative fees for each Fund were as follows:
| | | | |
Fund | | Administrative
Fees | |
Multi-Asset Income Fund | | $ | 69,200 | |
Intermediate Municipal Bond Fund | | | 16,653 | |
U.S. Equity Opportunities Fund | | | 232,145 | |
Multi-Asset Allocation Fund | | | 21,255 | |
d. Sub-Transfer Agent Fees. NGAM Distribution has entered into agreements, which include servicing agreements, with financial intermediaries that provide recordkeeping, processing, shareholder communications and other services to customers of the intermediaries that hold positions in the Funds and has agreed to compensate the intermediaries for providing those services. Intermediaries transact with the Funds primarily through the use of omnibus accounts on behalf of their customers who hold positions in the Funds. These services would have been provided by the Funds’ transfer agent and other service providers if the shareholders’ accounts were maintained directly at the Funds’ transfer agent. Accordingly, the Funds have agreed to reimburse NGAM Distribution for all or a portion of the servicing fees paid to these intermediaries. The reimbursement amounts (sub-transfer agent fees) paid to NGAM Distribution are
| 98
Notes to Financial Statements (continued)
December 31, 2015
subject to a current per-account equivalent fee limit approved by the Funds’ Board, which is based on fees for similar services paid to the Funds’ transfer agent and other service providers. Class N shares do not bear such expenses.
For the year ended December 31, 2015, the sub-transfer agent fees (which are reflected in transfer agent fees and expenses in the Statements of Operations) for each Fund were as follows:
| | | | |
Fund | | Sub-Transfer
Agent Fees | |
Multi-Asset Income Fund | | $ | 102,123 | |
Intermediate Municipal Bond Fund | | | 7,600 | |
U.S. Equity Opportunities Fund | | | 197,693 | |
Multi-Asset Allocation Fund | | | 523 | |
As of December 31, 2015, the Funds owe NGAM Distribution the following reimbursements for sub-transfer agent fees (which are reflected in the Statements of Assets and Liabilities as payable to distributor):
| | | | |
Fund | | Reimbursements
of Sub-Transfer
Agent Fees | |
Multi-Asset Income Fund | | $ | 826 | |
Intermediate Municipal Bond Fund | | | 202 | |
U.S. Equity Opportunities Fund | | | 2,163 | |
Multi-Asset Allocation Fund | | | 7 | |
Sub-transfer agent fees attributable to Class A, Class B, Class C and Class Y are allocated on a pro rata basis to each class based on the relative net assets of each class to the total net assets of those classes.
e. Commissions. Commissions (including CDSCs) on Fund shares retained by NGAM Distribution during the year ended December 31, 2015 were as follows:
| | | | |
Fund | | Commissions | |
Multi-Asset Income Fund | | $ | 13,342 | |
Intermediate Municipal Bond Fund | | | 24,485 | |
U.S. Equity Opportunities Fund | | | 45,032 | |
Multi-Asset Allocation Fund | | | 2 | |
f. Trustees Fees and Expenses. The Trusts do not pay any compensation directly to their officers or Trustees who are directors, officers or employees of NGAM Advisors, NGAM Distribution, Natixis US or their affiliates. The Chairperson of the Board of Trustees receives a retainer fee at the annual rate of $300,000. The Chairperson does not receive any meeting attendance fees for Board of Trustees meetings or committee meetings that she attends. Each Independent Trustee (other than the Chairperson)
99 |
Notes to Financial Statements (continued)
December 31, 2015
receives, in the aggregate, a retainer fee at the annual rate of $130,000. Each Independent Trustee also receives a meeting attendance fee of $10,000 for each meeting of the Board of Trustees that he or she attends in person and $5,000 for each meeting of the Board of Trustees that he or she attends telephonically. In addition, the chairperson of the Contract Review Committee and the chairperson of the Audit Committee each receive an additional retainer fee at the annual rate of $17,500. The chairperson of the Governance Committee receives an additional retainer fee at the annual rate of $5,000. Each Contract Review Committee member is compensated $6,000 for each Committee meeting that he or she attends in person and $3,000 for each meeting that he or she attends telephonically. Each Audit Committee member is compensated $6,000 for each Committee meeting that he or she attends in person and $3,000 for each meeting that he or she attends telephonically. These fees are allocated among the funds in the Natixis Funds Trusts and Loomis Sayles Funds Trusts based on a formula that takes into account, among other factors, the relative net assets of each fund. Trustees are reimbursed for travel expenses in connection with attendance at meetings.
Effective January 1, 2016, the Chairperson of the Board will receive a retainer fee at the annual rate of $325,000 and each Independent Trustee (other than the Chairperson) will receive, in the aggregate, a retainer fee at the annual rate of $155,000. The chairperson of the Governance Committee will receive an additional retainer fee at the annual rate of $10,000. All other Trustee fees will remain unchanged.
A deferred compensation plan (the “Plan”) is available to the Trustees on a voluntary basis. Deferred amounts remain in the Funds until distributed in accordance with the provisions of the Plan. The value of a participating Trustee’s deferral account is based on theoretical investments of deferred amounts, on the normal payment dates, in certain funds of the Natixis Funds Trusts and Loomis Sayles Funds Trusts as designated by the participating Trustees. Changes in the value of participants’ deferral accounts are allocated pro rata among the funds in the Natixis Funds Trusts and Loomis Sayles Funds Trusts and are normally reflected as Trustees’ fees and expenses in the Statements of Operations. The portions of the accrued obligations allocated to the Funds under the Plan are reflected as Deferred Trustees’ fees in the Statements of Assets and Liabilities.
g. Reimbursement of Transfer Agent Fees and Expenses. Effective September 1, 2015, NGAM Advisors has given a binding contractual undertaking to Multi-Asset Income Fund to reimburse any and all transfer agency expenses for the Fund’s Class N shares. This undertaking is in effect through April 30, 2017 and is not subject to recovery under the expense limitation agreement described above.
For the period from September 1, 2015 through December 31, 2015, NGAM Advisors reimbursed the Fund $44 for transfer agency expenses related to Class N shares.
| 100
Notes to Financial Statements (continued)
December 31, 2015
h. Affiliated Ownership. As of December 31, 2015 Natixis US and affiliates held shares of Multi-Asset Allocation Fund and Multi-Asset Income Fund representing 96.56% and less than 0.01% of the Funds’ net assets, respectively. Investment activities of affiliated shareholders could have material impacts on the Funds.
i. Payment by Affiliates. During the year ended December 31, 2015, Natixis AM US reimbursed Multi-Asset Allocation Fund $17 for losses incurred in connection with a trading error. This amount is included in realized gains on futures contracts in the Statements of Operations. Additionally, NGAM Advisors reimbursed Multi-Asset Income Fund $20,510 for brokerage commissions incurred on portfolio transactions executed in conjunction with a strategy change.
7. Class-Specific Transfer Agent Fees and Expenses. For the period from September 1, 2015 through December 31, 2015, Multi-Asset Income Fund incurred the following class-specific transfer agent fees and expenses (including sub-transfer agent fees, where applicable)
| | | | | | | | | | | | | | | | |
| | | Class A | | | Class C | | | Class N | | | Class Y | |
Transfer Agent Fees and Expenses | | $ | 17,680 | | | $ | 11,497 | | | $ | 44 | | | $ | 2,819 | |
Transfer agent fees and expenses attributable to Class A, Class C, and Class Y are allocated on a pro rata basis to each class based on the relative net assets of each class to the total net assets of those classes. Transfer agent fees and expenses attributable to Class N are allocated to Class N.
All other Funds in this report allocate transfer agent fees and expenses on a pro rata basis based on the relative net assets of each class to the total net assets of those classes.
8. Line of Credit. Effective April 16, 2015, each Fund, together with certain other funds of Natixis Funds Trusts and Loomis Sayles Funds Trusts, participates in a $150,000,000 committed unsecured line of credit provided by State Street Bank. Any one Fund may borrow up to the full $150,000,000 under the line of credit (as long as all borrowings by all Funds in the aggregate do not exceed the $150,000,000 limit at any time). Interest is charged to each participating Fund based on its borrowings at a rate per annum equal to the greater of the Federal Funds rate or overnight LIBOR, plus 1.25%. In addition, a commitment fee of 0.15% per annum, payable at the end of each calendar quarter, is accrued and apportioned among the participating funds based on their average daily unused portion of the line of credit.
For the year ended December 31, 2015, none of the Funds had borrowings under this agreement.
101 |
Notes to Financial Statements (continued)
December 31, 2015
Prior to April 16, 2015, the committed unsecured line of credit was $200,000,000 with an individual limit of $125,000,000 for each Fund that participated in the line of credit. In addition, the commitment fee was 0.10% per annum, payable at the end of each calendar quarter.
9. Brokerage Commission Recapture. Certain Funds have entered into agreements with certain brokers whereby the brokers will rebate a portion of brokerage commissions. All amounts rebated by the brokers are returned to the Funds under such agreements and are included in realized gains on investments in the Statements of Operations. For the year ended December 31, 2015, amounts rebated under these agreements were as follows:
| | | | |
Fund | | Rebates | |
Multi-Asset Income Fund | | $ | 906 | |
U.S. Equity Opportunities Fund | | | 6,865 | |
10. Concentration of Risk. Each Fund’s investments in foreign securities are subject to foreign currency fluctuations, higher volatility than U.S. securities, varying degrees of regulation and limited liquidity. Greater political, economic, credit and information risks are also associated with foreign securities.
The Multi-Asset Allocation Fund is non-diversified, which means that it is not limited under the 1940 Act to a percentage of assets that it may invest in any one issuer. Because the Fund may invest in the securities of a limited number of issuers, an investment in the Fund may involve a higher degree of risk than would be present in a diversified portfolio.
11. Interest Expense. Multi-Asset Allocation Fund incurs interest expense on net cash and foreign currency debit balances, if any, for accounts held at brokers. Interest expense incurred for the year ended December 31, 2015 is reflected on the Statements of Operations.
| 102
Notes to Financial Statements (continued)
December 31, 2015
12. Capital Shares. Each Fund may issue an unlimited number of shares of beneficial interest, without par value. Transactions in capital shares were as follows:
| | | | | | | | | | | | | | | | |
| |
| Year Ended
December 31, 2015 |
| |
| Year Ended
December 31, 2014 |
|
Multi-Asset Income Fund | | | Shares | | | | Amount | | | | Shares | | | | Amount | |
| Class A | | | | | | | | | | | | | | | | |
Issued from the sale of shares | | | 1,847,041 | | | $ | 25,047,639 | | | | 3,587,606 | | | $ | 46,772,806 | |
Issued in connection with the reinvestment of distributions | | | 135,940 | | | | 1,788,328 | | | | 145,859 | | | | 1,902,832 | |
Redeemed | | | (5,302,356 | ) | | | (70,529,840 | ) | | | (1,966,178 | ) | | | (25,485,685 | ) |
| | | | | | | | | | | | | | | | |
Net change | | | (3,319,375 | ) | | $ | (43,693,873 | ) | | | 1,767,287 | | | $ | 23,189,953 | |
| | | | | | | | | | | | | | | | |
| Class C | | | | | | | | | | | | | | | | |
Issued from the sale of shares | | | 809,470 | | | $ | 10,798,585 | | | | 641,777 | | | $ | 8,362,876 | |
Issued in connection with the reinvestment of distributions | | | 42,974 | | | | 560,787 | | | | 41,434 | | | | 539,625 | |
Redeemed | | | (1,076,310 | ) | | | (14,183,914 | ) | | | (711,476 | ) | | | (9,151,769 | ) |
| | | | | | | | | | | | | | | | |
Net change | | | (223,866 | ) | | $ | (2,824,542 | ) | | | (28,265 | ) | | $ | (249,268 | ) |
| | | | | | | | | | | | | | | | |
| Class N* | | | | | | | | | | | | | | | | |
Issued from the sale of shares | | | 79 | | | $ | 1,001 | | | | — | | | $ | — | |
Issued in connection with the reinvestment of distributions | | | 1 | | | | 14 | | | | — | | | | — | |
| | | | | | | | | | | | | | | | |
Net change | | | 80 | | | $ | 1,015 | | | | — | | | $ | — | |
| | | | | | | | | | | | | | | | |
| Class Y | | | | | | | | | | | | | | | | |
Issued from the sale of shares | | | 1,039,119 | | | $ | 14,008,487 | | | | 1,164,871 | | | $ | 15,288,075 | |
Issued in connection with the reinvestment of distributions | | | 31,764 | | | | 417,023 | | | | 10,893 | | | | 143,867 | |
Redeemed | | | (1,266,925 | ) | | | (16,678,449 | ) | | | (149,655 | ) | | | (1,908,448 | ) |
| | | | | | | | | | | | | | | | |
Net change | | | (196,042 | ) | | $ | (2,252,939 | ) | | | 1,026,109 | | | $ | 13,523,494 | |
| | | | | | | | | | | | | | | | |
Increase (decrease) from capital share transactions | | | (3,739,203 | ) | | $ | (48,770,339 | ) | | | 2,765,131 | | | $ | 36,464,179 | |
| | | | | | | | | | | | | | | | |
| | | | |
Intermediate Municipal Bond Fund | | | | | | | | | | | | | | | | |
| Class A | | | | | | | | | | | | | | | | |
Issued from the sale of shares | | | 592,244 | | | $ | 5,929,603 | | | | 440,562 | | | $ | 4,404,696 | |
Issued in connection with the reinvestment of distributions | | | 4,131 | | | | 41,346 | | | | 1,807 | | | | 17,881 | |
Redeemed | | | (199,347 | ) | | | (1,988,883 | ) | | | (312,110 | ) | | | (3,108,236 | ) |
| | | | | | | | | | | | | | | | |
Net change | | | 397,028 | | | $ | 3,982,066 | | | | 130,259 | | | $ | 1,314,341 | |
| | | | | | | | | | | | | | | | |
| Class C | | | | | | | | | | | | | | | | |
Issued from the sale of shares | | | 516,208 | | | $ | 5,183,929 | | | | 221,952 | | | $ | 2,199,823 | |
Issued in connection with the reinvestment of distributions | | | 478 | | | | 4,779 | | | | 125 | | | | 1,241 | |
Redeemed | | | (109,322 | ) | | | (1,092,827 | ) | | | (5,445 | ) | | | (53,806 | ) |
| | | | | | | | | | | | | | | | |
Net change | | | 407,364 | | | $ | 4,095,881 | | | | 216,632 | | | $ | 2,147,258 | |
| | | | | | | | | | | | | | | | |
| Class Y | | | | | | | | | | | | | | | | |
Issued from the sale of shares | | | 6,857,887 | | | $ | 68,754,803 | | | | 874,599 | | | $ | 8,630,106 | |
Issued in connection with the reinvestment of distributions | | | 19,332 | | | | 193,727 | | | | 31,302 | | | | 308,641 | |
Redeemed | | | (3,102,593 | ) | | | (31,008,201 | ) | | | (349,221 | ) | | | (3,485,532 | ) |
| | | | | | | | | | | | | | | | |
Net change | | | 3,774,626 | | | $ | 37,940,329 | | | | 556,680 | | | $ | 5,453,215 | |
| | | | | | | | | | | | | | | | |
Increase (decrease) from capital share transactions | | | 4,579,018 | | | $ | 46,018,276 | | | | 903,571 | | | $ | 8,914,814 | |
| | | | | | | | | | | | | | | | |
| * | From commencement of Class operations on August 31, 2015 through December 31, 2015. |
103 |
Notes to Financial Statements (continued)
December 31, 2015
12. Capital Shares (continued).
| | | | | | | | | | | | | | | | |
| |
| Year Ended
December 31, 2015 |
| |
| Year Ended
December 31, 2014 |
|
U.S. Equity Opportunities Fund | | | Shares | | | | Amount | | | | Shares | | | | Amount | |
| Class A | | | | | | | | | | | | | | | | |
Issued from the sale of shares | | | 1,905,649 | | | $ | 53,185,247 | | | | 1,244,707 | | | $ | 40,683,381 | |
Issued in connection with the reinvestment of distributions | | | 717,539 | | | | 19,984,422 | | | | 3,733,383 | | | | 104,238,574 | |
Redeemed | | | (1,954,194 | ) | | | (54,802,400 | ) | | | (1,579,897 | ) | | | (53,911,455 | ) |
| | | | | | | | | | | | | | | | |
Net change | | | 668,994 | | | $ | 18,367,269 | | | | 3,398,193 | | | $ | 91,010,500 | |
| | | | | | | | | | | | | | | | |
| Class B | | | | | | | | | | | | | | | | |
Issued from the sale of shares | | | 451 | | | $ | 9,116 | | | | 4,557 | | | $ | 112,874 | |
Issued in connection with the reinvestment of distributions | | | 2,049 | | | | 41,836 | | | | 54,550 | | | | 1,140,434 | |
Redeemed | | | (158,367 | ) | | | (3,248,117 | ) | | | (181,197 | ) | | | (5,000,162 | ) |
| | | | | | | | | | | | | | | | |
Net change | | | (155,867 | ) | | $ | (3,197,165 | ) | | | (122,090 | ) | | $ | (3,746,854 | ) |
| | | | | | | | | | | | | | | | |
| Class C | | | | | | | | | | | | | | | | |
Issued from the sale of shares | | | 731,050 | | | $ | 14,968,474 | | | | 639,156 | | | $ | 16,511,165 | |
Issued in connection with the reinvestment of distributions | | | 166,686 | | | | 3,355,438 | | | | 756,094 | | | | 15,641,654 | |
Redeemed | | | (447,307 | ) | | | (9,204,165 | ) | | | (371,115 | ) | | | (9,752,500 | ) |
| | | | | | | | | | | | | | | | |
Net change | | | 450,429 | | | $ | 9,119,747 | | | | 1,024,135 | | | $ | 22,400,319 | |
| | | | | | | | | | | | | | | | |
| Class Y | | | | | | | | | | | | | | | | |
Issued from the sale of shares | | | 1,585,958 | | | $ | 50,501,292 | | | | 837,095 | | | $ | 31,611,584 | |
Issued in connection with the reinvestment of distributions | | | 79,841 | | | | 2,543,672 | | | | 262,503 | | | | 8,306,725 | |
Redeemed | | | (638,372 | ) | | | (20,615,184 | ) | | | (571,477 | ) | | | (21,233,215 | ) |
| | | | | | | | | | | | | | | | |
Net change | | | 1,027,427 | | | $ | 32,429,780 | | | | 528,121 | | | $ | 18,685,094 | |
| | | | | | | | | | | | | | | | |
Increase (decrease) from capital share transactions | | | 1,990,983 | | | $ | 56,719,631 | | | | 4,828,359 | | | $ | 128,349,059 | |
| | | | | | | | | | | | | | | | |
| | |
| |
| Year Ended
December 31, 2015 |
| |
| Year Ended
December 31, 2014(a) |
|
Multi-Asset Allocation Fund | | | Shares | | | | Amount | | | | Shares | | | | Amount | |
| Class A | | | | | | | | | | | | | | | | |
Issued from the sale of shares | | | 27,184 | | | $ | 256,150 | | | | 101 | | | $ | 1,011 | |
Issued in connection with the reinvestment of distributions | | | 46 | | | | 454 | | | | — | | | | — | |
Redeemed | | | (101 | ) | | | (991 | ) | | | (1 | ) | | | (10 | ) |
| | | | | | | | | | | | | | | | |
Net change | | | 27,129 | | | $ | 255,613 | | | | 100 | | | $ | 1,001 | |
| | | | | | | | | | | | | | | | |
| Class C | | | | | | | | | | | | | | | | |
Issued from the sale of shares | | | 26,919 | | | $ | 257,993 | | | | 2,822 | | | $ | 27,973 | |
Issued in connection with the reinvestment of distributions | | | 58 | | | | 577 | | | | — | | | | — | |
Redeemed | | | (7,350 | ) | | | (70,270 | ) | | | (1 | ) | | | (10 | ) |
| | | | | | | | | | | | | | | | |
Net change | | | 19,627 | | | $ | 188,300 | | | | 2,821 | | | $ | 27,963 | |
| | | | | | | | | | | | | | | | |
| Class Y | | | | | | | | | | | | | | | | |
Issued from the sale of shares | | | 115,322 | | | $ | 1,137,630 | | | | 5,033,633 | | | $ | 50,330,682 | |
Issued in connection with the reinvestment of distributions | | | 66,280 | | | | 658,156 | | | | — | | | | — | |
Redeemed | | | (18,663 | ) | | | (174,596 | ) | | | (1 | ) | | | (10 | ) |
| | | | | | | | | | | | | | | | |
Net change | | | 162,939 | | | $ | 1,621,190 | | | | 5,033,632 | | | $ | 50,330,672 | |
| | | | | | | | | | | | | | | | |
Increase (decrease) from capital share transactions | | | 209,695 | | | $ | 2,065,103 | | | | 5,036,553 | | | $ | 50,359,636 | |
| | | | | | | | | | | | | | | | |
| (a) | From commencement of operations on July 23, 2014 through December 31, 2014. |
13. Subsequent Event. On September 10, 2015, the Board of Trustees approved the early conversion of all of the U.S. Equity Opportunities Fund’s remaining Class B shares into Class A shares, effective at the close of business on January 11, 2016, at which point Class B shares will be terminated.
| 104
Report of Independent Registered Public Accounting Firm
To the Board of Trustees of Natixis Funds Trust I and Natixis Funds Trust II and Shareholders of Loomis Sayles Multi-Asset Income Fund (formerly Natixis Diversified Income Fund), McDonnell Intermediate Municipal Bond Fund, Natixis U.S. Equity Opportunities Fund, and SeeyondSM Multi-Asset Allocation Fund:
In our opinion, the accompanying statement of assets and liabilities, including the portfolios of investments, and the related statements of operations and of changes in net assets and the financial highlights present fairly, in all material respects, the financial position of the Loomis Sayles Multi-Asset Income Fund (formerly Natixis Diversified Income Fund) and Natixis U.S. Equity Opportunities Fund, each a series of Natixis Funds Trust I; and McDonnell Intermediate Municipal Bond Fund and SeeyondSM Multi-Asset Allocation Fund, each a series of Natixis Funds Trust II (collectively, the “Funds”) at December 31, 2015, and the results of each of their operations, the changes in each of their net assets and the financial highlights for each of the periods indicated, in conformity with accounting principles generally accepted in the United States of America. These financial statements and financial highlights (hereafter referred to as “financial statements”) are the responsibility of the Funds’ management. Our responsibility is to express an opinion on these financial statements based on our audits. We conducted our audits of these financial statements in accordance with the standards of the Public Company Accounting Oversight Board (United States). Those standards require that we plan and perform the audit to obtain reasonable assurance about whether the financial statements are free of material misstatement. An audit includes examining, on a test basis, evidence supporting the amounts and disclosures in the financial statements, assessing the accounting principles used and significant estimates made by management, and evaluating the overall financial statement presentation. We believe that our audits, which included confirmation of securities at December 31, 2015 by correspondence with the custodian, agent banks and brokers, and the application of alternative auditing procedures where securities purchased had not been received, provide a reasonable basis for the opinion expressed above.
PricewaterhouseCoopers LLP
Boston, Massachusetts
February 23, 2016
105 |
2015 U.S. Tax Distribution Information to Shareholders (Unaudited)
Corporate Dividends Received Deduction. For the fiscal year ended December 31, 2015, a percentage of dividends distributed by the Funds listed below qualify for the dividends received deduction for corporate shareholders. These percentages are as follows:
| | | | |
Fund | | Qualifying
Percentage | |
Multi-Asset Income | | | 45.71 | % |
U.S. Equity Opportunities | | | 81.32 | % |
Capital Gains Distributions. Pursuant to Internal Revenue Section 852(b), the following Funds paid distributions, which have been designated as capital gains distributions for the fiscal year ended December 31, 2015.
| | | | |
Fund | | Amount | |
U.S. Equity Opportunities | | $ | 20,618,016 | |
Multi-Asset Allocation | | | 659,252 | |
Qualified Dividend Income. For the fiscal year ended December 31, 2015, a percentage of the ordinary income dividends paid by the Funds are considered qualified dividend income eligible for reduced tax rates. These lower rates range from 0% to 20% depending on an individual’s tax bracket. If the Funds paid a distribution during calendar year 2015, complete information will be reported in conjunction with Form 1099-DIV. These percentages are noted below:
| | | | |
Fund | | Qualifying
Percentage | |
Multi-Asset Income | | | 50.72 | % |
U.S. Equity Opportunities | | | 100.00 | % |
Exempt Interest Dividends
During the year ended December 31, 2015, Intermediate Municipal Bond paid dividends to shareholders from net investment income, of which 100.0% are designated as exempt interest dividends for federal tax purposes. However, state and local taxes differ from state to state and a portion of the dividends may be subject to the individual Alternative Minimum Tax, so it is suggested that you consult your own tax adviser.
| 106
Trustee and Officer Information
The tables below provide certain information regarding the trustees and officers of Natixis Funds Trust I and Natixis Funds Trust II (the “Trusts”). Unless otherwise indicated, the address of all persons below is 399 Boylston Street, Boston, MA 02116. The Funds’ Statement of Additional Information includes additional information about the trustees of the Trust and is available by calling Natixis Funds at 800-225-5478.
| | | | | | | | |
Name and Year of
Birth | | Position(s) Held
with the Trusts,
Length of Time
Served and Term
of Office1 | | Principal
Occupation(s)
During Past
5 Years | | Number of
Portfolios in
Fund Complex
Overseen2
and Other
Directorships Held
During Past
5 Years | | Experience,
Qualifications,
Attributes, Skills
for Board
Membership |
| | | |
| INDEPENDENT TRUSTEES | | | | | | |
| | | | |
Kenneth A. Drucker (1945) | | Trustee since 2008 Chairperson of the Audit Committee and Governance Committee Member | | Retired | | 42 None | | Significant experience on the Board and on the boards of other business organizations (including at investment companies); executive experience (including as treasurer of an aerospace, automotive, and metal manufacturing corporation) |
| | | | |
| Edmond J. English (1953) | | Trustee since 2013 Audit Committee Member | | Chief Executive Officer of Bob’s Discount Furniture (retail) | | 42 Formerly, Director, BJ’s Wholesale Club (retail) | | Experience on the Board and significant experience on the boards of other business organizations (including at a retail company and a bank); executive experience (including at a retail company) |
107 |
Trustee and Officer Information
| | | | | | | | |
Name and Year of
Birth | | Position(s) Held
with the Trusts,
Length of Time
Served and Term
of Office1 | | Principal
Occupation(s)
During Past
5 Years | | Number of
Portfolios in
Fund Complex
Overseen2
and Other
Directorships Held
During Past
5 Years | | Experience,
Qualifications,
Attributes, Skills
for Board
Membership |
| | | |
INDEPENDENT TRUSTEES continued | | | | | | |
| | | | |
Richard A. Goglia (1951) | | Trustee since 2015 Audit Committee Member | | Retired; formerly, Vice President and Treasurer of Raytheon Company (defense) | | 42 None | | Experience on the Board and executive experience (including his role as vice president and treasurer of a defense company and experience at a financial services company) |
| | | | |
Wendell J. Knox (1948) | | Trustee since 2009 Contract Review Committee Member and Governance Committee Member | | Director of Abt Associates Inc. (research and consulting) | | 42 Director, Eastern Bank (bank); Director, The Hanover Insurance Group (property and casualty insurance) | | Significant experience on the Board and on the boards of other business organizations (including at a bank and at a property and casualty insurance firm); executive experience (including roles as president and chief executive officer of a research and consulting company) |
| 108
Trustee and Officer Information
| | | | | | | | |
Name and Year of
Birth | | Position(s) Held
with the Trusts,
Length of Time
Served and Term
of Office1 | | Principal
Occupation(s)
During Past
5 Years | | Number of
Portfolios in
Fund Complex
Overseen2
and Other
Directorships Held
During Past
5 Years | | Experience,
Qualifications,
Attributes, Skills
for Board
Membership |
| | | |
INDEPENDENT TRUSTEES continued | | | | | | |
| | | | |
| Martin T. Meehan (1956) | | Trustee since 2012 Contract Review Committee Member | | President, University of Massachusetts; formerly, Chancellor and faculty member, University of Massachusetts Lowell | | 42 None | | Experience on the Board and on the boards of other business organizations; experience as President of the University of Massachusetts; government experience (including as a member of the U.S. House of Representatives); academic experience |
| | | | |
Sandra O. Moose (1942) | | Chairperson of the Board of Trustees since November 2005 Trustee since 1982 for Natixis Funds Trust I (including its predecessors) and since 1993 for Natixis Funds Trust II Ex Officio member of the Audit Committee, the Contract Review Committee and the Governance Committee | | President, Strategic Advisory Services (management consulting) | | 42 Formerly, Director, AES Corporation (international power company); formerly, Director, Verizon Communications (telecommunications company) | | Significant experience on the Board and on the boards of other business organizations (including at a telecommunications company, an international power company and a specialty chemicals corporation); executive experience (including at a management consulting company) |
109 |
Trustee and Officer Information
| | | | | | | | |
Name and Year of
Birth | | Position(s) Held
with the Trusts,
Length of Time
Served and Term
of Office1 | | Principal
Occupation(s)
During Past
5 Years | | Number of
Portfolios in
Fund Complex
Overseen2
and Other
Directorships Held
During Past
5 Years | | Experience,
Qualifications,
Attributes, Skills
for Board
Membership |
| | | |
INDEPENDENT TRUSTEES continued | | | | | | |
| | | | |
Erik R. Sirri (1958) | | Trustee since 2009 Audit Committee Member | | Professor of Finance at Babson College | | 42 None | | Significant experience on the Board; experience as Director of the Division of Trading and Markets at the Securities and Exchange Commission; academic experience; training as an economist |
| | | | |
Peter J. Smail (1952) | | Trustee since 2009 Chairperson of the Contract Review Committee and Governance Committee Member | | Retired | | 42 None | | Significant experience on the Board; mutual fund industry and executive experience (including roles as president and chief executive officer for an investment adviser) |
| | | | |
Cynthia L. Walker (1956) | | Trustee since 2005 Chairperson of the Governance Committee and Contract Review Committee Member | | Deputy Dean for Finance and Administration, Yale University School of Medicine | | 42 None | | Significant experience on the Board; executive experience in a variety of academic organizations (including roles as dean for finance and administration) |
| 110
Trustee and Officer Information
| | | | | | | | |
Name and Year of
Birth | | Position(s) Held
with the Trusts,
Length of Time
Served and Term
of Office1 | | Principal
Occupation(s)
During Past
5 Years | | Number of
Portfolios in
Fund Complex
Overseen2
and Other
Directorships Held
During Past
5 Years | | Experience,
Qualifications,
Attributes, Skills
for Board
Membership |
| | | |
| INTERESTED TRUSTEES | | | | | | |
| | | | |
Kevin P. Charleston3 (1965) One Financial Center Boston, MA 02111 | | Trustee since 2015 | | President, Chief Executive Officer and Director; formerly, Chief Financial Officer, Loomis, Sayles & Company, L.P. | | 42 None | | Continuing service as President, Chief Executive Officer and Director of Loomis, Sayles & Company, L.P. |
| | | | |
| David L. Giunta4 (1965) | | Trustee since 2011 President and Chief Executive Officer since 2008 | | President and Chief Executive Officer, NGAM Distribution Corporation, NGAM Advisors, L.P. and NGAM Distribution, L.P. | | 42 None | | Significant experience on the Board; continuing experience as President and Chief Executive Officer of NGAM Advisors, L.P. |
| | | | |
John T. Hailer5 (1960) | | Trustee since 2000 | | President and Chief Executive Officer – U.S. and Asia, Natixis Global Asset Management, L.P. | | 42 None | | Significant experience on the Board; continuing experience as President and Chief Executive Officer – U.S. and Asia, Natixis Global Asset Management, L.P. |
| 1 | Each trustee serves until retirement, resignation or removal from the Board. The current retirement age is 75. The position of Chairperson of the Board is appointed for a three-year term. Ms. Moose was appointed to serve an additional three-year term as the Chairperson of the Board on December 13, 2013. |
| 2 | The trustees of the Trust serve as trustees of a fund complex that includes all series of the Natixis Funds Trust I, Natixis Funds Trust II, Natixis Funds Trust IV and Gateway Trust (collectively, the “Natixis Funds Trusts”), Loomis Sayles Funds I and Loomis Sayles Funds II (collectively, the “Loomis Sayles Funds Trusts”) (collectively, the “Fund Complex”). |
| 3 | Mr. Charleston is deemed an “interested person” of the Trust because he holds the following positions with an affiliated person of the Trust: President and Chief Executive Officer of Loomis, Sayles & Company, L.P. |
| 4 | Mr. Giunta is deemed an “interested person” of the Trust because he holds the following positions with an affiliated person of the Trust: President and Chief Executive Officer of NGAM Distribution Corporation, NGAM Advisors, L.P. and NGAM Distribution, L.P. |
| 5 | Mr. Hailer is deemed an “interested person” of the Trust because he holds the following positions with an affiliated person of the Trust: President and Chief Executive Officer – U.S. and Asia, Natixis Global Asset Management, L.P. |
111 |
Trustee and Officer Information
| | | | | | |
Name and Year of Birth | | Position(s) Held with the Trusts | | Term of Office1 and
Length of Time Served | | Principal Occupation(s) During Past 5 Years2 |
| | |
| OFFICERS OF THE TRUST | | | | |
| | | |
Coleen Downs Dinneen (1960) | | Secretary, Clerk and Chief Legal Officer | | Since September 2004 | | Executive Vice President, General Counsel, Secretary and Clerk, NGAM Distribution Corporation, NGAM Advisors, L.P. and NGAM Distribution, L.P. |
| | | |
Russell L. Kane (1969) | | Chief Compliance Officer, Assistant Secretary and Anti-Money Laundering Officer | | Chief Compliance Officer since May 2006; Assistant Secretary since June 2004; and Anti-Money Laundering Officer since April 2007 | | Chief Compliance Officer for Mutual Funds, Senior Vice President, Deputy General Counsel, Assistant Secretary and Assistant Clerk, NGAM Distribution Corporation, NGAM Advisors, L.P. and NGAM Distribution, L.P. |
| | | |
Michael C. Kardok (1959) | | Treasurer, Principal Financial and Accounting Officer | | Since October 2004 | | Senior Vice President, NGAM Advisors, L.P. and NGAM Distribution, L.P. |
| 1 | Each officer of the Trust serves for an indefinite term in accordance with the Trust’s current by-laws until the date his or her successor is elected and qualified, or until he or she sooner dies, retires, is removed or becomes disqualified. |
| 2 | Each person listed above, except as noted, holds the same position(s) with the Fund Complex. Previous positions during the past five years with NGAM Distribution, L.P., NGAM Advisors, L.P. or Loomis, Sayles & Company, L.P. are omitted, if not materially different from a trustee’s or officer’s current position with such entity. |
| 112
The Registrant has adopted a code of ethics that applies to the Registrant’s principal executive officer, principal financial officer and persons performing similar functions. There have been no amendments or waivers of the Registrant’s code of ethics during the period.
| Item 3. | Audit Committee Financial Expert. |
The Board of Trustees of the Registrant has established an audit committee. Mr. Kenneth A. Drucker, Mr. Edmond J. English, Mr. Richard A. Goglia, and Mr. Erik R. Sirri are members of the audit committee and have been designated as “audit committee financial experts” by the Board of Trustees. Each of these individuals is also an Independent Trustee of the Registrant.
| Item 4. | Principal Accountant Fees and Services. |
Fees billed by the Principal Accountant for services rendered to the Registrant.
The table below sets forth fees billed by the principal accountant, PricewaterhouseCoopers LLP, for the past two fiscal years for professional services rendered in connection with a) the audit of the Registrant’s annual financial statements and services provided in connection with regulatory filings; b) audit-related services (including services that are reasonably related to the performance of the audit of the Registrant’s financial statements but not reported under “Audit Fees”); c) tax compliance, tax advice and tax planning and d) all other fees billed for professional services rendered by the principal accountant to the Registrant, other than the services provided as reported as a part of (a) through (c) of this Item.
| | | | | | | | | | | | | | | | | | | | | | | | | | | | | | | | |
| | | Audit fees | | | Audit-related fees1 | | | Tax fees2 | | | All other fees | |
| | | 1/1/14 –
12/31/14 | | | 1/1/15 –
12/31/15 | | | 1/1/14 –
12/31/14 | | | 1/1/15 –
12/31/15 | | | 1/1/14 –
12/31/14 | | | 1/1/15 –
12/31/15 | | | 1/1/14 –
12/31/14 | | | 1/1/15 –
12/31/15 | |
Natixis Funds Trust I | | $ | 170,582 | | | $ | 171,554 | | | $ | 310 | | | $ | 368 | | | $ | 47,525 | | | $ | 70,677 | | | $ | — | | | $ | — | |
| | 1. | Audit-related fees consist of: |
2014 & 2015 – performance of agreed-upon procedures related to the Registrant’s deferred compensation plan.
2014 & 2015 – review of the Registrant’s tax returns, quarterly review of asset diversification tests and preparation of application for change in accounting method (2015 only).
Aggregate fees billed to the Registrant for non-audit services during 2014 and 2015 were $47,835 and $71,045, respectively.
Fees billed by the Principal Accountant for services rendered to the Adviser and Control Affiliates.
The following table sets forth the fees billed by the Registrant’s principal accountant for non-audit services rendered to Capital Growth Management Limited Partnership (“CGM”), Loomis, Sayles & Company, L.P. (“Loomis”), NGAM Advisors, L.P. (“NGAM”) and entities controlling, controlled by or under common control with CGM, Loomis and NGAM (“Control Affiliates”) that provide ongoing services to the Registrant, for engagements that related directly to the operations and financial reporting of the Registrant for the last two fiscal years.
| | | | | | | | | | | | | | | | | | | | | | | | |
| | | Audit-related fees | | | Tax fees | | | All other fees | |
| | | 1/1/14–
12/31/14 | | | 1/1/15–
12/31/15 | | | 1/1/14–
12/31/14 | | | 1/1/15–
12/31/15 | | | 1/1/14–
12/31/14 | | | 1/1/15–
12/31/15 | |
Control Affiliates | | $ | — | | | $ | — | | | $ | — | | | $ | — | | | $ | — | | | $ | — | |
The following table sets forth the aggregate fees billed by the Registrant’s principal accountant for non-audit services rendered to CGM, Loomis, NGAM and Control Affiliates that provide ongoing services to the Registrant, for the last two fiscal years, including the fees disclosed in the table above.
| | | | | | | | |
| | | Aggregate Non-Audit Fees | |
| �� | | 1/1/14 –
12/31/14 | | | 1/1/15 –
12/31/15 | |
Control Affiliates | | $ | 426,200 | | | $ | 257,566 | |
None of the services described above were approved pursuant to (c)(7)(i)(C) of Regulation S-X.
Audit Committee Pre Approval Policies.
Annually, the Registrant’s Audit Committee reviews the audit, audit-related, tax and other non-audit services together with the projected fees, for services proposed to be rendered to the Trust and/or other entities for which pre-approval is required during the upcoming year. Any subsequent revisions to already pre-approved services or fees (including fee increases) and requests for pre-approval of new services would be presented for consideration quarterly as needed.
If, in the opinion of management, a proposed engagement by the Registrant’s independent accountants needs to commence before the next regularly scheduled Audit Committee meeting, any member of the Audit Committee who is an independent Board member is authorized to pre-approve the engagement, but only for engagements to provide audit, audit related and tax services. This approval is subject to review of the full Audit Committee at its next quarterly meeting. All other engagements require the approval of all the members of the Audit Committee.
| Item 5. | Audit Committee of Listed Registrants. |
Not applicable.
| Item 6. | Schedule of Investments. |
Included as part of the Report to Shareholders filed as Item 1 herewith.
| Item 7. | Disclosure of Proxy Voting Policies and Procedures for Closed-End Management Investment Companies. |
Not applicable.
| Item 8. | Portfolio Managers of Closed-End Management Investment Companies. |
Not applicable.
| Item 9. | Purchases of Equity Securities by Closed-End Management Investment Companies and Affiliated Purchasers. |
Not applicable.
| Item 10. | Submission of Matters to a Vote of Securities Holders. |
There were no material changes to the procedures by which shareholders may recommend nominees to the Registrant’s Board of Trustees.
| Item 11. | Controls and Procedures. |
The Registrant’s principal executive officer and principal financial officer have concluded that the Registrant’s disclosure controls and procedures are sufficient to ensure that information required to be disclosed by the Registrant in this Form N-CSR was recorded, processed, summarized and reported within the time periods specified in the Securities and Exchange Commission’s rules and forms, based upon such officers’ evaluation of these controls and procedures as of a date within 90 days of the filing date of the report.
There were no changes in the Registrant’s internal control over financial reporting that occurred during the Registrant’s last fiscal quarter of the period covered by this report that has materially affected, or is reasonably likely to materially affect, the Registrant’s internal control over financial reporting.
| | | | | | |
| | (a) | | (1) | | Code of Ethics required by Item 2 hereof, filed herewith as exhibit (a)(1). |
| | (a) | | (2) | | Certifications of Principal Executive Officer and Principal Financial Officer pursuant to Rule 30a-2(a) under the Investment Company Act of 1940 [17 CFR 270.30a-2(a)], filed herewith as Exhibits (a)(2)(1) and (a)(2)(2), respectively. |
| | (a) | | (3) | | Not applicable. |
| | (b) | | | | Certifications of Principal Executive Officer and Principal Financial Officer pursuant to Section 906 of Sarbanes-Oxley Act of 2002 are filed herewith as Exhibit (b). |
SIGNATURES
Pursuant to the requirements of the Securities Exchange Act of 1934 and the Investment Company Act of 1940, the Registrant has duly caused this report to be signed on its behalf by the undersigned, thereunto duly authorized.
| | |
Natixis Funds Trust I |
| |
| By: | | /s/ David L. Giunta |
| |
Name: | | David L. Giunta |
Title: | | President and Chief Executive Officer |
Date: | | February 23, 2016 |
Pursuant to the requirements of the Securities Exchange Act of 1934 and the Investment Company Act of 1940, this report has been signed by the following persons on behalf of the Registrant and in the capacities and on the dates indicated.
| | |
| By: | | /s/ David L. Giunta |
| |
Name: | | David L. Giunta |
Title: | | President and Chief Executive Officer |
Date: | | February 23, 2016 |
| | |
| |
| By: | | /s/ Michael C. Kardok |
| |
Name: | | Michael C. Kardok |
Title: | | Treasurer |
Date: | | February 23, 2016 |